Amy J. Lee
Form N-CSR is to be used by management investment companies to file reports with the Commission not later than 10 days after the transmission to stockholders of any report that is required to be transmitted to stockholders under Rule 30e-1 under the Investment Company Act of 1940 (17 CFR 270.30e-1). The Commission may use the information provided on Form N-CSR in its regulatory, disclosure review, inspection, and policymaking roles.
A registrant is required to disclose the information specified by Form N-CSR, and the Commission will make this information public. A registrant is not required to respond to the collection of information contained in Form N-CSR unless the Form displays a currently valid Office of Management and Budget ("OMB") control number. Please direct comments concerning the accuracy of the information collection burden estimate and any suggestions for reducing the burden to Secretary, Securities and Exchange Commission, 450 Fifth Street, NW, Washington, DC 20549-0609. The OMB has reviewed this collection of information under the clearance requirements of 44 U.S.C. § 3507.
Item 1. Reports to Stockholders.
The registrant’s annual report transmitted to shareholders pursuant to Rule 30e-1 under the Investment Company Act of 1940, as amended (the “Investment Company Act”), is as follows:
3.31.2015
Rydex Funds Annual Report
| Sector Funds |
| Banking Fund | | |
| Basic Materials Fund | | |
| Biotechnology Fund | | |
| Consumer Products Fund | | |
| Electronics Fund | | |
| Energy Fund | | |
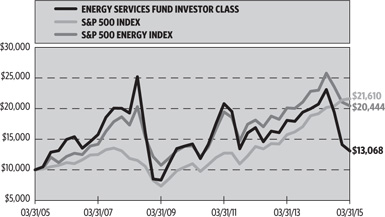
| Energy Services Fund | | |
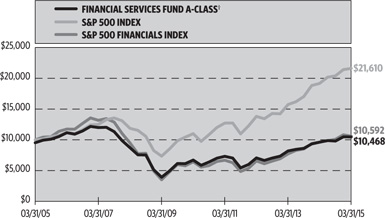
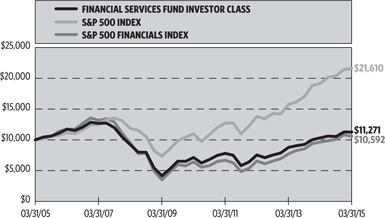
| Financial Services Fund | | |
| Health Care Fund | | |
| Internet Fund | | |
| Leisure Fund | | |
| Precious Metals Fund | | |
| Real Estate Fund | | |
| Retailing Fund | | |
| Technology Fund | | |
| Telecommunications Fund | | |
| Transportation Fund | | |
| Utilities Fund | | |
| RSECF-ANN-2-0315x0316 | guggenheiminvestments.com |
TABLE OF CONTENTS
| DEAR SHAREHOLDER | 2 |
| ECONOMIC AND MARKET OVERVIEW | 3 |
| ABOUT SHAREHOLDERS’ FUND EXPENSES | 6 |
| BANKING FUND | 11 |
| BASIC MATERIALS FUND | 19 |
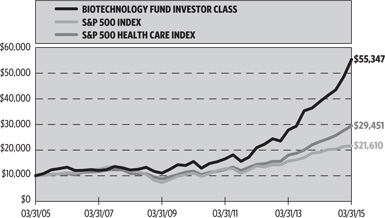
| BIOTECHNOLOGY FUND | 27 |
| CONSUMER PRODUCTS FUND | 35 |
| ELECTRONICS FUND | 44 |
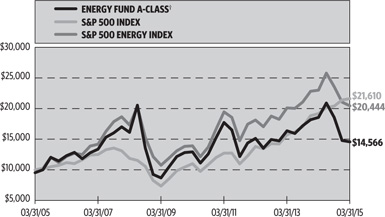
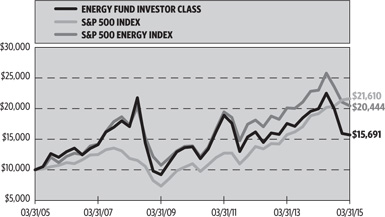
| ENERGY FUND | 52 |
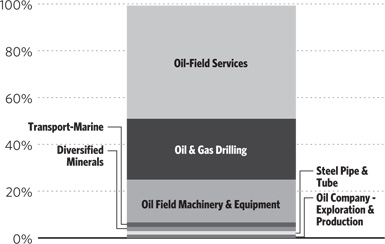
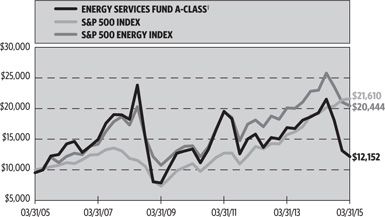
| ENERGY SERVICES FUND | 60 |
| FINANCIAL SERVICES FUND | 67 |
| HEALTH CARE FUND | 77 |
| INTERNET FUND | 87 |
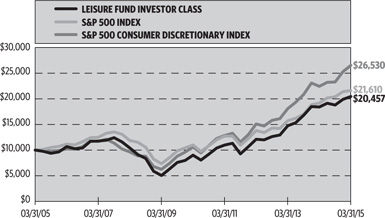
| LEISURE FUND | 95 |
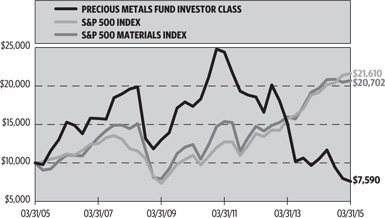
| PRECIOUS METALS FUND | 105 |
| REAL ESTATE FUND | 113 |
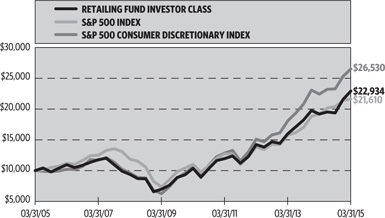
| RETAILING FUND | 122 |
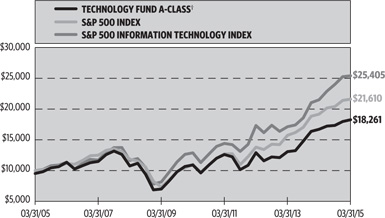
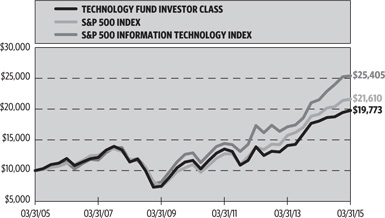
| TECHNOLOGY FUND | 131 |
| TELECOMMUNICATIONS FUND | 141 |
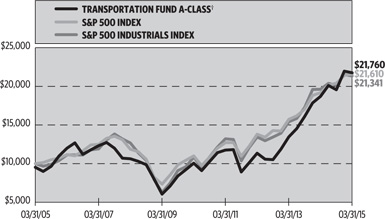
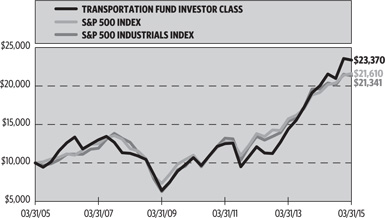
| TRANSPORTATION FUND | 149 |
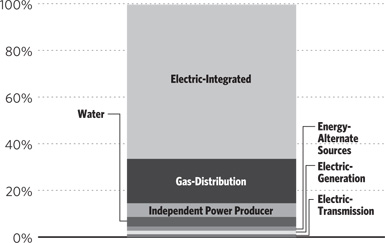
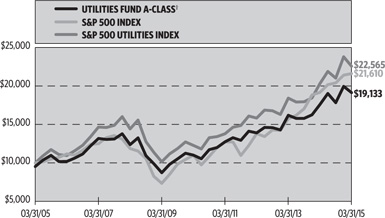
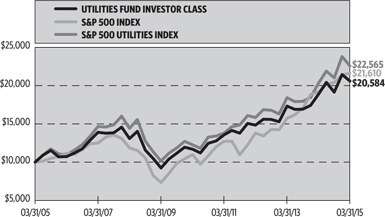
| UTILITIES FUND | 157 |
| NOTES TO FINANCIAL STATEMENTS | 165 |
| REPORT OF INDEPENDENT REGISTERED PUBLIC ACCOUNTING FIRM | 178 |
| OTHER INFORMATION | 179 |
| INFORMATION ON BOARD OF TRUSTEES AND OFFICERS | 181 |
| GUGGENHEIM INVESTMENTS PRIVACY POLICIES | 184 |
| | THE RYDEX FUNDS ANNUAL REPORT | 1 |
March 31, 2015
Dear Shareholder:
Security Investors, LLC (the “Investment Adviser”) is pleased to present the annual shareholder report for 18 of our sector funds (the “Funds”) for the annual period ended March 31, 2015.
The Investment Adviser is part of Guggenheim Investments, which represents the investment management businesses of Guggenheim Partners, LLC (“Guggenheim”), a global, diversified financial services firm.
Guggenheim Funds Distributors, LLC is the distributor of the Funds. Guggenheim Funds Distributors, LLC is affiliated with Guggenheim and the Investment Adviser.
We encourage you to read the Economic and Market Overview section of the report, which follows this letter, and then the Performance Report and Fund Profile for each Fund.
We are committed to providing innovative investment solutions and appreciate the trust you place in us.
Sincerely,
Donald C. Cacciapaglia
President
April 30, 2015
Read a prospectus and summary prospectus (if available) carefully before investing. It contains the investment objectives, risks, charges, expenses, and other information, which should be considered carefully before investing. Obtain a prospectus and summary prospectus (if available) at guggenheiminvestments.com or call 800.820.0888.
Sector funds may not be suitable for all investors. Investing in sector funds is more volatile than investing in broadly diversified funds, as there is a greater risk due to the concentration of the fund’s holdings in issuers of the same or similar offerings. These funds are considered non-diversified and can invest a greater portion of their assets in securities of individual issuers than a diversified fund. As a result, changes in the market value of a single security could cause greater fluctuations in the value of fund shares than would occur in a more diversified fund.
| 2 | THE RYDEX FUNDS ANNUAL REPORT | |
ECONOMIC AND MARKET OVERVIEW (Unaudited) | March 31, 2015 |
The U.S. continued to enjoy a self-sustaining economic expansion for the 12-month period ended March 31, 2015, although winter weather was likely to distort first-quarter economic data. In addition, U.S. companies scaled back hiring in the last month of the period, adding to evidence that the domestic economy has lost some momentum since the turn of the year. The March increase in payrolls was the smallest since December 2013 and broke a 12-month run of gains above 200,000.
Despite this short-term dislocation, the economy remains on track. Indeed, many other labor market indicators, such as initial jobless claims and the job openings rate, suggest that the U.S. labor market remains quite strong, supporting the conclusion that March’s payroll report was just a temporary blip, similar to the one witnessed last winter. As soon as temporary seasonal factors have dissipated, economic data is likely to bounce back. The labor market has improved over the past year, as subdued mortgage rates and tight housing inventory continue to point to fairly stable appreciation in the housing market, which is key to the ongoing recovery. Consumers are also being helped by lower fuel prices, which are acting as a tax cut for U.S. consumers, freeing up discretionary spending in other areas and acting as a support for consumption.
In Europe, economic data has been surprisingly good and should continue along that path on the back of the European Central Bank’s program of quantitative easing and depreciation of the euro. Japan’s economy remains weak and, without more structural reform, continued monetary accommodation could lead to stagflation. China’s policymakers appear likely to continue the supply of credit and do whatever else is necessary to maintain growth there at an acceptable pace for the near term.
Given weakness overseas and the effect of a stronger U.S. dollar on international earnings, some stocks could face a more challenging environment in the near term, but our research shows that equity markets tend to perform quite well in the periods leading up to a U.S. Federal Reserve (the “Fed”) rate increase. The yield on the 10-year Treasury note declined in January by more than 50 basis points before rebounding in February, echoing the pattern since 2009—Treasury yields decline and a sell-off ensues, driving rates higher. Then conditions stabilize, and rates test their previous lows. Liquidity from foreign central banks and comparatively attractive U.S. yields continue to push global investors to U.S. Treasuries, which should hold down U.S. interest rates in the near term.
Against this backdrop, the U.S. central bank feels pressure to raise its key rate above zero, but insists the decision will be data-dependent and not occur prematurely. With a secular inflation increase unlikely in the near term, slack in the economy, and disinflation being imported from abroad, the Fed may not hike rates until later in the year. The Fed for now appears to be focused on wage growth, which is key for sustaining the expansion but also an indicator of inflationary pressure. The lack of sustained wage growth has been a topic that has confounded the Fed lately. Given the strengthening employment numbers and the apparent reduction in labor market slack, wages should start to increase more steadily across the board. This is one of the most important data points at the moment for the Fed.
The underlying U.S. economy remains strong and investors should avoid being panicked by seasonal setbacks. Indeed, considering the strength of the economy and the wave of liquidity emanating from various central banks around the world, the general investment environment should remain attractive.
For the 12 months ended March 31, 2015, the Standard & Poor’s 500® (“S&P 500”) Index* returned 12.73%. The Morgan Stanley Capital International (“MSCI”) Europe-Australasia-Far East (“EAFE”) Index* returned -0.92%. The return of the MSCI Emerging Markets Index* was 0.44%.
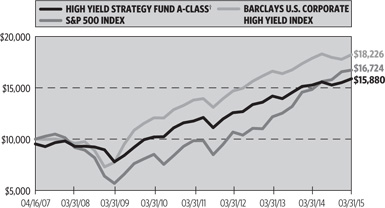
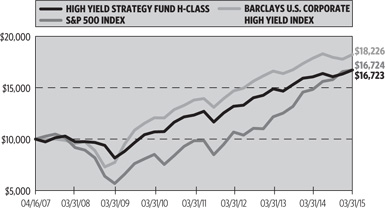
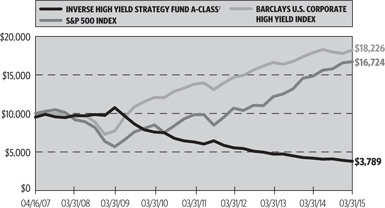
In the bond market, the Barclays U.S. Aggregate Bond Index* posted a 5.72% return for the period, while the Barclays U.S. Corporate High Yield Index* returned 2.00%. The return of the Bank of America Merrill Lynch 3-Month U.S. Treasury Bill Index* was 0.03% for the 12-month period.
The opinions and forecasts expressed may not actually come to pass. This information is subject to change at any time, based on market and other conditions, and should not be construed as a recommendation of any specific security or strategy.
| | THE RYDEX FUNDS ANNUAL REPORT | 3 |
ECONOMIC AND MARKET OVERVIEW (Unaudited)(continued) | March 31, 2015 |
*Index Definitions:
The following indices are referenced throughout this report. Indices are unmanaged and not available for direct investment. Index performance does not reflect transaction costs, fees, or expenses.
Barclays U.S. Aggregate Bond Index is a broad-based benchmark that measures the investment grade, U.S. dollar-denominated, fixed-rate taxable bond market, including U.S. Treasuries, government-related and corporate securities, MBS (agency fixed-rate and hybrid ARM pass-throughs), ABS, and CMBS.
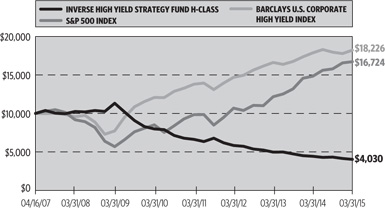
Barclays U.S. Corporate High Yield Index measures the market of U.S. dollar-denominated, non-investment grade, fixed-rate, taxable corporate bonds. Securities are classified as high yield if the middle rating of Moody’s, Fitch, and S&P is Ba1/BB+/BB+ or below.
Bank of America (“BofA”) Merrill Lynch 3-Month U.S. Treasury Bill Index is an unmanaged market index of U.S. Treasury securities maturing in 90 days that assumes reinvestment of all income.
MSCI EAFE Index is a free float-adjusted market capitalization index that is designed to measure the equity market performance of developed markets, excluding the U.S. & Canada.
MSCI Emerging Markets Index is a free float-adjusted market capitalization weighted index that is designed to measure equity market performance in the global emerging markets.
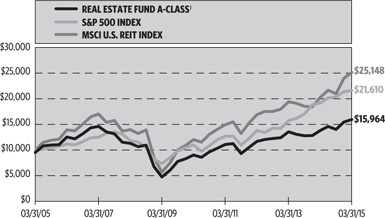
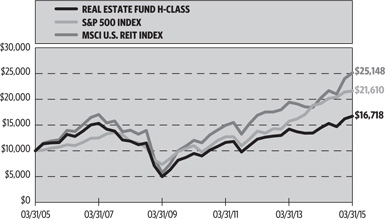
MSCI U.S. REIT Index is a free-float market capitalization weighted index that is comprised of equity real estate investment trust (“REIT”) securities that belong to the MSCI U.S. Investable Market 2500 Index. The MSCI U.S. REIT Index includes only REIT securities that are of reasonable size in terms of full and free float-adjusted market capitalization to ensure that the performance of the equity REIT universe can be captured and replicated in actual institutional and retail portfolios of different sizes.
S&P 500® Index is a capitalization-weighted index of 500 stocks designed to measure the performance of the broad economy, representing all major industries and is considered a representation of the U.S. stock market.
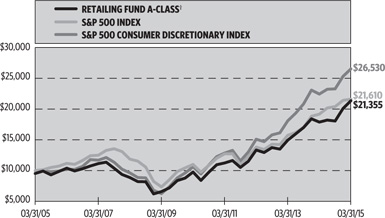
S&P 500® Consumer Discretionary Index is a sub-index of the S&P 500® Index, a capitalization-weighted index covering 500 industrial, utility, transportation, and financial companies of the U.S. markets (mostly NYSE Euronext issues). The Consumer Discretionary Index includes companies in the following industries: automobiles and components, consumer durables, apparel, hotels, restaurants, leisure, media, and retailing.
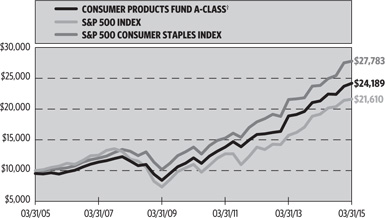
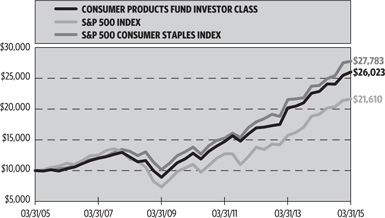
S&P 500® Consumer Staples Index is a sub-index of the S&P 500® Index, a capitalization-weighted index covering 500 industrial, utility, transportation, and financial companies of the U.S. markets (mostly NYSE Euronext issues). The Consumer Staples Index comprises companies whose businesses are less sensitive to economic cycles. It includes manufacturers and distributors of food, beverages, and tobacco and producers of non-durable household goods and personal products. It also includes food & drug retailing companies as well as hypermarkets and consumer super centers.
S&P 500® Energy Index is a sub-index of the S&P 500® Index, a capitalization-weighted index covering 500 industrial, utility, transportation, and financial companies of the U.S. markets (mostly NYSE Euronext issues). The Energy Index comprises companies whose businesses are dominated by either of the following activities: the construction or provision of oil rigs, drilling equipment, and other energy-related equipment and services, including seismic data collection; companies engaged in the exploration, production, marketing, refining, and/or transportation of oil and gas products, coal, and other consumable fuels.
S&P 500® Financials Index is a sub-index of the S&P 500® Index, a capitalization-weighted index covering 500 industrial, utility, transportation, and financial companies of the U.S. markets (mostly NYSE Euronext issues). The Financials Index contains companies involved in activities such as banking, mortgage finance, consumer finance, specialized finance, investment banking and brokerage, asset management and custody, corporate lending, insurance, financial investment, and real estate, including REITs.
S&P 500® Health Care Index is a sub-index of the S&P 500® Index, a capitalization-weighted index covering 500 industrial, utility, transportation, and financial companies of the U.S. markets (mostly NYSE Euronext issues). The Health Care Index encompasses two main industry groups. The first includes companies which manufacture health care equipment and supplies or provide health care-related services, including distributors of health care products, providers of basic health-care services, and owners and operators of health care facilities and organizations. The first group also includes companies operating in the health care technology industry. The second group includes companies primarily involved in the research, development, production, and marketing of pharmaceuticals, biotechnology, and life sciences products.
S&P 500® Industrials Index is a sub-index of the S&P 500® Index, a capitalization-weighted index covering 500 industrial, utility, transportation, and financial companies of the U.S. markets (mostly NYSE Euronext issues). The Industrials Index includes companies whose businesses are dominated by one of the following activities: the manufacture and distribution of capital goods, including aerospace & defense, construction, engineering & building products, electrical equipment, and industrial machinery; the provision of commercial services and supplies, including printing, environmental, office, and security services; the provision of professional services, including employment and research & consulting services; or the provision of transportation services, including airlines, couriers, marine, road & rail, and transportation infrastructure.
S&P 500® Information Technology Index is a sub-index of the S&P 500® Index, a capitalization-weighted index covering 500 industrial, utility, transportation, and financial companies of the U.S. markets (mostly NYSE Euronext issues). The Information Technology Index covers the following general areas: technology software & services, including companies that primarily develop software in various fields such as the internet, applications, systems, databases management, and/or home entertainment, and companies that provide information technology consulting and services, as well as data processing and outsourced services; secondly, technology hardware & equipment, including manufacturers and distributors of communications equipment, computers & peripherals, electronic equipment, and related instruments; and thirdly, semiconductors & semiconductor equipment manufacturers.
S&P 500® Materials Index is a sub-index of the S&P 500® Index, a capitalization-weighted index covering 500 industrial, utility, transportation, and financial companies of the U.S. markets (mostly NYSE Euronext issues). The Materials Index encompasses a wide range of commodity-related manufacturing industries. Included in this sector are companies that manufacture chemicals, construction materials, glass, paper, forest products, and related packaging products, and metals, minerals, and mining companies, including producers of steel.
| 4 | THE RYDEX FUNDS ANNUAL REPORT | |
ECONOMIC AND MARKET OVERVIEW (Unaudited)(concluded) | March 31, 2015 |
S&P 500® Telecommunication Services Index is a sub-index of the S&P 500® Index, a capitalization-weighted index covering 500 industrial, utility, transportation, and financial companies of the U.S. markets (mostly NYSE Euronext issues). The Telecommunications Services Index contains companies that provide communications services primarily through a fixed-line, cellular, wireless, high bandwidth, and/or fiber optic cable network.
S&P 500® Utilities Index is a sub-index of the S&P 500® Index, a capitalization-weighted index covering 500 industrial, utility, transportation, and financial companies of the U.S. markets (mostly NYSE Euronext issues). The Utilities Index encompasses those companies considered electric, gas or water utilities, or companies that operate as independent producers and/or distributors of power.
| | THE RYDEX FUNDS ANNUAL REPORT | 5 |
ABOUT SHAREHOLDERS’ FUND EXPENSES (Unaudited) | |
All mutual funds have operating expenses and it is important for our shareholders to understand the impact of costs on their investments. Shareholders of a Fund incur two types of costs: (i) transaction costs, including sales charges (loads) on purchase payments, reinvested dividends, or other distributions; and exchange fees; and (ii) ongoing costs, including management fees, administrative services, and shareholder reports, among others. These ongoing costs, or operating expenses, are deducted from a fund’s gross income and reduce the investment return of the fund.
A fund’s expenses are expressed as a percentage of its average net assets, which is known as the expense ratio. The following examples are intended to help investors understand the ongoing costs (in dollars) of investing in a Fund and to compare these costs with the ongoing costs of investing in other mutual funds.
The examples are based on an investment of $1,000 made at the beginning of the period and held for the entire six-month period beginning September 30, 2014 and ending March 31, 2015.
The following tables illustrate a Fund’s costs in two ways:
Table 1. Based on actual Fund return. This section helps investors estimate the actual expenses paid over the period. The “Ending Account Value” shown is derived from the Fund’s actual return, and the fourth column shows the dollar amount that would have been paid by an investor who started with $1,000 in the Fund. Investors may use the information here, together with the amount invested, to estimate the expenses paid over the period. Simply divide the Fund’s account value by $1,000 (for example, an $8,600 account value divided by $1,000 = 8.6), then multiply the result by the number provided under the heading “Expenses Paid During Period.”
Table 2. Based on hypothetical 5% return. This section is intended to help investors compare a Fund’s cost with those of other mutual funds. The table provides information about hypothetical account values and hypothetical expenses based on the Fund’s actual expense ratio and an assumed rate of return of 5% per year before expenses, which is not the Fund’s actual return. The hypothetical account values and expenses may not be used to estimate the actual ending account balance or expenses paid during the period. The example is useful in making comparisons because the U.S. Securities and Exchange Commission (the “SEC”) requires all mutual funds to calculate expenses based on the 5% return. Investors can assess a Fund’s costs by comparing this hypothetical example with the hypothetical examples that appear in shareholder reports of other funds.
The calculations illustrated above assume no shares were bought or sold during the period. Actual costs may have been higher or lower, depending on the amount of investment and the timing of any purchases or redemptions.
Please note that the expenses shown in the table are meant to highlight your ongoing costs only and do not reflect any transactional costs, such as sales charges (loads) on purchase payments, and contingent deferred sales charges (“CDSC”) on redemptions, if any. Therefore, the second table is useful in comparing ongoing costs only, and will not help you determine the relative total costs of owning different funds. In addition, if these transactional costs were included, your costs would have been higher.
More information about a Fund’s expenses, including annual expense ratios for the past five years, can be found in the Financial Highlights section of this report. For additional information on operating expenses and other shareholder costs, please refer to the appropriate Fund prospectus.
| 6 | THE RYDEX FUNDS ANNUAL REPORT | |
ABOUT SHAREHOLDERS’ FUND EXPENSES (Unaudited)(continued)
| | Expense Ratio1 | Fund Return | Beginning Account Value September 30, 2014 | Ending Account Value March 31, 2015 | Expenses Paid During Period2 |
Table 1. Based on actual Fund return3 | | | | | |
| Banking Fund | | | | | |
| Investor Class | 1.33% | 0.71% | $1,000.00 | $1,007.10 | $6.66 |
| Advisor Class | 1.84% | 0.47% | 1,000.00 | 1,004.70 | 9.20 |
| A-Class | 1.59% | 0.56% | 1,000.00 | 1,005.60 | 7.95 |
| C-Class | 2.33% | 0.21% | 1,000.00 | 1,002.10 | 11.63 |
| Basic Materials Fund | | | | | |
| Investor Class | 1.33% | (3.04%) | 1,000.00 | 969.60 | 6.53 |
| Advisor Class | 1.83% | (3.33%) | 1,000.00 | 966.70 | 8.97 |
| A-Class | 1.58% | (3.18%) | 1,000.00 | 968.20 | 7.75 |
| C-Class | 2.34% | (3.54%) | 1,000.00 | 964.60 | 11.46 |
| Biotechnology Fund | | | | | |
| Investor Class | 1.31% | 27.18% | 1,000.00 | 1,271.80 | 7.42 |
| Advisor Class | 1.81% | 26.86% | 1,000.00 | 1,268.60 | 10.24 |
| A-Class | 1.56% | 27.02% | 1,000.00 | 1,270.20 | 8.83 |
| C-Class | 2.31% | 26.52% | 1,000.00 | 1,265.20 | 13.05 |
| Consumer Products Fund | | | | | |
| Investor Class | 1.32% | 8.20% | 1,000.00 | 1,082.00 | 6.85 |
| Advisor Class | 1.83% | 7.93% | 1,000.00 | 1,079.30 | 9.49 |
| A-Class | 1.57% | 8.04% | 1,000.00 | 1,080.40 | 8.14 |
| C-Class | 2.32% | 7.64% | 1,000.00 | 1,076.40 | 12.01 |
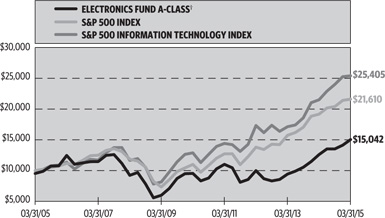
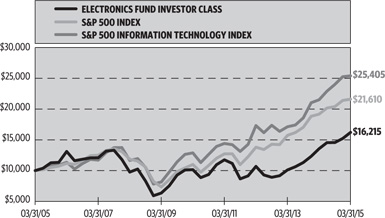
| Electronics Fund | | | | | |
| Investor Class | 1.33% | 11.39% | 1,000.00 | 1,113.90 | 7.01 |
| Advisor Class | 1.83% | 11.09% | 1,000.00 | 1,110.90 | 9.63 |
| A-Class | 1.59% | 11.27% | 1,000.00 | 1,112.70 | 8.37 |
| C-Class | 2.34% | 10.86% | 1,000.00 | 1,108.60 | 12.30 |
| Energy Fund | | | | | |
| Investor Class | 1.33% | (21.47%) | 1,000.00 | 785.30 | 5.92 |
| Advisor Class | 1.83% | (21.61%) | 1,000.00 | 783.90 | 8.14 |
| A-Class | 1.58% | (21.46%) | 1,000.00 | 785.40 | 7.03 |
| C-Class | 2.33% | (21.87%) | 1,000.00 | 781.30 | 10.35 |
| Energy Services Fund | | | | | |
| Investor Class | 1.34% | (32.66%) | 1,000.00 | 673.40 | 5.59 |
| Advisor Class | 1.83% | (32.89%) | 1,000.00 | 671.10 | 7.62 |
| A-Class | 1.58% | (32.76%) | 1,000.00 | 672.40 | 6.59 |
| C-Class | 2.34% | (33.01%) | 1,000.00 | 669.90 | 9.74 |
| Financial Services Fund | | | | | |
| Investor Class | 1.33% | 6.96% | 1,000.00 | 1,069.60 | 6.86 |
| Advisor Class | 1.83% | 6.70% | 1,000.00 | 1,067.00 | 9.43 |
| A-Class | 1.57% | 6.83% | 1,000.00 | 1,068.30 | 8.10 |
| C-Class | 2.33% | 6.44% | 1,000.00 | 1,064.40 | 11.99 |
| Health Care Fund | | | | | |
| Investor Class | 1.33% | 20.04% | 1,000.00 | 1,200.40 | 7.30 |
| Advisor Class | 1.83% | 19.74% | 1,000.00 | 1,197.40 | 10.03 |
| A-Class | 1.58% | 19.88% | 1,000.00 | 1,198.80 | 8.66 |
| C-Class | 2.33% | 19.47% | 1,000.00 | 1,194.70 | 12.75 |
| | THE RYDEX FUNDS ANNUAL REPORT | 7 |
ABOUT SHAREHOLDERS’ FUND EXPENSES (Unaudited)(continued)
| | Expense Ratio1 | Fund Return | Beginning Account Value September 30, 2014 | Ending Account Value March 31, 2015 | Expenses Paid During Period2 |
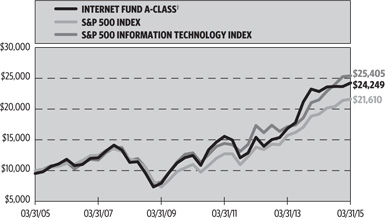
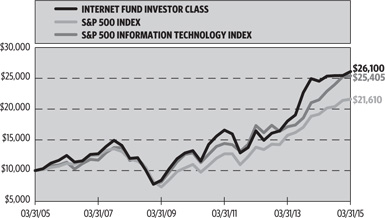
| Internet Fund | | | | | |
| Investor Class | 1.33% | 2.59% | $1,000.00 | $1,025.90 | $6.72 |
| Advisor Class | 1.83% | 2.32% | 1,000.00 | 1,023.20 | 9.23 |
| A-Class | 1.59% | 2.46% | 1,000.00 | 1,024.60 | 8.03 |
| C-Class | 2.33% | 2.07% | 1,000.00 | 1,020.70 | 11.74 |
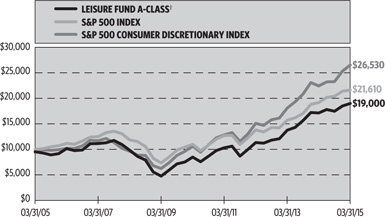
| Leisure Fund | | | | | |
| Investor Class | 1.32% | 8.86% | 1,000.00 | 1,088.60 | 6.87 |
| Advisor Class | 1.81% | 8.65% | 1,000.00 | 1,086.50 | 9.42 |
| A-Class | 1.56% | 8.73% | 1,000.00 | 1,087.30 | 8.12 |
| C-Class | 2.33% | 8.34% | 1,000.00 | 1,083.40 | 12.10 |
| Precious Metals Fund | | | | | |
| Investor Class | 1.23% | (19.68%) | 1,000.00 | 803.20 | 5.53 |
| Advisor Class | 1.73% | (19.90%) | 1,000.00 | 801.00 | 7.77 |
| A-Class | 1.48% | (19.85%) | 1,000.00 | 801.50 | 6.65 |
| C-Class | 2.23% | (20.13%) | 1,000.00 | 798.70 | 10.00 |
| Real Estate Fund | | | | | |
| A-Class | 1.58% | 13.81% | 1,000.00 | 1,138.10 | 8.42 |
| C-Class | 2.33% | 13.39% | 1,000.00 | 1,133.90 | 12.40 |
| H-Class | 1.57% | 13.81% | 1,000.00 | 1,138.10 | 8.37 |
| Retailing Fund | | | | | |
| Investor Class | 1.32% | 18.39% | 1,000.00 | 1,183.90 | 7.19 |
| Advisor Class | 1.81% | 18.16% | 1,000.00 | 1,181.60 | 9.84 |
| A-Class | 1.56% | 18.28% | 1,000.00 | 1,182.80 | 8.49 |
| C-Class | 2.33% | 17.77% | 1,000.00 | 1,177.70 | 12.65 |
| Technology Fund | | | | | |
| Investor Class | 1.33% | 5.44% | 1,000.00 | 1,054.40 | 6.81 |
| Advisor Class | 1.84% | 5.17% | 1,000.00 | 1,051.70 | 9.41 |
| A-Class | 1.58% | 5.33% | 1,000.00 | 1,053.30 | 8.09 |
| C-Class | 2.33% | 4.92% | 1,000.00 | 1,049.20 | 11.90 |
| Telecommunications Fund | | | | | |
| Investor Class | 1.34% | 0.08% | 1,000.00 | 1,000.80 | 6.68 |
| Advisor Class | 1.85% | (0.16%) | 1,000.00 | 998.40 | 9.22 |
| A-Class | 1.58% | (0.04%) | 1,000.00 | 999.60 | 7.88 |
| C-Class | 2.33% | (0.44%) | 1,000.00 | 995.60 | 11.59 |
| Transportation Fund | | | | | |
| Investor Class | 1.33% | 11.38% | 1,000.00 | 1,113.80 | 7.01 |
| Advisor Class | 1.83% | 11.08% | 1,000.00 | 1,110.80 | 9.63 |
| A-Class | 1.58% | 11.24% | 1,000.00 | 1,112.40 | 8.32 |
| C-Class | 2.33% | 10.81% | 1,000.00 | 1,108.10 | 12.25 |
| Utilities Fund | | | | | |
| Investor Class | 1.33% | 7.51% | 1,000.00 | 1,075.10 | 6.88 |
| Advisor Class | 1.83% | 7.25% | 1,000.00 | 1,072.50 | 9.46 |
| A-Class | 1.58% | 7.34% | 1,000.00 | 1,073.40 | 8.17 |
| C-Class | 2.33% | 6.98% | 1,000.00 | 1,069.80 | 12.02 |
| 8 | THE RYDEX FUNDS ANNUAL REPORT | |
ABOUT SHAREHOLDERS’ FUND EXPENSES (Unaudited)(continued)
| | Expense Ratio1 | Fund Return | Beginning Account Value September 30, 2014 | Ending Account Value March 31, 2015 | Expenses Paid During Period2 |
| Table 2. Based on hypothetical 5% return (before expenses) | | | | |
| Banking Fund | | | | | |
| Investor Class | 1.33% | 5.00% | $1,000.00 | $1,018.30 | $6.69 |
| Advisor Class | 1.84% | 5.00% | 1,000.00 | 1,015.76 | 9.25 |
| A-Class | 1.59% | 5.00% | 1,000.00 | 1,017.00 | 8.00 |
| C-Class | 2.33% | 5.00% | 1,000.00 | 1,013.31 | 11.70 |
| Basic Materials Fund | | | | | |
| Investor Class | 1.33% | 5.00% | 1,000.00 | 1,018.30 | 6.69 |
| Advisor Class | 1.83% | 5.00% | 1,000.00 | 1,015.81 | 9.20 |
| A-Class | 1.58% | 5.00% | 1,000.00 | 1,017.05 | 7.95 |
| C-Class | 2.34% | 5.00% | 1,000.00 | 1,013.26 | 11.75 |
| Biotechnology Fund | | | | | |
| Investor Class | 1.31% | 5.00% | 1,000.00 | 1,018.40 | 6.59 |
| Advisor Class | 1.81% | 5.00% | 1,000.00 | 1,015.91 | 9.10 |
| A-Class | 1.56% | 5.00% | 1,000.00 | 1,017.15 | 7.85 |
| C-Class | 2.31% | 5.00% | 1,000.00 | 1,013.41 | 11.60 |
| Consumer Products Fund | | | | | |
| Investor Class | 1.32% | 5.00% | 1,000.00 | 1,018.35 | 6.64 |
| Advisor Class | 1.83% | 5.00% | 1,000.00 | 1,015.81 | 9.20 |
| A-Class | 1.57% | 5.00% | 1,000.00 | 1,017.10 | 7.90 |
| C-Class | 2.32% | 5.00% | 1,000.00 | 1,013.36 | 11.65 |
| Electronics Fund | | | | | |
| Investor Class | 1.33% | 5.00% | 1,000.00 | 1,018.30 | 6.69 |
| Advisor Class | 1.83% | 5.00% | 1,000.00 | 1,015.81 | 9.20 |
| A-Class | 1.59% | 5.00% | 1,000.00 | 1,017.00 | 8.00 |
| C-Class | 2.34% | 5.00% | 1,000.00 | 1,013.26 | 11.75 |
| Energy Fund | | | | | |
| Investor Class | 1.33% | 5.00% | 1,000.00 | 1,018.30 | 6.69 |
| Advisor Class | 1.83% | 5.00% | 1,000.00 | 1,015.81 | 9.20 |
| A-Class | 1.58% | 5.00% | 1,000.00 | 1,017.05 | 7.95 |
| C-Class | 2.33% | 5.00% | 1,000.00 | 1,013.31 | 11.70 |
| Energy Services Fund | | | | | |
| Investor Class | 1.34% | 5.00% | 1,000.00 | 1,018.25 | 6.74 |
| Advisor Class | 1.83% | 5.00% | 1,000.00 | 1,015.81 | 9.20 |
| A-Class | 1.58% | 5.00% | 1,000.00 | 1,017.05 | 7.95 |
| C-Class | 2.34% | 5.00% | 1,000.00 | 1,013.26 | 11.75 |
| Financial Services Fund | | | | | |
| Investor Class | 1.33% | 5.00% | 1,000.00 | 1,018.30 | 6.69 |
| Advisor Class | 1.83% | 5.00% | 1,000.00 | 1,015.81 | 9.20 |
| A-Class | 1.57% | 5.00% | 1,000.00 | 1,017.10 | 7.90 |
| C-Class | 2.33% | 5.00% | 1,000.00 | 1,013.31 | 11.70 |
| Health Care Fund | | | | | |
| Investor Class | 1.33% | 5.00% | 1,000.00 | 1,018.30 | 6.69 |
| Advisor Class | 1.83% | 5.00% | 1,000.00 | 1,015.81 | 9.20 |
| A-Class | 1.58% | 5.00% | 1,000.00 | 1,017.05 | 7.95 |
| C-Class | 2.33% | 5.00% | 1,000.00 | 1,013.31 | 11.70 |
| | THE RYDEX FUNDS ANNUAL REPORT | 9 |
ABOUT SHAREHOLDERS’ FUND EXPENSES (Unaudited)(concluded)
| | Expense Ratio1 | Fund Return | Beginning Account Value September 30, 2014 | Ending Account Value March 31, 2015 | Expenses Paid During Period2 |
| Internet Fund | | | | | |
| Investor Class | 1.33% | 5.00% | $1,000.00 | $1,018.30 | $6.69 |
| Advisor Class | 1.83% | 5.00% | 1,000.00 | 1,015.81 | 9.20 |
| A-Class | 1.59% | 5.00% | 1,000.00 | 1,017.00 | 8.00 |
| C-Class | 2.33% | 5.00% | 1,000.00 | 1,013.31 | 11.70 |
| Leisure Fund | | | | | |
| Investor Class | 1.32% | 5.00% | 1,000.00 | 1,018.35 | 6.64 |
| Advisor Class | 1.81% | 5.00% | 1,000.00 | 1,015.91 | 9.10 |
| A-Class | 1.56% | 5.00% | 1,000.00 | 1,017.15 | 7.85 |
| C-Class | 2.33% | 5.00% | 1,000.00 | 1,013.31 | 11.70 |
| Precious Metals Fund | | | | | |
| Investor Class | 1.23% | 5.00% | 1,000.00 | 1,018.80 | 6.19 |
| Advisor Class | 1.73% | 5.00% | 1,000.00 | 1,016.31 | 8.70 |
| A-Class | 1.48% | 5.00% | 1,000.00 | 1,017.55 | 7.44 |
| C-Class | 2.23% | 5.00% | 1,000.00 | 1,013.81 | 11.20 |
| Real Estate Fund | | | | | |
| A-Class | 1.58% | 5.00% | 1,000.00 | 1,017.05 | 7.95 |
| C-Class | 2.33% | 5.00% | 1,000.00 | 1,013.31 | 11.70 |
| H-Class | 1.57% | 5.00% | 1,000.00 | 1,017.10 | 7.90 |
| Retailing Fund | | | | | |
| Investor Class | 1.32% | 5.00% | 1,000.00 | 1,018.35 | 6.64 |
| Advisor Class | 1.81% | 5.00% | 1,000.00 | 1,015.91 | 9.10 |
| A-Class | 1.56% | 5.00% | 1,000.00 | 1,017.15 | 7.85 |
| C-Class | 2.33% | 5.00% | 1,000.00 | 1,013.31 | 11.70 |
| Technology Fund | | | | | |
| Investor Class | 1.33% | 5.00% | 1,000.00 | 1,018.30 | 6.69 |
| Advisor Class | 1.84% | 5.00% | 1,000.00 | 1,015.76 | 9.25 |
| A-Class | 1.58% | 5.00% | 1,000.00 | 1,017.05 | 7.95 |
| C-Class | 2.33% | 5.00% | 1,000.00 | 1,013.31 | 11.70 |
| Telecommunications Fund | | | | | |
| Investor Class | 1.34% | 5.00% | 1,000.00 | 1,018.25 | 6.74 |
| Advisor Class | 1.85% | 5.00% | 1,000.00 | 1,015.71 | 9.30 |
| A-Class | 1.58% | 5.00% | 1,000.00 | 1,017.05 | 7.95 |
| C-Class | 2.33% | 5.00% | 1,000.00 | 1,013.31 | 11.70 |
| Transportation Fund | | | | | |
| Investor Class | 1.33% | 5.00% | 1,000.00 | 1,018.30 | 6.69 |
| Advisor Class | 1.83% | 5.00% | 1,000.00 | 1,015.81 | 9.20 |
| A-Class | 1.58% | 5.00% | 1,000.00 | 1,017.05 | 7.95 |
| C-Class | 2.33% | 5.00% | 1,000.00 | 1,013.31 | 11.70 |
| Utilities Fund | | | | | |
| Investor Class | 1.33% | 5.00% | 1,000.00 | 1,018.30 | 6.69 |
| Advisor Class | 1.83% | 5.00% | 1,000.00 | 1,015.81 | 9.20 |
| A-Class | 1.58% | 5.00% | 1,000.00 | 1,017.05 | 7.95 |
| C-Class | 2.33% | 5.00% | 1,000.00 | 1,013.31 | 11.70 |
1 | Annualized and excludes expenses in the underlying funds in which the Funds invest. |
2 | Expenses are equal to the Fund's annualized expense ratio, net of any applicable fee waivers, multiplied by the average account value over the period, multiplied by 182/365 (to reflect the one-half year period). |
3 | Actual cumulative return at net asset value for the period September 30, 2014 to March 31, 2015. |
| 10 | THE RYDEX FUNDS ANNUAL REPORT | |
PERFORMANCE REPORT AND FUND PROFILE (Unaudited) | March 31, 2015 |
BANKING FUND
OBJECTIVE: Seeks to provide capital appreciation by investing in companies that are involved in the banking sector, including commercial banks (and their holding companies) and savings and loan institutions (“banking companies”).
For the one-year period ended March 31, 2015, Banking Fund Investor Class returned -0.73%, compared with the S&P 500 Financials Index, which returned 9.96%. The broader S&P 500 Index returned 12.73%.
The industry that contributed most to performance was banks, followed by diversified financial services. The thrifts & mortgage finance industry contributed least to Fund return. The commercial banks industry was the only detractor from return.
Among the best-performing holdings in the Fund for the period were Wells Fargo & Co., HDFC Bank Ltd. ADR, and Bank of New York Mellon Corp. The worst-performing holdings for the period were Fifth Third Bancorp, Bancolombia S.A. ADR, and Bank of America Corp.
Performance displayed represents past performance, which is no guarantee of future results.
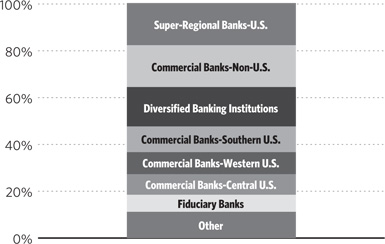
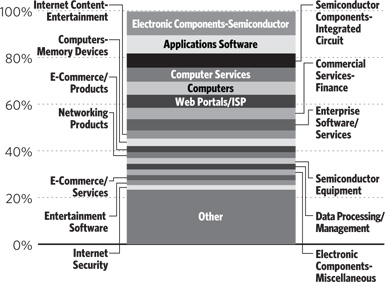
Holdings Diversification (Market Exposure as % of Net Assets)
“Holdings Diversification (Market Exposure as % of Net Assets)” excludes any temporary cash investments.
| Inception Dates: |
| Investor Class | April 1, 1998 |
| Advisor Class | April 1, 1998 |
| A-Class | September 1, 2004 |
| C-Class | March 30, 2001 |
| Ten Largest Holdings (% of Total Net Assets) |
| JPMorgan Chase & Co. | 4.0% |
| Wells Fargo & Co. | 4.0% |
| Citigroup, Inc. | 3.9% |
| Bank of America Corp. | 3.9% |
| U.S. Bancorp | 3.1% |
| PNC Financial Services Group, Inc. | 2.4% |
| Bank of New York Mellon Corp. | 2.4% |
| Capital One Financial Corp. | 2.3% |
| State Street Corp. | 1.9% |
| BB&T Corp. | 1.9% |
| Top Ten Total | 29.8% |
| | |
| “Ten Largest Holdings” exclude any temporary cash or derivative investments. |
| | THE RYDEX FUNDS ANNUAL REPORT | 11 |
PERFORMANCE REPORT AND FUND PROFILE (Unaudited)(concluded) | March 31, 2015 |
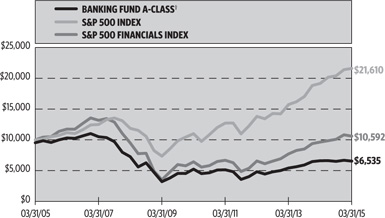
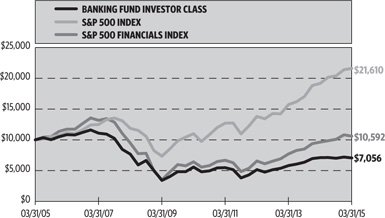
Cumulative Fund Performance*
Average Annual Returns*
Periods Ended March 31, 2015
| | 1 Year | 5 Year | 10 Year |
| Investor Class Shares | -0.73% | 4.84% | -3.43% |
| Advisor Class Shares | -1.19% | 4.32% | -3.92% |
| A-Class Shares | -0.98% | 4.57% | -3.70% |
A-Class Shares with sales charge† | -5.68% | 3.56% | -4.17% |
| C-Class Shares | -1.71% | 3.80% | -4.35% |
C-Class Shares with CDSC‡ | -2.69% | 3.80% | -4.35% |
| S&P 500 Financials Index | 9.96% | 10.53% | 0.58% |
| S&P 500 Index | 12.73% | 14.47% | 8.01% |
| * | The performance data above represents past performance that is not predictive of future results. The investment return and principal value of an investment in the Fund will fluctuate so that an investor’s shares, when redeemed, may be worth more or less than their original cost. Returns are historical and include changes in principal and reinvested dividends and capital gains and do not reflect the effect of taxes. The S&P 500 Index and the S&P 500 Financials Index are unmanaged indices and, unlike the Fund, have no management fees or operating expenses to reduce their reported returns. The graphs are based on Investor Class shares and A-Class shares only; performance for Advisor Class shares and C-Class shares will vary due to differences in fee structures. |
† | Fund returns are calculated using the maximum sales charge of 4.75%. |
‡ | Fund returns include a CDSC of 1% if redeemed within 12 months of purchase. |
| 12 | THE RYDEX FUNDS ANNUAL REPORT | |
| SCHEDULE OF INVESTMENTS | March 31, 2015 |
| BANKING FUND | |
| | |
Shares | | | Value | |
| | | | | | | | |
COMMON STOCKS† - 100.2% | |
| | | | | | | | |
| SUPER-REGIONAL BANKS-U.S. - 18.0% | |
| Wells Fargo & Co. | | | 35,627 | | | $ | 1,938,108 | |
| U.S. Bancorp | | | 34,469 | | | | 1,505,261 | |
| PNC Financial Services Group, Inc. | | | 12,816 | | | | 1,194,964 | |
| Capital One Financial Corp. | | | 14,201 | | | | 1,119,323 | |
| SunTrust Banks, Inc. | | | 19,199 | | | | 788,887 | |
| Fifth Third Bancorp | | | 35,731 | | | | 673,529 | |
| KeyCorp | | | 42,113 | | | | 596,320 | |
| Huntington Bancshares, Inc. | | | 47,017 | | | | 519,538 | |
| Comerica, Inc. | | | 10,827 | | | | 488,623 | |
| Total Super-Regional Banks-U.S. | | | | | | | 8,824,553 | |
| | | | | | | | |
| COMMERCIAL BANKS-NON-U.S. - 17.8% | |
| Itau Unibanco Holding S.A. ADR | | | 59,238 | | | | 655,172 | |
| ICICI Bank Ltd. ADR | | | 55,785 | | | | 577,933 | |
| Royal Bank of Canada | | | 9,556 | | | | 576,800 | |
| Banco Bradesco S.A. ADR | | | 62,088 | | | | 576,177 | |
| Toronto-Dominion Bank | | | 12,992 | | | | 556,707 | |
| Banco Santander S.A. ADR | | | 73,648 | | | | 548,678 | |
| HDFC Bank Ltd. ADR | | | 9,109 | | | | 536,429 | |
| Credicorp Ltd. | | | 3,755 | | | | 528,066 | |
| Bank of Montreal | | | 8,302 | | | | 497,871 | |
| Bank of Nova Scotia | | | 9,774 | | | | 490,948 | |
| Bancolombia S.A. ADR | | | 12,085 | | | | 475,303 | |
| Canadian Imperial Bank of Commerce | | | 6,496 | | | | 470,960 | |
| Banco Santander Chile ADR | | | 21,636 | | | | 469,068 | |
| ING Groep N.V. ADR* | | | 32,016 | | | | 467,754 | |
| Banco Bilbao Vizcaya Argentaria S.A. ADR | | | 45,631 | | | | 457,679 | |
| Grupo Financiero Santander Mexico SAB de CV ADR | | | 40,364 | | | | 440,775 | |
| Sumitomo Mitsui Financial Group, Inc. ADR | | | 55,234 | | | | 427,511 | |
| Total Commercial Banks-Non-U.S. | | | | | | | 8,753,831 | |
| | | | | | | | |
| DIVERSIFIED BANKING INSTITUTIONS - 16.7% | |
| JPMorgan Chase & Co. | | | 32,103 | | | | 1,944,799 | |
| Citigroup, Inc. | | | 36,973 | | | | 1,904,849 | |
| Bank of America Corp. | | | 123,107 | | | | 1,894,617 | |
| HSBC Holdings plc ADR | | | 14,146 | | | | 602,478 | |
| Deutsche Bank AG | | | 15,441 | | | | 536,266 | |
| Credit Suisse Group AG ADR | | | 18,892 | | | | 508,762 | |
| Barclays plc ADR | | | 31,220 | | | | 454,875 | |
| UBS Group AG* | | | 19,238 | | | | 361,097 | |
| Total Diversified Banking Institutions | | | | | | | 8,207,743 | |
| | | | | | | | |
| COMMERCIAL BANKS-SOUTHERN U.S. - 11.0% | |
| BB&T Corp. | | | 23,547 | | | | 918,098 | |
| Regions Financial Corp. | | | 64,389 | | | | 608,476 | |
| Popular, Inc.* | | | 13,019 | | | | 447,723 | |
| Synovus Financial Corp. | | | 11,987 | | | | 335,756 | |
| BankUnited, Inc. | | | 9,713 | | | | 318,004 | |
| First Horizon National Corp. | | | 22,158 | | | | 316,638 | |
| Bank of the Ozarks, Inc. | | | 8,382 | | | | 309,547 | |
| First Citizens BancShares, Inc. — Class A | | | 1,120 | | | | 290,853 | |
| IBERIABANK Corp. | | | 4,548 | | | | 286,660 | |
| United Bankshares, Inc. | | | 7,398 | | | | 278,017 | |
| Hancock Holding Co. | | | 9,166 | | | | 273,697 | |
| Home BancShares, Inc. | | | 7,760 | | | | 262,986 | |
| BancorpSouth, Inc. | | | 11,279 | | | | 261,898 | |
| Hilltop Holdings, Inc.* | | | 12,329 | | | | 239,676 | |
| Trustmark Corp. | | | 9,267 | | | | 225,003 | |
| Total Commercial Banks-Southern U.S. | | | | | | | 5,373,032 | |
| | | | | | | | |
| COMMERCIAL BANKS-WESTERN U.S. - 9.4% | |
| First Republic Bank | | | 8,642 | | | | 493,371 | |
| SVB Financial Group* | | | 3,560 | | | | 452,262 | |
| East West Bancorp, Inc. | | | 10,341 | | | | 418,397 | |
| Zions Bancorporation | | | 15,034 | | | | 405,918 | |
| City National Corp. | | | 4,413 | | | | 393,110 | |
| PacWest Bancorp | | | 8,101 | | | | 379,856 | |
| Umpqua Holdings Corp. | | | 19,749 | | | | 339,288 | |
| Bank of Hawaii Corp. | | | 4,749 | | | | 290,686 | |
| Western Alliance Bancorporation* | | | 9,408 | | | | 278,853 | |
| Cathay General Bancorp | | | 9,290 | | | | 264,301 | |
| Glacier Bancorp, Inc. | | | 9,490 | | | | 238,674 | |
| CVB Financial Corp. | | | 14,312 | | | | 228,133 | |
| Columbia Banking System, Inc. | | | 7,743 | | | | 224,315 | |
| Westamerica Bancorporation | | | 4,304 | | | | 185,976 | |
| Total Commercial Banks-Western U.S. | | | | | | | 4,593,140 | |
| | | | | | | | |
| COMMERCIAL BANKS-CENTRAL U.S. - 8.8% | |
| Cullen/Frost Bankers, Inc. | | | 5,243 | | | | 362,185 | |
| BOK Financial Corp. | | | 5,882 | | | | 360,096 | |
| Commerce Bancshares, Inc. | | | 8,287 | | | | 350,706 | |
| Prosperity Bancshares, Inc. | | | 6,393 | | | | 335,505 | |
| FirstMerit Corp. | | | 16,298 | | | | 310,640 | |
| Associated Banc-Corp. | | | 15,609 | | | | 290,327 | |
| PrivateBancorp, Inc. — Class A | | | 8,177 | | | | 287,585 | |
| TCF Financial Corp. | | | 17,904 | | | | 281,451 | |
| UMB Financial Corp. | | | 5,157 | | | | 272,754 | |
| MB Financial, Inc. | | | 8,530 | | | | 267,074 | |
| Wintrust Financial Corp. | | | 5,490 | | | | 261,763 | |
| Texas Capital Bancshares, Inc.* | | | 5,364 | | | | 260,959 | |
First Financial Bankshares, Inc.1 | | | 8,456 | | | | 233,724 | |
| Old National Bancorp | | | 15,777 | | | | 223,876 | |
| First Midwest Bancorp, Inc. | | | 11,650 | | | | 202,361 | |
| Total Commercial Banks-Central U.S. | | | | | | | 4,301,006 | |
| | | | | | | | |
| FIDUCIARY BANKS - 7.3% | |
| Bank of New York Mellon Corp. | | | 28,705 | | | | 1,155,088 | |
| State Street Corp. | | | 12,792 | | | | 940,596 | |
| Northern Trust Corp. | | | 9,860 | | | | 686,749 | |
| Citizens Financial Group, Inc. | | | 25,336 | | | | 611,358 | |
| Boston Private Financial Holdings, Inc. | | | 14,250 | | | | 173,138 | |
| Total Fiduciary Banks | | | | | | | 3,566,929 | |
| SEE NOTES TO FINANCIAL STATEMENTS. | THE RYDEX FUNDS ANNUAL REPORT | 13 |
SCHEDULE OF INVESTMENTS (concluded) | March 31, 2015 |
| BANKING FUND | |
| | |
Shares | | | Value | |
| | | | | | | | | |
| COMMERCIAL BANKS-EASTERN U.S. - 7.0% | |
| M&T Bank Corp. | | | 5,641 | | | $ | 716,408 | |
| CIT Group, Inc. | | | 10,944 | | | | 493,793 | |
| Signature Bank* | | | 3,436 | | | | 445,237 | |
| Webster Financial Corp. | | | 8,716 | | | | 322,928 | |
| Susquehanna Bancshares, Inc. | | | 19,997 | | | | 274,159 | |
| FNB Corp. | | | 20,060 | | | | 263,588 | |
| Fulton Financial Corp. | | | 21,032 | | | | 259,535 | |
| Valley National Bancorp | | | 27,355 | | | | 258,231 | |
| National Penn Bancshares, Inc. | | | 20,003 | | | | 215,432 | |
| Community Bank System, Inc. | | | 5,890 | | | | 208,447 | |
| Total Commercial Banks-Eastern U.S. | | | | | | | 3,457,758 | |
| | | | | | | | |
| SAVINGS & LOANS/THRIFTS-EASTERN U.S. - 3.1% | |
| New York Community Bancorp, Inc. | | | 28,284 | | | | 473,191 | |
| People’s United Financial, Inc. | | | 24,748 | | | | 376,170 | |
| Investors Bancorp, Inc. | | | 30,530 | | | | 357,812 | |
| First Niagara Financial Group, Inc. | | | 34,516 | | | | 305,121 | |
| Total Savings & Loans/Thrifts-Eastern U.S. | | | | | | | 1,512,294 | |
| | | | | | | | |
| MULTI-LINE INSURANCE - 1.1% | |
| Voya Financial, Inc. | | | 12,386 | | | | 533,960 | |
| | | | | | | | |
| Total Common Stocks | | | | | | | | |
| (Cost $45,373,174) | | | | | | | 49,124,246 | |
| | | Face
Amount | | | | |
| | | | | | | | |
REPURCHASE AGREEMENT††,2 - 0.3% | |
HSBC Group
issued 03/31/15 at 0.03%
due 04/01/15 | | $ | 174,353 | | | | 174,353 | |
| Total Repurchase Agreement | | | | | | | | |
| (Cost $174,353) | | | | | | | 174,353 | |
| | | | | | | | |
SECURITIES LENDING COLLATERAL††,3 - 0.4% | |
| Repurchase Agreements | | | | | | | | |
HSBC Securities, Inc.
issued 03/31/15 at 0.10%
due 04/01/15 | | | 117,470 | | | | 117,470 | |
BNP Paribas Securities Corp.
issued 03/31/15 at 0.10%
due 04/01/15 | | | 40,410 | | | | 40,410 | |
Barclays Capital, Inc.
issued 03/31/15 at 0.10%
due 04/01/15 | | | 20,858 | | | | 20,858 | |
| Total Securities Lending Collateral | | | | | | | | |
| (Cost $178,738) | | | | | | | 178,738 | |
| | | | | | | | |
| Total Investments - 100.9% | | | | | | | | |
| (Cost $45,726,265) | | | | | | $ | 49,477,337 | |
| Other Assets & Liabilities, net - (0.9)% | | | | | | | (456,235 | ) |
| Total Net Assets - 100.0% | | | | | | $ | 49,021,102 | |
| * | Non-income producing security. |
| † | Value determined based on Level 1 inputs — See Note 4. |
| †† | Value determined based on Level 2 inputs — See Note 4. |
| 1 | All or portion of this security is on loan at March 31, 2015 — See Note 6. |
| 2 | Repurchase Agreement — See Note 5. |
| 3 | Securities lending collateral — See Note 6. |
| ADR — American Depositary Receipt |
| plc — Public Limited Company |
| 14 | THE RYDEX FUNDS ANNUAL REPORT | SEE NOTES TO FINANCIAL STATEMENTS. |
STATEMENT OF ASSETS AND LIABILITIES
March 31, 2015
| Assets: | |
| Investments, at value - including $171,368 of securities loaned (cost $45,373,174) | | $ | 49,124,246 | |
| Repurchase agreements, at value (cost $353,091) | | | 353,091 | |
| Total investments (cost $45,726,265) | | | 49,477,337 | |
| Segregated cash with broker | | | 2,612 | |
| Receivables: | |
| Dividends | | | 47,797 | |
| Fund shares sold | | | 45,839 | |
| Foreign taxes reclaim | | | 237 | |
| Securities lending income | | | 199 | |
| Total assets | | | 49,574,021 | |
| | | | | |
| Liabilities: | |
| Payable for: | |
| Fund shares redeemed | | | 333,608 | |
| Return of securities loaned | | | 181,350 | |
| Management fees | | | 18,151 | |
| Transfer agent and administrative fees | | | 5,339 | |
| Distribution and service fees | | | 3,264 | |
| Portfolio accounting fees | | | 2,135 | |
| Miscellaneous | | | 9,072 | |
| Total liabilities | | | 552,919 | |
| Commitments and contingent liabilities (Note 10) | | | — | |
| Net assets | | $ | 49,021,102 | |
| | | | | |
| Net assets consist of: | |
| Paid in capital | | $ | 70,535,768 | |
| Undistributed net investment income | | | 84,494 | |
| Accumulated net realized loss on investments | | | (25,350,232 | ) |
| Net unrealized appreciation on investments | | | 3,751,072 | |
| Net assets | | $ | 49,021,102 | |
| | | | | |
| Investor Class: | |
| Net assets | | $ | 43,989,231 | |
| Capital shares outstanding | | | 701,415 | |
| Net asset value per share | | $ | 62.71 | |
| | | | | |
| Advisor Class: | |
| Net assets | | $ | 847,006 | |
| Capital shares outstanding | | | 15,045 | |
| Net asset value per share | | $ | 56.30 | |
| | | | | |
| A-Class: | |
| Net assets | | $ | 1,053,542 | |
| Capital shares outstanding | | | 18,240 | |
| Net asset value per share | | $ | 57.76 | |
| Maximum offering price per share (Net asset value divided by 95.25%) | | $ | 60.64 | |
| | | | | |
| C-Class: | |
| Net assets | | $ | 3,131,323 | |
| Capital shares outstanding | | | 58,704 | |
| Net asset value per share | | $ | 53.34 | |
STATEMENT OF OPERATIONS
Year Ended March 31, 2015
| Investment Income: | |
| Dividends (net of foreign withholding tax of $8,007) | | $ | 366,280 | |
| Income from securities lending, net | | | 1,021 | |
| Interest | | | 19 | |
| Total investment income | | | 367,320 | |
| | | | | |
| Expenses: | |
| Management fees | | | 148,278 | |
| Transfer agent and administrative fees | | | 43,611 | |
| Distribution and service fees: | |
| Advisor Class | | | 7,577 | |
| A-Class | | | 4,773 | |
| C-Class | | | 35,551 | |
| Portfolio accounting fees | | | 17,444 | |
| Custodian fees | | | 2,033 | |
| Trustees’ fees* | | | 1,235 | |
| Line of credit fees | | | 150 | |
| Tax expense | | | 85 | |
| Miscellaneous | | | 22,089 | |
| Total expenses | | | 282,826 | |
| Net investment income | | | 84,494 | |
| | | | | |
| Net Realized and Unrealized Gain (Loss): | |
| Net realized gain (loss) on: | |
| Investments | | | (1,094,981 | ) |
| Net realized loss | | | (1,094,981 | ) |
| Net change in unrealized appreciation (depreciation) on: | |
| Investments | | | (1,758,526 | ) |
| Net change in unrealized appreciation (depreciation) | | | (1,758,526 | ) |
| Net realized and unrealized loss | | | (2,853,507 | ) |
| Net decrease in net assets resulting from operations | | $ | (2,769,013 | ) |
| * | Relates to Trustees not deemed “interested persons” within the meaning of Section 2(a)(19) of the 1940 Act. |
| SEE NOTES TO FINANCIAL STATEMENTS. | THE RYDEX FUNDS ANNUAL REPORT | 15 |
STATEMENTS OF CHANGES IN NET ASSETS
| | | Year Ended March 31, 2015 | | | Year Ended March 31, 2014 | |
| Increase (Decrease) in Net Assets from Operations: | | | | | | |
| Net investment income | | $ | 84,494 | | | $ | 104,560 | |
| Net realized gain (loss) on investments | | | (1,094,981 | ) | | | 2,054,539 | |
| Net change in unrealized appreciation (depreciation) on investments | | | (1,758,526 | ) | | | 456,330 | |
| Net increase (decrease) in net assets resulting from operations | | | (2,769,013 | ) | | | 2,615,429 | |
| | | | | | | | | |
| Distributions to shareholders from: | | | | | | | | |
| Net investment income | | | | | | | | |
| Investor Class | | | (62,935 | ) | | | (69,539 | ) |
| Advisor Class | | | (2,498 | ) | | | (27,301 | ) |
| A-Class | | | (9,050 | ) | | | (69,825 | ) |
| C-Class | | | (30,239 | ) | | | (40,063 | ) |
| Total distributions to shareholders | | | (104,722 | ) | | | (206,728 | ) |
| | | | | | | | | |
| Capital share transactions: | | | | | | | | |
| Proceeds from sale of shares | | | | | | | | |
| Investor Class | | | 83,258,043 | | | | 55,738,638 | |
| Advisor Class | | | 50,602,118 | | | | 20,491,522 | |
| A-Class | | | 8,604,560 | | | | 21,112,841 | |
| C-Class | | | 17,385,423 | | | | 22,307,410 | |
| Distributions reinvested | | | | | | | | |
| Investor Class | | | 61,028 | | | | 66,494 | |
| Advisor Class | | | 2,476 | | | | 27,265 | |
| A-Class | | | 6,880 | | | | 34,044 | |
| C-Class | | | 27,648 | | | | 37,004 | |
| Cost of shares redeemed | | | | | | | | |
| Investor Class | | | (48,577,787 | ) | | | (54,691,263 | ) |
| Advisor Class | | | (50,158,024 | ) | | | (24,496,009 | ) |
| A-Class | | | (15,238,033 | ) | | | (15,248,615 | ) |
| C-Class | | | (18,472,784 | ) | | | (22,684,146 | ) |
| Net increase from capital share transactions | | | 27,501,548 | | | | 2,695,185 | |
| Net increase in net assets | | | 24,627,813 | | | | 5,103,886 | |
| | | | | | | | | |
| Net assets: | | | | | | | | |
| Beginning of year | | | 24,393,289 | | | | 19,289,403 | |
| End of year | | $ | 49,021,102 | | | $ | 24,393,289 | |
| Undistributed net investment income at end of year | | $ | 84,494 | | | $ | 104,722 | |
| | | | | | | | | |
| Capital share activity: | | | | | | | | |
| Shares sold | | | | | | | | |
| Investor Class | | | 1,317,679 | | | | 942,203 | |
| Advisor Class | | | 911,673 | | | | 383,290 | |
| A-Class | | | 147,860 | | | | 377,509 | |
| C-Class | | | 323,866 | | | | 443,798 | |
| Shares issued from reinvestment of distributions | | | | | | | | |
| Investor Class | | | 954 | | | | 1,089 | |
| Advisor Class | | | 43 | | | | 494 | |
| A-Class | | | 117 | | | | 603 | |
| C-Class | | | 507 | | | | 703 | |
| Shares redeemed | | | | | | | | |
| Investor Class | | | (793,962 | ) | | | (936,087 | ) |
| Advisor Class | | | (906,078 | ) | | | (463,143 | ) |
| A-Class | | | (271,097 | ) | | | (279,911 | ) |
| C-Class | | | (344,416 | ) | | | (453,983 | ) |
| Net increase in shares | | | 387,146 | | | | 16,565 | |
| 16 | THE RYDEX FUNDS ANNUAL REPORT | SEE NOTES TO FINANCIAL STATEMENTS. |
This table is presented to show selected data for a share outstanding throughout each period and to assist shareholders in evaluating a Fund’s performance for the periods presented.
| Investor Class | | Year Ended March 31, 2015 | | | Year Ended March 31, 2014 | | | Year Ended March 28, 2013 | | | Year Ended March 31, 2012 | | | Year Ended March 31, 2011 | |
| Per Share Data | | | | | | | | | | | | | | | |
| Net asset value, beginning of period | | $ | 63.60 | | | $ | 52.58 | | | $ | 46.75 | | | $ | 49.75 | | | $ | 50.73 | |
| Income (loss) from investment operations: | |
Net investment income (loss)a | | | .51 | | | | .54 | | | | .54 | | | | .44 | | | | .13 | |
| Net gain (loss) on investments (realized and unrealized) | | (.98 | ) | | | 11.09 | | | | 5.44 | | | | (3.39 | ) | | | (.99 | ) |
| Total from investment operations | | | (.47 | ) | | | 11.63 | | | | 5.98 | | | | (2.95 | ) | | | (.86 | ) |
| Less distributions from: | |
| Net investment income | | | (.42 | ) | | | (.61 | ) | | | (.15 | ) | | | (.05 | ) | | | (.12 | ) |
| Total distributions | | | (.42 | ) | | | (.61 | ) | | | (.15 | ) | | | (.05 | ) | | | (.12 | ) |
| Net asset value, end of period | | $ | 62.71 | | | $ | 63.60 | | | $ | 52.58 | | | $ | 46.75 | | | $ | 49.75 | |
| | |
Total Returnb | | | (0.73 | %) | | | 22.17 | % | | | 12.84 | % | | | (5.89 | %) | | | (1.66 | %) |
| Ratios/Supplemental Data | |
| Net assets, end of period (in thousands) | | $ | 43,989 | | | $ | 11,241 | | | $ | 8,915 | | | $ | 29,061 | | | $ | 8,711 | |
| Ratios to average net assets: | |
| Net investment income (loss) | | | 0.82 | % | | | 0.92 | % | | | 1.16 | % | | | 1.02 | % | | | 0.27 | % |
| Total expenses | | | 1.34 | % | | | 1.37 | % | | | 1.35 | % | | | 1.34 | % | | | 1.39 | % |
| Portfolio turnover rate | | | 583 | % | | | 481 | % | | | 382 | % | | | 544 | % | | | 1,130 | % |
| Advisor Class | | Year Ended March 31, 2015 | | | Year Ended March 31, 2014 | | | Year Ended March 28, 2013 | | | Year Ended March 31, 2012 | | | Year Ended March 31, 2011 | |
| Per Share Data | | | | | | | | | | | | | | | |
| Net asset value, beginning of period | | $ | 57.40 | | | $ | 47.71 | | | $ | 42.63 | | | $ | 45.63 | | | $ | 46.79 | |
| Income (loss) from investment operations: | |
Net investment income (loss)a | | | (.01 | ) | | | .23 | | | | .17 | | | | .12 | | | | (.08 | ) |
| Net gain (loss) on investments (realized and unrealized) | | | (.67 | ) | | | 10.07 | | | | 5.06 | | | | (3.07 | ) | | | (.96 | ) |
| Total from investment operations | | | (.68 | ) | | | 10.30 | | | | 5.23 | | | | (2.95 | ) | | | (1.04 | ) |
| Less distributions from: | |
| Net investment income | | | (.42 | ) | | | (.61 | ) | | | (.15 | ) | | | (.05 | ) | | | (.12 | ) |
| Total distributions | | | (.42 | ) | | | (.61 | ) | | | (.15 | ) | | | (.05 | ) | | | (.12 | ) |
| Net asset value, end of period | | $ | 56.30 | | | $ | 57.40 | | | $ | 47.71 | | | $ | 42.63 | | | $ | 45.63 | |
| | |
Total Returnb | | | (1.19 | %) | | | 21.64 | % | | | 12.32 | % | | | (6.43 | %) | | | (2.19 | %) |
| Ratios/Supplemental Data | |
| Net assets, end of period (in thousands) | | $ | 847 | | | $ | 540 | | | $ | 4,235 | | | $ | 1,105 | | | $ | 629 | |
| Ratios to average net assets: | |
| Net investment income (loss) | | | (0.02 | %) | | | 0.44 | % | | | 0.38 | % | | | 0.30 | % | | | (0.18 | %) |
| Total expenses | | | 1.85 | % | | | 1.87 | % | | | 1.86 | % | | | 1.83 | % | | | 1.89 | % |
| Portfolio turnover rate | | | 583 | % | | | 481 | % | | | 382 | % | | | 544 | % | | | 1,130 | % |
| SEE NOTES TO FINANCIAL STATEMENTS. | THE RYDEX FUNDS ANNUAL REPORT | 17 |
FINANCIAL HIGHLIGHTS (concluded)
This table is presented to show selected data for a share outstanding throughout each period and to assist shareholders in evaluating a Fund’s performance for the periods presented.
| A-Class | | Year Ended March 31, 2015 | | | Year Ended March 31, 2014 | | | Year Ended March 28, 2013 | | | Year Ended March 31, 2012 | | | Year Ended March 31, 2011 | |
| Per Share Data | | | | | | | | | | | | | | | |
| Net asset value, beginning of period | | $ | 58.75 | | | $ | 48.74 | | | $ | 43.45 | | | $ | 46.38 | | | $ | 47.41 | |
| Income (loss) from investment operations: | |
Net investment income (loss)a | | | .26 | | | | .39 | | | | .36 | | | | .30 | | | | .04 | |
| Net gain (loss) on investments (realized and unrealized) | | | (.83 | ) | | | 10.23 | | | | 5.08 | | | | (3.18 | ) | | | (.95 | ) |
| Total from investment operations | | | (.57 | ) | | | 10.62 | | | | 5.44 | | | | (2.88 | ) | | | (.91 | ) |
| Less distributions from: | |
| Net investment income | | | (.42 | ) | | | (.61 | ) | | | (.15 | ) | | | (.05 | ) | | | (.12 | ) |
| Total distributions | | | (.42 | ) | | | (.61 | ) | | | (.15 | ) | | | (.05 | ) | | | (.12 | ) |
| Net asset value, end of period | | $ | 57.76 | | | $ | 58.75 | | | $ | 48.74 | | | $ | 43.45 | | | $ | 46.38 | |
| | |
Total Returnb | | | (0.98 | %) | | | 21.84 | % | | | 12.60 | % | | | (6.19 | %) | | | (1.89 | %) |
| Ratios/Supplemental Data | |
| Net assets, end of period (in thousands) | | $ | 1,054 | | | $ | 8,305 | | | $ | 2,103 | | | $ | 3,088 | | | $ | 913 | |
| Ratios to average net assets: | |
| Net investment income (loss) | | | 0.45 | % | | | 0.71 | % | | | 0.88 | % | | | 0.73 | % | | | 0.09 | % |
| Total expenses | | | 1.60 | % | | | 1.62 | % | | | 1.59 | % | | | 1.61 | % | | | 1.64 | % |
| Portfolio turnover rate | | | 583 | % | | | 481 | % | | | 382 | % | | | 544 | % | | | 1,130 | % |
| C-Class | | Year Ended March 31, 2015 | | | Year Ended March 31, 2014 | | | Year Ended March 28, 2013 | | | Year Ended March 31, 2012 | | | Year Ended March 31, 2011 | |
| Per Share Data | | | | | | | | | | | | | | | |
| Net asset value, beginning of period | | $ | 54.69 | | | $ | 45.74 | | | $ | 41.09 | | | $ | 44.20 | | | $ | 45.51 | |
| Income (loss) from investment operations: | |
Net investment income (loss)a | | | (.14 | ) | | | (.05 | ) | | | .01 | | | | (.01 | ) | | | (.29 | ) |
| Net gain (loss) on investments (realized and unrealized) | | | (.79 | ) | | | 9.61 | | | | 4.79 | | | | (3.05 | ) | | | (.90 | ) |
| Total from investment operations | | | (.93 | ) | | | 9.56 | | | | 4.80 | | | | (3.06 | ) | | | (1.19 | ) |
| Less distributions from: | |
| Net investment income | | | (.42 | ) | | | (.61 | ) | | | (.15 | ) | | | (.05 | ) | | | (.12 | ) |
| Total distributions | | | (.42 | ) | | | (.61 | ) | | | (.15 | ) | | | (.05 | ) | | | (.12 | ) |
| Net asset value, end of period | | $ | 53.34 | | | $ | 54.69 | | | $ | 45.74 | | | $ | 41.09 | | | $ | 44.20 | |
| | |
Total Returnb | | | (1.71 | %) | | | 20.95 | % | | | 11.74 | % | | | (6.88 | %) | | | (2.58 | %) |
| Ratios/Supplemental Data | |
| Net assets, end of period (in thousands) | | $ | 3,131 | | | $ | 4,307 | | | $ | 4,036 | | | $ | 3,841 | | | $ | 2,844 | |
| Ratios to average net assets: | |
| Net investment income (loss) | | | (0.26 | %) | | | (0.10 | %) | | | 0.02 | % | | | (0.03 | %) | | | (0.67 | %) |
| Total expenses | | | 2.35 | % | | | 2.37 | % | | | 2.35 | % | | | 2.35 | % | | | 2.38 | % |
| Portfolio turnover rate | | | 583 | % | | | 481 | % | | | 382 | % | | | 544 | % | | | 1,130 | % |
a | Net investment income (loss) per share was computed using average shares outstanding throughout the period. |
b | Total return does not reflect the impact of any applicable sales charges. |
| 18 | THE RYDEX FUNDS ANNUAL REPORT | SEE NOTES TO FINANCIAL STATEMENTS. |
PERFORMANCE REPORT AND FUND PROFILE (Unaudited) | March 31, 2015 |
BASIC MATERIALS FUND
OBJECTIVE: Seeks to provide capital appreciation by investing in companies engaged in the mining, manufacture, or sale of basic materials, such as lumber, steel, iron, aluminum, concrete, chemicals, and other basic building and manufacturing materials (“basic materials companies”).
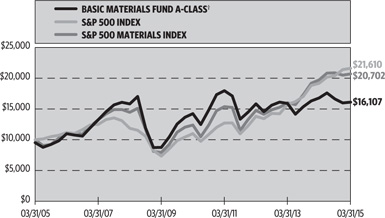
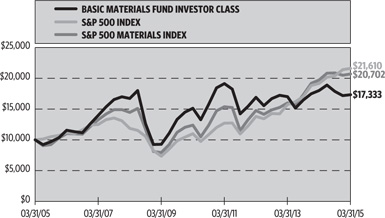
For the one-year period ended March 31, 2015, Basic Materials Fund Investor Class returned -3.77%, compared with 4.97% for the S&P 500 Materials Index. The broader S&P 500 Index returned 12.73%.
The Fund is composed largely of two industries—chemicals, and metals & mining. The industry that contributed most to performance was chemicals, followed by containers & packaging. The largest detractor from return was the metals & mining industry, followed by the capital markets industry.
The top-performing holdings were Sherwin-Williams Co., Sigma-Aldrich Corp., and Air Products & Chemicals, Inc. The worst-performing holdings included Barrick Gold Corp., Freeport-McMoRan, Inc., and Vale S.A. ADR.
Performance displayed represents past performance, which is no guarantee of future results.
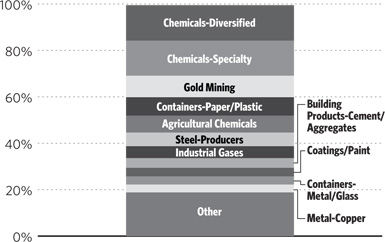
Holdings Diversification (Market Exposure as % of Net Assets)
“Holdings Diversification (Market Exposure as % of Net Assets)” excludes any temporary cash investments.
| Inception Dates: |
| Investor Class | April 1, 1998 |
| Advisor Class | April 14, 1998 |
| A-Class | September 1, 2004 |
| C-Class | May 3, 2001 |
| Ten Largest Holdings (% of Total Net Assets) |
| EI du Pont de Nemours & Co. | 2.9% |
| Dow Chemical Co. | 2.7% |
| Monsanto Co. | 2.6% |
| LyondellBasell Industries N.V. — Class A | 2.3% |
| Praxair, Inc. | 2.1% |
| Ecolab, Inc. | 2.1% |
| Air Products & Chemicals, Inc. | 2.1% |
| PPG Industries, Inc. | 2.0% |
| Sherwin-Williams Co. | 1.9% |
| Southern Copper Corp. | 1.8% |
| Top Ten Total | 22.5% |
| | |
| “Ten Largest Holdings” exclude any temporary cash or derivative investments. |
| | THE RYDEX FUNDS ANNUAL REPORT | 19 |
PERFORMANCE REPORT AND FUND PROFILE (Unaudited)(concluded) | March 31, 2015 |
Cumulative Fund Performance*
Average Annual Returns*
Periods Ended March 31, 2015
| | 1 Year | 5 Year | 10 Year |
| Investor Class Shares | -3.77% | 2.76% | 5.65% |
| Advisor Class Shares | -4.30% | 2.24% | 5.12% |
| A-Class Shares | -4.05% | 2.50% | 5.39% |
A-Class Shares with sales charge† | -8.61% | 1.50% | 4.88% |
| C-Class Shares | -4.76% | 1.73% | 4.60% |
C-Class Shares with CDSC‡ | -5.70% | 1.73% | 4.60% |
| S&P 500 Materials Index | 4.97% | 10.82% | 7.55% |
| S&P 500 Index | 12.73% | 14.47% | 8.01% |
| * | The performance data above represents past performance that is not predictive of future results. The investment return and principal value of an investment in the Fund will fluctuate so that an investor’s shares, when redeemed, may be worth more or less than their original cost. Returns are historical and include changes in principal and reinvested dividends and capital gains and do not reflect the effect of taxes. The S&P 500 Index and the S&P 500 Materials Index are unmanaged indices and, unlike the Fund, have no management fees or operating expenses to reduce their reported returns. The graphs are based on Investor Class shares and A-Class shares only; performance for Advisor Class shares and C-Class shares will vary due to differences in fee structures. |
† | Fund returns are calculated using the maximum sales charge of 4.75%. |
‡ | Fund returns include a CDSC of 1% if redeemed within 12 months of purchase. |
| 20 | THE RYDEX FUNDS ANNUAL REPORT | |
| SCHEDULE OF INVESTMENTS | March 31, 2015 |
| BASIC MATERIALS FUND | |
| | |
Shares | | | Value | |
| | | | | | | | |
COMMON STOCKS† - 99.5% | |
| | | | | | | | |
| CHEMICALS-DIVERSIFIED - 15.2% | |
| EI du Pont de Nemours & Co. | | | 23,128 | | | $ | 1,652,957 | |
| Dow Chemical Co. | | | 32,834 | | | | 1,575,375 | |
| LyondellBasell Industries N.V. — Class A | | | 15,476 | | | | 1,358,793 | |
| PPG Industries, Inc. | | | 5,100 | | | | 1,150,254 | |
| Westlake Chemical Corp. | | | 9,340 | | | | 671,920 | |
| Celanese Corp. — Class A | | | 11,082 | | | | 619,041 | |
| FMC Corp. | | | 9,851 | | | | 563,970 | |
| Huntsman Corp. | | | 22,235 | | | | 492,950 | |
| Axiall Corp. | | | 8,180 | | | | 383,969 | |
| Olin Corp. | | | 10,828 | | | | 346,929 | |
| Total Chemicals-Diversified | | | | | | | 8,816,158 | |
| | | | | | | | |
| CHEMICALS-SPECIALTY - 15.0% | |
| Ecolab, Inc. | | | 10,621 | | | | 1,214,831 | |
| Sigma-Aldrich Corp. | | | 6,169 | | | | 852,864 | |
| Eastman Chemical Co. | | | 9,728 | | | | 673,761 | |
| International Flavors & Fragrances, Inc. | | | 5,471 | | | | 642,295 | |
| Ashland, Inc. | | | 4,872 | | | | 620,254 | |
| WR Grace & Co.* | | | 5,845 | | | | 577,895 | |
| NewMarket Corp. | | | 1,175 | | | | 561,415 | |
| Albemarle Corp. | | | 9,649 | | | | 509,853 | |
| Platform Specialty Products Corp.* | | | 17,900 | | | | 459,314 | |
| Methanex Corp. | | | 8,470 | | | | 453,738 | |
| Cytec Industries, Inc. | | | 7,726 | | | | 417,513 | |
| Sensient Technologies Corp. | | | 5,680 | | | | 391,238 | |
| Cabot Corp. | | | 8,070 | | | | 363,150 | |
| Minerals Technologies, Inc. | | | 4,645 | | | | 339,550 | |
| HB Fuller Co. | | | 7,170 | | | | 307,378 | |
| Chemtura Corp.* | | | 10,800 | | | | 294,732 | |
| Total Chemicals-Specialty | | | | | | | 8,679,781 | |
| | | | | | | | |
| GOLD MINING - 9.3% | |
| Barrick Gold Corp. | | | 71,168 | | | | 780,000 | |
| Goldcorp, Inc. | | | 38,856 | | | | 704,071 | |
| Newmont Mining Corp. | | | 31,305 | | | | 679,632 | |
| Agnico Eagle Mines Ltd. | | | 18,903 | | | | 528,150 | |
| Randgold Resources Ltd. ADR | | | 7,484 | | | | 518,417 | |
| AngloGold Ashanti Ltd. ADR* | | | 52,039 | | | | 486,044 | |
| Franco-Nevada Corp. | | | 9,808 | | | | 476,080 | |
| Royal Gold, Inc. | | | 6,643 | | | | 419,240 | |
| Eldorado Gold Corp. | | | 89,632 | | | | 411,411 | |
| Cia de Minas Buenaventura S.A.A. ADR | | | 40,053 | | | | 405,737 | |
| Total Gold Mining | | | | | | | 5,408,782 | |
| | | | | | | | |
| CONTAINERS-PAPER/PLASTIC - 7.9% | |
| Sealed Air Corp. | | | 14,063 | | | | 640,710 | |
| Rock-Tenn Co. — Class A | | | 9,590 | | | | 618,555 | |
| MeadWestvaco Corp. | | | 11,972 | | | | 597,044 | |
| Packaging Corporation of America | | | 7,400 | | | | 578,606 | |
| Graphic Packaging Holding Co. | | | 31,120 | | | | 452,485 | |
| Sonoco Products Co. | | | 9,910 | | | | 450,509 | |
| Berry Plastics Group, Inc.* | | | 12,136 | | | | 439,202 | |
| Bemis Company, Inc. | | | 9,472 | | | | 438,648 | |
| KapStone Paper and Packaging Corp. | | | 11,411 | | | | 374,737 | |
| Total Containers-Paper/Plastic | | | | | | | 4,590,496 | |
| | | | | | | | |
| AGRICULTURAL CHEMICALS - 7.3% | |
| Monsanto Co. | | | 13,373 | | | | 1,504,997 | |
| Mosaic Co. | | | 18,438 | | | | 849,254 | |
| CF Industries Holdings, Inc. | | | 2,764 | | | | 784,092 | |
| Potash Corporation of Saskatchewan, Inc. | | | 18,980 | | | | 612,105 | |
| Agrium, Inc. | | | 4,813 | | | | 501,852 | |
| Total Agricultural Chemicals | | | | | | | 4,252,300 | |
| | | | | | | | |
| STEEL-PRODUCERS - 5.9% | |
| Nucor Corp. | | | 17,087 | | | | 812,145 | |
| Steel Dynamics, Inc. | | | 24,040 | | | | 483,204 | |
| Reliance Steel & Aluminum Co. | | | 7,678 | | | | 468,972 | |
ArcelorMittal1 | | | 44,714 | | | | 421,206 | |
United States Steel Corp.1 | | | 16,994 | | | | 414,654 | |
| Commercial Metals Co. | | | 19,110 | | | | 309,391 | |
| Carpenter Technology Corp. | | | 7,805 | | | | 303,458 | |
AK Steel Holding Corp.*,1 | | | 44,763 | | | | 200,091 | |
| Total Steel-Producers | | | | | | | 3,413,121 | |
| | | | | | | | |
| INDUSTRIAL GASES - 5.2% | |
| Praxair, Inc. | | | 10,112 | | | | 1,220,923 | |
| Air Products & Chemicals, Inc. | | | 7,858 | | | | 1,188,758 | |
| Airgas, Inc. | | | 5,366 | | | | 569,386 | |
| Total Industrial Gases | | | | | | | 2,979,067 | |
| | | | | | | | |
| BUILDING PRODUCTS-CEMENT/AGGREGATES - 4.2% | |
| Vulcan Materials Co. | | | 8,248 | | | | 695,307 | |
| Cemex SAB de CV ADR* | | | 70,686 | | | | 669,396 | |
| Martin Marietta Materials, Inc. | | | 4,559 | | | | 637,348 | |
| Eagle Materials, Inc. | | | 5,221 | | | | 436,267 | |
| Total Building Products-Cement/Aggregates | | | | | | | 2,438,318 | |
| | | | | | | | |
| COATINGS/PAINT - 3.7% | |
| Sherwin-Williams Co. | | | 3,856 | | | | 1,097,032 | |
| Valspar Corp. | | | 6,375 | | | | 535,691 | |
| RPM International, Inc. | | | 11,031 | | | | 529,378 | |
| Total Coatings/Paint | | | | | | | 2,162,101 | |
| | | | | | | | |
| CONTAINERS-METAL/GLASS - 3.5% | |
| Ball Corp. | | | 9,114 | | | | 643,813 | |
| Crown Holdings, Inc.* | | | 10,881 | | | | 587,792 | |
| Silgan Holdings, Inc. | | | 7,000 | | | | 406,910 | |
| Owens-Illinois, Inc.* | | | 17,441 | | | | 406,724 | |
| Total Containers-Metal/Glass | | | | | | | 2,045,239 | |
| | | | | | | | |
| METAL-COPPER - 3.4% | |
Southern Copper Corp.1 | | | 34,860 | | | | 1,017,215 | |
| Freeport-McMoRan, Inc. | | | 50,518 | | | | 957,316 | |
| Total Metal-Copper | | | | | | | 1,974,531 | |
| SEE NOTES TO FINANCIAL STATEMENTS. | THE RYDEX FUNDS ANNUAL REPORT | 21 |
SCHEDULE OF INVESTMENTS (concluded) | March 31, 2015 |
| BASIC MATERIALS FUND | |
| | |
Shares | | | Value | |
| | | | | | | | | |
| DIVERSIFIED MINERALS - 3.0% | |
BHP Billiton Ltd. ADR1 | | | 15,375 | | | $ | 714,476 | |
BHP Billiton plc ADR1 | | | 11,660 | | | | 516,072 | |
| Teck Resources Ltd. — Class B | | | 34,933 | | | | 479,630 | |
| Total Diversified Minerals | | | | | | | 1,710,178 | |
| | | | | | | | |
| METAL-ALUMINUM - 2.9% | |
| Alcoa, Inc. | | | 64,066 | | | | 827,733 | |
| Constellium N.V. — Class A* | | | 18,600 | | | | 377,952 | |
| Kaiser Aluminum Corp. | | | 3,190 | | | | 245,279 | |
| Century Aluminum Co.* | | | 16,700 | | | | 230,460 | |
| Total Metal-Aluminum | | | | | | | 1,681,424 | |
| | | | | | | | |
| PAPER & RELATED PRODUCTS - 2.6% | |
| International Paper Co. | | | 18,301 | | | | 1,015,523 | |
| Domtar Corp. | | | 10,443 | | | | 482,675 | |
| Total Paper & Related Products | | | | | | | 1,498,198 | |
| | | | | | | | |
| METAL-IRON - 1.7% | |
Vale S.A. ADR1 | | | 144,542 | | | | 816,663 | |
Cliffs Natural Resources, Inc.1 | | | 37,345 | | | | 179,629 | |
| Total Metal-Iron | | | | | | | 996,292 | |
| | | | | | | | |
| SILVER MINING - 1.6% | |
| Silver Wheaton Corp. | | | 27,856 | | | | 529,821 | |
| Pan American Silver Corp. | | | 44,306 | | | | 388,564 | |
| Total Silver Mining | | | | | | | 918,385 | |
| | | | | | | | |
| METAL-DIVERSIFIED - 1.0% | |
| Rio Tinto plc ADR | | | 13,825 | | | | 572,355 | |
| | | | | | | | |
| OFFICE SUPPLIES & FORMS - 0.8% | |
| Avery Dennison Corp. | | | 8,577 | | | | 453,809 | |
| | | | | | | | |
| GARDEN PRODUCTS - 0.7% | |
| Scotts Miracle-Gro Co. — Class A | | | 6,200 | | | | 416,454 | |
| | | | | | | | |
| MISCELLANEOUS MANUFACTURING - 0.7% | |
| AptarGroup, Inc. | | | 6,474 | | | | 411,228 | |
| | | | | | | | |
| CHEMICALS-PLASTICS - 0.7% | |
| PolyOne Corp. | | | 10,312 | | | | 385,153 | |
| | | | | | | | |
| STEEL-SPECIALTY - 0.7% | |
| Allegheny Technologies, Inc. | | | 12,698 | | | | 381,067 | |
| | | | | | | | |
| QUARRYING - 0.6% | |
| Compass Minerals International, Inc. | | | 3,978 | | | | 370,789 | |
| | | | | | | | |
| BUILDING & CONSTRUCTION PRODUCTS-MISCELLANEOUS - 0.6% | |
| Louisiana-Pacific Corp.* | | | 20,053 | | | | 331,075 | |
| | | | | | | | |
| BUILDING PRODUCTS - WOOD - 0.5% | |
| Boise Cascade Co.* | | | 7,000 | | | | 262,220 | |
| | | | | | | | |
| PLATINUM - 0.5% | |
| Stillwater Mining Co.* | | | 20,029 | | | | 258,775 | |
| | | | | | | | |
| OIL FIELD MACHINERY & EQUIPMENT - 0.3% | |
| Flotek Industries, Inc.* | | | 12,953 | | | | 190,927 | |
| | | | | | | | |
| Total Common Stocks | | | | | | | | |
| (Cost $41,804,915) | | | | | | | 57,598,223 | |
| | | | | | | | |
| | | Face
Amount | | | | |
| | | | | | | | |
REPURCHASE AGREEMENT††,2 - 0.5% | |
HSBC Group
issued 03/31/15 at 0.03%
due 04/01/15 | | $ | 298,279 | | | | 298,279 | |
| Total Repurchase Agreement | | | | | | | | |
| (Cost $298,279) | | | | | | | 298,279 | |
| | | | | | | | |
SECURITIES LENDING COLLATERAL††,3 - 5.1% | |
| Repurchase Agreements | | | | | | | | |
HSBC Securities, Inc.
issued 03/31/15 at 0.10%
due 04/01/15 | | | 1,942,643 | | | | 1,942,643 | |
BNP Paribas Securities Corp.
issued 03/31/15 at 0.10%
due 04/01/15 | | | 668,269 | | | | 668,269 | |
Barclays Capital, Inc.
issued 03/31/15 at 0.10%
due 04/01/15 | | | 344,936 | | | | 344,936 | |
| Total Securities Lending Collateral | | | | | | | | |
| (Cost $2,955,848) | | | | | | | 2,955,848 | |
| | | | | | | | |
| Total Investments - 105.1% | | | | | | | | |
| (Cost $45,059,042) | | | | | | $ | 60,852,350 | |
| Other Assets & Liabilities, net - (5.1)% | | | | | | | (2,944,129 | ) |
| Total Net Assets - 100.0% | | | | | | $ | 57,908,221 | |
| * | Non-income producing security. |
| † | Value determined based on Level 1 inputs — See Note 4. |
| †† | Value determined based on Level 2 inputs — See Note 4. |
| 1 | All or portion of this security is on loan at March 31, 2015 — See Note 6. |
| 2 | Repurchase Agreement — See Note 5. |
| 3 | Securities lending collateral — See Note 6. |
| ADR — American Depositary Receipt |
| plc — Public Limited Company |
| 22 | THE RYDEX FUNDS ANNUAL REPORT | SEE NOTES TO FINANCIAL STATEMENTS. |
STATEMENT OF ASSETS AND LIABILITIES
March 31, 2015
| Assets: | |
| Investments, at value - including $2,849,049 of securities loaned (cost $41,804,915) | | $ | 57,598,223 | |
| Repurchase agreements, at value (cost $3,254,127) | | | 3,254,127 | |
| Total investments (cost $45,059,042) | | | 60,852,350 | |
| Segregated cash with broker | | | 43,202 | |
| Cash | | | 18,409 | |
| Receivables: | |
| Securities sold | | | 1,302,096 | |
| Dividends | | | 98,965 | |
| Fund shares sold | | | 88,829 | |
| Securities lending income | | | 2,234 | |
| Total assets | | | 62,406,085 | |
| | | | | |
| Liabilities: | |
| Payable for: | |
| Return of securities loaned | | | 2,999,050 | |
| Fund shares redeemed | | | 1,402,711 | |
| Management fees | | | 45,083 | |
| Transfer agent and administrative fees | | | 13,260 | |
| Distribution and service fees | | | 6,264 | |
| Portfolio accounting fees | | | 5,304 | |
| Miscellaneous | | | 26,192 | |
| Total liabilities | | | 4,497,864 | |
| Commitments and contingent liabilities (Note 10) | | | — | |
| Net assets | | $ | 57,908,221 | |
| | | | | |
| Net assets consist of: | |
| Paid in capital | | $ | 69,726,908 | |
| Undistributed net investment income | | | 213,276 | |
| Accumulated net realized loss on investments | | | (27,825,271 | ) |
| Net unrealized appreciation on investments | | | 15,793,308 | |
| Net assets | | $ | 57,908,221 | |
| | | | | |
| Investor Class: | |
| Net assets | | $ | 46,508,703 | |
| Capital shares outstanding | | | 926,908 | |
| Net asset value per share | | $ | 50.18 | |
| | | | | |
| Advisor Class: | |
| Net assets | | $ | 2,073,365 | |
| Capital shares outstanding | | | 44,890 | |
| Net asset value per share | | $ | 46.19 | |
| | | | | |
| A-Class: | |
| Net assets | | $ | 6,193,560 | |
| Capital shares outstanding | | | 130,281 | |
| Net asset value per share | | $ | 47.54 | |
| Maximum offering price per share (Net asset value divided by 95.25%) | | $ | 49.91 | |
| | | | | |
| C-Class: | |
| Net assets | | $ | 3,132,593 | |
| Capital shares outstanding | | | 72,247 | |
| Net asset value per share | | $ | 43.36 | |
STATEMENT OF OPERATIONS
Year Ended March 31, 2015
| Investment Income: | |
| Dividends (net of foreign withholding tax of $19,591) | | $ | 967,278 | |
| Income from securities lending, net | | | 31,975 | |
| Interest | | | 50 | |
| Total investment income | | | 999,303 | |
| | | | | |
| Expenses: | |
| Management fees | | | 449,417 | |
| Transfer agent and administrative fees | | | 132,181 | |
| Distribution and service fees: | |
| Advisor Class | | | 17,912 | |
| A-Class | | | 22,151 | |
| C-Class | | | 45,185 | |
| Portfolio accounting fees | | | 52,872 | |
| Custodian fees | | | 6,156 | |
| Trustees’ fees* | | | 3,650 | |
| Tax expense | | | 1,493 | |
| Line of credit fees | | | 98 | |
| Miscellaneous | | | 66,506 | |
| Total expenses | | | 797,621 | |
| Net investment income | | | 201,682 | |
| | | | | |
| Net Realized and Unrealized Gain (Loss): | |
| Net realized gain (loss) on: | |
| Investments | | | 451,596 | |
| Net realized gain | | | 451,596 | |
| Net change in unrealized appreciation (depreciation) on: | |
| Investments | | | (3,176,749 | ) |
| Net change in unrealized appreciation (depreciation) | | | (3,176,749 | ) |
| Net realized and unrealized loss | | | (2,725,153 | ) |
| Net decrease in net assets resulting from operations | | $ | (2,523,471 | ) |
| * | Relates to Trustees not deemed “interested persons” within the meaning of Section 2(a)(19) of the 1940 Act. |
| SEE NOTES TO FINANCIAL STATEMENTS. | THE RYDEX FUNDS ANNUAL REPORT | 23 |
STATEMENTS OF CHANGES IN NET ASSETS
| | | Year Ended March 31, 2015 | | | Year Ended March 31, 2014 | |
| Increase (Decrease) in Net Assets from Operations: | | | | | | |
| Net investment income | | $ | 201,682 | | | $ | 217,641 | |
| Net realized gain on investments | | | 451,596 | | | | 6,023,395 | |
| Net change in unrealized appreciation (depreciation) on investments | | | (3,176,749 | ) | | | (5,738,840 | ) |
| Net increase (decrease) in net assets resulting from operations | | | (2,523,471 | ) | | | 502,196 | |
| | | | | | | | | |
| Distributions to shareholders from: | | | | | | | | |
| Net investment income | | | | | | | | |
| Investor Class | | | (126,318 | ) | | | (196,131 | ) |
| Advisor Class | | | (15,206 | ) | | | (14,384 | ) |
| A-Class | | | (52,521 | ) | | | (54,137 | ) |
| C-Class | | | (38,108 | ) | | | (34,529 | ) |
| Total distributions to shareholders | | | (232,153 | ) | | | (299,181 | ) |
| | | | | | | | | |
| Capital share transactions: | | | | | | | | |
| Proceeds from sale of shares | | | | | | | | |
| Investor Class | | | 174,133,848 | | | | 162,952,932 | |
| Advisor Class | | | 93,725,732 | | | | 8,129,722 | |
| A-Class | | | 17,363,620 | | | | 13,387,890 | |
| C-Class | | | 21,170,418 | | | | 22,384,921 | |
| Distributions reinvested | | | | | | | | |
| Investor Class | | | 122,696 | | | | 187,009 | |
| Advisor Class | | | 14,751 | | | | 13,713 | |
| A-Class | | | 48,718 | | | | 50,565 | |
| C-Class | | | 33,909 | | | | 31,129 | |
| Cost of shares redeemed | | | | | | | | |
| Investor Class | | | (159,713,668 | ) | | | (165,714,358 | ) |
| Advisor Class | | | (93,948,162 | ) | | | (9,087,918 | ) |
| A-Class | | | (24,254,035 | ) | | | (11,090,005 | ) |
| C-Class | | | (22,896,209 | ) | | | (23,983,376 | ) |
| Net increase (decrease) from capital share transactions | | | 5,801,618 | | | | (2,737,776 | ) |
| Net increase (decrease) in net assets | | | 3,045,994 | | | | (2,534,761 | ) |
| | | | | | | | | |
| Net assets: | | | | | | | | |
| Beginning of year | | | 54,862,227 | | | | 57,396,988 | |
| End of year | | $ | 57,908,221 | | | $ | 54,862,227 | |
| Undistributed net investment income at end of year | | $ | 213,276 | | | $ | 199,782 | |
| | | | | | | | | |
| Capital share activity: | | | | | | | | |
| Shares sold | | | | | | | | |
| Investor Class | | | 3,328,992 | | | | 3,283,583 | |
| Advisor Class | | | 1,959,976 | | | | 179,322 | |
| A-Class | | | 343,124 | | | | 276,591 | |
| C-Class | | | 460,459 | | | | 520,203 | |
| Shares issued from reinvestment of distributions | | | | | | | | |
| Investor Class | | | 2,376 | | | | 3,814 | |
| Advisor Class | | | 310 | | | | 302 | |
| A-Class | | | 995 | | | | 1,084 | |
| C-Class | | | 757 | | | | 724 | |
| Shares redeemed | | | | | | | | |
| Investor Class | | | (3,045,699 | ) | | | (3,367,228 | ) |
| Advisor Class | | | (1,970,445 | ) | | | (202,337 | ) |
| A-Class | | | (481,155 | ) | | | (243,630 | ) |
| C-Class | | | (501,150 | ) | | | (559,837 | ) |
| Net increase (decrease) in shares | | | 98,540 | | | | (107,409 | ) |
| 24 | THE RYDEX FUNDS ANNUAL REPORT | SEE NOTES TO FINANCIAL STATEMENTS. |
This table is presented to show selected data for a share outstanding throughout each period and to assist shareholders in evaluating a Fund’s performance for the periods presented.
| Investor Class | | Year Ended March 31, 2015 | | | Year Ended March 31, 2014 | | | Year Ended March 28, 2013 | | | Year Ended March 31, 2012 | | | Year Ended March 31, 2011 | |
| Per Share Data | | | | | | | | | | | | | | | |
| Net asset value, beginning of period | | $ | 52.53 | | | $ | 49.94 | | | $ | 49.80 | | | $ | 56.36 | | | $ | 44.65 | |
| Income (loss) from investment operations: | |
Net investment income (loss)a | | | .29 | | | | .32 | | | | .46 | | | | .09 | | | | — | b |
| Net gain (loss) on investments (realized and unrealized) | | | (2.26 | ) | | | 2.58 | | | | (.15 | ) | | | (6.65 | ) | | | 11.82 | |
| Total from investment operations | | | (1.97 | ) | | | 2.90 | | | | .31 | | | | (6.56 | ) | | | 11.82 | |
| Less distributions from: | |
| Net investment income | | | (.38 | ) | | | (.31 | ) | | | (.17 | ) | | | — | | | | (.11 | ) |
| Total distributions | | | (.38 | ) | | | (.31 | ) | | | (.17 | ) | | | — | | | | (.11 | ) |
| Net asset value, end of period | | $ | 50.18 | | | $ | 52.53 | | | $ | 49.94 | | | $ | 49.80 | | | $ | 56.36 | |
| | |
Total Returnc | | | (3.77 | %) | | | 5.84 | % | | | 0.65 | % | | | (11.66 | %) | | | 26.50 | % |
| Ratios/Supplemental Data | |
| Net assets, end of period (in thousands) | | $ | 46,509 | | | $ | 33,687 | | | $ | 36,012 | | | $ | 36,847 | | | $ | 73,606 | |
| Ratios to average net assets: | |
| Net investment income (loss) | | | 0.56 | % | | | 0.66 | % | | | 0.95 | % | | | 0.17 | % | | | 0.00 | % |
| Total expenses | | | 1.34 | % | | | 1.38 | % | | | 1.36 | % | | | 1.36 | % | | | 1.39 | % |
| Portfolio turnover rate | | | 358 | % | | | 349 | % | | | 251 | % | | | 217 | % | | | 292 | % |
| Advisor Class | | Year Ended March 31, 2015 | | | Year Ended March 31, 2014 | | | Year Ended March 28, 2013 | | | Year Ended March 31, 2012 | | | Year Ended March 31, 2011 | |
| Per Share Data | | | | | | | | | | | | | | | |
| Net asset value, beginning of period | | $ | 48.64 | | | $ | 46.50 | | | $ | 46.61 | | | $ | 53.00 | | | $ | 42.20 | |
| Income (loss) from investment operations: | |
Net investment income (loss)a | | | — | b | | | .08 | | | | .19 | | | | .08 | | | | (.20 | ) |
| Net gain (loss) on investments (realized and unrealized) | | | (2.07 | ) | | | 2.37 | | | | (.13 | ) | | | (6.47 | ) | | | 11.11 | |
| Total from investment operations | | | (2.07 | ) | | | 2.45 | | | | .06 | | | | (6.39 | ) | | | 10.91 | |
| Less distributions from: | |
| Net investment income | | | (.38 | ) | | | (.31 | ) | | | (.17 | ) | | | — | | | | (.11 | ) |
| Total distributions | | | (.38 | ) | | | (.31 | ) | | | (.17 | ) | | | — | | | | (.11 | ) |
| Net asset value, end of period | | $ | 46.19 | | | $ | 48.64 | | | $ | 46.50 | | | $ | 46.61 | | | $ | 53.00 | |
| | |
Total Returnc | | | (4.30 | %) | | | 5.31 | % | | | 0.16 | % | | | (12.08 | %) | | | 25.88 | % |
| Ratios/Supplemental Data | |
| Net assets, end of period (in thousands) | | $ | 2,073 | | | $ | 2,678 | | | $ | 3,616 | | | $ | 5,287 | | | $ | 15,986 | |
| Ratios to average net assets: | |
| Net investment income (loss) | | | 0.00 | %d | | | 0.18 | % | | | 0.43 | % | | | 0.17 | % | | | (0.44 | %) |
| Total expenses | | | 1.85 | % | | | 1.88 | % | | | 1.86 | % | | | 1.86 | % | | | 1.89 | % |
| Portfolio turnover rate | | | 358 | % | | | 349 | % | | | 251 | % | | | 217 | % | | | 292 | % |
| SEE NOTES TO FINANCIAL STATEMENTS. | THE RYDEX FUNDS ANNUAL REPORT | 25 |
FINANCIAL HIGHLIGHTS (concluded)
This table is presented to show selected data for a share outstanding throughout each period and to assist shareholders in evaluating a Fund’s performance for the periods presented.
| A-Class | | Year Ended March 31, 2015 | | | Year Ended March 31, 2014 | | | Year Ended March 28, 2013 | | | Year Ended March 31, 2012 | | | Year Ended March 31, 2011 | |
| Per Share Data | | | | | | | | | | | | | | | |
| Net asset value, beginning of period | | $ | 49.93 | | | $ | 47.60 | | | $ | 47.58 | | | $ | 53.99 | | | $ | 42.88 | |
| Income (loss) from investment operations: | |
Net investment income (loss)a | | | .13 | | | | .22 | | | | .32 | | | | (.01 | ) | | | (.09 | ) |
| Net gain (loss) on investments (realized and unrealized) | | | (2.14 | ) | | | 2.42 | | | | (.13 | ) | | | (6.40 | ) | | | 11.31 | |
| Total from investment operations | | | (2.01 | ) | | | 2.64 | | | | .19 | | | | (6.41 | ) | | | 11.22 | |
| Less distributions from: | |
| Net investment income | | | (.38 | ) | | | (.31 | ) | | | (.17 | ) | | | — | | | | (.11 | ) |
| Total distributions | | | (.38 | ) | | | (.31 | ) | | | (.17 | ) | | | — | | | | (.11 | ) |
| Net asset value, end of period | | $ | 47.54 | | | $ | 49.93 | | | $ | 47.60 | | | $ | 47.58 | | | $ | 53.99 | |
| | |
Total Returnc | | | (4.05 | %) | | | 5.58 | % | | | 0.41 | % | | | (11.87 | %) | | | 26.20 | % |
| Ratios/Supplemental Data | |
| Net assets, end of period (in thousands) | | $ | 6,194 | | | $ | 13,347 | | | $ | 11,104 | | | $ | 9,410 | | | $ | 18,187 | |
| Ratios to average net assets: | |
| Net investment income (loss) | | | 0.27 | % | | | 0.47 | % | | | 0.69 | % | | | (0.03 | %) | | | (0.19 | %) |
| Total expenses | | | 1.60 | % | | | 1.63 | % | | | 1.61 | % | | | 1.61 | % | | | 1.64 | % |
| Portfolio turnover rate | | | 358 | % | | | 349 | % | | | 251 | % | | | 217 | % | | | 292 | % |
| C-Class | | Year Ended March 31, 2015 | | | Year Ended March 31, 2014 | | | Year Ended March 28, 2013 | | | Year Ended March 31, 2012 | | | Year Ended March 31, 2011 | |
| Per Share Data | | | | | | | | | | | | | | | |
| Net asset value, beginning of period | | $ | 45.91 | | | $ | 44.12 | | | $ | 44.45 | | | $ | 50.80 | | | $ | 40.67 | |
| Income (loss) from investment operations: | |
Net investment income (loss)a | | | (.23 | ) | | | (.15 | ) | | | (.03 | ) | | | (.33 | ) | | | (.40 | ) |
| Net gain (loss) on investments (realized and unrealized) | | | (1.94 | ) | | | 2.25 | | | | (.13 | ) | | | (6.02 | ) | | | 10.64 | |
| Total from investment operations | | | (2.17 | ) | | | 2.10 | | | | (.16 | ) | | | (6.35 | ) | | | 10.24 | |
| Less distributions from: | |
| Net investment income | | | (.38 | ) | | | (.31 | ) | | | (.17 | ) | | | — | | | | (.11 | ) |
| Total distributions | | | (.38 | ) | | | (.31 | ) | | | (.17 | ) | | | — | | | | (.11 | ) |
| Net asset value, end of period | | $ | 43.36 | | | $ | 45.91 | | | $ | 44.12 | | | $ | 44.45 | | | $ | 50.80 | |
| | |
Total Returnc | | | (4.76 | %) | | | 4.80 | % | | | (0.35 | %) | | | (12.50 | %) | | | 25.21 | % |
| Ratios/Supplemental Data | |
| Net assets, end of period (in thousands) | | $ | 3,133 | | | $ | 5,150 | | | $ | 6,666 | | | $ | 8,317 | | | $ | 13,353 | |
| Ratios to average net assets: | |
| Net investment income (loss) | | | (0.49 | %) | | | (0.34 | %) | | | (0.07 | %) | | | (0.73 | %) | | | (0.93 | %) |
| Total expenses | | | 2.35 | % | | | 2.38 | % | | | 2.36 | % | | | 2.36 | % | | | 2.39 | % |
| Portfolio turnover rate | | | 358 | % | | | 349 | % | | | 251 | % | | | 217 | % | | | 292 | % |
a | Net investment income (loss) per share was computed using average shares outstanding throughout the period. |
b | Net investment income is less than $0.01 per share. |
c | Total return does not reflect the impact of any applicable sales charges. |
d | Less than 0.01%. |
| 26 | THE RYDEX FUNDS ANNUAL REPORT | SEE NOTES TO FINANCIAL STATEMENTS. |
PERFORMANCE REPORT AND FUND PROFILE (Unaudited) | March 31, 2015 |
BIOTECHNOLOGY FUND
OBJECTIVE: Seeks to provide capital appreciation by investing in companies that are involved in the biotechnology industry, including companies involved in research and development, genetic or biological engineering, and in the design, manufacture, or sale of related biotechnology products or services (“biotechnology companies”).
For the one-year period ended March 31, 2015, Biotechnology Fund Investor Class returned 42.19%, compared with the S&P 500 Health Care Index, which returned 26.19%. The broader S&P 500 Index returned 12.73%.
The industry that contributed most to return was biotechnology, followed by life sciences tools & services. The pharmaceuticals industry detracted from return.
The best-performing holdings in the Fund were Gilead Sciences, Inc., Celgene Corp., and Puma Biotechnology, Inc. The worst-performing holdings in the Fund included Seattle Genetics, Inc., Aegerion Pharmaceuticals, Inc., and Theravance Biopharma, Inc.
Performance displayed represents past performance, which is no guarantee of future results.
Holdings Diversification (Market Exposure as % of Net Assets)
“Holdings Diversification (Market Exposure as % of Net Assets)” excludes any temporary cash investments.
| Inception Dates: |
| Investor Class | April 1, 1998 |
| Advisor Class | April 1, 1998 |
| A-Class | September 1, 2004 |
| C-Class | March 30, 2001 |
| Ten Largest Holdings (% of Total Net Assets) |
| Gilead Sciences, Inc. | 6.8% |
| Amgen, Inc. | 6.1% |
| Biogen, Inc. | 5.7% |
| Celgene Corp. | 5.3% |
| Regeneron Pharmaceuticals, Inc. | 3.5% |
| Alexion Pharmaceuticals, Inc. | 3.3% |
| Vertex Pharmaceuticals, Inc. | 2.9% |
| Illumina, Inc. | 2.8% |
| BioMarin Pharmaceutical, Inc. | 2.6% |
| Pharmacyclics, Inc. | 2.5% |
| Top Ten Total | 41.5% |
| | |
| “Ten Largest Holdings” exclude any temporary cash or derivative investments. |
| | THE RYDEX FUNDS ANNUAL REPORT | 27 |
PERFORMANCE REPORT AND FUND PROFILE (Unaudited)(concluded) | March 31, 2015 |
Cumulative Fund Performance*
Average Annual Returns*
Periods Ended March 31, 2015
| | 1 Year | 5 Year | 10 Year |
| Investor Class Shares | 42.19% | 28.92% | 18.66% |
| Advisor Class Shares | 41.49% | 28.27% | 18.08% |
| A-Class Shares | 41.83% | 28.59% | 18.36% |
A-Class Shares with sales charge† | 35.10% | 27.34% | 17.79% |
| C-Class Shares | 40.75% | 27.64% | 17.50% |
C-Class Shares with CDSC‡ | 39.75% | 27.64% | 17.50% |
| S&P 500 Health Care Index | 26.19% | 20.09% | 11.41% |
| S&P 500 Index | 12.73% | 14.47% | 8.01% |
| * | The performance data above represents past performance that is not predictive of future results. The investment return and principal value of an investment in the Fund will fluctuate so that an investor’s shares, when redeemed, may be worth more or less than their original cost. Returns are historical and include changes in principal and reinvested dividends and capital gains and do not reflect the effect of taxes. The S&P 500 Index and the S&P 500 Health Care Index are unmanaged indices and, unlike the Fund, have no management fees or operating expenses to reduce their reported returns. The graphs are based on Investor Class shares and A-Class shares only; performance for Advisor Class shares and C-Class shares will vary due to differences in fee structures. |
† | Fund returns are calculated using the maximum sales charge of 4.75%. |
‡ | Fund returns include a CDSC of 1% if redeemed within 12 months of purchase. |
| 28 | THE RYDEX FUNDS ANNUAL REPORT | |
| SCHEDULE OF INVESTMENTS | March 31, 2015 |
| BIOTECHNOLOGY FUND | |
| | |
Shares | | | Value | |
| | | | | | | | |
COMMON STOCKS† - 99.4% | |
| | | | | | | | |
| MEDICAL-BIOMEDICAL/GENETICS - 70.4% | |
| Gilead Sciences, Inc.* | | | 477,742 | | | $ | 46,880,822 | |
| Amgen, Inc. | | | 263,144 | | | | 42,063,569 | |
| Biogen, Inc.* | | | 93,401 | | | | 39,437,638 | |
| Celgene Corp.* | | | 319,185 | | | | 36,795,647 | |
| Regeneron Pharmaceuticals, Inc.* | | | 54,314 | | | | 24,521,685 | |
| Alexion Pharmaceuticals, Inc.* | | | 132,602 | | | | 22,979,927 | |
| Vertex Pharmaceuticals, Inc.* | | | 168,670 | | | | 19,898,000 | |
| Illumina, Inc.* | | | 105,123 | | | | 19,515,034 | |
| BioMarin Pharmaceutical, Inc.* | | | 142,144 | | | | 17,713,985 | |
| Incyte Corp.* | | | 169,999 | | | | 15,582,108 | |
| Medivation, Inc.* | | | 95,545 | | | | 12,331,993 | |
Intrexon Corp.*,1 | | | 262,400 | | | | 11,905,088 | |
| Alnylam Pharmaceuticals, Inc.* | | | 106,133 | | | | 11,082,408 | |
| United Therapeutics Corp.* | | | 62,426 | | | | 10,764,427 | |
Isis Pharmaceuticals, Inc.*,1 | | | 160,787 | | | | 10,237,308 | |
Intercept Pharmaceuticals, Inc.*,1 | | | 31,335 | | | | 8,837,097 | |
| Puma Biotechnology, Inc.* | | | 36,836 | | | | 8,697,348 | |
Seattle Genetics, Inc.*,1 | | | 222,094 | | | | 7,851,023 | |
| Bio-Rad Laboratories, Inc. — Class A* | | | 58,069 | | | | 7,849,767 | |
| Bluebird Bio, Inc.* | | | 63,700 | | | | 7,693,049 | |
| Charles River Laboratories International, Inc.* | | | 94,485 | | | | 7,491,716 | |
Myriad Genetics, Inc.*,1 | | | 182,580 | | | | 6,463,332 | |
| Synageva BioPharma Corp.* | | | 64,880 | | | | 6,327,746 | |
Kite Pharma, Inc.*,1 | | | 104,300 | | | | 6,016,024 | |
Celldex Therapeutics, Inc.*,1 | | | 212,993 | | | | 5,936,115 | |
Exact Sciences Corp.*,1 | | | 250,055 | | | | 5,506,211 | |
| Novavax, Inc.* | | | 628,585 | | | | 5,198,398 | |
| Medicines Co.* | | | 182,472 | | | | 5,112,865 | |
| PTC Therapeutics, Inc.* | | | 83,175 | | | | 5,061,199 | |
AMAG Pharmaceuticals, Inc.*,1 | | | 92,200 | | | | 5,039,652 | |
| Halozyme Therapeutics, Inc.* | | | 349,655 | | | | 4,993,073 | |
ARIAD Pharmaceuticals, Inc.*,1 | | | 575,489 | | | | 4,742,029 | |
NewLink Genetics Corp.*,1 | | | 84,560 | | | | 4,626,278 | |
| Acorda Therapeutics, Inc.* | | | 138,922 | | | | 4,623,324 | |
Ligand Pharmaceuticals, Inc. — Class B*,1 | | | 59,143 | | | | 4,560,517 | |
Merrimack Pharmaceuticals, Inc.*,1 | | | 377,100 | | | | 4,479,948 | |
PDL BioPharma, Inc.1 | | | 601,170 | | | | 4,229,231 | |
| Repligen Corp.* | | | 130,224 | | | | 3,953,601 | |
Aegerion Pharmaceuticals, Inc.*,1 | | | 127,225 | | | | 3,329,478 | |
| Juno Therapeutics, Inc.* | | | 48,500 | | | | 2,942,010 | |
Theravance, Inc.1 | | | 165,064 | | | | 2,594,806 | |
ZIOPHARM Oncology, Inc.*,1 | | | 122,800 | | | | 1,322,556 | |
| Total Medical-Biomedical/Genetics | | | | | | | 487,188,032 | |
| | | | | | | | |
| MEDICAL-DRUGS - 16.8% | |
OPKO Health, Inc.*,1 | | | 814,640 | | | | 11,543,449 | |
| Quintiles Transnational Holdings, Inc.* | | | 169,264 | | | | 11,335,610 | |
| Alkermes plc* | | | 165,378 | | | | 10,083,097 | |
| Receptos, Inc.* | | | 53,513 | | | | 8,823,759 | |
| ACADIA Pharmaceuticals, Inc.* | | | 209,628 | | | | 6,831,777 | |
| Anacor Pharmaceuticals, Inc.* | | | 107,700 | | | | 6,230,445 | |
| Endo International plc* | | | 66,900 | | | | 6,000,930 | |
| Ironwood Pharmaceuticals, Inc. — Class A* | | | 369,996 | | | | 5,919,936 | |
Clovis Oncology, Inc.*,1 | | | 78,997 | | | | 5,863,947 | |
TESARO, Inc.*,1 | | | 100,403 | | | | 5,763,132 | |
Insys Therapeutics, Inc.*,1 | | | 97,823 | | | | 5,686,451 | |
Keryx Biopharmaceuticals, Inc.*,1 | | | 365,265 | | | | 4,649,823 | |
| Chimerix, Inc.* | | | 118,450 | | | | 4,464,381 | |
| Shire plc ADR | | | 17,900 | | | | 4,283,291 | |
| Salix Pharmaceuticals Ltd.* | | | 22,900 | | | | 3,957,349 | |
| Regulus Therapeutics, Inc.* | | | 202,632 | | | | 3,432,586 | |
| Akorn, Inc.* | | | 64,900 | | | | 3,083,399 | |
| Jazz Pharmaceuticals plc* | | | 14,100 | | | | 2,436,339 | |
| Pacira Pharmaceuticals, Inc.* | | | 22,900 | | | | 2,034,665 | |
| Radius Health, Inc.* | | | 34,000 | | | | 1,399,440 | |
| Cempra, Inc.* | | | 39,800 | | | | 1,365,538 | |
| Array BioPharma, Inc.* | | | 173,600 | | | | 1,279,432 | |
| Total Medical-Drugs | | | | | | | 116,468,776 | |
| | | | | | | | |
| THERAPEUTICS - 6.4% | |
| Pharmacyclics, Inc.* | | | 67,200 | | | | 17,199,840 | |
| Agios Pharmaceuticals, Inc.* | | | 75,104 | | | | 7,082,307 | |
| Neurocrine Biosciences, Inc.* | | | 174,775 | | | | 6,940,315 | |
| Dyax Corp.* | | | 351,565 | | | | 5,890,472 | |
| Portola Pharmaceuticals, Inc.* | | | 137,370 | | | | 5,214,565 | |
MannKind Corp.*,1 | | | 309,600 | | | | 1,609,920 | |
| Total Therapeutics | | | | | | | 43,937,419 | |
| | | | | | | | |
| MEDICAL-GENERIC DRUGS - 1.3% | |
| Mylan N.V.* | | | 115,700 | | | | 6,866,795 | |
| Impax Laboratories, Inc.* | | | 48,100 | | | | 2,254,447 | |
| Total Medical-Generic Drugs | | | | | | | 9,121,242 | |
| | | | | | | | |
| DIAGNOSTIC EQUIPMENT - 1.1% | |
| Cepheid* | | | 136,876 | | | | 7,788,244 | |
| | | | | | | | |
| MEDICAL INSTRUMENTS - 1.1% | |
| Bio-Techne Corp. | | | 77,597 | | | | 7,782,203 | |
| | | | | | | | |
| DIAGNOSTIC KITS - 1.1% | |
| QIAGEN N.V.* | | | 297,600 | | | | 7,499,520 | |
| | | | | | | | |
| DRUG DELIVERY SYSTEMS - 0.8% | |
| Nektar Therapeutics* | | | 380,280 | | | | 4,183,080 | |
| Depomed, Inc.* | | | 66,200 | | | | 1,483,542 | |
| Total Drug Delivery Systems | | | | | | | 5,666,622 | |
| | | | | | | | |
| DIVERSIFIED OPERATIONS - 0.4% | |
| Horizon Pharma plc* | | | 99,800 | | | | 2,591,806 | |
| | | | | | | | |
| Total Common Stocks | | | | | | | | |
| (Cost $375,167,671) | | | | | | | 688,043,864 | |
| SEE NOTES TO FINANCIAL STATEMENTS. | THE RYDEX FUNDS ANNUAL REPORT | 29 |
SCHEDULE OF INVESTMENTS (concluded) | March 31, 2015 |
| BIOTECHNOLOGY FUND | |
| | |
Shares | | | Value | |
| | | | | | | | | |
RIGHTS††† - 0.0% | |
| Chelsea Therapeutics International | | | | | | | | |
Expires 12/31/17*,1 | | | 263,700 | | | $ | 21,096 | |
| Clinical Data, Inc. | | | | | | | | |
| Expires 12/31/20* | | | 24,000 | | | | — | |
| Total Rights | | | | | | | | |
| (Cost $19,745) | | | | | | | 21,096 | |
| | | Face
Amount | | | | |
| | | | | | | | |
REPURCHASE AGREEMENT††,2 - 1.1% | |
HSBC Group
issued 03/31/15 at 0.03%
due 04/01/15 | | $ | 7,696,522 | | | | 7,696,522 | |
| Total Repurchase Agreement | | | | | | | | |
| (Cost $7,696,522) | | | | | | | 7,696,522 | |
| | | | | | | | |
SECURITIES LENDING COLLATERAL††,3 - 11.9% | |
| Repurchase Agreements | | | | | | | | |
HSBC Securities, Inc.
issued 03/31/15 at 0.10%
due 04/01/15 | | | 54,157,844 | | | | 54,157,844 | |
BNP Paribas Securities Corp.
issued 03/31/15 at 0.10%
due 04/01/15 | | | 18,630,298 | | | | 18,630,298 | |
Barclays Capital, Inc.
issued 03/31/15 at 0.10%
due 04/01/15 | | | 9,616,267 | | | | 9,616,267 | |
| Total Securities Lending Collateral | | | | | | | | |
| (Cost $82,404,409) | | | | | | | 82,404,409 | |
| | | | | | | | |
| Total Investments - 112.4% | | | | | | | | |
| (Cost $465,288,347) | | | | | | $ | 778,165,891 | |
| Other Assets & Liabilities, net - (12.4)% | | | | | | | (86,217,685 | ) |
| Total Net Assets - 100.0% | | | | | | $ | 691,948,206 | |
| * | Non-income producing security. |
| † | Value determined based on Level 1 inputs — See Note 4. |
| †† | Value determined based on Level 2 inputs — See Note 4. |
| ††† | Value determined based on Level 3 inputs — See Note 4. |
| 1 | All or portion of this security is on loan at March 31, 2015 — See Note 6. |
| 2 | Repurchase Agreement — See Note 5. |
| 3 | Securities lending collateral — See Note 6. |
| ADR — American Depositary Receipt |
| plc — Public Limited Company |
| 30 | THE RYDEX FUNDS ANNUAL REPORT | SEE NOTES TO FINANCIAL STATEMENTS. |
STATEMENT OF ASSETS AND LIABILITIES
March 31, 2015
| Assets: | |
| Investments, at value - including $79,529,180 of securities loaned (cost $375,187,416) | | $ | 688,064,960 | |
| Repurchase agreements, at value (cost $90,100,931) | | | 90,100,931 | |
| Total investments (cost $465,288,347) | | | 778,165,891 | |
| Segregated cash with broker | | | 1,204,397 | |
| Receivables: | |
| Securities sold | | | 6,644,482 | |
| Fund shares sold | | | 3,596,231 | |
| Securities lending income | | | 275,996 | |
| Interest | | | 6 | |
| Total assets | | | 789,887,003 | |
| | | | | |
| Liabilities: | |
| Payable for: | |
| Return of securities loaned | | | 83,608,806 | |
| Fund shares redeemed | | | 13,307,815 | |
| Management fees | | | 498,622 | |
| Transfer agent and administrative fees | | | 146,653 | |
| Distribution and service fees | | | 80,763 | |
| Portfolio accounting fees | | | 44,685 | |
| Miscellaneous | | | 251,453 | |
| Total liabilities | | | 97,938,797 | |
| Commitments and contingent liabilities (Note 10) | | | — | |
| Net assets | | $ | 691,948,206 | |
| | | | | |
| Net assets consist of: | |
| Paid in capital | | $ | 391,315,217 | |
| Undistributed net investment income | | | 1 | |
| Accumulated net realized loss on investments | | | (12,244,556 | ) |
| Net unrealized appreciation on investments | | | 312,877,544 | |
| Net assets | | $ | 691,948,206 | |
| | | | | |
| Investor Class: | |
| Net assets | | $ | 498,068,443 | |
| Capital shares outstanding | | | 5,319,592 | |
| Net asset value per share | | $ | 93.63 | |
| | | | | |
| Advisor Class: | |
| Net assets | | $ | 63,195,768 | |
| Capital shares outstanding | | | 740,128 | |
| Net asset value per share | | $ | 85.38 | |
| | | | | |
| A-Class: | |
| Net assets | | $ | 89,260,236 | |
| Capital shares outstanding | | | 1,018,626 | |
| Net asset value per share | | $ | 87.63 | |
| Maximum offering price per share (Net asset value divided by 95.25%) | | $ | 92.00 | |
| | | | | |
| C-Class: | |
| Net assets | | $ | 41,423,759 | |
| Capital shares outstanding | | | 512,184 | |
| Net asset value per share | | $ | 80.88 | |
STATEMENT OF OPERATIONS
Year Ended March 31, 2015
| Investment Income: | |
| Income from securities lending, net | | $ | 3,343,368 | |
| Dividends | | | 1,433,083 | |
| Interest | | | 540 | |
| Total investment income | | | 4,776,991 | |
| | | | | |
| Expenses: | |
| Management fees | | | 4,096,238 | |
| Transfer agent and administrative fees | | | 1,204,772 | |
| Distribution and service fees: | |
| Advisor Class | | | 219,630 | |
| A-Class | | | 146,149 | |
| C-Class | | | 287,763 | |
| Portfolio accounting fees | | | 414,558 | |
| Custodian fees | | | 56,160 | |
| Trustees’ fees* | | | 31,049 | |
| Line of credit fees | | | 5,296 | |
| Miscellaneous | | | 601,767 | |
| Total expenses | | | 7,063,382 | |
| Net investment loss | | | (2,286,391 | ) |
| | | | | |
| Net Realized and Unrealized Gain (Loss): | |
| Net realized gain (loss) on: | |
| Investments | | | 37,059,172 | |
| Net realized gain | | | 37,059,172 | |
| Net change in unrealized appreciation (depreciation) on: | |
| Investments | | | 131,104,324 | |
| Net change in unrealized appreciation (depreciation) | | | 131,104,324 | |
| Net realized and unrealized gain | | | 168,163,496 | |
| Net increase in net assets resulting from operations | | $ | 165,877,105 | |
| * | Relates to Trustees not deemed “interested persons” within the meaning of Section 2(a)(19) of the 1940 Act. |
| SEE NOTES TO FINANCIAL STATEMENTS. | THE RYDEX FUNDS ANNUAL REPORT | 31 |
STATEMENTS OF CHANGES IN NET ASSETS
| | | Year Ended March 31, 2015 | | | Year Ended March 31, 2014 | |
| Increase (Decrease) in Net Assets from Operations: | | | | | | |
| Net investment loss | | $ | (2,286,391 | ) | | $ | (3,549,985 | ) |
| Net realized gain on investments | | | 37,059,172 | | | | 22,271,740 | |
| Net change in unrealized appreciation (depreciation) on investments | | | 131,104,324 | | | | 84,195,149 | |
| Net increase in net assets resulting from operations | | | 165,877,105 | | | | 102,916,904 | |
| | | | | | | | | |
| Distributions to shareholders from: | | | | | | | | |
| Net realized gains | | | | | | | | |
| Investor Class | | | (14,483,457 | ) | | | — | |
| Advisor Class | | | (2,030,607 | ) | | | — | |
| A-Class | | | (2,447,445 | ) | | | — | |
| C-Class | | | (1,355,470 | ) | | | — | |
| Total distributions to shareholders | | | (20,316,979 | ) | | | — | |
| | | | | | | | | |
| Capital share transactions: | | | | | | | | |
| Proceeds from sale of shares | | | | | | | | |
| Investor Class | | | 565,896,488 | | | | 520,369,253 | |
| Advisor Class | | | 173,383,484 | | | | 128,608,371 | |
| A-Class | | | 66,728,700 | | | | 68,697,208 | |
| C-Class | | | 34,835,985 | | | | 39,913,128 | |
| Distributions reinvested | | | | | | | | |
| Investor Class | | | 13,882,734 | | | | — | |
| Advisor Class | | | 2,002,511 | | | | — | |
| A-Class | | | 2,278,723 | | | | — | |
| C-Class | | | 1,312,852 | | | | — | |
| Cost of shares redeemed | | | | | | | | |
| Investor Class | | | (501,097,404 | ) | | | (452,747,513 | ) |
| Advisor Class | | | (163,288,238 | ) | | | (123,757,687 | ) |
| A-Class | | | (48,804,711 | ) | | | (55,968,103 | ) |
| C-Class | | | (30,485,330 | ) | | | (32,688,163 | ) |
| Net increase from capital share transactions | | | 116,645,794 | | | | 92,426,494 | |
| Net increase in net assets | | | 262,205,920 | | | | 195,343,398 | |
| | | | | | | | | |
| Net assets: | | | | | | | | |
| Beginning of year | | | 429,742,286 | | | | 234,398,888 | |
| End of year | | $ | 691,948,206 | | | $ | 429,742,286 | |
| Undistributed net investment income at end of year | | $ | 1 | | | $ | — | |
| | | | | | | | | |
| Capital share activity: | | | | | | | | |
| Shares sold | | | | | | | | |
| Investor Class | | | 7,040,074 | | | | 8,519,648 | |
| Advisor Class | | | 2,393,490 | | | | 2,294,916 | |
| A-Class | | | 882,961 | | | | 1,179,822 | |
| C-Class | | | 511,004 | | | | 749,811 | |
| Shares issued from reinvestment of distributions | | | | | | | | |
| Investor Class | | | 174,846 | | | | — | |
| Advisor Class | | | 27,605 | | | | — | |
| A-Class | | | 30,636 | | | | — | |
| C-Class | | | 19,095 | | | | — | |
| Shares redeemed | | | | | | | | |
| Investor Class | | | (6,471,507 | ) | | | (7,452,878 | ) |
| Advisor Class | | | (2,283,995 | ) | | | (2,188,643 | ) |
| A-Class | | | (691,018 | ) | | | (955,296 | ) |
| C-Class | | | (470,009 | ) | | | (612,767 | ) |
| Net increase in shares | | | 1,163,182 | | | | 1,534,613 | |
| 32 | THE RYDEX FUNDS ANNUAL REPORT | SEE NOTES TO FINANCIAL STATEMENTS. |
This table is presented to show selected data for a share outstanding throughout each period and to assist shareholders in evaluating a Fund’s performance for the periods presented.
| Investor Class | | Year Ended March 31, 2015 | | | Year Ended March 31, 2014 | | | Year Ended March 28, 2013 | | | Year Ended March 31, 2012 | | | Year Ended March 31, 2011 | |
| Per Share Data | | | | | | | | | | | | | | | |
| Net asset value, beginning of period | | $ | 68.47 | | | $ | 48.97 | | | $ | 36.90 | | | $ | 29.16 | | | $ | 27.34 | |
| Income (loss) from investment operations: | |
Net investment income (loss)a | | | (.27 | ) | | | (.51 | ) | | | (.40 | ) | | | (.34 | ) | | | (.33 | ) |
| Net gain (loss) on investments (realized and unrealized) | | | 28.59 | | | | 20.01 | | | | 12.47 | | | | 8.08 | | | | 2.15 | |
| Total from investment operations | | | 28.32 | | | | 19.50 | | | | 12.07 | | | | 7.74 | | | | 1.82 | |
| Less distributions from: | |
| Net realized gains | | | (3.16 | ) | | | — | | | | — | | | | — | | | | — | |
| Total distributions | | | (3.16 | ) | | | — | | | | — | | | | — | | | | — | |
| Net asset value, end of period | | $ | 93.63 | | | $ | 68.47 | | | $ | 48.97 | | | $ | 36.90 | | | $ | 29.16 | |
| | |
Total Returnb | | | 42.19 | % | | | 39.82 | % | | | 32.71 | % | | | 26.54 | % | | | 6.66 | % |
| Ratios/Supplemental Data | |
| Net assets, end of period (in thousands) | | $ | 498,068 | | | $ | 313,324 | | | $ | 171,844 | | | $ | 89,027 | | | $ | 44,686 | |
| Ratios to average net assets: | |
| Net investment income (loss) | | | (0.34 | %) | | | (0.82 | %) | | | (0.98 | %) | | | (1.09 | %) | | | (1.26 | %) |
| Total expenses | | | 1.33 | % | | | 1.36 | % | | | 1.35 | % | | | 1.36 | % | | | 1.39 | % |
| Portfolio turnover rate | | | 107 | % | | | 119 | % | | | 197 | % | | | 333 | % | | | 337 | % |
| Advisor Class | | Year Ended March 31, 2015 | | | Year Ended March 31, 2014 | | | Year Ended March 28, 2013 | | | Year Ended March 31, 2012 | | | Year Ended March 31, 2011 | |
| Per Share Data | | | | | | | | | | | | | | | |
| Net asset value, beginning of period | | $ | 62.98 | | | $ | 45.27 | | | $ | 34.27 | | | $ | 27.22 | | | $ | 25.66 | |
| Income (loss) from investment operations: | |
Net investment income (loss)a | | | (.61 | ) | | | (.74 | ) | | | (.56 | ) | | | (.48 | ) | | | (.43 | ) |
| Net gain (loss) on investments (realized and unrealized) | | | 26.17 | | | | 18.45 | | | | 11.56 | | | | 7.53 | | | | 1.99 | |
| Total from investment operations | | | 25.56 | | | | 17.71 | | | | 11.00 | | | | 7.05 | | | | 1.56 | |
| Less distributions from: | |
| Net realized gains | | | (3.16 | ) | | | — | | | | — | | | | — | | | | — | |
| Total distributions | | | (3.16 | ) | | | — | | | | — | | | | — | | | | — | |
| Net asset value, end of period | | $ | 85.38 | | | $ | 62.98 | | | $ | 45.27 | | | $ | 34.27 | | | $ | 27.22 | |
| | |
Total Returnb | | | 41.49 | % | | | 39.12 | % | | | 32.10 | % | | | 25.90 | % | | | 6.08 | % |
| Ratios/Supplemental Data | |
| Net assets, end of period (in thousands) | | $ | 63,196 | | | $ | 37,978 | | | $ | 22,486 | | | $ | 8,313 | | | $ | 7,410 | |
| Ratios to average net assets: | |
| Net investment income (loss) | | | (0.84 | %) | | | (1.32 | %) | | | (1.46 | %) | | | (1.65 | %) | | | (1.77 | %) |
| Total expenses | | | 1.83 | % | | | 1.86 | % | | | 1.86 | % | | | 1.87 | % | | | 1.89 | % |
| Portfolio turnover rate | | | 107 | % | | | 119 | % | | | 197 | % | | | 333 | % | | | 337 | % |
| SEE NOTES TO FINANCIAL STATEMENTS. | THE RYDEX FUNDS ANNUAL REPORT | 33 |
FINANCIAL HIGHLIGHTS (concluded)
This table is presented to show selected data for a share outstanding throughout each period and to assist shareholders in evaluating a Fund’s performance for the periods presented.
| A-Class | | Year Ended March 31, 2015 | | | Year Ended March 31, 2014 | | | Year Ended March 28, 2013 | | | Year Ended March 31, 2012 | | | Year Ended March 31, 2011 | |
| Per Share Data | | | | | | | | | | | | | | | |
| Net asset value, beginning of period | | $ | 64.41 | | | $ | 46.18 | | | $ | 34.88 | | | $ | 27.64 | | | $ | 25.98 | |
| Income (loss) from investment operations: | |
Net investment income (loss)a | | | (.44 | ) | | | (.62 | ) | | | (.48 | ) | | | (.37 | ) | | | (.37 | ) |
| Net gain (loss) on investments (realized and unrealized) | | | 26.82 | | | | 18.85 | | | | 11.78 | | | | 7.61 | | | | 2.03 | |
| Total from investment operations | | | 26.38 | | | | 18.23 | | | | 11.30 | | | | 7.24 | | | | 1.66 | |
| Less distributions from: | |
| Net realized gains | | | (3.16 | ) | | | — | | | | — | | | | — | | | | — | |
| Total distributions | | | (3.16 | ) | | | — | | | | — | | | | — | | | | — | |
| Net asset value, end of period | | $ | 87.63 | | | $ | 64.41 | | | $ | 46.18 | | | $ | 34.88 | | | $ | 27.64 | |
| | |
Total Returnb | | | 41.83 | % | | | 39.48 | % | | | 32.40 | % | | | 26.19 | % | | | 6.39 | % |
| Ratios/Supplemental Data | |
| Net assets, end of period (in thousands) | | $ | 89,260 | | | $ | 51,270 | | | $ | 26,391 | | | $ | 4,741 | | | $ | 2,211 | |
| Ratios to average net assets: | |
| Net investment income (loss) | | | (0.59 | %) | | | (1.07 | %) | | | (1.21 | %) | | | (1.30 | %) | | | (1.51 | %) |
| Total expenses | | | 1.58 | % | | | 1.61 | % | | | 1.61 | % | | | 1.61 | % | | | 1.64 | % |
| Portfolio turnover rate | | | 107 | % | | | 119 | % | | | 197 | % | | | 333 | % | | | 337 | % |
| C-Class | | Year Ended March 31, 2015 | | | Year Ended March 31, 2014 | | | Year Ended March 28, 2013 | | | Year Ended March 31, 2012 | | | Year Ended March 31, 2011 | |
| Per Share Data | | | | | | | | | | | | | | | |
| Net asset value, beginning of period | | $ | 60.10 | | | $ | 43.41 | | | $ | 33.04 | | | $ | 26.38 | | | $ | 24.96 | |
| Income (loss) from investment operations: | |
Net investment income (loss)a | | | (.92 | ) | | | (.99 | ) | | | (.73 | ) | | | (.58 | ) | | | (.54 | ) |
| Net gain (loss) on investments (realized and unrealized) | | | 24.86 | | | | 17.68 | | | | 11.10 | | | | 7.24 | | | | 1.96 | |
| Total from investment operations | | | 23.94 | | | | 16.69 | | | | 10.37 | | | | 6.66 | | | | 1.42 | |
| Less distributions from: | |
| Net realized gains | | | (3.16 | ) | | | — | | | | — | | | | — | | | | — | |
| Total distributions | | | (3.16 | ) | | | — | | | | — | | | | — | | | | — | |
| Net asset value, end of period | | $ | 80.88 | | | $ | 60.10 | | | $ | 43.41 | | | $ | 33.04 | | | $ | 26.38 | |
| | |
Total Returnb | | | 40.75 | % | | | 38.45 | % | | | 31.39 | % | | | 25.25 | % | | | 5.65 | % |
| Ratios/Supplemental Data | |
| Net assets, end of period (in thousands) | | $ | 41,424 | | | $ | 27,170 | | | $ | 13,677 | | | $ | 6,969 | | | $ | 3,393 | |
| Ratios to average net assets: | |
| Net investment income (loss) | | | (1.34 | %) | | | (1.82 | %) | | | (1.96 | %) | | | (2.06 | %) | | | (2.27 | %) |
| Total expenses | | | 2.33 | % | | | 2.36 | % | | | 2.36 | % | | | 2.36 | % | | | 2.39 | % |
| Portfolio turnover rate | | | 107 | % | | | 119 | % | | | 197 | % | | | 333 | % | | | 337 | % |
a | Net investment income (loss) per share was computed using average shares outstanding throughout the period. |
b | Total return does not reflect the impact of any applicable sales charges. |
| 34 | THE RYDEX FUNDS ANNUAL REPORT | SEE NOTES TO FINANCIAL STATEMENTS. |
PERFORMANCE REPORT AND FUND PROFILE (Unaudited) | March 31, 2015 |
CONSUMER PRODUCTS FUND
OBJECTIVE: Seeks to provide capital appreciation by investing in companies engaged in manufacturing finished goods and services both domestically and internationally (“consumer products companies”).
For the one-year period ended March 31, 2015, Consumer Products Fund Investor Class returned 13.77%, compared with 16.53% for the S&P 500 Consumer Staples Index. The broader S&P 500 Index returned 12.73%.
The industry that contributed most to return was food products, followed by beverages. The leading detractors from return were the health care equipment & supplies industry, followed by the oil, gas & consumable fuels industry.
Fund performance for the period got the biggest boost from Altria Group, Inc., Kroger Co., and Kraft Foods Group, Inc. The Fund’s leading detractors during the period were Darling Ingredients, Inc., Ambev S.A. ADR, and Avon Products, Inc.
Performance displayed represents past performance, which is no guarantee of future results.
Holdings Diversification (Market Exposure as % of Net Assets)
“Holdings Diversification (Market Exposure as % of Net Assets)” excludes any temporary cash investments.
| Inception Dates: |
| Investor Class | July 6, 1998 |
| Advisor Class | August 17, 1998 |
| A-Class | September 1, 2004 |
| C-Class | July 24, 2001 |
| Ten Largest Holdings (% of Total Net Assets) |
| Procter & Gamble Co. | 5.0% |
| Coca-Cola Co. | 4.6% |
| PepsiCo, Inc. | 4.1% |
| Philip Morris International, Inc. | 3.7% |
| Altria Group, Inc. | 3.3% |
| Kraft Foods Group, Inc. | 2.9% |
| Colgate-Palmolive Co. | 2.7% |
| Mondelez International, Inc. — Class A | 2.7% |
| Kimberly-Clark Corp. | 2.2% |
| Kroger Co. | 2.1% |
| Top Ten Total | 33.3% |
| | |
| “Ten Largest Holdings” exclude any temporary cash or derivative investments. |
| | THE RYDEX FUNDS ANNUAL REPORT | 35 |
PERFORMANCE REPORT AND FUND PROFILE (Unaudited)(concluded) | March 31, 2015 |
Cumulative Fund Performance*
Average Annual Returns*
Periods Ended March 31, 2015
| | 1 Year | 5 Year | 10 Year |
| Investor Class Shares | 13.77% | 15.21% | 10.04% |
| Advisor Class Shares | 13.19% | 14.65% | 9.49% |
| A-Class Shares | 13.47% | 14.94% | 9.77% |
A-Class Shares with sales charge† | 8.09% | 13.82% | 9.24% |
| C-Class Shares | 12.62% | 14.08% | 8.93% |
C-Class Shares with CDSC‡ | 11.62% | 14.08% | 8.93% |
| S&P 500 Consumer Staples Index | 16.53% | 15.00% | 10.76% |
| S&P 500 Index | 12.73% | 14.47% | 8.01% |
| * | The performance data above represents past performance that is not predictive of future results. The investment return and principal value of an investment in the Fund will fluctuate so that an investor’s shares, when redeemed, may be worth more or less than their original cost. Returns are historical and include changes in principal and reinvested dividends and capital gains and do not reflect the effect of taxes. The S&P 500 Index and the S&P 500 Consumer Staples Index are unmanaged indices and, unlike the Fund, have no management fees or operating expenses to reduce their reported returns. The graphs are based on Investor Class shares and A-Class shares only; performance for Advisor Class shares and C-Class shares will vary due to differences in fee structures. |
† | Fund returns are calculated using the maximum sales charge of 4.75%. |
‡ | Fund returns include a CDSC of 1% if redeemed within 12 months of purchase. |
| 36 | THE RYDEX FUNDS ANNUAL REPORT | |
| SCHEDULE OF INVESTMENTS | March 31, 2015 |
| CONSUMER PRODUCTS FUND | |
| | |
Shares | | | Value | |
| | | | | | | | |
COMMON STOCKS† - 99.0% | |
| | | | | | | | |
| FOOD-MISCELLANEOUS/DIVERSIFIED - 17.2% | |
| Kraft Foods Group, Inc. | | | 108,390 | | | $ | 9,442,395 | |
| Mondelez International, Inc. — Class A | | | 242,626 | | | | 8,756,372 | |
| General Mills, Inc. | | | 119,537 | | | | 6,765,794 | |
| Kellogg Co. | | | 83,620 | | | | 5,514,739 | |
| ConAgra Foods, Inc. | | | 123,232 | | | | 4,501,665 | |
| Campbell Soup Co. | | | 92,717 | | | | 4,315,976 | |
| McCormick & Company, Inc. | | | 46,739 | | | | 3,604,044 | |
| Hain Celestial Group, Inc.* | | | 44,660 | | | | 2,860,473 | |
| Ingredion, Inc. | | | 33,430 | | | | 2,601,523 | |
| Pinnacle Foods, Inc. | | | 59,900 | | | | 2,444,519 | |
| Lancaster Colony Corp. | | | 19,452 | | | | 1,851,247 | |
Cal-Maine Foods, Inc.1 | | | 40,200 | | | | 1,570,212 | |
| B&G Foods, Inc. | | | 48,970 | | | | 1,441,187 | |
| Total Food-Miscellaneous/Diversified | | | | | | | 55,670,146 | |
| | | | | | | | |
| BEVERAGES-NON-ALCOHOLIC - 13.8% | |
| Coca-Cola Co. | | | 365,856 | | | | 14,835,460 | |
| PepsiCo, Inc. | | | 138,337 | | | | 13,227,783 | |
| Monster Beverage Corp.* | | | 38,753 | | | | 5,363,221 | |
| Dr Pepper Snapple Group, Inc. | | | 55,541 | | | | 4,358,858 | |
| Coca-Cola Enterprises, Inc. | | | 82,194 | | | | 3,632,975 | |
| Fomento Economico Mexicano SAB de CV ADR* | | | 32,793 | | | | 3,066,146 | |
| Total Beverages-Non-alcoholic | | | | | | | 44,484,443 | |
| | | | | | | | |
| TOBACCO - 12.4% | |
| Philip Morris International, Inc. | | | 157,097 | | | | 11,834,117 | |
| Altria Group, Inc. | | | 215,530 | | | | 10,780,811 | |
| Reynolds American, Inc. | | | 96,133 | | | | 6,624,525 | |
| Lorillard, Inc. | | | 81,001 | | | | 5,293,415 | |
| British American Tobacco plc ADR | | | 23,800 | | | | 2,469,726 | |
| Vector Group Ltd. | | | 83,900 | | | | 1,843,283 | |
Universal Corp.1 | | | 25,200 | | | | 1,188,432 | |
| Total Tobacco | | | | | | | 40,034,309 | |
| | | | | | | | |
| COSMETICS & TOILETRIES - 12.3% | |
| Procter & Gamble Co. | | | 198,630 | | | | 16,275,742 | |
| Colgate-Palmolive Co. | | | 127,499 | | | | 8,840,781 | |
| Estee Lauder Companies, Inc. — Class A | | | 75,856 | | | | 6,308,185 | |
| Coty, Inc. — Class A* | | | 138,000 | | | | 3,349,260 | |
| Unilever N.V. — Class Y | | | 66,561 | | | | 2,779,587 | |
| Avon Products, Inc. | | | 280,946 | | | | 2,244,759 | |
| Total Cosmetics & Toiletries | | | | | | | 39,798,314 | |
| | | | | | | | |
| FOOD-RETAIL - 5.5% | |
| Kroger Co. | | | 88,797 | | | | 6,807,178 | |
| Whole Foods Market, Inc. | | | 90,342 | | | | 4,705,011 | |
| Sprouts Farmers Market, Inc.* | | | 74,290 | | | | 2,617,237 | |
| SUPERVALU, Inc.* | | | 169,332 | | | | 1,969,331 | |
Fresh Market, Inc.*,1 | | | 38,020 | | | | 1,545,133 | |
| Total Food-Retail | | | | | | | 17,643,890 | |
| | | | | | | | |
| BREWERY - 4.9% | |
| Anheuser-Busch InBev N.V. ADR | | | 51,612 | | | | 6,292,019 | |
| Molson Coors Brewing Co. — Class B | | | 55,644 | | | | 4,142,696 | |
| Ambev S.A. ADR | | | 593,600 | | | | 3,419,136 | |
Boston Beer Company, Inc. — Class A*,1 | | | 7,835 | | | | 2,095,079 | |
| Total Brewery | | | | | | | 15,948,930 | |
| | | | | | | | |
| CONSUMER PRODUCTS-MISCELLANEOUS - 4.2% | |
| Kimberly-Clark Corp. | | | 65,162 | | | | 6,979,502 | |
| Clorox Co. | | | 38,567 | | | | 4,257,411 | |
| Spectrum Brands Holdings, Inc. | | | 26,800 | | | | 2,400,208 | |
| Total Consumer Products-Miscellaneous | | | | | | | 13,637,121 | |
| | | | | | | | |
| FOOD-MEAT PRODUCTS - 4.1% | |
| Tyson Foods, Inc. — Class A | | | 114,295 | | | | 4,377,498 | |
| Hormel Foods Corp. | | | 76,576 | | | | 4,353,346 | |
| BRF S.A. ADR | | | 142,080 | | | | 2,810,342 | |
| Darling Ingredients, Inc.* | | | 120,669 | | | | 1,690,573 | |
| Total Food-Meat Products | | | | | | | 13,231,759 | |
| | | | | | | | |
| BEVERAGES-WINE/SPIRITS - 4.0% | |
| Constellation Brands, Inc. — Class A* | | | 45,144 | | | | 5,246,184 | |
| Brown-Forman Corp. — Class B | | | 53,920 | | | | 4,871,672 | |
| Diageo plc ADR | | | 26,540 | | | | 2,934,528 | |
| Total Beverages-Wine/Spirits | | | | | | | 13,052,384 | |
| | | | | | | | |
| AGRICULTURAL OPERATIONS - 3.5% | |
| Archer-Daniels-Midland Co. | | | 130,103 | | | | 6,166,882 | |
| Bunge Ltd. | | | 47,696 | | | | 3,928,243 | |
| Andersons, Inc. | | | 30,500 | | | | 1,261,785 | |
| Total Agricultural Operations | | | | | | | 11,356,910 | |
| | | | | | | | |
| FOOD-CONFECTIONERY - 2.8% | |
| Hershey Co. | | | 51,992 | | | | 5,246,512 | |
| JM Smucker Co. | | | 33,531 | | | | 3,880,543 | |
| Total Food-Confectionery | | | | | | | 9,127,055 | |
| | | | | | | | |
| VITAMINS & NUTRITION PRODUCTS - 2.4% | |
| Mead Johnson Nutrition Co. — Class A | | | 49,479 | | | | 4,974,124 | |
Herbalife Ltd.1 | | | 61,614 | | | | 2,634,615 | |
| Total Vitamins & Nutrition Products | | | | | | | 7,608,739 | |
| | | | | | | | |
| FOOD-WHOLESALE/DISTRIBUTION - 2.3% | |
| Sysco Corp. | | | 137,815 | | | | 5,199,760 | |
| United Natural Foods, Inc.* | | | 28,866 | | | | 2,223,837 | |
| Total Food-Wholesale/Distribution | | | | | | | 7,423,597 | |
| | | | | | | | |
| FOOD-DAIRY PRODUCTS - 1.4% | |
| WhiteWave Foods Co. — Class A* | | | 71,900 | | | | 3,188,046 | |
| Dean Foods Co. | | | 87,540 | | | | 1,447,036 | |
| Total Food-Dairy Products | | | | | | | 4,635,082 | |
| | | | | | | | |
| COFFEE - 1.4% | |
| Keurig Green Mountain, Inc. | | | 39,974 | | | | 4,466,295 | |
| | | | | | | | |
| SEE NOTES TO FINANCIAL STATEMENTS. | THE RYDEX FUNDS ANNUAL REPORT | 37 |
SCHEDULE OF INVESTMENTS (concluded) | March 31, 2015 |
| CONSUMER PRODUCTS FUND | |
| | |
Shares | | | Value | |
| | | | | | | | | |
| POULTRY - 1.3% | |
Pilgrim’s Pride Corp.1 | | | 114,300 | | | $ | 2,582,037 | |
Sanderson Farms, Inc.1 | | | 19,409 | | | | 1,545,927 | |
| Total Poultry | | | | | | | 4,127,964 | |
| | | | | | | | |
| SOAP & CLEANING PREPARATION - 1.1% | |
| Church & Dwight Company, Inc. | | | 43,366 | | | | 3,704,324 | |
| | | | | | | | |
| BATTERIES/BATTERY SYSTEMS - 1.0% | |
| Energizer Holdings, Inc. | | | 23,535 | | | | 3,249,007 | |
| | | | | | | | |
| FOOD-BAKING - 0.8% | |
| Flowers Foods, Inc. | | | 109,492 | | | | 2,489,848 | |
| | | | | | | | |
| MULTILEVEL DIRECT SELLING - 0.7% | |
Nu Skin Enterprises, Inc. — Class A1 | | | 36,130 | | | | 2,175,388 | |
| | | | | | | | |
| FOOD-CANNED - 0.7% | |
| TreeHouse Foods, Inc.* | | | 24,901 | | | | 2,117,083 | |
| | | | | | | | |
| RETAIL-CONVENIENCE STORE - 0.6% | |
| Casey’s General Stores, Inc. | | | 23,423 | | | | 2,110,412 | |
| | | | | | | | |
| FOOD-FLOUR & GRAIN - 0.6% | |
| Post Holdings, Inc.* | | | 39,300 | | | | 1,840,812 | |
| | | | | | | | |
| Total Common Stocks | | | | | | | | |
| (Cost $237,185,815) | | | | | | | 319,933,812 | |
| | | | | | | | |
RIGHTS†††- 0.0% | |
| Casa Ley | | | | | | | | |
| Expires 01/17/19* | | | 93,765 | | | | 14,064 | |
| PDC | | | | | | | | |
| Expires 01/17/17* | | | 93,765 | | | | 6,564 | |
| Total Rights | | | | | | | | |
| (Cost $23,055) | | | | | | | 20,628 | |
| | | | | | | | |
| | | Face
Amount | | | | |
| | | | | | | | |
REPURCHASE AGREEMENT††,2 - 0.4% | |
HSBC Group
issued 03/31/15 at 0.03%
due 04/01/15 | | $ | 1,404,800 | | | | 1,404,800 | |
| Total Repurchase Agreement | | | | | | | | |
| (Cost $1,404,800) | | | | | | | 1,404,800 | |
| | | | | | | | |
SECURITIES LENDING COLLATERAL††,3 - 2.7% | |
| Repurchase Agreements | | | | | | | | |
HSBC Securities, Inc.
issued 03/31/15 at 0.10%
due 04/01/15 | | | 5,724,449 | | | | 5,724,449 | |
BNP Paribas Securities Corp.
issued 03/31/15 at 0.10%
due 04/01/15 | | | 1,969,210 | | | | 1,969,210 | |
Barclays Capital, Inc.
issued 03/31/15 at 0.10%
due 04/01/15 | | | 1,016,433 | | | | 1,016,433 | |
| Total Securities Lending Collateral | | | | | | | | |
| (Cost $8,710,092) | | | | | | | 8,710,092 | |
| | | | | | | | |
| Total Investments - 102.1% | | | | | | | | |
| (Cost $247,323,762) | | | | | | $ | 330,069,332 | |
| Other Assets & Liabilities, net - (2.1)% | | | | | | | (6,885,086 | ) |
| Total Net Assets - 100.0% | | | | | | $ | 323,184,246 | |
| * | Non-income producing security. |
| † | Value determined based on Level 1 inputs — See Note 4. |
| †† | Value determined based on Level 2 inputs — See Note 4. |
| ††† | Value determined based on Level 3 inputs — See Note 4. |
| 1 | All or portion of this security is on loan at March 31, 2015 — See Note 6. |
| 2 | Repurchase Agreement — See Note 5. |
| 3 | Securities lending collateral — See Note 6. |
| ADR — American Depositary Receipt |
| plc — Public Limited Company |
| 38 | THE RYDEX FUNDS ANNUAL REPORT | SEE NOTES TO FINANCIAL STATEMENTS. |
STATEMENT OF ASSETS AND LIABILITIES
March 31, 2015
| Assets: | |
| Investments, at value - including $8,624,874 of securities loaned (cost $237,208,870) | | $ | 319,954,440 | |
| Repurchase agreements, at value (cost $10,114,892) | | | 10,114,892 | |
| Total investments (cost $247,323,762) | | | 330,069,332 | |
| Segregated cash with broker | | | 127,304 | |
| Receivables: | |
| Fund shares sold | | | 3,769,399 | |
| Dividends | | | 852,417 | |
| Securities lending income | | | 14,002 | |
| Foreign taxes reclaim | | | 3,976 | |
| Total assets | | | 334,836,430 | |
| | | | | |
| Liabilities: | |
| Payable for: | |
| Return of securities loaned | | | 8,837,396 | |
| Fund shares redeemed | | | 2,319,682 | |
| Management fees | | | 224,959 | |
| Transfer agent and administrative fees | | | 66,164 | |
| Distribution and service fees | | | 40,613 | |
| Portfolio accounting fees | | | 24,986 | |
| Miscellaneous | | | 138,384 | |
| Total liabilities | | | 11,652,184 | |
| Commitments and contingent liabilities (Note 10) | | | — | |
| Net assets | | $ | 323,184,246 | |
| | | | | |
| Net assets consist of: | |
| Paid in capital | | $ | 253,407,913 | |
| Undistributed net investment income | | | 2,821,703 | |
| Accumulated net realized loss on investments | | | (15,790,940 | ) |
| Net unrealized appreciation on investments | | | 82,745,570 | |
| Net assets | | $ | 323,184,246 | |
| | | | | |
| Investor Class: | |
| Net assets | | $ | 222,954,377 | |
| Capital shares outstanding | | | 3,807,959 | |
| Net asset value per share | | $ | 58.55 | |
| | | | | |
| Advisor Class: | |
| Net assets | | $ | 49,750,721 | |
| Capital shares outstanding | | | 939,790 | |
| Net asset value per share | | $ | 52.94 | |
| | | | | |
| A-Class: | |
| Net assets | | $ | 32,762,389 | |
| Capital shares outstanding | | | 599,364 | |
| Net asset value per share | | $ | 54.66 | |
| Maximum offering price per share (Net asset value divided by 95.25%) | | $ | 57.39 | |
| | | | | |
| C-Class: | |
| Net assets | | $ | 17,716,759 | |
| Capital shares outstanding | | | 360,242 | |
| Net asset value per share | | $ | 49.18 | |
STATEMENT OF OPERATIONS
Year Ended March 31, 2015
| Investment Income: | |
| Dividends (net of foreign withholding tax of $19,260) | | $ | 6,677,348 | |
| Income from securities lending, net | | | 78,752 | |
| Interest | | | 255 | |
| Total investment income | | | 6,756,355 | |
| | | | | |
| Expenses: | |
| Management fees | | | 2,214,869 | |
| Transfer agent and administrative fees | | | 651,430 | |
| Distribution and service fees: | |
| Advisor Class | | | 204,711 | |
| A-Class | | | 68,773 | |
| C-Class | | | 157,545 | |
| Portfolio accounting fees | | | 252,145 | |
| Custodian fees | | | 30,334 | |
| Trustees’ fees* | | | 15,413 | |
| Tax expense | | | 14,930 | |
| Line of credit fees | | | 230 | |
| Miscellaneous | | | 328,357 | |
| Total expenses | | | 3,938,737 | |
| Net investment income | | | 2,817,618 | |
| | | | | |
| Net Realized and Unrealized Gain (Loss): | |
| Net realized gain (loss) on: | |
| Investments | | | 2,102,672 | |
| Net realized gain | | | 2,102,672 | |
| Net change in unrealized appreciation (depreciation) on: | |
| Investments | | | 28,060,008 | |
| Net change in unrealized appreciation (depreciation) | | | 28,060,008 | |
| Net realized and unrealized gain | | | 30,162,680 | |
| Net increase in net assets resulting from operations | | $ | 32,980,298 | |
| * | Relates to Trustees not deemed “interested persons” within the meaning of Section 2(a)(19) of the 1940 Act. |
| SEE NOTES TO FINANCIAL STATEMENTS. | THE RYDEX FUNDS ANNUAL REPORT | 39 |
STATEMENTS OF CHANGES IN NET ASSETS
| | | Year Ended March 31, 2015 | | | Year Ended March 31, 2014 | |
| Increase (Decrease) in Net Assets from Operations: | | | | | | |
| Net investment income | | $ | 2,817,618 | | | $ | 1,430,602 | |
| Net realized gain on investments | | | 2,102,672 | | | | 16,541,099 | |
| Net change in unrealized appreciation (depreciation) on investments | | | 28,060,008 | | | | 2,525,092 | |
| Net increase in net assets resulting from operations | | | 32,980,298 | | | | 20,496,793 | |
| | | | | | | | | |
| Distributions to shareholders from: | | | | | | | | |
| Net investment income | | | | | | | | |
| Investor Class | | | (990,101 | ) | | | (1,145,002 | ) |
| Advisor Class | | | (228,315 | ) | | | (232,317 | ) |
| A-Class | | | (146,232 | ) | | | (203,982 | ) |
| C-Class | | | (80,799 | ) | | | (138,802 | ) |
| Net realized gains | | | | | | | | |
| Investor Class | | | (1,759,312 | ) | | | (3,773,580 | ) |
| Advisor Class | | | (405,693 | ) | | | (765,646 | ) |
| A-Class | | | (259,839 | ) | | | (672,262 | ) |
| C-Class | | | (143,573 | ) | | | (457,448 | ) |
| Total distributions to shareholders | | | (4,013,864 | ) | | | (7,389,039 | ) |
| | | | | | | | | |
| Capital share transactions: | | | | | | | | |
| Proceeds from sale of shares | | | | | | | | |
| Investor Class | | | 261,191,921 | | | | 198,150,046 | |
| Advisor Class | | | 186,583,796 | | | | 38,899,657 | |
| A-Class | | | 31,333,989 | | | | 21,016,640 | |
| C-Class | | | 23,898,739 | | | | 27,537,280 | |
| Distributions reinvested | | | | | | | | |
| Investor Class | | | 2,302,863 | | | | 4,792,637 | |
| Advisor Class | | | 632,540 | | | | 995,811 | |
| A-Class | | | 319,969 | | | | 697,114 | |
| C-Class | | | 218,591 | | | | 581,614 | |
| Cost of shares redeemed | | | | | | | | |
| Investor Class | | | (162,176,613 | ) | | | (291,984,030 | ) |
| Advisor Class | | | (169,292,713 | ) | | | (24,065,444 | ) |
| A-Class | | | (27,757,505 | ) | | | (19,454,898 | ) |
| C-Class | | | (22,094,028 | ) | | | (26,613,638 | ) |
| Net increase (decrease) from capital share transactions | | | 125,161,549 | | | | (69,447,211 | ) |
| Net increase (decrease) in net assets | | | 154,127,983 | | | | (56,339,457 | ) |
| | | | | | | | | |
| Net assets: | | | | | | | | |
| Beginning of year | | | 169,056,263 | | | | 225,395,720 | |
| End of year | | $ | 323,184,246 | | | $ | 169,056,263 | |
| Undistributed net investment income at end of year | | $ | 2,821,703 | | | $ | 1,445,447 | |
| 40 | THE RYDEX FUNDS ANNUAL REPORT | SEE NOTES TO FINANCIAL STATEMENTS. |
STATEMENTS OF CHANGES IN NET ASSETS (concluded) |
| | | | Year Ended March 31, 2015 | | | | Year Ended March 31, 2014 | |
| Capital share activity: | | | | | | | | |
| Shares sold | | | | | | | | |
| Investor Class | | | 4,679,252 | | | | 3,954,307 | |
| Advisor Class | | | 3,693,937 | | | | 847,688 | |
| A-Class | | | 596,417 | | | | 446,742 | |
| C-Class | | | 506,456 | | | | 642,147 | |
| Shares issued from reinvestment of distributions | | | | | | | | |
| Investor Class | | | 40,408 | | | | 94,753 | |
| Advisor Class | | | 12,254 | | | | 21,601 | |
| A-Class | | | 6,008 | | | | 14,701 | |
| C-Class | | | 4,561 | | | | 13,476 | |
| Shares redeemed | | | | | | | | |
| Investor Class | | | (2,874,581 | ) | | | (5,892,976 | ) |
| Advisor Class | | | (3,339,602 | ) | | | (527,437 | ) |
| A-Class | | | (526,497 | ) | | | (418,104 | ) |
| C-Class | | | (469,691 | ) | | | (619,832 | ) |
| Net increase (decrease) in shares | | | 2,328,922 | | | | (1,422,934 | ) |
| SEE NOTES TO FINANCIAL STATEMENTS. | THE RYDEX FUNDS ANNUAL REPORT | 41 |
This table is presented to show selected data for a share outstanding throughout each period and to assist shareholders in evaluating a Fund’s performance for the periods presented.
| Investor Class | | Year Ended March 31, 2015 | | | Year Ended March 31, 2014 | | | Year Ended March 28, 2013 | | | Year Ended March 31, 2012 | | | Year Ended March 31, 2011 | |
| Per Share Data | | | | | | | | | | | | | | | |
| Net asset value, beginning of period | | $ | 52.08 | | | $ | 47.79 | | | $ | 40.19 | | | $ | 36.37 | | | $ | 37.83 | |
| Income (loss) from investment operations: | |
Net investment income (loss)a | | | .71 | | | | .46 | | | | .57 | | | | .49 | | | | .69 | |
| Net gain (loss) on investments (realized and unrealized) | | | 6.44 | | | | 5.81 | | | | 7.14 | | | | 4.82 | | | | 4.40 | |
| Total from investment operations | | | 7.15 | | | | 6.27 | | | | 7.71 | | | | 5.31 | | | | 5.09 | |
| Less distributions from: | |
| Net investment income | | | (.24 | ) | | | (.46 | ) | | | (.11 | ) | | | (.57 | ) | | | (.82 | ) |
| Net realized gains | | | (.44 | ) | | | (1.52 | ) | | | — | | | | (.92 | ) | | | (5.73 | ) |
| Total distributions | | | (.68 | ) | | | (1.98 | ) | | | (.11 | ) | | | (1.49 | ) | | | (6.55 | ) |
| Net asset value, end of period | | $ | 58.55 | | | $ | 52.08 | | | $ | 47.79 | | | $ | 40.19 | | | $ | 36.37 | |
| | |
Total Returnb | | | 13.77 | % | | | 13.24 | % | | | 19.26 | % | | | 15.06 | % | | | 14.81 | % |
| Ratios/Supplemental Data | |
| Net assets, end of period (in thousands) | | $ | 222,954 | | | $ | 102,231 | | | $ | 181,945 | | | $ | 155,432 | | | $ | 57,876 | |
| Ratios to average net assets: | |
| Net investment income (loss) | | | 1.27 | % | | | 0.91 | % | | | 1.38 | % | | | 1.29 | % | | | 1.84 | % |
| Total expenses | | | 1.34 | % | | | 1.37 | % | | | 1.35 | % | | | 1.35 | % | | | 1.38 | % |
| Portfolio turnover rate | | | 87 | % | | | 112 | % | | | 230 | % | | | 402 | % | | | 400 | % |
| Advisor Class | | Year Ended March 31, 2015 | | | Year Ended March 31, 2014 | | | Year Ended March 28, 2013 | | | Year Ended March 31, 2012 | | | Year Ended March 31, 2011 | |
| Per Share Data | | | | | | | | | | | | | | | |
| Net asset value, beginning of period | | $ | 47.39 | | | $ | 43.87 | | | $ | 37.08 | | | $ | 33.84 | | | $ | 35.77 | |
| Income (loss) from investment operations: | |
Net investment income (loss)a | | | .37 | | | | .24 | | | | .35 | | | | .24 | | | | .62 | |
| Net gain (loss) on investments (realized and unrealized) | | | 5.86 | | | | 5.26 | | | | 6.55 | | | | 4.49 | | | | 4.00 | |
| Total from investment operations | | | 6.23 | | | | 5.50 | | | | 6.90 | | | | 4.73 | | | | 4.62 | |
| Less distributions from: | |
| Net investment income | | | (.24 | ) | | | (.46 | ) | | | (.11 | ) | | | (.57 | ) | | | (.82 | ) |
| Net realized gains | | | (.44 | ) | | | (1.52 | ) | | | — | | | | (.92 | ) | | | (5.73 | ) |
| Total distributions | | | (.68 | ) | | | (1.98 | ) | | | (.11 | ) | | | (1.49 | ) | | | (6.55 | ) |
| Net asset value, end of period | | $ | 52.94 | | | $ | 47.39 | | | $ | 43.87 | | | $ | 37.08 | | | $ | 33.84 | |
| | |
Total Returnb | | | 13.19 | % | | | 12.66 | % | | | 18.66 | % | | | 14.49 | % | | | 14.32 | % |
| Ratios/Supplemental Data | |
| Net assets, end of period (in thousands) | | $ | 49,751 | | | $ | 27,162 | | | $ | 10,148 | | | $ | 16,975 | | | $ | 3,475 | |
| Ratios to average net assets: | |
| Net investment income (loss) | | | 0.74 | % | | | 0.51 | % | | | 0.93 | % | | | 0.68 | % | | | 1.78 | % |
| Total expenses | | | 1.85 | % | | | 1.87 | % | | | 1.85 | % | | | 1.84 | % | | | 1.88 | % |
| Portfolio turnover rate | | | 87 | % | | | 112 | % | | | 230 | % | | | 402 | % | | | 400 | % |
| 42 | THE RYDEX FUNDS ANNUAL REPORT | SEE NOTES TO FINANCIAL STATEMENTS. |
FINANCIAL HIGHLIGHTS (concluded)
This table is presented to show selected data for a share outstanding throughout each period and to assist shareholders in evaluating a Fund’s performance for the periods presented.
| A-Class | | Year Ended March 31, 2015 | | | Year Ended March 31, 2014 | | | Year Ended March 28, 2013 | | | Year Ended March 31, 2012 | | | Year Ended March 31, 2011 | |
| Per Share Data | | | | | | | | | | | | | | | |
| Net asset value, beginning of period | | $ | 48.79 | | | $ | 45.00 | | | $ | 37.93 | | | $ | 34.49 | | | $ | 36.26 | |
| Income (loss) from investment operations: | |
Net investment income (loss)a | | | .48 | | | | .33 | | | | .44 | | | | .40 | | | | .41 | |
| Net gain (loss) on investments (realized and unrealized) | | | 6.07 | | | | 5.44 | | | | 6.74 | | | | 4.53 | | | | 4.37 | |
| Total from investment operations | | | 6.55 | | | | 5.77 | | | | 7.18 | | | | 4.93 | | | | 4.78 | |
| Less distributions from: | |
| Net investment income | | | (.24 | ) | | | (.46 | ) | | | (.11 | ) | | | (.57 | ) | | | (.82 | ) |
| Net realized gains | | | (.44 | ) | | | (1.52 | ) | | | — | | | | (.92 | ) | | | (5.73 | ) |
| Total distributions | | | (.68 | ) | | | (1.98 | ) | | | (.11 | ) | | | (1.49 | ) | | | (6.55 | ) |
| Net asset value, end of period | | $ | 54.66 | | | $ | 48.79 | | | $ | 45.00 | | | $ | 37.93 | | | $ | 34.49 | |
| | |
Total Returnb | | | 13.47 | % | | | 12.95 | % | | | 18.98 | % | | | 14.80 | % | | | 14.58 | % |
| Ratios/Supplemental Data | |
| Net assets, end of period (in thousands) | | $ | 32,762 | | | $ | 25,538 | | | $ | 21,604 | | | $ | 21,021 | | | $ | 5,033 | |
| Ratios to average net assets: | |
| Net investment income (loss) | | | 0.92 | % | | | 0.70 | % | | | 1.12 | % | | | 1.11 | % | | | 1.14 | % |
| Total expenses | | | 1.60 | % | | | 1.62 | % | | | 1.60 | % | | | 1.60 | % | | | 1.63 | % |
| Portfolio turnover rate | | | 87 | % | | | 112 | % | | | 230 | % | | | 402 | % | | | 400 | % |
| C-Class | | Year Ended March 31, 2015 | | | Year Ended March 31, 2014 | | | Year Ended March 28, 2013 | | | Year Ended March 31, 2012 | | | Year Ended March 31, 2011 | |
| Per Share Data | | | | | | | | | | | | | | | |
| Net asset value, beginning of period | | $ | 44.29 | | | $ | 41.32 | | | $ | 35.11 | | | $ | 32.28 | | | $ | 34.57 | |
| Income (loss) from investment operations: | |
Net investment income (loss)a | | | .09 | | | | (.01 | ) | | | .13 | | | | .12 | | | | .30 | |
| Net gain (loss) on investments (realized and unrealized) | | | 5.48 | | | | 4.96 | | | | 6.19 | | | | 4.20 | | | | 3.96 | |
| Total from investment operations | | | 5.57 | | | | 4.95 | | | | 6.32 | | | | 4.32 | | | | 4.26 | |
| Less distributions from: | |
| Net investment income | | | (.24 | ) | | | (.46 | ) | | | (.11 | ) | | | (.57 | ) | | | (.82 | ) |
| Net realized gains | | | (.44 | ) | | | (1.52 | ) | | | — | | | | (.92 | ) | | | (5.73 | ) |
| Total distributions | | | (.68 | ) | | | (1.98 | ) | | | (.11 | ) | | | (1.49 | ) | | | (6.55 | ) |
| Net asset value, end of period | | $ | 49.18 | | | $ | 44.29 | | | $ | 41.32 | | | $ | 35.11 | | | $ | 32.28 | |
| | |
Total Returnb | | | 12.62 | % | | | 12.11 | % | | | 18.06 | % | | | 13.91 | % | | | 13.78 | % |
| Ratios/Supplemental Data | |
| Net assets, end of period (in thousands) | | $ | 17,717 | | | $ | 14,125 | | | $ | 11,699 | | | $ | 9,712 | | | $ | 3,484 | |
| Ratios to average net assets: | |
| Net investment income (loss) | | | 0.20 | % | | | (0.02 | %) | | | 0.37 | % | | | 0.36 | % | | | 0.90 | % |
| Total expenses | | | 2.35 | % | | | 2.37 | % | | | 2.35 | % | | | 2.35 | % | | | 2.38 | % |
| Portfolio turnover rate | | | 87 | % | | | 112 | % | | | 230 | % | | | 402 | % | | | 400 | % |
a | Net investment income (loss) per share was computed using average shares outstanding throughout the period. |
b | Total return does not reflect the impact of any applicable sales charges. |
| SEE NOTES TO FINANCIAL STATEMENTS. | THE RYDEX FUNDS ANNUAL REPORT | 43 |
PERFORMANCE REPORT AND FUND PROFILE (Unaudited) | March 31, 2015 |
ELECTRONICS FUND
OBJECTIVE: Seeks to provide capital appreciation by investing in companies that are involved in the electronics sector, including semiconductor manufacturers and distributors, and makers and vendors of other electronic components and devices (“electronics companies”).
For the one-year period ended March 31, 2015, Electronics Fund Investor Class returned 19.65%, compared with 18.11% for the S&P 500 Information Technology Index. The broader S&P 500 Index returned 12.73%.
Almost all the holdings in the Fund are in the semiconductors industry and the semiconductor equipment industry. Both contributed to the Fund’s positive performance for the period.
For the period, Fund performance got the biggest boost from Skyworks Solutions, Inc., Intel Corp., and Avago Technologies Ltd. Holdings detracting from Fund performance for the period were Himax Technologies, Inc. ADR, Yingli Green Energy Holding Company Ltd. ADR, and GT Advanced Technologies, Inc.
Performance displayed represents past performance, which is no guarantee of future results.
Holdings Diversification (Market Exposure as % of Net Assets)
“Holdings Diversification (Market Exposure as % of Net Assets)” excludes any temporary cash investments.
| Inception Dates: |
| Investor Class | April 1, 1998 |
| Advisor Class | April 2, 1998 |
| A-Class | September 1, 2004 |
| C-Class | March 26, 2001 |
| Ten Largest Holdings (% of Total Net Assets) |
| Intel Corp. | 8.3% |
| Texas Instruments, Inc. | 5.1% |
| Micron Technology, Inc. | 3.6% |
| Applied Materials, Inc. | 3.4% |
| Broadcom Corp. — Class A | 3.3% |
| Analog Devices, Inc. | 3.1% |
| Skyworks Solutions, Inc. | 2.9% |
| Avago Technologies Ltd. | 2.7% |
| NXP Semiconductor N.V. | 2.7% |
| Altera Corp. | 2.6% |
| Top Ten Total | 37.7% |
| | |
| “Ten Largest Holdings” exclude any temporary cash or derivative investments. |
| 44 | THE RYDEX FUNDS ANNUAL REPORT | |
PERFORMANCE REPORT AND FUND PROFILE (Unaudited)(concluded) | March 31, 2015 |
Cumulative Fund Performance*
Average Annual Returns*
Periods Ended March 31, 2015
| | 1 Year | 5 Year | 10 Year |
| Investor Class Shares | 19.65% | 9.82% | 4.95% |
| Advisor Class Shares | 19.04% | 9.26% | 4.43% |
| A-Class Shares | 19.36% | 9.54% | 4.68% |
A-Class Shares with sales charge† | 13.69% | 8.48% | 4.17% |
| C-Class Shares | 18.50% | 8.74% | 3.93% |
C-Class Shares with CDSC‡ | 17.50% | 8.74% | 3.93% |
| S&P 500 Information Technology Index | 18.11% | 14.55% | 9.77% |
| S&P 500 Index | 12.73% | 14.47% | 8.01% |
| * | The performance data above represents past performance that is not predictive of future results. The investment return and principal value of an investment in the Fund will fluctuate so that an investor’s shares, when redeemed, may be worth more or less than their original cost. Returns are historical and include changes in principal and reinvested dividends and capital gains and do not reflect the effect of taxes. The S&P 500 Index and the S&P 500 Information Technology Index are unmanaged indices and, unlike the Fund, have no management fees or operating expenses to reduce their reported returns. The graphs are based on Investor Class shares and A-Class shares only; performance for Advisor Class shares and C-Class shares will vary due to differences in fee structures. |
† | Fund returns are calculated using the maximum sales charge of 4.75%. |
‡ | Fund returns include a CDSC of 1% if redeemed within 12 months of purchase. |
| | THE RYDEX FUNDS ANNUAL REPORT | 45 |
| SCHEDULE OF INVESTMENTS | March 31, 2015 |
| ELECTRONICS FUND | |
| | |
Shares | | | Value | |
| | | | | | | | |
COMMON STOCKS† - 99.3% | |
| | | | | | | | |
| ELECTRONIC COMPONENTS - SEMICONDUCTOR - 53.5% | |
| Intel Corp. | | | 72,421 | | | $ | 2,264,607 | |
| Texas Instruments, Inc. | | | 24,455 | | | | 1,398,459 | |
| Micron Technology, Inc.* | | | 35,991 | | | | 976,436 | |
| Broadcom Corp. — Class A | | | 21,012 | | | | 909,715 | |
| Skyworks Solutions, Inc. | | | 8,025 | | | | 788,777 | |
| Avago Technologies Ltd. | | | 5,803 | | | | 736,865 | |
| Altera Corp. | | | 16,776 | | | | 719,858 | |
| Freescale Semiconductor Ltd.* | | | 15,713 | | | | 640,462 | |
| Xilinx, Inc. | | | 14,361 | | | | 607,470 | |
| NVIDIA Corp. | | | 28,375 | | | | 593,747 | |
| Microchip Technology, Inc. | | | 11,559 | | | | 565,235 | |
| ON Semiconductor Corp.* | | | 33,429 | | | | 404,825 | |
| Cavium, Inc.* | | | 5,100 | | | | 361,182 | |
Cree, Inc.*,1 | | | 10,052 | | | | 356,745 | |
| ARM Holdings plc ADR | | | 7,153 | | | | 352,643 | |
| Microsemi Corp.* | | | 9,671 | | | | 342,353 | |
| Mellanox Technologies Ltd.* | | | 6,526 | | | | 295,889 | |
Ambarella, Inc.*,1 | | | 3,840 | | | | 290,726 | |
| Tower Semiconductor Ltd.* | | | 16,810 | | | | 285,434 | |
| Silicon Laboratories, Inc.* | | | 5,259 | | | | 266,999 | |
| Fairchild Semiconductor International, Inc. — Class A* | | | 14,667 | | | | 266,646 | |
| Monolithic Power Systems, Inc. | | | 4,942 | | | | 260,196 | |
| PMC-Sierra, Inc.* | | | 26,740 | | | | 248,147 | |
| Intersil Corp. — Class A | | | 16,736 | | | | 239,660 | |
| Semtech Corp.* | | | 8,970 | | | | 239,006 | |
| OmniVision Technologies, Inc.* | | | 8,717 | | | | 229,867 | |
| Total Electronic Components - Semiconductor | | | | | | | 14,641,949 | |
| | | | | | | | |
| SEMICONDUCTOR COMPONENTS - INTEGRATED CIRCUIT - 21.3% | |
| Analog Devices, Inc. | | | 13,286 | | | | 837,018 | |
| NXP Semiconductor N.V.* | | | 7,311 | | | | 733,732 | |
| Linear Technology Corp. | | | 12,978 | | | | 607,370 | |
| Taiwan Semiconductor Manufacturing Company Ltd. ADR | | | 25,379 | | | | 595,899 | |
| Maxim Integrated Products, Inc. | | | 16,108 | | | | 560,719 | |
| Marvell Technology Group Ltd. | | | 31,594 | | | | 464,432 | |
| Cypress Semiconductor Corp. | | | 26,547 | | | | 374,578 | |
| Atmel Corp. | | | 39,976 | | | | 329,002 | |
| Integrated Device Technology, Inc.* | | | 15,647 | | | | 313,253 | |
Siliconware Precision Industries Company Ltd. ADR1 | | | 33,610 | | | | 274,930 | |
| Cirrus Logic, Inc.* | | | 7,779 | | | | 258,730 | |
| Himax Technologies, Inc. ADR | | | 40,593 | | | | 256,954 | |
| Power Integrations, Inc. | | | 4,200 | | | | 218,736 | |
| Total Semiconductor Components - Integrated Circuit | | | | | | | 5,825,353 | |
| | | | | | | | |
| SEMICONDUCTOR EQUIPMENT - 12.6% | |
| Applied Materials, Inc. | | | 40,976 | | | | 924,419 | |
| Lam Research Corp. | | | 8,175 | | | | 574,171 | |
| KLA-Tencor Corp. | | | 9,359 | | | | 545,536 | |
| Teradyne, Inc. | | | 19,134 | | | | 360,676 | |
| ASML Holding N.V. — Class G | | | 3,428 | | | | 346,331 | |
| Tessera Technologies, Inc. | | | 6,710 | | | | 270,279 | |
| MKS Instruments, Inc. | | | 7,030 | | | | 237,684 | |
| Veeco Instruments, Inc.* | | | 6,577 | | | | 200,927 | |
| Total Semiconductor Equipment | | | | | | | 3,460,023 | |
| | | | | | | | |
| ENERGY-ALTERNATE SOURCES - 5.8% | |
| SunEdison, Inc.* | | | 19,402 | | | | 465,648 | |
| First Solar, Inc.* | | | 7,549 | | | | 451,355 | |
JinkoSolar Holding Company Ltd. ADR*,1 | | | 13,347 | | | | 342,217 | |
Trina Solar Ltd. ADR*,1 | | | 26,770 | | | | 323,649 | |
| Total Energy-Alternate Sources | | | | | | | 1,582,869 | |
| | | | | | | | |
| POWER CONVERTER/SUPPLY EQUIPMENT - 2.7% | |
| Canadian Solar, Inc.* | | | 11,261 | | | | 376,004 | |
SunPower Corp. — Class A*,1 | | | 11,692 | | | | 366,077 | |
| Total Power Converter/Supply Equipment | | | | | | | 742,081 | |
| | | | | | | | |
| TELECOMMUNICATION SERVICES - 2.3% | |
| Qorvo, Inc.* | | | 7,933 | | | | 632,260 | |
| | | | | | | | |
| COMPUTERS-PERIPHERAL EQUIPMENT - 1.1% | |
| Synaptics, Inc.* | | | 3,835 | | | | 311,805 | |
| | | | | | | | |
| Total Common Stocks | | | | | | | | |
| (Cost $19,808,904) | | | | | | | 27,196,340 | |
| | | | | | | | |
| 46 | THE RYDEX FUNDS ANNUAL REPORT | SEE NOTES TO FINANCIAL STATEMENTS. |
SCHEDULE OF INVESTMENTS (concluded) | March 31, 2015 |
| ELECTRONICS FUND | |
| | | | | | | | | |
| | | Face
Amount | | | Value | |
| | | | | | | | |
REPURCHASE AGREEMENT††,2 - 0.9% | |
HSBC Group
issued 03/31/15 at 0.03%
due 04/01/15 | | $ | 245,325 | | | $ | 245,325 | |
| Total Repurchase Agreement | | | | | | | | |
| (Cost $245,325) | | | | | | | 245,325 | |
| | | | | | | | |
SECURITIES LENDING COLLATERAL††,3 - 5.1% | |
| Repurchase Agreements | | | | | | | | |
HSBC Securities, Inc.
issued 03/31/15 at 0.10%
due 04/01/15 | | | 923,258 | | | | 923,258 | |
BNP Paribas Securities Corp.
issued 03/31/15 at 0.10%
due 04/01/15 | | | 317,601 | | | | 317,601 | |
Barclays Capital, Inc.
issued 03/31/15 at 0.10%
due 04/01/15 | | | 163,934 | | | | 163,934 | |
| Total Securities Lending Collateral | | | | | | | | |
| (Cost $1,404,793) | | | | | | | 1,404,793 | |
| | | | | | | | |
| Total Investments - 105.3% | | | | | | | | |
| (Cost $21,459,022) | | | | | | $ | 28,846,458 | |
| Other Assets & Liabilities, net - (5.3)% | | | | | | | (1,458,770 | ) |
| Total Net Assets - 100.0% | | | | | | $ | 27,387,688 | |
| * | Non-income producing security. |
| † | Value determined based on Level 1 inputs — See Note 4. |
| †† | Value determined based on Level 2 inputs — See Note 4. |
| 1 | All or portion of this security is on loan at March 31, 2015 — See Note 6. |
| 2 | Repurchase Agreement — See Note 5. |
| 3 | Securities lending collateral — See Note 6. |
| ADR — American Depositary Receipt |
| plc — Public Limited Company |
| SEE NOTES TO FINANCIAL STATEMENTS. | THE RYDEX FUNDS ANNUAL REPORT | 47 |
STATEMENT OF ASSETS AND LIABILITIES
March 31, 2015
| Assets: | |
| Investments, at value - including $1,377,165 of securities loaned (cost $19,808,904) | | $ | 27,196,340 | |
| Repurchase agreements, at value (cost $1,650,118) | | | 1,650,118 | |
| Total investments (cost $21,459,022) | | | 28,846,458 | |
| Segregated cash with broker | | | 20,532 | |
| Cash | | | 2,080 | |
| Receivables: | |
| Fund shares sold | | | 325,848 | |
| Securities lending income | | | 7,880 | |
| Dividends | | | 7,077 | |
| Total assets | | | 29,209,875 | |
| | | | | |
| Liabilities: | |
| Payable for: | |
| Return of securities loaned | | | 1,425,325 | |
| Fund shares redeemed | | | 353,600 | |
| Management fees | | | 18,740 | |
| Transfer agent and administrative fees | | | 5,512 | |
| Distribution and service fees | | | 3,739 | |
| Portfolio accounting fees | | | 2,205 | |
| Miscellaneous | | | 13,066 | |
| Total liabilities | | | 1,822,187 | |
| Commitments and contingent liabilities (Note 10) | | | — | |
| Net assets | | $ | 27,387,688 | |
| | | | | |
| Net assets consist of: | |
| Paid in capital | | $ | 37,149,248 | |
| Undistributed net investment income | | | 42,413 | |
| Accumulated net realized loss on investments | | | (17,191,409 | ) |
| Net unrealized appreciation on investments | | | 7,387,436 | |
| Net assets | | $ | 27,387,688 | |
| | | | | |
| Investor Class: | |
| Net assets | | $ | 18,143,531 | |
| Capital shares outstanding | | | 217,173 | |
| Net asset value per share | | $ | 83.54 | |
| | | | | |
| Advisor Class: | |
| Net assets | | $ | 6,284,583 | |
| Capital shares outstanding | | | 81,976 | |
| Net asset value per share | | $ | 76.66 | |
| | | | | |
| A-Class: | |
| Net assets | | $ | 1,679,567 | |
| Capital shares outstanding | | | 21,364 | |
| Net asset value per share | | $ | 78.62 | |
| Maximum offering price per share (Net asset value divided by 95.25%) | | $ | 82.54 | |
| | | | | |
| C-Class: | |
| Net assets | | $ | 1,280,007 | |
| Capital shares outstanding | | | 17,593 | |
| Net asset value per share | | $ | 72.76 | |
STATEMENT OF OPERATIONS
Year Ended March 31, 2015
| Investment Income: | |
| Dividends (net of foreign withholding tax of $5,178) | | $ | 383,218 | |
| Income from securities lending, net | | | 67,567 | |
| Interest | | | 29 | |
| Total investment income | | | 450,814 | |
| | | | | |
| Expenses: | |
| Management fees | | | 221,570 | |
| Transfer agent and administrative fees | | | 65,167 | |
| Distribution and service fees: | |
| Advisor Class | | | 21,931 | |
| A-Class | | | 7,239 | |
| C-Class | | | 15,217 | |
| Portfolio accounting fees | | | 26,067 | |
| Custodian fees | | | 3,050 | |
| Trustees’ fees* | | | 1,503 | |
| Line of credit fees | | | 293 | |
| Miscellaneous | | | 33,950 | |
| Total expenses | | | 395,987 | |
| Net investment income | | | 54,827 | |
| | | | | |
| Net Realized and Unrealized Gain (Loss): | |
| Net realized gain (loss) on: | |
| Investments | | | (4,156,771 | ) |
| Net realized loss | | | (4,156,771 | ) |
| Net change in unrealized appreciation (depreciation) on: | |
| Investments | | | 4,425,744 | |
| Net change in unrealized appreciation (depreciation) | | | 4,425,744 | |
| Net realized and unrealized gain | | | 268,973 | |
| Net increase in net assets resulting from operations | | $ | 323,800 | |
| * | Relates to Trustees not deemed “interested persons” within the meaning of Section 2(a)(19) of the 1940 Act. |
| 48 | THE RYDEX FUNDS ANNUAL REPORT | SEE NOTES TO FINANCIAL STATEMENTS. |
STATEMENTS OF CHANGES IN NET ASSETS
| | | Year Ended March 31, 2015 | | | Year Ended March 31, 2014 | |
| Increase (Decrease) in Net Assets from Operations: | | | | | | |
| Net investment income (loss) | | $ | 54,827 | | | $ | (23,668 | ) |
| Net realized gain (loss) on investments | | | (4,156,771 | ) | | | 690,809 | |
| Net change in unrealized appreciation (depreciation) on investments | | | 4,425,744 | | | | 1,007,719 | |
| Net increase in net assets resulting from operations | | | 323,800 | | | | 1,674,860 | |
| | | | | | | | | |
| Distributions to shareholders from: | | | | | | | | |
| Net investment income | | | | | | | | |
| Investor Class | | | — | | | | (1,558 | ) |
| Advisor Class | | | — | | | | (974 | ) |
| A-Class | | | — | | | | (118 | ) |
| C-Class | | | — | | | | (329 | ) |
| Total distributions to shareholders | | | — | | | | (2,979 | ) |
| | | | | | | | | |
| Capital share transactions: | | | | | | | | |
| Proceeds from sale of shares | | | | | | | | |
| Investor Class | | | 149,252,908 | | | | 119,447,698 | |
| Advisor Class | | | 34,345,705 | | | | 29,407,626 | |
| A-Class | | | 15,359,168 | | | | 15,892,309 | |
| C-Class | | | 18,220,155 | | | | 20,348,276 | |
| Distributions reinvested | | | | | | | | |
| Investor Class | | | — | | | | 1,521 | |
| Advisor Class | | | — | | | | 967 | |
| A-Class | | | — | | | | 118 | |
| C-Class | | | — | | | | 328 | |
| Cost of shares redeemed | | | | | | | | |
| Investor Class | | | (140,624,704 | ) | | | (113,730,945 | ) |
| Advisor Class | | | (32,080,298 | ) | | | (27,385,057 | ) |
| A-Class | | | (18,830,964 | ) | | | (11,112,191 | ) |
| C-Class | | | (18,183,162 | ) | | | (20,133,392 | ) |
| Net increase from capital share transactions | | | 7,458,808 | | | | 12,737,258 | |
| Net increase in net assets | | | 7,782,608 | | | | 14,409,139 | |
| | | | | | | | | |
| Net assets: | | | | | | | | |
| Beginning of year | | | 19,605,080 | | | | 5,195,941 | |
| End of year | | $ | 27,387,688 | | | $ | 19,605,080 | |
| Undistributed net investment income/(Accumulated net investment loss) at end of year | | $ | 42,413 | | | $ | (12,414 | ) |
| | | | | | | | | |
| Capital share activity: | | | | | | | | |
| Shares sold | | | | | | | | |
| Investor Class | | | 1,964,674 | | | | 1,999,524 | |
| Advisor Class | | | 497,436 | | | | 523,694 | |
| A-Class | | | 217,511 | | | | 274,282 | |
| C-Class | | | 277,943 | | | | 391,550 | |
| Shares issued from reinvestment of distributions | | | | | | | | |
| Investor Class | | | — | | | | 25 | |
| Advisor Class | | | — | | | | 17 | |
| A-Class | | | — | | | | 2 | |
| C-Class | | | — | | | | 6 | |
| Shares redeemed | | | | | | | | |
| Investor Class | | | (1,885,797 | ) | | | (1,917,706 | ) |
| Advisor Class | | | (471,009 | ) | | | (494,817 | ) |
| A-Class | | | (277,054 | ) | | | (199,435 | ) |
| C-Class | | | (277,335 | ) | | | (388,980 | ) |
| Net increase in shares | | | 46,369 | | | | 188,162 | |
| SEE NOTES TO FINANCIAL STATEMENTS. | THE RYDEX FUNDS ANNUAL REPORT | 49 |
This table is presented to show selected data for a share outstanding throughout each period and to assist shareholders in evaluating a Fund’s performance for the periods presented.
| Investor Class | | Year Ended March 31, 2015 | | | Year Ended March 31, 2014 | | | Year Ended March 28, 2013 | | | Year Ended March 31, 2012 | | | Year Ended March 31, 2011 | |
| Per Share Data | | | | | | | | | | | | | | | |
| Net asset value, beginning of period | | $ | 69.82 | | | $ | 52.11 | | | $ | 55.09 | | | $ | 60.57 | | | $ | 52.33 | |
| Income (loss) from investment operations: | |
Net investment income (loss)a | | | .29 | | | | (.04 | ) | | | .22 | | | | (.12 | ) | | | (.13 | ) |
| Net gain (loss) on investments (realized and unrealized) | | | 13.43 | | | | 17.79 | | | | (3.20 | ) | | | (5.36 | ) | | | 8.37 | |
| Total from investment operations | | | 13.72 | | | | 17.75 | | | | (2.98 | ) | | | (5.48 | ) | | | 8.24 | |
| Less distributions from: | |
| Net investment income | | | — | | | | (.04 | ) | | | — | | | | — | | | | — | |
| Total distributions | | | — | | | | (.04 | ) | | | — | | | | — | | | | — | |
| Net asset value, end of period | | $ | 83.54 | | | $ | 69.82 | | | $ | 52.11 | | | $ | 55.09 | | | $ | 60.57 | |
| | |
Total Returnb | | | 19.65 | % | | | 34.07 | % | | | (5.41 | %) | | | (9.05 | %) | | | 15.75 | % |
| Ratios/Supplemental Data | |
| Net assets, end of period (in thousands) | | $ | 18,144 | | | $ | 9,655 | | | $ | 2,942 | | | $ | 5,453 | | | $ | 6,976 | |
| Ratios to average net assets: | |
| Net investment income (loss) | | | 0.38 | % | | | (0.07 | %) | | | 0.45 | % | | | (0.22 | %) | | | (0.23 | %) |
| Total expenses | | | 1.35 | % | | | 1.37 | % | | | 1.35 | % | | | 1.35 | % | | | 1.39 | % |
| Portfolio turnover rate | | | 562 | % | | | 1,436 | % | | | 1,640 | % | | | 1,329 | % | | | 1,171 | % |
| Advisor Class | | Year Ended March 31, 2015 | | | Year Ended March 31, 2014 | | | Year Ended March 28, 2013 | | | Year Ended March 31, 2012 | | | Year Ended March 31, 2011 | |
| Per Share Data | | | | | | | | | | | | | | | |
| Net asset value, beginning of period | | $ | 64.40 | | | $ | 48.33 | | | $ | 51.40 | | | $ | 56.77 | | | $ | 49.26 | |
| Income (loss) from investment operations: | |
Net investment income (loss)a | | | .06 | | | | (.17 | ) | | | (.12 | ) | | | (.34 | ) | | | (.41 | ) |
| Net gain (loss) on investments (realized and unrealized) | | | 12.20 | | | | 16.28 | | | | (2.95 | ) | | | (5.03 | ) | | | 7.92 | |
| Total from investment operations | | | 12.26 | | | | 16.11 | | | | (3.07 | ) | | | (5.37 | ) | | | 7.51 | |
| Less distributions from: | |
| Net investment income | | | — | | | | (.04 | ) | | | — | | | | — | | | | — | |
| Total distributions | | | — | | | | (.04 | ) | | | — | | | | — | | | | — | |
| Net asset value, end of period | | $ | 76.66 | | | $ | 64.40 | | | $ | 48.33 | | | $ | 51.40 | | | $ | 56.77 | |
| | |
Total Returnb | | | 19.04 | % | | | 33.34 | % | | | (5.97 | %) | | | (9.46 | %) | | | 15.25 | % |
| Ratios/Supplemental Data | |
| Net assets, end of period (in thousands) | | $ | 6,285 | | | $ | 3,577 | | | $ | 1,288 | | | $ | 1,271 | | | $ | 3,081 | |
| Ratios to average net assets: | |
| Net investment income (loss) | | | 0.09 | % | | | (0.29 | %) | | | (0.26 | %) | | | (0.67 | %) | | | (0.79 | %) |
| Total expenses | | | 1.85 | % | | | 1.87 | % | | | 1.85 | % | | | 1.86 | % | | | 1.89 | % |
| Portfolio turnover rate | | | 562 | % | | | 1,436 | % | | | 1,640 | % | | | 1,329 | % | | | 1,171 | % |
| 50 | THE RYDEX FUNDS ANNUAL REPORT | SEE NOTES TO FINANCIAL STATEMENTS. |
FINANCIAL HIGHLIGHTS (concluded)
This table is presented to show selected data for a share outstanding throughout each period and to assist shareholders in evaluating a Fund’s performance for the periods presented.
| A-Class | | Year Ended March 31, 2015 | | | Year Ended March 31, 2014 | | | Year Ended March 28, 2013 | | | Year Ended March 31, 2012 | | | Year Ended March 31, 2011 | |
| Per Share Data | | | | | | | | | | | | | | | |
| Net asset value, beginning of period | | $ | 65.87 | | | $ | 49.29 | | | $ | 52.23 | | | $ | 57.59 | | | $ | 49.88 | |
| Income (loss) from investment operations: | |
Net investment income (loss)a | | | (.17 | ) | | | (.33 | ) | | | .24 | | | | (.19 | ) | | | (.21 | ) |
| Net gain (loss) on investments (realized and unrealized) | | | 12.92 | | | | 16.95 | | | | (3.18 | ) | | | (5.17 | ) | | | 7.92 | |
| Total from investment operations | | | 12.75 | | | | 16.62 | | | | (2.94 | ) | | | (5.36 | ) | | | 7.71 | |
| Less distributions from: | |
| Net investment income | | | — | | | | (.04 | ) | | | — | | | | — | | | | — | |
| Total distributions | | | — | | | | (.04 | ) | | | — | | | | — | | | | — | |
| Net asset value, end of period | | $ | 78.62 | | | $ | 65.87 | | | $ | 49.29 | | | $ | 52.23 | | | $ | 57.59 | |
| | |
Total Returnb | | | 19.36 | % | | | 33.72 | % | | | (5.63 | %) | | | (9.31 | %) | | | 15.46 | % |
| Ratios/Supplemental Data | |
| Net assets, end of period (in thousands) | | $ | 1,680 | | | $ | 5,329 | | | $ | 299 | | | $ | 659 | | | $ | 1,619 | |
| Ratios to average net assets: | |
| Net investment income (loss) | | | (0.24 | %) | | | (0.59 | %) | | | 0.51 | % | | | (0.36 | %) | | | (0.43 | %) |
| Total expenses | | | 1.61 | % | | | 1.62 | % | | | 1.60 | % | | | 1.62 | % | | | 1.64 | % |
| Portfolio turnover rate | | | 562 | % | | | 1,436 | % | | | 1,640 | % | | | 1,329 | % | | | 1,171 | % |
| C-Class | | Year Ended March 31, 2015 | | | Year Ended March 31, 2014 | | | Year Ended March 28, 2013 | | | Year Ended March 31, 2012 | | | Year Ended March 31, 2011 | |
| Per Share Data | | | | | | | | | | | | | | | |
| Net asset value, beginning of period | | $ | 61.40 | | | $ | 46.32 | | | $ | 49.50 | | | $ | 55.03 | | | $ | 47.90 | |
| Income (loss) from investment operations: | |
Net investment income (loss)a | | | (.35 | ) | | | (.54 | ) | | | (.18 | ) | | | (.70 | ) | | | (.65 | ) |
| Net gain (loss) on investments (realized and unrealized) | | | 11.71 | | | | 15.66 | | | | (3.00 | ) | | | (4.83 | ) | | | 7.78 | |
| Total from investment operations | | | 11.36 | | | | 15.12 | | | | (3.18 | ) | | | (5.53 | ) | | | 7.13 | |
| Less distributions from: | |
| Net investment income | | | — | | | | (.04 | ) | | | — | | | | — | | | | — | |
| Total distributions | | | — | | | | (.04 | ) | | | — | | | | — | | | | — | |
| Net asset value, end of period | | $ | 72.76 | | | $ | 61.40 | | | $ | 46.32 | | | $ | 49.50 | | | $ | 55.03 | |
| | |
Total Returnb | | | 18.50 | % | | | 32.65 | % | | | (6.44 | %) | | | (10.01 | %) | | | 14.86 | % |
| Ratios/Supplemental Data | |
| Net assets, end of period (in thousands) | | $ | 1,280 | | | $ | 1,043 | | | $ | 667 | | | $ | 263 | | | $ | 1,246 | |
| Ratios to average net assets: | |
| Net investment income (loss) | | | (0.55 | %) | | | (1.03 | %) | | | (0.41 | %) | | | (1.42 | %) | | | (1.31 | %) |
| Total expenses | | | 2.35 | % | | | 2.37 | % | | | 2.35 | % | | | 2.36 | % | | | 2.39 | % |
| Portfolio turnover rate | | | 562 | % | | | 1,436 | % | | | 1,640 | % | | | 1,329 | % | | | 1,171 | % |
a | Net investment income (loss) per share was computed using average shares outstanding throughout the period. |
b | Total return does not reflect the impact of any applicable sales charges. |
| SEE NOTES TO FINANCIAL STATEMENTS. | THE RYDEX FUNDS ANNUAL REPORT | 51 |
PERFORMANCE REPORT AND FUND PROFILE (Unaudited) | March 31, 2015 |
ENERGY FUND
OBJECTIVE: Seeks to provide capital appreciation by investing in companies involved in the energy field, including the exploration, production, and development of oil, gas, coal, and alternative sources of energy (“energy companies”).
For the one-year period ended March 31, 2015, Energy Fund Investor Class returned -21.42%, compared with -11.11% for the S&P 500 Energy Index. The broader S&P 500 Index returned 12.73%.
Within the sector, the gas utilities industry was the largest contributor to return, followed by the commercial services & supplies industry. The oil, gas & consumable fuels industry was the largest detractor from return, followed by the energy equipment & services industry.
Kinder Morgan, Inc., Tesoro Corp., and Valero Energy Corp. were among the most significant positive contributors to Fund performance for the period. Holdings detracting most from performance were Transocean Ltd., Seadrill Ltd., and Petroleo Brasileiro S.A. ADR.
Performance displayed represents past performance, which is no guarantee of future results.
Holdings Diversification (Market Exposure as % of Net Assets)
“Holdings Diversification (Market Exposure as % of Net Assets)” excludes any temporary cash investments.
| Inception Dates: |
| Investor Class | April 21, 1998 |
| Advisor Class | May 5, 1998 |
| A-Class | September 1, 2004 |
| C-Class | April 19, 2001 |
| Ten Largest Holdings (% of Total Net Assets) |
| Exxon Mobil Corp. | 5.3% |
| Chevron Corp. | 4.0% |
| Schlumberger Ltd. | 3.0% |
| Kinder Morgan, Inc. | 2.7% |
| ConocoPhillips | 2.5% |
| Occidental Petroleum Corp. | 2.1% |
| EOG Resources, Inc. | 2.0% |
| Phillips 66 | 1.9% |
| Anadarko Petroleum Corp. | 1.8% |
| Williams Companies, Inc. | 1.8% |
| Top Ten Total | 27.1% |
| | |
| “Ten Largest Holdings” exclude any temporary cash or derivative investments. |
| 52 | THE RYDEX FUNDS ANNUAL REPORT | |
PERFORMANCE REPORT AND FUND PROFILE (Unaudited)(concluded) | March 31, 2015 |
Cumulative Fund Performance*
Average Annual Returns*
Periods Ended March 31, 2015
| | 1 Year | 5 Year | 10 Year |
| Investor Class Shares | -21.42% | 2.67% | 4.61% |
| Advisor Class Shares | -21.76% | 2.16% | 4.08% |
| A-Class Shares | -21.49% | 2.42% | 4.34% |
A-Class Shares with sales charge† | -25.22% | 1.42% | 3.83% |
| C-Class Shares | -22.18% | 1.64% | 3.56% |
C-Class Shares with CDSC‡ | -22.95% | 1.64% | 3.56% |
| S&P 500 Energy Index | -11.11% | 8.00% | 7.41% |
| S&P 500 Index | 12.73% | 14.47% | 8.01% |
| * | The performance data above represents past performance that is not predictive of future results. The investment return and principal value of an investment in the Fund will fluctuate so that an investor’s shares, when redeemed, may be worth more or less than their original cost. Returns are historical and include changes in principal and reinvested dividends and capital gains and do not reflect the effect of taxes. The S&P 500 Index and the S&P 500 Energy Index are unmanaged indices and, unlike the Fund, have no management fees or operating expenses to reduce their reported returns. The graphs are based on Investor Class shares and A-Class shares only; performance for Advisor Class shares and C-Class shares will vary due to differences in fee structures. |
† | Fund returns are calculated using the maximum sales charge of 4.75%. |
‡ | Fund returns include a CDSC of 1% if redeemed within 12 months of purchase. |
| | THE RYDEX FUNDS ANNUAL REPORT | 53 |
| SCHEDULE OF INVESTMENTS | March 31, 2015 |
| ENERGY FUND | |
| | |
Shares | | | Value | |
| | | | | | | | |
COMMON STOCKS† - 99.7% | |
| | | | | | | | |
| OIL COMPANY - EXPLORATION & PRODUCTION - 37.4% | |
| ConocoPhillips | | | 18,267 | | | $ | 1,137,303 | |
| Occidental Petroleum Corp. | | | 13,406 | | | | 978,638 | |
| EOG Resources, Inc. | | | 10,187 | | | | 934,046 | |
| Anadarko Petroleum Corp. | | | 10,228 | | | | 846,981 | |
| Devon Energy Corp. | | | 10,845 | | | | 654,062 | |
| Pioneer Natural Resources Co. | | | 3,995 | | | | 653,222 | |
| Apache Corp. | | | 10,345 | | | | 624,114 | |
| Noble Energy, Inc. | | | 11,852 | | | | 579,563 | |
| Hess Corp. | | | 8,382 | | | | 568,886 | |
| Continental Resources, Inc.* | | | 12,582 | | | | 549,456 | |
| Concho Resources, Inc.* | | | 4,301 | | | | 498,572 | |
| Equities Corp. | | | 5,750 | | | | 476,503 | |
| Cabot Oil & Gas Corp. — Class A | | | 15,810 | | | | 466,869 | |
| Cimarex Energy Co. | | | 3,714 | | | | 427,444 | |
| Antero Resources Corp.* | | | 11,650 | | | | 411,478 | |
| Range Resources Corp. | | | 7,850 | | | | 408,514 | |
Chesapeake Energy Corp.1 | | | 28,382 | | | | 401,889 | |
| Southwestern Energy Co.* | | | 17,006 | | | | 394,369 | |
| Newfield Exploration Co.* | | | 9,310 | | | | 326,688 | |
| Encana Corp. | | | 26,874 | | | | 299,645 | |
| Energen Corp. | | | 4,507 | | | | 297,462 | |
| Canadian Natural Resources Ltd. | | | 9,502 | | | | 291,806 | |
| Diamondback Energy, Inc.* | | | 3,790 | | | | 291,224 | |
| Whiting Petroleum Corp.* | | | 8,728 | | | | 269,695 | |
| Cobalt International Energy, Inc.* | | | 28,110 | | | | 264,515 | |
| Memorial Resource Development Corp.* | | | 14,870 | | | | 263,794 | |
| SM Energy Co. | | | 5,099 | | | | 263,516 | |
| Gulfport Energy Corp.* | | | 5,630 | | | | 258,473 | |
| QEP Resources, Inc. | | | 12,062 | | | | 251,493 | |
| Rice Energy, Inc.* | | | 11,230 | | | | 244,365 | |
| California Resources Corp. | | | 31,543 | | | | 240,042 | |
| Laredo Petroleum, Inc.* | | | 18,088 | | | | 235,868 | |
| Talisman Energy, Inc. | | | 30,198 | | | | 231,921 | |
Denbury Resources, Inc.1 | | | 28,548 | | | | 208,115 | |
Ultra Petroleum Corp.*,1 | | | 13,112 | | | | 204,941 | |
| Carrizo Oil & Gas, Inc.* | | | 4,069 | | | | 202,026 | |
| CNOOC Ltd. ADR | | | 1,400 | | | | 198,548 | |
| WPX Energy, Inc.* | | | 18,134 | | | | 198,205 | |
Oasis Petroleum, Inc.*,1 | | | 13,410 | | | | 190,690 | |
| PDC Energy, Inc.* | | | 3,460 | | | | 186,978 | |
| RSP Permian, Inc.* | | | 7,080 | | | | 178,345 | |
| Rosetta Resources, Inc.* | | | 8,680 | | | | 147,734 | |
| Bonanza Creek Energy, Inc.* | | | 5,980 | | | | 147,467 | |
Sanchez Energy Corp.*,1 | | | 9,510 | | | | 123,725 | |
| Stone Energy Corp.* | | | 8,020 | | | | 117,734 | |
Comstock Resources, Inc.1 | | | 14,477 | | | | 51,683 | |
| Total Oil Company - Exploration & Production | | | | | | | 17,198,607 | |
| | | | | | | | |
| OIL COMPANY - INTEGRATED - 16.8% | |
| Exxon Mobil Corp. | | | 28,947 | | | | 2,460,495 | |
| Chevron Corp. | | | 17,528 | | | | 1,840,089 | |
| Marathon Oil Corp. | | | 20,977 | | | | 547,709 | |
Petroleo Brasileiro S.A. ADR1 | | | 79,972 | | | | 480,632 | |
| Royal Dutch Shell plc — Class A ADR | | | 8,017 | | | | 478,214 | |
| BP plc ADR | | | 10,406 | | | | 406,979 | |
| Murphy Oil Corp. | | | 7,929 | | | | 369,491 | |
| Suncor Energy, Inc. | | | 10,431 | | | | 305,107 | |
| Statoil ASA ADR | | | 12,830 | | | | 225,680 | |
| Sasol Ltd. ADR | | | 6,300 | | | | 214,452 | |
| Cenovus Energy, Inc. | | | 12,570 | | | | 212,182 | |
| YPF S.A. ADR | | | 6,780 | | | | 186,111 | |
| Total Oil Company - Integrated | | | | | | | 7,727,141 | |
| | | | | | | | |
| OIL-FIELD SERVICES - 11.7% | |
| Schlumberger Ltd. | | | 16,319 | | | | 1,361,657 | |
| Halliburton Co. | | | 18,866 | | | | 827,840 | |
| Baker Hughes, Inc. | | | 11,036 | | | | 701,669 | |
| Oceaneering International, Inc. | | | 5,957 | | | | 321,261 | |
| Targa Resources Corp. | | | 3,240 | | | | 310,360 | |
| Weatherford International plc* | | | 24,410 | | | | 300,243 | |
Core Laboratories N.V.1 | | | 2,647 | | | | 276,585 | |
| Superior Energy Services, Inc. | | | 11,319 | | | | 252,866 | |
| Exterran Holdings, Inc. | | | 6,354 | | | | 213,304 | |
| Oil States International, Inc.* | | | 4,707 | | | | 187,197 | |
| Bristow Group, Inc. | | | 3,172 | | | | 172,715 | |
| Helix Energy Solutions Group, Inc.* | | | 11,532 | | | | 172,519 | |
CARBO Ceramics, Inc.1 | | | 3,601 | | | | 109,867 | |
| C&J Energy Services Ltd.* | | | 9,565 | | | | 106,458 | |
| Basic Energy Services, Inc.* | | | 11,960 | | | | 82,883 | |
| Total Oil-Field Services | | | | | | | 5,397,424 | |
| | | | | | | | |
| OIL REFINING & MARKETING - 9.6% | |
| Phillips 66 | | | 10,919 | | | | 858,234 | |
| Valero Energy Corp. | | | 12,034 | | | | 765,604 | |
| Marathon Petroleum Corp. | | | 6,839 | | | | 700,245 | |
| Cheniere Energy, Inc.* | | | 7,261 | | | | 562,001 | |
| Tesoro Corp. | | | 4,908 | | | | 448,051 | |
| HollyFrontier Corp. | | | 9,035 | | | | 363,839 | |
| Western Refining, Inc. | | | 5,760 | | | | 284,486 | |
| PBF Energy, Inc. — Class A | | | 7,020 | | | | 238,118 | |
| Delek US Holdings, Inc. | | | 5,030 | | | | 199,943 | |
| Total Oil Refining & Marketing | | | | | | | 4,420,521 | |
| | | | | | | | |
| PIPELINES - 8.4% | |
| Kinder Morgan, Inc. | | | 29,696 | | | | 1,249,014 | |
| Williams Companies, Inc. | | | 16,445 | | | | 831,953 | |
| Spectra Energy Corp. | | | 18,260 | | | | 660,464 | |
| ONEOK, Inc. | | | 8,867 | | | | 427,744 | |
| SemGroup Corp. — Class A | | | 3,150 | | | | 256,221 | |
| Enbridge, Inc. | | | 4,770 | | | | 231,345 | |
| TransCanada Corp. | | | 5,270 | | | | 225,134 | |
| Total Pipelines | | | | | | | 3,881,875 | |
| 54 | THE RYDEX FUNDS ANNUAL REPORT | SEE NOTES TO FINANCIAL STATEMENTS. |
SCHEDULE OF INVESTMENTS (concluded) | March 31, 2015 |
| ENERGY FUND | |
| | |
Shares | | | Value | |
| | | | | | | | | |
| OIL & GAS DRILLING - 7.2% | |
Transocean Ltd.1 | | | 31,256 | | | $ | 458,525 | |
| Ensco plc — Class A | | | 18,648 | | | | 392,913 | |
| Nabors Industries Ltd. | | | 27,324 | | | | 372,973 | |
| Helmerich & Payne, Inc. | | | 5,295 | | | | 360,431 | |
| Noble Corporation plc | | | 25,073 | | | | 358,042 | |
Seadrill Ltd.1 | | | 32,405 | | | | 302,987 | |
Diamond Offshore Drilling, Inc.1 | | | 9,161 | | | | 245,423 | |
| Patterson-UTI Energy, Inc. | | | 12,069 | | | | 226,595 | |
| Parsley Energy, Inc. — Class A* | | | 12,520 | | | | 200,070 | |
| Rowan Companies plc — Class A | | | 10,835 | | | | 191,888 | |
| Atwood Oceanics, Inc. | | | 6,250 | | | | 175,688 | |
| Total Oil & Gas Drilling | | | | | | | 3,285,535 | |
| | | | | | | | |
| OIL FIELD MACHINERY & EQUIPMENT - 4.2% | |
| National Oilwell Varco, Inc. | | | 12,053 | | | | 602,530 | |
| Cameron International Corp.* | | | 8,654 | | | | 390,468 | |
| FMC Technologies, Inc.* | | | 10,297 | | | | 381,092 | |
| Dresser-Rand Group, Inc.* | | | 4,040 | | | | 324,614 | |
| Dril-Quip, Inc.* | | | 3,149 | | | | 215,360 | |
| Total Oil Field Machinery & Equipment | | | | | | | 1,914,064 | |
| | | | | | | | |
| TRANSPORT-MARINE - 1.1% | |
Golar LNG Ltd.1 | | | 6,260 | | | | 208,332 | |
| Teekay Corp. | | | 4,240 | | | | 197,457 | |
Tidewater, Inc.1 | | | 5,998 | | | | 114,802 | |
| Total Transport-Marine | | | | | | | 520,591 | |
| | | | | | | | |
| COAL - 1.0% | |
| CONSOL Energy, Inc. | | | 11,976 | | | | 334,010 | |
Peabody Energy Corp.1 | | | 29,266 | | | | 143,989 | |
| Total Coal | | | | | | | 477,999 | |
| | | | | | | | |
| RETAIL-PETROLEUM PRODUCTS - 0.6% | |
| World Fuel Services Corp. | | | 4,680 | | | | 269,006 | |
| | | | | | | | |
| STEEL PIPE & TUBE - 0.5% | |
| Tenaris S.A. ADR | | | 8,249 | | | | 230,972 | |
| | | | | | | | |
| DIVERSIFIED MINERALS - 0.5% | |
US Silica Holdings, Inc.1 | | | 5,780 | | | | 205,826 | |
| | | | | | | | |
| NON-FERROUS METALS - 0.4% | |
| Cameco Corp. | | | 13,004 | | | | 181,146 | |
| | | | | | | | |
| ENERGY-ALTERNATE SOURCES - 0.3% | |
| Green Plains, Inc. | | | 4,900 | | | | 139,895 | |
| | | | | | | | |
| Total Common Stocks | | | | | | | | |
| (Cost $29,431,203) | | | | | | | 45,850,602 | |
| | | | | | | | |
| | | Face
Amount | | | | |
| | | | | | | | |
REPURCHASE AGREEMENT††,2 - 0.5% | |
HSBC Group
issued 03/31/15 at 0.03%
due 04/01/15 | | $ | 233,695 | | | | 233,695 | |
| Total Repurchase Agreement | | | | | | | | |
| (Cost $233,695) | | | | | | | 233,695 | |
| | | | | | | | |
SECURITIES LENDING COLLATERAL††,3 - 4.5% | |
| Repurchase Agreements | | | | | | | | |
HSBC Securities, Inc.
issued 03/31/15 at 0.10%
due 04/01/15 | | | 1,354,840 | | | | 1,354,840 | |
BNP Paribas Securities Corp.
issued 03/31/15 at 0.10%
due 04/01/15 | | | 466,065 | | | | 466,065 | |
Barclays Capital, Inc.
issued 03/31/15 at 0.10%
due 04/01/15 | | | 240,565 | | | | 240,565 | |
| Total Securities Lending Collateral | | | | | | | | |
| (Cost $2,061,470) | | | | | | | 2,061,470 | |
| | | | | | | | |
| Total Investments - 104.7% | | | | | | | | |
| (Cost $31,726,368) | | | | | | $ | 48,145,767 | |
| Other Assets & Liabilities, net - (4.7)% | | | | | | | (2,145,835 | ) |
| Total Net Assets - 100.0% | | | | | | $ | 45,999,932 | |
| * | Non-income producing security. |
| † | Value determined based on Level 1 inputs — See Note 4. |
| †† | Value determined based on Level 2 inputs — See Note 4. |
| 1 | All or portion of this security is on loan at March 31, 2015 — See Note 6. |
| 2 | Repurchase Agreement — See Note 5. |
| 3 | Securities lending collateral — See Note 6. |
| ADR — American Depositary Receipt |
| plc — Public Limited Company |
| SEE NOTES TO FINANCIAL STATEMENTS. | THE RYDEX FUNDS ANNUAL REPORT | 55 |
STATEMENT OF ASSETS AND LIABILITIES
March 31, 2015
| Assets: | |
| Investments, at value - including $2,013,020 of securities loaned (cost $29,431,203) | | $ | 45,850,602 | |
| Repurchase agreements, at value (cost $2,295,165) | | | 2,295,165 | |
| Total investments (cost $31,726,368) | | | 48,145,767 | |
| Segregated cash with broker | | | 30,130 | |
| Cash | | | 6,193 | |
| Receivables: | |
| Fund shares sold | | | 7,068,498 | |
| Dividends | | | 24,524 | |
| Securities lending income | | | 7,840 | |
| Total assets | | | 55,282,952 | |
| | | | | |
| Liabilities: | |
| Payable for: | |
| Securities purchased | | | 5,890,117 | |
| Return of securities loaned | | | 2,091,600 | |
| Fund shares redeemed | | | 1,229,755 | |
| Management fees | | | 28,631 | |
| Distribution and service fees | | | 8,442 | |
| Transfer agent and administrative fees | | | 8,421 | |
| Portfolio accounting fees | | | 3,368 | |
| Miscellaneous | | | 22,686 | |
| Total liabilities | | | 9,283,020 | |
| Commitments and contingent liabilities (Note 10) | | | — | |
| Net assets | | $ | 45,999,932 | |
| | | | | |
| Net assets consist of: | |
| Paid in capital | | $ | 39,403,380 | |
| Undistributed net investment income | | | 334,376 | |
| Accumulated net realized loss on investments | | | (10,157,223 | ) |
| Net unrealized appreciation on investments | | | 16,419,399 | |
| Net assets | | $ | 45,999,932 | |
| | | | | |
| Investor Class: | |
| Net assets | | $ | 28,123,067 | |
| Capital shares outstanding | | | 1,209,890 | |
| Net asset value per share | | $ | 23.24 | |
| | | | | |
| Advisor Class: | |
| Net assets | | $ | 6,452,354 | |
| Capital shares outstanding | | | 302,359 | |
| Net asset value per share | | $ | 21.34 | |
| | | | | |
| A-Class: | |
| Net assets | | $ | 4,670,595 | |
| Capital shares outstanding | | | 212,875 | |
| Net asset value per share | | $ | 21.94 | |
| Maximum offering price per share (Net asset value divided by 95.25%) | | $ | 23.03 | |
| | | | | |
| C-Class: | |
| Net assets | | $ | 6,753,916 | |
| Capital shares outstanding | | | 337,980 | |
| Net asset value per share | | $ | 19.98 | |
STATEMENT OF OPERATIONS
Year Ended March 31, 2015
| Investment Income: | |
| Dividends (net of foreign withholding tax of $18,860) | | $ | 1,270,683 | |
| Income from securities lending, net | | | 51,471 | |
| Interest | | | 53 | |
| Total investment income | | | 1,322,207 | |
| | | | | |
| Expenses: | |
| Management fees | | | 538,595 | |
| Transfer agent and administrative fees | | | 158,410 | |
| Distribution and service fees: | |
| Advisor Class | | | 34,422 | |
| A-Class | | | 15,536 | |
| C-Class | | | 81,628 | |
| Portfolio accounting fees | | | 63,363 | |
| Custodian fees | | | 7,404 | |
| Trustees’ fees* | | | 5,184 | |
| Line of credit fees | | | 189 | |
| Miscellaneous | | | 84,269 | |
| Total expenses | | | 989,000 | |
| Net investment income | | | 333,207 | |
| | | | | |
| Net Realized and Unrealized Gain (Loss): | |
| Net realized gain (loss) on: | |
| Investments | | | (139,801 | ) |
| Net realized loss | | | (139,801 | ) |
| Net change in unrealized appreciation (depreciation) on: | |
| Investments | | | (9,779,125 | ) |
| Net change in unrealized appreciation (depreciation) | | | (9,779,125 | ) |
| Net realized and unrealized loss | | | (9,918,926 | ) |
| Net decrease in net assets resulting from operations | | $ | (9,585,719 | ) |
| * | Relates to Trustees not deemed “interested persons” within the meaning of Section 2(a)(19) of the 1940 Act. |
| 56 | THE RYDEX FUNDS ANNUAL REPORT | SEE NOTES TO FINANCIAL STATEMENTS. |
STATEMENTS OF CHANGES IN NET ASSETS
| | | Year Ended March 31, 2015 | | | Year Ended March 31, 2014 | |
| Increase (Decrease) in Net Assets from Operations: | | | | | | |
| Net investment income | | $ | 333,207 | | | $ | 200,733 | |
| Net realized gain (loss) on investments | | | (139,801 | ) | | | 14,055,229 | |
| Net change in unrealized appreciation (depreciation) on investments | | | (9,779,125 | ) | | | (5,739,014 | ) |
| Net increase (decrease) in net assets resulting from operations | | | (9,585,719 | ) | | | 8,516,948 | |
| | | | | | | | | |
| Distributions to shareholders from: | | | | | | | | |
| Net investment income | | | | | | | | |
| Investor Class | | | (122,605 | ) | | | — | |
| Advisor Class | | | (19,193 | ) | | | — | |
| A-Class | | | (21,643 | ) | | | — | |
| C-Class | | | (37,292 | ) | | | — | |
| Total distributions to shareholders | | | (200,733 | ) | | | — | |
| | | | | | | | | |
| Capital share transactions: | | | | | | | | |
| Proceeds from sale of shares | | | | | | | | |
| Investor Class | | | 261,136,749 | | | | 143,421,747 | |
| Advisor Class | | | 75,602,721 | | | | 9,124,810 | |
| A-Class | | | 24,712,863 | | | | 9,853,780 | |
| C-Class | | | 24,858,323 | | | | 25,870,251 | |
| Distributions reinvested | | | | | | | | |
| Investor Class | | | 119,147 | | | | — | |
| Advisor Class | | | 18,825 | | | | — | |
| A-Class | | | 16,607 | | | | — | |
| C-Class | | | 35,962 | | | | — | |
| Cost of shares redeemed | | | | | | | | |
| Investor Class | | | (263,698,107 | ) | | | (163,234,190 | ) |
| Advisor Class | | | (72,212,828 | ) | | | (10,093,114 | ) |
| A-Class | | | (25,606,281 | ) | | | (9,665,717 | ) |
| C-Class | | | (24,487,521 | ) | | | (28,215,805 | ) |
| Net increase (decrease) from capital share transactions | | | 496,460 | | | | (22,938,238 | ) |
| Net decrease in net assets | | | (9,289,992 | ) | | | (14,421,290 | ) |
| | | | | | | | | |
| Net assets: | | | | | | | | |
| Beginning of year | | | 55,289,924 | | | | 69,711,214 | |
| End of year | | $ | 45,999,932 | | | $ | 55,289,924 | |
| Undistributed net investment income at end of year | | $ | 334,376 | | | $ | 200,733 | |
| | | | | | | | | |
| Capital share activity: | | | | | | | | |
| Shares sold | | | | | | | | |
| Investor Class | | | 8,974,883 | | | | 5,152,398 | |
| Advisor Class | | | 2,974,818 | | | | 356,398 | |
| A-Class | | | 986,870 | | | | 388,496 | |
| C-Class | | | 1,026,731 | | | | 1,083,634 | |
| Shares issued from reinvestment of distributions | | | | | | | | |
| Investor Class | | | 4,447 | | | | — | |
| Advisor Class | | | 764 | | | | — | |
| A-Class | | | 657 | | | | — | |
| C-Class | | | 1,548 | | | | — | |
| Shares redeemed | | | | | | | | |
| Investor Class | | | (8,966,417 | ) | | | (5,837,470 | ) |
| Advisor Class | | | (2,847,072 | ) | | | (400,131 | ) |
| A-Class | | | (1,010,592 | ) | | | (378,139 | ) |
| C-Class | | | (1,014,166 | ) | | | (1,182,490 | ) |
| Net increase (decrease) in shares | | | 132,471 | | | | (817,304 | ) |
| SEE NOTES TO FINANCIAL STATEMENTS. | THE RYDEX FUNDS ANNUAL REPORT | 57 |
This table is presented to show selected data for a share outstanding throughout each period and to assist shareholders in evaluating a Fund’s performance for the periods presented.
| Investor Class | | Year Ended March 31, 2015 | | | Year Ended March 31, 2014 | | | Year Ended March 28, 2013 | | | Year Ended March 31, 2012 | | | Year Ended March 31, 2011 | |
| Per Share Data | | | | | | | | | | | | | | | |
| Net asset value, beginning of period | | $ | 29.70 | | | $ | 26.12 | | | $ | 24.58 | | | $ | 28.70 | | | $ | 20.91 | |
| Income (loss) from investment operations: | |
Net investment income (loss)a | | | .21 | | | | .15 | | | | .12 | | | | .07 | | | | — | b |
| Net gain (loss) on investments (realized and unrealized) | | | (6.56 | ) | | | 3.43 | | | | 1.89 | | | | (4.19 | ) | | | 7.82 | |
| Total from investment operations | | | (6.35 | ) | | | 3.58 | | | | 2.01 | | | | (4.12 | ) | | | 7.82 | |
| Less distributions from: | |
| Net investment income | | | (.11 | ) | | | — | | | | (.07 | ) | | | — | | | | (.03 | ) |
| Return of capital | | | — | | | | — | | | | (.40 | ) | | | — | | | | — | |
| Total distributions | | | (.11 | ) | | | — | | | | (.47 | ) | | | — | | | | (.03 | ) |
| Net asset value, end of period | | $ | 23.24 | | | $ | 29.70 | | | $ | 26.12 | | | $ | 24.58 | | | $ | 28.70 | |
| | |
Total Returnc | | | (21.42 | %) | | | 13.71 | % | | | 8.50 | % | | | (14.39 | %) | | | 37.43 | % |
| Ratios/Supplemental Data | |
| Net assets, end of period (in thousands) | | $ | 28,123 | | | $ | 35,546 | | | $ | 49,160 | | | $ | 40,947 | | | $ | 93,648 | |
| Ratios to average net assets: | |
| Net investment income (loss) | | | 0.72 | % | | | 0.55 | % | | | 0.52 | % | | | 0.27 | % | | | 0.00 | % |
| Total expenses | | | 1.35 | % | | | 1.37 | % | | | 1.35 | % | | | 1.36 | % | | | 1.39 | % |
| Portfolio turnover rate | | | 463 | % | | | 231 | % | | | 248 | % | | | 288 | % | | | 273 | % |
| Advisor Class | | Year Ended March 31, 2015 | | | Year Ended March 31, 2014 | | | Year Ended March 28, 2013 | | | Year Ended March 31, 2012 | | | Year Ended March 31, 2011 | |
| Per Share Data | | | | | | | | | | | | | | | |
| Net asset value, beginning of period | | $ | 27.40 | | | $ | 24.23 | | | $ | 22.95 | | | $ | 26.93 | | | $ | 19.72 | |
| Income (loss) from investment operations: | |
Net investment income (loss)a | | | .07 | | | | (.02 | ) | | | .01 | | | | (.08 | ) | | | (.11 | ) |
| Net gain (loss) on investments (realized and unrealized) | | | (6.02 | ) | | | 3.19 | | | | 1.74 | | | | (3.90 | ) | | | 7.35 | |
| Total from investment operations | | | (5.95 | ) | | | 3.17 | | | | 1.75 | | | | (3.98 | ) | | | 7.24 | |
| Less distributions from: | |
| Net investment income | | | (.11 | ) | | | — | | | | (.07 | ) | | | — | | | | (.03 | ) |
| Return of capital | | | — | | | | — | | | | (.40 | ) | | | — | | | | — | |
| Total distributions | | | (.11 | ) | | | — | | | | (.47 | ) | | | — | | | | (.03 | ) |
| Net asset value, end of period | | $ | 21.34 | | | $ | 27.40 | | | $ | 24.23 | | | $ | 22.95 | | | $ | 26.93 | |
| | |
Total Returnc | | | (21.76 | %) | | | 13.08 | % | | | 7.92 | % | | | (14.78 | %) | | | 36.75 | % |
| Ratios/Supplemental Data | |
| Net assets, end of period (in thousands) | | $ | 6,452 | | | $ | 4,764 | | | $ | 5,272 | | | $ | 11,080 | | | $ | 16,015 | |
| Ratios to average net assets: | |
| Net investment income (loss) | | | 0.27 | % | | | (0.09 | %) | | | 0.06 | % | | | (0.33 | %) | | | (0.53 | %) |
| Total expenses | | | 1.85 | % | | | 1.87 | % | | | 1.85 | % | | | 1.86 | % | | | 1.89 | % |
| Portfolio turnover rate | | | 463 | % | | | 231 | % | | | 248 | % | | | 288 | % | | | 273 | % |
| 58 | THE RYDEX FUNDS ANNUAL REPORT | SEE NOTES TO FINANCIAL STATEMENTS. |
FINANCIAL HIGHLIGHTS (concluded)
This table is presented to show selected data for a share outstanding throughout each period and to assist shareholders in evaluating a Fund’s performance for the periods presented.
| A-Class | | Year Ended March 31, 2015 | | | Year Ended March 31, 2014 | | | Year Ended March 28, 2013 | | | Year Ended March 31, 2012 | | | Year Ended March 31, 2011 | |
| Per Share Data | | | | | | | | | | | | | | | |
| Net asset value, beginning of period | | $ | 28.07 | | | $ | 24.76 | | | $ | 23.38 | | | $ | 27.40 | | | $ | 20.01 | |
| Income (loss) from investment operations: | |
Net investment income (loss)a | | | .12 | | | | .08 | | | | .08 | | | | (.01 | ) | | | (.08 | ) |
| Net gain (loss) on investments (realized and unrealized) | | | (6.14 | ) | | | 3.23 | | | | 1.77 | | | | (4.01 | ) | | | 7.50 | |
| Total from investment operations | | | (6.02 | ) | | | 3.31 | | | | 1.85 | | | | (4.02 | ) | | | 7.42 | |
| Less distributions from: | |
| Net investment income | | | (.11 | ) | | | — | | | | (.07 | ) | | | — | | | | (.03 | ) |
| Return of capital | | | — | | | | — | | | | (.40 | ) | | | — | | | | — | |
| Total distributions | | | (.11 | ) | | | — | | | | (.47 | ) | | | — | | | | (.03 | ) |
| Net asset value, end of period | | $ | 21.94 | | | $ | 28.07 | | | $ | 24.76 | | | $ | 23.38 | | | $ | 27.40 | |
| | |
Total Returnc | | | (21.49 | %) | | | 13.37 | % | | | 8.20 | % | | | (14.67 | %) | | | 37.11 | % |
| Ratios/Supplemental Data | |
| Net assets, end of period (in thousands) | | $ | 4,671 | | | $ | 6,624 | | | $ | 5,586 | | | $ | 5,622 | | | $ | 14,752 | |
| Ratios to average net assets: | |
| Net investment income (loss) | | | 0.43 | % | | | 0.30 | % | | | 0.38 | % | | | (0.05 | %) | | | (0.38 | %) |
| Total expenses | | | 1.60 | % | | | 1.62 | % | | | 1.60 | % | | | 1.61 | % | | | 1.64 | % |
| Portfolio turnover rate | | | 463 | % | | | 231 | % | | | 248 | % | | | 288 | % | | | 273 | % |
| C-Class | | Year Ended March 31, 2015 | | | Year Ended March 31, 2014 | | | Year Ended March 28, 2013 | | | Year Ended March 31, 2012 | | | Year Ended March 31, 2011 | |
| Per Share Data | | | | | | | | | | | | | | | |
| Net asset value, beginning of period | | $ | 25.80 | | | $ | 22.93 | | | $ | 21.85 | | | $ | 25.78 | | | $ | 18.97 | |
| Income (loss) from investment operations: | |
Net investment income (loss)a | | | (.05 | ) | | | (.12 | ) | | | (.09 | ) | | | (.19 | ) | | | (.20 | ) |
| Net gain (loss) on investments (realized and unrealized) | | | (5.66 | ) | | | 2.99 | | | | 1.64 | | | | (3.74 | ) | | | 7.04 | |
| Total from investment operations | | | (5.71 | ) | | | 2.87 | | | | 1.55 | | | | (3.93 | ) | | | 6.84 | |
| Less distributions from: | |
| Net investment income | | | (.11 | ) | | | — | | | | (.07 | ) | | | — | | | | (.03 | ) |
| Return of capital | | | — | | | | — | | | | (.40 | ) | | | — | | | | — | |
| Total distributions | | | (.11 | ) | | | — | | | | (.47 | ) | | | — | | | | (.03 | ) |
| Net asset value, end of period | | $ | 19.98 | | | $ | 25.80 | | | $ | 22.93 | | | $ | 21.85 | | | $ | 25.78 | |
| | |
Total Returnc | | | (22.18 | %) | | | 12.52 | % | | | 7.40 | % | | | (15.24 | %) | | | 36.09 | % |
| Ratios/Supplemental Data | |
| Net assets, end of period (in thousands) | | $ | 6,754 | | | $ | 8,357 | | | $ | 9,693 | | | $ | 13,153 | | | $ | 19,993 | |
| Ratios to average net assets: | |
| Net investment income (loss) | | | (0.20 | %) | | | (0.52 | %) | | | (0.45 | %) | | | (0.84 | %) | | | (0.99 | %) |
| Total expenses | | | 2.35 | % | | | 2.37 | % | | | 2.35 | % | | | 2.36 | % | | | 2.39 | % |
| Portfolio turnover rate | | | 463 | % | | | 231 | % | | | 248 | % | | | 288 | % | | | 273 | % |
a | Net investment income (loss) per share was computed using average shares outstanding throughout the period. |
b | Net investment income is less than $0.01 per share. |
c | Total return does not reflect the impact of any applicable sales charges. |
| SEE NOTES TO FINANCIAL STATEMENTS. | THE RYDEX FUNDS ANNUAL REPORT | 59 |
PERFORMANCE REPORT AND FUND PROFILE (Unaudited) | March 31, 2015 |
ENERGY SERVICES FUND
OBJECTIVE: Seeks to provide capital appreciation by investing in companies that are involved in the energy services field, including those that provide services and equipment in the areas of oil, coal, and gas exploration and production (“energy services companies”).
For the one-year period ended March 31, 2015, Energy Services Fund Investor Class returned -36.95%, compared with the S&P 500 Energy Index, which returned -11.11%. The broader S&P 500 Index returned 12.73%.
The diversified support services industry accounted for all of the Fund’s positive return for the period. Detracting from return were the oil & gas equipment & services holdings, followed by the oil & gas drilling industry.
U.S. Silica Holdings, Inc., Dresser-Rank Group, Inc., and Baker Hughes, Inc. were the Fund’s best-performing holdings for the period. The Fund’s worst-performing holdings included Ensco plc — Class A, Seadrill Ltd., and Transocean Ltd.
Performance displayed represents past performance, which is no guarantee of future results.
Holdings Diversification (Market Exposure as % of Net Assets)
“Holdings Diversification (Market Exposure as % of Net Assets)” excludes any temporary cash investments.
| Inception Dates: |
| Investor Class | April 1, 1998 |
| Advisor Class | April 2, 1998 |
| A-Class | September 1, 2004 |
| C-Class | March 30, 2001 |
| Ten Largest Holdings (% of Total Net Assets) |
| Schlumberger Ltd. | 11.9% |
| Halliburton Co. | 7.2% |
| Baker Hughes, Inc. | 6.1% |
| National Oilwell Varco, Inc. | 5.3% |
| Transocean Ltd. | 3.9% |
| Cameron International Corp. | 3.4% |
| FMC Technologies, Inc. | 3.3% |
| Helmerich & Payne, Inc. | 3.2% |
| Ensco plc — Class A | 2.9% |
| Dresser-Rand Group, Inc. | 2.8% |
| Top Ten Total | 50.0% |
| | |
| “Ten Largest Holdings” exclude any temporary cash or derivative investments. |
| 60 | THE RYDEX FUNDS ANNUAL REPORT | |
PERFORMANCE REPORT AND FUND PROFILE (Unaudited)(concluded) | March 31, 2015 |
Cumulative Fund Performance*
Average Annual Returns*
Periods Ended March 31, 2015
| | 1 Year | 5 Year | 10 Year |
| Investor Class Shares | -36.95% | -1.68% | 2.71% |
| Advisor Class Shares | -37.33% | -2.18% | 2.19% |
| A-Class Shares | -37.11% | -1.92% | 2.47% |
A-Class Shares with sales charge† | -40.10% | -2.87% | 1.97% |
| C-Class Shares | -37.58% | -2.66% | 1.69% |
C-Class Shares with CDSC‡ | -38.21% | -2.66% | 1.69% |
| S&P 500 Energy Index | -11.11% | 8.00% | 7.41% |
| S&P 500 Index | 12.73% | 14.47% | 8.01% |
| * | The performance data above represents past performance that is not predictive of future results. The investment return and principal value of an investment in the Fund will fluctuate so that an investor’s shares, when redeemed, may be worth more or less than their original cost. Returns are historical and include changes in principal and reinvested dividends and capital gains and do not reflect the effect of taxes. The S&P 500 Index and the S&P 500 Energy Index are unmanaged indices and, unlike the Fund, have no management fees or operating expenses to reduce their reported returns. The graphs are based on Investor Class shares and A-Class shares only; performance for Advisor Class shares and C-Class shares will vary due to differences in fee structures. |
† | Fund returns are calculated using the maximum sales charge of 4.75%. |
‡ | Fund returns include a CDSC of 1% if redeemed within 12 months of purchase. |
| | THE RYDEX FUNDS ANNUAL REPORT | 61 |
| SCHEDULE OF INVESTMENTS | March 31, 2015 |
| ENERGY SERVICES FUND | |
| | |
Shares | | | Value | |
| | | | | | | | |
COMMON STOCKS† - 99.4% | |
| | | | | | | | |
| OIL-FIELD SERVICES - 48.4% | |
| Schlumberger Ltd. | | | 36,242 | | | $ | 3,024,031 | |
| Halliburton Co. | | | 41,894 | | | | 1,838,309 | |
| Baker Hughes, Inc. | | | 24,515 | | | | 1,558,664 | |
| Oceaneering International, Inc. | | | 13,233 | | | | 713,656 | |
| Superior Energy Services, Inc. | | | 25,142 | | | | 561,672 | |
| Weatherford International plc* | | | 42,640 | | | | 524,472 | |
| RPC, Inc. | | | 39,806 | | | | 509,915 | |
| Core Laboratories N.V. | | | 4,545 | | | | 474,907 | |
| Exterran Holdings, Inc. | | | 14,105 | | | | 473,505 | |
| Oil States International, Inc.* | | | 10,461 | | | | 416,034 | |
| Bristow Group, Inc. | | | 7,046 | | | | 383,655 | |
| Helix Energy Solutions Group, Inc.* | | | 25,614 | | | | 383,185 | |
| SEACOR Holdings, Inc.* | | | 4,734 | | | | 329,818 | |
| Frank’s International N.V. | | | 14,000 | | | | 261,800 | |
CARBO Ceramics, Inc.1 | | | 8,004 | | | | 244,202 | |
| C&J Energy Services Ltd.* | | | 21,238 | | | | 236,379 | |
| Basic Energy Services, Inc.* | | | 26,557 | | | | 184,040 | |
| Gulfmark Offshore, Inc. — Class A | | | 12,578 | | | | 164,017 | |
| Total Oil-Field Services | | | | | | | 12,282,261 | |
| | | | | | | | |
| OIL & GAS DRILLING - 26.0% | |
Transocean Ltd.1 | | | 67,848 | | | | 995,329 | |
| Helmerich & Payne, Inc. | | | 11,751 | | | | 799,891 | |
| Ensco plc — Class A | | | 34,416 | | | | 725,145 | |
| Nabors Industries Ltd. | | | 49,013 | | | | 669,027 | |
| Noble Corporation plc | | | 45,483 | | | | 649,497 | |
Diamond Offshore Drilling, Inc.1 | | | 22,535 | | | | 603,713 | |
Seadrill Ltd.1 | | | 57,042 | | | | 533,343 | |
| Patterson-UTI Energy, Inc. | | | 26,809 | | | | 503,339 | |
| Rowan Companies plc — Class A | | | 24,074 | | | | 426,351 | |
| Atwood Oceanics, Inc. | | | 13,885 | | | | 390,307 | |
| Precision Drilling Corp. | | | 49,890 | | | | 316,303 | |
| Total Oil & Gas Drilling | | | | | | | 6,612,245 | |
| | | | | | | | |
| OIL FIELD MACHINERY & EQUIPMENT - 18.3% | |
| National Oilwell Varco, Inc. | | | 26,769 | | | | 1,338,181 | |
| Cameron International Corp.* | | | 19,222 | | | | 867,297 | |
| FMC Technologies, Inc.* | | | 22,874 | | | | 846,567 | |
| Dresser-Rand Group, Inc.* | | | 8,973 | | | | 720,981 | |
| Dril-Quip, Inc.* | | | 6,989 | | | | 477,978 | |
| Forum Energy Technologies, Inc.* | | | 20,270 | | | | 397,292 | |
| Total Oil Field Machinery & Equipment | | | | | | | 4,648,296 | |
| | | | | | | | |
| TRANSPORT-MARINE - 2.0% | |
Tidewater, Inc.1 | | | 13,319 | | | | 254,926 | |
| Hornbeck Offshore Services, Inc.* | | | 12,710 | | | | 239,075 | |
| Total Transport-Marine | | | | | | | 494,001 | |
| | | | | | | | |
| DIVERSIFIED MINERALS - 1.8% | |
U.S. Silica Holdings, Inc.1 | | | 12,842 | | | | 457,304 | |
| | | | | | | | |
| STEEL PIPE & TUBE - 1.5% | |
| Tenaris S.A. ADR | | | 13,471 | | | | 377,188 | |
| | | | | | | | |
| OIL COMPANY - EXPLORATION & PRODUCTION - 1.4% | |
| Unit Corp.* | | | 12,758 | | | | 356,969 | |
| | | | | | | | |
| Total Common Stocks | | | | | | | | |
| (Cost $13,994,257) | | | | | | | 25,228,264 | |
| | | | | | | | |
| | | Face
Amount | | | | |
| | | | | | | | |
REPURCHASE AGREEMENT††,2 - 0.5% | |
HSBC Group
issued 03/31/15 at 0.03%
due 04/01/15 | | $ | 137,735 | | | | 137,735 | |
| Total Repurchase Agreement | | | | | | | | |
| (Cost $137,735) | | | | | | | 137,735 | |
| | | | | | | | |
SECURITIES LENDING COLLATERAL††,3 - 8.1% | |
| Repurchase Agreements | | | | | | | | |
HSBC Securities, Inc.
issued 03/31/15 at 0.10%
due 04/01/15 | | | 1,357,366 | | | | 1,357,366 | |
BNP Paribas Securities Corp.
issued 03/31/15 at 0.10%
due 04/01/15 | | | 466,934 | | | | 466,934 | |
Barclays Capital, Inc.
issued 03/31/15 at 0.10%
due 04/01/15 | | | 241,014 | | | | 241,014 | |
| Total Securities Lending Collateral | | | | | | | | |
| (Cost $2,065,314) | | | | | | | 2,065,314 | |
| | | | | | | | |
| Total Investments - 108.0% | | | | | | | | |
| (Cost $16,197,306) | | | | | | $ | 27,431,313 | |
| Other Assets & Liabilities, net - (8.0)% | | | | | | | (2,039,213 | ) |
| Total Net Assets - 100.0% | | | | | | $ | 25,392,100 | |
| * | Non-income producing security. |
| † | Value determined based on Level 1 inputs — See Note 4. |
| †† | Value determined based on Level 2 inputs — See Note 4. |
| 1 | All or portion of this security is on loan at March 31, 2015 — See Note 6. |
| 2 | Repurchase Agreement — See Note 5. |
| 3 | Securities lending collateral — See Note 6. |
| ADR — American Depositary Receipt |
| plc — Public Limited Company |
| 62 | THE RYDEX FUNDS ANNUAL REPORT | SEE NOTES TO FINANCIAL STATEMENTS. |
STATEMENT OF ASSETS AND LIABILITIES
March 31, 2015
| Assets: | |
| Investments, at value - including $2,024,426 of securities loaned (cost $13,994,257) | | $ | 25,228,264 | |
| Repurchase agreements, at value (cost $2,203,049) | | | 2,203,049 | |
| Total investments (cost $16,197,306) | | | 27,431,313 | |
| Segregated cash with broker | | | 30,186 | |
| Cash | | | 3,443 | |
| Receivables: | |
| Fund shares sold | | | 2,034,521 | |
| Dividends | | | 22,136 | |
| Securities lending income | | | 10,696 | |
| Total assets | | | 29,532,295 | |
| | | | | |
| Liabilities: | |
| Payable for: | |
| Return of securities loaned | | | 2,095,500 | |
| Fund shares redeemed | | | 1,483,589 | |
| Securities purchased | | | 514,227 | |
| Management fees | | | 18,013 | |
| Distribution and service fees | | | 5,496 | |
| Transfer agent and administrative fees | | | 5,298 | |
| Portfolio accounting fees | | | 2,119 | |
| Miscellaneous | | | 15,953 | |
| Total liabilities | | | 4,140,195 | |
| Commitments and contingent liabilities (Note 10) | | | — | |
| Net assets | | $ | 25,392,100 | |
| | | | | |
| Net assets consist of: | |
| Paid in capital | | $ | 48,271,893 | |
| Undistributed net investment income | | | 231,483 | |
| Accumulated net realized loss on investments | | | (34,345,283 | ) |
| Net unrealized appreciation on investments | | | 11,234,007 | |
| Net assets | | $ | 25,392,100 | |
| | | | | |
| Investor Class: | |
| Net assets | | $ | 16,144,400 | |
| Capital shares outstanding | | | 410,166 | |
| Net asset value per share | | $ | 39.36 | |
| | | | | |
| Advisor Class: | |
| Net assets | | $ | 1,813,787 | |
| Capital shares outstanding | | | 49,987 | |
| Net asset value per share | | $ | 36.29 | |
| | | | | |
| A-Class: | |
| Net assets | | $ | 3,545,100 | |
| Capital shares outstanding | | | 94,981 | |
| Net asset value per share | | $ | 37.32 | |
| Maximum offering price per share (Net asset value divided by 95.25%) | | $ | 39.18 | |
| | | | | |
| C-Class: | |
| Net assets | | $ | 3,888,813 | |
| Capital shares outstanding | | | 113,442 | |
| Net asset value per share | | $ | 34.28 | |
STATEMENT OF OPERATIONS
Year Ended March 31, 2015
| Investment Income: | |
| Dividends (net of foreign withholding tax of $4,579) | | $ | 861,642 | |
| Income from securities lending, net | | | 87,618 | |
| Interest | | | 33 | |
| Total investment income | | | 949,293 | |
| | | | | |
| Expenses: | |
| Management fees | | | 374,777 | |
| Transfer agent and administrative fees | | | 110,228 | |
| Distribution and service fees: | |
| Advisor Class | | | 30,842 | |
| A-Class | | | 13,437 | |
| C-Class | | | 70,278 | |
| Portfolio accounting fees | | | 44,091 | |
| Custodian fees | | | 5,155 | |
| Trustees’ fees* | | | 3,716 | |
| Line of credit fees | | | 322 | |
| Miscellaneous | | | 59,372 | |
| Total expenses | | | 712,218 | |
| Net investment income | | | 237,075 | |
| | | | | |
| Net Realized and Unrealized Gain (Loss): | |
| Net realized gain (loss) on: | |
| Investments | | | (5,210,662 | ) |
| Net realized loss | | | (5,210,662 | ) |
| Net change in unrealized appreciation (depreciation) on: | |
| Investments | | | (14,210,065 | ) |
| Net change in unrealized appreciation (depreciation) | | | (14,210,065 | ) |
| Net realized and unrealized loss | | | (19,420,727 | ) |
| Net decrease in net assets resulting from operations | | $ | (19,183,652 | ) |
| * | Relates to Trustees not deemed “interested persons” within the meaning of Section 2(a)(19) of the 1940 Act. |
| SEE NOTES TO FINANCIAL STATEMENTS. | THE RYDEX FUNDS ANNUAL REPORT | 63 |
STATEMENTS OF CHANGES IN NET ASSETS
| | | Year Ended March 31, 2015 | | | Year Ended March 31, 2014 | |
| Increase (Decrease) in Net Assets from Operations: | | | | | | |
| Net investment income (loss) | | $ | 237,075 | | | $ | (128,281 | ) |
| Net realized gain (loss) on investments | | | (5,210,662 | ) | | | 10,172,016 | |
| Net change in unrealized appreciation (depreciation) on investments | | | (14,210,065 | ) | | | (4,603,394 | ) |
| Net increase (decrease) in net assets resulting from operations | | | (19,183,652 | ) | | | 5,440,341 | |
| | | | | | | | | |
| Capital share transactions: | | | | | | | | |
| Proceeds from sale of shares | | | | | | | | |
| Investor Class | | | 155,300,672 | | | | 136,799,275 | |
| Advisor Class | | | 138,874,968 | | | | 47,862,323 | |
| A-Class | | | 18,229,626 | | | | 11,403,811 | |
| C-Class | | | 22,985,448 | | | | 25,331,498 | |
| Cost of shares redeemed | | | | | | | | |
| Investor Class | | | (160,581,256 | ) | | | (132,689,190 | ) |
| Advisor Class | | | (139,441,804 | ) | | | (53,070,944 | ) |
| A-Class | | | (20,303,746 | ) | | | (10,306,276 | ) |
| C-Class | | | (24,839,035 | ) | | | (26,390,621 | ) |
| Net decrease from capital share transactions | | | (9,775,127 | ) | | | (1,060,124 | ) |
| Net increase (decrease) in net assets | | | (28,958,779 | ) | | | 4,380,217 | |
| | | | | | | | | |
| Net assets: | | | | | | | | |
| Beginning of year | | | 54,350,879 | | | | 49,970,662 | |
| End of year | | $ | 25,392,100 | | | $ | 54,350,879 | |
| Undistributed net investment income/(Accumulated net investment loss) at end of year | | $ | 231,483 | | | $ | (5,592 | ) |
| | | | | | | | | |
| Capital share activity: | | | | | | | | |
| Shares sold | | | | | | | | |
| Investor Class | | | 2,859,922 | | | | 2,359,895 | |
| Advisor Class | | | 2,915,122 | | | | 898,924 | |
| A-Class | | | 419,738 | | | | 204,539 | |
| C-Class | | | 503,113 | | | | 497,418 | |
| Shares redeemed | | | | | | | | |
| Investor Class | | | (2,982,262 | ) | | | (2,306,869 | ) |
| Advisor Class | | | (2,950,353 | ) | | | (1,004,649 | ) |
| A-Class | | | (452,109 | ) | | | (183,900 | ) |
| C-Class | | | (546,543 | ) | | | (519,469 | ) |
| Net decrease in shares | | | (233,372 | ) | | | (54,111 | ) |
| 64 | THE RYDEX FUNDS ANNUAL REPORT | SEE NOTES TO FINANCIAL STATEMENTS. |
This table is presented to show selected data for a share outstanding throughout each period and to assist shareholders in evaluating a Fund’s performance for the periods presented.
| Investor Class | | Year Ended March 31, 2015 | | | Year Ended March 31, 2014 | | | Year Ended March 28, 2013 | | | Year Ended March 31, 2012 | | | Year Ended March 31, 2011 | |
| Per Share Data | | | | | | | | | | | | | | | |
| Net asset value, beginning of period | | $ | 62.43 | | | $ | 54.43 | | | $ | 50.87 | | | $ | 62.66 | | | $ | 42.83 | |
| Income (loss) from investment operations: | |
Net investment income (loss)a | | | .48 | | | | .02 | | | | (.05 | ) | | | (.14 | ) | | | (.21 | ) |
| Net gain (loss) on investments (realized and unrealized) | | | (23.55 | ) | | | 7.98 | | | | 3.61 | | | | (11.65 | ) | | | 20.04 | |
| Total from investment operations | | | (23.07 | ) | | | 8.00 | | | | 3.56 | | | | (11.79 | ) | | | 19.83 | |
| Net asset value, end of period | | $ | 39.36 | | | $ | 62.43 | | | $ | 54.43 | | | $ | 50.87 | | | $ | 62.66 | |
| | |
Total Returnb | | | (36.95 | %) | | | 14.70 | % | | | 7.00 | % | | | (18.82 | %) | | | 46.27 | % |
| Ratios/Supplemental Data | |
| Net assets, end of period (in thousands) | | $ | 16,144 | | | $ | 33,244 | | | $ | 26,097 | | | $ | 34,353 | | | $ | 151,318 | |
| Ratios to average net assets: | |
| Net investment income (loss) | | | 0.86 | % | | | 0.03 | % | | | (0.10 | %) | | | (0.25 | %) | | | (0.42 | %) |
| Total expenses | | | 1.36 | % | | | 1.37 | % | | | 1.35 | % | | | 1.36 | % | | | 1.39 | % |
| Portfolio turnover rate | | | 494 | % | | | 350 | % | | | 275 | % | | | 162 | % | | | 205 | % |
| Advisor Class | | Year Ended March 31, 2015 | | | Year Ended March 31, 2014 | | | Year Ended March 28, 2013 | | | Year Ended March 31, 2012 | | | Year Ended March 31, 2011 | |
| Per Share Data | | | | | | | | | | | | | | | |
| Net asset value, beginning of period | | $ | 57.89 | | | $ | 50.72 | | | $ | 47.64 | | | $ | 58.97 | | | $ | 40.50 | |
| Income (loss) from investment operations: | |
Net investment income (loss)a | | | .07 | | | | (.27 | ) | | | (.25 | ) | | | (.34 | ) | | | (.42 | ) |
| Net gain (loss) on investments (realized and unrealized) | | | (21.67 | ) | | | 7.44 | | | | 3.33 | | | | (10.99 | ) | | | 18.89 | |
| Total from investment operations | | | (21.60 | ) | | | 7.17 | | | | 3.08 | | | | (11.33 | ) | | | 18.47 | |
| Net asset value, end of period | | $ | 36.29 | | | $ | 57.89 | | | $ | 50.72 | | | $ | 47.64 | | | $ | 58.97 | |
| | |
Total Returnb | | | (37.33 | %) | | | 14.14 | % | | | 6.47 | % | | | (19.21 | %) | | | 45.61 | % |
| Ratios/Supplemental Data | |
| Net assets, end of period (in thousands) | | $ | 1,814 | | | $ | 4,933 | | | $ | 9,685 | | | $ | 8,025 | | | $ | 17,222 | |
| Ratios to average net assets: | |
| Net investment income (loss) | | | 0.13 | % | | | (0.50 | %) | | | (0.54 | %) | | | (0.66 | %) | | | (0.93 | %) |
| Total expenses | | | 1.86 | % | | | 1.87 | % | | | 1.85 | % | | | 1.86 | % | | | 1.89 | % |
| Portfolio turnover rate | | | 494 | % | | | 350 | % | | | 275 | % | | | 162 | % | | | 205 | % |
| SEE NOTES TO FINANCIAL STATEMENTS. | THE RYDEX FUNDS ANNUAL REPORT | 65 |
FINANCIAL HIGHLIGHTS (concluded)
This table is presented to show selected data for a share outstanding throughout each period and to assist shareholders in evaluating a Fund’s performance for the periods presented.
| A-Class | | Year Ended March 31, 2015 | | | Year Ended March 31, 2014 | | | Year Ended March 28, 2013 | | | Year Ended March 31, 2012 | | | Year Ended March 31, 2011 | |
| Per Share Data | | | | | | | | | | | | | | | |
| Net asset value, beginning of period | | $ | 59.34 | | | $ | 51.86 | | | $ | 48.59 | | | $ | 60.01 | | | $ | 41.12 | |
| Income (loss) from investment operations: | |
Net investment income (loss)a | | | .25 | | | | (.13 | ) | | | (.17 | ) | | | (.25 | ) | | | (.31 | ) |
| Net gain (loss) on investments (realized and unrealized) | | | (22.27 | ) | | | 7.61 | | | | 3.44 | | | | (11.17 | ) | | | 19.20 | |
| Total from investment operations | | | (22.02 | ) | | | 7.48 | | | | 3.27 | | | | (11.42 | ) | | | 18.89 | |
| Net asset value, end of period | | $ | 37.32 | | | $ | 59.34 | | | $ | 51.86 | | | $ | 48.59 | | | $ | 60.01 | |
| | |
Total Returnb | | | (37.11 | %) | | | 14.42 | % | | | 6.73 | % | | | (19.03 | %) | | | 45.94 | % |
| Ratios/Supplemental Data | |
| Net assets, end of period (in thousands) | | $ | 3,545 | | | $ | 7,557 | | | $ | 5,535 | | | $ | 7,115 | | | $ | 24,849 | |
| Ratios to average net assets: | |
| Net investment income (loss) | | | 0.47 | % | | | (0.23 | %) | | | (0.37 | %) | | | (0.47 | %) | | | (0.67 | %) |
| Total expenses | | | 1.60 | % | | | 1.62 | % | | | 1.60 | % | | | 1.61 | % | | | 1.64 | % |
| Portfolio turnover rate | | | 494 | % | | | 350 | % | | | 275 | % | | | 162 | % | | | 205 | % |
| C-Class | | Year Ended March 31, 2015 | | | Year Ended March 31, 2014 | | | Year Ended March 28, 2013 | | | Year Ended March 31, 2012 | | | Year Ended March 31, 2011 | |
| Per Share Data | | | | | | | | | | | | | | | |
| Net asset value, beginning of period | | $ | 54.92 | | | $ | 48.37 | | | $ | 45.66 | | | $ | 56.81 | | | $ | 39.22 | |
| Income (loss) from investment operations: | |
Net investment income (loss)a | | | (.12 | ) | | | (.50 | ) | | | (.49 | ) | | | (.54 | ) | | | (.60 | ) |
| Net gain (loss) on investments (realized and unrealized) | | | (20.52 | ) | | | 7.05 | | | | 3.20 | | | | (10.61 | ) | | | 18.19 | |
| Total from investment operations | | | (20.64 | ) | | | 6.55 | | | | 2.71 | | | | (11.15 | ) | | | 17.59 | |
| Net asset value, end of period | | $ | 34.28 | | | $ | 54.92 | | | $ | 48.37 | | | $ | 45.66 | | | $ | 56.81 | |
| | |
Total Returnb | | | (37.58 | %) | | | 13.54 | % | | | 5.94 | % | | | (19.63 | %) | | | 44.85 | % |
| Ratios/Supplemental Data | |
| Net assets, end of period (in thousands) | | $ | 3,889 | | | $ | 8,616 | | | $ | 8,654 | | | $ | 10,144 | | | $ | 15,276 | |
| Ratios to average net assets: | |
| Net investment income (loss) | | | (0.24 | %) | | | (0.97 | %) | | | (1.11 | %) | | | (1.13 | %) | | | (1.43 | %) |
| Total expenses | | | 2.36 | % | | | 2.37 | % | | | 2.35 | % | | | 2.36 | % | | | 2.39 | % |
| Portfolio turnover rate | | | 494 | % | | | 350 | % | | | 275 | % | | | 162 | % | | | 205 | % |
a | Net investment income (loss) per share was computed using average shares outstanding throughout the period. |
b | Total return does not reflect the impact of any applicable sales charges. |
| 66 | THE RYDEX FUNDS ANNUAL REPORT | SEE NOTES TO FINANCIAL STATEMENTS. |
PERFORMANCE REPORT AND FUND PROFILE (Unaudited) | March 31, 2015 |
FINANCIAL SERVICES FUND
OBJECTIVE: Seeks to provide capital appreciation by investing in companies involved in the financial services sector (“financial services companies”).
For the one-year period ended March 31, 2015, Financial Services Fund Investor Class returned 9.17%, while the S&P 500 Financials Index returned 9.96% over the same period. The broader S&P 500 Index returned 12.73%.
The real estate investment trust industry was the largest contributor to return, followed by the insurance industry. The thrifts & mortgage finance industry was the largest detractor from return, followed by the commercial banks industry.
Berkshire Hathaway, Inc. — Class B, Simon Property Group, Inc., and Wells Fargo & Co. were the best-performing holdings in the Fund for the period. The worst-performing holdings for the period were Bank of America Corp., Genworth Financial, Inc. — Class A, and Ocwen Financial Corp.
Performance displayed represents past performance, which is no guarantee of future results.
Holdings Diversification (Market Exposure as % of Net Assets)
“Holdings Diversification (Market Exposure as % of Net Assets)” excludes any temporary cash investments.
| Inception Dates: |
| Investor Class | April 2, 1998 |
| Advisor Class | April 6, 1998 |
| A-Class | September 1, 2004 |
| C-Class | April 19, 2001 |
| Ten Largest Holdings (% of Total Net Assets) |
| Berkshire Hathaway, Inc. — Class B | 2.5% |
| Wells Fargo & Co. | 2.2% |
| JPMorgan Chase & Co. | 2.0% |
| Bank of America Corp. | 1.7% |
| Citigroup, Inc. | 1.6% |
| Goldman Sachs Group, Inc. | 1.2% |
| American Express Co. | 1.2% |
| U.S. Bancorp | 1.2% |
| American International Group, Inc. | 1.1% |
| Morgan Stanley | 1.1% |
| Top Ten Total | 15.8% |
| | |
| “Ten Largest Holdings” exclude any temporary cash or derivative investments. |
| | THE RYDEX FUNDS ANNUAL REPORT | 67 |
PERFORMANCE REPORT AND FUND PROFILE (Unaudited)(concluded) | March 31, 2015 |
Cumulative Fund Performance*
Average Annual Returns*
Periods Ended March 31, 2015
| | 1 Year | 5 Year | 10 Year |
| Investor Class Shares | 9.17% | 9.58% | 1.20% |
| Advisor Class Shares | 8.63% | 9.04% | 0.68% |
| A-Class Shares | 8.89% | 9.31% | 0.95% |
A-Class Shares with sales charge† | 3.72% | 8.25% | 0.46% |
| C-Class Shares | 8.08% | 8.51% | 0.21% |
C-Class Shares with CDSC‡ | 7.08% | 8.51% | 0.21% |
| S&P 500 Financials Index | 9.96% | 10.53% | 0.58% |
| S&P 500 Index | 12.73% | 14.47% | 8.01% |
| * | The performance data above represents past performance that is not predictive of future results. The investment return and principal value of an investment in the Fund will fluctuate so that an investor’s shares, when redeemed, may be worth more or less than their original cost. Returns are historical and include changes in principal and reinvested dividends and capital gains and do not reflect the effect of taxes. The S&P 500 Index and the S&P 500 Financials Index are unmanaged indices and, unlike the Fund, have no management fees or operating expenses to reduce their reported returns. The graphs are based on Investor Class shares and A-Class shares only; performance for Advisor Class shares and C-Class shares will vary due to differences in fee structures. |
† | Fund returns are calculated using the maximum sales charge of 4.75%. |
‡ | Fund returns include a CDSC of 1% if redeemed within 12 months of purchase. |
| 68 | THE RYDEX FUNDS ANNUAL REPORT | |
| SCHEDULE OF INVESTMENTS | March 31, 2015 |
| FINANCIAL SERVICES FUND | |
| | |
Shares | | | Value | |
| | | | | | | | |
COMMON STOCKS† - 99.6% | |
| | | | | | | | |
| DIVERSIFIED BANKING INSTITUTIONS - 8.6% | |
| JPMorgan Chase & Co. | | | 18,997 | | | $ | 1,150,839 | |
| Bank of America Corp. | | | 62,801 | | | | 966,507 | |
| Citigroup, Inc. | | | 18,543 | | | | 955,335 | |
| Goldman Sachs Group, Inc. | | | 3,866 | | | | 726,692 | |
| Morgan Stanley | | | 17,994 | | | | 642,206 | |
| HSBC Holdings plc ADR | | | 7,224 | | | | 307,670 | |
| Deutsche Bank AG | | | 7,506 | | | | 260,683 | |
| Total Diversified Banking Institutions | | | | | | | 5,009,932 | |
| | | | | | | | |
| SUPER-REGIONAL BANKS-U.S. - 7.5% | |
| Wells Fargo & Co. | | | 23,606 | | | | 1,284,166 | |
| U.S. Bancorp | | | 15,453 | | | | 674,833 | |
| PNC Financial Services Group, Inc. | | | 5,882 | | | | 548,438 | |
| Capital One Financial Corp. | | | 6,491 | | | | 511,621 | |
| SunTrust Banks, Inc. | | | 8,759 | | | | 359,907 | |
| Fifth Third Bancorp | | | 16,044 | | | | 302,429 | |
| KeyCorp | | | 18,806 | | | | 266,293 | |
| Huntington Bancshares, Inc. | | | 21,013 | | | | 232,194 | |
| Comerica, Inc. | | | 4,954 | | | | 223,574 | |
| Total Super-Regional Banks-U.S. | | | | | | | 4,403,455 | |
| | | | | | | | |
| MULTI-LINE INSURANCE - 6.5% | |
| American International Group, Inc. | | | 12,161 | | | | 666,301 | |
| MetLife, Inc. | | | 11,351 | | | | 573,793 | |
| Allstate Corp. | | | 6,089 | | | | 433,354 | |
| ACE Ltd. | | | 3,542 | | | | 394,898 | |
| Hartford Financial Services Group, Inc. | | | 7,821 | | | | 327,074 | |
| Loews Corp. | | | 7,599 | | | | 310,267 | |
| XL Group plc — Class A | | | 7,997 | | | | 294,290 | |
| Voya Financial, Inc. | | | 5,500 | | | | 237,105 | |
| Cincinnati Financial Corp. | | | 4,417 | | | | 235,338 | |
| Assurant, Inc. | | | 2,650 | | | | 162,737 | |
| Genworth Financial, Inc. — Class A* | | | 20,072 | | | | 146,726 | |
| Total Multi-Line Insurance | | | | | | | 3,781,883 | |
| | | | | | | | |
| INVESTMENT MANAGEMENT/ADVISORY SERVICES - 5.4% | |
| BlackRock, Inc. — Class A | | | 1,560 | | | | 570,709 | |
| Franklin Resources, Inc. | | | 8,368 | | | | 429,446 | |
| Ameriprise Financial, Inc. | | | 2,952 | | | | 386,240 | |
| T. Rowe Price Group, Inc. | | | 4,383 | | | | 354,935 | |
| Invesco Ltd. | | | 7,828 | | | | 310,693 | |
| Affiliated Managers Group, Inc.* | | | 1,283 | | | | 275,563 | |
| Legg Mason, Inc. | | | 3,500 | | | | 193,200 | |
| Eaton Vance Corp. | | | 4,098 | | | | 170,641 | |
| Waddell & Reed Financial, Inc. — Class A | | | 3,196 | | | | 158,330 | |
| Janus Capital Group, Inc. | | | 8,215 | | | | 141,216 | |
| WisdomTree Investments, Inc. | | | 6,169 | | | | 132,387 | |
| Total Investment Management/Advisory Services | | | | | | | 3,123,360 | |
| | | | | | | | |
| REITs-DIVERSIFIED - 5.0% | |
| American Tower Corp. — Class A | | | 5,260 | | | | 495,230 | |
| Crown Castle International Corp. | | | 4,971 | | | | 410,306 | |
| Vornado Realty Trust | | | 3,212 | | | | 359,744 | |
| Weyerhaeuser Co. | | | 9,652 | | | | 319,964 | |
| Digital Realty Trust, Inc. | | | 3,663 | | | | 241,611 | |
| Plum Creek Timber Company, Inc. | | | 5,105 | | | | 221,812 | |
| Duke Realty Corp. | | | 9,819 | | | | 213,760 | |
| Lamar Advertising Co. — Class A | | | 3,100 | | | | 183,737 | |
| Liberty Property Trust | | | 5,130 | | | | 183,141 | |
| EPR Properties | | | 2,500 | | | | 150,075 | |
| Rayonier, Inc. | | | 5,394 | | | | 145,422 | |
| Total REITs-Diversified | | | | | | | 2,924,802 | |
| | | | | | | | |
| COMMERCIAL BANKS-NON-U.S. - 4.7% | |
| Itau Unibanco Holding S.A. ADR | | | 29,691 | | | | 328,382 | |
| ICICI Bank Ltd. ADR | | | 27,956 | | | | 289,624 | |
| Royal Bank of Canada | | | 4,700 | | | | 283,692 | |
| Banco Bradesco S.A. ADR | | | 30,528 | | | | 283,304 | |
| Toronto-Dominion Bank | | | 6,390 | | | | 273,812 | |
| Banco Santander S.A. ADR | | | 35,727 | | | | 266,166 | |
| HDFC Bank Ltd. ADR | | | 4,509 | | | | 265,535 | |
| Credicorp Ltd. | | | 1,870 | | | | 262,978 | |
| Bank of Nova Scotia | | | 4,800 | | | | 241,104 | |
| Bank of Montreal | | | 4,000 | | | | 239,880 | |
| Total Commercial Banks-Non-U.S. | | | | | | | 2,734,477 | |
| | | | | | | | |
| REINSURANCE - 4.6% | |
| Berkshire Hathaway, Inc. — Class B* | | | 10,125 | | | | 1,461,239 | |
| PartnerRe Ltd. | | | 2,470 | | | | 282,395 | |
| Everest Re Group Ltd. | | | 1,565 | | | | 272,310 | |
| Axis Capital Holdings Ltd. | | | 4,820 | | | | 248,616 | |
| RenaissanceRe Holdings Ltd. | | | 2,450 | | | | 244,339 | |
| Reinsurance Group of America, Inc. — Class A | | | 2,190 | | | | 204,086 | |
| Total Reinsurance | | | | | | | 2,712,985 | |
| | | | | | | | |
| REITs-APARTMENTS - 3.8% | |
| Equity Residential | | | 5,337 | | | | 415,539 | |
| AvalonBay Communities, Inc. | | | 2,064 | | | | 359,652 | |
| Essex Property Trust, Inc. | | | 1,301 | | | | 299,100 | |
| UDR, Inc. | | | 6,904 | | | | 234,943 | |
| Camden Property Trust | | | 2,558 | | | | 199,857 | |
| Apartment Investment & Management Co. — Class A | | | 4,940 | | | | 194,438 | |
| Mid-America Apartment Communities, Inc. | | | 2,390 | | | | 184,675 | |
| American Campus Communities, Inc. | | | 4,120 | | | | 176,624 | |
| Home Properties, Inc. | | | 2,300 | | | | 159,367 | |
| Total REITs-Apartments | | | | | | | 2,224,195 | |
| | | | | | | | |
| LIFE/HEALTH INSURANCE - 3.7% | |
| Prudential Financial, Inc. | | | 5,810 | | | | 466,602 | |
| Aflac, Inc. | | | 6,612 | | | | 423,234 | |
| Principal Financial Group, Inc. | | | 5,897 | | | | 302,929 | |
| Lincoln National Corp. | | | 5,240 | | | | 301,090 | |
| SEE NOTES TO FINANCIAL STATEMENTS. | THE RYDEX FUNDS ANNUAL REPORT | 69 |
SCHEDULE OF INVESTMENTS (continued) | March 31, 2015 |
| FINANCIAL SERVICES FUND | |
| | |
Shares | | | Value | |
| | | | | | | | | |
| Manulife Financial Corp. | | | 13,500 | | | $ | 229,635 | |
| Unum Group | | | 6,793 | | | | 229,128 | |
| Torchmark Corp. | | | 3,770 | | | | 207,048 | |
| Total Life/Health Insurance | | | | | | | 2,159,666 | |
| | | | | | | | |
| PROPERTY & CASUALTY INSURANCE - 3.6% | |
| Travelers Companies, Inc. | | | 4,164 | | | | 450,252 | |
| Chubb Corp. | | | 3,630 | | | | 366,993 | |
| Progressive Corp. | | | 11,353 | | | | 308,802 | |
| Arch Capital Group Ltd.* | | | 3,760 | | | | 231,616 | |
| Alleghany Corp.* | | | 470 | | | | 228,890 | |
| WR Berkley Corp. | | | 3,811 | | | | 192,494 | |
AmTrust Financial Services, Inc.1 | | | 3,100 | | | | 176,654 | |
| First American Financial Corp. | | | 4,400 | | | | 156,992 | |
| Total Property & Casualty Insurance | | | | | | | 2,112,693 | |
| | | | | | | | |
| REITs-OFFICE PROPERTY - 3.5% | |
| Boston Properties, Inc. | | | 2,648 | | | | 371,991 | |
| SL Green Realty Corp. | | | 2,243 | | | | 287,956 | |
| American Realty Capital Properties, Inc. | | | 23,391 | | | | 230,401 | |
| Alexandria Real Estate Equities, Inc. | | | 2,170 | | | | 212,747 | |
| Kilroy Realty Corp. | | | 2,600 | | | | 198,042 | |
| BioMed Realty Trust, Inc. | | | 7,510 | | | | 170,177 | |
| Douglas Emmett, Inc. | | | 5,552 | | | | 165,505 | |
| Highwoods Properties, Inc. | | | 3,590 | | | | 164,350 | |
| Brandywine Realty Trust | | | 8,563 | | | | 136,837 | |
| Corporate Office Properties Trust | | | 4,500 | | | | 132,210 | |
| Total REITs-Office Property | | | | | | | 2,070,216 | |
| | | | | | | | |
| REITs-HEALTH CARE - 2.9% | |
| Health Care REIT, Inc. | | | 5,381 | | | | 416,274 | |
| Ventas, Inc. | | | 5,385 | | | | 393,213 | |
| HCP, Inc. | | | 8,301 | | | | 358,686 | |
| Omega Healthcare Investors, Inc. | | | 4,662 | | | | 189,137 | |
| Senior Housing Properties Trust | | | 8,046 | | | | 178,541 | |
| Medical Properties Trust, Inc. | | | 9,300 | | | | 137,082 | |
| Total REITs-Health Care | | | | | | | 1,672,933 | |
| | | | | | | | |
| REITs-REGIONAL MALLS - 2.7% | |
| Simon Property Group, Inc. | | | 3,139 | | | | 614,114 | |
| General Growth Properties, Inc. | | | 13,259 | | | | 391,803 | |
| Macerich Co. | | | 3,252 | | | | 274,241 | |
| Taubman Centers, Inc. | | | 2,290 | | | | 176,628 | |
| Tanger Factory Outlet Centers, Inc. | | | 4,010 | | | | 141,032 | |
| Total REITs-Regional Malls | | | | | | | 1,597,818 | |
| | | | | | | | |
| REITs-SHOPPING CENTERS - 2.7% | |
| Federal Realty Investment Trust | | | 1,788 | | | | 263,211 | |
| Kimco Realty Corp. | | | 9,648 | | | | 259,049 | |
| Brixmor Property Group, Inc. | | | 8,500 | | | | 225,675 | |
| Regency Centers Corp. | | | 3,040 | | | | 206,842 | |
| DDR Corp. | | | 10,857 | | | | 202,157 | |
| Weingarten Realty Investors | | | 4,620 | | | | 166,228 | |
| WP GLIMCHER, Inc. | | | 8,300 | | | | 138,029 | |
| Urban Edge Properties | | | 5,206 | | | | 123,382 | |
| Total REITs-Shopping Centers | | | | | | | 1,584,573 | |
| | | | | | | | |
| FINANCE-INVESTMENT BANKERS/BROKERS - 2.5% | |
| Charles Schwab Corp. | | | 16,031 | | | | 487,984 | |
| TD Ameritrade Holding Corp. | | | 9,359 | | | | 348,716 | |
| E*TRADE Financial Corp.* | | | 8,000 | | | | 228,440 | |
| Raymond James Financial, Inc. | | | 3,912 | | | | 222,123 | |
| LPL Financial Holdings, Inc. | | | 3,500 | | | | 153,510 | |
| Total Finance-Investment Bankers/Brokers | | | | | | | 1,440,773 | |
| | | | | | | | |
| COMMERCIAL BANKS-WESTERN U.S. - 2.2% | |
| First Republic Bank | | | 3,840 | | | | 219,226 | |
| SVB Financial Group* | | | 1,600 | | | | 203,264 | |
| East West Bancorp, Inc. | | | 4,700 | | | | 190,162 | |
| Zions Bancorporation | | | 6,734 | | | | 181,818 | |
| City National Corp. | | | 2,000 | | | | 178,160 | |
| PacWest Bancorp | | | 3,655 | | | | 171,383 | |
| Umpqua Holdings Corp. | | | 8,857 | | | | 152,163 | |
| Total Commercial Banks-Western U.S. | | | | | | | 1,296,176 | |
| | | | | | | | |
| FIDUCIARY BANKS - 2.1% | |
| Bank of New York Mellon Corp. | | | 12,854 | | | | 517,245 | |
| State Street Corp. | | | 5,830 | | | | 428,680 | |
| Northern Trust Corp. | | | 4,392 | | | | 305,903 | |
| Total Fiduciary Banks | | | | | | | 1,251,828 | |
| | | | | | | | |
| FINANCE-OTHER SERVICES - 2.1% | |
| CME Group, Inc. — Class A | | | 4,520 | | | | 428,089 | |
| Intercontinental Exchange, Inc. | | | 1,777 | | | | 414,521 | |
| NASDAQ OMX Group, Inc. | | | 4,454 | | | | 226,887 | |
| CBOE Holdings, Inc. | | | 2,980 | | | | 171,067 | |
| Total Finance-Other Services | | | | | | | 1,240,564 | |
| | | | | | | | |
| REITs-STORAGE - 2.1% | |
| Public Storage | | | 2,418 | | | | 476,685 | |
| Extra Space Storage, Inc. | | | 3,371 | | | | 227,778 | |
| Iron Mountain, Inc. | | | 5,900 | | | | 215,232 | |
| CubeSmart | | | 6,600 | | | | 159,390 | |
| Sovran Self Storage, Inc. | | | 1,600 | | | | 150,304 | |
| Total REITs-Storage | | | | | | | 1,229,389 | |
| | | | | | | | |
| INSURANCE BROKERS - 2.1% | |
| Marsh & McLennan Companies, Inc. | | | 7,502 | | | | 420,787 | |
| Aon plc | | | 3,743 | | | | 359,777 | |
| Willis Group Holdings plc | | | 4,900 | | | | 236,082 | |
| Arthur J Gallagher & Co. | | | 4,538 | | | | 212,152 | |
| Total Insurance Brokers | | | | | | | 1,228,798 | |
| | | | | | | | |
| REITs-HOTELS - 2.1% | |
| Host Hotels & Resorts, Inc. | | | 14,704 | | | | 296,726 | |
| Hospitality Properties Trust | | | 5,400 | | | | 178,146 | |
| LaSalle Hotel Properties | | | 4,230 | | | | 164,378 | |
| RLJ Lodging Trust | | | 5,164 | | | | 161,685 | |
| 70 | THE RYDEX FUNDS ANNUAL REPORT | SEE NOTES TO FINANCIAL STATEMENTS. |
SCHEDULE OF INVESTMENTS (continued) | March 31, 2015 |
| FINANCIAL SERVICES FUND | |
| | |
Shares | | | Value | |
| | | | | | | | | |
| Sunstone Hotel Investors, Inc. | | | 8,722 | | | $ | 145,396 | |
| Strategic Hotels & Resorts, Inc.* | | | 11,600 | | | | 144,188 | |
| DiamondRock Hospitality Co. | | | 9,204 | | | | 130,053 | |
| Total REITs-Hotels | | | | | | | 1,220,572 | |
| | | | | | | | |
| FINANCE-CREDIT CARD - 1.8% | |
| American Express Co. | | | 8,833 | | | | 690,034 | |
| Discover Financial Services | | | 6,752 | | | | 380,475 | |
| Total Finance-Credit Card | | | | | | | 1,070,509 | |
| | | | | | | | |
| FINANCE-CONSUMER LOANS - 1.8% | |
| Synchrony Financial* | | | 12,600 | | | | 382,410 | |
| Navient Corp. | | | 11,070 | | | | 225,053 | |
| Santander Consumer USA Holdings, Inc. | | | 9,500 | | | | 219,830 | |
| SLM Corp.* | | | 16,750 | | | | 155,440 | |
Ocwen Financial Corp.*,1 | | | 9,847 | | | | 81,238 | |
| Total Finance-Consumer Loans | | | | | | | 1,063,971 | |
| | | | | | | | |
| COMMERCIAL SERVICES - FINANCE - 1.7% | |
| McGraw Hill Financial, Inc. | | | 3,920 | | | | 405,329 | |
| Moody’s Corp. | | | 3,489 | | | | 362,158 | |
| SEI Investments Co. | | | 4,904 | | | | 216,217 | |
| Total Commercial Services - Finance | | | | | | | 983,704 | |
| | | | | | | | |
| REITs-MORTGAGE - 1.7% | |
| Annaly Capital Management, Inc. | | | 23,401 | | | | 243,369 | |
| American Capital Agency Corp. | | | 9,981 | | | | 212,895 | |
| Starwood Property Trust, Inc. | | | 7,666 | | | | 186,284 | |
| NorthStar Realty Finance Corp. | | | 9,989 | | | | 181,001 | |
| Two Harbors Investment Corp. | | | 14,517 | | | | 154,171 | |
| Total REITs-Mortgage | | | | | | | 977,720 | |
| | | | | | | | |
| COMMERCIAL BANKS-SOUTHERN U.S. - 1.7% | |
| BB&T Corp. | | | 10,509 | | | | 409,746 | |
| Regions Financial Corp. | | | 28,745 | | | | 271,640 | |
| Synovus Financial Corp. | | | 5,493 | | | | 153,859 | |
| First Horizon National Corp. | | | 9,900 | | | | 141,471 | |
| Total Commercial Banks-Southern U.S. | | | | | | | 976,716 | |
| | | | | | | | |
| REAL ESTATE MANAGEMENT/SERVICES - 1.6% | |
| CBRE Group, Inc. — Class A* | | | 7,718 | | | | 298,763 | |
| Jones Lang LaSalle, Inc. | | | 1,374 | | | | 234,130 | |
| WP Carey, Inc. | | | 3,050 | | | | 207,400 | |
| Realogy Holdings Corp.* | | | 4,470 | | | | 203,296 | |
| Total Real Estate Management/Services | | | | | | | 943,589 | |
| | | | | | | | |
| COMMERCIAL BANKS-EASTERN U.S. - 1.6% | |
| M&T Bank Corp. | | | 2,598 | | | | 329,946 | |
| CIT Group, Inc. | | | 4,971 | | | | 224,292 | |
| Signature Bank* | | | 1,600 | | | | 207,328 | |
| Webster Financial Corp. | | | 4,000 | | | | 148,200 | |
| Total Commercial Banks-Eastern U.S. | | | | | | | 909,766 | |
| | | | | | | | |
| SAVINGS & LOANS/THRIFTS-EASTERN U.S. - 1.5% | |
| New York Community Bancorp, Inc. | | | 12,637 | | | | 211,417 | |
| Hudson City Bancorp, Inc. | | | 17,636 | | | | 184,825 | |
| People’s United Financial, Inc. | | | 11,055 | | | | 168,036 | |
| Investors Bancorp, Inc. | | | 13,670 | | | | 160,212 | |
| First Niagara Financial Group, Inc. | | | 15,370 | | | | 135,871 | |
| Total Savings & Loans/Thrifts-Eastern U.S. | | | | | | | 860,361 | |
| | | | | | | | |
| REITs-SINGLE TENANT - 1.1% | |
| Realty Income Corp. | | | 5,274 | | | | 272,138 | |
| National Retail Properties, Inc. | | | 4,455 | | | | 182,521 | |
| Spirit Realty Capital, Inc. | | | 14,509 | | | | 175,269 | |
| Total REITs-Single Tenant | | | | | | | 629,928 | |
| | | | | | | | |
| FINANCIAL GUARANTEE INSURANCE - 0.9% | |
| Assured Guaranty Ltd. | | | 9,090 | | | | 239,885 | |
| Radian Group, Inc. | | | 8,460 | | | | 142,043 | |
| MGIC Investment Corp.* | | | 14,360 | | | | 138,287 | |
| Total Financial Guarantee Insurance | | | | | | | 520,215 | |
| | | | | | | | |
| REITs-WAREHOUSE/INDUSTRIES - 0.9% | |
| Prologis, Inc. | | | 8,602 | | | | 374,703 | |
| DCT Industrial Trust, Inc. | | | 3,955 | | | | 137,080 | |
| Total REITs-Warehouse/Industries | | | | | | | 511,783 | |
| | | | | | | | |
| COMMERCIAL BANKS-CENTRAL U.S. - 0.7% | |
| Cullen/Frost Bankers, Inc. | | | 2,420 | | | | 167,174 | |
| Prosperity Bancshares, Inc. | | | 2,800 | | | | 146,944 | |
| Texas Capital Bancshares, Inc.* | | | 2,500 | | | | 121,625 | |
| Total Commercial Banks-Central U.S. | | | | | | | 435,743 | |
| | | | | | | | |
| INVESTMENT COMPANIES - 0.6% | |
| Ares Capital Corp. | | | 10,600 | | | | 182,002 | |
| American Capital Ltd.* | | | 10,500 | | | | 155,295 | |
| Total Investment Companies | | | | | | | 337,297 | |
| | | | | | | | |
| FINANCE-AUTO LOANS - 0.4% | |
| Ally Financial, Inc.* | | | 11,800 | | | | 247,564 | |
| | | | | | | | |
| DIVERSIFIED OPERATIONS - 0.4% | |
| Leucadia National Corp. | | | 9,617 | | | | 214,363 | |
| | | | | | | | |
| FINANCE-MORTGAGE LOAN/BANKER - 0.4% | |
| Home Loan Servicing Solutions Ltd. | | | 12,900 | | | | 213,366 | |
| | | | | | | | |
| DECISION SUPPORT SOFTWARE - 0.4% | |
| MSCI, Inc. — Class A | | | 3,361 | | | | 206,063 | |
| | | | | | | | |
| Total Common Stocks | | | | | | | | |
| (Cost $48,981,939) | | | | | | | 58,123,746 | |
| | | | | | | | |
| SEE NOTES TO FINANCIAL STATEMENTS. | THE RYDEX FUNDS ANNUAL REPORT | 71 |
SCHEDULE OF INVESTMENTS (concluded) | March 31, 2015 |
| FINANCIAL SERVICES FUND | |
| | | | | | | | | |
| | | Face
Amount | | | Value | |
| | | | | | | | |
SECURITIES LENDING COLLATERAL††,2 - 0.3% | |
| Repurchase Agreements | | | | | | | | |
HSBC Securities, Inc.
issued 03/31/15 at 0.10%
due 04/01/15 | | $ | 124,304 | | | $ | 124,304 | |
BNP Paribas Securities Corp.
issued 03/31/15 at 0.10%
due 04/01/15 | | | 42,760 | | | | 42,760 | |
Barclays Capital, Inc.
issued 03/31/15 at 0.10%
due 04/01/15 | | | 22,072 | | | | 22,072 | |
| Total Securities Lending Collateral | | | | | | | | |
| (Cost $189,136) | | | | | | | 189,136 | |
| | | | | | | | |
| Total Investments - 99.9% | | | | | | | | |
| (Cost $49,171,075) | | | | | | $ | 58,312,882 | |
| Other Assets & Liabilities, net - 0.1% | | | | | | | 51,267 | |
| Total Net Assets - 100.0% | | | | | | $ | 58,364,149 | |
| * | Non-income producing security. |
| † | Value determined based on Level 1 inputs — See Note 4. |
| †† | Value determined based on Level 2 inputs — See Note 4. |
| 1 | All or portion of this security is on loan at March 31, 2015 — See Note 6. |
| 2 | Securities lending collateral — See Note 6. |
| ADR — American Depositary Receipt |
| plc — Public Limited Company |
| REIT — Real Estate Investment Trust |
| 72 | THE RYDEX FUNDS ANNUAL REPORT | SEE NOTES TO FINANCIAL STATEMENTS. |
STATEMENT OF ASSETS AND LIABILITIES
March 31, 2015
| Assets: | |
| Investments, at value - including $187,242 of securities loaned (cost $48,981,939) | | $ | 58,123,746 | |
| Repurchase agreements, at value (cost $189,136) | | | 189,136 | |
| Total investments (cost $49,171,075) | | | 58,312,882 | |
| Cash | | | 2,776 | |
| Segregated cash with broker | | | 2,764 | |
| Receivables: | |
| Securities sold | | | 1,093,917 | |
| Dividends | | | 104,510 | |
| Fund shares sold | | | 98,504 | |
| Securities lending income | | | 72 | |
| Total assets | | | 59,615,425 | |
| | | | | |
| Liabilities: | |
| Line of credit | | | 557,000 | |
| Payable for: | |
| Fund shares redeemed | | | 413,668 | |
| Return of securities loaned | | | 191,900 | |
| Management fees | | | 42,150 | |
| Transfer agent and administrative fees | | | 12,397 | |
| Portfolio accounting fees | | | 4,959 | |
| Distribution and service fees | | | 3,847 | |
| Miscellaneous | | | 25,355 | |
| Total liabilities | | | 1,251,276 | |
| Commitments and contingent liabilities (Note 10) | | | — | |
| Net assets | | $ | 58,364,149 | |
| | | | | |
| Net assets consist of: | |
| Paid in capital | | $ | 53,791,827 | |
| Undistributed net investment income | | | 277,758 | |
| Accumulated net realized loss on investments | | | (4,847,243 | ) |
| Net unrealized appreciation on investments | | | 9,141,807 | |
| Net assets | | $ | 58,364,149 | |
| | | | | |
| Investor Class: | |
| Net assets | | $ | 49,897,087 | |
| Capital shares outstanding | | | 431,753 | |
| Net asset value per share | | $ | 115.57 | |
| | | | | |
| Advisor Class: | |
| Net assets | | $ | 4,478,509 | |
| Capital shares outstanding | | | 42,012 | |
| Net asset value per share | | $ | 106.60 | |
| | | | | |
| A-Class: | |
| Net assets | | $ | 2,733,856 | |
| Capital shares outstanding | | | 24,932 | |
| Net asset value per share | | $ | 109.65 | |
| Maximum offering price per share (Net asset value divided by 95.25%) | | $ | 115.12 | |
| | | | | |
| C-Class: | |
| Net assets | | $ | 1,254,697 | |
| Capital shares outstanding | | | 12,512 | |
| Net asset value per share | | $ | 100.28 | |
STATEMENT OF OPERATIONS
Year Ended March 31, 2015
| Investment Income: | |
| Dividends (net of foreign withholding tax of $2,822) | | $ | 884,332 | |
| Income from securities lending, net | | | 1,614 | |
| Interest | | | 47 | |
| Total investment income | | | 885,993 | |
| | | | | |
| Expenses: | |
| Management fees | | | 352,283 | |
| Transfer agent and administrative fees | | | 103,612 | |
| Distribution and service fees: | |
| Advisor Class | | | 30,258 | |
| A-Class | | | 8,492 | |
| C-Class | | | 14,519 | |
| Portfolio accounting fees | | | 41,445 | |
| Custodian fees | | | 4,815 | |
| Trustees’ fees* | | | 1,997 | |
| Line of credit fees | | | 211 | |
| Tax expense | | | 85 | |
| Miscellaneous | | | 50,518 | |
| Total expenses | | | 608,235 | |
| Net investment income | | | 277,758 | |
| | | | | |
| Net Realized and Unrealized Gain (Loss): | |
| Net realized gain (loss) on: | |
| Investments | | | (151,239 | ) |
| Net realized loss | | | (151,239 | ) |
| Net change in unrealized appreciation (depreciation) on: | |
| Investments | | | 2,347,454 | |
| Net change in unrealized appreciation (depreciation) | | | 2,347,454 | |
| Net realized and unrealized gain | | | 2,196,215 | |
| Net increase in net assets resulting from operations | | $ | 2,473,973 | |
| * | Relates to Trustees not deemed “interested persons” within the meaning of Section 2(a)(19) of the 1940 Act. |
| SEE NOTES TO FINANCIAL STATEMENTS. | THE RYDEX FUNDS ANNUAL REPORT | 73 |
STATEMENTS OF CHANGES IN NET ASSETS
| | | Year Ended March 31, 2015 | | | Year Ended March 31, 2014 | |
| Increase (Decrease) in Net Assets from Operations: | | | | | | |
| Net investment income | | $ | 277,758 | | | $ | 147,974 | |
| Net realized gain (loss) on investments | | | (151,239 | ) | | | 2,155,894 | |
| Net change in unrealized appreciation (depreciation) on investments | | | 2,347,454 | | | | 512,726 | |
| Net increase in net assets resulting from operations | | | 2,473,973 | | | | 2,816,594 | |
| | | | | | | | | |
| Distributions to shareholders from: | | | | | | | | |
| Net investment income | | | | | | | | |
| Investor Class | | | (124,825 | ) | | | (79,512 | ) |
| Advisor Class | | | (15,302 | ) | | | (17,906 | ) |
| A-Class | | | (5,719 | ) | | | (40,320 | ) |
| C-Class | | | (3,673 | ) | | | (7,809 | ) |
| Total distributions to shareholders | | | (149,519 | ) | | | (145,547 | ) |
| | | | | | | | | |
| Capital share transactions: | | | | | | | | |
| Proceeds from sale of shares | | | | | | | | |
| Investor Class | | | 142,998,248 | | | | 87,025,488 | |
| Advisor Class | | | 21,042,008 | | | | 9,891,676 | |
| A-Class | | | 16,301,408 | | | | 16,249,371 | |
| C-Class | | | 22,259,319 | | | | 21,219,453 | |
| Distributions reinvested | | | | | | | | |
| Investor Class | | | 50,229 | | | | 78,044 | |
| Advisor Class | | | 15,281 | | | | 17,860 | |
| A-Class | | | 4,742 | | | | 35,520 | |
| C-Class | | | 3,317 | | | | 7,710 | |
| Cost of shares redeemed | | | | | | | | |
| Investor Class | | | (112,502,368 | ) | | | (87,847,468 | ) |
| Advisor Class | | | (21,680,719 | ) | | | (12,957,819 | ) |
| A-Class | | | (21,300,899 | ) | | | (10,980,642 | ) |
| C-Class | | | (22,171,252 | ) | | | (21,766,316 | ) |
| Net increase from capital share transactions | | | 25,019,314 | | | | 972,877 | |
| Net increase in net assets | | | 27,343,768 | | | | 3,643,924 | |
| | | | | | | | | |
| Net assets: | | | | | | | | |
| Beginning of year | | | 31,020,381 | | | | 27,376,457 | |
| End of year | | $ | 58,364,149 | | | $ | 31,020,381 | |
| Undistributed net investment income at end of year | | $ | 277,758 | | | $ | 149,519 | |
| | | | | | | | | |
| Capital share activity: | | | | | | | | |
| Shares sold | | | | | | | | |
| Investor Class | | | 1,279,802 | | | | 880,833 | |
| Advisor Class | | | 203,091 | | | | 107,616 | |
| A-Class | | | 151,873 | | | | 170,038 | |
| C-Class | | | 231,403 | | | | 243,282 | |
| Shares issued from reinvestment of distributions | | | | | | | | |
| Investor Class | | | 443 | | | | 774 | |
| Advisor Class | | | 146 | | | | 191 | |
| A-Class | | | 44 | | | | 370 | |
| C-Class | | | 34 | | | | 87 | |
| Shares redeemed | | | | | | | | |
| Investor Class | | | (1,015,205 | ) | | | (902,467 | ) |
| Advisor Class | | | (207,816 | ) | | | (145,268 | ) |
| A-Class | | | (203,251 | ) | | | (115,259 | ) |
| C-Class | | | (230,221 | ) | | | (250,011 | ) |
| Net increase (decrease) in shares | | | 210,343 | | | | (9,814 | ) |
| 74 | THE RYDEX FUNDS ANNUAL REPORT | SEE NOTES TO FINANCIAL STATEMENTS. |
This table is presented to show selected data for a share outstanding throughout each period and to assist shareholders in evaluating a Fund’s performance for the periods presented.
| Investor Class | | Year Ended March 31, 2015 | | | Year Ended March 31, 2014 | | | Year Ended March 28, 2013 | | | Year Ended March 31, 2012 | | | Year Ended March 31, 2011 | |
| Per Share Data | | | | | | | | | | | | | | | |
| Net asset value, beginning of period | | $ | 106.10 | | | $ | 90.67 | | | $ | 78.47 | | | $ | 81.18 | | | $ | 75.23 | |
| Income (loss) from investment operations: | |
Net investment income (loss)a | | | .92 | | | | .78 | | | | .76 | | | | .61 | | | | .15 | |
| Net gain (loss) on investments (realized and unrealized) | | | 8.81 | | | | 15.21 | | | | 11.99 | | | | (3.29 | ) | | | 6.75 | |
| Total from investment operations | | | 9.73 | | | | 15.99 | | | | 12.75 | | | | (2.68 | ) | | | 6.90 | |
| Less distributions from: | |
| Net investment income | | | (.26 | ) | | | (.56 | ) | | | (.55 | ) | | | (.03 | ) | | | (.95 | ) |
| Total distributions | | | (.26 | ) | | | (.56 | ) | | | (.55 | ) | | | (.03 | ) | | | (.95 | ) |
| Net asset value, end of period | | $ | 115.57 | | | $ | 106.10 | | | $ | 90.67 | | | $ | 78.47 | | | $ | 81.18 | |
| | |
Total Returnb | | | 9.17 | % | | | 17.67 | % | | | 16.37 | % | | | (3.31 | %) | | | 9.33 | % |
| Ratios/Supplemental Data | |
| Net assets, end of period (in thousands) | | $ | 49,897 | | | $ | 17,688 | | | $ | 17,007 | | | $ | 19,973 | | | $ | 4,885 | |
| Ratios to average net assets: | |
| Net investment income (loss) | | | 0.82 | % | | | 0.81 | % | | | 0.95 | % | | | 0.86 | % | | | 0.19 | % |
| Total expenses | | | 1.34 | % | | | 1.37 | % | | | 1.36 | % | | | 1.34 | % | | | 1.39 | % |
| Portfolio turnover rate | | | 326 | % | | | 414 | % | | | 590 | % | | | 970 | % | | | 601 | % |
| Advisor Class | | Year Ended March 31, 2015 | | | Year Ended March 31, 2014 | | | Year Ended March 28, 2013 | | | Year Ended March 31, 2012 | | | Year Ended March 31, 2011 | |
| Per Share Data | | | | | | | | | | | | | | | |
| Net asset value, beginning of period | | $ | 98.37 | | | $ | 84.51 | | | $ | 73.53 | | | $ | 76.47 | | | $ | 71.29 | |
| Income (loss) from investment operations: | |
Net investment income (loss)a | | | .29 | | | | .24 | | | | .22 | | | | .26 | | | | (.14 | ) |
| Net gain (loss) on investments (realized and unrealized) | | | 8.20 | | | | 14.18 | | | | 11.31 | | | | (3.17 | ) | | | 6.27 | |
| Total from investment operations | | | 8.49 | | | | 14.42 | | | | 11.53 | | | | (2.91 | ) | | | 6.13 | |
| Less distributions from: | |
| Net investment income | | | (.26 | ) | | | (.56 | ) | | | (.55 | ) | | | (.03 | ) | | | (.95 | ) |
| Total distributions | | | (.26 | ) | | | (.56 | ) | | | (.55 | ) | | | (.03 | ) | | | (.95 | ) |
| Net asset value, end of period | | $ | 106.60 | | | $ | 98.37 | | | $ | 84.51 | | | $ | 73.53 | | | $ | 76.47 | |
| | |
Total Returnb | | | 8.63 | % | | | 17.10 | % | | | 15.80 | % | | | (3.80 | %) | | | 8.76 | % |
| Ratios/Supplemental Data | |
| Net assets, end of period (in thousands) | | $ | 4,479 | | | $ | 4,583 | | | $ | 7,103 | | | $ | 4,243 | | | $ | 3,634 | |
| Ratios to average net assets: | |
| Net investment income (loss) | | | 0.28 | % | | | 0.26 | % | | | 0.29 | % | | | 0.37 | % | | | (0.20 | %) |
| Total expenses | | | 1.85 | % | | | 1.87 | % | | | 1.85 | % | | | 1.85 | % | | | 1.89 | % |
| Portfolio turnover rate | | | 326 | % | | | 414 | % | | | 590 | % | | | 970 | % | | | 601 | % |
| SEE NOTES TO FINANCIAL STATEMENTS. | THE RYDEX FUNDS ANNUAL REPORT | 75 |
FINANCIAL HIGHLIGHTS (concluded)
This table is presented to show selected data for a share outstanding throughout each period and to assist shareholders in evaluating a Fund’s performance for the periods presented.
| A-Class | | Year Ended March 31, 2015 | | | Year Ended March 31, 2014 | | | Year Ended March 28, 2013 | | | Year Ended March 31, 2012 | | | Year Ended March 31, 2011 | |
| Per Share Data | | | | | | | | | | | | | | | |
| Net asset value, beginning of period | | $ | 100.94 | | | $ | 86.48 | | | $ | 75.07 | | | $ | 77.87 | | | $ | 72.38 | |
| Income (loss) from investment operations: | |
Net investment income (loss)a | | | .43 | | | | .58 | | | | .51 | | | | .45 | | | | (.01 | ) |
| Net gain (loss) on investments (realized and unrealized) | | | 8.54 | | | | 14.44 | | | | 11.45 | | | | (3.22 | ) | | | 6.45 | |
| Total from investment operations | | | 8.97 | | | | 15.02 | | | | 11.96 | | | | (2.77 | ) | | | 6.44 | |
| Less distributions from: | |
| Net investment income | | | (.26 | ) | | | (.56 | ) | | | (.55 | ) | | | (.03 | ) | | | (.95 | ) |
| Total distributions | | | (.26 | ) | | | (.56 | ) | | | (.55 | ) | | | (.03 | ) | | | (.95 | ) |
| Net asset value, end of period | | $ | 109.65 | | | $ | 100.94 | | | $ | 86.48 | | | $ | 75.07 | | | $ | 77.87 | |
| | |
Total Returnb | | | 8.89 | % | | | 17.41 | % | | | 16.06 | % | | | (3.57 | %) | | | 9.06 | % |
| Ratios/Supplemental Data | |
| Net assets, end of period (in thousands) | | $ | 2,734 | | | $ | 7,698 | | | $ | 1,826 | | | $ | 632 | | | $ | 1,782 | |
| Ratios to average net assets: | |
| Net investment income (loss) | | | 0.41 | % | | | 0.62 | % | | | 0.66 | % | | | 0.64 | % | | | (0.01 | %) |
| Total expenses | | | 1.59 | % | | | 1.62 | % | | | 1.61 | % | | | 1.61 | % | | | 1.64 | % |
| Portfolio turnover rate | | | 326 | % | | | 414 | % | | | 590 | % | | | 970 | % | | | 601 | % |
| C-Class | | Year Ended March 31, 2015 | | | Year Ended March 31, 2014 | | | Year Ended March 28, 2013 | | | Year Ended March 31, 2012 | | | Year Ended March 31, 2011 | |
| Per Share Data | | | | | | | | | | | | | | | |
| Net asset value, beginning of period | | $ | 93.02 | | | $ | 80.30 | | | $ | 70.26 | | | $ | 73.42 | | | $ | 68.79 | |
| Income (loss) from investment operations: | |
Net investment income (loss)a | | | (.22 | ) | | | (.16 | ) | | | .03 | | | | (.12 | ) | | | (.49 | ) |
| Net gain (loss) on investments (realized and unrealized) | | | 7.74 | | | | 13.44 | | | | 10.56 | | | | (3.01 | ) | | | 6.07 | |
| Total from investment operations | | | 7.52 | | | | 13.28 | | | | 10.59 | | | | (3.13 | ) | | | 5.58 | |
| Less distributions from: | |
| Net investment income | | | (.26 | ) | | | (.56 | ) | | | (.55 | ) | | | (.03 | ) | | | (.95 | ) |
| Total distributions | | | (.26 | ) | | | (.56 | ) | | | (.55 | ) | | | (.03 | ) | | | (.95 | ) |
| Net asset value, end of period | | $ | 100.28 | | | $ | 93.02 | | | $ | 80.30 | | | $ | 70.26 | | | $ | 73.42 | |
| | |
Total Returnb | | | 8.08 | % | | | 16.58 | % | | | 15.21 | % | | | (4.27 | %) | | | 8.28 | % |
| Ratios/Supplemental Data | |
| Net assets, end of period (in thousands) | | $ | 1,255 | | | $ | 1,051 | | | $ | 1,440 | | | $ | 817 | | | $ | 1,114 | |
| Ratios to average net assets: | |
| Net investment income (loss) | | | (0.23 | %) | | | (0.18 | %) | | | 0.04 | % | | | (0.18 | %) | | | (0.72 | %) |
| Total expenses | | | 2.35 | % | | | 2.37 | % | | | 2.36 | % | | | 2.36 | % | | | 2.39 | % |
| Portfolio turnover rate | | | 326 | % | | | 414 | % | | | 590 | % | | | 970 | % | | | 601 | % |
a | Net investment income (loss) per share was computed using average shares outstanding throughout the period. |
b | Total return does not reflect the impact of any applicable sales charges. |
| 76 | THE RYDEX FUNDS ANNUAL REPORT | SEE NOTES TO FINANCIAL STATEMENTS. |
PERFORMANCE REPORT AND FUND PROFILE (Unaudited) | March 31, 2015 |
HEALTH CARE FUND
OBJECTIVE: Seeks to provide capital appreciation by investing in companies that are involved in the health care industry (“health care companies”).
For the one-year period ended March 31, 2015, Health Care Fund Investor Class returned 30.51%, compared with a return of 26.19% for the S&P 500 Health Care Index. The broader S&P 500 Index returned 12.73%.
The biggest contributor to Fund performance was biotechnology, followed by pharmaceuticals. The health care technology segment was the largest detractor from return, followed by the electronic equipment instruments & components segment.
The Fund’s top-performing holdings were Allergan, Inc., Celgene Corp., and Gilead Sciences, Inc. The worst-performing holdings in the Fund included athenahealth, Inc., Theravance, Inc., and MannKind Corp.
Performance displayed represents past performance, which is no guarantee of future results.
Holdings Diversification (Market Exposure as % of Net Assets)
“Holdings Diversification (Market Exposure as % of Net Assets)” excludes any temporary cash investments.
| Inception Dates: |
| Investor Class | April 17, 1998 |
| Advisor Class | May 11, 1998 |
| A-Class | September 1, 2004 |
| C-Class | March 30, 2001 |
| Ten Largest Holdings (% of Total Net Assets) |
| Johnson & Johnson | 2.9% |
| Pfizer, Inc. | 2.6% |
| Merck & Company, Inc. | 2.2% |
| Gilead Sciences, Inc. | 2.1% |
| Medtronic plc | 2.0% |
| Amgen, Inc. | 1.9% |
| UnitedHealth Group, Inc. | 1.8% |
| Bristol-Myers Squibb Co. | 1.8% |
| Biogen, Inc. | 1.7% |
| AbbVie, Inc. | 1.7% |
| Top Ten Total | 20.7% |
| | |
| “Ten Largest Holdings” exclude any temporary cash or derivative investments. |
| | THE RYDEX FUNDS ANNUAL REPORT | 77 |
PERFORMANCE REPORT AND FUND PROFILE (Unaudited)(concluded) | March 31, 2015 |
Cumulative Fund Performance*
Average Annual Returns*
Periods Ended March 31, 2015
| | 1 Year | 5 Year | 10 Year |
| Investor Class Shares | 30.51% | 19.50% | 11.73% |
| Advisor Class Shares | 29.89% | 18.96% | 11.19% |
| A-Class Shares | 30.21% | 19.23% | 11.47% |
A-Class Shares with sales charge† | 24.04% | 18.08% | 10.93% |
| C-Class Shares | 29.21% | 18.39% | 10.63% |
C-Class Shares with CDSC‡ | 28.21% | 18.39% | 10.63% |
| S&P 500 Health Care Index | 26.19% | 20.09% | 11.41% |
| S&P 500 Index | 12.73% | 14.47% | 8.01% |
| * | The performance data above represents past performance that is not predictive of future results. The investment return and principal value of an investment in the Fund will fluctuate so that an investor’s shares, when redeemed, may be worth more or less than their original cost. Returns are historical and include changes in principal and reinvested dividends and capital gains and do not reflect the effect of taxes. The S&P 500 Index and the S&P 500 Health Care Index are unmanaged indices and, unlike the Fund, have no management fees or operating expenses to reduce their reported returns. The graphs are based on Investor Class shares and A-Class shares only; performance for Advisor Class shares and C-Class shares will vary due to differences in fee structures. |
† | Fund returns are calculated using the maximum sales charge of 4.75%. |
‡ | Fund returns include a CDSC of 1% if redeemed within 12 months of purchase. |
| 78 | THE RYDEX FUNDS ANNUAL REPORT | |
| SCHEDULE OF INVESTMENTS | March 31, 2015 |
| HEALTH CARE FUND | |
| | |
Shares | | | Value | |
| | | | | | | | |
COMMON STOCKS† - 99.1% | |
| | | | | | | | |
| MEDICAL-DRUGS - 26.3% | |
| Johnson & Johnson | | | 77,006 | | | $ | 7,746,803 | |
| Pfizer, Inc. | | | 196,537 | | | | 6,837,521 | |
| Merck & Company, Inc. | | | 103,520 | | | | 5,950,329 | |
| Bristol-Myers Squibb Co. | | | 72,546 | | | | 4,679,217 | |
| AbbVie, Inc. | | | 76,164 | | | | 4,458,641 | |
| Eli Lilly & Co. | | | 58,065 | | | | 4,218,422 | |
| Abbott Laboratories | | | 82,375 | | | | 3,816,434 | |
| Valeant Pharmaceuticals International, Inc.* | | | 18,844 | | | | 3,742,795 | |
| Endo International plc* | | | 27,158 | | | | 2,436,073 | |
| Zoetis, Inc. | | | 48,090 | | | | 2,226,086 | |
| Novartis AG ADR | | | 19,851 | | | | 1,957,507 | |
| Shire plc ADR | | | 8,172 | | | | 1,955,478 | |
| Mallinckrodt plc* | | | 14,144 | | | | 1,791,338 | |
OPKO Health, Inc.*,1 | | | 125,880 | | | | 1,783,720 | |
| Jazz Pharmaceuticals plc* | | | 9,800 | | | | 1,693,342 | |
| GlaxoSmithKline plc ADR | | | 36,497 | | | | 1,684,337 | |
| AstraZeneca plc ADR | | | 24,088 | | | | 1,648,342 | |
| Novo Nordisk A/S ADR | | | 30,300 | | | | 1,617,717 | |
| Alkermes plc* | | | 25,672 | | | | 1,565,222 | |
| Salix Pharmaceuticals Ltd.* | | | 8,986 | | | | 1,552,871 | |
| Quintiles Transnational Holdings, Inc.* | | | 20,139 | | | | 1,348,709 | |
| Receptos, Inc.* | | | 6,800 | | | | 1,121,252 | |
| Akorn, Inc.* | | | 22,835 | | | | 1,084,891 | |
| ACADIA Pharmaceuticals, Inc.* | | | 24,685 | | | | 804,484 | |
| Pacira Pharmaceuticals, Inc.* | | | 8,900 | | | | 790,765 | |
| Lannett Company, Inc.* | | | 11,000 | | | | 744,810 | |
| Clovis Oncology, Inc.* | | | 9,355 | | | | 694,422 | |
| Total Medical-Drugs | | | | | | | 69,951,528 | |
| | | | | | | | |
| MEDICAL-BIOMEDICAL/GENETICS - 21.6% | |
| Gilead Sciences, Inc.* | | | 56,315 | | | | 5,526,190 | |
| Amgen, Inc. | | | 31,070 | | | | 4,966,539 | |
| Biogen, Inc.* | | | 10,938 | | | | 4,618,461 | |
| Celgene Corp.* | | | 37,643 | | | | 4,339,485 | |
Theravance, Inc.1 | | | 215,100 | | | | 3,381,372 | |
| Regeneron Pharmaceuticals, Inc.* | | | 6,874 | | | | 3,103,474 | |
| Alexion Pharmaceuticals, Inc.* | | | 15,691 | | | | 2,719,250 | |
| Vertex Pharmaceuticals, Inc.* | | | 20,105 | | | | 2,371,787 | |
| Illumina, Inc.* | | | 12,414 | | | | 2,304,535 | |
| BioMarin Pharmaceutical, Inc.* | | | 16,632 | | | | 2,072,680 | |
| Incyte Corp.* | | | 20,127 | | | | 1,844,841 | |
| Medivation, Inc.* | | | 11,448 | | | | 1,477,593 | |
| Alnylam Pharmaceuticals, Inc.* | | | 12,445 | | | | 1,299,507 | |
| United Therapeutics Corp.* | | | 7,356 | | | | 1,268,432 | |
| Puma Biotechnology, Inc.* | | | 5,200 | | | | 1,227,772 | |
| Isis Pharmaceuticals, Inc.* | | | 18,871 | | | | 1,201,517 | |
Juno Therapeutics, Inc.*,1 | | | 18,900 | | | | 1,146,474 | |
Intercept Pharmaceuticals, Inc.*,1 | | | 4,000 | | | | 1,128,080 | |
| Intrexon Corp.* | | | 22,100 | | | | 1,002,677 | |
Seattle Genetics, Inc.*,1 | | | 26,133 | | | | 923,802 | |
| Bluebird Bio, Inc.* | | | 7,500 | | | | 905,775 | |
| Charles River Laboratories International, Inc.* | | | 11,185 | | | | 886,859 | |
Myriad Genetics, Inc.*,1 | | | 23,700 | | | | 838,980 | |
Exact Sciences Corp.*,1 | | | 37,300 | | | | 821,346 | |
| Synageva BioPharma Corp.* | | | 8,400 | | | | 819,252 | |
| Celldex Therapeutics, Inc.* | | | 25,600 | | | | 713,472 | |
Kite Pharma, Inc.*,1 | | | 12,300 | | | | 709,464 | |
| Medicines Co.* | | | 21,900 | | | | 613,638 | |
| Novavax, Inc.* | | | 74,200 | | | | 613,634 | |
| ARIAD Pharmaceuticals, Inc.* | | | 67,900 | | | | 559,496 | |
| Acorda Therapeutics, Inc.* | | | 16,500 | | | | 549,120 | |
| PDL BioPharma, Inc. | | | 71,141 | | | | 500,477 | |
| Achillion Pharmaceuticals, Inc.* | | | 48,200 | | | | 475,252 | |
ZIOPHARM Oncology, Inc.*,1 | | | 43,700 | | | | 470,649 | |
| Total Medical-Biomedical/Genetics | | | | | | | 57,401,882 | |
| | | | | | | | |
| MEDICAL-HMO - 7.5% | |
| UnitedHealth Group, Inc. | | | 41,455 | | | | 4,903,711 | |
| Anthem, Inc. | | | 19,384 | | | | 2,993,083 | |
| Aetna, Inc. | | | 26,537 | | | | 2,826,987 | |
| Cigna Corp. | | | 21,180 | | | | 2,741,539 | |
| Humana, Inc. | | | 13,442 | | | | 2,392,945 | |
| Centene Corp.* | | | 19,320 | | | | 1,365,731 | |
| Health Net, Inc.* | | | 16,696 | | | | 1,009,941 | |
| WellCare Health Plans, Inc.* | | | 10,100 | | | | 923,746 | |
| Molina Healthcare, Inc.* | | | 13,126 | | | | 883,249 | |
| Total Medical-HMO | | | | | | | 20,040,932 | |
| | | | | | | | |
| MEDICAL PRODUCTS - 7.2% | |
| Baxter International, Inc. | | | 41,397 | | | | 2,835,695 | |
| Stryker Corp. | | | 29,680 | | | | 2,737,980 | |
| Becton Dickinson and Co. | | | 17,234 | | | | 2,474,630 | |
| Zimmer Holdings, Inc. | | | 17,651 | | | | 2,074,346 | |
| Henry Schein, Inc.* | | | 11,390 | | | | 1,590,272 | |
| Varian Medical Systems, Inc.* | | | 15,137 | | | | 1,424,240 | |
| Cooper Companies, Inc. | | | 7,470 | | | | 1,400,027 | |
| Sirona Dental Systems, Inc.* | | | 11,922 | | | | 1,072,861 | |
| Teleflex, Inc. | | | 8,680 | | | | 1,048,804 | |
| West Pharmaceutical Services, Inc. | | | 16,500 | | | | 993,465 | |
| ABIOMED, Inc.* | | | 12,100 | | | | 866,118 | |
| Wright Medical Group, Inc.* | | | 20,300 | | | | 523,740 | |
| Total Medical Products | | | | | | | 19,042,178 | |
| | | | | | | | |
| MEDICAL INSTRUMENTS - 5.6% | |
| Medtronic plc | | | 67,304 | | | | 5,249,038 | |
| Boston Scientific Corp.* | | | 127,764 | | | | 2,267,811 | |
| Intuitive Surgical, Inc.* | | | 3,918 | | | | 1,978,708 | |
| St. Jude Medical, Inc. | | | 29,938 | | | | 1,957,945 | |
| Edwards Lifesciences Corp.* | | | 12,034 | | | | 1,714,364 | |
| DexCom, Inc.* | | | 16,100 | | | | 1,003,674 | |
| Thoratec Corp.* | | | 16,600 | | | | 695,374 | |
| Total Medical Instruments | | | | | | | 14,866,914 | |
| SEE NOTES TO FINANCIAL STATEMENTS. | THE RYDEX FUNDS ANNUAL REPORT | 79 |
SCHEDULE OF INVESTMENTS (continued) | March 31, 2015 |
| HEALTH CARE FUND | |
| | |
Shares | | | Value | |
| | | | | | | | | |
| MEDICAL-GENERIC DRUGS - 5.2% | |
| Actavis plc* | | | 14,099 | | | $ | 4,196,237 | |
| Mylan N.V.* | | | 41,252 | | | | 2,448,306 | |
| Teva Pharmaceutical Industries Ltd. ADR | | | 37,167 | | | | 2,315,504 | |
| Perrigo Company plc | | | 13,194 | | | | 2,184,267 | |
| Hospira, Inc.* | | | 20,653 | | | | 1,814,160 | |
| Impax Laboratories, Inc.* | | | 18,400 | | | | 862,408 | |
| Total Medical-Generic Drugs | | | | | | | 13,820,882 | |
| | | | | | | | |
| MEDICAL - WHOLESALE DRUG DISTRIBUTION - 3.1% | |
| McKesson Corp. | | | 14,807 | | | | 3,349,343 | |
| Cardinal Health, Inc. | | | 28,032 | | | | 2,530,449 | |
| AmerisourceBergen Corp. — Class A | | | 20,560 | | | | 2,337,055 | |
| Total Medical - Wholesale Drug Distribution | | | | | | | 8,216,847 | |
| | | | | | | | |
| MEDICAL-HOSPITALS - 2.7% | |
| HCA Holdings, Inc.* | | | 35,217 | | | | 2,649,375 | |
| Universal Health Services, Inc. — Class B | | | 13,576 | | | | 1,598,031 | |
| Community Health Systems, Inc.* | | | 22,185 | | | | 1,159,832 | |
| Tenet Healthcare Corp.* | | | 20,800 | | | | 1,029,808 | |
| LifePoint Hospitals, Inc.* | | | 11,341 | | | | 832,996 | |
| Total Medical-Hospitals | | | | | | | 7,270,042 | |
| | | | | | | | |
| THERAPEUTICS - 2.6% | |
MannKind Corp.*,1 | | | 624,500 | | | | 3,247,400 | |
| Pharmacyclics, Inc.* | | | 8,100 | | | | 2,073,195 | |
| Agios Pharmaceuticals, Inc.* | | | 8,800 | | | | 829,840 | |
| Neurocrine Biosciences, Inc.* | | | 20,700 | | | | 821,997 | |
| Total Therapeutics | | | | | | | 6,972,432 | |
| | | | | | | | |
| PHARMACY SERVICES - 2.6% | |
| Express Scripts Holding Co.* | | | 43,096 | | | | 3,739,439 | |
| Catamaran Corp.* | | | 29,990 | | | | 1,785,605 | |
| Omnicare, Inc. | | | 16,579 | | | | 1,277,578 | |
| Total Pharmacy Services | | | | | | | 6,802,622 | |
| | | | | | | | |
| INSTRUMENTS-SCIENTIFIC - 2.3% | |
| Thermo Fisher Scientific, Inc. | | | 24,979 | | | | 3,355,678 | |
| Waters Corp.* | | | 11,897 | | | | 1,479,035 | |
| PerkinElmer, Inc. | | | 22,423 | | | | 1,146,712 | |
| Total Instruments-Scientific | | | | | | | 5,981,425 | |
| | | | | | | | |
| MEDICAL INFORMATION SYSTEM - 1.5% | |
| Cerner Corp.* | | | 32,144 | | | | 2,354,870 | |
| athenahealth, Inc.* | | | 8,180 | | | | 976,610 | |
| Allscripts Healthcare Solutions, Inc.* | | | 58,000 | | | | 693,680 | |
| Total Medical Information System | | | | | | | 4,025,160 | |
| | | | | | | | |
| MEDICAL LABS & TESTING SERVICES - 1.2% | |
| Laboratory Corporation of America Holdings* | | | 13,163 | | | | 1,659,695 | |
| Quest Diagnostics, Inc. | | | 20,644 | | | | 1,586,491 | |
| Total Medical Labs & Testing Services | | | | | | | 3,246,186 | |
| | | | | | | | |
| DENTAL SUPPLIES & EQUIPMENTS - 1.2% | |
| DENTSPLY International, Inc. | | | 24,483 | | | | 1,245,941 | |
| Patterson Companies, Inc. | | | 21,227 | | | | 1,035,665 | |
| Align Technology, Inc.* | | | 17,654 | | | | 949,520 | |
| Total Dental Supplies & Equipments | | | | | | | 3,231,126 | |
| | | | | | | | |
| PHYSICAL PRACTICE MANAGEMENT - 0.9% | |
| Envision Healthcare Holdings, Inc.* | | | 32,900 | | | | 1,261,715 | |
| MEDNAX, Inc.* | | | 17,006 | | | | 1,233,105 | |
| Total Physical Practice Management | | | | | | | 2,494,820 | |
| | | | | | | | |
| DIALYSIS CENTERS - 0.7% | |
| DaVita HealthCare Partners, Inc.* | | | 24,031 | | | | 1,953,240 | |
| | | | | | | | |
| ELECTRONIC MEASURING INSTRUMENTS - 0.7% | |
| Agilent Technologies, Inc. | | | 41,483 | | | | 1,723,619 | |
| | | | | | | | |
| DISPOSABLE MEDICAL PRODUCTS - 0.6% | |
| CR Bard, Inc. | | | 9,818 | | | | 1,643,042 | |
| | | | | | | | |
| RESPIRATORY PRODUCTS - 0.6% | |
| ResMed, Inc. | | | 20,362 | | | | 1,461,584 | |
| | | | | | | | |
| X-RAY EQUIPMENT - 0.5% | |
| Hologic, Inc.* | | | 43,310 | | | | 1,430,313 | |
| | | | | | | | |
| INSTRUMENTS-CONTROLS - 0.5% | |
| Mettler-Toledo International, Inc.* | | | 4,350 | | | | 1,429,628 | |
| | | | | | | | |
| DIAGNOSTIC KITS - 0.5% | |
| IDEXX Laboratories, Inc.* | | | 8,127 | | | | 1,255,459 | |
| | | | | | | | |
| RETIREMENT/AGED CARE - 0.5% | |
| Brookdale Senior Living, Inc. — Class A* | | | 32,331 | | | | 1,220,819 | |
| | | | | | | | |
| VETERINARY DIAGNOSTICS - 0.4% | |
| VCA, Inc.* | | | 18,305 | | | | 1,003,480 | |
| | | | | | | | |
| MEDICAL STERILIZER PRODUCTS - 0.4% | |
| STERIS Corp. | | | 13,700 | | | | 962,699 | |
| | | | | | | | |
| HUMAN RESOURCES - 0.4% | |
| Team Health Holdings, Inc.* | | | 16,400 | | | | 959,564 | |
| | | | | | | | |
| PHYSICAL THERAPY/REHAB CENTERS - 0.4% | |
| HealthSouth Corp. | | | 21,100 | | | | 935,996 | |
| 80 | THE RYDEX FUNDS ANNUAL REPORT | SEE NOTES TO FINANCIAL STATEMENTS. |
SCHEDULE OF INVESTMENTS (concluded) | March 31, 2015 |
| HEALTH CARE FUND | |
| | |
Shares | | | Value | |
| | | | | | | | | |
| DIVERSIFIED OPERATIONS - 0.3% | |
| Horizon Pharma plc* | | | 35,400 | | | $ | 919,338 | |
| | | | | | | | |
| DIAGNOSTIC EQUIPMENT - 0.3% | |
| Cepheid* | | | 16,157 | | | | 919,333 | |
| | | | | | | | |
| RESEARCH & DEVELOPMENT - 0.3% | |
| PAREXEL International Corp.* | | | 13,300 | | | | 917,567 | |
| | | | | | | | |
| MEDICAL-OUTPATIENT/HOME MEDICINE - 0.3% | |
| Amsurg Corp. — Class A* | | | 13,100 | | | | 805,912 | |
| | | | | | | | |
| MEDICAL-NURSING HOMES - 0.2% | |
| Kindred Healthcare, Inc. | | | 26,500 | | | | 630,435 | |
| | | | | | | | |
| Total Common Stocks | | | | | | | | |
| (Cost $185,862,951) | | | | | | | 263,537,004 | |
| | | Face
Amount | | | | |
| | | | | | | | |
REPURCHASE AGREEMENT††,2 - 0.4% | |
HSBC Group
issued 03/31/15 at 0.03%
due 04/01/15 | | $ | 1,089,890 | | | | 1,089,890 | |
| Total Repurchase Agreement | | | | | | | | |
| (Cost $1,089,890) | | | | | | | 1,089,890 | |
| | | | | | | | |
SECURITIES LENDING COLLATERAL††,3 - 4.4% | |
| Repurchase Agreements | | | | | | | | |
HSBC Securities, Inc.
issued 03/31/15 at 0.10%
due 04/01/15 | | | 7,608,349 | | | | 7,608,349 | |
BNP Paribas Securities Corp.
issued 03/31/15 at 0.10%
due 04/01/15 | | | 2,617,272 | | | | 2,617,272 | |
Barclays Capital, Inc.
issued 03/31/15 at 0.10%
due 04/01/15 | | | 1,350,939 | | | | 1,350,939 | |
| Total Securities Lending Collateral | | | | | | | | |
| (Cost $11,576,560) | | | | | | | 11,576,560 | |
| | | | | | | | |
| Total Investments - 103.9% | | | | | | | | |
| (Cost $198,529,401) | | | | | | $ | 276,203,454 | |
| Other Assets & Liabilities, net - (3.9)% | | | | | | | (10,416,720 | ) |
| Total Net Assets - 100.0% | | | | | | $ | 265,786,734 | |
| * | Non-income producing security. |
| † | Value determined based on Level 1 inputs — See Note 4. |
| †† | Value determined based on Level 2 inputs — See Note 4. |
| 1 | All or portion of this security is on loan at March 31, 2015 — See Note 6. |
| 2 | Repurchase Agreement — See Note 5. |
| 3 | Securities lending collateral — See Note 6. |
| ADR — American Depositary Receipt |
| plc — Public Limited Company |
| SEE NOTES TO FINANCIAL STATEMENTS. | THE RYDEX FUNDS ANNUAL REPORT | 81 |
STATEMENT OF ASSETS AND LIABILITIES
March 31, 2015
| Assets: | |
| Investments, at value - including $10,954,785 of securities loaned (cost $185,862,951) | | $ | 263,537,004 | |
| Repurchase agreements, at value (cost $12,666,450) | | | 12,666,450 | |
| Total investments (cost $198,529,401) | | | 276,203,454 | |
| Segregated cash with broker | | | 169,200 | |
| Cash | | | 18,971 | |
| Receivables: | |
| Fund shares sold | | | 2,035,277 | |
| Dividends | | | 218,778 | |
| Securities lending income | | | 30,784 | |
| Total assets | | | 278,676,464 | |
| | | | | |
| Liabilities: | |
| Payable for: | |
| Return of securities loaned | | | 11,745,759 | |
| Fund shares redeemed | | | 741,493 | |
| Management fees | | | 189,416 | |
| Transfer agent and administrative fees | | | 55,711 | |
| Distribution and service fees | | | 37,217 | |
| Portfolio accounting fees | | | 21,850 | |
| Miscellaneous | | | 98,284 | |
| Total liabilities | | | 12,889,730 | |
| Commitments and contingent liabilities (Note 10) | | | — | |
| Net assets | | $ | 265,786,734 | |
| | | | | |
| Net assets consist of: | |
| Paid in capital | | $ | 192,785,494 | |
| Undistributed net investment income | | | — | |
| Accumulated net realized loss on investments | | | (4,672,813 | ) |
| Net unrealized appreciation on investments | | | 77,674,053 | |
| Net assets | | $ | 265,786,734 | |
| | | | | |
| Investor Class: | |
| Net assets | | $ | 175,397,190 | |
| Capital shares outstanding | | | 4,894,858 | |
| Net asset value per share | | $ | 35.83 | |
| | | | | |
| Advisor Class: | |
| Net assets | | $ | 50,134,590 | |
| Capital shares outstanding | | | 1,532,736 | |
| Net asset value per share | | $ | 32.71 | |
| | | | | |
| A-Class: | |
| Net assets | | $ | 28,703,656 | |
| Capital shares outstanding | | | 854,356 | |
| Net asset value per share | | $ | 33.60 | |
| Maximum offering price per share (Net asset value divided by 95.25%) | | $ | 35.28 | |
| | | | | |
| C-Class: | |
| Net assets | | $ | 11,551,298 | |
| Capital shares outstanding | | | 374,755 | |
| Net asset value per share | | $ | 30.82 | |
STATEMENT OF OPERATIONS
Year Ended March 31, 2015
| Investment Income: | |
| Dividends | | $ | 1,748,487 | |
| Income from securities lending, net | | | 189,515 | |
| Interest | | | 195 | |
| Total investment income | | | 1,938,197 | |
| | | | | |
| Expenses: | |
| Management fees | | | 1,486,151 | |
| Transfer agent and administrative fees | | | 437,102 | |
| Distribution and service fees: | |
| Advisor Class | | | 195,757 | |
| A-Class | | | 38,221 | |
| C-Class | | | 92,354 | |
| Portfolio accounting fees | | | 174,319 | |
| Custodian fees | | | 20,349 | |
| Trustees’ fees* | | | 9,986 | |
| Tax expense | | | 1,187 | |
| Line of credit fees | | | 248 | |
| Miscellaneous | | | 215,535 | |
| Total expenses | | | 2,671,209 | |
| Net investment loss | | | (733,012 | ) |
| | | | | |
| Net Realized and Unrealized Gain (Loss): | |
| Net realized gain (loss) on: | |
| Investments | | | 8,068,372 | |
| Net realized gain | | | 8,068,372 | |
| Net change in unrealized appreciation (depreciation) on: | |
| Investments | | | 40,282,429 | |
| Net change in unrealized appreciation (depreciation) | | | 40,282,429 | |
| Net realized and unrealized gain | | | 48,350,801 | |
| Net increase in net assets resulting from operations | | $ | 47,617,789 | |
| * | Relates to Trustees not deemed “interested persons” within the meaning of Section 2(a)(19) of the 1940 Act. |
| 82 | THE RYDEX FUNDS ANNUAL REPORT | SEE NOTES TO FINANCIAL STATEMENTS. |
STATEMENTS OF CHANGES IN NET ASSETS
| | | Year Ended March 31, 2015 | | | Year Ended March 31, 2014 | |
| Increase (Decrease) in Net Assets from Operations: | | | | | | |
| Net investment loss | | $ | (733,012 | ) | | $ | (254,146 | ) |
| Net realized gain on investments | | | 8,068,372 | | | | 20,336,238 | |
| Net change in unrealized appreciation (depreciation) on investments | | | 40,282,429 | | | | 7,106,133 | |
| Net increase in net assets resulting from operations | | | 47,617,789 | | | | 27,188,225 | |
| | | | | | | | | |
| Distributions to shareholders from: | | | | | | | | |
| Net investment income | | | | | | | | |
| Investor Class | | | — | | | | (89,982 | ) |
| Advisor Class | | | — | | | | (7,552 | ) |
| A-Class | | | — | | | | (7,852 | ) |
| C-Class | | | — | | | | (7,895 | ) |
| Net realized gains | | | | | | | | |
| Investor Class | | | (1,752,480 | ) | | | (3,786,592 | ) |
| Advisor Class | | | (465,325 | ) | | | (317,778 | ) |
| A-Class | | | (250,757 | ) | | | (326,428 | ) |
| C-Class | | | (125,703 | ) | | | (332,239 | ) |
| Total distributions to shareholders | | | (2,594,265 | ) | | | (4,876,318 | ) |
| | | | | | | | | |
| Capital share transactions: | | | | | | | | |
| Proceeds from sale of shares | | | | | | | | |
| Investor Class | | | 349,067,609 | | | | 324,677,607 | |
| Advisor Class | | | 141,454,376 | | | | 76,308,656 | |
| A-Class | | | 42,834,467 | | | | 20,247,591 | |
| C-Class | | | 27,276,806 | | | | 33,842,495 | |
| Distributions reinvested | | | | | | | | |
| Investor Class | | | 1,343,589 | | | | 3,851,003 | |
| Advisor Class | | | 464,580 | | | | 323,914 | |
| A-Class | | | 203,075 | | | | 330,789 | |
| C-Class | | | 120,158 | | | | 328,744 | |
| Cost of shares redeemed | | | | | | | | |
| Investor Class | | | (302,007,365 | ) | | | (354,047,641 | ) |
| Advisor Class | | | (139,767,422 | ) | | | (42,786,393 | ) |
| A-Class | | | (26,627,112 | ) | | | (17,317,347 | ) |
| C-Class | | | (25,514,379 | ) | | | (32,535,770 | ) |
| Net increase from capital share transactions | | | 68,848,382 | | | | 13,223,648 | |
| Net increase in net assets | | | 113,871,906 | | | | 35,535,555 | |
| | | | | | | | | |
| Net assets: | | | | | | | | |
| Beginning of year | | | 151,914,828 | | | | 116,379,273 | |
| End of year | | $ | 265,786,734 | | | $ | 151,914,828 | |
| Undistributed net investment income at end of year | | $ | — | | | $ | — | |
| SEE NOTES TO FINANCIAL STATEMENTS. | THE RYDEX FUNDS ANNUAL REPORT | 83 |
STATEMENTS OF CHANGES IN NET ASSETS (concluded)
| | | | Year Ended March 31, 2015 | | | | Year Ended March 31, 2014 | |
| Capital share activity: | | | | | | | | |
| Shares sold | | | | | | | | |
| Investor Class | | | 11,255,406 | | | | 12,765,655 | |
| Advisor Class | | | 4,878,949 | | | | 3,036,456 | |
| A-Class | | | 1,476,215 | | | | 823,789 | |
| C-Class | | | 1,010,754 | | | | 1,521,467 | |
| Shares issued from reinvestment of distributions | | | | | | | | |
| Investor Class | | | 41,909 | | | | 148,573 | |
| Advisor Class | | | 15,845 | | | | 13,587 | |
| A-Class | | | 6,749 | | | | 13,557 | |
| C-Class | | | 4,361 | | | | 14,527 | |
| Shares redeemed | | | | | | | | |
| Investor Class | | | (9,940,130 | ) | | | (14,053,114 | ) |
| Advisor Class | | | (4,871,552 | ) | | | (1,714,436 | ) |
| A-Class | | | (931,513 | ) | | | (707,448 | ) |
| C-Class | | | (943,291 | ) | | | (1,464,775 | ) |
| Net increase in shares | | | 2,003,702 | | | | 397,838 | |
| 84 | THE RYDEX FUNDS ANNUAL REPORT | SEE NOTES TO FINANCIAL STATEMENTS. |
This table is presented to show selected data for a share outstanding throughout each period and to assist shareholders in evaluating a Fund’s performance for the periods presented.
| Investor Class | | Year Ended March 31, 2015 | | | Year Ended March 31, 2014 | | | Year Ended March 28, 2013 | | | Year Ended March 31, 2012 | | | Year Ended March 31, 2011 | |
| Per Share Data | | | | | | | | | | | | | | | |
| Net asset value, beginning of period | | $ | 27.76 | | | $ | 22.35 | | | $ | 18.83 | | | $ | 17.14 | | | $ | 15.80 | |
| Income (loss) from investment operations: | |
Net investment income (loss)a | | | (.07 | ) | | | (.03 | ) | | | .09 | | | | .01 | | | | (.02 | ) |
| Net gain (loss) on investments (realized and unrealized) | | | 8.50 | | | | 7.00 | | | | 3.48 | | | | 1.68 | | | | 1.36 | |
| Total from investment operations | | | 8.43 | | | | 6.97 | | | | 3.57 | | | | 1.69 | | | | 1.34 | |
| Less distributions from: | |
| Net investment income | | | — | | | | (.03 | ) | | | (.05 | ) | | | — | | | | — | |
| Net realized gains | | | (.36 | ) | | | (1.53 | ) | | | — | | | | — | | | | — | |
| Total distributions | | | (.36 | ) | | | (1.56 | ) | | | (.05 | ) | | | — | | | | — | |
| Net asset value, end of period | | $ | 35.83 | | | $ | 27.76 | | | $ | 22.35 | | | $ | 18.83 | | | $ | 17.14 | |
| | |
Total Returnb | | | 30.51 | % | | | 31.70 | % | | | 18.98 | % | | | 9.86 | % | | | 8.48 | % |
| Ratios/Supplemental Data | |
| Net assets, end of period (in thousands) | | $ | 175,397 | | | $ | 98,209 | | | $ | 104,525 | | | $ | 39,036 | | | $ | 19,534 | |
| Ratios to average net assets: | |
| Net investment income (loss) | | | (0.23 | %) | | | (0.12 | %) | | | 0.45 | % | | | 0.08 | % | | | (0.10 | %) |
| Total expenses | | | 1.34 | % | | | 1.37 | % | | | 1.35 | % | | | 1.36 | % | | | 1.38 | % |
| Portfolio turnover rate | | | 176 | % | | | 277 | % | | | 266 | % | | | 582 | % | | | 619 | % |
| Advisor Class | | Year Ended March 31, 2015 | | | Year Ended March 31, 2014 | | | Year Ended March 28, 2013 | | | Year Ended March 31, 2012 | | | Year Ended March 31, 2011 | |
| Per Share Data | | | | | | | | | | | | | | | |
| Net asset value, beginning of period | | $ | 25.49 | | | $ | 20.73 | | | $ | 17.55 | | | $ | 16.04 | | | $ | 14.85 | |
| Income (loss) from investment operations: | |
Net investment income (loss)a | | | (.21 | ) | | | (.15 | ) | | | (.06 | ) | | | (.07 | ) | | | (.05 | ) |
| Net gain (loss) on investments (realized and unrealized) | | | 7.79 | | | | 6.47 | | | | 3.29 | | | | 1.58 | | | | 1.24 | |
| Total from investment operations | | | 7.58 | | | | 6.32 | | | | 3.23 | | | | 1.51 | | | | 1.19 | |
| Less distributions from: | |
| Net investment income | | | — | | | | (.03 | ) | | | (.05 | ) | | | — | | | | — | |
| Net realized gains | | | (.36 | ) | | | (1.53 | ) | | | — | | | | — | | | | — | |
| Total distributions | | | (.36 | ) | | | (1.56 | ) | | | (.05 | ) | | | — | | | | — | |
| Net asset value, end of period | | $ | 32.71 | | | $ | 25.49 | | | $ | 20.73 | | | $ | 17.55 | | | $ | 16.04 | |
| | |
Total Returnb | | | 29.89 | % | | | 31.03 | % | | | 18.43 | % | | | 9.41 | % | | | 8.01 | % |
| Ratios/Supplemental Data | |
| Net assets, end of period (in thousands) | | $ | 50,135 | | | $ | 38,480 | | | $ | 3,605 | | | $ | 4,275 | | | $ | 2,229 | |
| Ratios to average net assets: | |
| Net investment income (loss) | | | (0.73 | %) | | | (0.62 | %) | | | (0.31 | %) | | | (0.44 | %) | | | (0.36 | %) |
| Total expenses | | | 1.85 | % | | | 1.87 | % | | | 1.86 | % | | | 1.85 | % | | | 1.88 | % |
| Portfolio turnover rate | | | 176 | % | | | 277 | % | | | 266 | % | | | 582 | % | | | 619 | % |
| SEE NOTES TO FINANCIAL STATEMENTS. | THE RYDEX FUNDS ANNUAL REPORT | 85 |
FINANCIAL HIGHLIGHTS (concluded)
This table is presented to show selected data for a share outstanding throughout each period and to assist shareholders in evaluating a Fund’s performance for the periods presented.
| A-Class | | Year Ended March 31, 2015 | | | Year Ended March 31, 2014 | | | Year Ended March 28, 2013 | | | Year Ended March 31, 2012 | | | Year Ended March 31, 2011 | |
| Per Share Data | | | | | | | | | | | | | | | |
| Net asset value, beginning of period | | $ | 26.11 | | | $ | 21.15 | | | $ | 17.87 | | | $ | 16.30 | | | $ | 15.05 | |
| Income (loss) from investment operations: | |
Net investment income (loss)a | | | (.14 | ) | | | (.09 | ) | | | .04 | | | | (.02 | ) | | | (.02 | ) |
| Net gain (loss) on investments (realized and unrealized) | | | 7.99 | | | | 6.61 | | | | 3.29 | | | | 1.59 | | | | 1.27 | |
| Total from investment operations | | | 7.85 | | | | 6.52 | | | | 3.33 | | | | 1.57 | | | | 1.25 | |
| Less distributions from: | |
| Net investment income | | | — | | | | (.03 | ) | | | (.05 | ) | | | — | | | | — | |
| Net realized gains | | | (.36 | ) | | | (1.53 | ) | | | — | | | | — | | | | — | |
| Total distributions | | | (.36 | ) | | | (1.56 | ) | | | (.05 | ) | | | — | | | | — | |
| Net asset value, end of period | | $ | 33.60 | | | $ | 26.11 | | | $ | 21.15 | | | $ | 17.87 | | | $ | 16.30 | |
| | |
Total Returnb | | | 30.21 | % | | | 31.36 | % | | | 18.65 | % | | | 9.63 | % | | | 8.31 | % |
| Ratios/Supplemental Data | |
| Net assets, end of period (in thousands) | | $ | 28,704 | | | $ | 7,909 | | | $ | 3,660 | | | $ | 2,964 | | | $ | 1,156 | |
| Ratios to average net assets: | |
| Net investment income (loss) | | | (0.47 | %) | | | (0.37 | %) | | | 0.20 | % | | | (0.13 | %) | | | (0.14 | %) |
| Total expenses | | | 1.59 | % | | | 1.62 | % | | | 1.60 | % | | | 1.60 | % | | | 1.63 | % |
| Portfolio turnover rate | | | 176 | % | | | 277 | % | | | 266 | % | | | 582 | % | | | 619 | % |
| C-Class | | Year Ended March 31, 2015 | | | Year Ended March 31, 2014 | | | Year Ended March 28, 2013 | | | Year Ended March 31, 2012 | | | Year Ended March 31, 2011 | |
| Per Share Data | | | | | | | | | | | | | | | |
| Net asset value, beginning of period | | $ | 24.16 | | | $ | 19.81 | | | $ | 16.86 | | | $ | 15.50 | | | $ | 14.39 | |
| Income (loss) from investment operations: | |
Net investment income (loss)a | | | (.33 | ) | | | (.26 | ) | | | (.09 | ) | | | (.14 | ) | | | (.11 | ) |
| Net gain (loss) on investments (realized and unrealized) | | | 7.35 | | | | 6.17 | | | | 3.09 | | | | 1.50 | | | | 1.22 | |
| Total from investment operations | | | 7.02 | | | | 5.91 | | | | 3.00 | | | | 1.36 | | | | 1.11 | |
| Less distributions from: | |
| Net investment income | | | — | | | | (.03 | ) | | | (.05 | ) | | | — | | | | — | |
| Net realized gains | | | (.36 | ) | | | (1.53 | ) | | | — | | | | — | | | | — | |
| Total distributions | | | (.36 | ) | | | (1.56 | ) | | | (.05 | ) | | | — | | | | — | |
| Net asset value, end of period | | $ | 30.82 | | | $ | 24.16 | | | $ | 19.81 | | | $ | 16.86 | | | $ | 15.50 | |
| | |
Total Returnb | | | 29.21 | % | | | 30.38 | % | | | 17.81 | % | | | 8.77 | % | | | 7.71 | % |
| Ratios/Supplemental Data | |
| Net assets, end of period (in thousands) | | $ | 11,551 | | | $ | 7,318 | | | $ | 4,589 | | | $ | 3,468 | | | $ | 3,870 | |
| Ratios to average net assets: | |
| Net investment income (loss) | | | (1.24 | %) | | | (1.14 | %) | | | (0.53 | %) | | | (0.91 | %) | | | (0.76 | %) |
| Total expenses | | | 2.34 | % | | | 2.37 | % | | | 2.35 | % | | | 2.36 | % | | | 2.38 | % |
| Portfolio turnover rate | | | 176 | % | | | 277 | % | | | 266 | % | | | 582 | % | | | 619 | % |
a | Net investment income (loss) per share was computed using average shares outstanding throughout the period. |
b | Total return does not reflect the impact of any applicable sales charges. |
| 86 | THE RYDEX FUNDS ANNUAL REPORT | SEE NOTES TO FINANCIAL STATEMENTS. |
PERFORMANCE REPORT AND FUND PROFILE (Unaudited) | March 31, 2015 |
INTERNET FUND
OBJECTIVE: Seeks to provide capital appreciation by investing in companies that provide products or services designed for or related to the internet (“internet companies”).
For the one-year period ended March 31, 2015, Internet Fund Investor Class returned 6.40%, compared with 18.11% for the S&P 500 Information Technology Index. The broader S&P 500 Index returned 12.73%.
The internet & catalog retail segment was the largest contributor to return, followed by the communications equipment segment. Contributing least to return was the diversified telecommunication services segment. The only detractor from return was the health care technology segment.
Facebook, Inc. — Class A, Cisco Systems, Inc., and Time Warner, Inc. added the most to Fund performance for the period. Youku Tudou, Inc. ADR, Qihoo 360 Technology Company Ltd. ADR, and Alibaba Group Holding Ltd. ADR detracted most from Fund performance for the period.
Performance displayed represents past performance, which is no guarantee of future results.
Holdings Diversification (Market Exposure as % of Net Assets)
“Holdings Diversification (Market Exposure as % of Net Assets)” excludes any temporary cash investments.
| Inception Dates: |
| Investor Class | April 6, 2000 |
| Advisor Class | April 6, 2000 |
| A-Class | September 1, 2004 |
| C-Class | April 19, 2001 |
| Ten Largest Holdings (% of Total Net Assets) |
| Facebook, Inc. — Class A | 5.1% |
| Amazon.com, Inc. | 4.2% |
| Cisco Systems, Inc. | 3.8% |
| QUALCOMM, Inc. | 3.4% |
| Google, Inc. — Class A | 3.1% |
| Google, Inc. — Class C | 3.1% |
| Time Warner, Inc. | 2.7% |
| eBay, Inc. | 2.7% |
| Priceline Group, Inc. | 2.5% |
| salesforce.com, Inc. | 2.1% |
| Top Ten Total | 32.7% |
| | |
| “Ten Largest Holdings” exclude any temporary cash or derivative investments. |
| | THE RYDEX FUNDS ANNUAL REPORT | 87 |
PERFORMANCE REPORT AND FUND PROFILE (Unaudited)(concluded) | March 31, 2015 |
Cumulative Fund Performance*
Average Annual Returns*
Periods Ended March 31, 2015
| | 1 Year | 5 Year | 10 Year |
| Investor Class Shares | 6.40% | 14.54% | 10.07% |
| Advisor Class Shares | 5.80% | 13.96% | 9.52% |
| A-Class Shares | 6.12% | 14.26% | 9.80% |
A-Class Shares with sales charge† | 1.08% | 13.15% | 9.26% |
| C-Class Shares | 5.34% | 13.39% | 8.98% |
C-Class Shares with CDSC‡ | 4.34% | 13.39% | 8.98% |
| S&P 500 Information Technology Index | 18.11% | 14.55% | 9.77% |
| S&P 500 Index | 12.73% | 14.47% | 8.01% |
| * | The performance data above represents past performance that is not predictive of future results. The investment return and principal value of an investment in the Fund will fluctuate so that an investor’s shares, when redeemed, may be worth more or less than their original cost. Returns are historical and include changes in principal and reinvested dividends and capital gains and do not reflect the effect of taxes. The S&P 500 Index and the S&P 500 Information Technology Index are unmanaged indices and, unlike the Fund, have no management fees or operating expenses to reduce their reported returns. The graphs are based on Investor Class shares and A-Class shares only; performance for Advisor Class shares and C-Class shares will vary due to differences in fee structures. |
† | Fund returns are calculated using the maximum sales charge of 4.75%. |
‡ | Fund returns include a CDSC of 1% if redeemed within 12 months of purchase. |
| 88 | THE RYDEX FUNDS ANNUAL REPORT | |
| SCHEDULE OF INVESTMENTS | March 31, 2015 |
| INTERNET FUND | |
| | |
Shares | | | Value | |
| | | | | | | | |
COMMON STOCKS† - 99.4% | |
| | | | | | | | |
| E-COMMERCE/SERVICES - 14.1% | |
| Priceline Group, Inc.* | | | 320 | | | $ | 372,527 | |
| Netflix, Inc.* | | | 575 | | | | 239,597 | |
| Liberty Ventures* | | | 5,504 | | | | 231,223 | |
| Expedia, Inc. | | | 1,736 | | | | 163,410 | |
| TripAdvisor, Inc.* | | | 1,961 | | | | 163,096 | |
| IAC/InterActiveCorp | | | 1,680 | | | | 113,350 | |
| Zillow Group, Inc. — Class A* | | | 1,108 | | | | 111,132 | |
| Ctrip.com International Ltd. ADR* | | | 1,836 | | | | 107,626 | |
| Groupon, Inc. — Class A* | | | 13,912 | | | | 100,306 | |
| GrubHub, Inc.* | | | 2,020 | | | | 91,688 | |
| SouFun Holdings Ltd. ADR | | | 13,294 | | | | 79,764 | |
| 58.com, Inc. ADR* | | | 1,480 | | | | 78,262 | |
| Bitauto Holdings Ltd. ADR* | | | 1,534 | | | | 78,050 | |
| Autohome, Inc. ADR* | | | 1,650 | | | | 72,551 | |
| Orbitz Worldwide, Inc.* | | | 4,610 | | | | 53,753 | |
| Total E-Commerce/Services | | | | | | | 2,056,335 | |
| | | | | | | | |
| E-COMMERCE/PRODUCTS - 10.6% | |
| Amazon.com, Inc.* | | | 1,665 | | | | 619,547 | |
| eBay, Inc.* | | | 6,741 | | | | 388,821 | |
| Alibaba Group Holding Ltd. ADR* | | | 1,810 | | | | 150,664 | |
| JD.com, Inc. ADR* | | | 3,250 | | | | 95,485 | |
| Vipshop Holdings Ltd. ADR* | | | 3,193 | | | | 94,002 | |
| MercadoLibre, Inc. | | | 583 | | | | 71,429 | |
| zulily, Inc. — Class A* | | | 4,714 | | | | 61,235 | |
| Shutterfly, Inc.* | | | 1,342 | | | | 60,712 | |
| Total E-Commerce/Products | | | | | | | 1,541,895 | |
| | | | | | | | |
| WEB PORTALS/ISP - 10.4% | |
| Google, Inc. — Class A* | | | 822 | | | | 455,963 | |
| Google, Inc. — Class C* | | | 832 | | | | 455,936 | |
| Yahoo!, Inc.* | | | 6,918 | | | | 307,401 | |
| Baidu, Inc. ADR* | | | 679 | | | | 141,504 | |
| AOL, Inc.* | | | 2,121 | | | | 84,013 | |
| SINA Corp.* | | | 2,155 | | | | 69,305 | |
| Total Web Portals/ISP | | | | | | | 1,514,122 | |
| | | | | | | | |
| INTERNET CONTENT-ENTERTAINMENT - 8.5% | |
| Facebook, Inc. — Class A* | | | 9,005 | | | | 740,346 | |
| Twitter, Inc.* | | | 5,623 | | | | 281,600 | |
| Pandora Media, Inc.* | | | 5,648 | | | | 91,554 | |
| Shutterstock, Inc.* | | | 1,120 | | | | 76,910 | |
| Youku Tudou, Inc. ADR* | | | 4,492 | | | | 56,150 | |
| Total Internet Content-Entertainment | | | | | | | 1,246,560 | |
| | | | | | | | |
| NETWORKING PRODUCTS - 7.7% | |
| Cisco Systems, Inc. | | | 20,048 | | | | 551,820 | |
| Palo Alto Networks, Inc.* | | | 1,124 | | | | 164,194 | |
| Arista Networks, Inc.* | | | 1,420 | | | | 100,153 | |
| Infinera Corp.* | | | 3,850 | | | | 75,730 | |
| Telefonaktiebolaget LM Ericsson ADR | | | 5,383 | | | | 67,557 | |
| Polycom, Inc.* | | | 4,716 | | | | 63,194 | |
| LogMeIn, Inc.* | | | 1,000 | | | | 55,990 | |
| Ruckus Wireless, Inc.* | | | 3,930 | | | | 50,579 | |
| Total Networking Products | | | | | | | 1,129,217 | |
| | | | | | | | |
| APPLICATIONS SOFTWARE - 6.6% | |
| salesforce.com, Inc.* | | | 4,640 | | | | 309,998 | |
| Intuit, Inc. | | | 2,482 | | | | 240,655 | |
| Red Hat, Inc.* | | | 2,457 | | | | 186,118 | |
| Check Point Software Technologies Ltd.* | | | 990 | | | | 81,150 | |
| Demandware, Inc.* | | | 1,140 | | | | 69,426 | |
| Dealertrack Technologies, Inc.* | | | 1,743 | | | | 67,140 | |
| Total Applications Software | | | | | | | 954,487 | |
| | | | | | | | |
| WIRELESS EQUIPMENT - 5.4% | |
| Motorola Solutions, Inc. | | | 2,706 | | | | 180,409 | |
Gogo, Inc.*,1 | | | 9,347 | | | | 178,154 | |
| ViaSat, Inc.* | | | 1,300 | | | | 77,493 | |
| Aruba Networks, Inc.* | | | 3,153 | | | | 77,217 | |
| Ubiquiti Networks, Inc. | | | 2,476 | | | | 73,166 | |
| Nokia Oyj ADR | | | 9,265 | | | | 70,229 | |
| Sierra Wireless, Inc.* | | | 2,080 | | | | 68,827 | |
| InterDigital, Inc. | | | 1,260 | | | | 63,932 | |
| Total Wireless Equipment | | | | | | | 789,427 | |
| | | | | | | | |
| FINANCE-INVESTMENT BANKERS/BROKERS - 4.4% | |
| Charles Schwab Corp. | | | 9,730 | | | | 296,180 | |
| TD Ameritrade Holding Corp. | | | 5,680 | | | | 211,637 | |
| E*TRADE Financial Corp.* | | | 4,780 | | | | 136,493 | |
| Total Finance-Investment Bankers/Brokers | | | | | | | 644,310 | |
| | | | | | | | |
| TELECOMMUNICATION EQUIPMENT - 4.1% | |
| Harris Corp. | | | 1,790 | | | | 140,980 | |
| Juniper Networks, Inc. | | | 6,197 | | | | 139,928 | |
| CommScope Holding Company, Inc.* | | | 3,720 | | | | 106,169 | |
| ARRIS Group, Inc.* | | | 3,225 | | | | 93,186 | |
| Plantronics, Inc. | | | 1,310 | | | | 69,365 | |
| ADTRAN, Inc. | | | 2,439 | | | | 45,536 | |
| Total Telecommunication Equipment | | | | | | | 595,164 | |
| | | | | | | | |
| SEMICONDUCTOR COMPONENTS-INTEGRATED CIRCUIT - 3.4% | |
| QUALCOMM, Inc. | | | 7,215 | | | | 500,287 | |
| | | | | | | | |
| INTERNET CONTENT-INFORMATION/NETWORK - 3.3% | |
| LinkedIn Corp. — Class A* | | | 1,036 | | | | 258,855 | |
| Yelp, Inc. — Class A* | | | 1,894 | | | | 89,681 | |
YY, Inc. ADR*,1 | | | 1,434 | | | | 78,232 | |
| WebMD Health Corp. — Class A* | | | 1,399 | | | | 61,325 | |
| Total Internet Content-Information/Network | | | | | | | 488,093 | |
| | | | | | | | |
| INTERNET SECURITY - 2.8% | |
| Symantec Corp. | | | 8,003 | | | | 186,990 | |
| VeriSign, Inc.* | | | 2,024 | | | | 135,547 | |
| SEE NOTES TO FINANCIAL STATEMENTS. | THE RYDEX FUNDS ANNUAL REPORT | 89 |
SCHEDULE OF INVESTMENTS (concluded) | March 31, 2015 |
| INTERNET FUND | |
| | |
Shares | | | Value | |
| | | | | | | | | |
| Qihoo 360 Technology Company Ltd. ADR* | | | 1,719 | | | $ | 88,013 | |
| Total Internet Security | | | | | | | 410,550 | |
| | | | | | | | |
| MULTIMEDIA - 2.7% | |
| Time Warner, Inc. | | | 4,646 | | | | 392,308 | |
| | | | | | | | |
| COMPUTER SOFTWARE - 2.4% | |
| Akamai Technologies, Inc.* | | | 2,342 | | | | 166,388 | |
| Rackspace Hosting, Inc.* | | | 2,412 | | | | 124,435 | |
| Cornerstone OnDemand, Inc.* | | | 2,070 | | | | 59,802 | |
| Total Computer Software | | | | | | | 350,625 | |
| | | | | | | | |
| ELECTRONIC COMPONENTS-SEMICONDUCTOR - 1.6% | |
| Broadcom Corp. — Class A | | | 5,412 | | | | 234,313 | |
| | | | | | | | |
| COMMERCIAL SERVICES - 1.5% | |
| CoStar Group, Inc.* | | | 604 | | | | 119,490 | |
| Live Nation Entertainment, Inc.* | | | 4,180 | | | | 105,461 | |
| Total Commercial Services | | | | | | | 224,951 | |
| | | | | | | | |
| TELECOMMUNICATION EQUIPMENT FIBER OPTICS - 1.4% | |
| JDS Uniphase Corp.* | | | 6,076 | | | | 79,718 | |
| Finisar Corp.* | | | 3,157 | | | | 67,370 | |
| Ciena Corp.* | | | 3,317 | | | | 64,051 | |
| Total Telecommunication Equipment Fiber Optics | | | | | | | 211,139 | |
| | | | | | | | |
| COMPUTERS-INTEGRATED SYSTEMS - 1.4% | |
| Brocade Communications Systems, Inc. | | | 8,750 | | | | 103,819 | |
| Riverbed Technology, Inc.* | | | 4,945 | | | | 103,400 | |
| Total Computers-Integrated Systems | | | | | | | 207,219 | |
| | | | | | | | |
| WEB HOSTING/DESIGN - 1.2% | |
| Equinix, Inc. | | | 727 | | | | 169,283 | |
| | | | | | | | |
| INTERNET INFRASTRUCTURE SOFTWARE - 0.9% | |
| F5 Networks, Inc.* | | | 1,192 | | | | 137,008 | |
| | | | | | | | |
| FINANCE-CONSUMER LOANS - 0.9% | |
| LendingClub Corp.* | | | 6,570 | | | | 129,101 | |
| | | | | | | | |
| ENTERPRISE SOFTWARE/SERVICES - 0.6% | |
| Veeva Systems, Inc. — Class A* | | | 3,430 | | | | 87,568 | |
| | | | | | | | |
| COMPUTER SERVICES INTERNET TELEPHONY - 0.6% | |
| j2 Global, Inc. | | | 1,260 | | | | 82,757 | |
| | | | | | | | |
| INTERNET INCUBATORS - 0.5% | |
| HomeAway, Inc.* | | | 2,592 | | | | 78,201 | |
| | | | | | | | |
| ENTERTAINMENT SOFTWARE - 0.5% | |
| NetEase, Inc. ADR | | | 739 | | | | 77,817 | |
| | | | | | | | |
| PRINTING-COMMERCIAL - 0.5% | |
| Cimpress N.V.* | | | 834 | | | | 70,373 | |
| | | | | | | | |
| MEDICAL INFORMATION SYSTEM - 0.5% | |
| Allscripts Healthcare Solutions, Inc.* | | | 5,880 | | | | 70,325 | |
| | | | | | | | |
| COMPUTERS - 0.5% | |
| BlackBerry Ltd.* | | | 7,827 | | | | 69,895 | |
| | | | | | | | |
| INTERNET CONNECTIVITY SERVICES - 0.4% | |
| Cogent Communications Holdings, Inc. | | | 1,720 | | | | 60,768 | |
| | | | | | | | |
| Total Common Stocks | | | | | | | | |
| (Cost $8,653,198) | | | | | | | 14,524,098 | |
| | | | | | | | |
| | | Face
Amount | | | | |
| | | | | | | | |
REPURCHASE AGREEMENT††,2 - 0.5% | |
HSBC Group
issued 03/31/15 at 0.03%
due 04/01/15 | | $ | 77,876 | | | | 77,876 | |
| Total Repurchase Agreement | | | | | | | | |
| (Cost $77,876) | | | | | | | 77,876 | |
| | | | | | | | |
SECURITIES LENDING COLLATERAL††,3 - 1.2% | |
| Repurchase Agreements | | | | | | | | |
HSBC Securities, Inc.
issued 03/31/15 at 0.10%
due 04/01/15 | | | 112,397 | | | | 112,397 | |
BNP Paribas Securities Corp.
issued 03/31/15 at 0.10%
due 04/01/15 | | | 38,664 | | | | 38,664 | |
Barclays Capital, Inc.
issued 03/31/15 at 0.10%
due 04/01/15 | | | 19,957 | | | | 19,957 | |
| Total Securities Lending Collateral | | | | | | | | |
| (Cost $171,018) | | | | | | | 171,018 | |
| | | | | | | | |
| Total Investments - 101.1% | | | | | | | | |
| (Cost $8,902,092) | | | | | | $ | 14,772,992 | |
| Other Assets & Liabilities, net - (1.1)% | | | | | | | (156,792 | ) |
| Total Net Assets - 100.0% | | | | | | $ | 14,616,200 | |
| * | Non-income producing security. |
| † | Value determined based on Level 1 inputs — See Note 4. |
| †† | Value determined based on Level 2 inputs — See Note 4. |
| 1 | All or portion of this security is on loan at March 31, 2015 — See Note 6. |
| 2 | Repurchase Agreement — See Note 5. |
| 3 | Securities lending collateral — See Note 6. |
| ADR — American Depositary Receipt |
| 90 | THE RYDEX FUNDS ANNUAL REPORT | SEE NOTES TO FINANCIAL STATEMENTS. |
STATEMENT OF ASSETS AND LIABILITIES
March 31, 2015
| Assets: | |
| Investments, at value - including $169,972 of securities loaned (cost $8,653,198) | | $ | 14,524,098 | |
| Repurchase agreements, at value (cost $248,894) | | | 248,894 | |
| Total investments (cost $8,902,092) | | | 14,772,992 | |
| Segregated cash with broker | | | 2,500 | |
| Cash | | | 2,416 | |
| Receivables: | |
| Fund shares sold | | | 150,084 | |
| Dividends | | | 5,458 | |
| Securities lending income | | | 846 | |
| Foreign taxes reclaim | | | 743 | |
| Total assets | | | 14,935,039 | |
| | | | | |
| Liabilities: | |
| Payable for: | |
| Return of securities loaned | | | 173,518 | |
| Securities purchased | | | 81,065 | |
| Fund shares redeemed | | | 38,511 | |
| Management fees | | | 10,336 | |
| Distribution and service fees | | | 3,544 | |
| Transfer agent and administrative fees | | | 3,040 | |
| Portfolio accounting fees | | | 1,216 | |
| Miscellaneous | | | 7,609 | |
| Total liabilities | | | 318,839 | |
| Commitments and contingent liabilities (Note 10) | | | — | |
| Net assets | | $ | 14,616,200 | |
| | | | | |
| Net assets consist of: | |
| Paid in capital | | $ | 10,675,060 | |
| Undistributed net investment income | | | — | |
| Accumulated net realized loss on investments | | | (1,929,760 | ) |
| Net unrealized appreciation on investments | | | 5,870,900 | |
| Net assets | | $ | 14,616,200 | |
| | | | | |
| Investor Class: | |
| Net assets | | $ | 8,328,216 | |
| Capital shares outstanding | | | 106,948 | |
| Net asset value per share | | $ | 77.87 | |
| | | | | |
| Advisor Class: | |
| Net assets | | $ | 1,830,003 | |
| Capital shares outstanding | | | 25,545 | |
| Net asset value per share | | $ | 71.64 | |
| | | | | |
| A-Class: | |
| Net assets | | $ | 2,021,684 | |
| Capital shares outstanding | | | 27,427 | |
| Net asset value per share | | $ | 73.71 | |
| Maximum offering price per share (Net asset value divided by 95.25%) | | $ | 77.39 | |
| | | | | |
| C-Class: | |
| Net assets | | $ | 2,436,297 | |
| Capital shares outstanding | | | 36,271 | |
| Net asset value per share | | $ | 67.17 | |
STATEMENT OF OPERATIONS
Year Ended March 31, 2015
| Investment Income: | |
| Dividends (net of foreign withholding tax of $4,214) | | $ | 131,064 | |
| Income from securities lending, net | | | 15,390 | |
| Interest | | | 19 | |
| Total investment income | | | 146,473 | |
| | | | | |
| Expenses: | |
| Management fees | | | 174,201 | |
| Transfer agent and administrative fees | | | 51,236 | |
| Distribution and service fees: | | | | |
| Advisor Class | | | 13,133 | |
| A-Class | | | 8,861 | |
| C-Class | | | 29,629 | |
| Portfolio accounting fees | | | 20,494 | |
| Registration fees | | | 21,679 | |
| Custodian fees | | | 2,394 | |
| Trustees’ fees* | | | 2,283 | |
| Line of credit fees | | | 293 | |
| Miscellaneous | | | 4,821 | |
| Total expenses | | | 329,024 | |
| Net investment loss | | | (182,551 | ) |
| | | | | |
| Net Realized and Unrealized Gain (Loss): | |
| Net realized gain (loss) on: | |
| Investments | | | 3,805,670 | |
| Net realized gain | | | 3,805,670 | |
| Net change in unrealized appreciation (depreciation) on: | |
| Investments | | | (3,557,558 | ) |
| Net change in unrealized appreciation (depreciation) | | | (3,557,558 | ) |
| Net realized and unrealized gain | | | 248,112 | |
| Net increase in net assets resulting from operations | | $ | 65,561 | |
| * | Relates to Trustees not deemed “interested persons” within the meaning of Section 2(a)(19) of the 1940 Act. |
| SEE NOTES TO FINANCIAL STATEMENTS. | THE RYDEX FUNDS ANNUAL REPORT | 91 |
STATEMENTS OF CHANGES IN NET ASSETS
| | | Year Ended March 31, 2015 | | | Year Ended March 31, 2014 | |
| Increase (Decrease) in Net Assets from Operations: | | | | | | |
| Net investment loss | | $ | (182,551 | ) | | $ | (368,149 | ) |
| Net realized gain (loss) on investments | | | 3,805,670 | | | | (1,599,042 | ) |
| Net change in unrealized appreciation (depreciation) on investments | | | (3,557,558 | ) | | | 6,184,558 | |
| Net increase in net assets resulting from operations | | | 65,561 | | | | 4,217,367 | |
| | | | | | | | | |
| Distributions to shareholders from: | | | | | | | | |
| Net realized gains | | | | | | | | |
| Investor Class | | | (212,285 | ) | | | (111,377 | ) |
| Advisor Class | | | (44,657 | ) | | | (17,627 | ) |
| A-Class | | | (66,053 | ) | | | (40,920 | ) |
| C-Class | | | (76,244 | ) | | | (15,187 | ) |
| Total distributions to shareholders | | | (399,239 | ) | | | (185,111 | ) |
| | | | | | | | | |
| Capital share transactions: | | | | | | | | |
| Proceeds from sale of shares | | | | | | | | |
| Investor Class | | | 43,138,842 | | | | 137,136,622 | |
| Advisor Class | | | 94,544,871 | | | | 71,839,042 | |
| A-Class | | | 4,055,990 | | | | 18,920,974 | |
| C-Class | | | 11,747,458 | | | | 18,712,886 | |
| Distributions reinvested | | | | | | | | |
| Investor Class | | | 205,625 | | | | 108,663 | |
| Advisor Class | | | 44,428 | | | | 17,580 | |
| A-Class | | | 53,517 | | | | 37,431 | |
| C-Class | | | 74,878 | | | | 14,695 | |
| Cost of shares redeemed | | | | | | | | |
| Investor Class | | | (61,299,428 | ) | | | (119,310,474 | ) |
| Advisor Class | | | (105,054,927 | ) | | | (60,492,721 | ) |
| A-Class | | | (14,360,288 | ) | | | (8,526,665 | ) |
| C-Class | | | (14,064,904 | ) | | | (15,590,538 | ) |
| Net increase (decrease) from capital share transactions | | | (40,913,938 | ) | | | 42,867,495 | |
| Net increase (decrease) in net assets | | | (41,247,616 | ) | | | 46,899,751 | |
| | | | | | | | | |
| Net assets: | | | | | | | | |
| Beginning of year | | | 55,863,816 | | | | 8,964,065 | |
| End of year | | $ | 14,616,200 | | | $ | 55,863,816 | |
| Undistributed net investment income at end of year | | $ | — | | | $ | — | |
| | | | | | | | | |
| Capital share activity: | | | | | | | | |
| Shares sold | | | | | | | | |
| Investor Class | | | 568,304 | | | | 1,953,833 | |
| Advisor Class | | | 1,359,702 | | | | 1,024,297 | |
| A-Class | | | 55,579 | | | | 275,049 | |
| C-Class | | | 177,866 | | | | 314,443 | |
| Shares issued from reinvestment of distributions | | | | | | | | |
| Investor Class | | | 2,672 | | | | 1,528 | |
| Advisor Class | | | 626 | | | | 266 | |
| A-Class | | | 734 | | | | 554 | |
| C-Class | | | 1,124 | | | | 236 | |
| Shares redeemed | | | | | | | | |
| Investor Class | | | (821,508 | ) | | | (1,708,029 | ) |
| Advisor Class | | | (1,504,575 | ) | | | (865,440 | ) |
| A-Class | | | (205,087 | ) | | | (121,953 | ) |
| C-Class | | | (213,643 | ) | | | (266,422 | ) |
| Net increase (decrease) in shares | | | (578,206 | ) | | | 608,362 | |
| 92 | THE RYDEX FUNDS ANNUAL REPORT | SEE NOTES TO FINANCIAL STATEMENTS. |
This table is presented to show selected data for a share outstanding throughout each period and to assist shareholders in evaluating a Fund’s performance for the periods presented.
| Investor Class | | Year Ended March 31, 2015 | | | Year Ended March 31, 2014 | | | Year Ended March 28, 2013 | | | Year Ended March 31, 2012 | | | Year Ended March 31, 2011 | |
| Per Share Data | | | | | | | | | | | | | | | |
| Net asset value, beginning of period | | $ | 75.05 | | | $ | 55.46 | | | $ | 51.90 | | | $ | 52.28 | | | $ | 41.74 | |
| Income (loss) from investment operations: | |
Net investment income (loss)a | | | (.49 | ) | | | (.62 | ) | | | (.44 | ) | | | (.51 | ) | | | (.34 | ) |
| Net gain (loss) on investments (realized and unrealized) | | | 5.27 | | | | 20.53 | | | | 5.26 | | | | .13 | | | | 10.88 | |
| Total from investment operations | | | 4.78 | | | | 19.91 | | | | 4.82 | | | | (.38 | ) | | | 10.54 | |
| Less distributions from: | |
| Net realized gains | | | (1.96 | ) | | | (.32 | ) | | | (1.26 | ) | | | — | | | | — | |
| Total distributions | | | (1.96 | ) | | | (.32 | ) | | | (1.26 | ) | | | — | | | | — | |
| Net asset value, end of period | | $ | 77.87 | | | $ | 75.05 | | | $ | 55.46 | | | $ | 51.90 | | | $ | 52.28 | |
| | |
Total Returnb | | | 6.40 | % | | | 35.93 | % | | | 9.65 | % | | | (0.73 | %) | | | 25.25 | % |
| Ratios/Supplemental Data | |
| Net assets, end of period (in thousands) | | $ | 8,328 | | | $ | 26,828 | | | $ | 6,109 | | | $ | 6,206 | | | $ | 20,589 | |
| Ratios to average net assets: | |
| Net investment income (loss) | | | (0.64 | %) | | | (0.87 | %) | | | (0.87 | %) | | | (1.05 | %) | | | (0.69 | %) |
| Total expenses | | | 1.35 | % | | | 1.37 | % | | | 1.35 | % | | | 1.36 | % | | | 1.39 | % |
| Portfolio turnover rate | | | 495 | % | | | 472 | % | | | 442 | % | | | 380 | % | | | 291 | % |
| Advisor Class | | Year Ended March 31, 2015 | | | Year Ended March 31, 2014 | | | Year Ended March 28, 2013 | | | Year Ended March 31, 2012 | | | Year Ended March 31, 2011 | |
| Per Share Data | | | | | | | | | | | | | | | |
| Net asset value, beginning of period | | $ | 69.58 | | | $ | 51.70 | | | $ | 48.71 | | | $ | 49.31 | | | $ | 39.57 | |
| Income (loss) from investment operations: | |
Net investment income (loss)a | | | (.78 | ) | | | (1.07 | ) | | | (.64 | ) | | | (.71 | ) | | | (.59 | ) |
| Net gain (loss) on investments (realized and unrealized) | | | 4.80 | | | | 19.27 | | | | 4.89 | | | | .11 | | | | 10.33 | |
| Total from investment operations | | | 4.02 | | | | 18.20 | | | | 4.25 | | | | (.60 | ) | | | 9.74 | |
| Less distributions from: | |
| Net realized gains | | | (1.96 | ) | | | (.32 | ) | | | (1.26 | ) | | | — | | | | — | |
| Total distributions | | | (1.96 | ) | | | (.32 | ) | | | (1.26 | ) | | | — | | | | — | |
| Net asset value, end of period | | $ | 71.64 | | | $ | 69.58 | | | $ | 51.70 | | | $ | 48.71 | | | $ | 49.31 | |
| | |
Total Returnb | | | 5.80 | % | | | 35.23 | % | | | 9.13 | % | | | (1.24 | %) | | | 24.61 | % |
| Ratios/Supplemental Data | |
| Net assets, end of period (in thousands) | | $ | 1,830 | | | $ | 11,814 | | | $ | 552 | | | $ | 719 | | | $ | 2,124 | |
| Ratios to average net assets: | |
| Net investment income (loss) | | | (1.12 | %) | | | (1.53 | %) | | | (1.36 | %) | | | (1.58 | %) | | | (1.32 | %) |
| Total expenses | | | 1.85 | % | | | 1.87 | % | | | 1.85 | % | | | 1.86 | % | | | 1.89 | % |
| Portfolio turnover rate | | | 495 | % | | | 472 | % | | | 442 | % | | | 380 | % | | | 291 | % |
| SEE NOTES TO FINANCIAL STATEMENTS. | THE RYDEX FUNDS ANNUAL REPORT | 93 |
FINANCIAL HIGHLIGHTS (concluded)
This table is presented to show selected data for a share outstanding throughout each period and to assist shareholders in evaluating a Fund’s performance for the periods presented.
| A-Class | | Year Ended March 31, 2015 | | | Year Ended March 31, 2014 | | | Year Ended March 28, 2013 | | | Year Ended March 31, 2012 | | | Year Ended March 31, 2011 | |
| Per Share Data | | | | | | | | | | | | | | | |
| Net asset value, beginning of period | | $ | 71.32 | | | $ | 52.85 | | | $ | 49.63 | | | $ | 50.13 | | | $ | 40.12 | |
| Income (loss) from investment operations: | |
Net investment income (loss)a | | | (.61 | ) | | | (.79 | ) | | | (.52 | ) | | | (.64 | ) | | | (.46 | ) |
| Net gain (loss) on investments (realized and unrealized) | | | 4.96 | | | | 19.58 | | | | 5.00 | | | | .14 | | | | 10.47 | |
| Total from investment operations | | | 4.35 | | | | 18.79 | | | | 4.48 | | | | (.50 | ) | | | 10.01 | |
| Less distributions from: | |
| Net realized gains | | | (1.96 | ) | | | (.32 | ) | | | (1.26 | ) | | | — | | | | — | |
| Total distributions | | | (1.96 | ) | | | (.32 | ) | | | (1.26 | ) | | | — | | | | — | |
| Net asset value, end of period | | $ | 73.71 | | | $ | 71.32 | | | $ | 52.85 | | | $ | 49.63 | | | $ | 50.13 | |
| | |
Total Returnb | | | 6.12 | % | | | 35.58 | % | | | 9.41 | % | | | (1.00 | %) | | | 24.95 | % |
| Ratios/Supplemental Data | |
| Net assets, end of period (in thousands) | | $ | 2,022 | | | $ | 12,566 | | | $ | 1,192 | | | $ | 828 | | | $ | 1,101 | |
| Ratios to average net assets: | |
| Net investment income (loss) | | | (0.86 | %) | | | (1.12 | %) | | | (1.08 | %) | | | (1.39 | %) | | | (1.01 | %) |
| Total expenses | | | 1.61 | % | | | 1.62 | % | | | 1.60 | % | | | 1.61 | % | | | 1.64 | % |
| Portfolio turnover rate | | | 495 | % | | | 472 | % | | | 442 | % | | | 380 | % | | | 291 | % |
| C-Class | | Year Ended March 31, 2015 | | | Year Ended March 31, 2014 | | | Year Ended March 28, 2013 | | | Year Ended March 31, 2012 | | | Year Ended March 31, 2011 | |
| Per Share Data | | | | | | | | | | | | | | | |
| Net asset value, beginning of period | | $ | 65.64 | | | $ | 49.03 | | | $ | 46.50 | | | $ | 47.30 | | | $ | 38.17 | |
| Income (loss) from investment operations: | |
Net investment income (loss)a | | | (1.11 | ) | | | (1.16 | ) | | | (.85 | ) | | | (.94 | ) | | | (.83 | ) |
| Net gain (loss) on investments (realized and unrealized) | | | 4.60 | | | | 18.09 | | | | 4.64 | | | | .14 | | | | 9.96 | |
| Total from investment operations | | | 3.49 | | | | 16.93 | | | | 3.79 | | | | (.80 | ) | | | 9.13 | |
| Less distributions from: | |
| Net realized gains | | | (1.96 | ) | | | (.32 | ) | | | (1.26 | ) | | | — | | | | — | |
| Total distributions | | | (1.96 | ) | | | (.32 | ) | | | (1.26 | ) | | | — | | | | — | |
| Net asset value, end of period | | $ | 67.17 | | | $ | 65.64 | | | $ | 49.03 | | | $ | 46.50 | | | $ | 47.30 | |
| | |
Total Returnb | | | 5.34 | % | | | 34.56 | % | | | 8.55 | % | | | (1.69 | %) | | | 23.92 | % |
| Ratios/Supplemental Data | |
| Net assets, end of period (in thousands) | | $ | 2,436 | | | $ | 4,655 | | | $ | 1,111 | | | $ | 643 | | | $ | 1,770 | |
| Ratios to average net assets: | |
| Net investment income (loss) | | | (1.68 | %) | | | (1.85 | %) | | | (1.91 | %) | | | (2.17 | %) | | | (1.92 | %) |
| Total expenses | | | 2.35 | % | | | 2.37 | % | | | 2.35 | % | | | 2.36 | % | | | 2.39 | % |
| Portfolio turnover rate | | | 495 | % | | | 472 | % | | | 442 | % | | | 380 | % | | | 291 | % |
a | Net investment income (loss) per share was computed using average shares outstanding throughout the period. |
b | Total return does not reflect the impact of any applicable sales charges. |
| 94 | THE RYDEX FUNDS ANNUAL REPORT | SEE NOTES TO FINANCIAL STATEMENTS. |
PERFORMANCE REPORT AND FUND PROFILE (Unaudited) | March 31, 2015 |
LEISURE FUND
OBJECTIVE: Seeks to provide capital appreciation by investing in companies in leisure and entertainment businesses (“leisure companies”).
For the one-year period ended March 31, 2015, Leisure Fund Investor Class returned 11.15%, compared with 18.26% for the S&P 500 Consumer Discretionary Index. The broader S&P 500 Index returned 12.73%.
The media segment was the largest contributor to return, followed by the hotels, restaurants & leisure segment. The leisure products segment was the largest detractor from return, followed by the automobiles segment.
Among the holdings that contributed the most to the Fund’s performance for the period were Walt Disney Co., Altria Group, Inc., and Electronic Arts, Inc. The Fund’s weakest holdings for the period were Melco Crown Entertainment Ltd. ADR, Wynn Resorts Ltd., and Las Vegas Sands Corp.
Performance displayed represents past performance, which is no guarantee of future results.
Holdings Diversification (Market Exposure as % of Net Assets)
“Holdings Diversification (Market Exposure as % of Net Assets)” excludes any temporary cash investments.
| Inception Dates: |
| Investor Class | April 1, 1998 |
| Advisor Class | June 3, 1998 |
| A-Class | September 1, 2004 |
| C-Class | May 3, 2001 |
| Ten Largest Holdings (% of Total Net Assets) |
| Walt Disney Co. | 3.8% |
| Comcast Corp. — Class A | 3.3% |
| Philip Morris International, Inc. | 3.1% |
| Altria Group, Inc. | 2.8% |
| McDonald’s Corp. | 2.8% |
| Starbucks Corp. | 2.4% |
| Twenty-First Century Fox, Inc. — Class A | 2.4% |
| Time Warner, Inc. | 2.4% |
| Las Vegas Sands Corp. | 1.9% |
| DIRECTV | 1.9% |
| Top Ten Total | 26.8% |
| | |
| “Ten Largest Holdings” exclude any temporary cash or derivative investments. |
| | THE RYDEX FUNDS ANNUAL REPORT | 95 |
PERFORMANCE REPORT AND FUND PROFILE (Unaudited)(concluded) | March 31, 2015 |
Cumulative Fund Performance*
Average Annual Returns*
Periods Ended March 31, 2015
| | 1 Year | 5 Year | 10 Year |
| Investor Class Shares | 11.15% | 17.82% | 7.42% |
| Advisor Class Shares | 10.66% | 17.23% | 6.89% |
| A-Class Shares | 10.86% | 17.50% | 7.15% |
A-Class Shares with sales charge† | 5.59% | 16.36% | 6.63% |
| C-Class Shares | 10.04% | 16.63% | 6.34% |
C-Class Shares with CDSC‡ | 9.04% | 16.63% | 6.34% |
| S&P 500 Consumer Discretionary Index | 18.26% | 20.11% | 10.25% |
| S&P 500 Index | 12.73% | 14.47% | 8.01% |
| * | The performance data above represents past performance that is not predictive of future results. The investment return and principal value of an investment in the Fund will fluctuate so that an investor’s shares, when redeemed, may be worth more or less than their original cost. Returns are historical and include changes in principal and reinvested dividends and capital gains and do not reflect the effect of taxes. The S&P 500 Index and the S&P 500 Consumer Discretionary Index are unmanaged indices and, unlike the Fund, have no management fees or operating expenses to reduce their reported returns. The graphs are based on Investor Class shares and A-Class shares only; performance for Advisor Class shares and C-Class shares will vary due to differences in the fee structures. |
† | Fund returns are calculated using the maximum sales charge of 4.75%. |
‡ | Fund returns include a CDSC of 1% if redeemed within 12 months of purchase. |
| 96 | THE RYDEX FUNDS ANNUAL REPORT | |
| SCHEDULE OF INVESTMENTS | March 31, 2015 |
| LEISURE FUND | |
| | |
Shares | | | Value | |
| | | | | | | | |
COMMON STOCKS† - 99.4% | |
| | | | | | | | |
| RETAIL-RESTAURANTS - 18.0% | |
| McDonald’s Corp. | | | 19,419 | | | $ | 1,892,186 | |
| Starbucks Corp. | | | 17,419 | | | | 1,649,579 | |
| Yum! Brands, Inc. | | | 14,491 | | | | 1,140,732 | |
| Chipotle Mexican Grill, Inc. — Class A* | | | 1,329 | | | | 864,568 | |
| Darden Restaurants, Inc. | | | 8,429 | | | | 584,467 | |
| Restaurant Brands International, Inc. | | | 12,501 | | | | 480,163 | |
| Domino’s Pizza, Inc. | | | 4,614 | | | | 463,938 | |
| Dunkin’ Brands Group, Inc. | | | 8,880 | | | | 422,333 | |
| Panera Bread Co. — Class A* | | | 2,538 | | | | 406,067 | |
| Wendy’s Co. | | | 36,183 | | | | 394,395 | |
| Brinker International, Inc. | | | 6,354 | | | | 391,152 | |
| Jack in the Box, Inc. | | | 3,950 | | | | 378,884 | |
| Cracker Barrel Old Country Store, Inc. | | | 2,470 | | | | 375,786 | |
| Buffalo Wild Wings, Inc.* | | | 1,937 | | | | 351,062 | |
| Bloomin’ Brands, Inc. | | | 13,910 | | | | 338,430 | |
| Texas Roadhouse, Inc. — Class A | | | 8,534 | | | | 310,894 | |
| Cheesecake Factory, Inc. | | | 6,284 | | | | 309,990 | |
| Papa John’s International, Inc. | | | 5,000 | | | | 309,050 | |
| DineEquity, Inc. | | | 2,640 | | | | 282,506 | |
| Sonic Corp. | | | 7,960 | | | | 252,332 | |
| Red Robin Gourmet Burgers, Inc.* | | | 2,600 | | | | 226,200 | |
| Bob Evans Farms, Inc. | | | 4,440 | | | | 205,394 | |
El Pollo Loco Holdings, Inc.*,1 | | | 7,440 | | | | 190,538 | |
| Total Retail-Restaurants | | | | | | | 12,220,646 | |
| | | | | | | | |
| CABLE/SATELLITE TV - 12.0% | |
| Comcast Corp. — Class A | | | 40,205 | | | | 2,270,377 | |
| DIRECTV* | | | 14,989 | | | | 1,275,564 | |
| Time Warner Cable, Inc. | | | 8,138 | | | | 1,219,723 | |
| DISH Network Corp. — Class A* | | | 15,536 | | | | 1,088,452 | |
| Charter Communications, Inc. — Class A* | | | 4,750 | | | | 917,273 | |
| Liberty Global plc* | | | 13,559 | | | | 675,374 | |
| Cablevision Systems Corp. — Class A | | | 23,856 | | | | 436,565 | |
| Liberty Global plc — Class A* | | | 6,139 | | | | 315,974 | |
| Total Cable/Satellite TV | | | | | | | 8,199,302 | |
| | | | | | | | |
| MULTIMEDIA - 11.7% | |
| Walt Disney Co. | | | 24,521 | | | | 2,572,007 | |
| Twenty-First Century Fox, Inc. — Class A | | | 48,249 | | | | 1,632,746 | |
| Time Warner, Inc. | | | 19,132 | | | | 1,615,506 | |
| Thomson Reuters Corp. | | | 27,464 | | | | 1,113,940 | |
| Viacom, Inc. — Class B | | | 14,902 | | | | 1,017,807 | |
| Total Multimedia | | | | | | | 7,952,006 | |
| | | | | | | | |
| TOBACCO - 9.0% | |
| Philip Morris International, Inc. | | | 27,593 | | | | 2,078,580 | |
| Altria Group, Inc. | | | 37,839 | | | | 1,892,707 | |
| Reynolds American, Inc. | | | 16,885 | | | | 1,163,545 | |
| Lorillard, Inc. | | | 14,262 | | | | 932,022 | |
| Total Tobacco | | | | | | | 6,066,854 | |
| | | | | | | | |
| HOTELS & MOTELS - 6.3% | |
| Hilton Worldwide Holdings, Inc.* | | | 35,610 | | | | 1,054,769 | |
| Marriott International, Inc. — Class A | | | 11,163 | | | | 896,612 | |
| Starwood Hotels & Resorts Worldwide, Inc. | | | 8,926 | | | | 745,321 | |
| Wyndham Worldwide Corp. | | | 7,151 | | | | 646,951 | |
| Hyatt Hotels Corp. — Class A* | | | 9,810 | | | | 580,948 | |
| La Quinta Holdings, Inc.* | | | 14,700 | | | | 348,096 | |
| Total Hotels & Motels | | | | | | | 4,272,697 | |
| | | | | | | | |
| CASINO HOTELS - 5.3% | |
| Las Vegas Sands Corp. | | | 23,967 | | | | 1,319,143 | |
| Wynn Resorts Ltd. | | | 5,641 | | | | 710,089 | |
| Melco Crown Entertainment Ltd. ADR | | | 32,373 | | | | 694,725 | |
| MGM Resorts International* | | | 30,790 | | | | 647,514 | |
| Boyd Gaming Corp.* | | | 17,080 | | | | 242,536 | |
| Total Casino Hotels | | | | | | | 3,614,007 | |
| | | | | | | | |
| TELEVISION - 4.5% | |
| CBS Corp. — Class B | | | 17,415 | | | | 1,055,871 | |
| AMC Networks, Inc. — Class A* | | | 6,230 | | | | 477,467 | |
| Tribune Media Co. — Class A* | | | 7,300 | | | | 443,913 | |
| Sinclair Broadcast Group, Inc. — Class A | | | 11,270 | | | | 353,991 | |
| Liberty Media Corp. — Class C* | | | 9,140 | | | | 349,148 | |
| Liberty Media Corp. — Class A* | | | 9,030 | | | | 348,107 | |
| Total Television | | | | | | | 3,028,497 | |
| | | | | | | | |
| CRUISE LINES - 4.0% | |
| Carnival Corp. | | | 25,181 | | | | 1,204,659 | |
| Royal Caribbean Cruises Ltd. | | | 10,252 | | | | 839,126 | |
| Norwegian Cruise Line Holdings Ltd.* | | | 12,980 | | | | 701,050 | |
| Total Cruise Lines | | | | | | | 2,744,835 | |
| | | | | | | | |
| BROADCAST SERVICES/PROGRAM - 4.0% | |
| Discovery Communications, Inc. — Class A* | | | 27,633 | | | | 849,991 | |
| Scripps Networks Interactive, Inc. — Class A | | | 8,344 | | | | 572,065 | |
| Grupo Televisa SAB ADR* | | | 14,670 | | | | 484,257 | |
| Discovery Communications, Inc. — Class C* | | | 14,626 | | | | 431,101 | |
| Starz — Class A* | | | 10,747 | | | | 369,804 | |
| Total Broadcast Services/Program | | | | | | | 2,707,218 | |
| | | | | | | | |
| BREWERY - 3.8% | |
| Anheuser-Busch InBev N.V. ADR | | | 7,633 | | | | 930,539 | |
| Molson Coors Brewing Co. — Class B | | | 9,814 | | | | 730,652 | |
| Ambev S.A. ADR | | | 94,860 | | | | 546,394 | |
| Boston Beer Company, Inc. — Class A* | | | 1,400 | | | | 374,360 | |
| Total Brewery | | | | | | | 2,581,945 | |
| | | | | | | | |
| BEVERAGES-WINE/SPIRITS - 3.3% | |
| Constellation Brands, Inc. — Class A* | | | 8,041 | | | | 934,445 | |
| Brown-Forman Corp. — Class B | | | 9,423 | | | | 851,368 | |
| Diageo plc ADR | | | 4,290 | | | | 474,345 | |
| Total Beverages-Wine/Spirits | | | | | | | 2,260,158 | |
| SEE NOTES TO FINANCIAL STATEMENTS. | THE RYDEX FUNDS ANNUAL REPORT | 97 |
SCHEDULE OF INVESTMENTS (continued) | March 31, 2015 |
| LEISURE FUND | |
| | |
Shares | | | Value | |
| | | | | | | | | |
| ENTERTAINMENT SOFTWARE - 2.8% | |
| Electronic Arts, Inc.* | | | 14,557 | | | $ | 856,170 | |
| Activision Blizzard, Inc. | | | 34,511 | | | | 784,262 | |
| Take-Two Interactive Software, Inc.* | | | 11,164 | | | | 284,180 | |
| Total Entertainment Software | | | | | | | 1,924,612 | |
| | | | | | | | |
| PUBLISHING-NEWSPAPERS - 1.7% | |
| News Corp. — Class A* | | | 36,004 | | | | 576,424 | |
| Gannett Company, Inc. | | | 15,339 | | | | 568,770 | |
| Total Publishing-Newspapers | | | | | | | 1,145,194 | |
| | | | | | | | |
| RESORTS/THEME PARKS - 1.6% | |
| Six Flags Entertainment Corp. | | | 9,100 | | | | 440,531 | |
| Vail Resorts, Inc. | | | 3,690 | | | | 381,620 | |
| SeaWorld Entertainment, Inc. | | | 13,400 | | | | 258,352 | |
| Total Resorts/Theme Parks | | | | | | | 1,080,503 | |
| | | | | | | | |
| TOYS - 1.6% | |
| Hasbro, Inc. | | | 8,732 | | | | 552,211 | |
| Mattel, Inc. | | | 22,809 | | | | 521,186 | |
| Total Toys | | | | | | | 1,073,397 | |
| | | | | | | | |
| RECREATIONAL VEHICLES - 1.5% | |
| Polaris Industries, Inc. | | | 4,170 | | | | 588,387 | |
| Brunswick Corp. | | | 8,157 | | | | 419,678 | |
| Total Recreational Vehicles | | | | | | | 1,008,065 | |
| | | | | | | | |
| COMMERCIAL SERVICES - 1.4% | |
| Aramark | | | 16,700 | | | | 528,221 | |
| Live Nation Entertainment, Inc.* | | | 17,312 | | | | 436,782 | |
| Total Commercial Services | | | | | | | 965,003 | |
| | | | | | | | |
| THEATERS - 1.2% | |
| Cinemark Holdings, Inc. | | | 10,066 | | | | 453,675 | |
| Regal Entertainment Group — Class A | | | 16,260 | | | | 371,378 | |
| Total Theaters | | | | | | | 825,053 | |
| | | | | | | | |
| MOTION PICTURES & SERVICES - 1.1% | |
| Lions Gate Entertainment Corp. | | | 12,487 | | | | 423,559 | |
DreamWorks Animation SKG, Inc. — Class A*,1 | | | 12,065 | | | | 291,973 | |
| Total Motion Pictures & Services | | | | | | | 715,532 | |
| | | | | | | | |
| MOTORCYCLE/MOTOR SCOOTER - 1.0% | |
| Harley-Davidson, Inc. | | | 11,721 | | | | 711,934 | |
| | | | | | | | |
| PROFESSIONAL SPORTS - 0.8% | |
| Madison Square Garden Co. — Class A* | | | 6,210 | | | | 525,677 | |
| | | | | | | | |
| CASINO SERVICES - 0.6% | |
| International Game Technology | | | 23,274 | | | | 405,200 | |
| | | | | | | | |
| RECREATIONAL CENTERS - 0.5% | |
| Life Time Fitness, Inc.* | | | 4,549 | | | | 322,797 | |
| | | | | | | | |
| RETAIL-SPORTING GOODS - 0.5% | |
| Vista Outdoor, Inc.* | | | 7,500 | | | | 321,150 | |
| | | | | | | | |
| PUBLISHING-PERIODICALS - 0.5% | |
| Time, Inc. | | | 13,635 | | | | 305,969 | |
| | | | | | | | |
| GAMBLING (NON-HOTEL) - 0.4% | |
| Pinnacle Entertainment, Inc.* | | | 8,086 | | | | 291,824 | |
| | | | | | | | |
| RACETRACKS - 0.3% | |
| Penn National Gaming, Inc.* | | | 13,700 | | | | 214,542 | |
| | | | | | | | |
| Total Common Stocks | | | | | | | | |
| (Cost $59,964,877) | | | | | | | 67,484,617 | |
| 98 | THE RYDEX FUNDS ANNUAL REPORT | SEE NOTES TO FINANCIAL STATEMENTS. |
SCHEDULE OF INVESTMENTS (concluded) | March 31, 2015 |
| LEISURE FUND | |
| | | | | | | | | |
| | | Face
Amount | | | Value | |
| | | | | | | | |
REPURCHASE AGREEMENT††,2 - 0.4% | |
HSBC Group
issued 03/31/15 at 0.03%
due 04/01/15 | | $ | 242,050 | | | $ | 242,050 | |
| Total Repurchase Agreement | | | | | | | | |
| (Cost $242,050) | | | | | | | 242,050 | |
| | | | | | | | |
SECURITIES LENDING COLLATERAL††,3 - 0.5% | |
| Repurchase Agreements | | | | | | | | |
HSBC Securities, Inc.
issued 03/31/15 at 0.10%
due 04/01/15 | | | 215,232 | | | | 215,232 | |
BNP Paribas Securities Corp.
issued 03/31/15 at 0.10%
due 04/01/15 | | | 74,040 | | | | 74,040 | |
Barclays Capital, Inc.
issued 03/31/15 at 0.10%
due 04/01/15 | | | 38,216 | | | | 38,216 | |
| Total Securities Lending Collateral | | | | | | | | |
| (Cost $327,488) | | | | | | | 327,488 | |
| | | | | | | | |
| Total Investments - 100.3% | | | | | | | | |
| (Cost $60,534,415) | | | | | | $ | 68,054,155 | |
| Other Assets & Liabilities, net - (0.3)% | | | | | | | (193,603 | ) |
| Total Net Assets - 100.0% | | | | | | $ | 67,860,552 | |
| * | Non-income producing security. |
| † | Value determined based on Level 1 inputs — See Note 4. |
| †† | Value determined based on Level 2 inputs — See Note 4. |
| 1 | All or portion of this security is on loan at March 31, 2015 — See Note 6. |
| 2 | Repurchase Agreement — See Note 5. |
| 3 | Securities lending collateral — See Note 6. |
| ADR — American Depositary Receipt |
| plc — Public Limited Company |
| SEE NOTES TO FINANCIAL STATEMENTS. | THE RYDEX FUNDS ANNUAL REPORT | 99 |
STATEMENT OF ASSETS AND LIABILITIES
March 31, 2015
| Assets: | |
| Investments, at value - including $323,506 of securities loaned (cost $59,964,877) | | $ | 67,484,617 | |
| Repurchase agreements, at value (cost $569,538) | | | 569,538 | |
| Total investments (cost $60,534,415) | | | 68,054,155 | |
| Segregated cash with broker | | | 4,787 | |
| Receivables: | |
| Securities sold | | | 971,884 | |
| Fund shares sold | | | 463,036 | |
| Dividends | | | 179,944 | |
| Securities lending income | | | 1,654 | |
| Foreign taxes reclaim | | | 415 | |
| Total assets | | | 69,675,875 | |
| | | | | |
| Liabilities: | |
| Payable for: | |
| Fund shares redeemed | | | 1,385,994 | |
| Return of securities loaned | | | 332,275 | |
| Management fees | | | 49,120 | |
| Transfer agent and administrative fees | | | 14,447 | |
| Distribution and service fees | | | 7,058 | |
| Portfolio accounting fees | | | 5,779 | |
| Miscellaneous | | | 20,650 | |
| Total liabilities | | | 1,815,323 | |
| Commitments and contingent liabilities (Note 10) | | | — | |
| Net assets | | $ | 67,860,552 | |
| | | | | |
| Net assets consist of: | |
| Paid in capital | | $ | 61,974,363 | |
| Undistributed net investment income | | | 285,529 | |
| Accumulated net realized loss on investments | | | (1,919,080 | ) |
| Net unrealized appreciation on investments | | | 7,519,740 | |
| Net assets | | $ | 67,860,552 | |
| | | | | |
| Investor Class: | |
| Net assets | | $ | 48,494,346 | |
| Capital shares outstanding | | | 798,255 | |
| Net asset value per share | | $ | 60.75 | |
| | | | | |
| Advisor Class: | |
| Net assets | | $ | 7,073,710 | |
| Capital shares outstanding | | | 127,463 | |
| Net asset value per share | | $ | 55.50 | |
| | | | | |
| A-Class: | |
| Net assets | | $ | 10,702,824 | |
| Capital shares outstanding | | | 188,152 | |
| Net asset value per share | | $ | 56.88 | |
| Maximum offering price per share (Net asset value divided by 95.25%) | | $ | 59.72 | |
| | | | | |
| C-Class: | |
| Net assets | | $ | 1,589,672 | |
| Capital shares outstanding | | | 30,154 | |
| Net asset value per share | | $ | 52.72 | |
STATEMENT OF OPERATIONS
Year Ended March 31, 2015
| Investment Income: | |
| Dividends (net of foreign withholding tax of $5,773) | | $ | 761,308 | |
| Income from securities lending, net | | | 31,579 | |
| Interest | | | 38 | |
| Total investment income | | | 792,925 | |
| | | | | |
| Expenses: | |
| Management fees | | | 301,172 | |
| Transfer agent and administrative fees | | | 88,580 | |
| Distribution and service fees: | |
| Advisor Class | | | 12,784 | |
| A-Class | | | 8,605 | |
| C-Class | | | 12,255 | |
| Portfolio accounting fees | | | 35,431 | |
| Custodian fees | | | 4,114 | |
| Trustees’ fees* | | | 2,101 | |
| Line of credit fees | | | 116 | |
| Tax expense | | | 85 | |
| Miscellaneous | | | 42,153 | |
| Total expenses | | | 507,396 | |
| Net investment income | | | 285,529 | |
| | | | | |
| Net Realized and Unrealized Gain (Loss): | |
| Net realized gain (loss) on: | |
| Investments | | | 5,468,270 | |
| Net realized gain | | | 5,468,270 | |
| Net change in unrealized appreciation (depreciation) on: | |
| Investments | | | (1,903,716 | ) |
| Net change in unrealized appreciation (depreciation) | | | (1,903,716 | ) |
| Net realized and unrealized gain | | | 3,564,554 | |
| Net increase in net assets resulting from operations | | $ | 3,850,083 | |
| * | Relates to Trustees not deemed “interested persons” within the meaning of Section 2(a)(19) of the 1940 Act. |
| 100 | THE RYDEX FUNDS ANNUAL REPORT | SEE NOTES TO FINANCIAL STATEMENTS. |
STATEMENTS OF CHANGES IN NET ASSETS
| | | Year Ended March 31, 2015 | | | Year Ended March 31, 2014 | |
| Increase (Decrease) in Net Assets from Operations: | | | | | | |
| Net investment income | | $ | 285,529 | | | $ | 94,646 | |
| Net realized gain on investments | | | 5,468,270 | | | | 3,028,207 | |
| Net change in unrealized appreciation (depreciation) on investments | | | (1,903,716 | ) | | | 2,702,964 | |
| Net increase in net assets resulting from operations | | | 3,850,083 | | | | 5,825,817 | |
| | | | | | | | | |
| Distributions to shareholders from: | | | | | | | | |
| Net investment income | | | | | | | | |
| Investor Class | | | (86,741 | ) | | | (167,161 | ) |
| Advisor Class | | | (2,421 | ) | | | (17,486 | ) |
| A-Class | | | (3,222 | ) | | | (8,764 | ) |
| C-Class | | | (2,262 | ) | | | (6,684 | ) |
| Net realized gains | | | | | | | | |
| Investor Class | | | (819,251 | ) | | | — | |
| Advisor Class | | | (22,866 | ) | | | — | |
| A-Class | | | (30,437 | ) | | | — | |
| C-Class | | | (21,361 | ) | | | — | |
| Total distributions to shareholders | | | (988,561 | ) | | | (200,095 | ) |
| | | | | | | | | |
| Capital share transactions: | | | | | | | | |
| Proceeds from sale of shares | | | | | | | | |
| Investor Class | | | 66,551,897 | | | | 71,016,096 | |
| Advisor Class | | | 92,571,748 | | | | 18,567,120 | |
| A-Class | | | 16,562,062 | | | | 6,654,372 | |
| C-Class | | | 3,107,048 | | | | 1,632,199 | |
| Distributions reinvested | | | | | | | | |
| Investor Class | | | 233,102 | | | | 166,413 | |
| Advisor Class | | | 25,054 | | | | 17,418 | |
| A-Class | | | 32,921 | | | | 8,624 | |
| C-Class | | | 22,369 | | | | 6,192 | |
| Cost of shares redeemed | | | | | | | | |
| Investor Class | | | (44,791,384 | ) | �� | | (73,669,092 | ) |
| Advisor Class | | | (88,739,965 | ) | | | (17,145,281 | ) |
| A-Class | | | (7,989,563 | ) | | | (6,623,023 | ) |
| C-Class | | | (3,077,948 | ) | | | (1,347,238 | ) |
| Net increase (decrease) from capital share transactions | | | 34,507,341 | | | | (716,200 | ) |
| Net increase in net assets | | | 37,368,863 | | | | 4,909,522 | |
| | | | | | | | | |
| Net assets: | | | | | | | | |
| Beginning of year | | | 30,491,689 | | | | 25,582,167 | |
| End of year | | $ | 67,860,552 | | | $ | 30,491,689 | |
| Undistributed net investment income at end of year | | $ | 285,529 | | | $ | 94,646 | |
| SEE NOTES TO FINANCIAL STATEMENTS. | THE RYDEX FUNDS ANNUAL REPORT | 101 |
STATEMENTS OF CHANGES IN NET ASSETS (concluded)
| | | | Year Ended March 31, 2015 | | | | Year Ended March 31, 2014 | |
| Capital share activity: | | | | | | | | |
| Shares sold | | | | | | | | |
| Investor Class | | | 1,133,061 | | | | 1,384,928 | |
| Advisor Class | | | 1,731,706 | | | | 385,324 | |
| A-Class | | | 301,170 | | | | 134,495 | |
| C-Class | | | 61,845 | | | | 36,131 | |
| Shares issued from reinvestment of distributions | | | | | | | | |
| Investor Class | | | 4,036 | | | | 3,093 | |
| Advisor Class | | | 474 | | | | 351 | |
| A-Class | | | 608 | | | | 170 | |
| C-Class | | | 445 | | | | 130 | |
| Shares redeemed | | | | | | | | |
| Investor Class | | | (771,348 | ) | | | (1,445,332 | ) |
| Advisor Class | | | (1,665,419 | ) | | | (354,839 | ) |
| A-Class | | | (147,523 | ) | | | (134,028 | ) |
| C-Class | | | (61,892 | ) | | | (29,738 | ) |
| Net increase (decrease) in shares | | | 587,163 | | | | (19,315 | ) |
| 102 | THE RYDEX FUNDS ANNUAL REPORT | SEE NOTES TO FINANCIAL STATEMENTS. |
This table is presented to show selected data for a share outstanding throughout each period and to assist shareholders in evaluating a Fund’s performance for the periods presented.
| Investor Class | | Year Ended March 31, 2015 | | | Year Ended March 31, 2014 | | | Year Ended March 28, 2013 | | | Year Ended March 31, 2012 | | | Year Ended March 31, 2011 | |
| Per Share Data | | | | | | | | | | | | | | | |
| Net asset value, beginning of period | | $ | 55.81 | | | $ | 44.93 | | | $ | 36.94 | | | $ | 33.50 | | | $ | 27.48 | |
| Income (loss) from investment operations: | |
Net investment income (loss)a | | | .52 | | | | .20 | | | | .36 | | | | .17 | | | | (.02 | ) |
| Net gain (loss) on investments (realized and unrealized) | | | 5.64 | | | | 10.95 | | | | 7.66 | | | | 3.27 | | | | 6.04 | |
| Total from investment operations | | | 6.16 | | | | 11.15 | | | | 8.02 | | | | 3.44 | | | | 6.02 | |
| Less distributions from: | |
| Net investment income | | | (.12 | ) | | | (.27 | ) | | | (.03 | ) | | | — | | | | — | |
| Net realized gains | | | (1.10 | ) | | | — | | | | — | | | | — | | | | — | |
| Total distributions | | | (1.22 | ) | | | (.27 | ) | | | (.03 | ) | | | — | | | | — | |
| Net asset value, end of period | | $ | 60.75 | | | $ | 55.81 | | | $ | 44.93 | | | $ | 36.94 | | | $ | 33.50 | |
| | |
Total Returnb | | | 11.15 | % | | | 24.83 | % | | | 21.74 | % | | | 10.27 | % | | | 21.91 | % |
| Ratios/Supplemental Data | |
| Net assets, end of period (in thousands) | | $ | 48,494 | | | $ | 24,139 | | | $ | 22,005 | | | $ | 12,687 | | | $ | 2,141 | |
| Ratios to average net assets: | |
| Net investment income (loss) | | | 0.89 | % | | | 0.39 | % | | | 0.92 | % | | | 0.49 | % | | | (0.07 | %) |
| Total expenses | | | 1.34 | % | | | 1.37 | % | | | 1.35 | % | | | 1.35 | % | | | 1.39 | % |
| Portfolio turnover rate | | | 343 | % | | | 265 | % | | | 517 | % | | | 797 | % | | | 963 | % |
| Advisor Class | | Year Ended March 31, 2015 | | | Year Ended March 31, 2014 | | | Year Ended March 28, 2013 | | | Year Ended March 31, 2012 | | | Year Ended March 31, 2011 | |
| Per Share Data | | | | | | | | | | | | | | | |
| Net asset value, beginning of period | | $ | 51.31 | | | $ | 41.54 | | | $ | 34.33 | | | $ | 31.29 | | | $ | 25.81 | |
| Income (loss) from investment operations: | |
Net investment income (loss)a | | | .30 | | | | (.11 | ) | | | .29 | | | | (.01 | ) | | | (.16 | ) |
| Net gain (loss) on investments (realized and unrealized) | | | 5.11 | | | | 10.15 | | | | 6.95 | | | | 3.05 | | | | 5.64 | |
| Total from investment operations | | | 5.41 | | | | 10.04 | | | | 7.24 | | | | 3.04 | | | | 5.48 | |
| Less distributions from: | |
| Net investment income | | | (.12 | ) | | | (.27 | ) | | | (.03 | ) | | | — | | | | — | |
| Net realized gains | | | (1.10 | ) | | | — | | | | — | | | | — | | | | — | |
| Total distributions | | | (1.22 | ) | | | (.27 | ) | | | (.03 | ) | | | — | | | | — | |
| Net asset value, end of period | | $ | 55.50 | | | $ | 51.31 | | | $ | 41.54 | | | $ | 34.33 | | | $ | 31.29 | |
| | |
Total Returnb | | | 10.66 | % | | | 24.18 | % | | | 21.12 | % | | | 9.72 | % | | | 21.23 | % |
| Ratios/Supplemental Data | |
| Net assets, end of period (in thousands) | | $ | 7,074 | | | $ | 3,115 | | | $ | 1,241 | | | $ | 1,379 | | | $ | 582 | |
| Ratios to average net assets: | |
| Net investment income (loss) | | | 0.55 | % | | | (0.23 | %) | | | 0.80 | % | | | (0.03 | %) | | | (0.61 | %) |
| Total expenses | | | 1.83 | % | | | 1.87 | % | | | 1.85 | % | | | 1.86 | % | | | 1.89 | % |
| Portfolio turnover rate | | | 343 | % | | | 265 | % | | | 517 | % | | | 797 | % | | | 963 | % |
| SEE NOTES TO FINANCIAL STATEMENTS. | THE RYDEX FUNDS ANNUAL REPORT | 103 |
FINANCIAL HIGHLIGHTS (concluded)
This table is presented to show selected data for a share outstanding throughout each period and to assist shareholders in evaluating a Fund’s performance for the periods presented.
| A-Class | | Year Ended March 31, 2015 | | | Year Ended March 31, 2014 | | | Year Ended March 28, 2013 | | | Year Ended March 31, 2012 | | | Year Ended March 31, 2011 | |
| Per Share Data | | | | | | | | | | | | | | | |
| Net asset value, beginning of period | | $ | 52.46 | | | $ | 42.35 | | | $ | 34.91 | | | $ | 31.75 | | | $ | 26.13 | |
| Income (loss) from investment operations: | |
Net investment income (loss)a | | | .38 | | | | .04 | | | | .29 | | | | .07 | | | | (.05 | ) |
| Net gain (loss) on investments (realized and unrealized) | | | 5.26 | | | | 10.34 | | | | 7.18 | | | | 3.09 | | | | 5.67 | |
| Total from investment operations | | | 5.64 | | | | 10.38 | | | | 7.47 | | | | 3.16 | | | | 5.62 | |
| Less distributions from: | |
| Net investment income | | | (.12 | ) | | | (.27 | ) | | | (.03 | ) | | | — | | | | — | |
| Net realized gains | | | (1.10 | ) | | | — | | | | — | | | | — | | | | — | |
| Total distributions | | | (1.22 | ) | | | (.27 | ) | | | (.03 | ) | | | — | | | | — | |
| Net asset value, end of period | | $ | 56.88 | | | $ | 52.46 | | | $ | 42.35 | | | $ | 34.91 | | | $ | 31.75 | |
| | |
Total Returnb | | | 10.86 | % | | | 24.53 | % | | | 21.42 | % | | | 9.95 | % | | | 21.51 | % |
| Ratios/Supplemental Data | |
| Net assets, end of period (in thousands) | | $ | 10,703 | | | $ | 1,778 | | | $ | 1,409 | | | $ | 448 | | | $ | 1,157 | |
| Ratios to average net assets: | |
| Net investment income (loss) | | | 0.69 | % | | | 0.09 | % | | | 0.80 | % | | | 0.23 | % | | | (0.18 | %) |
| Total expenses | | | 1.58 | % | | | 1.62 | % | | | 1.60 | % | | | 1.60 | % | | | 1.63 | % |
| Portfolio turnover rate | | | 343 | % | | | 265 | % | | | 517 | % | | | 797 | % | | | 963 | % |
| C-Class | | Year Ended March 31, 2015 | | | Year Ended March 31, 2014 | | | Year Ended March 28, 2013 | | | Year Ended March 31, 2012 | | | Year Ended March 31, 2011 | |
| Per Share Data | | | | | | | | | | | | | | | |
| Net asset value, beginning of period | | $ | 49.07 | | | $ | 39.92 | | | $ | 33.16 | | | $ | 30.36 | | | $ | 25.19 | |
| Income (loss) from investment operations: | |
Net investment income (loss)a | | | (.19 | ) | | | (.27 | ) | | | .01 | | | | (.15 | ) | | | (.30 | ) |
| Net gain (loss) on investments (realized and unrealized) | | | 5.06 | | | | 9.69 | | | | 6.78 | | | | 2.95 | | | | 5.47 | |
| Total from investment operations | | | 4.87 | | | | 9.42 | | | | 6.79 | | | | 2.80 | | | | 5.17 | |
| Less distributions from: | |
| Net investment income | | | (.12 | ) | | | (.27 | ) | | | (.03 | ) | | | — | | | | — | |
| Net realized gains | | | (1.10 | ) | | | — | | | | — | | | | — | | | | — | |
| Total distributions | | | (1.22 | ) | | | (.27 | ) | | | (.03 | ) | | | — | | | | — | |
| Net asset value, end of period | | $ | 52.72 | | | $ | 49.07 | | | $ | 39.92 | | | $ | 33.16 | | | $ | 30.36 | |
| | |
Total Returnb | | | 10.04 | % | | | 23.61 | % | | | 20.54 | % | | | 9.19 | % | | | 20.52 | % |
| Ratios/Supplemental Data | |
| Net assets, end of period (in thousands) | | $ | 1,590 | | | $ | 1,460 | | | $ | 928 | | | $ | 1,345 | | | $ | 828 | |
| Ratios to average net assets: | |
| Net investment income (loss) | | | (0.37 | %) | | | (0.59 | %) | | | 0.03 | % | | | (0.50 | %) | | | (1.13 | %) |
| Total expenses | | | 2.35 | % | | | 2.37 | % | | | 2.35 | % | | | 2.35 | % | | | 2.39 | % |
| Portfolio turnover rate | | | 343 | % | | | 265 | % | | | 517 | % | | | 797 | % | | | 963 | % |
a | Net investment income (loss) per share was computed using average shares outstanding throughout the period. |
b | Total return does not reflect the impact of any applicable sales charges. |
| 104 | THE RYDEX FUNDS ANNUAL REPORT | SEE NOTES TO FINANCIAL STATEMENTS. |
PERFORMANCE REPORT AND FUND PROFILE (Unaudited) | March 31, 2015 |
PRECIOUS METALS FUND
OBJECTIVE: Seeks to provide capital appreciation by investing in U.S. and foreign companies that are involved in the precious metals sector, including exploration, mining, production and development, and other precious metals-related services (“precious metals companies”).
For the one-year period ended March 31, 2015, Precious Metals Fund Investor Class returned -27.88%, compared with 4.97% for the S&P 500 Materials Index. The broader S&P 500 Index returned 12.73%.
All segments detracted from return for the period. The gold mining segment was the main detractor from return, followed by the silver mining segment. The precious metals & minerals segment contributed least to return.
The leading contributors to return were RTI International Metals, Inc., Dominion Diamond Corp., and Gold Fields Ltd. ADR. The leading detractors were Yamana Gold, Inc., Barrick Gold Corp., and Freeport-McMoRan, Inc.
Performance displayed represents past performance, which is no guarantee of future results.
Holdings Diversification (Market Exposure as % of Net Assets)
“Holdings Diversification (Market Exposure as % of Net Assets)” excludes any temporary cash investments.
| Inception Dates: |
| Investor Class | December 1, 1993 |
| Advisor Class | August 1, 2003 |
| A-Class | September 1, 2004 |
| C-Class | April 27, 2001 |
| Ten Largest Holdings (% of Total Net Assets) |
| Goldcorp, Inc. | 6.9% |
| Newmont Mining Corp. | 6.7% |
| Barrick Gold Corp. | 6.5% |
| Agnico Eagle Mines Ltd. | 5.0% |
| Silver Wheaton Corp. | 5.0% |
| Franco-Nevada Corp. | 4.9% |
| Randgold Resources Ltd. ADR | 4.5% |
| Freeport-McMoRan, Inc. | 4.2% |
| Market Vectors Junior Gold Miners ETF | 4.1% |
| Royal Gold, Inc. | 3.8% |
| Top Ten Total | 51.6% |
| | |
| “Ten Largest Holdings” exclude any temporary cash or derivative investments. |
| | THE RYDEX FUNDS ANNUAL REPORT | 105 |
PERFORMANCE REPORT AND FUND PROFILE (Unaudited)(concluded) | March 31, 2015 |
Cumulative Fund Performance*
Average Annual Returns*
Periods Ended March 31, 2015
| | 1 Year | 5 Year | 10 Year |
| Investor Class Shares | -27.88% | -15.25% | -2.72% |
| Advisor Class Shares | -28.24% | -15.67% | -3.20% |
| A-Class Shares | -28.13% | -15.48% | -2.96% |
A-Class Shares with sales charge† | -31.54% | -16.30% | -3.44% |
| C-Class Shares | -28.64% | -16.10% | -3.70% |
C-Class Shares with CDSC‡ | -29.34% | -16.10% | -3.70% |
| S&P 500 Materials Index | 4.97% | 10.82% | 7.55% |
| S&P 500 Index | 12.73% | 14.47% | 8.01% |
| * | The performance data above represents past performance that is not predictive of future results. The investment return and principal value of an investment in the Fund will fluctuate so that an investor’s shares, when redeemed, may be worth more or less than their original cost. Returns are historical and include changes in principal and reinvested dividends and capital gains and do not reflect the effect of taxes. The S&P 500 Index and the S&P 500 Materials Index are unmanaged indices and, unlike the Fund, have no management fees or operating expenses to reduce their reported returns. The graphs are based on Investor Class shares and A-Class shares only; performance for Advisor Class shares and C-Class shares will vary due to differences in fee structures. |
† | Fund returns are calculated using the maximum sales charge of 4.75%. |
‡ | Fund returns include a CDSC of 1% if redeemed within 12 months of purchase. |
| 106 | THE RYDEX FUNDS ANNUAL REPORT | |
| SCHEDULE OF INVESTMENTS | March 31, 2015 |
| PRECIOUS METALS FUND | |
| | |
Shares | | | Value | |
| | | | | | | | |
COMMON STOCKS† - 95.5% | |
| | | | | | | | |
| GOLD MINING - 70.3% | |
| Goldcorp, Inc. | | | 187,853 | | | $ | 3,403,896 | |
| Newmont Mining Corp. | | | 151,488 | | | | 3,288,805 | |
| Barrick Gold Corp. | | | 291,742 | | | | 3,197,492 | |
| Agnico Eagle Mines Ltd. | | | 89,350 | | | | 2,496,439 | |
| Franco-Nevada Corp. | | | 49,775 | | | | 2,416,079 | |
| Randgold Resources Ltd. ADR | | | 31,997 | | | | 2,216,432 | |
| Royal Gold, Inc. | | | 29,913 | | | | 1,887,809 | |
| AngloGold Ashanti Ltd. ADR* | | | 185,184 | | | | 1,729,619 | |
| Eldorado Gold Corp. | | | 323,340 | | | | 1,484,131 | |
| Cia de Minas Buenaventura S.A.A. ADR | | | 138,679 | | | | 1,404,818 | |
| Gold Fields Ltd. ADR | | | 339,858 | | | | 1,362,831 | |
| Yamana Gold, Inc. | | | 376,131 | | | | 1,350,310 | |
| Kinross Gold Corp.* | | | 524,639 | | | | 1,175,191 | |
| Sibanye Gold Ltd. ADR | | | 133,235 | | | | 1,136,495 | |
| New Gold, Inc.* | | | 291,859 | | | | 989,402 | |
NOVAGOLD Resources, Inc.*,1 | | | 261,160 | | | | 773,034 | |
Alamos Gold, Inc.1 | | | 120,404 | | | | 705,567 | |
Harmony Gold Mining Company Ltd. ADR*,1 | | | 383,499 | | | | 667,288 | |
Pretium Resources, Inc.*,1 | | | 130,575 | | | | 658,098 | |
| IAMGOLD Corp.* | | | 346,031 | | | | 647,078 | |
| AuRico Gold, Inc. | | | 230,859 | | | | 639,479 | |
Sandstorm Gold Ltd.*,1 | | | 162,095 | | | | 531,672 | |
Seabridge Gold, Inc.*,1 | | | 80,883 | | | | 444,048 | |
| Gold Resource Corp. | | | 20,310 | | | | 64,789 | |
| McEwen Mining, Inc.* | | | 59,510 | | | | 60,700 | |
| B2Gold Corp.* | | | 34,720 | | | | 52,774 | |
| Total Gold Mining | | | | | | | 34,784,276 | |
| | | | | | | | |
| SILVER MINING - 11.5% | |
| Silver Wheaton Corp. | | | 128,696 | | | | 2,447,798 | |
| Pan American Silver Corp. | | | 114,898 | | | | 1,007,655 | |
Hecla Mining Co.1 | | | 274,307 | | | | 817,435 | |
| First Majestic Silver Corp.* | | | 140,573 | | | | 760,500 | |
Silver Standard Resources, Inc.*,1 | | | 127,608 | | | | 578,064 | |
| Endeavour Silver Corp.* | | | 27,570 | | | | 52,383 | |
| Total Silver Mining | | | | | | | 5,663,835 | |
| | | | | | | | |
| METAL-COPPER - 4.7% | |
| Freeport-McMoRan, Inc. | | | 110,516 | | | | 2,094,278 | |
| Southern Copper Corp. | | | 8,040 | | | | 234,607 | |
| Total Metal-Copper | | | | | | | 2,328,885 | |
| | | | | | | | |
| PRECIOUS METALS - 4.6% | |
| Tahoe Resources, Inc. | | | 95,313 | | | | 1,044,631 | |
Coeur Mining, Inc.*,1 | | | 131,302 | | | | 618,432 | |
Primero Mining Corp.*,1 | | | 177,763 | | | | 609,727 | |
| Total Precious Metals | | | | | | | 2,272,790 | |
| | | | | | | | |
| PLATINUM - 2.5% | |
| Stillwater Mining Co.* | | | 95,854 | | | | 1,238,434 | |
| | | | | | | | |
| METAL PROCESSORS & FABRICATIONS - 1.8% | |
| RTI International Metals, Inc.* | | | 24,686 | | | | 886,474 | |
| | | | | | | | |
| DIAMONDS/PRECIOUS STONES - 0.1% | |
| Dominion Diamond Corp.* | | | 3,390 | | | | 57,935 | |
| | | | | | | | |
| Total Common Stocks | | | | | | | | |
| (Cost $37,145,474) | | | | | | | 47,232,629 | |
| | | | | | | | |
EXCHANGE-TRADED FUNDS† - 4.1% | |
| Market Vectors Junior Gold Miners ETF | | | 88,153 | | | | 2,004,599 | |
| Total Exchange-Traded Funds | | | | | | | | |
| (Cost $2,058,006) | | | | | | | 2,004,599 | |
| | | | | | | | |
| | | Face
Amount | | | | |
| | | | | | | | |
REPURCHASE AGREEMENT††,2 - 0.6% | |
HSBC Group
issued 03/31/15 at 0.03%
due 04/01/15 | | $ | 321,629 | | | | 321,629 | |
| Total Repurchase Agreement | | | | | | | | |
| (Cost $321,629) | | | | | | | 321,629 | |
| SEE NOTES TO FINANCIAL STATEMENTS. | THE RYDEX FUNDS ANNUAL REPORT | 107 |
SCHEDULE OF INVESTMENTS (concluded) | March 31, 2015 |
| PRECIOUS METALS FUND | |
| | | | | | | | | |
| | | Face
Amount | | | Value | |
| | | | | | | | |
SECURITIES LENDING COLLATERAL††,3 - 5.5% | |
| Repurchase Agreements | | | | | | | | |
HSBC Securities, Inc.
issued 03/31/15 at 0.10%
due 04/01/15 | | $ | 1,789,709 | | | $ | 1,789,709 | |
BNP Paribas Securities Corp.
issued 03/31/15 at 0.10%
due 04/01/15 | | | 615,660 | | | | 615,660 | |
Barclays Capital, Inc.
issued 03/31/15 at 0.10%
due 04/01/15 | | | 317,781 | | | | 317,781 | |
| Total Securities Lending Collateral | | | | | | | | |
| (Cost $2,723,150) | | | | | | | 2,723,150 | |
| | | | | | | | |
| Total Investments - 105.7% | | | | | | | | |
| (Cost $42,248,259) | | | | | | $ | 52,282,007 | |
| Other Assets & Liabilities, net - (5.7)% | | | | | | | (2,836,237 | ) |
| Total Net Assets - 100.0% | | | | | | $ | 49,445,770 | |
| * | Non-income producing security. |
| † | Value determined based on Level 1 inputs — See Note 4. |
| †† | Value determined based on Level 2 inputs — See Note 4. |
| 1 | All or portion of this security is on loan at March 31, 2015 — See Note 6. |
| 2 | Repurchase Agreement — See Note 5. |
| 3 | Securities lending collateral — See Note 6. |
| ADR — American Depositary Receipt |
| 108 | THE RYDEX FUNDS ANNUAL REPORT | SEE NOTES TO FINANCIAL STATEMENTS. |
STATEMENT OF ASSETS AND LIABILITIES
March 31, 2015
| Assets: | |
| Investments, at value - including $2,546,558 of securities loaned (cost $39,203,480) | | $ | 49,237,228 | |
| Repurchase agreements, at value (cost $3,044,779) | | | 3,044,779 | |
| Total investments (cost $42,248,259) | | | 52,282,007 | |
| Segregated cash with broker | | | 39,801 | |
| Receivables: | |
| Fund shares sold | | | 9,096,132 | |
| Dividends | | | 38,292 | |
| Securities lending income | | | 5,395 | |
| Total assets | | | 61,461,627 | |
| | | | | |
| Liabilities: | |
| Payable for: | |
| Securities purchased | | | 6,909,333 | |
| Return of securities loaned | | | 2,762,950 | |
| Fund shares redeemed | | | 2,273,469 | |
| Management fees | | | 26,641 | |
| Transfer agent and administrative fees | | | 8,881 | |
| Distribution and service fees | | | 7,074 | |
| Portfolio accounting fees | | | 3,552 | |
| Miscellaneous | | | 23,957 | |
| Total liabilities | | | 12,015,857 | |
| Commitments and contingent liabilities (Note 10) | | | — | |
| Net assets | | $ | 49,445,770 | |
| | | | | |
| Net assets consist of: | |
| Paid in capital | | $ | 93,338,410 | |
| Accumulated net investment loss | | | (249,582 | ) |
| Accumulated net realized loss on investments | | | (53,676,804 | ) |
| Net unrealized appreciation on investments | | | 10,033,746 | |
| Net assets | | $ | 49,445,770 | |
| | | | | |
| Investor Class: | |
| Net assets | | $ | 30,527,636 | |
| Capital shares outstanding | | | 1,215,855 | |
| Net asset value per share | | $ | 25.11 | |
| | | | | |
| Advisor Class: | |
| Net assets | | $ | 8,400,225 | |
| Capital shares outstanding | | | 355,373 | |
| Net asset value per share | | $ | 23.64 | |
| | | | | |
| A-Class: | |
| Net assets | | $ | 4,927,551 | |
| Capital shares outstanding | | | 202,927 | |
| Net asset value per share | | $ | 24.28 | |
| Maximum offering price per share (Net asset value divided by 95.25%) | | $ | 25.49 | |
| | | | | |
| C-Class: | |
| Net assets | | $ | 5,590,358 | |
| Capital shares outstanding | | | 257,918 | |
| Net asset value per share | | $ | 21.67 | |
STATEMENT OF OPERATIONS
Year Ended March 31, 2015
| Investment Income: | |
| Dividends (net of foreign withholding tax of $50,032) | | $ | 630,055 | |
| Income from securities lending, net | | | 106,545 | |
| Interest | | | 59 | |
| Total investment income | | | 736,659 | |
| | | | | |
| Expenses: | |
| Management fees | | | 432,300 | |
| Transfer agent and administrative fees | | | 144,100 | |
| Distribution and service fees: | |
| Advisor Class | | | 18,999 | |
| A-Class | | | 13,077 | |
| C-Class | | | 83,580 | |
| Portfolio accounting fees | | | 57,640 | |
| Registration fees | | | 47,118 | |
| Custodian fees | | | 6,730 | |
| Trustees’ fees* | | | 4,937 | |
| Line of credit fees | | | 253 | |
| Miscellaneous | | | 28,172 | |
| Total expenses | | | 836,906 | |
| Net investment loss | | | (100,247 | ) |
| | | | | |
| Net Realized and Unrealized Gain (Loss): | |
| Net realized gain (loss) on: | |
| Investments | | | (4,218,177 | ) |
| Foreign currency | | | (8 | ) |
| Net realized loss | | | (4,218,185 | ) |
| Net change in unrealized appreciation (depreciation) on: | |
| Investments | | | (12,927,538 | ) |
| Foreign currency | | | 2 | |
| Net change in unrealized appreciation (depreciation) | | | (12,927,536 | ) |
| Net realized and unrealized loss | | | (17,145,721 | ) |
| Net decrease in net assets resulting from operations | | $ | (17,245,968 | ) |
| * | Relates to Trustees not deemed “interested persons” within the meaning of Section 2(a)(19) of the 1940 Act. |
| SEE NOTES TO FINANCIAL STATEMENTS. | THE RYDEX FUNDS ANNUAL REPORT | 109 |
STATEMENTS OF CHANGES IN NET ASSETS
| | | Year Ended March 31, 2015 | | | Year Ended March 31, 2014 | |
| Increase (Decrease) in Net Assets from Operations: | | | | | | |
| Net investment income (loss) | | $ | (100,247 | ) | | $ | 531,727 | |
| Net realized loss on investments | | | (4,218,185 | ) | | | (21,811,865 | ) |
| Net change in unrealized appreciation (depreciation) on investments | | | (12,927,536 | ) | | | (18,958,806 | ) |
| Net decrease in net assets resulting from operations | | | (17,245,968 | ) | | | (40,238,944 | ) |
| | | | | | | | | |
| Distributions to shareholders from: | | | | | | | | |
| Net investment income | | | | | | | | |
| Investor Class | | | (942,983 | ) | | | (214,700 | ) |
| Advisor Class | | | (77,995 | ) | | | (17,921 | ) |
| A-Class | | | (81,766 | ) | | | (18,796 | ) |
| C-Class | | | (226,581 | ) | | | (51,914 | ) |
| Total distributions to shareholders | | | (1,329,325 | ) | | | (303,331 | ) |
| | | | | | | | | |
| Capital share transactions: | | | | | | | | |
| Proceeds from sale of shares | | | | | | | | |
| Investor Class | | | 228,681,951 | | | | 338,664,021 | |
| Advisor Class | | | 81,461,920 | | | | 73,664,880 | |
| A-Class | | | 34,559,485 | | | | 8,057,501 | |
| C-Class | | | 19,812,912 | | | | 25,324,298 | |
| Distributions reinvested | | | | | | | | |
| Investor Class | | | 884,145 | | | | 205,735 | |
| Advisor Class | | | 77,943 | | | | 17,782 | |
| A-Class | | | 67,165 | | | | 15,489 | |
| C-Class | | | 219,239 | | | | 49,648 | |
| Cost of shares redeemed | | | | | | | | |
| Investor Class | | | (228,926,568 | ) | | | (336,034,319 | ) |
| Advisor Class | | | (76,224,107 | ) | | | (71,421,958 | ) |
| A-Class | | | (33,136,533 | ) | | | (6,716,766 | ) |
| C-Class | | | (20,795,740 | ) | | | (29,074,122 | ) |
| Net increase from capital share transactions | | | 6,681,812 | | | | 2,752,189 | |
| Net decrease in net assets | | | (11,893,481 | ) | | | (37,790,086 | ) |
| | | | | | | | | |
| Net assets: | | | | | | | | |
| Beginning of year | | | 61,339,251 | | | | 99,129,337 | |
| End of year | | $ | 49,445,770 | | | $ | 61,339,251 | |
| (Accumulated net investment loss)/Undistributed net investment income at end of year | | $ | (249,582 | ) | | $ | 741,411 | |
| | | | | | | | | |
| Capital share activity: | | | | | | | | |
| Shares sold | | | | | | | | |
| Investor Class | | | 7,016,300 | | | | 8,791,258 | |
| Advisor Class | | | 2,837,152 | | | | 2,073,315 | |
| A-Class | | | 1,168,449 | | | | 216,466 | |
| C-Class | | | 697,217 | | | | 747,420 | |
| Shares issued from reinvestment of distributions | | | | | | | | |
| Investor Class | | | 30,498 | | | | 6,301 | |
| Advisor Class | | | 2,851 | | | | 574 | |
| A-Class | | | 2,392 | | | | 488 | |
| C-Class | | | 8,684 | | | | 1,730 | |
| Shares redeemed | | | | | | | | |
| Investor Class | | | (7,028,380 | ) | | | (8,982,178 | ) |
| Advisor Class | | | (2,602,821 | ) | | | (2,019,696 | ) |
| A-Class | | | (1,118,576 | ) | | | (185,372 | ) |
| C-Class | | | (743,130 | ) | | | (860,994 | ) |
| Net increase (decrease) in shares | | | 270,636 | | | | (210,688 | ) |
| 110 | THE RYDEX FUNDS ANNUAL REPORT | SEE NOTES TO FINANCIAL STATEMENTS. |
This table is presented to show selected data for a share outstanding throughout each period and to assist shareholders in evaluating a Fund’s performance for the periods presented.
| Investor Class | | Year Ended March 31, 2015 | | | Year Ended March 31, 2014 | | | Year Ended March 28, 2013 | | | Year Ended March 31, 2012 | | | Year Ended March 31, 2011 | |
| Per Share Data | | | | | | | | | | | | | | | |
| Net asset value, beginning of period | | $ | 35.78 | | | $ | 51.65 | | | $ | 65.73 | | | $ | 86.74 | | | $ | 61.73 | |
| Income (loss) from investment operations: | |
Net investment income (loss)a | | | .01 | | | | .36 | | | | .34 | | | | (.02 | ) | | | (.28 | ) |
| Net gain (loss) on investments (realized and unrealized) | | | (9.88 | ) | | | (16.06 | ) | | | (12.12 | ) | | | (20.70 | ) | | | 25.32 | |
| Total from investment operations | | | (9.87 | ) | | | (15.70 | ) | | | (11.78 | ) | | | (20.72 | ) | | | 25.04 | |
| Less distributions from: | |
| Net investment income | | | (.80 | ) | | | (.17 | ) | | | (.10 | ) | | | (.29 | ) | | | (.03 | ) |
| Net realized gains | | | — | | | | — | | | | (2.20 | ) | | | — | | | | — | |
| Total distributions | | | (.80 | ) | | | (.17 | ) | | | (2.30 | ) | | | (.29 | ) | | | (.03 | ) |
| Net asset value, end of period | | $ | 25.11 | | | $ | 35.78 | | | $ | 51.65 | | | $ | 65.73 | | | $ | 86.74 | |
| | |
Total Returnb | | | (27.88 | %) | | | (30.37 | %) | | | (18.60 | %) | | | (23.91 | %) | | | 40.57 | % |
| Ratios/Supplemental Data | |
| Net assets, end of period (in thousands) | | $ | 30,528 | | | $ | 42,846 | | | $ | 71,386 | | | $ | 79,637 | | | $ | 141,798 | |
| Ratios to average net assets: | |
| Net investment income (loss) | | | 0.04 | % | | | 0.96 | % | | | 0.55 | % | | | (0.03 | %) | | | (0.37 | %) |
Total expensesc | | | 1.25 | % | | | 1.27 | % | | | 1.25 | % | | | 1.26 | % | | | 1.28 | % |
| Portfolio turnover rate | | | 371 | % | | | 348 | % | | | 206 | % | | | 235 | % | | | 322 | % |
| Advisor Class | | Year Ended March 31, 2015 | | | Year Ended March 31, 2014 | | | Year Ended March 28, 2013 | | | Year Ended March 31, 2012 | | | Year Ended March 31, 2011 | |
| Per Share Data | | | | | | | | | | | | | | | |
| Net asset value, beginning of period | | $ | 33.92 | | | $ | 49.20 | | | $ | 63.02 | | | $ | 83.59 | | | $ | 59.79 | |
| Income (loss) from investment operations: | |
Net investment income (loss)a | | | (.14 | ) | | | .12 | | | | (.02 | ) | | | (.44 | ) | | | (.61 | ) |
| Net gain (loss) on investments (realized and unrealized) | | | (9.34 | ) | | | (15.23 | ) | | | (11.50 | ) | | | (19.84 | ) | | | 24.44 | |
| Total from investment operations | | | (9.48 | ) | | | (15.11 | ) | | | (11.52 | ) | | | (20.28 | ) | | | 23.83 | |
| Less distributions from: | |
| Net investment income | | | (.80 | ) | | | (.17 | ) | | | (.10 | ) | | | (.29 | ) | | | (.03 | ) |
| Net realized gains | | | — | | | | — | | | | (2.20 | ) | | | — | | | | — | |
| Total distributions | | | (.80 | ) | | | (.17 | ) | | | (2.30 | ) | | | (.29 | ) | | | (.03 | ) |
| Net asset value, end of period | | $ | 23.64 | | | $ | 33.92 | | | $ | 49.20 | | | $ | 63.02 | | | $ | 83.59 | |
| | |
Total Returnb | | | (28.24 | %) | | | (30.71 | %) | | | (18.99 | %) | | | (24.29 | %) | | | 39.87 | % |
| Ratios/Supplemental Data | |
| Net assets, end of period (in thousands) | | $ | 8,400 | | | $ | 4,009 | | | $ | 3,148 | | | $ | 9,610 | | | $ | 30,418 | |
| Ratios to average net assets: | |
| Net investment income (loss) | | | (0.45 | %) | | | 0.34 | % | | | (0.04 | %) | | | (0.59 | %) | | | (0.86 | %) |
Total expensesc | | | 1.75 | % | | | 1.77 | % | | | 1.75 | % | | | 1.76 | % | | | 1.78 | % |
| Portfolio turnover rate | | | 371 | % | | | 348 | % | | | 206 | % | | | 235 | % | | | 322 | % |
| SEE NOTES TO FINANCIAL STATEMENTS. | THE RYDEX FUNDS ANNUAL REPORT | 111 |
FINANCIAL HIGHLIGHTS (concluded)
This table is presented to show selected data for a share outstanding throughout each period and to assist shareholders in evaluating a Fund’s performance for the periods presented.
| A-Class | | Year Ended March 31, 2015 | | | Year Ended March 31, 2014 | | | Year Ended March 28, 2013 | | | Year Ended March 31, 2012 | | | Year Ended March 31, 2011 | |
| Per Share Data | | | | | | | | | | | | | | | |
| Net asset value, beginning of period | | $ | 34.75 | | | $ | 50.28 | | | $ | 64.21 | | | $ | 84.97 | | | $ | 60.63 | |
| Income (loss) from investment operations: | |
Net investment income (loss)a | | | (.10 | ) | | | .16 | | | | .21 | | | | (.22 | ) | | | (.45 | ) |
| Net gain (loss) on investments (realized and unrealized) | | | (9.57 | ) | | | (15.52 | ) | | | (11.84 | ) | | | (20.25 | ) | | | 24.82 | |
| Total from investment operations | | | (9.67 | ) | | | (15.36 | ) | | | (11.63 | ) | | | (20.47 | ) | | | 24.37 | |
| Less distributions from: | |
| Net investment income | | | (.80 | ) | | | (.17 | ) | | | (.10 | ) | | | (.29 | ) | | | (.03 | ) |
| Net realized gains | | | — | | | | — | | | | (2.20 | ) | | | — | | | | — | |
| Total distributions | | | (.80 | ) | | | (.17 | ) | | | (2.30 | ) | | | (.29 | ) | | | (.03 | ) |
| Net asset value, end of period | | $ | 24.28 | | | $ | 34.75 | | | $ | 50.28 | | | $ | 64.21 | | | $ | 84.97 | |
| | |
Total Returnb | | | (28.13 | %) | | | (30.52 | %) | | | (18.80 | %) | | | (24.13 | %) | | | 40.21 | % |
| Ratios/Supplemental Data | |
| Net assets, end of period (in thousands) | | $ | 4,928 | | | $ | 5,235 | | | $ | 5,988 | | | $ | 6,412 | | | $ | 14,919 | |
| Ratios to average net assets: | |
| Net investment income (loss) | | | (0.29 | %) | | | 0.45 | % | | | 0.35 | % | | | (0.30 | %) | | | (0.63 | %) |
Total expensesc | | | 1.50 | % | | | 1.52 | % | | | 1.50 | % | | | 1.51 | % | | | 1.53 | % |
| Portfolio turnover rate | | | 371 | % | | | 348 | % | | | 206 | % | | | 235 | % | | | 322 | % |
| C-Class | | Year Ended March 31, 2015 | | | Year Ended March 31, 2014 | | | Year Ended March 28, 2013 | | | Year Ended March 31, 2012 | | | Year Ended March 31, 2011 | |
| Per Share Data | | | | | | | | | | | | | | | |
| Net asset value, beginning of period | | $ | 31.34 | | | $ | 45.72 | | | $ | 59.02 | | | $ | 78.70 | | | $ | 56.58 | |
| Income (loss) from investment operations: | |
Net investment income (loss)a | | | (.29 | ) | | | (.07 | ) | | | (.23 | ) | | | (.72 | ) | | | (.94 | ) |
| Net gain (loss) on investments (realized and unrealized) | | | (8.58 | ) | | | (14.14 | ) | | | (10.77 | ) | | | (18.67 | ) | | | 23.09 | |
| Total from investment operations | | | (8.87 | ) | | | (14.21 | ) | | | (11.00 | ) | | | (19.39 | ) | | | 22.15 | |
| Less distributions from: | |
| Net investment income | | | (.80 | ) | | | (.17 | ) | | | (.10 | ) | | | (.29 | ) | | | (.03 | ) |
| Net realized gains | | | — | | | | — | | | | (2.20 | ) | | | — | | | | — | |
| Total distributions | | | (.80 | ) | | | (.17 | ) | | | (2.30 | ) | | | (.29 | ) | | | (.03 | ) |
| Net asset value, end of period | | $ | 21.67 | | | $ | 31.34 | | | $ | 45.72 | | | $ | 59.02 | | | $ | 78.70 | |
| | |
Total Returnb | | | (28.64 | %) | | | (31.05 | %) | | | (19.39 | %) | | | (24.68 | %) | | | 39.18 | % |
| Ratios/Supplemental Data | |
| Net assets, end of period (in thousands) | | $ | 5,590 | | | $ | 9,250 | | | $ | 18,608 | | | $ | 26,533 | | | $ | 39,650 | |
| Ratios to average net assets: | |
| Net investment income (loss) | | | (0.99 | %) | | | (0.22 | %) | | | (0.42 | %) | | | (1.04 | %) | | | (1.37 | %) |
Total expensesc | | | 2.25 | % | | | 2.27 | % | | | 2.25 | % | | | 2.26 | % | | | 2.28 | % |
| Portfolio turnover rate | | | 371 | % | | | 348 | % | | | 206 | % | | | 235 | % | | | 322 | % |
a | Net investment income (loss) per share was computed using average shares outstanding throughout the period. |
b | Total return does not reflect the impact of any applicable sales charges. |
c | Does not include expenses of the underlying funds in which the Fund invests. |
| 112 | THE RYDEX FUNDS ANNUAL REPORT | SEE NOTES TO FINANCIAL STATEMENTS. |
PERFORMANCE REPORT AND FUND PROFILE (Unaudited) | March 31, 2015 |
REAL ESTATE FUND
OBJECTIVE: Seeks to provide capital appreciation by investing in companies that are involved in the real estate industry, including real estate investment trusts (“REITs”) (collectively, “real estate companies”).
For the one-year period ended March 31, 2015, Real Estate Fund H-Class returned 15.55%, compared to a return of 24.17% for the MSCI U.S. REIT Index. The broader S&P 500 Index returned 12.73%.
Retail REITs contributed most to the performance of the Fund, followed by residential REITs. The real estate services segment was the largest detractor from performance, followed by the specialty chemicals segment.
The strongest performing holdings included Simon Property Group, Inc., Equity Residential, and General Growth Properties, Inc. The main detractors were American Realty Capital Properties, Inc., E-House China Holdings Ltd. ADR, and Altisource Portfolio Solutions S.A.
Performance displayed represents past performance, which is no guarantee of future results.
Holdings Diversification (Market Exposure as % of Net Assets)
“Holdings Diversification (Market Exposure as % of Net Assets)” excludes any temporary cash investments.
| Inception Dates: |
| A-Class | September 1, 2004 |
| C-Class | February 20, 2004 |
| H-Class | February 20, 2004 |
| Ten Largest Holdings (% of Total Net Assets) |
| Simon Property Group, Inc. | 2.4% |
| American Tower Corp. — Class A | 1.8% |
| Public Storage | 1.7% |
| Health Care REIT, Inc. | 1.5% |
| Equity Residential | 1.5% |
| Crown Castle International Corp. | 1.5% |
| General Growth Properties, Inc. | 1.5% |
| Ventas, Inc. | 1.4% |
| AvalonBay Communities, Inc. | 1.4% |
| Prologis, Inc. | 1.4% |
| Top Ten Total | 16.1% |
| | |
| “Ten Largest Holdings” exclude any temporary cash or derivative investments. |
| | THE RYDEX FUNDS ANNUAL REPORT | 113 |
PERFORMANCE REPORT AND FUND PROFILE (Unaudited)(concluded) | March 31, 2015 |
Cumulative Fund Performance*
Average Annual Returns*
Periods Ended March 31, 2015
| | 1 Year | 5 Year | 10 Year |
| A-Class Shares | 15.58% | 12.06% | 5.30% |
A-Class Shares with sales charge† | 10.08% | 10.98% | 4.79% |
| C-Class Shares | 14.73% | 11.16% | 4.48% |
C-Class Shares with CDSC‡ | 13.73% | 11.16% | 4.48% |
| H-Class Shares | 15.55% | 12.03% | 5.27% |
| MSCI U.S. REIT Index | 24.17% | 15.89% | 9.66% |
| S&P 500 Index | 12.73% | 14.47% | 8.01% |
| * | The performance data above represents past performance that is not predictive of future results. The investment return and principal value of an investment in the Fund will fluctuate so that an investor’s shares, when redeemed, may be worth more or less than their original cost. Returns are historical and include changes in principal and reinvested dividends and capital gains and do not reflect the effect of taxes. The S&P 500 Index and the MSCI U.S. REIT Index are unmanaged indices and, unlike the Fund, have no management fees or operating expenses to reduce their reported returns. The graphs are based on A-Class shares and H-Class shares only; performance for C-Class shares will vary due to differences in fee structures. |
† | Fund returns are calculated using the maximum sales charge of 4.75%. |
‡ | Fund returns include a CDSC of 1% if redeemed within 12 months of purchase. |
| 114 | THE RYDEX FUNDS ANNUAL REPORT | |
| SCHEDULE OF INVESTMENTS | March 31, 2015 |
| REAL ESTATE FUND | |
| | |
Shares | | | Value | |
| | | | | | | | |
COMMON STOCKS† - 99.6% | |
| | | | | | | | |
| REITs - 90.5% | |
| REITs-DIVERSIFIED - 17.2% | |
| American Tower Corp. — Class A | | | 9,032 | | | $ | 850,362 | |
| Crown Castle International Corp. | | | 8,420 | | | | 694,987 | |
| Vornado Realty Trust | | | 5,801 | | | | 649,712 | |
| Weyerhaeuser Co. | | | 16,785 | | | | 556,423 | |
| Digital Realty Trust, Inc. | | | 6,318 | | | | 416,735 | |
| Plum Creek Timber Company, Inc. | | | 8,680 | | | | 377,146 | |
| Duke Realty Corp. | | | 17,150 | | | | 373,356 | |
| Lamar Advertising Co. — Class A | | | 5,580 | | | | 330,727 | |
| Liberty Property Trust | | | 8,746 | | | | 312,232 | |
| Corrections Corporation of America | | | 7,317 | | | | 294,582 | |
| Outfront Media, Inc. | | | 9,180 | | | | 274,665 | |
| Retail Properties of America, Inc. — Class A | | | 16,636 | | | | 266,675 | |
| EPR Properties | | | 4,289 | | | | 257,469 | |
| GEO Group, Inc. | | | 5,780 | | | | 252,817 | |
| Rayonier, Inc. | | | 9,218 | | | | 248,517 | |
| PS Business Parks, Inc. | | | 2,560 | | | | 212,582 | |
| Cousins Properties, Inc. | | | 19,629 | | | | 208,067 | |
| Lexington Realty Trust | | | 20,941 | | | | 205,850 | |
| DuPont Fabros Technology, Inc. | | | 6,239 | | | | 203,891 | |
| New Residential Investment Corp. | | | 13,050 | | | | 196,142 | |
| Washington Real Estate Investment Trust | | | 6,950 | | | | 192,029 | |
| American Assets Trust, Inc. | | | 4,420 | | | | 191,298 | |
| Potlatch Corp. | | | 4,419 | | | | 176,937 | |
| STAG Industrial, Inc. | | | 7,200 | | | | 169,344 | |
| Gramercy Property Trust, Inc. | | | 5,720 | | | | 160,560 | |
| Total REITs-Diversified | | | | | | | 8,073,105 | |
| | | | | | | | |
| REITs-OFFICE PROPERTY - 12.3% | |
| Boston Properties, Inc. | | | 4,616 | | | | 648,455 | |
| SL Green Realty Corp. | | | 3,856 | | | | 495,033 | |
| American Realty Capital Properties, Inc. | | | 40,790 | | | | 401,782 | |
| Alexandria Real Estate Equities, Inc. | | | 3,761 | | | | 368,728 | |
| Kilroy Realty Corp. | | | 4,706 | | | | 358,456 | |
| BioMed Realty Trust, Inc. | | | 13,068 | | | | 296,121 | |
| Highwoods Properties, Inc. | | | 6,360 | | | | 291,161 | |
| Douglas Emmett, Inc. | | | 9,714 | | | | 289,574 | |
| Paramount Group, Inc. | | | 14,050 | | | | 271,165 | |
| Equity Commonwealth* | | | 9,672 | | | | 256,792 | |
| Columbia Property Trust, Inc. | | | 9,310 | | | | 251,556 | |
| Brandywine Realty Trust | | | 14,621 | | | | 233,644 | |
| Piedmont Office Realty Trust, Inc. — Class A | | | 12,516 | | | | 232,923 | |
| Hudson Pacific Properties, Inc. | | | 6,886 | | | | 228,546 | |
| Corporate Office Properties Trust | | | 7,654 | | | | 224,875 | |
| Empire State Realty Trust, Inc. — Class A | | | 10,530 | | | | 198,069 | |
| Parkway Properties, Inc. | | | 10,954 | | | | 190,052 | |
| New York REIT, Inc. | | | 17,220 | | | | 180,466 | |
| Mack-Cali Realty Corp. | | | 9,171 | | | | 176,817 | |
| Government Properties Income Trust | | | 7,565 | | | | 172,860 | |
| Total REITs-Office Property | | | | | | | 5,767,075 | |
| | | | | | | | |
| REITs-APARTMENTS - 10.4% | |
| Equity Residential | | | 9,110 | | | | 709,304 | |
| AvalonBay Communities, Inc. | | | 3,795 | | | | 661,278 | |
| Essex Property Trust, Inc. | | | 2,310 | | | | 531,069 | |
| UDR, Inc. | | | 11,764 | | | | 400,329 | |
| Camden Property Trust | | | 4,640 | | | | 362,523 | |
| Mid-America Apartment Communities, Inc. | | | 4,354 | | | | 336,434 | |
| Apartment Investment & Management Co. — Class A | | | 8,484 | | | | 333,930 | |
| American Campus Communities, Inc. | | | 7,133 | | | | 305,792 | |
| Home Properties, Inc. | | | 3,999 | | | | 277,091 | |
| American Homes 4 Rent — Class A | | | 15,363 | | | | 254,258 | |
| Post Properties, Inc. | | | 4,315 | | | | 245,653 | |
| Education Realty Trust, Inc. | | | 5,111 | | | | 180,827 | |
| Associated Estates Realty Corp. | | | 6,740 | | | | 166,343 | |
| Starwood Waypoint Residential Trust | | | 5,262 | | | | 136,023 | |
| Total REITs-Apartments | | | | | | | 4,900,854 | |
| | | | | | | | |
| REITs-HEALTH CARE - 9.2% | |
| Health Care REIT, Inc. | | | 9,224 | | | | 713,568 | |
| Ventas, Inc. | | | 9,244 | | | | 674,997 | |
| HCP, Inc. | | | 14,405 | | | | 622,440 | |
| Omega Healthcare Investors, Inc. | | | 8,026 | | | | 325,615 | |
| Senior Housing Properties Trust | | | 14,008 | | | | 310,838 | |
| Healthcare Trust of America, Inc. — Class A | | | 9,166 | | | | 255,365 | |
| Medical Properties Trust, Inc. | | | 16,259 | | | | 239,658 | |
| Healthcare Realty Trust, Inc. | | | 8,253 | | | | 229,268 | |
| National Health Investors, Inc. | | | 3,200 | | | | 227,232 | |
| Sabra Health Care REIT, Inc. | | | 5,970 | | | | 197,906 | |
| Aviv REIT, Inc. | | | 5,120 | | | | 186,880 | |
| LTC Properties, Inc. | | | 3,964 | | | | 182,344 | |
| Physicians Realty Trust | | | 8,710 | | | | 153,383 | |
| Total REITs-Health Care | | | | | | | 4,319,494 | |
| | | | | | | | |
| REITs-SHOPPING CENTERS - 8.0% | |
| Kimco Realty Corp. | | | 16,836 | | | | 452,046 | |
| Federal Realty Investment Trust | | | 3,055 | | | | 449,727 | |
| Brixmor Property Group, Inc. | | | 14,520 | | | | 385,506 | |
| Regency Centers Corp. | | | 5,185 | | | | 352,787 | |
| DDR Corp. | | | 18,934 | | | | 352,551 | |
| Weingarten Realty Investors | | | 7,923 | | | | 285,070 | |
| Equity One, Inc. | | | 9,204 | | | | 245,655 | |
| WP GLIMCHER, Inc. | | | 14,185 | | | | 235,897 | |
| Acadia Realty Trust | | | 6,140 | | | | 214,163 | |
| Kite Realty Group Trust | | | 7,460 | | | | 210,148 | |
| Urban Edge Properties | | | 8,853 | | | | 209,816 | |
| Retail Opportunity Investments Corp. | | | 9,810 | | | | 179,523 | |
| Ramco-Gershenson Properties Trust | | | 8,710 | | | | 162,006 | |
| Total REITs-Shopping Centers | | | | | | | 3,734,895 | |
| | | | | | | | |
| REITs-MORTGAGE - 7.3% | |
| Annaly Capital Management, Inc. | | | 40,688 | | | | 423,156 | |
| American Capital Agency Corp. | | | 17,303 | | | | 369,073 | |
| Starwood Property Trust, Inc. | | | 13,130 | | | | 319,059 | |
| SEE NOTES TO FINANCIAL STATEMENTS. | THE RYDEX FUNDS ANNUAL REPORT | 115 |
SCHEDULE OF INVESTMENTS (continued) | March 31, 2015 |
| REAL ESTATE FUND | |
| | |
Shares | | | Value | |
| | | | | | | | | |
| NorthStar Realty Finance Corp. | | | 17,438 | | | $ | 315,977 | |
| Two Harbors Investment Corp. | | | 25,268 | | | | 268,346 | |
| MFA Financial, Inc. | | | 29,331 | | | | 230,542 | |
| Colony Capital, Inc. — Class A | | | 8,860 | | | | 229,651 | |
| Invesco Mortgage Capital, Inc. | | | 12,034 | | | | 186,888 | |
| Hatteras Financial Corp. | | | 9,917 | | | | 180,093 | |
| PennyMac Mortgage Investment Trust | | | 8,081 | | | | 172,044 | |
| Redwood Trust, Inc. | | | 9,120 | | | | 162,974 | |
| CYS Investments, Inc. | | | 18,153 | | | | 161,743 | |
| Capstead Mortgage Corp. | | | 12,195 | | | | 143,535 | |
| iStar Financial, Inc.* | | | 11,040 | | | | 143,520 | |
Western Asset Mortgage Capital Corp.1 | | | 7,140 | | | | 107,671 | |
| Total REITs-Mortgage | | | | | | | 3,414,272 | |
| | | | | | | | |
| REITs-HOTELS - 7.2% | |
| Host Hotels & Resorts, Inc. | | | 25,614 | | | | 516,890 | |
| Hospitality Properties Trust | | | 9,203 | | | | 303,607 | |
| LaSalle Hotel Properties | | | 7,186 | | | | 279,248 | |
| RLJ Lodging Trust | | | 8,768 | | | | 274,526 | |
| Sunstone Hotel Investors, Inc. | | | 15,119 | | | | 252,034 | |
| Pebblebrook Hotel Trust | | | 5,400 | | | | 251,478 | |
| Strategic Hotels & Resorts, Inc.* | | | 20,218 | | | | 251,310 | |
| Ryman Hospitality Properties, Inc. | | | 3,940 | | | | 239,985 | |
| DiamondRock Hospitality Co. | | | 15,943 | | | | 225,275 | |
| Chesapeake Lodging Trust | | | 5,640 | | | | 190,801 | |
| Hersha Hospitality Trust | | | 23,593 | | | | 152,647 | |
| Summit Hotel Properties, Inc. | | | 10,800 | | | | 151,956 | |
| Chatham Lodging Trust | | | 5,030 | | | | 147,932 | |
| Ashford Hospitality Trust, Inc. | | | 13,710 | | | | 131,890 | |
| Total REITs-Hotels | | | | | | | 3,369,579 | |
| | | | | | | | |
| REITs-REGIONAL MALLS - 6.9% | |
| Simon Property Group, Inc. | | | 5,641 | | | | 1,103,605 | |
| General Growth Properties, Inc. | | | 23,097 | | | | 682,516 | |
| Macerich Co. | | | 5,650 | | | | 476,465 | |
| Taubman Centers, Inc. | | | 3,893 | | | | 300,267 | |
| Tanger Factory Outlet Centers, Inc. | | | 7,206 | | | | 253,435 | |
| CBL & Associates Properties, Inc. | | | 12,711 | | | | 251,678 | |
| Pennsylvania Real Estate Investment Trust | | | 7,569 | | | | 175,828 | |
| Total REITs-Regional Malls | | | | | | | 3,243,794 | |
| | | | | | | | |
| REITs-STORAGE - 4.5% | |
| Public Storage | | | 4,153 | | | | 818,722 | |
| Extra Space Storage, Inc. | | | 5,859 | | | | 395,893 | |
| Iron Mountain, Inc. | | | 10,040 | | | | 366,259 | |
| CubeSmart | | | 11,287 | | | | 272,581 | |
| Sovran Self Storage, Inc. | | | 2,755 | | | | 258,805 | |
| Total REITs-Storage | | | | | | | 2,112,260 | |
| | | | | | | | |
| REITs-WAREHOUSE/INDUSTRIES - 3.5% | |
| Prologis, Inc. | | | 14,918 | | | | 649,828 | |
| DCT Industrial Trust, Inc. | | | 6,990 | | | | 242,273 | |
| First Industrial Realty Trust, Inc. | | | 9,886 | | | | 211,857 | |
| EastGroup Properties, Inc. | | | 3,240 | | | | 194,854 | |
| Chambers Street Properties | | | 23,768 | | | | 187,292 | |
| CyrusOne, Inc. | | | 4,750 | | | | 147,820 | |
| Total REITs-Warehouse/Industries | | | | | | | 1,633,924 | |
| | | | | | | | |
| REITs-SINGLE TENANT - 2.8% | |
| Realty Income Corp. | | | 8,999 | | | | 464,348 | |
| National Retail Properties, Inc. | | | 7,781 | | | | 318,788 | |
| Spirit Realty Capital, Inc. | | | 25,142 | | | | 303,715 | |
| Select Income REIT | | | 8,120 | | | | 202,919 | |
| Total REITs-Single Tenant | | | | | | | 1,289,770 | |
| | | | | | | | |
| REITs-MANUFACTURED HOMES - 1.2% | |
| Equity LifeStyle Properties, Inc. | | | 5,362 | | | | 294,642 | |
| Sun Communities, Inc. | | | 3,901 | | | | 260,275 | |
| Total REITs-Manufactured Homes | | | | | | | 554,917 | |
| Total REITs | | | | | | | 42,413,939 | |
| | | | | | | | |
| REAL ESTATE - 8.0% | |
| REAL ESTATE MANAGEMENT/SERVICES - 5.1% | |
| CBRE Group, Inc. — Class A* | | | 13,144 | | | | 508,804 | |
| Jones Lang LaSalle, Inc. | | | 2,333 | | | | 397,543 | |
| WP Carey, Inc. | | | 5,422 | | | | 368,696 | |
| Realogy Holdings Corp.* | | | 7,704 | | | | 350,378 | |
| Altisource Residential Corp. | | | 14,800 | | | | 308,728 | |
| E-House China Holdings Ltd. ADR | | | 51,070 | | | | 277,310 | |
| Kennedy-Wilson Holdings, Inc. | | | 8,126 | | | | 212,414 | |
| Total Real Estate Management/Services | | | | | | | 2,423,873 | |
| | | | | | | | |
| REAL ESTATE OPERATIONS/DEVELOPMENT - 2.9% | |
| Howard Hughes Corp.* | | | 2,292 | | | | 355,306 | |
| Brookfield Asset Management, Inc. — Class A | | | 6,120 | | | | 328,093 | |
| Forest City Enterprises, Inc. — Class A* | | | 12,072 | | | | 308,077 | |
| Alexander & Baldwin, Inc. | | | 4,820 | | | | 208,128 | |
| St. Joe Co.* | | | 9,915 | | | | 184,022 | |
| Total Real Estate Operations/Development | | | | | | | 1,383,626 | |
| Total Real Estate | | | | | | | 3,807,499 | |
| | | | | | | | |
| ENTERTAINMENT - 0.6% | |
| CASINO SERVICES - 0.6% | |
| Gaming and Leisure Properties, Inc. | | | 7,613 | | | | 280,691 | |
| | | | | | | | |
| DIVERSIFIED FINANCIAL SERVICES - 0.5% | |
| INVESTMENT MANAGEMENT/ADVISORY SERVICES - 0.5% | |
Altisource Portfolio Solutions S.A.*,1 | | | 17,856 | | | | 229,807 | |
| | | | | | | | |
| Total Common Stocks | | | | | | | | |
| (Cost $38,309,427) | | | | | | | 46,731,936 | |
| | | | | | | | |
| 116 | THE RYDEX FUNDS ANNUAL REPORT | SEE NOTES TO FINANCIAL STATEMENTS. |
SCHEDULE OF INVESTMENTS (concluded) | March 31, 2015 |
| REAL ESTATE FUND | |
| | | | | | | | | |
| | | Face
Amount | | | Value | |
| | | | | | | | |
REPURCHASE AGREEMENT††,2 - 0.3% | |
HSBC Group
issued 03/31/15 at 0.03%
due 04/01/15 | | $ | 127,316 | | | $ | 127,316 | |
| Total Repurchase Agreement | | | | | | | | |
| (Cost $127,316) | | | | | | | 127,316 | |
| | | | | | | | |
SECURITIES LENDING COLLATERAL††,3 - 0.3% | |
| Repurchase Agreements | | | | | | | | |
HSBC Securities, Inc.
issued 03/31/15 at 0.10%
due 04/01/15 | | | 88,936 | | | | 88,936 | |
BNP Paribas Securities Corp.
issued 03/31/15 at 0.10%
due 04/01/15 | | | 30,594 | | | | 30,594 | |
Barclays Capital, Inc.
issued 03/31/15 at 0.10%
due 04/01/15 | | | 15,792 | | | | 15,792 | |
| Total Securities Lending Collateral | | | | | | | | |
| (Cost $135,322) | | | | | | | 135,322 | |
| | | | | | | | |
| Total Investments - 100.2% | | | | | | | | |
| (Cost $38,572,065) | | | | | | $ | 46,994,574 | |
| Other Assets & Liabilities, net - (0.2)% | | | | | | | (103,144 | ) |
| Total Net Assets - 100.0% | | | | | | $ | 46,891,430 | |
| * | Non-income producing security. |
| † | Value determined based on Level 1 inputs — See Note 4. |
| †† | Value determined based on Level 2 inputs — See Note 4. |
| 1 | All or portion of this security is on loan at March 31, 2015 — See Note 6. |
| 2 | Repurchase Agreement — See Note 5. |
| 3 | Securities lending collateral — See Note 6. |
| ADR — American Depositary Receipt |
| REIT — Real Estate Investment Trust |
| SEE NOTES TO FINANCIAL STATEMENTS. | THE RYDEX FUNDS ANNUAL REPORT | 117 |
STATEMENT OF ASSETS AND LIABILITIES
March 31, 2015
| Assets: | |
| Investments, at value - including $132,470 of securities loaned (cost $38,309,427) | | $ | 46,731,936 | |
| Repurchase agreements, at value (cost $262,638) | | | 262,638 | |
| Total investments (cost $38,572,065) | | | 46,994,574 | |
| Segregated cash with broker | | | 1,978 | |
| Cash | | | 1,043 | |
| Receivables: | |
| Securities sold | | | 668,646 | |
| Dividends | | | 209,473 | |
| Fund shares sold | | | 177,316 | |
| Securities lending income | | | 2,325 | |
| Total assets | | | 48,055,355 | |
| | | | | |
| Liabilities: | |
| Payable for: | |
| Fund shares redeemed | | | 939,079 | |
| Return of securities loaned | | | 137,300 | |
| Management fees | | | 36,896 | |
| Distribution and service fees | | | 12,766 | |
| Transfer agent and administrative fees | | | 10,852 | |
| Portfolio accounting fees | | | 4,341 | |
| Miscellaneous | | | 22,691 | |
| Total liabilities | | | 1,163,925 | |
| Commitments and contingent liabilities (Note 10) | | | — | |
| Net assets | | $ | 46,891,430 | |
| | | | | |
| Net assets consist of: | |
| Paid in capital | | $ | 56,366,707 | |
| Undistributed net investment income | | | 344,392 | |
| Accumulated net realized loss on investments | | | (18,242,178 | ) |
| Net unrealized appreciation on investments | | | 8,422,509 | |
| Net assets | | $ | 46,891,430 | |
| | | | | |
| A-Class: | |
| Net assets | | $ | 6,329,314 | |
| Capital shares outstanding | | | 165,085 | |
| Net asset value per share | | $ | 38.34 | |
| Maximum offering price per share (Net asset value divided by 95.25%) | | $ | 40.25 | |
| | | | | |
| C-Class: | |
| Net assets | | $ | 2,937,409 | |
| Capital shares outstanding | | | 84,392 | |
| Net asset value per share | | $ | 34.81 | |
| | | | | |
| H-Class: | |
| Net assets | | $ | 37,624,707 | |
| Capital shares outstanding | | | 983,618 | |
| Net asset value per share | | $ | 38.25 | |
STATEMENT OF OPERATIONS
Year Ended March 31, 2015
| Investment Income: | |
| Dividends (net of foreign withholding tax of $1,787) | | $ | 1,252,359 | |
| Income from securities lending, net | | | 9,547 | |
| Interest | | | 40 | |
| Total investment income | | | 1,261,946 | |
| | | | | |
| Expenses: | |
| Management fees | | | 370,479 | |
| Transfer agent and administrative fees | | | 108,964 | |
| Distribution and service fees: | |
| A-Class | | | 15,658 | |
| C-Class | | | 27,819 | |
| H-Class | | | 86,351 | |
| Portfolio accounting fees | | | 43,586 | |
| Custodian fees | | | 5,073 | |
| Trustees’ fees* | | | 2,422 | |
| Tax expense | | | 1,794 | |
| Line of credit fees | | | 373 | |
| Miscellaneous | | | 54,500 | |
| Total expenses | | | 717,019 | |
| Net investment income | | | 544,927 | |
| | | | | |
| Net Realized and Unrealized Gain (Loss): | |
| Net realized gain (loss) on: | |
| Investments | | | (1,017,396 | ) |
| Net realized loss | | | (1,017,396 | ) |
| Net change in unrealized appreciation (depreciation) on: | |
| Investments | | | 4,374,041 | |
| Net change in unrealized appreciation (depreciation) | | | 4,374,041 | |
| Net realized and unrealized gain | | | 3,356,645 | |
| Net increase in net assets resulting from operations | | $ | 3,901,572 | |
| * | Relates to Trustees not deemed “interested persons” within the meaning of Section 2(a)(19) of the 1940 Act. |
| 118 | THE RYDEX FUNDS ANNUAL REPORT | SEE NOTES TO FINANCIAL STATEMENTS. |
STATEMENTS OF CHANGES IN NET ASSETS
| | | Year Ended March 31, 2015 | | | Year Ended March 31, 2014 | |
| Increase (Decrease) in Net Assets from Operations: | | | | | | |
| Net investment income | | $ | 544,927 | | | $ | 260,925 | |
| Net realized gain (loss) on investments | | | (1,017,396 | ) | | | 2,653,853 | |
| Net change in unrealized appreciation (depreciation) on investments | | | 4,374,041 | | | | (2,954,093 | ) |
| Net increase (decrease) in net assets resulting from operations | | | 3,901,572 | | | | (39,315 | ) |
| | | | | | | | | |
| Distributions to shareholders from: | | | | | | | | |
| Net investment income | | | | | | | | |
| A-Class | | | (70,427 | ) | | | (69,328 | ) |
| C-Class | | | (29,231 | ) | | | (67,311 | ) |
| H-Class | | | (291,502 | ) | | | (200,042 | ) |
| Total distributions to shareholders | | | (391,160 | ) | | | (336,681 | ) |
| | | | | | | | | |
| Capital share transactions: | | | | | | | | |
| Proceeds from sale of shares | | | | | | | | |
| A-Class | | | 33,310,377 | | | | 12,878,425 | |
| C-Class | | | 30,598,523 | | | | 28,309,538 | |
| H-Class | | | 323,711,905 | | | | 154,735,643 | |
| Distributions reinvested | | | | | | | | |
| A-Class | | | 55,690 | | | | 64,436 | |
| C-Class | | | 28,740 | | | | 64,791 | |
| H-Class | | | 288,471 | | | | 198,562 | |
| Cost of shares redeemed | | | | | | | | |
| A-Class | | | (32,058,111 | ) | | | (21,614,347 | ) |
| C-Class | | | (30,472,287 | ) | | | (28,623,424 | ) |
| H-Class | | | (308,456,378 | ) | | | (144,941,887 | ) |
| Net increase from capital share transactions | | | 17,006,930 | | | | 1,071,737 | |
| Net increase in net assets | | | 20,517,342 | | | | 695,741 | |
| | | | | | | | | |
| Net assets: | | | | | | | | |
| Beginning of year | | | 26,374,088 | | | | 25,678,347 | |
| End of year | | $ | 46,891,430 | | | $ | 26,374,088 | |
| Undistributed net investment income at end of year | | $ | 344,392 | | | $ | 179,827 | |
| | | | | | | | | |
| Capital share activity: | | | | | | | | |
| Shares sold | | | | | | | | |
| A-Class | | | 907,893 | | | | 388,565 | |
| C-Class | | | 928,450 | | | | 923,737 | |
| H-Class | | | 8,887,538 | | | | 4,583,841 | |
| Shares issued from reinvestment of distributions | | | | | | | | |
| A-Class | | | 1,534 | | | | 2,095 | |
| C-Class | | | 870 | | | | 2,296 | |
| H-Class | | | 7,964 | | | | 6,468 | |
| Shares redeemed | | | | | | | | |
| A-Class | | | (867,549 | ) | | | (630,360 | ) |
| C-Class | | | (926,436 | ) | | | (935,775 | ) |
| H-Class | | | (8,503,320 | ) | | | (4,297,722 | ) |
| Net increase in shares | | | 436,944 | | | | 43,145 | |
| SEE NOTES TO FINANCIAL STATEMENTS. | THE RYDEX FUNDS ANNUAL REPORT | 119 |
This table is presented to show selected data for a share outstanding throughout each period and to assist shareholders in evaluating a Fund’s performance for the periods presented.
| A-Class | | Year Ended March 31, 2015 | | | Year Ended March 31, 2014 | | | Year Ended March 28, 2013 | | | Year Ended March 31, 2012 | | | Year Ended March 31, 2011 | |
| Per Share Data | | | | | | | | | | | | | | | |
| Net asset value, beginning of period | | $ | 33.47 | | | $ | 34.43 | | | $ | 30.27 | | | $ | 29.06 | | | $ | 24.24 | |
| Income (loss) from investment operations: | |
Net investment income (loss)a | | | .42 | | | | .65 | | | | .58 | | | | .45 | | | | .27 | |
| Net gain (loss) on investments (realized and unrealized) | | | 4.77 | | | | (.14 | ) | | | 4.18 | | | | 1.07 | | | | 5.17 | |
| Total from investment operations | | | 5.19 | | | | .51 | | | | 4.76 | | | | 1.52 | | | | 5.44 | |
| Less distributions from: | |
| Net investment income | | | (.32 | ) | | | (1.47 | ) | | | (.60 | ) | | | (.31 | ) | | | (.62 | ) |
| Total distributions | | | (.32 | ) | | | (1.47 | ) | | | (.60 | ) | | | (.31 | ) | | | (.62 | ) |
| Net asset value, end of period | | $ | 38.34 | | | $ | 33.47 | | | $ | 34.43 | | | $ | 30.27 | | | $ | 29.06 | |
| | |
Total Returnb | | | 15.58 | % | | | 1.86 | % | | | 16.03 | % | | | 5.42 | % | | | 22.72 | % |
| Ratios/Supplemental Data | |
| Net assets, end of period (in thousands) | | $ | 6,329 | | | $ | 4,124 | | | $ | 12,495 | | | $ | 2,364 | | | $ | 3,991 | |
| Ratios to average net assets: | |
| Net investment income (loss) | | | 1.13 | % | | | 1.92 | % | | | 1.82 | % | | | 1.59 | % | | | 1.07 | % |
| Total expenses | | | 1.60 | % | | | 1.65 | % | | | 1.61 | % | | | 1.61 | % | | | 1.63 | % |
| Portfolio turnover rate | | | 599 | % | | | 788 | % | | | 699 | % | | | 974 | % | | | 485 | % |
| C-Class | | Year Ended March 31, 2015 | | | Year Ended March 31, 2014 | | | Year Ended March 28, 2013 | | | Year Ended March 31, 2012 | | | Year Ended March 31, 2011 | |
| Per Share Data | | | | | | | | | | | | | | | |
| Net asset value, beginning of period | | $ | 30.64 | | | $ | 31.89 | | | $ | 28.29 | | | $ | 27.41 | | | $ | 23.11 | |
| Income (loss) from investment operations: | |
Net investment income (loss)a | | | .23 | | | | .29 | | | | .27 | | | | .22 | | | | .10 | |
| Net gain (loss) on investments (realized and unrealized) | | | 4.26 | | | | (.07 | ) | | | 3.93 | | | | .97 | | | | 4.82 | |
| Total from investment operations | | | 4.49 | | | | .22 | | | | 4.20 | | | | 1.19 | | | | 4.92 | |
| Less distributions from: | |
| Net investment income | | | (.32 | ) | | | (1.47 | ) | | | (.60 | ) | | | (.31 | ) | | | (.62 | ) |
| Total distributions | | | (.32 | ) | | | (1.47 | ) | | | (.60 | ) | | | (.31 | ) | | | (.62 | ) |
| Net asset value, end of period | | $ | 34.81 | | | $ | 30.64 | | | $ | 31.89 | | | $ | 28.29 | | | $ | 27.41 | |
| | |
Total Returnb | | | 14.73 | % | | | 1.09 | % | | | 15.12 | % | | | 4.57 | % | | | 21.58 | % |
| Ratios/Supplemental Data | |
| Net assets, end of period (in thousands) | | $ | 2,937 | | | $ | 2,497 | | | $ | 2,910 | | | $ | 1,798 | | | $ | 2,356 | |
| Ratios to average net assets: | |
| Net investment income (loss) | | | 0.70 | % | | | 0.93 | % | | | 0.92 | % | | | 0.83 | % | | | 0.42 | % |
| Total expenses | | | 2.35 | % | | | 2.38 | % | | | 2.35 | % | | | 2.36 | % | | | 2.39 | % |
| Portfolio turnover rate | | | 599 | % | | | 788 | % | | | 699 | % | | | 974 | % | | | 485 | % |
| 120 | THE RYDEX FUNDS ANNUAL REPORT | SEE NOTES TO FINANCIAL STATEMENTS. |
FINANCIAL HIGHLIGHTS (concluded)
This table is presented to show selected data for a share outstanding throughout each period and to assist shareholders in evaluating a Fund’s performance for the periods presented.
| H-Class | | Year Ended March 31, 2015 | | | Year Ended March 31, 2014 | | | Year Ended March 28, 2013 | | | Year Ended March 31, 2012 | | | Year Ended March 31, 2011 | |
| Per Share Data | | | | | | | | | | | | | | | |
| Net asset value, beginning of period | | $ | 33.40 | | | $ | 34.38 | | | $ | 30.23 | | | $ | 29.02 | | | $ | 24.22 | |
| Income (loss) from investment operations: | |
Net investment income (loss)a | | | .48 | | | | .52 | | | | .46 | | | | .42 | | | | .29 | |
| Net gain (loss) on investments (realized and unrealized) | | | 4.69 | | | | (.03 | ) | | | 4.29 | | | | 1.10 | | | | 5.13 | |
| Total from investment operations | | | 5.17 | | | | .49 | | | | 4.75 | | | | 1.52 | | | | 5.42 | |
| Less distributions from: | |
| Net investment income | | | (.32 | ) | | | (1.47 | ) | | | (.60 | ) | | | (.31 | ) | | | (.62 | ) |
| Total distributions | | | (.32 | ) | | | (1.47 | ) | | | (.60 | ) | | | (.31 | ) | | | (.62 | ) |
| Net asset value, end of period | | $ | 38.25 | | | $ | 33.40 | | | $ | 34.38 | | | $ | 30.23 | | | $ | 29.02 | |
| | |
Total Returnb | | | 15.55 | % | | | 1.84 | % | | | 15.95 | % | | | 5.42 | % | | | 22.70 | % |
| Ratios/Supplemental Data | |
| Net assets, end of period (in thousands) | | $ | 37,625 | | | $ | 19,753 | | | $ | 10,273 | | | $ | 13,511 | | | $ | 22,045 | |
| Ratios to average net assets: | |
| Net investment income (loss) | | | 1.32 | % | | | 1.52 | % | | | 1.45 | % | | | 1.48 | % | | | 1.13 | % |
| Total expenses | | | 1.60 | % | | | 1.64 | % | | | 1.60 | % | | | 1.61 | % | | | 1.63 | % |
| Portfolio turnover rate | | | 599 | % | | | 788 | % | | | 699 | % | | | 974 | % | | | 485 | % |
a | Net investment income (loss) per share was computed using average shares outstanding throughout the period. |
b | Total return does not reflect the impact of any applicable sales charges. |
| SEE NOTES TO FINANCIAL STATEMENTS. | THE RYDEX FUNDS ANNUAL REPORT | 121 |
PERFORMANCE REPORT AND FUND PROFILE (Unaudited) | March 31, 2015 |
RETAILING FUND
OBJECTIVE: Seeks to provide capital appreciation by investing in companies engaged in merchandising finished goods and services, including department stores, mail-order operations, and other companies involved in selling products to consumers (“retailing companies”).
For the one-year period ended March 31, 2015, Retailing Fund Investor Class returned 19.50%, compared with 18.26% for the S&P 500 Consumer Discretionary Index. The broader S&P 500 Index returned 12.73%.
The specialty retail segment contributed most to Fund performance, followed by the multiline retail segment. The internet software & services industry was the leading detractor from return. The distributors segment contributed least.
Fund performance for the period benefited most from Home Depot, Inc., Lowe’s Companies, Inc., and CVS Health Corp. Abercrombie & Fitch Co. — Class A, Lumber Liquidators Holdings, Inc., and Zulilly, Inc. — Class A were the largest detractors from the Fund’s performance for the period.
Performance displayed represents past performance, which is no guarantee of future results.
Holdings Diversification (Market Exposure as % of Net Assets)
“Holdings Diversification (Market Exposure as % of Net Assets)” excludes any temporary cash investments.
| Inception Dates: |
| Investor Class | April 1, 1998 |
| Advisor Class | April 21, 1998 |
| A-Class | September 1, 2004 |
| C-Class | May 9, 2001 |
| Ten Largest Holdings (% of Total Net Assets) |
| Wal-Mart Stores, Inc. | 5.0% |
| Amazon.com, Inc. | 4.0% |
| Home Depot, Inc. | 3.7% |
| CVS Health Corp. | 3.3% |
| Walgreens Boots Alliance, Inc. | 2.9% |
| Lowe’s Companies, Inc. | 2.6% |
| Costco Wholesale Corp. | 2.5% |
| Priceline Group, Inc. | 2.4% |
| Target Corp. | 2.2% |
| TJX Companies, Inc. | 2.2% |
| Top Ten Total | 30.8% |
| | |
| “Ten Largest Holdings” exclude any temporary cash or derivative investments. |
| 122 | THE RYDEX FUNDS ANNUAL REPORT | |
PERFORMANCE REPORT AND FUND PROFILE (Unaudited)(concluded) | March 31, 2015 |
Cumulative Fund Performance*
Average Annual Returns*
Periods Ended March 31, 2015
| | 1 Year | 5 Year | 10 Year |
| Investor Class Shares | 19.50% | 17.21% | 8.65% |
| Advisor Class Shares | 19.18% | 16.72% | 8.17% |
| A-Class Shares | 19.44% | 16.95% | 8.41% |
A-Class Shares with sales charge† | 13.77% | 15.82% | 7.88% |
| C-Class Shares | 18.51% | 16.06% | 7.60% |
C-Class Shares with CDSC‡ | 17.51% | 16.06% | 7.60% |
| S&P 500 Consumer Discretionary Index | 18.26% | 20.11% | 10.25% |
| S&P 500 Index | 12.73% | 14.47% | 8.01% |
| * | The performance data above represents past performance that is not predictive of future results. The investment return and principal value of an investment in the Fund will fluctuate so that an investor’s shares, when redeemed, may be worth more or less than their original cost. Returns are historical and include changes in principal and reinvested dividends and capital gains and do not reflect the effect of taxes. The S&P 500 Index and the S&P 500 Consumer Discretionary Index are unmanaged indices and, unlike the Fund, have no management fees or operating expenses to reduce their reported returns. The graphs are based on Investor Class shares and A-Class shares only; performance for Advisor Class shares and C-Class shares will vary due to differences in fee structures. |
† | Fund returns are calculated using the maximum sales charge of 4.75%. |
‡ | Fund returns include a CDSC of 1% if redeemed within 12 months of purchase. |
| | THE RYDEX FUNDS ANNUAL REPORT | 123 |
| SCHEDULE OF INVESTMENTS | March 31, 2015 |
| RETAILING FUND | |
| | |
Shares | | | Value | |
| | | | | | | | |
COMMON STOCKS† - 99.6% | |
| | | | | | | | |
| RETAIL-DISCOUNT - 14.3% | |
| Wal-Mart Stores, Inc. | | | 47,089 | | | $ | 3,873,070 | |
| Costco Wholesale Corp. | | | 13,087 | | | | 1,982,615 | |
| Target Corp. | | | 21,414 | | | | 1,757,447 | |
| Dollar General Corp. | | | 15,191 | | | | 1,145,098 | |
| Dollar Tree, Inc.* | | | 11,879 | | | | 963,921 | |
| Family Dollar Stores, Inc. | | | 9,020 | | | | 714,745 | |
| HSN, Inc. | | | 6,687 | | | | 456,254 | |
| Big Lots, Inc. | | | 7,918 | | | | 380,302 | |
| Total Retail-Discount | | | | | | | 11,273,452 | |
| | | | | | | | |
| RETAIL-APPAREL/SHOE - 12.9% | |
| L Brands, Inc. | | | 13,477 | | | | 1,270,747 | |
| Ross Stores, Inc. | | | 10,670 | | | | 1,124,191 | |
| The Gap, Inc. | | | 24,443 | | | | 1,059,115 | |
| Foot Locker, Inc. | | | 11,737 | | | | 739,431 | |
| Urban Outfitters, Inc.* | | | 13,129 | | | | 599,339 | |
| Burlington Stores, Inc.* | | | 8,810 | | | | 523,490 | |
| DSW, Inc. — Class A | | | 11,910 | | | | 439,241 | |
| American Eagle Outfitters, Inc. | | | 25,690 | | | | 438,785 | |
| Chico’s FAS, Inc. | | | 22,317 | | | | 394,788 | |
| Men’s Wearhouse, Inc. | | | 7,321 | | | | 382,156 | |
| Ascena Retail Group, Inc.* | | | 26,186 | | | | 379,959 | |
Buckle, Inc.1 | | | 7,406 | | | | 378,373 | |
| Guess?, Inc. | | | 17,520 | | | | 325,697 | |
| ANN, Inc.* | | | 7,873 | | | | 323,029 | |
| Genesco, Inc.* | | | 4,467 | | | | 318,184 | |
| Abercrombie & Fitch Co. — Class A | | | 14,156 | | | | 311,998 | |
| Brown Shoe Company, Inc. | | | 9,140 | | | | 299,792 | |
| Children’s Place, Inc. | | | 4,401 | | | | 282,500 | |
| Express, Inc.* | | | 16,990 | | | | 280,845 | |
| Finish Line, Inc. — Class A | | | 10,846 | | | | 265,944 | |
| Total Retail-Apparel/Shoe | | | | | | | 10,137,604 | |
| | | | | | | | |
| E-COMMERCE/SERVICES - 10.6% | |
| Priceline Group, Inc.* | | | 1,578 | | | | 1,837,028 | |
| Netflix, Inc.* | | | 2,911 | | | | 1,212,985 | |
| Liberty Interactive Corp. — Class A* | | | 30,993 | | | | 904,686 | |
| Ctrip.com International Ltd. ADR* | | | 15,040 | | | | 881,645 | |
| TripAdvisor, Inc.* | | | 9,986 | | | | 830,536 | |
| Expedia, Inc. | | | 8,765 | | | | 825,049 | |
| Liberty Ventures* | | | 14,027 | | | | 589,274 | |
Groupon, Inc. — Class A*,1 | | | 70,742 | | | | 510,050 | |
Wayfair, Inc. — Class A*,1 | | | 12,200 | | | | 391,864 | |
| Orbitz Worldwide, Inc.* | | | 23,400 | | | | 272,844 | |
| Total E-Commerce/Services | | | | | | | 8,255,961 | |
| | | | | | | | |
| E-COMMERCE/PRODUCTS - 7.3% | |
| Amazon.com, Inc.* | | | 8,422 | | | | 3,133,826 | |
| JD.com, Inc. ADR* | | | 30,170 | | | | 886,395 | |
| Vipshop Holdings Ltd. ADR* | | | 26,085 | | | | 767,942 | |
| zulily, Inc. — Class A* | | | 23,976 | | | | 311,448 | |
| Shutterfly, Inc.* | | | 6,788 | | | | 307,089 | |
| Lands’ End, Inc.* | | | 7,360 | | | | 264,077 | |
| Total E-Commerce/Products | | | | | | | 5,670,777 | |
| | | | | | | | |
| RETAIL-DRUG STORE - 7.1% | |
| CVS Health Corp. | | | 24,882 | | | | 2,568,072 | |
| Walgreens Boots Alliance, Inc. | | | 26,536 | | | | 2,247,068 | |
| Rite Aid Corp.* | | | 87,497 | | | | 760,349 | |
| Total Retail-Drug Store | | | | | | | 5,575,489 | |
| | | | | | | | |
| RETAIL-BUILDING PRODUCTS - 6.6% | |
| Home Depot, Inc. | | | 25,495 | | | | 2,896,486 | |
| Lowe’s Companies, Inc. | | | 27,187 | | | | 2,022,441 | |
Lumber Liquidators Holdings, Inc.*,1 | | | 7,270 | | | | 223,771 | |
| Total Retail-Building Products | | | | | | | 5,142,698 | |
| | | | | | | | |
| RETAIL-MAJOR DEPARTMENT STORES - 4.6% | |
| TJX Companies, Inc. | | | 24,172 | | | | 1,693,248 | |
| Nordstrom, Inc. | | | 11,755 | | | | 944,162 | |
Sears Holdings Corp.*,1 | | | 12,661 | | | | 523,912 | |
JC Penney Company, Inc.*,1 | | | 47,497 | | | | 399,450 | |
| Total Retail-Major Department Stores | | | | | | | 3,560,772 | |
| | | | | | | | |
| RETAIL-AUTOMOBILE - 4.2% | |
| CarMax, Inc.* | | | 13,687 | | | | 944,540 | |
| AutoNation, Inc.* | | | 10,124 | | | | 651,277 | |
| Penske Automotive Group, Inc. | | | 10,150 | | | | 522,624 | |
| Lithia Motors, Inc. — Class A | | | 4,020 | | | | 399,628 | |
| Asbury Automotive Group, Inc.* | | | 4,490 | | | | 373,119 | |
| Group 1 Automotive, Inc. | | | 4,207 | | | | 363,190 | |
| Total Retail-Automobile | | | | | | | 3,254,378 | |
| | | | | | | | |
| RETAIL-AUTO PARTS - 3.9% | |
| O’Reilly Automotive, Inc.* | | | 5,233 | | | | 1,131,584 | |
| AutoZone, Inc.* | | | 1,650 | | | | 1,125,564 | |
| Advance Auto Parts, Inc. | | | 5,316 | | | | 795,752 | |
| Total Retail-Auto Parts | | | | | | | 3,052,900 | |
| | | | | | | | |
| RETAIL-REGIONAL DEPARTMENT STORES - 3.7% | |
| Macy’s, Inc. | | | 17,628 | | | | 1,144,234 | |
| Kohl’s Corp. | | | 12,625 | | | | 987,906 | |
| Dillard’s, Inc. — Class A | | | 4,239 | | | | 578,666 | |
| Stage Stores, Inc. | | | 9,000 | | | | 206,280 | |
| Total Retail-Regional Department Stores | | | | | | | 2,917,086 | |
| | | | | | | | |
| 124 | THE RYDEX FUNDS ANNUAL REPORT | SEE NOTES TO FINANCIAL STATEMENTS. |
SCHEDULE OF INVESTMENTS (continued) | March 31, 2015 |
| RETAILING FUND | |
| | |
Shares | | | Value | |
| | | | | | | | | |
| DISTRIBUTION/WHOLESALE - 2.6% | |
| Genuine Parts Co. | | | 9,573 | | | $ | 892,108 | |
| LKQ Corp.* | | | 26,643 | | | | 680,995 | |
| Pool Corp. | | | 6,050 | | | | 422,048 | |
| Total Distribution/Wholesale | | | | | | | 1,995,151 | |
| | | | | | | | |
| RETAIL-MISCELLANEOUS/DIVERSIFIED - 2.3% | |
| Sally Beauty Holdings, Inc.* | | | 16,616 | | | | 571,092 | |
| CST Brands, Inc. | | | 10,123 | | | | 443,691 | |
| PriceSmart, Inc. | | | 4,650 | | | | 395,157 | |
| Five Below, Inc.* | | | 10,210 | | | | 363,170 | |
| Total Retail-Miscellaneous/Diversified | | | | | | | 1,773,110 | |
| | | | | | | | |
| RETAIL-JEWELRY - 2.0% | |
| Tiffany & Co. | | | 9,295 | | | | 818,053 | |
| Signet Jewelers Ltd. | | | 5,293 | | | | 734,615 | |
| Total Retail-Jewelry | | | | | | | 1,552,668 | |
| | | | | | | | |
| RETAIL-SPORTING GOODS - 1.8% | |
| Dick’s Sporting Goods, Inc. | | | 11,057 | | | | 630,139 | |
| Cabela’s, Inc.* | | | 8,404 | | | | 470,456 | |
| Hibbett Sports, Inc.* | | | 5,590 | | | | 274,245 | |
| Total Retail-Sporting Goods | | | | | | | 1,374,840 | |
| | | | | | | | |
| RETAIL-OFFICE SUPPLIES - 1.7% | |
| Staples, Inc. | | | 48,157 | | | | 784,237 | |
| Office Depot, Inc.* | | | 58,209 | | | | 535,523 | |
| Total Retail-Office Supplies | | | | | | | 1,319,760 | |
| | | | | | | | |
| RETAIL-BEDDING - 1.7% | |
| Bed Bath & Beyond, Inc.* | | | 11,768 | | | | 903,488 | |
| Mattress Firm Holding Corp.* | | | 5,570 | | | | 387,895 | |
| Total Retail-Bedding | | | | | | | 1,291,383 | |
| | | | | | | | |
| RETAIL-CONSUMER ELECTRONICS - 1.1% | |
| Best Buy Company, Inc. | | | 21,855 | | | | 825,900 | |
| | | | | | | | |
| RETAIL-GARDENING PRODUCTS - 1.0% | |
| Tractor Supply Co. | | | 9,352 | | | | 795,481 | |
| | | | | | | | |
| RETAIL-VITAMINS/NUTRITIONAL SUPPLEMENTS - 1.0% | |
| GNC Holdings, Inc. — Class A | | | 10,601 | | | | 520,191 | |
| Vitamin Shoppe, Inc.* | | | 6,461 | | | | 266,129 | |
| Total Retail-Vitamins/Nutritional Supplements | | | | | | | 786,320 | |
| | | | | | | | |
| RETAIL-HOME FURNISHINGS - 1.0% | |
| Restoration Hardware Holdings, Inc.* | | | 4,970 | | | | 492,974 | |
| Pier 1 Imports, Inc. | | | 19,718 | | | | 275,658 | |
| Total Retail-Home Furnishings | | | | | | | 768,632 | |
| | | | | | | | |
| RETAIL-PERFUME & COSMETICS - 1.0% | |
| Ulta Salon Cosmetics & Fragrance, Inc.* | | | 5,035 | | | | 759,530 | |
| | | | | | | | |
| RETAIL-MAIL ORDER - 0.8% | |
| Williams-Sonoma, Inc. | | | 7,962 | | | | 634,651 | |
| | | | | | | | |
| RENTAL AUTO/EQUIPMENT - 0.8% | |
| Aaron’s, Inc. | | | 12,241 | | | | 346,542 | |
| Rent-A-Center, Inc. | | | 10,439 | | | | 286,446 | |
| Total Rental Auto/Equipment | | | | | | | 632,988 | |
| | | | | | | | |
| TRAVEL SERVICES - 0.7% | |
| Qunar Cayman Islands Ltd. ADR* | | | 14,000 | | | | 577,500 | |
| | | | | | | | |
| RETAIL-COMPUTER EQUIPMENT - 0.7% | |
GameStop Corp. — Class A1 | | | 14,218 | | | | 539,715 | |
| | | | | | | | |
| RETAIL-ARTS & CRAFTS - 0.7% | |
| Michaels Companies, Inc.* | | | 19,800 | | | | 535,788 | |
| | | | | | | | |
| OIL REFINING & MARKETING - 0.6% | |
| Murphy USA, Inc.* | | | 6,101 | | | | 441,529 | |
| | | | | | | | |
| FOOD-RETAIL - 0.5% | |
| Cia Brasileira de Distribuicao ADR | | | 13,800 | | | | 411,516 | |
| | | | | | | | |
| DIVERSIFIED OPERATIONS - 0.5% | |
| Liberty TripAdvisor Holdings, Inc. — Class A* | | | 11,870 | | | | 377,347 | |
| | | | | | | | |
| AUTO REPAIR CENTERS - 0.4% | |
| Monro Muffler Brake, Inc. | | | 5,350 | | | | 348,018 | |
| | | | | | | | |
| HOME FURNISHINGS - 0.4% | |
| Select Comfort Corp.* | | | 9,582 | | | | 330,292 | |
| | | | | | | | |
| RETAIL-BOOKSTORE - 0.4% | |
| Barnes & Noble, Inc.* | | | 12,735 | | | | 302,456 | |
| | | | | | | | |
| RETAIL-VIDEO RENTAL - 0.4% | |
Outerwall, Inc.1 | | | 4,220 | | | | 279,026 | |
| | | | | | | | |
| RETAIL-APPLIANCES - 0.3% | |
Conn’s, Inc.*,1 | | | 8,840 | | | | 267,675 | |
| | | | | | | | |
| Total Common Stocks | | | | | | | | |
| (Cost $65,108,296) | | | | | | | 77,762,393 | |
| | | | | | | | |
| SEE NOTES TO FINANCIAL STATEMENTS. | THE RYDEX FUNDS ANNUAL REPORT | 125 |
SCHEDULE OF INVESTMENTS (concluded) | March 31, 2015 |
| RETAILING FUND | |
| | | | | | | | | |
| | | Face
Amount | | | Value | |
| | | | | | | | |
REPURCHASE AGREEMENT††,2 - 0.9% | |
HSBC Group
issued 03/31/15 at 0.03%
due 04/01/15 | | $ | 723,263 | | | $ | 723,263 | |
| Total Repurchase Agreement | | | | | | | | |
| (Cost $723,263) | | | | | | | 723,263 | |
| | | | | | | | |
SECURITIES LENDING COLLATERAL††,3 - 2.9% | |
| Repurchase Agreements | | | | | | | | |
HSBC Securities, Inc.
issued 03/31/15 at 0.10%
due 04/01/15 | | | 1,471,340 | | | | 1,471,340 | |
BNP Paribas Securities Corp.
issued 03/31/15 at 0.10%
due 04/01/15 | | | 506,141 | | | | 506,141 | |
Barclays Capital, Inc.
issued 03/31/15 at 0.10%
due 04/01/15 | | | 261,251 | | | | 261,251 | |
| Total Securities Lending Collateral | | | | | | | | |
| (Cost $2,238,732) | | | | | | | 2,238,732 | |
| | | | | | | | |
| Total Investments - 103.4% | | | | | | | | |
| (Cost $68,070,291) | | | | | | $ | 80,724,388 | |
| Other Assets & Liabilities, net - (3.4)% | | | | | | | (2,613,913 | ) |
| Total Net Assets - 100.0% | | | | | | $ | 78,110,475 | |
| * | Non-income producing security. |
| † | Value determined based on Level 1 inputs — See Note 4. |
| †† | Value determined based on Level 2 inputs — See Note 4. |
| 1 | All or portion of this security is on loan at March 31, 2015 — See Note 6. |
| 2 | Repurchase Agreement — See Note 5. |
| 3 | Securities lending collateral — See Note 6. |
| ADR — American Depositary Receipt |
| 126 | THE RYDEX FUNDS ANNUAL REPORT | SEE NOTES TO FINANCIAL STATEMENTS. |
STATEMENT OF ASSETS AND LIABILITIES
March 31, 2015
| Assets: | |
| Investments, at value - including $2,216,055 of securities loaned (cost $65,108,296) | | $ | 77,762,393 | |
| Repurchase agreements, at value (cost $2,961,995) | | | 2,961,995 | |
| Total investments (cost $68,070,291) | | | 80,724,388 | |
| Segregated cash with broker | | | 32,721 | |
| Receivables: | |
| Fund shares sold | | | 740,321 | |
| Dividends | | | 69,939 | |
| Securities lending income | | | 6,049 | |
| Total assets | | | 81,573,418 | |
| | | | | |
| Liabilities: | |
| Payable for: | |
| Return of securities loaned | | | 2,271,453 | |
| Securities purchased | | | 769,758 | |
| Fund shares redeemed | | | 317,616 | |
| Management fees | | | 52,626 | |
| Transfer agent and administrative fees | | | 15,478 | |
| Distribution and service fees | | | 10,304 | |
| Portfolio accounting fees | | | 6,191 | |
| Miscellaneous | | | 19,517 | |
| Total liabilities | | | 3,462,943 | |
| Commitments and contingent liabilities (Note 10) | | | — | |
| Net assets | | $ | 78,110,475 | |
| | | | | |
| Net assets consist of: | |
| Paid in capital | | $ | 72,110,951 | |
| Undistributed net investment income | | | 32,233 | |
| Accumulated net realized loss on investments | | | (6,686,806 | ) |
| Net unrealized appreciation on investments | | | 12,654,097 | |
| Net assets | | $ | 78,110,475 | |
| | | | | |
| Investor Class: | |
| Net assets | | $ | 46,282,839 | |
| Capital shares outstanding | | | 1,645,568 | |
| Net asset value per share | | $ | 28.13 | |
| | | | | |
| Advisor Class: | |
| Net assets | | $ | 8,870,622 | |
| Capital shares outstanding | | | 338,254 | |
| Net asset value per share | | $ | 26.22 | |
| | | | | |
| A-Class: | |
| Net assets | | $ | 19,501,936 | |
| Capital shares outstanding | | | 726,355 | |
| Net asset value per share | | $ | 26.85 | |
| Maximum offering price per share (Net asset value divided by 95.25%) | | $ | 28.19 | |
| | | | | |
| C-Class: | |
| Net assets | | $ | 3,455,078 | |
| Capital shares outstanding | | | 141,241 | |
| Net asset value per share | | $ | 24.46 | |
STATEMENT OF OPERATIONS
Year Ended March 31, 2015
| Investment Income: | |
| Dividends (net of foreign withholding tax of $176) | | $ | 492,935 | |
| Income from securities lending, net | | | 27,608 | |
| Interest | | | 40 | |
| Total investment income | | | 520,583 | |
| | | | | |
| Expenses: | |
| Management fees | | | 251,067 | |
| Transfer agent and administrative fees | | | 73,843 | |
| Distribution and service fees: | |
| Advisor Class | | | 20,021 | |
| A-Class | | | 14,997 | |
| C-Class | | | 24,539 | |
| Portfolio accounting fees | | | 29,537 | |
| Custodian fees | | | 3,428 | |
| Trustees’ fees* | | | 1,590 | |
| Line of credit fees | | | 300 | |
| Miscellaneous | | | 32,869 | |
| Total expenses | | | 452,191 | |
| Net investment income | | | 68,392 | |
| | | | | |
| Net Realized and Unrealized Gain (Loss): | |
| Net realized gain (loss) on: | |
| Investments | | | 1,805,839 | |
| Net realized gain | | | 1,805,839 | |
| Net change in unrealized appreciation (depreciation) on: | |
| Investments | | | 5,758,303 | |
| Net change in unrealized appreciation (depreciation) | | | 5,758,303 | |
| Net realized and unrealized gain | | | 7,564,142 | |
| Net increase in net assets resulting from operations | | $ | 7,632,534 | |
| * | Relates to Trustees not deemed “interested persons” within the meaning of Section 2(a)(19) of the 1940 Act. |
| SEE NOTES TO FINANCIAL STATEMENTS. | THE RYDEX FUNDS ANNUAL REPORT | 127 |
STATEMENTS OF CHANGES IN NET ASSETS
| | | Year Ended March 31, 2015 | | | Year Ended March 31, 2014 | |
| Increase (Decrease) in Net Assets from Operations: | | | | | | |
| Net investment income (loss) | | $ | 68,392 | | | $ | (67,490 | ) |
| Net realized gain (loss) on investments | | | 1,805,839 | | | | (2,783,052 | ) |
| Net change in unrealized appreciation (depreciation) on investments | | | 5,758,303 | | | | 558,351 | |
| Net increase (decrease) in net assets resulting from operations | | | 7,632,534 | | | | (2,292,191 | ) |
| | | | | | | | | |
| Capital share transactions: | | | | | | | | |
| Proceeds from sale of shares | | | | | | | | |
| Investor Class | | | 60,134,467 | | | | 246,351,051 | |
| Advisor Class | | | 46,492,511 | | | | 32,015,902 | |
| A-Class | | | 35,188,984 | | | | 16,192,814 | |
| C-Class | | | 23,269,330 | | | | 25,676,530 | |
| Cost of shares redeemed | | | | | | | | |
| Investor Class | | | (83,827,188 | ) | | | (192,663,560 | ) |
| Advisor Class | | | (44,004,920 | ) | | | (29,499,902 | ) |
| A-Class | | | (19,080,379 | ) | | | (15,667,077 | ) |
| C-Class | | | (22,833,190 | ) | | | (25,431,108 | ) |
| Net increase (decrease) from capital share transactions | | | (4,660,385 | ) | | | 56,974,650 | |
| Net increase in net assets | | | 2,972,149 | | | | 54,682,459 | |
| | | | | | | | | |
| Net assets: | | | | | | | | |
| Beginning of year | | | 75,138,326 | | | | 20,455,867 | |
| End of year | | $ | 78,110,475 | | | $ | 75,138,326 | |
| Undistributed net investment income/(Accumulated net investment loss) at end of year | | $ | 32,233 | | | $ | (36,159 | ) |
| | | | | | | | | |
| Capital share activity: | | | | | | | | |
| Shares sold | | | | | | | | |
| Investor Class | | | 2,329,184 | | | | 10,597,354 | |
| Advisor Class | | | 1,959,097 | | | | 1,535,340 | |
| A-Class | | | 1,439,831 | | | | 747,562 | |
| C-Class | | | 1,069,690 | | | | 1,307,238 | |
| Shares redeemed | | | | | | | | |
| Investor Class | | | (3,453,617 | ) | | | (8,575,213 | ) |
| Advisor Class | | | (1,865,868 | ) | | | (1,423,331 | ) |
| A-Class | | | (804,635 | ) | | | (736,239 | ) |
| C-Class | | | (1,049,685 | ) | | | (1,291,235 | ) |
| Net increase (decrease) in shares | | | (376,003 | ) | | | 2,161,476 | |
| 128 | THE RYDEX FUNDS ANNUAL REPORT | SEE NOTES TO FINANCIAL STATEMENTS. |
This table is presented to show selected data for a share outstanding throughout each period and to assist shareholders in evaluating a Fund’s performance for the periods presented.
| Investor Class | | Year Ended March 31, 2015 | | | Year Ended March 31, 2014 | | | Year Ended March 28, 2013 | | | Year Ended March 31, 2012 | | | Year Ended March 31, 2011 | |
| Per Share Data | | | | | | | | | | | | | | | |
| Net asset value, beginning of period | | $ | 23.54 | | | $ | 19.62 | | | $ | 17.45 | | | $ | 14.66 | | | $ | 12.75 | |
| Income (loss) from investment operations: | |
Net investment income (loss)a | | | .11 | | | | — | b | | | .09 | | | | .01 | | | | .05 | |
| Net gain (loss) on investments (realized and unrealized) | | | 4.48 | | | | 3.92 | | | | 2.08 | | | | 2.79 | | | | 1.89 | |
| Total from investment operations | | | 4.59 | | | | 3.92 | | | | 2.17 | | | | 2.80 | | | | 1.94 | |
| Less distributions from: | |
| Net investment income | | | — | | | | — | | | | — | | | | (.01 | ) | | | (.03 | ) |
| Total distributions | | | — | | | | — | | | | — | | | | (.01 | ) | | | (.03 | ) |
| Net asset value, end of period | | $ | 28.13 | | | $ | 23.54 | | | $ | 19.62 | | | $ | 17.45 | | | $ | 14.66 | |
| | |
Total Returnc | | | 19.50 | % | | | 19.98 | % | | | 12.44 | % | | | 19.14 | % | | | 15.20 | % |
| Ratios/Supplemental Data | |
| Net assets, end of period (in thousands) | | $ | 46,283 | | | $ | 65,195 | | | $ | 14,671 | | | $ | 34,802 | | | $ | 3,776 | |
| Ratios to average net assets: | |
| Net investment income (loss) | | | 0.42 | % | | | 0.01 | % | | | 0.51 | % | | | 0.04 | % | | | 0.34 | % |
| Total expenses | | | 1.33 | % | | | 1.37 | % | | | 1.35 | % | | | 1.34 | % | | | 1.39 | % |
| Portfolio turnover rate | | | 395 | % | | | 671 | % | | | 472 | % | | | 822 | % | | | 1,062 | % |
| Advisor Class | | Year Ended March 31, 2015 | | | Year Ended March 31, 2014 | | | Year Ended March 28, 2013 | | | Year Ended March 31, 2012 | | | Year Ended March 31, 2011 | |
| Per Share Data | | | | | | | | | | | | | | | |
| Net asset value, beginning of period | | $ | 22.00 | | | $ | 18.45 | | | $ | 16.45 | | | $ | 13.91 | | | $ | 12.14 | |
| Income (loss) from investment operations: | |
Net investment income (loss)a | | | .01 | | | | (.14 | ) | | | (.01 | ) | | | (.09 | ) | | | (.07 | ) |
| Net gain (loss) on investments (realized and unrealized) | | | 4.21 | | | | 3.69 | | | | 2.01 | | | | 2.64 | | | | 1.87 | |
| Total from investment operations | | | 4.22 | | | | 3.55 | | | | 2.00 | | | | 2.55 | | | | 1.80 | |
| Less distributions from: | |
| Net investment income | | | — | | | | — | | | | — | | | | (.01 | ) | | | (.03 | ) |
| Total distributions | | | — | | | | — | | | | — | | | | (.01 | ) | | | (.03 | ) |
| Net asset value, end of period | | $ | 26.22 | | | $ | 22.00 | | | $ | 18.45 | | | $ | 16.45 | | | $ | 13.91 | |
| | |
Total Returnc | | | 19.18 | % | | | 19.24 | % | | | 12.16 | % | | | 18.38 | % | | | 14.81 | % |
| Ratios/Supplemental Data | |
| Net assets, end of period (in thousands) | | $ | 8,871 | | | $ | 5,391 | | | $ | 2,454 | | | $ | 3,979 | | | $ | 1,583 | |
| Ratios to average net assets: | |
| Net investment income (loss) | | | 0.05 | % | | | (0.64 | %) | | | (0.05 | %) | | | (0.66 | %) | | | (0.58 | %) |
| Total expenses | | | 1.83 | % | | | 1.87 | % | | | 1.85 | % | | | 1.84 | % | | | 1.89 | % |
| Portfolio turnover rate | | | 395 | % | | | 671 | % | | | 472 | % | | | 822 | % | | | 1,062 | % |
| SEE NOTES TO FINANCIAL STATEMENTS. | THE RYDEX FUNDS ANNUAL REPORT | 129 |
FINANCIAL HIGHLIGHTS (concluded)
This table is presented to show selected data for a share outstanding throughout each period and to assist shareholders in evaluating a Fund’s performance for the periods presented.
| A-Class | | Year Ended March 31, 2015 | | | Year Ended March 31, 2014 | | | Year Ended March 28, 2013 | | | Year Ended March 31, 2012 | | | Year Ended March 31, 2011 | |
| Per Share Data | | | | | | | | | | | | | | | |
| Net asset value, beginning of period | | $ | 22.48 | | | $ | 18.79 | | | $ | 16.77 | | | $ | 14.14 | | | $ | 12.31 | |
| Income (loss) from investment operations: | |
Net investment income (loss)a | | | .06 | | | | (.09 | ) | | | .03 | | | | (.03 | ) | | | .18 | |
| Net gain (loss) on investments (realized and unrealized) | | | 4.31 | | | | 3.78 | | | | 1.99 | | | | 2.67 | | | | 1.68 | |
| Total from investment operations | | | 4.37 | | | | 3.69 | | | | 2.02 | | | | 2.64 | | | | 1.86 | |
| Less distributions from: | |
| Net investment income | | | — | | | | — | | | | — | | | | (.01 | ) | | | (.03 | ) |
| Total distributions | | | — | | | | — | | | | — | | | | (.01 | ) | | | (.03 | ) |
| Net asset value, end of period | | $ | 26.85 | | | $ | 22.48 | | | $ | 18.79 | | | $ | 16.77 | | | $ | 14.14 | |
| | |
Total Returnc | | | 19.44 | % | | | 19.64 | % | | | 12.05 | % | | | 18.71 | % | | | 15.09 | % |
| Ratios/Supplemental Data | |
| Net assets, end of period (in thousands) | | $ | 19,502 | | | $ | 2,049 | | | $ | 1,500 | | | $ | 5,697 | | | $ | 517 | |
| Ratios to average net assets: | |
| Net investment income (loss) | | | 0.25 | % | | | (0.42 | %) | | | 0.20 | % | | | (0.18 | %) | | | 1.42 | % |
| Total expenses | | | 1.58 | % | | | 1.62 | % | | | 1.59 | % | | | 1.58 | % | | | 1.64 | % |
| Portfolio turnover rate | | | 395 | % | | | 671 | % | | | 472 | % | | | 822 | % | | | 1,062 | % |
| C-Class | | Year Ended March 31, 2015 | | | Year Ended March 31, 2014 | | | Year Ended March 28, 2013 | | | Year Ended March 31, 2012 | | | Year Ended March 31, 2011 | |
| Per Share Data | | | | | | | | | | | | | | | |
| Net asset value, beginning of period | | $ | 20.64 | | | $ | 17.40 | | | $ | 15.62 | | | $ | 13.27 | | | $ | 11.65 | |
| Income (loss) from investment operations: | |
Net investment income (loss)a | | | (.19 | ) | | | (.23 | ) | | | (.06 | ) | | | (.13 | ) | | | (.11 | ) |
| Net gain (loss) on investments (realized and unrealized) | | | 4.01 | | | | 3.47 | | | | 1.84 | | | | 2.49 | | | | 1.76 | |
| Total from investment operations | | | 3.82 | | | | 3.24 | | | | 1.78 | | | | 2.36 | | | | 1.65 | |
| Less distributions from: | |
| Net investment income | | | — | | | | — | | | | — | | | | (.01 | ) | | | (.03 | ) |
| Total distributions | | | — | | | | — | | | | — | | | | (.01 | ) | | | (.03 | ) |
| Net asset value, end of period | | $ | 24.46 | | | $ | 20.64 | | | $ | 17.40 | | | $ | 15.62 | | | $ | 13.27 | |
| | |
Total Returnc | | | 18.51 | % | | | 18.62 | % | | | 11.40 | % | | | 17.83 | % | | | 14.14 | % |
| Ratios/Supplemental Data | |
| Net assets, end of period (in thousands) | | $ | 3,455 | | | $ | 2,503 | | | $ | 1,831 | | | $ | 2,603 | | | $ | 2,705 | |
| Ratios to average net assets: | |
| Net investment income (loss) | | | (0.88 | %) | | | (1.16 | %) | | | (0.39 | %) | | | (0.96 | %) | | | (0.96 | %) |
| Total expenses | | | 2.34 | % | | | 2.37 | % | | | 2.35 | % | | | 2.35 | % | | | 2.39 | % |
| Portfolio turnover rate | | | 395 | % | | | 671 | % | | | 472 | % | | | 822 | % | | | 1,062 | % |
a | Net investment income (loss) per share was computed using average shares outstanding throughout the period. |
b | Net investment income is less than $0.01 per share. |
c | Total return does not reflect the impact of any applicable sales charges. |
| 130 | THE RYDEX FUNDS ANNUAL REPORT | SEE NOTES TO FINANCIAL STATEMENTS. |
PERFORMANCE REPORT AND FUND PROFILE (Unaudited) | March 31, 2015 |
TECHNOLOGY FUND
OBJECTIVE: Seeks to provide capital appreciation by investing in companies that are involved in the technology sector, including computer software and service companies, semiconductor manufacturers, networking and telecommunications equipment manufacturers, and PC hardware and peripherals companies (“technology companies”).
For the one-year period ended March 31, 2015, Technology Fund Investor Class returned 9.53%, compared with 18.11% for the S&P 500 Information Technology Index. The broader S&P 500 Index returned 12.73%.
The semiconductors & semiconductor equipment industry was the largest contributor to return, followed by the software industry. The internet software & services segment detracted most from return, followed by the media segment.
Top contributing holdings were Apple, Inc., Facebook, Inc. — Class A, and Skyworks Solutions, Inc. SINA Corp., Qihoo 360 Technology Company Ltd. ADR, and SouFun Holdings Ltd. ADR were the holdings detracting most from performance for the period.
Performance displayed represents past performance, which is no guarantee of future results.
Holdings Diversification (Market Exposure as % of Net Assets)
“Holdings Diversification (Market Exposure as % of Net Assets)” excludes any temporary cash investments.
| Inception Dates: |
| Investor Class | April 14, 1998 |
| Advisor Class | April 29, 1998 |
| A-Class | September 1, 2004 |
| C-Class | April 18, 2001 |
| Ten Largest Holdings (% of Total Net Assets) |
| Apple, Inc. | 3.9% |
| Microsoft Corp. | 2.6% |
| Facebook, Inc. — Class A | 2.3% |
| Oracle Corp. | 2.0% |
| International Business Machines Corp. | 1.8% |
| Intel Corp. | 1.8% |
| Cisco Systems, Inc. | 1.7% |
| QUALCOMM, Inc. | 1.5% |
| Google, Inc. — Class C | 1.5% |
| Google, Inc. — Class A | 1.5% |
| Top Ten Total | 20.6% |
| | |
| “Ten Largest Holdings” exclude any temporary cash or derivative investments. |
| | THE RYDEX FUNDS ANNUAL REPORT | 131 |
PERFORMANCE REPORT AND FUND PROFILE (Unaudited)(concluded) | March 31, 2015 |
Cumulative Fund Performance*
Average Annual Returns*
Periods Ended March 31, 2015
| | 1 Year | 5 Year | 10 Year |
| Investor Class Shares | 9.53% | 11.15% | 7.06% |
| Advisor Class Shares | 9.00% | 10.60% | 6.52% |
| A-Class Shares | 9.28% | 10.85% | 6.72% |
A-Class Shares with sales charge† | 4.10% | 9.78% | 6.21% |
| C-Class Shares | 8.52% | 10.05% | 5.99% |
C-Class Shares with CDSC‡ | 7.52% | 10.05% | 5.99% |
| S&P 500 Information Technology Index | 18.11% | 14.55% | 9.77% |
| S&P 500 Index | 12.73% | 14.47% | 8.01% |
| * | The performance data above represents past performance that is not predictive of future results. The investment return and principal value of an investment in the Fund will fluctuate so that an investor’s shares, when redeemed, may be worth more or less than their original cost. Returns are historical and include changes in principal and reinvested dividends and capital gains and do not reflect the effect of taxes. The S&P 500 Index and the S&P 500 Information Technology Index are unmanaged indices and, unlike the Fund, have no management fees or operating expenses to reduce their reported returns. The graphs are based on Investor Class shares and A-Class shares only; performance for Advisor Class shares and C-Class shares will vary due to differences in fee structures. |
† | Fund returns are calculated using the maximum sales charge of 4.75%. |
‡ | Fund returns include a CDSC of 1% if redeemed within 12 months of purchase. |
| 132 | THE RYDEX FUNDS ANNUAL REPORT | |
| SCHEDULE OF INVESTMENTS | March 31, 2015 |
| TECHNOLOGY FUND | |
| | |
Shares | | | Value | |
| | | | | | | | |
COMMON STOCKS† - 99.7% | |
| | | | | | | | |
| ELECTRONIC COMPONENTS-SEMICONDUCTOR - 10.2% | |
| Intel Corp. | | | 20,254 | | | $ | 633,342 | |
| Texas Instruments, Inc. | | | 6,976 | | | | 398,923 | |
| Micron Technology, Inc.* | | | 10,264 | | | | 278,462 | |
| Avago Technologies Ltd. | | | 2,112 | | | | 268,182 | |
| Broadcom Corp. — Class A | | | 5,993 | | | | 259,467 | |
| Skyworks Solutions, Inc. | | | 2,289 | | | | 224,986 | |
| Altera Corp. | | | 4,770 | | | | 204,681 | |
| ARM Holdings plc ADR | | | 4,140 | | | | 204,102 | |
| Freescale Semiconductor Ltd.* | | | 4,470 | | | | 182,197 | |
| Xilinx, Inc. | | | 4,088 | | | | 172,922 | |
| NVIDIA Corp. | | | 8,093 | | | | 169,346 | |
| Microchip Technology, Inc. | | | 3,291 | | | | 160,930 | |
| IPG Photonics Corp.* | | | 1,270 | | | | 117,729 | |
| ON Semiconductor Corp.* | | | 9,534 | | | | 115,457 | |
| Cavium, Inc.* | | | 1,540 | | | | 109,063 | |
| Cree, Inc.* | | | 2,865 | | | | 101,679 | |
Ambarella, Inc.*,1 | | | 1,150 | | | | 87,067 | |
| Total Electronic Components-Semiconductor | | | | | | | 3,688,535 | |
| | | | | | | | |
| APPLICATIONS SOFTWARE - 7.8% | |
| Microsoft Corp. | | | 22,867 | | | | 929,657 | |
| salesforce.com, Inc.* | | | 5,124 | | | | 342,334 | |
| Intuit, Inc. | | | 2,746 | | | | 266,252 | |
| Check Point Software Technologies Ltd.* | | | 2,800 | | | | 229,516 | |
| Red Hat, Inc.* | | | 2,717 | | | | 205,813 | |
| ServiceNow, Inc.* | | | 2,270 | | | | 178,831 | |
| Citrix Systems, Inc.* | | | 2,641 | | | | 168,681 | |
| NetSuite, Inc.* | | | 1,580 | | | | 146,561 | |
| Tableau Software, Inc. — Class A* | | | 1,510 | | | | 139,705 | |
| Nuance Communications, Inc.* | | | 8,060 | | | | 115,661 | |
| PTC, Inc.* | | | 3,003 | | | | 108,619 | |
| Total Applications Software | | | | | | | 2,831,630 | |
| | | | | | | | |
| SEMICONDUCTOR COMPONENTS-INTEGRATED CIRCUIT - 6.1% | |
| QUALCOMM, Inc. | | | 7,998 | | | | 554,580 | |
| NXP Semiconductor N.V.* | | | 2,639 | | | | 264,850 | |
| Taiwan Semiconductor Manufacturing Company Ltd. ADR | | | 10,537 | | | | 247,409 | |
| Analog Devices, Inc. | | | 3,780 | | | | 238,140 | |
| Marvell Technology Group Ltd. | | | 15,020 | | | | 220,794 | |
| Linear Technology Corp. | | | 3,696 | | | | 172,973 | |
| Maxim Integrated Products, Inc. | | | 4,586 | | | | 159,639 | |
| Cypress Semiconductor Corp. | | | 7,570 | | | | 106,813 | |
| Atmel Corp. | | | 11,405 | | | | 93,863 | |
| Integrated Device Technology, Inc.* | | | 4,453 | | | | 89,149 | |
| Cirrus Logic, Inc.* | | | 2,210 | | | | 73,505 | |
| Total Semiconductor Components-Integrated Circuit | | | | | | | 2,221,715 | |
| | | | | | | | |
| COMPUTER SERVICES - 6.0% | |
| International Business Machines Corp. | | | 4,128 | | | | 662,544 | |
| Cognizant Technology Solutions Corp. — Class A* | | | 5,170 | | | | 322,556 | |
| Accenture plc — Class A | | | 3,197 | | | | 299,527 | |
| Infosys Ltd. ADR | | | 6,374 | | | | 223,600 | |
| Computer Sciences Corp. | | | 2,396 | | | | 156,411 | |
| Amdocs Ltd. | | | 2,860 | | | | 155,584 | |
| Teradata Corp.* | | | 3,075 | | | | 135,731 | |
| DST Systems, Inc. | | | 1,030 | | | | 114,031 | |
| MAXIMUS, Inc. | | | 1,420 | | | | 94,799 | |
| Total Computer Services | | | | | | | 2,164,783 | |
| | | | | | | | |
| COMPUTERS - 5.6% | |
| Apple, Inc. | | | 11,302 | | | | 1,406,308 | |
| Hewlett-Packard Co. | | | 12,475 | | | | 388,721 | |
| BlackBerry Ltd.* | | | 22,588 | | | | 201,711 | |
| Total Computers | | | | | | | 1,996,740 | |
| | | | | | | | |
| WEB PORTALS/ISP - 5.6% | |
| Google, Inc. — Class C* | | | 971 | | | | 532,107 | |
| Google, Inc. — Class A* | | | 951 | | | | 527,520 | |
| Yahoo!, Inc.* | | | 7,660 | | | | 340,372 | |
| Baidu, Inc. ADR* | | | 1,326 | | | | 276,338 | |
| SINA Corp.* | | | 6,611 | | | | 212,610 | |
| AOL, Inc.* | | | 2,350 | | | | 93,084 | |
| Total Web Portals/ISP | | | | | | | 1,982,031 | |
| | | | | | | | |
| COMMERCIAL SERVICES-FINANCE - 4.9% | |
| MasterCard, Inc. — Class A | | | 5,974 | | | | 516,094 | |
| Automatic Data Processing, Inc. | | | 3,843 | | | | 329,115 | |
| FleetCor Technologies, Inc.* | | | 1,370 | | | | 206,760 | |
| Western Union Co. | | | 8,561 | | | | 178,154 | |
| Vantiv, Inc. — Class A* | | | 3,690 | | | | 139,113 | |
| Total System Services, Inc. | | | 3,620 | | | | 138,103 | |
| Global Payments, Inc. | | | 1,500 | | | | 137,520 | |
| WEX, Inc.* | | | 1,070 | | | | 114,875 | |
| Total Commercial Services-Finance | | | | | | | 1,759,734 | |
| | | | | | | | |
| ENTERPRISE SOFTWARE/SERVICES - 4.8% | |
| Oracle Corp. | | | 16,535 | | | | 713,485 | |
| SAP SE ADR | | | 3,148 | | | | 227,191 | |
| Workday, Inc. — Class A* | | | 2,460 | | | | 207,649 | |
| CA, Inc. | | | 6,252 | | | | 203,878 | |
| Ultimate Software Group, Inc.* | | | 712 | | | | 121,008 | |
| Informatica Corp.* | | | 2,608 | | | | 114,374 | |
| Qlik Technologies, Inc.* | | | 2,830 | | | | 88,098 | |
| Advent Software, Inc. | | | 1,540 | | | | 67,929 | |
| Total Enterprise Software/Services | | | | | | | 1,743,612 | |
| | | | | | | | |
| INTERNET CONTENT-ENTERTAINMENT - 3.5% | |
| Facebook, Inc. — Class A* | | | 9,980 | | | | 820,507 | |
| Twitter, Inc.* | | | 6,230 | | | | 311,998 | |
| SEE NOTES TO FINANCIAL STATEMENTS. | THE RYDEX FUNDS ANNUAL REPORT | 133 |
SCHEDULE OF INVESTMENTS (continued) | March 31, 2015 |
| TECHNOLOGY FUND | |
| | |
Shares | | | Value | |
| | | | | | | | | |
| Pandora Media, Inc.* | | | 6,264 | | | $ | 101,539 | |
| Total Internet Content-Entertainment | | | | | | | 1,234,044 | |
| | | | | | | | |
| COMPUTERS-MEMORY DEVICES - 3.2% | |
| EMC Corp. | | | 14,455 | | | | 369,470 | |
| Western Digital Corp. | | | 2,530 | | | | 230,255 | |
| Seagate Technology plc | | | 4,023 | | | | 209,317 | |
| NetApp, Inc. | | | 4,790 | | | | 169,853 | |
| SanDisk Corp. | | | 2,647 | | | | 168,402 | |
| Total Computers-Memory Devices | | | | | | | 1,147,297 | |
| | | | | | | | |
| E-COMMERCE/PRODUCTS - 2.6% | |
| eBay, Inc.* | | | 7,474 | | | | 431,100 | |
| Alibaba Group Holding Ltd. ADR* | | | 4,050 | | | | 337,122 | |
| MercadoLibre, Inc. | | | 1,477 | | | | 180,962 | |
| Total E-Commerce/Products | | | | | | | 949,184 | |
| | | | | | | | |
| NETWORKING PRODUCTS - 2.5% | |
| Cisco Systems, Inc. | | | 21,764 | | | | 599,054 | |
| Palo Alto Networks, Inc.* | | | 1,310 | | | | 191,365 | |
| Fortinet, Inc.* | | | 3,647 | | | | 127,463 | |
| Total Networking Products | | | | | | | 917,882 | |
| | | | | | | | |
| SEMICONDUCTOR EQUIPMENT - 2.5% | |
| Applied Materials, Inc. | | | 11,687 | | | | 263,659 | |
| ASML Holding N.V. — Class G | | | 2,048 | | | | 206,909 | |
| Lam Research Corp. | | | 2,324 | | | | 163,226 | |
| KLA-Tencor Corp. | | | 2,668 | | | | 155,518 | |
| Teradyne, Inc. | | | 5,443 | | | | 102,601 | |
| Total Semiconductor Equipment | | | | | | | 891,913 | |
| | | | | | | | |
| DATA PROCESSING/MANAGEMENT - 2.4% | |
| Fidelity National Information Services, Inc. | | | 3,394 | | | | 230,995 | |
| Fiserv, Inc.* | | | 2,866 | | | | 227,560 | |
| Paychex, Inc. | | | 4,383 | | | | 217,463 | |
| Broadridge Financial Solutions, Inc. | | | 2,480 | | | | 136,425 | |
| CommVault Systems, Inc.* | | | 1,400 | | | | 61,180 | |
| Total Data Processing/Management | | | | | | | 873,623 | |
| | | | | | | | |
| ELECTRONIC COMPONENTS-MISCELLANEOUS - 2.4% | |
| Corning, Inc. | | | 12,001 | | | | 272,182 | |
| TE Connectivity Ltd. | | | 3,417 | | | | 244,726 | |
| Flextronics International Ltd.* | | | 11,441 | | | | 145,015 | |
| Jabil Circuit, Inc. | | | 4,840 | | | | 113,159 | |
Knowles Corp.*,1 | | | 3,340 | | | | 64,362 | |
| Total Electronic Components-Miscellaneous | | | | | | | 839,444 | |
| | | | | | | | |
| E-COMMERCE/SERVICES - 2.2% | |
| SouFun Holdings Ltd. ADR | | | 39,830 | | | | 238,979 | |
| Bitauto Holdings Ltd. ADR* | | | 4,600 | | | | 234,048 | |
| Zillow Group, Inc. — Class A* | | | 1,290 | | | | 129,387 | |
| IAC/InterActiveCorp | | | 1,580 | | | | 106,603 | |
| GrubHub, Inc.* | | | 2,240 | | | | 101,674 | |
| Total E-Commerce/Services | | | | | | | 810,691 | |
| | | | | | | | |
| ENTERTAINMENT SOFTWARE - 2.1% | |
| NetEase, Inc. ADR | | | 2,210 | | | | 232,714 | |
| Electronic Arts, Inc.* | | | 3,891 | | | | 228,849 | |
| Activision Blizzard, Inc. | | | 9,253 | | | | 210,274 | |
| Take-Two Interactive Software, Inc.* | | | 2,980 | | | | 75,856 | |
| Total Entertainment Software | | | | | | | 747,693 | |
| | | | | | | | |
| INTERNET SECURITY - 2.0% | |
| Qihoo 360 Technology Company Ltd. ADR* | | | 4,940 | | | | 252,927 | |
| Symantec Corp. | | | 8,868 | | | | 207,201 | |
| VeriSign, Inc.* | | | 2,233 | | | | 149,544 | |
| FireEye, Inc.* | | | 3,170 | | | | 124,423 | |
| Total Internet Security | | | | | | | 734,095 | |
| | | | | | | | |
| INTERNET CONTENT-INFORMATION/NETWORK - 1.8% | |
| LinkedIn Corp. — Class A* | | | 1,215 | | | | 303,580 | |
YY, Inc. ADR*,1 | | | 4,260 | | | | 232,404 | |
| Yelp, Inc. — Class A* | | | 2,090 | | | | 98,962 | |
| Total Internet Content-Information/Network | | | | | | | 634,946 | |
| | | | | | | | |
| TELECOMMUNICATION EQUIPMENT - 1.4% | |
| Juniper Networks, Inc. | | | 6,873 | | | | 155,193 | |
| Harris Corp. | | | 1,690 | | | | 133,104 | |
| CommScope Holding Company, Inc.* | | | 4,110 | | | | 117,299 | |
| ARRIS Group, Inc.* | | | 3,560 | | | | 102,866 | |
| Total Telecommunication Equipment | | | | | | | 508,462 | |
| | | | | | | | |
| WIRELESS EQUIPMENT - 1.4% | |
| Nokia Oyj ADR | | | 27,452 | | | | 208,087 | |
| Motorola Solutions, Inc. | | | 2,990 | | | | 199,343 | |
| Aruba Networks, Inc.* | | | 3,482 | | | | 85,274 | |
| Total Wireless Equipment | | | | | | | 492,704 | |
| | | | | | | | |
| COMPUTERS-INTEGRATED SYSTEMS - 1.2% | |
| NCR Corp.* | | | 3,980 | | | | 117,449 | |
| Brocade Communications Systems, Inc. | | | 9,698 | | | | 115,067 | |
| Jack Henry & Associates, Inc. | | | 1,540 | | | | 107,631 | |
| VeriFone Systems, Inc.* | | | 2,910 | | | | 101,530 | |
| Total Computers-Integrated Systems | | | | | | | 441,677 | |
| | | | | | | | |
| COMPUTER AIDED DESIGN - 1.1% | |
| Autodesk, Inc.* | | | 3,167 | | | | 185,713 | |
| ANSYS, Inc.* | | | 1,440 | | | | 126,994 | |
| Aspen Technology, Inc.* | | | 2,570 | | | | 98,919 | |
| Total Computer Aided Design | | | | | | | 411,626 | |
| | | | | | | | |
| ELECTRONIC MEASURING INSTRUMENTS - 1.0% | |
| Trimble Navigation Ltd.* | | | 5,283 | | | | 133,132 | |
| Keysight Technologies, Inc.* | | | 3,460 | | | | 128,539 | |
| FLIR Systems, Inc. | | | 3,400 | | | | 106,352 | |
| Total Electronic Measuring Instruments | | | | | | | 368,023 | |
| 134 | THE RYDEX FUNDS ANNUAL REPORT | SEE NOTES TO FINANCIAL STATEMENTS. |
SCHEDULE OF INVESTMENTS (continued) | March 31, 2015 |
| TECHNOLOGY FUND | |
| | |
Shares | | | Value | |
| | | | | | | | | |
| POWER CONVERTER/SUPPLY EQUIPMENT - 0.9% | |
| Canadian Solar, Inc.* | | | 6,930 | | | $ | 231,393 | |
| SunPower Corp. — Class A* | | | 3,330 | | | | 104,262 | |
| Total Power Converter/Supply Equipment | | | | | | | 335,655 | |
| | | | | | | | |
| COMPUTER SOFTWARE - 0.9% | |
| Akamai Technologies, Inc.* | | | 2,595 | | | | 184,362 | |
| Rackspace Hosting, Inc.* | | | 2,673 | | | | 137,900 | |
| Total Computer Software | | | | | | | 322,262 | |
| | | | | | | | |
| SOFTWARE TOOLS - 0.9% | |
| VMware, Inc. — Class A* | | | 3,796 | | | | 311,310 | |
| | | | | | | | |
| ELECTRONIC FORMS - 0.9% | |
| Adobe Systems, Inc.* | | | 4,178 | | | | 308,921 | |
| | | | | | | | |
| ENERGY-ALTERNATE SOURCES - 0.7% | |
| SunEdison, Inc.* | | | 5,522 | | | | 132,528 | |
| First Solar, Inc.* | | | 2,152 | | | | 128,668 | |
| Total Energy-Alternate Sources | | | | | | | 261,196 | |
| | | | | | | | |
| ELECTRONIC DESIGN AUTOMATIC - 0.7% | |
| Synopsys, Inc.* | | | 3,000 | | | | 138,960 | |
| Cadence Design Systems, Inc.* | | | 6,544 | | | | 120,671 | |
| Total Electronic Design Automatic | | | | | | | 259,631 | |
| | | | | | | | |
| ELECTRONIC PARTS DISTRIBUTION - 0.7% | |
| Avnet, Inc. | | | 2,874 | | | | 127,893 | |
| Arrow Electronics, Inc.* | | | 2,066 | | | | 126,336 | |
| Total Electronic Parts Distribution | | | | | | | 254,229 | |
| | | | | | | | |
| COMPUTER GRAPHICS - 0.7% | |
| CyberArk Software Ltd.* | | | 4,330 | | | | 240,618 | |
| | | | | | | | |
| ADVERTISING AGENCIES - 0.7% | |
| Alliance Data Systems Corp.* | | | 809 | | | | 239,666 | |
| | | | | | | | |
| CONSULTING SERVICES - 0.6% | |
| Gartner, Inc.* | | | 1,470 | | | | 123,260 | |
| Booz Allen Hamilton Holding Corp. | | | 3,730 | | | | 107,946 | |
| Total Consulting Services | | | | | | | 231,206 | |
| | | | | | | | |
| ELECTRIC PRODUCTS-MISCELLANEOUS - 0.6% | |
| Mobileye N.V.* | | | 5,400 | | | | 226,962 | |
| | | | | | | | |
| ELECTRONIC CONNECTORS - 0.6% | |
| Amphenol Corp. — Class A | | | 3,751 | | | | 221,046 | |
| | | | | | | | |
| OFFICE AUTOMATION & EQUIPMENTS - 0.5% | |
| Xerox Corp. | | | 15,373 | | | | 197,543 | |
| | | | | | | | |
| WEB HOSTING/DESIGN - 0.5% | |
| Equinix, Inc. | | | 846 | | | | 196,991 | |
| | | | | | | | |
| COMPUTERS-OTHER - 0.5% | |
3D Systems Corp.*,1 | | | 4,171 | | | | 114,369 | |
Stratasys Ltd.*,1 | | | 1,330 | | | | 70,197 | |
| Total Computers-Other | | | | | | | 184,566 | |
| | | | | | | | |
| COMPUTERS-PERIPHERAL EQUIPMENT - 0.5% | |
| Synaptics, Inc.* | | | 1,158 | | | | 94,151 | |
| Lexmark International, Inc. — Class A | | | 2,040 | | | | 86,374 | |
| Total Computers-Peripheral Equipment | | | | | | | 180,525 | |
| | | | | | | | |
| TELECOMMUNICATION SERVICES - 0.5% | |
| Qorvo, Inc.* | | | 2,257 | | | | 179,883 | |
| | | | | | | | |
| FINANCE-CREDIT CARD - 0.4% | |
| Visa, Inc. — Class A | | | 2,484 | | | | 162,478 | |
| | | | | | | | |
| INTERNET INFRASTRUCTURE SOFTWARE - 0.4% | |
| F5 Networks, Inc.* | | | 1,398 | | | | 160,686 | |
| | | | | | | | |
| TELECOMMUNICATION EQUIPMENTS FIBER OPTICS - 0.4% | |
| JDS Uniphase Corp.* | | | 6,709 | | | | 88,022 | |
| Ciena Corp.* | | | 3,671 | | | | 70,887 | |
| Total Telecommunication Equipments Fiber Optics | | | | | | | 158,909 | |
| | | | | | | | |
| MULTIMEDIA - 0.4% | |
| FactSet Research Systems, Inc. | | | 900 | | | | 143,280 | |
| | | | | | | | |
| COMMERCIAL SERVICES - 0.4% | |
| CDK Global, Inc. | | | 3,024 | | | | 141,402 | |
| | | | | | | | |
| INTERNET APPLICATION SOFTWARE - 0.4% | |
| Splunk, Inc.* | | | 2,330 | | | | 137,936 | |
| | | | | | | | |
| MACHINERY-GENERAL INDUSTRY - 0.3% | |
| Zebra Technologies Corp. — Class A* | | | 1,320 | | | | 119,744 | |
| | | | | | | | |
| DISTRIBUTION/WHOLESALE - 0.3% | |
| Ingram Micro, Inc. — Class A* | | | 4,210 | | | | 105,755 | |
| | | | | | | | |
| COMMUNICATIONS SOFTWARE - 0.3% | |
| SolarWinds, Inc.* | | | 2,050 | | | | 105,042 | |
| | | | | | | | |
| INSTRUMENTS-SCIENTIFIC - 0.3% | |
| FEI Co. | | | 1,280 | | | | 97,715 | |
| | | | | | | | |
| INTERNET INCUBATORS - 0.2% | |
| HomeAway, Inc.* | | | 2,870 | | | | 86,588 | |
| | | | | | | | |
| TRANSACTIONAL SOFTWARE - 0.2% | |
| Solera Holdings, Inc. | | | 1,610 | | | | 83,173 | |
| | | | | | | | |
| Total Common Stocks | | | | | | | | |
| (Cost $23,124,938) | | | | | | | 36,047,002 | |
| SEE NOTES TO FINANCIAL STATEMENTS. | THE RYDEX FUNDS ANNUAL REPORT | 135 |
SCHEDULE OF INVESTMENTS (concluded) | March 31, 2015 |
| TECHNOLOGY FUND | |
| | | | | | | | | |
| | | Face
Amount | | | Value | |
| | | | | | | | |
SECURITIES LENDING COLLATERAL††,2 - 1.1% | |
| Repurchase Agreements | | | | | | | | |
HSBC Securities, Inc.
issued 03/31/15 at 0.10%
due 04/01/15 | | $ | 268,727 | | | $ | 268,727 | |
BNP Paribas Securities Corp.
issued 03/31/15 at 0.10%
due 04/01/15 | | | 92,443 | | | | 92,443 | |
Barclays Capital, Inc.
issued 03/31/15 at 0.10%
due 04/01/15 | | | 47,716 | | | | 47,716 | |
| Total Securities Lending Collateral | | | | | | | | |
| (Cost $408,886) | | | | | | | 408,886 | |
| | | | | | | | |
| Total Investments - 100.8% | | | | | | | | |
| (Cost $23,533,824) | | | | | | $ | 36,455,888 | |
| Other Assets & Liabilities, net - (0.8)% | | | | | | | (296,854 | ) |
| Total Net Assets - 100.0% | | | | | | $ | 36,159,034 | |
| * | Non-income producing security. |
| † | Value determined based on Level 1 inputs — See Note 4. |
| †† | Value determined based on Level 2 inputs — See Note 4. |
| 1 | All or portion of this security is on loan at March 31, 2015 — See Note 6. |
| 2 | Securities lending collateral — See Note 6. |
| ADR — American Depositary Receipt |
| plc — Public Limited Company |
| 136 | THE RYDEX FUNDS ANNUAL REPORT | SEE NOTES TO FINANCIAL STATEMENTS. |
STATEMENT OF ASSETS AND LIABILITIES
March 31, 2015
| Assets: | |
| Investments, at value - including $407,651 of securities loaned (cost $23,124,938) | | $ | 36,047,002 | |
| Repurchase agreements, at value (cost $408,886) | | | 408,886 | |
| Total investments (cost $23,533,824) | | | 36,455,888 | |
| Segregated cash with broker | | | 5,976 | |
| Cash | | | 5,942 | |
| Receivables: | |
| Securities sold | | | 402,528 | |
| Fund shares sold | | | 105,555 | |
| Dividends | | | 20,817 | |
| Securities lending income | | | 1,608 | |
| Total assets | | | 36,998,314 | |
| | | | | |
| Liabilities: | |
| Line of credit | | | 260,000 | |
| Payable for: | |
| Return of securities loaned | | | 414,863 | |
| Fund shares redeemed | | | 104,245 | |
| Management fees | | | 26,661 | |
| Transfer agent and administrative fees | | | 7,841 | |
| Distribution and service fees | | | 5,573 | |
| Portfolio accounting fees | | | 3,136 | |
| Miscellaneous | | | 16,961 | |
| Total liabilities | | | 839,280 | |
| Commitments and contingent liabilities (Note 10) | | | — | |
| Net assets | | $ | 36,159,034 | |
| | | | | |
| Net assets consist of: | |
| Paid in capital | | $ | 30,833,231 | |
| Accumulated net investment loss | | | (178,794 | ) |
| Accumulated net realized loss on investments | | | (7,417,467 | ) |
| Net unrealized appreciation on investments | | | 12,922,064 | |
| Net assets | | $ | 36,159,034 | |
| | | | | |
| Investor Class: | |
| Net assets | | $ | 20,458,431 | |
| Capital shares outstanding | | | 334,110 | |
| Net asset value per share | | $ | 61.23 | |
| | | | | |
| Advisor Class: | |
| Net assets | | $ | 2,831,064 | |
| Capital shares outstanding | | | 50,068 | |
| Net asset value per share | | $ | 56.54 | |
| | | | | |
| A-Class: | |
| Net assets | | $ | 9,959,635 | |
| Capital shares outstanding | | | 172,651 | |
| Net asset value per share | | $ | 57.69 | |
| Maximum offering price per share (Net asset value divided by 95.25%) | | $ | 60.57 | |
| | | | | |
| C-Class: | |
| Net assets | | $ | 2,909,904 | |
| Capital shares outstanding | | | 54,393 | |
| Net asset value per share | | $ | 53.50 | |
STATEMENT OF OPERATIONS
Year Ended March 31, 2015
| Investment Income: | |
| Dividends (net of foreign withholding tax of $6,073) | | $ | 400,532 | |
| Income from securities lending, net | | | 23,663 | |
| Interest | | | 46 | |
| Total investment income | | | 424,241 | |
| | | | | |
| Expenses: | |
| Management fees | | | 305,477 | |
| Transfer agent and administrative fees | | | 89,846 | |
| Distribution and service fees: | | | | |
| Advisor Class | | | 25,712 | |
| A-Class | | | 10,624 | |
| C-Class | | | 23,398 | |
| Portfolio accounting fees | | | 35,938 | |
| Custodian fees | | | 4,192 | |
| Trustees’ fees* | | | 2,757 | |
| Line of credit fees | | | 195 | |
| Tax expense | | | 85 | |
| Miscellaneous | | | 46,283 | |
| Total expenses | | | 544,507 | |
| Net investment loss | | | (120,266 | ) |
| | | | | |
| Net Realized and Unrealized Gain (Loss): | |
| Net realized gain (loss) on: | |
| Investments | | | 848,143 | |
| Net realized gain | | | 848,143 | |
| Net change in unrealized appreciation (depreciation) on: | |
| Investments | | | 516,435 | |
| Net change in unrealized appreciation (depreciation) | | | 516,435 | |
| Net realized and unrealized gain | | | 1,364,578 | |
| Net increase in net assets resulting from operations | | $ | 1,244,312 | |
| * | Relates to Trustees not deemed “interested persons” within the meaning of Section 2(a)(19) of the 1940 Act. |
| SEE NOTES TO FINANCIAL STATEMENTS. | THE RYDEX FUNDS ANNUAL REPORT | 137 |
STATEMENTS OF CHANGES IN NET ASSETS
| | | Year Ended March 31, 2015 | | | Year Ended March 31, 2014 | |
| Increase (Decrease) in Net Assets from Operations: | | | | | | |
| Net investment loss | | $ | (120,266 | ) | | $ | (99,486 | ) |
| Net realized gain on investments | | | 848,143 | | | | 1,519,835 | |
| Net change in unrealized appreciation (depreciation) on investments | | | 516,435 | | | | 5,854,636 | |
| Net increase in net assets resulting from operations | | | 1,244,312 | | | | 7,274,985 | |
| | | | | | | | | |
| Capital share transactions: | | | | | | | | |
| Proceeds from sale of shares | | | | | | | | |
| Investor Class | | | 78,754,571 | | | | 90,386,817 | |
| Advisor Class | | | 30,346,789 | | | | 19,872,814 | |
| A-Class | | | 18,659,402 | | | | 17,950,430 | |
| C-Class | | | 21,038,252 | | | | 25,610,311 | |
| Cost of shares redeemed | | | | | | | | |
| Investor Class | | | (92,812,678 | ) | | | (70,456,671 | ) |
| Advisor Class | | | (34,217,663 | ) | | | (15,430,118 | ) |
| A-Class | | | (14,187,804 | ) | | | (15,058,469 | ) |
| C-Class | | | (21,139,205 | ) | | | (25,000,548 | ) |
| Net increase (decrease) from capital share transactions | | | (13,558,336 | ) | | | 27,874,566 | |
| Net increase (decrease) in net assets | | | (12,314,024 | ) | | | 35,149,551 | |
| | | | | | | | | |
| Net assets: | | | | | | | | |
| Beginning of year | | | 48,473,058 | | | | 13,323,507 | |
| End of year | | $ | 36,159,034 | | | $ | 48,473,058 | |
| Accumulated net investment loss at end of year | | $ | (178,794 | ) | | $ | (58,528 | ) |
| | | | | | | | | |
| Capital share activity: | | | | | | | | |
| Shares sold | | | | | | | | |
| Investor Class | | | 1,362,713 | | | | 1,785,118 | * |
| Advisor Class | | | 573,554 | | | | 400,929 | * |
| A-Class | | | 328,301 | | | | 363,346 | * |
| C-Class | | | 413,675 | | | | 589,677 | * |
| Shares redeemed | | | | | | | | |
| Investor Class | | | (1,616,398 | ) | | | (1,388,328 | )* |
| Advisor Class | | | (656,798 | ) | | | (299,244 | )* |
| A-Class | | | (266,905 | ) | | | (300,472 | )* |
| C-Class | | | (416,613 | ) | | | (576,511 | )* |
| Net increase (decrease) in shares | | | (278,471 | ) | | | 574,515 | * |
| * | Capital share activity for the periods presented through February 7, 2014 has been restated to reflect a 1:3 reverse share split effective February 7, 2014. See Note 9 in Notes to Financial Statements. |
| 138 | THE RYDEX FUNDS ANNUAL REPORT | SEE NOTES TO FINANCIAL STATEMENTS. |
This table is presented to show selected data for a share outstanding throughout each period and to assist shareholders in evaluating a Fund’s performance for the periods presented.
| Investor Class | | Year Ended March 31, 2015 | | | Year Ended March 31, 2014c | | | Year Ended March 28, 2013 c | | | Year Ended March 31, 2012 c | | | Year Ended March 31, 2011 c | |
| Per Share Data | | | | | | | | | | | | | | | |
| Net asset value, beginning of period | | $ | 55.90 | | | $ | 43.58 | | | $ | 42.92 | | | $ | 41.81 | | | $ | 36.10 | |
| Income (loss) from investment operations: | |
Net investment income (loss)a | | | (.10 | ) | | | (.09 | ) | | | .03 | | | | (.03 | ) | | | (.18 | ) |
| Net gain (loss) on investments (realized and unrealized) | | | 5.43 | | | | 12.41 | | | | .63 | | | | 1.14 | | | | 5.89 | |
| Total from investment operations | | | 5.33 | | | | 12.32 | | | | .66 | | | | 1.11 | | | | 5.71 | |
| Net asset value, end of period | | $ | 61.23 | | | $ | 55.90 | | | $ | 43.58 | | | $ | 42.92 | | | $ | 41.81 | |
| | |
Total Returnb | | | 9.53 | % | | | 28.24 | % | | | 1.54 | % | | | 2.65 | % | | | 15.88 | % |
| Ratios/Supplemental Data | |
| Net assets, end of period (in thousands) | | $ | 20,458 | | | $ | 32,858 | | | $ | 8,325 | | | $ | 19,985 | | | $ | 35,408 | |
| Ratios to average net assets: | |
| Net investment income (loss) | | | (0.17 | %) | | | (0.18 | %) | | | 0.10 | % | | | (0.10 | %) | | | (0.48 | %) |
| Total expenses | | | 1.35 | % | | | 1.37 | % | | | 1.35 | % | | | 1.36 | % | | | 1.39 | % |
| Portfolio turnover rate | | | 280 | % | | | 321 | % | | | 324 | % | | | 487 | % | | | 393 | % |
| Advisor Class | | Year Ended March 31, 2015 | | | Year Ended March 31, 2014 c | | | Year Ended March 28, 2013 c | | | Year Ended March 31, 2012 c | | | Year Ended March 31, 2011 c | |
| Per Share Data | | | | | | | | | | | | | | | |
| Net asset value, beginning of period | | $ | 51.87 | | | $ | 40.65 | | | $ | 40.22 | | | $ | 39.39 | | | $ | 34.18 | |
| Income (loss) from investment operations: | |
Net investment income (loss)a | | | (.37 | ) | | | (.27 | ) | | | (.12 | ) | | | (.33 | ) | | | (.33 | ) |
| Net gain (loss) on investments (realized and unrealized) | | | 5.04 | | | | 11.49 | | | | .55 | | | | 1.16 | | | | 5.54 | |
| Total from investment operations | | | 4.67 | | | | 11.22 | | | | .43 | | | | .83 | | | | 5.21 | |
| Net asset value, end of period | | $ | 56.54 | | | $ | 51.87 | | | $ | 40.65 | | | $ | 40.22 | | | $ | 39.39 | |
| | |
Total Returnb | | | 9.00 | % | | | 27.60 | % | | | 1.04 | % | | | 2.13 | % | | | 15.28 | % |
| Ratios/Supplemental Data | |
| Net assets, end of period (in thousands) | | $ | 2,831 | | | $ | 6,915 | | | $ | 1,286 | | | $ | 2,361 | | | $ | 6,565 | |
| Ratios to average net assets: | |
| Net investment income (loss) | | | (0.69 | %) | | | (0.54 | %) | | | (0.33 | %) | | | (0.87 | %) | | | (0.94 | %) |
| Total expenses | | | 1.85 | % | | | 1.87 | % | | | 1.85 | % | | | 1.85 | % | | | 1.88 | % |
| Portfolio turnover rate | | | 280 | % | | | 321 | % | | | 324 | % | | | 487 | % | | | 393 | % |
| SEE NOTES TO FINANCIAL STATEMENTS. | THE RYDEX FUNDS ANNUAL REPORT | 139 |
FINANCIAL HIGHLIGHTS (concluded)
This table is presented to show selected data for a share outstanding throughout each period and to assist shareholders in evaluating a Fund’s performance for the periods presented.
| A-Class | | Year Ended March 31, 2015 | | | Year Ended March 31, 2014 c | | | Year Ended March 28, 2013 c | | | Year Ended March 31, 2012 c | | | Year Ended March 31, 2011 c | |
| Per Share Data | | | | | | | | | | | | | | | |
| Net asset value, beginning of period | | $ | 52.79 | | | $ | 41.30 | | | $ | 40.76 | | | $ | 39.83 | | | $ | 34.47 | |
| Income (loss) from investment operations: | |
Net investment income (loss)a | | | (.21 | ) | | | (.23 | ) | | | (.09 | ) | | | (.30 | ) | | | (.27 | ) |
| Net gain (loss) on investments (realized and unrealized) | | | 5.11 | | | | 11.72 | | | | .63 | | | | 1.23 | | | | 5.63 | |
| Total from investment operations | | | 4.90 | | | | 11.49 | | | | .54 | | | | .93 | | | | 5.36 | |
| Net asset value, end of period | | $ | 57.69 | | | $ | 52.79 | | | $ | 41.30 | | | $ | 40.76 | | | $ | 39.83 | |
| | |
Total Returnb | | | 9.28 | % | | | 27.79 | % | | | 1.32 | % | | | 2.33 | % | | | 15.58 | % |
| Ratios/Supplemental Data | |
| Net assets, end of period (in thousands) | | $ | 9,960 | | | $ | 5,873 | | | $ | 1,998 | | | $ | 7,367 | | | $ | 1,725 | |
| Ratios to average net assets: | |
| Net investment income (loss) | | | (0.39 | %) | | | (0.47 | %) | | | (0.27 | %) | | | (0.76 | %) | | | (0.73 | %) |
| Total expenses | | | 1.59 | % | | | 1.62 | % | | | 1.59 | % | | | 1.59 | % | | | 1.64 | % |
| Portfolio turnover rate | | | 280 | % | | | 321 | % | | | 324 | % | | | 487 | % | | | 393 | % |
| C-Class | | Year Ended March 31, 2015 | | | Year Ended March 31, 2014 c | | | Year Ended March 28, 2013 c | | | Year Ended March 31, 2012 c | | | Year Ended March 31, 2011 c | |
| Per Share Data | | | | | | | | | | | | | | | |
| Net asset value, beginning of period | | $ | 49.30 | | | $ | 38.84 | | | $ | 38.65 | | | $ | 38.07 | | | $ | 33.15 | |
| Income (loss) from investment operations: | |
Net investment income (loss)a | | | (.58 | ) | | | (.50 | ) | | | (.33 | ) | | | (.51 | ) | | | (.51 | ) |
| Net gain (loss) on investments (realized and unrealized) | | | 4.78 | | | | 10.96 | | | | .52 | | | | 1.09 | | | | 5.43 | |
| Total from investment operations | | | 4.20 | | | | 10.46 | | | | .19 | | | | .58 | | | | 4.92 | |
| Net asset value, end of period | | $ | 53.50 | | | $ | 49.30 | | | $ | 38.84 | | | $ | 38.65 | | | $ | 38.07 | |
| | |
Total Returnb | | | 8.52 | % | | | 26.90 | % | | | 0.54 | % | | | 1.50 | % | | | 14.84 | % |
| Ratios/Supplemental Data | |
| Net assets, end of period (in thousands) | | $ | 2,910 | | | $ | 2,827 | | | $ | 1,715 | | | $ | 2,743 | | | $ | 2,618 | |
| Ratios to average net assets: | |
| Net investment income (loss) | | | (1.13 | %) | | | (1.13 | %) | | | (0.90 | %) | | | (1.45 | %) | | | (1.53 | %) |
| Total expenses | | | 2.35 | % | | | 2.37 | % | | | 2.35 | % | | | 2.36 | % | | | 2.39 | % |
| Portfolio turnover rate | | | 280 | % | | | 321 | % | | | 324 | % | | | 487 | % | | | 393 | % |
a | Net investment income (loss) per share was computed using average shares outstanding throughout the period. |
b | Total return does not reflect the impact of any applicable sales charges. |
c | Reverse share split — Per share amounts for the periods presented through February 7, 2014 have been restated to reflect a 1:3 reverse share split effective February 7, 2014. See Note 9 in Notes to Financial Statements. |
| 140 | THE RYDEX FUNDS ANNUAL REPORT | SEE NOTES TO FINANCIAL STATEMENTS. |
PERFORMANCE REPORT AND FUND PROFILE (Unaudited) | March 31, 2015 |
TELECOMMUNICATIONS FUND
OBJECTIVE: Seeks to provide capital appreciation by investing in companies engaged in the development, manufacture, or sale of communications services or communications equipment (“telecommunications companies”).
For the one-year period ended March 31, 2015, Telecommunications Fund Investor Class returned 2.93%, compared with 4.09% for the S&P 500 Telecommunications Services Index. The broader S&P 500 Index returned 12.73%.
Communications equipment contributed most to the Fund’s return, followed by diversified telecommunication services. The wireless telecommunication services industry was the only detractor from return.
Cisco Systems, Inc., Palo Alto Networks, Inc., and Level 3 Communications, Inc. were the strongest performers for the period. VimpelCom Ltd. ADR, QUALCOMM, Inc., and Sprint Corp. detracted most from performance during the period.
Performance displayed represents past performance, which is no guarantee of future results.
Holdings Diversification (Market Exposure as % of Net Assets)
“Holdings Diversification (Market Exposure as % of Net Assets)” excludes any temporary cash investments.
| Inception Dates: |
| Investor Class | April 1, 1998 |
| Advisor Class | April 1, 1998 |
| A-Class | September 1, 2004 |
| C-Class | April 18, 2001 |
| Ten Largest Holdings (% of Total Net Assets) |
| Verizon Communications, Inc. | 8.6% |
| AT&T, Inc. | 7.9% |
| Cisco Systems, Inc. | 7.1% |
| QUALCOMM, Inc. | 6.4% |
| Crown Castle International Corp. | 3.1% |
| T-Mobile US, Inc. | 3.0% |
| CenturyLink, Inc. | 2.7% |
| Level 3 Communications, Inc. | 2.6% |
| Sprint Corp. | 2.5% |
| SBA Communications Corp. — Class A | 2.4% |
| Top Ten Total | 46.3% |
| | |
| “Ten Largest Holdings” exclude any temporary cash or derivative investments. |
| | THE RYDEX FUNDS ANNUAL REPORT | 141 |
PERFORMANCE REPORT AND FUND PROFILE (Unaudited)(concluded) | March 31, 2015 |
Cumulative Fund Performance*
Average Annual Returns*
Periods Ended March 31, 2015
| | 1 Year | 5 Year | 10 Year |
| Investor Class Shares | 2.93% | 4.20% | 2.58% |
| Advisor Class Shares | 2.42% | 3.71% | 2.10% |
| A-Class Shares | 2.75% | 3.97% | 2.31% |
A-Class Shares with sales charge† | -2.13% | 2.97% | 1.82% |
| C-Class Shares | 1.86% | 3.39% | 1.66% |
C-Class Shares with CDSC‡ | 0.87% | 3.39% | 1.66% |
| S&P 500 Telecommunication Services Index | 4.09% | 12.75% | 7.54% |
| S&P 500 Index | 12.73% | 14.47% | 8.01% |
| * | The performance data above represents past performance that is not predictive of future results. The investment return and principal value of an investment in the Fund will fluctuate so that an investor’s shares, when redeemed, may be worth more or less than their original cost. Returns are historical and include changes in principal and reinvested dividends and capital gains and do not reflect the effect of taxes. The S&P 500 Index and the S&P 500 Telecommunication Services Index are unmanaged indices and, unlike the Fund, have no management fees or operating expenses to reduce their reported returns. The graphs are based on Investor Class shares and A-Class shares only; performance for Advisor Class shares and C-Class shares will vary due to differences in fee structures. |
† | Fund returns are calculated using the maximum sales charge of 4.75%. |
‡ | Fund returns include a CDSC of 1% if redeemed within 12 months of purchase. |
| 142 | THE RYDEX FUNDS ANNUAL REPORT | |
| SCHEDULE OF INVESTMENTS | March 31, 2015 |
| TELECOMMUNICATIONS FUND | |
| | |
Shares | | | Value | |
| | | | | | | | |
COMMON STOCKS† - 98.9% | |
| | | | | | | | |
| TELEPHONE-INTEGRATED - 25.3% | |
| Verizon Communications, Inc. | | | 4,280 | | | $ | 208,136 | |
| AT&T, Inc. | | | 5,838 | | | | 190,611 | |
| CenturyLink, Inc. | | | 1,895 | | | | 65,472 | |
| Frontier Communications Corp. | | | 5,433 | | | | 38,303 | |
| Windstream Holdings, Inc. | | | 4,160 | | | | 30,784 | |
| Telefonica Brasil S.A. ADR | | | 1,849 | | | | 28,271 | |
| Telefonica S.A. ADR | | | 1,922 | | | | 27,581 | |
| Telephone & Data Systems, Inc. | | | 949 | | | | 23,630 | |
| Total Telephone-Integrated | | | | | | | 612,788 | |
| | | | | | | | |
| NETWORKING PRODUCTS - 14.8% | |
| Cisco Systems, Inc. | | | 6,246 | | | | 171,920 | |
| Palo Alto Networks, Inc.* | | | 350 | | | | 51,128 | |
| Arista Networks, Inc.* | | | 443 | | | | 31,245 | |
| Telefonaktiebolaget LM Ericsson ADR | | | 2,272 | | | | 28,514 | |
| Infinera Corp.* | | | 1,200 | | | | 23,604 | |
| Polycom, Inc.* | | | 1,467 | | | | 19,658 | |
| Ruckus Wireless, Inc.* | | | 1,225 | | | | 15,766 | |
| NETGEAR, Inc.* | | | 478 | | | | 15,717 | |
| Total Networking Products | | | | | | | 357,552 | |
| | | | | | | | |
| CELLULAR TELECOMMUNICATIONS - 13.8% | |
| T-Mobile US, Inc.* | | | 2,320 | �� | | | 73,521 | |
| Sprint Corp.* | | | 12,938 | | | | 61,326 | |
| Vodafone Group plc ADR | | | 1,251 | | | | 40,883 | |
| America Movil SAB de C.V. — Class L ADR | | | 1,970 | | | | 40,306 | |
| China Mobile Ltd. ADR | | | 552 | | | | 35,897 | |
| SK Telecom Company Ltd. ADR | | | 1,097 | | | | 29,849 | |
| Rogers Communications, Inc. — Class B | | | 790 | | | | 26,449 | |
| Tim Participacoes S.A. ADR | | | 1,497 | | | | 24,820 | |
| Total Cellular Telecommunications | | | | | | | 333,051 | |
| | | | | | | | |
| WIRELESS EQUIPMENT - 10.9% | |
| SBA Communications Corp. — Class A* | | | 489 | | | | 57,262 | |
| Motorola Solutions, Inc. | | | 842 | | | | 56,135 | |
| Nokia Oyj ADR | | | 4,072 | | | | 30,866 | |
| Sierra Wireless, Inc.* | | | 860 | | | | 28,457 | |
| ViaSat, Inc.* | | | 405 | | | | 24,142 | |
| Aruba Networks, Inc.* | | | 983 | | | | 24,074 | |
| Ubiquiti Networks, Inc. | | | 772 | | | | 22,813 | |
| InterDigital, Inc. | | | 393 | | | | 19,941 | |
| Total Wireless Equipment | | | | | | | 263,690 | |
| | | | | | | | |
| TELECOMMUNICATION EQUIPMENT - 7.7% | |
| Harris Corp. | | | 557 | | | | 43,869 | |
| Juniper Networks, Inc. | | | 1,932 | | | | 43,625 | |
| CommScope Holding Company, Inc.* | | | 1,159 | | | | 33,078 | |
| ARRIS Group, Inc.* | | | 1,005 | | | | 29,039 | |
| Plantronics, Inc. | | | 409 | | | | 21,657 | |
| ADTRAN, Inc. | | | 760 | | | | 14,189 | |
| Total Telecommunication Equipment | | | | | | | 185,457 | |
| | | | | | | | |
| SEMICONDUCTOR COMPONENTS-INTEGRATED CIRCUIT - 6.4% | |
| QUALCOMM, Inc. | | | 2,250 | | | | 156,015 | |
| | | | | | | | |
| TELECOMMUNICATION SERVICES - 5.6% | |
| Level 3 Communications, Inc.* | | | 1,176 | | | | 63,315 | |
| BCE, Inc. | | | 752 | | | | 31,855 | |
| VimpelCom Ltd. ADR | | | 5,169 | | | | 27,086 | |
| Consolidated Communications Holdings, Inc. | | | 717 | | | | 14,627 | |
| Total Telecommunication Services | | | | | | | 136,883 | |
| | | | | | | | |
| REITs-DIVERSIFIED - 3.1% | |
| Crown Castle International Corp. | | | 918 | | | | 75,772 | |
| | | | | | | | |
| COMPUTERS-INTEGRATED SYSTEMS - 2.8% | |
| Riverbed Technology, Inc.* | | | 1,654 | | | | 34,585 | |
| Brocade Communications Systems, Inc. | | | 2,727 | | | | 32,356 | |
| Total Computers-Integrated Systems | | | | | | | 66,941 | |
| | | | | | | | |
| TELECOMMUNICATION EQUIPMENT FIBER OPTICS - 2.7% | |
| JDS Uniphase Corp.* | | | 1,892 | | | | 24,823 | |
| Finisar Corp.* | | | 983 | | | | 20,977 | |
| Ciena Corp.* | | | 1,034 | | | | 19,967 | |
| Total Telecommunication Equipment Fiber Optics | | | | | | | 65,767 | |
| | | | | | | | |
| SATELLITE TELECOMMUNICATIONS - 1.9% | |
| EchoStar Corp. — Class A* | | | 623 | | | | 32,222 | |
| Iridium Communications, Inc.* | | | 1,468 | | | | 14,254 | |
| Total Satellite Telecommunications | | | | | | | 46,476 | |
| | | | | | | | |
| INTERNET INFRASTRUCTURE SOFTWARE - 1.8% | |
| F5 Networks, Inc.* | | | 372 | | | | 42,758 | |
| | | | | | | | |
| COMPUTERS - 1.3% | |
| BlackBerry Ltd.* | | | 3,653 | | | | 32,621 | |
| | | | | | | | |
| INTERNET CONNECTIVITY SERVICES - 0.8% | |
| Cogent Communications Holdings, Inc. | | | 534 | | | | 18,866 | |
| | | | | | | | |
| Total Common Stocks | | | | | | | | |
| (Cost $1,469,130) | | | | | | | 2,394,637 | |
| | | | | | | | |
RIGHTS† - 0.2% | |
| Leap Wireless International, Inc. | | | | | | | | |
Expires 09/17/15††† | | | 1,848 | | | | 4,657 | |
| Telefonica S.A. | | | | | | | | |
| Expires 04/12/15 | | | 1,626 | | | | 262 | |
| Total Rights | | | | | | | | |
| (Cost $4,544) | | | | | | | 4,919 | |
| SEE NOTES TO FINANCIAL STATEMENTS. | THE RYDEX FUNDS ANNUAL REPORT | 143 |
SCHEDULE OF INVESTMENTS (concluded) | March 31, 2015 |
| TELECOMMUNICATIONS FUND | |
| | | | | | | | | |
| | | Face
Amount | | | Value | |
| | | | | | | | |
REPURCHASE AGREEMENT††,1 - 0.2% | |
HSBC Group
issued 03/31/15 at 0.03%
due 04/01/15 | | $ | 5,514 | | | $ | 5,514 | |
| Total Repurchase Agreement | | | | | | | | |
| (Cost $5,514) | | | | | | | 5,514 | |
| | | | | | | | |
| Total Investments - 99.3% | | | | | | | | |
| (Cost $1,479,188) | | | | | | $ | 2,405,070 | |
| Other Assets & Liabilities, net - 0.7% | | | | | | | 15,939 | |
| Total Net Assets - 100.0% | | | | | | $ | 2,421,009 | |
| * | Non-income producing security. |
| † | Value determined based on Level 1 inputs, unless otherwise noted — See Note 4. |
| †† | Value determined based on Level 2 inputs — See Note 4. |
| ††† | Value determined based on Level 3 inputs — See Note 4. |
| 1 | Repurchase Agreement — See Note 5. |
| ADR — American Depositary Receipt |
| plc — Public Limited Company |
| 144 | THE RYDEX FUNDS ANNUAL REPORT | SEE NOTES TO FINANCIAL STATEMENTS. |
STATEMENT OF ASSETS AND LIABILITIES
March 31, 2015
| Assets: | |
| Investments, at value (cost $1,473,674) | | $ | 2,399,556 | |
| Repurchase agreements, at value (cost $5,514) | | | 5,514 | |
| Total investments (cost $1,479,188) | | | 2,405,070 | |
| Cash | | | 479 | |
| Receivables: | |
| Fund shares sold | | | 376,431 | |
| Dividends | | | 5,212 | |
| Securities lending income | | | 17 | |
| Total assets | | | 2,787,209 | |
| | | | | |
| Liabilities: | |
| Payable for: | |
| Securities purchased | | | 213,923 | |
| Fund shares redeemed | | | 146,797 | |
| Management fees | | | 2,048 | |
| Distribution and service fees | | | 720 | |
| Transfer agent and administrative fees | | | 602 | |
| Portfolio accounting fees | | | 241 | |
| Miscellaneous | | | 1,869 | |
| Total liabilities | | | 366,200 | |
| Commitments and contingent liabilities (Note 10) | | | — | |
| Net assets | | $ | 2,421,009 | |
| | | | | |
| Net assets consist of: | |
| Paid in capital | | $ | 6,391,061 | |
| Undistributed net investment income | | | 80,748 | |
| Accumulated net realized loss on investments | | | (4,976,682 | ) |
| Net unrealized appreciation on investments | | | 925,882 | |
| Net assets | | $ | 2,421,009 | |
| | | | | |
| Investor Class: | |
| Net assets | | $ | 1,316,405 | |
| Capital shares outstanding | | | 28,894 | |
| Net asset value per share | | $ | 45.56 | |
| | | | | |
| Advisor Class: | |
| Net assets | | $ | 151,052 | |
| Capital shares outstanding | | | 3,632 | |
| Net asset value per share | | $ | 41.59 | |
| | | | | |
| A-Class: | |
| Net assets | | $ | 454,478 | |
| Capital shares outstanding | | | 10,662 | |
| Net asset value per share | | $ | 42.63 | |
| Maximum offering price per share (Net asset value divided by 95.25%) | | $ | 44.76 | |
| | | | | |
| C-Class: | |
| Net assets | | $ | 499,074 | |
| Capital shares outstanding | | | 12,682 | |
| Net asset value per share | | $ | 39.35 | |
STATEMENT OF OPERATIONS
Year Ended March 31, 2015
| Investment Income: | |
| Dividends (net of foreign withholding tax of $4,863) | | $ | 178,334 | |
| Income from securities lending, net | | | 2,142 | |
| Interest | | | 4 | |
| Total investment income | | | 180,480 | |
| | | | | |
| Expenses: | |
| Management fees | | | 51,014 | |
| Transfer agent and administrative fees | | | 15,004 | |
| Distribution and service fees: | | | | |
| Advisor Class | | | 10,477 | |
| A-Class | | | 2,931 | |
| C-Class | | | 4,802 | |
| Portfolio accounting fees | | | 6,002 | |
| Custodian fees | | | 704 | |
| Trustees’ fees* | | | 495 | |
| Tax expense | | | 85 | |
| Line of credit fees | | | 48 | |
| Miscellaneous | | | 8,170 | |
| Total expenses | | | 99,732 | |
| Net investment income | | | 80,748 | |
| | | | | |
| Net Realized and Unrealized Gain (Loss): | |
| Net realized gain (loss) on: | |
| Investments | | | 204,448 | |
| Net realized gain | | | 204,448 | |
| Net change in unrealized appreciation (depreciation) on: | |
| Investments | | | (310,801 | ) |
| Net change in unrealized appreciation (depreciation) | | | (310,801 | ) |
| Net realized and unrealized loss | | | (106,353 | ) |
| Net decrease in net assets resulting from operations | | $ | (25,605 | ) |
| * | Relates to Trustees not deemed “interested persons” within the meaning of Section 2(a)(19) of the 1940 Act. |
| SEE NOTES TO FINANCIAL STATEMENTS. | THE RYDEX FUNDS ANNUAL REPORT | 145 |
STATEMENTS OF CHANGES IN NET ASSETS
| | | Year Ended March 31, 2015 | | | Year Ended March 31, 2014 | |
| Increase (Decrease) in Net Assets from Operations: | | | | | | |
| Net investment income | | $ | 80,748 | | | $ | 98,119 | |
| Net realized gain (loss) on investments | | | 204,448 | | | | (73,912 | ) |
| Net change in unrealized appreciation (depreciation) on investments | | | (310,801 | ) | | | 134,687 | |
| Net increase (decrease) in net assets resulting from operations | | | (25,605 | ) | | | 158,894 | |
| | | | | | | | | |
| Distributions to shareholders from: | | | | | | | | |
| Net investment income | | | | | | | | |
| Investor Class | | | (45,635 | ) | | | (77,513 | ) |
| Advisor Class | | | (14,600 | ) | | | (7,191 | ) |
| A-Class | | | (16,000 | ) | | | (8,359 | ) |
| C-Class | | | (21,884 | ) | | | (4,990 | ) |
| Total distributions to shareholders | | | (98,119 | ) | | | (98,053 | ) |
| | | | | | | | | |
| Capital share transactions: | | | | | | | | |
| Proceeds from sale of shares | | | | | | | | |
| Investor Class | | | 18,075,159 | | | | 40,052,105 | |
| Advisor Class | | | 12,552,746 | | | | 2,201,898 | |
| A-Class | | | 4,615,685 | | | | 7,692,352 | |
| C-Class | | | 24,640,143 | | | | 28,694,832 | |
| Distributions reinvested | | | | | | | | |
| Investor Class | | | 44,841 | | | | 76,714 | |
| Advisor Class | | | 14,600 | | | | 6,218 | |
| A-Class | | | 16,000 | | | | 8,202 | |
| C-Class | | | 19,446 | | | | 4,877 | |
| Cost of shares redeemed | | | | | | | | |
| Investor Class | | | (19,374,802 | ) | | | (40,533,973 | ) |
| Advisor Class | | | (12,596,170 | ) | | | (2,014,866 | ) |
| A-Class | | | (6,763,959 | ) | | | (5,702,771 | ) |
| C-Class | | | (24,414,344 | ) | | | (29,271,944 | ) |
| Net increase (decrease) from capital share transactions | | | (3,170,655 | ) | | | 1,213,644 | |
| Net increase (decrease) in net assets | | | (3,294,379 | ) | | | 1,274,485 | |
| | | | | | | | | |
| Net assets: | | | | | | | | |
| Beginning of year | | | 5,715,388 | | | | 4,440,903 | |
| End of year | | $ | 2,421,009 | | | $ | 5,715,388 | |
| Undistributed net investment income at end of year | | $ | 80,748 | | | $ | 98,119 | |
| | | | | | | | | |
| Capital share activity: | | | | | | | | |
| Shares sold | | | | | | | | |
| Investor Class | | | 392,906 | | | | 934,805 | * |
| Advisor Class | | | 294,638 | | | | 55,119 | * |
| A-Class | | | 105,986 | | | | 186,923 | * |
| C-Class | | | 611,975 | | | | 759,823 | * |
| Shares issued from reinvestment of distributions | | | | | | | | |
| Investor Class | | | 971 | | | | 1,788 | * |
| Advisor Class | | | 346 | | | | 157 | * |
| A-Class | | | 370 | | | | 203 | * |
| C-Class | | | 486 | | | | 129 | * |
| Shares redeemed | | | | | | | | |
| Investor Class | | | (419,860 | ) | | | (954,582 | )* |
| Advisor Class | | | (298,908 | ) | | | (51,252 | )* |
| A-Class | | | (157,255 | ) | | | (139,957 | )* |
| C-Class | | | (606,562 | ) | | | (774,952 | )* |
| Net increase (decrease) in shares | | | (74,907 | ) | | | 18,204 | * |
| * | Capital share activity for the periods presented through February 7, 2014 has been restated to reflect a 1:3 reverse share split effective February 7, 2014. See Note 9 in Notes to Financial Statements. |
| 146 | THE RYDEX FUNDS ANNUAL REPORT | SEE NOTES TO FINANCIAL STATEMENTS. |
This table is presented to show selected data for a share outstanding throughout each period and to assist shareholders in evaluating a Fund’s performance for the periods presented.
| Investor Class | | Year Ended March 31, 2015 | | | Year Ended March 31, 2014c | | | Year Ended March 28, 2013c | | | Year Ended March 31, 2012c | | | Year Ended March 31, 2011c | |
| Per Share Data | | | | | | | | | | | | | | | |
| Net asset value, beginning of period | | $ | 45.51 | | | $ | 40.76 | | | $ | 41.52 | | | $ | 47.13 | | | $ | 41.18 | |
| Income (loss) from investment operations: | |
Net investment income (loss)a | | | .72 | | | | 1.06 | | | | .81 | | | | 1.23 | | | | .30 | |
| Net gain (loss) on investments (realized and unrealized) | | | .63 | | | | 4.26 | | | | (.67 | ) | | | (5.52 | ) | | | 5.89 | |
| Total from investment operations | | | 1.35 | | | | 5.32 | | | | .14 | | | | (4.29 | ) | | | 6.19 | |
| Less distributions from: | |
| Net investment income | | | (1.30 | ) | | | (.57 | ) | | | (.90 | ) | | | (1.32 | ) | | | (.24 | ) |
| Total distributions | | | (1.30 | ) | | | (.57 | ) | | | (.90 | ) | | | (1.32 | ) | | | (.24 | ) |
| Net asset value, end of period | | $ | 45.56 | | | $ | 45.51 | | | $ | 40.76 | | | $ | 41.52 | | | $ | 47.13 | |
| | |
Total Returnb | | | 2.93 | % | | | 13.12 | % | | | 0.50 | % | | | (8.77 | %) | | | 15.06 | % |
| Ratios/Supplemental Data | |
| Net assets, end of period (in thousands) | | $ | 1,316 | | | $ | 2,497 | | | $ | 2,970 | | | $ | 7,028 | | | $ | 48,089 | |
| Ratios to average net assets: | |
| Net investment income (loss) | | | 1.55 | % | | | 2.47 | % | | | 2.06 | % | | | 2.86 | % | | | 0.73 | % |
| Total expenses | | | 1.36 | % | | | 1.38 | % | | | 1.35 | % | | | 1.36 | % | | | 1.39 | % |
| Portfolio turnover rate | | | 804 | % | | | 1,271 | % | | | 1,550 | % | | | 793 | % | | | 1,008 | % |
| Advisor Class | | Year Ended March 31, 2015 | | | Year Ended March 31, 2014c | | | Year Ended March 28, 2013c | | | Year Ended March 31, 2012c | | | Year Ended March 31, 2011c | |
| Per Share Data | | | | | | | | | | | | | | | |
| Net asset value, beginning of period | | $ | 41.86 | | | $ | 37.75 | | | $ | 38.69 | | | $ | 44.21 | | | $ | 38.82 | |
| Income (loss) from investment operations: | |
Net investment income (loss)a | | | .60 | | | | .29 | | | | .57 | | | | .66 | | | | .09 | |
| Net gain (loss) on investments (realized and unrealized) | | | .43 | | | | 4.39 | | | | (.61 | ) | | | (4.86 | ) | | | 5.54 | |
| Total from investment operations | | | 1.03 | | | | 4.68 | | | | (.04 | ) | | | (4.20 | ) | | | 5.63 | |
| Less distributions from: | |
| Net investment income | | | (1.30 | ) | | | (.57 | ) | | | (.90 | ) | | | (1.32 | ) | | | (.24 | ) |
| Total distributions | | | (1.30 | ) | | | (.57 | ) | | | (.90 | ) | | | (1.32 | ) | | | (.24 | ) |
| Net asset value, end of period | | $ | 41.59 | | | $ | 41.86 | | | $ | 37.75 | | | $ | 38.69 | | | $ | 44.21 | |
| | |
Total Returnb | | | 2.42 | % | | | 12.53 | % | | | (0.01 | %) | | | (9.15 | %) | | | 14.59 | % |
| Ratios/Supplemental Data | |
| Net assets, end of period (in thousands) | | $ | 151 | | | $ | 316 | | | $ | 133 | | | $ | 200 | | | $ | 695 | |
| Ratios to average net assets: | |
| Net investment income (loss) | | | 1.40 | % | | | 0.74 | % | | | 1.59 | % | | | 1.65 | % | | | 0.25 | % |
| Total expenses | | | 1.86 | % | | | 1.88 | % | | | 1.86 | % | | | 1.85 | % | | | 1.88 | % |
| Portfolio turnover rate | | | 804 | % | | | 1,271 | % | | | 1,550 | % | | | 793 | % | | | 1,008 | % |
| SEE NOTES TO FINANCIAL STATEMENTS. | THE RYDEX FUNDS ANNUAL REPORT | 147 |
FINANCIAL HIGHLIGHTS (concluded)
This table is presented to show selected data for a share outstanding throughout each period and to assist shareholders in evaluating a Fund’s performance for the periods presented.
| A-Class | | Year Ended March 31, 2015 | | | Year Ended March 31, 2014c | | | Year Ended March 28, 2013c | | | Year Ended March 31, 2012c | | | Year Ended March 31, 2011c | |
| Per Share Data | | | | | | | | | | | | | | | |
| Net asset value, beginning of period | | $ | 42.74 | | | $ | 38.44 | | | $ | 39.27 | | | $ | 44.72 | | | $ | 39.21 | |
| Income (loss) from investment operations: | |
Net investment income (loss)a | | | .58 | | | | .72 | | | | .72 | | | | .54 | | | | .42 | |
| Net gain (loss) on investments (realized and unrealized) | | | .61 | | | | 4.15 | | | | (.65 | ) | | | (4.67 | ) | | | 5.33 | |
| Total from investment operations | | | 1.19 | | | | 4.87 | | | | .07 | | | | (4.13 | ) | | | 5.75 | |
| Less distributions from: | |
| Net investment income | | | (1.30 | ) | | | (.57 | ) | | | (.90 | ) | | | (1.32 | ) | | | (.24 | ) |
| Total distributions | | | (1.30 | ) | | | (.57 | ) | | | (.90 | ) | | | (1.32 | ) | | | (.24 | ) |
| Net asset value, end of period | | $ | 42.63 | | | $ | 42.74 | | | $ | 38.44 | | | $ | 39.27 | | | $ | 44.72 | |
| | |
Total Returnb | | | 2.75 | % | | | 12.80 | % | | | 0.30 | % | | | (8.91 | %) | | | 14.75 | % |
| Ratios/Supplemental Data | |
| Net assets, end of period (in thousands) | | $ | 454 | | | $ | 2,631 | | | $ | 553 | | | $ | 1,566 | | | $ | 699 | |
| Ratios to average net assets: | |
| Net investment income (loss) | | | 1.35 | % | | | 1.79 | % | | | 1.98 | % | | | 1.41 | % | | | 1.01 | % |
| Total expenses | | | 1.60 | % | | | 1.63 | % | | | 1.61 | % | | | 1.60 | % | | | 1.64 | % |
| Portfolio turnover rate | | | 804 | % | | | 1,271 | % | | | 1,550 | % | | | 793 | % | | | 1,008 | % |
| C-Class | | Year Ended March 31, 2015 | | | Year Ended March 31, 2014c | | | Year Ended March 28, 2013c | | | Year Ended March 31, 2012c | | | Year Ended March 31, 2011c | |
| Per Share Data | | | | | | | | | | | | | | | |
| Net asset value, beginning of period | | $ | 39.89 | | | $ | 36.00 | | | $ | 37.04 | | | $ | 42.57 | | | $ | 37.49 | |
| Income (loss) from investment operations: | |
Net investment income (loss)a | | | .06 | | | | .54 | | | | .48 | | | | .15 | | | | (.03 | ) |
| Net gain (loss) on investments (realized and unrealized) | | | .70 | | | | 3.92 | | | | (.62 | ) | | | (4.36 | ) | | | 5.35 | |
| Total from investment operations | | | .76 | | | | 4.46 | | | | (.14 | ) | | | (4.21 | ) | | | 5.32 | |
| Less distributions from: | |
| Net investment income | | | (1.30 | ) | | | (.57 | ) | | | (.90 | ) | | | (1.32 | ) | | | (.24 | ) |
| Total distributions | | | (1.30 | ) | | | (.57 | ) | | | (.90 | ) | | | (1.32 | ) | | | (.24 | ) |
| Net asset value, end of period | | $ | 39.35 | | | $ | 39.89 | | | $ | 36.00 | | | $ | 37.04 | | | $ | 42.57 | |
| | |
Total Returnb | | | 1.86 | % | | | 12.49 | % | | | (0.24 | %) | | | (9.52 | %) | | | 14.22 | % |
| Ratios/Supplemental Data | |
| Net assets, end of period (in thousands) | | $ | 499 | | | $ | 271 | | | $ | 784 | | | $ | 672 | | | $ | 2,896 | |
| Ratios to average net assets: | |
| Net investment income (loss) | | | 0.14 | % | | | 1.42 | % | | | 1.41 | % | | | 0.39 | % | | | (0.07 | %) |
| Total expenses | | | 2.35 | % | | | 2.38 | % | | | 2.36 | % | | | 2.36 | % | | | 2.39 | % |
| Portfolio turnover rate | | | 804 | % | | | 1,271 | % | | | 1,550 | % | | | 793 | % | | | 1,008 | % |
a | Net investment income (loss) per share was computed using average shares outstanding throughout the period. |
b | Total return does not reflect the impact of any applicable sales charges. |
c | Reverse share split — Per share amounts for the periods presented through February 7, 2014 have been restated to reflect a 1:3 reverse share split reflective February 7, 2014. See Note 9 in Notes to Financial Statements. |
| 148 | THE RYDEX FUNDS ANNUAL REPORT | SEE NOTES TO FINANCIAL STATEMENTS. |
PERFORMANCE REPORT AND FUND PROFILE (Unaudited) | March 31, 2015 |
TRANSPORTATION FUND
OBJECTIVE: Seeks to provide capital appreciation by investing in companies engaged in providing transportation services or companies engaged in the design, manufacture, distribution, or sale of transportation equipment (“transportation companies”).
For the one-year period ended March 31, 2015, Transportation Fund Investor Class returned 16.65%, compared with 8.73% for the S&P 500 Industrials Index. The broader S&P 500 Index returned 12.73%.
The airlines segment was the largest contributor to return, followed by the road & rail segment. The marine industry contributed least.
Southwest Airlines Co., American Airlines Group, Inc., and United Continental Holdings, Inc. were the biggest contributors to performance for the period. Hertz Global Holdings, Inc., Kandi Technologies Group, Inc., and Copa Holdings S.A. — Class A detracted most from performance during the period.
Performance displayed represents past performance, which is no guarantee of future results.
Holdings Diversification (Market Exposure as % of Net Assets)
“Holdings Diversification (Market Exposure as % of Net Assets)” excludes any temporary cash investments.
| Inception Dates: |
| Investor Class | April 2, 1998 |
| Advisor Class | June 9, 1998 |
| A-Class | September 1, 2004 |
| C-Class | May 14, 2001 |
| Ten Largest Holdings (% of Total Net Assets) |
| Union Pacific Corp. | 4.6% |
| United Parcel Service, Inc. — Class B | 4.5% |
| Ford Motor Co. | 3.9% |
| General Motors Co. | 3.7% |
| FedEx Corp. | 3.2% |
| American Airlines Group, Inc. | 3.0% |
| Delta Air Lines, Inc. | 2.9% |
| Johnson Controls, Inc. | 2.8% |
| CSX Corp. | 2.7% |
| Norfolk Southern Corp. | 2.6% |
| Top Ten Total | 33.9% |
| | |
| “Ten Largest Holdings” exclude any temporary cash or derivative investments. |
| | THE RYDEX FUNDS ANNUAL REPORT | 149 |
PERFORMANCE REPORT AND FUND PROFILE (Unaudited)(concluded) | March 31, 2015 |
Cumulative Fund Performance*
Average Annual Returns*
Periods Ended March 31, 2015
| | 1 Year | 5 Year | 10 Year |
| Investor Class Shares | 16.65% | 16.96% | 8.86% |
| Advisor Class Shares | 16.03% | 16.40% | 8.33% |
| A-Class Shares | 16.34% | 16.70% | 8.61% |
A-Class Shares with sales charge† | 10.80% | 15.56% | 8.09% |
| C-Class Shares | 15.46% | 15.85% | 7.79% |
C-Class Shares with CDSC‡ | 14.46% | 15.85% | 7.79% |
| S&P 500 Industrials Index | 8.73% | 14.51% | 7.87% |
| S&P 500 Index | 12.73% | 14.47% | 8.01% |
| * | The performance data above represents past performance that is not predictive of future results. The investment return and principal value of an investment in the Fund will fluctuate so that an investor’s shares, when redeemed, may be worth more or less than their original cost. Returns are historical and include changes in principal and reinvested dividends and capital gains and do not reflect the effect of taxes. The S&P 500 Index and the S&P 500 Industrial Index are unmanaged indices and, unlike the Fund, have no management fees or operating expenses to reduce their reported return. The graphs are based on Investor Class shares and A-Class shares only; performance for Advisor Class shares and C-Class shares will vary due to differences in fee structures. |
† | Fund returns are calculated using the maximum sales charge of 4.75%. |
‡ | Fund returns include a CDSC of 1% if redeemed within 12 months of purchase. |
| 150 | THE RYDEX FUNDS ANNUAL REPORT | |
| SCHEDULE OF INVESTMENTS | March 31, 2015 |
| TRANSPORTATION FUND | |
| | |
Shares | | | Value | |
| | | | | | | | |
COMMON STOCKS† - 99.9% | |
| | | | | | | | |
| AIRLINES - 18.8% | |
| American Airlines Group, Inc. | | | 40,744 | | | $ | 2,150,468 | |
| Delta Air Lines, Inc. | | | 46,305 | | | | 2,081,873 | |
| Southwest Airlines Co. | | | 42,076 | | | | 1,863,967 | |
| United Continental Holdings, Inc.* | | | 26,210 | | | | 1,762,622 | |
| Alaska Air Group, Inc. | | | 15,327 | | | | 1,014,341 | |
| JetBlue Airways Corp.* | | | 44,344 | | | | 853,622 | |
| Copa Holdings S.A. — Class A | | | 8,262 | | | | 834,214 | |
| Spirit Airlines, Inc.* | | | 10,570 | | | | 817,695 | |
| Ryanair Holdings plc ADR | | | 11,100 | | | | 741,147 | |
| Allegiant Travel Co. — Class A | | | 2,399 | | | | 461,304 | |
| Hawaiian Holdings, Inc.* | | | 18,400 | | | | 405,260 | |
| Virgin America, Inc.* | | | 12,600 | | | | 383,040 | |
| Total Airlines | | | | | | | 13,369,553 | |
| | | | | | | | |
| AUTO/TRUCK PARTS & EQUIPMENT - 17.3% | |
| Johnson Controls, Inc. | | | 39,767 | | | | 2,005,848 | |
| Delphi Automotive plc | | | 18,000 | | | | 1,435,320 | |
| BorgWarner, Inc. | | | 21,227 | | | | 1,283,809 | |
| TRW Automotive Holdings Corp.* | | | 11,640 | | | | 1,220,454 | |
| Lear Corp. | | | 9,311 | | | | 1,031,845 | |
| Autoliv, Inc. | | | 7,583 | | | | 893,050 | |
| Magna International, Inc. | | | 16,380 | | | | 878,951 | |
| Visteon Corp.* | | | 7,541 | | | | 726,952 | |
| Tenneco, Inc.* | | | 11,510 | | | | 660,904 | |
| Dana Holding Corp. | | | 30,740 | | | | 650,458 | |
| American Axle & Manufacturing Holdings, Inc.* | | | 19,030 | | | | 491,545 | |
| Gentherm, Inc.* | | | 9,615 | | | | 485,654 | |
| Dorman Products, Inc.* | | | 9,690 | | | | 482,078 | |
| Total Auto/Truck Parts & Equipment | | | | | | | 12,246,868 | |
| | | | | | | | |
| TRANSPORT-RAIL - 15.3% | |
| Union Pacific Corp. | | | 30,007 | | | | 3,250,057 | |
| CSX Corp. | | | 58,630 | | | | 1,941,826 | |
| Norfolk Southern Corp. | | | 18,226 | | | | 1,875,820 | |
| Kansas City Southern | | | 10,769 | | | | 1,099,300 | |
| Canadian Pacific Railway Ltd. | | | 5,968 | | | | 1,090,354 | |
| Canadian National Railway Co. | | | 13,000 | | | | 869,310 | |
| Genesee & Wyoming, Inc. — Class A* | | | 7,866 | | | | 758,597 | |
| Total Transport-Rail | | | | | | | 10,885,264 | |
| | | | | | | | |
| TRANSPORT-SERVICES - 14.6% | |
| United Parcel Service, Inc. — Class B | | | 32,813 | | | | 3,180,893 | |
| FedEx Corp. | | | 13,767 | | | | 2,277,750 | |
| CH Robinson Worldwide, Inc. | | | 15,182 | | | | 1,111,626 | |
| Expeditors International of Washington, Inc. | | | 21,629 | | | | 1,042,085 | |
| Ryder System, Inc. | | | 8,214 | | | | 779,426 | |
| XPO Logistics, Inc.* | | | 14,500 | | | | 659,315 | |
| Matson, Inc. | | | 11,500 | | | | 484,840 | |
| Hub Group, Inc. — Class A* | | | 10,630 | | | | 417,653 | |
| UTI Worldwide, Inc.* | | | 31,320 | | | | 385,236 | |
| Total Transport-Services | | | | | | | 10,338,824 | |
| | | | | | | | |
| AUTO-CARS/LIGHT TRUCKS - 14.4% | |
| Ford Motor Co. | | | 169,576 | | | | 2,736,958 | |
| General Motors Co. | | | 70,894 | | | | 2,658,525 | |
Tesla Motors, Inc.*,1 | | | 8,687 | | | | 1,639,845 | |
Toyota Motor Corp. ADR1 | | | 6,190 | | | | 865,919 | |
| Tata Motors Ltd. ADR | | | 18,882 | | | | 850,823 | |
| Fiat Chrysler Automobiles N.V.* | | | 47,700 | | | | 777,987 | |
| Honda Motor Company Ltd. ADR | | | 21,390 | | | | 700,736 | |
| Total Auto-Cars/Light Trucks | | | | | | | 10,230,793 | |
| | | | | | | | |
| TRANSPORT-TRUCK - 8.4% | |
| J.B. Hunt Transport Services, Inc. | | | 12,398 | | | | 1,058,726 | |
| Old Dominion Freight Line, Inc.* | | | 11,501 | | | | 889,027 | |
| Swift Transportation Co. — Class A* | | | 24,580 | | | | 639,572 | |
| Landstar System, Inc. | | | 8,948 | | | | 593,252 | |
| Con-way, Inc. | | | 12,482 | | | | 550,831 | |
| Knight Transportation, Inc. | | | 16,930 | | | | 545,993 | |
| Werner Enterprises, Inc. | | | 16,349 | | | | 513,522 | |
| Heartland Express, Inc. | | | 20,900 | | | | 496,584 | |
| Saia, Inc.* | | | 8,200 | | | | 363,260 | |
| ArcBest Corp. | | | 8,903 | | | | 337,335 | |
| Total Transport-Truck | | | | | | | 5,988,102 | |
| | | | | | | | |
| RENTAL AUTO/EQUIPMENT - 2.8% | |
| Hertz Global Holdings, Inc.* | | | 50,288 | | | | 1,090,244 | |
| Avis Budget Group, Inc.* | | | 14,874 | | | | 877,789 | |
| Total Rental Auto/Equipment | | | | | | | 1,968,033 | |
| | | | | | | | |
| RUBBER-TIRES - 2.2% | |
| Goodyear Tire & Rubber Co. | | | 35,996 | | | | 974,771 | |
| Cooper Tire & Rubber Co. | | | 13,470 | | | | 577,055 | |
| Total Rubber-Tires | | | | | | | 1,551,826 | |
| | | | | | | | |
| MOTORCYCLE/MOTOR SCOOTER - 1.8% | |
| Harley-Davidson, Inc. | | | 20,761 | | | | 1,261,023 | |
| | | | | | | | |
| COMMERCIAL SERVICES - 1.3% | |
| Macquarie Infrastructure Company LLC | | | 10,800 | | | | 888,732 | |
| | | | | | | | |
| ELECTRONIC COMPONENTS-MISCELLANEOUS - 1.1% | |
| Gentex Corp. | | | 44,229 | | | | 809,391 | |
| | | | | | | | |
| TRANSPORT-MARINE - 1.0% | |
| Kirby Corp.* | | | 9,449 | | | | 709,147 | |
| | | | | | | | |
| BUILDING-MOBILE HOME/MANUFACTURED HOUSE - 0.9% | |
| Thor Industries, Inc. | | | 10,226 | | | | 646,385 | |
| | | | | | | | |
| Total Common Stocks | | | | | | | | |
| (Cost $42,720,644) | | | | | | | 70,893,941 | |
| SEE NOTES TO FINANCIAL STATEMENTS. | THE RYDEX FUNDS ANNUAL REPORT | 151 |
SCHEDULE OF INVESTMENTS (concluded) | March 31, 2015 |
| TRANSPORTATION FUND | |
| | | | | | | | | |
| | | Face
Amount | | | Value | |
| | | | | | | | |
REPURCHASE AGREEMENT††,2 - 0.9% | |
HSBC Group
issued 03/31/15 at 0.03%
due 04/01/15 | | $ | 610,654 | | | $ | 610,654 | |
| Total Repurchase Agreement | | | | | | | | |
| (Cost $610,654) | | | | | | | 610,654 | |
| | | | | | | | |
SECURITIES LENDING COLLATERAL††,3 - 3.0% | |
| Repurchase Agreements | | | | | | | | |
HSBC Securities, Inc.
issued 03/31/15 at 0.10%
due 04/01/15 | | | 1,390,758 | | | | 1,390,758 | |
BNP Paribas Securities Corp.
issued 03/31/15 at 0.10%
due 04/01/15 | | | 478,421 | | | | 478,421 | |
Barclays Capital, Inc.
issued 03/31/15 at 0.10%
due 04/01/15 | | | 246,943 | | | | 246,943 | |
| Total Securities Lending Collateral | | | | | | | | |
| (Cost $2,116,122) | | | | | | | 2,116,122 | |
| | | | | | | | |
| Total Investments - 103.8% | | | | | | | | |
| (Cost $45,447,420) | | | | | | $ | 73,620,717 | |
| Other Assets & Liabilities, net - (3.8)% | | | | | | | (2,660,424 | ) |
| Total Net Assets - 100.0% | | | | | | $ | 70,960,293 | |
| * | Non-income producing security. |
| † | Value determined based on Level 1 inputs — See Note 4. |
| †† | Value determined based on Level 2 inputs — See Note 4. |
| 1 | All or portion of this security is on loan at March 31, 2015 — See Note 6. |
| 2 | Repurchase Agreement — See Note 5. |
| 3 | Securities lending collateral — See Note 6. |
| ADR — American Depositary Receipt |
| plc — Public Limited Company |
| 152 | THE RYDEX FUNDS ANNUAL REPORT | SEE NOTES TO FINANCIAL STATEMENTS. |
STATEMENT OF ASSETS AND LIABILITIES
March 31, 2015
| Assets: | |
| Investments, at value - including $2,076,173 of securities loaned (cost $42,720,644) | | $ | 70,893,941 | |
| Repurchase agreements, at value (cost $2,726,776) | | | 2,726,776 | |
| Total investments (cost $45,447,420) | | | 73,620,717 | |
| Segregated cash with broker | | | 30,929 | |
| Cash | | | 3,264 | |
| Receivables: | |
| Fund shares sold | | | 478,107 | |
| Securities lending income | | | 35,696 | |
| Dividends | | | 23,240 | |
| Total assets | | | 74,191,953 | |
| | | | | |
| Liabilities: | |
| Payable for: | |
| Return of securities loaned | | | 2,147,050 | |
| Fund shares redeemed | | | 946,560 | |
| Management fees | | | 58,248 | |
| Transfer agent and administrative fees | | | 17,132 | |
| Distribution and service fees | | | 13,121 | |
| Portfolio accounting fees | | | 6,853 | |
| Miscellaneous | | | 42,696 | |
| Total liabilities | | | 3,231,660 | |
| Commitments and contingent liabilities (Note 10) | | | — | |
| Net assets | | $ | 70,960,293 | |
| | | | | |
| Net assets consist of: | |
| Paid in capital | | $ | 63,855,070 | |
| Undistributed net investment income | | | 132,339 | |
| Accumulated net realized loss on investments | | | (21,200,413 | ) |
| Net unrealized appreciation on investments | | | 28,173,297 | |
| Net assets | | $ | 70,960,293 | |
| | | | | |
| Investor Class: | |
| Net assets | | $ | 42,946,710 | |
| Capital shares outstanding | | | 825,017 | |
| Net asset value per share | | $ | 52.06 | |
| | | | | |
| Advisor Class: | |
| Net assets | | $ | 6,249,183 | |
| Capital shares outstanding | | | 132,609 | |
| Net asset value per share | | $ | 47.12 | |
| | | | | |
| A-Class: | |
| Net assets | | $ | 15,358,983 | |
| Capital shares outstanding | | | 317,256 | |
| Net asset value per share | | $ | 48.41 | |
| Maximum offering price per share (Net asset value divided by 95.25%) | | $ | 50.82 | |
| | | | | |
| C-Class: | |
| Net assets | | $ | 6,405,417 | |
| Capital shares outstanding | | | 140,368 | |
| Net asset value per share | | $ | 45.63 | |
STATEMENT OF OPERATIONS
Year Ended March 31, 2015
| Investment Income: | |
| Dividends (net of foreign withholding tax of $12,567) | | $ | 1,125,794 | |
| Income from securities lending, net | | | 394,520 | |
| Interest | | | 106 | |
| Total investment income | | | 1,520,420 | |
| | | | | |
| Expenses: | |
| Management fees | | | 755,304 | |
| Transfer agent and administrative fees | | | 222,148 | |
| Distribution and service fees: | |
| Advisor Class | | | 33,336 | |
| A-Class | | | 43,131 | |
| C-Class | | | 59,488 | |
| Portfolio accounting fees | | | 88,858 | |
| Custodian fees | | | 10,358 | |
| Trustees’ fees* | | | 6,015 | |
| Line of credit fees | | | 549 | |
| Miscellaneous | | | 115,237 | |
| Total expenses | | | 1,334,424 | |
| Net investment income | | | 185,996 | |
| | | | | |
| Net Realized and Unrealized Gain (Loss): | |
| Net realized gain (loss) on: | |
| Investments | | | 618,158 | |
| Net realized gain | | | 618,158 | |
| Net change in unrealized appreciation (depreciation) on: | |
| Investments | | | 8,404,635 | |
| Net change in unrealized appreciation (depreciation) | | | 8,404,635 | |
| Net realized and unrealized gain | | | 9,022,793 | |
| Net increase in net assets resulting from operations | | $ | 9,208,789 | |
| * | Relates to Trustees not deemed “interested persons” within the meaning of Section 2(a)(19) of the 1940 Act. |
| SEE NOTES TO FINANCIAL STATEMENTS. | THE RYDEX FUNDS ANNUAL REPORT | 153 |
STATEMENTS OF CHANGES IN NET ASSETS
| | | Year Ended March 31, 2015 | | | Year Ended March 31, 2014 | |
| Increase (Decrease) in Net Assets from Operations: | | | | | | |
| Net investment income (loss) | | $ | 185,996 | | | $ | (121,576 | ) |
| Net realized gain on investments | | | 618,158 | | | | 2,214,194 | |
| Net change in unrealized appreciation (depreciation) on investments | | | 8,404,635 | | | | 12,043,472 | |
| Net increase in net assets resulting from operations | | | 9,208,789 | | | | 14,136,090 | |
| | | | | | | | | |
| Capital share transactions: | | | | | | | | |
| Proceeds from sale of shares | | | | | | | | |
| Investor Class | | | 225,561,497 | | | | 442,197,154 | |
| Advisor Class | | | 41,190,056 | | | | 15,406,895 | |
| A-Class | | | 41,341,080 | | | | 35,299,972 | |
| C-Class | | | 28,834,797 | | | | 20,204,027 | |
| Cost of shares redeemed | | | | | | | | |
| Investor Class | | | (232,830,435 | ) | | | (486,392,760 | ) |
| Advisor Class | | | (37,870,325 | ) | | | (18,129,650 | ) |
| A-Class | | | (40,894,730 | ) | | | (29,905,841 | ) |
| C-Class | | | (26,857,147 | ) | | | (19,951,182 | ) |
| Net decrease from capital share transactions | | | (1,525,207 | ) | | | (41,271,385 | ) |
| Net increase (decrease) in net assets | | | 7,683,582 | | | | (27,135,295 | ) |
| | | | | | | | | |
| Net assets: | | | | | | | | |
| Beginning of year | | | 63,276,711 | | | | 90,412,006 | |
| End of year | | $ | 70,960,293 | | | $ | 63,276,711 | |
| Undistributed net investment income/(Accumulated net investment loss) at end of year | | $ | 132,339 | | | $ | (53,657 | ) |
| | | | | | | | | |
| Capital share activity: | | | | | | | | |
| Shares sold | | | | | | | | |
| Investor Class | | | 4,633,899 | | | | 11,397,922 | |
| Advisor Class | | | 922,719 | | | | 430,435 | |
| A-Class | | | 919,079 | | | | 957,561 | |
| C-Class | | | 671,966 | | | | 587,228 | |
| Shares redeemed | | | | | | | | |
| Investor Class | | | (4,795,289 | ) | | | (12,864,102 | ) |
| Advisor Class | | | (853,724 | ) | | | (519,741 | ) |
| A-Class | | | (912,772 | ) | | | (798,761 | ) |
| C-Class | | | (626,094 | ) | | | (587,841 | ) |
| Net decrease in shares | | | (40,216 | ) | | | (1,397,299 | ) |
| 154 | THE RYDEX FUNDS ANNUAL REPORT | SEE NOTES TO FINANCIAL STATEMENTS. |
This table is presented to show selected data for a share outstanding throughout each period and to assist shareholders in evaluating a Fund’s performance for the periods presented.
| Investor Class | | Year Ended March 31, 2015 | | | Year Ended March 31, 2014 | | | Year Ended March 28, 2013 | | | Year Ended March 31, 2012 | | | Year Ended March 31, 2011 | |
| Per Share Data | | | | | | | | | | | | | | | |
| Net asset value, beginning of period | | $ | 44.63 | | | $ | 32.07 | | | $ | 26.96 | | | $ | 27.85 | | | $ | 23.79 | |
| Income (loss) from investment operations: | |
Net investment income (loss)a | | | .18 | | | | (.04 | ) | | | (.07 | ) | | | (.06 | ) | | | — | b |
| Net gain (loss) on investments (realized and unrealized) | | | 7.25 | | | | 12.60 | | | | 5.18 | | | | (.83 | ) | | | 4.06 | |
| Total from investment operations | | | 7.43 | | | | 12.56 | | | | 5.11 | | | | (.89 | ) | | | 4.06 | |
| Net asset value, end of period | | $ | 52.06 | | | $ | 44.63 | | | $ | 32.07 | | | $ | 26.96 | | | $ | 27.85 | |
| | |
Total Returnc | | | 16.65 | % | | | 39.16 | % | | | 18.95 | % | | | (3.20 | %) | | | 17.07 | % |
| Ratios/Supplemental Data | |
| Net assets, end of period (in thousands) | | $ | 42,947 | | | $ | 44 | | | $ | 78,644 | | | $ | 8,031 | | | $ | 5,320 | |
| Ratios to average net assets: | |
| Net investment income (loss) | | | 0.37 | % | | | (0.09 | %) | | | (0.25 | %) | | | (0.22 | %) | | | 0.02 | % |
| Total expenses | | | 1.35 | % | | | 1.37 | % | | | 1.37 | % | | | 1.35 | % | | | 1.38 | % |
| Portfolio turnover rate | | | 247 | % | | | 593 | % | | | 737 | % | | | 1,082 | % | | | 1,217 | % |
| Advisor Class | | Year Ended March 31, 2015 | | | Year Ended March 31, 2014 | | | Year Ended March 28, 2013 | | | Year Ended March 31, 2012 | | | Year Ended March 31, 2011 | |
| Per Share Data | | | | | | | | | | | | | | | |
| Net asset value, beginning of period | | $ | 40.61 | | | $ | 29.32 | | | $ | 24.76 | | | $ | 25.70 | | | $ | 22.05 | |
| Income (loss) from investment operations: | |
Net investment income (loss)a | | | (.10 | ) | | | (.18 | ) | | | (.15 | ) | | | (.14 | ) | | | (.17 | ) |
| Net gain (loss) on investments (realized and unrealized) | | | 6.61 | | | | 11.47 | | | | 4.71 | | | | (.80 | ) | | | 3.82 | |
| Total from investment operations | | | 6.51 | | | | 11.29 | | | | 4.56 | | | | (.94 | ) | | | 3.65 | |
| Net asset value, end of period | | $ | 47.12 | | | $ | 40.61 | | | $ | 29.32 | | | $ | 24.76 | | | $ | 25.70 | |
| | |
Total Returnc | | | 16.03 | % | | | 38.51 | % | | | 18.42 | % | | | (3.66 | %) | | | 16.55 | % |
| Ratios/Supplemental Data | |
| Net assets, end of period (in thousands) | | $ | 6,249 | | | $ | 2,583 | | | $ | 4,483 | | | $ | 2,355 | | | $ | 2,902 | |
| Ratios to average net assets: | |
| Net investment income (loss) | | | (0.22 | %) | | | (0.50 | %) | | | (0.57 | %) | | | (0.55 | %) | | | (0.74 | %) |
| Total expenses | | | 1.85 | % | | | 1.87 | % | | | 1.86 | % | | | 1.86 | % | | | 1.89 | % |
| Portfolio turnover rate | | | 247 | % | | | 593 | % | | | 737 | % | | | 1,082 | % | | | 1,217 | % |
| SEE NOTES TO FINANCIAL STATEMENTS. | THE RYDEX FUNDS ANNUAL REPORT | 155 |
FINANCIAL HIGHLIGHTS (concluded)
This table is presented to show selected data for a share outstanding throughout each period and to assist shareholders in evaluating a Fund’s performance for the periods presented.
| A-Class | | Year Ended March 31, 2015 | | | Year Ended March 31, 2014 | | | Year Ended March 28, 2013 | | | Year Ended March 31, 2012 | | | Year Ended March 31, 2011 | |
| Per Share Data | | | | | | | | | | | | | | | |
| Net asset value, beginning of period | | $ | 41.61 | | | $ | 29.96 | | | $ | 25.25 | | | $ | 26.15 | | | $ | 22.37 | |
| Income (loss) from investment operations: | |
Net investment income (loss)a | | | .05 | | | | (.11 | ) | | | (.01 | ) | | | (.12 | ) | | | (.10 | ) |
| Net gain (loss) on investments (realized and unrealized) | | | 6.75 | | | | 11.76 | | | | 4.72 | | | | (.78 | ) | | | 3.88 | |
| Total from investment operations | | | 6.80 | | | | 11.65 | | | | 4.71 | | | | (.90 | ) | | | 3.78 | |
| Net asset value, end of period | | $ | 48.41 | | | $ | 41.61 | | | $ | 29.96 | | | $ | 25.25 | | | $ | 26.15 | |
| | |
Total Returnc | | | 16.34 | % | | | 38.89 | % | | | 18.70 | % | | | (3.48 | %) | | | 16.90 | % |
| Ratios/Supplemental Data | |
| Net assets, end of period (in thousands) | | $ | 15,359 | | | $ | 12,938 | | | $ | 4,558 | | | $ | 1,600 | | | $ | 1,239 | |
| Ratios to average net assets: | |
| Net investment income (loss) | | | 0.12 | % | | | (0.28 | %) | | | (0.05 | %) | | | (0.51 | %) | | | (0.42 | %) |
| Total expenses | | | 1.60 | % | | | 1.62 | % | | | 1.60 | % | | | 1.61 | % | | | 1.64 | % |
| Portfolio turnover rate | | | 247 | % | | | 593 | % | | | 737 | % | | | 1,082 | % | | | 1,217 | % |
| C-Class | | Year Ended March 31, 2015 | | | Year Ended March 31, 2014 | | | Year Ended March 28, 2013 | | | Year Ended March 31, 2012 | | | Year Ended March 31, 2011 | |
| Per Share Data | | | | | | | | | | | | | | | |
| Net asset value, beginning of period | | $ | 39.52 | | | $ | 28.67 | | | $ | 24.34 | | | $ | 25.38 | | | $ | 21.87 | |
| Income (loss) from investment operations: | |
Net investment income (loss)a | | | (.27 | ) | | | (.37 | ) | | | (.26 | ) | | | (.29 | ) | | | (.24 | ) |
| Net gain (loss) on investments (realized and unrealized) | | | 6.38 | | | | 11.22 | | | | 4.59 | | | | (.75 | ) | | | 3.75 | |
| Total from investment operations | | | 6.11 | | | | 10.85 | | | | 4.33 | | | | (1.04 | ) | | | 3.51 | |
| Net asset value, end of period | | $ | 45.63 | | | $ | 39.52 | | | $ | 28.67 | | | $ | 24.34 | | | $ | 25.38 | |
| | |
Total Returnc | | | 15.46 | % | | | 37.84 | % | | | 17.79 | % | | | (4.10 | %) | | | 16.05 | % |
| Ratios/Supplemental Data | |
| Net assets, end of period (in thousands) | | $ | 6,405 | | | $ | 3,734 | | | $ | 2,727 | | | $ | 2,729 | | | $ | 2,069 | |
| Ratios to average net assets: | |
| Net investment income (loss) | | | (0.62 | %) | | | (1.07 | %) | | | (1.06 | %) | | | (1.24 | %) | | | (1.04 | %) |
| Total expenses | | | 2.35 | % | | | 2.37 | % | | | 2.35 | % | | | 2.35 | % | | | 2.39 | % |
| Portfolio turnover rate | | | 247 | % | | | 593 | % | | | 737 | % | | | 1,082 | % | | | 1,217 | % |
a | Net investment income (loss) per share was computed using average shares outstanding throughout the period. |
b | Net investment income is less than $0.01 per share. |
c | Total return does not reflect the impact of any applicable sales charges. |
| 156 | THE RYDEX FUNDS ANNUAL REPORT | SEE NOTES TO FINANCIAL STATEMENTS. |
PERFORMANCE REPORT AND FUND PROFILE (Unaudited) | March 31, 2015 |
UTILITIES FUND
OBJECTIVE: Seeks to provide capital appreciation by investing in companies that operate public utilities (“utilities companies”).
For the one-year period ended March 31, 2015, Utilities Fund Investor Class returned 9.12%, compared with 11.09% for the S&P 500 Utilities Index. The broader S&P 500 Index returned 12.73%.
The electric utilities segment provided the largest contribution to return, followed by the multi-utilities segment. The oil, gas & consumable fuels industry contributed least to return. No industry detracted.
PG&E Corp., Duke Energy Corp., and NiSource, Inc. were the best-performing holdings over the period, while NRG Energy, Inc., Cia de Saneamento Basico do Estado de Sao Paulo ADR, and MDU Resources Group, Inc. were the main detractors.
Performance displayed represents past performance, which is no guarantee of future results.
Holdings Diversification (Market Exposure as % of Net Assets)
“Holdings Diversification (Market Exposure as % of Net Assets)” excludes any temporary cash investments.
| Inception Dates: |
| Investor Class | April 3, 2000 |
| Advisor Class | April 3, 2000 |
| A-Class | September 1, 2004 |
| C-Class | April 27, 2001 |
| Ten Largest Holdings (% of Total Net Assets) |
| Duke Energy Corp. | 3.6% |
| NextEra Energy, Inc. | 3.3% |
| Dominion Resources, Inc. | 3.2% |
| Southern Co. | 3.1% |
| Exelon Corp. | 2.7% |
| American Electric Power Company, Inc. | 2.6% |
| Sempra Energy | 2.6% |
| PG&E Corp. | 2.4% |
| PPL Corp. | 2.4% |
| Public Service Enterprise Group, Inc. | 2.3% |
| Top Ten Total | 28.2% |
| | |
| “Ten Largest Holdings” exclude any temporary cash or derivative investments. |
| | THE RYDEX FUNDS ANNUAL REPORT | 157 |
PERFORMANCE REPORT AND FUND PROFILE (Unaudited)(concluded) | March 31, 2015 |
Cumulative Fund Performance*
Average Annual Returns*
Periods Ended March 31, 2015
| | 1 Year | 5 Year | 10 Year |
| Investor Class Shares | 9.12% | 11.97% | 7.49% |
| Advisor Class Shares | 8.53% | 11.42% | 6.96% |
| A-Class Shares | 8.78% | 11.69% | 7.23% |
A-Class Shares with sales charge† | 3.60% | 10.61% | 6.70% |
| C-Class Shares | 7.99% | 10.85% | 6.41% |
C-Class Shares with CDSC‡ | 6.99% | 10.85% | 6.41% |
| S&P 500 Utilities Index | 11.09% | 12.95% | 8.48% |
| S&P 500 Index | 12.73% | 14.47% | 8.01% |
| * | The performance data above represents past performance that is not predictive of future results. The investment return and principal value of an investment in the Fund will fluctuate so that an investor’s shares, when redeemed, may be worth more or less than their original cost. Returns are historical and include changes in principal and reinvested dividends and capital gains and do not reflect the effect of taxes. The S&P 500 Index and S&P 500 Utilities Index are unmanaged indices and, unlike the Fund, have no management fees or operating expenses to reduce their reported returns. The graphs are based on Investor Class shares and A-Class shares only; performance for Advisor Class shares and C-Class shares will vary due to differences in fee structures. |
† | Fund returns are calculated using the maximum sales charge of 4.75%. |
‡ | Fund returns include a CDSC of 1% if redeemed within 12 months of purchase. |
| 158 | THE RYDEX FUNDS ANNUAL REPORT | |
| SCHEDULE OF INVESTMENTS | March 31, 2015 |
| UTILITIES FUND | |
| | |
Shares | | | Value | |
| | | | | | | | |
COMMON STOCKS† - 99.6% | |
| | | | | | | | |
| ELECTRIC-INTEGRATED - 66.1% | |
| Duke Energy Corp. | | | 41,306 | | | $ | 3,171,475 | |
| NextEra Energy, Inc. | | | 27,936 | | | | 2,906,742 | |
| Dominion Resources, Inc. | | | 39,159 | | | | 2,775,198 | |
| Southern Co. | | | 61,056 | | | | 2,703,560 | |
| Exelon Corp. | | | 69,558 | | | | 2,337,844 | |
| American Electric Power Company, Inc. | | | 39,894 | | | | 2,244,038 | |
| PG&E Corp. | | | 40,009 | | | | 2,123,278 | |
| PPL Corp. | | | 61,459 | | | | 2,068,710 | |
| Public Service Enterprise Group, Inc. | | | 47,299 | | | | 1,982,774 | |
| Edison International | | | 30,423 | | | | 1,900,525 | |
| Xcel Energy, Inc. | | | 52,010 | | | | 1,810,468 | |
| Consolidated Edison, Inc. | | | 29,513 | | | | 1,800,293 | |
| Eversource Energy | | | 34,198 | | | | 1,727,683 | |
| FirstEnergy Corp. | | | 46,857 | | | | 1,642,806 | |
| DTE Energy Co. | | | 20,356 | | | | 1,642,526 | |
| Entergy Corp. | | | 20,781 | | | | 1,610,320 | |
| Wisconsin Energy Corp. | | | 29,004 | | | | 1,435,698 | |
| Ameren Corp. | | | 32,496 | | | | 1,371,331 | |
| CMS Energy Corp. | | | 38,254 | | | | 1,335,447 | |
| SCANA Corp. | | | 22,034 | | | | 1,211,650 | |
| Alliant Energy Corp. | | | 18,046 | | | | 1,136,898 | |
| Pinnacle West Capital Corp. | | | 17,824 | | | | 1,136,280 | |
| Pepco Holdings, Inc. | | | 41,664 | | | | 1,117,845 | |
| OGE Energy Corp. | | | 34,182 | | | | 1,080,493 | |
| Integrys Energy Group, Inc. | | | 14,208 | | | | 1,023,260 | |
| Westar Energy, Inc. | | | 25,327 | | | | 981,675 | |
| TECO Energy, Inc. | | | 47,435 | | | | 920,239 | |
| MDU Resources Group, Inc. | | | 41,153 | | | | 878,205 | |
| Great Plains Energy, Inc. | | | 32,467 | | | | 866,220 | |
| Cleco Corp. | | | 14,347 | | | | 782,198 | |
| Korea Electric Power Corp. ADR* | | | 37,900 | | | | 776,950 | |
| Hawaiian Electric Industries, Inc. | | | 23,951 | | | | 769,306 | |
| IDACORP, Inc. | | | 12,182 | | | | 765,882 | |
| UIL Holdings Corp. | | | 14,610 | | | | 751,246 | |
| Portland General Electric Co. | | | 20,063 | | | | 744,137 | |
| NorthWestern Corp. | | | 12,952 | | | | 696,688 | |
| PNM Resources, Inc. | | | 22,637 | | | | 661,000 | |
| ALLETE, Inc. | | | 12,499 | | | | 659,447 | |
| Black Hills Corp. | | | 12,860 | | | | 648,658 | |
| Avista Corp. | | | 18,619 | | | | 636,397 | |
| El Paso Electric Co. | | | 14,230 | | | | 549,847 | |
| Total Electric-Integrated | | | | | | | 57,385,237 | |
| | | | | | | | |
| GAS-DISTRIBUTION - 19.0% | |
| Sempra Energy | | | 20,327 | | | | 2,216,049 | |
| NiSource, Inc. | | | 37,169 | | | | 1,641,382 | |
| CenterPoint Energy, Inc. | | | 61,815 | | | | 1,261,644 | |
| AGL Resources, Inc. | | | 21,320 | | | | 1,058,538 | |
| Atmos Energy Corp. | | | 18,456 | | | | 1,020,617 | |
| UGI Corp. | | | 31,288 | | | | 1,019,676 | |
| National Fuel Gas Co. | | | 16,101 | | | | 971,373 | |
| Questar Corp. | | | 37,339 | | | | 890,909 | |
| Vectren Corp. | | | 18,687 | | | | 824,844 | |
| National Grid plc ADR | | | 12,190 | | | | 787,596 | |
| Piedmont Natural Gas Company, Inc. | | | 20,005 | | | | 738,385 | |
| WGL Holdings, Inc. | | | 13,034 | | | | 735,118 | |
| New Jersey Resources Corp. | | | 23,008 | | | | 714,628 | |
| Southwest Gas Corp. | | | 12,260 | | | | 713,164 | |
| ONE Gas, Inc. | | | 15,037 | | | | 650,050 | |
| Laclede Group, Inc. | | | 12,632 | | | | 647,011 | |
| South Jersey Industries, Inc. | | | 10,809 | | | | 586,713 | |
| Total Gas-Distribution | | | | | | | 16,477,697 | |
| | | | | | | | |
| INDEPENDENT POWER PRODUCER - 5.9% | |
| Calpine Corp.* | | | 57,843 | | | | 1,322,869 | |
| NRG Energy, Inc. | | | 50,992 | | | | 1,284,488 | |
| Dynegy, Inc.* | | | 28,975 | | | | 910,684 | |
NRG Yield, Inc. — Class A1 | | | 16,950 | | | | 859,874 | |
| Abengoa Yield plc | | | 23,029 | | | | 777,920 | |
| Total Independent Power Producer | | | | | | | 5,155,835 | |
| | | | | | | | |
| WATER - 4.1% | |
| American Water Works Company, Inc. | | | 24,997 | | | | 1,355,088 | |
| Aqua America, Inc. | | | 35,120 | | | | 925,412 | |
| Cia de Saneamento Basico do Estado de Sao Paulo ADR | | | 139,620 | | | | 756,740 | |
| American States Water Co. | | | 13,200 | | | | 526,548 | |
| Total Water | | | | | | | 3,563,788 | |
| | | | | | | | |
| ENERGY-ALTERNATE SOURCES - 1.8% | |
| TerraForm Power, Inc. — Class A | | | 25,769 | | | | 940,826 | |
| Pattern Energy Group, Inc. | | | 21,740 | | | | 615,677 | |
| Total Energy-Alternate Sources | | | | | | | 1,556,503 | |
| | | | | | | | |
| ELECTRIC-GENERATION - 1.5% | |
| AES Corp. | | | 103,805 | | | | 1,333,894 | |
| | | | | | | | |
| ELECTRIC-TRANSMISSION - 1.2% | |
| ITC Holdings Corp. | | | 27,975 | | | | 1,047,104 | |
| | | | | | | | |
| PIPELINES - 0.0% | |
| Kinder Morgan, Inc. | | | 1 | | | | 42 | |
| | | | | | | | |
| Total Common Stocks | | | | | | | | |
| (Cost $70,706,523) | | | | | | | 86,520,100 | |
| SEE NOTES TO FINANCIAL STATEMENTS. | THE RYDEX FUNDS ANNUAL REPORT | 159 |
SCHEDULE OF INVESTMENTS (concluded) | March 31, 2015 |
| UTILITIES FUND | |
| | | | | | | | | |
| | | Face
Amount | | | Value | |
| | | | | | | | |
REPURCHASE AGREEMENT††,2 - 0.4% | |
HSBC Group
issued 03/31/15 at 0.03%
due 04/01/15 | | $ | 355,487 | | | $ | 355,487 | |
| Total Repurchase Agreement | | | | | | | | |
| (Cost $355,487) | | | | | | | 355,487 | |
| | | | | | | | |
SECURITIES LENDING COLLATERAL††,3 - 0.7% | |
| Repurchase Agreements | | | | | | | | |
HSBC Securities, Inc.
issued 03/31/15 at 0.10%
due 04/01/15 | | | 402,254 | | | | 402,254 | |
BNP Paribas Securities Corp.
issued 03/31/15 at 0.10%
due 04/01/15 | | | 138,376 | | | | 138,376 | |
Barclays Capital, Inc.
issued 03/31/15 at 0.10%
due 04/01/15 | | | 71,424 | | | | 71,424 | |
| Total Securities Lending Collateral | | | | | | | | |
| (Cost $612,054) | | | | | | | 612,054 | |
| | | | | | | | |
| Total Investments - 100.7% | | | | | | | | |
| (Cost $71,674,064) | | | | | | $ | 87,487,641 | |
| Other Assets & Liabilities, net - (0.7)% | | | | | | | (586,161 | ) |
| Total Net Assets - 100.0% | | | | | | $ | 86,901,480 | |
| * | Non-income producing security. |
| † | Value determined based on Level 1 inputs — See Note 4. |
| †† | Value determined based on Level 2 inputs — See Note 4. |
| 1 | All or portion of this security is on loan at March 31, 2015— See Note 6. |
| 2 | Repurchase Agreement — See Note 5. |
| 3 | Securities lending collateral — See Note 6. |
| ADR — American Depositary Receipt |
| plc — Public Limited Company |
| 160 | THE RYDEX FUNDS ANNUAL REPORT | SEE NOTES TO FINANCIAL STATEMENTS. |
STATEMENT OF ASSETS AND LIABILITIES
March 31, 2015
| Assets: | |
| Investments, at value - including $608,760 of securities loaned (cost $70,706,523) | | $ | 86,520,100 | |
| Repurchase agreements, at value (cost $967,541) | | | 967,541 | |
| Total investments (cost $71,674,064) | | | 87,487,641 | |
| Segregated cash with broker | | | 8,946 | |
| Receivables: | |
| Fund shares sold | | | 2,870,159 | |
| Dividends | | | 184,173 | |
| Securities lending income | | | 758 | |
| Total assets | | | 90,551,677 | |
| | | | | |
| Liabilities: | |
| Overdraft due to custodian bank | | | 418 | |
| Payable for: | |
| Securities purchased | | | 2,638,614 | |
| Return of securities loaned | | | 621,000 | |
| Fund shares redeemed | | | 245,069 | |
| Management fees | | | 60,164 | |
| Transfer agent and administrative fees | | | 17,695 | |
| Distribution and service fees | | | 13,675 | |
| Portfolio accounting fees | | | 7,078 | |
| Miscellaneous | | | 46,484 | |
| Total liabilities | | | 3,650,197 | |
| Commitments and contingent liabilities (Note 10) | | | — | |
| Net assets | | $ | 86,901,480 | |
| | | | | |
| Net assets consist of: | |
| Paid in capital | | $ | 78,241,428 | |
| Undistributed net investment income | | | — | |
| Accumulated net realized loss on investments | | | (7,153,525 | ) |
| Net unrealized appreciation on investments | | | 15,813,577 | |
| Net assets | | $ | 86,901,480 | |
| | | | | |
| Investor Class: | |
| Net assets | | $ | 55,156,324 | |
| Capital shares outstanding | | | 1,491,659 | |
| Net asset value per share | | $ | 36.98 | |
| | | | | |
| Advisor Class: | |
| Net assets | | $ | 13,545,752 | |
| Capital shares outstanding | | | 402,987 | |
| Net asset value per share | | $ | 33.61 | |
| | | | | |
| A-Class: | |
| Net assets | | $ | 9,782,242 | |
| Capital shares outstanding | | | 281,891 | |
| Net asset value per share | | $ | 34.70 | |
| Maximum offering price per share (Net asset value divided by 95.25%) | | $ | 36.43 | |
| | | | | |
| C-Class: | |
| Net assets | | $ | 8,417,162 | |
| Capital shares outstanding | | | 274,190 | |
| Net asset value per share | | $ | 30.70 | |
STATEMENT OF OPERATIONS
Year Ended March 31, 2015
| Investment Income: | |
| Dividends (net of foreign withholding tax of $20,619) | | $ | 3,404,551 | |
| Income from securities lending, net | | | 8,896 | |
| Interest | | | 85 | |
| Total investment income | | | 3,413,532 | |
| | | | | |
| Expenses: | |
| Management fees | | | 799,938 | |
| Transfer agent and administrative fees | | | 235,275 | |
| Distribution and service fees: | | | | |
| Advisor Class | | | 53,324 | |
| A-Class | | | 25,020 | |
| C-Class | | | 93,662 | |
| Portfolio accounting fees | | | 94,110 | |
| Custodian fees | | | 10,931 | |
| Trustees’ fees* | | | 5,637 | |
| Tax expense | | | 3,490 | |
| Line of credit fees | | | 1,247 | |
| Miscellaneous | | | 118,023 | |
| Total expenses | | | 1,440,657 | |
| Net investment income | | | 1,972,875 | |
| | | | | |
| Net Realized and Unrealized Gain (Loss): | |
| Net realized gain (loss) on: | |
| Investments | | | (770,439 | ) |
| Net realized loss | | | (770,439 | ) |
| Net change in unrealized appreciation (depreciation) on: | |
| Investments | | | 2,118,506 | |
| Net change in unrealized appreciation (depreciation) | | | 2,118,506 | |
| Net realized and unrealized gain | | | 1,348,067 | |
| Net increase in net assets resulting from operations | | $ | 3,320,942 | |
| * | Relates to Trustees not deemed “interested persons” within the meaning of Section 2(a)(19) of the 1940 Act. |
| SEE NOTES TO FINANCIAL STATEMENTS. | THE RYDEX FUNDS ANNUAL REPORT | 161 |
STATEMENTS OF CHANGES IN NET ASSETS
| | | Year Ended March 31, 2015 | | | Year Ended March 31, 2014 | |
| Increase (Decrease) in Net Assets from Operations: | | | | | | |
| Net investment income | | $ | 1,972,875 | | | $ | 1,150,415 | |
| Net realized gain (loss) on investments | | | (770,439 | ) | | | 3,726,063 | |
| Net change in unrealized appreciation (depreciation) on investments | | | 2,118,506 | | | | (345,635 | ) |
| Net increase in net assets resulting from operations | | | 3,320,942 | | | | 4,530,843 | |
| | | | | | | | | |
| Distributions to shareholders from: | | | | | | | | |
| Net investment income | | | | | | | | |
| Investor Class | | | (272,237 | ) | | | (653,403 | ) |
| Advisor Class | | | (76,869 | ) | | | (166,669 | ) |
| A-Class | | | (26,090 | ) | | | (161,160 | ) |
| C-Class | | | (39,413 | ) | | | (302,460 | ) |
| Total distributions to shareholders | | | (414,609 | ) | | | (1,283,692 | ) |
| | | | | | | | | |
| Capital share transactions: | | | | | | | | |
| Proceeds from sale of shares | | | | | | | | |
| Investor Class | | | 270,237,495 | | | | 273,458,616 | |
| Advisor Class | | | 237,983,954 | | | | 89,095,236 | |
| A-Class | | | 49,228,912 | | | | 23,091,679 | |
| C-Class | | | 34,705,230 | | | | 36,830,999 | |
| Distributions reinvested | | | | | | | | |
| Investor Class | | | 144,586 | | | | 639,026 | |
| Advisor Class | | | 76,768 | | | | 162,897 | |
| A-Class | | | 22,710 | | | | 143,241 | |
| C-Class | | | 35,206 | | | | 277,036 | |
| Cost of shares redeemed | | | | | | | | |
| Investor Class | | | (313,431,370 | ) | | | (224,424,635 | ) |
| Advisor Class | | | (226,632,966 | ) | | | (91,124,222 | ) |
| A-Class | | | (51,074,156 | ) | | | (19,091,917 | ) |
| C-Class | | | (35,228,923 | ) | | | (36,035,250 | ) |
| Net increase (decrease) from capital share transactions | | | (33,932,554 | ) | | | 53,022,706 | |
| Net increase (decrease) in net assets | | | (31,026,221 | ) | | | 56,269,857 | |
| | | | | | | | | |
| Net assets: | | | | | | | | |
| Beginning of year | | | 117,927,701 | | | | 61,657,844 | |
| End of year | | $ | 86,901,480 | | | $ | 117,927,701 | |
| Undistributed net investment income at end of year | | $ | — | | | $ | 414,609 | |
| | | | | | | | | |
| Capital share activity: | | | | | | | | |
| Shares sold | | | | | | | | |
| Investor Class | | | 7,335,372 | | | | 8,321,501 | |
| Advisor Class | | | 7,128,509 | | | | 2,982,830 | |
| A-Class | | | 1,412,405 | | | | 747,486 | |
| C-Class | | | 1,145,355 | | | | 1,344,893 | |
| Shares issued from reinvestment of distributions | | | | | | | | |
| Investor Class | | | 3,887 | | | | 20,594 | |
| Advisor Class | | | 2,266 | | | | 5,732 | |
| A-Class | | | 650 | | | | 4,900 | |
| C-Class | | | 1,130 | | | | 10,603 | |
| Shares redeemed | | | | | | | | |
| Investor Class | | | (8,665,636 | ) | | | (6,835,762 | ) |
| Advisor Class | | | (6,800,787 | ) | | | (3,074,956 | ) |
| A-Class | | | (1,487,751 | ) | | | (619,975 | ) |
| C-Class | | | (1,166,095 | ) | | | (1,312,120 | ) |
| Net increase (decrease) in shares | | | (1,090,695 | ) | | | 1,595,726 | |
| 162 | THE RYDEX FUNDS ANNUAL REPORT | SEE NOTES TO FINANCIAL STATEMENTS. |
This table is presented to show selected data for a share outstanding throughout each period and to assist shareholders in evaluating a Fund’s performance for the periods presented.
| Investor Class | | Year Ended March 31, 2015 | | | Year Ended March 31, 2014 | | | Year Ended March 28, 2013 | | | Year Ended March 31, 2012 | | | Year Ended March 31, 2011 | |
| Per Share Data | | | | | | | | | | | | | | | |
| Net asset value, beginning of period | | $ | 34.01 | | | $ | 32.71 | | | $ | 29.13 | | | $ | 27.00 | | | $ | 24.80 | |
| Income (loss) from investment operations: | |
Net investment income (loss)a | | | .84 | | | | .78 | | | | .74 | | | | .73 | | | | .86 | |
| Net gain (loss) on investments (realized and unrealized) | | | 2.26 | | | | 1.98 | | | | 3.96 | | | | 1.80 | | | | 2.96 | |
| Total from investment operations | | | 3.10 | | | | 2.76 | | | | 4.70 | | | | 2.53 | | | | 3.82 | |
| Less distributions from: | |
| Net investment income | | | (.13 | ) | | | (1.46 | ) | | | (1.12 | ) | | | (.40 | ) | | | (1.62 | ) |
| Total distributions | | | (.13 | ) | | | (1.46 | ) | | | (1.12 | ) | | | (.40 | ) | | | (1.62 | ) |
| Net asset value, end of period | | $ | 36.98 | | | $ | 34.01 | | | $ | 32.71 | | | $ | 29.13 | | | $ | 27.00 | |
| | |
Total Returnb | | | 9.12 | % | | | 8.88 | % | | | 16.75 | % | | | 9.44 | % | | | 15.94 | % |
| Ratios/Supplemental Data | |
| Net assets, end of period (in thousands) | | $ | 55,156 | | | $ | 95,854 | | | $ | 42,907 | | | $ | 37,469 | | | $ | 9,328 | |
| Ratios to average net assets: | |
| Net investment income (loss) | | | 2.31 | % | | | 2.38 | % | | | 2.45 | % | | | 2.59 | % | | | 3.35 | % |
| Total expenses | | | 1.35 | % | | | 1.40 | % | | | 1.35 | % | | | 1.35 | % | | | 1.37 | % |
| Portfolio turnover rate | | | 384 | % | | | 508 | % | | | 534 | % | | | 549 | % | | | 800 | % |
| Advisor Class | | Year Ended March 31, 2015 | | | Year Ended March 31, 2014 | | | Year Ended March 28, 2013 | | | Year Ended March 31, 2012 | | | Year Ended March 31, 2011 | |
| Per Share Data | | | | | | | | | | | | | | | |
| Net asset value, beginning of period | | $ | 31.09 | | | $ | 30.19 | | | $ | 27.10 | | | $ | 25.26 | | | $ | 23.40 | |
| Income (loss) from investment operations: | |
Net investment income (loss)a | | | .60 | | | | .69 | | | | .48 | | | | .56 | | | | .62 | |
| Net gain (loss) on investments (realized and unrealized) | | | 2.05 | | | | 1.67 | | | | 3.73 | | | | 1.68 | | | | 2.86 | |
| Total from investment operations | | | 2.65 | | | | 2.36 | | | | 4.21 | | | | 2.24 | | | | 3.48 | |
| Less distributions from: | |
| Net investment income | | | (.13 | ) | | | (1.46 | ) | | | (1.12 | ) | | | (.40 | ) | | | (1.62 | ) |
| Total distributions | | | (.13 | ) | | | (1.46 | ) | | | (1.12 | ) | | | (.40 | ) | | | (1.62 | ) |
| Net asset value, end of period | | $ | 33.61 | | | $ | 31.09 | | | $ | 30.19 | | | $ | 27.10 | | | $ | 25.26 | |
| | |
Total Returnb | | | 8.53 | % | | | 8.29 | % | | | 16.23 | % | | | 8.90 | % | | | 15.43 | % |
| Ratios/Supplemental Data | |
| Net assets, end of period (in thousands) | | $ | 13,546 | | | $ | 2,269 | | | $ | 4,812 | | | $ | 8,036 | | | $ | 1,240 | |
| Ratios to average net assets: | |
| Net investment income (loss) | | | 1.79 | % | | | 2.32 | % | | | 1.70 | % | | | 2.11 | % | | | 2.53 | % |
| Total expenses | | | 1.84 | % | | | 1.88 | % | | | 1.85 | % | | | 1.84 | % | | | 1.87 | % |
| Portfolio turnover rate | | | 384 | % | | | 508 | % | | | 534 | % | | | 549 | % | | | 800 | % |
| SEE NOTES TO FINANCIAL STATEMENTS. | THE RYDEX FUNDS ANNUAL REPORT | 163 |
FINANCIAL HIGHLIGHTS (concluded)
This table is presented to show selected data for a share outstanding throughout each period and to assist shareholders in evaluating a Fund’s performance for the periods presented.
| A-Class | | Year Ended March 31, 2015 | | | Year Ended March 31, 2014 | | | Year Ended March 28, 2013 | | | Year Ended March 31, 2012 | | | Year Ended March 31, 2011 | |
| Per Share Data | | | | | | | | | | | | | | | |
| Net asset value, beginning of period | | $ | 32.02 | | | $ | 30.95 | | | $ | 27.69 | | | $ | 25.75 | | | $ | 23.77 | |
| Income (loss) from investment operations: | |
Net investment income (loss)a | | | .66 | | | | .63 | | | | .65 | | | | .67 | | | | .54 | |
| Net gain (loss) on investments (realized and unrealized) | | | 2.15 | | | | 1.90 | | | | 3.73 | | | | 1.67 | | | | 3.06 | |
| Total from investment operations | | | 2.81 | | | | 2.53 | | | | 4.38 | | | | 2.34 | | | | 3.60 | |
| Less distributions from: | |
| Net investment income | | | (.13 | ) | | | (1.46 | ) | | | (1.12 | ) | | | (.40 | ) | | | (1.62 | ) |
| Total distributions | | | (.13 | ) | | | (1.46 | ) | | | (1.12 | ) | | | (.40 | ) | | | (1.62 | ) |
| Net asset value, end of period | | $ | 34.70 | | | $ | 32.02 | | | $ | 30.95 | | | $ | 27.69 | | | $ | 25.75 | |
| | |
Total Returnb | | | 8.78 | % | | | 8.64 | % | | | 16.46 | % | | | 9.16 | % | | | 15.70 | % |
| Ratios/Supplemental Data | |
| Net assets, end of period (in thousands) | | $ | 9,782 | | | $ | 11 | | | $ | 6,938 | | | $ | 7,912 | | | $ | 3,289 | |
| Ratios to average net assets: | |
| Net investment income (loss) | | | 1.93 | % | | | 2.05 | % | | | 2.26 | % | | | 2.47 | % | | | 2.23 | % |
| Total expenses | | | 1.60 | % | | | 1.63 | % | | | 1.61 | % | | | 1.60 | % | | | 1.63 | % |
| Portfolio turnover rate | | | 384 | % | | | 508 | % | | | 534 | % | | | 549 | % | | | 800 | % |
| C-Class | | Year Ended March 31, 2015 | | | Year Ended March 31, 2014 | | | Year Ended March 28, 2013 | | | Year Ended March 31, 2012 | | | Year Ended March 31, 2011 | |
| Per Share Data | | | | | | | | | | | | | | | |
| Net asset value, beginning of period | | $ | 28.55 | | | $ | 27.96 | | | $ | 25.31 | | | $ | 23.76 | | | $ | 22.21 | |
| Income (loss) from investment operations: | |
Net investment income (loss)a | | | .36 | | | | .34 | | | | .42 | | | | .42 | | | | .39 | |
| Net gain (loss) on investments (realized and unrealized) | | | 1.92 | | | | 1.71 | | | | 3.35 | | | | 1.53 | | | | 2.78 | |
| Total from investment operations | | | 2.28 | | | | 2.05 | | | | 3.77 | | | | 1.95 | | | | 3.17 | |
| Less distributions from: | |
| Net investment income | | | (.13 | ) | | | (1.46 | ) | | | (1.12 | ) | | | (.40 | ) | | | (1.62 | ) |
| Total distributions | | | (.13 | ) | | | (1.46 | ) | | | (1.12 | ) | | | (.40 | ) | | | (1.62 | ) |
| Net asset value, end of period | | $ | 30.70 | | | $ | 28.55 | | | $ | 27.96 | | | $ | 25.31 | | | $ | 23.76 | |
| | |
Total Returnb | | | 7.99 | % | | | 7.83 | % | | | 15.58 | % | | | 8.28 | % | | | 14.85 | % |
| Ratios/Supplemental Data | |
| Net assets, end of period (in thousands) | | $ | 8,417 | | | $ | 8,387 | | | $ | 7,001 | | | $ | 6,961 | | | $ | 4,751 | |
| Ratios to average net assets: | |
| Net investment income (loss) | | | 1.18 | % | | | 1.22 | % | | | 1.62 | % | | | 1.70 | % | | | 1.72 | % |
| Total expenses | | | 2.35 | % | | | 2.38 | % | | | 2.36 | % | | | 2.35 | % | | | 2.38 | % |
| Portfolio turnover rate | | | 384 | % | | | 508 | % | | | 534 | % | | | 549 | % | | | 800 | % |
a | Net investment income (loss) per share was computed using average shares outstanding throughout the period. |
b | Total return does not reflect the impact of any applicable sales charges. |
| 164 | THE RYDEX FUNDS ANNUAL REPORT | SEE NOTES TO FINANCIAL STATEMENTS. |
NOTES TO FINANCIAL STATEMENTS
1. Organization and Significant Accounting Policies
Organization
The Rydex Series Funds (the “Trust”), a Delaware business trust, is registered with the SEC under the Investment Company Act of 1940 (”1940 Act”), as a non-diversified, open-ended investment company of the series type. Each series, in effect, is representing a separate Fund. The Trust is authorized to issue an unlimited number of no par value shares. The Trust accounts for the assets of each fund separately.
The Trust offers a combination of eight separate classes of shares: Investor Class shares, Advisor Class shares, A-Class shares, C-Class shares, H-Class shares, Y-Class shares, Institutional Class shares and Money Market Class shares. Sales of shares of each Class are made without a front-end sales charge at the net asset value per share (“NAV”), with the exception of A-Class shares. A-Class shares are sold at the NAV, plus the applicable front-end sales charge. The sales charge varies depending on the amount purchased, but will not exceed 4.75%. A-Class share purchases of $1 million or more are exempt from the front-end sales charge but have a 1% contingent deferred sales charge (“CDSC”) if shares are redeemed within 12 months of purchase. C-Class shares have a 1% CDSC if shares are redeemed within 12 months of purchase. Institutional Class shares are offered primarily for direct investment by institutions such as pension and profit sharing plans, endowments, foundations and corporations. Institutional Class shares have a minimum initial investment of $2 million and a minimum account balance of $1 million. Institutional Class shares are offered without a front-end sales charge or CDSC. At March 31, 2015, the Trust consisted of fifty-two funds.
This report covers Banking Fund, Basic Materials Fund, Biotechnology Fund, Consumer Products Fund, Electronics Fund, Energy Fund, Energy Services Fund, Financial Services Fund, Health Care Fund, Internet Fund, Leisure Fund, Precious Metals Fund, Real Estate Fund, Retailing Fund, Technology Fund, Telecommunications Fund, Transportation Fund and Utilities Fund (the “Funds”). Only Investor Class, Advisor Class, A-Class, C-Class and H-Class had been issued by the Funds.
The Funds invest in a specific industry sector. To the extent that investments are concentrated in a single sector, the Funds are subject to legislative or regulatory changes, adverse market conditions and/or increased competition affecting such sector.
The Funds seek capital appreciation and invest substantially all of their assets in equity securities of companies involved in their sector.
The Funds are designed and operated to accommodate frequent trading by shareholders and, unlike most mutual funds, offer unlimited exchange privileges with no minimum holding periods or transactions fees, which may cause the Funds to experience high portfolio turnover.
Guggenheim Investments (“GI”) provides advisory services, and Rydex Fund Services, LLC (“RFS”) provides transfer agent, administrative and accounting services to the Trust. Guggenheim Funds Distributors, LLC (“GFD”) acts as principal underwriter for the Trust. GI, RFS and GFD are affiliated entities.
Significant Accounting Policies
The Funds operate as investment companies and accordingly follow the investment company accounting and reporting guidance of the Financial Accounting Standards Board (“FASB”) Accounting Standards Codification Topic 946 Financial Services – Investment Companies.
The following significant accounting policies are in conformity with U.S. generally accepted accounting principles (“U.S. GAAP”) and are consistently followed by the Trust. This requires management to make estimates and assumptions that affect the reported amount of assets and liabilities and disclosure of contingent assets and liabilities at the date of the financial statements and the reported amounts of revenues and expenses during the reporting period. Actual results could differ from these estimates. All time references are based on Eastern Time.
The NAV of each Class of the Funds is calculated by dividing the market value of the Fund’s securities and other assets, less all liabilities, attributable to the Class by the number of outstanding shares of the Class.
A. The Board of Trustees of the Funds (the “Board”) has adopted policies and procedures for the valuation of the Funds’ investments (the “Valuation Procedures”). Pursuant to the Valuation Procedures, the Board has delegated to a valuation committee, consisting of representatives from Guggenheim’s investment management, fund administration, legal and compliance departments (the “Valuation Committee”), the day-to-day responsibility for implementing the Valuation
| | THE RYDEX FUNDS ANNUAL REPORT | 165 |
NOTES TO FINANCIAL STATEMENTS (continued)
Procedures, including, under most circumstances, the responsibility for determining the fair value of the Funds’ securities or other assets.
Valuations of the Funds’ securities are supplied primarily by pricing services appointed pursuant to the processes set forth in the Valuation Procedures. The Valuation Committee convenes monthly, or more frequently as needed and will review the valuation of all assets which have been fair valued for reasonableness. The Funds’ officers, through the Valuation Committee and consistent with the monitoring and review responsibilities set forth in the Valuation Procedures, regularly review procedures used by, and valuations provided by, the pricing services.
If the pricing service cannot or does not provide a valuation for a particular investment or such valuation is deemed unreliable, such investment is fair valued by the Valuation Committee.
Equity securities listed on an exchange (New York Stock Exchange (“NYSE”) or American Stock Exchange) are valued at the last quoted sales price as of the close of business on the NYSE, usually 4:00 p.m. on the valuation date. Equity securities listed on the NASDAQ market system are valued at the NASDAQ Official Closing Price on the valuation date, which may not necessarily represent the last sale price. If there has been no sale on such exchange or NASDAQ on a given day, the security is valued at the closing bid price on that day.
Open-end investment companies (“Mutual Funds”) are valued at their NAV as of the close of business, on the valuation date. Exchange-traded funds (“ETFs”) and closed-end investment companies (“CEFs”) are valued at the last quoted sales price.
Repurchase agreements are valued at amortized cost, which approximates market value.
Investments for which market quotations are not readily available are fair valued as determined in good faith by GI under the direction of the Board of Trustees using methods established or ratified by the Board of Trustees.
Valuations in accordance with these methods are intended to reflect each security’s (or asset’s) “fair value.” Each such determination is based on a consideration of all relevant factors, which are likely to vary from one pricing context to another. Examples of such factors may include, but are not limited to: (i) the type of security, (ii) the initial cost of the security, (iii) the existence of any contractual restrictions on the security’s disposition, (iv) the price and extent of public trading in similar securities of the issuer or of comparable companies, (v) quotations or evaluated prices from broker-dealers and/or pricing services, (vi) information obtained from the issuer, analysts, and/or the appropriate stock exchange (for exchange-traded securities), (vii) an analysis of the company’s financial statements, and (viii) an evaluation of the forces that influence the issuer of pending merger activity, public offerings or tender offers that might affect the value of the security).
B. Security transactions are recorded on the trade date for financial reporting purposes. Realized gains and losses from securities transactions are recorded using the identified cost basis. Proceeds from lawsuits related to investment holdings are recorded as realized gains in the respective Fund. Dividend income is recorded on the ex-dividend date, net of applicable taxes withheld by foreign countries. Taxable non-cash dividends are recorded as dividend income. Interest income, including amortization of premiums and accretion of discounts, is accrued on a daily basis. Dividend income from REITs is recorded based on the income included in the distributions received from the REIT investments using published REIT classifications, including some management estimates when actual amounts are not available. Distributions received in excess of this estimated amount are recorded as a reduction of the cost of investments or reclassified to capital gains. The actual amounts of income, return of capital, and capital gains are only determined by each REIT after its fiscal year-end, and may differ from the estimated amounts.
C. Distributions of net investment income and net realized gains, if any, are declared and paid at least annually. Dividends are reinvested in additional shares unless shareholders request payment in cash. Distributions are recorded on the ex-dividend date and are determined in accordance with income tax regulations which may differ from U.S. GAAP.
D. Interest and dividend income, most expenses, all realized gains and losses, and all unrealized gains and losses are allocated to the classes based upon the value of the outstanding shares in each Class. Certain costs, such as distribution and service fees are charged directly to specific classes. In addition, certain expenses have been allocated to the individual Funds in the Trust on a pro rata basis upon the respective aggregate net assets of each Fund included in the Trust.
| 166 | THE RYDEX FUNDS ANNUAL REPORT | |
NOTES TO FINANCIAL STATEMENTS (continued)
E. The Funds may leave cash overnight in their cash account with the custodian. Periodically, a Fund may have cash due to the custodian bank as an overdraft balance. A fee is incurred on this overdraft, calculated by multiplying the overdraft by a rate based on the federal funds rate.
F. Under the Funds’ organizational documents, their Trustees and Officers are indemnified against certain liabilities arising out of the performance of their duties to the Trust. In addition, throughout the normal course of business, the Funds enter into contracts that contain a variety of representations and warranties which provide general indemnifications. The Funds’ maximum exposure under these arrangements is unknown, as this would involve future claims that may be made against the Funds and/or their affiliates that have not yet occurred. However, based on experience, the Funds expect the risk of loss to be remote.
2. Fees and Other Transactions with Affiliates
Under the terms of an investment advisory contract, the Funds pay GI investment advisory fees calculated at their annualized rates below, based on the average daily net assets of the Funds:
| Fund | Management Fees (as a % of Net Assets) |
| Banking Fund | 0.85% |
| Basic Materials Fund | 0.85% |
| Biotechnology Fund | 0.85% |
| Consumer Products Fund | 0.85% |
| Electronics Fund | 0.85% |
| Energy Fund | 0.85% |
| Energy Services Fund | 0.85% |
| Financial Services Fund | 0.85% |
| Health Care Fund | 0.85% |
| Internet Fund | 0.85% |
| Leisure Fund | 0.85% |
| Precious Metals Fund | 0.75% |
| Real Estate Fund | 0.85% |
| Retailing Fund | 0.85% |
| Technology Fund | 0.85% |
| Telecommunications Fund | 0.85% |
| Transportation Fund | 0.85% |
| Utilities Fund | 0.85% |
RFS provides transfer agent and administrative services to the Funds for fees calculated at the annualized rate of 0.25% based on the average daily net assets of each Fund.
RFS also provides accounting services to the Funds for fees calculated at annualized rates below, based on the average daily net assets of each Fund.
| Fund Accounting Fees | (as a % of Net Assets) |
| On the first $250 million | 0.10% |
| On the next $250 million | 0.075% |
| On the next $250 million | 0.05% |
| Over $750 million | 0.03% |
RFS engages external service providers to perform other necessary services for the Trust, such as audit and accounting related services, legal services, custody, printing and mailing, etc., on a pass-through basis. Such expenses are allocated to various Funds within the complex based on relative net assets.
The Trust has adopted a Distribution and Shareholder Services Plan applicable to its Advisor Class shares and a Distribution Plan applicable to A-Class shares and H-Class shares for which GFD and other firms that provide distribution and/or shareholder services (“Service Providers”) may receive compensation. If a Service Provider provides distribution services, the Funds will pay distribution fees to GFD at an annual rate not to exceed 0.25% of average daily net assets, pursuant to Rule 12b-1 of the 1940 Act. GFD, in turn, will pay the Service Provider out of its fees. GFD may, at its discretion, retain a portion of such payments to compensate itself for distribution services. With regard to Advisor Class shares only, if a Service Provider provides shareholder services, GFD will receive shareholder servicing fees from the Funds at an annual rate not to exceed 0.25% of average daily net assets. GFD, in turn, will compensate Service Providers for providing such services, while retaining a portion of such payments to compensate itself for shareholder services it performs.
The Trust has adopted a separate Distribution and Shareholder Services Plan applicable to its C-Class shares that allows the Funds to pay annual distribution and service fees of 1.00% of the Funds’ C-Class shares average daily net assets. The annual 0.25% service fee compensates a shareholder’s financial adviser for providing ongoing services to the shareholder. The annual distribution fee of 0.75% reimburses GFD for paying the shareholder’s financial adviser an ongoing sales commission. GFD advances the first year’s service and distribution fees to the financial adviser. GFD retains the service and distribution fees on accounts with no authorized dealer of record.
| | THE RYDEX FUNDS ANNUAL REPORT | 167 |
NOTES TO FINANCIAL STATEMENTS (continued)
For the year ended March 31, 2015, GFD retained sales charges of $360,571 relating to sales of A-Class shares of the Trust.
Certain trustees and officers of the Trust are also officers of GI, RFS and GFD.
3. Federal Income Tax Information
The Funds intend to comply with the provisions of Subchapter M of the Internal Revenue Code applicable to regulated investment companies and will distribute substantially all taxable net investment income and capital gains sufficient to relieve the Funds from all, or substantially all, federal income, excise and state income taxes. Therefore, no provision for federal or state income tax is required.
Tax positions taken or expected to be taken in the course of preparing the Funds’ tax returns are evaluated to determine whether the tax positions are “more-likely-than-not” of being sustained by the applicable tax authority. Tax positions not deemed to meet the more-likely-than-not threshold would be recorded as a tax benefit or expense in the current year. Management has analyzed the Funds' tax positions taken, or to be taken, on Federal income tax returns for all open tax years, and has concluded that no provision for income tax is required in the Funds' financial statements. The Funds’ federal tax returns are subject to examination by the Internal Revenue Service for a period of three years after they are filed.
Tax basis capital losses in excess of capital gains are carried forward to offset future net capital gains. For the year ended March 31, 2015, the following capital loss carryforward amounts were expired or used:
| Fund | | Amount | |
| Basic Materials Fund | | $ | 1,525,433 | |
| Electronics Fund | | | 5,495,145 | |
| Energy Fund | | | 3,472,546 | |
| Energy Services Fund | | | 1,541,919 | |
| Financial Services Fund | | | 1,081,486 | |
| Leisure Fund | | | 1,238,160 | |
| Real Estate Fund | | | 2,162,377 | |
| Retailing Fund | | | 1,675,233 | |
| Technology Fund | | | 1,136,122 | |
| Transportation Fund | | | 1,487,487 | |
| Utilities Fund | | | 1,369,019 | |
The tax character of distributions paid during the year ended March 31, 2015 was as follows:
| Fund | | Ordinary Income | | | Long-Term Capital Gain | | | Total Distributions | |
| Banking Fund | | $ | 104,722 | | | $ | — | | | $ | 104,722 | |
| Basic Materials Fund | | | 232,153 | | | | — | | | | 232,153 | |
| Biotechnology Fund | | | 16,555,696 | | | | 3,761,283 | | | | 20,316,979 | |
| Consumer Products Fund | | | 4,013,864 | | | | — | | | | 4,013,864 | |
| Electronics Fund | | | — | | | | — | | | | — | |
| Energy Fund | | | 200,733 | | | | — | | | | 200,733 | |
| Energy Services Fund | | | — | | | | — | | | | — | |
| Financial Services Fund | | | 149,519 | | | | — | | | | 149,519 | |
| Health Care Fund | | | 498,400 | | | | 2,095,865 | | | | 2,594,265 | |
| Internet Fund | | | 399,239 | | | | — | | | | 399,239 | |
| Leisure Fund | | | 94,646 | | | | 893,915 | | | | 988,561 | |
| Precious Metals Fund | | | 1,329,325 | | | | — | | | | 1,329,325 | |
| Real Estate Fund | | | 391,160 | | | | — | | | | 391,160 | |
| Retailing Fund | | | — | | | | — | | | | — | |
| Technology Fund | | | — | | | | — | | | | — | |
| Telecommunications Fund | | | 98,119 | | | | — | | | | 98,119 | |
| Transportation Fund | | | — | | | | — | | | | — | |
| Utilities Fund | | | 414,609 | | | | — | | | | 414,609 | |
| 168 | THE RYDEX FUNDS ANNUAL REPORT | |
NOTES TO FINANCIAL STATEMENTS (continued)
The tax character of distributions paid during the year ended March 31, 2014 was as follows:
| Fund | | Ordinary Income | | | Long-Term Capital Gain | | | Total Distributions | |
| Banking Fund | | $ | 206,728 | | | $ | — | | | $ | 206,728 | |
| Basic Materials Fund | | | 299,181 | | | | — | | | | 299,181 | |
| Biotechnology Fund | | | — | | | | — | | | | — | |
| Consumer Products Fund | | | 1,720,103 | | | | 5,668,936 | | | | 7,389,039 | |
| Electronics Fund | | | 2,979 | | | | — | | | | 2,979 | |
| Energy Fund | | | — | | | | — | | | | — | |
| Energy Services Fund | | | — | | | | — | | | | — | |
| Financial Services Fund | | | 145,547 | | | | — | | | | 145,547 | |
| Health Care Fund | | | 113,186 | | | | 4,763,132 | | | | 4,876,318 | |
| Internet Fund | | | — | | | | 185,111 | | | | 185,111 | |
| Leisure Fund | | | 200,095 | | | | — | | | | 200,095 | |
| Precious Metals Fund | | | 303,331 | | | | — | | | | 303,331 | |
| Real Estate Fund | | | 336,681 | | | | — | | | | 336,681 | |
| Retailing Fund | | | — | | | | — | | | | — | |
| Technology Fund | | | — | | | | — | | | | — | |
| Telecommunications Fund | | | 98,053 | | | | — | | | | 98,053 | |
| Transportation Fund | | | — | | | | — | | | | — | |
| Utilities Fund | | | 1,283,692 | | | | — | | | | 1,283,692 | |
Note: For federal income tax purposes, short-term capital gain distributions are treated as ordinary income distributions.
The tax character of distributable earnings/(accumulated losses) at March 31, 2015 was as follows:
| Fund | | Undistributed Ordinary Income | | | Undistributed Long-Term Capital Gain | | | Net Unrealized Appreciation/ (Depreciation) | | | Capital Loss Carryforward & Other Losses | |
| Banking Fund | | $ | 84,494 | | | $ | — | | | $ | (186,951 | ) | | $ | (21,412,209 | ) |
| Basic Materials Fund | | | 252,786 | | | | — | | | | 4,142,106 | | | | (16,213,579 | ) |
| Biotechnology Fund | | | 9,120,813 | | | | — | | | | 291,512,176 | | | | — | |
| Consumer Products Fund | | | 3,082,889 | | | | — | | | | 66,693,444 | | | | — | |
| Electronics Fund | | | 42,413 | | | | — | | | | 3,183,353 | | | | (12,987,326 | ) |
| Energy Fund | | | 334,376 | | | | 369,647 | | | | 5,892,529 | | | | — | |
| Energy Services Fund | | | 231,483 | | | | — | | | | 515,158 | | | | (23,626,434 | ) |
| Financial Services Fund | | | 277,773 | | | | 141,563 | | | | 4,152,986 | | | | — | |
| Health Care Fund | | | 4,516,377 | | | | 2,057,091 | | | | 66,427,772 | | | | — | |
| Internet Fund | | | 142,232 | | | | 88,617 | | | | 3,710,291 | | | | — | |
| Leisure Fund | | | 285,529 | | | | 96,180 | | | | 5,504,480 | | | | — | |
| Precious Metals Fund | | | 183,913 | | | | — | | | | (16,830,803 | ) | | | (27,245,750 | ) |
| Real Estate Fund | | | 344,392 | | | | — | | | | 2,342,260 | | | | (12,161,929 | ) |
| Retailing Fund | | | 32,233 | | | | — | | | | 9,930,358 | | | | (3,963,067 | ) |
| Technology Fund | | | — | | | | — | | | | 9,445,665 | | | | (4,119,862 | ) |
| Telecommunications Fund | | | 80,748 | | | | — | | | | 175,325 | | | | (4,226,125 | ) |
| Transportation Fund | | | 132,339 | | | | — | | | | 23,269,619 | | | | (16,296,735 | ) |
| Utilities Fund | | | — | | | | — | | | | 8,660,052 | | | | — | |
Capital Loss Carryforward amounts may be limited due to Federal income tax regulations.
For Federal income tax purposes, capital loss carryforwards represent realized losses of the Funds that may be carried forward and applied against future capital gains. For taxable years beginning on or before December 22, 2010, such capital losses may be carried forward for a maximum of eight years. Under the RIC Modernization Act of 2010, the Funds are permitted to carry forward capital losses incurred in taxable years beginning after December 22, 2010 for an unlimited period. However, any losses incurred during those taxable years must be utilized prior to the losses incurred in pre-enactment taxable years. As a result of this ordering rule, pre-enactment capital loss carryforwards may be more likely
| | THE RYDEX FUNDS ANNUAL REPORT | 169 |
NOTES TO FINANCIAL STATEMENTS (continued)
to expire unused. Additionally, post-enactment capital losses that are carried forward will retain their character as either short-term or long-term capital losses rather than being considered all short-term as under previous law. As of March 31, 2015, capital loss carryforwards for the Funds were as follows:
| | Expires in | | | Expires in | | | Expires in | | | Expires in | | | Unlimited | | | Total Capital Loss | |
| Fund | | 2016 | | | 2017 | | | 2018 | | | 2019 | | | Short-Term | | | Long-Term | | | Carryforward | |
| Banking Fund | | $ | (311,892 | ) | | $ | (1,809,926 | ) | | $ | (16,385,824 | ) | | $ | (912,723 | ) | | $ | (1,524,659 | ) | | $ | (467,185 | ) | | $ | (21,412,209 | ) |
| Basic Materials Fund | | | — | | | | (6,151,760 | ) | | | (8,009,421 | ) | | | — | | | | (2,052,398 | ) | | | — | | | | (16,213,579 | ) |
| Biotechnology Fund | | | — | | | | — | | | | — | | | | — | | | | — | | | | — | | | | — | |
| Consumer Products Fund | | | — | | | | — | | | | — | | | | — | | | | — | | | | — | | | | — | |
| Electronics Fund | | | (1,900,883 | ) | | | (6,118,835 | ) | | | — | | | | (3,055,204 | ) | | | (1,733,388 | ) | | | (179,016 | ) | | | (12,987,326 | ) |
| Energy Fund | | | — | | | | — | | | | — | | | | — | | | | — | | | | — | | | | — | |
| Energy Services Fund | | | — | | | | (16,789,802 | ) | | | (5,702,829 | ) | | | — | | | | — | | | | — | | | | (22,492,631 | ) |
| Financial Services Fund | | | — | | | | — | | | | — | | | | — | | | | — | | | | — | | | | — | |
| Health Care Fund | | | — | | | | — | | | | — | | | | — | | | | — | | | | — | | | | — | |
| Internet Fund | | | — | | | | — | | | | — | | | | — | | | | — | | | | — | | | | — | |
| Leisure Fund | | | — | | | | — | | | | — | | | | — | | | | — | | | | — | | | | — | |
| Precious Metals Fund | | | — | | | | — | | | | — | | | | — | | | | (6,090,469 | ) | | | (21,155,281 | ) | | | (27,245,750 | ) |
| Real Estate Fund | | | — | | | | (2,247,435 | ) | | | (4,305,317 | ) | | | — | | | | (5,609,177 | ) | | | — | | | | (12,161,929 | ) |
| Retailing Fund | | | — | | | | (1,564,877 | ) | | | — | | | | — | | | | (2,398,190 | ) | | | — | | | | (3,963,067 | ) |
| Technology Fund | | | — | | | | (3,941,068 | ) | | | — | | | | — | | | | — | | | | — | | | | (3,941,068 | ) |
| Telecommunications Fund | | | — | | | | (1,745,552 | ) | | | — | | | | — | | | | (1,763,826 | ) | | | (716,747 | ) | | | (4,226,125 | ) |
| Transportation Fund | | | — | | | | — | | | | (9,430,280 | ) | | | (6,866,455 | ) | | | — | | | | — | | | | (16,296,735 | ) |
| Utilities Fund | | | — | | | | — | | | | — | | | | — | | | | — | | | | — | | | | — | |
Net investment income and net realized gains (losses) may differ for financial statement and tax purposes because of temporary or permanent book/tax differences. These differences are typically due to post-October losses, losses deferred due to wash sales, utilization of earnings and profits on shareholder redemptions, and the “mark-to-market of certain passive foreign investment companies (PFICs) for tax purposes. Additional differences may result from tax treatment of net investment losses and expired expired capital loss carryforwards. To the extent these differences are permanent, reclassifications are made to the appropriate equity accounts in the period that the differences arise. These reclassifications have no effect on the net assets or NAV per share.
On the Statements of Assets and Liabilities the following adjustments were made for permanent book/tax differences:
| Fund | | Paid In Capital | | | Undistributed Net Investment Income | | | Accumulated Net Realized Gain/(Loss) | |
| Banking Fund | | $ | — | | | $ | — | | | $ | — | |
| Basic Materials Fund | | | (2,029 | ) | | | 43,965 | | | | (41,936 | ) |
| Biotechnology Fund | | | 22,005,007 | | | | 2,286,392 | | | | (24,291,399 | ) |
| Consumer Products Fund | | | 5,367,327 | | | | 4,085 | | | | (5,371,412 | ) |
| Electronics Fund | | | (5,495,145 | ) | | | — | | | | 5,495,145 | |
| Energy Fund | | | 738,104 | | | | 1,169 | | | | (739,273 | ) |
| Energy Services Fund | | | — | | | | — | | | | — | |
| Financial Services Fund | | | 42,471 | | | | — | | | | (42,471 | ) |
| Health Care Fund | | | 3,146,358 | | | | 733,012 | | | | (3,879,370 | ) |
| Internet Fund | | | 1,008,905 | | | | 182,551 | | | | (1,191,456 | ) |
| Leisure Fund | | | 3,786,003 | | | | — | | | | (3,786,003 | ) |
| Precious Metals Fund | | | — | | | | 438,579 | | | | (438,579 | ) |
| Real Estate Fund | | | (10,798 | ) | | | 10,798 | | | | — | |
| Retailing Fund | | | — | | | | — | | | | — | |
| Technology Fund | | | — | | | | — | | | | — | |
| Telecommunications Fund | | | — | | | | — | | | | — | |
| Transportation Fund | | | — | | | | — | | | | — | |
| Utilities Fund | | | 2,849,391 | | | | (1,972,875 | ) | | | (876,516 | ) |
| 170 | THE RYDEX FUNDS ANNUAL REPORT | |
NOTES TO FINANCIAL STATEMENTS (continued)
At March 31, 2015, the cost of securities for Federal income tax purposes, the aggregate gross unrealized gain for all securities for which there was an excess of value over tax cost and the aggregate gross unrealized loss for all securities for which there was an excess of tax cost over value, were as follows:
| Fund | | Tax Cost | | | Tax Unrealized Gain | | | Tax Unrealized Loss | | | Net Unrealized Gain/(Loss) | |
| Banking Fund | | $ | 49,664,288 | | | $ | 911,335 | | | $ | (1,098,286 | ) | | $ | (186,951 | ) |
| Basic Materials Fund | | | 56,710,244 | | | | 5,648,610 | | | | (1,506,504 | ) | | | 4,142,106 | |
| Biotechnology Fund | | | 486,653,716 | | | | 299,044,252 | | | | (7,532,077 | ) | | | 291,512,175 | |
| Consumer Products Fund | | | 263,375,888 | | | | 71,340,374 | | | | (4,646,930 | ) | | | 66,693,444 | |
| Electronics Fund | | | 25,663,105 | | | | 3,381,563 | | | | (198,210 | ) | | | 3,183,353 | |
| Energy Fund | | | 42,253,238 | | | | 6,977,992 | | | | (1,085,463 | ) | | | 5,892,529 | |
| Energy Services Fund | | | 26,916,155 | | | | 846,495 | | | | (331,337 | ) | | | 515,158 | |
| Financial Services Fund | | | 54,159,896 | | | | 5,018,435 | | | | (865,449 | ) | | | 4,152,986 | |
| Health Care Fund | | | 209,775,682 | | | | 68,919,609 | | | | (2,491,837 | ) | | | 66,427,772 | |
| Internet Fund | | | 11,062,701 | | | | 3,841,858 | | | | (131,567 | ) | | | 3,710,291 | |
| Leisure Fund | | | 62,549,675 | | | | 6,723,810 | | | | (1,219,330 | ) | | | 5,504,480 | |
| Precious Metals Fund | | | 69,112,808 | | | | — | | | | (16,830,801 | ) | | | (16,830,801 | ) |
| Real Estate Fund | | | 44,652,314 | | | | 2,491,570 | | | | (149,310 | ) | | | 2,342,260 | |
| Retailing Fund | | | 70,794,030 | | | | 10,835,352 | | | | (904,994 | ) | | | 9,930,358 | |
| Technology Fund | | | 27,010,223 | | | | 10,153,919 | | | | (708,254 | ) | | | 9,445,665 | |
| Telecommunications Fund | | | 2,229,745 | | | | 189,452 | | | | (14,127 | ) | | | 175,325 | |
| Transportation Fund | | | 50,351,098 | | | | 23,387,723 | | | | (118,104 | ) | | | 23,269,619 | |
| Utilities Fund | | | 78,827,589 | | | | 9,332,845 | | | | (672,793 | ) | | | 8,660,052 | |
Pursuant to Federal income tax regulations applicable to investment companies, the Funds have elected to treat net capital losses and certain ordinary losses realized between November 1 and March 31 of each year as occurring on the first day of the following tax year. The Funds have also elected to treat certain ordinary losses realized between January 1 and March 31 of each year as occurring on the first day of the following tax year. For the year ended March 31, 2015, the following losses reflected in the accompanying financial statements were deferred for Federal income tax purposes until April 1, 2015:
| Fund | | Ordinary | | | Capital | |
| Energy Services Fund | | $ | — | | | $ | (1,133,803 | ) |
| Technology Fund | | | (178,794 | ) | | | — | |
4. Fair Value Measurement
In accordance with U.S. GAAP, fair value is defined as the price that the Funds would receive to sell an investment or pay to transfer a liability in an orderly transaction with an independent buyer in the principal market, or in the absence of a principal market, the most advantageous market for the investment or liability. U.S. GAAP establishes a three-tier fair value hierarchy based on the types of inputs used to value assets and liabilities and requires corresponding disclosure. The hierarchy and the corresponding inputs are summarized below:
Level 1 — quoted prices in active markets for identical assets or liabilities.
Level 2 — significant other observable inputs (for example quoted prices for securities that are similar based on characteristics such as interest rates, prepayment speeds, credit risk, etc.).
Level 3 — significant unobservable inputs based on the best information available under the circumstances, to the extent observable inputs are not available, which may include assumptions.
The types of inputs available depend on a variety of factors, such as the type of security and the characteristics of the markets in which it trades, if any. Fair valuation determinations that rely on fewer or no observable inputs require greater judgment. Accordingly, fair value determinations for Level 3 securities require the greatest amount of judgment.
| | THE RYDEX FUNDS ANNUAL REPORT | 171 |
NOTES TO FINANCIAL STATEMENTS (continued)
The following table summarizes the inputs used to value the Funds’ investments at March 31, 2015:
| | | Level 1 Investments In Securities | | | Level 2 Investments In Securities | | | Level 3 Investments In Securities | | | Total | |
| Assets | | | | | | | | | | | | |
| Banking Fund | | $ | 49,124,246 | | | $ | 353,091 | | | $ | — | | | $ | 49,477,337 | |
| Basic Materials Fund | | | 57,598,223 | | | | 3,254,127 | | | | — | | | | 60,852,350 | |
| Biotechnology Fund | | | 688,043,864 | | | | 90,100,931 | | | | 21,096 | | | | 778,165,891 | |
| Consumer Products Fund | | | 319,933,812 | | | | 10,114,892 | | | | 20,628 | | | | 330,069,332 | |
| Electronics Fund | | | 27,196,340 | | | | 1,650,118 | | | | — | | | | 28,846,458 | |
| Energy Fund | | | 45,850,602 | | | | 2,295,165 | | | | — | | | | 48,145,767 | |
| Energy Services Fund | | | 25,228,264 | | | | 2,203,049 | | | | — | | | | 27,431,313 | |
| Financial Services Fund | | | 58,123,746 | | | | 189,136 | | | | — | | | | 58,312,882 | |
| Health Care Fund | | | 263,537,004 | | | | 12,666,450 | | | | — | | | | 276,203,454 | |
| Internet Fund | | | 14,524,098 | | | | 248,894 | | | | — | | | | 14,772,992 | |
| Leisure Fund | | | 67,484,617 | | | | 569,538 | | | | — | | | | 68,054,155 | |
| Precious Metals Fund | | | 49,237,228 | | | | 3,044,779 | | | | — | | | | 52,282,007 | |
| Real Estate Fund | | | 46,731,936 | | | | 262,638 | | | | — | | | | 46,994,574 | |
| Retailing Fund | | | 77,762,393 | | | | 2,961,995 | | | | — | | | | 80,724,388 | |
| Technology Fund | | | 36,047,002 | | | | 408,886 | | | | — | | | | 36,455,888 | |
| Telecommunications Fund | | | 2,394,899 | | | | 5,514 | | | | 4,657 | | | | 2,405,070 | |
| Transportation Fund | | | 70,893,941 | | | | 2,726,776 | | | | — | | | | 73,620,717 | |
| Utilities Fund | | | 86,520,100 | | | | 967,541 | | | | — | | | | 87,487,641 | |
Transfers between investment levels may occur as the markets fluctuate and/or the availability of data used in the investment’s valuation changes. The Funds recognize transfers between the levels as of the beginning of the period. As of March 31, 2015, Telecommunications Fund had securities with a total value of $4,657, transfer from Level 2 to Level 3 based on a change in availability of market information.
The inputs or methodologies used for valuing securities are not necessarily an indication of the risk associated with investing in those securities. The suitability of the techniques and sources employed to determine fair valuation are regularly monitored and subject to change.
5. Repurchase Agreements
The Funds transfer uninvested cash balances into a single joint account, the daily aggregate balance of which is invested in one or more repurchase agreements collateralized by obligations of the U.S. Treasury and U.S. Government Agencies. The collateral is in the possession of the Funds’ custodian and is evaluated to ensure that its market value exceeds, at a minimum, 102% of the original face amount of the repurchase agreements. Each Fund holds a pro rata share of the collateral based on the dollar amount of the repurchase agreement entered into by each Fund.
At March 31, 2015, the repurchase agreements in the joint account were as follows:
Counterparty and Terms of Agreement | | | Face Value | | | Repurchase Price | | | Collateral | | | Par Value | | | Fair Value | |
| HSBC Group | | | | | | | | | U.S. Treasury Strips | | | | | | | |
| 0.03% | | | | | | | | | 0.00% | | | | | | | |
| Due 04/01/15 | | | $ | 15,774,664 | | | | $ 15,774,677 | | | 11/15/22 | | | $ | 18,558,500 | | | $ | 16,090,220 | |
In the event of counterparty default, the Funds have the right to collect the collateral to offset losses incurred. There is potential loss to the Funds in the event the Funds are delayed or prevented from exercising their rights to dispose of the collateral securities, including the risk of a possible decline in the value of the underlying securities during the period while the Funds seek to assert their rights. The Funds’ investment adviser, acting under the supervision of the Board of Trustees, reviews the value of the collateral and the creditworthiness of those banks and dealers with which the Funds enter into repurchase agreements to evaluate potential risks.
| 172 | THE RYDEX FUNDS ANNUAL REPORT | |
NOTES TO FINANCIAL STATEMENTS (continued)
6. Portfolio Securities Loaned
The Funds may lend their securities to approved brokers to earn additional income. Security lending income shown on the Statements of Operations is shown net of rebates paid to the borrowers and earnings on cash collateral investments shared with the lending agent. Within this arrangement, the Funds act as the lender, Credit Suisse acts as the lending agent, and other approved registered broker dealers act as the borrowers. The Funds receive cash collateral, valued at 102% of the value of the securities on loan. Under the terms of the Funds’ securities lending agreement with Credit Suisse, cash collateral is invested in one or more joint repurchase agreements collateralized by obligations of the U.S. Treasury or Government Agencies and cash. The Funds bear the risk of loss on cash collateral investments. Collateral is maintained over the life of the loan in an amount not less than the value of loaned securities, as determined at the close of fund business each day; any additional collateral required due to changes in security values is delivered to the Funds the next business day. Although the collateral mitigates the risk, the Funds could experience a delay in recovering its securities and a possible loss of income or value if the borrower fails to return the securities. The Funds have the right under the securities lending agreement to recover the securities from the borrower on demand.
At March 31, 2015, the Funds participated in securities lending as follows:
| Fund | | Value of Securities Loaned | | | Cash Collateral Received | |
| Banking Fund | | $ | 171,368 | | | $ | 181,350 | |
| Basic Materials Fund | | | 2,849,049 | | | | 2,999,050 | |
| Biotechnology Fund | | | 79,529,180 | | | | 83,608,806 | |
| Consumer Products Fund | | | 8,624,874 | | | | 8,837,396 | |
| Electronics Fund | | | 1,377,165 | | | | 1,425,325 | |
| Energy Fund | | | 2,013,020 | | | | 2,091,600 | |
| Energy Services Fund | | | 2,024,426 | | | | 2,095,500 | |
| Financial Services Fund | | | 187,242 | | | | 191,900 | |
| Health Care Fund | | | 10,954,785 | | | | 11,745,759 | |
| Internet Fund | | | 169,972 | | | | 173,518 | |
| Leisure Fund | | | 323,506 | | | | 332,275 | |
| Precious Metals Fund | | | 2,546,558 | | | | 2,762,950 | |
| Real Estate Fund | | | 132,470 | | | | 137,300 | |
| Retailing Fund | | | 2,216,055 | | | | 2,271,453 | |
| Technology Fund | | | 407,651 | | | | 414,863 | |
| Transportation Fund | | | 2,076,173 | | | | 2,147,050 | |
| Utilities Fund | | | 608,760 | | | | 621,000 | |
| | THE RYDEX FUNDS ANNUAL REPORT | 173 |
NOTES TO FINANCIAL STATEMENTS (continued)
Cash collateral received was invested in the following joint repurchase agreements at March 31, 2015:
Counterparty and
Terms of Agreement | | Face Value | | Repurchase Price | | Collateral | | Par Value | | Fair Value |
| HSBC Securities, Inc. | | | | | | Fannie Mae Strips | | | | |
| 0.10% | | | | | | 0.00% | | | | |
| Due 04/01/15 | $ | 79,049,877 | $ | 79,050,097 | | 11/15/17 - 07/15/37 | $ | 88,174,397 | $ | 60,687,161 |
| | | | | | | Federal Farm Credit Bank | | |
| | | | | | | 0.19% | | | | |
| | | | | | | 06/12/17 | | 19,951,092 | | 19,953,750 |
| | | | | | | | | | | |
| BNP Paribas Securities Corp. | | | | U.S. Treasury Note | | | | |
| 0.10% | | | | | | 2.13% | | | | |
| Due 04/01/15 | | 27,193,159 | | 27,193,235 | | 12/31/21 | | 12,501,039 | | 12,885,473 |
| | | | | | | U.S. Treasury Bond | | | | |
| | | | | | | 4.38% | | | | |
| | | | | | | 05/15/41 | | 10,788,895 | | 14,854,435 |
| | | | | | | | | | | |
| Barclays Capital Corp. | | | | | | U.S. Treasury Strips | | | | |
| 0.10% | | | | | | 0.00% | | | | |
| Due 04/01/15 | | 14,036,097 | | 14,036,136 | | 05/15/20 - 05/15/44 | | 21,715,762 | | 12,902,275 |
| | | | | | | U.S. Treasury Bond | | | | |
| | | | | | | 4.75% | | | | |
| | | | | | | 02/15/41 | | 985,316 | | 1,416,081 |
There is also $1,757,962 in segregated cash held as collateral.
7. Securities Transactions
For the year ended March 31, 2015, the cost of purchases and proceeds from sales of investment securities, excluding government securities, short-term investments and derivatives, were as follows:
| Fund | | Purchases | | | Sales | |
| Banking Fund | | $ | 135,946,530 | | | $ | 108,340,149 | |
| Basic Materials Fund | | | 200,119,765 | | | | 194,143,266 | |
| Biotechnology Fund | | | 611,639,225 | | | | 520,960,890 | |
| Consumer Products Fund | | | 346,285,232 | | | | 223,825,308 | |
| Electronics Fund | | | 160,176,965 | | | | 152,855,827 | |
| Energy Fund | | | 279,180,603 | | | | 278,416,963 | |
| Energy Services Fund | | | 216,265,966 | | | | 225,371,504 | |
| Financial Services Fund | | | 160,654,349 | | | | 135,362,342 | |
| Health Care Fund | | | 374,084,671 | | | | 310,722,642 | |
| Internet Fund | | | 110,052,345 | | | | 151,315,640 | |
| Leisure Fund | | | 155,263,174 | | | | 121,627,373 | |
| Precious Metals Fund | | | 216,481,995 | | | | 211,473,003 | |
| Real Estate Fund | | | 275,117,133 | | | | 257,426,152 | |
| Retailing Fund | | | 138,363,362 | | | | 142,920,592 | |
| Technology Fund | | | 103,419,562 | | | | 117,071,746 | |
| Telecommunications Fund | | | 48,004,904 | | | | 51,178,819 | |
| Transportation Fund | | | 218,510,025 | | | | 219,921,665 | |
| Utilities Fund | | | 367,917,354 | | | | 400,036,847 | |
| 174 | THE RYDEX FUNDS ANNUAL REPORT | |
NOTES TO FINANCIAL STATEMENTS (continued)
8. Line of Credit
The Trust, along with other affiliated trusts, secured an uncommitted, $75,000,000 line of credit from U.S. Bank, N.A., which expires June 13, 2015. This line of credit is reserved for emergency or temporary purposes. Borrowings, if any, under this arrangement bear interest equal to the Prime Rate, minus 2%, which shall be paid monthly, averaging 1.25% for the year ended March 31, 2015. On March 31, 2015, the Financial Services Fund and Technology Fund borrowed $557,000 and $260,000, respectively, under this agreement. The Funds did not have any other borrowings under this agreement at March 31, 2015.
The average daily balances borrowed for the year ended March 31, 2015, were as follows:
| Fund | | Average Daily Balance | |
| Banking Fund | | $ | 11,630 | |
| Basic Materials Fund | | | 7,706 | |
| Biotechnology Fund | | | 417,893 | |
| Consumer Products Fund | | | 18,134 | |
| Electronics Fund | | | 23,079 | |
| Energy Fund | | | 14,944 | |
| Energy Services Fund | | | 25,436 | |
| Financial Services Fund | | | 18,157 | |
| Health Care Fund | | | 19,592 | |
| Internet Fund | | | 23,123 | |
| Leisure Fund | | | 9,128 | |
| Precious Metals Fund | | | 19,996 | |
| Real Estate Fund | | | 29,421 | |
| Retailing Fund | | | 23,655 | |
| Technology Fund | | | 16,097 | |
| Telecommunications Fund | | | 3,748 | |
| Transportation Fund | | | 40,928 | |
| Utilities Fund | | | 98,347 | |
9. Reverse Share Splits
A reverse share split occurred for the following Funds at the close of business:
| Fund | Effective Date | Split Type |
| Technology Fund | February 7, 2014 | One-for-Three-Reverse Split |
| Telecommunications Fund | February 7, 2014 | One-for-Three-Reverse Split |
The effect of these transactions was to divide the number of outstanding shares of the Funds by the respective split ratio, resulting in a corresponding increase in the NAV. The share transactions presented in the statements of changes in net assets and the per share data in the financial highlights for each of the periods presented through February 7, 2014 have been restated to reflect these reverse share splits. There were no changes in net assets, results of operations or total return as a result of these transactions.
| | THE RYDEX FUNDS ANNUAL REPORT | 175 |
NOTES TO FINANCIAL STATEMENTS (continued)
10. Legal Proceedings
Tribune Company
Rydex Series Funds has been named as a defendant and a putative member of the proposed defendant class of shareholders in the case entitled Kirschner v. FitzSimons, No. 12-2652 (S.D.N.Y.) (formerly Official Committee of Unsecured Creditors of Tribune Co. v. FitzSimons, Adv. Pro. No. 10-54010 (Bankr. D. Del.)) (the “FitzSimons action”), as a result of ownership by certain series of the Rydex Series Funds of shares in the Tribune Company (“Tribune”) in 2007, when Tribune effected a leveraged buyout transaction (“LBO”) by which Tribune converted to a privately-held company. In his complaint, the plaintiff has alleged that, in connection with the LBO, Tribune insiders and shareholders were overpaid for their Tribune stock using financing that the insiders knew would, and ultimately did, leave the Tribune Company insolvent. The plaintiff has asserted claims against certain insiders, major shareholders, professional advisers, and others involved in the LBO. The plaintiff is also attempting to obtain from former Tribune shareholders, including the Rydex Series Funds, the proceeds they received in connection with the LBO.
In June 2011, a group of Tribune creditors filed multiple actions against former Tribune shareholders involving state law constructive fraudulent conveyance claims arising out of the 2007 LBO (the “SLCFC actions”). Rydex Series Funds has been named as a defendant in one of the SLCFC actions: Deutsche Bank Trust Co. Americas v. McGurn, No. 11-1510 (S.D.N.Y.). In those actions, the creditors seek to recover from Tribune’s former shareholders the proceeds received in connection with the 2007 LBO.
The FitzSimons action and the SLCFC actions have been consolidated with the majority of the other Tribune LBO-related lawsuits in a multidistrict litigation proceeding captioned In re Tribune Company Fraudulent Conveyance Litig., No. 11-md-2696 (S.D.N.Y.) (the “MDL Proceeding”).
On September 23, 2013, the District Court granted the defendants’ omnibus motion to dismiss the SLCFC actions, on the basis that the creditors lacked standing. On September 30, 2013, the creditors filed a notice of appeal of the September 23 order. On October 28, 2013, the defendants filed a joint notice of cross-appeal of that same order.
The SLCFC appeals have been fully briefed, and oral argument in front of the U.S. Court of Appeals for the Second Circuit occurred on November 5, 2014. The Court has not yet issued a decision on the appeals.
On May 23, 2014, the defendants filed motions to dismiss the FitzSimons action, including a global motion to dismiss Count I, which is the claim brought against former Tribune shareholders for intentional fraudulent conveyance under U.S. federal law. The Court has not yet issued a decision on any of these motions.
None of these lawsuits alleges any wrongdoing on the part of Rydex Series Funds. The following series of Rydex Series Funds held shares of Tribune and tendered these shares as part of Tribune’s LBO: Nova Fund, S&P 500® Pure Value Fund, Multi-Cap Core Equity Fund, S&P 500® Fund, Multi-Hedge Strategies Fund and Hedged Equity Fund (the “Funds”). The value of the proceeds received by the foregoing Funds was $28,220, $109,242, $9,860, $3,400, $1,181,160, and $10,880, respectively. At this stage of the proceedings, Rydex Series Funds is not able to make a reliable predication as to the outcome of these lawsuits or the effect, if any, on a Fund’s net asset value.
Lyondell Chemical Company
In December 2011, Rydex Series Funds was named as a defendant in Weisfelner, as Trustee of the LB Creditor Trust, v. Fund 1 (In re Lyondell Chemical Co.), Adv. Pro. No. 10-4609 (Bankr. S.D.N.Y.) (the “Creditor Trust action”).
Similar to the claims made in the Tribune matter, the Weisfelner complaint seeks to have set aside and recovered as fraudulent transfers from former Lyondell Chemical Company (“Lyondell”) shareholders the consideration paid to them pursuant to the cash out merger of Lyondell shareholders in connection with the combination of Lyondell and Basell AF in 2007. Lyondell filed for bankruptcy in 2008.
| 176 | THE RYDEX FUNDS ANNUAL REPORT | |
NOTES TO FINANCIAL STATEMENTS (concluded)
On April 7, 2014, the plaintiff filed a Third Amended Complaint. In the related action entitled Weisfelner, as Trustee of the LB Litigation Trust v. A. Holmes & H. Holmes TTEE (In re Lyondell Co.), Adversary Proceeding No. 10-5525 (Bankr. S.D.N.Y.) (the “Litigation Trust action”), the plaintiff also filed a Second Amended Complaint that alleges a claim against the former Lyondell shareholders under federal law for intentional fraudulent transfer. A third related action against the former Lyondell shareholders, Weisfelner, as Trustee of the LB Creditor Trust v. Reichman, Adversary Proceeding No. 12-1570 (Bankr. S.D.N.Y.) (the “Reichman action”), is pending as well.
On May 8, 2014, the plaintiff in the Litigation Trust action filed a motion to certify a defendant class generally comprised of all former Lyondell shareholders that received proceeds in exchange for their shares in the 2007 merger transaction.
On July 30, 2014, the defendants filed a motion to dismiss these lawsuits. The Court held oral argument on the motions to dismiss and on the motion for class certification on January 14 and January 15, 2015. The Court has not yet issued decisions on these motions. Discovery has commenced in these lawsuits.
These lawsuits do not allege any wrongdoing on the part of Rydex Series Funds. The following series of Rydex Series Funds received cash proceeds from the cash out merger in the following amounts: Basic Materials Fund - $1,725,168; Long Short Equity Fund f/k/a U.S. Long Short Momentum Fund - $2,193,600; Global 130/30 Strategy Fund - $37,920; Hedged Equity Fund - $1,440; and Multi-Hedge Strategies Fund - $1,116,480. At this stage of the proceedings, Rydex Series Funds is not able to make a reliable predication as to the outcome of these lawsuits or the effect, if any, on a Fund’s net asset value.
| | THE RYDEX FUNDS ANNUAL REPORT | 177 |
REPORT OF INDEPENDENT REGISTERED PUBLIC ACCOUNTING FIRM
The Board of Trustees and Shareholders
of Rydex Series Funds:
We have audited the accompanying statements of assets and liabilities, including the schedules of investments, of Banking Fund, Basic Materials Fund, Biotechnology Fund, Consumer Products Fund, Electronics Fund, Energy Fund, Energy Services Fund, Financial Services Fund, Health Care Fund, Internet Fund, Leisure Fund, Precious Metals Fund, Real Estate Fund, Retailing Fund, Technology Fund, Telecommunications Fund, Transportation Fund and Utilities Fund (eighteen of the series constituting the Rydex Series Funds) (the “Funds”) as of March 31, 2015, and the related statements of operations for the year then ended, the statements of changes in net assets for each of the two years in the period then ended, and the financial highlights for each of the five years in the period then ended. These financial statements and financial highlights are the responsibility of the Funds’ management. Our responsibility is to express an opinion on these financial statements and financial highlights based on our audits.
We conducted our audits in accordance with the standards of the Public Company Accounting Oversight Board (United States). Those standards require that we plan and perform the audit to obtain reasonable assurance about whether the financial statements and financial highlights are free of material misstatement. We were not engaged to perform an audit of the Funds’ internal control over financial reporting. Our audits included consideration of internal control over financial reporting as a basis for designing audit procedures that are appropriate in the circumstances, but not for the purpose of expressing an opinion on the effectiveness of the Funds’ internal control over financial reporting. Accordingly, we express no such opinion. An audit also includes examining, on a test basis, evidence supporting the amounts and disclosures in the financial statements and financial highlights, assessing the accounting principles used and significant estimates made by management, and evaluating the overall financial statement presentation. Our procedures included confirmation of securities owned as of March 31, 2015, by correspondence with the custodian and brokers or by other appropriate auditing procedures where replies from brokers were not received. We believe that our audits provide a reasonable basis for our opinion.
In our opinion, the financial statements and financial highlights referred to above present fairly, in all material respects, the financial position of the above listed Funds (eighteen of the series constituting the Rydex Series Funds) at March 31, 2015, the results of their operations for the year then ended, the changes in their net assets for each of the two years in the period then ended, and their financial highlights for each of the five years in the period then ended, in conformity with U.S. generally accepted accounting principles.
McLean, Virginia
May 21, 2015
| 178 | THE RYDEX FUNDS ANNUAL REPORT | |
OTHER INFORMATION (Unaudited)
Tax Information
This information is being provided as required by the Internal Revenue Code. Amounts shown may differ from those elsewhere in the report because of differences in tax and financial reporting practice.
Of the taxable ordinary income distributions paid during the fiscal year ending March 31, 2015, the following funds had the corresponding percentages qualify for the dividends received deduction for corporations:
| Fund | % Qualifying |
| Banking Fund | 100.00% |
| Basic Materials Fund | 100.00% |
| Consumer Products Fund | 65.82% |
| Energy Fund | 100.00% |
| Financial Services Fund | 100.00% |
| Health Care Fund | 100.00% |
| Internet Fund | 11.55% |
| Leisure Fund | 100.00% |
| Precious Metals Fund | 74.97% |
| Real Estate Fund | 1.75% |
| Telecommunications Fund | 100.00% |
| Utilities Fund | 100.00% |
Additionally, the following amounts of taxable ordinary income dividends paid during the fiscal year qualified for the lower income tax rate available to individuals under the Jobs and Growth Tax Relief Reconciliation Act of 2003:
| Fund | % Qualifying |
| Banking Fund | 100.00% |
| Basic Materials Fund | 100.00% |
| Consumer Products Fund | 59.55% |
| Energy Fund | 100.00% |
| Financial Services Fund | 100.00% |
| Health Care Fund | 100.00% |
| Internet Fund | 7.55% |
| Leisure Fund | 100.00% |
| Precious Metals Fund | 97.79% |
| Real Estate Fund | 0.11% |
| Telecommunications Fund | 100.00% |
| Utilities Fund | 100.00% |
Additionally, of the taxable ordinary income distributions paid during the fiscal year ending March 31, 2015, the following funds had the corresponding percentages qualify as interest related dividends and qualified short-term capital gains as permitted by IRC Section 871(k)(1) and IRC Section 871(k)(2), respectively:
| Fund | % Qualifying | % STCG Qualifying |
| Biotechnology Fund | 0.00% | 100.00% |
| Consumer Products Fund | 0.00% | 100.00% |
| Health Care Fund | 0.00% | 100.00% |
| Internet Fund | 0.00% | 100.00% |
| | THE RYDEX FUNDS ANNUAL REPORT | 179 |
OTHER INFORMATION (Unaudited)(concluded)
With respect to the taxable year ended March 31, 2015, the Funds hereby designate as capital gain dividends the amounts listed below, or, if subsequently determined to be different, the net capital gain of such year:
| Fund | | From long-term capital gains, subject to the 15% rate gains category: | | | From long-term capital gains, using proceeds from shareholder redemptions: | |
| Biotechnology Fund | | $ | 3,761,283 | | | $ | 18,139,533 | |
| Consumer Products Fund | | | — | | | | 2,853,980 | |
| Energy Fund | | | — | | | | 739,273 | |
| Financial Services Fund | | | — | | | | 42,471 | |
| Health Care Fund | | | 2,095,865 | | | | 3,146,358 | |
| Internet Fund | | | — | | | | 1,008,905 | |
| Leisure Fund | | | 893,915 | | | | 3,786,003 | |
Proxy Voting Information
A description of the policies and procedures that the Trust uses to determine how to vote proxies relating to securities held in the Funds’ portfolios is available, without charge and upon request, by calling 800.820.0888. This information is also available from the EDGAR database on the SEC’s website at http://www.sec.gov.
Information regarding how the Funds voted proxies relating to portfolio securities during the most recent 12-month period ended June 30 is available without charge, upon request, by calling 800.820.0888. This information is also available from the EDGAR database on the SEC’s website at http://www.sec.gov.
Quarterly Portfolio Schedules Information
The Trust files its complete schedule of portfolio holdings with the SEC for the first and third quarters of each fiscal year on Form N-Q; which are available on the SEC’s website at http://www.sec.gov. The Funds’ Forms N-Q may be reviewed and copied at the SEC’s Public Reference Room in Washington, DC, and that information on the operation of the Public Reference Room may be obtained by calling 800-SEC-0330. Copies of the portfolio holdings are also available to shareholders, without charge and upon request, by calling 800.820.0888.
| 180 | THE RYDEX FUNDS ANNUAL REPORT | |
INFORMATION ON BOARD OF TRUSTEES AND OFFICERS (Unaudited)
A Board of Trustees oversees the Trust, as well as other trusts of GI, in which its members have no stated term of service, and continue to serve after election until resignation. The Statement of Additional Information includes further information about Fund Trustees and Officers, and can be obtained without charge by calling 800.820.0888.
Name, Address* and Year of Birth of Trustee | | Position(s) Held with the Trust, Term of Office and Length of Time Served | | Principal Occupation(s) During Past 5 Years | | Number of Portfolios in Fund Complex Overseen by Trustee*** | | Other Directorships Held by Trustee |
| INTERESTED TRUSTEE | | | | | | |
Donald C. Cacciapaglia** (1951) | | Trustee from 2012 to present. | | Current: President and CEO, certain other funds in the Fund Complex (2012-present); Vice Chairman, Guggenheim Investments (2010-present). Former: Chairman and CEO, Channel Capital Group, Inc. (2002-2010). | | 221 | | Clear Spring Life Insurance Company (2015-present); Guggenheim Partners Japan, Ltd. (2014-present); Delaware Life (2013-present); Guggenheim Life and Annuity Company (2011-present); Paragon Life Insurance Company of Indiana (2011-present). |
| INDEPENDENT TRUSTEES | | | | | | |
Corey A. Colehour (1945) | | Trustee and Member of the Audit, Governance, Nominating, and Investment and Performance Committees from 1998 to present. | | Retired. | | 133 | | None. |
J. Kenneth Dalton (1941) | | Trustee, Member and Chairman of the Audit Committee, and Member of the Governance and Nominating Committees from 1998 to present; and Member of the Risk Oversight Committee from 2010 to present. | | Retired. | | 133 | | Epiphany Funds (4) (2009-present). |
John O. Demaret (1940) | | Vice Chairman of the Board of Trustees from 2014 to present; Trustee from 1998 to present and Chairman of the Board from 2006 to 2014; Member and Chairman of the Audit Committee from 1998 to present; and Member of the Risk Oversight Committee from 2010 to present. | | Retired. | | 133 | | None. |
| | THE RYDEX FUNDS ANNUAL REPORT | 181 |
INFORMATION ON BOARD OF TRUSTEES AND OFFICERS (Unaudited)(continued)
Name, Address* and Year of Birth of Trustee | | Position(s) Held with the Trust, Term of Office and Length of Time Served | | Principal Occupation(s) During Past 5 Years | | Number of Portfolios in Fund Complex Overseen by Trustee*** | | Other Directorships Held by Trustee |
| INDEPENDENT TRUSTEES - concluded | | | | | | |
Werner E. Keller (1940) | | Chairman of the Board from 2014 to present; Vice Chairman of the Board of Trustees from 2010 to 2014; Trustee and Member of the Audit, Governance, and Nominating Committees from 2005 to present; and Chairman and Member of the Risk Oversight Committee from 2010 to present. | | Current: Founder and President, Keller Partners, LLC (investment research firm) (2005-present). | | 133 | | None. |
Thomas F. Lydon, Jr. (1960) | | Trustee and Member of the Audit, Governance, and Nominating Committees from 2005 to present. | | Current: President, Global Trends Investments (registered investment adviser) (1996-present). | | 133 | | US Global Investors (GROW) (1995-present). |
Patrick T. McCarville (1942) | | Trustee, Member of the Audit Committee, and Chairman and Member of the Governance and Nominating Committees from 1998 to present. | | Retired. Former: Chief Executive Officer, Par Industries, Inc., d/b/a Par Leasing (1977-2010). | | 133 | | None. |
Name, Address* and Year of Birth | | Position(s) Held with the Trust, Term of Office and Length of Time Served | | Principal Occupation(s) During Past 5 Years |
| OFFICERS | | | | |
Donald C. Cacciapaglia (1951) | | President (2012-present). | | Current: President and CEO, certain other funds in the Fund Complex (2012-present); Vice Chairman, Guggenheim Investments (2010-present). Former: Chairman and CEO, Channel Capital Group Inc. (2002-2010). |
Michael P. Byrum (1970) | | Vice President (1999-present). | | Current: Senior Vice President, Security Investors, LLC (2010-present); President and Chief Investment Officer, Rydex Holdings, LLC (2008-present); Director and Chairman, Advisory Research Center, Inc. (2006-present); Manager, Guggenheim Specialized Products, LLC (2005-present). Former: Vice President, Guggenheim Distributors, LLC (2009); Director (2009-2010) and Secretary (2002-2010), Rydex Fund Services, LLC; Director (2008-2010), Chief Investment Officer (2006-2010), President (2004-2010) and Secretary (2002-2010), Rydex Advisors, LLC; Director (2008-2010), Chief Investment Officer (2006-2010), President (2004-2010) and Secretary (2002-2010), Rydex Advisors II, LLC. |
| 182 | THE RYDEX FUNDS ANNUAL REPORT | |
INFORMATION ON BOARD OF TRUSTEES AND OFFICERS (Unaudited)(concluded)
Name, Address* and Year of Birth | | Position(s) Held with the Trust, Term of Office and Length of Time Served | | Principal Occupation(s) During Past 5 Years |
| OFFICERS - concluded | | |
Nikolaos Bonos (1963) | | Vice President and Treasurer (2003-present). | | Current: Senior Vice President, Security Investors, LLC (2010-present); Chief Executive Officer, Guggenheim Specialized Products, LLC (2009-present); Chief Executive Officer & President, Rydex Fund Services, LLC (2009-present); Vice President, Rydex Holdings, LLC (2008-present). Former: Senior Vice President, Security Global Investors, LLC (2010-2011); and Senior Vice President, Rydex Advisors, LLC and Rydex Advisors II, LLC (2006-2011). |
Elisabeth Miller (1968) | | Chief Compliance Officer (2012-present). | | Current: CCO, certain other funds in the Fund Complex (2012-present); CCO, Security Investors, LLC (2012-present); CCO, Guggenheim Funds Investment Advisors, LLC (2012-present); Managing Director, Guggenheim Investments (2012-present); Vice President, Guggenheim Funds Distributors, LLC (March 2014-present). Former: CCO, Guggenheim Distributors, LLC (2009-March 2014); Senior Manager, Security Investors, LLC (2004-2009); Senior Manager, Guggenheim Distributors, LLC (2004-2009). |
Joseph M. Arruda (1966) | | Assistant Treasurer (2006-present). | | Current: Assistant Treasurer, certain other funds in the Fund Complex (2006-present); Vice President, Security Investors, LLC (2010-present); CFO and Manager, Guggenheim Specialized Products, LLC (2009-present). Former: Vice President, Security Global Investors, LLC (2010-2011); Vice President, Rydex Advisors, LLC (2010); Vice President, Rydex Advisors II, LLC (2010). |
Paul J. Davio (1972) | | Assistant Treasurer (2014-present). | | Current: Assistant Treasurer, certain other funds in the Fund Complex (2014-present); Director, Guggenheim Investments (2006-present). Former: Manager, Mutual Fund Administration, Guggenheim Investments (2003-2006). |
Amy J. Lee (1961) | | Vice President (2009-present) and Secretary (2012-present). | | Current: Chief Legal Officer, certain other funds in the Fund Complex (2013-present); Senior Managing Director, Guggenheim Investments (2012-present). Former: Vice President, Associate General Counsel and Assistant Secretary, Security Benefit Life Insurance Company and Security Benefit Corporation (2004-2012). |
| * | All Trustees and Officers may be reached c/o Guggenheim Investments, 805 King Farm Boulevard, Suite 600, Rockville, MD 20850. |
| ** | Mr. Cacciapaglia is an “interested” person of the Trust, as that term is defined in the 1940 Act by virtue of his affiliation with the Adviser’s parent company. |
| *** | The “Fund Complex” includes all closed-end and open-end funds (including all of their portfolios) advised by the Adviser and any funds that have an investment adviser or servicing agent that is an affiliated person of the Adviser. Information provided is as of the date of this report. |
| | THE RYDEX FUNDS ANNUAL REPORT | 183 |
GUGGENHEIM INVESTMENTS PRIVACY POLICIES (Unaudited)
Rydex Funds, Guggenheim Funds, Rydex Investments, Guggenheim Funds Distributors, LLC, Security Investors, LLC, Security Distributors, Inc., Guggenheim Partners Investment Managers, LLC, and Rydex Advisory Services (Collectively “Guggenheim Investments”).
Our Commitment to You
When you become a Guggenheim Investments investor, you entrust us with not only your hard-earned money but also with personal and financial information about you. We recognize that your relationship with us is based on trust and that you expect us to act responsibly and in your best interests. Because we have access to this private information about you, we hold ourselves to the highest standards in its safekeeping and use. This means, most importantly, that we do not sell client information to anyone—whether it is your personal information or if you are a current or former Guggenheim Investments client.
The Information We Collect About You
In the course of doing business with shareholders and investors, we collect nonpublic personal information about you. You typically provide personal information when you complete a Guggenheim Investments account application or when you request a transaction that involves Rydex and Guggenheim Investments funds or one of the Guggenheim Investments affiliated companies. “Nonpublic personal information” is personally identifiable private information about you. For example, it includes information regarding your name and address, Social Security or taxpayer identification number, assets, income, account balance, bank account information and investment activity (e.g., purchase and redemption history).
How We Handle Your Personal Information
As emphasized above, we do not sell information about current or former clients or their accounts to third parties. Nor do we share such information, except when necessary to complete transactions at your request or to make you aware of related investment products and services that we offer. Additional details about how we handle your personal information are provided below. To complete certain transactions or account changes that you direct, it may be necessary to provide identifying information to companies, individuals or groups that are not affiliated with Guggenheim Investments. For example, if you ask to transfer assets from another financial institution to Guggenheim Investments, we will need to provide certain information about you to that company to complete the transaction. To alert you to other Guggenheim Investments investment products and services, we may share your information within the Guggenheim Investments family of affiliated companies. This would include, for example, sharing your information within Guggenheim Investments so we can make you aware of new Rydex and Guggenheim Investments funds or the services offered through another Guggenheim Investments affiliated company. In certain instances, we may contract with nonaffiliated companies to perform services for us. Where necessary, we will disclose information we have about you to these third parties. In all such cases, we provide the third party with only the information necessary to carry out its assigned responsibilities and only for that purpose. And we require these third parties to treat your private information with the same high degree of confidentiality that we do. In certain instances, we may share information with other financial institutions regarding individuals and entities in response to the U.S.A. Patriot Act. Finally, we will release information about you if you direct us to do so, if we are compelled by law to do so or in other circumstances permitted by law.
Opt Out Provisions
We do not sell your personal information to anyone. The law allows you to “opt out” of only certain kinds of information sharing with third parties. The firm does not share personal information about you with any third parties that triggers this opt-out right. This means YOU ARE ALREADY OPTED OUT.
| 184 | THE RYDEX FUNDS ANNUAL REPORT | |
GUGGENHEIM INVESTMENTS PRIVACY POLICIES (Unaudited)(concluded)
How We Protect Privacy Online
Our concern for the privacy of our shareholders also extends to those who use our web site, guggenheiminvestments.com. Our web site uses some of the most secure forms of online communication available, including encryption technology, Secure Socket Layer (SSL) protocol, firewalls and user names and passwords. These technologies provide a high level of security and privacy when you access your account information or initiate online transactions. The Guggenheim Investments web site offers customized features that require our use of “http cookies”—tiny pieces of information that we ask your browser to store. However, we make very limited use of these cookies. We only use cookies for session management and security features on the Guggenheim Investments web site. We do not use them to pull data from your hard drive, to learn your email address, or to view data in cookies created by other web sites. We will not share the information in our cookies or give others access to it. See the legal information area on our web site for more details about web site security and privacy features.
How We Safeguard Your Personal Information
We restrict access to nonpublic personal information about shareholders to our employees and in some cases to third parties (for example, the service providers described above) as permitted by law. We maintain strict physical, electronic and procedural safeguards that comply with federal standards to guard your nonpublic personal information.
We’ll Keep You Informed
As required by federal law, we will notify shareholders of our privacy policy annually. We reserve the right to modify this policy at any time, but rest assured that if we do change it, we will tell you promptly. You will also be able to access our privacy policy from our web site at guggenheiminvestments.com. Should you have any questions regarding our privacy policy, contact us at 800.820.0888 or 301.296.5100.
| | THE RYDEX FUNDS ANNUAL REPORT | 185 |
This page intentionally left blank.
This page intentionally left blank.
This page intentionally left blank.
This page intentionally left blank.
3.31.2015
Rydex Funds Annual Report
| Domestic Equity Fund |
NASDAQ-100® Fund | | |
| ROTC-ANN-2-0315x0316 | guggenheiminvestments.com |

| DEAR SHAREHOLDER | 2 |
| ECONOMIC AND MARKET OVERVIEW | 3 |
| ABOUT SHAREHOLDERS’ FUND EXPENSES | 6 |
NASDAQ-100® FUND | 9 |
| NOTES TO FINANCIAL STATEMENTS | 25 |
| REPORT OF INDEPENDENT REGISTERED PUBLIC ACCOUNTING FIRM | 45 |
| OTHER INFORMATION | 46 |
| INFORMATION ON BOARD OF TRUSTEES AND OFFICERS | 48 |
| GUGGENHEIM INVESTMENTS PRIVACY POLICIES | 53 |
| | THE RYDEX FUNDS ANNUAL REPORT | 1 |
Dear Shareholder:
Security Investors, LLC (the “Investment Adviser”) is pleased to present the annual shareholder report for one of our Rydex Funds (the “Fund”). This report covers performance for the one-year period ended March 31, 2015.
The Investment Adviser is part of Guggenheim Investments, which represents the investment management businesses of Guggenheim Partners, LLC, (“Guggenheim”) a global, diversified financial services firm.
Guggenheim Funds Distributors, LLC is the distributor of the Funds. Guggenheim Funds Distributors, LLC is affiliated with Guggenheim and the Investment Adviser.
We encourage you to read the Economic and Market Overview section of the report, which follows this letter, and then the Performance Report and Fund Profile for the Fund.
We are committed to providing innovative investment solutions and appreciate the trust you place in us.
Sincerely,
Donald C. Cacciapaglia
President
April 30, 2015
Read a prospectus and summary prospectus (if available) carefully before investing. It contains the investment objectives, risks, charges, expenses, and other information, which should be considered carefully before investing. Obtain a prospectus and summary prospectus (if available) at guggenheiminvestments.com or call 800.820.0888.
There can be no assurance that any investment product will achieve its investment objective(s). There are risks associated with investing, including the entire loss of principal invested. Investing involves market risks. The investment return and principal value of any investment product will fluctuate with changes in market conditions. The Fund is subject to the risk that large-capitalization stocks may underperform other segments of the equity market or the equity markets as a whole.
| 2 | THE RYDEX FUNDS ANNUAL REPORT | |
ECONOMIC AND MARKET OVERVIEW (Unaudited) | March 31, 2015 |
The U.S. continued to enjoy a self-sustaining economic expansion for the 12-month period ended March 31, 2015, although winter weather was likely to distort first-quarter economic data. In addition, U.S. companies scaled back hiring in the last month of the period, adding to evidence that the domestic economy has lost some momentum since the turn of the year. The March increase in payrolls was the smallest since December 2013 and broke a 12-month run of gains above 200,000.
Despite this short-term dislocation, the economy remains on track. Indeed, many other labor market indicators, such as initial jobless claims and the job openings rate, suggest that the U.S. labor market remains quite strong, supporting the conclusion that March’s payroll report was just a temporary blip, similar to the one witnessed last winter. As soon as temporary seasonal factors have dissipated, economic data is likely to bounce back. The labor market has improved over the past year, as subdued mortgage rates and tight housing inventory continue to point to fairly stable appreciation in the housing market, which is key to the ongoing recovery. Consumers are also being helped by lower fuel prices, which are acting as a tax cut for U.S. consumers, freeing up discretionary spending in other areas and acting as a support for consumption.
In Europe, economic data has been surprisingly good and should continue along that path on the back of the European Central Bank’s program of quantitative easing and depreciation of the euro. Japan’s economy remains weak and, without more structural reform, continued monetary accommodation could lead to stagflation. China’s policymakers appear likely to continue the supply of credit and do whatever else is necessary to maintain growth there at an acceptable pace for the near term.
Given weakness overseas and the effect of a stronger U.S. dollar on international earnings, some stocks could face a more challenging environment in the near term, but our research shows that equity markets tend to perform quite well in the periods leading up to a U.S. Federal Reserve (the “Fed”) rate increase. The yield on the 10-year Treasury note declined in January by more than 50 basis points before rebounding in February, echoing the pattern since 2009—Treasury yields decline and a sell-off ensues, driving rates higher. Then conditions stabilize, and rates test their previous lows. Liquidity from foreign central banks and comparatively attractive U.S. yields continue to push global investors to U.S. Treasuries, which should hold down U.S. interest rates in the near term.
Against this backdrop, the U.S. central bank feels pressure to raise its key rate above zero, but insists the decision will be data-dependent and not occur prematurely. With a secular inflation increase unlikely in the near term, slack in the economy, and disinflation being imported from abroad, the Fed may not hike rates until later in the year. The Fed for now appears to be focused on wage growth,
| | THE RYDEX FUNDS ANNUAL REPORT | 3 |
ECONOMIC AND MARKET OVERVIEW (Unaudited)(continued) | March 31, 2015 |
which is key for sustaining the expansion but also an indicator of inflationary pressure. The lack of sustained wage growth has been a topic that has confounded the Fed lately. Given the strengthening employment numbers and the apparent reduction in labor market slack, wages should start to increase more steadily across the board. This is one of the most important data points at the moment for the Fed.
The underlying U.S. economy remains strong and investors should avoid being panicked by seasonal setbacks. Indeed, considering the strength of the economy and the wave of liquidity emanating from various central banks around the world, the general investment environment should remain attractive.
For the 12 months ended March 31, 2015, the Standard & Poor’s 500® (“S&P 500”) Index* returned 12.73%. The Morgan Stanley Capital International (“MSCI”) Europe-Australasia-Far East (“EAFE”) Index* returned -0.92%. The return of the MSCI Emerging Markets Index* was 0.44%.
In the bond market, the Barclays U.S. Aggregate Bond Index* posted a 5.72% return for the period, while the Barclays U.S. Corporate High Yield Index* returned 2.00%. The return of the Bank of America Merrill Lynch 3-Month U.S. Treasury Bill Index* was 0.03% for the 12-month period.
The opinions and forecasts expressed may not actually come to pass. This information is subject to change at any time, based on market and other conditions, and should not be construed as a recommendation of any specific security or strategy.
*Index Definitions:
The following indices are referenced throughout this report. Indices are unmanaged and not available for direct investment. Index performance does not reflect transaction costs, fees, or expenses.
Barclays U.S. Aggregate Bond Index is a broad-based benchmark that measures the investment grade, U.S. dollar-denominated, fixed-rate taxable bond market, including U.S. Treasuries, government-related and corporate securities, MBS (agency fixed-rate and hybrid ARM pass-throughs), ABS, and CMBS.
Barclays U.S. Corporate High Yield Index measures the market of U.S. dollar-denominated, non-investment grade, fixed-rate, taxable corporate bonds. Securities are classified as high yield if the middle rating of Moody’s, Fitch, and S&P is Ba1/BB+/BB+ or below.
Bank of America (“BofA”) Merrill Lynch 3-Month U.S. Treasury Bill Index is an unmanaged market index of U.S. Treasury securities maturing in 90 days that assumes reinvestment of all income.
MSCI EAFE Index is a free float-adjusted market capitalization index that is designed to measure the equity market performance of developed markets, excluding the U.S. & Canada.
| 4 | THE RYDEX FUNDS ANNUAL REPORT | |
ECONOMIC AND MARKET OVERVIEW (Unaudited)(concluded) | March 31, 2015 |
MSCI Emerging Markets Index is a free float-adjusted market capitalization weighted index that is designed to measure equity market performance in the global emerging markets.
NASDAQ-100® Index includes 100 of the largest domestic and international non-financial securities listed on The Nasdaq Stock Market based on market capitalization. The index reflects companies across major industry groups including computer hardware and software, telecommunications, retail/wholesale trade, and biotechnology. It does not contain securities of financial companies, including investment companies.
S&P 500® Index is a capitalization-weighted index of 500 stocks designed to measure the performance of the broad economy, representing all major industries and is considered a representation of the U.S. stock market.
| | THE RYDEX FUNDS ANNUAL REPORT | 5 |
ABOUT SHAREHOLDERS’ FUND EXPENSES (Unaudited)
All mutual funds have operating expenses and it is important for our shareholders to understand the impact of costs on their investments. Shareholders of a Fund incur two types of costs: (i) transaction costs, including sales charges (loads) on purchase payments, reinvested dividends, or other distributions; and exchange fees; and (ii) ongoing costs, including management fees, administrative services, and shareholder reports, among others. These ongoing costs, or operating expenses, are deducted from a fund’s gross income and reduce the investment return of the fund.
A fund’s expenses are expressed as a percentage of its average net assets, which is known as the expense ratio. The following examples are intended to help investors understand the ongoing costs (in dollars) of investing in a Fund and to compare these costs with the ongoing costs of investing in other mutual funds.
The examples are based on an investment of $1,000 made at the beginning of the period and held for the entire six-month period beginning September 30, 2014 and ending March 31, 2015.
The following tables illustrate a Fund’s costs in two ways:
Table 1. Based on actual Fund return. This section helps investors estimate the actual expenses paid over the period. The “Ending Account Value” shown is derived from the Fund’s actual return, and the fourth column shows the dollar amount that would have been paid by an investor who started with $1,000 in the Fund. Investors may use the information here, together with the amount invested, to estimate the expenses paid over the period. Simply divide the Fund’s account value by $1,000 (for example, an $8,600 account value divided by $1,000 = 8.6), then multiply the result by the number provided under the heading “Expenses Paid During Period.”
Table 2. Based on hypothetical 5% return. This section is intended to help investors compare a Fund’s cost with those of other mutual funds. The table provides information about hypothetical account values and hypothetical expenses based on the Fund’s actual expense ratio and an assumed rate of return of 5% per year before expenses, which is not the Fund’s actual return. The hypothetical account values and expenses may not be used to estimate the actual ending account balance or expenses paid during the period. The example is useful in making comparisons because the U.S. Securities and Exchange Commission (the “SEC”) requires all mutual funds to calculate expenses based on the 5% return. Investors can assess a Fund’s costs by comparing this hypothetical example with the hypothetical examples that appear in shareholder reports of other funds.
| 6 | THE RYDEX FUNDS ANNUAL REPORT | |
ABOUT SHAREHOLDERS’ FUND EXPENSES (Unaudited)(continued)
The calculations illustrated above assume no shares were bought or sold during the period. Actual costs may have been higher or lower, depending on the amount of investment and the timing of any purchases or redemptions.
Please note that the expenses shown in the table are meant to highlight your ongoing costs only and do not reflect any transactional costs, such as sales charges (loads) on purchase payments, and contingent deferred sales charges ("CDSC") on redemptions, if any. Therefore, the second table is useful in comparing ongoing costs only, and will not help you determine the relative total costs of owning different funds. In addition, if these transactional costs were included, your costs would have been higher.
More information about a Fund’s expenses, including annual expense ratios for the past five years, can be found in the Financial Highlights section of this report. For additional information on operating expenses and other shareholder costs, please refer to the appropriate Fund prospectus.
| | THE RYDEX FUNDS ANNUAL REPORT | 7 |
ABOUT SHAREHOLDERS’ FUND EXPENSES (Unaudited)(concluded)
| | Expense Ratio1 | Fund Return | Beginning Account Value September 30, 2014 | Ending Account Value March 31, 2015 | Expenses Paid During Period2 |
Table 1. Based on actual Fund return3 |
NASDAQ-100® Fund |
| Investor Class | 1.24% | 7.01% | $1,000.00 | $1,070.10 | $6.40 |
| Advisor Class | 1.74% | 6.78% | 1,000.00 | 1,067.80 | 8.97 |
| A-Class | 1.48% | 6.89% | 1,000.00 | 1,068.90 | 7.63 |
| C-Class | 2.23% | 6.48% | 1,000.00 | 1,064.80 | 11.48 |
| H-Class | 1.47% | 6.76% | 1,000.00 | 1,067.60 | 7.58 |
| |
| Table 2. Based on hypothetical 5% return (before expenses) |
NASDAQ-100® Fund |
| Investor Class | 1.24% | 5.00% | $1,000.00 | $1,018.75 | $6.24 |
| Advisor Class | 1.74% | 5.00% | 1,000.00 | 1,016.26 | 8.75 |
| A-Class | 1.48% | 5.00% | 1,000.00 | 1,017.55 | 7.44 |
| C-Class | 2.23% | 5.00% | 1,000.00 | 1,013.81 | 11.20 |
| H-Class | 1.47% | 5.00% | 1,000.00 | 1,017.60 | 7.39 |
1 | Annualized and excludes expenses of the underlying funds in which the Fund invests. |
2 | Expenses are equal to the Fund's annualized expense ratio, net of any applicable fee waivers, multiplied by the average account value over the period, multiplied by 182/365 (to reflect the one-half year period). |
3 | Actual cumulative return at net asset value for the period September 30, 2014 to March 31, 2015. |
| 8 | THE RYDEX FUNDS ANNUAL REPORT | |
PERFORMANCE REPORT AND FUND PROFILE (Unaudited) | March 31, 2015 |
NASDAQ-100® FUND
OBJECTIVE: Seeks to provide investment results that correspond, before fees and expenses, to a benchmark for over-the-counter securities on a daily basis. The Fund’s current benchmark is the NASDAQ-100® Index (the “underlying index”).
For the one-year period ended March 31, 2015, NASDAQ-100® Fund maintained a daily correlation of over 99% to its benchmark of 100% of the daily price movement of the NASDAQ-100 Index. The NASDAQ-100® Fund Investor Class rose 20.53%, while the NASDAQ-100 Index returned 22.03% over the same period.
The Information Technology sector contributed most to performance of the underlying index, followed by the Health Care sector. Telecommunications Services was the only sector that detracted from performance. The Materials sector contributed least, followed by the Industrials sector.
Apple, Inc., Gilead Sciences, Inc., and Facebook, Inc. — Class A were the holdings contributing most to performance of the underlying index for the year. Wynn Resorts Ltd., Google, Inc. — Class C, and QUALCOMM, Inc. detracted most from performance of the underlying index for the year.
Derivatives in the Fund were used to help provide exposure to the composition of the benchmark in the highest efficient manner and not for hedging purposes. The results of derivatives used during the period were within our expectations and contributed to the Fund’s performance.
The Fund invests excess cash into the Guggenheim Strategy Funds, which, in turn, invest in a diversified portfolio of debt securities and financial instruments providing exposure to fixed-income markets. The investment objective of the Guggenheim Strategy Funds is to seek a high level of income consistent with the preservation of capital. For the one year period ended March 31, 2015, investment in the Guggenheim Strategy Funds benefited Fund performance relative to investing in other short-term investments such as overnight repurchase agreements.
Performance displayed represents past performance, which is no guarantee of future results.
| | THE RYDEX FUNDS ANNUAL REPORT | 9 |
PERFORMANCE REPORT AND FUND PROFILE (Unaudited)(continued) | March 31, 2015 |
Holdings Diversification (Market Exposure as % of Net Assets)
“Holdings Diversification (Market Exposure as % of Net Assets)” excludes any temporary cash investments or investments in Guggenheim Strategy Funds Trust mutual funds. Investments in those Funds do not provide “market exposure” to meet the Fund’s investment objective, but will significantly increase the portfolio’s exposure to certain other asset categories (and their associated risks), which may cause the Fund to deviate from its principal investment strategy, including: (i) high yield, high risk debt securities rated below the top four long-term rating categories by a nationally recognized statistical rating organization (also known as “junk bonds”); (ii) securities issued by the U.S. government or its agencies and instrumentalities; (iii) CLOs and similar investments; and (iv) other short-term fixed income securities.
| Inception Dates: |
| Investor Class | February 14, 1994 |
| Advisor Class | September 22, 1998 |
| A-Class | March 31, 2004 |
| C-Class | March 26, 2001 |
| H-Class | September 18, 2014 |
| Ten Largest Holdings (% of Total Net Assets) |
| Guggenheim Strategy Fund I | 14.6% |
| Apple, Inc. | 10.8% |
| Microsoft Corp. | 5.0% |
| Google, Inc. — Class C | 2.8% |
| Facebook, Inc. — Class A | 2.7% |
| Amazon.com, Inc. | 2.6% |
| Google, Inc. — Class A | 2.4% |
| Intel Corp. | 2.2% |
| Gilead Sciences, Inc. | 2.2% |
| Cisco Systems, Inc. | 2.1% |
| Top Ten Total | 47.4% |
| | |
| “Ten Largest Holdings” exclude any temporary cash or derivative investments. |
| 10 | THE RYDEX FUNDS ANNUAL REPORT | |
PERFORMANCE REPORT AND FUND PROFILE (Unaudited)(continued) | March 31, 2015 |
Cumulative Fund Performance*
| | THE RYDEX FUNDS ANNUAL REPORT | 11 |
PERFORMANCE REPORT AND FUND PROFILE (Unaudited)(concluded) | March 31, 2015 |
Average Annual Returns*
Periods Ended March 31, 2015
| | 1 Year | 5 Year | 10 Year |
| Investor Class Shares | 20.53% | 17.14% | 11.06% |
| Advisor Class Shares | 19.94% | 16.51% | 10.50% |
| A-Class Shares | 20.24% | 16.82% | 10.77% |
A-Class Shares with sales charge† | 14.54% | 15.69% | 10.23% |
| C-Class Shares | 19.37% | 15.97% | 9.97% |
C-Class Shares with CDSC‡ | 18.37% | 15.97% | 9.97% |
| NASDAQ-100 Index | 22.03% | 18.59% | 12.27% |
| | | | |
| | Since Inception (09/18/14) | | |
| H-Class Shares | 5.40% | | |
| NASDAQ-100 Index | 6.29% | | |
| * | The performance data above represents past performance that is not predictive of future results. The investment return and principal value of an investment in the Fund will fluctuate so that an investor’s shares, when redeemed, may be worth more or less than their original cost. Returns are historical and include changes in principal and reinvested dividends and capital gains and do not reflect the effect of taxes. The NASDAQ-100 Index is an unmanaged index and, unlike the Fund, has no management fees or operating expenses to reduce its reported return. The graphs are based on the Investor Class shares and A-Class shares only; performance for Advisor Class shares, C-Class shares and H-Class shares will vary due to differences in fee structures. |
† | Fund returns are calculated using the maximum sales charge of 4.75%. |
‡ | Fund returns include a CDSC of 1% if redeemed within 12 months of purchase. |
| 12 | THE RYDEX FUNDS ANNUAL REPORT | |
| SCHEDULE OF INVESTMENTS | March 31, 2015 |
NASDAQ-100® FUND | |
| | |
Shares | | | Value | |
| | | | | | | | |
COMMON STOCKS† - 74.2% | |
| | | | | | | | |
| TECHNOLOGY - 28.7% | |
| Apple, Inc. | | | 825,435 | | | $ | 102,708,876 | |
| Microsoft Corp. | | | 1,162,431 | | | | 47,258,632 | |
| Intel Corp. | | | 671,066 | | | | 20,984,234 | |
| QUALCOMM, Inc. | | | 233,735 | | | | 16,207,185 | |
| Texas Instruments, Inc. | | | 148,375 | | | | 8,484,824 | |
| Cognizant Technology Solutions Corp. — Class A* | | | 86,380 | | | | 5,389,248 | |
| Adobe Systems, Inc.* | | | 70,978 | | | | 5,248,113 | |
| Avago Technologies Ltd. | | | 36,327 | | | | 4,612,802 | |
| Micron Technology, Inc.* | | | 152,650 | | | | 4,141,395 | |
| Applied Materials, Inc. | | | 174,100 | | | | 3,927,696 | |
| Intuit, Inc. | | | 39,211 | | | | 3,801,899 | |
| Cerner Corp.* | | | 48,544 | | | | 3,556,333 | |
| Broadcom Corp. — Class A | | | 77,933 | | | | 3,374,109 | |
| NXP Semiconductor N.V.* | | | 32,696 | | | | 3,281,371 | |
| Western Digital Corp. | | | 32,736 | | | | 2,979,304 | |
| Analog Devices, Inc. | | | 44,156 | | | | 2,781,828 | |
| Fiserv, Inc.* | | | 33,821 | | | | 2,685,388 | |
| Electronic Arts, Inc.* | | | 43,931 | | | | 2,583,802 | |
| Paychex, Inc. | | | 51,456 | | | | 2,552,989 | |
| Seagate Technology plc | | | 46,525 | | | | 2,420,696 | |
| Activision Blizzard, Inc. | | | 102,435 | | | | 2,327,835 | |
| Check Point Software Technologies Ltd.* | | | 26,043 | | | | 2,134,745 | |
| CA, Inc. | | | 62,744 | | | | 2,046,082 | |
| SanDisk Corp. | | | 30,183 | | | | 1,920,242 | |
| Autodesk, Inc.* | | | 32,239 | | | | 1,890,495 | |
| Altera Corp. | | | 42,635 | | | | 1,829,468 | |
| Akamai Technologies, Inc.* | | | 25,221 | | | | 1,791,826 | |
| NVIDIA Corp. | | | 77,016 | | | | 1,611,560 | |
| Linear Technology Corp. | | | 33,893 | | | | 1,586,192 | |
| Lam Research Corp. | | | 22,576 | | | | 1,585,625 | |
| Xilinx, Inc. | | | 37,045 | | | | 1,567,004 | |
| NetApp, Inc. | | | 44,176 | | | | 1,566,481 | |
| Citrix Systems, Inc.* | | | 22,647 | | | | 1,446,464 | |
| KLA-Tencor Corp. | | | 23,048 | | | | 1,343,468 | |
| Total Technology | | | | | | | 273,628,211 | |
| | | | | | | | |
| COMMUNICATIONS - 23.5% | |
| Google, Inc. — Class C* | | | 48,272 | | | | 26,453,056 | |
| Facebook, Inc. — Class A* | | | 316,877 | | | | 26,052,043 | |
| Amazon.com, Inc.* | | | 65,801 | | | | 24,484,552 | |
| Google, Inc. — Class A* | | | 40,659 | | | | 22,553,547 | |
| Cisco Systems, Inc. | | | 723,314 | | | | 19,909,218 | |
| Comcast Corp. — Class A | | | 301,971 | | | | 17,052,302 | |
| eBay, Inc.* | | | 171,459 | | | | 9,889,755 | |
| Priceline Group, Inc.* | | | 7,360 | | | | 8,568,144 | |
| Baidu, Inc. ADR* | | | 39,259 | | | | 8,181,576 | |
| Twenty-First Century Fox, Inc. — Class A | | | 188,115 | | | | 6,365,812 | |
| DIRECTV* | | | 71,246 | | | | 6,063,035 | |
| Yahoo!, Inc.* | | | 132,644 | | | | 5,894,036 | |
| Liberty Global plc* | | | 88,665 | | | | 4,416,404 | |
| Twenty-First Century Fox, Inc. — Class B | | | 113,146 | | | | 3,720,240 | |
| Netflix, Inc.* | | | 8,573 | | | | 3,572,283 | |
| Viacom, Inc. — Class B | | | 50,324 | | | | 3,437,129 | |
| Comcast Corp. — Class A | | | 56,746 | | | | 3,181,464 | |
| Charter Communications, Inc. — Class A* | | | 15,870 | | | | 3,064,656 | |
| Sirius XM Holdings, Inc.* | | | 790,859 | | | | 3,021,081 | |
| Symantec Corp. | | | 96,690 | | | | 2,259,162 | |
| DISH Network Corp. — Class A* | | | 31,654 | | | | 2,217,679 | |
| Vodafone Group plc ADR | | | 61,083 | | | | 1,996,192 | |
| Liberty Interactive Corp. — Class A* | | | 63,127 | | | | 1,842,677 | |
| Liberty Global plc — Class A* | | | 35,608 | | | | 1,832,744 | |
| TripAdvisor, Inc.* | | | 18,439 | | | | 1,533,572 | |
| VimpelCom Ltd. ADR | | | 248,850 | | | | 1,303,974 | |
| Liberty Media Corp. — Class C* | | | 32,348 | | | | 1,235,694 | |
| Discovery Communications, Inc. — Class C* | | | 40,251 | | | | 1,186,398 | |
| Liberty Ventures* | | | 19,063 | | | | 800,837 | |
| Discovery Communications, Inc. — Class A* | | | 21,061 | | | | 647,836 | |
| Liberty Media Corp. — Class A* | | | 14,809 | | | | 570,887 | |
| Total Communications | | | | | | | 223,307,985 | |
| SEE NOTES TO FINANCIAL STATEMENTS. | THE RYDEX FUNDS ANNUAL REPORT | 13 |
SCHEDULE OF INVESTMENTS (continued) | March 31, 2015 |
NASDAQ-100® FUND | |
| | |
Shares | | | Value | |
| | | | | | | | | |
| CONSUMER, NON-CYCLICAL - 14.1% | |
| Gilead Sciences, Inc.* | | | 211,042 | | | $ | 20,709,550 | |
| Amgen, Inc. | | | 107,526 | | | | 17,188,031 | |
| Biogen, Inc.* | | | 33,244 | | | | 14,036,947 | |
| Celgene Corp.* | | | 113,439 | | | | 13,077,248 | |
| Express Scripts Holding Co.* | | | 102,997 | | | | 8,937,049 | |
| Mondelez International, Inc. — Class A | | | 233,724 | | | | 8,435,098 | |
| Kraft Foods Group, Inc. | | | 83,317 | | | | 7,258,160 | |
| Regeneron Pharmaceuticals, Inc.* | | | 14,260 | | | | 6,438,105 | |
| Automatic Data Processing, Inc. | | | 67,326 | | | | 5,765,798 | |
| Alexion Pharmaceuticals, Inc.* | | | 28,643 | | | | 4,963,832 | |
| Vertex Pharmaceuticals, Inc.* | | | 34,303 | | | | 4,046,725 | |
| Illumina, Inc.* | | | 20,376 | | | | 3,782,601 | |
| Monster Beverage Corp.* | | | 23,764 | | | | 3,288,819 | |
| Mylan N.V.* | | | 53,142 | | | | 3,153,978 | |
| Whole Foods Market, Inc. | | | 51,119 | | | | 2,662,278 | |
| Intuitive Surgical, Inc.* | | | 5,186 | | | | 2,619,086 | |
| Keurig Green Mountain, Inc. | | | 22,909 | | | | 2,559,623 | |
| Catamaran Corp.* | | | 29,401 | | | | 1,750,536 | |
| Henry Schein, Inc.* | | | 11,875 | | | | 1,657,988 | |
| Verisk Analytics, Inc. — Class A* | | | 22,404 | | | | 1,599,646 | |
| Total Consumer, Non-cyclical | | | | | | | 133,931,098 | |
| | | | | | | | |
| CONSUMER, CYCLICAL - 6.9% | |
| Walgreens Boots Alliance, Inc. | | | 154,443 | | | | 13,078,233 | |
| Starbucks Corp. | | | 106,242 | | | | 10,061,117 | |
| Costco Wholesale Corp. | | | 62,419 | | | | 9,456,166 | |
| American Airlines Group, Inc. | | | 98,713 | | | | 5,210,072 | |
Tesla Motors, Inc.*,1 | | | 17,820 | | | | 3,363,881 | |
| PACCAR, Inc. | | | 50,233 | | | | 3,171,712 | |
| Marriott International, Inc. — Class A | | | 39,185 | | | | 3,147,339 | |
| O’Reilly Automotive, Inc.* | | | 14,403 | | | | 3,114,505 | |
| Ross Stores, Inc. | | | 29,541 | | | | 3,112,440 | |
| Dollar Tree, Inc.* | | | 29,140 | | | | 2,364,565 | |
| Bed Bath & Beyond, Inc.* | | | 26,300 | | | | 2,019,183 | |
| Wynn Resorts Ltd. | | | 14,386 | | | | 1,810,910 | |
| Fastenal Co. | | | 41,871 | | | | 1,734,925 | |
| Tractor Supply Co. | | | 19,299 | | | | 1,641,573 | |
| Staples, Inc. | | | 90,731 | | | | 1,477,554 | |
| Mattel, Inc. | | | 47,929 | | | | 1,095,178 | |
| Total Consumer, Cyclical | | | | | | | 65,859,353 | |
| | | | | | | | |
| INDUSTRIAL - 0.8% | |
| SBA Communications Corp. — Class A* | | | 18,298 | | | | 2,142,696 | |
| Stericycle, Inc.* | | | 12,034 | | | | 1,689,935 | |
| CH Robinson Worldwide, Inc. | | | 20,753 | | | | 1,519,534 | |
| Expeditors International of Washington, Inc. | | | 27,170 | | | | 1,309,051 | |
| Garmin Ltd. | | | 27,179 | | | | 1,291,546 | |
| Total Industrial | | | | | | | 7,952,762 | |
| | | | | | | | |
| BASIC MATERIALS - 0.2% | |
| Sigma-Aldrich Corp. | | | 16,923 | | | | 2,339,605 | |
| | | | | | | | |
| Total Common Stocks | | | | | | | | |
| (Cost $298,897,283) | | | | | | | 707,019,014 | |
| | | | | | | | |
MUTUAL FUNDS† - 15.1% | |
Guggenheim Strategy Fund I2 | | | 5,591,468 | | | | 139,227,564 | |
Guggenheim Strategy Fund II3 | | | 160,062 | | | | 3,987,152 | |
| Total Mutual Funds | | | | | | | | |
| (Cost $142,966,534) | | | | | | | 143,214,716 | |
| | | | | | | | |
| | | Face
Amount | | | | |
| | | | | | | | |
REPURCHASE AGREEMENTS††,4 - 10.4% | |
HSBC Group
issued 03/31/15 at 0.03%
due 04/01/15 | | $ | 77,233,046 | | | | 77,233,046 | |
RBC Capital Markets
issued 03/31/15 at 0.05%
due 04/01/15 | | | 11,802,849 | | | | 11,802,849 | |
| 14 | THE RYDEX FUNDS ANNUAL REPORT | SEE NOTES TO FINANCIAL STATEMENTS. |
SCHEDULE OF INVESTMENTS (concluded) | March 31, 2015 |
NASDAQ-100® FUND | |
| | | Face
Amount | | | Value | |
| | | | | | | | | |
UMB Financial Corp.
issued 03/31/15 at 0.03%
due 04/01/15 | | $ | 9,473,727 | | | $ | 9,473,727 | |
| Total Repurchase Agreements | | | | | | | | |
| (Cost $98,509,622) | | | | | | | 98,509,622 | |
| | | | | | | | |
SECURITIES LENDING COLLATERAL††,5 - 0.3% | |
| Repurchase Agreements | | | | | | | | |
HSBC Securities, Inc.
issued 03/31/15 at 0.10%
due 04/01/15 | | | 1,625,277 | | | | 1,625,277 | |
BNP Paribas Securities Corp.
issued 03/31/15 at 0.10%
due 04/01/15 | | | 559,095 | | | | 559,095 | |
Barclays Capital, Inc.
issued 03/31/15 at 0.10%
due 04/01/15 | | | 288,584 | | | | 288,584 | |
| Total Securities Lending Collateral | | | | | | | | |
| (Cost $2,472,956) | | | | | | | 2,472,956 | |
| | | | | | | | |
| Total Investments - 100.0% | | | | | | | | |
| (Cost $542,846,395) | | | | | | $ | 951,216,308 | |
| Other Assets & Liabilities, net - 0.0% | | | | | | | 196,765 | |
| Total Net Assets - 100.0% | | | | | | $ | 951,413,073 | |
| | | | | | | | | |
| | | Contracts | | | Unrealized
Gain (Loss) | |
| | | | | | | | |
EQUITY FUTURES CONTRACTS PURCHASED† | |
June 2015 NASDAQ-100 Index
Mini Futures Contracts
(Aggregate Value of
Contracts $181,699,935) | | | 2,099 | | | $ | 1,035,096 | |
| | | | | | | | |
| | | Units | | | | |
| | | | | | | | |
OTC EQUITY INDEX SWAP AGREEMENTS†† | |
Goldman Sachs International
April 2015 NASDAQ-100 Index Swap,
Terminating 04/28/156
(Notional Value $25,655,951) | | | 5,920 | | | $ | 118,356 | |
Credit Suisse Capital, LLC
April 2015 NASDAQ-100 Index Swap,
Terminating 04/28/156
(Notional Value $4,196,576) | | | 968 | | | | 19,347 | |
Barclays Bank plc
April 2015 NASDAQ-100 Index Swap,
Terminating 04/30/156
(Notional Value $34,752,147) | | | 8,019 | | | | (30,008 | ) |
| (Total Notional Value $64,604,674) | | | | | | $ | 107,695 | |
| * | Non-income producing security. |
| † | Value determined based on Level 1 inputs — See Note 4. |
| †† | Value determined based on Level 2 inputs — See Note 4. |
| 1 | All or portion of this security is on loan at March 31, 2015 — See Note 6. |
| 2 | Affiliated issuer — See Note 12. |
| 3 | Investment in a product that is managed by and/or pays a management fee to a party related to the Adviser — See Note 12. |
| 4 | Repurchase Agreements — See Note 5. |
| 5 | Securities lending collateral — See Note 6. |
| 6 | Total Return based on NASDAQ-100 Index +/- financing at a variable rate. |
| ADR — American Depositary Receipt |
| plc — Public Limited Company |
| SEE NOTES TO FINANCIAL STATEMENTS. | THE RYDEX FUNDS ANNUAL REPORT | 15 |
| STATEMENT OF ASSETS AND LIABILITIES |
NASDAQ-100® FUND |
March 31, 2015
| Assets: | |
| Investments in unaffiliated issuers, at value – including $2,435,133 of securities loaned (cost $302,875,249) | | $ | 711,006,166 | |
| Investments in affiliated issuers, at value (cost $138,988,568) | | | 139,227,564 | |
| Repurchase agreements, at value (cost $100,982,578) | | | 100,982,578 | |
| Total investments (cost $542,846,395) | | | 951,216,308 | |
| Segregated cash with broker | | | 15,165,820 | |
| Unrealized appreciation on swap agreements | | | 137,703 | |
| Cash | | | 23,491 | |
| Receivables: | |
| Fund shares sold | | | 7,739,578 | |
| Dividends | | | 585,271 | |
| Swap settlement | | | 143,040 | |
| Securities lending income | | | 627 | |
| Interest | | | 89 | |
| Total assets | | | 975,011,927 | |
| | | | | |
| Liabilities: | |
| Unrealized depreciation on swap agreements | | | 30,008 | |
| Payable for: | |
| Securities purchased | | | 10,032,075 | |
| Fund shares redeemed | | | 7,794,993 | |
| Return of securities loaned | | | 2,509,100 | |
| Variation margin | | | 1,769,197 | |
| Management fees | | | 599,002 | |
| Transfer agent and administrative fees | | | 199,667 | |
| Distribution and service fees | | | 74,035 | |
| Portfolio accounting fees | | | 51,700 | |
| Miscellaneous | | | 539,077 | |
| Total liabilities | | | 23,598,854 | |
| Commitments and contingent liabilities (Note 13) | | | — | |
| Net assets | | $ | 951,413,073 | |
| | | | | |
| Net assets consist of: | |
| Paid in capital | | $ | 542,505,104 | |
| Accumulated net investment income | | | — | |
| Accumulated net realized loss on investments | | | (604,735 | ) |
| Net unrealized appreciation on investments | | | 409,512,704 | |
| Net assets | | $ | 951,413,073 | |
| | | | | |
| Investor Class: | |
| Net assets | | $ | 769,256,933 | |
| Capital shares outstanding | | | 30,308,944 | |
| Net asset value per share | | $ | 25.38 | |
| | | | | |
| Advisor Class: | |
| Net assets | | $ | 67,002,133 | |
| Capital shares outstanding | | | 2,905,465 | |
| Net asset value per share | | $ | 23.06 | |
| | | | | |
| A-Class: | |
| Net assets | | $ | 70,820,622 | |
| Capital shares outstanding | | | 2,978,334 | |
| Net asset value per share | | $ | 23.78 | |
| Maximum offering price per share (Net asset value divided by 95.25%) | | $ | 24.97 | |
| | | | | |
| C-Class: | |
| Net assets | | $ | 32,324,422 | |
| Capital shares outstanding | | | 1,496,403 | |
| Net asset value per share | | $ | 21.60 | |
| | | | | |
| H-Class: | |
| Net assets | | $ | 12,008,963 | |
| Capital shares outstanding | | | 505,455 | |
| Net asset value per share | | $ | 23.76 | |
| 16 | THE RYDEX FUNDS ANNUAL REPORT | SEE NOTES TO FINANCIAL STATEMENTS. |
| STATEMENT OF OPERATIONS |
NASDAQ-100® FUND |
Year Ended March 31, 2015
| Investment Income: | |
| Dividends from securities of unaffiliated issuers (net of foreign withholding tax of $9,352) | | $ | 8,895,722 | |
| Dividends from securities of affiliated issuers | | | 1,821,180 | |
| Income from securities lending, net | | | 10,952 | |
| Interest | | | 10,766 | |
| Total investment income | | | 10,738,620 | |
| | | | | |
| Expenses: | |
| Management fees | | | 6,621,043 | |
| Transfer agent and administrative fees | | | 2,207,014 | |
| Distribution and service fees: | |
| Advisor Class | | | 455,838 | |
| A-Class | | | 101,398 | |
| C-Class | | | 236,879 | |
| H-Class** | | | 69,811 | |
| Portfolio accounting fees | | | 601,265 | |
| Custodian fees | | | 102,854 | |
| Trustees’ fees* | | | 56,966 | |
| Line of credit fees | | | 4,333 | |
| Miscellaneous | | | 1,475,616 | |
| Total expenses | | | 11,933,017 | |
| Net investment loss | | | (1,194,397 | ) |
| | | | | |
| Net Realized and Unrealized Gain (Loss): | |
| Net realized gain (loss) on: | |
| Investments in unaffiliated issuers | | $ | 68,298,965 | |
| Investments in affiliated issuers | | | (732,612 | ) |
| Swap agreements | | | 35,794,059 | |
| Futures contracts | | | 2,316,996 | |
| Net realized gain | | | 105,677,408 | |
| Net change in unrealized appreciation (depreciation) on: | |
| Investments in unaffiliated issuers | | | 62,274,002 | |
| Investments in affiliated issuers | | | 238,996 | |
| Swap agreements | | | 40,731 | |
| Futures contracts | | | 1,086,931 | |
| Net change in unrealized appreciation (depreciation) | | | 63,640,660 | |
| Net realized and unrealized gain | | | 169,318,068 | |
| Net increase in net assets resulting from operations | | $ | 168,123,671 | |
| * | Relates to Trustees not deemed "interested persons" within the meaning of Section 2(a)(19) of the 1940 Act. |
| ** | Since commencement of operations: September 18, 2014. |
| SEE NOTES TO FINANCIAL STATEMENTS. | THE RYDEX FUNDS ANNUAL REPORT | 17 |
| STATEMENTS OF CHANGES IN NET ASSETS |
NASDAQ-100® FUND | |
| | | Year Ended March 31, 2015 | | | Year Ended March 31, 2014 | |
| Increase (Decrease) in Net Assets from Operations: | | | | | | |
| Net investment income (loss) | | $ | (1,194,397 | ) | | $ | 358,208 | |
| Net realized gain on investments | | | 105,677,408 | | | | 94,903,636 | |
| Net change in unrealized appreciation (depreciation) on investments | | | 63,640,660 | | | | 67,794,671 | |
| Net increase in net assets resulting from operations | | | 168,123,671 | | | | 163,056,515 | |
| | | | | | | | | |
| Distributions to shareholders from: | | | | | | | | |
| Net realized gains | | | | | | | | |
| Investor Class | | | (11,799,003 | ) | | | (52,374,827 | ) |
| Advisor Class | | | (844,563 | ) | | | (3,185,736 | ) |
| A-Class | | | (713,323 | ) | | | (2,215,102 | ) |
| C-Class | | | (455,105 | ) | | | (1,712,829 | ) |
| H-Class* | | | (13,134 | ) | | | — | |
| Total distributions to shareholders | | | (13,825,128 | ) | | | (59,488,494 | ) |
| | | | | | | | | |
| Capital share transactions: | | | | | | | | |
| Proceeds from sale of shares | | | | | | | | |
| Investor Class | | | 1,029,136,798 | | | | 797,805,960 | |
| Advisor Class | | | 977,291,285 | | | | 747,398,780 | |
| A-Class | | | 126,142,545 | | | | 65,905,567 | |
| C-Class | | | 31,988,339 | | | | 26,628,147 | |
| H-Class* | | | 1,146,379,957 | | | | — | |
| Distributions reinvested | | | | | | | | |
| Investor Class | | | 10,894,558 | | | | 46,546,535 | |
| Advisor Class | | | 841,695 | | | | 3,164,981 | |
| A-Class | | | 687,698 | | | | 2,113,562 | |
| C-Class | | | 439,832 | | | | 1,686,286 | |
| H-Class* | | | 13,134 | | | | — | |
| Cost of shares redeemed | | | | | | | | |
| Investor Class | | | (1,013,748,379 | ) | | | (743,050,821 | ) |
| Advisor Class | | | (984,316,693 | ) | | | (761,022,258 | ) |
| A-Class | | | (83,648,854 | ) | | | (71,718,486 | ) |
| C-Class | | | (22,518,343 | ) | | | (23,621,291 | ) |
| H-Class* | | | (1,132,744,353 | ) | | | — | |
| Net increase from capital share transactions | | | 86,839,219 | | | | 91,836,962 | |
| Net increase in net assets | | | 241,137,762 | | | | 195,404,983 | |
| | | | | | | | | |
| Net assets: | | | | | | | | |
| Beginning of year | | | 710,275,311 | | | | 514,870,328 | |
| End of year | | $ | 951,413,073 | | | $ | 710,275,311 | |
| Accumulated net investment income at end of year | | $ | — | | | $ | — | |
| 18 | THE RYDEX FUNDS ANNUAL REPORT | SEE NOTES TO FINANCIAL STATEMENTS. |
STATEMENTS OF CHANGES IN NET ASSETS (concluded) |
NASDAQ-100® FUND | |
| | | Year Ended March 31, 2015 | | | Year Ended March 31, 2014 | |
| Capital share activity: | | | | | | |
| Shares sold | | | | | | |
| Investor Class | | | 43,087,905 | | | | 38,652,000 | |
| Advisor Class | | | 47,220,519 | | | | 40,432,732 | |
| A-Class | | | 5,505,586 | | | | 3,476,725 | |
| C-Class | | | 1,558,513 | | | | 1,472,390 | |
| H-Class* | | | 49,097,507 | | | | — | |
| Shares issued from reinvestment of distributions | | | | | | | | |
| Investor Class | | | 438,589 | | | | 2,248,625 | |
| Advisor Class | | | 37,226 | | | | 166,841 | |
| A-Class | | | 29,528 | | | | 108,499 | |
| C-Class | | | 20,727 | | | | 94,206 | |
| H-Class* | | | 563 | | | | — | |
| Shares redeemed | | | | | | | | |
| Investor Class | | | (42,808,208 | ) | | | (36,409,149 | ) |
| Advisor Class | | | (46,232,015 | ) | | | (39,713,114 | ) |
| A-Class | | | (3,638,949 | ) | | | (3,861,027 | ) |
| C-Class | | | (1,123,559 | ) | | | (1,328,165 | ) |
| H-Class* | | | (48,592,615 | ) | | | — | |
| Net increase in shares | | | 4,601,317 | | | | 5,340,563 | |
| * | Since commencement of operations: September 18, 2014. |
| SEE NOTES TO FINANCIAL STATEMENTS. | THE RYDEX FUNDS ANNUAL REPORT | 19 |
| FINANCIAL HIGHLIGHTS |
NASDAQ-100® FUND | |
This table is presented to show selected data for a share outstanding throughout each period and to assist shareholders in evaluating a Fund’s performance for the periods presented.
| Investor Class | | Year Ended March 31, 2015 | | | Year Ended March 31, 2014 | | | Year Ended March 28, 2013 | | | Year Ended March 31, 2012 | | | Year Ended March 31, 2011 | |
| Per Share Data | | | | | | | | | | | | | | | |
| Net asset value, beginning of period | | $ | 21.38 | | | $ | 18.38 | | | $ | 17.92 | | | $ | 15.23 | | | $ | 12.83 | |
| Income (loss) from investment operations: | |
Net investment income (loss)a | | | (.01 | ) | | | .02 | | | | .02 | | | | (.05 | ) | | | (.07 | ) |
Net gain (loss) on investments (realized and unrealized) | | | 4.39 | | | | 5.01 | | | | .44 | | | | 2.74 | | | | 2.47 | |
| Total from investment operations | | | 4.38 | | | | 5.03 | | | | .46 | | | | 2.69 | | | | 2.40 | |
| Less distributions from: | |
| Net realized gains | | | (.38 | ) | | | (2.03 | ) | | | — | | | | — | | | | — | |
| Total distributions | | | (.38 | ) | | | (2.03 | ) | | | — | | | | — | | | | — | |
| Net asset value, end of period | | $ | 25.38 | | | $ | 21.38 | | | $ | 18.38 | | | $ | 17.92 | | | $ | 15.23 | |
| | |
Total Returnb | | | 20.53 | % | | | 27.74 | % | | | 2.57 | % | | | 17.66 | % | | | 18.71 | % |
| Ratios/Supplemental Data | |
| Net assets, end of period (in thousands) | | $ | 769,257 | | | $ | 632,598 | | | $ | 461,269 | | | $ | 770,626 | | | $ | 579,925 | |
| Ratios to average net assets: | |
| Net investment income (loss) | | | (0.05 | %) | | | 0.10 | % | | | 0.13 | % | | | (0.34 | %) | | | (0.50 | %) |
Total expensesc | | | 1.26 | % | | | 1.29 | % | | | 1.26 | % | | | 1.27 | % | | | 1.31 | % |
| Portfolio turnover rate | | | 267 | % | | | 141 | % | | | 94 | % | | | 94 | % | | | 39 | % |
| 20 | THE RYDEX FUNDS ANNUAL REPORT | SEE NOTES TO FINANCIAL STATEMENTS. |
FINANCIAL HIGHLIGHTS (continued) |
NASDAQ-100® FUND |
This table is presented to show selected data for a share outstanding throughout each period and to assist shareholders in evaluating a Fund’s performance for the periods presented.
| Advisor Class | | Year Ended March 31, 2015 | | | Year Ended March 31, 2014 | | | Year Ended March 28, 2013 | | | Year Ended March 31, 2012 | | | Year Ended March 31, 2011 | |
| Per Share Data | | | | | | | | | | | | | | | |
| Net asset value, beginning of period | | $ | 19.55 | | | $ | 17.04 | | | $ | 16.70 | | | $ | 14.27 | | | $ | 12.09 | |
| Income (loss) from investment operations: | |
Net investment income (loss)a | | | (.11 | ) | | | (.01 | ) | | | (.08 | ) | | | (.13 | ) | | | (.12 | ) |
Net gain (loss) on investments (realized and unrealized) | | | 4.00 | | | | 4.55 | | | | .42 | | | | 2.56 | | | | 2.30 | |
| Total from investment operations | | | 3.89 | | | | 4.54 | | | | .34 | | | | 2.43 | | | | 2.18 | |
| Less distributions from: | |
| Net realized gains | | | (.38 | ) | | | (2.03 | ) | | | — | | | | — | | | | — | |
| Total distributions | | | (.38 | ) | | | (2.03 | ) | | | — | | | | — | | | | — | |
| Net asset value, end of period | | $ | 23.06 | | | $ | 19.55 | | | $ | 17.04 | | | $ | 16.70 | | | $ | 14.27 | |
| | |
Total Returnb | | | 19.94 | % | | | 27.02 | % | | | 2.04 | % | | | 17.03 | % | | | 18.03 | % |
| Ratios/Supplemental Data | |
| Net assets, end of period (in thousands) | | $ | 67,002 | | | $ | 36,751 | | | $ | 16,930 | | | $ | 65,970 | | | $ | 120,277 | |
| Ratios to average net assets: | |
| Net investment income (loss) | | | (0.53 | %) | | | (0.05 | %) | | | (0.51 | %) | | | (0.87 | %) | | | (1.00 | %) |
Total expensesc | | | 1.75 | % | | | 1.79 | % | | | 1.75 | % | | | 1.76 | % | | | 1.80 | % |
| Portfolio turnover rate | | | 267 | % | | | 141 | % | | | 94 | % | | | 94 | % | | | 39 | % |
| SEE NOTES TO FINANCIAL STATEMENTS. | THE RYDEX FUNDS ANNUAL REPORT | 21 |
FINANCIAL HIGHLIGHTS (continued) |
NASDAQ-100® FUND |
This table is presented to show selected data for a share outstanding throughout each period and to assist shareholders in evaluating a Fund’s performance for the periods presented.
| A-Class | | Year Ended March 31, 2015 | | | Year Ended March 31, 2014 | | | Year Ended March 28, 2013 | | | Year Ended March 31, 2012 | | | Year Ended March 31, 2011 | |
| Per Share Data | | | | | | | | | | | | | | | |
| Net asset value, beginning of period | | $ | 20.10 | | | $ | 17.42 | | | $ | 17.03 | | | $ | 14.52 | | | $ | 12.27 | |
| Income (loss) from investment operations: | |
Net investment income (loss)a | | | (.06 | ) | | | (.03 | ) | | | (.02 | ) | | | (.09 | ) | | | (.11 | ) |
Net gain (loss) on investments (realized and unrealized) | | | 4.12 | | | | 4.74 | | | | .41 | | | | 2.60 | | | | 2.36 | |
| Total from investment operations | | | 4.06 | | | | 4.71 | | | | .39 | | | | 2.51 | | | | 2.25 | |
| Less distributions from: | |
| Net realized gains | | | (.38 | ) | | | (2.03 | ) | | | — | | | | — | | | | — | |
| Total distributions | | | (.38 | ) | | | (2.03 | ) | | | — | | | | — | | | | — | |
| Net asset value, end of period | | $ | 23.78 | | | $ | 20.10 | | | $ | 17.42 | | | $ | 17.03 | | | $ | 14.52 | |
| | |
Total Returnb | | | 20.24 | % | | | 27.42 | % | | | 2.29 | % | | | 17.29 | % | | | 18.34 | % |
| Ratios/Supplemental Data | |
| Net assets, end of period (in thousands) | | $ | 70,821 | | | $ | 21,751 | | | $ | 23,656 | | | $ | 14,553 | | | $ | 19,806 | |
| Ratios to average net assets: | |
| Net investment income (loss) | | | (0.29 | %) | | | (0.14 | %) | | | (0.09 | %) | | | (0.61 | %) | | | (0.81 | %) |
Total expensesc | | | 1.50 | % | | | 1.54 | % | | | 1.52 | % | | | 1.53 | % | | | 1.56 | % |
| Portfolio turnover rate | | | 267 | % | | | 141 | % | | | 94 | % | | | 94 | % | | | 39 | % |
| 22 | THE RYDEX FUNDS ANNUAL REPORT | SEE NOTES TO FINANCIAL STATEMENTS. |
FINANCIAL HIGHLIGHTS (continued) |
NASDAQ-100® FUND |
This table is presented to show selected data for a share outstanding throughout each period and to assist shareholders in evaluating a Fund’s performance for the periods presented.
| C-Class | | Year Ended March 31, 2015 | | | Year Ended March 31, 2014 | | | Year Ended March 28, 2013 | | | Year Ended March 31, 2012 | | | Year Ended March 31, 2011 | |
| Per Share Data | | | | | | | | | | | | | | | |
| Net asset value, beginning of period | | $ | 18.42 | | | $ | 16.22 | | | $ | 15.97 | | | $ | 13.72 | | | $ | 11.67 | |
| Income (loss) from investment operations: | |
Net investment income (loss)a | | | (.21 | ) | | | (.16 | ) | | | (.13 | ) | | | (.19 | ) | | | (.19 | ) |
Net gain (loss) on investments (realized and unrealized) | | | 3.77 | | | | 4.39 | | | | .38 | | | | 2.44 | | | | 2.24 | |
| Total from investment operations | | | 3.56 | | | | 4.23 | | | | .25 | | | | 2.25 | | | | 2.05 | |
| Less distributions from: | |
| Net realized gains | | | (.38 | ) | | | (2.03 | ) | | | — | | | | — | | | | — | |
| Total distributions | | | (.38 | ) | | | (2.03 | ) | | | — | | | | — | | | | — | |
| Net asset value, end of period | | $ | 21.60 | | | $ | 18.42 | | | $ | 16.22 | | | $ | 15.97 | | | $ | 13.72 | |
| | |
Total Returnb | | | 19.37 | % | | | 26.46 | % | | | 1.57 | % | | | 16.40 | % | | | 17.57 | % |
| Ratios/Supplemental Data | |
| Net assets, end of period (in thousands) | | $ | 32,324 | | | $ | 19,175 | | | $ | 13,015 | | | $ | 15,177 | | | $ | 11,864 | |
| Ratios to average net assets: | |
| Net investment income (loss) | | | (1.05 | %) | | | (0.89 | %) | | | (0.84 | %) | | | (1.35 | %) | | | (1.52 | %) |
Total expensesc | | | 2.25 | % | | | 2.29 | % | | | 2.26 | % | | | 2.27 | % | | | 2.31 | % |
| Portfolio turnover rate | | | 267 | % | | | 141 | % | | | 94 | % | | | 94 | % | | | 39 | % |
| SEE NOTES TO FINANCIAL STATEMENTS. | THE RYDEX FUNDS ANNUAL REPORT | 23 |
FINANCIAL HIGHLIGHTS (concluded) |
NASDAQ-100® FUND |
This table is presented to show selected data for a share outstanding throughout each period and to assist shareholders in evaluating a Fund’s performance for the periods presented.
| H-Class | | Period Ended March 31, 2015d | |
| Per Share Data | | | |
| Net asset value, beginning of period | | $ | 22.91 | |
| Income (loss) from investment operations: | |
Net investment income (loss)a | | | .01 | |
| Net gain (loss) on investments (realized and unrealized) | | | 1.22 | |
| Total from investment operations | | | 1.23 | |
| Less distributions from: | |
| Net realized gains | | | (.38 | ) |
| Total distributions | | | (.38 | ) |
| Net asset value, end of period | | $ | 23.76 | |
| | | | | |
Total Returnb | | | 5.40 | % |
| Ratios/Supplemental Data | |
| Net assets, end of period (in thousands) | | $ | 12,009 | |
| Ratios to average net assets: | |
| Net investment income (loss) | | | 0.07 | % |
Total expensesc | | | 1.47 | % |
| Portfolio turnover rate | | | 267 | % |
a | Net investment income (loss) per share was computed using average shares outstanding throughout the period. |
b | Total return does not reflect the impact of any applicable sales charges. |
c | Does not include expenses of the underlying funds in which the Fund invests. |
d | Since commencement of operations: September 18, 2014. Percentage amounts for the period, except total return and portfolio turnover rate, have been annualized. The portfolio turnover rate stated is for the entire period of the Fund, not since commencement of operations of the class. |
| 24 | THE RYDEX FUNDS ANNUAL REPORT | SEE NOTES TO FINANCIAL STATEMENTS. |
| NOTES TO FINANCIAL STATEMENTS |
1. Organization and Significant Accounting Policies
Organization
The Rydex Series Funds (the “Trust”), a Delaware business trust, is registered with the SEC under the Investment Company Act of 1940 (”1940 Act”), as a non-diversified, open-ended investment company of the series type. Each series, in effect, is representing a separate Fund. The Trust is authorized to issue an unlimited number of no par value shares. The Trust accounts for the assets of each fund separately.
The Trust offers a combination of eight separate classes of shares: Investor Class shares, Advisor Class shares, A-Class shares, C-Class shares, H-Class shares, Y-Class shares, Institutional Class shares and Money Market Class shares. Sales of shares of each Class are made without a front-end sales charge at the net asset value per share (“NAV”), with the exception of A-Class shares. A-Class shares are sold at the NAV, plus the applicable front-end sales charge. The sales charge varies depending on the amount purchased, but will not exceed 4.75%. A-Class share purchases of $1 million or more are exempt from the front-end sales charge but have a 1% contingent deferred sales charge (“CDSC”) if shares are redeemed within 12 months of purchase. C-Class shares have a 1% CDSC if shares are redeemed within 12 months of purchase. Institutional Class shares are offered primarily for direct investment by institutions such as pension and profit sharing plans, endowments, foundations and corporations. Institutional Class shares have a minimum initial investment of $2 million and a minimum account balance of $1 million. Institutional Class shares are offered without a front-end sales charge or CDSC. At March 31, 2015, the Trust consisted of fifty-two funds (the "Funds").
This report covers the NASDAQ-100® Fund (the “Fund”). Only Investor Class, Advisor Class, A-Class, C-Class, and H-Class shares had been issued by the Fund.
The Fund is designed and operated to accommodate frequent trading by shareholders and, unlike most mutual funds, offers unlimited exchange privileges with no minimum holding periods or transactions fees, which may cause the Fund to experience high portfolio turnover.
Guggenheim Investments (“GI”) provides advisory services, and Rydex Fund Services, LLC (“RFS”) provides transfer agent, administrative and accounting services to the Trust. Guggenheim Funds Distributors, LLC (“GFD”) acts as principal underwriter for the Trust. GI, RFS and GFD are affiliated entities.
| | THE RYDEX FUNDS ANNUAL REPORT | 25 |
NOTES TO FINANCIAL STATEMENTS (continued)
Significant Accounting Policies
The Fund operates as an investment company and accordingly follows the investment company accounting and reporting guidance of the Financial Accounting Standards Board (“FASB”) Accounting Standards Codification Topic 946 Financial Services – Investment Companies.
The following significant accounting policies are in conformity with U.S. generally accepted accounting principles ("U.S. GAAP") and are consistently followed by the Trust. This requires management to make estimates and assumptions that affect the reported amount of assets and liabilities and disclosure of contingent assets and liabilities at the date of the financial statements and the reported amounts of revenues and expenses during the reporting period. Actual results could differ from these estimates. All time references are based on Eastern Time.
The NAV of each Class of the Fund is calculated by dividing the market value of the Fund’s securities and other assets, less all liabilities, attributable to the Class by the number of outstanding shares of the Class.
A. The Board of Trustees of the Fund (the “Board”) has adopted policies and procedures for the valuation of the Fund's investments (the “Valuation Procedures”). Pursuant to the Valuation Procedures, the Board has delegated to a valuation committee, consisting of representatives from Guggenheim’s investment management, fund administration, legal and compliance departments (the “Valuation Committee”), the day-to-day responsibility for implementing the Valuation Procedures, including, under most circumstances, the responsibility for determining the fair value of the Fund’s securities or other assets.
Valuations of the Fund's securities are supplied primarily by pricing services appointed pursuant to the processes set forth in the Valuation Procedures. The Valuation Committee convenes monthly, or more frequently as needed and will review the valuation of all assets which have been fair valued for reasonableness. The Fund's officers, through the Valuation Committee and consistent with the monitoring and review responsibilities set forth in the Valuation Procedures, regularly review procedures used by, and valuations provided by, the pricing services.
If the pricing service cannot or does not provide a valuation for a particular investment or such valuation is deemed unreliable, such investment is fair valued by the Valuation Committee.
Equity securities listed on an exchange (New York Stock Exchange (“NYSE”) or American Stock Exchange) are valued at the last quoted sales price as of the close of business on the NYSE, usually 4:00 p.m. on the valuation date. Equity securities listed on the NASDAQ market system are valued at the NASDAQ Official Closing
| 26 | THE RYDEX FUNDS ANNUAL REPORT | |
NOTES TO FINANCIAL STATEMENTS (continued)
Price on the valuation date, which may not necessarily represent the last sale price. If there has been no sale on such exchange or NASDAQ on a given day, the security is valued at the closing bid price on that day.
Open-end investment companies ("Mutual Funds") are valued at their NAV as of the close of business, on the valuation date. Exchange-traded funds ("ETFs") and closed-end investment companies ("CEFs") are valued at the last quoted sales price.
Repurchase agreements are valued at amortized cost, which approximates market value.
The value of futures contracts is accounted for using the unrealized gain or loss on the contracts that is determined by marking the contracts to their current realized settlement prices. Financial futures contracts are valued at the 4:00 p.m. price on the valuation date. In the event that the exchange for a specific futures contract closes earlier than 4:00 p.m., the futures contract is valued at the Official Settlement Price of the exchange. However, the underlying securities from which the futures contract value is derived are monitored until 4:00 p.m. to determine if fair valuation would provide a more accurate valuation.
The value of OTC swap agreements entered into by a Fund is accounted for using the unrealized gain or loss on the agreements that is determined by marking the agreements to the last quoted value of the index that the swap pertains to at the close of the NYSE. The swap's value is then adjusted to include dividends accrued, and financing charges and/or interest associated with the swap agreements.
Investments for which market quotations are not readily available are fair valued as determined in good faith by GI under the direction of the Board of Trustees using methods established or ratified by the Board of Trustees.
Valuations in accordance with these methods are intended to reflect each security’s (or asset’s) “fair value.” Each such determination is based on a consideration of all relevant factors, which are likely to vary from one pricing context to another. Examples of such factors may include, but are not limited to: (i) the type of security, (ii) the initial cost of the security, (iii) the existence of any contractual restrictions on the security’s disposition, (iv) the price and extent of public trading in similar securities of the issuer or of comparable companies, (v) quotations or evaluated prices from broker-dealers and/or pricing services, (vi) information obtained from the issuer, analysts, and/or the appropriate stock exchange (for exchange-traded securities), (vii) an analysis of the company’s financial statements, and (viii) an evaluation of the forces that influence the issuer
| | THE RYDEX FUNDS ANNUAL REPORT | 27 |
NOTES TO FINANCIAL STATEMENTS (continued)
and the market(s) in which the security is purchased and sold (e.g. the existence of pending merger activity, public offerings or tender offers that might affect the value of the security).
In connection with futures contracts and other derivative investments, such factors may include obtaining information as to how (a) these contracts and other derivative investments trade in the futures or other derivative markets, respectively, and (b) the securities underlying these contracts and other derivative investments trade in the cash market.
B. Upon entering into a futures contract, the Fund deposits and maintains as collateral such initial margin as required by the exchange on which the transaction is affected. Pursuant to the contract, the Fund agrees to receive from or pay to the broker an amount of cash equal to the daily fluctuation in value of the contract. Such receipts or payments are known as variation margin and are recorded by the Fund as unrealized gains or losses. When the contract is closed, the Fund records a realized gain or loss equal to the difference between the value of the contract at the time it was opened and the value at the time it was closed.
C. Swap agreements are marked-to-market daily and the change, if any, is recorded as unrealized gain or loss. Payments received or made as a result of an agreement or termination of the agreement are recognized as realized gains or losses.
D. Security transactions are recorded on the trade date for financial reporting purposes. Realized gains and losses from securities transactions are recorded using the identified cost basis. Proceeds from lawsuits related to investment holdings are recorded as realized gains in the Fund. Dividend income is recorded on the ex-dividend date, net of applicable taxes withheld by foreign countries. Taxable non-cash dividends are recorded as dividend income. Interest income, including amortization of premiums and accretion of discounts, is accrued on a daily basis. Dividend income from REITs is recorded based on the income included in the distributions received from the REIT investments using published REIT classifications, including some management estimates when actual amounts are not available. Distributions received in excess of this estimated amount are recorded as a reduction of the cost of investments or reclassified to capital gains. The actual amounts of income, return of capital, and capital gains are only determined by each REIT after its fiscal year-end, and may differ from the estimated amounts.
| 28 | THE RYDEX FUNDS ANNUAL REPORT | |
NOTES TO FINANCIAL STATEMENTS (continued)
E. Distributions of net investment income and net realized gains, if any, are declared and paid at least annually. Dividends are reinvested in additional shares unless shareholders request payment in cash. Distributions are recorded on the ex-dividend date and are determined in accordance with income tax regulations which may differ from U.S. GAAP.
F. Interest and dividend income, most expenses, all realized gains and losses, and all unrealized gains and losses are allocated to the classes based upon the value of the outstanding shares in each Class. Certain costs, such as distribution and service fees are charged directly to specific classes. In addition, certain expenses have been allocated to the individual Funds in the Trust on a pro rata basis upon the respective aggregate net assets of each Fund included in the Trust.
G. The Fund may leave cash overnight in its cash account with the custodian. Periodically, the Fund may have cash due to the custodian bank as an overdraft balance. A fee is incurred on this overdraft, calculated by multiplying the overdraft by a rate based on the federal funds rate.
H. Under the Fund's organizational documents, its Trustees and Officers are indemnified against certain liabilities arising out of the performance of their duties to the Trust. In addition, throughout the normal course of business, the Fund enters into contracts that contain a variety of representations and warranties which provide general indemnifications. The Fund's maximum exposure under these arrangements is unknown, as this would involve future claims that may be made against the Fund and/or its affiliates that have not yet occurred. However, based on experience, the Fund expects the risk of loss to be remote.
2. Financial Instruments
As part of its investment strategy, the Fund utilizes a variety of derivative instruments. These investments involve, to varying degrees, elements of market risk and risks in excess of the amounts recognized in the Statement of Assets and Liabilities.
A futures contract is an agreement to purchase (long) or sell (short) an agreed amount of securities or other instruments at a set price for delivery at a future date. There are significant risks associated with a Fund’s use of futures contracts, including (i) there may be an imperfect or no correlation between the changes in market value of the underlying asset and the prices of futures contracts; (ii) there may not be a liquid secondary market for a futures contract; (iii) trading restrictions or limitations may be imposed by an exchange; and (iv) government regulations may restrict trading in futures contracts. When investing in futures, there is minimal counterparty credit risk to the Fund because futures are exchange-traded and the exchange’s clearinghouse, as counterparty to all
| | THE RYDEX FUNDS ANNUAL REPORT | 29 |
NOTES TO FINANCIAL STATEMENTS (continued)
exchange-traded futures, guarantees against default. Cash deposits are shown as segregated cash with broker on the Statement of Assets and Liabilities; securities held as collateral are noted on the Schedule of Investments.
A swap is an agreement that obligates two parties to exchange a series of cash flows at specified intervals based upon or calculated by reference to changes in specified prices or rates for a specified amount of an underlying asset. A Fund utilizing OTC swaps bears the risk of loss of the amount expected to be received under a swap agreement in the event of the default or bankruptcy of a swap agreement counterparty. Additionally, there is no guarantee that a Fund or an underlying fund could eliminate its exposure under an outstanding swap agreement by entering into an offsetting swap agreement with the same or another party.
In conjunction with the use of derivative instruments, the Fund is required to maintain collateral in various forms. The Fund uses, where appropriate, depending on the financial instrument utilized and the broker involved, margin deposits at the broker, cash and/or securities segregated at the custodian bank, discount notes or the repurchase agreements allocated to the Fund.
The Trust has established counterparty credit guidelines and enters into transactions only with financial institutions of investment grade or better. The Trust monitors the counterparty credit risk.
3. Fees and Other Transactions with Affiliates
Under the terms of an investment advisory contract, the Fund pays GI investment advisory fees calculated at an annualized rate of 0.75% of the average daily net assets of the Fund.
RFS provides transfer agent and administrative services to the Fund calculated at the annualized rate of 0.25% based on the average daily net assets of the Fund.
RFS also provides accounting services to the Fund for fees calculated at annualized rates below, based on the average daily net assets of the Fund.
| Fund Accounting Fees | (as a % of Net Assets) |
| On the first $250 million | 0.10% |
| On the next $250 million | 0.075% |
| On the next $250 million | 0.05% |
| Over $750 million | 0.03% |
| 30 | THE RYDEX FUNDS ANNUAL REPORT | |
NOTES TO FINANCIAL STATEMENTS (continued)
RFS engages external service providers to perform other necessary services for the Trust, such as audit and accounting related services, legal services, custody, printing and mailing, etc., on a pass-through basis. Such expenses are allocated to various Funds within the complex based on relative net assets.
The Trust has adopted a Distribution and Shareholder Services Plan applicable to its Advisor Class shares and a Distribution Plan applicable to A-Class shares and H-Class shares for which GFD and other firms that provide distribution and/or shareholder services (“Service Providers”) may receive compensation. If a Service Provider provides distribution services, the Fund will pay distribution fees to GFD at an annual rate not to exceed 0.25% of average daily net assets, pursuant to Rule 12b-1 of the 1940 Act. GFD, in turn, will pay the Service Provider out of its fees. GFD may, at its discretion, retain a portion of such payments to compensate itself for distribution services. With regard to Advisor Class shares only, if a Service Provider provides shareholder services, GFD will receive shareholder servicing fees from the Fund at an annual rate not to exceed 0.25% of average daily net assets. GFD, in turn, will compensate Service Providers for providing such services, while retaining a portion of such payments to compensate itself for shareholder services it performs.
The Trust has adopted a separate Distribution and Shareholder Services Plan applicable to its C-Class shares that allows the Fund to pay annual distribution and service fees of 1.00% of the Fund's C-Class shares average daily net assets. The annual 0.25% service fee compensates a shareholder’s financial adviser for providing ongoing services to the shareholder. The annual distribution fee of 0.75% reimburses GFD for paying the shareholder’s financial adviser an ongoing sales commission. GFD advances the first year’s service and distribution fees to the financial adviser. GFD retains the service and distribution fees on accounts with no authorized dealer of record.
For the year ended March 31, 2015, GFD retained sales charges of $360,571 relating to sales of A-Class shares of the Trust.
Certain trustees and officers of the Trust are also officers of GI, RFS and GFD.
| | THE RYDEX FUNDS ANNUAL REPORT | 31 |
NOTES TO FINANCIAL STATEMENTS (continued)
4. Fair Value Measurement
In accordance with U.S. GAAP, fair value is defined as the price that the Fund would receive to sell an investment or pay to transfer a liability in an orderly transaction with an independent buyer in the principal market, or in the absence of a principal market, the most advantageous market for the investment or liability. U.S. GAAP establishes a three-tier fair value hierarchy based on the types of inputs used to value assets and liabilities and requires corresponding disclosure. The hierarchy and the corresponding inputs are summarized below:
Level 1 — quoted prices in active markets for identical assets or liabilities.
Level 2 — significant other observable inputs (for example quoted prices for securities that are similar based on characteristics such as interest rates, prepayment speeds, credit risk, etc.).
Level 3 — significant unobservable inputs based on the best information available under the circumstances, to the extent observable inputs are not available, which may include assumptions.
The types of inputs available depend on a variety of factors, such as the type of security and the characteristics of the markets in which it trades, if any. Fair valuation determinations that rely on fewer or no observable inputs require greater judgment. Accordingly, fair value determinations for Level 3 securities require the greatest amount of judgment.
The following table summarizes the inputs used to value the Fund's investments at March 31, 2015:
| | | Level 1 Investments In Securities | | | Level 1 Other Financial Instruments* | | | Level 2 Investments In Securities | | | Level 2 Other Financial Instruments* | | | Level 3 Investments In Securities | | | Total | |
| Assets | | | | | | | | | | | | | | | | | | |
NASDAQ-100® Fund | | $ | 850,233,730 | | | $ | 1,035,096 | | | $ | 100,982,578 | | | $ | 137,703 | | | $ | — | | | $ | 952,389,107 | |
| | |
| Liabilities | | | | | | | | | | | | | | | | | | | | | | | | |
NASDAQ-100® Fund | | $ | — | | | $ | — | | | $ | — | | | $ | 30,008 | | | $ | — | | | $ | 30,008 | |
| * | Other financial instruments may include futures contracts and/or swaps, which are reported as unrealized gain/loss at period end. |
For the year ended March 31, 2015, there were no transfers between levels.
| 32 | THE RYDEX FUNDS ANNUAL REPORT | |
NOTES TO FINANCIAL STATEMENTS (continued)
The inputs or methodologies used for valuing securities are not necessarily an indication of the risk associated with investing in those securities. The suitability of the techniques and sources employed to determine fair valuation are regularly monitored and subject to change.
5. Repurchase Agreements
The Funds transfer uninvested cash balances into a single joint account, the daily aggregate balance of which is invested in one or more repurchase agreements collateralized by obligations of the U.S. Treasury and U.S. Government Agencies. The collateral is in the possession of the Funds’ custodian and is evaluated to ensure that its market value exceeds, at a minimum, 102% of the original face amount of the repurchase agreements. Each Fund holds a pro rata share of the collateral based on the dollar amount of the repurchase agreement entered into by each Fund.
At March 31, 2015, the repurchase agreements in the joint account were as follows:
Counterparty and Terms of Agreement | Face Value | Repurchase Price | | Collateral | Par Value | Fair Value |
| HSBC Group | | | | U.S. Treasury Strips | | |
| 0.03% | | | | 0.00% | | |
| Due 04/01/15 | $922,646,685 | $922,647,454 | | 02/15/24 - 05/15/44 | $1,876,361,900 | $941,099,692 |
| | | | | | | |
| RBC Capital Markets | | | | U.S. Treasury Note | | |
| 0.05% | | | | 2.13% | | |
| Due 04/01/15 | 141,000,000 | 141,000,196 | | 12/31/21 | 92,325,000 | 95,818,749 |
| | | | | | | |
| | | | | U.S. TIP Bond | | |
| | | | | 3.88% | | |
| | | | | 04/25/29 | 22,465,400 | 48,001,266 |
| | | | | | | |
| UMB Financial Corp. | | | | U.S. Treasury Notes | | |
| 0.03% | | | | 1.38% - 3.25% | | |
| Due 04/01/15 | 113,175,677 | 113,175,772 | | 11/30/15 - 12/31/16 | 109,984,100 | 115,439,211 |
In the event of counterparty default, the Funds have the right to collect the collateral to offset losses incurred. There is potential loss to the Funds in the event the Funds are delayed or prevented from exercising their rights to dispose of the collateral securities, including the risk of a possible decline in the value of the underlying securities during the period while the Funds seek to assert their rights. The Funds’ investment adviser, acting under the supervision of the Board of Trustees, reviews the value of the collateral and the creditworthiness of those banks and dealers with which the Funds enter into repurchase agreements to evaluate potential risks.
| | THE RYDEX FUNDS ANNUAL REPORT | 33 |
NOTES TO FINANCIAL STATEMENTS (continued)
6. Portfolio Securities Loaned
The Funds may lend their securities to approved brokers to earn additional income. Security lending income shown on the Statement of Operations is shown net of rebates paid to the borrowers and earnings on cash collateral investments shared with the lending agent. Within this arrangement, the Funds act as the lender, Credit Suisse acts as the lending agent, and other approved registered broker dealers act as the borrowers. The Funds receive cash collateral, valued at 102% of the value of the securities on loan. Under the terms of the Funds’ securities lending agreement with Credit Suisse, cash collateral is invested in one or more joint repurchase agreements collateralized by obligations of the U.S. Treasury or Government Agencies and cash. The Funds bear the risk of loss on cash collateral investments. Collateral is maintained over the life of the loan in an amount not less than the value of loaned securities, as determined at the close of fund business each day; any additional collateral required due to changes in security values is delivered to the Funds the next business day. Although the collateral mitigates the risk, the Funds could experience a delay in recovering its securities and a possible loss of income or value if the borrower fails to return the securities. The Funds have the right under the securities lending agreement to recover the securities from the borrower on demand.
At March 31, 2015, the Fund participated in securities lending as follows:
| Fund | | Value of Securities Loaned | | | Cash Collateral Received | |
NASDAQ-100® Fund | | $ | 2,435,133 | | | $ | 2,509,100 | |
| 34 | THE RYDEX FUNDS ANNUAL REPORT | |
NOTES TO FINANCIAL STATEMENTS (continued)
Cash collateral received was invested in the following joint repurchase agreements at March 31, 2015:
Counterparty and Terms of Agreement | Face Value | Repurchase Price | | Collateral | Par Value | Fair Value |
| HSBC Securities, Inc. | | | | Fannie Mae Strips | | |
| 0.10% | | | | 0.00% | | |
| Due 04/01/15 | $1,625,277 | $1,625,281 | | 11/15/17 - 07/15/37 | $1,812,691 | $1,247,608 |
| | | | | Federal Farm Credit Bank | | |
| | | | | 0.19% | | |
| | | | | 06/12/17 | 410,155 | 410,209 |
| | | | | | | |
| BNP Paribas Securities Corp. | | | | U.S. Treasury Note | | |
| 0.10% | | | | 2.13% | | |
| Due 04/01/15 | 559,095 | 559,097 | | 12/31/21 | 256,997 | 264,900 |
| | | | | U.S. Treasury Bond | | |
| | | | | 4.38% | | |
| | | | | 05/15/41 | 221,798 | 305,378 |
| | | | | | | |
| Barclays Capital Corp. | | | | U.S. Treasury Strips | | |
| 0.10% | | | | 0.00% | | |
| Due 04/01/15 | 288,584 | 288,585 | | 05/15/20 - 05/15/44 | 446,433 | 265,245 |
| | | | | U.S. Treasury Bond | | |
| | | | | 4.75% | | |
| | | | | 02/15/41 | 20,256 | 29,112 |
There is also a $36,144 in segregated cash held as collateral.
7. Derivative Investment Holdings Categorized by Risk Exposure
U.S. GAAP requires disclosures to enable investors to better understand how and why the Fund uses derivative instruments, how these derivative instruments are accounted for and their effects on the Fund's financial position and results of operations.
The Fund utilized derivatives for the following purposes:
| Fund | Index Exposure | Liquidity |
NASDAQ-100® Fund | x | x |
| | THE RYDEX FUNDS ANNUAL REPORT | 35 |
NOTES TO FINANCIAL STATEMENTS (continued)
The following table represents the notional amount of derivative instruments outstanding as an approximate percentage of the Fund’s net assets on a daily basis.
| | Approximate percentage of Fund's Net Assets on a daily basis |
| Fund | Long | Short |
NASDAQ-100® Fund | 25% | — |
The following is a summary of the location of derivative investments on the Fund's Statement of Assets and Liabilities as of March 31, 2015:
| Derivative Investment Type | Asset Derivatives | Liability Derivatives |
| Equity contracts | | Variation margin |
| | Unrealized appreciation on swap agreements | Unrealized depreciation on swap agreements |
The following table sets forth the fair value of the Fund's derivative investments categorized by primary risk exposure at March 31, 2015:
| Asset Derivative Investments Value | |
| Fund | | Futures Equity Contracts* | | | Swaps Equity Contracts | | | Total Value at March 31, 2015 | |
NASDAQ-100® Fund | | $ | 1,035,096 | | | $ | 137,703 | | | $ | 1,172,799 | |
| Liability Derivative Investments Value | |
| Fund | | Futures Equity Contracts* | | | Swaps Equity Contracts | | | Total Value at March 31, 2015 | |
NASDAQ-100® Fund | | $ | — | | | $ | 30,008 | | | $ | 30,008 | |
| * | Includes cumulative appreciation (depreciation) of futures contracts as reported on the Schedule of Investments. Only current day’s variation margin is reported within the Statement of Assets and Liabilities. |
| 36 | THE RYDEX FUNDS ANNUAL REPORT | |
NOTES TO FINANCIAL STATEMENTS (continued)
The following is a summary of the location of derivative investments on the Fund's Statement of Operations for the year ended March 31, 2015:
| Derivative Investment Type | Location of Gain (Loss) on Derivatives |
| Equity contracts | Net realized gain (loss) on futures contracts |
| | Net realized gain (loss) on swap agreements |
| | Net change in unrealized appreciation (depreciation) on futures contracts |
| | Net change in unrealized appreciation (depreciation) on swap agreements |
The following is a summary of the Fund's realized gain (loss) and change in unrealized appreciation (depreciation) on derivative investments recognized on the Statement of Operations categorized by primary risk exposure for the year ended March 31, 2015:
Realized Gain (Loss) on Derivative Investments Recognized on the Statement of Operations | |
| Fund | | Futures Equity Contracts | | | Swaps Equity Contracts | | | Total | |
NASDAQ-100® Fund | | $ | 2,316,996 | | | $ | 35,794,059 | | | $ | 38,111,055 | |
Change in Unrealized Appreciation (Depreciation) on Derivative Investments Recognized on the Statement of Operations | |
| Fund | | Futures Equity Contracts | | | Swaps Equity Contracts | | | Total | |
NASDAQ-100® Fund | | $ | 1,086,931 | | | $ | 40,731 | | | $ | 1,127,662 | |
8. Offsetting
In the normal course of business, the Fund enters into transactions subject to enforceable master netting arrangements or other similar arrangements. Generally, the right to offset in those agreements allows the Fund to counteract the exposure to a specific counterparty with collateral received or delivered to that counterparty based on the terms of the arrangements. These arrangements provide for the right to liquidate upon the occurrence of an event of default, credit event upon merger or additional termination event.
| | THE RYDEX FUNDS ANNUAL REPORT | 37 |
NOTES TO FINANCIAL STATEMENTS (continued)
In order to better define their contractual rights and to secure rights that will help the Fund mitigate its counterparty risk, the Fund may enter into an International Swaps and Derivatives Association, Inc. Master Agreement (“ISDA Master Agreement”) or similar agreement with its derivative contract counterparties. An ISDA Master Agreement is a bilateral agreement between a Fund and a counterparty that governs OTC derivatives, including foreign exchange contracts, and typically contains, among other things, collateral posting terms and netting provisions in the event of a default and/or termination event. The provisions of the ISDA Master Agreement typically permit a single net payment in the event of a default (close-out netting) or similar event, including the bankruptcy or insolvency of the counterparty.
For derivatives traded under an ISDA Master Agreement, the collateral requirements are typically calculated by netting the mark to market amount for each transaction under such agreement and comparing that amount to the value of any collateral currently pledged by the Fund and the counterparty. For financial reporting purposes, cash collateral that has been pledged to cover obligations of the Fund and cash collateral received from the counterparty, if any, is reported separately on the Statement of Assets and Liabilities as segregated cash with broker/receivable for variation margin, or payable for swap settlement/variation margin. Generally, the amount of collateral due from or to a counterparty must exceed a minimum transfer amount threshold (e.g., $300,000) before a transfer is required to be made. To the extent amounts due to the Fund from its counterparties are not fully collateralized, contractually or otherwise, the Fund bears the risk of loss from counterparty nonperformance. The Fund attempts to mitigate counterparty risk by only entering into agreements with counterparties that they believe to be of good standing and by monitoring the financial stability of those counterparties.
For financial reporting purposes, the Fund does not offset derivative assets and derivative liabilities that are subject to netting arrangements in the Statement of Assets and Liabilities.
| 38 | THE RYDEX FUNDS ANNUAL REPORT | |
NOTES TO FINANCIAL STATEMENTS (continued)
The following tables present derivative financial instruments and secured financing transactions that are subject to enforceable netting arrangements and offset in the Statement of Assets and Liabilities in conformity with U.S. GAAP.
| | | | | | | | | | | | | Gross Amounts Not Offset in the Statement of Assets and Liabilities | | | | |
| Fund | Instrument | | Gross Amounts of Recognized Assets1 | | | Gross Amounts Offset In the Statement of Assets and Liabilities | | | Net Amount of Assets Presented on the Statement of Assets and Liabilities | | | Financial Instruments | | | Cash Collateral Received | | | Net Amount | |
NASDAQ-100® Fund | Swap equity contracts | | $ | 137,703 | | | $ | — | | | $ | 137,703 | | | $ | — | | | $ | — | | | $ | 137,703 | |
| | | | | | | | | | | | | Gross Amounts Not Offset in the Statement of Assets and Liabilities | | | | |
| Fund | Instrument | | Gross Amounts of Recognized Liabilities1 | | | Gross Amounts Offset In the Statement of Assets and Liabilities | | | Net Amount of Liabilities Presented on the Statement of Assets and Liabilities | | | Financial Instruments | | | Cash Collateral Pledged | | | Net Amount | |
NASDAQ-100® Fund | Swap equity contracts | | $ | 30,008 | | | $ | — | | | $ | 30,008 | | | $ | — | | | $ | 30,008 | | | $ | — | |
1 | Exchange-traded futures are excluded from these reported amounts. |
9. Federal Income Tax Information
The Fund intends to comply with the provisions of Subchapter M of the Internal Revenue Code applicable to regulated investment companies and will distribute substantially all taxable net investment income and capital gains sufficient to relieve the Fund from all, or substantially all, federal income, excise and state income taxes. Therefore, no provision for federal or state income tax is required.
Tax positions taken or expected to be taken in the course of preparing the Fund’s tax returns are evaluated to determine whether the tax positions are “more-likely-than-not” of being sustained by the applicable tax authority. Tax positions not deemed to meet the more-likely-than-not threshold would be recorded as a
| | THE RYDEX FUNDS ANNUAL REPORT | 39 |
NOTES TO FINANCIAL STATEMENTS (continued)
tax benefit or expense in the current year. Management has analyzed the Fund’s tax positions taken, or to be taken, on Federal income tax returns for all open tax years, and has concluded that no provision for income tax is required in the Fund’s financial statements. The Fund’s federal tax returns are subject to examination by the Internal Revenue Service for a period of three years after they are filed.
The tax character of distributions paid during the year ended March 31, 2015 was as follows:
| Fund | | Ordinary Income | | | Long-Term Capital Gain | | | Total Distributions | |
NASDAQ-100® Fund | | $ | 13,825,128 | | | $ | — | | | $ | 13,825,128 | |
The tax character of distributions paid during the year ended March 31, 2014 was as follows:
| Fund | | Ordinary Income | | | Long-Term Capital Gain | | | Total Distributions | |
NASDAQ-100® Fund | | $ | — | | | $ | 59,488,494 | | | $ | 59,488,494 | |
Note: For federal income tax purposes, short-term capital gain distributions are treated as ordinary income distributions.
The tax character of distributable earnings/(accumulated losses) at March 31, 2015 was as follows:
| Fund | | Undistributed Ordinary Income | | | Undistributed Long-Term Capital Gain | | | Net Unrealized Appreciation/ (Depreciation) | | | Capital Loss Carryforward | |
NASDAQ-100® Fund | | $ | 26,051,997 | | | $ | — | | | $ | 382,855,972 | | | $ | — | |
For Federal income tax purposes, capital loss carryforwards represent realized losses of the Funds that may be carried forward and applied against future capital gains. Under the RIC Modernization Act of 2010, the Funds are permitted to carry forward capital losses incurred in taxable years beginning after December 22, 2010 for an unlimited period and such capital loss carryforwards will retain their character as either short-term or long-term capital losses. As of March 31, 2015, the Fund had no capital loss carryforwards.
Net investment income and net realized gains (losses) may differ for financial statement and tax purposes because of temporary or permanent book/tax differences. These differences are typically due to wash sales, mark-to-market on futures contracts, and utilization of earnings and profits on shareholder redemptions. Additional differences may result from tax treatment of net
| 40 | THE RYDEX FUNDS ANNUAL REPORT | |
NOTES TO FINANCIAL STATEMENTS (continued)
investment losses and expired capital loss carryforwards. To the extent these differences are permanent, reclassifications are made to the appropriate equity accounts in the period that the differences arise. These reclassifications have no effect on the net assets or NAV per share.
On the Statement of Assets and Liabilities the following adjustments were made for permanent book/tax differences:
| Fund | | Paid In Capital | | Undistributed Net Investment Income | | | Accumulated Net Realized Gain (Loss) | |
NASDAQ-100® Fund | | $ | 85,260,255 | | | $ | 1,194,397 | | | $ | (86,454,652 | ) |
At March 31, 2015, the cost of securities for Federal income tax purposes, the aggregate gross unrealized gain for all securities for which there was an excess of value over tax cost and the aggregate gross unrealized loss for all securities for which there was an excess of tax cost over value, were as follows:
| Fund | | Tax Cost | | | Tax Unrealized Gain | | | Tax Unrealized Loss | | | Net Unrealized Gain | |
NASDAQ-100® Fund | | $ | 568,468,031 | | | $ | 385,599,882 | | | $ | (2,851,605 | ) | | $ | 382,748,277 | |
10. Securities Transactions
For the year ended March 31, 2015, the cost of purchases and proceeds from sales of investment securities, excluding government securities, short-term investments and derivatives, were as follows:
| Fund | | Purchases | | | Sales | |
NASDAQ-100® Fund | | $ | 2,144,783,279 | | | $ | 2,072,231,587 | |
11. Line of Credit
The Trust, along with other affiliated trusts, secured an uncommitted, $75,000,000 line of credit from U.S. Bank, N.A., which expires June 13, 2015. This line of credit is reserved for emergency or temporary purposes. Borrowings, if any, under this arrangement bear interest equal to the Prime Rate, minus 2%, which shall be paid monthly, averaging 1.25% for the year ended March 31, 2015. The Fund did not have any borrowings under this agreement at March 31, 2015.
| | THE RYDEX FUNDS ANNUAL REPORT | 41 |
NOTES TO FINANCIAL STATEMENTS (continued)
The average daily balances borrowed for the year ended March 31, 2015 were as follows:
| Fund | | Average Daily Balance | |
NASDAQ-100® Fund | | $ | 341,854 | |
12. Affiliated and/or Related Transactions
Investments representing 5% or more of the outstanding voting shares of a portfolio company of a fund, or control of or by, or common control under GI, result in that portfolio company being considered an affiliated company of such fund, as defined in the 1940 Act.
The Funds may invest in the Guggenheim Strategy Funds Trust consisting of Guggenheim Strategy Fund I, Guggenheim Strategy Fund II, and Guggenheim Strategy Fund III (collectively, the “Cash Management Funds”), open-end management investment companies managed by GI. The Cash Management Funds, which launched on March 11, 2014, are offered as cash management options only to mutual funds, trusts, and other accounts managed by GI and/or its affiliates, and are not available to the public. The Cash Management Funds pay no investment management fees. The Cash Management Funds’ annual report on Form N-CSR dated September 30, 2014 is available publicly or upon request. This information is also available from the EDGAR database on the SEC’s website at http://www.sec.gov.
Transactions during the period ended March 31, 2015, in which the portfolio company is an “affiliated person” are as follows:
| Affiliated issuers by Fund | | Value 03/31/14 | | | Additions | | | Reductions | | | Value 03/31/15 | | | Shares 03/31/15 | | | Investment Income | | | Realized Loss | | | Capital Gain Distributions | |
NASDAQ-100® Fund | | | | | | | | | | | | | |
| Guggenheim Strategy Fund I | | $ | — | | | $ | 463,721,180 | | | $ | (324,000,000 | ) | | $ | 139,227,564 | | | | 5,591,468 | | | $ | 1,821,180 | | | $ | (732,612 | ) | | $ | — | |
13. Legal Proceedings
Tribune Company
Rydex Series Funds has been named as a defendant and a putative member of the proposed defendant class of shareholders in the case entitled Kirschner v. FitzSimons, No. 12-2652 (S.D.N.Y.) (formerly Official Committee of Unsecured Creditors of Tribune Co. v. FitzSimons, Adv. Pro. No. 10-54010 (Bankr. D. Del.)) (the “FitzSimons action”), as a result of ownership by certain series of the Rydex Series Funds of shares in the Tribune Company (“Tribune”) in 2007, when Tribune
| 42 | THE RYDEX FUNDS ANNUAL REPORT | |
NOTES TO FINANCIAL STATEMENTS (continued)
effected a leveraged buyout transaction (“LBO”) by which Tribune converted to a privately-held company. In his complaint, the plaintiff has alleged that, in connection with the LBO, Tribune insiders and shareholders were overpaid for their Tribune stock using financing that the insiders knew would, and ultimately did, leave the Tribune Company insolvent. The plaintiff has asserted claims against certain insiders, major shareholders, professional advisers, and others involved in the LBO. The plaintiff is also attempting to obtain from former Tribune shareholders, including the Rydex Series Funds, the proceeds they received in connection with the LBO.
In June 2011, a group of Tribune creditors filed multiple actions against former Tribune shareholders involving state law constructive fraudulent conveyance claims arising out of the 2007 LBO (the “SLCFC actions”). Rydex Series Funds has been named as a defendant in one of the SLCFC actions: Deutsche Bank Trust Co. Americas v. McGurn, No. 11-1510 (S.D.N.Y.). In those actions, the creditors seek to recover from Tribune’s former shareholders the proceeds received in connection with the 2007 LBO.
The FitzSimons action and the SLCFC actions have been consolidated with the majority of the other Tribune LBO-related lawsuits in a multidistrict litigation proceeding captioned In re Tribune Company Fraudulent Conveyance Litig., No. 11-md-2696 (S.D.N.Y.) (the “MDL Proceeding”).
On September 23, 2013, the District Court granted the defendants’ omnibus motion to dismiss the SLCFC actions, on the basis that the creditors lacked standing. On September 30, 2013, the creditors filed a notice of appeal of the September 23 order. On October 28, 2013, the defendants filed a joint notice of cross-appeal of that same order.
The SLCFC appeals have been fully briefed, and oral argument in front of the U.S. Court of Appeals for the Second Circuit occurred on November 5, 2014. The Court has not yet issued a decision on the appeals.
On May 23, 2014, the defendants filed motions to dismiss the FitzSimons action, including a global motion to dismiss Count I, which is the claim brought against former Tribune shareholders for intentional fraudulent conveyance under U.S. federal law. The Court has not yet issued a decision on any of these motions.
None of these lawsuits alleges any wrongdoing on the part of Rydex Series Funds. The following series of Rydex Series Funds held shares of Tribune and tendered these shares as part of Tribune’s LBO: Nova Fund, S&P 500® Pure Value Fund, Multi-Cap Core Equity Fund, S&P 500® Fund, Multi-Hedge Strategies Fund and Hedged Equity Fund (the “Funds”). The value of the proceeds received by the foregoing Funds was $28,220, $109,242, $9,860, $3,400, $1,181,160, and $10,880,
| | THE RYDEX FUNDS ANNUAL REPORT | 43 |
NOTES TO FINANCIAL STATEMENTS (concluded)
respectively. At this stage of the proceedings, Rydex Series Funds is not able to make a reliable predication as to the outcome of these lawsuits or the effect, if any, on a Fund’s net asset value.
Lyondell Chemical Company
In December 2011, Rydex Series Funds was named as a defendant in Weisfelner, as Trustee of the LB Creditor Trust, v. Fund 1 (In re Lyondell Chemical Co.), Adv. Pro. No. 10-4609 (Bankr. S.D.N.Y.) (the “Creditor Trust action”).
Similar to the claims made in the Tribune matter, the Weisfelner complaint seeks to have set aside and recovered as fraudulent transfers from former Lyondell Chemical Company (“Lyondell”) shareholders the consideration paid to them pursuant to the cash out merger of Lyondell shareholders in connection with the combination of Lyondell and Basell AF in 2007. Lyondell filed for bankruptcy in 2008.
On April 7, 2014, the plaintiff filed a Third Amended Complaint. In the related action entitled Weisfelner, as Trustee of the LB Litigation Trust v. A. Holmes & H. Holmes TTEE (In re Lyondell Co.), Adversary Proceeding No. 10-5525 (Bankr. S.D.N.Y.) (the “Litigation Trust action”), the plaintiff also filed a Second Amended Complaint that alleges a claim against the former Lyondell shareholders under federal law for intentional fraudulent transfer. A third related action against the former Lyondell shareholders, Weisfelner, as Trustee of the LB Creditor Trust v. Reichman, Adversary Proceeding No. 12-1570 (Bankr. S.D.N.Y.) (the “Reichman action”), is pending as well.
On May 8, 2014, the plaintiff in the Litigation Trust action filed a motion to certify a defendant class generally comprised of all former Lyondell shareholders that received proceeds in exchange for their shares in the 2007 merger transaction.
On July 30, 2014, the defendants filed a motion to dismiss these lawsuits. The Court held oral argument on the motions to dismiss and on the motion for class certification on January 14 and January 15, 2015. The Court has not yet issued decisions on these motions. Discovery has commenced in these lawsuits.
These lawsuits do not allege any wrongdoing on the part of Rydex Series Funds. The following series of Rydex Series Funds received cash proceeds from the cash out merger in the following amounts: Basic Materials Fund - $1,725,168; Long Short Equity Fund f/k/a U.S. Long Short Momentum Fund - $2,193,600; Global 130/30 Strategy Fund - $37,920; Hedged Equity Fund - $1,440; and Multi-Hedge Strategies Fund - $1,116,480. At this stage of the proceedings, Rydex Series Funds is not able to make a reliable predication as to the outcome of these lawsuits or the effect, if any, on a Fund’s net asset value.
| 44 | THE RYDEX FUNDS ANNUAL REPORT | |
REPORT OF INDEPENDENT REGISTERED PUBLIC ACCOUNTING FIRM
The Board of Trustees and
Shareholders of Rydex Series Funds:
We have audited the accompanying statement of assets and liabilities, including the schedule of investments, of NASDAQ-100® Fund (one of the series constituting the Rydex Series Funds) (the “Fund”) as of March 31, 2015, and the related statement of operations for the year then ended, the statements of changes in net assets for each of the two years in the period then ended, and the financial highlights for each of the years or periods indicated therein. These financial statements and financial highlights are the responsibility of the Fund’s management. Our responsibility is to express an opinion on these financial statements and financial highlights based on our audits.
We conducted our audits in accordance with the standards of the Public Company Accounting Oversight Board (United States). Those standards require that we plan and perform the audit to obtain reasonable assurance about whether the financial statements and financial highlights are free of material misstatement. We were not engaged to perform an audit of the Fund’s internal control over financial reporting. Our audits included consideration of internal control over financial reporting as a basis for designing audit procedures that are appropriate in the circumstances, but not for the purpose of expressing an opinion on the effectiveness of the Fund’s internal control over financial reporting. Accordingly, we express no such opinion. An audit also includes examining, on a test basis, evidence supporting the amounts and disclosures in the financial statements and financial highlights, assessing the accounting principles used and significant estimates made by management, and evaluating the overall financial statement presentation. Our procedures included confirmation of securities owned as of March 31, 2015, by correspondence with the custodian, transfer agent, and brokers or by other appropriate auditing procedures where replies from brokers were not received. We believe that our audits provide a reasonable basis for our opinion.
In our opinion, the financial statements and financial highlights referred to above present fairly, in all material respects, the financial position of NASDAQ-100® Fund (one of the series constituting the Rydex Series Funds) at March 31, 2015, the results of its operations for the year then ended, the changes in its net assets for each of the two years in the period then ended, and its financial highlights for each of the years or periods indicated therein, in conformity with U.S. generally accepted accounting principles.
McLean, Virginia
May 21, 2015
| | THE RYDEX FUNDS ANNUAL REPORT | 45 |
OTHER INFORMATION (Unaudited)
Tax Information
This information is being provided as required by the Internal Revenue Code. Amounts shown may differ from those elsewhere in the report because of differences in tax and financial reporting practice.
Of the ordinary income distributions paid during the year, the following fund had the corresponding percentage qualify for the dividends received deduction for corporations:
| Fund | % Qualifying |
NASDAQ-100® Fund | 20.44% |
Additionally, the following amounts of taxable ordinary income dividends paid during the fiscal year qualified for the lower income tax rate available to individuals under the Jobs and Growth Tax Relief Reconciliation Act of 2003:
| Fund | % Qualifying |
NASDAQ-100® Fund | 19.41% |
Additionally, of the taxable ordinary income distributions paid during the fiscal year ending March 31, 2015, the following fund had the corresponding percentages qualify as interest related dividends and qualified short-term capital gains as permitted by IRC Section 871(k)(1) and IRC Section 871(k)(2), respectively:
| Fund | % Qualifying | % STCG Qualifying |
NASDAQ-100® Fund | 0.00% | 100.00% |
With respect to the taxable year ended March 31, 2015, the Fund hereby designates as capital gain dividends the amount listed below, or, if subsequently determined to be different, the net capital gain of such year:
| Fund | | From long-term capital gains, using proceeds from shareholder redemptions: | |
NASDAQ-100® Fund | | $ | 44,371,323 | |
| 46 | THE RYDEX FUNDS ANNUAL REPORT | |
OTHER INFORMATION (Unaudited)(concluded)
Proxy Voting Information
A description of the policies and procedures that the Trust uses to determine how to vote proxies relating to securities held in the Funds’ portfolios is available, without charge and upon request, by calling 800.820.0888. This information is also available from the EDGAR database on the SEC’s website at http://www.sec.gov.
Information regarding how the Funds voted proxies relating to portfolio securities during the most recent 12-month period ended June 30 is available without charge, upon request, by calling 800.820.0888. This information is also available from the EDGAR database on the SEC’s website at http://www.sec.gov.
Quarterly Portfolio Schedules Information
The Trust files its complete schedule of portfolio holdings with the SEC for the first and third quarters of each fiscal year on Form N-Q; which are available on the SEC’s website at http://www.sec.gov. The Funds’ Forms N-Q may be reviewed and copied at the SEC’s Public Reference Room in Washington, DC, and that information on the operation of the Public Reference Room may be obtained by calling 800-SEC-0330. Copies of the portfolio holdings are also available to shareholders, without charge and upon request, by calling 800.820.0888.
| | THE RYDEX FUNDS ANNUAL REPORT | 47 |
INFORMATION ON BOARD OF TRUSTEES AND OFFICERS (Unaudited)
A Board of Trustees oversees the Trust, as well as other trusts of GI, in which its members have no stated term of service, and continue to serve after election until resignation. The Statement of Additional Information includes further information about Fund Trustees and Officers, and can be obtained without charge by calling 800.820.0888.
Name, Address* and Year of Birth of Trustee | Position(s) Held with the Trust, Term of Office and Length of Time Served | Principal Occupation(s) During Past 5 Years | Number of Portfolios in Fund Complex Overseen by Trustee*** | Other Directorships Held by Trustee |
| INTERESTED TRUSTEE | | | |
Donald C. Cacciapaglia** (1951) | Trustee from 2012 to present. | Current: President and CEO, certain other funds in the Fund Complex (2012-present); Vice Chairman, Guggenheim Investments (2010-present). Former: Chairman and CEO, Channel Capital Group, Inc. (2002-2010). | 221 | Clear Spring Life Insurance Company (2015-present); Guggenheim Partners Japan, Ltd. (2014-present); Delaware Life (2013-present); Guggenheim Life and Annuity Company (2011-present); Paragon Life Insurance Company of Indiana (2011-present). |
| INDEPENDENT TRUSTEES | | | |
Corey A. Colehour (1945) | Trustee and Member of the Audit, Governance, Nominating, and Investment and Performance Committees from 1998 to present. | Retired. | 133 | None. |
| 48 | THE RYDEX FUNDS ANNUAL REPORT | |
INFORMATION ON BOARD OF TRUSTEES AND OFFICERS (Unaudited)(continued)
Name, Address* and Year of Birth of Trustee | Position(s) Held with the Trust, Term of Office and Length of Time Served | Principal Occupation(s) During Past 5 Years | Number of Portfolios in Fund Complex Overseen by Trustee*** | Other Directorships Held by Trustee |
| INDEPENDENT TRUSTEES - continued |
J. Kenneth Dalton (1941) | Trustee, Member and Chairman of the Audit Committee, and Member of the Governance and Nominating Committees from 1998 to present; and Member of the Risk Oversight Committee from 2010 to present. | Retired. | 133 | Epiphany Funds (4) (2009-present). |
John O. Demaret (1940) | Vice Chairman of the Board of Trustees from 2014 to present; Trustee from 1998 to present and Chairman of the Board from 2006 to 2014; Member and Chairman of the Audit Committee from 1998 to present; and Member of the Risk Oversight Committee from 2010 to present. | Retired. | 133 | None. |
Werner E. Keller (1940) | Chairman of the Board from 2014 to present; Vice Chairman of the Board of Trustees from 2010 to 2014; Trustee and Member of the Audit, Governance, and Nominating Committees from 2005 to present; and Chairman and Member of the Risk Oversight Committee from 2010 to present. | Current: Founder and President, Keller Partners, LLC (investment research firm) (2005-present). | 133 | None. |
| | THE RYDEX FUNDS ANNUAL REPORT | 49 |
INFORMATION ON BOARD OF TRUSTEES AND OFFICERS (Unaudited)(continued)
Name, Address* and Year of Birth of Trustee | Position(s) Held with the Trust, Term of Office and Length of Time Served | Principal Occupation(s) During Past 5 Years | Number of Portfolios in Fund Complex Overseen by Trustee*** | Other Directorships Held by Trustee |
| INDEPENDENT TRUSTEES - concluded |
Thomas F. Lydon, Jr. (1960) | Trustee and Member of the Audit, Governance, and Nominating Committees from 2005 to present. | Current: President, Global Trends Investments (registered investment adviser) (1996-present). | 133 | US Global Investors (GROW) (1995-present). |
Patrick T. McCarville (1942) | Trustee, Member of the Audit Committee, and Chairman and Member of the Governance and Nominating Committees from 1998 to present. | Retired. Former: Chief Executive Officer, Par Industries, Inc., d/b/a Par Leasing (1977-2010). | 133 | None. |
Name, Address* and Year of Birth | Position(s) Held with the Trust, Term of Office and Length of Time Served | Principal Occupation(s) During Past 5 Years |
| OFFICERS | | |
Donald C. Cacciapaglia (1951) | President (2012-present). | Current: President and CEO, certain other funds in the Fund Complex (2012-present); Vice Chairman, Guggenheim Investments (2010-present). Former: Chairman and CEO, Channel Capital Group Inc. (2002-2010). |
| 50 | THE RYDEX FUNDS ANNUAL REPORT | |
INFORMATION ON BOARD OF TRUSTEES AND OFFICERS (Unaudited)(continued)
Name, Address* and Year of Birth | Position(s) Held with the Trust, Term of Office and Length of Time Served | Principal Occupation(s) During Past 5 Years |
| OFFICERS - continued | |
Michael P. Byrum (1970) | Vice President (1999-present). | Current: Senior Vice President, Security Investors, LLC (2010-present); President and Chief Investment Officer, Rydex Holdings, LLC (2008-present); Director and Chairman, Advisory Research Center, Inc. (2006-present); Manager, Guggenheim Specialized Products, LLC (2005-present). Former: Vice President, Guggenheim Distributors, LLC (2009); Director (2009-2010) and Secretary (2002-2010), Rydex Fund Services, LLC; Director (2008-2010), Chief Investment Officer (2006-2010), President (2004-2010) and Secretary (2002-2010), Rydex Advisors, LLC; Director (2008-2010), Chief Investment Officer (2006-2010), President (2004-2010) and Secretary (2002-2010), Rydex Advisors II, LLC. |
Nikolaos Bonos (1963) | Vice President and Treasurer (2003-present). | Current: Senior Vice President, Security Investors, LLC (2010-present); Chief Executive Officer, Guggenheim Specialized Products, LLC (2009-present); Chief Executive Officer & President, Rydex Fund Services, LLC (2009-present); Vice President, Rydex Holdings, LLC (2008-present). Former: Senior Vice President, Security Global Investors, LLC (2010-2011); and Senior Vice President, Rydex Advisors, LLC and Rydex Advisors II, LLC (2006-2011). |
Elisabeth Miller (1968) | Chief Compliance Officer (2012-present). | Current: CCO, certain other funds in the Fund Complex (2012-present); CCO, Security Investors, LLC (2012-present); CCO, Guggenheim Funds Investment Advisors, LLC (2012-present); Managing Director, Guggenheim Investments (2012-present); Vice President, Guggenheim Funds Distributors, LLC (March 2014-present). Former: CCO, Guggenheim Distributors, LLC (2009-March 2014); Senior Manager, Security Investors, LLC (2004-2009); Senior Manager, Guggenheim Distributors, LLC (2004-2009). |
| | THE RYDEX FUNDS ANNUAL REPORT | 51 |
INFORMATION ON BOARD OF TRUSTEES AND OFFICERS (Unaudited)(concluded)
Name, Address* and Year of Birth | Position(s) Held with the Trust, Term of Office and Length of Time Served | Principal Occupation(s) During Past 5 Years |
| OFFICERS - concluded | |
Joseph M. Arruda (1966) | Assistant Treasurer (2006-present). | Current: Assistant Treasurer, certain other funds in the Fund Complex (2006-present); Vice President, Security Investors, LLC (2010-present); CFO and Manager, Guggenheim Specialized Products, LLC (2009-present). Former: Vice President, Security Global Investors, LLC (2010-2011); Vice President, Rydex Advisors, LLC (2010); Vice President, Rydex Advisors II, LLC (2010). |
Paul J. Davio (1972) | Assistant Treasurer (2014-present). | Current: Assistant Treasurer, certain other funds in the Fund Complex (2014-present); Director, Guggenheim Investments (2006-present). Former: Manager, Mutual Fund Administration, Guggenheim Investments (2003-2006). |
Amy J. Lee (1961) | Vice President (2009-present) and Secretary (2012-present). | Current: Chief Legal Officer, certain other funds in the Fund Complex (2013-present); Senior Managing Director, Guggenheim Investments (2012-present). Former: Vice President, Associate General Counsel and Assistant Secretary, Security Benefit Life Insurance Company and Security Benefit Corporation (2004-2012). |
| * | All Trustees and Officers may be reached c/o Guggenheim Investments, 805 King Farm Boulevard, Suite 600, Rockville, MD 20850. |
| ** | Mr. Cacciapaglia is an “interested” person of the Trust, as that term is defined in the 1940 Act by virtue of his affiliation with the Adviser’s parent company. |
| *** | The “Fund Complex” includes all closed-end and open-end funds (including all of their portfolios) advised by the Adviser and any funds that have an investment adviser or servicing agent that is an affiliated person of the Adviser. Information provided is as of the date of this report. |
| 52 | THE RYDEX FUNDS ANNUAL REPORT | |
GUGGENHEIM INVESTMENTS PRIVACY POLICIES (Unaudited)
Rydex Funds, Guggenheim Funds, Rydex Investments, Guggenheim Funds Distributors, LLC, Security Investors, LLC, Security Distributors, Inc., Guggenheim Partners Investment Managers, LLC, and Rydex Advisory Services (Collectively “Guggenheim Investments”).
Our Commitment to You
When you become a Guggenheim Investments investor, you entrust us with not only your hard-earned money but also with personal and financial information about you. We recognize that your relationship with us is based on trust and that you expect us to act responsibly and in your best interests. Because we have access to this private information about you, we hold ourselves to the highest standards in its safekeeping and use. This means, most importantly, that we do not sell client information to anyone—whether it is your personal information or if you are a current or former Guggenheim Investments client.
The Information We Collect About You
In the course of doing business with shareholders and investors, we collect nonpublic personal information about you. You typically provide personal information when you complete a Guggenheim Investments account application or when you request a transaction that involves Rydex and Guggenheim Investments funds or one of the Guggenheim Investments affiliated companies. “Nonpublic personal information” is personally identifiable private information about you. For example, it includes information regarding your name and address, Social Security or taxpayer identification number, assets, income, account balance, bank account information and investment activity (e.g., purchase and redemption history).
How We Handle Your Personal Information
As emphasized above, we do not sell information about current or former clients or their accounts to third parties. Nor do we share such information, except when necessary to complete transactions at your request or to make you aware of related investment products and services that we offer. Additional details about how we handle your personal information are provided below. To complete certain transactions or account changes that you direct, it may be necessary to provide identifying information to companies, individuals or groups that are not affiliated with Guggenheim Investments. For example, if you ask to transfer assets from another financial institution to Guggenheim Investments, we will need to provide certain information about you to that company to complete the transaction. To alert you to other Guggenheim Investments investment products and services, we may share your information within the Guggenheim Investments family of affiliated companies. This would include, for example, sharing your information within Guggenheim Investments so we can make you aware of
| | THE RYDEX FUNDS ANNUAL REPORT | 53 |
GUGGENHEIM INVESTMENTS PRIVACY POLICIES (Unaudited)(continued)
new Rydex and Guggenheim Investments funds or the services offered through another Guggenheim Investments affiliated company. In certain instances, we may contract with nonaffiliated companies to perform services for us. Where necessary, we will disclose information we have about you to these third parties. In all such cases, we provide the third party with only the information necessary to carry out its assigned responsibilities and only for that purpose. And we require these third parties to treat your private information with the same high degree of confidentiality that we do. In certain instances, we may share information with other financial institutions regarding individuals and entities in response to the U.S.A. Patriot Act. Finally, we will release information about you if you direct us to do so, if we are compelled by law to do so or in other circumstances permitted by law.
Opt Out Provisions
We do not sell your personal information to anyone. The law allows you to “opt out” of only certain kinds of information sharing with third parties. The firm does not share personal information about you with any third parties that triggers this opt-out right. This means YOU ARE ALREADY OPTED OUT.
How We Protect Privacy Online
Our concern for the privacy of our shareholders also extends to those who use our web site, guggenheiminvestments.com. Our web site uses some of the most secure forms of online communication available, including encryption technology, Secure Socket Layer (SSL) protocol, firewalls and user names and passwords. These technologies provide a high level of security and privacy when you access your account information or initiate online transactions. The Guggenheim Investments web site offers customized features that require our use of “http cookies”—tiny pieces of information that we ask your browser to store. However, we make very limited use of these cookies. We only use cookies for session management and security features on the Guggenheim Investments web site. We do not use them to pull data from your hard drive, to learn your email address, or to view data in cookies created by other web sites. We will not share the information in our cookies or give others access to it. See the legal information area on our web site for more details about web site security and privacy features.
How We Safeguard Your Personal Information
We restrict access to nonpublic personal information about shareholders to our employees and in some cases to third parties (for example, the service providers described above) as permitted by law. We maintain strict physical, electronic and procedural safeguards that comply with federal standards to guard your nonpublic personal information.
| 54 | THE RYDEX FUNDS ANNUAL REPORT | |
GUGGENHEIM INVESTMENTS PRIVACY POLICIES (Unaudited)(concluded)
We’ll Keep You Informed
As required by federal law, we will notify shareholders of our privacy policy annually. We reserve the right to modify this policy at any time, but rest assured that if we do change it, we will tell you promptly. You will also be able to access our privacy policy from our web site at guggenheiminvestments.com. Should you have any questions regarding our privacy policy, contact us at 800.820.0888 or 301.296.5100.
| | THE RYDEX FUNDS ANNUAL REPORT | 55 |
This page intentionally left blank.
This page intentionally left blank.
This page intentionally left blank.
This page intentionally left blank.
This page intentionally left blank.
This page intentionally left blank.