UNITED STATES
SECURITIES AND EXCHANGE COMMISSION
Washington, D.C. 20549
FORM N-CSR
CERTIFIED SHAREHOLDER REPORT OF REGISTERED
MANAGEMENT INVESTMENT COMPANIES
Investment Company Act file number 811- 07584
Rydex Series Funds
(Exact name of registrant as specified in charter)
805 King Farm Boulevard, Suite 600
Rockville, Maryland 20850
(Address of principal executive offices) (Zip code)
Amy J. Lee
Rydex Series Funds
805 King Farm Boulevard, Suite 600
Rockville, Maryland 20850
(Name and address of agent for service)
Registrant's telephone number, including area code: 1-301-296-5100
Date of fiscal year end: December 31
Date of reporting period: December 31, 2016
Form N-CSR is to be used by management investment companies to file reports with the Commission not later than 10 days after the transmission to stockholders of any report that is required to be transmitted to stockholders under Rule 30e-1 under the Investment Company Act of 1940 (17 CFR 270.30e-1). The Commission may use the information provided on Form N-CSR in its regulatory, disclosure review, inspection, and policymaking roles.
A registrant is required to disclose the information specified by Form N-CSR, and the Commission will make this information public. A registrant is not required to respond to the collection of information contained in Form N-CSR unless the Form displays a currently valid Office of Management and Budget ("OMB") control number. Please direct comments concerning the accuracy of the information collection burden estimate and any suggestions for reducing the burden to Secretary, Securities and Exchange Commission, 450 Fifth Street, NW, Washington, DC 20549-0609. The OMB has reviewed this collection of information under the clearance requirements of 44 U.S.C. § 3507.
Item 1. Reports to Stockholders.
The registrant’s annual report transmitted to shareholders pursuant to Rule 30e-1 under the Investment Company Act of 1940, as amended (the “Investment Company Act”), is as follows:
12.31.2016
Guggenheim Funds Annual Report
Guggenheim Alternative Fund |
Guggenheim Multi-Hedge Strategies Fund | | |
Rydex Commodities Fund |
Rydex Commodities Strategy Fund | | |
GuggenheimInvestments.com | RDXSGIALT-ANN-1216x1217 |

DEAR SHAREHOLDER | 2 |
ECONOMIC AND MARKET OVERVIEW | 4 |
ABOUT SHAREHOLDERS’ FUND EXPENSES | 6 |
ALTERNATIVE FUND | |
MULTI-HEDGE STRATEGIES FUND | 9 |
COMMODITIES FUND | |
COMMODITIES STRATEGY FUND | 47 |
NOTES TO CONSOLIDATED FINANCIAL STATEMENTS | 59 |
REPORT OF INDEPENDENT REGISTERED PUBLIC ACCOUNTING FIRM | 84 |
OTHER INFORMATION | 85 |
INFORMATION ON BOARD OF TRUSTEES AND OFFICERS | 86 |
GUGGENHEIM INVESTMENTS PRIVACY POLICIES | 92 |
| | THE GUGGENHEIM FUNDS ANNUAL REPORT | 1 |
Dear Shareholder:
Security Investors, LLC (the “Investment Adviser”) is pleased to present the annual shareholder report for one alternative strategy fund and one commodities fund (the “Funds”) that are part of the Rydex Series Funds. This report covers performance of the Funds for the annual period ended December 31, 2016.
The Investment Adviser is a part of Guggenheim Investments, which represents the investment management businesses of Guggenheim Partners, LLC (“Guggenheim”), a global, diversified financial services firm.
Guggenheim Funds Distributors, LLC is the distributor of the Funds. Guggenheim Funds Distributors, LLC is affiliated with Guggenheim and the Investment Adviser.
We encourage you to read the Economic and Market Overview section of the report, which follows this letter, and then the Performance Report and Fund Profile for each Fund.
We are committed to providing innovative investment solutions and appreciate the trust you place in us.
Sincerely,

Donald C. Cacciapaglia
President
January 31, 2017
Read a prospectus and summary prospectus (if available) carefully before investing. It contains the investment objectives, risks, charges, expenses and other information, which should be considered carefully before investing. Obtain a prospectus and summary prospectus (if available) at guggenheiminvestments.com or call 800.820.0888.
The Multi-Hedge Strategies Fund is subject to a number of risks and may not be suitable for all investors. ● The Fund’s use of derivatives such as futures, options and swap agreements may expose the Fund to additional risks that it would not be subject to if it invested directly in the securities underlying those derivatives. ● The more the Fund invests in leveraged instruments, the more the leverage will magnify any gains or losses on those investments. ● The Fund’s use of short selling involves increased risks and costs. The Fund risks paying more for a security than it received from its sale. ● The Fund’s investments in high yield securities and unrated securities of similar credit quality (“junk bonds”) may be subject to greater levels of interest rate, credit and liquidity risk than funds that do not invest in such securities. ● The Fund’s fixed income investments will change in value in response to interest rate changes and other factors. ● The Fund’s exposure to the commodity and currency markets may subject the fund to greater volatility as commodity- and currency-linked derivative investments may be affected by changes in overall market movements, commodity index volatility, changes in interest rates or factors affecting a particular industry, commodity or currency—such as droughts, floods, weather,
2 | THE GUGGENHEIM FUNDS ANNUAL REPORT | |
livestock disease, embargoes, tariffs and international economic, political and regulatory developments. The Fund may also incur transaction costs with the conversion between various currencies. ● The Fund’s exposure to foreign currencies subjects the Fund to the risk that those currencies will decline in value relative to the U.S. dollar, or, in the case of short positions, that the U.S. dollar will decline in value relative to the currency being hedged. ● These risks may cause the Fund to experience higher losses and/or volatility than a fund that does not invest in derivatives, use leverage or short sales or have exposure to high yield/fixed income securities, foreign currencies and/or securities. ● This Fund is considered non-diversified and can invest a greater portion of its assets in securities of individual issuers than a diversified fund. As a result, changes in the market value of a single security could cause greater fluctuations in the value of Fund shares than would occur in a more diversified fund. ● Please read the prospectus for more detailed information regarding these and other risks.
The Commodities Strategy Fund may not be suitable for all investors. ● The Fund’s exposure to the commodity markets may subject the Fund to greater volatility as commodity-linked investments may be affected by changes in overall market movements, commodity index volatility, changes in interest rates or factors affecting a particular industry or commodity—such as droughts, floods, weather, embargos, tariffs and international economic, political and regulatory developments. ● To the extent that the Fund’s investments are concentrated in energy-related commodities, the Fund is subject to the risk that this sector will underperform the market as a whole. ● The Fund’s use of derivatives, such as futures, options, structured notes and swap agreements, may expose the Fund to additional risks that it would not be subject to if it invested directly in the securities or investments underlying those derivatives. ● The more the Fund invests in leveraged instruments, the more the leverage will magnify any gains or losses on those investments. ● The Fund is subject to tracking error risks, which may cause the Fund’s performance not to match that of or be lower than the Fund’s underlying benchmark. ● The Fund’s investments in other investment companies subjects the Fund to those risks affecting the investment company, including the possibility that the value of the underlying securities held by the investment company could decrease. Moreover, the Fund will incur its pro rata share of the expenses of the underlying investment companies’ expenses. ● This Fund is considered non-diversified and can invest a greater portion of its assets in securities of individual issuers than a diversified fund. As a result, changes in the market value of a single security could cause greater fluctuations in the value of fund shares than would occur in a more diversified fund. ● See the prospectus for more information on these and additional risks.
| | THE GUGGENHEIM FUNDS ANNUAL REPORT | 3 |
ECONOMIC AND MARKET OVERVIEW (Unaudited) | December 31, 2016 |
Behind the performance numbers for the past 12 months are a multitude of events that unfolded throughout 2016, including an increase in U.S. corporate defaults, several quarters of negative earnings growth, stubbornly low inflation across the globe, the British vote to exit the European Union, and a U.S. presidential election outcome that defied investor expectations and polling trends. That was on top of one of the worst selloffs for U.S. corporate bonds since the financial crisis in the first six weeks of the year, and one of the worst selloffs in government bonds since 2013’s taper tantrum in the fourth quarter, and the Standard & Poor’s 500® (“S&P 500”) Index* falling almost 11% early in the year. Nevertheless, or perhaps because of all the pre-election turmoil, between election day and the end of December, the S&P 500 rallied 4.6%, high-yield spreads tightened 83 basis points, and 10-year Treasury yields rose 57 basis points.
The market reaction to the outcome of the U.S. presidential election set the stage for the U.S. Federal Reserve (the “Fed”) to hike in December. As widely expected, the Fed raised target interest rates by 25 basis points from a range of 0.25–0.50% to 0.50–0.75%. More importantly, the Federal Open Market Committee (“FOMC”) now projects three rate increases in 2017, up from two in September.
The upward shift appears to reflect the view that there may be less room for accommodative policy to continue in light of recent labor market data. We believe the participation rate introduces meaningful uncertainty to the pace of Fed tightening. In 2016, a rising participation rate helped keep the Fed at bay for most of the year as it stabilized the unemployment rate slightly above what the Fed considers full employment. However, the participation trend reversed in October and November, causing the unemployment rate to decline to only 4.7% by December.
Early indications that fiscal spending (and/or tax cuts) will be prioritized in the new administration suggest that the risks to real Gross Domestic Product (“GDP”) growth in 2017 and 2018 are now skewed to the upside. U.S. real GDP grew by 3.5% in the third quarter, up from 1.4% in the second quarter. We expect output to rise by around 2% on average in coming quarters, a bit faster than the trend rate over the past year, as drags from past dollar strength and an inventory adjustment cycle fade.
A post-election rise in consumer confidence, along with continued income growth and healthier household balance sheets, bodes well for consumption in the coming quarters. The trend rate of job growth should slow as we near full employment. Even so, the unemployment rate should continue to fall toward 4.0% as employment growth outstrips labor force growth. A tighter labor market will begin to put more upward pressure on wage growth, which is being held back by meager productivity gains. An improving labor market, low borrowing costs, and rising household formation will continue to bolster housing, as evidenced by housing starts at cyclical highs. Key inflation measures will rise over the next year due to energy price base effects and reductions in labor market slack.
Given our view that the Fed will raise rates three, possibly four, times in 2017, the effects of monetary policy divergence will be important to watch as two major central banks, the European Central Bank (“ECB”) and the Bank of Japan (“BOJ”), continue their purchase programs. In December, the ECB committed to extend its asset-purchase program through the end of 2017, albeit at a reduced monthly pace of €60 billion (from €80 billion currently) beginning in April. The ECB also changed its criteria for asset purchases, allowing the purchase of sovereign bonds with yields lower than the -0.40% deposit
4 | THE GUGGENHEIM FUNDS ANNUAL REPORT | |
ECONOMIC AND MARKET OVERVIEW (Unaudited)(concluded) | December 31, 2016 |
rate. In our view, the extension of the program to at least the end of 2017 makes it highly likely that the ECB will continue to buy assets well into 2018. The growing gap in policy rates and global yields could drive further U.S. dollar appreciation, which would weigh on oil prices and stem the recovery in the energy market. Currently, our oil model projects oil prices will remain below $60 per barrel through the end of 2017.
For the year ended December 31, 2016, the S&P 500 Index returned 11.96%. The MSCI Europe-Australasia-Far East (“EAFE”) Index* returned 1.00%. The return of the MSCI Emerging Markets Index* was 11.19%.
In the bond market, the Bloomberg Barclays U.S. Aggregate Bond Index* posted a 2.65% return for the year, while the Bloomberg Barclays U.S. Corporate High Yield Index* returned 17.13%. The return of the Bank of America (“BofA”) Merrill Lynch 3-Month U.S. Treasury Bill Index* was 0.33% for the 12-month period.
The opinions and forecasts expressed may not actually come to pass. This information is subject to change at any time, based on market and other conditions, and should not be construed as a recommendation of any specific security or strategy.
*Index Definitions:
The following indices are referenced throughout this report. Indices are unmanaged and not available for direct investment. Index performance does not reflect transaction costs, fees, or expenses.
Bloomberg Barclays U.S. Aggregate Bond Index is a broad-based flagship benchmark that measures the investment grade, U.S. dollar-denominated, fixed-rate taxable bond market, including U.S. Treasuries, government-related and corporate securities, mortgage-backed securities or “MBS” (agency fixed-rate and hybrid adjustable-rate mortgage, or “ARM”, pass-throughs), asset-backed securities (“ABS”), and commercial mortgage-backed securities (“CMBS”) (agency and non-agency).
Bloomberg Barclays U.S. Corporate High Yield Index measures the U.S. dollar-denominated, high yield, fixed-rate corporate bond market. Securities are classified as high yield if the middle rating of Moody’s, Fitch, and S&P is Ba1/BB +/BB + or below.
BofA Merrill Lynch 3-Month U.S. Treasury Bill Index is an unmanaged market index of U.S. Treasury securities maturing in 90 days that assumes reinvestment of all income.
MSCI EAFE Index is a free float-adjusted market capitalization index that is designed to measure the equity market performance of developed markets, excluding the U.S. & Canada.
MSCI Emerging Markets Index is a free float-adjusted market capitalization weighted index that is designed to measure equity market performance in the global emerging markets.
S&P 500® Index is a capitalization-weighted index of 500 stocks designed to measure the performance of the broad economy, representing all major industries and is considered a representation of the U.S. stock market.
S&P Goldman Sachs Commodity Index (“GSCI”)TM, a benchmark for investment performance in the commodity markets, measures investable commodity price movements and inflation in the world economy. The index is calculated primarily on a world production weighted basis and is comprised of the principal physical commodities that are the subject of active, liquid futures markets.
HFRX Global Hedge Fund Index is designed to be representative of the overall composition of the hedge fund universe. It is comprised of all eligible hedge fund strategies, including, but not limited to, convertible arbitrage, distressed securities, equity hedge, equity market neutral, event driven, macro, merger arbitrage and relative-value arbitrage. The strategies are asset weighted based on the distribution of assets in the hedge fund industry.
| | THE GUGGENHEIM FUNDS ANNUAL REPORT | 5 |
ABOUT SHAREHOLDERS’ FUND EXPENSES (Unaudited) |
All mutual funds have operating expenses, and it is important for our shareholders to understand the impact of costs on their investments. Shareholders of a fund incur two types of costs: (i) transaction costs, including sales charges (loads) on purchase payments, reinvested dividends, other distributions, and exchange fees, and (ii) ongoing costs, including management fees, administrative services, and shareholder reports, among others. These ongoing costs, or operating expenses, are deducted from a fund’s gross income and reduce the investment return of the fund.
A fund’s expenses are expressed as a percentage of its average net assets, which is known as the expense ratio. The following examples are intended to help investors understand the ongoing costs (in dollars) of investing in a fund and to compare these costs with the ongoing costs of investing in other mutual funds.
The examples are based on an investment of $1,000 made at the beginning of the period and held for the entire six-month period beginning June 30, 2016 and ending December 31, 2016.
The following tables illustrate the Funds’ costs in two ways:
Table 1. Based on actual Fund return: This section helps investors estimate the actual expenses paid over the period. The “Ending Account Value” shown is derived from the Fund’s actual return, and the fifth column shows the dollar amount that would have been paid by an investor who started with $1,000 in the Fund. Investors may use the information here, together with the amount invested, to estimate the expenses paid over the period. Simply divide the Fund’s account value by $1,000 (for example, an $8,600 account value divided by $1,000 = 8.6), then multiply the result by the number provided under the heading “Expenses Paid During Period.”
Table 2. Based on hypothetical 5% return: This section is intended to help investors compare a Fund’s cost with those of other mutual funds. The table provides information about hypothetical account values and hypothetical expenses based on the Fund’s actual expense ratio and an assumed rate of return of 5% per year before expenses, which is not the Fund’s actual return. The hypothetical account values and expenses may not be used to estimate the actual ending account balance or expenses paid during the period. The example is useful in making comparisons because the U.S. Securities and Exchange Commission (the “SEC”) requires all mutual funds to calculate expenses based on the 5% return. Investors can assess a Fund’s costs by comparing this hypothetical example with the hypothetical examples that appear in shareholder reports of other funds.
The calculations illustrated above assume no shares were bought or sold during the period. Actual costs may have been higher or lower, depending on the amount of investment and the timing of any purchases or redemptions.
6 | THE GUGGENHEIM FUNDS ANNUAL REPORT | |
ABOUT SHAREHOLDERS’ FUND EXPENSES (Unaudited)(continued) |
Please note that the expenses shown in the table are meant to highlight your ongoing costs only and do not reflect any transactional costs, such as sales charges (loads) on purchase payments, and contingent deferred sales charges (“CDSC”) on redemptions, if any. Therefore, the second table is useful in comparing ongoing costs only, and will not help you determine the relative total costs of owning different funds. In addition, if these transactional costs were included, your costs would have been higher.
More information about the Funds’ expenses, including annual expense ratios for periods up to five years (subject to the Fund’s inception date), can be found in the Consolidated Financial Highlights section of this report. For additional information on operating expenses and other shareholder costs, please refer to the appropriate Fund prospectus.
| | THE GUGGENHEIM FUNDS ANNUAL REPORT | 7 |
ABOUT SHAREHOLDERS’ FUND EXPENSES (Unaudited)(concluded) |
| | Expense
Ratio1 | Fund
Return | Beginning
Account Value
June 30,
2016 | Ending
Account Value
December 31,
2016 | Expenses
Paid During
Period2 |
Table 1. Based on actual Fund return3 |
Multi-Hedge Strategies Fund |
A-Class | 2.61% | 0.57% | $ 1,000.00 | $ 1,005.70 | $ 13.19 |
C-Class | 3.36% | 0.16% | 1,000.00 | 1,001.60 | 16.95 |
P-Class | 2.59% | 0.57% | 1,000.00 | 1,005.70 | 13.09 |
Institutional Class | 2.36% | 0.68% | 1,000.00 | 1,006.80 | 11.94 |
Commodities Strategy Fund |
A-Class | 1.64% | 1.48% | 1,000.00 | 1,014.80 | 8.33 |
C-Class | 2.33% | 1.01% | 1,000.00 | 1,010.10 | 11.81 |
H-Class | 1.62% | 1.57% | 1,000.00 | 1,015.70 | 8.23 |
| |
Table 2. Based on hypothetical 5% return (before expenses) | | | |
Multi-Hedge Strategies Fund | |
A-Class | 2.61% | 5.00% | $ 1,000.00 | $ 1,012.05 | $ 13.24 |
C-Class | 3.36% | 5.00% | 1,000.00 | 1,008.27 | 17.01 |
P-Class | 2.59% | 5.00% | 1,000.00 | 1,012.15 | 13.14 |
Institutional Class | 2.36% | 5.00% | 1,000.00 | 1,013.31 | 11.98 |
Commodities Strategy Fund |
A-Class | 1.64% | 5.00% | 1,000.00 | 1,016.94 | 8.34 |
C-Class | 2.33% | 5.00% | 1,000.00 | 1,013.46 | 11.82 |
H-Class | 1.62% | 5.00% | 1,000.00 | 1,017.04 | 8.24 |
1 | Annualized and excludes expenses of the underlying funds in which the Funds invest. This ratio represents net expenses which include interest and dividend expenses related to securities sold short. Excluding short interest and dividend expenses, the net expense ratio of the Multi-Hedge Strategies Fund would be 1.43%, 2.17%, 1.43% and 1.18% for the A-Class, C-Class, P-Class and Institutional Class, respectively. |
2 | Expenses are equal to the Fund's annualized expense ratio, net of any applicable fee waivers, multiplied by the average account value over the period, multiplied by 184/365 (to reflect the one-half year period). |
3 | Actual cumulative return at net asset value for the period June 30, 2016 to December 31, 2016. |
8 | THE GUGGENHEIM FUNDS ANNUAL REPORT | |
PERFORMANCE REPORT AND FUND PROFILE (Unaudited) | December 31, 2016 |
MULTI-HEDGE STRATEGIES FUND
OBJECTIVE: Seeks to provide long-term capital appreciation with less risk than traditional equity funds.
2016 was the seventh full fiscal year of performance since the Fund’s objective was changed from hedge fund replication to capital appreciation. The Fund seeks capital appreciation with low correlation* to equity and fixed income markets, while doing so with low risk–typically in the 5.0% to 8.0% range. For the year, the Institutional Class of the Fund produced a return of -0.18% with annualized risk of 2.8%. 2016 represents the first fiscal year of negative performance for the Fund since the strategy change occurred in late 2009; however, the Fund still succeeded in maintaining low correlation with stock and bond indices, as its correlation with the S&P 500 Index and the Bloomberg Barclays U.S. Aggregate Bond Index came in at .45 and .09, respectively.
While no longer a hedge fund replication product, the Fund still maintains the HFRX Global Hedge Fund Index as one of its benchmarks. This benchmark returned 2.50% for the year. In contrast to the diversification benefits provided by the Multi-Hedge Strategies Fund, the HFRX Global Hedge Fund Index had a correlation of .81 with the S&P 500 in 2016. Since the Fund changed its investment objective (starting 8/1/2009), it has outperformed the HFRX Global Hedge Fund Index by more than 10% (roughly 1.2% annualized), net of fees, while doing so with much lower correlation to equity markets.
Three of the five hedge fund strategies used within the Fund contributed positively to gross Fund returns in 2016–one strategy contributed negatively, while another strategy did not receive an allocation throughout the year, so it did not contribute.
The Equity Market Neutral strategies contributed 0.52% to gross Fund returns. The Quantitative Market Neutral model detracted -0.09%; this model allocates to stocks resulting in a portfolio with tilts toward value and momentum characteristics while seeking equity beta neutrality. The Closed-end Fund Arbitrage model contributed 0.61%; this strategy purchases closed-end funds trading at discounts while hedging the market-related risks associated with each fund.
The Fixed Income strategies did not contribute during 2016; both the U.S. Treasury Flattener and the High Yield Credit Spread strategies are tactical and neither was attractive throughout the year.
The Global Macro strategies detracted -1.78%. Within Global Macro, the Managed Futures models detracted -2.42%. The Managed Futures models seek to profit from global trends and reversions by trading commodity, currency, equity, and fixed income futures. The Volatility Arbitrage model contributed 0.64%; this strategy seeks to profit from relative value trades across the VIX futures curve.
The Merger Arbitrage strategy contributed 1.18%; this strategy typically invests in definitive merger deals and makes allocations based upon the expected return and risk parameters of each deal.
| | THE GUGGENHEIM FUNDS ANNUAL REPORT | 9 |
PERFORMANCE REPORT AND FUND PROFILE (Unaudited)(continued) | December 31, 2016 |
The Long/Short Equity strategies contributed 1.20% to gross Fund returns. The Industry and Factor Rotation model contributed 0.09% for the year; this model allocates to industries and risk factors based upon recent trends while maintaining a positive equity market beta, generally in the 30%-60% range. The Tactical Size model contributed 1.11% in 2016; this model tactically trades the relative performance of large-capitalization equities versus small-capitalization equities.
Throughout the year an equity market hedge was used, as the combination of the Fund’s strategies resulted in a forecast equity market correlation reasonably higher than our long-term, upper-bound target of 60%. The hedge was used explicitly to bring the Fund’s forecast risk characteristics in-line with its objectives, which resulted in a -0.07% contribution to gross Fund returns.
Performance displayed represents past performance which is no guarantee of future results.
* | Correlation is a measurement between -1 and 1, which indicates the linear relationship between two variables. If there is no relationship between two variables, the correlation coefficient is 0. If there is a perfect relationship, the correlation is 1. And if there is a perfect inverse relationship, the correlation is -1. |
10 | THE GUGGENHEIM FUNDS ANNUAL REPORT | |
PERFORMANCE REPORT AND FUND PROFILE (Unaudited)(continued) | December 31, 2016 |
Consolidated Holdings Diversification (Market Exposure as % of Net Assets)
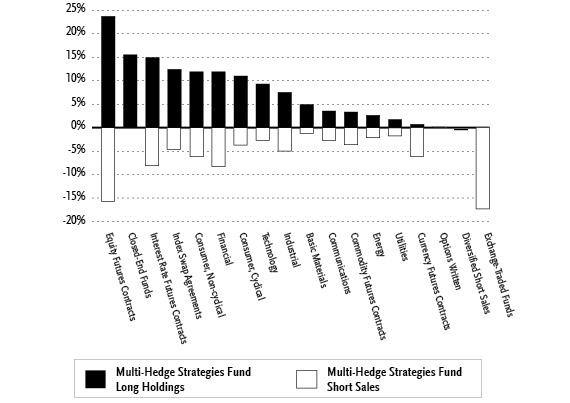
“Consolidated Holdings Diversification (Market Exposure as % of Net Assets)” excludes any temporary cash investments or investments in Guggenheim Strategy Funds Trust mutual funds. Investments in those funds will significantly increase the portfolio’s exposure to certain other asset categories (and their associated risks), which may cause the Fund to deviate from its principal investment strategy, including: (i) high yield, high risk debt securities rated below the top four long-term rating categories by a nationally recognized statistical rating organization (also known as “junk bonds”); (ii) securities issued by the U.S. government or its agencies and instrumentalities; (iii) CLOs and similar investments; and (iv) other short-term fixed income securities.
Inception Dates: |
A-Class | September 19, 2005 |
C-Class | September 19, 2005 |
P-Class | September 19, 2005 |
Institutional Class | May 3, 2010 |
Ten Largest Holdings (% of Total Net Assets) |
WhiteWave Foods Co. — Class A | 2.3% |
Harman International Industries, Inc. | 1.8% |
Endurance Specialty Holdings Ltd. | 1.8% |
G&K Services, Inc. — Class A | 1.7% |
Cabela’s, Inc. | 1.6% |
Mentor Graphics Corp. | 1.5% |
Chemtura Corp. | 1.5% |
EverBank Financial Corp. | 1.4% |
NXP Semiconductor N.V. | 1.4% |
Team Health Holdings, Inc. | 1.4% |
Top Ten Total | 16.4% |
“Ten Largest Holdings” excludes any temporary cash or derivative investments. |
| | THE GUGGENHEIM FUNDS ANNUAL REPORT | 11 |
PERFORMANCE REPORT AND FUND PROFILE (Unaudited)(continued) | December 31, 2016 |
Cumulative Fund Performance*


12 | THE GUGGENHEIM FUNDS ANNUAL REPORT | |
PERFORMANCE REPORT AND FUND PROFILE (Unaudited)(concluded) | December 31, 2016 |
Average Annual Returns*
Periods Ended December 31, 2016
| | 1 Year | 5 Year | 10 Year |
A-Class Shares | -0.43% | 1.80% | -0.14% |
A-Class Shares with sales charge† | -5.17% | 0.81% | -0.63% |
C-Class Shares | -1.18% | 1.04% | -0.89% |
C-Class Shares with CDSC‡ | -2.17% | 1.04% | -0.89% |
P-Class Shares | -0.47% | 1.80% | -0.14% |
S&P 500 Index | 11.96% | 14.66% | 6.95% |
HFRX Global Hedge Fund Index | 2.50% | 1.65% | -0.58% |
| | | | |
| | 1 Year | 5 Year | Since Inception
(05/03/10) |
Institutional Class Shares | -0.18% | 2.06% | 2.88% |
HFRX Global Hedge Fund Index | 2.50% | 1.65% | 0.24% |
S&P 500 Index | 11.96% | 14.66% | 10.51% |
* | The performance data above represents past performance that is not predictive of future results. The investment return and principal value of an investment in the Fund will fluctuate so that an investor’s shares, when redeemed, may be worth more or less than their original cost. Returns are historical and include changes in principal and reinvested dividends and capital gains and do not reflect the effect of taxes. The HFRX Global Hedge Fund Index and the S&P 500 Index are unmanaged indices and, unlike the Fund, have no management fees or operating expenses to reduce their reported returns. The graphs are based on A-Class shares and P-Class shares only; performance for C-Class and Institutional Class shares will vary due to differences in fee structures. |
† | Fund returns are calculated using the maximum sales charge of 4.75%. |
‡ | Fund returns include a CDSC of 1% if redeemed within 12 months of purchase. |
| | THE GUGGENHEIM FUNDS ANNUAL REPORT | 13 |
CONSOLIDATED SCHEDULE OF INVESTMENTS | December 31, 2016 |
MULTI-HEDGE STRATEGIES FUND | |
| | | Shares | | | Value | |
| | | | | | | |
COMMON STOCKS† - 64.3% | |
| | | | | | | |
Consumer, Non-cyclical - 11.9% | |
WhiteWave Foods Co. — Class A*,1 | | | 41,831 | | | $ | 2,325,803 | |
Team Health Holdings, Inc.*,1 | | | 32,960 | | | | 1,432,111 | |
St. Jude Medical, Inc.1 | | | 14,168 | | | | 1,136,131 | |
Alere, Inc.*,1 | | | 26,748 | | | | 1,042,370 | |
Humana, Inc.1 | | | 2,810 | | | | 573,324 | |
Allergan plc*,1 | | | 1,601 | | | | 336,226 | |
Apollo Education Group, Inc. — Class A*,1 | | | 28,345 | | | | 280,615 | |
Cigna Corp.1 | | | 1,719 | | | | 229,297 | |
United Therapeutics Corp.*,1 | | | 1,224 | | | | 175,558 | |
Pilgrim’s Pride Corp.1 | | | 8,600 | | | | 163,314 | |
Tyson Foods, Inc. — Class A1 | | | 2,646 | | | | 163,205 | |
Spectrum Brands Holdings, Inc.1 | | | 1,290 | | | | 157,806 | |
Ingredion, Inc.1 | | | 1,257 | | | | 157,074 | |
Archer-Daniels-Midland Co.1 | | | 3,440 | | | | 157,036 | |
Quanta Services, Inc.*,1 | | | 4,498 | | | | 156,756 | |
ManpowerGroup, Inc.1 | | | 1,753 | | | | 155,789 | |
Western Union Co.1 | | | 7,111 | | | | 154,450 | |
Amgen, Inc.1 | | | 1,048 | | | | 153,228 | |
Procter & Gamble Co.1 | | | 1,820 | | | | 153,026 | |
JM Smucker Co.1 | | | 1,191 | | | | 152,520 | |
Bio-Rad Laboratories, Inc. — Class A*,1 | | | 827 | | | | 150,746 | |
CoreLogic, Inc.*,1 | | | 4,002 | | | | 147,394 | |
AbbVie, Inc.1 | | | 2,349 | | | | 147,094 | |
Baxter International, Inc.1 | | | 3,142 | | | | 139,316 | |
Danaher Corp.1 | | | 1,786 | | | | 139,022 | |
S&P Global, Inc.1 | | | 1,290 | | | | 138,727 | |
Constellation Brands, Inc. — Class A1 | | | 893 | | | | 136,906 | |
Charles River Laboratories International, Inc.*,1 | | | 1,687 | | | | 128,533 | |
Teleflex, Inc.1 | | | 793 | | | | 127,791 | |
Post Holdings, Inc.*,1 | | | 1,554 | | | | 124,926 | |
Cooper Companies, Inc.1 | | | 694 | | | | 121,401 | |
KAR Auction Services, Inc.1 | | | 2,811 | | | | 119,805 | |
Gilead Sciences, Inc.1 | | | 1,620 | | | | 116,008 | |
DaVita, Inc.*,1 | | | 1,786 | | | | 114,661 | |
Dr Pepper Snapple Group, Inc.1 | | | 1,191 | | | | 107,988 | |
WellCare Health Plans, Inc.*,1 | | | 694 | | | | 95,134 | |
Vascular Solutions, Inc.* | | | 1,633 | | | | 91,611 | |
United Rentals, Inc.*,1 | | | 860 | | | | 90,799 | |
Universal Health Services, Inc. — Class B1 | | | 761 | | | | 80,956 | |
Edwards Lifesciences Corp.*,1 | | | 860 | | | | 80,582 | |
VCA, Inc.*,1 | | | 1,092 | | | | 74,966 | |
AMERCO1 | | | 198 | | | | 73,179 | |
Laboratory Corporation of America Holdings*,1 | | | 397 | | | | 50,967 | |
Johnson & Johnson1 | | | 430 | | | | 49,540 | |
Pinnacle Foods, Inc.1 | | | 893 | | | | 47,731 | |
Kroger Co.1 | | | 1,323 | | | | 45,657 | |
Biogen, Inc.*,1 | | | 133 | | | | 37,716 | |
Vantiv, Inc. — Class A*,1 | | | 563 | | | | 33,566 | |
Quest Diagnostics, Inc.1 | | | 298 | | | | 27,386 | |
MEDNAX, Inc.*,1 | | | 397 | | | | 26,464 | |
Eli Lilly & Co.1 | | | 264 | | | | 19,417 | |
Hormel Foods Corp.1 | | | 331 | | | | 11,522 | |
Service Corporation International1 | | | 165 | | | | 4,686 | |
VWR Corp.* | | | 99 | | | | 2,478 | |
Hill-Rom Holdings, Inc.1 | | | 33 | | | | 1,853 | |
Hologic, Inc.*,1 | | | 33 | | | | 1,324 | |
Total Consumer, Non-cyclical | | | | 12,163,491 | |
14 | THE GUGGENHEIM FUNDS ANNUAL REPORT | SEE NOTES TO FINANCIAL STATEMENTS. |
CONSOLIDATED SCHEDULE OF INVESTMENTS (continued) | December 31, 2016 |
MULTI-HEDGE STRATEGIES FUND | |
| | | Shares | | | Value | |
| | | | | | | |
Financial - 11.9% | |
Endurance Specialty Holdings Ltd.1 | | | 19,395 | | | $ | 1,792,097 | |
EverBank Financial Corp.1 | | | 75,080 | | | | 1,460,305 | |
Bats Global Markets, Inc.1 | | | 16,050 | | | | 537,836 | |
Equity One, Inc.1 | | | 5,978 | | | | 183,465 | |
Corporate Office Properties Trust1 | | | 5,226 | | | | 163,157 | |
Camden Property Trust1 | | | 1,919 | | | | 161,331 | |
Senior Housing Properties Trust1 | | | 8,501 | | | | 160,924 | |
Popular, Inc.1 | | | 3,672 | | | | 160,907 | |
Piedmont Office Realty Trust, Inc. — Class A1 | | | 7,674 | | | | 160,463 | |
American Financial Group, Inc.1 | | | 1,820 | | | | 160,379 | |
Aspen Insurance Holdings Ltd.1 | | | 2,911 | | | | 160,104 | |
SunTrust Banks, Inc.1 | | | 2,911 | | | | 159,669 | |
Regions Financial Corp.1 | | | 11,080 | | | | 159,109 | |
PNC Financial Services Group, Inc.1 | | | 1,356 | | | | 158,598 | |
Goldman Sachs Group, Inc.1 | | | 662 | | | | 158,516 | |
Fifth Third Bancorp1 | | | 5,854 | | | | 157,882 | |
RenaissanceRe Holdings Ltd.1 | | | 1,158 | | | | 157,743 | |
Hospitality Properties Trust1 | | | 4,962 | | | | 157,494 | |
Assured Guaranty Ltd.1 | | | 4,167 | | | | 157,388 | |
Arch Capital Group Ltd.*,1 | | | 1,820 | | | | 157,048 | |
Spirit Realty Capital, Inc.1 | | | 14,355 | | | | 155,895 | |
EPR Properties1 | | | 2,149 | | | | 154,234 | |
Liberty Property Trust1 | | | 3,903 | | | | 154,169 | |
Chimera Investment Corp.1 | | | 9,056 | | | | 154,133 | |
Reinsurance Group of America, Inc. — Class A1 | | | 1,224 | | | | 154,016 | |
Morgan Stanley1 | | | 3,638 | | | | 153,706 | |
STORE Capital Corp.1 | | | 6,219 | | | | 153,671 | |
Capital One Financial Corp.1 | | | 1,753 | | | | 152,932 | |
Validus Holdings Ltd.1 | | | 2,778 | | | | 152,818 | |
Nasdaq, Inc.1 | | | 2,250 | | | | 151,020 | |
Berkshire Hathaway, Inc. — Class B*,1 | | | 926 | | | | 150,919 | |
Bank of New York Mellon Corp.1 | | | 3,176 | | | | 150,478 | |
Everest Re Group Ltd.1 | | | 694 | | | | 150,182 | |
Navient Corp.1 | | | 9,129 | | | | 149,990 | |
State Street Corp.1 | | | 1,919 | | | | 149,145 | |
American National Insurance Co.1 | | | 1,191 | | | | 148,411 | |
Old Republic International Corp.1 | | | 7,740 | | | | 147,060 | |
Air Lease Corp. — Class A1 | | | 4,267 | | | | 146,486 | |
Cincinnati Financial Corp.1 | | | 1,919 | | | | 145,364 | |
Ally Financial, Inc.1 | | | 7,607 | | | | 144,685 | |
Aflac, Inc.1 | | | 2,050 | | | | 142,679 | |
Associated Banc-Corp.1 | | | 5,755 | | | | 142,149 | |
Lamar Advertising Co. — Class A1 | | | 2,084 | | | | 140,128 | |
Citigroup, Inc.1 | | | 2,349 | | | | 139,601 | |
Annaly Capital Management, Inc.1 | | | 13,826 | | | | 137,845 | |
Retail Properties of America, Inc. — Class A1 | | | 8,798 | | | | 134,873 | |
Suffolk Bancorp1 | | | 3,080 | | | | 131,886 | |
Discover Financial Services1 | | | 1,720 | | | | 123,995 | |
VEREIT, Inc.1 | | | 14,288 | | | | 120,876 | |
Prologis, Inc.1 | | | 2,149 | | | | 113,446 | |
Ventas, Inc.1 | | | 1,786 | | | | 111,661 | |
JPMorgan Chase & Co.1 | | | 1,290 | | | | 111,314 | |
Allied World Assurance Company Holdings AG1 | | | 2,018 | | | | 108,387 | |
Welltower, Inc.1 | | | 1,588 | | | | 106,285 | |
Hartford Financial Services Group, Inc.1 | | | 2,209 | | | | 105,259 | |
Cascade Bancorp*,1 | | | 12,034 | | | | 97,716 | |
Heritage Oaks Bancorp | | | 7,525 | | | | 92,783 | |
SEE NOTES TO FINANCIAL STATEMENTS. | THE GUGGENHEIM FUNDS ANNUAL REPORT | 15 |
CONSOLIDATED SCHEDULE OF INVESTMENTS (continued) | December 31, 2016 |
MULTI-HEDGE STRATEGIES FUND | |
| | | Shares | | | Value | |
| | | | | | | |
Fidelity & Guaranty Life1 | | | 3,754 | | | $ | 88,970 | |
Southwest Bancorp, Inc. | | | 3,055 | | | | 88,595 | |
E*TRADE Financial Corp.*,1 | | | 2,415 | | | | 83,680 | |
Genworth Financial, Inc. — Class A*,1 | | | 19,752 | | | | 75,255 | |
MFA Financial, Inc.1 | | | 7,872 | | | | 60,063 | |
Bank of America Corp.1 | | | 2,050 | | | | 45,305 | |
CIT Group, Inc.1 | | | 629 | | | | 26,846 | |
American Homes 4 Rent — Class A1 | | | 991 | | | | 20,791 | |
Citizens Financial Group, Inc.1 | | | 331 | | | | 11,794 | |
AGNC Investment Corp.1 | | | 495 | | | | 8,974 | |
Travelers Companies, Inc.1 | | | 34 | | | | 4,162 | |
Total Financial | | | | 12,119,047 | |
| | | | | | | | | |
Consumer, Cyclical – 11.0% | |
Harman International Industries, Inc. | | | 16,778 | | | | 1,865,041 | |
G&K Services, Inc. — Class A1 | | | 18,435 | | | | 1,778,056 | |
Cabela’s, Inc.*,1 | | | 28,125 | | | | 1,646,719 | |
CST Brands, Inc.1 | | | 21,382 | | | | 1,029,544 | |
Rite Aid Corp.*,1 | | | 57,025 | | | | 469,886 | |
WCI Communities, Inc.*,1 | | | 8,329 | | | | 195,315 | |
Whirlpool Corp.1 | | | 893 | | | | 162,321 | |
World Fuel Services Corp.1 | | | 3,473 | | | | 159,445 | |
Lear Corp.1 | | | 1,191 | | | | 157,653 | |
Royal Caribbean Cruises Ltd.1 | | | 1,919 | | | | 157,435 | |
International Game Technology plc1 | | | 6,152 | | | | 156,999 | |
Carnival Corp.1 | | | 3,010 | | | | 156,701 | |
Penske Automotive Group, Inc.1 | | | 2,976 | | | | 154,276 | |
Darden Restaurants, Inc.1 | | | 2,018 | | | | 146,750 | |
Wal-Mart Stores, Inc.1 | | | 2,117 | | | | 146,326 | |
Nu Skin Enterprises, Inc. — Class A1 | | | 3,010 | | | | 143,818 | |
Best Buy Co., Inc.1 | | | 3,307 | | | | 141,110 | |
Michael Kors Holdings Ltd.*,1 | | | 3,275 | | | | 140,760 | |
Dick’s Sporting Goods, Inc.1 | | | 2,580 | | | | 136,998 | |
Urban Outfitters, Inc.*,1 | | | 4,796 | | | | 136,590 | |
Target Corp.1 | | | 1,885 | | | | 136,154 | |
Kohl’s Corp.1 | | | 2,746 | | | | 135,597 | |
PVH Corp.1 | | | 1,455 | | | | 131,299 | |
Dolby Laboratories, Inc. — Class A1 | | | 2,712 | | | | 122,555 | |
DR Horton, Inc.1 | | | 4,366 | | | | 119,323 | |
Goodyear Tire & Rubber Co.1 | | | 3,771 | | | | 116,411 | |
WESCO International, Inc.*,1 | | | 1,720 | | | | 114,467 | |
Isle of Capri Casinos, Inc.*,1 | | | 4,418 | | | | 109,080 | |
Foot Locker, Inc.1 | | | 1,489 | | | | 105,555 | |
Extended Stay America, Inc.1 | | | 6,285 | | | | 101,503 | |
The Gap, Inc.1 | | | 4,433 | | | | 99,477 | |
Spirit Airlines, Inc.*,1 | | | 1,654 | | | | 95,700 | |
Liberty Interactive Corporation QVC Group — Class A*,1 | | | 4,532 | | | | 90,549 | |
Brinker International, Inc.1,2 | | | 1,753 | | | | 86,826 | |
Vista Outdoor, Inc.*,1 | | | 2,349 | | | | 86,678 | |
Mohawk Industries, Inc.*,1 | | | 331 | | | | 66,094 | |
Coach, Inc.1 | | | 1,654 | | | | 57,923 | |
United Continental Holdings, Inc.*,1 | | | 662 | | | | 48,247 | |
Alaska Air Group, Inc.1 | | | 529 | | | | 46,938 | |
Norwegian Cruise Line Holdings Ltd.*,1 | | | 1,059 | | | | 45,039 | |
Casey’s General Stores, Inc.1 | | | 331 | | | | 39,349 | |
Ford Motor Co.1 | | | 3,043 | | | | 36,912 | |
PACCAR, Inc.1 | | | 563 | | | | 35,976 | |
General Motors Co.1 | | | 860 | | | | 29,962 | |
Dillard’s, Inc. — Class A1 | | | 397 | | | | 24,888 | |
CVS Health Corp.1 | | | 264 | | | | 20,832 | |
16 | THE GUGGENHEIM FUNDS ANNUAL REPORT | SEE NOTES TO FINANCIAL STATEMENTS. |
CONSOLIDATED SCHEDULE OF INVESTMENTS (continued) | December 31, 2016 |
MULTI-HEDGE STRATEGIES FUND | |
| | | Shares | | | Value | |
| | | | | | | |
LKQ Corp.*,1 | | | 133 | | | $ | 4,076 | |
AutoNation, Inc.*,1 | | | 66 | | | | 3,211 | |
Gaming and Leisure Properties, Inc.1 | | | 33 | | | | 1,010 | |
Tesla Motors, Inc.* | | | 1 | | | | 115 | |
Total Consumer, Cyclical | | | | 11,193,489 | |
| | | | | | | | | |
Technology - 9.3% | |
Mentor Graphics Corp.1 | | | 40,789 | | | | 1,504,707 | |
NXP Semiconductor N.V.*,1 | | | 14,872 | | | | 1,457,604 | |
Intersil Corp. — Class A1 | | | 52,076 | | | | 1,161,294 | |
Brocade Communications Systems, Inc.1 | | | 87,365 | | | | 1,091,188 | |
InvenSense, Inc. — Class A* | | | 35,661 | | | | 456,104 | |
Dell Technologies Incorporated Class V — Class V*,1 | | | 5,216 | | | | 286,723 | |
Linear Technology Corp.1 | | | 4,482 | | | | 279,452 | |
Lattice Semiconductor Corp.*,1 | | | 25,405 | | | | 186,981 | |
Teradyne, Inc.1 | | | 6,350 | | | | 161,290 | |
Microsoft Corp.1 | | | 2,547 | | | | 158,271 | |
CA, Inc.1 | | | 4,895 | | | | 155,515 | |
Citrix Systems, Inc.*,1 | | | 1,720 | | | | 153,613 | |
ON Semiconductor Corp.*,1 | | | 12,006 | | | | 153,197 | |
Activision Blizzard, Inc.1 | | | 4,233 | | | | 152,854 | |
Leidos Holdings, Inc.1 | | | 2,976 | | | | 152,192 | |
Oracle Corp.1 | | | 3,936 | | | | 151,339 | |
Cadence Design Systems, Inc.*,1 | | | 5,821 | | | | 146,806 | |
Amdocs Ltd.1 | | | 2,514 | | | | 146,441 | |
Synopsys, Inc.*,1 | | | 2,480 | | | | 145,973 | |
Fidelity National Information Services, Inc.1 | | | 1,885 | | | | 142,581 | |
Intel Corp.1 | | | 3,903 | | | | 141,562 | |
Electronic Arts, Inc.*,1 | | | 1,720 | | | | 135,467 | |
Applied Materials, Inc.1 | | | 4,068 | | | | 131,274 | |
DST Systems, Inc.1 | | | 1,224 | | | | 131,152 | |
Allscripts Healthcare Solutions, Inc.*,1 | | | 10,650 | | | | 108,737 | |
International Business Machines Corp.1 | | | 628 | | | | 104,242 | |
Datalink Corp.*,1 | | | 8,668 | | | | 97,602 | |
Broadridge Financial Solutions, Inc.1 | | | 1,455 | | | | 96,467 | |
Apple, Inc.1 | | | 793 | | | | 91,846 | |
Xerox Corp.1 | | | 7,409 | | | | 64,681 | |
NVIDIA Corp.1 | | | 463 | | | | 49,421 | |
Akamai Technologies, Inc.*,1 | | | 694 | | | | 46,276 | |
Genpact Ltd.*,1 | | | 1,191 | | | | 28,989 | |
Black Knight Financial Services, Inc. — Class A*,1,2 | | | 563 | | | | 21,281 | |
HP, Inc.1 | | | 661 | | | | 9,809 | |
Pitney Bowes, Inc.1 | | | 595 | | | | 9,038 | |
Nuance Communications, Inc.*,1 | | | 330 | | | | 4,917 | |
Total Technology | | | | 9,516,886 | |
| | | | | | | | | |
Industrial - 7.5% | |
B/E Aerospace, Inc.1 | | | 19,056 | | | | 1,146,980 | |
Headwaters, Inc.*,1 | | | 40,919 | | | | 962,415 | |
CLARCOR, Inc.1 | | | 7,751 | | | | 639,225 | |
Joy Global, Inc.1 | | | 14,933 | | | | 418,124 | |
Terex Corp.1 | | | 5,160 | | | | 162,694 | |
Arrow Electronics, Inc.*,1 | | | 2,216 | | | | 158,001 | |
Jabil Circuit, Inc.1 | | | 6,648 | | | | 157,358 | |
AGCO Corp.1 | | | 2,679 | | | | 155,007 | |
Republic Services, Inc. — Class A1 | | | 2,712 | | | | 154,719 | |
Norfolk Southern Corp.1 | | | 1,422 | | | | 153,676 | |
Deere & Co.1 | | | 1,489 | | | | 153,427 | |
Huntington Ingalls Industries, Inc.1 | | | 827 | | | | 152,325 | |
Timken Co.1 | | | 3,836 | | | | 152,289 | |
Corning, Inc.1 | | | 6,251 | | | | 151,712 | |
Ingersoll-Rand plc1 | | | 2,018 | | | | 151,432 | |
Spirit AeroSystems Holdings, Inc. — Class A1 | | | 2,580 | | | | 150,543 | |
SEE NOTES TO FINANCIAL STATEMENTS. | THE GUGGENHEIM FUNDS ANNUAL REPORT | 17 |
CONSOLIDATED SCHEDULE OF INVESTMENTS (continued) | December 31, 2016 |
MULTI-HEDGE STRATEGIES FUND | |
| | | Shares | | | Value | |
| | | | | | | |
Owens Corning1 | | | 2,911 | | | $ | 150,091 | |
CSX Corp.1 | | | 4,167 | | | | 149,720 | |
Eaton Corp. plc1 | | | 2,216 | | | | 148,671 | |
Sonoco Products Co.1 | | | 2,778 | | | | 146,401 | |
L-3 Communications Holdings, Inc.1 | | | 959 | | | | 145,873 | |
Ryder System, Inc.1 | | | 1,919 | | | | 142,851 | |
Jacobs Engineering Group, Inc.*,1 | | | 2,480 | | | | 141,360 | |
Oshkosh Corp.1 | | | 2,183 | | | | 141,044 | |
Stanley Black & Decker, Inc.1 | | | 1,224 | | | | 140,380 | |
Northrop Grumman Corp.1 | | | 595 | | | | 138,385 | |
Avnet, Inc.1 | | | 2,877 | | | | 136,974 | |
Trinity Industries, Inc.1 | | | 4,730 | | | | 131,305 | |
FedEx Corp.1 | | | 695 | | | | 129,409 | |
Carlisle Companies, Inc.1 | | | 1,158 | | | | 127,716 | |
Crane Co.1 | | | 1,720 | | | | 124,046 | |
Regal Beloit Corp.1 | | | 1,455 | | | | 100,759 | |
USG Corp.*,1 | | | 3,208 | | | | 92,647 | |
Crown Holdings, Inc.*,1 | | | 1,455 | | | | 76,489 | |
Bemis Company, Inc.1 | | | 1,554 | | | | 74,312 | |
Packaging Corporation of America1 | | | 860 | | | | 72,945 | |
Waste Management, Inc.1 | | | 1,025 | | | | 72,683 | |
Kirby Corp.*,1 | | | 363 | | | | 24,140 | |
AECOM*,1 | | | 563 | | | | 20,471 | |
Energizer Holdings, Inc.1 | | | 430 | | | | 19,182 | |
PerkinElmer, Inc.1 | | | 232 | | | | 12,099 | |
Textron, Inc.1 | | | 165 | | | | 8,012 | |
FLIR Systems, Inc.1 | | | 165 | | | | 5,971 | |
Orbital ATK, Inc.1 | | | 66 | | | | 5,790 | |
Cummins, Inc.1 | | | 33 | | | | 4,510 | |
Harris Corp.1 | | | 33 | | | | 3,382 | |
Garmin Ltd.1 | | | 33 | | | | 1,600 | |
Total Industrial | | | | 7,709,145 | |
| | | | | | | | | |
Basic Materials – 4.9% | |
Chemtura Corp.* | | | 45,277 | | | | 1,503,196 | |
Valspar Corp.1 | | | 11,270 | | | | 1,167,684 | |
Monsanto Co.1 | | | 4,713 | | | | 495,855 | |
Syngenta AG ADR1 | | | 3,032 | | | | 239,680 | |
Stillwater Mining Co.* | | | 10,454 | | | | 168,414 | |
Eastman Chemical Co.1 | | | 2,050 | | | | 154,180 | |
Albemarle Corp.1 | | | 1,786 | | | | 153,739 | |
Domtar Corp.1 | | | 3,903 | | | | 152,334 | |
Huntsman Corp.1 | | | 7,905 | | | | 150,827 | |
Cabot Corp.1 | | | 2,976 | | | | 150,407 | |
Steel Dynamics, Inc.1 | | | 4,134 | | | | 147,087 | |
Reliance Steel & Aluminum Co.1 | | | 1,820 | | | | 144,763 | |
Mosaic Co.1 | | | 4,762 | | | | 139,669 | |
Westlake Chemical Corp.1 | | | 1,985 | | | | 111,140 | |
Newmont Mining Corp.1 | | | 2,514 | | | | 85,652 | |
Nucor Corp.1 | | | 761 | | | | 45,295 | |
United States Steel Corp.1,2 | | | 993 | | | | 32,779 | |
Total Basic Materials | | | | 5,042,701 | |
| | | | | | | | | |
Communications - 3.5% | |
Time Warner, Inc.1 | | | 8,085 | | | | 780,446 | |
Yahoo!, Inc.*,1 | | | 6,627 | | | | 256,266 | |
Blue Nile, Inc.1 | | | 4,774 | | | | 193,968 | |
Level 3 Communications, Inc.*,1 | | | 3,322 | | | | 187,228 | |
Scripps Networks Interactive, Inc. — Class A1 | | | 2,216 | | | | 158,156 | |
Comcast Corp. — Class A1 | | | 2,216 | | | | 153,015 | |
Thomson Reuters Corp.1 | | | 3,473 | | | | 152,049 | |
Cisco Systems, Inc.1 | | | 4,663 | | | | 140,916 | |
Verizon Communications, Inc.1 | | | 2,514 | | | | 134,197 | |
eBay, Inc.*,1 | | | 4,498 | | | | 133,546 | |
TEGNA, Inc.1 | | | 6,185 | | | | 132,297 | |
John Wiley & Sons, Inc. — Class A1 | | | 2,349 | | | | 128,021 | |
Symantec Corp.1 | | | 4,994 | | | | 119,307 | |
Juniper Networks, Inc.1 | | | 4,134 | | | | 116,827 | |
T-Mobile US, Inc.*,1 | | | 1,985 | | | | 114,157 | |
Inteliquent, Inc. | | | 4,216 | | | | 96,631 | |
Liberty Ventures1 | | | 2,547 | | | | 93,908 | |
18 | THE GUGGENHEIM FUNDS ANNUAL REPORT | SEE NOTES TO FINANCIAL STATEMENTS. |
CONSOLIDATED SCHEDULE OF INVESTMENTS (continued) | December 31, 2016 |
MULTI-HEDGE STRATEGIES FUND | |
| | | Shares | | | Value | |
| | | | | | | |
NeuStar, Inc. — Class A* | | | 2,756 | | | $ | 92,050 | |
Liberty Broadband Corp. — Class C*,1 | | | 860 | | | | 63,700 | |
Telephone & Data Systems, Inc.1 | | | 1,951 | | | | 56,325 | |
VeriSign, Inc.*,1 | | | 694 | | | | 52,793 | |
Liberty Media Corporation-Liberty SiriusXM — Class A*,1 | | | 1,521 | | | | 52,505 | |
Alphabet, Inc. — Class A*,1 | | | 66 | | | | 52,302 | |
Alphabet, Inc. — Class C*,1 | | | 66 | | | | 50,940 | |
Liberty Media Corporation-Liberty SiriusXM — Class C*,1 | | | 959 | | | | 32,529 | |
Omnicom Group, Inc.1 | | | 198 | | | | 16,852 | |
Interpublic Group of Companies, Inc.1 | | | 198 | | | | 4,635 | |
GoDaddy, Inc. — Class A*,1 | | | 66 | | | | 2,307 | |
Total Communications | | | | 3,567,873 | |
| | | | | | | | | |
Energy - 2.6% | |
Columbia Pipeline Partners, LP1 | | | 27,884 | | | | 478,210 | |
Trina Solar Ltd. ADR*,1 | | | 19,344 | | | | 179,899 | |
Valero Energy Corp.1 | | | 2,448 | | | | 167,246 | |
Chevron Corp.1 | | | 1,323 | | | | 155,718 | |
Helmerich & Payne, Inc.1,2 | | | 1,885 | | | | 145,898 | |
Patterson-UTI Energy, Inc.1 | | | 5,391 | | | | 145,126 | |
Antero Resources Corp.*,1 | | | 5,987 | | | | 141,594 | |
Exxon Mobil Corp.1 | | | 1,521 | | | | 137,285 | |
Murphy USA, Inc.*,1 | | | 2,216 | | | | 136,217 | |
Rowan Companies plc — Class A*,1 | | | 7,111 | | | | 134,327 | |
QEP Resources, Inc.*,1 | | | 5,193 | | | | 95,603 | |
ONEOK, Inc.1 | | | 1,620 | | | | 93,004 | |
Spectra Energy Corp. | | | 2,104 | | | | 86,453 | |
Western Refining, Inc. | | | 2,210 | | | | 83,649 | |
CONSOL Energy, Inc.1 | | | 4,267 | | | | 77,787 | |
Nabors Industries Ltd.1 | | | 4,333 | | | | 71,061 | |
Pioneer Natural Resources Co.1 | | | 363 | | | | 65,365 | |
Rice Energy, Inc.*,1 | | | 2,746 | | | | 58,627 | |
Targa Resources Corp.1 | | | 893 | | | | 50,071 | |
PBF Energy, Inc. — Class A1 | | | 1,786 | | | | 49,794 | |
Diamond Offshore Drilling, Inc.*,2 | | | 1,885 | | | | 33,365 | |
Marathon Petroleum Corp.1 | | | 662 | | | | 33,332 | |
Baker Hughes, Inc.1 | | | 397 | | | | 25,793 | |
Equities Corp.1 | | | 331 | | | | 21,647 | |
SM Energy Co.1 | | | 397 | | | | 13,689 | |
WPX Energy, Inc.*,1 | | | 695 | | | | 10,126 | |
Noble Corporation plc1 | | | 1,224 | | | | 7,246 | |
Parsley Energy, Inc. — Class A*,1 | | | 132 | | | | 4,652 | |
Total Energy | | | | 2,702,784 | |
| | | | | | | | | |
Utilities - 1.7% | |
Consolidated Edison, Inc.1 | | | 2,183 | | | | 160,842 | |
Pinnacle West Capital Corp.1 | | | 2,050 | | | | 159,962 | |
Duke Energy Corp.1 | | | 2,050 | | | | 159,121 | |
Xcel Energy, Inc.1 | | | 3,903 | | | | 158,852 | |
Ameren Corp.1 | | | 3,010 | | | | 157,905 | |
UGI Corp.1 | | | 3,406 | | | | 156,948 | |
SCANA Corp.1 | | | 1,951 | | | | 142,969 | |
Public Service Enterprise Group, Inc.1 | | | 3,241 | | | | 142,215 | |
Edison International1 | | | 1,919 | | | | 138,149 | |
Exelon Corp.1 | | | 3,374 | | | | 119,743 | |
AES Corp.1 | | | 8,733 | | | | 101,477 | |
Atmos Energy Corp.1 | | | 1,257 | | | | 93,207 | |
Entergy Corp.1 | | | 761 | | | | 55,911 | |
Total Utilities | | | | 1,747,301 | |
| | | | | | | | | |
Total Common Stocks | | | | | |
(Cost $61,179,707) | | | | 65,762,717 | |
SEE NOTES TO FINANCIAL STATEMENTS. | THE GUGGENHEIM FUNDS ANNUAL REPORT | 19 |
CONSOLIDATED SCHEDULE OF INVESTMENTS (continued) | December 31, 2016 |
MULTI-HEDGE STRATEGIES FUND | |
| | | Shares | | | Value | |
| | | | | | | |
MUTUAL FUNDS† - 0.0% | |
Guggenheim Strategy Fund I3 | | | 1,022 | | | $ | 25,559 | |
Guggenheim Strategy Fund II3 | | | 244 | | | | 6,081 | |
Total Mutual Funds | | | | | |
(Cost $31,444) | | | | 31,640 | |
| | | | | | | | | |
CLOSED-END FUNDS† - 15.5% | |
Neuberger Berman Real Estate Securities Income Fund, Inc.1 | | | 93,455 | | | | 501,852 | |
Tri-Continental Corp.1 | | | 21,072 | | | | 464,637 | |
BlackRock Resources & Commodities Strategy Trust1 | | | 55,941 | | | | 462,631 | |
Morgan Stanley Emerging Markets Debt Fund, Inc.1 | | | 50,723 | | | | 461,578 | |
First Trust High Income Long/Short Fund1,2 | | | 28,535 | | | | 458,842 | |
Cohen & Steers REIT and Preferred Income Fund, Inc.1 | | | 23,844 | | | | 455,659 | |
BlackRock Enhanced Equity Dividend Trust1 | | | 54,751 | | | | 446,221 | |
Adams Diversified Equity Fund, Inc.1 | | | 34,843 | | | | 442,855 | |
Western Asset/Claymore Inflation-Linked Opportunities & Income Fund1,3 | | | 39,617 | | | | 441,333 | |
Calamos Strategic Total Return Fund1 | | | 42,877 | | | | 440,775 | |
Alpine Total Dynamic Dividend Fund1 | | | 56,607 | | | | 429,081 | |
AllianzGI Equity & Convertible Income Fund1 | | | 23,218 | | | | 427,792 | |
Western Asset Emerging Markets Debt Fund, Inc.1 | | | 28,059 | | | | 412,755 | |
BlackRock Credit Allocation Income Trust1 | | | 31,704 | | | | 411,201 | |
Western Asset/Claymore Inflation-Linked Securities & Income Fund1,3 | | | 34,885 | | | | 400,480 | |
GDL Fund1 | | | 39,843 | | | | 392,055 | |
Boulder Growth & Income Fund, Inc.1 | | | 41,318 | | | | 369,383 | |
General American Investors Company, Inc.1 | | | 8,421 | | | | 262,146 | |
Virtus Global Dividend & Income Fund, Inc.1 | | | 20,680 | | | | 248,987 | |
Clough Global Dividend and Income Fund1 | | | 20,492 | | | | 246,724 | |
Gabelli Healthcare & WellnessRx Trust1 | | | 25,145 | | | | 237,117 | |
Swiss Helvetia Fund, Inc.1 | | | 20,780 | | | | 212,164 | |
Advent Claymore Convertible Securities and Income Fund II1,3 | | | 34,495 | | | | 202,831 | |
Zweig Fund, Inc.1 | | | 14,026 | | | | 169,013 | |
Ellsworth Growth and Income Fund Ltd.1 | | | 17,629 | | | | 145,616 | |
Bancroft Fund Ltd.1 | | | 6,879 | | | | 139,025 | |
Putnam High Income Securities Fund1 | | | 16,807 | | | | 137,985 | |
Central Securities Corp.1 | | | 5,473 | | | | 119,257 | |
China Fund, Inc.1 | | | 7,900 | | | | 118,895 | |
Lazard Global Total Return and Income Fund, Inc.1 | | | 8,624 | | | | 118,494 | |
Ares Dynamic Credit Allocation Fund, Inc.1 | | | 7,120 | | | | 107,370 | |
Nuveen New Jersey Quality Municipal Income Fund1 | | | 7,984 | | | | 105,069 | |
RMR Real Estate Income Fund1 | | | 4,978 | | | | 101,850 | |
20 | THE GUGGENHEIM FUNDS ANNUAL REPORT | SEE NOTES TO FINANCIAL STATEMENTS. |
CONSOLIDATED SCHEDULE OF INVESTMENTS (continued) | December 31, 2016 |
MULTI-HEDGE STRATEGIES FUND | |
| | | Shares | | | Value | |
| | | | | | | |
Delaware Enhanced Global Dividend & Income Fund1 | | | 9,883 | | | $ | 99,917 | |
Duff & Phelps Global Utility Income Fund, Inc.1 | | | 6,436 | | | | 99,629 | |
Wells Fargo Multi-Sector Income Fund1,2 | | | 7,692 | | | | 98,688 | |
Templeton Emerging Markets Income Fund1 | | | 8,676 | | | | 94,655 | |
Nuveen Diversified Dividend & Income Fund1 | | | 8,101 | | | | 90,488 | |
Ivy High Income Opportunities Fund1 | | | 6,110 | | | | 90,245 | |
First Trust Aberdeen Global Opportunity Income Fund1 | | | 7,961 | | | | 88,845 | |
Western Asset Global High Income Fund, Inc.1 | | | 8,480 | | | | 83,358 | |
MFS Multimarket Income Trust1 | | | 13,492 | | | | 81,762 | |
AllianceBernstein Global High Income Fund, Inc.1 | | | 6,350 | | | | 79,820 | |
DoubleLine Income Solutions Fund1 | | | 4,150 | | | | 78,809 | |
Cohen & Steers Quality Income Realty Fund, Inc.1 | | | 6,393 | | | | 78,059 | |
Wells Fargo Income Opportunities Fund1 | | | 9,205 | | | | 78,058 | |
Eaton Vance Risk-Managed Diversified Equity Income Fund1 | | | 8,630 | | | | 77,325 | |
Franklin Limited Duration Income Trust1 | | | 6,376 | | | | 76,767 | |
New Ireland Fund, Inc.1 | | | 6,356 | | | | 76,081 | |
Blackstone / GSO Strategic Credit Fund1 | | | 4,945 | | | | 75,856 | |
AllianzGI NFJ Dividend Interest & Premium Strategy Fund1 | | | 5,844 | | | | 73,692 | |
Royce Value Trust, Inc.1 | | | 5,480 | | | | 73,377 | |
Cohen & Steers Closed-End Opportunity Fund, Inc.1 | | | 6,173 | | | | 72,224 | |
Gabelli Dividend & Income Trust1 | | | 3,489 | | | | 69,920 | |
First Trust Enhanced Equity Income Fund1 | | | 5,135 | | | | 69,374 | |
BlackRock Debt Strategies Fund, Inc.1 | | | 6,087 | | | | 69,027 | |
BlackRock Global Opportunities Equity Trust1 | | | 5,903 | | | | 68,298 | |
BlackRock Corporate High Yield Fund, Inc.1 | | | 6,262 | | | | 67,817 | |
Prudential Global Short Duration High Yield Fund, Inc.1 | | | 4,529 | | | | 67,437 | |
Eaton Vance Limited Duration Income Fund1 | | | 4,890 | | | | 67,091 | |
Liberty All Star Equity Fund1 | | | 12,933 | | | | 66,734 | |
BlackRock Limited Duration Income Trust1 | | | 4,303 | | | | 65,277 | |
BlackRock International Growth and Income Trust1 | | | 11,835 | | | | 65,211 | |
MFS Charter Income Trust1 | | | 7,644 | | | | 65,127 | |
Western Asset High Yield Defined Opportunity Fund, Inc.1 | | | 4,325 | | | | 65,048 | |
BlackRock Multi-Sector Income Trust1 | | | 3,919 | | | | 64,585 | |
Cohen & Steers Infrastructure Fund, Inc.1 | | | 3,296 | | | | 63,811 | |
SEE NOTES TO FINANCIAL STATEMENTS. | THE GUGGENHEIM FUNDS ANNUAL REPORT | 21 |
CONSOLIDATED SCHEDULE OF INVESTMENTS (continued) | December 31, 2016 |
MULTI-HEDGE STRATEGIES FUND | |
| | | Shares | | | Value | |
| | | | | | | |
Advent/Claymore Enhanced Growth & Income Fund1,3 | | | 7,312 | | | $ | 60,763 | |
CBRE Clarion Global Real Estate Income Fund1 | | | 8,286 | | | | 60,488 | |
Western Asset High Income Opportunity Fund, Inc.1 | | | 11,209 | | | | 55,933 | |
Asia Tigers Fund, Inc.1 | | | 6,002 | | | | 54,858 | |
BlackRock Enhanced Capital and Income Fund, Inc.1 | | | 3,995 | | | | 54,771 | |
Nuveen Global High Income Fund1 | | | 3,397 | | | | 54,318 | |
Royce Micro-Capital Trust, Inc.1 | | | 6,560 | | | | 53,333 | |
Cohen & Steers MLP Income and Energy Opportunity Fund, Inc.1 | | | 4,786 | | | | 52,120 | |
Brookfield Global Listed Infrastructure Income Fund, Inc.1 | | | 4,027 | | | | 51,626 | |
Voya Infrastructure Industrials and Materials Fund1 | | | 3,958 | | | | 51,375 | |
Putnam Premier Income Trust1 | | | 10,226 | | | | 50,823 | |
Nuveen Dow 30sm Dynamic Overwrite Fund1 | | | 3,381 | | | | 50,715 | |
ClearBridge American Energy MLP Fund, Inc.1 | | | 5,399 | | | | 49,563 | |
LMP Capital and Income Fund, Inc.1 | | | 3,694 | | | | 49,093 | |
Adams Natural Resources Fund, Inc.1 | | | 2,403 | | | | 48,469 | |
Avenue Income Credit Strategies Fund1 | | | 3,559 | | | | 47,797 | |
Calamos Global Dynamic Income Fund1 | | | 6,832 | | | | 47,619 | |
Morgan Stanley India Investment Fund, Inc.1 | | | 1,848 | | | | 47,346 | |
Diversified Real Asset Income Fund1 | | | 2,973 | | | | 46,349 | |
Templeton Dragon Fund, Inc.1 | | | 2,824 | | | | 46,257 | |
Clough Global Opportunities Fund1 | | | 5,164 | | | | 46,218 | |
Legg Mason BW Global Income Opportunities Fund, Inc.1 | | | 3,904 | | | | 46,184 | |
AllianzGI Diversified Income & Convertible Fund1 | | | 2,426 | | | | 45,560 | |
Barings Global Short Duration High Yield Fund1 | | | 2,368 | | | | 45,537 | |
KKR Income Opportunities Fund1 | | | 2,819 | | | | 45,189 | |
Voya Global Equity Dividend and Premium Opportunity Fund1 | | | 6,615 | | | | 44,850 | |
Eaton Vance Tax-Advantaged Global Dividend Income Fund1 | | | 3,172 | | | | 44,630 | |
Wells Fargo Global Dividend Opportunity Fund1 | | | 8,139 | | | | 44,358 | |
Macquarie Global Infrastructure Total Return Fund, Inc.1 | | | 2,248 | | | | 44,353 | |
Neuberger Berman High Yield Strategies Fund, Inc.1 | | | 3,736 | | | | 43,599 | |
Virtus Global Multi-Sector Income Fund1 | | | 2,777 | | | | 42,571 | |
First Trust Dynamic Europe Equity Income Fund1 | | | 2,723 | | | | 42,261 | |
India Fund, Inc.1 | | | 1,952 | | | | 41,753 | |
22 | THE GUGGENHEIM FUNDS ANNUAL REPORT | SEE NOTES TO FINANCIAL STATEMENTS. |
CONSOLIDATED SCHEDULE OF INVESTMENTS (continued) | December 31, 2016 |
MULTI-HEDGE STRATEGIES FUND | |
| | | Shares | | | Value | |
| | | | | | | |
Voya Global Advantage and Premium Opportunity Fund1 | | | 4,223 | | | $ | 41,512 | |
Blackrock Science & Technology Trust1 | | | 2,241 | | | | 40,204 | |
Nuveen Tax-Advantaged Total Return Strategy Fund1 | | | 3,477 | | | | 39,464 | |
Templeton Emerging Markets Fund/United States1 | | | 3,140 | | | | 37,963 | |
Nuveen Tax-Advantaged Dividend Growth Fund1 | | | 2,677 | | | | 37,291 | |
Nuveen Real Asset Income and Growth Fund1 | | | 2,277 | | | | 35,840 | |
Clough Global Equity Fund1 | | | 3,226 | | | | 35,809 | |
Brookfield Real Assets Income Fund, Inc.1 | | | 1,594 | | | | 35,571 | |
Dividend and Income Fund1 | | | 2,950 | | | | 34,958 | |
Cushing Renaissance Fund1 | | | 1,984 | | | | 34,422 | |
Credit Suisse Asset Management Income Fund, Inc.1 | | | 10,792 | | | | 34,103 | |
Cohen & Steers Global Income Builder, Inc.1 | | | 3,977 | | | | 33,924 | |
Gabelli Multimedia Trust, Inc.1 | | | 4,672 | | | | 33,825 | |
Putnam Master Intermediate Income Trust1 | | | 7,244 | | | | 33,395 | |
Nuveen AMT-Free Quality Municipal Income Fund1 | | | 2,483 | | | | 33,123 | |
Voya Emerging Markets High Income Dividend Equity Fund1 | | | 4,437 | | | | 33,056 | |
Sprott Focus Trust, Inc.1 | | | 4,717 | | | | 32,830 | |
First Trust Strategic High Income Fund II1 | | | 2,554 | | | | 31,363 | |
Invesco High Income Trust II1 | | | 2,176 | | | | 31,030 | |
Voya Asia Pacific High Dividend Equity Income Fund1 | | | 3,518 | | | | 30,642 | |
Franklin Universal Trust1 | | | 4,555 | | | | 30,427 | |
Alpine Global Dynamic Dividend Fund1 | | | 3,461 | | | | 30,353 | |
Nuveen Municipal Credit Income Fund1 | | | 2,146 | | | | 30,344 | |
Lazard World Dividend & Income Fund, Inc.1 | | | 2,931 | | | | 29,046 | |
Mexico Fund, Inc.1 | | | 2,037 | | | | 28,661 | |
Calamos Dynamic Convertible & Income Fund1 | | | 1,607 | | | | 28,171 | |
Macquarie/First Trust Global Infrastructure/Utilities Dividend & Income Fund1 | | | 2,375 | | | | 27,123 | |
Japan Smaller Capitalization Fund, Inc.1 | | | 2,769 | | | | 26,915 | |
Korea Fund, Inc.1 | | | 837 | | | | 26,700 | |
Aberdeen Singapore Fund, Inc.1 | | | 3,054 | | | | 26,448 | |
Calamos Global Total Return Fund1 | | | 2,465 | | | | 25,956 | |
Central Europe Russia and Turkey Fund, Inc.1 | | | 1,121 | | | | 23,149 | |
Nuveen Flexible Investment Income Fund1 | | | 1,351 | | | | 22,481 | |
Nuveen Multi-Market Income Fund, Inc.1 | | | 3,070 | | | | 22,411 | |
Special Opportunities Fund, Inc.1 | | | 1,588 | | | | 21,676 | |
Morgan Stanley Emerging Markets Fund, Inc.1 | | | 1,573 | | | | 20,732 | |
New Germany Fund, Inc.1 | | | 1,562 | | | | 20,415 | |
SEE NOTES TO FINANCIAL STATEMENTS. | THE GUGGENHEIM FUNDS ANNUAL REPORT | 23 |
CONSOLIDATED SCHEDULE OF INVESTMENTS (continued) | December 31, 2016 |
MULTI-HEDGE STRATEGIES FUND | |
| | | Shares | | | Value | |
| | | | | | | |
Delaware Investments Dividend & Income Fund, Inc.1 | | | 1,888 | | | $ | 18,899 | |
First Trust Aberdeen Emerging Opportunity Fund1 | | | 1,352 | | | | 18,793 | |
Gabelli Global Utility & Income Trust1 | | | 1,117 | | | | 18,766 | |
Aberdeen Latin America Equity Fund, Inc.1 | | | 930 | | | | 18,405 | |
Liberty All Star Growth Fund, Inc.1 | | | 4,282 | | | | 17,899 | |
John Hancock Tax-Advantaged Dividend Income Fund1 | | | 775 | | | | 17,887 | |
Aberdeen Greater China Fund, Inc.1 | | | 2,023 | | | | 17,580 | |
Eagle Growth & Income Opportunities Fund1 | | | 1,014 | | | | 16,447 | |
Principal Real Estate Income Fund1 | | | 1,023 | | | | 16,327 | |
Morgan Stanley Asia-Pacific Fund, Inc.1 | | | 1,197 | | | | 16,218 | |
Aberdeen Chile Fund, Inc.1 | | | 2,709 | | | | 16,146 | |
Aberdeen Japan Equity Fund, Inc.1 | | | 2,145 | | | | 15,830 | |
Taiwan Fund, Inc.*,1 | | | 951 | | | | 15,311 | |
European Equity Fund, Inc.1 | | | 1,840 | | | | 14,205 | |
JPMorgan China Region Fund, Inc.1 | | | 914 | | | | 14,048 | |
MFS Intermediate High Income Fund1 | | | 5,040 | | | | 13,003 | |
Asia Pacific Fund, Inc.1 | | | 1,321 | | | | 12,840 | |
Tekla Healthcare Opportunities Fund1 | | | 804 | | | | 12,478 | |
Aberdeen Emerging Markets Smaller Company Opportunities Fund, Inc.1 | | | 1,065 | | | | 11,981 | |
Mexico Equity & Income Fund, Inc.1 | | | 1,296 | | | | 11,884 | |
Western Asset Global Corporate Defined Opportunity Fund, Inc.1 | | | 529 | | | | 9,056 | |
Advent Claymore Convertible Securities and Income Fund1,3 | | | 602 | | | | 8,837 | |
Latin American Discovery Fund, Inc.1 | | | 930 | | | | 8,640 | |
Guggenheim Enhanced Equity Strategy Fund1,3 | | | 518 | | | | 8,366 | |
Aberdeen Australia Equity Fund, Inc.1 | | | 1,502 | | | | 8,141 | |
Guggenheim Equal Weight Enhanced Equity Income Fund1,3 | | | 486 | | | | 7,956 | |
Total Closed-End Funds | | | | | |
(Cost $15,201,163) | | | | 15,812,040 | |
| | | | | | | | | |
| | | Face
Amount | | | | | |
| | | | | | | | | |
U.S. TREASURY BILLS†† - 1.4% | |
U.S. Treasury Bill | | | | | | | | |
0.46% due 01/12/14,5,11 | | $ | 1,450,000 | | | | 1,449,855 | |
Total U.S. Treasury Bills | | | | | |
(Cost $1,449,790) | | | | 1,449,855 | |
| | | | | | | | | |
REPURCHASE AGREEMENTS††,6 - 13.0% | |
Royal Bank of Canada
issued 12/30/16 at 0.24%
due 01/03/1711 | | | 7,867,276 | | | | 7,867,276 | |
HSBC Securities, Inc.
issued 12/30/16 at 0.28%
due 01/03/1711 | | | 5,082,843 | | | | 5,082,843 | |
24 | THE GUGGENHEIM FUNDS ANNUAL REPORT | SEE NOTES TO FINANCIAL STATEMENTS. |
CONSOLIDATED SCHEDULE OF INVESTMENTS (continued) | December 31, 2016 |
MULTI-HEDGE STRATEGIES FUND | |
| | | Face
Amount | | | Value | |
| | | | | | | |
UMB Financial Corp.
issued 12/30/16 at 0.24%
due 01/03/1711 | | $ | 288,950 | | | $ | 288,950 | |
Total Repurchase Agreements | | | | | |
(Cost $13,239,069) | | | | 13,239,069 | |
| | | | | | | | | |
| | | Shares | | | | | |
| | | | | | | | | |
SECURITIES LENDING COLLATERAL†,7 - 0.2% | |
First American Government Obligations Fund - Class Z, 0.42%10 | | | 222,226 | | | | 222,226 | |
Total Securities Lending Collateral | | | | | |
(Cost $222,226) | | | | 222,226 | |
| | | | | | | | | |
Total Investments - 94.4% | | | | | | | | |
(Cost $91,323,399) | | | | | | $ | 96,517,547 | |
| | |
COMMON STOCKS SOLD SHORT† - (33.7)% | |
| | |
Diversified - (0.1)% | |
Leucadia National Corp. | | | 4,678 | | | | (108,764 | ) |
| | | | | | | | | |
Basic Materials - (1.2)% | |
Sherwin-Williams Co. | | | 233 | | | | (62,616 | ) |
Praxair, Inc. | | | 564 | | | | (66,095 | ) |
NewMarket Corp. | | | 166 | | | | (70,357 | ) |
RPM International, Inc. | | | 1,593 | | | | (85,751 | ) |
Ashland Global Holdings, Inc. | | | 796 | | | | (86,995 | ) |
Freeport-McMoRan, Inc.* | | | 6,902 | | | | (91,037 | ) |
Platform Specialty Products Corp.* | | | 10,319 | | | | (101,229 | ) |
Southern Copper Corp. | | | 3,218 | | | | (102,783 | ) |
PPG Industries, Inc. | | | 1,095 | | | | (103,762 | ) |
FMC Corp. | | | 1,858 | | | | (105,088 | ) |
Compass Minerals International, Inc. | | | 1,360 | | | | (106,556 | ) |
WR Grace & Co. | | | 1,626 | | | | (109,983 | ) |
Axalta Coating Systems Ltd.* | | | 4,247 | | | | (115,518 | ) |
Total Basic Materials | | | | | | | (1,207,770 | ) |
Utilities - (1.7)% | |
DTE Energy Co. | | | 67 | | | | (6,600 | ) |
American Water Works Co., Inc. | | | 265 | | | | (19,175 | ) |
WEC Energy Group, Inc. | | | 465 | | | | (27,272 | ) |
NRG Energy, Inc. | | | 5,342 | | | | (65,493 | ) |
Southern Co. | | | 1,958 | | | | (96,314 | ) |
PG&E Corp. | | | 1,626 | | | | (98,812 | ) |
Eversource Energy | | | 1,792 | | | | (98,972 | ) |
Alliant Energy Corp. | | | 2,621 | | | | (99,310 | ) |
Vectren Corp. | | | 1,991 | | | | (103,831 | ) |
National Fuel Gas Co. | | | 1,858 | | | | (105,237 | ) |
CenterPoint Energy, Inc. | | | 4,313 | | | | (106,272 | ) |
Sempra Energy | | | 1,062 | | | | (106,880 | ) |
Aqua America, Inc. | | | 3,575 | | | | (107,393 | ) |
Hawaiian Electric Industries, Inc. | | | 3,251 | | | | (107,511 | ) |
PPL Corp. | | | 3,186 | | | | (108,483 | ) |
MDU Resources Group, Inc. | | | 3,772 | | | | (108,520 | ) |
OGE Energy Corp. | | | 3,285 | | | | (109,883 | ) |
Dominion Resources, Inc. | | | 1,449 | | | | (110,979 | ) |
Calpine Corp.* | | | 10,186 | | | | (116,426 | ) |
Total Utilities | | | | | | | (1,703,363 | ) |
| | | | | | | | | |
Energy - (2.1)% | |
Whiting Petroleum Corp.* | | | 298 | | | | (3,582 | ) |
Hess Corp. | | | 132 | | | | (8,222 | ) |
Dril-Quip, Inc.* | | | 166 | | | | (9,968 | ) |
Murphy Oil Corp. | | | 730 | | | | (22,725 | ) |
Ensco plc — Class A | | | 2,489 | | | | (24,193 | ) |
Laredo Petroleum, Inc.* | | | 1,824 | | | | (25,791 | ) |
RPC, Inc. | | | 1,328 | | | | (26,308 | ) |
Energen Corp.* | | | 465 | | | | (26,817 | ) |
Superior Energy Services, Inc. | | | 1,792 | | | | (30,249 | ) |
Concho Resources, Inc.* | | | 265 | | | | (35,139 | ) |
HollyFrontier Corp. | | | 1,228 | | | | (40,229 | ) |
Schlumberger Ltd. | | | 564 | | | | (47,348 | ) |
Williams Companies, Inc. | | | 1,958 | | | | (60,972 | ) |
SEE NOTES TO FINANCIAL STATEMENTS. | THE GUGGENHEIM FUNDS ANNUAL REPORT | 25 |
CONSOLIDATED SCHEDULE OF INVESTMENTS (continued) | December 31, 2016 |
MULTI-HEDGE STRATEGIES FUND | |
| | | Shares | | | Value | |
| | | | | | | |
Southwestern Energy Co.* | | | 5,906 | | | $ | (63,903 | ) |
Devon Energy Corp. | | | 1,593 | | | | (72,752 | ) |
EOG Resources, Inc. | | | 796 | | | | (80,476 | ) |
Apache Corp. | | | 1,294 | | | | (82,130 | ) |
Tesoro Corp. | | | 961 | | | | (84,039 | ) |
ConocoPhillips | | | 1,725 | | | | (86,491 | ) |
Enbridge, Inc. | | | 2,070 | | | | (87,188 | ) |
Gulfport Energy Corp.* | | | 4,048 | | | | (87,599 | ) |
Anadarko Petroleum Corp. | | | 1,294 | | | | (90,231 | ) |
Chesapeake Energy Corp.* | | | 13,007 | | | | (91,309 | ) |
Cabot Oil & Gas Corp. — Class A | | | 4,014 | | | | (93,767 | ) |
FMC Technologies, Inc.* | | | 2,854 | | | | (101,403 | ) |
Cimarex Energy Co. | | | 763 | | | | (103,692 | ) |
Occidental Petroleum Corp. | | | 1,460 | | | | (103,995 | ) |
Halliburton Co. | | | 1,925 | | | | (104,123 | ) |
Weatherford International plc* | | | 20,904 | | | | (104,311 | ) |
Phillips 66 | | | 1,228 | | | | (106,111 | ) |
First Solar, Inc.* | | | 3,518 | | | | (112,893 | ) |
Kosmos Energy Ltd.* | | | 20,970 | | | | (147,000 | ) |
Total Energy | | | | (2,164,956 | ) |
| | | | | | | | | |
Communications - (2.7)% | |
Viacom, Inc. — Class B | | | 166 | | | | (5,827 | ) |
United States Cellular Corp.* | | | 299 | | | | (13,072 | ) |
Discovery Communications, Inc. — Class A* | | | 1,725 | | | | (47,282 | ) |
Expedia, Inc. | | | 431 | | | | (48,824 | ) |
Twenty-First Century Fox, Inc. — Class A | | | 1,825 | | | | (51,173 | ) |
Twenty-First Century Fox, Inc. — Class B | | | 1,891 | | | | (51,530 | ) |
Frontier Communications Corp. | | | 15,960 | | | | (53,945 | ) |
CommScope Holding Company, Inc.* | | | 2,024 | | | | (75,293 | ) |
Twitter, Inc.* | | | 5,109 | | | | (83,277 | ) |
Zayo Group Holdings, Inc.* | | | 2,621 | | | | (86,126 | ) |
Netflix, Inc.* | | | 697 | | | | (86,289 | ) |
Priceline Group, Inc.* | | | 67 | | | | (98,226 | ) |
FireEye, Inc.* | | | 8,494 | | | | (101,079 | ) |
Palo Alto Networks, Inc.* | | | 830 | | | | (103,792 | ) |
AMC Networks, Inc. — Class A* | | | 1,991 | | | | (104,209 | ) |
Pandora Media, Inc.* | | | 7,997 | | | | (104,281 | ) |
IAC/InterActiveCorp* | | | 1,626 | | | | (105,349 | ) |
CDW Corp. | | | 2,024 | | | | (105,430 | ) |
TripAdvisor, Inc.* | | | 2,289 | | | | (106,140 | ) |
FactSet Research Systems, Inc. | | | 664 | | | | (108,518 | ) |
ARRIS International plc* | | | 3,650 | | | | (109,975 | ) |
Motorola Solutions, Inc. | | | 1,328 | | | | (110,078 | ) |
DISH Network Corp. — Class A* | | | 1,925 | | | | (111,515 | ) |
CenturyLink, Inc. | | | 4,746 | | | | (112,860 | ) |
Tribune Media Co. — Class A | | | 3,257 | | | | (113,930 | ) |
Alibaba Group Holding Ltd. ADR* | | | 2,659 | | | | (233,488 | ) |
AT&T, Inc. | | | 9,379 | | | | (398,888 | ) |
Total Communications | | | | (2,730,396 | ) |
| | | | | | | | | |
Technology - (2.7)% | |
Western Digital Corp. | | | 332 | | | | (22,559 | ) |
Dun & Bradstreet Corp. | | | 199 | | | | (24,143 | ) |
CDK Global, Inc. | | | 531 | | | | (31,695 | ) |
Autodesk, Inc.* | | | 464 | | | | (34,341 | ) |
Teradata Corp.* | | | 1,328 | | | | (36,082 | ) |
Marvell Technology Group Ltd. | | | 3,020 | | | | (41,887 | ) |
SS&C Technologies Holdings, Inc. | | | 2,356 | | | | (67,382 | ) |
Cerner Corp.* | | | 1,460 | | | | (69,160 | ) |
PTC, Inc.* | | | 1,559 | | | | (72,135 | ) |
Analog Devices, Inc. | | | 1,041 | | | | (75,597 | ) |
Workday, Inc. — Class A* | | | 1,228 | | | | (81,159 | ) |
26 | THE GUGGENHEIM FUNDS ANNUAL REPORT | SEE NOTES TO FINANCIAL STATEMENTS. |
CONSOLIDATED SCHEDULE OF INVESTMENTS (continued) | December 31, 2016 |
MULTI-HEDGE STRATEGIES FUND | |
| | | Shares | | | Value | |
| | | | | | | |
Veeva Systems, Inc. — Class A* | | | 2,057 | | | $ | (83,720 | ) |
Skyworks Solutions, Inc. | | | 1,128 | | | | (84,216 | ) |
Zynga, Inc. — Class A* | | | 35,735 | | | | (91,839 | ) |
Maxim Integrated Products, Inc. | | | 2,389 | | | | (92,144 | ) |
Ultimate Software Group, Inc.* | | | 531 | | | | (96,828 | ) |
Red Hat, Inc.* | | | 1,393 | | | | (97,092 | ) |
Tyler Technologies, Inc.* | | | 697 | | | | (99,511 | ) |
Guidewire Software, Inc.* | | | 2,024 | | | | (99,844 | ) |
Tableau Software, Inc. — Class A* | | | 2,389 | | | | (100,696 | ) |
Fortinet, Inc.* | | | 3,417 | | | | (102,920 | ) |
ServiceNow, Inc.* | | | 1,393 | | | | (103,556 | ) |
First Data Corp. — Class A* | | | 7,399 | | | | (104,992 | ) |
Cognizant Technology Solutions Corp. — Class A* | | | 1,891 | | | | (105,953 | ) |
salesforce.com, Inc.* | | | 1,559 | | | | (106,729 | ) |
Manhattan Associates, Inc.* | | | 2,024 | | | | (107,333 | ) |
VeriFone Systems, Inc.* | | | 6,055 | | | | (107,355 | ) |
athenahealth, Inc.* | | | 1,095 | | | | (115,162 | ) |
Cypress Semiconductor Corp. | | | 10,407 | | | | (119,056 | ) |
VMware, Inc. — Class A* | | | 5,195 | | | | (409,002 | ) |
Total Technology | | | | (2,784,088 | ) |
| | | | | | | | | |
Consumer, Cyclical - (3.7)% | |
JetBlue Airways Corp.* | | | 167 | | | | (3,744 | ) |
Domino’s Pizza, Inc. | | | 33 | | | | (5,255 | ) |
Macy’s, Inc. | | | 200 | | | | (7,162 | ) |
Toro Co. | | | 133 | | | | (7,441 | ) |
Tupperware Brands Corp. | | | 199 | | | | (10,471 | ) |
Sally Beauty Holdings, Inc.* | | | 397 | | | | (10,489 | ) |
Scotts Miracle-Gro Co. — Class A | | | 133 | | | | (12,709 | ) |
Skechers U.S.A., Inc. — Class A* | | | 597 | | | | (14,674 | ) |
Brunswick Corp. | | | 398 | | | | (21,707 | ) |
Ulta Salon Cosmetics & Fragrance, Inc.* | | | 99 | | | | (25,239 | ) |
Nordstrom, Inc. | | | 564 | | | | (27,033 | ) |
Southwest Airlines Co. | | | 597 | | | | (29,754 | ) |
Ralph Lauren Corp. — Class A | | | 365 | | | | (32,967 | ) |
J.C. Penney Company, Inc.* | | | 4,180 | | | | (34,736 | ) |
Hasbro, Inc. | | | 498 | | | | (38,739 | ) |
BorgWarner, Inc. | | | 1,228 | | | | (48,432 | ) |
Eldorado Resorts, Inc.* | | | 3,040 | | | | (51,528 | ) |
AutoZone, Inc.* | | | 67 | | | | (52,916 | ) |
Hyatt Hotels Corp. — Class A* | | | 1,062 | | | | (58,686 | ) |
Walgreens Boots Alliance, Inc. | | | 730 | | | | (60,415 | ) |
TJX Companies, Inc. | | | 862 | | | | (64,761 | ) |
Costco Wholesale Corp. | | | 431 | | | | (69,007 | ) |
lululemon athletica, Inc.* | | | 1,194 | | | | (77,598 | ) |
Dollar Tree, Inc.* | | | 1,062 | | | | (81,965 | ) |
Hilton Worldwide Holdings, Inc. | | | 3,218 | | | | (87,530 | ) |
Williams-Sonoma, Inc. | | | 1,825 | | | | (88,312 | ) |
Staples, Inc. | | | 9,789 | | | | (88,590 | ) |
Signet Jewelers Ltd. | | | 962 | | | | (90,678 | ) |
L Brands, Inc. | | | 1,427 | | | | (93,954 | ) |
WW Grainger, Inc. | | | 409 | | | | (94,990 | ) |
Panera Bread Co. — Class A* | | | 464 | | | | (95,162 | ) |
Kate Spade & Co.* | | | 5,176 | | | | (96,636 | ) |
Tiffany & Co. | | | 1,261 | | | | (97,639 | ) |
VF Corp. | | | 1,858 | | | | (99,124 | ) |
Chipotle Mexican Grill, Inc. — Class A* | | | 265 | | | | (99,990 | ) |
Hanesbrands, Inc. | | | 4,645 | | | | (100,193 | ) |
Advance Auto Parts, Inc. | | | 597 | | | | (100,965 | ) |
O’Reilly Automotive, Inc.* | | | 365 | | | | (101,619 | ) |
Madison Square Garden Co. — Class A* | | | 597 | | | | (102,391 | ) |
SEE NOTES TO FINANCIAL STATEMENTS. | THE GUGGENHEIM FUNDS ANNUAL REPORT | 27 |
CONSOLIDATED SCHEDULE OF INVESTMENTS (continued) | December 31, 2016 |
MULTI-HEDGE STRATEGIES FUND | |
| | | Shares | | | Value | |
| | | | | | | |
Dunkin’ Brands Group, Inc. | | | 1,958 | | | $ | (102,678 | ) |
Allison Transmission Holdings, Inc. | | | 3,053 | | | | (102,856 | ) |
Starbucks Corp. | | | 1,858 | | | | (103,156 | ) |
Fastenal Co. | | | 2,223 | | | | (104,437 | ) |
NIKE, Inc. — Class B | | | 2,057 | | | | (104,557 | ) |
Tractor Supply Co. | | | 1,393 | | | | (105,603 | ) |
Visteon Corp. | | | 1,328 | | | | (106,692 | ) |
WABCO Holdings, Inc.* | | | 1,028 | | | | (109,122 | ) |
Marriott International, Inc. — Class A | | | 1,328 | | | | (109,799 | ) |
Delphi Automotive plc | | | 1,659 | | | | (111,734 | ) |
NVR, Inc.* | | | 67 | | | | (111,823 | ) |
Tempur Sealy International, Inc.* | | | 1,659 | | | | (113,277 | ) |
Choice Hotels International, Inc. | | | 2,057 | | | | (115,295 | ) |
CarMax, Inc.* | | | 1,825 | | | | (117,512 | ) |
Total Consumer, Cyclical | | | | (3,803,742 | ) |
| | | | | | | | | |
Industrial - (5.0)% | |
Caterpillar, Inc. | | | 67 | | | | (6,214 | ) |
Fortune Brands Home & Security, Inc. | | | 265 | | | | (14,167 | ) |
Union Pacific Corp. | | | 166 | | | | (17,211 | ) |
Honeywell International, Inc. | | | 166 | | | | (19,231 | ) |
Hexcel Corp. | | | 862 | | | | (44,341 | ) |
Nordson Corp. | | | 431 | | | | (48,294 | ) |
AptarGroup, Inc. | | | 664 | | | | (48,771 | ) |
Vulcan Materials Co. | | | 498 | | | | (62,325 | ) |
General Electric Co. | | | 2,123 | | | | (67,087 | ) |
Chicago Bridge & Iron Company N.V. | | | 2,156 | | | | (68,453 | ) |
General Dynamics Corp. | | | 398 | | | | (68,719 | ) |
Johnson Controls International plc | | | 1,759 | | | | (72,453 | ) |
Expeditors International of Washington, Inc. | | | 1,460 | | | | (77,322 | ) |
HEICO Corp. | | | 1,062 | | | | (81,934 | ) |
TransDigm Group, Inc. | | | 332 | | | | (82,655 | ) |
Kansas City Southern | | | 1,028 | | | | (87,226 | ) |
Pentair plc | | | 1,593 | | | | (89,320 | ) |
Eagle Materials, Inc. | | | 929 | | | | (91,534 | ) |
Acuity Brands, Inc. | | | 398 | | | | (91,882 | ) |
Stericycle, Inc.* | | | 1,228 | | | | (94,605 | ) |
Ball Corp. | | | 1,261 | | | | (94,663 | ) |
Covanta Holding Corp. | | | 6,139 | | | | (95,768 | ) |
Lennox International, Inc. | | | 630 | | | | (96,497 | ) |
Hubbell, Inc. | | | 830 | | | | (96,861 | ) |
Rockwell Automation, Inc. | | | 730 | | | | (98,112 | ) |
Valmont Industries, Inc. | | | 697 | | | | (98,207 | ) |
Middleby Corp.* | | | 763 | | | | (98,282 | ) |
IDEX Corp. | | | 1,095 | | | | (98,616 | ) |
United Parcel Service, Inc. — Class B | | | 862 | | | | (98,820 | ) |
3M Co. | | | 564 | | | | (100,713 | ) |
Lincoln Electric Holdings, Inc. | | | 1,328 | | | | (101,818 | ) |
Silgan Holdings, Inc. | | | 1,991 | | | | (101,899 | ) |
Wabtec Corp. | | | 1,228 | | | | (101,948 | ) |
Donaldson Company, Inc. | | | 2,423 | | | | (101,960 | ) |
Flowserve Corp. | | | 2,123 | | | | (102,010 | ) |
Snap-on, Inc. | | | 597 | | | | (102,248 | ) |
Sealed Air Corp. | | | 2,257 | | | | (102,332 | ) |
J.B. Hunt Transport Services, Inc. | | | 1,062 | | | | (103,088 | ) |
Roper Technologies, Inc. | | | 564 | | | | (103,257 | ) |
Boeing Co. | | | 664 | | | | (103,371 | ) |
Allegion plc | | | 1,626 | | | | (104,064 | ) |
CH Robinson Worldwide, Inc. | | | 1,427 | | | | (104,542 | ) |
Graco, Inc. | | | 1,261 | | | | (104,777 | ) |
United Technologies Corp. | | | 962 | | | | (105,454 | ) |
Cree, Inc.* | | | 4,014 | | | | (105,929 | ) |
KBR, Inc. | | | 6,370 | | | | (106,316 | ) |
AMETEK, Inc. | | | 2,190 | | | | (106,434 | ) |
Landstar System, Inc. | | | 1,250 | | | | (106,625 | ) |
Armstrong World Industries, Inc.* | | | 2,589 | | | | (108,220 | ) |
National Instruments Corp. | | | 3,583 | | | | (110,428 | ) |
SBA Communications Corp. — Class A* | | | 1,095 | | | | (113,070 | ) |
28 | THE GUGGENHEIM FUNDS ANNUAL REPORT | SEE NOTES TO FINANCIAL STATEMENTS. |
CONSOLIDATED SCHEDULE OF INVESTMENTS (continued) | December 31, 2016 |
MULTI-HEDGE STRATEGIES FUND | |
| | | Shares | | | Value | |
| | | | | | | |
Trimble, Inc.* | | | 3,783 | | | $ | (114,057 | ) |
Cognex Corp. | | | 1,825 | | | | (116,106 | ) |
Zebra Technologies Corp. — Class A* | | | 1,360 | | | | (116,634 | ) |
Rockwell Collins, Inc. | | | 4,243 | | | | (393,580 | ) |
Total Industrial | | | | (5,150,450 | ) |
| | | | | | | | | |
Consumer, Non-cyclical - (6.2)% | |
Altria Group, Inc. | | | 67 | | | | (4,531 | ) |
Neurocrine Biosciences, Inc.* | | | 166 | | | | (6,424 | ) |
Flowers Foods, Inc. | | | 332 | | | | (6,630 | ) |
HCA Holdings, Inc.* | | | 132 | | | | (9,771 | ) |
Akorn, Inc.* | | | 464 | | | | (10,129 | ) |
Juno Therapeutics, Inc.* | | | 763 | | | | (14,383 | ) |
AmerisourceBergen Corp. — Class A | | | 265 | | | | (20,720 | ) |
Hertz Global Holdings, Inc.* | | | 1,001 | | | | (21,582 | ) |
Agios Pharmaceuticals, Inc.* | | | 531 | | | | (22,159 | ) |
Patterson Companies, Inc. | | | 630 | | | | (25,849 | ) |
Tenet Healthcare Corp.* | | | 1,759 | | | | (26,104 | ) |
Endo International plc* | | | 1,892 | | | | (31,161 | ) |
Perrigo Company plc | | | 398 | | | | (33,126 | ) |
WEX, Inc.* | | | 299 | | | | (33,368 | ) |
Philip Morris International, Inc. | | | 365 | | | | (33,393 | ) |
Avis Budget Group, Inc.* | | | 962 | | | | (35,286 | ) |
Acadia Healthcare Company, Inc.* | | | 1,095 | | | | (36,245 | ) |
Bruker Corp. | | | 1,858 | | | | (39,352 | ) |
Intuitive Surgical, Inc.* | | | 67 | | | | (42,489 | ) |
Bristol-Myers Squibb Co. | | | 730 | | | | (42,661 | ) |
Clorox Co. | | | 464 | | | | (55,689 | ) |
Incyte Corp.* | | | 564 | | | | (56,552 | ) |
Robert Half International, Inc. | | | 1,294 | | | | (63,121 | ) |
Graham Holdings Co. — Class B | | | 133 | | | | (68,089 | ) |
Nielsen Holdings plc | | | 1,626 | | | | (68,211 | ) |
Global Payments, Inc. | | | 1,028 | | | | (71,353 | ) |
Moody’s Corp. | | | 763 | | | | (71,928 | ) |
Alnylam Pharmaceuticals, Inc.* | | | 1,991 | | | | (74,543 | ) |
Hain Celestial Group, Inc.* | | | 1,991 | | | | (77,709 | ) |
Kimberly-Clark Corp. | | | 697 | | | | (79,542 | ) |
Align Technology, Inc.* | | | 862 | | | | (82,864 | ) |
Sprouts Farmers Market, Inc.* | | | 4,380 | | | | (82,870 | ) |
Estee Lauder Companies, Inc. — Class A | | | 1,095 | | | | (83,757 | ) |
FleetCor Technologies, Inc.* | | | 597 | | | | (84,487 | ) |
Vertex Pharmaceuticals, Inc.* | | | 1,162 | | | | (85,605 | ) |
H&R Block, Inc. | | | 3,816 | | | | (87,730 | ) |
BioMarin Pharmaceutical, Inc.* | | | 1,062 | | | | (87,976 | ) |
ACADIA Pharmaceuticals, Inc.* | | | 3,085 | | | | (88,971 | ) |
Colgate-Palmolive Co. | | | 1,382 | | | | (90,438 | ) |
TreeHouse Foods, Inc.* | | | 1,294 | | | | (93,414 | ) |
Edgewell Personal Care Co.* | | | 1,294 | | | | (94,449 | ) |
Coca-Cola Co. | | | 2,289 | | | | (94,902 | ) |
McCormick & Company, Inc. | | | 1,028 | | | | (95,943 | ) |
PepsiCo, Inc. | | | 929 | | | | (97,201 | ) |
Illumina, Inc.* | | | 763 | | | | (97,695 | ) |
Premier, Inc. — Class A* | | | 3,218 | | | | (97,698 | ) |
Brown-Forman Corp. — Class B | | | 2,190 | | | | (98,375 | ) |
DexCom, Inc.* | | | 1,659 | | | | (99,042 | ) |
Stryker Corp. | | | 830 | | | | (99,442 | ) |
Alkermes plc* | | | 1,792 | | | | (99,599 | ) |
Macquarie Infrastructure Corp. | | | 1,228 | | | | (100,328 | ) |
Live Nation Entertainment, Inc.* | | | 3,783 | | | | (100,628 | ) |
Ecolab, Inc. | | | 862 | | | | (101,044 | ) |
Gartner, Inc.* | | | 1,028 | | | | (103,900 | ) |
SEE NOTES TO FINANCIAL STATEMENTS. | THE GUGGENHEIM FUNDS ANNUAL REPORT | 29 |
CONSOLIDATED SCHEDULE OF INVESTMENTS (continued) | December 31, 2016 |
MULTI-HEDGE STRATEGIES FUND | |
| | | Shares | | | Value | |
| | | | | | | |
Sabre Corp. | | | 4,180 | | | $ | (104,291 | ) |
Monster Beverage Corp.* | | | 2,356 | | | | (104,465 | ) |
IDEXX Laboratories, Inc.* | | | 896 | | | | (105,074 | ) |
Blue Buffalo Pet Products, Inc.* | | | 4,380 | | | | (105,295 | ) |
Mead Johnson Nutrition Co. — Class A | | | 1,494 | | | | (105,715 | ) |
CoStar Group, Inc.* | | | 564 | | | | (106,308 | ) |
Morningstar, Inc. | | | 1,460 | | | | (107,398 | ) |
Coty, Inc. — Class A | | | 5,873 | | | | (107,535 | ) |
Hershey Co. | | | 1,062 | | | | (109,843 | ) |
Kellogg Co. | | | 1,494 | | | | (110,123 | ) |
Rollins, Inc. | | | 3,285 | | | | (110,967 | ) |
CR Bard, Inc. | | | 498 | | | | (111,881 | ) |
Automatic Data Processing, Inc. | | | 1,095 | | | | (112,544 | ) |
Mondelez International, Inc. — Class A | | | 2,589 | | | | (114,770 | ) |
Intercept Pharmaceuticals, Inc.* | | | 1,062 | | | | (115,386 | ) |
Brookdale Senior Living, Inc. — Class A* | | | 9,390 | | | | (116,624 | ) |
Ionis Pharmaceuticals, Inc.* | | | 2,455 | | | | (117,423 | ) |
Anthem, Inc. | | | 887 | | | | (127,524 | ) |
Verisk Analytics, Inc. — Class A* | | | 1,973 | | | | (160,148 | ) |
Aetna, Inc. | | | 2,353 | | | | (291,796 | ) |
Abbott Laboratories | | | 12,338 | | | | (473,902 | ) |
Total Consumer, Non-cyclical | | | | (6,349,470 | ) |
| | | | | | | | | |
Financial - (8.3)% | |
Unum Group | | | 67 | | | | (2,943 | ) |
Realty Income Corp. | | | 67 | | | | (3,851 | ) |
Invesco Ltd. | | | 233 | | | | (7,069 | ) |
Torchmark Corp. | | | 166 | | | | (12,244 | ) |
Santander Consumer USA Holdings, Inc.* | | | 962 | | | | (12,987 | ) |
Chubb Ltd. | | | 133 | | | | (17,572 | ) |
Iron Mountain, Inc. | | | 597 | | | | (19,391 | ) |
First Republic Bank | | | 265 | | | | (24,417 | ) |
SL Green Realty Corp. | | | 365 | | | | (39,256 | ) |
Hanover Insurance Group, Inc. | | | 464 | | | | (42,229 | ) |
Howard Hughes Corp.* | | | 398 | | | | (45,412 | ) |
LendingClub Corp.* | | | 8,992 | | | | (47,208 | ) |
Douglas Emmett, Inc. | | | 1,294 | | | | (47,309 | ) |
HCP, Inc. | | | 1,692 | | | | (50,286 | ) |
Northern Trust Corp. | | | 597 | | | | (53,163 | ) |
Kilroy Realty Corp. | | | 763 | | | | (55,867 | ) |
Federated Investors, Inc. — Class B | | | 2,257 | | | | (63,828 | ) |
Simmons First National Corp. — Class A | | | 1,192 | | | | (74,083 | ) |
First Interstate BancSystem, Inc. — Class A | | | 1,788 | | | | (76,079 | ) |
White Mountains Insurance Group Ltd. | | | 99 | | | | (82,769 | ) |
Franklin Resources, Inc. | | | 2,223 | | | | (87,986 | ) |
BlackRock, Inc. — Class A | | | 233 | | | | (88,666 | ) |
Crown Castle International Corp. | | | 1,028 | | | | (89,200 | ) |
Markel Corp.* | | | 99 | | | | (89,546 | ) |
LPL Financial Holdings, Inc. | | | 2,589 | | | | (91,159 | ) |
Healthcare Trust of America, Inc. — Class A | | | 3,152 | | | | (91,755 | ) |
UDR, Inc. | | | 2,522 | | | | (92,003 | ) |
Pacific Premier Bancorp, Inc.* | | | 2,612 | | | | (92,334 | ) |
Intercontinental Exchange, Inc. | | | 1,659 | | | | (93,601 | ) |
Principal Financial Group, Inc. | | | 1,626 | | | | (94,080 | ) |
American Tower Corp. — Class A | | | 896 | | | | (94,689 | ) |
Loews Corp. | | | 2,024 | | | | (94,784 | ) |
FNF Group | | | 2,820 | | | | (95,767 | ) |
Commerce Bancshares, Inc. | | | 1,721 | | | | (99,491 | ) |
Aon plc | | | 896 | | | | (99,931 | ) |
Simon Property Group, Inc. | | | 564 | | | | (100,206 | ) |
Taubman Centers, Inc. | | | 1,360 | | | | (100,545 | ) |
30 | THE GUGGENHEIM FUNDS ANNUAL REPORT | SEE NOTES TO FINANCIAL STATEMENTS. |
CONSOLIDATED SCHEDULE OF INVESTMENTS (continued) | December 31, 2016 |
MULTI-HEDGE STRATEGIES FUND | |
| | | Shares | | | Value | |
| | | | | | | |
Alleghany Corp.* | | | 166 | | | $ | (100,948 | ) |
Starwood Property Trust, Inc. | | | 4,613 | | | | (101,255 | ) |
Eaton Vance Corp. | | | 2,423 | | | | (101,475 | ) |
Weyerhaeuser Co. | | | 3,384 | | | | (101,825 | ) |
ProAssurance Corp. | | | 1,825 | | | | (102,565 | ) |
Mastercard, Inc. — Class A | | | 996 | | | | (102,837 | ) |
Public Storage | | | 464 | | | | (103,704 | ) |
Signature Bank* | | | 697 | | | | (104,689 | ) |
T. Rowe Price Group, Inc. | | | 1,393 | | | | (104,838 | ) |
Arthur J Gallagher & Co. | | | 2,024 | | | | (105,167 | ) |
Marsh & McLennan Companies, Inc. | | | 1,559 | | | | (105,373 | ) |
OneMain Holdings, Inc.* | | | 4,777 | | | | (105,763 | ) |
Alliance Data Systems Corp. | | | 464 | | | | (106,024 | ) |
Two Harbors Investment Corp. | | | 12,177 | | | | (106,183 | ) |
Voya Financial, Inc. | | | 2,721 | | | | (106,718 | ) |
Outfront Media, Inc. | | | 4,313 | | | | (107,264 | ) |
Vornado Realty Trust | | | 1,028 | | | | (107,292 | ) |
BOK Financial Corp. | | | 1,294 | | | | (107,454 | ) |
Essex Property Trust, Inc. | | | 464 | | | | (107,880 | ) |
SVB Financial Group* | | | 630 | | | | (108,146 | ) |
American Express Co. | | | 1,460 | | | | (108,157 | ) |
Erie Indemnity Co. — Class A | | | 962 | | | | (108,177 | ) |
Paramount Group, Inc. | | | 6,769 | | | | (108,236 | ) |
American International Group, Inc. | | | 1,659 | | | | (108,349 | ) |
Boston Properties, Inc. | | | 862 | | | | (108,422 | ) |
Federal Realty Investment Trust | | | 763 | | | | (108,430 | ) |
Visa, Inc. — Class A | | | 1,393 | | | | (108,682 | ) |
Charles Schwab Corp. | | | 2,754 | | | | (108,700 | ) |
Huntington Bancshares, Inc. | | | 8,262 | | | | (109,224 | ) |
TFS Financial Corp. | | | 5,740 | | | | (109,290 | ) |
Wells Fargo & Co. | | | 1,991 | | | | (109,724 | ) |
SEI Investments Co. | | | 2,223 | | | | (109,727 | ) |
Mercury General Corp. | | | 1,825 | | | | (109,883 | ) |
Western Alliance Bancorporation* | | | 2,257 | | | | (109,938 | ) |
XL Group Ltd. | | | 2,953 | | | | (110,028 | ) |
First Horizon National Corp. | | | 5,508 | | | | (110,215 | ) |
Life Storage, Inc. | | | 1,294 | | | | (110,326 | ) |
Brown & Brown, Inc. | | | 2,466 | | | | (110,624 | ) |
BankUnited, Inc. | | | 2,953 | | | | (111,299 | ) |
East West Bancorp, Inc. | | | 2,190 | | | | (111,318 | ) |
TD Ameritrade Holding Corp. | | | 2,555 | | | | (111,398 | ) |
CBRE Group, Inc. — Class A* | | | 3,550 | | | | (111,789 | ) |
Bank of Hawaii Corp. | | | 1,261 | | | | (111,838 | ) |
Synchrony Financial | | | 3,085 | | | | (111,893 | ) |
Progressive Corp. | | | 3,186 | | | | (113,103 | ) |
SLM Corp.* | | | 10,286 | | | | (113,352 | ) |
AmTrust Financial Services, Inc. | | | 4,148 | | | | (113,572 | ) |
Assurant, Inc. | | | 1,228 | | | | (114,032 | ) |
Extra Space Storage, Inc. | | | 1,494 | | | | (115,397 | ) |
CubeSmart | | | 4,313 | | | | (115,459 | ) |
People’s United Financial, Inc. | | | 6,853 | | | | (132,674 | ) |
Regency Centers Corp. | | | 2,690 | | | | (185,476 | ) |
CBOE Holdings, Inc. | | | 5,138 | | | | (379,647 | ) |
Total Financial | | | | (8,489,485 | ) |
| | | | | | | | | |
Total Common Stocks Sold Short | | | | | |
(Proceeds $34,285,556) | | | | (34,492,484 | ) |
| | | | | | | | | |
EXCHANGE-TRADED FUNDS SOLD SHORT† - (17.3)% | |
iShares Core U.S. Aggregate Bond ETF | | | 391 | | | | (42,251 | ) |
iShares MSCI Australia ETF | | | 4,434 | | | | (89,700 | ) |
VanEck Vectors Russia ETF | | | 4,905 | | | | (104,084 | ) |
iShares MSCI South Korea Capped ETF | | | 2,057 | | | | (109,474 | ) |
VanEck Vectors Gold Miners ETF | | | 5,562 | | | | (116,357 | ) |
SPDR S&P 500 ETF Trust | | | 570 | | | | (127,412 | ) |
SEE NOTES TO FINANCIAL STATEMENTS. | THE GUGGENHEIM FUNDS ANNUAL REPORT | 31 |
CONSOLIDATED SCHEDULE OF INVESTMENTS (continued) | December 31, 2016 |
MULTI-HEDGE STRATEGIES FUND | |
| | | Shares | | | Value | |
| | | | | | | |
iShares MSCI Mexico Capped ETF | | | 3,756 | | | $ | (165,151 | ) |
iShares 20+ Year Treasury Bond ETF | | | 1,448 | | | | (172,500 | ) |
Materials Select Sector SPDR Fund | | | 4,794 | | | | (238,262 | ) |
iShares 7-10 Year Treasury Bond ETF | | | 2,348 | | | | (246,117 | ) |
iShares MSCI Emerging Markets ETF | | | 7,334 | | | | (256,763 | ) |
PowerShares QQQ Trust Series 1 | | | 2,456 | | | | (290,987 | ) |
iShares China Large-Capital ETF | | | 8,489 | | | | (294,653 | ) |
Industrial Select Sector SPDR Fund | | | 5,176 | | | | (322,051 | ) |
Utilities Select Sector SPDR Fund | | | 6,912 | | | | (335,716 | ) |
iShares MSCI Taiwan Capped ETF | | | 13,324 | | | | (391,326 | ) |
iShares Russell 1000 Growth ETF | | | 3,878 | | | | (406,802 | ) |
Consumer Discretionary Select Sector SPDR Fund | | | 5,106 | | | | (415,628 | ) |
Consumer Staples Select Sector SPDR Fund | | | 8,084 | | | | (418,024 | ) |
Technology Select Sector SPDR Fund | | | 9,286 | | | | (449,071 | ) |
iShares MSCI EAFE ETF | | | 7,830 | | | | (452,026 | ) |
iShares MSCI United Kingdom ETF | | | 16,476 | | | | (505,648 | ) |
iShares iBoxx $ Investment Grade Corporate Bond ETF | | | 4,981 | | | | (583,674 | ) |
Financial Select Sector SPDR Fund | | | 27,025 | | | | (628,331 | ) |
iShares MSCI Japan ETF | | | 12,973 | | | | (633,861 | ) |
iShares Russell 2000 Index ETF | | | 5,697 | | | | (768,240 | ) |
Health Care Select Sector SPDR Fund | | | 12,399 | | | | (854,787 | ) |
Energy Select Sector SPDR Fund | | | 13,731 | | | | (1,034,219 | ) |
iShares Russell 1000 Value ETF | | | 9,268 | | | | (1,038,294 | ) |
iShares U.S. Real Estate ETF | | | 15,653 | | | | (1,204,343 | ) |
iShares TIPS Bond ETF | | | 11,430 | | | | (1,293,533 | ) |
SPDR Bloomberg Barclays High Yield Bond ETF | | | 101,621 | | | | (3,704,086 | ) |
Total Exchange-Traded Funds Sold Short | | | | | |
(Proceeds $17,306,155) | | | | (17,693,371 | ) |
Total Securities Sold Short - (51.0)% | | | | | |
(Proceeds $51,591,711) | | | | | | $ | (52,185,855 | ) |
| | | | | | | | | |
| | | Contracts | | | | | |
| | | | | | | | | |
OPTIONS WRITTEN† - 0.0% | |
Call options on: | | | | | | | | |
InvenSense, Inc. Expiring January 2017 with strike price of $13.00 | | | 20 | | | | (750 | ) |
InvenSense, Inc. Expiring February 2017 with strike price of $13.00 | | | 110 | | | | (26,125 | ) |
Total Call options | | | | | | | (26,875 | ) |
Total Options Written | | | | | |
(Premiums received $530) | | | | (26,875 | ) |
Other Assets & Liabilities, net - 56.6% | | | | 57,892,585 | |
Total Net Assets - 100.0% | | | | | | $ | 102,197,402 | |
32 | THE GUGGENHEIM FUNDS ANNUAL REPORT | SEE NOTES TO FINANCIAL STATEMENTS. |
CONSOLIDATED SCHEDULE OF INVESTMENTS (continued) | December 31, 2016 |
MULTI-HEDGE STRATEGIES FUND | |
| | | Contracts | | | Unrealized
Gain | |
| | | | | | | |
INTEREST RATE FUTURES CONTRACTS PURCHASED† | |
March 2017 Long Gilt
Futures Contracts††
(Aggregate Value of
Contracts $3,421,132) | | | 22 | | | $ | 62,717 | |
March 2017 Euro - Bobl
Futures Contracts
(Aggregate Value of
Contracts $3,234,912) | | | 23 | | | | 33,394 | |
March 2017 Euro - Bund
Futures Contracts
(Aggregate Value of
Contracts $2,245,753) | | | 13 | | | | 11,852 | |
March 2017 Euro - Schatz
Futures Contracts
(Aggregate Value of
Contracts $6,146,027) | | | 52 | | | | 11,422 | |
March 2017 U.S. Treasury Long Bond
Futures Contracts
(Aggregate Value of
Contracts $150,344) | | | 1 | | | | 1,748 | |
(Total Aggregate Value of Contracts $15,198,168) | | | $ | 121,133 | |
| | | | | | | | | |
EQUITY FUTURES CONTRACTS PURCHASED† | |
March 2017 Dow Jones Industrial Average Index
Mini Futures Contracts
(Aggregate Value of
Contracts $3,549,600) | | | 36 | | | $ | 41,256 | |
March 2017 SPI 200 Index
Futures Contracts††
(Aggregate Value of
Contracts $1,626,010) | | | 16 | | | | 30,052 | |
April 2017 CBOE Volatility Index
Futures Contracts
(Aggregate Value of
Contracts $1,000,620) | | | 54 | | | | 26,987 | |
January 2017 IBEX 35 Index
Futures Contracts††
(Aggregate Value of
Contracts $1,764,775) | | | 18 | | | | 21,407 | |
March 2017 DAX Index
Futures Contracts
(Aggregate Value of
Contracts $1,806,757) | | | 6 | | | | 13,166 | |
January 2017 MSCI Taiwan Stock Index
Futures Contracts
(Aggregate Value of
Contracts $923,400) | | | 27 | | | | 10,747 | |
February 2017 CBOE Volatility Index
Futures Contracts
(Aggregate Value of
Contracts $83,250) | | | 5 | | | | 4,837 | |
March 2017 NASDAQ-100 Index
Mini Futures Contracts
(Aggregate Value of
Contracts $583,800) | | | 6 | | | | 3,352 | |
March 2017 Nikkei 225 (OSE) Index
Futures Contracts††
(Aggregate Value of
Contracts $1,140,038) | | | 7 | | | | 3,116 | |
March 2017 Tokyo Stock Price Index
Futures Contracts††
(Aggregate Value of
Contracts $776,507) | | | 6 | | | | 2,853 | |
January 2017 Amsterdam Index
Futures Contracts
(Aggregate Value of
Contracts $1,116,209) | | | 11 | | | | 2,263 | |
March 2017 Euro STOXX 50 Index
Futures Contracts
(Aggregate Value of
Contracts $103,221) | | | 3 | | | | 2,029 | |
March 2017 FTSE 100 Index
Futures Contracts††
(Aggregate Value of
Contracts $345,308) | | | 4 | | | | 2,008 | |
SEE NOTES TO FINANCIAL STATEMENTS. | THE GUGGENHEIM FUNDS ANNUAL REPORT | 33 |
CONSOLIDATED SCHEDULE OF INVESTMENTS (continued) | December 31, 2016 |
MULTI-HEDGE STRATEGIES FUND | |
| | | Contracts | | | Unrealized
Gain (Loss) | |
| | | | | | | |
January 2017 Hang Seng Index
Futures Contracts††
(Aggregate Value of
Contracts $141,193) | | | 1 | | | $ | 574 | |
March 2017 S&P/TSX 60 IX Index
Futures Contracts
(Aggregate Value of
Contracts $133,763) | | | 1 | | | | (1,146 | ) |
March 2017 CBOE Volatility Index
Futures Contracts
(Aggregate Value of
Contracts $1,839,760) | | | 104 | | | | (44,110 | ) |
March 2017 S&P MidCap 400 Index
Mini Futures Contracts
(Aggregate Value of
Contracts $3,981,120) | | | 24 | | | | (52,063 | ) |
March 2017 Russell 2000 Index
Mini Futures Contracts
(Aggregate Value of
Contracts $3,325,630) | | | 49 | | | | (55,616 | ) |
(Total Aggregate Value of Contracts $24,240,961) | | | $ | 11,712 | |
| | | | | | | | | |
CURRENCY FUTURES CONTRACTS PURCHASED† | |
March 2017 Australian Dollar
Futures Contracts
(Aggregate Value of
Contracts $648,270) | | | 9 | | | $ | (18,493 | ) |
| | | | | | | | | |
COMMODITY FUTURES CONTRACTS PURCHASED† | |
February 2017 Lean Hogs
Futures Contracts11
(Aggregate Value of
Contracts $342,160) | | | 13 | | | $ | 11,872 | |
February 2017 Natural Gas
Futures Contracts11
(Aggregate Value of
Contracts $299,360) | | | 8 | | | | 11,204 | |
February 2017 NY Harbor ULSD
Futures Contracts11
(Aggregate Value of
Contracts $217,451) | | | 3 | | | | 5,613 | |
February 2017 Live Cattle
Futures Contracts11
(Aggregate Value of
Contracts $788,630) | | | 17 | | | | 4,311 | |
March 2017 Brent Crude
Futures Contracts11
(Aggregate Value of
Contracts $113,500) | | | 2 | | | | 2,497 | |
February 2017 Gasoline RBOB
Futures Contracts11
(Aggregate Value of
Contracts $210,344) | | | 3 | | | | 1,346 | |
March 2017 Silver
Futures Contracts11
(Aggregate Value of
Contracts $79,875) | | | 1 | | | | 38 | |
March 2017 Soybean
Futures Contracts11
(Aggregate Value of
Contracts $50,250) | | | 1 | | | | (589 | ) |
March 2017 Corn
Futures Contracts11
(Aggregate Value of
Contracts $368,550) | | | 21 | | | | (3,158 | ) |
March 2017 Soybean Oil
Futures Contracts11
(Aggregate Value of
Contracts $62,442) | | | 3 | | | | (6,148 | ) |
February 2017 LME Nickel
Futures Contracts11
(Aggregate Value of
Contracts $59,958) | | | 1 | | | | (8,437 | ) |
February 2017 LME Zinc
Futures Contracts11
(Aggregate Value of
Contracts $770,430) | | | 12 | | | | (42,089 | ) |
(Total Aggregate Value of Contracts $3,362,950) | | | $ | (23,540 | ) |
34 | THE GUGGENHEIM FUNDS ANNUAL REPORT | SEE NOTES TO FINANCIAL STATEMENTS. |
CONSOLIDATED SCHEDULE OF INVESTMENTS (continued) | December 31, 2016 |
MULTI-HEDGE STRATEGIES FUND | |
| | | Contracts | | | Unrealized
Gain (Loss) | |
| | | | | | | |
EQUITY FUTURES CONTRACTS SOLD SHORT† | |
January 2017 CBOE Volatility Index
Futures Contracts
(Aggregate Value of
Contracts $1,439,250) | | | 95 | | | $ | 333,038 | |
March 2017 S&P 500 Index
Mini Futures Contracts
(Aggregate Value of
Contracts $12,298,001) | | | 110 | | | | 99,760 | |
March 2017 FTSE/JSE TOP 40 Index
Futures Contracts††
(Aggregate Value of
Contracts $64,438) | | | 2 | | | | 684 | |
January 2017 H-Shares Index
Futures Contracts††
(Aggregate Value of
Contracts $1,083,604) | | | 18 | | | | (2,643 | ) |
January 2017 CAC 40 10 Euro Index
Futures Contracts
(Aggregate Value of
Contracts $1,174,329) | | | 23 | | | | (16,595 | ) |
(Total Aggregate Value of Contracts $16,059,622) | | | $ | 414,244 | |
| | | | | | | | | |
CURRENCY FUTURES CONTRACTS SOLD SHORT† | |
March 2017 British Pound
Futures Contracts
(Aggregate Value of
Contracts $2,854,318) | | | 37 | | | $ | 56,829 | |
March 2017 Canadian Dollar
Futures Contracts
(Aggregate Value of
Contracts $2,161,515) | | | 29 | | | | 26,069 | |
March 2017 Japanese Yen
Futures Contracts
(Aggregate Value of
Contracts $1,072,750) | | | 10 | | | | 19,413 | |
March 2017 Mexican Peso
Futures Contracts
(Aggregate Value of
Contracts $47,780) | | | 2 | | | | 1,135 | |
March 2017 Euro FX
Futures Contracts
(Aggregate Value of
Contracts $132,013) | | | 1 | | | | (876 | ) |
(Total Aggregate Value of Contracts $6,268,376) | | | $ | 102,570 | |
| | | | | | | | | |
COMMODITY FUTURES CONTRACTS SOLD SHORT† | |
March 2017 Wheat
Futures Contracts11
(Aggregate Value of
Contracts $940,124) | | | 46 | | | | 34,861 | |
March 2017 Hard Red Winter Wheat
Futures Contracts11
(Aggregate Value of
Contracts $879,375) | | | 42 | | | | 25,385 | |
March 2017 Cocoa
Futures Contracts11
(Aggregate Value of
Contracts $64,110) | | | 3 | | | | 9,396 | |
February 2017 Gold 100 oz.
Futures Contracts11
(Aggregate Value of
Contracts $115,110) | | | 1 | | | | 6,291 | |
March 2017 Copper
Futures Contracts11
(Aggregate Value of
Contracts $313,375) | | | 5 | | | | 5,660 | |
March 2017 Coffee ‘C’
Futures Contracts11
(Aggregate Value of
Contracts $205,950) | | | 4 | | | | 3,026 | |
April 2017 Platinum
Futures Contracts11
(Aggregate Value of
Contracts $45,215) | | | 1 | | | | 1,797 | |
February 2017 LME Lead
Futures Contracts11
(Aggregate Value of
Contracts $50,191) | | | 1 | | | | (11 | ) |
SEE NOTES TO FINANCIAL STATEMENTS. | THE GUGGENHEIM FUNDS ANNUAL REPORT | 35 |
CONSOLIDATED SCHEDULE OF INVESTMENTS (continued) | December 31, 2016 |
MULTI-HEDGE STRATEGIES FUND | |
| | | Contracts | | | Unrealized
Gain (Loss) | |
| | | | | | | |
March 2017 Cattle Feeder
Futures Contracts11
(Aggregate Value of
Contracts $62,713) | | | 1 | | | $ | (817 | ) |
March 2017 Cotton #2
Futures Contracts11
(Aggregate Value of
Contracts $212,160) | | | 6 | | | | (912 | ) |
February 2017 Low Sulphur Gas Oil
Futures Contracts11
(Aggregate Value of
Contracts $101,250) | | | 2 | | | | (2,803 | ) |
February 2017 WTI Crude
Futures Contracts11
(Aggregate Value of
Contracts $161,280) | | | 3 | | | | (5,648 | ) |
March 2017 Sugar #11
Futures Contracts11
(Aggregate Value of
Contracts $505,669) | | | 23 | | | | (18,025 | ) |
(Total Aggregate Value of Contracts $3,656,522) | | | $ | 58,200 | |
| | | | | | | | | |
INTEREST RATE FUTURES CONTRACTS SOLD SHORT† | |
March 2017 U.S. Treasury Ultra Long Bond
Futures Contracts
(Aggregate Value of
Contracts $1,277,500) | | | 8 | | | $ | 3,643 | |
March 2017 U.S. Treasury 5 Year Note
Futures Contracts
(Aggregate Value of
Contracts $940,563) | | | 8 | | | | 1,862 | |
March 2017 U.S. Treasury 2 Year Note
Futures Contracts
(Aggregate Value of
Contracts $3,249,609) | | | 15 | | | | 1,290 | |
March 2017 Australian Government 10 Year Bond
Futures Contracts††
(Aggregate Value of
Contracts $554,279) | | | 6 | | | | (2,376 | ) |
March 2017 Canadian Government 10 Year Bond
Futures Contracts††
(Aggregate Value of
Contracts $2,251,903) | | | 22 | | | | (7,825 | ) |
(Total Aggregate Value of Contracts $8,273,854) | | | $ | (3,406 | ) |
| | | | | | | | | |
| | | Units | | | | | |
| | | | | | | | | |
OTC EQUITY INDEX SWAP AGREEMENTS†† | |
Goldman Sachs International
March 2017 Goldman Sachs Multi-Hedge Strategies Short Index Swap 0.31%8, Terminating 03/10/17 (Notional Value $4,655,025) | | | 38,250 | | | $ | 52,516 | |
Goldman Sachs International
March 2017 Goldman Sachs Multi-Hedge Strategies Long Index Swap 1.01%9, Terminating 03/10/17 (Notional Value $12,716,335) | | | 92,014 | | | $ | (181,644 | ) |
36 | THE GUGGENHEIM FUNDS ANNUAL REPORT | SEE NOTES TO FINANCIAL STATEMENTS. |
CONSOLIDATED SCHEDULE OF INVESTMENTS (continued) | December 31, 2016 |
MULTI-HEDGE STRATEGIES FUND | |
SECTOR DIVERSIFICATION
Goldman Sachs Multi-Hedge Strategies Short Index Swap8
Sector | % of Index |
Health Care | 25.5% |
Consumer Discretionary | 23.8% |
Financials | 13.7% |
Technology | 11.0% |
Communications | 6.2% |
Materials | 5.1% |
Energy | 5.0% |
Consumer Staples | 3.7% |
Utilities | 3.5% |
Industrials | 2.5% |
Total | 100.0% |
Goldman Sachs Multi-Hedge Strategies Long Index Swap9
Sector | % of Index |
Financials | 24.5% |
Industrials | 16.8% |
Consumer Discretionary | 14.4% |
Energy | 11.7% |
Technology | 11.7% |
Materials | 10.7% |
Health Care | 5.7% |
Communications | 2.5% |
Consumer Staples | 1.2% |
Utilities | 0.8% |
Total | 100.0% |
* | Non-income producing security. |
† | Value determined based on Level 1 inputs, unless otherwise noted — See Note 4. |
†† | Value determined based on Level 2 inputs — See Note 4. |
1 | All or a portion of this security is pledged as short security collateral at December 31, 2016. |
2 | All or portion of this security is on loan at December 31, 2016 — See Note 6. |
3 | Affiliated issuer — See Note 10. |
4 | All or a portion of this security is pledged as futures collateral at December 31, 2016. |
5 | Zero coupon rate security. Rate indicated is the effective yield at the time of purchase. |
6 | Repurchase Agreements — See Note 5. |
7 | Securities lending collateral — See Note 6. |
8 | Customized basket of 142 exchange-traded equity securities. Total return based on Goldman Sachs Multi-Hedge Strategies Short Index +/- financing at a variable rate. Rated indicated is the rate effective at December 31, 2016. |
9 | Customized basket of 200 exchange-traded equity securities. Total return based on Goldman Sachs Multi-Hedge Strategies Long Index +/- financing at a variable rate. Rated indicated is the rate effective at December 31, 2016. |
10 | Rate indicated is the 7 day yield as of December 31, 2016. |
11 | All or a portion of this security is owned by Cayman Islands subsidiary, which is a 100% owned subsidiary of the Fund — See Note 15. |
| | ADR — American Depositary Receipt |
| | plc — Public Limited Company |
| | REIT — Real Estate Investment Trust |
| | |
| | See Sector Classification in Other Information section. |
SEE NOTES TO FINANCIAL STATEMENTS. | THE GUGGENHEIM FUNDS ANNUAL REPORT | 37 |
CONSOLIDATED SCHEDULE OF INVESTMENTS (concluded) | December 31, 2016 |
MULTI-HEDGE STRATEGIES FUND | |
The following table summarizes the inputs used to value the Fund’s investments at December 31, 2016 (See Note 4 in the Notes to Consolidated Financial Statements):
Investments in Securities (Assets) | | Level 1 | | | Level 1 - Other* | | | Level 2 | | | Level 2 - Other* | | | Level 3 | | | Total | |
Commodity Futures Contracts | | $ | — | | | $ | 123,297 | | | $ | — | | | $ | — | | | $ | — | | | $ | 123,297 | |
Common Stocks | | | 65,762,717 | | | | — | | | | — | | | | — | | | | — | | | | 65,762,717 | |
Closed-End Funds | | | 15,812,040 | | | | — | | | | — | | | | — | | | | — | | | | 15,812,040 | |
Currency Futures Contracts | | | — | | | | 103,446 | | | | — | | | | — | | | | — | | | | 103,446 | |
Equity Futures Contracts | | | — | | | | 537,435 | | | | — | | | | 60,694 | | | | — | | | | 598,129 | |
Equity Index Swap Agreements | | | — | | | | — | | | | — | | | | 52,516 | | | | — | | | | 52,516 | |
Interest Rate Futures Contracts | | | — | | | | 65,211 | | | | — | | | | 62,717 | | | | — | | | | 127,928 | |
Mutual Funds | | | 31,640 | | | | — | | | | — | | | | — | | | | — | | | | 31,640 | |
Repurchase Agreements | | | — | | | | — | | | | 13,239,069 | | | | — | | | | — | | | | 13,239,069 | |
Securities Lending Collateral | | | 222,226 | | | | — | | | | — | | | | — | | | | — | | | | 222,226 | |
U.S. Treasury Bills | | | — | | | | — | | | | 1,449,855 | | | | — | | | | — | | | | 1,449,855 | |
Total | | $ | 81,828,623 | | | $ | 829,389 | | | $ | 14,688,924 | | | $ | 175,927 | | | $ | — | | | $ | 97,522,863 | |
| | | | | | | | | | | | | | | | | | | | | | | | | |
Investments in Securities (Liabilities) | | Level 1 | | | Level 1 - Other* | | | Level 2 | | | Level 2 - Other* | | | Level 3 | | | Total | |
Commodity Futures Contracts | | $ | — | | | $ | 88,637 | | | $ | — | | | $ | — | | | $ | — | | | $ | 88,637 | |
Common Stocks | | | 34,492,484 | | | | — | | | | — | | | | — | | | | — | | | | 34,492,484 | |
Currency Futures Contracts | | | — | | | | 19,369 | | | | — | | | | — | | | | — | | | | 19,369 | |
Equity Futures Contracts | | | — | | | | 169,530 | | | | — | | | | 2,643 | | | | — | | | | 172,173 | |
Equity Index Swap Agreements | | | — | | | | — | | | | — | | | | 181,644 | | | | — | | | | 181,644 | |
Exchange-Traded Funds | | | 17,693,371 | | | | — | | | | — | | | | — | | | | — | | | | 17,693,371 | |
Interest Rate Futures Contracts | | | — | | | | — | | | | — | | | | 10,201 | | | | — | | | | 10,201 | |
Options Written | | | 26,875 | | | | — | | | | — | | | | — | | | | — | | | | 26,875 | |
Total | | $ | 52,212,730 | | | $ | 277,536 | | | $ | — | | | $ | 194,488 | | | $ | — | | | $ | 52,684,754 | |
* | Other financial instruments include futures contracts and/or swaps, which are reported as unrealized gain/loss at period end. |
Transfers between investment levels may occur as the markets fluctuate and/or the availability of data used in an investment’s valuation changes. Transfers between valuation levels, if any, are in comparison to the valuation levels at the end of the previous fiscal year, and are effective using the fair value as of the end of the previous fiscal period.
For the year ended December 31, 2016, there were no transfers between levels.
38 | THE GUGGENHEIM FUNDS ANNUAL REPORT | SEE NOTES TO FINANCIAL STATEMENTS. |
CONSOLIDATED STATEMENT OF ASSETS AND LIABILITIES |
MULTI-HEDGE STRATEGIES FUND |
December 31, 2016
Assets: | |
Investments in unaffiliated issuers, at value - including $215,562 of securities loaned (cost $76,798,416) | | $ | 82,116,272 | |
Investments in affiliated issuers, at value (cost $1,285,914) | | | 1,162,206 | |
Repurchase agreements, at value (cost $13,239,069) | | | 13,239,069 | |
Total investments (cost $91,323,399) | | | 96,517,547 | |
Foreign currency, at value (cost $23,814) | | | 23,910 | |
Segregated cash with broker | | | 58,321,523 | |
Unrealized appreciation on swap agreements | | | 52,516 | |
Receivables: | |
Securities sold | | | 29,766 | |
Fund shares sold | | | 56,313 | |
Dividends | | | 158,584 | |
Interest | | | 188 | |
Securities lending income | | | 325 | |
Miscellaneous | | | 10,084 | |
Total assets | | | 155,170,756 | |
| | | | | |
Liabilities: | |
Securities sold short, at value (proceeds $51,591,711) | | | 52,185,855 | |
Unrealized depreciation on swap agreements | | | 181,644 | |
Options written, at value (premiums received $530) | | | 26,875 | |
Segregated cash due to broker | | | 23,420 | |
Overdraft due to custodian bank | | | 16 | |
Payable for: | |
Return of securities loaned | | | 222,226 | |
Management fees | | | 102,940 | |
Fund shares redeemed | | | 60,982 | |
Variation margin | | | 55,569 | |
Distribution and service fees | | | 16,475 | |
Securities purchased | | | 47 | |
Miscellaneous | | | 97,305 | |
Total liabilities | | | 52,973,354 | |
Commitments and contingent liabilities (Note 12) | | | — | |
Net assets | | $ | 102,197,402 | |
| | | | | |
Net assets consist of: | |
Paid in capital | | $ | 110,615,268 | |
Accumulated net investment loss | | | (3,833,116 | ) |
Accumulated net realized loss on investments and foreign currency | | | (9,691,790 | ) |
Net unrealized appreciation on investments and foreign currency | | | 5,107,040 | |
Net assets | | $ | 102,197,402 | |
| | | | | |
A-Class: | |
Net assets | | $ | 12,407,423 | |
Capital shares outstanding | | | 515,298 | |
Net asset value per share | | $ | 24.08 | |
Maximum offering price per share (Net asset value divided by 95.25%) | | $ | 25.28 | |
| | | | | |
C-Class: | |
Net assets | | $ | 8,594,755 | |
Capital shares outstanding | | | 389,196 | |
Net asset value per share | | $ | 22.08 | |
| | | | | |
P-Class: | |
Net assets | | $ | 30,800,673 | |
Capital shares outstanding | | | 1,278,283 | |
Net asset value per share | | $ | 24.10 | |
| | | | | |
Institutional Class: | |
Net assets | | $ | 50,394,551 | |
Capital shares outstanding | | | 2,056,864 | |
Net asset value per share | | $ | 24.50 | |
SEE NOTES TO FINANCIAL STATEMENTS. | THE GUGGENHEIM FUNDS ANNUAL REPORT | 39 |
CONSOLIDATED STATEMENT OF OPERATIONS |
MULTI-HEDGE STRATEGIES FUND |
Year Ended December 31, 2016
Investment Income: | |
Dividends from securities of unaffiliated issuers (net of foreign withholding tax of $1,562) | | $ | 1,772,532 | |
Interest | | | 90,970 | |
Dividends from securities of affiliated issuers | | | 61,991 | |
Income from securities lending, net | | | 2,883 | |
Total investment income | | | 1,928,376 | |
| | | | | |
Expenses: | |
Management fees | | | 1,550,634 | |
Distribution and service fees: | |
A-Class | | | 38,889 | |
C-Class | | | 101,083 | |
P-Class | | | 112,775 | |
Short sales dividend expense | | | 1,198,812 | |
Prime broker interest expense | | | 167,693 | |
Trustees’ fees* | | | 8,253 | |
Custodian fees | | | 3,833 | |
Miscellaneous | | | 29,659 | |
Total expenses | | | 3,211,631 | |
Less: | |
Expenses waived by Adviser | | | (62,857 | ) |
Net expenses | | | 3,148,774 | |
Net investment loss | | | (1,220,398 | ) |
| | | | | |
Net Realized and Unrealized Gain (Loss): | |
Net realized gain (loss) on: | |
Investments in unaffiliated issuers | | | 3,485,227 | |
Investments in affiliated issuers | | | 3,712 | |
Swap agreements | | | 414,530 | |
Futures contracts | | | (1,382,645 | ) |
Foreign currency | | | 11,666 | |
Securities sold short | | | (2,824,649 | ) |
Options purchased | | | (89 | ) |
Options written | | | 5,948 | |
Net realized loss on investments and foreign currency | | | (286,300 | ) |
Net change in unrealized appreciation (depreciation) on: | |
Investments in unaffiliated issuers | | | 4,102,712 | |
Investments in affiliated issuers | | | 52,896 | |
Securities sold short | | | (3,579,584 | ) |
Swap agreements | | | (26,259 | ) |
Futures contracts | | | 192,284 | |
Options written | | | (27,244 | ) |
Foreign currency | | | 33 | |
Net change in unrealized appreciation (depreciation) on investments and foreign currency | | | 714,838 | |
Net realized and unrealized loss on investments and foreign currency | | | 428,538 | |
Net decrease in net assets resulting from operations | | $ | (791,860 | ) |
* | Relates to Trustees not deemed “interested persons” within the meaning of Section 2(a)(19) of the 1940 Act. |
40 | THE GUGGENHEIM FUNDS ANNUAL REPORT | SEE NOTES TO FINANCIAL STATEMENTS. |
CONSOLIDATED STATEMENTS OF CHANGES IN NET ASSETS |
MULTI-HEDGE STRATEGIES FUND | |
| | | Year Ended
December 31,
2016 | | | Year Ended
December 31,
2015 | |
Increase (Decrease) in Net Assets from Operations: | | | | | | |
Net investment loss | | $ | (1,220,398 | ) | | $ | (1,016,220 | ) |
Net realized gain (loss) on investments and foreign currency | | | (286,300 | ) | | | 3,368,869 | |
Net change in unrealized appreciation (depreciation) on investments and foreign currency | | | 714,838 | | | | (1,091,957 | ) |
Net increase (decrease) in net assets resulting from operations | | | (791,860 | ) | | | 1,260,692 | |
| | | | | | | | | |
Distributions to shareholders from: | | | | | | | | |
Net investment income | | | | | | | | |
A-Class | | | (18,960 | ) | | | — | |
C-Class | | | (13,563 | ) | | | — | |
P-Class | | | (47,562 | ) | | | — | * |
Institutional Class | | | (80,274 | ) | | | — | |
Total distributions to shareholders | | | (160,359 | ) | | | — | |
| | | | | | | | | |
Capital share transactions: | | | | | | | | |
Proceeds from sale of shares | | | | | | | | |
A-Class | | | 4,253,544 | | | | 12,859,054 | |
C-Class | | | 5,080,618 | | | | 2,154,033 | |
P-Class | | | 29,060,073 | | | | 43,746,255 | * |
Institutional Class | | | 22,680,675 | | | | 18,843,539 | |
Distributions reinvested | | | | | | | | |
A-Class | | | 17,082 | | | | — | |
C-Class | | | 11,255 | | | | — | |
P-Class | | | 45,475 | | | | — | * |
Institutional Class | | | 76,006 | | | | — | |
Cost of shares redeemed | | | | | | | | |
A-Class | | | (7,364,993 | ) | | | (8,996,021 | ) |
C-Class | | | (5,699,800 | ) | | | (2,484,058 | ) |
P-Class | | | (47,382,265 | ) | | | (31,075,932 | )* |
Institutional Class | | | (21,871,294 | ) | | | (11,927,077 | ) |
Net increase (decrease) from capital share transactions | | | (21,093,624 | ) | | | 23,119,793 | |
Net increase (decrease) in net assets | | | (22,045,843 | ) | | | 24,380,485 | |
| | | | | | | | | |
Net assets: | | | | | | | | |
Beginning of year | | | 124,243,245 | | | | 99,862,760 | |
End of year | | $ | 102,197,402 | | | $ | 124,243,245 | |
Accumulated net investment loss at end of year | | $ | (3,833,116 | ) | | $ | (3,677,930 | ) |
SEE NOTES TO FINANCIAL STATEMENTS. | THE GUGGENHEIM FUNDS ANNUAL REPORT | 41 |
CONSOLIDATED STATEMENTS OF CHANGES IN NET ASSETS (concluded) |
MULTI-HEDGE STRATEGIES FUND | |
| | | Year Ended
December 31,
2016 | | | Year Ended
December 31,
2015 | |
Capital share activity: | | | | | | |
Shares sold | | | | | | |
A-Class | | | 176,821 | | | | 530,162 | |
C-Class | | | 228,850 | | | | 96,154 | |
P-Class | | | 1,203,802 | | | | 1,805,460 | * |
Institutional Class | | | 926,919 | | | | 767,679 | |
Shares issued from reinvestment of distributions | | | | | | | | |
A-Class | | | 710 | | | | — | |
C-Class | | | 510 | | | | — | |
P-Class | | | 1,890 | | | | — | * |
Institutional Class | | | 3,106 | | | | — | |
Shares redeemed | | | | | | | | |
A-Class | | | (307,132 | ) | | | (370,661 | ) |
C-Class | | | (257,538 | ) | | | (110,700 | ) |
P-Class | | | (1,971,217 | ) | | | (1,281,530 | )* |
Institutional Class | | | (896,437 | ) | | | (485,631 | ) |
Net increase (decrease) in shares | | | (889,716 | ) | | | 950,933 | |
* | H-Class shares redesignated as P-Class shares effective following the close of business on April 30, 2015 — See Note 14. |
42 | THE GUGGENHEIM FUNDS ANNUAL REPORT | SEE NOTES TO FINANCIAL STATEMENTS. |
CONSOLIDATED FINANCIAL HIGHLIGHTS |
MULTI-HEDGE STRATEGIES FUND | |
This table is presented to show selected data for a share outstanding throughout each period and to assist shareholders in evaluating a Fund’s performance for the periods presented.
A-Class | | Year Ended
Dec. 31,
2016 | | | Year Ended
Dec. 31,
2015 | | | Year Ended
Dec. 31,
2014 | | | Year Ended
Dec. 31,
2013 | | | Year Ended
Dec. 31,
2012 | |
Per Share Data | | | | | | | | | | | | | | | |
Net asset value, beginning of period | | $ | 24.22 | | | $ | 23.94 | | | $ | 23.03 | | | $ | 22.68 | | | $ | 22.21 | |
Income (loss) from investment operations: | |
Net investment income (loss)a | | | (.24 | ) | | | (.23 | ) | | | (.26 | ) | | | (.18 | ) | | | (.35 | ) |
Net gain (loss) on investments (realized and unrealized) | | | .14 | | | | .51 | | | | 1.36 | | | | .53 | | | | .82 | |
Total from investment operations | | | (.10 | ) | | | .28 | | | | 1.10 | | | | .35 | | | | .47 | |
Less distributions from: | |
Net investment income | | | (.04 | ) | | | — | | | | (.19 | ) | | | — | | | | — | |
Total distributions | | | (.04 | ) | | | — | | | | (.19 | ) | | | — | | | | — | |
Net asset value, end of period | | $ | 24.08 | | | $ | 24.22 | | | $ | 23.94 | | | $ | 23.03 | | | $ | 22.68 | |
| |
Total Returnb | | | (0.43 | %) | | | 1.21 | % | | | 4.73 | % | | | 1.54 | % | | | 2.02 | % |
Ratios/Supplemental Data | |
Net assets, end of period (in thousands) | | $ | 12,407 | | | $ | 15,620 | | | $ | 11,620 | | | $ | 18,307 | | | $ | 27,700 | |
Ratios to average net assets: | |
Net investment income (loss) | | | (1.00 | %) | | | (0.96 | %) | | | (1.13 | %) | | | (0.79 | %) | | | (1.54 | %) |
Total expensesc | | | 2.54 | % | | | 2.72 | % | | | 2.86 | % | | | 2.74 | % | | | 3.09 | % |
Net expensesd,e | | | 2.49 | % | | | 2.65 | % | | | 2.81 | % | | | 2.69 | % | | | 3.05 | % |
Portfolio turnover rate | | | 123 | % | | | 163 | % | | | 304 | % | | | 302 | % | | | 465 | % |
SEE NOTES TO FINANCIAL STATEMENTS. | THE GUGGENHEIM FUNDS ANNUAL REPORT | 43 |
CONSOLIDATED FINANCIAL HIGHLIGHTS (continued) |
MULTI-HEDGE STRATEGIES FUND | |
This table is presented to show selected data for a share outstanding throughout each period and to assist shareholders in evaluating a Fund’s performance for the periods presented.
C-Class | | Year Ended
Dec. 31,
2016 | | | Year Ended
Dec. 31,
2015 | | | Year Ended
Dec. 31,
2014 | | | Year Ended
Dec. 31,
2013 | | | Year Ended
Dec. 31,
2012 | |
Per Share Data | | | | | | | | | | | | | | | |
Net asset value, beginning of period | | $ | 22.38 | | | $ | 22.29 | | | $ | 21.62 | | | $ | 21.45 | | | $ | 21.17 | |
Income (loss) from investment operations: | |
Net investment income (loss)a | | | (.39 | ) | | | (.39 | ) | | | (.40 | ) | | | (.35 | ) | | | (.50 | ) |
Net gain (loss) on investments (realized and unrealized) | | | .13 | | | | .48 | | | | 1.26 | | | | .52 | | | | .78 | |
Total from investment operations | | | (.26 | ) | | | .09 | | | | .86 | | | | .17 | | | | .28 | |
Less distributions from: | |
Net investment income | | | (.04 | ) | | | — | | | | (.19 | ) | | | — | | | | — | |
Total distributions | | | (.04 | ) | | | — | | | | (.19 | ) | | | — | | | | — | |
Net asset value, end of period | | $ | 22.08 | | | $ | 22.38 | | | $ | 22.29 | | | $ | 21.62 | | | $ | 21.45 | |
| |
Total Returnb | | | (1.18 | %) | | | 0.45 | % | | | 3.97 | % | | | 0.79 | % | | | 1.23 | % |
Ratios/Supplemental Data | |
Net assets, end of period (in thousands) | | $ | 8,595 | | | $ | 9,342 | | | $ | 9,627 | | | $ | 12,705 | | | $ | 16,780 | |
Ratios to average net assets: | |
Net investment income (loss) | | | (1.76 | %) | | | (1.73 | %) | | | (1.84 | %) | | | (1.60 | %) | | | (2.33 | %) |
Total expensesc | | | 3.30 | % | | | 3.47 | % | | | 3.62 | % | | | 3.50 | % | | | 3.85 | % |
Net expensesd,e | | | 3.25 | % | | | 3.40 | % | | | 3.57 | % | | | 3.45 | % | | | 3.81 | % |
Portfolio turnover rate | | | 123 | % | | | 163 | % | | | 304 | % | | | 302 | % | | | 465 | % |
44 | THE GUGGENHEIM FUNDS ANNUAL REPORT | SEE NOTES TO FINANCIAL STATEMENTS. |
CONSOLIDATED FINANCIAL HIGHLIGHTS (continued) |
MULTI-HEDGE STRATEGIES FUND |
This table is presented to show selected data for a share outstanding throughout each period and to assist shareholders in evaluating a Fund’s performance for the periods presented.
P-Class | | Year Ended
Dec. 31,
2016 | | | Year Ended
Dec. 31,
2015 | | | Year Ended
Dec. 31,
2014 | | | Year Ended
Dec. 31,
2013 | | | Year Ended
Dec. 31,
2012 | |
Per Share Data | | | | | | | | | | | | | | | |
Net asset value, beginning of period | | $ | 24.24 | | | $ | 23.96 | | | $ | 23.04 | | | $ | 22.69 | | | $ | 22.23 | |
Income (loss) from investment operations: | |
Net investment income (loss)a | | | (.24 | ) | | | (.23 | ) | | | (.25 | ) | | | (.19 | ) | | | (.36 | ) |
Net gain (loss) on investments (realized and unrealized) | | | .14 | | | | .51 | | | | 1.36 | | | | .54 | | | | .82 | |
Total from investment operations | | | (.10 | ) | | | .28 | | | | 1.11 | | | | .35 | | | | .46 | |
Less distributions from: | |
Net investment income | | | (.04 | ) | | | — | | | | (.19 | ) | | | — | | | | — | |
Total distributions | | | (.04 | ) | | | — | | | | (.19 | ) | | | — | | | | — | |
Net asset value, end of period | | $ | 24.10 | | | $ | 24.24 | | | $ | 23.96 | | | $ | 23.04 | | | $ | 22.69 | |
| |
Total Returnb | | | (0.47 | %) | | | 1.21 | % | | | 4.77 | % | | | 1.54 | % | | | 2.02 | % |
Ratios/Supplemental Data | |
Net assets, end of period (in thousands) | | $ | 30,801 | | | $ | 49,539 | | | $ | 36,411 | | | $ | 50,990 | | | $ | 66,818 | |
Ratios to average net assets: | |
Net investment income (loss) | | | (1.00 | %) | | | (0.95 | %) | | | (1.09 | %) | | | (0.82 | %) | | | (1.59 | %) |
Total expensesc | | | 2.52 | % | | | 2.72 | % | | | 2.87 | % | | | 2.75 | % | | | 3.07 | % |
Net expensesd,e | | | 2.47 | % | | | 2.65 | % | | | 2.82 | % | | | 2.71 | % | | | 3.03 | % |
Portfolio turnover rate | | | 123 | % | | | 163 | % | | | 304 | % | | | 302 | % | | | 465 | % |
SEE NOTES TO FINANCIAL STATEMENTS. | THE GUGGENHEIM FUNDS ANNUAL REPORT | 45 |
CONSOLIDATED FINANCIAL HIGHLIGHTS (concluded) |
MULTI-HEDGE STRATEGIES FUND |
This table is presented to show selected data for a share outstanding throughout each period and to assist shareholders in evaluating a Fund’s performance for the periods presented.
Institutional Class | | Year Ended
Dec. 31,
2016 | | | Year Ended
Dec. 31,
2015 | | | Year Ended
Dec. 31,
2014 | | | Year Ended
Dec. 31,
2013 | | | Year Ended
Dec. 31,
2012 | |
Per Share Data | | | | | | | | | | | | | | | |
Net asset value, beginning of period | | $ | 24.58 | | | $ | 24.24 | | | $ | 23.26 | | | $ | 22.84 | | | $ | 22.32 | |
Income (loss) from investment operations: | |
Net investment income (loss)a | | | (.18 | ) | | | (.18 | ) | | | (.18 | ) | | | (.13 | ) | | | (.33 | ) |
Net gain (loss) on investments (realized and unrealized) | | | .14 | | | | .52 | | | | 1.35 | | | | .55 | | | | .85 | |
Total from investment operations | | | (.04 | ) | | | .34 | | | | 1.17 | | | | .42 | | | | .52 | |
Less distributions from: | |
Net investment income | | | (.04 | ) | | | — | | | | (.19 | ) | | | — | | | | — | |
Total distributions | | | (.04 | ) | | | — | | | | (.19 | ) | | | — | | | | — | |
Net asset value, end of period | | $ | 24.50 | | | $ | 24.58 | | | $ | 24.24 | | | $ | 23.26 | | | $ | 22.84 | |
| |
Total Returnb | | | (0.18 | %) | | | 1.44 | % | | | 4.98 | % | | | 1.84 | % | | | 2.28 | % |
Ratios/Supplemental Data | |
Net assets, end of period (in thousands) | | $ | 50,395 | | | $ | 49,742 | | | $ | 42,204 | | | $ | 25,435 | | | $ | 14,130 | |
Ratios to average net assets: | |
Net investment income (loss) | | | (0.74 | %) | | | (0.71 | %) | | | (0.79 | %) | | | (0.54 | %) | | | (1.46 | %) |
Total expensesc | | | 2.30 | % | | | 2.47 | % | | | 2.67 | % | | | 2.56 | % | | | 3.05 | % |
Net expensesd,e | | | 2.25 | % | | | 2.40 | % | | | 2.62 | % | | | 2.51 | % | | | 3.01 | % |
Portfolio turnover rate | | | 123 | % | | | 163 | % | | | 304 | % | | | 302 | % | | | 465 | % |
a | Net investment income (loss) per share was computed using average shares outstanding throughout the period. |
b | Total return does not reflect the impact of any applicable sales charges. |
c | Does not include expenses of the underlying funds in which the Fund invests. |
d | Net expense information reflects the expense ratios after expense waivers. |
e | Excluding interest and dividend expense related to short sales, the net expense ratios for the years presented would be: |
| | | 12/31/16 | 12/31/15 | 12/31/14 | 12/31/13 | 12/31/12 |
| | A-Class | 1.43% | 1.44% | 1.42% | 1.40% | 1.40% |
| | C-Class | 2.18% | 2.19% | 2.17% | 2.15% | 2.15% |
| | P-Class | 1.43% | 1.45% | 1.42% | 1.40% | 1.40% |
| | Institutional Class | 1.18% | 1.19% | 1.17% | 1.15% | 1.15% |
46 | THE GUGGENHEIM FUNDS ANNUAL REPORT | SEE NOTES TO FINANCIAL STATEMENTS. |
PERFORMANCE REPORT AND FUND PROFILE (Unaudited) | December 31, 2016 |
COMMODITIES STRATEGY FUND
OBJECTIVE: Seeks to provide investment results that correlate, before fees and expenses, to the performance of a benchmark for commodities. The Fund’s current benchmark is the S&P Goldman Sachs Commodity Index (“GSCI” or “Index”).
For the one-year period ended December 31, 2016, the Fund’s H-Class returned 10.52%, compared with a return of 11.37% for its benchmark, the GSCI.
The GSCI had a positive return for the first time in four years. 16 of the 24 components in the Index had positive returns during the period. The best performing component was Zinc, with a return topping 50%. Energy components such as Heating Oil, Gas Oil, and Brent Crude also had strong returns above 25%. The other component with over 20% returns during the period was Sugar.
Cocoa, Kansas Wheat, Wheat, and Feeder Cattle each had double digit declines during the period.
Commodities were up in 2016 due to continued economic expansion in China and the U.S. Energy and Industrial Metals components led the way. The U.S. rig count bottomed in May and reductions in production helped stabilize and also increase petroleum market prices. The prospect of potential OPEC production limits or cuts also helped oil prices rebound from multi-year lows.
The strongest GSCI sectors were Energy and Industrial Metals, both up over 15%. Precious Metals was also positive for the year. Agriculture and Livestock sectors were down for the year.
Derivatives in the Fund are used to help provide exposure to the composition of the benchmark in the most efficient manner, as well as to provide liquidity.
Performance displayed represents past performance which is no guarantee of future results.
| | THE GUGGENHEIM FUNDS ANNUAL REPORT | 47 |
PERFORMANCE REPORT AND FUND PROFILE (Unaudited)(continued) | December 31, 2016 |
Holdings Diversification (Market Exposure as % of Net Assets)

“Consolidated Holdings Diversification (Market Exposure as % of Net Assets)” excludes any temporary cash investments or investments in Guggenheim Strategy Funds Trust mutual funds. Investments in those Funds will significantly increase the portfolio’s exposure to certain other asset categories (and their associated risks), which may cause the Fund to deviate from its principal investment strategy, including: (i) high yield, high risk debt securities rated below the top four long-term rating categories by a nationally recognized statistical rating organization (also known as “junk bonds”); (ii) securities issued by the U.S. government or its agencies and instrumentalities; (iii) CLOs and similar investments; and (iv) other short-term fixed income securities.
Inception Dates: |
A-Class | May 25, 2005 |
C-Class | May 25, 2005 |
H-Class | May 25, 2005 |
The Fund invests principally in derivative investments such as commodity-linked futures contracts.
Largest Holdings (% of Total Net Assets) |
Guggenheim Strategy Fund II | 16.6% |
Guggenheim Strategy Fund I | 16.6% |
Total | 33.2% |
“Largest Holdings” excludes any temporary cash or derivative investments. |
48 | THE GUGGENHEIM FUNDS ANNUAL REPORT | |
PERFORMANCE REPORT AND FUND PROFILE (Unaudited)(continued) | December 31, 2016 |
Cumulative Fund Performance*
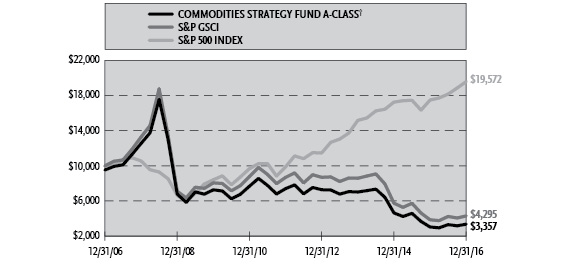

| | THE GUGGENHEIM FUNDS ANNUAL REPORT | 49 |
PERFORMANCE REPORT AND FUND PROFILE (Unaudited)(concluded) | December 31, 2016 |
Average Annual Returns*
Periods Ended December 31, 2016
| | 1 Year | 5 Year | 10 Year |
A-Class Shares | 10.59% | -14.62% | -9.90% |
A-Class Shares with sales charge† | 5.37% | -15.45% | -10.34% |
C-Class Shares | 9.66% | -15.24% | -10.56% |
C-Class Shares with CDSC‡ | 8.66% | -15.24% | -10.56% |
H-Class Shares | 10.52% | -14.61% | -9.89% |
S&P 500 Index | 11.96% | 14.66% | 6.95% |
S&P Goldman Sachs Commodity Index | 11.37% | -13.13% | -8.10% |
* | The performance data above represents past performance that is not predictive of future results. The investment return and principal value of an investment in the Fund will fluctuate so that an investor’s shares, when redeemed, may be worth more or less than their original cost. Returns are historical and include changes in principal and reinvested dividends and capital gains and do not reflect the effect of taxes. The S&P GSCI and the S&P 500 Index are unmanaged indices and, unlike the Fund, have no management fees or operating expenses to reduce their reported returns. The graphs are based on A-Class shares and H-Class shares only; performance for C-Class shares will vary due to differences in fee structures. |
† | Fund returns are calculated using the maximum sales charge of 4.75%. |
‡ | Fund returns include a CDSC of 1% if redeemed within 12 months of purchase. |
50 | THE GUGGENHEIM FUNDS ANNUAL REPORT | |
CONSOLIDATED SCHEDULE OF INVESTMENTS | December 31, 2016 |
COMMODITIES STRATEGY FUND | |
| | | Shares | | | Value | |
| | | | | | | |
MUTUAL FUNDS† - 33.2% | |
Guggenheim Strategy Fund II1 | | | 58,232 | | | $ | 1,452,892 | |
Guggenheim Strategy Fund I1 | | | 58,115 | | | | 1,452,887 | |
Total Mutual Funds | | | | | | | | |
(Cost $2,894,775) | | | | | | | 2,905,779 | |
| | | | | | | | | |
| | | Face
Amount | | | | | |
| | | | | | | | | |
U.S. TREASURY BILLS††- 11.5% | |
U.S. Treasury Bill | | | | | | | | |
0.46% due 01/12/172,3,5 | | $ | 1,000,000 | | | | 999,900 | |
Total U.S. Treasury Bills | | | | | |
(Cost $999,855) | | | | | | | 999,900 | |
| | | | | | | | | |
REPURCHASE AGREEMENTS††,4 - 55.2% | |
HSBC Securities, Inc.
issued 12/30/16 at 0.28%
due 01/03/175 | | | 4,543,184 | | | | 4,543,184 | |
Royal Bank of Canada
issued 12/30/16 at 0.24%
due 01/03/175 | | | 273,324 | | | | 273,324 | |
UMB Financial Corp.
issued 12/30/16 at 0.24%
due 01/03/175 | | | 10,039 | | | | 10,039 | |
Total Repurchase Agreements | | | | | |
(Cost $4,826,547) | | | | 4,826,547 | |
| | | | | | | | | |
Total Investments - 99.9% | | | | | |
(Cost $8,721,177) | | | $ | 8,732,226 | |
Other Assets & Liabilities, net - 0.1% | | | | 10,844 | |
Total Net Assets - 100.0% | | | $ | 8,743,070 | |
| | | | | | | | | |
| | | Contracts | | | Unrealized
Gain | |
| | | | | | | | | |
COMMODITY FUTURES CONTRACTS PURCHASED† | |
January 2017 Goldman Sachs Commodity Index
Futures Contracts5
(Aggregate Value of
Contracts $8,762,600) | | | 88 | | | $ | 199,040 | |
† | Value determined based on Level 1 inputs — See Note 4. |
†† | Value determined based on Level 2 inputs — See Note 4. |
1 | Affiliated issuer — See Note 10. |
2 | All or a portion of this security is pledged as futures collateral at December 31, 2016. |
3 | Zero coupon rate security. Rate indicated is the effective yield at the time of purchase. |
4 | Repurchase Agreements — See Note 5. |
5 | All or a portion of this security is owned by Cayman Islands subsidiary, which is a 100% owned subsidiary of the Fund — See Note 15. |
| | |
| | See Sector Classification in Other Information section. |
SEE NOTES TO FINANCIAL STATEMENTS. | THE GUGGENHEIM FUNDS ANNUAL REPORT | 51 |
CONSOLIDATED SCHEDULE OF INVESTMENTS (concluded) | December 31, 2016 |
COMMODITIES STRATEGY FUND | |
The following table summarizes the inputs used to value the Fund’s investments at December 31, 2016 (See Note 4 in the Notes to Consolidated Financial Statements):
Investments in Securities (Assets) | | Level 1 | | | Level 1 - Other* | | | Level 2 | | | Level 2 - Other* | | | Level 3 | | | Total | |
Commodity Futures Contracts | | $ | — | | | $ | 199,040 | | | $ | — | | | $ | — | | | $ | — | | | $ | 199,040 | |
Mutual Funds | | | 2,905,779 | | | | — | | | | — | | | | — | | | | — | | | | 2,905,779 | |
Repurchase Agreements | | | — | | | | — | | | | 4,826,547 | | | | — | | | | — | | | | 4,826,547 | |
U.S. Treasury Bills | | | — | | | | — | | | | 999,900 | | | | — | | | | — | | | | 999,900 | |
Total | | $ | 2,905,779 | | | $ | 199,040 | | | $ | 5,826,447 | | | $ | — | | | $ | — | | | $ | 8,931,266 | |
* | Other financial instruments include futures contracts, which are reported as unrealized gain/loss at period end. |
Transfers between investment levels may occur as the markets fluctuate and/or the availability of data used in an investment’s valuation changes. Transfers between valuation levels, if any, are in comparison to the valuation levels at the end of the previous fiscal year, and are effective using the fair value as of the end of the previous fiscal period.
For the year ended December 31, 2016, there were no transfers between levels.
52 | THE GUGGENHEIM FUNDS ANNUAL REPORT | SEE NOTES TO FINANCIAL STATEMENTS. |
CONSOLIDATED STATEMENT OF ASSETS AND LIABILITIES |
COMMODITIES STRATEGY FUND |
December 31, 2016
Assets: | |
Investments in unaffiliated issuers, at value (cost $999,855) | | $ | 999,900 | |
Investments in affiliated issuers, at value (cost $2,894,775) | | | 2,905,779 | |
Repurchase agreements, at value (cost $4,826,547) | | | 4,826,547 | |
Total investments (cost $8,721,177) | | | 8,732,226 | |
Receivables: | |
Fund shares sold | | | 17,239 | |
Dividends | | | 4,719 | |
Interest | | | 75 | |
Miscellaneous | | | 11,818 | |
Total assets | | | 8,766,077 | |
| | | | | |
Liabilities: | |
Overdraft due to custodian bank | | | 2 | |
Payable for: | |
Management fees | | | 7,202 | |
Variation margin | | | 3,266 | |
Distribution and service fees | | | 2,834 | |
Transfer agent and administrative fees | | | 2,533 | |
Fund shares redeemed | | | 1,585 | |
Portfolio accounting fees | | | 1,013 | |
Miscellaneous | | | 4,572 | |
Total liabilities | | | 23,007 | |
Commitments and contingent liabilities (Note 12) | | | — | |
NET ASSETS | | $ | 8,743,070 | |
| | | | | |
Net assets consist of: | |
Paid in capital | | $ | 31,203,133 | |
Accumulated net investment loss | | | (2,770,217 | ) |
Accumulated net realized loss on investments | | | (19,899,935 | ) |
Net unrealized appreciation on investments | | | 210,089 | |
Net assets | | $ | 8,743,070 | |
| | | | | |
A-Class: | |
Net assets | | $ | 874,964 | |
Capital shares outstanding | | | 10,204 | |
Net asset value per share | | $ | 85.75 | |
Maximum offering price per share (Net asset value divided by 95.25%) | | $ | 90.03 | |
| | | | | |
C-Class: | |
Net assets | | $ | 482,043 | |
Capital shares outstanding | | | 6,155 | |
Net asset value per share | | $ | 78.32 | |
| | | | | |
H-Class: | |
Net assets | | $ | 7,386,063 | |
Capital shares outstanding | | | 86,064 | |
Net asset value per share | | $ | 85.82 | |
SEE NOTES TO FINANCIAL STATEMENTS. | THE GUGGENHEIM FUNDS ANNUAL REPORT | 53 |
CONSOLIDATED STATEMENT OF OPERATIONS |
COMMODITIES STRATEGY FUND |
Year Ended December 31, 2016
Investment Income: | |
Dividends from securities of affiliated issuers | | $ | 40,740 | |
Interest | | | 11,248 | |
Total investment income | | | 51,988 | |
| | | | | |
EXPENSES: | |
Management fees | | | 61,596 | |
Transfer agent and administrative fees | | | 17,736 | |
Distribution and service fees: | |
A-Class | | | 3,885 | |
C-Class | | | 4,496 | |
H-Class | | | 12,727 | |
Portfolio accounting fees | | | 7,094 | |
Custodian fees | | | 1,087 | |
Trustees' fees** | | | 515 | |
Miscellaneous | | | 18,229 | |
Total expenses | | | 127,365 | |
Less: | |
Expenses waived by Adviser | | | (8,648 | ) |
Net expenses | | | 118,717 | |
Net investment loss | | | (66,729 | ) |
| | | | | |
Net Realized and Unrealized Gain (Loss): | |
Net realized gain (loss) on: | |
Investments in unaffiliated issuers | | | 62 | |
Investments in affiliated issuers | | | (5,588 | ) |
Futures contracts | | | (1,099,488 | ) |
Net realized loss | | | (1,105,014 | ) |
Net change in unrealized appreciation (depreciation) on: | |
Investments in unaffiliated issuers | | | 45 | |
Investments in affiliated issuers | | | 11,062 | |
Futures contracts | | | 257,277 | |
Net change in unrealized appreciation (depreciation) | | | 268,384 | |
Net realized and unrealized loss | | | (836,630 | ) |
Net decrease in net assets resulting from operations | | $ | (903,359 | ) |
** | Relates to Trustees not deemed “interested persons” within the meaning of Section 2(a)(19) of the 1940 Act. |
54 | THE GUGGENHEIM FUNDS ANNUAL REPORT | SEE NOTES TO FINANCIAL STATEMENTS. |
CONSOLIDATED STATEMENTS OF CHANGES IN NET ASSETS |
COMMODITIES STRATEGY FUND | |
| | | Year Ended
December 31,
2016 | | | Year Ended
December 31,
2015 | |
Increase (Decrease) in Net Assets from Operations: | | | | | | |
Net investment loss | | $ | (66,729 | ) | | $ | (108,475 | ) |
Net realized loss on investments | | | (1,105,014 | ) | | | (4,937,573 | ) |
Net change in unrealized appreciation (depreciation) on investments | | | 268,384 | | | | 497,419 | |
Net decrease in net assets resulting from operations | | | (903,359 | ) | | | (4,548,629 | ) |
| | | | | | | | | |
Capital share transactions: | | | | | | | | |
Proceeds from sale of shares | | | | | | | | |
A-Class | | | 112,059,540 | | | | 14,899,309 | |
C-Class | | | 273,332 | | | | 200,478 | |
H-Class | | | 139,296,552 | | | | 148,883,679 | |
Cost of shares redeemed | | | | | | | | |
A-Class | | | (111,853,025 | ) | | | (17,157,407 | ) |
C-Class | | | (323,925 | ) | | | (514,210 | ) |
H-Class | | | (139,483,654 | ) | | | (144,799,682 | ) |
Net increase (decrease) from capital share transactions | | | (31,180 | ) | | | 1,512,167 | |
Net decrease in net assets | | | (934,539 | ) | | | (3,036,462 | ) |
| | | | | | | | | |
Net assets: | | | | | | | | |
Beginning of year | | | 9,677,609 | | | | 12,714,071 | |
End of year | | $ | 8,743,070 | | | $ | 9,677,609 | |
Accumulated net investment loss at end of year | | $ | (2,770,217 | ) | | $ | (2,770,217 | ) |
| | | | | | | | | |
CAPITAL SHARE ACTIVITY:* | | | | | | | | |
Shares sold | | | | | | | | |
A-Class | | | 1,420,897 | | | | 140,915 | |
C-Class | | | 3,655 | | | | 2,046 | |
H-Class | | | 1,729,009 | | | | 1,475,462 | |
Shares redeemed | | | | | | | | |
A-Class | | | (1,418,693 | ) | | | (161,777 | ) |
C-Class | | | (4,539 | ) | | | (5,349 | ) |
H-Class | | | (1,753,049 | ) | | | (1,434,113 | ) |
Net increase (decrease) in shares | | | (22,720 | ) | | | 17,184 | |
* | Capital share activity for the periods presented through December 31, 2016 has been restated to reflect a 1:12 reverse share split effective October 28, 2016 — See Note 13. |
SEE NOTES TO FINANCIAL STATEMENTS. | THE GUGGENHEIM FUNDS ANNUAL REPORT | 55 |
CONSOLIDATED FINANCIAL HIGHLIGHTS |
COMMODITIES STRATEGY FUND | |
This table is presented to show selected data for a share outstanding throughout each period and to assist shareholders in evaluating a Fund’s performance for the periods presented.
A-Class | | Year Ended Dec. 31, 2016e | | | Year Ended Dec. 31, 2015e | | | Year Ended Dec. 31, 2014e | | | Year Ended Dec. 31, 2013e | | | Year Ended Dec. 31, 2012e | |
Per Share Data | | | | | | | | | | | | | | | |
Net asset value, beginning of period | | $ | 77.58 | | | $ | 118.46 | | | $ | 179.18 | | | $ | 185.89 | | | $ | 194.11 | |
Income (loss) from investment operations: | |
Net investment income (loss)a | | | (.09 | ) | | | (1.32 | ) | | | (1.80 | ) | | | (2.76 | ) | | | (2.76 | ) |
Net gain (loss) on investments (realized and unrealized) | | | 8.26 | | | | (39.56 | ) | | | (58.92 | ) | | | (3.95 | ) | | | (.54 | ) |
Total from investment operations | | | 8.17 | | | | (40.88 | ) | | | (60.72 | ) | | | (6.71 | ) | | | (3.30 | ) |
Less distributions from: | |
Net investment income | | | — | | | | — | | | | — | | | | — | | | | (4.92 | ) |
Total distributions | | | — | | | | — | | | | — | | | | — | | | | (4.92 | ) |
Net asset value, end of period | | $ | 85.75 | | | $ | 77.58 | | | $ | 118.46 | | | $ | 179.18 | | | $ | 185.89 | |
| |
Total Returnb | | | 10.59 | % | | | (34.55 | %) | | | (33.89 | %) | | | (3.62 | %) | | | (1.63 | %) |
Ratios/Supplemental Data | |
Net assets, end of period (in thousands) | | $ | 875 | | | $ | 621 | | | $ | 3,419 | | | $ | 1,990 | | | $ | 5,840 | |
Ratios to average net assets: | |
Net investment income (loss) | | | (1.02 | %) | | | (1.26 | %) | | | (1.03 | %) | | | (1.50 | %) | | | (1.40 | %) |
Total expensesc | | | 1.77 | % | | | 1.75 | % | | | 1.64 | % | | | 1.63 | % | | | 1.59 | % |
Net expensesd | | | 1.65 | % | | | 1.62 | % | | | 1.56 | % | | | 1.53 | % | | | 1.49 | % |
Portfolio turnover rate | | | 208 | % | | | 486 | % | | | 238 | % | | | — | | | | — | |
56 | THE GUGGENHEIM FUNDS ANNUAL REPORT | SEE NOTES TO FINANCIAL STATEMENTS. |
CONSOLIDATED FINANCIAL HIGHLIGHTS (continued) |
COMMODITIES STRATEGY FUND | |
This table is presented to show selected data for a share outstanding throughout each period and to assist shareholders in evaluating a Fund’s performance for the periods presented.
C-Class | | Year Ended Dec. 31, 2016e | | | Year Ended Dec. 31, 2015e | | | Year Ended Dec. 31, 2014e | | | Year Ended Dec. 31, 2013e | | | Year Ended Dec. 31, 2012e | |
Per Share Data | | | | | | | | | | | | | | | |
Net asset value, beginning of period | | $ | 71.38 | | | $ | 109.79 | | | $ | 167.19 | | | $ | 174.69 | | | $ | 184.06 | |
Income (loss) from investment operations: | |
Net investment income (loss)a | | | (.11 | ) | | | (1.92 | ) | | | (2.76 | ) | | | (3.84 | ) | | | (3.96 | ) |
Net gain (loss) on investments (realized and unrealized) | | | 7.05 | | | | (36.49 | ) | | | (54.64 | ) | | | (3.66 | ) | | | (.49 | ) |
Total from investment operations | | | 6.94 | | | | (38.41 | ) | | | (57.40 | ) | | | (7.50 | ) | | | (4.45 | ) |
Less distributions from: | |
Net investment income | | | — | | | | — | | | | — | | | | — | | | | (4.92 | ) |
Total distributions | | | — | | | | — | | | | — | | | | — | | | | (4.92 | ) |
Net asset value, end of period | | $ | 78.32 | | | $ | 71.38 | | | $ | 109.79 | | | $ | 167.19 | | | $ | 174.69 | |
| |
Total Returnb | | | 9.66 | % | | | (34.97 | %) | | | (34.31 | %) | | | (4.33 | %) | | | (2.38 | %) |
Ratios/Supplemental Data | |
Net assets, end of period (in thousands) | | $ | 482 | | | $ | 502 | | | $ | 1,135 | | | $ | 1,947 | | | $ | 2,575 | |
Ratios to average net assets: | |
Net investment income (loss) | | | (1.48 | %) | | | (1.95 | %) | | | (1.77 | %) | | | (2.25 | %) | | | (2.15 | %) |
Total expensesc | | | 2.51 | % | | | 2.49 | % | | | 2.39 | % | | | 2.39 | % | | | 2.34 | % |
Net expensesd | | | 2.38 | % | | | 2.35 | % | | | 2.32 | % | | | 2.28 | % | | | 2.24 | % |
Portfolio turnover rate | | | 208 | % | | | 486 | % | | | 238 | % | | | — | | | | — | |
SEE NOTES TO FINANCIAL STATEMENTS. | THE GUGGENHEIM FUNDS ANNUAL REPORT | 57 |
CONSOLIDATED FINANCIAL HIGHLIGHTS (concluded) |
COMMODITIES STRATEGY FUND | |
This table is presented to show selected data for a share outstanding throughout each period and to assist shareholders in evaluating a Fund’s performance for the periods presented.
H-Class | | Year Ended Dec. 31, 2016e | | | Year Ended Dec. 31, 2015e | | | Year Ended Dec. 31, 2014e | | | Year Ended Dec. 31, 2013e | | | Year Ended Dec. 31, 2012e | |
Per Share Data | | | | | | | | | | | | | | | |
Net asset value, beginning of period | | $ | 77.69 | | | $ | 118.68 | | | $ | 179.41 | | | $ | 185.95 | | | $ | 194.10 | |
Income (loss) from investment operations: | |
Net investment income (loss)a | | | (.07 | ) | | | (1.32 | ) | | | (1.80 | ) | | | (2.76 | ) | | | (2.76 | ) |
Net gain (loss) on investments (realized and unrealized) | | | 8.20 | | | | (39.67 | ) | | | (58.93 | ) | | | (3.78 | ) | | | (.47 | ) |
Total from investment operations | | | 8.13 | | | | (40.99 | ) | | | (60.73 | ) | | | (6.54 | ) | | | (3.23 | ) |
Less distributions from: | |
Net investment income | | | — | | | | — | | | | — | | | | — | | | | (4.92 | ) |
Total distributions | | | — | | | | — | | | | — | | | | — | | | | (4.92 | ) |
Net asset value, end of period | | $ | 85.82 | | | $ | 77.69 | | | $ | 118.68 | | | $ | 179.41 | | | $ | 185.95 | |
| |
Total Returnb | | | 10.52 | % | | | (34.58 | %) | | | (33.85 | %) | | | (3.55 | %) | | | (1.57 | %) |
Ratios/Supplemental Data | |
Net assets, end of period (in thousands) | | $ | 7,386 | | | $ | 8,555 | | | $ | 8,160 | | | $ | 12,042 | | | $ | 23,671 | |
Ratios to average net assets: | |
Net investment income (loss) | | | (0.87 | %) | | | (1.33 | %) | | | (1.05 | %) | | | (1.50 | %) | | | (1.40 | %) |
Total expensesc | | | 1.74 | % | | | 1.75 | % | | | 1.65 | % | | | 1.63 | % | | | 1.60 | % |
Net expensesd | | | 1.62 | % | | | 1.63 | % | | | 1.57 | % | | | 1.53 | % | | | 1.49 | % |
Portfolio turnover rate | | | 208 | % | | | 486 | % | | | 238 | % | | | — | | | | — | |
a | Net investment income (loss) per share was computed using average shares outstanding throughout the period. |
b | Total return does not reflect the impact of any applicable sales charges. |
c | Does not include expenses of the underlying funds in which the Fund invests. |
d | Net expense information reflects the expense ratios after expense waivers. |
e | Reverse share split — Per share amounts for the periods presented through December 31, 2016 have been restated to reflect a 1:12 reverse share split effective October 28, 2016 — See Note 13. |
58 | THE GUGGENHEIM FUNDS ANNUAL REPORT | SEE NOTES TO FINANCIAL STATEMENTS. |
NOTES TO CONSOLIDATED FINANCIAL STATEMENTS |
1. Organization and Significant Accounting Policies
Organization
The Rydex Series Funds (the “Trust”), a Delaware statutory trust, is registered with the SEC under the Investment Company Act of 1940 (”1940 Act”), as an open-ended investment company of the series type. Each series, in effect, is representing a separate Fund. The Trust is authorized to issue an unlimited number of no par value shares. The Trust accounts for the assets of each fund separately.
The Trust offers a combination of seven separate classes of shares: Investor Class shares, A-Class shares, C-Class shares, H-Class shares, P-Class shares, Institutional Class shares and Money Market Class shares. Sales of shares of each Class are made without a front-end sales charge at the net asset value per share (“NAV”), with the exception of A-Class shares. A-Class shares are sold at the NAV, plus the applicable front-end sales charge. The sales charge varies depending on the amount purchased, but will not exceed 4.75%. A-Class share purchases of $1 million or more are exempt from the front-end sales charge but have a 1% contingent deferred sales charge (“CDSC”) if shares are redeemed within 12 months of purchase. C-Class shares have a 1% CDSC if shares are redeemed within 12 months of purchase. Institutional Class shares are offered primarily for direct investment by institutions such as pension and profit sharing plans, endowments, foundations and corporations. Institutional Class shares require a minimum initial investment of $2 million and a minimum account balance of $1 million. At December 31, 2016, the Trust consisted of fifty-three funds.
This report covers the Multi-Hedge Strategies Fund and Commodities Strategy Fund (the “Funds”), each a non-diversified investment company. Only A-Class, C-Class, H-Class, P-Class and Institutional Class had been issued by the Funds.
Guggenheim Investments (“GI”) provides advisory services. Guggenheim Funds Distributors, LLC (“GFD”) acts as principal underwriter for the Trust. GI and GFD are affiliated entities.
Significant Accounting Policies
The Funds operate as investment companies and, accordingly, follow the investment company accounting and reporting guidance of the Financial Accounting Standards Board (“FASB”) Accounting Standards Codification Topic 946 Financial Services – Investment Companies.
The following significant accounting policies are in conformity with U.S. generally accepted accounting principles (“U.S. GAAP”) and are consistently followed by the Trust. This requires management to make estimates and assumptions that affect the reported amount of assets and liabilities, contingent assets and liabilities at the date of the financial statements, and the reported amounts of revenues and expenses during the reporting period. Actual results could differ from these estimates. All time references are based on Eastern Time.
The NAV of each Class of the Funds is calculated by dividing the market value of the Fund’s securities and other assets, less all liabilities, attributable to the Class by the number of outstanding shares of the Class.
| | THE GUGGENHEIM FUNDS ANNUAL REPORT | 59 |
NOTES TO CONSOLIDATED FINANCIAL STATEMENTS (continued) |
The Board of Trustees of the Funds (the “Board”) has adopted policies and procedures for the valuation of the Funds’ investments (the “Valuation Procedures”). Pursuant to the Valuation Procedures, the Board has delegated to a valuation committee, consisting of representatives from Guggenheim’s investment management, fund administration, legal and compliance departments (the “Valuation Committee”), the day-to-day responsibility for implementing the Valuation Procedures, including, under most circumstances, the responsibility for determining the fair value of the Funds’ securities and/or other assets.
Valuations of the Funds’ securities are supplied primarily by pricing services appointed pursuant to the processes set forth in the Valuation Procedures. The Valuation Committee convenes monthly, or more frequently as needed, to review the valuation of all assets which have been fair valued for reasonableness. The Funds’ officers, through the Valuation Committee and consistent with the monitoring and review responsibilities set forth in the Valuation Procedures, regularly review procedures used and valuations provided by the pricing services.
If the pricing service cannot or does not provide a valuation for a particular investment or such valuation is deemed unreliable, such investment is fair valued by the Valuation Committee.
Equity securities listed on an exchange (New York Stock Exchange (“NYSE”) or American Stock Exchange) are valued at the last quoted sales price as of the close of business on the NYSE, usually 4:00 p.m. on the valuation date. Equity securities listed on the NASDAQ market system are valued at the NASDAQ Official Closing Price on the valuation date, which may not necessarily represent the last sale price. If there has been no sale on such exchange or NASDAQ on a given day, the security is valued at the closing bid price on that day.
Generally, trading in foreign securities markets is substantially completed each day at various times prior to the close of the NYSE. The values of foreign securities are determined as of the close of such foreign markets or the close of the NYSE, if earlier. All investments quoted in foreign currencies are valued in U.S. dollars on the basis of the foreign currency exchange rates prevailing at the close of business. Investments in foreign securities may involve risks not present in domestic investments. The Valuation Committee will determine the current value of such foreign securities by taking into consideration certain factors which may include those discussed above, as well as the following factors, among others: the value of the securities traded on other foreign markets, ADR trading, closed-end fund trading, foreign currency exchange activity, and the trading prices of financial products that are tied to foreign securities. In addition, the Board has authorized the Valuation Committee and GI to use prices and other information supplied by a third party pricing vendor in valuing foreign securities.
Open-end investment companies (“mutual funds”) are valued at their NAV as of the close of business, on the valuation date. Exchange-traded funds (“ETFs”) and closed-end investment companies (“CEFs”) are valued at the last quoted sales price.
U.S. Government securities are valued by either independent pricing services, the last traded fill price, or at the reported bid price at the close of business.
60 | THE GUGGENHEIM FUNDS ANNUAL REPORT | |
NOTES TO CONSOLIDATED FINANCIAL STATEMENTS (continued) |
Repurchase agreements are valued at amortized cost, provided such amounts approximate market value.
Listed options are valued at the Official Settlement Price listed by the exchange, usually as of 4:00 p.m. Long options are valued using the bid price and short options are valued using the ask price. In the event that a settlement price is not available, fair valuation is enacted. Over-the-counter (“OTC”) options are valued using the average bid price (for long options) or average ask price (for short options) obtained from one or more security dealers.
The value of futures contracts is accounted for using the unrealized gain or loss on the contracts that is determined by marking the contracts to their current realized settlement prices. Financial futures contracts are valued at the 4:00 p.m. price on the valuation date. In the event that the exchange for a specific futures contract closes earlier than 4:00 p.m., the futures contract is valued at the Official Settlement Price of the exchange. However, the underlying securities from which the futures contract value is derived are monitored until 4:00 p.m. to determine if fair valuation would provide a more accurate valuation.
The values of OTC swap agreements entered into by a Fund are accounted for using the unrealized gains or losses on the agreements that are determined by marking the agreements to the last quoted value of the index that the swaps pertain to at the close of the NYSE. The swaps’ values are then adjusted to include dividends accrued, financing charges and/or interest associated with the swap agreements.
Investments for which market quotations are not readily available are fair-valued as determined in good faith by GI under the direction of the Board using methods established or ratified by the Board. Valuations in accordance with these methods are intended to reflect each security’s (or asset’s) “fair value.” Each such determination is based on a consideration of all relevant factors, which are likely to vary from one pricing context to another. Examples of such factors may include, but are not limited to market prices; sale prices; broker quotes; and models which derive prices based on inputs such as prices of securities with comparable maturities and characteristics, or based on inputs such as anticipated cash flows or collateral, spread over Treasuries, and other information analysis.
In connection with futures contracts and other derivative investments, such factors may include obtaining information as to how (a) these contracts and other derivative investments trade in the futures or other derivative markets, respectively, and (b) the securities underlying these contracts and other derivative investments trade in the cash market.
B. Certain U.S. Government and Agency Obligations are traded on a discount basis; the interest rates shown on the Schedules of Investments reflect the effective rates paid at the time of purchase by the Funds. Other securities bear interest at the rates shown, payable at fixed dates through maturity.
| | THE GUGGENHEIM FUNDS ANNUAL REPORT | 61 |
NOTES TO CONSOLIDATED FINANCIAL STATEMENTS (continued) |
C. When a Fund engages in a short sale of a security, an amount equal to the proceeds is reflected as an asset and an equivalent liability. The amount of the liability is subsequently marked-to-market to reflect the market value of the short sale. The Fund maintains a segregated account of cash and/or securities as collateral for short sales.
Fees, if any, paid to brokers to borrow securities in connection with short sales are recorded as interest expense. In addition, the Fund must pay out the dividend rate of the equity or coupon rate of the obligation to the lender and record this as an expense. Short dividend or interest expense is a cost associated with the investment objective of short sales transactions, rather than an operational cost associated with the day-to-day management of any mutual fund. The Fund may also receive rebate income from the broker resulting from the investment of the proceeds from securities sold short.
D. Upon the purchase of an option, the premium paid is recorded as an investment, the value of which is marked-to-market daily. If a purchased option expires, the Fund realizes a loss in the amount of the cost of the option. When the Fund enters into a closing sale transaction, it realizes a gain or loss depending on whether the proceeds from the closing sale transaction are greater or less than the cost of the option. If the Fund exercises a put option, it realizes a gain or loss from the sale of the underlying security and the proceeds from such sale will be decreased by the premium originally paid. When the Fund exercises a call option, the cost of the security purchased by the Fund upon exercise increases by the premium originally paid.
When the Fund writes (sells) an option, an amount equal to the premium received is entered in that Fund’s accounting records as an asset and equivalent liability. The amount of the liability is subsequently marked-to-market to reflect the current value of the option written. When a written option expires, or if the Fund enters into a closing purchase transaction, it realizes a gain (or loss if the cost of a closing purchase transaction exceeds the premium received when the option was sold).
E. Upon entering into a futures contract, a Fund deposits and maintains as collateral such initial margin as required by the exchange on which the transaction is affected. Pursuant to the contract, the Fund agrees to receive from or pay to the broker an amount of cash equal to the daily fluctuation in value of the contract. Such receipts or payments are known as variation margin and are recorded by the Fund as unrealized gains or losses. When the contract is closed, the Fund records a realized gain or loss equal to the difference between the value of the contract at the time it was opened and the value at the time it was closed.
F. Swap agreements are marked-to-market daily and the change, if any, is recorded as unrealized gain or loss. Payments received or made as a result of an agreement or termination of an agreement are recognized as realized gains or losses.
G. The accounting records of the Funds are maintained in U.S. dollars. All assets and liabilities initially expressed in foreign currencies are converted into U.S. dollars at prevailing exchange rates. Purchases and sales of investment securities, dividend and interest income, and certain expenses are translated at the rates of exchange prevailing on the respective dates of such
62 | THE GUGGENHEIM FUNDS ANNUAL REPORT | |
NOTES TO CONSOLIDATED FINANCIAL STATEMENTS (continued) |
transactions. Changes in the relationship of these foreign currencies to the U.S. dollar can significantly affect the value of the investments and earnings of the Funds. Foreign investments may also subject the Funds to foreign government exchange restrictions, expropriation, taxation, or other political, social or economic developments, all of which could affect the market and/or credit risk of the investments.
The Funds do not isolate that portion of the results of operations resulting from changes in the foreign exchange rates on investments from the fluctuations arising from changes in the market prices of securities held. Such fluctuations are included with the net realized and unrealized gain or loss on investments.
Reported net realized foreign exchange gains and losses arise from sales of foreign currencies and currency gains or losses realized between the trade and settlement dates on investment transactions. Net unrealized exchange gains and losses arise from changes in the fair values of assets and liabilities other than investments in securities at the fiscal period end, resulting from changes in exchange rates.
H. Security transactions are recorded on the trade date for financial reporting purposes. Realized gains and losses from securities transactions are recorded using the identified cost basis. Proceeds from lawsuits related to investment holdings are recorded as realized gains in the respective Fund. Dividend income is recorded on the ex-dividend date, net of applicable taxes withheld by foreign countries. Taxable non-cash dividends are recorded as dividend income. Interest income, including amortization of premiums and accretion of discounts, is accrued on a daily basis. Dividend income from REITs is recorded based on the income included in the distributions received from the REIT investments using published REIT classifications, including some management estimates when actual amounts are not available. Distributions received in excess of this estimated amount are recorded as a reduction of the cost of investments or reclassified to capital gains. The actual amounts of income, return of capital, and capital gains are only determined by each REIT after its fiscal year-end, and may differ from the estimated amounts.
I. Distributions of net investment income and net realized gains, if any, are declared and paid at least annually. Dividends are reinvested in additional shares unless shareholders request payment in cash. Distributions are recorded on the ex-dividend date and are determined in accordance with income tax regulations which may differ from U.S. GAAP.
J. Interest and dividend income, most expenses, all realized gains and losses, and all unrealized gains and losses are allocated to the classes based upon the value of the outstanding shares in each Class. Certain costs, such as distribution and service fees are charged directly to specific classes. In addition, certain expenses have been allocated to the individual Funds in the Trust on a pro rata basis upon the respective aggregate net assets of each Fund included in the Trust.
K. The Funds may leave cash overnight in their cash account with the custodian. Periodically, a Fund may have cash due to the custodian bank as an overdraft balance. A fee is incurred on this overdraft, calculated by multiplying the overdraft by a rate based on the federal funds rate, which was 0.55% at December 31, 2016.
| | THE GUGGENHEIM FUNDS ANNUAL REPORT | 63 |
NOTES TO CONSOLIDATED FINANCIAL STATEMENTS (continued) |
L. Under the Funds’ organizational documents, the Trustees and Officers are indemnified against certain liabilities arising out of the performance of their duties to the Trust. In addition, throughout the normal course of business, the Funds enter into contracts that contain a variety of representations and warranties which provide general indemnifications. The Funds’ maximum exposure under these arrangements is unknown, as this would involve future claims that may be made against the Funds and/or their affiliates that have not yet occurred. However, based on experience, the Funds expect the risk of loss to be remote.
2. Financial Instruments and Derivatives
As part of their investment strategy, the Funds utilize short sales and a variety of derivative instruments. These investments involve, to varying degrees, elements of market risk and risks in excess of the amounts recognized in the Consolidated Statements of Assets and Liabilities. Valuation and accounting treatment of these instruments can be found under Significant Accounting Policies in Note 1 of these Notes to Consolidated Financial Statements.
Short Sales
A short sale is a transaction in which a Fund sells a security it does not own. If the security sold short decreases in price between the time the Fund sells the security and closes its short position, the Fund will realize a gain on the transaction. Conversely, if the security increases in price during the period, the Fund will realize a loss on the transaction. The risk of such price increases is the principal risk of engaging in short sales.
Derivatives
Derivatives are instruments whose values depend on, or are derived from, in whole or in part, the value of one or more other assets, such as securities, currencies, commodities or indices. Derivative instruments may be used to increase investment flexibility (including to maintain cash reserves while maintaining exposure to certain other assets), for risk management (hedging) purposes, to facilitate trading, to reduce transaction costs and to pursue higher investment returns. Derivative instruments may also be used to mitigate certain investment risks, such as foreign currency exchange rate risk, interest rate risk and credit risk. U.S. GAAP requires disclosures to enable investors to better understand how and why a Fund uses derivative instruments, how these derivative instruments are accounted for and their effects on the Fund’s financial position and results of operations. The Funds may utilize derivatives for the following purposes:
Duration: the use of an instrument to manage the interest rate risk of a portfolio.
Hedge: an investment made in order to reduce the risk of adverse price movements in a security, by taking an offsetting position to protect against broad market moves.
Income: the use of any instrument that distributes cash flows typically based upon some rate of interest.
Index Exposure: the use of an instrument to obtain exposure to a listed or other type of index.
64 | THE GUGGENHEIM FUNDS ANNUAL REPORT | |
NOTES TO CONSOLIDATED FINANCIAL STATEMENTS (continued) |
Leverage: gaining total exposure to equities or other assets on the long and short sides at greater than 100% of invested capital.
Liquidity: the ability to buy or sell exposure with little price/market impact.
Speculation: the use of an instrument to express macro-economic and other investment views.
For any Fund whose investment strategy consistently involves applying leverage, the value of the Fund’s shares will tend to increase or decrease more than the value of any increase or decrease in the underlying index or other asset. In addition, because an investment in derivative instruments generally requires a small investment relative to the amount of investment exposure assumed, an opportunity for increased net income is created; but, at the same time, leverage risk will increase. The Fund’s use of leverage, through borrowings or instruments such as derivatives, may cause the Fund to be more volatile and riskier than if they had not been leveraged.
Options Written
The risk in writing a call option is that a Fund may incur a loss if the market price of the underlying security increases and the option is exercised. The risk in writing a put option is that a Fund may incur a loss if the market price of the underlying security decreases and the option is exercised. In addition, there may be an imperfect correlation between the movement in prices of options and the underlying securities where a Fund may not be able to enter into a closing transaction because of an illiquid secondary market; or, for OTC options, a Fund may be at risk because of the counterparty’s inability to perform.
The following tables represent the Funds’ use and activity of options written for the year ended December 31, 2016:
Fund | Use |
Multi-Hedge Strategies Fund | Hedge, Income |
Written Call Options | | | |
| | | Multi-Hedge Strategies Fund | |
| | | Number of
Contracts | | | Premium
Amount | |
Balance at December 31, 2015 | | | 30 | | | $ | 1,349 | |
Options Written | | | 507 | | | | 5,129 | |
Options terminated in closing purchase transactions | | | — | | | | — | |
Options expired | | | (407 | ) | | | (5,948 | ) |
Options exercised | | | — | | | | — | |
Balance at December 31, 2016 | | | 130 | | | $ | 530 | |
| | THE GUGGENHEIM FUNDS ANNUAL REPORT | 65 |
NOTES TO CONSOLIDATED FINANCIAL STATEMENTS (continued) |
Futures
A futures contract is an agreement to purchase (long) or sell (short) an agreed amount of securities or other instruments at a set price for delivery at a future date. There are significant risks associated with a Fund’s use of futures contracts, including (i) there may be an imperfect or no correlation between the changes in market value of the underlying asset and the prices of futures contracts; (ii) there may not be a liquid secondary market for a futures contract; (iii) trading restrictions or limitations may be imposed by an exchange; and (iv) government regulations may restrict trading in futures contracts. When investing in futures, there is minimal counterparty credit risk to a Fund because futures are exchange-traded and the exchange’s clearinghouse, as counterparty to all exchange-traded futures, guarantees against default. Cash deposits are shown as segregated cash with broker on the Consolidated Statements of Assets and Liabilities; securities held as collateral are noted on the Consolidated Schedules of Investments.
The following table represents the Funds’ use and volume of futures on a quarterly basis:
| | | | Average Notional | |
Fund | Use | | Long | | | Short | |
Multi-Hedge Strategies Fund | Duration, Hedge, Index exposure, Leverage, Liquidity, Speculation | | $ | 74,330,770 | | | $ | 37,138,014 | |
Commodities Strategy Fund | Index exposure, Liquidity | | | 6,456,906 | | | | — | |
Swaps
A swap is an agreement that obligates two parties to exchange a series of cash flows at specified intervals based upon or calculated by reference to changes in specified prices or rates for a specified amount of an underlying asset. A fund utilizing OTC swaps bears the risk of loss of the amount expected to be received under a swap agreement in the event of the default or bankruptcy of a swap agreement counterparty or if the underlying asset declines in value. Certain standardized swaps are subject to mandatory central clearing. Central clearing generally reduces counterparty credit risk and increases liquidity, but central clearing does not make swap transactions risk-free. Additionally, there is no guarantee that a fund or an underlying fund could eliminate its exposure under an outstanding swap agreement by entering into an offsetting swap agreement with the same or another party.
Total return swaps involve commitments where single or multiple cash flows are exchanged based on the price of an underlying reference asset (such as index or basket) or a fixed or variable interest rate. Index swaps will usually be computed based on the current index value as of the close of regular trading on the NYSE or other exchange, with the swap value being adjusted to include dividends accrued, financing charges and/or interest associated with the swap agreement. A fund utilizing a total return index swap bears the risk of loss of the amount expected to be received under a swap agreement in the event of the default or bankruptcy of a swap agreement counterparty or if the underlying index declines in value.
66 | THE GUGGENHEIM FUNDS ANNUAL REPORT | |
NOTES TO CONSOLIDATED FINANCIAL STATEMENTS (continued) |
The following table represents the Funds’ use and volume of total return swaps on a quarterly basis:
| | | Average Notional | |
Fund | Use | Long | | Short | |
Multi-Hedge Strategies Fund | Hedge, Index exposure, Leverage, Liquidity, Speculation | | $ | 16,843,068 | | | $ | 7,798,784 | |
Derivative Investment Holdings Categorized by Risk Exposure
The following is a summary of the location of derivative investments on the Funds’ Consolidated Statements of Assets and Liabilities as of December 31, 2016:
Derivative Investment Type | Asset Derivatives | Liability Derivatives |
Equity/Currency/Interest Rate/Commodity contracts | — | Variation margin |
Equity contracts | Unrealized appreciation on swap agreements | Unrealized depreciation on swap agreements |
| | | Options written, at value |
The following table sets forth the fair value of the Funds’ derivative investments categorized by primary risk exposure at December 31, 2016:
Asset Derivative Investments Value | |
Fund | Futures Equity Contracts* | | Swaps Equity Contracts | | Futures Currency Contracts* | | Futures Interest Rate Contracts* | | Futures Commodity Contracts* | | Options
Written
Equity
Contracts | | Total Value at December 31, 2016 | |
Multi-Hedge Strategies Fund | | $ | 598,129 | | | $ | 52,516 | | | $ | 103,446 | | | $ | 127,928 | | | $ | 123,297 | | | $ | — | | | $ | 1,005,316 | |
Commodities Strategy Fund | | | — | | | | — | | | | — | | | | — | | | | 199,040 | | | | — | | | | 199,040 | |
Liability Derivative Investments Value | |
Fund | | Futures Equity Contracts* | | | Swaps Equity Contracts | | | Futures Currency Contracts* | | | Futures Interest Rate Contracts* | | | Futures Commodity Contracts* | | | Options
Written
Equity
Contracts | | | Total Value at December 31, 2016 | |
Multi-Hedge Strategies Fund | | $ | 172,173 | | | $ | 181,644 | | | $ | 19,369 | | | $ | 10,201 | | | $ | 88,637 | | | $ | 26,875 | | | $ | 498,899 | |
* | Includes cumulative appreciation (depreciation) of futures contracts as reported on the Consolidated Schedules of Investments. Only current day’s variation margin is reported within the Consolidated Statements of Assets and Liabilities. |
| | THE GUGGENHEIM FUNDS ANNUAL REPORT | 67 |
NOTES TO CONSOLIDATED FINANCIAL STATEMENTS (continued) |
The following is a summary of the location of derivative investments on the Funds’ Consolidated Statements of Operations for the year ended December 31, 2016:
Derivative Investment Type | Location of Gain (Loss) on Derivatives |
Equity/Currency/Interest Rate/Commodity contracts | Net realized gain (loss) on futures contracts |
| Net change in unrealized appreciation (depreciation) on futures contracts |
Equity contracts | Net realized gain (loss) on swap agreements |
| Net change in unrealized appreciation (depreciation) on swap agreements |
Equity contracts | Net realized gain (loss) on options written |
| | Net realized gain (loss) on options purchased |
| | Net change in unrealized appreciation (depreciation) on options written |
The following is a summary of the Funds’ realized gain (loss) and change in unrealized appreciation (depreciation) on derivative investments recognized on the Consolidated Statements of Operations categorized by primary risk exposure for the year ended December 31, 2016:
Realized Gain (Loss) on Derivative Investments Recognized on the Consolidated Statements of Operations | |
Fund | | Futures Equity Contracts | | | Swaps Equity Contracts | | | Futures Currency Contracts | | | Futures Interest Rate Contracts | | | Futures Commodity Contracts | | | Options
Written
Equity
Contracts | | | Options
Purchased
Equity
Contracts | | | Total | |
Multi-Hedge Strategies Fund | | $ | 1,134,220 | | | $ | 414,530 | | | $ | (370,860 | ) | | $ | 403,286 | | | $ | (2,549,291 | ) | | $ | 5,948 | | | $ | (89 | ) | | $ | (962,256 | ) |
Commodities Strategy Fund | | | — | | | | — | | | | — | | | | — | | | | (1,099,488 | ) | | | — | | | | — | | | | (1,099,488 | ) |
Change in Unrealized Appreciation (Depreciation) on Derivative Investments Recognized on the Consolidated Statements of Operations | |
Fund | | Futures Equity Contracts | | | Swaps Equity Contracts | | | Futures Currency Contracts | | | Futures Interest Rate Contracts | | | Futures Commodity Contracts | | | Options
Written
Equity
Contracts | | | Total | |
Multi-Hedge Strategies Fund | | $ | 278,201 | | | $ | (26,259 | ) | | $ | 35,672 | | | $ | (8,847 | ) | | $ | (112,742 | ) | | $ | (27,244 | ) | | $ | 138,781 | |
Commodities Strategy Fund | | | — | | | | — | | | | — | | | | — | | | | 257,277 | | | | — | | | | 257,277 | |
In conjunction with the use of short sales and derivative instruments, the Funds are required to maintain collateral in various forms. The Funds use, where appropriate, depending on the financial instrument utilized and the broker involved, margin deposits at the broker, cash and/or securities segregated at the custodian bank, discount notes or the repurchase agreements allocated to the Funds.
68 | THE GUGGENHEIM FUNDS ANNUAL REPORT | |
NOTES TO CONSOLIDATED FINANCIAL STATEMENTS (continued) |
The Trust has established counterparty credit guidelines and enters into transactions only with financial institutions of investment grade or better. The Trust monitors the counterparty credit risk.
3. Fees and Other Transactions with Affiliates
Under the terms of an investment advisory contract, the Funds pay GI investment advisory fees calculated at the annualized rates below, based on the average daily net assets of the Funds:
Fund | Management Fees
(as a % of Net Assets) |
Multi-Hedge Strategies Fund | 1.15% |
Commodities Strategy Fund | 0.75% |
Each of the consolidated financial statements of the Multi-Hedge Strategies Fund and the Commodities Strategy Fund include the accounts of a wholly-owned and controlled Cayman Islands subsidiary (the “Subsidiary”). All inter-company accounts and transactions have been eliminated in consolidation for the Funds.
GI has contractually agreed to waive the management fee it receives from each Subsidiary in an amount equal to the management fee paid to GI by the Subsidiaries. This undertaking will continue in effect for so long as the Funds invest in the Subsidiaries, and may not be terminated by GI unless GI obtains the prior approval of the Funds’ Board of Trustees for such termination. For the year ended December 31, 2016, Multi-Hedge Strategies Fund and Commodities Strategy Fund waived $62,601 and $8,648, respectively, related to investments in the Subsidiary.
As part of its agreement with the Trust, GI will pay all expenses of the Multi-Hedge Strategies Fund, including the cost of transfer agency, custody, fund administration, legal, audit and other services, except interest expense, taxes (expected to be de minimis), brokerage commissions and other expenses connected with execution of portfolio transactions, short dividend expenses, subsidiary expenses and extraordinary expenses.
GI engages external service providers to perform other necessary services for the Trust, such as audit and accounting related services, legal services, custody, printing and mailing, etc., on a pass-through basis. Such expenses are allocated to various Funds within the complex based on relative net assets.
The Trust has adopted a Distribution Plan applicable to A-Class shares, H-Class and P-Class shares for which GFD and other firms that provide distribution and/or shareholder services (“Service Providers”) may receive compensation. If a Service Provider provides distribution services, the Funds will pay distribution fees to GFD at an annual rate not to exceed 0.25% of average daily net assets, pursuant to Rule 12b-1 of the 1940 Act. GFD, in turn, will pay the Service Provider out of its fees. GFD may, at its discretion, retain a portion of such payments to compensate itself for distribution services.
| | THE GUGGENHEIM FUNDS ANNUAL REPORT | 69 |
NOTES TO CONSOLIDATED FINANCIAL STATEMENTS (continued) |
The Trust has adopted a separate Distribution and Shareholder Services Plan applicable to its C-Class shares that allows the Funds to pay annual distribution and service fees of 1.00% of the Funds’ C-Class shares average daily net assets. The annual 0.25% service fee compensates a shareholder’s financial adviser for providing ongoing services to the shareholder. The annual distribution fee of 0.75% reimburses GFD for paying the shareholder’s financial adviser an ongoing sales commission. GFD advances the first year’s service and distribution fees to the financial adviser. GFD retains the service and distribution fees on accounts with no authorized dealer of record.
If a Fund invests in an affiliated fund, the investing Fund’s adviser has agreed to waive fees at the investing fund level. Fee waivers will be calculated at the investing Fund level without regard to any expense cap, if any, in effect for the investing Fund. Fees waived under this arrangement are not subject to reimbursement to GI. For the year December 31, 2016, the Multi–Hedge Strategies Fund waived $255 related to investments in affiliated funds.
For the year ended December 31, 2016, GFD retained sales charges of $278,697 relating to sales of A-Class shares of the Trust.
Certain trustees and officers of the Trust are also officers of GI and GFD.
On October 4, 2016, Rydex Fund Services, LLC (“RFS”) was purchased by MUFG Investor Services and as of that date RFS ceased to be an affiliate of GI. In connection with its acquisition, RFS changed its name to MUFG Investor Services (US), LLC (“MUIS”). This change has no impact on the financial statements of the Trust.
MUIS acts as the Trust’s administrator, transfer agent and accounting agent. As administrator, transfer agent and accounting agent, MUIS is responsible for maintaining the books and records of the Trust’s securities and cash. For providing the aforementioned services, MUIS is entitled to receive a monthly fee equal to an annual percentage of the Funds’ average daily net assets subject to certain minimum monthly fees and out of pocket expenses.
4. Fair Value Measurement
In accordance with U.S. GAAP, fair value is defined as the price that the Funds would receive to sell an investment or pay to transfer a liability in an orderly transaction with an independent buyer in the principal market, or in the absence of a principal market, the most advantageous market for the investment or liability. U.S. GAAP establishes a three-tier fair value hierarchy based on the types of inputs used to value assets and liabilities and requires corresponding disclosure. The hierarchy and the corresponding inputs are summarized below:
Level 1 — | quoted prices in active markets for identical assets or liabilities. |
Level 2 — | significant other observable inputs (for example quoted prices for securities that are similar based on characteristics such as interest rates, prepayment speeds, credit risk, etc.). |
70 | THE GUGGENHEIM FUNDS ANNUAL REPORT | |
NOTES TO CONSOLIDATED FINANCIAL STATEMENTS (continued) |
Level 3 — | significant unobservable inputs based on the best information available under the circumstances, to the extent observable inputs are not available, which may include assumptions. |
The types of inputs available depend on a variety of factors, such as the type of security and the characteristics of the markets in which it trades, if any. Fair valuation determinations that rely on fewer or no observable inputs require greater judgment. Accordingly, fair value determinations for Level 3 securities require the greatest amount of judgment.
The inputs or methodologies used for valuing securities are not necessarily an indication of the risk associated with investing in those securities. The suitability of the techniques and sources employed to determine fair valuation are regularly monitored and subject to change.
5. Repurchase Agreements
The Trust, along with other affiliated trusts, transfers uninvested cash balances into a single joint account, the daily aggregate balance of which is invested in one or more repurchase agreements collateralized by obligations of the U.S. Treasury and U.S. government agencies. The collateral is in the possession of the Funds’ custodian and is evaluated to ensure that its market value exceeds, at a minimum, 102% of the original face amount of the repurchase agreements. Each Fund holds a pro rata share of the collateral based on the dollar amount of the repurchase agreement entered into by each Fund.
At December 31, 2016, the repurchase agreements in the joint account were as follows:
Counterparty and
Terms of Agreement | | | Face
Value | | | Repurchase
Price | | | Collateral | | | Par
Value | | | Fair
Value | |
HSBC Securities, Inc. 0.28% Due 01/03/17 | | | $ | 118,620,787 | | | $ | 118,624,477 | | | U.S. Treasury Strips 0.00% 02/15/37 - 02/15/40 | | | $ | 242,391,800 | | | $ | 119,544,576 | |
| | | | | | | | | | | | U.S. Treasury Notes 4.25% 11/15/40 | | | | 1,194,300 | | | | 1,448,637 | |
| | | | | | | | | | | | | | | | $ | 243,586,100 | | | $ | 120,993,213 | |
| | | | | | | | | | | | | | | | | | | | | | |
Royal Bank of Canada 0.24% Due 01/03/17 | | | | 166,315,262 | | | | 166,319,697 | | | U.S. TIP Notes 0.13% 04/15/20 | | | | 162,878,400 | | | | 169,641,588 | |
| UMB Financial Corp. 0.24% Due 01/03/17 | | | | 6,108,437 | | | | 6,108,600 | | | Federal Farm Credit Bank 0.78% 05/17/17 | | | | 6,232,000 | | | | 6,230,837 | |
In the event of counterparty default, the Funds have the right to collect the collateral to offset losses incurred. There is potential loss to the Funds in the event the Funds are delayed or prevented from exercising their rights to dispose of the collateral securities, including the risk of
| | THE GUGGENHEIM FUNDS ANNUAL REPORT | 71 |
NOTES TO CONSOLIDATED FINANCIAL STATEMENTS (continued) |
a possible decline in the value of the underlying securities during the period while the Funds seek to assert their rights. The Funds’ investment adviser, acting under the supervision of the Board, reviews the value of the collateral and the creditworthiness of those banks and dealers with which the Funds enter into repurchase agreements to evaluate potential risks.
6. Portfolio Securities Loaned
The Funds may lend their securities to approved brokers to earn additional income. Security lending income shown on the Consolidated Statements of Operations is shown net of rebates paid to the borrowers and earnings on cash collateral investments shared with the lending agent. Within this arrangement, the Funds act as the lender, U.S. Bank acts as the lending agent, and other approved registered broker dealers act as the borrowers. The Funds receive cash collateral, valued at 102% of the value of the securities on loan. Under the terms of the Funds’ securities lending agreement with U.S. Bank, cash collateral and proceeds are invested in the First American Government Obligations Fund - Class Z. The Funds bear the risk of loss on cash collateral investments. Collateral is maintained over the life of the loan in an amount not less than the value of loaned securities, as determined at the close of business each day; any additional collateral required due to changes in security values is delivered to the Funds the next business day. Although the collateral mitigates the risk, the Funds could experience a delay in recovering its securities and a possible loss of income or value if the borrower fails to return the securities. The Funds have the right under the securities lending agreement to recover the securities from the borrower on demand. Securities lending transactions are accounted for as secured borrowings. The remaining contractual maturity of the securities lending agreement is overnight and continuous.
At December 31, 2016, the Funds participated in securities lending transactions, which are subject to enforceable netting arrangements, as follows:
| | | Gross Amounts Not Offset in the Consolidated Statements of Assets and Liabilities | | | Securities Lending Collateral | |
Fund | | Value of Securities Loaned | | | Collateral Received(a) | | | Net
Amount | | | Cash
Collateral Invested | | | Cash
Collateral Uninvested | | | Total
Collateral | |
Multi-Hedge Strategies Fund | | $ | 215,562 | | | $ | (215,562 | ) | | $ | — | | | $ | 222,226 | | | $ | — | | | $ | 222,226 | |
(a) | Actual collateral received by the Fund is greater than the amount shown due to overcollateralization. |
In the event of counterparty default, the Funds have the right to collect the collateral to offset losses incurred. There is potential loss to the Funds in the event the Funds are delayed or prevented from exercising their rights to dispose of the collateral securities, including the risk of a possible decline in the value of the underlying securities during the period while the Funds seek to assert their rights. GI, acting under the supervision of the Board, reviews the value of the collateral and the creditworthiness of those banks and dealers to evaluate potential risks.
72 | THE GUGGENHEIM FUNDS ANNUAL REPORT | |
NOTES TO CONSOLIDATED FINANCIAL STATEMENTS (continued) |
7. Offsetting
In the normal course of business, the Funds enter into transactions subject to enforceable master netting arrangements or other similar arrangements. Generally, the right to offset in those agreements allows the Funds to counteract the exposure to a specific counterparty with collateral received from or delivered to that counterparty based on the terms of the arrangements. These arrangements provide for the right to liquidate upon the occurrence of an event of default, credit event upon merger or additional termination event.
In order to better define their contractual rights and to secure rights that will help the Funds mitigate their counterparty risk, the Funds may enter into an International Swaps and Derivatives Association, Inc. Master Agreement (“ISDA Master Agreement”) or similar agreement with their derivative contract counterparties. An ISDA Master Agreement is a bilateral agreement between a Fund and a counterparty that governs OTC derivatives, including foreign exchange contracts, and typically contains, among other things, collateral posting terms and netting provisions in the event of a default and/or termination event. The provisions of the ISDA Master Agreement typically permit a single net payment in the event of a default (close-out netting) or similar event, including the bankruptcy or insolvency of the counterparty.
For derivatives traded under an ISDA Master Agreement, the collateral requirements are typically calculated by netting the mark-to-market amount for each transaction under such agreement and comparing that amount to the value of any collateral currently pledged by the Funds and the counterparty. For financial reporting purposes, cash collateral that has been pledged to cover obligations of the Funds and cash collateral received from the counterparty, if any, are reported separately on the Statements of Assets and Liabilities as segregated cash with broker/receivable for variation margin, or payable for swap settlement/variation margin. Generally, the amount of collateral due from or to a counterparty must exceed a minimum transfer amount threshold (e.g., $300,000) before a transfer is required to be made. To the extent amounts due to the Funds from their counterparties are not fully collateralized, contractually or otherwise, the Funds bear the risk of loss from counterparty nonperformance. The Funds attempt to mitigate counterparty risk by only entering into agreements with counterparties that they believe to be of good standing and by monitoring the financial stability of those counterparties.
For financial reporting purposes, the Funds do not offset derivative assets and derivative liabilities that are subject to netting arrangements in the Consolidated Statements of Assets and Liabilities.
| | THE GUGGENHEIM FUNDS ANNUAL REPORT | 73 |
NOTES TO CONSOLIDATED FINANCIAL STATEMENTS (continued) |
The following tables present derivative financial instruments and secured financing transactions that are subject to enforceable netting arrangements and offset in the Consolidated Statements of Assets and Liabilities in conformity with U.S. GAAP:
| | | | | | | | | | | | | Gross Amounts Not Offset
in the Consolidated Statements of
Assets and Liabilities | | | | |
Fund | Instrument | | Gross Amounts of Recognized Assets1 | | | Gross Amounts Offset in the Consolidated Statements of Assets and Liabilities | | | Net Amount of Assets Presented on the Consolidated Statements of Assets and Liabilities | | | Financial
Instruments | | | Cash
Collateral
Received | | | Net
Amount | |
Multi-Hedge Strategies Fund | Swap equity contracts | | $ | 52,516 | | | $ | — | | | $ | 52,516 | | | $ | 52,516 | | | $ | — | | | $ | — | |
| | | | | | | | | | | | | Gross Amounts Not Offset
in the Consolidated Statements of
Assets and Liabilities | | | | |
Fund | Instrument | | Gross Amounts of Recognized Liabilities1 | | | Gross Amounts Offset in the Consolidated Statements of Assets and Liabilities | | | Net Amount of Liabilities Presented on the Consolidated Statements of Assets and Liabilities | | | Financial
Instruments | | | Cash
Collateral
Pledged | | | Net
Amount | |
Multi-Hedge Strategies Fund | Swap equity contracts | | $ | 181,644 | | | $ | — | | | $ | 181,644 | | | $ | 52,516 | | | $ | 129,128 | | | $ | — | |
Options Written | | | 26,875 | | | | — | | | | 26,875 | | | | — | | | | — | | | | — | |
1 | Exchange-traded futures are excluded from these reported amounts. |
74 | THE GUGGENHEIM FUNDS ANNUAL REPORT | |
NOTES TO CONSOLIDATED FINANCIAL STATEMENTS (continued) |
8. Federal Income Tax Information
The Funds intend to comply with the provisions of Subchapter M of the Internal Revenue Code applicable to regulated investment companies and will distribute substantially all taxable net investment income and capital gains sufficient to relieve the Funds from all, or substantially all, federal income, excise and state income taxes. Therefore, no provision for federal or state income tax is required.
Tax positions taken or expected to be taken in the course of preparing the Funds’ tax returns are evaluated to determine whether the tax positions are “more-likely-than-not” of being sustained by the applicable tax authority. Tax positions not deemed to meet the more-likely-than-not threshold would be recorded as a tax benefit or expense in the current year. Management has analyzed the Funds’ tax positions taken, or to be taken, on federal income tax returns for all open tax years, and has concluded that no provision for income tax is required in the Funds’ financial statements. The Funds’ federal tax returns are subject to examination by the Internal Revenue Service for a period of three years after they are filed.
The Funds intend to invest up to 25% of their assets in the respective Subsidiary which is expected to provide the Funds with exposure to the commodities markets within the limitations of the federal tax requirements under Subchapter M of the Internal Revenue Code. The Funds have received a private letter ruling from the IRS that concludes that the income the Funds receive from the Subsidiary will constitute qualifying income for purposes of Subchapter M of the Internal Revenue Code. The Subsidiary will be classified as a corporation for U.S. federal income tax purposes. A foreign corporation, such as the Subsidiary, will generally not be subject to U.S. federal income taxation unless it is deemed to be engaged in a U.S. trade or business.
Tax basis capital losses in excess of capital gains are carried forward to offset future net capital gains. For the year ended December 31, 2016 the following capital loss carryforward amounts expired, were used, or were permanently lost due to loss limitation rules in Section 382 of the Internal Revenue Code:
Fund | | Expired | | | Utilized | | | Total | |
Multi-Hedge Strategies Fund | | $ | 30,623,423 | | | $ | 1,782,964 | | | $ | 32,406,387 | |
The tax character of distributions paid during the year ended December 31, 2016 were as follows:
Fund | | Ordinary
Income | | | Long-Term
Capital Gain | | | Total
Distributions | |
Multi-Hedge Strategies Fund | | $ | 160,359 | | | $ | — | | | $ | 160,359 | |
Commodities Strategy Fund | | | — | | | | — | | | | — | |
| | THE GUGGENHEIM FUNDS ANNUAL REPORT | 75 |
NOTES TO CONSOLIDATED FINANCIAL STATEMENTS (continued) |
The tax character of distributions paid during the year ended December 31, 2015 were as follows:
Fund | | Ordinary
Income | | | Long-Term
Capital Gain | | | Total
Distributions | |
Multi-Hedge Strategies Fund | | $ | — | | | $ | — | | | $ | — | |
Commodities Strategy Fund | | | — | | | | — | | | | — | |
Note: For federal income tax purposes, short-term capital gain distributions are treated as ordinary income distributions.
The tax character of distributable earnings/(accumulated losses) as of December 31, 2016 are as follows:
Fund | | Undistributed
Ordinary
Income | | | Undistributed
Long-Term
Capital Gain | | | Net Unrealized
Appreciation/
(Depreciation) | | | Capital Loss
Carryforward | |
Multi-Hedge Strategies Fund | | $ | — | | | $ | — | | | $ | 625,320 | | | $ | (9,043,186 | ) |
Commodities Strategy Fund | | | — | | | | — | | | | (2,565,413 | ) | | | (19,894,650 | ) |
For Federal income tax purposes capital loss carryfowards represent realized losses that may be carried forward and applied against future capital gains. For taxable years beginning on or before December 22, 2010 such capital losses may be carried forward for a maximum of eight years. Pursuant to the RIC Modernization Act of 2010, the Fund is permitted to carryforward capital losses incurred in taxable years beginning after December 22, 2010 without expiration and retain their short and/or long-term character. However, post-enactment losses must be utilized prior to pre-enactment capital loss carryfowards. As a result of this ordering rule pre-enactment carryfowards are more likely to expire unused. As of December 31, 2016 capital loss carryfowards for the Funds were as follows:
| | | | | | | | | Unlimited | | | | |
Fund | | Expires in
2017 | | | Expires in
2018 | | | Short-Term | | | Long-Term | | | Total
Capital Loss
Carryforward | |
Multi-Hedge Strategies Fund | | $ | (8,823,539 | ) | | $ | (219,649 | ) | | $ | — | | | $ | — | | | $ | (9,043,188 | ) |
Commodities Strategy Fund | | | (19,850,783 | ) | | | — | | | | (33,667 | ) | | | (10,200 | ) | | | (19,894,650 | ) |
Net investment income and net realized gains (losses) may differ for financial statement and tax purposes because of temporary or permanent book/tax differences. These differences are primarily due to wash sales, investments in subsidiary, net operating losses, and expired capital loss carry forwards. To the extent these differences are permanent, reclassifications are made to the appropriate equity accounts in the period that the differences arise. These reclassifications have no effect on net assets or NAV.
76 | THE GUGGENHEIM FUNDS ANNUAL REPORT | |
NOTES TO CONSOLIDATED FINANCIAL STATEMENTS (continued) |
On the Statements of Assets and Liabilities the following adjustments were made for permanent book/tax differences:
Fund | | Paid In
Capital | | | Undistributed
Net Investment
Loss | | | Accumulated
Net Realized
Gain (Loss) | |
Multi-Hedge Strategies Fund | | $ | (34,367,102 | ) | | $ | 1,225,571 | | | $ | 33,141,531 | |
Commodities Strategy Fund | | | (1,166,217 | ) | | | 66,729 | | | | 1,099,488 | |
At December 31, 2016, the cost of securities for Federal income tax purposes, the aggregate gross unrealized gain for all securities for which there was an excess of value over tax cost and the aggregate gross unrealized loss for all securities for which there was an excess of tax cost over value, were as follows:
Fund | | Tax
Cost | | | Tax
Unrealized
Gain | | | Tax
Unrealized
Loss | | | Net
Unrealized
Gain (Loss) | |
Multi-Hedge Strategies Fund | | $ | 95,216,570 | | | $ | 4,388,594 | | | $ | (3,087,617 | ) | | $ | 1,300,977 | |
Commodities Strategy Fund | | | 11,496,679 | | | | — | | | | (2,764,453 | ) | | | (2,764,453 | ) |
9. Securities Transactions
For the year ended December 31, 2016, the cost of purchases and proceeds from sales of investment securities, excluding government securities, short-term investments and derivatives, were as follows:
Fund | | Purchases | | | Sales | |
Multi-Hedge Strategies Fund | | $ | 171,198,991 | | | $ | 173,750,768 | |
Commodities Strategy Fund | | | 4,797,502 | | | | 6,030,000 | |
The Funds are permitted to purchase or sell securities from or to certain affiliated funds under specified conditions outlined in procedures adopted by the Board of the Trust. The procedures have been designed to ensure that any purchase or sale of securities by a Fund from or to another fund or portfolio that is or could be considered an affiliate by virtue of having a common investment adviser (or affiliated investment advisers), common Trustees and/or common officers complies with Rule 17a-7 of the 1940 Act. Further, as defined under these procedures, each transaction is effected at the current market price to save costs, where permissible. For the year ended December 31, 2016, the Funds did not engage in purchases and sales of securities, pursuant to Rule 17a-7 of the 1940 Act.
| | THE GUGGENHEIM FUNDS ANNUAL REPORT | 77 |
NOTES TO CONSOLIDATED FINANCIAL STATEMENTS (continued) |
10. Affiliated Transactions
Investments representing 5% or more of the outstanding voting shares of a portfolio company of a fund, or control of or by, or common control under GI, result in that portfolio company being considered an affiliated company of such fund, as defined in the 1940 Act.
The Funds may invest in the Guggenheim Strategy Funds Trust consisting of Guggenheim Strategy Fund I, Guggenheim Strategy Fund II, Guggenheim Strategy Fund III, and Guggenheim Variable Insurance Strategy Fund III (collectively, the “Cash Management Funds”), open-end management investment companies managed by GI. The Cash Management Funds, which launched on March 11, 2014, are offered as cash management options only to mutual funds, trusts, and other accounts managed by GI and/or its affiliates, and are not available to the public. The Cash Management Funds pay no investment management fees. The Cash Management Funds’ annual report on Form N-CSR dated September 30, 2016, is available publicly or upon request. This information is available from the EDGAR database on the SEC’s website at https://www.sec.gov/Archives/edgar/data/1601445/000089180416001923/gug65857-ncsr.htm.
Transactions during the year ended December 31, 2016, in which the portfolio company is an “affiliated person,” were as follows:
Affiliated issuers by Fund | | Value
12/31/15 | | | Additions | | | Reductions | | | Value
12/31/16 | | | Shares
12/31/16 | | | Investment
Income | | | Realized
Gain (Loss) | |
Multi-Hedge Strategies Fund | | | | | | | | | | |
Advent Claymore Convertible Securities and Income Fund | | $ | 9,667 | | | $ | — | | | $ | (1,594 | ) | | $ | 8,837 | | | | 602 | | | $ | 795 | | | $ | (235 | ) |
Advent Claymore Convertible Securities and Income Fund II | | | 191,447 | | | | — | | | | — | | | | 202,831 | | | | 34,495 | | | | 19,455 | | | | — | |
Advent/Claymore Enhanced Growth & Income Fund | | | 60,470 | | | | — | | | | — | | | | 60,763 | | | | 7,312 | | | | 6,142 | | | | — | |
Guggenheim Enhanced Equity Income Fund | | | 13,286 | | | | — | | | | (13,835 | ) | | | — | | | | — | | | | 830 | | | | 105 | |
Guggenheim Enhanced Equity Strategy Fund | | | 13,042 | | | | — | | | | (4,874 | ) | | | 8,366 | | | | 518 | | | | 1,605 | | | | (268 | ) |
Guggenheim Equal Weight Enhanced Equity Income Fund | | | 8,170 | | | | — | | | | (234 | ) | | | 7,956 | | | | 486 | | | | 656 | | | | 9 | |
Guggenheim Strategy Fund I | | | 19,796 | | | | 7,502,581 | | | | (7,500,000 | ) | | | 25,559 | | | | 1,022 | | | | 2,580 | | | | 2,937 | |
Guggenheim Strategy Fund II | | | 5,903 | | | | 132 | | | | — | | | | 6,081 | | | | 244 | | | | 132 | | | | — | |
Managed Duration Investment Grade Municipal Fund | | | 12,989 | | | | — | | | | (13,655 | ) | | | — | | | | — | | | | 291 | | | | 1,164 | |
78 | THE GUGGENHEIM FUNDS ANNUAL REPORT | |
NOTES TO CONSOLIDATED FINANCIAL STATEMENTS (continued) |
Affiliated issuers by
Fund | | Value
12/31/15 | | | Additions | | | Reductions | | | Value
12/31/16 | | | Shares
12/31/16 | | | Investment
Income | | | Realized
Gain (Loss) | |
Western Asset/Claymore Inflation-Linked Opportunities & Income Fund | | $ | 407,659 | | | $ | — | | | $ | — | | | $ | 441,333 | | | | 39,617 | | | $ | 16,109 | | | $ | — | |
Western Asset/Claymore Inflation-Linked Securities & Income Fund | | | 368,734 | | | | — | | | | — | | | | 400,480 | | | | 34,885 | | | | 13,396 | | | | — | |
| | | $ | 1,111,163 | | | $ | 7,502,713 | | | $ | (7,534,192 | ) | | $ | 1,162,206 | | | | | | | $ | 61,991 | | | $ | 3,712 | |
| | | | | | | | | | | | | | | | | | | | | | | | | | | | | |
Commodities Strategy Fund | | | | | | | | | | | | | | | | | | | | | | | | | | | | |
Guggenheim Strategy Fund I | | $ | 3,139,901 | | | $ | 2,295,490 | | | $ | (3,985,000 | ) | | $ | 1,452,887 | | | | 58,115 | | | $ | 17,376 | | | $ | (97 | ) |
Guggenheim Strategy Fund II | | | 992,902 | | | | 2,502,012 | | | | (2,045,000 | ) | | | 1,452,892 | | | | 58,232 | | | | 23,364 | | | | (5,491 | ) |
| | | $ | 4,132,803 | | | $ | 4,797,502 | | | $ | (6,030,000 | ) | | $ | 2,905,779 | | | | | | | $ | 40,740 | | | $ | (5,588 | ) |
11.Line of Credit
The Trust, along with other affiliated trusts, secured an uncommitted $75,000,000 line of credit from U.S. Bank, N.A., which expires June 11, 2017. This line of credit is reserved for emergency or temporary purposes. Borrowings, if any, under this arrangement bear interest equal to the Prime Rate, minus 2%, which shall be paid monthly, averaging 1.25% for the year ended December 31, 2016. The Funds did not have any borrowings outstanding under this agreement at December 31, 2016, and did not participate in borrowing during the year.
12. Legal Proceedings
Tribune Company
Rydex Series Funds has been named as a defendant and a putative member of the proposed defendant class of shareholders in the case entitled Kirschner v. FitzSimons, No. 12-2652 (S.D.N.Y.) (formerly Official Committee of Unsecured Creditors of Tribune Co. v. FitzSimons, Adv. Pro. No. 10-54010 (Bankr. D. Del.)) (the “FitzSimons action”), as a result of ownership by certain series of the Rydex Series Funds of shares in the Tribune Company (“Tribune”) in 2007, when Tribune effected a leveraged buyout transaction (“LBO”) by which Tribune converted to a privately-held company. In his complaint, the plaintiff has alleged that, in connection with the LBO, Tribune insiders and shareholders were overpaid for their Tribune stock using financing that the insiders knew would, and ultimately did, leave Tribune insolvent. The plaintiff has asserted claims against certain insiders, major shareholders, professional advisers, and others involved in the LBO. The plaintiff is also attempting to obtain from former Tribune shareholders, including the Rydex Series Funds, the proceeds they received in connection with the LBO.
| | THE GUGGENHEIM FUNDS ANNUAL REPORT | 79 |
NOTES TO CONSOLIDATED FINANCIAL STATEMENTS (continued) |
In June 2011, a group of Tribune creditors filed multiple actions against former Tribune shareholders involving state law constructive fraudulent conveyance claims arising out of the 2007 LBO (the “SLCFC actions”). Rydex Series Funds has been named as a defendant in one or more of these suits. In those actions, the creditors seek to recover from Tribune’s former shareholders the proceeds received in connection with the 2007 LBO.
The FitzSimons action and the SLCFC actions have been consolidated with the majority of the other Tribune LBO-related lawsuits in a multidistrict litigation proceeding captioned In re Tribune Company Fraudulent Conveyance Litig., No. 11-md-2696 (S.D.N.Y.) (the “MDL Proceeding”).
On September 23, 2013, the District Court granted the defendants’ omnibus motion to dismiss the SLCFC actions, on the basis that the creditors lacked standing. On September 30, 2013, the creditors filed a notice of appeal of the September 23 order. On October 28, 2013, the defendants filed a joint notice of cross-appeal of that same order.
On March 29, 2016, the U.S. Court of Appeals for the Second Circuit issued its opinion on the appeal of the SLCFC actions. The appeals court affirmed the district court’s dismissal of those lawsuits, but on different grounds than the district court. The appeals court held that while the plaintiffs have standing under the U.S. Bankruptcy Code, their claims were preempted by Section 546(e) of the Bankruptcy Code—the statutory safe harbor for settlement payments. On April 12, 2016, the Plaintiffs in the SLCFC actions filed a petition seeking rehearing en banc before the appeals court. On July 22, 2016, the appeals court denied the petition. On September 9, 2016, the plaintiffs filed a petition for writ of certiorari in the U.S. Supreme Court challenging the Second Circuit’s decision that the safe harbor of Section 546(e) applied to their claims. The shareholder defendants, including the Funds, filed a joint brief in opposition to the petition for certiorari on October 24, 2016. The Supreme Court has not yet granted or denied the petition for certiorari.
On May 23, 2014, the defendants filed motions to dismiss the FitzSimons action, including a global motion to dismiss Count I, which is the claim brought against former Tribune shareholders for intentional fraudulent conveyance under U.S. federal law. On January 6, 2017, the United States District Court for the Southern District of New York granted the shareholder defendants’ motion to dismiss the intentional fraudulent conveyance claim in the FitzSimons action. The Court concluded that the plaintiff had failed to allege that Tribune entered the LBO with actual intent to hinder, delay, or defraud its creditors, and therefore the complaint failed to state a claim. In dismissing the intentional fraudulent conveyance claim, the Court denied the plaintiff’s request to amend the complaint. The Court’s order is not immediately appealable, but any party might ask the Court to direct entry of a final judgment in order to make the order immediately appealable.
None of these lawsuits alleges any wrongdoing on the part of Rydex Series Funds. The following series of Rydex Series Funds held shares of Tribune and tendered these shares as part of Tribune’s LBO: Nova Fund, S&P 500® Pure Value Fund, Multi-Cap Core Equity Fund, S&P 500® Fund, Multi-Hedge Strategies Fund and Hedged Equity Fund (the “Funds”). The value of the proceeds
80 | THE GUGGENHEIM FUNDS ANNUAL REPORT | |
NOTES TO CONSOLIDATED FINANCIAL STATEMENTS (continued) |
received by the foregoing Funds was $28,220, $109,242, $9,860, $3,400, $1,181,160, and $10,880, respectively. At this stage of the proceedings, Rydex Series Funds is not able to make a reliable predication as to the outcome of these lawsuits or the effect, if any, on a Fund’s net asset value.
Lyondell Chemical Company
In December 2011, Rydex Series Funds was named as a defendant in Weisfelner, as Trustee of the LB Creditor Trust, v. Fund 1 (In re Lyondell Chemical Co.), Adv. Pro. No. 10-4609 (Bankr. S.D.N.Y.) (the “Creditor Trust Action”). Its funds may also be putative members of the proposed defendant classes in Weisfelner, as Trustee of the LB Litigation Trust v. A. Holmes & H. Holmes TTEE (In re Lyondell Co.), Adv. Pro. No. 10-5525 (Bankr. S.D.N.Y.) (the “Litigation Trust Action”) and Weisfelner, as Trustee of the LB Creditor Trust, v. Reichman (In re Lyondell Chemical Co.), Adv. Pro. No. 12-1570 (Bankr. S.D.N.Y.).
Similar to the claims made in the Tribune matter, the Weisfelner complaints seek to have set aside and recovered as fraudulent transfers from former Lyondell Chemical Company (“Lyondell”) shareholders the consideration paid to them pursuant to the cash out merger of Lyondell shareholders in connection with the combination of Lyondell and Basell AF in 2007. Lyondell filed for bankruptcy in 2008. The Creditor Trust Action and Reichman allege claims against the former Lyondell shareholders under state law for both constructive fraudulent transfer and intentional fraudulent transfer. The Litigation Trust Action alleges a claim against the former Lyondell shareholders under federal law for intentional fraudulent transfer.
On April 7, 2014, the plaintiff filed a Third Amended Complaint in the Creditor Trust Action, a Second Amended Complaint in the Litigation Trust Action, and an Amended Complaint in Reichman.
On May 8, 2014, the plaintiff in the Litigation Trust Action filed a motion to certify a defendant class generally comprised of all former Lyondell shareholders that received proceeds in exchange for their shares in the 2007 merger transaction.
On July 30, 2014, the defendants filed a motion to dismiss these lawsuits. The Bankruptcy Court held oral argument on the motion to dismiss and on the motion for class certification on January 14 and January 15, 2015. On September 15, 2015, the Bankruptcy Court denied the motion for class certification without prejudice to the plaintiff’s right to file a renewed motion. On November 18, 2015, the Bankruptcy Court granted the defendants’ motion to dismiss the intentional fraudulent transfer claims in the Creditor Trust Action, the Litigation Trust Action, and in Reichman, but denied the motion to dismiss the constructive fraudulent transfer claims in the Creditor Trust Action and in Reichman. The Bankruptcy Court entered final judgment dismissing the Litigation Trust Action, but the plaintiff appealed the dismissal to the U.S. District Court for the Southern District of New York.
On May 4, 2016, the defendants filed a motion to dismiss, or in the alternative, for a stay of, the Creditor Trust Action and Reichman in light of the U.S. Court of Appeals for the Second Circuit’s opinion in the appeal of the Tribune SLCFC actions. On July 20, 2016, the Bankruptcy
| | THE GUGGENHEIM FUNDS ANNUAL REPORT | 81 |
NOTES TO CONSOLIDATED FINANCIAL STATEMENTS (continued) |
Court issued a report and recommendation granting the defendants’ motion to dismiss. The U.S. District Court for the Southern District of New York has not yet accepted the Bankruptcy Court’s recommendation or entered a final judgment.
On July 27, 2016, the District Court reversed the Bankruptcy Court and reinstated the federal law intentional fraudulent transfer claim in the Litigation Trust Action and remanded to the Bankruptcy Court for further proceedings. The District Court found that the fraudulent intent that mattered was that of Lyondell’s CEO, not its board, because the CEO’s intent could be imputed to Lyondell under Delaware law agency principles. The District Court did note, however, that plaintiff faces a high standard for proving “actual intent” to harm creditors, and that it remains to be seen whether plaintiff will be able to make this showing. On August 11, 2016, the shareholder defendants filed a motion for reconsideration and/or to certify an interlocutory appeal of the District Court’s opinion. On October 5, 2016, the District Court denied the motion for reconsideration and/or to certify an interlocutory appeal. In light of this ruling, the federal intentional fraudulent conveyance claim will move forward before the Bankruptcy Court, but a schedule for that case has not yet been set.
These lawsuits do not allege any wrongdoing on the part of Rydex Series Funds. The following series of Rydex Series Funds received cash proceeds from the cash out merger in the following amounts: Basic Materials Fund - $1,725,168; Long Short Equity Fund f/k/a U.S. Long Short Momentum Fund - $2,193,600; Global 130/30 Strategy Fund - $37,920; Hedged Equity Fund - $1,440; and Multi-Hedge Strategies Fund - $1,116,480. At this stage of the proceedings, Rydex Series Funds is not able to make a reliable predication as to the outcome of these lawsuits or the effect, if any, on a Fund’s net asset value.
13. Share Splits
Share splits occurred for the following Funds at the close of business:
Fund | Effective Date | Split Type |
Commodities Strategy Fund | October 28, 2016 | One-for-twelve Reverse Share Split |
The effect of this transaction was to divide the number of outstanding shares of the Commodities Strategy Fund by its reverse split ratio, resulting in a corresponding increase in the NAV. The share transactions presented in the Statement of Changes in net assets and the per share data in the Financial Highlights for each of the periods presented through December 31, 2016, have been restated to reflect the share split. There was no change in net assets, results of operations or total return as a result of this transaction.
14. H-Class Shares Redesignated P-Class Shares
Effective following the close of business on April 30, 2015, (the “Redesignation Date”), all outstanding H-Class shares of the Guggenheim Multi-Hedge Strategies Fund were redesignated as P-Class shares, and the Fund will no longer offer H-Class shares.
82 | THE GUGGENHEIM FUNDS ANNUAL REPORT | |
NOTES TO CONSOLIDATED FINANCIAL STATEMENTS (concluded) |
15. Consolidation of Subsidiary
Each Fund may invest up to 25% of its total assets in its Subsidiary which acts as an investment vehicle in order to effect certain investments consistent with the Fund’s investment objectives and policies. Holdings specific to the Subsidiary are footnoted on the Consolidated Schedule of Investments. The Funds’ Consolidated Statement of Assets and Liabilities, Consolidated Statement of Operations and Consolidated Statement of Changes in Net Assets include the account balances of both the Funds and the Subsidiaries.
See the table below for details regarding the structure, incorporation and relationship as of period end of the Funds.
Multi-Hedge Strategies Fund | | | |
Inception Date of Subsidiary | | 09/18/09 | |
Consolidated Fund Net Assets | | $ | 102,197,402 | |
% of Net Assets of the Fund at December 31, 2016 | | | 3.9 | % |
Subsidiary Financial Statement Information | | | | |
Total assets | | $ | 4,057,223 | |
Total liabilities | | | 21,244 | |
Net assets | | $ | 4,035,979 | |
| | | | | |
Net investment income (loss) | | $ | (90,872 | ) |
Net realized gain (loss) | | | (2,549,991 | ) |
Net change in unrealized appreciation (depreciation) | | | (112,733 | ) |
Increase (decrease) in net assets resulting from operations | | $ | (2,753,596 | ) |
Commodities Strategy Fund | | | |
Inception Date of Subsidiary | | 09/08/09 | |
Consolidated Fund Net Assets | | $ | 8,743,070 | |
% of Net Assets of the Fund at December 31, 2016 | | | 16.8 | % |
Subsidiary Financial Statement Information | | | | |
Total assets | | $ | 1,456,588 | |
Total liabilities | | | (8,475 | ) |
Net assets | | $ | 1,465,063 | |
| | | | | |
Net investment income (loss) | | $ | (14,897 | ) |
Net realized gain (loss) | | | (1,099,488 | ) |
Net change in unrealized appreciation (depreciation) | | | 257,322 | |
Increase (decrease) in net assets resulting from operations | | $ | (857,063 | ) |
| | THE GUGGENHEIM FUNDS ANNUAL REPORT | 83 |
REPORT OF INDEPENDENT REGISTERED PUBLIC ACCOUNTING FIRM |
The Board of Trustees and Shareholders
of Rydex Series Funds:
We have audited the accompanying consolidated statements of assets and liabilities, including the consolidated schedules of investments, of Guggenheim Multi-Hedge Strategies Fund and Rydex Commodities Strategy Fund (two of the series constituting the Rydex Series Funds) (the “Funds”) as of December 31, 2016, and the related consolidated statements of operations for the year then ended, the consolidated statements of changes in net assets for each of the two years in the period then ended, and the consolidated financial highlights for each of the five years in the period then ended. These financial statements and financial highlights are the responsibility of the Funds’ management. Our responsibility is to express an opinion on these financial statements and financial highlights based on our audits.
We conducted our audits in accordance with the standards of the Public Company Accounting Oversight Board (United States). Those standards require that we plan and perform the audit to obtain reasonable assurance about whether the financial statements and financial highlights are free of material misstatement. We were not engaged to perform an audit of the Funds’ internal control over financial reporting. Our audits included consideration of internal control over financial reporting as a basis for designing audit procedures that are appropriate in the circumstances, but not for the purpose of expressing an opinion on the effectiveness of the Funds’ internal control over financial reporting. Accordingly, we express no such opinion. An audit also includes examining, on a test basis, evidence supporting the amounts and disclosures in the financial statements and financial highlights, assessing the accounting principles used and significant estimates made by management, and evaluating the overall financial statement presentation. Our procedures included confirmation of securities owned as of December 31, 2016, by correspondence with the custodian, transfer agent, and brokers or by other appropriate auditing procedures where replies from brokers were not received. We believe that our audits provide a reasonable basis for our opinion.
In our opinion, the financial statements and financial highlights referred to above present fairly, in all material respects, the consolidated financial position of the above listed Funds (two of the series constituting the Rydex Series Funds) at December 31, 2016, the consolidated results of their operations for the year then ended, the consolidated changes in their net assets for each of the two years in the period then ended, and their consolidated financial highlights for each of the five years in the period then ended, in conformity with U.S. generally accepted accounting principles.

McLean, Virginia
February 28, 2017
84 | THE GUGGENHEIM FUNDS ANNUAL REPORT | |
OTHER INFORMATION (Unaudited) |
Proxy Voting Information
A description of the policies and procedures that the Trust uses to determine how to vote proxies relating to securities held in the Funds’ portfolios is available, without charge and upon request, by calling 800.820.0888. This information is also available from the EDGAR database on the SEC’s website at https://www.sec.gov.
Information regarding how the Funds voted proxies relating to portfolio securities during the most recent 12-month period ended June 30 is available without charge, upon request, by calling 800.820.0888. This information is also available from the EDGAR database on the SEC’s website at https://www.sec.gov.
Sector Classification
Information in the Schedule of Investments is categorized by sectors using sector-level Classifications defined by the Bloomberg Industry Classification System, a widely recognized industry classification system provider. Each Fund’s registration statement has investment policies relating to concentration in specific sectors/industries. For purposes of these investment policies, the Funds usually classify sectors/industries based on industry-level Classifications used by widely recognized industry classification system providers such as Bloomberg Industry Classification System, Global Industry Classification Standards and Barclays Global Classification Scheme.
Quarterly Portfolio Schedules Information
The Trust files its complete schedule of portfolio holdings with the SEC for the first and third quarters of each fiscal year on Form N-Q, which are available on the SEC’s website at https://www.sec.gov. The Funds’ Forms N-Q may be reviewed and copied at the SEC’s Public Reference Room in Washington, DC, and that information on the operation of the Public Reference Room may be obtained by calling 800-SEC-0330. Copies of the portfolio holdings are also available to shareholders, without charge and upon request, by calling 800.820.0888.
| | THE GUGGENHEIM FUNDS ANNUAL REPORT | 85 |
INFORMATION ON BOARD OF TRUSTEES AND OFFICERS (Unaudited) |
A Board of Trustees oversees the Trust, as well as other trusts of GI, in which its members have no stated term of service, and continue to serve after election until resignation. The Statement of Additional Information includes further information about Fund Trustees and Officers, and can be obtained without charge by visiting guggenheiminvestments.com or by calling 800.820.0888.
Name, Address* and Year of Birth of Trustee | Position(s) Held with the Trust, Term of Office and Length of Time Served | Principal Occupation(s) During Past 5 Years | Number of Portfolios in Fund Complex Overseen by Trustee*** | Other
Directorships
Held by
Trustee**** |
INTERESTED TRUSTEE | | | |
Donald C. Cacciapaglia**
(1951) | President and Trustee from 2012 to present. | Current: President and CEO, certain other funds in the Fund Complex (2012-present); Vice Chairman, Guggenheim Investments (2010-present).
Former: Chairman and CEO, Channel Capital Group, Inc. (2002-2010). | 230 | Clear Spring Life Insurance Company (2015-present); Guggenheim Partners Japan, Ltd. (2014-present); Guggenheim Partners Investment Management Holdings, LLC (2014-present); Delaware Life (2013-present); Guggenheim Life and Annuity Company (2011-present); Paragon Life Insurance Company of Indiana (2011-present). |
INDEPENDENT TRUSTEES | | | |
Angela
Brock-Kyle*****
(1959) | Trustee from August 2016 to present. | Current: Founder and Chief Executive Officer, B.O.A.R.D.S (consulting firm)
Former: Senior Leader, TIAA (financial services firm) (1987-2012). | 135 | Infinity Property & Casualty Corporation (2014-present). |
86 | THE GUGGENHEIM FUNDS ANNUAL REPORT | |
INFORMATION ON BOARD OF TRUSTEES AND OFFICERS (Unaudited)(continued) |
Name, Address* and Year of Birth of Trustee | Position(s) Held with the Trust, Term of Office and Length of Time Served | Principal Occupation(s) During Past 5 Years | Number of Portfolios in Fund Complex Overseen by Trustee*** | Other
Directorships
Held by
Trustee**** |
INDEPENDENT TRUSTEES - continued |
Corey A. Colehour
(1945) | Trustee from 1993 to present; Member of the Audit Committee from 1994 to present; Member of the Governance Committee from 2014 to present; and Member of the Investment and Performance Committee from 2014 to present. | Retired. | 135 | None. |
J. Kenneth Dalton
(1941) | Trustee from 1995 to present; Chairman and Member of the Audit Committee from 1997 to present; and Member of the Compliance and Risk Oversight Committee from 2010 to present. | Retired. | 135 | Epiphany Funds (4) (2009-present). |
John O. Demaret
(1940) | Vice Chairman of the Board from 2014 to present (Chairman of the Board from 2006 to 2014); Trustee and Member of the Audit Committee from 1997 to present; Chairman (since 2014) and Member of the Compliance and Risk Oversight Committee from 2010 to present; Chairman and Member of the Investment and Performance Committee from 2014 to present; and Member of the Nominating Committee from 2014 to present. | Retired. | 135 | None. |
| | THE GUGGENHEIM FUNDS ANNUAL REPORT | 87 |
INFORMATION ON BOARD OF TRUSTEES AND OFFICERS (Unaudited)(continued) |
Name, Address* and Year of Birth of Trustee | Position(s) Held with the Trust, Term of Office and Length of Time Served | Principal Occupation(s) During Past 5 Years | Number of Portfolios in Fund Complex Overseen by Trustee*** | Other
Directorships
Held by
Trustee**** |
INDEPENDENT TRUSTEES - concluded |
Werner E. Keller
(1940) | Chairman of the Board from 2014 to present (Vice Chairman of the Board from 2010 to 2014); Trustee and Member of the Audit Committee from 2005 to present; and Member of the Investment and Performance Committee from 2014 to present. | Current: Founder and President, Keller Partners, LLC (investment research firm) (2005-present). | 135 | None. |
Thomas F.
Lydon, Jr.
(1960) | Trustee and Member of the Audit Committee from 2005 to present; Member of the Nominating Committee from 2005 to present; and Member of the Governance Committee from 2007 to present. | Current: President, Global Trends Investments (registered investment adviser) (1996-present). | 135 | US Global Investors (GROW) (1995-present). |
Patrick T. McCarville
(1942) | Trustee from 1997 to present; Member of the Audit Committee from 1997 to present; Chairman and Member of the Nominating Committee from 2004 to present; Chairman and Member of the Governance Committee from 2007 to present; and Member of the Compliance and Risk Oversight Committee from 2014 to present. | Retired.
Former: Chief Executive Officer, Par Industries, Inc., d/b/a Par Leasing (1977-2010). | 135 | None. |
Sandra G. Sponem*****
(1958) | Trustee from August 2016 to present. | Current: Senior Vice President and Chief Financial Officer, M.A. Mortenson Companies, Inc. (general contracting firm) (2007-present). | 135 | None. |
88 | THE GUGGENHEIM FUNDS ANNUAL REPORT | |
INFORMATION ON BOARD OF TRUSTEES AND OFFICERS (Unaudited)(continued) |
Name, Address*
and Year of Birth | Position(s) Held with the Trust, Term of Office and Length of Time Served | Principal Occupation(s)
During Past 5 Years |
OFFICERS | | |
Michael P. Byrum
(1970) | Vice President (1999-present) | Current: Senior Vice President, Security Investors, LLC (2010-present); President and Chief Investment Officer, Rydex Holdings, LLC (2008-present); Director and Chairman, Advisory Research Center, Inc. (2006-present); Manager, Guggenheim Specialized Products, LLC (2005-present).
Former: Vice President, Guggenheim Distributors, LLC (2009); Director (2009-2010) and Secretary (2002-2010), Rydex Fund Services, LLC; Director (2008-2010), Chief Investment Officer (2006-2010), President (2004-2010) and Secretary (2002-2010), Rydex Advisors, LLC; Director (2008-2010), Chief Investment Officer (2006-2010), President (2004-2010) and Secretary (2002-2010), Rydex Advisors II, LLC. |
Joanna M. Catalucci
(1966) | AML Officer (2016-present) | Current: Chief Compliance Officer, certain funds in the Fund Complex (2012-present); Senior Managing Director, Guggenheim Investments (2012-present); AML Officer, certain funds in the Fund Complex (2016-present).
Former: Chief Compliance Officer and Secretary, certain other funds in the Fund Complex (2008-2012); Senior Vice President & Chief Compliance Officer, Security Investors, LLC and certain affiliates (2010-2012); Chief Compliance Officer and Senior Vice President, Rydex Advisors, LLC and certain affiliates (2010-2011). |
James M. Howley
(1972) | Assistant Treasurer (2016-present) | Current: Director, Guggenheim Investments (2004-present); Assistant Treasurer, certain other funds in the Fund Complex (2006-present).
Former: Manager, Mutual Fund Administration of Van Kampen Investments, Inc. (1996-2004). |
Keith D. Kemp
(1960) | Assistant Treasurer (2016-present) | Current: Managing Director of Transparent Value, LLC (April 2015-present); Managing Director of Guggenheim Investments (April 2015-present).
Former: Director, Transparent Value, LLC (2010-2015); Director, Guggenheim Investments (2010-2015); Chief Operating Officer, Macquarie Capital Investment Management (2007-2009). |
| | THE GUGGENHEIM FUNDS ANNUAL REPORT | 89 |
INFORMATION ON BOARD OF TRUSTEES AND OFFICERS (Unaudited)(continued) |
Name, Address* and Year of Birth | Position(s) Held with the Trust, Term of Office and Length of Time Served | Principal Occupation(s)
During Past 5 Years |
OFFICERS - continued | |
Amy J. Lee
(1961) | Vice President (2009-present) and Secretary (2012-present) | Current: Chief Legal Officer, certain other funds in the Fund Complex (2013-present); Senior Managing Director, Guggenheim Investments (2012-present).
Former: Vice President, Associate General Counsel and Assistant Secretary, Security Benefit Life Insurance Company and Security Benefit Corporation (2004-2012). |
Elisabeth Miller
(1968) | Chief Compliance Officer (2012-present) | Current: CCO, certain other funds in the Fund Complex (2012-present); CCO, Security Investors, LLC (2012-present); CCO, Guggenheim Funds Investment Advisors, LLC (2012-present); Managing Director, Guggenheim Investments (2012-present); Vice President, Guggenheim Funds Distributors, LLC (March 2014-present).
Former: CCO, Guggenheim Distributors, LLC (2009-March 2014); Senior Manager, Security Investors, LLC (2004-2009); Senior Manager, Guggenheim Distributors, LLC (2004-2009). |
Glenn McWhinnie
(1969) | Assistant Treasurer (2016-present) | Current: Vice President, Guggenheim Investments (2009-present).
Former: Tax Compliance Manager, Ernst & Young LLP (1996-2009). |
Adam J. Nelson
(1979) | Assistant Treasurer (2016-present) | Current: Vice President, Guggenheim Investments (2015-present); Assistant Treasurer, certain other funds in the Fund Complex (2015-present).
Former: Assistant Vice President and Fund Administration Director, State Street Corporation (2013-2015); Fund Administration Assistant Director, State Street (2011-2013); Fund Administration Manager, State Street (2009-2011). |
90 | THE GUGGENHEIM FUNDS ANNUAL REPORT | |
INFORMATION ON BOARD OF TRUSTEES AND OFFICERS (Unaudited)(concluded) |
Name, Address* and Year of Birth | Position(s) Held with the Trust, Term of Office and Length of Time Served | Principal Occupation(s)
During Past 5 Years |
OFFICERS - concluded | |
Kimberly J. Scott
(1974) | Assistant Treasurer (2016-present) | Current: Vice President, Guggenheim Investments (2012-present); Assistant Treasurer, certain other funds in the Fund Complex (2012-present).
Former: Financial Reporting Manager, Invesco, Ltd. (2010-2011); Vice President/Assistant Treasurer, Mutual Fund Administration for Van Kampen Investments, Inc./Morgan Stanley Investment Management (2009-2010); Manager of Mutual Fund Administration, Van Kampen Investments, Inc./Morgan Stanley Investment Management (2005-2009). |
John L. Sullivan
(1955) | Chief Financial Officer and Treasurer (2016-present) | Current: CFO, Chief Accounting Officer and Treasurer, certain other funds in the Fund Complex (2010-present); Senior Managing Director, Guggenheim Investments (2010-present).
Former: Managing Director and CCO, each of the funds in the Van Kampen Investments fund complex (2004-2010); Managing Director and Head of Fund Accounting and Administration, Morgan Stanley Investment Management (2002-2004); CFO and Treasurer, Van Kampen Funds (1996-2004). |
* | All Trustees and Officers may be reached c/o Guggenheim Investments, 227 West Monroe Street, Chicago, Illinois 60606. |
** | Mr. Cacciapaglia is an “interested” person of the Trust, as that term is defined in the 1940 Act by virtue of his affiliation with the Adviser’s parent company. |
*** | The “Fund Complex” includes all closed-end and open-end funds (including all of their portfolios) advised by the Adviser and any funds that have an investment adviser or servicing agent that is an affiliated person of the Adviser. Information provided is as of the date of this report. |
**** | Certain of the Trustees may serve as directors on the boards of companies not required to be disclosed above, including certain non-profit companies and charitable foundations. |
***** | Mses. Brock-Kyle and Sponem commence serving as independent Trustees effective August 18, 2016. |
| | THE GUGGENHEIM FUNDS ANNUAL REPORT | 91 |
GUGGENHEIM INVESTMENTS PRIVACY POLICIES (Unaudited) |
Guggenheim Investments as used herein refers to Guggenheim Partners, LLC, Guggenheim Funds Investment Advisors, LLC, Guggenheim Partners Investment Management, LLC, Guggenheim Funds Distributors, LLC and Security Investors, LLC as well as the funds in the Guggenheim Funds complex (the “funds”).
Our Commitment to You
When you become a Guggenheim Investments investor, you entrust us with not only your hard-earned money but also with personal and financial information about you. We recognize that your relationship with us is based on trust and that you expect us to act responsibly and in your best interests. Because we have access to personal information about you, we hold ourselves to high standards in its safekeeping and use. This means, most importantly, that we do not sell client or account information to anyone—whether you are a current or former Guggenheim Investments client.
The Information We Collect About You and How We Collect It
In the course of doing business with shareholders and investors, we collect nonpublic personal information about you. You typically provide personal information when you complete a Guggenheim Investments account application or when you request a transaction that involves Rydex and Guggenheim Funds or one of the Guggenheim affiliated companies. “Nonpublic personal information” is personally identifiable information about you. For example it includes your name and address, Social Security or taxpayer identification number, assets, income, account balance, bank account information and investment activity (e.g. purchase and redemption history).
How We Share Your Personal Information
As a matter of policy, we do not disclose your nonpublic personal information to nonaffiliated third parties except as required or permitted by law. As emphasized above, we do not sell information about current or former clients or their accounts to third parties. Nor do we share such information, except when necessary to complete transactions at your request or to make you aware of related investment products and services that we offer. Additional details about how we handle your personal information are provided below.
To complete certain transactions or account changes that you direct, it may be necessary to provide your personal information to companies, individuals or groups that are not affiliated with Guggenheim Investments. For example if you ask to transfer assets from another financial institution to Guggenheim Investments, we will need to provide certain information about you to that company to complete the transaction. In connection with servicing your accounts or to alert you to other Guggenheim Investments investment products and services, we may share your information within the Guggenheim Investments family of affiliated companies. This would include, for example, sharing your information within Guggenheim Investments so we can make you aware of new funds or the services offered through another Guggenheim Investments
92 | THE GUGGENHEIM FUNDS ANNUAL REPORT | |
GUGGENHEIM INVESTMENTS PRIVACY POLICIES (Unaudited)(concluded) |
affiliated company. In certain instances, we may contract with nonaffiliated companies to perform services for us. Where necessary, we will disclose information we have about you to these third parties. In all such cases, we provide the third party with only the information necessary to carry out its assigned responsibilities and only for that purpose. And we require these third parties to treat your personal information with the same high degree of confidentiality that we do. In certain instances, we may share information with other financial institutions regarding individuals and entities in response to the U.S.A. Patriot Act. Finally we will share personal information about you if we are compelled by law to do so, if you direct us to do so with your consent, or in other circumstances as permitted by law.
How We Safeguard Your Personal Information
We maintain physical, electronic and procedural safeguards to protect your personal information. Within Guggenheim Investments, access to such information is limited to those who need it to perform their jobs such as servicing your account, resolving problems or informing you of new products and services.
| | THE GUGGENHEIM FUNDS ANNUAL REPORT | 93 |
This page intentionally left blank.
This page intentionally left blank.
This page intentionally left blank.
This page intentionally left blank.
12.31.2016
Guggenheim Funds Annual Report
Guggenheim Alternative Fund |
Guggenheim Managed Futures Strategy Fund | | |
GuggenheimInvestments.com | RMFSF-ANN-2-1216x1217 |
DEAR SHAREHOLDER | 2 |
ECONOMIC AND MARKET OVERVIEW | 4 |
ABOUT SHAREHOLDERS’ FUND EXPENSES | 6 |
MANAGED FUTURES STRATEGY FUND | 9 |
NOTES TO CONSOLIDATED FINANCIAL STATEMENTS | 30 |
REPORT OF INDEPENDENT REGISTERED PUBLIC ACCOUNTING FIRM | 49 |
OTHER INFORMATION | 50 |
INFORMATION ON BOARD OF TRUSTEES AND OFFICERS | 51 |
GUGGENHEIM INVESTMENTS PRIVACY POLICIES | 57 |
| | THE GUGGENHEIM FUNDS ANNUAL REPORT | 1 |
Dear Shareholder:
Security Investors, LLC (the “Investment Adviser”), is pleased to present the annual shareholder report for the Managed Futures Strategy Fund (the “Fund”) that is part of the Rydex Series Funds. This report covers performance of the Fund for the annual period ended December 31, 2016.
The Investment Adviser is a part of Guggenheim Investments, which represents the investment management businesses of Guggenheim Partners, LLC (“Guggenheim”), a global, diversified financial services firm.
Guggenheim Funds Distributors, LLC is the distributor of the Fund. Guggenheim Funds Distributors, LLC is affiliated with Guggenheim and the Investment Adviser.
We encourage you to read the Economic and Market Overview section of the report, which follows this letter, and then the Performance Report and Fund Profile for each Fund.
We are committed to providing innovative investment solutions and appreciate the trust you place in us.
Sincerely,
Donald C. Cacciapaglia
President
January 31, 2017
Read a prospectus and summary prospectus (if available) carefully before investing. It contains the investment objectives, risks, charges, expenses and other information, which should be considered carefully before investing. Obtain a prospectus and summary prospectus (if available) at guggenheiminvestments.com or call 800.820.0888.
2 | THE GUGGENHEIM FUNDS ANNUAL REPORT | |
The Managed Futures Strategy Fund may not be suitable for all investors. ● The Fund’s investments in securities and derivatives, in general, are subject to market risks that may cause their prices, and therefore the Fund’s value, to fluctuate over time. An investment in the Fund may lose money. ● The Fund’s investments in derivatives may pose risks in addition to those associated with investing directly in securities or other investments, including illiquidity of the derivatives, imperfect correlations with underlying investments or the Fund’s other portfolio holdings, lack of availability and counterparty risk. To the extent the Fund invests in derivatives to seek to hedge risk or limit leveraged exposure created by other investments, there is no guarantee that such hedging strategies will be effective at managing risk or limiting exposure to leveraged investments. ● The Fund’s use of leverage will exaggerate the effect on net asset value of any increase or decrease in the market value of the Fund’s portfolio. ● The Fund’s use of short selling involves increased risk and costs. The Fund risks paying more for a security than it received from its sale. Theoretically, securities sold short have the risk of unlimited losses. ● The Fund’s investments in fixed income securities will change in value in response to interest rate changes and other factors. In general, bond prices rise when interest rates fall and vice versa. ● The Fund’s exposure to high yield, asset-backed and mortgaged-backed securities may subject the Fund to greater volatility. ● The Fund’s indirect and direct exposure to foreign currencies subjects the Fund to the risk that those currencies will decline in value relative to the U.S. dollar, or, in the case of short positions, that the U.S. dollar will decline in value relative to the currency being hedged. ● The Fund’s exposure to the commodity markets may subject the Fund to greater volatility as commodity-linked investments may be affected by changes in overall market movements, commodity index volatility, changes in interest rates or factors affecting a particular industry or commodity such as droughts, floods, weather, embargos, tariffs and international economic, political and regulatory developments. ● The Fund may invest in securities of foreign companies directly, or indirectly through the use of other investment companies and financial instruments that are linked to the performance of foreign issuers. Foreign securities markets generally have less trading volume and less liquidity than U.S. markets, and prices in some foreign markets may fluctuate more than those of securities traded on U.S. markets. ● This Fund is considered nondiversified and can invest a greater portion of its assets in securities of individual issuers than a diversified fund. As a result, changes in the market value of a single security could cause greater fluctuations in the value of Fund shares than would occur in a more diversified fund. ● See the prospectus for more information on these and other risks.
| | THE GUGGENHEIM FUNDS ANNUAL REPORT | 3 |
ECONOMIC AND MARKET OVERVIEW (Unaudited) | December 31, 2016 |
Behind the performance numbers for the past 12 months are a multitude of events that unfolded throughout 2016, including an increase in U.S. corporate defaults, several quarters of negative earnings growth, stubbornly low inflation across the globe, the British vote to exit the European Union, and a U.S. presidential election outcome that defied investor expectations and polling trends. That was on top of one of the worst selloffs for U.S. corporate bonds since the financial crisis in the first six weeks of the year, and one of the worst selloffs in government bonds since 2013’s taper tantrum in the fourth quarter, and the Standard & Poor’s 500® (“S&P 500”) Index* falling almost 11% early in the year. Nevertheless, or perhaps because of all the pre-election turmoil, between election day and the end of December, the S&P 500 rallied 4.6%, high-yield spreads tightened 83 basis points, and 10-year Treasury yields rose 57 basis points.
The market reaction to the outcome of the U.S. presidential election set the stage for the U.S. Federal Reserve (the “Fed”) to hike in December. As widely expected, the Fed raised target interest rates by 25 basis points from a range of 0.25–0.50% to 0.50–0.75%. More importantly, the Federal Open Market Committee (“FOMC”) now projects three rate increases in 2017, up from two in September.
The upward shift appears to reflect the view that there may be less room for accommodative policy to continue in light of recent labor market data. We believe the participation rate introduces meaningful uncertainty to the pace of Fed tightening. In 2016, a rising participation rate helped keep the Fed at bay for most of the year as it stabilized the unemployment rate slightly above what the Fed considers full employment. However, the participation trend reversed in October and November, causing the unemployment rate to decline to only 4.7% by December.
Early indications that fiscal spending (and/or tax cuts) will be prioritized in the new administration suggest that the risks to real Gross Domestic Product (“GDP”) growth in 2017 and 2018 are now skewed to the upside. U.S. real GDP grew by 3.5% in the third quarter, up from 1.4% in the second quarter. We expect output to rise by around 2% on average in coming quarters, a bit faster than the trend rate over the past year, as drags from past dollar strength and an inventory adjustment cycle fade.
A post-election rise in consumer confidence, along with continued income growth and healthier household balance sheets, bodes well for consumption in the coming quarters. The trend rate of job growth should slow as we near full employment. Even so, the unemployment rate should continue to fall toward 4.0% as employment growth outstrips labor force growth. A tighter labor market will begin to put more upward pressure on wage growth, which is being held back by meager productivity gains. An improving labor market, low borrowing costs, and rising household formation will continue to bolster housing, as evidenced by housing starts at cyclical highs. Key inflation measures will rise over the next year due to energy price base effects and reductions in labor market slack.
Given our view that the Fed will raise rates three, possibly four, times in 2017, the effects of monetary policy divergence will be important to watch as two major central banks, the European Central Bank (“ECB”) and the Bank of Japan (“BOJ”), continue their purchase programs. In
4 | THE GUGGENHEIM FUNDS ANNUAL REPORT | |
ECONOMIC AND MARKET OVERVIEW (Unaudited)(concluded) | December 31, 2016 |
December, the ECB committed to extend its asset-purchase program through the end of 2017, albeit at a reduced monthly pace of €60 billion (from €80 billion currently) beginning in April. The ECB also changed its criteria for asset purchases, allowing the purchase of sovereign bonds with yields lower than the -0.40% deposit rate. In our view, the extension of the program to at least the end of 2017 makes it highly likely that the ECB will continue to buy assets well into 2018. The growing gap in policy rates and global yields could drive further U.S. dollar appreciation, which would weigh on oil prices and stem the recovery in the energy market. Currently, our oil model projects oil prices will remain below $60 per barrel through the end of 2017.
For the year ended December 31, 2016, the S&P 500 Index returned 11.96%. The MSCI Europe-Australasia-Far East (“EAFE”) Index* returned 1.00%. The return of the MSCI Emerging Markets Index* was 11.19%.
In the bond market, the Bloomberg Barclays U.S. Aggregate Bond Index* posted a 2.65% return for the year, while the Bloomberg Barclays U.S. Corporate High Yield Index* returned 17.13%. The return of the Bank of America (“BofA”) Merrill Lynch 3-Month U.S. Treasury Bill Index* was 0.33% for the 12-month period.
The opinions and forecasts expressed may not actually come to pass. This information is subject to change at any time, based on market and other conditions, and should not be construed as a recommendation of any specific security or strategy.
*Index Definitions:
The following indices are referenced throughout this report. Indices are unmanaged and not available for direct investment. Index performance does not reflect transaction costs, fees, or expenses.
Bloomberg Barclays U.S. Aggregate Bond Index is a broad-based flagship benchmark that measures the investment grade, U.S. dollar-denominated, fixed-rate taxable bond market, including U.S. Treasuries, government-related and corporate securities, mortgage-backed securities or “MBS” (agency fixed-rate and hybrid adjustable-rate mortgage, or “ARM”, pass-throughs), asset-backed securities (“ABS”), and commercial mortgage-backed securities (“CMBS”) (agency and non-agency).
Bloomberg Barclays U.S. Corporate High Yield Index measures the U.S. dollar-denominated, high yield, fixed-rate corporate bond market. Securities are classified as high yield if the middle rating of Moody’s, Fitch, and S&P is Ba1/BB +/BB + or below.
BofA Merrill Lynch 3-Month U.S. Treasury Bill Index is an unmanaged market index of U.S. Treasury securities maturing in 90 days that assumes reinvestment of all income.
MSCI EAFE Index is a free float-adjusted market capitalization index that is designed to measure the equity market performance of developed markets, excluding the U.S. & Canada.
MSCI Emerging Markets Index is a free float-adjusted market capitalization weighted index that is designed to measure equity market performance in the global emerging markets.
S&P 500® Index is a capitalization-weighted index of 500 stocks designed to measure the performance of the broad economy, representing all major industries and is considered a representation of the U.S. stock market.
| | THE GUGGENHEIM FUNDS ANNUAL REPORT | 5 |
ABOUT SHAREHOLDERS’ FUND EXPENSES (Unaudited) |
All mutual funds have operating expenses, and it is important for our shareholders to understand the impact of costs on their investments. Shareholders of a fund incur two types of costs: (i) transaction costs, including sales charges (loads) on purchase payments, reinvested dividends, other distributions, and exchange fees, and (ii) ongoing costs, including management fees, administrative services, and shareholder reports, among others. These ongoing costs, or operating expenses, are deducted from a fund’s gross income and reduce the investment return of the fund.
A fund’s expenses are expressed as a percentage of its average net assets, which is known as the expense ratio. The following examples are intended to help investors understand the ongoing costs (in dollars) of investing in a fund and to compare these costs with the ongoing costs of investing in other mutual funds.
The examples are based on an investment of $1,000 made at the beginning of the period and held for the entire six-month period beginning June 30, 2016 and ending December 31, 2016.
The following tables illustrate the Fund’s costs in two ways:
Table 1. Based on actual Fund return: This section helps investors estimate the actual expenses paid over the period. The “Ending Account Value” shown is derived from the Fund’s actual return, and the fifth column shows the dollar amount that would have been paid by an investor who started with $1,000 in the Fund. Investors may use the information here, together with the amount invested, to estimate the expenses paid over the period. Simply divide the Fund’s account value by $1,000 (for example, an $8,600 account value divided by $1,000 = 8.6), then multiply the result by the number provided under the heading “Expenses Paid During Period.”
Table 2. Based on hypothetical 5% return: This section is intended to help investors compare a Fund’s cost with those of other mutual funds. The table provides information about hypothetical account values and hypothetical expenses based on the Fund’s actual expense ratio and an assumed rate of return of 5% per year before expenses, which is not the Fund’s actual return. The hypothetical account values and expenses may not be used to estimate the actual ending account balance or expenses paid during the period. The example is useful in making comparisons because the U.S. Securities and Exchange Commission (the “SEC”) requires all mutual funds to calculate expenses based on the 5% return. Investors can assess a Fund’s costs by comparing this hypothetical example with the hypothetical examples that appear in shareholder reports of other funds.
The calculations illustrated above assume no shares were bought or sold during the period. Actual costs may have been higher or lower, depending on the amount of investment and the timing of any purchases or redemptions.
6 | THE GUGGENHEIM FUNDS ANNUAL REPORT | |
ABOUT SHAREHOLDERS’ FUND EXPENSES (Unaudited)(continued) |
Please note that the expenses shown in the table are meant to highlight your ongoing costs only and do not reflect any transactional costs, such as sales charges (loads) on purchase payments, and contingent deferred sales charges (“CDSC”) on redemptions, if any. Therefore, the second table is useful in comparing ongoing costs only, and will not help you determine the relative total costs of owning different funds. In addition, if these transactional costs were included, your costs would have been higher.
More information about the Fund’s expenses, including annual expense ratios for periods up to five years (subject to the Fund’s inception date), can be found in the Consolidated Financial Highlights section of this report. For additional information on operating expenses and other shareholder costs, please refer to the Fund’s prospectus.
| | THE GUGGENHEIM FUNDS ANNUAL REPORT | 7 |
ABOUT SHAREHOLDERS’ FUND EXPENSES (Unaudited)(concluded) |
| | Expense
Ratio1 | Fund
Return | Beginning
Account Value
June 30,
2016 | Ending
Account Value
December 31,
2016 | Expenses
Paid During
Period2 |
Table 1. Based on actual Fund return3 |
Managed Futures Strategy Fund |
A-Class | 1.67% | (6.65%) | $ 1,000.00 | $ 933.50 | $ 8.14 |
C-Class | 2.47% | (7.01%) | 1,000.00 | 929.90 | 12.02 |
P-Class | 1.72% | (6.65%) | 1,000.00 | 933.50 | 8.38 |
Institutional Class | 1.47% | (6.50%) | 1,000.00 | 935.00 | 7.17 |
| | | | | | |
Table 2. Based on hypothetical 5% return (before expenses) |
Managed Futures Strategy Fund |
A-Class | 1.67% | 5.00% | $ 1,000.00 | $ 1,016.79 | $ 8.49 |
C-Class | 2.47% | 5.00% | 1,000.00 | 1,012.75 | 12.53 |
P-Class | 1.72% | 5.00% | 1,000.00 | 1,016.53 | 8.74 |
Institutional Class | 1.47% | 5.00% | 1,000.00 | 1,017.80 | 7.48 |
1 | Annualized and excludes expenses of the underlying funds in which the Fund invests. |
2 | Expenses are equal to the Fund's annualized expense ratio, net of any applicable fee waivers, multiplied by the average account value over the period, multiplied by 184/365 (to reflect the one-half year period). |
3 | Actual cumulative return at net asset value for the period June 30, 2016 to December 31, 2016. |
8 | THE GUGGENHEIM FUNDS ANNUAL REPORT | |
PERFORMANCE REPORT AND FUND PROFILE (Unaudited) | December 31, 2016 |
MANAGED FUTURES STRATEGY FUND
OBJECTIVE: Seeks to achieve absolute returns.
For the one-year period ended December 31, 2016, the Managed Futures Strategy Fund Institutional shares returned -14.95%. The BofA Merrill Lynch 3-Month U.S. Treasury Bill Index, the Fund’s cash benchmark, returned 0.33%.
2016 was a difficult year for systematic managed futures strategies. The Fund had negative returns in all quarters. In the first quarter, losses were primarily attributable to Equities, Agriculturals, and Metals, while Fixed Income and Energy positions contributed positively. In the second quarter, Equities, Energies, and Metals detracted, while Fixed Income positions contributed positively. In the third quarter, Equities and Agriculturals added return, while Fixed Income, Energies, and Metals detracted. And in the fourth quarter, all sectors were negative, with Agriculturals and Energies dominating losses. On the year, Fixed Income was the only positive contributing sector, with all others–Energies, Metals, Agriculturals, Currencies, and Equities–detracting from performance.
On the year, the largest positive individual market returns came mostly from Fixed Income; from the Japanese Government 10-Year Bond, the German Government 2- and 5-Year Bonds, Soybeans, and the U.S. Government 30-Year Bond. The largest losses came mostly from Commodities (Gold, Gas Oil, Aluminum and Copper), as well as Nasdaq exposure.
The Fund is comprised of multiple proprietary strategies designed to systematically exploit market inefficiencies in futures markets around the globe.
The Fund holds derivatives for a number of reasons, including liquidity, leverage, speculation, and hedging. Derivatives are liquid and allow the fund to gain leveraged access to markets in order to express investment views and to hedge exposures.
The Fund takes advantage of Guggenheim’s fixed income expertise in managing the Fund’s cash positions primarily through the use of the Guggenheim Strategy Funds.
Performance displayed represents past performance which is no guarantee of future results.
| | THE GUGGENHEIM FUNDS ANNUAL REPORT | 9 |
PERFORMANCE REPORT AND FUND PROFILE (Unaudited)(continued) | December 31, 2016 |
Consolidated Holdings Diversification (Market Exposure as % of Net Assets)
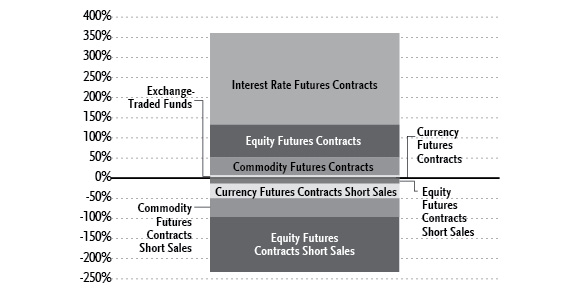
“Consolidated Holdings Diversification (Market Exposure as % of Net Assets)” excludes any temporary cash investments or investments in Guggenheim Strategy Funds Trust mutual funds. Investments in those Funds will significantly increase the portfolio’s exposure to certain other asset categories (and their associated risks), which may cause the Fund to deviate from its principal investment strategy, including: (i) high yield, high risk debt securities rated below the top four long-term rating categories by a nationally recognized statistical rating organization (also known as “junk bonds”); (ii) securities issued by the U.S. government or its agencies and instrumentalities; (iii) CLOs and similar investments; and (iv) other short-term fixed income securities.
Inception Dates: |
Institutional Class | May 3, 2010 |
A-Class | March 2, 2007 |
C-Class | March 2, 2007 |
P-Class | March 2, 2007 |
The Fund invests principally in derivative investments such as futures contracts.
Largest Holdings (% of Total Net Assets) |
Guggenheim Strategy Fund III | 23.1% |
Guggenheim Strategy Fund I | 22.7% |
Guggenheim Strategy Fund II | 22.5% |
Guggenheim Enhanced Short Duration ETF | 4.6% |
Total | 72.9% |
“Largest Holdings” excludes any temporary cash or derivative investments. |
10 | THE GUGGENHEIM FUNDS ANNUAL REPORT | |
PERFORMANCE REPORT AND FUND PROFILE (Unaudited)(continued) | December 31, 2016 |
Cumulative Fund Performance*
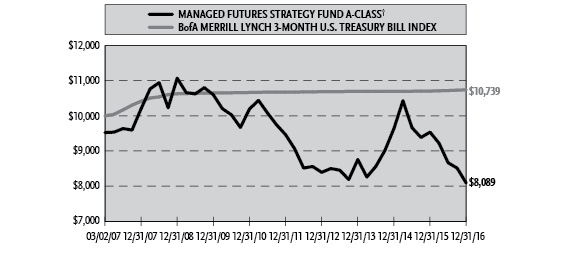
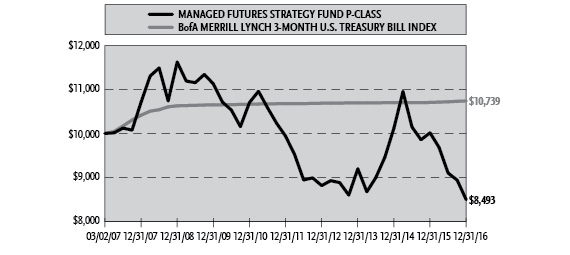
| | THE GUGGENHEIM FUNDS ANNUAL REPORT | 11 |
PERFORMANCE REPORT AND FUND PROFILE (Unaudited)(concluded) | December 31, 2016 |
Average Annual Returns*
Periods Ended December 31, 2016
| | 1 Year | 5 Year | Since Inception
(03/02/07) |
A-Class Shares | -15.18% | -3.09% | -1.65% |
A-Class Shares with sales charge† | -19.21% | -4.03% | -2.13% |
C-Class Shares | -15.81% | -3.83% | -2.38% |
C-Class Shares with CDSC‡ | -16.61% | -3.83% | -2.38% |
P-Class Shares | -15.18% | -3.09% | -1.65% |
BofA Merrill Lynch 3-Month U.S. Treasury Bill Index | 0.33% | 0.12% | 0.73% |
| | | | |
| | 1 Year | 5 Year | Since Inception
(05/03/10) |
Institutional Class Shares | -14.95% | -2.86% | -3.05% |
BofA Merrill Lynch 3-Month U.S. Treasury Bill Index | 0.33% | 0.12% | 0.12% |
* | The performance data above represents past performance that is not predictive of future results. The investment return and principal value of an investment in the Fund will fluctuate so that an investor’s shares, when redeemed, may be worth more or less than their original cost. Returns are historical and include changes in principal and reinvested dividends and capital gains and do not reflect the effect of taxes. The BofA Merrill Lynch 3-Month U.S. Treasury Bill Index is an unmanaged index and, unlike the Fund, has no management fees or operating expenses to reduce its reported return. The graphs are based on A-Class shares and P-Class shares only; performance for C-Class shares and Instiutional Class shares will vary due to differences in fee structure. |
† | Fund returns are calculated using the maximum sales charge of 4.75%. |
‡ | Fund returns include a CDSC of 1% if redeemed within 12 months of purchase. |
12 | THE GUGGENHEIM FUNDS ANNUAL REPORT | |
CONSOLIDATED SCHEDULE OF INVESTMENTS | December 31, 2016 |
MANAGED FUTURES STRATEGY FUND | |
| | | Shares | | | Value | |
| | | | | | | |
EXCHANGE-TRADED FUNDS† - 4.6% | |
Guggenheim Enhanced Short Duration ETF1,2 | | | 108,400 | | | $ | 5,433,008 | |
Total Exchange-Traded Funds | | | | | |
(Cost $5,429,550) | | | | | | | 5,433,008 | |
| | | | | | | | | |
MUTUAL FUNDS† - 68.4% | |
Guggenheim Strategy Fund III1 | | | 1,092,274 | | | | 27,274,077 | |
Guggenheim Strategy Fund I1 | | | 1,073,156 | | | | 26,828,893 | |
Guggenheim Strategy Fund II1 | | | 1,063,235 | | | | 26,527,725 | |
Total Mutual Funds | | | | | | | | |
(Cost $80,421,739) | | | | | | | 80,630,695 | |
| | | | | | | | | |
| | Face
Amount | | | | | |
| | | | | | | | | |
U.S. TREASURY BILLS†† - 7.8% | |
U.S. Treasury Bill | | | | | | | | |
0.46% due 01/12/173,4,8 | | $ | 9,250,000 | | | | 9,249,075 | |
Total U.S. Treasury Bills | | | | | | | | |
(Cost $9,248,657) | | | | | | | 9,249,075 | |
| | | | | | | | | |
REPURCHASE AGREEMENTS††,5 - 15.1% | |
Royal Bank of Canada
issued 12/30/16 at 0.24%
due 01/03/178 | | | 10,608,453 | | | | 10,608,453 | |
HSBC Securities, Inc.
issued 12/30/16 at 0.28%
due 01/03/17 | | | 6,853,846 | | | | 6,853,846 | |
UMB Financial Corp.
issued 12/30/16 at 0.24%
due 01/03/17 | | | 389,628 | | | | 389,628 | |
Total Repurchase Agreements | | | | | |
(Cost $17,851,927) | | | | | | | 17,851,927 | |
| | | | | | | | | |
SECURITIES LENDING COLLATERAL†,6 - 1.8% | |
First American Government Obligations Fund - Class Z, 0.42%7 | | | 2,091,000 | | | $ | 2,091,000 | |
Total Securities Lending Collateral | | | | | |
(Cost $2,091,000) | | | | | | | 2,091,000 | |
| | | | | | | | | |
Total Investments - 97.7% | | | | | | | | |
(Cost $115,042,873) | | | | | | $ | 115,255,705 | |
Other Assets & Liabilities, net - 2.3% | | | | 2,732,716 | |
Total Net Assets - 100.0% | | | | | | $ | 117,988,421 | |
| | | | | | | | | |
| | | Contracts | | | Unrealized
Gain | |
| | | | | | | | | |
INTEREST RATE FUTURES CONTRACTS PURCHASED† | |
March 2017 Euro - Bobl
Futures Contracts
(Aggregate Value of
Contracts $94,796,990) | | | 674 | | | $ | 766,694 | |
March 2017 Long Gilt
Futures Contracts††,8
(Aggregate Value of
Contracts $27,369,054) | | | 176 | | | | 437,194 | |
March 2017 Euro - Schatz
Futures Contracts
(Aggregate Value of
Contracts $118,192,823) | | | 1,000 | | | | 198,124 | |
March 2017 Euro - Bund
Futures Contracts
(Aggregate Value of
Contracts $13,301,768) | | | 77 | | | | 65,911 | |
March 2017 U.S. Treasury 10 Year Note
Futures Contracts8
(Aggregate Value of
Contracts $5,337,375) | | | 43 | | | | 25,130 | |
March 2017 U.S. Treasury Long Bond
Futures Contracts
(Aggregate Value of
Contracts $1,353,094) | | | 9 | | | | 12,579 | |
SEE NOTES TO FINANCIAL STATEMENTS. | THE GUGGENHEIM FUNDS ANNUAL REPORT | 13 |
CONSOLIDATED SCHEDULE OF INVESTMENTS (continued) | December 31, 2016 |
MANAGED FUTURES STRATEGY FUND | |
| | | Contracts | | | Unrealized
Gain (Loss) | |
| | | | | | | |
March 2017 Canadian Government 10 Year Bond
Futures Contracts††,8
(Aggregate Value of
Contracts $102,359) | | | 1 | | | $ | 16 | |
March 2017 Euro - OATS
Futures Contracts††,8
(Aggregate Value of
Contracts $3,671,382) | | | 23 | | | | (1,137 | ) |
March 2017 Euro - BTP Italian Government Bond
Futures Contracts††,8
(Aggregate Value of
Contracts $4,838,943) | | | 34 | | | | (2,765 | ) |
(Total Aggregate Value of Contracts $268,963,788) | | | | | | $ | 1,501,746 | |
| | | | | | | | | |
EQUITY FUTURES CONTRACTS PURCHASED† | |
March 2017 Dow Jones Industrial Average Index
Mini Futures Contracts
(Aggregate Value of
Contracts $20,213,000) | | | 205 | | | $ | 272,599 | |
March 2017 SPI 200 Index
Futures Contracts††,8
(Aggregate Value of
Contracts $9,857,682) | | | 97 | | | | 174,188 | |
January 2017 IBEX 35 Index
Futures Contracts††,8
(Aggregate Value of
Contracts $10,098,434) | | | 103 | | | | 116,345 | |
March 2017 DAX Index
Futures Contracts8
(Aggregate Value of
Contracts $10,539,417) | | | 35 | | | | 97,964 | |
January 2017 MSCI Taiwan Stock Index
Futures Contracts
(Aggregate Value of
Contracts $5,335,200) | | | 156 | | | | 66,452 | |
March 2017 Tokyo Stock Price Index
Futures Contracts††,8
(Aggregate Value of
Contracts $4,270,788) | | | 33 | | | | 32,334 | |
January 2017
Amsterdam Index
Futures Contracts
(Aggregate Value of
Contracts $6,798,726) | | | 67 | | | | 19,058 | |
March 2017 NASDAQ-
100 Index
Mini Futures Contracts8
(Aggregate Value of
Contracts $3,892,000) | | | 40 | | | | 18,234 | |
March 2017 FTSE
100 Index
Futures Contracts††
(Aggregate Value of
Contracts $1,899,196) | | | 22 | | | | 18,007 | |
March 2017 Russell
2000 Index
Mini Futures Contracts8
(Aggregate Value of
Contracts $2,918,410) | | | 43 | | | | 15,164 | |
March 2017 Euro STOXX 50 Index
Futures Contracts8
(Aggregate Value of
Contracts $791,358) | | | 23 | | | | 9,904 | |
March 2017 Nikkei 225 (OSE) Index
Futures Contracts††,8
(Aggregate Value of
Contracts $6,840,227) | | | 42 | | | | 9,013 | |
January 2017 Hang
Seng Index
Futures Contracts††
(Aggregate Value of
Contracts $1,129,544) | | | 8 | | | | 5,210 | |
March 2017 S&P MidCap 400 Index
Mini Futures Contracts
(Aggregate Value of
Contracts $6,966,960) | | | 42 | | | | 2,882 | |
14 | THE GUGGENHEIM FUNDS ANNUAL REPORT | SEE NOTES TO FINANCIAL STATEMENTS. |
CONSOLIDATED SCHEDULE OF INVESTMENTS (continued) | December 31, 2016 |
MANAGED FUTURES STRATEGY FUND | |
| | | Contracts | | | Unrealized
Gain (Loss) | |
| | | | | | | |
January 2017 CAC 40 10 Euro Index
Futures Contracts8
(Aggregate Value of
Contracts $255,289) | | | 5 | | | $ | 843 | |
March 2017 MSCI EAFE Index
Mini Futures Contracts
(Aggregate Value of
Contracts $167,460) | | | 2 | | | | 352 | |
March 2017 FTSE MIB Index
Futures Contracts††,8
(Aggregate Value of
Contracts $202,151) | | | 2 | | | | (706 | ) |
March 2017 S&P/TSX 60 IX Index
Futures Contracts8
(Aggregate Value of
Contracts $1,070,106) | | | 8 | | | | (1,133 | ) |
March 2017 MSCI Emerging Markets Index
Mini Futures Contracts
(Aggregate Value of
Contracts $85,920) | | | 2 | | | | (1,963 | ) |
January 2017 OMX Stockholm 30 Index
Futures Contracts††,8
(Aggregate Value of
Contracts $282,247) | | | 17 | | | | (2,662 | ) |
March 2017 S&P 500 Index
Mini Futures Contracts8
(Aggregate Value of
Contracts $1,677,000) | | | 15 | | | | (8,254 | ) |
(Total Aggregate Value of Contracts $95,291,115) | | | | | | $ | 843,831 | |
| | | | | | | | | |
COMMODITY FUTURES CONTRACTS PURCHASED† | |
July 2017 Sugar #11
Futures Contracts8
(Aggregate Value of
Contracts $2,056,555) | | | 97 | | | $ | 122,800 | |
February 2017 Natural Gas
Futures Contracts8
(Aggregate Value of
Contracts $2,207,780) | | | 59 | | | | 96,628 | |
April 2017 Natural Gas
Futures Contracts8
(Aggregate Value of
Contracts $1,646,340) | | | 46 | | | | 83,002 | |
February 2017 Lean Hogs
Futures Contracts8
(Aggregate Value of
Contracts $1,868,720) | | | 71 | | | | 74,686 | |
December 2018 Brent Crude
Futures Contracts8
(Aggregate Value of
Contracts $1,853,760) | | | 32 | | | | 44,307 | |
December 2017 Low Sulphur Gas Oil
Futures Contracts8
(Aggregate Value of
Contracts $1,833,125) | | | 35 | | | | 41,167 | |
February 2017 NY Harbor ULSD
Futures Contracts8
(Aggregate Value of
Contracts $1,377,188) | | | 19 | | | | 40,101 | |
April 2017 NY Harbor ULSD
Futures Contracts8
(Aggregate Value of
Contracts $1,459,164) | | | 20 | | | | 39,168 | |
July 2017 Hard Red Winter Wheat
Futures Contracts8
(Aggregate Value of
Contracts $2,668,050) | | | 121 | | | | 29,415 | |
February 2017 Live Cattle
Futures Contracts8
(Aggregate Value of
Contracts $4,685,391) | | | 101 | | | | 28,524 | |
March 2017 Brent Crude
Futures Contracts8
(Aggregate Value of
Contracts $624,250) | | | 11 | | | | 22,842 | |
SEE NOTES TO FINANCIAL STATEMENTS. | THE GUGGENHEIM FUNDS ANNUAL REPORT | 15 |
CONSOLIDATED SCHEDULE OF INVESTMENTS (continued) | December 31, 2016 |
MANAGED FUTURES STRATEGY FUND | |
| | | Contracts | | | Unrealized
Gain (Loss) | |
| | | | | | | |
July 2017 Cotton #2
Futures Contracts8
(Aggregate Value of
Contracts $3,073,210) | | | 86 | | | $ | 22,785 | |
February 2017 Gasoline RBOB
Futures Contracts8
(Aggregate Value of
Contracts $1,262,066) | | | 18 | | | | 14,654 | |
March 2017 Cotton #2
Futures Contracts8
(Aggregate Value of
Contracts $530,400) | | | 15 | | | | 2,188 | |
March 2017 Copper
Futures Contracts8
(Aggregate Value of
Contracts $250,700) | | | 4 | | | | 948 | |
June 2018 WTI Crude
Futures Contracts8
(Aggregate Value of
Contracts $1,753,670) | | | 31 | | | | (273 | ) |
March 2017 Silver
Futures Contracts8
(Aggregate Value of
Contracts $479,250) | | | 6 | | | | (377 | ) |
March 2017 Soybean Oil Futures Contracts8
(Aggregate Value of
Contracts $63,340) | | | 2 | | | | (957 | ) |
August 2017 Gasoline RBOB
Futures Contracts8
(Aggregate Value of
Contracts $1,685,930) | | | 22 | | | | (2,557 | ) |
February 2017 LME Primary Aluminum Futures Contracts8
(Aggregate Value of
Contracts $295,820) | | | 7 | | | | (5,931 | ) |
March 2017 Soybean
Futures Contracts8
(Aggregate Value of
Contracts $402,000) | | | 8 | | | | (6,355 | ) |
December 2017 Wheat
Futures Contracts8
(Aggregate Value of
Contracts $2,927,925) | | | 126 | | | | (11,765 | ) |
February 2017 LME Lead
Futures Contracts8
(Aggregate Value of
Contracts $150,574) | | | 3 | | | | (12,573 | ) |
December 2017 Corn
Futures Contracts8
(Aggregate Value of
Contracts $2,922,150) | | | 154 | | | | (13,200 | ) |
March 2017 Corn
Futures Contracts8
(Aggregate Value of
Contracts $2,035,800) | | | 116 | | | | (16,863 | ) |
July 2017 Soybean
Futures Contracts8
(Aggregate Value of
Contracts $2,754,675) | | | 54 | | | | (28,601 | ) |
March 2017 Soybean Oil
Futures Contracts8
(Aggregate Value of
Contracts $374,652) | | | 18 | | | | (32,392 | ) |
February 2017 LME Nickel
Futures Contracts8
(Aggregate Value of
Contracts $419,706) | | | 7 | | | | (36,235 | ) |
September 2017 Coffee ‘C’
Futures Contracts8
(Aggregate Value of
Contracts $2,210,925) | | | 41 | | | | (100,158 | ) |
May 2017 Cocoa
Futures Contracts8
(Aggregate Value of
Contracts $2,296,080) | | | 108 | | | | (148,057 | ) |
February 2017 LME Zinc
Futures Contracts8
(Aggregate Value of
Contracts $4,686,783) | | | 73 | | | | (254,646 | ) |
(Total Aggregate Value of Contracts $52,855,979) | | | | | | $ | (7,725 | ) |
16 | THE GUGGENHEIM FUNDS ANNUAL REPORT | SEE NOTES TO FINANCIAL STATEMENTS. |
CONSOLIDATED SCHEDULE OF INVESTMENTS (continued) | December 31, 2016 |
MANAGED FUTURES STRATEGY FUND | |
| | | Contracts | | | Unrealized
Gain (Loss) | |
| | | | | | | |
CURRENCY FUTURES CONTRACTS PURCHASED† | |
March 2017 Australian Dollar
Futures Contracts
(Aggregate Value of
Contracts $3,745,560) | | | 52 | | | $ | (109,191 | ) |
| | | | | | | | | |
CURRENCY FUTURES CONTRACTS SOLD SHORT† | |
March 2017 British Pound
Futures Contracts8
(Aggregate Value of
Contracts $16,971,625) | | | 220 | | | $ | 368,569 | |
March 2017 Canadian Dollar
Futures Contracts8
(Aggregate Value of
Contracts $14,385,255) | | | 193 | | | | 153,769 | |
March 2017 Japanese Yen
Futures Contracts8
(Aggregate Value of
Contracts $8,474,725) | | | 79 | | | | 100,401 | |
March 2017 Mexican Peso
Futures Contracts
(Aggregate Value of
Contracts $358,350) | | | 15 | | | | 8,346 | |
March 2017 Australian Dollar
Futures Contracts8
(Aggregate Value of
Contracts $1,296,540) | | | 18 | | | | 4,845 | |
March 2017 Euro FX
Futures Contracts8
(Aggregate Value of
Contracts $1,452,138) | | | 11 | | | | (11,402 | ) |
(Total Aggregate Value of Contracts $42,938,633) | | | | | | $ | 624,528 | |
| | | | | | | | | |
INTEREST RATE FUTURES CONTRACTS SOLD SHORT† | |
March 2017 Australian Government 3 Year Bond
Futures Contracts††
(Aggregate Value of
Contracts $105,959,286) | | | 1,318 | | | $ | 139,707 | |
March 2017 U.S. Treasury Ultra Long Bond
Futures Contracts8
(Aggregate Value of
Contracts $8,303,750) | | | 52 | | | | 26,281 | |
March 2017 U.S. Treasury 2 Year Note
Futures Contracts
(Aggregate Value of
Contracts $17,764,531) | | | 82 | | | | 14,077 | |
March 2017 U.S. Treasury 5 Year Note
Futures Contracts
(Aggregate Value of
Contracts $5,525,805) | | | 47 | | | | 12,093 | |
March 2017 U.S. Treasury Long Bond
Futures Contracts8
(Aggregate Value of
Contracts $902,063) | | | 6 | | | | 1,628 | |
March 2017 Euro - Bund
Futures Contracts8
(Aggregate Value of
Contracts $5,182,507) | | | 30 | | | | 302 | |
March 2017 Euro - 30 year Bond
Futures Contracts8
(Aggregate Value of
Contracts $182,381) | | | 1 | | | | 267 | |
March 2017 U.S. Treasury 10 Year Note
Futures Contracts
(Aggregate Value of
Contracts $124,125) | | | 1 | | | | (189 | ) |
March 2017 Australian Government 10 Year Bond
Futures Contracts††,8
(Aggregate Value of
Contracts $4,803,753) | | | 52 | | | | (18,050 | ) |
SEE NOTES TO FINANCIAL STATEMENTS. | THE GUGGENHEIM FUNDS ANNUAL REPORT | 17 |
CONSOLIDATED SCHEDULE OF INVESTMENTS (continued) | December 31, 2016 |
MANAGED FUTURES STRATEGY FUND | |
| | | Contracts | | | Unrealized
Gain (Loss) | |
| | | | | | | |
March 2017 Canadian Government 10 Year Bond
Futures Contracts††
(Aggregate Value of
Contracts $12,794,902) | | | 125 | | | $ | (47,648 | ) |
(Total Aggregate Value of Contracts $161,543,103) | | | | | | $ | 128,468 | |
| | | | | | | | | |
COMMODITY FUTURES CONTRACTS SOLD SHORT† | |
March 2017 Wheat
Futures Contracts8
(Aggregate Value of
Contracts $5,947,312) | | | 291 | | | $ | 143,251 | |
May 2017 Coffee ‘C’
Futures Contracts8
(Aggregate Value of
Contracts $2,094,000) | | | 40 | | | | 97,096 | |
March 2017 Cocoa
Futures Contracts8
(Aggregate Value of
Contracts $1,068,500) | | | 50 | | | | 91,569 | |
March 2017 Hard Red Winter Wheat
Futures Contracts8
(Aggregate Value of
Contracts $5,653,125) | | | 270 | | | | 86,994 | |
March 2017 Copper
Futures Contracts8
(Aggregate Value of
Contracts $1,692,225) | | | 27 | | | | 47,055 | |
May 2018 Cocoa
Futures Contracts8
(Aggregate Value of
Contracts $2,569,320) | | | 117 | | | | 41,645 | |
March 2017 Coffee ‘C’
Futures Contracts8
(Aggregate Value of
Contracts $1,493,138) | | | 29 | | | | 22,280 | |
March 2017 Soybean
Futures Contracts8
(Aggregate Value of
Contracts $2,010,000) | | | 40 | | | | 21,723 | |
February 2017 Gold 100 oz.
Futures Contracts8
(Aggregate Value of
Contracts $1,151,100) | | | 10 | | | | 14,443 | |
April 2017 Platinum
Futures Contracts8
(Aggregate Value of
Contracts $180,860) | | | 4 | | | | 6,898 | |
March 2017 WTI Crude
Futures Contracts8
(Aggregate Value of
Contracts $1,312,800) | | | 24 | | | | 5,542 | |
July 2017 Corn
Futures Contracts8
(Aggregate Value of
Contracts $2,617,200) | | | 144 | | | | 2,935 | |
March 2017 Soybean Oil
Futures Contracts8
(Aggregate Value of
Contracts $41,628) | | | 2 | | | | 974 | |
March 2017 Silver
Futures Contracts8
(Aggregate Value of
Contracts $79,875) | | | 1 | | | | 72 | |
March 2017 Brent Crude
Futures Contracts8
(Aggregate Value of
Contracts $1,418,750) | | | 25 | | | | (21 | ) |
February 2017 LME Primary Alumnium Futures Contracts8
(Aggregate Value of
Contracts $84,520) | | | 2 | | | | (22 | ) |
March 2017 Soybean Oil Futures Contracts8
(Aggregate Value of
Contracts $221,690) | | | 7 | | | | (692 | ) |
February 2017 LME Lead
Futures Contracts8
(Aggregate Value of
Contracts $301,148) | | | 6 | | | | (1,241 | ) |
March 2017 Corn
Futures Contracts8
(Aggregate Value of
Contracts $544,050) | | | 31 | | | | (1,371 | ) |
18 | THE GUGGENHEIM FUNDS ANNUAL REPORT | SEE NOTES TO FINANCIAL STATEMENTS. |
CONSOLIDATED SCHEDULE OF INVESTMENTS (continued) | December 31, 2016 |
MANAGED FUTURES STRATEGY FUND | |
| | | Contracts | | | Unrealized
Gain (Loss | ) |
| | | | | | | |
March 2017 Cotton #2
Futures Contracts8
(Aggregate Value of
Contracts $1,166,880) | | | 33 | | | $ | (1,638 | ) |
March 2017 Cattle Feeder
Futures Contracts8
(Aggregate Value of
Contracts $501,700) | | | 8 | | | | (4,984 | ) |
February 2017 Lean Hogs
Futures Contracts8
(Aggregate Value of
Contracts $394,800) | | | 15 | | | | (5,683 | ) |
May 2017 Cotton #2
Futures Contracts8
(Aggregate Value of
Contracts $2,914,280) | | | 82 | | | | (17,242 | ) |
September 2017 Hard Red Winter Wheat
Futures Contracts8
(Aggregate Value of
Contracts $2,734,600) | | | 121 | | | | (19,438 | ) |
February 2017 WTI Crude
Futures Contracts8
(Aggregate Value of
Contracts $1,182,720) | | | 22 | | | | (23,411 | ) |
April 2017 Gasoline RBOB
Futures Contracts8
(Aggregate Value of
Contracts $1,560,300) | | | 20 | | | | (29,401 | ) |
July 2017 Wheat
Futures Contracts8
(Aggregate Value of
Contracts $2,608,500) | | | 120 | | | | (35,294 | ) |
February 2017 NY Harbor ULSD
Futures Contracts8
(Aggregate Value of
Contracts $1,377,188) | | | 19 | | | | (41,904 | ) |
February 2017 Low Sulphur Gas Oil
Futures Contracts8
(Aggregate Value of
Contracts $1,974,375) | | | 39 | | | | (50,590 | ) |
March 2017 Sugar #11
Futures Contracts8
(Aggregate Value of
Contracts $2,858,128) | | | 130 | | | | (85,030 | ) |
October 2017 Sugar #11
Futures Contracts8
(Aggregate Value of
Contracts $2,362,875) | | | 113 | | | | (112,099 | ) |
January 2018 Natural Gas
Futures Contracts8
(Aggregate Value of
Contracts $3,091,400) | | | 82 | | | | (114,246 | ) |
(Total Aggregate Value of Contracts $55,208,987) | | | | | | $ | 38,170 | |
| | |
EQUITY FUTURES CONTRACTS SOLD SHORT† | |
March 2017 FTSE/JSE TOP 40 Index
Futures Contracts††
(Aggregate Value of
Contracts $418,845) | | | 13 | | | $ | 4,446 | |
March 2017 FTSE 100 Index
Futures Contracts††,8
(Aggregate Value of
Contracts $604,290) | | | 7 | | | | (2,572 | ) |
January 2017 H-Shares Index
Futures Contracts††
(Aggregate Value of
Contracts $6,260,824) | | | 104 | | | | (9,935 | ) |
January 2017 CAC 40 10 Euro Index
Futures Contracts
(Aggregate Value of
Contracts $6,790,685) | | | 133 | | | | (95,136 | ) |
(Total Aggregate Value of Contracts $14,074,644) | | | | | | $ | (103,197 | ) |
SEE NOTES TO FINANCIAL STATEMENTS. | THE GUGGENHEIM FUNDS ANNUAL REPORT | 19 |
CONSOLIDATED SCHEDULE OF INVESTMENTS (continued) | December 31, 2016 |
MANAGED FUTURES STRATEGY FUND | |
* | Non-income producing security. |
† | Value determined based on Level 1 inputs, unless otherwise noted — See Note 4. |
†† | Value determined based on Level 2 inputs — See Note 4. |
1 | Affiliated issuer — See Note 10. |
2 | All or portion of this security is on loan at December 31, 2016 — See Note 7. |
3 | All or a portion of this security is pledged as futures collateral at December 31, 2016. |
4 | Zero coupon rate security. Rate indicated is the effective yield at the time of purchase. |
5 | Repurchase Agreements — See Note 5. |
6 | Securities lending collateral — See Note 7. |
7 | Rate indicated is the 7 day yield as of December 31, 2016. |
8 | All or a portion of this security is owned by Cayman Island subsidiary, which is a 100% owned subsidiary of the Fund — See Note 15. |
| | |
| | See Sector Classification in Other Information section. |
20 | THE GUGGENHEIM FUNDS ANNUAL REPORT | SEE NOTES TO FINANCIAL STATEMENTS. |
CONSOLIDATED SCHEDULE OF INVESTMENTS (concluded) | December 31, 2016 |
MANAGED FUTURES STRATEGY FUND | |
The following table summarizes the inputs used to value the Fund’s investments at December 31, 2016 (See Note 4 in the Notes to Consolidated Financial Statements):
Investments in Securities (Assets) | | Level 1 | | | Level 1 -
Other* | | | Level 2 | | | Level 2 -
Other* | | | Level 3 | | | Total | |
Commodity Futures Contracts | | $ | — | | | $ | 1,245,692 | | | $ | — | | | $ | — | | | $ | — | | | $ | 1,245,692 | |
Currency Futures Contracts | | | — | | | | 635,930 | | | | — | | | | — | | | | — | | | | 635,930 | |
Equity Futures Contracts | | | — | | | | 503,452 | | | | — | | | | 359,543 | | | | — | | | | 862,995 | |
Exchange-Traded Funds | | | 5,433,008 | | | | — | | | | — | | | | — | | | | — | | | | 5,433,008 | |
Interest Rate Futures Contracts | | | — | | | | 1,123,086 | | | | — | | | | 576,917 | | | | — | | | | 1,700,003 | |
Mutual Funds | | | 80,630,695 | | | | — | | | | — | | | | — | | | | — | | | | 80,630,695 | |
Repurchase Agreements | | | — | | | | — | | | | 17,851,927 | | | | — | | | | — | | | | 17,851,927 | |
Securities Lending Collateral | | | 2,091,000 | | | | — | | | | — | | | | — | | | | — | | | | 2,091,000 | |
U.S. Treasury Bills | | | — | | | | — | | | | 9,249,075 | | | | — | | | | — | | | | 9,249,075 | |
Total | | $ | 88,154,703 | | | $ | 3,508,160 | | | $ | 27,101,002 | | | $ | 936,460 | | | $ | — | | | $ | 119,700,325 | |
| | | | | | | | | | | | | | | | | | | | | | | | |
Investments in Securities (Liabilities) | | Level 1 | | | Level 1 -
Other* | | | Level 2 | | | Level 2 -
Other* | | | Level 3 | | | Total | |
Commodity Futures Contracts | | $ | — | | | $ | 1,215,247 | | | $ | — | | | $ | — | | | $ | — | | | $ | 1,215,247 | |
Currency Futures Contracts | | | — | | | | 120,593 | | | | — | | | | — | | | | — | | | | 120,593 | |
Equity Futures Contracts | | | — | | | | 106,486 | | | | — | | | | 15,875 | | | | — | | | | 122,361 | |
Interest Rate Futures Contracts | | | — | | | | 189 | | | | — | | | | 69,600 | | | | — | | | | 69,789 | |
Total | | $ | — | | | $ | 1,442,515 | | | $ | — | | | $ | 85,475 | | | $ | — | | | $ | 1,527,990 | |
* | Other financial instruments include futures contracts, which are reported as unrealized gain/loss at period end. |
Transfers between investment levels may occur as the markets fluctuate and/or the availability of data used in an investment’s valuation changes. Transfers between valuation levels, if any, are in comparison to the valuation levels at the end of the previous fiscal year, and are effective using the fair value as of the end of the previous fiscal period.
For the year ended December 31, 2016, there were no transfers between levels.
SEE NOTES TO FINANCIAL STATEMENTS. | THE GUGGENHEIM FUNDS ANNUAL REPORT | 21 |
CONSOLIDATED STATEMENT OF ASSETS AND LIABILITIES |
MANAGED FUTURES STRATEGY FUND |
December 31, 2016
Assets: | |
Investments in unaffiliated issuers, at value (cost $11,339,657) | | $ | 11,340,075 | |
Investments in affiliated issuers, at value - including $2,044,896 of securities loaned (cost $85,851,289) | | | 86,063,703 | |
Repurchase agreements, at value (cost $17,851,927) | | | 17,851,927 | |
Total investments (cost $115,042,873) | | | 115,255,705 | |
Foreign currency, at value (cost $282,402) | | | 285,076 | |
Segregated cash with broker | | | 6,026,963 | |
Receivables: | |
Fund shares sold | | | 900,090 | |
Dividends | | | 169,955 | |
Interest | | | 253 | |
Securities lending income | | | 1,532 | |
Total assets | | | 122,639,574 | |
| | | | | |
Liabilities: | |
Overdraft due to custodian | | | 315,448 | |
Payable for: | |
Return of securities loaned | | | 2,091,000 | |
Fund shares redeemed | | | 1,126,067 | |
Variation margin | | | 647,758 | |
Securities purchased | | | 168,634 | |
Management fees | | | 91,868 | |
Distribution and service fees | | | 31,875 | |
Transfer agent and administrative fees | | | 25,770 | |
Portfolio accounting fees | | | 10,308 | |
Miscellaneous | | | 142,425 | |
Total liabilities | | | 4,651,153 | |
Commitments and contingent liabilities (Note 12) | | | — | |
Net assets | | $ | 117,988,421 | |
| | | | | |
Net assets consist of: | |
Paid in capital | | $ | 220,066,060 | |
Accumulated net investment loss | | | (13,385,447 | ) |
Accumulated net realized loss on investments and foreign currency | | | (91,824,365 | ) |
Net unrealized appreciation on investments and foreign currency | | | 3,132,173 | |
Net assets | | $ | 117,988,421 | |
| | | | | |
A-Class: | |
Net assets | | $ | 22,733,979 | |
Capital shares outstanding | | | 1,214,877 | |
Net asset value per share | | $ | 18.71 | |
Maximum offering price per share (Net asset value divided by 95.25%) | | $ | 19.64 | |
| | | | | |
C-Class: | |
Net assets | | $ | 11,244,978 | |
Capital shares outstanding | | | 651,559 | |
Net asset value per share | | $ | 17.26 | |
| | | | | |
P-Class: | |
Net assets | | $ | 77,858,722 | |
Capital shares outstanding | | | 4,160,964 | |
Net asset value per share | | $ | 18.71 | |
| | | | | |
Institutional Class: | |
Net assets | | $ | 6,150,742 | |
Capital shares outstanding | | | 322,587 | |
Net asset value per share | | $ | 19.07 | |
22 | THE GUGGENHEIM FUNDS ANNUAL REPORT | SEE NOTES TO FINANCIAL STATEMENTS. |
CONSOLIDATED STATEMENT OF OPERATIONS |
MANAGED FUTURES STRATEGY FUND |
Year Ended December 31, 2016
Investment Income: | |
Dividends from securities of affiliated issuers | | $ | 2,870,297 | |
Interest | | | 69,886 | |
Income from securities lending, net | | | 6,117 | |
Total investment income | | | 2,946,300 | |
| | | | | |
Expenses: | |
Management fees | | | 1,653,724 | |
Transfer agent and administrative fees | | | 426,334 | |
Distribution and service fees: | |
A-Class | | | 58,849 | |
C-Class | | | 164,167 | |
P-Class | | | 307,590 | |
Portfolio accounting fees | | | 170,531 | |
Tax expense | | | 103,523 | |
Custodian fees | | | 25,966 | |
Trustees’ fees* | | | 11,524 | |
Interest expense | | | 296 | |
Miscellaneous | | | 358,978 | |
Total expenses | | | 3,281,482 | |
Less: | | | | |
Expenses waived by Adviser | | | (129,750 | ) |
Net expenses | | | 3,151,732 | |
Net investment loss | | | (205,432 | ) |
| | | | | |
Net Realized and Unrealized Gain (Loss): | |
Net realized gain (loss) on: | |
Investments in unaffiliated issuers | | $ | 80,151 | |
Investments in affiliated issuers | | | (266,989 | ) |
Futures contracts | | | (27,820,541 | ) |
Foreign currency | | | 98,506 | |
Net realized loss on investments and foreign currency | | | (27,908,873 | ) |
Net change in unrealized appreciation (depreciation) on: | |
Investments in unaffiliated issuers | | | 20,532 | |
Investments in affiliated issuers | | | 890,313 | |
Futures contracts | | | (1,489,916 | ) |
Foreign currency | | | 3,301 | |
Net change in unrealized appreciation (depreciation) on investments and foreign currency | | | (575,770 | ) |
Net realized and unrealized loss on investments and foreign currency | | | (28,484,643 | ) |
Net decrease in net assets resulting from operations | | $ | (28,690,075 | ) |
* | Relates to Trustees not deemed “interested persons” within the meaning of Section 2(a)(19) of the 1940 Act. |
SEE NOTES TO FINANCIAL STATEMENTS. | THE GUGGENHEIM FUNDS ANNUAL REPORT | 23 |
CONSOLIDATED STATEMENTS OF CHANGES IN NET ASSETS |
MANAGED FUTURES STRATEGY FUND | |
| | | Year Ended
December 31,
2016 | | | Year Ended
December 31,
2015 | |
Increase (Decrease) in Net Assets from Operations: | | | | | | |
Net investment loss | | $ | (205,432 | ) | | $ | (1,539,186 | ) |
Net realized gain (loss) on investments and foreign currency | | | (27,908,873 | ) | | | 4,869,804 | |
Net change in unrealized appreciation (depreciation) on investments and foreign currency | | | (575,770 | ) | | | (7,131,885 | ) |
Net decrease in net assets resulting from operations | | | (28,690,075 | ) | | | (3,801,267 | ) |
| | | | | | | | | |
Distributions to shareholders from: | | | | | | | | |
Net investment income | | | | | | | | |
A-Class | | | (835,216 | ) | | | (659,707 | ) |
C-Class | | | (642,841 | ) | | | (603,205 | ) |
P-Class | | | (4,344,074 | ) | | | (4,478,036 | )** |
Institutional Class | | | (320,377 | ) | | | (233,782 | ) |
Total distributions to shareholders | | | (6,142,508 | ) | | | (5,974,730 | ) |
| | | | | | | | | |
Capital share transactions: | | | | | | | | |
Proceeds from sale of shares | | | | | | | | |
A-Class | | | 11,456,330 | | | | 14,833,359 | |
C-Class | | | 640,671 | | | | 3,008,613 | |
P-Class | | | 35,495,477 | | | | 113,741,530 | ** |
Institutional Class | | | 2,088,056 | | | | 3,251,329 | |
Y-Class | | | — | | | | 8 | * |
Distributions reinvested | | | | | | | | |
A-Class | | | 793,205 | | | | 600,241 | |
C-Class | | | 623,208 | | | | 576,733 | |
P-Class | | | 4,259,964 | | | | 4,380,633 | ** |
Institutional Class | | | 320,377 | | | | 231,451 | |
Cost of shares redeemed | | | | | | | | |
A-Class | | | (12,534,971 | ) | | | (14,056,594 | ) |
C-Class | | | (7,812,593 | ) | | | (5,352,267 | ) |
P-Class | | | (101,986,446 | ) | | | (126,557,150 | )** |
Institutional Class | | | (3,737,316 | ) | | | (5,112,553 | ) |
Y-Class | | | — | | | | (623,374 | )* |
Net decrease from capital share transactions | | | (70,394,038 | ) | | | (11,078,041 | ) |
Net decrease in net assets | | | (105,226,621 | ) | | | (20,854,038 | ) |
| | | | | | | | | |
Net assets: | | | | | | | | |
Beginning of year | | | 223,215,042 | | | | 244,069,080 | |
End of year | | $ | 117,988,421 | | | $ | 223,215,042 | |
Accumulated net investment loss at end of year | | $ | (13,385,447 | ) | | $ | (9,910,569 | ) |
24 | THE GUGGENHEIM FUNDS ANNUAL REPORT | SEE NOTES TO FINANCIAL STATEMENTS. |
CONSOLIDATED STATEMENTS OF CHANGES IN NET ASSETS (concluded) |
MANAGED FUTURES STRATEGY FUND | |
| | | Year Ended
December 31,
2016 | | | Year Ended
December 31,
2015 | |
| | | | | | | |
Capital share activity: | | | | | | |
Shares sold | | | | | | |
A-Class | | | 576,626 | | | | 604,688 | |
C-Class | | | 31,071 | | | | 129,839 | |
P-Class | | | 1,641,302 | | | | 4,570,087 | ** |
Institutional Class | | | 96,780 | | | | 131,429 | |
Y-Class | | | — | | | | —* | ,*** |
Shares issued from reinvestment of distributions | | | | | | | | |
A-Class | | | 42,720 | | | | 25,951 | |
C-Class | | | 36,360 | | | | 26,713 | |
P-Class | | | 229,476 | | | | 189,391 | ** |
Institutional Class | | | 16,860 | | | | 9,857 | |
Shares redeemed | | | | | | | | |
A-Class | | | (603,653 | ) | | | (572,398 | ) |
C-Class | | | (398,335 | ) | | | (233,693 | ) |
P-Class | | | (4,824,503 | ) | | | (5,145,916 | )** |
Institutional Class | | | (174,306 | ) | | | (208,931 | ) |
Y-Class | | | — | | | | (24,965 | )* |
Net decrease in shares | | | (3,329,602 | ) | | | (497,948 | ) |
* | Y-Class closed on June 26, 2015 — See Note 13. |
** | H-Class shares redesignated as P-Class shares effective following the close of business on April 30, 2015 — See Note 14. |
*** | Less than 1 share. |
SEE NOTES TO FINANCIAL STATEMENTS. | THE GUGGENHEIM FUNDS ANNUAL REPORT | 25 |
CONSOLIDATED FINANCIAL HIGHLIGHTS |
MANAGED FUTURES STRATEGY FUND | |
This table is presented to show selected data for a share outstanding throughout each period and to assist shareholders in evaluating a Fund’s performance for the periods presented.
A-Class | | Year Ended
Dec. 31,
2016 | | | Year Ended
Dec. 31,
2015 | | | Year Ended
Dec. 31,
2014 | | | Year Ended
Dec. 31,
2013 | | | Year Ended
Dec. 31,
2012 | |
Per Share Data | | | | | | | | | | | | | | | |
Net asset value, beginning of period | | $ | 23.21 | | | $ | 24.12 | | | $ | 22.15 | | | $ | 21.23 | | | $ | 23.95 | |
Income (loss) from investment operations: | |
Net investment income (loss)a | | | — | b | | | (.14 | ) | | | .02 | | | | (.19 | ) | | | (.39 | ) |
Net gain (loss) on investments (realized and unrealized) | | | (3.53 | ) | | | (.15 | ) | | | 2.23 | | | | 1.11 | | | | (2.33 | ) |
Total from investment operations | | | (3.53 | ) | | | (.29 | ) | | | 2.25 | | | | .92 | | | | (2.72 | ) |
Less distributions from: | |
Net investment income | | | (.97 | ) | | | (.62 | ) | | | (.28 | ) | | | — | | | | — | |
Total distributions | | | (.97 | ) | | | (.62 | ) | | | (.28 | ) | | | — | | | | — | |
Net asset value, end of period | | $ | 18.71 | | | $ | 23.21 | | | $ | 24.12 | | | $ | 22.15 | | | $ | 21.23 | |
| |
Total Returnc | | | (15.18 | %) | | | (1.06 | %) | | | 10.06 | % | | | 4.33 | % | | | (11.32 | %) |
Ratios/Supplemental Data | |
Net assets, end of period (in thousands) | | $ | 22,734 | | | $ | 27,828 | | | $ | 27,514 | | | $ | 76,900 | | | $ | 145,950 | |
Ratios to average net assets: | |
Net investment income (loss) | | | (0.02 | %) | | | (0.57 | %) | | | 0.07 | % | | | (0.89 | %) | | | (1.71 | %) |
Total expensesd | | | 1.84 | % | | | 1.77 | % | | | 1.74 | % | | | 1.74 | % | | | 1.96 | % |
Net expensese | | | 1.76 | % | | | 1.69 | % | | | 1.68 | % | | | 1.67 | % | | | 1.89 | % |
Portfolio turnover rate | | | 16 | % | | | 24 | % | | | 83 | % | | | 102 | % | | | 172 | % |
26 | THE GUGGENHEIM FUNDS ANNUAL REPORT | SEE NOTES TO FINANCIAL STATEMENTS. |
CONSOLIDATED FINANCIAL HIGHLIGHTS (continued) |
MANAGED FUTURES STRATEGY FUND | |
This table is presented to show selected data for a share outstanding throughout each period and to assist shareholders in evaluating a Fund’s performance for the periods presented.
C-Class | | Year Ended
Dec. 31,
2016 | | | Year Ended
Dec. 31,
2015 | | | Year Ended
Dec. 31,
2014 | | | Year Ended
Dec. 31,
2013 | | | Year Ended
Dec. 31,
2012 | |
Per Share Data | | | | | | | | | | | | | | | |
Net asset value, beginning of period | | $ | 21.65 | | | $ | 22.71 | | | $ | 21.04 | | | $ | 20.31 | | | $ | 23.09 | |
Income (loss) from investment operations: | |
Net investment income (loss)a | | | (.16 | ) | | | (.30 | ) | | | (.15 | ) | | | (.33 | ) | | | (.53 | ) |
Net gain (loss) on investments (realized and unrealized) | | | (3.26 | ) | | | (.14 | ) | | | 2.10 | | | | 1.06 | | | | (2.25 | ) |
Total from investment operations | | | (3.42 | ) | | | (.44 | ) | | | 1.95 | | | | .73 | | | | (2.78 | ) |
Less distributions from: | |
Net investment income | | | (.97 | ) | | | (.62 | ) | | | (.28 | ) | | | — | | | | — | |
Total distributions | | | (.97 | ) | | | (.62 | ) | | | (.28 | ) | | | — | | | | — | |
Net asset value, end of period | | $ | 17.26 | | | $ | 21.65 | | | $ | 22.71 | | | $ | 21.04 | | | $ | 20.31 | |
| |
Total Returnc | | | (15.81 | %) | | | (1.84 | %) | | | 9.22 | % | | | 3.59 | % | | | (12.04 | %) |
Ratios/Supplemental Data | |
Net assets, end of period (in thousands) | | $ | 11,245 | | | $ | 21,272 | | | $ | 24,066 | | | $ | 29,637 | | | $ | 49,378 | |
Ratios to average net assets: | |
Net investment income (loss) | | | (0.81 | %) | | | (1.32 | %) | | | (0.72 | %) | | | (1.63 | %) | | | (2.45 | %) |
Total expensesd | | | 2.61 | % | | | 2.52 | % | | | 2.50 | % | | | 2.48 | % | | | 2.70 | % |
Net expensese | | | 2.54 | % | | | 2.44 | % | | | 2.43 | % | | | 2.42 | % | | | 2.64 | % |
Portfolio turnover rate | | | 16 | % | | | 24 | % | | | 83 | % | | | 102 | % | | | 172 | % |
SEE NOTES TO FINANCIAL STATEMENTS. | THE GUGGENHEIM FUNDS ANNUAL REPORT | 27 |
CONSOLIDATED FINANCIAL HIGHLIGHTS (continued) |
MANAGED FUTURES STRATEGY FUND |
This table is presented to show selected data for a share outstanding throughout each period and to assist shareholders in evaluating a Fund’s performance for the periods presented.
P-Class | | Year Ended
Dec. 31,
2016 | | | Year Ended
Dec. 31,
2015 | | | Year Ended
Dec. 31,
2014 | | | Year Ended
Dec. 31,
2013 | | | Year Ended
Dec. 31,
2012 | |
Per Share Data | | | | | | | | | | | | | | | |
Net asset value, beginning of period | | $ | 23.20 | | | $ | 24.11 | | | $ | 22.15 | | | $ | 21.23 | | | $ | 23.95 | |
Income (loss) from investment operations: | |
Net investment income (loss)a | | | (.01 | ) | | | (.14 | ) | | | — | b | | | (.20 | ) | | | (.38 | ) |
Net gain (loss) on investments (realized and unrealized) | | | (3.51 | ) | | | (.15 | ) | | | 2.24 | | | | 1.12 | | | | (2.34 | ) |
Total from investment operations | | | (3.52 | ) | | | (.29 | ) | | | 2.24 | | | | .92 | | | | (2.72 | ) |
Less distributions from: | |
Net investment income | | | (.97 | ) | | | (.62 | ) | | | (.28 | ) | | | — | | | | — | |
Total distributions | | | (.97 | ) | | | (.62 | ) | | | (.28 | ) | | | — | | | | — | |
Net asset value, end of period | | $ | 18.71 | | | $ | 23.20 | | | $ | 24.11 | | | $ | 22.15 | | | $ | 21.23 | |
| |
Total Returnc | | | (15.18 | %) | | | (1.06 | %) | | | 10.06 | % | | | 4.33 | % | | | (11.32 | %) |
Ratios/Supplemental Data | |
Net assets, end of period (in thousands) | | $ | 77,859 | | | $ | 165,086 | | | $ | 180,872 | | | $ | 191,400 | | | $ | 501,109 | |
Ratios to average net assets: | |
Net investment income (loss) | | | (0.07 | %) | | | (0.57 | %) | | | 0.01 | % | | | (0.94 | %) | | | (1.70 | %) |
Total expensesd | | | 1.87 | % | | | 1.77 | % | | | 1.75 | % | | | 1.75 | % | | | 1.95 | % |
Net expensese | | | 1.79 | % | | | 1.69 | % | | | 1.68 | % | | | 1.68 | % | | | 1.89 | % |
Portfolio turnover rate | | | 16 | % | | | 24 | % | | | 83 | % | | | 102 | % | | | 172 | % |
28 | THE GUGGENHEIM FUNDS ANNUAL REPORT | SEE NOTES TO FINANCIAL STATEMENTS. |
CONSOLIDATED FINANCIAL HIGHLIGHTS (concluded) |
MANAGED FUTURES STRATEGY FUND |
This table is presented to show selected data for a share outstanding throughout each period and to assist shareholders in evaluating a Fund’s performance for the periods presented.
Institutional Class | | Year Ended
Dec. 31,
2016 | | | Year Ended
Dec. 31,
2015 | | | Year Ended
Dec. 31,
2014 | | | Year Ended
Dec. 31,
2013 | | | Year Ended
Dec. 31,
2012 | |
Per Share Data | | | | | | | | | | | | | | | |
Net asset value, beginning of period | | $ | 23.56 | | | $ | 24.41 | | | $ | 22.36 | | | $ | 21.38 | | | $ | 24.06 | |
Income (loss) from investment operations: | |
Net investment income (loss)a | | | .04 | | | | (.08 | ) | | | .05 | | | | (.19 | ) | | | (.33 | ) |
Net gain (loss) on investments (realized and unrealized) | | | (3.56 | ) | | | (.15 | ) | | | 2.28 | | | | 1.17 | | | | (2.35 | ) |
Total from investment operations | | | (3.52 | ) | | | (.23 | ) | | | 2.33 | | | | .98 | | | | (2.68 | ) |
Less distributions from: | |
Net investment income | | | (.97 | ) | | | (.62 | ) | | | (.28 | ) | | | — | | | | — | |
Total distributions | | | (.97 | ) | | | (.62 | ) | | | (.28 | ) | | | — | | | | — | |
Net asset value, end of period | | $ | 19.07 | | | $ | 23.56 | | | $ | 24.41 | | | $ | 22.36 | | | $ | 21.38 | |
| |
Total Returnc | | | (14.95 | %) | | | (0.80 | %) | | | 10.28 | % | | | 4.63 | % | | | (11.14 | %) |
Ratios/Supplemental Data | |
Net assets, end of period (in thousands) | | $ | 6,151 | | | $ | 9,029 | | | $ | 11,007 | | | $ | 2,464 | | | $ | 45,700 | |
Ratios to average net assets: | |
Net investment income (loss) | | | 0.20 | % | | | (0.32 | %) | | | 0.21 | % | | | (0.86 | %) | | | (1.45 | %) |
Total expensesd | | | 1.61 | % | | | 1.52 | % | | | 1.50 | % | | | 1.52 | % | | | 1.70 | % |
Net expensese | | | 1.54 | % | | | 1.44 | % | | | 1.44 | % | | | 1.45 | % | | | 1.64 | % |
Portfolio turnover rate | | | 16 | % | | | 24 | % | | | 83 | % | | | 102 | % | | | 172 | % |
a | Net investment income (loss) per share was computed using average shares outstanding throughout the period. |
b | Net investment income (loss) is less than $0.01 per share. |
c | Total return does not reflect the impact of any applicable sales charges. |
d | Does not include expenses of the underlying funds in which the Fund invests. |
e | Net expense information reflects the expense ratios after expense waivers. |
SEE NOTES TO FINANCIAL STATEMENTS. | THE GUGGENHEIM FUNDS ANNUAL REPORT | 29 |
NOTES TO CONSOLIDATED FINANCIAL STATEMENTS |
1. Organization and Significant Accounting Policies
Organization
The Rydex Series Funds (the “Trust”), a Delaware statutory trust, is registered with the SEC under the Investment Company Act of 1940 (“1940 Act”), as an open-ended investment company of the series type. Each series, in effect, is representing a separate Fund. The Trust is authorized to issue an unlimited number of no par value shares. The Trust accounts for the assets of each fund separately.
The Trust offers a combination of seven separate classes of shares: Investor Class shares, A-Class shares, C-Class shares, H-Class shares, P-Class shares, Institutional Class shares and Money Market Class shares. Sales of shares of each Class are made without a front-end sales charge at the net asset value per share (“NAV”), with the exception of A-Class shares. A-Class shares are sold at the NAV, plus the applicable front-end sales charge. The sales charge varies depending on the amount purchased, but will not exceed 4.75%. A-Class share purchases of $1 million or more are exempt from the front-end sales charge but have a 1% contingent deferred sales charge (“CDSC”) if shares are redeemed within 12 months of purchase. C-Class shares have a 1% CDSC if shares are redeemed within 12 months of purchase. Institutional Class shares are offered primarily for direct investment by institutions such as pension and profit sharing plans, endowments, foundations and corporations. Institutional Class shares require a minimum initial investment of $2 million and a minimum account balance of $1 million. At December 31, 2016, the Trust consisted of fifty-three funds (the “Funds”).
This report covers the Managed Futures Strategy Fund (the “Fund”), a non-diversified investment company. Only A-Class, C-Class, P-Class and Institutional Class shares had been issued by the Fund.
Guggenheim Investments (“GI”) provides advisory services. Guggenheim Funds Distributors, LLC (“GFD”) acts as principal underwriter for the Trust. GI and GFD are affiliated entities.
Significant Accounting Policies
The Fund operates as an investment company and, accordingly, follows the investment company accounting and reporting guidance of the Financial Accounting Standards Board (“FASB”) Accounting Standards Codification Topic 946 Financial Services – Investment Companies.
The following significant accounting policies are in conformity with U.S. generally accepted accounting principles (“U.S. GAAP”) and are consistently followed by the Trust. This requires management to make estimates and assumptions that affect the reported amount of assets and liabilities, contingent assets and liabilities at the date of the financial statements, and the reported amounts of revenues and expenses during the reporting period. Actual results could differ from these estimates. All time references are based on Eastern Time.
30 | THE GUGGENHEIM FUNDS ANNUAL REPORT | |
NOTES TO CONSOLIDATED FINANCIAL STATEMENTS (continued) |
The NAV of each Class of the Fund is calculated by dividing the market value of the Fund’s securities and other assets, less all liabilities, attributable to the Class by the number of outstanding shares of the Class.
A. The Board of Trustees of the Fund (the “Board”) has adopted policies and procedures for the valuation of the Fund’s investments (the “Valuation Procedures”). Pursuant to the Valuation Procedures, the Board has delegated to a valuation committee, consisting of representatives from Guggenheim’s investment management, fund administration, legal and compliance departments (the “Valuation Committee”), the day-to-day responsibility for implementing the Valuation Procedures, including, under most circumstances, the responsibility for determining the fair value of the Fund’s securities and/or other assets.
Valuations of the Fund’s securities are supplied primarily by pricing services appointed pursuant to the processes set forth in the Valuation Procedures. The Valuation Committee convenes monthly, or more frequently as needed, to review the valuation of all assets which have been fair valued for reasonableness. The Fund’s officers, through the Valuation Committee and consistent with the monitoring and review responsibilities set forth in the Valuation Procedures, regularly review procedures used and valuations provided by the pricing services.
If the pricing service cannot or does not provide a valuation for a particular investment or such valuation is deemed unreliable, such investment is fair valued by the Valuation Committee.
Open-end investment companies (“mutual funds”) are valued at their NAV as of the close of business, on the valuation date. Exchange-traded funds (“ETFs”) and closed-end investment companies (“CEFs”) are valued at the last quoted sales price.
U.S. Government securities are valued by either independent pricing services, the last traded fill price, or at the reported bid price at the close of business.
Repurchase agreements are valued at amortized cost, provided such amounts approximate market value.
The value of futures contracts is accounted for using the unrealized gain or loss on the contracts that is determined by marking the contracts to their current realized settlement prices. Financial futures contracts are valued at the 4:00 p.m. price on the valuation date. In the event that the exchange for a specific futures contract closes earlier than 4:00 p.m., the futures contract is valued at the Official Settlement Price of the exchange. However, the underlying securities from which the futures contract value is derived are monitored until 4:00 p.m. to determine if fair valuation would provide a more accurate valuation.
Investments for which market quotations are not readily available are fair-valued as determined in good faith by GI under the direction of the Board using methods established or ratified by the Board. Valuations in accordance with these methods are intended to reflect each security’s (or asset’s) “fair value.” Each such determination is based on a consideration of all relevant factors, which are likely to vary from one pricing context to another. Examples of such factors may include,
| | THE GUGGENHEIM FUNDS ANNUAL REPORT | 31 |
NOTES TO CONSOLIDATED FINANCIAL STATEMENTS (continued) |
but are not limited to market prices; sale prices; broker quotes; and models which derive prices based on inputs such as prices of securities with comparable maturities and characteristics, or based on inputs such as anticipated cash flows or collateral, spread over Treasuries, and other information analysis. In connection with futures contracts and other derivative investments, such factors may include obtaining information as to how (a) these contracts and other derivative investments trade in the futures or other derivative markets, respectively, and (b) the securities underlying these contracts and other derivative investments trade in the cash market.
B. Certain U.S. Government and Agency Obligations are traded on a discount basis; the interest rates shown on the Schedule of Investments reflect the effective rates paid at the time of purchase by the Fund. Other securities bear interest at the rates shown, payable at fixed dates through maturity.
C. Upon entering into a futures contract, the Fund deposits and maintains as collateral such initial margin as required by the exchange on which the transaction is affected. Pursuant to the contract, the Fund agrees to receive from or pay to the broker an amount of cash equal to the daily fluctuation in value of the contract. Such receipts or payments are known as variation margin and are recorded by the Fund as unrealized gains or losses. When the contract is closed, the Fund records a realized gain or loss equal to the difference between the value of the contract at the time it was opened and the value at the time it was closed.
D. The accounting records of the Fund are maintained in U.S. dollars. All assets and liabilities initially expressed in foreign currencies are converted into U.S. dollars at prevailing exchange rates. Purchases and sales of investment securities, dividend and interest income, and certain expenses are translated at the rates of exchange prevailing on the respective dates of such transactions. Changes in the relationship of these foreign currencies to the U.S. dollar can significantly affect the value of the investments and earnings of the Fund. Foreign investments may also subject the Fund to foreign government exchange restrictions, expropriation, taxation, or other political, social or economic developments, all of which could affect the market and/or credit risk of the investments.
The Fund does not isolate that portion of the results of operations resulting from changes in the foreign exchange rates on investments from the fluctuations arising from changes in the market prices of securities held. Such fluctuations are included with the net realized and unrealized gain or loss on investments.
Reported net realized foreign exchange gains and losses arise from sales of foreign currencies and currency gains or losses realized between the trade and settlement dates on investment transactions. Net unrealized exchange gains and losses arise from changes in the fair values of assets and liabilities other than investments in securities at the fiscal period end, resulting from changes in exchange rates.
32 | THE GUGGENHEIM FUNDS ANNUAL REPORT | |
NOTES TO CONSOLIDATED FINANCIAL STATEMENTS (continued) |
E. Security transactions are recorded on the trade date for financial reporting purposes. Realized gains and losses from securities transactions are recorded using the identified cost basis. Proceeds from lawsuits related to investment holdings are recorded as realized gains in the Fund. Dividend income is recorded on the ex-dividend date, net of applicable taxes withheld by foreign countries. Taxable non-cash dividends are recorded as dividend income. Interest income, including amortization of premiums and accretion of discounts, is accrued on a daily basis.
F. Distributions of net investment income and net realized gains, if any, are declared and paid at least annually. Dividends are reinvested in additional shares unless shareholders request payment in cash. Distributions are recorded on the ex-dividend date and are determined in accordance with income tax regulations which may differ from U.S. GAAP.
G. Interest and dividend income, most expenses, all realized gains and losses, and all unrealized gains and losses are allocated to the classes based upon the value of the outstanding shares in each Class. Certain costs, such as distribution and service fees are charged directly to specific classes. In addition, certain expenses have been allocated to the individual Funds in the Trust on a pro rata basis upon the respective aggregate net assets of each Fund included in the Trust.
H. The Fund may leave cash overnight in its cash account with the custodian. Periodically, the Fund may have cash due to the custodian bank as an overdraft balance. A fee is incurred on this overdraft, calculated by multiplying the overdraft by a rate based on the federal funds rate, which was 0.55% at December 31, 2016.
I. Under the Fund’s organizational documents, its Trustees and Officers are indemnified against certain liabilities arising out of the performance of their duties to the Trust. In addition, throughout the normal course of business, the Fund enters into contracts that contain a variety of representations and warranties which provide general indemnifications. The Fund’s maximum exposure under these arrangements is unknown, as this would involve future claims that may be made against the Fund and/or its affiliates that have not yet occurred. However, based on experience, the Fund expects the risk of loss to be remote.
2. Financial Instruments and Derivatives
As part of its investment strategy, the Fund utilizes a variety of derivative instruments. These investments involve, to varying degrees, elements of market risk and risks in excess of the amounts recognized in the Consolidated Statement of Assets and Liabilities. Valuation and accounting treatment of these instruments can be found under Significant Accounting Policies in Note 1 of these Notes to Consolidated Financial Statements.
Derivatives
Derivatives are instruments whose values depend on, or are derived from, in whole or in part, the value of one or more other assets, such as securities, currencies, commodities or indices. Derivative instruments may be used to increase investment flexibility (including to maintain cash reserves while maintaining exposure to certain other assets), for risk management (hedging)
| | THE GUGGENHEIM FUNDS ANNUAL REPORT | 33 |
NOTES TO CONSOLIDATED FINANCIAL STATEMENTS (continued) |
purposes, to facilitate trading, to reduce transaction costs and to pursue higher investment returns. Derivative instruments may also be used to mitigate certain investment risks, such as foreign currency exchange rate risk, interest rate risk and credit risk. U.S. GAAP requires disclosures to enable investors to better understand how and why the Fund uses derivative instruments, how these derivative instruments are accounted for and their effects on the Fund’s financial position and results of operations. The Fund may utilize derivatives for the following purposes:
Hedge: an investment made in order to reduce the risk of adverse price movements in a security, by taking an offsetting position to protect against broad market moves.
Leverage: gaining total exposure to equities or other assets on the long and short sides at greater than 100% of invested capital.
Liquidity: the ability to buy or sell exposure with little price/market impact.
Speculation: the use of an instrument to express macro-economic and other investment views.
For any Fund whose investment strategy consistently involves applying leverage, the value of the Fund’s shares will tend to increase or decrease more than the value of any increase or decrease in the underlying index or other asset. In addition, because an investment in derivative instruments generally requires a small investment relative to the amount of investment exposure assumed, an opportunity for increased net income is created; but, at the same time, leverage risk will increase. The Fund’s use of leverage, through borrowings or instruments such as derivatives, may cause the Fund to be more volatile and riskier than if they had not been leveraged.
Futures
A futures contract is an agreement to purchase (long) or sell (short) an agreed amount of securities or other instruments at a set price for delivery at a future date. There are significant risks associated with a Fund’s use of futures contracts, including (i) there may be an imperfect or no correlation between the changes in market value of the underlying asset and the prices of futures contracts; (ii) there may not be a liquid secondary market for a futures contract; (iii) trading restrictions or limitations may be imposed by an exchange; and (iv) government regulations may restrict trading in futures contracts. When investing in futures, there is minimal counterparty credit risk to a Fund because futures are exchange-traded and the exchange’s clearinghouse, as counterparty to all exchange-traded futures, guarantees against default. Cash deposits are shown as segregated cash with broker on the Consolidated Statement of Assets and Liabilities; securities held as collateral are noted on the Consolidated Schedule of Investments.
34 | THE GUGGENHEIM FUNDS ANNUAL REPORT | |
NOTES TO CONSOLIDATED FINANCIAL STATEMENTS (continued) |
The following table represents the Fund’s use and volume of futures on a quarterly basis:
| | | | Average Notional | |
Fund | Use | | Long | | | Short | |
Managed Futures Strategy Fund | Hedge, Leverage, Liquidity, Speculation | | $ | 747,619,240 | | | $ | 290,997,081 | |
The following is a summary of the location of derivative investments on the Fund’s Consolidated Statement of Assets and Liabilities as of December 31, 2016:
Derivative Investment Type | Asset Derivatives | Liability Derivatives |
Equity/Interest Rate/Currency/Commodity contracts | — | Variation margin |
The following table sets forth the fair value of the Fund’s derivative investments categorized by primary risk exposure at December 31, 2016:
Asset Derivative Investments Value | |
Fund | | Futures
Equity
Contracts* | | | Futures
Currency
Contracts* | | | Futures
Interest Rate
Contracts* | | | Futures
Commodity
Contracts* | | | Total Value at
December 31,
2016 | |
Managed Futures Strategy Fund | | $ | 862,995 | | | $ | 635,930 | | | $ | 1,700,003 | | | $ | 1,245,692 | | | $ | 4,444,620 | |
Liability Derivative Investments Value | |
Fund | | Futures
Equity
Contracts* | | | Futures
Currency
Contracts* | | | Futures
Interest Rate
Contracts* | | | Futures
Commodity
Contracts* | | | Total Value at
December 31,
2016 | |
Managed Futures Strategy Fund | | $ | 122,361 | | | $ | 120,593 | | | $ | 69,789 | | | $ | 1,215,247 | | | $ | 1,527,990 | |
* | Includes cumulative appreciation (depreciation) of futures contracts as reported on the Consolidated Schedule of Investments. Only current day’s variation margin is reported within the Consolidated Statement of Assets and Liabilities. |
The following is a summary of the location of derivative investments on the Fund’s Consolidated Statement of Operations for the year ended December 31, 2016:
Derivative Investment Type | Location of Gain (Loss) on Derivatives |
Equity/Interest Rate/Currency/Commodity contracts | Net realized gain (loss) on futures contracts |
| Net change in unrealized appreciation (depreciation) on futures contracts |
| | THE GUGGENHEIM FUNDS ANNUAL REPORT | 35 |
NOTES TO CONSOLIDATED FINANCIAL STATEMENTS (continued) |
The following is a summary of the Fund’s realized gain (loss) and change in unrealized appreciation (depreciation) on derivative investments recognized on the Consolidated Statement of Operations categorized by primary risk exposure for the year ended December 31, 2016:
Realized Gain (Loss) on Derivative Investments Recognized on the Consolidated Statement of Operations | |
Fund | | Futures
Equity
Contracts | | | Futures
Currency
Contracts | | | Futures
Interest Rate
Contracts | | | Futures
Commodity
Contracts | | | Total | |
Managed Futures Strategy Fund | | $ | (10,016,077 | ) | | $ | (3,820,392 | ) | | $ | 3,476,628 | | | $ | (17,460,700 | ) | | $ | (27,820,541 | ) |
Change in Unrealized Appreciation (Depreciation) on Derivative
Investments Recognized on the Consolidated Statement of Operations | |
Fund | Futures
Equity
Contracts | | Futures
Currency
Contracts | | Futures
Interest Rate
Contracts | | Futures
Commodity
Contracts | | Total | |
Managed Futures Strategy Fund | | $ | 608,131 | | | $ | 45,265 | | | $ | (265,296 | ) | | $ | (1,878,016 | ) | | $ | (1,489,916 | ) |
In conjunction with the use of derivative instruments, the Fund is required to maintain collateral in various forms. The Fund uses, where appropriate, depending on the financial instrument utilized and the broker involved, margin deposits at the broker, cash and/or securities segregated at the custodian bank, discount notes or the repurchase agreements allocated to the Fund.
The Trust has established counterparty credit guidelines and enters into transactions only with financial institutions of investment grade or better. The Trust monitors the counterparty credit risk.
3. Fees and Other Transactions with Affiliates
Under the terms of an investment advisory contract, the Fund pays GI investment advisory fees calculated at an annualized rate of 0.90% of the average daily net assets of the Fund.
Each of the consolidated financial statements of the Managed Futures Strategy Fund include the accounts of a wholly-owned and controlled Cayman Islands subsidiary (the “Subsidiary”). All inter-company accounts and transactions have been eliminated in consolidation for the Fund.
GI has contractually agreed to waive the management fee it receives from the Subsidiary in an amount equal to the management fee paid to GI by the Subsidiary. This undertaking will continue in effect for so long as the Fund invests in the Subsidiary, and may not be terminated by GI unless GI obtains the prior approval of the Fund’s Board of Trustees for such termination. For the year ended December 31, 2016, Managed Future Strategy Fund waived $118,902 related to investments in the Subsidiary.
GI engages external service providers to perform other necessary services for the Trust, such as audit and accounting related services, legal services, custody, printing and mailing, etc., on a pass-through basis. Such expenses are allocated to various Funds within the complex based on relative net assets.
36 | THE GUGGENHEIM FUNDS ANNUAL REPORT | |
NOTES TO CONSOLIDATED FINANCIAL STATEMENTS (continued) |
The Trust has adopted a Distribution Plan applicable to A-Class shares and P-Class shares for which GFD and other firms that provide distribution and/or shareholder services (“Service Providers”) may receive compensation. If a Service Provider provides distribution services, the Fund will pay distribution fees to GFD at an annual rate not to exceed 0.25% of average daily net assets, pursuant to Rule 12b-1 of the 1940 Act. GFD, in turn, will pay the Service Providers out of its fees. GFD may, at its discretion, retain a portion of such payments to compensate itself for distribution services.
The Trust has adopted a separate Distribution and Shareholder Services Plan applicable to its C-Class shares that allows the Fund to pay annual distribution and service fees of 1.00% of the Fund’s C-Class shares average daily net assets. The annual 0.25% service fee compensates a shareholder’s financial adviser for providing ongoing services to the shareholder. The annual distribution fee of 0.75% reimburses GFD for paying the shareholder’s financial adviser an ongoing sales commission. GFD advances the first year’s service and distribution fees to the financial adviser. GFD retains the service and distribution fees on accounts with no authorized dealer of record.
If a Fund invests in an affiliated fund, the investing Fund’s adviser has agreed to waive fees at the investing fund level. Fee waivers will be calculated at the investing Fund level without regard to any expense cap, if any, in effect for the investing Fund. Fees waived under this arrangement are not subject to reimbursement to GI. For the year December 31, 2016, the Fund waived $10,848 related to investments in affiliated funds.
For the year ended December 31, 2016, GFD retained sales charges of $278,697 relating to sales of A-Class shares of the Trust.
Certain trustees and officers of the Trust are also officers of GI and GFD.
On October 4, 2016, Rydex Fund Services, LLC (“RFS”) was purchased by MUFG Investor Services and as of that date RFS ceased to be an affiliate of GI. In connection with its acquisition, RFS changed its name to MUFG Investor Services (US), LLC (“MUIS”). This change has no impact on the financial statements of the Trust.
MUIS acts as the Trust’s administrator, transfer agent and accounting agent. As administrator, transfer agent and accounting agent, MUIS is responsible for maintaining the books and records of the Trust’s securities and cash. For providing the aforementioned services, MUIS is entitled to receive a monthly fee equal to an annual percentage of the Fund’s average daily net assets subject to certain minimum monthly fees and out of pocket expenses.
4. Fair Value Measurement
In accordance with U.S. GAAP, fair value is defined as the price that the Fund would receive to sell an investment or pay to transfer a liability in an orderly transaction with an independent buyer in the principal market, or in the absence of a principal market, the most advantageous market for
| | THE GUGGENHEIM FUNDS ANNUAL REPORT | 37 |
NOTES TO CONSOLIDATED FINANCIAL STATEMENTS (continued) |
the investment or liability. U.S. GAAP establishes a three-tier fair value hierarchy based on the types of inputs used to value assets and liabilities and requires corresponding disclosure. The hierarchy and the corresponding inputs are summarized below:
Level 1 — | quoted prices in active markets for identical assets or liabilities. |
Level 2 — | significant other observable inputs (for example quoted prices for securities that are similar based on characteristics such as interest rates, prepayment speeds, credit risk, etc.). |
Level 3 — | significant unobservable inputs based on the best information available under the circumstances, to the extent observable inputs are not available, which may include assumptions. |
The types of inputs available depend on a variety of factors, such as the type of security and the characteristics of the markets in which it trades, if any. Fair valuation determinations that rely on fewer or no observable inputs require greater judgment. Accordingly, fair value determinations for Level 3 securities require the greatest amount of judgment.
The inputs or methodologies used for valuing securities are not necessarily an indication of the risk associated with investing in those securities. The suitability of the techniques and sources employed to determine fair valuation are regularly monitored and subject to change.
5. Repurchase Agreements
The Funds transfer uninvested cash balances into a single joint account, the daily aggregate balance of which is invested in one or more repurchase agreements collateralized by obligations of the U.S. Treasury and U.S. government agencies. The collateral is in the possession of the Funds’ custodian and is evaluated to ensure that its market value exceeds, at a minimum, 102% of the original face amount of the repurchase agreements. Each Fund holds a pro rata share of the collateral based on the dollar amount of the repurchase agreement entered into by each Fund.
At December 31, 2016, the repurchase agreements in the joint account were as follows:
Counterparty and
Terms of Agreement | | Face
Value | | | Repurchase
Price | | Collateral | | Par
Value | | | Fair
Value | |
Royal Bank of Canada 0.24% Due 01/03/17 | | $ | 166,315,262 | | | $ | 166,319,697 | | U.S. TIP Notes 0.13% 04/15/20 | | $ | 162,878,400 | | | $ | 169,641,588 | |
HSBC Securities, Inc. 0.28% Due 01/03/17 | | | 107,451,980 | | | | 107,455,323 | | U.S. Treasury Strips 0.00% 02/15/40 | | | 223,858,300 | | | | 109,601,024 | |
UMB Financial Corp. 0.24% Due 01/03/17 | | | 6,108,437 | | | | 6,108,600 | | Federal Farm Credit Bank 0.78% 05/17/17 | | | 6,232,000 | | | | 6,230,837 | |
38 | THE GUGGENHEIM FUNDS ANNUAL REPORT | |
NOTES TO CONSOLIDATED FINANCIAL STATEMENTS (continued) |
In the event of counterparty default, the Funds have the right to collect the collateral to offset losses incurred. There is potential loss to the Funds in the event the Funds are delayed or prevented from exercising their rights to dispose of the collateral securities, including the risk of a possible decline in the value of the underlying securities during the period while the Funds seek to assert their rights. The Funds’ investment adviser, acting under the supervision of the Board, reviews the value of the collateral and the creditworthiness of those banks and dealers with which the Funds enter into repurchase agreements to evaluate potential risks.
6. Offsetting
In the normal course of business, the Fund enters into transactions subject to enforceable master netting arrangements or other similar arrangements. Generally, the right to offset in those agreements allows the Fund to counteract the exposure to a specific counterparty with collateral received from or delivered to that counterparty based on the terms of the arrangements. These arrangements provide for the right to liquidate upon the occurrence of an event of default, credit event upon merger or additional termination event.
In order to better define their contractual rights and to secure rights that will help the Fund mitigate its counterparty risk, the Fund may enter into an International Swaps and Derivatives Association, Inc. Master Agreement (“ISDA Master Agreement”) or similar agreement with their derivative contract counterparties. An ISDA Master Agreement is a bilateral agreement between a Fund and a counterparty that governs OTC derivatives, including foreign exchange contracts, and typically contains, among other things, collateral posting terms and netting provisions in the event of a default and/or termination event. The provisions of the ISDA Master Agreement typically permit a single net payment in the event of a default (close-out netting) or similar event, including the bankruptcy or insolvency of the counterparty.
For derivatives traded under an ISDA Master Agreement, the collateral requirements are typically calculated by netting the mark-to-market amount for each transaction under such agreement and comparing that amount to the value of any collateral currently pledged by the Fund and the counterparty. For financial reporting purposes, cash collateral that has been pledged to cover obligations of the Fund and cash collateral received from the counterparty, if any, are reported separately on the Consolidated Statement of Assets and Liabilities as segregated cash with broker/receivable for variation margin, or payable for swap settlement/variation margin. Generally, the amount of collateral due from or to a counterparty must exceed a minimum transfer amount threshold (e.g., $300,000) before a transfer is required to be made. To the extent amounts due to the Fund from its counterparties are not fully collateralized, contractually or otherwise, the Fund bears the risk of loss from counterparty nonperformance. The Fund attempts to mitigate counterparty risk by only entering into agreements with counterparties that they believe to be of good standing and by monitoring the financial stability of those counterparties.
For financial reporting purposes, the Fund does not offset derivative assets and derivative liabilities that are subject to netting arrangements in the Consolidated Statement of Assets and Liabilities.
| | THE GUGGENHEIM FUNDS ANNUAL REPORT | 39 |
NOTES TO CONSOLIDATED FINANCIAL STATEMENTS (continued) |
7. Portfolio Securities Loaned
The Fund may lend its securities to approved brokers to earn additional income. Security lending income shown on the Consolidated Statement of Operations is shown net of rebates paid to the borrowers and earnings on cash collateral investments shared with the lending agent. Within this arrangement, the Fund act as the lender, U.S. Bank acts as the lending agent, and other approved registered broker dealers act as the borrowers. The Fund receives cash collateral, valued at 102% of the value of the securities on loan. Under the terms of the Fund’s securities lending agreement with U.S. Bank, cash collateral and proceeds are invested in the First American Government Obligations Fund - Class Z. The Fund bears the risk of loss on cash collateral investments. Collateral is maintained over the life of the loan in an amount not less than the value of loaned securities, as determined at the close of business each day; any additional collateral required due to changes in security values is delivered to the Fund the next business day. Although the collateral mitigates the risk, the Fund could experience a delay in recovering its securities and a possible loss of income or value if the borrower fails to return the securities. The Fund has the right under the securities lending agreement to recover the securities from the borrower on demand. Securities lending transactions are accounted for as secured borrowings. The remaining contractual maturity of the securities lending agreement is overnight and continuous.
At December 31, 2016, the Fund participated in securities lending transactions, which are subject to enforceable netting arrangements, as follows:
| | | Gross Amounts Not Offset in the
Consolidated Statement of Assets and Liabilities | | | Securities Lending Collateral | |
Fund | | Value of Securities Loaned | | | Collateral Received(a) | | | Net
Amount | | | Cash
Collateral Invested | | | Cash
Collateral Uninvested | | | Total
Collateral | |
Managed Futures Strategy Fund | | $ | 2,044,896 | | | $ | (2,044,896 | ) | | $ | — | | | $ | 2,091,000 | | | $ | — | | | $ | 2,091,000 | |
(a) | Actual collateral received by the Fund is greater than the amount shown due to overcollateralization. |
In the event of counterparty default, the Fund has the right to collect the collateral to offset losses incurred. There is potential loss to the Fund in the event the Fund is delayed or prevented from exercising its right to dispose of the collateral securities, including the risk of a possible decline in the value of the underlying securities during the period while the Fund seeks to assert its rights. GI, acting under the supervision of the Board, reviews the value of the collateral and the creditworthiness of those banks and dealers to evaluate potential risks.
40 | THE GUGGENHEIM FUNDS ANNUAL REPORT | |
NOTES TO CONSOLIDATED FINANCIAL STATEMENTS (continued) |
8. Federal Income Tax Information
The Fund intends to comply with the provisions of Subchapter M of the Internal Revenue Code applicable to regulated investment companies and will distribute substantially all taxable net investment income and capital gains sufficient to relieve the Fund from all, or substantially all, federal income, excise and state income taxes. Therefore, no provision for federal or state income tax is required.
Tax positions taken or expected to be taken in the course of preparing the Fund’s tax returns are evaluated to determine whether the tax positions are “more-likely-than-not” of being sustained by the applicable tax authority. Tax positions not deemed to meet the more-likely-than-not threshold would be recorded as a tax benefit or expense in the current year. Management has analyzed the Fund’s tax positions taken, or to be taken, on federal income tax returns for all open tax years, and has concluded that no provision for income tax is required in the Fund’s financial statements. The Fund’s federal tax returns are subject to examination by the Internal Revenue Service for a period of three years after they are filed.
The Fund intends to invest up to 25% of its assets in the Subsidiary which is expected to provide the Fund with exposure to the commodities markets within the limitations of the federal tax requirements under Subchapter M of the Internal Revenue Code. The Fund has received a private letter ruling from the IRS that concludes that the income the Fund receives from the Subsidiary will constitute qualifying income for purposes of Subchapter M of the Internal Revenue Code. The Subsidiary will be classified as a corporation for U.S. federal income tax purposes. A foreign corporation, such as the Subsidiary, will generally not be subject to U.S. federal income taxation unless it is deemed to be engaged in a U.S. trade or business.
The tax character of distributions paid during the year ended December 31, 2016 are as follows:
Fund | | Ordinary
Income | | | Long-Term
Capital Gain | | | Total
Distributions | |
Managed Futures Strategy Fund | | $ | 6,142,508 | | | $ | — | | | $ | 6,142,508 | |
The tax character of distributions paid during the year ended December 31, 2015 were as follows:
Fund | | Ordinary
Income | | | Long-Term
Capital Gain | | | Total
Distributions | |
Managed Futures Strategy Fund | | $ | 5,974,730 | | | $ | — | | | $ | 5,974,730 | |
Note: For federal income tax purposes, short-term capital gain distributions are treated as ordinary income distributions.
| | THE GUGGENHEIM FUNDS ANNUAL REPORT | 41 |
NOTES TO CONSOLIDATED FINANCIAL STATEMENTS (continued) |
The tax character of distributable earnings/(accumulated losses) as of December 31, 2016 are as follows:
Fund | | Undistributed
Ordinary
Income | | | Undistributed
Long-Term
Capital Gain | | | Net Unrealized
Appreciation/
(Depreciation) | | | Capital Loss
Carryforward | |
Managed Futures Strategy Fund | | $ | 2,338,727 | | | $ | — | | | $ | (15,005,285 | ) | | $ | (89,411,081 | ) |
For Federal income tax purposes capital loss carryfowards represent realized losses that may be carried forward and applied against future capital gains. For taxable years beginning on or before December 22, 2010 such capital losses may be carried forward for a maximum of eight years. Pursuant to the RIC Modernization Act of 2010, the Fund is permitted to carryforward capital losses incurred in taxable years beginning after December 22, 2010 without expiration and retain their short and/or long-term character. However, post-enactment losses must be utilized prior to pre-enactment capital loss carryfowards. As a result of this ordering rule pre-enactment carryfowards are more likely to expire unused. As of December 31, 2016 capital loss carryfowards for the Fund were as follows:
| | | | | | | | | Unlimited | | | | |
Fund | | Expires in
2017 | | | Expires in
2018 | | | Short-Term | | | Long-Term | | | Total
Capital Loss
Carryforward | |
Managed Futures Strategy Fund | | $ | (9,859,364 | ) | | $ | (42,873,423 | ) | | $ | (10,486,623 | ) | | $ | (26,191,671 | ) | | $ | (89,411,081 | ) |
Net investment income and net realized gains (losses) may differ for financial statement and tax purposes because of temporary or permanent book/tax differences. These differences are primarily due to wash sales, foreign currency gains and losses reclasses, excise tax paid, and investments in subsidiary. Additional differences may result from the tax treatment of net investment losses and expired capital loss carryforwards. To the extent these differences are permanent, reclassifications are made to the appropriate equity accounts in the period that the differences arise. These reclassifications have no effect on net assets or NAV.
On the Consolidated Statement of Assets and Liabilities the following adjustments were made for permanent book/tax differences:
Fund | | Paid In
Capital | | | Accumulated
Net Investment
Loss | | | Accumulated
Net Realized
Loss | |
Managed Futures Strategy Fund | | $ | (17,765,233 | ) | | $ | 2,873,062 | | | $ | 14,892,171 | |
42 | THE GUGGENHEIM FUNDS ANNUAL REPORT | |
NOTES TO CONSOLIDATED FINANCIAL STATEMENTS (continued) |
At December 31, 2016, the cost of securities for Federal income tax purposes, the aggregate gross unrealized gain for all securities for which there was an excess of value over tax cost and the aggregate gross unrealized loss for all securities for which there was an excess of tax cost over value, were as follows:
Fund | | Tax
Cost | | | Tax
Unrealized
Gain | | | Tax
Unrealized
Loss | | | Net Tax
Unrealized
Gain (Loss) | |
Managed Futures Strategy Fund | | $ | 130,784,148 | | | $ | — | | | $ | (15,528,443 | ) | | $ | (15,528,443 | ) |
9. Securities Transactions
For the year ended December 31, 2016, the cost of purchases and proceeds from sales of investment securities, excluding government securities, short-term investments and derivatives, were as follows:
Fund | | Purchases | | | Sales | |
Managed Futures Strategy Fund | | $ | 22,755,281 | | | $ | 115,261,334 | |
The Fund is permitted to purchase or sell securities from or to certain affiliated funds under specified conditions outlined in procedures adopted by the Board of the Trust. The procedures have been designed to ensure that any purchase or sale of securities by a Fund from or to another fund or portfolio that is or could be considered an affiliate by virtue of having a common investment adviser (or affiliated investment advisers), common Trustees and/or common officers complies with Rule 17a-7 of the 1940 Act. Further, as defined under these procedures, each transaction is effected at the current market price to save costs, where permissible. For the year ended December 31, 2016, the Fund did not engage in purchases and sales of securities, pursuant to Rule 17a-7 of the 1940 Act.
10. Affiliated Transactions
Investments representing 5% or more of the outstanding voting shares of a portfolio company of a fund, or control of or by, or common control under GI, result in that portfolio company being considered an affiliated company of such fund, as defined in the 1940 Act.
The Fund may invest in the Guggenheim Strategy Funds Trust consisting of Guggenheim Strategy Fund I, Guggenheim Strategy Fund II, Guggenheim Strategy Fund III, and Guggenheim Variable Insurance Strategy Fund III (collectively, the “Cash Management Funds”), open-end management investment companies managed by GI. The Cash Management Funds, which launched on March 11, 2014, are offered as cash management options only to mutual funds, trusts, and other accounts managed by GI and/or its affiliates, and are not available to the public. The Cash Management Funds pay no investment management fees. The Cash Management
| | THE GUGGENHEIM FUNDS ANNUAL REPORT | 43 |
NOTES TO CONSOLIDATED FINANCIAL STATEMENTS (continued) |
Funds’ annual report on Form N-CSR dated September 30, 2016, is available publicly or upon request. This information is available from the EDGAR database on the SEC’s website at https://www.sec.gov/Archives/edgar/data/1601445/000089180416001923/gug65857-ncsr.htm.
Transactions during the year ended December 31, 2016, in which the portfolio company is an “affiliated person,” were as follows:
Affiliated issuers by Fund | | Value
12/31/15 | | | Additions | | | Reductions | | | Value
12/31/16 | | | Shares
12/31/16 | | | Investment
Income | | | Realized
Gain (Loss) | |
Managed Futures Strategy Fund | | | | | | | | | | |
Guggenheim Enhanced Short Duration ETF | | $ | 5,405,908 | | | $ | — | | | $ | — | | | $ | 5,433,008 | | | $ | 108,400 | | | $ | 70,536 | | | $ | — | |
Guggenheim Strategy Fund I | | | 71,145,807 | | | | 17,623,688 | | | | (62,130,000 | ) | | | 26,828,893 | | | | 1,073,156 | | | | 858,746 | | | | (27,470 | ) |
Guggenheim Strategy Fund II | | | 67,025,688 | | | | 1,350,325 | | | | (42,153,979 | ) | | | 26,527,725 | | | | 1,063,235 | | | | 1,157,601 | | | | (174,523 | ) |
Guggenheim Strategy Fund III | | | 33,962,550 | | | | 781,268 | | | | (7,651,000 | ) | | | 27,274,077 | | | | 1,092,274 | | | | 783,414 | | | | (64,996 | ) |
| | | $ | 177,539,953 | | | $ | 19,755,281 | | | $ | (111,934,979 | ) | | $ | 86,063,703 | | | | | | | $ | 2,870,297 | | | $ | (266,989 | ) |
11. Line of Credit
The Trust, along with other affiliated trusts, secured an uncommitted $75,000,000 line of credit from U.S. Bank, N.A., which expires June 11, 2017. This line of credit is reserved for emergency or temporary purposes. Borrowings, if any, under this arrangement bear interest equal to the Prime Rate, minus 2%, which shall be paid monthly, averaging 1.25% for the year ended December 31, 2016. The Fund did not have any borrowings outstanding under this agreement at December 31, 2016.
The average daily balances borrowed for the year ended December 31, 2016, were as follows:
Fund | | Average
Daily
Balance | |
Managed Futures Strategy Fund | | $ | 23,314 | |
12. Legal Proceedings
Tribune Company
Rydex Series Funds has been named as a defendant and a putative member of the proposed defendant class of shareholders in the case entitled Kirschner v. FitzSimons, No. 12-2652 (S.D.N.Y.) (formerly Official Committee of Unsecured Creditors of Tribune Co. v. FitzSimons, Adv. Pro. No. 10-54010 (Bankr. D. Del.)) (the “FitzSimons action”), as a result of ownership by certain series of the Rydex Series Funds of shares in the Tribune Company (“Tribune”) in 2007, when Tribune effected a leveraged buyout transaction (“LBO”) by which
44 | THE GUGGENHEIM FUNDS ANNUAL REPORT | |
NOTES TO CONSOLIDATED FINANCIAL STATEMENTS (continued) |
Tribune converted to a privately-held company. In his complaint, the plaintiff has alleged that, in connection with the LBO, Tribune insiders and shareholders were overpaid for their Tribune stock using financing that the insiders knew would, and ultimately did, leave Tribune insolvent. The plaintiff has asserted claims against certain insiders, major shareholders, professional advisers, and others involved in the LBO. The plaintiff is also attempting to obtain from former Tribune shareholders, including the Rydex Series Funds, the proceeds they received in connection with the LBO.
In June 2011, a group of Tribune creditors filed multiple actions against former Tribune shareholders involving state law constructive fraudulent conveyance claims arising out of the 2007 LBO (the “SLCFC actions”). Rydex Series Funds has been named as a defendant in one or more of these suits. In those actions, the creditors seek to recover from Tribune’s former shareholders the proceeds received in connection with the 2007 LBO.
The FitzSimons action and the SLCFC actions have been consolidated with the majority of the other Tribune LBO-related lawsuits in a multidistrict litigation proceeding captioned In re Tribune Company Fraudulent Conveyance Litig., No. 11-md-2696 (S.D.N.Y.) (the “MDL Proceeding”).
On September 23, 2013, the District Court granted the defendants’ omnibus motion to dismiss the SLCFC actions, on the basis that the creditors lacked standing. On September 30, 2013, the creditors filed a notice of appeal of the September 23 order. On October 28, 2013, the defendants filed a joint notice of cross-appeal of that same order.
On March 29, 2016, the U.S. Court of Appeals for the Second Circuit issued its opinion on the appeal of the SLCFC actions. The appeals court affirmed the district court’s dismissal of those lawsuits, but on different grounds than the district court. The appeals court held that while the plaintiffs have standing under the U.S. Bankruptcy Code, their claims were preempted by Section 546(e) of the Bankruptcy Code—the statutory safe harbor for settlement payments. On April 12, 2016, the Plaintiffs in the SLCFC actions filed a petition seeking rehearing en banc before the appeals court. On July 22, 2016, the appeals court denied the petition. On September 9, 2016, the plaintiffs filed a petition for writ of certiorari in the U.S. Supreme Court challenging the Second Circuit’s decision that the safe harbor of Section 546(e) applied to their claims. The shareholder defendants, including the Funds, filed a joint brief in opposition to the petition for certiorari on October 24, 2016. The Supreme Court has not yet granted or denied the petition for certiorari.
On May 23, 2014, the defendants filed motions to dismiss the FitzSimons action, including a global motion to dismiss Count I, which is the claim brought against former Tribune shareholders for intentional fraudulent conveyance under U.S. federal law. On January 6, 2017, the United States District Court for the Southern District of New York granted the shareholder defendants’ motion to dismiss the intentional fraudulent conveyance claim in the FitzSimons action. The Court concluded that the plaintiff had failed to allege that Tribune entered the LBO with actual intent to hinder, delay, or defraud its creditors, and therefore the complaint failed to state a claim. In
| | THE GUGGENHEIM FUNDS ANNUAL REPORT | 45 |
NOTES TO CONSOLIDATED FINANCIAL STATEMENTS (continued) |
dismissing the intentional fraudulent conveyance claim, the Court denied the plaintiff’s request to amend the complaint. The Court’s order is not immediately appealable, but any party might ask the Court to direct entry of a final judgment in order to make the order immediately appealable.
None of these lawsuits alleges any wrongdoing on the part of Rydex Series Funds. The following series of Rydex Series Funds held shares of Tribune and tendered these shares as part of Tribune’s LBO: Nova Fund, S&P 500® Pure Value Fund, Multi-Cap Core Equity Fund, S&P 500® Fund, Multi-Hedge Strategies Fund and Hedged Equity Fund (the “Funds”). The value of the proceeds received by the foregoing Funds was $28,220, $109,242, $9,860, $3,400, $1,181,160, and $10,880, respectively. At this stage of the proceedings, Rydex Series Funds is not able to make a reliable predication as to the outcome of these lawsuits or the effect, if any, on a Fund’s net asset value.
Lyondell Chemical Company
In December 2011, Rydex Series Funds was named as a defendant in Weisfelner, as Trustee of the LB Creditor Trust, v. Fund 1 (In re Lyondell Chemical Co.), Adv. Pro. No. 10-4609 (Bankr. S.D.N.Y.) (the “Creditor Trust Action”). Its funds may also be putative members of the proposed defendant classes in Weisfelner, as Trustee of the LB Litigation Trust v. A. Holmes & H. Holmes TTEE (In re Lyondell Co.), Adv. Pro. No. 10-5525 (Bankr. S.D.N.Y.) (the “Litigation Trust Action”) and Weisfelner, as Trustee of the LB Creditor Trust, v. Reichman (In re Lyondell Chemical Co.), Adv. Pro. No. 12-1570 (Bankr. S.D.N.Y.).
Similar to the claims made in the Tribune matter, the Weisfelner complaints seek to have set aside and recovered as fraudulent transfers from former Lyondell Chemical Company (“Lyondell”) shareholders the consideration paid to them pursuant to the cash out merger of Lyondell shareholders in connection with the combination of Lyondell and Basell AF in 2007. Lyondell filed for bankruptcy in 2008. The Creditor Trust Action and Reichman allege claims against the former Lyondell shareholders under state law for both constructive fraudulent transfer and intentional fraudulent transfer. The Litigation Trust Action alleges a claim against the former Lyondell shareholders under federal law for intentional fraudulent transfer.
On April 7, 2014, the plaintiff filed a Third Amended Complaint in the Creditor Trust Action, a Second Amended Complaint in the Litigation Trust Action, and an Amended Complaint in Reichman.
On May 8, 2014, the plaintiff in the Litigation Trust Action filed a motion to certify a defendant class generally comprised of all former Lyondell shareholders that received proceeds in exchange for their shares in the 2007 merger transaction.
On July 30, 2014, the defendants filed a motion to dismiss these lawsuits. The Bankruptcy Court held oral argument on the motion to dismiss and on the motion for class certification on January 14 and January 15, 2015. On September 15, 2015, the Bankruptcy Court denied the motion for class certification without prejudice to the plaintiff’s right to file a renewed motion. On November 18, 2015, the Bankruptcy Court granted the defendants’ motion to dismiss the intentional fraudulent
46 | THE GUGGENHEIM FUNDS ANNUAL REPORT | |
NOTES TO CONSOLIDATED FINANCIAL STATEMENTS (continued) |
transfer claims in the Creditor Trust Action, the Litigation Trust Action, and in Reichman, but denied the motion to dismiss the constructive fraudulent transfer claims in the Creditor Trust Action and in Reichman. The Bankruptcy Court entered final judgment dismissing the Litigation Trust Action, but the plaintiff appealed the dismissal to the U.S. District Court for the Southern District of New York.
On May 4, 2016, the defendants filed a motion to dismiss, or in the alternative, for a stay of, the Creditor Trust Action and Reichman in light of the U.S. Court of Appeals for the Second Circuit’s opinion in the appeal of the Tribune SLCFC actions. On July 20, 2016, the Bankruptcy Court issued a report and recommendation granting the defendants’ motion to dismiss. The U.S. District Court for the Southern District of New York has not yet accepted the Bankruptcy Court’s recommendation or entered a final judgment.
On July 27, 2016, the District Court reversed the Bankruptcy Court and reinstated the federal law intentional fraudulent transfer claim in the Litigation Trust Action and remanded to the Bankruptcy Court for further proceedings. The District Court found that the fraudulent intent that mattered was that of Lyondell’s CEO, not its board, because the CEO’s intent could be imputed to Lyondell under Delaware law agency principles. The District Court did note, however, that plaintiff faces a high standard for proving “actual intent” to harm creditors, and that it remains to be seen whether plaintiff will be able to make this showing. On August 11, 2016, the shareholder defendants filed a motion for reconsideration and/or to certify an interlocutory appeal of the District Court’s opinion. On October 5, 2016, the District Court denied the motion for reconsideration and/or to certify an interlocutory appeal. In light of this ruling, the federal intentional fraudulent conveyance claim will move forward before the Bankruptcy Court, but a schedule for that case has not yet been set.
These lawsuits do not allege any wrongdoing on the part of Rydex Series Funds. The following series of Rydex Series Funds received cash proceeds from the cash out merger in the following amounts: Basic Materials Fund - $1,725,168; Long Short Equity Fund f/k/a U.S. Long Short Momentum Fund - $2,193,600; Global 130/30 Strategy Fund - $37,920; Hedged Equity Fund - $1,440; and Multi-Hedge Strategies Fund - $1,116,480. At this stage of the proceedings, Rydex Series Funds is not able to make a reliable predication as to the outcome of these lawsuits or the effect, if any, on a Fund’s net asset value.
13. Y-Class Share Information
At a meeting of the Board of Trustees of Rydex Series Funds held on May 18, 2015, Security Investors, LLC, the investment adviser to the Managed Futures Strategy Fund (the “Fund”), recommended, and the Board approved, the closing and subsequent liquidation of the Fund’s Class Y shares (the “Liquidation”). Accordingly, the Fund’s Class Y shares ceased operations, were liquidated, and the liquidation proceeds were distributed to Class Y shareholders of record on June 26, 2015 (the “Liquidation Date”).
| | THE GUGGENHEIM FUNDS ANNUAL REPORT | 47 |
NOTES TO CONSOLIDATED FINANCIAL STATEMENTS (concluded) |
14. H-Class Shares Redesignated to P-Class Shares
Effective following the close of business on April 30, 2015, (the “Redesignation Date”), all outstanding H-Class shares of the Guggenheim Managed Futures Strategy Fund, were redesignated as P-Class shares, and the Fund no longer offers H-Class shares.
15. Consolidation of Subsidiary
The Fund may invest up to 25% of its total assets in its Subsidiary which acts as an investment vehicle in order to effect certain investments consistent with the Fund’s investment objectives and policies. Holdings specific to the Subsidiary are footnoted on the Consolidated Schedule of Investments. The Fund’s Consolidated Statement of Assets and Liabilities, Consolidated Statement of Operations and Consolidated Statement of Changes in Net Assets include the account balances of both the Fund and the Subsidiary.
See the table below for details regarding the structure, incorporation and relationship as of period end of the Fund.
Managed Futures Strategy Fund | | | |
Inception Date of Subsidiary | | 05/01/08 | |
Consolidated Fund Net Assets | | $ | 117,988,421 | |
% of Net Assets of the Fund at December 31, 2016 | | | 9.4 | % |
Subsidiary Financial Statement Information | | | | |
Total assets | | $ | 11,307,610 | |
Total liabilities | | | 170,673 | |
Net assets | | $ | 11,136,937 | |
| | | | | |
Net investment income (loss) | | $ | (190,677 | ) |
Net realized gain (loss) | | | (17,466,946 | ) |
Net change in unrealized appreciation (depreciation) | | | (1,868,653 | ) |
Increase (decrease) in net assets resulting from operations | | $ | (19,526,276 | ) |
48 | THE GUGGENHEIM FUNDS ANNUAL REPORT | |
REPORT OF INDEPENDENT REGISTERED PUBLIC ACCOUNTING FIRM |
The Board of Trustees and Shareholders
of Rydex Series Funds:
We have audited the accompanying consolidated statements of assets and liabilities, including the consolidated schedules of investments, of Managed Futures Strategy Fund (one of the series constituting the Rydex Series Funds) (the “Fund”) as of December 31, 2016, and the related consolidated statements of operations for the year then ended, the consolidated statements of changes in net assets for each of the two years in the period then ended, and the consolidated financial highlights for each of the five years in the period then ended. These financial statements and financial highlights are the responsibility of the Fund’s management. Our responsibility is to express an opinion on these financial statements and financial highlights based on our audits.
We conducted our audits in accordance with the standards of the Public Company Accounting Oversight Board (United States). Those standards require that we plan and perform the audit to obtain reasonable assurance about whether the financial statements and financial highlights are free of material misstatement. We were not engaged to perform an audit of the Fund’s internal control over financial reporting. Our audits included consideration of internal control over financial reporting as a basis for designing audit procedures that are appropriate in the circumstances, but not for the purpose of expressing an opinion on the effectiveness of the Fund’s internal control over financial reporting. Accordingly, we express no such opinion. An audit also includes examining, on a test basis, evidence supporting the amounts and disclosures in the financial statements and financial highlights, assessing the accounting principles used and significant estimates made by management, and evaluating the overall financial statement presentation. Our procedures included confirmation of securities owned as of December 31, 2016, by correspondence with the custodian, transfer agent, and brokers. We believe that our audits provide a reasonable basis for our opinion.
In our opinion, the financial statements and financial highlights referred to above present fairly, in all material respects, the consolidated financial position of Managed Futures Strategy Fund (one of the series constituting the Rydex Series Funds) at December 31, 2016, the consolidated results of its operations for the year then ended, the consolidated changes in its net assets for each of the two years in the period then ended, and its consolidated financial highlights for each of the five years in the period then ended, in conformity with U.S. generally accepted accounting principles.
McLean, Virginia
February 28, 2017
| | THE GUGGENHEIM FUNDS ANNUAL REPORT | 49 |
OTHER INFORMATION (Unaudited) |
Proxy Voting Information
A description of the policies and procedures that the Trust uses to determine how to vote proxies relating to securities held in the Funds’ portfolios is available, without charge and upon request, by calling 800.820.0888. This information is also available from the EDGAR database on the SEC’s website at https://www.sec.gov.
Information regarding how the Funds voted proxies relating to portfolio securities during the most recent 12-month period ended June 30 is available without charge, upon request, by calling 800.820.0888. This information is also available from the EDGAR database on the SEC’s website at https://www.sec.gov.
Sector Classification
Information in the Schedule of Investments is categorized by sectors using sector-level Classifications defined by the Bloomberg Industry Classification System, a widely recognized industry classification system provider. Each Fund’s registration statement has investment policies relating to concentration in specific sectors/industries. For purposes of these investment policies, the Fund usually classifies sectors/industries based on industry-level Classifications used by widely recognized industry classification system providers such as Bloomberg Industry Classification System, Global Industry Classification Standards and Barclays Global Classification Scheme.
Quarterly Portfolio Schedules Information
The Trust files its complete schedule of portfolio holdings with the SEC for the first and third quarters of each fiscal year on Form N-Q, which are available on the SEC’s website at https://www.sec.gov. The Fund’s Forms N-Q may be reviewed and copied at the SEC’s Public Reference Room in Washington, DC, and that information on the operation of the Public Reference Room may be obtained by calling 800-SEC-0330. Copies of the portfolio holdings are also available to shareholders, without charge and upon request, by calling 800.820.0888.
50 | THE GUGGENHEIM FUNDS ANNUAL REPORT | |
INFORMATION ON BOARD OF TRUSTEES AND OFFICERS (Unaudited) |
A Board of Trustees oversees the Trust, as well as other trusts of GI, in which its members have no stated term of service, and continue to serve after election until resignation. The Statement of Additional Information includes further information about Fund Trustees and Officers, and can be obtained without charge by calling 800.820.0888.
Name, Address*
and Year of Birth
of Trustee | Position(s) Held with the
Trust, Term of Office and
Length of Time Served | Principal Occupation(s)
During Past 5 Years | Number of
Portfolios in
Fund Complex
Overseen by
Trustee*** | Other
Directorships
Held by
Trustee **** |
INTERESTED TRUSTEE | | | |
Donald C. Cacciapaglia**
(1951) | President and Trustee from 2012 to present. | Current: President and CEO, certain other funds in the Fund Complex (2012-present); Vice Chairman, Guggenheim Investments (2010-present). Former: Chairman and CEO, Channel Capital Group, Inc. (2002-2010). | 230 | Clear Spring Life Insurance Company (2015-present); Guggenheim Partners Japan, Ltd. (2014-present); Guggenheim Partners Investment Management Holdings, LLC (2014-present); Delaware Life (2013-present); Guggenheim Life and Annuity Company (2011-present); Paragon Life Insurance Company of Indiana (2011-present). |
INDEPENDENT TRUSTEES | | | |
Angela Brock-Kyle*****
(1959) | Trustee from August 2016 to present. | Current: Founder and Chief Executive Officer, B.O.A.R.D.S (consulting firm) Former: Senior Leader, TIAA (financial services firm) (1987-2012). | 135 | Infinity Property & Casualty Corporation (2014-present). |
| | THE GUGGENHEIM FUNDS ANNUAL REPORT | 51 |
INFORMATION ON BOARD OF TRUSTEES AND OFFICERS (Unaudited)(continued) |
Name, Address*
and Year of Birth
of Trustee | Position(s) Held with the
Trust, Term of Office and
Length of Time Served | Principal Occupation(s)
During Past 5 Years | Number of
Portfolios in
Fund Complex
Overseen by
Trustee*** | Other
Directorships
Held by
Trustee**** |
INDEPENDENT TRUSTEES - continued |
Corey A. Colehour
(1945) | Trustee from 1993 to present; Member of the Audit Committee from 1994 to present; Member of the Governance Committee from 2014 to present; and Member of the Investment and Performance Committee from 2014 to present. | Retired. | 135 | None. |
J. Kenneth Dalton
(1941) | Trustee from 1995 to present; Chairman and Member of the Audit Committee from 1997 to present; and Member of the Compliance and Risk Oversight Committee from 2010 to present. | Retired. | 135 | Epiphany Funds (4) (2009-present). |
John O. Demaret
(1940) | Vice Chairman of the Board from 2014 to present (Chairman of the Board from 2006 to 2014); Trustee and Member of the Audit Committee from 1997 to present; Chairman (since 2014) and Member of the Compliance and Risk Oversight Committee from 2010 to present; Chairman and Member of the Investment and Performance Committee from 2014 to present; and Member of the Nominating Committee from 2014 to present. | Retired. | 135 | None. |
Werner E. Keller
(1940) | Chairman of the Board from 2014 to present (Vice Chairman of the Board from 2010 to 2014); Trustee and Member of the Audit Committee from 2005 to present; and Member of the Investment and Performance Committee from 2014 to present. | Current: Founder and President, Keller Partners, LLC (investment research firm) (2005-present). | 135 | None. |
52 | THE GUGGENHEIM FUNDS ANNUAL REPORT | |
INFORMATION ON BOARD OF TRUSTEES AND OFFICERS (Unaudited)(continued) |
Name, Address*
and Year of Birth
of Trustee | Position(s) Held with the
Trust, Term of Office and
Length of Time Served | Principal Occupation(s)
During Past 5 Years | Number of
Portfolios in
Fund Complex
Overseen by
Trustee*** | Other
Directorships
Held by
Trustee**** |
INDEPENDENT TRUSTEES - concluded |
Thomas F.
Lydon, Jr.
(1960) | Trustee and Member of the Audit Committee from 2005 to present; Member of the Nominating Committee from 2005 to present; and Member of the Governance Committee from 2007 to present. | Current: President, Global Trends Investments (registered investment adviser) (1996-present). | 135 | US Global Investors (GROW) (1995-present). |
Patrick T. McCarville
(1942) | Trustee from 1997 to present; Member of the Audit Committee from 1997 to present; Chairman and Member of the Nominating Committee from 2004 to present; Chairman and Member of the Governance Committee from 2007 to present; and Member of the Compliance and Risk Oversight Committee from 2014 to present. | Retired. Former: Chief Executive Officer, Par Industries, Inc., d/b/a Par Leasing (1977-2010). | 135 | None. |
Sandra G. Sponem*****
(1958) | Trustee from August 2016 to present. | Current: Senior Vice President and Chief Financial Officer, M.A. Mortenson Companies, Inc. (general contracting firm) (2007-present). | 135 | None. |
| | THE GUGGENHEIM FUNDS ANNUAL REPORT | 53 |
INFORMATION ON BOARD OF TRUSTEES AND OFFICERS (Unaudited)(continued) |
Name, Address*
and Year of Birth | Position(s) Held with the
Trust, Term of Office and
Length of Time Served | Principal Occupation(s)
During Past 5 Years |
OFFICERS | | |
Michael P. Byrum (1970) | Vice President (1999-present) | Current: Senior Vice President, Security Investors, LLC (2010-present); President and Chief Investment Officer, Rydex Holdings, LLC (2008-present); Director and Chairman, Advisory Research Center, Inc. (2006-present); Manager, Guggenheim Specialized Products, LLC (2005-present). Former: Vice President, Guggenheim Distributors, LLC (2009); Director (2009-2010) and Secretary (2002-2010), Rydex Fund Services, LLC; Director (2008-2010), Chief Investment Officer (2006-2010), President (2004-2010) and Secretary (2002-2010), Rydex Advisors, LLC; Director (2008-2010), Chief Investment Officer (2006-2010), President (2004-2010) and Secretary (2002-2010), Rydex Advisors II, LLC. |
Joanna M. Catalucci
(1966) | AML Officer (2016-present) | Current: Chief Compliance Officer, certain funds in the Fund Complex (2012-present); Senior Managing Director, Guggenheim Investments (2012-present); AML Officer, certain funds in the Fund Complex (2016-present). Former: Chief Compliance Officer and Secretary, certain other funds in the Fund Complex (2008-2012); Senior Vice President & Chief Compliance Officer, Security Investors, LLC and certain affiliates (2010-2012); Chief Compliance Officer and Senior Vice President, Rydex Advisors, LLC and certain affiliates (2010-2011). |
James M. Howley
(1972) | Assistant Treasurer (2016-present) | Current: Director, Guggenheim Investments (2004-present); Assistant Treasurer, certain other funds in the Fund Complex (2006-present). Former: Manager, Mutual Fund Administration of Van Kampen Investments, Inc. (1996-2004). |
54 | THE GUGGENHEIM FUNDS ANNUAL REPORT | |
INFORMATION ON BOARD OF TRUSTEES AND OFFICERS (Unaudited)(continued) |
Name, Address*
and Year of Birth | Position(s) Held with the
Trust, Term of Office and
Length of Time Served | Principal Occupation(s)
During Past 5 Years |
OFFICERS - continued | |
Keith D. Kemp
(1960) | Assistant Treasurer (2016-present) | Current: Managing Director of Transparent Value, LLC (April 2015-present); Managing Director of Guggenheim Investments (April 2015-present). Former: Director, Transparent Value, LLC (2010-2015); Director, Guggenheim Investments (2010-2015); Chief Operating Officer, Macquarie Capital Investment Management (2007-2009). |
Amy J. Lee
(1961) | Vice President (2009-present) and Secretary (2012-present) | Current: Chief Legal Officer, certain other funds in the Fund Complex (2013-present); Senior Managing Director, Guggenheim Investments (2012-present). Former: Vice President, Associate General Counsel and Assistant Secretary, Security Benefit Life Insurance Company and Security Benefit Corporation (2004-2012). |
Elisabeth Miller
(1968) | Chief Compliance Officer (2012-present) | Current: CCO, certain other funds in the Fund Complex (2012-present); CCO, Security Investors, LLC (2012-present); CCO, Guggenheim Funds Investment Advisors, LLC (2012-present); Managing Director, Guggenheim Investments (2012-present); Vice President, Guggenheim Funds Distributors, LLC (March 2014-present). Former: CCO, Guggenheim Distributors, LLC (2009-March 2014); Senior Manager, Security Investors, LLC (2004-2009); Senior Manager, Guggenheim Distributors, LLC (2004-2009). |
Glenn McWhinnie
(1969) | Assistant Treasurer (2016-present) | Current: Vice President, Guggenheim Investments (2009-present). Former: Tax Compliance Manager, Ernst & Young LLP (1996-2009). |
Adam J. Nelson
(1979) | Assistant Treasurer (2016-present) | Current: Vice President, Guggenheim Investments (2015-present); Assistant Treasurer, certain other funds in the Fund Complex (2015-present). Former: Assistant Vice President and Fund Administration Director, State Street Corporation (2013-2015); Fund Administration Assistant Director, State Street (2011-2013); Fund Administration Manager, State Street (2009-2011). |
| | THE GUGGENHEIM FUNDS ANNUAL REPORT | 55 |
INFORMATION ON BOARD OF TRUSTEES AND OFFICERS (Unaudited)(concluded) |
Name, Address*
and Year of Birth | Position(s) Held with the
Trust, Term of Office and
Length of Time Served | Principal Occupation(s)
During Past 5 Years |
OFFICERS - concluded | |
Kimberly J. Scott
(1974) | Assistant Treasurer (2016-present) | Current: Vice President, Guggenheim Investments (2012-present); Assistant Treasurer, certain other funds in the Fund Complex (2012-present). Former: Financial Reporting Manager, Invesco, Ltd. (2010-2011); Vice President/Assistant Treasurer, Mutual Fund Administration for Van Kampen Investments, Inc./Morgan Stanley Investment Management (2009-2010); Manager of Mutual Fund Administration, Van Kampen Investments, Inc./Morgan Stanley Investment Management (2005-2009). |
John L. Sullivan
(1955) | Chief Financial Officer and Treasurer (2016-present) | Current: CFO, Chief Accounting Officer and Treasurer, certain other funds in the Fund Complex (2010-present); Senior Managing Director, Guggenheim Investments (2010-present). Former: Managing Director and CCO, each of the funds in the Van Kampen Investments fund complex (2004-2010); Managing Director and Head of Fund Accounting and Administration, Morgan Stanley Investment Management (2002-2004); CFO and Treasurer, Van Kampen Funds (1996-2004). |
* | All Trustees and Officers may be reached c/o Guggenheim Investments, 227 West Monroe Street, Chicago, Illinois 60606. |
** | Mr. Cacciapaglia is an “interested” person of the Trust, as that term is defined in the 1940 Act by virtue of his affiliation with the Adviser’s parent company. |
*** | The “Fund Complex” includes all closed-end and open-end funds (including all of their portfolios) advised by the Adviser and any funds that have an investment adviser or servicing agent that is an affiliated person of the Adviser. Information provided is as of the date of this report. |
**** | Certain of the Trustees may serve as directors on the boards of companies not required to be disclosed above, including certain non-profit companies and charitable foundations. |
***** | Mses. Brock-Kyle and Sponem commence serving as independent Trustees effective August 18, 2016. |
56 | THE GUGGENHEIM FUNDS ANNUAL REPORT | |
GUGGENHEIM INVESTMENTS PRIVACY POLICIES (Unaudited) |
Guggenheim Investments as used herein refers to Guggenheim Partners, LLC, Guggenheim Funds Investment Advisors, LLC, Guggenheim Partners Investment Management, LLC, Guggenheim Funds Distributors, LLC and Security Investors, LLC as well as the funds in the Guggenheim Funds complex (the “funds”).
Our Commitment to You
When you become a Guggenheim Investments investor, you entrust us with not only your hard-earned money but also with personal and financial information about you. We recognize that your relationship with us is based on trust and that you expect us to act responsibly and in your best interests. Because we have access to personal information about you, we hold ourselves to high standards in its safekeeping and use. This means, most importantly, that we do not sell client or account information to anyone—whether you are a current or former Guggenheim Investments client.
The Information We Collect About You and How We Collect It
In the course of doing business with shareholders and investors, we collect nonpublic personal information about you. You typically provide personal information when you complete a Guggenheim Investments account application or when you request a transaction that involves Rydex and Guggenheim Funds or one of the Guggenheim affiliated companies. “Nonpublic personal information” is personally identifiable information about you. For example it includes your name and address, Social Security or taxpayer identification number, assets, income, account balance, bank account information and investment activity (e.g. purchase and redemption history).
How We Share Your Personal Information
As a matter of policy, we do not disclose your nonpublic personal information to nonaffiliated third parties except as required or permitted by law. As emphasized above, we do not sell information about current or former clients or their accounts to third parties. Nor do we share such information, except when necessary to complete transactions at your request or to make you aware of related investment products and services that we offer. Additional details about how we handle your personal information are provided below.
To complete certain transactions or account changes that you direct, it may be necessary to provide your personal information to companies, individuals or groups that are not affiliated with Guggenheim Investments. For example if you ask to transfer assets from another financial institution to Guggenheim Investments, we will need to provide certain information about you to that company to complete the transaction. In connection with servicing your accounts or to alert you to other Guggenheim Investments investment products and services, we may share your information within the Guggenheim Investments family of affiliated companies. This would include, for example, sharing your information within Guggenheim Investments so we can make you aware of new funds or the services offered through another Guggenheim Investments
| | THE GUGGENHEIM FUNDS ANNUAL REPORT | 57 |
GUGGENHEIM INVESTMENTS PRIVACY POLICIES (Unaudited)(concluded) |
affiliated company. In certain instances, we may contract with nonaffiliated companies to perform services for us. Where necessary, we will disclose information we have about you to these third parties. In all such cases, we provide the third party with only the information necessary to carry out its assigned responsibilities and only for that purpose. And we require these third parties to treat your personal information with the same high degree of confidentiality that we do. In certain instances, we may share information with other financial institutions regarding individuals and entities in response to the U.S.A. Patriot Act. Finally we will share personal information about you if we are compelled by law to do so, if you direct us to do so with your consent, or in other circumstances as permitted by law.
How We Safeguard Your Personal Information
We maintain physical, electronic and procedural safeguards to protect your personal information. Within Guggenheim Investments, access to such information is limited to those who need it to perform their jobs such as servicing your account, resolving problems or informing you of new products and services.
58 | THE GUGGENHEIM FUNDS ANNUAL REPORT | |
This page intentionally left blank.
This page intentionally left blank.
This page intentionally left blank.
This page intentionally left blank.
This page intentionally left blank.
This page intentionally left blank.
This page intentionally left blank.
Item 2. Code of Ethics.
The registrant’s Board of Trustees has adopted a code of ethics that applies to the registrant’s principal executive officer and principal financial officer. No substantive amendments were approved or waivers were granted to the Code during the period covered by this report. The Code is filed as an exhibit to this Form N-CSR.
Item 3. Audit Committee Financial Expert.
The registrant's Board of Trustees has determined that Werner Keller, an "independent" Trustee serving on the registrant's audit committee, is an "audit committee financial expert," as defined in Item 3 of Form N-CSR. Under applicable securities laws, a person who is determined to be an audit committee financial expert will not be deemed an "expert" for any purpose, including without limitation for the purposes of Section 11 of the Securities Act of 1933, as a result of being designated or identified as an audit committee financial expert. The designation or identification of a person as an audit committee financial expert does not impose on such person any duties, obligations, or liabilities that are greater than the duties, obligations, and liabilities imposed on such person as a member of the audit committee and Board of Trustees in the absence of such designation or identification.
Item 4. Principal Accountant Fees and Services.
(a) Audit Fees. The aggregate Audit Fees billed by the registrant’s principal accountant, for the audit of the annual financial statements in connection with statutory and regulatory filings for the fiscal years ended December 31, 2016 and December 31, 2015 were $77,198 and $74,202, respectively.
(b) Audit Related Fees. The aggregate Audit Related Fees by the registrant’s principal accountant billed for the fiscal years ended December 31, 2016 and December 31, 2015 were $0 and $0, respectively.
The aggregate fees billed in the Reporting Periods for assurance and related services by the Auditor to the registrant’s investment adviser (not including any sub‑investment adviser whose role is primarily portfolio management and is subcontracted with or overseen by another investment adviser), and any entity controlling, controlled by or under common control with the investment adviser that provides ongoing services to the registrant (“Service Affiliates”) which required pre‑approval by the Audit Committee which related to the review of the transfer agent function for the fiscal years ended December 31, 2016 and December 31, 2015 were $0 and $38,585, respectively.
(c) Tax Fees: The aggregate Tax Fees billed by the registrant’s principal accountant for professional services rendered for tax compliance, tax advice, and tax planning, including preparation of tax returns and distribution assistance, for the fiscal years ended December 31, 2016 and December 31, 2015 were $32,518 and $68,566, respectively.
(d) All Other Fees. The aggregate All Other Fees billed by the registrant’s principal accountant for products and services provided by the Auditor, other than the services reported in paragraphs (a) through (c) of this Item, for the fiscal years ended December 31, 2016 and December 31, 2015 were $0 and $0, respectively.
(e) Audit Committee Pre-Approval Policies and Procedures. The audit committee has adopted a policy whereby audit and non-audit services performed by the registrant’s principal accountant for the registrant, its investment advisor, and any entity controlling, controlled by, or under common control with the investment advisor that provides ongoing services to the registrant require pre-approval in advance at regularly scheduled audit committee meetings. If such service is required between regularly scheduled audit committee meetings, the chairman of the audit committee, J. Kenneth Dalton, is authorized to pre-approve the service with full committee approval at the next scheduled meeting. There shall be no waivers of the pre-approval process. No services described in (b)-(d) above were approved pursuant to paragraph (c)(7)(i)(C) of Rule 2-01 of Regulation S-X.
(f) Not applicable.
(g) Non-Audit Fees. The aggregate non-audit fees billed by the registrant’s accountant for the most recent fiscal year and the preceding fiscal year for services rendered to the registrant, the investment advisor, and any entity controlling, controlled by, or under common control with the advisor that provides ongoing services to the registrant were $100,091 and $107,151, respectively. These aggregate fees were less than the aggregate fees billed for the same periods by the registrant’s principal accountant for audit services rendered to the registrant, the investment advisor, and any entity controlling, controlled by, or under common control with the advisor that provides ongoing services to the registrant.
(h) Auditor Independence. All non-audit services rendered in (g) above were pre-approved by the registrant’s audit committee. As such, the audit committee has considered these services in maintaining the principal accountant’s independence.
Item 5. Audit Committee of Listed Registrants.
Not applicable.
Item 6. Investments.
Schedule of Investments is included as part of the report to shareholders filed under Item 1 of this form.
Item 7. Disclosure of Proxy Voting Policies and Procedures for Closed-End Management Investment Companies.
Not applicable.
Item 8. Portfolio Managers of Closed-End Management Investment Companies.
Not applicable.
Item 9. Purchases of Equity Securities by Closed-End Management Investment Company and Affiliated Purchasers.
Not applicable.
Item 10. Submission of Matters to a Vote of Security Holders.
Not applicable.
Item 11. Controls and Procedures.
(a) The registrant’s President (principal executive officer) and Treasurer (principal financial officer) have evaluated the registrant’s disclosure controls and procedures within 90 days of this filing and have concluded that the registrant’s disclosure controls and procedures were effective as of that date in ensuring that information required to be disclosed by the registrant in this Form N-CSR was recorded, processed, summarized, and reported timely.
(b) The registrant’s principal executive officer and principal financial officer are aware of no change in the registrant’s internal control over financial reporting that occurred during the registrant’s second fiscal quarter covered by this report that has materially affected, or is reasonably likely to materially affect, the registrant’s internal control over financial reporting.
Item 12. Exhibits.
(a)(1) The registrant’s code of ethics pursuant to Item 2 of Form N-CSR is attached.
(a)(2) Separate certifications by the President (principal executive officer) and Treasurer (principal financial officer) of the registrant as required by Rule 30a-2(a) under the Act (17 CFR 270.30a-2(a)) are attached.
(b) A certification by the registrant’s President (principal executive officer) and Treasurer (principal financial officer) as required by Rule 30a-2(b) under the Act (17 CFR 270.30a-2(b)) is attached.

