UNITED STATES
SECURITIES AND EXCHANGE COMMISSION
Washington, D.C. 20549
FORM N-CSR
CERTIFIED SHAREHOLDER REPORT OF REGISTERED
MANAGEMENT INVESTMENT COMPANIES
Investment Company Act file number 811- 07584
Rydex Series Funds
(Exact name of registrant as specified in charter)
805 King Farm Boulevard, Suite 600
Rockville, Maryland 20850
(Address of principal executive offices) (Zip code)
Amy J. Lee
Rydex Series Funds
805 King Farm Boulevard, Suite 600
Rockville, Maryland 20850
(Name and address of agent for service)
Registrant's telephone number, including area code: 1-301-296-5100
Date of fiscal year end: March 31
Date of reporting period: September 30, 2016
Form N-CSR is to be used by management investment companies to file reports with the Commission not later than 10 days after the transmission to stockholders of any report that is required to be transmitted to stockholders under Rule 30e-1 under the Investment Company Act of 1940 (17 CFR 270.30e-1). The Commission may use the information provided on Form N-CSR in its regulatory, disclosure review, inspection, and policymaking roles.
A registrant is required to disclose the information specified by Form N-CSR, and the Commission will make this information public. A registrant is not required to respond to the collection of information contained in Form N-CSR unless the Form displays a currently valid Office of Management and Budget ("OMB") control number. Please direct comments concerning the accuracy of the information collection burden estimate and any suggestions for reducing the burden to Secretary, Securities and Exchange Commission, 450 Fifth Street, NW, Washington, DC 20549-0609. The OMB has reviewed this collection of information under the clearance requirements of 44 U.S.C. § 3507.
Item 1. Reports to Stockholders.
The registrant’s semi-annual report transmitted to shareholders pursuant to Rule 30e-1 under the Investment Company Act of 1940, as amended (the “Investment Company Act”), is as follows:
9.30.2016
Rydex Funds Semi-Annual Report
Sector Funds |
Banking Fund | | |
Basic Materials Fund | | |
Biotechnology Fund | | |
Consumer Products Fund | | |
Electronics Fund | | |
Energy Fund | | |
Energy Services Fund | | |
Financial Services Fund | | |
Health Care Fund | | |
Internet Fund | | |
Leisure Fund | | |
Precious Metals Fund | | |
Real Estate Fund | | |
Retailing Fund | | |
Technology Fund | | |
Telecommunications Fund | | |
Transportation Fund | | |
Utilities Fund | | |
GuggenheimInvestments.com | RSECF-SEMI-0916x0917 |

DEAR SHAREHOLDER | 2 |
ECONOMIC AND MARKET OVERVIEW | 3 |
ABOUT SHAREHOLDERS’ FUND EXPENSES | 4 |
BANKING FUND | 9 |
BASIC MATERIALS FUND | 16 |
BIOTECHNOLOGY FUND | 23 |
CONSUMER PRODUCTS FUND | 30 |
ELECTRONICS FUND | 38 |
ENERGY FUND | 45 |
ENERGY SERVICES FUND | 54 |
FINANCIAL SERVICES FUND | 60 |
HEALTH CARE FUND | 70 |
INTERNET FUND | 78 |
LEISURE FUND | 85 |
PRECIOUS METALS FUND | 93 |
REAL ESTATE FUND | 99 |
RETAILING FUND | 107 |
TECHNOLOGY FUND | 114 |
TELECOMMUNICATIONS FUND | 122 |
TRANSPORTATION FUND | 129 |
UTILITIES FUND | 136 |
NOTES TO FINANCIAL STATEMENTS | 143 |
OTHER INFORMATION | 152 |
INFORMATION ON BOARD OF TRUSTEES AND OFFICERS | 155 |
GUGGENHEIM INVESTMENTS PRIVACY POLICIES | 159 |
| | THE RYDEX FUNDS SEMI-ANNUAL REPORT | 1 |
Dear Shareholder:
Security Investors, LLC (the “Investment Adviser”) is pleased to present the semi-annual shareholder report for 18 of our Sector Funds (the “Funds”) for the six-month period ended September 30, 2016.
The Investment Adviser is part of Guggenheim Investments, which represents the investment management businesses of Guggenheim Partners, LLC (“Guggenheim”), a global, diversified financial services firm.
Guggenheim Funds Distributors, LLC is the distributor of the Funds. Guggenheim Funds Distributors, LLC is affiliated with Guggenheim and the Investment Adviser.
We encourage you to read the Economic and Market Overview section of the report, which follows this letter.
We are committed to providing innovative investment solutions and appreciate the trust you place in us.
Sincerely,

Donald C. Cacciapaglia
President and Chief Executive Officer
October 31, 2016
Read a prospectus and summary prospectus (if available) carefully before investing. It contains the investment objectives, risks, charges, expenses, and other information, which should be considered carefully before investing. Obtain a prospectus and summary prospectus (if available) at guggenheiminvestments.com or call 800.820.0888.
There can be no assurance that any investment product will achieve its investment objective(s). There are risks associated with investing, including the entire loss of principal invested. Investing involves market risks. The investment return and principal value of any investment product will fluctuate with changes in market conditions.
2 | THE RYDEX FUNDS SEMI-ANNUAL REPORT | |
ECONOMIC AND MARKET OVERVIEW (Unaudited) | September 30, 2016 |
Economic growth continues to rebound, even though the rise in U.S. Gross Domestic Product (“GDP”) disappointed in the first half of 2016. There was a large headwind from inventory drawdowns, which should soon reverse after five quarters of dragging on growth. Real GDP growth is expected to be around 2.5 percent in the second half of the year, driven by consumption, housing, and a fading trade drag, and supporting the view that U.S. economic growth remains resilient to global weakness.
The euro zone economy is slowly improving, but inflation will likely persist well below the European Central Bank’s (“ECB”) target in the coming quarters due to substantial slack. The ECB has indicated that more quantitative easing is possible, but will soon need to alter the quantitative easing program in order to keep up their purchase pace. Both China and Japan need weaker currencies. Chinese growth and capital flows have stabilized for now, but surging construction and a credit boom raise the prospect of future instability. Japan’s economic prospects are weak, and inflation remains far from the Bank of Japan’s (“BOJ”) target. The surging yen could drive further policy easing, including an increase in fiscal stimulus.
It appears the U.S. Federal Reserve (the “Fed”) will move forward with raising rates in December, absent any economic or geopolitical surprise or a meaningful tightening of financial conditions over the fourth quarter. But key events could influence risk asset performance for the balance of the year: A continued recovery in oil prices following the Organization of Petroleum Exporting Countries (“OPEC”) agreement to keep production between 32.5 to 33 million barrels per day would help sustain the rally (although we are skeptical that they will adhere to any quota based on historical production levels). Global oil inventories remain high, but supply and demand are moving toward balance. A rebound in GDP growth would also lift U.S. equity and corporate bond prices higher.
The macroeconomic picture remains the same; we are not on the verge of a recession. But despite our positive outlook on the U.S. economy, valuations across risk assets argue for caution. Ongoing accommodation from central bankers across the globe has alleviated much of the initial macroeconomic tail risk posed by Brexit but may not be enough to dampen the seasonal volatility typically observed in the fourth quarter. Ongoing troubles in the banking sector, such as the woes afflicting Deutsche Bank and Wells Fargo, coupled with uncertainty surrounding upcoming political events, which include the new Trump administration, the Italian constitutional referendum, and key European elections, may create volatility for risk assets for the balance of the year.
For the six months ended September 30, 2016, the Standard & Poor’s 500® (“S&P 500®”) Index* returned 6.40%. The MSCI Europe-Australasia-Far East (“EAFE”) Index* returned 4.88%. The return of the MSCI Emerging Markets Index* was 9.75%.
In the bond market, the Bloomberg Barclays U.S. Aggregate Bond Index* posted a 2.68% return for the period, while the Bloomberg Barclays U.S. Corporate High Yield Index* returned 11.38%. The return of the Bank of America (“BofA”) Merrill Lynch 3-Month U.S. Treasury Bill Index* was 0.17% for the six-month period.
The opinions and forecasts expressed may not actually come to pass. This information is subject to change at any time, based on market and other conditions, and should not be construed as a recommendation of any specific security or strategy.
*Index Definitions:
The following indices are referenced throughout this report. Indices are unmanaged and not available for direct investment. Index performance does not reflect transaction costs, fees, or expenses.
BofA Merrill Lynch 3-Month U.S. Treasury Bill Index is an unmanaged market Index of U.S. Treasury securities maturing in 90 days that assumes reinvestment of all income.
Bloomberg Barclays U.S. Aggregate Bond Index is a broad-based flagship benchmark that measures the investment grade, U.S. dollar denominated, fixed-rate taxable bond market, including U.S. Treasuries, government-related and corporate securities, mortgage-backed securities or (“MBS”) (agency fixed-rate and hybrid adjustable-rate mortgage, or “ARM”, pass-throughs), asset-backed securities (“ABS”), and commercial mortgage-backed securities (“CMBS”) (agency and non-agency).
Bloomberg Barclays U.S. Corporate High Yield Index measures the U.S. dollar denominated, high yield, fixed-rate corporate bond market. Securities are classified as high yield if the middle rating of Moody’s, Fitch, and S&P is Ba1/BB +/BB + or below.
MSCI EAFE Index is a capitalization-weighted measure of stock markets in Europe, Australasia, and the Far East.
MSCI Emerging Markets Index is a free float-adjusted market capitalization-weighted index that is designed to measure equity market performance in the global emerging markets.
S&P 500® Index is a broad-based index, the performance of which is based on the performance of 500 widely held common stocks chosen for market size, liquidity, and industry group representation.
| | THE RYDEX FUNDS SEMI-ANNUAL REPORT | 3 |
ABOUT SHAREHOLDERS’ FUND EXPENSES (Unaudited) | |
All mutual funds have operating expenses, and it is important for our shareholders to understand the impact of costs on their investments. Shareholders of a fund incur two types of costs: (i) transaction costs, including sales charges (loads) on purchase payments, reinvested dividends, other distributions, and exchange fees, and (ii) ongoing costs, including management fees, administrative services, and shareholder reports, among others. These ongoing costs, or operating expenses, are deducted from a fund’s gross income and reduce the investment return of the fund.
A fund’s expenses are expressed as a percentage of its average net assets, which is known as the expense ratio. The following examples are intended to help investors understand the ongoing costs (in dollars) of investing in a fund and to compare these costs with the ongoing costs of investing in other mutual funds.
The examples are based on an investment of $1,000 made at the beginning of the period and held for the entire six-month period beginning March 31, 2016 and ending September 30, 2016.
The following tables illustrate the Funds’ costs in two ways:
Table 1. Based on actual Fund return: This section helps investors estimate the actual expenses paid over the period. The “Ending Account Value” shown is derived from the Fund’s actual return, and the fifth column shows the dollar amount that would have been paid by an investor who started with $1,000 in the Fund. Investors may use the information here, together with the amount invested, to estimate the expenses paid over the period. Simply divide the Fund’s account value by $1,000 (for example, an $8,600 account value divided by $1,000 = 8.6), then multiply the result by the number provided under the heading “Expenses Paid During Period.”
Table 2. Based on hypothetical 5% return: This section is intended to help investors compare a Fund’s cost with those of other mutual funds. The table provides information about hypothetical account values and hypothetical expenses based on the Fund’s actual expense ratio and an assumed rate of return of 5% per year before expenses, which is not the Fund’s actual return. The hypothetical account values and expenses may not be used to estimate the actual ending account balance or expenses paid during the period. The example is useful in making comparisons because the U.S. Securities and Exchange Commission (the “SEC”) requires all mutual funds to calculate expenses based on the 5% return. Investors can assess a Fund’s costs by comparing this hypothetical example with the hypothetical examples that appear in shareholder reports of other funds.
The calculations illustrated above assume no shares were bought or sold during the period. Actual costs may have been higher or lower, depending on the amount of investment and the timing of any purchases or redemptions.
Please note that the expenses shown in the table are meant to highlight your ongoing costs only and do not reflect any transactional costs, such as sales charges (loads) on purchase payments, and contingent deferred sales charges (“CDSC”) on redemptions, if any. Therefore, the second table is useful in comparing ongoing costs only, and will not help you determine the relative total costs of owning different funds. In addition, if these transactional costs were included, your costs would have been higher.
More information about the Funds’ expenses, including annual expense ratios for periods up to five years (subject to the Fund’s inception date), can be found in the Financial Highlights section of this report. For additional information on operating expenses and other shareholder costs, please refer to the appropriate Fund prospectus.
4 | THE RYDEX FUNDS SEMI-ANNUAL REPORT | |
ABOUT SHAREHOLDERS’ FUND EXPENSES (Unaudited)(continued) | |
| | Expense
Ratio1 | Fund
Return | Beginning
Account Value
March 31, 2016 | Ending
Account Value
September 30, 2016 | Expenses
Paid During
Period2 |
Table 1. Based on actual Fund return3 |
Banking Fund | | | | | |
Investor Class | 1.36% | 10.42% | $ 1,000.00 | $ 1,104.20 | $ 7.17 |
A-Class | 1.61% | 10.32% | 1,000.00 | 1,103.20 | 8.49 |
C-Class | 2.36% | 9.89% | 1,000.00 | 1,098.90 | 12.42 |
H-Class | 1.61% | 10.33% | 1,000.00 | 1,103.30 | 8.49 |
Basic Materials Fund | | | | | |
Investor Class | 1.37% | 13.59% | 1,000.00 | 1,135.90 | 7.34 |
A-Class | 1.61% | 13.46% | 1,000.00 | 1,134.60 | 8.62 |
C-Class | 2.36% | 13.03% | 1,000.00 | 1,130.30 | 12.60 |
H-Class | 1.61% | 13.49% | 1,000.00 | 1,134.90 | 8.62 |
Biotechnology Fund | | | | | |
Investor Class | 1.36% | 14.35% | 1,000.00 | 1,143.50 | 7.31 |
A-Class | 1.60% | 14.21% | 1,000.00 | 1,142.10 | 8.59 |
C-Class | 2.35% | 13.76% | 1,000.00 | 1,137.60 | 12.59 |
H-Class | 1.60% | 14.16% | 1,000.00 | 1,141.60 | 8.59 |
Consumer Products Fund | | | | | |
Investor Class | 1.36% | 3.18% | 1,000.00 | 1,031.80 | 6.93 |
A-Class | 1.61% | 3.06% | 1,000.00 | 1,030.60 | 8.20 |
C-Class | 2.35% | 2.67% | 1,000.00 | 1,026.70 | 11.94 |
H-Class | 1.61% | 3.06% | 1,000.00 | 1,030.60 | 8.20 |
Electronics Fund | | | | | |
Investor Class | 1.37% | 17.69% | 1,000.00 | 1,176.90 | 7.48 |
A-Class | 1.62% | 17.59% | 1,000.00 | 1,175.90 | 8.84 |
C-Class | 2.36% | 17.12% | 1,000.00 | 1,171.20 | 12.85 |
H-Class | 1.61% | 17.46% | 1,000.00 | 1,174.60 | 8.78 |
Energy Fund | | | | | |
Investor Class | 1.36% | 19.34% | 1,000.00 | 1,193.40 | 7.48 |
A-Class | 1.61% | 19.14% | 1,000.00 | 1,191.40 | 8.84 |
C-Class | 2.36% | 18.74% | 1,000.00 | 1,187.40 | 12.94 |
H-Class | 1.61% | 19.12% | 1,000.00 | 1,191.20 | 8.84 |
Energy Services Fund | | | | | |
Investor Class | 1.36% | 7.92% | 1,000.00 | 1,079.20 | 7.09 |
A-Class | 1.61% | 7.71% | 1,000.00 | 1,077.10 | 8.38 |
C-Class | 2.36% | 7.32% | 1,000.00 | 1,073.20 | 12.27 |
H-Class | 1.61% | 7.67% | 1,000.00 | 1,076.70 | 8.38 |
Financial Services Fund | | | | | |
Investor Class | 1.37% | 7.24% | 1,000.00 | 1,072.40 | 7.12 |
A-Class | 1.61% | 7.11% | 1,000.00 | 1,071.10 | 8.36 |
C-Class | 2.36% | 6.70% | 1,000.00 | 1,067.00 | 12.23 |
H-Class | 1.61% | 7.11% | 1,000.00 | 1,071.10 | 8.36 |
Health Care Fund | | | | | |
Investor Class | 1.36% | 7.57% | 1,000.00 | 1,075.70 | 7.08 |
A-Class | 1.61% | 7.38% | 1,000.00 | 1,073.80 | 8.37 |
C-Class | 2.36% | 7.00% | 1,000.00 | 1,070.00 | 12.25 |
H-Class | 1.61% | 7.41% | 1,000.00 | 1,074.10 | 8.37 |
| | THE RYDEX FUNDS SEMI-ANNUAL REPORT | 5 |
ABOUT SHAREHOLDERS’ FUND EXPENSES (Unaudited)(continued) | |
| | Expense
Ratio1 | Fund
Return | Beginning
Account Value
March 31, 2016 | Ending
Account Value
September 30, 2016 | Expenses
Paid During
Period2 |
Internet Fund | | | | | |
Investor Class | 1.37% | 14.91% | $ 1,000.00 | $ 1,149.10 | $ 7.38 |
A-Class | 1.61% | 14.77% | 1,000.00 | 1,147.70 | 8.67 |
C-Class | 2.36% | 14.33% | 1,000.00 | 1,143.30 | 12.68 |
H-Class | 1.61% | 14.79% | 1,000.00 | 1,147.90 | 8.67 |
Leisure Fund | | | | | |
Investor Class | 1.36% | 1.73% | 1,000.00 | 1,017.30 | 6.88 |
A-Class | 1.61% | 1.61% | 1,000.00 | 1,016.10 | 8.14 |
C-Class | 2.36% | 1.22% | 1,000.00 | 1,012.20 | 11.90 |
H-Class | 1.61% | 1.59% | 1,000.00 | 1,015.90 | 8.14 |
Precious Metals Fund | | | | | |
Investor Class | 1.26% | 34.53% | 1,000.00 | 1,345.30 | 7.41 |
A-Class | 1.51% | 34.33% | 1,000.00 | 1,343.30 | 8.87 |
C-Class | 2.26% | 33.88% | 1,000.00 | 1,338.80 | 13.25 |
H-Class | 1.51% | 34.40% | 1,000.00 | 1,344.00 | 8.87 |
Real Estate Fund | | | | | |
A-Class | 1.62% | 6.49% | 1,000.00 | 1,064.90 | 8.39 |
C-Class | 2.37% | 6.11% | 1,000.00 | 1,061.10 | 12.25 |
H-Class | 1.62% | 6.50% | 1,000.00 | 1,065.00 | 8.39 |
Retailing Fund | | | | | |
Investor Class | 1.37% | (2.26%) | 1,000.00 | 977.40 | 6.79 |
A-Class | 1.62% | (2.37%) | 1,000.00 | 976.30 | 8.03 |
C-Class | 2.36% | (2.76%) | 1,000.00 | 972.40 | 11.67 |
H-Class | 1.61% | (2.39%) | 1,000.00 | 976.10 | 7.98 |
Technology Fund | | | | | |
Investor Class | 1.37% | 12.67% | 1,000.00 | 1,126.70 | 7.30 |
A-Class | 1.62% | 12.55% | 1,000.00 | 1,125.50 | 8.63 |
C-Class | 2.36% | 12.11% | 1,000.00 | 1,121.10 | 12.55 |
H-Class | 1.61% | 12.49% | 1,000.00 | 1,124.90 | 8.58 |
Telecommunications Fund | | | | | |
Investor Class | 1.37% | 9.81% | 1,000.00 | 1,098.10 | 7.21 |
A-Class | 1.61% | 9.63% | 1,000.00 | 1,096.30 | 8.46 |
C-Class | 2.36% | 9.25% | 1,000.00 | 1,092.50 | 12.38 |
H-Class | 1.61% | 9.65% | 1,000.00 | 1,096.50 | 8.46 |
Transportation Fund | | | | | |
Investor Class | 1.37% | 2.18% | 1,000.00 | 1,021.80 | 6.94 |
A-Class | 1.61% | 2.08% | 1,000.00 | 1,020.80 | 8.16 |
C-Class | 2.36% | 1.70% | 1,000.00 | 1,017.00 | 11.93 |
H-Class | 1.62% | 2.06% | 1,000.00 | 1,020.60 | 8.21 |
Utilities Fund | | | | | |
Investor Class | 1.39% | 1.74% | 1,000.00 | 1,017.40 | 7.03 |
A-Class | 1.64% | 1.59% | 1,000.00 | 1,015.90 | 8.29 |
C-Class | 2.38% | 1.21% | 1,000.00 | 1,012.10 | 12.00 |
H-Class | 1.62% | 1.62% | 1,000.00 | 1,016.20 | 8.19 |
6 | THE RYDEX FUNDS SEMI-ANNUAL REPORT | |
ABOUT SHAREHOLDERS’ FUND EXPENSES (Unaudited)(continued) | |
| | Expense
Ratio1 | Fund
Return | Beginning
Account Value
March 31, 2016 | Ending
Account Value
September 30, 2016 | Expenses
Paid During
Period2 |
Table 2. Based on hypothetical 5% return (before expenses) |
Banking Fund | | | | | |
Investor Class | 1.36% | 5.00% | $ 1,000.00 | $ 1,018.25 | $ 6.88 |
A-Class | 1.61% | 5.00% | 1,000.00 | 1,017.00 | 8.14 |
C-Class | 2.36% | 5.00% | 1,000.00 | 1,013.24 | 11.91 |
H-Class | 1.61% | 5.00% | 1,000.00 | 1,017.00 | 8.14 |
Basic Materials Fund | | | | | |
Investor Class | 1.37% | 5.00% | 1,000.00 | 1,018.20 | 6.93 |
A-Class | 1.61% | 5.00% | 1,000.00 | 1,017.00 | 8.14 |
C-Class | 2.36% | 5.00% | 1,000.00 | 1,013.24 | 11.91 |
H-Class | 1.61% | 5.00% | 1,000.00 | 1,017.00 | 8.14 |
Biotechnology Fund | | | | | |
Investor Class | 1.36% | 5.00% | 1,000.00 | 1,018.25 | 6.88 |
A-Class | 1.60% | 5.00% | 1,000.00 | 1,017.05 | 8.09 |
C-Class | 2.35% | 5.00% | 1,000.00 | 1,013.29 | 11.86 |
H-Class | 1.60% | 5.00% | 1,000.00 | 1,017.05 | 8.09 |
Consumer Products Fund | | | | | |
Investor Class | 1.36% | 5.00% | 1,000.00 | 1,018.25 | 6.88 |
A-Class | 1.61% | 5.00% | 1,000.00 | 1,017.00 | 8.14 |
C-Class | 2.35% | 5.00% | 1,000.00 | 1,013.29 | 11.86 |
H-Class | 1.61% | 5.00% | 1,000.00 | 1,017.00 | 8.14 |
Electronics Fund | | | | | |
Investor Class | 1.37% | 5.00% | 1,000.00 | 1,018.20 | 6.93 |
A-Class | 1.62% | 5.00% | 1,000.00 | 1,016.95 | 8.19 |
C-Class | 2.36% | 5.00% | 1,000.00 | 1,013.24 | 11.91 |
H-Class | 1.61% | 5.00% | 1,000.00 | 1,017.00 | 8.14 |
Energy Fund | | | | | |
Investor Class | 1.36% | 5.00% | 1,000.00 | 1,018.25 | 6.88 |
A-Class | 1.61% | 5.00% | 1,000.00 | 1,017.00 | 8.14 |
C-Class | 2.36% | 5.00% | 1,000.00 | 1,013.24 | 11.91 |
H-Class | 1.61% | 5.00% | 1,000.00 | 1,017.00 | 8.14 |
Energy Services Fund | | | | | |
Investor Class | 1.36% | 5.00% | 1,000.00 | 1,018.25 | 6.88 |
A-Class | 1.61% | 5.00% | 1,000.00 | 1,017.00 | 8.14 |
C-Class | 2.36% | 5.00% | 1,000.00 | 1,013.24 | 11.91 |
H-Class | 1.61% | 5.00% | 1,000.00 | 1,017.00 | 8.14 |
Financial Services Fund | | | | | |
Investor Class | 1.37% | 5.00% | 1,000.00 | 1,018.20 | 6.93 |
A-Class | 1.61% | 5.00% | 1,000.00 | 1,017.00 | 8.14 |
C-Class | 2.36% | 5.00% | 1,000.00 | 1,013.24 | 11.91 |
H-Class | 1.61% | 5.00% | 1,000.00 | 1,017.00 | 8.14 |
Health Care Fund | | | | | |
Investor Class | 1.36% | 5.00% | 1,000.00 | 1,018.25 | 6.88 |
A-Class | 1.61% | 5.00% | 1,000.00 | 1,017.00 | 8.14 |
C-Class | 2.36% | 5.00% | 1,000.00 | 1,013.24 | 11.91 |
H-Class | 1.61% | 5.00% | 1,000.00 | 1,017.00 | 8.14 |
| | THE RYDEX FUNDS SEMI-ANNUAL REPORT | 7 |
ABOUT SHAREHOLDERS’ FUND EXPENSES (Unaudited)(concluded) | |
| | Expense
Ratio1 | Fund
Return | Beginning
Account Value
March 31, 2016 | Ending
Account Value
September 30, 2016 | Expenses
Paid During
Period2 |
Internet Fund | | | | | |
Investor Class | 1.37% | 5.00% | $ 1,000.00 | $ 1,018.20 | $ 6.93 |
A-Class | 1.61% | 5.00% | 1,000.00 | 1,017.00 | 8.14 |
C-Class | 2.36% | 5.00% | 1,000.00 | 1,013.24 | 11.91 |
H-Class | 1.61% | 5.00% | 1,000.00 | 1,017.00 | 8.14 |
Leisure Fund | | | | | |
Investor Class | 1.36% | 5.00% | 1,000.00 | 1,018.25 | 6.88 |
A-Class | 1.61% | 5.00% | 1,000.00 | 1,017.00 | 8.14 |
C-Class | 2.36% | 5.00% | 1,000.00 | 1,013.24 | 11.91 |
H-Class | 1.61% | 5.00% | 1,000.00 | 1,017.00 | 8.14 |
Precious Metals Fund | | | | | |
Investor Class | 1.26% | 5.00% | 1,000.00 | 1,018.75 | 6.38 |
A-Class | 1.51% | 5.00% | 1,000.00 | 1,017.50 | 7.64 |
C-Class | 2.26% | 5.00% | 1,000.00 | 1,013.74 | 11.41 |
H-Class | 1.51% | 5.00% | 1,000.00 | 1,017.50 | 7.64 |
Real Estate Fund | | | | | |
A-Class | 1.62% | 5.00% | 1,000.00 | 1,016.95 | 8.19 |
C-Class | 2.37% | 5.00% | 1,000.00 | 1,013.19 | 11.96 |
H-Class | 1.62% | 5.00% | 1,000.00 | 1,016.95 | 8.19 |
Retailing Fund | | | | | |
Investor Class | 1.37% | 5.00% | 1,000.00 | 1,018.20 | 6.93 |
A-Class | 1.62% | 5.00% | 1,000.00 | 1,016.95 | 8.19 |
C-Class | 2.36% | 5.00% | 1,000.00 | 1,013.24 | 11.91 |
H-Class | 1.61% | 5.00% | 1,000.00 | 1,017.00 | 8.14 |
Technology Fund | | | | | |
Investor Class | 1.37% | 5.00% | 1,000.00 | 1,018.20 | 6.93 |
A-Class | 1.62% | 5.00% | 1,000.00 | 1,016.95 | 8.19 |
C-Class | 2.36% | 5.00% | 1,000.00 | 1,013.24 | 11.91 |
H-Class | 1.61% | 5.00% | 1,000.00 | 1,017.00 | 8.14 |
Telecommunications Fund | | | | | |
Investor Class | 1.37% | 5.00% | 1,000.00 | 1,018.20 | 6.93 |
A-Class | 1.61% | 5.00% | 1,000.00 | 1,017.00 | 8.14 |
C-Class | 2.36% | 5.00% | 1,000.00 | 1,013.24 | 11.91 |
H-Class | 1.61% | 5.00% | 1,000.00 | 1,017.00 | 8.14 |
Transportation Fund | | | | | |
Investor Class | 1.37% | 5.00% | 1,000.00 | 1,018.20 | 6.93 |
A-Class | 1.61% | 5.00% | 1,000.00 | 1,017.00 | 8.14 |
C-Class | 2.36% | 5.00% | 1,000.00 | 1,013.24 | 11.91 |
H-Class | 1.62% | 5.00% | 1,000.00 | 1,016.95 | 8.19 |
Utilities Fund | | | | | |
Investor Class | 1.39% | 5.00% | 1,000.00 | 1,018.10 | 7.03 |
A-Class | 1.64% | 5.00% | 1,000.00 | 1,016.85 | 8.29 |
C-Class | 2.38% | 5.00% | 1,000.00 | 1,013.14 | 12.01 |
H-Class | 1.62% | 5.00% | 1,000.00 | 1,016.95 | 8.19 |
1 | Annualized and excludes expenses of the underlying funds in which the Funds invest. |
2 | Expenses are equal to the Fund's annualized expense ratio, net of any applicable fee waivers, multiplied by the average account value over the period, multiplied by 183/365 (to reflect the one-half year period). |
3 | Actual cumulative return at net asset value for the period March 31, 2016 to September 30, 2016. |
8 | THE RYDEX FUNDS SEMI-ANNUAL REPORT | |
FUND PROFILE (Unaudited) | September 30, 2016 |
BANKING FUND
OBJECTIVE: Seeks to provide capital appreciation by investing in companies that are involved in the banking sector, including commercial banks (and their holding companies) and savings and loan institutions (“Banking Companies”).
Holdings Diversification (Market Exposure as % of Net Assets)
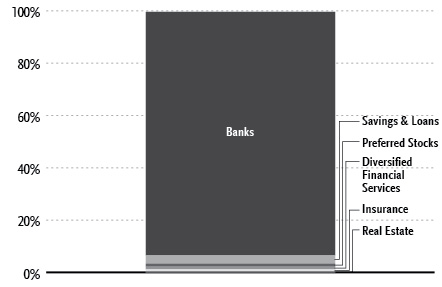
“Holdings Diversification (Market Exposure as % of Net Assets)” excludes any temporary cash investments.
Inception Dates: |
Investor Class | April 1, 1998 |
A-Class | September 1, 2004 |
C-Class | March 30, 2001 |
H-Class* | April 1, 1998 |
Ten Largest Holdings (% of Total Net Assets) |
Citigroup, Inc. | 4.1% |
JPMorgan Chase & Co. | 4.1% |
Bank of America Corp. | 4.0% |
Wells Fargo & Co. | 3.9% |
U.S. Bancorp | 3.0% |
PNC Financial Services Group, Inc. | 2.3% |
Bank of New York Mellon Corp. | 2.3% |
Capital One Financial Corp. | 2.1% |
BB&T Corp. | 1.9% |
State Street Corp. | 1.8% |
Top Ten Total | 29.5% |
| | |
“Ten Largest Holdings” excludes any temporary cash investments. |
* | Effective September 30, 2015, the Fund’s Advisor Class shares were converted into H-Class shares — See Note 8. |
| | THE RYDEX FUNDS SEMI-ANNUAL REPORT | 9 |
SCHEDULE OF INVESTMENTS (Unaudited) | September 30, 2016 |
BANKING FUND | |
| | | Shares | | | Value | |
| | | | | | | |
COMMON STOCKS† - 98.5% | |
| | | | | | | |
Banks - 93.1% | |
Citigroup, Inc. | | | 25,081 | | | $ | 1,184,576 | |
JPMorgan Chase & Co. | | | 17,701 | | | | 1,178,710 | |
Bank of America Corp. | | | 73,873 | | | | 1,156,112 | |
Wells Fargo & Co. | | | 25,605 | | | | 1,133,789 | |
U.S. Bancorp | | | 20,041 | | | | 859,558 | |
PNC Financial Services Group, Inc. | | | 7,432 | | | | 669,549 | |
Bank of New York Mellon Corp. | | | 16,327 | | | | 651,120 | |
Capital One Financial Corp. | | | 8,578 | | | | 616,158 | |
BB&T Corp. | | | 14,681 | | | | 553,767 | |
State Street Corp. | | | 7,520 | | | | 523,618 | |
SunTrust Banks, Inc. | | | 10,659 | | | | 466,864 | |
M&T Bank Corp. | | | 3,715 | | | | 431,312 | |
Fifth Third Bancorp | | | 19,484 | | | | 398,643 | |
Northern Trust Corp. | | | 5,765 | | | | 391,962 | |
Citizens Financial Group, Inc. | | | 14,697 | | | | 363,163 | |
KeyCorp | | | 29,749 | | | | 362,045 | |
Regions Financial Corp. | | | 35,619 | | | | 351,560 | |
First Republic Bank | | | 4,439 | | | | 342,291 | |
Huntington Bancshares, Inc. | | | 32,945 | | | | 324,840 | |
Banco Bradesco S.A. ADR | | | 34,507 | | | | 312,978 | |
Comerica, Inc. | | | 6,152 | | | | 291,113 | |
Credicorp Ltd. | | | 1,780 | | | | 270,952 | |
ICICI Bank Ltd. ADR | | | 35,850 | | | | 267,799 | |
Toronto-Dominion Bank | | | 6,028 | | | | 267,643 | |
Signature Bank* | | | 2,250 | | | | 266,513 | |
HDFC Bank Ltd. ADR | | | 3,657 | �� | | | 262,902 | |
HSBC Holdings plc ADR | | | 6,971 | | | | 262,179 | |
Royal Bank of Canada | | | 4,210 | | | | 260,852 | |
Zions Bancorporation | | | 8,285 | | | | 257,001 | |
SVB Financial Group* | | | 2,302 | | | | 254,463 | |
Bank of Montreal | | | 3,783 | | | | 248,051 | |
Canadian Imperial Bank of Commerce | | | 3,175 | | | | 246,158 | |
Bank of Nova Scotia | | | 4,570 | | | | 242,164 | |
Popular, Inc. | | | 6,292 | | | | 240,480 | |
Barclays plc ADR | | | 27,642 | | | | 240,209 | |
Credit Suisse Group AG ADR | | | 17,886 | | | | 235,022 | |
East West Bancorp, Inc. | | | 6,384 | | | | 234,357 | |
ING Groep N.V. ADR | | | 18,904 | | | | 233,275 | |
PacWest Bancorp | | | 5,323 | | | | 228,410 | |
Deutsche Bank AG* | | | 17,280 | | | | 226,195 | |
Banco Santander Chile ADR | | | 10,910 | | | | 225,728 | |
Grupo Financiero Santander Mexico SAB de CV ADR | | | 25,645 | | | | 225,676 | |
Banco Santander Brasil S.A. ADR | | | 33,510 | | | | 224,517 | |
UBS Group AG | | | 16,464 | | | | 224,240 | |
Bancolombia S.A. ADR | | | 5,718 | | | | 223,231 | |
Sumitomo Mitsui Financial Group, Inc. ADR | | | 33,032 | | | | 222,966 | |
Banco Santander S.A. ADR | | | 50,338 | | | | 221,991 | |
Commerce Bancshares, Inc. | | | 4,492 | | | | 221,277 | |
Banco Bilbao Vizcaya Argentaria S.A. ADR | | | 36,751 | | | | 219,036 | |
BOK Financial Corp. | | | 3,163 | | | | 218,152 | |
Cullen/Frost Bankers, Inc. | | | 3,023 | | | | 217,475 | |
Bank of the Ozarks, Inc. | | | 5,658 | | | | 217,267 | |
Western Alliance Bancorporation* | | | 5,430 | | | | 203,842 | |
First Citizens BancShares, Inc. — Class A | | | 685 | | | | 201,315 | |
Synovus Financial Corp. | | | 6,177 | | | | 200,938 | |
Prosperity Bancshares, Inc. | | | 3,652 | | | | 200,458 | |
PrivateBancorp, Inc. — Class A | | | 4,236 | | | | 194,517 | |
First Horizon National Corp. | | | 12,460 | | | | 189,766 | |
Webster Financial Corp. | | | 4,949 | | | | 188,111 | |
Umpqua Holdings Corp. | | | 12,125 | | | | 182,481 | |
Chemical Financial Corp. | | | 3,988 | | | | 175,990 | |
BankUnited, Inc. | | | 5,820 | | | | 175,764 | |
UMB Financial Corp. | | | 2,928 | | | | 174,070 | |
Associated Banc-Corp. | | | 8,875 | | | | 173,861 | |
United Bankshares, Inc. | | | 4,554 | | | | 171,549 | |
Wintrust Financial Corp. | | | 3,073 | | | | 170,767 | |
MB Financial, Inc. | | | 4,447 | | | | 169,164 | |
Home BancShares, Inc. | | | 7,958 | | | | 165,606 | |
Texas Capital Bancshares, Inc.* | | | 2,995 | | | | 164,485 | |
FNB Corp. | | | 13,271 | | | | 163,233 | |
Valley National Bancorp | | | 16,678 | | | | 162,277 | |
Hancock Holding Co. | | | 4,964 | | | | 160,983 | |
Fulton Financial Corp. | | | 11,010 | | | | 159,865 | |
TCF Financial Corp. | | | 10,948 | | | | 158,855 | |
First Financial Bankshares, Inc. | | | 4,316 | | | | 157,275 | |
Cathay General Bancorp | | | 5,106 | | | | 157,163 | |
Pinnacle Financial Partners, Inc. | | | 2,904 | | | | 157,048 | |
Hope Bancorp, Inc. | | | 8,987 | | | | 156,104 | |
Hilltop Holdings, Inc.* | | | 6,716 | | | | 150,841 | |
Community Bank System, Inc. | | | 3,093 | | | | 148,804 | |
Glacier Bancorp, Inc. | | | 5,217 | | | | 148,789 | |
BancorpSouth, Inc. | | | 6,317 | | | | 146,554 | |
Great Western Bancorp, Inc. | | | 4,249 | | | | 141,577 | |
CVB Financial Corp. | | | 8,039 | | | | 141,567 | |
Bank of Hawaii Corp. | | | 1,949 | | | | 141,536 | |
South State Corp. | | | 1,880 | | | | 141,075 | |
Old National Bancorp | | | 9,988 | | | | 140,431 | |
Columbia Banking System, Inc. | | | 4,240 | | | | 138,733 | |
Trustmark Corp. | | | 4,995 | | | | 137,662 | |
IBERIABANK Corp. | | | 1,966 | | | | 131,958 | |
First Midwest Bancorp, Inc. | | | 6,570 | | | | 127,195 | |
United Community Banks, Inc. | | | 5,943 | | | | 124,922 | |
LegacyTexas Financial Group, Inc. | | | 3,935 | | | | 124,464 | |
Westamerica Bancorporation | | | 2,405 | | | | 122,366 | |
Boston Private Financial Holdings, Inc. | | | 8,220 | | | | 105,463 | |
Total Banks | | | | | | | 26,819,333 | |
| | | | | | | | | |
Savings & Loans - 3.2% | |
New York Community Bancorp, Inc. | | | 18,396 | | | | 261,775 | |
People’s United Financial, Inc. | | | 14,101 | | | | 223,078 | |
Investors Bancorp, Inc. | | | 16,285 | | | | 195,583 | |
Sterling Bancorp | | | 8,792 | | | | 153,860 | |
Banc of California, Inc. | | | 4,987 | | | | 87,073 | |
Total Savings & Loans | | | | | | | 921,369 | |
| | | | | | | | | |
Diversified Financial Services - 1.0% | |
CIT Group, Inc. | | | 7,619 | | | | 276,570 | |
10 | THE RYDEX FUNDS SEMI-ANNUAL REPORT | SEE NOTES TO FINANCIAL STATEMENTS. |
SCHEDULE OF INVESTMENTS (Unaudited)(concluded) | September 30, 2016 |
BANKING FUND | |
| | | Shares | | | Value | |
| | | | | | | |
Insurance - 0.8% | |
Voya Financial, Inc. | | | 8,304 | | | $ | 239,321 | |
| | | | | | | | | |
Real Estate - 0.4% | |
HFF, Inc. — Class A | | | 3,829 | | | | 106,025 | |
| | | | | | | | | |
Total Common Stocks | | | | | | | | |
(Cost $24,760,053) | | | | | | | 28,362,618 | |
| | | | | | | | | |
PREFERRED STOCKS†† - 1.1% | |
Financial - 1.1% | |
Itau Unibanco Holding S.A. ADR due | | | 29,415 | | | | 321,800 | |
Total Preferred Stocks | | | | | | | | |
(Cost $273,052) | | | | | | | 321,800 | |
| | | Face
Amount | | | | |
| | | | | | | |
REPURCHASE AGREEMENT††,1 - 0.4% | |
Royal Bank of Canada
issued 09/30/16 at 0.36%
due 10/03/16 | | $ | 119,708 | | | | 119,708 | |
Total Repurchase Agreement | | | | | | | | |
(Cost $119,708) | | | | | | | 119,708 | |
| | | | | | | | | |
Total Investments - 100.0% | | | | | | | | |
(Cost $25,152,813) | | | | | | $ | 28,804,126 | |
Other Assets & Liabilities, net - 0.0% | | | | | | | 4,058 | |
Total Net Assets - 100.0% | | | | | | $ | 28,808,184 | |
* | Non-income producing security. |
† | Value determined based on Level 1 inputs — See Note 4. |
†† | Value determined based on Level 2 inputs — See Note 4. |
1 | Repurchase Agreement — See Note 5. |
| | ADR — American Depositary Receipt |
| | plc — Public Limited Company |
| | |
| | See Sector Classification in Other Information section. |
The following table summarizes the inputs used to value the Fund’s investments at September 30, 2016 (See Note 4 in the Notes to Financial Statements):
Investments in Securities (Assets) | | Level 1 | | | Level 2 | | | Level 3 | | | Total | |
Common Stocks | | $ | 28,362,618 | | | $ | — | | | $ | — | | | $ | 28,362,618 | |
Preferred Stocks | | | 321,800 | | | | — | | | | — | | | | 321,800 | |
Repurchase Agreement | | | — | | | | 119,708 | | | | — | | | | 119,708 | |
Total | | $ | 28,684,418 | | | $ | 119,708 | | | $ | — | | | $ | 28,804,126 | |
Transfers between investment levels may occur as the markets fluctuate and/or the availability of data used in an investment’s valuation changes. Transfers between valuation levels, if any, are in comparison to the valuation levels at the end of the previous fiscal year, and are effective using the fair value as of the end of the previous fiscal period.
For the period ended September 30, 2016, there were no transfers between levels.
SEE NOTES TO FINANCIAL STATEMENTS. | THE RYDEX FUNDS SEMI-ANNUAL REPORT | 11 |
STATEMENT OF ASSETS AND LIABILITIES (Unaudited) |
September 30, 2016 |
Assets: | |
Investments, at value (cost $25,033,105) | | $ | 28,684,418 | |
Repurchase agreements, at value (cost $119,708) | | | 119,708 | |
Total investments (cost $25,152,813) | | | 28,804,126 | |
Receivables: | |
Securities sold | | | 159,096 | |
Fund shares sold | | | 34,270 | |
Dividends | | | 58,606 | |
Foreign taxes reclaim | | | 3,873 | |
Total assets | | | 29,059,971 | |
| | | | | |
Liabilities: | |
Payable for: | |
Fund shares redeemed | | | 213,990 | |
Management fees | | | 21,303 | |
Transfer agent and administrative fees | | | 6,266 | |
Distribution and service fees | | | 3,897 | |
Portfolio accounting fees | | | 2,506 | |
Miscellaneous | | | 3,825 | |
Total liabilities | | | 251,787 | |
Commitments and contingent liabilities (Note 9) | | | — | |
Net assets | | $ | 28,808,184 | |
| | | | | |
Net assets consist of: | |
Paid in capital | | $ | 52,249,802 | |
Undistributed net investment income | | | 362,505 | |
Accumulated net realized loss on investments | | | (27,455,436 | ) |
Net unrealized appreciation on investments | | | 3,651,313 | |
Net assets | | $ | 28,808,184 | |
| | | | | |
Investor Class: | |
Net assets | | $ | 19,651,626 | |
Capital shares outstanding | | | 317,023 | |
Net asset value per share | | $ | 61.99 | |
| | | | | |
A-Class: | |
Net assets | | $ | 1,838,674 | |
Capital shares outstanding | | | 32,330 | |
Net asset value per share | | $ | 56.87 | |
Maximum offering price per share (Net asset value divided by 95.25%) | | $ | 59.71 | |
| | | | | |
C-Class: | |
Net assets | | $ | 3,208,712 | |
Capital shares outstanding | | | 61,827 | |
Net asset value per share | | $ | 51.90 | |
| | | | | |
H-Class: | |
Net assets | | $ | 4,109,172 | |
Capital shares outstanding | | | 74,157 | |
Net asset value per share | | $ | 55.41 | |
STATEMENT OF OPERATIONS (Unaudited) |
Period Ended September 30, 2016 |
Investment Income: | |
Dividends (net of foreign withholding tax of $4,847) | | $ | 238,706 | |
Interest | | | 201 | |
Total investment income | | | 238,907 | |
| | | | | |
Expenses: | |
Management fees | | | 76,869 | |
Transfer agent and administrative fees | | | 22,609 | |
Distribution and service fees: | |
A-Class | | | 1,366 | |
C-Class | | | 16,027 | |
H-Class | | | 4,553 | |
Portfolio accounting fees | | | 9,043 | |
Custodian fees | | | 1,066 | |
Trustees’ fees* | | | 775 | |
Line of credit fees | | | 38 | |
Miscellaneous | | | 13,104 | |
Total expenses | | | 145,450 | |
Net investment income | | | 93,457 | |
| | | | | |
Net Realized and Unrealized Gain (Loss): | |
Net realized gain (loss) on: | |
Investments | | | 747,843 | |
Net realized gain | | | 747,843 | |
Net change in unrealized appreciation (depreciation) on: | |
Investments | | | (68,711 | ) |
Net change in unrealized appreciation (depreciation) | | | (68,711 | ) |
Net realized and unrealized gain | | | 679,132 | |
Net increase in net assets resulting from operations | | $ | 772,589 | |
* | Relates to Trustees not deemed “interested persons” within the meaning of Section 2(a)(19) of the 1940 Act. |
12 | THE RYDEX FUNDS SEMI-ANNUAL REPORT | SEE NOTES TO FINANCIAL STATEMENTS. |
STATEMENTS OF CHANGES IN NET ASSETS |
| | | Period Ended
September 30,
2016
(Unaudited) | | | Year Ended
March 31,
2016 | |
Increase (Decrease) in Net Assets from Operations: | | | | | | |
Net investment income | | $ | 93,457 | | | $ | 269,048 | |
Net realized gain (loss) on investments | | | 747,843 | | | | (3,164,939 | ) |
Net change in unrealized appreciation (depreciation) on investments | | | (68,711 | ) | | | (31,048 | ) |
Net increase (decrease) in net assets resulting from operations | | | 772,589 | | | | (2,926,939 | ) |
| | | | | | | | | |
Distributions to shareholders from: | | | | | | | | |
Net investment income | | | | | | | | |
Investor Class | | | — | | | | (51,827 | ) |
A-Class | | | — | | | | (8,948 | ) |
C-Class | | | — | | | | (21,332 | ) |
H-Class | | | — | | | | (2,387 | )* |
Total distributions to shareholders | | | — | | | | (84,494 | ) |
| | | | | | | | | |
Capital share transactions: | | | | | | | | |
Proceeds from sale of shares | | | | | | | | |
Investor Class | | | 111,747,789 | | | | 87,235,741 | |
A-Class | | | 1,521,136 | | | | 10,514,018 | |
C-Class | | | 2,422,746 | | | | 17,189,341 | |
H-Class | | | 133,844,228 | | | | 112,516,867 | * |
Distributions reinvested | | | | | | | | |
Investor Class | | | — | | | | 49,679 | |
A-Class | | | — | | | | 8,716 | |
C-Class | | | — | | | | 21,120 | |
H-Class | | | — | | | | 2,376 | * |
Cost of shares redeemed | | | | | | | | |
Investor Class | | | (99,916,325 | ) | | | (123,610,616 | ) |
A-Class | | | (626,210 | ) | | | (9,638,810 | ) |
C-Class | | | (2,690,294 | ) | | | (16,568,748 | ) |
H-Class | | | (130,897,396 | ) | | | (111,099,432 | )* |
Net increase (decrease) from capital share transactions | | | 15,405,674 | | | | (33,379,748 | ) |
Net increase (decrease) in net assets | | | 16,178,263 | | | | (36,391,181 | ) |
| | | | | | | | | |
Net assets: | | | | | | | | |
Beginning of period | | | 12,629,921 | | | | 49,021,102 | |
End of period | | $ | 28,808,184 | | | $ | 12,629,921 | |
Undistributed net investment income at end of period | | $ | 362,505 | | | $ | 269,048 | |
| | | | | | | | | |
Capital share activity: | | | | | | | | |
Shares sold | | | | | | | | |
Investor Class | | | 1,858,484 | | | | 1,376,130 | |
A-Class | | | 26,975 | | | | 175,337 | |
C-Class | | | 48,725 | | | | 320,598 | |
H-Class | | | 2,651,848 | | | | 2,045,614 | * |
Shares issued from reinvestment of distributions | | | | | | | | |
Investor Class | | | — | | | | 788 | |
A-Class | | | — | | | | 150 | |
C-Class | | | — | | | | 396 | |
H-Class | | | — | | | | 42 | * |
Shares redeemed | | | | | | | | |
Investor Class | | | (1,669,838 | ) | | | (1,949,956 | ) |
A-Class | | | (11,645 | ) | | | (176,727 | ) |
C-Class | | | (54,413 | ) | | | (312,183 | ) |
H-Class | | | (2,604,769 | ) | | | (2,033,623 | )* |
Net increase (decrease) in shares | | | 245,367 | | | | (553,434 | ) |
* | Effective September 30, 2015, the Fund’s Advisor Class shares were converted into H-Class shares — See Note 8. |
SEE NOTES TO FINANCIAL STATEMENTS. | THE RYDEX FUNDS SEMI-ANNUAL REPORT | 13 |
This table is presented to show selected data for a share outstanding throughout each period and to assist shareholders in evaluating a Fund’s performance for the periods presented.
Investor Class | | Period Ended
September 30,
2016a | | | Year Ended
March 31,
2016 | | | Year Ended
March 31,
2015 | | | Year Ended
March 31,
2014 | | | Year Ended
March 28,
2013 | | | Year Ended
March 31,
2012 | |
Per Share Data | | | | | | | | | | | | | | | | | | |
Net asset value, beginning of period | | $ | 56.13 | | | $ | 62.71 | | | $ | 63.60 | | | $ | 52.58 | | | $ | 46.75 | | | $ | 49.75 | |
Income (loss) from investment operations: | |
Net investment income (loss)b | | | .40 | | | | .68 | | | | .51 | | | | .54 | | | | .54 | | | | .44 | |
Net gain (loss) on investments (realized and unrealized) | | | 5.46 | | | | (6.97 | ) | | | (.98 | ) | | | 11.09 | | | | 5.44 | | | | (3.39 | ) |
Total from investment operations | | | 5.86 | | | | (6.29 | ) | | | (.47 | ) | | | 11.63 | | | | 5.98 | | | | (2.95 | ) |
Less distributions from: | |
Net investment income | | | — | | | | (.29 | ) | | | (.42 | ) | | | (.61 | ) | | | (.15 | ) | | | (.05 | ) |
Total distributions | | | — | | | | (.29 | ) | | | (.42 | ) | | | (.61 | ) | | | (.15 | ) | | | (.05 | ) |
Net asset value, end of period | | $ | 61.99 | | | $ | 56.13 | | | $ | 62.71 | | | $ | 63.60 | | | $ | 52.58 | | | $ | 46.75 | |
| | |
Total Returnc | | | 10.42 | % | | | (10.10 | %) | | | (0.73 | %) | | | 22.17 | % | | | 12.84 | % | | | (5.89 | %) |
Ratios/Supplemental Data | |
Net assets, end of period (in thousands) | | $ | 19,652 | | | $ | 7,206 | | | $ | 43,989 | | | $ | 11,241 | | | $ | 8,915 | | | $ | 29,061 | |
Ratios to average net assets: | |
Net investment income (loss) | | | 1.33 | % | | | 1.07 | % | | | 0.82 | % | | | 0.92 | % | | | 1.16 | % | | | 1.02 | % |
Total expenses | | | 1.36 | % | | | 1.34 | % | | | 1.34 | % | | | 1.37 | % | | | 1.35 | % | | | 1.34 | % |
Portfolio turnover rate | | | 1,080 | % | | | 514 | % | | | 583 | % | | | 481 | % | | | 382 | % | | | 544 | % |
A-Class | | Period Ended
September 30,
2016a | | | Year Ended
March 31,
2016 | | | Year Ended
March 31,
2015 | | | Year Ended
March 31,
2014 | | | Year Ended
March 28,
2013 | | | Year Ended
March 31,
2012 | |
Per Share Data | | | | | | | | | | | | | | | | | | |
Net asset value, beginning of period | | $ | 51.55 | | | $ | 57.76 | | | $ | 58.75 | | | $ | 48.74 | | | $ | 43.45 | | | $ | 46.38 | |
Income (loss) from investment operations: | |
Net investment income (loss)b | | | .30 | | | | .40 | | | | .26 | | | | .39 | | | | .36 | | | | .30 | |
Net gain (loss) on investments (realized and unrealized) | | | 5.02 | | | | (6.32 | ) | | | (.83 | ) | | | 10.23 | | | | 5.08 | | | | (3.18 | ) |
Total from investment operations | | | 5.32 | | | | (5.92 | ) | | | (.57 | ) | | | 10.62 | | | | 5.44 | | | | (2.88 | ) |
Less distributions from: | |
Net investment income | | | — | | | | (.29 | ) | | | (.42 | ) | | | (.61 | ) | | | (.15 | ) | | | (.05 | ) |
Total distributions | | | — | | | | (.29 | ) | | | (.42 | ) | | | (.61 | ) | | | (.15 | ) | | | (.05 | ) |
Net asset value, end of period | | $ | 56.87 | | | $ | 51.55 | | | $ | 57.76 | | | $ | 58.75 | | | $ | 48.74 | | | $ | 43.45 | |
| | |
Total Returnc | | | 10.32 | % | | | (10.31 | %) | | | (0.98 | %) | | | 21.84 | % | | | 12.60 | % | | | (6.19 | %) |
Ratios/Supplemental Data | |
Net assets, end of period (in thousands) | | $ | 1,839 | | | $ | 876 | | | $ | 1,054 | | | $ | 8,305 | | | $ | 2,103 | | | $ | 3,088 | |
Ratios to average net assets: | |
Net investment income (loss) | | | 1.08 | % | | | 0.69 | % | | | 0.45 | % | | | 0.71 | % | | | 0.88 | % | | | 0.73 | % |
Total expenses | | | 1.61 | % | | | 1.59 | % | | | 1.60 | % | | | 1.62 | % | | | 1.59 | % | | | 1.61 | % |
Portfolio turnover rate | | | 1,080 | % | | | 514 | % | | | 583 | % | | | 481 | % | | | 382 | % | | | 544 | % |
14 | THE RYDEX FUNDS SEMI-ANNUAL REPORT | SEE NOTES TO FINANCIAL STATEMENTS. |
FINANCIAL HIGHLIGHTS (concluded) |
This table is presented to show selected data for a share outstanding throughout each period and to assist shareholders in evaluating a Fund’s performance for the periods presented.
C-Class | | Period Ended
September 30,
2016a | | | Year Ended
March 31,
2016 | | | Year Ended
March 31,
2015 | | | Year Ended
March 31,
2014 | | | Year Ended
March 28,
2013 | | | Year Ended
March 31,
2012 | |
Per Share Data | | | | | | | | | | | | | | | | | | |
Net asset value, beginning of period | | $ | 47.22 | | | $ | 53.34 | | | $ | 54.69 | | | $ | 45.74 | | | $ | 41.09 | | | $ | 44.20 | |
Income (loss) from investment operations: | |
Net investment income (loss)b | | | .09 | | | | .03 | | | | (.14 | ) | | | (.05 | ) | | | .01 | | | | (.01 | ) |
Net gain (loss) on investments (realized and unrealized) | | | 4.59 | | | | (5.86 | ) | | | (.79 | ) | | | 9.61 | | | | 4.79 | | | | (3.05 | ) |
Total from investment operations | | | 4.68 | | | | (5.83 | ) | | | (.93 | ) | | | 9.56 | | | | 4.80 | | | | (3.06 | ) |
Less distributions from: | |
Net investment income | | | — | | | | (.29 | ) | | | (.42 | ) | | | (.61 | ) | | | (.15 | ) | | | (.05 | ) |
Total distributions | | | — | | | | (.29 | ) | | | (.42 | ) | | | (.61 | ) | | | (.15 | ) | | | (.05 | ) |
Net asset value, end of period | | $ | 51.90 | | | $ | 47.22 | | | $ | 53.34 | | | $ | 54.69 | | | $ | 45.74 | | | $ | 41.09 | |
| | |
Total Returnc | | | 9.89 | % | | | (10.99 | %) | | | (1.71 | %) | | | 20.95 | % | | | 11.74 | % | | | (6.88 | %) |
Ratios/Supplemental Data | |
Net assets, end of period (in thousands) | | $ | 3,209 | | | $ | 3,188 | | | $ | 3,131 | | | $ | 4,307 | | | $ | 4,036 | | | $ | 3,841 | |
Ratios to average net assets: | |
Net investment income (loss) | | | 0.36 | % | | | 0.05 | % | | | (0.26 | %) | | | (0.10 | %) | | | 0.02 | % | | | (0.03 | %) |
Total expenses | | | 2.36 | % | | | 2.35 | % | | | 2.35 | % | | | 2.37 | % | | | 2.35 | % | | | 2.35 | % |
Portfolio turnover rate | | | 1,080 | % | | | 514 | % | | | 583 | % | | | 481 | % | | | 382 | % | | | 544 | % |
H-Class | | Period Ended
September 30,
2016a | | | Year Ended
March 31,
2016d | | | Year Ended
March 31,
2015d | | | Year Ended
March 31,
2014d | | | Year Ended
March 28,
2013d | | | Year Ended
March 31,
2012d | |
Per Share Data | | | | | | | | | | | | | | | | | | |
Net asset value, beginning of period | | $ | 50.22 | | | $ | 56.30 | | | $ | 57.40 | | | $ | 47.71 | | | $ | 42.63 | | | $ | 45.63 | |
Income (loss) from investment operations: | |
Net investment income (loss)b | | | .20 | | | | .33 | | | | (.01 | ) | | | .23 | | | | .17 | | | | .12 | |
Net gain (loss) on investments (realized and unrealized) | | | 4.99 | | | | (6.12 | ) | | | (.67 | ) | | | 10.07 | | | | 5.06 | | | | (3.07 | ) |
Total from investment operations | | | 5.19 | | | | (5.79 | ) | | | (.68 | ) | | | 10.30 | | | | 5.23 | | | | (2.95 | ) |
Less distributions from: | |
Net investment income | | | — | | | | (.29 | ) | | | (.42 | ) | | | (.61 | ) | | | (.15 | ) | | | (.05 | ) |
Total distributions | | | — | | | | (.29 | ) | | | (.42 | ) | | | (.61 | ) | | | (.15 | ) | | | (.05 | ) |
Net asset value, end of period | | $ | 55.41 | | | $ | 50.22 | | | $ | 56.30 | | | $ | 57.40 | | | $ | 47.71 | | | $ | 42.63 | |
| | |
Total Returnc | | | 10.33 | % | | | (10.34 | %) | | | (1.19 | %) | | | 21.64 | % | | | 12.32 | % | | | (6.43 | %) |
Ratios/Supplemental Data | |
Net assets, end of period (in thousands) | | $ | 4,109 | | | $ | 1,360 | | | $ | 847 | | | $ | 540 | | | $ | 4,235 | | | $ | 1,105 | |
Ratios to average net assets: | |
Net investment income (loss) | | | 0.78 | % | | | 0.57 | % | | | (0.02 | %) | | | 0.44 | % | | | 0.38 | % | | | 0.30 | % |
Total expenses | | | 1.61 | % | | | 1.68 | % | | | 1.85 | % | | | 1.87 | % | | | 1.86 | % | | | 1.83 | % |
Portfolio turnover rate | | | 1,080 | % | | | 514 | % | | | 583 | % | | | 481 | % | | | 382 | % | | | 544 | % |
a | Unaudited figures for the period ended September 30, 2016. Percentage amounts for the period, except total return and portfolio turnover rate, have been annualized. |
b | Net investment income (loss) per share was computed using average shares outstanding throughout the period. |
c | Total return does not reflect the impact of any applicable sales charges. |
d | Effective September 30, 2015, the Fund’s Advisor Class shares were converted into H-Class shares. The financial highlights for periods prior to that date reflect the performance of the former Advisor Class — See Note 8. |
SEE NOTES TO FINANCIAL STATEMENTS. | THE RYDEX FUNDS SEMI-ANNUAL REPORT | 15 |
FUND PROFILE (Unaudited) | September 30, 2016 |
BASIC MATERIALS FUND
OBJECTIVE: Seeks to provide capital appreciation by investing in companies engaged in the mining, manufacture, or sale of basic materials, such as lumber, steel, iron, aluminum, concrete, chemicals and other basic building and manufacturing materials (“Basic Materials Companies”).
Holdings Diversification (Market Exposure as % of Net Assets)
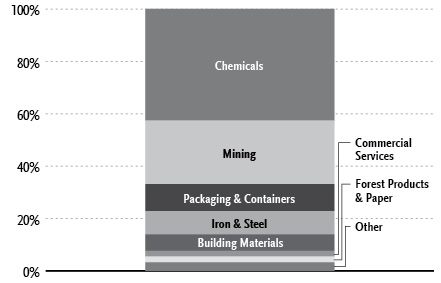
“Holdings Diversification (Market Exposure as % of Net Assets)” excludes any temporary cash investments.
Inception Dates: |
Investor Class | April 1, 1998 |
A-Class | September 1, 2004 |
C-Class | May 3, 2001 |
H-Class* | April 14, 1998 |
Ten Largest Holdings (% of Total Net Assets) |
EI du Pont de Nemours & Co. | 2.8% |
Dow Chemical Co. | 2.8% |
Monsanto Co. | 2.4% |
Ecolab, Inc. | 2.2% |
LyondellBasell Industries N.V. — Class A | 2.2% |
Praxair, Inc. | 2.2% |
Air Products & Chemicals, Inc. | 2.1% |
PPG Industries, Inc. | 1.9% |
Sherwin-Williams Co. | 1.9% |
Newmont Mining Corp. | 1.7% |
Top Ten Total | 22.2% |
| | |
“Ten Largest Holdings” excludes any temporary cash investments. |
* | Effective September 30, 2015, the Fund’s Advisor Class shares were converted into H-Class shares — See Note 8. |
16 | THE RYDEX FUNDS SEMI-ANNUAL REPORT | |
SCHEDULE OF INVESTMENTS (Unaudited) | September 30, 2016 |
BASIC MATERIALS FUND | |
| | | Shares | | | Value | |
| | | | | | | |
COMMON STOCKS† - 100.1% | |
| | | | | | | |
Chemicals - 42.7% | |
EI du Pont de Nemours & Co. | | | 48,828 | | | $ | 3,270,011 | |
Dow Chemical Co. | | | 62,674 | | | | 3,248,393 | |
Monsanto Co. | | | 28,026 | | | | 2,864,256 | |
LyondellBasell Industries N.V. — Class A | | | 31,666 | | | | 2,554,180 | |
Praxair, Inc. | | | 21,052 | | | | 2,543,713 | |
Air Products & Chemicals, Inc. | | | 16,518 | | | | 2,483,316 | |
PPG Industries, Inc. | | | 22,070 | | | | 2,281,155 | |
Sherwin-Williams Co. | | | 7,916 | | | | 2,190,040 | |
International Flavors & Fragrances, Inc. | | | 10,461 | | | | 1,495,609 | |
Albemarle Corp. | | | 16,379 | | | | 1,400,241 | |
Eastman Chemical Co. | | | 20,568 | | | | 1,392,042 | |
Celanese Corp. — Class A | | | 20,762 | | | | 1,381,919 | |
Potash Corporation of Saskatchewan, Inc. | | | 81,830 | | | | 1,335,466 | |
Valspar Corp. | | | 11,824 | | | | 1,254,172 | |
Mosaic Co. | | | 50,013 | | | | 1,223,318 | |
RPM International, Inc. | | | 21,797 | | | | 1,170,935 | |
Westlake Chemical Corp. | | | 21,740 | | | | 1,163,090 | |
Axalta Coating Systems Ltd.* | | | 40,090 | | | | 1,133,344 | |
Ashland Global Holdings, Inc. | | | 9,772 | | | | 1,133,063 | |
FMC Corp. | | | 22,570 | | | | 1,091,034 | |
CF Industries Holdings, Inc. | | | 42,270 | | | | 1,029,275 | |
NewMarket Corp. | | | 2,326 | | | | 998,598 | |
WR Grace & Co. | | | 13,286 | | | | 980,507 | |
Agrium, Inc. | | | 10,033 | | | | 909,893 | |
Huntsman Corp. | | | 55,698 | | | | 906,206 | |
Methanex Corp. | | | 23,980 | | | | 855,606 | |
Olin Corp. | | | 40,034 | | | | 821,498 | |
Sensient Technologies Corp. | | | 10,520 | | | | 797,416 | |
Chemours Co. | | | 49,700 | | | | 795,200 | |
Cabot Corp. | | | 15,158 | | | | 794,431 | |
PolyOne Corp. | | | 21,942 | | | | 741,859 | |
Syngenta AG ADR | | | 8,120 | | | | 711,312 | |
Minerals Technologies, Inc. | | | 9,905 | | | | 700,184 | |
Chemtura Corp.* | | | 20,660 | | | | 677,855 | |
HB Fuller Co. | | | 14,030 | | | | 651,974 | |
Ingevity Corp.* | | | 12,956 | | | | 597,272 | |
Platform Specialty Products Corp.* | | | 70,800 | | | | 574,188 | |
Total Chemicals | | | | | | | 50,152,571 | |
| | | | | | | | | |
Mining - 24.3% | |
Newmont Mining Corp. | | | 50,067 | | | | 1,967,133 | |
Barrick Gold Corp. | | | 106,544 | | | | 1,887,960 | |
Freeport-McMoRan, Inc. | | | 159,006 | | | | 1,726,805 | |
Alcoa, Inc. | | | 159,839 | | | | 1,620,767 | |
Goldcorp, Inc. | | | 85,088 | | | | 1,405,654 | |
Silver Wheaton Corp. | | | 50,618 | | | | 1,368,204 | |
BHP Billiton Ltd. ADR | | | 37,915 | | | | 1,313,755 | |
Rio Tinto plc ADR | | | 38,345 | | | | 1,280,723 | |
Teck Resources Ltd. — Class B | | | 61,961 | | | | 1,117,157 | |
Agnico Eagle Mines Ltd. | | | 20,580 | | | | 1,115,024 | |
Randgold Resources Ltd. ADR | | | 10,404 | | | | 1,041,128 | |
AngloGold Ashanti Ltd. ADR* | | | 64,001 | | | | 1,018,896 | |
Royal Gold, Inc. | | | 12,729 | | | | 985,606 | |
Kinross Gold Corp.* | | | 219,649 | | | | 924,722 | |
Franco-Nevada Corp. | | | 12,422 | | | | 867,925 | |
Pan American Silver Corp. | | | 48,487 | | | | 854,341 | |
Tahoe Resources, Inc. | | | 66,118 | | | | 848,294 | |
First Majestic Silver Corp.* | | | 82,192 | | | | 846,578 | |
Southern Copper Corp. | | | 29,750 | | | | 782,425 | |
Eldorado Gold Corp.* | | | 192,445 | | | | 756,309 | |
Cia de Minas Buenaventura S.A.A. ADR* | | | 50,803 | | | | 703,114 | |
Silver Standard Resources, Inc.* | | | 58,200 | | | | 701,892 | |
Compass Minerals International, Inc. | | | 9,358 | | | | 689,685 | |
Hecla Mining Co. | | | 113,100 | | | | 644,670 | |
Coeur Mining, Inc.* | | | 49,667 | | | | 587,561 | |
Stillwater Mining Co.* | | | 42,998 | | | | 574,453 | |
Kaiser Aluminum Corp. | | | 6,350 | | | | 549,212 | |
Century Aluminum Co.* | | | 52,702 | | | | 366,279 | |
Total Mining | | | | | | | 28,546,272 | |
| | | | | | | | | |
Packaging & Containers - 10.3% | |
Ball Corp. | | | 20,144 | | | | 1,650,801 | |
WestRock Co. | | | 31,619 | | | | 1,532,888 | |
Sealed Air Corp. | | | 27,863 | | | | 1,276,683 | |
Crown Holdings, Inc.* | | | 21,734 | | | | 1,240,794 | |
Packaging Corporation of America | | | 14,684 | | | | 1,193,222 | |
Sonoco Products Co. | | | 18,730 | | | | 989,506 | |
Berry Plastics Group, Inc.* | | | 22,346 | | | | 979,872 | |
Bemis Company, Inc. | | | 18,422 | | | | 939,706 | |
Graphic Packaging Holding Co. | | | 64,329 | | | | 899,963 | |
Owens-Illinois, Inc.* | | | 40,300 | | | | 741,117 | |
KapStone Paper and Packaging Corp. | | | 31,700 | | | | 599,764 | |
Total Packaging & Containers | | | | | | | 12,044,316 | |
| | | | | | | | | |
Iron & Steel - 8.9% | |
Nucor Corp. | | | 35,981 | | | | 1,779,261 | |
Vale S.A. ADR | | | 279,392 | | | | 1,536,656 | |
Steel Dynamics, Inc. | | | 43,415 | | | | 1,084,941 | |
ArcelorMittal* | | | 176,954 | | | | 1,068,802 | |
Reliance Steel & Aluminum Co. | | | 14,018 | | | | 1,009,717 | |
United States Steel Corp. | | | 44,108 | | | | 831,877 | |
POSCO ADR | | | 14,090 | | | | 719,717 | |
Allegheny Technologies, Inc. | | | 35,659 | | | | 644,358 | |
Carpenter Technology Corp. | | | 15,558 | | | | 641,923 | |
Commercial Metals Co. | | | 37,381 | | | | 605,198 | |
Cliffs Natural Resources, Inc.* | | | 87,900 | | | | 514,215 | |
Total Iron & Steel | | | | | | | 10,436,665 | |
| | | | | | | | | |
Building Materials - 6.3% | |
Vulcan Materials Co. | | | 14,894 | | | | 1,693,894 | |
Martin Marietta Materials, Inc. | | | 8,109 | | | | 1,452,403 | |
Cemex SAB de CV ADR* | | | 165,354 | | | | 1,312,911 | |
Eagle Materials, Inc. | | | 10,861 | | | | 839,555 | |
Louisiana-Pacific Corp.* | | | 36,963 | | | | 696,013 | |
Summit Materials, Inc. — Class A* | | | 31,370 | | | | 581,914 | |
Boise Cascade Co.* | | | 17,090 | | | | 434,086 | |
US Concrete, Inc.* | | | 7,500 | | | | 345,488 | |
Total Building Materials | | | | | | | 7,356,264 | |
SEE NOTES TO FINANCIAL STATEMENTS. | THE RYDEX FUNDS SEMI-ANNUAL REPORT | 17 |
SCHEDULE OF INVESTMENTS (Unaudited)(concluded) | September 30, 2016 |
BASIC MATERIALS FUND | |
| | | Shares | | | Value | |
| | | | | | | |
Commercial Services - 2.2% | |
Ecolab, Inc. | | | 21,349 | | | $ | 2,598,600 | |
| | | | | | | | | |
Forest Products & Paper - 2.2% | |
International Paper Co. | | | 39,673 | | | | 1,903,510 | |
Domtar Corp. | | | 18,021 | | | | 669,120 | |
Total Forest Products & Paper | | | | | | | 2,572,630 | |
| | | | | | | | | |
Miscellaneous Manufacturing - 1.4% | |
AptarGroup, Inc. | | | 12,194 | | | | 943,938 | |
Trinseo S.A. | | | 12,490 | | | | 706,434 | |
Total Miscellaneous Manufacturing | | | | | | | 1,650,372 | |
| | | | | | | | | |
Household Products & Housewares - 1.0% | |
Avery Dennison Corp. | | | 14,525 | | | | 1,129,900 | |
| | | | | | | | | |
Housewares - 0.8% | |
Scotts Miracle-Gro Co. — Class A | | | 11,780 | | | | 980,921 | |
| | | | | | | | | |
Total Common Stocks | | | | | | | | |
(Cost $99,687,607) | | | | | | | 117,468,511 | |
| | | Face
Amount | | | | |
| | | | | | | |
REPURCHASE AGREEMENT††,1 - 0.4% | |
Royal Bank of Canada
issued 09/30/16 at 0.36%
due 10/03/16 | | $ | 528,312 | | | | 528,312 | |
Total Repurchase Agreement | | | | | | | | |
(Cost $528,312) | | | | | | | 528,312 | |
| | | | | | | | | |
Total Investments - 100.5% | | | | | | | | |
(Cost $100,215,919) | | | | | | $ | 117,996,823 | |
Other Assets & Liabilities, net - (0.5)% | | | | | | | (535,432 | ) |
Total Net Assets - 100.0% | | | | | | $ | 117,461,391 | |
* | Non-income producing security. |
† | Value determined based on Level 1 inputs — See Note 4. |
†† | Value determined based on Level 2 inputs — See Note 4. |
1 | Repurchase Agreement — See Note 5. |
| | ADR — American Depositary Receipt |
| | plc — Public Limited Company |
| | |
| | See Sector Classification in Other Information section. |
The following table summarizes the inputs used to value the Fund’s investments at September 30, 2016 (See Note 4 in the Notes to Financial Statements):
Investments in Securities (Assets) | | Level 1 | | | Level 2 | | | Level 3 | | | Total | |
Common Stocks | | $ | 117,468,511 | | | $ | — | | | $ | — | | | $ | 117,468,511 | |
Repurchase Agreement | | | — | | | | 528,312 | | | | — | | | | 528,312 | |
Total | | $ | 117,468,511 | | | $ | 528,312 | | | $ | — | | | $ | 117,996,823 | |
Transfers between investment levels may occur as the markets fluctuate and/or the availability of data used in an investment’s valuation changes. Transfers between valuation levels, if any, are in comparison to the valuation levels at the end of the previous fiscal year, and are effective using the fair value as of the end of the previous fiscal period.
For the period ended September 30, 2016, there were no transfers between levels.
18 | THE RYDEX FUNDS SEMI-ANNUAL REPORT | SEE NOTES TO FINANCIAL STATEMENTS. |
STATEMENT OF ASSETS AND LIABILITIES (Unaudited) |
September 30, 2016 |
Assets: | |
Investments, at value (cost $99,687,607) | | $ | 117,468,511 | |
Repurchase agreements, at value (cost $528,312) | | | 528,312 | |
Total investments (cost $100,215,919) | | | 117,996,823 | |
Receivables: | |
Fund shares sold | | | 54,990 | |
Dividends | | | 124,450 | |
Interest | | | 5 | |
Total assets | | | 118,176,268 | |
| | | | | |
Liabilities: | |
Overdraft due to custodian bank | | | 7,792 | |
Payable for: | |
Fund shares redeemed | | | 548,337 | |
Management fees | | | 87,208 | |
Transfer agent and administrative fees | | | 25,650 | |
Distribution and service fees | | | 10,859 | |
Portfolio accounting fees | | | 10,260 | |
Miscellaneous | | | 24,771 | |
Total liabilities | | | 714,877 | |
Commitments and contingent liabilities (Note 9) | | | — | |
Net assets | | $ | 117,461,391 | |
| | | | | |
Net assets consist of: | |
Paid in capital | | $ | 124,110,611 | |
Undistributed net investment income | | | 163,675 | |
Accumulated net realized loss on investments | | | (24,593,799 | ) |
Net unrealized appreciation on investments | | | 17,780,904 | |
Net assets | | $ | 117,461,391 | |
| | | | | |
Investor Class: | |
Net assets | | $ | 80,427,134 | |
Capital shares outstanding | | | 1,566,950 | |
Net asset value per share | | $ | 51.33 | |
| | | | | |
A-Class: | |
Net assets | | $ | 28,603,847 | |
Capital shares outstanding | | | 591,078 | |
Net asset value per share | | $ | 48.39 | |
Maximum offering price per share (Net asset value divided by 95.25%) | | $ | 50.80 | |
| | | | | |
C-Class: | |
Net assets | | $ | 4,408,235 | |
Capital shares outstanding | | | 101,231 | |
Net asset value per share | | $ | 43.55 | |
| | | | | |
H-Class: | |
Net assets | | $ | 4,022,175 | |
Capital shares outstanding | | | 85,659 | |
Net asset value per share | | $ | 46.96 | |
STATEMENT OF OPERATIONS (Unaudited) | |
Period Ended September 30, 2016 | |
Investment Income: | |
Dividends (net of foreign withholding tax of $13,826) | | $ | 903,537 | |
Interest | | | 863 | |
Total investment income | | | 904,400 | |
| | | | | |
Expenses: | |
Management fees | | | 457,127 | |
Transfer agent and administrative fees | | | 134,449 | |
Distribution and service fees: | |
A-Class | | | 29,177 | |
C-Class | | | 20,856 | |
H-Class | | | 16,018 | |
Portfolio accounting fees | | | 53,779 | |
Custodian fees | | | 6,376 | |
Trustees’ fees* | | | 5,111 | |
Line of credit fees | | | 45 | |
Miscellaneous | | | 79,413 | |
Total expenses | | | 802,351 | |
Net investment income | | | 102,049 | |
| | | | | |
Net Realized and Unrealized Gain (Loss): | |
Net realized gain (loss) on: | |
Investments | | | 2,425,366 | |
Net realized gain | | | 2,425,366 | |
Net change in unrealized appreciation (depreciation) on: | |
Investments | | | 7,922,916 | |
Net change in unrealized appreciation (depreciation) | | | 7,922,916 | |
Net realized and unrealized gain | | | 10,348,282 | |
Net increase in net assets resulting from operations | | $ | 10,450,331 | |
* | Relates to Trustees not deemed “interested persons” within the meaning of Section 2(a)(19) of the 1940 Act. |
SEE NOTES TO FINANCIAL STATEMENTS. | THE RYDEX FUNDS SEMI-ANNUAL REPORT | 19 |
STATEMENTS OF CHANGES IN NET ASSETS |
| | | Period Ended
September 30,
2016
(Unaudited) | | | Year Ended
March 31,
2016 | |
Increase (Decrease) in Net Assets from Operations: | | | | | | |
Net investment income | | $ | 102,049 | | | $ | 117,635 | |
Net realized gain on investments | | | 2,425,366 | | | | 884,104 | |
Net change in unrealized appreciation (depreciation) on investments | | | 7,922,916 | | | | (5,935,320 | ) |
Net increase (decrease) in net assets resulting from operations | | | 10,450,331 | | | | (4,933,581 | ) |
| | | | | | | | | |
Distributions to shareholders from: | | | | | | | | |
Net investment income | | | | | | | | |
Investor Class | | | — | | | | (195,078 | ) |
A-Class | | | — | | | | (71,772 | ) |
C-Class | | | — | | | | (53,293 | ) |
H-Class | | | — | | | | (28,410 | )* |
Total distributions to shareholders | | | — | | | | (348,553 | ) |
| | | | | | | | | |
Capital share transactions: | | | | | | | | |
Proceeds from sale of shares | | | | | | | | |
Investor Class | | | 182,467,644 | | | | 80,427,494 | |
A-Class | | | 39,480,076 | | | | 14,088,359 | |
C-Class | | | 3,799,940 | | | | 6,344,599 | |
H-Class | | | 25,966,620 | | | | 83,252,748 | * |
Distributions reinvested | | | | | | | | |
Investor Class | | | — | | | | 192,206 | |
A-Class | | | — | | | | 67,673 | |
C-Class | | | — | | | | 51,084 | |
H-Class | | | — | | | | 28,316 | * |
Cost of shares redeemed | | | | | | | | |
Investor Class | | | (138,360,540 | ) | | | (95,728,062 | ) |
A-Class | | | (17,331,261 | ) | | | (15,228,557 | ) |
C-Class | | | (2,274,066 | ) | | | (6,757,601 | ) |
H-Class | | | (26,583,669 | ) | | | (79,518,030 | )* |
Net increase (decrease) from capital share transactions | | | 67,164,744 | | | | (12,779,771 | ) |
Net increase (decrease) in net assets | | | 77,615,075 | | | | (18,061,905 | ) |
| | | | | | | | | |
Net assets: | | | | | | | | |
Beginning of period | | | 39,846,316 | | | | 57,908,221 | |
End of period | | $ | 117,461,391 | | | $ | 39,846,316 | |
Undistributed net investment income at end of period | | $ | 163,675 | | | $ | 61,626 | |
| | | | | | | | | |
Capital share activity: | | | | | | | | |
Shares sold | | | | | | | | |
Investor Class | | | 3,684,098 | | | | 1,809,760 | |
A-Class | | | 863,967 | | | | 314,160 | |
C-Class | | | 92,153 | | | | 159,907 | |
H-Class | | | 596,136 | | | | 1,979,353 | * |
Shares issued from reinvestment of distributions | | | | | | | | |
Investor Class | | | — | | | | 4,625 | |
A-Class | | | — | | | | 1,725 | |
C-Class | | | — | | | | 1,437 | |
H-Class | | | — | | | | 744 | * |
Shares redeemed | | | | | | | | |
Investor Class | | | (2,795,637 | ) | | | (2,062,804 | ) |
A-Class | | | (370,242 | ) | | | (348,813 | ) |
C-Class | | | (53,997 | ) | | | (170,516 | ) |
H-Class | | | (573,604 | ) | | | (1,961,860 | )* |
Net increase (decrease) in shares | | | 1,442,874 | | | | (272,282 | ) |
* | Effective September 30, 2015, the Fund’s Advisor Class shares were converted into H-Class shares — See Note 8. |
20 | THE RYDEX FUNDS SEMI-ANNUAL REPORT | SEE NOTES TO FINANCIAL STATEMENTS. |
This table is presented to show selected data for a share outstanding throughout each period and to assist shareholders in evaluating a Fund’s performance for the periods presented.
Investor Class | | Period Ended
September 30,
2016a | | | Year Ended
March 31,
2016 | | | Year Ended
March 31,
2015 | | | Year Ended
March 31,
2014 | | | Year Ended
March 28,
2013 | | | Year Ended
March 31,
2012 | |
Per Share Data | | | | | | | | | | | | | | | | | | |
Net asset value, beginning of period | | $ | 45.18 | | | $ | 50.18 | | | $ | 52.53 | | | $ | 49.94 | | | $ | 49.80 | | | $ | 56.36 | |
Income (loss) from investment operations: | |
Net investment income (loss)b | | | .08 | | | | .26 | | | | .29 | | | | .32 | | | | .46 | | | | .09 | |
Net gain (loss) on investments (realized and unrealized) | | | 6.07 | | | | (4.39 | ) | | | (2.26 | ) | | | 2.58 | | | | (.15 | ) | | | (6.65 | ) |
Total from investment operations | | | 6.15 | | | | (4.13 | ) | | | (1.97 | ) | | | 2.90 | | | | .31 | | | | (6.56 | ) |
Less distributions from: | |
Net investment income | | | — | | | | (.87 | ) | | | (.38 | ) | | | (.31 | ) | | | (.17 | ) | | | — | |
Total distributions | | | — | | | | (.87 | ) | | | (.38 | ) | | | (.31 | ) | | | (.17 | ) | | | — | |
Net asset value, end of period | | $ | 51.33 | | | $ | 45.18 | | | $ | 50.18 | | | $ | 52.53 | | | $ | 49.94 | | | $ | 49.80 | |
| | |
Total Returnc | | | 13.59 | % | | | (8.07 | %) | | | (3.77 | %) | | | 5.84 | % | | | 0.65 | % | | | (11.66 | %) |
Ratios/Supplemental Data | |
Net assets, end of period (in thousands) | | $ | 80,427 | | | $ | 30,653 | | | $ | 46,509 | | | $ | 33,687 | | | $ | 36,012 | | | $ | 36,847 | |
Ratios to average net assets: | |
Net investment income (loss) | | | 0.33 | % | | | 0.55 | % | | | 0.56 | % | | | 0.66 | % | | | 0.95 | % | | | 0.17 | % |
Total expenses | | | 1.37 | % | | | 1.35 | % | | | 1.34 | % | | | 1.38 | % | | | 1.36 | % | | | 1.36 | % |
Portfolio turnover rate | | | 121 | % | | | 471 | % | | | 358 | % | | | 349 | % | | | 251 | % | | | 217 | % |
A-Class | | Period Ended
September 30,
2016a | | | Year Ended
March 31,
2016 | | | Year Ended
March 31,
2015 | | | Year Ended
March 31,
2014 | | | Year Ended
March 28,
2013 | | | Year Ended
March 31,
2012 | |
Per Share Data | | | | | | | | | | | | | | | | | | |
Net asset value, beginning of period | | $ | 42.65 | | | $ | 47.54 | | | $ | 49.93 | | | $ | 47.60 | | | $ | 47.58 | | | $ | 53.99 | |
Income (loss) from investment operations: | |
Net investment income (loss)b | | | .01 | | | | .10 | | | | .13 | | | | .22 | | | | .32 | | | | (.01 | ) |
Net gain (loss) on investments (realized and unrealized) | | | 5.73 | | | | (4.12 | ) | | | (2.14 | ) | | | 2.42 | | | | (.13 | ) | | | (6.40 | ) |
Total from investment operations | | | 5.74 | | | | (4.02 | ) | | | (2.01 | ) | | | 2.64 | | | | .19 | | | | (6.41 | ) |
Less distributions from: | |
Net investment income | | | — | | | | (.87 | ) | | | (.38 | ) | | | (.31 | ) | | | (.17 | ) | | | — | |
Total distributions | | | — | | | | (.87 | ) | | | (.38 | ) | | | (.31 | ) | | | (.17 | ) | | | — | |
Net asset value, end of period | | $ | 48.39 | | | $ | 42.65 | | | $ | 47.54 | | | $ | 49.93 | | | $ | 47.60 | | | $ | 47.58 | |
| | |
Total Returnc | | | 13.46 | % | | | (8.29 | %) | | | (4.05 | %) | | | 5.58 | % | | | 0.41 | % | | | (11.87 | %) |
Ratios/Supplemental Data | |
Net assets, end of period (in thousands) | | $ | 28,604 | | | $ | 4,152 | | | $ | 6,194 | | | $ | 13,347 | | | $ | 11,104 | | | $ | 9,410 | |
Ratios to average net assets: | |
Net investment income (loss) | | | 0.05 | % | | | 0.24 | % | | | 0.27 | % | | | 0.47 | % | | | 0.69 | % | | | (0.03 | %) |
Total expenses | | | 1.61 | % | | | 1.60 | % | | | 1.60 | % | | | 1.63 | % | | | 1.61 | % | | | 1.61 | % |
Portfolio turnover rate | | | 121 | % | | | 471 | % | | | 358 | % | | | 349 | % | | | 251 | % | | | 217 | % |
SEE NOTES TO FINANCIAL STATEMENTS. | THE RYDEX FUNDS SEMI-ANNUAL REPORT | 21 |
FINANCIAL HIGHLIGHTS (concluded) |
This table is presented to show selected data for a share outstanding throughout each period and to assist shareholders in evaluating a Fund’s performance for the periods presented.
C-Class | | Period Ended
September 30,
2016a | | | Year Ended
March 31,
2016 | | | Year Ended
March 31,
2015 | | | Year Ended
March 31,
2014 | | | Year Ended
March 28,
2013 | | | Year Ended
March 31,
2012 | |
Per Share Data | | | | | | | | | | | | | | | | | | |
Net asset value, beginning of period | | $ | 38.52 | | | $ | 43.36 | | | $ | 45.91 | | | $ | 44.12 | | | $ | 44.45 | | | $ | 50.80 | |
Income (loss) from investment operations: | |
Net investment income (loss)b | | | (.15 | ) | | | (.17 | ) | | | (.23 | ) | | | (.15 | ) | | | (.03 | ) | | | (.33 | ) |
Net gain (loss) on investments (realized and unrealized) | | | 5.18 | | | | (3.80 | ) | | | (1.94 | ) | | | 2.25 | | | | (.13 | ) | | | (6.02 | ) |
Total from investment operations | | | 5.03 | | | | (3.97 | ) | | | (2.17 | ) | | | 2.10 | | | | (.16 | ) | | | (6.35 | ) |
Less distributions from: | |
Net investment income | | | — | | | | (.87 | ) | | | (.38 | ) | | | (.31 | ) | | | (.17 | ) | | | — | |
Total distributions | | | — | | | | (.87 | ) | | | (.38 | ) | | | (.31 | ) | | | (.17 | ) | | | — | |
Net asset value, end of period | | $ | 43.55 | | | $ | 38.52 | | | $ | 43.36 | | | $ | 45.91 | | | $ | 44.12 | | | $ | 44.45 | |
| | |
Total Returnc | | | 13.03 | % | | | (8.98 | %) | | | (4.76 | %) | | | 4.80 | % | | | (0.35 | %) | | | (12.50 | %) |
Ratios/Supplemental Data | |
Net assets, end of period (in thousands) | | $ | 4,408 | | | $ | 2,430 | | | $ | 3,133 | | | $ | 5,150 | | | $ | 6,666 | | | $ | 8,317 | |
Ratios to average net assets: | |
Net investment income (loss) | | | (0.69 | %) | | | (0.43 | %) | | | (0.49 | %) | | | (0.34 | %) | | | (0.07 | %) | | | (0.73 | %) |
Total expenses | | | 2.36 | % | | | 2.35 | % | | | 2.35 | % | | | 2.38 | % | | | 2.36 | % | | | 2.36 | % |
Portfolio turnover rate | | | 121 | % | | | 471 | % | | | 358 | % | | | 349 | % | | | 251 | % | | | 217 | % |
H-Class | | Period Ended
September 30,
2016a | | | Year Ended
March 31,
2016f | | | Year Ended
March 31, 2015f | | | Year Ended
March 31, 2014f | | | Year Ended
March 28, 2013f | | | Year Ended
March 31, 2012f | |
Per Share Data | | | | | | | | | | | | | | | | | | |
Net asset value, beginning of period | | $ | 41.37 | | | $ | 46.19 | | | $ | 48.64 | | | $ | 46.50 | | | $ | 46.61 | | | $ | 53.00 | |
Income (loss) from investment operations: | |
Net investment income (loss)b | | | (.01 | ) | | | .09 | | | | — | d | | | .08 | | | | .19 | | | | .08 | |
Net gain (loss) on investments (realized and unrealized) | | | 5.60 | | | | (4.04 | ) | | | (2.07 | ) | | | 2.37 | | | | (.13 | ) | | | (6.47 | ) |
Total from investment operations | | | 5.59 | | | | (3.95 | ) | | | (2.07 | ) | | | 2.45 | | | | .06 | | | | (6.39 | ) |
Less distributions from: | |
Net investment income | | | — | | | | (.87 | ) | | | (.38 | ) | | | (.31 | ) | | | (.17 | ) | | | — | |
Total distributions | | | — | | | | (.87 | ) | | | (.38 | ) | | | (.31 | ) | | | (.17 | ) | | | — | |
Net asset value, end of period | | $ | 46.96 | | | $ | 41.37 | | | $ | 46.19 | | | $ | 48.64 | | | $ | 46.50 | | | $ | 46.61 | |
| | |
Total Returnc | | | 13.49 | % | | | (8.36 | %) | | | (4.30 | %) | | | 5.31 | % | | | 0.16 | % | | | (12.08 | %) |
Ratios/Supplemental Data | |
Net assets, end of period (in thousands) | | $ | 4,022 | | | $ | 2,612 | | | $ | 2,073 | | | $ | 2,678 | | | $ | 3,616 | | | $ | 5,287 | |
Ratios to average net assets: | |
Net investment income (loss) | | | (0.03 | %) | | | 0.24 | % | | | 0.00 | %e | | | 0.18 | % | | | 0.43 | % | | | 0.17 | % |
Total expenses | | | 1.61 | % | | | 1.64 | % | | | 1.85 | % | | | 1.88 | % | | | 1.86 | % | | | 1.86 | % |
Portfolio turnover rate | | | 121 | % | | | 471 | % | | | 358 | % | | | 349 | % | | | 251 | % | | | 217 | % |
a | Unaudited figures for the period ended September 30, 2016. Percentage amounts for the period, except total return and portfolio turnover rate, have been annualized. |
b | Net investment income (loss) per share was computed using average shares outstanding throughout the period. |
c | Total return does not reflect the impact of any applicable sales charges. |
d | Net investment income is less than $0.01 per share. |
e | Less than 0.01%. |
f | Effective September 30, 2015, the Fund’s Advisor Class shares were converted into H-Class shares. The financial highlights for periods prior to that date reflect the performance of the former Advisor Class — See Note 8. |
22 | THE RYDEX FUNDS SEMI-ANNUAL REPORT | SEE NOTES TO FINANCIAL STATEMENTS. |
FUND PROFILE (Unaudited) | September 30, 2016 |
BIOTECHNOLOGY FUND
OBJECTIVE: Seeks to provide capital appreciation by investing in companies that are involved in the biotechnology industry, including companies involved in research and development, genetic or other biological engineering, and in the design, manufacture, or sale of related biotechnology products or services (“Biotechnology Companies”).
Holdings Diversification (Market Exposure as % of Net Assets)
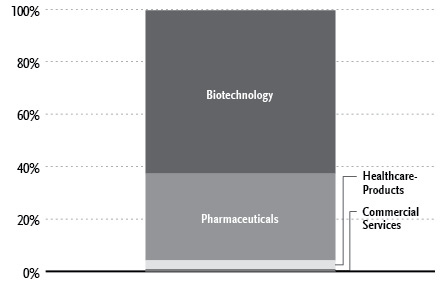
“Holdings Diversification (Market Exposure as % of Net Assets)” excludes any temporary cash investments.
Inception Dates: |
Investor Class | April 1, 1998 |
A-Class | September 1, 2004 |
C-Class | March 30, 2001 |
H-Class* | April 1, 1998 |
Ten Largest Holdings (% of Total Net Assets) |
Amgen, Inc. | 6.0% |
Gilead Sciences, Inc. | 5.6% |
AbbVie, Inc. | 5.6% |
Celgene Corp. | 4.9% |
Biogen, Inc. | 4.6% |
Shire plc ADR | 4.2% |
Regeneron Pharmaceuticals, Inc. | 3.6% |
Illumina, Inc. | 2.9% |
Alexion Pharmaceuticals, Inc. | 2.8% |
Incyte Corp. | 2.5% |
Top Ten Total | 42.7% |
| | |
“Ten Largest Holdings” excludes any temporary cash investments. |
* | Effective September 30, 2015, the Fund’s Advisor Class shares were converted into H-Class shares — See Note 8. |
| | THE RYDEX FUNDS SEMI-ANNUAL REPORT | 23 |
SCHEDULE OF INVESTMENTS (Unaudited) | September 30, 2016 |
BIOTECHNOLOGY FUND | |
| | | Shares | | | Value | |
| | | | | | | |
COMMON STOCKS† - 99.6% | |
| | | | | | | |
Biotechnology - 62.3% | |
Amgen, Inc. | | | 126,999 | | | $ | 21,184,704 | |
Gilead Sciences, Inc. | | | 249,792 | | | | 19,763,544 | |
Celgene Corp.* | | | 163,925 | | | | 17,135,081 | |
Biogen, Inc.* | | | 51,881 | | | | 16,240,309 | |
Regeneron Pharmaceuticals, Inc.* | | | 31,310 | | | | 12,587,246 | |
Illumina, Inc.* | | | 56,100 | | | | 10,191,126 | |
Alexion Pharmaceuticals, Inc.* | | | 80,317 | | | | 9,842,045 | |
Incyte Corp.* | | | 92,962 | | | | 8,765,387 | |
Vertex Pharmaceuticals, Inc.* | | | 99,464 | | | | 8,674,255 | |
BioMarin Pharmaceutical, Inc.* | | | 81,782 | | | | 7,566,471 | |
Seattle Genetics, Inc.* | | | 99,187 | | | | 5,357,090 | |
Ionis Pharmaceuticals, Inc.* | | | 121,157 | | | | 4,439,192 | |
Alnylam Pharmaceuticals, Inc.* | | | 65,341 | | | | 4,428,813 | |
Bio-Rad Laboratories, Inc. — Class A* | | | 26,372 | | | | 4,319,997 | |
United Therapeutics Corp.* | | | 36,316 | | | | 4,288,193 | |
Intercept Pharmaceuticals, Inc.* | | | 24,535 | | | | 4,038,216 | |
Charles River Laboratories International, Inc.* | | | 46,715 | | | | 3,893,228 | |
Prothena Corporation plc* | | | 63,280 | | | | 3,794,902 | |
Intrexon Corp.* | | | 126,210 | | | | 3,536,404 | |
Juno Therapeutics, Inc.* | | | 114,970 | | | | 3,450,250 | |
ARIAD Pharmaceuticals, Inc.* | | | 245,041 | | | | 3,354,611 | |
Exelixis, Inc.* | | | 255,300 | | | | 3,265,287 | |
Kite Pharma, Inc.* | | | 57,400 | | | | 3,206,364 | |
Medicines Co.* | | | 83,668 | | | | 3,157,630 | |
Ultragenyx Pharmaceutical, Inc.* | | | 44,000 | | | | 3,121,360 | |
Puma Biotechnology, Inc.* | | | 44,800 | | | | 3,003,840 | |
Bluebird Bio, Inc.* | | | 43,500 | | | | 2,948,430 | |
Exact Sciences Corp.* | | | 143,794 | | | | 2,670,255 | |
Ligand Pharmaceuticals, Inc. — Class B* | | | 26,120 | | | | 2,665,807 | |
Sage Therapeutics, Inc.* | | | 55,600 | | | | 2,560,380 | |
Halozyme Therapeutics, Inc.* | | | 208,655 | | | | 2,520,552 | |
Alder Biopharmaceuticals, Inc.* | | | 74,960 | | | | 2,456,439 | |
Five Prime Therapeutics, Inc.* | | | 45,900 | | | | 2,409,291 | |
Myriad Genetics, Inc.* | | | 107,387 | | | | 2,210,024 | |
Achillion Pharmaceuticals, Inc.* | | | 254,700 | | | | 2,063,070 | |
AMAG Pharmaceuticals, Inc.* | | | 71,106 | | | | 1,742,808 | |
Acorda Therapeutics, Inc.* | | | 81,338 | | | | 1,698,337 | |
Novavax, Inc.* | | | 347,062 | | | | 721,889 | |
Total Biotechnology | | | | | | | 219,272,827 | |
| | | | | | | | | |
Pharmaceuticals - 33.1% | |
AbbVie, Inc. | | | 310,034 | | | | 19,553,843 | |
Shire plc ADR | | | 75,395 | | | | 14,616,075 | |
Mylan N.V.* | | | 220,003 | | | | 8,386,515 | |
Quintiles IMS Holdings, Inc.* | | | 75,804 | | | | 6,144,672 | |
OPKO Health, Inc.* | | | 453,079 | | | | 4,798,107 | |
Sarepta Therapeutics, Inc.* | | | 76,100 | | | | 4,673,301 | |
Jazz Pharmaceuticals plc* | | | 37,900 | | | | 4,604,092 | |
TESARO, Inc.* | | | 43,803 | | | | 4,390,813 | |
Alkermes plc* | | | 88,458 | | | | 4,160,180 | |
Neurocrine Biosciences, Inc.* | | | 77,581 | | | | 3,928,702 | |
PRA Health Sciences, Inc.* | | | 65,360 | | | | 3,693,494 | |
ACADIA Pharmaceuticals, Inc.* | | | 113,854 | | | | 3,621,696 | |
Akorn, Inc.* | | | 129,091 | | | | 3,519,021 | |
Horizon Pharma plc* | | | 175,624 | | | | 3,184,063 | |
Agios Pharmaceuticals, Inc.* | | | 58,704 | | | | 3,100,745 | |
Ironwood Pharmaceuticals, Inc. — Class A* | | | 188,096 | | | | 2,986,964 | |
Radius Health, Inc.* | | | 54,200 | | | | 2,931,678 | |
Depomed, Inc.* | | | 115,258 | | | | 2,880,298 | |
Nektar Therapeutics* | | | 163,260 | | | | 2,804,807 | |
Impax Laboratories, Inc.* | | | 103,499 | | | | 2,452,926 | |
Ophthotech Corp.* | | | 47,500 | | | | 2,191,175 | |
Portola Pharmaceuticals, Inc.* | | | 94,950 | | | | 2,156,315 | |
Eagle Pharmaceuticals, Inc.* | | | 30,500 | | | | 2,135,000 | |
Pacira Pharmaceuticals, Inc.* | | | 58,800 | | | | 2,012,136 | |
Heron Therapeutics, Inc.* | | | 85,480 | | | | 1,472,820 | |
Total Pharmaceuticals | | | | | | | 116,399,438 | |
| | | | | | | | | |
Healthcare-Products - 3.3% | |
Bio-Techne Corp. | | | 35,757 | | | | 3,915,392 | |
QIAGEN N.V.* | | | 140,800 | | | | 3,863,552 | |
Cepheid* | | | 72,118 | | | | 3,799,897 | |
Total Healthcare-Products | | | | | | | 11,578,841 | |
| | | | | | | | | |
Commercial Services - 0.9% | |
Incorporated Research Holdings, Inc. — Class A* | | | 68,300 | | | | 3,044,814 | |
| | | | | | | | | |
Total Common Stocks | | | | | | | | |
(Cost $175,660,696) | | | | | | | 350,295,920 | |
| | | | | | | | | |
RIGHTS††† - 0.0% | |
Chelsea Therapeutics International | | | | | | | | |
Expires 12/31/17* | | | 231,107 | | | | — | |
Dyax Corp. | | | | | | | | |
Expires 01/25/17* | | | 167,165 | | | | — | |
Clinical Data, Inc. | | | | | | | | |
Expires 12/31/20* | | | 24,000 | | | | — | |
Total Rights | | | | | | | | |
(Cost $17,304) | | | | | | | — | |
| | | | | | | | | |
| | | Face
Amount | | | | | |
| | | | | | | | | |
REPURCHASE AGREEMENT††,1 - 0.0% | |
Royal Bank of Canada
issued 09/30/16 at 0.36%
due 10/03/16 | | $ | 426 | | | | 426 | |
Total Repurchase Agreement | | | | | | | | |
(Cost $426) | | | | | | | 426 | |
| | | | | | | | | |
Total Investments - 99.6% | | | | | | | | |
(Cost $175,678,426) | | | | | | $ | 350,296,346 | |
Other Assets & Liabilities, net - 0.4% | | | | | | | 1,365,359 | |
Total Net Assets - 100.0% | | | | | | $ | 351,661,705 | |
24 | THE RYDEX FUNDS SEMI-ANNUAL REPORT | SEE NOTES TO FINANCIAL STATEMENTS. |
SCHEDULE OF INVESTMENTS (Unaudited)(concluded) | September 30, 2016 |
BIOTECHNOLOGY FUND | |
* | Non-income producing security. |
† | Value determined based on Level 1 inputs — See Note 4. |
†† | Value determined based on Level 2 inputs — See Note 4. |
††† | Value determined based on Level 3 inputs — See Note 4. |
1 | Repurchase Agreement — See Note 5. |
| | ADR — American Depositary Receipt |
| | plc — Public Limited Company |
| | |
| | See Sector Classification in Other Information section. |
The following table summarizes the inputs used to value the Fund’s investments at September 30, 2016 (See Note 4 in the Notes to Financial Statements):
Investments in Securities (Assets) | | Level 1 | | | Level 2 | | | Level 3 | | | Total | |
Common Stocks | | $ | 350,295,920 | | | $ | — | | | $ | — | | | $ | 350,295,920 | |
Repurchase Agreement | | | — | | | | 426 | | | | — | | | | 426 | |
Rights | | | — | | | | — | | | | — | | | | — | |
Total | | $ | 350,295,920 | | | $ | 426 | | | $ | — | | | $ | 350,296,346 | |
Transfers between investment levels may occur as the markets fluctuate and/or the availability of data used in an investment’s valuation changes. Transfers between valuation levels, if any, are in comparison to the valuation levels at the end of the previous fiscal year, and are effective using the fair value as of the end of the previous fiscal period.
For the period ended September 30, 2016, there were no transfers between levels.
SEE NOTES TO FINANCIAL STATEMENTS. | THE RYDEX FUNDS SEMI-ANNUAL REPORT | 25 |
STATEMENT OF ASSETS AND LIABILITIES (Unaudited) |
September 30, 2016 |
Assets: | |
Investments, at value (cost $175,678,000) | | $ | 350,295,920 | |
Repurchase agreements, at value (cost $426) | | | 426 | |
Total investments (cost $175,678,426) | | | 350,296,346 | |
Cash | | | 2,673,290 | |
Receivables: | |
Securities sold | | | 37,147,985 | |
Fund shares sold | | | 812,286 | |
Dividends | | | 11,278 | |
Total assets | | | 390,941,185 | |
| | | | | |
Liabilities: | |
Payable for: | |
Fund shares redeemed | | | 38,802,263 | |
Management fees | | | 258,009 | |
Transfer agent and administrative fees | | | 75,885 | |
Distribution and service fees | | | 35,021 | |
Portfolio accounting fees | | | 27,888 | |
Miscellaneous | | | 80,414 | |
Total liabilities | | | 39,279,480 | |
Commitments and contingent liabilities (Note 9) | | | — | |
Net assets | | $ | 351,661,705 | |
| | | | | |
Net assets consist of: | |
Paid in capital | | $ | 201,942,381 | |
Accumulated net investment loss | | | (2,824,844 | ) |
Accumulated net realized loss on investments | | | (22,073,752 | ) |
Net unrealized appreciation on investments | | | 174,617,920 | |
Net assets | | $ | 351,661,705 | |
| | | | | |
Investor Class: | |
Net assets | | $ | 257,552,893 | |
Capital shares outstanding | | | 3,297,673 | |
Net asset value per share | | $ | 78.10 | |
| | | | | |
A-Class: | |
Net assets | | $ | 43,492,800 | |
Capital shares outstanding | | | 597,905 | |
Net asset value per share | | $ | 72.74 | |
Maximum offering price per share (Net asset value divided by 95.25%) | | $ | 76.37 | |
| | | | | |
C-Class: | |
Net assets | | $ | 25,632,232 | |
Capital shares outstanding | | | 386,600 | |
Net asset value per share | | $ | 66.30 | |
| | | | | |
H-Class: | |
Net assets | | $ | 24,983,780 | |
Capital shares outstanding | | | 352,948 | |
Net asset value per share | | $ | 70.79 | |
STATEMENT OF OPERATIONS (Unaudited) | |
Period Ended September 30, 2016 | |
Investment Income: | |
Dividends | | $ | 912,992 | |
Interest | | | 2,057 | |
Total investment income | | | 915,049 | |
| | | | | |
Expenses: | |
Management fees | | | 1,558,568 | |
Transfer agent and administrative fees | | | 458,403 | |
Distribution and service fees: | |
A-Class | | | 56,673 | |
C-Class | | | 131,061 | |
H-Class | | | 33,768 | |
Portfolio accounting fees | | | 168,769 | |
Custodian fees | | | 21,608 | |
Trustees’ fees* | | | 14,694 | |
Line of credit fees | | | 1,033 | |
Miscellaneous | | | 268,884 | |
Total expenses | | | 2,713,461 | |
Net investment loss | | | (1,798,412 | ) |
| | | | | |
Net Realized and Unrealized Gain (Loss): | |
Net realized gain (loss) on: | |
Investments | | | 1,142,004 | |
Net realized gain | | | 1,142,004 | |
Net change in unrealized appreciation (depreciation) on: | |
Investments | | | 46,246,492 | |
Net change in unrealized appreciation (depreciation) | | | 46,246,492 | |
Net realized and unrealized gain | | | 47,388,496 | |
Net increase in net assets resulting from operations | | $ | 45,590,084 | |
* | Relates to Trustees not deemed “interested persons” within the meaning of Section 2(a)(19) of the 1940 Act. |
26 | THE RYDEX FUNDS SEMI-ANNUAL REPORT | SEE NOTES TO FINANCIAL STATEMENTS. |
STATEMENTS OF CHANGES IN NET ASSETS |
| | | Period Ended
September 30,
2016
(Unaudited) | | | Year Ended
March 31,
2016 | |
Increase (Decrease) in Net Assets from Operations: | | | | | | |
Net investment loss | | $ | (1,798,412 | ) | | $ | (6,270,830 | ) |
Net realized gain on investments | | | 1,142,004 | | | | 7,692,022 | |
Net change in unrealized appreciation (depreciation) on investments | | | 46,246,492 | | | | (184,506,116 | ) |
Net increase (decrease) in net assets resulting from operations | | | 45,590,084 | | | | (183,084,924 | ) |
| | | | | | | | | |
Distributions to shareholders from: | | | | | | | | |
Net realized gains | | | | | | | | |
Investor Class | | | — | | | | (6,254,804 | ) |
A-Class | | | — | | | | (1,249,744 | ) |
C-Class | | | — | | | | (670,534 | ) |
H-Class | | | — | | | | (945,732 | )* |
Total distributions to shareholders | | | — | | | | (9,120,814 | ) |
| | | | | | | | | |
Capital share transactions: | | | | | | | | |
Proceeds from sale of shares | | | | | | | | |
Investor Class | | | 244,822,779 | | | | 417,939,980 | |
A-Class | | | 4,770,236 | | | | 49,892,327 | |
C-Class | | | 3,636,773 | | | | 25,666,356 | |
H-Class | | | 139,950,179 | | | | 179,430,634 | * |
Distributions reinvested | | | | | | | | |
Investor Class | | | — | | | | 6,001,463 | |
A-Class | | | — | | | | 1,177,072 | |
C-Class | | | — | | | | 654,350 | |
H-Class | | | — | | | | 945,257 | * |
Cost of shares redeemed | | | | | | | | |
Investor Class | | | (281,455,201 | ) | | | (524,242,886 | ) |
A-Class | | | (16,114,270 | ) | | | (66,310,633 | ) |
C-Class | | | (7,531,656 | ) | | | (29,104,862 | ) |
H-Class | | | (144,685,769 | ) | | | (199,112,976 | )* |
Net decrease from capital share transactions | | | (56,606,929 | ) | | | (137,063,918 | ) |
Net decrease in net assets | | | (11,016,845 | ) | | | (329,269,656 | ) |
| | | | | | | | | |
Net assets: | | | | | | | | |
Beginning of period | | | 362,678,550 | | | | 691,948,206 | |
End of period | | $ | 351,661,705 | | | $ | 362,678,550 | |
Accumulated net investment loss at end of period | | $ | (2,824,844 | ) | | $ | (1,026,432 | ) |
| | | | | | | | | |
Capital share activity: | | | | | | | | |
Shares sold | | | | | | | | |
Investor Class | | | 3,255,313 | | | | 4,464,545 | |
A-Class | | | 68,449 | | | | 581,344 | |
C-Class | | | 58,011 | | | | 323,436 | |
H-Class | | | 2,195,969 | | | | 2,176,992 | * |
Shares issued from reinvestment of distributions | | | | | | | | |
Investor Class | | | — | | | | 69,159 | |
A-Class | | | — | | | | 14,537 | |
C-Class | | | — | | | | 8,806 | |
H-Class | | | — | | | | 11,990 | * |
Shares redeemed | | | | | | | | |
Investor Class | | | (3,771,307 | ) | | | (6,039,629 | ) |
A-Class | | | (234,683 | ) | | | (850,368 | ) |
C-Class | | | (120,759 | ) | | | (395,078 | ) |
H-Class | | | (2,284,108 | ) | | | (2,488,023 | )* |
Net decrease in shares | | | (833,115 | ) | | | (2,122,289 | ) |
* | Effective September 30, 2015, the Fund’s Advisor Class shares were converted into H-Class shares — See Note 8. |
SEE NOTES TO FINANCIAL STATEMENTS. | THE RYDEX FUNDS SEMI-ANNUAL REPORT | 27 |
This table is presented to show selected data for a share outstanding throughout each period and to assist shareholders in evaluating a Fund’s performance for the periods presented.
Investor Class | | Period Ended
September 30,
2016a | | | Year Ended
March 31,
2016 | | | Year Ended
March 31,
2015 | | | Year Ended
March 31,
2014 | | | Year Ended
March 28,
2013 | | | Year Ended
March 31,
2012 | |
Per Share Data | | | | | | | | | | | | | | | | | | |
Net asset value, beginning of period | | $ | 68.30 | | | $ | 93.63 | | | $ | 68.47 | | | $ | 48.97 | | | $ | 36.90 | | | $ | 29.16 | |
Income (loss) from investment operations: | |
Net investment income (loss)b | | | (.32 | ) | | | (.75 | ) | | | (.27 | ) | | | (.51 | ) | | | (.40 | ) | | | (.34 | ) |
Net gain (loss) on investments (realized and unrealized) | | | 10.12 | | | | (23.30 | ) | | | 28.59 | | | | 20.01 | | | | 12.47 | | | | 8.08 | |
Total from investment operations | | | 9.80 | | | | (24.05 | ) | | | 28.32 | | | | 19.50 | | | | 12.07 | | | | 7.74 | |
Less distributions from: | |
Net realized gains | | | — | | | | (1.28 | ) | | | (3.16 | ) | | | — | | | | — | | | | — | |
Total distributions | | | — | | | | (1.28 | ) | | | (3.16 | ) | | | — | | | | — | | | | — | |
Net asset value, end of period | | $ | 78.10 | | | $ | 68.30 | | | $ | 93.63 | | | $ | 68.47 | | | $ | 48.97 | | | $ | 36.90 | |
| | |
Total Returnc | | | 14.35 | % | | | (25.98 | %) | | | 42.19 | % | | | 39.82 | % | | | 32.71 | % | | | 26.54 | % |
Ratios/Supplemental Data | |
Net assets, end of period (in thousands) | | $ | 257,553 | | | $ | 260,476 | | | $ | 498,068 | | | $ | 313,324 | | | $ | 171,844 | | | $ | 89,027 | |
Ratios to average net assets: | |
Net investment income (loss) | | | (0.86 | %) | | | (0.84 | %) | | | (0.34 | %) | | | (0.82 | %) | | | (0.98 | %) | | | (1.09 | %) |
Total expenses | | | 1.36 | % | | | 1.32 | % | | | 1.33 | % | | | 1.36 | % | | | 1.35 | % | | | 1.36 | % |
Portfolio turnover rate | | | 88 | % | | | 83 | % | | | 107 | % | | | 119 | % | | | 197 | % | | | 333 | % |
A-Class | | Period Ended
September 30,
2016a | | | Year Ended
March 31,
2016 | | | Year Ended
March 31,
2015 | | | Year Ended
March 31,
2014 | | | Year Ended
March 28,
2013 | | | Year Ended
March 31,
2012 | |
Per Share Data | | | | | | | | | | | | | | | | | | |
Net asset value, beginning of period | | $ | 63.69 | | | $ | 87.63 | | | $ | 64.41 | | | $ | 46.18 | | | $ | 34.88 | | | $ | 27.64 | |
Income (loss) from investment operations: | |
Net investment income (loss)b | | | (.38 | ) | | | (.91 | ) | | | (.44 | ) | | | (.62 | ) | | | (.48 | ) | | | (.37 | ) |
Net gain (loss) on investments (realized and unrealized) | | | 9.43 | | | | (21.75 | ) | | | 26.82 | | | | 18.85 | | | | 11.78 | | | | 7.61 | |
Total from investment operations | | | 9.05 | | | | (22.66 | ) | | | 26.38 | | | | 18.23 | | | | 11.30 | | | | 7.24 | |
Less distributions from: | |
Net realized gains | | | — | | | | (1.28 | ) | | | (3.16 | ) | | | — | | | | — | | | | — | |
Total distributions | | | — | | | | (1.28 | ) | | | (3.16 | ) | | | — | | | | — | | | | — | |
Net asset value, end of period | | $ | 72.74 | | | $ | 63.69 | | | $ | 87.63 | | | $ | 64.41 | | | $ | 46.18 | | | $ | 34.88 | |
| | |
Total Returnc | | | 14.21 | % | | | (26.17 | %) | | | 41.83 | % | | | 39.48 | % | | | 32.40 | % | | | 26.19 | % |
Ratios/Supplemental Data | |
Net assets, end of period (in thousands) | | $ | 43,493 | | | $ | 48,672 | | | $ | 89,260 | | | $ | 51,270 | | | $ | 26,391 | | | $ | 4,741 | |
Ratios to average net assets: | |
Net investment income (loss) | | | (1.10 | %) | | | (1.09 | %) | | | (0.59 | %) | | | (1.07 | %) | | | (1.21 | %) | | | (1.30 | %) |
Total expenses | | | 1.60 | % | | | 1.57 | % | | | 1.58 | % | | | 1.61 | % | | | 1.61 | % | | | 1.61 | % |
Portfolio turnover rate | | | 88 | % | | | 83 | % | | | 107 | % | | | 119 | % | | | 197 | % | | | 333 | % |
28 | THE RYDEX FUNDS SEMI-ANNUAL REPORT | SEE NOTES TO FINANCIAL STATEMENTS. |
FINANCIAL HIGHLIGHTS (concluded) |
This table is presented to show selected data for a share outstanding throughout each period and to assist shareholders in evaluating a Fund’s performance for the periods presented.
C-Class | | Period Ended
September 30,
2016a | | | Year Ended
March 31,
2016 | | | Year Ended
March 31,
2015 | | | Year Ended
March 31,
2014 | | | Year Ended
March 28,
2013 | | | Year Ended
March 31,
2012 | |
Per Share Data | | | | | | | | | | | | | | | | | | |
Net asset value, beginning of period | | $ | 58.27 | | | $ | 80.88 | | | $ | 60.10 | | | $ | 43.41 | | | $ | 33.04 | | | $ | 26.38 | |
Income (loss) from investment operations: | |
Net investment income (loss)b | | | (.58 | ) | | | (1.40 | ) | | | (.92 | ) | | | (.99 | ) | | | (.73 | ) | | | (.58 | ) |
Net gain (loss) on investments (realized and unrealized) | | | 8.61 | | | | (19.93 | ) | | | 24.86 | | | | 17.68 | | | | 11.10 | | | | 7.24 | |
Total from investment operations | | | 8.03 | | | | (21.33 | ) | | | 23.94 | | | | 16.69 | | | | 10.37 | | | | 6.66 | |
Less distributions from: | |
Net realized gains | | | — | | | | (1.28 | ) | | | (3.16 | ) | | | — | | | | — | | | | — | |
Total distributions | | | — | | | | (1.28 | ) | | | (3.16 | ) | | | — | | | | — | | | | — | |
Net asset value, end of period | | $ | 66.30 | | | $ | 58.27 | | | $ | 80.88 | | | $ | 60.10 | | | $ | 43.41 | | | $ | 33.04 | |
| | |
Total Returnc | | | 13.76 | % | | | (26.72 | %) | | | 40.75 | % | | | 38.45 | % | | | 31.39 | % | | | 25.25 | % |
Ratios/Supplemental Data | |
Net assets, end of period (in thousands) | | $ | 25,632 | | | $ | 26,185 | | | $ | 41,424 | | | $ | 27,170 | | | $ | 13,677 | | | $ | 6,969 | |
Ratios to average net assets: | |
Net investment income (loss) | | | (1.85 | %) | | | (1.84 | %) | | | (1.34 | %) | | | (1.82 | %) | | | (1.96 | %) | | | (2.06 | %) |
Total expenses | | | 2.35 | % | | | 2.33 | % | | | 2.33 | % | | | 2.36 | % | | | 2.36 | % | | | 2.36 | % |
Portfolio turnover rate | | | 88 | % | | | 83 | % | | | 107 | % | | | 119 | % | | | 197 | % | | | 333 | % |
H-Class | | Period Ended
September 30,
2016a | | | Year Ended
March 31,
2016d | | | Year Ended
March 31, 2015d | | | Year Ended
March 31, 2014d | | | Year Ended
March 28, 2013d | | | Year Ended
March 31, 2012d | |
Per Share Data | | | | | | | | | | | | | | | | | | |
Net asset value, beginning of period | | $ | 62.00 | | | $ | 85.38 | | | $ | 62.98 | | | $ | 45.27 | | | $ | 34.27 | | | $ | 27.22 | |
Income (loss) from investment operations: | |
Net investment income (loss)b | | | (.38 | ) | | | (.96 | ) | | | (.61 | ) | | | (.74 | ) | | | (.56 | ) | | | (.48 | ) |
Net gain (loss) on investments (realized and unrealized) | | | 9.17 | | | | (21.14 | ) | | | 26.17 | | | | 18.45 | | | | 11.56 | | | | 7.53 | |
Total from investment operations | | | 8.79 | | | | (22.10 | ) | | | 25.56 | | | | 17.71 | | | | 11.00 | | | | 7.05 | |
Less distributions from: | |
Net realized gains | | | — | | | | (1.28 | ) | | | (3.16 | ) | | | — | | | | — | | | | — | |
Total distributions | | | — | | | | (1.28 | ) | | | (3.16 | ) | | | — | | | | — | | | | — | |
Net asset value, end of period | | $ | 70.79 | | | $ | 62.00 | | | $ | 85.38 | | | $ | 62.98 | | | $ | 45.27 | | | $ | 34.27 | |
| | |
Total Returnc | | | 14.16 | % | | | (26.22 | %) | | | 41.49 | % | | | 39.12 | % | | | 32.10 | % | | | 25.90 | % |
Ratios/Supplemental Data | |
Net assets, end of period (in thousands) | | $ | 24,984 | | | $ | 27,346 | | | $ | 63,196 | | | $ | 37,978 | | | $ | 22,486 | | | $ | 8,313 | |
Ratios to average net assets: | |
Net investment income (loss) | | | (1.13 | %) | | | (1.17 | %) | | | (0.84 | %) | | | (1.32 | %) | | | (1.46 | %) | | | (1.65 | %) |
Total expenses | | | 1.60 | % | | | 1.65 | % | | | 1.83 | % | | | 1.86 | % | | | 1.86 | % | | | 1.87 | % |
Portfolio turnover rate | | | 88 | % | | | 83 | % | | | 107 | % | | | 119 | % | | | 197 | % | | | 333 | % |
a | Unaudited figures for the period ended September 30, 2016. Percentage amounts for the period, except total return and portfolio turnover rate, have been annualized. |
b | Net investment income (loss) per share was computed using average shares outstanding throughout the period. |
c | Total return does not reflect the impact of any applicable sales charges. |
d | Effective September 30, 2015, the Fund’s Advisor Class shares were converted into H-Class shares. The financial highlights for periods prior to that date reflect the performance of the former Advisor Class — See Note 8. |
SEE NOTES TO FINANCIAL STATEMENTS. | THE RYDEX FUNDS SEMI-ANNUAL REPORT | 29 |
FUND PROFILE (Unaudited) | September 30, 2016 |
CONSUMER PRODUCTS FUND
OBJECTIVE: Seeks to provide capital appreciation by investing in companies engaged in manufacturing finished goods and services both domestically and internationally (“Consumer Products Companies”).
Holdings Diversification (Market Exposure as % of Net Assets)
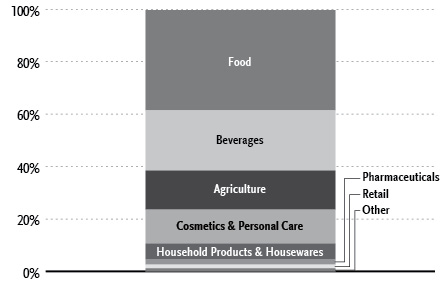
“Holdings Diversification (Market Exposure as % of Net Assets)” excludes any temporary cash investments.
Inception Dates: |
Investor Class | July 6, 1998 |
A-Class | September 1, 2004 |
C-Class | July 24, 2001 |
H-Class* | August 17, 1998 |
Ten Largest Holdings (% of Total Net Assets) |
Procter & Gamble Co. | 5.2% |
Coca-Cola Co. | 4.5% |
PepsiCo, Inc. | 4.3% |
Philip Morris International, Inc. | 4.1% |
Altria Group, Inc. | 3.7% |
Kraft Heinz Co. | 3.5% |
Mondelez International, Inc. — Class A | 2.8% |
Colgate-Palmolive Co. | 2.8% |
Reynolds American, Inc. | 2.8% |
Kimberly-Clark Corp. | 2.3% |
Top Ten Total | 36.0% |
| | |
“Ten Largest Holdings” excludes any temporary cash investments. |
* | Effective September 30, 2015, the Fund’s Advisor Class shares were converted into H-Class shares — See Note 8. |
30 | THE RYDEX FUNDS SEMI-ANNUAL REPORT | |
SCHEDULE OF INVESTMENTS (Unaudited) | September 30, 2016 |
CONSUMER PRODUCTS FUND | |
| | | Shares | | | Value | |
| | | | | | | |
COMMON STOCKS† - 99.7% | |
| | | | | | | |
Food - 38.3% | |
Kraft Heinz Co. | | | 182,721 | | | $ | 16,355,356 | |
Mondelez International, Inc. — Class A | | | 297,536 | | | | 13,061,830 | |
General Mills, Inc. | | | 150,227 | | | | 9,596,501 | |
Tyson Foods, Inc. — Class A | | | 115,469 | | | | 8,622,070 | |
Sysco Corp. | | | 166,464 | | | | 8,158,401 | |
Kellogg Co. | | | 105,056 | | | | 8,138,688 | |
Kroger Co. | | | 272,094 | | | | 8,075,750 | |
ConAgra Foods, Inc. | | | 157,732 | | | | 7,430,755 | |
Hormel Foods Corp. | | | 188,016 | | | | 7,131,447 | |
Hershey Co. | | | 73,992 | | | | 7,073,635 | |
Campbell Soup Co. | | | 116,607 | | | | 6,378,403 | |
JM Smucker Co. | | | 45,531 | | | | 6,171,272 | |
McCormick & Company, Inc. | | | 56,350 | | | | 5,630,492 | |
Ingredion, Inc. | | | 36,730 | | | | 4,887,294 | |
WhiteWave Foods Co. — Class A* | | | 88,881 | | | | 4,837,793 | |
Whole Foods Market, Inc. | | | 164,797 | | | | 4,671,995 | |
Pinnacle Foods, Inc. | | | 76,200 | | | | 3,822,954 | |
BRF S.A. ADR | | | 222,000 | | | | 3,787,320 | |
Pilgrim’s Pride Corp. | | | 171,889 | | | | 3,630,296 | |
Post Holdings, Inc.* | | | 46,200 | | | | 3,565,254 | |
TreeHouse Foods, Inc.* | | | 39,801 | | | | 3,470,249 | |
Blue Buffalo Pet Products, Inc.* | | | 138,700 | | | | 3,295,512 | |
Hain Celestial Group, Inc.* | | | 84,745 | | | | 3,015,227 | |
Lancaster Colony Corp. | | | 22,652 | | | | 2,992,103 | |
B&G Foods, Inc. | | | 58,031 | | | | 2,853,965 | |
Snyder’s-Lance, Inc. | | | 83,800 | | | | 2,814,004 | |
Fresh Del Monte Produce, Inc. | | | 46,800 | | | | 2,803,320 | |
Sprouts Farmers Market, Inc.* | | | 134,800 | | | | 2,783,620 | |
Flowers Foods, Inc. | | | 182,592 | | | | 2,760,791 | |
Darling Ingredients, Inc.* | | | 175,564 | | | | 2,371,870 | |
Sanderson Farms, Inc. | | | 24,098 | | | | 2,321,360 | |
United Natural Foods, Inc.* | | | 55,930 | | | | 2,239,437 | |
Cal-Maine Foods, Inc. | | | 53,200 | | | | 2,050,328 | |
Dean Foods Co. | | | 115,163 | | | | 1,888,673 | |
Total Food | | | | | | | 178,687,965 | |
| | | | | | | | | |
Beverages - 22.9% | |
Coca-Cola Co. | | | 500,240 | | | | 21,170,157 | |
PepsiCo, Inc. | | | 183,405 | | | | 19,948,962 | |
Constellation Brands, Inc. — Class A | | | 54,319 | | | | 9,043,570 | |
Monster Beverage Corp.* | | | 56,486 | | | | 8,292,710 | |
Molson Coors Brewing Co. — Class B | | | 71,540 | | | | 7,855,091 | |
Brown-Forman Corp. — Class B | | | 147,970 | | | | 7,019,697 | |
Dr Pepper Snapple Group, Inc. | | | 71,219 | | | | 6,503,007 | |
Anheuser-Busch InBev S.A. ADR | | | 44,780 | | | | 5,884,540 | |
Coca-Cola European Partners plc | | | 134,094 | | | | 5,350,351 | |
Ambev S.A. ADR | | | 870,552 | | | | 5,301,662 | |
Fomento Economico Mexicano SAB de CV ADR | | | 47,983 | | | | 4,416,355 | |
Diageo plc ADR | | | 33,000 | | | | 3,829,320 | |
Boston Beer Company, Inc. — Class A* | | | 13,700 | | | | 2,127,062 | |
Total Beverages | | | | | | | 106,742,484 | |
| | | | | | | | | |
Agriculture - 14.9% | |
Philip Morris International, Inc. | | | 195,814 | | | | 19,037,037 | |
Altria Group, Inc. | | | 275,701 | | | | 17,432,574 | |
Reynolds American, Inc. | | | 272,777 | | | | 12,861,436 | |
Archer-Daniels-Midland Co. | | | 183,916 | | | | 7,755,738 | |
Bunge Ltd. | | | 75,400 | | | | 4,465,942 | |
British American Tobacco plc ADR | | | 25,500 | | | | 3,255,075 | |
Vector Group Ltd. | | | 121,192 | | | | 2,609,264 | |
Universal Corp. | | | 31,484 | | | | 1,832,998 | |
Total Agriculture | | | | | | | 69,250,064 | |
| | | | | | | | | |
Cosmetics & Personal Care - 13.0% | |
Procter & Gamble Co. | | | 272,274 | | | | 24,436,592 | |
Colgate-Palmolive Co. | | | 174,599 | | | | 12,944,770 | |
Estee Lauder Companies, Inc. — Class A | | | 101,156 | | | | 8,958,375 | |
Coty, Inc. — Class A* | | | 184,202 | | | | 4,328,747 | |
Unilever N.V. — Class Y | | | 82,751 | | | | 3,814,821 | |
Edgewell Personal Care Co.* | | | 43,788 | | | | 3,482,022 | |
Avon Products, Inc. | | | 452,600 | | | | 2,561,716 | |
Total Cosmetics & Personal Care | | | | | | | 60,527,043 | |
| | | | | | | | | |
Household Products & Housewares - 5.9% | |
Kimberly-Clark Corp. | | | 85,109 | | | | 10,735,649 | |
Clorox Co. | | | 51,067 | | | | 6,392,567 | |
Church & Dwight Company, Inc. | | | 116,032 | | | | 5,560,253 | |
Spectrum Brands Holdings, Inc. | | | 33,300 | | | | 4,585,077 | |
Total Household Products & Housewares | | | | | | | 27,273,546 | |
| | | | | | | | | |
Pharmaceuticals - 2.1% | |
Mead Johnson Nutrition Co. — Class A | | | 76,879 | | | | 6,074,210 | |
Herbalife Ltd.* | | | 60,159 | | | | 3,729,256 | |
Total Pharmaceuticals | | | | | | | 9,803,466 | |
| | | | | | | | | |
Retail - 1.4% | |
Casey’s General Stores, Inc. | | | 28,423 | | | | 3,415,024 | |
Nu Skin Enterprises, Inc. — Class A | | | 48,930 | | | | 3,169,685 | |
Total Retail | | | | | | | 6,584,709 | |
| | | | | | | | | |
Electrical Components & Equipment - 0.6% | |
Energizer Holdings, Inc. | | | 57,735 | | | | 2,884,441 | |
| | | | | | | | | |
Holding Companies-Diversified - 0.6% | |
HRG Group, Inc.* | | | 178,600 | | | | 2,804,020 | |
| | | | | | | | | |
Total Common Stocks | | | | | | | | |
(Cost $354,884,359) | | | | | | | 464,557,738 | |
| | | | | | | | | |
RIGHTS††† - 0.0% | |
PDC | | | | | | | | |
Expires 01/17/17* | | | 93,765 | | | | — | |
Casa Ley | | | | | | | | |
Expires 01/17/19* | | | 93,765 | | | | — | |
Total Rights | | | | | | | | |
(Cost $23,055) | | | | | | | — | |
SEE NOTES TO FINANCIAL STATEMENTS. | THE RYDEX FUNDS SEMI-ANNUAL REPORT | 31 |
SCHEDULE OF INVESTMENTS (Unaudited)(concluded) | September 30, 2016 |
CONSUMER PRODUCTS FUND | |
| | | Face
Amount | | | Value | |
| | | | | | | |
REPURCHASE AGREEMENT††,1 - 0.2% | |
Royal Bank of Canada
issued 09/30/16 at 0.36%
due 10/03/16 | | $ | 1,056,385 | | | $ | 1,056,385 | |
Total Repurchase Agreement | | | | | | | | |
(Cost $1,056,385) | | | | | | | 1,056,385 | |
| | | | | | | | | |
Total Investments - 99.9% | | | | | | | | |
(Cost $355,963,799) | | | | | | $ | 465,614,123 | |
Other Assets & Liabilities, net - 0.1% | | | | | | | 505,980 | |
Total Net Assets - 100.0% | | | | | | $ | 466,120,103 | |
* | Non-income producing security. |
† | Value determined based on Level 1 inputs — See Note 4. |
†† | Value determined based on Level 2 inputs — See Note 4. |
††† | Value determined based on Level 3 inputs — See Note 4. |
1 | Repurchase Agreement — See Note 5. |
| | ADR — American Depositary Receipt |
| | plc — Public Limited Company |
| | |
| | See Sector Classification in Other Information section. |
The following table summarizes the inputs used to value the Fund’s investments at September 30, 2016 (See Note 4 in the Notes to Financial Statements):
Investments in Securities (Assets) | | Level 1 | | | Level 2 | | | Level 3 | | | Total | |
Common Stocks | | $ | 464,557,738 | | | $ | — | | | $ | — | | | $ | 464,557,738 | |
Repurchase Agreement | | | — | | | | 1,056,385 | | | | — | | | | 1,056,385 | |
Rights | | | — | | | | — | | | | — | | | | — | |
Total | | $ | 464,557,738 | | | $ | 1,056,385 | | | $ | — | | | $ | 465,614,123 | |
Transfers between investment levels may occur as the markets fluctuate and/or the availability of data used in an investment’s valuation changes. Transfers between valuation levels, if any, are in comparison to the valuation levels at the end of the previous fiscal year, and are effective using the fair value as of the end of the previous fiscal period.
For the period ended September 30, 2016, there were no transfers between levels.
32 | THE RYDEX FUNDS SEMI-ANNUAL REPORT | SEE NOTES TO FINANCIAL STATEMENTS. |
STATEMENT OF ASSETS AND LIABILITIES (Unaudited) | |
September 30, 2016 | |
Assets: | |
Investments, at value (cost $354,907,414) | | $ | 464,557,738 | |
Repurchase agreements, at value (cost $1,056,385) | | | 1,056,385 | |
Total investments (cost $355,963,799) | | | 465,614,123 | |
Receivables: | |
Fund shares sold | | | 332,353 | |
Dividends | | | 1,212,252 | |
Foreign taxes reclaim | | | 30,323 | |
Interest | | | 11 | |
Total assets | | | 467,189,062 | |
| | | | | |
Liabilities: | |
Overdraft due to custodian bank | | | 140,156 | |
Payable for: | |
Management fees | | | 331,360 | |
Fund shares redeemed | | | 328,039 | |
Transfer agent and administrative fees | | | 97,459 | |
Distribution and service fees | | | 51,347 | |
Portfolio accounting fees | | | 34,361 | |
Miscellaneous | | | 86,237 | |
Total liabilities | | | 1,068,959 | |
Commitments and contingent liabilities (Note 9) | | | — | |
Net assets | | $ | 466,120,103 | |
| | | | | |
Net assets consist of: | |
Paid in capital | | $ | 362,190,432 | |
Undistributed net investment income | | | 4,927,805 | |
Accumulated net realized loss on investments | | | (10,648,458 | ) |
Net unrealized appreciation on investments | | | 109,650,324 | |
Net assets | | $ | 466,120,103 | |
| | | | | |
Investor Class: | |
Net assets | | $ | 311,318,936 | |
Capital shares outstanding | | | 4,800,790 | |
Net asset value per share | | $ | 64.85 | |
| | | | | |
A-Class: | |
Net assets | | $ | 53,123,204 | |
Capital shares outstanding | | | 882,106 | |
Net asset value per share | | $ | 60.22 | |
Maximum offering price per share (Net asset value divided by 95.25%) | | $ | 63.23 | |
| | | | | |
C-Class: | |
Net assets | | $ | 32,346,441 | |
Capital shares outstanding | | | 605,358 | |
Net asset value per share | | $ | 53.43 | |
| | | | | |
H-Class: | |
Net assets | | $ | 69,331,522 | |
Capital shares outstanding | | | 1,190,599 | |
Net asset value per share | | $ | 58.23 | |
STATEMENT OF OPERATIONS (Unaudited) | |
Period Ended September 30, 2016 | |
Investment Income: | |
Dividends (net of foreign withholding tax of $15,952) | | $ | 5,596,658 | |
Interest | | | 3,025 | |
Total investment income | | | 5,599,683 | |
| | | | | |
Expenses: | |
Management fees | | | 2,015,777 | |
Transfer agent and administrative fees | | | 592,877 | |
Distribution and service fees: | |
A-Class | | | 68,967 | |
C-Class | | | 144,869 | |
H-Class | | | 89,102 | |
Portfolio accounting fees | | | 208,899 | |
Custodian fees | | | 28,004 | |
Trustees’ fees* | | | 24,378 | |
Line of credit fees | | | 131 | |
Miscellaneous | | | 358,650 | |
Total expenses | | | 3,531,654 | |
Net investment income | | | 2,068,029 | |
| | | | | |
Net Realized and Unrealized Gain (Loss): | |
Net realized gain (loss) on: | |
Investments | | | 8,454,733 | |
Net realized gain | | | 8,454,733 | |
Net change in unrealized appreciation (depreciation) on: | |
Investments | | | 2,391,945 | |
Net change in unrealized appreciation (depreciation) | | | 2,391,945 | |
Net realized and unrealized gain | | | 10,846,678 | |
Net increase in net assets resulting from operations | | $ | 12,914,707 | |
* | Relates to Trustees not deemed “interested persons” within the meaning of Section 2(a)(19) of the 1940 Act. |
SEE NOTES TO FINANCIAL STATEMENTS. | THE RYDEX FUNDS SEMI-ANNUAL REPORT | 33 |
STATEMENTS OF CHANGES IN NET ASSETS |
| | | Period Ended
September 30,
2016
(Unaudited) | | | Year Ended
March 31,
2016 | |
Increase (Decrease) in Net Assets from Operations: | | | | | | |
Net investment income | | $ | 2,068,029 | | | $ | 2,837,658 | |
Net realized gain on investments | | | 8,454,733 | | | | 973,509 | |
Net change in unrealized appreciation (depreciation) on investments | | | 2,391,945 | | | | 24,512,809 | |
Net increase in net assets resulting from operations | | | 12,914,707 | | | | 28,323,976 | |
| | | | | | | | | |
Distributions to shareholders from: | | | | | | | | |
Net investment income | | | | | | | | |
Investor Class | | | — | | | | (1,910,579 | ) |
A-Class | | | — | | | | (334,945 | ) |
C-Class | | | — | | | | (184,219 | ) |
H-Class | | | — | | | | (391,960 | )* |
Net realized gains | | | | | | | | |
Investor Class | | | — | | | | (2,901,894 | ) |
A-Class | | | — | | | | (508,733 | ) |
C-Class | | | — | | | | (279,802 | ) |
H-Class | | | — | | | | (595,331 | )* |
Total distributions to shareholders | | | — | | | | (7,107,463 | ) |
| | | | | | | | | |
Capital share transactions: | | | | | | | | |
Proceeds from sale of shares | | | | | | | | |
Investor Class | | | 189,942,688 | | | | 350,581,088 | |
A-Class | | | 26,374,851 | | | | 60,872,986 | |
C-Class | | | 11,420,730 | | | | 20,783,158 | |
H-Class | | | 99,671,685 | | | | 167,016,501 | * |
Distributions reinvested | | | | | | | | |
Investor Class | | | — | | | | 4,699,482 | |
A-Class | | | — | | | | 687,164 | |
C-Class | | | — | | | | 448,009 | |
H-Class | | | — | | | | 985,550 | * |
Cost of shares redeemed | | | | | | | | |
Investor Class | | | (163,738,250 | ) | | | (316,067,877 | ) |
A-Class | | | (28,320,730 | ) | | | (43,169,090 | ) |
C-Class | | | (3,492,293 | ) | | | (16,365,257 | ) |
H-Class | | | (98,292,204 | ) | | | (155,233,554 | )* |
Net increase from capital share transactions | | | 33,566,477 | | | | 75,238,160 | |
Net increase in net assets | | | 46,481,184 | | | | 96,454,673 | |
| | | | | | | | | |
Net assets: | | | | | | | | |
Beginning of period | | | 419,638,919 | | | | 323,184,246 | |
End of period | | $ | 466,120,103 | | | $ | 419,638,919 | |
Undistributed net investment income at end of period | | $ | 4,927,805 | | | $ | 2,859,776 | |
34 | THE RYDEX FUNDS SEMI-ANNUAL REPORT | SEE NOTES TO FINANCIAL STATEMENTS. |
STATEMENTS OF CHANGES IN NET ASSETS (concluded) |
| | | Period Ended
September 30,
2016
(Unaudited) | | | Year Ended
March 31,
2016 | |
Capital share activity: | | | | | | |
Shares sold | | | | | | |
Investor Class | | | 2,933,625 | | | | 5,896,971 | |
A-Class | | | 440,484 | | | | 1,101,512 | |
C-Class | | | 213,149 | | | | 420,631 | |
H-Class | | | 1,759,338 | | | | 3,121,495 | * |
Shares issued from reinvestment of distributions | | | | | | | | |
Investor Class | | | — | | | | 81,887 | |
A-Class | | | — | | | | 12,863 | |
C-Class | | | — | | | | 9,390 | |
H-Class | | | — | | | | 19,078 | * |
Shares redeemed | | | | | | | | |
Investor Class | | | (2,534,212 | ) | | | (5,385,440 | ) |
A-Class | | | (475,033 | ) | | | (797,084 | ) |
C-Class | | | (65,118 | ) | | | (332,936 | ) |
H-Class | | | (1,731,536 | ) | | | (2,917,566 | )* |
Net increase in shares | | | 540,697 | | | | 1,230,801 | |
* | Effective September 30, 2015, the Fund’s Advisor Class shares were converted into H-Class shares — See Note 8. |
SEE NOTES TO FINANCIAL STATEMENTS. | THE RYDEX FUNDS SEMI-ANNUAL REPORT | 35 |
This table is presented to show selected data for a share outstanding throughout each period and to assist shareholders in evaluating a Fund’s performance for the periods presented.
Investor Class | | Period Ended
September 30,
2016a | | | Year Ended
March 31,
2016 | | | Year Ended
March 31,
2015 | | | Year Ended
March 31,
2014 | | | Year Ended
March 28,
2013 | | | Year Ended
March 31,
2012 | |
Per Share Data | | | | | | | | | | | | | | | | | | |
Net asset value, beginning of period | | $ | 62.84 | | | $ | 58.55 | | | $ | 52.08 | | | $ | 47.79 | | | $ | 40.19 | | | $ | 36.37 | |
Income (loss) from investment operations: | |
Net investment income (loss)b | | | .32 | | | | .61 | | | | .71 | | | | .46 | | | | .57 | | | | .49 | |
Net gain (loss) on investments (realized and unrealized) | | | 1.69 | | | | 4.92 | | | | 6.44 | | | | 5.81 | | | | 7.14 | | | | 4.82 | |
Total from investment operations | | | 2.01 | | | | 5.53 | | | | 7.15 | | | | 6.27 | | | | 7.71 | | | | 5.31 | |
Less distributions from: | |
Net investment income | | | — | | | | (.49 | ) | | | (.24 | ) | | | (.46 | ) | | | (.11 | ) | | | (.57 | ) |
Net realized gains | | | — | | | | (.75 | ) | | | (.44 | ) | | | (1.52 | ) | | | — | | | | (.92 | ) |
Total distributions | | | — | | | | (1.24 | ) | | | (.68 | ) | | | (1.98 | ) | | | (.11 | ) | | | (1.49 | ) |
Net asset value, end of period | | $ | 64.85 | | | $ | 62.84 | | | $ | 58.55 | | | $ | 52.08 | | | $ | 47.79 | | | $ | 40.19 | |
| | |
Total Returnc | | | 3.18 | % | | | 9.65 | % | | | 13.77 | % | | | 13.24 | % | | | 19.26 | % | | | 15.06 | % |
Ratios/Supplemental Data | |
Net assets, end of period (in thousands) | | $ | 311,319 | | | $ | 276,578 | | | $ | 222,954 | | | $ | 102,231 | | | $ | 181,945 | | | $ | 155,432 | |
Ratios to average net assets: | |
Net investment income (loss) | | | 1.00 | % | | | 1.03 | % | | | 1.27 | % | | | 0.91 | % | | | 1.38 | % | | | 1.29 | % |
Total expenses | | | 1.36 | % | | | 1.34 | % | | | 1.34 | % | | | 1.37 | % | | | 1.35 | % | | | 1.35 | % |
Portfolio turnover rate | | | 42 | % | | | 104 | % | | | 87 | % | | | 112 | % | | | 230 | % | | | 402 | % |
A-Class | | Period Ended
September 30,
2016a | | | Year Ended
March 31,
2016 | | | Year Ended
March 31,
2015 | | | Year Ended
March 31,
2014 | | | Year Ended
March 28,
2013 | | | Year Ended
March 31,
2012 | |
Per Share Data | | | | | | | | | | | | | | | | | | |
Net asset value, beginning of period | | $ | 58.43 | | | $ | 54.66 | | | $ | 48.79 | | | $ | 45.00 | | | $ | 37.93 | | | $ | 34.49 | |
Income (loss) from investment operations: | |
Net investment income (loss)b | | | .23 | | | | .45 | | | | .48 | | | | .33 | | | | .44 | | | | .40 | |
Net gain (loss) on investments (realized and unrealized) | | | 1.56 | | | | 4.56 | | | | 6.07 | | | | 5.44 | | | | 6.74 | | | | 4.53 | |
Total from investment operations | | | 1.79 | | | | 5.01 | | | | 6.55 | | | | 5.77 | | | | 7.18 | | | | 4.93 | |
Less distributions from: | |
Net investment income | | | — | | | | (.49 | ) | | | (.24 | ) | | | (.46 | ) | | | (.11 | ) | | | (.57 | ) |
Net realized gains | | | — | | | | (.75 | ) | | | (.44 | ) | | | (1.52 | ) | | | — | | | | (.92 | ) |
Total distributions | | | — | | | | (1.24 | ) | | | (.68 | ) | | | (1.98 | ) | | | (.11 | ) | | | (1.49 | ) |
Net asset value, end of period | | $ | 60.22 | | | $ | 58.43 | | | $ | 54.66 | | | $ | 48.79 | | | $ | 45.00 | | | $ | 37.93 | |
| | |
Total Returnc | | | 3.06 | % | | | 9.38 | % | | | 13.47 | % | | | 12.95 | % | | | 18.98 | % | | | 14.80 | % |
Ratios/Supplemental Data | |
Net assets, end of period (in thousands) | | $ | 53,123 | | | $ | 53,560 | | | $ | 32,762 | | | $ | 25,538 | | | $ | 21,604 | | | $ | 21,021 | |
Ratios to average net assets: | |
Net investment income (loss) | | | 0.76 | % | | | 0.82 | % | | | 0.92 | % | | | 0.70 | % | | | 1.12 | % | | | 1.11 | % |
Total expenses | | | 1.61 | % | | | 1.60 | % | | | 1.60 | % | | | 1.62 | % | | | 1.60 | % | | | 1.60 | % |
Portfolio turnover rate | | | 42 | % | | | 104 | % | | | 87 | % | | | 112 | % | | | 230 | % | | | 402 | % |
36 | THE RYDEX FUNDS SEMI-ANNUAL REPORT | SEE NOTES TO FINANCIAL STATEMENTS. |
FINANCIAL HIGHLIGHTS (concluded) |
This table is presented to show selected data for a share outstanding throughout each period and to assist shareholders in evaluating a Fund’s performance for the periods presented.
C-Class | | Period Ended
September 30,
2016a | | | Year Ended
March 31,
2016 | | | Year Ended
March 31,
2015 | | | Year Ended
March 31,
2014 | | | Year Ended
March 28,
2013 | | | Year Ended
March 31,
2012 | |
Per Share Data | | | | | | | | | | | | | | | | | | |
Net asset value, beginning of period | | $ | 52.04 | | | $ | 49.18 | | | $ | 44.29 | | | $ | 41.32 | | | $ | 35.11 | | | $ | 32.28 | |
Income (loss) from investment operations: | |
Net investment income (loss)b | | | — | d | | | .03 | | | | .09 | | | | (.01 | ) | | | .13 | | | | .12 | |
Net gain (loss) on investments (realized and unrealized) | | | 1.39 | | | | 4.07 | | | | 5.48 | | | | 4.96 | | | | 6.19 | | | | 4.20 | |
Total from investment operations | | | 1.39 | | | | 4.10 | | | | 5.57 | | | | 4.95 | | | | 6.32 | | | | 4.32 | |
Less distributions from: | |
Net investment income | | | — | | | | (.49 | ) | | | (.24 | ) | | | (.46 | ) | | | (.11 | ) | | | (.57 | ) |
Net realized gains | | | — | | | | (.75 | ) | | | (.44 | ) | | | (1.52 | ) | | | — | | | | (.92 | ) |
Total distributions | | | — | | | | (1.24 | ) | | | (.68 | ) | | | (1.98 | ) | | | (.11 | ) | | | (1.49 | ) |
Net asset value, end of period | | $ | 53.43 | | | $ | 52.04 | | | $ | 49.18 | | | $ | 44.29 | | | $ | 41.32 | | | $ | 35.11 | |
| | |
Total Returnc | | | 2.67 | % | | | 8.57 | % | | | 12.62 | % | | | 12.11 | % | | | 18.06 | % | | | 13.91 | % |
Ratios/Supplemental Data | |
Net assets, end of period (in thousands) | | $ | 32,346 | | | $ | 23,799 | | | $ | 17,717 | | | $ | 14,125 | | | $ | 11,699 | | | $ | 9,712 | |
Ratios to average net assets: | |
Net investment income (loss) | | | 0.01 | % | | | 0.05 | % | | | 0.20 | % | | | (0.02 | %) | | | 0.37 | % | | | 0.36 | % |
Total expenses | | | 2.35 | % | | | 2.35 | % | | | 2.35 | % | | | 2.37 | % | | | 2.35 | % | | | 2.35 | % |
Portfolio turnover rate | | | 42 | % | | | 104 | % | | | 87 | % | | | 112 | % | | | 230 | % | | | 402 | % |
H-Class | | Period Ended
September 30,
2016a | | | Year Ended
March 31, 2016e | | | Year Ended
March 31, 2015e | | | Year Ended
March 31, 2014e | | | Year Ended
March 28, 2013e | | | Year Ended
March 31, 2012e | |
Per Share Data | | | | | | | | | | | | | | | | | | |
Net asset value, beginning of period | | $ | 56.50 | | | $ | 52.94 | | | $ | 47.39 | | | $ | 43.87 | | | $ | 37.08 | | | $ | 33.84 | |
Income (loss) from investment operations: | |
Net investment income (loss)b | | | .22 | | | | .39 | | | | .37 | | | | .24 | | | | .35 | | | | .24 | |
Net gain (loss) on investments (realized and unrealized) | | | 1.51 | | | | 4.41 | | | | 5.86 | | | | 5.26 | | | | 6.55 | | | | 4.49 | |
Total from investment operations | | | 1.73 | | | | 4.80 | | | | 6.23 | | | | 5.50 | | | | 6.90 | | | | 4.73 | |
Less distributions from: | |
Net investment income | | | — | | | | (.49 | ) | | | (.24 | ) | | | (.46 | ) | | | (.11 | ) | | | (.57 | ) |
Net realized gains | | | — | | | | (.75 | ) | | | (.44 | ) | | | (1.52 | ) | | | — | | | | (.92 | ) |
Total distributions | | | — | | | | (1.24 | ) | | | (.68 | ) | | | (1.98 | ) | | | (.11 | ) | | | (1.49 | ) |
Net asset value, end of period | | $ | 58.23 | | | $ | 56.50 | | | $ | 52.94 | | | $ | 47.39 | | | $ | 43.87 | | | $ | 37.08 | |
| | |
Total Returnc | | | 3.06 | % | | | 9.29 | % | | | 13.19 | % | | | 12.66 | % | | | 18.66 | % | | | 14.49 | % |
Ratios/Supplemental Data | |
Net assets, end of period (in thousands) | | $ | 69,332 | | | $ | 65,702 | | | $ | 49,751 | | | $ | 27,162 | | | $ | 10,148 | | | $ | 16,975 | |
Ratios to average net assets: | |
Net investment income (loss) | | | 0.74 | % | | | 0.72 | % | | | 0.74 | % | | | 0.51 | % | | | 0.93 | % | | | 0.68 | % |
Total expenses | | | 1.61 | % | | | 1.66 | % | | | 1.85 | % | | | 1.87 | % | | | 1.85 | % | | | 1.84 | % |
Portfolio turnover rate | | | 42 | % | | | 104 | % | | | 87 | % | | | 112 | % | | | 230 | % | | | 402 | % |
a | Unaudited figures for the period ended September 30, 2016. Percentage amounts for the period, except total return and portfolio turnover rate, have been annualized. |
b | Net investment income (loss) per share was computed using average shares outstanding throughout the period. |
c | Total return does not reflect the impact of any applicable sales charges. |
d | Net investment income is less than $0.01 per share. |
e | Effective September 30, 2015, the Fund’s Advisor Class shares were converted into H-Class shares. The financial highlights for periods prior to that date reflect the performance of the former Advisor Class — See Note 8. |
SEE NOTES TO FINANCIAL STATEMENTS. | THE RYDEX FUNDS SEMI-ANNUAL REPORT | 37 |
FUND PROFILE (Unaudited) | September 30, 2016 |
ELECTRONICS FUND
OBJECTIVE: Seeks to provide capital appreciation by investing in companies that are involved in the electronics sector, including semiconductor manufacturers and distributors, and makers and vendors of other electronic components and devices (“Electronics Companies”).
Holdings Diversification (Market Exposure as % of Net Assets)
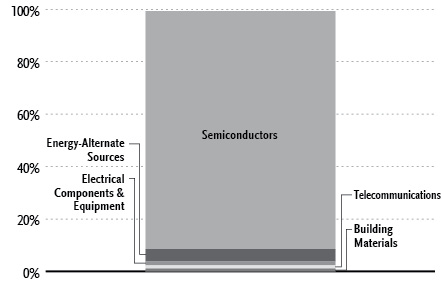
“Holdings Diversification (Market Exposure as % of Net Assets)” excludes any temporary cash investments.
Inception Dates: |
Investor Class | April 1, 1998 |
A-Class | September 1, 2004 |
C-Class | March 26, 2001 |
H-Class* | April 2, 1998 |
Ten Largest Holdings (% of Total Net Assets) |
Intel Corp. | 8.6% |
QUALCOMM, Inc. | 6.7% |
Texas Instruments, Inc. | 5.4% |
NVIDIA Corp. | 4.0% |
Broadcom Ltd. | 3.9% |
Applied Materials, Inc. | 3.6% |
NXP Semiconductor N.V. | 3.3% |
Analog Devices, Inc. | 2.9% |
Micron Technology, Inc. | 2.7% |
Taiwan Semiconductor Manufacturing Company Ltd. ADR | 2.5% |
Top Ten Total | 43.6% |
| | |
“Ten Largest Holdings” excludes any temporary cash investments. |
* | Effective September 30, 2015, the Fund’s Advisor Class shares were converted into H-Class shares — See Note 8. |
38 | THE RYDEX FUNDS SEMI-ANNUAL REPORT | |
SCHEDULE OF INVESTMENTS (Unaudited) | September 30, 2016 |
ELECTRONICS FUND | |
| | | Shares | | | Value | |
| | | | | | | |
COMMON STOCKS† - 99.3% | |
| | | | | | | |
Semiconductors - 90.8% | |
Intel Corp. | | | 89,257 | | | $ | 3,369,451 | |
QUALCOMM, Inc. | | | 38,275 | | | | 2,621,837 | |
Texas Instruments, Inc. | | | 29,947 | | | | 2,101,679 | |
NVIDIA Corp. | | | 22,918 | | | | 1,570,341 | |
Broadcom Ltd. | | | 8,904 | | | | 1,536,117 | |
Applied Materials, Inc. | | | 47,391 | | | | 1,428,839 | |
NXP Semiconductor N.V.* | | | 12,514 | | | | 1,276,553 | |
Analog Devices, Inc. | | | 17,399 | | | | 1,121,366 | |
Micron Technology, Inc.* | | | 60,284 | | | | 1,071,850 | |
Taiwan Semiconductor Manufacturing Company Ltd. ADR | | | 32,508 | | | | 994,420 | |
Lam Research Corp. | | | 10,448 | | | | 989,530 | |
Linear Technology Corp. | | | 15,955 | | | | 945,972 | |
Skyworks Solutions, Inc. | | | 12,271 | | | | 934,314 | |
Xilinx, Inc. | | | 17,175 | | | | 933,290 | |
Microchip Technology, Inc. | | | 14,896 | | | | 925,637 | |
Maxim Integrated Products, Inc. | | | 21,299 | | | | 850,469 | |
KLA-Tencor Corp. | | | 11,720 | | | | 817,001 | |
Marvell Technology Group Ltd. | | | 51,407 | | | | 682,171 | |
Advanced Micro Devices, Inc.* | | | 97,070 | | | | 670,754 | |
Qorvo, Inc.* | | | 11,886 | | | | 662,526 | |
ON Semiconductor Corp.* | | | 48,761 | | | | 600,736 | |
Microsemi Corp.* | | | 13,036 | | | | 547,251 | |
Teradyne, Inc. | | | 24,442 | | | | 527,458 | |
ASML Holding N.V. — Class G | | | 4,602 | | | | 504,287 | |
Cypress Semiconductor Corp. | | | 40,440 | | | | 491,750 | |
Monolithic Power Systems, Inc. | | | 5,863 | | | | 471,972 | |
Cavium, Inc.* | | | 8,017 | | | | 466,589 | |
Integrated Device Technology, Inc.* | | | 19,988 | | | | 461,723 | |
Cirrus Logic, Inc.* | | | 8,481 | | | | 450,765 | |
Mellanox Technologies Ltd.* | | | 10,268 | | | | 444,091 | |
Silicon Motion Technology Corp. ADR | | | 8,340 | | | | 431,929 | |
Intersil Corp. — Class A | | | 19,690 | | | | 431,802 | |
MKS Instruments, Inc. | | | 8,422 | | | | 418,826 | |
Silicon Laboratories, Inc.* | | | 6,892 | | | | 405,250 | |
Ambarella, Inc.* | | | 5,495 | | | | 404,487 | |
MACOM Technology Solutions Holdings, Inc.* | | | 8,926 | | | | 377,927 | |
Tessera Technologies, Inc. | | | 9,640 | | | | 370,562 | |
Synaptics, Inc.* | | | 6,119 | | | | 358,451 | |
Power Integrations, Inc. | | | 5,599 | | | | 352,905 | |
Inphi Corp.* | | | 8,019 | | | | 348,907 | |
Semtech Corp.* | | | 12,259 | | | | 339,942 | |
Himax Technologies, Inc. ADR | | | 37,285 | | | | 320,278 | |
MaxLinear, Inc. — Class A* | | | 14,321 | | | | 290,287 | |
Rambus, Inc.* | | | 23,114 | | | | 288,925 | |
Total Semiconductors | | | | | | | 35,611,217 | |
| | | | | | | | | |
Energy-Alternate Sources - 4.6% | |
First Solar, Inc.* | | | 13,447 | | | | 531,022 | |
Canadian Solar, Inc.* | | | 33,666 | | | | 462,571 | |
SolarEdge Technologies, Inc.* | | | 24,947 | | | | 429,837 | |
Trina Solar Ltd. ADR* | | | 37,150 | | | | 380,416 | |
Total Energy-Alternate Sources | | | | | | | 1,803,846 | |
| | | | | | | | | |
Electrical Components & Equipment - 1.6% | |
Advanced Energy Industries, Inc.* | | | 7,520 | | | | 355,847 | |
SunPower Corp. — Class A* | | | 32,677 | | | | 291,479 | |
Total Electrical Components & Equipment | | | | | | | 647,326 | |
| | | | | | | | | |
Telecommunications - 1.2% | |
Acacia Communications, Inc.* | | | 4,650 | | | | 480,252 | |
| | | | | | | | | |
Building Materials - 1.1% | |
Cree, Inc.* | | | 16,106 | | | | 414,246 | |
| | | | | | | | | |
Total Common Stocks | | | | | | | | |
(Cost $34,384,356) | | | | | | | 38,956,887 | |
| | | | | | | | | |
| | | Face
Amount | | | | | |
| | | | | | | | | |
REPURCHASE AGREEMENT††,1 - 0.0% | |
Royal Bank of Canada
issued 09/30/16 at 0.36%
due 10/03/16 | | $ | 445 | | | | 445 | |
Total Repurchase Agreement | | | | | | | | |
(Cost $445) | | | | | | | 445 | |
| | | | | | | | | |
Total Investments - 99.3% | | | | | | | | |
(Cost $34,384,801) | | | | | | $ | 38,957,332 | |
Other Assets & Liabilities, net - 0.7% | | | | | | | 276,697 | |
Total Net Assets - 100.0% | | | | | | $ | 39,234,029 | |
* | Non-income producing security. |
† | Value determined based on Level 1 inputs — See Note 4. |
†† | Value determined based on Level 2 inputs — See Note 4. |
1 | Repurchase Agreement — See Note 5. |
| | ADR — American Depositary Receipt |
| | |
| | See Sector Classification in Other Information section. |
SEE NOTES TO FINANCIAL STATEMENTS. | THE RYDEX FUNDS SEMI-ANNUAL REPORT | 39 |
SCHEDULE OF INVESTMENTS (Unaudited)(concluded) | September 30, 2016 |
ELECTRONICS FUND | |
The following table summarizes the inputs used to value the Fund’s investments at September 30, 2016 (See Note 4 in the Notes to Financial Statements):
Investments in Securities (Assets) | | Level 1 | | | Level 2 | | | Level 3 | | | Total | |
Common Stocks | | $ | 38,956,887 | | | $ | — | | | $ | — | | | $ | 38,956,887 | |
Repurchase Agreement | | | — | | | | 445 | | | | — | | | | 445 | |
Total | | $ | 38,956,887 | | | $ | 445 | | | $ | — | | | $ | 38,957,332 | |
Transfers between investment levels may occur as the markets fluctuate and/or the availability of data used in an investment’s valuation changes. Transfers between valuation levels, if any, are in comparison to the valuation levels at the end of the previous fiscal year, and are effective using the fair value as of the end of the previous fiscal period.
For the period ended September 30, 2016, there were no transfers between levels.
40 | THE RYDEX FUNDS SEMI-ANNUAL REPORT | SEE NOTES TO FINANCIAL STATEMENTS. |
STATEMENT OF ASSETS AND LIABILITIES (Unaudited) |
September 30, 2016 |
Assets: | |
Investments, at value (cost $34,384,356) | | $ | 38,956,887 | |
Repurchase agreements, at value (cost $445) | | | 445 | |
Total investments (cost $34,384,801) | | | 38,957,332 | |
Receivables: | |
Fund shares sold | | | 480,508 | |
Dividends | | | 9,612 | |
Total assets | | | 39,447,452 | |
| | | | | |
Liabilities: | |
Overdraft due to custodian bank | | | 39,025 | |
Payable for: | |
Fund shares redeemed | | | 127,169 | |
Management fees | | | 27,138 | |
Transfer agent and administrative fees | | | 7,982 | |
Portfolio accounting fees | | | 3,192 | |
Distribution and service fees | | | 2,095 | |
Miscellaneous | | | 6,822 | |
Total liabilities | | | 213,423 | |
Commitments and contingent liabilities (Note 9) | | | — | |
Net assets | | $ | 39,234,029 | |
| | | | | |
Net assets consist of: | |
Paid in capital | | $ | 48,749,738 | |
Undistributed net investment income | | | 57,101 | |
Accumulated net realized loss on investments | | | (14,145,341 | ) |
Net unrealized appreciation on investments | | | 4,572,531 | |
Net assets | | $ | 39,234,029 | |
| | | | | |
Investor Class: | |
Net assets | | $ | 31,107,346 | |
Capital shares outstanding | | | 325,464 | |
Net asset value per share | | $ | 95.58 | |
| | | | | |
A-Class: | |
Net assets | | $ | 3,477,105 | |
Capital shares outstanding | | | 38,791 | |
Net asset value per share | | $ | 89.64 | |
Maximum offering price per share (Net asset value divided by 95.25%) | | $ | 94.11 | |
| | | | | |
C-Class: | |
Net assets | | $ | 963,965 | |
Capital shares outstanding | | | 11,756 | |
Net asset value per share | | $ | 82.00 | |
| | | | | |
H-Class: | |
Net assets | | $ | 3,685,613 | |
Capital shares outstanding | | | 42,224 | |
Net asset value per share | | $ | 87.29 | |
STATEMENT OF OPERATIONS (Unaudited) | |
Period Ended September 30, 2016 | |
Investment Income: | |
Dividends (net of foreign withholding tax of $374) | | $ | 271,858 | |
Interest | | | 160 | |
Total investment income | | | 272,018 | |
| | | | | |
Expenses: | |
Management fees | | | 124,778 | |
Transfer agent and administrative fees | | | 36,700 | |
Distribution and service fees: | |
A-Class | | | 1,741 | |
C-Class | | | 4,172 | |
H-Class | | | 7,789 | |
Portfolio accounting fees | | | 14,680 | |
Custodian fees | | | 1,730 | |
Trustees’ fees* | | | 1,326 | |
Line of credit fees | | | 469 | |
Miscellaneous | | | 21,532 | |
Total expenses | | | 214,917 | |
Net investment income | | | 57,101 | |
| | | | | |
Net Realized and Unrealized Gain (Loss): | |
Net realized gain (loss) on: | |
Investments | | | 1,758,409 | |
Net realized gain | | | 1,758,409 | |
Net change in unrealized appreciation (depreciation) on: | |
Investments | | | (594,083 | ) |
Net change in unrealized appreciation (depreciation) | | | (594,083 | ) |
Net realized and unrealized gain | | | 1,164,326 | |
Net increase in net assets resulting from operations | | $ | 1,221,427 | |
* | Relates to Trustees not deemed “interested persons” within the meaning of Section 2(a)(19) of the 1940 Act. |
SEE NOTES TO FINANCIAL STATEMENTS. | THE RYDEX FUNDS SEMI-ANNUAL REPORT | 41 |
STATEMENTS OF CHANGES IN NET ASSETS |
| | | Period Ended
September 30,
2016
(Unaudited) | | | Year Ended
March 31,
2016 | |
Increase (Decrease) in Net Assets from Operations: | | | | | | |
Net investment income (loss) | | $ | 57,101 | | | $ | (48,472 | ) |
Net realized gain (loss) on investments | | | 1,758,409 | | | | (613,224 | ) |
Net change in unrealized appreciation (depreciation) on investments | | | (594,083 | ) | | | (2,220,822 | ) |
Net increase (decrease) in net assets resulting from operations | | | 1,221,427 | | | | (2,882,518 | ) |
| | | | | | | | | |
Distributions to shareholders from: | | | | | | | | |
Net investment income | | | | | | | | |
Investor Class | | | — | | | | (18,251 | ) |
A-Class | | | — | | | | (3,858 | ) |
C-Class | | | — | | | | (1,389 | ) |
H-Class | | | — | | | | (18,915 | )* |
Total distributions to shareholders | | | — | | | | (42,413 | ) |
| | | | | | | | | |
Capital share transactions: | | | | | | | | |
Proceeds from sale of shares | | | | | | | | |
Investor Class | | | 137,131,997 | | | | 83,406,696 | |
A-Class | | | 5,712,878 | | | | 14,991,695 | |
C-Class | | | 1,761,907 | | | | 13,427,149 | |
H-Class | | | 83,941,860 | | | | 136,348,968 | * |
Distributions reinvested | | | | | | | | |
Investor Class | | | — | | | | 16,547 | |
A-Class | | | — | | | | 925 | |
C-Class | | | — | | | | 1,387 | |
H-Class | | | — | | | | 18,915 | * |
Cost of shares redeemed | | | | | | | | |
Investor Class | | | (116,059,476 | ) | | | (91,725,809 | ) |
A-Class | | | (4,257,278 | ) | | | (14,864,321 | ) |
C-Class | | | (1,626,414 | ) | | | (13,783,514 | ) |
H-Class | | | (90,548,112 | ) | | | (130,346,155 | )* |
Net increase (decrease) from capital share transactions | | | 16,057,362 | | | | (2,507,517 | ) |
Net increase (decrease) in net assets | | | 17,278,789 | | | | (5,432,448 | ) |
| | | | | | | | | |
Net assets: | | | | | | | | |
Beginning of period | | | 21,955,240 | | | | 27,387,688 | |
End of period | | $ | 39,234,029 | | | $ | 21,955,240 | |
Undistributed net investment income at end of period | | $ | 57,101 | | | $ | — | |
| | | | | | | | | |
Capital share activity: | | | | | | | | |
Shares sold | | | | | | | | |
Investor Class | | | 1,602,212 | | | | 1,040,573 | |
A-Class | | | 68,830 | | | | 198,666 | |
C-Class | | | 24,055 | | | | 195,375 | |
H-Class | | | 1,165,066 | | | | 1,832,769 | * |
Shares issued from reinvestment of distributions | | | | | | | | |
Investor Class | | | — | | | | 213 | |
A-Class | | | — | | | | 13 | |
C-Class | | | — | | | | 21 | |
H-Class | | | — | | | | 266 | * |
Shares redeemed | | | | | | | | |
Investor Class | | | (1,377,901 | ) | | | (1,156,806 | ) |
A-Class | | | (53,152 | ) | | | (196,930 | ) |
C-Class | | | (22,574 | ) | | | (202,714 | ) |
H-Class | | | (1,274,300 | ) | | | (1,763,553 | )* |
Net increase (decrease) in shares | | | 132,236 | | | | (52,107 | ) |
* | Effective September 30, 2015, the Fund’s Advisor Class shares were converted into H-Class shares — See Note 8. |
42 | THE RYDEX FUNDS SEMI-ANNUAL REPORT | SEE NOTES TO FINANCIAL STATEMENTS. |
This table is presented to show selected data for a share outstanding throughout each period and to assist shareholders in evaluating a Fund’s performance for the periods presented.
Investor Class | | Period Ended
September 30,
2016a | | | Year Ended
March 31,
2016 | | | Year Ended
March 31,
2015 | | | Year Ended
March 31,
2014 | | | Year Ended
March 28,
2013 | | | Year Ended
March 31,
2012 | |
Per Share Data | | | | | | | | | | | | | | | | | | |
Net asset value, beginning of period | | $ | 81.23 | | | $ | 83.54 | | | $ | 69.82 | | | $ | 52.11 | | | $ | 55.09 | | | $ | 60.57 | |
Income (loss) from investment operations: | |
Net investment income (loss)b | | | .20 | | | | .02 | | | | .29 | | | | (.04 | ) | | | .22 | | | | (.12 | ) |
Net gain (loss) on investments (realized and unrealized) | | | 14.15 | | | | (2.20 | ) | | | 13.43 | | | | 17.79 | | | | (3.20 | ) | | | (5.36 | ) |
Total from investment operations | | | 14.35 | | | | (2.18 | ) | | | 13.72 | | | | 17.75 | | | | (2.98 | ) | | | (5.48 | ) |
Less distributions from: | |
Net investment income | | | — | | | | (.13 | ) | | | — | | | | (.04 | ) | | | — | | | | — | |
Total distributions | | | — | | | | (.13 | ) | | | — | | | | (.04 | ) | | | — | | | | — | |
Net asset value, end of period | | $ | 95.58 | | | $ | 81.23 | | | $ | 83.54 | | | $ | 69.82 | | | $ | 52.11 | | | $ | 55.09 | |
| | |
Total Returnc | | | 17.69 | % | | | (2.61 | %) | | | 19.65 | % | | | 34.07 | % | | | (5.41 | %) | | | (9.05 | %) |
Ratios/Supplemental Data | |
Net assets, end of period (in thousands) | | $ | 31,116 | | | $ | 8,217 | | | $ | 18,144 | | | $ | 9,655 | | | $ | 2,942 | | | $ | 5,453 | |
Ratios to average net assets: | |
Net investment income (loss) | | | 0.46 | % | | | 0.02 | % | | | 0.38 | % | | | (0.07 | %) | | | 0.45 | % | | | (0.22 | %) |
Total expenses | | | 1.37 | % | | | 1.34 | % | | | 1.35 | % | | | 1.37 | % | | | 1.35 | % | | | 1.35 | % |
Portfolio turnover rate | | | 666 | % | | | 769 | % | | | 562 | % | | | 1,436 | % | | | 1,640 | % | | | 1,329 | % |
A-Class | | Period Ended
September 30,
2016a | | | Year Ended
March 31,
2016 | | | Year Ended
March 31,
2015 | | | Year Ended
March 31,
2014 | | | Year Ended
March 28,
2013 | | | Year Ended
March 31,
2012 | |
Per Share Data | | | | | | | | | | | | | | | | | | |
Net asset value, beginning of period | | $ | 76.25 | | | $ | 78.62 | | | $ | 65.87 | | | $ | 49.29 | | | $ | 52.23 | | | $ | 57.59 | |
Income (loss) from investment operations: | |
Net investment income (loss)b | | | .06 | | | | (.20 | ) | | | (.17 | ) | | | (.33 | ) | | | .24 | | | | (.19 | ) |
Net gain (loss) on investments (realized and unrealized) | | | 13.33 | | | | (2.04 | ) | | | 12.92 | | | | 16.95 | | | | (3.18 | ) | | | (5.17 | ) |
Total from investment operations | | | 13.39 | | | | (2.24 | ) | | | 12.75 | | | | 16.62 | | | | (2.94 | ) | | | (5.36 | ) |
Less distributions from: | |
Net investment income | | | — | | | | (.13 | ) | | | — | | | | (.04 | ) | | | — | | | | — | |
Total distributions | | | — | | | | (.13 | ) | | | — | | | | (.04 | ) | | | — | | | | — | |
Net asset value, end of period | | $ | 89.64 | | | $ | 76.25 | | | $ | 78.62 | | | $ | 65.87 | | | $ | 49.29 | | | $ | 52.23 | |
| | |
Total Returnc | | | 17.59 | % | | | (2.84 | %) | | | 19.36 | % | | | 33.72 | % | | | (5.63 | %) | | | (9.31 | %) |
Ratios/Supplemental Data | |
Net assets, end of period (in thousands) | | $ | 3,478 | | | $ | 1,762 | | | $ | 1,680 | | | $ | 5,329 | | | $ | 299 | | | $ | 659 | |
Ratios to average net assets: | |
Net investment income (loss) | | | 0.14 | % | | | (0.26 | %) | | | (0.24 | %) | | | (0.59 | %) | | | 0.51 | % | | | (0.36 | %) |
Total expenses | | | 1.62 | % | | | 1.60 | % | | | 1.61 | % | | | 1.62 | % | | | 1.60 | % | | | 1.62 | % |
Portfolio turnover rate | | | 666 | % | | | 769 | % | | | 562 | % | | | 1,436 | % | | | 1,640 | % | | | 1,329 | % |
SEE NOTES TO FINANCIAL STATEMENTS. | THE RYDEX FUNDS SEMI-ANNUAL REPORT | 43 |
FINANCIAL HIGHLIGHTS (concluded) |
This table is presented to show selected data for a share outstanding throughout each period and to assist shareholders in evaluating a Fund’s performance for the periods presented.
C-Class | | Period Ended
September 30,
2016a | | | Year Ended
March 31,
2016 | | | Year Ended
March 31,
2015 | | | Year Ended
March 31,
2014 | | | Year Ended
March 28,
2013 | | | Year Ended
March 31,
2012 | |
Per Share Data | | | | | | | | | | | | | | | | | | |
Net asset value, beginning of period | | $ | 70.02 | | | $ | 72.76 | | | $ | 61.40 | | | $ | 46.32 | | | $ | 49.50 | | | $ | 55.03 | |
Income (loss) from investment operations: | |
Net investment income (loss)b | | | (.22 | ) | | | (.63 | ) | | | (.35 | ) | | | (.54 | ) | | | (.18 | ) | | | (.70 | ) |
Net gain (loss) on investments (realized and unrealized) | | | 12.20 | | | | (1.98 | ) | | | 11.71 | | | | 15.66 | | | | (3.00 | ) | | | (4.83 | ) |
Total from investment operations | | | 11.98 | | | | (2.61 | ) | | | 11.36 | | | | 15.12 | | | | (3.18 | ) | | | (5.53 | ) |
Less distributions from: | |
Net investment income | | | — | | | | (.13 | ) | | | — | | | | (.04 | ) | | | — | | | | — | |
Total distributions | | | — | | | | (.13 | ) | | | — | | | | (.04 | ) | | | — | | | | — | |
Net asset value, end of period | | $ | 82.00 | | | $ | 70.02 | | | $ | 72.76 | | | $ | 61.40 | | | $ | 46.32 | | | $ | 49.50 | |
| | |
Total Returnc | | | 17.12 | % | | | (3.58 | %) | | | 18.50 | % | | | 32.65 | % | | | (6.44 | %) | | | (10.01 | %) |
Ratios/Supplemental Data | |
Net assets, end of period (in thousands) | | $ | 964 | | | $ | 719 | | | $ | 1,280 | | | $ | 1,043 | | | $ | 667 | | | $ | 263 | |
Ratios to average net assets: | |
Net investment income (loss) | | | (0.60 | %) | | | (0.91 | %) | | | (0.55 | %) | | | (1.03 | %) | | | (0.41 | %) | | | (1.42 | %) |
Total expenses | | | 2.36 | % | | | 2.35 | % | | | 2.35 | % | | | 2.37 | % | | | 2.35 | % | | | 2.36 | % |
Portfolio turnover rate | | | 666 | % | | | 769 | % | | | 562 | % | | | 1,436 | % | | | 1,640 | % | | | 1,329 | % |
H-Class | | Period Ended
September 30,
2016a | | | Year Ended
March 31, 2016d | | | Year Ended
March 31,
2015d | | | Year Ended
March 31,
2014d | | | Year Ended
March 28,
2013d | | | Year Ended
March 31,
2012d | |
Per Share Data | | | | | | | | | | | | | | | | | | |
Net asset value, beginning of period | | $ | 74.32 | | | $ | 76.66 | | | $ | 64.40 | | | $ | 48.33 | | | $ | 51.40 | | | $ | 56.77 | |
Income (loss) from investment operations: | |
Net investment income (loss)b | | | .12 | | | | (.30 | ) | | | .06 | | | | (.17 | ) | | | (.12 | ) | | | (.34 | ) |
Net gain (loss) on investments (realized and unrealized) | | | 12.85 | | | | (1.91 | ) | | | 12.20 | | | | 16.28 | | | | (2.95 | ) | | | (5.03 | ) |
Total from investment operations | | | 12.97 | | | | (2.21 | ) | | | 12.26 | | | | 16.11 | | | | (3.07 | ) | | | (5.37 | ) |
Less distributions from: | |
Net investment income | | | — | | | | (.13 | ) | | | — | | | | (.04 | ) | | | — | | | | — | |
Total distributions | | | — | | | | (.13 | ) | | | — | | | | (.04 | ) | | | — | | | | — | |
Net asset value, end of period | | $ | 87.29 | | | $ | 74.32 | | | $ | 76.66 | | | $ | 64.40 | | | $ | 48.33 | | | $ | 51.40 | |
| | |
Total Returnc | | | 17.46 | % | | | (2.88 | %) | | | 19.04 | % | | | 33.34 | % | | | (5.97 | %) | | | (9.46 | %) |
Ratios/Supplemental Data | |
Net assets, end of period (in thousands) | | $ | 3,687 | | | $ | 11,257 | | | $ | 6,285 | | | $ | 3,577 | | | $ | 1,288 | | | $ | 1,271 | |
Ratios to average net assets: | |
Net investment income (loss) | | | 0.33 | % | | | (0.40 | %) | | | 0.09 | % | | | (0.29 | %) | | | (0.26 | %) | | | (0.67 | %) |
Total expenses | | | 1.61 | % | | | 1.74 | % | | | 1.85 | % | | | 1.87 | % | | | 1.85 | % | | | 1.86 | % |
Portfolio turnover rate | | | 666 | % | | | 769 | % | | | 562 | % | | | 1,436 | % | | | 1,640 | % | | | 1,329 | % |
a | Unaudited figures for the period ended September 30, 2016. Percentage amounts for the period, except total return and portfolio turnover rate, have been annualized. |
b | Net investment income (loss) per share was computed using average shares outstanding throughout the period. |
c | Total return does not reflect the impact of any applicable sales charges. |
d | Effective September 30, 2015, the Fund’s Advisor Class shares were converted into H-Class shares. The financial highlights for periods prior to that date reflect the performance of the former Advisor Class — See Note 8. |
44 | THE RYDEX FUNDS SEMI-ANNUAL REPORT | SEE NOTES TO FINANCIAL STATEMENTS. |
FUND PROFILE (Unaudited) | September 30, 2016 |
ENERGY FUND
OBJECTIVE: Seeks to provide capital appreciation by investing in companies involved in the energy field, including the exploration, production, and development of oil, gas, coal and alternative sources of energy (“Energy Companies”).
Holdings Diversification (Market Exposure as % of Net Assets)
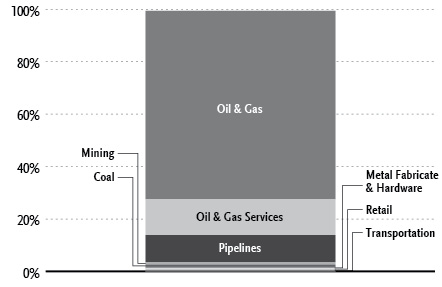
“Holdings Diversification (Market Exposure as % of Net Assets)” excludes any temporary cash investments.
Inception Dates: |
Investor Class | April 21, 1998 |
A-Class | September 1, 2004 |
C-Class | April 19, 2001 |
H-Class* | May 5, 1998 |
Ten Largest Holdings (% of Total Net Assets) |
Exxon Mobil Corp. | 6.0% |
Chevron Corp. | 4.4% |
Schlumberger Ltd. | 3.3% |
ConocoPhillips | 2.4% |
Occidental Petroleum Corp. | 2.3% |
EOG Resources, Inc. | 2.3% |
Kinder Morgan, Inc. | 2.3% |
Phillips 66 | 2.0% |
Halliburton Co. | 2.0% |
Anadarko Petroleum Corp. | 1.9% |
Top Ten Total | 28.9% |
| | |
“Ten Largest Holdings” excludes any temporary cash investments. |
* | Effective September 30, 2015, the Fund’s Advisor Class shares were converted into H-Class shares — See Note 8. |
| | THE RYDEX FUNDS SEMI-ANNUAL REPORT | 45 |
SCHEDULE OF INVESTMENTS (Unaudited) | September 30, 2016 |
ENERGY FUND | |
| | | Shares | | | Value | |
| | | | | | | |
COMMON STOCKS† - 99.4% | |
| | | | | | | |
Oil & Gas - 71.8% | |
Exxon Mobil Corp. | | | 34,742 | | | $ | 3,032,282 | |
Chevron Corp. | | | 21,705 | | | | 2,233,879 | |
ConocoPhillips | | | 27,701 | | | | 1,204,163 | |
Occidental Petroleum Corp. | | | 16,172 | | | | 1,179,262 | |
EOG Resources, Inc. | | | 12,169 | | | | 1,176,864 | |
Phillips 66 | | | 12,745 | | | | 1,026,609 | |
Anadarko Petroleum Corp. | | | 15,451 | | | | 978,975 | |
Pioneer Natural Resources Co. | | | 4,824 | | | | 895,576 | |
Apache Corp. | | | 12,480 | | | | 797,098 | |
Devon Energy Corp. | | | 17,715 | | | | 781,409 | |
Valero Energy Corp. | | | 14,320 | | | | 758,960 | |
Continental Resources, Inc.* | | | 14,279 | | | | 741,937 | |
Concho Resources, Inc.* | | | 5,223 | | | | 717,379 | |
Marathon Petroleum Corp. | | | 17,158 | | | | 696,443 | |
Hess Corp. | | | 12,949 | | | | 694,325 | |
Range Resources Corp. | | | 17,277 | | | | 669,484 | |
Noble Energy, Inc. | | | 17,837 | | | | 637,494 | |
Marathon Oil Corp. | | | 38,385 | | | | 606,866 | |
Cimarex Energy Co. | | | 4,270 | | | | 573,760 | |
Equities Corp. | | | 7,697 | | | | 558,956 | |
Cabot Oil & Gas Corp. — Class A | | | 21,500 | | | | 554,700 | |
Royal Dutch Shell plc — Class A ADR | | | 11,000 | | | | 550,770 | |
Transocean Ltd.* | | | 51,636 | | | | 550,440 | |
BP plc ADR | | | 15,553 | | | | 546,843 | |
Petroleo Brasileiro S.A. ADR* | | | 54,658 | | | | 509,959 | |
Tesoro Corp. | | | 6,082 | | | | 483,884 | |
Newfield Exploration Co.* | | | 11,017 | | | | 478,799 | |
Helmerich & Payne, Inc. | | | 6,831 | | | | 459,726 | |
Antero Resources Corp.* | | | 16,782 | | | | 452,275 | |
Diamondback Energy, Inc.* | | | 4,602 | | | | 444,277 | |
Ensco plc — Class A | | | 52,146 | | | | 443,241 | |
Suncor Energy, Inc. | | | 15,441 | | | | 428,951 | |
Parsley Energy, Inc. — Class A* | | | 12,556 | | | | 420,752 | |
Southwestern Energy Co.* | | | 29,435 | | | | 407,380 | |
Noble Corporation plc | | | 63,903 | | | | 405,145 | |
Encana Corp. | | | 38,674 | | | | 404,917 | |
Canadian Natural Resources Ltd. | | | 12,296 | | | | 393,964 | |
Energen Corp. | | | 6,802 | | | | 392,611 | |
Murphy Oil Corp. | | | 12,775 | | | | 388,360 | |
QEP Resources, Inc. | | | 18,844 | | | | 368,023 | |
WPX Energy, Inc.* | | | 26,723 | | | | 352,476 | |
Nabors Industries Ltd. | | | 26,917 | | | | 327,311 | |
Chesapeake Energy Corp.* | | | 51,368 | | | | 322,077 | |
HollyFrontier Corp. | | | 13,122 | | | | 321,489 | |
Statoil ASA ADR | | | 19,060 | | | | 320,208 | |
Patterson-UTI Energy, Inc. | | | 13,881 | | | | 310,518 | |
Rice Energy, Inc.* | | | 11,891 | | | | 310,474 | |
RSP Permian, Inc.* | | | 7,979 | | | | 309,426 | |
SM Energy Co. | | | 7,969 | | | | 307,444 | |
PDC Energy, Inc.* | | | 4,547 | | | | 304,922 | |
Gulfport Energy Corp.* | | | 10,548 | | | | 297,981 | |
Laredo Petroleum, Inc.* | | | 23,046 | | | | 297,293 | |
Cenovus Energy, Inc. | | | 20,100 | | | | 288,837 | |
YPF S.A. ADR | | | 15,229 | | | | 277,472 | |
Whiting Petroleum Corp.* | | | 31,381 | | | | 274,270 | |
Carrizo Oil & Gas, Inc.* | | | 6,564 | | | | 266,630 | |
Western Refining, Inc. | | | 9,970 | | | | 263,806 | |
CNOOC Ltd. ADR | | | 2,080 | | | | 263,099 | |
Callon Petroleum Co.* | | | 16,560 | | | | 259,992 | |
Diamond Offshore Drilling, Inc. | | | 14,559 | | | | 256,384 | |
Oasis Petroleum, Inc.* | | | 22,350 | | | | 256,355 | |
Matador Resources Co.* | | | 10,454 | | | | 254,450 | |
Rowan Companies plc — Class A | | | 15,549 | | | | 235,723 | |
PBF Energy, Inc. — Class A | | | 10,318 | | | | 233,600 | |
Synergy Resources Corp.* | | | 28,133 | | | | 194,962 | |
Delek US Holdings, Inc. | | | 9,161 | | | | 158,394 | |
Atwood Oceanics, Inc. | | | 15,216 | | | | 132,227 | |
Total Oil & Gas | | | | | | | 36,444,558 | |
| | | | | | | | | |
Oil & Gas Services - 13.7% | |
Schlumberger Ltd. | | | 21,134 | | | | 1,661,977 | |
Halliburton Co. | | | 22,583 | | | | 1,013,524 | |
Baker Hughes, Inc. | | | 14,666 | | | | 740,193 | |
National Oilwell Varco, Inc. | | | 16,793 | | | | 616,975 | |
Targa Resources Corp. | | | 9,350 | | | | 459,179 | |
FMC Technologies, Inc.* | | | 14,172 | | | | 420,483 | |
Weatherford International plc* | | | 69,987 | | | | 393,327 | |
Core Laboratories N.V. | | | 3,129 | | | | 351,481 | |
RPC, Inc.* | | | 19,260 | | | | 323,568 | |
Superior Energy Services, Inc. | | | 15,632 | | | | 279,813 | |
Oceaneering International, Inc. | | | 9,750 | | | | 268,223 | |
Dril-Quip, Inc.* | | | 4,210 | | | | 234,665 | |
Oil States International, Inc.* | | | 6,609 | | | | 208,646 | |
Total Oil & Gas Services | | | | | | | 6,972,054 | |
| | | | | | | | | |
Pipelines - 10.3% | |
Kinder Morgan, Inc. | | | 50,810 | | | | 1,175,235 | |
Spectra Energy Corp. | | | 20,238 | | | | 865,175 | |
Williams Companies, Inc. | | | 25,004 | | | | 768,373 | |
ONEOK, Inc. | | | 10,577 | | | | 543,552 | |
Cheniere Energy, Inc.* | | | 11,582 | | | | 504,975 | |
Plains GP Holdings, LP — Class A | | | 37,225 | | | | 481,692 | |
TransCanada Corp. | | | 6,878 | | | | 327,118 | |
Enbridge, Inc. | | | 7,357 | | | | 325,400 | |
SemGroup Corp. — Class A | | | 6,330 | | | | 223,829 | |
Total Pipelines | | | | | | | 5,215,349 | |
| | | | | | | | | |
Mining - 1.1% | |
U.S. Silica Holdings, Inc. | | | 6,111 | | | | 284,528 | |
Cameco Corp. | | | 30,062 | | | | 257,331 | |
Total Mining | | | | | | | 541,859 | |
| | | | | | | | | |
Coal - 0.7% | |
CONSOL Energy, Inc. | | | 18,598 | | | | 357,082 | |
| | | | | | | | | |
Metal Fabricate & Hardware - 0.6% | |
Tenaris S.A. ADR | | | 11,635 | | | | 330,434 | |
| | | | | | | | | |
46 | THE RYDEX FUNDS SEMI-ANNUAL REPORT | SEE NOTES TO FINANCIAL STATEMENTS. |
SCHEDULE OF INVESTMENTS (Unaudited)(concluded) | September 30, 2016 |
ENERGY FUND | |
| | | Shares | | | Value | |
| | | | | | | |
Retail - 0.6% | |
World Fuel Services Corp. | | | 6,223 | | | $ | 287,876 | |
| | | | | | | | | |
Transportation - 0.6% | |
Golar LNG Ltd. | | | 13,419 | | | | 284,483 | |
| | | | | | | | | |
Total Common Stocks | | | | | | | | |
(Cost $31,062,967) | | | | | | | 50,433,695 | |
| | | Face
Amount | | | | |
| | | | | | | |
REPURCHASE AGREEMENT††,1 - 0.2% | |
Royal Bank of Canada
issued 09/30/16 at 0.36%
due 10/03/16 | | $ | 94,940 | | | $ | 94,940 | |
Total Repurchase Agreement | | | | | | | | |
(Cost $94,940) | | | | | | | 94,940 | |
| | | | | | | | | |
Total Investments - 99.6% | | | | | | | | |
(Cost $31,157,907) | | | | | | $ | 50,528,635 | |
Other Assets & Liabilities, net - 0.4% | | | | | | | 192,003 | |
Total Net Assets - 100.0% | | | | | | $ | 50,720,638 | |
* | Non-income producing security. |
† | Value determined based on Level 1 inputs — See Note 4. |
†† | Value determined based on Level 2 inputs — See Note 4. |
1 | Repurchase Agreement — See Note 5. |
| | ADR — American Depositary Receipt |
| | plc — Public Limited Company |
| | |
| | See Sector Classification in Other Information section. |
The following table summarizes the inputs used to value the Fund’s investments at September 30, 2016 (See Note 4 in the Notes to Financial Statements):
Investments in Securities (Assets) | | Level 1 | | | Level 2 | | | Level 3 | | | Total | |
Common Stocks | | $ | 50,433,695 | | | $ | — | | | $ | — | | | $ | 50,433,695 | |
Repurchase Agreement | | | — | | | | 94,940 | | | | — | | | | 94,940 | |
Total | | $ | 50,433,695 | | | $ | 94,940 | | | $ | — | | | $ | 50,528,635 | |
Transfers between investment levels may occur as the markets fluctuate and/or the availability of data used in an investment’s valuation changes. Transfers between valuation levels, if any, are in comparison to the valuation levels at the end of the previous fiscal year, and are effective using the fair value as of the end of the previous fiscal period.
For the period ended September 30, 2016, there were no transfers between levels.
SEE NOTES TO FINANCIAL STATEMENTS. | THE RYDEX FUNDS SEMI-ANNUAL REPORT | 47 |
STATEMENT OF ASSETS AND LIABILITIES (Unaudited) |
September 30, 2016 |
Assets: | |
Investments, at value (cost $31,062,967) | | $ | 50,433,695 | |
Repurchase agreements, at value (cost $94,940) | | | 94,940 | |
Total investments (cost $31,157,907) | | | 50,528,635 | |
Receivables: | |
Fund shares sold | | | 1,542,289 | |
Dividends | | | 40,253 | |
Total assets | | | 52,111,177 | |
| | | | | |
Liabilities: | |
Overdraft due to custodian bank | | | 5,702 | |
Payable for: | |
Securities purchased | | | 1,271,343 | |
Fund shares redeemed | | | 41,908 | |
Management fees | | | 40,243 | |
Transfer agent and administrative fees | | | 11,836 | |
Distribution and service fees | | | 5,950 | |
Portfolio accounting fees | | | 4,735 | |
Miscellaneous | | | 8,822 | |
Total liabilities | | | 1,390,539 | |
Commitments and contingent liabilities (Note 9) | | | — | |
Net assets | | $ | 50,720,638 | |
| | | | | |
Net assets consist of: | |
Paid in capital | | $ | 55,843,446 | |
Undistributed net investment income | | | 642,901 | |
Accumulated net realized loss on investments | | | (25,136,437 | ) |
Net unrealized appreciation on investments | | | 19,370,728 | |
Net assets | | $ | 50,720,638 | |
| | | | | |
Investor Class: | |
Net assets | | $ | 34,378,732 | |
Capital shares outstanding* | | | 432,470 | |
Net asset value per share* | | $ | 79.49 | |
| | | | | |
A-Class: | |
Net assets | | $ | 5,964,264 | |
Capital shares outstanding* | | | 79,842 | |
Net asset value per share* | | $ | 74.70 | |
Maximum offering price per share (Net asset value divided by 95.25%)* | | $ | 78.43 | |
| | | | | |
C-Class: | |
Net assets | | $ | 5,031,422 | |
Capital shares outstanding* | | | 74,924 | |
Net asset value per share* | | $ | 67.15 | |
| | | | | |
H-Class: | |
Net assets | | $ | 5,346,220 | |
Capital shares outstanding* | | | 73,714 | |
Net asset value per share* | | $ | 72.53 | |
STATEMENT OF OPERATIONS (Unaudited) | |
Period Ended September 30, 2016 | |
Investment Income: | |
Dividends (net of foreign withholding tax of $7,032) | | $ | 573,620 | |
Interest | | | 338 | |
Total investment income | | | 573,958 | |
| | | | | |
Expenses: | |
Management fees | | | 229,443 | |
Transfer agent and administrative fees | | | 67,483 | |
Distribution and service fees: | |
A-Class | | | 10,274 | |
C-Class | | | 24,368 | |
H-Class | | | 4,693 | |
Portfolio accounting fees | | | 26,993 | |
Custodian fees | | | 3,190 | |
Trustees’ fees** | | | 2,558 | |
Line of credit fees | | | 219 | |
Miscellaneous | | | 38,634 | |
Total expenses | | | 407,855 | |
Net investment income | | | 166,103 | |
| | | | | |
Net Realized and Unrealized Gain (Loss): | |
Net realized gain (loss) on: | |
Investments | | | 471,761 | |
Net realized gain | | | 471,761 | |
Net change in unrealized appreciation (depreciation) on: | |
Investments | | | 7,109,735 | |
Net change in unrealized appreciation (depreciation) | | | 7,109,735 | |
Net realized and unrealized gain | | | 7,581,496 | |
Net increase in net assets resulting from operations | | $ | 7,747,599 | |
* | The shares outstanding, net asset value per share and the maximum offering price per share have been restated to reflect a 1:4 reverse share split effective November 7, 2016. See Note 10. |
** | Relates to Trustees not deemed “interested persons” within the meaning of Section 2(a)(19) of the 1940 Act. |
48 | THE RYDEX FUNDS SEMI-ANNUAL REPORT | SEE NOTES TO FINANCIAL STATEMENTS. |
STATEMENTS OF CHANGES IN NET ASSETS |
| | | Period Ended
September 30,
2016
(Unaudited) | | | Year Ended
March 31,
2016 | |
Increase (Decrease) in Net Assets from Operations: | | | | | | |
Net investment income | | $ | 166,103 | | | $ | 476,798 | |
Net realized gain (loss) on investments | | | 471,761 | | | | (15,081,328 | ) |
Net change in unrealized appreciation (depreciation) on investments | | | 7,109,735 | | | | (4,158,406 | ) |
Net increase (decrease) in net assets resulting from operations | | | 7,747,599 | | | | (18,762,936 | ) |
| | | | | | | | | |
Distributions to shareholders from: | | | | | | | | |
Net investment income | | | | | | | | |
Investor Class | | | — | | | | (242,198 | ) |
A-Class | | | — | | | | (32,840 | ) |
C-Class | | | — | | | | (41,958 | ) |
H-Class | | | — | | | | (17,380 | )** |
Net realized gains | | | | | | | | |
Investor Class | | | — | | | | (267,745 | ) |
A-Class | | | — | | | | (36,304 | ) |
C-Class | | | — | | | | (46,384 | ) |
H-Class | | | — | | | | (19,214 | )** |
Total distributions to shareholders | | | — | | | | (704,023 | ) |
| | | | | | | | | |
Capital share transactions: | | | | | | | | |
Proceeds from sale of shares | | | | | | | | |
Investor Class | | | 270,879,717 | | | | 150,597,823 | |
A-Class | | | 10,624,385 | | | | 36,665,768 | |
C-Class | | | 1,856,647 | | | | 10,483,191 | |
H-Class | | | 53,719,094 | | | | 121,269,635 | ** |
Distributions reinvested | | | | | | | | |
Investor Class | | | — | | | | 504,502 | |
A-Class | | | — | | | | 63,735 | |
C-Class | | | — | | | | 86,557 | |
H-Class | | | — | | | | 36,578 | ** |
Cost of shares redeemed | | | | | | | | |
Investor Class | | | (263,702,968 | ) | | | (144,378,187 | ) |
A-Class | | | (11,860,717 | ) | | | (32,806,713 | ) |
C-Class | | | (1,822,194 | ) | | | (11,203,791 | ) |
H-Class | | | (52,204,573 | ) | | | (122,368,423 | )** |
Net increase from capital share transactions | | | 7,489,391 | | | | 8,950,675 | |
Net increase (decrease) in net assets | | | 15,236,990 | | | | (10,516,284 | ) |
| | | | | | | | | |
Net assets: | | | | | | | | |
Beginning of period | | | 35,483,648 | | | | 45,999,932 | |
End of period | | $ | 50,720,638 | | | $ | 35,483,648 | |
Undistributed net investment income at end of period | | $ | 642,901 | | | $ | 476,798 | |
SEE NOTES TO FINANCIAL STATEMENTS. | THE RYDEX FUNDS SEMI-ANNUAL REPORT | 49 |
STATEMENTS OF CHANGES IN NET ASSETS (concluded) |
| | | Period Ended
September 30,
2016
(Unaudited) | | | Year Ended
March 31,
2016 | |
Capital share activity:* | | | | | | |
Shares sold | | | | | | |
Investor Class | | $ | 3,621,815 | | | $ | 1,809,980 | |
A-Class | | | 152,345 | | | | 486,100 | |
C-Class | | | 29,943 | | | | 151,465 | |
H-Class | | | 828,150 | | | | 1,772,212 | ** |
Shares issued from reinvestment of distributions | | | | | | | | |
Investor Class | | | — | | | | 6,687 | |
A-Class | | | — | | | | 898 | |
C-Class | | | — | | | | 1,348 | |
H-Class | | | — | | | | 530 | ** |
Shares redeemed | | | | | | | | |
Investor Class | | | (3,522,888 | ) | | | (1,785,596 | ) |
A-Class | | | (172,615 | ) | | | (440,104 | ) |
C-Class | | | (29,264 | ) | | | (163,063 | ) |
H-Class | | | (800,336 | ) | | | (1,802,431 | )** |
Net increase in shares | | | 107,150 | | | | 38,026 | |
* | Capital share activity for the periods presented through September 30, 2016, has been restated to reflect a 1:4 reverse share split effective November 7, 2016. See Note 10. |
** | Effective September 30, 2015, the Fund’s Advisor Class shares were converted into H-Class shares — See Note 8. |
50 | THE RYDEX FUNDS SEMI-ANNUAL REPORT | SEE NOTES TO FINANCIAL STATEMENTS. |
This table is presented to show selected data for a share outstanding throughout each period and to assist shareholders in evaluating a Fund’s performance for the periods presented.
Investor Class | | Period Ended
September 30,
2016a,e | | | Year Ended
March 31, 2016e | | | Year Ended
March 31,
2015e | | | Year Ended
March 31,
2014e | | | Year Ended
March 28,
2013e | | | Year Ended
March 31,
2012e | |
Per Share Data | | | | | | | | | | | | | | | | | | |
Net asset value, beginning of period | | $ | 66.61 | | | $ | 92.98 | | | $ | 118.79 | | | $ | 104.48 | | | $ | 98.30 | | | $ | 114.81 | |
Income (loss) from investment operations: | |
Net investment income (loss)b | | | .28 | | | | 1.12 | | | | .84 | | | | .60 | | | | .48 | | | | .28 | |
Net gain (loss) on investments (realized and unrealized) | | | 12.60 | | | | (26.37 | ) | | | (26.21 | ) | | | 13.71 | | | | 7.58 | | | | (16.79 | ) |
Total from investment operations | | | 12.88 | | | | (25.25 | ) | | | (25.37 | ) | | | 14.31 | | | | 8.06 | | | | (16.51 | ) |
Less distributions from: | |
Net investment income | | | — | | | | (.52 | ) | | | (.44 | ) | | | — | | | | (.28 | ) | | | — | |
Net realized gains | | | — | | | | (.60 | ) | | | — | | | | — | | | | — | | | | — | |
Return of capital | | | — | | | | — | | | | — | | | | — | | | | (1.60 | ) | | | — | |
Total distributions | | | — | | | | (1.12 | ) | | | (.44 | ) | | | — | | | | (1.88 | ) | | | — | |
Net asset value, end of period | | $ | 79.49 | | | $ | 66.61 | | | $ | 92.98 | | | $ | 118.79 | | | $ | 104.48 | | | $ | 98.30 | |
| | |
Total Returnc | | | 19.34 | % | | | (27.30 | %) | | | (21.42 | %) | | | 13.71 | % | | | 8.50 | % | | | (14.39 | %) |
Ratios/Supplemental Data | |
Net assets, end of period (in thousands) | | $ | 34,379 | | | $ | 22,216 | | | $ | 28,123 | | | $ | 35,546 | | | $ | 49,160 | | | $ | 40,947 | |
Ratios to average net assets: | |
Net investment income (loss) | | | 0.78 | % | | | 1.38 | % | | | 0.72 | % | | | 0.55 | % | | | 0.52 | % | | | 0.27 | % |
Total expenses | | | 1.36 | % | | | 1.35 | % | | | 1.35 | % | | | 1.37 | % | | | 1.35 | % | | | 1.36 | % |
Portfolio turnover rate | | | 550 | % | | | 595 | % | | | 463 | % | | | 231 | % | | | 248 | % | | | 288 | % |
A-Class | | Period Ended
September 30,
2016a,e | | | Year Ended
March 31, 2016e | | | Year Ended
March 31,
2015e | | | Year Ended
March 31,
2014e | | | Year Ended
March 28,
2013e | | | Year Ended
March 31,
2012e | |
Per Share Data | | | | | | | | | | | | | | | | | | |
Net asset value, beginning of period | | $ | 62.67 | | | $ | 87.76 | | | $ | 112.30 | | | $ | 99.06 | | | $ | 93.54 | | | $ | 109.60 | |
Income (loss) from investment operations: | |
Net investment income (loss)b | | | .20 | | | | .76 | | | | .48 | | | | .32 | | | | .32 | | | | (.04 | ) |
Net gain (loss) on investments (realized and unrealized) | | | 11.83 | | | | (24.73 | ) | | | (24.58 | ) | | | 12.92 | | | | 7.08 | | | | (16.02 | ) |
Total from investment operations | | | 12.03 | | | | (23.97 | ) | | | (24.10 | ) | | | 13.24 | | | | 7.40 | | | | (16.06 | ) |
Less distributions from: | |
Net investment income | | | — | | | | (.52 | ) | | | (.44 | ) | | | — | | | | (.28 | ) | | | — | |
Net realized gains | | | — | | | | (.60 | ) | | | — | | | | — | | | | — | | | | — | |
Return of capital | | | — | | | | — | | | | — | | | | — | | | | (1.60 | ) | | | — | |
Total distributions | | | — | | | | (1.12 | ) | | | (.44 | ) | | | — | | | | (1.88 | ) | | | — | |
Net asset value, end of period | | $ | 74.70 | | | $ | 62.67 | | | $ | 87.76 | | | $ | 112.30 | | | $ | 99.06 | | | $ | 93.54 | |
| | |
Total Returnc | | | 19.14 | % | | | (27.46 | %) | | | (21.49 | %) | | | 13.37 | % | | | 8.20 | % | | | (14.67 | %) |
Ratios/Supplemental Data | |
Net assets, end of period (in thousands) | | $ | 5,964 | | | $ | 6,274 | | | $ | 4,671 | | | $ | 6,624 | | | $ | 5,586 | | | $ | 5,622 | |
Ratios to average net assets: | |
Net investment income (loss) | | | 0.55 | % | | | 1.02 | % | | | 0.43 | % | | | 0.30 | % | | | 0.38 | % | | | (0.05 | %) |
Total expenses | | | 1.61 | % | | | 1.60 | % | | | 1.60 | % | | | 1.62 | % | | | 1.60 | % | | | 1.61 | % |
Portfolio turnover rate | | | 550 | % | | | 595 | % | | | 463 | % | | | 231 | % | | | 248 | % | | | 288 | % |
SEE NOTES TO FINANCIAL STATEMENTS. | THE RYDEX FUNDS SEMI-ANNUAL REPORT | 51 |
FINANCIAL HIGHLIGHTS (continued) |
This table is presented to show selected data for a share outstanding throughout each period and to assist shareholders in evaluating a Fund’s performance for the periods presented.
C-Class | | Period Ended
September 30,
2016a,e | | | Year Ended
March 31, 2016e | | | Year Ended
March 31,
2015e | | | Year Ended
March 31,
2014e | | | Year Ended
March 28,
2013e | | | Year Ended
March 31,
2012e | |
Per Share Data | | | | | | | | | | | | | | | | | | |
Net asset value, beginning of period | | $ | 56.55 | | | $ | 79.93 | | | $ | 103.21 | | | $ | 91.72 | | | $ | 87.40 | | | $ | 103.12 | |
Income (loss) from investment operations: | |
Net investment income (loss)b | | | (.08 | ) | | | .08 | | | | (.20 | ) | | | (.48 | ) | | | (.36 | ) | | | (.76 | ) |
Net gain (loss) on investments (realized and unrealized) | | | 10.68 | | | | (22.34 | ) | | | (22.64 | ) | | | 11.97 | | | | 6.56 | | | | (14.96 | ) |
Total from investment operations | | | 10.60 | | | | (22.26 | ) | | | (22.84 | ) | | | 11.49 | | | | 6.20 | | | | (15.72 | ) |
Less distributions from: | |
Net investment income | | | — | | | | (.52 | ) | | | (.44 | ) | | | — | | | | (.28 | ) | | | — | |
Net realized gains | | | — | | | | (.60 | ) | | | — | | | | — | | | | — | | | | — | |
Return of capital | | | — | | | | — | | | | — | | | | — | | | | (1.60 | ) | | | — | |
Total distributions | | | — | | | | (1.12 | ) | | | (.44 | ) | | | — | | | | (1.88 | ) | | | — | |
Net asset value, end of period | | $ | 67.15 | | | $ | 56.55 | | | $ | 79.93 | | | $ | 103.21 | | | $ | 91.72 | | | $ | 87.40 | |
| | |
Total Returnc | | | 18.74 | % | | | (28.01 | %) | | | (22.18 | %) | | | 12.52 | % | | | 7.40 | % | | | (15.24 | %) |
Ratios/Supplemental Data | |
Net assets, end of period (in thousands) | | $ | 5,031 | | | $ | 4,198 | | | $ | 6,754 | | | $ | 8,357 | | | $ | 9,693 | | | $ | 13,153 | |
Ratios to average net assets: | |
Net investment income (loss) | | | (0.20 | %) | | | 0.15 | % | | | (0.20 | %) | | | (0.52 | %) | | | (0.45 | %) | | | (0.84 | %) |
Total expenses | | | 2.36 | % | | | 2.35 | % | | | 2.35 | % | | | 2.37 | % | | | 2.35 | % | | | 2.36 | % |
Portfolio turnover rate | | | 550 | % | | | 595 | % | | | 463 | % | | | 231 | % | | | 248 | % | | | 288 | % |
52 | THE RYDEX FUNDS SEMI-ANNUAL REPORT | SEE NOTES TO FINANCIAL STATEMENTS. |
FINANCIAL HIGHLIGHTS (concluded) |
This table is presented to show selected data for a share outstanding throughout each period and to assist shareholders in evaluating a Fund’s performance for the periods presented.
H-Class | | Period Ended
September 30,
2016a,e | | | Year Ended
March 31, 2016d,e | | | Year Ended
March 31,
2015d,e | | | Year Ended
March 31,
2014d,e | | | Year Ended
March 28,
2013d,e | | | Year Ended
March 31,
2012d,e | |
Per Share Data | | | | | | | | | | | | | | | | | | |
Net asset value, beginning of period | | $ | 60.90 | | | $ | 85.36 | | | $ | 109.61 | | | $ | 96.92 | | | $ | 91.78 | | | $ | 107.74 | |
Income (loss) from investment operations: | |
Net investment income (loss)b | | | .04 | | | | .40 | | | | .28 | | | | (.08 | ) | | | .04 | | | | (.32 | ) |
Net gain (loss) on investments (realized and unrealized) | | | 11.59 | | | | (23.74 | ) | | | (24.09 | ) | | | 12.77 | | | | 6.98 | | | | (15.64 | ) |
Total from investment operations | | | 11.63 | | | | (23.34 | ) | | | (23.81 | ) | | | 12.69 | | | | 7.02 | | | | (15.96 | ) |
Less distributions from: | |
Net investment income | | | — | | | | (.52 | ) | | | (.44 | ) | | | — | | | | (.28 | ) | | | — | |
Net realized gains | | | — | | | | (.60 | ) | | | — | | | | — | | | | — | | | | — | |
Return of capital | | | — | | | | — | | | | — | | | | — | | | | (1.60 | ) | | | — | |
Total distributions | | | — | | | | (1.12 | ) | | | (.44 | ) | | | — | | | | (1.88 | ) | | | — | |
Net asset value, end of period | | $ | 72.53 | | | $ | 60.90 | | | $ | 85.36 | | | $ | 109.61 | | | $ | 96.92 | | | $ | 91.78 | |
| | |
Total Returnc | | | 19.12 | % | | | (27.53 | %) | | | (21.76 | %) | | | 13.08 | % | | | 7.92 | % | | | (14.78 | %) |
Ratios/Supplemental Data | |
Net assets, end of period (in thousands) | | $ | 5,346 | | | $ | 2,795 | | | $ | 6,452 | | | $ | 4,764 | | | $ | 5,272 | | | $ | 11,080 | |
Ratios to average net assets: | |
Net investment income (loss) | | | 0.17 | % | | | 0.55 | % | | | 0.27 | % | | | (0.09 | %) | | | 0.06 | % | | | (0.33 | %) |
Total expenses | | | 1.61 | % | | | 1.70 | % | | | 1.85 | % | | | 1.87 | % | | | 1.85 | % | | | 1.86 | % |
Portfolio turnover rate | | | 550 | % | | | 595 | % | | | 463 | % | | | 231 | % | | | 248 | % | | | 288 | % |
a | Unaudited figures for the period ended September 30, 2016. Percentage amounts for the period, except total return and portfolio turnover rate, have been annualized. |
b | Net investment income (loss) per share was computed using average shares outstanding throughout the period. |
c | Total return does not reflect the impact of any applicable sales charges. |
d | Effective September 30, 2015, the Fund’s Advisor Class shares were converted into H-Class shares. The financial highlights for periods prior to that date reflect the performance of the former Advisor Class — See Note 8. |
e | Reverse share split — Per share amounts for the periods presented through September 30, 2016 have been restated to reflect a 1:4 reverse share split effective November 7, 2016. See Note 10. |
SEE NOTES TO FINANCIAL STATEMENTS. | THE RYDEX FUNDS SEMI-ANNUAL REPORT | 53 |
FUND PROFILE (Unaudited) | September 30, 2016 |
ENERGY SERVICES FUND
OBJECTIVE: Seeks to provide capital appreciation by investing in companies that are involved in the energy services field, including those that provide services and equipment in the areas of oil, coal, and gas exploration and production (“Energy Services Companies”).
Holdings Diversification (Market Exposure as % of Net Assets)
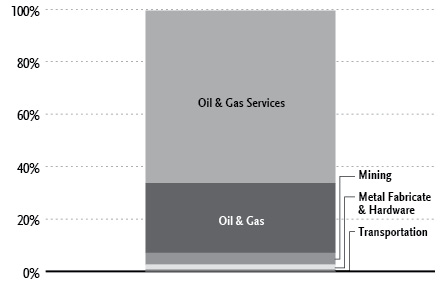
“Holdings Diversification (Market Exposure as % of Net Assets)” excludes any temporary cash investments.
Inception Dates: |
Investor Class | April 1, 1998 |
A-Class | September 1, 2004 |
C-Class | March 30, 2001 |
H-Class* | April 2, 1998 |
Ten Largest Holdings (% of Total Net Assets) |
Schlumberger Ltd. | 14.9% |
Halliburton Co. | 9.0% |
Baker Hughes, Inc. | 6.6% |
National Oilwell Varco, Inc. | 5.5% |
Transocean Ltd. | 4.2% |
Helmerich & Payne, Inc. | 4.1% |
FMC Technologies, Inc. | 3.8% |
Nabors Industries Ltd. | 2.9% |
Ensco plc — Class A | 2.9% |
Patterson-UTI Energy, Inc. | 2.8% |
Top Ten Total | 56.7% |
| | |
“Ten Largest Holdings” excludes any temporary cash investments. |
* | Effective September 30, 2015, the Fund’s Advisor Class shares were converted into H-Class shares — See Note 8. |
54 | THE RYDEX FUNDS SEMI-ANNUAL REPORT | |
SCHEDULE OF INVESTMENTS (Unaudited) | September 30, 2016 |
ENERGY SERVICES FUND | |
| | | Shares | | | Value | |
| | | | | | | |
COMMON STOCKS† - 99.5% | |
| | | | | | | |
Oil & Gas Services - 65.8% | |
Schlumberger Ltd. | | | 29,349 | | | $ | 2,308,004 | |
Halliburton Co. | | | 31,103 | | | | 1,395,903 | |
Baker Hughes, Inc. | | | 20,316 | | | | 1,025,349 | |
National Oilwell Varco, Inc. | | | 23,320 | | | | 856,777 | |
FMC Technologies, Inc.* | | | 19,580 | | | | 580,939 | |
Weatherford International plc* | | | 76,009 | | | | 427,171 | |
RPC, Inc.* | | | 23,944 | | | | 402,259 | |
Superior Energy Services, Inc. | | | 21,604 | | | | 386,712 | |
Core Laboratories N.V. | | | 3,149 | | | | 353,727 | |
Oceaneering International, Inc. | | | 12,063 | | | | 331,853 | |
Dril-Quip, Inc.* | | | 5,830 | | | | 324,964 | |
Forum Energy Technologies, Inc.* | | | 15,971 | | | | 317,184 | |
Oil States International, Inc.* | | | 9,133 | | | | 288,329 | |
McDermott International, Inc.* | | | 48,239 | | | | 241,677 | |
SEACOR Holdings, Inc.* | | | 3,831 | | | | 227,906 | |
Helix Energy Solutions Group, Inc.* | | | 27,850 | | | | 226,421 | |
Frank’s International N.V. | | | 15,351 | | | | 199,563 | |
Bristow Group, Inc. | | | 11,960 | | | | 167,679 | |
CARBO Ceramics, Inc. | | | 9,622 | | | | 105,265 | |
Total Oil & Gas Services | | | | | | | 10,167,682 | |
| | | | | | | | | |
Oil & Gas - 26.6% | |
Transocean Ltd.* | | | 60,764 | | | | 647,744 | |
Helmerich & Payne, Inc. | | | 9,445 | | | | 635,649 | |
Nabors Industries Ltd. | | | 37,152 | | | | 451,768 | |
Ensco plc — Class A | | | 52,691 | | | | 447,874 | |
Patterson-UTI Energy, Inc. | | | 19,190 | | | | 429,280 | |
Noble Corporation plc | | | 62,496 | | | | 396,225 | |
Diamond Offshore Drilling, Inc. | | | 20,145 | | | | 354,753 | |
Rowan Companies plc — Class A | | | 21,577 | | | | 327,107 | |
Unit Corp.* | | | 12,289 | | | | 228,575 | |
Atwood Oceanics, Inc. | | | 21,090 | | | | 183,272 | |
Total Oil & Gas | | | | | | | 4,102,247 | |
| | | | | | | | | |
Mining - 4.5% | |
U.S. Silica Holdings, Inc. | | | 8,424 | | | | 392,222 | |
Fairmount Santrol Holdings, Inc.* | | | 35,690 | | | | 302,651 | |
Total Mining | | | | | | | 694,873 | |
| | | | | | | | | |
Metal Fabricate & Hardware - 1.9% | |
Tenaris S.A. ADR | | | 10,386 | | | | 294,962 | |
| | | | | | | | | |
Transportation - 0.7% | |
Hornbeck Offshore Services, Inc.* | | | 18,567 | | | | 102,119 | |
| | | | | | | | | |
Total Common Stocks | | | | | | | | |
(Cost $8,768,210) | | | | | | | 15,361,883 | |
| | | | | | | | | |
| | | Face
Amount | | | | | |
| | | | | | | | | |
REPURCHASE AGREEMENT††,1 - 0.0% | |
Royal Bank of Canada
issued 09/30/16 at 0.36%
due 10/03/16 | | $ | 354 | | | | 354 | |
Total Repurchase Agreement | | | | | | | | |
(Cost $354) | | | | | | | 354 | |
| | | | | | | | | |
Total Investments - 99.5% | | | | | | | | |
(Cost $8,768,564) | | | | | | $ | 15,362,237 | |
Other Assets & Liabilities, net - 0.5% | | | | | | | 80,722 | |
Total Net Assets - 100.0% | | | | | | $ | 15,442,959 | |
* | Non-income producing security. |
† | Value determined based on Level 1 inputs — See Note 4. |
†† | Value determined based on Level 2 inputs — See Note 4. |
1 | Repurchase Agreement — See Note 5. |
| | ADR — American Depositary Receipt |
| | plc — Public Limited Company |
| | |
| | See Sector Classification in Other Information section. |
The following table summarizes the inputs used to value the Fund’s investments at September 30, 2016 (See Note 4 in the Notes to Financial Statements):
Investments in Securities (Assets) | | Level 1 | | | Level 2 | | | Level 3 | | | Total | |
Common Stocks | | $ | 15,361,883 | | | $ | — | | | $ | — | | | $ | 15,361,883 | |
Repurchase Agreement | | | — | | | | 354 | | | | — | | | | 354 | |
Total | | $ | 15,361,883 | | | $ | 354 | | | $ | — | | | $ | 15,362,237 | |
Transfers between investment levels may occur as the markets fluctuate and/or the availability of data used in an investment’s valuation changes. Transfers between valuation levels, if any, are in comparison to the valuation levels at the end of the previous fiscal year, and are effective using the fair value as of the end of the previous fiscal period.
For the period ended September 30, 2016, there were no transfers between levels.
SEE NOTES TO FINANCIAL STATEMENTS. | THE RYDEX FUNDS SEMI-ANNUAL REPORT | 55 |
STATEMENT OF ASSETS AND LIABILITIES (Unaudited) |
September 30, 2016 |
Assets: | |
Investments, at value (cost $8,768,210) | | $ | 15,361,883 | |
Repurchase agreements, at value (cost $354) | | | 354 | |
Total investments (cost $8,768,564) | | �� | 15,362,237 | |
Receivables: | |
Securities sold | | | 168,379 | |
Fund shares sold | | | 104,892 | |
Dividends | | | 46,785 | |
Total assets | | | 15,682,293 | |
| | | | | |
Liabilities: | |
Overdraft due to custodian bank | | | 98,000 | |
Payable for: | |
Fund shares redeemed | | | 115,756 | |
Management fees | | | 14,252 | |
Transfer agent and administrative fees | | | 4,192 | |
Distribution and service fees | | | 2,527 | |
Portfolio accounting fees | | | 1,677 | |
Miscellaneous | | | 2,930 | |
Total liabilities | | | 239,334 | |
Commitments and contingent liabilities (Note 9) | | | — | |
Net assets | | $ | 15,442,959 | |
| | | | | |
Net assets consist of: | |
Paid in capital | | $ | 49,815,753 | |
Undistributed net investment income | | | 113,247 | |
Accumulated net realized loss on investments | | | (41,079,714 | ) |
Net unrealized appreciation on investments | | | 6,593,673 | |
Net assets | | $ | 15,442,959 | |
| | | | | |
Investor Class: | |
Net assets | | $ | 10,193,199 | |
Capital shares outstanding | | | 332,396 | |
Net asset value per share | | $ | 30.67 | |
| | | | | |
A-Class: | |
Net assets | | $ | 1,254,140 | |
Capital shares outstanding | | | 43,342 | |
Net asset value per share | | $ | 28.94 | |
Maximum offering price per share (Net asset value divided by 95.25%) | | $ | 30.38 | |
| | | | | |
C-Class: | |
Net assets | | $ | 2,554,064 | |
Capital shares outstanding | | | 97,302 | |
Net asset value per share | | $ | 26.25 | |
| | | | | |
H-Class: | |
Net assets | | $ | 1,441,556 | |
Capital shares outstanding | | | 51,343 | |
Net asset value per share | | $ | 28.08 | |
STATEMENT OF OPERATIONS (Unaudited) | |
Period Ended September 30, 2016 | |
Investment Income: | |
Dividends (net of foreign withholding tax of $1,581) | | $ | 176,628 | |
Interest | | | 155 | |
Total investment income | | | 176,783 | |
| | | | | |
Expenses: | |
Management fees | | | 102,707 | |
Transfer agent and administrative fees | | | 30,208 | |
Distribution and service fees: | |
A-Class | | | 2,445 | |
C-Class | | | 13,174 | |
H-Class | | | 8,199 | |
Portfolio accounting fees | | | 12,083 | |
Custodian fees | | | 1,427 | |
Trustees’ fees* | | | 1,204 | |
Line of credit fees | | | 185 | |
Miscellaneous | | | 17,179 | |
Total expenses | | | 188,811 | |
Net investment loss | | | (12,028 | ) |
| | | | | |
Net Realized and Unrealized Gain (Loss): | |
Net realized gain (loss) on: | |
Investments | | | (2,357,998 | ) |
Net realized loss | | | (2,357,998 | ) |
Net change in unrealized appreciation (depreciation) on: | |
Investments | | | (818,536 | ) |
Net change in unrealized appreciation (depreciation) | | | (818,536 | ) |
Net realized and unrealized loss | | | (3,176,534 | ) |
Net decrease in net assets resulting from operations | | $ | (3,188,562 | ) |
* | Relates to Trustees not deemed “interested persons” within the meaning of Section 2(a)(19) of the 1940 Act. |
56 | THE RYDEX FUNDS SEMI-ANNUAL REPORT | SEE NOTES TO FINANCIAL STATEMENTS. |
STATEMENTS OF CHANGES IN NET ASSETS |
| | | Period Ended
September 30,
2016
(Unaudited) | | | Year Ended
March 31,
2016 | |
Increase (Decrease) in Net Assets from Operations: | | | | | | |
Net investment income (loss) | | $ | (12,028 | ) | | $ | 125,275 | |
Net realized loss on investments | | | (2,357,998 | ) | | | (4,376,432 | ) |
Net change in unrealized appreciation (depreciation) on investments | | | (818,536 | ) | | | (3,821,798 | ) |
Net decrease in net assets resulting from operations | | | (3,188,562 | ) | | | (8,072,955 | ) |
| | | | | | | | | |
Distributions to shareholders from: | | | | | | | | |
Net investment income | | | | | | | | |
Investor Class | | | — | | | | (130,036 | ) |
A-Class | | | — | | | | (22,719 | ) |
C-Class | | | — | | | | (36,447 | ) |
H-Class | | | — | | | | (42,281 | )* |
Total distributions to shareholders | | | — | | | | (231,483 | ) |
| | | | | | | | | |
Capital share transactions: | | | | | | | | |
Proceeds from sale of shares | | | | | | | | |
Investor Class | | | 164,230,305 | | | | 88,241,476 | |
A-Class | | | 4,887,513 | | | | 22,986,249 | |
C-Class | | | 930,928 | | | | 7,557,655 | |
H-Class | | | 109,387,586 | | | | 206,028,733 | * |
Distributions reinvested | | | | | | | | |
Investor Class | | | — | | | | 126,359 | |
A-Class | | | — | | | | 22,184 | |
C-Class | | | — | | | | 36,117 | |
H-Class | | | — | | | | 42,273 | * |
Cost of shares redeemed | | | | | | | | |
Investor Class | | | (163,085,960 | ) | | | (90,245,009 | ) |
A-Class | | | (6,404,393 | ) | | | (22,683,979 | ) |
C-Class | | | (1,081,395 | ) | | | (7,871,938 | ) |
H-Class | | | (106,846,688 | ) | | | (204,714,157 | )* |
Net increase (decrease) from capital share transactions | | | 2,017,896 | | | | (474,037 | ) |
Net decrease in net assets | | | (1,170,666 | ) | | | (8,778,475 | ) |
| | | | | | | | | |
Net assets: | | | | | | | | |
Beginning of period | | | 16,613,625 | | | | 25,392,100 | |
End of period | | $ | 15,442,959 | | | $ | 16,613,625 | |
Undistributed net investment income at end of period | | $ | 113,247 | | | $ | 125,275 | |
| | | | | | | | | |
Capital share activity: | | | | | | | | |
Shares sold | | | | | | | | |
Investor Class | | | 5,643,641 | | | | 2,540,657 | |
A-Class | | | 168,308 | | | | 622,276 | |
C-Class | | | 35,752 | | | | 251,887 | |
H-Class | | | 3,958,222 | | | | 6,776,423 | * |
Shares issued from reinvestment of distributions | | | | | | | | |
Investor Class | | | — | | | | 3,947 | |
A-Class | | | — | | | | 733 | |
C-Class | | | — | | | | 1,305 | |
H-Class | | | — | | | | 1,438 | * |
Shares redeemed | | | | | | | | |
Investor Class | | | (5,646,361 | ) | | | (2,619,654 | ) |
A-Class | | | (231,054 | ) | | | (611,902 | ) |
C-Class | | | (42,460 | ) | | | (262,624 | ) |
H-Class | | | (3,972,100 | ) | | | (6,762,627 | )* |
Net decrease in shares | | | (86,052 | ) | | | (58,141 | ) |
* | Effective September 30, 2015, the Fund’s Advisor Class shares were converted into H-Class shares — See Note 8. |
SEE NOTES TO FINANCIAL STATEMENTS. | THE RYDEX FUNDS SEMI-ANNUAL REPORT | 57 |
This table is presented to show selected data for a share outstanding throughout each period and to assist shareholders in evaluating a Fund’s performance for the periods presented.
Investor Class | | Period Ended
September 30,
2016a | | | Year Ended
March 31,
2016 | | | Year Ended
March 31,
2015 | | | Year Ended
March 31,
2014 | | | Year Ended
March 28,
2013 | | | Year Ended
March 31,
2012 | |
Per Share Data | | | | | | | | | | | | | | | | | | |
Net asset value, beginning of period | | $ | 28.41 | | | $ | 39.36 | | | $ | 62.43 | | | $ | 54.43 | | | $ | 50.87 | | | $ | 62.66 | |
Income (loss) from investment operations: | |
Net investment income (loss)b | | | .07 | | | | .29 | | | | .48 | | | | .02 | | | | (.05 | ) | | | (.14 | ) |
Net gain (loss) on investments (realized and unrealized) | | | 2.19 | | | | (10.90 | ) | | | (23.55 | ) | | | 7.98 | | | | 3.61 | | | | (11.65 | ) |
Total from investment operations | | | 2.26 | | | | (10.61 | ) | | | (23.07 | ) | | | 8.00 | | | | 3.56 | | | | (11.79 | ) |
Less distributions from: | |
Net investment income | | | — | | | | (.34 | ) | | | — | | | | — | | | | — | | | | — | |
Total distributions | | | — | | | | (.34 | ) | | | — | | | | — | | | | — | | | | — | |
Net asset value, end of period | | $ | 30.67 | | | $ | 28.41 | | | $ | 39.36 | | | $ | 62.43 | | | $ | 54.43 | | | $ | 50.87 | |
| | |
Total Returnc | | | 7.92 | % | | | (27.05 | %) | | | (36.95 | %) | | | 14.70 | % | | | 7.00 | % | | | (18.82 | %) |
Ratios/Supplemental Data | |
Net assets, end of period (in thousands) | | $ | 10,193 | | | $ | 9,521 | | | $ | 16,144 | | | $ | 33,244 | | | $ | 26,097 | | | $ | 34,353 | |
Ratios to average net assets: | |
Net investment income (loss) | | | 0.46 | % | | | 0.83 | % | | | 0.86 | % | | | 0.03 | % | | | (0.10 | %) | | | (0.25 | %) |
Total expenses | | | 1.36 | % | | | 1.35 | % | | | 1.36 | % | | | 1.37 | % | | | 1.35 | % | | | 1.36 | % |
Portfolio turnover rate | | | 1,143 | % | | | 1,241 | % | | | 494 | % | | | 350 | % | | | 275 | % | | | 162 | % |
A-Class | | Period Ended
September 30,
2016a | | | Year Ended
March 31,
2016 | | | Year Ended
March 31,
2015 | | | Year Ended
March 31,
2014 | | | Year Ended
March 28,
2013 | | | Year Ended
March 31,
2012 | |
Per Share Data | | | | | | | | | | | | | | | | | | |
Net asset value, beginning of period | | $ | 26.86 | | | $ | 37.32 | | | $ | 59.34 | | | $ | 51.86 | | | $ | 48.59 | | | $ | 60.01 | |
Income (loss) from investment operations: | |
Net investment income (loss)b | | | (.05 | ) | | | .24 | | | | .25 | | | | (.13 | ) | | | (.17 | ) | | | (.25 | ) |
Net gain (loss) on investments (realized and unrealized) | | | 2.13 | | | | (10.36 | ) | | | (22.27 | ) | | | 7.61 | | | | 3.44 | | | | (11.17 | ) |
Total from investment operations | | | 2.08 | | | | (10.12 | ) | | | (22.02 | ) | | | 7.48 | | | | 3.27 | | | | (11.42 | ) |
Less distributions from: | |
Net investment income | | | — | | | | (.34 | ) | | | — | | | | — | | | | — | | | | — | |
Total distributions | | | — | | | | (.34 | ) | | | — | | | | — | | | | — | | | | — | |
Net asset value, end of period | | $ | 28.94 | | | $ | 26.86 | | | $ | 37.32 | | | $ | 59.34 | | | $ | 51.86 | | | $ | 48.59 | |
| | |
Total Returnc | | | 7.71 | % | | | (27.22 | %) | | | (37.11 | %) | | | 14.42 | % | | | 6.73 | % | | | (19.03 | %) |
Ratios/Supplemental Data | |
Net assets, end of period (in thousands) | | $ | 1,254 | | | $ | 2,849 | | | $ | 3,545 | | | $ | 7,557 | | | $ | 5,535 | | | $ | 7,115 | |
Ratios to average net assets: | |
Net investment income (loss) | | | (0.36 | %) | | | 0.73 | % | | | 0.47 | % | | | (0.23 | %) | | | (0.37 | %) | | | (0.47 | %) |
Total expenses | | | 1.61 | % | | | 1.59 | % | | | 1.60 | % | | | 1.62 | % | | | 1.60 | % | | | 1.61 | % |
Portfolio turnover rate | | | 1,143 | % | | | 1,241 | % | | | 494 | % | | | 350 | % | | | 275 | % | | | 162 | % |
58 | THE RYDEX FUNDS SEMI-ANNUAL REPORT | SEE NOTES TO FINANCIAL STATEMENTS. |
FINANCIAL HIGHLIGHTS (concluded) |
This table is presented to show selected data for a share outstanding throughout each period and to assist shareholders in evaluating a Fund’s performance for the periods presented.
C-Class | | Period Ended
September 30,
2016a | | | Year Ended
March 31,
2016 | | | Year Ended
March 31,
2015 | | | Year Ended
March 31,
2014 | | | Year Ended
March 28,
2013 | | | Year Ended
March 31,
2012 | |
Per Share Data | | | | | | | | | | | | | | | | | | |
Net asset value, beginning of period | | $ | 24.46 | | | $ | 34.28 | | | $ | 54.92 | | | $ | 48.37 | | | $ | 45.66 | | | $ | 56.81 | |
Income (loss) from investment operations: | |
Net investment income (loss)b | | | (.14 | ) | | | (.05 | ) | | | (.12 | ) | | | (.50 | ) | | | (.49 | ) | | | (.54 | ) |
Net gain (loss) on investments (realized and unrealized) | | | 1.93 | | | | (9.43 | ) | | | (20.52 | ) | | | 7.05 | | | | 3.20 | | | | (10.61 | ) |
Total from investment operations | | | 1.79 | | | | (9.48 | ) | | | (20.64 | ) | | | 6.55 | | | | 2.71 | | | | (11.15 | ) |
Less distributions from: | |
Net investment income | | | — | | | | (.34 | ) | | | — | | | | — | | | | — | | | | — | |
Total distributions | | | — | | | | (.34 | ) | | | — | | | | — | | | | — | | | | — | |
Net asset value, end of period | | $ | 26.25 | | | $ | 24.46 | | | $ | 34.28 | | | $ | 54.92 | | | $ | 48.37 | | | $ | 45.66 | |
| | |
Total Returnc | | | 7.32 | % | | | (27.76 | %) | | | (37.58 | %) | | | 13.54 | % | | | 5.94 | % | | | (19.63 | %) |
Ratios/Supplemental Data | |
Net assets, end of period (in thousands) | | $ | 2,554 | | | $ | 2,544 | | | $ | 3,889 | | | $ | 8,616 | | | $ | 8,654 | | | $ | 10,144 | |
Ratios to average net assets: | |
Net investment income (loss) | | | (1.06 | %) | | | (0.16 | %) | | | (0.24 | %) | | | (0.97 | %) | | | (1.11 | %) | | | (1.13 | %) |
Total expenses | | | 2.36 | % | | | 2.35 | % | | | 2.36 | % | | | 2.37 | % | | | 2.35 | % | | | 2.36 | % |
Portfolio turnover rate | | | 1,143 | % | | | 1,241 | % | | | 494 | % | | | 350 | % | | | 275 | % | | | 162 | % |
H-Class | | Period Ended
September 30,
2016a | | | Year Ended
March 31,
2016d | | | Year Ended
March 31, 2015d | | | Year Ended
March 31, 2014d | | | Year Ended
March 28, 2013d | | | Year Ended
March 31,
2012d | |
Per Share Data | | | | | | | | | | | | | | | | | | |
Net asset value, beginning of period | | $ | 26.07 | | | $ | 36.29 | | | $ | 57.89 | | | $ | 50.72 | | | $ | 47.64 | | | $ | 58.97 | |
Income (loss) from investment operations: | |
Net investment income (loss)b | | | (.10 | ) | | | .05 | | | | .07 | | | | (.27 | ) | | | (.25 | ) | | | (.34 | ) |
Net gain (loss) on investments (realized and unrealized) | | | 2.11 | | | | (9.93 | ) | | | (21.67 | ) | | | 7.44 | | | | 3.33 | | | | (10.99 | ) |
Total from investment operations | | | 2.01 | | | | (9.88 | ) | | | (21.60 | ) | | | 7.17 | | | | 3.08 | | | | (11.33 | ) |
Less distributions from: | |
Net investment income | | | — | | | | (.34 | ) | | | — | | | | — | | | | — | | | | — | |
Total distributions | | | — | | | | (.34 | ) | | | — | | | | — | | | | — | | | | — | |
Net asset value, end of period | | $ | 28.08 | | | $ | 26.07 | | | $ | 36.29 | | | $ | 57.89 | | | $ | 50.72 | | | $ | 47.64 | |
| | |
Total Returnc | | | 7.67 | % | | | (27.31 | %) | | | (37.33 | %) | | | 14.14 | % | | | 6.47 | % | | | (19.21 | %) |
Ratios/Supplemental Data | |
Net assets, end of period (in thousands) | | $ | 1,442 | | | $ | 1,700 | | | $ | 1,814 | | | $ | 4,933 | | | $ | 9,685 | | | $ | 8,025 | |
Ratios to average net assets: | |
Net investment income (loss) | | | (0.75 | %) | | | 0.15 | % | | | 0.13 | % | | | (0.50 | %) | | | (0.54 | %) | | | (0.66 | %) |
Total expenses | | | 1.61 | % | | | 1.67 | % | | | 1.86 | % | | | 1.87 | % | | | 1.85 | % | | | 1.86 | % |
Portfolio turnover rate | | | 1,143 | % | | | 1,241 | % | | | 494 | % | | | 350 | % | | | 275 | % | | | 162 | % |
a | Unaudited figures for the period ended September 30, 2016. Percentage amounts for the period, except total return and portfolio turnover rate, have been annualized. |
b | Net investment income (loss) per share was computed using average shares outstanding throughout the period. |
c | Total return does not reflect the impact of any applicable sales charges. |
d | Effective September 30, 2015, the Fund’s Advisor Class shares were converted into H-Class shares. The financial highlights for periods prior to that date reflect the performance of the former Advisor Class — See Note 8. |
SEE NOTES TO FINANCIAL STATEMENTS. | THE RYDEX FUNDS SEMI-ANNUAL REPORT | 59 |
FUND PROFILE (Unaudited) | September 30, 2016 |
FINANCIAL SERVICES FUND
OBJECTIVE: Seeks to provide capital appreciation by investing in companies that are involved in the financial services sector (“Financial Services Companies”).
Holdings Diversification (Market Exposure as % of Net Assets)
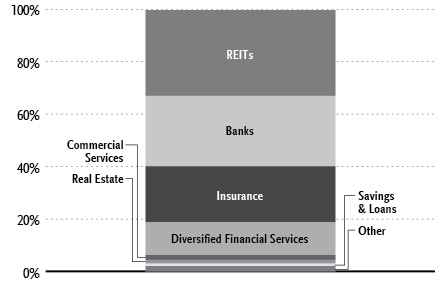
“Holdings Diversification (Market Exposure as % of Net Assets)” excludes any temporary cash investments.
Inception Dates: |
Investor Class | April 2, 1998 |
A-Class | September 1, 2004 |
C-Class | April 19, 2001 |
H-Class* | April 6, 1998 |
Ten Largest Holdings (% of Total Net Assets) |
Berkshire Hathaway, Inc. — Class B | 2.4% |
JPMorgan Chase & Co. | 2.0% |
Wells Fargo & Co. | 1.9% |
Bank of America Corp. | 1.6% |
Citigroup, Inc. | 1.5% |
U.S. Bancorp | 1.1% |
Goldman Sachs Group, Inc. | 1.0% |
American International Group, Inc. | 1.0% |
Simon Property Group, Inc. | 1.0% |
BlackRock, Inc. — Class A | 1.0% |
Top Ten Total | 14.5% |
| | |
“Ten Largest Holdings” excludes any temporary cash investments. |
* | Effective September 30, 2015, the Fund’s Advisor Class shares were converted into H-Class shares — See Note 8. |
60 | THE RYDEX FUNDS SEMI-ANNUAL REPORT | |
SCHEDULE OF INVESTMENTS (Unaudited) | September 30, 2016 |
FINANCIAL SERVICES FUND | |
| | | Shares | | | Value | |
| | | | | | | |
COMMON STOCKS† - 98.6% | |
| | | | | | | |
REITs - 32.7% | |
Simon Property Group, Inc. | | | 2,419 | | | $ | 500,757 | |
American Tower Corp. — Class A | | | 3,913 | | | | 443,461 | |
Public Storage | | | 1,776 | | | | 396,297 | |
Equinix, Inc. | | | 955 | | | | 344,039 | |
Crown Castle International Corp. | | | 3,637 | | | | 342,642 | |
Welltower, Inc. | | | 4,431 | | | | 331,305 | |
Prologis, Inc. | | | 6,171 | | | | 330,395 | |
Ventas, Inc. | | | 4,510 | | | | 318,541 | |
Weyerhaeuser Co. | | | 9,893 | | | | 315,982 | |
General Growth Properties, Inc. | | | 11,117 | | | | 306,829 | |
Equity Residential | | | 4,720 | | | | 303,637 | |
Boston Properties, Inc. | | | 2,112 | | | | 287,845 | |
AvalonBay Communities, Inc. | | | 1,589 | | | | 282,588 | |
Vornado Realty Trust | | | 2,735 | | | | 276,809 | |
HCP, Inc. | | | 7,069 | | | | 268,269 | |
Realty Income Corp. | | | 3,791 | | | | 253,731 | |
Essex Property Trust, Inc. | | | 1,114 | | | | 248,088 | |
Digital Realty Trust, Inc. | | | 2,480 | | | | 240,858 | |
Kimco Realty Corp. | | | 7,610 | | | | 220,310 | |
Federal Realty Investment Trust | | | 1,412 | | | | 217,349 | |
SL Green Realty Corp. | | | 2,003 | | | | 216,525 | |
Host Hotels & Resorts, Inc. | | | 13,561 | | | | 211,145 | |
Annaly Capital Management, Inc. | | | 19,601 | | | | 205,810 | |
Extra Space Storage, Inc. | | | 2,589 | | | | 205,592 | |
VEREIT, Inc. | | | 19,675 | | | | 204,030 | |
Iron Mountain, Inc. | | | 5,436 | | | | 204,013 | |
Macerich Co. | | | 2,488 | | | | 201,205 | |
UDR, Inc. | | | 5,491 | | | | 197,621 | |
Duke Realty Corp. | | | 7,225 | | | | 197,459 | |
Alexandria Real Estate Equities, Inc. | | | 1,690 | | | | 183,821 | |
Regency Centers Corp. | | | 2,307 | | | | 178,769 | |
Brixmor Property Group, Inc. | | | 6,397 | | | | 177,773 | |
National Retail Properties, Inc. | | | 3,482 | | | | 177,060 | |
Apartment Investment & Management Co. — Class A | | | 3,808 | | | | 174,825 | |
Camden Property Trust | | | 2,076 | | | | 173,844 | |
Omega Healthcare Investors, Inc. | | | 4,789 | | | | 169,770 | |
Mid-America Apartment Communities, Inc. | | | 1,787 | | | | 167,960 | |
American Campus Communities, Inc. | | | 3,296 | | | | 167,668 | |
Lamar Advertising Co. — Class A | | | 2,566 | | | | 167,585 | |
Equity LifeStyle Properties, Inc. | | | 2,169 | | | | 167,403 | |
WP Carey, Inc. | | | 2,529 | | | | 163,196 | |
Spirit Realty Capital, Inc. | | | 12,063 | | | | 160,800 | |
AGNC Investment Corp. | | | 8,227 | | | | 160,756 | |
Kilroy Realty Corp. | | | 2,289 | | | | 158,742 | |
DDR Corp. | | | 9,036 | | | | 157,497 | |
Forest City Realty Trust, Inc. — Class A | | | 6,755 | | | | 156,243 | |
Liberty Property Trust | | | 3,861 | | | | 155,791 | |
Sun Communities, Inc. | | | 1,925 | | | | 151,074 | |
Senior Housing Properties Trust | | | 6,591 | | | | 149,682 | |
Douglas Emmett, Inc. | | | 4,067 | | | | 148,974 | |
Highwoods Properties, Inc. | | | 2,842 | | | | 148,125 | |
Starwood Property Trust, Inc. | | | 6,492 | | | | 146,200 | |
American Homes 4 Rent — Class A | | | 6,650 | | | | 143,906 | |
Hospitality Properties Trust | | | 4,826 | | | | 143,429 | |
CubeSmart | | | 5,157 | | | | 140,580 | |
Weingarten Realty Investors | | | 3,600 | | | | 140,328 | |
STORE Capital Corp. | | | 4,684 | | | | 138,037 | |
Taubman Centers, Inc. | | | 1,833 | | | | 136,394 | |
Healthcare Trust of America, Inc. — Class A | | | 4,170 | | | | 136,025 | |
Equity One, Inc. | | | 4,424 | | | | 135,419 | |
Life Storage, Inc. | | | 1,519 | | | | 135,100 | |
DCT Industrial Trust, Inc. | | | 2,738 | | | | 132,930 | |
Healthcare Realty Trust, Inc. | | | 3,727 | | | | 126,942 | |
CyrusOne, Inc. | | | 2,661 | | | | 126,584 | |
Hudson Pacific Properties, Inc. | | | 3,830 | | | | 125,892 | |
CoreSite Realty Corp. | | | 1,700 | | | | 125,868 | |
Post Properties, Inc. | | | 1,875 | | | | 123,994 | |
Tanger Factory Outlet Centers, Inc. | | | 3,149 | | | | 122,685 | |
Medical Properties Trust, Inc. | | | 8,276 | | | | 122,237 | |
First Industrial Realty Trust, Inc. | | | 4,154 | | | | 117,226 | |
Equity Commonwealth* | | | 3,864 | | | | 116,770 | |
New Residential Investment Corp. | | | 8,322 | | | | 114,927 | |
Education Realty Trust, Inc. | | | 2,601 | | | | 112,207 | |
Physicians Realty Trust | | | 5,144 | | | | 110,802 | |
DuPont Fabros Technology, Inc. | | | 2,631 | | | | 108,529 | |
Corporate Office Properties Trust | | | 3,807 | | | | 107,928 | |
Two Harbors Investment Corp. | | | 12,462 | | | | 106,301 | |
Sunstone Hotel Investors, Inc. | | | 8,279 | | | | 105,888 | |
Brandywine Realty Trust | | | 6,723 | | | | 105,013 | |
LaSalle Hotel Properties | | | 4,317 | | | | 103,047 | |
RLJ Lodging Trust | | | 4,865 | | | | 102,311 | |
Mack-Cali Realty Corp. | | | 3,658 | | | | 99,571 | |
NorthStar Realty Finance Corp. | | | 7,439 | | | | 97,972 | |
Washington Prime Group, Inc. | | | 7,843 | | | | 97,096 | |
CBL & Associates Properties, Inc. | | | 7,280 | | | | 88,379 | |
Pebblebrook Hotel Trust | | | 3,235 | | | | 86,051 | |
DiamondRock Hospitality Co. | | | 9,232 | | | | 84,011 | |
Corrections Corporation of America | | | 5,142 | | | | 71,320 | |
EPR Properties | | | 537 | | | | 42,283 | |
Total REITs | | | | | | | 16,070,672 | |
| | | | | | | | | |
Banks - 26.9% | |
JPMorgan Chase & Co. | | | 14,604 | | | | 972,481 | |
Wells Fargo & Co. | | | 20,679 | | | | 915,667 | |
Bank of America Corp. | | | 50,462 | | | | 789,730 | |
Citigroup, Inc. | | | 15,633 | | | | 738,347 | |
U.S. Bancorp | | | 12,491 | | | | 535,740 | |
Goldman Sachs Group, Inc. | | | 3,145 | | | | 507,194 | |
Morgan Stanley | | | 15,364 | | | | 492,570 | |
PNC Financial Services Group, Inc. | | | 4,616 | | | | 415,856 | |
Bank of New York Mellon Corp. | | | 10,178 | | | | 405,900 | |
Capital One Financial Corp. | | | 5,402 | | | | 388,026 | |
BB&T Corp. | | | 9,153 | | | | 345,250 | |
State Street Corp. | | | 4,748 | | | | 330,603 | |
SunTrust Banks, Inc. | | | 6,643 | | | | 290,963 | |
M&T Bank Corp. | | | 2,300 | | | | 267,030 | |
Banco Bradesco S.A. ADR | | | 29,292 | | | | 265,678 | |
Fifth Third Bancorp | | | 12,138 | | | | 248,343 | |
Northern Trust Corp. | | | 3,579 | | | | 243,336 | |
SEE NOTES TO FINANCIAL STATEMENTS. | THE RYDEX FUNDS SEMI-ANNUAL REPORT | 61 |
SCHEDULE OF INVESTMENTS (Unaudited)(continued) | September 30, 2016 |
FINANCIAL SERVICES FUND | |
| | | Shares | | | Value | |
| | | | | | | |
Toronto-Dominion Bank | | | 5,133 | | | $ | 227,906 | |
ICICI Bank Ltd. ADR | | | 30,489 | | | | 227,752 | |
Citizens Financial Group, Inc. | | | 9,157 | | | | 226,269 | |
KeyCorp | | | 18,542 | | | | 225,656 | |
Credicorp Ltd. | | | 1,479 | | | | 225,133 | |
Regions Financial Corp. | | | 22,655 | | | | 223,605 | |
HSBC Holdings plc ADR | | | 5,855 | | | | 220,207 | |
HDFC Bank Ltd. ADR | | | 3,059 | | | | 219,912 | |
Royal Bank of Canada | | | 3,528 | | | | 218,595 | |
Bank of Montreal | | | 3,270 | | | | 214,414 | |
Huntington Bancshares, Inc. | | | 20,934 | | | | 206,409 | |
First Republic Bank | | | 2,587 | | | | 199,484 | |
Bank of Nova Scotia | | | 3,671 | | | | 194,526 | |
Deutsche Bank AG* | | | 14,538 | | | | 190,302 | |
Comerica, Inc. | | | 3,826 | | | | 181,046 | |
Signature Bank* | | | 1,403 | | | | 166,185 | |
Zions Bancorporation | | | 5,162 | | | | 160,125 | |
SVB Financial Group* | | | 1,419 | | | | 156,856 | |
East West Bancorp, Inc. | | | 4,030 | | | | 147,941 | |
PacWest Bancorp | | | 3,302 | | | | 141,689 | |
Bank of the Ozarks, Inc. | | | 3,615 | | | | 138,816 | |
Cullen/Frost Bankers, Inc. | | | 1,869 | | | | 134,455 | |
Synovus Financial Corp. | | | 3,837 | | | | 124,818 | |
PrivateBancorp, Inc. — Class A | | | 2,718 | | | | 124,811 | |
Prosperity Bancshares, Inc. | | | 2,264 | | | | 124,271 | |
First Horizon National Corp. | | | 7,773 | | | | 118,383 | |
Webster Financial Corp. | | | 3,074 | | | | 116,843 | |
Umpqua Holdings Corp. | | | 7,560 | | | | 113,778 | |
Texas Capital Bancshares, Inc.* | | | 1,849 | | | | 101,547 | |
Total Banks | | | | | | | 13,224,448 | |
| | | | | | | | | |
Insurance - 21.3% | |
Berkshire Hathaway, Inc. — Class B* | | | 8,157 | | | | 1,178,441 | |
American International Group, Inc. | | | 8,506 | | | | 504,746 | |
MetLife, Inc. | | | 9,908 | | | | 440,212 | |
Prudential Financial, Inc. | | | 4,718 | | | | 385,225 | |
Marsh & McLennan Companies, Inc. | | | 5,550 | | | | 373,237 | |
Chubb Ltd. | | | 2,885 | | | | 362,500 | |
Travelers Companies, Inc. | | | 3,132 | | | | 358,770 | |
Aflac, Inc. | | | 4,783 | | | | 343,754 | |
Allstate Corp. | | | 4,443 | | | | 307,367 | |
Aon plc | | | 2,651 | | | | 298,211 | |
Progressive Corp. | | | 8,600 | | | | 270,900 | |
XL Group Ltd. | | | 7,754 | | | | 260,767 | |
Hartford Financial Services Group, Inc. | | | 6,018 | | | | 257,691 | |
Principal Financial Group, Inc. | | | 4,879 | | | | 251,317 | |
Arch Capital Group Ltd.* | | | 3,081 | | | | 244,200 | |
Willis Towers Watson plc | | | 1,793 | | | | 238,057 | |
Markel Corp.* | | | 255 | | | | 236,836 | |
Loews Corp. | | | 5,697 | | | | 234,432 | |
Everest Re Group Ltd. | | | 1,214 | | | | 230,624 | |
RenaissanceRe Holdings Ltd. | | | 1,835 | | | | 220,494 | |
Cincinnati Financial Corp. | | | 2,917 | | | | 220,000 | |
Axis Capital Holdings Ltd. | | | 3,930 | | | | 213,517 | |
Lincoln National Corp. | | | 4,454 | | | | 209,249 | |
Manulife Financial Corp. | | | 14,687 | | | | 207,234 | |
Assured Guaranty Ltd. | | | 7,319 | | | | 203,102 | |
Endurance Specialty Holdings Ltd. | | | 3,078 | | | | 201,455 | |
Arthur J Gallagher & Co. | | | 3,722 | | | | 189,338 | |
Unum Group | | | 5,170 | | | | 182,553 | |
Torchmark Corp. | | | 2,696 | | | | 172,247 | |
Reinsurance Group of America, Inc. — Class A | | | 1,582 | | | | 170,761 | |
WR Berkley Corp. | | | 2,892 | | | | 167,042 | |
Alleghany Corp.* | | | 315 | | | | 165,381 | |
American Financial Group, Inc. | | | 2,128 | | | | 159,600 | |
Assurant, Inc. | | | 1,712 | | | | 157,932 | |
Brown & Brown, Inc. | | | 3,834 | | | | 144,580 | |
Voya Financial, Inc. | | | 5,004 | | | | 144,215 | |
Old Republic International Corp. | | | 7,537 | | | | 132,802 | |
First American Financial Corp. | | | 3,209 | | | | 126,050 | |
Radian Group, Inc. | | | 7,914 | | | | 107,235 | |
MGIC Investment Corp.* | | | 12,983 | | | | 103,864 | |
Genworth Financial, Inc. — Class A* | | | 19,738 | | | | 97,900 | |
Total Insurance | | | | | | | 10,473,838 | |
| | | | | | | | | |
Diversified Financial Services - 12.6% | |
BlackRock, Inc. — Class A | | | 1,376 | | | | 498,744 | |
American Express Co. | | | 7,567 | | | | 484,591 | |
Charles Schwab Corp. | | | 12,963 | | | | 409,241 | |
CME Group, Inc. — Class A | | | 3,479 | | | | 363,625 | |
Intercontinental Exchange, Inc. | | | 1,346 | | | | 362,559 | |
Synchrony Financial | | | 11,021 | | | | 308,589 | |
Discover Financial Services | | | 5,251 | | | | 296,944 | |
Franklin Resources, Inc. | | | 7,982 | | | | 283,920 | |
TD Ameritrade Holding Corp. | | | 7,873 | | | | 277,445 | |
T. Rowe Price Group, Inc. | | | 3,823 | | | | 254,230 | |
Ameriprise Financial, Inc. | | | 2,325 | | | | 231,965 | |
Invesco Ltd. | | | 7,265 | | | | 227,177 | |
Nasdaq, Inc. | | | 3,065 | | | | 207,010 | |
Ally Financial, Inc. | | | 9,921 | | | | 193,162 | |
Raymond James Financial, Inc. | | | 3,113 | | | | 181,208 | |
E*TRADE Financial Corp.* | | | 6,199 | | | | 180,515 | |
Affiliated Managers Group, Inc.* | | | 1,229 | | | | 177,836 | |
CIT Group, Inc. | | | 4,805 | | | | 174,422 | |
SEI Investments Co. | | | 3,753 | | | | 171,174 | |
CBOE Holdings, Inc. | | | 2,250 | | | | 145,913 | |
Navient Corp. | | | 9,524 | | | | 137,812 | |
Eaton Vance Corp. | | | 3,505 | | | | 136,870 | |
Legg Mason, Inc. | | | 3,440 | | | | 115,171 | |
SLM Corp.* | | | 14,918 | | | | 111,437 | |
Janus Capital Group, Inc. | | | 7,216 | | | | 101,096 | |
LendingClub Corp.* | | | 15,652 | | | | 96,729 | |
WisdomTree Investments, Inc. | | | 7,050 | | | | 72,545 | |
Total Diversified Financial Services | | | | | | | 6,201,930 | |
| | | | | | | | | |
Commercial Services - 1.8% | |
S&P Global, Inc. | | | 2,877 | | | | 364,113 | |
Moody’s Corp. | | | 2,627 | | | | 284,452 | |
MarketAxess Holdings, Inc. | | | 973 | | | | 161,119 | |
LendingTree, Inc.* | | | 754 | | | | 73,070 | |
Total Commercial Services | | | | | | | 882,754 | |
| | | | | | | | | |
62 | THE RYDEX FUNDS SEMI-ANNUAL REPORT | SEE NOTES TO FINANCIAL STATEMENTS. |
SCHEDULE OF INVESTMENTS (Unaudited)(concluded) | September 30, 2016 |
FINANCIAL SERVICES FUND | |
| | | Shares | | | Value | |
| | | | | | | |
Real Estate - 1.4% | |
Brookfield Asset Management, Inc. — Class A | | | 6,063 | | | $ | 213,296 | |
CBRE Group, Inc. — Class A* | | | 6,852 | | | | 191,718 | |
Jones Lang LaSalle, Inc. | | | 1,273 | | | | 144,855 | |
Realogy Holdings Corp. | | | 4,774 | | | | 123,456 | |
Total Real Estate | | | | | | | 673,325 | |
| | | | | | | | | |
Savings & Loans - 1.0% | |
New York Community Bancorp, Inc. | | | 11,488 | | | | 163,475 | |
People’s United Financial, Inc. | | | 8,789 | | | | 139,042 | |
Investors Bancorp, Inc. | | | 10,149 | | | | 121,889 | |
BofI Holding, Inc.* | | | 3,165 | | | | 70,896 | |
Total Savings & Loans | | | | | | | 495,302 | |
| | | | | | | | | |
Software - 0.4% | |
MSCI, Inc. — Class A | | | 2,070 | | | | 173,756 | |
| | | | | | | | | |
Entertainment - 0.3% | |
Gaming and Leisure Properties, Inc. | | | 4,974 | | | | 166,380 | |
| | | | | | | | | |
Holding Companies-Diversified - 0.3% | |
Leucadia National Corp. | | | 8,603 | | | | 163,801 | |
| | | | | | | | | |
Media - 0.3% | |
FactSet Research Systems, Inc. | | | 957 | | | | 155,130 | |
| | | | | | | | | |
Investment Companies - 0.1% | |
American Capital Ltd.* | | | 3,000 | | | | 50,730 | |
| | | | | | | | | |
Total Common Stocks | | | | | | | | |
(Cost $43,046,198) | | | | | | | 48,732,066 | |
| | | | | | | | | |
PREFERRED STOCKS† - 0.6% | |
Financial – 0.6% | |
Itau Unibanco Holding S.A. ADR | | | 24,884 | | | | 272,232 | |
Total Preferred Stocks | | | | | | | | |
(Cost $227,832) | | | | | | | 272,232 | |
| | | | | | | | | |
| | | Face
Amount | | | | | |
| | | | | | | | | |
REPURCHASE AGREEMENT††,1 - 0.2% | |
Royal Bank of Canada
issued 09/30/16 at 0.36%
due 10/03/16 | | $ | 122,182 | | | | 122,182 | |
Total Repurchase Agreement | | | | | | | | |
(Cost $122,182) | | | | | | | 122,182 | |
| | | | | | | | | |
Total Investments - 99.9% | | | | | | | | |
(Cost $43,396,212) | | | | | | $ | 49,126,480 | |
Other Assets & Liabilities, net - 0.1% | | | | | | | 27,686 | |
Total Net Assets - 100.0% | | | | | | $ | 49,154,166 | |
* | Non-income producing security. |
† | Value determined based on Level 1 inputs — See Note 4. |
†† | Value determined based on Level 2 inputs — See Note 4. |
1 | Repurchase Agreement — See Note 5. |
| | ADR — American Depositary Receipt |
| | plc — Public Limited Company |
| | REIT — Real Estate Investment Trust |
| | |
| | See Sector Classification in Other Information section. |
The following table summarizes the inputs used to value the Fund’s investments at September 30, 2016 (See Note 4 in the Notes to Financial Statements):
Investments in Securities (Assets) | | Level 1 | | | Level 2 | | | Level 3 | | | Total | |
Common Stocks | | $ | 48,732,066 | | | $ | — | | | $ | — | | | $ | 48,732,066 | |
Preferred Stocks | | | 272,232 | | | | — | | | | — | | | | 272,232 | |
Repurchase Agreement | | | — | | | | 122,182 | | | | — | | | | 122,182 | |
Total | | $ | 49,004,298 | | | $ | 122,182 | | | $ | — | | | $ | 49,126,480 | |
Transfers between investment levels may occur as the markets fluctuate and/or the availability of data used in an investment’s valuation changes. Transfers between valuation levels, if any, are in comparison to the valuation levels at the end of the previous fiscal year, and are effective using the fair value as of the end of the previous fiscal period.
For the period ended September 30, 2016, there were no transfers between levels.
SEE NOTES TO FINANCIAL STATEMENTS. | THE RYDEX FUNDS SEMI-ANNUAL REPORT | 63 |
STATEMENT OF ASSETS AND LIABILITIES (Unaudited) |
September 30, 2016 |
Assets: | |
Investments, at value (cost $43,274,030) | | $ | 49,004,298 | |
Repurchase agreements, at value (cost $122,182) | | | 122,182 | |
Total investments (cost $43,396,212) | | | 49,126,480 | |
Receivables: | |
Securities sold | | | 298,766 | |
Fund shares sold | | | 31,701 | |
Dividends | | | 116,955 | |
Foreign taxes reclaim | | | 35 | |
Total assets | | | 49,573,937 | |
| | | | | |
Liabilities: | |
Overdraft due to custodian bank | | | 5,453 | |
Payable for: | |
Fund shares redeemed | | | 348,555 | |
Management fees | | | 36,442 | |
Transfer agent and administrative fees | | | 10,718 | |
Portfolio accounting fees | | | 4,287 | |
Distribution and service fees | | | 2,544 | |
Miscellaneous | | | 11,772 | |
Total liabilities | | | 419,771 | |
Commitments and contingent liabilities (Note 9) | | | — | |
Net assets | | $ | 49,154,166 | |
| | | | | |
Net assets consist of: | |
Paid in capital | | $ | 52,935,945 | |
Undistributed net investment income | | | 738,635 | |
Accumulated net realized loss on investments | | | (10,250,682 | ) |
Net unrealized appreciation on investments | | | 5,730,268 | |
Net assets | | $ | 49,154,166 | |
| | | | | |
Investor Class: | |
Net assets | | $ | 40,136,372 | |
Capital shares outstanding* | | | 694,270 | |
Net asset value per share* | | $ | 57.81 | |
| | | | | |
A-Class: | |
Net assets | | $ | 3,543,026 | |
Capital shares outstanding* | | | 64,858 | |
Net asset value per share* | | $ | 54.63 | |
Maximum offering price per share (Net asset value divided by 95.25%)* | | $ | 57.35 | |
| | | | | |
C-Class: | |
Net assets | | $ | 1,268,743 | |
Capital shares outstanding* | | | 25,708 | |
Net asset value per share* | | $ | 49.35 | |
| | | | | |
H-Class: | |
Net assets | | $ | 4,206,025 | |
Capital shares outstanding* | | | 79,278 | |
Net asset value per share* | | $ | 53.05 | |
STATEMENT OF OPERATIONS (Unaudited) | |
Period Ended September 30, 2016 | |
Investment Income: | |
Dividends (net of foreign withholding tax of $2,481) | | $ | 374,188 | |
Interest | | | 172 | |
Total investment income | | | 374,360 | |
| | | | | |
Expenses: | |
Management fees | | | 120,308 | |
Transfer agent and administrative fees | | | 35,385 | |
Distribution and service fees: | |
A-Class | | | 2,441 | |
C-Class | | | 5,506 | |
H-Class | | | 4,248 | |
Portfolio accounting fees | | | 14,154 | |
Custodian fees | | | 1,675 | |
Trustees’ fees** | | | 709 | |
Line of credit fees | | | 146 | |
Miscellaneous | | | 21,406 | |
Total expenses | | | 205,978 | |
Net investment income | | | 168,382 | |
| | | | | |
Net Realized and Unrealized Gain (Loss): | |
Net realized gain (loss) on: | |
Investments | | | 1,179,019 | |
Net realized gain | | | 1,179,019 | |
Net change in unrealized appreciation (depreciation) on: | |
Investments | | | (731,992 | ) |
Net change in unrealized appreciation (depreciation) | | | (731,992 | ) |
Net realized and unrealized gain | | | 447,027 | |
Net increase in net assets resulting from operations | | $ | 615,409 | |
* | The shares outstanding, net asset value per share and the maximum offering price per share have been restated to reflect a 2:1 share split effective October 31, 2016. See Note 10. |
** | Relates to Trustees not deemed “interested persons” within the meaning of Section 2(a)(19) of the 1940 Act. |
64 | THE RYDEX FUNDS SEMI-ANNUAL REPORT | SEE NOTES TO FINANCIAL STATEMENTS. |
STATEMENTS OF CHANGES IN NET ASSETS |
| | | Period Ended
September 30,
2016
(Unaudited) | | | Year Ended
March 31,
2016 | |
Increase (Decrease) in Net Assets from Operations: | | | | | | |
Net investment income | | $ | 168,382 | | | $ | 570,268 | |
Net realized gain (loss) on investments | | | 1,179,019 | | | | (6,440,895 | ) |
Net change in unrealized appreciation (depreciation) on investments | | | (731,992 | ) | | | (2,679,547 | ) |
Net increase (decrease) in net assets resulting from operations | | | 615,409 | | | | (8,550,174 | ) |
| | | | | | | | | |
Distributions to shareholders from: | | | | | | | | |
Net investment income | | | | | | | | |
Investor Class | | | — | | | | (197,056 | ) |
A-Class | | | — | | | | (34,956 | ) |
C-Class | | | — | | | | (9,406 | ) |
H-Class | | | — | | | | (36,355 | )** |
Net realized gains | | | | | | | | |
Investor Class | | | — | | | | (100,426 | ) |
A-Class | | | — | | | | (17,815 | ) |
C-Class | | | — | | | | (4,794 | ) |
H-Class | | | — | | | | (18,528 | )** |
Total distributions to shareholders | | | — | | | | (419,336 | ) |
| | | | | | | | | |
Capital share transactions: | | | | | | | | |
Proceeds from sale of shares | | | | | | | | |
Investor Class | | | 60,070,897 | | | | 81,929,333 | |
A-Class | | | 7,685,597 | | | | 19,166,428 | |
C-Class | | | 1,757,810 | | | | 15,134,609 | |
H-Class | | | 4,616,496 | | | | 39,630,649 | ** |
Distributions reinvested | | | | | | | | |
Investor Class | | | — | | | | 230,452 | |
A-Class | | | — | | | | 52,090 | |
C-Class | | | — | | | | 14,200 | |
H-Class | | | — | | | | 54,808 | ** |
Cost of shares redeemed | | | | | | | | |
Investor Class | | | (35,512,391 | ) | | | (111,107,892 | ) |
A-Class | | | (5,128,621 | ) | | | (19,489,521 | ) |
C-Class | | | (1,611,785 | ) | | | (15,116,335 | ) |
H-Class | | | (3,580,204 | ) | | | (39,652,502 | )** |
Net increase (decrease) from capital share transactions | | | 28,297,799 | | | | (29,153,681 | ) |
Net increase (decrease) in net assets | | | 28,913,208 | | | | (38,123,191 | ) |
| | | | | | | | | |
Net assets: | | | | | | | | |
Beginning of period | | | 20,240,958 | | | | 58,364,149 | |
End of period | | $ | 49,154,166 | | | $ | 20,240,958 | |
Undistributed net investment income at end of period | | $ | 738,635 | | | $ | 570,253 | |
SEE NOTES TO FINANCIAL STATEMENTS. | THE RYDEX FUNDS SEMI-ANNUAL REPORT | 65 |
STATEMENTS OF CHANGES IN NET ASSETS (concluded) |
| | | Period Ended
September 30,
2016
(Unaudited) | | | Year Ended
March 31,
2016 | |
Capital share activity:* | | | | | | |
Shares sold | | | | | | |
Investor Class | | $ | 1,046,424 | | | $ | 1,449,078 | |
A-Class | | | 142,590 | | | | 356,434 | |
C-Class | | | 36,268 | | | | 308,394 | |
H-Class | | | 88,348 | | | | 758,632 | ** |
Shares issued from reinvestment of distributions | | | | | | | | |
Investor Class | | | — | | | | 4,140 | |
A-Class | | | — | | | | 988 | |
C-Class | | | — | | | | 296 | |
H-Class | | | — | | | | 1,070 | ** |
Shares redeemed | | | | | | | | |
Investor Class | | | (632,460 | ) | | | (2,036,418 | ) |
A-Class | | | (98,106 | ) | | | (386,912 | ) |
C-Class | | | (33,580 | ) | | | (310,694 | ) |
H-Class | | | (70,198 | ) | | | (782,598 | )** |
Net increase (decrease) in shares | | | 479,286 | | | | (637,590 | ) |
* | Capital share activity for the periods presented through September 30, 2016, has been restated to reflect a 2:1 share split effective October 31, 2016. See Note 10. |
** | Effective September 30, 2015, the Fund’s Advisor Class shares were converted into H-Class shares — See Note 8. |
66 | THE RYDEX FUNDS SEMI-ANNUAL REPORT | SEE NOTES TO FINANCIAL STATEMENTS. |
This table is presented to show selected data for a share outstanding throughout each period and to assist shareholders in evaluating a Fund’s performance for the periods presented.
Investor Class | | Period Ended
September 30,
2016a,e | | | Year Ended
March 31, 2016e | | | Year Ended
March 31,
2015e | | | Year Ended
March 31,
2014e | | | Year Ended
March 28,
2013e | | | Year Ended
March 31,
2012e | |
Per Share Data | | | | | | | | | | | | | | | | | | |
Net asset value, beginning of period | | $ | 53.90 | | | $ | 57.78 | | | $ | 53.05 | | | $ | 45.33 | | | $ | 39.23 | | | $ | 40.59 | |
Income (loss) from investment operations: | |
Net investment income (loss)b | | | .37 | | | | .77 | | | | .46 | | | | .39 | | | | .38 | | | | .31 | |
Net gain (loss) on investments (realized and unrealized) | | | 3.54 | | | | (4.19 | ) | | | 4.40 | | | | 7.61 | | | | 6.00 | | | | (1.65 | ) |
Total from investment operations | | | 3.91 | | | | (3.42 | ) | | | 4.86 | | | | 8.00 | | | | 6.38 | | | | (1.34 | ) |
Less distributions from: | |
Net investment income | | | — | | | | (.30 | ) | | | (.13 | ) | | | (.28 | ) | | | (.28 | ) | | | (.02 | ) |
Net realized gains | | | — | | | | (.16 | ) | | | — | | | | — | | | | — | | | | — | |
Total distributions | | | — | | | | (.46 | ) | | | (.13 | ) | | | (.28 | ) | | | (.28 | ) | | | (.02 | ) |
Net asset value, end of period | | $ | 57.81 | | | $ | 53.90 | | | $ | 57.78 | | | $ | 53.05 | | | $ | 45.33 | | | $ | 39.23 | |
| | |
Total Returnc | | | 7.24 | % | | | (5.95 | %) | | | 9.17 | % | | | 17.67 | % | | | 16.37 | % | | | (3.31 | %) |
Ratios/Supplemental Data | |
Net assets, end of period (in thousands) | | $ | 40,136 | | | $ | 15,110 | | | $ | 49,897 | | | $ | 17,688 | | | $ | 17,007 | | | $ | 19,973 | |
Ratios to average net assets: | |
Net investment income (loss) | | | 1.30 | % | | | 1.36 | % | | | 0.82 | % | | | 0.81 | % | | | 0.95 | % | | | 0.86 | % |
Total expenses | | | 1.37 | % | | | 1.34 | % | | | 1.34 | % | | | 1.37 | % | | | 1.36 | % | | | 1.34 | % |
Portfolio turnover rate | | | 133 | % | | | 268 | % | | | 326 | % | | | 414 | % | | | 590 | % | | | 970 | % |
A-Class | | Period Ended
September 30,
2016a,e | | | Year Ended
March 31, 2016e | | | Year Ended
March 31,
2015e | | | Year Ended
March 31,
2014e | | | Year Ended
March 28,
2013e | | | Year Ended
March 31,
2012e | |
Per Share Data | | | | | | | | | | | | | | | | | | |
Net asset value, beginning of period | | $ | 51.00 | | | $ | 54.83 | | | $ | 50.47 | | | $ | 43.24 | | | $ | 37.53 | | | $ | 38.93 | |
Income (loss) from investment operations: | |
Net investment income (loss)b | | | .34 | | | | .46 | | | | .21 | | | | .29 | | | | .26 | | | | .23 | |
Net gain (loss) on investments (realized and unrealized) | | | 3.29 | | | | (3.83 | ) | | | 4.28 | | | | 7.22 | | | | 5.73 | | | | (1.61 | ) |
Total from investment operations | | | 3.63 | | | | (3.37 | ) | | | 4.49 | | | | 7.51 | | | | 5.99 | | | | (1.38 | ) |
Less distributions from: | |
Net investment income | | | — | | | | (.30 | ) | | | (.13 | ) | | | (.28 | ) | | | (.28 | ) | | | (.02 | ) |
Net realized gains | | | — | | | | (.16 | ) | | | — | | | | — | | | | — | | | | — | |
Total distributions | | | — | | | | (.46 | ) | | | (.13 | ) | | | (.28 | ) | | | (.28 | ) | | | (.02 | ) |
Net asset value, end of period | | $ | 54.63 | | | $ | 51.00 | | | $ | 54.83 | | | $ | 50.47 | | | $ | 43.24 | | | $ | 37.53 | |
| | |
Total Returnc | | | 7.11 | % | | | (6.17 | %) | | | 8.89 | % | | | 17.41 | % | | | 16.06 | % | | | (3.57 | %) |
Ratios/Supplemental Data | |
Net assets, end of period (in thousands) | | $ | 3,543 | | | $ | 1,039 | | | $ | 2,734 | | | $ | 7,698 | | | $ | 1,826 | | | $ | 632 | |
Ratios to average net assets: | |
Net investment income (loss) | | | 1.26 | % | | | 0.87 | % | | | 0.41 | % | | | 0.62 | % | | | 0.66 | % | | | 0.64 | % |
Total expenses | | | 1.61 | % | | | 1.60 | % | | | 1.59 | % | | | 1.62 | % | | | 1.61 | % | | | 1.61 | % |
Portfolio turnover rate | | | 133 | % | | | 268 | % | | | 326 | % | | | 414 | % | | | 590 | % | | | 970 | % |
SEE NOTES TO FINANCIAL STATEMENTS. | THE RYDEX FUNDS SEMI-ANNUAL REPORT | 67 |
FINANCIAL HIGHLIGHTS (continued) |
This table is presented to show selected data for a share outstanding throughout each period and to assist shareholders in evaluating a Fund’s performance for the periods presented.
C-Class | | Period Ended
September 30,
2016a,e | | | Year Ended
March 31, 2016e | | | Year Ended
March 31,
2015e | | | Year Ended
March 31,
2014e | | | Year Ended
March 28,
2013e | | | Year Ended
March 31,
2012e | |
Per Share Data | | | | | | | | | | | | | | | | | | |
Net asset value, beginning of period | | $ | 46.24 | | | $ | 50.14 | | | $ | 46.51 | | | $ | 40.15 | | | $ | 35.13 | | | $ | 36.71 | |
Income (loss) from investment operations: | |
Net investment income (loss)b | | | .02 | | | | .11 | | | | (.11 | ) | | | (.08 | ) | | | .02 | | | | (.06 | ) |
Net gain (loss) on investments (realized and unrealized) | | | 3.09 | | | | (3.55 | ) | | | 3.87 | | | | 6.72 | | | | 5.28 | | | | (1.50 | ) |
Total from investment operations | | | 3.11 | | | | (3.44 | ) | | | 3.76 | | | | 6.64 | | | | 5.30 | | | | (1.56 | ) |
Less distributions from: | |
Net investment income | | | — | | | | (.30 | ) | | | (.13 | ) | | | (.28 | ) | | | (.28 | ) | | | (.02 | ) |
Net realized gains | | | — | | | | (.16 | ) | | | — | | | | — | | | | — | | | | — | |
Total distributions | | | — | | | | (.46 | ) | | | (.13 | ) | | | (.28 | ) | | | (.28 | ) | | | (.02 | ) |
Net asset value, end of period | | $ | 49.35 | | | $ | 46.24 | | | $ | 50.14 | | | $ | 46.51 | | | $ | 40.15 | | | $ | 35.13 | |
| | |
Total Returnc | | | 6.70 | % | | | (6.89 | %) | | | 8.08 | % | | | 16.58 | % | | | 15.21 | % | | | (4.27 | %) |
Ratios/Supplemental Data | |
Net assets, end of period (in thousands) | | $ | 1,269 | | | $ | 1,065 | | | $ | 1,255 | | | $ | 1,051 | | | $ | 1,440 | | | $ | 817 | |
Ratios to average net assets: | |
Net investment income (loss) | | | 0.07 | % | | | 0.22 | % | | | (0.23 | %) | | | (0.18 | %) | | | 0.04 | % | | | (0.18 | %) |
Total expenses | | | 2.36 | % | | | 2.35 | % | | | 2.35 | % | | | 2.37 | % | | | 2.36 | % | | | 2.36 | % |
Portfolio turnover rate | | | 133 | % | | | 268 | % | | | 326 | % | | | 414 | % | | | 590 | % | | | 970 | % |
68 | THE RYDEX FUNDS SEMI-ANNUAL REPORT | SEE NOTES TO FINANCIAL STATEMENTS. |
FINANCIAL HIGHLIGHTS (concluded) |
This table is presented to show selected data for a share outstanding throughout each period and to assist shareholders in evaluating a Fund’s performance for the periods presented.
H-Class | | Period Ended
September 30,
2016a,e | | | Year Ended
March 31, 2016d,e | | | Year Ended
March 31,
2015d,e | | | Year Ended
March 31,
2014d,e | | | Year Ended
March 28,
2013d,e | | | Year Ended
March 31,
2012d,e | |
Per Share Data | | | | | | | | | | | | | | | | | | |
Net asset value, beginning of period | | $ | 49.53 | | | $ | 53.30 | | | $ | 49.18 | | | $ | 42.25 | | | $ | 36.77 | | | $ | 38.24 | |
Income (loss) from investment operations: | |
Net investment income (loss)b | | | .22 | | | | .43 | | | | .15 | | | | .12 | | | | .11 | | | | .13 | |
Net gain (loss) on investments (realized and unrealized) | | | 3.30 | | | | (3.74 | ) | | | 4.10 | | | | 7.09 | | | | 5.65 | | | | (1.58 | ) |
Total from investment operations | | | 3.52 | | | | (3.31 | ) | | | 4.25 | | | | 7.21 | | | | 5.76 | | | | (1.45 | ) |
Less distributions from: | |
Net investment income | | | — | | | | (.30 | ) | | | (.13 | ) | | | (.28 | ) | | | (.28 | ) | | | (.02 | ) |
Net realized gains | | | — | | | | (.16 | ) | | | — | | | | — | | | | — | | | | — | |
Total distributions | | | — | | | | (.46 | ) | | | (.13 | ) | | | (.28 | ) | | | (.28 | ) | | | (.02 | ) |
Net asset value, end of period | | $ | 53.05 | | | $ | 49.53 | | | $ | 53.30 | | | $ | 49.18 | | | $ | 42.25 | | | $ | 36.77 | |
| | |
Total Returnc | | | 7.11 | % | | | (6.25 | %) | | | 8.63 | % | | | 17.10 | % | | | 15.80 | % | | | (3.80 | %) |
Ratios/Supplemental Data | |
Net assets, end of period (in thousands) | | $ | 4,206 | | | $ | 3,028 | | | $ | 4,479 | | | $ | 4,583 | | | $ | 7,103 | | | $ | 4,243 | |
Ratios to average net assets: | |
Net investment income (loss) | | | 0.83 | % | | | 0.83 | % | | | 0.28 | % | | | 0.26 | % | | | 0.29 | % | | | 0.37 | % |
Total expenses | | | 1.61 | % | | | 1.65 | % | | | 1.85 | % | | | 1.87 | % | | | 1.85 | % | | | 1.85 | % |
Portfolio turnover rate | | | 133 | % | | | 268 | % | | | 326 | % | | | 414 | % | | | 590 | % | | | 970 | % |
a | Unaudited figures for the period ended September 30, 2016. Percentage amounts for the period, except total return and portfolio turnover rate, have been annualized. |
b | Net investment income (loss) per share was computed using average shares outstanding throughout the period. |
c | Total return does not reflect the impact of any applicable sales charges. |
d | Effective September 30, 2015, the Fund’s Advisor Class shares were converted into H-Class shares. The financial highlights for periods prior to that date reflect the performance of the former Advisor Class — See Note 8. |
e | Share split — Per share amounts for the periods presented through September 30 , 2016 have been restated to reflect a 2:1 share split effective October 31, 2016. See Note 10. |
SEE NOTES TO FINANCIAL STATEMENTS. | THE RYDEX FUNDS SEMI-ANNUAL REPORT | 69 |
FUND PROFILE (Unaudited) | September 30, 2016 |
HEALTH CARE FUND
OBJECTIVE: Seeks to provide capital appreciation by investing in companies that are involved in the health care industry (“Health Care Companies”).
Holdings Diversification (Market Exposure as % of Net Assets)
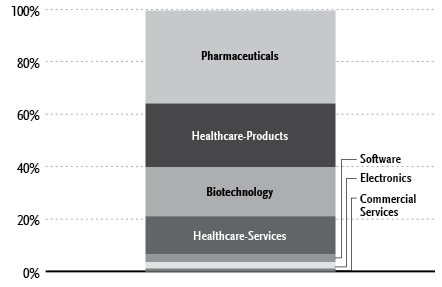
“Holdings Diversification (Market Exposure as % of Net Assets)” excludes any temporary cash investments.
Inception Dates: |
Investor Class | April 17, 1998 |
A-Class | September 1, 2004 |
C-Class | March 30, 2001 |
H-Class* | May 11, 1998 |
Ten Largest Holdings (% of Total Net Assets) |
Johnson & Johnson | 3.3% |
Pfizer, Inc. | 2.6% |
Merck & Company, Inc. | 2.4% |
UnitedHealth Group, Inc. | 2.2% |
Amgen, Inc. | 2.0% |
Gilead Sciences, Inc. | 1.9% |
AbbVie, Inc. | 1.8% |
Eli Lilly & Co. | 1.7% |
Allergan plc | 1.7% |
Bristol-Myers Squibb Co. | 1.7% |
Top Ten Total | 21.3% |
| | |
“Ten Largest Holdings” excludes any temporary cash investments. |
* | Effective September 30, 2015, the Fund’s Advisor Class shares were converted into H-Class shares — See Note 8. |
70 | THE RYDEX FUNDS SEMI-ANNUAL REPORT | |
SCHEDULE OF INVESTMENTS (Unaudited) | September 30, 2016 |
HEALTH CARE FUND | |
| | | Shares | | | Value | |
| | | | | | | |
COMMON STOCKS† - 99.5% | |
| | | | | | | |
Pharmaceuticals - 35.5% | |
Johnson & Johnson | | | 13,826 | | | $ | 1,633,264 | |
Pfizer, Inc. | | | 38,281 | | | | 1,296,576 | |
Merck & Company, Inc. | | | 19,070 | | | | 1,190,158 | |
AbbVie, Inc. | | | 14,603 | | | | 921,011 | |
Eli Lilly & Co. | | | 10,785 | | | | 865,604 | |
Allergan plc* | | | 3,719 | | | | 856,523 | |
Bristol-Myers Squibb Co. | | | 15,696 | | | | 846,328 | |
Shire plc ADR | | | 3,617 | | | | 701,192 | |
Express Scripts Holding Co.* | | | 8,566 | | | | 604,160 | |
McKesson Corp. | | | 3,287 | | | | 548,107 | |
Zoetis, Inc. | | | 9,040 | | | | 470,170 | |
Cardinal Health, Inc. | | | 5,922 | | | | 460,139 | |
Teva Pharmaceutical Industries Ltd. ADR | | | 9,557 | | | | 439,718 | |
Mylan N.V.* | | | 10,342 | | | | 394,237 | |
AmerisourceBergen Corp. — Class A | | | 4,860 | | | | 392,591 | |
AstraZeneca plc ADR | | | 10,286 | | | | 337,998 | |
GlaxoSmithKline plc ADR | | | 7,597 | | | | 327,659 | |
Jazz Pharmaceuticals plc* | | | 2,470 | | | | 300,056 | |
Novartis AG ADR | | | 3,731 | | | | 294,600 | |
Quintiles IMS Holdings, Inc.* | | | 3,629 | | | | 294,167 | |
Alkermes plc* | | | 6,098 | | | | 286,789 | |
Novo Nordisk A/S ADR | | | 6,380 | | | | 265,344 | |
Valeant Pharmaceuticals International, Inc.* | | | 10,144 | | | | 249,035 | |
DexCom, Inc.* | | | 2,830 | | | | 248,078 | |
Mallinckrodt plc* | | | 3,374 | | | | 235,438 | |
OPKO Health, Inc.* | | | 21,407 | | | | 226,700 | |
Sarepta Therapeutics, Inc.* | | | 3,650 | | | | 224,147 | |
VCA, Inc.* | | | 3,095 | | | | 216,588 | |
Perrigo Company plc | | | 2,270 | | | | 209,589 | |
TESARO, Inc.* | | | 2,090 | | | | 209,502 | |
Neurocrine Biosciences, Inc.* | | | 3,720 | | | | 188,381 | |
PRA Health Sciences, Inc.* | | | 3,150 | | | | 178,007 | |
ACADIA Pharmaceuticals, Inc.* | | | 5,365 | | | | 170,661 | |
Akorn, Inc.* | | | 6,135 | | | | 167,240 | |
Endo International plc* | | | 8,110 | | | | 163,417 | |
Catalent, Inc.* | | | 6,254 | | | | 161,603 | |
Prestige Brands Holdings, Inc.* | | | 3,160 | | | | 152,533 | |
Agios Pharmaceuticals, Inc.* | | | 2,860 | | | | 151,065 | |
Horizon Pharma plc* | | | 8,300 | | | | 150,479 | |
Radius Health, Inc.* | | | 2,560 | | | | 138,470 | |
Owens & Minor, Inc. | | | 3,951 | | | | 137,218 | |
Depomed, Inc.* | | | 5,090 | | | | 127,199 | |
Impax Laboratories, Inc.* | | | 4,840 | | | | 114,708 | |
Ophthotech Corp.* | | | 2,250 | | | | 103,793 | |
Pacira Pharmaceuticals, Inc.* | | | 2,830 | | | | 96,843 | |
Total Pharmaceuticals | | | | | | | 17,747,085 | |
| | | | | | | | | |
HealthCare-Products - 24.2% | |
Thermo Fisher Scientific, Inc. | | | 4,699 | | | | 747,424 | |
Medtronic plc | | | 8,647 | | | | 747,100 | |
Abbott Laboratories | | | 17,225 | | | | 728,445 | |
Stryker Corp. | | | 5,220 | | | | 607,659 | |
Becton Dickinson and Co. | | | 3,149 | | | | 565,970 | |
Boston Scientific Corp.* | | | 21,736 | | | | 517,317 | |
Zimmer Biomet Holdings, Inc. | | | 3,711 | | | | 482,504 | |
Intuitive Surgical, Inc.* | | | 658 | | | | 476,938 | |
Edwards Lifesciences Corp.* | | | 3,948 | | | | 475,971 | |
Baxter International, Inc. | | | 9,764 | | | | 464,766 | |
St. Jude Medical, Inc. | | | 5,478 | | | | 436,925 | |
CR Bard, Inc. | | | 1,588 | | | | 356,157 | |
Danaher Corp. | | | 4,360 | | | | 341,780 | |
Dentsply Sirona, Inc. | | | 5,654 | | | | 336,017 | |
Henry Schein, Inc.* | | | 2,060 | | | | 335,739 | |
IDEXX Laboratories, Inc.* | | | 2,704 | | | | 304,822 | |
Hologic, Inc.* | | | 7,820 | | | | 303,651 | |
STERIS plc | | | 4,110 | | | | 300,441 | |
Varian Medical Systems, Inc.* | | | 2,927 | | | | 291,324 | |
ResMed, Inc. | | | 4,302 | | | | 278,727 | |
LivaNova plc* | | | 4,381 | | | | 263,342 | |
Cooper Companies, Inc. | | | 1,400 | | | | 250,964 | |
Align Technology, Inc.* | | | 2,674 | | | | 250,687 | |
Teleflex, Inc. | | | 1,390 | | | | 233,590 | |
ABIOMED, Inc.* | | | 1,720 | | | | 221,158 | |
West Pharmaceutical Services, Inc. | | | 2,790 | | | | 207,855 | |
Patterson Companies, Inc. | | | 4,267 | | | | 196,026 | |
Hill-Rom Holdings, Inc. | | | 3,020 | | | | 187,180 | |
Cepheid* | | | 3,467 | | | | 182,676 | |
Alere, Inc.* | | | 4,140 | | | | 179,014 | |
Bio-Techne Corp. | | | 1,610 | | | | 176,295 | |
Bruker Corp. | | | 7,770 | | | | 175,991 | |
NuVasive, Inc.* | | | 2,500 | | | | 166,650 | |
Nevro Corp.* | | | 1,510 | | | | 157,629 | |
Wright Medical Group N.V.* | | | 5,960 | | | | 146,199 | |
Total Healthcare-Products | | | | | | | 12,094,933 | |
| | | | | | | | | |
Biotechnology - 18.8% | |
Amgen, Inc. | | | 6,053 | | | | 1,009,700 | |
Gilead Sciences, Inc. | | | 11,778 | | | | 931,875 | |
Celgene Corp.* | | | 7,829 | | | | 818,365 | |
Biogen, Inc.* | | | 2,458 | | | | 769,428 | |
Regeneron Pharmaceuticals, Inc.* | | | 1,424 | | | | 572,476 | |
Illumina, Inc.* | | | 2,624 | | | | 476,676 | |
Alexion Pharmaceuticals, Inc.* | | | 3,844 | | | | 471,044 | |
Incyte Corp.* | | | 4,417 | | | | 416,479 | |
Vertex Pharmaceuticals, Inc.* | | | 4,705 | | | | 410,323 | |
BioMarin Pharmaceutical, Inc.* | | | 3,912 | | | | 361,938 | |
Seattle Genetics, Inc.* | | | 4,697 | | | | 253,685 | |
Ionis Pharmaceuticals, Inc.* | | | 5,700 | | | | 208,848 | |
Alnylam Pharmaceuticals, Inc.* | | | 3,065 | | | | 207,746 | |
United Therapeutics Corp.* | | | 1,746 | | | | 206,168 | |
Charles River Laboratories International, Inc.* | | | 2,205 | | | | 183,765 | |
Intercept Pharmaceuticals, Inc.* | | | 1,110 | | | | 182,695 | |
Intrexon Corp.* | | | 6,020 | | | | 168,680 | |
Juno Therapeutics, Inc.* | | | 5,420 | | | | 162,654 | |
ARIAD Pharmaceuticals, Inc.* | | | 11,555 | | | | 158,188 | |
Kite Pharma, Inc.* | | | 2,800 | | | | 156,408 | |
Exelixis, Inc.* | | | 12,030 | | | | 153,864 | |
Medicines Co.* | | | 3,975 | | | | 150,017 | |
Ultragenyx Pharmaceutical, Inc.* | | | 2,100 | | | | 148,974 | |
SEE NOTES TO FINANCIAL STATEMENTS. | THE RYDEX FUNDS SEMI-ANNUAL REPORT | 71 |
SCHEDULE OF INVESTMENTS (Unaudited)(continued) | September 30, 2016 |
HEALTH CARE FUND | |
| | | Shares | | | Value | |
| | | | | | | |
Puma Biotechnology, Inc.* | | | 2,130 | | | $ | 142,817 | |
Bluebird Bio, Inc.* | | | 2,070 | | | | 140,305 | |
Exact Sciences Corp.* | | | 6,720 | | | | 124,790 | |
Ligand Pharmaceuticals, Inc. — Class B* | | | 1,180 | | | | 120,431 | |
Myriad Genetics, Inc.* | | | 5,070 | | | | 104,341 | |
AMAG Pharmaceuticals, Inc.* | | | 3,320 | | | | 81,373 | |
Acorda Therapeutics, Inc.* | | | 3,880 | | | | 81,014 | |
Novavax, Inc.* | | | 16,345 | | | | 33,998 | |
Total Biotechnology | | | | | | | 9,409,065 | |
| | | | | | | | | |
HealthCare-Services - 14.5% | |
UnitedHealth Group, Inc. | | | 7,725 | | | | 1,081,499 | |
Aetna, Inc. | | | 5,039 | | | | 581,753 | |
Cigna Corp. | | | 4,110 | | | | 535,615 | |
Anthem, Inc. | | | 4,254 | | | | 533,069 | |
HCA Holdings, Inc.* | | | 6,424 | | | | 485,846 | |
Humana, Inc. | | | 2,672 | | | | 472,650 | |
Laboratory Corporation of America Holdings* | | | 2,512 | | | | 345,349 | |
DaVita, Inc.* | | | 5,171 | | | | 341,648 | |
Quest Diagnostics, Inc. | | | 3,774 | | | | 319,394 | |
Universal Health Services, Inc. — Class B | | | 2,576 | | | | 317,415 | |
Centene Corp.* | | | 4,607 | | | | 308,485 | |
MEDNAX, Inc.* | | | 3,506 | | | | 232,273 | |
WellCare Health Plans, Inc.* | | | 1,850 | | | | 216,617 | |
Acadia Healthcare Company, Inc.* | | | 3,890 | | | | 192,750 | |
Envision Healthcare Holdings, Inc.* | | | 8,430 | | | | 187,736 | |
Amsurg Corp. — Class A* | | | 2,640 | | | | 177,012 | |
HealthSouth Corp. | | | 4,330 | | | | 175,668 | |
Molina Healthcare, Inc.* | | | 2,996 | | | | 174,727 | |
Brookdale Senior Living, Inc. — Class A* | | | 9,464 | | | | 165,147 | |
LifePoint Health, Inc.* | | | 2,501 | | | | 148,134 | |
Tenet Healthcare Corp.* | | | 6,110 | | | | 138,453 | |
Community Health Systems, Inc.* | | | 9,481 | | | | 109,411 | |
Total Healthcare-Services | | | | | | | 7,240,651 | |
| | | | | | | | | |
Software - 2.9% | |
Cerner Corp.* | | | 6,627 | | | | 409,218 | |
IMS Health Holdings, Inc.* | | | 9,510 | | | | 298,043 | |
Veeva Systems, Inc. — Class A* | | | 5,290 | | | | 218,371 | |
athenahealth, Inc.* | | | 1,560 | | | | 196,747 | |
Medidata Solutions, Inc.* | | | 2,989 | | | | 166,667 | |
Allscripts Healthcare Solutions, Inc.* | | | 10,860 | | | | 143,026 | |
Total Software | | | | | | | 1,432,072 | |
| | | | | | | | | |
Electronics - 2.5% | |
Agilent Technologies, Inc. | | | 7,813 | | | | 367,914 | |
Waters Corp.* | | | 2,097 | | | | 332,354 | |
Mettler-Toledo International, Inc.* | | | 710 | | | | 298,079 | |
PerkinElmer, Inc. | | | 4,159 | | | | 233,361 | |
Total Electronics | | | | | | | 1,231,708 | |
| | | | | | | | | |
Commercial Services - 1.1% | |
PAREXEL International Corp.* | | | 2,570 | | | | 178,487 | |
Incorporated Research Holdings, Inc. — Class A* | | | 3,180 | | | | 141,764 | |
Team Health Holdings, Inc.* | | | 4,338 | | | | 141,245 | |
AMN Healthcare Services, Inc.* | | | 3,340 | | | | 106,446 | |
Total Commercial Services | | | | | | | 567,942 | |
| | | | | | | | | |
Total Common Stocks | | | | | | | | |
(Cost $32,284,007) | | | | | | | 49,723,456 | |
| | | | | | | | | |
RIGHTS††† - 0.0% | |
Dyax Corp. | | | | | | | | |
Expires 01/25/17* | | | 5,700 | | | | — | |
Total Rights | | | | | | | | |
(Cost $—) | | | | | | | — | |
| | | | | | | | | |
| | | Face
Amount | | | | | |
| | | | | | | | | |
REPURCHASE AGREEMENT††,1 - 0.0% | |
Royal Bank of Canada
issued 09/30/16 at 0.36%
due 10/03/16 | | $ | 132 | | | | 132 | |
Total Repurchase Agreement | | | | | | | | |
(Cost $132) | | | | | | | 132 | |
| | | | | | | | | |
Total Investments - 99.5% | | | | | | | | |
(Cost $32,284,139) | | | | | | $ | 49,723,588 | |
Other Assets & Liabilities, net - 0.5% | | | | | | | 241,970 | |
Total Net Assets - 100.0% | | | | | | $ | 49,965,558 | |
* | Non-income producing security. |
† | Value determined based on Level 1 inputs — See Note 4. |
†† | Value determined based on Level 2 inputs — See Note 4. |
††† | Value determined based on Level 3 inputs — See Note 4. |
1 | Repurchase Agreement — See Note 5. |
| | ADR — American Depositary Receipt |
| | plc — Public Limited Company |
| | |
| | See Sector Classification in Other Information section. |
72 | THE RYDEX FUNDS SEMI-ANNUAL REPORT | SEE NOTES TO FINANCIAL STATEMENTS. |
SCHEDULE OF INVESTMENTS (Unaudited)(concluded) | September 30, 2016 |
HEALTH CARE FUND | |
The following table summarizes the inputs used to value the Fund’s investments at September 30, 2016 (See Note 4 in the Notes to Financial Statements):
Investments in Securities (Assets) | | Level 1 | | | Level 2 | | | Level 3 | | | Total | |
Common Stocks | | $ | 49,723,456 | | | $ | — | | | $ | — | | | $ | 49,723,456 | |
Repurchase Agreement | | | — | | | | 132 | | | | — | | | | 132 | |
Rights | | | — | | | | — | | | | — | | | | — | |
Total | | $ | 49,723,456 | | | $ | 132 | | | $ | — | | | $ | 49,723,588 | |
Transfers between investment levels may occur as the markets fluctuate and/or the availability of data used in an investment’s valuation changes. Transfers between valuation levels, if any, are in comparison to the valuation levels at the end of the previous fiscal year, and are effective using the fair value as of the end of the previous fiscal period.
For the period ended September 30, 2016, there were no transfers between levels.
SEE NOTES TO FINANCIAL STATEMENTS. | THE RYDEX FUNDS SEMI-ANNUAL REPORT | 73 |
STATEMENT OF ASSETS AND LIABILITIES (Unaudited) |
September 30, 2016 |
Assets: | |
Investments, at value (cost $32,284,007) | | $ | 49,723,456 | |
Repurchase agreements, at value (cost $132) | | | 132 | |
Total investments (cost $32,284,139) | | | 49,723,588 | |
Cash | | | 255,794 | |
Receivables: | |
Securities sold | | | 1,105,015 | |
Fund shares sold | | | 209,559 | |
Dividends | | | 33,309 | |
Foreign taxes reclaim | | | 401 | |
Total assets | | | 51,327,666 | |
| | | | | |
Liabilities: | |
Payable for: | |
Fund shares redeemed | | | 1,292,636 | |
Management fees | | | 35,118 | |
Transfer agent and administrative fees | | | 10,329 | |
Distribution and service fees | | | 8,398 | |
Portfolio accounting fees | | | 4,131 | |
Miscellaneous | | | 11,496 | |
Total liabilities | | | 1,362,108 | |
Commitments and contingent liabilities (Note 9) | | | — | |
Net assets | | $ | 49,965,558 | |
| | | | | |
Net assets consist of: | |
Paid in capital | | $ | 26,026,689 | |
Accumulated net investment loss | | | (217,197 | ) |
Accumulated net realized gain on investments | | | 6,716,617 | |
Net unrealized appreciation on investments | | | 17,439,449 | |
Net assets | | $ | 49,965,558 | |
| | | | | |
Investor Class: | |
Net assets | | $ | 28,942,640 | |
Capital shares outstanding | | | 939,115 | |
Net asset value per share | | $ | 30.82 | |
| | | | | |
A-Class: | |
Net assets | | $ | 5,201,684 | |
Capital shares outstanding | | | 181,514 | |
Net asset value per share | | $ | 28.66 | |
Maximum offering price per share (Net asset value divided by 95.25%) | | $ | 30.09 | |
| | | | | |
C-Class: | |
Net assets | | $ | 6,770,201 | |
Capital shares outstanding | | | 262,183 | |
Net asset value per share | | $ | 25.82 | |
| | | | | |
H-Class: | |
Net assets | | $ | 9,051,033 | |
Capital shares outstanding | | | 325,187 | |
Net asset value per share | | $ | 27.83 | |
STATEMENT OF OPERATIONS (Unaudited) | |
Period Ended September 30, 2016 | |
Investment Income: | |
Dividends (net of foreign withholding tax of $502) | | $ | 249,326 | |
Interest | | | 267 | |
Total investment income | | | 249,593 | |
| | | | | |
Expenses: | |
Management fees | | | 222,284 | |
Transfer agent and administrative fees | | | 65,378 | |
Distribution and service fees: | |
A-Class | | | 8,289 | |
C-Class | | | 37,428 | |
H-Class | | | 8,735 | |
Portfolio accounting fees | | | 26,151 | |
Custodian fees | | | 3,074 | |
Trustees’ fees* | | | 2,105 | |
Line of credit fees | | | 34 | |
Miscellaneous | | | 38,700 | |
Total expenses | | | 412,178 | |
Net investment loss | | | (162,585 | ) |
| | | | | |
Net Realized and Unrealized Gain (Loss): | |
Net realized gain (loss) on: | |
Investments | | | 8,123,948 | |
Net realized gain | | | 8,123,948 | |
Net change in unrealized appreciation (depreciation) on: | |
Investments | | | (5,124,613 | ) |
Net change in unrealized appreciation (depreciation) | | | (5,124,613 | ) |
Net realized and unrealized gain | | | 2,999,335 | |
Net increase in net assets resulting from operations | | $ | 2,836,750 | |
* | Relates to Trustees not deemed “interested persons” within the meaning of Section 2(a)(19) of the 1940 Act. |
74 | THE RYDEX FUNDS SEMI-ANNUAL REPORT | SEE NOTES TO FINANCIAL STATEMENTS. |
STATEMENTS OF CHANGES IN NET ASSETS |
| | | Period Ended
September 30,
2016
(Unaudited) | | | Year Ended
March 31,
2016 | |
Increase (Decrease) in Net Assets from Operations: | | | | | | |
Net investment loss | | $ | (162,585 | ) | | $ | (518,753 | ) |
Net realized gain on investments | | | 8,123,948 | | | | 28,773,483 | |
Net change in unrealized appreciation (depreciation) on investments | | | (5,124,613 | ) | | | (55,109,991 | ) |
Net increase (decrease) in net assets resulting from operations | | | 2,836,750 | | | | (26,855,261 | ) |
| | | | | | | | | |
Distributions to shareholders from: | | | | | | | | |
Net realized gains | | | | | | | | |
Investor Class | | | — | | | | (2,551,979 | ) |
A-Class | | | — | | | | (751,373 | ) |
C-Class | | | — | | | | (771,085 | ) |
H-Class | | | — | | | | (2,499,031 | )* |
Total distributions to shareholders | | | — | | | | (6,573,468 | ) |
| | | | | | | | | |
Capital share transactions: | | | | | | | | |
Proceeds from sale of shares | | | | | | | | |
Investor Class | | | 105,620,505 | | | | 288,312,509 | |
A-Class | | | 7,540,160 | | | | 51,799,265 | |
C-Class | | | 2,114,902 | | | | 20,161,059 | |
H-Class | | | 8,374,395 | | | | 245,917,636 | * |
Distributions reinvested | | | | | | | | |
Investor Class | | | — | | | | 2,527,332 | |
A-Class | | | — | | | | 734,523 | |
C-Class | | | — | | | | 758,819 | |
H-Class | | | — | | | | 2,496,935 | * |
Cost of shares redeemed | | | | | | | | |
Investor Class | | | (122,882,912 | ) | | | (402,516,466 | ) |
A-Class | | | (9,230,694 | ) | | | (68,969,564 | ) |
C-Class | | | (4,150,694 | ) | | | (21,424,094 | ) |
H-Class | | | (4,856,934 | ) | | | (287,555,879 | )* |
Net decrease from capital share transactions | | | (17,471,272 | ) | | | (167,757,925 | ) |
Net decrease in net assets | | | (14,634,522 | ) | | | (201,186,654 | ) |
| | | | | | | | | |
Net assets: | | | | | | | | |
Beginning of period | | | 64,600,080 | | | | 265,786,734 | |
End of period | | $ | 49,965,558 | | | $ | 64,600,080 | |
Accumulated net investment loss at end of period | | $ | (217,197 | ) | | $ | (54,612 | ) |
| | | | | | | | | |
Capital share activity: | | | | | | | | |
Shares sold | | | | | | | | |
Investor Class | | | 3,445,839 | | | | 8,380,890 | |
A-Class | | | 267,488 | | | | 1,575,077 | |
C-Class | | | 82,489 | | | | 680,967 | |
H-Class | | | 301,112 | | | | 7,391,856 | * |
Shares issued from reinvestment of distributions | | | | | | | | |
Investor Class | | | — | | | | 81,233 | |
A-Class | | | — | | | | 25,356 | |
C-Class | | | — | | | | 28,863 | |
H-Class | | | — | | | | 88,733 | * |
Shares redeemed | | | | | | | | |
Investor Class | | | (4,065,386 | ) | | | (11,798,319 | ) |
A-Class | | | (326,223 | ) | | | (2,214,540 | ) |
C-Class | | | (163,591 | ) | | | (741,300 | ) |
H-Class | | | (178,303 | ) | | | (8,810,947 | )* |
Net decrease in shares | | | (636,575 | ) | | | (5,312,131 | ) |
* | Effective September 30, 2015, the Fund’s Advisor Class shares were converted into H-Class shares — See Note 8. |
SEE NOTES TO FINANCIAL STATEMENTS. | THE RYDEX FUNDS SEMI-ANNUAL REPORT | 75 |
This table is presented to show selected data for a share outstanding throughout each period and to assist shareholders in evaluating a Fund’s performance for the periods presented.
Investor Class | | Period Ended
September 30,
2016a | | | Year Ended
March 31,
2016 | | | Year Ended
March 31,
2015 | | | Year Ended
March 31,
2014 | | | Year Ended
March 28,
2013 | | | Year Ended
March 31,
2012 | |
Per Share Data | | | | | | | | | | | | | | | | | | |
Net asset value, beginning of period | | $ | 28.65 | | | $ | 35.83 | | | $ | 27.76 | | | $ | 22.35 | | | $ | 18.83 | | | $ | 17.14 | |
Income (loss) from investment operations: | |
Net investment income (loss)b | | | (.06 | ) | | | (.04 | ) | | | (.07 | ) | | | (.03 | ) | | | .09 | | | | .01 | |
Net gain (loss) on investments (realized and unrealized) | | | 2.23 | | | | (5.11 | ) | | | 8.50 | | | | 7.00 | | | | 3.48 | | | | 1.68 | |
Total from investment operations | | | 2.17 | | | | (5.15 | ) | | | 8.43 | | | | 6.97 | | | | 3.57 | | | | 1.69 | |
Less distributions from: | |
Net investment income | | | — | | | | — | | | | — | | | | (.03 | ) | | | (.05 | ) | | | — | |
Net realized gains | | | — | | | | (2.03 | ) | | | (.36 | ) | | | (1.53 | ) | | | — | | | | — | |
Total distributions | | | — | | | | (2.03 | ) | | | (.36 | ) | | | (1.56 | ) | | | (.05 | ) | | | — | |
Net asset value, end of period | | $ | 30.82 | | | $ | 28.65 | | | $ | 35.83 | | | $ | 27.76 | | | $ | 22.35 | | | $ | 18.83 | |
| | |
Total Returnc | | | 7.57 | % | | | (14.82 | %) | | | 30.51 | % | | | 31.70 | % | | | 18.98 | % | | | 9.86 | % |
Ratios/Supplemental Data | |
Net assets, end of period (in thousands) | | $ | 28,943 | | | $ | 44,663 | | | $ | 175,397 | | | $ | 98,209 | | | $ | 104,525 | | | $ | 39,036 | |
Ratios to average net assets: | |
Net investment income (loss) | | | (0.42 | %) | | | (0.11 | %) | | | (0.23 | %) | | | (0.12 | %) | | | 0.45 | % | | | 0.08 | % |
Total expenses | | | 1.36 | % | | | 1.34 | % | | | 1.34 | % | | | 1.37 | % | | | 1.35 | % | | | 1.36 | % |
Portfolio turnover rate | | | 187 | % | | | 249 | % | | | 176 | % | | | 277 | % | | | 266 | % | | | 582 | % |
A-Class | | Period Ended
September 30,
2016a | | | Year Ended
March 31,
2016 | | | Year Ended
March 31,
2015 | | | Year Ended
March 31,
2014 | | | Year Ended
March 28,
2013 | | | Year Ended
March 31,
2012 | |
Per Share Data | | | | | | | | | | | | | | | | | | |
Net asset value, beginning of period | | $ | 26.68 | | | $ | 33.60 | | | $ | 26.11 | | | $ | 21.15 | | | $ | 17.87 | | | $ | 16.30 | |
Income (loss) from investment operations: | |
Net investment income (loss)b | | | (.09 | ) | | | (.13 | ) | | | (.14 | ) | | | (.09 | ) | | | .04 | | | | (.02 | ) |
Net gain (loss) on investments (realized and unrealized) | | | 2.07 | | | | (4.76 | ) | | | 7.99 | | | | 6.61 | | | | 3.29 | | | | 1.59 | |
Total from investment operations | | | 1.98 | | | | (4.89 | ) | | | 7.85 | | | | 6.52 | | | | 3.33 | | | | 1.57 | |
Less distributions from: | |
Net investment income | | | — | | | | — | | | | — | | | | (.03 | ) | | | (.05 | ) | | | — | |
Net realized gains | | | — | | | | (2.03 | ) | | | (.36 | ) | | | (1.53 | ) | | | — | | | | — | |
Total distributions | | | — | | | | (2.03 | ) | | | (.36 | ) | | | (1.56 | ) | | | (.05 | ) | | | — | |
Net asset value, end of period | | $ | 28.66 | | | $ | 26.68 | | | $ | 33.60 | | | $ | 26.11 | | | $ | 21.15 | | | $ | 17.87 | |
| | |
Total Returnc | | | 7.38 | % | | | (15.04 | %) | | | 30.21 | % | | | 31.36 | % | | | 18.65 | % | | | 9.63 | % |
Ratios/Supplemental Data | |
Net assets, end of period (in thousands) | | $ | 5,202 | | | $ | 6,410 | | | $ | 28,704 | | | $ | 7,909 | | | $ | 3,660 | | | $ | 2,964 | |
Ratios to average net assets: | |
Net investment income (loss) | | | (0.66 | %) | | | (0.42 | %) | | | (0.47 | %) | | | (0.37 | %) | | | 0.20 | % | | | (0.13 | %) |
Total expenses | | | 1.61 | % | | | 1.59 | % | | | 1.59 | % | | | 1.62 | % | | | 1.60 | % | | | 1.60 | % |
Portfolio turnover rate | | | 187 | % | | | 249 | % | | | 176 | % | | | 277 | % | | | 266 | % | | | 582 | % |
76 | THE RYDEX FUNDS SEMI-ANNUAL REPORT | SEE NOTES TO FINANCIAL STATEMENTS. |
FINANCIAL HIGHLIGHTS (concluded) |
This table is presented to show selected data for a share outstanding throughout each period and to assist shareholders in evaluating a Fund’s performance for the periods presented.
C-Class | | Period Ended
September 30,
2016a | | | Year Ended
March 31,
2016 | | | Year Ended
March 31,
2015 | | | Year Ended
March 31,
2014 | | | Year Ended
March 28,
2013 | | | Year Ended
March 31,
2012 | |
Per Share Data | | | | | | | | | | | | | | | | | | |
Net asset value, beginning of period | | $ | 24.13 | | | $ | 30.82 | | | $ | 24.16 | | | $ | 19.81 | | | $ | 16.86 | | | $ | 15.50 | |
Income (loss) from investment operations: | |
Net investment income (loss)b | | | (.18 | ) | | | (.33 | ) | | | (.33 | ) | | | (.26 | ) | | | (.09 | ) | | | (.14 | ) |
Net gain (loss) on investments (realized and unrealized) | | | 1.87 | | | | (4.33 | ) | | | 7.35 | | | | 6.17 | | | | 3.09 | | | | 1.50 | |
Total from investment operations | | | 1.69 | | | | (4.66 | ) | | | 7.02 | | | | 5.91 | | | | 3.00 | | | | 1.36 | |
Less distributions from: | |
Net investment income | | | — | | | | — | | | | — | | | | (.03 | ) | | | (.05 | ) | | | — | |
Net realized gains | | | — | | | | (2.03 | ) | | | (.36 | ) | | | (1.53 | ) | | | — | | | | — | |
Total distributions | | | — | | | | (2.03 | ) | | | (.36 | ) | | | (1.56 | ) | | | (.05 | ) | | | — | |
Net asset value, end of period | | $ | 25.82 | | | $ | 24.13 | | | $ | 30.82 | | | $ | 24.16 | | | $ | 19.81 | | | $ | 16.86 | |
| | |
Total Returnc | | | 7.00 | % | | | (15.67 | %) | | | 29.21 | % | | | 30.38 | % | | | 17.81 | % | | | 8.77 | % |
Ratios/Supplemental Data | |
Net assets, end of period (in thousands) | | $ | 6,770 | | | $ | 8,284 | | | $ | 11,551 | | | $ | 7,318 | | | $ | 4,589 | | | $ | 3,468 | |
Ratios to average net assets: | |
Net investment income (loss) | | | (1.41 | %) | | | (1.17 | %) | | | (1.24 | %) | | | (1.14 | %) | | | (0.53 | %) | | | (0.91 | %) |
Total expenses | | | 2.36 | % | | | 2.35 | % | | | 2.34 | % | | | 2.37 | % | | | 2.35 | % | | | 2.36 | % |
Portfolio turnover rate | | | 187 | % | | | 249 | % | | | 176 | % | | | 277 | % | | | 266 | % | | | 582 | % |
H-Class | | Period Ended
September 30,
2016a | | | Year Ended
March 31, 2016d | | | Year Ended
March 31,
2015d | | | Year Ended
March 31,
2014d | | | Year Ended
March 28,
2013d | | | Year Ended
March 31,
2012d | |
Per Share Data | | | | | | | | | | | | | | | | | | |
Net asset value, beginning of period | | $ | 25.91 | | | $ | 32.71 | | | $ | 25.49 | | | $ | 20.73 | | | $ | 17.55 | | | $ | 16.04 | |
Income (loss) from investment operations: | |
Net investment income (loss)b | | | (.09 | ) | | | (.14 | ) | | | (.21 | ) | | | (.15 | ) | | | (.06 | ) | | | (.07 | ) |
Net gain (loss) on investments (realized and unrealized) | | | 2.01 | | | | (4.63 | ) | | | 7.79 | | | | 6.47 | | | | 3.29 | | | | 1.58 | |
Total from investment operations | | | 1.92 | | | | (4.77 | ) | | | 7.58 | | | | 6.32 | | | | 3.23 | | | | 1.51 | |
Less distributions from: | |
Net investment income | | | — | | | | — | | | | — | | | | (.03 | ) | | | (.05 | ) | | | — | |
Net realized gains | | | — | | | | (2.03 | ) | | | (.36 | ) | | | (1.53 | ) | | | — | | | | — | |
Total distributions | | | — | | | | (2.03 | ) | | | (.36 | ) | | | (1.56 | ) | | | (.05 | ) | | | — | |
Net asset value, end of period | | $ | 27.83 | | | $ | 25.91 | | | $ | 32.71 | | | $ | 25.49 | | | $ | 20.73 | | | $ | 17.55 | |
| | |
Total Returnc | | | 7.41 | % | | | (15.08 | %) | | | 29.89 | % | | | 31.03 | % | | | 18.43 | % | | | 9.41 | % |
Ratios/Supplemental Data | |
Net assets, end of period (in thousands) | | $ | 9,051 | | | $ | 5,244 | | | $ | 50,135 | | | $ | 38,480 | | | $ | 3,605 | | | $ | 4,275 | |
Ratios to average net assets: | |
Net investment income (loss) | | | (0.62 | %) | | | (0.44 | %) | | | (0.73 | %) | | | (0.62 | %) | | | (0.31 | %) | | | (0.44 | %) |
Total expenses | | | 1.61 | % | | | 1.71 | % | | | 1.85 | % | | | 1.87 | % | | | 1.86 | % | | | 1.85 | % |
Portfolio turnover rate | | | 187 | % | | | 249 | % | | | 176 | % | | | 277 | % | | | 266 | % | | | 582 | % |
a | Unaudited figures for the period ended September 30, 2016. Percentage amounts for the period, except total return and portfolio turnover rate, have been annualized. |
b | Net investment income (loss) per share was computed using average shares outstanding throughout the period. |
c | Total return does not reflect the impact of any applicable sales charges. |
d | Effective September 30, 2015, the Fund’s Advisor Class shares were converted into H-Class shares. The financial highlights for periods prior to that date reflect the performance of the former Advisor Class — See Note 8. |
SEE NOTES TO FINANCIAL STATEMENTS. | THE RYDEX FUNDS SEMI-ANNUAL REPORT | 77 |
FUND PROFILE (Unaudited) | September 30, 2016 |
INTERNET FUND
OBJECTIVE: Seeks to provide capital appreciation by investing in companies that provide products or services designed for or related to the Internet (“Internet Companies”).
Holdings Diversification (Market Exposure as % of Net Assets)
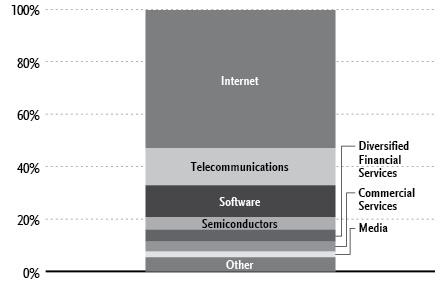
“Holdings Diversification (Market Exposure as % of Net Assets)” excludes any temporary cash investments.
Inception Dates: |
Investor Class | April 6, 2000 |
A-Class | September 1, 2004 |
C-Class | April 19, 2001 |
H-Class* | April 6, 2000 |
Ten Largest Holdings (% of Total Net Assets) |
Alphabet, Inc. — Class A | 6.2% |
Amazon.com, Inc. | 5.6% |
Facebook, Inc. — Class A | 5.2% |
Cisco Systems, Inc. | 3.4% |
QUALCOMM, Inc. | 2.8% |
Alibaba Group Holding Ltd. ADR | 2.6% |
Priceline Group, Inc. | 2.2% |
Time Warner, Inc. | 2.2% |
Broadcom Ltd. | 2.0% |
PayPal Holdings, Inc. | 1.9% |
Top Ten Total | 34.1% |
| | |
“Ten Largest Holdings” excludes any temporary cash investments. |
* | Effective September 30, 2015, the Fund’s Advisor Class shares were converted into H-Class shares — See Note 8. |
78 | THE RYDEX FUNDS SEMI-ANNUAL REPORT | |
SCHEDULE OF INVESTMENTS (Unaudited) | September 30, 2016 |
INTERNET FUND | |
| | | Shares | | | Value | |
| | | | | | | |
COMMON STOCKS† - 99.6% | |
| | | | | | | |
Internet - 52.7% | |
Alphabet, Inc. — Class A* | | | 3,509 | | | $ | 2,821,446 | |
Amazon.com, Inc.* | | | 3,020 | | | | 2,528,675 | |
Facebook, Inc. — Class A* | | | 18,237 | | | | 2,339,259 | |
Alibaba Group Holding Ltd. ADR* | | | 11,340 | | | | 1,199,659 | |
Priceline Group, Inc.* | | | 668 | | | | 982,956 | |
Netflix, Inc.* | | | 8,079 | | | | 796,186 | |
Yahoo!, Inc.* | | | 17,848 | | | | 769,249 | |
eBay, Inc.* | | | 22,822 | | | | 750,844 | |
Baidu, Inc. ADR* | | | 4,081 | | | | 743,028 | |
LinkedIn Corp. — Class A* | | | 3,216 | | | | 614,642 | |
JD.com, Inc. ADR* | | | 21,809 | | | | 568,997 | |
Twitter, Inc.* | | | 23,894 | | | | 550,757 | |
Ctrip.com International Ltd. ADR* | | | 11,234 | | | | 523,167 | |
Expedia, Inc. | | | 4,434 | | | | 517,536 | |
Symantec Corp. | | | 19,252 | | | | 483,225 | |
TripAdvisor, Inc.* | | | 5,882 | | | | 371,625 | |
Vipshop Holdings Ltd. ADR* | | | 24,645 | | | | 361,542 | |
58.com, Inc. ADR* | | | 7,413 | | | | 353,304 | |
VeriSign, Inc.* | | | 4,507 | | | | 352,628 | |
F5 Networks, Inc.* | | | 2,768 | | | | 345,004 | |
MercadoLibre, Inc. | | | 1,760 | | | | 325,547 | |
Zillow Group, Inc. — Class A* | | | 8,998 | | | | 309,981 | |
Zillow Group, Inc. — Class C* | | | 8,885 | | | | 307,865 | |
SINA Corp.* | | | 4,163 | | | | 307,354 | |
Weibo Corp. ADR* | | | 6,052 | | | | 303,462 | |
YY, Inc. ADR* | | | 5,671 | | | | 302,151 | |
Shopify, Inc. — Class A* | | | 6,920 | | | | 297,006 | |
GoDaddy, Inc. — Class A* | | | 8,510 | | | | 293,850 | |
Bitauto Holdings Ltd. ADR* | | | 10,057 | | | | 292,458 | |
Liberty Ventures* | | | 7,256 | | | | 289,297 | |
Autohome, Inc. ADR* | | | 11,583 | | | | 280,888 | |
IAC/InterActiveCorp | | | 4,477 | | | | 279,678 | |
Fang Holdings Ltd. ADR* | | | 59,182 | | | | 265,727 | |
GrubHub, Inc.* | | | 5,555 | | | | 238,809 | |
Pandora Media, Inc.* | | | 16,140 | | | | 231,286 | |
Yelp, Inc. — Class A* | | | 5,448 | | | | 227,182 | |
Wayfair, Inc. — Class A* | | | 5,564 | | | | 219,055 | |
Groupon, Inc. — Class A* | | | 38,765 | | | | 199,640 | |
Shutterstock, Inc.* | | | 2,788 | | | | 177,596 | |
WebMD Health Corp. — Class A* | | | 3,306 | | | | 164,308 | |
comScore, Inc.* | | | 5,297 | | | | 162,406 | |
Cogent Communications Holdings, Inc. | | | 4,345 | | | | 159,939 | |
Stamps.com, Inc.* | | | 1,648 | | | | 155,752 | |
Shutterfly, Inc.* | | | 3,097 | | | | 138,250 | |
Total Internet | | | | | | | 23,903,216 | |
| | | | | | | | | |
Telecommunications - 14.1% | |
Cisco Systems, Inc. | | | 48,586 | | | | 1,541,148 | |
Palo Alto Networks, Inc.* | | | 3,026 | | | | 482,133 | |
Motorola Solutions, Inc. | | | 5,696 | | | | 434,491 | |
Juniper Networks, Inc. | | | 15,669 | | | | 376,996 | |
Nokia Oyj ADR | | | 52,825 | | | | 305,857 | |
Arista Networks, Inc.* | | | 3,482 | | | | 296,249 | |
CommScope Holding Company, Inc.* | | | 9,670 | | | | 291,164 | |
Telefonaktiebolaget LM Ericsson ADR | | | 39,862 | | | | 287,405 | |
ARRIS International plc* | | | 9,905 | | | | 280,609 | |
Ubiquiti Networks, Inc.* | | | 4,800 | | | | 256,800 | |
Finisar Corp.* | | | 7,687 | | | | 229,073 | |
ViaSat, Inc.* | | | 3,016 | | | | 225,144 | |
Ciena Corp.* | | | 9,880 | | | | 215,384 | |
InterDigital, Inc. | | | 2,481 | | | | 196,495 | |
LogMeIn, Inc. | | | 1,939 | | | | 175,266 | |
NETGEAR, Inc.* | | | 2,784 | | | | 168,404 | |
Plantronics, Inc. | | | 3,124 | | | | 162,323 | |
Viavi Solutions, Inc.* | | | 21,630 | | | | 159,846 | |
Infinera Corp.* | | | 15,470 | | | | 139,694 | |
Oclaro, Inc.* | | | 15,740 | | | | 134,577 | |
Gogo, Inc.* | | | 8,123 | | | | 89,678 | |
Total Telecommunications | | | | | | | 6,448,736 | |
| | | | | | | | | |
Software - 12.1% | |
salesforce.com, Inc.* | | | 11,707 | | | | 835,059 | |
Intuit, Inc. | | | 5,897 | | | | 648,729 | |
Red Hat, Inc.* | | | 6,028 | | | | 487,243 | |
NetEase, Inc. ADR | | | 1,895 | | | | 456,278 | |
Citrix Systems, Inc.* | | | 5,244 | | | | 446,894 | |
Check Point Software Technologies Ltd.* | | | 5,576 | | | | 432,753 | |
Akamai Technologies, Inc.* | | | 7,077 | | | | 375,011 | |
NetSuite, Inc.* | | | 3,308 | | | | 366,163 | |
Veeva Systems, Inc. — Class A* | | | 7,060 | | | | 291,437 | |
Twilio, Inc. — Class A* | | | 4,510 | | | | 290,264 | |
Rackspace Hosting, Inc.* | | | 7,709 | | | | 244,298 | |
j2 Global, Inc. | | | 3,220 | | | | 214,484 | |
Cornerstone OnDemand, Inc.* | | | 4,340 | | | | 199,423 | |
Allscripts Healthcare Solutions, Inc.* | | | 14,370 | | | | 189,253 | |
Total Software | | | | | | | 5,477,289 | |
| | | | | | | | | |
Semiconductors - 4.9% | |
QUALCOMM, Inc. | | | 18,678 | | | | 1,279,443 | |
Broadcom Ltd. | | | 5,214 | | | | 899,519 | |
Total Semiconductors | | | | | | | 2,178,962 | |
| | | | | | | | | |
Diversified Financial Services - 4.5% | |
Charles Schwab Corp. | | | 25,167 | | | | 794,521 | |
TD Ameritrade Holding Corp. | | | 15,270 | | | | 538,115 | |
E*TRADE Financial Corp.* | | | 11,958 | | | | 348,217 | |
LendingClub Corp.* | | | 30,635 | | | | 189,324 | |
BGC Partners, Inc. — Class A | | | 21,366 | | | | 186,953 | |
Total Diversified Financial Services | | | | | | | 2,057,130 | |
| | | | | | | | | |
Commercial Services - 3.8% | |
PayPal Holdings, Inc.* | | | 20,918 | | | | 857,011 | |
CoStar Group, Inc.* | | | 1,412 | | | | 305,740 | |
Live Nation Entertainment, Inc.* | | | 10,700 | | | | 294,036 | |
Cimpress N.V.* | | | 2,660 | | | | 269,139 | |
Total Commercial Services | | | | | | | 1,725,926 | |
| | | | | | | | | |
Media - 2.2% | |
Time Warner, Inc. | | | 12,341 | | | | 982,467 | |
| | | | | | | | | |
SEE NOTES TO FINANCIAL STATEMENTS. | THE RYDEX FUNDS SEMI-ANNUAL REPORT | 79 |
SCHEDULE OF INVESTMENTS (Unaudited)(concluded) | September 30, 2016 |
INTERNET FUND | |
| | | Shares | | | Value | |
| | | | | | | |
Computers - 1.9% | |
BlackBerry Ltd.* | | | 36,267 | | | $ | 289,411 | |
Brocade Communications Systems, Inc. | | | 25,358 | | | | 234,054 | |
NetScout Systems, Inc.* | | | 6,801 | | | | 198,929 | |
Lumentum Holdings, Inc.* | | | 4,750 | | | | 198,408 | |
Total Computers | | | | | | | 920,802 | |
| | | | | | | | | |
REITs - 1.3% | |
Equinix, Inc. | | | 1,642 | | | | 591,531 | |
| | | | | | | | | |
Aerospace & Defense - 0.9% | |
Harris Corp. | | | 4,482 | | | | 410,596 | |
| | | | | | | | | |
Retail - 0.9% | |
Liberty Interactive Corporation QVC Group — Class A* | | | 19,273 | | | | 385,652 | |
| | | | | | | | | |
Leisure Time - 0.3% | |
Liberty TripAdvisor Holdings, Inc. — Class A* | | | 7,190 | | | | 157,102 | |
| | | | | | | | | |
Total Common Stocks | | | | | | | | |
(Cost $36,143,713) | | | | | | | 45,239,409 | |
| | | Face
Amount | | | | |
| | | | | | | |
REPURCHASE AGREEMENT††,1 - 0.5% | |
Royal Bank of Canada
issued 09/30/16 at 0.36%
due 10/03/16 | | $ | 209,870 | | | | 209,870 | |
Total Repurchase Agreement | | | | | | | | |
(Cost $209,870) | | | | | | | 209,870 | |
| | | | | | | | | |
Total Investments - 100.1% | | | | | | | | |
(Cost $36,353,583) | | | | | | $ | 45,449,279 | |
Other Assets & Liabilities, net - (0.1)% | | | | | | | (45,485 | ) |
Total Net Assets - 100.0% | | | | | | $ | 45,403,794 | |
* | Non-income producing security. |
† | Value determined based on Level 1 inputs — See Note 4. |
†† | Value determined based on Level 2 inputs — See Note 4. |
1 | Repurchase Agreement — See Note 5. |
| | ADR — American Depositary Receipt |
| | plc — Public Limited Company |
| | |
| | See Sector Classification in Other Information section. |
The following table summarizes the inputs used to value the Fund’s investments at September 30, 2016 (See Note 4 in the Notes to Financial Statements):
Investments in Securities (Assets) | | Level 1 | | | Level 2 | | | Level 3 | | | Total | |
Common Stocks | | $ | 45,239,409 | | | $ | — | | | $ | — | | | $ | 45,239,409 | |
Repurchase Agreement | | | — | | | | 209,870 | | | | — | | | | 209,870 | |
Total | | $ | 45,239,409 | | | $ | 209,870 | | | $ | — | | | $ | 45,449,279 | |
Transfers between investment levels may occur as the markets fluctuate and/or the availability of data used in an investment’s valuation changes. Transfers between valuation levels, if any, are in comparison to the valuation levels at the end of the previous fiscal year, and are effective using the fair value as of the end of the previous fiscal period.
For the period ended September 30, 2016, there were no transfers between levels.
80 | THE RYDEX FUNDS SEMI-ANNUAL REPORT | SEE NOTES TO FINANCIAL STATEMENTS. |
STATEMENT OF ASSETS AND LIABILITIES (Unaudited) |
September 30, 2016 |
Assets: | |
Investments, at value (cost $36,143,713) | | $ | 45,239,409 | |
Repurchase agreements, at value (cost $209,870) | | | 209,870 | |
Total investments (cost $36,353,583) | | | 45,449,279 | |
Cash | | | 1,710 | |
Receivables: | |
Fund shares sold | | | 46,752 | |
Dividends | | | 3,954 | |
Interest | | | 2 | |
Total assets | | | 45,501,697 | |
| | | | | |
Liabilities: | |
Payable for: | |
Fund shares redeemed | | | 47,429 | |
Management fees | | | 28,550 | |
Transfer agent and administrative fees | | | 8,397 | |
Portfolio accounting fees | | | 3,359 | |
Distribution and service fees | | | 3,252 | |
Miscellaneous | | | 6,916 | |
Total liabilities | | | 97,903 | |
Commitments and contingent liabilities (Note 9) | | | — | |
Net assets | | $ | 45,403,794 | |
| | | | | |
Net assets consist of: | |
Paid in capital | | $ | 43,275,566 | |
Accumulated net investment loss | | | (166,009 | ) |
Accumulated net realized loss on investments | | | (6,801,459 | ) |
Net unrealized appreciation on investments | | | 9,095,696 | |
Net assets | | $ | 45,403,794 | |
| | | | | |
Investor Class: | |
Net assets | | $ | 37,634,140 | |
Capital shares outstanding | | | 420,336 | |
Net asset value per share | | $ | 89.53 | |
| | | | | |
A-Class: | |
Net assets | | $ | 3,787,581 | |
Capital shares outstanding | | | 44,874 | |
Net asset value per share | | $ | 84.40 | |
Maximum offering price per share (Net asset value divided by 95.25%) | | $ | 88.61 | |
| | | | | |
C-Class: | |
Net assets | | $ | 2,774,645 | |
Capital shares outstanding | | | 36,496 | |
Net asset value per share | | $ | 76.03 | |
| | | | | |
H-Class: | |
Net assets | | $ | 1,207,428 | |
Capital shares outstanding | | | 14,731 | |
Net asset value per share | | $ | 81.97 | |
STATEMENT OF OPERATIONS (Unaudited) | |
Period Ended September 30, 2016 | |
Investment Income: | |
Dividends (net of foreign withholding tax of $6,619) | | $ | 113,607 | |
Interest | | | 187 | |
Total investment income | | | 113,794 | |
| | | | | |
Expenses: | |
Management fees | | | 127,206 | |
Transfer agent and administrative fees | | | 37,414 | |
Distribution and service fees: | |
A-Class | | | 3,872 | |
C-Class | | | 12,650 | |
H-Class | | | 6,073 | |
Portfolio accounting fees | | | 14,965 | |
Custodian fees | | | 1,760 | |
Trustees’ fees* | | | 1,180 | |
Line of credit fees | | | 48 | |
Miscellaneous | | | 22,244 | |
Total expenses | | | 227,412 | |
Net investment loss | | | (113,618 | ) |
| | | | | |
Net Realized and Unrealized Gain (Loss): | |
Net realized gain (loss) on: | |
Investments | | | 3,774,515 | |
Net realized gain | | | 3,774,515 | |
Net change in unrealized appreciation (depreciation) on: | |
Investments | | | 285,305 | |
Net change in unrealized appreciation (depreciation) | | | 285,305 | |
Net realized and unrealized gain | | | 4,059,820 | |
Net increase in net assets resulting from operations | | $ | 3,946,202 | |
* | Relates to Trustees not deemed “interested persons” within the meaning of Section 2(a)(19) of the 1940 Act. |
SEE NOTES TO FINANCIAL STATEMENTS. | THE RYDEX FUNDS SEMI-ANNUAL REPORT | 81 |
STATEMENTS OF CHANGES IN NET ASSETS |
| | | Period Ended
September 30,
2016
(Unaudited) | | | Year Ended
March 31,
2016 | |
Increase (Decrease) in Net Assets from Operations: | | | | | | |
Net investment loss | | $ | (113,618 | ) | | $ | (292,593 | ) |
Net realized gain (loss) on investments | | | 3,774,515 | | | | (8,402,113 | ) |
Net change in unrealized appreciation (depreciation) on investments | | | 285,305 | | | | 2,939,491 | |
Net increase (decrease) in net assets resulting from operations | | | 3,946,202 | | | | (5,755,215 | ) |
| | | | | | | | | |
Distributions to shareholders from: | | | | | | | | |
Net realized gains | | | | | | | | |
Investor Class | | | — | | | | (131,247 | ) |
A-Class | | | — | | | | (27,718 | ) |
C-Class | | | — | | | | (14,060 | ) |
H-Class | | | — | | | | (57,824 | )* |
Total distributions to shareholders | | | — | | | | (230,849 | ) |
| | | | | | | | | |
Capital share transactions: | | | | | | | | |
Proceeds from sale of shares | | | | | | | | |
Investor Class | | | 60,030,189 | | | | 97,142,398 | |
A-Class | | | 11,641,648 | | | | 19,084,067 | |
C-Class | | | 1,331,334 | | | | 7,825,210 | |
H-Class | | | 15,754,033 | | | | 181,150,735 | * |
Distributions reinvested | | | | | | | | |
Investor Class | | | — | | | | 130,284 | |
A-Class | | | — | | | | 27,197 | |
C-Class | | | — | | | | 13,853 | |
H-Class | | | — | | | | 57,824 | * |
Cost of shares redeemed | | | | | | | | |
Investor Class | | | (49,718,713 | ) | | | (78,468,395 | ) |
A-Class | | | (9,879,257 | ) | | | (19,052,730 | ) |
C-Class | | | (1,693,018 | ) | | | (7,377,638 | ) |
H-Class | | | (22,176,330 | ) | | | (172,995,235 | )* |
Net increase from capital share transactions | | | 5,289,886 | | | | 27,537,570 | |
Net increase in net assets | | | 9,236,088 | | | | 21,551,506 | |
| | | | | | | | | |
Net assets: | | | | | | | | |
Beginning of period | | | 36,167,706 | | | | 14,616,200 | |
End of period | | $ | 45,403,794 | | | $ | 36,167,706 | |
Accumulated net investment loss at end of period | | $ | (166,009 | ) | | $ | (52,391 | ) |
| | | | | | | | | |
Capital share activity: | | | | | | | | |
Shares sold | | | | | | | | |
Investor Class | | | 716,383 | | | | 1,219,475 | |
A-Class | | | 152,414 | | | | 253,474 | |
C-Class | | | 18,865 | | | | 114,412 | |
H-Class | | | 217,466 | | | | 2,463,941 | * |
Shares issued from reinvestment of distributions | | | | | | | | |
Investor Class | | | — | | | | 1,607 | |
A-Class | | | — | | | | 355 | |
C-Class | | | — | | | | 199 | |
H-Class | | | — | | | | 777 | * |
Shares redeemed | | | | | | | | |
Investor Class | | | (609,666 | ) | | | (1,014,411 | ) |
A-Class | | | (132,054 | ) | | | (256,742 | ) |
C-Class | | | (24,447 | ) | | | (108,804 | ) |
H-Class | | | (302,618 | ) | | | (2,390,380 | )* |
Net increase in shares | | | 36,343 | | | | 283,903 | |
* | Effective September 30, 2015, the Fund’s Advisor Class shares were converted into H-Class shares — See Note 8. |
82 | THE RYDEX FUNDS SEMI-ANNUAL REPORT | SEE NOTES TO FINANCIAL STATEMENTS. |
This table is presented to show selected data for a share outstanding throughout each period and to assist shareholders in evaluating a Fund’s performance for the periods presented.
Investor Class | | Period Ended
September 30,
2016a | | | Year Ended
March 31,
2016 | | | Year Ended
March 31,
2015 | | | Year Ended
March 31,
2014 | | | Year Ended
March 28,
2013 | | | Year Ended
March 31,
2012 | |
Per Share Data | | | | | | | | | | | | | | | | | | |
Net asset value, beginning of period | | $ | 77.91 | | | $ | 77.87 | | | $ | 75.05 | | | $ | 55.46 | | | $ | 51.90 | | | $ | 52.28 | |
Income (loss) from investment operations: | |
Net investment income (loss)b | | | (.24 | ) | | | (.41 | ) | | | (.49 | ) | | | (.62 | ) | | | (.44 | ) | | | (.51 | ) |
Net gain (loss) on investments (realized and unrealized) | | | 11.86 | | | | .78 | | | | 5.27 | | | | 20.53 | | | | 5.26 | | | | .13 | |
Total from investment operations | | | 11.62 | | | | .37 | | | | 4.78 | | | | 19.91 | | | | 4.82 | | | | (.38 | ) |
Less distributions from: | |
Net realized gains | | | — | | | | (.33 | ) | | | (1.96 | ) | | | (.32 | ) | | | (1.26 | ) | | | — | |
Total distributions | | | — | | | | (.33 | ) | | | (1.96 | ) | | | (.32 | ) | | | (1.26 | ) | | | — | |
Net asset value, end of period | | $ | 89.53 | | | $ | 77.91 | | | $ | 77.87 | | | $ | 75.05 | | | $ | 55.46 | | | $ | 51.90 | |
| | |
Total Returnc | | | 14.91 | % | | | 0.46 | % | | | 6.40 | % | | | 35.93 | % | | | 9.65 | % | | | (0.73 | %) |
Ratios/Supplemental Data | |
Net assets, end of period (in thousands) | | $ | 37,634 | | | $ | 24,435 | | | $ | 8,328 | | | $ | 26,828 | | | $ | 6,109 | | | $ | 6,206 | |
Ratios to average net assets: | |
Net investment income (loss) | | | (0.58 | %) | | | (0.52 | %) | | | (0.64 | %) | | | (0.87 | %) | | | (0.87 | %) | | | (1.05 | %) |
Total expenses | | | 1.37 | % | | | 1.35 | % | | | 1.35 | % | | | 1.37 | % | | | 1.35 | % | | | 1.36 | % |
Portfolio turnover rate | | | 207 | % | | | 520 | % | | | 495 | % | | | 472 | % | | | 442 | % | | | 380 | % |
A-Class | | Period Ended
September 30,
2016a | | | Year Ended
March 31,
2016 | | | Year Ended
March 31,
2015 | | | Year Ended
March 31,
2014 | | | Year Ended
March 28,
2013 | | | Year Ended
March 31,
2012 | |
Per Share Data | | | | | | | | | | | | | | | | | | |
Net asset value, beginning of period | | $ | 73.54 | | | $ | 73.71 | | | $ | 71.32 | | | $ | 52.85 | | | $ | 49.63 | | | $ | 50.13 | |
Income (loss) from investment operations: | |
Net investment income (loss)b | | | (.32 | ) | | | (.69 | ) | | | (.61 | ) | | | (.79 | ) | | | (.52 | ) | | | (.64 | ) |
Net gain (loss) on investments (realized and unrealized) | | | 11.18 | | | | .85 | | | | 4.96 | | | | 19.58 | | | | 5.00 | | | | .14 | |
Total from investment operations | | | 10.86 | | | | .16 | | | | 4.35 | | | | 18.79 | | | | 4.48 | | | | (.50 | ) |
Less distributions from: | |
Net realized gains | | | — | | | | (.33 | ) | | | (1.96 | ) | | | (.32 | ) | | | (1.26 | ) | | | — | |
Total distributions | | | — | | | | (.33 | ) | | | (1.96 | ) | | | (.32 | ) | | | (1.26 | ) | | | — | |
Net asset value, end of period | | $ | 84.40 | | | $ | 73.54 | | | $ | 73.71 | | | $ | 71.32 | | | $ | 52.85 | | | $ | 49.63 | |
| | |
Total Returnc | | | 14.77 | % | | | 0.20 | % | | | 6.12 | % | | | 35.58 | % | | | 9.41 | % | | | (1.00 | %) |
Ratios/Supplemental Data | |
Net assets, end of period (in thousands) | | $ | 3,788 | | | $ | 1,803 | | | $ | 2,022 | | | $ | 12,566 | | | $ | 1,192 | | | $ | 828 | |
Ratios to average net assets: | |
Net investment income (loss) | | | (0.84 | %) | | | (0.92 | %) | | | (0.86 | %) | | | (1.12 | %) | | | (1.08 | %) | | | (1.39 | %) |
Total expenses | | | 1.61 | % | | | 1.60 | % | | | 1.61 | % | | | 1.62 | % | | | 1.60 | % | | | 1.61 | % |
Portfolio turnover rate | | | 207 | % | | | 520 | % | | | 495 | % | | | 472 | % | | | 442 | % | | | 380 | % |
SEE NOTES TO FINANCIAL STATEMENTS. | THE RYDEX FUNDS SEMI-ANNUAL REPORT | 83 |
FINANCIAL HIGHLIGHTS (concluded) |
This table is presented to show selected data for a share outstanding throughout each period and to assist shareholders in evaluating a Fund’s performance for the periods presented.
C-Class | | Period Ended
September 30,
2016a | | | Year Ended
March 31,
2016 | | | Year Ended
March 31,
2015 | | | Year Ended
March 31,
2014 | | | Year Ended
March 28,
2013 | | | Year Ended
March 31,
2012 | |
Per Share Data | | | | | | | | | | | | | | | | | | |
Net asset value, beginning of period | | $ | 66.49 | | | $ | 67.17 | | | $ | 65.64 | | | $ | 49.03 | | | $ | 46.50 | | | $ | 47.30 | |
Income (loss) from investment operations: | |
Net investment income (loss)b | | | (.55 | ) | | | (1.03 | ) | | | (1.11 | ) | | | (1.16 | ) | | | (.85 | ) | | | (.94 | ) |
Net gain (loss) on investments (realized and unrealized) | | | 10.09 | | | | .68 | | | | 4.60 | | | | 18.09 | | | | 4.64 | | | | .14 | |
Total from investment operations | | | 9.54 | | | | (.35 | ) | | | 3.49 | | | | 16.93 | | | | 3.79 | | | | (.80 | ) |
Less distributions from: | |
Net realized gains | | | — | | | | (.33 | ) | | | (1.96 | ) | | | (.32 | ) | | | (1.26 | ) | | | — | |
Total distributions | | | — | | | | (.33 | ) | | | (1.96 | ) | | | (.32 | ) | | | (1.26 | ) | | | — | |
Net asset value, end of period | | $ | 76.03 | | | $ | 66.49 | | | $ | 67.17 | | | $ | 65.64 | | | $ | 49.03 | | | $ | 46.50 | |
| | |
Total Returnc | | | 14.33 | % | | | (0.54 | %) | | | 5.34 | % | | | 34.56 | % | | | 8.55 | % | | | (1.69 | %) |
Ratios/Supplemental Data | |
Net assets, end of period (in thousands) | | $ | 2,775 | | | $ | 2,798 | | | $ | 2,436 | | | $ | 4,655 | | | $ | 1,111 | | | $ | 643 | |
Ratios to average net assets: | |
Net investment income (loss) | | | (1.59 | %) | | | (1.53 | %) | | | (1.68 | %) | | | (1.85 | %) | | | (1.91 | %) | | | (2.17 | %) |
Total expenses | | | 2.36 | % | | | 2.35 | % | | | 2.35 | % | | | 2.37 | % | | | 2.35 | % | | | 2.36 | % |
Portfolio turnover rate | | | 207 | % | | | 520 | % | | | 495 | % | | | 472 | % | | | 442 | % | | | 380 | % |
H-Class | | Period Ended
September 30,
2016a | | | Year Ended
March 31,
2016d | | | Year Ended
March 31,
2015d | | | Year Ended
March 31,
2014d | | | Year Ended
March 28,
2013d | | | Year Ended
March 31,
2012d | |
Per Share Data | | | | | | | | | | | | | | | | | | |
Net asset value, beginning of period | | $ | 71.40 | | | $ | 71.64 | | | $ | 69.58 | | | $ | 51.70 | | | $ | 48.71 | | | $ | 49.31 | |
Income (loss) from investment operations: | |
Net investment income (loss)b | | | (.36 | ) | | | (.72 | ) | | | (.78 | ) | | | (1.07 | ) | | | (.64 | ) | | | (.71 | ) |
Net gain (loss) on investments (realized and unrealized) | | | 10.93 | | | | .81 | | | | 4.80 | | | | 19.27 | | | | 4.89 | | | | .11 | |
Total from investment operations | | | 10.57 | | | | .09 | | | | 4.02 | | | | 18.20 | | | | 4.25 | | | | (.60 | ) |
Less distributions from: | |
Net realized gains | | | — | | | | (.33 | ) | | | (1.96 | ) | | | (.32 | ) | | | (1.26 | ) | | | — | |
Total distributions | | | — | | | | (.33 | ) | | | (1.96 | ) | | | (.32 | ) | | | (1.26 | ) | | | — | |
Net asset value, end of period | | $ | 81.97 | | | $ | 71.40 | | | $ | 71.64 | | | $ | 69.58 | | | $ | 51.70 | | | $ | 48.71 | |
| | |
Total Returnc | | | 14.79 | % | | | 0.11 | % | | | 5.80 | % | | | 35.23 | % | | | 9.13 | % | | | (1.24 | %) |
Ratios/Supplemental Data | |
Net assets, end of period (in thousands) | | $ | 1,207 | | | $ | 7,132 | | | $ | 1,830 | | | $ | 11,814 | | | $ | 552 | | | $ | 719 | |
Ratios to average net assets: | |
Net investment income (loss) | | | (0.99 | %) | | | (0.97 | %) | | | (1.12 | %) | | | (1.53 | %) | | | (1.36 | %) | | | (1.58 | %) |
Total expenses | | | 1.61 | % | | | 1.67 | % | | | 1.85 | % | | | 1.87 | % | | | 1.85 | % | | | 1.86 | % |
Portfolio turnover rate | | | 207 | % | | | 520 | % | | | 495 | % | | | 472 | % | | | 442 | % | | | 380 | % |
a | Unaudited figures for the period ended September 30, 2016. Percentage amounts for the period, except total return and portfolio turnover rate, have been annualized. |
b | Net investment income (loss) per share was computed using average shares outstanding throughout the period. |
c | Total return does not reflect the impact of any applicable sales charges. |
d | Effective September 30, 2015, the Fund’s Advisor Class shares were converted into H-Class shares. The financial highlights for periods prior to that date reflect the performance of the former Advisor Class — See Note 8. |
84 | THE RYDEX FUNDS SEMI-ANNUAL REPORT | SEE NOTES TO FINANCIAL STATEMENTS. |
FUND PROFILE (Unaudited) | September 30, 2016 |
LEISURE FUND
OBJECTIVE: Seeks to provide capital appreciation by investing in companies engaged in leisure and entertainment businesses (“Leisure Companies”).
Holdings Diversification (Market Exposure as % of Net Assets)
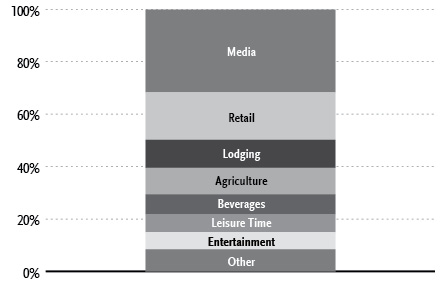
“Holdings Diversification (Market Exposure as % of Net Assets)” excludes any temporary cash investments.
Inception Dates: |
Investor Class | April 1, 1998 |
A-Class | September 1, 2004 |
C-Class | May 3, 2001 |
H-Class* | June 3, 1998 |
Ten Largest Holdings (% of Total Net Assets) |
Comcast Corp. — Class A | 3.8% |
Walt Disney Co. | 3.7% |
Philip Morris International, Inc. | 3.7% |
Altria Group, Inc. | 3.4% |
McDonald’s Corp. | 3.0% |
Charter Communications, Inc. — Class A | 2.8% |
Starbucks Corp. | 2.7% |
Reynolds American, Inc. | 2.5% |
Time Warner, Inc. | 2.5% |
Twenty-First Century Fox, Inc. — Class A | 2.1% |
Top Ten Total | 30.2% |
| | |
“Ten Largest Holdings” excludes any temporary cash investments. |
* | Effective September 30, 2015, the Fund’s Advisor Class shares were converted into H-Class shares — See Note 8. |
| | THE RYDEX FUNDS SEMI-ANNUAL REPORT | 85 |
SCHEDULE OF INVESTMENTS (Unaudited) | September 30, 2016 |
LEISURE FUND | |
| | | Shares | | | Value | |
| | | | | | | |
COMMON STOCKS† - 99.9% | |
| | | | | | | |
Media - 31.6% | |
Comcast Corp. — Class A | | | 11,205 | | | $ | 743,340 | |
Walt Disney Co. | | | 7,737 | | | | 718,457 | |
Charter Communications, Inc. — Class A* | | | 2,016 | | | | 544,260 | |
Time Warner, Inc. | | | 5,962 | | | | 474,635 | |
Twenty-First Century Fox, Inc. — Class A | | | 16,509 | | | | 399,848 | |
DISH Network Corp. — Class A* | | | 5,526 | | | | 302,714 | |
CBS Corp. — Class B | | | 5,435 | | | | 297,512 | |
Discovery Communications, Inc. — Class A* | | | 9,341 | | | | 251,461 | |
Viacom, Inc. — Class B | | | 6,122 | | | | 233,248 | |
Liberty Broadband Corp. — Class C* | | | 2,970 | | | | 212,296 | |
Liberty Media Corporation-Liberty SiriusXM — Class A* | | | 5,840 | | | | 198,443 | |
News Corp. — Class A | | | 12,232 | | | | 171,003 | |
Scripps Networks Interactive, Inc. — Class A | | | 2,674 | | | | 169,772 | |
Liberty Global plc* | | | 4,809 | | | | 158,889 | |
Tribune Media Co. — Class A | | | 3,900 | | | | 142,428 | |
Grupo Televisa SAB ADR | | | 5,170 | | | | 132,817 | |
TEGNA, Inc. | | | 5,939 | | | | 129,827 | |
AMC Networks, Inc. — Class A* | | | 2,220 | | | | 115,129 | |
Liberty Global plc LiLAC — Class C* | | | 3,701 | | | | 103,813 | |
Starz — Class A* | | | 3,297 | | | | 102,833 | |
Sinclair Broadcast Group, Inc. — Class A | | | 3,380 | | | | 97,614 | |
Media General, Inc.* | | | 5,000 | | | | 92,150 | |
Meredith Corp. | | | 1,740 | | | | 90,463 | |
Gannett Company, Inc. | | | 7,333 | | | | 85,356 | |
Nexstar Broadcasting Group, Inc. — Class A | | | 1,410 | | | | 81,371 | |
Time, Inc. | | | 4,845 | | | | 70,156 | |
Total Media | | | | | | | 6,119,835 | |
| | | | | | | | | |
Retail - 18.1% | |
McDonald’s Corp. | | | 5,039 | | | | 581,299 | |
Starbucks Corp. | | | 9,684 | | | | 524,292 | |
Yum! Brands, Inc. | | | 3,911 | | | | 355,158 | |
Chipotle Mexican Grill, Inc. — Class A* | | | 499 | | | | 211,327 | |
Darden Restaurants, Inc. | | | 2,643 | | | | 162,069 | |
Domino’s Pizza, Inc. | | | 1,044 | | | | 158,531 | |
Dunkin’ Brands Group, Inc. | | | 2,570 | | | | 133,846 | |
Panera Bread Co. — Class A* | | | 638 | | | | 124,231 | |
Restaurant Brands International, Inc. | | | 2,531 | | | | 112,832 | |
Jack in the Box, Inc. | | | 1,080 | | | | 103,615 | |
Cracker Barrel Old Country Store, Inc. | | | 770 | | | | 101,809 | |
Papa John’s International, Inc. | | | 1,284 | | | | 101,243 | |
Wendy’s Co. | | | 9,092 | | | | 98,194 | |
Brinker International, Inc. | | | 1,944 | | | | 98,036 | |
Texas Roadhouse, Inc. — Class A | | | 2,374 | | | | 92,657 | |
Cheesecake Factory, Inc. | | | 1,840 | | | | 92,110 | |
Buffalo Wild Wings, Inc.* | | | 637 | | | | 89,651 | |
Bloomin’ Brands, Inc. | | | 4,762 | | | | 82,097 | |
Dave & Buster’s Entertainment, Inc.* | | | 1,880 | | | | 73,658 | |
DineEquity, Inc. | | | 910 | | | | 72,063 | |
Shake Shack, Inc. — Class A* | | | 1,920 | | | | 66,566 | |
Sonic Corp. | | | 2,509 | | | | 65,686 | |
Total Retail | | | | | | | 3,500,970 | |
| | | | | | | | | |
Lodging - 10.7% | |
Las Vegas Sands Corp. | | | 6,867 | | | | 395,126 | |
Marriott International, Inc. — Class A | | | 5,798 | | | | 390,366 | |
Hilton Worldwide Holdings, Inc. | | | 12,230 | | | | 280,434 | |
MGM Resorts International* | | | 8,750 | | | | 227,763 | |
Wynn Resorts Ltd. | | | 1,811 | | | | 176,428 | |
Wyndham Worldwide Corp. | | | 2,361 | | | | 158,966 | |
Hyatt Hotels Corp. — Class A* | | | 2,990 | | | | 147,168 | |
Melco Crown Entertainment Ltd. ADR | | | 7,623 | | | | 122,807 | |
Boyd Gaming Corp.* | | | 4,573 | | | | 90,454 | |
Interval Leisure Group, Inc. | | | 5,114 | | | | 87,807 | |
Total Lodging | | | | | | | 2,077,319 | |
| | | | | | | | | |
Agriculture - 10.1% | |
Philip Morris International, Inc. | | | 7,341 | | | | 713,691 | |
Altria Group, Inc. | | | 10,342 | | | | 653,925 | |
Reynolds American, Inc. | | | 10,226 | | | | 482,156 | |
Vector Group Ltd. | | | 4,645 | | | | 100,013 | |
Total Agriculture | | | | | | | 1,949,785 | |
| | | | | | | | | |
Beverages - 7.5% | |
Constellation Brands, Inc. — Class A | | | 2,046 | | | | 340,639 | |
Molson Coors Brewing Co. — Class B | | | 2,685 | | | | 294,813 | |
Brown-Forman Corp. — Class B | | | 5,548 | | | | 263,197 | |
Anheuser-Busch InBev S.A. ADR | | | 1,443 | | | | 189,625 | |
Ambev S.A. ADR | | | 27,788 | | | | 169,229 | |
Diageo plc ADR | | | 1,000 | | | | 116,040 | |
Boston Beer Company, Inc. — Class A* | | | 520 | | | | 80,735 | |
Total Beverages | | | | | | | 1,454,278 | |
| | | | | | | | | |
Leisure Time - 6.9% | |
Carnival Corp. | | | 7,430 | | | | 362,733 | |
Royal Caribbean Cruises Ltd. | | | 3,342 | | | | 250,483 | |
Harley-Davidson, Inc. | | | 3,467 | | | | 182,330 | |
Norwegian Cruise Line Holdings Ltd.* | | | 4,670 | | | | 176,059 | |
Polaris Industries, Inc. | | | 1,770 | | | | 137,069 | |
Brunswick Corp. | | | 2,605 | | | | 127,072 | |
Vista Outdoor, Inc.* | | | 2,318 | | | | 92,395 | |
Total Leisure Time | | | | | | | 1,328,141 | |
| | | | | | | | | |
Entertainment - 6.6% | |
Gaming and Leisure Properties, Inc. | | | 4,662 | | | | 155,944 | |
Vail Resorts, Inc. | | | 880 | | | | 138,054 | |
Six Flags Entertainment Corp. | | | 2,480 | | | | 132,953 | |
International Game Technology plc | | | 5,380 | | | | 131,164 | |
Cinemark Holdings, Inc. | | | 3,226 | | | | 123,491 | |
Madison Square Garden Co. — Class A* | | | 703 | | | | 119,095 | |
Regal Entertainment Group — Class A | | | 4,980 | | | | 108,315 | |
Lions Gate Entertainment Corp. | | | 5,017 | | | | 100,290 | |
Marriott Vacations Worldwide Corp. | | | 1,121 | | | | 82,192 | |
SeaWorld Entertainment, Inc. | | | 4,970 | | | | 66,996 | |
Penn National Gaming, Inc.* | | | 4,647 | | | | 63,060 | |
86 | THE RYDEX FUNDS SEMI-ANNUAL REPORT | SEE NOTES TO FINANCIAL STATEMENTS. |
SCHEDULE OF INVESTMENTS (Unaudited)(concluded) | September 30, 2016 |
LEISURE FUND | |
| | | Shares | | | Value | |
| | | | | | | |
Pinnacle Entertainment, Inc.* | | | 4,126 | | | $ | 50,915 | |
Total Entertainment | | | | | | | 1,272,469 | |
| | | | | | | | | |
Software - 3.9% | |
Activision Blizzard, Inc. | | | 7,579 | | | | 335,750 | |
Electronic Arts, Inc.* | | | 3,510 | | | | 299,754 | |
Take-Two Interactive Software, Inc.* | | | 2,562 | | | | 115,495 | |
Total Software | | | | | | | 750,999 | |
| | | | | | | | | |
Toys, Games & Hobbies - 1.9% | |
Hasbro, Inc. | | | 2,372 | | | | 188,170 | |
Mattel, Inc. | | | 6,159 | | | | 186,495 | |
Total Toys, Games & Hobbies | | | | | | | 374,665 | |
| | | | | | | | | |
Commercial Services - 1.7% | |
Aramark | | | 4,746 | | | | 180,490 | |
Live Nation Entertainment, Inc.* | | | 5,164 | | | | 141,907 | |
Total Commercial Services | | | | | | | 322,397 | |
| | | | | | | | | |
Electronics - 0.5% | |
IMAX Corp.* | | | 3,508 | | | | 101,626 | |
| | | | | | | | | |
Miscellaneous Manufacturing - 0.4% | |
Smith & Wesson Holding Corp.* | | | 2,650 | | | | 70,464 | |
| | | | | | | | | |
Total Common Stocks | | | | | | | | |
(Cost $15,274,382) | | | | | | | 19,322,948 | |
| | | Face
Amount | | | | |
| | | | | | | |
REPURCHASE AGREEMENT††,1 - 0.0% | |
Royal Bank of Canada
issued 09/30/16 at 0.36%
due 10/03/16 | | $ | 299 | | | | 299 | |
Total Repurchase Agreement | | | | | | | | |
(Cost $299) | | | | | | | 299 | |
| | | | | | | | | |
Total Investments - 99.9% | | | | | | | | |
(Cost $15,274,681) | | | | | | $ | 19,323,247 | |
Other Assets & Liabilities, net - 0.1% | | | | | | | 20,046 | |
Total Net Assets - 100.0% | | | | | | $ | 19,343,293 | |
* | Non-income producing security. |
† | Value determined based on Level 1 inputs — See Note 4. |
†† | Value determined based on Level 2 inputs — See Note 4. |
1 | Repurchase Agreement — See Note 5. |
| | ADR — American Depositary Receipt |
| | plc — Public Limited Company |
| | |
| | See Sector Classification in Other Information section. |
The following table summarizes the inputs used to value the Fund’s investments at September 30, 2016 (See Note 4 in the Notes to Financial Statements):
Investments in Securities (Assets) | | Level 1 | | | Level 2 | | | Level 3 | | | Total | |
Common Stocks | | $ | 19,322,948 | | | $ | — | | | $ | — | | | $ | 19,322,948 | |
Repurchase Agreement | | | — | | | | 299 | | | | — | | | | 299 | |
Total | | $ | 19,322,948 | | | $ | 299 | | | $ | — | | | $ | 19,323,247 | |
Transfers between investment levels may occur as the markets fluctuate and/or the availability of data used in an investment’s valuation changes. Transfers between valuation levels, if any, are in comparison to the valuation levels at the end of the previous fiscal year, and are effective using the fair value as of the end of the previous fiscal period.
For the period ended September 30, 2016, there were no transfers between levels.
SEE NOTES TO FINANCIAL STATEMENTS. | THE RYDEX FUNDS SEMI-ANNUAL REPORT | 87 |
STATEMENT OF ASSETS AND LIABILITIES (Unaudited) |
September 30, 2016 |
Assets: | |
Investments, at value (cost $15,274,382) | | $ | 19,322,948 | |
Repurchase agreements, at value (cost $299) | | | 299 | |
Total investments (cost $15,274,681) | | | 19,323,247 | |
Receivables: | |
Fund shares sold | | | 15,591 | |
Dividends | | | 34,835 | |
Foreign taxes reclaim | | | 3,881 | |
Total assets | | | 19,377,554 | |
| | | | | |
Liabilities: | |
Overdraft due to custodian bank | | | 2,244 | |
Payable for: | |
Management fees | | | 14,582 | |
Transfer agent and administrative fees | | | 4,289 | |
Fund shares redeemed | | | 4,284 | |
Distribution and service fees | | | 2,639 | |
Portfolio accounting fees | | | 1,716 | |
Miscellaneous | | | 4,507 | |
Total liabilities | | | 34,261 | |
Commitments and contingent liabilities (Note 9) | | | — | |
Net assets | | $ | 19,343,293 | |
| | | | | |
Net assets consist of: | |
Paid in capital | | $ | 16,580,137 | |
Undistributed net investment income | | | 181,841 | |
Accumulated net realized loss on investments | | | (1,467,251 | ) |
Net unrealized appreciation on investments | | | 4,048,566 | |
Net assets | | $ | 19,343,293 | |
| | | | | |
Investor Class: | |
Net assets | | $ | 9,285,890 | |
Capital shares outstanding | | | 148,755 | |
Net asset value per share | | $ | 62.42 | |
| | | | | |
A-Class: | |
Net assets | | $ | 6,199,697 | |
Capital shares outstanding | | | 106,541 | |
Net asset value per share | | $ | 58.19 | |
Maximum offering price per share (Net asset value divided by 95.25%) | | $ | 61.09 | |
| | | | | |
C-Class: | |
Net assets | | $ | 1,160,503 | |
Capital shares outstanding | | | 21,776 | |
Net asset value per share | | $ | 53.29 | |
| | | | | |
H-Class: | |
Net assets | | $ | 2,697,203 | |
Capital shares outstanding | | | 47,531 | |
Net asset value per share | | $ | 56.75 | |
STATEMENT OF OPERATIONS (Unaudited) | |
Period Ended September 30, 2016 | |
Investment Income: | |
Dividends (net of foreign withholding tax of $2,154) | | $ | 232,496 | |
Interest | | | 110 | |
Total investment income | | | 232,607 | |
| | | | | |
Expenses: | |
Management fees | | | 100,779 | |
Transfer agent and administrative fees | | | 29,641 | |
Distribution and service fees: | |
A-Class | | | 9,340 | |
C-Class | | | 6,434 | |
H-Class | | | 4,780 | |
Portfolio accounting fees | | | 11,856 | |
Custodian fees | | | 1,393 | |
Trustees’ fees* | | | 943 | |
Line of credit fees | | | 45 | |
Miscellaneous | | | 17,310 | |
Total expenses | | | 182,521 | |
Net investment income | | | 50,086 | |
| | | | | |
Net Realized and Unrealized Gain (Loss): | |
Net realized gain (loss) on: | |
Investments | | | 3,871,041 | |
Net realized gain | | | 3,871,041 | |
Net change in unrealized appreciation (depreciation) on: | |
Investments | | | (3,555,477 | ) |
Net change in unrealized appreciation (depreciation) | | | (3,555,477 | ) |
Net realized and unrealized gain | | | 315,564 | |
Net increase in net assets resulting from operations | | $ | 365,650 | |
* | Relates to Trustees not deemed “interested persons” within the meaning of Section 2(a)(19) of the 1940 Act. |
88 | THE RYDEX FUNDS SEMI-ANNUAL REPORT | SEE NOTES TO FINANCIAL STATEMENTS. |
STATEMENTS OF CHANGES IN NET ASSETS |
| | | Period Ended
September 30,
2016
(Unaudited) | | | Year Ended
March 31,
2016 | |
Increase (Decrease) in Net Assets from Operations: | | | | | | |
Net investment income | | $ | 50,086 | | | $ | 131,755 | |
Net realized gain (loss) on investments | | | 3,871,041 | | | | (3,323,030 | ) |
Net change in unrealized appreciation (depreciation) on investments | | | (3,555,477 | ) | | | 84,303 | |
Net increase (decrease) in net assets resulting from operations | | | 365,650 | | | | (3,106,972 | ) |
| | | | | | | | | |
Distributions to shareholders from: | | | | | | | | |
Net investment income | | | | | | | | |
Investor Class | | | — | | | | (136,576 | ) |
A-Class | | | — | | | | (73,115 | ) |
C-Class | | | — | | | | (10,686 | ) |
H-Class | | | — | | | | (65,152 | )* |
Net realized gains | | | | | | | | |
Investor Class | | | — | | | | (46,005 | ) |
A-Class | | | — | | | | (24,629 | ) |
C-Class | | | — | | | | (3,600 | ) |
H-Class | | | — | | | | (21,946 | )* |
Total distributions to shareholders | | | — | | | | (381,709 | ) |
| | | | | | | | | |
Capital share transactions: | | | | | | | | |
Proceeds from sale of shares | | | | | | | | |
Investor Class | | | 20,816,026 | | | | 71,375,657 | |
A-Class | | | 5,782,299 | | | | 23,772,534 | |
C-Class | | | 37,202 | | | | 946,866 | |
H-Class | | | 15,304,191 | | | | 98,127,231 | * |
Distributions reinvested | | | | | | | | |
Investor Class | | | — | | | | 178,912 | |
A-Class | | | — | | | | 83,611 | |
C-Class | | | — | | | | 13,503 | |
H-Class | | | — | | | | 87,017 | * |
Cost of shares redeemed | | | | | | | | |
Investor Class | | | (26,925,902 | ) | | | (102,869,164 | ) |
A-Class | | | (7,702,844 | ) | | | (26,178,067 | ) |
C-Class | | | (244,668 | ) | | | (1,158,823 | ) |
H-Class | | | (25,817,050 | ) | | | (91,022,759 | )* |
Net decrease from capital share transactions | | | (18,750,746 | ) | | | (26,643,482 | ) |
Net decrease in net assets | | | (18,385,096 | ) | | | (30,132,163 | ) |
| | | | | | | | | |
Net assets: | | | | | | | | |
Beginning of period | | | 37,728,389 | | | | 67,860,552 | |
End of period | | $ | 19,343,293 | | | $ | 37,728,389 | |
Undistributed net investment income at end of period | | $ | 181,841 | | | $ | 131,755 | |
SEE NOTES TO FINANCIAL STATEMENTS. | THE RYDEX FUNDS SEMI-ANNUAL REPORT | 89 |
STATEMENTS OF CHANGES IN NET ASSETS (concluded) |
| | | Period Ended
September 30,
2016
(Unaudited) | | | Year Ended
March 31,
2016 | |
Capital share activity: | | | | | | |
Shares sold | | | | | | |
Investor Class | | | 336,226 | | | | 1,162,945 | |
A-Class | | | 100,541 | | | | 421,600 | |
C-Class | | | 710 | | | | 18,122 | |
H-Class | | | 275,036 | | | | 1,771,250 | * |
Shares issued from reinvestment of distributions | | | | | | | | |
Investor Class | | | — | | | | 2,989 | |
A-Class | | | — | | | | 1,495 | |
C-Class | | | — | | | | 262 | |
H-Class | | | — | | | | 1,596 | * |
Shares redeemed | | | | | | | | |
Investor Class | | | (434,743 | ) | | | (1,716,917 | ) |
A-Class | | | (133,502 | ) | | | (471,745 | ) |
C-Class | | | (4,628 | ) | | | (22,844 | ) |
H-Class | | | (464,078 | ) | | | (1,663,736 | )* |
Net decrease in shares | | | (324,438 | ) | | | (494,983 | ) |
* | Effective September 30, 2015, the Fund’s Advisor Class shares were converted into H-Class shares — See Note 8. |
90 | THE RYDEX FUNDS SEMI-ANNUAL REPORT | SEE NOTES TO FINANCIAL STATEMENTS. |
This table is presented to show selected data for a share outstanding throughout each period and to assist shareholders in evaluating a Fund’s performance for the periods presented.
Investor Class | | Period Ended
September 30,
2016a | | | Year Ended
March 31,
2016 | | | Year Ended
March 31,
2015 | | | Year Ended
March 31,
2014 | | | Year Ended
March 28,
2013 | | | Year Ended
March 31,
2012 | |
Per Share Data | | | | | | | | | | | | | | | | | | |
Net asset value, beginning of period | | $ | 61.36 | | | $ | 60.75 | | | $ | 55.81 | | | $ | 44.93 | | | $ | 36.94 | | | $ | 33.50 | |
Income (loss) from investment operations: | |
Net investment income (loss)b | | | .20 | | | | .22 | | | | .52 | | | | .20 | | | | .36 | | | | .17 | |
Net gain (loss) on investments (realized and unrealized) | | | .86 | | | | .82 | | | | 5.64 | | | | 10.95 | | | | 7.66 | | | | 3.27 | |
Total from investment operations | | | 1.06 | | | | 1.04 | | | | 6.16 | | | | 11.15 | | | | 8.02 | | | | 3.44 | |
Less distributions from: | |
Net investment income | | | — | | | | (.32 | ) | | | (.12 | ) | | | (.27 | ) | | | (.03 | ) | | | — | |
Net realized gains | | | — | | | | (.11 | ) | | | (1.10 | ) | | | — | | | | — | | | | — | |
Total distributions | | | — | | | | (.43 | ) | | | (1.22 | ) | | | (.27 | ) | | | (.03 | ) | | | — | |
Net asset value, end of period | | $ | 62.42 | | | $ | 61.36 | | | $ | 60.75 | | | $ | 55.81 | | | $ | 44.93 | | | $ | 36.94 | |
| | |
Total Returnc | | | 1.73 | % | | | 1.72 | % | | | 11.15 | % | | | 24.83 | % | | | 21.74 | % | | | 10.27 | % |
Ratios/Supplemental Data | |
Net assets, end of period (in thousands) | | $ | 9,286 | | | $ | 15,173 | | | $ | 48,494 | | | $ | 24,139 | | | $ | 22,005 | | | $ | 12,687 | |
Ratios to average net assets: | |
Net investment income (loss) | | | 0.64 | % | | | 0.35 | % | | | 0.89 | % | | | 0.39 | % | | | 0.92 | % | | | 0.49 | % |
Total expenses | | | 1.36 | % | | | 1.34 | % | | | 1.34 | % | | | 1.37 | % | | | 1.35 | % | | | 1.35 | % |
Portfolio turnover rate | | | 141 | % | | | 339 | % | | | 343 | % | | | 265 | % | | | 517 | % | | | 797 | % |
A-Class | | Period Ended
September 30,
2016a | | | Year Ended
March 31,
2016 | | | Year Ended
March 31,
2015 | | | Year Ended
March 31,
2014 | | | Year Ended
March 28,
2013 | | | Year Ended
March 31,
2012 | |
Per Share Data | | | | | | | | | | | | | | | | | | |
Net asset value, beginning of period | | $ | 57.27 | | | $ | 56.88 | | | $ | 52.46 | | | $ | 42.35 | | | $ | 34.91 | | | $ | 31.75 | |
Income (loss) from investment operations: | |
Net investment income (loss)b | | | .10 | | | | .08 | | | | .38 | | | | .04 | | | | .29 | | | | .07 | |
Net gain (loss) on investments (realized and unrealized) | | | .82 | | | | .74 | | | | 5.26 | | | | 10.34 | | | | 7.18 | | | | 3.09 | |
Total from investment operations | | | .92 | | | | .82 | | | | 5.64 | | | | 10.38 | | | | 7.47 | | | | 3.16 | |
Less distributions from: | |
Net investment income | | | — | | | | (.32 | ) | | | (.12 | ) | | | (.27 | ) | | | (.03 | ) | | | — | |
Net realized gains | | | — | | | | (.11 | ) | | | (1.10 | ) | | | — | | | | — | | | | — | |
Total distributions | | | — | | | | (.43 | ) | | | (1.22 | ) | | | (.27 | ) | | | (.03 | ) | | | — | |
Net asset value, end of period | | $ | 58.19 | | | $ | 57.27 | | | $ | 56.88 | | | $ | 52.46 | | | $ | 42.35 | | | $ | 34.91 | |
| | |
Total Returnc | | | 1.61 | % | | | 1.45 | % | | | 10.86 | % | | | 24.53 | % | | | 21.42 | % | | | 9.95 | % |
Ratios/Supplemental Data | |
Net assets, end of period (in thousands) | | $ | 6,200 | | | $ | 7,990 | | | $ | 10,703 | | | $ | 1,778 | | | $ | 1,409 | | | $ | 448 | |
Ratios to average net assets: | |
Net investment income (loss) | | | 0.35 | % | | | 0.15 | % | | | 0.69 | % | | | 0.09 | % | | | 0.80 | % | | | 0.23 | % |
Total expenses | | | 1.61 | % | | | 1.60 | % | | | 1.58 | % | | | 1.62 | % | | | 1.60 | % | | | 1.60 | % |
Portfolio turnover rate | | | 141 | % | | | 339 | % | | | 343 | % | | | 265 | % | | | 517 | % | | | 797 | % |
SEE NOTES TO FINANCIAL STATEMENTS. | THE RYDEX FUNDS SEMI-ANNUAL REPORT | 91 |
FINANCIAL HIGHLIGHTS (concluded) |
This table is presented to show selected data for a share outstanding throughout each period and to assist shareholders in evaluating a Fund’s performance for the periods presented.
C-Class | | Period Ended
September 30,
2016a | | | Year Ended
March 31,
2016 | | | Year Ended
March 31,
2015 | | | Year Ended
March 31,
2014 | | | Year Ended
March 28,
2013 | | | Year Ended
March 31,
2012 | |
Per Share Data | | | | | | | | | | | | | | | | | | |
Net asset value, beginning of period | | $ | 52.65 | | | $ | 52.72 | | | $ | 49.07 | | | $ | 39.92 | | | $ | 33.16 | | | $ | 30.36 | |
Income (loss) from investment operations: | |
Net investment income (loss)b | | | (.10 | ) | | | (.28 | ) | | | (.19 | ) | | | (.27 | ) | | | .01 | | | | (.15 | ) |
Net gain (loss) on investments (realized and unrealized) | | | .74 | | | | .64 | | | | 5.06 | | | | 9.69 | | | | 6.78 | | | | 2.95 | |
Total from investment operations | | | .64 | | | | .36 | | | | 4.87 | | | | 9.42 | | | | 6.79 | | | | 2.80 | |
Less distributions from: | |
Net investment income | | | — | | | | (.32 | ) | | | (.12 | ) | | | (.27 | ) | | | (.03 | ) | | | — | |
Net realized gains | | | — | | | | (.11 | ) | | | (1.10 | ) | | | — | | | | — | | | | — | |
Total distributions | | | — | | | | (.43 | ) | | | (1.22 | ) | | | (.27 | ) | | | (.03 | ) | | | — | |
Net asset value, end of period | | $ | 53.29 | | | $ | 52.65 | | | $ | 52.72 | | | $ | 49.07 | | | $ | 39.92 | | | $ | 33.16 | |
| | |
Total Returnc | | | 1.22 | % | | | 0.69 | % | | | 10.04 | % | | | 23.61 | % | | | 20.54 | % | | | 9.19 | % |
Ratios/Supplemental Data | |
Net assets, end of period (in thousands) | | $ | 1,161 | | | $ | 1,353 | | | $ | 1,590 | | | $ | 1,460 | | | $ | 928 | | | $ | 1,345 | |
Ratios to average net assets: | |
Net investment income (loss) | | | (0.39 | %) | | | (0.54 | %) | | | (0.37 | %) | | | (0.59 | %) | | | 0.03 | % | | | (0.50 | %) |
Total expenses | | | 2.36 | % | | | 2.35 | % | | | 2.35 | % | | | 2.37 | % | | | 2.35 | % | | | 2.35 | % |
Portfolio turnover rate | | | 141 | % | | | 339 | % | | | 343 | % | | | 265 | % | | | 517 | % | | | 797 | % |
H-Class | | Period Ended
September 30,
2016a | | | Year Ended
March 31,
2016d | | | Year Ended
March 31,
2015d | | | Year Ended
March 31,
2014d | | | Year Ended
March 28,
2013d | | | Year Ended
March 31,
2012d | |
Per Share Data | | | | | | | | | | | | | | | | | | |
Net asset value, beginning of period | | $ | 55.85 | | | $ | 55.50 | | | $ | 51.31 | | | $ | 41.54 | | | $ | 34.33 | | | $ | 31.29 | |
Income (loss) from investment operations: | |
Net investment income (loss)b | | | .06 | | | | .27 | | | | .30 | | | | (.11 | ) | | | .29 | | | | (.01 | ) |
Net gain (loss) on investments (realized and unrealized) | | | .84 | | | | .51 | | | | 5.11 | | | | 10.15 | | | | 6.95 | | | | 3.05 | |
Total from investment operations | | | .90 | | | | .78 | | | | 5.41 | | | | 10.04 | | | | 7.24 | | | | 3.04 | |
Less distributions from: | |
Net investment income | | | — | | | | (.32 | ) | | | (.12 | ) | | | (.27 | ) | | | (.03 | ) | | | — | |
Net realized gains | | | — | | | | (.11 | ) | | | (1.10 | ) | | | — | | | | — | | | | — | |
Total distributions | | | — | | | | (.43 | ) | | | (1.22 | ) | | | (.27 | ) | | | (.03 | ) | | | — | |
Net asset value, end of period | | $ | 56.75 | | | $ | 55.85 | | | $ | 55.50 | | | $ | 51.31 | | | $ | 41.54 | | | $ | 34.33 | |
| | |
Total Returnc | | | 1.59 | % | | | 1.41 | % | | | 10.66 | % | | | 24.18 | % | | | 21.12 | % | | | 9.72 | % |
Ratios/Supplemental Data | |
Net assets, end of period (in thousands) | | $ | 2,697 | | | $ | 13,212 | | | $ | 7,074 | | | $ | 3,115 | | | $ | 1,241 | | | $ | 1,379 | |
Ratios to average net assets: | |
Net investment income (loss) | | | 0.21 | % | | | 0.49 | % | | | 0.55 | % | | | (0.23 | %) | | | 0.80 | % | | | (0.03 | %) |
Total expenses | | | 1.61 | % | | | 1.64 | % | | | 1.83 | % | | | 1.87 | % | | | 1.85 | % | | | 1.86 | % |
Portfolio turnover rate | | | 141 | % | | | 339 | % | | | 343 | % | | | 265 | % | | | 517 | % | | | 797 | % |
a | Unaudited figures for the period ended September 30, 2016. Percentage amounts for the period, except total return and portfolio turnover rate, have been annualized. |
b | Net investment income (loss) per share was computed using average shares outstanding throughout the period. |
c | Total return does not reflect the impact of any applicable sales charges. |
d | Effective September 30, 2015, the Fund’s Advisor Class shares were converted into H-Class shares. The financial highlights for periods prior to that date reflect the performance of the former Advisor Class — See Note 8. |
92 | THE RYDEX FUNDS SEMI-ANNUAL REPORT | SEE NOTES TO FINANCIAL STATEMENTS. |
FUND PROFILE (Unaudited) | September 30, 2016 |
PRECIOUS METALS FUND
OBJECTIVE: Seeks to provide capital appreciation by investing in U.S. and foreign companies that are involved in the precious metals sector, including exploration, mining, production and development, and other precious metals related services (“Precious Metals Companies”).
Holdings Diversification (Market Exposure as % of Net Assets)

“Holdings Diversification (Market Exposure as % of Net Assets)” excludes any temporary cash investments.
Inception Dates: |
Investor Class | December 1, 1993 |
A-Class | September 1, 2004 |
C-Class | April 27, 2001 |
H-Class* | August 1, 2003 |
Ten Largest Holdings (% of Total Net Assets) |
Newmont Mining Corp. | 6.2% |
Barrick Gold Corp. | 6.1% |
Freeport-McMoRan, Inc. | 5.4% |
Goldcorp, Inc. | 5.2% |
Agnico Eagle Mines Ltd. | 4.8% |
Franco-Nevada Corp. | 4.7% |
Silver Wheaton Corp. | 4.7% |
Randgold Resources Ltd. ADR | 4.2% |
VanEck Vectors Junior Gold Miners ETF | 3.9% |
AngloGold Ashanti Ltd. ADR | 3.5% |
Top Ten Total | 48.7% |
| | |
“Ten Largest Holdings” excludes any temporary cash investments. |
* | Effective September 30, 2015, the Fund’s Advisor Class shares were converted into H-Class shares — See Note 8. |
| | THE RYDEX FUNDS SEMI-ANNUAL REPORT | 93 |
SCHEDULE OF INVESTMENTS (Unaudited) | September 30, 2016 |
PRECIOUS METALS FUND | |
| | | Shares | | | Value | |
| | | | | | | |
COMMON STOCKS† - 95.6% | |
| | | | | | | |
Mining - 95.6% | |
Newmont Mining Corp. | | | 176,139 | | | $ | 6,920,500 | |
Barrick Gold Corp. | | | 387,461 | | | | 6,865,808 | |
Freeport-McMoRan, Inc. | | | 557,619 | | | | 6,055,742 | |
Goldcorp, Inc. | | | 351,233 | | | | 5,802,369 | |
Agnico Eagle Mines Ltd. | | | 99,641 | | | | 5,398,549 | |
Franco-Nevada Corp. | | | 75,350 | | | | 5,264,705 | |
Silver Wheaton Corp. | | | 193,432 | | | | 5,228,467 | |
Randgold Resources Ltd. ADR | | | 46,825 | | | | 4,685,778 | |
AngloGold Ashanti Ltd. ADR* | | | 244,085 | | | | 3,885,833 | |
Kinross Gold Corp.* | | | 830,362 | | | | 3,495,824 | |
Royal Gold, Inc. | | | 44,453 | | | | 3,441,996 | |
Gold Fields Ltd. ADR | | | 621,859 | | | | 3,016,016 | |
Yamana Gold, Inc. | | | 694,875 | | | | 2,994,911 | |
Tahoe Resources, Inc. | | | 232,502 | | | | 2,983,001 | |
Cia de Minas Buenaventura S.A.A. ADR* | | | 210,862 | | | | 2,918,330 | |
Sibanye Gold Ltd. ADR | | | 192,526 | | | | 2,720,392 | |
Eldorado Gold Corp.* | | | 658,684 | | | | 2,588,628 | |
Pan American Silver Corp. | | | 142,111 | | | | 2,503,996 | |
B2Gold Corp.* | | | 910,204 | | | | 2,393,837 | |
Hecla Mining Co. | | | 397,924 | | | | 2,268,167 | |
New Gold, Inc.* | | | 514,919 | | | | 2,239,898 | |
Alamos Gold, Inc. — Class A | | | 268,455 | | | | 2,201,331 | |
Novagold Resources, Inc.* | | | 374,001 | | | | 2,094,406 | |
Coeur Mining, Inc.* | | | 173,783 | | | | 2,055,853 | |
IAMGOLD Corp.* | | | 506,154 | | | | 2,049,924 | |
Pretium Resources, Inc.* | | | 197,317 | | | | 2,026,446 | |
Stillwater Mining Co.* | | | 151,374 | | | | 2,022,357 | |
Harmony Gold Mining Company Ltd. ADR | | | 547,046 | | | | 1,909,191 | |
First Majestic Silver Corp.* | | | 178,911 | | | | 1,842,783 | |
Silver Standard Resources, Inc.* | | | 148,774 | | | | 1,794,214 | |
Sandstorm Gold Ltd.* | | | 248,585 | | | | 1,250,383 | |
Seabridge Gold, Inc.* | | | 105,979 | | | | 1,168,948 | |
McEwen Mining, Inc. | | | 216,660 | | | | 795,142 | |
Fortuna Silver Mines, Inc.* | | | 104,320 | | | | 755,277 | |
Richmont Mines, Inc.* | | | 61,870 | | | | 621,794 | |
Endeavour Silver Corp.* | | | 120,500 | | | | 618,165 | |
AuRico Metals, Inc.* | | | 5 | | | | 4 | |
Total Mining | | | | | | | 106,878,965 | |
| | | | | | | | | |
Total Common Stocks | | | | | | | | |
(Cost $63,588,526) | | | | | | | 106,878,965 | |
| | | | | | | | | |
EXCHANGE-TRADED FUND† - 3.9% | |
VanEck Vectors Junior Gold Miners ETF | | | 98,923 | | | | 4,381,300 | |
Total Exchange-Traded Fund | | | | | | | | |
(Cost $2,228,620) | | | | | | | 4,381,300 | |
| | | | | | | | | |
| | | Face
Amount | | | | | |
| | | | | | | | | |
REPURCHASE AGREEMENT††,1 - 0.0% | |
Royal Bank of Canada
issued 09/30/16 at 0.36%
due 10/03/16 | | $ | 47 | | | | 47 | |
Total Repurchase Agreement | | | | | | | | |
(Cost $47) | | | | | | | 47 | |
| | | | | | | | | |
Total Investments - 99.5% | | | | | | | | |
(Cost $65,817,193) | | | | | | $ | 111,260,312 | |
Other Assets & Liabilities, net - 0.5% | | | | | | | 529,860 | |
Total Net Assets - 100.0% | | | | | | $ | 111,790,172 | |
* | Non-income producing security. |
† | Value determined based on Level 1 inputs — See Note 4. |
†† | Value determined based on Level 2 inputs — See Note 4. |
1 | Repurchase Agreement — See Note 5. |
| | ADR — American Depositary Receipt |
| | |
| | See Sector Classification in Other Information section. |
The following table summarizes the inputs used to value the Fund’s investments at September 30, 2016 (See Note 4 in the Notes to Financial Statements):
Investments in Securities (Assets) | | Level 1 | | | Level 2 | | | Level 3 | | | Total | |
Common Stocks | | $ | 106,878,965 | | | $ | — | | | $ | — | | | $ | 106,878,965 | |
Exchange-Traded Fund | | | 4,381,300 | | | | — | | | | — | | | | 4,381,300 | |
Repurchase Agreement | | | — | | | | 47 | | | | — | | | | 47 | |
Total | | $ | 111,260,265 | | | $ | 47 | | | $ | — | | | $ | 111,260,312 | |
Transfers between investment levels may occur as the markets fluctuate and/or the availability of data used in an investment’s valuation changes. Transfers between valuation levels, if any, are in comparison to the valuation levels at the end of the previous fiscal year, and are effective using the fair value as of the end of the previous fiscal period.
For the period ended September 30, 2016, there were no transfers between levels.
94 | THE RYDEX FUNDS SEMI-ANNUAL REPORT | SEE NOTES TO FINANCIAL STATEMENTS. |
STATEMENT OF ASSETS AND LIABILITIES (Unaudited) |
September 30, 2016 |
Assets: | |
Investments, at value (cost $65,817,146) | | $ | 111,260,265 | |
Repurchase agreements, at value (cost $47) | | | 47 | |
Total investments (cost $65,817,193) | | | 111,260,312 | |
Receivables: | |
Securities sold | | | 28,647,499 | |
Fund shares sold | | | 1,247,505 | |
Dividends | | | 58,834 | |
Total assets | | | 141,214,150 | |
| | | | | |
Liabilities: | |
Overdraft due to custodian bank | | | 274,000 | |
Payable for: | |
Fund shares redeemed | | | 28,986,890 | |
Management fees | | | 80,518 | |
Transfer agent and administrative fees | | | 26,839 | |
Distribution and service fees | | | 11,334 | |
Portfolio accounting fees | | | 10,736 | |
Miscellaneous | | | 33,661 | |
Total liabilities | | | 29,423,978 | |
Commitments and contingent liabilities (Note 9) | | | — | |
Net assets | | $ | 111,790,172 | |
| | | | | |
Net assets consist of: | |
Paid in capital | | $ | 124,077,392 | |
Accumulated net investment loss | | | (486,573 | ) |
Accumulated net realized loss on investments | | | (57,243,766 | ) |
Net unrealized appreciation on investments | | | 45,443,119 | |
Net assets | | $ | 111,790,172 | |
| | | | | |
Investor Class: | |
Net assets | | $ | 85,948,160 | |
Capital shares outstanding | | | 2,333,919 | |
Net asset value per share | | $ | 36.83 | |
| | | | | |
A-Class: | |
Net assets | | $ | 12,210,128 | |
Capital shares outstanding | | | 344,379 | |
Net asset value per share | | $ | 35.46 | |
Maximum offering price per share (Net asset value divided by 95.25%) | | $ | 37.22 | |
| | | | | |
C-Class: | |
Net assets | | $ | 8,826,473 | |
Capital shares outstanding | | | 281,982 | |
Net asset value per share | | $ | 31.30 | |
| | | | | |
H-Class: | |
Net assets | | $ | 4,805,411 | |
Capital shares outstanding | | | 139,427 | |
Net asset value per share | | $ | 34.47 | |
STATEMENT OF OPERATIONS (Unaudited) | |
Period Ended September 30, 2016 | |
Investment Income: | |
Dividends (net of foreign withholding tax of $22,744) | | $ | 243,139 | |
Interest | | | 944 | |
Total investment income | | | 244,083 | |
| | | | | |
Expenses: | |
Management fees | | | 436,357 | |
Transfer agent and administrative fees | | | 145,453 | |
Distribution and service fees: | |
A-Class | | | 15,739 | |
C-Class | | | 45,418 | |
H-Class | | | 8,575 | |
Portfolio accounting fees | | | 58,180 | |
Custodian fees | | | 6,900 | |
Trustees’ fees* | | | 4,459 | |
Line of credit fees | | | 81 | |
Miscellaneous | | | 85,217 | |
Total expenses | | | 806,379 | |
Net investment loss | | | (562,296 | ) |
| | | | | |
Net Realized and Unrealized Gain (Loss): | |
Net realized gain (loss) on: | |
Investments | | | 4,708,279 | |
Net realized gain | | | 4,708,279 | |
Net change in unrealized appreciation (depreciation) on: | |
Investments | | | 22,679,643 | |
Net change in unrealized appreciation (depreciation) | | | 22,679,643 | |
Net realized and unrealized gain | | | 27,387,922 | |
Net increase in net assets resulting from operations | | $ | 26,825,626 | |
* | Relates to Trustees not deemed “interested persons” within the meaning of Section 2(a)(19) of the 1940 Act. |
SEE NOTES TO FINANCIAL STATEMENTS. | THE RYDEX FUNDS SEMI-ANNUAL REPORT | 95 |
STATEMENTS OF CHANGES IN NET ASSETS |
| | | Period Ended
September 30,
2016
(Unaudited) | | | Year Ended
March 31,
2016 | |
Increase (Decrease) in Net Assets from Operations: | | | | | | |
Net investment loss | | $ | (562,296 | ) | | $ | (184,033 | ) |
Net realized gain (loss) on investments | | | 4,708,279 | | | | (7,581,988 | ) |
Net change in unrealized appreciation (depreciation) on investments | | | 22,679,643 | | | | 12,729,730 | |
Net increase in net assets resulting from operations | | | 26,825,626 | | | | 4,963,709 | |
| | | | | | | | | |
Distributions to shareholders from: | | | | | | | | |
Net investment income | | | | | | | | |
Investor Class | | | — | | | | (126,920 | ) |
A-Class | | | — | | | | (12,863 | ) |
C-Class | | | — | | | | (26,376 | ) |
H-Class | | | — | | | | (17,754 | )* |
Total distributions to shareholders | | | — | | | | (183,913 | ) |
| | | | | | | | | |
Capital share transactions: | | | | | | | | |
Proceeds from sale of shares | | | | | | | | |
Investor Class | | | 324,961,954 | | | | 253,246,357 | |
A-Class | | | 23,074,451 | | | | 32,975,820 | |
C-Class | | | 6,480,585 | | | | 11,345,908 | |
H-Class | | | 40,034,903 | | | | 219,344,787 | * |
Distributions reinvested | | | | | | | | |
Investor Class | | | — | | | | 121,222 | |
A-Class | | | — | | | | 9,017 | |
C-Class | | | — | | | | 26,086 | |
H-Class | | | — | | | | 17,751 | * |
Cost of shares redeemed | | | | | | | | |
Investor Class | | | (309,709,964 | ) | | | (238,675,293 | ) |
A-Class | | | (16,939,813 | ) | | | (34,545,272 | ) |
C-Class | | | (6,540,930 | ) | | | (10,512,858 | ) |
H-Class | | | (38,809,349 | ) | | | (225,166,382 | )* |
Net increase from capital share transactions | | | 22,551,837 | | | | 8,187,143 | |
Net increase in net assets | | | 49,377,463 | | | | 12,966,939 | |
| | | | | | | | | |
Net assets: | | | | | | | | |
Beginning of period | | | 62,412,709 | | | | 49,445,770 | |
End of period | | $ | 111,790,172 | | | $ | 62,412,709 | |
Accumulated net investment loss/Undistributed net investment income at end of period | | $ | (486,573 | ) | | $ | 75,723 | |
| | | | | | | | | |
Capital share activity: | | | | | | | | |
Shares sold | | | | | | | | |
Investor Class | | | 8,753,241 | | | | 11,832,927 | |
A-Class | | | 668,340 | | | | 1,496,099 | |
C-Class | | | 206,851 | | | | 599,391 | |
H-Class | | | 1,252,819 | | | | 10,896,192 | * |
Shares issued from reinvestment of distributions | | | | | | | | |
Investor Class | | | — | | | | 6,994 | |
A-Class | | | — | | | | 540 | |
C-Class | | | — | | | | 1,755 | |
H-Class | | | — | | | | 1,092 | * |
Shares redeemed | | | | | | | | |
Investor Class | | | (8,221,281 | ) | | | (11,253,817 | ) |
A-Class | | | (464,591 | ) | | | (1,558,936 | ) |
C-Class | | | (216,773 | ) | | | (567,160 | ) |
H-Class | | | (1,213,048 | ) | | | (11,153,001 | )* |
Net increase in shares | | | 765,558 | | | | 302,076 | |
* | Effective September 30, 2015, the Fund’s Advisor Class shares were converted into H-Class shares — See Note 8. |
96 | THE RYDEX FUNDS SEMI-ANNUAL REPORT | SEE NOTES TO FINANCIAL STATEMENTS. |
This table is presented to show selected data for a share outstanding throughout each period and to assist shareholders in evaluating a Fund’s performance for the periods presented.
Investor Class | | Period Ended
September 30,
2016a | | | Year Ended
March 31,
2016 | | | Year Ended
March 31,
2015 | | | Year Ended
March 31,
2014 | | | Year Ended
March 28,
2013 | | | Year Ended
March 31,
2012 | |
Per Share Data | | | | | | | | | | | | | | | | | | |
Net asset value, beginning of period | | $ | 27.37 | | | $ | 25.11 | | | $ | 35.78 | | | $ | 51.65 | | | $ | 65.73 | | | $ | 86.74 | |
Income (loss) from investment operations: | |
Net investment income (loss)b | | | (.16 | ) | | | (.07 | ) | | | .01 | | | | .36 | | | | .34 | | | | (.02 | ) |
Net gain (loss) on investments (realized and unrealized) | | | 9.62 | | | | 2.44 | | | | (9.88 | ) | | | (16.06 | ) | | | (12.12 | ) | | | (20.70 | ) |
Total from investment operations | | | 9.46 | | | | 2.37 | | | | (9.87 | ) | | | (15.70 | ) | | | (11.78 | ) | | | (20.72 | ) |
Less distributions from: | |
Net investment income | | | — | | | | (.11 | ) | | | (.80 | ) | | | (.17 | ) | | | (.10 | ) | | | (.29 | ) |
Net realized gains | | | — | | | | — | | | | — | | | | — | | | | (2.20 | ) | | | — | |
Total distributions | | | — | | | | (.11 | ) | | | (.80 | ) | | | (.17 | ) | | | (2.30 | ) | | | (.29 | ) |
Net asset value, end of period | | $ | 36.83 | | | $ | 27.37 | | | $ | 25.11 | | | $ | 35.78 | | | $ | 51.65 | | | $ | 65.73 | |
| | |
Total Returnc | | | 34.53 | % | | | 9.67 | % | | | (27.88 | %) | | | (30.37 | %) | | | (18.60 | %) | | | (23.91 | %) |
Ratios/Supplemental Data | |
Net assets, end of period (in thousands) | | $ | 85,948 | | | $ | 49,321 | | | $ | 30,528 | | | $ | 42,846 | | | $ | 71,386 | | | $ | 79,637 | |
Ratios to average net assets: | |
Net investment income (loss) | | | (0.84 | %) | | | (0.31 | %) | | | 0.04 | % | | | 0.96 | % | | | 0.55 | % | | | (0.03 | %) |
Total expensesd | | | 1.26 | % | | | 1.25 | % | | | 1.25 | % | | | 1.27 | % | | | 1.25 | % | | | 1.26 | % |
Portfolio turnover rate | | | 217 | % | | | 797 | % | | | 371 | % | | | 348 | % | | | 206 | % | | | 235 | % |
A-Class | | Period Ended
September 30,
2016a | | | Year Ended
March 31,
2016 | | | Year Ended
March 31,
2015 | | | Year Ended
March 31,
2014 | | | Year Ended
March 28,
2013 | | | Year Ended
March 31,
2012 | |
Per Share Data | | | | | | | | | | | | | | | | | | |
Net asset value, beginning of period | | $ | 26.39 | | | $ | 24.28 | | | $ | 34.75 | | | $ | 50.28 | | | $ | 64.21 | | | $ | 84.97 | |
Income (loss) from investment operations: | |
Net investment income (loss)b | | | (.20 | ) | | | (.12 | ) | | | (.10 | ) | | | .16 | | | | .21 | | | | (.22 | ) |
Net gain (loss) on investments (realized and unrealized) | | | 9.27 | | | | 2.34 | | | | (9.57 | ) | | | (15.52 | ) | | | (11.84 | ) | | | (20.25 | ) |
Total from investment operations | | | 9.07 | | | | 2.22 | | | | (9.67 | ) | | | (15.36 | ) | | | (11.63 | ) | | | (20.47 | ) |
Less distributions from: | |
Net investment income | | | — | | | | (.11 | ) | | | (.80 | ) | | | (.17 | ) | | | (.10 | ) | | | (.29 | ) |
Net realized gains | | | — | | | | — | | | | — | | | | — | | | | (2.20 | ) | | | — | |
Total distributions | | | — | | | | (.11 | ) | | | (.80 | ) | | | (.17 | ) | | | (2.30 | ) | | | (.29 | ) |
Net asset value, end of period | | $ | 35.46 | | | $ | 26.39 | | | $ | 24.28 | | | $ | 34.75 | | | $ | 50.28 | | | $ | 64.21 | |
| | |
Total Returnc | | | 34.33 | % | | | 9.38 | % | | | (28.13 | %) | | | (30.52 | %) | | | (18.80 | %) | | | (24.13 | %) |
Ratios/Supplemental Data | |
Net assets, end of period (in thousands) | | $ | 12,210 | | | $ | 3,711 | | | $ | 4,928 | | | $ | 5,235 | | | $ | 5,988 | | | $ | 6,412 | |
Ratios to average net assets: | |
Net investment income (loss) | | | (1.10 | %) | | | (0.54 | %) | | | (0.29 | %) | | | 0.45 | % | | | 0.35 | % | | | (0.30 | %) |
Total expensesd | | | 1.51 | % | | | 1.50 | % | | | 1.50 | % | | | 1.52 | % | | | 1.50 | % | | | 1.51 | % |
Portfolio turnover rate | | | 217 | % | | | 797 | % | | | 371 | % | | | 348 | % | | | 206 | % | | | 235 | % |
SEE NOTES TO FINANCIAL STATEMENTS. | THE RYDEX FUNDS SEMI-ANNUAL REPORT | 97 |
FINANCIAL HIGHLIGHTS (concluded) |
This table is presented to show selected data for a share outstanding throughout each period and to assist shareholders in evaluating a Fund’s performance for the periods presented.
C-Class | | Period Ended
September 30,
2016a | | | Year Ended
March 31,
2016 | | | Year Ended
March 31,
2015 | | | Year Ended
March 31,
2014 | | | Year Ended
March 28,
2013 | | | Year Ended
March 31,
2012 | |
Per Share Data | | | | | | | | | | | | | | | | | | |
Net asset value, beginning of period | | $ | 23.38 | | | $ | 21.67 | | | $ | 31.34 | | | $ | 45.72 | | | $ | 59.02 | | | $ | 78.70 | |
Income (loss) from investment operations: | |
Net investment income (loss)b | | | (.29 | ) | | | (.26 | ) | | | (.29 | ) | | | (.07 | ) | | | (.23 | ) | | | (.72 | ) |
Net gain (loss) on investments (realized and unrealized) | | | 8.21 | | | | 2.08 | | | | (8.58 | ) | | | (14.14 | ) | | | (10.77 | ) | | | (18.67 | ) |
Total from investment operations | | | 7.92 | | | | 1.82 | | | | (8.87 | ) | | | (14.21 | ) | | | (11.00 | ) | | | (19.39 | ) |
Less distributions from: | |
Net investment income | | | — | | | | (.11 | ) | | | (.80 | ) | | | (.17 | ) | | | (.10 | ) | | | (.29 | ) |
Net realized gains | | | — | | | | — | | | | — | | | | — | | | | (2.20 | ) | | | — | |
Total distributions | | | — | | | | (.11 | ) | | | (.80 | ) | | | (.17 | ) | | | (2.30 | ) | | | (.29 | ) |
Net asset value, end of period | | $ | 31.30 | | | $ | 23.38 | | | $ | 21.67 | | | $ | 31.34 | | | $ | 45.72 | | | $ | 59.02 | |
| | |
Total Returnc | | | 33.88 | % | | | 8.66 | % | | | (28.64 | %) | | | (31.05 | %) | | | (19.39 | %) | | | (24.68 | %) |
Ratios/Supplemental Data | |
Net assets, end of period (in thousands) | | $ | 8,826 | | | $ | 6,825 | | | $ | 5,590 | | | $ | 9,250 | | | $ | 18,608 | | | $ | 26,533 | |
Ratios to average net assets: | |
Net investment income (loss) | | | (1.86 | %) | | | (1.34 | %) | | | (0.99 | %) | | | (0.22 | %) | | | (0.42 | %) | | | (1.04 | %) |
Total expensesd | | | 2.26 | % | | | 2.25 | % | | | 2.25 | % | | | 2.27 | % | | | 2.25 | % | | | 2.26 | % |
Portfolio turnover rate | | | 217 | % | | | 797 | % | | | 371 | % | | | 348 | % | | | 206 | % | | | 235 | % |
H-Class | | Period Ended
September 30,
2016a | | | Year Ended
March 31,
2016e | | | Year Ended
March 31,
2015e | | | Year Ended
March 31,
2014e | | | Year Ended
March 28,
2013e | | | Year Ended
March 31,
2012e | |
Per Share Data | | | | | | | | | | | | | | | | | | |
Net asset value, beginning of period | | $ | 25.64 | | | $ | 23.64 | | | $ | 33.92 | | | $ | 49.20 | | | $ | 63.02 | | | $ | 83.59 | |
Income (loss) from investment operations: | |
Net investment income (loss)b | | | (.20 | ) | | | (.11 | ) | | | (.14 | ) | | | .12 | | | | (.02 | ) | | | (.44 | ) |
Net gain (loss) on investments (realized and unrealized) | | | 9.03 | | | | 2.22 | | | | (9.34 | ) | | | (15.23 | ) | | | (11.50 | ) | | | (19.84 | ) |
Total from investment operations | | | 8.83 | | | | 2.11 | | | | (9.48 | ) | | | (15.11 | ) | | | (11.52 | ) | | | (20.28 | ) |
Less distributions from: | |
Net investment income | | | — | | | | (.11 | ) | | | (.80 | ) | | | (.17 | ) | | | (.10 | ) | | | (.29 | ) |
Net realized gains | | | — | | | | — | | | | — | | | | — | | | | (2.20 | ) | | | — | |
Total distributions | | | — | | | | (.11 | ) | | | (.80 | ) | | | (.17 | ) | | | (2.30 | ) | | | (.29 | ) |
Net asset value, end of period | | $ | 34.47 | | | $ | 25.64 | | | $ | 23.64 | | | $ | 33.92 | | | $ | 49.20 | | | $ | 63.02 | |
| | |
Total Returnc | | | 34.40 | % | | | 9.17 | % | | | (28.24 | %) | | | (30.71 | %) | | | (18.99 | %) | | | (24.29 | %) |
Ratios/Supplemental Data | |
Net assets, end of period (in thousands) | | $ | 4,805 | | | $ | 2,556 | | | $ | 8,400 | | | $ | 4,009 | | | $ | 3,148 | | | $ | 9,610 | |
Ratios to average net assets: | |
Net investment income (loss) | | | (1.13 | %) | | | (0.53 | %) | | | (0.45 | %) | | | 0.34 | % | | | (0.04 | %) | | | (0.59 | %) |
Total expensesd | | | 1.51 | % | | | 1.59 | % | | | 1.75 | % | | | 1.77 | % | | | 1.75 | % | | | 1.76 | % |
Portfolio turnover rate | | | 217 | % | | | 797 | % | | | 371 | % | | | 348 | % | | | 206 | % | | | 235 | % |
a | Unaudited figures for the period ended September 30, 2016. Percentage amounts for the period, except total return and portfolio turnover rate, have been annualized. |
b | Net investment income (loss) per share was computed using average shares outstanding throughout the period. |
c | Total return does not reflect the impact of any applicable sales charges. |
d | Does not include expenses of the underlying funds in which the Fund invests. |
e | Effective September 30, 2015, the Fund’s Advisor Class shares were converted into H-Class shares. The financial highlights for periods prior to that date reflect the performance of the former Advisor Class — See Note 8. |
98 | THE RYDEX FUNDS SEMI-ANNUAL REPORT | SEE NOTES TO FINANCIAL STATEMENTS. |
FUND PROFILE (Unaudited) | September 30, 2016 |
REAL ESTATE FUND
OBJECTIVE: Seeks to provide capital appreciation by investing in companies that are involved in the real estate industry, including real estate investment trusts (“REITs”) (collectively, “Real Estate Companies”).
Holdings Diversification (Market Exposure as % of Net Assets)
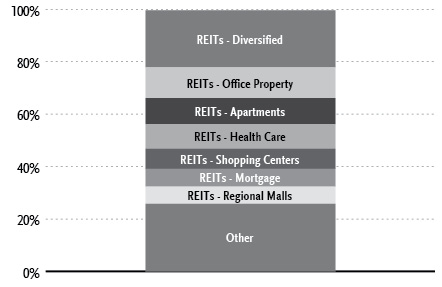
“Holdings Diversification (Market Exposure as % of Net Assets)” excludes any temporary cash investments.
Inception Dates: |
A-Class | September 1, 2004 |
C-Class | February 20, 2004 |
H-Class | February 20, 2004 |
Ten Largest Holdings (% of Total Net Assets) |
Simon Property Group, Inc. | 2.2% |
American Tower Corp. — Class A | 1.9% |
Public Storage | 1.7% |
Crown Castle International Corp. | 1.6% |
EPR Properties | 1.5% |
Prologis, Inc. | 1.5% |
Equinix, Inc. | 1.5% |
Welltower, Inc. | 1.4% |
Ventas, Inc. | 1.4% |
Weyerhaeuser Co. | 1.4% |
Top Ten Total | 16.1% |
| | |
“Ten Largest Holdings” excludes any temporary cash investments. |
| | THE RYDEX FUNDS SEMI-ANNUAL REPORT | 99 |
SCHEDULE OF INVESTMENTS (Unaudited) | September 30, 2016 |
REAL ESTATE FUND | |
| | | Shares | | | Value | |
| | | | | | | |
COMMON STOCKS† - 99.6% | |
| | | | | | | |
REITs - 93.9% | |
REITs-Diversified - 21.8% | |
American Tower Corp. — Class A | | | 5,853 | | | $ | 663,319 | |
Crown Castle International Corp. | | | 5,705 | | | | 537,468 | |
EPR Properties | | | 6,660 | | | | 524,408 | |
Equinix, Inc. | | | 1,394 | | | | 502,189 | |
Weyerhaeuser Co. | | | 14,722 | | | | 470,221 | |
Vornado Realty Trust | | | 4,050 | | | | 409,901 | |
Digital Realty Trust, Inc. | | | 3,680 | | | | 357,402 | |
Duke Realty Corp. | | | 10,748 | | | | 293,743 | |
WP Carey, Inc. | | | 3,740 | | | | 241,342 | |
Lamar Advertising Co. — Class A | | | 3,683 | | | | 240,537 | |
Forest City Realty Trust, Inc. — Class A | | | 10,056 | | | | 232,595 | |
Liberty Property Trust | | | 5,702 | | | | 230,076 | |
Communications Sales & Leasing, Inc. | | | 6,555 | | | | 205,893 | |
STORE Capital Corp. | | | 6,865 | | | | 202,312 | |
Retail Properties of America, Inc. — Class A | | | 11,279 | | | | 189,487 | |
CoreSite Realty Corp. | | | 2,409 | | | | 178,362 | |
Outfront Media, Inc. | | | 7,287 | | | | 172,338 | |
New Residential Investment Corp. | | | 12,365 | | | | 170,761 | |
Rayonier, Inc. | | | 6,418 | | | | 170,334 | |
PS Business Parks, Inc. | | | 1,473 | | | | 167,289 | |
DuPont Fabros Technology, Inc. | | | 3,888 | | | | 160,380 | |
Lexington Realty Trust | | | 14,418 | | | | 148,505 | |
NorthStar Realty Finance Corp. | | | 11,070 | | | | 145,792 | |
Washington Real Estate Investment Trust | | | 4,562 | | | | 141,969 | |
Cousins Properties, Inc. | | | 13,016 | | | | 135,887 | |
American Assets Trust, Inc. | | | 3,031 | | | | 131,485 | |
STAG Industrial, Inc. | | | 5,358 | | | | 131,325 | |
GEO Group, Inc. | | | 5,457 | | | | 129,767 | |
Potlatch Corp. | | | 3,060 | | | | 119,003 | |
Corrections Corporation of America | | | 7,926 | | | | 109,934 | |
Total REITs-Diversified | | | | | | | 7,514,024 | |
| | | | | | | | | |
REITs-Office Property - 11.7% | |
Boston Properties, Inc. | | | 3,130 | | | | 426,588 | |
SL Green Realty Corp. | | | 2,842 | | | | 307,220 | |
VEREIT, Inc. | | | 29,273 | | | | 303,561 | |
Alexandria Real Estate Equities, Inc. | | | 2,511 | | | | 273,121 | |
Kilroy Realty Corp. | | | 3,378 | | | | 234,264 | |
Douglas Emmett, Inc. | | | 6,082 | | | | 222,784 | |
Highwoods Properties, Inc. | | | 4,072 | | | | 212,233 | |
Gramercy Property Trust | | | 19,806 | | | | 190,930 | |
Hudson Pacific Properties, Inc. | | | 5,709 | | | | 187,655 | |
Equity Commonwealth* | | | 6,044 | | | | 182,650 | |
Paramount Group, Inc. | | | 10,676 | | | | 174,980 | |
Piedmont Office Realty Trust, Inc. — Class A | | | 7,881 | | | | 171,569 | |
Empire State Realty Trust, Inc. — Class A | | | 8,090 | | | | 169,486 | |
Corporate Office Properties Trust | | | 5,532 | | | | 156,832 | |
Brandywine Realty Trust | | | 9,998 | | | | 156,169 | |
Columbia Property Trust, Inc. | | | 6,892 | | | | 154,312 | |
Mack-Cali Realty Corp. | | | 5,458 | | | | 148,567 | |
Parkway Properties, Inc. | | | 7,448 | | | | 126,690 | |
Government Properties Income Trust | | | 5,300 | | | | 119,886 | |
New York REIT, Inc. | | | 12,629 | | | | 115,555 | |
Total REITs-Office Property | | | | | | | 4,035,052 | |
| | | | | | | | | |
REITs-Apartments - 9.9% | |
AvalonBay Communities, Inc. | | | 2,596 | | | | 461,672 | |
Equity Residential | | | 7,054 | | | | 453,784 | |
Essex Property Trust, Inc. | | | 1,589 | | | | 353,870 | |
UDR, Inc. | | | 8,184 | | | | 294,542 | |
Apartment Investment & Management Co. — Class A | | | 5,595 | | | | 256,866 | |
Camden Property Trust | | | 2,981 | | | | 249,629 | |
American Campus Communities, Inc. | | | 4,895 | | | | 249,009 | |
Mid-America Apartment Communities, Inc. | | | 2,643 | | | | 248,416 | |
American Homes 4 Rent — Class A | | | 9,891 | | | | 214,041 | |
Post Properties, Inc. | | | 2,659 | | | | 175,840 | |
Education Realty Trust, Inc. | | | 3,837 | | | | 165,528 | |
Colony Starwood Homes | | | 5,388 | | | | 154,636 | |
Monogram Residential Trust, Inc. | | | 12,233 | | | | 130,159 | |
Total REITs-Apartments | | | | | | | 3,407,992 | |
| | | | | | | | | |
REITs-Health Care - 9.4% | |
Welltower, Inc. | | | 6,522 | | | | 487,649 | |
Ventas, Inc. | | | 6,728 | | | | 475,199 | |
HCP, Inc. | | | 10,506 | | | | 398,703 | |
Omega Healthcare Investors, Inc. | | | 7,013 | | | | 248,611 | |
Senior Housing Properties Trust | | | 9,810 | | | | 222,785 | |
Healthcare Trust of America, Inc. — Class A | | | 6,234 | | | | 203,353 | |
Healthcare Realty Trust, Inc. | | | 5,511 | | | | 187,705 | |
Medical Properties Trust, Inc. | | | 12,326 | | | | 182,055 | |
Physicians Realty Trust | | | 7,662 | | | | 165,039 | |
National Health Investors, Inc. | | | 2,079 | | | | 163,160 | |
Care Capital Properties, Inc. | | | 5,083 | | | | 144,866 | |
LTC Properties, Inc. | | | 2,576 | | | | 133,926 | |
Sabra Health Care REIT, Inc. | | | 4,951 | | | | 124,666 | |
New Senior Investment Group, Inc. | | | 8,048 | | | | 92,874 | |
Total REITs-Health Care | | | | | | | 3,230,591 | |
| | | | | | | | | |
REITs-Shopping Centers - 7.7% | |
Kimco Realty Corp. | | | 11,310 | | | | 327,425 | |
Federal Realty Investment Trust | | | 1,985 | | | | 305,551 | |
Brixmor Property Group, Inc. | | | 9,861 | | | | 274,037 | |
Regency Centers Corp. | | | 3,416 | | | | 264,706 | |
DDR Corp. | | | 13,461 | | | | 234,625 | |
Weingarten Realty Investors | | | 5,384 | | | | 209,868 | |
Equity One, Inc. | | | 6,499 | | | | 198,934 | |
Acadia Realty Trust | | | 4,440 | | | | 160,906 | |
Urban Edge Properties | | | 5,642 | | | | 158,766 | |
Retail Opportunity Investments Corp. | | | 6,692 | | | | 146,956 | |
Kite Realty Group Trust | | | 5,162 | | | | 143,091 | |
Seritage Growth Properties | | | 2,410 | | | | 122,139 | |
Ramco-Gershenson Properties Trust | | | 6,219 | | | | 116,544 | |
Total REITs-Shopping Centers | | | | | | | 2,663,548 | |
| | | | | | | | | |
100 | THE RYDEX FUNDS SEMI-ANNUAL REPORT | SEE NOTES TO FINANCIAL STATEMENTS. |
SCHEDULE OF INVESTMENTS (Unaudited)(continued) | September 30, 2016 |
REAL ESTATE FUND | |
| | | Shares | | | Value | |
| | | | | | | |
REITs-Mortgage - 6.7% | |
Annaly Capital Management, Inc. | | | 29,134 | | | $ | 305,907 | |
AGNC Investment Corp. | | | 12,245 | | | | 239,267 | |
Starwood Property Trust, Inc. | | | 9,642 | | | | 217,138 | |
Chimera Investment Corp. | | | 10,087 | | | | 160,888 | |
Two Harbors Investment Corp. | | | 18,568 | | | | 158,385 | |
Blackstone Mortgage Trust, Inc. — Class A | | | 5,345 | | | | 157,410 | |
MFA Financial, Inc. | | | 20,753 | | | | 155,232 | |
Colony Capital, Inc. — Class A | | | 7,438 | | | | 135,595 | |
Invesco Mortgage Capital, Inc. | | | 7,918 | | | | 120,591 | |
Apollo Commercial Real Estate Finance, Inc. | | | 6,512 | | | | 106,601 | |
CYS Investments, Inc. | | | 12,203 | | | | 106,410 | |
Redwood Trust, Inc. | | | 7,082 | | | | 100,281 | |
PennyMac Mortgage Investment Trust | | | 6,241 | | | | 97,235 | |
Capstead Mortgage Corp. | | | 9,227 | | | | 87,011 | |
ARMOUR Residential REIT, Inc. | | | 3,783 | | | | 85,269 | |
iStar, Inc.* | | | 7,683 | | | | 82,439 | |
Total REITs-Mortgage | | | | | | | 2,315,659 | |
| | | | | | | | | |
REITs-Regional Malls - 6.6% | |
Simon Property Group, Inc. | | | 3,603 | | | | 745,856 | |
General Growth Properties, Inc. | | | 16,535 | | | | 456,366 | |
Macerich Co. | | | 3,919 | | | | 316,930 | |
Taubman Centers, Inc. | | | 2,638 | | | | 196,294 | |
Tanger Factory Outlet Centers, Inc. | | | 4,616 | | | | 179,839 | |
Washington Prime Group, Inc. | | | 11,661 | | | | 144,363 | |
CBL & Associates Properties, Inc. | | | 10,833 | | | | 131,513 | |
Pennsylvania Real Estate Investment Trust | | | 5,137 | | | | 118,305 | |
Total REITs-Regional Malls | | | | | | | 2,289,466 | |
| | | | | | | | | |
REITs-Hotels - 6.7% | |
Host Hotels & Resorts, Inc. | | | 20,176 | | | | 314,139 | |
MGM Growth Properties LLC — Class A | | | 8,605 | | | | 224,332 | |
Hospitality Properties Trust | | | 7,068 | | | | 210,061 | |
Apple Hospitality REIT, Inc. | | | 10,288 | | | | 190,431 | |
Sunstone Hotel Investors, Inc. | | | 12,320 | | | | 157,573 | |
LaSalle Hotel Properties | | | 6,323 | | | | 150,930 | |
RLJ Lodging Trust | | | 7,141 | | | | 150,175 | |
Ryman Hospitality Properties, Inc. | | | 2,931 | | | | 141,157 | |
Pebblebrook Hotel Trust | | | 4,816 | | | | 128,106 | |
DiamondRock Hospitality Co. | | | 13,749 | | | | 125,116 | |
Xenia Hotels & Resorts, Inc. | | | 7,816 | | | | 118,647 | |
Chesapeake Lodging Trust | | | 4,714 | | | | 107,951 | |
Summit Hotel Properties, Inc. | | | 7,485 | | | | 98,503 | |
FelCor Lodging Trust, Inc. | | | 13,580 | | | | 87,319 | |
Hersha Hospitality Trust | | | 4,413 | | | | 79,522 | |
Total REITs-Hotels | | | | | | | 2,283,962 | |
| | | | | | | | | |
REITs-Storage - 4.8% | |
Public Storage | | | 2,629 | | | | 586,634 | |
Iron Mountain, Inc. | | | 7,967 | | | | 299,002 | |
Extra Space Storage, Inc. | | | 3,717 | | | | 295,167 | |
CubeSmart | | | 7,684 | | | | 209,466 | |
Life Storage, Inc. | | | 2,118 | | | | 188,375 | |
National Storage Affiliates Trust | | | 3,970 | | | | 83,132 | |
Total REITs-Storage | | | | | | | 1,661,776 | |
| | | | | | | | | |
REITs-Warehouse/Industries - 4.3% | |
Prologis, Inc. | | | 9,463 | | | | 506,649 | |
DCT Industrial Trust, Inc. | | | 4,048 | | | | 196,530 | |
CyrusOne, Inc. | | | 3,820 | | | | 181,717 | |
First Industrial Realty Trust, Inc. | | | 6,116 | | | | 172,594 | |
EastGroup Properties, Inc. | | | 2,019 | | | | 148,518 | |
QTS Realty Trust, Inc. — Class A | | | 2,741 | | | | 144,862 | |
Rexford Industrial Realty, Inc. | | | 5,223 | | | | 119,554 | |
Total REITs-Warehouse/Industries | | | | | | | 1,470,424 | |
| | | | | | | | | |
REITs-Single Tenant - 3.0% | |
Realty Income Corp. | | | 5,930 | | | | 396,895 | |
National Retail Properties, Inc. | | | 5,151 | | | | 261,928 | |
Spirit Realty Capital, Inc. | | | 17,959 | | | | 239,393 | |
Select Income REIT | | | 5,453 | | | | 146,686 | |
Total REITs-Single Tenant | | | | | | | 1,044,902 | |
| | | | | | | | | |
REITs-Manufactured Homes - 1.3% | |
Equity LifeStyle Properties, Inc. | | | 3,092 | | | | 238,641 | |
Sun Communities, Inc. | | | 2,855 | | | | 224,060 | |
Total REITs-Manufactured Homes | | | | | | | 462,701 | |
| | | | | | | | | |
Total REITs | | | | | | | 32,380,097 | |
| | | | | | | | | |
Real Estate - 4.5% | |
Real Estate Management/Services - 2.7% | |
CBRE Group, Inc. — Class A* | | | 10,207 | | | | 285,593 | |
Jones Lang LaSalle, Inc. | | | 1,843 | | | | 209,715 | |
Realogy Holdings Corp. | | | 7,113 | | | | 183,942 | |
Kennedy-Wilson Holdings, Inc. | | | 6,717 | | | | 151,468 | |
Four Corners Property Trust, Inc. | | | 5,122 | | | | 109,252 | |
Total Real Estate Management/Services | | | | | | | 939,970 | |
| | | | | | | | | |
Real Estate Operations/Development - 1.8% | |
Howard Hughes Corp.* | | | 1,742 | | | | 199,459 | |
Brookfield Asset Management, Inc. — Class A | | | 5,542 | | | | 194,968 | |
Alexander & Baldwin, Inc. | | | 3,339 | | | | 128,284 | |
St. Joe Co.* | | | 6,086 | | | | 111,861 | |
Total Real Estate Operations/Development | | | | | | | 634,572 | |
| | | | | | | | | |
Total Real Estate | | | | | | | 1,574,542 | |
| | | | | | | | | |
Entertainment - 0.7% | |
Casino Services - 0.7% | |
Gaming and Leisure Properties, Inc. | | | 7,402 | | | | 247,597 | |
| | | | | | | | | |
Diversified Financial Services - 0.5% | |
Investment Management/Advisory Services - 0.5% | |
Altisource Portfolio Solutions S.A.* | | | 4,913 | | | | 159,181 | |
| | | | | | | | | |
Total Common Stocks | | | | | | | | |
(Cost $30,271,493) | | | | | | | 34,361,417 | |
SEE NOTES TO FINANCIAL STATEMENTS. | THE RYDEX FUNDS SEMI-ANNUAL REPORT | 101 |
SCHEDULE OF INVESTMENTS (Unaudited)(concluded) | September 30, 2016 |
REAL ESTATE FUND | |
| | | Face
Amount | | | Value | |
| | | | | | | |
REPURCHASE AGREEMENT††,1 - 0.1% | |
Royal Bank of Canada
issued 09/30/16 at 0.36%
due 10/03/16 | | $ | 35,928 | | | $ | 35,928 | |
Total Repurchase Agreement | | | | | | | | |
(Cost $35,928) | | | | | | | 35,928 | |
| | | | | | | | | |
Total Investments - 99.7% | | | | | | | | |
(Cost $30,307,421) | | | | | | $ | 34,397,345 | |
Other Assets & Liabilities, net - 0.3% | | | | | | | 98,868 | |
Total Net Assets - 100.0% | | | | | | $ | 34,496,213 | |
* | Non-income producing security. |
† | Value determined based on Level 1 inputs — See Note 4. |
†† | Value determined based on Level 2 inputs — See Note 4. |
1 | Repurchase Agreement — See Note 5. |
| | REIT — Real Estate Investment Trust |
| | |
| | See Sector Classification in Other Information section. |
The following table summarizes the inputs used to value the Fund’s investments at September 30, 2016 (See Note 4 in the Notes to Financial Statements):
Investments in Securities (Assets) | | Level 1 | | | Level 2 | | | Level 3 | | | Total | |
Common Stocks | | $ | 34,361,417 | | | $ | — | | | $ | — | | | $ | 34,361,417 | |
Repurchase Agreement | | | — | | | | 35,928 | | | | — | | | | 35,928 | |
Total | | $ | 34,361,417 | | | $ | 35,928 | | | $ | — | | | $ | 34,397,345 | |
Transfers between investment levels may occur as the markets fluctuate and/or the availability of data used in an investment’s valuation changes. Transfers between valuation levels, if any, are in comparison to the valuation levels at the end of the previous fiscal year, and are effective using the fair value as of the end of the previous fiscal period.
For the period ended September 30, 2016, there were no transfers between levels.
102 | THE RYDEX FUNDS SEMI-ANNUAL REPORT | SEE NOTES TO FINANCIAL STATEMENTS. |
STATEMENT OF ASSETS AND LIABILITIES (Unaudited) |
September 30, 2016 |
Assets: | |
Investments, at value (cost $30,271,493) | | $ | 34,361,417 | |
Repurchase agreements, at value (cost $35,928) | | | 35,928 | |
Total investments (cost $30,307,421) | | | 34,397,345 | |
Cash | | | 1,307 | |
Receivables: | |
Securities sold | | | 1,714,920 | |
Fund shares sold | | | 76,624 | |
Dividends | | | 179,673 | |
Total assets | | | 36,369,869 | |
| | | | | |
Liabilities: | |
Payable for: | |
Fund shares redeemed | | | 1,817,100 | |
Management fees | | | 27,794 | |
Distribution and service fees | | | 9,731 | |
Transfer agent and administrative fees | | | 8,175 | |
Portfolio accounting fees | | | 3,270 | |
Miscellaneous | | | 7,586 | |
Total liabilities | | | 1,873,656 | |
Commitments and contingent liabilities (Note 9) | | | — | |
Net assets | | $ | 34,496,213 | |
| | | | | |
Net assets consist of: | |
Paid in capital | | $ | 40,700,512 | |
Undistributed net investment income | | | 771,747 | |
Accumulated net realized loss on investments | | | (11,065,970 | ) |
Net unrealized appreciation on investments | | | 4,089,924 | |
Net assets | | $ | 34,496,213 | |
| | | | | |
A-Class: | |
Net assets | | $ | 5,163,128 | |
Capital shares outstanding | | | 129,930 | |
Net asset value per share | | $ | 39.74 | |
Maximum offering price per share (Net asset value divided by 95.25%) | | $ | 41.71 | |
| | | | | |
C-Class: | |
Net assets | | $ | 2,296,916 | |
Capital shares outstanding | | | 64,497 | |
Net asset value per share | | $ | 35.61 | |
| | | | | |
H-Class: | |
Net assets | | $ | 27,036,169 | |
Capital shares outstanding | | | 682,229 | |
Net asset value per share | | $ | 39.63 | |
STATEMENT OF OPERATIONS (Unaudited) | |
Period Ended September 30, 2016 | |
Investment Income: | |
Dividends (net of foreign withholding tax of $1,149) | | $ | 883,503 | |
Interest | | | 363 | |
Total investment income | | | 883,866 | |
| | | | | |
Expenses: | |
Management fees | | | 261,334 | |
Transfer agent and administrative fees | | | 76,863 | |
Distribution and service fees: | |
A-Class | | | 11,775 | |
C-Class | | | 11,483 | |
H-Class | | | 62,217 | |
Portfolio accounting fees | | | 30,745 | |
Trustees’ fees* | | | 3,682 | |
Custodian fees | | | 3,639 | |
Line of credit fees | | | 55 | |
Miscellaneous | | | 46,604 | |
Total expenses | | | 508,397 | |
Net investment income | | | 375,469 | |
| | | | | |
Net Realized and Unrealized Gain (Loss): | |
Net realized gain (loss) on: | |
Investments | | | 7,401,986 | |
Net realized gain | | | 7,401,986 | |
Net change in unrealized appreciation (depreciation) on: | |
Investments | | | (2,433,266 | ) |
Net change in unrealized appreciation (depreciation) | | | (2,433,266 | ) |
Net realized and unrealized gain | | | 4,968,720 | |
Net increase in net assets resulting from operations | | $ | 5,344,189 | |
* | Relates to Trustees not deemed “interested persons” within the meaning of Section 2(a)(19) of the 1940 Act. |
SEE NOTES TO FINANCIAL STATEMENTS. | THE RYDEX FUNDS SEMI-ANNUAL REPORT | 103 |
STATEMENTS OF CHANGES IN NET ASSETS |
| | | Period Ended
September 30,
2016
(Unaudited) | | | Year Ended
March 31,
2016 | |
Increase (Decrease) in Net Assets from Operations: | | | | | | |
Net investment income | | $ | 375,469 | | | $ | 476,009 | |
Net realized gain (loss) on investments | | | 7,401,986 | | | | (225,778 | ) |
Net change in unrealized appreciation (depreciation) on investments | | | (2,433,266 | ) | | | (1,899,319 | ) |
Net increase (decrease) in net assets resulting from operations | | | 5,344,189 | | | | (1,649,088 | ) |
| | | | | | | | | |
Distributions to shareholders from: | | | | | | | | |
Net investment income | | | | | | | | |
A-Class | | | — | | | | (72,600 | ) |
C-Class | | | — | | | | (24,943 | ) |
H-Class | | | — | | | | (335,675 | ) |
Total distributions to shareholders | | | — | | | | (433,218 | ) |
| | | | | | | | | |
Capital share transactions: | | | | | | | | |
Proceeds from sale of shares | | | | | | | | |
A-Class | | | 8,364,671 | | | | 37,206,021 | |
C-Class | | | 5,234,219 | | | | 18,768,804 | |
H-Class | | | 269,524,719 | | | | 281,436,754 | |
Distributions reinvested | | | | | | | | |
A-Class | | | — | | | | 66,044 | |
C-Class | | | — | | | | 24,184 | |
H-Class | | | — | | | | 335,273 | |
Cost of shares redeemed | | | | | | | | |
A-Class | | | (13,266,631 | ) | | | (34,288,463 | ) |
C-Class | | | (5,028,462 | ) | | | (19,545,538 | ) |
H-Class | | | (281,350,707 | ) | | | (283,137,988 | ) |
Net increase (decrease) from capital share transactions | | | (16,522,191 | ) | | | 865,091 | |
Net decrease in net assets | | | (11,178,002 | ) | | | (1,217,215 | ) |
| | | | | | | | | |
Net assets: | | | | | | | | |
Beginning of period | | | 45,674,215 | | | | 46,891,430 | |
End of period | | $ | 34,496,213 | | | $ | 45,674,215 | |
Undistributed net investment income at end of period | | $ | 771,747 | | | $ | 396,278 | |
| | | | | | | | | |
Capital share activity: | | | | | | | | |
Shares sold | | | | | | | | |
A-Class | | | 213,645 | | | | 1,043,014 | |
C-Class | | | 148,168 | | | | 581,211 | |
H-Class | | | 6,954,264 | | | | 7,922,736 | |
Shares issued from reinvestment of distributions | | | | | | | | |
A-Class | | | — | | | | 1,903 | |
C-Class | | | — | | | | 772 | |
H-Class | | | — | | | | 9,684 | |
Shares redeemed | | | | | | | | |
A-Class | | | (330,931 | ) | | | (962,786 | ) |
C-Class | | | (141,690 | ) | | | (608,356 | ) |
H-Class | | | (7,199,220 | ) | | | (7,988,853 | ) |
Net decrease in shares | | | (355,764 | ) | | | (675 | ) |
104 | THE RYDEX FUNDS SEMI-ANNUAL REPORT | SEE NOTES TO FINANCIAL STATEMENTS. |
This table is presented to show selected data for a share outstanding throughout each period and to assist shareholders in evaluating a Fund’s performance for the periods presented.
A-Class | | Period Ended
September 30,
2016a | | | Year Ended
March 31,
2016 | | | Year Ended
March 31,
2015 | | | Year Ended
March 31,
2014 | | | Year Ended
March 28,
2013 | | | Year Ended
March 31,
2012 | |
Per Share Data | | | | | | | | | | | | | | | | | | |
Net asset value, beginning of period | | $ | 37.31 | | | $ | 38.34 | | | $ | 33.47 | | | $ | 34.43 | | | $ | 30.27 | | | $ | 29.06 | |
Income (loss) from investment operations: | |
Net investment income (loss)b | | | .27 | | | | .65 | | | | .42 | | | | .65 | | | | .58 | | | | .45 | |
Net gain (loss) on investments (realized and unrealized) | | | 2.16 | | | | (1.24 | ) | | | 4.77 | | | | (.14 | ) | | | 4.18 | | | | 1.07 | |
Total from investment operations | | | 2.43 | | | | (.59 | ) | | | 5.19 | | | | .51 | | | | 4.76 | | | | 1.52 | |
Less distributions from: | |
Net investment income | | | — | | | | (.44 | ) | | | (.32 | ) | | | (1.47 | ) | | | (.60 | ) | | | (.31 | ) |
Total distributions | | | — | | | | (.44 | ) | | | (.32 | ) | | | (1.47 | ) | | | (.60 | ) | | | (.31 | ) |
Net asset value, end of period | | $ | 39.74 | | | $ | 37.31 | | | $ | 38.34 | | | $ | 33.47 | | | $ | 34.43 | | | $ | 30.27 | |
| | |
Total Returnc | | | 6.49 | % | | | (1.46 | %) | | | 15.58 | % | | | 1.86 | % | | | 16.03 | % | | | 5.42 | % |
Ratios/Supplemental Data | |
Net assets, end of period (in thousands) | | $ | 5,163 | | | $ | 9,223 | | | $ | 6,329 | | | $ | 4,124 | | | $ | 12,495 | | | $ | 2,364 | |
Ratios to average net assets: | |
Net investment income (loss) | | | 1.36 | % | | | 1.82 | % | | | 1.13 | % | | | 1.92 | % | | | 1.82 | % | | | 1.59 | % |
Total expenses | | | 1.62 | % | | | 1.62 | % | | | 1.60 | % | | | 1.65 | % | | | 1.61 | % | | | 1.61 | % |
Portfolio turnover rate | | | 363 | % | | | 880 | % | | | 599 | % | | | 788 | % | | | 699 | % | | | 974 | % |
C-Class | | Period Ended
September 30,
2016a | | | Year Ended
March 31,
2016 | | | Year Ended
March 31,
2015 | | | Year Ended
March 31,
2014 | | | Year Ended
March 28,
2013 | | | Year Ended
March 31,
2012 | |
Per Share Data | | | | | | | | | | | | | | | | | | |
Net asset value, beginning of period | | $ | 33.56 | | | $ | 34.81 | | | $ | 30.64 | | | $ | 31.89 | | | $ | 28.29 | | | $ | 27.41 | |
Income (loss) from investment operations: | |
Net investment income (loss)b | | | .21 | | | | .22 | | | | .23 | | | | .29 | | | | .27 | | | | .22 | |
Net gain (loss) on investments (realized and unrealized) | | | 1.84 | | | | (1.03 | ) | | | 4.26 | | | | (.07 | ) | | | 3.93 | | | | .97 | |
Total from investment operations | | | 2.05 | | | | (.81 | ) | | | 4.49 | | | | .22 | | | | 4.20 | | | | 1.19 | |
Less distributions from: | |
Net investment income | | | — | | | | (.44 | ) | | | (.32 | ) | | | (1.47 | ) | | | (.60 | ) | | | (.31 | ) |
Total distributions | | | — | | | | (.44 | ) | | | (.32 | ) | | | (1.47 | ) | | | (.60 | ) | | | (.31 | ) |
Net asset value, end of period | | $ | 35.61 | | | $ | 33.56 | | | $ | 34.81 | | | $ | 30.64 | | | $ | 31.89 | | | $ | 28.29 | |
| | |
Total Returnc | | | 6.11 | % | | | (2.25 | %) | | | 14.73 | % | | | 1.09 | % | | | 15.12 | % | | | 4.57 | % |
Ratios/Supplemental Data | |
Net assets, end of period (in thousands) | | $ | 2,297 | | | $ | 1,947 | | | $ | 2,937 | | | $ | 2,497 | | | $ | 2,910 | | | $ | 1,798 | |
Ratios to average net assets: | |
Net investment income (loss) | | | 1.16 | % | | | 0.69 | % | | | 0.70 | % | | | 0.93 | % | | | 0.92 | % | | | 0.83 | % |
Total expenses | | | 2.37 | % | | | 2.36 | % | | | 2.35 | % | | | 2.38 | % | | | 2.35 | % | | | 2.36 | % |
Portfolio turnover rate | | | 363 | % | | | 880 | % | | | 599 | % | | | 788 | % | | | 699 | % | | | 974 | % |
SEE NOTES TO FINANCIAL STATEMENTS. | THE RYDEX FUNDS SEMI-ANNUAL REPORT | 105 |
FINANCIAL HIGHLIGHTS (concluded) |
This table is presented to show selected data for a share outstanding throughout each period and to assist shareholders in evaluating a Fund’s performance for the periods presented.
H-Class | | Period Ended
September 30,
2016a | | | Year Ended
March 31,
2016 | | | Year Ended
March 31,
2015 | | | Year Ended
March 31,
2014 | | | Year Ended
March 28,
2013 | | | Year Ended
March 31,
2012 | |
Per Share Data | | | | | | | | | | | | | | | | | | |
Net asset value, beginning of period | | $ | 37.21 | | | $ | 38.25 | | | $ | 33.40 | | | $ | 34.38 | | | $ | 30.23 | | | $ | 29.02 | |
Income (loss) from investment operations: | |
Net investment income (loss)b | | | .23 | | | | .71 | | | | .48 | | | | .52 | | | | .46 | | | | .42 | |
Net gain (loss) on investments (realized and unrealized) | | | 2.19 | | | | (1.31 | ) | | | 4.69 | | | | (.03 | ) | | | 4.29 | | | | 1.10 | |
Total from investment operations | | | 2.42 | | | | (.60 | ) | | | 5.17 | | | | .49 | | | | 4.75 | | | | 1.52 | |
Less distributions from: | |
Net investment income | | | — | | | | (.44 | ) | | | (.32 | ) | | | (1.47 | ) | | | (.60 | ) | | | (.31 | ) |
Total distributions | | | — | | | | (.44 | ) | | | (.32 | ) | | | (1.47 | ) | | | (.60 | ) | | | (.31 | ) |
Net asset value, end of period | | $ | 39.63 | | | $ | 37.21 | | | $ | 38.25 | | | $ | 33.40 | | | $ | 34.38 | | | $ | 30.23 | |
| | |
Total Returnc | | | 6.50 | % | | | (1.49 | %) | | | 15.55 | % | | | 1.84 | % | | | 15.95 | % | | | 5.42 | % |
Ratios/Supplemental Data | |
Net assets, end of period (in thousands) | | $ | 27,036 | | | $ | 34,504 | | | $ | 37,625 | | | $ | 19,753 | | | $ | 10,273 | | | $ | 13,511 | |
Ratios to average net assets: | |
Net investment income (loss) | | | 1.19 | % | | | 1.97 | % | | | 1.32 | % | | | 1.52 | % | | | 1.45 | % | | | 1.48 | % |
Total expenses | | | 1.62 | % | | | 1.62 | % | | | 1.60 | % | | | 1.64 | % | | | 1.60 | % | | | 1.61 | % |
Portfolio turnover rate | | | 363 | % | | | 880 | % | | | 599 | % | | | 788 | % | | | 699 | % | | | 974 | % |
a | Unaudited figures for the period ended September 30, 2016. Percentage amounts for the period, except total return and portfolio turnover rate, have been annualized. |
b | Net investment income (loss) per share was computed using average shares outstanding throughout the period. |
c | Total return does not reflect the impact of any applicable sales charges. |
106 | THE RYDEX FUNDS SEMI-ANNUAL REPORT | SEE NOTES TO FINANCIAL STATEMENTS. |
FUND PROFILE (Unaudited) | September 30, 2016 |
RETAILING FUND
OBJECTIVE: Seeks to provide capital appreciation by investing in companies engaged in merchandising finished goods and services, including department stores, mail order operations and other companies involved in selling products to consumers (“Retailing Companies”).
Holdings Diversification (Market Exposure as % of Net Assets)
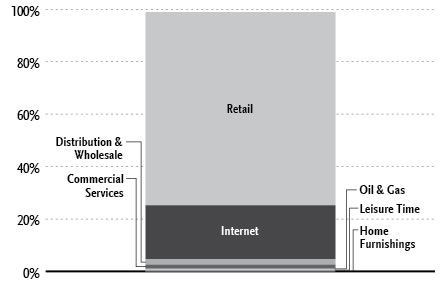
“Holdings Diversification (Market Exposure as % of Net Assets)” excludes any temporary cash investments.
Inception Dates: |
Investor Class | April 1, 1998 |
A-Class | September 1, 2004 |
C-Class | May 9, 2001 |
H-Class* | April 21, 1998 |
Ten Largest Holdings (% of Total Net Assets) |
Amazon.com, Inc. | 7.1% |
Wal-Mart Stores, Inc. | 5.1% |
Home Depot, Inc. | 4.3% |
CVS Health Corp. | 3.3% |
Walgreens Boots Alliance, Inc. | 3.2% |
Priceline Group, Inc. | 2.9% |
Costco Wholesale Corp. | 2.8% |
Lowe’s Companies, Inc. | 2.7% |
TJX Companies, Inc. | 2.4% |
Netflix, Inc. | 2.2% |
Top Ten Total | 36.0% |
| | |
“Ten Largest Holdings” excludes any temporary cash investments. |
* | Effective September 30, 2015, the Fund’s Advisor Class shares were converted into H-Class shares — See Note 8. |
| | THE RYDEX FUNDS SEMI-ANNUAL REPORT | 107 |
SCHEDULE OF INVESTMENTS (Unaudited) | September 30, 2016 |
RETAILING FUND | |
| | | Shares | | | Value | |
| | | | | | | |
COMMON STOCKS† - 98.9% | |
| | | | | | | |
Retail - 73.7% | |
Wal-Mart Stores, Inc. | | | 7,684 | | | $ | 554,169 | |
Home Depot, Inc. | | | 3,663 | | | | 471,355 | |
CVS Health Corp. | | | 4,031 | | | | 358,719 | |
Walgreens Boots Alliance, Inc. | | | 4,286 | | | | 345,537 | |
Costco Wholesale Corp. | | | 1,987 | | | | 303,037 | |
Lowe’s Companies, Inc. | | | 4,121 | | | | 297,577 | |
TJX Companies, Inc. | | | 3,482 | | | | 260,384 | |
Target Corp. | | | 3,378 | | | | 232,001 | |
O’Reilly Automotive, Inc.* | | | 693 | | | | 194,117 | |
Ross Stores, Inc. | | | 2,965 | | | | 190,650 | |
AutoZone, Inc.* | | | 226 | | | | 173,645 | |
L Brands, Inc. | | | 2,347 | | | | 166,097 | |
Dollar General Corp. | | | 2,305 | | | | 161,327 | |
Dollar Tree, Inc.* | | | 1,986 | | | | 156,755 | |
Genuine Parts Co. | | | 1,463 | | | | 146,958 | |
Ulta Salon Cosmetics & Fragrance, Inc.* | | | 605 | | | | 143,978 | |
Best Buy Company, Inc. | | | 3,425 | | | | 130,767 | |
Macy’s, Inc. | | | 3,470 | | | | 128,563 | |
Advance Auto Parts, Inc. | | | 836 | | | | 124,664 | |
Liberty Interactive Corporation QVC Group — Class A* | | | 5,903 | | | | 118,119 | |
CarMax, Inc.* | | | 2,160 | | | | 115,237 | |
Foot Locker, Inc. | | | 1,677 | | | | 113,566 | |
Nordstrom, Inc. | | | 2,145 | | | | 111,283 | |
Tiffany & Co. | | | 1,525 | | | | 110,760 | |
Tractor Supply Co. | | | 1,642 | | | | 110,589 | |
The Gap, Inc. | | | 4,811 | | | | 106,997 | |
Kohl’s Corp. | | | 2,413 | | | | 105,569 | |
Rite Aid Corp.* | | | 13,442 | | | | 103,369 | |
Bed Bath & Beyond, Inc. | | | 2,233 | | | | 96,265 | |
Dick’s Sporting Goods, Inc. | | | 1,607 | | | | 91,149 | |
Burlington Stores, Inc.* | | | 1,087 | | | | 88,069 | |
Staples, Inc. | | | 10,238 | | | | 87,534 | |
Signet Jewelers Ltd. | | | 1,152 | | | | 85,859 | |
Michaels Companies, Inc.* | | | 3,440 | | | | 83,145 | |
AutoNation, Inc.* | | | 1,694 | | | | 82,515 | |
Williams-Sonoma, Inc. | | | 1,572 | | | | 80,298 | |
Cabela’s, Inc.* | | | 1,395 | | | | 76,627 | |
Penske Automotive Group, Inc. | | | 1,540 | | | | 74,197 | |
Urban Outfitters, Inc.* | | | 2,099 | | | | 72,457 | |
CST Brands, Inc. | | | 1,483 | | | | 71,317 | |
Sally Beauty Holdings, Inc.* | | | 2,762 | | | | 70,928 | |
American Eagle Outfitters, Inc. | | | 3,660 | | | | 65,368 | |
GameStop Corp. — Class A | | | 2,288 | | | | 63,126 | |
PriceSmart, Inc. | | | 717 | | | | 60,056 | |
Lithia Motors, Inc. — Class A | | | 620 | | | | 59,222 | |
J.C. Penney Company, Inc.* | | | 6,399 | | | | 58,999 | |
Dillard’s, Inc. — Class A | | | 919 | | | | 57,906 | |
Five Below, Inc.* | | | 1,350 | | | | 54,392 | |
Big Lots, Inc. | | | 1,128 | | | | 53,862 | |
HSN, Inc. | | | 1,327 | | | | 52,815 | |
Office Depot, Inc. | | | 14,650 | | | | 52,301 | |
Chico’s FAS, Inc. | | | 3,860 | | | | 45,934 | |
DSW, Inc. — Class A | | | 2,200 | | | | 45,056 | |
Group 1 Automotive, Inc. | | | 697 | | | | 44,524 | |
Children’s Place, Inc. | | | 551 | | | | 44,008 | |
Restoration Hardware Holdings, Inc.* | | | 1,267 | | | | 43,813 | |
GNC Holdings, Inc. — Class A | | | 2,101 | | | | 42,903 | |
Asbury Automotive Group, Inc.* | | | 740 | | | | 41,196 | |
Genesco, Inc.* | | | 747 | | | | 40,682 | |
Guess?, Inc. | | | 2,757 | | | | 40,280 | |
Sears Holdings Corp.* | | | 3,496 | | | | 40,064 | |
Buckle, Inc. | | | 1,646 | | | | 39,553 | |
Caleres, Inc. | | | 1,530 | | | | 38,694 | |
Abercrombie & Fitch Co. — Class A | | | 2,306 | | | | 36,642 | |
Finish Line, Inc. — Class A | | | 1,586 | | | | 36,605 | |
Express, Inc.* | | | 3,000 | | | | 35,370 | |
Hibbett Sports, Inc.* | | | 870 | | | | 34,713 | |
Barnes & Noble, Inc. | | | 3,048 | | | | 34,442 | |
Ascena Retail Group, Inc.* | | | 5,876 | | | | 32,847 | |
Tailored Brands, Inc. | | | 2,009 | | | | 31,541 | |
Lumber Liquidators Holdings, Inc.* | | | 1,530 | | | | 30,095 | |
Vitamin Shoppe, Inc.* | | | 1,111 | | | | 29,830 | |
Francesca’s Holdings Corp.* | | | 1,830 | | | | 28,237 | |
Pier 1 Imports, Inc. | | | 5,387 | | | | 22,841 | |
Total Retail | | | | | | | 8,034,066 | |
| | | | | | | | | |
Internet - 20.5% | |
Amazon.com, Inc.* | | | 922 | | | | 771,999 | |
Priceline Group, Inc.* | | | 217 | | | | 319,313 | |
Netflix, Inc.* | | | 2,480 | | | | 244,404 | |
JD.com, Inc. ADR* | | | 6,320 | | | | 164,889 | |
Expedia, Inc. | | | 1,355 | | | | 158,156 | |
Ctrip.com International Ltd. ADR* | | | 3,160 | | | | 147,161 | |
TripAdvisor, Inc.* | | | 1,804 | | | | 113,977 | |
Vipshop Holdings Ltd. ADR* | | | 6,328 | | | | 92,832 | |
Wayfair, Inc. — Class A* | | | 1,700 | | | | 66,929 | |
Groupon, Inc. — Class A* | | | 12,240 | | | | 63,036 | |
Etsy, Inc.* | | | 3,400 | | | | 48,552 | |
Shutterfly, Inc.* | | | 951 | | | | 42,453 | |
Total Internet | | | | | | | 2,233,701 | |
| | | | | | | | | |
Distribution & Wholesale - 2.2% | |
LKQ Corp.* | | | 3,452 | | | | 122,408 | |
Pool Corp. | | | 786 | | | | 74,293 | |
Core-Mark Holding Company, Inc. | | | 1,333 | | | | 47,721 | |
Total Distribution & Wholesale | | | | | | | 244,422 | |
| | | | | | | | | |
Commercial Services - 1.2% | |
Monro Muffler Brake, Inc. | | | 870 | | | | 53,218 | |
Aaron’s, Inc. | | | 2,001 | | | | 50,866 | |
Rent-A-Center, Inc. | | | 2,399 | | | | 30,323 | |
Total Commercial Services | | | | | | | 134,407 | |
| | | | | | | | | |
Oil & Gas - 0.6% | |
Murphy USA, Inc.* | | | 861 | | | | 61,441 | |
| | | | | | | | | |
Leisure Time - 0.4% | |
Liberty TripAdvisor Holdings, Inc. — Class A* | | | 2,197 | | | | 48,004 | |
108 | THE RYDEX FUNDS SEMI-ANNUAL REPORT | SEE NOTES TO FINANCIAL STATEMENTS. |
SCHEDULE OF INVESTMENTS (Unaudited)(concluded) | September 30, 2016 |
RETAILING FUND | |
| | | Shares | | | Value | |
| | | | | | | |
Home Furnishings - 0.3% | |
Select Comfort Corp.* | | | 1,602 | | | $ | 34,603 | |
| | | | | | | | | |
Total Common Stocks | | | | | | | | |
(Cost $7,407,002) | | | | | | | 10,790,644 | |
| | | Face
Amount | | | | |
| | | | | | | |
REPURCHASE AGREEMENT††,1 - 0.5% | |
Royal Bank of Canada
issued 09/30/16 at 0.36%
due 10/03/16 | | $ | 51,294 | | | | 51,294 | |
Total Repurchase Agreement | | | | | | | | |
(Cost $51,294) | | | | | | | 51,294 | |
| | | | | | | | | |
Total Investments - 99.4% | | | | | | | | |
(Cost $7,458,296) | | | | | | $ | 10,841,938 | |
Other Assets & Liabilities, net - 0.6% | | | | | | | 64,005 | |
Total Net Assets - 100.0% | | | | | | $ | 10,905,943 | |
* | Non-income producing security. |
† | Value determined based on Level 1 inputs — See Note 4. |
†† | Value determined based on Level 2 inputs — See Note 4. |
1 | Repurchase Agreement — See Note 5. |
| | ADR — American Depositary Receipt |
| | |
| | See Sector Classification in Other Information section. |
The following table summarizes the inputs used to value the Fund’s investments at September 30, 2016 (See Note 4 in the Notes to Financial Statements):
Investments in Securities (Assets) | | Level 1 | | | Level 2 | | | Level 3 | | | Total | |
Common Stocks | | $ | 10,790,644 | | | $ | — | | | $ | — | | | $ | 10,790,644 | |
Repurchase Agreement | | | — | | | | 51,294 | | | | — | | | | 51,294 | |
Total | | $ | 10,790,644 | | | $ | 51,294 | | | $ | — | | | $ | 10,841,938 | |
Transfers between investment levels may occur as the markets fluctuate and/or the availability of data used in an investment’s valuation changes. Transfers between valuation levels, if any, are in comparison to the valuation levels at the end of the previous fiscal year, and are effective using the fair value as of the end of the previous fiscal period.
For the period ended September 30, 2016, there were no transfers between levels.
SEE NOTES TO FINANCIAL STATEMENTS. | THE RYDEX FUNDS SEMI-ANNUAL REPORT | 109 |
STATEMENT OF ASSETS AND LIABILITIES (Unaudited) |
September 30, 2016 |
Assets: | |
Investments, at value (cost $7,407,002) | | $ | 10,790,644 | |
Repurchase agreements, at value (cost $51,294) | | | 51,294 | |
Total investments (cost $7,458,296) | | | 10,841,938 | |
Receivables: | |
Fund shares sold | | | 320,998 | |
Dividends | | | 7,107 | |
Total assets | | | 11,170,043 | |
| | | | | |
Liabilities: | |
Overdraft due to custodian bank | | | 7,012 | |
Payable for: | |
Securities purchased | | | 234,898 | |
Management fees | | | 11,761 | |
Transfer agent and administrative fees | | | 3,459 | |
Distribution and service fees | | | 2,181 | |
Portfolio accounting fees | | | 1,384 | |
Miscellaneous | | | 3,405 | |
Total liabilities | | | 264,100 | |
Commitments and contingent liabilities (Note 9) | | | — | |
Net assets | | $ | 10,905,943 | |
| | | | | |
Net assets consist of: | |
Paid in capital | | $ | 10,853,629 | |
Accumulated net investment loss | | | (19,724 | ) |
Accumulated net realized loss on investments | | | (3,311,604 | ) |
Net unrealized appreciation on investments | | | 3,383,642 | |
Net assets | | $ | 10,905,943 | |
| | | | | |
Investor Class: | |
Net assets | | $ | 6,801,811 | |
Capital shares outstanding | | | 257,939 | |
Net asset value per share | | $ | 26.37 | |
| | | | | |
A-Class: | |
Net assets | | $ | 1,380,612 | |
Capital shares outstanding | | | 55,040 | |
Net asset value per share | | $ | 25.08 | |
Maximum offering price per share (Net asset value divided by 95.25%) | | $ | 26.33 | |
| | | | | |
C-Class: | |
Net assets | | $ | 2,161,066 | |
Capital shares outstanding | | | 95,670 | |
Net asset value per share | | $ | 22.59 | |
| | | | | |
H-Class: | |
Net assets | | $ | 562,454 | |
Capital shares outstanding | | | 22,980 | |
Net asset value per share | | $ | 24.48 | |
STATEMENT OF OPERATIONS (Unaudited) | |
Period Ended September 30, 2016 | |
Investment Income: | |
Dividends (net of foreign withholding tax of $1,271) | | $ | 113,586 | |
Interest | | | 97 | |
Total investment income | | | 113,683 | |
| | | | | |
Expenses: | |
Management fees | | | 72,617 | |
Transfer agent and administrative fees | | | 21,358 | |
Distribution and service fees: | | | | |
A-Class | | | 2,323 | |
C-Class | | | 11,514 | |
H-Class | | | 2,671 | |
Portfolio accounting fees | | | 8,543 | |
Custodian fees | | | 1,004 | |
Trustees’ fees* | | | 679 | |
Line of credit fees | | | 142 | |
Miscellaneous | | | 12,556 | |
Total expenses | | | 133,407 | |
Net investment loss | | | (19,724 | ) |
| | | | | |
Net Realized and Unrealized Gain (Loss): | |
Net realized gain (loss) on: | |
Investments | | | 4,489,348 | |
Net realized gain | | | 4,489,348 | |
Net change in unrealized appreciation (depreciation) on: | |
Investments | | | (4,990,539 | ) |
Net change in unrealized appreciation (depreciation) | | | (4,990,539 | ) |
Net realized and unrealized loss | | | (501,191 | ) |
Net decrease in net assets resulting from operations | | $ | (520,915 | ) |
* | Relates to Trustees not deemed “interested persons” within the meaning of Section 2(a)(19) of the 1940 Act. |
110 | THE RYDEX FUNDS SEMI-ANNUAL REPORT | SEE NOTES TO FINANCIAL STATEMENTS. |
STATEMENTS OF CHANGES IN NET ASSETS |
| | | Period Ended
September 30,
2016
(Unaudited) | | | Year Ended
March 31,
2016 | |
Increase (Decrease) in Net Assets from Operations: | | | | | | |
Net investment loss | | $ | (19,724 | ) | | $ | (136,470 | ) |
Net realized gain (loss) on investments | | | 4,489,348 | | | | (1,114,146 | ) |
Net change in unrealized appreciation (depreciation) on investments | | | (4,990,539 | ) | | | (4,279,916 | ) |
Net decrease in net assets resulting from operations | | | (520,915 | ) | | | (5,530,532 | ) |
| | | | | | | | | |
Distributions to shareholders from: | | | | | | | | |
Net investment income | | | | | | | | |
Investor Class | | | — | | | | (14,287 | ) |
A-Class | | | — | | | | (4,835 | ) |
C-Class | | | — | | | | (3,881 | ) |
H-Class | | | — | | | | (9,230 | )* |
Total distributions to shareholders | | | — | | | | (32,233 | ) |
| | | | | | | | | |
Capital share transactions: | | | | | | | | |
Proceeds from sale of shares | | | | | | | | |
Investor Class | | | 49,765,174 | | | | 58,531,964 | |
A-Class | | | 537,412 | | | | 26,869,075 | |
C-Class | | | 869,284 | | | | 21,109,377 | |
H-Class | | | 39,783,156 | | | | 75,174,384 | * |
Distributions reinvested | | | | | | | | |
Investor Class | | | — | | | | 14,238 | |
A-Class | | | — | | | | 4,654 | |
C-Class | | | — | | | | 2,509 | |
H-Class | | | — | | | | 9,207 | * |
Cost of shares redeemed | | | | | | | | |
Investor Class | | | (52,994,896 | ) | | | (91,432,944 | ) |
A-Class | | | (5,261,304 | ) | | | (39,196,534 | ) |
C-Class | | | (1,168,445 | ) | | | (21,796,959 | ) |
H-Class | | | (42,620,498 | ) | | | (79,319,706 | )* |
Net decrease from capital share transactions | | | (11,090,117 | ) | | | (50,030,735 | ) |
Net decrease in net assets | | | (11,611,032 | ) | | | (55,593,500 | ) |
| | | | | | | | | |
Net assets: | | | | | | | | |
Beginning of period | | | 22,516,975 | | | | 78,110,475 | |
End of period | | $ | 10,905,943 | | | $ | 22,516,975 | |
Accumulated net investment loss at end of period | | $ | (19,724 | ) | | $ | — | |
| | | | | | | | | |
Capital share activity: | | | | | | | | |
Shares sold | | | | | | | | |
Investor Class | | | 1,886,827 | | | | 2,149,723 | |
A-Class | | | 21,408 | | | | 1,066,330 | |
C-Class | | | 38,773 | | | | 896,154 | |
H-Class | | | 1,691,155 | | | | 2,910,370 | * |
Shares issued from reinvestment of distributions | | | | | | | | |
Investor Class | | | — | | | | 555 | |
A-Class | | | — | | | | 190 | |
C-Class | | | — | | | | 113 | |
H-Class | | | — | | | | 386 | * |
Shares redeemed | | | | | | | | |
Investor Class | | | (2,009,372 | ) | | | (3,415,362 | ) |
A-Class | | | (212,090 | ) | | | (1,547,153 | ) |
C-Class | | | (52,094 | ) | | | (928,517 | ) |
H-Class | | | (1,804,078 | ) | | | (3,113,107 | )* |
Net decrease in shares | | | (439,471 | ) | | | (1,980,318 | ) |
* | Effective September 30, 2015, the Fund’s Advisor Class shares were converted into H-Class shares — See Note 8. |
SEE NOTES TO FINANCIAL STATEMENTS. | THE RYDEX FUNDS SEMI-ANNUAL REPORT | 111 |
This table is presented to show selected data for a share outstanding throughout each period and to assist shareholders in evaluating a Fund’s performance for the periods presented.
Investor Class | | Period Ended
September 30,
2016a | | | Year Ended
March 31,
2016 | | | Year Ended
March 31,
2015 | | | Year Ended
March 31,
2014 | | | Year Ended
March 28,
2013 | | | Year Ended
March 31,
2012 | |
Per Share Data | | | | | | | | | | | | | | | | | | |
Net asset value, beginning of period | | $ | 26.98 | | | $ | 28.13 | | | $ | 23.54 | | | $ | 19.62 | | | $ | 17.45 | | | $ | 14.66 | |
Income (loss) from investment operations: | |
Net investment income (loss)b | | | (.01 | ) | | | (.03 | ) | | | .11 | | | | — | c | | | .09 | | | | .01 | |
Net gain (loss) on investments (realized and unrealized) | | | (.60 | ) | | | (1.10 | ) | | | 4.48 | | | | 3.92 | | | | 2.08 | | | | 2.79 | |
Total from investment operations | | | (.61 | ) | | | (1.13 | ) | | | 4.59 | | | | 3.92 | | | | 2.17 | | | | 2.80 | |
Less distributions from: | |
Net investment income | | | — | | | | (.02 | ) | | | — | | | | — | | | | — | | | | (.01 | ) |
Total distributions | | | — | | | | (.02 | ) | | | — | | | | — | | | | — | | | | (.01 | ) |
Net asset value, end of period | | $ | 26.37 | | | $ | 26.98 | | | $ | 28.13 | | | $ | 23.54 | | | $ | 19.62 | | | $ | 17.45 | |
| | |
Total Returnd | | | (2.26 | %) | | | (4.01 | %) | | | 19.50 | % | | | 19.98 | % | | | 12.44 | % | | | 19.14 | % |
Ratios/Supplemental Data | |
Net assets, end of period (in thousands) | | $ | 6,802 | | | $ | 10,265 | | | $ | 46,283 | | | $ | 65,195 | | | $ | 14,671 | | | $ | 34,802 | |
Ratios to average net assets: | |
Net investment income (loss) | | | (0.04 | %) | | | (0.10 | %) | | | 0.42 | % | | | 0.01 | % | | | 0.51 | % | | | 0.04 | % |
Total expenses | | | 1.37 | % | | | 1.34 | % | | | 1.33 | % | | | 1.37 | % | | | 1.35 | % | | | 1.34 | % |
Portfolio turnover rate | | | 517 | % | | | 238 | % | | | 395 | % | | | 671 | % | | | 472 | % | | | 822 | % |
A-Class | | Period Ended
September 30,
2016a | | | Year Ended
March 31,
2016 | | | Year Ended
March 31,
2015 | | | Year Ended
March 31,
2014 | | | Year Ended
March 28,
2013 | | | Year Ended
March 31,
2012 | |
Per Share Data | | | | | | | | | | | | | | | | | | |
Net asset value, beginning of period | | $ | 25.69 | | | $ | 26.85 | | | $ | 22.48 | | | $ | 18.79 | | | $ | 16.77 | | | $ | 14.14 | |
Income (loss) from investment operations: | |
Net investment income (loss)b | | | (.05 | ) | | | (.09 | ) | | | .06 | | | | (.09 | ) | | | .03 | | | | (.03 | ) |
Net gain (loss) on investments (realized and unrealized) | | | (.56 | ) | | | (1.05 | ) | | | 4.31 | | | | 3.78 | | | | 1.99 | | | | 2.67 | |
Total from investment operations | | | (.61 | ) | | | (1.14 | ) | | | 4.37 | | | | 3.69 | | | | 2.02 | | | | 2.64 | |
Less distributions from: | |
Net investment income | | | — | | | | (.02 | ) | | | — | | | | — | | | | — | | | | (.01 | ) |
Total distributions | | | — | | | | (.02 | ) | | | — | | | | — | | | | — | | | | (.01 | ) |
Net asset value, end of period | | $ | 25.08 | | | $ | 25.69 | | | $ | 26.85 | | | $ | 22.48 | | | $ | 18.79 | | | $ | 16.77 | |
| | |
Total Returnd | | | (2.37 | %) | | | (4.24 | %) | | | 19.44 | % | | | 19.64 | % | | | 12.05 | % | | | 18.71 | % |
Ratios/Supplemental Data | |
Net assets, end of period (in thousands) | | $ | 1,381 | | | $ | 6,313 | | | $ | 19,502 | | | $ | 2,049 | | | $ | 1,500 | | | $ | 5,697 | |
Ratios to average net assets: | |
Net investment income (loss) | | | (0.41 | %) | | | (0.36 | %) | | | 0.25 | % | | | (0.42 | %) | | | 0.20 | % | | | (0.18 | %) |
Total expenses | | | 1.62 | % | | | 1.60 | % | | | 1.58 | % | | | 1.62 | % | | | 1.59 | % | | | 1.58 | % |
Portfolio turnover rate | | | 517 | % | | | 238 | % | | | 395 | % | | | 671 | % | | | 472 | % | | | 822 | % |
112 | THE RYDEX FUNDS SEMI-ANNUAL REPORT | SEE NOTES TO FINANCIAL STATEMENTS. |
FINANCIAL HIGHLIGHTS (concluded) |
This table is presented to show selected data for a share outstanding throughout each period and to assist shareholders in evaluating a Fund’s performance for the periods presented.
C-Class | | Period Ended
September 30,
2016a | | | Year Ended
March 31,
2016 | | | Year Ended
March 31,
2015 | | | Year Ended
March 31,
2014 | | | Year Ended
March 28,
2013 | | | Year Ended
March 31,
2012 | |
Per Share Data | | | | | | | | | | | | | | | | | | |
Net asset value, beginning of period | | $ | 23.23 | | | $ | 24.46 | | | $ | 20.64 | | | $ | 17.40 | | | $ | 15.62 | | | $ | 13.27 | |
Income (loss) from investment operations: | |
Net investment income (loss)b | | | (.12 | ) | | | (.24 | ) | | | (.19 | ) | | | (.23 | ) | | | (.06 | ) | | | (.13 | ) |
Net gain (loss) on investments (realized and unrealized) | | | (.52 | ) | | | (.97 | ) | | | 4.01 | | | | 3.47 | | | | 1.84 | | | | 2.49 | |
Total from investment operations | | | (.64 | ) | | | (1.21 | ) | | | 3.82 | | | | 3.24 | | | | 1.78 | | | | 2.36 | |
Less distributions from: | |
Net investment income | | | — | | | | (.02 | ) | | | — | | | | — | | | | — | | | | (.01 | ) |
Total distributions | | | — | | | | (.02 | ) | | | — | | | | — | | | | — | | | | (.01 | ) |
Net asset value, end of period | | $ | 22.59 | | | $ | 23.23 | | | $ | 24.46 | | | $ | 20.64 | | | $ | 17.40 | | | $ | 15.62 | |
| | |
Total Returnd | | | (2.76 | %) | | | (4.94 | %) | | | 18.51 | % | | | 18.62 | % | | | 11.40 | % | | | 17.83 | % |
Ratios/Supplemental Data | |
Net assets, end of period (in thousands) | | $ | 2,161 | | | $ | 2,532 | | | $ | 3,455 | | | $ | 2,503 | | | $ | 1,831 | | | $ | 2,603 | |
Ratios to average net assets: | |
Net investment income (loss) | | | (1.05 | %) | | | (1.04 | %) | | | (0.88 | %) | | | (1.16 | %) | | | (0.39 | %) | | | (0.96 | %) |
Total expenses | | | 2.36 | % | �� | | 2.35 | % | | | 2.34 | % | | | 2.37 | % | | | 2.35 | % | | | 2.35 | % |
Portfolio turnover rate | | | 517 | % | | | 238 | % | | | 395 | % | | | 671 | % | | | 472 | % | | | 822 | % |
H-Class | | Period Ended
September 30,
2016a | | | Year Ended
March 31,
2016e | | | Year Ended
March 31,
2015e | | | Year Ended
March 31,
2014e | | | Year Ended
March 28,
2013e | | | Year Ended
March 31,
2012e | |
Per Share Data | | | | | | | | | | | | | | | | | | |
Net asset value, beginning of period | | $ | 25.07 | | | $ | 26.22 | | | $ | 22.00 | | | $ | 18.45 | | | $ | 16.45 | | | $ | 13.91 | |
Income (loss) from investment operations: | |
Net investment income (loss)b | | | (.02 | ) | | | (.11 | ) | | | .01 | | | | (.14 | ) | | | (.01 | ) | | | (.09 | ) |
Net gain (loss) on investments (realized and unrealized) | | | (.57 | ) | | | (1.02 | ) | | | 4.21 | | | | 3.69 | | | | 2.01 | | | | 2.64 | |
Total from investment operations | | | (.59 | ) | | | (1.13 | ) | | | 4.22 | | | | 3.55 | | | | 2.00 | | | | 2.55 | |
Less distributions from: | |
Net investment income | | | — | | | | (.02 | ) | | | — | | | | — | | | | — | | | | (.01 | ) |
Total distributions | | | — | | | | (.02 | ) | | | — | | | | — | | | | — | | | | (.01 | ) |
Net asset value, end of period | | $ | 24.48 | | | $ | 25.07 | | | $ | 26.22 | | | $ | 22.00 | | | $ | 18.45 | | | $ | 16.45 | |
| | |
Total Returnd | | | (2.39 | %) | | | (4.31 | %) | | | 19.18 | % | | | 19.24 | % | | | 12.16 | % | | | 18.38 | % |
Ratios/Supplemental Data | |
Net assets, end of period (in thousands) | | $ | 562 | | | $ | 3,407 | | | $ | 8,871 | | | $ | 5,391 | | | $ | 2,454 | | | $ | 3,979 | |
Ratios to average net assets: | |
Net investment income (loss) | | | (0.13 | %) | | | (0.44 | %) | | | 0.05 | % | | | (0.64 | %) | | | (0.05 | %) | | | (0.66 | %) |
Total expenses | | | 1.61 | % | | | 1.71 | % | | | 1.83 | % | | | 1.87 | % | | | 1.85 | % | | | 1.84 | % |
Portfolio turnover rate | | | 517 | % | | | 238 | % | | | 395 | % | | | 671 | % | | | 472 | % | | | 822 | % |
a | Unaudited figures for the period ended September 30, 2016. Percentage amounts for the period, except total return and portfolio turnover rate, have been annualized. |
b | Net investment income (loss) per share was computed using average shares outstanding throughout the period. |
c | Net investment income is less than $0.01 per share. |
d | Total return does not reflect the impact of any applicable sales charges. |
e | Effective September 30, 2015, the Fund’s Advisor Class shares were converted into H-Class shares. The financial highlights for periods prior to that date reflect the performance of the former Advisor Class — See Note 8. |
SEE NOTES TO FINANCIAL STATEMENTS. | THE RYDEX FUNDS SEMI-ANNUAL REPORT | 113 |
FUND PROFILE (Unaudited) | September 30, 2016 |
TECHNOLOGY FUND
OBJECTIVE: Seeks to provide capital appreciation by investing in companies that are involved in the technology sector, including computer software and service companies, semiconductor manufacturers, networking and telecommunications equipment manufacturers, PC hardware and peripherals companies (“Technology Companies”).
Holdings Diversification (Market Exposure as % of Net Assets)
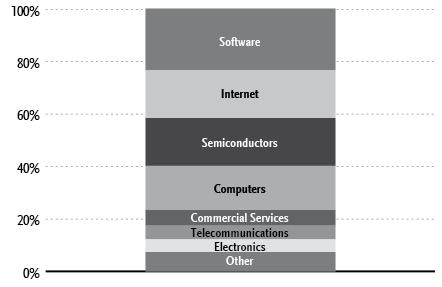
“Holdings Diversification (Market Exposure as % of Net Assets)” excludes any temporary cash investments.
Inception Dates: |
Investor Class | April 14, 1998 |
A-Class | September 1, 2004 |
C-Class | April 18, 2001 |
H-Class* | April 29, 1998 |
Ten Largest Holdings (% of Total Net Assets) |
Apple, Inc. | 3.4% |
Alphabet, Inc. — Class A | 3.2% |
Microsoft Corp. | 3.0% |
Facebook, Inc. — Class A | 2.7% |
Visa, Inc. — Class A | 2.0% |
Intel Corp. | 1.9% |
Cisco Systems, Inc. | 1.8% |
Oracle Corp. | 1.7% |
International Business Machines Corp. | 1.7% |
Alibaba Group Holding Ltd. ADR | 1.6% |
Top Ten Total | 23.0% |
| | |
“Ten Largest Holdings” excludes any temporary cash investments. |
* | Effective September 30, 2015, the Fund’s Advisor Class shares were converted into H-Class shares — See Note 8. |
114 | THE RYDEX FUNDS SEMI-ANNUAL REPORT | |
SCHEDULE OF INVESTMENTS (Unaudited) | September 30, 2016 |
TECHNOLOGY FUND | |
| | | Shares | | | Value | |
| | | | | | | |
COMMON STOCKS† - 100.3% | |
| | | | | | | |
Software - 23.4% | |
Microsoft Corp. | | | 25,615 | | | $ | 1,475,425 | |
Oracle Corp. | | | 22,048 | | | | 866,046 | |
Adobe Systems, Inc.* | | | 4,908 | | | | 532,714 | |
salesforce.com, Inc.* | | | 6,692 | | | | 477,340 | |
Activision Blizzard, Inc. | | | 8,949 | | | | 396,441 | |
VMware, Inc. — Class A* | | | 5,288 | | | | 387,875 | |
Intuit, Inc. | | | 3,436 | | | | 377,994 | |
Electronic Arts, Inc.* | | | 4,141 | | | | 353,641 | |
Fidelity National Information Services, Inc. | | | 4,533 | | | | 349,177 | |
Fiserv, Inc.* | | | 3,326 | | | | 330,837 | |
NetEase, Inc. ADR | | | 1,320 | | | | 317,830 | |
Paychex, Inc. | | | 5,424 | | | | 313,887 | |
Workday, Inc. — Class A* | | | 3,370 | | | | 308,995 | |
Check Point Software Technologies Ltd.* | | | 3,790 | | | | 294,142 | |
Autodesk, Inc.* | | | 3,967 | | | | 286,933 | |
Red Hat, Inc.* | | | 3,527 | | | | 285,087 | |
Citrix Systems, Inc.* | | | 3,081 | | | | 262,563 | |
CA, Inc. | | | 7,883 | | | | 260,770 | |
SAP SE ADR | | | 2,818 | | | | 257,593 | |
ServiceNow, Inc.* | | | 3,230 | | | | 255,655 | |
First Data Corp. — Class A* | | | 18,005 | | | | 236,945 | |
Akamai Technologies, Inc.* | | | 4,045 | | | | 214,345 | |
NetSuite, Inc.* | | | 1,880 | | | | 208,097 | |
CDK Global, Inc. | | | 3,584 | | | | 205,579 | |
Broadridge Financial Solutions, Inc. | | | 2,970 | | | | 201,336 | |
ANSYS, Inc.* | | | 2,110 | | | | 195,407 | |
Twilio, Inc. — Class A* | | | 2,840 | | | | 182,782 | |
Jack Henry & Associates, Inc. | | | 2,090 | | | | 178,800 | |
SS&C Technologies Holdings, Inc. | | | 5,520 | | | | 177,468 | |
Tyler Technologies, Inc.* | | | 1,010 | | | | 172,942 | |
Ultimate Software Group, Inc.* | | | 814 | | | | 166,373 | |
PTC, Inc.* | | | 3,653 | | | | 161,864 | |
Tableau Software, Inc. — Class A* | | | 2,560 | | | | 141,491 | |
Aspen Technology, Inc.* | | | 3,000 | | | | 140,370 | |
Nuance Communications, Inc.* | | | 9,680 | | | | 140,360 | |
Take-Two Interactive Software, Inc.* | | | 3,110 | | | | 140,199 | |
Rackspace Hosting, Inc.* | | | 4,403 | | | | 139,531 | |
j2 Global, Inc. | | | 1,830 | | | | 121,896 | |
Proofpoint, Inc.* | | | 1,620 | | | | 121,257 | |
Total Software | | | | | | | 11,637,987 | |
| | | | | | | | | |
Internet - 18.3% | |
Alphabet, Inc. — Class A* | | | 2,001 | | | | 1,608,924 | |
Facebook, Inc. — Class A* | | | 10,423 | | | | 1,336,959 | |
Alibaba Group Holding Ltd. ADR* | | | 7,370 | | | | 779,672 | |
Yahoo!, Inc.* | | | 10,202 | | | | 439,706 | |
Baidu, Inc. ADR* | | | 2,386 | | | | 434,419 | |
eBay, Inc.* | | | 13,054 | | | | 429,477 | |
LinkedIn Corp. — Class A* | | | 1,835 | | | | 350,706 | |
Twitter, Inc.* | | | 13,662 | | | | 314,909 | |
Symantec Corp. | | | 11,021 | | | | 276,627 | |
58.com, Inc. ADR* | | | 5,730 | | | | 273,092 | |
MercadoLibre, Inc. | | | 1,423 | | | | 263,212 | |
SINA Corp.* | | | 3,337 | | | | 246,371 | |
Weibo Corp. ADR* | | | 4,889 | | | | 245,119 | |
YY, Inc. ADR* | | | 4,500 | | | | 239,760 | |
F5 Networks, Inc.* | | | 1,638 | | | | 204,160 | |
VeriSign, Inc.* | | | 2,563 | | | | 200,529 | |
Splunk, Inc.* | | | 3,390 | | | | 198,925 | |
CDW Corp. | | | 4,198 | | | | 191,975 | |
Zillow Group, Inc. — Class C* | | | 5,080 | | | | 176,022 | |
IAC/InterActiveCorp | | | 2,550 | | | | 159,299 | |
GrubHub, Inc.* | | | 3,260 | | | | 140,147 | |
Yelp, Inc. — Class A* | | | 3,202 | | | | 133,523 | |
Pandora Media, Inc.* | | | 9,219 | | | | 132,108 | |
FireEye, Inc.* | | | 7,660 | | | | 112,832 | |
WebMD Health Corp. — Class A* | | | 1,880 | | | | 93,436 | |
Stamps.com, Inc.* | | | 970 | | | | 91,675 | |
Total Internet | | | | | | | 9,073,584 | |
| | | | | | | | | |
Semiconductors - 18.2% | |
Intel Corp. | | | 24,909 | | | | 940,316 | |
QUALCOMM, Inc. | | | 10,670 | | | | 730,894 | |
Texas Instruments, Inc. | | | 8,350 | | | | 586,003 | |
Broadcom Ltd. | | | 2,766 | | | | 477,190 | |
NXP Semiconductor N.V.* | | | 4,307 | | | | 439,357 | |
NVIDIA Corp. | | | 6,395 | | | | 438,185 | |
Applied Materials, Inc. | | | 13,223 | | | | 398,674 | |
Taiwan Semiconductor Manufacturing Company Ltd. ADR | | | 11,767 | | | | 359,953 | |
Analog Devices, Inc. | | | 4,850 | | | | 312,583 | |
Micron Technology, Inc.* | | | 16,819 | | | | 299,042 | |
Marvell Technology Group Ltd. | | | 22,312 | | | | 296,080 | |
Lam Research Corp. | | | 2,964 | | | | 280,720 | |
Skyworks Solutions, Inc. | | | 3,503 | | | | 266,718 | |
Linear Technology Corp. | | | 4,446 | | | | 263,603 | |
Xilinx, Inc. | | | 4,785 | | | | 260,017 | |
Microchip Technology, Inc. | | | 4,153 | | | | 258,067 | |
ASML Holding N.V. — Class G | | | 2,338 | | | | 256,198 | |
Maxim Integrated Products, Inc. | | | 5,941 | | | | 237,224 | |
KLA-Tencor Corp. | | | 3,348 | | | | 233,389 | |
Qorvo, Inc.* | | | 3,397 | | | | 189,349 | |
Advanced Micro Devices, Inc.* | | | 27,090 | | | | 187,192 | |
ON Semiconductor Corp.* | | | 13,609 | | | | 167,663 | |
Microsemi Corp.* | | | 3,631 | | | | 152,429 | |
Teradyne, Inc. | | | 6,818 | | | | 147,132 | |
IPG Photonics Corp.* | | | 1,760 | | | | 144,936 | |
Cypress Semiconductor Corp. | | | 11,282 | | | | 137,189 | |
Integrated Device Technology, Inc.* | | | 5,567 | | | | 128,598 | |
Cavium, Inc.* | | | 2,200 | | | | 128,040 | |
Cirrus Logic, Inc.* | | | 2,327 | | | | 123,680 | |
Ambarella, Inc.* | | | 1,510 | | | | 111,151 | |
Synaptics, Inc.* | | | 1,682 | | | | 98,532 | |
Total Semiconductors | | | | | | | 9,050,104 | |
| | | | | | | | | |
Computers - 16.9% | |
Apple, Inc. | | | 15,032 | | | | 1,699,367 | |
International Business Machines Corp. | | | 5,438 | | | | 863,826 | |
Accenture plc — Class A | | | 3,787 | | | | 462,658 | |
Hewlett Packard Enterprise Co. | | | 18,945 | | | | 430,999 | |
HP, Inc. | | | 23,905 | | | | 371,245 | |
SEE NOTES TO FINANCIAL STATEMENTS. | THE RYDEX FUNDS SEMI-ANNUAL REPORT | 115 |
SCHEDULE OF INVESTMENTS (Unaudited)(continued) | September 30, 2016 |
TECHNOLOGY FUND | |
| | | Shares | | | Value | |
| | | | | | | |
Cognizant Technology Solutions Corp. — Class A* | | | 7,376 | | | $ | 351,909 | |
Western Digital Corp. | | | 5,074 | | | | 296,677 | |
Infosys Ltd. ADR | | | 16,850 | | | | 265,893 | |
BlackBerry Ltd.* | | | 32,003 | | | | 255,384 | |
Seagate Technology plc | | | 6,313 | | | | 243,366 | |
FleetMatics Group plc* | | | 4,030 | | | | 241,719 | |
Dell Technologies Incorporated - VMware Inc — Class V* | | | 4,695 | | | | 224,416 | |
NetApp, Inc. | | | 6,216 | | | | 222,657 | |
Synopsys, Inc.* | | | 3,620 | | | | 214,847 | |
Amdocs Ltd. | | | 3,570 | | | | 206,525 | |
Cadence Design Systems, Inc.* | | | 7,518 | | | | 191,935 | |
Computer Sciences Corp. | | | 3,676 | | | | 191,924 | |
Leidos Holdings, Inc. | | | 4,140 | | | | 179,179 | |
Fortinet, Inc.* | | | 4,838 | | | | 178,667 | |
CSRA, Inc. | | | 5,570 | | | | 149,833 | |
Teradata Corp.* | | | 4,575 | | | | 141,825 | |
NCR Corp.* | | | 4,320 | | | | 139,061 | |
Manhattan Associates, Inc.* | | | 2,400 | | | | 138,288 | |
DST Systems, Inc. | | | 1,140 | | | | 134,429 | |
Brocade Communications Systems, Inc. | | | 14,498 | | | | 133,817 | |
MAXIMUS, Inc. | | | 2,340 | | | | 132,350 | |
EPAM Systems, Inc.* | | | 1,890 | | | | 130,996 | |
3D Systems Corp.* | | | 5,807 | | | | 104,236 | |
VeriFone Systems, Inc.* | | | 5,150 | | | | 81,061 | |
Total Computers | | | | | | | 8,379,089 | |
| | | | | | | | | |
Commercial Services - 5.9% | |
PayPal Holdings, Inc.* | | | 11,919 | | | | 488,321 | |
Automatic Data Processing, Inc. | | | 4,999 | | | | 440,913 | |
FleetCor Technologies, Inc.* | | | 1,650 | | | | 286,655 | |
Global Payments, Inc. | | | 3,221 | | | | 247,244 | |
Vantiv, Inc. — Class A* | | | 4,130 | | | | 232,395 | |
Western Union Co. | | | 10,794 | | | | 224,731 | |
Total System Services, Inc. | | | 4,283 | | | | 201,943 | |
Sabre Corp. | | | 7,007 | | | | 197,457 | |
Gartner, Inc.* | | | 2,080 | | | | 183,976 | |
Booz Allen Hamilton Holding Corp. | | | 4,869 | | | | 153,909 | |
WEX, Inc.* | | | 1,390 | | | | 150,245 | |
Square, Inc. — Class A* | | | 11,980 | | | | 139,687 | |
Total Commercial Services | | | | | | | 2,947,476 | |
| | | | | | | | | |
Telecommunications - 5.3% | |
Cisco Systems, Inc. | | | 27,792 | | | | 881,562 | |
Palo Alto Networks, Inc.* | | | 1,720 | | | | 274,048 | |
Motorola Solutions, Inc. | | | 3,337 | | | | 254,546 | |
Nokia Oyj ADR | | | 42,807 | | | | 247,853 | |
Juniper Networks, Inc. | | | 8,953 | | | | 215,409 | |
Arista Networks, Inc.* | | | 1,980 | | | | 168,458 | |
CommScope Holding Company, Inc.* | | | 5,528 | | | | 166,448 | |
ARRIS International plc* | | | 5,655 | | | | 160,206 | |
Acacia Communications, Inc.* | | | 1,280 | | | | 132,198 | |
Ciena Corp.* | | | 5,645 | | | | 123,061 | |
Total Telecommunications | | | | | | | 2,623,789 | |
| | | | | | | | | |
Electronics - 4.8% | |
Corning, Inc. | | | 14,899 | | | | 352,361 | |
Amphenol Corp. — Class A | | | 4,871 | | | | 316,225 | |
TE Connectivity Ltd. | | | 4,781 | | | | 307,801 | |
Flextronics International Ltd.* | | | 14,257 | | | | 194,180 | |
Trimble, Inc.* | | | 6,734 | | | | 192,324 | |
Arrow Electronics, Inc.* | | | 2,656 | | | | 169,904 | |
Keysight Technologies, Inc.* | | | 5,218 | | | | 165,358 | |
Avnet, Inc. | | | 3,934 | | | | 161,530 | |
FLIR Systems, Inc. | | | 4,610 | | | | 144,846 | |
Jabil Circuit, Inc. | | | 6,352 | | | | 138,601 | |
Tech Data Corp.* | | | 1,553 | | | | 131,555 | |
Fitbit, Inc. — Class A* | | | 8,090 | | | | 120,056 | |
Total Electronics | | | | | | | 2,394,741 | |
| | | | | | | | | |
Diversified Financial Services - 4.3% | |
Visa, Inc. — Class A | | | 12,051 | | | | 996,618 | |
Mastercard, Inc. — Class A | | | 7,516 | | | | 764,903 | |
Alliance Data Systems Corp.* | | | 1,139 | | | | 244,350 | |
Ellie Mae, Inc.* | | | 1,280 | | | | 134,784 | |
Total Diversified Financial Services | | | | | | | 2,140,655 | |
| | | | | | | | | |
Auto Parts & Equipment - 0.6% | |
Mobileye N.V.* | | | 6,576 | | | | 279,940 | |
| | | | | | | | | |
Aerospace & Defense - 0.5% | |
Harris Corp. | | | 2,550 | | | | 233,606 | |
| | | | | | | | | |
Electrical Components & Equipment - 0.5% | |
Belden, Inc. | | | 1,761 | | | | 121,491 | |
Universal Display Corp.* | | | 1,950 | | | | 108,245 | |
Total Electrical Components & Equipment | | | | | | | 229,736 | |
| | | | | | | | | |
Office & Business Equipment - 0.5% | |
Xerox Corp. | | | 22,331 | | | | 226,213 | |
| | | | | | | | | |
Distribution & Wholesale - 0.3% | |
Ingram Micro, Inc. — Class A | | | 4,562 | | | | 162,681 | |
| | | | | | | | | |
Energy-Alternate Sources - 0.3% | |
First Solar, Inc.* | | | 3,834 | | | | 151,405 | |
| | | | | | | | | |
Machinery-Diversified - 0.3% | |
Zebra Technologies Corp. — Class A* | | | 1,940 | | | | 135,043 | |
| | | | | | | | | |
Building Materials - 0.2% | |
Cree, Inc.* | | | 4,485 | | | | 115,354 | |
| | | | | | | | | |
Total Common Stocks | | | | | | | | |
(Cost $42,032,092) | | | | | | | 49,781,403 | |
116 | THE RYDEX FUNDS SEMI-ANNUAL REPORT | SEE NOTES TO FINANCIAL STATEMENTS. |
SCHEDULE OF INVESTMENTS (Unaudited)(concluded) | September 30, 2016 |
TECHNOLOGY FUND | |
| | | Face
Amount | | | Value | |
| | | | | | | |
REPURCHASE AGREEMENT††,1 - 0.4% | |
Royal Bank of Canada
issued 09/30/16 at 0.36%
due 10/03/16 | | $ | 216,866 | | | | 216,866 | |
Total Repurchase Agreement | | | | | | | | |
(Cost $216,866) | | | | | | | 216,866 | |
| | | | | | | | | |
Total Investments - 100.7% | | | | | | | | |
(Cost $42,248,958) | | | | | | $ | 49,998,269 | |
Other Assets & Liabilities, net - (0.7)% | | | | | | | (327,761 | ) |
Total Net Assets - 100.0% | | | | | | $ | 49,670,508 | |
* | Non-income producing security. |
† | Value determined based on Level 1 inputs — See Note 4. |
†† | Value determined based on Level 2 inputs — See Note 4. |
1 | Repurchase Agreement — See Note 5. |
| | ADR — American Depositary Receipt |
| | plc — Public Limited Company |
| | |
| | See Sector Classification in Other Information section. |
The following table summarizes the inputs used to value the Fund’s investments at September 30, 2016 (See Note 4 in the Notes to Financial Statements):
Investments in Securities (Assets) | | Level 1 | | | Level 2 | | | Level 3 | | | Total | |
Common Stocks | | $ | 49,781,403 | | | $ | — | | | $ | — | | | $ | 49,781,403 | |
Repurchase Agreement | | | — | | | | 216,866 | | | | — | | | | 216,866 | |
Total | | $ | 49,781,403 | | | $ | 216,866 | | | $ | — | | | $ | 49,998,269 | |
Transfers between investment levels may occur as the markets fluctuate and/or the availability of data used in an investment’s valuation changes. Transfers between valuation levels, if any, are in comparison to the valuation levels at the end of the previous fiscal year, and are effective using the fair value as of the end of the previous fiscal period.
For the period ended September 30, 2016, there were no transfers between levels.
SEE NOTES TO FINANCIAL STATEMENTS. | THE RYDEX FUNDS SEMI-ANNUAL REPORT | 117 |
STATEMENT OF ASSETS AND LIABILITIES (Unaudited) |
September 30, 2016 |
Assets: | |
Investments, at value (cost $42,032,092) | | $ | 49,781,403 | |
Repurchase agreements, at value (cost $216,866) | | | 216,866 | |
Total investments (cost $42,248,958) | | | 49,998,269 | |
Cash | | | 7,988 | |
Receivables: | |
Fund shares sold | | | 1,154,066 | |
Dividends | | | 22,887 | |
Foreign taxes reclaim | | | 1,105 | |
Interest | | | 2 | |
Total assets | | | 51,184,317 | |
| | | | | |
Liabilities: | |
Payable for: | |
Fund shares redeemed | | | 1,450,264 | |
Management fees | | | 34,232 | |
Transfer agent and administrative fees | | | 10,068 | |
Portfolio accounting fees | | | 4,027 | |
Distribution and service fees | | | 3,709 | |
Miscellaneous | | | 11,509 | |
Total liabilities | | | 1,513,809 | |
Commitments and contingent liabilities (Note 9) | | | — | |
Net assets | | $ | 49,670,508 | |
| | | | | |
Net assets consist of: | |
Paid in capital | | $ | 44,290,571 | |
Accumulated net investment loss | | | (28,722 | ) |
Accumulated net realized loss on investments | | | (2,340,652 | ) |
Net unrealized appreciation on investments | | | 7,749,311 | |
Net assets | | $ | 49,670,508 | |
| | | | | |
Investor Class: | |
Net assets | | $ | 37,181,101 | |
Capital shares outstanding | | | 545,172 | |
Net asset value per share | | $ | 68.20 | |
| | | | | |
A-Class: | |
Net assets | | $ | 5,203,599 | |
Capital shares outstanding | | | 81,278 | |
Net asset value per share | | $ | 64.02 | |
Maximum offering price per share (Net asset value divided by 95.25%) | | $ | 67.21 | |
| | | | | |
C-Class: | |
Net assets | | $ | 2,208,825 | |
Capital shares outstanding | | | 37,619 | |
Net asset value per share | | $ | 58.72 | |
| | | | | |
H-Class: | |
Net assets | | $ | 5,076,983 | |
Capital shares outstanding | | | 80,992 | |
Net asset value per share | | $ | 62.69 | |
STATEMENT OF OPERATIONS (Unaudited) | |
Period Ended September 30, 2016 | |
| | |
Investment Income: | |
Dividends (net of foreign withholding tax of $3,086) | | $ | 244,938 | |
Interest | | | 206 | |
Total investment income | | | 245,144 | |
| | | | | |
Expenses: | |
Management fees | | | 140,071 | |
Transfer agent and administrative fees | | | 41,197 | |
Distribution and service fees: | |
A-Class | | | 4,033 | |
C-Class | | | 9,162 | |
H-Class | | | 3,582 | |
Portfolio accounting fees | | | 16,479 | |
Custodian fees | | | 1,947 | |
Trustees’ fees* | | | 1,046 | |
Line of credit fees | | | 135 | |
Miscellaneous | | | 24,686 | |
Total expenses | | | 242,338 | |
Net investment income | | | 2,806 | |
| | | | | |
Net Realized and Unrealized Gain (Loss): | |
Net realized gain (loss) on: | |
Investments | | | 5,060,140 | |
Net realized gain | | | 5,060,140 | |
Net change in unrealized appreciation (depreciation) on: | |
Investments | | | (1,122,913 | ) |
Net change in unrealized appreciation (depreciation) | | | (1,122,913 | ) |
Net realized and unrealized gain | | | 3,937,227 | |
Net increase in net assets resulting from operations | | $ | 3,940,033 | |
* | Relates to Trustees not deemed “interested persons” within the meaning of Section 2(a)(19) of the 1940 Act. |
118 | THE RYDEX FUNDS SEMI-ANNUAL REPORT | SEE NOTES TO FINANCIAL STATEMENTS. |
STATEMENTS OF CHANGES IN NET ASSETS |
| | | Period Ended
September 30,
2016
(Unaudited) | | | Year Ended
March 31,
2016 | |
Increase (Decrease) in Net Assets from Operations: | | | | | | |
Net investment income (loss) | | $ | 2,806 | | | $ | (90,295 | ) |
Net realized gain on investments | | | 5,060,140 | | | | 123,656 | |
Net change in unrealized appreciation (depreciation) on investments | | | (1,122,913 | ) | | | (4,049,840 | ) |
Net increase (decrease) in net assets resulting from operations | | | 3,940,033 | | | | (4,016,479 | ) |
| | | | | | | | | |
Capital share transactions: | | | | | | | | |
Proceeds from sale of shares | | | | | | | | |
Investor Class | | | 52,612,985 | | | | 99,486,819 | |
A-Class | | | 3,563,375 | | | | 20,272,499 | |
C-Class | | | 2,254,285 | | | | 17,598,381 | |
H-Class | | | 23,346,790 | | | | 60,138,342 | * |
Cost of shares redeemed | | | | | | | | |
Investor Class | | | (40,805,745 | ) | | | (94,488,616 | ) |
A-Class | | | (6,899,227 | ) | | | (21,811,056 | ) |
C-Class | | | (2,470,469 | ) | | | (18,142,641 | ) |
H-Class | | | (20,428,191 | ) | | | (60,639,611 | )* |
Net increase from capital share transactions | | | 11,173,803 | | | | 2,414,117 | |
Net increase (decrease) in net assets | | | 15,113,836 | | | | (1,602,362 | ) |
| | | | | | | | | |
Net assets: | | | | | | | | |
Beginning of period | | | 34,556,672 | | | | 36,159,034 | |
End of period | | $ | 49,670,508 | | | $ | 34,556,672 | |
Accumulated net investment loss at end of period | | $ | (28,722 | ) | | $ | (31,528 | ) |
| | | | | | | | | |
Capital share activity: | | | | | | | | |
Shares sold | | | | | | | | |
Investor Class | | | 832,341 | | | | 1,642,615 | |
A-Class | | | 57,770 | | | | 358,240 | |
C-Class | | | 41,305 | | | | 332,333 | |
H-Class | | | 417,915 | | | | 1,063,419 | * |
Shares redeemed | | | | | | | | |
Investor Class | | | (653,390 | ) | | | (1,610,504 | ) |
A-Class | | | (122,878 | ) | | | (384,505 | ) |
C-Class | | | (46,337 | ) | | | (344,075 | ) |
H-Class | | | (369,751 | ) | | | (1,080,659 | )* |
Net increase (decrease) in shares | | | 156,975 | | | | (23,136 | ) |
* | Effective September 30, 2015, the Fund’s Advisor Class shares were converted into H-Class shares — See Note 8. |
SEE NOTES TO FINANCIAL STATEMENTS. | THE RYDEX FUNDS SEMI-ANNUAL REPORT | 119 |
This table is presented to show selected data for a share outstanding throughout each period and to assist shareholders in evaluating a Fund’s performance for the periods presented.
Investor Class | | Period Ended
September 30,
2016a | | | Year Ended
March 31,
2016 | | | Year Ended
March 31,
2015 | | | Year Ended
March 31,
2014d | | | Year Ended
March 28,
2013d | | | Year Ended
March 31,
2012d | |
Per Share Data | | | | | | | | | | | | | | | | | | |
Net asset value, beginning of period | | $ | 60.53 | | | $ | 61.23 | | | $ | 55.90 | | | $ | 43.58 | | | $ | 42.92 | | | $ | 41.81 | |
Income (loss) from investment operations: | |
Net investment income (loss)b | | | .04 | | | | (.06 | ) | | | (.10 | ) | | | (.09 | ) | | | .03 | | | | (.03 | ) |
Net gain (loss) on investments (realized and unrealized) | | | 7.63 | | | | (.64 | ) | | | 5.43 | | | | 12.41 | | | | .63 | | | | 1.14 | |
Total from investment operations | | | 7.67 | | | | (.70 | ) | | | 5.33 | | | | 12.32 | | | | .66 | | | | 1.11 | |
Net asset value, end of period | | $ | 68.20 | | | $ | 60.53 | | | $ | 61.23 | | | $ | 55.90 | | | $ | 43.58 | | | $ | 42.92 | |
| | |
Total Returnc | | | 12.67 | % | | | (1.14 | %) | | | 9.53 | % | | | 28.24 | % | | | 1.54 | % | | | 2.65 | % |
Ratios/Supplemental Data | |
Net assets, end of period (in thousands) | | $ | 37,181 | | | $ | 22,167 | | | $ | 20,458 | | | $ | 32,858 | | | $ | 8,325 | | | $ | 19,985 | |
Ratios to average net assets: | |
Net investment income (loss) | | | 0.13 | % | | | (0.10 | %) | | | (0.17 | %) | | | (0.18 | %) | | | 0.10 | % | | | (0.10 | %) |
Total expenses | | | 1.37 | % | | | 1.35 | % | | | 1.35 | % | | | 1.37 | % | | | 1.35 | % | | | 1.36 | % |
Portfolio turnover rate | | | 166 | % | | | 388 | % | | | 280 | % | | | 321 | % | | | 324 | % | | | 487 | % |
A-Class | | Period Ended
September 30,
2016a | | | Year Ended
March 31,
2016 | | | Year Ended
March 31,
2015 | | | Year Ended
March 31,
2014d | | | Year Ended
March 28,
2013d | | | Year Ended
March 31,
2012d | |
Per Share Data | | | | | | | | | | | | | | | | | | |
Net asset value, beginning of period | | $ | 56.88 | | | $ | 57.69 | | | $ | 52.79 | | | $ | 41.30 | | | $ | 40.76 | | | $ | 39.83 | |
Income (loss) from investment operations: | |
Net investment income (loss)b | | | (.06 | ) | | | (.14 | ) | | | (.21 | ) | | | (.23 | ) | | | (.09 | ) | | | (.30 | ) |
Net gain (loss) on investments (realized and unrealized) | | | 7.20 | | | | (.67 | ) | | | 5.11 | | | | 11.72 | | | | .63 | | | | 1.23 | |
Total from investment operations | | | 7.14 | | | | (.81 | ) | | | 4.90 | | | | 11.49 | | | | .54 | | | | .93 | |
Net asset value, end of period | | $ | 64.02 | | | $ | 56.88 | | | $ | 57.69 | | | $ | 52.79 | | | $ | 41.30 | | | $ | 40.76 | |
| | |
Total Returnc | | | 12.55 | % | | | (1.40 | %) | | | 9.28 | % | | | 27.79 | % | | | 1.32 | % | | | 2.33 | % |
Ratios/Supplemental Data | |
Net assets, end of period (in thousands) | | $ | 5,204 | | | $ | 8,327 | | | $ | 9,960 | | | $ | 5,873 | | | $ | 1,998 | | | $ | 7,367 | |
Ratios to average net assets: | |
Net investment income (loss) | | | (0.19 | %) | | | (0.25 | %) | | | (0.39 | %) | | | (0.47 | %) | | | (0.27 | %) | | | (0.76 | %) |
Total expenses | | | 1.62 | % | | | 1.60 | % | | | 1.59 | % | | | 1.62 | % | | | 1.59 | % | | | 1.59 | % |
Portfolio turnover rate | | | 166 | % | | | 388 | % | | | 280 | % | | | 321 | % | | | 324 | % | | | 487 | % |
120 | THE RYDEX FUNDS SEMI-ANNUAL REPORT | SEE NOTES TO FINANCIAL STATEMENTS. |
FINANCIAL HIGHLIGHTS (concluded) |
This table is presented to show selected data for a share outstanding throughout each period and to assist shareholders in evaluating a Fund’s performance for the periods presented.
C-Class | | Period Ended
September 30,
2016a | | | Year Ended
March 31,
2016 | | | Year Ended
March 31,
2015 | | | Year Ended
March 31,
2014d | | | Year Ended
March 28,
2013d | | | Year Ended
March 31,
2012d | |
Per Share Data | | | | | | | | | | | | | | | | | | |
Net asset value, beginning of period | | $ | 52.37 | | | $ | 53.50 | | | $ | 49.30 | | | $ | 38.84 | | | $ | 38.65 | | | $ | 38.07 | |
Income (loss) from investment operations: | |
Net investment income (loss)b | | | (.25 | ) | | | (.59 | ) | | | (.58 | ) | | | (.50 | ) | | | (.33 | ) | | | (.51 | ) |
Net gain (loss) on investments (realized and unrealized) | | | 6.60 | | | | (.54 | ) | | | 4.78 | | | | 10.96 | | | | .52 | | | | 1.09 | |
Total from investment operations | | | 6.35 | | | | (1.13 | ) | | | 4.20 | | | | 10.46 | | | | .19 | | | | .58 | |
Net asset value, end of period | | $ | 58.72 | | | $ | 52.37 | | | $ | 53.50 | | | $ | 49.30 | | | $ | 38.84 | | | $ | 38.65 | |
| | |
Total Returnc | | | 12.11 | % | | | (2.11 | %) | | | 8.52 | % | | | 26.90 | % | | | 0.54 | % | | | 1.50 | % |
Ratios/Supplemental Data | |
Net assets, end of period (in thousands) | | $ | 2,209 | | | $ | 2,234 | | | $ | 2,910 | | | $ | 2,827 | | | $ | 1,715 | | | $ | 2,743 | |
Ratios to average net assets: | |
Net investment income (loss) | | | (0.91 | %) | | | (1.12 | %) | | | (1.13 | %) | | | (1.13 | %) | | | (0.90 | %) | | | (1.45 | %) |
Total expenses | | | 2.36 | % | | | 2.35 | % | | | 2.35 | % | | | 2.37 | % | | | 2.35 | % | | | 2.36 | % |
Portfolio turnover rate | | | 166 | % | | | 388 | % | | | 280 | % | | | 321 | % | | | 324 | % | | | 487 | % |
H-Class | | Period Ended
September 30,
2016a | | | Year Ended
March 31,
2016e | | | Year Ended
March 31,
2015e | | | Year Ended
March 31,
2014d,e | | | Year Ended
March 28,
2013d,e | | | Year Ended
March 31,
2012d,e | |
Per Share Data | | | | | | | | | | | | | | | | | | |
Net asset value, beginning of period | | $ | 55.72 | | | $ | 56.54 | | | $ | 51.87 | | | $ | 40.65 | | | $ | 40.22 | | | $ | 39.39 | |
Income (loss) from investment operations: | |
Net investment income (loss)b | | | (.05 | ) | | | (.23 | ) | | | (.37 | ) | | | (.27 | ) | | | (.12 | ) | | | (.33 | ) |
Net gain (loss) on investments (realized and unrealized) | | | 7.02 | | | | (.59 | ) | | | 5.04 | | | | 11.49 | | | | .55 | | | | 1.16 | |
Total from investment operations | | | 6.97 | | | | (.82 | ) | | | 4.67 | | | | 11.22 | | | | .43 | | | | .83 | |
Net asset value, end of period | | $ | 62.69 | | | $ | 55.72 | | | $ | 56.54 | | | $ | 51.87 | | | $ | 40.65 | | | $ | 40.22 | |
| | |
Total Returnc | | | 12.49 | % | | | (1.45 | %) | | | 9.00 | % | | | 27.60 | % | | | 1.04 | % | | | 2.13 | % |
Ratios/Supplemental Data | |
Net assets, end of period (in thousands) | | $ | 5,077 | | | $ | 1,829 | | | $ | 2,831 | | | $ | 6,915 | | | $ | 1,286 | | | $ | 2,361 | |
Ratios to average net assets: | |
Net investment income (loss) | | | (0.16 | %) | | | (0.42 | %) | | | (0.69 | %) | | | (0.54 | %) | | | (0.33 | %) | | | (0.87 | %) |
Total expenses | | | 1.61 | % | | | 1.68 | % | | | 1.85 | % | | | 1.87 | % | | | 1.85 | % | | | 1.85 | % |
Portfolio turnover rate | | | 166 | % | | | 388 | % | | | 280 | % | | | 321 | % | | | 324 | % | | | 487 | % |
a | Unaudited figures for the period ended September 30, 2016. Percentage amounts for the period, except total return and portfolio turnover rate, have been annualized. |
b | Net investment income (loss) per share was computed using average shares outstanding throughout the period. |
c | Total return does not reflect the impact of any applicable sales charges. |
d | Reverse share split — Per share amounts for the periods presented through February 7, 2014 have been restated to reflect a 1:3 reverse share split effective February 7, 2014. |
e | Effective September 30, 2015, the Fund’s Advisor Class shares were converted into H-Class shares. The financial highlights for periods prior to that date reflect the performance of the former Advisor Class — See Note 8. |
SEE NOTES TO FINANCIAL STATEMENTS. | THE RYDEX FUNDS SEMI-ANNUAL REPORT | 121 |
FUND PROFILE (Unaudited) | September 30, 2016 |
TELECOMMUNICATIONS FUND
OBJECTIVE: Seeks to provide capital appreciation by investing in companies engaged in the development, manufacture, or sale of communications services or communications equipment (“Telecommunications Companies”).
Holdings Diversification (Market Exposure as % of Net Assets)
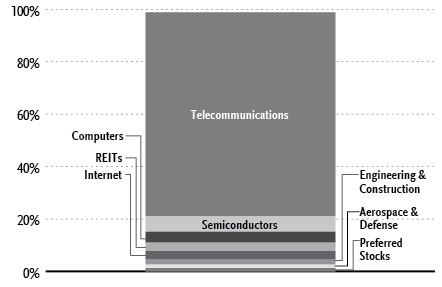
“Holdings Diversification (Market Exposure as % of Net Assets)” excludes any temporary cash investments.
Inception Dates: |
Investor Class | April 1, 1998 |
A-Class | September 1, 2004 |
C-Class | April 18, 2001 |
H-Class* | April 1, 1998 |
Ten Largest Holdings (% of Total Net Assets) |
AT&T, Inc. | 8.9% |
Verizon Communications, Inc. | 8.1% |
Cisco Systems, Inc. | 7.1% |
QUALCOMM, Inc. | 5.9% |
T-Mobile US, Inc. | 3.4% |
Crown Castle International Corp. | 3.2% |
Sprint Corp. | 2.8% |
Level 3 Communications, Inc. | 2.2% |
Palo Alto Networks, Inc. | 2.2% |
CenturyLink, Inc. | 2.2% |
Top Ten Total | 46.0% |
| | |
“Ten Largest Holdings” excludes any temporary cash investments. |
* | Effective September 30, 2015, the Fund’s Advisor Class shares were converted into H-Class shares — See Note 8. |
122 | THE RYDEX FUNDS SEMI-ANNUAL REPORT | |
SCHEDULE OF INVESTMENTS (Unaudited) | September 30, 2016 |
TELECOMMUNICATIONS FUND | |
| | | Shares | | | Value | |
| | | | | | | |
COMMON STOCKS† - 98.1% | |
| | | | | | | |
Telecommunications – 77.8% | |
AT&T, Inc. | | | 37,630 | | | $ | 1,528,155 | |
Verizon Communications, Inc. | | | 27,021 | | | | 1,404,552 | |
Cisco Systems, Inc. | | | 38,719 | | | | 1,228,167 | |
T-Mobile US, Inc.* | | | 12,726 | | | | 594,559 | |
Sprint Corp.* | | | 73,256 | | | | 485,687 | |
Level 3 Communications, Inc.* | | | 8,300 | | | | 384,954 | |
Palo Alto Networks, Inc.* | | | 2,411 | | | | 384,145 | |
CenturyLink, Inc. | | | 13,934 | | | | 382,210 | |
Motorola Solutions, Inc. | | | 4,538 | | | | 346,159 | |
Juniper Networks, Inc. | | | 12,489 | | | | 300,486 | |
Vodafone Group plc ADR | | | 9,744 | | | | 284,038 | |
Zayo Group Holdings, Inc.* | | | 8,838 | | | | 262,577 | |
Arista Networks, Inc.* | | | 2,766 | | | | 235,331 | |
America Movil SAB de CV — Class L ADR | | | 20,319 | | | | 232,449 | |
CommScope Holding Company, Inc.* | | | 7,708 | | | | 232,088 | |
ARRIS International plc* | | | 7,887 | | | | 223,439 | |
Nokia Oyj ADR | | | 37,185 | | | | 215,301 | |
Frontier Communications Corp. | | | 50,753 | | | | 211,132 | |
EchoStar Corp. — Class A* | | | 4,796 | | | | 210,209 | |
China Mobile Ltd. ADR | | | 3,409 | | | | 209,722 | |
Ubiquiti Networks, Inc.* | | | 3,820 | | | | 204,370 | |
BCE, Inc. | | | 4,304 | | | | 198,759 | |
KT Corp. ADR | | | 12,360 | | | | 198,378 | |
Telefonaktiebolaget LM Ericsson ADR | | | 27,320 | | | | 196,977 | |
SK Telecom Company Ltd. ADR | | | 8,570 | | | | 193,682 | |
Telekomunikasi Indonesia Persero Tbk PT ADR | | | 2,850 | | | | 188,327 | |
ViaSat, Inc.* | | | 2,494 | | | | 186,177 | |
Nippon Telegraph & Telephone Corp. ADR | | | 4,042 | | | | 185,164 | |
Finisar Corp.* | | | 6,126 | | | | 182,555 | |
TIM Participacoes S.A. ADR | | | 14,635 | | | | 179,132 | |
Rogers Communications, Inc. — Class B | | | 4,184 | | | | 177,485 | |
Chunghwa Telecom Company Ltd. ADR | | | 5,020 | | | | 175,851 | |
Telefonica S.A. ADR | | | 17,266 | | | | 174,041 | |
Ciena Corp.* | | | 7,876 | | | | 171,697 | |
Telephone & Data Systems, Inc. | | | 6,123 | | | | 166,423 | |
InterDigital, Inc. | | | 2,046 | | | | 162,043 | |
NETGEAR, Inc.* | | | 2,301 | | | | 139,187 | |
Plantronics, Inc. | | | 2,493 | | | | 129,536 | |
Viavi Solutions, Inc.* | | | 17,234 | | | | 127,359 | |
Infinera Corp.* | | | 12,660 | | | | 114,320 | |
Shenandoah Telecommunications Co. | | | 4,140 | | | | 112,649 | |
Consolidated Communications Holdings, Inc. | | | 4,413 | | | | 111,384 | |
Windstream Holdings, Inc. | | | 9,988 | | | | 100,379 | |
ADTRAN, Inc. | | | 4,995 | | | | 95,604 | |
Iridium Communications, Inc.* | | | 10,911 | | | | 88,488 | |
Vonage Holdings Corp.* | | | 8,955 | | | | 59,193 | |
Oclaro, Inc.* | | | 6,260 | | | | 53,523 | |
Total Telecommunications | | | | | | | 13,428,043 | |
| | | | | | | | | |
Semiconductors - 5.9% | |
QUALCOMM, Inc. | | | 14,889 | | | | 1,019,896 | |
| | | | | | | | | |
Computers - 4.1% | |
BlackBerry Ltd.* | | | 25,862 | | | | 206,379 | |
Brocade Communications Systems, Inc. | | | 20,201 | | | | 186,455 | |
NetScout Systems, Inc.* | | | 5,407 | | | | 158,155 | |
Lumentum Holdings, Inc.* | | | 3,784 | | | | 158,058 | |
Total Computers | | | | | | | 709,047 | |
| | | | | | | | | |
REITs - 3.2% | |
Crown Castle International Corp. | | | 5,881 | | | | 554,049 | |
| | | | | | | | | |
Internet - 3.1% | |
F5 Networks, Inc.* | | | 2,284 | | | | 284,678 | |
Cogent Communications Holdings, Inc. | | | 3,467 | | | | 127,620 | |
8x8, Inc.* | | | 7,562 | | | | 116,682 | |
Total Internet | | | | | | | 528,980 | |
| | | | | | | | | |
Engineering & Construction - 2.1% | |
SBA Communications Corp. — Class A* | | | 3,275 | | | | 367,324 | |
| | | | | | | | | |
Aerospace & Defense - 1.9% | |
Harris Corp. | | | 3,579 | | | | 327,872 | |
| | | | | | | | | |
Total Common Stocks | | | | | | | | |
(Cost $14,878,194) | | | | | | | 16,935,211 | |
| | | | | | | | | |
PREFERRED STOCKS†† - 1.3% | | | | | | | | |
Communications - 1.3% | | | | | | | | |
Telefonica Brasil S.A. ADR | | | 14,971 | | | | 216,630 | |
Total Preferred Stocks | | | | | | | | |
(Cost $172,326) | | | | | | | 216,630 | |
| | | | | | | | | |
RIGHTS††† - 0.0% | |
Leap Wireless International, Inc. | | | | | | | | |
Expires 03/06/17 | | | 1,848 | | | | — | |
Total Rights | | | | | | | | |
(Cost $4,327) | | | | | | | — | |
| | | | | | | | | |
| | | Face
Amount | | | | | |
| | | | | | | | | |
REPURCHASE AGREEMENT††,1 - 0.6% | |
Royal Bank of Canada
issued 09/30/16 at 0.36%
due 10/03/16 | | $ | 103,877 | | | | 103,877 | |
Total Repurchase Agreement | | | | | | | | |
(Cost $103,877) | | | | | | | 103,877 | |
| | | | | | | | | |
Total Investments - 100.0% | | | | | | | | |
(Cost $15,158,724) | | | | | | $ | 17,255,718 | |
Other Assets & Liabilities, net - 0.0% | | | | | | | 972 | |
Total Net Assets - 100.0% | | | | | | $ | 17,256,690 | |
SEE NOTES TO FINANCIAL STATEMENTS. | THE RYDEX FUNDS SEMI-ANNUAL REPORT | 123 |
SCHEDULE OF INVESTMENTS (Unaudited)(concluded) | September 30, 2016 |
TELECOMMUNICATIONS FUND | |
* | Non-income producing security. |
† | Value determined based on Level 1 inputs — See Note 4. |
†† | Value determined based on Level 2 inputs — See Note 4. |
††† | Value determined based on Level 3 inputs — See Note 4. |
1 | Repurchase Agreement — See Note 5. |
| | ADR — American Depositary Receipt |
| | plc — Public Limited Company |
| | |
| | See Sector Classification in Other Information section. |
The following table summarizes the inputs used to value the Fund’s investments at September 30, 2016 (See Note 4 in the Notes to Financial Statements):
Investments in Securities (Assets) | | Level 1 | | | Level 2 | | | Level 3 | | | Total | |
Common Stocks | | $ | 16,935,211 | | | $ | — | | | $ | — | | | $ | 16,935,211 | |
Preferred Stocks | | | 216,630 | | | | — | | | | — | | | | 216,630 | |
Repurchase Agreement | | | — | | | | 103,877 | | | | — | | | | 103,877 | |
Rights | | | — | | | | — | | | | — | | | | — | |
Total | | $ | 17,151,841 | | | $ | 103,877 | | | $ | — | | | $ | 17,255,718 | |
Transfers between investment levels may occur as the markets fluctuate and/or the availability of data used in an investment’s valuation changes. Transfers between valuation levels, if any, are in comparison to the valuation levels at the end of the previous fiscal year, and are effective using the fair value as of the end of the previous fiscal period.
For the period ended September 30, 2016, there were no transfers between levels.
124 | THE RYDEX FUNDS SEMI-ANNUAL REPORT | SEE NOTES TO FINANCIAL STATEMENTS. |
STATEMENT OF ASSETS AND LIABILITIES (Unaudited) |
September 30, 2016 |
Assets: | |
Investments, at value (cost $15,054,847) | | $ | 17,151,841 | |
Repurchase agreements, at value (cost $103,877) | | | 103,877 | |
Total investments (cost $15,158,724) | | | 17,255,718 | |
Cash | | | 10,320 | |
Receivables: | |
Fund shares sold | | | 122,881 | |
Dividends | | | 10,822 | |
Foreign taxes reclaim | | | 920 | |
Total assets | | | 17,400,661 | |
| | | | | |
Liabilities: | |
Payable for: | |
Fund shares redeemed | | | 125,581 | |
Management fees | | | 9,580 | |
Transfer agent and administrative fees | | | 2,818 | |
Portfolio accounting fees | | | 1,127 | |
Distribution and service fees | | | 710 | |
Miscellaneous | | | 4,155 | |
Total liabilities | | | 143,971 | |
Commitments and contingent liabilities (Note 9) | | | — | |
Net assets | | $ | 17,256,690 | |
| | | | | |
Net assets consist of: | |
Paid in capital | | $ | 17,117,849 | |
Undistributed net investment income | | | 299,396 | |
Accumulated net realized loss on investments | | | (2,257,549 | ) |
Net unrealized appreciation on investments | | | 2,096,994 | |
Net assets | | $ | 17,256,690 | |
| | | | | |
Investor Class: | |
Net assets | | $ | 13,090,261 | |
Capital shares outstanding | | | 277,766 | |
Net asset value per share | | $ | 47.13 | |
| | | | | |
A-Class: | |
Net assets | | $ | 948,060 | |
Capital shares outstanding | | | 21,682 | |
Net asset value per share | | $ | 43.73 | |
Maximum offering price per share (Net asset value divided by 95.25%) | | $ | 45.90 | |
| | | | | |
C-Class: | |
Net assets | | $ | 438,580 | |
Capital shares outstanding | | | 11,019 | |
Net asset value per share | | $ | 39.80 | |
| | | | | |
H-Class: | |
Net assets | | $ | 2,779,789 | |
Capital shares outstanding | | | 65,248 | |
Net asset value per share | | $ | 42.60 | |
STATEMENT OF OPERATIONS (Unaudited) | |
Period Ended September 30, 2016 | |
| | |
Investment Income: | |
Dividends (net of foreign withholding tax of $11,301) | | $ | 464,858 | |
Interest | | | 168 | |
Total investment income | | | 465,026 | |
| | | | | |
Expenses: | |
Management fees | | | 138,379 | |
Transfer agent and administrative fees | | | 40,700 | |
Distribution and service fees: | |
A-Class | | | 9,471 | |
C-Class | | | 2,171 | |
H-Class | | | 11,481 | |
Portfolio accounting fees | | | 16,279 | |
Custodian fees | | | 1,924 | |
Trustees’ fees* | | | 1,653 | |
Line of credit fees | | | 108 | |
Miscellaneous | | | 23,209 | |
Total expenses | | | 245,375 | |
Net investment income | | | 219,651 | |
| | | | | |
Net Realized and Unrealized Gain (Loss): | |
Net realized gain (loss) on: | |
Investments | | | 3,732,785 | |
Net realized gain | | | 3,732,785 | |
Net change in unrealized appreciation (depreciation) on: | |
Investments | | | (475,370 | ) |
Net change in unrealized appreciation (depreciation) | | | (475,370 | ) |
Net realized and unrealized gain | | | 3,257,415 | |
Net increase in net assets resulting from operations | | $ | 3,477,066 | |
* | Relates to Trustees not deemed “interested persons” within the meaning of Section 2(a)(19) of the 1940 Act. |
SEE NOTES TO FINANCIAL STATEMENTS. | THE RYDEX FUNDS SEMI-ANNUAL REPORT | 125 |
STATEMENTS OF CHANGES IN NET ASSETS |
| | | Period Ended
September 30,
2016
(Unaudited) | | | Year Ended
March 31,
2016 | |
Increase (Decrease) in Net Assets from Operations: | | | | | | |
Net investment income | | $ | 219,651 | | | $ | 96,347 | |
Net realized gain (loss) on investments | | | 3,732,785 | | | | (1,013,651 | ) |
Net change in unrealized appreciation (depreciation) on investments | | | (475,370 | ) | | | 1,646,482 | |
Net increase in net assets resulting from operations | | | 3,477,066 | | | | 729,178 | |
| | | | | | | | | |
Distributions to shareholders from: | | | | | | | | |
Net investment income | | | | | | | | |
Investor Class | | | — | | | | (53,710 | ) |
A-Class | | | — | | | | (14,192 | ) |
C-Class | | | — | | | | (14,927 | ) |
H-Class | | | — | | | | (14,554 | )* |
Total distributions to shareholders | | | — | | | | (97,383 | ) |
| | | | | | | | | |
Capital share transactions: | | | | | | | | |
Proceeds from sale of shares | | | | | | | | |
Investor Class | | | 48,277,799 | | | | 74,044,688 | |
A-Class | | | 36,214,349 | | | | 10,919,225 | |
C-Class | | | 2,546,568 | | | | 11,849,862 | |
H-Class | | | 13,184,683 | | | | 19,440,257 | * |
Distributions reinvested | | | | | | | | |
Investor Class | | | — | | | | 52,983 | |
A-Class | | | — | | | | 14,149 | |
C-Class | | | — | | | | 14,893 | |
H-Class | | | — | | | | 14,553 | * |
Cost of shares redeemed | | | | | | | | |
Investor Class | | | (54,954,399 | ) | | | (55,976,185 | ) |
A-Class | | | (38,521,726 | ) | | | (9,651,492 | ) |
C-Class | | | (2,406,250 | ) | | | (12,071,566 | ) |
H-Class | | | (21,903,957 | ) | | | (10,361,614 | )* |
Net increase (decrease) from capital share transactions | | | (17,562,933 | ) | | | 28,289,753 | |
Net increase (decrease) in net assets | | | (14,085,867 | ) | | | 28,921,548 | |
| | | | | | | | | |
Net assets: | | | | | | | | |
Beginning of period | | | 31,342,557 | | | | 2,421,009 | |
End of period | | $ | 17,256,690 | | | $ | 31,342,557 | |
Undistributed net investment income at end of period | | $ | 299,396 | | | $ | 79,745 | |
| | | | | | | | | |
Capital share activity: | | | | | | | | |
Shares sold | | | | | | | | |
Investor Class | | | 1,082,922 | | | | 1,679,168 | |
A-Class | | | 901,623 | | | | 264,455 | |
C-Class | | | 68,092 | | | | 312,004 | |
H-Class | | | 330,057 | | | | 531,126 | * |
Shares issued from reinvestment of distributions | | | | | | | | |
Investor Class | | | — | | | | 1,285 | |
A-Class | | | — | | | | 370 | |
C-Class | | | — | | | | 424 | |
H-Class | | | — | | | | 390 | * |
Shares redeemed | | | | | | | | |
Investor Class | | | (1,252,573 | ) | | | (1,261,930 | ) |
A-Class | | | (918,652 | ) | | | (236,776 | ) |
C-Class | | | (63,878 | ) | | | (318,305 | ) |
H-Class | | | (531,256 | ) | | | (268,701 | )* |
Net increase (decrease) in shares | | | (383,665 | ) | | | 703,510 | |
* | Effective September 30, 2015, the Fund’s Advisor Class shares were converted into H-Class shares — See Note 8. |
126 | THE RYDEX FUNDS SEMI-ANNUAL REPORT | SEE NOTES TO FINANCIAL STATEMENTS. |
This table is presented to show selected data for a share outstanding throughout each period and to assist shareholders in evaluating a Fund’s performance for the periods presented.
Investor Class | | Period Ended
September 30,
2016a | | | Year Ended
March 31,
2016 | | | Year Ended
March 31,
2015 | | | Year Ended
March 31,
2014e | | | Year Ended
March 28,
2013e | | | Year Ended
March 31,
2012e | |
Per Share Data | | | | | | | | | | | | | | | | | | |
Net asset value, beginning of period | | $ | 42.91 | | | $ | 45.56 | | | $ | 45.51 | | | $ | 40.76 | | | $ | 41.52 | | | $ | 47.13 | |
Income (loss) from investment operations: | |
Net investment income (loss)b | | | .25 | | | | .44 | | | | .72 | | | | 1.06 | | | | .81 | | | | 1.23 | |
Net gain (loss) on investments (realized and unrealized) | | | 3.97 | | | | (1.64 | ) | | | .63 | | | | 4.26 | | | | (.67 | ) | | | (5.52 | ) |
Total from investment operations | | | 4.22 | | | | (1.20 | ) | | | 1.35 | | | | 5.32 | | | | .14 | | | | (4.29 | ) |
Less distributions from: | |
Net investment income | | | — | | | | (1.45 | ) | | | (1.30 | ) | | | (.57 | ) | | | (.90 | ) | | | (1.32 | ) |
Total distributions | | | — | | | | (1.45 | ) | | | (1.30 | ) | | | (.57 | ) | | | (.90 | ) | | | (1.32 | ) |
Net asset value, end of period | | $ | 47.13 | | | $ | 42.91 | | | $ | 45.56 | | | $ | 45.51 | | | $ | 40.76 | | | $ | 41.52 | |
| | |
Total Returnc | | | 9.81 | % | | | (2.49 | %) | | | 2.93 | % | | | 13.12 | % | | | 0.50 | % | | | (8.77 | %) |
Ratios/Supplemental Data | |
Net assets, end of period (in thousands) | | $ | 13,090 | | | $ | 19,198 | | | $ | 1,316 | | | $ | 2,497 | | | $ | 2,970 | | | $ | 7,028 | |
Ratios to average net assets: | |
Net investment income (loss) | | | 1.12 | % | | | 0.97 | % | | | 1.55 | % | | | 2.47 | % | | | 2.06 | % | | | 2.86 | % |
Total expenses | | | 1.37 | % | | | 1.34 | % | | | 1.36 | % | | | 1.38 | % | | | 1.35 | % | | | 1.36 | % |
Portfolio turnover rate | | | 212 | % | | | 660 | % | | | 804 | % | | | 1,271 | % | | | 1,550 | % | | | 793 | % |
A-Class | | Period Ended
September 30,
2016a | | | Year Ended
March 31,
2016 | | | Year Ended
March 31,
2015 | | | Year Ended
March 31,
2014e | | | Year Ended
March 28,
2013e | | | Year Ended
March 31,
2012e | |
Per Share Data | | | | | | | | | | | | | | | | | | |
Net asset value, beginning of period | | $ | 39.88 | | | $ | 42.63 | | | $ | 42.74 | | | $ | 38.44 | | | $ | 39.27 | | | $ | 44.72 | |
Income (loss) from investment operations: | |
Net investment income (loss)b | | | .31 | | | | .58 | | | | .58 | | | | .72 | | | | .72 | | | | .54 | |
Net gain (loss) on investments (realized and unrealized) | | | 3.54 | | | | (1.88 | ) | | | .61 | | | | 4.15 | | | | (.65 | ) | | | (4.67 | ) |
Total from investment operations | | | 3.85 | | | | (1.30 | ) | | | 1.19 | | | | 4.87 | | | | .07 | | | | (4.13 | ) |
Less distributions from: | |
Net investment income | | | — | | | | (1.45 | ) | | | (1.30 | ) | | | (.57 | ) | | | (.90 | ) | | | (1.32 | ) |
Total distributions | | | — | | | | (1.45 | ) | | | (1.30 | ) | | | (.57 | ) | | | (.90 | ) | | | (1.32 | ) |
Net asset value, end of period | | $ | 43.73 | | | $ | 39.88 | | | $ | 42.63 | | | $ | 42.74 | | | $ | 38.44 | | | $ | 39.27 | |
| | |
Total Returnc | | | 9.63 | % | | | (2.90 | %) | | | 2.75 | % | | | 12.80 | % | | | 0.30 | % | | | (8.91 | %) |
Ratios/Supplemental Data | |
Net assets, end of period (in thousands) | | $ | 948 | | | $ | 1,544 | | | $ | 454 | | | $ | 2,631 | | | $ | 553 | | | $ | 1,566 | |
Ratios to average net assets: | |
Net investment income (loss) | | | 1.50 | % | | | 1.41 | % | | | 1.35 | % | | | 1.79 | % | | | 1.98 | % | | | 1.41 | % |
Total expenses | | | 1.61 | % | | | 1.59 | % | | | 1.60 | % | | | 1.63 | % | | | 1.61 | % | | | 1.60 | % |
Portfolio turnover rate | | | 212 | % | | | 660 | % | | | 804 | % | | | 1,271 | % | | | 1,550 | % | | | 793 | % |
SEE NOTES TO FINANCIAL STATEMENTS. | THE RYDEX FUNDS SEMI-ANNUAL REPORT | 127 |
FINANCIAL HIGHLIGHTS (concluded) |
This table is presented to show selected data for a share outstanding throughout each period and to assist shareholders in evaluating a Fund’s performance for the periods presented.
C-Class | | Period Ended
September 30,
2016a | | | Year Ended
March 31,
2016 | | | Year Ended
March 31,
2015 | | | Year Ended
March 31,
2014e | | | Year Ended
March 28,
2013e | | | Year Ended
March 31,
2012e | |
Per Share Data | | | | | | | | | | | | | | | | | | |
Net asset value, beginning of period | | $ | 36.43 | | | $ | 39.35 | | | $ | 39.89 | | | $ | 36.00 | | | $ | 37.04 | | | $ | 42.57 | |
Income (loss) from investment operations: | |
Net investment income (loss)b | | | .07 | | | | (.01 | ) | | | .06 | | | | .54 | | | | .48 | | | | .15 | |
Net gain (loss) on investments (realized and unrealized) | | | 3.30 | | | | (1.46 | ) | | | .70 | | | | 3.92 | | | | (.62 | ) | | | (4.36 | ) |
Total from investment operations | | | 3.37 | | | | (1.47 | ) | | | .76 | | | | 4.46 | | | | (.14 | ) | | | (4.21 | ) |
Less distributions from: | |
Net investment income | | | — | | | | (1.45 | ) | | | (1.30 | ) | | | (.57 | ) | | | (.90 | ) | | | (1.32 | ) |
Total distributions | | | — | | | | (1.45 | ) | | | (1.30 | ) | | | (.57 | ) | | | (.90 | ) | | | (1.32 | ) |
Net asset value, end of period | | $ | 39.80 | | | $ | 36.43 | | | $ | 39.35 | | | $ | 39.89 | | | $ | 36.00 | | | $ | 37.04 | |
| | |
Total Returnc | | | 9.25 | % | | | (3.59 | %) | | | 1.86 | % | | | 12.49 | % | | | (0.24 | %) | | | (9.52 | %) |
Ratios/Supplemental Data | |
Net assets, end of period (in thousands) | | $ | 439 | | | $ | 248 | | | $ | 499 | | | $ | 271 | | | $ | 784 | | | $ | 672 | |
Ratios to average net assets: | |
Net investment income (loss) | | | 0.36 | % | | | (0.03 | %) | | | 0.14 | % | | | 1.42 | % | | | 1.41 | % | | | 0.39 | % |
Total expenses | | | 2.36 | % | | | 2.35 | % | | | 2.35 | % | | | 2.38 | % | | | 2.36 | % | | | 2.36 | % |
Portfolio turnover rate | | | 212 | % | | | 660 | % | | | 804 | % | | | 1,271 | % | | | 1,550 | % | | | 793 | % |
H-Class | | Period Ended
September 30,
2016a | | | Year Ended
March 31,
2016d | | | Year Ended
March 31,
2015d | | | Year Ended
March 31,
2014d,e | | | Year Ended
March 28,
2013d,e | | | Year Ended
March 31,
2012d,e | |
Per Share Data | | | | | | | | | | | | | | | | | | |
Net asset value, beginning of period | | $ | 38.85 | | | $ | 41.59 | | | $ | 41.86 | | | $ | 37.75 | | | $ | 38.69 | | | $ | 44.21 | |
Income (loss) from investment operations: | |
Net investment income (loss)b | | | .32 | | | | .17 | | | | .60 | | | | .29 | | | | .57 | | | | .66 | |
Net gain (loss) on investments (realized and unrealized) | | | 3.43 | | | | (1.46 | ) | | | .43 | | | | 4.39 | | | | (.61 | ) | | | (4.86 | ) |
Total from investment operations | | | 3.75 | | | | (1.29 | ) | | | 1.03 | | | | 4.68 | | | | (.04 | ) | | | (4.20 | ) |
Less distributions from: | |
Net investment income | | | — | | | | (1.45 | ) | | | (1.30 | ) | | | (.57 | ) | | | (.90 | ) | | | (1.32 | ) |
Total distributions | | | — | | | | (1.45 | ) | | | (1.30 | ) | | | (.57 | ) | | | (.90 | ) | | | (1.32 | ) |
Net asset value, end of period | | $ | 42.60 | | | $ | 38.85 | | | $ | 41.59 | | | $ | 41.86 | | | $ | 37.75 | | | $ | 38.69 | |
| | |
Total Returnc | | | 9.65 | % | | | (2.95 | %) | | | 2.42 | % | | | 12.53 | % | | | (0.01 | %) | | | (9.15 | %) |
Ratios/Supplemental Data | |
Net assets, end of period (in thousands) | | $ | 2,780 | | | $ | 10,353 | | | $ | 151 | | | $ | 316 | | | $ | 133 | | | $ | 200 | |
Ratios to average net assets: | |
Net investment income (loss) | | | 1.65 | % | | | 0.44 | % | | | 1.40 | % | | | 0.74 | % | | | 1.59 | % | | | 1.65 | % |
Total expenses | | | 1.61 | % | | | 1.64 | % | | | 1.86 | % | | | 1.88 | % | | | 1.86 | % | | | 1.85 | % |
Portfolio turnover rate | | | 212 | % | | | 660 | % | | | 804 | % | | | 1,271 | % | | | 1,550 | % | | | 793 | % |
a | Unaudited figures for the period ended September 30, 2016. Percentage amounts for the period, except total return and portfolio turnover rate, have been annualized. |
b | Net investment income (loss) per share was computed using average shares outstanding throughout the period. |
c | Total return does not reflect the impact of any applicable sales charges. |
d | Effective September 30, 2015, the Fund’s Advisor Class shares were converted into H-Class shares. The financial highlights for periods prior to that date reflect the performance of the former Advisor Class — See Note 8. |
e | Reverse share split — Per share amounts for the periods presented through February 7, 2014 have been restated to reflect a 1:3 reverse share split effective February 7, 2014. |
128 | THE RYDEX FUNDS SEMI-ANNUAL REPORT | SEE NOTES TO FINANCIAL STATEMENTS. |
FUND PROFILE (Unaudited) | September 30, 2016 |
TRANSPORTATION FUND
OBJECTIVE: Seeks to provide capital appreciation by investing in companies engaged in providing transportation services or companies engaged in the design, manufacture, distribution, or sale of transportation equipment (“Transportation Companies”).
Holdings Diversification (Market Exposure as % of Net Assets)
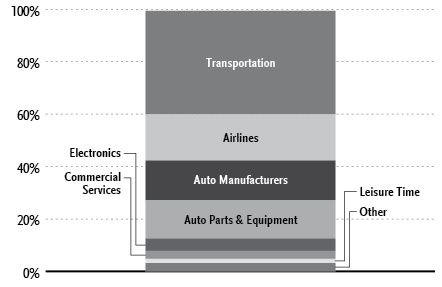
“Holdings Diversification (Market Exposure as % of Net Assets)” excludes any temporary cash investments.
Inception Dates: |
Investor Class | April 2, 1998 |
A-Class | September 1, 2004 |
C-Class | May 14, 2001 |
H-Class* | June 9, 1998 |
Ten Largest Holdings (% of Total Net Assets) |
United Parcel Service, Inc. — Class B | 5.0% |
Union Pacific Corp. | 4.7% |
General Motors Co. | 3.6% |
FedEx Corp. | 3.6% |
Ford Motor Co. | 3.5% |
Johnson Controls International plc | 3.5% |
Delta Air Lines, Inc. | 2.8% |
Tesla Motors, Inc. | 2.8% |
Norfolk Southern Corp. | 2.8% |
CSX Corp. | 2.8% |
Top Ten Total | 35.1% |
| | |
“Ten Largest Holdings” excludes any temporary cash investments. |
* | Effective September 30, 2015, the Fund’s Advisor Class shares were converted into H-Class shares — See Note 8. |
| | THE RYDEX FUNDS SEMI-ANNUAL REPORT | 129 |
SCHEDULE OF INVESTMENTS (Unaudited) | September 30, 2016 |
TRANSPORTATION FUND | |
| | | Shares | | | Value | |
| | | | | | | |
COMMON STOCKS† - 99.3% | |
| | | | | | | |
Transportation - 39.5% | |
United Parcel Service, Inc. — Class B | | | 10,848 | | | $ | 1,186,337 | |
Union Pacific Corp. | | | 11,319 | | | | 1,103,943 | |
FedEx Corp. | | | 4,866 | | | | 849,993 | |
Norfolk Southern Corp. | | | 6,756 | | | | 655,737 | |
CSX Corp. | | | 21,483 | | | | 655,232 | |
CH Robinson Worldwide, Inc. | | | 5,616 | | | | 395,703 | |
Kansas City Southern | | | 4,103 | | | | 382,892 | |
Canadian Pacific Railway Ltd. | | | 2,457 | | | | 375,184 | |
Expeditors International of Washington, Inc. | | | 7,169 | | | | 369,347 | |
J.B. Hunt Transport Services, Inc. | | | 4,429 | | | | 359,368 | |
Canadian National Railway Co. | | | 4,360 | | | | 285,144 | |
Old Dominion Freight Line, Inc.* | | | 4,138 | | | | 283,908 | |
XPO Logistics, Inc.* | | | 6,692 | | | | 245,396 | |
Genesee & Wyoming, Inc. — Class A* | | | 3,511 | | | | 242,083 | |
Kirby Corp.* | | | 3,720 | | | | 231,235 | |
Ryder System, Inc. | | | 3,390 | | | | 223,571 | |
Landstar System, Inc. | | | 2,986 | | | | 203,287 | |
Swift Transportation Co. — Class A* | | | 9,402 | | | | 201,861 | |
Knight Transportation, Inc. | | | 6,279 | | | | 180,145 | |
Matson, Inc. | | | 4,005 | | | | 159,719 | |
Werner Enterprises, Inc. | | | 6,657 | | | | 154,908 | |
Heartland Express, Inc. | | | 7,752 | | | | 146,358 | |
Hub Group, Inc. — Class A* | | | 3,454 | | | | 140,785 | |
Forward Air Corp. | | | 3,080 | | | | 133,241 | |
Atlas Air Worldwide Holdings, Inc.* | | | 3,013 | | | | 129,017 | |
Total Transportation | | | | | | | 9,294,394 | |
| | | | | | | | | |
Airlines - 17.6% | |
Delta Air Lines, Inc. | | | 16,974 | | | | 668,096 | |
Southwest Airlines Co. | | | 15,486 | | | | 602,251 | |
American Airlines Group, Inc. | | | 14,411 | | | | 527,587 | |
United Continental Holdings, Inc.* | | | 9,408 | | | | 493,638 | |
Alaska Air Group, Inc. | | | 5,137 | | | | 338,323 | |
JetBlue Airways Corp.* | | | 16,205 | | | | 279,374 | |
Copa Holdings S.A. — Class A | | | 2,727 | | | | 239,785 | |
Ryanair Holdings plc ADR | | | 2,916 | | | | 218,787 | |
Spirit Airlines, Inc.* | | | 5,144 | | | | 218,774 | |
Hawaiian Holdings, Inc.* | | | 4,041 | | | | 196,393 | |
Allegiant Travel Co. — Class A | | | 1,393 | | | | 183,974 | |
Virgin America, Inc.* | | | 3,391 | | | | 181,452 | |
Total Airlines | | | | | | | 4,148,434 | |
| | | | | | | | | |
Auto Manufacturers - 15.1% | |
General Motors Co. | | | 26,788 | | | | 851,054 | |
Ford Motor Co. | | | 68,759 | | | | 829,921 | |
Tesla Motors, Inc.* | | | 3,251 | | | | 663,302 | |
Tata Motors Ltd. ADR | | | 6,736 | | | | 269,305 | |
Toyota Motor Corp. ADR | | | 2,163 | | | | 251,038 | |
Ferrari N.V. | | | 4,508 | | | | 233,830 | |
Fiat Chrysler Automobiles N.V. | | | 36,152 | | | | 231,373 | |
Honda Motor Company Ltd. ADR | | | 7,598 | | | | 219,734 | |
Total Auto Manufacturers | | | | | | | 3,549,557 | |
| | | | | | | | | |
Auto Parts & Equipment - 14.7% | |
Delphi Automotive plc | | | 6,936 | | | | 494,675 | |
Lear Corp. | | | 2,948 | | | | 357,357 | |
Goodyear Tire & Rubber Co. | | | 10,797 | | | | 348,743 | |
BorgWarner, Inc. | | | 9,383 | | | | 330,094 | |
Magna International, Inc. | | | 6,620 | | | | 284,329 | |
Autoliv, Inc. | | | 2,455 | | | | 262,194 | |
Tenneco, Inc.* | | | 3,748 | | | | 218,396 | |
Visteon Corp. | | | 2,581 | | | | 184,954 | |
Dana, Inc. | | | 11,702 | | | | 182,434 | |
Cooper Tire & Rubber Co. | | | 4,695 | | | | 178,504 | |
Dorman Products, Inc.* | | | 2,771 | | | | 177,067 | |
Cooper-Standard Holding, Inc.* | | | 1,640 | | | | 162,032 | |
American Axle & Manufacturing Holdings, Inc.* | | | 8,116 | | | | 139,758 | |
Gentherm, Inc.* | | | 4,130 | | | | 129,765 | |
Total Auto Parts & Equipment | | | | | | | 3,450,302 | |
| | | | | | | | | |
Electronics - 4.6% | |
Johnson Controls International plc | | | 17,500 | | | | 814,273 | |
Gentex Corp. | | | 15,348 | | | | 269,511 | |
Total Electronics | | | | | | | 1,083,784 | |
| | | | | | | | | |
Commercial Services - 3.1% | |
Macquarie Infrastructure Corp. | | | 3,782 | | | | 314,814 | |
Avis Budget Group, Inc.* | | | 6,184 | | | | 211,554 | |
Hertz Global Holdings, Inc.* | | | 5,018 | | | | 201,523 | |
Total Commercial Services | | | | | | | 727,891 | |
| | | | | | | | | |
Leisure Time - 1.6% | |
Harley-Davidson, Inc. | | | 7,048 | | | | 370,654 | |
| | | | | | | | | |
Trucking & Leasing - 1.2% | |
AMERCO | | | 900 | | | | 291,807 | |
| | | | | | | | | |
Home Builders - 1.1% | |
Thor Industries, Inc. | | | 3,063 | | | | 259,436 | |
| | | | | | | | | |
Building Materials - 0.8% | |
Drew Industries, Inc. | | | 2,000 | | | | 196,040 | |
| | | | | | | | | |
Total Common Stocks | | | | | | | | |
(Cost $15,122,229) | | | | | | | 23,372,299 | |
130 | THE RYDEX FUNDS SEMI-ANNUAL REPORT | SEE NOTES TO FINANCIAL STATEMENTS. |
SCHEDULE OF INVESTMENTS (Unaudited)(concluded) | September 30, 2016 |
TRANSPORTATION FUND | |
| | | Face
Amount | | | Value | |
| | | | | | | |
REPURCHASE AGREEMENT††,1 - 0.6% | |
Royal Bank of Canada
issued 09/30/16 at 0.36%
due 10/03/16 | | $ | 135,358 | | | $ | 135,358 | |
Total Repurchase Agreement | | | | | | | | |
(Cost $135,358) | | | | | | | 135,358 | |
| | | | | | | | | |
Total Investments - 99.9% | | | | | | | | |
(Cost $15,257,587) | | | | | | $ | 23,507,657 | |
Other Assets & Liabilities, net - 0.1% | | | | | | | 18,779 | |
Total Net Assets - 100.0% | | | | | | $ | 23,526,436 | |
* | Non-income producing security. |
† | Value determined based on Level 1 inputs — See Note 4. |
†† | Value determined based on Level 2 inputs — See Note 4. |
1 | Repurchase Agreement — See Note 5. |
| | ADR — American Depositary Receipt |
| | plc — Public Limited Company |
| | |
| | See Sector Classification in Other Information section. |
The following table summarizes the inputs used to value the Fund’s investments at September 30, 2016 (See Note 4 in the Notes to Financial Statements):
Investments in Securities (Assets) | | Level 1 | | | Level 2 | | | Level 3 | | | Total | |
Common Stocks | | $ | 23,372,299 | | | $ | — | | | $ | — | | | $ | 23,372,299 | |
Repurchase Agreement | | | — | | | | 135,358 | | | | — | | | | 135,358 | |
Total | | $ | 23,372,299 | | | $ | 135,358 | | | $ | — | | | $ | 23,507,657 | |
Transfers between investment levels may occur as the markets fluctuate and/or the availability of data used in an investment’s valuation changes. Transfers between valuation levels, if any, are in comparison to the valuation levels at the end of the previous fiscal year, and are effective using the fair value as of the end of the previous fiscal period.
For the period ended September 30, 2016, there were no transfers between levels.
SEE NOTES TO FINANCIAL STATEMENTS. | THE RYDEX FUNDS SEMI-ANNUAL REPORT | 131 |
STATEMENT OF ASSETS AND LIABILITIES (Unaudited) |
September 30, 2016 |
Assets: | |
Investments, at value (cost $15,122,229) | | $ | 23,372,299 | |
Repurchase agreements, at value (cost $135,358) | | | 135,358 | |
Total investments (cost $15,257,587) | | | 23,507,657 | |
Cash | | | 993 | |
Receivables: | |
Fund shares sold | | | 256,721 | |
Dividends | | | 4,253 | |
Foreign taxes reclaim | | | 191 | |
Total assets | | | 23,769,815 | |
| | | | | |
Liabilities: | |
Payable for: | |
Fund shares redeemed | | | 215,719 | |
Management fees | | | 15,674 | |
Transfer agent and administrative fees | | | 4,610 | |
Distribution and service fees | | | 2,602 | |
Portfolio accounting fees | | | 1,844 | |
Miscellaneous | | | 2,930 | |
Total liabilities | | | 243,379 | |
Commitments and contingent liabilities (Note 9) | | | — | |
Net assets | | $ | 23,526,436 | |
| | | | | |
Net assets consist of: | |
Paid in capital | | $ | 22,088,297 | |
Undistributed net investment income | | | 53,832 | |
Accumulated net realized loss on investments | | | (6,865,763 | ) |
Net unrealized appreciation on investments | | | 8,250,070 | |
Net assets | | $ | 23,526,436 | |
| | | | | |
Investor Class: | |
Net assets | | $ | 16,654,340 | |
Capital shares outstanding | | | 352,491 | |
Net asset value per share | | $ | 47.25 | |
| | | | | |
A-Class: | |
Net assets | | $ | 4,077,156 | |
Capital shares outstanding | | | 93,158 | |
Net asset value per share | | $ | 43.77 | |
Maximum offering price per share (Net asset value divided by 95.25%) | | $ | 45.94 | |
| | | | | |
C-Class: | |
Net assets | | $ | 1,927,540 | |
Capital shares outstanding | | | 47,275 | |
Net asset value per share | | $ | 40.77 | |
| | | | | |
H-Class: | |
Net assets | | $ | 867,400 | |
Capital shares outstanding | | | 20,373 | |
Net asset value per share | | $ | 42.58 | |
STATEMENT OF OPERATIONS (Unaudited) | |
Period Ended September 30, 2016 | |
Investment Income: | |
Dividends (net of foreign withholding tax of $2,129) | | $ | 188,132 | |
Interest | | | 119 | |
Total investment income | | | 188,251 | |
| | | | | |
Expenses: | |
Management fees | | | 98,592 | |
Transfer agent and administrative fees | | | 28,998 | |
Distribution and service fees: | |
A-Class | | | 6,085 | |
C-Class | | | 10,870 | |
H-Class | | | 4,180 | |
Portfolio accounting fees | | | 11,599 | |
Custodian fees | | | 1,364 | |
Trustees’ fees* | | | 1,200 | |
Line of credit fees | | | 176 | |
Tax expense | | | 85 | |
Miscellaneous | | | 16,883 | |
Total expenses | | | 180,032 | |
Net investment income | | | 8,219 | |
| | | | | |
Net Realized and Unrealized Gain (Loss): | |
Net realized gain (loss) on: | |
Investments | | | 1,691,663 | |
Net realized gain | | | 1,691,663 | |
Net change in unrealized appreciation (depreciation) on: | |
Investments | | | (772,323 | ) |
Net change in unrealized appreciation (depreciation) | | | (772,323 | ) |
Net realized and unrealized gain | | | 919,340 | |
Net increase in net assets resulting from operations | | $ | 927,559 | |
* | Relates to Trustees not deemed “interested persons” within the meaning of Section 2(a)(19) of the 1940 Act. |
132 | THE RYDEX FUNDS SEMI-ANNUAL REPORT | SEE NOTES TO FINANCIAL STATEMENTS. |
STATEMENTS OF CHANGES IN NET ASSETS |
| | | Period Ended
September 30,
2016
(Unaudited) | | | Year Ended
March 31,
2016 | |
Increase (Decrease) in Net Assets from Operations: | | | | | | |
Net investment income | | $ | 8,219 | | | $ | 45,613 | |
Net realized gain on investments | | | 1,691,663 | | | | 12,642,987 | |
Net change in unrealized appreciation (depreciation) on investments | | | (772,323 | ) | | | (19,150,904 | ) |
Net increase (decrease) in net assets resulting from operations | | | 927,559 | | | | (6,462,304 | ) |
| | | | | | | | | |
Distributions to shareholders from: | | | | | | | | |
Net investment income | | | | | | | | |
Investor Class | | | — | | | | (68,541 | ) |
A-Class | | | — | | | | (39,806 | ) |
C-Class | | | — | | | | (17,180 | ) |
H-Class | | | — | | | | (6,812 | )* |
Total distributions to shareholders | | | — | | | | (132,339 | ) |
| | | | | | | | | |
Capital share transactions: | | | | | | | | |
Proceeds from sale of shares | | | | | | | | |
Investor Class | | | 35,959,747 | | | | 59,874,682 | |
A-Class | | | 6,627,858 | | | | 9,344,709 | |
C-Class | | | 1,973,523 | | | | 13,489,052 | |
H-Class | | | 54,086,156 | | | | 25,514,022 | * |
Distributions reinvested | | | | | | | | |
Investor Class | | | — | | | | 66,183 | |
A-Class | | | — | | | | 37,973 | |
C-Class | | | — | | | | 16,835 | |
H-Class | | | — | | | | 6,762 | * |
Cost of shares redeemed | | | | | | | | |
Investor Class | | | (33,213,791 | ) | | | (85,095,507 | ) |
A-Class | | | (7,697,468 | ) | | | (18,030,528 | ) |
C-Class | | | (3,008,840 | ) | | | (16,300,469 | ) |
H-Class | | | (63,113,668 | ) | | | (22,304,004 | )* |
Net decrease from capital share transactions | | | (8,386,483 | ) | | | (33,380,290 | ) |
Net decrease in net assets | | | (7,458,924 | ) | | | (39,974,933 | ) |
| | | | | | | | | |
Net assets: | | | | | | | | |
Beginning of period | | | 30,985,360 | | | | 70,960,293 | |
End of period | | $ | 23,526,436 | | | $ | 30,985,360 | |
Undistributed net investment income at end of period | | $ | 53,832 | | | $ | 45,613 | |
| | | | | | | | | |
Capital share activity: | | | | | | | | |
Shares sold | | | | | | | | |
Investor Class | | | 791,051 | | | | 1,248,273 | |
A-Class | | | 154,101 | | | | 212,086 | |
C-Class | | | 50,232 | | | | 323,931 | |
H-Class | | | 1,417,111 | | | | 585,638 | * |
Shares issued from reinvestment of distributions | | | | | | | | |
Investor Class | | | — | | | | 1,414 | |
A-Class | | | — | | | | 874 | |
C-Class | | | — | | | | 413 | |
H-Class | | | — | | | | 160 | * |
Shares redeemed | | | | | | | | |
Investor Class | | | (733,587 | ) | | | (1,779,677 | ) |
A-Class | | | (185,500 | ) | | | (405,659 | ) |
C-Class | | | (77,216 | ) | | | (390,453 | ) |
H-Class | | | (1,613,255 | ) | | | (501,890 | )* |
Net decrease in shares | | | (197,063 | ) | | | (704,890 | ) |
* | Effective September 30, 2015, the Fund’s Advisor Class shares were converted into H-Class shares — See Note 8. |
SEE NOTES TO FINANCIAL STATEMENTS. | THE RYDEX FUNDS SEMI-ANNUAL REPORT | 133 |
This table is presented to show selected data for a share outstanding throughout each period and to assist shareholders in evaluating a Fund’s performance for the periods presented.
Investor Class | | Period Ended
September 30,
2016a | | | Year Ended
March 31,
2016 | | | Year Ended
March 31,
2015 | | | Year Ended
March 31,
2014 | | | Year Ended
March 28,
2013 | | | Year Ended
March 31,
2012 | |
Per Share Data | | | | | | | | | | | | | | | | | | |
Net asset value, beginning of period | | $ | 46.23 | | | $ | 52.06 | | | $ | 44.63 | | | $ | 32.07 | | | $ | 26.96 | | | $ | 27.85 | |
Income (loss) from investment operations: | |
Net investment income (loss)b | | | .07 | | | | .16 | | | | .18 | | | | (.04 | ) | | | (.07 | ) | | | (.06 | ) |
Net gain (loss) on investments (realized and unrealized) | | | .95 | | | | (5.78 | ) | | | 7.25 | | | | 12.60 | | | | 5.18 | | | | (.83 | ) |
Total from investment operations | | | 1.02 | | | | (5.62 | ) | | | 7.43 | | | | 12.56 | | | | 5.11 | | | | (.89 | ) |
Less distributions from: | |
Net investment income | | | — | | | | (.21 | ) | | | — | | | | — | | | | — | | | | — | |
Total distributions | | | — | | | | (.21 | ) | | | — | | | | — | | | | — | | | | — | |
Net asset value, end of period | | $ | 47.25 | | | $ | 46.23 | | | $ | 52.06 | | | $ | 44.63 | | | $ | 32.07 | | | $ | 26.96 | |
| | |
Total Returnc | | | 2.18 | % | | | (10.80 | %) | | | 16.65 | % | | | 39.16 | % | | | 18.95 | % | | | (3.20 | %) |
Ratios/Supplemental Data | |
Net assets, end of period (in thousands) | | $ | 16,654 | | | $ | 13,638 | | | $ | 42,947 | | | $ | 44,021 | | | $ | 78,644 | | | $ | 8,031 | |
Ratios to average net assets: | |
Net investment income (loss) | | | 0.31 | % | | | 0.33 | % | | | 0.37 | % | | | (0.09 | %) | | | (0.25 | %) | | | (0.22 | %) |
Total expenses | | | 1.37 | % | | | 1.34 | % | | | 1.35 | % | | | 1.37 | % | | | 1.37 | % | | | 1.35 | % |
Portfolio turnover rate | | | 351 | % | | | 219 | % | | | 247 | % | | | 593 | % | | | 737 | % | | | 1,082 | % |
A-Class | | Period Ended
September 30,
2016a | | | Year Ended
March 31,
2016 | | | Year Ended
March 31,
2015 | | | Year Ended
March 31,
2014 | | | Year Ended
March 28,
2013 | | | Year Ended
March 31,
2012 | |
Per Share Data | | | | | | | | | | | | | | | | | | |
Net asset value, beginning of period | | $ | 42.87 | | | $ | 48.41 | | | $ | 41.61 | | | $ | 29.96 | | | $ | 25.25 | | | $ | 26.15 | |
Income (loss) from investment operations: | |
Net investment income (loss)b | | | .02 | | | | .04 | | | | .05 | | | | (.11 | ) | | | (.01 | ) | | | (.12 | ) |
Net gain (loss) on investments (realized and unrealized) | | | .88 | | | | (5.37 | ) | | | 6.75 | | | | 11.76 | | | | 4.72 | | | | (.78 | ) |
Total from investment operations | | | .90 | | | | (5.33 | ) | | | 6.80 | | | | 11.65 | | | | 4.71 | | | | (.90 | ) |
Less distributions from: | |
Net investment income | | | — | | | | (.21 | ) | | | — | | | | — | | | | — | | | | — | |
Total distributions | | | — | | | | (.21 | ) | | | — | | | | — | | | | — | | | | — | |
Net asset value, end of period | | $ | 43.77 | | | $ | 42.87 | | | $ | 48.41 | | | $ | 41.61 | | | $ | 29.96 | | | $ | 25.25 | |
| | |
Total Returnc | | | 2.08 | % | | | (11.01 | %) | | | 16.34 | % | | | 38.89 | % | | | 18.70 | % | | | (3.48 | %) |
Ratios/Supplemental Data | |
Net assets, end of period (in thousands) | | $ | 4,077 | | | $ | 5,340 | | | $ | 15,359 | | | $ | 12,938 | | | $ | 4,558 | | | $ | 1,600 | |
Ratios to average net assets: | |
Net investment income (loss) | | | 0.09 | % | | | 0.08 | % | | | 0.12 | % | | | (0.28 | %) | | | (0.05 | %) | | | (0.51 | %) |
Total expenses | | | 1.61 | % | | | 1.60 | % | | | 1.60 | % | | | 1.62 | % | | | 1.60 | % | | | 1.61 | % |
Portfolio turnover rate | | | 351 | % | | | 219 | % | | | 247 | % | | | 593 | % | | | 737 | % | | | 1,082 | % |
134 | THE RYDEX FUNDS SEMI-ANNUAL REPORT | SEE NOTES TO FINANCIAL STATEMENTS. |
FINANCIAL HIGHLIGHTS (concluded) |
This table is presented to show selected data for a share outstanding throughout each period and to assist shareholders in evaluating a Fund’s performance for the periods presented.
C-Class | | Period Ended
September 30,
2016a | | | Year Ended
March 31,
2016 | | | Year Ended
March 31,
2015 | | | Year Ended
March 31,
2014 | | | Year Ended
March 28,
2013 | | | Year Ended
March 31,
2012 | |
Per Share Data | | | | | | | | | | | | | | | | | | |
Net asset value, beginning of period | | $ | 40.09 | | | $ | 45.63 | | | $ | 39.52 | | | $ | 28.67 | | | $ | 24.34 | | | $ | 25.38 | |
Income (loss) from investment operations: | |
Net investment income (loss)b | | | (.13 | ) | | | (.24 | ) | | | (.27 | ) | | | (.37 | ) | | | (.26 | ) | | | (.29 | ) |
Net gain (loss) on investments (realized and unrealized) | | | .81 | | | | (5.09 | ) | | | 6.38 | | | | 11.22 | | | | 4.59 | | | | (.75 | ) |
Total from investment operations | | | .68 | | | | (5.33 | ) | | | 6.11 | | | | 10.85 | | | | 4.33 | | | | (1.04 | ) |
Less distributions from: | |
Net investment income | | | — | | | | (.21 | ) | | | — | | | | — | | | | — | | | | — | |
Total distributions | | | — | | | | (.21 | ) | | | — | | | | — | | | | — | | | | — | |
Net asset value, end of period | | $ | 40.77 | | | $ | 40.09 | | | $ | 45.63 | | | $ | 39.52 | | | $ | 28.67 | | | $ | 24.34 | |
| | |
Total Returnc | | | 1.70 | % | | | (11.69 | %) | | | 15.46 | % | | | 37.84 | % | | | 17.79 | % | | | (4.10 | %) |
Ratios/Supplemental Data | |
Net assets, end of period (in thousands) | | $ | 1,928 | | | $ | 2,977 | | | $ | 6,405 | | | $ | 3,734 | | | $ | 2,727 | | | $ | 2,729 | |
Ratios to average net assets: | |
Net investment income (loss) | | | (0.68 | %) | | | (0.57 | %) | | | (0.62 | %) | | | (1.07 | %) | | | (1.06 | %) | | | (1.24 | %) |
Total expenses | | | 2.36 | % | | | 2.35 | % | | | 2.35 | % | | | 2.37 | % | | | 2.35 | % | | | 2.35 | % |
Portfolio turnover rate | | | 351 | % | | | 219 | % | | | 247 | % | | | 593 | % | | | 737 | % | | | 1,082 | % |
H-Class | | Period Ended
September 30,
2016a | | | Year Ended
March 31,
2016d | | | Year Ended
March 31,
2015d | | | Year Ended
March 31,
2014d | | | Year Ended
March 28,
2013d | | | Year Ended
March 31,
2012d | |
Per Share Data | | | | | | | | | | | | | | | | | | |
Net asset value, beginning of period | | $ | 41.71 | | | $ | 47.12 | | | $ | 40.61 | | | $ | 29.32 | | | $ | 24.76 | | | $ | 25.70 | |
Income (loss) from investment operations: | |
Net investment income (loss)b | | | (.08 | ) | | | (.09 | ) | | | (.10 | ) | | | (.18 | ) | | | (.15 | ) | | | (.14 | ) |
Net gain (loss) on investments (realized and unrealized) | | | .95 | | | | (5.11 | ) | | | 6.61 | | | | 11.47 | | | | 4.71 | | | | (.80 | ) |
Total from investment operations | | | .87 | | | | (5.20 | ) | | | 6.51 | | | | 11.29 | | | | 4.56 | | | | (.94 | ) |
Less distributions from: | |
Net investment income | | | — | | | | (.21 | ) | | | — | | | | — | | | | — | | | | — | |
Total distributions | | | — | | | | (.21 | ) | | | — | | | | — | | | | — | | | | — | |
Net asset value, end of period | | $ | 42.58 | | | $ | 41.71 | | | $ | 47.12 | | | $ | 40.61 | | | $ | 29.32 | | | $ | 24.76 | |
| | |
Total Returnc | | | 2.06 | % | | | (11.04 | %) | | | 16.03 | % | | | 38.51 | % | | | 18.42 | % | | | (3.66 | %) |
Ratios/Supplemental Data | |
Net assets, end of period (in thousands) | | $ | 867 | | | $ | 9,031 | | | $ | 6,249 | | | $ | 2,583 | | | $ | 4,483 | | | $ | 2,355 | |
Ratios to average net assets: | |
Net investment income (loss) | | | (0.38 | %) | | | (0.20 | %) | | | (0.22 | %) | | | (0.50 | %) | | | (0.57 | %) | | | (0.55 | %) |
Total expenses | | | 1.62 | % | | | 1.72 | % | | | 1.85 | % | | | 1.87 | % | | | 1.86 | % | | | 1.86 | % |
Portfolio turnover rate | | | 351 | % | | | 219 | % | | | 247 | % | | | 593 | % | | | 737 | % | | | 1,082 | % |
a | Unaudited figures for the period ended September 30, 2016. Percentage amounts for the period, except total return and portfolio turnover rate, have been annualized. |
b | Net investment income (loss) per share was computed using average shares outstanding throughout the period. |
c | Total return does not reflect the impact of any applicable sales charges. |
d | Effective September 30, 2015, the Fund’s Advisor Class shares were converted into H-Class shares. The financial highlights for periods prior to that date reflect the performance of the former Advisor Class — See Note 8. |
SEE NOTES TO FINANCIAL STATEMENTS. | THE RYDEX FUNDS SEMI-ANNUAL REPORT | 135 |
FUND PROFILE (Unaudited) | September 30, 2016 |
UTILITIES FUND
OBJECTIVE: Seeks to provide capital appreciation by investing in companies that operate public utilities (“Utilities Companies”).
Holdings Diversification (Market Exposure as % of Net Assets)
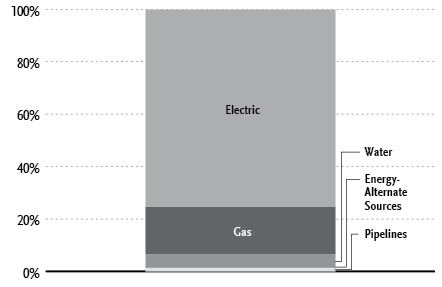
“Holdings Diversification (Market Exposure as % of Net Assets)” excludes any temporary cash investments.
Inception Dates: |
Investor Class | April 3, 2000 |
A-Class | September 1, 2004 |
C-Class | April 27, 2001 |
H-Class* | April 3, 2000 |
Ten Largest Holdings (% of Total Net Assets) |
NextEra Energy, Inc. | 3.7% |
Duke Energy Corp. | 3.6% |
Southern Co. | 3.5% |
Dominion Resources, Inc. | 3.3% |
American Electric Power Company, Inc. | 2.7% |
PG&E Corp. | 2.7% |
Exelon Corp. | 2.7% |
Sempra Energy | 2.5% |
Edison International | 2.4% |
PPL Corp. | 2.3% |
Top Ten Total | 29.4% |
| | |
“Ten Largest Holdings” excludes any temporary cash investments. |
* | Effective September 30, 2015, the Fund’s Advisor Class shares were converted into H-Class shares — See Note 8. |
136 | THE RYDEX FUNDS SEMI-ANNUAL REPORT | |
SCHEDULE OF INVESTMENTS (Unaudited) | September 30, 2016 |
UTILITIES FUND | |
| | | Shares | | | Value | |
| | | | | | | |
COMMON STOCKS† - 99.9% | |
| | | | | | | |
Electric - 75.4% | |
NextEra Energy, Inc. | | | 19,719 | | | $ | 2,412,027 | |
Duke Energy Corp. | | | 30,041 | | | | 2,404,482 | |
Southern Co. | | | 44,415 | | | | 2,278,490 | |
Dominion Resources, Inc. | | | 29,482 | | | | 2,189,628 | |
American Electric Power Company, Inc. | | | 28,145 | | | | 1,807,190 | |
PG&E Corp. | | | 28,995 | | | | 1,773,624 | |
Exelon Corp. | | | 53,007 | | | | 1,764,603 | |
Edison International | | | 21,640 | | | | 1,563,490 | |
PPL Corp. | | | 44,838 | | | | 1,550,050 | |
Consolidated Edison, Inc. | | | 20,548 | | | | 1,547,264 | |
Xcel Energy, Inc. | | | 35,843 | | | | 1,474,581 | |
Public Service Enterprise Group, Inc. | | | 35,196 | | | | 1,473,657 | |
WEC Energy Group, Inc. | | | 23,236 | | | | 1,391,372 | |
Eversource Energy | | | 24,703 | | | | 1,338,409 | |
DTE Energy Co. | | | 14,143 | | | | 1,324,775 | |
FirstEnergy Corp. | | | 36,511 | | | | 1,207,784 | |
Entergy Corp. | | | 15,540 | | | | 1,192,384 | |
Avangrid, Inc. | | | 27,875 | | | | 1,164,618 | |
Ameren Corp. | | | 22,693 | | | | 1,116,042 | |
CMS Energy Corp. | | | 26,224 | | | | 1,101,670 | |
SCANA Corp. | | | 14,401 | | | | 1,042,200 | |
Alliant Energy Corp. | | | 24,790 | | | | 949,705 | |
AES Corp. | | | 73,207 | | | | 940,710 | |
Pinnacle West Capital Corp. | | | 12,340 | | | | 937,717 | |
Westar Energy, Inc. | | | 16,214 | | | | 920,145 | |
ITC Holdings Corp. | | | 18,728 | | | | 870,477 | |
OGE Energy Corp. | | | 25,696 | | | | 812,508 | |
MDU Resources Group, Inc. | | | 29,166 | | | | 741,983 | |
Calpine Corp.* | | | 53,128 | | | | 671,538 | |
Great Plains Energy, Inc. | | | 24,434 | | | | 666,804 | |
IDACORP, Inc. | | | 8,270 | | | | 647,376 | |
Portland General Electric Co. | | | 14,647 | | | | 623,816 | |
NRG Energy, Inc. | | | 53,268 | | | | 597,134 | |
Black Hills Corp. | | | 9,661 | | | | 591,446 | |
Atlantica Yield plc | | | 30,994 | | | | 589,195 | |
Hawaiian Electric Industries, Inc. | | | 19,397 | | | | 579,000 | |
Korea Electric Power Corp. ADR | | | 23,640 | | | | 576,343 | |
Enersis Americas S.A. ADR | | | 68,675 | | | | 562,448 | |
NRG Yield, Inc. — Class C | | | 32,612 | | | | 553,100 | |
ALLETE, Inc. | | | 9,254 | | | | 551,723 | |
NorthWestern Corp. | | | 9,451 | | | | 543,716 | |
Avista Corp. | | | 12,745 | | | | 532,614 | |
PNM Resources, Inc. | | | 15,953 | | | | 521,982 | |
El Paso Electric Co. | | | 9,747 | | | | 455,867 | |
Talen Energy Corp.* | | | 31,004 | | | | 429,405 | |
Empire District Electric Co. | | | 11,661 | | | | 398,107 | |
Dynegy, Inc.* | | | 31,102 | | | | 385,354 | |
Total Electric | | | | | | | 49,768,553 | |
| | | | | | | | | |
Gas - 18.0% | |
Sempra Energy | | | 15,646 | | | | 1,677,096 | |
CenterPoint Energy, Inc. | | | 44,288 | | | | 1,028,810 | |
NiSource, Inc. | | | 37,435 | | | | 902,558 | |
Atmos Energy Corp. | | | 12,117 | | | | 902,353 | |
UGI Corp. | | | 19,800 | | | | 895,752 | |
Piedmont Natural Gas Company, Inc. | | | 11,978 | | | | 719,159 | |
National Fuel Gas Co. | | | 12,541 | | | | 678,092 | |
Vectren Corp. | | | 13,311 | | | | 668,212 | |
National Grid plc ADR | | | 9,146 | | | | 650,372 | |
Southwest Gas Corp. | | | 8,566 | | | | 598,421 | |
ONE Gas, Inc. | | | 9,529 | | | | 589,273 | |
WGL Holdings, Inc. | | | 9,333 | | | | 585,179 | |
Spire, Inc. | | | 8,722 | | | | 555,940 | |
New Jersey Resources Corp. | | | 16,383 | | | | 538,345 | |
South Jersey Industries, Inc. | | | 17,024 | | | | 503,059 | |
Northwest Natural Gas Co. | | | 6,974 | | | | 419,207 | |
Total Gas | | | | | | | 11,911,828 | |
| | | | | | | | | |
Water - 5.1% | |
American Water Works Company, Inc. | | | 15,796 | | | | 1,182,172 | |
Aqua America, Inc. | | | 24,742 | | | | 754,136 | |
Cia de Saneamento Basico do Estado de Sao Paulo ADR | | | 69,979 | | | | 648,006 | |
California Water Service Group | | | 12,700 | | | | 407,543 | |
American States Water Co. | | | 9,970 | | | | 399,299 | |
Total Water | | | | | | | 3,391,156 | |
| | | | | | | | | |
Energy-Alternate Sources - 1.4% | |
TerraForm Power, Inc. — Class A* | | | 33,143 | | | | 461,020 | |
Pattern Energy Group, Inc. | | | 19,607 | | | | 440,961 | |
Total Energy-Alternate Sources | | | | | | | 901,981 | |
| | | | | | | | | |
Pipelines - 0.0% | |
Kinder Morgan, Inc. | | | 1 | | | | 23 | |
| | | | | | | | | |
Total Common Stocks | | | | | | | | |
(Cost $54,187,760) | | | | | | | 65,973,541 | |
| | | | | | | | | |
| | | Face
Amount | | | | | |
| | | | | | | | | |
REPURCHASE AGREEMENT††,1 - 0.4% | |
Royal Bank of Canada
issued 09/30/16 at 0.36%
due 10/03/16 | | $ | 254,582 | | | | 254,582 | |
Total Repurchase Agreement | | | | | | | | |
(Cost $254,582) | | | | | | | 254,582 | |
| | | | | | | | | |
Total Investments - 100.3% | | | | | | | | |
(Cost $54,442,342) | | | | | | $ | 66,228,123 | |
Other Assets & Liabilities, net - (0.3)% | | | | | | | (203,912 | ) |
Total Net Assets - 100.0% | | | | | | $ | 66,024,211 | |
SEE NOTES TO FINANCIAL STATEMENTS. | THE RYDEX FUNDS SEMI-ANNUAL REPORT | 137 |
SCHEDULE OF INVESTMENTS (Unaudited)(concluded) | September 30, 2016 |
UTILITIES FUND | |
* | Non-income producing security. |
† | Value determined based on Level 1 inputs — See Note 4. |
†† | Value determined based on Level 2 inputs — See Note 4. |
1 | Repurchase Agreement — See Note 5. |
| | ADR — American Depositary Receipt |
| | plc — Public Limited Company |
| | |
| | See Sector Classification in Other Information section. |
The following table summarizes the inputs used to value the Fund’s investments at September 30, 2016 (See Note 4 in the Notes to Financial Statements):
Investments in Securities (Assets) | | Level 1 | | | Level 2 | | | Level 3 | | | Total | |
Common Stocks | | $ | 65,973,541 | | | $ | — | | | $ | — | | | $ | 65,973,541 | |
Repurchase Agreement | | | — | | | | 254,582 | | | | — | | | | 254,582 | |
Total | | $ | 65,973,541 | | | $ | 254,582 | | | $ | — | | | $ | 66,228,123 | |
Transfers between investment levels may occur as the markets fluctuate and/or the availability of data used in an investment’s valuation changes. Transfers between valuation levels, if any, are in comparison to the valuation levels at the end of the previous fiscal year, and are effective using the fair value as of the end of the previous fiscal period.
For the period ended September 30, 2016, there were no transfers between levels.
138 | THE RYDEX FUNDS SEMI-ANNUAL REPORT | SEE NOTES TO FINANCIAL STATEMENTS. |
STATEMENT OF ASSETS AND LIABILITIES (Unaudited) |
September 30, 2016 |
Assets: | |
Investments, at value (cost $54,187,760) | | $ | 65,973,541 | |
Repurchase agreements, at value (cost $254,582) | | | 254,582 | |
Total investments (cost $54,442,342) | | | 66,228,123 | |
Receivables: | |
Securities sold | | | 615,666 | |
Fund shares sold | | | 246,186 | |
Dividends | | | 142,553 | |
Interest | | | 3 | |
Total assets | | | 67,232,531 | |
| | | | | |
Liabilities: | |
Payable for: | |
Fund shares redeemed | | | 1,128,711 | |
Management fees | | | 44,020 | |
Transfer agent and administrative fees | | | 12,947 | |
Distribution and service fees | | | 11,372 | |
Portfolio accounting fees | | | 5,179 | |
Miscellaneous | | | 6,091 | |
Total liabilities | | | 1,208,320 | |
Commitments and contingent liabilities (Note 9) | | | — | |
Net assets | | $ | 66,024,211 | |
| | | | | |
Net assets consist of: | |
Paid in capital | | $ | 51,046,418 | |
Undistributed net investment income | | | 634,385 | |
Accumulated net realized gain on investments | | | 2,557,627 | |
Net unrealized appreciation on investments | | | 11,785,781 | |
Net assets | | $ | 66,024,211 | |
| | | | | |
Investor Class: | |
Net assets | | $ | 46,294,073 | |
Capital shares outstanding | | | 1,131,055 | |
Net asset value per share | | $ | 40.93 | |
| | | | | |
A-Class: | |
Net assets | | $ | 6,505,517 | |
Capital shares outstanding | | | 170,131 | |
Net asset value per share | | $ | 38.24 | |
Maximum offering price per share (Net asset value divided by 95.25%) | | $ | 40.14 | |
| | | | | |
C-Class: | |
Net assets | | $ | 11,003,015 | |
Capital shares outstanding | | | 329,780 | |
Net asset value per share | | $ | 33.36 | |
| | | | | |
H-Class: | |
Net assets | | $ | 2,221,606 | |
Capital shares outstanding | | | 60,053 | |
Net asset value per share | | $ | 36.99 | |
STATEMENT OF OPERATIONS (Unaudited) | |
Period Ended September 30, 2016 | |
Investment Income: | |
Dividends (net of foreign withholding tax of $9,481) | | $ | 1,376,101 | |
Interest | | | 488 | |
Total investment income | | | 1,376,589 | |
| | | | | |
Expenses: | |
Management fees | | | 394,712 | |
Transfer agent and administrative fees | | | 116,092 | |
Distribution and service fees: | |
A-Class | | | 26,971 | |
C-Class | | | 58,643 | |
H-Class | | | 11,359 | |
Portfolio accounting fees | | | 46,436 | |
Trustees’ fees* | | | 6,848 | |
Custodian fees | | | 5,484 | |
Line of credit fees | | | 251 | |
Miscellaneous | | | 75,408 | |
Total expenses | | | 742,204 | |
Net investment income | | | 634,385 | |
| | | | | |
Net Realized and Unrealized Gain (Loss): | |
Net realized gain (loss) on: | |
Investments | | | 9,337,287 | |
Net realized gain | | | 9,337,287 | |
Net change in unrealized appreciation (depreciation) on: | |
Investments | | | (8,323,113 | ) |
Net change in unrealized appreciation (depreciation) | | | (8,323,113 | ) |
Net realized and unrealized gain | | | 1,014,174 | |
Net increase in net assets resulting from operations | | $ | 1,648,559 | |
* | Relates to Trustees not deemed “interested persons” within the meaning of Section 2(a)(19) of the 1940 Act. |
SEE NOTES TO FINANCIAL STATEMENTS. | THE RYDEX FUNDS SEMI-ANNUAL REPORT | 139 |
STATEMENTS OF CHANGES IN NET ASSETS |
| | | Period Ended
September 30,
2016
(Unaudited) | | | Year Ended
March 31,
2016 | |
Increase (Decrease) in Net Assets from Operations: | | | | | | |
Net investment income | | $ | 634,385 | | | $ | 957,252 | |
Net realized gain on investments | | | 9,337,287 | | | | 376,530 | |
Net change in unrealized appreciation (depreciation) on investments | | | (8,323,113 | ) | | | 4,295,317 | |
Net increase in net assets resulting from operations | | | 1,648,559 | | | | 5,629,099 | |
| | | | | | | | | |
Distributions to shareholders from: | | | | | | | | |
Net investment income | | | | | | | | |
Investor Class | | | — | | | | (406,169 | ) |
A-Class | | | — | | | | (268,532 | ) |
C-Class | | | — | | | | (122,718 | ) |
H-Class | | | — | | | | (173,650 | )* |
Total distributions to shareholders | | | — | | | | (971,069 | ) |
| | | | | | | | | |
Capital share transactions: | | | | | | | | |
Proceeds from sale of shares | | | | | | | | |
Investor Class | | | 157,815,337 | | | | 150,469,741 | |
A-Class | | | 25,158,141 | | | | 48,138,913 | |
C-Class | | | 5,589,626 | | | | 22,853,937 | |
H-Class | | | 89,734,743 | | | | 142,307,243 | * |
Distributions reinvested | | | | | | | | |
Investor Class | | | — | | | | 394,790 | |
A-Class | | | — | | | | 260,843 | |
C-Class | | | — | | | | 121,826 | |
H-Class | | | — | | | | 173,410 | * |
Cost of shares redeemed | | | | | | | | |
Investor Class | | | (162,445,140 | ) | | | (157,218,282 | ) |
A-Class | | | (41,773,799 | ) | | | (37,759,601 | ) |
C-Class | | | (5,161,907 | ) | | | (21,684,803 | ) |
H-Class | | | (94,628,598 | ) | | | (149,530,278 | )* |
Net decrease from capital share transactions | | | (25,711,597 | ) | | | (1,472,261 | ) |
Net increase (decrease) in net assets | | | (24,063,038 | ) | | | 3,185,769 | |
| | | | | | | | | |
Net assets: | | | | | | | | |
Beginning of period | | | 90,087,249 | | | | 86,901,480 | |
End of period | | $ | 66,024,211 | | | $ | 90,087,249 | |
Undistributed net investment income at end of period | | $ | 634,385 | | | $ | — | |
| | | | | | | | | |
Capital share activity: | | | | | | | | |
Shares sold | | | | | | | | |
Investor Class | | | 3,798,655 | | | | 4,123,058 | |
A-Class | | | 641,674 | | | | 1,422,806 | |
C-Class | | | 166,009 | | | | 771,627 | |
H-Class | | | 2,461,009 | | | | 4,366,895 | * |
Shares issued from reinvestment of distributions | | | | | | | | |
Investor Class | | | — | | | | 11,581 | |
A-Class | | | — | | | | 8,172 | |
C-Class | | | — | | | | 4,346 | |
H-Class | | | — | | | | 5,619 | * |
Shares redeemed | | | | | | | | |
Investor Class | | | (3,929,163 | ) | | | (4,364,735 | ) |
A-Class | | | (1,068,069 | ) | | | (1,116,343 | ) |
C-Class | | | (152,976 | ) | | | (733,416 | ) |
H-Class | | | (2,578,093 | ) | | | (4,598,364 | )* |
Net decrease in shares | | | (660,954 | ) | | | (98,754 | ) |
* | Effective September 30, 2015, the Fund’s Advisor Class shares were converted into H-Class shares — See Note 8. |
140 | THE RYDEX FUNDS SEMI-ANNUAL REPORT | SEE NOTES TO FINANCIAL STATEMENTS. |
This table is presented to show selected data for a share outstanding throughout each period and to assist shareholders in evaluating a Fund’s performance for the periods presented.
Investor Class | | Period Ended
September 30,
2016a | | | Year Ended
March 31,
2016 | | | Year Ended
March 31,
2015 | | | Year Ended
March 31,
2014 | | | Year Ended
March 28,
2013 | | | Year Ended
March 31,
2012 | |
Per Share Data | | | | | | | | | | | | | | | | | | |
Net asset value, beginning of period | | $ | 40.23 | | | $ | 36.98 | | | $ | 34.01 | | | $ | 32.71 | | | $ | 29.13 | | | $ | 27.00 | |
Income (loss) from investment operations: | |
Net investment income (loss)b | | | .33 | | | | .73 | | | | .84 | | | | .78 | | | | .74 | | | | .73 | |
Net gain (loss) on investments (realized and unrealized) | | | .37 | | | | 3.09 | | | | 2.26 | | | | 1.98 | | | | 3.96 | | | | 1.80 | |
Total from investment operations | | | .70 | | | | 3.82 | | | | 3.10 | | | | 2.76 | | | | 4.70 | | | | 2.53 | |
Less distributions from: | |
Net investment income | | | — | | | | (.57 | ) | | | (.13 | ) | | | (1.46 | ) | | | (1.12 | ) | | | (.40 | ) |
Total distributions | | | — | | | | (.57 | ) | | | (.13 | ) | | | (1.46 | ) | | | (1.12 | ) | | | (.40 | ) |
Net asset value, end of period | | $ | 40.93 | | | $ | 40.23 | | | $ | 36.98 | | | $ | 34.01 | | | $ | 32.71 | | | $ | 29.13 | |
| | |
Total Returnc | | | 1.74 | % | | | 10.61 | % | | | 9.12 | % | | | 8.88 | % | | | 16.75 | % | | | 9.44 | % |
Ratios/Supplemental Data | |
Net assets, end of period (in thousands) | | $ | 46,294 | | | $ | 50,753 | | | $ | 55,156 | | | $ | 95,854 | | | $ | 42,907 | | | $ | 37,469 | |
Ratios to average net assets: | |
Net investment income (loss) | | | 1.58 | % | | | 2.00 | % | | | 2.31 | % | | | 2.38 | % | | | 2.45 | % | | | 2.59 | % |
Total expenses | | | 1.39 | % | | | 1.35 | % | | | 1.35 | % | | | 1.40 | % | | | 1.35 | % | | | 1.35 | % |
Portfolio turnover rate | | | 241 | % | | | 475 | % | | | 384 | % | | | 508 | % | | | 534 | % | | | 549 | % |
A-Class | | Period Ended
September 30,
2016a | | | Year Ended
March 31,
2016 | | | Year Ended
March 31,
2015 | | | Year Ended
March 31,
2014 | | | Year Ended
March 28,
2013 | | | Year Ended
March 31,
2012 | |
Per Share Data | | | | | | | | | | | | | | | | | | |
Net asset value, beginning of period | | $ | 37.63 | | | $ | 34.70 | | | $ | 32.02 | | | $ | 30.95 | | | $ | 27.69 | | | $ | 25.75 | |
Income (loss) from investment operations: | |
Net investment income (loss)b | | | .25 | | | | .63 | | | | .66 | | | | .63 | | | | .65 | | | | .67 | |
Net gain (loss) on investments (realized and unrealized) | | | .36 | | | | 2.87 | | | | 2.15 | | | | 1.90 | | | | 3.73 | | | | 1.67 | |
Total from investment operations | | | .61 | | | | 3.50 | | | | 2.81 | | | | 2.53 | | | | 4.38 | | | | 2.34 | |
Less distributions from: | |
Net investment income | | | — | | | | (.57 | ) | | | (.13 | ) | | | (1.46 | ) | | | (1.12 | ) | | | (.40 | ) |
Total distributions | | | — | | | | (.57 | ) | | | (.13 | ) | | | (1.46 | ) | | | (1.12 | ) | | | (.40 | ) |
Net asset value, end of period | | $ | 38.24 | | | $ | 37.63 | | | $ | 34.70 | | | $ | 32.02 | | | $ | 30.95 | | | $ | 27.69 | |
| | |
Total Returnc | | | 1.59 | % | | | 10.38 | % | | | 8.78 | % | | | 8.64 | % | | | 16.46 | % | | | 9.16 | % |
Ratios/Supplemental Data | |
Net assets, end of period (in thousands) | | $ | 6,506 | | | $ | 22,448 | | | $ | 9,782 | | | $ | 11 | | | $ | 6,938 | | | $ | 7,912 | |
Ratios to average net assets: | |
Net investment income (loss) | | | 1.29 | % | | | 1.85 | % | | | 1.93 | % | | | 2.05 | % | | | 2.26 | % | | | 2.47 | % |
Total expenses | | | 1.64 | % | | | 1.60 | % | | | 1.60 | % | | | 1.63 | % | | | 1.61 | % | | | 1.60 | % |
Portfolio turnover rate | | | 241 | % | | | 475 | % | | | 384 | % | | | 508 | % | | | 534 | % | | | 549 | % |
SEE NOTES TO FINANCIAL STATEMENTS. | THE RYDEX FUNDS SEMI-ANNUAL REPORT | 141 |
FINANCIAL HIGHLIGHTS (concluded) |
This table is presented to show selected data for a share outstanding throughout each period and to assist shareholders in evaluating a Fund’s performance for the periods presented.
C-Class | | Period Ended
September 30,
2016a | | | Year Ended
March 31,
2016 | | | Year Ended
March 31,
2015 | | | Year Ended
March 31,
2014 | | | Year Ended
March 28,
2013 | | | Year Ended
March 31,
2012 | |
Per Share Data | | | | | | | | | | | | | | | | | | |
Net asset value, beginning of period | | $ | 32.96 | | | $ | 30.70 | | | $ | 28.55 | | | $ | 27.96 | | | $ | 25.31 | | | $ | 23.76 | |
Income (loss) from investment operations: | |
Net investment income (loss)b | | | .13 | | | | .28 | | | | .36 | | | | .34 | | | | .42 | | | | .42 | |
Net gain (loss) on investments (realized and unrealized) | | | .27 | | | | 2.55 | | | | 1.92 | | | | 1.71 | | | | 3.35 | | | | 1.53 | |
Total from investment operations | | | .40 | | | | 2.83 | | | | 2.28 | | | | 2.05 | | | | 3.77 | | | | 1.95 | |
Less distributions from: | |
Net investment income | | | — | | | | (.57 | ) | | | (.13 | ) | | | (1.46 | ) | | | (1.12 | ) | | | (.40 | ) |
Total distributions | | | — | | | | (.57 | ) | | | (.13 | ) | | | (1.46 | ) | | | (1.12 | ) | | | (.40 | ) |
Net asset value, end of period | | $ | 33.36 | | | $ | 32.96 | | | $ | 30.70 | | | $ | 28.55 | | | $ | 27.96 | | | $ | 25.31 | |
| | |
Total Returnc | | | 1.21 | % | | | 9.55 | % | | | 7.99 | % | | | 7.83 | % | | | 15.58 | % | | | 8.28 | % |
Ratios/Supplemental Data | |
Net assets, end of period (in thousands) | | $ | 11,003 | | | $ | 10,439 | | | $ | 8,417 | | | $ | 8,387 | | | $ | 7,001 | | | $ | 6,961 | |
Ratios to average net assets: | |
Net investment income (loss) | | | 0.78 | % | | | 0.94 | % | | | 1.18 | % | | | 1.22 | % | | | 1.62 | % | | | 1.70 | % |
Total expenses | | | 2.38 | % | | | 2.35 | % | | | 2.35 | % | | | 2.38 | % | | | 2.36 | % | | | 2.35 | % |
Portfolio turnover rate | | | 241 | % | | | 475 | % | | | 384 | % | | | 508 | % | | | 534 | % | | | 549 | % |
H-Class | | Period Ended
September 30,
2016a | | | Year Ended
March 31,
2016d | | | Year Ended
March 31,
2015d | | | Year Ended
March 31,
2014d | | | Year Ended
March 28,
2013d | | | Year Ended
March 31,
2012d | |
Per Share Data | | | | | | | | | | | | | | | | | | |
Net asset value, beginning of period | | $ | 36.40 | | | $ | 33.61 | | | $ | 31.09 | | | $ | 30.19 | | | $ | 27.10 | | | $ | 25.26 | |
Income (loss) from investment operations: | |
Net investment income (loss)b | | | .20 | | | | .54 | | | | .60 | | | | .69 | | | | .48 | | | | .56 | |
Net gain (loss) on investments (realized and unrealized) | | | .39 | | | | 2.82 | | | | 2.05 | | | | 1.67 | | | | 3.73 | | | | 1.68 | |
Total from investment operations | | | .59 | | | | 3.36 | | | | 2.65 | | | | 2.36 | | | | 4.21 | | | | 2.24 | |
Less distributions from: | |
Net investment income | | | — | | | | (.57 | ) | | | (.13 | ) | | | (1.46 | ) | | | (1.12 | ) | | | (.40 | ) |
Total distributions | | | — | | | | (.57 | ) | | | (.13 | ) | | | (1.46 | ) | | | (1.12 | ) | | | (.40 | ) |
Net asset value, end of period | | $ | 36.99 | | | $ | 36.40 | | | $ | 33.61 | | | $ | 31.09 | | | $ | 30.19 | | | $ | 27.10 | |
| | |
Total Returnc | | | 1.62 | % | | | 10.31 | % | | | 8.53 | % | | | 8.29 | % | | | 16.23 | % | | | 8.90 | % |
Ratios/Supplemental Data | |
Net assets, end of period (in thousands) | | $ | 2,222 | | | $ | 6,448 | | | $ | 13,546 | | | $ | 2,269 | | | $ | 4,812 | | | $ | 8,036 | |
Ratios to average net assets: | |
Net investment income (loss) | | | 1.06 | % | | | 1.65 | % | | | 1.79 | % | | | 2.32 | % | | | 1.70 | % | | | 2.11 | % |
Total expenses | | | 1.62 | % | | | 1.68 | % | | | 1.84 | % | | | 1.88 | % | | | 1.85 | % | | | 1.84 | % |
Portfolio turnover rate | | | 241 | % | | | 475 | % | | | 384 | % | | | 508 | % | | | 534 | % | | | 549 | % |
a | Unaudited figures for the period ended September 30, 2016. Percentage amounts for the period, except total return and portfolio turnover rate, have been annualized. |
b | Net investment income (loss) per share was computed using average shares outstanding throughout the period. |
c | Total return does not reflect the impact of any applicable sales charges. |
d | Effective September 30, 2015, the Fund’s Advisor Class shares were converted into H-Class shares. The financial highlights for periods prior to that date reflect the performance of the former Advisor Class — See Note 8. |
142 | THE RYDEX FUNDS SEMI-ANNUAL REPORT | SEE NOTES TO FINANCIAL STATEMENTS. |
NOTES TO FINANCIAL STATEMENTS (Unaudited) |
1. Organization and Significant Accounting Policies
Organization
The Rydex Series Funds (the “Trust”), a Delaware statutory trust, is registered with the SEC under the Investment Company Act of 1940 (“1940 Act”), as an open-ended investment company of the series type. Each series, in effect, is representing a separate Fund. The Trust is authorized to issue an unlimited number of no par value shares. The Trust accounts for the assets of each fund separately.
The Trust offers a combination of seven separate classes of shares: Investor Class shares, A-Class shares, C-Class shares, H-Class shares, P-Class shares, Institutional Class shares and Money Market Class shares. Sales of shares of each Class are made without a front-end sales charge at the net asset value per share (“NAV”), with the exception of A-Class shares. A-Class shares are sold at the NAV, plus the applicable front-end sales charge. The sales charge varies depending on the amount purchased, but will not exceed 4.75%. A-Class share purchases of $1 million or more are exempt from the front-end sales charge but have a 1% contingent deferred sales charge (“CDSC”) if shares are redeemed within 12 months of purchase. C-Class shares have a 1% CDSC if shares are redeemed within 12 months of purchase. Institutional Class shares are offered primarily for direct investment by institutions such as pension and profit sharing plans, endowments, foundations and corporations. Institutional Class shares require a minimum initial investment of $2 million and a minimum account balance of $1 million. At September 30, 2016, the Trust consisted of fifty-three funds.
This report covers the Banking Fund, Basic Materials Fund, Biotechnology Fund, Consumer Products Fund, Electronics Fund, Energy Fund, Energy Services Fund, Financial Services Fund, Health Care Fund, Internet Fund, Leisure Fund, Precious Metals Fund, Real Estate Fund, Retailing Fund, Technology Fund, Telecommunications Fund, Transportation Fund and Utilities Fund (the “Funds”), each a non-diversified investment company. Only Investor Class, A-Class, C-Class and H-Class had been issued by the Funds.
The Funds invest in a specific industry sector. To the extent that investments are concentrated in a single sector, the Funds are subject to legislative or regulatory changes, adverse market conditions and/or increased competition affecting such sector.
The Funds seek capital appreciation and invest substantially all of their assets in equity securities of companies involved in their sector.
The Funds are designed and operated to accommodate frequent trading by shareholders and, unlike most mutual funds, offer unlimited exchange privileges with no minimum holding periods or transactions fees, which may cause the Funds to experience high portfolio turnover.
Guggenheim Investments (“GI”) provides advisory services, and Rydex Fund Services, LLC (“RFS”) provides transfer agent, administrative and accounting services to the Trust. Guggenheim Funds Distributors, LLC (“GFD”) acts as principal underwriter for the Trust. GI and GFD are affiliated entities; RFS ceased to be an affiliate of GI as of October 4, 2016, when it was acquired by MUFG Investor Services. In connection with its acquisition, RFS changed its name to MUFG Investor Services (US), LLC (“MUIS”). This change has no impact on the financial statements of the Funds.
Significant Accounting Policies
The Funds operate as investment companies and, accordingly, follow the investment company accounting and reporting guidance of the Financial Accounting Standards Board (“FASB”) Accounting Standards Codification Topic 946 Financial Services – Investment Companies.
The following significant accounting policies are in conformity with U.S. generally accepted accounting principles (“U.S. GAAP”) and are consistently followed by the Trust. This requires management to make estimates and assumptions that affect the reported amount of assets and liabilities, contingent assets and liabilities at the date of the financial statements, and the reported amounts of revenues and expenses during the reporting period. Actual results could differ from these estimates. All time references are based on Eastern Time.
The NAV of each Class of the Funds is calculated by dividing the market value of the Fund’s securities and other assets, less all liabilities, attributable to the Class by the number of outstanding shares of the Class.
A. The Board of Trustees of the Funds (the “Board”) has adopted policies and procedures for the valuation of the Funds’ investments (the “Valuation Procedures”). Pursuant to the Valuation Procedures, the Board has delegated to a valuation committee, consisting of representatives from Guggenheim’s investment management, fund administration, legal and compliance departments (the “Valuation Committee”), the day-to-day responsibility for implementing the Valuation Procedures, including, under most circumstances, the responsibility for determining the fair value of the Funds’ securities and/or other assets.
| | THE RYDEX FUNDS SEMI-ANNUAL REPORT | 143 |
NOTES TO FINANCIAL STATEMENTS (Unaudited)(continued) |
Valuations of the Funds’ securities are supplied primarily by pricing services appointed pursuant to the processes set forth in the Valuation Procedures. The Valuation Committee convenes monthly, or more frequently as needed, to review the valuation of all assets which have been fair valued for reasonableness. The Funds’ officers, through the Valuation Committee and consistent with the monitoring and review responsibilities set forth in the Valuation Procedures, regularly review procedures used and valuations provided by the pricing services.
If the pricing service cannot or does not provide a valuation for a particular investment or such valuation is deemed unreliable, such investment is fair valued by the Valuation Committee.
Equity securities listed on an exchange (New York Stock Exchange (“NYSE”) or American Stock Exchange) are valued at the last quoted sales price as of the close of business on the NYSE, usually 4:00 p.m. on the valuation date. Equity securities listed on the NASDAQ market system are valued at the NASDAQ Official Closing Price on the valuation date, which may not necessarily represent the last sale price. If there has been no sale on such exchange or NASDAQ on a given day, the security is valued at the closing bid price on that day.
Open-end investment companies (“mutual funds”) are valued at their NAV as of the close of business, on the valuation date. Exchange-traded funds (“ETFs”) are valued at the last quoted sales price.
Repurchase agreements are valued at amortized cost, provided such amounts approximate market value.
Investments for which market quotations are not readily available are fair-valued as determined in good faith by GI under the direction of the Board using methods established or ratified by the Board. Valuations in accordance with these methods are intended to reflect each security’s (or asset’s) “fair value.” Each such determination is based on a consideration of all relevant factors, which are likely to vary from one pricing context to another. Examples of such factors may include, but are not limited to: market prices; sale prices; broker quotes; and models which derive prices based on inputs such as prices of securities with comparable maturities and characteristics, or based on inputs such as anticipated cash flows or collateral, spread over Treasuries, and other information analysis.
B. The accounting records of the Funds are maintained in U.S. dollars. All assets and liabilities initially expressed in foreign currencies are converted into U.S. dollars at prevailing exchange rates. Purchases and sales of investment securities, dividend and interest income, and certain expenses are translated at the rates of exchange prevailing on the respective dates of such transactions. Changes in the relationship of these foreign currencies to the U.S. dollar can significantly affect the value of the investments and earnings of the Funds. Foreign investments may also subject the Funds to foreign government exchange restrictions, expropriation, taxation, or other political, social or economic developments, all of which could affect the market and/or credit risk of the investments.
The Funds do not isolate that portion of the results of operations resulting from changes in the foreign exchange rates on investments from the fluctuations arising from changes in the market prices of securities held. Such fluctuations are included with the net realized and unrealized gain or loss on investments.
Reported net realized foreign exchange gains and losses arise from sales of foreign currencies and currency gains or losses realized between the trade and settlement dates on investment transactions. Net unrealized exchange gains and losses arise from changes in the fair values of assets and liabilities other than investments in securities at the fiscal period end, resulting from changes in exchange rates.
C. Security transactions are recorded on the trade date for financial reporting purposes. Realized gains and losses from securities transactions are recorded using the identified cost basis. Proceeds from lawsuits related to investment holdings are recorded as realized gains in the respective Fund. Dividend income is recorded on the ex-dividend date, net of applicable taxes withheld by foreign countries. Taxable non-cash dividends are recorded as dividend income. Interest income, including amortization of premiums and accretion of discounts, is accrued on a daily basis. Dividend income from REITs is recorded based on the income included in the distributions received from the REIT investments using published REIT classifications, including some management estimates when actual amounts are not available. Distributions received in excess of this estimated amount are recorded as a reduction of the cost of investments or reclassified to capital gains. The actual amounts of income, return of capital, and capital gains are only determined by each REIT after its fiscal year-end, and may differ from the estimated amounts.
D. Distributions of net investment income and net realized gains, if any, are declared and paid at least annually. Dividends are reinvested in additional shares unless shareholders request payment in cash. Distributions are recorded on the ex-dividend date and are determined in accordance with income tax regulations which may differ from U.S. GAAP.
E. Interest and dividend income, most expenses, all realized gains and losses, and all unrealized gains and losses are allocated to the classes based upon the value of the outstanding shares in each Class. Certain costs, such as distribution and service fees are charged directly to specific classes. In addition, certain expenses
144 | THE RYDEX FUNDS SEMI-ANNUAL REPORT | |
NOTES TO FINANCIAL STATEMENTS (Unaudited)(continued) |
have been allocated to the individual Funds in the Trust on a pro rata basis upon the respective aggregate net assets of each Fund included in the Trust.
F. The Funds may leave cash overnight in their cash account with the custodian. Periodically, a Fund may have cash due to the custodian bank as an overdraft balance. A fee is incurred on this overdraft, calculated by multiplying the overdraft by a rate based on the federal funds rate, which was 0.29% at September 30, 2016.
G. Under the Funds’ organizational documents, the Trustees and Officers are indemnified against certain liabilities arising out of the performance of their duties to the Trust. In addition, throughout the normal course of business, the Funds enter into contracts that contain a variety of representations and warranties which provide general indemnifications. The Funds’ maximum exposure under these arrangements is unknown, as this would involve future claims that may be made against the Funds and/or their affiliates that have not yet occurred. However, based on experience, the Funds expect the risk of loss to be remote.
2. Fees and Other Transactions with Affiliates
Under the terms of an investment advisory contract, the Funds pay GI investment advisory fees calculated at the annualized rates below, based on the average daily net assets of the Funds:
Fund | Management Fees
(as a % of Net Assets) |
Banking Fund | 0.85% |
Basic Materials Fund | 0.85% |
Biotechnology Fund | 0.85% |
Consumer Products Fund | 0.85% |
Electronics Fund | 0.85% |
Energy Fund | 0.85% |
Energy Services Fund | 0.85% |
Financial Services Fund | 0.85% |
Health Care Fund | 0.85% |
Internet Fund | 0.85% |
Leisure Fund | 0.85% |
Precious Metals Fund | 0.75% |
Real Estate Fund | 0.85% |
Retailing Fund | 0.85% |
Technology Fund | 0.85% |
Telecommunications Fund | 0.85% |
Transportation Fund | 0.85% |
Utilities Fund | 0.85% |
RFS provided transfer agent and administrative services to the Funds for fees calculated at the annualized rate of 0.25% based on the average daily net assets of each Fund.
RFS also provided accounting services to the Funds for fees calculated at annualized rates below, based on the average daily net assets of each Fund:
Fund Accounting Fees | (as a % of Net Assets) |
On the first $250 million | 0.10% |
On the next $250 million | 0.075% |
On the next $250 million | 0.05% |
Over $750 million | 0.03% |
GI engages external service providers to perform other necessary services for the Trust, such as audit and accounting related services, legal services, custody, printing and mailing, etc., on a pass-through basis. Such expenses are allocated to various Funds within the complex based on relative net assets.
The Trust has adopted a Distribution Plan applicable to A-Class shares and H-Class shares for which GFD and other firms that provide distribution and/or shareholder services (“Service Providers”) may receive compensation. If a Service Provider provides distribution services, the Funds will pay distribution fees to GFD at an annual rate not to exceed 0.25% of average daily net assets, pursuant to Rule 12b-1 of the 1940 Act. GFD, in turn, will pay the Service Provider out of its fees. GFD may, at its discretion, retain a portion of such payments to compensate itself for distribution services.
The Trust has adopted a separate Distribution and Shareholder Services Plan applicable to its C-Class shares that allows the Funds to pay annual distribution and service fees of 1.00% of the Funds’ C-Class shares average daily net assets. The annual 0.25% service fee compensates a shareholder’s financial adviser for providing ongoing services to the shareholder. The annual distribution fee of 0.75% reimburses GFD for paying the shareholder’s financial adviser an ongoing sales commission. GFD advances the first year’s service and distribution fees to the financial adviser. GFD retains the service and distribution fees on accounts with no authorized dealer of record.
For the period ended September 30, 2016, GFD retained sales charges of $145,031 relating to sales of A-Class shares of the Trust.
Certain trustees and officers of the Trust are also officers of GI and GFD.
3. Federal Income Tax Information
The Funds intend to comply with the provisions of Subchapter M of the Internal Revenue Code applicable to regulated investment companies and will distribute substantially all taxable net investment income and capital gains sufficient to relieve the Funds from all, or substantially all, federal income, excise and state income taxes. Therefore, no provision for federal or state income tax is required.
| | THE RYDEX FUNDS SEMI-ANNUAL REPORT | 145 |
NOTES TO FINANCIAL STATEMENTS (Unaudited)(continued) |
Tax positions taken or expected to be taken in the course of preparing the Funds’ tax returns are evaluated to determine whether the tax positions are “more-likely-than-not” of being sustained by the applicable tax authority. Tax positions not deemed to meet the more-likely-than-not threshold would be recorded as a tax benefit or expense in the current year. Management has analyzed the Funds’ tax positions taken, or to be taken, on Federal income tax returns for all open tax years, and has concluded that no provision for income tax is required in the Funds’ financial statements. The Funds’ federal tax returns are subject to examination by the Internal Revenue Service for a period of three years after they are filed.
At September 30, 2016, the cost of securities for federal income tax purposes, the aggregate gross unrealized gain for all securities for which there was an excess of value over tax cost, and the aggregate gross unrealized loss for all securities for which there was an excess of tax cost over value were as follows:
Fund | | Tax
Cost | | | Tax
Unrealized
Gain | | | Tax
Unrealized
Loss | | | Net
Unrealized
Gain (Loss) | |
Banking Fund | | $ | 28,529,494 | | | $ | 351,889 | | | $ | (77,258 | ) | | $ | 274,631 | |
Basic Materials Fund | | | 110,242,034 | | | | 8,680,420 | | | | (925,631 | ) | | | 7,754,789 | |
Biotechnology Fund | | | 202,925,223 | | | | 152,577,509 | | | | (5,206,386 | ) | | | 147,371,123 | |
Consumer Products Fund | | | 376,330,868 | | | | 94,047,990 | | | | (4,764,735 | ) | | | 89,283,255 | |
Electronics Fund | | | 39,860,817 | | | | — | | | | (903,485 | ) | | | (903,485 | ) |
Energy Fund | | | 46,881,184 | | | | 3,664,892 | | | | (17,441 | ) | | | 3,647,451 | |
Energy Services Fund | | | 15,730,009 | | | | — | | | | (367,772 | ) | | | (367,772 | ) |
Financial Services Fund | | | 47,232,189 | | | | 2,868,323 | | | | (974,032 | ) | | | 1,894,291 | |
Health Care Fund | | | 37,842,162 | | | | 12,392,190 | | | | (510,764 | ) | | | 11,881,426 | |
Internet Fund | | | 40,442,007 | | | | 5,360,120 | | | | (352,848 | ) | | | 5,007,272 | |
Leisure Fund | | | 17,995,188 | | | | 1,519,366 | | | | (191,307 | ) | | | 1,328,059 | |
Precious Metals Fund | | | 98,178,538 | | | | 13,226,686 | | | | (144,913 | ) | | | 13,081,773 | |
Real Estate Fund | | | 34,141,502 | | | | 388,814 | | | | (132,971 | ) | | | 255,843 | |
Retailing Fund | | | 10,340,283 | | | | 581,775 | | | | (80,120 | ) | | | 501,655 | |
Technology Fund | | | 45,574,226 | | | | 4,949,912 | | | | (525,868 | ) | | | 4,424,044 | |
Telecommunications Fund | | | 16,027,966 | | | | 1,316,125 | | | | (88,374 | ) | | | 1,227,751 | |
Transportation Fund | | | 17,367,443 | | | | 6,204,340 | | | | (64,126 | ) | | | 6,140,214 | |
Utilities Fund | | | 60,126,279 | | | | 6,574,049 | | | | (472,205 | ) | | | 6,101,844 | |
4. Fair Value Measurement
In accordance with U.S. GAAP, fair value is defined as the price that the Funds would receive to sell an investment or pay to transfer a liability in an orderly transaction with an independent buyer in the principal market, or in the absence of a principal market, the most advantageous market for the investment or liability. U.S. GAAP establishes a three-tier fair value hierarchy based on the types of inputs used to value assets and liabilities and requires corresponding disclosure. The hierarchy and the corresponding inputs are summarized below:
Level 1 — | quoted prices in active markets for identical assets or liabilities. |
Level 2 — | significant other observable inputs (for example quoted prices for securities that are similar based on characteristics such as interest rates, prepayment speeds, credit risk, etc.). |
Level 3 — | significant unobservable inputs based on the best information available under the circumstances, to the extent observable inputs are not available, which may include assumptions. |
The types of inputs available depend on a variety of factors, such as the type of security and the characteristics of the markets in which it trades, if any. Fair valuation determinations that rely on fewer or no observable inputs require greater judgment. Accordingly, fair value determinations for Level 3 securities require the greatest amount of judgment.
The inputs or methodologies used for valuing securities are not necessarily an indication of the risk associated with investing in those securities. The suitability of the techniques and sources employed to determine fair valuation are regularly monitored and subject to change.
146 | THE RYDEX FUNDS SEMI-ANNUAL REPORT | |
NOTES TO FINANCIAL STATEMENTS (Unaudited)(continued) |
5. Repurchase Agreements
The Funds transfer uninvested cash balances into a single joint account, the daily aggregate balance of which is invested in one or more repurchase agreements collateralized by obligations of the U.S. Treasury and U.S. government agencies. The collateral is in the possession of the Funds’ custodian and is evaluated to ensure that its market value exceeds, at a minimum, 102% of the original face amount of the repurchase agreements. Each Fund holds a pro rata share of the collateral based on the dollar amount of the repurchase agreement entered into by each Fund.
At September 30, 2016, the repurchase agreements in the joint account were as follows:
Counterparty and
Terms of Agreement | | | Face Value | | | Repurchase Price | | | Collateral | | | Par Value | | | Fair Value | |
Royal Bank of Canada | | | | | | | | | U.S. TIP Notes | | | | | | | |
0.36% | | | | | | | | | 0.63% | | | | | | | |
Due 10/03/16 | | | $ | 3,446,119 | | | $ | 3,446,222 | | | 07/15/21 | | | $ | 3,127,500 | | | $ | 3,515,043 | |
In the event of counterparty default, the Funds have the right to collect the collateral to offset losses incurred. There is potential loss to the Funds in the event the Funds are delayed or prevented from exercising their rights to dispose of the collateral securities, including the risk of a possible decline in the value of the underlying securities during the period while the Funds seek to assert their rights. The Funds’ investment adviser, acting under the supervision of the Board, reviews the value of the collateral and the creditworthiness of those banks and dealers with which the Funds enter into repurchase agreements to evaluate potential risks.
6. Securities Transactions
For the period ended September 30, 2016, the cost of purchases and proceeds from sales of investment securities, excluding government securities, short-term investments and derivatives, were as follows:
Fund | | Purchases | | | Sales | |
Banking Fund | | $ | 231,851,852 | | | $ | 216,437,499 | |
Basic Materials Fund | | | 185,878,703 | | | | 118,364,021 | |
Biotechnology Fund | | | 322,443,284 | | | | 381,739,931 | |
Consumer Products Fund | | | 233,919,273 | | | | 196,672,531 | |
Electronics Fund | | | 205,398,741 | | | | 189,556,066 | |
Energy Fund | | | 291,895,168 | | | | 284,446,095 | |
Energy Services Fund | | | 257,648,515 | | | | 255,695,759 | |
Financial Services Fund | | | 67,286,590 | | | | 38,822,474 | |
Health Care Fund | | | 97,983,201 | | | | 115,790,213 | |
Internet Fund | | | 71,639,801 | | | | 66,375,032 | |
Leisure Fund | | | 36,049,391 | | | | 54,594,830 | |
Precious Metals Fund | | | 250,501,315 | | | | 228,589,152 | |
Real Estate Fund | | | 213,797,115 | | | | 229,507,731 | |
Retailing Fund | | | 79,477,624 | | | | 90,617,959 | |
Technology Fund | | | 67,529,622 | | | | 56,077,698 | |
Telecommunications Fund | | | 70,935,347 | | | | 88,355,522 | |
Transportation Fund | | | 82,860,502 | | | | 91,270,552 | |
Utilities Fund | | | 217,404,006 | | | | 242,019,674 | |
| | THE RYDEX FUNDS SEMI-ANNUAL REPORT | 147 |
NOTES TO FINANCIAL STATEMENTS (Unaudited)(continued) |
The Funds are permitted to purchase or sell securities from or to certain affiliated funds under specified conditions outlined in procedures adopted by the Board of the Trust. The procedures have been designed to ensure that any purchase or sale of securities by a Fund from or to another fund or portfolio that is or could be considered an affiliate by virtue of having a common investment adviser (or affiliated investment advisers), common Trustees and/or common officers complies with Rule 17a-7 of the 1940 Act. Further, as defined under these procedures, each transaction is effected at the current market price to save costs, where permissible. For the period ended September 30, 2016, the Funds engaged in purchases and sales of securities, pursuant to Rule 17a-7 of the 1940 Act, as follows:
Fund | | Purchases | | | Sales | | | Realized
Gain (Loss) | |
Banking Fund | | $ | 7,463,395 | | | $ | 9,196,752 | | | $ | 325,001 | |
Basic Materials Fund | | | 15,497,951 | | | | 10,414,627 | | | | 226,555 | |
Biotechnology Fund | | | 12,788,137 | | | | 23,792,916 | | | | 1,220,238 | |
Consumer Products Fund | | | 19,526,134 | | | | 5,081,797 | | | | 74,500 | |
Electronics Fund | | | 7,042,168 | | | | 10,038,101 | | | | 108,337 | |
Energy Fund | | | 21,315,447 | | | | 13,171,680 | | | | 3,816 | |
Energy Services Fund | | | 9,156,168 | | | | 8,169,156 | | | | (31,010 | ) |
Financial Services Fund | | | 11,814,879 | | | | 9,641,087 | | | | 38,932 | |
Health Care Fund | | | 15,638,266 | | | | 12,765,727 | | | | (105,600 | ) |
Internet Fund | | | 16,089,136 | | | | 10,310,639 | | | | 344,529 | |
Leisure Fund | | | 3,648,496 | | | | 6,946,532 | | | | 532,597 | |
Precious Metals Fund | | | 20,060,490 | | | | 16,654,089 | | | | 1,122,305 | |
Real Estate Fund | | | 14,821,195 | | | | 19,003,518 | | | | 450,828 | |
Retailing Fund | | | 4,133,750 | | | | 7,430,731 | | | | 379,676 | |
Technology Fund | | | 10,486,116 | | | | 6,956,791 | | | | 414,386 | |
Telecommunications Fund | | | 4,886,653 | | | | 7,110,186 | | | | 866,127 | |
Transportation Fund | | | 1,754,835 | | | | 2,039,474 | | | | 175,075 | |
Utilities Fund | | | 13,158,003 | | | | 10,644,285 | | | | 553,866 | |
7. Line of Credit
The Trust, along with other affiliated trusts, secured an uncommitted $75,000,000 line of credit from U.S. Bank, N.A., which expires June 11, 2017. This line of credit is reserved for emergency or temporary purposes. Borrowings, if any, under this arrangement bear interest equal to the Prime Rate, minus 2%, which shall be paid monthly, averaging 1.25% for the period ended September 30, 2016. The Funds did not have any borrowings outstanding under this agreement at September 30, 2016.
The average daily balances borrowed for the period ended September 30, 2016, were as follows:
Fund | | Average Daily Balance | |
Banking Fund | | $ | 5,960 | |
Basic Materials Fund | | | 7,156 | |
Biotechnology Fund | | | 192,494 | |
Consumer Products Fund | | | 20,642 | |
Electronics Fund | | | 74,049 | |
Energy Fund | | | 34,469 | |
Energy Services Fund | | | 29,698 | |
Financial Services Fund | | | 22,956 | |
Health Care Fund | | | 5,880 | |
Internet Fund | | | 7,510 | |
Leisure Fund | | | 7,137 | |
Precious Metals Fund | | | 14,590 | |
Real Estate Fund | | | 8,664 | |
Retailing Fund | | | 22,375 | |
Technology Fund | | | 21,315 | |
Telecommunications Fund | | | 17,086 | |
Transportation Fund | | | 27,644 | |
Utilities Fund | | | 39,567 | |
148 | THE RYDEX FUNDS SEMI-ANNUAL REPORT | |
NOTES TO FINANCIAL STATEMENTS (Unaudited)(continued) |
8. Conversion of Advisor Class Shares to H-Class Shares
Effective upon the close of business on September 30, 2015, the Funds converted their existing Advisor Class shares to H-Class shares, which effectively reduced the distribution and shareholder services fees paid by the Funds.
9. Legal Proceedings
Tribune Company
Rydex Series Funds has been named as a defendant and a putative member of the proposed defendant class of shareholders in the case entitled Kirschner v. FitzSimons, No. 12-2652 (S.D.N.Y.) (formerly Official Committee of Unsecured Creditors of Tribune Co. v. FitzSimons, Adv. Pro. No. 10-54010 (Bankr. D. Del.)) (the “FitzSimons action”), as a result of ownership by certain series of the Rydex Series Funds of shares in the Tribune Company (“Tribune”) in 2007, when Tribune effected a leveraged buyout transaction (“LBO”) by which Tribune converted to a privately-held company. In his complaint, the plaintiff has alleged that, in connection with the LBO, Tribune insiders and shareholders were overpaid for their Tribune stock using financing that the insiders knew would, and ultimately did, leave Tribune insolvent. The plaintiff has asserted claims against certain insiders, major shareholders, professional advisers, and others involved in the LBO. The plaintiff is also attempting to obtain from former Tribune shareholders, including the Rydex Series Funds, the proceeds they received in connection with the LBO.
In June 2011, a group of Tribune creditors filed multiple actions against former Tribune shareholders involving state law constructive fraudulent conveyance claims arising out of the 2007 LBO (the “SLCFC actions”). Rydex Series Funds has been named as a defendant in one or more of these suits. In those actions, the creditors seek to recover from Tribune’s former shareholders the proceeds received in connection with the 2007 LBO.
The FitzSimons action and the SLCFC actions have been consolidated with the majority of the other Tribune LBO-related lawsuits in a multidistrict litigation proceeding captioned In re Tribune Company Fraudulent Conveyance Litig., No. 11-md-2696 (S.D.N.Y.) (the “MDL Proceeding”).
On September 23, 2013, the District Court granted the defendants’ omnibus motion to dismiss the SLCFC actions, on the basis that the creditors lacked standing. On September 30, 2013, the creditors filed a notice of appeal of the September 23 order. On October 28, 2013, the defendants filed a joint notice of cross-appeal of that same order.
On March 29, 2016, the U.S. Court of Appeals for the Second Circuit issued its opinion on the appeal of the SLCFC actions. The appeals court affirmed the district court’s dismissal of those lawsuits, but on different grounds than the district court. The appeals court held that while the plaintiffs have standing under the U.S. Bankruptcy Code, their claims were preempted by Section 546(e) of the Bankruptcy Code—the statutory safe harbor for settlement payments. On April 12, 2016, the Plaintiffs in the SLCFC actions filed a petition seeking rehearing en banc before the appeals court. On July 22, 2016, the appeals court denied the petition. On September 9, 2016, the plaintiffs filed a petition for writ of certiorari in the U.S. Supreme Court challenging the Second Circuit’s decision that the safe harbor of Section 546(e) applied to their claims. The shareholder defendants, including the Funds, filed a joint brief in opposition to the petition for certiorari on October 24, 2016. The Supreme Court has not yet granted or denied the petition for certiorari.
On May 23, 2014, the defendants filed motions to dismiss the FitzSimons action, including a global motion to dismiss Count I, which is the claim brought against former Tribune shareholders for intentional fraudulent conveyance under U.S. federal law. The Court has not yet issued a decision on any of these motions.
None of these lawsuits alleges any wrongdoing on the part of Rydex Series Funds. The following series of Rydex Series Funds held shares of Tribune and tendered these shares as part of Tribune’s LBO: Nova Fund, S&P 500® Pure Value Fund, Multi-Cap Core Equity Fund, S&P 500® Fund, Multi-Hedge Strategies Fund and Hedged Equity Fund (the “Funds”). The value of the proceeds received by the foregoing Funds was $28,220, $109,242, $9,860, $3,400, $1,181,160, and $10,880, respectively. At this stage of the proceedings, Rydex Series Funds is not able to make a reliable predication as to the outcome of these lawsuits or the effect, if any, on a Fund’s net asset value.
| | THE RYDEX FUNDS SEMI-ANNUAL REPORT | 149 |
NOTES TO FINANCIAL STATEMENTS (Unaudited)(continued) |
Lyondell Chemical Company
In December 2011, Rydex Series Funds was named as a defendant in Weisfelner, as Trustee of the LB Creditor Trust, v. Fund 1 (In re Lyondell Chemical Co.), Adv. Pro. No. 10-4609 (Bankr. S.D.N.Y.) (the “Creditor Trust Action”). Its funds may also be putative members of the proposed defendant classes in Weisfelner, as Trustee of the LB Litigation Trust v. A. Holmes & H. Holmes TTEE (In re Lyondell Co.), Adv. Pro. No. 10-5525 (Bankr. S.D.N.Y.) (the “Litigation Trust Action”) and Weisfelner, as Trustee of the LB Creditor Trust, v. Reichman (In re Lyondell Chemical Co.), Adv. Pro. No. 12-1570 (Bankr. S.D.N.Y.).
Similar to the claims made in the Tribune matter, the Weisfelner complaints seek to have set aside and recovered as fraudulent transfers from former Lyondell Chemical Company (“Lyondell”) shareholders the consideration paid to them pursuant to the cash out merger of Lyondell shareholders in connection with the combination of Lyondell and Basell AF in 2007. Lyondell filed for bankruptcy in 2008. The Creditor Trust Action and Reichman allege claims against the former Lyondell shareholders under state law for both constructive fraudulent transfer and intentional fraudulent transfer. The Litigation Trust Action alleges a claim against the former Lyondell shareholders under federal law for intentional fraudulent transfer.
On April 7, 2014, the plaintiff filed a Third Amended Complaint in the Creditor Trust Action, a Second Amended Complaint in the Litigation Trust Action, and an Amended Complaint in Reichman.
On May 8, 2014, the plaintiff in the Litigation Trust Action filed a motion to certify a defendant class generally comprised of all former Lyondell shareholders that received proceeds in exchange for their shares in the 2007 merger transaction.
On July 30, 2014, the defendants filed a motion to dismiss these lawsuits. The Bankruptcy Court held oral argument on the motion to dismiss and on the motion for class certification on January 14 and January 15, 2015. On September 15, 2015, the Bankruptcy Court denied the motion for class certification without prejudice to the plaintiff’s right to file a renewed motion. On November 18, 2015, the Bankruptcy Court granted the defendants’ motion to dismiss the intentional fraudulent transfer claims in the Creditor Trust Action, the Litigation Trust Action, and in Reichman, but denied the motion to dismiss the constructive fraudulent transfer claims in the Creditor Trust Action and in Reichman. The Bankruptcy Court entered final judgment dismissing the Litigation Trust Action, but the plaintiff appealed the dismissal to the U.S. District Court for the Southern District of New York.
On July 27, 2016, the District Court reversed the Bankruptcy Court and reinstated the federal law intentional fraudulent transfer claim in the Litigation Trust Action and remanded to the Bankruptcy Court for further proceedings. The District Court found that the fraudulent intent that mattered was that of Lyondell’s CEO, not its board, because the CEO’s intent could be imputed to Lyondell under Delaware law agency principles. The District Court did note, however, that plaintiff faces a high standard for proving “actual intent” to harm creditors, and that it remains to be seen whether plaintiff will be able to make this showing. On August 11, 2016, the shareholder defendants filed a motion for reconsideration and/or to certify an interlocutory appeal of the District Court’s opinion. On October 5, 2016, the District Court denied the motion for reconsideration and/or to certify an interlocutory appeal. In light of this ruling, the federal intentional fraudulent conveyance claim will move forward before the Bankruptcy Court, but a schedule for that case has not yet been set.
On May 4, 2016, the defendants filed a motion to dismiss, or in the alternative, for a stay of, the Creditor Trust Action and Reichman in light of the U.S. Court of Appeals for the Second Circuit’s opinion in the appeal of the Tribune SLCFC actions. On July 20, 2016, the Bankruptcy Court issued a report and recommendation granting the defendants’ motion to dismiss. The U.S. District Court for the Southern District of New York has not yet accepted the Bankruptcy Court’s recommendation or entered a final judgment.
These lawsuits do not allege any wrongdoing on the part of Rydex Series Funds. The following series of Rydex Series Funds received cash proceeds from the cash out merger in the following amounts: Basic Materials Fund - $1,725,168; Long Short Equity Fund f/k/a U.S. Long Short Momentum Fund - $2,193,600; Global 130/30 Strategy Fund - $37,920; Hedged Equity Fund - $1,440; and Multi-Hedge Strategies Fund - $1,116,480. At this stage of the proceedings, Rydex Series Funds is not able to make a reliable predication as to the outcome of these lawsuits or the effect, if any, on a Fund’s net asset value.
150 | THE RYDEX FUNDS SEMI-ANNUAL REPORT | |
NOTES TO FINANCIAL STATEMENTS (Unaudited)(concluded) |
10. Subsequent Event
Share Splits.
Share splits occurred for the following Funds at the close of business:
Fund | Effective Date | Split Type |
Energy Fund | November 7, 2016 | One-for-Four Reverse Split |
Financial Services Fund | October 31, 2016 | Two-for-One Share Split |
The effect of the reverse share split was to divide the number of outstanding shares of the Energy Fund by its split ratio, resulting in a corresponding increase in the NAV. The effect of the share split was to multiply the number of outstanding shares of the Financial Services Fund by its split ratio, resulting in a corresponding decrease in the NAV. The share transactions presented in the Statements of Changes in net assets and the per share data in the Financial Highlights for each of the periods presented through September 30, 2016, have been restated to reflect these respective share splits. There were no changes in net assets, results of operations or total return as a result of these transactions.
Portfolio Securities Loaned
Effective October 6, 2016, each Fund may lend portfolio securities to certain creditworthy borrowers, including the Funds’ securities lending agent. The loans would be collateralized at all times by cash and/or high grade debt obligations in an amount at least equal to 102% of the market value of securities loaned as determined at the close of business on the preceding business day. The cash collateral received would be held in a separately managed account established for each respective Fund and maintained by the lending agent exclusively for the investment of securities lending cash collateral on behalf of each Fund. The separately managed accounts will invest in short-term investments valued at amortized cost, which approximates market value. Each Fund will receive compensation for lending securities from interest or dividends earned on the cash, cash equivalents or U.S. government securities held as collateral, net of fee rebates paid to the borrower plus reasonable administrative and custody fees paid to the lending agent. Such compensation will be accrued daily and payable to the Fund monthly. The dividend and interest income earned on the securities loaned will be accounted for in the same manner as other dividend and interest income. The borrower will pay to the Funds an amount equal to any dividends or interest received on loaned securities. These payments from the borrower are not eligible for reduced tax rates as “qualified dividend income” under the Jobs and Growth Tax Reconciliation Act of 2003. The Funds would retain all or a portion of the interest received on investment of cash collateral or receives a fee from the borrower.
Although the collateral mitigates risk, the Funds could experience a delay in recovering its securities and a possible loss of income or value if the borrower fails to return the securities. The Funds have the right under the securities lending agreement to recover the securities from the borrower on demand.
| | THE RYDEX FUNDS SEMI-ANNUAL REPORT | 151 |
OTHER INFORMATION (Unaudited) |
Proxy Voting Information
A description of the policies and procedures that the Trust uses to determine how to vote proxies relating to securities held in the Funds’ portfolios is available, without charge and upon request, by calling 800.820.0888. This information is also available from the EDGAR database on the SEC’s website at https://www.sec.gov.
Information regarding how the Funds voted proxies relating to portfolio securities during the most recent 12-month period ended June 30 is available without charge, upon request, by calling 800.820.0888. This information is also available from the EDGAR database on the SEC’s website at https://www.sec.gov.
Sector Classification
Information in the Schedule of Investments is categorized by sectors using sector-level Classifications defined by the Bloomberg Industry Classification System, a widely recognized industry classification system provider. Each Fund’s registration statement has investment policies relating to concentration in specific sectors/industries. For purposes of these investment policies, the Funds usually classify sectors/industries based on industry-level Classifications used by widely recognized industry classification system providers such as Bloomberg Industry Classification System, Global Industry Classification Standards and Barclays Global Classification Scheme.
Quarterly Portfolio Schedules Information
The Trust files its complete schedule of portfolio holdings with the SEC for the first and third quarters of each fiscal year on Form N-Q, which are available on the SEC’s website at https://www.sec.gov. The Funds’ Forms N-Q may be reviewed and copied at the SEC’s Public Reference Room in Washington, DC, and that information on the operation of the Public Reference Room may be obtained by calling 800-SEC-0330. Copies of the portfolio holdings are also available to shareholders, without charge and upon request, by calling 800.820.0888.
Board Considerations in Approving the Continuation of the Investment Advisory Agreement
The Board of Trustees (the “Board”) of Rydex Series Funds (the “Trust”), including the Trustees who are not “interested persons,” as defined by the Investment Company Act of 1940, of the Trust (“Independent Trustees”), attended an in-person meeting held on May 19, 2016, called for the purpose of, among other things, the consideration of, and voting on, the approval and continuation of the investment advisory agreement (the “Investment Advisory Agreement”) between the Trust and the Advisor applicable to each series of the Trust (each, a “Fund” and, collectively, the “Funds”). The Board unanimously approved the continuation of the Investment Advisory Agreement for an additional one-year period based on the Board’s review of qualitative and quantitative information provided by the Advisor. The Board had previously considered information pertaining to the renewal of the Investment Advisory Agreement at an in-person meeting held on April 26, 2016 (together, with the May 19 meeting, the “Meetings”).
Prior to reaching the conclusion to approve the continuation of the Investment Advisory Agreement, the Independent Trustees requested and obtained from the Advisor such information as the Independent Trustees deemed reasonably necessary to evaluate the Investment Advisory Agreement. In addition, the Board received a memorandum from Fund counsel regarding the responsibilities of the Board with respect to the approval of investment advisory agreements and participated in question and answer sessions with representatives of the Advisor. The Independent Trustees also carefully considered information that they had received throughout the year as part of their regular oversight of the Funds. At the Meetings, the Board obtained and reviewed a wide variety of information, including certain comparative information regarding the Funds’ fees, expenses, and performance relative to the fees, expenses, and performance of other comparable funds (the “FUSE reports”). The Independent Trustees carefully evaluated this information, met in executive session outside the presence of fund management, and were advised by independent legal counsel with respect to their deliberations.
At the Meetings, the Board, including the Independent Trustees, evaluated a number of factors, including among others: (a) the nature, extent and quality of the Advisor’s investment advisory and other services; (b) the Advisor’s investment management personnel; (c) the Advisor’s operations and financial condition; (d) the Advisor’s brokerage practices (including any soft dollar arrangements) and the variety and complexity of its investment strategies; (e) a comparison of the Funds’ advisory fees to the advisory fees charged to comparable funds or accounts, giving special attention to the existence of economies of scale and the absence of breakpoints in these fees and the Advisor’s rationale for not providing for breakpoints at this point in time; (f) each Fund’s overall fees and operating expenses compared with those of similar funds; (g) the level of the Advisor’s profitability from its Fund-related operations; (h) the Advisor’s compliance processes and systems; (i) the Advisor’s compliance
152 | THE RYDEX FUNDS SEMI-ANNUAL REPORT | |
OTHER INFORMATION (Unaudited)(continued) |
policies and procedures; (j) the Advisor’s reputation, expertise and resources in the financial markets; and (k) Fund performance compared with that of similar funds and/or appropriate benchmarks. In its deliberations, the Trustees did not identify any single piece of information that was all-important or controlling, noting that each Trustee could attribute different weights to the various factors considered.
Based on the Board’s deliberations at the Meetings, the Board, including all of the Independent Trustees, unanimously: (a) concluded that the terms of the Investment Advisory Agreement are fair and reasonable; (b) concluded that the Advisor’s fees are reasonable in light of the services that it provides to the Funds; and (c) agreed to approve and continue the Investment Advisory Agreement based upon the following considerations, among others:
| | ● | Nature, Extent and Quality of Services Provided by the Advisor. The Board evaluated, among other things, the Advisor’s business, financial resources, quality and quantity of personnel, experience, past performance, the variety and complexity of its investment strategies (including the extent to which the Funds use derivatives), Fund risk management process, brokerage practices, and the adequacy of its compliance systems and processes, proxy voting policies and practices, and cybersecurity programs. The Board reviewed the scope of services to be provided by the Advisor under the Investment Advisory Agreement and noted that there would be no significant differences between the scope of services required to be provided by the Advisor for the past year and the scope of services required to be provided during the upcoming year. The Board also considered the Advisor’s representations to the Board that the Advisor would continue to provide investment and related services that were of materially the same quality and quantity as services provided to the Funds in the past, and whether these services are appropriate in scope and extent in light of the Funds’ operations, the competitive landscape of the investment company business and investor needs. Based on the foregoing, the Trustees determined that the approval of the Investment Advisory Agreement would enable shareholders of the Funds to receive high quality services at a cost that was appropriate and reasonable. |
| | ● | Fund Expenses and Performance of the Funds and the Advisor. The Board reviewed statistical information provided by the Advisor regarding the expense ratio components and performance of each Fund. The Advisor engaged FUSE Research Network LLC (“FUSE”), an independent, third party research provider, to prepare reports to help the Board compare the Funds’ fees, expenses, and total return performance with those of a peer group and peer universe of funds selected by FUSE. In the reports, each Fund’s expense ratio components, including actual advisory fees, waivers/reimbursements, and gross and net total expenses, are compared to those of other funds with shared key characteristics (e.g., asset size, fee structure, sector or industry investment focus) determined by FUSE to comprise a Fund’s applicable peer group. The Board considered the Advisor’s representation that it found the peer groups compiled by FUSE to be appropriate, but also acknowledged the existence of certain differences between the Funds and their peer funds (e.g., specific differences in principal investment strategies and, if applicable, tradability) that should be reviewed in context. With respect to tradability, in particular, the Board considered that non-tradable funds incur lower expense ratios than tradable funds because non-tradable funds experience less shareholder activity and lower transaction volumes than tradable funds. The statistical information related to the performance of each Fund included three-month and one-, three-, and five-year performance for the Fund compared to that of its peers. Based on the foregoing, the Board determined that the proposed advisory fees paid by the Funds are reasonable in relation to the nature and quality of the services provided by the Advisor. |
| | ● | Costs of Services Provided to the Funds and Profits Realized by the Advisor and its Affiliates. The Board reviewed information about the profitability of the Funds to the Advisor based on the advisory fees payable under the current Investment Advisory Agreement for the last calendar year. The Board analyzed the Funds’ expenses, including the investment advisory fees paid to the Advisor, and reviewed the FUSE reports. The Board also reviewed information regarding the direct revenue received by the Advisor and ancillary revenue, if any, received by the Advisor and/or its affiliates in connection with the services provided to the Funds by the Advisor and/or its affiliates. The Board also discussed the Advisor’s profit margin, including the expense allocation methodology used in the Advisor’s profitability analysis. Based on the foregoing, the Board determined that the profit to the Advisor on the fees paid by the Funds is not excessive in view of the nature and quality of the services provided by the Advisor. |
| | ● | Economies of Scale. The Board considered the absence of breakpoints in the Advisor’s fee schedule and reviewed information regarding the extent to which economies of scale or other efficiencies may result from increases in the Funds’ asset levels. In light of the relatively small size of many of the Funds and the fact that the size of individual Funds in the complex often increase and decrease significantly due to the unlimited trading that is permitted among most of the Funds in the complex, the Board concluded that the Funds have not yet achieved sufficient asset levels to realize meaningful economies of scale. The Board noted that it intends to continue to monitor fees as each Fund grows in size and assess whether fee breakpoints may be warranted. |
| | THE RYDEX FUNDS SEMI-ANNUAL REPORT | 153 |
OTHER INFORMATION (Unaudited)(concluded) |
| | ● | Other Benefits to the Advisor and/or its Affiliates. In addition to evaluating the Advisor’s services, the Board considered the nature and amount of other benefits to be received by the Advisor and its affiliates as a result of their relationship with the Fund, including any soft dollar usage by the Advisor and any intangible benefits. In particular, the Board considered the nature, extent, quality, and cost of certain administrative, distribution, and shareholder services performed by the Advisor’s affiliates under separate agreements and the Distribution and Shareholders Services Plan pursuant to Rule 12b-1 of the 1940 Act. In light of the costs of providing services pursuant to the separate agreements as well as the Advisor’s and its affiliates’ commitment to the Funds, the Board concluded the ancillary benefits the Advisor and its affiliates received were reasonable. |
On the basis of the information provided to it and its evaluation of that information, the Board, including the Independent Trustees, concluded that the terms of the Investment Advisory Agreement were reasonable, and that approval of the continuation of the Investment Advisory Agreement was in the best interests of the Funds and their shareholders.
154 | THE RYDEX FUNDS SEMI-ANNUAL REPORT | |
INFORMATION ON BOARD OF TRUSTEES AND OFFICERS (Unaudited) |
A Board of Trustees oversees the Trust, as well as other trusts of GI, in which its members have no stated term of service, and continue to serve after election until resignation. The Statement of Additional Information includes further information about Fund Trustees and Officers, and can be obtained without charge by visiting guggenheiminvestments.com or by calling 800.820.0888.
Name, Address*
and Year of Birth
of Trustee | Position(s) Held with the
Trust, Term of Office and
Length of Time Served | Principal Occupation(s)
During Past 5 Years | Number of Portfolios in
Fund Complex
Overseen
by Trustee*** | Other
Directorships
Held by
Trustee**** |
INTERESTED TRUSTEE | | | |
Donald C. Cacciapaglia**
(1951) | Trustee from 2012 to present. | Current: President and CEO, certain other funds in the Fund Complex (2012-present); Vice Chairman, Guggenheim Investments (2010-present). Former: Chairman and CEO, Channel Capital Group, Inc. (2002-2010). | 232 | Clear Spring Life Insurance Company (2015-present); Guggenheim Partners Japan, Ltd. (2014-present); Guggenheim Partners Investment Management Holdings, LLC (2014-present); Delaware Life (2013-present); Guggenheim Life and Annuity Company (2011-present); Paragon Life Insurance Company of Indiana (2011-present). |
INDEPENDENT TRUSTEES | | | |
Angela Brock-Kyle*****
(1959) | Trustee from August 2016 to present. | Current: Founder and Chief Executive Officer, B.O.A.R.D.S (consulting firm) Former: Senior Leader, TIAA (financial services firm) (1987-2012). | 135 | Infinity Property & Casualty Corporation (2014-present). |
Corey A. Colehour
(1945) | Trustee from 1993 to present; Member of the Audit Committee from 1994 to present; Member of the Governance Committee from 2014 to present; and Member of the Investment and Performance Committee from 2014 to present. | Retired. | 135 | None. |
J. Kenneth Dalton
(1941) | Trustee from 1995 to present; Chairman and Member of the Audit Committee from 1997 to present; and Member of the Compliance and Risk Oversight Committee from 2010 to present. | Retired. | 135 | Epiphany Funds (4) (2009-present). |
| | THE RYDEX FUNDS SEMI-ANNUAL REPORT | 155 |
INFORMATION ON BOARD OF TRUSTEES AND OFFICERS (Unaudited)(continued) |
Name, Address*
and Year of Birth
of Trustee | Position(s) Held with the
Trust, Term of Office and
Length of Time Served | Principal Occupation(s)
During Past 5 Years | Number of Portfolios in
Fund Complex
Overseen
by Trustee*** | Other
Directorships
Held by
Trustee**** |
INDEPENDENT TRUSTEES - concluded | | | |
John O. Demaret
(1940) | Vice Chairman of the Board from 2014 to present (Chairman of the Board from 2006 to 2014); Trustee and Member of the Audit Committee from 1997 to present; Chairman (since 2014) and Member of the Compliance and Risk Oversight Committee from 2010 to present; Chairman and Member of the Investment and Performance Committee from 2014 to present; and Member of the Nominating Committee from 2014 to present. | Retired. | 135 | None. |
Werner E. Keller
(1940) | Chairman of the Board from 2014 to present (Vice Chairman of the Board from 2010 to 2014); Trustee and Member of the Audit Committee from 2005 to present; and Member of the Investment and Performance Committee from 2014 to present. | Current: Founder and President, Keller Partners, LLC (investment research firm) (2005-present). | 135 | None. |
Thomas F. Lydon, Jr.
(1960) | Trustee and Member of the Audit Committee from 2005 to present; Member of the Nominating Committee from 2005 to present; and Member of the Governance Committee from 2007 to present. | Current: President, Global Trends Investments (registered investment adviser) (1996-present). | 135 | US Global Investors (GROW) (1995-present). |
Patrick T. McCarville
(1942) | Trustee from 1997 to present; Member of the Audit Committee from 1997 to present; Chairman and Member of the Nominating Committee from 2004 to present; Chairman and Member of the Governance Committee from 2007 to present; and Member of the Compliance and Risk Oversight Committee from 2014 to present. | Retired. Former: Chief Executive Officer, Par Industries, Inc., d/b/a Par Leasing (1977-2010). | 135 | None. |
Sandra G. Sponem*****
(1958) | Trustee from August 2016 to present. | Current: Senior Vice President and Chief Financial Officer, M.A. Mortenson Companies, Inc. (general contracting firm) (2007-present). | 135 | None. |
156 | THE RYDEX FUNDS SEMI-ANNUAL REPORT | |
INFORMATION ON BOARD OF TRUSTEES AND OFFICERS (Unaudited)(continued) |
Name, Address*
and Year of Birth | Position(s) Held with the
Trust, Term of Office and
Length of Time Served | Principal Occupation(s)
During Past 5 Years |
OFFICERS | | |
Donald C. Cacciapaglia
(1951) | President (2012-present). | Current: President and CEO, certain other funds in the Fund Complex (2012-present); Vice Chairman, Guggenheim Investments (2010-present). Former: Chairman and CEO, Channel Capital Group Inc. (2002-2010). |
Joanna M. Catalucci
(1966) | AML Officer (2016-present) | Current: Chief Compliance Officer, certain funds in the Fund Complex (2012-present); Senior Managing Director, Guggenheim Investments (2012-present); AML Officer, certain funds in the Fund Complex (2016-present). Former: Chief Compliance Officer and Secretary, certain other funds in the Fund Complex (2008-2012); Senior Vice President & Chief Compliance Officer, Security Investors, LLC and certain affiliates (2010-2012); Chief Compliance Officer and Senior Vice President, Rydex Advisors, LLC and certain affiliates (2010-2011). |
Michael P. Byrum
(1970) | Vice President (1999-present). | Current: Senior Vice President, Security Investors, LLC (2010-present); President and Chief Investment Officer, Rydex Holdings, LLC (2008-present); Director and Chairman, Advisory Research Center, Inc. (2006-present); Manager, Guggenheim Specialized Products, LLC (2005-present). Former: Vice President, Guggenheim Distributors, LLC (2009); Director (2009-2010) and Secretary (2002-2010), Rydex Fund Services, LLC; Director (2008-2010), Chief Investment Officer (2006-2010), President (2004-2010) and Secretary (2002-2010), Rydex Advisors, LLC; Director (2008-2010), Chief Investment Officer (2006-2010), President (2004-2010) and Secretary (2002-2010), Rydex Advisors II, LLC. |
Elisabeth Miller
(1968) | Chief Compliance Officer (2012-present). | Current: CCO, certain other funds in the Fund Complex (2012-present); CCO, Security Investors, LLC (2012-present); CCO, Guggenheim Funds Investment Advisors, LLC (2012-present); Managing Director, Guggenheim Investments (2012-present); Vice President, Guggenheim Funds Distributors, LLC (2014-present). Former: CCO, Guggenheim Distributors, LLC (2009-2014); Senior Manager, Security Investors, LLC (2004-2009); Senior Manager, Guggenheim Distributors, LLC (2004-2009). |
Amy J. Lee
(1961) | Vice President (2009-present) and Secretary (2012-present). | Current: Chief Legal Officer, certain other funds in the Fund Complex (2013-present); Senior Managing Director, Guggenheim Investments (2012-present). Former: Vice President, Associate General Counsel and Assistant Secretary, Security Benefit Life Insurance Company and Security Benefit Corporation (2004-2012). |
James M. Howley
(1972) | Assistant Treasurer (2016-present) | Current: Director, Guggenheim Investments (2004-present); Assistant Treasurer, certain other funds in the Fund Complex (2006-present). Former: Manager, Mutual Fund Administration of Van Kampen Investments, Inc. (1996-2004). |
Keith D. Kemp
(1960) | Assistant Treasurer (2016-present) | Current: Managing Director of Transparent Value, LLC (2015-present); Managing Director of Guggenheim Investments (2015-present). Former: Director, Transparent Value, LLC (2010-2015); Director, Guggenheim Investments (2010-2015); Chief Operating Officer, Macquarie Capital Investment Management (2007-2009). |
| | THE RYDEX FUNDS SEMI-ANNUAL REPORT | 157 |
INFORMATION ON BOARD OF TRUSTEES AND OFFICERS (Unaudited)(concluded) |
Name, Address*
and Year of Birth | Position(s) Held with the
Trust, Term of Office and
Length of Time Served | Principal Occupation(s)
During Past 5 Years |
OFFICERS - concluded | | |
Glenn McWhinnie
(1969) | Assistant Treasurer (2016-present) | Current: Vice President, Guggenheim Investments (2009-present). Former: Tax Compliance Manager, Ernst & Young LLP (1996-2009). |
Adam J. Nelson
(1979) | Assistant Treasurer (2016-present) | Current: Vice President, Guggenheim Investments (2015-present); Assistant Treasurer, certain other funds in the Fund Complex (2015-present). Former: Assistant Vice President and Fund Administration Director, State Street Corporation (2013-2015); Fund Administration Assistant Director, State Street (2011-2013); Fund Administration Manager, State Street (2009-2011). |
Kimberly J. Scott
(1974) | Assistant Treasurer (2016-present) | Current: Vice President, Guggenheim Investments (2012-present); Assistant Treasurer, certain other funds in the Fund Complex (2012-present). Former: Financial Reporting Manager, Invesco, Ltd. (2010-2011); Vice President/Assistant Treasurer, Mutual Fund Administration for Van Kampen Investments, Inc./Morgan Stanley Investment Management (2009-2010); Manager of Mutual Fund Administration, Van Kampen Investments, Inc./Morgan Stanley Investment Management (2005-2009). |
John L. Sullivan
(1955) | Chief Financial Officer and Treasurer (2016-present) | Current: CFO, Chief Accounting Officer and Treasurer, certain other funds in the Fund Complex (2010-present); Senior Managing Director, Guggenheim Investments (2010-present). Former: Managing Director and CCO, each of the funds in the Van Kampen Investments fund complex (2004-2010); Managing Director and Head of Fund Accounting and Administration, Morgan Stanley Investment Management (2002-2004); CFO and Treasurer, Van Kampen Funds (1996-2004). |
* | All Trustees and Officers may be reached c/o Guggenheim Investments, 227 West Monroe Street, Chicago, Illinois 60606. |
** | Mr. Cacciapaglia is an “interested” person of the Trust, as that term is defined in the 1940 Act by virtue of his affiliation with the Adviser’s parent company. |
*** | The “Fund Complex” includes all closed-end and open-end funds (including all of their portfolios) advised by the Adviser and any funds that have an investment adviser or servicing agent that is an affiliated person of the Adviser. Information provided is as of the date of this report. |
**** | Some of the Trustees may serve as directors on the boards of companies not required to be disclosed above, including certain non-profit companies and charitable foundations. |
***** | Mses. Brock-Kyle and Sponem commenced serving as independent Trustees effective August 18, 2016. |
158 | THE RYDEX FUNDS SEMI-ANNUAL REPORT | |
GUGGENHEIM INVESTMENTS PRIVACY POLICIES (Unaudited) |
Guggenheim Investments as used herein refers to Guggenheim Partners, LLC, Guggenheim Funds Investment Advisors, LLC, Guggenheim Partners Investment Management, LLC, Guggenheim Funds Distributors, LLC and Security Investors, LLC as well as the funds in the Guggenheim Funds complex (the “funds”).
Our Commitment to You
When you become a Guggenheim Investments investor, you entrust us with not only your hard-earned money but also with personal and financial information about you. We recognize that your relationship with us is based on trust and that you expect us to act responsibly and in your best interests. Because we have access to personal information about you, we hold ourselves to high standards in its safekeeping and use. This means, most importantly, that we do not sell client or account information to anyone—whether you are a current or former Guggenheim Investments client.
The Information We Collect About You and How We Collect It
In the course of doing business with shareholders and investors, we collect nonpublic personal information about you. You typically provide personal information when you complete a Guggenheim Investments account application or when you request a transaction that involves Rydex and Guggenheim Funds or one of the Guggenheim affiliated companies. “Nonpublic personal information” is personally identifiable information about you. For example it includes your name and address, Social Security or taxpayer identification number, assets, income, account balance, bank account information and investment activity (e.g. purchase and redemption history).
How We Share Your Personal Information
As a matter of policy, we do not disclose your nonpublic personal information to nonaffiliated third parties except as required or permitted by law. As emphasized above, we do not sell information about current or former clients or their accounts to third parties. Nor do we share such information, except when necessary to complete transactions at your request or to make you aware of related investment products and services that we offer. Additional details about how we handle your personal information are provided below.
To complete certain transactions or account changes that you direct, it may be necessary to provide your personal information to companies, individuals or groups that are not affiliated with Guggenheim Investments. For example if you ask to transfer assets from another financial institution to Guggenheim Investments, we will need to provide certain information about you to that company to complete the transaction. In connection with servicing your accounts or to alert you to other Guggenheim Investments investment products and services, we may share your information within the Guggenheim Investments family of affiliated companies. This would include, for example, sharing your information within Guggenheim Investments so we can make you aware of new funds or the services offered through another Guggenheim Investments affiliated company. In certain instances, we may contract with nonaffiliated companies to perform services for us. Where necessary, we will disclose information we have about you to these third parties. In all such cases, we provide the third party with only the information necessary to carry out its assigned responsibilities and only for that purpose. And we require these third parties to treat your personal information with the same high degree of confidentiality that we do. In certain instances, we may share information with other financial institutions regarding individuals and entities in response to the U.S.A. Patriot Act. Finally we will share personal information about you if we are compelled by law to do so, if you direct us to do so with your consent, or in other circumstances as permitted by law.
How We Safeguard Your Personal Information
We maintain physical, electronic and procedural safeguards to protect your personal information. Within Guggenheim Investments, access to such information is limited to those who need it to perform their jobs such as servicing your account, resolving problems or informing you of new products and services.
| | THE RYDEX FUNDS SEMI-ANNUAL REPORT | 159 |
This page intentionally left blank.
This page intentionally left blank.
This page intentionally left blank.
This page intentionally left blank.
This page intentionally left blank.
This page intentionally left blank.
9.30.2016
Rydex Funds Semi-Annual Report
Domestic Equity Funds |
Nova Fund |
S&P 500® Fund |
Inverse S&P 500® Strategy Fund |
Monthly Rebalance NASDAQ-100® 2x Strategy Fund |
Inverse NASDAQ-100® Strategy Fund |
Mid-Cap 1.5x Strategy Fund |
Inverse Mid-Cap Strategy Fund |
Russell 2000® 1.5x Strategy Fund |
Russell 2000® Fund |
Inverse Russell 2000® Strategy Fund |
Dow Jones Industrial Average® Fund |
Fixed Income Funds |
Government Long Bond 1.2x Strategy Fund |
Inverse Government Long Bond Strategy Fund |
High Yield Strategy Fund |
Inverse High Yield Strategy Fund |
Money Market Fund |
U.S. Government Money Market Fund |
GuggenheimInvestments.com | RBENF-SEMI-0916x0317 |
DEAR SHAREHOLDER | 2 |
ECONOMIC AND MARKET OVERVIEW | 3 |
A BRIEF NOTE ON THE COMPOUNDING OF RETURNS | 4 |
ABOUT SHAREHOLDERS’ FUND EXPENSES | 5 |
NOVA FUND | 10 |
S&P 500® FUND | 24 |
INVERSE S&P 500® STRATEGY FUND | 36 |
MONTHLY REBALANCE NASDAQ-100® 2x STRATEGY FUND | 44 |
INVERSE NASDAQ-100® STRATEGY FUND | 52 |
MID-CAP 1.5x STRATEGY FUND | 60 |
INVERSE MID-CAP STRATEGY FUND | 71 |
RUSSELL 2000® 1.5x STRATEGY FUND | 78 |
RUSSELL 2000® FUND | 103 |
INVERSE RUSSELL 2000® STRATEGY FUND | 129 |
DOW JONES INDUSTRIAL AVERAGE® FUND | 136 |
GOVERNMENT LONG BOND 1.2x STRATEGY FUND | 143 |
INVERSE GOVERNMENT LONG BOND STRATEGY FUND | 152 |
HIGH YIELD STRATEGY FUND | 160 |
INVERSE HIGH YIELD STRATEGY FUND | 168 |
U.S. GOVERNMENT MONEY MARKET FUND | 175 |
NOTES TO FINANCIAL STATEMENTS | 181 |
OTHER INFORMATION | 200 |
INFORMATION ON BOARD OF TRUSTEES AND OFFICERS | 203 |
GUGGENHEIM INVESTMENTS PRIVACY POLICIES | 207 |
| | THE RYDEX FUNDS SEMI-ANNUAL REPORT | 1 |
Dear Shareholder:
Security Investors, LLC (the “Investment Adviser”) is pleased to present the semi-annual shareholder report for 16 of our Target Beta 1 Funds (the “Funds”) for the six-month period ended September 30, 2016.
The Investment Adviser is part of Guggenheim Investments, which represents the investment management businesses of Guggenheim Partners, LLC (“Guggenheim”), a global, diversified financial services firm.
Guggenheim Funds Distributors, LLC is the distributor of the Funds. Guggenheim Funds Distributors, LLC, is affiliated with Guggenheim Partners, LLC and Security Investors, LLC.
We encourage you to read the Economic and Market Overview section of the report, which follows this letter.
We are committed to providing innovative investment solutions and appreciate the trust you place in us.
Sincerely,

Donald C. Cacciapaglia
President and Chief Executive Officer
October 31, 2016
Read a prospectus and summary prospectus (if available) carefully before investing. It contains the investment objectives, risks, charges, expenses, and other information, which should be considered carefully before investing. Obtain a prospectus and summary prospectus (if available) at guggenheiminvestments.com or call 800.820.0888.
There can be no assurance that any investment product will achieve its investment objective(s). There are risks associated with investing, including the entire loss of principal invested. Investing involves market risks. The investment return and principal value of any investment product will fluctuate with changes in market conditions.
2 | THE RYDEX FUNDS SEMI-ANNUAL REPORT | |
ECONOMIC AND MARKET OVERVIEW (Unaudited) | September 30, 2016 |
Economic growth continues to rebound, even though the rise in U.S. Gross Domestic Product (“GDP”) disappointed in the first half of 2016. There was a large headwind from inventory drawdowns, which should soon reverse after five quarters of dragging on growth. Real GDP growth is expected to be around 2.5 percent in the second half of the year, driven by consumption, housing, and a fading trade drag, and supporting the view that U.S. economic growth remains resilient to global weakness.
The euro zone economy is slowly improving, but inflation will likely persist well below the European Central Bank’s (“ECB”) target in the coming quarters due to substantial slack. The ECB has indicated that more quantitative easing is possible, but will soon need to alter the quantitative easing program in order to keep up their purchase pace. Both China and Japan need weaker currencies. Chinese growth and capital flows have stabilized for now, but surging construction and a credit boom raise the prospect of future instability. Japan’s economic prospects are weak, and inflation remains far from the Bank of Japan’s (“BOJ”) target. The surging yen could drive further policy easing, including an increase in fiscal stimulus.
It appears the U.S. Federal Reserve (the “Fed”) will move forward with raising rates in December, absent any economic or geopolitical surprise or a meaningful tightening of financial conditions over the fourth quarter. But key events could influence risk asset performance for the balance of the year. A continued recovery in oil prices following the Organization of Petroleum Exporting Countries (“OPEC”) agreement to keep production between 32.5 to 33 million barrels per day would help sustain the rally (although we are skeptical that they will adhere to any quota based on historical production levels). Global oil inventories remain high, but supply and demand are moving toward balance. A rebound in GDP growth would also lift U.S. equity and corporate bond prices higher.
The macroeconomic picture remains the same; we are not on the verge of a recession. But despite our positive outlook on the U.S. economy, valuations across risk assets argue for caution. Ongoing accommodation from central bankers across the globe has alleviated much of the initial macroeconomic tail risk posed by Brexit but may not be enough to dampen the seasonal volatility typically observed in the fourth quarter. Ongoing troubles in the banking sector, such as the woes afflicting Deutsche Bank and Wells Fargo, coupled with uncertainty surrounding upcoming political events, which include the new Trump administration, the Italian constitutional referendum, and key European elections, may create volatility for risk assets for the balance of the year.
For the six months ended September 30, 2016, the Standard & Poor’s 500® (“S&P 500®”) Index* returned 6.40%. The MSCI Europe-Australasia-Far East (“EAFE”) Index* returned 4.88%. The return of the MSCI Emerging Markets Index* was 9.75%.
In the bond market, the Bloomberg Barclays U.S. Aggregate Bond Index* posted a 2.68% return for the period, while the Bloomberg Barclays U.S. Corporate High Yield Index* returned 11.38%. The return of the Bank of America (“BofA”) Merrill Lynch 3-Month U.S. Treasury Bill Index* was 0.17% for the six-month period.
The opinions and forecasts expressed may not actually come to pass. This information is subject to change at any time, based on market and other conditions, and should not be construed as a recommendation of any specific security or strategy.
*Index Definitions:
The following indicies are referenced throughout this report. Indices are unmanaged and not available for direct investment. Index performance does not reflect transaction costs, fees, or expenses.
BofA Merrill Lynch 3-Month U.S. Treasury Bill Index is an unmanaged market Index of U.S. Treasury securities maturing in 90 days that assumes reinvestment of all income.
Bloomberg Barclays U.S. Aggregate Bond Index is a broad-based flagship benchmark that measures the investment grade, U.S. dollar denominated, fixed-rate taxable bond market, including U.S. Treasuries, government-related and corporate securities, mortgage-backed securities (“MBS”) (agency fixed-rate and hybrid adjustable-rate mortgage, or “ARM”, pass-throughs), asset-backed securities (“ABS”), and commercial mortgage-backed securities (“CMBS”) (agency and non-agency).
Bloomberg Barclays U.S. Corporate High Yield Index measures the U.S. dollar denominated, high yield, fixed-rate corporate bond market. Securities are classified as high yield if the middle rating of Moody’s, Fitch, and S&P is Ba1/BB +/BB + or below.
MSCI EAFE Index is a capitalization-weighted measure of stock markets in Europe, Australasia, and the Far East.
MSCI Emerging Markets Index is a free float-adjusted market capitalization-weighted index that is designed to measure equity market performance in the global emerging markets.
S&P 500® Index is a broad-based index, the performance of which is based on the performance of 500 widely held common stocks chosen for market size, liquidity, and industry group representation.
| | THE RYDEX FUNDS SEMI-ANNUAL REPORT | 3 |
A BRIEF NOTE ON THE COMPOUNDING OF RETURNS (Unaudited) | |
Many of the Funds described in this report are benchmarked daily to leveraged and/or inverse leveraged versions of published indices. To properly evaluate the performance of these funds, it is essential to understand the effect of mathematical compounding on their respective returns.
Because of the nonlinear effects of leverage applied over time, it is possible for a fund to perform in line with its benchmark for several individual periods in a row, yet seem to trail the benchmark over the entire period. It is also possible that a fund that performs in-line with its benchmark on a daily basis may seem to outperform its benchmark over longer periods.
An Example of Compounding
For example, consider a hypothetical fund that is designed to produce returns that correspond to 150% of an index. On the first day of a period, the index rises from a level of 100 to a level of 106, producing a 6.0% gain and an expectation that the fund will rise by 9.0%. On the same day, the fund’s net asset value per share (“NAV”) increases from $10.00 to $10.90 for a gain of 9.0% — in line with its benchmark.
On day two, assume the index falls from 106 to 99 for a loss of about 6.6%. The fund, as expected, falls 9.9% to a price of $9.82. On each day, the fund performed exactly in line with its benchmark, but for the two-day period, the fund was down 1.8%, while the index was down only 1.0%. Without taking into account the daily compounding of returns, one would expect the fund to lose 1.5% and would see the fund as trailing by 0.3% when in fact it had performed perfectly. This example is summarized in the table below.
| | Index
Level | Index
Performance | Fund
Expectation | Fund
NAV | Fund
Performance | Assessment |
Start | 100 | | | $ 10.00 | | |
Day 1 | 106 | 6.0% | 9.0% | $ 10.90 | 9.0% | In line |
Day 2 | 99 | -6.6% | -9.9% | $ 9.82 | -9.9% | In line |
Cumulative | | -1.0% | -1.5% | | -1.8% | -0.3% |
As illustrated by this simple example, the effect of leverage can make it difficult to form expectations or judgments about fund performance given only the returns of the unleveraged index.
Because certain funds seek to track the performance of their benchmark on a daily basis, mathematical compounding, especially with respect to those funds that use leverage as part of their investment strategy, may prevent a fund from correlating with the monthly, quarterly, annual or other period performance of its benchmark. Due to the compounding of daily returns, leveraged and inverse funds’ returns over periods other than one day will likely differ in amount and possibly direction from the benchmark return for the same period. Investors should monitor their leveraged and inverse funds’ holdings consistent with their strategies, as frequently as daily. For those funds that consistently apply leverage, the value of the fund’s shares will tend to increase or decrease more than the value of any increase or decrease in its benchmark index. For more on correlation, leverage and other risks, please read the prospectus.
In general, any change in direction in an index will produce compounding that seems to work against an investor. Were the index to move in the same direction (either up or down) for two or more periods in a row, the compounding of those returns would work in an investor’s favor, causing the fund to seemingly beat its benchmark.
As a general rule of thumb, more leverage in a fund will magnify the compounding effect, while less leverage will generally produce results that are more in line with expectations. In addition, periods of high volatility in an underlying index will also cause the effects of compounding to be more pronounced, while lower volatility will produce a more muted effect.
4 | THE RYDEX FUNDS SEMI-ANNUAL REPORT | |
ABOUT SHAREHOLDERS’ FUND EXPENSES (Unaudited) | |
All mutual funds have operating expenses, and it is important for our shareholders to understand the impact of costs on their investments. Shareholders of a fund incur two types of costs: (i) transaction costs, including sales charges (loads) on purchase payments, reinvested dividends, other distributions, and exchange fees, and (ii) ongoing costs, including management fees, administrative services, and shareholder reports, among others. These ongoing costs, or operating expenses, are deducted from a fund’s gross income and reduce the investment return of the fund.
A fund’s expenses are expressed as a percentage of its average net assets, which is known as the expense ratio. The following examples are intended to help investors understand the ongoing costs (in dollars) of investing in a fund and to compare these costs with the ongoing costs of investing in other mutual funds.
The examples are based on an investment of $1,000 made at the beginning of the period and held for the entire six-month period beginning March 31, 2016 and ending September 30, 2016.
The following tables illustrate the Funds’ costs in two ways:
Table 1. Based on actual Fund return: This section helps investors estimate the actual expenses paid over the period. The “Ending Account Value” shown is derived from the Fund’s actual return, and the fifth column shows the dollar amount that would have been paid by an investor who started with $1,000 in the Fund. Investors may use the information here, together with the amount invested, to estimate the expenses paid over the period. Simply divide the Fund’s account value by $1,000 (for example, an $8,600 account value divided by $1,000 = 8.6), then multiply the result by the number provided under the heading “Expenses Paid During Period.”
Table 2. Based on hypothetical 5% return: This section is intended to help investors compare a Fund’s cost with those of other mutual funds. The table provides information about hypothetical account values and hypothetical expenses based on the Fund’s actual expense ratio and an assumed rate of return of 5% per year before expenses, which is not the Fund’s actual return. The hypothetical account values and expenses may not be used to estimate the actual ending account balance or expenses paid during the period. The example is useful in making comparisons because the U.S. Securities and Exchange Commission (the “SEC”) requires all mutual funds to calculate expenses based on the 5% return. Investors can assess a Fund’s costs by comparing this hypothetical example with the hypothetical examples that appear in shareholder reports of other funds.
The calculations illustrated above assume no shares were bought or sold during the period. Actual costs may have been higher or lower, depending on the amount of investment and the timing of any purchases or redemptions.
Please note that the expenses shown in the table are meant to highlight your ongoing costs only and do not reflect any transactional costs, such as sales charges (loads) on purchase payments, and contingent deferred sales charges (“CDSC”) on redemptions, if any. Therefore, the second table is useful in comparing ongoing costs only, and will not help you determine the relative total costs of owning different funds. In addition, if these transactional costs were included, your costs would have been higher.
More information about the Funds’ expenses, including annual expense ratios for periods up to five years (subject to the Fund’s inception date), can be found in the Financial Highlights section of this report. For additional information on operating expenses and other shareholder costs, please refer to the appropriate Fund prospectus.
| | THE RYDEX FUNDS SEMI-ANNUAL REPORT | 5 |
ABOUT SHAREHOLDERS’ FUND EXPENSES (Unaudited)(continued) | |
| | Expense
Ratio1 | Fund
Return | Beginning
Account Value
March 31, 2016 | Ending
Account Value
September 30, 2016 | Expenses
Paid During
Period2 |
Table 1. Based on actual Fund return3 |
Nova Fund | | | | | |
Investor Class | 1.27% | 8.50% | $ 1,000.00 | $ 1,085.00 | $ 6.64 |
A-Class | 1.52% | 8.42% | 1,000.00 | 1,084.20 | 7.94 |
C-Class | 2.27% | 7.98% | 1,000.00 | 1,079.80 | 11.84 |
H-Class | 1.52% | 8.36% | 1,000.00 | 1,083.60 | 7.94 |
S&P 500® Fund | | | | | |
A-Class | 1.57% | 5.50% | 1,000.00 | 1,055.00 | 8.09 |
C-Class | 2.32% | 5.09% | 1,000.00 | 1,050.90 | 11.93 |
H-Class | 1.57% | 5.50% | 1,000.00 | 1,055.00 | 8.09 |
Inverse S&P 500® Strategy Fund | | | | | |
Investor Class | 1.42% | (6.64%) | 1,000.00 | 933.60 | 6.88 |
A-Class | 1.67% | (6.76%) | 1,000.00 | 932.40 | 8.09 |
C-Class | 2.42% | (7.12%) | 1,000.00 | 928.80 | 11.70 |
H-Class | 1.67% | (6.61%) | 1,000.00 | 933.90 | 8.10 |
Monthly Rebalance NASDAQ-100® 2x Strategy Fund | | | | |
A-Class | 1.35% | 17.63% | 1,000.00 | 1,176.30 | 7.37 |
C-Class | 2.10% | 17.19% | 1,000.00 | 1,171.90 | 11.38 |
H-Class | 1.35% | 17.66% | 1,000.00 | 1,176.60 | 7.37 |
Inverse NASDAQ-100® Strategy Fund |
Investor Class | 1.46% | (9.50%) | 1,000.00 | 905.00 | 6.92 |
A-Class | 1.70% | (9.49%) | 1,000.00 | 905.10 | 8.12 |
C-Class | 2.46% | (9.98%) | 1,000.00 | 900.20 | 11.67 |
H-Class | 1.70% | (9.66%) | 1,000.00 | 903.40 | 8.11 |
Mid-Cap 1.5x Strategy Fund | | | | | |
A-Class | 1.67% | 11.21% | 1,000.00 | 1,112.10 | 8.84 |
C-Class | 2.42% | 10.78% | 1,000.00 | 1,107.80 | 12.73 |
H-Class | 1.67% | 11.20% | 1,000.00 | 1,112.00 | 8.84 |
Inverse Mid-Cap Strategy Fund | | | | | |
A-Class | 1.67% | (8.86%) | 1,000.00 | 911.40 | 8.00 |
C-Class | 2.41% | (9.21%) | 1,000.00 | 907.90 | 11.53 |
H-Class | 1.66% | (8.83%) | 1,000.00 | 911.70 | 7.96 |
Russell 2000® 1.5x Strategy Fund | | | | | |
A-Class | 1.71% | 18.83% | 1,000.00 | 1,188.30 | 9.38 |
C-Class | 2.46% | 18.38% | 1,000.00 | 1,183.80 | 13.47 |
H-Class | 1.71% | 18.77% | 1,000.00 | 1,187.70 | 9.38 |
Russell 2000® Fund | | | | | |
A-Class | 1.61% | 12.13% | 1,000.00 | 1,121.30 | 8.56 |
C-Class | 2.36% | 11.70% | 1,000.00 | 1,117.00 | 12.52 |
H-Class | 1.61% | 12.10% | 1,000.00 | 1,121.00 | 8.56 |
Inverse Russell 2000® Strategy Fund |
A-Class | 1.71% | (13.13%) | 1,000.00 | 868.70 | 8.01 |
C-Class | 2.46% | (13.47%) | 1,000.00 | 865.30 | 11.50 |
H-Class | 1.71% | (13.10%) | 1,000.00 | 869.00 | 8.01 |
6 | THE RYDEX FUNDS SEMI-ANNUAL REPORT | |
ABOUT SHAREHOLDERS’ FUND EXPENSES (Unaudited)(continued) | |
| | Expense
Ratio1 | Fund
Return | Beginning
Account Value
March 31, 2016 | Ending
Account Value
September 30, 2016 | Expenses
Paid During
Period2 |
Dow Jones Industrial Average® Fund |
A-Class | 1.55% | 4.13% | $ 1,000.00 | $ 1,041.30 | $ 7.93 |
C-Class | 2.30% | 3.74% | 1,000.00 | 1,037.40 | 11.75 |
H-Class | 1.55% | 4.21% | 1,000.00 | 1,042.10 | 7.93 |
Government Long Bond 1.2x Strategy Fund |
Investor Class | 0.97% | 8.91% | 1,000.00 | 1,089.10 | 5.08 |
A-Class | 1.22% | 8.78% | 1,000.00 | 1,087.80 | 6.39 |
C-Class | 1.97% | 8.36% | 1,000.00 | 1,083.60 | 10.29 |
H-Class | 1.22% | 8.82% | 1,000.00 | 1,088.20 | 6.33 |
Inverse Government Long Bond Strategy Fund | | | | |
Investor Class | 3.04% | (7.79%) | 1,000.00 | 922.10 | 14.60 |
A-Class | 3.32% | (7.91%) | 1,000.00 | 920.90 | 15.94 |
C-Class | 4.08% | (8.25%) | 1,000.00 | 917.50 | 19.56 |
H-Class | 3.36% | (7.64%) | 1,000.00 | 923.60 | 16.20 |
High Yield Strategy Fund | | | | | |
A-Class | 1.50% | 5.81% | 1,000.00 | 1,058.10 | 7.74 |
C-Class | 2.25% | 5.38% | 1,000.00 | 1,053.80 | 11.53 |
H-Class | 1.50% | 5.77% | 1,000.00 | 1,057.70 | 7.74 |
Inverse High Yield Strategy Fund | | | | | |
A-Class | 1.51% | (5.41%) | 1,000.00 | 945.90 | 7.37 |
C-Class | 2.27% | (5.85%) | 1,000.00 | 941.50 | 11.00 |
H-Class | 1.51% | (4.79%) | 1,000.00 | 952.10 | 7.39 |
U.S. Government Money Market Fund | |
Money Market Class | 0.30% | 0.00% | 1,000.00 | 1,000.00 | 1.50 |
| | THE RYDEX FUNDS SEMI-ANNUAL REPORT | 7 |
ABOUT SHAREHOLDERS’ FUND EXPENSES (Unaudited)(continued) | |
| | Expense
Ratio1 | Fund
Return | Beginning
Account Value
March 31, 2016 | Ending
Account Value
September 30, 2016 | Expenses
Paid During
Period2 |
Table 2. Based on hypothetical 5% return (before expenses) |
Nova Fund | | | | | |
Investor Class | 1.27% | 5.00% | $ 1,000.00 | $ 1,018.70 | $ 6.43 |
A-Class | 1.52% | 5.00% | 1,000.00 | 1,017.45 | 7.69 |
C-Class | 2.27% | 5.00% | 1,000.00 | 1,013.69 | 11.46 |
H-Class | 1.52% | 5.00% | 1,000.00 | 1,017.45 | 7.69 |
S&P 500® Fund | | | | | |
A-Class | 1.57% | 5.00% | 1,000.00 | 1,017.20 | 7.94 |
C-Class | 2.32% | 5.00% | 1,000.00 | 1,013.44 | 11.71 |
H-Class | 1.57% | 5.00% | 1,000.00 | 1,017.20 | 7.94 |
Inverse S&P 500® Strategy Fund | | | | | |
Investor Class | 1.42% | 5.00% | 1,000.00 | 1,017.95 | 7.18 |
A-Class | 1.67% | 5.00% | 1,000.00 | 1,016.70 | 8.44 |
C-Class | 2.42% | 5.00% | 1,000.00 | 1,012.94 | 12.21 |
H-Class | 1.67% | 5.00% | 1,000.00 | 1,016.70 | 8.44 |
Monthly Rebalance NASDAQ-100® 2x Strategy Fund | | | | |
A-Class | 1.35% | 5.00% | 1,000.00 | 1,018.30 | 6.83 |
C-Class | 2.10% | 5.00% | 1,000.00 | 1,014.59 | 10.56 |
H-Class | 1.35% | 5.00% | 1,000.00 | 1,018.30 | 6.83 |
Inverse NASDAQ-100® Strategy Fund | |
Investor Class | 1.46% | 5.00% | 1,000.00 | 1,017.80 | 7.33 |
A-Class | 1.70% | 5.00% | 1,000.00 | 1,016.55 | 8.59 |
C-Class | 2.46% | 5.00% | 1,000.00 | 1,012.78 | 12.36 |
H-Class | 1.70% | 5.00% | 1,000.00 | 1,016.55 | 8.59 |
Mid-Cap 1.5x Strategy Fund | | | | | |
A-Class | 1.67% | 5.00% | 1,000.00 | 1,016.70 | 8.44 |
C-Class | 2.42% | 5.00% | 1,000.00 | 1,012.99 | 12.16 |
H-Class | 1.67% | 5.00% | 1,000.00 | 1,016.70 | 8.44 |
Inverse Mid-Cap Strategy Fund | | | | | |
A-Class | 1.67% | 5.00% | 1,000.00 | 1,016.70 | 8.44 |
C-Class | 2.41% | 5.00% | 1,000.00 | 1,012.99 | 12.16 |
H-Class | 1.66% | 5.00% | 1,000.00 | 1,016.75 | 8.39 |
Russell 2000® 1.5x Strategy Fund | | | | | |
A-Class | 1.71% | 5.00% | 1,000.00 | 1,016.50 | 8.64 |
C-Class | 2.46% | 5.00% | 1,000.00 | 1,012.73 | 12.41 |
H-Class | 1.71% | 5.00% | 1,000.00 | 1,016.50 | 8.64 |
Russell 2000® Fund | | | | | |
A-Class | 1.61% | 5.00% | 1,000.00 | 1,017.00 | 8.14 |
C-Class | 2.36% | 5.00% | 1,000.00 | 1,013.24 | 11.91 |
H-Class | 1.61% | 5.00% | 1,000.00 | 1,017.00 | 8.14 |
Inverse Russell 2000® Strategy Fund | |
A-Class | 1.71% | 5.00% | 1,000.00 | 1,016.50 | 8.64 |
C-Class | 2.46% | 5.00% | 1,000.00 | 1,012.73 | 12.41 |
H-Class | 1.71% | 5.00% | 1,000.00 | 1,016.50 | 8.64 |
8 | THE RYDEX FUNDS SEMI-ANNUAL REPORT | |
ABOUT SHAREHOLDERS’ FUND EXPENSES (Unaudited)(concluded) | |
| | Expense
Ratio1 | Fund
Return | Beginning
Account Value
March 31, 2016 | Ending
Account Value
September 30, 2016 | Expenses
Paid During
Period2 |
Dow Jones Industrial Average® Fund | | | |
A-Class | 1.55% | 5.00% | $ 1,000.00 | $ 1,017.30 | $ 7.84 |
C-Class | 2.30% | 5.00% | 1,000.00 | 1,013.54 | 11.61 |
H-Class | 1.55% | 5.00% | 1,000.00 | 1,017.30 | 7.84 |
Government Long Bond 1.2x Strategy Fund | | | |
Investor Class | 0.97% | 5.00% | 1,000.00 | 1,020.21 | 4.91 |
A-Class | 1.22% | 5.00% | 1,000.00 | 1,018.95 | 6.17 |
C-Class | 1.97% | 5.00% | 1,000.00 | 1,015.19 | 9.95 |
H-Class | 1.22% | 5.00% | 1,000.00 | 1,019.00 | 6.12 |
Inverse Government Long Bond Strategy Fund | | | | |
Investor Class | 3.04% | 5.00% | 1,000.00 | 1,009.88 | 15.27 |
A-Class | 3.32% | 5.00% | 1,000.00 | 1,008.47 | 16.67 |
C-Class | 4.08% | 5.00% | 1,000.00 | 1,004.66 | 20.45 |
H-Class | 3.36% | 5.00% | 1,000.00 | 1,008.22 | 16.92 |
High Yield Strategy Fund | | | | | |
A-Class | 1.50% | 5.00% | 1,000.00 | 1,017.55 | 7.59 |
C-Class | 2.25% | 5.00% | 1,000.00 | 1,013.84 | 11.31 |
H-Class | 1.50% | 5.00% | 1,000.00 | 1,017.55 | 7.59 |
Inverse High Yield Strategy Fund | | | | | |
A-Class | 1.51% | 5.00% | 1,000.00 | 1,017.50 | 7.64 |
C-Class | 2.27% | 5.00% | 1,000.00 | 1,013.74 | 11.41 |
H-Class | 1.51% | 5.00% | 1,000.00 | 1,017.50 | 7.64 |
U.S. Government Money Market Fund | | | |
Money Market Class | 0.30% | 5.00% | 1,000.00 | 1,023.56 | 1.52 |
1 | This ratio represents annualized Net Expenses, which include interest expense related to securities sold short. Excluding short interest expense, the operating expense ratio of the Inverse Government Long Bond Strategy Fund would be 1.41%, 1.66%, 2.41% and 1.67% for the Investor Class, A-Class, C-Class and H-Class, respectively. Excludes expenses of the underlying funds in which the Funds invest. |
2 | Expenses are equal to the Fund's annualized expense ratio, net of any applicable fee waivers, multiplied by the average account value over the period, multiplied by 183/365 (to reflect the one-half year period). |
3 | Actual cumulative return at net asset value for the period March 31, 2016 to September 30, 2016. |
| | THE RYDEX FUNDS SEMI-ANNUAL REPORT | 9 |
FUND PROFILE (Unaudited) | September 30, 2016 |
NOVA FUND
OBJECTIVE: Seeks to provide investment results that match, before fees and expenses, the performance of a specific benchmark on a daily basis. The Fund’s current benchmark is 150% of the performance of the S&P 500® Index (the “underlying index”). The Fund does not seek to achieve its investment objective over a period of time greater than one day.
Holdings Diversification (Market Exposure as % of Net Assets)
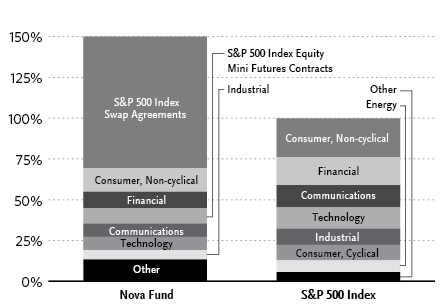
“Holdings Diversification (Market Exposure as % of Net Assets)” excludes any temporary cash investments or investments in Guggenheim Strategy Funds Trust mutual funds. Investments in those Funds do not provide “market exposure” to meet the Fund’s investment objective, but will significantly increase the portfolio’s exposure to certain other asset categories (and their associated risks), which may cause the Fund to deviate from its principal investment strategy, including: (i) high yield, high risk debt securities rated below the top four long-term rating categories by a nationally recognized statistical rating organization (also known as “junk bonds”); (ii) securities issued by the U.S. government or its agencies and instrumentalities; (iii) CLOs and similar investments; and (iv) other short-term fixed income securities.
Inception Dates: |
Investor Class | July 12, 1993 |
A-Class | March 31, 2004 |
C-Class | March 14, 2001 |
H-Class | September 18, 2014 |
Ten Largest Holdings (% of Total Net Assets) |
Guggenheim Strategy Fund I | 4.4% |
Guggenheim Strategy Fund II | 3.9% |
Federal Farm Credit Bank | 3.7% |
Apple, Inc. | 2.0% |
Microsoft Corp. | 1.4% |
Exxon Mobil Corp. | 1.2% |
Amazon.com, Inc. | 1.1% |
Johnson & Johnson | 1.0% |
Facebook, Inc. — Class A | 1.0% |
Berkshire Hathaway, Inc. — Class B | 0.9% |
Top Ten Total | 20.6% |
| | |
“Ten Largest Holdings” excludes any temporary cash or derivative investments. |
10 | THE RYDEX FUNDS SEMI-ANNUAL REPORT | |
SCHEDULE OF INVESTMENTS (Unaudited) | September 30, 2016 |
NOVA FUND | |
| | | Shares | | | Value | |
| | | | | | | |
COMMON STOCKS† - 59.8% | |
| | | | | | | |
Consumer, Non-cyclical - 14.3% | |
Johnson & Johnson | | | 23,650 | | | $ | 2,793,774 | |
Procter & Gamble Co. | | | 23,070 | | | | 2,070,532 | |
Pfizer, Inc. | | | 52,434 | | | | 1,775,939 | |
Merck & Company, Inc. | | | 23,904 | | | | 1,491,849 | |
Coca-Cola Co. | | | 33,579 | | | | 1,421,063 | |
PepsiCo, Inc. | | | 12,441 | | | | 1,353,208 | |
Philip Morris International, Inc. | | | 13,410 | | | | 1,303,720 | |
UnitedHealth Group, Inc. | | | 8,233 | | | | 1,152,621 | |
Amgen, Inc. | | | 6,469 | | | | 1,079,093 | |
Altria Group, Inc. | | | 16,890 | | | | 1,067,955 | |
Medtronic plc | | | 11,946 | | | | 1,032,134 | |
Gilead Sciences, Inc. | | | 11,407 | | | | 902,521 | |
AbbVie, Inc. | | | 14,078 | | | | 887,899 | |
Allergan plc* | | | 3,423 | | | | 788,351 | |
Bristol-Myers Squibb Co. | | | 14,444 | | | | 778,820 | |
Celgene Corp.* | | | 6,700 | | | | 700,351 | |
Eli Lilly & Co. | | | 8,396 | | | | 673,863 | |
Biogen, Inc.* | | | 1,894 | | | | 592,879 | |
Mondelez International, Inc. — Class A | | | 13,447 | | | | 590,322 | |
Colgate-Palmolive Co. | | | 7,706 | | | | 571,323 | |
Thermo Fisher Scientific, Inc. | | | 3,408 | | | | 542,077 | |
Abbott Laboratories | | | 12,707 | | | | 537,379 | |
Kraft Heinz Co. | | | 5,150 | | | | 460,977 | |
Danaher Corp. | | | 5,253 | | | | 411,783 | |
PayPal Holdings, Inc.* | | | 9,702 | | | | 397,491 | |
Kimberly-Clark Corp. | | | 3,109 | | | | 392,169 | |
Express Scripts Holding Co.* | | | 5,448 | | | | 384,248 | |
Aetna, Inc. | | | 3,032 | | | | 350,044 | |
Automatic Data Processing, Inc. | | | 3,943 | | | | 347,773 | |
Reynolds American, Inc. | | | 7,156 | | | | 337,405 | |
Becton Dickinson and Co. | | | 1,841 | | | | 330,883 | |
General Mills, Inc. | | | 5,160 | | | | 329,621 | |
McKesson Corp. | | | 1,951 | | | | 325,329 | |
Stryker Corp. | | | 2,686 | | | | 312,677 | |
Cigna Corp. | | | 2,218 | | | | 289,050 | |
S&P Global, Inc. | | | 2,281 | | | | 288,683 | |
Anthem, Inc. | | | 2,275 | | | | 285,080 | |
Boston Scientific Corp.* | | | 11,763 | | | | 279,959 | |
Ecolab, Inc. | | | 2,269 | | | | 276,183 | |
Regeneron Pharmaceuticals, Inc.* | | | 652 | | | | 262,117 | |
Constellation Brands, Inc. — Class A | | | 1,531 | | | | 254,897 | |
Kroger Co. | | | 8,203 | | | | 243,465 | |
Intuitive Surgical, Inc.* | | | 333 | | | | 241,368 | |
Alexion Pharmaceuticals, Inc.* | | | 1,938 | | | | 237,483 | |
Illumina, Inc.* | | | 1,267 | | | | 230,163 | |
Humana, Inc. | | | 1,289 | | | | 228,011 | |
Zimmer Biomet Holdings, Inc. | | | 1,729 | | | | 224,805 | |
Zoetis, Inc. | | | 4,279 | | | | 222,551 | |
Edwards Lifesciences Corp.* | | | 1,840 | | | | 221,830 | |
Sysco Corp. | | | 4,415 | | | | 216,379 | |
Cardinal Health, Inc. | | | 2,753 | | | | 213,908 | |
Archer-Daniels-Midland Co. | | | 5,029 | | | | 212,073 | |
Baxter International, Inc. | | | 4,231 | | | | 201,396 | |
St. Jude Medical, Inc. | | | 2,463 | | | | 196,449 | |
HCA Holdings, Inc.* | | | 2,553 | | | | 193,084 | |
Tyson Foods, Inc. — Class A | | | 2,571 | | | | 191,977 | |
Vertex Pharmaceuticals, Inc.* | | | 2,142 | | | | 186,804 | |
Molson Coors Brewing Co. — Class B | | | 1,592 | | | | 174,802 | |
Monster Beverage Corp.* | | | 1,168 | | | | 171,474 | |
ConAgra Foods, Inc. | | | 3,603 | | | | 169,737 | |
Estee Lauder Companies, Inc. — Class A | | | 1,909 | | | | 169,061 | |
Kellogg Co. | | | 2,180 | | | | 168,885 | |
Moody’s Corp. | | | 1,446 | | | | 156,573 | |
Nielsen Holdings plc | | | 2,903 | | | | 155,514 | |
Mylan N.V.* | | | 3,977 | | | | 151,603 | |
Dr Pepper Snapple Group, Inc. | | | 1,602 | | | | 146,279 | |
CR Bard, Inc. | | | 635 | | | | 142,418 | |
Clorox Co. | | | 1,118 | | | | 139,951 | |
Equifax, Inc. | | | 1,032 | | | | 138,887 | |
JM Smucker Co. | | | 1,006 | | | | 136,353 | |
AmerisourceBergen Corp. — Class A | | | 1,563 | | | | 126,259 | |
Mead Johnson Nutrition Co. — Class A | | | 1,596 | | | | 126,100 | |
Laboratory Corporation of America Holdings* | | | 884 | | | | 121,532 | |
DENTSPLY SIRONA, Inc. | | | 2,013 | | | | 119,633 | |
Hershey Co. | | | 1,213 | | | | 115,963 | |
Henry Schein, Inc.* | | | 707 | | | | 115,227 | |
Perrigo Company plc | | | 1,238 | | | | 114,305 | |
Verisk Analytics, Inc. — Class A* | | | 1,358 | | | | 110,378 | |
Church & Dwight Company, Inc. | | | 2,227 | | | | 106,718 | |
Global Payments, Inc. | | | 1,328 | | | | 101,937 | |
Quest Diagnostics, Inc. | | | 1,202 | | | | 101,725 | |
McCormick & Company, Inc. | | | 994 | | | | 99,320 | |
Centene Corp.* | | | 1,476 | | | | 98,833 | |
Universal Health Services, Inc. — Class B | | | 779 | | | | 95,988 | |
DaVita, Inc.* | | | 1,431 | | | | 94,546 | |
Hologic, Inc.* | | | 2,398 | | | | 93,114 | |
Campbell Soup Co. | | | 1,681 | | | | 91,951 | |
Hormel Foods Corp. | | | 2,335 | | | | 88,567 | |
Western Union Co. | | | 4,216 | | | | 87,777 | |
Cintas Corp. | | | 739 | | | | 83,211 | |
Varian Medical Systems, Inc.* | | | 807 | | | | 80,321 | |
Whole Foods Market, Inc. | | | 2,755 | | | | 78,104 | |
Cooper Companies, Inc. | | | 421 | | | | 75,468 | |
Brown-Forman Corp. — Class B | | | 1,576 | | | | 74,765 | |
Total System Services, Inc. | | | 1,430 | | | | 67,425 | |
Mallinckrodt plc* | | | 931 | | | | 64,965 | |
Avery Dennison Corp. | | | 768 | | | | 59,743 | |
United Rentals, Inc.* | | | 745 | | | | 58,475 | |
H&R Block, Inc. | | | 1,894 | | | | 43,846 | |
Robert Half International, Inc. | | | 1,125 | | | | 42,593 | |
Quanta Services, Inc.* | | | 1,305 | | | | 36,527 | |
Endo International plc* | | | 1,713 | | | | 34,517 | |
Patterson Companies, Inc. | | | 719 | | | | 33,031 | |
Coty, Inc. — Class A* | | | 599 | | | | 14,077 | |
Total Consumer, Non-cyclical | | | | | | | 38,764,266 | |
| | | | | | | | | |
Financial - 10.1% | |
Berkshire Hathaway, Inc. — Class B* | | | 16,413 | | | | 2,371,186 | |
JPMorgan Chase & Co. | | | 31,223 | | | | 2,079,139 | |
Wells Fargo & Co. | | | 39,254 | | | | 1,738,167 | |
SEE NOTES TO FINANCIAL STATEMENTS. | THE RYDEX FUNDS SEMI-ANNUAL REPORT | 11 |
SCHEDULE OF INVESTMENTS (Unaudited)(continued) | September 30, 2016 |
NOVA FUND | |
| | | Shares | | | Value | |
| | | | | | | |
Bank of America Corp. | | | 88,214 | | | $ | 1,380,549 | |
Visa, Inc. — Class A | | | 16,307 | | | | 1,348,589 | |
Citigroup, Inc. | | | 25,115 | | | | 1,186,181 | |
Mastercard, Inc. — Class A | | | 8,289 | | | | 843,572 | |
U.S. Bancorp | | | 13,907 | | | | 596,471 | |
Simon Property Group, Inc. | | | 2,715 | | | | 562,032 | |
Goldman Sachs Group, Inc. | | | 3,260 | | | | 525,740 | |
American International Group, Inc. | | | 8,792 | | | | 521,716 | |
Chubb Ltd. | | | 4,020 | | | | 505,113 | |
American Express Co. | | | 6,708 | | | | 429,580 | |
MetLife, Inc. | | | 9,498 | | | | 421,995 | |
American Tower Corp. — Class A | | | 3,678 | | | | 416,827 | |
Morgan Stanley | | | 12,725 | | | | 407,964 | |
PNC Financial Services Group, Inc. | | | 4,248 | | | | 382,702 | |
BlackRock, Inc. — Class A | | | 1,055 | | | | 382,395 | |
Bank of New York Mellon Corp. | | | 9,229 | | | | 368,053 | |
Charles Schwab Corp. | | | 10,407 | | | | 328,549 | |
Capital One Financial Corp. | | | 4,375 | | | | 314,256 | |
Prudential Financial, Inc. | | | 3,778 | | | | 308,474 | |
CME Group, Inc. — Class A | | | 2,928 | | | | 306,035 | |
Marsh & McLennan Companies, Inc. | | | 4,480 | | | | 301,280 | |
Public Storage | | | 1,289 | | | | 287,628 | |
Travelers Companies, Inc. | | | 2,492 | | | | 285,459 | |
Intercontinental Exchange, Inc. | | | 1,029 | | | | 277,171 | |
Crown Castle International Corp. | | | 2,918 | | | | 274,905 | |
BB&T Corp. | | | 7,041 | | | | 265,587 | |
Aon plc | | | 2,296 | | | | 258,277 | |
Aflac, Inc. | | | 3,540 | | | | 254,420 | |
Prologis, Inc. | | | 4,554 | | | | 243,821 | |
Welltower, Inc. | | | 3,094 | | | | 231,338 | |
Allstate Corp. | | | 3,211 | | | | 222,137 | |
Equinix, Inc. | | | 614 | | | | 221,194 | |
State Street Corp. | | | 3,169 | | | | 220,657 | |
Ventas, Inc. | | | 3,036 | | | | 214,433 | |
AvalonBay Communities, Inc. | | | 1,187 | | | | 211,096 | |
Weyerhaeuser Co. | | | 6,472 | | | | 206,716 | |
Equity Residential | | | 3,160 | | | | 203,283 | |
Discover Financial Services | | | 3,489 | | | | 197,303 | |
Synchrony Financial | | | 6,848 | | | | 191,744 | |
SunTrust Banks, Inc. | | | 4,334 | | | | 189,829 | |
Boston Properties, Inc. | | | 1,329 | | | | 181,129 | |
Progressive Corp. | | | 5,030 | | | | 158,445 | |
M&T Bank Corp. | | | 1,355 | | | | 157,316 | |
HCP, Inc. | | | 4,041 | | | | 153,356 | |
Vornado Realty Trust | | | 1,485 | | | | 150,297 | |
Realty Income Corp. | | | 2,235 | | | | 149,589 | |
Willis Towers Watson plc | | | 1,121 | | | | 148,835 | |
T. Rowe Price Group, Inc. | | | 2,149 | | | | 142,909 | |
Hartford Financial Services Group, Inc. | | | 3,335 | | | | 142,805 | |
General Growth Properties, Inc. | | | 5,047 | | | | 139,297 | |
Ameriprise Financial, Inc. | | | 1,395 | | | | 139,179 | |
Fifth Third Bancorp | | | 6,625 | | | | 135,548 | |
Essex Property Trust, Inc. | | | 566 | | | | 126,048 | |
Northern Trust Corp. | | | 1,841 | | | | 125,170 | |
Digital Realty Trust, Inc. | | | 1,269 | | | | 123,245 | |
Principal Financial Group, Inc. | | | 2,312 | | | | 119,091 | |
KeyCorp | | | 9,355 | | | | 113,850 | |
Citizens Financial Group, Inc. | | | 4,490 | | | | 110,948 | |
Invesco Ltd. | | | 3,543 | | | | 110,790 | |
Alliance Data Systems Corp.* | | | 506 | | | | 108,552 | |
Franklin Resources, Inc. | | | 3,037 | | | | 108,026 | |
Regions Financial Corp. | | | 10,850 | | | | 107,090 | |
Kimco Realty Corp. | | | 3,631 | | | | 105,118 | |
Host Hotels & Resorts, Inc. | | | 6,418 | | | | 99,928 | |
Loews Corp. | | | 2,390 | | | | 98,349 | |
Cincinnati Financial Corp. | | | 1,295 | | | | 97,669 | |
Lincoln National Corp. | | | 2,012 | | | | 94,524 | |
Federal Realty Investment Trust | | | 613 | | | | 94,359 | |
SL Green Realty Corp. | | | 867 | | | | 93,723 | |
Huntington Bancshares, Inc. | | | 9,383 | | | | 92,516 | |
Extra Space Storage, Inc. | | | 1,087 | | | | 86,319 | |
Macerich Co. | | | 1,042 | | | | 84,267 | |
UDR, Inc. | | | 2,309 | | | | 83,101 | |
XL Group Ltd. | | | 2,377 | | | | 79,939 | |
Iron Mountain, Inc. | | | 2,116 | | | | 79,413 | |
Arthur J Gallagher & Co. | | | 1,530 | | | | 77,831 | |
CBRE Group, Inc. — Class A* | | | 2,582 | | | | 72,244 | |
Unum Group | | | 2,028 | | | | 71,609 | |
Comerica, Inc. | | | 1,503 | | | | 71,122 | |
E*TRADE Financial Corp.* | | | 2,366 | | | | 68,898 | |
Affiliated Managers Group, Inc.* | | | 466 | | | | 67,430 | |
Nasdaq, Inc. | | | 987 | | | | 66,662 | |
Apartment Investment & Management Co. — Class A | | | 1,354 | | | | 62,162 | |
Torchmark Corp. | | | 963 | | | | 61,526 | |
Zions Bancorporation | | | 1,773 | | | | 54,998 | |
Assurant, Inc. | | | 520 | | | | 47,970 | |
People’s United Financial, Inc. | | | 2,688 | | | | 42,524 | |
Navient Corp. | | | 2,740 | | | | 39,648 | |
Legg Mason, Inc. | | | 796 | | | | 26,650 | |
Total Financial | | | | | | | 27,455,577 | |
| | | | | | | | | |
Communications - 8.2% | |
Amazon.com, Inc.* | | | 3,401 | | | | 2,847,692 | |
Facebook, Inc. — Class A* | | | 20,081 | | | | 2,575,791 | |
AT&T, Inc. | | | 53,180 | | | | 2,159,640 | |
Alphabet, Inc. — Class A* | | | 2,548 | | | | 2,048,745 | |
Alphabet, Inc. — Class C* | | | 2,554 | | | | 1,985,199 | |
Verizon Communications, Inc. | | | 35,237 | | | | 1,831,619 | |
Cisco Systems, Inc. | | | 43,479 | | | | 1,379,154 | |
Comcast Corp. — Class A | | | 20,767 | | | | 1,377,682 | |
Walt Disney Co. | | | 12,781 | | | | 1,186,843 | |
Priceline Group, Inc.* | | | 429 | | | | 631,269 | |
Time Warner, Inc. | | | 6,724 | | | | 535,298 | |
Charter Communications, Inc. — Class A* | | | 1,874 | | | | 505,924 | |
Netflix, Inc.* | | | 3,706 | | | | 365,226 | |
Yahoo!, Inc.* | | | 7,569 | | | | 326,224 | |
eBay, Inc.* | | | 9,077 | | | | 298,633 | |
Twenty-First Century Fox, Inc. — Class A | | | 9,198 | | | | 222,776 | |
CBS Corp. — Class B | | | 3,517 | | | | 192,520 | |
Omnicom Group, Inc. | | | 2,045 | | | | 173,825 | |
Symantec Corp. | | | 5,321 | | | | 133,557 | |
CenturyLink, Inc. | | | 4,720 | | | | 129,470 | |
12 | THE RYDEX FUNDS SEMI-ANNUAL REPORT | SEE NOTES TO FINANCIAL STATEMENTS. |
SCHEDULE OF INVESTMENTS (Unaudited)(continued) | September 30, 2016 |
NOVA FUND | |
| | | Shares | | | Value | |
| | | | | | | |
Expedia, Inc. | | | 1,042 | | | $ | 121,622 | |
Level 3 Communications, Inc.* | | | 2,517 | | | | 116,738 | |
Viacom, Inc. — Class B | | | 3,002 | | | | 114,376 | |
Motorola Solutions, Inc. | | | 1,441 | | | | 109,919 | |
Twenty-First Century Fox, Inc. — Class B | | | 4,211 | | | | 104,180 | |
Juniper Networks, Inc. | | | 3,310 | | | | 79,639 | |
Interpublic Group of Companies, Inc. | | | 3,464 | | | | 77,420 | |
F5 Networks, Inc.* | | | 572 | | | | 71,294 | |
VeriSign, Inc.* | | | 802 | | | | 62,748 | |
TripAdvisor, Inc.* | | | 988 | | | | 62,422 | |
Scripps Networks Interactive, Inc. — Class A | | | 822 | | | | 52,189 | |
Discovery Communications, Inc. — Class C* | | | 1,938 | | | | 50,989 | |
News Corp. — Class A | | | 3,290 | | | | 45,994 | |
Frontier Communications Corp. | | | 10,140 | | | | 42,182 | |
TEGNA, Inc. | | | 1,852 | | | | 40,485 | |
Discovery Communications, Inc. — Class A* | | | 1,304 | | | | 35,104 | |
News Corp. — Class B | | | 1,035 | | | | 14,718 | |
Total Communications | | | | | | | 22,109,106 | |
| | | | | | | | | |
Technology – 8.0% | |
Apple, Inc. | | | 46,580 | | | | 5,265,868 | |
Microsoft Corp. | | | 67,362 | | | | 3,880,051 | |
Intel Corp. | | | 40,897 | | | | 1,543,861 | |
International Business Machines Corp. | | | 7,519 | | | | 1,194,393 | |
Oracle Corp. | | | 26,016 | | | | 1,021,908 | |
QUALCOMM, Inc. | | | 12,739 | | | | 872,622 | |
Accenture plc — Class A | | | 5,382 | | | | 657,519 | |
Texas Instruments, Inc. | | | 8,672 | | | | 608,600 | |
Broadcom Ltd. | | | 3,419 | | | | 589,846 | |
Adobe Systems, Inc.* | | | 4,307 | | | | 467,481 | |
salesforce.com, Inc.* | | | 5,566 | | | | 397,023 | |
Hewlett Packard Enterprise Co. | | | 14,365 | | | | 326,804 | |
NVIDIA Corp. | | | 4,625 | | | | 316,905 | |
Applied Materials, Inc. | | | 9,344 | | | | 281,722 | |
Activision Blizzard, Inc. | | | 5,897 | | | | 261,237 | |
Cognizant Technology Solutions Corp. — Class A* | | | 5,246 | | | | 250,287 | |
Intuit, Inc. | | | 2,118 | | | | 233,001 | |
HP, Inc. | | | 14,789 | | | | 229,673 | |
Electronic Arts, Inc.* | | | 2,600 | | | | 222,040 | |
Fidelity National Information Services, Inc. | | | 2,834 | | | | 218,304 | |
Fiserv, Inc.* | | | 1,900 | | | | 188,993 | |
Analog Devices, Inc. | | | 2,657 | | | | 171,244 | |
Paychex, Inc. | | | 2,774 | | | | 160,531 | |
Cerner Corp.* | | | 2,598 | | | | 160,427 | |
Micron Technology, Inc.* | | | 8,976 | | | | 159,593 | |
Western Digital Corp. | | | 2,457 | | | | 143,660 | |
Lam Research Corp. | | | 1,385 | | | | 131,173 | |
Red Hat, Inc.* | | | 1,565 | | | | 126,499 | |
Skyworks Solutions, Inc. | | | 1,621 | | | | 123,423 | |
Linear Technology Corp. | | | 2,072 | | | | 122,849 | |
Autodesk, Inc.* | | | 1,687 | | | | 122,021 | |
Xilinx, Inc. | | | 2,191 | | | | 119,059 | |
Microchip Technology, Inc. | | | 1,861 | | | | 115,643 | |
Citrix Systems, Inc.* | | | 1,346 | | | | 114,706 | |
Seagate Technology plc | | | 2,581 | | | | 99,498 | |
KLA-Tencor Corp. | | | 1,348 | | | | 93,969 | |
CA, Inc. | | | 2,716 | | | | 89,845 | |
NetApp, Inc. | | | 2,408 | | | | 86,255 | |
Akamai Technologies, Inc.* | | | 1,510 | | | | 80,015 | |
Xerox Corp. | | | 7,358 | | | | 74,537 | |
Qorvo, Inc.* | | | 1,105 | | | | 61,593 | |
Dun & Bradstreet Corp. | | | 313 | | | | 42,762 | |
Teradata Corp.* | | | 1,127 | | | | 34,937 | |
CSRA, Inc. | | | 1,259 | | | | 33,867 | |
Pitney Bowes, Inc. | | | 1,604 | | | | 29,129 | |
Total Technology | | | | | | | 21,525,373 | |
| | | | | | | | | |
Industrial - 5.7% | |
General Electric Co. | | | 77,464 | | | | 2,294,483 | |
3M Co. | | | 5,224 | | | | 920,625 | |
Honeywell International, Inc. | | | 6,577 | | | | 766,811 | |
Union Pacific Corp. | | | 7,199 | | | | 702,118 | |
United Technologies Corp. | | | 6,728 | | | | 683,565 | |
Boeing Co. | | | 5,015 | | | | 660,676 | |
United Parcel Service, Inc. — Class B | | | 5,976 | | | | 653,535 | |
Lockheed Martin Corp. | | | 2,182 | | | | 523,069 | |
Caterpillar, Inc. | | | 5,050 | | | | 448,289 | |
General Dynamics Corp. | | | 2,480 | | | | 384,797 | |
FedEx Corp. | | | 2,112 | | | | 368,924 | |
Raytheon Co. | | | 2,551 | | | | 347,268 | |
Illinois Tool Works, Inc. | | | 2,762 | | | | 330,998 | |
Northrop Grumman Corp. | | | 1,544 | | | | 330,339 | |
Emerson Electric Co. | | | 5,563 | | | | 303,240 | |
Eaton Corporation plc | | | 3,931 | | | | 258,306 | |
CSX Corp. | | | 8,178 | | | | 249,429 | |
Norfolk Southern Corp. | | | 2,537 | | | | 246,241 | |
Waste Management, Inc. | | | 3,517 | | | | 224,244 | |
Deere & Co. | | | 2,501 | | | | 213,460 | |
Corning, Inc. | | | 8,963 | | | | 211,975 | |
TE Connectivity Ltd. | | | 3,073 | | | | 197,840 | |
Amphenol Corp. — Class A | | | 2,668 | | | | 173,207 | |
Cummins, Inc. | | | 1,341 | | | | 171,849 | |
Stanley Black & Decker, Inc. | | | 1,300 | | | | 159,874 | |
Roper Technologies, Inc. | | | 875 | | | | 159,661 | |
Ingersoll-Rand plc | | | 2,230 | | | | 151,506 | |
Parker-Hannifin Corp. | | | 1,157 | | | | 145,238 | |
Rockwell Automation, Inc. | | | 1,119 | | | | 136,898 | |
Agilent Technologies, Inc. | | | 2,814 | | | | 132,511 | |
Vulcan Materials Co. | | | 1,150 | | | | 130,790 | |
TransDigm Group, Inc.* | | | 433 | | | | 125,189 | |
Ball Corp. | | | 1,506 | | | | 123,417 | |
Waters Corp.* | | | 697 | | | | 110,468 | |
WestRock Co. | | | 2,174 | | | | 105,396 | |
Republic Services, Inc. — Class A | | | 2,015 | | | | 101,657 | |
L-3 Communications Holdings, Inc. | | | 668 | | | | 100,688 | |
Acuity Brands, Inc. | | | 379 | | | | 100,283 | |
Dover Corp. | | | 1,342 | | | | 98,825 | |
Harris Corp. | | | 1,074 | | | | 98,389 | |
Martin Marietta Materials, Inc. | | | 548 | | | | 98,152 | |
SEE NOTES TO FINANCIAL STATEMENTS. | THE RYDEX FUNDS SEMI-ANNUAL REPORT | 13 |
SCHEDULE OF INVESTMENTS (Unaudited)(continued) | September 30, 2016 |
NOVA FUND | |
| | | Shares | | | Value | |
| | | | | | | |
Masco Corp. | | | 2,854 | | | $ | 97,921 | |
AMETEK, Inc. | | | 2,009 | | | | 95,990 | |
Mettler-Toledo International, Inc.* | | | 228 | | | | 95,721 | |
Rockwell Collins, Inc. | | | 1,122 | | | | 94,629 | |
Textron, Inc. | | | 2,329 | | | | 92,578 | |
Pentair plc | | | 1,440 | | | | 92,506 | |
Kansas City Southern | | | 933 | | | | 87,068 | |
CH Robinson Worldwide, Inc. | | | 1,234 | | | | 86,948 | |
Xylem, Inc. | | | 1,549 | | | | 81,245 | |
Expeditors International of Washington, Inc. | | | 1,565 | | | | 80,629 | |
Sealed Air Corp. | | | 1,700 | | | | 77,894 | |
Fortune Brands Home & Security, Inc. | | | 1,330 | | | | 77,273 | |
Snap-on, Inc. | | | 502 | | | | 76,284 | |
Fluor Corp. | | | 1,204 | | | | 61,790 | |
J.B. Hunt Transport Services, Inc. | | | 760 | | | | 61,666 | |
Stericycle, Inc.* | | | 735 | | | | 58,903 | |
Allegion plc | | | 829 | | | | 57,126 | |
Flowserve Corp. | | | 1,127 | | | | 54,366 | |
Jacobs Engineering Group, Inc.* | | | 1,049 | | | | 54,254 | |
PerkinElmer, Inc. | | | 946 | | | | 53,080 | |
Garmin Ltd. | | | 996 | | | | 47,918 | |
FLIR Systems, Inc. | | | 1,187 | | | | 37,296 | |
Ryder System, Inc. | | | 462 | | | | 30,469 | |
Owens-Illinois, Inc.* | | | 1,401 | | | | 25,764 | |
Total Industrial | | | | | | | 15,423,548 | |
| | | | | | | | | |
Consumer, Cyclical - 5.6% | |
Home Depot, Inc. | | | 10,681 | | | | 1,374,432 | |
Wal-Mart Stores, Inc. | | | 13,102 | | | | 944,917 | |
McDonald’s Corp. | | | 7,377 | | | | 851,011 | |
CVS Health Corp. | | | 9,217 | | | | 820,221 | |
Starbucks Corp. | | | 12,678 | | | | 686,387 | |
NIKE, Inc. — Class B | | | 11,656 | | | | 613,688 | |
Walgreens Boots Alliance, Inc. | | | 7,391 | | | | 595,862 | |
Costco Wholesale Corp. | | | 3,787 | | | | 577,556 | |
Lowe’s Companies, Inc. | | | 7,561 | | | | 545,980 | |
TJX Companies, Inc. | | | 5,676 | | | | 424,452 | |
Ford Motor Co. | | | 33,734 | | | | 407,169 | |
General Motors Co. | | | 12,287 | | | | 390,358 | |
Target Corp. | | | 4,969 | | | | 341,271 | |
Yum! Brands, Inc. | | | 3,202 | | | | 290,774 | |
Delta Air Lines, Inc. | | | 6,474 | | | | 254,817 | |
O’Reilly Automotive, Inc.* | | | 820 | | | | 229,690 | |
Ross Stores, Inc. | | | 3,428 | | | | 220,420 | |
Newell Brands, Inc. | | | 4,168 | | | | 219,487 | |
Southwest Airlines Co. | | | 5,362 | | | | 208,528 | |
AutoZone, Inc.* | | | 252 | | | | 193,622 | |
Marriott International, Inc. — Class A | | | 2,765 | | | | 186,181 | |
Carnival Corp. | | | 3,742 | | | | 182,684 | |
PACCAR, Inc. | | | 3,030 | | | | 178,103 | |
Delphi Automotive plc | | | 2,358 | | | | 168,173 | |
American Airlines Group, Inc. | | | 4,581 | | | | 167,710 | |
Dollar Tree, Inc.* | | | 2,038 | | | | 160,859 | |
VF Corp. | | | 2,868 | | | | 160,751 | |
Dollar General Corp. | | | 2,241 | | | | 156,848 | |
L Brands, Inc. | | | 2,077 | | | | 146,989 | |
United Continental Holdings, Inc.* | | | 2,536 | | | | 133,064 | |
Genuine Parts Co. | | | 1,287 | | | | 129,279 | |
Ulta Salon Cosmetics & Fragrance, Inc.* | | | 507 | | | | 120,656 | |
Mohawk Industries, Inc.* | | | 545 | | | | 109,186 | |
Royal Caribbean Cruises Ltd. | | | 1,451 | | | | 108,752 | |
WW Grainger, Inc. | | | 481 | | | | 108,148 | |
Chipotle Mexican Grill, Inc. — Class A* | | | 252 | | | | 106,722 | |
Whirlpool Corp. | | | 652 | | | | 105,728 | |
Fastenal Co. | | | 2,498 | | | | 104,366 | |
Macy’s, Inc. | | | 2,667 | | | | 98,813 | |
Advance Auto Parts, Inc. | | | 636 | | | | 94,840 | |
LKQ Corp.* | | | 2,655 | | | | 94,146 | |
Best Buy Company, Inc. | | | 2,386 | | | | 91,097 | |
Mattel, Inc. | | | 2,944 | | | | 89,144 | |
DR Horton, Inc. | | | 2,929 | | | | 88,456 | |
CarMax, Inc.* | | | 1,655 | | | | 88,294 | |
Coach, Inc. | | | 2,411 | | | | 88,146 | |
Hanesbrands, Inc. | | | 3,266 | | | | 82,467 | |
Harley-Davidson, Inc. | | | 1,546 | | | | 81,304 | |
Foot Locker, Inc. | | | 1,170 | | | | 79,232 | |
Tractor Supply Co. | | | 1,155 | | | | 77,789 | |
Hasbro, Inc. | | | 976 | | | | 77,426 | |
PVH Corp. | | | 694 | | | | 76,687 | |
Goodyear Tire & Rubber Co. | | | 2,269 | | | | 73,289 | |
Alaska Air Group, Inc. | | | 1,064 | | | | 70,075 | |
Lennar Corp. — Class A | | | 1,624 | | | | 68,760 | |
Michael Kors Holdings Ltd.* | | | 1,461 | | | | 68,360 | |
Kohl’s Corp. | | | 1,552 | | | | 67,900 | |
Tiffany & Co. | | | 928 | | | | 67,401 | |
Darden Restaurants, Inc. | | | 1,091 | | | | 66,900 | |
Wynn Resorts Ltd. | | | 686 | | | | 66,830 | |
Wyndham Worldwide Corp. | | | 950 | | | | 63,964 | |
Under Armour, Inc. — Class A* | | | 1,585 | | | | 61,308 | |
BorgWarner, Inc. | | | 1,741 | | | | 61,248 | |
Bed Bath & Beyond, Inc. | | | 1,334 | | | | 57,509 | |
Under Armour, Inc. — Class C* | | | 1,594 | | | | 53,973 | |
PulteGroup, Inc. | | | 2,673 | | | | 53,567 | |
Leggett & Platt, Inc. | | | 1,156 | | | | 52,690 | |
Nordstrom, Inc. | | | 1,005 | | | | 52,139 | |
Harman International Industries, Inc. | | | 603 | | | | 50,923 | |
Ralph Lauren Corp. — Class A | | | 487 | | | | 49,255 | |
Signet Jewelers Ltd. | | | 652 | | | | 48,594 | |
Staples, Inc. | | | 5,622 | | | | 48,068 | |
The Gap, Inc. | | | 1,894 | | | | 42,123 | |
AutoNation, Inc.* | | | 574 | | | | 27,960 | |
Urban Outfitters, Inc.* | | | 770 | | | | 26,580 | |
Total Consumer, Cyclical | | | | | | | 15,232,098 | |
| | | | | | | | | |
Energy - 4.4% | |
Exxon Mobil Corp. | | | 35,845 | | | | 3,128,551 | |
Chevron Corp. | | | 16,307 | | | | 1,678,316 | |
Schlumberger Ltd. | | | 12,022 | | | | 945,410 | |
Occidental Petroleum Corp. | | | 6,604 | | | | 481,564 | |
ConocoPhillips | | | 10,706 | | | | 465,390 | |
EOG Resources, Inc. | | | 4,759 | | | | 460,243 | |
Kinder Morgan, Inc. | | | 16,595 | | | | 383,842 | |
Halliburton Co. | | | 7,444 | | | | 334,087 | |
14 | THE RYDEX FUNDS SEMI-ANNUAL REPORT | SEE NOTES TO FINANCIAL STATEMENTS. |
SCHEDULE OF INVESTMENTS (Unaudited)(continued) | September 30, 2016 |
NOVA FUND | |
| | | Shares | | | Value | |
| | | | | | | |
Phillips 66 | | | 3,842 | | | $ | 309,473 | |
Anadarko Petroleum Corp. | | | 4,716 | | | | 298,806 | |
Pioneer Natural Resources Co. | | | 1,465 | | | | 271,977 | |
Spectra Energy Corp. | | | 6,061 | | | | 259,108 | |
Valero Energy Corp. | | | 3,988 | | | | 211,364 | |
Apache Corp. | | | 3,280 | | | | 209,494 | |
Devon Energy Corp. | | | 4,526 | | | | 199,642 | |
Baker Hughes, Inc. | | | 3,698 | | | | 186,638 | |
Marathon Petroleum Corp. | | | 4,570 | | | | 185,496 | |
Williams Companies, Inc. | | | 5,904 | | | | 181,430 | |
Concho Resources, Inc.* | | | 1,228 | | | | 168,666 | |
Noble Energy, Inc. | | | 3,714 | | | | 132,738 | |
Hess Corp. | | | 2,327 | | | | 124,774 | |
National Oilwell Varco, Inc. | | | 3,264 | | | | 119,919 | |
Marathon Oil Corp. | | | 7,324 | | | | 115,792 | |
Cimarex Energy Co. | | | 820 | | | | 110,183 | |
Equities Corp. | | | 1,493 | | | | 108,422 | |
Cabot Oil & Gas Corp. — Class A | | | 4,020 | | | | 103,716 | |
ONEOK, Inc. | | | 1,819 | | | | 93,478 | |
Tesoro Corp. | | | 1,027 | | | | 81,708 | |
Newfield Exploration Co.* | | | 1,717 | | | | 74,621 | |
Range Resources Corp. | | | 1,625 | | | | 62,969 | |
Helmerich & Payne, Inc. | | | 934 | | | | 62,858 | |
Southwestern Energy Co.* | | | 4,266 | | | | 59,041 | |
FMC Technologies, Inc.* | | | 1,950 | | | | 57,857 | |
Murphy Oil Corp. | | | 1,399 | | | | 42,530 | |
Chesapeake Energy Corp.* | | | 5,641 | | | | 35,369 | |
Transocean Ltd.* | | | 2,969 | | | | 31,650 | |
First Solar, Inc.* | | | 663 | | | | 26,182 | |
Total Energy | | | | | | | 11,803,304 | |
| | | | | | | | | |
Utilities - 2.0% | |
NextEra Energy, Inc. | | | 4,037 | | | | 493,805 | |
Duke Energy Corp. | | | 5,954 | | | | 476,558 | |
Southern Co. | | | 8,460 | | | | 433,998 | |
Dominion Resources, Inc. | | | 5,409 | | | | 401,727 | |
American Electric Power Company, Inc. | | | 4,250 | | | | 272,893 | |
Exelon Corp. | | | 7,978 | | | | 265,588 | |
PG&E Corp. | | | 4,309 | | | | 263,582 | |
Sempra Energy | | | 2,159 | | | | 231,423 | |
Edison International | | | 2,816 | | | | 203,456 | |
PPL Corp. | | | 5,861 | | | | 202,615 | |
Consolidated Edison, Inc. | | | 2,631 | | | | 198,114 | |
Public Service Enterprise Group, Inc. | | | 4,373 | | | | 183,098 | |
Xcel Energy, Inc. | | | 4,391 | | | | 180,646 | |
WEC Energy Group, Inc. | | | 2,728 | | | | 163,353 | |
Eversource Energy | | | 2,742 | | | | 148,562 | |
DTE Energy Co. | | | 1,551 | | | | 145,282 | |
FirstEnergy Corp. | | | 3,676 | | | | 121,602 | |
Entergy Corp. | | | 1,547 | | | | 118,701 | |
American Water Works Company, Inc. | | | 1,537 | | | | 115,029 | |
Ameren Corp. | | | 2,097 | | | | 103,130 | |
CMS Energy Corp. | | | 2,411 | | | | 101,286 | |
SCANA Corp. | | | 1,235 | | | | 89,377 | |
CenterPoint Energy, Inc. | | | 3,723 | | | | 86,485 | |
Alliant Energy Corp. | | | 1,965 | | | | 75,279 | |
AES Corp. | | | 5,697 | | | | 73,207 | |
Pinnacle West Capital Corp. | | | 960 | | | | 72,950 | |
NiSource, Inc. | | | 2,785 | | | | 67,146 | |
NRG Energy, Inc. | | | 2,725 | | | | 30,547 | |
Total Utilities | | | | | | | 5,319,439 | |
| | | | | | | | | |
Basic Materials - 1.4% | |
EI du Pont de Nemours & Co. | | | 7,558 | | | | 506,160 | |
Dow Chemical Co. | | | 9,741 | | | | 504,876 | |
Monsanto Co. | | | 3,783 | | | | 386,623 | |
Praxair, Inc. | | | 2,465 | | | | 297,846 | |
Air Products & Chemicals, Inc. | | | 1,871 | | | | 281,286 | |
PPG Industries, Inc. | | | 2,302 | | | | 237,935 | |
LyondellBasell Industries N.V. — Class A | | | 2,947 | | | | 237,706 | |
Sherwin-Williams Co. | | | 694 | | | | 192,002 | |
Newmont Mining Corp. | | | 4,586 | | | | 180,184 | |
International Paper Co. | | | 3,554 | | | | 170,521 | |
Nucor Corp. | | | 2,752 | | | | 136,086 | |
Alcoa, Inc. | | | 11,371 | | | | 115,302 | |
Freeport-McMoRan, Inc. | | | 10,563 | | | | 114,714 | |
International Flavors & Fragrances, Inc. | | | 688 | | | | 98,363 | |
Eastman Chemical Co. | | | 1,277 | | | | 86,427 | |
Albemarle Corp. | | | 972 | | | | 83,096 | |
Mosaic Co. | | | 3,027 | | | | 74,040 | |
FMC Corp. | | | 1,157 | | | | 55,929 | |
CF Industries Holdings, Inc. | | | 2,014 | | | | 49,041 | |
Total Basic Materials | | | | | | | 3,808,137 | |
| | | | | | | | | |
Consumer Discretionary - 0.1% | |
Johnson Controls International plc | | | 8,161 | | | | 379,711 | |
| | | | | | | | | |
Information Technology - 0.0% | |
Fortive Corp. | | | 2,599 | | | | 132,289 | |
Dell Technologies Incorporated - VMware Inc — Class V* | | | 1 | | | | 39 | |
Total Information Technology | | | | | | | 132,328 | |
| | | | | | | | | |
Diversified - 0.0% | |
Leucadia National Corp. | | | 2,804 | | | | 53,388 | |
| | | | | | | | | |
Total Common Stocks | | | | | | | | |
(Cost $152,334,222) | | | | | | | 162,006,275 | |
| | | | | | | | | |
MUTUAL FUNDS† - 8.3% | |
Guggenheim Strategy Fund I1 | | | 481,979 | | | | 12,044,643 | |
Guggenheim Strategy Fund II1 | | | 422,407 | | | | 10,534,842 | |
Total Mutual Funds | | | | | | | | |
(Cost $22,468,825) | | | | | | | 22,579,485 | |
| | | | | | | | | |
| | | Face
Amount | | | | | |
| | | | | | | | | |
FEDERAL AGENCY NOTES†† - 3.7% | |
Federal Farm Credit Bank2 | | | | | | | | |
0.73% due 09/14/173 | | $ | 10,000,000 | | | | 10,015,380 | |
Total Federal Agency Notes | | | | | | | | |
(Cost $10,012,530) | | | | | | | 10,015,380 | |
| | | | | | | | | |
SEE NOTES TO FINANCIAL STATEMENTS. | THE RYDEX FUNDS SEMI-ANNUAL REPORT | 15 |
SCHEDULE OF INVESTMENTS (Unaudited)(continued) | September 30, 2016 |
NOVA FUND | |
| | | Face
Amount | | | Value | |
| | |
FEDERAL AGENCY DISCOUNT NOTES†† - 3.0% | |
Farmer Mac2 | | | | | | |
0.66% due 12/09/16 | | $ | 8,000,000 | | | $ | 7,996,128 | |
Total Federal Agency Discount Notes | | | | | | | | |
(Cost $7,989,880) | | | | | | | 7,996,128 | |
| | | | | | | | | |
U.S. TREASURY BILLS† - 0.2% | |
United States Treasury Bill | | | | | | | | |
0.00% due 10/13/16††,4,5 | | | 500,000 | | | | 499,977 | |
Total U.S. Treasury Bills | | | | | | | | |
(Cost $499,987) | | | | | | | 499,977 | |
| | | | | | | | | |
REPURCHASE AGREEMENTS††,6 - 23.1% | |
Royal Bank of Canada
issued 09/30/16 at 0.36%
due 10/03/167 | | | 37,550,042 | | | | 37,550,042 | |
HSBC Securities, Inc.
issued 09/30/16 at 0.38%
due 10/03/16 | | | 24,984,144 | | | | 24,984,144 | |
Total Repurchase Agreements | | | | | | | | |
(Cost $62,534,186) | | | | | | | 62,534,186 | |
| | | | | | | | | |
Total Investments - 98.1% | | | | | | | | |
(Cost $255,839,630) | | | | | | $ | 265,631,431 | |
Other Assets & Liabilities, net - 1.9% | | | | | | | 5,159,225 | |
Total Net Assets - 100.0% | | | | | | $ | 270,790,656 | |
| | Contracts | | | Unrealized
Gain (Loss) | |
| | | | | | |
EQUITY FUTURES CONTRACTS PURCHASED† | |
December 2016 S&P 500 Index
Mini Futures Contracts
(Aggregate Value of
Contracts $25,490,950) | | | 236 | | | $ | 490,032 | |
| | | | | | | | | |
| | Units | | | | | |
| | | | | | | | | |
OTC EQUITY INDEX SWAP AGREEMENTS†† | |
Goldman Sachs International
October 2016
S&P 500 Index Swap 0.95%8,
Terminating 10/27/16
(Notional Value $91,166,334) | | | 42,046 | | | $ | 926,186 | |
BNP Paribas
November 2016
S&P 500 Index Swap 0.78%8,
Terminating 11/01/16
(Notional Value $83,179,822) | | | 38,362 | | | | 652,780 | |
Barclays Bank plc
October 2016
S&P 500 Index Swap 0.80%8,
Terminating 10/27/16
(Notional Value $44,424,870) | | | 20,489 | | | | (54,685 | ) |
(Total Notional Value $218,771,026) | | | | | | $ | 1,524,281 | |
* | Non-income producing security. |
† | Value determined based on Level 1 inputs — See Note 4. |
†† | Value determined based on Level 2 inputs — See Note 4. |
1 | Affiliated issuer — See Note 9. |
2 | The issuer operates under a Congressional charter; its securities are neither issued nor guaranteed by the U.S. Government. |
3 | Variable rate security. Rate indicated is rate effective at September 30, 2016. |
4 | All or a portion of this security is pledged as futures collateral at September 30, 2016. |
5 | Zero coupon rate security. |
6 | Repurchase Agreements — See Note 5. |
7 | All or a portion of this security is pledged as equity index swap collateral at September 30, 2016. |
8 | Total Return based on S&P 500 Index +/- financing at a variable rate. Rate indicated is the rate effective at September 30, 2016. |
| | plc — Public Limited Company |
| | |
| | See Sector Classification in Other Information section. |
16 | THE RYDEX FUNDS SEMI-ANNUAL REPORT | SEE NOTES TO FINANCIAL STATEMENTS. |
SCHEDULE OF INVESTMENTS (Unaudited)(concluded) | September 30, 2016 |
NOVA FUND | |
The following table summarizes the inputs used to value the Fund’s investments at September 30, 2016 (See Note 4 in the Notes to Financial Statements):
Investments in Securities (Assets) | | Level 1 | | | Level 1 -
Other* | | | Level 2 | | | Level 2 -
Other* | | | Level 3 | | | Total | |
Common Stocks | | $ | 162,006,275 | | | $ | — | | | $ | — | | | $ | — | | | $ | — | | | $ | 162,006,275 | |
Equity Futures Contracts | | | — | | | | 490,032 | | | | — | | | | — | | | | — | | | | 490,032 | |
Equity Index Swap Agreements | | | — | | | | — | | | | — | | | | 1,578,966 | | | | — | | | | 1,578,966 | |
Federal Agency Discount Notes | | | — | | | | — | | | | 7,996,128 | | | | — | | | | — | | | | 7,996,128 | |
Federal Agency Notes | | | — | | | | — | | | | 10,015,380 | | | | — | | | | — | | | | 10,015,380 | |
Mutual Funds | | | 22,579,485 | | | | — | | | | — | | | | — | | | | — | | | | 22,579,485 | |
Repurchase Agreements | | | — | | | | — | | | | 62,534,186 | | | | — | | | | — | | | | 62,534,186 | |
U.S. Treasury Bills | | | — | | | | — | | | | 499,977 | | | | — | | | | — | | | | 499,977 | |
Total | | $ | 184,585,760 | | | $ | 490,032 | | | $ | 81,045,671 | | | $ | 1,578,966 | | | $ | — | | | $ | 267,700,429 | |
| | | | | | | | | | | | | | | | | | | | | | | | |
Investments in Securities (Liabilities) | | Level 1 | | | Level 1 -
Other* | | | Level 2 | | | Level 2 -
Other* | | | Level 3 | | | Total | |
Equity Index Swap Agreements | | $ | — | | | $ | — | | | $ | — | | | $ | 54,685 | | | $ | — | | | $ | 54,685 | |
* | Other financial instruments include futures contracts and/or swaps, which are reported as unrealized gain/loss at period end. |
Transfers between investment levels may occur as the markets fluctuate and/or the availability of data used in an investment’s valuation changes. Transfers between valuation levels, if any, are in comparison to the valuation levels at the end of the previous fiscal year, and are effective using the fair value as of the end of the previous fiscal period.
For the period ended September 30, 2016, there were no transfers between levels.
SEE NOTES TO FINANCIAL STATEMENTS. | THE RYDEX FUNDS SEMI-ANNUAL REPORT | 17 |
STATEMENT OF ASSETS AND LIABILITIES (Unaudited) |
September 30, 2016 |
Assets: | |
Investments in unaffiliated issuers, at value (cost $170,836,619) | | $ | 180,517,760 | |
Investments in affiliated issuers, at value (cost $22,468,825) | | | 22,579,485 | |
Repurchase agreements, at value (cost $62,534,186) | | | 62,534,186 | |
Total investments (cost $255,839,630) | | | 265,631,431 | |
Segregated cash with broker | | | 5,374,710 | |
Unrealized appreciation on swap agreements | | | 1,578,966 | |
Cash | | | 2,583 | |
Receivables: | |
Swap settlement | | | 111 | |
Variation margin | | | 141,707 | |
Securities sold | | | 9,685 | |
Fund shares sold | | | 967,971 | |
Dividends | | | 199,642 | |
Interest | | | 4,086 | |
Total assets | | | 273,910,892 | |
| | | | | |
Liabilities: | |
Unrealized depreciation on swap agreements | | | 54,685 | |
Payable for: | |
Securities purchased | | | 1,996,609 | |
Fund shares redeemed | | | 735,526 | |
Management fees | | | 141,074 | |
Transfer agent and administrative fees | | | 47,025 | |
Portfolio accounting fees | | | 18,652 | |
Distribution and service fees | | | 12,784 | |
Miscellaneous | | | 113,881 | |
Total liabilities | | | 3,120,236 | |
Commitments and contingent liabilities (Note 13) | | | — | |
Net assets | | $ | 270,790,656 | |
| | | | | |
Net assets consist of: | |
Paid in capital | | $ | 234,460,793 | |
Undistributed net investment income | | | 272,166 | |
Accumulated net realized gain on investments | | | 24,251,583 | |
Net unrealized appreciation on investments | | | 11,806,114 | |
Net assets | | $ | 270,790,656 | |
| | | | | |
Investor Class: | |
Net assets | | $ | 228,820,226 | |
Capital shares outstanding | | | 4,288,036 | |
Net asset value per share | | $ | 53.36 | |
| | | | | |
A-Class: | |
Net assets | | $ | 15,383,991 | |
Capital shares outstanding | | | 307,915 | |
Net asset value per share | | $ | 49.96 | |
Maximum offering price per share (Net asset value divided by 95.25%) | | $ | 52.45 | |
| | | | | |
C-Class: | |
Net assets | | $ | 9,723,748 | |
Capital shares outstanding | | | 215,113 | |
Net asset value per share | | $ | 45.20 | |
| | | | | |
H-Class: | |
Net assets | | $ | 16,862,691 | |
Capital shares outstanding | | | 337,845 | |
Net asset value per share | | $ | 49.91 | |
18 | THE RYDEX FUNDS SEMI-ANNUAL REPORT | SEE NOTES TO FINANCIAL STATEMENTS. |
STATEMENT OF OPERATIONS (Unaudited) |
Period Ended September 30, 2016 |
Investment Income: | |
Dividends from securities of unaffiliated issuers (net of foreign withholding tax of $50) | | $ | 1,353,894 | |
Dividends from securities of affiliated issuers | | | 179,116 | |
Interest | | | 98,888 | |
Total investment income | | | 1,631,898 | |
| | | | | |
Expenses: | |
Management fees | | | 771,949 | |
Transfer agent and administrative fees | | | 257,316 | |
Distribution and service fees: | | | | |
A-Class | | | 13,714 | |
C-Class | | | 47,468 | |
H-Class | | | 23,439 | |
Portfolio accounting fees | | | 102,714 | |
Custodian fees | | | 12,161 | |
Trustees’ fees* | | | 8,157 | |
Line of credit fees | | | 634 | |
Miscellaneous | | | 158,202 | |
Total expenses | | | 1,395,754 | |
Net investment income | | | 236,144 | |
| | | | | |
Net Realized and Unrealized Gain (Loss): | |
Net realized gain (loss) on: | |
Investments in unaffiliated issuers | | $ | 19,484,368 | |
Investments in affiliated issuers | | | 54,712 | |
Swap agreements | | | 7,288,690 | |
Futures contracts | | | 709,524 | |
Net realized gain | | | 27,537,294 | |
Net change in unrealized appreciation (depreciation) on: | |
Investments in unaffiliated issuers | | | (12,187,959 | ) |
Investments in affiliated issuers | | | 109,759 | |
Swap agreements | | | 912,532 | |
Futures contracts | | | 325,968 | |
Net change in unrealized appreciation (depreciation) | | | (10,839,700 | ) |
Net realized and unrealized gain | | | 16,697,594 | |
Net increase in net assets resulting from operations | | $ | 16,933,738 | |
* | Relates to Trustees not deemed “interested persons” within the meaning of Section 2(a)(19) of the 1940 Act. |
SEE NOTES TO FINANCIAL STATEMENTS. | THE RYDEX FUNDS SEMI-ANNUAL REPORT | 19 |
STATEMENTS OF CHANGES IN NET ASSETS |
| | | Period Ended
September 30,
2016
(Unaudited) | | | Year Ended
March 31,
2016 | |
Increase (Decrease) in Net Assets from Operations: | | | | | | |
Net investment income | | $ | 236,144 | | | $ | 36,022 | |
Net realized gain on investments | | | 27,537,294 | | | | 8,569,413 | |
Net change in unrealized appreciation (depreciation) on investments | | | (10,839,700 | ) | | | (9,602,834 | ) |
Net increase (decrease) in net assets resulting from operations | | | 16,933,738 | | | | (997,399 | ) |
| | | | | | | | | |
Distributions to shareholders from: | | | | | | | | |
Net investment income | | | | | | | | |
Investor Class | | | — | | | | (220,226 | ) |
Advisor Class | | | — | | | | — | * |
A-Class | | | — | | | | (16,296 | ) |
C-Class | | | — | | | | (17,646 | ) |
H-Class | | | — | | | | (6,865 | ) |
Total distributions to shareholders | | | — | | | | (261,033 | ) |
| | | | | | | | | |
Capital share transactions: | | | | | | | | |
Proceeds from sale of shares | | | | | | | | |
Investor Class | | | 851,695,893 | | | | 1,146,890,963 | |
Advisor Class | | | — | | | | 42,136,814 | * |
A-Class | | | 69,517,891 | | | | 97,617,577 | |
C-Class | | | 1,449,020 | | | | 5,328,959 | |
H-Class | | | 213,401,789 | | | | 338,809,074 | |
Distributions reinvested | | | | | | | | |
Investor Class | | | — | | | | 211,470 | |
Advisor Class | | | — | | | | — | * |
A-Class | | | — | | | | 16,174 | |
C-Class | | | — | | | | 17,443 | |
H-Class | | | — | | | | 6,864 | |
Cost of shares redeemed | | | | | | | | |
Investor Class | | | (801,226,103 | ) | | | (1,116,506,927 | ) |
Advisor Class | | | — | | | | (40,531,593 | )* |
A-Class | | | (68,526,456 | ) | | | (88,372,143 | ) |
C-Class | | | (3,502,799 | ) | | | (6,024,829 | ) |
H-Class | | | (212,426,470 | ) | | | (333,139,118 | ) |
Conversion activity* | | | | | | | | |
Advisor Class | | | — | | | | (4,895,263 | ) |
H-Class | | | — | | | | 4,895,263 | |
Net increase from capital share transactions | | | 50,382,765 | | | | 46,460,728 | |
Net increase in net assets | | | 67,316,503 | | | | 45,202,296 | |
| | | | | | | | | |
Net assets: | | | | | | | | |
Beginning of period | | | 203,474,153 | | | | 158,271,857 | |
End of period | | $ | 270,790,656 | | | $ | 203,474,153 | |
Undistributed net investment income at end of period | | $ | 272,166 | | | $ | 36,022 | |
20 | THE RYDEX FUNDS SEMI-ANNUAL REPORT | SEE NOTES TO FINANCIAL STATEMENTS. |
STATEMENTS OF CHANGES IN NET ASSETS (concluded) |
| | | Period Ended
September 30,
2016
(Unaudited) | | | Year Ended
March 31,
2016 | |
Capital share activity: | | | | | | |
Shares sold | | | | | | |
Investor Class | | | 16,699,756 | | | | 24,114,641 | |
Advisor Class | | | — | | | | 945,322 | * |
A-Class | | | 1,463,916 | | | | 2,237,941 | |
C-Class | | | 33,437 | | | | 129,164 | |
H-Class | | | 4,487,942 | | | | 7,584,301 | |
Shares issued from reinvestment of distributions | | | | | | | | |
Investor Class | | | — | | | | 4,228 | |
Advisor Class | | | — | | | | — | * |
A-Class | | | — | | | | 345 | |
C-Class | | | — | | | | 408 | |
H-Class | | | — | | | | 146 | |
Shares redeemed | | | | | | | | |
Investor Class | | | (15,763,180 | ) | | | (23,535,529 | ) |
Advisor Class | | | — | | | | (909,434 | )* |
A-Class | | | (1,451,696 | ) | | | (2,027,298 | ) |
C-Class | | | (83,237 | ) | | | (146,842 | ) |
H-Class | | | (4,452,696 | ) | | | (7,436,202 | ) |
Conversion activity* | | | | | | | | |
Advisor Class | | | — | | | | (121,453 | ) |
H-Class | | | — | | | | 117,885 | |
Net increase in shares | | | 934,242 | | | | 957,623 | |
* | Effective September 30, 2015, all outstanding Advisor Class shares converted into H-Class shares — See Note 11. |
SEE NOTES TO FINANCIAL STATEMENTS. | THE RYDEX FUNDS SEMI-ANNUAL REPORT | 21 |
This table is presented to show selected data for a share outstanding throughout each period and to assist shareholders in evaluating a Fund’s performance for the periods presented.
Investor Class | | Period Ended
September 30,
2016a | | | Year Ended
March 31,
2016 | | | Year Ended
March 31,
2015 | | | Year Ended
March 31,
2014 | | | Year Ended
March 28,
2013 | | | Year Ended
March 31,
2012 | |
Per Share Data | | | | | | | | | | | | | | | | | | |
Net asset value, beginning of period | | $ | 49.18 | | | $ | 49.42 | | | $ | 42.15 | | | $ | 32.05 | | | $ | 26.82 | | | $ | 24.59 | |
Income (loss) from investment operations: | |
Net investment income (loss)b | | | .08 | | | | .07 | | | | .14 | | | | .14 | | | | .05 | | | | .08 | |
Net gain (loss) on investments (realized and unrealized) | | | 4.10 | | | | (.25 | ) | | | 7.18 | | | | 9.96 | | | | 5.21 | | | | 2.15 | |
Total from investment operations | | | 4.18 | | | | (.18 | ) | | | 7.32 | | | | 10.10 | | | | 5.26 | | | | 2.23 | |
Less distributions from: | |
Net investment income | | | — | | | | (.06 | ) | | | (.05 | ) | | | — | | | | (.03 | ) | | | — | |
Total distributions | | | — | | | | (.06 | ) | | | (.05 | ) | | | — | | | | (.03 | ) | | | — | |
Net asset value, end of period | | $ | 53.36 | | | $ | 49.18 | | | $ | 49.42 | | | $ | 42.15 | | | $ | 32.05 | | | $ | 26.82 | |
| | |
Total Returnc | | | 8.50 | % | | | (0.36 | %) | | | 17.36 | % | | | 31.51 | % | | | 19.62 | % | | | 9.07 | % |
Ratios/Supplemental Data | |
Net assets, end of period (in thousands) | | $ | 228,820 | | | $ | 164,820 | | | $ | 136,800 | | | $ | 103,254 | | | $ | 52,785 | | | $ | 54,598 | |
Ratios to average net assets: | |
Net investment income (loss) | | | 0.32 | % | | | 0.14 | % | | | 0.31 | % | | | 0.37 | % | | | 0.20 | % | | | 0.36 | % |
Total expensesd | | | 1.27 | % | | | 1.25 | % | | | 1.27 | % | | | 1.28 | % | | | 1.26 | % | | | 1.26 | % |
Portfolio turnover rate | | | 427 | % | | | 619 | % | | | 403 | % | | | 259 | % | | | 137 | % | | | 116 | % |
A-Class | | Period Ended
September 30,
2016a | | | Year Ended
March 31,
2016 | | | Year Ended
March 31,
2015 | | | Year Ended
March 31,
2014 | | | Year Ended
March 28,
2013 | | | Year Ended
March 31,
2012 | |
Per Share Data | | | | | | | | | | | | | | | | | | |
Net asset value, beginning of period | | $ | 46.08 | | | $ | 46.40 | | | $ | 39.67 | | | $ | 30.23 | | | $ | 25.38 | | | $ | 23.32 | |
Income (loss) from investment operations: | |
Net investment income (loss)b | | | .03 | | | | (.05 | ) | | | .02 | | | | .05 | | | | (.01 | ) | | | .01 | |
Net gain (loss) on investments (realized and unrealized) | | | 3.85 | | | | (.21 | ) | | | 6.76 | | | | 9.39 | | | | 4.89 | | | | 2.05 | |
Total from investment operations | | | 3.88 | | | | (.26 | ) | | | 6.78 | | | | 9.44 | | | | 4.88 | | | | 2.06 | |
Less distributions from: | |
Net investment income | | | — | | | | (.06 | ) | | | (.05 | ) | | | — | | | | (.03 | ) | | | — | |
Total distributions | | | — | | | | (.06 | ) | | | (.05 | ) | | | — | | | | (.03 | ) | | | — | |
Net asset value, end of period | | $ | 49.96 | | | $ | 46.08 | | | $ | 46.40 | | | $ | 39.67 | | | $ | 30.23 | | | $ | 25.38 | |
| | |
Total Returnc | | | 8.42 | % | | | (0.56 | %) | | | 17.09 | % | | | 31.23 | % | | | 19.28 | % | | | 8.79 | % |
Ratios/Supplemental Data | |
Net assets, end of period (in thousands) | | $ | 15,384 | | | $ | 13,626 | | | $ | 3,930 | | | $ | 1,237 | | | $ | 1,189 | | | $ | 1,472 | |
Ratios to average net assets: | |
Net investment income (loss) | | | 0.10 | % | | | (0.11 | %) | | | 0.05 | % | | | 0.14 | % | | | (0.04 | %) | | | 0.06 | % |
Total expensesd | | | 1.52 | % | | | 1.51 | % | | | 1.52 | % | | | 1.53 | % | | | 1.50 | % | | | 1.51 | % |
Portfolio turnover rate | | | 427 | % | | | 619 | % | | | 403 | % | | | 259 | % | | | 137 | % | | | 116 | % |
22 | THE RYDEX FUNDS SEMI-ANNUAL REPORT | SEE NOTES TO FINANCIAL STATEMENTS. |
FINANCIAL HIGHLIGHTS (concluded) |
This table is presented to show selected data for a share outstanding throughout each period and to assist shareholders in evaluating a Fund’s performance for the periods presented.
C-Class | | Period Ended
September 30,
2016a | | | Year Ended
March 31,
2016 | | | Year Ended
March 31,
2015 | | | Year Ended
March 31,
2014 | | | Year Ended
March 28,
2013 | | | Year Ended
March 31,
2012 | |
Per Share Data | | | | | | | | | | | | | | | | | | |
Net asset value, beginning of period | | $ | 41.86 | | | $ | 42.50 | | | $ | 36.62 | | | $ | 28.11 | | | $ | 23.77 | | | $ | 22.01 | |
Income (loss) from investment operations: | |
Net investment income (loss)b | | | (.16 | ) | | | (.34 | ) | | | (.28 | ) | | | (.20 | ) | | | (.19 | ) | | | (.13 | ) |
Net gain (loss) on investments (realized and unrealized) | | | 3.50 | | | | (.24 | ) | | | 6.21 | | | | 8.71 | | | | 4.56 | | | | 1.89 | |
Total from investment operations | | | 3.34 | | | | (.58 | ) | | | 5.93 | | | | 8.51 | | | | 4.37 | | | | 1.76 | |
Less distributions from: | |
Net investment income | | | — | | | | (.06 | ) | | | (.05 | ) | | | — | | | | (.03 | ) | | | — | |
Total distributions | | | — | | | | (.06 | ) | | | (.05 | ) | | | — | | | | (.03 | ) | | | — | |
Net asset value, end of period | | $ | 45.20 | | | $ | 41.86 | | | $ | 42.50 | | | $ | 36.62 | | | $ | 28.11 | | | $ | 23.77 | |
| | |
Total Returnc | | | 7.98 | % | | | (1.36 | %) | | | 16.19 | % | | | 30.27 | % | | | 18.39 | % | | | 8.00 | % |
Ratios/Supplemental Data | |
Net assets, end of period (in thousands) | | $ | 9,724 | | | $ | 11,090 | | | $ | 11,993 | | | $ | 10,394 | | | $ | 8,705 | | | $ | 8,829 | |
Ratios to average net assets: | |
Net investment income (loss) | | | (0.71 | %) | | | (0.83 | %) | | | (0.70 | %) | | | (0.62 | %) | | | (0.79 | %) | | | (0.62 | %) |
Total expensesd | | | 2.27 | % | | | 2.26 | % | | | 2.27 | % | | | 2.28 | % | | | 2.25 | % | | | 2.26 | % |
Portfolio turnover rate | | | 427 | % | | | 619 | % | | | 403 | % | | | 259 | % | | | 137 | % | | | 116 | % |
H-Class | | Period Ended
September 30,
2016a | | | Year Ended
March 31,
2016 | | | Period Ended
March 31,
2015e | |
Per Share Data | | | | | | | | | |
Net asset value, beginning of period | | $ | 46.06 | | | $ | 46.40 | | | $ | 44.40 | |
Income (loss) from investment operations: | |
Net investment income (loss)b | | | — | f | | | (.06 | ) | | | .02 | |
Net gain (loss) on investments (realized and unrealized) | | | 3.85 | | | | (.22 | ) | | | 2.03 | |
Total from investment operations | | | 3.85 | | | | (.28 | ) | | | 2.05 | |
Less distributions from: | |
Net investment income | | | — | | | | (.06 | ) | | | (.05 | ) |
Total distributions | | | — | | | | (.06 | ) | | | (.05 | ) |
Net asset value, end of period | | $ | 49.91 | | | $ | 46.06 | | | $ | 46.40 | |
| | |
Total Returnc | | | 8.36 | % | | | (0.60 | %) | | | 4.61 | % |
Ratios/Supplemental Data | |
Net assets, end of period (in thousands) | | $ | 16,863 | | | $ | 13,938 | | | $ | 1,692 | |
Ratios to average net assets: | |
Net investment income (loss) | | | (0.02 | %) | | | (0.14 | %) | | | 0.08 | % |
Total expensesd | | | 1.52 | % | | | 1.51 | % | | | 1.51 | % |
Portfolio turnover rate | | | 427 | % | | | 619 | % | | | 403 | % |
a | Unaudited figures for the period ended September 30, 2016. Percentage amounts for the period, except total return and portfolio turnover rate, have been annualized. |
b | Net investment income (loss) per share was computed using average shares outstanding throughout the period. |
c | Total return does not reflect the impact of any applicable sales charges. |
d | Does not include expenses of the underlying funds in which the Fund invests. |
e | Since commencement of operations: September 18, 2014. Percentage amounts for the period, except total return and portfolio turnover rate, have been annualized. The portfolio turnover rate stated is for the entire period of the Fund, not since the commencement of operations of the Class. |
f | Net investment income is less than $0.01 per share. |
SEE NOTES TO FINANCIAL STATEMENTS. | THE RYDEX FUNDS SEMI-ANNUAL REPORT | 23 |
FUND PROFILE (Unaudited) | September 30, 2016 |
S&P 500® FUND
OBJECTIVE: Seeks to provide investment results that match, before fees and expenses, the performance of a specific benchmark on a daily basis. The Fund’s current benchmark is the S&P 500® Index (the “underlying index”).
Holdings Diversification (Market Exposure as % of Net Assets)
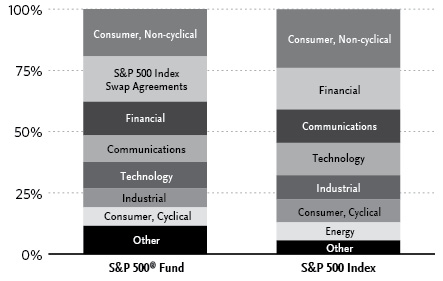
“Holdings Diversification (Market Exposure as % of Net Assets)” excludes any temporary cash investments.
Inception Dates: |
A-Class | May 31, 2006 |
C-Class | May 31, 2006 |
H-Class | May 31, 2006 |
Ten Largest Holdings (% of Total Net Assets) |
Apple, Inc. | 2.6% |
Alphabet, Inc. | 2.0% |
Microsoft Corp. | 1.9% |
Exxon Mobil Corp. | 1.6% |
Amazon.com, Inc. | 1.4% |
Johnson & Johnson | 1.4% |
Facebook, Inc. — Class A | 1.3% |
Berkshire Hathaway, Inc. — Class B | 1.2% |
General Electric Co. | 1.1% |
AT&T, Inc. | 1.1% |
Top Ten Total | 15.6% |
| | |
“Ten Largest Holdings” excludes any temporary cash or derivative investments. |
24 | THE RYDEX FUNDS SEMI-ANNUAL REPORT | |
SCHEDULE OF INVESTMENTS (Unaudited) | September 30, 2016 |
S&P 500® FUND | |
| | | Shares | | | Value | |
| | | | | | | |
COMMON STOCKS† - 80.6% | |
| | | | | | | |
Consumer, Non-cyclical - 19.3% | |
Johnson & Johnson | | | 25,369 | | | $ | 2,996,840 | |
Procter & Gamble Co. | | | 24,745 | | | | 2,220,864 | |
Pfizer, Inc. | | | 56,242 | | | | 1,904,917 | |
Merck & Company, Inc. | | | 25,639 | | | | 1,600,130 | |
Coca-Cola Co. | | | 36,017 | | | | 1,524,239 | |
PepsiCo, Inc. | | | 13,345 | | | | 1,451,536 | |
Philip Morris International, Inc. | | | 14,384 | | | | 1,398,412 | |
UnitedHealth Group, Inc. | | | 8,833 | | | | 1,236,620 | |
Amgen, Inc. | | | 6,940 | | | | 1,157,662 | |
Altria Group, Inc. | | | 18,118 | | | | 1,145,601 | |
Medtronic plc | | | 12,814 | | | | 1,107,129 | |
Gilead Sciences, Inc. | | | 12,236 | | | | 968,112 | |
AbbVie, Inc. | | | 15,100 | | | | 952,357 | |
Allergan plc* | | | 3,672 | | | | 845,698 | |
Bristol-Myers Squibb Co. | | | 15,492 | | | | 835,329 | |
Celgene Corp.* | | | 7,187 | | | | 751,257 | |
Eli Lilly & Co. | | | 9,007 | | | | 722,902 | |
Biogen, Inc.* | | | 2,033 | | | | 636,390 | |
Mondelez International, Inc. — Class A | | | 14,423 | | | | 633,169 | |
Colgate-Palmolive Co. | | | 8,267 | | | | 612,915 | |
Thermo Fisher Scientific, Inc. | | | 3,656 | | | | 581,523 | |
Abbott Laboratories | | | 13,631 | | | | 576,455 | |
Kraft Heinz Co. | | | 5,525 | | | | 494,542 | |
Danaher Corp. | | | 5,634 | | | | 441,649 | |
PayPal Holdings, Inc.* | | | 10,407 | | | | 426,375 | |
Kimberly-Clark Corp. | | | 3,335 | | | | 420,677 | |
Express Scripts Holding Co.* | | | 5,844 | | | | 412,177 | |
Aetna, Inc. | | | 3,253 | | | | 375,559 | |
Automatic Data Processing, Inc. | | | 4,231 | | | | 373,174 | |
Reynolds American, Inc. | | | 7,677 | | | | 361,971 | |
Becton Dickinson and Co. | | | 1,974 | | | | 354,787 | |
General Mills, Inc. | | | 5,536 | | | | 353,640 | |
McKesson Corp. | | | 2,093 | | | | 349,007 | |
Stryker Corp. | | | 2,881 | | | | 335,377 | |
Cigna Corp. | | | 2,379 | | | | 310,031 | |
S&P Global, Inc. | | | 2,448 | | | | 309,819 | |
Anthem, Inc. | | | 2,440 | | | | 305,756 | |
Boston Scientific Corp.* | | | 12,617 | | | | 300,285 | |
Ecolab, Inc. | | | 2,433 | | | | 296,145 | |
Regeneron Pharmaceuticals, Inc.* | | | 700 | | | | 281,414 | |
Constellation Brands, Inc. — Class A | | | 1,643 | | | | 273,543 | |
Kroger Co. | | | 8,800 | | | | 261,184 | |
Intuitive Surgical, Inc.* | | | 357 | | | | 258,764 | |
Alexion Pharmaceuticals, Inc.* | | | 2,081 | | | | 255,006 | |
Illumina, Inc.* | | | 1,359 | | | | 246,876 | |
Humana, Inc. | | | 1,382 | | | | 244,462 | |
Zimmer Biomet Holdings, Inc. | | | 1,855 | | | | 241,187 | |
Zoetis, Inc. | | | 4,592 | | | | 238,830 | |
Edwards Lifesciences Corp.* | | | 1,975 | | | | 238,106 | |
Sysco Corp. | | | 4,735 | | | | 232,062 | |
Cardinal Health, Inc. | | | 2,954 | | | | 229,526 | |
Archer-Daniels-Midland Co. | | | 5,396 | | | | 227,549 | |
Baxter International, Inc. | | | 4,539 | | | | 216,056 | |
St. Jude Medical, Inc. | | | 2,642 | | | | 210,726 | |
HCA Holdings, Inc.* | | | 2,739 | | | | 207,150 | |
Tyson Foods, Inc. — Class A | | | 2,759 | | | | 206,015 | |
Vertex Pharmaceuticals, Inc.* | | | 2,297 | | | | 200,321 | |
Molson Coors Brewing Co. — Class B | | | 1,709 | | | | 187,648 | |
Monster Beverage Corp.* | | | 1,254 | | | | 184,100 | |
ConAgra Foods, Inc. | | | 3,865 | | | | 182,080 | |
Estee Lauder Companies, Inc. — Class A | | | 2,049 | | | | 181,459 | |
Kellogg Co. | | | 2,339 | | | | 181,202 | |
Moody’s Corp. | | | 1,551 | | | | 167,942 | |
Nielsen Holdings plc | | | 3,115 | | | | 166,871 | |
Mylan N.V.* | | | 4,266 | | | | 162,620 | |
Dr Pepper Snapple Group, Inc. | | | 1,719 | | | | 156,962 | |
CR Bard, Inc. | | | 681 | | | | 152,735 | |
Clorox Co. | | | 1,200 | | | | 150,216 | |
Equifax, Inc. | | | 1,106 | | | | 148,845 | |
JM Smucker Co. | | | 1,080 | | | | 146,383 | |
AmerisourceBergen Corp. — Class A | | | 1,678 | | | | 135,549 | |
Mead Johnson Nutrition Co. — Class A | | | 1,712 | | | | 135,265 | |
Laboratory Corporation of America Holdings* | | | 949 | | | | 130,469 | |
DENTSPLY SIRONA, Inc. | | | 2,161 | | | | 128,428 | |
Hershey Co. | | | 1,301 | | | | 124,376 | |
Henry Schein, Inc.* | | | 758 | | | | 123,539 | |
Perrigo Company plc | | | 1,329 | | | | 122,707 | |
Verisk Analytics, Inc. — Class A* | | | 1,458 | | | | 118,506 | |
Church & Dwight Company, Inc. | | | 2,389 | | | | 114,481 | |
Global Payments, Inc. | | | 1,426 | | | | 109,460 | |
Quest Diagnostics, Inc. | | | 1,289 | | | | 109,088 | |
McCormick & Company, Inc. | | | 1,068 | | | | 106,715 | |
Centene Corp.* | | | 1,583 | | | | 105,998 | |
Universal Health Services, Inc. — Class B | | | 835 | | | | 102,889 | |
DaVita, Inc.* | | | 1,535 | | | | 101,417 | |
Hologic, Inc.* | | | 2,573 | | | | 99,910 | |
Campbell Soup Co. | | | 1,803 | | | | 98,624 | |
Hormel Foods Corp. | | | 2,506 | | | | 95,053 | |
Western Union Co. | | | 4,522 | | | | 94,148 | |
Cintas Corp. | | | 793 | | | | 89,292 | |
Varian Medical Systems, Inc.* | | | 866 | | | | 86,193 | |
Whole Foods Market, Inc. | | | 2,956 | | | | 83,803 | |
Cooper Companies, Inc. | | | 452 | | | | 81,026 | |
Brown-Forman Corp. — Class B | | | 1,691 | | | | 80,221 | |
Total System Services, Inc. | | | 1,535 | | | | 72,375 | |
Mallinckrodt plc* | | | 999 | | | | 69,710 | |
Avery Dennison Corp. | | | 825 | | | | 64,177 | |
United Rentals, Inc.* | | | 799 | | | | 62,714 | |
H&R Block, Inc. | | | 2,032 | | | | 47,041 | |
Robert Half International, Inc. | | | 1,207 | | | | 45,697 | |
Quanta Services, Inc.* | | | 1,401 | | | | 39,214 | |
Endo International plc* | | | 1,838 | | | | 37,036 | |
Patterson Companies, Inc. | | | 773 | | | | 35,512 | |
Coty, Inc. — Class A* | | | 644 | | | | 15,134 | |
Total Consumer, Non-cyclical | | | | | | | 41,584,635 | |
| | | | | | | | | |
Financial - 13.6% | |
Berkshire Hathaway, Inc. — Class B* | | | 17,604 | | | | 2,543,250 | |
JPMorgan Chase & Co. | | | 33,492 | | | | 2,230,231 | |
Wells Fargo & Co. | | | 42,105 | | | | 1,864,410 | |
SEE NOTES TO FINANCIAL STATEMENTS. | THE RYDEX FUNDS SEMI-ANNUAL REPORT | 25 |
SCHEDULE OF INVESTMENTS (Unaudited)(continued) | September 30, 2016 |
S&P 500® FUND | |
| | | Shares | | | Value | |
| | | | | | | |
Bank of America Corp. | | | 94,624 | | | $ | 1,480,866 | |
Visa, Inc. — Class A | | | 17,492 | | | | 1,446,589 | |
Citigroup, Inc. | | | 26,940 | | | | 1,272,376 | |
Mastercard, Inc. — Class A | | | 8,892 | | | | 904,939 | |
U.S. Bancorp | | | 14,917 | | | | 639,790 | |
Simon Property Group, Inc. | | | 2,914 | | | | 603,227 | |
Goldman Sachs Group, Inc. | | | 3,497 | | | | 563,961 | |
American International Group, Inc. | | | 9,431 | | | | 559,636 | |
Chubb Ltd. | | | 4,312 | | | | 541,803 | |
American Express Co. | | | 7,195 | | | | 460,768 | |
MetLife, Inc. | | | 10,189 | | | | 452,697 | |
American Tower Corp. — Class A | | | 3,945 | | | | 447,088 | |
Morgan Stanley | | | 13,650 | | | | 437,619 | |
PNC Financial Services Group, Inc. | | | 4,557 | | | | 410,541 | |
BlackRock, Inc. — Class A | | | 1,132 | | | | 410,304 | |
Bank of New York Mellon Corp. | | | 9,900 | | | | 394,812 | |
Charles Schwab Corp. | | | 11,163 | | | | 352,416 | |
Capital One Financial Corp. | | | 4,692 | | | | 337,026 | |
Prudential Financial, Inc. | | | 4,052 | | | | 330,846 | |
CME Group, Inc. — Class A | | | 3,142 | | | | 328,402 | |
Marsh & McLennan Companies, Inc. | | | 4,806 | | | | 323,204 | |
Public Storage | | | 1,383 | | | | 308,602 | |
Travelers Companies, Inc. | | | 2,674 | | | | 306,307 | |
Intercontinental Exchange, Inc. | | | 1,105 | | | | 297,643 | |
Crown Castle International Corp. | | | 3,130 | | | | 294,877 | |
BB&T Corp. | | | 7,552 | | | | 284,861 | |
Aon plc | | | 2,464 | | | | 277,175 | |
Aflac, Inc. | | | 3,798 | | | | 272,962 | |
Prologis, Inc. | | | 4,886 | | | | 261,596 | |
Welltower, Inc. | | | 3,319 | | | | 248,161 | |
Allstate Corp. | | | 3,445 | | | | 238,325 | |
Equinix, Inc. | | | 660 | | | | 237,765 | |
State Street Corp. | | | 3,399 | | | | 236,672 | |
Ventas, Inc. | | | 3,258 | | | | 230,113 | |
AvalonBay Communities, Inc. | | | 1,274 | | | | 226,568 | |
Weyerhaeuser Co. | | | 6,943 | | | | 221,759 | |
Equity Residential | | | 3,390 | | | | 218,079 | |
Discover Financial Services | | | 3,743 | | | | 211,667 | |
Synchrony Financial | | | 7,346 | | | | 205,688 | |
SunTrust Banks, Inc. | | | 4,650 | | | | 203,670 | |
Boston Properties, Inc. | | | 1,425 | | | | 194,213 | |
Progressive Corp. | | | 5,396 | | | | 169,974 | |
M&T Bank Corp. | | | 1,454 | | | | 168,809 | |
HCP, Inc. | | | 4,335 | | | | 164,513 | |
Vornado Realty Trust | | | 1,593 | | | | 161,228 | |
Realty Income Corp. | | | 2,397 | | | | 160,431 | |
Willis Towers Watson plc | | | 1,203 | | | | 159,722 | |
T. Rowe Price Group, Inc. | | | 2,305 | | | | 153,283 | |
Hartford Financial Services Group, Inc. | | | 3,579 | | | | 153,253 | |
General Growth Properties, Inc. | | | 5,414 | | | | 149,426 | |
Ameriprise Financial, Inc. | | | 1,497 | | | | 149,356 | |
Fifth Third Bancorp | | | 7,106 | | | | 145,389 | |
Essex Property Trust, Inc. | | | 607 | | | | 135,179 | |
Northern Trust Corp. | | | 1,976 | | | | 134,348 | |
Digital Realty Trust, Inc. | | | 1,362 | | | | 132,277 | |
Principal Financial Group, Inc. | | | 2,481 | | | | 127,796 | |
KeyCorp | | | 10,035 | | | | 122,126 | |
Citizens Financial Group, Inc. | | | 4,817 | | | | 119,028 | |
Invesco Ltd. | | | 3,802 | | | | 118,889 | |
Alliance Data Systems Corp.* | | | 544 | | | | 116,704 | |
Franklin Resources, Inc. | | | 3,259 | | | | 115,923 | |
Regions Financial Corp. | | | 11,639 | | | | 114,877 | |
Kimco Realty Corp. | | | 3,895 | | | | 112,760 | |
Host Hotels & Resorts, Inc. | | | 6,885 | | | | 107,199 | |
Loews Corp. | | | 2,563 | | | | 105,467 | |
Cincinnati Financial Corp. | | | 1,389 | | | | 104,758 | |
Lincoln National Corp. | | | 2,158 | | | | 101,383 | |
Federal Realty Investment Trust | | | 657 | | | | 101,132 | |
SL Green Realty Corp. | | | 932 | | | | 100,749 | |
Huntington Bancshares, Inc. | | | 10,065 | | | | 99,241 | |
Extra Space Storage, Inc. | | | 1,166 | | | | 92,592 | |
Macerich Co. | | | 1,119 | | | | 90,494 | |
UDR, Inc. | | | 2,476 | | | | 89,111 | |
XL Group Ltd. | | | 2,550 | | | | 85,757 | |
Iron Mountain, Inc. | | | 2,271 | | | | 85,231 | |
Arthur J Gallagher & Co. | | | 1,641 | | | | 83,478 | |
CBRE Group, Inc. — Class A* | | | 2,770 | | | | 77,505 | |
Unum Group | | | 2,176 | | | | 76,835 | |
Comerica, Inc. | | | 1,613 | | | | 76,327 | |
E*TRADE Financial Corp.* | | | 2,538 | | | | 73,907 | |
Affiliated Managers Group, Inc.* | | | 500 | | | | 72,350 | |
Nasdaq, Inc. | | | 1,059 | | | | 71,525 | |
Apartment Investment & Management Co. — Class A | | | 1,452 | | | | 66,661 | |
Torchmark Corp. | | | 1,033 | | | | 65,998 | |
Zions Bancorporation | | | 1,902 | | | | 59,000 | |
Assurant, Inc. | | | 559 | | | | 51,568 | |
People’s United Financial, Inc. | | | 2,884 | | | | 45,625 | |
Navient Corp. | | | 2,940 | | | | 42,542 | |
Legg Mason, Inc. | | | 855 | | | | 28,625 | |
Total Financial | | | | | | | 29,453,855 | |
| | | | | | | | | |
Communications - 11.0% | |
Amazon.com, Inc.* | | | 3,651 | | | | 3,057,019 | |
Facebook, Inc. — Class A* | | | 21,539 | | | | 2,762,807 | |
AT&T, Inc. | | | 57,045 | | | | 2,316,598 | |
Alphabet, Inc. — Class A* | | | 2,734 | | | | 2,198,300 | |
Alphabet, Inc. — Class C* | | | 2,740 | | | | 2,129,775 | |
Verizon Communications, Inc. | | | 37,798 | | | | 1,964,740 | |
Cisco Systems, Inc. | | | 46,637 | | | | 1,479,326 | |
Comcast Corp. — Class A | | | 22,276 | | | | 1,477,789 | |
Walt Disney Co. | | | 13,709 | | | | 1,273,017 | |
Priceline Group, Inc.* | | | 461 | | | | 678,357 | |
Time Warner, Inc. | | | 7,212 | | | | 574,147 | |
Charter Communications, Inc. — Class A* | | | 2,010 | | | | 542,640 | |
Netflix, Inc.* | | | 3,977 | | | | 391,933 | |
Yahoo!, Inc.* | | | 8,120 | | | | 349,972 | |
eBay, Inc.* | | | 9,736 | | | | 320,314 | |
Twenty-First Century Fox, Inc. — Class A | | | 9,866 | | | | 238,955 | |
CBS Corp. — Class B | | | 3,774 | | | | 206,589 | |
Omnicom Group, Inc. | | | 2,193 | | | | 186,405 | |
Symantec Corp. | | | 5,708 | | | | 143,271 | |
CenturyLink, Inc. | | | 5,062 | | | | 138,851 | |
26 | THE RYDEX FUNDS SEMI-ANNUAL REPORT | SEE NOTES TO FINANCIAL STATEMENTS. |
SCHEDULE OF INVESTMENTS (Unaudited)(continued) | September 30, 2016 |
S&P 500® FUND | |
| | | Shares | | | Value | |
| | | | | | | |
Expedia, Inc. | | | 1,118 | | | $ | 130,493 | |
Level 3 Communications, Inc.* | | | 2,700 | | | | 125,226 | |
Viacom, Inc. — Class B | | | 3,219 | | | | 122,644 | |
Motorola Solutions, Inc. | | | 1,547 | | | | 118,005 | |
Twenty-First Century Fox, Inc. — Class B | | | 4,516 | | | | 111,726 | |
Juniper Networks, Inc. | | | 3,553 | | | | 85,485 | |
Interpublic Group of Companies, Inc. | | | 3,715 | | | | 83,030 | |
F5 Networks, Inc.* | | | 614 | | | | 76,529 | |
VeriSign, Inc.* | | | 861 | | | | 67,365 | |
TripAdvisor, Inc.* | | | 1,059 | | | | 66,908 | |
Scripps Networks Interactive, Inc. — Class A | | | 883 | | | | 56,062 | |
Discovery Communications, Inc. — Class C* | | | 2,080 | | | | 54,725 | |
News Corp. — Class A | | | 3,528 | | | | 49,321 | |
Frontier Communications Corp. | | | 10,878 | | | | 45,252 | |
TEGNA, Inc. | | | 1,987 | | | | 43,436 | |
Discovery Communications, Inc. — Class A* | | | 1,399 | | | | 37,661 | |
News Corp. — Class B | | | 1,112 | | | | 15,813 | |
Total Communications | | | | | | | 23,720,486 | |
| | | | | | | | | |
Technology - 10.7% | |
Apple, Inc. | | | 49,965 | | | | 5,648,544 | |
Microsoft Corp. | | | 72,254 | | | | 4,161,831 | |
Intel Corp. | | | 43,867 | | | | 1,655,980 | |
International Business Machines Corp. | | | 8,066 | | | | 1,281,284 | |
Oracle Corp. | | | 27,906 | | | | 1,096,148 | |
QUALCOMM, Inc. | | | 13,664 | | | | 935,984 | |
Accenture plc — Class A | | | 5,772 | | | | 705,165 | |
Texas Instruments, Inc. | | | 9,302 | | | | 652,814 | |
Broadcom Ltd. | | | 3,668 | | | | 632,803 | |
Adobe Systems, Inc.* | | | 4,620 | | | | 501,454 | |
salesforce.com, Inc.* | | | 5,971 | | | | 425,911 | |
Hewlett Packard Enterprise Co. | | | 15,408 | | | | 350,532 | |
NVIDIA Corp. | | | 4,961 | | | | 339,928 | |
Applied Materials, Inc. | | | 10,023 | | | | 302,193 | |
Activision Blizzard, Inc. | | | 6,325 | | | | 280,197 | |
Cognizant Technology Solutions Corp. — Class A* | | | 5,628 | | | | 268,512 | |
Intuit, Inc. | | | 2,273 | | | | 250,053 | |
HP, Inc. | | | 15,865 | | | | 246,383 | |
Electronic Arts, Inc.* | | | 2,789 | | | | 238,181 | |
Fidelity National Information Services, Inc. | | | 3,040 | | | | 234,172 | |
Fiserv, Inc.* | | | 2,039 | | | | 202,819 | |
Analog Devices, Inc. | | | 2,851 | | | | 183,747 | |
Paychex, Inc. | | | 2,975 | | | | 172,163 | |
Cerner Corp.* | | | 2,787 | | | | 172,097 | |
Micron Technology, Inc.* | | | 9,629 | | | | 171,204 | |
Western Digital Corp. | | | 2,636 | | | | 154,126 | |
Lam Research Corp. | | | 1,486 | | | | 140,739 | |
Red Hat, Inc.* | | | 1,680 | | | | 135,794 | |
Skyworks Solutions, Inc. | | | 1,738 | | | | 132,331 | |
Linear Technology Corp. | | | 2,223 | | | | 131,802 | |
Autodesk, Inc.* | | | 1,811 | | | | 130,990 | |
Xilinx, Inc. | | | 2,350 | | | | 127,699 | |
Microchip Technology, Inc. | | | 1,996 | | | | 124,031 | |
Citrix Systems, Inc.* | | | 1,445 | | | | 123,143 | |
Seagate Technology plc | | | 2,770 | | | | 106,784 | |
KLA-Tencor Corp. | | | 1,446 | | | | 100,801 | |
CA, Inc. | | | 2,913 | | | | 96,362 | |
NetApp, Inc. | | | 2,584 | | | | 92,559 | |
Akamai Technologies, Inc.* | | | 1,622 | | | | 85,950 | |
Xerox Corp. | | | 7,892 | | | | 79,946 | |
Qorvo, Inc.* | | | 1,186 | | | | 66,108 | |
Dun & Bradstreet Corp. | | | 337 | | | | 46,041 | |
Teradata Corp.* | | | 1,209 | | | | 37,479 | |
CSRA, Inc. | | | 1,350 | | | | 36,315 | |
Pitney Bowes, Inc. | | | 1,721 | | | | 31,253 | |
Total Technology | | | | | | | 23,090,352 | |
| | | | | | | | | |
Industrial - 7.7% | |
General Electric Co. | | | 83,092 | | | | 2,461,186 | |
3M Co. | | | 5,604 | | | | 987,593 | |
Honeywell International, Inc. | | | 7,055 | | | | 822,542 | |
Union Pacific Corp. | | | 7,723 | | | | 753,224 | |
United Technologies Corp. | | | 7,217 | | | | 733,247 | |
Boeing Co. | | | 5,380 | | | | 708,761 | |
United Parcel Service, Inc. — Class B | | | 6,410 | | | | 700,997 | |
Lockheed Martin Corp. | | | 2,341 | | | | 561,185 | |
Caterpillar, Inc. | | | 5,418 | | | | 480,955 | |
General Dynamics Corp. | | | 2,661 | | | | 412,881 | |
FedEx Corp. | | | 2,265 | | | | 395,650 | |
Raytheon Co. | | | 2,736 | | | | 372,452 | |
Illinois Tool Works, Inc. | | | 2,963 | | | | 355,087 | |
Northrop Grumman Corp. | | | 1,656 | | | | 354,301 | |
Emerson Electric Co. | | | 5,969 | | | | 325,369 | |
Eaton Corporation plc | | | 4,216 | | | | 277,034 | |
CSX Corp. | | | 8,772 | | | | 267,546 | |
Norfolk Southern Corp. | | | 2,722 | | | | 264,197 | |
Waste Management, Inc. | | | 3,774 | | | | 240,631 | |
Deere & Co. | | | 2,682 | | | | 228,909 | |
Corning, Inc. | | | 9,615 | | | | 227,395 | |
TE Connectivity Ltd. | | | 3,297 | | | | 212,261 | |
Amphenol Corp. — Class A | | | 2,863 | | | | 185,866 | |
Cummins, Inc. | | | 1,439 | | | | 184,408 | |
Stanley Black & Decker, Inc. | | | 1,395 | | | | 171,557 | |
Roper Technologies, Inc. | | | 940 | | | | 171,522 | |
Ingersoll-Rand plc | | | 2,393 | | | | 162,580 | |
Parker-Hannifin Corp. | | | 1,242 | | | | 155,908 | |
Rockwell Automation, Inc. | | | 1,200 | | | | 146,808 | |
Agilent Technologies, Inc. | | | 3,018 | | | | 142,117 | |
Vulcan Materials Co. | | | 1,235 | | | | 140,456 | |
TransDigm Group, Inc.* | | | 465 | | | | 134,441 | |
Ball Corp. | | | 1,617 | | | | 132,513 | |
Waters Corp.* | | | 747 | | | | 118,392 | |
WestRock Co. | | | 2,332 | | | | 113,055 | |
Republic Services, Inc. — Class A | | | 2,162 | | | | 109,073 | |
Acuity Brands, Inc. | | | 408 | | | | 107,957 | |
L-3 Communications Holdings, Inc. | | | 716 | | | | 107,923 | |
Dover Corp. | | | 1,439 | | | | 105,968 | |
Harris Corp. | | | 1,153 | | | | 105,626 | |
Martin Marietta Materials, Inc. | | | 589 | | | | 105,496 | |
SEE NOTES TO FINANCIAL STATEMENTS. | THE RYDEX FUNDS SEMI-ANNUAL REPORT | 27 |
SCHEDULE OF INVESTMENTS (Unaudited)(continued) | September 30, 2016 |
S&P 500® FUND | |
| | | Shares | | | Value | |
| | | | | | | |
Masco Corp. | | | 3,062 | | | $ | 105,057 | |
Mettler-Toledo International, Inc.* | | | 246 | | | | 103,278 | |
AMETEK, Inc. | | | 2,156 | | | | 103,014 | |
Rockwell Collins, Inc. | | | 1,205 | | | | 101,630 | |
Textron, Inc. | | | 2,500 | | | | 99,375 | |
Pentair plc | | | 1,545 | | | | 99,251 | |
Kansas City Southern | | | 1,002 | | | | 93,507 | |
CH Robinson Worldwide, Inc. | | | 1,323 | | | | 93,219 | |
Xylem, Inc. | | | 1,661 | | | | 87,119 | |
Expeditors International of Washington, Inc. | | | 1,679 | | | | 86,502 | |
Sealed Air Corp. | | | 1,824 | | | | 83,576 | |
Fortune Brands Home & Security, Inc. | | | 1,427 | | | | 82,909 | |
Snap-on, Inc. | | | 540 | | | | 82,058 | |
Fluor Corp. | | | 1,292 | | | | 66,305 | |
J.B. Hunt Transport Services, Inc. | | | 815 | | | | 66,129 | |
Stericycle, Inc.* | | | 789 | | | | 63,230 | |
Allegion plc | | | 889 | | | | 61,261 | |
Flowserve Corp. | | | 1,210 | | | | 58,370 | |
Jacobs Engineering Group, Inc.* | | | 1,126 | | | | 58,237 | |
PerkinElmer, Inc. | | | 1,014 | | | | 56,896 | |
Garmin Ltd. | | | 1,068 | | | | 51,381 | |
FLIR Systems, Inc. | | | 1,273 | | | | 39,998 | |
Ryder System, Inc. | | | 496 | | | | 32,711 | |
Owens-Illinois, Inc.* | | | 1,504 | | | | 27,659 | |
Total Industrial | | | | | | | 16,547,741 | |
| | | | | | | | | |
Consumer, Cyclical - 7.6% | |
Home Depot, Inc. | | | 11,456 | | | | 1,474,158 | |
Wal-Mart Stores, Inc. | | | 14,054 | | | | 1,013,574 | |
McDonald’s Corp. | | | 7,913 | | | | 912,843 | |
CVS Health Corp. | | | 9,886 | | | | 879,755 | |
Starbucks Corp. | | | 13,598 | | | | 736,195 | |
NIKE, Inc. — Class B | | | 12,502 | | | | 658,230 | |
Walgreens Boots Alliance, Inc. | | | 7,929 | | | | 639,236 | |
Costco Wholesale Corp. | | | 4,062 | | | | 619,496 | |
Lowe’s Companies, Inc. | | | 8,110 | | | | 585,623 | |
TJX Companies, Inc. | | | 6,090 | | | | 455,409 | |
Ford Motor Co. | | | 36,185 | | | | 436,753 | |
General Motors Co. | | | 13,180 | | | | 418,729 | |
Target Corp. | | | 5,330 | | | | 366,064 | |
Yum! Brands, Inc. | | | 3,434 | | | | 311,842 | |
Delta Air Lines, Inc. | | | 6,944 | | | | 273,316 | |
O’Reilly Automotive, Inc.* | | | 880 | | | | 246,497 | |
Ross Stores, Inc. | | | 3,677 | | | | 236,431 | |
Newell Brands, Inc. | | | 4,472 | | | | 235,496 | |
Southwest Airlines Co. | | | 5,751 | | | | 223,656 | |
AutoZone, Inc.* | | | 271 | | | | 208,220 | |
Marriott International, Inc. — Class A | | | 2,999 | | | | 201,923 | |
Carnival Corp. | | | 4,015 | | | | 196,012 | |
PACCAR, Inc. | | | 3,252 | | | | 191,153 | |
Delphi Automotive plc | | | 2,529 | | | | 180,368 | |
American Airlines Group, Inc. | | | 4,914 | | | | 179,902 | |
Dollar Tree, Inc.* | | | 2,187 | | | | 172,620 | |
VF Corp. | | | 3,077 | | | | 172,465 | |
Dollar General Corp. | | | 2,403 | | | | 168,186 | |
L Brands, Inc. | | | 2,228 | | | | 157,676 | |
United Continental Holdings, Inc.* | | | 2,720 | | | | 142,718 | |
Genuine Parts Co. | | | 1,381 | | | | 138,722 | |
Ulta Salon Cosmetics & Fragrance, Inc.* | | | 544 | | | | 129,462 | |
Mohawk Industries, Inc.* | | | 584 | | | | 116,998 | |
Royal Caribbean Cruises Ltd. | | | 1,559 | | | | 116,847 | |
WW Grainger, Inc. | | | 515 | | | | 115,792 | |
Chipotle Mexican Grill, Inc. — Class A* | | | 270 | | | | 114,345 | |
Whirlpool Corp. | | | 700 | | | | 113,512 | |
Fastenal Co. | | | 2,679 | | | | 111,929 | |
Macy’s, Inc. | | | 2,860 | | | | 105,963 | |
Advance Auto Parts, Inc. | | | 683 | | | | 101,849 | |
LKQ Corp.* | | | 2,848 | | | | 100,990 | |
Best Buy Company, Inc. | | | 2,560 | | | | 97,741 | |
Mattel, Inc. | | | 3,158 | | | | 95,624 | |
DR Horton, Inc. | | | 3,142 | | | | 94,888 | |
CarMax, Inc.* | | | 1,775 | | | | 94,696 | |
Coach, Inc. | | | 2,587 | | | | 94,581 | |
Hanesbrands, Inc. | | | 3,503 | | | | 88,451 | |
Harley-Davidson, Inc. | | | 1,659 | | | | 87,247 | |
Foot Locker, Inc. | | | 1,255 | | | | 84,989 | |
Tractor Supply Co. | | | 1,240 | | | | 83,514 | |
Hasbro, Inc. | | | 1,047 | | | | 83,059 | |
PVH Corp. | | | 744 | | | | 82,212 | |
Goodyear Tire & Rubber Co. | | | 2,433 | | | | 78,586 | |
Alaska Air Group, Inc. | | | 1,142 | | | | 75,212 | |
Lennar Corp. — Class A | | | 1,742 | | | | 73,756 | |
Michael Kors Holdings Ltd.* | | | 1,567 | | | | 73,320 | |
Kohl’s Corp. | | | 1,665 | | | | 72,844 | |
Tiffany & Co. | | | 996 | | | | 72,339 | |
Darden Restaurants, Inc. | | | 1,171 | | | | 71,806 | |
Wynn Resorts Ltd. | | | 737 | | | | 71,799 | |
Wyndham Worldwide Corp. | | | 1,019 | | | | 68,609 | |
Under Armour, Inc. — Class A* | | | 1,701 | | | | 65,795 | |
BorgWarner, Inc. | | | 1,868 | | | | 65,716 | |
Bed Bath & Beyond, Inc. | | | 1,431 | | | | 61,690 | |
Under Armour, Inc. — Class C* | | | 1,709 | | | | 57,867 | |
PulteGroup, Inc. | | | 2,869 | | | | 57,495 | |
Leggett & Platt, Inc. | | | 1,239 | | | | 56,474 | |
Nordstrom, Inc. | | | 1,077 | | | | 55,875 | |
Harman International Industries, Inc. | | | 647 | | | | 54,639 | |
Ralph Lauren Corp. — Class A | | | 523 | | | | 52,896 | |
Signet Jewelers Ltd. | | | 701 | | | | 52,246 | |
Staples, Inc. | | | 6,031 | | | | 51,565 | |
The Gap, Inc. | | | 2,032 | | | | 45,192 | |
AutoNation, Inc.* | | | 615 | | | | 29,957 | |
Urban Outfitters, Inc.* | | | 825 | | | | 28,479 | |
Total Consumer, Cyclical | | | | | | | 16,342,114 | |
| | | | | | | | | |
Energy - 5.9% | |
Exxon Mobil Corp. | | | 38,449 | | | | 3,355,828 | |
Chevron Corp. | | | 17,492 | | | | 1,800,277 | |
Schlumberger Ltd. | | | 12,896 | | | | 1,014,141 | |
Occidental Petroleum Corp. | | | 7,084 | | | | 516,565 | |
ConocoPhillips | | | 11,484 | | | | 499,209 | |
EOG Resources, Inc. | | | 5,106 | | | | 493,802 | |
Kinder Morgan, Inc. | | | 17,801 | | | | 411,737 | |
Halliburton Co. | | | 7,984 | | | | 358,322 | |
28 | THE RYDEX FUNDS SEMI-ANNUAL REPORT | SEE NOTES TO FINANCIAL STATEMENTS. |
SCHEDULE OF INVESTMENTS (Unaudited)(continued) | September 30, 2016 |
S&P 500® FUND | |
| | | Shares | | | Value | |
| | | | | | | |
Phillips 66 | | | 4,121 | | | $ | 331,947 | |
Anadarko Petroleum Corp. | | | 5,060 | | | | 320,602 | |
Pioneer Natural Resources Co. | | | 1,573 | | | | 292,027 | |
Spectra Energy Corp. | | | 6,501 | | | | 277,918 | |
Valero Energy Corp. | | | 4,278 | | | | 226,734 | |
Apache Corp. | | | 3,519 | | | | 224,759 | |
Devon Energy Corp. | | | 4,855 | | | | 214,154 | |
Baker Hughes, Inc. | | | 3,968 | | | | 200,265 | |
Marathon Petroleum Corp. | | | 4,903 | | | | 199,013 | |
Williams Companies, Inc. | | | 6,334 | | | | 194,644 | |
Concho Resources, Inc.* | | | 1,318 | | | | 181,027 | |
Noble Energy, Inc. | | | 3,985 | | | | 142,424 | |
Hess Corp. | | | 2,496 | | | | 133,836 | |
National Oilwell Varco, Inc. | | | 3,501 | | | | 128,627 | |
Marathon Oil Corp. | | | 7,856 | | | | 124,203 | |
Cimarex Energy Co. | | | 881 | | | | 118,380 | |
Equities Corp. | | | 1,603 | | | | 116,410 | |
Cabot Oil & Gas Corp. — Class A | | | 4,313 | | | | 111,275 | |
ONEOK, Inc. | | | 1,952 | | | | 100,313 | |
Tesoro Corp. | | | 1,102 | | | | 87,675 | |
Newfield Exploration Co.* | | | 1,842 | | | | 80,053 | |
Range Resources Corp. | | | 1,743 | | | | 67,541 | |
Helmerich & Payne, Inc. | | | 1,002 | | | | 67,434 | |
Southwestern Energy Co.* | | | 4,575 | | | | 63,318 | |
FMC Technologies, Inc.* | | | 2,092 | | | | 62,070 | |
Murphy Oil Corp. | | | 1,501 | | | | 45,630 | |
Chesapeake Energy Corp.* | | | 6,051 | | | | 37,940 | |
Transocean Ltd.* | | | 3,186 | | | | 33,963 | |
First Solar, Inc.* | | | 712 | | | | 28,117 | |
Total Energy | | | | | | | 12,662,180 | |
| | | | | | | | | |
Utilities - 2.6% | |
NextEra Energy, Inc. | | | 4,331 | | | | 529,767 | |
Duke Energy Corp. | | | 6,388 | | | | 511,295 | |
Southern Co. | | | 9,076 | | | | 465,599 | |
Dominion Resources, Inc. | | | 5,804 | | | | 431,063 | |
American Electric Power Company, Inc. | | | 4,559 | | | | 292,733 | |
Exelon Corp. | | | 8,558 | | | | 284,896 | |
PG&E Corp. | | | 4,623 | | | | 282,789 | |
Sempra Energy | | | 2,317 | | | | 248,359 | |
Edison International | | | 3,023 | | | | 218,412 | |
PPL Corp. | | | 6,287 | | | | 217,342 | |
Consolidated Edison, Inc. | | | 2,823 | | | | 212,572 | |
Public Service Enterprise Group, Inc. | | | 4,692 | | | | 196,454 | |
Xcel Energy, Inc. | | | 4,710 | | | | 193,769 | |
WEC Energy Group, Inc. | | | 2,926 | | | | 175,209 | |
Eversource Energy | | | 2,942 | | | | 159,398 | |
DTE Energy Co. | | | 1,664 | | | | 155,867 | |
FirstEnergy Corp. | | | 3,942 | | | | 130,401 | |
Entergy Corp. | | | 1,660 | | | | 127,372 | |
American Water Works Company, Inc. | | | 1,650 | | | | 123,486 | |
Ameren Corp. | | | 2,251 | | | | 110,704 | |
CMS Energy Corp. | | | 2,587 | | | | 108,680 | |
SCANA Corp. | | | 1,325 | | | | 95,890 | |
CenterPoint Energy, Inc. | | | 3,994 | | | | 92,781 | |
Alliant Energy Corp. | | | 2,109 | | | | 80,796 | |
AES Corp. | | | 6,111 | | | | 78,526 | |
Pinnacle West Capital Corp. | | | 1,031 | | | | 78,346 | |
NiSource, Inc. | | | 2,987 | | | | 72,017 | |
NRG Energy, Inc. | | | 2,924 | | | | 32,778 | |
Total Utilities | | | | | | | 5,707,301 | |
| | | | | | | | | |
Basic Materials - 1.9% | |
EI du Pont de Nemours & Co. | | | 8,107 | | | | 542,926 | |
Dow Chemical Co. | | | 10,448 | | | | 541,520 | |
Monsanto Co. | | | 4,058 | | | | 414,727 | |
Praxair, Inc. | | | 2,645 | | | | 319,595 | |
Air Products & Chemicals, Inc. | | | 2,008 | | | | 301,883 | |
PPG Industries, Inc. | | | 2,470 | | | | 255,299 | |
LyondellBasell Industries N.V. — Class A | | | 3,162 | | | | 255,046 | |
Sherwin-Williams Co. | | | 744 | | | | 205,835 | |
Newmont Mining Corp. | | | 4,920 | | | | 193,307 | |
International Paper Co. | | | 3,813 | | | | 182,948 | |
Nucor Corp. | | | 2,952 | | | | 145,976 | |
Alcoa, Inc. | | | 12,196 | | | | 123,667 | |
Freeport-McMoRan, Inc. | | | 11,331 | | | | 123,055 | |
International Flavors & Fragrances, Inc. | | | 739 | | | | 105,655 | |
Eastman Chemical Co. | | | 1,370 | | | | 92,722 | |
Albemarle Corp. | | | 1,042 | | | | 89,081 | |
Mosaic Co. | | | 3,247 | | | | 79,422 | |
FMC Corp. | | | 1,241 | | | | 59,990 | |
CF Industries Holdings, Inc. | | | 2,162 | | | | 52,645 | |
Total Basic Materials | | | | | | | 4,085,299 | |
| | | | | | | | | |
Consumer Discretionary - 0.2% | |
Johnson Controls International plc | | | 8,752 | | | | 407,240 | |
| | | | | | | | | |
Information Technology - 0.1% | |
Fortive Corp. | | | 2,788 | | | | 141,924 | |
Total Information Technology | | | | | | | 141,924 | |
| | | | | | | | | |
Diversified - 0.0% | |
Leucadia National Corp. | | | 3,007 | | | | 57,253 | |
| | | | | | | | | |
Total Common Stocks | | | | | | | | |
(Cost $130,824,926) | | | | | | | 173,800,380 | |
| | | | | | | | | |
| | | Face
Amount | | | | | |
| | | | | | | | | |
FEDERAL AGENCY NOTES†† - 4.6% | |
Federal Farm Credit Bank1 | | | | | | | | |
0.73% due 09/14/172 | | $ | 10,000,000 | | | | 10,015,380 | |
Total Federal Agency Notes | | | | | | | | |
(Cost $10,012,530) | | | | | | | 10,015,380 | |
| | | | | | | | | |
FEDERAL AGENCY DISCOUNT NOTES†† - 3.7% | |
Farmer Mac1 | | | | | | | | |
0.66% due 12/09/16 | | | 8,000,000 | | | | 7,996,128 | |
Total Federal Agency Discount Notes | | | | | | | | |
(Cost $7,989,880) | | | | | | | 7,996,128 | |
SEE NOTES TO FINANCIAL STATEMENTS. | THE RYDEX FUNDS SEMI-ANNUAL REPORT | 29 |
SCHEDULE OF INVESTMENTS (Unaudited)(continued) | September 30, 2016 |
S&P 500® FUND | |
| | | Face
Amount | | | Value | |
| | | | | | | |
REPURCHASE AGREEMENTS††,3 - 13.3% | |
Royal Bank of Canada
issued 09/30/16 at 0.36%
due 10/03/164 | | $ | 14,700,866 | | | $ | 14,700,866 | |
HSBC Securities, Inc.
issued 09/30/16 at 0.38%
due 10/03/16 | | | 14,100,388 | | | | 14,100,388 | |
Total Repurchase Agreements | | | | | | | | |
(Cost $28,801,254) | | | | | | | 28,801,254 | |
| | | | | | | | | |
Total Investments - 102.2% | | | | | | | | |
(Cost $177,628,590) | | | | | | $ | 220,613,142 | |
Other Assets & Liabilities, net - (2.2)% | | | | | | | (4,646,673 | ) |
Total Net Assets - 100.0% | | | | | | $ | 215,966,469 | |
| | | Contracts | | | Unrealized
Gain (Loss) | |
| | | | | | | |
EQUITY FUTURES CONTRACTS PURCHASED† | |
December 2016 S&P 500 Index
Mini Futures Contracts
(Aggregate Value of
Contracts $1,728,200) | | | 16 | | | $ | 14,225 | |
| | | | | | | | | |
| | | Units | | | | | |
| | | | | | | | | |
OTC EQUITY INDEX SWAP AGREEMENTS†† | |
Goldman Sachs International
October 2016
S&P 500 Index Swap 0.95%5,
Terminating 10/27/16
(Notional Value $14,888,124) | | | 6,866 | | | $ | 156,638 | |
BNP Paribas
November 2016
S&P 500 Index Swap 0.78%5,
Terminating 11/01/16
(Notional Value $15,155,507) | | | 6,990 | | | | 118,938 | |
Barclays Bank plc
October 2016
S&P 500 Index Swap 0.80%5,
Terminating 10/27/16
(Notional Value $10,139,498) | | | 4,676 | | | | (10,380 | ) |
(Total Notional Value $40,183,129) | | | | | | $ | 265,196 | |
* | Non-income producing security. |
† | Value determined based on Level 1 inputs — See Note 4. |
†† | Value determined based on Level 2 inputs — See Note 4. |
1 | The issuer operates under a Congressional charter; its securities are neither issued nor guaranteed by the U.S. Government. |
2 | Variable rate security. Rate indicated is rate effective at September 30, 2016. |
3 | Repurchase Agreements — See Note 5. |
4 | All or a portion of this security is pledged as equity index swap collateral at September 30, 2016. |
5 | Total Return based on S&P 500 Index +/- financing at a variable rate. Rate indicated is the rate effective at September 30, 2016. |
| | plc — Public Limited Company |
| | |
| | See Sector Classification in Other Information section. |
30 | THE RYDEX FUNDS SEMI-ANNUAL REPORT | SEE NOTES TO FINANCIAL STATEMENTS. |
SCHEDULE OF INVESTMENTS (Unaudited)(concluded) | September 30, 2016 |
S&P 500® FUND | |
The following table summarizes the inputs used to value the Fund’s investments at September 30, 2016 (See Note 4 in the Notes to Financial Statements):
Investments in Securities (Assets) | | Level 1 | | | Level 1 -
Other* | | | Level 2 | | | Level 2 -
Other* | | | Level 3 | | | Total | |
Common Stocks | | $ | 173,800,380 | | | $ | — | | | $ | — | | | $ | — | | | $ | — | | | $ | 173,800,380 | |
Equity Futures Contracts | | | — | | | | 14,225 | | | | — | | | | — | | | | — | | | | 14,225 | |
Equity Index Swap Agreements | | | — | | | | — | | | | — | | | | 275,576 | | | | — | | | | 275,576 | |
Federal Agency Discount Notes | | | — | | | | — | | | | 7,996,128 | | | | — | | | | — | | | | 7,996,128 | |
Federal Agency Notes | | | — | | | | — | | | | 10,015,380 | | | | — | | | | — | | | | 10,015,380 | |
Repurchase Agreements | | | — | | | | — | | | | 28,801,254 | | | | — | | | | — | | | | 28,801,254 | |
Total | | $ | 173,800,380 | | | $ | 14,225 | | | $ | 46,812,762 | | | $ | 275,576 | | | $ | — | | | $ | 220,902,943 | |
| | | | | | | | | | | | | | | | | | | | | | | | | |
Investments in Securities (Liabilities) | | Level 1 | | | Level 1 -
Other* | | | Level 2 | | | Level 2 -
Other* | | | Level 3 | | | Total | |
Equity Index Swap Agreements | | $ | — | | | $ | — | | | $ | — | | | $ | 10,380 | | | $ | — | | | $ | 10,380 | |
* | Other financial instruments include futures contracts and/or swaps, which are reported as unrealized gain/loss at period end. |
Transfers between investment levels may occur as the markets fluctuate and/or the availability of data used in an investment’s valuation changes. Transfers between valuation levels, if any, are in comparison to the valuation levels at the end of the previous fiscal year, and are effective using the fair value as of the end of the previous fiscal period.
For the period ended September 30, 2016, there were no transfers between levels.
SEE NOTES TO FINANCIAL STATEMENTS. | THE RYDEX FUNDS SEMI-ANNUAL REPORT | 31 |
STATEMENT OF ASSETS AND LIABILITIES (Unaudited) | |
September 30, 2016 | |
Assets: | |
Investments, at value (cost $148,827,336) | | $ | 191,811,888 | |
Repurchase agreements, at value (cost $28,801,254) | | | 28,801,254 | |
Total investments (cost $177,628,590) | | | 220,613,142 | |
Segregated cash with broker | | | 1,429,200 | |
Unrealized appreciation on swap agreements | | | 275,576 | |
Cash | | | 3,195 | |
Receivables: | |
Swap settlement | | | 44,123 | |
Variation margin | | | 15,513 | |
Securities sold | | | 6,976,937 | |
Fund shares sold | | | 816,601 | |
Dividends | | | 192,672 | |
Interest | | | 3,743 | |
Total assets | | | 230,370,702 | |
| | | | | |
Liabilities: | |
Unrealized depreciation on swap agreements | | | 10,380 | |
Payable for: | |
Fund shares redeemed | | | 13,905,873 | |
Management fees | | | 132,679 | |
Distribution and service fees | | | 53,973 | |
Transfer agent and administrative fees | | | 44,226 | |
Portfolio accounting fees | | | 26,536 | |
Securities purchased | | | 15,718 | |
Miscellaneous | | | 214,848 | |
Total liabilities | | | 14,404,233 | |
Commitments and contingent liabilities (Note 13) | | | — | |
Net assets | | $ | 215,966,469 | |
| | | | | |
Net assets consist of: | |
Paid in capital | | $ | 169,623,939 | |
Undistributed net investment income | | | 83,300 | |
Accumulated net realized gain on investments | | | 2,995,257 | |
Net unrealized appreciation on investments | | | 43,263,973 | |
Net assets | | $ | 215,966,469 | |
| | | | | |
A-Class: | |
Net assets | | $ | 26,889,480 | |
Capital shares outstanding | | | 639,635 | |
Net asset value per share | | $ | 42.04 | |
Maximum offering price per share (Net asset value divided by 95.25%) | | $ | 44.14 | |
| | | | | |
C-Class: | |
Net assets | | $ | 15,902,651 | |
Capital shares outstanding | | | 411,838 | |
Net asset value per share | | $ | 38.61 | |
| | | | | |
H-Class: | |
Net assets | | $ | 173,174,338 | |
Capital shares outstanding | | | 4,119,787 | |
Net asset value per share | | $ | 42.03 | |
STATEMENT OF OPERATIONS (Unaudited) | |
Period Ended September 30, 2016 | |
Investment Income: | |
Dividends (net of foreign withholding tax of $136) | | $ | 1,984,778 | |
Interest | | | 110,762 | |
Total investment income | | | 2,095,540 | |
| | | | | |
Expenses: | |
Management fees | | | 932,132 | |
Transfer agent and administrative fees | | | 310,711 | |
Distribution and service fees: | | | | |
A-Class | | | 38,950 | |
C-Class | | | 78,633 | |
H-Class | | | 252,105 | |
Portfolio accounting fees | | | 186,429 | |
Custodian fees | | | 14,664 | |
Trustees’ fees* | | | 11,966 | |
Miscellaneous | | | 186,650 | |
Total expenses | | | 2,012,240 | |
Net investment income | | | 83,300 | |
| | | | | |
Net Realized and Unrealized Gain (Loss): | |
Net realized gain (loss) on: | |
Investments | | | 25,496,338 | |
Swap agreements | | | 1,796,786 | |
Futures contracts | | | 848,586 | |
Net realized gain | | | 28,141,710 | |
Net change in unrealized appreciation (depreciation) on: | |
Investments | | | (15,772,116 | ) |
Swap agreements | | | (166,449 | ) |
Futures contracts | | | (260,103 | ) |
Net change in unrealized appreciation (depreciation) | | | (16,198,668 | ) |
Net realized and unrealized gain | | | 11,943,042 | |
Net increase in net assets resulting from operations | | $ | 12,026,342 | |
* | Relates to Trustees not deemed “interested persons” within the meaning of Section 2(a)(19) of the 1940 Act. |
32 | THE RYDEX FUNDS SEMI-ANNUAL REPORT | SEE NOTES TO FINANCIAL STATEMENTS. |
STATEMENTS OF CHANGES IN NET ASSETS |
| | | Period Ended
September 30,
2016
(Unaudited) | | | Year Ended
March 31,
2016 | |
Increase (Decrease) in Net Assets from Operations: | | | | | | |
Net investment income (loss) | | $ | 83,300 | | | $ | (65,779 | ) |
Net realized gain on investments | | | 28,141,710 | | | | 24,739,527 | |
Net change in unrealized appreciation (depreciation) on investments | | | (16,198,668 | ) | | | (38,842,371 | ) |
Net increase (decrease) in net assets resulting from operations | | | 12,026,342 | | | | (14,168,623 | ) |
| | | | | | | | | |
Distributions to shareholders from: | | | | | | | | |
Net investment income | | | | | | | | |
A-Class | | | — | | | | (6,128 | ) |
C-Class | | | — | | | | (5,127 | ) |
H-Class | | | — | | | | (73,343 | ) |
Net realized gains | | | | | | | | |
A-Class | | | — | | | | (964,527 | ) |
C-Class | | | — | | | | (806,970 | ) |
H-Class | | | — | | | | (11,544,030 | ) |
Total distributions to shareholders | | | — | | | | (13,400,125 | ) |
| | | | | | | | | |
Capital share transactions: | | | | | | | | |
Proceeds from sale of shares | | | | | | | | |
A-Class | | | 32,634,261 | | | | 164,205,961 | |
C-Class | | | 11,194,225 | | | | 36,973,427 | |
H-Class | | | 667,789,577 | | | | 1,458,575,350 | |
Distributions reinvested | | | | | | | | |
A-Class | | | — | | | | 885,581 | |
C-Class | | | — | | | | 784,294 | |
H-Class | | | — | | | | 11,569,754 | |
Cost of shares redeemed | | | | | | | | |
A-Class | | | (46,903,492 | ) | | | (153,213,908 | ) |
C-Class | | | (11,787,562 | ) | | | (41,974,574 | ) |
H-Class | | | (733,866,928 | ) | | | (1,468,966,601 | ) |
Net increase (decrease) from capital share transactions | | | (80,939,919 | ) | | | 8,839,284 | |
Net decrease in net assets | | | (68,913,577 | ) | | | (18,729,464 | ) |
| | | | | | | | | |
Net assets: | | | | | | | | |
Beginning of period | | | 284,880,046 | | | | 303,609,510 | |
End of period | | $ | 215,966,469 | | | $ | 284,880,046 | |
Undistributed net investment income at end of period | | $ | 83,300 | | | $ | — | |
| | | | | | | | | |
Capital share activity: | | | | | | | | |
Shares sold | | | | | | | | |
A-Class | | | 811,811 | | | | 4,121,399 | |
C-Class | | | 298,012 | | | | 995,592 | |
H-Class | | | 16,326,536 | | | | 36,101,253 | |
Shares issued from reinvestment of distributions | | | | | | | | |
A-Class | | | — | | | | 22,217 | |
C-Class | | | — | | | | 21,289 | |
H-Class | | | — | | | | 290,260 | |
Shares redeemed | | | | | | | | |
A-Class | | | (1,170,812 | ) | | | (3,821,927 | ) |
C-Class | | | (312,633 | ) | | | (1,134,175 | ) |
H-Class | | | (17,964,906 | ) | | | (36,783,666 | ) |
Net decrease in shares | | | (2,011,992 | ) | | | (187,758 | ) |
SEE NOTES TO FINANCIAL STATEMENTS. | THE RYDEX FUNDS SEMI-ANNUAL REPORT | 33 |
This table is presented to show selected data for a share outstanding throughout each period and to assist shareholders in evaluating a Fund’s performance for the periods presented.
A-Class | | Period Ended
September 30,
2016a | | | Year Ended
March 31,
2016 | | | Year Ended
March 31,
2015 | | | Year Ended
March 31,
2014 | | | Year Ended
March 28,
2013 | | | Year Ended
March 31,
2012 | |
Per Share Data | | | | | | | | | | | | | | | | | | |
Net asset value, beginning of period | | $ | 39.85 | | | $ | 41.40 | | | $ | 37.78 | | | $ | 31.55 | | | $ | 28.20 | | | $ | 26.41 | |
Income (loss) from investment operations: | |
Net investment income (loss)b | | | .03 | | | | .03 | | | | .04 | | | | .07 | | | | .06 | | | | .01 | |
Net gain (loss) on investments (realized and unrealized) | | | 2.16 | | | | — | | | | 4.08 | | | | 6.20 | | | | 3.36 | | | | 1.78 | |
Total from investment operations | | | 2.19 | | | | .03 | | | | 4.12 | | | | 6.27 | | | | 3.42 | | | | 1.79 | |
Less distributions from: | |
Net investment income | | | — | | | | (.01 | ) | | | (.02 | ) | | | (.04 | ) | | | (.07 | ) | | | — | |
Net realized gains | | | — | | | | (1.57 | ) | | | (.48 | ) | | | — | | | | — | | | | — | |
Total distributions | | | — | | | | (1.58 | ) | | | (.50 | ) | | | (.04 | ) | | | (.07 | ) | | | — | |
Net asset value, end of period | | $ | 42.04 | | | $ | 39.85 | | | $ | 41.40 | | | $ | 37.78 | | | $ | 31.55 | | | $ | 28.20 | |
| | |
Total Returnc | | | 5.50 | % | | | 0.08 | % | | | 10.90 | % | | | 19.87 | % | | | 12.16 | % | | | 6.78 | % |
Ratios/Supplemental Data | |
Net assets, end of period (in thousands) | | $ | 26,889 | | | $ | 39,793 | | | $ | 28,022 | | | $ | 28,028 | | | $ | 12,014 | | | $ | 13,413 | |
Ratios to average net assets: | |
Net investment income (loss) | | | 0.14 | % | | | 0.02 | % | | | 0.11 | % | | | 0.19 | % | | | 0.22 | % | | | 0.05 | % |
Total expenses | | | 1.57 | % | | | 1.55 | % | | | 1.59 | % | | | 1.57 | % | | | 1.50 | % | | | 1.51 | % |
Portfolio turnover rate | | | 68 | % | | | 181 | % | | | 256 | % | | | 157 | % | | | 76 | % | | | 196 | % |
C-Class | | Period Ended
September 30,
2016a | | | Year Ended
March 31,
2016 | | | Year Ended
March 31,
2015 | | | Year Ended
March 31,
2014 | | | Year Ended
March 28,
2013 | | | Year Ended
March 31,
2012 | |
Per Share Data | | | | | | | | | | | | | | | | | | |
Net asset value, beginning of period | | $ | 36.74 | | | $ | 38.58 | | | $ | 35.51 | | | $ | 29.87 | | | $ | 26.91 | | | $ | 25.41 | |
Income (loss) from investment operations: | |
Net investment income (loss)b | | | (.12 | ) | | | (.26 | ) | | | (.23 | ) | | | (.19 | ) | | | (.14 | ) | | | (.20 | ) |
Net gain (loss) on investments (realized and unrealized) | | | 1.99 | | | | — | | | | 3.80 | | | | 5.87 | | | | 3.17 | | | | 1.70 | |
Total from investment operations | | | 1.87 | | | | (.26 | ) | | | 3.57 | | | | 5.68 | | | | 3.03 | | | | 1.50 | |
Less distributions from: | |
Net investment income | | | — | | | | (.01 | ) | | | (.02 | ) | | | (.04 | ) | | | (.07 | ) | | | — | |
Net realized gains | | | — | | | | (1.57 | ) | | | (.48 | ) | | | — | | | | — | | | | — | |
Total distributions | | | — | | | | (1.58 | ) | | | (.50 | ) | | | (.04 | ) | | | (.07 | ) | | | — | |
Net asset value, end of period | | $ | 38.61 | | | $ | 36.74 | | | $ | 38.58 | | | $ | 35.51 | | | $ | 29.87 | | | $ | 26.91 | |
| | |
Total Returnc | | | 5.09 | % | | | (0.67 | %) | | | 10.04 | % | | | 19.01 | % | | | 11.29 | % | | | 5.90 | % |
Ratios/Supplemental Data | |
Net assets, end of period (in thousands) | | $ | 15,903 | | | $ | 15,667 | | | $ | 20,977 | | | $ | 16,182 | | | $ | 10,231 | | | $ | 10,110 | |
Ratios to average net assets: | |
Net investment income (loss) | | | (0.64 | %) | | | (0.70 | %) | | | (0.62 | %) | | | (0.59 | %) | | | (0.52 | %) | | | (0.80 | %) |
Total expenses | | | 2.32 | % | | | 2.31 | % | | | 2.34 | % | | | 2.32 | % | | | 2.28 | % | | | 2.26 | % |
Portfolio turnover rate | | | 68 | % | | | 181 | % | | | 256 | % | | | 157 | % | | | 76 | % | | | 196 | % |
34 | THE RYDEX FUNDS SEMI-ANNUAL REPORT | SEE NOTES TO FINANCIAL STATEMENTS. |
FINANCIAL HIGHLIGHTS (continued) |
This table is presented to show selected data for a share outstanding throughout each period and to assist shareholders in evaluating a Fund’s performance for the periods presented.
H-Class | | Period Ended
September 30,
2016a | | | Year Ended
March 31,
2016 | | | Year Ended
March 31,
2015 | | | Year Ended
March 31,
2014 | | | Year Ended
March 28,
2013 | | | Year Ended
March 31,
2012 | |
Per Share Data | | | | | | | | | | | | | | | | | | |
Net asset value, beginning of period | | $ | 39.84 | | | $ | 41.40 | | | $ | 37.78 | | | $ | 31.55 | | | $ | 28.20 | | | $ | 26.39 | |
Income (loss) from investment operations: | |
Net investment income (loss)b | | | .02 | | | | .03 | | | | .05 | | | | .05 | | | | .07 | | | | (.02 | ) |
Net gain (loss) on investments (realized and unrealized) | | | 2.17 | | | | (.01 | ) | | | 4.07 | | | | 6.22 | | | | 3.35 | | | | 1.83 | |
Total from investment operations | | | 2.19 | | | | .02 | | | | 4.12 | | | | 6.27 | | | | 3.42 | | | | 1.81 | |
Less distributions from: | |
Net investment income | | | — | | | | (.01 | ) | | | (.02 | ) | | | (.04 | ) | | | (.07 | ) | | | — | |
Net realized gains | | | — | | | | (1.57 | ) | | | (.48 | ) | | | — | | | | — | | | | — | |
Total distributions | | | — | | | | (1.58 | ) | | | (.50 | ) | | | (.04 | ) | | | (.07 | ) | | | — | |
Net asset value, end of period | | $ | 42.03 | | | $ | 39.84 | | | $ | 41.40 | | | $ | 37.78 | | | $ | 31.55 | | | $ | 28.20 | |
| | |
Total Returnc | | | 5.50 | % | | | 0.06 | % | | | 10.90 | % | | | 19.87 | % | | | 12.16 | % | | | 6.86 | % |
Ratios/Supplemental Data | |
Net assets, end of period (in thousands) | | $ | 173,174 | | | $ | 229,420 | | | $ | 254,610 | | | $ | 255,912 | | | $ | 265,358 | | | $ | 240,847 | |
Ratios to average net assets: | |
Net investment income (loss) | | | 0.11 | % | | | 0.07 | % | | | 0.12 | % | | | 0.15 | % | | | 0.24 | % | | | (0.07 | %) |
Total expenses | | | 1.57 | % | | | 1.55 | % | | | 1.58 | % | | | 1.56 | % | | | 1.50 | % | | | 1.50 | % |
Portfolio turnover rate | | | 68 | % | | | 181 | % | | | 256 | % | | | 157 | % | | | 76 | % | | | 196 | % |
a | Unaudited figures for the period ended September 30, 2016. Percentage amounts for the period, except total return and portfolio turnover rate, have been annualized. |
b | Net investment income (loss) per share was computed using average shares outstanding throughout the period. |
c | Total return does not reflect the impact of any applicable sales charges. |
SEE NOTES TO FINANCIAL STATEMENTS. | THE RYDEX FUNDS SEMI-ANNUAL REPORT | 35 |
FUND PROFILE (Unaudited) | September 30, 2016 |
INVERSE S&P 500® STRATEGY FUND
OBJECTIVE: Seeks to provide investment results that match, before fees and expenses, the performance of a specific benchmark on a daily basis. The Fund’s current benchmark is the inverse (opposite) of the performance of the S&P 500® Index (the “underlying index”). The Fund does not seek to achieve its investment objective over a period of time greater than one day.
Holdings Diversification (Market Exposure as % of Net Assets)
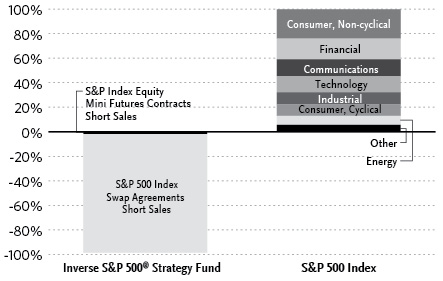
“Holdings Diversification (Market Exposure as % of Net Assets)” excludes any temporary cash investments or investments in Guggenheim Strategy Funds Trust mutual funds. Investments in those Funds do not provide “market exposure” to meet the Fund’s investment objective, but will significantly increase the portfolio’s exposure to certain other asset categories (and their associated risks), which may cause the Fund to deviate from its principal investment strategy, including: (i) high yield, high risk debt securities rated below the top four long-term rating categories by a nationally recognized statistical rating organization (also known as “junk bonds”); (ii) securities issued by the U.S. government or its agencies and instrumentalities; (iii) CLOs and similar investments; and (iv) other short-term fixed income securities.
Inception Dates: |
Investor Class | January 7, 1994 |
A-Class | March 31, 2004 |
C-Class | March 15, 2001 |
H-Class | September 18, 2014 |
The Fund invests principally in derivative investments such as swap agreements and futures contracts.
Largest Holdings (% of Total Net Assets) |
Guggenheim Strategy Fund II | 6.7% |
Guggenheim Strategy Fund I | 6.4% |
Total | 13.1% |
| | |
“Largest Holdings” excludes any temporary cash or derivative investments. |
36 | THE RYDEX FUNDS SEMI-ANNUAL REPORT | |
SCHEDULE OF INVESTMENTS (Unaudited) | September 30, 2016 |
INVERSE S&P 500® STRATEGY FUND | |
| | | Shares | | | Value | |
| | | | | | | |
MUTUAL FUNDS† - 13.0% | |
Guggenheim Strategy Fund II1 | | | 356,875 | | | $ | 8,900,469 | |
Guggenheim Strategy Fund I1 | | | 338,146 | | | | 8,450,262 | |
Total Mutual Funds | | | | | | | | |
(Cost $17,244,306) | | | | | | | 17,350,731 | |
| | | | | | | | | |
| | | Face
Amount | | | | | |
| | | | | | | | | |
FEDERAL AGENCY NOTES†† - 55.2% | |
Federal Farm Credit Bank2 | | | | | | | | |
0.65% due 08/10/183 | | $ | 35,000,000 | | | | 34,977,601 | |
0.55% due 12/08/173 | | | 600,000 | | | | 600,120 | |
Total Federal Farm Credit Bank | | | | | | | 35,577,721 | |
Federal Home Loan Bank2 | | | | | | | | |
0.56% due 12/20/173 | | | 15,000,000 | | | | 14,989,155 | |
0.63% due 05/17/183 | | | 7,000,000 | | | | 6,994,862 | |
Total Federal Home Loan Bank | | | | | | | 21,984,017 | |
Farmer Mac | | | | | | | | |
5.13% due 04/19/172 | | | 8,000,000 | | | | 8,193,600 | |
Freddie Mac4 | | | | | | | | |
0.80% due 10/27/17 | | | 7,500,000 | | | | 7,497,345 | |
Total Federal Agency Notes | | | | | | | | |
(Cost $73,277,046) | | | | | | | 73,252,683 | |
| | | | | | | | | |
FEDERAL AGENCY DISCOUNT NOTES†† - 7.5% | |
Federal Home Loan Bank2 | | | | | | | | |
0.53% due 03/10/17 | | | 10,000,000 | | | | 9,982,880 | |
Total Federal Agency Discount Notes | | | | | | | | |
(Cost $9,976,533) | | | | | | | 9,982,880 | |
| | | | | | | | | |
REPURCHASE AGREEMENTS††,5 - 23.6% | |
Royal Bank of Canada
issued 09/30/16 at 0.36%
due 10/03/166 | | | 24,306,857 | | | | 24,306,857 | |
HSBC Group
issued 09/30/16 at 0.38%
due 10/03/16 | | | 7,110,336 | | | | 7,110,336 | |
Total Repurchase Agreements | | | | | | | | |
(Cost $31,417,193) | | | | | | | 31,417,193 | |
| | | | | | | | | |
Total Investments - 99.3% | | | | | | | | |
(Cost $131,915,078) | | | | | | $ | 132,003,487 | |
Other Assets & Liabilities, net - 0.7% | | | | | | | 955,575 | |
Total Net Assets - 100.0% | | | | | | $ | 132,959,062 | |
| | | | | | | | | |
| | | Contracts | | | Unrealized
Loss | |
| | | | | | | | | |
EQUITY FUTURES CONTRACTS SOLD SHORT† | |
December 2016 S&P 500 Index
Mini Futures Contracts
(Aggregate Value of
Contracts $2,268,263) | | | 21 | | | $ | (10,776 | ) |
| | | | | | | | | |
| | | Units | | | | | |
| | | | | | | | | |
OTC EQUITY INDEX SWAP AGREEMENTS SOLD SHORT†† | |
Barclays Bank plc
October 2016
S&P 500 Index Swap 0.65%7,
Terminating 10/27/16
(Notional Value $7,138,444) | | | 3,292 | | | $ | (12,510 | ) |
BNP Paribas
November 2016
S&P 500 Index Swap 0.28%7,
Terminating 11/01/16
(Notional Value $2,329,212) | | | 1,074 | | | | (18,331 | ) |
Goldman Sachs International
October 2016
S&P 500 Index Swap 0.85%7,
Terminating 10/27/16
(Notional Value $119,366,933) | | | 55,052 | | | | (1,247,274 | ) |
(Total Notional Value $128,834,589) | | | | | | $ | (1,278,115 | ) |
† | Value determined based on Level 1 inputs — See Note 4. |
†† | Value determined based on Level 2 inputs — See Note 4. |
1 | Affiliated issuer — See Note 9. |
2 | The issuer operates under a Congressional charter; its securities are neither issued nor guaranteed by the U.S. Government. |
3 | Variable rate security. Rate indicated is rate effective at September 30, 2016. |
4 | On September 7, 2008, the issuer was placed in conservatorship by the Federal Housing Finance Agency (FHFA). As conservator, the FHFA has full powers to control the assets and operations of the firm. |
5 | Repurchase Agreements — See Note 5. |
6 | All or a portion of this security is pledged as equity index swap collateral at September 30, 2016. |
7 | Total Return based on S&P 500 Index +/- financing at a variable rate. Rate indicated is the rate effective at September 30, 2016. |
| | plc — Public Limited Company |
| | |
| | See Sector Classification in Other Information section. |
SEE NOTES TO FINANCIAL STATEMENTS. | THE RYDEX FUNDS SEMI-ANNUAL REPORT | 37 |
SCHEDULE OF INVESTMENTS (Unaudited)(concluded) | September 30, 2016 |
INVERSE S&P 500® STRATEGY FUND | |
The following table summarizes the inputs used to value the Fund’s investments at September 30, 2016 (See Note 4 in the Notes to Financial Statements):
Investments in Securities (Assets) | | Level 1 | | | Level 1 -
Other* | | | Level 2 | | | Level 2 -
Other* | | | Level 3 | | | Total | |
Federal Agency Discount Notes | | $ | — | | | $ | — | | | $ | 9,982,880 | | | $ | — | | | $ | — | | | $ | 9,982,880 | |
Federal Agency Notes | | | — | | | | — | | | | 73,252,683 | | | | — | | | | — | | | | 73,252,683 | |
Mutual Funds | | | 17,350,731 | | | | — | | | | — | | | | — | | | | — | | | | 17,350,731 | |
Repurchase Agreements | | | — | | | | — | | | | 31,417,193 | | | | — | | | | — | | | | 31,417,193 | |
Total | | $ | 17,350,731 | | | $ | — | | | $ | 114,652,756 | | | $ | — | | | $ | — | | | $ | 132,003,487 | |
| | | | | | | | | | | | | | | | | | | | | | | | | |
Investments in Securities (Liabilities) | | Level 1 | | | Level 1 -
Other* | | | Level 2 | | | Level 2 -
Other* | | | Level 3 | | | Total | |
Equity Futures Contracts | | $ | — | | | $ | 10,776 | | | $ | — | | | $ | — | | | $ | — | | | $ | 10,776 | |
Equity Index Swap Agreements | | | — | | | | — | | | | — | | | | 1,278,115 | | | | — | | | | 1,278,115 | |
Total | | $ | — | | | $ | 10,776 | | | $ | — | | | $ | 1,278,115 | | | $ | — | | | $ | 1,288,891 | |
* | Other financial instruments include futures contracts and/or swaps, which are reported as unrealized gain/loss at period end. |
Transfers between investment levels may occur as the markets fluctuate and/or the availability of data used in an investment’s valuation changes. Transfers between valuation levels, if any, are in comparison to the valuation levels at the end of the previous fiscal year, and are effective using the fair value as of the end of the previous fiscal period.
For the period ended September 30, 2016, there were no transfers between levels.
38 | THE RYDEX FUNDS SEMI-ANNUAL REPORT | SEE NOTES TO FINANCIAL STATEMENTS. |
INVERSE S&P 500® STRATEGY FUND | |
STATEMENT OF ASSETS AND LIABILITIES (Unaudited) |
September 30, 2016 |
Assets: | |
Investments in unaffiliated issuers, at value (cost $83,253,579) | | $ | 83,235,563 | |
Investments in affiliated issuers, at value (cost $17,244,306) | | | 17,350,731 | |
Repurchase agreements, at value (cost $31,417,193) | | | 31,417,193 | |
Total investments (cost $131,915,078) | | | 132,003,487 | |
Segregated cash with broker | | | 638,200 | |
Receivables: | |
Fund shares sold | | | 1,810,740 | |
Dividends | | | 26,914 | |
Interest | | | 251,636 | |
Total assets | | | 134,730,977 | |
| | | | | |
Liabilities: | |
Unrealized depreciation on swap agreements | | | 1,278,115 | |
Payable for: | |
Fund shares redeemed | | | 247,933 | |
Management fees | | | 100,159 | |
Swap settlement | | | 35,526 | |
Transfer agent and administrative fees | | | 27,822 | |
Variation margin | | | 12,337 | |
Portfolio accounting fees | | | 11,129 | |
Distribution and service fees | | | 10,544 | |
Miscellaneous | | | 48,350 | |
Total liabilities | | | 1,771,915 | |
Commitments and contingent liabilities (Note 13) | | | — | |
Net assets | | $ | 132,959,062 | |
| | | | | |
Net assets consist of: | |
Paid in capital | | $ | 484,690,035 | |
Accumulated net investment loss | | | (1,053,306 | ) |
Accumulated net realized loss on investments | | | (349,477,185 | ) |
Net unrealized depreciation on investments | | | (1,200,482 | ) |
Net assets | | $ | 132,959,062 | |
| | | | | |
Investor Class: | |
Net assets | | $ | 107,907,097 | |
Capital shares outstanding* | | | 1,390,382 | |
Net asset value per share* | | $ | 77.60 | |
| | | | | |
A-Class: | |
Net assets | | $ | 12,033,871 | |
Capital shares outstanding* | | | 167,070 | |
Net asset value per share* | | $ | 72.03 | |
Maximum offering price per share (Net asset value divided by 95.25%)* | | $ | 75.62 | |
| | | | | |
C-Class: | |
Net assets | | $ | 8,582,297 | |
Capital shares outstanding* | | | 130,470 | |
Net asset value per share* | | $ | 65.78 | |
| | | | | |
H-Class: | |
Net assets | | $ | 4,435,797 | |
Capital shares outstanding* | | | 61,567 | |
Net asset value per share* | | $ | 72.04 | |
* | The shares outstanding, net asset value per share and the maximum offering price per share have been restated to reflect a 1:6 reverse share split effective October 28, 2016 — See Note 12. |
SEE NOTES TO FINANCIAL STATEMENTS. | THE RYDEX FUNDS SEMI-ANNUAL REPORT | 39 |
INVERSE S&P 500® STRATEGY FUND | |
STATEMENT OF OPERATIONS (Unaudited) |
Period Ended September 30, 2016 |
Investment Income: | |
Interest | | $ | 289,950 | |
Dividends from securities of affiliated issuers | | | 282,411 | |
Total investment income | | | 572,361 | |
| | | | | |
Expenses: | |
Management fees | | | 765,012 | |
Transfer agent and administrative fees | | | 212,503 | |
Distribution and service fees: | |
A-Class | | | 16,695 | |
C-Class | | | 42,808 | |
H-Class | | | 7,968 | |
Portfolio accounting fees | | | 85,000 | |
Custodian fees | | | 9,997 | |
Trustees’ fees* | | | 8,221 | |
Miscellaneous | | | 126,756 | |
Total expenses | | | 1,274,960 | |
Net investment loss | | | (702,599 | ) |
| | | | | |
Net Realized and Unrealized Gain (Loss): | |
Net realized gain (loss) on: | |
Investments in unaffiliated issuers | | $ | 32,042 | |
Investments in affiliated issuers | | | 69,777 | |
Swap agreements | | | (10,664,125 | ) |
Futures contracts | | | (1,807,306 | ) |
Net realized loss | | | (12,369,612 | ) |
Net change in unrealized appreciation (depreciation) on: | |
Investments in unaffiliated issuers | | | 10,224 | |
Investments in affiliated issuers | | | 225,138 | |
Swap agreements | | | (98,977 | ) |
Futures contracts | | | (12,114 | ) |
Net change in unrealized appreciation (depreciation) | | | 124,271 | |
Net realized and unrealized loss | | | (12,245,341 | ) |
Net decrease in net assets resulting from operations | | $ | (12,947,940 | ) |
* | Relates to Trustees not deemed “interested persons” within the meaning of Section 2(a)(19) of the 1940 Act. |
40 | THE RYDEX FUNDS SEMI-ANNUAL REPORT | SEE NOTES TO FINANCIAL STATEMENTS. |
INVERSE S&P 500® STRATEGY FUND | |
STATEMENTS OF CHANGES IN NET ASSETS |
| | | Period Ended
September 30,
2016
(Unaudited) | | | Year Ended
March 31,
2016 | |
Increase (Decrease) in Net Assets from Operations: | | | | | | |
Net investment loss | | $ | (702,599 | ) | | $ | (1,289,467 | ) |
Net realized loss on investments | | | (12,369,612 | ) | | | (16,589,035 | ) |
Net change in unrealized appreciation (depreciation) on investments | | | 124,271 | | | | (1,016,491 | ) |
Net decrease in net assets resulting from operations | | | (12,947,940 | ) | | | (18,894,993 | ) |
| | | | | | | | | |
Capital share transactions: | | | | | | | | |
Proceeds from sale of shares | | | | | | | | |
Investor Class | | | 125,766,661 | | | | 437,076,905 | |
Advisor Class | | | — | | | | 17,264,802 | |
A-Class | | | 27,898,445 | | | | 56,820,759 | |
C-Class | | | 6,636,001 | | | | 16,209,864 | |
H-Class | | | 36,589,737 | | | | 93,034,530 | |
Cost of shares redeemed | | | | | | | | |
Investor Class | | | (161,003,405 | ) | | | (328,788,115 | ) |
Advisor Class | | | — | | | | (8,791,665 | ) |
A-Class | | | (23,892,363 | ) | | | (51,421,612 | ) |
C-Class | | | (6,769,711 | ) | | | (11,608,019 | ) |
H-Class | | | (38,680,876 | ) | | | (107,318,749 | ) |
Conversion activity* | | | | | | | | |
Advisor Class | | | — | | | | (10,823,213 | ) |
H-Class | | | — | | | | 10,823,213 | |
Net increase (decrease) from capital share transactions | | | (33,455,511 | ) | | | 112,478,700 | |
Net increase (decrease) in net assets | | | (46,403,451 | ) | | | 93,583,707 | |
| | | | | | | | | |
Net assets: | | | | | | | | |
Beginning of period | | | 179,362,513 | | | | 85,778,806 | |
End of period | | $ | 132,959,062 | | | $ | 179,362,513 | |
Accumulated net investment loss at end of period | | $ | (1,053,306 | ) | | $ | (350,707 | ) |
| | | | | | | | | |
Capital share activity:** | | | | | | | | |
Shares sold | | | | | | | | |
Investor Class | | | 1,561,673 | | | | 4,893,922 | |
Advisor Class | | | — | | | | 211,392 | |
A-Class | | | 365,809 | | | | 685,595 | |
C-Class | | | 99,607 | | | | 217,622 | |
H-Class | | | 482,896 | | | | 1,134,310 | |
Shares redeemed | | | | | | | | |
Investor Class | | | (2,019,257 | ) | | | (3,739,882 | ) |
Advisor Class | | | — | | | | (107,453 | ) |
A-Class | | | (318,607 | ) | | | (624,084 | ) |
C-Class | | | (99,723 | ) | | | (155,015 | ) |
H-Class | | | (516,165 | ) | | | (1,326,748 | ) |
Conversion activity* | | | | | | | | |
Advisor Class | | | — | | | | (129,908 | ) |
H-Class | | | — | | | | 126,804 | |
Net increase (decrease) in shares | | | (2,662,603 | ) | | | 7,119,325 | |
* | Effective September 30, 2015, all outstanding Advisor Class shares converted into H-Class shares — See Note 11. |
** | Capital share activity for the periods presented through September 30, 2016 has been restated to reflect a 1:6 reverse share split effective October 28, 2016 — See Note 12. |
SEE NOTES TO FINANCIAL STATEMENTS. | THE RYDEX FUNDS SEMI-ANNUAL REPORT | 41 |
INVERSE S&P 500® STRATEGY FUND | |
This table is presented to show selected data for a share outstanding throughout each period and to assist shareholders in evaluating a Fund’s performance for the periods presented.
Investor Class | | Period Ended
September 30,
2016a,f | | | Year Ended
March 31,
2016f | | | Year Ended
March 31,
2015f | | | Year Ended
March 31,
2014f | | | Year Ended
March 28,
2013f | | | Year Ended
March 31,
2012f | |
Per Share Data | | | | | | | | | | | | | | | | | | |
Net asset value, beginning of period | | $ | 83.09 | | | $ | 87.54 | | | $ | 100.90 | | | $ | 126.16 | | | $ | 147.65 | | | $ | 171.00 | |
Income (loss) from investment operations: | |
Net investment income (loss)b | | | .30 | | | | (.78 | ) | | | (1.02 | ) | | | (1.50 | ) | | | (1.80 | ) | | | (2.28 | ) |
Net gain (loss) on investments (realized and unrealized) | | | (5.79 | ) | | | (3.67 | ) | | | (12.34 | ) | | | (23.76 | ) | | | (19.69 | ) | | | (21.07 | ) |
Total from investment operations | | | (5.49 | ) | | | (4.45 | ) | | | (13.36 | ) | | | (25.26 | ) | | | (21.49 | ) | | | (23.35 | ) |
Net asset value, end of period | | $ | 77.60 | | | $ | 83.09 | | | $ | 87.54 | | | $ | 100.90 | | | $ | 126.16 | | | $ | 147.65 | |
| | |
Total Returnc | | | (6.64 | %) | | | (5.07 | %) | | | (13.26 | %) | | | (20.02 | %) | | | (14.55 | %) | | | (13.65 | %) |
Ratios/Supplemental Data | |
Net assets, end of period (in thousands) | | $ | 107,907 | | | $ | 153,544 | | | $ | 60,745 | | | $ | 79,172 | | | $ | 106,158 | | | $ | 112,334 | |
Ratios to average net assets: | |
Net investment income (loss) | | | (0.75 | %) | | | (0.91 | %) | | | (1.07 | %) | | | (1.35 | %) | | | (1.27 | %) | | | (1.31 | %) |
Total expensesd | | | 1.42 | % | | | 1.41 | % | | | 1.41 | % | | | 1.42 | % | | | 1.41 | % | | | 1.41 | % |
Portfolio turnover rate | | | 42 | % | | | 63 | % | | | 103 | % | | | — | | | | — | | | | — | |
A-Class | | Period Ended
September 30,
2016a,f | | | Year Ended
March 31,
2016f | | | Year Ended
March 31,
2015f | | | Year Ended
March 31,
2014f | | | Year Ended
March 28,
2013f | | | Year Ended
March 31,
2012f | |
Per Share Data | | | | | | | | | | | | | | | | | | |
Net asset value, beginning of period | | $ | 77.21 | | | $ | 81.54 | | | $ | 94.27 | | | $ | 118.13 | | | $ | 138.59 | | | $ | 160.92 | |
Income (loss) from investment operations: | |
Net investment income (loss)b | | | .36 | | | | (.96 | ) | | | (1.14 | ) | | | (1.68 | ) | | | (2.04 | ) | | | (2.52 | ) |
Net gain (loss) on investments (realized and unrealized) | | | (5.54 | ) | | | (3.37 | ) | | | (11.59 | ) | | | (22.18 | ) | | | (18.42 | ) | | | (19.81 | ) |
Total from investment operations | | | (5.18 | ) | | | (4.33 | ) | | | (12.73 | ) | | | (23.86 | ) | | | (20.46 | ) | | | (22.33 | ) |
Net asset value, end of period | | $ | 72.03 | | | $ | 77.21 | | | $ | 81.54 | | | $ | 94.27 | | | $ | 118.13 | | | $ | 138.59 | |
| | |
Total Returnc | | | (6.76 | %) | | | (5.30 | %) | | | (13.49 | %) | | | (20.21 | %) | | | (14.76 | %) | | | (13.87 | %) |
Ratios/Supplemental Data | |
Net assets, end of period (in thousands) | | $ | 12,034 | | | $ | 9,256 | | | $ | 4,758 | | | $ | 5,468 | | | $ | 5,912 | | | $ | 7,915 | |
Ratios to average net assets: | |
Net investment income (loss) | | | (1.00 | %) | | | (1.18 | %) | | | (1.32 | %) | | | (1.58 | %) | | | (1.52 | %) | | | (1.56 | %) |
Total expensesd | | | 1.67 | % | | | 1.66 | % | | | 1.66 | % | | | 1.68 | % | | | 1.65 | % | | | 1.66 | % |
Portfolio turnover rate | | | 42 | % | | | 63 | % | | | 103 | % | | | — | | | | — | | | | — | |
42 | THE RYDEX FUNDS SEMI-ANNUAL REPORT | SEE NOTES TO FINANCIAL STATEMENTS. |
INVERSE S&P 500® STRATEGY FUND | |
FINANCIAL HIGHLIGHTS (concluded) |
This table is presented to show selected data for a share outstanding throughout each period and to assist shareholders in evaluating a Fund’s performance for the periods presented.
C-Class | | Period Ended
September 30,
2016a,f | | | Year Ended
March 31,
2016f | | | Year Ended
March 31,
2015f | | | Year Ended
March 31,
2014f | | | Year Ended
March 28,
2013f | | | Year Ended
March 31,
2012f | |
Per Share Data | | | | | | | | | | | | | | | | | | |
Net asset value, beginning of period | | $ | 70.79 | | | $ | 75.34 | | | $ | 87.73 | | | $ | 110.78 | | | $ | 130.97 | | | $ | 153.20 | |
Income (loss) from investment operations: | |
Net investment income (loss)b | | | .60 | | | | (1.44 | ) | | | (1.68 | ) | | | (2.28 | ) | | | (2.88 | ) | | | (3.54 | ) |
Net gain (loss) on investments (realized and unrealized) | | | (5.61 | ) | | | (3.11 | ) | | | (10.71 | ) | | | (20.77 | ) | | | (17.31 | ) | | | (18.69 | ) |
Total from investment operations | | | (5.01 | ) | | | (4.55 | ) | | | (12.39 | ) | | | (23.05 | ) | | | (20.19 | ) | | | (22.23 | ) |
Net asset value, end of period | | $ | 65.78 | | | $ | 70.79 | | | $ | 75.34 | | | $ | 87.73 | | | $ | 110.78 | | | $ | 130.97 | |
| | |
Total Returnc | | | (7.12 | %) | | | (6.05 | %) | | | (14.09 | %) | | | (20.80 | %) | | | (15.44 | %) | | | (14.49 | %) |
Ratios/Supplemental Data | |
Net assets, end of period (in thousands) | | $ | 8,582 | | | $ | 9,244 | | | $ | 5,121 | | | $ | 6,177 | | | $ | 7,041 | | | $ | 7,870 | |
Ratios to average net assets: | |
Net investment income (loss) | | | (1.75 | %) | | | (1.93 | %) | | | (2.07 | %) | | | (2.34 | %) | | | (2.27 | %) | | | (2.31 | %) |
Total expensesd | | | 2.42 | % | | | 2.41 | % | | | 2.41 | % | | | 2.42 | % | | | 2.40 | % | | | 2.42 | % |
Portfolio turnover rate | | | 42 | % | | | 63 | % | | | 103 | % | | | — | | | | — | | | | — | |
H-Class | | Period Ended
September 30,
2016a,f | | | Year Ended
March 31,
2016f | | | Period Ended
March 31,
2015e,f | |
Per Share Data | | | | | | | | | |
Net asset value, beginning of period | | $ | 77.17 | | | $ | 81.54 | | | $ | 86.10 | |
Income (loss) from investment operations: | |
Net investment income (loss)b | | | .36 | | | | (.90 | ) | | | (.54 | ) |
Net gain (loss) on investments (realized and unrealized) | | | (5.49 | ) | | | (3.47 | ) | | | (4.02 | ) |
Total from investment operations | | | (5.13 | ) | | | (4.37 | ) | | | (4.56 | ) |
Net asset value, end of period | | $ | 72.04 | | | $ | 77.17 | | | $ | 81.54 | |
| | |
Total Returnc | | | (6.61 | %) | | | (5.37 | %) | | | (5.30 | %) |
Ratios/Supplemental Data | |
Net assets, end of period (in thousands) | | $ | 4,436 | | | $ | 7,319 | | | $ | 13,085 | |
Ratios to average net assets: | |
Net investment income (loss) | | | (0.99 | %) | | | (1.08 | %) | | | (1.27 | %) |
Total expensesd | | | 1.67 | % | | | 1.67 | % | | | 1.60 | % |
Portfolio turnover rate | | | 42 | % | | | 63 | % | | | 103 | % |
a | Unaudited figures for the period ended September 30, 2016. Percentage amounts for the period, except total return and portfolio turnover rate, have been annualized. |
b | Net investment income (loss) per share was computed using average shares outstanding throughout the period. |
c | Total return does not reflect the impact of any applicable sales charges. |
d | Does not include expenses of the underlying funds in which the Fund invests. |
e | Since commencement of operations: September 18, 2014. Percentage amounts for the period, except total return and portfolio turnover rate, have been annualized. The portfolio turnover table rate stated is for the entire period of the Fund, not since the commencement of operations of the Class. |
f | Reverse share split — Per share amounts for the periods presented through September 30, 2016 have been restated to reflect a 1:6 reverse share split effective October 28, 2016 — See Note 12. |
SEE NOTES TO FINANCIAL STATEMENTS. | THE RYDEX FUNDS SEMI-ANNUAL REPORT | 43 |
FUND PROFILE (Unaudited) | September 30, 2016 |
MONTHLY REBALANCE NASDAQ-100 2x STRATEGY FUND
OBJECTIVE: Seeks to provide investment results that match, before fees and expenses, the performance of a specific benchmark on a calendar month basis. The Fund’s current benchmark is 200% of the performance of the NASDAQ-100 Index® (the “underlying index”). The Fund does not seek to achieve its investment objective over a period of time different than a full calendar month.
Holdings Diversification (Market Exposure as % of Net Assets)
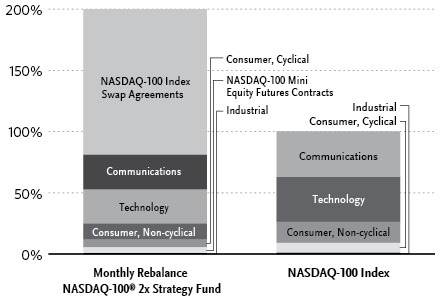
“Holdings Diversification (Market Exposure as % of Net Assets)” excludes any temporary cash investments or investments in Guggenheim Strategy Funds Trust mutual funds. Investments in those Funds do not provide “market exposure” to meet the Fund’s investment objective, but will significantly increase the portfolio’s exposure to certain other asset categories (and their associated risks), which may cause the Fund to deviate from its principal investment strategy, including: (i) high yield, high risk debt securities rated below the top four long-term rating categories by a nationally recognized statistical rating organization (also known as “junk bonds”); (ii) securities issued by the U.S. government or its agencies and instrumentalities; (iii) CLOs and similar investments; and (iv) other short-term fixed income securities.
Inception Dates: |
A-Class | November 28, 2014 |
C-Class | November 28, 2014 |
H-Class | November 28, 2014 |
Ten Largest Holdings (% of Total Net Assets) |
Apple, Inc. | 8.2% |
Microsoft Corp. | 6.1% |
Guggenheim Strategy Fund II | 5.8% |
Guggenheim Strategy Fund I | 5.7% |
Amazon.com, Inc. | 5.4% |
Facebook, Inc. — Class A | 4.0% |
Alphabet, Inc. — Class C | 3.6% |
Alphabet, Inc. — Class A | 3.2% |
Intel Corp. | 2.4% |
Cisco Systems, Inc. | 2.2% |
Top Ten Total | 46.6% |
| | |
“Ten Largest Holdings” excludes any temporary cash or derivative investments. |
44 | THE RYDEX FUNDS SEMI-ANNUAL REPORT | |
SCHEDULE OF INVESTMENTS (Unaudited) | September 30, 2016 |
MONTHLY REBALANCE NASDAQ-100® 2x STRATEGY FUND | |
| | | Shares | | | Value | |
| | | | | | | |
COMMON STOCKS† - 76.3% | |
| | | | | | | |
Communications - 28.4% | |
Amazon.com, Inc.* | | | 3,460 | | | $ | 2,897,092 | |
Facebook, Inc. — Class A* | | | 16,955 | | | | 2,174,818 | |
Alphabet, Inc. — Class C* | | | 2,508 | | | | 1,949,442 | |
Alphabet, Inc. — Class A* | | | 2,152 | | | | 1,730,337 | |
Cisco Systems, Inc. | | | 36,711 | | | | 1,164,473 | |
Comcast Corp. — Class A | | | 17,534 | | | | 1,163,206 | |
Charter Communications, Inc. — Class A* | | | 1,977 | | | | 533,731 | |
Priceline Group, Inc.* | | | 361 | | | | 531,207 | |
Baidu, Inc. ADR* | | | 2,000 | | | | 364,140 | |
Netflix, Inc.* | | | 3,129 | | | | 308,363 | |
Yahoo!, Inc.* | | | 6,947 | | | | 299,416 | |
T-Mobile US, Inc.* | | | 6,005 | | | | 280,554 | |
eBay, Inc.* | | | 8,240 | | | | 271,095 | |
Twenty-First Century Fox, Inc. — Class A | | | 7,766 | | | | 188,093 | |
JD.com, Inc. ADR* | | | 6,685 | | | | 174,412 | |
Liberty Global plc* | | | 4,706 | | | | 155,486 | |
Sirius XM Holdings, Inc.* | | | 35,603 | | | | 148,465 | |
Twenty-First Century Fox, Inc. — Class B | | | 5,828 | | | | 144,185 | |
Ctrip.com International Ltd. ADR* | | | 2,731 | | | | 127,183 | |
Expedia, Inc. | | | 1,001 | | | | 116,837 | |
Symantec Corp. | | | 4,493 | | | | 112,774 | |
Viacom, Inc. — Class B | | | 2,534 | | | | 96,545 | |
DISH Network Corp. — Class A* | | | 1,653 | | | | 90,551 | |
Vodafone Group plc ADR | | | 2,920 | | | | 85,118 | |
Liberty Global plc — Class A* | | | 1,930 | | | | 65,967 | |
TripAdvisor, Inc.* | | | 970 | | | | 61,285 | |
Discovery Communications, Inc. — Class C* | | | 1,741 | | | | 45,806 | |
Liberty Ventures* | | | 987 | | | | 39,352 | |
Discovery Communications, Inc. — Class A* | | | 1,101 | | | | 29,639 | |
Liberty Global plc LiLAC — Class C* | | | 63 | | | | 1,767 | |
Liberty Global plc LiLAC — Class A* | | | 42 | | | | 1,159 | |
Total Communications | | | | | | | 15,352,498 | |
| | | | | | | | | |
Technology - 27.8% | |
Apple, Inc. | | | 39,329 | | | | 4,446,144 | |
Microsoft Corp. | | | 56,876 | | | | 3,276,057 | |
Intel Corp. | | | 34,531 | | | | 1,303,544 | |
QUALCOMM, Inc. | | | 10,756 | | | | 736,785 | |
Texas Instruments, Inc. | | | 7,322 | | | | 513,858 | |
Broadcom Ltd. | | | 2,887 | | | | 498,065 | |
Adobe Systems, Inc.* | | | 3,637 | | | | 394,760 | |
NVIDIA Corp. | | | 3,905 | | | | 267,571 | |
NXP Semiconductor N.V.* | | | 2,476 | | | | 252,577 | |
Activision Blizzard, Inc. | | | 5,412 | | | | 239,752 | |
Applied Materials, Inc. | | | 7,889 | | | | 237,853 | |
Cognizant Technology Solutions Corp. — Class A* | | | 4,430 | | | | 211,355 | |
Intuit, Inc. | | | 1,868 | | | | 205,499 | |
Electronic Arts, Inc.* | | | 2,195 | | | | 187,453 | |
Fiserv, Inc.* | | | 1,604 | | | | 159,550 | |
Paychex, Inc. | | | 2,631 | | | | 152,256 | |
Cerner Corp.* | | | 2,465 | | | | 152,214 | |
Analog Devices, Inc. | | | 2,244 | | | | 144,626 | |
Micron Technology, Inc.* | | | 7,579 | | | | 134,755 | |
NetEase, Inc. ADR | | | 557 | | | | 134,114 | |
Western Digital Corp. | | | 2,075 | | | | 121,326 | |
Autodesk, Inc.* | | | 1,620 | | | | 117,175 | |
Lam Research Corp. | | | 1,170 | | | | 110,811 | |
Skyworks Solutions, Inc. | | | 1,368 | | | | 104,160 | |
Linear Technology Corp. | | | 1,750 | | | | 103,758 | |
CA, Inc. | | | 3,058 | | | | 101,159 | |
Xilinx, Inc. | | | 1,850 | | | | 100,529 | |
Microchip Technology, Inc. | | | 1,571 | | | | 97,622 | |
Check Point Software Technologies Ltd.* | | | 1,252 | | | | 97,168 | |
Citrix Systems, Inc.* | | | 1,137 | | | | 96,895 | |
Seagate Technology plc | | | 2,188 | | | | 84,347 | |
Maxim Integrated Products, Inc. | | | 2,069 | | | | 82,615 | |
NetApp, Inc. | | | 2,031 | | | | 72,750 | |
Akamai Technologies, Inc.* | | | 1,275 | | | | 67,562 | |
Total Technology | | | | | | | 15,006,665 | |
| | | | | | | | | |
Consumer, Non-cyclical - 13.1% | |
Amgen, Inc. | | | 5,462 | | | | 911,117 | |
Kraft Heinz Co. | | | 8,887 | | | | 795,475 | |
Gilead Sciences, Inc. | | | 9,632 | | | | 762,085 | |
Celgene Corp.* | | | 5,657 | | | | 591,326 | |
Biogen, Inc.* | | | 1,599 | | | | 500,535 | |
Mondelez International, Inc. — Class A | | | 11,354 | | | | 498,441 | |
PayPal Holdings, Inc.* | | | 8,809 | | | | 360,905 | |
Express Scripts Holding Co.* | | | 4,600 | | | | 324,438 | |
Regeneron Pharmaceuticals, Inc.* | | | 755 | | | | 303,525 | |
Automatic Data Processing, Inc. | | | 3,330 | | | | 293,706 | |
Monster Beverage Corp.* | | | 1,389 | | | | 203,919 | |
Intuitive Surgical, Inc.* | | | 281 | | | | 203,677 | |
Alexion Pharmaceuticals, Inc.* | | | 1,637 | | | | 200,598 | |
Illumina, Inc.* | | | 1,070 | | | | 194,376 | |
Vertex Pharmaceuticals, Inc.* | | | 1,808 | | | | 157,676 | |
Mylan N.V.* | | | 3,904 | | | | 148,820 | |
Incyte Corp.* | | | 1,372 | | | | 129,366 | |
BioMarin Pharmaceutical, Inc.* | | | 1,249 | | | | 115,557 | |
DENTSPLY SIRONA, Inc. | | | 1,701 | | | | 101,090 | |
Verisk Analytics, Inc. — Class A* | | | 1,233 | | | | 100,218 | |
Henry Schein, Inc.* | | | 597 | | | | 97,299 | |
Whole Foods Market, Inc. | | | 2,327 | | | | 65,970 | |
Total Consumer, Non-cyclical | | | | | | | 7,060,119 | |
| | | | | | | | | |
Consumer, Cyclical - 6.3% | |
Walgreens Boots Alliance, Inc. | | | 7,900 | | | | 636,897 | |
Starbucks Corp. | | | 10,704 | | | | 579,515 | |
Costco Wholesale Corp. | | | 3,197 | | | | 487,574 | |
Tesla Motors, Inc.* | | | 1,089 | | | | 222,189 | |
O’Reilly Automotive, Inc.* | | | 693 | | | | 194,116 | |
Ross Stores, Inc. | | | 2,916 | | | | 187,499 | |
PACCAR, Inc. | | | 2,558 | | | | 150,359 | |
American Airlines Group, Inc. | | | 3,868 | | | | 141,607 | |
Dollar Tree, Inc.* | | | 1,720 | | | | 135,760 | |
Marriott International, Inc. — Class A | | | 1,857 | | | | 125,032 | |
Ulta Salon Cosmetics & Fragrance, Inc.* | | | 455 | | | | 108,281 | |
Fastenal Co. | | | 2,109 | | | | 88,114 | |
SEE NOTES TO FINANCIAL STATEMENTS. | THE RYDEX FUNDS SEMI-ANNUAL REPORT | 45 |
SCHEDULE OF INVESTMENTS (Unaudited)(continued) | September 30, 2016 |
MONTHLY REBALANCE NASDAQ-100® 2x STRATEGY FUND | |
| | | Shares | | | Value | |
| | | | | | | |
Mattel, Inc. | | | 2,486 | | | $ | 75,276 | |
Tractor Supply Co. | | | 976 | | | | 65,734 | |
Liberty Interactive Corporation QVC Group — Class A* | | | 3,260 | | | | 65,233 | |
Norwegian Cruise Line Holdings Ltd.* | | | 1,658 | | | | 62,507 | |
Bed Bath & Beyond, Inc. | | | 1,127 | | | | 48,585 | |
Total Consumer, Cyclical | | | | | | | 3,374,278 | |
| | | | | | | | | |
Industrial - 0.7% | |
CSX Corp. | | | 6,905 | | | | 210,602 | |
SBA Communications Corp. — Class A* | | | 910 | | | | 102,066 | |
Stericycle, Inc.* | | | 621 | | | | 49,767 | |
Total Industrial | | | | | | | 362,435 | |
| | | | | | | | | |
Total Common Stocks | | | | | | | | |
(Cost $40,209,598) | | | | | | | 41,155,995 | |
| | | | | | | | | |
MUTUAL FUNDS† - 11.5% | |
Guggenheim Strategy Fund II1 | | | 124,896 | | | | 3,114,907 | |
Guggenheim Strategy Fund I1 | | | 124,631 | | | | 3,114,537 | |
Total Mutual Funds | | | | | | | | |
(Cost $6,219,870) | | | | | | | 6,229,444 | |
| | | | | | | | | |
| | | Face
Amount | | | | | |
| | | | | | | | | |
REPURCHASE AGREEMENTS††,2 - 4.0% | |
Royal Bank of Canada
issued 09/30/16 at 0.36%
due 10/03/163 | | $ | 1,624,121 | | | | 1,624,121 | |
HSBC Securities, Inc.
issued 09/30/16 at 0.38%
due 10/03/16 | | | 545,385 | | | | 545,385 | |
Total Repurchase Agreements | | | | | | | | |
(Cost $2,169,506) | | | | | | | 2,169,506 | |
| | | | | | | | | |
Total Investments - 91.8% | | | | | | | | |
(Cost $48,598,974) | | | | | | $ | 49,554,945 | |
Other Assets & Liabilities, net - 8.2% | | | | | | | 4,407,565 | |
Total Net Assets - 100.0% | | | | | | $ | 53,962,510 | |
| | | Contracts | | | Unrealized
Gain | |
| | | | | | | |
EQUITY FUTURES CONTRACTS PURCHASED† | |
December 2016 NASDAQ-100 Index
Mini Futures Contracts
(Aggregate Value of
Contracts $2,532,010) | | | 26 | | | $ | 104,661 | |
| | | | | | | | | |
| | | Units | | | | | |
| | | | | | | | | |
OTC EQUITY INDEX SWAP AGREEMENTS†† | |
BNP Paribas
November 2016
NASDAQ-100 Index Swap 0.78%4,
Terminating 11/01/16
(Notional Value $22,231,404) | | | 4,560 | | | $ | 169,115 | |
Goldman Sachs International
October 2016
NASDAQ-100 Index Swap 1.05%4,
Terminating 10/27/16
(Notional Value $646,358) | | | 133 | | | | 7,760 | |
Barclays Bank plc
October 2016
NASDAQ-100 Index Swap 0.75%4,
Terminating 10/27/16
(Notional Value $41,375,733) | | | 8,486 | | | | 500 | |
(Total Notional Value $64,253,495) | | | | | | $ | 177,375 | |
* | Non-income producing security. |
† | Value determined based on Level 1 inputs — See Note 4. |
†† | Value determined based on Level 2 inputs — See Note 4. |
1 | Affiliated issuer — See Note 9. |
2 | Repurchase Agreements — See Note 5. |
3 | All or a portion of this security is pledged as equity index swap collateral at September 30, 2016. |
4 | Total Return based on NASDAQ-100 Index +/- financing at a variable rate. Rate indicated is rate effective at September 30, 2016. |
| | ADR — American Depositary Receipt |
| | plc — Public Limited Company |
| | |
| | See Sector Classification in Other Information section. |
46 | THE RYDEX FUNDS SEMI-ANNUAL REPORT | SEE NOTES TO FINANCIAL STATEMENTS. |
SCHEDULE OF INVESTMENTS (Unaudited)(concluded) | September 30, 2016 |
MONTHLY REBALANCE NASDAQ-100® 2x STRATEGY FUND | |
The following table summarizes the inputs used to value the Fund’s investments at September 30, 2016 (See Note 4 in the Notes to Financial Statements):
Investments in Securities (Assets) | | Level 1 | | | Level 1 -
Other* | | | Level 2 | | | Level 2 -
Other* | | | Level 3 | | | Total | |
Common Stocks | | $ | 41,155,995 | | | $ | — | | | $ | — | | | $ | — | | | $ | — | | | $ | 41,155,995 | |
Equity Futures Contracts | | | — | | | | 104,661 | | | | — | | | | — | | | | — | | | | 104,661 | |
Equity Index Swap Agreements | | | — | | | | — | | | | — | | | | 177,375 | | | | — | | | | 177,375 | |
Mutual Funds | | | 6,229,444 | | | | — | | | | — | | | | — | | | | — | | | | 6,229,444 | |
Repurchase Agreements | | | — | | | | — | | | | 2,169,506 | | | | — | | | | — | | | | 2,169,506 | |
Total | | $ | 47,385,439 | | | $ | 104,661 | | | $ | 2,169,506 | | | $ | 177,375 | | | $ | — | | | $ | 49,836,981 | |
* | Other financial instruments include futures contracts and/or swaps, which are reported as unrealized gain/loss at period end. |
Transfers between investment levels may occur as the markets fluctuate and/or the availability of data used in an investment’s valuation changes. Transfers between valuation levels, if any, are in comparison to the valuation levels at the end of the previous fiscal year, and are effective using the fair value as of the end of the previous fiscal period.
For the period ended September 30, 2016, there were no transfers between levels.
SEE NOTES TO FINANCIAL STATEMENTS. | THE RYDEX FUNDS SEMI-ANNUAL REPORT | 47 |
MONTHLY REBALANCE NASDAQ-100® 2x STRATEGY FUND | |
STATEMENT OF ASSETS AND LIABILITIES (Unaudited) | |
September 30, 2016 | |
Assets: | |
Investments in unaffiliated issuers, at value (cost $40,209,598) | | $ | 41,155,995 | |
Investments in affiliated issuers, at value (cost $6,219,870) | | | 6,229,444 | |
Repurchase agreements, at value (cost $2,169,506) | | | 2,169,506 | |
Total investments (cost $48,598,974) | | | 49,554,945 | |
Segregated cash with broker | | | 4,358,400 | |
Unrealized appreciation on swap agreements | | | 177,375 | |
Cash | | | 1,449 | |
Receivables: | |
Variation margin | | | 13,000 | |
Fund shares sold | | | 16,002 | |
Dividends | | | 26,415 | |
Interest | | | 22 | |
Investment adviser | | | 17,444 | |
Total assets | | | 54,165,052 | |
| | | | | |
Liabilities: | |
Payable for: | |
Licensing fees | | | 82,323 | |
Management fees | | | 42,777 | |
Fund shares redeemed | | | 38,836 | |
Distribution and service fees | | | 11,899 | |
Transfer agent and administrative fees | | | 11,882 | |
Portfolio accounting fees | | | 4,753 | |
Miscellaneous | | | 10,072 | |
Total liabilities | | | 202,542 | |
Commitments and contingent liabilities (Note 13) | | | — | |
Net assets | | $ | 53,962,510 | |
| | | | | |
Net assets consist of: | |
Paid in capital | | $ | 148,873,903 | |
Accumulated net investment loss | | | (39,105 | ) |
Accumulated net realized loss on investments | | | (96,110,294 | ) |
Net unrealized appreciation on investments | | | 1,238,006 | |
Net assets | | $ | 53,962,510 | |
| | | | | |
A-Class: | |
Net assets | | $ | 326,757 | |
Capital shares outstanding | | | 5,100 | |
Net asset value per share | | $ | 64.07 | |
Maximum offering price per share (Net asset value divided by 95.25%) | | $ | 67.25 | |
| | | | | |
C-Class: | |
Net assets | | $ | 32,098 | |
Capital shares outstanding | | | 509 | |
Net asset value per share | | $ | 63.06 | |
| | | | | |
H-Class: | |
Net assets | | $ | 53,603,655 | |
Capital shares outstanding | | | 816,583 | |
Net asset value per share | | $ | 65.64 | |
STATEMENT OF OPERATIONS (Unaudited) | |
Period Ended September 30, 2016 | |
Investment Income: | |
Dividends from securities of unaffiliated issuers (net of foreign withholding tax of $687) | | $ | 52,328 | |
Dividends from securities of affiliated issuers | | | 16,132 | |
Interest | | | 1,399 | |
Total investment income | | | 69,859 | |
| | | | | |
Expenses: | |
Management fees | | | 72,536 | |
Transfer agent and administrative fees | | | 20,149 | |
Distribution and service fees: | |
A-Class | | | 472 | |
C-Class | | | 138 | |
H-Class | | | 19,642 | |
Portfolio accounting fees | | | 8,059 | |
Miscellaneous - Move to Misc | | | 7,675 | |
Custodian fees | | | 958 | |
Trustees’ fees* | | | 137 | |
Line of credit fees | | | 66 | |
Miscellaneous | | | 8,467 | |
Total expenses | | | 138,299 | |
Less: | | | | |
Expenses waived by Adviser | | | (29,335 | ) |
Net expenses | | | 108,964 | |
Net investment loss | | | (39,105 | ) |
| | | | | |
Net Realized and Unrealized Gain (Loss): | |
Net realized gain (loss) on: | |
Investments in unaffiliated issuers | | | (189,662 | ) |
Investments in affiliated issuers | | | 756 | |
Swap agreements | | | 865,472 | |
Futures contracts | | | (13,742 | ) |
Net realized gain | | | 662,824 | |
Net change in unrealized appreciation (depreciation) on: | |
Investments in unaffiliated issuers | | | 835,156 | |
Investments in affiliated issuers | | | 10,395 | |
Swap agreements | | | 147,847 | |
Futures contracts | | | 81,300 | |
Net change in unrealized appreciation (depreciation) | | | 1,074,698 | |
Net realized and unrealized gain | | | 1,737,522 | |
Net increase in net assets resulting from operations | | $ | 1,698,417 | |
* | Relates to Trustees not deemed “interested persons” within the meaning of Section 2(a)(19) of the 1940 Act. |
48 | THE RYDEX FUNDS SEMI-ANNUAL REPORT | SEE NOTES TO FINANCIAL STATEMENTS. |
MONTHLY REBALANCE NASDAQ-100® 2x STRATEGY FUND | |
STATEMENTS OF CHANGES IN NET ASSETS |
| | | Period Ended
September 30,
2016
(Unaudited) | | | Year Ended
March 31,
2016 | |
Increase (Decrease) in Net Assets from Operations: | | | | | | |
Net investment loss | | $ | (39,105 | ) | | $ | (427,077 | ) |
Net realized gain (loss) on investments | | | 662,824 | | | | (79,531,367 | ) |
Net change in unrealized appreciation (depreciation) on investments | | | 1,074,698 | | | | 2,435,917 | |
Net increase (decrease) in net assets resulting from operations | | | 1,698,417 | | | | (77,522,527 | ) |
| | | | | | | | | |
Capital share transactions: | | | | | | | | |
Proceeds from sale of shares | | | | | | | | |
A-Class | | | 410,462 | | | | 4,791,065 | |
C-Class | | | 39,566 | | | | 60,141 | |
H-Class | | | 63,767,806 | | | | 722,965,697 | |
Cost of shares redeemed | | | | | | | | |
A-Class | | | (397,894 | ) | | | (4,159,012 | ) |
C-Class | | | (33,782 | ) | | | (44,714 | ) |
H-Class | | | (16,010,981 | ) | | | (984,738,898 | ) |
Net increase (decrease) from capital share transactions | | | 47,775,177 | | | | (261,125,721 | ) |
Net increase (decrease) in net assets | | | 49,473,594 | | | | (338,648,248 | ) |
| | | | | | | | | |
Net assets: | | | | | | | | |
Beginning of period | | | 4,488,916 | | | | 343,137,164 | |
End of period | | $ | 53,962,510 | | | $ | 4,488,916 | |
Accumulated net investment loss at end of period | | $ | (39,105 | ) | | $ | — | |
| | | | | | | | | |
Capital share activity: | | | | | | | | |
Shares sold | | | | | | | | |
A-Class | | | 6,970 | | | | 82,637 | |
C-Class | | | 690 | | | | 1,072 | |
H-Class | | | 997,757 | | | | 12,184,515 | |
Shares redeemed | | | | | | | | |
A-Class | | | (6,390 | ) | | | (87,115 | ) |
C-Class | | | (606 | ) | | | (920 | ) |
H-Class | | | (256,812 | ) | | | (18,752,891 | ) |
Net increase (decrease) in shares | | | 741,609 | | | | (6,572,702 | ) |
SEE NOTES TO FINANCIAL STATEMENTS. | THE RYDEX FUNDS SEMI-ANNUAL REPORT | 49 |
MONTHLY REBALANCE NASDAQ-100® 2x STRATEGY FUND | |
This table is presented to show selected data for a share outstanding throughout each period and to assist shareholders in evaluating a Fund’s performance for the periods presented.
A-Class | | Period Ended
September 30,
2016a | | | Year Ended
March 31,
2016 | | | Period Ended
March 31,
2015b | |
Per Share Data | | | | | | | | | |
Net asset value, beginning of period | | $ | 54.45 | | | $ | 51.68 | | | $ | 50.00 | |
Income (loss) from investment operations: | |
Net investment income (loss)c | | | (.07 | ) | | | (.27 | ) | | | (.07 | ) |
Net gain (loss) on investments (realized and unrealized) | | | 9.69 | | | | 3.04 | | | | 1.75 | |
Total from investment operations | | | 9.62 | | | | 2.77 | | | | 1.68 | |
Net asset value, end of period | | $ | 64.07 | | | $ | 54.45 | | | $ | 51.68 | |
| | |
Total Returnf | | | 17.63 | % | | | 5.38 | % | | | 3.36 | % |
Ratios/Supplemental Data | |
Net assets, end of period (in thousands) | | $ | 327 | | | $ | 246 | | | $ | 465 | |
Ratios to average net assets: | |
Net investment income (loss) | | | (0.26 | %) | | | (0.48 | %) | | | (0.38 | %) |
Total expensesd | | | 1.71 | % | | | 1.70 | % | | | 1.63 | % |
Net expensese | | | 1.35 | % | | | 1.37 | % | | | 1.35 | % |
Portfolio turnover rate | | | 66 | % | | | 551 | % | | | 84 | % |
C-Class | | Period Ended
September 30,
2016a | | | Year Ended
March 31,
2016 | | | Period Ended
March 31,
2015b | |
Per Share Data | | | | | | | | | |
Net asset value, beginning of period | | $ | 53.80 | | | $ | 51.55 | | | $ | 50.00 | |
Income (loss) from investment operations: | |
Net investment income (loss)c | | | (.30 | ) | | | (.56 | ) | | | (.19 | ) |
Net gain (loss) on investments (realized and unrealized) | | | 9.56 | | | | 2.81 | | | | 1.74 | |
Total from investment operations | | | 9.26 | | | | 2.25 | | | | 1.55 | |
Net asset value, end of period | | $ | 63.06 | | | $ | 53.80 | | | $ | 51.55 | |
| | |
Total Returnf | | | 17.19 | % | | | 4.40 | % | | | 3.10 | % |
Ratios/Supplemental Data | |
Net assets, end of period (in thousands) | | $ | 32 | | | $ | 23 | | | $ | 14 | |
Ratios to average net assets: | |
Net investment income (loss) | | | (1.06 | %) | | | (1.04 | %) | | | (1.13 | %) |
Total expensesd | | | 2.46 | % | | | 2.51 | % | | | 2.43 | % |
Net expensese | | | 2.10 | % | | | 2.17 | % | | | 2.13 | % |
Portfolio turnover rate | | | 66 | % | | | 551 | % | | | 84 | % |
50 | THE RYDEX FUNDS SEMI-ANNUAL REPORT | SEE NOTES TO FINANCIAL STATEMENTS. |
MONTHLY REBALANCE NASDAQ-100® 2x STRATEGY FUND | |
FINANCIAL HIGHLIGHTS (concluded) |
This table is presented to show selected data for a share outstanding throughout each period and to assist shareholders in evaluating a Fund’s performance for the periods presented.
H-Class | | Period Ended
September 30,
2016a | | | Year Ended
March 31,
2016 | | | Period Ended
March 31,
2015b | |
Per Share Data | | | | | | | | | |
Net asset value, beginning of period | | $ | 55.79 | | | $ | 51.57 | | | $ | 50.00 | |
Income (loss) from investment operations: | |
Net investment income (loss)c | | | (.15 | ) | | | (.17 | ) | | | (.11 | ) |
Net gain (loss) on investments (realized and unrealized) | | | 10.00 | | | | 4.39 | | | | 1.67 | |
Total from investment operations | | | 9.85 | | | | 4.22 | | | | 1.57 | |
Net asset value, end of period | | $ | 65.64 | | | $ | 55.79 | | | $ | 51.57 | |
| | |
Total Returnf | | | 17.66 | % | | | 8.18 | % | | | 3.14 | % |
Ratios/Supplemental Data | |
Net assets, end of period (in thousands) | | $ | 53,604 | | | $ | 4,220 | | | $ | 342,658 | |
Ratios to average net assets: | |
Net investment income (loss) | | | (0.49 | %) | | | (0.30 | %) | | | (0.60 | %) |
Total expensesd | | | 1.71 | % | | | 1.67 | % | | | 1.64 | % |
Net expensese | | | 1.35 | % | | | 1.35 | % | | | 1.35 | % |
Portfolio turnover rate | | | 66 | % | | | 551 | % | | | 84 | % |
a | Unaudited figures for the period ended September 30, 2016. Percentage amounts for the period, except total return and portfolio turnover rate, have been annualized. |
b | Since commencement of operations: November 28, 2014. Percentage amounts for the period, except total return and portfolio turnover rate, have been annualized. |
c | Net investment income (loss) per share was computed using average shares outstanding throughout the period. |
d | Does not include expenses of the underlying funds in which the Fund invests. |
e | Net expense information reflects the expense ratios after expense waivers. |
f | Total return does not reflect the impact of any applicable sales charge and has not been annualized. |
g | Net expenses may include expenses that are excluded from the expense limitation agreement. Excluding these expenses, the operating expense ratios for the periods ended would be: |
| | 9/30/16 | 3/31/16 | 3/31/15 |
A-Class | 1.35% | 1.35% | 1.35% |
C-Class | 2.10% | 2.10% | 2.10% |
H-Class | 1.35% | 1.35% | 1.35% |
SEE NOTES TO FINANCIAL STATEMENTS. | THE RYDEX FUNDS SEMI-ANNUAL REPORT | 51 |
FUND PROFILE (Unaudited) | September 30, 2016 |
INVERSE NASDAQ-100® STRATEGY FUND
OBJECTIVE: Seeks to provide investment results that match, before fees and expenses, the performance of a specific benchmark on a daily basis. The Fund’s current benchmark is the inverse (opposite) of the performance of the NASDAQ-100 Index® (the “underlying index”). The Fund does not seek to achieve its investment objective over a period of time greater than one day.
Holdings Diversification (Market Exposure as % of Net Assets)
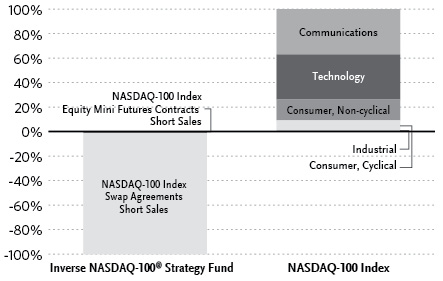
“Holdings Diversification (Market Exposure as % of Net Assets)” excludes any temporary cash investments or investments in Guggenheim Strategy Funds Trust mutual funds. Investments in those Funds do not provide “market exposure” to meet the Fund’s investment objective, but will significantly increase the portfolio’s exposure to certain other asset categories (and their associated risks), which may cause the Fund to deviate from its principal investment strategy, including: (i) high yield, high risk debt securities rated below the top four long-term rating categories by a nationally recognized statistical rating organization (also known as “junk bonds”); (ii) securities issued by the U.S. government or its agencies and instrumentalities; (iii) CLOs and similar investments; and (iv) other short-term fixed income securities.
Inception Dates: |
Investor Class | September 3, 1998 |
A-Class | March 31, 2004 |
C-Class | March 7, 2001 |
H-Class | September 18, 2014 |
The Fund invests principally in derivative investments such as swap agreements and futures contracts.
Largest Holdings (% of Total Net Assets) |
Guggenheim Strategy Fund II | 22.3% |
Guggenheim Strategy Fund I | 22.3% |
Federal Farm Credit Bank | 21.3% |
Total | 65.9% |
| | |
“Largest Holdings” excludes any temporary cash or derivative investments. |
52 | THE RYDEX FUNDS SEMI-ANNUAL REPORT | |
SCHEDULE OF INVESTMENTS (Unaudited) | September 30, 2016 |
INVERSE NASDAQ-100® STRATEGY FUND | |
| | | Shares | | | Value | |
| | | | | | | |
MUTUAL FUNDS† - 44.7% | |
Guggenheim Strategy Fund II1 | | | 104,998 | | | $ | 2,618,643 | |
Guggenheim Strategy Fund I1 | | | 104,616 | | | | 2,614,361 | |
Total Mutual Funds | | | | | | | | |
(Cost $5,211,633) | | | | | | | 5,233,004 | |
| | | | | | | | | |
| | | Face
Amount | | | | | |
| | | | | | | | | |
FEDERAL AGENCY NOTES†† - 21.3% | |
Federal Farm Credit Bank2 | | | | | | | | |
0.65% due 08/10/183 | | $ | 2,500,000 | | | | 2,498,400 | |
Total Federal Agency Notes | | | | | | | | |
(Cost $2,498,595) | | | | | | | 2,498,400 | |
| | | | | | | | | |
REPURCHASE AGREEMENTS††,4 - 32.6% | |
Royal Bank of Canada
issued 09/30/16 at 0.36%
due 10/03/165 | | | 2,519,708 | | | | 2,519,708 | |
HSBC Securities, Inc.
issued 09/30/16 at 0.38%
due 10/03/16 | | | 1,305,130 | | | | 1,305,130 | |
Total Repurchase Agreements | | | | | | | | |
(Cost $3,824,838) | | | | | | | 3,824,838 | |
| | | | | | | | | |
Total Investments - 98.6% | | | | | | | | |
(Cost $11,535,066) | | | | | | $ | 11,556,242 | |
Other Assets & Liabilities, net - 1.4% | | | | | | | 164,656 | |
Total Net Assets - 100.0% | | | | | | $ | 11,720,898 | |
| | | Contracts | | | Unrealized
Loss | |
| | | | | | | |
EQUITY FUTURES CONTRACTS SOLD SHORT† | |
December 2016 NASDAQ-100 Index
Mini Futures Contracts
(Aggregate Value of
Contracts $97,385) | | | 1 | | | $ | (406 | ) |
| | | | | | | | | |
| | | Units | | | | | |
| | | | | | | | | |
OTC EQUITY INDEX SWAP AGREEMENTS SOLD SHORT†† | |
Barclays Bank plc
October 2016
NASDAQ-100 Index Swap 0.60%6,
Terminating 10/27/16
(Notional Value $1,803,462) | | | 370 | | | $ | (62 | ) |
BNP Paribas
November 2016
NASDAQ-100 Index Swap 0.28% 6,
Terminating 11/01/16
(Notional Value $2,736,492) | | | 561 | | | | (20,880 | ) |
Goldman Sachs International
October 2016
NASDAQ-100 Index Swap 0.75%6,
Terminating 10/27/16
(Notional Value $7,112,410) | | | 1,459 | | | | (85,449 | ) |
(Total Notional Value $11,652,364) | | | | | | $ | (106,391 | ) |
† | Value determined based on Level 1 inputs — See Note 4. |
†† | Value determined based on Level 2 inputs — See Note 4. |
1 | Affiliated issuer — See Note 9. |
2 | The issuer operates under a Congressional charter; its securities are neither issued nor guaranteed by the U.S. Government. |
3 | Variable rate security. Rate indicated is rate effective at September 30, 2016. |
4 | Repurchase Agreements — See Note 5. |
5 | All or a portion of this security is pledged as equity index swap collateral at September 30, 2016. |
6 | Total Return based on NASDAQ-100 Index +/- financing at a variable rate. Rate indicated is the rate effective at September 30, 2016. |
| | plc — Public Limited Company |
| | |
| | See Sector Classification in Other Information section. |
SEE NOTES TO FINANCIAL STATEMENTS. | THE RYDEX FUNDS SEMI-ANNUAL REPORT | 53 |
SCHEDULE OF INVESTMENTS (Unaudited)(concluded) | September 30, 2016 |
INVERSE NASDAQ-100® STRATEGY FUND | |
The following table summarizes the inputs used to value the Fund’s investments at September 30, 2016 (See Note 4 in the Notes to Financial Statements):
Investments in Securities (Assets) | | Level 1 | | | Level 1 -
Other* | | | Level 2 | | | Level 2 -
Other* | | | Level 3 | | | Total | |
Federal Agency Notes | | $ | — | | | $ | — | | | $ | 2,498,400 | | | $ | — | | | $ | — | | | $ | 2,498,400 | |
Mutual Funds | | | 5,233,004 | | | | — | | | | — | | | | — | | | | — | | | | 5,233,004 | |
Repurchase Agreements | | | — | | | | — | | | | 3,824,838 | | | | — | | | | — | | | | 3,824,838 | |
Total | | $ | 5,233,004 | | | $ | — | | | $ | 6,323,238 | | | $ | — | | | $ | — | | | $ | 11,556,242 | |
| | | | | | | | | | | | | | | | | | | | | | | | | |
Investments in Securities (Liabilities) | | Level 1 | | | Level 1 -
Other* | | | Level 2 | | | Level 2 -
Other* | | | Level 3 | | | Total | |
Equity Futures Contracts | | $ | — | | | $ | 406 | | | $ | — | | | $ | — | | | $ | — | | | $ | 406 | |
Equity Index Swap Agreements | | | — | | | | — | | | | — | | | | 106,391 | | | | — | | | | 106,391 | |
Total | | $ | — | | | $ | 406 | | | $ | — | | | $ | 106,391 | | | $ | — | | | $ | 106,797 | |
* | Other financial instruments include futures contracts and/or swaps, which are reported as unrealized gain/loss at period end. |
Transfers between investment levels may occur as the markets fluctuate and/or the availability of data used in an investment’s valuation changes. Transfers between valuation levels, if any, are in comparison to the valuation levels at the end of the previous fiscal year, and are effective using the fair value as of the end of the previous fiscal period.
For the period ended September 30, 2016, there were no transfers between levels.
54 | THE RYDEX FUNDS SEMI-ANNUAL REPORT | SEE NOTES TO FINANCIAL STATEMENTS. |
INVERSE NASDAQ-100® STRATEGY FUND | |
STATEMENT OF ASSETS AND LIABILITIES (Unaudited) |
September 30, 2016 |
Assets: | |
Investments in unaffiliated issuers, at value (cost $2,498,595) | | $ | 2,498,400 | |
Investments in affiliated issuers, at value (cost $5,211,633) | | | 5,233,004 | |
Repurchase agreements, at value (cost $3,824,838) | | | 3,824,838 | |
Total investments (cost $11,535,066) | | | 11,556,242 | |
Segregated cash with broker | | | 282,400 | |
Receivables: | |
Swap settlement | | | 813 | |
Fund shares sold | | | 27,559 | |
Dividends | | | 8,082 | |
Interest | | | 2,386 | |
Total assets | | | 11,877,482 | |
| | | | | |
Liabilities: | |
Unrealized depreciation on swap agreements | | | 106,391 | |
Payable for: | |
Fund shares redeemed | | | 28,479 | |
Management fees | | | 9,827 | |
Variation margin | | | 4,530 | |
Transfer agent and administrative fees | | | 2,730 | |
Distribution and service fees | | | 1,992 | |
Portfolio accounting fees | | | 1,092 | |
Miscellaneous | | | 1,543 | |
Total liabilities | | | 156,584 | |
Commitments and contingent liabilities (Note 13) | | | — | |
Net assets | | $ | 11,720,898 | |
| | | | | |
Net assets consist of: | |
Paid in capital | | $ | 64,375,199 | |
Accumulated net investment loss | | | (286,898 | ) |
Accumulated net realized loss on investments | | | (52,281,782 | ) |
Net unrealized depreciation on investments | | | (85,621 | ) |
Net assets | | $ | 11,720,898 | |
| | | | | |
Investor Class: | |
Net assets | | $ | 7,642,796 | |
Capital shares outstanding* | | | 87,601 | |
Net asset value per share* | | $ | 87.24 | |
| | | | | |
A-Class: | |
Net assets | | $ | 2,148,260 | |
Capital shares outstanding* | | | 25,254 | |
Net asset value per share* | | $ | 85.06 | |
Maximum offering price per share (Net asset value divided by 95.25%)* | | $ | 89.30 | |
| | | | | |
C-Class: | |
Net assets | | $ | 1,640,666 | |
Capital shares outstanding* | | | 22,275 | |
Net asset value per share* | | $ | 73.65 | |
| | | | | |
H-Class: | |
Net assets | | $ | 289,176 | |
Capital shares outstanding* | | | 3,448 | |
Net asset value per share* | | $ | 83.87 | |
* | The shares outstanding, net asset value per share and the maximum offering price per share have been restated to reflect a 1:4 reverse share split, effective November 4, 2016 — See Note 12. |
SEE NOTES TO FINANCIAL STATEMENTS. | THE RYDEX FUNDS SEMI-ANNUAL REPORT | 55 |
INVERSE NASDAQ-100® STRATEGY FUND | |
STATEMENT OF OPERATIONS (Unaudited) |
Period Ended September 30, 2016 |
Investment Income: | |
Dividends from securities of affiliated issuers | | $ | 55,650 | |
Interest | | | 33,160 | |
Total investment income | | | 88,810 | |
| | | | | |
Expenses: | |
Management fees | | | 130,822 | |
Transfer agent and administrative fees | | | 36,339 | |
Distribution and service fees: | |
A-Class | | | 18,336 | |
C-Class | | | 8,685 | |
H-Class | | | 2,338 | |
Portfolio accounting fees | | | 14,536 | |
Registration fees | | | 13,900 | |
Custodian fees | | | 1,965 | |
Trustees’ fees* | | | 1,709 | |
Line of credit fees | | | 76 | |
Miscellaneous | | | 12,244 | |
Total expenses | | | 240,950 | |
Net investment loss | | | (152,140 | ) |
| | | | | |
Net Realized and Unrealized Gain (Loss): | |
Net realized gain (loss) on: | |
Investments in unaffiliated issuers | | $ | (821 | ) |
Investments in affiliated issuers | | | 16,107 | |
Swap agreements | | | (4,354,267 | ) |
Futures contracts | | | (780,104 | ) |
Net realized loss | | | (5,119,085 | ) |
Net change in unrealized appreciation (depreciation) on: | |
Investments in unaffiliated issuers | | | 5,450 | |
Investments in affiliated issuers | | | 18,956 | |
Swap agreements | | | 965,015 | |
Futures contracts | | | 246,930 | |
Net change in unrealized appreciation (depreciation) | | | 1,236,351 | |
Net realized and unrealized loss | | | (3,882,734 | ) |
Net decrease in net assets resulting from operations | | $ | (4,034,874 | ) |
* | Relates to Trustees not deemed “interested persons” within the meaning of Section 2(a)(19) of the 1940 Act. |
56 | THE RYDEX FUNDS SEMI-ANNUAL REPORT | SEE NOTES TO FINANCIAL STATEMENTS. |
INVERSE NASDAQ-100® STRATEGY FUND | |
STATEMENTS OF CHANGES IN NET ASSETS |
| | | Period Ended
September 30,
2016
(Unaudited) | | | Year Ended
March 31,
2016 | |
Increase (Decrease) in Net Assets from Operations: | | | | | | |
Net investment loss | | $ | (152,140 | ) | | $ | (432,506 | ) |
Net realized loss on investments | | | (5,119,085 | ) | | | (3,792,495 | ) |
Net change in unrealized appreciation (depreciation) on investments | | | 1,236,351 | | | | (1,299,301 | ) |
Net decrease in net assets resulting from operations | | | (4,034,874 | ) | | | (5,524,302 | ) |
| | | | | | | | | |
Capital share transactions: | | | | | | | | |
Proceeds from sale of shares | | | | | | | | |
Investor Class | | | 26,831,101 | | | | 259,319,436 | |
Advisor Class* | | | — | | | | 20,257,419 | |
A-Class | | | 194,094,379 | | | | 751,596,238 | |
C-Class | | | 1,527,461 | | | | 6,855,284 | |
H-Class | | | 25,547,151 | | | | 298,858,706 | |
Cost of shares redeemed | | | | | | | | |
Investor Class | | | (29,880,435 | ) | | | (250,066,675 | ) |
Advisor Class* | | | — | | | | (18,148,285 | ) |
A-Class | | | (244,871,505 | ) | | | (697,029,713 | ) |
C-Class | | | (1,173,025 | ) | | | (6,200,636 | ) |
H-Class | | | (24,832,672 | ) | | | (300,183,230 | ) |
Conversion activity* | | | | | | | | |
Advisor Class | | | — | | | | (2,231,827 | ) |
H-Class | | | — | | | | 2,231,827 | |
Net increase (decrease) from capital share transactions | | | (52,757,545 | ) | | | 65,258,544 | |
Net increase (decrease) in net assets | | | (56,792,419 | ) | | | 59,734,242 | |
| | | | | | | | | |
Net assets: | | | | | | | | |
Beginning of period | | | 68,513,317 | | | | 8,779,075 | |
End of period | | $ | 11,720,898 | | | $ | 68,513,317 | |
Accumulated net investment loss at end of period | | $ | (286,898 | ) | | $ | (134,758 | ) |
| | | | | | | | | |
Capital share activity:** | | | | | | | | |
Shares sold | | | | | | | | |
Investor Class | | | 287,635 | | | | 1,681,015 | |
Advisor Class* | | | — | | | | 140,061 | |
A-Class | | | 2,105,263 | | | | 5,088,141 | |
C-Class | | | 19,423 | | | | 53,909 | |
H-Class | | | 269,727 | | | | 2,008,582 | |
Shares redeemed | | | | | | | | |
Investor Class | | | (323,011 | ) | | | (1,642,144 | ) |
Advisor Class* | | | — | | | | (125,569 | ) |
A-Class | | | (2,664,508 | ) | | | (4,702,210 | ) |
C-Class | | | (14,956 | ) | | | (49,400 | ) |
H-Class | | | (268,993 | ) | | | (2,023,436 | ) |
Conversion activity* | | | | | | | | |
Advisor Class | | | — | | | | (14,868 | ) |
H-Class | | | — | | | | 14,469 | |
Net increase (decrease) in shares | | | (589,420 | ) | | | 2,571,297 | |
* | Effective September 30,2015, all outstanding Advisor Class shares converted into H-Class shares — See Note 11. |
** | Capital share activity for the periods presented through September 30, 2016 has been restated to reflect a 1:4 reverse share split effective November 4, 2016 — See Note 12. |
SEE NOTES TO FINANCIAL STATEMENTS. | THE RYDEX FUNDS SEMI-ANNUAL REPORT | 57 |
INVERSE NASDAQ-100® STRATEGY FUND | |
This table is presented to show selected data for a share outstanding throughout each period and to assist shareholders in evaluating a Fund’s performance for the periods presented.
Investor Class | | Period Ended
September 30,
2016a,g | | | Year Ended
March 31,
2016g | | | Year Ended
March 31,
2015g | | | Year Ended
March 31,
2014f,g | | | Year Ended
March 28,
2013f,g | | | Year Ended
March 31,
2012f,g | |
Per Share Data | | | | | | | | | | | | | | | | | | |
Net asset value, beginning of period | | $ | 96.42 | | | $ | 105.47 | | | $ | 132.37 | | | $ | 175.63 | | | $ | 187.81 | | | $ | 187.34 | |
Income (loss) from investment operations: | |
Net investment income (loss)b | | | .36 | | | | (1.08 | ) | | | (1.32 | ) | | | (2.16 | ) | | | (2.40 | ) | | | (3.20 | ) |
Net gain (loss) on investments (realized and unrealized) | | | (9.54 | ) | | | (7.97 | ) | | | (25.58 | ) | | | (41.10 | ) | | | (9.78 | ) | | | 3.67 | |
Total from investment operations | | | (9.18 | ) | | | (9.05 | ) | | | (26.90 | ) | | | (43.26 | ) | | | (12.18 | ) | | | (.47 | ) |
Net asset value, end of period | | $ | 87.24 | | | $ | 96.42 | | | $ | 105.47 | | | $ | 132.37 | | | $ | 175.63 | | | $ | 187.81 | |
| | |
Total Returnc | | | (9.50 | %) | | | (8.61 | %) | | | (20.31 | %) | | | (24.62 | %) | | | (6.50 | %) | | | (21.22 | %) |
Ratios/Supplemental Data | |
Net assets, end of period (in thousands) | | $ | 7,643 | | | $ | 11,857 | | | $ | 6,821 | | | $ | 6,865 | | | $ | 7,709 | | | $ | 8,792 | |
Ratios to average net assets: | |
Net investment income (loss) | | | (0.77 | %) | | | (1.04 | %) | | | (1.14 | %) | | | (1.44 | %) | | | (1.32 | %) | | | (1.38 | %) |
Total expensesd | | | 1.46 | % | | | 1.44 | % | | | 1.46 | % | | | 1.46 | % | | | 1.44 | % | | | 1.45 | % |
Portfolio turnover rate | | | 453 | % | | | 1,674 | % | | | 149 | % | | | — | | | | — | | | | — | |
A-Class | | Period Ended
September 30,
2016a,g | | | Year Ended
March 31,
2016g | | | Year Ended
March 31,
2015g | | | Year Ended
March 31,
2014f,g | | | Year Ended
March 28,
2013f,g | | | Year Ended
March 31,
2012f,g | |
Per Share Data | | | | | | | | | | | | | | | | | | |
Net asset value, beginning of period | | $ | 94.01 | | | $ | 101.76 | | | $ | 127.98 | | | $ | 170.45 | | | $ | 183.06 | | | $ | 233.20 | |
Income (loss) from investment operations: | |
Net investment income (loss)b | | | .56 | | | | (1.32 | ) | | | (1.48 | ) | | | (2.40 | ) | | | (2.80 | ) | | | (3.60 | ) |
Net gain (loss) on investments (realized and unrealized) | | | (9.51 | ) | | | (6.43 | ) | | | (24.74 | ) | | | (40.07 | ) | | | (9.81 | ) | | | (46.54 | ) |
Total from investment operations | | | (8.95 | ) | | | (7.75 | ) | | | (26.22 | ) | | | (42.47 | ) | | | (12.61 | ) | | | (50.14 | ) |
Net asset value, end of period | | $ | 85.06 | | | $ | 94.01 | | | $ | 101.76 | | | $ | 127.98 | | | $ | 170.45 | | | $ | 183.06 | |
| | |
Total Returnc | | | (9.49 | %) | | | (7.63 | %) | | | (20.50 | %) | | | (24.88 | %) | | | (6.89 | %) | | | (21.53 | %) |
Ratios/Supplemental Data | |
Net assets, end of period (in thousands) | | $ | 2,148 | | | $ | 54,948 | | | $ | 570 | | | $ | 372 | | | $ | 183 | | | $ | 474 | |
Ratios to average net assets: | |
Net investment income (loss) | | | (1.17 | %) | | | (1.36 | %) | | | (1.35 | %) | | | (1.69 | %) | | | (1.56 | %) | | | (1.62 | %) |
Total expensesd | | | 1.70 | % | | | 1.69 | % | | | 1.71 | % | | | 1.71 | % | | | 1.68 | % | | | 1.69 | % |
Portfolio turnover rate | | | 453 | % | | | 1,674 | % | | | 149 | % | | | — | | | | — | | | | — | |
58 | THE RYDEX FUNDS SEMI-ANNUAL REPORT | SEE NOTES TO FINANCIAL STATEMENTS. |
INVERSE NASDAQ-100® STRATEGY FUND | |
FINANCIAL HIGHLIGHTS (concluded) |
This table is presented to show selected data for a share outstanding throughout each period and to assist shareholders in evaluating a Fund’s performance for the periods presented.
C-Class | | Period Ended
September 30,
2016a,g | | | Year Ended
March 31,
2016g | | | Year Ended
March 31,
2015g | | | Year Ended
March 31,
2014f,g | | | Year Ended
March 28,
2013f,g | | | Year Ended
March 31,
2012f,g | |
Per Share Data | | | | | | | | | | | | | | | | | | |
Net asset value, beginning of period | | $ | 81.79 | | | $ | 90.32 | | | $ | 114.51 | | | $ | 153.69 | | | $ | 166.31 | | | $ | 213.36 | |
Income (loss) from investment operations: | |
Net investment income (loss)b | | | .68 | | | | (1.80 | ) | | | (2.12 | ) | | | (3.20 | ) | | | (3.80 | ) | | | (4.80 | ) |
Net gain (loss) on investments (realized and unrealized) | | | (8.82 | ) | | | (6.73 | ) | | | (22.07 | ) | | | (35.98 | ) | | | (8.82 | ) | | | (42.25 | ) |
Total from investment operations | | | (8.14 | ) | | | (8.53 | ) | | | (24.19 | ) | | | (39.18 | ) | | | (12.62 | ) | | | (47.05 | ) |
Net asset value, end of period | | $ | 73.65 | | | $ | 81.79 | | | $ | 90.32 | | | $ | 114.51 | | | $ | 153.69 | | | $ | 166.31 | |
| | |
Total Returnc | | | (9.98 | %) | | | (9.43 | %) | | | (21.13 | %) | | | (25.44 | %) | | | (7.58 | %) | | | (22.12 | %) |
Ratios/Supplemental Data | |
Net assets, end of period (in thousands) | | $ | 1,641 | | | $ | 1,457 | | | $ | 998 | | | $ | 561 | | | $ | 678 | | | $ | 752 | |
Ratios to average net assets: | |
Net investment income (loss) | | | (1.72 | %) | | | (2.09 | %) | | | (2.12 | %) | | | (2.44 | %) | | | (2.32 | %) | | | (2.37 | %) |
Total expensesd | | | 2.46 | % | | | 2.44 | % | | | 2.46 | % | | | 2.46 | % | | | 2.44 | % | | | 2.45 | % |
Portfolio turnover rate | | | 453 | % | | | 1,674 | % | | | 149 | % | | | — | | | | — | | | | — | |
H-Class | | Period Ended
September 30,
2016a,g | | | Year Ended
March 31,
2016g | | | Period Ended
March 31,
2015e,g | |
Per Share Data | | | | | | | | | |
Net asset value, beginning of period | | $ | 92.82 | | | $ | 101.76 | | | $ | 110.00 | |
Income (loss) from investment operations: | |
Net investment income (loss)b | | | .52 | | | | (1.16 | ) | | | (.80 | ) |
Net gain (loss) on investments (realized and unrealized) | | | (9.47 | ) | | | (7.78 | ) | | | (7.44 | ) |
Total from investment operations | | | (8.95 | ) | | | (8.94 | ) | | | (8.24 | ) |
Net asset value, end of period | | $ | 83.87 | | | $ | 92.82 | | | $ | 101.76 | |
| | |
Total Returnc | | | (9.66 | %) | | | (8.80 | %) | | | (7.49 | %) |
Ratios/Supplemental Data | |
Net assets, end of period (in thousands) | | $ | 289 | | | $ | 252 | | | $ | 335 | |
Ratios to average net assets: | |
Net investment income (loss) | | | (1.08 | %) | | | (1.18 | %) | | | (1.35 | %) |
Total expensesd | | | 1.70 | % | | | 1.70 | % | | | 1.68 | % |
Portfolio turnover rate | | | 453 | % | | | 1,674 | % | | | 149 | % |
a | Unaudited figures for the period ended September 30, 2016. Percentage amounts for the period, except total return and portfolio turnover rate, have been annualized. |
b | Net investment income (loss) per share was computed using average shares outstanding throughout the period. |
c | Total return does not reflect the impact of any applicable sales charges. |
d | Does not include expenses of the underlying funds in which the Fund invests. |
e | Since commencement of operations: September 18, 2014. Percentage amounts for the period, except total return and portfolio turnover rate, have been annualized. |
f | Reverse share split — Per share amounts for the periods presented through February 21, 2014, have been restated to reflect a 1:5 reverse share split effective February 21, 2014. |
g | Reverse share split — Per share amounts for the periods presented through September 30, 2016 have been restated to reflect a 1:4 reverse share split effective November 4, 2016 — See Note 12. |
SEE NOTES TO FINANCIAL STATEMENTS. | THE RYDEX FUNDS SEMI-ANNUAL REPORT | 59 |
FUND PROFILE (Unaudited) | September 30, 2016 |
MID-CAP 1.5x STRATEGY FUND
OBJECTIVE: Seeks to provide investment results that correlate, before fees and expenses, to the performance of a specific benchmark for mid-cap securities on a daily basis. The Fund’s current benchmark is 150% of the performance of the S&P MidCap 400® Index (the “underlying index”). The Fund does not seek to achieve its investment objective over a period of time greater than one day.
Holdings Diversification (Market Exposure as % of Net Assets)
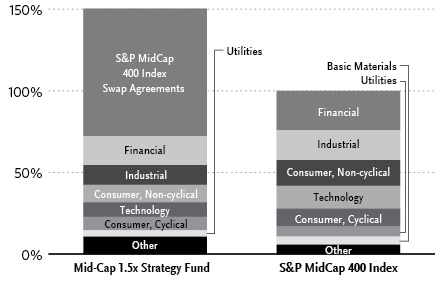
“Holdings Diversification (Market Exposure as % of Net Assets)” excludes any temporary cash investments or investments in Guggenheim Strategy Funds Trust mutual funds. Investments in those Funds do not provide “market exposure” to meet the Fund’s investment objective, but will significantly increase the portfolio’s exposure to certain other asset categories (and their associated risks), which may cause the Fund to deviate from its principal investment strategy, including: (i) high yield, high risk debt securities rated below the top four long-term rating categories by a nationally recognized statistical rating organization (also known as “junk bonds”); (ii) securities issued by the U.S. government or its agencies and instrumentalities; (iii) CLOs and similar investments; and (iv) other short-term fixed income securities.
Inception Dates: |
A-Class | March 31, 2004 |
C-Class | August 20, 2001 |
H-Class | August 16, 2001 |
Ten Largest Holdings (% of Total Net Assets) |
Guggenheim Strategy Fund II | 10.6% |
Guggenheim Strategy Fund I | 10.5% |
IDEXX Laboratories, Inc. | 0.5% |
WhiteWave Foods Co. — Class A | 0.4% |
Ingredion, Inc. | 0.4% |
Duke Realty Corp. | 0.4% |
ResMed, Inc. | 0.4% |
Synopsys, Inc. | 0.4% |
CDK Global, Inc. | 0.4% |
Alexandria Real Estate Equities, Inc. | 0.4% |
Top Ten Total | 24.4% |
| | |
“Ten Largest Holdings” excludes any temporary cash or derivative investments. |
60 | THE RYDEX FUNDS SEMI-ANNUAL REPORT | |
SCHEDULE OF INVESTMENTS (Unaudited) | September 30, 2016 |
MID-CAP 1.5x STRATEGY FUND | |
| | | Shares | | | Value | |
| | | | | | | |
COMMON STOCKS† - 69.8% | |
| | | | | | | |
Financial - 17.7% | |
Duke Realty Corp. | | | 3,271 | | | $ | 89,396 | |
Alexandria Real Estate Equities, Inc. | | | 727 | | | | 79,077 | |
Alleghany Corp.* | | | 144 | | | | 75,604 | |
Regency Centers Corp. | | | 974 | | | | 75,476 | |
Everest Re Group Ltd. | | | 391 | | | | 74,278 | |
National Retail Properties, Inc. | | | 1,371 | | | | 69,715 | |
Raymond James Financial, Inc. | | | 1,176 | | | | 68,455 | |
Camden Property Trust | | | 815 | | | | 68,248 | |
Mid-America Apartment Communities, Inc. | | | 704 | | | | 66,169 | |
New York Community Bancorp, Inc. | | | 4,542 | | | | 64,633 | |
Reinsurance Group of America, Inc. — Class A | | | 597 | | | | 64,440 | |
Omega Healthcare Investors, Inc. | | | 1,803 | | | | 63,915 | |
American Campus Communities, Inc. | | | 1,217 | | | | 61,909 | |
Kilroy Realty Corp. | | | 860 | | | | 59,641 | |
Signature Bank* | | | 501 | | | | 59,343 | |
SEI Investments Co. | | | 1,264 | | | | 57,651 | |
Liberty Property Trust | | | 1,368 | | | | 55,199 | |
SVB Financial Group* | | | 485 | | | | 53,612 | |
WR Berkley Corp. | | | 916 | | | | 52,908 | |
American Financial Group, Inc. | | | 681 | | | | 51,075 | |
Lamar Advertising Co. — Class A | | | 773 | | | | 50,485 | |
Senior Housing Properties Trust | | | 2,214 | | | | 50,280 | |
East West Bancorp, Inc. | | | 1,344 | | | | 49,338 | |
CBOE Holdings, Inc. | | | 758 | | | | 49,156 | |
Douglas Emmett, Inc. | | | 1,338 | | | | 49,011 | |
PacWest Bancorp | | | 1,123 | | | | 48,188 | |
Highwoods Properties, Inc. | | | 920 | | | | 47,950 | |
Jones Lang LaSalle, Inc. | | | 421 | | | | 47,906 | |
EPR Properties | | | 593 | | | | 46,693 | |
RenaissanceRe Holdings Ltd. | | | 384 | | | | 46,141 | |
Hospitality Properties Trust | | | 1,531 | | | | 45,501 | |
Weingarten Realty Investors | | | 1,097 | | | | 42,761 | |
Taubman Centers, Inc. | | | 563 | | | | 41,893 | |
Eaton Vance Corp. | | | 1,058 | | | | 41,315 | |
DCT Industrial Trust, Inc. | | | 841 | | | | 40,830 | |
Medical Properties Trust, Inc. | | | 2,731 | | | | 40,337 | |
Brown & Brown, Inc. | | | 1,069 | | | | 40,312 | |
First American Financial Corp. | | | 1,023 | | | | 40,183 | |
Old Republic International Corp. | | | 2,276 | | | | 40,103 | |
Communications Sales & Leasing, Inc. | | | 1,268 | | | | 39,828 | |
Endurance Specialty Holdings Ltd. | | | 599 | | | | 39,205 | |
Life Storage, Inc. | | | 433 | | | | 38,511 | |
Commerce Bancshares, Inc. | | | 774 | | | | 38,127 | |
Synovus Financial Corp. | | | 1,146 | | | | 37,279 | |
Cullen/Frost Bankers, Inc. | | | 515 | | | | 37,049 | |
Healthcare Realty Trust, Inc. | | | 1,080 | | | | 36,785 | |
Prosperity Bancshares, Inc. | | | 648 | | | | 35,569 | |
Tanger Factory Outlet Centers, Inc. | | | 896 | | | | 34,908 | |
PrivateBancorp, Inc. — Class A | | | 741 | | | | 34,027 | |
Post Properties, Inc. | | | 499 | | | | 32,999 | |
First Horizon National Corp. | | | 2,164 | | | | 32,958 | |
Bank of the Ozarks, Inc. | | | 847 | | | | 32,525 | |
Webster Financial Corp. | | | 855 | | | | 32,499 | |
Umpqua Holdings Corp. | | | 2,053 | | | | 30,898 | |
First Industrial Realty Trust, Inc. | | | 1,090 | | | | 30,760 | |
Rayonier, Inc. | | | 1,146 | | | | 30,415 | |
Hanover Insurance Group, Inc. | | | 399 | | | | 30,093 | |
SLM Corp.* | | | 3,990 | | | | 29,805 | |
Education Realty Trust, Inc. | | | 681 | | | | 29,378 | |
Bank of Hawaii Corp. | | | 400 | | | | 29,048 | |
Chemical Financial Corp. | | | 652 | | | | 28,773 | |
Associated Banc-Corp. | | | 1,386 | | | | 27,152 | |
Equity One, Inc. | | | 858 | | | | 26,263 | |
Aspen Insurance Holdings Ltd. | | | 561 | | | | 26,137 | |
Federated Investors, Inc. — Class B | | | 875 | | | | 25,926 | |
MB Financial, Inc. | | | 665 | | | | 25,297 | |
LaSalle Hotel Properties | | | 1,054 | | | | 25,159 | |
Corporate Office Properties Trust | | | 884 | | | | 25,061 | |
CNO Financial Group, Inc. | | | 1,633 | | | | 24,936 | |
FNB Corp. | | | 1,959 | | | | 24,096 | |
Urban Edge Properties | | | 853 | | | | 24,003 | |
Stifel Financial Corp.* | | | 617 | | | | 23,724 | |
Hancock Holding Co. | | | 723 | | | | 23,447 | |
Fulton Financial Corp. | | | 1,614 | | | | 23,435 | |
TCF Financial Corp. | | | 1,595 | | | | 23,143 | |
Valley National Bancorp | | | 2,372 | | | | 23,080 | |
Genworth Financial, Inc. — Class A* | | | 4,647 | | | | 23,049 | |
Primerica, Inc. | | | 433 | | | | 22,962 | |
Mack-Cali Realty Corp. | | | 836 | | | | 22,756 | |
Washington Federal, Inc. | | | 844 | | | | 22,518 | |
Care Capital Properties, Inc. | | | 783 | | | | 22,316 | |
Cathay General Bancorp | | | 691 | | | | 21,269 | |
Janus Capital Group, Inc. | | | 1,335 | | | | 18,703 | |
Mercury General Corp. | | | 340 | | | | 18,649 | |
BancorpSouth, Inc. | | | 802 | | | | 18,606 | |
Kemper Corp. | | | 453 | | | | 17,812 | |
Trustmark Corp. | | | 631 | | | | 17,390 | |
Alexander & Baldwin, Inc. | | | 429 | | | | 16,482 | |
International Bancshares Corp. | | | 541 | | | | 16,111 | |
Corrections Corporation of America | | | 1,096 | | | | 15,202 | |
Potlatch Corp. | | | 378 | | | | 14,700 | |
Waddell & Reed Financial, Inc. — Class A | | | 772 | | | | 14,020 | |
WisdomTree Investments, Inc. | | | 1,070 | | | | 11,010 | |
Total Financial | | | | | | | 3,594,980 | |
| | | | | | | | | |
Industrial - 12.0% | |
Packaging Corporation of America | | | 879 | | | | 71,427 | |
Wabtec Corp. | | | 840 | | | | 68,586 | |
AO Smith Corp. | | | 691 | | | | 68,264 | |
Huntington Ingalls Industries, Inc. | | | 436 | | | | 66,891 | |
IDEX Corp. | | | 710 | | | | 66,435 | |
Trimble, Inc.* | | | 2,324 | | | | 66,374 | |
Carlisle Companies, Inc. | | | 603 | | | | 61,850 | |
Lennox International, Inc. | | | 365 | | | | 57,316 | |
Arrow Electronics, Inc.* | | | 851 | | | | 54,439 | |
Hubbell, Inc. | | | 480 | | | | 51,715 | |
Keysight Technologies, Inc.* | | | 1,585 | | | | 50,229 | |
Nordson Corp. | | | 496 | | | | 49,416 | |
Sonoco Products Co. | | | 935 | | | | 49,396 | |
B/E Aerospace, Inc. | | | 948 | | | | 48,973 | |
SEE NOTES TO FINANCIAL STATEMENTS. | THE RYDEX FUNDS SEMI-ANNUAL REPORT | 61 |
SCHEDULE OF INVESTMENTS (Unaudited)(continued) | September 30, 2016 |
MID-CAP 1.5x STRATEGY FUND | |
| | | Shares | | | Value | |
| | | | | | | |
Avnet, Inc. | | | 1,188 | | | $ | 48,779 | |
Gentex Corp. | | | 2,674 | | | | 46,955 | |
Donaldson Company, Inc. | | | 1,241 | | | | 46,327 | |
AptarGroup, Inc. | | | 587 | | | | 45,439 | |
Bemis Company, Inc. | | | 883 | | | | 45,042 | |
Old Dominion Freight Line, Inc.* | | | 649 | | | | 44,528 | |
AECOM* | | | 1,433 | | | | 42,602 | |
Cognex Corp. | | | 794 | | | | 41,971 | |
Orbital ATK, Inc. | | | 546 | | | | 41,622 | |
Jabil Circuit, Inc. | | | 1,782 | | | | 38,883 | |
Graco, Inc. | | | 519 | | | | 38,406 | |
Oshkosh Corp. | | | 685 | | | | 38,360 | |
Curtiss-Wright Corp. | | | 414 | | | | 37,720 | |
Lincoln Electric Holdings, Inc. | | | 590 | | | | 36,946 | |
Genesee & Wyoming, Inc. — Class A* | | | 534 | | | | 36,819 | |
Teledyne Technologies, Inc.* | | | 323 | | | | 34,861 | |
Eagle Materials, Inc. | | | 450 | | | | 34,785 | |
Trinity Industries, Inc. | | | 1,421 | | | | 34,360 | |
Zebra Technologies Corp. — Class A* | | | 492 | | | | 34,248 | |
EMCOR Group, Inc. | | | 567 | | | | 33,805 | |
Woodward, Inc. | | | 516 | | | | 32,240 | |
AGCO Corp. | | | 635 | | | | 31,318 | |
Kirby Corp.* | | | 502 | | | | 31,204 | |
ITT, Inc. | | | 836 | | | | 29,962 | |
CLARCOR, Inc. | | | 455 | | | | 29,575 | |
Crane Co. | | | 463 | | | | 29,174 | |
Energizer Holdings, Inc. | | | 577 | | | | 28,827 | |
Valmont Industries, Inc. | | | 211 | | | | 28,394 | |
EnerSys | | | 405 | | | | 28,022 | |
National Instruments Corp. | | | 983 | | | | 27,917 | |
Tech Data Corp.* | | | 328 | | | | 27,785 | |
Belden, Inc. | | | 393 | | | | 27,113 | |
Landstar System, Inc. | | | 393 | | | | 26,755 | |
Terex Corp. | | | 1,013 | | | | 25,740 | |
Joy Global, Inc. | | | 915 | | | | 25,382 | |
Louisiana-Pacific Corp.* | | | 1,326 | | | | 24,969 | |
Regal Beloit Corp. | | | 417 | | | | 24,807 | |
Cree, Inc.* | | | 940 | | | | 24,177 | |
Dycom Industries, Inc.* | | | 293 | | | | 23,962 | |
Clean Harbors, Inc.* | | | 488 | | | | 23,414 | |
Timken Co. | | | 657 | | | | 23,087 | |
Kennametal, Inc. | | | 743 | | | | 21,562 | |
Esterline Technologies Corp.* | | | 274 | | | | 20,835 | |
KBR, Inc. | | | 1,329 | | | | 20,108 | |
Silgan Holdings, Inc. | | | 383 | | | | 19,376 | |
Granite Construction, Inc. | | | 369 | | | | 18,354 | |
Vishay Intertechnology, Inc. | | | 1,257 | | | | 17,711 | |
KLX, Inc.* | | | 491 | | | | 17,283 | |
MSA Safety, Inc. | | | 290 | | | | 16,832 | |
GATX Corp. | | | 377 | | | | 16,795 | |
Triumph Group, Inc. | | | 462 | | | | 12,881 | |
Greif, Inc. — Class A | | | 240 | | | | 11,902 | |
Knowles Corp.* | | | 827 | | | | 11,619 | |
Werner Enterprises, Inc. | | | 417 | | | | 9,704 | |
Total Industrial | | | | | | | 2,422,555 | |
| | | | | | | | | |
Consumer, Non-cyclical - 10.8% | |
IDEXX Laboratories, Inc.* | | | 835 | | | | 94,129 | |
WhiteWave Foods Co. — Class A* | | | 1,652 | | | | 89,918 | |
Ingredion, Inc. | | | 673 | | | | 89,549 | |
ResMed, Inc. | | | 1,312 | | | | 85,005 | |
Teleflex, Inc. | | | 411 | | | | 69,069 | |
Gartner, Inc.* | | | 770 | | | | 68,107 | |
Align Technology, Inc.* | | | 702 | | | | 65,812 | |
STERIS plc | | | 803 | | | | 58,699 | |
MarketAxess Holdings, Inc. | | | 351 | | | | 58,122 | |
MEDNAX, Inc.* | | | 858 | | | | 56,843 | |
VCA, Inc.* | | | 754 | | | | 52,764 | |
West Pharmaceutical Services, Inc. | | | 683 | | | | 50,884 | |
WellCare Health Plans, Inc.* | | | 413 | | | | 48,358 | |
ABIOMED, Inc.* | | | 373 | | | | 47,960 | |
Service Corporation International | | | 1,806 | | | | 47,931 | |
United Therapeutics Corp.* | | | 405 | | | | 47,822 | |
Post Holdings, Inc.* | | | 603 | | | | 46,534 | |
ManpowerGroup, Inc. | | | 639 | | | | 46,174 | |
TreeHouse Foods, Inc.* | | | 529 | | | | 46,124 | |
Edgewell Personal Care Co.* | | | 550 | | | | 43,736 | |
WEX, Inc.* | | | 359 | | | | 38,804 | |
Bio-Techne Corp. | | | 348 | | | | 38,106 | |
Charles River Laboratories International, Inc.* | | | 441 | | | | 36,753 | |
Hill-Rom Holdings, Inc. | | | 556 | | | | 34,461 | |
Hain Celestial Group, Inc.* | | | 965 | | | | 34,335 | |
Amsurg Corp. — Class A* | | | 511 | | | | 34,263 | |
PAREXEL International Corp.* | | | 493 | | | | 34,239 | |
Live Nation Entertainment, Inc.* | | | 1,231 | | | | 33,828 | |
CoreLogic, Inc.* | | | 823 | | | | 32,278 | |
Bio-Rad Laboratories, Inc. — Class A* | | | 193 | | | | 31,615 | |
NuVasive, Inc.* | | | 469 | | | | 31,264 | |
Deluxe Corp. | | | 455 | | | | 30,403 | |
Avis Budget Group, Inc.* | | | 879 | | | | 30,071 | |
Catalent, Inc.* | | | 1,162 | | | | 30,026 | |
Sprouts Farmers Market, Inc.* | | | 1,301 | | | | 26,866 | |
Snyder’s-Lance, Inc. | | | 797 | | | | 26,763 | |
Rollins, Inc. | | | 896 | | | | 26,235 | |
Flowers Foods, Inc. | | | 1,698 | | | | 25,674 | |
LivaNova plc* | | | 412 | | | | 24,765 | |
Lancaster Colony Corp. | | | 182 | | | | 24,040 | |
Prestige Brands Holdings, Inc.* | | | 493 | | | | 23,797 | |
LifePoint Health, Inc.* | | | 398 | | | | 23,574 | |
Molina Healthcare, Inc.* | | | 397 | | | | 23,153 | |
Avon Products, Inc.* | | | 4,075 | | | | 23,065 | |
Akorn, Inc.* | | | 823 | | | | 22,435 | |
Helen of Troy Ltd.* | | | 260 | | | | 22,404 | |
Graham Holdings Co. — Class B | | | 43 | | | | 20,699 | |
Owens & Minor, Inc. | | | 582 | | | | 20,213 | |
United Natural Foods, Inc.* | | | 470 | | | | 18,819 | |
FTI Consulting, Inc.* | | | 393 | | | | 17,512 | |
Sotheby’s | | | 447 | | | | 16,995 | |
Tenet Healthcare Corp.* | | | 742 | | | | 16,814 | |
CEB, Inc. | | | 300 | | | | 16,341 | |
Aaron’s, Inc. | | | 604 | | | | 15,354 | |
62 | THE RYDEX FUNDS SEMI-ANNUAL REPORT | SEE NOTES TO FINANCIAL STATEMENTS. |
SCHEDULE OF INVESTMENTS (Unaudited)(continued) | September 30, 2016 |
MID-CAP 1.5x STRATEGY FUND | |
| | | Shares | | | Value | |
| | | | | | | |
Halyard Health, Inc.* | | | 435 | | | $ | 15,077 | |
Dean Foods Co. | | | 843 | | | | 13,825 | |
Boston Beer Company, Inc. — Class A* | | | 84 | | | | 13,042 | |
Community Health Systems, Inc.* | | | 1,060 | | | | 12,232 | |
DeVry Education Group, Inc. | | | 529 | | | | 12,199 | |
Tootsie Roll Industries, Inc. | | | 164 | | | | 6,040 | |
Total Consumer, Non-cyclical | | | | | | | 2,191,919 | |
| | | | | | | | | |
Technology - 8.8% | |
Synopsys, Inc.* | | | 1,411 | | | | 83,744 | |
CDK Global, Inc. | | | 1,400 | | | | 80,304 | |
ANSYS, Inc.* | | | 813 | | | | 75,292 | |
Broadridge Financial Solutions, Inc. | | | 1,103 | | | | 74,772 | |
MSCI, Inc. — Class A | | | 882 | | | | 74,035 | |
Cadence Design Systems, Inc.* | | | 2,726 | | | | 69,595 | |
Computer Sciences Corp. | | | 1,309 | | | | 68,343 | |
Jack Henry & Associates, Inc. | | | 732 | | | | 62,623 | |
Leidos Holdings, Inc. | | | 1,326 | | | | 57,389 | |
Ultimate Software Group, Inc.* | | | 270 | | | | 55,185 | |
Tyler Technologies, Inc.* | | | 308 | | | | 52,739 | |
Fortinet, Inc.* | | | 1,369 | | | | 50,557 | |
PTC, Inc.* | | | 1,072 | | | | 47,500 | |
Advanced Micro Devices, Inc.* | | | 6,843 | | | | 47,286 | |
Microsemi Corp.* | | | 1,055 | | | | 44,289 | |
Teradyne, Inc. | | | 1,887 | | | | 40,721 | |
Manhattan Associates, Inc.* | | | 668 | | | | 38,490 | |
NCR Corp.* | | | 1,154 | | | | 37,147 | |
Cypress Semiconductor Corp. | | | 2,995 | | | | 36,419 | |
Fair Isaac Corp. | | | 288 | | | | 35,882 | |
DST Systems, Inc. | | | 304 | | | | 35,848 | |
Brocade Communications Systems, Inc. | | | 3,738 | | | | 34,502 | |
MAXIMUS, Inc. | | | 605 | | | | 34,219 | |
Rackspace Hosting, Inc.* | | | 997 | | | | 31,595 | |
SYNNEX Corp. | | | 271 | | | | 30,924 | |
Cirrus Logic, Inc.* | | | 581 | | | | 30,880 | |
j2 Global, Inc. | | | 448 | | | | 29,841 | |
Science Applications International Corp. | | | 418 | | | | 28,997 | |
Integrated Device Technology, Inc.* | | | 1,253 | | | | 28,944 | |
IPG Photonics Corp.* | | | 347 | | | | 28,575 | |
Monolithic Power Systems, Inc. | | | 347 | | | | 27,934 | |
Intersil Corp. — Class A | | | 1,263 | | | | 27,698 | |
Convergys Corp. | | | 894 | | | | 27,195 | |
Mentor Graphics Corp. | | | 1,009 | | | | 26,678 | |
NetScout Systems, Inc.* | | | 858 | | | | 25,097 | |
Lexmark International, Inc. — Class A | | | 584 | | | | 23,336 | |
Allscripts Healthcare Solutions, Inc.* | | | 1,740 | | | | 22,916 | |
Silicon Laboratories, Inc.* | | | 388 | | | | 22,814 | |
ACI Worldwide, Inc.* | | | 1,093 | | | | 21,182 | |
CommVault Systems, Inc.* | | | 385 | | | | 20,455 | |
Acxiom Corp.* | | | 722 | | | | 19,241 | |
Synaptics, Inc.* | | | 325 | | | | 19,039 | |
3D Systems Corp.* | | | 994 | | | | 17,842 | |
Diebold, Inc. | | | 700 | | | | 17,353 | |
VeriFone Systems, Inc.* | | | 1,035 | | | | 16,291 | |
Total Technology | | | | | | | 1,781,708 | |
| | | | | | | | | |
Consumer, Cyclical - 8.3% | |
Domino’s Pizza, Inc. | | | 450 | | | | 68,332 | |
NVR, Inc.* | | | 34 | | | | 55,755 | |
JetBlue Airways Corp.* | | | 3,018 | | | | 52,030 | |
Ingram Micro, Inc. — Class A | | | 1,396 | | | | 49,781 | |
Copart, Inc.* | | | 908 | | | | 48,632 | |
Toro Co. | | | 1,023 | | | | 47,917 | |
Dick’s Sporting Goods, Inc. | | | 821 | | | | 46,568 | |
Dunkin’ Brands Group, Inc. | | | 855 | | | | 44,528 | |
Casey’s General Stores, Inc. | | | 365 | | | | 43,855 | |
Polaris Industries, Inc. | | | 556 | | | | 43,056 | |
Toll Brothers, Inc.* | | | 1,407 | | | | 42,013 | |
Brunswick Corp. | | | 841 | | | | 41,024 | |
Panera Bread Co. — Class A* | | | 208 | | | | 40,501 | |
Carter’s, Inc. | | | 467 | | | | 40,494 | |
Williams-Sonoma, Inc. | | | 765 | | | | 39,077 | |
Cinemark Holdings, Inc. | | | 986 | | | | 37,744 | |
Thor Industries, Inc. | | | 445 | | | | 37,692 | |
Pool Corp. | | | 392 | | | | 37,052 | |
Scotts Miracle-Gro Co. — Class A | | | 422 | | | | 35,140 | |
Sally Beauty Holdings, Inc.* | | | 1,364 | | | | 35,028 | |
CST Brands, Inc. | | | 706 | | | | 33,952 | |
Watsco, Inc. | | | 240 | | | | 33,816 | |
Tupperware Brands Corp. | | | 471 | | | | 30,789 | |
MSC Industrial Direct Company, Inc. — Class A | | | 415 | | | | 30,465 | |
World Fuel Services Corp. | | | 657 | | | | 30,393 | |
Cracker Barrel Old Country Store, Inc. | | | 223 | | | | 29,485 | |
Jack in the Box, Inc. | | | 305 | | | | 29,262 | |
Skechers U.S.A., Inc. — Class A* | | | 1,243 | | | | 28,465 | |
American Eagle Outfitters, Inc. | | | 1,593 | | | | 28,451 | |
Tempur Sealy International, Inc.* | | | 474 | | | | 26,895 | |
GameStop Corp. — Class A | | | 969 | | | | 26,735 | |
J.C. Penney Company, Inc.* | | | 2,870 | | | | 26,461 | |
Cabela’s, Inc.* | | | 479 | | | | 26,311 | |
Brinker International, Inc. | | | 512 | | | | 25,820 | |
Buffalo Wild Wings, Inc.* | | | 171 | | | | 24,067 | |
Texas Roadhouse, Inc. — Class A | | | 598 | | | | 23,340 | |
CalAtlantic Group, Inc. | | | 696 | | | | 23,274 | |
Vista Outdoor, Inc.* | | | 563 | | | | 22,441 | |
Cheesecake Factory, Inc. | | | 417 | | | | 20,875 | |
Dana, Inc. | | | 1,337 | | | | 20,844 | |
Wendy’s Co. | | | 1,900 | | | | 20,520 | |
Kate Spade & Co.* | | | 1,194 | | | | 20,453 | |
Big Lots, Inc. | | | 414 | | | | 19,769 | |
Office Depot, Inc. | | | 5,071 | | | | 18,103 | |
TRI Pointe Group, Inc.* | | | 1,363 | | | | 17,964 | |
Deckers Outdoor Corp.* | | | 299 | | | | 17,805 | |
Churchill Downs, Inc. | | | 116 | | | | 16,977 | |
HNI Corp. | | | 415 | | | | 16,517 | |
Herman Miller, Inc. | | | 558 | | | | 15,959 | |
Chico’s FAS, Inc. | | | 1,231 | | | | 14,649 | |
KB Home | | | 771 | | | | 12,429 | |
Restoration Hardware Holdings, Inc.* | | | 356 | | | | 12,310 | |
HSN, Inc. | | | 297 | | | | 11,821 | |
Fossil Group, Inc.* | | | 390 | | | | 10,830 | |
SEE NOTES TO FINANCIAL STATEMENTS. | THE RYDEX FUNDS SEMI-ANNUAL REPORT | 63 |
SCHEDULE OF INVESTMENTS (Unaudited)(continued) | September 30, 2016 |
MID-CAP 1.5x STRATEGY FUND | |
| | | Shares | | | Value | |
| | | | | | | |
Abercrombie & Fitch Co. — Class A | | | 631 | | | $ | 10,027 | |
Ascena Retail Group, Inc.* | | | 1,556 | | | | 8,698 | |
Guess?, Inc. | | | 574 | | | | 8,386 | |
International Speedway Corp. — Class A | | | 243 | | | | 8,121 | |
Total Consumer, Cyclical | | | | | | | 1,689,698 | |
| | | | | | | | | |
Utilities - 3.9% | |
Westar Energy, Inc. | | | 1,322 | | | | 75,023 | |
UGI Corp. | | | 1,615 | | | | 73,063 | |
Atmos Energy Corp. | | | 968 | | | | 72,087 | |
OGE Energy Corp. | | | 1,862 | | | | 58,877 | |
Great Plains Energy, Inc. | | | 1,932 | | | | 52,724 | |
Aqua America, Inc. | | | 1,654 | | | | 50,414 | |
MDU Resources Group, Inc. | | | 1,821 | | | | 46,326 | |
National Fuel Gas Co. | | | 792 | | | | 42,823 | |
Vectren Corp. | | | 772 | | | | 38,754 | |
IDACORP, Inc. | | | 470 | | | | 36,792 | |
Southwest Gas Corp. | | | 443 | | | | 30,948 | |
Hawaiian Electric Industries, Inc. | | | 1,009 | | | | 30,119 | |
ONE Gas, Inc. | | | 487 | | | | 30,116 | |
Black Hills Corp. | | | 488 | | | | 29,875 | |
WGL Holdings, Inc. | | | 476 | | | | 29,845 | |
New Jersey Resources Corp. | | | 803 | | | | 26,387 | |
NorthWestern Corp. | | | 451 | | | | 25,946 | |
PNM Resources, Inc. | | | 743 | | | | 24,311 | |
Talen Energy Corp.* | | | 802 | | | | 11,108 | |
Total Utilities | | | | | | | 785,538 | |
| | | | | | | | | |
Basic Materials - 3.1% | |
Valspar Corp. | | | 680 | | | | 72,127 | |
RPM International, Inc. | | | 1,241 | | | | 66,667 | |
Steel Dynamics, Inc. | | | 2,273 | | | | 56,803 | |
Reliance Steel & Aluminum Co. | | | 676 | | | | 48,692 | |
Royal Gold, Inc. | | | 609 | | | | 47,155 | |
NewMarket Corp. | | | 86 | | | | 36,922 | |
Sensient Technologies Corp. | | | 418 | | | | 31,684 | |
Olin Corp. | | | 1,540 | | | | 31,600 | |
Cabot Corp. | | | 582 | | | | 30,503 | |
United States Steel Corp. | | | 1,571 | | | | 29,629 | |
PolyOne Corp. | | | 784 | | | | 26,507 | |
Compass Minerals International, Inc. | | | 315 | | | | 23,216 | |
Minerals Technologies, Inc. | | | 325 | | | | 22,974 | |
Domtar Corp. | | | 584 | | | | 21,684 | |
Worthington Industries, Inc. | | | 411 | | | | 19,740 | |
Allegheny Technologies, Inc. | | | 1,016 | | | | 18,359 | |
Carpenter Technology Corp. | | | 435 | | | | 17,948 | |
Commercial Metals Co. | | | 1,069 | | | | 17,307 | |
Total Basic Materials | | | | | | | 619,517 | |
| | | | | | | | | |
Energy - 2.8% | |
Energen Corp. | | | 905 | | | | 52,237 | |
QEP Resources, Inc. | | | 2,234 | | | | 43,630 | |
WPX Energy, Inc.* | | | 3,210 | | | | 42,340 | |
HollyFrontier Corp. | | | 1,646 | | | | 40,327 | |
Gulfport Energy Corp.* | | | 1,169 | | | | 33,024 | |
Nabors Industries Ltd. | | | 2,642 | | | | 32,127 | |
CONSOL Energy, Inc. | | | 1,647 | | | | 31,622 | |
SM Energy Co. | | | 810 | | | | 31,250 | |
Patterson-UTI Energy, Inc. | | | 1,378 | | | | 30,826 | |
Superior Energy Services, Inc. | | | 1,415 | | | | 25,329 | |
Oceaneering International, Inc. | | | 914 | | | | 25,144 | |
Murphy USA, Inc.* | | | 343 | | | | 24,476 | |
Ensco plc — Class A | | | 2,810 | | | | 23,885 | |
NOW, Inc.* | | | 1,002 | | | | 21,473 | |
Western Refining, Inc. | | | 738 | | | | 19,527 | |
Dril-Quip, Inc.* | | | 350 | | | | 19,509 | |
Rowan Companies plc — Class A | | | 1,170 | | | | 17,737 | |
Oil States International, Inc.* | | | 479 | | | | 15,122 | |
Noble Corporation plc | | | 2,268 | | | | 14,379 | |
Denbury Resources, Inc.* | | | 3,714 | | | | 11,996 | |
Diamond Offshore Drilling, Inc. | | | 601 | | | | 10,584 | |
Total Energy | | | | | | | 566,544 | |
| | | | | | | | | |
Communications - 2.0% | |
FactSet Research Systems, Inc. | | | 379 | | | | 61,436 | |
ARRIS International plc* | | | 1,778 | | | | 50,370 | |
ViaSat, Inc.* | | | 423 | | | | 31,577 | |
AMC Networks, Inc. — Class A* | | | 559 | | | | 28,990 | |
Ciena Corp.* | | | 1,288 | | | | 28,078 | |
Cable One, Inc. | | | 44 | | | | 25,696 | |
InterDigital, Inc. | | | 319 | | | | 25,265 | |
Telephone & Data Systems, Inc. | | | 867 | | | | 23,565 | |
John Wiley & Sons, Inc. — Class A | | | 417 | | | | 21,521 | |
WebMD Health Corp. — Class A* | | | 364 | | | | 18,091 | |
Meredith Corp. | | | 341 | | | | 17,729 | |
Plantronics, Inc. | | | 309 | | | | 16,056 | |
New York Times Co. — Class A | | | 1,135 | | | | 13,563 | |
Time, Inc. | | | 933 | | | | 13,510 | |
NeuStar, Inc. — Class A* | | | 508 | | | | 13,508 | |
comScore, Inc.* | | | 417 | | | | 12,785 | |
Total Communications | | | | | | | 401,740 | |
| | | | | | | | | |
Materials - 0.3% | |
Ashland Global Holdings, Inc. | | | 579 | | | | 67,135 | |
| | | | | | | | | |
Financials - 0.1% | |
Washington Prime Group, Inc. | | | 1,728 | | | | 21,393 | |
| | | | | | | | | |
Total Common Stocks | | | | | | | | |
(Cost $12,363,258) | | | | | | | 14,142,727 | |
| | | | | | | | | |
MUTUAL FUNDS† - 21.1% | |
Guggenheim Strategy Fund II1 | | | 85,758 | | | | 2,138,806 | |
Guggenheim Strategy Fund I1 | | | 85,481 | | | | 2,136,164 | |
Total Mutual Funds | | | | | | | | |
(Cost $4,260,498) | | | | | | | 4,274,970 | |
64 | THE RYDEX FUNDS SEMI-ANNUAL REPORT | SEE NOTES TO FINANCIAL STATEMENTS. |
SCHEDULE OF INVESTMENTS (Unaudited)(continued) | September 30, 2016 |
MID-CAP 1.5x STRATEGY FUND | |
| | | Face
Amount | | | Value | |
| | | | | | | |
REPURCHASE AGREEMENTS††,2 - 15.4% | |
Royal Bank of Canada
issued 09/30/16 at 0.36%
due 10/03/163 | | $ | 1,975,028 | | | $ | 1,975,028 | |
HSBC Securities, Inc.
issued 09/30/16 at 0.38%
due 10/03/16 | | | 1,144,709 | | | | 1,144,709 | |
Total Repurchase Agreements | | | | | | | | |
(Cost $3,119,737) | | | | | | | 3,119,737 | |
| | | | | | | | | |
Total Investments - 106.3% | | | | | | | | |
(Cost $19,743,493) | | | | | | $ | 21,537,434 | |
Other Assets & Liabilities, net - (6.3)% | | | | | | | (1,284,020 | ) |
Total Net Assets - 100.0% | | | | | | $ | 20,253,413 | |
| | | | | | | | | |
| | | Contracts | | | Unrealized
Gain | |
| | | | | | | | | |
EQUITY FUTURES CONTRACTS PURCHASED† | |
December 2016 S&P MidCap 400 Index
Mini Futures Contracts
(Aggregate Value of
Contracts $464,580) | | | 3 | | | $ | 9,455 | |
| | | Units | | | Unrealized
Gain (Loss) | |
| | | | | | | |
OTC EQUITY INDEX SWAP AGREEMENTS†† | |
BNP Paribas
November 2016
S&P MidCap 400 Index Swap 0.63% 4,
Terminating 11/01/16
(Notional Value $9,567,237) | | | 6,163 | | | $ | 77,807 | |
Goldman Sachs International
October 2016
S&P MidCap 400 Index Swap 0.80%4,
Terminating 10/27/16
(Notional Value $748,731) | | | 482 | | | | 6,636 | |
Barclays Bank plc
October 2016
S&P MidCap 400 Index Swap 0.70%4,
Terminating 10/27/16
(Notional Value $5,500,643) | | | 3,544 | | | | (16,127 | ) |
(Total Notional Value $15,816,611) | | | | | | $ | 68,316 | |
* | Non-income producing security. |
† | Value determined based on Level 1 inputs — See Note 4. |
†† | Value determined based on Level 2 inputs — See Note 4. |
1 | Affiliated issuer — See Note 9. |
2 | Repurchase Agreements — See Note 5. |
3 | All or a portion of this security is pledged as equity index swap collateral at September 30, 2016. |
4 | Total Return based on S&P MidCap 400 Index +/- financing at a variable rate. Rate indicated is the rate effective at September 30, 2016. |
| | plc — Public Limited Company |
| | |
| | See Sector Classification in Other Information section. |
SEE NOTES TO FINANCIAL STATEMENTS. | THE RYDEX FUNDS SEMI-ANNUAL REPORT | 65 |
SCHEDULE OF INVESTMENTS (Unaudited)(concluded) | September 30, 2016 |
MID-CAP 1.5x STRATEGY FUND | |
The following table summarizes the inputs used to value the Fund’s investments at September 30, 2016 (See Note 4 in the Notes to Financial Statements):
Investments in Securities (Assets) | | Level 1 | | | Level 1 -
Other* | | | Level 2 | | | Level 2 -
Other* | | | Level 3 | | | Total | |
Common Stocks | | $ | 14,142,727 | | | $ | — | | | $ | — | | | $ | — | | | $ | — | | | $ | 14,142,727 | |
Equity Futures Contracts | | | — | | | | 9,455 | | | | — | | | | — | | | | — | | | | 9,455 | |
Equity Index Swap Agreements | | | — | | | | — | | | | — | | | | 84,443 | | | | — | | | | 84,443 | |
Mutual Funds | | | 4,274,970 | | | | — | | | | — | | | | — | | | | — | | | | 4,274,970 | |
Repurchase Agreements | | | — | | | | — | | | | 3,119,737 | | | | — | | | | — | | | | 3,119,737 | |
Total | | $ | 18,417,697 | | | $ | 9,455 | | | $ | 3,119,737 | | | $ | 84,443 | | | $ | — | | | $ | 21,631,332 | |
| | | | | | | | | | | | | | | | | | | | | | | | | |
Investments in Securities (Liabilities) | | Level 1 | | | Level 1 -
Other* | | | Level 2 | | | Level 2 -
Other* | | | Level 3 | | | Total | |
Equity Index Swap Agreements | | $ | — | | | $ | — | | | $ | — | | | $ | 16,127 | | | $ | — | | | $ | 16,127 | |
* | Other financial instruments include futures contracts and/or swaps, which are reported as unrealized gain/loss at period end. |
Transfers between investment levels may occur as the markets fluctuate and/or the availability of data used in an investment’s valuation changes. Transfers between valuation levels, if any, are in comparison to the valuation levels at the end of the previous fiscal year, and are effective using the fair value as of the end of the previous fiscal period.
For the period ended September 30, 2016, there were no transfers between levels.
66 | THE RYDEX FUNDS SEMI-ANNUAL REPORT | SEE NOTES TO FINANCIAL STATEMENTS. |
MID-CAP 1.5x STRATEGY FUND | |
STATEMENT OF ASSETS AND LIABILITIES (Unaudited) | |
September 30, 2016 | |
Assets: | |
Investments in unaffiliated issuers, at value (cost $12,363,258) | | $ | 14,142,727 | |
Investments in affiliated issuers, at value (cost $4,260,498) | | | 4,274,970 | |
Repurchase agreements, at value (cost $3,119,737) | | | 3,119,737 | |
Total investments (cost $19,743,493) | | | 21,537,434 | |
Segregated cash with broker | | | 735,331 | |
Unrealized appreciation on swap agreements | | | 84,443 | |
Receivables: | |
Swap settlement | | | 18,137 | |
Variation margin | | | 3,750 | |
Fund shares sold | | | 300,124 | |
Dividends | | | 24,577 | |
Interest | | | 32 | |
Total assets | | | 22,703,828 | |
| | | | | |
Liabilities: | |
Unrealized depreciation on swap agreements | | | 16,127 | |
Payable for: | |
Fund shares redeemed | | | 2,373,669 | |
Management fees | | | 18,286 | |
Securities purchased | | | 10,581 | |
Distribution and service fees | | | 9,149 | |
Transfer agent and administrative fees | | | 5,079 | |
Portfolio accounting fees | | | 2,032 | |
Miscellaneous | | | 15,492 | |
Total liabilities | | | 2,450,415 | |
Commitments and contingent liabilities (Note 13) | | | — | |
Net assets | | $ | 20,253,413 | |
| | | | | |
Net assets consist of: | |
Paid in capital | | $ | 16,960,102 | |
Accumulated net investment loss | | | (129,707 | ) |
Accumulated net realized gain on investments | | | 1,551,306 | |
Net unrealized appreciation on investments | | | 1,871,712 | |
Net assets | | $ | 20,253,413 | |
| | | | | |
A-Class: | |
Net assets | | $ | 1,139,386 | |
Capital shares outstanding | | | 16,621 | |
Net asset value per share | | $ | 68.55 | |
Maximum offering price per share (Net asset value divided by 95.25%) | | $ | 71.97 | |
| | | | | |
C-Class: | |
Net assets | | $ | 6,598,331 | |
Capital shares outstanding | | | 108,811 | |
Net asset value per share | | $ | 60.64 | |
| | | | | |
H-Class: | |
Net assets | | $ | 12,515,696 | |
Capital shares outstanding | | | 181,954 | |
Net asset value per share | | $ | 68.78 | |
STATEMENT OF OPERATIONS (Unaudited) | |
Period Ended September 30, 2016 | |
Investment Income: | |
Dividends from securities of unaffiliated issuers | | $ | 125,028 | |
Dividends from securities of affiliated issuers | | | 20,393 | |
Interest | | | 5,407 | |
Total investment income | | | 150,828 | |
| | | | | |
Expenses: | |
Management fees | | | 95,149 | |
Transfer agent and administrative fees | | | 26,430 | |
Distribution and service fees: | | | | |
A-Class | | | 2,376 | |
C-Class | | | 30,179 | |
H-Class | | | 16,510 | |
Portfolio accounting fees | | | 10,572 | |
Custodian fees | | | 1,248 | |
Trustees’ fees* | | | 570 | |
Line of credit fees | | | 3 | |
Miscellaneous | | | 16,408 | |
Total expenses | | | 199,445 | |
Net investment loss | | | (48,617 | ) |
| | | | | |
Net Realized and Unrealized Gain (Loss): | |
Net realized gain (loss) on: | |
Investments in unaffiliated issuers | | | 401,711 | |
Investments in affiliated issuers | | | 3,554 | |
Swap agreements | | | 977,070 | |
Futures contracts | | | 206,385 | |
Net realized gain | | | 1,588,720 | |
Net change in unrealized appreciation (depreciation) on: | |
Investments in unaffiliated issuers | | | 277,380 | |
Investments in affiliated issuers | | | 15,659 | |
Swap agreements | | | (14,768 | ) |
Futures contracts | | | (139,984 | ) |
Net change in unrealized appreciation (depreciation) | | | 138,287 | |
Net realized and unrealized gain | | | 1,727,007 | |
Net increase in net assets resulting from operations | | $ | 1,678,390 | |
* | Relates to Trustees not deemed “interested persons” within the meaning of Section 2(a)(19) of the 1940 Act. |
SEE NOTES TO FINANCIAL STATEMENTS. | THE RYDEX FUNDS SEMI-ANNUAL REPORT | 67 |
MID-CAP 1.5x STRATEGY FUND | |
STATEMENTS OF CHANGES IN NET ASSETS |
| | | Period Ended
September 30,
2016
(Unaudited) | | | Year Ended
March 31,
2016 | |
Increase (Decrease) in Net Assets from Operations: | | | | | | |
Net investment loss | | $ | (48,617 | ) | | $ | (522,399 | ) |
Net realized gain on investments | | | 1,588,720 | | | | 3,651,862 | |
Net change in unrealized appreciation (depreciation) on investments | | | 138,287 | | | | (3,723,276 | ) |
Net increase (decrease) in net assets resulting from operations | | | 1,678,390 | | | | (593,813 | ) |
| | | | | | | | | |
Distributions to shareholders from: | | | | | | | | |
Net realized gains | | | | | | | | |
A-Class | | | — | | | | (39,098 | ) |
C-Class | | | — | | | | (32,393 | ) |
H-Class | | | — | | | | (1,799,216 | ) |
Total distributions to shareholders | | | — | | | | (1,870,707 | ) |
| | | | | | | | | |
Capital share transactions: | | | | | | | | |
Proceeds from sale of shares | | | | | | | | |
A-Class | | | 29,115,167 | | | | 12,111,577 | |
C-Class | | | 1,779,909 | | | | 2,908,743 | |
H-Class | | | 60,105,606 | | | | 867,760,588 | |
Distributions reinvested | | | | | | | | |
A-Class | | | — | | | | 30,028 | |
C-Class | | | — | | | | 31,941 | |
H-Class | | | — | | | | 573,424 | |
Cost of shares redeemed | | | | | | | | |
A-Class | | | (29,549,685 | ) | | | (14,445,041 | ) |
C-Class | | | (574,501 | ) | | | (2,169,886 | ) |
H-Class | | | (62,585,308 | ) | | | (870,431,834 | ) |
Net decrease from capital share transactions | | | (1,708,812 | ) | | | (3,630,460 | ) |
Net decrease in net assets | | | (30,422 | ) | | | (6,094,980 | ) |
| | | | | | | | | |
Net assets: | | | | | | | | |
Beginning of period | | | 20,283,835 | | | | 26,378,815 | |
End of period | | $ | 20,253,413 | | | $ | 20,283,835 | |
Accumulated net investment loss at end of period | | $ | (129,707 | ) | | $ | (81,090 | ) |
| | | | | | | | | |
Capital share activity: | | | | | | | | |
Shares sold | | | | | | | | |
A-Class | | | 429,554 | | | | 201,123 | |
C-Class | | | 31,346 | | | | 51,115 | |
H-Class | | | 913,486 | | | | 14,189,381 | |
Shares issued from reinvestment of distributions | | | | | | | | |
A-Class | | | — | | | | 473 | |
C-Class | | | — | | | | 566 | |
H-Class | | | — | | | | 9,018 | |
Shares redeemed | | | | | | | | |
A-Class | | | (443,412 | ) | | | (250,294 | ) |
C-Class | | | (10,117 | ) | | | (40,676 | ) |
H-Class | | | (951,599 | ) | | | (14,221,967 | ) |
Net decrease in shares | | | (30,742 | ) | | | (61,261 | ) |
68 | THE RYDEX FUNDS SEMI-ANNUAL REPORT | SEE NOTES TO FINANCIAL STATEMENTS. |
MID-CAP 1.5x STRATEGY FUND | |
This table is presented to show selected data for a share outstanding throughout each period and to assist shareholders in evaluating a Fund’s performance for the periods presented.
A-Class | | Period Ended
September 30,
2016a | | | Year Ended
March 31,
2016 | | | Year Ended
March 31,
2015 | | | Year Ended
March 31,
2014 | | | Year Ended
March 31,
2013 | | | Year Ended
March 31,
2012 | |
Per Share Data | | | | | | | | | | | | | | | | | | |
Net asset value, beginning of period | | $ | 61.64 | | | $ | 67.32 | | | $ | 58.48 | | | $ | 45.07 | | | $ | 36.23 | | | $ | 37.14 | |
Income (loss) from investment operations: | |
Net investment income (loss)b | | | .12 | | | | (.47 | ) | | | (.41 | ) | | | (.35 | ) | | | (.16 | ) | | | (.23 | ) |
Net gain (loss) on investments (realized and unrealized) | | | 6.79 | | | | (4.81 | ) | | | 9.45 | | | | 13.76 | | | | 9.00 | | | | (.68 | ) |
Total from investment operations | | | 6.91 | | | | (5.28 | ) | | | 9.04 | | | | 13.41 | | | | 8.84 | | | | (.91 | ) |
Less distributions from: | |
Net realized gains | | | — | | | | (.40 | ) | | | (.20 | ) | | | — | | | | — | | | | — | |
Total distributions | | | — | | | | (.40 | ) | | | (.20 | ) | | | — | | | | — | | | | — | |
Net asset value, end of period | | $ | 68.55 | | | $ | 61.64 | | | $ | 67.32 | | | $ | 58.48 | | | $ | 45.07 | | | $ | 36.23 | |
| | |
Total Returnc | | | 11.21 | % | | | (7.86 | %) | | | 15.50 | % | | | 29.75 | % | | | 24.40 | % | | | (2.45 | %) |
Ratios/Supplemental Data | |
Net assets, end of period (in thousands) | | $ | 1,139 | | | $ | 1,879 | | | $ | 5,331 | | | $ | 2,632 | | | $ | 2,199 | | | $ | 1,997 | |
Ratios to average net assets: | |
Net investment income (loss) | | | 0.38 | % | | | (0.75 | %) | | | (0.66 | %) | | | (0.68 | %) | | | (0.43 | %) | | | (0.68 | %) |
Total expensesd | | | 1.67 | % | | | 1.65 | % | | | 1.64 | % | | | 1.67 | % | | | 1.66 | % | | | 1.66 | % |
Portfolio turnover rate | | | 191 | % | | | 1,506 | % | | | 598 | % | | | 563 | % | | | 447 | % | | | 141 | % |
C-Class | | Period Ended
September 30,
2016a | | | Year Ended
March 31,
2016 | | | Year Ended
March 31,
2015 | | | Year Ended
March 31,
2014 | | | Year Ended
March 31,
2013 | | | Year Ended
March 31,
2012 | |
Per Share Data | | | | | | | | | | | | | | | | | | |
Net asset value, beginning of period | | $ | 54.73 | | | $ | 60.27 | | | $ | 52.77 | | | $ | 40.97 | | | $ | 33.18 | | | $ | 34.26 | |
Income (loss) from investment operations: | |
Net investment income (loss)b | | | (.31 | ) | | | (.78 | ) | | | (.76 | ) | | | (.64 | ) | | | (.41 | ) | | | (.43 | ) |
Net gain (loss) on investments (realized and unrealized) | | | 6.22 | | | | (4.36 | ) | | | 8.46 | | | | 12.44 | | | | 8.20 | | | | (.65 | ) |
Total from investment operations | | | 5.91 | | | | (5.14 | ) | | | 7.70 | | | | 11.80 | | | | 7.79 | | | | (1.08 | ) |
Less distributions from: | |
Net realized gains | | | — | | | | (.40 | ) | | | (.20 | ) | | | — | | | | — | | | | — | |
Total distributions | | | — | | | | (.40 | ) | | | (.20 | ) | | | — | | | | — | | | | — | |
Net asset value, end of period | | $ | 60.64 | | | $ | 54.73 | | | $ | 60.27 | | | $ | 52.77 | | | $ | 40.97 | | | $ | 33.18 | |
| | |
Total Returnc | | | 10.78 | % | | | (8.55 | %) | | | 14.63 | % | | | 28.80 | % | | | 23.48 | % | | | (3.15 | %) |
Ratios/Supplemental Data | |
Net assets, end of period (in thousands) | | $ | 6,598 | | | $ | 4,794 | | | $ | 4,615 | | | $ | 4,549 | | | $ | 5,107 | | | $ | 4,815 | |
Ratios to average net assets: | |
Net investment income (loss) | | | (1.05 | %) | | | (1.41 | %) | | | (1.39 | %) | | | (1.40 | %) | | | (1.23 | %) | | | (1.42 | %) |
Total expensesd | | | 2.42 | % | | | 2.40 | % | | | 2.40 | % | | | 2.42 | % | | | 2.40 | % | | | 2.41 | % |
Portfolio turnover rate | | | 191 | % | | | 1,506 | % | | | 598 | % | | | 563 | % | | | 447 | % | | | 141 | % |
SEE NOTES TO FINANCIAL STATEMENTS. | THE RYDEX FUNDS SEMI-ANNUAL REPORT | 69 |
MID-CAP 1.5x STRATEGY FUND | |
FINANCIAL HIGHLIGHTS (concluded) |
This table is presented to show selected data for a share outstanding throughout each period and to assist shareholders in evaluating a Fund’s performance for the periods presented.
H-Class | | Period Ended
September 30,
2016a | | | Year Ended
March 31,
2016 | | | Year Ended
March 31,
2015 | | | Year Ended
March 31,
2014 | | | Year Ended
March 31,
2013 | | | Year Ended
March 31,
2012 | |
Per Share Data | | | | | | | | | | | | | | | | | | |
Net asset value, beginning of period | | $ | 61.85 | | | $ | 67.45 | | | $ | 58.56 | | | $ | 45.13 | | | $ | 36.27 | | | $ | 37.12 | |
Income (loss) from investment operations: | |
Net investment income (loss)b | | | (.10 | ) | | | (.57 | ) | | | (.29 | ) | | | (.34 | ) | | | (.15 | ) | | | (.24 | ) |
Net gain (loss) on investments (realized and unrealized) | | | 7.03 | | | | (4.63 | ) | | | 9.38 | | | | 13.77 | | | | 9.01 | | | | (.61 | ) |
Total from investment operations | | | 6.93 | | | | (5.20 | ) | | | 9.09 | | | | 13.43 | | | | 8.86 | | | | (.85 | ) |
Less distributions from: | |
Net realized gains | | | — | | | | (.40 | ) | | | (.20 | ) | | | — | | | | — | | | | — | |
Total distributions | | | — | | | | (.40 | ) | | | (.20 | ) | | | — | | | | — | | | | — | |
Net asset value, end of period | | $ | 68.78 | | | $ | 61.85 | | | $ | 67.45 | | | $ | 58.56 | | | $ | 45.13 | | | $ | 36.27 | |
| | |
Total Returnc | | | 11.20 | % | | | (7.73 | %) | | | 15.56 | % | | | 29.76 | % | | | 24.43 | % | | | (2.29 | %) |
Ratios/Supplemental Data | |
Net assets, end of period (in thousands) | | $ | 12,516 | | | $ | 13,611 | | | $ | 16,433 | | | $ | 19,413 | | | $ | 57,067 | | | $ | 16,974 | |
Ratios to average net assets: | |
Net investment income (loss) | | | (0.31 | %) | | | (0.93 | %) | | | (0.47 | %) | | | (0.66 | %) | | | (0.41 | %) | | | (0.72 | %) |
Total expensesd | | | 1.67 | % | | | 1.66 | % | | | 1.66 | % | | | 1.68 | % | | | 1.67 | % | | | 1.66 | % |
Portfolio turnover rate | | | 191 | % | | | 1,506 | % | | | 598 | % | | | 563 | % | | | 447 | % | | | 141 | % |
a | Unaudited figures for the period ended September 30, 2016. Percentage amounts for the period, except total return and portfolio turnover rate, have been annualized. |
b | Net investment income (loss) per share was computed using average shares outstanding throughout the period. |
c | Total return does not reflect the impact of any applicable sales charges. |
d | Does not include expenses of the underlying funds in which the Fund invests. |
70 | THE RYDEX FUNDS SEMI-ANNUAL REPORT | SEE NOTES TO FINANCIAL STATEMENTS. |
FUND PROFILE (Unaudited) | September 30, 2016 |
INVERSE MID-CAP STRATEGY FUND
OBJECTIVE: Seeks to provide investment results that match, before fees and expenses, the performance of a specific benchmark on a daily basis. The Fund’s current benchmark is the inverse (opposite) of the performance of the S&P MidCap 400 Index (the “underlying index”). The Fund does not seek to achieve its investment objective over a period of time greater than one day.
Holdings Diversification (Market Exposure as % of Net Assets)
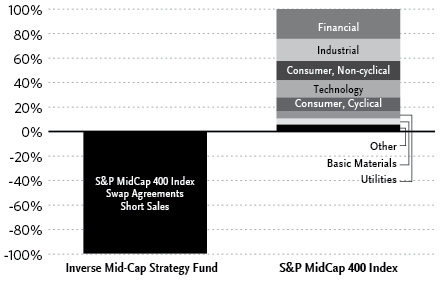
“Holdings Diversification (Market Exposure as % of Net Assets)” excludes any temporary cash investments or investments in Guggenheim Strategy Funds Trust mutual funds. Investments in those Funds do not provide “market exposure” to meet the Fund’s investment objective, but will significantly increase the portfolio’s exposure to certain other asset categories (and their associated risks), which may cause the Fund to deviate from its principal investment strategy, including: (i) high yield, high risk debt securities rated below the top four long-term rating categories by a nationally recognized statistical rating organization (also known as “junk bonds”); (ii) securities issued by the U.S. government or its agencies and instrumentalities; (iii) CLOs and similar investments; and (iv) other short-term fixed income securities.
Inception Dates: |
A-Class | March 31, 2004 |
C-Class | February 20, 2004 |
H-Class | February 20, 2004 |
The Fund invests principally in derivative investments such as swap agreements and futures contracts.
Largest Holdings (% of Total Net Assets) |
Guggenheim Strategy Fund I | 11.8% |
Guggenheim Strategy Fund II | 11.8% |
Total | 23.6% |
| | |
“Largest Holdings” excludes any temporary cash or derivative investments. |
| | THE RYDEX FUNDS SEMI-ANNUAL REPORT | 71 |
SCHEDULE OF INVESTMENTS (Unaudited) | September 30, 2016 |
INVERSE MID-CAP STRATEGY FUND | |
| | | Shares | | | Value | |
| | | | | | | |
MUTUAL FUNDS† - 23.6% | |
Guggenheim Strategy Fund I1 | | | 5,440 | | | $ | 135,946 | |
Guggenheim Strategy Fund II1 | | | 5,446 | | | | 135,813 | |
Total Mutual Funds | | | | | | | | |
(Cost $270,358) | | | | | | | 271,759 | |
| | | | | | | | | |
| | | Face
Amount | | | | | |
| | | | | | | | | |
REPURCHASE AGREEMENTS††,2 - 55.7% | |
Royal Bank of Canada
issued 09/30/16 at 0.36%
due 10/03/163 | | $ | 399,887 | | | | 399,887 | |
HSBC Securities, Inc.
issued 09/30/16 at 0.38%
due 10/03/16 | | | 239,421 | | | | 239,421 | |
Total Repurchase Agreements | | | | | | | | |
(Cost $639,308) | | | | | | | 639,308 | |
| | | | | | | | | |
Total Investments - 79.3% | | | | | | | | |
(Cost $909,666) | | | | | | $ | 911,067 | |
Other Assets & Liabilities, net - 20.7% | | | | | | | 237,671 | |
Total Net Assets - 100.0% | | | | | | $ | 1,148,738 | |
| | | Units | | | Unrealized
Gain (Loss) | |
| | | | | | | |
OTC EQUITY INDEX SWAP AGREEMENTS SOLD SHORT†† | |
Barclays Bank plc
October 2016
S&P MidCap 400
Index Swap 0.55%4,
Terminating 10/31/16
(Notional Value $52,424) | | | 34 | | | $ | 152 | |
BNP Paribas
November 2016
S&P MidCap 400
Index Swap 0.13%4,
Terminating 11/01/16
(Notional Value $404,422) | | | 261 | | | | (3,299 | ) |
Goldman Sachs International
September 2016 S&P MidCap 400
Index Swap 0.50%4,
Terminating 10/26/16
(Notional Value $687,559) | | | 443 | | | | (4,705 | ) |
(Total Notional Value $1,144,405) | | | | | | $ | (7,852 | ) |
† | Value determined based on Level 1 inputs — See Note 4. |
†† | Value determined based on Level 2 inputs — See Note 4. |
1 | Affiliated issuer — See Note 9. |
2 | Repurchase Agreements — See Note 5. |
3 | All or a portion of this security is pledged as equity index swap collateral at September 30, 2016. |
4 | Total Return based on S&P MidCap 400 Index +/- financing at a variable rate. Rate indicated is the rate effective at September 30, 2016. |
| | plc — Public Limited Company |
| | |
| | See Sector Classification in Other Information section. |
72 | THE RYDEX FUNDS SEMI-ANNUAL REPORT | SEE NOTES TO FINANCIAL STATEMENTS. |
SCHEDULE OF INVESTMENTS (Unaudited)(concluded) | September 30, 2016 |
INVERSE MID-CAP STRATEGY FUND | |
The following table summarizes the inputs used to value the Fund’s investments at September 30, 2016 (See Note 4 in the Notes to Financial Statements):
Investments in Securities (Assets) | | Level 1 | | | Level 2 | | | Level 2 -
Other* | | | Level 3 | | | Total | |
Equity Index Swap Agreements | | $ | — | | | $ | — | | | $ | 152 | | | $ | — | | | $ | 152 | |
Mutual Funds | | | 271,759 | | | | — | | | | — | | | | — | | | | 271,759 | |
Repurchase Agreements | | | — | | | | 639,308 | | | | — | | | | — | | | | 639,308 | |
Total | | $ | 271,759 | | | $ | 639,308 | | | $ | 152 | | | $ | — | | | $ | 911,219 | |
| | | | | | | | | | | | | | | | | | | | | |
Investments in Securities (Liabilities) | | Level 1 | | | Level 2 | | | Level 2 -
Other* | | | Level 3 | | | Total | |
Equity Index Swap Agreements | | $ | — | | | $ | — | | | $ | 8,004 | | | $ | — | | | $ | 8,004 | |
* | Other financial instruments include swaps, which are reported as unrealized gain/loss at period end. |
Transfers between investment levels may occur as the markets fluctuate and/or the availability of data used in an investment’s valuation changes. Transfers between valuation levels, if any, are in comparison to the valuation levels at the end of the previous fiscal year, and are effective using the fair value as of the end of the previous fiscal period.
For the period ended September 30, 2016, there were no transfers between levels.
SEE NOTES TO FINANCIAL STATEMENTS. | THE RYDEX FUNDS SEMI-ANNUAL REPORT | 73 |
INVERSE MID-CAP STRATEGY FUND | |
STATEMENT OF ASSETS AND LIABILITIES (Unaudited) | |
September 30, 2016 | |
Assets: | |
Investments in affiliated issuers, at value (cost $270,358) | | $ | 271,759 | |
Repurchase agreements, at value (cost $639,308) | | | 639,308 | |
Total investments (cost $909,666) | | | 911,067 | |
Segregated cash with broker | | | 250,000 | |
Unrealized appreciation on swap agreements | | | 152 | |
Receivables: | |
Fund shares sold | | | 90 | |
Dividends | | | 420 | |
Interest | | | 7 | |
Total assets | | | 1,161,736 | |
| | | | | |
Liabilities: | |
Unrealized depreciation on swap agreements | | | 8,004 | |
Payable for: | |
Fund shares redeemed | | | 2,020 | |
Management fees | | | 904 | |
Licensing fees | | | 858 | |
Distribution and service fees | | | 427 | |
Transfer agent and administrative fees | | | 251 | |
Swap settlement | | | 159 | |
Portfolio accounting fees | | | 101 | |
Miscellaneous | | | 274 | |
Total liabilities | | | 12,998 | |
Commitments and contingent liabilities (Note 13) | | | — | |
Net assets | | $ | 1,148,738 | |
| | | | | |
Net assets consist of: | |
Paid in capital | | $ | 13,480,775 | |
Accumulated net investment loss | | | (26,650 | ) |
Accumulated net realized loss on investments | | | (12,298,936 | ) |
Net unrealized depreciation on investments | | | (6,451 | ) |
Net assets | | $ | 1,148,738 | |
| | | | | |
A-Class: | |
Net assets | | $ | 116,325 | |
Capital shares outstanding | | | 4,155 | |
Net asset value per share | | $ | 28.00 | |
Maximum offering price per share (Net asset value divided by 95.25%) | | $ | 29.40 | |
| | | | | |
C-Class: | |
Net assets | | $ | 310,156 | |
Capital shares outstanding | | | 12,247 | |
Net asset value per share | | $ | 25.33 | |
| | | | | |
H-Class: | |
Net assets | | $ | 722,257 | |
Capital shares outstanding | | | 25,815 | |
Net asset value per share | | $ | 27.98 | |
STATEMENT OF OPERATIONS (Unaudited) | |
Period Ended September 30, 2016 | |
Investment Income: | |
Dividends from securities of affiliated issuers | | $ | 4,320 | |
Interest | | | 2,216 | |
Total investment income | | | 6,536 | |
| | | | | |
Expenses: | |
Management fees | | | 10,866 | |
Transfer agent and administrative fees | | | 3,019 | |
Distribution and service fees: | |
A-Class | | | 149 | |
C-Class | | | 1,360 | |
H-Class | | | 2,529 | |
Portfolio accounting fees | | | 1,207 | |
Custodian fees | | | 141 | |
Trustees’ fees* | | | 103 | |
Miscellaneous | | | 1,800 | |
Total expenses | | | 21,174 | |
Net investment loss | | | (14,638 | ) |
| | | | | |
Net Realized and Unrealized Gain (Loss): | |
Net realized gain (loss) on: | |
Investments in affiliated issuers | | | 477 | |
Swap agreements | | | (265,179 | ) |
Futures contracts | | | (39,702 | ) |
Net realized loss | | | (304,404 | ) |
Net change in unrealized appreciation (depreciation) on: | |
Investments in affiliated issuers | | | 3,576 | |
Swap agreements | | | 26,752 | |
Futures contracts | | | 24,045 | |
Net change in unrealized appreciation (depreciation) | | | 54,373 | |
Net realized and unrealized loss | | | (250,031 | ) |
Net decrease in net assets resulting from operations | | $ | (264,669 | ) |
* | Relates to Trustees not deemed “interested persons” within the meaning of Section 2(a)(19) of the 1940 Act. |
74 | THE RYDEX FUNDS SEMI-ANNUAL REPORT | SEE NOTES TO FINANCIAL STATEMENTS. |
INVERSE MID-CAP STRATEGY FUND | |
STATEMENTS OF CHANGES IN NET ASSETS |
| | | Period Ended
September 30,
2016
(Unaudited) | | | Year Ended
March 31,
2016 | |
Increase (Decrease) in Net Assets from Operations: | | | | | | |
Net investment loss | | $ | (14,638 | ) | | $ | (60,272 | ) |
Net realized gain (loss) on investments | | | (304,404 | ) | | | 555,698 | |
Net change in unrealized appreciation (depreciation) on investments | | | 54,373 | | | | (15,222 | ) |
Net increase (decrease) in net assets resulting from operations | | | (264,669 | ) | | | 480,204 | |
| | | | | | | | | |
Capital share transactions: | | | | | | | | |
Proceeds from sale of shares | | | | | | | | |
A-Class | | | 63,859 | | | | 2,309,572 | |
C-Class | | | 90,828 | | | | 572,876 | |
H-Class | | | 10,220,900 | | | | 102,675,850 | |
Cost of shares redeemed | | | | | | | | |
A-Class | | | (47,120 | ) | | | (2,246,291 | ) |
C-Class | | | (26,928 | ) | | | (364,765 | ) |
H-Class | | | (11,952,269 | ) | | | (103,514,443 | ) |
Net decrease from capital share transactions | | | (1,650,730 | ) | | | (567,201 | ) |
Net decrease in net assets | | | (1,915,399 | ) | | | (86,997 | ) |
| | | | | | | | | |
Net assets: | | | | | | | | |
Beginning of period | | | 3,064,137 | | | | 3,151,134 | |
End of period | | $ | 1,148,738 | | | $ | 3,064,137 | |
Accumulated net investment loss at end of period | | $ | (26,650 | ) | | $ | (12,012 | ) |
| | | | | | | | | |
Capital share activity: | | | | | | | | |
Shares sold | | | | | | | | |
A-Class | | | 2,189 | | | | 69,625 | |
C-Class | | | 3,443 | | | | 18,922 | |
H-Class | | | 352,554 | | | | 3,247,874 | |
Shares redeemed | | | | | | | | |
A-Class | | | (1,646 | ) | | | (67,547 | ) |
C-Class | | | (988 | ) | | | (12,293 | ) |
H-Class | | | (414,077 | ) | | | (3,258,727 | ) |
Net decrease in shares | | | (58,525 | ) | | | (2,146 | ) |
SEE NOTES TO FINANCIAL STATEMENTS. | THE RYDEX FUNDS SEMI-ANNUAL REPORT | 75 |
INVERSE MID-CAP STRATEGY FUND | |
This table is presented to show selected data for a share outstanding throughout each period and to assist shareholders in evaluating a Fund’s performance for the periods presented.
A-Class | | Period Ended
September 30,
2016a | | | Year Ended
March 31,
2016 | | | Year Ended
March 31,
2015 | | | Year Ended
March 31,
2014e | | | Year Ended
March 28,
2013e | | | Year Ended
March 31,
2012e | |
Per Share Data | | | | | | | | | | | | | | | | | | |
Net asset value, beginning of period | | $ | 30.70 | | | $ | 30.76 | | | $ | 35.55 | | | $ | 44.64 | | | $ | 54.64 | | | $ | 61.14 | |
Income (loss) from investment operations: | |
Net investment income (loss)b | | | (.16 | ) | | | (.38 | ) | | | (.48 | ) | | | (.64 | ) | | | (.84 | ) | | | (1.02 | ) |
Net gain (loss) on investments (realized and unrealized) | | | (2.54 | ) | | | .32 | | | | (4.31 | ) | | | (8.45 | ) | | | (9.16 | ) | | | (5.48 | ) |
Total from investment operations | | | (2.70 | ) | | | (.06 | ) | | | (4.79 | ) | | | (9.09 | ) | | | (10.00 | ) | | | (6.50 | ) |
Net asset value, end of period | | $ | 28.00 | | | $ | 30.70 | | | $ | 30.76 | | | $ | 35.55 | | | $ | 44.64 | | | $ | 54.64 | |
| | |
Total Returnc | | | (8.86 | %) | | | (0.16 | %) | | | (13.47 | %) | | | (20.36 | %) | | | (18.29 | %) | | | (10.65 | %) |
Ratios/Supplemental Data | |
Net assets, end of period (in thousands) | | $ | 116 | | | $ | 111 | | | $ | 47 | | | $ | 93 | | | $ | 26 | | | $ | 115 | |
Ratios to average net assets: | |
Net investment income (loss) | | | (1.12 | %) | | | (1.18 | %) | | | (1.40 | %) | | | (1.65 | %) | | | (1.52 | %) | | | (1.63 | %) |
Total expensesd | | | 1.67 | % | | | 1.65 | % | | | 1.66 | % | | | 1.67 | % | | | 1.64 | % | | | 1.66 | % |
Portfolio turnover rate | | | 91 | % | | | 199 | % | | | 38 | % | | | — | | | | — | | | | — | |
C-Class | | Period Ended
September 30,
2016a | | | Year Ended
March 31,
2016 | | | Year Ended
March 31,
2015 | | | Year Ended
March 31,
2014e | | | Year Ended
March 28,
2013e | | | Year Ended
March 31,
2012e | |
Per Share Data | | | | | | | | | | | | | | | | | | |
Net asset value, beginning of period | | $ | 27.89 | | | $ | 28.16 | | | $ | 32.78 | | | $ | 41.49 | | | $ | 51.18 | | | $ | 57.72 | |
Income (loss) from investment operations: | |
Net investment income (loss)b | | | (.25 | ) | | | (.59 | ) | | | (.67 | ) | | | (.90 | ) | | | (1.14 | ) | | | (1.44 | ) |
Net gain (loss) on investments (realized and unrealized) | | | (2.31 | ) | | | .32 | | | | (3.95 | ) | | | (7.81 | ) | | | (8.55 | ) | | | (5.10 | ) |
Total from investment operations | | | (2.56 | ) | | | (.27 | ) | | | (4.62 | ) | | | (8.71 | ) | | | (9.69 | ) | | | (6.54 | ) |
Net asset value, end of period | | $ | 25.33 | | | $ | 27.89 | | | $ | 28.16 | | | $ | 32.78 | | | $ | 41.49 | | | $ | 51.18 | |
| | |
Total Returnc | | | (9.21 | %) | | | (0.96 | %) | | | (14.09 | %) | | | (20.99 | %) | | | (18.93 | %) | | | (11.33 | %) |
Ratios/Supplemental Data | |
Net assets, end of period (in thousands) | | $ | 310 | | | $ | 273 | | | $ | 89 | | | $ | 131 | | | $ | 216 | | | $ | 121 | |
Ratios to average net assets: | |
Net investment income (loss) | | | (1.87 | %) | | | (2.00 | %) | | | (2.13 | %) | | | (2.40 | %) | | | (2.29 | %) | | | (2.39 | %) |
Total expensesd | | | 2.41 | % | | | 2.41 | % | | | 2.41 | % | | | 2.42 | % | | | 2.40 | % | | | 2.42 | % |
Portfolio turnover rate | | | 91 | % | | | 199 | % | | | 38 | % | | | — | | | | — | | | | — | |
76 | THE RYDEX FUNDS SEMI-ANNUAL REPORT | SEE NOTES TO FINANCIAL STATEMENTS. |
INVERSE MID-CAP STRATEGY FUND | |
FINANCIAL HIGHLIGHTS (concluded) |
This table is presented to show selected data for a share outstanding throughout each period and to assist shareholders in evaluating a Fund’s performance for the periods presented.
H-Class | | Period Ended
September 30,
2016a | | | Year Ended
March 31,
2016 | | | Year Ended
March 31,
2015 | | | Year Ended
March 31,
2014e | | | Year Ended
March 28,
2013e | | | Year Ended
March 31,
2012e | |
Per Share Data | | | | | | | | | | | | | | | | | | |
Net asset value, beginning of period | | $ | 30.69 | | | $ | 30.70 | | | $ | 35.49 | | | $ | 44.59 | | | $ | 54.57 | | | $ | 61.08 | |
Income (loss) from investment operations: | |
Net investment income (loss)b | | | (.17 | ) | | | (.42 | ) | | | (.47 | ) | | | (.66 | ) | | | (.81 | ) | | | (1.05 | ) |
Net gain (loss) on investments (realized and unrealized) | | | (2.54 | ) | | | .41 | | | | (4.32 | ) | | | (8.44 | ) | | | (9.17 | ) | | | (5.46 | ) |
Total from investment operations | | | (2.71 | ) | | | (.01 | ) | | | (4.79 | ) | | | (9.10 | ) | | | (9.98 | ) | | | (6.51 | ) |
Net asset value, end of period | | $ | 27.98 | | | $ | 30.69 | | | $ | 30.70 | | | $ | 35.49 | | | $ | 44.59 | | | $ | 54.57 | |
| | |
Total Returnc | | | (8.83 | %) | | | (0.07 | %) | | | (13.47 | %) | | | (20.39 | %) | | | (18.31 | %) | | | (10.66 | %) |
Ratios/Supplemental Data | |
Net assets, end of period (in thousands) | | $ | 722 | | | $ | 2,680 | | | $ | 3,015 | | | $ | 3,825 | | | $ | 1,409 | | | $ | 1,578 | |
Ratios to average net assets: | |
Net investment income (loss) | | | (1.13 | %) | | | (1.32 | %) | | | (1.38 | %) | | | (1.65 | %) | | | (1.53 | %) | | | (1.64 | %) |
Total expensesd | | | 1.66 | % | | | 1.65 | % | | | 1.65 | % | | | 1.67 | % | | | 1.65 | % | | | 1.67 | % |
Portfolio turnover rate | | | 91 | % | | | 199 | % | | | 38 | % | | | — | | | | — | | | | — | |
a | Unaudited figures for the period ended September 30, 2016. Percentage amounts for the period, except total return and portfolio turnover rate, have been annualized. |
b | Net investment income (loss) per share was computed using average shares outstanding throughout the period. |
c | Total return does not reflect the impact of any applicable sales charges. |
d | Does not include expenses of the underlying funds in which the Fund invests. |
e | Reverse share split — Per share amounts for the periods presented through February 7, 2014 have been restated to reflect a 1:3 reverse share split effective February 7, 2014. |
SEE NOTES TO FINANCIAL STATEMENTS. | THE RYDEX FUNDS SEMI-ANNUAL REPORT | 77 |
FUND PROFILE (Unaudited) | September 30, 2016 |
RUSSELL 2000® 1.5x STRATEGY FUND
OBJECTIVE: Seeks to provide investment results that correlate, before fees and expenses, to the performance of a specific benchmark for small-cap securities on a daily basis. The Fund’s current benchmark is 150% of the performance of the Russell 2000® Index (the “underlying index”). The Fund does not seek to achieve its investment objective over a period of time greater than one day.
Holdings Diversification (Market Exposure as % of Net Assets)
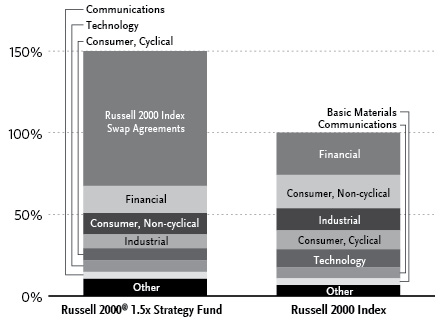
“Holdings Diversification (Market Exposure as % of Net Assets)” excludes any temporary cash investments or investments in Guggenheim Strategy Funds Trust mutual funds. Investments in those Funds do not provide “market exposure” to meet the Fund’s investment objective, but will significantly increase the portfolio’s exposure to certain other asset categories (and their associated risks), which may cause the Fund to deviate from its principal investment strategy, including: (i) high yield, high risk debt securities rated below the top four long-term rating categories by a nationally recognized statistical rating organization (also known as “junk bonds”); (ii) securities issued by the U.S. government or its agencies and instrumentalities; (iii) CLOs and similar investments; and (iv) other short-term fixed income securities.
Inception Dates: |
A-Class | March 31, 2004 |
C-Class | January 23, 2001 |
H-Class | November 1, 2000 |
Ten Largest Holdings (% of Total Net Assets) |
Guggenheim Strategy Fund II | 4.8% |
Guggenheim Strategy Fund I | 4.8% |
Microsemi Corp. | 0.2% |
Advanced Micro Devices, Inc. | 0.2% |
Gramercy Property Trust | 0.2% |
Curtiss-Wright Corp. | 0.2% |
IDACORP, Inc. | 0.2% |
Healthcare Realty Trust, Inc. | 0.1% |
Fair Isaac Corp. | 0.1% |
Aspen Technology, Inc. | 0.1% |
Top Ten Total | 10.9% |
| | |
“Ten Largest Holdings” excludes any temporary cash or derivative investments. |
78 | THE RYDEX FUNDS SEMI-ANNUAL REPORT | |
SCHEDULE OF INVESTMENTS (Unaudited) | September 30, 2016 |
RUSSELL 2000® 1.5x STRATEGY FUND | |
| | | Shares | | | Value | |
| | | | | | | |
COMMON STOCKS† - 63.9% | |
| | | | | | | |
Financial - 16.6% | |
Gramercy Property Trust | | | 1,641 | | | $ | 15,820 | |
Healthcare Realty Trust, Inc. | | | 443 | | | | 15,088 | |
Prosperity Bancshares, Inc. | | | 259 | | | | 14,216 | |
PrivateBancorp, Inc. — Class A | | | 304 | | | | 13,959 | |
Investors Bancorp, Inc. | | | 1,154 | | | | 13,859 | |
Medical Properties Trust, Inc. | | | 921 | | | | 13,603 | |
Webster Financial Corp. | | | 357 | | | | 13,569 | |
Ellie Mae, Inc.* | | | 127 | | | | 13,373 | |
Bank of the Ozarks, Inc. | | | 344 | | | | 13,210 | |
New Residential Investment Corp. | | | 942 | | | | 13,008 | |
Umpqua Holdings Corp. | | | 859 | | | | 12,928 | |
First Industrial Realty Trust, Inc. | | | 452 | | | | 12,755 | |
Education Realty Trust, Inc. | | | 285 | | | | 12,296 | |
DuPont Fabros Technology, Inc. | | | 290 | | | | 11,963 | |
Hudson Pacific Properties, Inc. | | | 363 | | | | 11,932 | |
Radian Group, Inc. | | | 836 | | | | 11,327 | |
Physicians Realty Trust | | | 525 | | | | 11,309 | |
National Health Investors, Inc. | | | 144 | | | | 11,301 | |
Chemical Financial Corp. | | | 255 | | | | 11,253 | |
Acadia Realty Trust | | | 310 | | | | 11,235 | |
Wintrust Financial Corp. | | | 200 | | | | 11,114 | |
Sunstone Hotel Investors, Inc. | | | 845 | | | | 10,808 | |
IBERIABANK Corp. | | | 159 | | | | 10,672 | |
CNO Financial Group, Inc. | | | 697 | | | | 10,644 | |
MGIC Investment Corp.* | | | 1,325 | | | | 10,599 | |
MB Financial, Inc. | | | 272 | | | | 10,347 | |
UMB Financial Corp. | | | 174 | | | | 10,344 | |
FNB Corp. | | | 817 | | | | 10,049 | |
RLI Corp. | | | 147 | | | | 10,048 | |
RLJ Lodging Trust | | | 474 | | | | 9,968 | |
LaSalle Hotel Properties | | | 415 | | | | 9,906 | |
Texas Capital Bancshares, Inc.* | | | 179 | | | | 9,831 | |
Urban Edge Properties | | | 349 | | | | 9,821 | |
Home BancShares, Inc. | | | 471 | | | | 9,802 | |
Hancock Holding Co. | | | 301 | | | | 9,761 | |
Fulton Financial Corp. | | | 669 | | | | 9,714 | |
Genworth Financial, Inc. — Class A* | | | 1,951 | | | | 9,677 | |
Primerica, Inc. | | | 182 | | | | 9,651 | |
CoreSite Realty Corp. | | | 130 | | | | 9,625 | |
Stifel Financial Corp.* | | | 250 | | | | 9,612 | |
United Bankshares, Inc. | | | 255 | | | | 9,606 | |
QTS Realty Trust, Inc. — Class A | | | 181 | | | | 9,566 | |
Mack-Cali Realty Corp. | | | 347 | | | | 9,445 | |
Washington Federal, Inc. | | | 352 | | | | 9,390 | |
Valley National Bancorp | | | 962 | | | | 9,360 | |
Lexington Realty Trust | | | 893 | | | | 9,198 | |
Retail Opportunity Investments Corp. | | | 417 | | | | 9,157 | |
Pinnacle Financial Partners, Inc. | | | 168 | | | | 9,085 | |
EastGroup Properties, Inc. | | | 123 | | | | 9,048 | |
First Financial Bankshares, Inc. | | | 247 | | | | 9,001 | |
Washington Prime Group, Inc. | | | 720 | | | | 8,914 | |
Kite Realty Group Trust | | | 320 | | | | 8,870 | |
Washington Real Estate Investment Trust | | | 285 | | | | 8,869 | |
Cathay General Bancorp | | | 288 | | | | 8,865 | |
Selective Insurance Group, Inc. | | | 220 | | | | 8,769 | |
FirstCash, Inc. | | | 185 | | | | 8,709 | |
Hope Bancorp, Inc. | | | 498 | | | | 8,650 | |
PS Business Parks, Inc. | | | 76 | | | | 8,631 | |
Sterling Bancorp | | | 492 | | | | 8,609 | |
WageWorks, Inc.* | | | 141 | | | | 8,588 | |
First Citizens BancShares, Inc. — Class A | | | 29 | | | | 8,523 | |
Cousins Properties, Inc. | | | 807 | | | | 8,425 | |
Glacier Bancorp, Inc. | | | 295 | | | | 8,413 | |
Ryman Hospitality Properties, Inc. | | | 168 | | | | 8,091 | |
Community Bank System, Inc. | | | 167 | | | | 8,034 | |
Colony Capital, Inc. — Class A | | | 437 | | | | 7,966 | |
CBL & Associates Properties, Inc. | | | 654 | | | | 7,940 | |
LendingClub Corp.* | | | 1,275 | | | | 7,880 | |
Janus Capital Group, Inc. | | | 562 | | | | 7,875 | |
BancorpSouth, Inc. | | | 336 | | | | 7,795 | |
Evercore Partners, Inc. — Class A | | | 151 | | | | 7,778 | |
EverBank Financial Corp. | | | 400 | | | | 7,743 | |
Essent Group Ltd.* | | | 289 | | | | 7,690 | |
Great Western Bancorp, Inc. | | | 229 | | | | 7,630 | |
LTC Properties, Inc. | | | 146 | | | | 7,591 | |
BGC Partners, Inc. — Class A | | | 846 | | | | 7,403 | |
Enstar Group Ltd.* | | | 45 | | | | 7,401 | |
Pebblebrook Hotel Trust | | | 277 | | | | 7,368 | |
Columbia Banking System, Inc. | | | 225 | | | | 7,362 | |
Old National Bancorp | | | 515 | | | | 7,241 | |
Kennedy-Wilson Holdings, Inc. | | | 321 | | | | 7,239 | |
Colony Starwood Homes | | | 252 | | | | 7,232 | |
Trustmark Corp. | | | 261 | | | | 7,193 | |
DiamondRock Hospitality Co. | | | 780 | | | | 7,098 | |
Alexander & Baldwin, Inc. | | | 182 | | | | 6,993 | |
Monogram Residential Trust, Inc. | | | 655 | | | | 6,969 | |
Capitol Federal Financial, Inc. | | | 495 | | | | 6,965 | |
CVB Financial Corp. | | | 393 | | | | 6,921 | |
South State Corp. | | | 92 | | | | 6,904 | |
GEO Group, Inc. | | | 288 | | | | 6,849 | |
Invesco Mortgage Capital, Inc. | | | 437 | | | | 6,656 | |
American Assets Trust, Inc. | | | 153 | | | | 6,637 | |
Select Income REIT | | | 246 | | | | 6,617 | |
Hilltop Holdings, Inc.* | | | 291 | | | | 6,536 | |
STAG Industrial, Inc. | | | 266 | | | | 6,520 | |
Blackhawk Network Holdings, Inc.* | | | 213 | | | | 6,427 | |
Argo Group International Holdings Ltd. | | | 113 | | | | 6,375 | |
International Bancshares Corp. | | | 212 | | | | 6,313 | |
Sabra Health Care REIT, Inc. | | | 250 | | | | 6,295 | |
PRA Group, Inc.* | | | 179 | | | | 6,183 | |
Government Properties Income Trust | | | 273 | | | | 6,175 | |
Financial Engines, Inc. | | | 207 | | | | 6,150 | |
Potlatch Corp. | | | 157 | | | | 6,106 | |
Pennsylvania Real Estate Investment Trust | | | 265 | | | | 6,103 | |
Xenia Hotels & Resorts, Inc. | | | 401 | | | | 6,087 | |
Kemper Corp. | | | 154 | | | | 6,055 | |
First Midwest Bancorp, Inc. | | | 312 | | | | 6,040 | |
American Equity Investment Life Holding Co. | | | 332 | | | | 5,886 | |
Northwest Bancshares, Inc. | | | 374 | | | | 5,876 | |
SEE NOTES TO FINANCIAL STATEMENTS. | THE RYDEX FUNDS SEMI-ANNUAL REPORT | 79 |
SCHEDULE OF INVESTMENTS (Unaudited)(continued) | September 30, 2016 |
RUSSELL 2000® 1.5x STRATEGY FUND | |
| | | Shares | | | Value | |
| | | | | | | |
New York REIT, Inc. | | | 642 | | | $ | 5,874 | |
Eagle Bancorp, Inc.* | | | 119 | | | | 5,870 | |
TowneBank | | | 242 | | | | 5,815 | |
Rexford Industrial Realty, Inc. | | | 254 | | | | 5,814 | |
Horace Mann Educators Corp. | | | 157 | | | | 5,754 | |
United Community Banks, Inc. | | | 272 | | | | 5,717 | |
Ramco-Gershenson Properties Trust | | | 305 | | | | 5,716 | |
Simmons First National Corp. — Class A | | | 114 | | | | 5,689 | |
Waddell & Reed Financial, Inc. — Class A | | | 308 | | | | 5,593 | |
LegacyTexas Financial Group, Inc. | | | 172 | | | | 5,440 | |
NBT Bancorp, Inc. | | | 165 | | | | 5,424 | |
Independent Bank Corp. | | | 100 | | | | 5,409 | |
Global Net Lease, Inc. | | | 661 | | | | 5,393 | |
Renasant Corp. | | | 158 | | | | 5,314 | |
Parkway Properties, Inc. | | | 312 | | | | 5,307 | |
Chesapeake Lodging Trust | | | 230 | | | | 5,267 | |
Astoria Financial Corp. | | | 358 | | | | 5,227 | |
BofI Holding, Inc.* | | | 232 | | | | 5,197 | |
First Financial Bancorp | | | 237 | | | | 5,176 | |
WesBanco, Inc. | | | 157 | | | | 5,162 | |
CYS Investments, Inc. | | | 588 | | | | 5,127 | |
Banner Corp. | | | 117 | | | | 5,118 | |
Franklin Street Properties Corp. | | | 405 | | | | 5,103 | |
Yadkin Financial Corp. | | | 193 | | | | 5,074 | |
Provident Financial Services, Inc. | | | 237 | | | | 5,032 | |
Park National Corp. | | | 52 | | | | 4,992 | |
Four Corners Property Trust, Inc. | | | 234 | | | | 4,991 | |
Seritage Growth Properties | | | 97 | | | | 4,916 | |
Kearny Financial Corp. | | | 359 | | | | 4,886 | |
Westamerica Bancorporation | | | 96 | | | | 4,884 | |
Terreno Realty Corp. | | | 175 | | | | 4,814 | |
ServisFirst Bancshares, Inc. | | | 89 | | | | 4,620 | |
Ameris Bancorp | | | 132 | | | | 4,613 | |
WisdomTree Investments, Inc. | | | 447 | | | | 4,600 | |
Apollo Commercial Real Estate Finance, Inc. | | | 281 | | | | 4,597 | |
Union Bankshares Corp. | | | 168 | | | | 4,497 | |
FCB Financial Holdings, Inc. — Class A* | | | 117 | | | | 4,496 | |
Summit Hotel Properties, Inc. | | | 335 | | | | 4,409 | |
Agree Realty Corp. | | | 88 | | | | 4,351 | |
AMERISAFE, Inc. | | | 74 | | | | 4,350 | |
Tompkins Financial Corp. | | | 56 | | | | 4,279 | |
First Merchants Corp. | | | 158 | | | | 4,227 | |
Redwood Trust, Inc. | | | 297 | | | | 4,206 | |
National General Holdings Corp. | | | 188 | | | | 4,181 | |
Navigators Group, Inc. | | | 43 | | | | 4,168 | |
PennyMac Mortgage Investment Trust | | | 264 | | | | 4,113 | |
Boston Private Financial Holdings, Inc. | | | 317 | | | | 4,067 | |
WSFS Financial Corp. | | | 111 | | | | 4,050 | |
Beneficial Bancorp, Inc. | | | 272 | | | | 4,001 | |
MBIA, Inc.* | | | 510 | | | | 3,973 | |
Stewart Information Services Corp. | | | 89 | | | | 3,956 | |
HFF, Inc. — Class A | | | 140 | | | | 3,877 | |
S&T Bancorp, Inc. | | | 132 | | | | 3,827 | |
BNC Bancorp | | | 157 | | | | 3,818 | |
Alexander’s, Inc. | | | 9 | | | | 3,776 | |
Safety Insurance Group, Inc. | | | 56 | | | | 3,764 | |
Employers Holdings, Inc. | | | 124 | | | | 3,699 | |
Aircastle Ltd. | | | 186 | | | | 3,694 | |
Hannon Armstrong Sustainable Infrastructure Capital, Inc. | | | 158 | | | | 3,692 | |
St. Joe Co.* | | | 196 | | | | 3,602 | |
United Fire Group, Inc. | | | 84 | | | | 3,555 | |
Capstead Mortgage Corp. | | | 371 | | | | 3,499 | |
Monmouth Real Estate Investment Corp. | | | 244 | | | | 3,482 | |
First Commonwealth Financial Corp. | | | 344 | | | | 3,471 | |
Infinity Property & Casualty Corp. | | | 42 | | | | 3,470 | |
Cohen & Steers, Inc. | | | 81 | | | | 3,463 | |
New Senior Investment Group, Inc. | | | 296 | | | | 3,416 | |
FelCor Lodging Trust, Inc. | | | 530 | | | | 3,408 | |
CareTrust REIT, Inc. | | | 224 | | | | 3,310 | |
Banc of California, Inc. | | | 189 | | | | 3,300 | |
Berkshire Hills Bancorp, Inc. | | | 119 | | | | 3,297 | |
Lakeland Financial Corp. | | | 93 | | | | 3,294 | |
Brookline Bancorp, Inc. | | | 269 | | | | 3,279 | |
Hanmi Financial Corp. | | | 123 | | | | 3,240 | |
Ambac Financial Group, Inc.* | | | 175 | | | | 3,218 | |
iStar, Inc.* | | | 299 | | | | 3,208 | |
ARMOUR Residential REIT, Inc. | | | 142 | | | | 3,201 | |
Universal Insurance Holdings, Inc. | | | 127 | | | | 3,200 | |
CenterState Banks, Inc. | | | 180 | | | | 3,191 | |
Cardinal Financial Corp. | | | 122 | | | | 3,183 | |
FNFV Group* | | | 255 | | | | 3,182 | |
KCG Holdings, Inc. — Class A* | | | 203 | | | | 3,153 | |
Nelnet, Inc. — Class A | | | 78 | | | | 3,149 | |
Southside Bancshares, Inc. | | | 97 | | | | 3,121 | |
State Bank Financial Corp. | | | 136 | | | | 3,104 | |
Third Point Reinsurance Ltd.* | | | 256 | | | | 3,072 | |
Heartland Financial USA, Inc. | | | 85 | | | | 3,066 | |
MTGE Investment Corp. | | | 178 | | | | 3,060 | |
Piper Jaffray Cos.* | | | 63 | | | | 3,043 | |
Universal Health Realty Income Trust | | | 48 | | | | 3,024 | |
RE/MAX Holdings, Inc. — Class A | | | 69 | | | | 3,021 | |
PHH Corp.* | | | 205 | | | | 2,962 | |
Central Pacific Financial Corp. | | | 117 | | | | 2,947 | |
City Holding Co. | | | 58 | | | | 2,917 | |
Meridian Bancorp, Inc. | | | 187 | | | | 2,912 | |
Maiden Holdings Ltd. | | | 229 | | | | 2,906 | |
Hersha Hospitality Trust | | | 160 | | | | 2,883 | |
Tier REIT, Inc. | | | 185 | | | | 2,856 | |
National Storage Affiliates Trust | | | 136 | | | | 2,848 | |
InfraREIT, Inc. | | | 155 | | | | 2,812 | |
Chatham Lodging Trust | | | 146 | | | | 2,811 | |
Investors Real Estate Trust | | | 471 | | | | 2,802 | |
Sandy Spring Bancorp, Inc. | | | 91 | | | | 2,783 | |
Pacific Premier Bancorp, Inc.* | | | 105 | | | | 2,778 | |
First Busey Corp. | | | 120 | | | | 2,712 | |
Walker & Dunlop, Inc.* | | | 107 | | | | 2,703 | |
Stock Yards Bancorp, Inc. | | | 82 | | | | 2,703 | |
United Financial Bancorp, Inc. | | | 194 | | | | 2,685 | |
Northfield Bancorp, Inc. | | | 163 | | | | 2,624 | |
New York Mortgage Trust, Inc. REIT | | | 427 | | | | 2,571 | |
80 | THE RYDEX FUNDS SEMI-ANNUAL REPORT | SEE NOTES TO FINANCIAL STATEMENTS. |
SCHEDULE OF INVESTMENTS (Unaudited)(continued) | September 30, 2016 |
RUSSELL 2000® 1.5x STRATEGY FUND | |
| | | Shares | | | Value | |
| | | | | | | |
Flushing Financial Corp. | | | 108 | | | $ | 2,562 | |
Greenhill & Company, Inc. | | | 108 | | | | 2,546 | |
Virtus Investment Partners, Inc. | | | 26 | | | | 2,544 | |
Saul Centers, Inc. | | | 38 | | | | 2,531 | |
NorthStar Realty Europe Corp. | | | 231 | | | | 2,529 | |
National Bank Holdings Corp. — Class A | | | 108 | | | | 2,524 | |
Urstadt Biddle Properties, Inc. — Class A | | | 113 | | | | 2,511 | |
TrustCo Bank Corp. NY | | | 354 | | | | 2,510 | |
Capital Bank Financial Corp. — Class A | | | 77 | | | | 2,472 | |
Getty Realty Corp. | | | 103 | | | | 2,465 | |
FBL Financial Group, Inc. — Class A | | | 38 | | | | 2,431 | |
First Interstate BancSystem, Inc. — Class A | | | 77 | | | | 2,426 | |
Easterly Government Properties, Inc. | | | 126 | | | | 2,404 | |
First BanCorp* | | | 462 | | | | 2,402 | |
Cass Information Systems, Inc. | | | 42 | | | | 2,379 | |
Opus Bank | | | 67 | | | | 2,370 | |
Customers Bancorp, Inc.* | | | 94 | | | | 2,365 | |
Oritani Financial Corp. | | | 150 | | | | 2,358 | |
Greenlight Capital Re Ltd. — Class A* | | | 115 | | | | 2,351 | |
Washington Trust Bancorp, Inc. | | | 58 | | | | 2,333 | |
Enterprise Financial Services Corp. | | | 74 | | | | 2,313 | |
Cedar Realty Trust, Inc. | | | 321 | | | | 2,311 | |
HomeStreet, Inc.* | | | 92 | | | | 2,306 | |
Silver Bay Realty Trust Corp. | | | 130 | | | | 2,279 | |
International. FCStone, Inc.* | | | 58 | | | | 2,253 | |
Flagstar Bancorp, Inc.* | | | 81 | | | | 2,248 | |
Univest Corporation of Pennsylvania | | | 96 | | | | 2,243 | |
Community Trust Bancorp, Inc. | | | 60 | | | | 2,227 | |
MainSource Financial Group, Inc. | | | 89 | | | | 2,221 | |
Diamond Hill Investment Group, Inc. | | | 12 | | | | 2,217 | |
Altisource Residential Corp. | | | 203 | | | | 2,213 | |
Investment Technology Group, Inc. | | | 129 | | | | 2,211 | |
1st Source Corp. | | | 61 | | | | 2,177 | |
BancFirst Corp. | | | 30 | | | | 2,175 | |
OM Asset Management plc | | | 155 | | | | 2,156 | |
German American Bancorp, Inc. | | | 55 | | | | 2,141 | |
TriCo Bancshares | | | 79 | | | | 2,115 | |
Lakeland Bancorp, Inc. | | | 150 | | | | 2,106 | |
Nationstar Mortgage Holdings, Inc.* | | | 141 | | | | 2,088 | |
Bryn Mawr Bank Corp. | | | 65 | | | | 2,079 | |
Encore Capital Group, Inc.* | | | 92 | | | | 2,068 | |
First Potomac Realty Trust | | | 225 | | | | 2,059 | |
Heritage Financial Corp. | | | 114 | | | | 2,046 | |
Dime Community Bancshares, Inc. | | | 122 | | | | 2,045 | |
James River Group Holdings Ltd. | | | 55 | | | | 1,991 | |
ConnectOne Bancorp, Inc. | | | 110 | | | | 1,987 | |
Ladder Capital Corp. — Class A | | | 149 | | | | 1,973 | |
Moelis & Co. — Class A | | | 73 | | | | 1,963 | |
Meta Financial Group, Inc. | | | 32 | | | | 1,940 | |
CoBiz Financial, Inc. | | | 145 | | | | 1,930 | |
Independent Bank Group, Inc. | | | 43 | | | | 1,899 | |
Bridge Bancorp, Inc. | | | 66 | | | | 1,887 | |
PJT Partners, Inc. — Class A | | | 69 | | | | 1,882 | |
Camden National Corp. | | | 39 | | | | 1,862 | |
First of Long Island Corp. | | | 56 | | | | 1,856 | |
Seacoast Banking Corporation of Florida* | | | 115 | | | | 1,850 | |
National Western Life Group, Inc. — Class A | | | 9 | | | | 1,848 | |
WMIH Corp.* | | | 787 | | | | 1,842 | |
Anworth Mortgage Asset Corp. | | | 372 | | | | 1,830 | |
Ashford Hospitality Trust, Inc. | | | 303 | | | | 1,785 | |
CatchMark Timber Trust, Inc. — Class A | | | 150 | | | | 1,754 | |
Armada Hoffler Properties, Inc. | | | 129 | | | | 1,729 | |
AG Mortgage Investment Trust, Inc. | | | 109 | | | | 1,717 | |
Great Southern Bancorp, Inc. | | | 42 | | | | 1,709 | |
OFG Bancorp | | | 168 | | | | 1,698 | |
Citizens, Inc.* | | | 181 | | | | 1,694 | |
Waterstone Financial, Inc. | | | 99 | | | | 1,682 | |
Preferred Bank/Los Angeles CA | | | 47 | | | | 1,680 | |
Mercantile Bank Corp. | | | 62 | | | | 1,665 | |
Western Asset Mortgage Capital Corp. REIT | | | 159 | | | | 1,657 | |
Westwood Holdings Group, Inc. | | | 31 | | | | 1,646 | |
Park Sterling Corp. | | | 200 | | | | 1,624 | |
Gladstone Commercial Corp. | | | 87 | | | | 1,621 | |
First Financial Corp. | | | 39 | | | | 1,587 | |
Forestar Group, Inc.* | | | 132 | | | | 1,546 | |
Suffolk Bancorp | | | 44 | | | | 1,530 | |
Peoples Bancorp, Inc. | | | 62 | | | | 1,525 | |
OceanFirst Financial Corp. | | | 79 | | | | 1,522 | |
First Defiance Financial Corp. | | | 34 | | | | 1,518 | |
First Community Bancshares, Inc. | | | 61 | | | | 1,513 | |
Resource Capital Corp. | | | 118 | | | | 1,512 | |
First Bancorp | | | 76 | | | | 1,504 | |
Horizon Bancorp | | | 51 | | | | 1,498 | |
Ashford Hospitality Prime, Inc. | | | 106 | | | | 1,495 | |
QCR Holdings, Inc. | | | 47 | | | | 1,492 | |
Arrow Financial Corp. | | | 45 | | | | 1,488 | |
Stonegate Bank | | | 44 | | | | 1,485 | |
Heritage Insurance Holdings, Inc. | | | 103 | | | | 1,484 | |
Fidelity Southern Corp. | | | 80 | | | | 1,471 | |
Virtu Financial, Inc. — Class A | | | 98 | | | | 1,467 | |
Marcus & Millichap, Inc.* | | | 56 | | | | 1,464 | |
Financial Institutions, Inc. | | | 54 | | | | 1,464 | |
Altisource Portfolio Solutions S.A.* | | | 45 | | | | 1,458 | |
NMI Holdings, Inc. — Class A* | | | 191 | | | | 1,455 | |
Blue Hills Bancorp, Inc. | | | 96 | | | | 1,442 | |
Cowen Group, Inc. — Class A* | | | 397 | | | | 1,441 | |
CU Bancorp* | | | 63 | | | | 1,437 | |
Ocwen Financial Corp.* | | | 390 | | | | 1,431 | |
State Auto Financial Corp. | | | 60 | | | | 1,429 | |
Whitestone REIT — Class B | | | 102 | | | | 1,416 | |
Independence Realty Trust, Inc. | | | 157 | | | | 1,413 | |
TriState Capital Holdings, Inc.* | | | 86 | | | | 1,389 | |
Franklin Financial Network, Inc.* | | | 37 | | | | 1,384 | |
CorEnergy Infrastructure Trust, Inc. | | | 47 | | | | 1,379 | |
NexPoint Residential Trust, Inc. | | | 70 | | | | 1,376 | |
Peapack Gladstone Financial Corp. | | | 61 | | | | 1,367 | |
Independent Bank Corp. | | | 79 | | | | 1,330 | |
Southwest Bancorp, Inc. | | | 70 | | | | 1,329 | |
State National Companies, Inc. | | | 118 | | | | 1,312 | |
Ares Commercial Real Estate Corp. | | | 104 | | | | 1,310 | |
Farmer Mac — Class C | | | 33 | | | | 1,304 | |
SEE NOTES TO FINANCIAL STATEMENTS. | THE RYDEX FUNDS SEMI-ANNUAL REPORT | 81 |
SCHEDULE OF INVESTMENTS (Unaudited)(continued) | September 30, 2016 |
RUSSELL 2000® 1.5x STRATEGY FUND | |
| | | Shares | | | Value | |
| | | | | | | |
Clifton Bancorp, Inc. | | | 85 | | | $ | 1,300 | |
Dynex Capital, Inc. | | | 174 | | | | 1,291 | |
United Community Financial Corp. | | | 181 | | | | 1,287 | |
Arlington Asset Investment Corp. — Class A | | | 87 | | | | 1,287 | |
Acacia Research Corp. | | | 194 | | | | 1,265 | |
First Foundation, Inc.* | | | 51 | | | | 1,258 | |
Pacific Continental Corp. | | | 74 | | | | 1,245 | |
One Liberty Properties, Inc. | | | 51 | | | | 1,232 | |
Bank Mutual Corp. | | | 159 | | | | 1,221 | |
Triumph Bancorp, Inc.* | | | 61 | | | | 1,210 | |
RAIT Financial Trust | | | 357 | | | | 1,207 | |
West Bancorporation, Inc. | | | 61 | | | | 1,196 | |
Preferred Apartment Communities, Inc. — Class A | | | 88 | | | | 1,189 | |
HomeTrust Bancshares, Inc.* | | | 64 | | | | 1,184 | |
Houlihan Lokey, Inc. | | | 47 | | | | 1,177 | |
Allegiance Bancshares, Inc.* | | | 43 | | | | 1,161 | |
Republic Bancorp, Inc. — Class A | | | 37 | | | | 1,150 | |
Bank of Marin Bancorp | | | 23 | | | | 1,144 | |
CNB Financial Corp. | | | 54 | | | | 1,143 | |
United Insurance Holdings Corp. | | | 67 | | | | 1,138 | |
World Acceptance Corp.* | | | 23 | | | | 1,128 | |
UMH Properties, Inc. | | | 94 | | | | 1,120 | |
Nicolet Bankshares, Inc.* | | | 29 | | | | 1,112 | |
Heritage Commerce Corp. | | | 101 | | | | 1,105 | |
Peoples Financial Services Corp. | | | 27 | | | | 1,101 | |
OneBeacon Insurance Group Ltd. — Class A | | | 77 | | | | 1,100 | |
Live Oak Bancshares, Inc. | | | 76 | | | | 1,096 | |
Community Healthcare Trust, Inc. | | | 49 | | | | 1,074 | |
City Office REIT, Inc. | | | 84 | | | | 1,069 | |
Fidelity & Guaranty Life | | | 46 | | | | 1,067 | |
On Deck Capital, Inc.* | | | 186 | | | | 1,060 | |
Guaranty Bancorp | | | 59 | | | | 1,053 | |
Farmers National Banc Corp. | | | 96 | | | | 1,035 | |
RMR Group, Inc. — Class A | | | 27 | | | | 1,024 | |
Safeguard Scientifics, Inc.* | | | 79 | | | | 1,024 | |
People’s Utah Bancorp | | | 50 | | | | 1,018 | |
Atlantic Capital Bancshares, Inc.* | | | 67 | | | | 1,004 | |
HCI Group, Inc. | | | 33 | | | | 1,002 | |
Enova International, Inc.* | | | 103 | | | | 997 | |
Citizens & Northern Corp. | | | 45 | | | | 989 | |
Global Indemnity plc — Class A* | | | 33 | | | | 980 | |
Enterprise Bancorp, Inc. | | | 35 | | | | 980 | |
MidWestOne Financial Group, Inc. | | | 32 | | | | 972 | |
Sun Bancorp, Inc. | | | 42 | | | | 969 | |
First Connecticut Bancorp, Inc. | | | 54 | | | | 961 | |
National Bankshares, Inc. | | | 26 | | | | 956 | |
Bluerock Residential Growth REIT, Inc. | | | 73 | | | | 949 | |
Trupanion, Inc.* | | | 56 | | | | 946 | |
National Interstate Corp. | | | 29 | | | | 943 | |
First Bancorp, Inc. | | | 39 | | | | 935 | |
NewStar Financial, Inc.* | | | 96 | | | | 932 | |
Old Second Bancorp, Inc. | | | 111 | | | | 922 | |
Federated National Holding Co. | | | 49 | | | | 916 | |
Ames National Corp. | | | 33 | | | | 913 | |
Ladenburg Thalmann Financial Services, Inc.* | | | 393 | | | | 908 | |
PennyMac Financial Services, Inc. — Class A* | | | 53 | | | | 902 | |
Baldwin & Lyons, Inc. — Class B | | | 35 | | | | 897 | |
American National Bankshares, Inc. | | | 32 | | | | 894 | |
Carolina Financial Corp. | | | 40 | | | | 894 | |
National Commerce Corp.* | | | 33 | | | | 893 | |
GAIN Capital Holdings, Inc. | | | 144 | | | | 890 | |
EMC Insurance Group, Inc. | | | 33 | | | | 889 | |
Regional Management Corp.* | | | 41 | | | | 888 | |
Green Bancorp, Inc.* | | | 80 | | | | 874 | |
Bancorp, Inc.* | | | 136 | | | | 873 | |
Farmers Capital Bank Corp. | | | 29 | | | | 860 | |
Bar Harbor Bankshares | | | 23 | | | | 845 | |
Sierra Bancorp | | | 45 | | | | 844 | |
Territorial Bancorp, Inc. | | | 29 | | | | 831 | |
Orchid Island Capital, Inc. | | | 79 | | | | 823 | |
Consolidated-Tomoka Land Co. | | | 16 | | | | 819 | |
Macatawa Bank Corp. | | | 102 | | | | 815 | |
Penns Woods Bancorp, Inc. | | | 18 | | | | 800 | |
Great Ajax Corp. | | | 58 | | | | 792 | |
eHealth, Inc.* | | | 70 | | | | 785 | |
Heritage Oaks Bancorp | | | 94 | | | | 771 | |
Access National Corp. | | | 32 | | | | 765 | |
WashingtonFirst Bankshares, Inc. | | | 31 | | | | 763 | |
BankFinancial Corp. | | | 60 | | | | 762 | |
FRP Holdings, Inc.* | | | 24 | | | | 746 | |
Cascade Bancorp* | | | 122 | | | | 739 | |
Trinity Place Holdings, Inc.* | | | 75 | | | | 734 | |
First Business Financial Services, Inc. | | | 31 | | | | 729 | |
BSB Bancorp, Inc.* | | | 31 | | | | 726 | |
Merchants Bancshares, Inc. | | | 22 | | | | 713 | |
Hingham Institution for Savings | | | 5 | | | | 693 | |
Charter Financial Corp. | | | 53 | | | | 683 | |
CommunityOne Bancorp* | | | 49 | | | | 678 | |
Owens Realty Mortgage, Inc. | | | 39 | | | | 675 | |
Northrim BanCorp, Inc. | | | 26 | | | | 670 | |
Codorus Valley Bancorp, Inc. | | | 30 | | | | 656 | |
Atlas Financial Holdings, Inc.* | | | 41 | | | | 647 | |
Bear State Financial, Inc. | | | 70 | | | | 643 | |
Capital City Bank Group, Inc. | | | 43 | | | | 635 | |
Old Line Bancshares, Inc. | | | 32 | | | | 631 | |
First Mid-Illinois Bancshares, Inc. | | | 23 | | | | 627 | |
MBT Financial Corp. | | | 69 | | | | 624 | |
Real Industry, Inc.* | | | 102 | | | | 624 | |
Marlin Business Services Corp. | | | 32 | | | | 620 | |
LCNB Corp. | | | 34 | | | | 619 | |
Home Bancorp, Inc. | | | 22 | | | | 616 | |
Summit Financial Group, Inc. | | | 32 | | | | 613 | |
ACNB Corp. | | | 23 | | | | 611 | |
Southern First Bancshares, Inc.* | | | 22 | | | | 607 | |
Associated Capital Group, Inc. — Class A | | | 17 | | | | 603 | |
Tiptree Financial, Inc. — Class A | | | 101 | | | | 600 | |
Investors Title Co. | | | 6 | | | | 597 | |
82 | THE RYDEX FUNDS SEMI-ANNUAL REPORT | SEE NOTES TO FINANCIAL STATEMENTS. |
SCHEDULE OF INVESTMENTS (Unaudited)(continued) | September 30, 2016 |
RUSSELL 2000® 1.5x STRATEGY FUND | |
| | | Shares | | | Value | |
| | | | | | | |
Stratus Properties, Inc.* | | | 24 | | | $ | 586 | |
MutualFirst Financial, Inc. | | | 21 | | | | 582 | |
First Northwest Bancorp* | | | 43 | | | | 580 | |
Shore Bancshares, Inc. | | | 49 | | | | 577 | |
First NBC Bank Holding Co.* | | | 61 | | | | 576 | |
Orrstown Financial Services, Inc. | | | 29 | | | | 573 | |
Southern Missouri Bancorp, Inc. | | | 23 | | | | 573 | |
SI Financial Group, Inc. | | | 43 | | | | 568 | |
Premier Financial Bancorp, Inc. | | | 33 | | | | 566 | |
Southern National Bancorp of Virginia, Inc. | | | 43 | | | | 561 | |
Veritex Holdings, Inc.* | | | 32 | | | | 556 | |
Hallmark Financial Services, Inc.* | | | 54 | | | | 556 | |
Equity Bancshares, Inc. — Class A* | | | 21 | | | | 545 | |
Century Bancorp, Inc. — Class A | | | 12 | | | | 544 | |
Oppenheimer Holdings, Inc. — Class A | | | 38 | | | | 543 | |
Lake Sunapee Bank Group | | | 30 | | | | 542 | |
Central Valley Community Bancorp | | | 34 | | | | 539 | |
Republic First Bancorp, Inc.* | | | 130 | | | | 534 | |
Crawford & Co. — Class B | | | 46 | | | | 522 | |
Bankwell Financial Group, Inc. | | | 22 | | | | 521 | |
C&F Financial Corp. | | | 12 | | | | 517 | |
Donegal Group, Inc. — Class A | | | 32 | | | | 516 | |
Union Bankshares, Inc. | | | 15 | | | | 511 | |
Middleburg Financial Corp. | | | 18 | | | | 509 | |
Provident Financial Holdings, Inc. | | | 26 | | | | 509 | |
First Community Financial Partners, Inc.* | | | 53 | | | | 505 | |
Farmland Partners, Inc. | | | 45 | | | | 504 | |
First Financial Northwest, Inc. | | | 35 | | | | 496 | |
GAMCO Investors, Inc. — Class A | | | 17 | | | | 484 | |
Independence Holding Co. | | | 28 | | | | 481 | |
Westfield Financial, Inc. | | | 62 | | | | 474 | |
First Internet Bancorp | | | 20 | | | | 462 | |
Calamos Asset Management, Inc. — Class A | | | 66 | | | | 450 | |
ESSA Bancorp, Inc. | | | 32 | | | | 443 | |
Pzena Investment Management, Inc. — Class A | | | 57 | | | | 439 | |
Pacific Mercantile Bancorp* | | | 59 | | | | 435 | |
Blue Capital Reinsurance Holdings Ltd. | | | 23 | | | | 421 | |
Manning & Napier, Inc. — Class A | | | 58 | | | | 411 | |
Impac Mortgage Holdings, Inc.* | | | 31 | | | | 409 | |
Hennessy Advisors, Inc. | | | 11 | | | | 390 | |
Xenith Bankshares, Inc.* | | | 168 | | | | 388 | |
County Bancorp, Inc. | | | 19 | | | | 380 | |
Midland States Bancorp, Inc. | | | 14 | | | | 355 | |
Chemung Financial Corp. | | | 12 | | | | 348 | |
FBR & Co. | | | 26 | | | | 344 | |
Silvercrest Asset Management Group, Inc. — Class A | | | 27 | | | | 320 | |
Walter Investment Management Corp.* | | | 72 | | | | 292 | |
Provident Bancorp, Inc.* | | | 17 | | | | 265 | |
BBX Capital Corp. — Class A* | | | 12 | | | | 248 | |
Greene County Bancorp, Inc. | | | 12 | | | | 200 | |
Medley Management, Inc. — Class A | | | 23 | | | | 193 | |
Griffin Industrial Realty, Inc. | | | 4 | | | | 127 | |
California First National Bancorp | | | 9 | | | | 126 | |
Fifth Street Asset Management, Inc. | | | 20 | | | | 110 | |
Huntington Bancshares, Inc. | | | 1 | | | | 8 | |
United Development Funding IV††† | | | 150 | | | | — | |
Total Financial | | | | | | | 1,755,234 | |
| | | | | | | | | |
Consumer, Non-cyclical - 13.1% | |
Cepheid* | | | 283 | | | | 14,910 | |
PAREXEL International Corp.* | | | 204 | | | | 14,167 | |
HealthSouth Corp. | | | 344 | | | | 13,956 | |
NuVasive, Inc.* | | | 192 | | | | 12,799 | |
Deluxe Corp. | | | 190 | | | | 12,696 | |
B&G Foods, Inc. | | | 255 | | | | 12,540 | |
Bright Horizons Family Solutions, Inc.* | | | 170 | | | | 11,370 | |
Horizon Pharma plc* | | | 625 | | | | 11,330 | |
Exelixis, Inc.* | | | 883 | | | | 11,293 | |
Cantel Medical Corp. | | | 140 | | | | 10,917 | |
Healthcare Services Group, Inc. | | | 274 | | | | 10,844 | |
Snyder’s-Lance, Inc. | | | 312 | | | | 10,476 | |
TESARO, Inc.* | | | 104 | | | | 10,424 | |
Sarepta Therapeutics, Inc.* | | | 166 | | | | 10,193 | |
Ultragenyx Pharmaceutical, Inc.* | | | 141 | | | | 10,002 | |
Catalent, Inc.* | | | 386 | | | | 9,973 | |
Prestige Brands Holdings, Inc.* | | | 206 | | | | 9,944 | |
Medicines Co.* | | | 262 | | | | 9,888 | |
Cimpress N.V.* | | | 97 | | | | 9,815 | |
Wright Medical Group N.V.* | | | 400 | | | | 9,812 | |
Molina Healthcare, Inc.* | | | 168 | | | | 9,797 | |
Bluebird Bio, Inc.* | | | 144 | | | | 9,759 | |
Integra LifeSciences Holdings Corp.* | | | 118 | | | | 9,741 | |
Nevro Corp.* | | | 93 | | | | 9,708 | |
Avon Products, Inc.* | | | 1,707 | | | | 9,662 | |
Lancaster Colony Corp. | | | 73 | | | | 9,643 | |
ARIAD Pharmaceuticals, Inc.* | | | 687 | | | | 9,404 | |
Masimo Corp.* | | | 158 | | | | 9,399 | |
Helen of Troy Ltd.* | | | 109 | | | | 9,393 | |
Insulet Corp.* | | | 224 | | | | 9,171 | |
Chemed Corp. | | | 63 | | | | 8,886 | |
Nektar Therapeutics* | | | 503 | | | | 8,642 | |
Darling Ingredients, Inc.* | | | 639 | | | | 8,633 | |
Team Health Holdings, Inc.* | | | 264 | | | | 8,596 | |
ABM Industries, Inc. | | | 216 | | | | 8,575 | |
Kite Pharma, Inc.* | | | 152 | | | | 8,491 | |
Owens & Minor, Inc. | | | 242 | | | | 8,405 | |
Sotheby’s | | | 215 | | | | 8,175 | |
Prothena Corporation plc* | | | 135 | | | | 8,096 | |
Ironwood Pharmaceuticals, Inc. — Class A* | | | 502 | | | | 7,972 | |
Neogen Corp.* | | | 141 | | | | 7,887 | |
Cardtronics plc — Class A* | | | 175 | | | | 7,805 | |
Vector Group Ltd. | | | 361 | | | | 7,776 | |
United Natural Foods, Inc.* | | | 193 | | | | 7,727 | |
Exact Sciences Corp.* | | | 410 | | | | 7,614 | |
Ligand Pharmaceuticals, Inc. — Class B* | | | 74 | | | | 7,552 | |
Matthews International Corp. — Class A | | | 124 | | | | 7,534 | |
Monro Muffler Brake, Inc. | | | 123 | | | | 7,524 | |
Penumbra, Inc.* | | | 99 | | | | 7,523 | |
Sanderson Farms, Inc. | | | 78 | | | | 7,514 | |
SEE NOTES TO FINANCIAL STATEMENTS. | THE RYDEX FUNDS SEMI-ANNUAL REPORT | 83 |
SCHEDULE OF INVESTMENTS (Unaudited)(continued) | September 30, 2016 |
RUSSELL 2000® 1.5x STRATEGY FUND | |
| | | Shares | | | Value | |
| | | | | | | |
Fresh Del Monte Produce, Inc. | | | 125 | | | $ | 7,488 | |
HMS Holdings Corp.* | | | 328 | | | | 7,272 | |
ICU Medical, Inc.* | | | 57 | | | | 7,204 | |
FTI Consulting, Inc.* | | | 161 | | | | 7,175 | |
Haemonetics Corp.* | | | 198 | | | | 7,170 | |
On Assignment, Inc.* | | | 197 | | | | 7,149 | |
Incorporated Research Holdings, Inc. — Class A* | | | 160 | | | | 7,132 | |
Advisory Board Co.* | | | 159 | | | | 7,114 | |
Grand Canyon Education, Inc.* | | | 174 | | | | 7,028 | |
J&J Snack Foods Corp. | | | 58 | | | | 6,909 | |
CEB, Inc. | | | 125 | | | | 6,809 | |
Travelport Worldwide Ltd. | | | 450 | | | | 6,763 | |
Impax Laboratories, Inc.* | | | 284 | | | | 6,731 | |
Radius Health, Inc.* | | | 122 | | | | 6,599 | |
Brink’s Co. | | | 175 | | | | 6,489 | |
Aaron’s, Inc. | | | 255 | | | | 6,482 | |
Puma Biotechnology, Inc.* | | | 96 | | | | 6,437 | |
HealthEquity, Inc.* | | | 167 | | | | 6,321 | |
Halyard Health, Inc.* | | | 181 | | | | 6,273 | |
WD-40 Co. | | | 55 | | | | 6,184 | |
NxStage Medical, Inc.* | | | 247 | | | | 6,173 | |
Globus Medical, Inc. — Class A* | | | 272 | | | | 6,139 | |
Alder Biopharmaceuticals, Inc.* | | | 182 | | | | 5,964 | |
Depomed, Inc.* | | | 237 | | | | 5,923 | |
AMN Healthcare Services, Inc.* | | | 183 | | | | 5,832 | |
Dean Foods Co. | | | 355 | | | | 5,822 | |
Select Medical Holdings Corp.* | | | 414 | | | | 5,589 | |
DeVry Education Group, Inc. | | | 242 | | | | 5,581 | |
Five Prime Therapeutics, Inc.* | | | 106 | | | | 5,564 | |
LifeLock, Inc.* | | | 328 | | | | 5,550 | |
Ophthotech Corp.* | | | 119 | | | | 5,489 | |
Cambrex Corp.* | | | 123 | | | | 5,469 | |
Myriad Genetics, Inc.* | | | 263 | | | | 5,413 | |
Zeltiq Aesthetics, Inc.* | | | 138 | | | | 5,412 | |
PRA Health Sciences, Inc.* | | | 94 | | | | 5,312 | |
Boston Beer Company, Inc. — Class A* | | | 34 | | | | 5,279 | |
Magellan Health, Inc.* | | | 97 | | | | 5,212 | |
SUPERVALU, Inc.* | | | 1,033 | | | | 5,155 | |
Theravance Biopharma, Inc.* | | | 142 | | | | 5,146 | |
Amedisys, Inc.* | | | 108 | | | | 5,124 | |
Halozyme Therapeutics, Inc.* | | | 423 | | | | 5,110 | |
Surgical Care Affiliates, Inc.* | | | 104 | | | | 5,071 | |
Huron Consulting Group, Inc.* | | | 84 | | | | 5,020 | |
Universal Corp. | | | 86 | | | | 5,007 | |
Diplomat Pharmacy, Inc.* | | | 177 | | | | 4,958 | |
Natus Medical, Inc.* | | | 126 | | | | 4,951 | |
Community Health Systems, Inc.* | | | 428 | | | | 4,939 | |
Pacira Pharmaceuticals, Inc.* | | | 141 | | | | 4,825 | |
Sage Therapeutics, Inc.* | | | 103 | | | | 4,743 | |
Cynosure, Inc. — Class A* | | | 92 | | | | 4,686 | |
Korn/Ferry International | | | 222 | | | | 4,662 | |
Cal-Maine Foods, Inc. | | | 120 | | | | 4,625 | |
Supernus Pharmaceuticals, Inc.* | | | 182 | | | | 4,501 | |
Clovis Oncology, Inc.* | | | 124 | | | | 4,470 | |
Spark Therapeutics, Inc.* | | | 74 | | | | 4,444 | |
Abaxis, Inc. | | | 86 | | | | 4,439 | |
Insperity, Inc. | | | 61 | | | | 4,431 | |
Air Methods Corp.* | | | 138 | | | | 4,346 | |
Portola Pharmaceuticals, Inc.* | | | 191 | | | | 4,338 | |
CONMED Corp. | | | 108 | | | | 4,326 | |
Analogic Corp. | | | 48 | | | | 4,253 | |
FibroGen, Inc.* | | | 203 | | | | 4,202 | |
Cempra, Inc.* | | | 173 | | | | 4,187 | |
Spectranetics Corp.* | | | 166 | | | | 4,165 | |
SpartanNash Co. | | | 143 | | | | 4,136 | |
EVERTEC, Inc. | | | 246 | | | | 4,127 | |
Amicus Therapeutics, Inc.* | | | 552 | | | | 4,085 | |
Merit Medical Systems, Inc.* | | | 167 | | | | 4,056 | |
Endologix, Inc.* | | | 314 | | | | 4,019 | |
Emergent BioSolutions, Inc.* | | | 126 | | | | 3,973 | |
ACCO Brands Corp.* | | | 412 | | | | 3,971 | |
TherapeuticsMD, Inc.* | | | 583 | | | | 3,970 | |
Repligen Corp.* | | | 131 | | | | 3,955 | |
Calavo Growers, Inc. | | | 60 | | | | 3,926 | |
Synergy Pharmaceuticals, Inc.* | | | 704 | | | | 3,879 | |
Acceleron Pharma, Inc.* | | | 107 | | | | 3,872 | |
Green Dot Corp. — Class A* | | | 165 | | | | 3,805 | |
Array BioPharma, Inc.* | | | 561 | | | | 3,787 | |
Inogen, Inc.* | | | 63 | | | | 3,774 | |
Andersons, Inc. | | | 104 | | | | 3,763 | |
Paylocity Holding Corp.* | | | 84 | | | | 3,735 | |
Ensign Group, Inc. | | | 185 | | | | 3,724 | |
Navigant Consulting, Inc.* | | | 184 | | | | 3,720 | |
MacroGenics, Inc.* | | | 124 | | | | 3,709 | |
Achillion Pharmaceuticals, Inc.* | | | 456 | | | | 3,694 | |
TrueBlue, Inc.* | | | 163 | | | | 3,694 | |
Team, Inc.* | | | 112 | | | | 3,664 | |
Performance Food Group Co.* | | | 145 | | | | 3,596 | |
TriNet Group, Inc.* | | | 163 | | | | 3,526 | |
Aerie Pharmaceuticals, Inc.* | | | 93 | | | | 3,510 | |
Luminex Corp.* | | | 154 | | | | 3,499 | |
Acorda Therapeutics, Inc.* | | | 167 | | | | 3,487 | |
Insmed, Inc.* | | | 240 | | | | 3,485 | |
Innoviva, Inc.* | | | 314 | | | | 3,451 | |
Seaboard Corp.* | | | 1 | | | | 3,440 | |
MiMedx Group, Inc.* | | | 397 | | | | 3,406 | |
NutriSystem, Inc. | | | 113 | | | | 3,355 | |
Kindred Healthcare, Inc. | | | 328 | | | | 3,352 | |
AMAG Pharmaceuticals, Inc.* | | | 135 | | | | 3,309 | |
Healthways, Inc.* | | | 123 | | | | 3,255 | |
Central Garden & Pet Co. — Class A* | | | 130 | | | | 3,224 | |
Dermira, Inc.* | | | 95 | | | | 3,213 | |
PharMerica Corp.* | | | 114 | | | | 3,200 | |
Vascular Solutions, Inc.* | | | 65 | | | | 3,135 | |
Retrophin, Inc.* | | | 140 | | | | 3,133 | |
Meridian Bioscience, Inc. | | | 162 | | | | 3,125 | |
ICF International, Inc.* | | | 70 | | | | 3,102 | |
Coherus Biosciences, Inc.* | | | 115 | | | | 3,080 | |
Xencor, Inc.* | | | 125 | | | | 3,061 | |
Merrimack Pharmaceuticals, Inc.* | | | 475 | | | | 3,016 | |
Quad/Graphics, Inc. | | | 112 | | | | 2,993 | |
84 | THE RYDEX FUNDS SEMI-ANNUAL REPORT | SEE NOTES TO FINANCIAL STATEMENTS. |
SCHEDULE OF INVESTMENTS (Unaudited)(continued) | September 30, 2016 |
RUSSELL 2000® 1.5x STRATEGY FUND | |
| | | Shares | | | Value | |
| | | | | | | |
Raptor Pharmaceutical Corp.* | | | 331 | | | $ | 2,969 | |
Lexicon Pharmaceuticals, Inc.* | | | 164 | | | | 2,963 | |
Momenta Pharmaceuticals, Inc.* | | | 253 | | | | 2,958 | |
US Physical Therapy, Inc. | | | 47 | | | | 2,947 | |
Cardiovascular Systems, Inc.* | | | 123 | | | | 2,920 | |
Orthofix International N.V.* | | | 68 | | | | 2,908 | |
McGrath RentCorp | | | 91 | | | | 2,886 | |
Viad Corp. | | | 78 | | | | 2,876 | |
Lannett Company, Inc.* | | | 107 | | | | 2,843 | |
National Healthcare Corp. | | | 43 | | | | 2,838 | |
Pacific Biosciences of California, Inc.* | | | 311 | | | | 2,787 | |
USANA Health Sciences, Inc.* | | | 20 | | | | 2,767 | |
Coca-Cola Bottling Company Consolidated | | | 18 | | | | 2,667 | |
ZIOPHARM Oncology, Inc.* | | | 472 | | | | 2,657 | |
Apollo Education Group, Inc. — Class A* | | | 332 | | | | 2,639 | |
Amphastar Pharmaceuticals, Inc.* | | | 139 | | | | 2,637 | |
Anika Therapeutics, Inc.* | | | 55 | | | | 2,632 | |
Capella Education Co. | | | 45 | | | | 2,612 | |
Atrion Corp. | | | 6 | | | | 2,560 | |
Rent-A-Center, Inc. | | | 201 | | | | 2,541 | |
Providence Service Corp.* | | | 51 | | | | 2,480 | |
Tootsie Roll Industries, Inc. | | | 67 | | | | 2,468 | |
Glaukos Corp.* | | | 65 | | | | 2,453 | |
Cerus Corp.* | | | 393 | | | | 2,441 | |
Accelerate Diagnostics, Inc.* | | | 89 | | | | 2,426 | |
LendingTree, Inc.* | | | 25 | | | | 2,423 | |
Inovio Pharmaceuticals, Inc.* | | | 257 | | | | 2,395 | |
Eagle Pharmaceuticals, Inc.* | | | 34 | | | | 2,380 | |
Vanda Pharmaceuticals, Inc.* | | | 142 | | | | 2,363 | |
Adeptus Health, Inc. — Class A* | | | 54 | | | | 2,325 | |
Blueprint Medicines Corp.* | | | 78 | | | | 2,317 | |
Quidel Corp.* | | | 104 | | | | 2,297 | |
Inter Parfums, Inc. | | | 68 | | | | 2,194 | |
Kelly Services, Inc. — Class A | | | 114 | | | | 2,191 | |
Novavax, Inc.* | | | 1,048 | | | | 2,180 | |
PDL BioPharma, Inc. | | | 642 | | | | 2,151 | |
CryoLife, Inc. | | | 122 | | | | 2,144 | |
LHC Group, Inc.* | | | 58 | | | | 2,139 | |
CBIZ, Inc.* | | | 191 | | | | 2,137 | |
Heron Therapeutics, Inc.* | | | 124 | | | | 2,137 | |
Ingles Markets, Inc. — Class A | | | 54 | | | | 2,135 | |
Vitae Pharmaceuticals, Inc.* | | | 102 | | | | 2,134 | |
Genomic Health, Inc.* | | | 72 | | | | 2,082 | |
Resources Connection, Inc. | | | 138 | | | | 2,062 | |
ANI Pharmaceuticals, Inc.* | | | 31 | | | | 2,057 | |
RPX Corp.* | | | 192 | | | | 2,052 | |
Intra-Cellular Therapies, Inc.* | | | 134 | | | | 2,042 | |
Agenus, Inc.* | | | 284 | | | | 2,039 | |
SciClone Pharmaceuticals, Inc.* | | | 194 | | | | 1,989 | |
Omega Protein Corp.* | | | 85 | | | | 1,986 | |
MGP Ingredients, Inc. | | | 49 | | | | 1,985 | |
Phibro Animal Health Corp. — Class A | | | 73 | | | | 1,984 | |
National Beverage Corp.* | | | 45 | | | | 1,982 | |
Triple-S Management Corp. — Class B* | | | 90 | | | | 1,974 | |
BioTelemetry, Inc.* | | | 106 | | | | 1,968 | |
Accuray, Inc.* | | | 309 | | | | 1,968 | |
Kforce, Inc. | | | 96 | | | | 1,967 | |
Weis Markets, Inc. | | | 37 | | | | 1,961 | |
Atara Biotherapeutics, Inc.* | | | 91 | | | | 1,946 | |
AtriCure, Inc.* | | | 122 | | | | 1,930 | |
Strayer Education, Inc.* | | | 41 | | | | 1,914 | |
Corcept Therapeutics, Inc.* | | | 290 | | | | 1,885 | |
K12, Inc.* | | | 131 | | | | 1,880 | |
Universal American Corp. | | | 245 | | | | 1,874 | |
AngioDynamics, Inc.* | | | 106 | | | | 1,859 | |
GenMark Diagnostics, Inc.* | | | 156 | | | | 1,841 | |
Capital Senior Living Corp.* | | | 109 | | | | 1,831 | |
Amplify Snack Brands, Inc.* | | | 113 | | | | 1,831 | |
PTC Therapeutics, Inc.* | | | 130 | | | | 1,821 | |
K2M Group Holdings, Inc.* | | | 100 | | | | 1,778 | |
Career Education Corp.* | | | 259 | | | | 1,759 | |
Flexion Therapeutics, Inc.* | | | 90 | | | | 1,759 | |
Omeros Corp.* | | | 157 | | | | 1,752 | |
Arrowhead Pharmaceuticals, Inc.* | | | 234 | | | | 1,720 | |
SP Plus Corp.* | | | 67 | | | | 1,713 | |
Progenics Pharmaceuticals, Inc.* | | | 270 | | | | 1,709 | |
Aduro Biotech, Inc.* | | | 137 | | | | 1,703 | |
Lion Biotechnologies, Inc.* | | | 206 | | | | 1,695 | |
John B Sanfilippo & Son, Inc. | | | 33 | | | | 1,694 | |
Otonomy, Inc.* | | | 93 | | | | 1,692 | |
NeoGenomics, Inc.* | | | 205 | | | | 1,685 | |
Novocure Ltd.* | | | 196 | | | | 1,674 | |
OraSure Technologies, Inc.* | | | 210 | | | | 1,674 | |
Ennis, Inc. | | | 99 | | | | 1,668 | |
Albany Molecular Research, Inc.* | | | 101 | | | | 1,668 | |
Arena Pharmaceuticals, Inc.* | | | 950 | | | | 1,663 | |
Revlon, Inc. — Class A* | | | 45 | | | | 1,655 | |
Landauer, Inc. | | | 37 | | | | 1,646 | |
Cotiviti Holdings, Inc.* | | | 49 | | | | 1,642 | |
Keryx Biopharmaceuticals, Inc.* | | | 306 | | | | 1,625 | |
Bellicum Pharmaceuticals, Inc.* | | | 81 | | | | 1,612 | |
Enanta Pharmaceuticals, Inc.* | | | 60 | | | | 1,597 | |
Dynavax Technologies Corp.* | | | 151 | | | | 1,584 | |
Intersect ENT, Inc.* | | | 99 | | | | 1,568 | |
Ardelyx, Inc.* | | | 121 | | | | 1,566 | |
Medifast, Inc. | | | 41 | | | | 1,549 | |
Epizyme, Inc.* | | | 156 | | | | 1,535 | |
Aimmune Therapeutics, Inc.* | | | 102 | | | | 1,530 | |
Surmodics, Inc.* | | | 50 | | | | 1,505 | |
Celldex Therapeutics, Inc.* | | | 371 | | | | 1,499 | |
Advaxis, Inc.* | | | 139 | | | | 1,486 | |
Teladoc, Inc.* | | | 81 | | | | 1,483 | |
Forrester Research, Inc. | | | 38 | | | | 1,478 | |
Global Blood Therapeutics, Inc.* | | | 64 | | | | 1,475 | |
Cross Country Healthcare, Inc.* | | | 125 | | | | 1,473 | |
CorVel Corp.* | | | 38 | | | | 1,459 | |
Surgery Partners, Inc.* | | | 72 | | | | 1,457 | |
STAAR Surgical Co.* | | | 155 | | | | 1,457 | |
Hackett Group, Inc. | | | 87 | | | | 1,437 | |
Spectrum Pharmaceuticals, Inc.* | | | 300 | | | | 1,401 | |
ConforMIS, Inc.* | | | 139 | | | | 1,379 | |
Invacare Corp. | | | 123 | | | | 1,374 | |
SEE NOTES TO FINANCIAL STATEMENTS. | THE RYDEX FUNDS SEMI-ANNUAL REPORT | 85 |
SCHEDULE OF INVESTMENTS (Unaudited)(continued) | September 30, 2016 |
RUSSELL 2000® 1.5x STRATEGY FUND | |
| | | Shares | | | Value | |
| | | | | | | |
Loxo Oncology, Inc.* | | | 52 | | | $ | 1,361 | |
Tobira Therapeutics, Inc.* | | | 34 | | | | 1,351 | |
Carriage Services, Inc. — Class A | | | 57 | | | | 1,348 | |
Barrett Business Services, Inc. | | | 27 | | | | 1,339 | |
Axovant Sciences Ltd.* | | | 95 | | | | 1,330 | |
Geron Corp.* | | | 587 | | | | 1,327 | |
Rigel Pharmaceuticals, Inc.* | | | 361 | | | | 1,325 | |
Heidrick & Struggles International, Inc. | | | 71 | | | | 1,317 | |
Tejon Ranch Co.* | | | 54 | | | | 1,313 | |
Heska Corp.* | | | 24 | | | | 1,306 | |
Versartis, Inc.* | | | 106 | | | | 1,299 | |
La Jolla Pharmaceutical Co.* | | | 54 | | | | 1,285 | |
Revance Therapeutics, Inc.* | | | 79 | | | | 1,281 | |
Organovo Holdings, Inc.* | | | 334 | | | | 1,266 | |
NewLink Genetics Corp.* | | | 84 | | | | 1,262 | |
Akebia Therapeutics, Inc.* | | | 139 | | | | 1,258 | |
BioCryst Pharmaceuticals, Inc.* | | | 285 | | | | 1,257 | |
Rockwell Medical, Inc.* | | | 186 | | | | 1,246 | |
Sangamo BioSciences, Inc.* | | | 269 | | | | 1,245 | |
CytomX Therapeutics, Inc.* | | | 79 | | | | 1,239 | |
Foundation Medicine, Inc.* | | | 53 | | | | 1,238 | |
Monster Worldwide, Inc.* | | | 340 | | | | 1,227 | |
Teligent, Inc.* | | | 160 | | | | 1,216 | |
Aratana Therapeutics, Inc.* | | | 129 | | | | 1,207 | |
Cytokinetics, Inc.* | | | 131 | | | | 1,203 | |
American Public Education, Inc.* | | | 60 | | | | 1,189 | |
Trevena, Inc.* | | | 173 | | | | 1,168 | |
Alarm.com Holdings, Inc.* | | | 40 | | | | 1,154 | |
ServiceSource International, Inc.* | | | 236 | | | | 1,152 | |
Smart & Final Stores, Inc.* | | | 90 | | | | 1,149 | |
Almost Family, Inc.* | | | 31 | | | | 1,140 | |
NanoString Technologies, Inc.* | | | 57 | | | | 1,139 | |
Farmer Brothers Co.* | | | 32 | | | | 1,138 | |
Curis, Inc.* | | | 433 | | | | 1,130 | |
Natera, Inc.* | | | 101 | | | | 1,122 | |
Sucampo Pharmaceuticals, Inc. — Class A* | | | 91 | | | | 1,120 | |
Weight Watchers International, Inc.* | | | 108 | | | | 1,115 | |
Exactech, Inc.* | | | 41 | | | | 1,108 | |
TG Therapeutics, Inc.* | | | 143 | | | | 1,107 | |
Immunomedics, Inc.* | | | 339 | | | | 1,102 | |
Zogenix, Inc.* | | | 96 | | | | 1,097 | |
REGENXBIO, Inc.* | | | 78 | | | | 1,093 | |
Oxford Immunotec Global plc* | | | 86 | | | | 1,080 | |
Civitas Solutions, Inc.* | | | 59 | | | | 1,077 | |
RadNet, Inc.* | | | 145 | | | | 1,073 | |
Insys Therapeutics, Inc.* | | | 91 | | | | 1,073 | |
Adamas Pharmaceuticals, Inc.* | | | 65 | | | | 1,067 | |
BioTime, Inc.* | | | 269 | | | | 1,049 | |
Minerva Neurosciences, Inc.* | | | 74 | | | | 1,045 | |
LeMaitre Vascular, Inc. | | | 52 | | | | 1,032 | |
Collegium Pharmaceutical, Inc.* | | | 53 | | | | 1,021 | |
Central Garden & Pet Co.* | | | 39 | | | | 1,014 | |
Nutraceutical International Corp.* | | | 32 | | | | 1,000 | |
Primo Water Corp.* | | | 82 | | | | 995 | |
BioSpecifics Technologies Corp.* | | | 21 | | | | 959 | |
CRA International, Inc.* | | | 36 | | | | 957 | |
Aclaris Therapeutics, Inc.* | | | 37 | | | | 948 | |
BioScrip, Inc.* | | | 327 | | | | 945 | |
WaVe Life Sciences Ltd.* | | | 29 | | | | 942 | |
OncoMed Pharmaceuticals, Inc.* | | | 82 | | | | 937 | |
Ascent Capital Group, Inc. — Class A* | | | 40 | | | | 927 | |
Paratek Pharmaceuticals, Inc.* | | | 71 | | | | 924 | |
Craft Brew Alliance, Inc.* | | | 49 | | | | 923 | |
Sorrento Therapeutics, Inc.* | | | 119 | | | | 921 | |
XBiotech, Inc.* | | | 68 | | | | 915 | |
Chimerix, Inc.* | | | 165 | | | | 914 | |
Village Super Market, Inc. — Class A | | | 28 | | | | 896 | |
Karyopharm Therapeutics, Inc.* | | | 92 | | | | 895 | |
Idera Pharmaceuticals, Inc.* | | | 345 | | | | 883 | |
ImmunoGen, Inc.* | | | 327 | | | | 876 | |
OvaScience, Inc.* | | | 122 | | | | 874 | |
Limoneira Co. | | | 46 | | | | 869 | |
MediciNova, Inc.* | | | 115 | | | | 861 | |
InVivo Therapeutics Holdings Corp.* | | | 125 | | | | 850 | |
Seres Therapeutics, Inc.* | | | 69 | | | | 848 | |
CSS Industries, Inc. | | | 33 | | | | 844 | |
AxoGen, Inc.* | | | 93 | | | | 840 | |
TerraVia Holdings, Inc.* | | | 304 | | | | 836 | |
Chefs’ Warehouse, Inc.* | | | 75 | | | | 836 | |
Natural Health Trends Corp. | | | 29 | | | | 820 | |
MoneyGram International, Inc.* | | | 115 | | | | 817 | |
Great Lakes Dredge & Dock Corp.* | | | 229 | | | | 802 | |
Enzo Biochem, Inc.* | | | 154 | | | | 784 | |
Avexis, Inc.* | | | 19 | | | | 783 | |
MannKind Corp.* | | | 1,258 | | | | 780 | |
Utah Medical Products, Inc. | | | 13 | | | | 777 | |
Invitae Corp.* | | | 88 | | | | 771 | |
Esperion Therapeutics, Inc.* | | | 55 | | | | 762 | |
Addus HomeCare Corp.* | | | 29 | | | | 759 | |
Quorum Health Corp.* | | | 115 | | | | 721 | |
Nobilis Health Corp.* | | | 215 | | | | 720 | |
MyoKardia, Inc.* | | | 44 | | | | 719 | |
Ignyta, Inc.* | | | 114 | | | | 717 | |
Franklin Covey Co.* | | | 40 | | | | 712 | |
Seneca Foods Corp. — Class A* | | | 25 | | | | 706 | |
Stemline Therapeutics, Inc.* | | | 65 | | | | 704 | |
PharmAthene, Inc.* | | | 241 | | | | 699 | |
RTI Surgical, Inc.* | | | 223 | | | | 698 | |
Inventure Foods, Inc.* | | | 74 | | | | 696 | |
Cellular Biomedicine Group, Inc.* | | | 47 | | | | 682 | |
Durect Corp.* | | | 490 | | | | 681 | |
Cara Therapeutics, Inc.* | | | 81 | | | | 676 | |
Care.com, Inc.* | | | 67 | | | | 667 | |
AAC Holdings, Inc.* | | | 38 | | | | 661 | |
Textainer Group Holdings Ltd. | | | 88 | | | | 659 | |
Edge Therapeutics, Inc.* | | | 63 | | | | 656 | |
Egalet Corp.* | | | 86 | | | | 654 | |
Concert Pharmaceuticals, Inc.* | | | 64 | | | | 647 | |
Inotek Pharmaceuticals Corp.* | | | 68 | | | | 645 | |
Entellus Medical, Inc.* | | | 29 | | | | 643 | |
Pfenex, Inc.* | | | 71 | | | | 635 | |
86 | THE RYDEX FUNDS SEMI-ANNUAL REPORT | SEE NOTES TO FINANCIAL STATEMENTS. |
SCHEDULE OF INVESTMENTS (Unaudited)(continued) | September 30, 2016 |
RUSSELL 2000® 1.5x STRATEGY FUND | |
| | | Shares | | | Value | |
| | | | | | | |
Athersys, Inc.* | | | 295 | | | $ | 628 | |
Vectrus, Inc.* | | | 41 | | | | 624 | |
American Renal Associates Holdings, Inc.* | | | 34 | | | | 621 | |
Alliance One International, Inc.* | | | 32 | | | | 612 | |
ARC Document Solutions, Inc.* | | | 159 | | | | 595 | |
Medgenics, Inc.* | | | 105 | | | | 585 | |
Reata Pharmaceuticals, Inc. — Class A* | | | 22 | | | | 580 | |
Vital Therapies, Inc.* | | | 92 | | | | 563 | |
Tandem Diabetes Care, Inc.* | | | 72 | | | | 552 | |
Cutera, Inc.* | | | 46 | | | | 548 | |
Voyager Therapeutics, Inc.* | | | 45 | | | | 540 | |
Tetraphase Pharmaceuticals, Inc.* | | | 141 | | | | 540 | |
ChemoCentryx, Inc.* | | | 89 | | | | 538 | |
Collectors Universe, Inc. | | | 29 | | | | 537 | |
AcelRx Pharmaceuticals, Inc.* | | | 137 | | | | 533 | |
Nature’s Sunshine Products, Inc. | | | 33 | | | | 528 | |
National Research Corp. — Class A | | | 32 | | | | 521 | |
PFSweb, Inc.* | | | 57 | | | | 509 | |
NantKwest, Inc.* | | | 65 | | | | 506 | |
CAI International, Inc.* | | | 61 | | | | 504 | |
Synthetic Biologics, Inc.* | | | 293 | | | | 504 | |
Lifevantage Corp.* | | | 53 | | | | 501 | |
CPI Card Group, Inc. | | | 82 | | | | 495 | |
Regulus Therapeutics, Inc.* | | | 150 | | | | 495 | |
Trovagene, Inc.* | | | 109 | | | | 489 | |
Flex Pharma, Inc.* | | | 41 | | | | 483 | |
B. Riley Financial, Inc. | | | 36 | | | | 481 | |
Cidara Therapeutics, Inc.* | | | 42 | | | | 481 | |
Bridgepoint Education, Inc.* | | | 70 | | | | 481 | |
Bio-Path Holdings, Inc.* | | | 343 | | | | 480 | |
Applied Genetic Technologies Corp.* | | | 49 | | | | 479 | |
Anthera Pharmaceuticals, Inc.* | | | 152 | | | | 479 | |
Information Services Group, Inc.* | | | 120 | | | | 479 | |
Ocular Therapeutix, Inc.* | | | 69 | | | | 474 | |
Anavex Life Sciences Corp.* | | | 127 | | | | 461 | |
Intellia Therapeutics, Inc.* | | | 27 | | | | 460 | |
TransEnterix, Inc.* | | | 270 | | | | 456 | |
Endocyte, Inc.* | | | 147 | | | | 454 | |
Titan Pharmaceuticals, Inc.* | | | 73 | | | | 429 | |
Senseonics Holdings, Inc.* | | | 108 | | | | 421 | |
Iridex Corp.* | | | 29 | | | | 420 | |
T2 Biosystems, Inc.* | | | 57 | | | | 413 | |
Veracyte, Inc.* | | | 54 | | | | 411 | |
Fortress Biotech, Inc.* | | | 132 | | | | 392 | |
Natural Grocers by Vitamin Cottage, Inc.* | | | 35 | | | | 391 | |
Genesis Healthcare, Inc.* | | | 146 | | | | 390 | |
Proteostasis Therapeutics, Inc.* | | | 25 | | | | 390 | |
Osiris Therapeutics, Inc. | | | 77 | | | | 382 | |
Patriot National, Inc.* | | | 42 | | | | 378 | |
Dimension Therapeutics, Inc.* | | | 47 | | | | 376 | |
Asterias Biotherapeutics, Inc.* | | | 88 | | | | 373 | |
Adverum Biotechnologies, Inc.* | | | 89 | | | | 366 | |
Editas Medicine, Inc.* | | | 27 | | | | 364 | |
Agile Therapeutics, Inc.* | | | 51 | | | | 356 | |
Neff Corp. — Class A* | | | 37 | | | | 352 | |
Synutra International, Inc.* | | | 82 | | | | 349 | |
Neos Therapeutics, Inc.* | | | 53 | | | | 349 | |
Axsome Therapeutics, Inc.* | | | 43 | | | | 339 | |
Immune Design Corp.* | | | 44 | | | | 334 | |
Liberty Tax, Inc. | | | 26 | | | | 332 | |
ChromaDex Corp.* | | | 111 | | | | 331 | |
GlycoMimetics, Inc.* | | | 46 | | | | 329 | |
Mirati Therapeutics, Inc.* | | | 49 | | | | 324 | |
Alico, Inc. | | | 12 | | | | 322 | |
Lifeway Foods, Inc.* | | | 18 | | | | 305 | |
Infinity Pharmaceuticals, Inc.* | | | 191 | | | | 298 | |
Zafgen, Inc.* | | | 89 | | | | 295 | |
Galena Biopharma, Inc.* | | | 820 | | | | 287 | |
Lipocine, Inc.* | | | 64 | | | | 285 | |
Cambium Learning Group, Inc.* | | | 52 | | | | 282 | |
Argos Therapeutics, Inc.* | | | 56 | | | | 278 | |
Avinger, Inc.* | | | 58 | | | | 277 | |
Turning Point Brands, Inc.* | | | 23 | | | | 276 | |
Syndax Pharmaceuticals, Inc.* | | | 18 | | | | 273 | |
iRadimed Corp.* | | | 16 | | | | 272 | |
vTv Therapeutics, Inc. — Class A* | | | 30 | | | | 216 | |
Eiger BioPharmaceuticals, Inc.* | | | 16 | | | | 214 | |
Corvus Pharmaceuticals, Inc.* | | | 13 | | | | 214 | |
CytRx Corp.* | | | 359 | | | | 211 | |
USMD Holdings, Inc.* | | | 9 | | | | 204 | |
Second Sight Medical Products, Inc.* | | | 55 | | | | 194 | |
Ampio Pharmaceuticals, Inc.* | | | 170 | | | | 126 | |
ViewRay, Inc.* | | | 26 | | | | 118 | |
Tokai Pharmaceuticals, Inc.* | | | 39 | | | | 60 | |
Total Consumer, Non-cyclical | | | | | | | 1,380,787 | |
| | | | | | | | | |
Industrial - 8.6% | |
Curtiss-Wright Corp. | | | 172 | | | | 15,671 | |
Teledyne Technologies, Inc.* | | | 133 | | | | 14,355 | |
EMCOR Group, Inc. | | | 235 | | | | 14,010 | |
XPO Logistics, Inc.* | | | 381 | | | | 13,970 | |
Woodward, Inc. | | | 206 | | | | 12,872 | |
CLARCOR, Inc. | | | 185 | | | | 12,024 | |
EnerSys | | | 169 | | | | 11,693 | |
Tech Data Corp.* | | | 136 | | | | 11,521 | |
Belden, Inc. | | | 163 | | | | 11,245 | |
Littelfuse, Inc. | | | 86 | | | | 11,077 | |
Joy Global, Inc. | | | 382 | | | | 10,596 | |
Louisiana-Pacific Corp.* | | | 561 | | | | 10,564 | |
Coherent, Inc.* | | | 94 | | | | 10,392 | |
Dycom Industries, Inc.* | | | 118 | | | | 9,649 | |
Generac Holdings, Inc.* | | | 254 | | | | 9,220 | |
Drew Industries, Inc. | | | 92 | | | | 9,017 | |
Universal Display Corp.* | | | 161 | | | | 8,937 | |
Kennametal, Inc. | | | 306 | | | | 8,880 | |
Esterline Technologies Corp.* | | | 115 | | | | 8,745 | |
Sanmina Corp.* | | | 286 | | | | 8,142 | |
John Bean Technologies Corp. | | | 113 | | | | 7,972 | |
Tetra Tech, Inc. | | | 224 | | | | 7,945 | |
Barnes Group, Inc. | | | 195 | | | | 7,907 | |
MasTec, Inc.* | | | 257 | | | | 7,643 | |
Granite Construction, Inc. | | | 153 | | | | 7,610 | |
Mueller Water Products, Inc. — Class A | | | 606 | | | | 7,605 | |
SEE NOTES TO FINANCIAL STATEMENTS. | THE RYDEX FUNDS SEMI-ANNUAL REPORT | 87 |
SCHEDULE OF INVESTMENTS (Unaudited)(continued) | September 30, 2016 |
RUSSELL 2000® 1.5x STRATEGY FUND | |
| | | Shares | | | Value | |
| | | | | | | |
Universal Forest Products, Inc. | | | 77 | | | $ | 7,583 | |
Vishay Intertechnology, Inc. | | | 529 | | | | 7,454 | |
Knight Transportation, Inc. | | | 259 | | | | 7,430 | |
Moog, Inc. — Class A* | | | 124 | | | | 7,383 | |
Masonite International Corp.* | | | 118 | | | | 7,335 | |
Golar LNG Ltd. | | | 345 | | | | 7,314 | |
Itron, Inc.* | | | 130 | | | | 7,249 | |
Franklin Electric Company, Inc. | | | 178 | | | | 7,246 | |
Hillenbrand, Inc. | | | 229 | | | | 7,246 | |
Advanced Energy Industries, Inc.* | | | 153 | | | | 7,240 | |
KLX, Inc.* | | | 205 | | | | 7,216 | |
Mueller Industries, Inc. | | | 220 | | | | 7,132 | |
GATX Corp. | | | 159 | | | | 7,083 | |
Simpson Manufacturing Company, Inc. | | | 161 | | | | 7,076 | |
MSA Safety, Inc. | | | 121 | | | | 7,022 | |
Watts Water Technologies, Inc. — Class A | | | 108 | | | | 7,003 | |
Rexnord Corp.* | | | 322 | | | | 6,894 | |
Trex Company, Inc.* | | | 115 | | | | 6,753 | |
RBC Bearings, Inc.* | | | 88 | | | | 6,730 | |
Matson, Inc. | | | 168 | | | | 6,700 | |
IMAX Corp.* | | | 228 | | | | 6,605 | |
AZZ, Inc. | | | 101 | | | | 6,592 | |
Applied Industrial Technologies, Inc. | | | 141 | | | | 6,590 | |
GoPro, Inc. — Class A* | | | 392 | | | | 6,539 | |
KapStone Paper and Packaging Corp. | | | 335 | | | | 6,338 | |
Trinseo S.A. | | | 111 | | | | 6,278 | |
Swift Transportation Co. — Class A* | | | 291 | | | | 6,247 | |
Brady Corp. — Class A | | | 178 | | | | 6,161 | |
Plexus Corp.* | | | 129 | | | | 6,035 | |
Fabrinet* | | | 135 | | | | 6,020 | |
Proto Labs, Inc.* | | | 97 | | | | 5,811 | |
TASER International, Inc.* | | | 202 | | | | 5,779 | |
Smith & Wesson Holding Corp.* | | | 212 | | | | 5,637 | |
II-VI, Inc.* | | | 231 | | | | 5,620 | |
Summit Materials, Inc. — Class A* | | | 295 | | | | 5,473 | |
Triumph Group, Inc. | | | 191 | | | | 5,325 | |
Actuant Corp. — Class A | | | 229 | | | | 5,322 | |
Hub Group, Inc. — Class A* | | | 130 | | | | 5,299 | |
Exponent, Inc. | | | 100 | | | | 5,106 | |
Forward Air Corp. | | | 115 | | | | 4,975 | |
Methode Electronics, Inc. | | | 142 | | | | 4,966 | |
Apogee Enterprises, Inc. | | | 111 | | | | 4,961 | |
TopBuild Corp.* | | | 149 | | | | 4,947 | |
Greif, Inc. — Class A | | | 99 | | | | 4,909 | |
Knowles Corp.* | | | 343 | | | | 4,819 | |
Benchmark Electronics, Inc.* | | | 193 | | | | 4,815 | |
Headwaters, Inc.* | | | 283 | | | | 4,788 | |
EnPro Industries, Inc. | | | 84 | | | | 4,773 | |
Albany International Corp. — Class A | | | 111 | | | | 4,704 | |
Cubic Corp. | | | 98 | | | | 4,587 | |
Kaman Corp. | | | 104 | | | | 4,568 | |
Standex International Corp. | | | 49 | | | | 4,551 | |
ESCO Technologies, Inc. | | | 98 | | | | 4,549 | |
Gibraltar Industries, Inc.* | | | 122 | | | | 4,532 | |
AAON, Inc. | | | 157 | | | | 4,525 | |
Astec Industries, Inc. | | | 75 | | | | 4,490 | |
OSI Systems, Inc.* | | | 68 | | | | 4,446 | |
Tennant Co. | | | 68 | | | | 4,406 | |
Rogers Corp.* | | | 70 | | | | 4,276 | |
SPX FLOW, Inc.* | | | 137 | | | | 4,236 | |
Comfort Systems USA, Inc. | | | 144 | | | | 4,221 | |
Sturm Ruger & Company, Inc. | | | 72 | | | | 4,159 | |
Atlas Air Worldwide Holdings, Inc.* | | | 96 | | | | 4,111 | |
Aerojet Rocketdyne Holdings, Inc.* | | | 231 | | | | 4,061 | |
Werner Enterprises, Inc. | | | 173 | | | | 4,026 | |
AAR Corp. | | | 128 | | | | 4,009 | |
Chart Industries, Inc.* | | | 119 | | | | 3,907 | |
Boise Cascade Co.* | | | 151 | | | | 3,835 | |
CIRCOR International, Inc. | | | 64 | | | | 3,812 | |
US Ecology, Inc. | | | 85 | | | | 3,811 | |
Greenbrier Companies, Inc. | | | 106 | | | | 3,742 | |
Builders FirstSource, Inc.* | | | 325 | | | | 3,741 | |
Badger Meter, Inc. | | | 109 | | | | 3,653 | |
Multi-Color Corp. | | | 53 | | | | 3,498 | |
Caesarstone Ltd.* | | | 92 | | | | 3,469 | |
Patrick Industries, Inc.* | | | 56 | | | | 3,468 | |
Astronics Corp.* | | | 76 | | | | 3,424 | |
Ship Finance International Ltd. | | | 232 | | | | 3,417 | |
Nordic American Tankers Ltd. | | | 337 | | | | 3,407 | |
Heartland Express, Inc. | | | 179 | | | | 3,380 | |
Rofin-Sinar Technologies, Inc.* | | | 105 | | | | 3,379 | |
Lydall, Inc.* | | | 64 | | | | 3,272 | |
TriMas Corp.* | | | 175 | | | | 3,257 | |
Advanced Drainage Systems, Inc. | | | 135 | | | | 3,248 | |
Raven Industries, Inc. | | | 141 | | | | 3,247 | |
SPX Corp.* | | | 161 | | | | 3,243 | |
TTM Technologies, Inc.* | | | 281 | | | | 3,217 | |
Primoris Services Corp. | | | 156 | | | | 3,214 | |
Tutor Perini Corp.* | | | 146 | | | | 3,135 | |
Harsco Corp. | | | 313 | | | | 3,108 | |
Federal Signal Corp. | | | 233 | | | | 3,090 | |
Argan, Inc. | | | 52 | | | | 3,078 | |
Briggs & Stratton Corp. | | | 165 | | | | 3,077 | |
Air Transport Services Group, Inc.* | | | 213 | | | | 3,057 | |
Lindsay Corp. | | | 41 | | | | 3,033 | |
Sun Hydraulics Corp. | | | 91 | | | | 2,937 | |
Saia, Inc.* | | | 98 | | | | 2,936 | |
Scorpio Tankers, Inc. | | | 634 | | | | 2,935 | |
Babcock & Wilcox Enterprises, Inc.* | | | 177 | | | | 2,921 | |
Continental Building Products, Inc.* | | | 137 | | | | 2,876 | |
Encore Wire Corp. | | | 78 | | | | 2,868 | |
Altra Industrial Motion Corp. | | | 98 | | | | 2,839 | |
General Cable Corp. | | | 188 | | | | 2,816 | |
Aegion Corp. — Class A* | | | 136 | | | | 2,594 | |
Echo Global Logistics, Inc.* | | | 111 | | | | 2,560 | |
US Concrete, Inc.* | | | 55 | | | | 2,534 | |
AVX Corp. | | | 181 | | | | 2,496 | |
Insteel Industries, Inc. | | | 68 | | | | 2,464 | |
Alamo Group, Inc. | | | 37 | | | | 2,438 | |
Global Brass & Copper Holdings, Inc. | | | 82 | | | | 2,369 | |
Manitowoc Company, Inc. | | | 493 | | | | 2,361 | |
GasLog Ltd. | | | 159 | | | | 2,313 | |
88 | THE RYDEX FUNDS SEMI-ANNUAL REPORT | SEE NOTES TO FINANCIAL STATEMENTS. |
SCHEDULE OF INVESTMENTS (Unaudited)(continued) | September 30, 2016 |
RUSSELL 2000® 1.5x STRATEGY FUND | |
| | | Shares | | | Value | |
| | | | | | | |
FARO Technologies, Inc.* | | | 64 | | | $ | 2,301 | |
Quanex Building Products Corp. | | | 133 | | | | 2,296 | |
Hyster-Yale Materials Handling, Inc. | | | 38 | | | | 2,285 | |
CTS Corp. | | | 122 | | | | 2,269 | |
Kadant, Inc. | | | 42 | | | | 2,189 | |
Novanta, Inc.* | | | 124 | | | | 2,151 | |
Energy Recovery, Inc.* | | | 133 | | | | 2,125 | |
MYR Group, Inc.* | | | 70 | | | | 2,107 | |
Triton International Ltd. | | | 155 | | | | 2,044 | |
Griffon Corp. | | | 117 | | | | 1,990 | |
PGT, Inc.* | | | 185 | | | | 1,974 | |
Chase Corp. | | | 28 | | | | 1,935 | |
Aerovironment, Inc.* | | | 79 | | | | 1,928 | |
Stoneridge, Inc.* | | | 104 | | | | 1,914 | |
Marten Transport Ltd. | | | 90 | | | | 1,890 | |
NN, Inc. | | | 102 | | | | 1,862 | |
Tredegar Corp. | | | 99 | | | | 1,840 | |
ArcBest Corp. | | | 95 | | | | 1,807 | |
Frontline Ltd. | | | 252 | | | | 1,807 | |
Haynes International, Inc. | | | 48 | | | | 1,781 | |
AEP Industries, Inc. | | | 16 | | | | 1,750 | |
Gorman-Rupp Co. | | | 68 | | | | 1,741 | |
Armstrong Flooring, Inc.* | | | 91 | | | | 1,718 | |
National Presto Industries, Inc. | | | 19 | | | | 1,668 | |
TimkenSteel Corp.* | | | 153 | | | | 1,599 | |
Overseas Shipholding Group, Inc. — Class A | | | 150 | | | | 1,587 | |
YRC Worldwide, Inc.* | | | 127 | | | | 1,565 | |
Mistras Group, Inc.* | | | 66 | | | | 1,549 | |
NCI Building Systems, Inc.* | | | 106 | | | | 1,547 | |
Casella Waste Systems, Inc. — Class A* | | | 150 | | | | 1,545 | |
Kimball Electronics, Inc.* | | | 110 | | | | 1,525 | |
DHT Holdings, Inc. | | | 356 | | | | 1,492 | |
Applied Optoelectronics, Inc.* | | | 66 | | | | 1,466 | |
DXP Enterprises, Inc.* | | | 50 | | | | 1,410 | |
Mesa Laboratories, Inc. | | | 12 | | | | 1,372 | |
Powell Industries, Inc. | | | 34 | | | | 1,362 | |
Columbus McKinnon Corp. | | | 75 | | | | 1,338 | |
Greif, Inc. — Class B | | | 22 | | | | 1,333 | |
Teekay Corp. | | | 170 | | | | 1,311 | |
Park Electrochemical Corp. | | | 75 | | | | 1,303 | |
American Railcar Industries, Inc. | | | 31 | | | | 1,286 | |
CECO Environmental Corp. | | | 113 | | | | 1,275 | |
Kratos Defense & Security Solutions, Inc.* | | | 180 | | | | 1,240 | |
GP Strategies Corp.* | | | 50 | | | | 1,231 | |
Park-Ohio Holdings Corp. | | | 33 | | | | 1,203 | |
Multi Packaging Solutions International Ltd.* | | | 82 | | | | 1,182 | |
Ply Gem Holdings, Inc.* | | | 86 | | | | 1,149 | |
Teekay Tankers Ltd. — Class A | | | 452 | | | | 1,144 | |
VSE Corp. | | | 33 | | | | 1,122 | |
NVE Corp. | | | 19 | | | | 1,120 | |
Energous Corp.* | | | 57 | | | | 1,118 | |
Myers Industries, Inc. | | | 84 | | | | 1,091 | |
LSI Industries, Inc. | | | 92 | | | | 1,033 | |
Control4 Corp.* | | | 78 | | | | 958 | |
Roadrunner Transportation Systems, Inc.* | | | 119 | | | | 950 | |
Sparton Corp.* | | | 36 | | | | 945 | |
Costamare, Inc. | | | 103 | | | | 941 | |
Ducommun, Inc.* | | | 41 | | | | 936 | |
Celadon Group, Inc. | | | 106 | | | | 926 | |
Covenant Transportation Group, Inc. — Class A* | | | 47 | | | | 909 | |
Fluidigm Corp.* | | | 113 | | | | 905 | |
NV5 Global, Inc.* | | | 28 | | | | 905 | |
Milacron Holdings Corp.* | | | 56 | | | | 894 | |
Bel Fuse, Inc. — Class B | | | 37 | | | | 893 | |
ZAGG, Inc.* | | | 107 | | | | 867 | |
Olympic Steel, Inc. | | | 36 | | | | 796 | |
Gener8 Maritime, Inc.* | | | 152 | | | | 778 | |
Ardmore Shipping Corp. | | | 109 | | | | 767 | |
Vishay Precision Group, Inc.* | | | 47 | | | | 753 | |
Vicor Corp.* | | | 64 | | | | 742 | |
Orion Group Holdings, Inc.* | | | 104 | | | | 712 | |
Graham Corp. | | | 37 | | | | 707 | |
Hurco Companies, Inc. | | | 25 | | | | 702 | |
Hornbeck Offshore Services, Inc.* | | | 126 | | | | 693 | |
LSB Industries, Inc.* | | | 80 | | | | 686 | |
FreightCar America, Inc. | | | 47 | | | | 676 | |
UFP Technologies, Inc.* | | | 25 | | | | 663 | |
Heritage-Crystal Clean, Inc.* | | | 49 | | | | 651 | |
Scorpio Bulkers, Inc.* | | | 187 | | | | 647 | |
TRC Companies, Inc.* | | | 73 | | | | 633 | |
Electro Scientific Industries, Inc.* | | | 107 | | | | 603 | |
Layne Christensen Co.* | | | 70 | | | | 596 | |
Hill International, Inc.* | | | 125 | | | | 576 | |
Dynamic Materials Corp. | | | 54 | | | | 576 | |
Dorian LPG Ltd.* | | | 94 | | | | 564 | |
IES Holdings, Inc.* | | | 30 | | | | 534 | |
Tidewater, Inc. | | | 183 | | | | 516 | |
Hardinge, Inc. | | | 45 | | | | 501 | |
Allied Motion Technologies, Inc. | | | 24 | | | | 454 | |
Universal Logistics Holdings, Inc. | | | 32 | | | | 429 | |
Lawson Products, Inc.* | | | 24 | | | | 426 | |
Omega Flex, Inc. | | | 11 | | | | 424 | |
Navios Maritime Acquisition Corp. | | | 313 | | | | 423 | |
Radiant Logistics, Inc.* | | | 146 | | | | 415 | |
Willis Lease Finance Corp.* | | | 17 | | | | 404 | |
USA Truck, Inc.* | | | 37 | | | | 379 | |
Aqua Metals, Inc.* | | | 42 | | | | 372 | |
Ampco-Pittsburgh Corp. | | | 33 | | | | 366 | |
Gencor Industries, Inc.* | | | 30 | | | | 359 | |
American Superconductor Corp.* | | | 45 | | | | 315 | |
Handy & Harman Ltd.* | | | 11 | | | | 231 | |
Power Solutions International, Inc.* | | | 19 | | | | 195 | |
PAM Transportation Services, Inc.* | | | 9 | | | | 180 | |
NL Industries, Inc.* | | | 32 | | | | 126 | |
Total Industrial | | | | | | | 908,483 | |
| | | | | | | | | |
Consumer, Cyclical - 7.3% | |
Tenneco, Inc.* | | | 219 | | | | 12,761 | |
Jack in the Box, Inc. | | | 127 | | | | 12,183 | |
American Eagle Outfitters, Inc. | | | 648 | | | | 11,573 | |
SEE NOTES TO FINANCIAL STATEMENTS. | THE RYDEX FUNDS SEMI-ANNUAL REPORT | 89 |
SCHEDULE OF INVESTMENTS (Unaudited)(continued) | September 30, 2016 |
RUSSELL 2000® 1.5x STRATEGY FUND | |
| | | Shares | | | Value | |
| | | | | | | |
Buffalo Wild Wings, Inc.* | | | 73 | | | $ | 10,273 | |
Texas Roadhouse, Inc. — Class A | | | 257 | | | | 10,031 | |
Hawaiian Holdings, Inc.* | | | 205 | | | | 9,963 | |
Cracker Barrel Old Country Store, Inc. | | | 74 | | | | 9,784 | |
Beacon Roofing Supply, Inc.* | | | 232 | | | | 9,760 | |
Dana, Inc. | | | 580 | | | | 9,042 | |
Big Lots, Inc. | | | 186 | | | | 8,882 | |
TiVo Corp.* | | | 454 | | | | 8,848 | |
Cheesecake Factory, Inc. | | | 176 | | | | 8,811 | |
Lithia Motors, Inc. — Class A | | | 92 | | | | 8,788 | |
Wolverine World Wide, Inc. | | | 376 | | | | 8,659 | |
Five Below, Inc.* | | | 208 | | | | 8,380 | |
Steven Madden Ltd.* | | | 240 | | | | 8,294 | |
Papa John’s International, Inc. | | | 105 | | | | 8,279 | |
Cooper Tire & Rubber Co. | | | 215 | | | | 8,174 | |
UniFirst Corp. | | | 59 | | | | 7,780 | |
Office Depot, Inc. | | | 2,145 | | | | 7,658 | |
Bloomin’ Brands, Inc. | | | 442 | | | | 7,620 | |
TRI Pointe Group, Inc.* | | | 578 | | | | 7,619 | |
Churchill Downs, Inc. | | | 52 | | | | 7,610 | |
Interval Leisure Group, Inc. | | | 440 | | | | 7,555 | |
Deckers Outdoor Corp.* | | | 126 | | | | 7,503 | |
G&K Services, Inc. — Class A | | | 76 | | | | 7,258 | |
Anixter International, Inc.* | | | 112 | | | | 7,224 | |
HNI Corp. | | | 176 | | | | 7,006 | |
Allegiant Travel Co. — Class A | | | 51 | | | | 6,736 | |
Herman Miller, Inc. | | | 233 | | | | 6,664 | |
Dorman Products, Inc.* | | | 103 | | | | 6,582 | |
PriceSmart, Inc. | | | 78 | | | | 6,533 | |
Marriott Vacations Worldwide Corp. | | | 87 | | | | 6,379 | |
Boyd Gaming Corp.* | | | 321 | | | | 6,349 | |
Core-Mark Holding Company, Inc. | | | 177 | | | | 6,337 | |
Liberty TripAdvisor Holdings, Inc. — Class A* | | | 281 | | | | 6,140 | |
Chico’s FAS, Inc. | | | 506 | | | | 6,021 | |
Columbia Sportswear Co. | | | 106 | | | | 6,014 | |
Children’s Place, Inc. | | | 73 | | | | 5,831 | |
Dave & Buster’s Entertainment, Inc.* | | | 147 | | | | 5,759 | |
Cooper-Standard Holding, Inc.* | | | 57 | | | | 5,632 | |
GNC Holdings, Inc. — Class A | | | 266 | | | | 5,432 | |
DineEquity, Inc. | | | 68 | | | | 5,385 | |
DSW, Inc. — Class A | | | 261 | | | | 5,345 | |
KB Home | | | 323 | | | | 5,207 | |
Mobile Mini, Inc. | | | 172 | | | | 5,194 | |
Restoration Hardware Holdings, Inc.* | | | 150 | | | | 5,188 | |
Group 1 Automotive, Inc. | | | 81 | | | | 5,174 | |
Meritage Homes Corp.* | | | 149 | | | | 5,170 | |
SkyWest, Inc. | | | 195 | | | | 5,150 | |
American Axle & Manufacturing Holdings, Inc.* | | | 297 | | | | 5,114 | |
G-III Apparel Group Ltd.* | | | 167 | | | | 4,868 | |
HSN, Inc. | | | 121 | | | | 4,816 | |
Sonic Corp. | | | 182 | | | | 4,765 | |
La-Z-Boy, Inc. | | | 191 | | | | 4,691 | |
Steelcase, Inc. — Class A | | | 335 | | | | 4,653 | |
iRobot Corp.* | | | 104 | | | | 4,574 | |
Fossil Group, Inc.* | | | 163 | | | | 4,527 | |
Popeyes Louisiana Kitchen, Inc.* | | | 84 | | | | 4,464 | |
Gentherm, Inc.* | | | 142 | | | | 4,462 | |
Navistar International Corp.* | | | 192 | | | | 4,395 | |
Genesco, Inc.* | | | 80 | | | | 4,357 | |
American Woodmark Corp.* | | | 54 | | | | 4,351 | |
Asbury Automotive Group, Inc.* | | | 77 | | | | 4,287 | |
Knoll, Inc. | | | 186 | | | | 4,250 | |
Callaway Golf Co. | | | 366 | | | | 4,249 | |
Abercrombie & Fitch Co. — Class A | | | 265 | | | | 4,211 | |
Interface, Inc. — Class A | | | 252 | | | | 4,206 | |
Caleres, Inc. | | | 166 | | | | 4,198 | |
Belmond Ltd. — Class A* | | | 324 | | | | 4,118 | |
Universal Electronics, Inc.* | | | 55 | | | | 4,095 | |
Virgin America, Inc.* | | | 75 | | | | 4,013 | |
Oxford Industries, Inc. | | | 59 | | | | 3,994 | |
Meritor, Inc.* | | | 357 | | | | 3,973 | |
Standard Motor Products, Inc. | | | 83 | | | | 3,964 | |
MDC Holdings, Inc. | | | 153 | | | | 3,947 | |
Penn National Gaming, Inc.* | | | 289 | | | | 3,922 | |
Select Comfort Corp.* | | | 180 | | | | 3,888 | |
BMC Stock Holdings, Inc.* | | | 214 | | | | 3,794 | |
Ascena Retail Group, Inc.* | | | 672 | | | | 3,756 | |
Finish Line, Inc. — Class A | | | 162 | | | | 3,739 | |
La Quinta Holdings, Inc.* | | | 330 | | | | 3,689 | |
ClubCorp Holdings, Inc. | | | 249 | | | | 3,602 | |
Hibbett Sports, Inc.* | | | 90 | | | | 3,591 | |
Wabash National Corp.* | | | 251 | | | | 3,574 | |
ScanSource, Inc.* | | | 97 | | | | 3,541 | |
National CineMedia, Inc. | | | 239 | | | | 3,518 | |
SeaWorld Entertainment, Inc. | | | 259 | | | | 3,491 | |
Guess?, Inc. | | | 237 | | | | 3,463 | |
International Speedway Corp. — Class A | | | 102 | | | | 3,409 | |
Express, Inc.* | | | 289 | | | | 3,407 | |
Cavco Industries, Inc.* | | | 33 | | | | 3,269 | |
Cato Corp. — Class A | | | 99 | | | | 3,256 | |
BJ’s Restaurants, Inc.* | | | 90 | | | | 3,200 | |
Denny’s Corp.* | | | 294 | | | | 3,143 | |
Carmike Cinemas, Inc.* | | | 94 | | | | 3,072 | |
Ethan Allen Interiors, Inc. | | | 97 | | | | 3,033 | |
Tailored Brands, Inc. | | | 189 | | | | 2,967 | |
Essendant, Inc. | | | 144 | | | | 2,955 | |
Pinnacle Entertainment, Inc.* | | | 239 | | | | 2,949 | |
Bob Evans Farms, Inc. | | | 77 | | | | 2,949 | |
Wesco Aircraft Holdings, Inc.* | | | 216 | | | | 2,901 | |
DTS, Inc. | | | 68 | | | | 2,893 | |
Superior Industries International, Inc. | | | 97 | | | | 2,829 | |
Installed Building Products, Inc.* | | | 78 | | | | 2,798 | |
Rush Enterprises, Inc. — Class A* | | | 114 | | | | 2,791 | |
Barnes & Noble, Inc. | | | 245 | | | | 2,769 | |
Douglas Dynamics, Inc. | | | 86 | | | | 2,747 | |
Red Rock Resorts, Inc. — Class A | | | 116 | | | | 2,736 | |
Nautilus, Inc.* | | | 119 | | | | 2,704 | |
Buckle, Inc. | | | 111 | | | | 2,667 | |
AMC Entertainment Holdings, Inc. — Class A | | | 84 | | | | 2,612 | |
90 | THE RYDEX FUNDS SEMI-ANNUAL REPORT | SEE NOTES TO FINANCIAL STATEMENTS. |
SCHEDULE OF INVESTMENTS (Unaudited)(continued) | September 30, 2016 |
RUSSELL 2000® 1.5x STRATEGY FUND | |
| | | Shares | | | Value | |
| | | | | | | |
Vitamin Shoppe, Inc.* | | | 95 | | | $ | 2,551 | |
Fiesta Restaurant Group, Inc.* | | | 103 | | | | 2,472 | |
Winnebago Industries, Inc. | | | 104 | | | | 2,451 | |
Francesca’s Holdings Corp.* | | | 156 | | | | 2,407 | |
Red Robin Gourmet Burgers, Inc.* | | | 53 | | | | 2,382 | |
Crocs, Inc.* | | | 286 | | | | 2,374 | |
Caesars Acquisition Co. — Class A* | | | 185 | | | | 2,298 | |
Scientific Games Corp. — Class A* | | | 201 | | | | 2,265 | |
LGI Homes, Inc.* | | | 60 | | | | 2,210 | |
M/I Homes, Inc.* | | | 92 | | | | 2,168 | |
EZCORP, Inc. — Class A* | | | 196 | | | | 2,168 | |
Isle of Capri Casinos, Inc.* | | | 97 | | | | 2,161 | |
Modine Manufacturing Co.* | | | 182 | | | | 2,159 | |
Shake Shack, Inc. — Class A* | | | 61 | | | | 2,115 | |
Tile Shop Holdings, Inc.* | | | 127 | | | | 2,102 | |
Taylor Morrison Home Corp. — Class A* | | | 118 | | | | 2,077 | |
H&E Equipment Services, Inc. | | | 122 | | | | 2,045 | |
Ollie’s Bargain Outlet Holdings, Inc.* | | | 78 | | | | 2,044 | |
Motorcar Parts of America, Inc.* | | | 71 | | | | 2,043 | |
Sonic Automotive, Inc. — Class A | | | 108 | | | | 2,030 | |
WCI Communities, Inc.* | | | 85 | | | | 2,016 | |
MarineMax, Inc.* | | | 96 | | | | 2,011 | |
Lumber Liquidators Holdings, Inc.* | | | 102 | | | | 2,006 | |
Fox Factory Holding Corp.* | | | 87 | | | | 1,998 | |
Tower International, Inc. | | | 80 | | | | 1,928 | |
Kimball International, Inc. — Class B | | | 143 | | | | 1,850 | |
Regis Corp.* | | | 144 | | | | 1,807 | |
Marcus Corp. | | | 72 | | | | 1,803 | |
Unifi, Inc.* | | | 61 | | | | 1,796 | |
Chuy’s Holdings, Inc.* | | | 64 | | | | 1,788 | |
Wingstop, Inc. | | | 61 | | | | 1,787 | |
Party City Holdco, Inc.* | | | 104 | | | | 1,780 | |
Carrols Restaurant Group, Inc.* | | | 134 | | | | 1,770 | |
Eros International plc* | | | 115 | | | | 1,762 | |
Ruth’s Hospitality Group, Inc. | | | 124 | | | | 1,751 | |
Biglari Holdings, Inc.* | | | 4 | | | | 1,744 | |
Titan International, Inc. | | | 171 | | | | 1,731 | |
William Lyon Homes — Class A* | | | 93 | | | | 1,725 | |
Zoe’s Kitchen, Inc.* | | | 74 | | | | 1,642 | |
Caesars Entertainment Corp.* | | | 219 | | | | 1,632 | |
Haverty Furniture Companies, Inc. | | | 81 | | | | 1,623 | |
SiteOne Landscape Supply, Inc.* | | | 45 | | | | 1,617 | |
Veritiv Corp.* | | | 32 | | | | 1,605 | |
PetMed Express, Inc. | | | 78 | | | | 1,582 | |
Eldorado Resorts, Inc.* | | | 112 | | | | 1,575 | |
Libbey, Inc. | | | 85 | | | | 1,517 | |
Barnes & Noble Education, Inc.* | | | 155 | | | | 1,483 | |
Shoe Carnival, Inc. | | | 55 | | | | 1,466 | |
Beazer Homes USA, Inc.* | | | 122 | | | | 1,423 | |
Horizon Global Corp.* | | | 71 | | | | 1,415 | |
Daktronics, Inc. | | | 143 | | | | 1,364 | |
Iconix Brand Group, Inc.* | | | 166 | | | | 1,348 | |
Pier 1 Imports, Inc. | | | 314 | | | | 1,331 | |
Movado Group, Inc. | | | 61 | | | | 1,310 | |
Flexsteel Industries, Inc. | | | 25 | | | | 1,293 | |
Century Communities, Inc.* | | | 59 | | | | 1,269 | |
Zumiez, Inc.* | | | 70 | | | | 1,260 | |
Culp, Inc. | | | 42 | | | | 1,250 | |
Fred’s, Inc. — Class A | | | 137 | | | | 1,241 | |
Del Frisco’s Restaurant Group, Inc.* | | | 92 | | | | 1,239 | |
Spartan Motors, Inc. | | | 129 | | | | 1,236 | |
Planet Fitness, Inc. — Class A* | | | 61 | | | | 1,224 | |
Sequential Brands Group, Inc.* | | | 152 | | | | 1,216 | |
Vera Bradley, Inc.* | | | 80 | | | | 1,212 | |
PC Connection, Inc. | | | 44 | | | | 1,162 | |
Federal-Mogul Holdings Corp.* | | | 120 | | | | 1,153 | |
Potbelly Corp.* | | | 92 | | | | 1,144 | |
America’s Car-Mart, Inc.* | | | 31 | | | | 1,128 | |
Citi Trends, Inc. | | | 56 | | | | 1,116 | |
NACCO Industries, Inc. — Class A | | | 16 | | | | 1,087 | |
Hooker Furniture Corp. | | | 44 | | | | 1,078 | |
Del Taco Restaurants, Inc.* | | | 90 | | | | 1,073 | |
Sportsman’s Warehouse Holdings, Inc.* | | | 100 | | | | 1,052 | |
Malibu Boats, Inc. — Class A* | | | 70 | | | | 1,043 | |
Tuesday Morning Corp.* | | | 174 | | | | 1,041 | |
Monarch Casino & Resort, Inc.* | | | 41 | | | | 1,032 | |
El Pollo Loco Holdings, Inc.* | | | 80 | | | | 1,007 | |
Intrawest Resorts Holdings, Inc.* | | | 62 | | | | 1,006 | |
PICO Holdings, Inc.* | | | 85 | | | | 1,002 | |
Duluth Holdings, Inc. — Class B* | | | 37 | | | | 981 | |
Miller Industries, Inc. | | | 43 | | | | 980 | |
Supreme Industries, Inc. — Class A | | | 50 | | | | 965 | |
Winmark Corp. | | | 9 | | | | 950 | |
Perry Ellis International, Inc.* | | | 49 | | | | 945 | |
Big 5 Sporting Goods Corp. | | | 69 | | | | 940 | |
Bassett Furniture Industries, Inc. | | | 40 | | | | 930 | |
Metaldyne Performance Group, Inc. | | | 58 | | | | 919 | |
Reading International, Inc. — Class A* | | | 65 | | | | 868 | |
Conn’s, Inc.* | | | 80 | | | | 826 | |
Speedway Motorsports, Inc. | | | 46 | | | | 822 | |
Hovnanian Enterprises, Inc. — Class A* | | | 473 | | | | 799 | |
Arctic Cat, Inc. | | | 51 | | | | 790 | |
AV Homes, Inc.* | | | 47 | | | | 782 | |
Stein Mart, Inc. | | | 121 | | | | 768 | |
Freshpet, Inc.* | | | 87 | | | | 753 | |
Green Brick Partners, Inc.* | | | 91 | | | | 752 | |
Habit Restaurants, Inc. — Class A* | | | 52 | | | | 728 | |
Titan Machinery, Inc.* | | | 69 | | | | 718 | |
Kirkland’s, Inc.* | | | 57 | | | | 694 | |
Johnson Outdoors, Inc. — Class A | | | 19 | | | | 691 | |
Weyco Group, Inc. | | | 25 | | | | 672 | |
Superior Uniform Group, Inc. | | | 32 | | | | 633 | |
Rush Enterprises, Inc. — Class B* | | | 26 | | | | 632 | |
Nathan’s Famous, Inc.* | | | 12 | | | | 631 | |
GMS, Inc.* | | | 28 | | | | 622 | |
Destination XL Group, Inc.* | | | 141 | | | | 611 | |
Bojangles’, Inc.* | | | 38 | | | | 606 | |
Performance Sports Group Ltd.* | | | 148 | | | | 601 | |
West Marine, Inc.* | | | 72 | | | | 595 | |
Boot Barn Holdings, Inc.* | | | 52 | | | | 592 | |
Lifetime Brands, Inc. | | | 43 | | | | 579 | |
Ruby Tuesday, Inc.* | | | 231 | | | | 578 | |
SEE NOTES TO FINANCIAL STATEMENTS. | THE RYDEX FUNDS SEMI-ANNUAL REPORT | 91 |
SCHEDULE OF INVESTMENTS (Unaudited)(continued) | September 30, 2016 |
RUSSELL 2000® 1.5x STRATEGY FUND | |
| | | Shares | | | Value | |
| | | | | | | |
Century Casinos, Inc.* | | | 83 | | | $ | 574 | |
Stage Stores, Inc. | | | 100 | | | | 561 | |
Build-A-Bear Workshop, Inc. — Class A* | | | 53 | | | | 549 | |
Jamba, Inc.* | | | 49 | | | | 535 | |
J Alexander’s Holdings, Inc.* | | | 52 | | | | 527 | |
Escalade, Inc. | | | 41 | | | | 523 | |
New Home Company, Inc.* | | | 49 | | | | 523 | |
JAKKS Pacific, Inc.* | | | 60 | | | | 518 | |
Lindblad Expeditions Holdings, Inc.* | | | 57 | | | | 513 | |
Sears Holdings Corp.* | | | 44 | | | | 504 | |
Golden Entertainment, Inc. | | | 40 | | | | 499 | |
Vince Holding Corp.* | | | 84 | | | | 474 | |
Delta Apparel, Inc.* | | | 28 | | | | 461 | |
Strattec Security Corp. | | | 13 | | | | 459 | |
Red Lion Hotels Corp.* | | | 55 | | | | 459 | |
Gaia, Inc.* | | | 60 | | | | 432 | |
Kona Grill, Inc.* | | | 34 | | | | 427 | |
Tilly’s, Inc. — Class A* | | | 45 | | | | 423 | |
Marine Products Corp. | | | 42 | | | | 377 | |
Systemax, Inc. | | | 45 | | | | 356 | |
MCBC Holdings, Inc. | | | 30 | | | | 342 | |
Luby’s, Inc.* | | | 75 | | | | 322 | |
Workhorse Group, Inc.* | | | 44 | | | | 319 | |
Unique Fabricating, Inc. | | | 26 | | | | 318 | |
Container Store Group, Inc.* | | | 63 | | | | 316 | |
Blue Bird Corp.* | | | 21 | | | | 307 | |
UCP, Inc. — Class A* | | | 31 | | | | 273 | |
Empire Resorts, Inc.* | | | 13 | | | | 263 | |
Sears Hometown and Outlet Stores, Inc.* | | | 44 | | | | 217 | |
Noodles & Co.* | | | 43 | | | | 205 | |
Fogo De Chao, Inc.* | | | 19 | | | | 201 | |
CompX International, Inc. | | | 6 | | | | 69 | |
Total Consumer, Cyclical | | | | | | | 772,577 | |
| | | | | | | | | |
Technology - 7.1% | |
Microsemi Corp.* | | | 442 | | | | 18,556 | |
Advanced Micro Devices, Inc.* | | | 2,545 | | | | 17,586 | |
Fair Isaac Corp. | | | 121 | | | | 15,075 | |
Aspen Technology, Inc.* | | | 321 | | | | 15,020 | |
Take-Two Interactive Software, Inc.* | | | 324 | | | | 14,606 | |
Cavium, Inc.* | | | 250 | | | | 14,550 | |
MAXIMUS, Inc. | | | 249 | | | | 14,083 | |
EPAM Systems, Inc.* | | | 187 | | | | 12,961 | |
Cirrus Logic, Inc.* | | | 243 | | | | 12,915 | |
SYNNEX Corp. | | | 113 | | | | 12,895 | |
Monolithic Power Systems, Inc. | | | 151 | | | | 12,156 | |
Blackbaud, Inc. | | | 183 | | | | 12,140 | |
j2 Global, Inc. | | | 182 | | | | 12,124 | |
Integrated Device Technology, Inc.* | | | 523 | | | | 12,081 | |
Medidata Solutions, Inc.* | | | 213 | | | | 11,876 | |
Proofpoint, Inc.* | | | 158 | | | | 11,826 | |
Intersil Corp. — Class A | | | 522 | | | | 11,447 | |
Science Applications International Corp. | | | 164 | | | | 11,377 | |
Mentor Graphics Corp. | | | 416 | | | | 10,999 | |
NetScout Systems, Inc.* | | | 365 | | | | 10,676 | |
Convergys Corp. | | | 346 | | | | 10,526 | |
MKS Instruments, Inc. | | | 206 | | | | 10,244 | |
CACI International, Inc. — Class A* | | | 95 | | | | 9,586 | |
Entegris, Inc.* | | | 549 | | | | 9,564 | |
Silicon Laboratories, Inc.* | | | 160 | | | | 9,408 | |
Ambarella, Inc.* | | | 124 | | | | 9,128 | |
FleetMatics Group plc* | | | 152 | | | | 9,117 | |
Verint Systems, Inc.* | | | 241 | | | | 9,069 | |
Cornerstone OnDemand, Inc.* | | | 195 | | | | 8,960 | |
Electronics for Imaging, Inc.* | | | 183 | | | | 8,951 | |
ACI Worldwide, Inc.* | | | 449 | | | | 8,702 | |
Paycom Software, Inc.* | | | 171 | | | | 8,572 | |
Synaptics, Inc.* | | | 144 | | | | 8,436 | |
Lumentum Holdings, Inc.* | | | 196 | | | | 8,188 | |
Acxiom Corp.* | | | 302 | | | | 8,048 | |
CommVault Systems, Inc.* | | | 150 | | | | 7,970 | |
3D Systems Corp.* | | | 416 | | | | 7,467 | |
Tessera Technologies, Inc. | | | 191 | | | | 7,342 | |
Semtech Corp.* | | | 251 | | | | 6,960 | |
Inphi Corp.* | | | 156 | | | | 6,788 | |
Power Integrations, Inc. | | | 106 | | | | 6,681 | |
Synchronoss Technologies, Inc.* | | | 160 | | | | 6,589 | |
Diebold, Inc. | | | 265 | | | | 6,568 | |
HubSpot, Inc.* | | | 112 | | | | 6,453 | |
ExlService Holdings, Inc.* | | | 127 | | | | 6,330 | |
MicroStrategy, Inc. — Class A* | | | 37 | | | | 6,195 | |
Imperva, Inc.* | | | 111 | | | | 5,962 | |
Envestnet, Inc.* | | | 161 | | | | 5,868 | |
Ebix, Inc. | | | 98 | | | | 5,571 | |
2U, Inc.* | | | 143 | | | | 5,475 | |
RealPage, Inc.* | | | 209 | | | | 5,371 | |
Omnicell, Inc.* | | | 139 | | | | 5,324 | |
BroadSoft, Inc.* | | | 114 | | | | 5,307 | |
Syntel, Inc.* | | | 126 | | | | 5,281 | |
Progress Software Corp. | | | 194 | | | | 5,277 | |
Rambus, Inc.* | | | 422 | | | | 5,275 | |
CSG Systems International, Inc. | | | 124 | | | | 5,125 | |
Cabot Microelectronics Corp. | | | 92 | | | | 4,868 | |
SPS Commerce, Inc.* | | | 64 | | | | 4,698 | |
Insight Enterprises, Inc.* | | | 142 | | | | 4,622 | |
Stratasys Ltd.* | | | 190 | | | | 4,577 | |
MaxLinear, Inc. — Class A* | | | 216 | | | | 4,378 | |
Sykes Enterprises, Inc.* | | | 150 | | | | 4,220 | |
Globant S.A.* | | | 100 | | | | 4,212 | |
Interactive Intelligence Group, Inc.* | | | 70 | | | | 4,210 | |
Pegasystems, Inc. | | | 140 | | | | 4,129 | |
Qualys, Inc.* | | | 105 | | | | 4,010 | |
Callidus Software, Inc.* | | | 216 | | | | 3,964 | |
MACOM Technology Solutions Holdings, Inc.* | | | 90 | | | | 3,811 | |
Amkor Technology, Inc.* | | | 389 | | | | 3,781 | |
Cvent, Inc.* | | | 117 | | | | 3,710 | |
Mercury Systems, Inc.* | | | 151 | | | | 3,709 | |
Cray, Inc.* | | | 156 | | | | 3,672 | |
Bottomline Technologies de, Inc.* | | | 156 | | | | 3,636 | |
ManTech International Corp. — Class A | | | 96 | | | | 3,618 | |
Brooks Automation, Inc. | | | 264 | | | | 3,593 | |
Pure Storage, Inc. — Class A* | | | 264 | | | | 3,577 | |
92 | THE RYDEX FUNDS SEMI-ANNUAL REPORT | SEE NOTES TO FINANCIAL STATEMENTS. |
SCHEDULE OF INVESTMENTS (Unaudited)(continued) | September 30, 2016 |
RUSSELL 2000® 1.5x STRATEGY FUND | |
| | | Shares | | | Value | |
| | | | | | | |
Super Micro Computer, Inc.* | | | 150 | | | $ | 3,506 | |
Press Ganey Holdings, Inc.* | | | 86 | | | | 3,474 | |
Monotype Imaging Holdings, Inc. | | | 157 | | | | 3,471 | |
New Relic, Inc.* | | | 85 | | | | 3,257 | |
inContact, Inc.* | | | 228 | | | | 3,188 | |
Diodes, Inc.* | | | 148 | | | | 3,158 | |
Lattice Semiconductor Corp.* | | | 466 | | | | 3,024 | |
Veeco Instruments, Inc.* | | | 154 | | | | 3,023 | |
MTS Systems Corp. | | | 65 | | | | 2,992 | |
FormFactor, Inc.* | | | 266 | | | | 2,886 | |
CEVA, Inc.* | | | 77 | | | | 2,700 | |
Virtusa Corp.* | | | 107 | | | | 2,641 | |
Photronics, Inc.* | | | 253 | | | | 2,608 | |
InvenSense, Inc. — Class A* | | | 317 | | | | 2,352 | |
Quality Systems, Inc. | | | 199 | | | | 2,253 | |
PROS Holdings, Inc.* | | | 98 | | | | 2,216 | |
Engility Holdings, Inc.* | | | 70 | | | | 2,205 | |
Barracuda Networks, Inc.* | | | 85 | | | | 2,166 | |
Nimble Storage, Inc.* | | | 244 | | | | 2,155 | |
Silver Spring Networks, Inc.* | | | 147 | | | | 2,084 | |
Rudolph Technologies, Inc.* | | | 116 | | | | 2,058 | |
Nanometrics, Inc.* | | | 92 | | | | 2,055 | |
Applied Micro Circuits Corp.* | | | 294 | | | | 2,043 | |
Five9, Inc.* | | | 129 | | | | 2,023 | |
Benefitfocus, Inc.* | | | 50 | | | | 1,996 | |
Ultratech, Inc.* | | | 84 | | | | 1,939 | |
Unisys Corp.* | | | 196 | | | | 1,909 | |
PDF Solutions, Inc.* | | | 105 | | | | 1,908 | |
TeleTech Holdings, Inc. | | | 64 | | | | 1,855 | |
Actua Corp.* | | | 139 | | | | 1,800 | |
LivePerson, Inc.* | | | 206 | | | | 1,732 | |
Vocera Communications, Inc.* | | | 97 | | | | 1,639 | |
KEYW Holding Corp.* | | | 140 | | | | 1,546 | |
Workiva, Inc.* | | | 85 | | | | 1,541 | |
Alpha & Omega Semiconductor Ltd.* | | | 70 | | | | 1,520 | |
Brightcove, Inc.* | | | 116 | | | | 1,514 | |
Axcelis Technologies, Inc.* | | | 113 | | | | 1,501 | |
Epiq Systems, Inc. | | | 91 | | | | 1,501 | |
Exar Corp.* | | | 158 | | | | 1,471 | |
Evolent Health, Inc. — Class A* | | | 59 | | | | 1,453 | |
Digimarc Corp.* | | | 37 | | | | 1,419 | |
InnerWorkings, Inc.* | | | 150 | | | | 1,413 | |
Hortonworks, Inc.* | | | 156 | | | | 1,303 | |
Xactly Corp.* | | | 88 | | | | 1,295 | |
Xcerra Corp.* | | | 205 | | | | 1,242 | |
Varonis Systems, Inc.* | | | 41 | | | | 1,234 | |
Sapiens International Corporation N.V. | | | 94 | | | | 1,200 | |
Cohu, Inc. | | | 102 | | | | 1,197 | |
IXYS Corp. | | | 98 | | | | 1,181 | |
Digi International, Inc.* | | | 101 | | | | 1,151 | |
Computer Programs & Systems, Inc. | | | 43 | | | | 1,121 | |
American Software, Inc. — Class A | | | 100 | | | | 1,110 | |
MINDBODY, Inc. — Class A* | | | 56 | | | | 1,101 | |
Silicon Graphics International Corp.* | | | 141 | | | | 1,086 | |
Sigma Designs, Inc.* | | | 139 | | | | 1,083 | |
Carbonite, Inc.* | | | 69 | | | | 1,060 | |
Apigee Corp.* | | | 60 | | | | 1,044 | |
Instructure, Inc.* | | | 41 | | | | 1,040 | |
DSP Group, Inc.* | | | 85 | | | | 1,021 | |
Eastman Kodak Co.* | | | 67 | | | | 1,005 | |
Avid Technology, Inc.* | | | 125 | | | | 993 | |
Model N, Inc.* | | | 87 | | | | 967 | |
Jive Software, Inc.* | | | 224 | | | | 954 | |
Mitek Systems, Inc.* | | | 114 | | | | 945 | |
Immersion Corp.* | | | 113 | | | | 922 | |
Ultra Clean Holdings, Inc.* | | | 124 | | | | 919 | |
Glu Mobile, Inc.* | | | 400 | | | | 896 | |
Tangoe, Inc.* | | | 107 | | | | 883 | |
pdvWireless, Inc.* | | | 38 | | | | 870 | |
Exa Corp.* | | | 54 | | | | 867 | |
Everyday Health, Inc.* | | | 110 | | | | 846 | |
QAD, Inc. — Class A | | | 37 | | | | 828 | |
Datalink Corp.* | | | 78 | | | | 828 | |
TubeMogul, Inc.* | | | 85 | | | | 796 | |
USA Technologies, Inc.* | | | 139 | | | | 780 | |
Radisys Corp.* | | | 138 | | | | 738 | |
Amber Road, Inc.* | | | 69 | | | | 666 | |
Agilysys, Inc.* | | | 59 | | | | 656 | |
Castlight Health, Inc. — Class B* | | | 156 | | | | 649 | |
ExOne Co.* | | | 42 | | | | 639 | |
Rosetta Stone, Inc.* | | | 75 | | | | 636 | |
Maxwell Technologies, Inc.* | | | 122 | | | | 630 | |
Planet Payment, Inc.* | | | 164 | | | | 608 | |
Park City Group, Inc.* | | | 50 | | | | 590 | |
Appfolio, Inc. — Class A* | | | 30 | | | | 583 | |
EMCORE Corp. | | | 102 | | | | 581 | |
GigPeak, Inc.* | | | 226 | | | | 531 | |
Guidance Software, Inc.* | | | 88 | | | | 524 | |
Kopin Corp.* | | | 239 | | | | 521 | |
MobileIron, Inc.* | | | 180 | | | | 495 | |
Cogint, Inc.* | | | 59 | | | | 300 | |
SecureWorks Corp. — Class A* | | | 23 | | | | 288 | |
NCI, Inc. — Class A | | | 23 | | | | 266 | |
Majesco* | | | 23 | | | | 117 | |
Total Technology | | | | | | | 754,603 | |
| | | | | | | | | |
Communications - 4.2% | |
GrubHub, Inc.* | | | 314 | | | | 13,498 | |
ViaSat, Inc.* | | | 172 | | | | 12,839 | |
Finisar Corp.* | | | 417 | | | | 12,426 | |
Ciena Corp.* | | | 533 | | | | 11,618 | |
InterDigital, Inc. | | | 134 | | | | 10,613 | |
Zendesk, Inc.* | | | 316 | | | | 9,705 | |
LogMeIn, Inc. | | | 98 | | | | 8,857 | |
Media General, Inc.* | | | 424 | | | | 7,813 | |
NETGEAR, Inc.* | | | 126 | | | | 7,622 | |
Meredith Corp. | | | 146 | | | | 7,591 | |
Sinclair Broadcast Group, Inc. — Class A | | | 256 | | | | 7,394 | |
WebMD Health Corp. — Class A* | | | 145 | | | | 7,207 | |
Gigamon, Inc.* | | | 127 | | | | 6,960 | |
DigitalGlobe, Inc.* | | | 245 | | | | 6,738 | |
Viavi Solutions, Inc.* | | | 909 | | | | 6,718 | |
Plantronics, Inc. | | | 129 | | | | 6,703 | |
SEE NOTES TO FINANCIAL STATEMENTS. | THE RYDEX FUNDS SEMI-ANNUAL REPORT | 93 |
SCHEDULE OF INVESTMENTS (Unaudited)(continued) | September 30, 2016 |
RUSSELL 2000® 1.5x STRATEGY FUND | |
| | | Shares | | | Value | |
| | | | | | | |
Nexstar Broadcasting Group, Inc. — Class A | | | 116 | | | $ | 6,694 | |
Houghton Mifflin Harcourt Co.* | | | 482 | | | | 6,464 | |
Shutterfly, Inc.* | | | 135 | | | | 6,027 | |
Stamps.com, Inc.* | | | 63 | | | | 5,954 | |
Cogent Communications Holdings, Inc. | | | 161 | | | | 5,926 | |
Etsy, Inc.* | | | 407 | | | | 5,812 | |
NIC, Inc. | | | 246 | | | | 5,781 | |
Time, Inc. | | | 399 | | | | 5,778 | |
New York Times Co. — Class A | | | 483 | | | | 5,772 | |
Infoblox, Inc.* | | | 218 | | | | 5,749 | |
comScore, Inc.* | | | 186 | | | | 5,703 | |
NeuStar, Inc. — Class A* | | | 211 | | | | 5,610 | |
Ubiquiti Networks, Inc.* | | | 101 | | | | 5,404 | |
RingCentral, Inc. — Class A* | | | 227 | | | | 5,370 | |
Gannett Company, Inc. | | | 456 | | | | 5,308 | |
8x8, Inc.* | | | 343 | | | | 5,292 | |
Liberty Media Corporation-Liberty Media — Class C* | | | 179 | | | | 5,037 | |
Infinera Corp.* | | | 547 | | | | 4,939 | |
Vonage Holdings Corp.* | | | 743 | | | | 4,911 | |
Consolidated Communications Holdings, Inc. | | | 193 | | | | 4,872 | |
Shenandoah Telecommunications Co. | | | 179 | | | | 4,871 | |
Wayfair, Inc. — Class A* | | | 122 | | | | 4,803 | |
Shutterstock, Inc.* | | | 73 | | | | 4,650 | |
MSG Networks, Inc. — Class A* | | | 231 | | | | 4,299 | |
Scholastic Corp. | | | 105 | | | | 4,133 | |
AVG Technologies N.V.* | | | 163 | | | | 4,077 | |
Windstream Holdings, Inc. | | | 373 | | | | 3,749 | |
West Corp. | | | 167 | | | | 3,687 | |
EW Scripps Co. — Class A* | | | 231 | | | | 3,673 | |
ADTRAN, Inc. | | | 190 | | | | 3,637 | |
Cincinnati Bell, Inc.* | | | 817 | | | | 3,333 | |
Quotient Technology, Inc.* | | | 249 | | | | 3,314 | |
Oclaro, Inc.* | | | 383 | | | | 3,275 | |
Ixia* | | | 250 | | | | 3,125 | |
World Wrestling Entertainment, Inc. — Class A | | | 140 | | | | 2,982 | |
Box, Inc. — Class A* | | | 189 | | | | 2,979 | |
Q2 Holdings, Inc.* | | | 100 | | | | 2,866 | |
Web.com Group, Inc.* | | | 165 | | | | 2,850 | |
Perficient, Inc.* | | | 137 | | | | 2,761 | |
HealthStream, Inc.* | | | 100 | | | | 2,760 | |
ATN International, Inc. | | | 41 | | | | 2,667 | |
Iridium Communications, Inc.* | | | 321 | | | | 2,603 | |
Gray Television, Inc.* | | | 248 | | | | 2,569 | |
ORBCOMM, Inc.* | | | 250 | | | | 2,563 | |
Liberty Media Corporation-Liberty Media — Class A* | | | 89 | | | | 2,550 | |
EarthLink Holdings Corp. | | | 408 | | | | 2,530 | |
Gogo, Inc.* | | | 219 | | | | 2,418 | |
GTT Communications, Inc.* | | | 102 | | | | 2,400 | |
ePlus, Inc.* | | | 25 | | | | 2,360 | |
New Media Investment Group, Inc. | | | 151 | | | | 2,341 | |
Chegg, Inc.* | | | 313 | | | | 2,219 | |
MDC Partners, Inc. — Class A | | | 199 | | | | 2,133 | |
Liberty Media Corporation-Liberty Braves — Class C* | | | 122 | | | | 2,120 | |
ShoreTel, Inc.* | | | 262 | | | | 2,096 | |
Acacia Communications, Inc.* | | | 20 | | | | 2,066 | |
VASCO Data Security International, Inc.* | | | 117 | | | | 2,060 | |
Inteliquent, Inc. | | | 127 | | | | 2,050 | |
Endurance International Group Holdings, Inc.* | | | 233 | | | | 2,039 | |
TrueCar, Inc.* | | | 212 | | | | 2,001 | |
Loral Space & Communications, Inc.* | | | 50 | | | | 1,956 | |
NeoPhotonics Corp.* | | | 119 | | | | 1,944 | |
CalAmp Corp.* | | | 139 | | | | 1,939 | |
Entravision Communications Corp. — Class A | | | 253 | | | | 1,930 | |
XO Group, Inc.* | | | 98 | | | | 1,894 | |
Bazaarvoice, Inc.* | | | 318 | | | | 1,879 | |
A10 Networks, Inc.* | | | 171 | | | | 1,828 | |
Extreme Networks, Inc.* | | | 401 | | | | 1,800 | |
Harmonic, Inc.* | | | 297 | | | | 1,761 | |
Globalstar, Inc.* | | | 1,448 | | | | 1,752 | |
tronc, Inc.* | | | 103 | | | | 1,739 | |
Blucora, Inc.* | | | 152 | | | | 1,702 | |
Intralinks Holdings, Inc.* | | | 160 | | | | 1,610 | |
Bankrate, Inc.* | | | 184 | | | | 1,560 | |
General Communication, Inc. — Class A* | | | 112 | | | | 1,540 | |
DHI Group, Inc.* | | | 194 | | | | 1,531 | |
Angie’s List, Inc.* | | | 154 | | | | 1,526 | |
Global Eagle Entertainment, Inc.* | | | 182 | | | | 1,512 | |
Blue Nile, Inc. | | | 43 | | | | 1,480 | |
RetailMeNot, Inc.* | | | 149 | | | | 1,474 | |
Sonus Networks, Inc.* | | | 185 | | | | 1,439 | |
Boingo Wireless, Inc.* | | | 138 | | | | 1,419 | |
Spok Holdings, Inc. | | | 79 | | | | 1,408 | |
FTD Companies, Inc.* | | | 68 | | | | 1,399 | |
Rapid7, Inc.* | | | 77 | | | | 1,359 | |
Entercom Communications Corp. — Class A | | | 101 | | | | 1,307 | |
FairPoint Communications, Inc.* | | | 82 | | | | 1,232 | |
Rubicon Project, Inc.* | | | 144 | | | | 1,192 | |
ChannelAdvisor Corp.* | | | 91 | | | | 1,177 | |
Calix, Inc.* | | | 160 | | | | 1,176 | |
IDT Corp. — Class B | | | 68 | | | | 1,172 | |
Lionbridge Technologies, Inc.* | | | 222 | | | | 1,110 | |
Liquidity Services, Inc.* | | | 97 | | | | 1,090 | |
Lumos Networks Corp.* | | | 73 | | | | 1,022 | |
MeetMe, Inc.* | | | 160 | | | | 992 | |
Comtech Telecommunications Corp. | | | 76 | | | | 974 | |
Straight Path Communications, Inc. — Class B* | | | 37 | | | | 948 | |
1-800-Flowers.com, Inc. — Class A* | | | 101 | | | | 926 | |
Silicom Ltd. | | | 22 | | | | 911 | |
Daily Journal Corp.* | | | 4 | | | | 876 | |
Zix Corp.* | | | 206 | | | | 845 | |
Lands’ End, Inc.* | | | 58 | | | | 841 | |
Clearfield, Inc.* | | | 44 | | | | 827 | |
94 | THE RYDEX FUNDS SEMI-ANNUAL REPORT | SEE NOTES TO FINANCIAL STATEMENTS. |
SCHEDULE OF INVESTMENTS (Unaudited)(continued) | September 30, 2016 |
RUSSELL 2000® 1.5x STRATEGY FUND | |
| | | Shares | | | Value | |
| | | | | | | |
Black Box Corp. | | | 58 | | | $ | 806 | |
Overstock.com, Inc.* | | | 51 | | | | 781 | |
RigNet, Inc.* | | | 49 | | | | 741 | |
Telenav, Inc.* | | | 127 | | | | 728 | |
HC2 Holdings, Inc.* | | | 129 | | | | 703 | |
Reis, Inc. | | | 34 | | | | 696 | |
NII Holdings, Inc.* | | | 207 | | | | 689 | |
Central European Media Enterprises Ltd. — Class A* | | | 296 | | | | 684 | |
TechTarget, Inc.* | | | 79 | | | | 637 | |
Saga Communications, Inc. — Class A | | | 14 | | | | 635 | |
Liberty Media Corporation-Liberty Braves — Class A* | | | 35 | | | | 611 | |
Autobytel, Inc.* | | | 34 | | | | 605 | |
VirnetX Holding Corp.* | | | 188 | | | | 575 | |
Aerohive Networks, Inc.* | | | 94 | | | | 572 | |
KVH Industries, Inc.* | | | 59 | | | | 520 | |
Hawaiian Telcom Holdco, Inc.* | | | 23 | | | | 515 | |
Limelight Networks, Inc.* | | | 275 | | | | 514 | |
QuinStreet, Inc.* | | | 142 | | | | 429 | |
Preformed Line Products Co. | | | 10 | | | | 422 | |
Numerex Corp. — Class A* | | | 54 | | | | 420 | |
Rightside Group Ltd.* | | | 45 | | | | 410 | |
RealNetworks, Inc.* | | | 91 | | | | 406 | |
Marchex, Inc. — Class B* | | | 129 | | | | 357 | |
Hemisphere Media Group, Inc.* | | | 27 | | | | 344 | |
Intelsat S.A.* | | | 122 | | | | 331 | |
Townsquare Media, Inc. — Class A* | | | 33 | | | | 308 | |
Radio One, Inc. — Class D* | | | 96 | | | | 291 | |
Global Sources Ltd.* | | | 32 | | | | 271 | |
Salem Media Group, Inc. — Class A | | | 43 | | | | 253 | |
Corindus Vascular Robotics, Inc.* | | | 213 | | | | 236 | |
Value Line, Inc. | | | 5 | | | | 81 | |
Total Communications | | | | | | | 447,884 | |
| | | | | | | | | |
Basic Materials - 2.6% | |
Olin Corp. | | | 644 | | | | 13,215 | |
Sensient Technologies Corp. | | | 173 | | | | 13,112 | |
US Silica Holdings, Inc. | | | 249 | | | | 11,593 | |
Chemours Co. | | | 710 | | | | 11,359 | |
PolyOne Corp. | | | 325 | | | | 10,987 | |
Minerals Technologies, Inc. | | | 135 | | | | 9,543 | |
Balchem Corp. | | | 122 | | | | 9,459 | |
HB Fuller Co. | | | 195 | | | | 9,062 | |
Hecla Mining Co. | | | 1,481 | | | | 8,442 | |
Worthington Industries, Inc. | | | 175 | | | | 8,405 | |
Chemtura Corp.* | | | 248 | | | | 8,137 | |
GCP Applied Technologies, Inc.* | | | 275 | | | | 7,788 | |
Allegheny Technologies, Inc. | | | 421 | | | | 7,607 | |
Ingevity Corp.* | | | 165 | | | | 7,607 | |
Coeur Mining, Inc.* | | | 628 | | | | 7,429 | |
Carpenter Technology Corp. | | | 179 | | | | 7,386 | |
Commercial Metals Co. | | | 447 | | | | 7,237 | |
Stillwater Mining Co.* | | | 475 | | | | 6,346 | |
Kaiser Aluminum Corp. | | | 69 | | | | 5,968 | |
Stepan Co. | | | 77 | | | | 5,595 | |
Innospec, Inc. | | | 92 | | | | 5,595 | |
Quaker Chemical Corp. | | | 50 | | | | 5,297 | |
Neenah Paper, Inc. | | | 64 | | | | 5,057 | |
Cliffs Natural Resources, Inc.* | | | 855 | | | | 5,002 | |
Schweitzer-Mauduit International, Inc. | | | 117 | | | | 4,512 | |
Ferro Corp.* | | | 324 | | | | 4,474 | |
AK Steel Holding Corp.* | | | 921 | | | | 4,448 | |
Clearwater Paper Corp.* | | | 66 | | | | 4,268 | |
Kraton Corp.* | | | 115 | | | | 4,030 | |
Univar, Inc.* | | | 167 | | | | 3,649 | |
PH Glatfelter Co. | | | 168 | | | | 3,642 | |
A. Schulman, Inc. | | | 112 | | | | 3,261 | |
Innophos Holdings, Inc. | | | 76 | | | | 2,966 | |
Calgon Carbon Corp. | | | 195 | | | | 2,958 | |
Deltic Timber Corp. | | | 41 | | | | 2,777 | |
Fairmount Santrol Holdings, Inc.* | | | 302 | | | | 2,561 | |
Koppers Holdings, Inc.* | | | 79 | | | | 2,542 | |
Materion Corp. | | | 77 | | | | 2,365 | |
Tronox Ltd. — Class A | | | 250 | | | | 2,343 | |
Ferroglobe plc | | | 254 | | | | 2,294 | |
Rayonier Advanced Materials, Inc. | | | 167 | | | | 2,233 | |
Aceto Corp. | | | 113 | | | | 2,146 | |
Schnitzer Steel Industries, Inc. — Class A | | | 101 | | | | 2,111 | |
CSW Industrials, Inc.* | | | 56 | | | | 1,814 | |
American Vanguard Corp. | | | 109 | | | | 1,751 | |
Hawkins, Inc. | | | 37 | | | | 1,603 | |
Gold Resource Corp. | | | 194 | | | | 1,439 | |
Landec Corp.* | | | 104 | | | | 1,395 | |
OMNOVA Solutions, Inc.* | | | 165 | | | | 1,393 | |
Century Aluminum Co.* | | | 193 | | | | 1,341 | |
KMG Chemicals, Inc. | | | 35 | | | | 992 | |
Orchids Paper Products Co. | | | 35 | | | | 953 | |
Oil-Dri Corporation of America | | | 19 | | | | 715 | |
Kronos Worldwide, Inc. | | | 85 | | | | 705 | |
Codexis, Inc.* | | | 130 | | | | 577 | |
Ryerson Holding Corp.* | | | 49 | | | | 553 | |
United States Lime & Minerals, Inc. | | | 8 | | | | 528 | |
AgroFresh Solutions, Inc.* | | | 85 | | | | 450 | |
ALJ Regional Holdings, Inc.* | | | 72 | | | | 338 | |
Valhi, Inc. | | | 97 | | | | 223 | |
Total Basic Materials | | | | | | | 273,578 | |
| | | | | | | | | |
Utilities - 2.3% | |
IDACORP, Inc. | | | 196 | | | | 15,343 | |
Portland General Electric Co. | | | 347 | | | | 14,779 | |
Southwest Gas Corp. | | | 184 | | | | 12,854 | |
ONE Gas, Inc. | | | 203 | | | | 12,554 | |
WGL Holdings, Inc. | | | 196 | | | | 12,289 | |
Black Hills Corp. | | | 200 | | | | 12,244 | |
ALLETE, Inc. | | | 192 | | | | 11,447 | |
Spire, Inc. | | | 174 | | | | 11,091 | |
New Jersey Resources Corp. | | | 334 | | | | 10,975 | |
NorthWestern Corp. | | | 189 | | | | 10,873 | |
Avista Corp. | | | 245 | | | | 10,239 | |
PNM Resources, Inc. | | | 310 | | | | 10,143 | |
South Jersey Industries, Inc. | | | 310 | | | | 9,161 | |
MGE Energy, Inc. | | | 136 | | | | 7,685 | |
SEE NOTES TO FINANCIAL STATEMENTS. | THE RYDEX FUNDS SEMI-ANNUAL REPORT | 95 |
SCHEDULE OF INVESTMENTS (Unaudited)(continued) | September 30, 2016 |
RUSSELL 2000® 1.5x STRATEGY FUND | |
| | | Shares | | | Value | |
| | | | | | | |
El Paso Electric Co. | | | 157 | | | $ | 7,343 | |
Ormat Technologies, Inc. | | | 151 | | | | 7,310 | |
Northwest Natural Gas Co. | | | 105 | | | | 6,312 | |
California Water Service Group | | | 186 | | | | 5,968 | |
Empire District Electric Co. | | | 171 | | | | 5,838 | |
American States Water Co. | | | 142 | | | | 5,686 | |
Dynegy, Inc.* | | | 454 | | | | 5,625 | |
Otter Tail Corp. | | | 147 | | | | 5,085 | |
Talen Energy Corp.* | | | 327 | | | | 4,529 | |
Atlantica Yield plc | | | 228 | | | | 4,334 | |
NRG Yield, Inc. — Class C | | | 246 | | | | 4,172 | |
Chesapeake Utilities Corp. | | | 57 | | | | 3,480 | |
SJW Corp. | | | 63 | | | | 2,752 | |
NRG Yield, Inc. — Class A | | | 136 | | | | 2,220 | |
Middlesex Water Co. | | | 61 | | | | 2,150 | |
Unitil Corp. | | | 54 | | | | 2,109 | |
Connecticut Water Service, Inc. | | | 42 | | | | 2,089 | |
York Water Co. | | | 51 | | | | 1,513 | |
Atlantic Power Corp. | | | 474 | | | | 1,171 | |
Artesian Resources Corp. — Class A | | | 31 | | | | 885 | |
Consolidated Water Company Ltd. | | | 56 | | | | 651 | |
Delta Natural Gas Company, Inc. | | | 26 | | | | 620 | |
EnerNOC, Inc.* | | | 104 | | | | 563 | |
Spark Energy, Inc. — Class A | | | 19 | | | | 553 | |
Ameresco, Inc. — Class A* | | | 82 | | | | 431 | |
Genie Energy Ltd. — Class B* | | | 50 | | | | 295 | |
Global Water Resources, Inc. | | | 32 | | | | 256 | |
Total Utilities | | | | | | | 245,617 | |
| | | | | | | | | |
Energy - 2.0% | |
PDC Energy, Inc.* | | | 179 | | | | 12,005 | |
RSP Permian, Inc.* | | | 305 | | | | 11,828 | |
NOW, Inc.* | | | 415 | | | | 8,893 | |
Carrizo Oil & Gas, Inc.* | | | 216 | | | | 8,774 | |
Western Refining, Inc. | | | 313 | | | | 8,281 | |
Oasis Petroleum, Inc.* | | | 692 | | | | 7,937 | |
Matador Resources Co.* | | | 322 | | | | 7,837 | |
Callon Petroleum Co.* | | | 471 | | | | 7,395 | |
SemGroup Corp. — Class A | | | 205 | | | | 7,249 | |
Oil States International, Inc.* | | | 199 | | | | 6,281 | |
MRC Global, Inc.* | | | 363 | | | | 5,964 | |
Pattern Energy Group, Inc. | | | 257 | | | | 5,780 | |
Synergy Resources Corp.* | | | 722 | | | | 5,003 | |
TerraForm Power, Inc. — Class A* | | | 339 | | | | 4,715 | |
McDermott International, Inc.* | | | 939 | | | | 4,704 | |
Forum Energy Technologies, Inc.* | | | 233 | | | | 4,627 | |
Denbury Resources, Inc.* | | | 1,363 | | | | 4,402 | |
Delek US Holdings, Inc. | | | 239 | | | | 4,132 | |
Green Plains, Inc. | | | 142 | | | | 3,720 | |
SEACOR Holdings, Inc.* | | | 62 | | | | 3,688 | |
Unit Corp.* | | | 196 | | | | 3,645 | |
Archrock, Inc. | | | 270 | | | | 3,532 | |
Seadrill Ltd.* | | | 1,465 | | | | 3,472 | |
Helix Energy Solutions Group, Inc.* | | | 390 | | | | 3,171 | |
Flotek Industries, Inc.* | | | 212 | | | | 3,083 | |
Thermon Group Holdings, Inc.* | | | 124 | | | | 2,449 | |
Newpark Resources, Inc.* | | | 322 | | | | 2,370 | |
TETRA Technologies, Inc.* | | | 350 | | | | 2,139 | |
Atwood Oceanics, Inc. | | | 236 | | | | 2,051 | |
SunCoke Energy, Inc.* | | | 250 | | | | 2,005 | |
Clayton Williams Energy, Inc.* | | | 23 | | | | 1,965 | |
Cobalt International Energy, Inc.* | | | 1,581 | | | | 1,960 | |
Matrix Service Co.* | | | 103 | | | | 1,932 | |
Exterran Corp.* | | | 123 | | | | 1,929 | |
Sanchez Energy Corp.* | | | 217 | | | | 1,918 | |
REX American Resources Corp.* | | | 22 | | | | 1,865 | |
Bristow Group, Inc. | | | 131 | | | | 1,837 | |
Par Pacific Holdings, Inc.* | | | 119 | | | | 1,557 | |
Sunrun, Inc.* | | | 245 | | | | 1,544 | |
California Resources Corp.* | | | 123 | | | | 1,538 | |
Renewable Energy Group, Inc.* | | | 180 | | | | 1,525 | |
Ring Energy, Inc.* | | | 139 | | | | 1,522 | |
Clean Energy Fuels Corp.* | | | 340 | | | | 1,520 | |
Tesco Corp. | | | 179 | | | | 1,461 | |
TerraForm Global, Inc. — Class A | | | 354 | | | | 1,455 | |
Plug Power, Inc.* | | | 702 | | | | 1,200 | |
Natural Gas Services Group, Inc.* | | | 48 | | | | 1,180 | |
FutureFuel Corp. | | | 97 | | | | 1,094 | |
Bill Barrett Corp.* | | | 190 | | | | 1,056 | |
Panhandle Oil and Gas, Inc. — Class A | | | 59 | | | | 1,034 | |
Parker Drilling Co.* | | | 469 | | | | 1,018 | |
Pioneer Energy Services Corp.* | | | 247 | | | | 998 | |
Geospace Technologies Corp.* | | | 51 | | | | 993 | |
Alon USA Energy, Inc. | | | 122 | | | | 983 | |
Contango Oil & Gas Co.* | | | 87 | | | | 889 | |
Trecora Resources* | | | 77 | | | | 879 | |
CVR Energy, Inc. | | | 61 | | | | 840 | |
PHI, Inc.* | | | 46 | | | | 836 | |
CARBO Ceramics, Inc. | | | 75 | | | | 821 | |
Abraxas Petroleum Corp.* | | | 481 | | | | 813 | |
Pacific Ethanol, Inc.* | | | 111 | | | | 767 | |
Eclipse Resources Corp.* | | | 221 | | | | 727 | |
EP Energy Corp. — Class A* | | | 150 | | | | 657 | |
Westmoreland Coal Co.* | | | 71 | | | | 629 | |
Era Group, Inc.* | | | 76 | | | | 612 | |
Independence Contract Drilling, Inc.* | | | 116 | | | | 609 | |
FuelCell Energy, Inc.* | | | 111 | | | | 602 | |
Evolution Petroleum Corp. | | | 95 | | | | 597 | |
Dawson Geophysical Co.* | | | 78 | | | | 595 | |
EXCO Resources, Inc.* | | | 543 | | | | 581 | |
Northern Oil and Gas, Inc.* | | | 181 | | | | 485 | |
Jones Energy, Inc. — Class A* | | | 119 | | | | 424 | |
Isramco, Inc.* | | | 4 | | | | 334 | |
Willbros Group, Inc.* | | | 168 | | | | 316 | |
Adams Resources & Energy, Inc. | | | 8 | | | | 315 | |
Vivint Solar, Inc.* | | | 88 | | | | 278 | |
W&T Offshore, Inc.* | | | 138 | | | | 243 | |
Erin Energy Corp.* | | | 56 | | | | 132 | |
Earthstone Energy, Inc.* | | | 8 | | | | 69 | |
Total Energy | | | | | | | 210,266 | |
96 | THE RYDEX FUNDS SEMI-ANNUAL REPORT | SEE NOTES TO FINANCIAL STATEMENTS. |
SCHEDULE OF INVESTMENTS (Unaudited)(continued) | September 30, 2016 |
RUSSELL 2000® 1.5x STRATEGY FUND | |
| | | Shares | | | Value | |
| | | | | | | |
Diversified - 0.1% | |
HRG Group, Inc.* | | | 461 | | | $ | 7,238 | |
Wins Finance Holdings, Inc.* | | | 5 | | | | 148 | |
Total Diversified | | | | | | | 7,386 | |
| | | | | | | | | |
Government - 0.0% | |
Banco Latinoamericano de Comercio Exterior S.A. — Class E | | | 117 | | | | 3,297 | |
| | | | | | | | | |
Health Care - 0.0% | |
Integer Holdings Corp.* | | | 118 | | | | 2,559 | |
Aptevo Therapeutics, Inc.* | | | 69 | | | | 177 | |
Total Health Care | | | | | | | 2,736 | |
| | | | | | | | | |
Total Common Stocks | | | | | | | | |
(Cost $5,995,433) | | | | | | | 6,762,448 | |
| | | | | | | | | |
WARRANTS†† - 0.0% | |
Imperial Holdings, Inc. | | | | | | | | |
$10.75, 10/06/19 | | | 4 | | | | — | |
Total Warrants | | | | | | | | |
(Cost $—) | | | | | | | — | |
| | | | | | | | | |
RIGHTS††† - 0.0% | |
Omthera Pharmaceuticals, Inc. | | | | | | | | |
Expires 12/31/20 | | | 57 | | | | — | |
Leap Wireless International, Inc. | | | | | | | | |
Expires 03/06/17 | | | 513 | | | | — | |
Dyax Corp. | | | | | | | | |
Expires 01/25/17 | | | 714 | | | | — | |
Total Rights | | | | | | | | |
(Cost $398) | | | | | | | — | |
| | | | | | | | | |
MUTUAL FUNDS† - 9.6% | |
Guggenheim Strategy Fund II1 | | | 20,369 | | | | 507,996 | |
Guggenheim Strategy Fund I1 | | | 20,322 | | | | 507,856 | |
Total Mutual Funds | | | | | | | | |
(Cost $1,011,246) | | | | | | | 1,015,852 | |
| | | | | | | | | |
| | | Face
Amount | | | | | |
| | | | | | | | | |
FEDERAL AGENCY NOTES†† - 9.5% | |
Federal Farm Credit Bank2 | | | | | | | | |
0.67% due 09/12/183 | | $ | 1,000,000 | | | | 999,224 | |
Total Federal Agency Notes | | | | | | | | |
(Cost $999,804) | | | | | | | 999,224 | |
REPURCHASE AGREEMENTS††,4 - 12.1% | |
Royal Bank of Canada
issued 09/30/16 at 0.36%
due 10/03/165 | | | 679,631 | | | | 679,631 | |
HSBC Securities, Inc.
issued 09/30/16 at 0.38%
due 10/03/16 | | | 594,537 | | | | 594,537 | |
Total Repurchase Agreements | | | | | | | | |
(Cost $1,274,168) | | | | | | | 1,274,168 | |
| | | | | | | | | |
Total Investments - 95.1% | | | | | | | | |
(Cost $9,281,049) | | | | | | $ | 10,051,692 | |
Other Assets & Liabilities, net - 4.9% | | | | | | | 516,786 | |
Total Net Assets - 100.0% | | | | | | $ | 10,568,478 | |
| | | | | | | | | |
| | | Contracts | | | Unrealized
Gain (Loss) | |
| | | | | | | | | |
EQUITY FUTURES CONTRACTS PURCHASED† | |
December 2016 Russell 2000 Index
Mini Futures Contracts
(Aggregate Value of
Contracts $374,100) | | | 3 | | | $ | 11,035 | |
| | | | | | | | | |
| | | Units | | | | | |
| | | | | | | | | |
OTC EQUITY INDEX SWAP AGREEMENTS†† | |
BNP Paribas
November 2016
Russell 2000 Index Swap 0.13%6,
Terminating 11/01/16
(Notional Value $2,808,699) | | | 2,244 | | | $ | 31,205 | |
Goldman Sachs International
October 2016
Russell 2000 Index Swap 0.30%6,
Terminating 10/26/16
(Notional Value $360,925) | | | 288 | | | | 3,315 | |
Barclays Bank plc
October 2016
Russell 2000 Index Swap 0.30%6,
Terminating 10/31/16
(Notional Value $5,558,221) | | | 4,441 | | | | (16,884 | ) |
(Total Notional Value $8,727,845) | | | | | | $ | 17,636 | |
SEE NOTES TO FINANCIAL STATEMENTS. | THE RYDEX FUNDS SEMI-ANNUAL REPORT | 97 |
SCHEDULE OF INVESTMENTS (Unaudited)(concluded) | September 30, 2016 |
RUSSELL 2000® 1.5x STRATEGY FUND | |
* | Non-income producing security. |
† | Value determined based on Level 1 inputs, unless otherwise noted — See Note 4. |
†† | Value determined based on Level 2 inputs — See Note 4. |
††† | Value determined based on Level 3 inputs — See Note 4. |
1 | Affiliated issuer — See Note 9. |
2 | The issuer operates under a Congressional charter; its securities are neither issued nor guaranteed by the U.S. Government. |
3 | Variable rate security. Rate indicated is rate effective at September 30, 2016. |
4 | Repurchase Agreements — See Note 5. |
5 | All or a portion of this security is pledged as equity index swap collateral at September 30, 2016. |
6 | Total Return based on Russell 2000 Index +/- financing at a variable rate. Rate indicated is the rate effective at September 30, 2016. |
| | plc — Public Limited Company |
| | REIT — Real Estate Investment Trust |
| | |
| | See Sector Classification in Other Information section. |
The following table summarizes the inputs used to value the Fund’s investments at September 30, 2016 (See Note 4 in the Notes to Financial Statements):
Investments in Securities (Assets) | | Level 1 | | | Level 1 -
Other* | | | Level 2 | | | Level 2 -
Other* | | | Level 3 | | | Total | |
Common Stocks | | $ | 6,762,448 | | | $ | — | | | $ | — | | | $ | — | | | $ | — | | | $ | 6,762,448 | |
Equity Futures Contracts | | | — | | | | 11,035 | | | | — | | | | — | | | | — | | | | 11,035 | |
Equity Index Swap Agreements | | | — | | | | — | | | | — | | | | 34,520 | | | | — | | | | 34,520 | |
Federal Agency Notes | | | — | | | | — | | | | 999,224 | | | | — | | | | — | | | | 999,224 | |
Mutual Funds | | | 1,015,852 | | | | — | | | | — | | | | — | | | | — | | | | 1,015,852 | |
Repurchase Agreements | | | — | | | | — | | | | 1,274,168 | | | | — | | | | — | | | | 1,274,168 | |
Rights | | | — | | | | — | | | | — | | | | — | | | | — | | | | — | |
Warrants | | | — | | | | — | | | | — | | | | — | | | | — | | | | — | |
Total | | $ | 7,778,300 | | | $ | 11,035 | | | $ | 2,273,392 | | | $ | 34,520 | | | $ | — | | | $ | 10,097,247 | |
| | | | | | | | | | | | | | | | | | | | | | | | | |
Investments in Securities (Liabilities) | | Level 1 | | | Level 1 -
Other* | | | Level 2 | | | Level 2 -
Other* | | | Level 3 | | | Total | |
Equity Index Swap Agreements | | $ | — | | | $ | — | | | $ | — | | | $ | 16,884 | | | $ | — | | | $ | 16,884 | |
* | Other financial instruments include futures contracts and/or swaps, which are reported as unrealized gain/loss at period end. |
Transfers between investment levels may occur as the markets fluctuate and/or the availability of data used in an investment’s valuation changes. Transfers between valuation levels, if any, are in comparison to the valuation levels at the end of the previous fiscal year, and are effective using the fair value as of the end of the previous fiscal period.
For the period ended September 30, 2016, there were no transfers between levels.
98 | THE RYDEX FUNDS SEMI-ANNUAL REPORT | SEE NOTES TO FINANCIAL STATEMENTS. |
RUSSELL 2000® 1.5x STRATEGY FUND | |
STATEMENT OF ASSETS AND LIABILITIES (Unaudited) | |
September 30, 2016 | |
Assets: | |
Investments in unaffiliated issuers, at value (cost $6,995,635) | | $ | 7,761,672 | |
Investments in affiliated issuers, at value (cost $1,011,246) | | | 1,015,852 | |
Repurchase agreements, at value (cost $1,274,168) | | | 1,274,168 | |
Total investments (cost $9,281,049) | | | 10,051,692 | |
Segregated cash with broker | | | 517,700 | |
Unrealized appreciation on swap agreements | | | 34,520 | |
Cash | | | 127 | |
Receivables: | |
Variation margin | | | 3,240 | |
Fund shares sold | | | 6,697 | |
Dividends | | | 9,902 | |
Interest | | | 367 | |
Total assets | | | 10,624,245 | |
| | | | | |
Liabilities: | |
Unrealized depreciation on swap agreements | | | 16,884 | |
Payable for: | |
Fund shares redeemed | | | 14,184 | |
Management fees | | | 8,399 | |
Swap settlement | | | 5,791 | |
Distribution and service fees | | | 3,221 | |
Transfer agent and administrative fees | | | 2,333 | |
Portfolio accounting fees | | | 933 | |
Miscellaneous | | | 4,022 | |
Total liabilities | | | 55,767 | |
Commitments and contingent liabilities (Note 13) | | | — | |
Net assets | | $ | 10,568,478 | |
| | | | | |
Net assets consist of: | |
Paid in capital | | $ | 7,892,521 | |
Accumulated net investment loss | | | (83,980 | ) |
Accumulated net realized gain on investments | | | 1,960,623 | |
Net unrealized appreciation on investments | | | 799,314 | |
Net assets | | $ | 10,568,478 | |
| | | | | |
A-Class: | |
Net assets | | $ | 887,890 | |
Capital shares outstanding | | | 16,684 | |
Net asset value per share | | $ | 53.22 | |
Maximum offering price per share (Net asset value divided by 95.25%) | | $ | 55.87 | |
| | | | | |
C-Class: | |
Net assets | | $ | 1,449,482 | |
Capital shares outstanding | | | 31,042 | |
Net asset value per share | | $ | 46.69 | |
| | | | | |
H-Class: | |
Net assets | | $ | 8,231,106 | |
Capital shares outstanding | | | 154,853 | |
Net asset value per share | | $ | 53.15 | |
STATEMENT OF OPERATIONS (Unaudited) | |
Period Ended September 30, 2016 | |
Investment Income: | |
Dividends from securities of unaffiliated issuers (net of foreign withholding tax of $27) | | $ | 37,040 | |
Dividends from securities of affiliated issuers | | | 10,397 | |
Interest | | | 4,784 | |
Total investment income | | | 52,221 | |
| | | | | |
Expenses: | |
Management fees | | | 49,825 | |
Transfer agent and administrative fees | | | 13,840 | |
Distribution and service fees: | |
A-Class | | | 940 | |
C-Class | | | 7,005 | |
H-Class | | | 11,149 | |
Portfolio accounting fees | | | 5,536 | |
Custodian fees | | | 653 | |
Trustees’ fees* | | | 387 | |
Line of credit fees | | | 53 | |
Miscellaneous | | | 10,930 | |
Total expenses | | | 100,318 | |
Net investment loss | | | (48,097 | ) |
| | | | | |
Net Realized and Unrealized Gain (Loss): | |
Net realized gain (loss) on: | |
Investments in unaffiliated issuers | | | 929,532 | |
Investments in affiliated issuers | | | 4,936 | |
Swap agreements | | | 1,084,879 | |
Futures contracts | | | 140,681 | |
Net realized gain | | | 2,160,028 | |
Net change in unrealized appreciation (depreciation) on: | |
Investments in unaffiliated issuers | | | 92,321 | |
Investments in affiliated issuers | | | 4,675 | |
Swap agreements | | | (74,707 | ) |
Futures contracts | | | 733 | |
Net change in unrealized appreciation (depreciation) | | | 23,022 | |
Net realized and unrealized gain | | | 2,183,050 | |
Net increase in net assets resulting from operations | | $ | 2,134,953 | |
* | Relates to Trustees not deemed “interested persons” within the meaning of Section 2(a)(19) of the 1940 Act. |
SEE NOTES TO FINANCIAL STATEMENTS. | THE RYDEX FUNDS SEMI-ANNUAL REPORT | 99 |
RUSSELL 2000® 1.5x STRATEGY FUND | |
STATEMENTS OF CHANGES IN NET ASSETS |
| | | Period Ended
September 30,
2016
(Unaudited) | | | Year Ended
March 31,
2016 | |
Increase (Decrease) in Net Assets from Operations: | | | | | | |
Net investment loss | | $ | (48,097 | ) | | $ | (232,821 | ) |
Net realized gain on investments | | | 2,160,028 | | | | 2,034,802 | |
Net change in unrealized appreciation (depreciation) on investments | | | 23,022 | | | | (2,714,053 | ) |
Net increase (decrease) in net assets resulting from operations | | | 2,134,953 | | | | (912,072 | ) |
| | | | | | | | | |
Distributions to shareholders from: | | | | | | | | |
Net realized gains | | | | | | | | |
A-Class | | | — | | | | (37,011 | ) |
C-Class | | | — | | | | (125,275 | ) |
H-Class | | | — | | | | (816,653 | ) |
Total distributions to shareholders | | | — | | | | (978,939 | ) |
| | | | | | | | | |
Capital share transactions: | | | | | | | | |
Proceeds from sale of shares | | | | | | | | |
A-Class | | | 935,104 | | | | 4,129,543 | |
C-Class | | | 77,840 | | | | 123,456 | |
H-Class | | | 78,087,222 | | | | 340,767,371 | |
Distributions reinvested | | | | | | | | |
A-Class | | | — | | | | 34,810 | |
C-Class | | | — | | | | 123,960 | |
H-Class | | | — | | | | 813,382 | |
Cost of shares redeemed | | | | | | | | |
A-Class | | | (675,656 | ) | | | (4,165,989 | ) |
C-Class | | | (188,376 | ) | | | (293,524 | ) |
H-Class | | | (79,671,371 | ) | | | (350,796,800 | ) |
Net decrease from capital share transactions | | | (1,435,237 | ) | | | (9,263,791 | ) |
Net increase (decrease) in net assets | | | 699,716 | | | | (11,154,802 | ) |
| | | | | | | | | |
Net assets: | | | | | | | | |
Beginning of period | | | 9,868,762 | | | | 21,023,564 | |
End of period | | $ | 10,568,478 | | | $ | 9,868,762 | |
Accumulated net investment loss at end of period | | $ | (83,980 | ) | | $ | (35,883 | ) |
| | | | | | | | | |
Capital share activity: | | | | | | | | |
Shares sold | | | | | | | | |
A-Class | | | 19,464 | | | | 74,547 | |
C-Class | | | 1,915 | | | | 2,397 | |
H-Class | | | 1,707,803 | | | | 6,930,733 | |
Shares issued from reinvestment of distributions | | | | | | | | |
A-Class | | | — | | | | 723 | |
C-Class | | | — | | | | 2,917 | |
H-Class | | | — | | | | 16,938 | |
Shares redeemed | | | | | | | | |
A-Class | | | (13,878 | ) | | | (74,982 | ) |
C-Class | | | (4,400 | ) | | | (6,389 | ) |
H-Class | | | (1,732,839 | ) | | | (7,088,735 | ) |
Net decrease in shares | | | (21,935 | ) | | | (141,851 | ) |
100 | THE RYDEX FUNDS SEMI-ANNUAL REPORT | SEE NOTES TO FINANCIAL STATEMENTS. |
RUSSELL 2000® 1.5x STRATEGY FUND | |
This table is presented to show selected data for a share outstanding throughout each period and to assist shareholders in evaluating a Fund’s performance for the periods presented.
A-Class | | Period Ended
September 30,
2016a | | | Year Ended
March 31,
2016 | | | Year Ended
March 31,
2015 | | | Year Ended
March 31,
2014 | | | Year Ended
March 28,
2013 | | | Year Ended
March 31,
2012 | |
Per Share Data | | | | | | | | | | | | | | | | | | |
Net asset value, beginning of period | | $ | 44.78 | | | $ | 58.05 | | | $ | 53.23 | | | $ | 39.32 | | | $ | 32.20 | | | $ | 34.37 | |
Income (loss) from investment operations: | |
Net investment income (loss)b | | | (.18 | ) | | | (.43 | ) | | | (.39 | ) | | | (.37 | ) | | | (.16 | ) | | | (.39 | ) |
Net gain (loss) on investments (realized and unrealized) | | | 8.62 | | | | (9.03 | ) | | | 5.41 | | | | 14.28 | | | | 7.28 | | | | (1.78 | ) |
Total from investment operations | | | 8.44 | | | | (9.46 | ) | | | 5.02 | | | | 13.91 | | | | 7.12 | | | | (2.17 | ) |
Less distributions from: | |
Net realized gains | | | — | | | | (3.81 | ) | | | (.20 | ) | | | — | | | | — | | | | — | |
Total distributions | | | — | | | | (3.81 | ) | | | (.20 | ) | | | — | | | | — | | | | — | |
Net asset value, end of period | | $ | 53.22 | | | $ | 44.78 | | | $ | 58.05 | | | $ | 53.23 | | | $ | 39.32 | | | $ | 32.20 | |
| | |
Total Returnc | | | 18.83 | % | | | (16.75 | %) | | | 9.48 | % | | | 35.38 | % | | | 22.11 | % | | | (6.31 | %) |
Ratios/Supplemental Data | |
Net assets, end of period (in thousands) | | $ | 888 | | | $ | 497 | | | $ | 627 | | | $ | 614 | | | $ | 392 | | | $ | 1,355 | |
Ratios to average net assets: | |
Net investment income (loss) | | | (0.72 | %) | | | (0.85 | %) | | | (0.74 | %) | | | (0.78 | %) | | | (0.51 | %) | | | (1.24 | %) |
Total expensesd | | | 1.71 | % | | | 1.70 | % | | | 1.70 | % | | | 1.72 | % | | | 1.71 | % | | | 1.73 | % |
Portfolio turnover rate | | | 353 | % | | | 971 | % | | | 830 | % | | | 472 | % | | | 527 | % | | | 177 | % |
C-Class | | Period Ended
September 30,
2016a | | | Year Ended
March 31,
2016 | | | Year Ended
March 31,
2015 | | | Year Ended
March 31,
2014 | | | Year Ended
March 28,
2013 | | | Year Ended
March 31,
2012 | |
Per Share Data | | | | | | | | | | | | | | | | | | |
Net asset value, beginning of period | | $ | 39.44 | | | $ | 52.01 | | | $ | 48.08 | | | $ | 35.78 | | | $ | 29.52 | | | $ | 31.75 | |
Income (loss) from investment operations: | |
Net investment income (loss)b | | | (.32 | ) | | | (.73 | ) | | | (.70 | ) | | | (.65 | ) | | | (.34 | ) | | | (.54 | ) |
Net gain (loss) on investments (realized and unrealized) | | | 7.57 | | | | (8.03 | ) | | | 4.83 | | | | 12.95 | | | | 6.60 | | | | (1.69 | ) |
Total from investment operations | | | 7.25 | | | | (8.76 | ) | | | 4.13 | | | | 12.30 | | | | 6.26 | | | | (2.23 | ) |
Less distributions from: | |
Net realized gains | | | — | | | | (3.81 | ) | | | (.20 | ) | | | — | | | | — | | | | — | |
Total distributions | | | — | | | | (3.81 | ) | | | (.20 | ) | | | — | | | | — | | | | — | |
Net asset value, end of period | | $ | 46.69 | | | $ | 39.44 | | | $ | 52.01 | | | $ | 48.08 | | | $ | 35.78 | | | $ | 29.52 | |
| | |
Total Returnc | | | 18.38 | % | | | (17.36 | %) | | | 8.64 | % | | | 34.38 | % | | | 21.21 | % | | | (7.02 | %) |
Ratios/Supplemental Data | |
Net assets, end of period (in thousands) | | $ | 1,449 | | | $ | 1,322 | | | $ | 1,800 | | | $ | 1,864 | | | $ | 1,685 | | | $ | 1,839 | |
Ratios to average net assets: | |
Net investment income (loss) | | | (1.51 | %) | | | (1.62 | %) | | | (1.49 | %) | | | (1.55 | %) | | | (1.15 | %) | | | (1.99 | %) |
Total expensesd | | | 2.46 | % | | | 2.45 | % | | | 2.45 | % | | | 2.47 | % | | | 2.46 | % | | | 2.49 | % |
Portfolio turnover rate | | | 353 | % | | | 971 | % | | | 830 | % | | | 472 | % | | | 527 | % | | | 177 | % |
SEE NOTES TO FINANCIAL STATEMENTS. | THE RYDEX FUNDS SEMI-ANNUAL REPORT | 101 |
RUSSELL 2000® 1.5x STRATEGY FUND | |
FINANCIAL HIGHLIGHTS (concluded) |
This table is presented to show selected data for a share outstanding throughout each period and to assist shareholders in evaluating a Fund’s performance for the periods presented.
H-Class | | Period Ended
September 30,
2016a | | | Year Ended
March 31,
2016 | | | Year Ended
March 31,
2015 | | | Year Ended
March 31,
2014 | | | Year Ended
March 28,
2013 | | | Year Ended
March 31,
2012 | |
Per Share Data | | | | | | | | | | | | | | | | | | |
Net asset value, beginning of period | | $ | 44.75 | | | $ | 57.94 | | | $ | 53.13 | | | $ | 39.24 | | | $ | 32.13 | | | $ | 34.29 | |
Income (loss) from investment operations: | |
Net investment income (loss)b | | | (.19 | ) | | | (.51 | ) | | | (.40 | ) | | | (.37 | ) | | | (.08 | ) | | | (.37 | ) |
Net gain (loss) on investments (realized and unrealized) | | | 8.59 | | | | (8.87 | ) | | | 5.41 | | | | 14.26 | | | | 7.19 | | | | (1.79 | ) |
Total from investment operations | | | 8.40 | | | | (9.38 | ) | | | 5.01 | | | | 13.89 | | | | 7.11 | | | | (2.16 | ) |
Less distributions from: | |
Net realized gains | | | — | | | | (3.81 | ) | | | (.20 | ) | | | — | | | | — | | | | — | |
Total distributions | | | — | | | | (3.81 | ) | | | (.20 | ) | | | — | | | | — | | | | — | |
Net asset value, end of period | | $ | 53.15 | | | $ | 44.75 | | | $ | 57.94 | | | $ | 53.13 | | | $ | 39.24 | | | $ | 32.13 | |
| | |
Total Returnc | | | 18.77 | % | | | (16.63 | %) | | | 9.48 | % | | | 35.40 | % | | | 22.13 | % | | | (6.30 | %) |
Ratios/Supplemental Data | |
Net assets, end of period (in thousands) | | $ | 8,231 | | | $ | 8,049 | | | $ | 18,596 | | | $ | 19,056 | | | $ | 44,955 | | | $ | 14,902 | |
Ratios to average net assets: | |
Net investment income (loss) | | | (0.78 | %) | | | (1.01 | %) | | | (0.76 | %) | | | (0.81 | %) | | | (0.25 | %) | | | (1.24 | %) |
Total expensesd | | | 1.71 | % | | | 1.70 | % | | | 1.70 | % | | | 1.72 | % | | | 1.71 | % | | | 1.73 | % |
Portfolio turnover rate | | | 353 | % | | | 971 | % | | | 830 | % | | | 472 | % | | | 527 | % | | | 177 | % |
a | Unaudited figures for the period ended September 30, 2016. Percentage amounts for the period, except total return and portfolio turnover rate, have been annualized. |
b | Net investment income (loss) per share was computed using average shares outstanding throughout the period. |
c | Total return does not reflect the impact of any applicable sales charges. |
d | Does not include expenses of the underlying funds in which the Fund invests. |
102 | THE RYDEX FUNDS SEMI-ANNUAL REPORT | SEE NOTES TO FINANCIAL STATEMENTS. |
FUND PROFILE (Unaudited) | September 30, 2016 |
RUSSELL 2000® FUND
OBJECTIVE: Seeks to provide investment results that match, before fees and expenses, the performance of a specific benchmark on a daily basis. The Fund’s current benchmark is the Russell 2000® Index (the “underlying index”).
Holdings Diversification (Market Exposure as % of Net Assets)
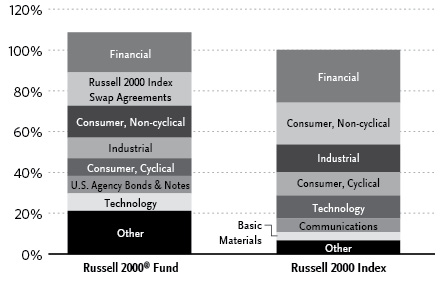
“Holdings Diversification (Market Exposure as % of Net Assets)” excludes any temporary cash investments.
Inception Dates: |
A-Class | May 31, 2006 |
C-Class | May 31, 2006 |
H-Class | May 31, 2006 |
Ten Largest Holdings (% of Total Net Assets) |
Microsemi Corp. | 0.2% |
Advanced Micro Devices, Inc. | 0.2% |
Gramercy Property Trust | 0.2% |
Curtiss-Wright Corp. | 0.2% |
IDACORP, Inc. | 0.2% |
Healthcare Realty Trust, Inc. | 0.2% |
Aspen Technology, Inc. | 0.2% |
Fair Isaac Corp. | 0.2% |
Cepheid | 0.2% |
Portland General Electric Co. | 0.2% |
Top Ten Total | 2.0% |
| | |
“Ten Largest Holdings” excludes any temporary cash or derivative investments. |
| | THE RYDEX FUNDS SEMI-ANNUAL REPORT | 103 |
SCHEDULE OF INVESTMENTS (Unaudited) | September 30, 2016 |
RUSSELL 2000® FUND | |
| | | Shares | | | Value | |
| | | | | | | |
COMMON STOCKS† - 75.8% | |
| | | | | | | |
Financial - 19.6% | |
Gramercy Property Trust | | | 6,387 | | | $ | 61,571 | |
Healthcare Realty Trust, Inc. | | | 1,726 | | | | 58,788 | |
Prosperity Bancshares, Inc. | | | 1,012 | | | | 55,549 | |
PrivateBancorp, Inc. — Class A | | | 1,187 | | | | 54,507 | |
Investors Bancorp, Inc. | | | 4,498 | | | | 54,021 | |
Medical Properties Trust, Inc. | | | 3,585 | | | | 52,950 | |
Webster Financial Corp. | | | 1,387 | | | | 52,720 | |
Ellie Mae, Inc.* | | | 496 | | | | 52,229 | |
Bank of the Ozarks, Inc. | | | 1,341 | | | | 51,494 | |
New Residential Investment Corp. | | | 3,674 | | | | 50,738 | |
Umpqua Holdings Corp. | | | 3,341 | | | | 50,282 | |
First Industrial Realty Trust, Inc. | | | 1,756 | | | | 49,554 | |
Education Realty Trust, Inc. | | | 1,111 | | | | 47,929 | |
DuPont Fabros Technology, Inc. | | | 1,128 | | | | 46,530 | |
Hudson Pacific Properties, Inc. | | | 1,414 | | | | 46,478 | |
National Health Investors, Inc. | | | 564 | | | | 44,263 | |
Radian Group, Inc. | | | 3,255 | | | | 44,106 | |
Physicians Realty Trust | | | 2,043 | | | | 44,006 | |
Chemical Financial Corp. | | | 996 | | | | 43,953 | |
Acadia Realty Trust | | | 1,208 | | | | 43,778 | |
Wintrust Financial Corp. | | | 778 | | | | 43,233 | |
Sunstone Hotel Investors, Inc. | | | 3,286 | | | | 42,028 | |
IBERIABANK Corp. | | | 620 | | | | 41,614 | |
CNO Financial Group, Inc. | | | 2,709 | | | | 41,366 | |
MGIC Investment Corp.* | | | 5,159 | | | | 41,273 | |
UMB Financial Corp. | | | 679 | | | | 40,367 | |
MB Financial, Inc. | | | 1,058 | | | | 40,246 | |
RLI Corp. | | | 575 | | | | 39,306 | |
FNB Corp. | | | 3,177 | | | | 39,077 | |
RLJ Lodging Trust | | | 1,844 | | | | 38,779 | |
LaSalle Hotel Properties | | | 1,613 | | | | 38,502 | |
Texas Capital Bancshares, Inc.* | | | 699 | | | | 38,389 | |
Urban Edge Properties | | | 1,357 | | | | 38,186 | |
Home BancShares, Inc. | | | 1,830 | | | | 38,082 | |
Hancock Holding Co. | | | 1,170 | | | | 37,943 | |
Fulton Financial Corp. | | | 2,600 | | | | 37,752 | |
Genworth Financial, Inc. — Class A* | | | 7,608 | | | | 37,737 | |
Primerica, Inc. | | | 711 | | | | 37,704 | |
CoreSite Realty Corp. | | | 507 | | | | 37,538 | |
QTS Realty Trust, Inc. — Class A | | | 708 | | | | 37,418 | |
United Bankshares, Inc. | | | 993 | | | | 37,406 | |
Stifel Financial Corp.* | | | 969 | | | | 37,257 | |
Mack-Cali Realty Corp. | | | 1,349 | | | | 36,720 | |
Washington Federal, Inc. | | | 1,374 | | | | 36,658 | |
Valley National Bancorp | | | 3,744 | | | | 36,429 | |
Lexington Realty Trust | | | 3,476 | | | | 35,803 | |
Retail Opportunity Investments Corp. | | | 1,626 | | | | 35,707 | |
Pinnacle Financial Partners, Inc. | | | 652 | | | | 35,260 | |
EastGroup Properties, Inc. | | | 478 | | | | 35,162 | |
First Financial Bankshares, Inc. | | | 964 | | | | 35,128 | |
Washington Prime Group, Inc. | | | 2,809 | | | | 34,775 | |
Kite Realty Group Trust | | | 1,250 | | | | 34,650 | |
Washington Real Estate Investment Trust | | | 1,110 | | | | 34,543 | |
Cathay General Bancorp | | | 1,122 | | | | 34,535 | |
Selective Insurance Group, Inc. | | | 859 | | | | 34,239 | |
FirstCash, Inc. | | | 719 | | | | 33,850 | |
PS Business Parks, Inc. | | | 298 | | | | 33,844 | |
Hope Bancorp, Inc. | | | 1,940 | | | | 33,698 | |
WageWorks, Inc.* | | | 552 | | | | 33,622 | |
Sterling Bancorp | | | 1,916 | | | | 33,530 | |
First Citizens BancShares, Inc. — Class A | | | 114 | | | | 33,503 | |
Glacier Bancorp, Inc. | | | 1,152 | | | | 32,855 | |
Cousins Properties, Inc. | | | 3,141 | | | | 32,792 | |
Ryman Hospitality Properties, Inc. | | | 657 | | | | 31,641 | |
Community Bank System, Inc. | | | 651 | | | | 31,320 | |
Colony Capital, Inc. — Class A | | | 1,701 | | | | 31,010 | |
CBL & Associates Properties, Inc. | | | 2,551 | | | | 30,969 | |
LendingClub Corp.* | | | 4,972 | | | | 30,727 | |
Janus Capital Group, Inc. | | | 2,183 | | | | 30,585 | |
Evercore Partners, Inc. — Class A | | | 591 | | | | 30,442 | |
BancorpSouth, Inc. | | | 1,309 | | | | 30,369 | |
EverBank Financial Corp. | | | 1,557 | | | | 30,144 | |
Essent Group Ltd.* | | | 1,129 | | | | 30,043 | |
Great Western Bancorp, Inc. | | | 892 | | | | 29,721 | |
LTC Properties, Inc. | | | 570 | | | | 29,634 | |
BGC Partners, Inc. — Class A | | | 3,291 | | | | 28,796 | |
Pebblebrook Hotel Trust | | | 1,081 | | | | 28,755 | |
Columbia Banking System, Inc. | | | 877 | | | | 28,695 | |
Enstar Group Ltd.* | | | 172 | | | | 28,290 | |
Old National Bancorp | | | 2,009 | | | | 28,247 | |
Colony Starwood Homes | | | 982 | | | | 28,183 | |
Kennedy-Wilson Holdings, Inc. | | | 1,247 | | | | 28,120 | |
Trustmark Corp. | | | 1,019 | | | | 28,084 | |
DiamondRock Hospitality Co. | | | 3,035 | | | | 27,619 | |
Capitol Federal Financial, Inc. | | | 1,928 | | | | 27,127 | |
Monogram Residential Trust, Inc. | | | 2,546 | | | | 27,089 | |
Alexander & Baldwin, Inc. | | | 705 | | | | 27,086 | |
CVB Financial Corp. | | | 1,529 | | | | 26,926 | |
South State Corp. | | | 358 | | | | 26,864 | |
GEO Group, Inc. | | | 1,122 | | | | 26,681 | |
Invesco Mortgage Capital, Inc. | | | 1,702 | | | | 25,921 | |
Select Income REIT | | | 958 | | | | 25,770 | |
American Assets Trust, Inc. | | | 592 | | | | 25,681 | |
Hilltop Holdings, Inc.* | | | 1,134 | | | | 25,469 | |
STAG Industrial, Inc. | | | 1,039 | | | | 25,466 | |
Blackhawk Network Holdings, Inc.* | | | 830 | | | | 25,041 | |
International Bancshares Corp. | | | 827 | | | | 24,628 | |
Argo Group International Holdings Ltd. | | | 436 | | | | 24,599 | |
Sabra Health Care REIT, Inc. | | | 976 | | | | 24,576 | |
PRA Group, Inc.* | | | 697 | | | | 24,073 | |
Financial Engines, Inc. | | | 808 | | | | 24,006 | |
Government Properties Income Trust | | | 1,060 | | | | 23,977 | |
Potlatch Corp. | | | 615 | | | | 23,917 | |
Pennsylvania Real Estate Investment Trust | | | 1,032 | | | | 23,767 | |
Xenia Hotels & Resorts, Inc. | | | 1,564 | | | | 23,742 | |
Kemper Corp. | | | 600 | | | | 23,592 | |
First Midwest Bancorp, Inc. | | | 1,216 | | | | 23,542 | |
American Equity Investment Life Holding Co. | | | 1,295 | | | | 22,960 | |
New York REIT, Inc. | | | 2,498 | | | | 22,857 | |
104 | THE RYDEX FUNDS SEMI-ANNUAL REPORT | SEE NOTES TO FINANCIAL STATEMENTS. |
SCHEDULE OF INVESTMENTS (Unaudited)(continued) | September 30, 2016 |
RUSSELL 2000® FUND | |
| | | Shares | | | Value | |
| | | | | | | |
Northwest Bancshares, Inc. | | | 1,452 | | | $ | 22,811 | |
Eagle Bancorp, Inc.* | | | 462 | | | | 22,790 | |
Rexford Industrial Realty, Inc. | | | 991 | | | | 22,684 | |
Horace Mann Educators Corp. | | | 613 | | | | 22,466 | |
Ramco-Gershenson Properties Trust | | | 1,191 | | | | 22,319 | |
United Community Banks, Inc. | | | 1,060 | | | | 22,281 | |
Simmons First National Corp. — Class A | | | 443 | | | | 22,106 | |
Waddell & Reed Financial, Inc. — Class A | | | 1,200 | | | | 21,792 | |
LegacyTexas Financial Group, Inc. | | | 671 | | | | 21,224 | |
Independent Bank Corp. | | | 391 | | | | 21,149 | |
NBT Bancorp, Inc. | | | 641 | | | | 21,070 | |
Global Net Lease, Inc. | | | 2,578 | | | | 21,037 | |
Renasant Corp. | | | 618 | | | | 20,783 | |
Parkway Properties, Inc. | | | 1,212 | | | | 20,616 | |
Chesapeake Lodging Trust | | | 898 | | | | 20,564 | |
Astoria Financial Corp. | | | 1,392 | | | | 20,323 | |
BofI Holding, Inc.* | | | 906 | | | | 20,294 | |
TowneBank | | | 844 | | | | 20,281 | |
First Financial Bancorp | | | 926 | | | | 20,224 | |
WesBanco, Inc. | | | 608 | | | | 19,982 | |
CYS Investments, Inc. | | | 2,290 | | | | 19,969 | |
Franklin Street Properties Corp. | | | 1,579 | | | | 19,895 | |
Banner Corp. | | | 454 | | | | 19,858 | |
Yadkin Financial Corp. | | | 754 | | | | 19,823 | |
Provident Financial Services, Inc. | | | 923 | | | | 19,595 | |
Four Corners Property Trust, Inc. | | | 913 | | | | 19,474 | |
Park National Corp. | | | 201 | | | | 19,296 | |
Seritage Growth Properties | | | 378 | | | | 19,157 | |
Westamerica Bancorporation | | | 373 | | | | 18,978 | |
Kearny Financial Corp. | | | 1,394 | | | | 18,972 | |
Terreno Realty Corp. | | | 683 | | | | 18,790 | |
ServisFirst Bancshares, Inc. | | | 348 | | | | 18,065 | |
Ameris Bancorp | | | 515 | | | | 17,999 | |
WisdomTree Investments, Inc. | | | 1,738 | | | | 17,884 | |
Apollo Commercial Real Estate Finance, Inc. | | | 1,091 | | | | 17,852 | |
Union Bankshares Corp. | | | 656 | | | | 17,561 | |
FCB Financial Holdings, Inc. — Class A* | | | 453 | | | | 17,409 | |
Summit Hotel Properties, Inc. | | | 1,308 | | | | 17,213 | |
Agree Realty Corp. | | | 344 | | | | 17,008 | |
AMERISAFE, Inc. | | | 287 | | | | 16,870 | |
Tompkins Financial Corp. | | | 219 | | | | 16,734 | |
First Merchants Corp. | | | 616 | | | | 16,478 | |
Navigators Group, Inc. | | | 170 | | | | 16,476 | |
Redwood Trust, Inc. | | | 1,153 | | | | 16,326 | |
National General Holdings Corp. | | | 731 | | | | 16,257 | |
PennyMac Mortgage Investment Trust | | | 1,030 | | | | 16,047 | |
Boston Private Financial Holdings, Inc. | | | 1,237 | | | | 15,871 | |
WSFS Financial Corp. | | | 433 | | | | 15,800 | |
Beneficial Bancorp, Inc. | | | 1,061 | | | | 15,607 | |
MBIA, Inc.* | | | 1,989 | | | | 15,494 | |
Stewart Information Services Corp. | | | 346 | | | | 15,380 | |
HFF, Inc. — Class A | | | 543 | | | | 15,036 | |
S&T Bancorp, Inc. | | | 516 | | | | 14,959 | |
BNC Bancorp | | | 614 | | | | 14,932 | |
Safety Insurance Group, Inc. | | | 218 | | | | 14,654 | |
Employers Holdings, Inc. | | | 485 | | | | 14,468 | |
Hannon Armstrong Sustainable Infrastructure Capital, Inc. | | | 615 | | | | 14,373 | |
Aircastle Ltd. | | | 721 | | | | 14,319 | |
St. Joe Co.* | | | 763 | | | | 14,024 | |
United Fire Group, Inc. | | | 327 | | | | 13,839 | |
Capstead Mortgage Corp. | | | 1,444 | | | | 13,617 | |
Monmouth Real Estate Investment Corp. | | | 953 | | | | 13,599 | |
First Commonwealth Financial Corp. | | | 1,339 | | | | 13,511 | |
Cohen & Steers, Inc. | | | 316 | | | | 13,509 | |
Infinity Property & Casualty Corp. | | | 163 | | | | 13,469 | |
Alexander’s, Inc. | | | 32 | | | | 13,428 | |
New Senior Investment Group, Inc. | | | 1,154 | | | | 13,317 | |
FelCor Lodging Trust, Inc. | | | 2,061 | | | | 13,252 | |
Lakeland Financial Corp. | | | 365 | | | | 12,928 | |
Berkshire Hills Bancorp, Inc. | | | 465 | | | | 12,885 | |
Banc of California, Inc. | | | 737 | | | | 12,868 | |
CareTrust REIT, Inc. | | | 870 | | | | 12,859 | |
Brookline Bancorp, Inc. | | | 1,046 | | | | 12,751 | |
ARMOUR Residential REIT, Inc. | | | 556 | | | | 12,532 | |
Ambac Financial Group, Inc.* | | | 681 | | | | 12,524 | |
Hanmi Financial Corp. | | | 474 | | | | 12,485 | |
Universal Insurance Holdings, Inc. | | | 495 | | | | 12,474 | |
CenterState Banks, Inc. | | | 701 | | | | 12,429 | |
FNFV Group* | | | 994 | | | | 12,405 | |
Cardinal Financial Corp. | | | 475 | | | | 12,393 | |
Nelnet, Inc. — Class A | | | 306 | | | | 12,353 | |
KCG Holdings, Inc. — Class A* | | | 792 | | | | 12,300 | |
State Bank Financial Corp. | | | 529 | | | | 12,072 | |
Third Point Reinsurance Ltd.* | | | 998 | | | | 11,976 | |
Heartland Financial USA, Inc. | | | 332 | | | | 11,975 | |
MTGE Investment Corp. | | | 696 | | | | 11,964 | |
Southside Bancshares, Inc. | | | 371 | | | | 11,939 | |
Universal Health Realty Income Trust | | | 188 | | | | 11,848 | |
RE/MAX Holdings, Inc. — Class A | | | 268 | | | | 11,733 | |
PHH Corp.* | | | 800 | | | | 11,560 | |
Central Pacific Financial Corp. | | | 458 | | | | 11,537 | |
Meridian Bancorp, Inc. | | | 729 | | | | 11,351 | |
Maiden Holdings Ltd. | | | 893 | | | | 11,332 | |
Hersha Hospitality Trust | | | 626 | | | | 11,281 | |
Tier REIT, Inc. | | | 721 | | | | 11,132 | |
National Storage Affiliates Trust | | | 531 | | | | 11,119 | |
iStar, Inc.* | | | 1,036 | | | | 11,116 | |
City Holding Co. | | | 221 | | | | 11,114 | |
InfraREIT, Inc. | | | 603 | | | | 10,938 | |
Chatham Lodging Trust | | | 568 | | | | 10,934 | |
Investors Real Estate Trust | | | 1,831 | | | | 10,895 | |
Sandy Spring Bancorp, Inc. | | | 356 | | | | 10,886 | |
Pacific Premier Bancorp, Inc.* | | | 411 | | | | 10,875 | |
Stock Yards Bancorp, Inc. | | | 321 | | | | 10,580 | |
Piper Jaffray Cos.* | | | 219 | | | | 10,578 | |
First Busey Corp. | | | 468 | | | | 10,577 | |
Walker & Dunlop, Inc.* | | | 416 | | | | 10,508 | |
United Financial Bancorp, Inc. | | | 757 | | | | 10,477 | |
Northfield Bancorp, Inc. | | | 637 | | | | 10,256 | |
New York Mortgage Trust, Inc. REIT | | | 1,663 | | | | 10,011 | |
SEE NOTES TO FINANCIAL STATEMENTS. | THE RYDEX FUNDS SEMI-ANNUAL REPORT | 105 |
SCHEDULE OF INVESTMENTS (Unaudited)(continued) | September 30, 2016 |
RUSSELL 2000® FUND | |
| | | Shares | | | Value | |
| | | | | | | |
Flushing Financial Corp. | | | 420 | | | $ | 9,962 | |
Greenhill & Company, Inc. | | | 420 | | | | 9,899 | |
NorthStar Realty Europe Corp. | | | 901 | | | | 9,866 | |
Urstadt Biddle Properties, Inc. — Class A | | | 443 | | | | 9,843 | |
TrustCo Bank Corp. NY | | | 1,380 | | | | 9,784 | |
Saul Centers, Inc. | | | 145 | | | | 9,657 | |
Capital Bank Financial Corp. — Class A | | | 300 | | | | 9,633 | |
FBL Financial Group, Inc. — Class A | | | 149 | | | | 9,532 | |
Getty Realty Corp. | | | 396 | | | | 9,476 | |
Cass Information Systems, Inc. | | | 166 | | | | 9,404 | |
First Interstate BancSystem, Inc. — Class A | | | 298 | | | | 9,390 | |
First BanCorp* | | | 1,798 | | | | 9,350 | |
Customers Bancorp, Inc.* | | | 368 | | | | 9,259 | |
Oritani Financial Corp. | | | 584 | | | | 9,180 | |
Opus Bank | | | 259 | | | | 9,161 | |
Greenlight Capital Re Ltd. — Class A* | | | 444 | | | | 9,075 | |
Enterprise Financial Services Corp. | | | 290 | | | | 9,063 | |
Washington Trust Bancorp, Inc. | | | 225 | | | | 9,050 | |
Cedar Realty Trust, Inc. | | | 1,247 | | | | 8,978 | |
HomeStreet, Inc.* | | | 357 | | | | 8,946 | |
International. FCStone, Inc.* | | | 228 | | | | 8,858 | |
Silver Bay Realty Trust Corp. | | | 503 | | | | 8,818 | |
Flagstar Bancorp, Inc.* | | | 316 | | | | 8,769 | |
Univest Corporation of Pennsylvania | | | 375 | | | | 8,760 | |
MainSource Financial Group, Inc. | | | 349 | | | | 8,708 | |
Virtus Investment Partners, Inc. | | | 88 | | | | 8,612 | |
Altisource Residential Corp. | | | 790 | | | | 8,611 | |
Easterly Government Properties, Inc. | | | 451 | | | | 8,605 | |
BancFirst Corp. | | | 118 | | | | 8,556 | |
Investment Technology Group, Inc. | | | 498 | | | | 8,536 | |
Community Trust Bancorp, Inc. | | | 230 | | | | 8,535 | |
Diamond Hill Investment Group, Inc. | | | 46 | | | | 8,500 | |
National Bank Holdings Corp. — Class A | | | 363 | | | | 8,483 | |
1st Source Corp. | | | 237 | | | | 8,460 | |
OM Asset Management plc | | | 607 | | | | 8,443 | |
German American Bancorp, Inc. | | | 215 | | | | 8,370 | |
Lakeland Bancorp, Inc. | | | 587 | | | | 8,241 | |
TriCo Bancshares | | | 306 | | | | 8,192 | |
Encore Capital Group, Inc.* | | | 360 | | | | 8,093 | |
Bryn Mawr Bank Corp. | | | 252 | | | | 8,061 | |
First Potomac Realty Trust | | | 876 | | | | 8,015 | |
Heritage Financial Corp. | | | 446 | | | | 8,006 | |
Dime Community Bancshares, Inc. | | | 473 | | | | 7,927 | |
James River Group Holdings Ltd. | | | 216 | | | | 7,819 | |
ConnectOne Bancorp, Inc. | | | 430 | | | | 7,766 | |
Ladder Capital Corp. — Class A | | | 579 | | | | 7,666 | |
Moelis & Co. — Class A | | | 281 | | | | 7,556 | |
Meta Financial Group, Inc. | | | 124 | | | | 7,516 | |
CoBiz Financial, Inc. | | | 562 | | | | 7,480 | |
Independent Bank Group, Inc. | | | 168 | | | | 7,421 | |
Camden National Corp. | | | 154 | | | | 7,352 | |
PJT Partners, Inc. — Class A | | | 268 | | | | 7,308 | |
Nationstar Mortgage Holdings, Inc.* | | | 489 | | | | 7,242 | |
Bridge Bancorp, Inc. | | | 253 | | | | 7,233 | |
Seacoast Banking Corporation of Florida* | | | 448 | | | | 7,208 | |
WMIH Corp.* | | | 3,069 | | | | 7,181 | |
First of Long Island Corp. | | | 215 | | | | 7,127 | |
Anworth Mortgage Asset Corp. | | | 1,447 | | | | 7,119 | |
National Western Life Group, Inc. — Class A | | | 34 | | | | 6,983 | |
Ashford Hospitality Trust, Inc. | | | 1,181 | | | | 6,956 | |
CatchMark Timber Trust, Inc. — Class A | | | 587 | | | | 6,862 | |
Armada Hoffler Properties, Inc. | | | 503 | | | | 6,740 | |
AG Mortgage Investment Trust, Inc. | | | 425 | | | | 6,694 | |
OFG Bancorp | | | 654 | | | | 6,612 | |
Great Southern Bancorp, Inc. | | | 162 | | | | 6,593 | |
Preferred Bank/Los Angeles CA | | | 184 | | | | 6,578 | |
Citizens, Inc.* | | | 702 | | | | 6,571 | |
Waterstone Financial, Inc. | | | 385 | | | | 6,541 | |
Western Asset Mortgage Capital Corp. REIT | | | 619 | | | | 6,450 | |
Mercantile Bank Corp. | | | 240 | | | | 6,444 | |
Westwood Holdings Group, Inc. | | | 121 | | | | 6,426 | |
Park Sterling Corp. | | | 779 | | | | 6,325 | |
Gladstone Commercial Corp. | | | 338 | | | | 6,297 | |
First Financial Corp. | | | 151 | | | | 6,143 | |
Forestar Group, Inc.* | | | 517 | | | | 6,054 | |
Suffolk Bancorp | | | 173 | | | | 6,015 | |
Peoples Bancorp, Inc. | | | 243 | | | | 5,975 | |
OceanFirst Financial Corp. | | | 310 | | | | 5,971 | |
First Defiance Financial Corp. | | | 133 | | | | 5,937 | |
First Bancorp | | | 298 | | | | 5,897 | |
Resource Capital Corp. | | | 458 | | | | 5,867 | |
First Community Bancshares, Inc. | | | 236 | | | | 5,853 | |
Stonegate Bank | | | 173 | | | | 5,839 | |
Horizon Bancorp | | | 198 | | | | 5,817 | |
Heritage Insurance Holdings, Inc. | | | 402 | | | | 5,793 | |
Fidelity Southern Corp. | | | 314 | | | | 5,774 | |
Marcus & Millichap, Inc.* | | | 220 | | | | 5,753 | |
QCR Holdings, Inc. | | | 180 | | | | 5,713 | |
Virtu Financial, Inc. — Class A | | | 381 | | | | 5,704 | |
Financial Institutions, Inc. | | | 210 | | | | 5,693 | |
NMI Holdings, Inc. — Class A* | | | 746 | | | | 5,685 | |
Altisource Portfolio Solutions S.A.* | | | 175 | | | | 5,670 | |
Arrow Financial Corp. | | | 171 | | | | 5,628 | |
CU Bancorp* | | | 246 | | | | 5,611 | |
Cowen Group, Inc. — Class A* | | | 1,544 | | | | 5,605 | |
Blue Hills Bancorp, Inc. | | | 373 | | | | 5,602 | |
Ocwen Financial Corp.* | | | 1,521 | | | | 5,582 | |
State Auto Financial Corp. | | | 234 | | | | 5,572 | |
Whitestone REIT — Class B | | | 396 | | | | 5,496 | |
Independence Realty Trust, Inc. | | | 610 | | | | 5,490 | |
TriState Capital Holdings, Inc.* | | | 332 | | | | 5,362 | |
NexPoint Residential Trust, Inc. | | | 272 | | | | 5,348 | |
Peapack Gladstone Financial Corp. | | | 238 | | | | 5,334 | |
Franklin Financial Network, Inc.* | | | 142 | | | | 5,311 | |
CorEnergy Infrastructure Trust, Inc. | | | 181 | | | | 5,309 | |
Southwest Bancorp, Inc. | | | 273 | | | | 5,184 | |
Independent Bank Corp. | | | 308 | | | | 5,184 | |
Farmer Mac — Class C | | | 130 | | | | 5,135 | |
State National Companies, Inc. | | | 461 | | | | 5,126 | |
Ares Commercial Real Estate Corp. | | | 406 | | | | 5,116 | |
Clifton Bancorp, Inc. | | | 331 | | | | 5,061 | |
106 | THE RYDEX FUNDS SEMI-ANNUAL REPORT | SEE NOTES TO FINANCIAL STATEMENTS. |
SCHEDULE OF INVESTMENTS (Unaudited)(continued) | September 30, 2016 |
RUSSELL 2000® FUND | |
| | | Shares | | | Value | |
| | | | | | | |
Arlington Asset Investment Corp. — Class A | | | 341 | | | $ | 5,043 | |
Dynex Capital, Inc. | | | 679 | | | | 5,038 | |
United Community Financial Corp. | | | 703 | | | | 4,998 | |
Ashford Hospitality Prime, Inc. | | | 350 | | | | 4,935 | |
First Foundation, Inc.* | | | 200 | | | | 4,934 | |
Acacia Research Corp. | | | 754 | | | | 4,916 | |
Pacific Continental Corp. | | | 289 | | | | 4,861 | |
One Liberty Properties, Inc. | | | 200 | | | | 4,832 | |
Bank Mutual Corp. | | | 617 | | | | 4,739 | |
West Bancorporation, Inc. | | | 240 | | | | 4,704 | |
RAIT Financial Trust | | | 1,387 | | | | 4,688 | |
Triumph Bancorp, Inc.* | | | 234 | | | | 4,643 | |
Preferred Apartment Communities, Inc. — Class A | | | 343 | | | | 4,634 | |
HomeTrust Bancshares, Inc.* | | | 250 | | | | 4,625 | |
Houlihan Lokey, Inc. | | | 184 | | | | 4,609 | |
Republic Bancorp, Inc. — Class A | | | 146 | | | | 4,538 | |
Allegiance Bancshares, Inc.* | | | 166 | | | | 4,482 | |
Bank of Marin Bancorp | | | 90 | | | | 4,476 | |
World Acceptance Corp.* | | | 91 | | | | 4,463 | |
CNB Financial Corp. | | | 209 | | | | 4,422 | |
United Insurance Holdings Corp. | | | 260 | | | | 4,415 | |
UMH Properties, Inc. | | | 369 | | | | 4,398 | |
Nicolet Bankshares, Inc.* | | | 114 | | | | 4,372 | |
OneBeacon Insurance Group Ltd. — Class A | | | 302 | | | | 4,313 | |
Heritage Commerce Corp. | | | 394 | | | | 4,310 | |
Live Oak Bancshares, Inc. | | | 296 | | | | 4,268 | |
Peoples Financial Services Corp. | | | 104 | | | | 4,239 | |
Community Healthcare Trust, Inc. | | | 191 | | | | 4,187 | |
Fidelity & Guaranty Life | | | 180 | | | | 4,174 | |
City Office REIT, Inc. | | | 326 | | | | 4,150 | |
On Deck Capital, Inc.* | | | 725 | | | | 4,133 | |
Farmers National Banc Corp. | | | 376 | | | | 4,053 | |
Guaranty Bancorp | | | 227 | | | | 4,052 | |
People’s Utah Bancorp | | | 196 | | | | 3,989 | |
RMR Group, Inc. — Class A | | | 105 | | | | 3,984 | |
HCI Group, Inc. | | | 131 | | | | 3,977 | |
Safeguard Scientifics, Inc.* | | | 304 | | | | 3,940 | |
Atlantic Capital Bancshares, Inc.* | | | 262 | | | | 3,925 | |
Citizens & Northern Corp. | | | 177 | | | | 3,889 | |
Enova International, Inc.* | | | 401 | | | | 3,882 | |
Enterprise Bancorp, Inc. | | | 138 | | | | 3,864 | |
MidWestOne Financial Group, Inc. | | | 125 | | | | 3,796 | |
National Bankshares, Inc. | | | 103 | | | | 3,788 | |
Global Indemnity plc — Class A* | | | 127 | | | | 3,772 | |
First Connecticut Bancorp, Inc. | | | 211 | | | | 3,754 | |
Sun Bancorp, Inc. | | | 162 | | | | 3,736 | |
Bluerock Residential Growth REIT, Inc. | | | 284 | | | | 3,692 | |
First Bancorp, Inc. | | | 154 | | | | 3,691 | |
Trupanion, Inc.* | | | 218 | | | | 3,684 | |
National Interstate Corp. | | | 113 | | | | 3,676 | |
Old Second Bancorp, Inc. | | | 435 | | | | 3,615 | |
NewStar Financial, Inc.* | | | 371 | | | | 3,602 | |
Ames National Corp. | | | 130 | | | | 3,596 | |
Federated National Holding Co. | | | 190 | | | | 3,551 | |
Ladenburg Thalmann Financial Services, Inc.* | | | 1,528 | | | | 3,530 | |
PennyMac Financial Services, Inc. — Class A* | | | 206 | | | | 3,504 | |
Baldwin & Lyons, Inc. — Class B | | | 136 | | | | 3,486 | |
GAIN Capital Holdings, Inc. | | | 564 | | | | 3,486 | |
American National Bankshares, Inc. | | | 124 | | | | 3,466 | |
Regional Management Corp.* | | | 160 | | | | 3,464 | |
National Commerce Corp.* | | | 128 | | | | 3,464 | |
Carolina Financial Corp. | | | 155 | | | | 3,463 | |
Green Bancorp, Inc.* | | | 313 | | | | 3,421 | |
Bancorp, Inc.* | | | 530 | | | | 3,403 | |
EMC Insurance Group, Inc. | | | 126 | | | | 3,393 | |
Bar Harbor Bankshares | | | 90 | | | | 3,305 | |
Sierra Bancorp | | | 176 | | | | 3,302 | |
Farmers Capital Bank Corp. | | | 111 | | | | 3,290 | |
Territorial Bancorp, Inc. | | | 114 | | | | 3,267 | |
Orchid Island Capital, Inc. | | | 308 | | | | 3,209 | |
Macatawa Bank Corp. | | | 400 | | | | 3,196 | |
Consolidated-Tomoka Land Co. | | | 62 | | | | 3,174 | |
Penns Woods Bancorp, Inc. | | | 70 | | | | 3,112 | |
Great Ajax Corp. | | | 225 | | | | 3,071 | |
eHealth, Inc.* | | | 273 | | | | 3,061 | |
WashingtonFirst Bankshares, Inc. | | | 122 | | | | 3,002 | |
Heritage Oaks Bancorp | | | 363 | | | | 2,977 | |
FRP Holdings, Inc.* | | | 95 | | | | 2,952 | |
Access National Corp. | | | 123 | | | | 2,940 | |
BankFinancial Corp. | | | 230 | | | | 2,921 | |
First Mid-Illinois Bancshares, Inc. | | | 106 | | | | 2,890 | |
Cascade Bancorp* | | | 475 | | | | 2,879 | |
First Business Financial Services, Inc. | | | 122 | | | | 2,867 | |
Trinity Place Holdings, Inc.* | | | 293 | | | | 2,866 | |
BSB Bancorp, Inc.* | | | 122 | | | | 2,858 | |
Merchants Bancshares, Inc. | | | 87 | | | | 2,818 | |
Hingham Institution for Savings | | | 20 | | | | 2,770 | |
Charter Financial Corp. | | | 206 | | | | 2,653 | |
Owens Realty Mortgage, Inc. | | | 152 | | | | 2,633 | |
CommunityOne Bancorp* | | | 190 | | | | 2,630 | |
Northrim BanCorp, Inc. | | | 102 | | | | 2,627 | |
Codorus Valley Bancorp, Inc. | | | 117 | | | | 2,560 | |
Atlas Financial Holdings, Inc.* | | | 161 | | | | 2,539 | |
Old Line Bancshares, Inc. | | | 127 | | | | 2,506 | |
Bear State Financial, Inc. | | | 271 | | | | 2,490 | |
Capital City Bank Group, Inc. | | | 166 | | | | 2,452 | |
Home Bancorp, Inc. | | | 87 | | | | 2,436 | |
MBT Financial Corp. | | | 269 | | | | 2,434 | |
Real Industry, Inc.* | | | 396 | | | | 2,424 | |
LCNB Corp. | | | 133 | | | | 2,423 | |
Marlin Business Services Corp. | | | 125 | | | | 2,423 | |
Summit Financial Group, Inc. | | | 126 | | | | 2,414 | |
Associated Capital Group, Inc. — Class A | | | 68 | | | | 2,411 | |
ACNB Corp. | | | 90 | | | | 2,392 | |
MutualFirst Financial, Inc. | | | 82 | | | | 2,274 | |
Stratus Properties, Inc.* | | | 93 | | | | 2,269 | |
First Northwest Bancorp* | | | 168 | | | | 2,266 | |
SEE NOTES TO FINANCIAL STATEMENTS. | THE RYDEX FUNDS SEMI-ANNUAL REPORT | 107 |
SCHEDULE OF INVESTMENTS (Unaudited)(continued) | September 30, 2016 |
RUSSELL 2000® FUND | |
| | | Shares | | | Value | |
| | | | | | | |
Shore Bancshares, Inc. | | | 190 | | | $ | 2,238 | |
First NBC Bank Holding Co.* | | | 237 | | | | 2,237 | |
SI Financial Group, Inc. | | | 168 | | | | 2,218 | |
Orrstown Financial Services, Inc. | | | 112 | | | | 2,212 | |
Premier Financial Bancorp, Inc. | | | 129 | | | | 2,211 | |
Southern National Bancorp of Virginia, Inc. | | | 169 | | | | 2,205 | |
Southern Missouri Bancorp, Inc. | | | 88 | | | | 2,191 | |
Investors Title Co. | | | 22 | | | | 2,189 | |
Veritex Holdings, Inc.* | | | 125 | | | | 2,174 | |
Hallmark Financial Services, Inc.* | | | 211 | | | | 2,171 | |
Oppenheimer Holdings, Inc. — Class A | | | 150 | | | | 2,144 | |
Lake Sunapee Bank Group | | | 118 | | | | 2,132 | |
C&F Financial Corp. | | | 49 | | | | 2,111 | |
Central Valley Community Bancorp | | | 132 | | | | 2,094 | |
Republic First Bancorp, Inc.* | | | 509 | | | | 2,092 | |
Tiptree Financial, Inc. — Class A | | | 346 | | | | 2,055 | |
Crawford & Co. — Class B | | | 181 | | | | 2,054 | |
Century Bancorp, Inc. — Class A | | | 45 | | | | 2,039 | |
Bankwell Financial Group, Inc. | | | 86 | | | | 2,037 | |
Donegal Group, Inc. — Class A | | | 126 | | | | 2,030 | |
Union Bankshares, Inc. | | | 59 | | | | 2,010 | |
Middleburg Financial Corp. | | | 71 | | | | 2,008 | |
Equity Bancshares, Inc. — Class A* | | | 76 | | | | 1,971 | |
Farmland Partners, Inc. | | | 176 | | | | 1,971 | |
First Community Financial Partners, Inc.* | | | 206 | | | | 1,961 | |
Provident Financial Holdings, Inc. | | | 100 | | | | 1,956 | |
First Financial Northwest, Inc. | | | 137 | | | | 1,941 | |
Southern First Bancshares, Inc.* | | | 70 | | | | 1,931 | |
GAMCO Investors, Inc. — Class A | | | 66 | | | | 1,879 | |
Westfield Financial, Inc. | | | 241 | | | | 1,844 | |
Independence Holding Co. | | | 107 | | | | 1,838 | |
First Internet Bancorp | | | 79 | | | | 1,824 | |
Calamos Asset Management, Inc. — Class A | | | 255 | | | | 1,739 | |
Pacific Mercantile Bancorp* | | | 232 | | | | 1,710 | |
Pzena Investment Management, Inc. — Class A | | | 221 | | | | 1,702 | |
ESSA Bancorp, Inc. | | | 123 | | | | 1,701 | |
Blue Capital Reinsurance Holdings Ltd. | | | 89 | | | | 1,630 | |
Xenith Bankshares, Inc.* | | | 697 | | | | 1,610 | |
Manning & Napier, Inc. — Class A | | | 226 | | | | 1,602 | |
Impac Mortgage Holdings, Inc.* | | | 119 | | | | 1,570 | |
Hennessy Advisors, Inc. | | | 43 | | | | 1,525 | |
County Bancorp, Inc. | | | 72 | | | | 1,441 | |
Midland States Bancorp, Inc. | | | 55 | | | | 1,394 | |
Chemung Financial Corp. | | | 47 | | | | 1,363 | |
Silvercrest Asset Management Group, Inc. — Class A | | | 106 | | | | 1,258 | |
FBR & Co. | | | 88 | | | | 1,165 | |
Walter Investment Management Corp.* | | | 282 | | | | 1,145 | |
Provident Bancorp, Inc.* | | | 67 | | | | 1,045 | |
BBX Capital Corp. — Class A* | | | 46 | | | | 949 | |
Greene County Bancorp, Inc. | | | 46 | | | | 767 | |
Medley Management, Inc. — Class A | | | 86 | | | | 723 | |
California First National Bancorp | | | 35 | | | | 489 | |
Fifth Street Asset Management, Inc. | | | 77 | | | | 424 | |
Griffin Industrial Realty, Inc. | | | 11 | | | | 349 | |
United Development Funding IV††† | | | 200 | | | | — | |
Total Financial | | | | | | | 6,825,014 | |
| | | | | | | | | |
Consumer, Non-cyclical - 15.5% | |
Cepheid* | | | 1,099 | | | | 57,905 | |
PAREXEL International Corp.* | | | 793 | | | | 55,074 | |
HealthSouth Corp. | | | 1,341 | | | | 54,403 | |
NuVasive, Inc.* | | | 748 | | | | 49,862 | |
Deluxe Corp. | | | 739 | | | | 49,380 | |
B&G Foods, Inc. | | | 993 | | | | 48,835 | |
Bright Horizons Family Solutions, Inc.* | | | 664 | | | | 44,415 | |
Horizon Pharma plc* | | | 2,438 | | | | 44,201 | |
Exelixis, Inc.* | | | 3,436 | | | | 43,946 | |
Cantel Medical Corp. | | | 542 | | | | 42,265 | |
Healthcare Services Group, Inc. | | | 1,064 | | | | 42,114 | |
Snyder’s-Lance, Inc. | | | 1,217 | | | | 40,866 | |
TESARO, Inc.* | | | 405 | | | | 40,597 | |
Sarepta Therapeutics, Inc.* | | | 646 | | | | 39,671 | |
Catalent, Inc.* | | | 1,506 | | | | 38,914 | |
Prestige Brands Holdings, Inc.* | | | 804 | | | | 38,809 | |
Ultragenyx Pharmaceutical, Inc.* | | | 545 | | | | 38,662 | |
Cimpress N.V.* | | | 380 | | | | 38,448 | |
Medicines Co.* | | | 1,017 | | | | 38,381 | |
Wright Medical Group N.V.* | | | 1,559 | | | | 38,242 | |
Molina Healthcare, Inc.* | | | 654 | | | | 38,142 | |
Bluebird Bio, Inc.* | | | 560 | | | | 37,957 | |
Nevro Corp.* | | | 363 | | | | 37,894 | |
Integra LifeSciences Holdings Corp.* | | | 457 | | | | 37,725 | |
Avon Products, Inc.* | | | 6,658 | | | | 37,684 | |
Lancaster Colony Corp. | | | 284 | | | | 37,514 | |
Masimo Corp.* | | | 618 | | | | 36,765 | |
ARIAD Pharmaceuticals, Inc.* | | | 2,674 | | | | 36,607 | |
Helen of Troy Ltd.* | | | 424 | | | | 36,536 | |
Insulet Corp.* | | | 871 | | | | 35,659 | |
Chemed Corp. | | | 245 | | | | 34,562 | |
Nektar Therapeutics* | | | 1,957 | | | | 33,620 | |
Darling Ingredients, Inc.* | | | 2,482 | | | | 33,533 | |
ABM Industries, Inc. | | | 842 | | | | 33,427 | |
Team Health Holdings, Inc.* | | | 1,025 | | | | 33,374 | |
Kite Pharma, Inc.* | | | 593 | | | | 33,125 | |
Owens & Minor, Inc. | | | 943 | | | | 32,751 | |
Prothena Corporation plc* | | | 525 | | | | 31,484 | |
Ironwood Pharmaceuticals, Inc. — Class A* | | | 1,956 | | | | 31,061 | |
Neogen Corp.* | | | 551 | | | | 30,822 | |
Cardtronics plc — Class A* | | | 682 | | | | 30,417 | |
Vector Group Ltd. | | | 1,404 | | | | 30,217 | |
United Natural Foods, Inc.* | | | 749 | | | | 29,990 | |
Exact Sciences Corp.* | | | 1,598 | | | | 29,675 | |
Matthews International Corp. — Class A | | | 484 | | | | 29,408 | |
Ligand Pharmaceuticals, Inc. — Class B* | | | 288 | | | | 29,393 | |
Fresh Del Monte Produce, Inc. | | | 489 | | | | 29,291 | |
Penumbra, Inc.* | | | 385 | | | | 29,256 | |
Sanderson Farms, Inc. | | | 303 | | | | 29,188 | |
Monro Muffler Brake, Inc. | | | 475 | | | | 29,056 | |
Sotheby’s | | | 744 | | | | 28,287 | |
108 | THE RYDEX FUNDS SEMI-ANNUAL REPORT | SEE NOTES TO FINANCIAL STATEMENTS. |
SCHEDULE OF INVESTMENTS (Unaudited)(continued) | September 30, 2016 |
RUSSELL 2000® FUND | |
| | | Shares | | | Value | |
| | | | | | | |
HMS Holdings Corp.* | | | 1,274 | | | $ | 28,245 | |
ICU Medical, Inc.* | | | 222 | | | | 28,056 | |
Haemonetics Corp.* | | | 773 | | | | 27,990 | |
FTI Consulting, Inc.* | | | 628 | | | | 27,983 | |
Incorporated Research Holdings, Inc. — Class A* | | | 626 | | | | 27,907 | |
On Assignment, Inc.* | | | 768 | | | | 27,871 | |
Advisory Board Co.* | | | 620 | | | | 27,739 | |
Grand Canyon Education, Inc.* | | | 680 | | | | 27,465 | |
J&J Snack Foods Corp. | | | 227 | | | | 27,040 | |
CEB, Inc. | | | 486 | | | | 26,472 | |
Travelport Worldwide Ltd. | | | 1,747 | | | | 26,257 | |
Impax Laboratories, Inc.* | | | 1,107 | | | | 26,236 | |
Radius Health, Inc.* | | | 477 | | | | 25,801 | |
Brink’s Co. | | | 681 | | | | 25,251 | |
Aaron’s, Inc. | | | 993 | | | | 25,242 | |
Puma Biotechnology, Inc.* | | | 373 | | | | 25,010 | |
HealthEquity, Inc.* | | | 653 | | | | 24,716 | |
Halyard Health, Inc.* | | | 708 | | | | 24,539 | |
NxStage Medical, Inc.* | | | 962 | | | | 24,040 | |
WD-40 Co. | | | 213 | | | | 23,947 | |
Globus Medical, Inc. — Class A* | | | 1,059 | | | | 23,902 | |
Alder Biopharmaceuticals, Inc.* | | | 708 | | | | 23,201 | |
Depomed, Inc.* | | | 922 | | | | 23,041 | |
AMN Healthcare Services, Inc.* | | | 715 | | | | 22,787 | |
Dean Foods Co. | | | 1,385 | | | | 22,714 | |
DeVry Education Group, Inc. | | | 945 | | | | 21,792 | |
Select Medical Holdings Corp.* | | | 1,613 | | | | 21,776 | |
LifeLock, Inc.* | | | 1,277 | | | | 21,607 | |
Cambrex Corp.* | | | 482 | | | | 21,430 | |
Five Prime Therapeutics, Inc.* | | | 408 | | | | 21,416 | |
Ophthotech Corp.* | | | 461 | | | | 21,266 | |
Zeltiq Aesthetics, Inc.* | | | 536 | | | | 21,022 | |
Myriad Genetics, Inc.* | | | 1,020 | | | | 20,992 | |
PRA Health Sciences, Inc.* | | | 366 | | | | 20,683 | |
Boston Beer Company, Inc. — Class A* | | | 133 | | | | 20,649 | |
Magellan Health, Inc.* | | | 376 | | | | 20,202 | |
Amedisys, Inc.* | | | 423 | | | | 20,067 | |
SUPERVALU, Inc.* | | | 4,019 | | | | 20,054 | |
Halozyme Therapeutics, Inc.* | | | 1,648 | | | | 19,908 | |
Theravance Biopharma, Inc.* | | | 549 | | | | 19,896 | |
Surgical Care Affiliates, Inc.* | | | 406 | | | | 19,797 | |
Universal Corp. | | | 336 | | | | 19,562 | |
Huron Consulting Group, Inc.* | | | 327 | | | | 19,542 | |
Diplomat Pharmacy, Inc.* | | | 692 | | | | 19,383 | |
Natus Medical, Inc.* | | | 492 | | | | 19,331 | |
Community Health Systems, Inc.* | | | 1,668 | | | | 19,249 | |
Pacira Pharmaceuticals, Inc.* | | | 551 | | | | 18,855 | |
Sage Therapeutics, Inc.* | | | 399 | | | | 18,374 | |
Cynosure, Inc. — Class A* | | | 359 | | | | 18,287 | |
Korn/Ferry International | | | 866 | | | | 18,186 | |
Cal-Maine Foods, Inc. | | | 468 | | | | 18,037 | |
Supernus Pharmaceuticals, Inc.* | | | 709 | | | | 17,534 | |
Spark Therapeutics, Inc.* | | | 289 | | | | 17,357 | |
Clovis Oncology, Inc.* | | | 481 | | | | 17,340 | |
Insperity, Inc. | | | 237 | | | | 17,216 | |
Abaxis, Inc. | | | 332 | | | | 17,138 | |
Air Methods Corp.* | | | 538 | | | | 16,942 | |
Portola Pharmaceuticals, Inc.* | | | 744 | | | | 16,896 | |
CONMED Corp. | | | 417 | | | | 16,705 | |
Analogic Corp. | | | 188 | | | | 16,657 | |
FibroGen, Inc.* | | | 791 | | | | 16,374 | |
Cempra, Inc.* | | | 675 | | | | 16,335 | |
Spectranetics Corp.* | | | 646 | | | | 16,208 | |
SpartanNash Co. | | | 559 | | | | 16,166 | |
EVERTEC, Inc. | | | 960 | | | | 16,109 | |
Amicus Therapeutics, Inc.* | | | 2,152 | | | | 15,925 | |
Merit Medical Systems, Inc.* | | | 651 | | | | 15,813 | |
Endologix, Inc.* | | | 1,225 | | | | 15,680 | |
ACCO Brands Corp.* | | | 1,607 | | | | 15,491 | |
Emergent BioSolutions, Inc.* | | | 491 | | | | 15,481 | |
TherapeuticsMD, Inc.* | | | 2,268 | | | | 15,445 | |
Repligen Corp.* | | | 511 | | | | 15,427 | |
Calavo Growers, Inc. | | | 234 | | | | 15,311 | |
Synergy Pharmaceuticals, Inc.* | | | 2,742 | | | | 15,108 | |
Acceleron Pharma, Inc.* | | | 414 | | | | 14,983 | |
Green Dot Corp. — Class A* | | | 645 | | | | 14,874 | |
Inogen, Inc.* | | | 247 | | | | 14,795 | |
Array BioPharma, Inc.* | | | 2,182 | | | | 14,729 | |
Andersons, Inc. | | | 406 | | | | 14,689 | |
Navigant Consulting, Inc.* | | | 718 | | | | 14,518 | |
Ensign Group, Inc. | | | 721 | | | | 14,514 | |
Paylocity Holding Corp.* | | | 326 | | | | 14,494 | |
TrueBlue, Inc.* | | | 637 | | | | 14,434 | |
MacroGenics, Inc.* | | | 482 | | | | 14,417 | |
Achillion Pharmaceuticals, Inc.* | | | 1,771 | | | | 14,345 | |
Team, Inc.* | | | 437 | | | | 14,294 | |
Performance Food Group Co.* | | | 566 | | | | 14,037 | |
TriNet Group, Inc.* | | | 637 | | | | 13,778 | |
Seaboard Corp.* | | | 4 | | | | 13,760 | |
Aerie Pharmaceuticals, Inc.* | | | 364 | | | | 13,737 | |
Luminex Corp.* | | | 601 | | | | 13,655 | |
Insmed, Inc.* | | | 935 | | | | 13,576 | |
Acorda Therapeutics, Inc.* | | | 650 | | | | 13,572 | |
Innoviva, Inc.* | | | 1,221 | | | | 13,419 | |
MiMedx Group, Inc.* | | | 1,545 | | | | 13,256 | |
NutriSystem, Inc. | | | 440 | | | | 13,064 | |
Kindred Healthcare, Inc. | | | 1,273 | | | | 13,010 | |
AMAG Pharmaceuticals, Inc.* | | | 527 | | | | 12,917 | |
Healthways, Inc.* | | | 482 | | | | 12,754 | |
Dermira, Inc.* | | | 372 | | | | 12,581 | |
Central Garden & Pet Co. — Class A* | | | 506 | | | | 12,549 | |
PharMerica Corp.* | | | 447 | | | | 12,547 | |
Vascular Solutions, Inc.* | | | 255 | | | | 12,299 | |
Retrophin, Inc.* | | | 548 | | | | 12,264 | |
Meridian Bioscience, Inc. | | | 631 | | | | 12,172 | |
ICF International, Inc.* | | | 273 | | | | 12,099 | |
Coherus Biosciences, Inc.* | | | 446 | | | | 11,944 | |
Xencor, Inc.* | | | 486 | | | | 11,902 | |
Merrimack Pharmaceuticals, Inc.* | | | 1,845 | | | | 11,716 | |
Quad/Graphics, Inc. | | | 438 | | | | 11,703 | |
Raptor Pharmaceutical Corp.* | | | 1,292 | | | | 11,589 | |
SEE NOTES TO FINANCIAL STATEMENTS. | THE RYDEX FUNDS SEMI-ANNUAL REPORT | 109 |
SCHEDULE OF INVESTMENTS (Unaudited)(continued) | September 30, 2016 |
RUSSELL 2000® FUND | |
| | | Shares | | | Value | |
| | | | | | | |
Lexicon Pharmaceuticals, Inc.* | | | 639 | | | $ | 11,547 | |
Momenta Pharmaceuticals, Inc.* | | | 982 | | | | 11,480 | |
US Physical Therapy, Inc. | | | 183 | | | | 11,474 | |
Cardiovascular Systems, Inc.* | | | 482 | | | | 11,443 | |
Orthofix International N.V.* | | | 265 | | | | 11,334 | |
McGrath RentCorp | | | 355 | | | | 11,257 | |
Viad Corp. | | | 304 | | | | 11,208 | |
National Healthcare Corp. | | | 169 | | | | 11,152 | |
Lannett Company, Inc.* | | | 419 | | | | 11,133 | |
USANA Health Sciences, Inc.* | | | 79 | | | | 10,930 | |
Pacific Biosciences of California, Inc.* | | | 1,214 | | | | 10,877 | |
Coca-Cola Bottling Company Consolidated | | | 71 | | | | 10,520 | |
ZIOPHARM Oncology, Inc.* | | | 1,837 | | | | 10,342 | |
Apollo Education Group, Inc. — Class A* | | | 1,291 | | | | 10,263 | |
Amphastar Pharmaceuticals, Inc.* | | | 538 | | | | 10,206 | |
Anika Therapeutics, Inc.* | | | 213 | | | | 10,192 | |
Capella Education Co. | | | 171 | | | | 9,925 | |
Rent-A-Center, Inc. | | | 784 | | | | 9,910 | |
Tootsie Roll Industries, Inc. | | | 260 | | | | 9,576 | |
Glaukos Corp.* | | | 253 | | | | 9,548 | |
Providence Service Corp.* | | | 196 | | | | 9,531 | |
Cerus Corp.* | | | 1,531 | | | | 9,508 | |
Accelerate Diagnostics, Inc.* | | | 348 | | | | 9,486 | |
Eagle Pharmaceuticals, Inc.* | | | 134 | | | | 9,380 | |
Inovio Pharmaceuticals, Inc.* | | | 1,002 | | | | 9,339 | |
LendingTree, Inc.* | | | 96 | | | | 9,303 | |
Vanda Pharmaceuticals, Inc.* | | | 554 | | | | 9,219 | |
Blueprint Medicines Corp.* | | | 303 | | | | 8,999 | |
Adeptus Health, Inc. — Class A* | | | 209 | | | | 8,997 | |
Quidel Corp.* | | | 406 | | | | 8,969 | |
Atrion Corp. | | | 21 | | | | 8,959 | |
Kelly Services, Inc. — Class A | | | 444 | | | | 8,534 | |
Inter Parfums, Inc. | | | 264 | | | | 8,519 | |
Novavax, Inc.* | | | 4,080 | | | | 8,486 | |
CryoLife, Inc. | | | 477 | | | | 8,381 | |
LHC Group, Inc.* | | | 227 | | | | 8,372 | |
PDL BioPharma, Inc. | | | 2,497 | | | | 8,365 | |
Ingles Markets, Inc. — Class A | | | 211 | | | | 8,343 | |
CBIZ, Inc.* | | | 745 | | | | 8,337 | |
Vitae Pharmaceuticals, Inc.* | | | 398 | | | | 8,326 | |
Heron Therapeutics, Inc.* | | | 481 | | | | 8,288 | |
Genomic Health, Inc.* | | | 282 | | | | 8,155 | |
Resources Connection, Inc. | | | 539 | | | | 8,053 | |
RPX Corp.* | | | 750 | | | | 8,018 | |
ANI Pharmaceuticals, Inc.* | | | 120 | | | | 7,962 | |
Agenus, Inc.* | | | 1,104 | | | | 7,927 | |
Intra-Cellular Therapies, Inc.* | | | 519 | | | | 7,910 | |
National Beverage Corp.* | | | 177 | | | | 7,797 | |
SciClone Pharmaceuticals, Inc.* | | | 757 | | | | 7,759 | |
Omega Protein Corp.* | | | 331 | | | | 7,735 | |
Triple-S Management Corp. — Class B* | | | 352 | | | | 7,719 | |
MGP Ingredients, Inc. | | | 190 | | | | 7,699 | |
Phibro Animal Health Corp. — Class A | | | 283 | | | | 7,692 | |
Weis Markets, Inc. | | | 145 | | | | 7,685 | |
Accuray, Inc.* | | | 1,204 | | | | 7,669 | |
Kforce, Inc. | | | 371 | | | | 7,602 | |
BioTelemetry, Inc.* | | | 408 | | | | 7,577 | |
AtriCure, Inc.* | | | 475 | | | | 7,515 | |
Atara Biotherapeutics, Inc.* | | | 351 | | | | 7,508 | |
Strayer Education, Inc.* | | | 159 | | | | 7,422 | |
Corcept Therapeutics, Inc.* | | | 1,129 | | | | 7,339 | |
K12, Inc.* | | | 511 | | | | 7,333 | |
GenMark Diagnostics, Inc.* | | | 607 | | | | 7,163 | |
Amplify Snack Brands, Inc.* | | | 442 | | | | 7,160 | |
AngioDynamics, Inc.* | | | 408 | | | | 7,156 | |
Capital Senior Living Corp.* | | | 425 | | | | 7,140 | |
PTC Therapeutics, Inc.* | | | 503 | | | | 7,047 | |
K2M Group Holdings, Inc.* | | | 389 | | | | 6,916 | |
Career Education Corp.* | | | 1,010 | | | | 6,858 | |
Omeros Corp.* | | | 612 | | | | 6,830 | |
Arrowhead Pharmaceuticals, Inc.* | | | 914 | | | | 6,718 | |
SP Plus Corp.* | | | 261 | | | | 6,674 | |
Aduro Biotech, Inc.* | | | 536 | | | | 6,662 | |
Progenics Pharmaceuticals, Inc.* | | | 1,052 | | | | 6,659 | |
John B Sanfilippo & Son, Inc. | | | 129 | | | | 6,622 | |
Lion Biotechnologies, Inc.* | | | 803 | | | | 6,609 | |
Otonomy, Inc.* | | | 363 | | | | 6,603 | |
Flexion Therapeutics, Inc.* | | | 337 | | | | 6,585 | |
NeoGenomics, Inc.* | | | 801 | | | | 6,584 | |
Novocure Ltd.* | | | 765 | | | | 6,533 | |
OraSure Technologies, Inc.* | | | 819 | | | | 6,527 | |
Ennis, Inc. | | | 387 | | | | 6,521 | |
Revlon, Inc. — Class A* | | | 177 | | | | 6,510 | |
Albany Molecular Research, Inc.* | | | 393 | | | | 6,488 | |
Arena Pharmaceuticals, Inc.* | | | 3,705 | | | | 6,484 | |
Landauer, Inc. | | | 144 | | | | 6,405 | |
Cotiviti Holdings, Inc.* | | | 191 | | | | 6,403 | |
Keryx Biopharmaceuticals, Inc.* | | | 1,193 | | | | 6,335 | |
Bellicum Pharmaceuticals, Inc.* | | | 317 | | | | 6,308 | |
Enanta Pharmaceuticals, Inc.* | | | 236 | | | | 6,280 | |
Dynavax Technologies Corp.* | | | 588 | | | | 6,168 | |
Intersect ENT, Inc.* | | | 386 | | | | 6,114 | |
Epizyme, Inc.* | | | 609 | | | | 5,993 | |
Medifast, Inc. | | | 158 | | | | 5,971 | |
Aimmune Therapeutics, Inc.* | | | 397 | | | | 5,955 | |
Surmodics, Inc.* | | | 196 | | | | 5,898 | |
Forrester Research, Inc. | | | 150 | | | | 5,836 | |
Celldex Therapeutics, Inc.* | | | 1,444 | | | | 5,834 | |
Advaxis, Inc.* | | | 542 | | | | 5,794 | |
Global Blood Therapeutics, Inc.* | | | 250 | | | | 5,763 | |
CorVel Corp.* | | | 150 | | | | 5,760 | |
Teladoc, Inc.* | | | 314 | | | | 5,749 | |
Cross Country Healthcare, Inc.* | | | 485 | | | | 5,713 | |
Surgery Partners, Inc.* | | | 281 | | | | 5,687 | |
STAAR Surgical Co.* | | | 605 | | | | 5,687 | |
Hackett Group, Inc. | | | 339 | | | | 5,600 | |
Spectrum Pharmaceuticals, Inc.* | | | 1,171 | | | | 5,469 | |
Ardelyx, Inc.* | | | 417 | | | | 5,396 | |
ConforMIS, Inc.* | | | 541 | | | | 5,367 | |
Invacare Corp. | | | 479 | | | | 5,350 | |
Tobira Therapeutics, Inc.* | | | 134 | | | | 5,325 | |
Universal American Corp. | | | 694 | | | | 5,309 | |
110 | THE RYDEX FUNDS SEMI-ANNUAL REPORT | SEE NOTES TO FINANCIAL STATEMENTS. |
SCHEDULE OF INVESTMENTS (Unaudited)(continued) | September 30, 2016 |
RUSSELL 2000® FUND | |
| | | Shares | | | Value | |
| | | | | | | |
Barrett Business Services, Inc. | | | 107 | | | $ | 5,308 | |
Carriage Services, Inc. — Class A | | | 224 | | | | 5,298 | |
Loxo Oncology, Inc.* | | | 202 | | | | 5,288 | |
Axovant Sciences Ltd.* | | | 370 | | | | 5,180 | |
Rigel Pharmaceuticals, Inc.* | | | 1,407 | | | | 5,164 | |
Geron Corp.* | | | 2,281 | | | | 5,155 | |
Heidrick & Struggles International, Inc. | | | 277 | | | | 5,138 | |
Tejon Ranch Co.* | | | 211 | | | | 5,132 | |
Versartis, Inc.* | | | 413 | | | | 5,059 | |
Revance Therapeutics, Inc.* | | | 309 | | | | 5,009 | |
Heska Corp.* | | | 92 | | | | 5,008 | |
La Jolla Pharmaceutical Co.* | | | 210 | | | | 4,996 | |
Organovo Holdings, Inc.* | | | 1,301 | | | | 4,931 | |
Akebia Therapeutics, Inc.* | | | 543 | | | | 4,914 | |
NewLink Genetics Corp.* | | | 327 | | | | 4,912 | |
BioCryst Pharmaceuticals, Inc.* | | | 1,110 | | | | 4,895 | |
Sangamo BioSciences, Inc.* | | | 1,049 | | | | 4,857 | |
Rockwell Medical, Inc.* | | | 724 | | | | 4,851 | |
CytomX Therapeutics, Inc.* | | | 309 | | | | 4,845 | |
Monster Worldwide, Inc.* | | | 1,324 | | | | 4,780 | |
Teligent, Inc.* | | | 626 | | | | 4,758 | |
Foundation Medicine, Inc.* | | | 203 | | | | 4,740 | |
Aratana Therapeutics, Inc.* | | | 504 | | | | 4,717 | |
Cytokinetics, Inc.* | | | 512 | | | | 4,700 | |
American Public Education, Inc.* | | | 234 | | | | 4,636 | |
Trevena, Inc.* | | | 676 | | | | 4,563 | |
Almost Family, Inc.* | | | 123 | | | | 4,523 | |
Alarm.com Holdings, Inc.* | | | 156 | | | | 4,502 | |
ServiceSource International, Inc.* | | | 922 | | | | 4,499 | |
NanoString Technologies, Inc.* | | | 224 | | | | 4,476 | |
Smart & Final Stores, Inc.* | | | 350 | | | | 4,470 | |
Curis, Inc.* | | | 1,686 | | | | 4,400 | |
Natera, Inc.* | | | 394 | | | | 4,377 | |
Sucampo Pharmaceuticals, Inc. — Class A* | | | 354 | | | | 4,358 | |
Farmer Brothers Co.* | | | 122 | | | | 4,337 | |
Weight Watchers International, Inc.* | | | 420 | | | | 4,334 | |
TG Therapeutics, Inc.* | | | 557 | | | | 4,311 | |
REGENXBIO, Inc.* | | | 306 | | | | 4,287 | |
Immunomedics, Inc.* | | | 1,319 | | | | 4,287 | |
Zogenix, Inc.* | | | 375 | | | | 4,286 | |
Exactech, Inc.* | | | 158 | | | | 4,271 | |
Oxford Immunotec Global plc* | | | 336 | | | | 4,220 | |
Insys Therapeutics, Inc.* | | | 355 | | | | 4,185 | |
Civitas Solutions, Inc.* | | | 228 | | | | 4,163 | |
RadNet, Inc.* | | | 562 | | | | 4,159 | |
Adamas Pharmaceuticals, Inc.* | | | 252 | | | | 4,135 | |
BioTime, Inc.* | | | 1,051 | | | | 4,099 | |
Minerva Neurosciences, Inc.* | | | 287 | | | | 4,050 | |
LeMaitre Vascular, Inc. | | | 204 | | | | 4,047 | |
Central Garden & Pet Co.* | | | 153 | | | | 3,978 | |
Collegium Pharmaceutical, Inc.* | | | 205 | | | | 3,948 | |
Nutraceutical International Corp.* | | | 125 | | | | 3,905 | |
Primo Water Corp.* | | | 319 | | | | 3,869 | |
BioSpecifics Technologies Corp.* | | | 81 | | | | 3,699 | |
Aclaris Therapeutics, Inc.* | | | 144 | | | | 3,688 | |
OncoMed Pharmaceuticals, Inc.* | | | 321 | | | | 3,669 | |
BioScrip, Inc.* | | | 1,261 | | | | 3,644 | |
WaVe Life Sciences Ltd.* | | | 112 | | | | 3,637 | |
Craft Brew Alliance, Inc.* | | | 191 | | | | 3,597 | |
Chimerix, Inc.* | | | 646 | | | | 3,579 | |
Ascent Capital Group, Inc. — Class A* | | | 154 | | | | 3,568 | |
XBiotech, Inc.* | | | 264 | | | | 3,553 | |
Village Super Market, Inc. — Class A | | | 111 | | | | 3,553 | |
Karyopharm Therapeutics, Inc.* | | | 357 | | | | 3,474 | |
Idera Pharmaceuticals, Inc.* | | | 1,345 | | | | 3,443 | |
Paratek Pharmaceuticals, Inc.* | | | 263 | | | | 3,422 | |
ImmunoGen, Inc.* | | | 1,273 | | | | 3,412 | |
OvaScience, Inc.* | | | 475 | | | | 3,401 | |
MediciNova, Inc.* | | | 449 | | | | 3,363 | |
Limoneira Co. | | | 177 | | | | 3,345 | |
Seres Therapeutics, Inc.* | | | 270 | | | | 3,318 | |
InVivo Therapeutics Holdings Corp.* | | | 487 | | | | 3,312 | |
CSS Industries, Inc. | | | 129 | | | | 3,300 | |
AxoGen, Inc.* | | | 365 | | | | 3,296 | |
TerraVia Holdings, Inc.* | | | 1,187 | | | | 3,264 | |
Chefs’ Warehouse, Inc.* | | | 293 | | | | 3,264 | |
CRA International, Inc.* | | | 121 | | | | 3,217 | |
MoneyGram International, Inc.* | | | 448 | | | | 3,181 | |
Natural Health Trends Corp. | | | 112 | | | | 3,165 | |
Great Lakes Dredge & Dock Corp.* | | | 892 | | | | 3,122 | |
Enzo Biochem, Inc.* | | | 600 | | | | 3,054 | |
Utah Medical Products, Inc. | | | 51 | | | | 3,050 | |
MannKind Corp.* | | | 4,901 | | | | 3,039 | |
Invitae Corp.* | | | 344 | | | | 3,013 | |
Esperion Therapeutics, Inc.* | | | 216 | | | | 2,992 | |
Avexis, Inc.* | | | 72 | | | | 2,967 | |
Sorrento Therapeutics, Inc.* | | | 381 | | | | 2,949 | |
Addus HomeCare Corp.* | | | 112 | | | | 2,930 | |
Quorum Health Corp.* | | | 449 | | | | 2,815 | |
Nobilis Health Corp.* | | | 838 | | | | 2,807 | |
Ignyta, Inc.* | | | 446 | | | | 2,805 | |
Seneca Foods Corp. — Class A* | | | 99 | | | | 2,796 | |
MyoKardia, Inc.* | | | 170 | | | | 2,778 | |
Stemline Therapeutics, Inc.* | | | 255 | | | | 2,762 | |
Franklin Covey Co.* | | | 154 | | | | 2,743 | |
RTI Surgical, Inc.* | | | 868 | | | | 2,717 | |
Inventure Foods, Inc.* | | | 287 | | | | 2,698 | |
Cellular Biomedicine Group, Inc.* | | | 184 | | | | 2,668 | |
Cara Therapeutics, Inc.* | | | 318 | | | | 2,655 | |
Durect Corp.* | | | 1,907 | | | | 2,651 | |
AAC Holdings, Inc.* | | | 150 | | | | 2,609 | |
Edge Therapeutics, Inc.* | | | 246 | | | | 2,561 | |
Egalet Corp.* | | | 335 | | | | 2,549 | |
Concert Pharmaceuticals, Inc.* | | | 249 | | | | 2,517 | |
Entellus Medical, Inc.* | | | 113 | | | | 2,506 | |
Inotek Pharmaceuticals Corp.* | | | 264 | | | | 2,503 | |
Pfenex, Inc.* | | | 275 | | | | 2,461 | |
Vectrus, Inc.* | | | 161 | | | | 2,452 | |
Athersys, Inc.* | | | 1,150 | | | | 2,450 | |
American Renal Associates Holdings, Inc.* | | | 132 | | | | 2,412 | |
Alliance One International, Inc.* | | | 126 | | | | 2,409 | |
SEE NOTES TO FINANCIAL STATEMENTS. | THE RYDEX FUNDS SEMI-ANNUAL REPORT | 111 |
SCHEDULE OF INVESTMENTS (Unaudited)(continued) | September 30, 2016 |
RUSSELL 2000® FUND | |
| | | Shares | | | Value | |
| | | | | | | |
ARC Document Solutions, Inc.* | | | 621 | | | $ | 2,323 | |
Medgenics, Inc.* | | | 411 | | | | 2,289 | |
Reata Pharmaceuticals, Inc. — Class A* | | | 86 | | | | 2,267 | |
PharmAthene, Inc.* | | | 766 | | | | 2,221 | |
Vital Therapies, Inc.* | | | 358 | | | | 2,191 | |
Tandem Diabetes Care, Inc.* | | | 281 | | | | 2,152 | |
Voyager Therapeutics, Inc.* | | | 177 | | | | 2,126 | |
Care.com, Inc.* | | | 212 | | | | 2,112 | |
Cutera, Inc.* | | | 177 | | | | 2,110 | |
Tetraphase Pharmaceuticals, Inc.* | | | 550 | | | | 2,107 | |
ChemoCentryx, Inc.* | | | 348 | | | | 2,102 | |
Collectors Universe, Inc. | | | 113 | | | | 2,094 | |
Textainer Group Holdings Ltd. | | | 279 | | | | 2,090 | |
AcelRx Pharmaceuticals, Inc.* | | | 535 | | | | 2,081 | |
National Research Corp. — Class A | | | 127 | | | | 2,069 | |
Nature’s Sunshine Products, Inc. | | | 129 | | | | 2,064 | |
PFSweb, Inc.* | | | 222 | | | | 1,982 | |
Lifevantage Corp.* | | | 208 | | | | 1,968 | |
Synthetic Biologics, Inc.* | | | 1,143 | | | | 1,966 | |
NantKwest, Inc.* | | | 252 | | | | 1,961 | |
CAI International, Inc.* | | | 237 | | | | 1,960 | |
Regulus Therapeutics, Inc.* | | | 587 | | | | 1,937 | |
CPI Card Group, Inc. | | | 317 | | | | 1,915 | |
Trovagene, Inc.* | | | 426 | | | | 1,913 | |
Flex Pharma, Inc.* | | | 161 | | | | 1,897 | |
Applied Genetic Technologies Corp.* | | | 192 | | | | 1,878 | |
Information Services Group, Inc.* | | | 470 | | | | 1,875 | |
Anthera Pharmaceuticals, Inc.* | | | 595 | | | | 1,874 | |
Bio-Path Holdings, Inc.* | | | 1,337 | | | | 1,872 | |
B. Riley Financial, Inc. | | | 140 | | | | 1,870 | |
Ocular Therapeutix, Inc.* | | | 271 | | | | 1,862 | |
Bridgepoint Education, Inc.* | | | 270 | | | | 1,855 | |
Cidara Therapeutics, Inc.* | | | 162 | | | | 1,855 | |
Intellia Therapeutics, Inc.* | | | 106 | | | | 1,804 | |
Endocyte, Inc.* | | | 575 | | | | 1,777 | |
TransEnterix, Inc.* | | | 1,051 | | | | 1,776 | |
Titan Pharmaceuticals, Inc.* | | | 284 | | | | 1,670 | |
Iridex Corp.* | | | 114 | | | | 1,652 | |
Senseonics Holdings, Inc.* | | | 421 | | | | 1,642 | |
Veracyte, Inc.* | | | 212 | | | | 1,613 | |
T2 Biosystems, Inc.* | | | 221 | | | | 1,600 | |
Natural Grocers by Vitamin Cottage, Inc.* | | | 138 | | | | 1,540 | |
Fortress Biotech, Inc.* | | | 515 | | | | 1,530 | |
Genesis Healthcare, Inc.* | | | 566 | | | | 1,511 | |
Osiris Therapeutics, Inc. | | | 301 | | | | 1,493 | |
Proteostasis Therapeutics, Inc.* | | | 95 | | | | 1,481 | |
Dimension Therapeutics, Inc.* | | | 185 | | | | 1,478 | |
Patriot National, Inc.* | | | 164 | | | | 1,478 | |
Anavex Life Sciences Corp.* | | | 401 | | | | 1,456 | |
Asterias Biotherapeutics, Inc.* | | | 343 | | | | 1,454 | |
Adverum Biotechnologies, Inc.* | | | 348 | | | | 1,430 | |
Agile Therapeutics, Inc.* | | | 201 | | | | 1,403 | |
Editas Medicine, Inc.* | | | 104 | | | | 1,402 | |
Neos Therapeutics, Inc.* | | | 208 | | | | 1,369 | |
Neff Corp. — Class A* | | | 144 | | | | 1,368 | |
Synutra International, Inc.* | | | 319 | | | | 1,359 | |
Axsome Therapeutics, Inc.* | | | 168 | | | | 1,324 | |
Liberty Tax, Inc. | | | 103 | | | | 1,316 | |
GlycoMimetics, Inc.* | | | 181 | | | | 1,294 | |
ChromaDex Corp.* | | | 433 | | | | 1,290 | |
Alico, Inc. | | | 48 | | | | 1,289 | |
Mirati Therapeutics, Inc.* | | | 192 | | | | 1,269 | |
Immune Design Corp.* | | | 167 | | | | 1,266 | |
Lifeway Foods, Inc.* | | | 71 | | | | 1,203 | |
Infinity Pharmaceuticals, Inc.* | | | 742 | | | | 1,158 | |
Zafgen, Inc.* | | | 346 | | | | 1,145 | |
Galena Biopharma, Inc.* | | | 3,198 | | | | 1,120 | |
Lipocine, Inc.* | | | 250 | | | | 1,115 | |
Cambium Learning Group, Inc.* | | | 203 | | | | 1,102 | |
Turning Point Brands, Inc.* | | | 90 | | | | 1,082 | |
Syndax Pharmaceuticals, Inc.* | | | 71 | | | | 1,076 | |
iRadimed Corp.* | | | 61 | | | | 1,036 | |
Avinger, Inc.* | | | 205 | | | | 978 | |
Argos Therapeutics, Inc.* | | | 192 | | | | 954 | |
Eiger BioPharmaceuticals, Inc.* | | | 63 | | | | 844 | |
vTv Therapeutics, Inc. — Class A* | | | 115 | | | | 827 | |
Corvus Pharmaceuticals, Inc.* | | | 50 | | | | 823 | |
Second Sight Medical Products, Inc.* | | | 215 | | | | 757 | |
CytRx Corp.* | | | 1,217 | | | | 716 | |
USMD Holdings, Inc.* | | | 29 | | | | 657 | |
Ampio Pharmaceuticals, Inc.* | | | 663 | | | | 491 | |
ViewRay, Inc.* | | | 100 | | | | 452 | |
Tokai Pharmaceuticals, Inc.* | | | 150 | | | | 230 | |
Total Consumer, Non-cyclical | | | | | | | 5,367,473 | |
| | | | | | | | | |
Industrial - 10.2% | |
Curtiss-Wright Corp. | | | 670 | | | | 61,043 | |
Teledyne Technologies, Inc.* | | | 518 | | | | 55,907 | |
EMCOR Group, Inc. | | | 915 | | | | 54,553 | |
XPO Logistics, Inc.* | | | 1,480 | | | | 54,271 | |
Woodward, Inc. | | | 800 | | | | 49,983 | |
CLARCOR, Inc. | | | 719 | | | | 46,735 | |
EnerSys | | | 659 | | | | 45,596 | |
Tech Data Corp.* | | | 529 | | | | 44,812 | |
Belden, Inc. | | | 634 | | | | 43,740 | |
Littelfuse, Inc. | | | 335 | | | | 43,150 | |
Joy Global, Inc. | | | 1,490 | | | | 41,332 | |
Louisiana-Pacific Corp.* | | | 2,179 | | | | 41,031 | |
Coherent, Inc.* | | | 366 | | | | 40,458 | |
Dycom Industries, Inc.* | | | 462 | | | | 37,782 | |
Generac Holdings, Inc.* | | | 988 | | | | 35,864 | |
Drew Industries, Inc. | | | 359 | | | | 35,190 | |
Universal Display Corp.* | | | 627 | | | | 34,805 | |
Kennametal, Inc. | | | 1,194 | | | | 34,650 | |
Esterline Technologies Corp.* | | | 447 | | | | 33,990 | |
Sanmina Corp.* | | | 1,110 | | | | 31,602 | |
John Bean Technologies Corp. | | | 441 | | | | 31,113 | |
Tetra Tech, Inc. | | | 873 | | | | 30,965 | |
Barnes Group, Inc. | | | 759 | | | | 30,777 | |
MasTec, Inc.* | | | 1,001 | | | | 29,770 | |
Granite Construction, Inc. | | | 598 | | | | 29,745 | |
Mueller Water Products, Inc. — Class A | | | 2,356 | | | | 29,568 | |
Universal Forest Products, Inc. | | | 300 | | | | 29,546 | |
112 | THE RYDEX FUNDS SEMI-ANNUAL REPORT | SEE NOTES TO FINANCIAL STATEMENTS. |
SCHEDULE OF INVESTMENTS (Unaudited)(continued) | September 30, 2016 |
RUSSELL 2000® FUND | |
| | | Shares | | | Value | |
| | | | | | | |
Vishay Intertechnology, Inc. | | | 2,063 | | | $ | 29,068 | |
Knight Transportation, Inc. | | | 1,012 | | | | 29,033 | |
Moog, Inc. — Class A* | | | 484 | | | | 28,817 | |
Masonite International Corp.* | | | 459 | | | | 28,535 | |
Golar LNG Ltd. | | | 1,344 | | | | 28,493 | |
Franklin Electric Company, Inc. | | | 697 | | | | 28,375 | |
Advanced Energy Industries, Inc.* | | | 597 | | | | 28,250 | |
Hillenbrand, Inc. | | | 892 | | | | 28,223 | |
Itron, Inc.* | | | 506 | | | | 28,215 | |
KLX, Inc.* | | | 798 | | | | 28,090 | |
Mueller Industries, Inc. | | | 856 | | | | 27,752 | |
Simpson Manufacturing Company, Inc. | | | 628 | | | | 27,601 | |
GATX Corp. | | | 619 | | | | 27,577 | |
Watts Water Technologies, Inc. — Class A | | | 421 | | | | 27,298 | |
MSA Safety, Inc. | | | 470 | | | | 27,278 | |
Rexnord Corp.* | | | 1,253 | | | | 26,827 | |
RBC Bearings, Inc.* | | | 343 | | | | 26,233 | |
Trex Company, Inc.* | | | 446 | | | | 26,189 | |
Matson, Inc. | | | 654 | | | | 26,082 | |
IMAX Corp.* | | | 890 | | | | 25,783 | |
Applied Industrial Technologies, Inc. | | | 549 | | | | 25,661 | |
AZZ, Inc. | | | 392 | | | | 25,585 | |
GoPro, Inc. — Class A* | | | 1,527 | | | | 25,470 | |
KapStone Paper and Packaging Corp. | | | 1,305 | | | | 24,691 | |
Trinseo S.A. | | | 435 | | | | 24,603 | |
Swift Transportation Co. — Class A* | | | 1,129 | | | | 24,240 | |
Brady Corp. — Class A | | | 692 | | | | 23,950 | |
Plexus Corp.* | | | 504 | | | | 23,577 | |
Fabrinet* | | | 527 | | | | 23,499 | |
TASER International, Inc.* | | | 789 | | | | 22,573 | |
Proto Labs, Inc.* | | | 373 | | | | 22,346 | |
Smith & Wesson Holding Corp.* | | | 828 | | | | 22,016 | |
II-VI, Inc.* | | | 899 | | | | 21,873 | |
Summit Materials, Inc. — Class A* | | | 1,151 | | | | 21,351 | |
Triumph Group, Inc. | | | 745 | | | | 20,771 | |
Hub Group, Inc. — Class A* | | | 507 | | | | 20,665 | |
Actuant Corp. — Class A | | | 888 | | | | 20,637 | |
Exponent, Inc. | | | 387 | | | | 19,760 | |
Forward Air Corp. | | | 450 | | | | 19,467 | |
TopBuild Corp.* | | | 583 | | | | 19,356 | |
Methode Electronics, Inc. | | | 552 | | | | 19,303 | |
Greif, Inc. — Class A | | | 387 | | | | 19,190 | |
Apogee Enterprises, Inc. | | | 429 | | | | 19,172 | |
Knowles Corp.* | | | 1,334 | | | | 18,743 | |
Benchmark Electronics, Inc.* | | | 748 | | | | 18,663 | |
Headwaters, Inc.* | | | 1,099 | | | | 18,595 | |
EnPro Industries, Inc. | | | 326 | | | | 18,523 | |
Albany International Corp. — Class A | | | 433 | | | | 18,351 | |
Cubic Corp. | | | 381 | | | | 17,835 | |
Kaman Corp. | | | 406 | | | | 17,832 | |
Standex International Corp. | | | 192 | | | | 17,831 | |
ESCO Technologies, Inc. | | | 384 | | | | 17,825 | |
Gibraltar Industries, Inc.* | | | 477 | | | | 17,721 | |
AAON, Inc. | | | 611 | | | | 17,609 | |
Astec Industries, Inc. | | | 293 | | | | 17,541 | |
OSI Systems, Inc.* | | | 265 | | | | 17,326 | |
Tennant Co. | | | 265 | | | | 17,172 | |
Rogers Corp.* | | | 273 | | | | 16,675 | |
SPX FLOW, Inc.* | | | 534 | | | | 16,511 | |
Comfort Systems USA, Inc. | | | 561 | | | | 16,443 | |
Sturm Ruger & Company, Inc. | | | 281 | | | | 16,231 | |
Atlas Air Worldwide Holdings, Inc.* | | | 371 | | | | 15,886 | |
Aerojet Rocketdyne Holdings, Inc.* | | | 900 | | | | 15,822 | |
Werner Enterprises, Inc. | | | 676 | | | | 15,731 | |
AAR Corp. | | | 500 | | | | 15,660 | |
Chart Industries, Inc.* | | | 463 | | | | 15,200 | |
Boise Cascade Co.* | | | 590 | | | | 14,986 | |
CIRCOR International, Inc. | | | 249 | | | | 14,830 | |
US Ecology, Inc. | | | 330 | | | | 14,797 | |
Builders FirstSource, Inc.* | | | 1,267 | | | | 14,583 | |
Greenbrier Companies, Inc. | | | 410 | | | | 14,473 | |
Badger Meter, Inc. | | | 424 | | | | 14,208 | |
Multi-Color Corp. | | | 206 | | | | 13,596 | |
Caesarstone Ltd.* | | | 360 | | | | 13,576 | |
Patrick Industries, Inc.* | | | 219 | | | | 13,560 | |
Ship Finance International Ltd. | | | 905 | | | | 13,331 | |
Nordic American Tankers Ltd. | | | 1,312 | | | | 13,264 | |
Rofin-Sinar Technologies, Inc.* | | | 409 | | | | 13,162 | |
Heartland Express, Inc. | | | 697 | | | | 13,159 | |
Astronics Corp.* | | | 292 | | | | 13,155 | |
Lydall, Inc.* | | | 251 | | | | 12,834 | |
TriMas Corp.* | | | 682 | | | | 12,692 | |
SPX Corp.* | | | 629 | | | | 12,668 | |
Raven Industries, Inc. | | | 549 | | | | 12,643 | |
Advanced Drainage Systems, Inc. | | | 525 | | | | 12,632 | |
Primoris Services Corp. | | | 609 | | | | 12,545 | |
TTM Technologies, Inc.* | | | 1,095 | | | | 12,538 | |
Tutor Perini Corp.* | | | 571 | | | | 12,259 | |
Harsco Corp. | | | 1,218 | | | | 12,095 | |
Federal Signal Corp. | | | 906 | | | | 12,014 | |
Briggs & Stratton Corp. | | | 642 | | | | 11,973 | |
Argan, Inc. | | | 202 | | | | 11,956 | |
Lindsay Corp. | | | 160 | | | | 11,837 | |
Scorpio Tankers, Inc. | | | 2,470 | | | | 11,436 | |
Saia, Inc.* | | | 381 | | | | 11,415 | |
Babcock & Wilcox Enterprises, Inc.* | | | 691 | | | | 11,402 | |
Sun Hydraulics Corp. | | | 352 | | | | 11,359 | |
Encore Wire Corp. | | | 306 | | | | 11,252 | |
Continental Building Products, Inc.* | | | 533 | | | | 11,188 | |
Altra Industrial Motion Corp. | | | 381 | | | | 11,038 | |
General Cable Corp. | | | 732 | | | | 10,965 | |
Air Transport Services Group, Inc.* | | | 733 | | | | 10,519 | |
Aegion Corp. — Class A* | | | 529 | | | | 10,088 | |
Echo Global Logistics, Inc.* | | | 435 | | | | 10,031 | |
US Concrete, Inc.* | | | 217 | | | | 9,996 | |
AVX Corp. | | | 704 | | | | 9,708 | |
Insteel Industries, Inc. | | | 265 | | | | 9,604 | |
Alamo Group, Inc. | | | 143 | | | | 9,422 | |
Global Brass & Copper Holdings, Inc. | | | 319 | | | | 9,216 | |
Manitowoc Company, Inc. | | | 1,923 | | | | 9,211 | |
FARO Technologies, Inc.* | | | 251 | | | | 9,023 | |
GasLog Ltd. | | | 619 | | | | 9,006 | |
SEE NOTES TO FINANCIAL STATEMENTS. | THE RYDEX FUNDS SEMI-ANNUAL REPORT | 113 |
SCHEDULE OF INVESTMENTS (Unaudited)(continued) | September 30, 2016 |
RUSSELL 2000® FUND | |
| | | Shares | | | Value | |
| | | | | | | |
Quanex Building Products Corp. | | | 518 | | | $ | 8,941 | |
CTS Corp. | | | 474 | | | | 8,816 | |
Hyster-Yale Materials Handling, Inc. | | | 143 | | | | 8,599 | |
Kadant, Inc. | | | 162 | | | | 8,442 | |
Energy Recovery, Inc.* | | | 521 | | | | 8,326 | |
Novanta, Inc.* | | | 478 | | | | 8,293 | |
Triton International Ltd. | | | 607 | | | | 8,006 | |
Griffon Corp. | | | 457 | | | | 7,774 | |
PGT, Inc.* | | | 722 | | | | 7,704 | |
Aerovironment, Inc.* | | | 310 | | | | 7,567 | |
Stoneridge, Inc.* | | | 406 | | | | 7,470 | |
Chase Corp. | | | 107 | | | | 7,396 | |
Marten Transport Ltd. | | | 348 | | | | 7,308 | |
NN, Inc. | | | 397 | | | | 7,245 | |
Tredegar Corp. | | | 384 | | | | 7,139 | |
ArcBest Corp. | | | 372 | | | | 7,075 | |
Frontline Ltd. | | | 982 | | | | 7,041 | |
Haynes International, Inc. | | | 188 | | | | 6,977 | |
Gorman-Rupp Co. | | | 266 | | | | 6,812 | |
MYR Group, Inc.* | | | 226 | | | | 6,803 | |
Armstrong Flooring, Inc.* | | | 354 | | | | 6,684 | |
AEP Industries, Inc. | | | 61 | | | | 6,672 | |
National Presto Industries, Inc. | | | 74 | | | | 6,496 | |
TimkenSteel Corp.* | | | 596 | | | | 6,228 | |
Overseas Shipholding Group, Inc. — Class A | | | 584 | | | | 6,172 | |
Mistras Group, Inc.* | | | 259 | | | | 6,079 | |
YRC Worldwide, Inc.* | | | 492 | | | | 6,061 | |
Casella Waste Systems, Inc. — Class A* | | | 585 | | | | 6,026 | |
NCI Building Systems, Inc.* | | | 411 | | | | 5,996 | |
Kimball Electronics, Inc.* | | | 425 | | | | 5,891 | |
DHT Holdings, Inc. | | | 1,387 | | | | 5,812 | |
Applied Optoelectronics, Inc.* | | | 249 | | | | 5,530 | |
DXP Enterprises, Inc.* | | | 196 | | | | 5,525 | |
Powell Industries, Inc. | | | 132 | | | | 5,287 | |
Greif, Inc. — Class B | | | 87 | | | | 5,271 | |
Columbus McKinnon Corp. | | | 294 | | | | 5,245 | |
Mesa Laboratories, Inc. | | | 45 | | | | 5,146 | |
Teekay Corp. | | | 662 | | | | 5,104 | |
Park Electrochemical Corp. | | | 292 | | | | 5,072 | |
CECO Environmental Corp. | | | 443 | | | | 4,997 | |
American Railcar Industries, Inc. | | | 117 | | | | 4,852 | |
Kratos Defense & Security Solutions, Inc.* | | | 701 | | | | 4,830 | |
GP Strategies Corp.* | | | 193 | | | | 4,752 | |
Park-Ohio Holdings Corp. | | | 129 | | | | 4,702 | |
Multi Packaging Solutions International Ltd.* | | | 321 | | | | 4,626 | |
Teekay Tankers Ltd. — Class A | | | 1,761 | | | | 4,455 | |
Ply Gem Holdings, Inc.* | | | 333 | | | | 4,449 | |
VSE Corp. | | | 130 | | | | 4,419 | |
Energous Corp.* | | | 224 | | | | 4,393 | |
Myers Industries, Inc. | | | 328 | | | | 4,261 | |
NVE Corp. | | | 72 | | | | 4,244 | |
LSI Industries, Inc. | | | 360 | | | | 4,043 | |
Control4 Corp.* | | | 304 | | | | 3,733 | |
Sparton Corp.* | | | 142 | | | | 3,729 | |
Roadrunner Transportation Systems, Inc.* | | | 463 | | | | 3,695 | |
Costamare, Inc. | | | 400 | | | | 3,656 | |
Celadon Group, Inc. | | | 412 | | | | 3,601 | |
NV5 Global, Inc.* | | | 111 | | | | 3,586 | |
Ducommun, Inc.* | | | 157 | | | | 3,586 | |
Fluidigm Corp.* | | | 440 | | | | 3,524 | |
Milacron Holdings Corp.* | | | 220 | | | | 3,511 | |
Covenant Transportation Group, Inc. — Class A* | | | 179 | | | | 3,460 | |
Bel Fuse, Inc. — Class B | | | 140 | | | | 3,380 | |
ZAGG, Inc.* | | | 417 | | | | 3,378 | |
Olympic Steel, Inc. | | | 139 | | | | 3,072 | |
Gener8 Maritime, Inc.* | | | 594 | | | | 3,041 | |
Vishay Precision Group, Inc.* | | | 183 | | | | 2,933 | |
Vicor Corp.* | | | 249 | | | | 2,888 | |
Orion Group Holdings, Inc.* | | | 407 | | | | 2,788 | |
Ardmore Shipping Corp. | | | 395 | | | | 2,781 | |
Graham Corp. | | | 144 | | | | 2,750 | |
Hornbeck Offshore Services, Inc.* | | | 492 | | | | 2,706 | |
Hurco Companies, Inc. | | | 96 | | | | 2,695 | |
LSB Industries, Inc.* | | | 312 | | | | 2,677 | |
FreightCar America, Inc. | | | 183 | | | | 2,632 | |
UFP Technologies, Inc.* | | | 97 | | | | 2,571 | |
Heritage-Crystal Clean, Inc.* | | | 193 | | | | 2,563 | |
TRC Companies, Inc.* | | | 281 | | | | 2,436 | |
Scorpio Bulkers, Inc.* | | | 694 | | | | 2,401 | |
Electro Scientific Industries, Inc.* | | | 416 | | | | 2,346 | |
Layne Christensen Co.* | | | 274 | | | | 2,332 | |
Dynamic Materials Corp. | | | 212 | | | | 2,260 | |
Hill International, Inc.* | | | 489 | | | | 2,254 | |
Dorian LPG Ltd.* | | | 366 | | | | 2,196 | |
IES Holdings, Inc.* | | | 118 | | | | 2,099 | |
Tidewater, Inc. | | | 715 | | | | 2,016 | |
Hardinge, Inc. | | | 177 | | | | 1,970 | |
Allied Motion Technologies, Inc. | | | 93 | | | | 1,759 | |
Omega Flex, Inc. | | | 44 | | | | 1,697 | |
Universal Logistics Holdings, Inc. | | | 126 | | | | 1,691 | |
Lawson Products, Inc.* | | | 95 | | | | 1,684 | |
Navios Maritime Acquisition Corp. | | | 1,219 | | | | 1,646 | |
Radiant Logistics, Inc.* | | | 571 | | | | 1,622 | |
Aqua Metals, Inc.* | | | 163 | | | | 1,444 | |
Ampco-Pittsburgh Corp. | | | 129 | | | | 1,431 | |
Willis Lease Finance Corp.* | | | 59 | | | | 1,402 | |
Gencor Industries, Inc.* | | | 117 | | | | 1,402 | |
USA Truck, Inc.* | | | 123 | | | | 1,260 | |
American Superconductor Corp.* | | | 177 | | | | 1,241 | |
Handy & Harman Ltd.* | | | 44 | | | | 926 | |
Power Solutions International, Inc.* | | | 72 | | | | 738 | |
PAM Transportation Services, Inc.* | | | 35 | | | | 701 | |
NL Industries, Inc.* | | | 126 | | | | 495 | |
Total Industrial | | | | | | | 3,533,863 | |
| | | | | | | | | |
Consumer, Cyclical - 8.6% | |
Tenneco, Inc.* | | | 852 | | | | 49,645 | |
Jack in the Box, Inc. | | | 494 | | | | 47,395 | |
American Eagle Outfitters, Inc. | | | 2,518 | | | | 44,970 | |
Buffalo Wild Wings, Inc.* | | | 286 | | | | 40,252 | |
114 | THE RYDEX FUNDS SEMI-ANNUAL REPORT | SEE NOTES TO FINANCIAL STATEMENTS. |
SCHEDULE OF INVESTMENTS (Unaudited)(continued) | September 30, 2016 |
RUSSELL 2000® FUND | |
| | | Shares | | | Value | |
| | | | | | | |
Texas Roadhouse, Inc. — Class A | | | 1,001 | | | $ | 39,069 | |
Hawaiian Holdings, Inc.* | | | 797 | | | | 38,735 | |
Cracker Barrel Old Country Store, Inc. | | | 290 | | | | 38,344 | |
Beacon Roofing Supply, Inc.* | | | 903 | | | | 37,989 | |
Dana, Inc. | | | 2,253 | | | | 35,124 | |
TiVo Corp.* | | | 1,771 | | | | 34,499 | |
Cheesecake Factory, Inc. | | | 687 | | | | 34,391 | |
Lithia Motors, Inc. — Class A | | | 359 | | | | 34,293 | |
Wolverine World Wide, Inc. | | | 1,465 | | | | 33,739 | |
Five Below, Inc.* | | | 809 | | | | 32,595 | |
Papa John’s International, Inc. | | | 411 | | | | 32,407 | |
Big Lots, Inc. | | | 674 | | | | 32,184 | |
Steven Madden Ltd.* | | | 930 | | | | 32,141 | |
Cooper Tire & Rubber Co. | | | 837 | | | | 31,823 | |
UniFirst Corp. | | | 229 | | | | 30,195 | |
Office Depot, Inc. | | | 8,364 | | | | 29,859 | |
Churchill Downs, Inc. | | | 204 | | | | 29,856 | |
Bloomin’ Brands, Inc. | | | 1,721 | | | | 29,670 | |
TRI Pointe Group, Inc.* | | | 2,251 | | | | 29,669 | |
Interval Leisure Group, Inc. | | | 1,711 | | | | 29,379 | |
Deckers Outdoor Corp.* | | | 491 | | | | 29,239 | |
Anixter International, Inc.* | | | 439 | | | | 28,316 | |
G&K Services, Inc. — Class A | | | 296 | | | | 28,265 | |
HNI Corp. | | | 686 | | | | 27,302 | |
Allegiant Travel Co. — Class A | | | 200 | | | | 26,414 | |
Herman Miller, Inc. | | | 905 | | | | 25,883 | |
Dorman Products, Inc.* | | | 401 | | | | 25,624 | |
PriceSmart, Inc. | | | 303 | | | | 25,379 | |
Marriott Vacations Worldwide Corp. | | | 339 | | | | 24,855 | |
Core-Mark Holding Company, Inc. | | | 691 | | | | 24,738 | |
Boyd Gaming Corp.* | | | 1,247 | | | | 24,666 | |
Liberty TripAdvisor Holdings, Inc. — Class A* | | | 1,097 | | | | 23,969 | |
Chico’s FAS, Inc. | | | 1,973 | | | | 23,478 | |
Columbia Sportswear Co. | | | 408 | | | | 23,150 | |
Children’s Place, Inc. | | | 283 | | | | 22,602 | |
Dave & Buster’s Entertainment, Inc.* | | | 573 | | | | 22,450 | |
Cooper-Standard Holding, Inc.* | | | 224 | | | | 22,131 | |
GNC Holdings, Inc. — Class A | | | 1,037 | | | | 21,176 | |
DineEquity, Inc. | | | 265 | | | | 20,985 | |
DSW, Inc. — Class A | | | 1,017 | | | | 20,827 | |
KB Home | | | 1,261 | | | | 20,327 | |
Mobile Mini, Inc. | | | 670 | | | | 20,234 | |
Restoration Hardware Holdings, Inc.* | | | 585 | | | | 20,229 | |
Group 1 Automotive, Inc. | | | 314 | | | | 20,058 | |
Meritage Homes Corp.* | | | 578 | | | | 20,057 | |
SkyWest, Inc. | | | 759 | | | | 20,045 | |
American Axle & Manufacturing Holdings, Inc.* | | | 1,159 | | | | 19,958 | |
G-III Apparel Group Ltd.* | | | 650 | | | | 18,948 | |
HSN, Inc. | | | 473 | | | | 18,825 | |
Sonic Corp. | | | 711 | | | | 18,614 | |
La-Z-Boy, Inc. | | | 742 | | | | 18,223 | |
Steelcase, Inc. — Class A | | | 1,301 | | | | 18,071 | |
iRobot Corp.* | | | 406 | | | | 17,856 | |
Fossil Group, Inc.* | | | 634 | | | | 17,606 | |
Popeyes Louisiana Kitchen, Inc.* | | | 328 | | | | 17,430 | |
Gentherm, Inc.* | | | 552 | | | | 17,344 | |
Navistar International Corp.* | | | 748 | | | | 17,121 | |
Genesco, Inc.* | | | 311 | | | | 16,937 | |
American Woodmark Corp.* | | | 209 | | | | 16,839 | |
Asbury Automotive Group, Inc.* | | | 302 | | | | 16,812 | |
Knoll, Inc. | | | 726 | | | | 16,589 | |
Callaway Golf Co. | | | 1,425 | | | | 16,545 | |
Caleres, Inc. | | | 648 | | | | 16,388 | |
Abercrombie & Fitch Co. — Class A | | | 1,029 | | | | 16,351 | |
Interface, Inc. — Class A | | | 978 | | | | 16,323 | |
Belmond Ltd. — Class A* | | | 1,265 | | | | 16,078 | |
Universal Electronics, Inc.* | | | 214 | | | | 15,934 | |
Virgin America, Inc.* | | | 293 | | | | 15,678 | |
Oxford Industries, Inc. | | | 230 | | | | 15,571 | |
Standard Motor Products, Inc. | | | 325 | | | | 15,522 | |
MDC Holdings, Inc. | | | 599 | | | | 15,454 | |
Penn National Gaming, Inc.* | | | 1,126 | | | | 15,280 | |
Select Comfort Corp.* | | | 701 | | | | 15,142 | |
BMC Stock Holdings, Inc.* | | | 832 | | | | 14,751 | |
Ascena Retail Group, Inc.* | | | 2,615 | | | | 14,618 | |
Finish Line, Inc. — Class A | | | 632 | | | | 14,587 | |
La Quinta Holdings, Inc.* | | | 1,282 | | | | 14,333 | |
ClubCorp Holdings, Inc. | | | 972 | | | | 14,065 | |
Wabash National Corp.* | | | 975 | | | | 13,884 | |
ScanSource, Inc.* | | | 380 | | | | 13,870 | |
Meritor, Inc.* | | | 1,243 | | | | 13,835 | |
Hibbett Sports, Inc.* | | | 346 | | | | 13,805 | |
National CineMedia, Inc. | | | 930 | | | | 13,690 | |
SeaWorld Entertainment, Inc. | | | 1,011 | | | | 13,628 | |
Guess?, Inc. | | | 924 | | | | 13,500 | |
International Speedway Corp. — Class A | | | 399 | | | | 13,335 | |
Express, Inc.* | | | 1,124 | | | | 13,252 | |
Cato Corp. — Class A | | | 386 | | | | 12,696 | |
Cavco Industries, Inc.* | | | 128 | | | | 12,678 | |
BJ’s Restaurants, Inc.* | | | 353 | | | | 12,549 | |
Denny’s Corp.* | | | 1,146 | | | | 12,251 | |
Carmike Cinemas, Inc.* | | | 364 | | | | 11,900 | |
Ethan Allen Interiors, Inc. | | | 373 | | | | 11,664 | |
Tailored Brands, Inc. | | | 738 | | | | 11,587 | |
Essendant, Inc. | | | 564 | | | | 11,573 | |
Bob Evans Farms, Inc. | | | 300 | | | | 11,490 | |
Wesco Aircraft Holdings, Inc.* | | | 841 | | | | 11,295 | |
DTS, Inc. | | | 264 | | | | 11,231 | |
Superior Industries International, Inc. | | | 380 | | | | 11,081 | |
Rush Enterprises, Inc. — Class A* | | | 446 | | | | 10,918 | |
Installed Building Products, Inc.* | | | 304 | | | | 10,904 | |
Barnes & Noble, Inc. | | | 955 | | | | 10,792 | |
Red Rock Resorts, Inc. — Class A | | | 455 | | | | 10,733 | |
Douglas Dynamics, Inc. | | | 335 | | | | 10,700 | |
Nautilus, Inc.* | | | 464 | | | | 10,542 | |
Buckle, Inc. | | | 433 | | | | 10,405 | |
AMC Entertainment Holdings, Inc. — Class A | | | 327 | | | | 10,166 | |
Pinnacle Entertainment, Inc.* | | | 822 | | | | 10,143 | |
Vitamin Shoppe, Inc.* | | | 365 | | | | 9,800 | |
SEE NOTES TO FINANCIAL STATEMENTS. | THE RYDEX FUNDS SEMI-ANNUAL REPORT | 115 |
SCHEDULE OF INVESTMENTS (Unaudited)(continued) | September 30, 2016 |
RUSSELL 2000® FUND | |
| | | Shares | | | Value | |
| | | | | | | |
Fiesta Restaurant Group, Inc.* | | | 403 | | | $ | 9,672 | |
Winnebago Industries, Inc. | | | 405 | | | | 9,546 | |
Red Robin Gourmet Burgers, Inc.* | | | 207 | | | | 9,303 | |
Crocs, Inc.* | | | 1,114 | | | | 9,246 | |
Caesars Acquisition Co. — Class A* | | | 719 | | | | 8,930 | |
Francesca’s Holdings Corp.* | | | 578 | | | | 8,919 | |
Scientific Games Corp. — Class A* | | | 784 | | | | 8,836 | |
LGI Homes, Inc.* | | | 234 | | | | 8,621 | |
EZCORP, Inc. — Class A* | | | 765 | | | | 8,461 | |
Modine Manufacturing Co.* | | | 712 | | | | 8,444 | |
M/I Homes, Inc.* | | | 358 | | | | 8,438 | |
Isle of Capri Casinos, Inc.* | | | 378 | | | | 8,422 | |
Shake Shack, Inc. — Class A* | | | 238 | | | | 8,251 | |
Tile Shop Holdings, Inc.* | | | 493 | | | | 8,159 | |
Taylor Morrison Home Corp. — Class A* | | | 460 | | | | 8,096 | |
Ollie’s Bargain Outlet Holdings, Inc.* | | | 306 | | | | 8,020 | |
H&E Equipment Services, Inc. | | | 477 | | | | 7,995 | |
Motorcar Parts of America, Inc.* | | | 277 | | | | 7,972 | |
Sonic Automotive, Inc. — Class A | | | 423 | | | | 7,952 | |
MarineMax, Inc.* | | | 374 | | | | 7,835 | |
Lumber Liquidators Holdings, Inc.* | | | 398 | | | | 7,829 | |
WCI Communities, Inc.* | | | 328 | | | | 7,780 | |
Fox Factory Holding Corp.* | | | 338 | | | | 7,764 | |
Tower International, Inc. | | | 310 | | | | 7,471 | |
Kimball International, Inc. — Class B | | | 558 | | | | 7,221 | |
Regis Corp.* | | | 562 | | | | 7,053 | |
Marcus Corp. | | | 281 | | | | 7,036 | |
Biglari Holdings, Inc.* | | | 16 | | | | 6,976 | |
Unifi, Inc.* | | | 237 | | | | 6,974 | |
Wingstop, Inc. | | | 238 | | | | 6,973 | |
Party City Holdco, Inc.* | | | 407 | | | | 6,968 | |
Chuy’s Holdings, Inc.* | | | 247 | | | | 6,901 | |
Carrols Restaurant Group, Inc.* | | | 519 | | | | 6,856 | |
Eros International plc* | | | 447 | | | | 6,848 | |
Ruth’s Hospitality Group, Inc. | | | 482 | | | | 6,806 | |
Titan International, Inc. | | | 669 | | | | 6,770 | |
William Lyon Homes — Class A* | | | 362 | | | | 6,715 | |
Zoe’s Kitchen, Inc.* | | | 289 | | | | 6,413 | |
Caesars Entertainment Corp.* | | | 852 | | | | 6,347 | |
SiteOne Landscape Supply, Inc.* | | | 176 | | | | 6,324 | |
Veritiv Corp.* | | | 125 | | | | 6,271 | |
Eldorado Resorts, Inc.* | | | 433 | | | | 6,088 | |
PetMed Express, Inc. | | | 300 | | | | 6,084 | |
Libbey, Inc. | | | 332 | | | | 5,926 | |
Barnes & Noble Education, Inc.* | | | 606 | | | | 5,799 | |
Shoe Carnival, Inc. | | | 216 | | | | 5,759 | |
Haverty Furniture Companies, Inc. | | | 282 | | | | 5,651 | |
Beazer Homes USA, Inc.* | | | 476 | | | | 5,550 | |
Horizon Global Corp.* | | | 276 | | | | 5,501 | |
Daktronics, Inc. | | | 555 | | | | 5,295 | |
Iconix Brand Group, Inc.* | | | 648 | | | | 5,262 | |
Pier 1 Imports, Inc. | | | 1,224 | | | | 5,190 | |
Flexsteel Industries, Inc. | | | 98 | | | | 5,069 | |
Movado Group, Inc. | | | 233 | | | | 5,005 | |
Century Communities, Inc.* | | | 230 | | | | 4,947 | |
Zumiez, Inc.* | | | 273 | | | | 4,914 | |
Culp, Inc. | | | 163 | | | | 4,853 | |
Fred’s, Inc. — Class A | | | 534 | | | | 4,838 | |
Del Frisco’s Restaurant Group, Inc.* | | | 358 | | | | 4,822 | |
Spartan Motors, Inc. | | | 503 | | | | 4,819 | |
Sequential Brands Group, Inc.* | | | 594 | | | | 4,752 | |
Planet Fitness, Inc. — Class A* | | | 236 | | | | 4,737 | |
Vera Bradley, Inc.* | | | 307 | | | | 4,651 | |
PC Connection, Inc. | | | 172 | | | | 4,544 | |
Potbelly Corp.* | | | 360 | | | | 4,475 | |
Federal-Mogul Holdings Corp.* | | | 464 | | | | 4,459 | |
Citi Trends, Inc. | | | 218 | | | | 4,345 | |
America’s Car-Mart, Inc.* | | | 119 | | | | 4,330 | |
Hooker Furniture Corp. | | | 172 | | | | 4,212 | |
Del Taco Restaurants, Inc.* | | | 350 | | | | 4,172 | |
Sportsman’s Warehouse Holdings, Inc.* | | | 390 | | | | 4,103 | |
Malibu Boats, Inc. — Class A* | | | 273 | | | | 4,068 | |
Tuesday Morning Corp.* | | | 679 | | | | 4,060 | |
Monarch Casino & Resort, Inc.* | | | 161 | | | | 4,052 | |
NACCO Industries, Inc. — Class A | | | 59 | | | | 4,010 | |
Intrawest Resorts Holdings, Inc.* | | | 244 | | | | 3,958 | |
PICO Holdings, Inc.* | | | 331 | | | | 3,902 | |
El Pollo Loco Holdings, Inc.* | | | 307 | | | | 3,865 | |
Duluth Holdings, Inc. — Class B* | | | 145 | | | | 3,844 | |
Miller Industries, Inc. | | | 167 | | | | 3,806 | |
Supreme Industries, Inc. — Class A | | | 196 | | | | 3,783 | |
Perry Ellis International, Inc.* | | | 190 | | | | 3,663 | |
Big 5 Sporting Goods Corp. | | | 268 | | | | 3,650 | |
Bassett Furniture Industries, Inc. | | | 156 | | | | 3,627 | |
Metaldyne Performance Group, Inc. | | | 227 | | | | 3,598 | |
Winmark Corp. | | | 34 | | | | 3,588 | |
Reading International, Inc. — Class A* | | | 254 | | | | 3,391 | |
Conn’s, Inc.* | | | 307 | | | | 3,168 | |
Speedway Motorsports, Inc. | | | 177 | | | | 3,161 | |
Hovnanian Enterprises, Inc. — Class A* | | | 1,842 | | | | 3,113 | |
AV Homes, Inc.* | | | 185 | | | | 3,078 | |
Arctic Cat, Inc. | | | 198 | | | | 3,067 | |
Stein Mart, Inc. | | | 471 | | | | 2,991 | |
Freshpet, Inc.* | | | 338 | | | | 2,924 | |
Green Brick Partners, Inc.* | | | 351 | | | | 2,899 | |
Habit Restaurants, Inc. — Class A* | | | 203 | | | | 2,842 | |
Kirkland’s, Inc.* | | | 223 | | | | 2,716 | |
Johnson Outdoors, Inc. — Class A | | | 74 | | | | 2,691 | |
Weyco Group, Inc. | | | 98 | | | | 2,633 | |
Rush Enterprises, Inc. — Class B* | | | 100 | | | | 2,431 | |
Nathan’s Famous, Inc.* | | | 46 | | | | 2,417 | |
GMS, Inc.* | | | 108 | | | | 2,401 | |
Superior Uniform Group, Inc. | | | 121 | | | | 2,395 | |
Destination XL Group, Inc.* | | | 549 | | | | 2,377 | |
Bojangles’, Inc.* | | | 148 | | | | 2,362 | |
Performance Sports Group Ltd.* | | | 578 | | | | 2,347 | |
West Marine, Inc.* | | | 279 | | | | 2,307 | |
Boot Barn Holdings, Inc.* | | | 202 | | | | 2,299 | |
Titan Machinery, Inc.* | | | 218 | | | | 2,267 | |
Lifetime Brands, Inc. | | | 167 | | | | 2,248 | |
Ruby Tuesday, Inc.* | | | 898 | | | | 2,245 | |
Century Casinos, Inc.* | | | 323 | | | | 2,232 | |
116 | THE RYDEX FUNDS SEMI-ANNUAL REPORT | SEE NOTES TO FINANCIAL STATEMENTS. |
SCHEDULE OF INVESTMENTS (Unaudited)(continued) | September 30, 2016 |
RUSSELL 2000® FUND | |
| | | Shares | | | Value | |
| | | | | | | |
Stage Stores, Inc. | | | 388 | | | $ | 2,177 | |
Build-A-Bear Workshop, Inc. — Class A* | | | 205 | | | | 2,124 | |
Jamba, Inc.* | | | 193 | | | | 2,108 | |
New Home Company, Inc.* | | | 192 | | | | 2,049 | |
J Alexander’s Holdings, Inc.* | | | 202 | | | | 2,046 | |
Escalade, Inc. | | | 159 | | | | 2,029 | |
Lindblad Expeditions Holdings, Inc.* | | | 223 | | | | 2,007 | |
JAKKS Pacific, Inc.* | | | 232 | | | | 2,004 | |
Sears Holdings Corp.* | | | 170 | | | | 1,948 | |
Golden Entertainment, Inc. | | | 156 | | | | 1,945 | |
Strattec Security Corp. | | | 53 | | | | 1,871 | |
Vince Holding Corp.* | | | 326 | | | | 1,839 | |
Red Lion Hotels Corp.* | | | 215 | | | | 1,793 | |
Delta Apparel, Inc.* | | | 108 | | | | 1,778 | |
Tilly’s, Inc. — Class A* | | | 176 | | | | 1,653 | |
Kona Grill, Inc.* | | | 118 | | | | 1,483 | |
Marine Products Corp. | | | 163 | | | | 1,462 | |
Systemax, Inc. | | | 174 | | | | 1,378 | |
MCBC Holdings, Inc. | | | 117 | | | | 1,334 | |
Luby’s, Inc.* | | | 294 | | | | 1,261 | |
Workhorse Group, Inc.* | | | 173 | | | | 1,253 | |
Unique Fabricating, Inc. | | | 100 | | | | 1,224 | |
Container Store Group, Inc.* | | | 241 | | | | 1,210 | |
Blue Bird Corp.* | | | 81 | | | | 1,183 | |
UCP, Inc. — Class A* | | | 122 | | | | 1,075 | |
Empire Resorts, Inc.* | | | 50 | | | | 1,012 | |
Sears Hometown and Outlet Stores, Inc.* | | | 170 | | | | 838 | |
Noodles & Co.* | | | 167 | | | | 795 | |
Fogo De Chao, Inc.* | | | 75 | | | | 793 | |
Gaia, Inc.* | | | 104 | | | | 749 | |
CompX International, Inc. | | | 24 | | | | 278 | |
Total Consumer, Cyclical | | | | | | | 3,001,053 | |
| | | | | | | | | |
Technology - 8.5% | |
Microsemi Corp.* | | | 1,722 | | | | 72,290 | |
Advanced Micro Devices, Inc.* | | | 9,874 | | | | 68,229 | |
Aspen Technology, Inc.* | | | 1,250 | | | | 58,487 | |
Fair Isaac Corp. | | | 469 | | | | 58,432 | |
Take-Two Interactive Software, Inc.* | | | 1,258 | | | | 56,711 | |
Cavium, Inc.* | | | 974 | | | | 56,687 | |
MAXIMUS, Inc. | | | 970 | | | | 54,863 | |
EPAM Systems, Inc.* | | | 728 | | | | 50,458 | |
SYNNEX Corp. | | | 442 | | | | 50,437 | |
Cirrus Logic, Inc.* | | | 947 | | | | 50,333 | |
j2 Global, Inc. | | | 712 | | | | 47,427 | |
Monolithic Power Systems, Inc. | | | 589 | | | | 47,415 | |
Blackbaud, Inc. | | | 713 | | | | 47,299 | |
Integrated Device Technology, Inc.* | | | 2,038 | | | | 47,078 | |
Medidata Solutions, Inc.* | | | 831 | | | | 46,336 | |
Proofpoint, Inc.* | | | 617 | | | | 46,183 | |
Intersil Corp. — Class A | | | 2,031 | | | | 44,540 | |
Science Applications International Corp. | | | 640 | | | | 44,397 | |
Mentor Graphics Corp. | | | 1,620 | | | | 42,833 | |
Convergys Corp. | | | 1,344 | | | | 40,885 | |
MKS Instruments, Inc. | | | 804 | | | | 39,984 | |
NetScout Systems, Inc.* | | | 1,354 | | | | 39,605 | |
Entegris, Inc.* | | | 2,138 | | | | 37,244 | |
CACI International, Inc. — Class A* | | | 368 | | | | 37,131 | |
Silicon Laboratories, Inc.* | | | 624 | | | | 36,691 | |
Ambarella, Inc.* | | | 484 | | | | 35,627 | |
FleetMatics Group plc* | | | 593 | | | | 35,569 | |
Verint Systems, Inc.* | | | 938 | | | | 35,297 | |
Cornerstone OnDemand, Inc.* | | | 761 | | | | 34,968 | |
Electronics for Imaging, Inc.* | | | 711 | | | | 34,783 | |
ACI Worldwide, Inc.* | | | 1,744 | | | | 33,799 | |
Paycom Software, Inc.* | | | 666 | | | | 33,387 | |
Lumentum Holdings, Inc.* | | | 763 | | | | 31,870 | |
Acxiom Corp.* | | | 1,172 | | | | 31,234 | |
Synaptics, Inc.* | | | 531 | | | | 31,106 | |
CommVault Systems, Inc.* | | | 585 | | | | 31,081 | |
3D Systems Corp.* | | | 1,622 | | | | 29,115 | |
Tessera Technologies, Inc. | | | 744 | | | | 28,599 | |
Semtech Corp.* | | | 977 | | | | 27,092 | |
Inphi Corp.* | | | 608 | | | | 26,454 | |
Power Integrations, Inc. | | | 415 | | | | 26,157 | |
Synchronoss Technologies, Inc.* | | | 624 | | | | 25,696 | |
Diebold, Inc. | | | 1,034 | | | | 25,632 | |
HubSpot, Inc.* | | | 436 | | | | 25,122 | |
ExlService Holdings, Inc.* | | | 492 | | | | 24,521 | |
MicroStrategy, Inc. — Class A* | | | 144 | | | | 24,111 | |
Imperva, Inc.* | | | 434 | | | | 23,310 | |
Envestnet, Inc.* | | | 627 | | | | 22,854 | |
Ebix, Inc. | | | 381 | | | | 21,660 | |
2U, Inc.* | | | 555 | | | | 21,251 | |
RealPage, Inc.* | | | 816 | | | | 20,971 | |
BroadSoft, Inc.* | | | 445 | | | | 20,715 | |
Omnicell, Inc.* | | | 538 | | | | 20,605 | |
Progress Software Corp. | | | 757 | | | | 20,590 | |
Rambus, Inc.* | | | 1,644 | | | | 20,550 | |
Syntel, Inc.* | | | 488 | | | | 20,452 | |
CSG Systems International, Inc. | | | 485 | | | | 20,045 | |
Cabot Microelectronics Corp. | | | 356 | | | | 18,836 | |
SPS Commerce, Inc.* | | | 251 | | | | 18,426 | |
Insight Enterprises, Inc.* | | | 555 | | | | 18,065 | |
Stratasys Ltd.* | | | 741 | | | | 17,851 | |
MaxLinear, Inc. — Class A* | | | 844 | | | | 17,108 | |
Sykes Enterprises, Inc.* | | | 585 | | | | 16,456 | |
Globant S.A.* | | | 389 | | | | 16,385 | |
Interactive Intelligence Group, Inc.* | | | 272 | | | | 16,358 | |
Pegasystems, Inc. | | | 546 | | | | 16,102 | |
Qualys, Inc.* | | | 411 | | | | 15,696 | |
Callidus Software, Inc.* | | | 840 | | | | 15,414 | |
MACOM Technology Solutions Holdings, Inc.* | | | 352 | | | | 14,904 | |
Amkor Technology, Inc.* | | | 1,513 | | | | 14,706 | |
Mercury Systems, Inc.* | | | 589 | | | | 14,472 | |
Cvent, Inc.* | | | 456 | | | | 14,460 | |
Cray, Inc.* | | | 609 | | | | 14,336 | |
Bottomline Technologies de, Inc.* | | | 608 | | | | 14,172 | |
ManTech International Corp. — Class A | | | 374 | | | | 14,096 | |
Brooks Automation, Inc. | | | 1,027 | | | | 13,977 | |
Pure Storage, Inc. — Class A* | | | 1,030 | | | | 13,956 | |
Super Micro Computer, Inc.* | | | 585 | | | | 13,671 | |
SEE NOTES TO FINANCIAL STATEMENTS. | THE RYDEX FUNDS SEMI-ANNUAL REPORT | 117 |
SCHEDULE OF INVESTMENTS (Unaudited)(continued) | September 30, 2016 |
RUSSELL 2000® FUND | |
| | | Shares | | | Value | |
| | | | | | | |
Monotype Imaging Holdings, Inc. | | | 614 | | | $ | 13,576 | |
Press Ganey Holdings, Inc.* | | | 335 | | | | 13,534 | |
New Relic, Inc.* | | | 332 | | | | 12,722 | |
inContact, Inc.* | | | 887 | | | | 12,400 | |
Diodes, Inc.* | | | 576 | | | | 12,292 | |
Veeco Instruments, Inc.* | | | 601 | | | | 11,798 | |
Lattice Semiconductor Corp.* | | | 1,813 | | | | 11,766 | |
MTS Systems Corp. | | | 253 | | | | 11,646 | |
FormFactor, Inc.* | | | 1,039 | | | | 11,273 | |
CEVA, Inc.* | | | 298 | | | | 10,451 | |
Virtusa Corp.* | | | 418 | | | | 10,316 | |
Photronics, Inc.* | | | 986 | | | | 10,166 | |
InvenSense, Inc. — Class A* | | | 1,236 | | | | 9,171 | |
Quality Systems, Inc. | | | 772 | | | | 8,739 | |
PROS Holdings, Inc.* | | | 381 | | | | 8,614 | |
Engility Holdings, Inc.* | | | 273 | | | | 8,599 | |
Barracuda Networks, Inc.* | | | 333 | | | | 8,485 | |
Nimble Storage, Inc.* | | | 951 | | | | 8,397 | |
Silver Spring Networks, Inc.* | | | 573 | | | | 8,125 | |
Rudolph Technologies, Inc.* | | | 453 | | | | 8,036 | |
Nanometrics, Inc.* | | | 358 | | | | 7,998 | |
Applied Micro Circuits Corp.* | | | 1,147 | | | | 7,972 | |
Five9, Inc.* | | | 500 | | | | 7,840 | |
Benefitfocus, Inc.* | | | 195 | | | | 7,784 | |
Ultratech, Inc.* | | | 327 | | | | 7,547 | |
PDF Solutions, Inc.* | | | 409 | | | | 7,432 | |
Unisys Corp.* | | | 759 | | | | 7,393 | |
TeleTech Holdings, Inc. | | | 248 | | | | 7,190 | |
Actua Corp.* | | | 544 | | | | 7,045 | |
LivePerson, Inc.* | | | 805 | | | | 6,770 | |
Vocera Communications, Inc.* | | | 374 | | | | 6,321 | |
Workiva, Inc.* | | | 332 | | | | 6,019 | |
KEYW Holding Corp.* | | | 543 | | | | 5,995 | |
Alpha & Omega Semiconductor Ltd.* | | | 275 | | | | 5,973 | |
Brightcove, Inc.* | | | 453 | | | | 5,912 | |
Axcelis Technologies, Inc.* | | | 441 | | | | 5,856 | |
Exar Corp.* | | | 617 | | | | 5,744 | |
Evolent Health, Inc. — Class A* | | | 230 | | | | 5,663 | |
Digimarc Corp.* | | | 146 | | | | 5,599 | |
InnerWorkings, Inc.* | | | 581 | | | | 5,473 | |
Hortonworks, Inc.* | | | 610 | | | | 5,094 | |
Xactly Corp.* | | | 345 | | | | 5,078 | |
Varonis Systems, Inc.* | | | 162 | | | | 4,876 | |
Xcerra Corp.* | | | 799 | | | | 4,842 | |
Epiq Systems, Inc. | | | 287 | | | | 4,733 | |
Sapiens International Corporation N.V. | | | 367 | | | | 4,687 | |
Cohu, Inc. | | | 399 | | | | 4,684 | |
IXYS Corp. | | | 380 | | | | 4,579 | |
Digi International, Inc.* | | | 392 | | | | 4,469 | |
Computer Programs & Systems, Inc. | | | 169 | | | | 4,404 | |
American Software, Inc. — Class A | | | 390 | | | | 4,329 | |
MINDBODY, Inc. — Class A* | | | 218 | | | | 4,286 | |
Sigma Designs, Inc.* | | | 542 | | | | 4,222 | |
Silicon Graphics International Corp.* | | | 548 | | | | 4,220 | |
Carbonite, Inc.* | | | 269 | | | | 4,132 | |
Apigee Corp.* | | | 233 | | | | 4,054 | |
Instructure, Inc.* | | | 159 | | | | 4,034 | |
DSP Group, Inc.* | | | 326 | | | | 3,915 | |
Eastman Kodak Co.* | | | 258 | | | | 3,870 | |
Avid Technology, Inc.* | | | 486 | | | | 3,859 | |
Model N, Inc.* | | | 336 | | | | 3,733 | |
Jive Software, Inc.* | | | 872 | | | | 3,715 | |
Mitek Systems, Inc.* | | | 445 | | | | 3,689 | |
Ultra Clean Holdings, Inc.* | | | 485 | | | | 3,594 | |
Immersion Corp.* | | | 438 | | | | 3,574 | |
Glu Mobile, Inc.* | | | 1,555 | | | | 3,483 | |
Tangoe, Inc.* | | | 418 | | | | 3,449 | |
pdvWireless, Inc.* | | | 148 | | | | 3,389 | |
Exa Corp.* | | | 210 | | | | 3,371 | |
Everyday Health, Inc.* | | | 428 | | | | 3,291 | |
Datalink Corp.* | | | 304 | | | | 3,225 | |
QAD, Inc. — Class A | | | 142 | | | | 3,178 | |
TubeMogul, Inc.* | | | 333 | | | | 3,120 | |
USA Technologies, Inc.* | | | 542 | | | | 3,037 | |
Radisys Corp.* | | | 539 | | | | 2,881 | |
Amber Road, Inc.* | | | 268 | | | | 2,586 | |
Agilysys, Inc.* | | | 229 | | | | 2,546 | |
Castlight Health, Inc. — Class B* | | | 610 | | | | 2,538 | |
ExOne Co.* | | | 165 | | | | 2,511 | |
Rosetta Stone, Inc.* | | | 292 | | | | 2,476 | |
Maxwell Technologies, Inc.* | | | 476 | | | | 2,456 | |
Planet Payment, Inc.* | | | 640 | | | | 2,374 | |
Park City Group, Inc.* | | | 195 | | | | 2,301 | |
EMCORE Corp. | | | 395 | | | | 2,252 | |
Appfolio, Inc. — Class A* | | | 114 | | | | 2,216 | |
Guidance Software, Inc.* | | | 342 | | | | 2,038 | |
Kopin Corp.* | | | 931 | | | | 2,030 | |
GigPeak, Inc.* | | | 828 | | | | 1,946 | |
MobileIron, Inc.* | | | 703 | | | | 1,933 | |
Cogint, Inc.* | | | 230 | | | | 1,171 | |
SecureWorks Corp. — Class A* | | | 92 | | | | 1,151 | |
NCI, Inc. — Class A | | | 91 | | | | 1,053 | |
Majesco* | | | 89 | | | | 453 | |
Total Technology | | | | | | | 2,934,404 | |
| | | | | | | | | |
Communications - 5.0% | |
GrubHub, Inc.* | | | 1,221 | | | | 52,490 | |
ViaSat, Inc.* | | | 672 | | | | 50,166 | |
Finisar Corp.* | | | 1,625 | | | | 48,426 | |
Ciena Corp.* | | | 2,076 | | | | 45,257 | |
InterDigital, Inc. | | | 524 | | | | 41,501 | |
Zendesk, Inc.* | | | 1,227 | | | | 37,681 | |
LogMeIn, Inc. | | | 381 | | | | 34,439 | |
Media General, Inc.* | | | 1,649 | | | | 30,391 | |
NETGEAR, Inc.* | | | 490 | | | | 29,640 | |
Meredith Corp. | | | 568 | | | | 29,530 | |
Sinclair Broadcast Group, Inc. — Class A | | | 999 | | | | 28,851 | |
WebMD Health Corp. — Class A* | | | 565 | | | | 28,081 | |
Gigamon, Inc.* | | | 491 | | | | 26,907 | |
DigitalGlobe, Inc.* | | | 954 | | | | 26,235 | |
Viavi Solutions, Inc.* | | | 3,546 | | | | 26,205 | |
Plantronics, Inc. | | | 502 | | | | 26,084 | |
118 | THE RYDEX FUNDS SEMI-ANNUAL REPORT | SEE NOTES TO FINANCIAL STATEMENTS. |
SCHEDULE OF INVESTMENTS (Unaudited)(continued) | September 30, 2016 |
RUSSELL 2000® FUND | |
| | | Shares | | | Value | |
| | | | | | | |
Nexstar Broadcasting Group, Inc. — Class A | | | 451 | | | $ | 26,027 | |
Houghton Mifflin Harcourt Co.* | | | 1,875 | | | | 25,144 | |
Shutterfly, Inc.* | | | 523 | | | | 23,348 | |
Stamps.com, Inc.* | | | 245 | | | | 23,155 | |
Cogent Communications Holdings, Inc. | | | 629 | | | | 23,154 | |
Etsy, Inc.* | | | 1,587 | | | | 22,662 | |
NIC, Inc. | | | 959 | | | | 22,537 | |
Time, Inc. | | | 1,553 | | | | 22,487 | |
New York Times Co. — Class A | | | 1,881 | | | | 22,478 | |
Infoblox, Inc.* | | | 851 | | | | 22,441 | |
comScore, Inc.* | | | 721 | | | | 22,106 | |
NeuStar, Inc. — Class A* | | | 818 | | | | 21,751 | |
Ubiquiti Networks, Inc.* | | | 392 | | | | 20,972 | |
RingCentral, Inc. — Class A* | | | 885 | | | | 20,939 | |
Gannett Company, Inc. | | | 1,777 | | | | 20,684 | |
8x8, Inc.* | | | 1,333 | | | | 20,568 | |
Liberty Media Corporation-Liberty Media — Class C* | | | 698 | | | | 19,642 | |
Infinera Corp.* | | | 2,124 | | | | 19,180 | |
Vonage Holdings Corp.* | | | 2,888 | | | | 19,090 | |
Shenandoah Telecommunications Co. | | | 700 | | | | 19,047 | |
Consolidated Communications Holdings, Inc. | | | 750 | | | | 18,930 | |
Wayfair, Inc. — Class A* | | | 477 | | | | 18,779 | |
Shutterstock, Inc.* | | | 287 | | | | 18,282 | |
MSG Networks, Inc. — Class A* | | | 899 | | | | 16,730 | |
Scholastic Corp. | | | 409 | | | | 16,098 | |
Windstream Holdings, Inc. | | | 1,451 | | | | 14,583 | |
West Corp. | | | 654 | | | | 14,440 | |
EW Scripps Co. — Class A* | | | 900 | | | | 14,310 | |
ADTRAN, Inc. | | | 742 | | | | 14,202 | |
Cincinnati Bell, Inc.* | | | 3,180 | | | | 12,974 | |
AVG Technologies N.V.* | | | 517 | | | | 12,930 | |
Quotient Technology, Inc.* | | | 968 | | | | 12,884 | |
Oclaro, Inc.* | | | 1,486 | | | | 12,705 | |
Ixia* | | | 970 | | | | 12,125 | |
World Wrestling Entertainment, Inc. — Class A | | | 547 | | | | 11,651 | |
Box, Inc. — Class A* | | | 737 | | | | 11,615 | |
Web.com Group, Inc.* | | | 643 | | | | 11,105 | |
Q2 Holdings, Inc.* | | | 387 | | | | 11,091 | |
Perficient, Inc.* | | | 533 | | | | 10,740 | |
HealthStream, Inc.* | | | 389 | | | | 10,736 | |
ATN International, Inc. | | | 159 | | | | 10,341 | |
Iridium Communications, Inc.* | | | 1,246 | | | | 10,105 | |
Gray Television, Inc.* | | | 969 | | | | 10,039 | |
ORBCOMM, Inc.* | | | 977 | | | | 10,014 | |
Liberty Media Corporation-Liberty Media — Class A* | | | 346 | | | | 9,913 | |
EarthLink Holdings Corp. | | | 1,588 | | | | 9,846 | |
GTT Communications, Inc.* | | | 399 | | | | 9,388 | |
Gogo, Inc.* | | | 850 | | | | 9,384 | |
New Media Investment Group, Inc. | | | 587 | | | | 9,099 | |
ePlus, Inc.* | | | 96 | | | | 9,063 | |
Chegg, Inc.* | | | 1,216 | | | | 8,621 | |
MDC Partners, Inc. — Class A | | | 774 | | | | 8,297 | |
Liberty Media Corporation-Liberty Braves — Class C* | | | 476 | | | | 8,273 | |
Acacia Communications, Inc.* | | | 79 | | | | 8,159 | |
ShoreTel, Inc.* | | | 1,017 | | | | 8,136 | |
VASCO Data Security International, Inc.* | | | 456 | | | | 8,030 | |
Inteliquent, Inc. | | | 493 | | | | 7,957 | |
Endurance International Group Holdings, Inc.* | | | 906 | | | | 7,928 | |
TrueCar, Inc.* | | | 821 | | | | 7,750 | |
Loral Space & Communications, Inc.* | | | 195 | | | | 7,626 | |
NeoPhotonics Corp.* | | | 466 | | | | 7,614 | |
CalAmp Corp.* | | | 541 | | | | 7,547 | |
Entravision Communications Corp. — Class A | | | 983 | | | | 7,500 | |
XO Group, Inc.* | | | 384 | | | | 7,423 | |
Bazaarvoice, Inc.* | | | 1,241 | | | | 7,334 | |
A10 Networks, Inc.* | | | 667 | | | | 7,130 | |
Extreme Networks, Inc.* | | | 1,562 | | | | 7,013 | |
Harmonic, Inc.* | | | 1,156 | | | | 6,855 | |
Globalstar, Inc.* | | | 5,638 | | | | 6,822 | |
tronc, Inc.* | | | 403 | | | | 6,803 | |
Blucora, Inc.* | | | 593 | | | | 6,642 | |
Intralinks Holdings, Inc.* | | | 626 | | | | 6,298 | |
Bankrate, Inc.* | | | 716 | | | | 6,072 | |
General Communication, Inc. — Class A* | | | 438 | | | | 6,023 | |
DHI Group, Inc.* | | | 758 | | | | 5,981 | |
Angie’s List, Inc.* | | | 601 | | | | 5,956 | |
Global Eagle Entertainment, Inc.* | | | 708 | | | | 5,883 | |
RetailMeNot, Inc.* | | | 583 | | | | 5,766 | |
Blue Nile, Inc. | | | 167 | | | | 5,748 | |
Sonus Networks, Inc.* | | | 721 | | | | 5,609 | |
Boingo Wireless, Inc.* | | | 539 | | | | 5,541 | |
Spok Holdings, Inc. | | | 310 | | | | 5,524 | |
FTD Companies, Inc.* | | | 264 | | | | 5,430 | |
Rapid7, Inc.* | | | 301 | | | | 5,313 | |
Entercom Communications Corp. — Class A | | | 393 | | | | 5,085 | |
FairPoint Communications, Inc.* | | | 321 | | | | 4,825 | |
Rubicon Project, Inc.* | | | 563 | | | | 4,662 | |
Calix, Inc.* | | | 624 | | | | 4,586 | |
ChannelAdvisor Corp.* | | | 351 | | | | 4,538 | |
IDT Corp. — Class B | | | 262 | | | | 4,517 | |
Lionbridge Technologies, Inc.* | | | 862 | | | | 4,310 | |
Liquidity Services, Inc.* | | | 377 | | | | 4,237 | |
Lumos Networks Corp.* | | | 286 | | | | 4,004 | |
MeetMe, Inc.* | | | 624 | | | | 3,869 | |
Daily Journal Corp.* | | | 17 | | | | 3,723 | |
Straight Path Communications, Inc. — Class B* | | | 145 | | | | 3,713 | |
Comtech Telecommunications Corp. | | | 286 | | | | 3,664 | |
1-800-Flowers.com, Inc. — Class A* | | | 394 | | | | 3,613 | |
Silicom Ltd. | | | 85 | | | | 3,519 | |
Zix Corp.* | | | 804 | | | | 3,296 | |
Lands’ End, Inc.* | | | 226 | | | | 3,277 | |
Clearfield, Inc.* | | | 173 | | | | 3,252 | |
SEE NOTES TO FINANCIAL STATEMENTS. | THE RYDEX FUNDS SEMI-ANNUAL REPORT | 119 |
SCHEDULE OF INVESTMENTS (Unaudited)(continued) | September 30, 2016 |
RUSSELL 2000® FUND | |
| | | Shares | | | Value | |
| | | | | | | |
Black Box Corp. | | | 227 | | | $ | 3,155 | |
Overstock.com, Inc.* | | | 200 | | | | 3,064 | |
RigNet, Inc.* | | | 191 | | | | 2,888 | |
Telenav, Inc.* | | | 493 | | | | 2,825 | |
HC2 Holdings, Inc.* | | | 505 | | | | 2,752 | |
Reis, Inc. | | | 132 | | | | 2,701 | |
NII Holdings, Inc.* | | | 809 | | | | 2,694 | |
Central European Media Enterprises Ltd. — Class A* | | | 1,155 | | | | 2,668 | |
Saga Communications, Inc. — Class A | | | 55 | | | | 2,494 | |
Liberty Media Corporation-Liberty Braves — Class A* | | | 138 | | | | 2,408 | |
Autobytel, Inc.* | | | 132 | | | | 2,350 | |
VirnetX Holding Corp.* | | | 731 | | | | 2,237 | |
Aerohive Networks, Inc.* | | | 362 | | | | 2,205 | |
Hawaiian Telcom Holdco, Inc.* | | | 91 | | | | 2,037 | |
KVH Industries, Inc.* | | | 228 | | | | 2,009 | |
Limelight Networks, Inc.* | | | 1,072 | | | | 2,005 | |
TechTarget, Inc.* | | | 239 | | | | 1,926 | |
QuinStreet, Inc.* | | | 554 | | | | 1,673 | |
Numerex Corp. — Class A* | | | 209 | | | | 1,626 | |
Preformed Line Products Co. | | | 38 | | | | 1,602 | |
Rightside Group Ltd.* | | | 176 | | | | 1,602 | |
RealNetworks, Inc.* | | | 355 | | | | 1,583 | |
Marchex, Inc. — Class B* | | | 505 | | | | 1,399 | |
Intelsat S.A.* | | | 478 | | | | 1,295 | |
Townsquare Media, Inc. — Class A* | | | 131 | | | | 1,224 | |
Radio One, Inc. — Class D* | | | 373 | | | | 1,130 | |
Global Sources Ltd.* | | | 124 | | | | 1,052 | |
Hemisphere Media Group, Inc.* | | | 81 | | | | 1,033 | |
Salem Media Group, Inc. — Class A | | | 167 | | | | 982 | |
Corindus Vascular Robotics, Inc.* | | | 830 | | | | 921 | |
Value Line, Inc. | | | 17 | | | | 276 | |
Total Communications | | | | | | | 1,740,508 | |
| | | | | | | | | |
Basic Materials - 3.1% | |
Olin Corp. | | | 2,504 | | | | 51,382 | |
Sensient Technologies Corp. | | | 674 | | | | 51,089 | |
US Silica Holdings, Inc. | | | 967 | | | | 45,023 | |
Chemours Co. | | | 2,770 | | | | 44,320 | |
PolyOne Corp. | | | 1,268 | | | | 42,871 | |
Minerals Technologies, Inc. | | | 524 | | | | 37,042 | �� |
Balchem Corp. | | | 476 | | | | 36,904 | |
HB Fuller Co. | | | 757 | | | | 35,178 | |
Hecla Mining Co. | | | 5,769 | | | | 32,883 | |
Worthington Industries, Inc. | | | 681 | | | | 32,707 | |
Chemtura Corp.* | | | 963 | | | | 31,596 | |
GCP Applied Technologies, Inc.* | | | 1,072 | | | | 30,359 | |
Ingevity Corp.* | | | 644 | | | | 29,688 | |
Allegheny Technologies, Inc. | | | 1,641 | | | | 29,652 | |
Coeur Mining, Inc.* | | | 2,448 | | | | 28,960 | |
Carpenter Technology Corp. | | | 699 | | | | 28,841 | |
Commercial Metals Co. | | | 1,737 | | | | 28,122 | |
Stillwater Mining Co.* | | | 1,848 | | | | 24,689 | |
Kaiser Aluminum Corp. | | | 268 | | | | 23,180 | |
Innospec, Inc. | | | 357 | | | | 21,709 | |
Stepan Co. | | | 297 | | | | 21,580 | |
Quaker Chemical Corp. | | | 196 | | | | 20,762 | |
Neenah Paper, Inc. | | | 251 | | | | 19,832 | |
Cliffs Natural Resources, Inc.* | | | 3,334 | | | | 19,504 | |
Schweitzer-Mauduit International, Inc. | | | 458 | | | | 17,660 | |
Ferro Corp.* | | | 1,258 | | | | 17,373 | |
AK Steel Holding Corp.* | | | 3,585 | | | | 17,316 | |
Clearwater Paper Corp.* | | | 256 | | | | 16,556 | |
Kraton Corp.* | | | 448 | | | | 15,698 | |
PH Glatfelter Co. | | | 658 | | | | 14,265 | |
Univar, Inc.* | | | 650 | | | | 14,202 | |
A. Schulman, Inc. | | | 435 | | | | 12,667 | |
Calgon Carbon Corp. | | | 761 | | | | 11,545 | |
Innophos Holdings, Inc. | | | 292 | | | | 11,397 | |
Deltic Timber Corp. | | | 161 | | | | 10,905 | |
Fairmount Santrol Holdings, Inc.* | | | 1,179 | | | | 9,998 | |
Koppers Holdings, Inc.* | | | 308 | | | | 9,911 | |
Materion Corp. | | | 301 | | | | 9,244 | |
Tronox Ltd. — Class A | | | 974 | | | | 9,126 | |
Ferroglobe plc | | | 988 | | | | 8,922 | |
Rayonier Advanced Materials, Inc. | | | 651 | | | | 8,704 | |
Aceto Corp. | | | 440 | | | | 8,356 | |
Schnitzer Steel Industries, Inc. — Class A | | | 395 | | | | 8,256 | |
CSW Industrials, Inc.* | | | 218 | | | | 7,061 | |
American Vanguard Corp. | | | 427 | | | | 6,858 | |
Hawkins, Inc. | | | 145 | | | | 6,283 | |
Gold Resource Corp. | | | 755 | | | | 5,602 | |
Landec Corp.* | | | 405 | | | | 5,431 | |
OMNOVA Solutions, Inc.* | | | 642 | | | | 5,418 | |
Century Aluminum Co.* | | | 754 | | | | 5,240 | |
KMG Chemicals, Inc. | | | 136 | | | | 3,853 | |
Orchids Paper Products Co. | | | 137 | | | | 3,731 | |
Oil-Dri Corporation of America | | | 75 | | | | 2,823 | |
Kronos Worldwide, Inc. | | | 333 | | | | 2,761 | |
Codexis, Inc.* | | | 506 | | | | 2,247 | |
Ryerson Holding Corp.* | | | 191 | | | | 2,156 | |
United States Lime & Minerals, Inc. | | | 30 | | | | 1,980 | |
AgroFresh Solutions, Inc.* | | | 333 | | | | 1,762 | |
ALJ Regional Holdings, Inc.* | | | 280 | | | | 1,316 | |
Valhi, Inc. | | | 380 | | | | 874 | |
Total Basic Materials | | | | | | | 1,065,370 | |
| | | | | | | | | |
Utilities - 2.8% | |
IDACORP, Inc. | | | 764 | | | | 59,805 | |
Portland General Electric Co. | | | 1,353 | | | | 57,624 | |
Southwest Gas Corp. | | | 715 | | | | 49,951 | |
ONE Gas, Inc. | | | 787 | | | | 48,668 | |
WGL Holdings, Inc. | | | 763 | | | | 47,840 | |
Black Hills Corp. | | | 780 | | | | 47,751 | |
ALLETE, Inc. | | | 750 | | | | 44,715 | |
Spire, Inc. | | | 676 | | | | 43,088 | |
New Jersey Resources Corp. | | | 1,297 | | | | 42,619 | |
NorthWestern Corp. | | | 735 | | | | 42,285 | |
Avista Corp. | | | 957 | | | | 39,993 | |
PNM Resources, Inc. | | | 1,209 | | | | 39,558 | |
South Jersey Industries, Inc. | | | 1,207 | | | | 35,667 | |
MGE Energy, Inc. | | | 529 | | | | 29,894 | |
120 | THE RYDEX FUNDS SEMI-ANNUAL REPORT | SEE NOTES TO FINANCIAL STATEMENTS. |
SCHEDULE OF INVESTMENTS (Unaudited)(continued) | September 30, 2016 |
RUSSELL 2000® FUND | |
| | | Shares | | | Value | |
| | | | | | | |
El Paso Electric Co. | | | 611 | | | $ | 28,576 | |
Ormat Technologies, Inc. | | | 588 | | | | 28,465 | |
Northwest Natural Gas Co. | | | 411 | | | | 24,705 | |
California Water Service Group | | | 726 | | | | 23,297 | |
Empire District Electric Co. | | | 668 | | | | 22,806 | |
American States Water Co. | | | 553 | | | | 22,148 | |
Dynegy, Inc.* | | | 1,767 | | | | 21,893 | |
Otter Tail Corp. | | | 574 | | | | 19,855 | |
Talen Energy Corp.* | | | 1,274 | | | | 17,645 | |
Atlantica Yield plc | | | 889 | | | | 16,900 | |
NRG Yield, Inc. — Class C | | | 959 | | | | 16,265 | |
Chesapeake Utilities Corp. | | | 222 | | | | 13,555 | |
SJW Corp. | | | 247 | | | | 10,789 | |
NRG Yield, Inc. — Class A | | | 528 | | | | 8,617 | |
Middlesex Water Co. | | | 240 | | | | 8,458 | |
Unitil Corp. | | | 210 | | | | 8,203 | |
Connecticut Water Service, Inc. | | | 164 | | | | 8,156 | |
York Water Co. | | | 195 | | | | 5,784 | |
Atlantic Power Corp. | | | 1,843 | | | | 4,552 | |
Artesian Resources Corp. — Class A | | | 117 | | | | 3,339 | |
Consolidated Water Company Ltd. | | | 220 | | | | 2,556 | |
Delta Natural Gas Company, Inc. | | | 103 | | | | 2,457 | |
EnerNOC, Inc.* | | | 405 | | | | 2,191 | |
Spark Energy, Inc. — Class A | | | 74 | | | | 2,156 | |
Ameresco, Inc. — Class A* | | | 321 | | | | 1,688 | |
Genie Energy Ltd. — Class B* | | | 195 | | | | 1,151 | |
Global Water Resources, Inc. | | | 124 | | | | 993 | |
Total Utilities | | | | | | | 956,658 | |
| | | | | | | | | |
Energy - 2.4% | |
PDC Energy, Inc.* | | | 692 | | | | 46,407 | |
RSP Permian, Inc.* | | | 1,189 | | | | 46,110 | |
NOW, Inc.* | | | 1,618 | | | | 34,674 | |
Carrizo Oil & Gas, Inc.* | | | 843 | | | | 34,243 | |
Western Refining, Inc. | | | 1,219 | | | | 32,255 | |
Oasis Petroleum, Inc.* | | | 2,690 | | | | 30,854 | |
Matador Resources Co.* | | | 1,255 | | | | 30,547 | |
Callon Petroleum Co.* | | | 1,822 | | | | 28,605 | |
SemGroup Corp. — Class A | | | 800 | | | | 28,288 | |
Oil States International, Inc.* | | | 773 | | | | 24,403 | |
MRC Global, Inc.* | | | 1,417 | | | | 23,281 | |
Pattern Energy Group, Inc. | | | 1,002 | | | | 22,535 | |
Synergy Resources Corp.* | | | 2,809 | | | | 19,466 | |
TerraForm Power, Inc. — Class A* | | | 1,322 | | | | 18,389 | |
McDermott International, Inc.* | | | 3,653 | | | | 18,302 | |
Forum Energy Technologies, Inc.* | | | 907 | | | | 18,012 | |
Denbury Resources, Inc.* | | | 5,315 | | | | 17,167 | |
Delek US Holdings, Inc. | | | 931 | | | | 16,097 | |
SEACOR Holdings, Inc.* | | | 241 | | | | 14,337 | |
Green Plains, Inc. | | | 547 | | | | 14,331 | |
Unit Corp.* | | | 764 | | | | 14,209 | |
Archrock, Inc. | | | 1,051 | | | | 13,747 | |
Seadrill Ltd.* | | | 5,715 | | | | 13,545 | |
Helix Energy Solutions Group, Inc.* | | | 1,522 | | | | 12,374 | |
Flotek Industries, Inc.* | | | 827 | | | | 12,024 | |
Thermon Group Holdings, Inc.* | | | 484 | | | | 9,558 | |
Newpark Resources, Inc.* | | | 1,253 | | | | 9,222 | |
TETRA Technologies, Inc.* | | | 1,365 | | | | 8,340 | |
Atwood Oceanics, Inc. | | | 920 | | | | 7,995 | |
SunCoke Energy, Inc.* | | | 974 | | | | 7,811 | |
Clayton Williams Energy, Inc.* | | | 90 | | | | 7,690 | |
Cobalt International Energy, Inc.* | | | 6,168 | | | | 7,648 | |
Matrix Service Co.* | | | 402 | | | | 7,542 | |
Exterran Corp.* | | | 479 | | | | 7,511 | |
Sanchez Energy Corp.* | | | 844 | | | | 7,461 | |
REX American Resources Corp.* | | | 86 | | | | 7,289 | |
Bristow Group, Inc. | | | 508 | | | | 7,122 | |
Par Pacific Holdings, Inc.* | | | 465 | | | | 6,082 | |
Sunrun, Inc.* | | | 955 | | | | 6,017 | |
California Resources Corp.* | | | 479 | | | | 5,988 | |
Ring Energy, Inc.* | | | 541 | | | | 5,924 | |
Clean Energy Fuels Corp.* | | | 1,325 | | | | 5,923 | |
Tesco Corp. | | | 699 | | | | 5,704 | |
TerraForm Global, Inc. — Class A | | | 1,381 | | | | 5,676 | |
Renewable Energy Group, Inc.* | | | 579 | | | | 4,904 | |
Plug Power, Inc.* | | | 2,729 | | | | 4,667 | |
Natural Gas Services Group, Inc.* | | | 186 | | | | 4,574 | |
FutureFuel Corp. | | | 377 | | | | 4,253 | |
Bill Barrett Corp.* | | | 740 | | | | 4,114 | |
Panhandle Oil and Gas, Inc. — Class A | | | 232 | | | | 4,067 | |
Parker Drilling Co.* | | | 1,827 | | | | 3,965 | |
Pioneer Energy Services Corp.* | | | 964 | | | | 3,895 | |
Alon USA Energy, Inc. | | | 477 | | | | 3,845 | |
Geospace Technologies Corp.* | | | 197 | | | | 3,838 | |
Trecora Resources* | | | 300 | | | | 3,426 | |
Contango Oil & Gas Co.* | | | 331 | | | | 3,383 | |
CVR Energy, Inc. | | | 239 | | | | 3,291 | |
CARBO Ceramics, Inc. | | | 294 | | | | 3,216 | |
PHI, Inc.* | | | 177 | | | | 3,216 | |
Abraxas Petroleum Corp.* | | | 1,867 | | | | 3,155 | |
Pacific Ethanol, Inc.* | | | 434 | | | | 2,999 | |
Eclipse Resources Corp.* | | | 861 | | | | 2,833 | |
EP Energy Corp. — Class A* | | | 585 | | | | 2,562 | |
Westmoreland Coal Co.* | | | 279 | | | | 2,472 | |
Era Group, Inc.* | | | 296 | | | | 2,383 | |
Independence Contract Drilling, Inc.* | | | 453 | | | | 2,378 | |
FuelCell Energy, Inc.* | | | 434 | | | | 2,352 | |
Dawson Geophysical Co.* | | | 305 | | | | 2,327 | |
Evolution Petroleum Corp. | | | 369 | | | | 2,317 | |
EXCO Resources, Inc.* | | | 2,117 | | | | 2,265 | |
Northern Oil and Gas, Inc.* | | | 707 | | | | 1,895 | |
Jones Energy, Inc. — Class A* | | | 448 | | | | 1,595 | |
Adams Resources & Energy, Inc. | | | 32 | | | | 1,258 | |
Willbros Group, Inc.* | | | 654 | | | | 1,230 | |
Vivint Solar, Inc.* | | | 344 | | | | 1,087 | |
W&T Offshore, Inc.* | | | 538 | | | | 947 | |
Isramco, Inc.* | | | 11 | | | | 917 | |
Erin Energy Corp.* | | | 219 | | | | 515 | |
Earthstone Energy, Inc.* | | | 31 | | | | 267 | |
Total Energy | | | | | | | 817,113 | |
SEE NOTES TO FINANCIAL STATEMENTS. | THE RYDEX FUNDS SEMI-ANNUAL REPORT | 121 |
SCHEDULE OF INVESTMENTS (Unaudited)(continued) | September 30, 2016 |
RUSSELL 2000® FUND | |
| | | Shares | | | Value | |
| | | | | | | |
Diversified - 0.1% | |
HRG Group, Inc.* | | | 1,794 | | | $ | 28,166 | |
Wins Finance Holdings, Inc.* | | | 21 | | | | 621 | |
Total Diversified | | | | | | | 28,787 | |
| | | | | | | | | |
Government - 0.0% | |
Banco Latinoamericano de Comercio Exterior S.A. — Class E | | | 458 | | | | 12,906 | |
| | | | | | | | | |
Health Care - 0.0% | |
Integer Holdings Corp.* | | | 462 | | | | 10,021 | |
Aptevo Therapeutics, Inc.* | | | 246 | | | | 630 | |
Total Health Care | | | | | | | 10,651 | |
| | | | | | | | | |
Total Common Stocks | | | | | | | | |
(Cost $23,706,932) | | | | | | | 26,293,800 | |
| | | | | | | | | |
RIGHTS††† - 0.0% | |
Omthera Pharmaceuticals, Inc. | | | | | | | | |
Expires 12/31/20 | | | 86 | | | | — | |
Leap Wireless International, Inc. | | | | | | | | |
Expires 03/06/17 | | | 1,211 | | | | — | |
Dyax Corp. | | | | | | | | |
Expires 01/25/17 | | | 757 | | | | — | |
Total Rights | | | | | | | | |
(Cost $1,618) | | | | | | | — | |
| | | | | | | | | |
| | | Face
Amount | | | | | |
| | | | | | | | | |
FEDERAL AGENCY NOTES†† - 8.6% | |
Federal Farm Credit Bank5 | | | | | | | | |
0.67% due 09/12/181 | | $ | 3,000,000 | | | | 2,997,672 | |
Total Federal Agency Notes | | | | | | | | |
(Cost $2,999,412) | | | | | | | 2,997,672 | |
| | | | | | | | | |
REPURCHASE AGREEMENTS††,2 - 27.7% | |
HSBC Securities, Inc.
issued 09/30/16 at 0.38%
due 10/03/16 | | | 5,132,264 | | | | 5,132,264 | |
Royal Bank of Canada
issued 09/30/16 at 0.36%
due 10/03/163 | | | 4,495,350 | | | | 4,495,350 | |
Total Repurchase Agreements | | | | | | | | |
(Cost $9,627,614) | | | | | | | 9,627,614 | |
| | | | | | | | | |
Total Investments - 112.1% | | | | | | | | |
(Cost $36,335,576) | | | | | | $ | 38,919,086 | |
Other Assets & Liabilities, net - (12.1)% | | | | | | | (4,204,832 | ) |
Total Net Assets - 100.0% | | | | | | $ | 34,714,254 | |
| | | Contracts | | | Unrealized
Gain (Loss) | |
| | | | | | | |
EQUITY FUTURES CONTRACTS PURCHASED† | |
December 2016 Russell 2000 Index
Mini Futures Contracts
(Aggregate Value of
Contracts $2,743,400) | | | 22 | | | $ | 36,008 | |
| | | | | | | | | |
| | | Units | | | | | |
| | | | | | | | | |
OTC EQUITY INDEX SWAP AGREEMENTS†† | |
BNP Paribas
November 2016
Russell 2000 Index Swap 0.13%4,
Terminating 11/01/16
(Notional Value $3,048,114) | | | 2,435 | | | $ | 33,882 | |
Goldman Sachs International
October 2016
Russell 2000 Index Swap 0.30%4,
Terminating 10/26/16
(Notional Value $811,396) | | | 648 | | | | 7,452 | |
Barclays Bank plc
October 2016
Russell 2000 Index Swap 0.30%4,
Terminating 10/31/16
(Notional Value $1,830,251) | | | 1,462 | | | | (5,203 | ) |
(Total Notional Value $5,689,761) | | | | | | $ | 36,131 | |
122 | THE RYDEX FUNDS SEMI-ANNUAL REPORT | SEE NOTES TO FINANCIAL STATEMENTS. |
SCHEDULE OF INVESTMENTS (Unaudited)(concluded) | September 30, 2016 |
RUSSELL 2000® FUND | |
* | Non-income producing security. |
† | Value determined based on Level 1 inputs, unless otherwise noted — See Note 4. |
†† | Value determined based on Level 2 inputs — See Note 4. |
††† | Value determined based on Level 3 inputs — See Note 4. |
1 | Variable rate security. Rate indicated is rate effective at September 30, 2016. |
2 | Repurchase Agreements — See Note 5. |
3 | All or a portion of this security is pledged as equity index swap collateral at September 30, 2016. |
4 | Total Return based on Russell 2000 Index +/- financing at a variable rate. Rate indicated is the rate effective at September 30, 2016. |
5 | The issuer operates under a Congressional charter; its securities are neither issued nor guaranteed by the U.S. Government. |
| | plc — Public Limited Company |
| | REIT — Real Estate Investment Trust |
| | |
| | See Sector Classification in Other Information section. |
The following table summarizes the inputs used to value the Fund’s investments at September 30, 2016 (See Note 4 in the Notes to Financial Statements):
Investments in Securities (Assets) | | Level 1 | | | Level 1 -
Other* | | | Level 2 | | | Level 2 -
Other* | | | Level 3 | | | Total | |
Common Stocks | | $ | 26,293,800 | | | $ | — | | | $ | — | | | $ | — | | | $ | — | | | $ | 26,293,800 | |
Equity Futures Contracts | | | — | | | | 36,008 | | | | — | | | | — | | | | — | | | | 36,008 | |
Equity Index Swap Agreements | | | — | | | | — | | | | — | | | | 41,334 | | | | — | | | | 41,334 | |
Federal Agency Notes | | | — | | | | — | | | | 2,997,672 | | | | — | | | | — | | | | 2,997,672 | |
Repurchase Agreements | | | — | | | | — | | | | 9,627,614 | | | | — | | | | — | | | | 9,627,614 | |
Rights | | | — | | | | — | | | | — | | | | — | | | | — | | | | — | |
Total | | $ | 26,293,800 | | | $ | 36,008 | | | $ | 12,625,286 | | | $ | 41,334 | | | $ | — | | | $ | 38,996,428 | |
| | | | | | | | | | | | | | | | | | | | | | | | | |
Investments in Securities (Liabilities) | | Level 1 | | | Level 1 -
Other* | | | Level 2 | | | Level 2 -
Other* | | | Level 3 | | | Total | |
Equity Index Swap Agreements | | $ | — | | | $ | — | | | $ | — | | | $ | 5,203 | | | $ | — | | | $ | 5,203 | |
* | Other financial instruments include futures contracts and/or swaps, which are reported as unrealized gain/loss at period end. |
Transfers between investment levels may occur as the markets fluctuate and/or the availability of data used in an investment’s valuation changes. Transfers between valuation levels, if any, are in comparison to the valuation levels at the end of the previous fiscal year, and are effective using the fair value as of the end of the previous fiscal period.
For the period ended September 30, 2016, there were no transfers between levels.
SEE NOTES TO FINANCIAL STATEMENTS. | THE RYDEX FUNDS SEMI-ANNUAL REPORT | 123 |
STATEMENT OF ASSETS AND LIABILITIES (Unaudited) |
September 30, 2016 |
Assets: | |
Investments, at value (cost $26,707,962) | | $ | 29,291,472 | |
Repurchase agreements, at value (cost $9,627,614) | | | 9,627,614 | |
Total investments (cost $36,335,576) | | | 38,919,086 | |
Segregated cash with broker | | | 659,800 | |
Unrealized appreciation on swap agreements | | | 41,334 | |
Cash | | | 513 | |
Receivables: | |
Variation margin | | | 23,760 | |
Fund shares sold | | | 43,710 | |
Dividends | | | 25,432 | |
Interest | | | 1,160 | |
Total assets | | | 39,714,795 | |
| | | | | |
Liabilities: | |
Unrealized depreciation on swap agreements | | | 5,203 | |
Payable for: | |
Securities purchased | | | 4,906,687 | |
Fund shares redeemed | | | 28,730 | |
Management fees | | | 22,740 | |
Distribution and service fees | | | 9,495 | |
Transfer agent and administrative fees | | | 7,580 | |
Swap settlement | | | 5,712 | |
Portfolio accounting fees | | | 4,548 | |
Miscellaneous | | | 9,846 | |
Total liabilities | | | 5,000,541 | |
Commitments and contingent liabilities (Note 13) | | | — | |
Net assets | | $ | 34,714,254 | |
| | | | | |
Net assets consist of: | |
Paid in capital | | $ | 33,354,337 | |
Accumulated net investment loss | | | (227,874 | ) |
Accumulated net realized loss on investments | | | (1,067,858 | ) |
Net unrealized appreciation on investments | | | 2,655,649 | |
Net assets | | $ | 34,714,254 | |
| | | | | |
A-Class: | |
Net assets | | $ | 12,610,836 | |
Capital shares outstanding | | | 335,106 | |
Net asset value per share | | $ | 37.63 | |
Maximum offering price per share (Net asset value divided by 95.25%) | | $ | 39.51 | |
| | | | | |
C-Class: | |
Net assets | | $ | 3,015,064 | |
Capital shares outstanding | | | 87,685 | |
Net asset value per share | | $ | 34.39 | |
| | | | | |
H-Class: | |
Net assets | | $ | 19,088,354 | |
Capital shares outstanding | | | 508,532 | |
Net asset value per share | | $ | 37.54 | |
124 | THE RYDEX FUNDS SEMI-ANNUAL REPORT | SEE NOTES TO FINANCIAL STATEMENTS. |
STATEMENT OF OPERATIONS (Unaudited) |
Period Ended September 30, 2016 |
Investment Income: | |
Dividends (net of foreign withholding tax of $91) | | $ | 143,885 | |
Interest | | | 18,185 | |
Other income | | | 87 | |
Total investment income | | | 162,157 | |
| | | | | |
Expenses: | |
Management fees | | | 132,571 | |
Transfer agent and administrative fees | | | 44,191 | |
Distribution and service fees: | |
A-Class | | | 17,067 | |
C-Class | | | 14,963 | |
H-Class | | | 23,385 | |
Portfolio accounting fees | | | 26,515 | |
Custodian fees | | | 2,075 | |
Trustees’ fees* | | | 1,599 | |
Line of credit fees | | | 134 | |
Miscellaneous | | | 34,437 | |
Total expenses | | | 296,937 | |
Net investment loss | | | (134,780 | ) |
| | | | | |
Net Realized and Unrealized Gain (Loss): | |
Net realized gain (loss) on: | |
Investments | | $ | 544,164 | |
Swap agreements | | | 1,217,787 | |
Futures contracts | | | 383,050 | |
Net realized gain | | | 2,145,001 | |
Net change in unrealized appreciation (depreciation) on: | |
Investments | | | 1,467,408 | |
Swap agreements | | | (188,214 | ) |
Futures contracts | | | (5,303 | ) |
Net change in unrealized appreciation (depreciation) | | | 1,273,891 | |
Net realized and unrealized gain | | | 3,418,892 | |
Net increase in net assets resulting from operations | | $ | 3,284,112 | |
* | Relates to Trustees not deemed “interested persons” within the meaning of Section 2(a)(19) of the 1940 Act. |
SEE NOTES TO FINANCIAL STATEMENTS. | THE RYDEX FUNDS SEMI-ANNUAL REPORT | 125 |
STATEMENTS OF CHANGES IN NET ASSETS |
| | | Period Ended
September 30,
2016
(Unaudited) | | | Year Ended
March 31,
2016 | |
Increase (Decrease) in Net Assets from Operations: | | | | | | |
Net investment loss | | $ | (134,780 | ) | | $ | (353,047 | ) |
Net realized gain (loss) on investments | | | 2,145,001 | | | | (2,172,044 | ) |
Net change in unrealized appreciation (depreciation) on investments | | | 1,273,891 | | | | 771,104 | |
Net increase (decrease) in net assets resulting from operations | | | 3,284,112 | | | | (1,753,987 | ) |
| | | | | | | | | |
Distributions to shareholders from: | | | | | | | | |
Net realized gains | | | | | | | | |
A-Class | | | — | | | | (378,494 | ) |
C-Class | | | — | | | | (84,593 | ) |
H-Class | | | — | | | | (279,804 | ) |
Total distributions to shareholders | | | — | | | | (742,891 | ) |
| | | | | | | | | |
Capital share transactions: | | | | | | | | |
Proceeds from sale of shares | | | | | | | | |
A-Class | | | 16,350,794 | | | | 44,154,351 | |
C-Class | | | 2,089,446 | | | | 14,311,898 | |
H-Class | | | 110,006,453 | | | | 344,016,927 | |
Distributions reinvested | | | | | | | | |
A-Class | | | — | | | | 344,126 | |
C-Class | | | — | | | | 76,580 | |
H-Class | | | — | | | | 275,570 | |
Cost of shares redeemed | | | | | | | | |
A-Class | | | (17,376,842 | ) | | | (44,563,233 | ) |
C-Class | | | (2,183,479 | ) | | | (15,370,265 | ) |
H-Class | | | (138,460,846 | ) | | | (325,825,130 | ) |
Net increase (decrease) from capital share transactions | | | (29,574,474 | ) | | | 17,420,824 | |
Net increase (decrease) in net assets | | | (26,290,362 | ) | | | 14,923,946 | |
| | | | | | | | | |
Net assets: | | | | | | | | |
Beginning of period | | | 61,004,616 | | | | 46,080,670 | |
End of period | | $ | 34,714,254 | | | $ | 61,004,616 | |
Accumulated net investment loss at end of period | | $ | (227,874 | ) | | $ | (93,094 | ) |
| | | | | | | | | |
Capital share activity: | | | | | | | | |
Shares sold | | | | | | | | |
A-Class | | | 456,054 | | | | 1,257,318 | |
C-Class | | | 64,588 | | | | 422,747 | |
H-Class | | | 3,181,963 | | | | 9,826,186 | |
Shares issued from reinvestment of distributions | | | | | | | | |
A-Class | | | — | | | | 9,852 | |
C-Class | | | — | | | | 2,386 | |
H-Class | | | — | | | | 7,908 | |
Shares redeemed | | | | | | | | |
A-Class | | | (478,301 | ) | | | (1,267,797 | ) |
C-Class | | | (66,587 | ) | | | (453,761 | ) |
H-Class | | | (4,054,986 | ) | | | (9,171,878 | ) |
Net increase (decrease) in shares | | | (897,269 | ) | | | 632,961 | |
126 | THE RYDEX FUNDS SEMI-ANNUAL REPORT | SEE NOTES TO FINANCIAL STATEMENTS. |
This table is presented to show selected data for a share outstanding throughout each period and to assist shareholders in evaluating a Fund’s performance for the periods presented.
A-Class | | Period Ended
September 30,
2016a | | | Year Ended
March 31,
2016 | | | Year Ended
March 31,
2015 | | | Year Ended
March 31,
2014 | | | Year Ended
March 28,
2013 | | | Year Ended
March 31,
2012 | |
Per Share Data | | | | | | | | | | | | | | | | | | |
Net asset value, beginning of period | | $ | 33.56 | | | $ | 38.88 | | | $ | 37.80 | | | $ | 32.26 | | | $ | 28.20 | | | $ | 28.54 | |
Income (loss) from investment operations: | |
Net investment income (loss)b | | | (.12 | ) | | | (.29 | ) | | | (.25 | ) | | | (.27 | ) | | | (.13 | ) | | | (.23 | ) |
Net gain (loss) on investments (realized and unrealized) | | | 4.19 | | | | (4.12 | ) | | | 2.61 | | | | 7.54 | | | | 4.19 | | | | (.11 | ) |
Total from investment operations | | | 4.07 | | | | (4.41 | ) | | | 2.36 | | | | 7.27 | | | | 4.06 | | | | (.34 | ) |
Less distributions from: | |
Net realized gains | | | — | | | | (.91 | ) | | | (1.28 | ) | | | (1.73 | ) | | | — | | | | — | |
Total distributions | | | — | | | | (.91 | ) | | | (1.28 | ) | | | (1.73 | ) | | | — | | | | — | |
Net asset value, end of period | | $ | 37.63 | | | $ | 33.56 | | | $ | 38.88 | | | $ | 37.80 | | | $ | 32.26 | | | $ | 28.20 | |
| | |
Total Returnc | | | 12.13 | % | | | (11.43 | %) | | | 6.42 | % | | | 22.87 | % | | | 14.40 | % | | | (1.19 | %) |
Ratios/Supplemental Data | |
Net assets, end of period (in thousands) | | $ | 12,611 | | | $ | 11,993 | | | $ | 13,920 | | | $ | 3,219 | | | $ | 3,723 | | | $ | 670 | |
Ratios to average net assets: | |
Net investment income (loss) | | | (0.65 | %) | | | (0.83 | %) | | | (0.67 | %) | | | (0.77 | %) | | | (0.44 | %) | | | (0.89 | %) |
Total expenses | | | 1.61 | % | | | 1.59 | % | | | 1.57 | % | | | 1.60 | % | | | 1.55 | % | | | 1.58 | % |
Portfolio turnover rate | | | 200 | % | | | 442 | % | | | 947 | % | | | 267 | % | | | 160 | % | | | 121 | % |
C-Class | | Period Ended
September 30,
2016a | | | Year Ended
March 31,
2016 | | | Year Ended
March 31,
2015 | | | Year Ended
March 31,
2014 | | | Year Ended
March 28,
2013 | | | Year Ended
March 31,
2012 | |
Per Share Data | | | | | | | | | | | | | | | | | | |
Net asset value, beginning of period | | $ | 30.78 | | | $ | 36.00 | | | $ | 35.36 | | | $ | 30.54 | | | $ | 26.90 | | | $ | 27.46 | |
Income (loss) from investment operations: | |
Net investment income (loss)b | | | (.23 | ) | | | (.51 | ) | | | (.60 | ) | | | (.48 | ) | | | (.31 | ) | | | (.46 | ) |
Net gain (loss) on investments (realized and unrealized) | | | 3.84 | | | | (3.80 | ) | | | 2.52 | | | | 7.03 | | | | 3.95 | | | | (.10 | ) |
Total from investment operations | | | 3.61 | | | | (4.31 | ) | | | 1.92 | | | | 6.55 | | | | 3.64 | | | | (.56 | ) |
Less distributions from: | |
Net realized gains | | | — | | | | (.91 | ) | | | (1.28 | ) | | | (1.73 | ) | | | — | | | | — | |
Total distributions | | | — | | | | (.91 | ) | | | (1.28 | ) | | | (1.73 | ) | | | — | | | | — | |
Net asset value, end of period | | $ | 34.39 | | | $ | 30.78 | | | $ | 36.00 | | | $ | 35.36 | | | $ | 30.54 | | | $ | 26.90 | |
| | |
Total Returnc | | | 11.70 | % | | | (12.07 | %) | | | 5.61 | % | | | 21.78 | % | | | 13.53 | % | | | (2.04 | %) |
Ratios/Supplemental Data | |
Net assets, end of period (in thousands) | | $ | 3,015 | | | $ | 2,760 | | | $ | 4,259 | | | $ | 3,245 | | | $ | 2,599 | | | $ | 6,285 | |
Ratios to average net assets: | |
Net investment income (loss) | | | (1.40 | %) | | | (1.56 | %) | | | (1.77 | %) | | | (1.47 | %) | | | (1.19 | %) | | | (1.83 | %) |
Total expenses | | | 2.36 | % | | | 2.35 | % | | | 2.57 | % | | | 2.37 | % | | | 2.31 | % | | | 2.34 | % |
Portfolio turnover rate | | | 200 | % | | | 442 | % | | | 947 | % | | | 267 | % | | | 160 | % | | | 121 | % |
SEE NOTES TO FINANCIAL STATEMENTS. | THE RYDEX FUNDS SEMI-ANNUAL REPORT | 127 |
FINANCIAL HIGHLIGHTS (concluded) |
This table is presented to show selected data for a share outstanding throughout each period and to assist shareholders in evaluating a Fund’s performance for the periods presented.
H-Class | | Period Ended
September 30,
2016a | | | Year Ended
March 31,
2016 | | | Year Ended
March 31,
2015 | | | Year Ended
March 31,
2014 | | | Year Ended
March 28,
2013 | | | Year Ended
March 31,
2012 | |
Per Share Data | | | | | | | | | | | | | | | | | | |
Net asset value, beginning of period | | $ | 33.48 | | | $ | 38.79 | | | $ | 37.73 | | | $ | 32.25 | | | $ | 28.16 | | | $ | 28.52 | |
Income (loss) from investment operations: | |
Net investment income (loss)b | | | (.13 | ) | | | (.35 | ) | | | (.28 | ) | | | (.27 | ) | | | (.12 | ) | | | (.22 | ) |
Net gain (loss) on investments (realized and unrealized) | | | 4.19 | | | | (4.05 | ) | | | 2.62 | | | | 7.48 | | | | 4.21 | | | | (.14 | ) |
Total from investment operations | | | 4.06 | | | | (4.40 | ) | | | 2.34 | | | | 7.21 | | | | 4.09 | | | | (.36 | ) |
Less distributions from: | |
Net realized gains | | | — | | | | (.91 | ) | | | (1.28 | ) | | | (1.73 | ) | | | — | | | | — | |
Total distributions | | | — | | | | (.91 | ) | | | (1.28 | ) | | | (1.73 | ) | | | — | | | | — | |
Net asset value, end of period | | $ | 37.54 | | | $ | 33.48 | | | $ | 38.79 | | | $ | 37.73 | | | $ | 32.25 | | | $ | 28.16 | |
| | |
Total Returnc | | | 12.10 | % | | | (11.43 | %) | | | 6.37 | % | | | 22.69 | % | | | 14.52 | % | | | (1.26 | %) |
Ratios/Supplemental Data | |
Net assets, end of period (in thousands) | | $ | 19,088 | | | $ | 46,251 | | | $ | 27,902 | | | $ | 44,185 | | | $ | 101,053 | | | $ | 63,447 | |
Ratios to average net assets: | |
Net investment income (loss) | | | (0.74 | %) | | | (0.97 | %) | | | (0.77 | %) | | | (0.78 | %) | | | (0.42 | %) | | | (0.83 | %) |
Total expenses | | | 1.61 | % | | | 1.60 | % | | | 1.58 | % | | | 1.59 | % | | | 1.52 | % | | | 1.58 | % |
Portfolio turnover rate | | | 200 | % | | | 442 | % | | | 947 | % | | | 267 | % | | | 160 | % | | | 121 | % |
a | Unaudited figures for the period ended September 30, 2016. Percentage amounts for the period, except total return and portfolio turnover rate, have been annualized. |
b | Net investment income (loss) per share was computed using average shares outstanding throughout the period. |
c | Total return does not reflect the impact of any applicable sales charges. |
128 | THE RYDEX FUNDS SEMI-ANNUAL REPORT | SEE NOTES TO FINANCIAL STATEMENTS. |
FUND PROFILE (Unaudited) | September 30, 2016 |
INVERSE RUSSELL 2000® STRATEGY FUND
OBJECTIVE: Seeks to provide investment results that match, before fees and expenses, the performance of a specific benchmark on a daily basis. The Fund’s current benchmark is the inverse (opposite) of the performance of the Russell 2000® Index (the “underlying index”). The Fund does not seek to achieve its investment objective over a period of time greater than one day.
Holdings Diversification (Market Exposure as % of Net Assets)
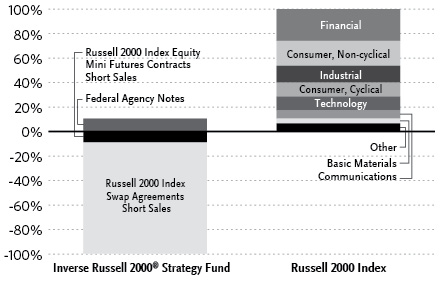
“Holdings Diversification (Market Exposure as % of Net Assets)” excludes any temporary cash investments or investments in Guggenheim Strategy Funds Trust mutual funds. Investments in those Funds do not provide “market exposure” to meet the Fund’s investment objective, but will significantly increase the portfolio’s exposure to certain other asset categories (and their associated risks), which may cause the Fund to deviate from its principal investment strategy, including: (i) high yield, high risk debt securities rated below the top four long-term rating categories by a nationally recognized statistical rating organization (also known as “junk bonds”); (ii) securities issued by the U.S. government or its agencies and instrumentalities; (iii) CLOs and similar investments; and (iv) other short-term fixed income securities.
Inception Dates: |
A-Class | March 31, 2004 |
C-Class | February 20, 2004 |
H-Class | February 20, 2004 |
The Fund invests principally in derivative investments such as swap agreements and futures contracts.
Largest Holdings (% of Total Net Assets) |
Guggenheim Strategy Fund I | 6.9% |
Guggenheim Strategy Fund II | 6.8% |
Total | 13.7% |
| | |
“Largest Holdings” excludes any temporary cash or derivative investments. |
| | THE RYDEX FUNDS SEMI-ANNUAL REPORT | 129 |
SCHEDULE OF INVESTMENTS (Unaudited) | September 30, 2016 |
INVERSE RUSSELL 2000® STRATEGY FUND | |
| | | Shares | | | Value | |
| | | | | | | |
MUTUAL FUNDS† - 13.7% | |
Guggenheim Strategy Fund I1 | | | 24,377 | | | $ | 609,191 | |
Guggenheim Strategy Fund II1 | | | 24,220 | | | | 604,038 | |
Total Mutual Funds | | | | | | | | |
(Cost $1,204,971) | | | | | | | 1,213,229 | |
| | | | | | | | | |
| | | Face
Amount | | | | | |
| | | | | | | | | |
FEDERAL AGENCY NOTES†† - 11.3% | |
Federal Farm Credit Bank6 | | | | | | | | |
0.67% due 09/12/182 | | $ | 1,000,000 | | | | 999,224 | |
Total Federal Agency Notes | | | | | | | | |
(Cost $999,804) | | | | | | | 999,224 | |
| | | | | | | | | |
REPURCHASE AGREEMENTS††,3 - 67.4% | |
HSBC Securities, Inc.
issued 09/30/16 at 0.38%
due 10/03/16 | | | 3,258,999 | | | | 3,258,999 | |
Royal Bank of Canada
issued 09/30/16 at 0.36%
due 10/03/164 | | | 2,684,838 | | | | 2,684,838 | |
Total Repurchase Agreements | | | | | | | | |
(Cost $5,943,837) | | | | | | | 5,943,837 | |
| | | | | | | | | |
Total Investments - 92.4% | | | | | | | | |
(Cost $8,148,612) | | | | | | $ | 8,156,290 | |
Other Assets & Liabilities, net - 7.6% | | | | | | | 668,475 | |
Total Net Assets - 100.0% | | | | | | $ | 8,824,765 | |
| | | Contracts | | | Unrealized
Gain (Loss) | |
| | | | | | | |
EQUITY FUTURES CONTRACTS SOLD SHORT† | |
December 2016 Russell 2000 Index
Mini Futures Contracts
(Aggregate Value of
Contracts $748,200) | | | 6 | | | $ | (5,352 | ) |
| | | | | | | | | |
| | | Units | | | | | |
| | | | | | | | | |
OTC EQUITY INDEX SWAP AGREEMENTS SOLD SHORT†† | |
Barclays Bank plc
October 2016
Russell 2000 Index Swap (0.20%)5,
Terminating 10/31/16
(Notional Value $5,201,473) | | | 4,156 | | | $ | 14,098 | |
Goldman Sachs International
October 2016
Russell 2000 Index Swap 0.00%5,
Terminating 10/26/16
(Notional Value $575,256) | | | 460 | | | | (5,311 | ) |
BNP Paribas
November 2016
Russell 2000 Index Swap (0.36%)5,
Terminating 11/01/16
(Notional Value $2,268,980) | | | 1,813 | | | | (25,262 | ) |
(Total Notional Value $8,045,709) | | | | | | $ | (16,475 | ) |
† | Value determined based on Level 1 inputs — See Note 4. |
†† | Value determined based on Level 2 inputs — See Note 4. |
1 | Affiliated issuer — See Note 9. |
2 | Variable rate security. Rate indicated is rate effective at September 30, 2016. |
3 | Repurchase Agreements — See Note 5. |
4 | All or a portion of this security is pledged as equity index swap collateral at September 30, 2016. |
5 | Total Return based on Russell 2000 Index +/- financing at a variable rate. Rate indicated is the rate effective at September 30, 2016. |
6 | The issuer operates under a Congressional charter; its securities are neither issued nor guaranteed by the U.S. Government. |
| | plc — Public Limited Company |
| | |
| | See Sector Classification in Other Information section. |
130 | THE RYDEX FUNDS SEMI-ANNUAL REPORT | SEE NOTES TO FINANCIAL STATEMENTS. |
SCHEDULE OF INVESTMENTS (Unaudited)(concluded) | September 30, 2016 |
INVERSE RUSSELL 2000® STRATEGY FUND | |
The following table summarizes the inputs used to value the Fund’s investments at September 30, 2016 (See Note 4 in the Notes to Financial Statements):
Investments in Securities (Assets) | | Level 1 | | | Level 1 -
Other* | | | Level 2 | | | Level 2 -
Other* | | | Level 3 | | | Total | |
Equity Index Swap Agreements | | $ | — | | | $ | — | | | $ | — | | | $ | 14,098 | | | $ | — | | | $ | 14,098 | |
Federal Agency Notes | | | — | | | | — | | | | 999,224 | | | | — | | | | — | | | | 999,224 | |
Mutual Funds | | | 1,213,229 | | | | — | | | | — | | | | — | | | | — | | | | 1,213,229 | |
Repurchase Agreements | | | — | | | | — | | | | 5,943,837 | | | | — | | | | — | | | | 5,943,837 | |
Total | | $ | 1,213,229 | | | $ | — | | | $ | 6,943,061 | | | $ | 14,098 | | | $ | — | | | $ | 8,170,388 | |
| | | | | | | | | | | | | | | | | | | | | | | | | |
Investments in Securities (Liabilities) | | Level 1 | | | Level 1 -
Other* | | | Level 2 | | | Level 2 -
Other* | | | Level 3 | | | Total | |
Equity Futures Contracts | | $ | — | | | $ | 5,352 | | | $ | — | | | $ | — | | | $ | — | | | $ | 5,352 | |
Equity Index Swap Agreements | | | — | | | | — | | | | — | | | | 30,573 | | | | — | | | | 30,573 | |
Total | | $ | — | | | $ | 5,352 | | | $ | — | | | $ | 30,573 | | | $ | — | | | $ | 35,925 | |
* | Other financial instruments include futures contracts and/or swaps, which are reported as unrealized gain/loss at period end. |
Transfers between investment levels may occur as the markets fluctuate and/or the availability of data used in an investment’s valuation changes. Transfers between valuation levels, if any, are in comparison to the valuation levels at the end of the previous fiscal year, and are effective using the fair value as of the end of the previous fiscal period.
For the period ended September 30, 2016, there were no transfers between levels.
SEE NOTES TO FINANCIAL STATEMENTS. | THE RYDEX FUNDS SEMI-ANNUAL REPORT | 131 |
INVERSE RUSSELL 2000® STRATEGY FUND | |
STATEMENT OF ASSETS AND LIABILITIES (Unaudited) | |
September 30, 2016 | |
Assets: | |
Investments in unaffiliated issuers, at value (cost $999,804) | | $ | 999,224 | |
Investments in affiliated issuers, at value (cost $1,204,971) | | | 1,213,229 | |
Repurchase agreements, at value (cost $5,943,837) | | | 5,943,837 | |
Total investments (cost $8,148,612) | | | 8,156,290 | |
Segregated cash with broker | | | 485,400 | |
Unrealized appreciation on swap agreements | | | 14,098 | |
Receivables: | |
Fund shares sold | | | 221,951 | |
Dividends | | | 1,872 | |
Interest | | | 415 | |
Total assets | | | 8,880,026 | |
| | | | | |
Liabilities: | |
Unrealized depreciation on swap agreements | | | 30,573 | |
Payable for: | |
Fund shares redeemed | | | 11,005 | |
Management fees | | | 7,177 | |
Variation margin | | | 6,480 | |
Distribution and service fees | | | 2,849 | |
Transfer agent and administrative fees | | | 1,994 | |
Portfolio accounting fees | | | 797 | |
Miscellaneous | | | (5,614 | ) |
Total liabilities | | | 55,261 | |
Commitments and contingent liabilities (Note 13) | | | — | |
Net assets | | $ | 8,824,765 | |
| | | | | |
Net assets consist of: | |
Paid in capital | | $ | 58,858,984 | |
Accumulated net investment loss | | | (278,922 | ) |
Accumulated net realized loss on investments | | | (49,741,148 | ) |
Net unrealized depreciation on investments | | | (14,149 | ) |
Net assets | | $ | 8,824,765 | |
| | | | | |
A-Class: | |
Net assets | | $ | 506,681 | |
Capital shares outstanding | | | 18,965 | |
Net asset value per share | | $ | 26.72 | |
Maximum offering price per share (Net asset value divided by 95.25%) | | $ | 28.05 | |
| | | | | |
C-Class: | |
Net assets | | $ | 1,392,524 | |
Capital shares outstanding | | | 57,312 | |
Net asset value per share | | $ | 24.30 | |
| | | | | |
H-Class: | |
Net assets | | $ | 6,925,560 | |
Capital shares outstanding | | | 258,529 | |
Net asset value per share | | $ | 26.79 | |
STATEMENT OF OPERATIONS (Unaudited) | |
Period Ended September 30, 2016 | |
Investment Income: | |
Dividends from securities of affiliated issuers | | $ | 20,756 | |
Interest | | | 18,660 | |
Total investment income | | | 39,416 | |
| | | | | |
Expenses: | |
Management fees | | | 66,554 | |
Transfer agent and administrative fees | | | 18,487 | |
Distribution and service fees: | |
A-Class | | | 2,492 | |
C-Class | | | 7,727 | |
H-Class | | | 14,063 | |
Portfolio accounting fees | | | 7,395 | |
Registration fees | | | 13,088 | |
Professional fees | | | 7,683 | |
Pricing service expense | | | 7,187 | |
Trustees’ fees* | | | 1,074 | |
Custodian fees | | | 862 | |
Miscellaneous | | | (13,948 | ) |
Total expenses | | | 132,664 | |
Net investment loss | | | (93,248 | ) |
| | | | | |
Net Realized and Unrealized Gain (Loss): | |
Net realized gain (loss) on: | |
Investments in affiliated issuers | | | 14,887 | |
Investments in unaffiliated issuers | | | (715 | ) |
Swap agreements | | | (2,320,856 | ) |
Futures contracts | | | 12,480 | |
Net realized loss | | | (2,294,204 | ) |
Net change in unrealized appreciation (depreciation) on: | |
Investments in unaffiliated issuers | | | 5,945 | |
Investments in affiliated issuers | | | 5,566 | |
Swap agreements | | | 326,387 | |
Futures contracts | | | (2,853 | ) |
Net change in unrealized appreciation (depreciation) | | | 335,045 | |
Net realized and unrealized loss | | | (1,959,159 | ) |
Net decrease in net assets resulting from operations | | $ | (2,052,407 | ) |
* | Relates to Trustees not deemed “interested persons” within the meaning of Section 2(a)(19) of the 1940 Act. |
132 | THE RYDEX FUNDS SEMI-ANNUAL REPORT | SEE NOTES TO FINANCIAL STATEMENTS. |
INVERSE RUSSELL 2000® STRATEGY FUND | |
STATEMENTS OF CHANGES IN NET ASSETS |
| | | Period Ended
September 30,
2016
(Unaudited) | | | Year Ended
March 31,
2016 | |
Increase (Decrease) in Net Assets from Operations: | | | | | | |
Net investment loss | | $ | (93,248 | ) | | $ | (478,582 | ) |
Net realized loss on investments | | | (2,294,204 | ) | | | (1,808,075 | ) |
Net change in unrealized appreciation (depreciation) on investments | | | 335,045 | | | | (283,532 | ) |
Net decrease in net assets resulting from operations | | | (2,052,407 | ) | | | (2,570,189 | ) |
| | | | | | | | | |
Capital share transactions: | | | | | | | | |
Proceeds from sale of shares | | | | | | | | |
A-Class | | | 4,688,369 | | | | 9,085,916 | |
C-Class | | | 471,953 | | | | 1,059,867 | |
H-Class | | | 46,645,582 | | | | 505,306,463 | |
Cost of shares redeemed | | | | | | | | |
A-Class | | | (6,785,532 | ) | | | (6,953,249 | ) |
C-Class | | | (580,947 | ) | | | (1,084,198 | ) |
H-Class | | | (74,799,559 | ) | | | (471,955,412 | ) |
Net increase (decrease) from capital share transactions | | | (30,360,134 | ) | | | 35,459,387 | |
Net increase (decrease) in net assets | | | (32,412,541 | ) | | | 32,889,198 | |
| | | | | | | | | |
Net assets: | | | | | | | | |
Beginning of period | | | 41,237,306 | | | | 8,348,108 | |
End of period | | $ | 8,824,765 | | | $ | 41,237,306 | |
Accumulated net investment loss at end of period | | $ | (278,922 | ) | | $ | (185,674 | ) |
| | | | | | | | | |
Capital share activity: | | | | | | | | |
Shares sold | | | | | | | | |
A-Class | | | 154,943 | | | | 278,747 | |
C-Class | | | 17,054 | | | | 36,768 | |
H-Class | | | 1,591,800 | | | | 15,797,309 | |
Shares redeemed | | | | | | | | |
A-Class | | | (226,844 | ) | | | (218,466 | ) |
C-Class | | | (21,339 | ) | | | (37,693 | ) |
H-Class | | | (2,524,132 | ) | | | (14,803,569 | ) |
Net increase (decrease) in shares | | | (1,008,518 | ) | | | 1,053,096 | |
SEE NOTES TO FINANCIAL STATEMENTS. | THE RYDEX FUNDS SEMI-ANNUAL REPORT | 133 |
INVERSE RUSSELL 2000® STRATEGY FUND | |
This table is presented to show selected data for a share outstanding throughout each period and to assist shareholders in evaluating a Fund’s performance for the periods presented.
A-Class | | Period Ended
September 30,
2016a | | | Year Ended
March 31,
2016 | | | Year Ended
March 31,
2015 | | | Year Ended
March 31,
2014e | | | Year Ended
March 28,
2013e | | | Year Ended
March 31,
2012e | |
Per Share Data | | | | | | | | | | | | | | | | | | |
Net asset value, beginning of period | | $ | 30.76 | | | $ | 29.22 | | | $ | 33.01 | | | $ | 43.21 | | | $ | 52.38 | | | $ | 59.31 | |
Income (loss) from investment operations: | |
Net investment income (loss)b | | | (.17 | ) | | | (.39 | ) | | | (.46 | ) | | | (.61 | ) | | | (.81 | ) | | | (1.02 | ) |
Net gain (loss) on investments (realized and unrealized) | | | (3.87 | ) | | | 1.93 | | | | (3.33 | ) | | | (9.59 | ) | | | (8.36 | ) | | | (5.91 | ) |
Total from investment operations | | | (4.04 | ) | | | 1.54 | | | | (3.79 | ) | | | (10.20 | ) | | | (9.17 | ) | | | (6.93 | ) |
Net asset value, end of period | | $ | 26.72 | | | $ | 30.76 | | | $ | 29.22 | | | $ | 33.01 | | | $ | 43.21 | | | $ | 52.38 | |
| | |
Total Returnc | | | (13.13 | %) | | | 5.27 | % | | | (11.48 | %) | | | (23.59 | %) | | | (17.53 | %) | | | (11.68 | %) |
Ratios/Supplemental Data | |
Net assets, end of period (in thousands) | | $ | 507 | | | $ | 2,795 | | | $ | 894 | | | $ | 7,302 | | | $ | 635 | | | $ | 612 | |
Ratios to average net assets: | |
Net investment income (loss) | | | (1.17 | %) | | | (1.23 | %) | | | (1.40 | %) | | | (1.69 | %) | | | (1.60 | %) | | | (1.66 | %) |
Total expensesd | | | 1.71 | % | | | 1.70 | % | | | 1.71 | % | | | 1.72 | % | | | 1.72 | % | | | 1.75 | % |
Portfolio turnover rate | | | 39 | % | | | 584 | % | | | 189 | % | | | — | | | | — | | | | — | |
C-Class | | Period Ended
September 30,
2016a | | | Year Ended
March 31,
2016 | | | Year Ended
March 31,
2015 | | | Year Ended
March 31,
2014e | | | Year Ended
March 28,
2013e | | | Year Ended
March 31,
2012e | |
Per Share Data | | | | | | | | | | | | | | | | | | |
Net asset value, beginning of period | | $ | 28.07 | | | $ | 26.86 | | | $ | 30.59 | | | $ | 40.30 | | | $ | 49.22 | | | $ | 56.14 | |
Income (loss) from investment operations: | |
Net investment income (loss)b | | | (.25 | ) | | | (.58 | ) | | | (.63 | ) | | | (.83 | ) | | | (1.14 | ) | | | (1.41 | ) |
Net gain (loss) on investments (realized and unrealized) | | | (3.52 | ) | | | 1.79 | | | | (3.10 | ) | | | (8.88 | ) | | | (7.78 | ) | | | (5.51 | ) |
Total from investment operations | | | (3.77 | ) | | | 1.21 | | | | (3.73 | ) | | | (9.71 | ) | | | (8.92 | ) | | | (6.92 | ) |
Net asset value, end of period | | $ | 24.30 | | | $ | 28.07 | | | $ | 26.86 | | | $ | 30.59 | | | $ | 40.30 | | | $ | 49.22 | |
| | |
Total Returnc | | | (13.47 | %) | | | 4.50 | % | | | (12.19 | %) | | | (24.08 | %) | | | (18.16 | %) | | | (12.29 | %) |
Ratios/Supplemental Data | |
Net assets, end of period (in thousands) | | $ | 1,393 | | | $ | 1,729 | | | $ | 1,680 | | | $ | 568 | | | $ | 409 | | | $ | 837 | |
Ratios to average net assets: | |
Net investment income (loss) | | | (1.93 | %) | | | (2.08 | %) | | | (2.13 | %) | | | (2.45 | %) | | | (2.35 | %) | | | (2.43 | %) |
Total expensesd | | | 2.46 | % | | | 2.45 | % | | | 2.45 | % | | | 2.47 | % | | | 2.47 | % | | | 2.51 | % |
Portfolio turnover rate | | | 39 | % | | | 584 | % | | | 189 | % | | | — | | | | — | | | | — | |
134 | THE RYDEX FUNDS SEMI-ANNUAL REPORT | SEE NOTES TO FINANCIAL STATEMENTS. |
INVERSE RUSSELL 2000® STRATEGY FUND | |
FINANCIAL HIGHLIGHTS (concluded) |
This table is presented to show selected data for a share outstanding throughout each period and to assist shareholders in evaluating a Fund’s performance for the periods presented.
H-Class | | Period Ended
September 30,
2016a | | | Year Ended
March 31,
2016 | | | Year Ended
March 31,
2015 | | | Year Ended
March 31,
2014e | | | Year Ended
March 28,
2013e | | | Year Ended
March 31,
2012e | |
Per Share Data | | | | | | | | | | | | | | | | | | |
Net asset value, beginning of period | | $ | 30.83 | | | $ | 29.30 | | | $ | 33.11 | | | $ | 43.26 | | | $ | 52.42 | | | $ | 59.37 | |
Income (loss) from investment operations: | |
Net investment income (loss)b | | | (.17 | ) | | | (.41 | ) | | | (.46 | ) | | | (.65 | ) | | | (.84 | ) | | | (1.05 | ) |
Net gain (loss) on investments (realized and unrealized) | | | (3.87 | ) | | | 1.94 | | | | (3.35 | ) | | | (9.50 | ) | | | (8.32 | ) | | | (5.90 | ) |
Total from investment operations | | | (4.04 | ) | | | 1.53 | | | | (3.81 | ) | | | (10.15 | ) | | | (9.16 | ) | | | (6.95 | ) |
Net asset value, end of period | | $ | 26.79 | | | $ | 30.83 | | | $ | 29.30 | | | $ | 33.11 | | | $ | 43.26 | | | $ | 52.42 | |
| | |
Total Returnc | | | (13.10 | %) | | | 5.22 | % | | | (11.51 | %) | | | (23.46 | %) | | | (17.46 | %) | | | (11.72 | %) |
Ratios/Supplemental Data | |
Net assets, end of period (in thousands) | | $ | 6,926 | | | $ | 36,713 | | | $ | 5,775 | | | $ | 11,691 | | | $ | 12,822 | | | $ | 17,283 | |
Ratios to average net assets: | |
Net investment income (loss) | | | (1.18 | %) | | | (1.28 | %) | | | (1.41 | %) | | | (1.69 | %) | | | (1.62 | %) | | | (1.70 | %) |
Total expensesd | | | 1.71 | % | | | 1.70 | % | | | 1.70 | % | | | 1.72 | % | | | 1.74 | % | | | 1.77 | % |
Portfolio turnover rate | | | 39 | % | | | 584 | % | | | 189 | % | | | — | | | | — | | | | — | |
a | Unaudited figures for the period ended September 30, 2016. Percentage amounts for the period, except total return and portfolio turnover rate, have been annualized. |
b | Net investment income (loss) per share was computed using average shares outstanding throughout the period. |
c | Total return does not reflect the impact of any applicable sales charges. |
d | Does not include expenses of the underlying funds in which the Fund invests. |
e | Reverse share split — Per share amounts for the periods presented through February 7, 2014 have been restated to reflect a 1:3 reverse share split effective February 7, 2104. |
SEE NOTES TO FINANCIAL STATEMENTS. | THE RYDEX FUNDS SEMI-ANNUAL REPORT | 135 |
FUND PROFILE (Unaudited) | September 30, 2016 |
DOW JONES INDUSTRIAL AVERAGE® FUND
OBJECTIVE: Seeks to provide investment results that match before fees and expenses, the performance of a specific benchmark on a daily basis. The Fund’s current benchmark is the Dow Jones Industrial Average® (the “underlying index”).
Holdings Diversification (Market Exposure as % of Net Assets)
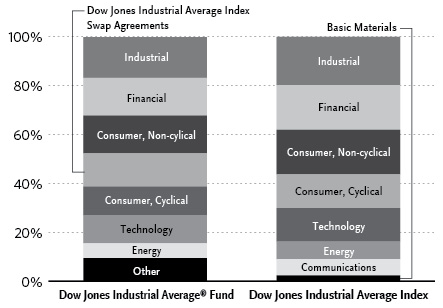
“Holdings Diversification (Market Exposure as % of Net Assets)” excludes any temporary cash investments or investments in Guggenheim Strategy Funds Trust mutual funds. Investments in those Funds do not provide “market exposure” to meet the Fund’s investment objective, but will significantly increase the portfolio’s exposure to certain other asset categories (and their associated risks), which may cause the Fund to deviate from its principal investment strategy, including: (i) high yield, high risk debt securities rated below the top four long-term rating categories by a nationally recognized statistical rating organization (also known as “junk bonds”); (ii) securities issued by the U.S. government or its agencies and instrumentalities; (iii) CLOs and similar investments; and (iv) other short-term fixed income securities.
Inception Dates: |
A-Class | December 1, 2015 |
C-Class | December 1, 2015 |
H-Class | December 1, 2015 |
Ten Largest Holdings (% of Total Net Assets) |
3M Co. | 5.6% |
Goldman Sachs Group, Inc. | 5.1% |
International Business Machines Corp. | 5.0% |
Guggenheim Strategy Fund II | 4.9% |
Guggenheim Strategy Fund I | 4.9% |
UnitedHealth Group, Inc. | 4.4% |
Boeing Co. | 4.2% |
Home Depot, Inc. | 4.1% |
Johnson & Johnson | 3.7% |
McDonald’s Corp. | 3.6% |
Top Ten Total | 45.5% |
| | |
“Ten Largest Holdings” excludes any temporary cash or derivative investments. |
136 | THE RYDEX FUNDS SEMI-ANNUAL REPORT | |
SCHEDULE OF INVESTMENTS (Unaudited) | September 30, 2016 |
DOW JONES INDUSTRIAL AVERAGE® FUND | |
| | | Shares | | | Value | |
| | | | | | | |
COMMON STOCKS† - 84.4% | |
| | | | | | | |
Industrial - 16.7% | |
3M Co. | | | 12,336 | | | $ | 2,173,974 | |
Boeing Co. | | | 12,336 | | | | 1,625,145 | |
United Technologies Corp. | | | 12,336 | | | | 1,253,338 | |
Caterpillar, Inc. | | | 12,336 | | | | 1,095,067 | |
General Electric Co. | | | 12,336 | | | | 365,392 | |
Total Industrial | | | | | | | 6,512,916 | |
| | | | | | | | | |
Financial - 15.4% | |
Goldman Sachs Group, Inc. | | | 12,336 | | | | 1,989,426 | |
Travelers Companies, Inc. | | | 12,336 | | | | 1,413,089 | |
Visa, Inc. — Class A | | | 12,336 | | | | 1,020,188 | |
JPMorgan Chase & Co. | | | 12,336 | | | | 821,454 | |
American Express Co. | | | 12,336 | | | | 789,997 | |
Total Financial | | | | | | | 6,034,154 | |
| | | | | | | | | |
Consumer, Non-cyclical - 15.4% | |
UnitedHealth Group, Inc. | | | 12,336 | | | | 1,727,040 | |
Johnson & Johnson | | | 12,336 | | | | 1,457,251 | |
Procter & Gamble Co. | | | 12,336 | | | | 1,107,156 | |
Merck & Company, Inc. | | | 12,336 | | | | 769,890 | |
Coca-Cola Co. | | | 12,336 | | | | 522,060 | |
Pfizer, Inc. | | | 12,336 | | | | 417,820 | |
Total Consumer, Non-cyclical | | | | | | | 6,001,217 | |
| | | | | | | | | |
Consumer, Cyclical - 11.6% | |
Home Depot, Inc. | | | 12,336 | | | | 1,587,397 | |
McDonald’s Corp. | | | 12,336 | | | | 1,423,081 | |
Wal-Mart Stores, Inc. | | | 12,336 | | | | 889,672 | |
NIKE, Inc. — Class B | | | 12,336 | | | | 649,490 | |
Total Consumer, Cyclical | | | | | | | 4,549,640 | |
| | | | | | | | | |
Technology - 11.6% | |
International Business Machines Corp. | | | 12,336 | | | | 1,959,573 | |
Apple, Inc. | | | 12,336 | | | | 1,394,585 | |
Microsoft Corp. | | | 12,336 | | | | 710,554 | |
Intel Corp. | | | 12,336 | | | | 465,684 | |
Total Technology | | | | | | | 4,530,396 | |
| | | | | | | | | |
Energy - 6.0% | |
Chevron Corp. | | | 12,336 | | | | 1,269,621 | |
Exxon Mobil Corp. | | | 12,336 | | | | 1,076,686 | |
Total Energy | | | | | | | 2,346,307 | |
| | | | | | | | | |
Communications - 5.6% | |
Walt Disney Co. | | | 12,336 | | | | 1,145,521 | |
Verizon Communications, Inc. | | | 12,336 | | | | 641,225 | |
Cisco Systems, Inc. | | | 12,336 | | | | 391,298 | |
Total Communications | | | | | | | 2,178,044 | |
| | | | | | | | | |
Basic Materials - 2.1% | |
EI du Pont de Nemours & Co. | | | 12,336 | | | | 826,142 | |
| | | | | | | | | |
Total Common Stocks | | | | | | | | |
(Cost $32,166,265) | | | | | | | 32,978,816 | |
| | | | | | | | | |
MUTUAL FUNDS† - 9.8% | |
Guggenheim Strategy Fund II1 | | | 77,162 | | | $ | 1,924,408 | |
Guggenheim Strategy Fund I1 | | | 76,918 | | | | 1,922,170 | |
Total Mutual Funds | | | | | | | | |
(Cost $3,827,834) | | | | | | | 3,846,578 | |
| | | | | | | | | |
| | | Face
Amount | | | | | |
| | | | | | | | | |
REPURCHASE AGREEMENTS††,2 - 5.3% | |
HSBC Securities, Inc.
issued 09/30/16 at 0.38%
due 10/03/16 | | $ | 1,065,577 | | | | 1,065,577 | |
Royal Bank of Canada
issued 09/30/16 at 0.36%
due 10/03/163 | | | 996,096 | | | | 996,096 | |
Total Repurchase Agreements | | | | | | | | |
(Cost $2,061,673) | | | | | | | 2,061,673 | |
| | | | | | | | | |
Total Investments - 99.5% | | | | | | | | |
(Cost $38,055,772) | | | | | | $ | 38,887,067 | |
Other Assets & Liabilities, net - 0.5% | | | | | | | 200,493 | |
Total Net Assets - 100.0% | | | | | | $ | 39,087,560 | |
| | | | | | | | | |
| | | Contracts | | | Unrealized
Gain (Loss) | |
| | | | | | | | | |
EQUITY FUTURES CONTRACTS PURCHASED† | |
December 2016 Dow Jones Industrial Average Index
Mini Futures Contracts
(Aggregate Value of
Contracts $728,560) | | | 8 | | | $ | 9,813 | |
| | | | | | | | | |
| | | Units | | | | | |
| | | | | | | | | |
OTC EQUITY INDEX SWAP AGREEMENTS†† | |
BNP Paribas
November 2016 Swap 0.78%4,
Terminating 11/01/16
(Notional Value $4,453,662) | | | 243 | | | $ | 39,820 | |
Barclays Bank plc
October 2016 Swap 0.80%4,
Terminating 10/31/16
(Notional Value $871,072) | | | 48 | | | | (1,542 | ) |
(Total Notional Value $5,324,734) | | | | | | $ | 38,278 | |
SEE NOTES TO FINANCIAL STATEMENTS. | THE RYDEX FUNDS SEMI-ANNUAL REPORT | 137 |
SCHEDULE OF INVESTMENTS (Unaudited)(concluded) | September 30, 2016 |
DOW JONES INDUSTRIAL AVERAGE® FUND | |
† | Value determined based on Level 1 inputs — See Note 4. |
†† | Value determined based on Level 2 inputs — See Note 4. |
1 | Affiliated issuer — See Note 9. |
2 | Repurchase Agreements — See Note 5. |
3 | All or a portion of this security is pledged as equity index swap collateral at September 30, 2016. |
4 | Total Return based on Dow Jones Industrial Average Index +/- financing at a variable rate effective September 30, 2016. |
| | plc — Public Limited Company |
| | |
| | See Sector Classification in Other Information section. |
The following table summarizes the inputs used to value the Fund’s investments at September 30, 2016 (See Note 4 in the Notes to Financial Statements):
Investments in Securities (Assets) | | Level 1 | | | Level 1 -
Other* | | | Level 2 | | | Level 2 -
Other* | | | Level 3 | | | Total | |
Common Stocks | | $ | 32,978,816 | | | $ | — | | | $ | — | | | $ | — | | | $ | — | | | $ | 32,978,816 | |
Equity Futures Contracts | | | — | | | | 9,813 | | | | — | | | | — | | | | — | | | | 9,813 | |
Equity Index Swap Agreements | | | — | | | | — | | | | — | | | | 39,820 | | | | — | | | | 39,820 | |
Mutual Funds | | | 3,846,578 | | | | — | | | | — | | | | — | | | | — | | | | 3,846,578 | |
Repurchase Agreements | | | — | | | | — | | | | 2,061,673 | | | | — | | | | — | | | | 2,061,673 | |
Total | | $ | 36,825,394 | | | $ | 9,813 | | | $ | 2,061,673 | | | $ | 39,820 | | | $ | — | | | $ | 38,936,700 | |
| | | | | | | | | | | | | | | | | | | | | | | | | |
Investments in Securities (Liabilities) | | Level 1 | | | Level 1 -
Other* | | | Level 2 | | | Level 2 -
Other* | | | Level 3 | | | Total | |
Equity Index Swap Agreements | | $ | — | | | $ | — | | | $ | — | | | $ | 1,542 | | | $ | — | | | $ | 1,542 | |
* | Other financial instruments include futures contracts and/or swaps, which are reported as unrealized gain/loss at period end. |
Transfers between investment levels may occur as the markets fluctuate and/or the availability of data used in an investment’s valuation changes. Transfers between valuation levels, if any, are in comparison to the valuation levels at the end of the previous fiscal year, and are effective using the fair value as of the end of the previous fiscal period.
For the period ended September 30, 2016, there were no transfers between levels.
138 | THE RYDEX FUNDS SEMI-ANNUAL REPORT | SEE NOTES TO FINANCIAL STATEMENTS. |
DOW JONES INDUSTRIAL AVERAGE® FUND | |
STATEMENT OF ASSETS AND LIABILITIES (Unaudited) | |
September 30, 2016 | |
Assets: | |
Investments in unaffiliated issuers, at value (cost $32,166,265) | | $ | 32,978,816 | |
Investments in affiliated issuers, at value (cost $3,827,834) | | | 3,846,578 | |
Repurchase agreements, at value (cost $2,061,673) | | | 2,061,673 | |
Total investments (cost $38,055,772) | | | 38,887,067 | |
Segregated cash with broker | | | 228,400 | |
Unrealized appreciation on swap agreements | | | 39,820 | |
Receivables: | |
Swap settlement | | | 890 | |
Variation margin | | | 4,680 | |
Fund shares sold | | | 49,145 | |
Dividends | | | 12,200 | |
Interest | | | 21 | |
Total assets | | | 39,222,223 | |
| | | | | |
Liabilities: | |
Unrealized depreciation on swap agreements | | | 1,542 | |
Payable for: | |
Fund shares redeemed | | | 87,035 | |
Management fees | | | 18,983 | |
Distribution and service fees | | | 6,981 | |
Transfer agent and administrative fees | | | 6,328 | |
Portfolio accounting fees | | | 2,531 | |
Miscellaneous | | | 11,263 | |
Total liabilities | | | 134,663 | |
Commitments and contingent liabilities (Note 13) | | | — | |
Net assets | | $ | 39,087,560 | |
| | | | | |
Net assets consist of: | |
Paid in capital | | $ | 38,165,457 | |
Undistributed net investment income | | | 84,313 | |
Accumulated net realized loss on investments | | | (41,596 | ) |
Net unrealized appreciation on investments | | | 879,386 | |
Net assets | | $ | 39,087,560 | |
| | | | | |
A-Class: | |
Net assets | | $ | 4,438,890 | |
Capital shares outstanding | | | 85,929 | |
Net asset value per share | | $ | 51.66 | |
Maximum offering price per share (Net asset value divided by 95.25%) | | $ | 54.24 | |
| | | | | |
C-Class: | |
Net assets | | $ | 1,198,045 | |
Capital shares outstanding | | | 23,342 | |
Net asset value per share | | $ | 51.33 | |
| | | | | |
H-Class: | |
Net assets | | $ | 33,450,625 | |
Capital shares outstanding | | | 647,176 | |
Net asset value per share | | $ | 51.69 | |
STATEMENT OF OPERATIONS (Unaudited) | |
Period Ended September 30, 2016 | |
Investment Income: | |
Dividends from securities of unaffiliated issuers | | $ | 273,623 | |
Dividends from securities of affiliated issuers | | | 27,237 | |
Interest | | | 6,274 | |
Total investment income | | | 307,134 | |
| | | | | |
Expenses: | |
Management fees | | | 105,614 | |
Transfer agent and administrative fees | | | 35,205 | |
Distribution and service fees: | |
A-Class | | | 10,193 | |
C-Class | | | 4,484 | |
H-Class | | | 23,891 | |
Portfolio accounting fees | | | 14,082 | |
Custodian fees | | | 1,785 | |
Trustees’ fees* | | | 1,421 | |
Line of credit fees | | | 10 | |
Miscellaneous | | | 26,136 | |
Total expenses | | | 222,821 | |
Net investment income | | | 84,313 | |
| | | | | |
Net Realized and Unrealized Gain (Loss): | |
Net realized gain (loss) on: | |
Investments in unaffiliated issuers | | | 525,716 | |
Investments in affiliated issuers | | | 3,249 | |
Swap agreements | | | (292,956 | ) |
Futures contracts | | | 72,641 | |
Net realized gain | | | 308,650 | |
Net change in unrealized appreciation (depreciation) on: | |
Investments in unaffiliated issuers | | | 59,226 | |
Investments in affiliated issuers | | | 19,448 | |
Swap agreements | | | (4,967 | ) |
Futures contracts | | | (150,905 | ) |
Net change in unrealized appreciation (depreciation) | | | (77,198 | ) |
Net realized and unrealized gain | | | 231,452 | |
Net increase in net assets resulting from operations | | $ | 315,765 | |
* | Relates to Trustees not deemed “interested persons” within the meaning of Section 2(a)(19) of the 1940 Act. |
SEE NOTES TO FINANCIAL STATEMENTS. | THE RYDEX FUNDS SEMI-ANNUAL REPORT | 139 |
DOW JONES INDUSTRIAL AVERAGE® FUND | |
STATEMENTS OF CHANGES IN NET ASSETS |
| | | Period Ended
September 30,
2016
(Unaudited) | | | Period Ended March 31,
2016a | |
Increase (Decrease) in Net Assets from Operations: | | | | | | |
Net investment income (loss) | | $ | 84,313 | | | $ | (10,240 | ) |
Net realized gain (loss) on investments | | | 308,650 | | | | (350,012 | ) |
Net change in unrealized appreciation (depreciation) on investments | | | (77,198 | ) | | | 956,584 | |
Net increase in net assets resulting from operations | | | 315,765 | | | | 596,332 | |
| | | | | | | | | |
Capital share transactions: | | | | | | | | |
Proceeds from sale of shares | | | | | | | | |
A-Class | | | 7,041,976 | | | | 62,850,014 | |
C-Class | | | 766,721 | | | | 930,648 | |
H-Class | | | 190,729,324 | | | | 34,887,020 | |
Cost of shares redeemed | | | | | | | | |
A-Class | | | (47,086,294 | ) | | | (19,048,769 | ) |
C-Class | | | (335,756 | ) | | | (221,789 | ) |
H-Class | | | (176,349,994 | ) | | | (15,987,638 | ) |
Net increase (decrease) from capital share transactions | | | (25,234,023 | ) | | | 63,409,486 | |
Net increase (decrease) in net assets | | | (24,918,258 | ) | | | 64,005,818 | |
| | | | | | | | | |
Net assets: | | | | | | | | |
Beginning of year | | | 64,005,818 | | | | — | |
End of year | | $ | 39,087,560 | | | $ | 64,005,818 | |
Undistributed net investment income at end of year | | $ | 84,313 | | | $ | — | |
| | | | | | | | | |
Capital share activity: | | | | | | | | |
Shares sold | | | | | | | | |
A-Class | | | 140,446 | | | | 1,299,093 | |
C-Class | | | 15,384 | | | | 19,674 | |
H-Class | | | 3,712,095 | | | | 716,927 | |
Shares redeemed | | | | | | | | |
A-Class | | | (948,609 | ) | | | (405,001 | ) |
C-Class | | | (6,835 | ) | | | (4,881 | ) |
H-Class | | | (3,446,479 | ) | | | (335,367 | ) |
Net increase (decrease) in shares | | | (533,998 | ) | | | 1,290,445 | |
a | Since commencement of operations: December 1, 2015. |
140 | THE RYDEX FUNDS SEMI-ANNUAL REPORT | SEE NOTES TO FINANCIAL STATEMENTS. |
DOW JONES INDUSTRIAL AVERAGE® FUND | |
This table is presented to show selected data for a share outstanding throughout each period and to assist shareholders in evaluating a Fund’s performance for the periods presented.
A-Class | | Period Ended
September 30,
2016a | | | Period Ended
March 31,
2016b | |
Per Share Data | | | | | | |
Net asset value, beginning of period | | $ | 49.60 | | | $ | 50.00 | |
Income (loss) from investment operations: | |
Net investment income (loss)c | | | .10 | | | | (.03 | ) |
Net gain (loss) on investments (realized and unrealized) | | | 1.96 | | | | (.37 | ) |
Total from investment operations | | | 2.06 | | | | (.40 | ) |
Net asset value, end of period | | $ | 51.66 | | | $ | 49.60 | |
| | |
Total Returne | | | 4.13 | % | | | (0.80 | %) |
Ratios/Supplemental Data | |
Net assets, end of period (in thousands) | | $ | 4,439 | | | $ | 44,351 | |
Ratios to average net assets: | |
Net investment income (loss) | | | 0.38 | % | | | (0.21 | %) |
Total expensesd | | | 1.55 | % | | | 1.55 | % |
Portfolio turnover rate | | | 413 | % | | | 98 | % |
C-Class | | Period Ended
September 30,
2016a | | | Period Ended
March 31,
2016b | |
Per Share Data | | | | | | |
Net asset value, beginning of period | | $ | 49.47 | | | $ | 50.00 | |
Income (loss) from investment operations: | |
Net investment income (loss)c | | | (.07 | ) | | | (.07 | ) |
Net gain (loss) on investments (realized and unrealized) | | | 1.93 | | | | (.46 | ) |
Total from investment operations | | | 1.86 | | | | (.53 | ) |
Net asset value, end of period | | $ | 51.33 | | | $ | 49.47 | |
| | |
Total Returne | | | 3.74 | % | | | (1.06 | %) |
Ratios/Supplemental Data | |
Net assets, end of period (in thousands) | | $ | 1,198 | | | $ | 732 | |
Ratios to average net assets: | |
Net investment income (loss) | | | (0.29 | %) | | | (0.43 | %) |
Total expensesd | | | 2.30 | % | | | 2.30 | % |
Portfolio turnover rate | | | 413 | % | | | 98 | % |
SEE NOTES TO FINANCIAL STATEMENTS. | THE RYDEX FUNDS SEMI-ANNUAL REPORT | 141 |
DOW JONES INDUSTRIAL AVERAGE® FUND | |
FINANCIAL HIGHLIGHTS (concluded) |
This table is presented to show selected data for a share outstanding throughout each period and to assist shareholders in evaluating a Fund’s performance for the periods presented.
H-Class | | Period Ended
September 30,
2016a | | | Period Ended
March 31,
2016b | |
Per Share Data | | | | | | |
Net asset value, beginning of period | | $ | 49.59 | | | $ | 50.00 | |
Income (loss) from investment operations: | |
Net investment income (loss)c | | | .19 | | | | (.03 | ) |
Net gain (loss) on investments (realized and unrealized) | | | 1.91 | | | | (.38 | ) |
Total from investment operations | | | 2.10 | | | | (.41 | ) |
Net asset value, end of period | | $ | 51.69 | | | $ | 49.59 | |
| | |
Total Returne | | | 4.21 | % | | | (0.82 | %) |
Ratios/Supplemental Data | |
Net assets, end of period (in thousands) | | $ | 33,451 | | | $ | 18,923 | |
Ratios to average net assets: | |
Net investment income (loss) | | | 0.73 | % | | | (0.17 | %) |
Total expensesd | | | 1.55 | % | | | 1.55 | % |
Portfolio turnover rate | | | 413 | % | | | 98 | % |
a | Unaudited figures for the period ended September 30, 2016. Percentage amounts for the period, except total return and portfolio turnover rate, have been annualized. |
b | Since commencement of operations: December 1, 2015. Percentage amounts for the period, except total return and portfolio turnover rate, have been annualized. |
c | Net investment income (loss) per share was computed using average shares outstanding throughout the period. |
d | Does not include expenses of the underlying funds in which the Fund invests. |
e | Total return does not reflect the impact of any applicable sales charges. |
142 | THE RYDEX FUNDS SEMI-ANNUAL REPORT | SEE NOTES TO FINANCIAL STATEMENTS. |
FUND PROFILE (Unaudited) | September 30, 2016 |
GOVERNMENT LONG BOND 1.2x STRATEGY FUND
OBJECTIVE: Seeks to provide investment results that correspond, before fees and expenses, to a benchmark for U.S. Government securities on a daily basis. The Fund’s current benchmark is 120% of the daily price movement of the Long Treasury Bond. The Long Treasury Bond is the U.S. Treasury bond with the longest maturity, which is currently 30 years. The price movement of the Long Treasury Bond is based on the daily price change of the most recently issued Long Treasury Bond. The Fund does not seek to achieve its investment objective over a period of time greater than one day.
Holdings Diversification (Market Exposure as % of Net Assets)
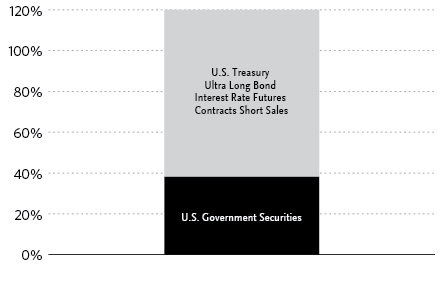
“Holdings Diversification (Market Exposure as % of Net Assets)” excludes any temporary cash investments or investments in Guggenheim Strategy Funds Trust mutual funds. Investments in those Funds do not provide “market exposure” to meet the Fund’s investment objective, but will significantly increase the portfolio’s exposure to certain other asset categories (and their associated risks), which may cause the Fund to deviate from its principal investment strategy, including: (i) high yield, high risk debt securities rated below the top four long-term rating categories by a nationally recognized statistical rating organization (also known as “junk bonds”); (ii) securities issued by the U.S. government or its agencies and instrumentalities; (iii) CLOs and similar investments; and (iv) other short-term fixed income securities.
Inception Dates: |
Investor Class | January 3, 1994 |
A-Class | March 31, 2004 |
C-Class | May 2, 2001 |
H-Class | September 18, 2014 |
The Fund invests principally in U.S. Government securities and in derivative investments such as futures contracts.
Largest Holdings (% of Total Net Assets) |
U.S. Treasury Bond | 38.1% |
Guggenheim Strategy Fund II | 13.0% |
Guggenheim Strategy Fund I | 7.9% |
Total | 59.0% |
| | |
“Largest Holdings” excludes any temporary cash or derivative investments. |
| | THE RYDEX FUNDS SEMI-ANNUAL REPORT | 143 |
SCHEDULE OF INVESTMENTS (Unaudited) | September 30, 2016 |
GOVERNMENT LONG BOND 1.2x STRATEGY FUND | |
| | | Shares | | | Value | |
| | | | | | | |
MUTUAL FUNDS† - 20.9% | |
Guggenheim Strategy Fund II1 | | | 302,926 | | | $ | 7,554,969 | |
Guggenheim Strategy Fund I1 | | | 181,882 | | | | 4,545,237 | |
Total Mutual Funds | | | | | | | | |
(Cost $12,030,296) | | | | | | | 12,100,206 | |
| | | | | | | | | |
| | | Face
Amount | | | | | |
| | | | | | | | | |
U.S. GOVERNMENT SECURITIES†† - 38.1% | |
U.S. Treasury Bond | | | | | | | | |
2.25% due 08/15/46 | | $ | 22,400,000 | | | | 22,067,500 | |
Total U.S. Government Securities | | | | | | | | |
(Cost $21,687,032) | | | | | | | 22,067,500 | |
| | | | | | | | | |
U.S. TREASURY BILLS†† - 1.0% | |
United States Treasury Bill | | | | | | | | |
0.00% due 10/13/162 | | | 600,000 | | | | 599,972 | |
Total U.S. Treasury Bills | | | | | | | | |
(Cost $599,985) | | | | | | | 599,972 | |
| | | | | | | | | |
REPURCHASE AGREEMENTS††,3 - 86.4% | |
HSBC Securities, Inc.
issued 09/30/16 at 0.38%
due 10/03/16 | | | 27,877,307 | | | | 27,877,307 | |
Royal Bank of Canada
issued 09/30/16 at 0.36%
due 10/03/16 | | | 22,134,722 | | | | 22,134,722 | |
Total Repurchase Agreements | | | | | | | | |
(Cost $50,012,029) | | | | | | | 50,012,029 | |
| | | | | | | | | |
Total Investments - 146.4% | | | | | | | | |
(Cost $84,329,342) | | | | | | $ | 84,779,707 | |
Other Assets & Liabilities, net - (46.4)% | | | | | | | (26,875,531 | ) |
Total Net Assets - 100.0% | | | | | | $ | 57,904,176 | |
| | | | | | | | | |
| | | Contracts | | | Unrealized
Gain | |
| | | | | | | | | |
INTEREST RATE FUTURES CONTRACTS PURCHASED† | |
December 2016 U.S. Treasury
Ultra Long Bond
Futures Contracts
(Aggregate Value of
Contracts $55,865,625) | | | 303 | | | $ | 286,513 | |
† | Value determined based on Level 1 inputs — See Note 4. |
†† | Value determined based on Level 2 inputs — See Note 4. |
1 | Affiliated issuer — See Note 9. |
2 | Zero coupon rate security. |
3 | Repurchase Agreements — See Note 5. |
| | See Sector Classification in Other Information section. |
The following table summarizes the inputs used to value the Fund’s investments at September 30, 2016 (See Note 4 in the Notes to Financial Statements):
Investments in Securities (Assets) | | Level 1 | | | Level 1 -
Other* | | | Level 2 | | | Level 2 -
Other* | | | Level 3 | | | Total | |
Interest Rate Futures Contracts | | $ | — | | | $ | 286,513 | | | $ | — | | | $ | — | | | $ | — | | | $ | 286,513 | |
Mutual Funds | | | 12,100,206 | | | | — | | | | — | | | | — | | | | — | | | | 12,100,206 | |
Repurchase Agreements | | | — | | | | — | | | | 50,012,029 | | | | — | | | | — | | | | 50,012,029 | |
U.S. Government Securities | | | — | | | | — | | | | 22,067,500 | | | | — | | | | — | | | | 22,067,500 | |
U.S. Treasury Bills | | | — | | | | — | | | | 599,972 | | | | — | | | | — | | | | 599,972 | |
Total | | $ | 12,100,206 | | | $ | 286,513 | | | $ | 72,679,501 | | | $ | — | | | $ | — | | | $ | 85,066,220 | |
* | Other financial instruments include futures contracts and/or swaps, which are reported as unrealized gain/loss at period end. |
Transfers between investment levels may occur as the markets fluctuate and/or the availability of data used in an investment’s valuation changes. Transfers between valuation levels, if any, are in comparison to the valuation levels at the end of the previous fiscal year, and are effective using the fair value as of the end of the previous fiscal period.
For the period ended September 30, 2016, there were no transfers between levels.
144 | THE RYDEX FUNDS SEMI-ANNUAL REPORT | SEE NOTES TO FINANCIAL STATEMENTS. |
GOVERNMENT LONG BOND 1.2x STRATEGY FUND | |
STATEMENT OF ASSETS AND LIABILITIES (Unaudited) |
September 30, 2016 |
Assets: | |
Investments in unaffiliated issuers, at value (cost $22,287,017) | | $ | 22,667,472 | |
Investments in affiliated issuers, at value (cost $12,030,296) | | | 12,100,206 | |
Repurchase agreements, at value (cost $50,012,029) | | | 50,012,029 | |
Total investments (cost $84,329,342) | | | 84,779,707 | |
Segregated cash with broker | | | 2,015,812 | |
Receivables: | |
Securities sold | | | 36,056,719 | |
Fund shares sold | | | 7,775,062 | |
Dividends | | | 21,803 | |
Interest | | | 279,113 | |
Total assets | | | 130,928,216 | |
| | | | | |
Liabilities: | |
Payable for: | |
Fund shares redeemed | | | 71,873,202 | |
Variation margin | | | 960,935 | |
Management fees | | | 36,849 | |
Transfer agent and administrative fees | | | 14,740 | |
Portfolio accounting fees | | | 7,370 | |
Distribution and service fees | | | 6,200 | |
Miscellaneous | | | 124,744 | |
Total liabilities | | | 73,024,040 | |
Commitments and contingent liabilities (Note 13) | | | — | |
Net assets | | $ | 57,904,176 | |
| | | | | |
Net assets consist of: | |
Paid in capital | | $ | 44,500,783 | |
Undistributed net investment income | | | 1,039 | |
Accumulated net realized gain on investments | | | 12,665,476 | |
Net unrealized appreciation on investments | | | 736,878 | |
Net assets | | $ | 57,904,176 | |
| | | | | |
Investor Class: | |
Net assets | | $ | 44,590,393 | |
Capital shares outstanding | | | 708,477 | |
Net asset value per share | | $ | 62.94 | |
| | | | | |
A-Class: | |
Net assets | | $ | 2,784,733 | |
Capital shares outstanding | | | 43,957 | |
Net asset value per share | | $ | 63.35 | |
Maximum offering price per share (Net asset value divided by 95.25%) | | $ | 66.51 | |
| | | | | |
C-Class: | |
Net assets | | $ | 3,062,032 | |
Capital shares outstanding | | | 48,646 | |
Net asset value per share | | $ | 62.95 | |
| | | | | |
H-Class: | |
Net assets | | $ | 7,467,018 | |
Capital shares outstanding | | | 117,709 | |
Net asset value per share | | $ | 63.44 | |
SEE NOTES TO FINANCIAL STATEMENTS. | THE RYDEX FUNDS SEMI-ANNUAL REPORT | 145 |
GOVERNMENT LONG BOND 1.2x STRATEGY FUND | |
STATEMENT OF OPERATIONS (Unaudited) |
Period Ended September 30, 2016 |
Investment Income: | |
Interest | | $ | 1,035,456 | |
Dividends from securities of affiliated issuers | | | 156,755 | |
Total investment income | | | 1,192,211 | |
| | | | | |
Expenses: | |
Management fees | | | 281,155 | |
Transfer agent and administrative fees | | | 112,462 | |
Distribution and service fees: | |
A-Class | | | 5,511 | |
C-Class | | | 18,216 | |
H-Class | | | 51,096 | |
Portfolio accounting fees | | | 56,230 | |
Registration fees | | | 42,213 | |
Custodian fees | | | 7,031 | |
Trustees’ fees* | | | 4,851 | |
Line of credit fees | | | 1,777 | |
Miscellaneous | | | 39,278 | |
Total expenses | | | 619,820 | |
Net investment income | | | 572,391 | |
| | | | | |
Net Realized and Unrealized Gain (Loss): | |
Net realized gain (loss) on: | |
Investments in unaffiliated issuers | | | 9,512,519 | |
Investments in affiliated issuers | | | 109,933 | |
Futures contracts | | | 4,413,413 | |
Net realized gain | | | 14,035,865 | |
Net change in unrealized appreciation (depreciation) on: | |
Investments in unaffiliated issuers | | | (955,505 | ) |
Investments in affiliated issuers | | | 57,303 | |
Futures contracts | | | (1,218,369 | ) |
Net change in unrealized appreciation (depreciation) | | | (2,116,571 | ) |
Net realized and unrealized gain | | | 11,919,294 | |
Net increase in net assets resulting from operations | | $ | 12,491,685 | |
* | Relates to Trustees not deemed “interested persons” within the meaning of Section 2(a)(19) of the 1940 Act. |
146 | THE RYDEX FUNDS SEMI-ANNUAL REPORT | SEE NOTES TO FINANCIAL STATEMENTS. |
GOVERNMENT LONG BOND 1.2x STRATEGY FUND | |
STATEMENTS OF CHANGES IN NET ASSETS |
| | | Period Ended
September 30,
2016
(Unaudited) | | | Year Ended
March 31,
2016 | |
Increase (Decrease) in Net Assets from Operations: | | | | | | |
Net investment income | | $ | 572,391 | | | $ | 1,571,845 | |
Net realized gain on investments | | | 14,035,865 | | | | 17,793,226 | |
Net change in unrealized appreciation (depreciation) on investments | | | (2,116,571 | ) | | | (1,775,157 | ) |
Net increase in net assets resulting from operations | | | 12,491,685 | | | | 17,589,914 | |
| | | | | | | | | |
Distributions to shareholders from: | | | | | | | | |
Net investment income | | | | | | | | |
Investor Class | | | (362,286 | ) | | | (951,034 | ) |
Advisor Class | | | — | | | | (40,983 | )* |
A-Class | | | (20,286 | ) | | | (53,217 | ) |
C-Class | | | (2,885 | ) | | | (29,111 | ) |
H-Class | | | (185,895 | ) | | | (903,740 | ) |
Total distributions to shareholders | | | (571,352 | ) | | | (1,978,085 | ) |
| | | | | | | | | |
Capital share transactions: | | | | | | | | |
Proceeds from sale of shares | | | | | | | | |
Investor Class | | | 523,683,912 | | | | 883,887,497 | |
Advisor Class | | | — | | | | 209,857,554 | * |
A-Class | | | 3,324,812 | | | | 40,024,720 | |
C-Class | | | 4,608,556 | | | | 10,755,886 | |
H-Class | | | 1,004,427,230 | | | | 3,211,356,226 | |
Distributions reinvested | | | | | | | | |
Investor Class | | | 363,855 | | | | 945,843 | |
Advisor Class | | | — | | | | 40,282 | * |
A-Class | | | 15,413 | | | | 49,337 | |
C-Class | | | 2,702 | | | | 26,814 | |
H-Class | | | 186,035 | | | | 902,679 | |
Cost of shares redeemed | | | | | | | | |
Investor Class | | | (539,199,076 | ) | | | (897,206,827 | ) |
Advisor Class | | | — | | | | (212,004,112 | )* |
A-Class | | | (10,065,332 | ) | | | (34,656,013 | ) |
C-Class | | | (5,085,734 | ) | | | (10,299,100 | ) |
H-Class | | | (1,055,051,013 | ) | | | (3,257,317,015 | ) |
Conversion activity* | | | | | | | | |
Advisor Class | | | — | | | | (7,238,724 | ) |
H-Class | | | — | | | | 7,238,724 | |
Net decrease from capital share transactions | | | (72,788,640 | ) | | | (53,636,229 | ) |
Net decrease in net assets | | | (60,868,307 | ) | | | (38,024,400 | ) |
| | | | | | | | | |
Net assets: | | | | | | | | |
Beginning of period | | | 118,772,483 | | | | 156,796,883 | |
End of period | | $ | 57,904,176 | | | $ | 118,772,483 | |
Undistributed net investment income at end of period | | $ | 1,039 | | | $ | — | |
SEE NOTES TO FINANCIAL STATEMENTS. | THE RYDEX FUNDS SEMI-ANNUAL REPORT | 147 |
GOVERNMENT LONG BOND 1.2x STRATEGY FUND | |
STATEMENTS OF CHANGES IN NET ASSETS (concluded) |
| | | Period Ended
September 30,
2016
(Unaudited) | | | Year Ended
March 31,
2016 | |
Capital share activity: | | | | | | |
Shares sold | | | | | | |
Investor Class | | | 8,415,151 | | | | 16,290,807 | |
Advisor Class | | | — | | | | 3,932,239 | * |
A-Class | | | 54,644 | | | | 741,077 | |
C-Class | | | 74,999 | | | | 196,471 | |
H-Class | | | 16,195,774 | | | | 58,647,379 | |
Shares issued from reinvestment of distributions | | | | | | | | |
Investor Class | | | 5,885 | | | | 17,306 | |
Advisor Class | | | — | | | | 756 | * |
A-Class | | | 249 | | | | 905 | |
C-Class | | | 44 | | | | 498 | |
H-Class | | | 3,012 | | | | 16,483 | |
Shares redeemed | | | | | | | | |
Investor Class | | | (8,683,274 | ) | | | (16,377,059 | ) |
Advisor | | | — | | | | (3,973,055 | )* |
A-Class | | | (172,258 | ) | | | (645,888 | ) |
C-Class | | | (82,755 | ) | | | (189,233 | ) |
H-Class | | | (16,928,950 | ) | | | (59,266,476 | ) |
Conversion activity* | | | | | | | | |
Advisor Class | | | — | | | | (133,556 | ) |
H-Class | | | — | | | | 131,901 | |
Net decrease in shares | | | (1,117,479 | ) | | | (609,445 | ) |
* | Effective September 30, 2015, all outstanding Advisor Class shares converted into H-Class shares — See Note 11. |
148 | THE RYDEX FUNDS SEMI-ANNUAL REPORT | SEE NOTES TO FINANCIAL STATEMENTS. |
GOVERNMENT LONG BOND 1.2x STRATEGY FUND | |
This table is presented to show selected data for a share outstanding throughout each period and to assist shareholders in evaluating a Fund’s performance for the periods presented.
Investor Class | | Period Ended
September 30,
2016a | | | Year Ended
March 31,
2016 | | | Year Ended
March 31,
2015 | | | Year Ended
March 31,
2014f | | | Year Ended
March 28,
2013f | | | Year Ended
March 31,
2012f | |
Per Share Data | | | | | | | | | | | | | | | | | | |
Net asset value, beginning of period | | $ | 58.12 | | | $ | 59.12 | | | $ | 45.80 | | | $ | 48.55 | | | $ | 44.73 | | | $ | 34.28 | |
Income (loss) from investment operations: | |
Net investment income (loss)b | | | .35 | | | | .76 | | | | .63 | | | | .61 | | | | .57 | | | | .96 | |
Net gain (loss) on investments (realized and unrealized) | | | 4.82 | | | | (.67 | ) | | | 13.34 | | | | (2.76 | ) | | | 4.21 | | | | 10.45 | |
Total from investment operations | | | 5.17 | | | | .09 | | | | 13.97 | | | | (2.15 | ) | | | 4.78 | | | | 11.41 | |
Less distributions from: | |
Net investment income | | | (.35 | ) | | | (1.09 | ) | | | (.65 | ) | | | (.60 | ) | | | (.72 | ) | | | (.96 | ) |
Net realized gains | | | — | | | | — | | | | — | | | | — | | | | (.24 | ) | | | — | |
Total distributions | | | (.35 | ) | | | (1.09 | ) | | | (.65 | ) | | | (.60 | ) | | | (.96 | ) | | | (.96 | ) |
Net asset value, end of period | | $ | 62.94 | | | $ | 58.12 | | | $ | 59.12 | | | $ | 45.80 | | | $ | 48.55 | | | $ | 44.73 | |
| | |
Total Returnc | | | 8.91 | % | | | 0.33 | % | | | 30.66 | % | | | (4.37 | %) | | | 10.63 | % | | | 33.38 | % |
Ratios/Supplemental Data | |
Net assets, end of period (in thousands) | | $ | 44,590 | | | $ | 56,419 | | | $ | 61,460 | | | $ | 43,573 | | | $ | 281,800 | | | $ | 43,709 | |
Ratios to average net assets: | |
Net investment income (loss) | | | 1.14 | % | | | 1.39 | % | | | 1.21 | % | | | 1.22 | % | | | 1.15 | % | | | 2.24 | % |
Total expensesd | | | 0.97 | % | | | 0.94 | % | | | 0.95 | % | | | 0.97 | % | | | 0.95 | % | | | 0.95 | % |
Portfolio turnover rate | | | 1,118 | % | | | 2,699 | % | | | 1,932 | % | | | 2,661 | % | | | 1,759 | % | | | 2,322 | % |
A-Class | | Period Ended
September 30,
2016a | | | Year Ended
March 31,
2016 | | | Year Ended
March 31,
2015 | | | Year Ended
March 31,
2014f | | | Year Ended
March 28,
2013f | | | Year Ended
March 31,
2012f | |
Per Share Data | | | | | | | | | | | | | | | | | | |
Net asset value, beginning of period | | $ | 58.50 | | | $ | 59.47 | | | $ | 46.07 | | | $ | 48.73 | | | $ | 44.77 | | | $ | 34.34 | |
Income (loss) from investment operations: | |
Net investment income (loss)b | | | .28 | | | | .64 | | | | .51 | | | | .48 | | | | .48 | | | | .87 | |
Net gain (loss) on investments (realized and unrealized) | | | 4.85 | | | | (.65 | ) | | | 13.42 | | | | (2.65 | ) | | | 4.29 | | | | 10.43 | |
Total from investment operations | | | 5.13 | | | | (.01 | ) | | | 13.93 | | | | (2.17 | ) | | | 4.77 | | | | 11.30 | |
Less distributions from: | |
Net investment income | | | (.28 | ) | | | (.96 | ) | | | (.53 | ) | | | (.49 | ) | | | (.57 | ) | | | (.87 | ) |
Net realized gains | | | — | | | | — | | | | — | | | | — | | | | (.24 | ) | | | — | |
Total distributions | | | (.28 | ) | | | (.96 | ) | | | (.53 | ) | | | (.49 | ) | | | (.81 | ) | | | (.87 | ) |
Net asset value, end of period | | $ | 63.35 | | | $ | 58.50 | | | $ | 59.47 | | | $ | 46.07 | | | $ | 48.73 | | | $ | 44.77 | |
| | |
Total Returnc | | | 8.78 | % | | | 0.12 | % | | | 30.37 | % | | | (4.40 | %) | | | 10.62 | % | | | 33.00 | % |
Ratios/Supplemental Data | |
Net assets, end of period (in thousands) | | $ | 2,785 | | | $ | 9,438 | | | $ | 3,879 | | | $ | 1,724 | | | $ | 15,476 | | | $ | 10,885 | |
Ratios to average net assets: | |
Net investment income (loss) | | | 0.92 | % | | | 1.16 | % | | | 0.97 | % | | | 1.04 | % | | | 0.94 | % | | | 2.02 | % |
Total expensesd | | | 1.22 | % | | | 1.20 | % | | | 1.20 | % | | | 1.22 | % | | | 1.20 | % | | | 1.20 | % |
Portfolio turnover rate | | | 1,118 | % | | | 2,699 | % | | | 1,932 | % | | | 2,661 | % | | | 1,759 | % | | | 2,322 | % |
SEE NOTES TO FINANCIAL STATEMENTS. | THE RYDEX FUNDS SEMI-ANNUAL REPORT | 149 |
GOVERNMENT LONG BOND 1.2x STRATEGY FUND | |
FINANCIAL HIGHLIGHTS (continued) |
This table is presented to show selected data for a share outstanding throughout each period and to assist shareholders in evaluating a Fund’s performance for the periods presented.
C-Class | | Period Ended
September 30,
2016a | | | Year Ended
March 31,
2016 | | | Year Ended
March 31,
2015 | | | Year Ended
March 31,
2014f | | | Year Ended
March 28,
2013f | | | Year Ended
March 31,
2012f | |
Per Share Data | | | | | | | | | | | | | | | | | | |
Net asset value, beginning of period | | $ | 58.13 | | | $ | 59.09 | | | $ | 45.79 | | | $ | 48.51 | | | $ | 44.63 | | | $ | 34.25 | |
Income (loss) from investment operations: | |
Net investment income (loss)b | | | .04 | | | | .22 | | | | .13 | | | | .12 | | | | .15 | | | | .57 | |
Net gain (loss) on investments (realized and unrealized) | | | 4.83 | | | | (.64 | ) | | | 13.30 | | | | (2.71 | ) | | | 4.21 | | | | 10.35 | |
Total from investment operations | | | 4.87 | | | | (.42 | ) | | | 13.43 | | | | (2.59 | ) | | | 4.36 | | | | 10.92 | |
Less distributions from: | |
Net investment income | | | (.05 | ) | | | (.54 | ) | | | (.13 | ) | | | (.13 | ) | | | (.24 | ) | | | (.54 | ) |
Net realized gains | | | — | | | | — | | | | — | | | | — | | | | (.24 | ) | | | — | |
Total distributions | | | (.05 | ) | | | (.54 | ) | | | (.13 | ) | | | (.13 | ) | | | (.48 | ) | | | (.54 | ) |
Net asset value, end of period | | $ | 62.95 | | | $ | 58.13 | | | $ | 59.09 | | | $ | 45.79 | | | $ | 48.51 | | | $ | 44.63 | |
| | |
Total Returnc | | | 8.36 | % | | | (0.62 | %) | | | 29.37 | % | | | (5.33 | %) | | | 9.69 | % | | | 32.01 | % |
Ratios/Supplemental Data | |
Net assets, end of period (in thousands) | | $ | 3,062 | | | $ | 3,276 | | | $ | 2,873 | | | $ | 3,198 | | | $ | 4,594 | | | $ | 4,451 | |
Ratios to average net assets: | |
Net investment income (loss) | | | 0.15 | % | | | 0.41 | % | | | 0.26 | % | | | 0.34 | % | | | 0.31 | % | | | 1.32 | % |
Total expensesd | | | 1.97 | % | | | 1.95 | % | | | 1.95 | % | | | 1.97 | % | | | 1.94 | % | | | 1.95 | % |
Portfolio turnover rate | | | 1,118 | % | | | 2,699 | % | | | 1,932 | % | | | 2,661 | % | | | 1,759 | % | | | 2,322 | % |
150 | THE RYDEX FUNDS SEMI-ANNUAL REPORT | SEE NOTES TO FINANCIAL STATEMENTS. |
GOVERNMENT LONG BOND 1.2x STRATEGY FUND | |
FINANCIAL HIGHLIGHTS (concluded) |
This table is presented to show selected data for a share outstanding throughout each period and to assist shareholders in evaluating a Fund’s performance for the periods presented.
H-Class | | Period Ended
September 30,
2016a | | | Year Ended
March 31,
2016 | | | Period Ended
March 31,
2015e | |
Per Share Data | | | | | | | | | |
Net asset value, beginning of period | | $ | 58.55 | | | $ | 59.44 | | | $ | 48.83 | |
Income (loss) from investment operations: | |
Net investment income (loss)b | | | .28 | | | | .61 | | | | .28 | |
Net gain (loss) on investments (realized and unrealized) | | | 4.89 | | | | (.54 | ) | | | 10.59 | |
Total from investment operations | | | 5.17 | | | | .07 | | | | 10.87 | |
Less distributions from: | |
Net investment income | | | (.28 | ) | | | (.96 | ) | | | (.26 | ) |
Total distributions | | | (.28 | ) | | | (.96 | ) | | | (.26 | ) |
Net asset value, end of period | | $ | 63.44 | | | $ | 58.55 | | | $ | 59.44 | |
| | |
Total Returnc | | | 8.82 | % | | | 0.26 | % | | | 22.28 | % |
Ratios/Supplemental Data | |
Net assets, end of period (in thousands) | | $ | 7,467 | | | $ | 49,639 | | | $ | 78,382 | |
Ratios to average net assets: | |
Net investment income (loss) | | | 0.91 | % | | | 1.11 | % | | | 0.89 | % |
Total expensesd | | | 1.22 | % | | | 1.20 | % | | | 1.18 | % |
Portfolio turnover rate | | | 1,118 | % | | | 2,699 | % | | | 1,932 | % |
a | Unaudited figures for the period ended September 30, 2016. Percentage amounts for the period, except total return and portfolio turnover rate, have been annualized. |
b | Net investment income (loss) per share was computed using average shares outstanding throughout the period. |
c | Total return does not reflect the impact of any applicable sales charges. |
d | Does not include expenses of the underlying funds in which the Fund invests. |
e | Since commencement of operations: September 18, 2014. Percentage amounts for the period, except total return and portfolio turnover rate, have been annualized. The Portfolio turnover rate stated is for the entire period of the Funds, not since the commencement of operations of the Class. |
f | Reverse share split — Per share amounts for the periods presented through February 7, 2014 have been restated to reflect a 1:3 reverse share split effective February 7, 2014. |
SEE NOTES TO FINANCIAL STATEMENTS. | THE RYDEX FUNDS SEMI-ANNUAL REPORT | 151 |
FUND PROFILE (Unaudited) | September 30, 2016 |
INVERSE GOVERNMENT LONG BOND STRATEGY FUND
OBJECTIVE: Seeks to provide total returns that inversely correlate, before fees and expenses, to the price movements of a benchmark for U.S. Treasury debt instruments or futures contracts on a specified debt instrument on a daily basis. The Fund’s current benchmark is the daily price movement of the Long Treasury Bond. The Long Treasury Bond is the U.S. Treasury bond with the longest maturity, which is currently 30 years. The price movement of the Long Treasury Bond is based on the daily price change of the most recently issued Long Treasury Bond. The Fund does not seek to achieve its investment objective over a period of time greater than one day.
Holdings Diversification (Market Exposure as % of Net Assets)
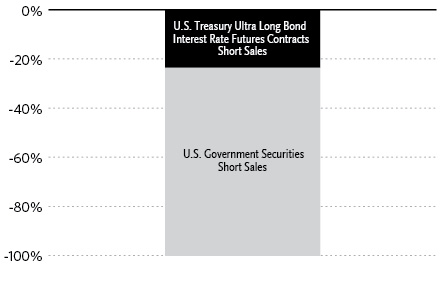
“Holdings Diversification (Market Exposure as % of Net Assets)” excludes any temporary cash investments or investments in Guggenheim Strategy Funds Trust mutual funds. Investments in those Funds do not provide “market exposure” to meet the Fund’s investment objective, but will significantly increase the portfolio’s exposure to certain other asset categories (and their associated risks), which may cause the Fund to deviate from its principal investment strategy, including: (i) high yield, high risk debt securities rated below the top four long-term rating categories by a nationally recognized statistical rating organization (also known as “junk bonds”); (ii) securities issued by the U.S. government or its agencies and instrumentalities; (iii) CLOs and similar investments; and (iv) other short-term fixed income securities.
Inception Dates: |
Investor Class | March 3, 1995 |
A-Class | March 31, 2004 |
C-Class | March 28, 2001 |
H-Class | September 18, 2014 |
The Fund invests principally in short sales and derivative investments such as futures contracts.
Largest Holdings (% of Total Net Assets) |
Federal Farm Credit Bank | 36.0% |
Guggenheim Strategy Fund I | 8.7% |
Guggenheim Strategy Fund II | 7.7% |
Federal Home Loan Bank | 7.2% |
Federal Home Loan Bank | 7.2% |
Farmer Mac | 5.9% |
Federal Farm Credit Bank | 3.5% |
Federal Farm Credit Bank | 1.4% |
Federal Farm Credit Bank | 0.9% |
Federal Farm Credit Bank | 0.7% |
Total | 79.2% |
| | |
“Largest Holdings” excludes any temporary cash or derivative investments. |
152 | THE RYDEX FUNDS SEMI-ANNUAL REPORT | |
SCHEDULE OF INVESTMENTS (Unaudited) | September 30, 2016 |
INVERSE GOVERNMENT LONG BOND STRATEGY FUND | |
| | | Shares | | | Value | |
| | | | | | | |
MUTUAL FUNDS† - 16.3% | |
Guggenheim Strategy Fund I1 | | | 483,680 | | | $ | 12,087,171 | |
Guggenheim Strategy Fund II1 | | | 424,204 | | | | 10,579,660 | |
Total Mutual Funds | | | | | | | | |
(Cost $22,537,267) | | | | | | | 22,666,831 | |
| | | | | | | | | |
| | | Face
Amount | | | | | |
| | | | | | | | | |
FEDERAL AGENCY NOTES†† - 57.1% | |
Federal Farm Credit Bank2 | | | | | | | | |
0.65% due 08/10/183 | | $ | 50,000,000 | | | | 49,968,001 | |
0.52% due 03/09/183 | | | 4,800,000 | | | | 4,791,086 | |
0.57% due 09/18/173 | | | 1,875,000 | | | | 1,874,820 | |
0.72% due 06/12/183 | | | 1,300,000 | | | | 1,300,711 | |
0.75% due 07/18/183 | | | 1,000,000 | | | | 1,000,816 | |
0.82% due 06/13/173 | | | 200,000 | | | | 200,417 | |
0.50% due 04/10/173 | | | 100,000 | | | | 100,000 | |
Total Federal Farm Credit Bank | | | | | | | 59,235,851 | |
Federal Home Loan Bank2 | | | | | | | | |
0.56% due 12/20/173 | | | 10,000,000 | | | | 9,992,770 | |
0.63% due 05/17/183 | | | 10,000,000 | | | | 9,992,660 | |
Total Federal Home Loan Bank | | | | | | | 19,985,430 | |
Total Federal Agency Notes | | | | | | | | |
(Cost $79,239,791) | | | | | | | 79,221,281 | |
| | | | | | | | | |
FEDERAL AGENCY BONDS†† - 5.9% | |
Farmer Mac2 | | | | | | | | |
5.13% due 04/19/17 | | | 8,000,000 | | | | 8,193,600 | |
Total Federal Agency Bonds | | | | | | | | |
(Cost $8,197,389) | | | | | | | 8,193,600 | |
| | | | | | | | | |
U.S. TREASURY BILLS† - 1.4% | |
United States Treasury Bill | | | | | | | | |
0.00% due 10/13/16††,4 | | | 2,000,000 | | | | 1,999,906 | |
Total U.S. Treasury Bills | | | | | | | | |
(Cost $1,999,948) | | | | | | | 1,999,906 | |
| | | | | | | | | |
REPURCHASE AGREEMENTS†† - 120.6% | |
Individual Repurchase Agreements | | | | | | | | |
Barclays Capital
issued 09/30/16 at (0.25)%
due 10/01/16 (Secured by U.S. Treasury Bond at rate of 2.25% and maturing 08/15/46 as collateral with a value of $87,142,170) to be repurchased at $85,433,755. | | | 85,433,500 | | | | 85,433,500 | |
Mizuho Financial Group, Inc.
issued 09/30/16 at (0.15)%
due 10/03/16 (Secured by U.S. Treasury Bond at rate of 2.25% and maturing 08/15/46 as collateral with a value of $36,286,250) to be repurchased at $35,574,755. | | | 35,574,755 | | | | 35,574,755 | |
Joint Repurchase Agreements5 | | | | | | | | |
HSBC Securities, Inc.
issued 09/30/16 at 0.38%
due 10/01/16 | | | 25,772,084 | | | | 25,772,084 | |
Royal Bank of Canada
issued 09/30/16 at 0.36%
due 10/03/16 | | | 20,463,163 | | | | 20,463,163 | |
Total Repurchase Agreements | | | | | | | | |
(Cost $167,243,502) | | | | | | | 167,243,502 | |
| | | | | | | | | |
Total Investments - 201.3% | | | | | | | | |
(Cost $279,217,897) | | | | | | $ | 279,325,120 | |
| | | | | | | | | |
U.S. Government Securities Sold Short†† - (76.6)% | |
U.S. Treasury Bond | | | | | | | | |
2.25% due 08/15/46 | | | 108,000,000 | | | | (106,396,875 | ) |
Total U.S. Government Securities Sold Short | | | | | | | | |
(Proceeds $107,872,981) | | | | | | | (106,396,875 | ) |
Other Assets & Liabilities, net - (24.7)% | | | | | | | (34,240,524 | ) |
Total Net Assets - 100.0% | | | | | | $ | 138,687,721 | |
| | | | | | | | | |
| | | Contracts | | | Unrealized
Gain | |
| | | | | | | | | |
INTEREST RATE FUTURES CONTRACTS SOLD SHORT† | |
December 2016 U.S. Treasury
Ultra Long Bond
Futures Contracts
(Aggregate Value of
Contracts $38,350,000) | | | 208 | | | $ | 500,735 | |
SEE NOTES TO FINANCIAL STATEMENTS. | THE RYDEX FUNDS SEMI-ANNUAL REPORT | 153 |
SCHEDULE OF INVESTMENTS (Unaudited)(concluded) | September 30, 2016 |
INVERSE GOVERNMENT LONG BOND STRATEGY FUND | |
† | Value determined based on Level 1 inputs — See Note 4. |
†† | Value determined based on Level 2 inputs — See Note 4. |
1 | Affiliated issuer — See Note 9. |
2 | The issuer operates under a Congressional charter; its securities are neither issued nor guaranteed by the U.S. Government. |
3 | Variable rate security. Rate indicated is rate effective at September 30, 2016. |
4 | Zero coupon rate security. |
5 | Repurchase Agreements — See Note 5. |
| | See Sector Classification in Other Information section. |
The following table summarizes the inputs used to value the Fund’s investments at September 30, 2016 (See Note 4 in the Notes to Financial Statements):
Investments in Securities (Assets) | | Level 1 | | | Level 1 -
Other* | | | Level 2 | | | Level 3 | | | Total | |
Federal Agency Bonds | | $ | — | | | $ | — | | | $ | 8,193,600 | | | $ | — | | | $ | 8,193,600 | |
Federal Agency Notes | | | — | | | | — | | | | 79,221,281 | | | | — | | | | 79,221,281 | |
Interest Rate Futures Contracts | | | — | | | | 500,735 | | | | — | | | | — | | | | 500,735 | |
Mutual Funds | | | 22,666,831 | | | | — | | | | — | | | | — | | | | 22,666,831 | |
Repurchase Agreements | | | — | | | | — | | | | 167,243,502 | | | | — | | | | 167,243,502 | |
U.S. Treasury Bills | | | — | | | | — | | | | 1,999,906 | | | | — | | | | 1,999,906 | |
Total | | $ | 22,666,831 | | | $ | 500,735 | | | $ | 256,658,289 | | | $ | — | | | $ | 279,825,855 | |
| | | | | | | | | | | | | | | | | | | | | |
Investments in Securities (Liabilities) | | Level 1 | | | Level 1 -
Other* | | | Level 2 | | | Level 3 | | | Total | |
U.S. Government Securities | | $ | — | | | $ | — | | | $ | 106,396,875 | | | $ | — | | | $ | 106,396,875 | |
Total | | $ | — | | | $ | — | | | $ | 106,396,875 | | | $ | — | | | $ | 106,396,875 | |
* | Other financial instruments include futures contracts, which are reported as unrealized gain/loss at period end. |
Transfers between investment levels may occur as the markets fluctuate and/or the availability of data used in an investment’s valuation changes. Transfers between valuation levels, if any, are in comparison to the valuation levels at the end of the previous fiscal year, and are effective using the fair value as of the end of the previous fiscal period.
For the period ended September 30, 2016, there were no transfers between levels.
154 | THE RYDEX FUNDS SEMI-ANNUAL REPORT | SEE NOTES TO FINANCIAL STATEMENTS. |
INVERSE GOVERNMENT LONG BOND STRATEGY FUND | |
STATEMENT OF ASSETS AND LIABILITIES (Unaudited) |
September 30, 2016 |
Assets: | |
Investments in unaffiliated issuers, at value (cost $89,437,128) | | $ | 89,414,787 | |
Investments in affiliated issuers, at value (cost $22,537,267) | | | 22,666,831 | |
Repurchase agreements, at value (cost $167,243,502) | | | 167,243,502 | |
Total investments (cost $279,217,897) | | | 279,325,120 | |
Receivables: | |
Variation margin | | | 344,500 | |
Fund shares sold | | | 30,617,385 | |
Dividends | | | 34,590 | |
Interest | | | 292,043 | |
Total assets | | | 310,613,638 | |
| | | | | |
Liabilities: | |
Securities sold short, at value (proceeds $107,872,981) | | | 106,396,875 | |
Overdraft due to custodian bank | | | 9,005 | |
Payable for: | |
Fund shares redeemed | | | 49,288,469 | |
Securities purchased | | | 15,565,469 | |
Management fees | | | 143,041 | |
Transfer agent and administrative fees | | | 39,734 | |
Distribution and service fees | | | 27,548 | |
Portfolio accounting fees | | | 15,893 | |
Miscellaneous | | | 439,883 | |
Total liabilities | | | 171,925,917 | |
Commitments and contingent liabilities (Note 13) | | | — | |
Net assets | | $ | 138,687,721 | |
| | | | | |
Net assets consist of: | |
Paid in capital | | $ | 525,079,033 | |
Accumulated net investment loss | | | (3,503,838 | ) |
Accumulated net realized loss on investments | | | (384,971,538 | ) |
Net unrealized appreciation on investments | | | 2,084,064 | |
Net assets | | $ | 138,687,721 | |
| | | | | |
Investor Class: | |
Net assets | | $ | 87,771,969 | |
Capital shares outstanding | | | 2,777,525 | |
Net asset value per share | | $ | 31.60 | |
| | | | | |
A-Class: | |
Net assets | | $ | 17,546,840 | |
Capital shares outstanding | | | 575,388 | |
Net asset value per share | | $ | 30.50 | |
Maximum offering price per share (Net asset value divided by 95.25%) | | $ | 32.02 | |
| | | | | |
C-Class: | |
Net assets | | $ | 22,368,052 | |
Capital shares outstanding | | | 827,453 | |
Net asset value per share | | $ | 27.03 | |
| | | | | |
H-Class: | |
Net assets | | $ | 11,000,860 | |
Capital shares outstanding | | | 359,474 | |
Net asset value per share | | $ | 30.60 | |
SEE NOTES TO FINANCIAL STATEMENTS. | THE RYDEX FUNDS SEMI-ANNUAL REPORT | 155 |
INVERSE GOVERNMENT LONG BOND STRATEGY FUND | |
STATEMENT OF OPERATIONS (Unaudited) |
Period Ended September 30, 2016 |
Investment Income: | |
Interest | | $ | 403,490 | |
Dividends from securities of affiliated issuers | | | 236,106 | |
Total investment income | | | 639,596 | |
| | | | | |
Expenses: | |
Management fees | | | 788,744 | |
Transfer agent and administrative fees | | | 219,095 | |
Distribution and service fees: | |
A-Class | | | 21,201 | |
C-Class | | | 124,686 | |
H-Class | | | 50,661 | |
Portfolio accounting fees | | | 87,637 | |
Short interest expense | | | 1,443,453 | |
Custodian fees | | | 10,390 | |
Trustees’ fees* | | | 7,377 | |
Line of credit fees | | | 921 | |
Miscellaneous | | | 128,814 | |
Total expenses | | | 2,882,979 | |
Net investment loss | | | (2,243,383 | ) |
| | | | | |
Net Realized and Unrealized Gain (Loss): | |
Net realized gain (loss) on: | |
Investments in unaffiliated issuers | | | 45,801 | |
Investments in affiliated issuers | | | 83,900 | |
Futures contracts | | | (7,291,824 | ) |
Securities sold short | | | (5,447,898 | ) |
Net realized loss | | | (12,610,021 | ) |
Net change in unrealized appreciation (depreciation) on: | |
Investments in unaffiliated issuers | | | 15,075 | |
Investments in affiliated issuers | | | 132,699 | |
Securities sold short | | | 1,682,993 | |
Futures contracts | | | 181,754 | |
Net change in unrealized appreciation (depreciation) | | | 2,012,521 | |
Net realized and unrealized loss | | | (10,597,500 | ) |
Net decrease in net assets resulting from operations | | $ | (12,840,883 | ) |
* | Relates to Trustees not deemed “interested persons” within the meaning of Section 2(a)(19) of the 1940 Act. |
156 | THE RYDEX FUNDS SEMI-ANNUAL REPORT | SEE NOTES TO FINANCIAL STATEMENTS. |
INVERSE GOVERNMENT LONG BOND STRATEGY FUND | |
STATEMENTS OF CHANGES IN NET ASSETS |
| | | Period Ended
September 30,
2016
(Unaudited) | | | Year Ended
March 31,
2016 | |
Increase (Decrease) in Net Assets from Operations: | | | | | | |
Net investment loss | | $ | (2,243,383 | ) | | $ | (6,742,953 | ) |
Net realized loss on investments | | | (12,610,021 | ) | | | (2,550,139 | ) |
Net change in unrealized appreciation (depreciation) on investments | | | 2,012,521 | | | | 3,855,117 | |
Net decrease in net assets resulting from operations | | | (12,840,883 | ) | | | (5,437,975 | ) |
| | | | | | | | | |
Capital share transactions: | | | | | | | | |
Proceeds from sale of shares | | | | | | | | |
Investor Class | | | 704,811,885 | | | | 419,488,684 | |
Advisor Class | | | — | | | | 77,182,234 | * |
A-Class | | | 5,386,254 | | | | 21,327,705 | |
C-Class | | | 3,223,080 | | | | 10,592,963 | |
H-Class | | | 1,612,783,208 | | | | 2,119,121,239 | |
Cost of shares redeemed | | | �� | | | | | |
Investor Class | | | (700,180,695 | ) | | | (430,488,671 | ) |
Advisor Class | | | — | | | | (80,838,817 | )* |
A-Class | | | (4,158,181 | ) | | | (24,329,743 | ) |
C-Class | | | (6,536,455 | ) | | | (17,049,334 | ) |
H-Class | | | (1,671,279,910 | ) | | | (2,100,739,161 | ) |
Conversion activity* | | | | | | | | |
Advisor Class | | | — | | | | (8,597,033 | ) |
H-Class | | | — | | | | 8,597,033 | |
Net decrease from capital share transactions | | | (55,950,814 | ) | | | (5,732,901 | ) |
Net decrease in net assets | | | (68,791,697 | ) | | | (11,170,876 | ) |
| | | | | | | | | |
Net assets: | | | | | | | | |
Beginning of period | | | 207,479,418 | | | | 218,650,294 | |
End of period | | $ | 138,687,721 | | | $ | 207,479,418 | |
Accumulated net investment loss at end of period | | $ | (3,503,838 | ) | | $ | (1,260,455 | ) |
| | | | | | | | | |
Capital share activity: | | | | | | | | |
Shares sold | | | | | | | | |
Investor Class | | | 22,252,564 | | | | 11,180,250 | |
Advisor Class | | | — | | | | 2,146,208 | * |
A-Class | | | 174,832 | | | | 580,663 | |
C-Class | | | 115,754 | | | | 319,610 | |
H-Class | | | 50,883,947 | | | | 58,800,072 | |
Shares redeemed | | | | | | | | |
Investor Class | | | (22,074,298 | ) | | | (11,534,880 | ) |
Advisor Class | | | — | | | | (2,246,748 | )* |
A-Class | | | (133,310 | ) | | | (669,422 | ) |
C-Class | | | (235,344 | ) | | | (527,194 | ) |
H-Class | | | (52,723,475 | ) | | | (58,103,890 | ) |
Conversion activity* | | | | | | | | |
Advisor Class | | | — | | | | (245,419 | ) |
H-Class | | | — | | | | 239,405 | |
Net decrease in shares | | | (1,739,329 | ) | | | (61,345 | ) |
* | Effective September 30, 2015, all outstanding Advisor Class shares converted into H-Class shares — See Note 11. |
SEE NOTES TO FINANCIAL STATEMENTS. | THE RYDEX FUNDS SEMI-ANNUAL REPORT | 157 |
INVERSE GOVERNMENT LONG BOND STRATEGY FUND | |
This table is presented to show selected data for a share outstanding throughout each period and to assist shareholders in evaluating a Fund’s performance for the periods presented.
Investor Class | | Period Ended
September 30,
2016a | | | Year Ended
March 31,
2016 | | | Year Ended
March 31,
2015 | | | Year Ended
March 31,
2014f | | | Year Ended
March 28,
2013f | | | Year Ended
March 31,
2012f | |
Per Share Data | | | | | | | | | | | | | | | | | | |
Net asset value, beginning of period | | $ | 34.27 | | | $ | 35.78 | | | $ | 46.01 | | | $ | 43.94 | | | $ | 48.33 | | | $ | 65.42 | |
Income (loss) from investment operations: | |
Net investment income (loss)b | | | (.37 | ) | | | (1.15 | ) | | | (1.15 | ) | | | (1.65 | ) | | | (1.20 | ) | | | (2.15 | ) |
Net gain (loss) on investments (realized and unrealized) | | | (2.30 | ) | | | (.36 | ) | | | (9.08 | ) | | | 3.72 | | | | (3.19 | ) | | | (14.94 | ) |
Total from investment operations | | | (2.67 | ) | | | (1.51 | ) | | | (10.23 | ) | | | 2.07 | | | | (4.39 | ) | | | (17.09 | ) |
Net asset value, end of period | | $ | 31.60 | | | $ | 34.27 | | | $ | 35.78 | | | $ | 46.01 | | | $ | 43.94 | | | $ | 48.33 | |
| | |
Total Returnc | | | (7.79 | %) | | | (4.22 | %) | | | (22.23 | %) | | | 4.69 | % | | | (9.10 | %) | | | (26.07 | %) |
Ratios/Supplemental Data | |
Net assets, end of period (in thousands) | | $ | 87,772 | | | $ | 89,071 | | | $ | 105,696 | | | $ | 177,735 | | | $ | 143,739 | | | $ | 247,454 | |
Ratios to average net assets: | |
Net investment income (loss) | | | (2.31 | %) | | | (3.07 | %) | | | (2.80 | %) | | | (3.46 | %) | | | (2.82 | %) | | | (3.99 | %) |
Total expensesd,g | | | 3.04 | % | | | 3.48 | % | | | 3.15 | % | | | 3.50 | % | | | 2.99 | % | | | 4.13 | % |
Portfolio turnover rate | | | 877 | % | | | 838 | % | | | 2,190 | % | | | 1,097 | % | | | 1,309 | % | | | 1,107 | % |
A-Class | | Period Ended
September 30,
2016a | | | Year Ended
March 31,
2016 | | | Year Ended
March 31,
2015 | | | Year Ended
March 31,
2014f | | | Year Ended
March 28,
2013f | | | Year Ended
March 31,
2012f | |
Per Share Data | | | | | | | | | | | | | | | | | | |
Net asset value, beginning of period | | $ | 33.11 | | | $ | 34.66 | | | $ | 44.68 | | | $ | 42.77 | | | $ | 47.18 | | | $ | 64.00 | |
Income (loss) from investment operations: | |
Net investment income (loss)b | | | (.41 | ) | | | (1.20 | ) | | | (1.23 | ) | | | (1.73 | ) | | | (1.35 | ) | | | (2.25 | ) |
Net gain (loss) on investments (realized and unrealized) | | | (2.20 | ) | | | (.35 | ) | | | (8.79 | ) | | | 3.64 | | | | (3.06 | ) | | | (14.57 | ) |
Total from investment operations | | | (2.61 | ) | | | (1.55 | ) | | | (10.02 | ) | | | 1.91 | | | | (4.41 | ) | | | (16.82 | ) |
Net asset value, end of period | | $ | 30.50 | | | $ | 33.11 | | | $ | 34.66 | | | $ | 44.68 | | | $ | 42.77 | | | $ | 47.18 | |
| | |
Total Returnc | | | (7.91 | %) | | | (4.47 | %) | | | (22.43 | %) | | | 4.51 | % | | | (9.43 | %) | | | (26.25 | %) |
Ratios/Supplemental Data | |
Net assets, end of period (in thousands) | | $ | 17,547 | | | $ | 17,676 | | | $ | 21,580 | | | $ | 49,859 | | | $ | 32,842 | | | $ | 37,607 | |
Ratios to average net assets: | |
Net investment income (loss) | | | (2.58 | %) | | | (3.32 | %) | | | (3.06 | %) | | | (3.73 | %) | | | (3.20 | %) | | | (4.24 | %) |
Total expensesd,g | | | 3.32 | % | | | 3.75 | % | | | 3.40 | % | | | 3.78 | % | | | 3.37 | % | | | 4.38 | % |
Portfolio turnover rate | | | 877 | % | | | 838 | % | | | 2,190 | % | | | 1,097 | % | | | 1,309 | % | | | 1,107 | % |
158 | THE RYDEX FUNDS SEMI-ANNUAL REPORT | SEE NOTES TO FINANCIAL STATEMENTS. |
INVERSE GOVERNMENT LONG BOND STRATEGY FUND | |
FINANCIAL HIGHLIGHTS (concluded) |
This table is presented to show selected data for a share outstanding throughout each period and to assist shareholders in evaluating a Fund’s performance for the periods presented.
C-Class | | Period Ended
September 30,
2016a | | | Year Ended
March 31,
2016 | | | Year Ended
March 31,
2015 | | | Year Ended
March 31,
2014f | | | Year Ended
March 28,
2013f | | | Year Ended
March 31,
2012f | |
Per Share Data | | | | | | | | | | | | | | | | | | |
Net asset value, beginning of period | | $ | 29.46 | | | $ | 31.07 | | | $ | 40.35 | | | $ | 38.92 | | | $ | 43.25 | | | $ | 59.09 | |
Income (loss) from investment operations: | |
Net investment income (loss)b | | | (.47 | ) | | | (1.31 | ) | | | (1.36 | ) | | | (1.86 | ) | | | (1.50 | ) | | | (2.40 | ) |
Net gain (loss) on investments (realized and unrealized) | | | (1.96 | ) | | | (.30 | ) | | | (7.92 | ) | | | 3.29 | | | | (2.83 | ) | | | (13.44 | ) |
Total from investment operations | | | (2.43 | ) | | | (1.61 | ) | | | (9.28 | ) | | | 1.43 | | | | (4.33 | ) | | | (15.84 | ) |
Net asset value, end of period | | $ | 27.03 | | | $ | 29.46 | | | $ | 31.07 | | | $ | 40.35 | | | $ | 38.92 | | | $ | 43.25 | |
| | |
Total Returnc | | | (8.25 | %) | | | (5.18 | %) | | | (23.00 | %) | | | 3.73 | % | | | (10.06 | %) | | | (26.82 | %) |
Ratios/Supplemental Data | |
Net assets, end of period (in thousands) | | $ | 22,368 | | | $ | 27,899 | | | $ | 35,874 | | | $ | 57,323 | | | $ | 55,404 | | | $ | 69,472 | |
Ratios to average net assets: | |
Net investment income (loss) | | | (3.34 | %) | | | (4.08 | %) | | | (3.78 | %) | | | (4.45 | %) | | | (3.96 | %) | | | (4.98 | %) |
Total expensesd,g | | | 4.08 | % | | | 4.50 | % | | | 4.14 | % | | | 4.49 | % | | | 4.13 | % | | | 5.12 | % |
Portfolio turnover rate | | | 877 | % | | | 838 | % | | | 2,190 | % | | | 1,097 | % | | | 1,309 | % | | | 1,107 | % |
H-Class | | Period Ended
September 30,
2016a | | | Year Ended
March 31,
2016 | | | Period Ended
March 31,
2015e | |
Per Share Data | | | | | | | | | |
Net asset value, beginning of period | | $ | 33.12 | | | $ | 34.67 | | | $ | 41.85 | |
Income (loss) from investment operations: | |
Net investment income (loss)b | | | (.42 | ) | | | (1.15 | ) | | | (.52 | ) |
Net gain (loss) on investments (realized and unrealized) | | | (2.10 | ) | | | (.40 | ) | | | (6.66 | ) |
Total from investment operations | | | (2.52 | ) | | | (1.55 | ) | | | (7.18 | ) |
Net asset value, end of period | | $ | 30.60 | | | $ | 33.12 | | | $ | 34.67 | |
| | |
Total Returnc | | | (7.64 | %) | | | (4.47 | %) | | | (17.16 | %) |
Ratios/Supplemental Data | |
Net assets, end of period (in thousands) | | $ | 11,001 | | | $ | 72,833 | | | $ | 43,800 | |
Ratios to average net assets: | |
Net investment income (loss) | | | (2.65 | %) | | | (3.17 | %) | | | (2.75 | %) |
Total expensesd,g | | | 3.36 | % | | | 3.61 | % | | | 3.07 | % |
Portfolio turnover rate | | | 877 | % | | | 838 | % | | | 2,190 | % |
a | Unaudited figures for the period ended September 30, 2016. Percentage amounts for the period, except total return and portfolio turnover rate, have been annualized. |
b | Net investment income (loss) per share was computed using average shares outstanding throughout the period. |
c | Total return does not reflect the impact of any applicable sales charges. |
d | Does not include expenses of the underlying funds in which the Fund invests. |
e | Since commencement of operations: September 18, 2014. Percentage amounts for the period, except total return and portfolio turnover rate, have been annualized. Percentage amounts for the period, except total return and portfolio turnover rate, have been annualized. The Portfolio turnover rate stated is for the entire period of the Funds, not since the commencement of operations of the Class. |
f | Reverse share split — Per share amounts for the periods presented through February 7, 2014 have been restated to reflect a 1:3 reverse share split effective February 7, 2014. |
g | Total expenses may include interest expense related to short sales. Excluding interest expense, the opening expense ratio for the period add years ended would be: |
| | 9/30/16 | 3/31/16 | 3/31/15 | 3/31/14 | 3/31/13 | 3/31/12 |
Investor Class | 1.41% | 1.40% | 1.40% | 1.41% | 1.39% | 1.39% |
A-Class | 1.66% | 1.65% | 1.65% | 1.66% | 1.64% | 1.65% |
C-Class | 2.41% | 2.40% | 2.40% | 2.41% | 2.39% | 2.40% |
H-Class | 1.67% | 1.65% | 1.60% | — | — | — |
SEE NOTES TO FINANCIAL STATEMENTS. | THE RYDEX FUNDS SEMI-ANNUAL REPORT | 159 |
FUND PROFILE (Unaudited) | September 30, 2016 |
HIGH YIELD STRATEGY FUND
OBJECTIVE: Seeks to provide investment results that correlate, before fees and expenses, to the performance of the high yield bond market.
Holdings Diversification (Market Exposure as % of Net Assets)
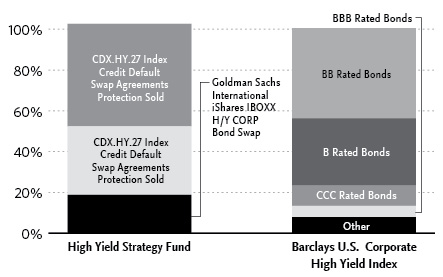
“Holdings Diversification (Market Exposure as % of Net Assets)” excludes any temporary cash investments or investments in Guggenheim Strategy Funds Trust mutual funds. Investments in those Funds do not provide “market exposure” to meet the Fund’s investment objective, but will significantly increase the portfolio’s exposure to certain other asset categories (and their associated risks), which may cause the Fund to deviate from its principal investment strategy, including: (i) high yield, high risk debt securities rated below the top four long-term rating categories by a nationally recognized statistical rating organization (also known as “junk bonds”); (ii) securities issued by the U.S. government or its agencies and instrumentalities; (iii) CLOs and similar investments; and (iv) other short-term fixed income securities.
Inception Dates: |
A-Class | April 16, 2007 |
C-Class | April 16, 2007 |
H-Class | April 16, 2007 |
The Fund invests principally in derivative investments such as high yield credit default swap agreements and futures contracts.
Largest Holdings (% of Total Net Assets) |
Guggenheim Strategy Fund I | 2.1% |
Guggenheim Strategy Fund II | 1.8% |
Guggenheim Strategy Fund III | 1.0% |
Total | 4.9% |
| | |
“Largest Holdings” excludes any temporary cash or derivative investments. |
160 | THE RYDEX FUNDS SEMI-ANNUAL REPORT | |
SCHEDULE OF INVESTMENTS (Unaudited) | September 30, 2016 |
HIGH YIELD STRATEGY FUND | |
| | | Shares | | | Value | |
| | | | | | | |
MUTUAL FUNDS† - 4.9% | |
Guggenheim Strategy Fund I1 | | | 482,750 | | | $ | 12,063,914 | |
Guggenheim Strategy Fund II1 | | | 424,281 | | | | 10,581,556 | |
Guggenheim Strategy Fund III1 | | | 241,684 | | | | 6,037,272 | |
Total Mutual Funds | | | | | | | | |
(Cost $28,495,924) | | | | | | | 28,682,742 | |
| | | | | | | | | |
| | | Face
Amount | | | | | |
| | | | | | | | | |
U.S. TREASURY BILLS†† - 2.1% | |
United States Treasury Bill | | | | | | | | |
0.00% due 10/13/162 | | $ | 12,000,000 | | | | 11,999,436 | |
Total U.S. Treasury Bills | | | | | | | | |
(Cost $11,999,690) | | | | | | | 11,999,436 | |
| | | | | | | | | |
FEDERAL AGENCY DISCOUNT NOTES†† - 1.2% | |
Freddie Mac3 | | | | | | | | |
0.17% due 10/07/16 | | | 7,267,000 | | | | 7,266,794 | |
Total Federal Agency Discount Notes | | | | | | | | |
(Cost $7,266,794) | | | | | | | 7,266,794 | |
| | | | | | | | | |
FEDERAL AGENCY NOTES†† - 0.6% | |
Federal Farm Credit Bank4 | | | | | | | | |
0.63% due 05/17/185 | | | 3,000,000 | | | | 2,997,798 | |
Fannie Mae3 | | | | | | | | |
0.73% due 10/03/165 | | | 500,000 | | | | 500,000 | |
Total Federal Agency Notes | | | | | | | | |
(Cost $3,500,009) | | | | | | | 3,497,798 | |
REPURCHASE AGREEMENTS††,6 - 88.0% | |
HSBC Securities, Inc.
issued 09/30/16 at 0.38%
due 10/03/16 | | | 277,133,857 | | | | 277,133,857 | |
Royal Bank of Canada
issued 09/30/16 at 0.36%
due 10/03/167 | | | 236,383,580 | | | | 236,383,580 | |
Total Repurchase Agreements | | | | | | | | |
(Cost $513,517,437) | | | | | | | 513,517,437 | |
| | | | | | | | | |
Total Investments - 96.8% | | | | | | | | |
(Cost $564,779,854) | | | | | | $ | 564,964,207 | |
Other Assets & Liabilities, net - 3.2% | | | | | | | 18,872,963 | |
Total Net Assets - 100.0% | | | | | | $ | 583,837,170 | |
| | | | | | | | | |
| | | Contracts | | | Unrealized
Gain | |
| | | | | | | | | |
INTEREST RATE FUTURES CONTRACTS PURCHASED† | |
December 2016 U.S. Treasury 5 Year Note
Futures Contracts
(Aggregate Value of
Contracts $430,612,898) | | | 3,543 | | | $ | 874,303 | |
| | | | | | | | | |
| | | Units | | | | | |
| | | | | | | | | |
INTEREST RATE SWAP AGREEMENTS†† | |
Goldman Sachs International
October 2016
iShares IBOXX H/Y Corp Bond Swap 0.31%,
Terminating 10/31/16
(Notional Value $109,597,426) | | | 1,255,987 | | | $ | 477,275 | |
SEE NOTES TO FINANCIAL STATEMENTS. | THE RYDEX FUNDS SEMI-ANNUAL REPORT | 161 |
SCHEDULE OF INVESTMENTS (Unaudited)(concluded) | September 30, 2016 |
HIGH YIELD STRATEGY FUND | |
† | Value determined based on Level 1 inputs — See Note 4. |
†† | Value determined based on Level 2 inputs — See Note 4. |
1 | Affiliated issuer — See Note 9. |
2 | Zero coupon rate security. |
3 | On September 7, 2008, the issuer was placed in conservatorship by the Federal Housing Finance Agency (FHFA). As conservator, the FHFA has full powers to control the assets and operations of the firm. |
4 | The issuer operates under a Congressional charter; its securities are neither issued nor guaranteed by the U.S. Government. |
5 | Variable rate security. Rate indicated is rate effective at September 30, 2016. |
6 | Repurchase Agreements — See Note 5. |
7 | All or a portion of this security is pledged as equity swap collateral at September 30, 2016. |
| | plc — Public Limited Company |
| | CDX.NA.HY27 Index — Credit Default Swap North American High Yield Series 27 Index |
| | ICE — Intercontinental Exchange |
| | |
| | See Sector Classification in Other Information section. |
The following table summarizes the inputs used to value the Fund’s investments at September 30, 2016 (See Note 4 in the Notes to Financial Statements):
Investments in Securities (Assets) | | Level 1 | | | Level 1 -
Other* | | | Level 2 | | | Level 2 -
Other* | | | Level 3 | | | Total | |
Credit Default Swaps | | $ | — | | | $ | — | | | $ | — | | | $ | 4,492,739 | | | $ | — | | | $ | 4,492,739 | |
Interest Rate Swap Agreements | | | — | | | | — | | | | — | | | | 477,275 | | | | — | | | | 477,275 | |
Federal Agency Discount Notes | | | — | | | | — | | | | 7,266,794 | | | | — | | | | — | | | | 7,266,794 | |
Federal Agency Notes | | | — | | | | — | | | | 3,497,798 | | | | — | | | | — | | | | 3,497,798 | |
Interest Rate Futures Contracts | | | — | | | | 874,303 | | | | — | | | | — | | | | — | | | | 874,303 | |
Mutual Funds | | | 28,682,742 | | | | — | | | | — | | | | — | | | | — | | | | 28,682,742 | |
Repurchase Agreements | | | — | | | | — | | | | 513,517,437 | | | | — | | | | — | | | | 513,517,437 | |
U.S. Treasury Bills | | | — | | | | — | | | | 11,999,436 | | | | — | | | | — | | | | 11,999,436 | |
Total | | $ | 28,682,742 | | | $ | 874,303 | | | $ | 536,281,465 | | | $ | 4,970,014 | | | $ | — | | | $ | 570,808,524 | |
* | Other financial instruments include futures contracts and/or swaps, which are reported as unrealized gain/loss at period end. |
Transfers between investment levels may occur as the markets fluctuate and/or the availability of data used in an investment’s valuation changes. Transfers between valuation levels, if any, are in comparison to the valuation levels at the end of the previous fiscal year, and are effective using the fair value as of the end of the previous fiscal period.
For the period ended September 30, 2016, there were no transfers between levels.
162 | THE RYDEX FUNDS SEMI-ANNUAL REPORT | SEE NOTES TO FINANCIAL STATEMENTS. |
STATEMENT OF ASSETS AND LIABILITIES (Unaudited) |
September 30, 2016 |
Assets: | |
Investments in unaffiliated issuers, at value (cost $22,766,493) | | $ | 22,764,028 | |
Investments in affiliated issuers, at value (cost $28,495,924) | | | 28,682,742 | |
Repurchase agreements, at value (cost $513,517,437) | | | 513,517,437 | |
Total investments (cost $564,779,854) | | | 564,964,207 | |
Unamortized upfront premiums paid on credit default swaps | | | 16,271,930 | |
Unrealized appreciation on swap agreements | | | 4,970,014 | |
Segregated cash with broker | | | 4,418,174 | |
Receivables: | |
Swap settlement | | | 522,939 | |
Securities sold | | | 3,540,034 | |
Fund shares sold | | | 2,700,611 | |
Dividends | | | 48,052 | |
Interest | | | 961,201 | |
Total assets | | | 598,397,162 | |
| | | | | |
Liabilities: | |
Segregated cash due to broker | | | 6,851,078 | |
Overdraft due to custodian bank | | | 517 | |
Payable for: | |
Fund shares redeemed | | | 3,373,382 | |
Securities purchased | | | 2,785,804 | |
Variation margin | | | 657,256 | |
Management fees | | | 352,390 | |
Distribution and service fees | | | 120,162 | |
Transfer agent and administrative fees | | | 117,463 | |
Portfolio accounting fees | | | 38,858 | |
Miscellaneous | | | 263,082 | |
Total liabilities | | | 14,559,992 | |
Commitments and contingent liabilities (Note 13) | | | — | |
Net assets | | $ | 583,837,170 | |
| | | | | |
Net assets consist of: | |
Paid in capital | | $ | 557,955,590 | |
Accumulated net investment loss | | | (1,848,460 | ) |
Accumulated net realized gain on investments | | | 21,701,370 | |
Net unrealized appreciation on investments | | | 6,028,670 | |
Net assets | | $ | 583,837,170 | |
| | | | | |
A-Class: | |
Net assets | | $ | 17,056,820 | |
Capital shares outstanding | | | 696,803 | |
Net asset value per share | | $ | 24.48 | |
Maximum offering price per share (Net asset value divided by 95.25%) | | $ | 25.70 | |
| | | | | |
C-Class: | |
Net assets | | $ | 4,962,987 | |
Capital shares outstanding | | | 223,552 | |
Net asset value per share | | $ | 22.20 | |
| | | | | |
H-Class: | |
Net assets | | $ | 561,817,363 | |
Capital shares outstanding | | | 22,970,562 | |
Net asset value per share | | $ | 24.46 | |
SEE NOTES TO FINANCIAL STATEMENTS. | THE RYDEX FUNDS SEMI-ANNUAL REPORT | 163 |
STATEMENT OF OPERATIONS (Unaudited) |
Period Ended September 30, 2016 |
Investment Income: | |
Dividends from securities of unaffiliated issuers | | $ | 1,682,503 | |
Interest | | | 698,177 | |
Dividends from securities of affiliated issuers | | | 538,644 | |
Total investment income | | | 2,919,324 | |
| | | | | |
Expenses: | |
Management fees | | | 2,374,984 | |
Transfer agent and administrative fees | | | 791,661 | |
Distribution and service fees: | | | | |
A-Class | | | 19,501 | |
C-Class | | | 16,611 | |
H-Class | | | 768,007 | |
Portfolio accounting fees | | | 249,393 | |
Trustees’ fees* | | | 41,040 | |
Custodian fees | | | 37,274 | |
Line of credit fees | | | 419 | |
Miscellaneous | | | 468,894 | |
Total expenses | | | 4,767,784 | |
Net investment loss | | | (1,848,460 | ) |
| | | | | |
Net Realized and Unrealized Gain (Loss): | |
Net realized gain (loss) on: | |
Investments in unaffiliated issuers | | | 6,691,726 | |
Investments in affiliated issuers | | | 569,019 | |
Swap agreements | | | 21,428,914 | |
Futures contracts | | | 3,515,383 | |
Net realized gain | | | 32,205,042 | |
Net change in unrealized appreciation (depreciation) on: | |
Investments in unaffiliated issuers | | | (4,136,774 | ) |
Investments in affiliated issuers | | | 10,093 | |
Swap agreements | | | (3,270,327 | ) |
Futures contracts | | | (1,954,435 | ) |
Net change in unrealized appreciation (depreciation) | | | (9,351,443 | ) |
Net realized and unrealized gain | | | 22,853,599 | |
Net increase in net assets resulting from operations | | $ | 21,005,139 | |
* | Relates to Trustees not deemed “interested persons” within the meaning of Section 2(a)(19) of the 1940 Act. |
164 | THE RYDEX FUNDS SEMI-ANNUAL REPORT | SEE NOTES TO FINANCIAL STATEMENTS. |
STATEMENTS OF CHANGES IN NET ASSETS |
| | | Period Ended
September 30,
2016
(Unaudited) | | | Year Ended
March 31,
2016 | |
Increase (Decrease) in Net Assets from Operations: | | | | | | |
Net investment loss | | $ | (1,848,460 | ) | | $ | (1,703,514 | ) |
Net realized gain on investments | | | 32,205,042 | | | | 6,489,628 | |
Net change in unrealized appreciation (depreciation) on investments | | | (9,351,443 | ) | | | 10,455,204 | |
Net increase in net assets resulting from operations | | | 21,005,139 | | | | 15,241,318 | |
| | | | | | | | | |
Distributions to shareholders from: | | | | | | | | |
Net investment income | | | | | | | | |
A-Class | | | (105,676 | ) | | | (371,618 | ) |
C-Class | | | (27,189 | ) | | | (81,569 | ) |
H-Class | | | (5,223,520 | ) | | | (7,985,052 | ) |
Total distributions to shareholders | | | (5,356,385 | ) | | | (8,438,239 | ) |
| | | | | | | | | |
Capital share transactions: | | | | | | | | |
Proceeds from sale of shares | | | | | | | | |
A-Class | | | 27,016,333 | | | | 146,402,399 | |
C-Class | | | 4,531,301 | | | | 6,136,367 | |
H-Class | | | 1,395,562,354 | | | | 2,450,058,825 | |
Distributions reinvested | | | | | | | | |
A-Class | | | 88,026 | | | | 324,878 | |
C-Class | | | 25,492 | | | | 77,774 | |
H-Class | | | 5,178,647 | | | | 7,939,241 | |
Cost of shares redeemed | | | | | | | | |
A-Class | | | (22,530,532 | ) | | | (143,631,198 | ) |
C-Class | | | (1,772,328 | ) | | | (7,731,465 | ) |
H-Class | | | (1,636,735,997 | ) | | | (2,304,764,599 | ) |
Net increase (decrease) from capital share transactions | | | (228,636,704 | ) | | | 154,812,222 | |
Net increase (decrease) in net assets | | | (212,987,951 | ) | | | 161,615,301 | |
| | | | | | | | | |
Net assets: | | | | | | | | |
Beginning of period | | | 796,825,120 | | | | 635,209,819 | |
End of period | | $ | 583,837,170 | | | $ | 796,825,120 | |
Accumulated net investment loss at end of period | | $ | (1,848,460 | ) | | $ | (5,356,385 | ) |
| | | | | | | | | |
Capital share activity: | | | | | | | | |
Shares sold | | | | | | | | |
A-Class | | | 1,139,912 | | | | 6,185,339 | |
C-Class | | | 209,027 | | | | 292,032 | |
H-Class | | | 58,412,139 | | | | 106,740,553 | |
Shares issued from reinvestment of distributions | | | | | | | | |
A-Class | | | 3,732 | | | | 14,262 | |
C-Class | | | 1,188 | | | | 3,739 | |
H-Class | | | 219,620 | | | | 348,212 | |
Shares redeemed | | | | | | | | |
A-Class | | | (952,175 | ) | | | (6,118,943 | ) |
C-Class | | | (81,713 | ) | | | (365,790 | ) |
H-Class | | | (69,249,581 | ) | | | (99,505,770 | ) |
Net increase (decrease) in shares | | | (10,297,851 | ) | | | 7,593,634 | |
SEE NOTES TO FINANCIAL STATEMENTS. | THE RYDEX FUNDS SEMI-ANNUAL REPORT | 165 |
This table is presented to show selected data for a share outstanding throughout each period and to assist shareholders in evaluating a Fund’s performance for the periods presented.
A-Class | | Period Ended
September 30,
2016a | | | Year Ended
March 31,
2016 | | | Year Ended
March 31,
2015 | | | Year Ended
March 31,
2014 | | | Year Ended
March 31,
2013 | | | Year Ended
March 31,
2012 | |
Per Share Data | | | | | | | | | | | | | | | | | | |
Net asset value, beginning of period | | $ | 23.32 | | | $ | 23.84 | | | $ | 22.89 | | | $ | 25.16 | | | $ | 22.93 | | | $ | 21.98 | |
Income (loss) from investment operations: | |
Net investment income (loss)b | | | (.09 | ) | | | (.09 | ) | | | (.15 | ) | | | (.30 | ) | | | (.22 | ) | | | (.27 | ) |
Net gain (loss) on investments (realized and unrealized) | | | 1.44 | | | | .46 | | | | 1.10 | | | | 2.13 | | | | 3.13 | | | | 1.77 | |
Total from investment operations | | | 1.35 | | | | .37 | | | | .95 | | | | 1.83 | | | | 2.91 | | | | 1.50 | |
Less distributions from: | |
Net investment income | | | (.19 | ) | | | (.89 | ) | | | — | | | | (1.14 | ) | | | (.43 | ) | | | (.55 | ) |
Net realized gains | | | — | | | | — | | | | — | | | | (2.96 | ) | | | (.25 | ) | | | — | |
Total distributions | | | (.19 | ) | | | (.89 | ) | | | — | | | | (4.10 | ) | | | (.68 | ) | | | (.55 | ) |
Net asset value, end of period | | $ | 24.48 | | | $ | 23.32 | | | $ | 23.84 | | | $ | 22.89 | | | $ | 25.16 | | | $ | 22.93 | |
| | |
Total Returnc | | | 5.81 | % | | | 1.66 | % | | | 4.06 | % | | | 7.53 | % | | | 12.86 | % | | | 6.94 | % |
Ratios/Supplemental Data | |
Net assets, end of period (in thousands) | | $ | 17,057 | | | $ | 11,787 | | | $ | 10,123 | | | $ | 12,499 | | | $ | 10,777 | | | $ | 11,890 | |
Ratios to average net assets: | |
Net investment income (loss) | | | (0.71 | %) | | | (0.38 | %) | | | (0.63 | %) | | | (1.21 | %) | | | (0.92 | %) | | | (1.21 | %) |
Total expensesd | | | 1.50 | % | | | 1.49 | % | | | 1.50 | % | | | 1.53 | % | | | 1.50 | % | | | 1.49 | % |
Portfolio turnover rate | | | 45 | % | | | 521 | % | | | 393 | % | | | 205 | % | | | 95 | % | | | 583 | % |
C-Class | | Period Ended
September 30,
2016a | | | Year Ended
March 31,
2016 | | | Year Ended
March 31,
2015 | | | Year Ended
March 31,
2014 | | | Year Ended
March 31,
2013 | | | Year Ended
March 31,
2012 | |
Per Share Data | | | | | | | | | | | | | | | | | | |
Net asset value, beginning of period | | $ | 21.25 | | | $ | 22.01 | | | $ | 21.29 | | | $ | 23.83 | | | $ | 21.92 | | | $ | 21.19 | |
Income (loss) from investment operations: | |
Net investment income (loss)b | | | (.17 | ) | | | (.19 | ) | | | (.27 | ) | | | (.44 | ) | | | (.37 | ) | | | (.45 | ) |
Net gain (loss) on investments (realized and unrealized) | | | 1.31 | | | | .32 | | | | .99 | | | | 2.00 | | | | 2.96 | | | | 1.73 | |
Total from investment operations | | | 1.14 | | | | .13 | | | | .72 | | | | 1.56 | | | | 2.59 | | | | 1.28 | |
Less distributions from: | |
Net investment income | | | (.19 | ) | | | (.89 | ) | | | — | | | | (1.14 | ) | | | (.43 | ) | | | (.55 | ) |
Net realized gains | | | — | | | | — | | | | — | | | | (2.96 | ) | | | (.25 | ) | | | — | |
Total distributions | | | (.19 | ) | | | (.89 | ) | | | — | | | | (4.10 | ) | | | (.68 | ) | | | (.55 | ) |
Net asset value, end of period | | $ | 22.20 | | | $ | 21.25 | | | $ | 22.01 | | | $ | 21.29 | | | $ | 23.83 | | | $ | 21.92 | |
| | |
Total Returnc | | | 5.38 | % | | | 0.70 | % | | | 3.33 | % | | | 6.74 | % | | | 11.98 | % | | | 6.16 | % |
Ratios/Supplemental Data | |
Net assets, end of period (in thousands) | | $ | 4,963 | | | $ | 2,020 | | | $ | 3,632 | | | $ | 5,100 | | | $ | 6,958 | | | $ | 7,343 | |
Ratios to average net assets: | |
Net investment income (loss) | | | (1.55 | %) | | | (0.87 | %) | | | (1.25 | %) | | | (1.89 | %) | | | (1.62 | %) | | | (2.10 | %) |
Total expensesd | | | 2.25 | % | | | 2.24 | % | | | 2.25 | % | | | 2.28 | % | | | 2.27 | % | | | 2.25 | % |
Portfolio turnover rate | | | 45 | % | | | 521 | % | | | 393 | % | | | 205 | % | | | 95 | % | | | 583 | % |
166 | THE RYDEX FUNDS SEMI-ANNUAL REPORT | SEE NOTES TO FINANCIAL STATEMENTS. |
FINANCIAL HIGHLIGHTS (concluded) |
This table is presented to show selected data for a share outstanding throughout each period and to assist shareholders in evaluating a Fund’s performance for the periods presented.
H-Class | | Period Ended
September 30,
2016a | | | Year Ended
March 31,
2016 | | | Year Ended
March 31,
2015 | | | Year Ended
March 31,
2014 | | | Year Ended
March 31,
2013 | | | Year Ended
March 31,
2012 | |
Per Share Data | | | | | | | | | | | | | | | | | | |
Net asset value, beginning of period | | $ | 23.31 | | | $ | 23.90 | | | $ | 22.94 | | | $ | 25.12 | | | $ | 22.90 | | | $ | 21.95 | |
Income (loss) from investment operations: | |
Net investment income (loss)b | | | (.07 | ) | | | (.15 | ) | | | (.19 | ) | | | (.24 | ) | | | (.24 | ) | | | (.28 | ) |
Net gain (loss) on investments (realized and unrealized) | | | 1.41 | | | | .45 | | | | 1.15 | | | | 2.16 | | | | 3.14 | | | | 1.78 | |
Total from investment operations | | | 1.34 | | | | .30 | | | | .96 | | | | 1.92 | | | | 2.90 | | | | 1.50 | |
Less distributions from: | |
Net investment income | | | (.19 | ) | | | (.89 | ) | | | — | | | | (1.14 | ) | | | (.43 | ) | | | (.55 | ) |
Net realized gains | | | — | | | | — | | | | — | | | | (2.96 | ) | | | (.25 | ) | | | — | |
Total distributions | | | (.19 | ) | | | (.89 | ) | | | — | | | | (4.10 | ) | | | (.68 | ) | | | (.55 | ) |
Net asset value, end of period | | $ | 24.46 | | | $ | 23.31 | | | $ | 23.90 | | | $ | 22.94 | | | $ | 25.12 | | | $ | 22.90 | |
| | |
Total Returnc | | | 5.77 | % | | | 1.36 | % | | | 4.14 | % | | | 7.86 | % | | | 12.83 | % | | | 6.95 | % |
Ratios/Supplemental Data | |
Net assets, end of period (in thousands) | | $ | 561,817 | | | $ | 783,018 | | | $ | 621,455 | | | $ | 87,315 | | | $ | 434,113 | | | $ | 266,950 | |
Ratios to average net assets: | |
Net investment income (loss) | | | (0.58 | %) | | | (0.64 | %) | | | (0.81 | %) | | | (0.97 | %) | | | (0.99 | %) | | | (1.26 | %) |
Total expensesd | | | 1.50 | % | | | 1.49 | % | | | 1.46 | % | | | 1.53 | % | | | 1.51 | % | | | 1.49 | % |
Portfolio turnover rate | | | 45 | % | | | 521 | % | | | 393 | % | | | 205 | % | | | 95 | % | | | 583 | % |
a | Unaudited figures for the period ended September 30, 2016. Percentage amounts for the period, except total return and portfolio turnover rate, have been annualized. |
b | Net investment income (loss) per share was computed using average shares outstanding throughout the period. |
c | Total return does not reflect the impact of any applicable sales charges. |
d | Does not include expenses of the underlying funds in which the Fund invests. |
SEE NOTES TO FINANCIAL STATEMENTS. | THE RYDEX FUNDS SEMI-ANNUAL REPORT | 167 |
FUND PROFILE (Unaudited) | September 30, 2016 |
INVERSE HIGH YIELD STRATEGY FUND
OBJECTIVE: Seeks to provide investment results that inversely correlate, before fees and expenses, to the performance of the high yield bond market.
Holdings Diversification (Market Exposure as % of Net Assets)
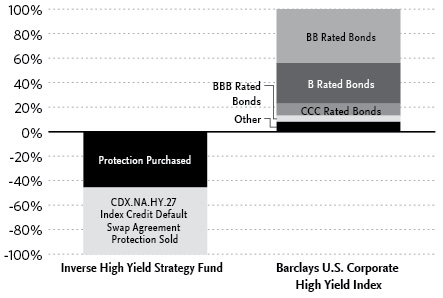
“Holdings Diversification (Market Exposure as % of Net Assets)” excludes any temporary cash investments or investments in Guggenheim Strategy Funds Trust mutual funds. Investments in those Funds do not provide “market exposure” to meet the Fund’s investment objective, but will significantly increase the portfolio’s exposure to certain other asset categories (and their associated risks), which may cause the Fund to deviate from its principal investment strategy, including: (i) high yield, high risk debt securities rated below the top four long-term rating categories by a nationally recognized statistical rating organization (also known as “junk bonds”); (ii) securities issued by the U.S. government or its agencies and instrumentalities; (iii) CLOs and similar investments; and (iv) other short-term fixed income securities.
Inception Dates: |
A-Class | April 16, 2007 |
C-Class | April 16, 2007 |
H-Class | April 16, 2007 |
The Fund invests principally in derivative investments such as high yield credit default swap agreements and futures contracts.
Largest Holdings (% of Total Net Assets) |
Guggenheim Strategy Fund II | 4.9% |
Guggenheim Strategy Fund I | 4.9% |
Total | 9.8% |
| | |
“Largest Holdings” excludes any temporary cash or derivative investments. |
168 | THE RYDEX FUNDS SEMI-ANNUAL REPORT | |
SCHEDULE OF INVESTMENTS (Unaudited) | September 30, 2016 |
INVERSE HIGH YIELD STRATEGY FUND | |
| | | Shares | | | Value | |
| | | | | | | |
MUTUAL FUNDS† - 9.8% | |
Guggenheim Strategy Fund II1 | | | 49,983 | | | $ | 1,246,572 | |
Guggenheim Strategy Fund I1 | | | 48,999 | | | | 1,224,497 | |
Total Mutual Funds | | | | | | | | |
(Cost $2,455,598) | | | | | | | 2,471,069 | |
| | | | | | | | | |
| | | Face
Amount | | | | | |
| | | | | | | | | |
REPURCHASE AGREEMENTS††,2 - 88.4% | |
HSBC Securities, Inc.
issued 09/30/16 at 0.38%
due 10/03/16 | | $ | 12,508,731 | | | | 12,508,731 | |
Royal Bank of Canada
issued 09/30/16 at 0.36%
due 10/03/16 | | | 9,931,995 | | | | 9,931,995 | |
Total Repurchase Agreements | | | | | | | | |
(Cost $22,440,726) | | | | | | | 22,440,726 | |
| | | | | | | | | |
Total Investments - 98.2% | | | | | | | | |
(Cost $24,896,324) | | | | | | $ | 24,911,795 | |
Other Assets & Liabilities, net - 1.8% | | | | | | | 463,433 | |
Total Net Assets - 100.0% | | | | | | $ | 25,375,228 | |
| | | Contracts | | | Unrealized
Loss | |
| | | | | | | |
INTEREST RATE FUTURES CONTRACTS SOLD SHORT† | |
December 2016 U.S. Treasury 5 Year Note
Futures Contracts
(Aggregate Value of
Contracts $22,363,188) | | | 184 | | | $ | (66,569 | ) |
CENTRALLY CLEARED CREDIT DEFAULT SWAPS PROTECTION PURCHASED†† | |
Index | Counterparty | Exchange | Protection Premium
Rate | | Maturity
Date | | Notional
Principal | | | Notional
Value | | | Upfront
Premiums
Received | | | Unrealized
Depreciation | |
CDX.NA.HY.27 Index | Barclays Bank plc | ICE | 5.00% | | 12/20/21 | | $ | 13,400,000 | | | $ | 13,994,290 | | | $ | (472,542 | ) | | $ | (121,748 | ) |
CDX.NA.HY.27 Index | Goldman Sachs International | ICE | 5.00% | | 12/20/21 | | | 11,000,000 | | | | 11,487,850 | | | | (377,575 | | | | (110,275 | ) |
| | | | | | | | | | | | | | | | $ | (850,117 | ) | | $ | (232,023 | ) |
† | Value determined based on Level 1 inputs — See Note 4. |
†† | Value determined based on Level 2 inputs — See Note 4. |
1 | Affiliated issuer — See Note 9. |
2 | Repurchase Agreements — See Note 5. |
| | plc — Public Limited Company |
| | CDX.NA.HY.26 Index — Credit Default Swap North America High Yield Series 26 Index |
| | ICE — Intercontinental Exchange |
| | |
| | See Sector Classification in Other Information section. |
SEE NOTES TO FINANCIAL STATEMENTS. | THE RYDEX FUNDS SEMI-ANNUAL REPORT | 169 |
SCHEDULE OF INVESTMENTS (Unaudited)(concluded) | September 30, 2016 |
INVERSE HIGH YIELD STRATEGY FUND | |
The following table summarizes the inputs used to value the Fund’s investments at September 30, 2016 (See Note 4 in the Notes to Financial Statements):
Investments in Securities (Assets) | | Level 1 | | | Level 1 -
Other* | | | Level 2 | | | Level 2 -
Other* | | | Level 3 | | | Total | |
Mutual Funds | | $ | 2,471,069 | | | $ | — | | | $ | — | | | $ | — | | | $ | — | | | $ | 2,471,069 | |
Repurchase Agreements | | | — | | | | — | | | | 22,440,726 | | | | — | | | | — | | | | 22,440,726 | |
Total | | $ | 2,471,069 | | | $ | — | | | $ | 22,440,726 | | | $ | — | | | $ | — | | | $ | 24,911,795 | |
| | | | | | | | | | | | | | | | | | | | | | | | | |
Investments in Securities (Liabilities) | | Level 1 | | | Level 1 -
Other* | | | Level 2 | | | Level 2 -
Other* | | | Level 3 | | | Total | |
Credit Default Swaps | | $ | — | | | $ | — | | | $ | — | | | $ | 232,023 | | | $ | — | | | $ | 232,023 | |
Interest Rate Futures Contracts | | | — | | | | 66,569 | | | | — | | | | — | | | | — | | | | 66,569 | |
Total | | $ | — | | | $ | 66,569 | | | $ | — | | | $ | 232,023 | | | $ | — | | | $ | 298,592 | |
* | Other financial instruments include futures contracts and/or swaps, which are reported as unrealized gain/loss at period end. |
Transfers between investment levels may occur as the markets fluctuate and/or the availability of data used in an investment’s valuation changes. Transfers between valuation levels, if any, are in comparison to the valuation levels at the end of the previous fiscal year, and are effective using the fair value as of the end of the previous fiscal period.
For the period ended September 30, 2016, there were no transfers between levels.
170 | THE RYDEX FUNDS SEMI-ANNUAL REPORT | SEE NOTES TO FINANCIAL STATEMENTS. |
INVERSE HIGH YIELD STRATEGY FUND | |
STATEMENT OF ASSETS AND LIABILITIES (Unaudited) | |
September 30, 2016 | |
Assets: | |
Investments in affiliated issuers, at value (cost $2,455,598) | | $ | 2,471,069 | |
Repurchase agreements, at value (cost $22,440,726) | | | 22,440,726 | |
Total investments (cost $24,896,324) | | | 24,911,795 | |
Segregated cash with broker | | | 2,000,396 | |
Receivables: | |
Variation margin | | | 34,499 | |
Fund shares sold | | | 18,234 | |
Dividends | | | 3,822 | |
Interest | | | 820 | |
Total assets | | | 26,969,566 | |
| | | | | |
Liabilities: | |
Unrealized depreciation on swap agreements | | | 232,023 | |
Unamortized upfront premiums received on credit default swaps | | | 850,117 | |
Payable for: | |
Fund shares redeemed | | | 421,099 | |
Interest | | | 38,478 | |
Securities purchased | | | 17,858 | |
Management fees | | | 16,385 | |
Distribution and service fees | | | 6,076 | |
Transfer agent and administrative fees | | | 5,462 | |
Portfolio accounting fees | | | 2,185 | |
Miscellaneous | | | 4,655 | |
Total liabilities | | | 1,594,338 | |
Commitments and contingent liabilities (Note 13) | | | — | |
Net assets | | $ | 25,375,228 | |
| | | | | |
Net assets consist of: | |
Paid in capital | | $ | 44,594,107 | |
Accumulated net investment loss | | | (634,302 | ) |
Accumulated net realized loss on investments | | | (18,301,456 | ) |
Net unrealized depreciation on investments | | | (283,121 | ) |
Net assets | | $ | 25,375,228 | |
| | | | | |
A-Class: | |
Net assets | | $ | 1,202,251 | |
Capital shares outstanding* | | | 17,731 | |
Net asset value per share* | | $ | 67.80 | |
Maximum offering price per share (Net asset value divided by 95.25%)* | | $ | 71.18 | |
| | | | | |
C-Class: | |
Net assets | | $ | 981,264 | |
Capital shares outstanding* | | | 15,392 | |
Net asset value per share* | | $ | 63.75 | |
| | | | | |
H-Class: | |
Net assets | | $ | 23,191,713 | |
Capital shares outstanding* | | | 334,748 | |
Net asset value per share* | | $ | 69.28 | |
STATEMENT OF OPERATIONS (Unaudited) | |
Period Ended September 30, 2016 | |
Investment Income: | |
Dividends from securities of affiliated issuers | | $ | 30,063 | |
Interest | | | 23,247 | |
Total investment income | | | 53,310 | |
| | | | | |
Expenses: | |
Management fees | | | 78,550 | |
Transfer agent and administrative fees | | | 26,184 | |
Distribution and service fees: | |
A-Class | | | 3,731 | |
C-Class | | | 6,768 | |
H-Class | | | 20,760 | |
Portfolio accounting fees | | | 10,473 | |
Custodian fees | | | 1,240 | |
Trustees’ fees** | | | 529 | |
Miscellaneous | | | 15,357 | |
Total expenses | | | 163,592 | |
Net investment loss | | | (110,282 | ) |
| | | | | |
Net Realized and Unrealized Gain (Loss): | |
Net realized gain (loss) on: | |
Investments in affiliated issuers | | | 14,170 | |
Swap agreements | | | (2,650,018 | ) |
Futures contracts | | | (571,622 | ) |
Net realized loss | | | (3,207,470 | ) |
Net change in unrealized appreciation (depreciation) on: | |
Investments in affiliated issuers | | | 15,859 | |
Swap agreements | | | (142,177 | ) |
Futures contracts | | | (60,869 | ) |
Net change in unrealized appreciation (depreciation) | | | (187,187 | ) |
Net realized and unrealized loss | | | (3,394,657 | ) |
Net decrease in net assets resulting from operations | | $ | (3,504,939 | ) |
* | The shares outstanding, net asset value per share and the maximum offering price per share have been restated to reflect a 1:4 reverse share split, effective November 4, 2016 — See Note 12. |
** | Relates to Trustees not deemed “interested persons” within the meaning of Section 2(a)(19) of the 1940 Act. |
SEE NOTES TO FINANCIAL STATEMENTS. | THE RYDEX FUNDS SEMI-ANNUAL REPORT | 171 |
INVERSE HIGH YIELD STRATEGY FUND | |
STATEMENTS OF CHANGES IN NET ASSETS |
| | | Period Ended
September 30,
2016
(Unaudited) | | | Year Ended
March 31,
2016 | |
Increase (Decrease) in Net Assets from Operations: | | | | | | |
Net investment loss | | $ | (110,282 | ) | | $ | (391,713 | ) |
Net realized loss on investments | | | (3,207,470 | ) | | | (137,828 | ) |
Net change in unrealized appreciation (depreciation) on investments | | | (187,187 | ) | | | (70,380 | ) |
Net decrease in net assets resulting from operations | | | (3,504,939 | ) | | | (599,921 | ) |
| | | | | | | | | |
Capital share transactions: | | | | | | | | |
Proceeds from sale of shares | | | | | | | | |
A-Class | | | 28,863,809 | | | | 259,628,046 | |
C-Class | | | 685,536 | | | | 6,506,143 | |
H-Class | | | 805,512,111 | | | | 1,025,905,429 | |
Cost of shares redeemed | | | | | | | | |
A-Class | | | (30,035,301 | ) | | | (256,881,526 | ) |
C-Class | | | (1,279,433 | ) | | | (5,476,553 | ) |
H-Class | | | (781,673,740 | ) | | | (1,025,503,843 | ) |
Net increase from capital share transactions | | | 22,072,982 | | | | 4,177,696 | |
Net increase in net assets | | | 18,568,043 | | | | 3,577,775 | |
| | | | | | | | | |
Net assets: | | | | | | | | |
Beginning of period | | | 6,807,185 | | | | 3,229,410 | |
End of period | | $ | 25,375,228 | | | $ | 6,807,185 | |
Accumulated net investment loss at end of period | | $ | (634,302 | ) | | $ | (524,020 | ) |
| | | | | | | | | |
Capital share activity:* | | | | | | | | |
Shares sold | | | | | | | | |
A-Class | | | 407,418 | | | | 3,394,379 | |
C-Class | | | 10,440 | | | | 90,940 | |
H-Class | | | 11,301,366 | | | | 13,339,921 | |
Shares redeemed | | | | | | | | |
A-Class | | | (426,535 | ) | | | (3,362,360 | ) |
C-Class | | | (19,473 | ) | | | (76,538 | ) |
H-Class | | | (11,001,180 | ) | | | (13,332,620 | ) |
Net increase in shares | | | 272,036 | | | | 53,722 | |
* | Capital share activity for the periods presented through September 30, 2016 has been restated to reflect a 1:4 reverse share split effective November 4, 2016 — See Note 12. |
172 | THE RYDEX FUNDS SEMI-ANNUAL REPORT | SEE NOTES TO FINANCIAL STATEMENTS. |
INVERSE HIGH YIELD STRATEGY FUND | |
This table is presented to show selected data for a share outstanding throughout each period and to assist shareholders in evaluating a Fund’s performance for the periods presented.
A-Class | | Period Ended
September 30,
2016a,e | | | Year Ended
March 31,
2016e | | | Year Ended
March 31,
2015e | | | Year Ended
March 31,
2014e | | | Year Ended
March 31,
2013e | | | Year Ended
March 31,
2012e | |
Per Share Data | | | | | | | | | | | | | | | | | | |
Net asset value, beginning of period | | $ | 71.69 | | | $ | 76.94 | | | $ | 85.28 | | | $ | 95.91 | | | $ | 112.61 | | | $ | 127.96 | |
Income (loss) from investment operations: | |
Net investment income (loss)b | | | (.28 | ) | | | (.80 | ) | | | (.84 | ) | | | (1.40 | ) | | | (1.48 | ) | | | (1.72 | ) |
Net gain (loss) on investments (realized and unrealized) | | | (3.61 | ) | | | (4.45 | ) | | | (7.50 | ) | | | (9.23 | ) | | | (15.22 | ) | | | (13.63 | ) |
Total from investment operations | | | (3.89 | ) | | | (5.25 | ) | | | (8.34 | ) | | | (10.63 | ) | | | (16.70 | ) | | | (15.35 | ) |
Net asset value, end of period | | $ | 67.80 | | | $ | 71.69 | | | $ | 76.94 | | | $ | 85.28 | | | $ | 95.91 | | | $ | 112.61 | |
| | |
Total Returnc | | | (5.41 | %) | | | (6.81 | %) | | | (9.59 | %) | | | (11.30 | %) | | | (14.81 | %) | | | (11.98 | %) |
Ratios/Supplemental Data | |
Net assets, end of period (in thousands) | | $ | 1,202 | | | $ | 2,642 | | | $ | 372 | | | $ | 5,155 | | | $ | 157 | | | $ | 556 | |
Ratios to average net assets: | |
Net investment income (loss) | | | (0.80 | %) | | | (1.07 | %) | | | (1.02 | %) | | | (1.52 | %) | | | (1.38 | %) | | | (1.39 | %) |
Total expensesd | | | 1.51 | % | | | 1.50 | % | | | 1.52 | % | | | 1.54 | % | | | 1.49 | % | | | 1.51 | % |
Portfolio turnover rate | | | 408 | % | | | 1,722 | % | | | 784 | % | | | — | | | | — | | | | — | |
C-Class | | Period Ended
September 30,
2016a,e | | | Year Ended
March 31,
2016e | | | Year Ended
March 31,
2015e | | | Year Ended
March 31,
2014e | | | Year Ended
March 31,
2013e | | | Year Ended
March 31,
2012e | |
Per Share Data | | | | | | | | | | | | | | | | | | |
Net asset value, beginning of period | | $ | 67.67 | | | $ | 73.24 | | | $ | 81.11 | | | $ | 91.93 | | | $ | 108.83 | | | $ | 124.49 | |
Income (loss) from investment operations: | |
Net investment income (loss)b | | | (.48 | ) | | | (1.16 | ) | | | (1.20 | ) | | | (2.00 | ) | | | (2.12 | ) | | | (2.20 | ) |
Net gain (loss) on investments (realized and unrealized) | | | (3.44 | ) | | | (4.41 | ) | | | (6.67 | ) | | | (8.82 | ) | | | (14.78 | ) | | | (13.46 | ) |
Total from investment operations | | | (51.73 | ) | | | (5.57 | ) | | | (7.87 | ) | | | (10.82 | ) | | | (16.90 | ) | | | (15.66 | ) |
Net asset value, end of period | | $ | 63.75 | | | $ | 67.67 | | | $ | 73.24 | | | $ | 81.11 | | | $ | 91.93 | | | $ | 108.83 | |
| | |
Total Returnc | | | (5.85 | %) | | | (7.59 | %) | | | (9.49 | %) | | | (11.97 | %) | | | (15.51 | %) | | | (12.60 | %) |
Ratios/Supplemental Data | |
Net assets, end of period (in thousands) | | $ | 981 | | | $ | 1,653 | | | $ | 734 | | | $ | 1,561 | | | $ | 2,037 | | | $ | 693 | |
Ratios to average net assets: | |
Net investment income (loss) | | | (1.44 | %) | | | (1.60 | %) | | | (1.53 | %) | | | (2.28 | %) | | | (2.13 | %) | | | (1.87 | %) |
Total expensesd | | | 2.27 | % | | | 2.25 | % | | | 2.25 | % | | | 2.30 | % | | | 2.25 | % | | | 2.26 | % |
Portfolio turnover rate | | | 408 | % | | | 1,722 | % | | | 784 | % | | | — | | | | — | | | | — | |
SEE NOTES TO FINANCIAL STATEMENTS. | THE RYDEX FUNDS SEMI-ANNUAL REPORT | 173 |
INVERSE HIGH YIELD STRATEGY FUND | |
FINANCIAL HIGHLIGHTS (concluded) |
This table is presented to show selected data for a share outstanding throughout each period and to assist shareholders in evaluating a Fund’s performance for the periods presented.
H-Class | | Period Ended
September 30,
2016a,e | | | Year Ended
March 31,
2016e | | | Year Ended
March 31,
2015e | | | Year Ended
March 31,
2014e | | | Year Ended
March 31,
2013e | | | Year Ended
March 31,
2012e | |
Per Share Data | | | | | | | | | | | | | | | | | | |
Net asset value, beginning of period | | $ | 72.70 | | | $ | 77.91 | | | $ | 85.66 | | | $ | 96.16 | | | $ | 112.88 | | | $ | 128.15 | |
Income (loss) from investment operations: | |
Net investment income (loss)b | | | (.36 | ) | | | (.64 | ) | | | (.76 | ) | | | (1.40 | ) | | | (1.44 | ) | | | (1.88 | ) |
Net gain (loss) on investments (realized and unrealized) | | | (3.06 | ) | | | (4.57 | ) | | | (6.99 | ) | | | (9.10 | ) | | | (15.28 | ) | | | (13.39 | ) |
Total from investment operations | | | (3.42 | ) | | | (5.21 | ) | | | (7.75 | ) | | | (10.50 | ) | | | (16.72 | ) | | | (15.27 | ) |
Net asset value, end of period | | $ | 69.28 | | | $ | 72.70 | | | $ | 77.91 | | | $ | 85.66 | | | $ | 96.16 | | | $ | 112.88 | |
| | |
Total Returnc | | | (4.79 | %) | | | (6.67 | %) | | | (8.84 | %) | | | (11.11 | %) | | | (14.81 | %) | | | (11.92 | %) |
Ratios/Supplemental Data | |
Net assets, end of period (in thousands) | | $ | 23,192 | | | $ | 2,513 | | | $ | 2,124 | | | $ | 2,453 | | | $ | 9,208 | | | $ | 13,357 | |
Ratios to average net assets: | |
Net investment income (loss) | | | (1.07 | %) | | | (0.84 | %) | | | (0.93 | %) | | | (1.50 | %) | | | (1.38 | %) | | | (1.51 | %) |
Total expensesd | | | 1.51 | % | | | 1.50 | % | | | 1.51 | % | | | 1.52 | % | | | 1.50 | % | | | 1.51 | % |
Portfolio turnover rate | | | 408 | % | | | 1,722 | % | | | 784 | % | | | — | | | | — | | | | — | |
a | Unaudited figures for the period ended September 30, 2016. Percentage amounts for the period, except total return and portfolio turnover rate, have been annualized. |
b | Net investment income (loss) per share was computed using average shares outstanding throughout the period. |
c | Total return does not reflect the impact of any applicable sales charges. |
d | Does not include expenses of the underlying funds in which the Fund invests. |
e | Reverse share split — Per share amounts for the periods presented through September 30, 2016 have been restated to reflect a 1:4 reverse share split effective November 4, 2016 — See Note 12. |
174 | THE RYDEX FUNDS SEMI-ANNUAL REPORT | SEE NOTES TO FINANCIAL STATEMENTS. |
FUND PROFILE (Unaudited) | September 30, 2016 |
U.S. GOVERNMENT MONEY MARKET FUND
OBJECTIVE: Seeks to provide security of principal, high current income, and liquidity.
Holdings Diversification (Market Exposure as % of Net Assets)
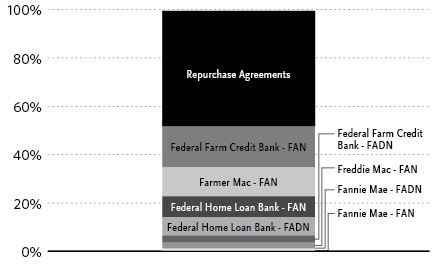
FAND – Federal Agency Discount Note
FAN – Federal Agency Note
Inception Date: June 18, 2012 |
The Fund invests principally in money market instruments issued or guaranteed as to principal and interest by the U.S. Government, its agencies or instrumentalities and enters into repurchase agreements fully collateralized by U.S. government securities.
| | THE RYDEX FUNDS SEMI-ANNUAL REPORT | 175 |
SCHEDULE OF INVESTMENTS (Unaudited) | September 30, 2016 |
U.S. GOVERNMENT MONEY MARKET FUND | |
| | | Face
Amount | | | Value | |
| | | | | | | |
FEDERAL AGENCY NOTES†† - 40.2% | |
Federal Farm Credit Bank1 | | | | | | |
0.59% due 08/21/172 | | $ | 60,000,000 | | | $ | 60,016,164 | |
0.65% due 05/30/172 | | | 10,860,000 | | | | 10,868,032 | |
0.60% due 05/23/172 | | | 10,000,000 | | | | 10,003,926 | |
0.50% due 04/10/172 | | | 5,000,000 | | | | 4,999,999 | |
Total Federal Farm Credit Bank | | | | | | | 85,888,121 | |
Farmer Mac1 | | | | | | | | |
0.64% due 03/21/172 | | | 50,000,000 | | | | 50,034,294 | |
0.70% due 05/11/172 | | | 12,000,000 | | | | 12,012,436 | |
Total Farmer Mac | | | | | | | 62,046,730 | |
Federal Home Loan Bank1 | | | | | | | | |
1.63% due 12/09/16 | | | 12,960,000 | | | | 12,988,472 | |
1.00% due 06/09/17 | | | 12,690,000 | | | | 12,724,317 | |
0.61% due 02/24/172 | | | 10,000,000 | | | | 10,008,338 | |
1.00% due 06/21/17 | | | 5,970,000 | | | | 5,986,921 | |
0.63% due 03/20/17 | | | 2,300,000 | | | | 2,300,442 | |
Total Federal Home Loan Bank | | | | | | | 44,008,490 | |
Freddie Mac3 | | | | | | | | |
1.00% due 06/29/17 | | | 10,000,000 | | | | 10,028,465 | |
0.75% due 05/26/17 | | | 2,500,000 | | | | 2,502,363 | |
Total Freddie Mac | | | | | | | 12,530,828 | |
Fannie Mae3 | | | | | | | | |
5.38% due 06/12/17 | | | 1,050,000 | | | | 1,084,789 | |
Total Federal Agency Notes | | | | | | | | |
(Cost $205,558,958) | | | | | | | 205,558,958 | |
| | | | | | | | | |
FEDERAL AGENCY DISCOUNT NOTES†† - 11.5% | |
Federal Home Loan Bank1 | | | | | | | | |
0.53% due 03/10/17 | | | 29,000,000 | | | | 28,931,947 | |
0.50% due 12/14/16 | | | 6,000,000 | | | | 5,993,833 | |
0.53% due 11/18/16 | | | 4,060,000 | | | | 4,057,131 | |
Total Federal Home Loan Bank | | | | | | | 38,982,911 | |
Federal Farm Credit Bank1 | | | | | | | | |
0.61% due 07/03/17 | | | 15,000,000 | | | | 14,930,104 | |
Fannie Mae3 | | | | | | | | |
0.60% due 06/01/17 | | | 4,750,000 | | | | 4,730,824 | |
Total Federal Agency Discount Notes | | | | | | | | |
(Cost $58,643,839) | | | | | | | 58,643,839 | |
| | | | | | | | | |
REPURCHASE AGREEMENTS††,4 - 47.7% | |
Individual Repurchase Agreements | | | | | | | | |
HSBC Securities, Inc.
issued 09/30/16 at 0.38%
due 10/01/16 (secured by U.S. Treasury Bond at a rate of 0.00% and maturing 11/15/2039 as collateral with a value of $160,709,808) to be repurchased at $157,558,695 | | | 157,558,695 | | | | 157,558,695 | |
UMB Financial Corporation
issued 09/30/16 at 0.38%
due 10/31/16 (secured by Federal Home Loan Mortgage Corp. Agency Notes, 0.75%-1.30% 10/11/2010-1/12/2018 with a value of $47,489,586, Federal Home Loan Bank Agency Notes, 0.63-0.88% 12/28/2016-5/24/2017 with the value of $25,027,667, Federal Farm Credit Bank Agency Notes, 0.60-1.00% 3/11/2017-5/17-2017 with a value of 38,075,497) to be repurchased at $85,852,740 | | | 85,852,740 | | | | 85,852,740 | |
Total Repurchase Agreements | | | | | | | | |
(Cost $243,411,435) | | | | | | | 243,411,435 | |
| | | | | | | | | |
Total Investments - 99.4% | | | | | | | | |
(Cost $507,614,232) | | | | | | $ | 507,614,232 | |
Other Assets & Liabilities, net - 0.6% | | | | | | | 3,115,013 | |
Total Net Assets - 100.0% | | | | | | $ | 510,729,245 | |
†† | Value determined based on Level 2 inputs — See Note 4. |
1 | The issuer operates under a Congressional charter; its securities are neither issued nor guaranteed by the U.S. Government. |
2 | Variable rate security. Rate indicated is rate effective at September 30, 2016. |
3 | On September 7, 2008, the issuer was placed in conservatorship by the Federal Housing Finance Agency (FHFA). As conservator, the FHFA has full powers to control the assets and operations of the firm. |
4 | Repurchase Agreements — See Note 5. |
| | |
| | See Sector Classification in Other Information section. |
176 | THE RYDEX FUNDS SEMI-ANNUAL REPORT | SEE NOTES TO FINANCIAL STATEMENTS. |
SCHEDULE OF INVESTMENTS (Unaudited)(concluded) | September 30, 2016 |
U.S. GOVERNMENT MONEY MARKET FUND | |
The following table summarizes the inputs used to value the Fund’s investments at September 30, 2016 (See Note 4 in the Notes to Financial Statements):
Investments in Securities (Assets) | | Level 1 | | | Level 2 | | | Level 3 | | | Total | |
Federal Agency Discount Notes | | $ | — | | | $ | 58,643,839 | | | $ | — | | | $ | 58,643,839 | |
Federal Agency Notes | | | — | | | | 205,558,958 | | | | — | | | | 205,558,958 | |
Repurchase Agreements | | | — | | | | 243,411,435 | | | | — | | | | 243,411,435 | |
Total | | $ | — | | | $ | 507,614,232 | | | $ | — | | | $ | 507,614,232 | |
Transfers between investment levels may occur as the markets fluctuate and/or the availability of data used in an investment’s valuation changes. Transfers between valuation levels, if any, are in comparison to the valuation levels at the end of the previous fiscal year, and are effective using the fair value as of the end of the previous fiscal period.
For the period ended September 30, 2016, there were no transfers between levels.
SEE NOTES TO FINANCIAL STATEMENTS. | THE RYDEX FUNDS SEMI-ANNUAL REPORT | 177 |
U.S. GOVERNMENT MONEY MARKET FUND | |
STATEMENT OF ASSETS AND LIABILITIES (Unaudited) | |
September 30, 2016 | |
Assets: | |
Investments, at value (cost $264,202,797) | | $ | 264,202,797 | |
Repurchase agreements, at value (cost $243,411,435) | | | 243,411,435 | |
Total investments (cost $507,614,232) | | | 507,614,232 | |
Receivables: | |
Fund shares sold | | | 27,891,129 | |
Interest | | | 254,504 | |
Total assets | | | 535,759,865 | |
| | | | | |
Liabilities: | |
Overdraft due to custodian bank | | | 1,916 | |
Payable for: | |
Fund shares redeemed | | | 24,808,404 | |
Transfer agent and administrative fees | | | 53,596 | |
Portfolio accounting fees | | | 37,521 | |
Management fees | | | 6,981 | |
Miscellaneous | | | 122,202 | |
Total liabilities | | | 25,030,620 | |
Commitments and contingent liabilities (Note 13) | | | — | |
Net assets | | $ | 510,729,245 | |
| | | | | |
Net assets consist of: | |
Paid in capital | | $ | 510,096,746 | |
Accumulated net investment loss | | | (7,183 | ) |
Accumulated net realized gain on investments | | | 639,682 | |
Net assets | | $ | 510,729,245 | |
Capital shares outstanding | | | 510,674,648 | |
Net asset value per share | | $ | 1.00 | |
STATEMENT OF OPERATIONS (Unaudited) | |
Period Ended September 30, 2016 | |
Investment Income: | |
Interest | | $ | 1,270,476 | |
Total investment income | | | 1,270,476 | |
| | | | | |
Expenses: | |
Management fees | | | 1,626,858 | |
Transfer agent and administrative fees | | | 650,746 | |
Portfolio accounting fees | | | 256,069 | |
Registration fees | | | 235,044 | |
Custodian fees | | | 38,324 | |
Trustees’ fees* | | | 26,351 | |
Line of credit fees | | | 1,414 | |
Miscellaneous | | | 238,470 | |
Total expenses | | | 3,073,276 | |
Less: | | | | |
Expenses waived by service company | | | (178,180 | ) |
Expenses waived by Adviser | | | (1,617,556 | ) |
Total waived expenses | | | (1,795,736 | ) |
Net expenses | | | 1,277,540 | |
Net investment loss | | | (7,064 | ) |
| | | | | |
Net Realized and Unrealized Gain (Loss): | |
Net realized gain (loss) on: | |
Investments | | | 310,331 | |
Net realized gain | | | 310,331 | |
Net increase in net assets resulting from operations | | $ | 303,267 | |
* | Relates to Trustees not deemed “interested persons” within the meaning of Section 2(a)(19) of the 1940 Act. |
178 | THE RYDEX FUNDS SEMI-ANNUAL REPORT | SEE NOTES TO FINANCIAL STATEMENTS. |
U.S. GOVERNMENT MONEY MARKET FUND | |
STATEMENTS OF CHANGES IN NET ASSETS |
| | | Period Ended
September 30,
2016
(Unaudited) | | | Year Ended
March 31,
2016 | |
Increase (Decrease) in Net Assets from Operations: | | | | | | |
Net investment income (loss) | | $ | (7,064 | ) | | $ | 342 | |
Net realized gain on investments | | | 310,331 | | | | 347,141 | |
Net increase in net assets resulting from operations | | | 303,267 | | | | 347,483 | |
| | | | | | | | | |
Distributions to shareholders from: | | | | | | | | |
Net investment income | | | (119 | ) | | | (342 | ) |
Total distributions to shareholders | | | (119 | ) | | | (342 | ) |
| | | | | | | | | |
Capital share transactions: | | | | | | | | |
Proceeds from sale of shares | | | 5,007,181,828 | | | | 12,102,235,298 | |
Distributions reinvested | | | 123 | | | | 264 | |
Cost of shares redeemed | | | (5,140,627,904 | ) | | | (12,153,259,388 | ) |
Net decrease from capital share transactions | | | (133,445,953 | ) | | | (51,023,826 | ) |
Net decrease in net assets | | | (133,142,805 | ) | | | (50,676,685 | ) |
| | | | | | | | | |
Net assets: | | | | | | | | |
Beginning of period | | | 643,872,050 | | | | 694,548,735 | |
End of period | | $ | 510,729,245 | | | $ | 643,872,050 | |
Accumulated net investment loss at end of period | | $ | (7,183 | ) | | $ | — | |
| | | | | | | | | |
Capital share activity: | | | | | | | | |
Shares sold | | | 5,007,181,827 | | | | 12,102,235,298 | |
Shares issued from reinvestment of distributions | | | 92 | | | | 270 | |
Shares redeemed | | | (5,140,626,217 | ) | | | (12,153,259,388 | ) |
Net decrease in shares | | | (133,444,298 | ) | | | (51,023,820 | ) |
SEE NOTES TO FINANCIAL STATEMENTS. | THE RYDEX FUNDS SEMI-ANNUAL REPORT | 179 |
U.S. GOVERNMENT MONEY MARKET FUND | |
This table is presented to show selected data for a share outstanding throughout each period and to assist shareholders in evaluating a Fund’s performance for the periods presented.
Money Market Classb | | Period Ended
September 30,
2016a | | | Year Ended
March 31,
2016 | | | Year Ended
March 31,
2015 | | | Year Ended
March 31,
2014 | | | Period Ended
March 31,
2013 | |
Per Share Data | | | | | | | | | | | | | | | |
Net asset value, beginning of period | | $ | 1.00 | | | $ | 1.00 | | | $ | 1.00 | | | $ | 1.00 | | | $ | 1.00 | |
Income (loss) from investment operations: | |
Net investment income (loss)c | | | — | c | | | — | c | | | — | c | | | — | c | | | — | c |
Net gain (loss) on investments (realized and unrealized) | | | — | c | | | — | c | | | — | c | | | — | c | | | — | c |
Total from investment operations | | | — | c | | | — | c | | | — | c | | | — | c | | | — | c |
Less distributions from: | | | | | | | | | | | | | | | | | | | | |
Net investment income | | | (— | )c | | | (— | )c | | | (— | )c | | | (— | )c | | | (— | )c |
Net realized gains | | | — | | | | (— | )c | | | (— | )c | | | — | | | | (— | )c |
Total distributions | | | (— | )c | | | (— | )c | | | (— | )c | | | (— | )c | | | (— | )c |
Net asset value, end of period | | $ | 1.00 | | | $ | 1.00 | | | $ | 1.00 | | | $ | 1.00 | | | $ | 1.00 | |
| | |
Total Returng | | | 0.00 | % | | | 0.00 | % | | | 0.00 | % | | | 0.00 | % | | | 0.00 | % |
Ratios/Supplemental Data | |
Net assets, end of period (in thousands) | | $ | 510,729 | | | $ | 643,872 | | | $ | 694,549 | | | $ | 780,135 | | | $ | 848,370 | |
Ratios to average net assets: | |
Net investment income (loss) | | | 0.00 | %e | | | 0.00 | %e | | | 0.00 | %e | | | 0.00 | %e | | | 0.00 | %e |
Total expenses | | | 0.71 | % | | | 0.91 | % | | | 0.92 | % | | | 0.93 | % | | | 0.95 | % |
Net expensesd | | | 0.30 | % | | | 0.22 | % | | | 0.08 | % | | | 0.09 | % | | | 0.17 | % |
Portfolio turnover rate | | | — | | | | — | | | | — | | | | — | | | | — | |
a | Unaudited figures for the period ended September 30, 2016. Percentage amounts for the period, except total return and portfolio turnover rate, have been annualized. |
b | Effective June 15, 2012, the Fund’s Investor Class shares, Advisor Class shares, A-Class shares, C-Class shares and Investor 2 Class shares were converted into the newly created Money Market Class. The financial highlights for periods prior to that date reflect the performance of the former Investor Class. |
c | Less than $0.01 per share. |
d | Net expense information reflects the expense ratios after expense waivers. |
e | Less that 0.01%. |
180 | THE RYDEX FUNDS SEMI-ANNUAL REPORT | SEE NOTES TO FINANCIAL STATEMENTS. |
NOTES TO FINANCIAL STATEMENTS (Unaudited) |
1. Organization and Significant Accounting Policies
Organization
The Rydex Series Funds (the “Trust”), a Delaware statutory trust, is registered with the SEC under the Investment Company Act of 1940 (”1940 Act”), as an open-ended investment company of the series type. Each series, in effect, is representing a separate Fund. The Trust is authorized to issue an unlimited number of no par value shares. The Trust accounts for the assets of each fund separately.
The Trust offers a combination of seven separate classes of shares: Investor Class shares, A-Class shares, C-Class shares, H-Class shares, P-Class shares, Institutional Class shares and Money Market Class shares. Sales of shares of each Class are made without a front-end sales charge at the net asset value per share (“NAV”), with the exception of A-Class shares. A-Class shares are sold at the NAV, plus the applicable front-end sales charge. The sales charge varies depending on the amount purchased, but will not exceed 4.75%. A-Class share purchases of $1 million or more are exempt from the front-end sales charge but have a 1% contingent deferred sales charge (“CDSC”) if shares are redeemed within 12 months of purchase. C-Class shares have a 1% CDSC if shares are redeemed within 12 months of purchase. Institutional Class shares are offered primarily for direct investment by institutions such as pension and profit sharing plans, endowments, foundations and corporations. Institutional Class shares require a minimum initial investment of $2 million and a minimum account balance of $1 million. At September 30, 2016, the Trust consisted of fifty-three funds.
This report covers the Nova Fund, S&P 500® Fund, Inverse S&P 500® Strategy Fund, Monthly Rebalance NASDAQ-100® 2x Strategy Fund, Inverse NASDAQ-100® Strategy Fund, Mid-Cap 1.5x Strategy Fund, Inverse Mid-Cap Strategy Fund, Russell 2000® 1.5x Strategy Fund, Russell 2000® Fund, Inverse Russell 2000® Strategy Fund, Government Long Bond 1.2x Strategy Fund, Inverse Government Long Bond Strategy Fund, High Yield Strategy Fund, Inverse High Yield Strategy Fund, and U.S. Government Money Market Fund (the “Funds”). Only Investor Class, Advisor Class, A-Class, C-Class, H-Class and Money Market Class shares had been issued by the Funds.
The Funds are designed and operated to accommodate frequent trading by shareholders and, unlike most mutual funds, offer unlimited exchange privileges with no minimum holding periods or transactions fees, which may cause the Funds to experience high portfolio turnover.
Guggenheim Investments (“GI”) provides advisory services, and Rydex Fund Services, LLC (“RFS”) provides transfer agent, administrative and accounting services to the Trust. Guggenheim Funds Distributors, LLC (“GFD”) acts as principal underwriter for the Trust. GI and GFD are affiliated entities; RFS ceased to be an affiliate of GI as of October 4, 2016, when it was acquired by MUFG Investor Services. In connection with its acquisition, RFS changed its name to MUFG Investor Services (US), LLC (“MUIS”). This change has no impact on the financial statements of the Funds.
Significant Accounting Policies
The Funds operate as investment companies and, accordingly, follow the investment company accounting and reporting guidance of the Financial Accounting Standards Board (“FASB”) Accounting Standards Codification Topic 946 Financial Services – Investment Companies.
The following significant accounting policies are in conformity with U.S. generally accepted accounting principles (“U.S. GAAP”) and are consistently followed by the Trust. This requires management to make estimates and assumptions that affect the reported amount of assets and liabilities, contingent assets and liabilities at the date of the financial statements, and the reported amounts of revenues and expenses during the reporting period. Actual results could differ from these estimates. All time references are based on Eastern Time.
The NAV of each Class of the Funds is calculated by dividing the market value of the Fund’s securities and other assets, less all liabilities, attributable to the Class by the number of outstanding shares of the Class.
The Trust calculates a NAV twice each business day; at 10:45 a.m. and at the close of the New York Stock Exchange (“NYSE”), usually 4:00 p.m. for the Russell 2000® Fund and the S&P 500® Fund. All other Funds in this report will price at the afternoon NAV. The NAV is calculated using the current market value of each Fund’s total assets as of the respective time of calculation. These financial statements are based on the September 30, 2016, afternoon NAV.
A. The Board of Trustees of the Funds (the “Board”) has adopted policies and procedures for the valuation of the Funds’ investments (the “Valuation Procedures”). Pursuant to the Valuation Procedures, the Board has delegated to a valuation committee, consisting of representatives from Guggenheim’s investment management, fund administration, legal and compliance departments (the “Valuation Committee”), the day-to-day responsibility for implementing the Valuation Procedures, including, under most circumstances, the responsibility for determining the fair value of the Funds’ securities and/or other assets.
Valuations of the Funds’ securities are supplied primarily by pricing services appointed pursuant to the processes set forth in the Valuation Procedures. The Valuation Committee convenes monthly, or more frequently as needed, to review the valuation of all assets which have been fair valued for reasonableness. The Funds’
| | THE RYDEX FUNDS SEMI-ANNUAL REPORT | 181 |
NOTES TO FINANCIAL STATEMENTS (Unaudited)(continued) |
officers, through the Valuation Committee and consistent with the monitoring and review responsibilities set forth in the Valuation Procedures, regularly review procedures used and valuations provided by the pricing services.
If the pricing service cannot or does not provide a valuation for a particular investment or such valuation is deemed unreliable, such investment is fair valued by the Valuation Committee.
Equity securities listed on an exchange (New York Stock Exchange (“NYSE”) or American Stock Exchange) are valued at the last quoted sales price as of the close of business on the NYSE, usually 4:00 p.m. on the valuation date. Equity securities listed on the NASDAQ market system are valued at the NASDAQ Official Closing Price on the valuation date, which may not necessarily represent the last sale price. If there has been no sale on such exchange or NASDAQ on a given day, the security is valued at the closing bid price on that day.
Open-end investment companies (“mutual funds”) are valued at their NAV as of the close of business, on the valuation date. Exchange-traded funds (“ETFs”) and closed-end investment companies (“CEFs”) are valued at the last quoted sales price.
The U.S. Government Money Market Fund values debt securities at amortized cost pursuant to Rule 2a-7 of the 1940 Act, which approximates market value. With the exception of the U.S. Government Money Market Fund, U.S. Government securities are valued by either independent pricing services, the last traded fill price, or at the reported bid price at the close of business.
Debt securities with a maturity of greater than 60 days at acquisition are valued at prices that reflect broker-dealer supplied valuations or are obtained from independent pricing services, which may consider the trade activity, treasury spreads, yields or price of bonds of comparable quality, coupon, maturity, and type, as well as prices quoted by dealers who make markets in such securities. Short-term debt securities with a maturity of 60 days or less at acquisition are valued at amortized cost, provided such amount approximates market value.
Repurchase agreements are valued at amortized cost, provided such amounts approximate market value.
The value of futures contracts is accounted for using the unrealized gain or loss on the contracts that is determined by marking the contracts to their current realized settlement prices. Financial futures contracts are valued at the 4:00 p.m. price on the valuation date. In the event that the exchange for a specific futures contract closes earlier than 4:00 p.m., the futures contract is valued at the Official Settlement Price of the exchange. However, the underlying securities from which the futures contract value is derived are monitored until 4:00 p.m. to determine if fair valuation would provide a more accurate valuation.
The values of OTC swap agreements and credit default swap agreements entered into by a Fund are accounted for using the unrealized gains or losses on the agreements that are determined by marking the agreements to the last quoted value of the index that the swaps pertain to at the close of the NYSE. The swaps’ values are then adjusted to include dividends accrued, financing charges and/or interest associated with the swap agreements.
Investments for which market quotations are not readily available are fair-valued as determined in good faith by GI under the direction of the Board using methods established or ratified by the Board. Valuations in accordance with these methods are intended to reflect each security’s (or asset’s) “fair value.” Each such determination is based on a consideration of all relevant factors, which are likely to vary from one pricing context to another. Examples of such factors may include, but are not limited to: market prices; sale prices; broker quotes; and models which derive prices based on inputs such as prices of securities with comparable maturities and characteristics, or based on inputs such as anticipated cash flows or collateral, spread over Treasuries, and other information analysis.
In connection with futures contracts and other derivative investments, such factors may include obtaining information as to how (a) these contracts and other derivative investments trade in the futures or other derivative markets, respectively, and (b) the securities underlying these contracts and other derivative investments trade in the cash market.
B. Certain U.S. Government and Agency Obligations are traded on a discount basis; the interest rates shown on the Schedules of Investments reflect the effective rates paid at the time of purchase by the Funds. Other securities bear interest at the rates shown, payable at fixed dates through maturity.
C. When a Fund engages in a short sale of a security, an amount equal to the proceeds is reflected as an asset and an equivalent liability. The amount of the liability is subsequently marked-to-market to reflect the market value of the short sale. The Fund maintains a segregated account of cash and/or securities as collateral for short sales.
Fees, if any, paid to brokers to borrow securities in connection with short sales are recorded as interest expense. In addition, the Fund must pay out the dividend rate of the equity or coupon rate of the obligation to the lender and record this as an expense. Short dividend or interest expense is a cost associated with the investment objective of short sales transactions, rather than an operational cost associated with the day-to-day management of
182 | THE RYDEX FUNDS SEMI-ANNUAL REPORT | |
NOTES TO FINANCIAL STATEMENTS (Unaudited)(continued) |
any mutual fund. The Fund may also receive rebate income from the broker resulting from the investment of the proceeds from securities sold short.
D. Upon entering into a futures contract, a Fund deposits and maintains as collateral such initial margin as required by the exchange on which the transaction is affected. Pursuant to the contract, the Fund agrees to receive from or pay to the broker an amount of cash equal to the daily fluctuation in value of the contract. Such receipts or payments are known as variation margin and are recorded by the Fund as unrealized gains or losses. When the contract is closed, the Fund records a realized gain or loss equal to the difference between the value of the contract at the time it was opened and the value at the time it was closed.
E. Swap agreements are marked-to-market daily and the change, if any, is recorded as unrealized gain or loss. Payments received or made as a result of an agreement or termination of an agreement are recognized as realized gains or losses.
Credit default swap agreements are marked-to-market daily and the change, if any, is recorded as unrealized gain or loss. Upfront payments received or made by a Fund on credit default swap agreements are amortized over the expected life of the agreement. Periodic payments received or paid by a Fund are recorded as realized gains or losses. Payments received or made as a result of a credit event or termination of the contract are recognized, net of a proportional amount of the upfront payment, as realized gains or losses.
F. The accounting records of the Funds are maintained in U.S. dollars. All assets and liabilities initially expressed in foreign currencies are converted into U.S. dollars at prevailing exchange rates. Purchases and sales of investment securities, dividend and interest income, and certain expenses are translated at the rates of exchange prevailing on the respective dates of such transactions. Changes in the relationship of these foreign currencies to the U.S. dollar can significantly affect the value of the investments and earnings of the Funds. Foreign investments may also subject the Funds to foreign government exchange restrictions, expropriation, taxation, or other political, social or economic developments, all of which could affect the market and/or credit risk of the investments.
The Funds do not isolate that portion of the results of operations resulting from changes in the foreign exchange rates on investments from the fluctuations arising from changes in the market prices of securities held. Such fluctuations are included with the net realized and unrealized gain or loss on investments.
Reported net realized foreign exchange gains and losses arise from sales of foreign currencies and currency gains or losses realized between the trade and settlement dates on investment transactions. Net unrealized exchange gains and losses arise from changes in the fair values of assets and liabilities other than investments in securities at the fiscal period end, resulting from changes in exchange rates.
G. Security transactions are recorded on the trade date for financial reporting purposes. Realized gains and losses from securities transactions are recorded using the identified cost basis. Proceeds from lawsuits related to investment holdings are recorded as realized gains in the respective Fund. Dividend income is recorded on the ex-dividend date, net of applicable taxes withheld by foreign countries. Taxable non-cash dividends are recorded as dividend income. Interest income, including amortization of premiums and accretion of discounts, is accrued on a daily basis. Dividend income from REITs is recorded based on the income included in the distributions received from the REIT investments using published REIT classifications, including some management estimates when actual amounts are not available. Distributions received in excess of this estimated amount are recorded as a reduction of the cost of investments or reclassified to capital gains. The actual amounts of income, return of capital, and capital gains are only determined by each REIT after its fiscal year-end, and may differ from the estimated amounts.
H. Dividends from net investment income are declared daily in the Government Long Bond 1.2x Strategy Fund and the U.S. Government Money Market Fund. Dividends are reinvested in additional shares unless shareholders request payment in cash. Distributions of net investment income in the remaining Funds and distributions of net realized gains, if any, in all Funds are declared at least annually and recorded on the ex-dividend date and are determined in accordance with income tax regulations which may differ from U.S. GAAP.
I. Interest and dividend income, most expenses, all realized gains and losses, and all unrealized gains and losses are allocated to the classes based upon the value of the outstanding shares in each Class. Certain costs, such as distribution and service fees are charged directly to specific classes. In addition, certain expenses have been allocated to the individual Funds in the Trust on a pro rata basis upon the respective aggregate net assets of each Fund included in the Trust.
J. The Funds may leave cash overnight in their cash account with the custodian. Periodically, a Fund may have cash due to the custodian bank as an overdraft balance. A fee is incurred on this overdraft, calculated by multiplying the overdraft by a rate based on the federal funds rate.
K. Under the Funds’ organizational documents, the Trustees and Officers are indemnified against certain liabilities arising out of the performance of their duties to the Trust. In addition, throughout the normal course of business, the Funds enter into contracts that contain a variety of representations and warranties which provide
| | THE RYDEX FUNDS SEMI-ANNUAL REPORT | 183 |
NOTES TO FINANCIAL STATEMENTS (Unaudited)(continued) |
general indemnifications. The Funds’ maximum exposure under these arrangements is unknown, as this would involve future claims that may be made against the Funds and/or their affiliates that have not yet occurred. However, based on experience, the Funds expect the risk of loss to be remote.
2. Financial Instruments and Derivatives
As part of their investment strategy, the Funds utilize short sales and a variety of derivative instruments. These investments involve, to varying degrees, elements of market risk and risks in excess of the amounts recognized in the Statements of Assets and Liabilities. Valuation and accounting treatment of these instruments can be found under Significant Accounting Policies in Note 1 of these Notes to Financial Statements.
Short Sales
A short sale is a transaction in which a Fund sells a security it does not own. If the security sold short decreases in price between the time the Fund sells the security and closes its short position, the Fund will realize a gain on the transaction. Conversely, if the security increases in price during the period, the Fund will realize a loss on the transaction. The risk of such price increases is the principal risk of engaging in short sales.
Derivatives
Derivatives are instruments whose values depend on, or are derived from, in whole or in part, the value of one or more other assets, such as securities, currencies, commodities or indices. Derivative instruments may be used to increase investment flexibility (including to maintain cash reserves while maintaining exposure to certain other assets), for risk management (hedging) purposes, to facilitate trading, to reduce transaction costs and to pursue higher investment returns. Derivative instruments may also be used to mitigate certain investment risks, such as foreign currency exchange rate risk, interest rate risk and credit risk. U.S. GAAP requires disclosures to enable investors to better understand how and why a Fund uses derivative instruments, how these derivative instruments are accounted for and their effects on the Fund’s financial position and results of operations. The Funds may utilize derivatives for the following purposes:
Index Exposure: the use of an instrument to obtain exposure to a listed or other type of index.
Duration: the use of an instrument to manage the interest rate risk of a portfolio.
Leverage: gaining total exposure to equities or other assets on the long and short sides at greater than 100% of invested capital.
Liquidity: the ability to buy or sell exposure with little price/market impact.
For any Fund whose investment strategy consistently involves applying leverage, the value of the Fund’s shares will tend to increase or decrease more than the value of any increase or decrease in the underlying index or other asset. In addition, because an investment in derivative instruments generally requires a small investment relative to the amount of investment exposure assumed, an opportunity for increased net income is created; but, at the same time, leverage risk will increase. The Fund’s use of leverage, through borrowings or instruments such as derivatives, may cause the Fund to be more volatile and riskier than if they had not been leveraged.
Futures
A futures contract is an agreement to purchase (long) or sell (short) an agreed amount of securities or other instruments at a set price for delivery at a future date. There are significant risks associated with a Fund’s use of futures contracts, including (i) there may be an imperfect or no correlation between the changes in market value of the underlying asset and the prices of futures contracts; (ii) there may not be a liquid secondary market for a futures contract; (iii) trading restrictions or limitations may be imposed by an exchange; and (iv) government regulations may restrict trading in futures contracts. When investing in futures, there is minimal counterparty credit risk to a Fund because futures are exchange-traded and the exchange’s clearinghouse, as counterparty to all exchange-traded futures, guarantees against default. Cash deposits are shown as segregated cash with broker on the Statements of Assets and Liabilities; securities held as collateral are noted on the Schedules of Investments.
184 | THE RYDEX FUNDS SEMI-ANNUAL REPORT | |
NOTES TO FINANCIAL STATEMENTS (Unaudited)(continued) |
The following table represents the Funds’ use and volume of futures on a quarterly basis:
| | | | Average Notional | |
Fund | Use | | Long | | | Short | |
Nova Fund | Index exposure, Leverage, Liquidity | | $ | 19,775,144 | | | $ | — | |
S&P 500® Fund | Index exposure, Liquidity | | | 10,921,525 | | | | — | |
Inverse S&P 500® Strategy Fund | Index exposure, Liquidity | | | — | | | | 2,757,122 | |
Monthly Rebalance NASDAQ-100® 2x Strategy Fund | Index exposure, Leverage, Liquidity | | | 6,813,335 | | | | — | |
Inverse NASDAQ-100® Strategy Fund | Index exposure, Liquidity | | | — | | | | 3,133,245 | |
Mid-Cap 1.5x Strategy Fund | Index exposure, Leverage, Liquidity | | | 6,674,480 | | | | — | |
Inverse Mid-Cap Strategy Fund | Index exposure, Liquidity | | | — | | | | 218,720 | |
Russell 2000® 1.5x Strategy Fund | Index exposure, Leverage, Liquidity | | | 1,390,080 | | | | — | |
Russell 2000® Fund | Index exposure, Leverage, Liquidity | | | 907,630 | | | | — | |
Inverse Russell 2000® Strategy Fund | Index exposure, Liquidity | | | — | | | | 464,275 | |
Dow Jones Industrial Average® Fund | Index exposure, Liquidity | | | 2,093,633 | | | | — | |
Government Long Bond 1.2x Strategy Fund | Index exposure, Duration, Leverage, Liquidity | | | 64,931,797 | | | | — | |
Inverse Government Long Bond Strategy Fund | Index exposure, Duration, Liquidity | | | — | | | | 47,007,641 | |
High Yield Strategy Fund | Index exposure, Duration, Liquidity | | | 303,992,012 | | | | — | |
Inverse High Yield Strategy Fund | Index exposure, Duration, Liquidity | | | — | | | | 36,475,113 | |
Swaps
A swap is an agreement that obligates two parties to exchange a series of cash flows at specified intervals based upon or calculated by reference to changes in specified prices or rates for a specified amount of an underlying asset. A Fund utilizing OTC swaps bears the risk of loss of the amount expected to be received under a swap agreement in the event of the default or bankruptcy of a swap agreement counterparty or if the underlying asset declines in value. Certain standardized swaps are subject to mandatory central clearing. Central clearing generally reduces counterparty credit risk and increases liquidity, but central clearing does not make swap transactions risk-free. Additionally, there is no guarantee that a Fund or an underlying fund could eliminate its exposure under an outstanding swap agreement by entering into an offsetting swap agreement with the same or another party.
Total return swaps involve commitments where single or multiple cash flows are exchanged based on the price of an underlying reference asset (such as index or basket) or a fixed or variable interest rate. Index swaps will usually be computed based on the current index value as of the close of regular trading on the NYSE or other exchange, with the swap value being adjusted to include dividends accrued, financing charges and/or interest associated with the swap agreement. A fund utilizing a total return index swap bears the risk of loss of the amount expected to be received under a swap agreement in the event of the default or bankruptcy of a swap agreement counterparty or if the underlying index declines in value.
The following table represents the Funds’ use and volume of total return swaps on a quarterly basis:
| | | | Average Notional | |
Fund | Use | | Long | | | Short | |
Nova Fund | Index exposure, Leverage, Liquidity | | $ | 191,784,769 | | | $ | — | |
S&P 500® Fund | Index exposure, Liquidity | | | 56,733,287 | | | | — | |
Inverse S&P 500® Strategy Fund | Index exposure, Liquidity | | | — | | | | 149,408,668 | |
Monthly Rebalance NASDAQ-100® 2x Strategy Fund | Index exposure, Leverage, Liquidity | | | 83,860,571 | | | | — | |
Inverse NASDAQ-100® Strategy Fund | Index exposure, Liquidity | | | — | | | | 24,086,916 | |
Mid-Cap 1.5x Strategy Fund | Index exposure, Leverage, Liquidity | | | 13,061,734 | | | | — | |
Inverse Mid-Cap Strategy Fund | Index exposure, Liquidity | | | — | | | | 2,445,342 | |
Russell 2000® 1.5x Strategy Fund | Index exposure, Leverage, Liquidity | | | 6,873,140 | | | | — | |
Russell 2000® Fund | Index exposure, Leverage, Liquidity | | | 14,317,879 | | | | — | |
Inverse Russell 2000® Strategy Fund | Index exposure, Liquidity | | | — | | | | 36,863,556 | |
Dow Jones Industrial Average® Fund | Index exposure, Liquidity | | | 8,688,534 | | | | — | |
High Yield Strategy Fund | Index exposure, Duration, Liquidity | | | 46,284,486 | | | | — | |
| | THE RYDEX FUNDS SEMI-ANNUAL REPORT | 185 |
NOTES TO FINANCIAL STATEMENTS (Unaudited)(continued) |
Credit default swaps are instruments which allow for the full or partial transfer of third party credit risk, with respect to a particular entity or entities, from one counterparty to the other. In accordance with its principal investment strategy, the Funds enter into credit default swaps as a seller of protection primarily to gain exposure similar to the high yield bond market. A seller of credit default swaps is selling credit protection or assuming credit risk with respect to the underlying entity or entities. If a credit event occurs, as defined under the terms of the swap agreement, the Fund will either (i) pay to the buyer of protection an amount equal to the notional amount of the swap and take delivery of the referenced obligation or underlying securities comprising the referenced index or (ii) pay a net settlement amount in the form of cash or securities equal to the notional amount of the swap less the recovery value of the referenced obligation or underlying securities comprising the referenced index. The Notional Principal reflects the maximum potential amount the Fund could be required to pay as a seller of credit protection if a credit event occurs. As the seller of protection, the Fund receives periodic premium payments from the counterparty and may also receive or pay an upfront premium adjustment to the stated periodic premium. In the event a credit event occurs, an adjustment will be made to any upfront premiums that were received by a reduction of 1.00% per credit event.
The quoted market prices and resulting market values for credit default swap agreements on securities and credit indices serve as an indicator of the current status of the payment/performance risk and represent the likelihood of an expected liability (or profit) for the credit derivative had the notional amount of the swap agreement been closed/sold as of the period end. Increasing market values, in absolute terms when compared to the notional amount of the swap, represent a deterioration of the referenced entity’s credit soundness and a greater likelihood or risk of default or other credit event occurring as defined under the terms of the agreement.
The following table represents the Funds’ use and volume of credit default swaps on a quarterly basis:
| | | | Average Notional | |
Fund | Use | | Long | | | Short | |
High Yield Strategy Fund | Index exposure, Duration, Liquidity | | $ | 352,137,310 | | | $ | — | |
Inverse High Yield Strategy Fund | Index exposure, Duration, Liquidity | | | — | | | | 43,670,968 | |
A credit default swap enables a Fund to buy or sell protection against a defined credit event of an issuer or a basket of securities. Generally, the seller of credit protection against an issuer or basket of securities receives a periodic payment from the buyer to compensate against potential default events. If a default event occurs, the seller must pay the buyer the full notional value of the reference obligation in exchange for the reference obligation. If no default occurs, the counterparty will pay the stream of payments and have no further obligations to the Fund selling the credit protection. A Fund bears the risk of loss of the amount expected to be received under a swap agreement in the event of the default or bankruptcy of a swap agreement counterparty, or in the case of a credit default swap in which the Fund is selling credit protection, the default of a third party issuer.
Derivative Investment Holdings Categorized by Risk Exposure
The following is a summary of the location of derivative investments on the Funds’ Statements of Assets and Liabilities as of September 30, 2016:
Derivative Investment Type | Asset Derivatives | Liability Derivatives |
Equity/Interest Rate contracts | Variation margin | Variation margin |
Equity/Credit contracts | Unrealized appreciation on swap agreements | Unrealized depreciation on swap agreements |
186 | THE RYDEX FUNDS SEMI-ANNUAL REPORT | |
NOTES TO FINANCIAL STATEMENTS (Unaudited)(continued) |
The following table sets forth the fair value of the Funds’ derivative investments categorized by primary risk exposure at September 30, 2016:
Asset Derivative Investments Value | |
Fund | | Futures
Equity
Contracts* | | | Swap
Equity
Contracts | | | Swaps
Interest Rate
Contracts | | | Futures
Interest Rate
Contracts* | | | Swaps
Credit Default
Contracts | | | Total Value at
September 30,
2016 | |
Nova Fund | | $ | 490,032 | | | $ | 1,578,966 | | | $ | — | | | $ | — | | | $ | — | | | $ | 2,068,998 | |
S&P 500® Fund | | | 14,225 | | | | 275,576 | | | | — | | | | — | | | | — | | | | 289,801 | |
Monthly Rebalance NASDAQ-100® 2x Strategy Fund | | | 104,661 | | | | 177,375 | | | | — | | | | — | | | | — | | | | 282,036 | |
Mid-Cap 1.5x Strategy Fund | | | 9,455 | | | | 84,443 | | | | — | | | | — | | | | — | | | | 93,898 | |
Inverse Mid-Cap Strategy Fund | | | — | | | | 152 | | | | — | | | | — | | | | — | | | | 152 | |
Russell 2000® 1.5x Strategy Fund | | | 11,035 | | | | 34,520 | | | | — | | | | — | | | | — | | | | 45,555 | |
Russell 2000® Fund | | | 36,008 | | | | 41,334 | | | | — | | | | — | | | | — | | | | 77,342 | |
Inverse Russell 2000® Strategy Fund | | | — | | | | 14,098 | | | | — | | | | — | | | | — | | | | 14,098 | |
Dow Jones Industrial Average® Fund | | | 9,813 | | | | 39,820 | | | | — | | | | — | | | | — | | | | 49,633 | |
Government Long Bond 1.2x Strategy Fund | | | — | | | | — | | | | — | | | | 286,513 | | | | — | | | | 286,513 | |
Inverse Government Long Bond Strategy Fund | | | — | | | | — | | | | — | | | | 500,735 | | | | — | | | | 500,735 | |
High Yield Strategy Fund | | | — | | | | — | | | | 477,275 | | | | 874,303 | | | | 4,492,739 | | | | 5,844,317 | |
Liability Derivative Investments Value | |
Fund | | Futures
Equity
Contracts* | | | Swap
Equity
Contracts | | | Futures
Interest Rate
Contracts* | | | Swaps
Credit Default
Contracts | | | Total Value at
September 30,
2016 | |
Nova Fund | | $ | — | | | $ | 54,685 | | | $ | — | | | $ | — | | | $ | 54,685 | |
S&P 500® Fund | | | — | | | | 10,380 | | | | — | | | | — | | | | 10,380 | |
Inverse S&P 500® Strategy Fund | | | 10,776 | | | | 1,278,115 | | | | — | | | | — | | | | 1,288,891 | |
Inverse NASDAQ-100® Strategy Fund | | | 406 | | | | 106,391 | | | | — | | | | — | | | | 106,797 | |
Mid-Cap 1.5x Strategy Fund | | | — | | | | 16,127 | | | | — | | | | — | | | | 16,127 | |
Inverse Mid-Cap Strategy Fund | | | — | | | | 8,004 | | | | — | | | | — | | | | 8,004 | |
Russell 2000® 1.5x Strategy Fund | | | — | | | | 16,884 | | | | — | | | | — | | | | 16,884 | |
Russell 2000® Fund | | | — | | | | 5,203 | | | | — | | | | — | | | | 5,203 | |
Inverse Russell 2000® Strategy Fund | | | 5,352 | | | | 30,573 | | | | — | | | | — | | | | 35,925 | |
Dow Jones Industrial Average® Fund | | | — | | | | 1,542 | | | | — | | | | — | | | | 1,542 | |
Inverse High Yield Strategy Fund | | | — | | | | — | | | | 66,569 | | | | 232,023 | | | | 298,592 | |
* | Includes cumulative appreciation (depreciation) of futures contracts as reported on the Schedules of Investments. Only current day’s variation margin is reported within the Statements of Assets and Liabilities. |
The following is a summary of the location of derivative investments on the Funds’ Statements of Operations for the period ended September 30, 2016:
Derivative Investment Type | Location of Gain (Loss) on Derivatives |
Equity/Interest Rate contracts | Net realized gain (loss) on futures contracts |
| Net change in unrealized appreciation (depreciation) on futures contracts |
Equity/Credit contracts | Net realized gain (loss) on swap agreements |
| Net change in unrealized appreciation (depreciation) on swap agreements |
| | THE RYDEX FUNDS SEMI-ANNUAL REPORT | 187 |
NOTES TO FINANCIAL STATEMENTS (Unaudited)(continued) |
The following is a summary of the Funds’ realized gain (loss) and change in unrealized appreciation (depreciation) on derivative investments recognized on the Statements of Operations categorized by primary risk exposure for the period ended September 30, 2016:
Realized Gain (Loss) on Derivative Investments Recognized on the Statements of Operations | |
Fund | | Futures
Equity
Contracts | | | Swap
Equity
Contracts | | | Interest
Rate
Contracts | | | Futures
Interest Rate
Contracts | | | Swaps
Credit Default
Contracts | | | Total Value at
September 30,
2016 | |
Nova Fund | | $ | 709,524 | | | $ | 7,288,690 | | | $ | — | | | $ | — | | | $ | — | | | $ | 7,998,214 | |
S&P 500® Fund | | | 848,586 | | | | 1,796,786 | | | | — | | | | — | | | | — | | | | 2,645,372 | |
Inverse S&P 500® Strategy Fund | | | (1,807,306 | ) | | | (10,664,125 | ) | | | — | | | | — | | | | — | | | | (12,471,431 | ) |
Monthly Rebalance NASDAQ-100® 2x Strategy Fund | | | (13,742 | ) | | | 865,472 | | | | — | | | | — | | | | — | | | | 851,730 | |
Inverse NASDAQ-100® Strategy Fund | | | (780,104 | ) | | | (4,354,267 | ) | | | — | | | | — | | | | — | | | | (5,134,371 | ) |
Mid-Cap 1.5x Strategy Fund | | | 206,385 | | | | 977,070 | | | | — | | | | — | | | | — | | | | 1,183,454 | |
Inverse Mid-Cap Strategy Fund | | | (39,702 | ) | | | (265,179 | ) | | | — | | | | — | | | | — | | | | (304,881 | ) |
Russell 2000® 1.5x Strategy Fund | | | 140,681 | | | | 1,084,879 | | | | — | | | | — | | | | — | | | | 1,225,560 | |
Russell 2000® Fund | | | 383,050 | | | | 1,217,787 | | | | — | | | | — | | | | — | | | | 1,600,837 | |
Inverse Russell 2000® Strategy Fund | | | 12,480 | | | | (2,320,856 | ) | | | — | | | | — | | | | — | | | | (2,308,376 | ) |
Dow Jones Industrial Average® Fund | | | 72,641 | | | | (292,956 | ) | | | — | | | | — | | | | — | | | | (220,315 | ) |
Government Long Bond 1.2x Strategy Fund | | | — | | | | — | | | | — | | | | 4,413,413 | | | | — | | | | 4,413,413 | |
Inverse Government Long Bond Strategy Fund | | | — | | | | — | | | | — | | | | (7,291,824 | ) | | | — | | | | (7,291,824 | ) |
High Yield Strategy Fund | | | (27 | ) | | | — | | | | 4,158,953 | | | | 3,515,410 | | | | 17,269,961 | | | | 24,944,297 | |
Inverse High Yield Strategy Fund | | | — | | | | — | | | | — | | | | (571,622 | ) | | | (2,650,018 | ) | | | 3,221,640 | |
Change in Unrealized Appreciation (Depreciation) on Derivative Investments Recognized on the Statements of Operations | |
Fund | | Futures
Equity
Contracts | | | Swap
Equity
Contracts | | | Interest
Rate
Contracts | | | Futures
Interest Rate
Contracts | | | Swaps
Credit Default
Contracts | | | Total | |
Nova Fund | | $ | 325,968 | | | $ | 912,532 | | | $ | — | | | $ | — | | | $ | — | | | $ | 1,238,500 | |
S&P 500® Fund | | | (260,103 | ) | | | (166,449 | ) | | | — | | | | — | | | | — | | | | (426,552 | ) |
Inverse S&P 500® Strategy Fund | | | (12,114 | ) | | | (98,977 | ) | | | — | | | | — | | | | — | | | | (111,091 | ) |
Monthly Rebalance NASDAQ-100® 2x Strategy Fund | | | 81,300 | | | | 147,847 | | | | — | | | | — | | | | — | | | | 229,147 | |
Inverse NASDAQ-100® Strategy Fund | | | 246,930 | | | | 965,015 | | | | — | | | | — | | | | — | | | | 1,211,945 | |
Mid-Cap 1.5x Strategy Fund | | | (139,985 | ) | | | (14,768 | ) | | | — | | | | — | | | | — | | | | (154,753 | ) |
Inverse Mid-Cap Strategy Fund | | | 24,045 | | | | 26,752 | | | | — | | | | — | | | | — | | | | 50,797 | |
Russell 2000® 1.5x Strategy Fund | | | 733 | | | | (74,707 | ) | | | — | | | | — | | | | — | | | | (73,974 | ) |
Russell 2000® Fund | | | (5,303 | ) | | | (188,214 | ) | | | — | | | | — | | | | — | | | | (193,517 | ) |
Inverse Russell 2000® Strategy Fund | | | (2,853 | ) | | | 326,387 | | | | — | | | | — | | | | — | | | | 323,534 | |
Dow Jones Industrial Average® Fund | | | (150,905 | ) | | | (4,967 | ) | | | — | | | | — | | | | — | | | | (155,872 | ) |
Government Long Bond 1.2x Strategy Fund | | | — | | | | — | | | | — | | | | (1,218,369 | ) | | | — | | | | (1,218,369 | ) |
Inverse Government Long Bond Strategy Fund | | | — | | | | — | | | | — | | | | 181,754 | | | | — | | | | 181,754 | |
High Yield Strategy Fund | | | — | | | | — | | | | 477,275 | | | | (1,954,435 | ) | | | (3,747,602 | ) | | | (5,224,762 | ) |
Inverse High Yield Strategy Fund | | | — | | | | — | | | | — | | | | (60,869 | ) | | | (142,177 | ) | | | (203,046 | ) |
In conjunction with the use of short sales and derivative instruments, the Funds are required to maintain collateral in various forms. The Funds use, where appropriate, depending on the financial instrument utilized and the broker involved, margin deposits at the broker, cash and/or securities segregated at the custodian bank, discount notes or the repurchase agreements allocated to the Funds.
The Trust has established counterparty credit guidelines and enters into transactions only with financial institutions of investment grade or better. The Trust monitors the counterparty credit risk.
188 | THE RYDEX FUNDS SEMI-ANNUAL REPORT | |
NOTES TO FINANCIAL STATEMENTS (Unaudited)(continued) |
3. Fees and Other Transactions with Affiliates
Under the terms of an investment advisory contract, the Funds pay GI investment advisory fees calculated at the annualized rates below, based on the average daily net assets of the Funds:
Fund | Management Fees
(as a % of Net Assets) |
Nova Fund | 0.75% |
S&P 500® Fund | 0.75% |
Inverse S&P 500® Strategy Fund | 0.90% |
Monthly Rebalance NASDAQ-100® 2x Strategy Fund | 0.90% |
Inverse NASDAQ-100® Strategy Fund | 0.90% |
Mid-Cap 1.5x Strategy Fund | 0.90% |
Inverse Mid-Cap Strategy Fund | 0.90% |
Russell 2000® 1.5x Strategy Fund | 0.90% |
Russell 2000® Fund | 0.75% |
Inverse Russell 2000® Strategy Fund | 0.90% |
Dow Jones Industrial Average® Fund | 0.75% |
Government Long Bond 1.2x Strategy Fund | 0.50% |
Inverse Government Long Bond Strategy Fund | 0.90% |
High Yield Strategy Fund | 0.75% |
Inverse High Yield Strategy Fund | 0.75% |
U.S. Government Money Market Fund | 0.50% |
GI has contractually agreed to reduce fees and/or reimburse expenses for the Monthly Rebalance NASDAQ-100 2x Strategy Fund to the extent necessary to keep net operating expenses for A-Class , C-Class and H-Class shares ( including Rule 12b-1 fees if any) (excluding brokerage, dividends on securities sold short, acquired fund fees and expenses, interest, taxes, litigation, indemnification, and extraordinary expenses) from exceeding 1.35%, 2.10% and 1.35% of the Fund’s A-Class, C-Class and H-Class shares average daily net assets, respectively. The Total Annual Fund Operating Expenses After Fee Waiver and /or Expense Reimbursement includes Excluded Expenses and, thus, from time to time may be higher than 1.35%, 2.10% and 1.35%, respectively. This agreement may be terminated only with the approval of the Fund’s Board of Trustees.
RFS provided transfer agent and administrative services to the Funds for fees calculated at the annualized rates below, based on the average daily net assets of the Funds. For these services, RFS received the following:
Fund | Transfer Agent and Administrative Fees
(as a % of Net Assets) |
Government Long Bond 1.2x Strategy Fund | 0.20% |
U.S. Government Money Market Fund | 0.20% |
Remaining Funds | 0.25% |
RFS also provided accounting services to the Funds for fees calculated at annualized rates below, based on the average daily net assets of each Fund:
Fund | Accounting Fees
(as a % of Net Assets) |
S&P 500® Fund | 0.15% |
Russell 2000® Fund | 0.15% |
Remaining Funds | |
On the first $250 million | 0.10% |
On the next $250 million | 0.075% |
On the next $250 million | 0.05% |
Over $750 million | 0.03% |
| | THE RYDEX FUNDS SEMI-ANNUAL REPORT | 189 |
NOTES TO FINANCIAL STATEMENTS (Unaudited)(continued) |
GI engages external service providers to perform other necessary services for the Trust, such as audit and accounting related services, legal services, custody, printing and mailing, etc., on a pass-through basis. Such expenses are allocated to various Funds within the complex based on relative net assets.
The Trust has adopted a Distribution Plan applicable to A-Class shares and H-Class shares for which GFD and other firms that provide distribution and/or shareholder services (“Service Providers”) may receive compensation. If a Service Provider provides distribution services, the Funds will pay distribution fees to GFD at an annual rate not to exceed 0.25% of average daily net assets, pursuant to Rule 12b-1 of the 1940 Act. GFD, in turn, will pay the Service Provider out of its fees. GFD may, at its discretion, retain a portion of such payments to compensate itself for distribution services.
The Trust has adopted a separate Distribution and Shareholder Services Plan applicable to its C-Class shares that allows the Funds to pay annual distribution and service fees of 1.00% of the Funds’ C-Class shares average daily net assets. The annual 0.25% service fee compensates a shareholder’s financial adviser for providing ongoing services to the shareholder. The annual distribution fee of 0.75% reimburses GFD for paying the shareholder’s financial adviser an ongoing sales commission. GFD advances the first year’s service and distribution fees to the financial adviser. GFD retains the service and distribution fees on accounts with no authorized dealer of record.
GI and its affiliates have voluntarily agreed to waive their fees, including but not limited to accounting, shareholder investor services and investment advisory fees, in an attempt to maintain a positive net yield for the U.S. Government Money Market Fund. GI or its affiliates may terminate this voluntary waiver at any time upon notice to the Fund. When shareholder investor services fees are waived, dealer compensation will be reduced to the extent of such waiver.
For the period ended September 30, 2016, GFD retained sales charges of $145,031 relating to sales of A-Class shares of the Trust.
Certain trustees and officers of the Trust are also officers of GI and GFD.
4. Fair Value Measurement
In accordance with U.S. GAAP, fair value is defined as the price that the Funds would receive to sell an investment or pay to transfer a liability in an orderly transaction with an independent buyer in the principal market, or in the absence of a principal market, the most advantageous market for the investment or liability. U.S. GAAP establishes a three-tier fair value hierarchy based on the types of inputs used to value assets and liabilities and requires corresponding disclosure. The hierarchy and the corresponding inputs are summarized below:
Level 1 — | quoted prices in active markets for identical assets or liabilities. |
Level 2 — | significant other observable inputs (for example quoted prices for securities that are similar based on characteristics such as interest rates, prepayment speeds, credit risk, etc.). |
Level 3 — | significant unobservable inputs based on the best information available under the circumstances, to the extent observable inputs are not available, which may include assumptions. |
The types of inputs available depend on a variety of factors, such as the type of security and the characteristics of the markets in which it trades, if any. Fair valuation determinations that rely on fewer or no observable inputs require greater judgment. Accordingly, fair value determinations for Level 3 securities require the greatest amount of judgment.
The inputs or methodologies used for valuing securities are not necessarily an indication of the risk associated with investing in those securities. The suitability of the techniques and sources employed to determine fair valuation are regularly monitored and subject to change.
190 | THE RYDEX FUNDS SEMI-ANNUAL REPORT | |
NOTES TO FINANCIAL STATEMENTS (Unaudited)(continued) |
5. Repurchase Agreements
The Funds transfer uninvested cash balances into a single joint account, the daily aggregate balance of which is invested in one or more repurchase agreements collateralized by obligations of the U.S. Treasury and U.S. government agencies. The collateral is in the possession of the Funds’ custodian and is evaluated to ensure that its market value exceeds, at a minimum, 102% of the original face amount of the repurchase agreements. Each Fund holds a pro rata share of the collateral based on the dollar amount of the repurchase agreement entered into by each Fund.
At September 30, 2016, the repurchase agreements in the joint account were as follows:
Counterparty and
Terms of Agreement | | Face Value | | | Repurchase Price | | | Collateral | | | Par Value | | | Fair Value | |
Royal Bank of Canada | | | | | | | | U.S. Treasury Notes | | | | | | | |
0.36% | | | | | | | | 1.38% - 1.50 | | | | | | | |
Due 10/03/16 | | $ | 479,657,128 | | | $ | 479,671,517 | | | 05/31/20% | | | $ | 370,488,200 | | | $ | 380,230,860 | |
| | | | | | | | | | | U.S. TIP Notes | | | | | | | | | |
| | | | | | | | | | | 0.13% - 0.25% | | | | | | | | | |
| | | | | | | | | | | 07/15/22 - 01/15/25 | | | | 104,007,100 | | | | 109,019,578 | |
| | | | | | | | | | | | | | | 474,495,300 | | | | 489,250,438 | |
HSBC Securities, Inc. | | | | | | | | | | U.S. Treasury Strips | | | | | | | | | |
0.38% | | | | | | | | | | 0.00% | | | | | | | | | |
Due 10/03/16 | | | 469,487,376 | | | | 469,502,243 | | | 11/15/39 | | | | 803,943,000 | | | | 478,877,146 | |
In the event of counterparty default, the Funds have the right to collect the collateral to offset losses incurred. There is potential loss to the Funds in the event the Funds are delayed or prevented from exercising their rights to dispose of the collateral securities, including the risk of a possible decline in the value of the underlying securities during the period while the Funds seek to assert their rights. The Funds’ investment adviser, acting under the supervision of the Board, reviews the value of the collateral and the creditworthiness of those banks and dealers with which the Funds enter into repurchase agreements to evaluate potential risks.
6. Offsetting
In the normal course of business, the Funds enter into transactions subject to enforceable master netting arrangements or other similar arrangements. Generally, the right to offset in those agreements allows the Funds to counteract the exposure to a specific counterparty with collateral received from or delivered to that counterparty based on the terms of the arrangements. These arrangements provide for the right to liquidate upon the occurrence of an event of default, credit event upon merger or additional termination event.
In order to better define their contractual rights and to secure rights that will help the Funds mitigate their counterparty risk, the Funds may enter into an International Swaps and Derivatives Association, Inc. Master Agreement (“ISDA Master Agreement”) or similar agreement with their derivative contract counterparties. An ISDA Master Agreement is a bilateral agreement between a Fund and a counterparty that governs OTC derivatives, including foreign exchange contracts, and typically contains, among other things, collateral posting terms and netting provisions in the event of a default and/or termination event. The provisions of the ISDA Master Agreement typically permit a single net payment in the event of a default (close-out netting) or similar event, including the bankruptcy or insolvency of the counterparty.
For derivatives traded under an ISDA Master Agreement, the collateral requirements are typically calculated by netting the mark-to-market amount for each transaction under such agreement and comparing that amount to the value of any collateral currently pledged by the Funds and the counterparty. For financial reporting purposes, cash collateral that has been pledged to cover obligations of the Funds and cash collateral received from the counterparty, if any, are reported separately on the Statements of Assets and Liabilities as segregated cash with broker/receivable for variation margin, or payable for swap settlement/variation margin. Generally, the amount of collateral due from or to a counterparty must exceed a minimum transfer amount threshold (e.g., $300,000) before a transfer is required to be made. To the extent amounts due to the Funds from their counterparties are not fully collateralized, contractually or otherwise, the Funds bear the risk of loss from counterparty nonperformance. The Funds attempt to mitigate counterparty risk by only entering into agreements with counterparties that they believe to be of good standing and by monitoring the financial stability of those counterparties.
For financial reporting purposes, the Funds do not offset derivative assets and derivative liabilities that are subject to netting arrangements in the Statements of Assets and Liabilities.
| | THE RYDEX FUNDS SEMI-ANNUAL REPORT | 191 |
NOTES TO FINANCIAL STATEMENTS (Unaudited)(continued) |
The following tables present derivative financial instruments and secured financing transactions that are subject to enforceable netting arrangements and offset in the Statements of Assets and Liabilities in conformity with U.S. GAAP:
| | | | | | | | | | | | Gross Amounts Not Offset
in the Statements of
Assets and Liabilities | | | | |
Fund | Instrument | | Gross Amounts of Recognized Assets1 | | | Gross Amounts Offset In the Statements of Assets and Liabilities | | | Net Amount of Assets Presented on the Statements of Assets and Liabilities | | | Financial
Instruments | | | Cash
Collateral
Received | | | Net
Amount | |
Nova Fund | Swap equity contracts | | $ | 1,578,966 | | | $ | — | | | $ | 1,578,966 | | | $ | — | | | $ | — | | | $ | 1,578,966 | |
S&P 500® Fund | Swap equity contracts | | | 275,576 | | | | — | | | | 275,576 | | | | — | | | | — | | | | 275,576 | |
Monthly Rebalance NASDAQ-100 2x Strategy Fund | Swap equity contracts | | | 177,375 | | | | — | | | | 177,375 | | | | — | | | | — | | | | 177,375 | |
Mid-Cap 1.5x Strategy Fund | Swap equity contracts | | | 84,443 | | | | — | | | | 84,443 | | | | — | | | | — | | | | 84,443 | |
Inverse Mid-Cap Strategy Fund | Swap equity contracts | | | 152 | | | | — | | | | 152 | | | | — | | | | — | | | | 152 | |
Russell 2000® 1.5x Strategy Fund | Swap equity contracts | | | 34,520 | | | | — | | | | 34,520 | | | | — | | | | — | | | | 34,520 | |
Russell 2000® Fund | Swap equity contracts | | | 41,334 | | | | — | | | | 41,334 | | | | — | | | | — | | | | 41,334 | |
Inverse Russell 2000® Strategy Fund | Swap equity contracts | | | 14,098 | | | | — | | | | 14,098 | | | | — | | | | — | | | | 14,098 | |
Dow Jones Industrial Average® Fund | Swap equity contracts | | | 39,820 | | | | — | | | | 39,820 | | | | — | | | | — | | | | 39,820 | |
High Yield Strategy Fund | Interest rate contracts | | | 477,275 | | | | — | | | | 477,275 | | | | — | | | | — | | | | 477,275 | |
| | | | | | | | | | | | Gross Amounts Not Offset
in the Statements of
Assets and Liabilities | | | | |
Fund | Instrument | | Gross Amounts of Recognized Liabilities1 | | | Gross Amounts Offset In the Statements of Assets and Liabilities | | | Net Amount of Assets Presented on the Statements of Assets and Liabilities | | | Financial
Instruments | | | Cash
Collateral
Pledged | | | Net
Amount | |
Nova Fund | Swap equity contracts | | $ | 54,685 | | | $ | — | | | $ | 54,685 | | | $ | — | | | $ | 54,685 | | | $ | — | |
S&P 500® Fund | Swap equity contracts | | | 10,380 | | | | — | | | | 10,380 | | | | — | | | | 10,380 | | | | — | |
Inverse S&P 500® Strategy Fund | Swap equity contracts | | | 1,278,115 | | | | — | | | | 1,278,115 | | | | — | | | | 1,278,115 | | | | — | |
Inverse NASDAQ-100® Strategy Fund | Swap equity contracts | | | 106,391 | | | | — | | | | 106,391 | | | | — | | | | 106,391 | | | | — | |
Mid-Cap 1.5x Strategy Fund | Swap equity contracts | | | 16,127 | | | | — | | | | 16,127 | | | | — | | | | 16,127 | | | | — | |
Inverse Mid-Cap Strategy Fund | Swap equity contracts | | | 8,004 | | | | — | | | | 8,004 | | | | — | | | | 8,004 | | | | — | |
Russell 2000® 1.5x Strategy Fund | Swap equity contracts | | | 16,884 | | | | — | | | | 16,884 | | | | — | | | | 16,884 | | | | — | |
Russell 2000® Fund | Swap equity contracts | | | 5,203 | | | | — | | | | 5,203 | | | | — | | | | 5,203 | | | | — | |
Inverse Russell 2000® Strategy Fund | Swap equity contracts | | | 30,573 | | | | — | | | | 30,573 | | | | — | | | | 30,573 | | | | — | |
Dow Jones Industrial Average® Fund | Swap equity contracts | | | 1,542 | | | | — | | | | 1,542 | | | | — | | | | 1,542 | | | | — | |
1 | Exchange-traded futures and centrally cleared swaps are excluded from these reported amounts. |
192 | THE RYDEX FUNDS SEMI-ANNUAL REPORT | |
NOTES TO FINANCIAL STATEMENTS (Unaudited)(continued) |
7. Federal Income Tax Information
The Funds intend to comply with the provisions of Subchapter M of the Internal Revenue Code applicable to regulated investment companies and will distribute substantially all taxable net investment income and capital gains sufficient to relieve the Funds from all, or substantially all, federal income, excise and state income taxes. Therefore, no provision for federal or state income tax is required.
Tax positions taken or expected to be taken in the course of preparing the Funds’ tax returns are evaluated to determine whether the tax positions are “more-likely-than-not” of being sustained by the applicable tax authority. Tax positions not deemed to meet the more-likely-than-not threshold would be recorded as a tax benefit or expense in the current year. Management has analyzed the Funds’ tax positions taken, or to be taken, on federal income tax returns for all open tax years, and has concluded that no provision for income tax is required in the Funds’ financial statements. The Funds’ federal tax returns are subject to examination by the Internal Revenue Service for a period of three years after they are filed.
At September 30, 2016, the cost of securities for federal income tax purposes, the aggregate gross unrealized gain for all securities for which there was an excess of value over tax cost, and the aggregate gross unrealized loss for all securities for which there was an excess of tax cost over value were as follows:
Fund | | Tax
Cost | | | Tax
Unrealized
Gain | | | Tax
Unrealized
Loss | | | Net
Unrealized
Gain (Loss) | |
Nova Fund | | $ | 263,608,777 | | | $ | 3,794,005 | | | $ | (1,771,351 | ) | | $ | 2,022,654 | |
S&P 500® Fund | | | 198,383,994 | | | | 23,355,408 | | | | (1,126,261 | ) | | | 22,229,147 | |
Monthly Rebalance NASDAQ-100® 2x Strategy | | | 48,929,987 | | | | 1,283,852 | | | | (658,895 | ) | | | 624,957 | |
Inverse S&P 500® Strategy Fund | | | 131,915,078 | | | | 113,644 | | | | (25,235 | ) | | | 88,409 | |
NASDAQ-100® Fund | | | 571,633,461 | | | | 260,389,545 | | | | (4,091,089 | ) | | | 256,298,456 | |
Inverse NASDAQ-100® Strategy Fund | | | 11,535,066 | | | | 21,371 | | | | (195 | ) | | | 21,176 | |
Mid-Cap 1.5x Strategy Fund | | | 20,374,352 | | | | 1,258,138 | | | | (95,056 | ) | | | 1,163,082 | |
Inverse Mid-Cap Strategy Fund | | | 909,666 | | | | 1,401 | | | | — | | | | 1,401 | |
Russell 2000® 1.5x Strategy Fund | | | 9,512,268 | | | | 691,964 | | | | (152,540 | ) | | | 539,424 | |
Russell 2000® Fund | | | 38,130,038 | | | | 1,349,891 | | | | (560,843 | ) | | | 789,048 | |
Inverse Russell 2000® Strategy Fund | | | 8,148,612 | | | | 8,258 | | | | (580 | ) | | | 7,678 | |
Dow Jones Industrial Average Fund | | | 39,233,599 | | | | — | | | | (346,532 | ) | | | (346,532 | ) |
Government Long Bond 1.2x Strategy Fund | | | 87,125,358 | | | | — | | | | (2,345,651 | ) | | | (2,345,651 | ) |
Inverse Government Long Bond Strategy Fund | | | 279,217,897 | | | | 131,732 | | | | (24,509 | ) | | | 107,223 | |
High Yield Strategy Fund | | | 564,790,704 | | | | 176,109 | | | | (2,606 | ) | | | 173,503 | |
Inverse High Yield Strategy Fund | | | 24,896,324 | | | | 15,471 | | | | — | | | | 15,471 | |
U.S. Government Money Market Fund | | | 507,614,232 | | | | — | | | | — | | | | — | |
| | THE RYDEX FUNDS SEMI-ANNUAL REPORT | 193 |
NOTES TO FINANCIAL STATEMENTS (Unaudited)(continued) |
8. Securities Transactions
For the period ended September 30, 2016, the cost of purchases and proceeds from sales of investment securities, excluding government securities, short-term investments and derivatives, were as follows:
Fund | | Purchases | | | Sales | |
Nova Fund | | $ | 700,665,955 | | | $ | 686,213,444 | |
S&P 500® Fund | | | 130,618,643 | | | | 163,033,391 | |
Inverse S&P 500® Strategy Fund | | | 22,001,933 | | | | 101,534,904 | |
Monthly Rebalance NASDAQ-100® 2x Strategy Fund | | | 54,528,828 | | | | 11,511,562 | |
Inverse NASDAQ-100® Strategy Fund | | | 27,857,549 | | | | 32,097,837 | |
Mid-Cap 1.5x Strategy Fund | | | 31,327,968 | | | | 30,879,700 | |
Inverse Mid-Cap Strategy Fund | | | 526,638 | | | | 1,239,000 | |
Russell 2000® 1.5x Strategy Fund | | | 25,743,066 | | | | 26,026,702 | |
Russell 2000® Fund | | | 55,855,367 | | | | 43,518,318 | |
Inverse Russell 2000® Strategy Fund | | | 1,662,123 | | | | 10,577,977 | |
Dow Jones Industrial Average® Fund | | | 116,825,185 | | | | 125,668,460 | |
Government Long Bond 1.2x Strategy Fund | | | 62,858,440 | | | | 82,160,000 | |
Inverse Government Long Bond Strategy Fund | | | 98,283,820 | | | | 164,089,072 | |
High Yield Strategy Fund | | | 56,495,307 | | | | 394,732,450 | |
Inverse High Yield Strategy Fund | | | 12,511,053 | | | | 14,160,000 | |
U.S. Government Money Market Fund | | | — | | | | — | |
For the period ended September 30, 2016, the cost of purchases and proceeds from sales of government securities were as follows:
Fund | | Purchases | | | Sales | |
Government Long Bond 1.2x Strategy Fund | | $ | 951,177,953 | | | $ | 1,010,120,500 | |
Inverse Government Long Bond Strategy Fund | | | 1,378,203,609 | | | | 7,324,059,938 | |
The Funds are permitted to purchase or sell securities from or to certain affiliated funds under specified conditions outlined in procedures adopted by the Board of the Trust. The procedures have been designed to ensure that any purchase or sale of securities by a Fund from or to another fund or portfolio that is or could be considered an affiliate by virtue of having a common investment adviser (or affiliated investment advisers), common Trustees and/or common officers complies with Rule 17a-7 of the 1940 Act. Further, as defined under these procedures, each transaction is effected at the current market price to save costs, where permissible. For the period ended September 30, 2016, the Funds engaged in purchases and sales of securities, pursuant to Rule 17a-7 of the 1940 Act, as follows:
9. Affiliated Transactions
Investments representing 5% or more of the outstanding voting shares of a portfolio company of a fund, or control of or by, or common control under GI, result in that portfolio company being considered an affiliated company of such fund, as defined in the 1940 Act.
The Funds may invest in the Guggenheim Strategy Funds Trust consisting of Guggenheim Strategy Fund I, Guggenheim Strategy Fund II, Guggenheim Strategy Fund III, and Guggenheim Variable Insurance Strategy Fund III (collectively, the “Cash Management Funds”), open-end management investment companies managed by GI. The Cash Management Funds, which launched on March 11, 2014, are offered as cash management options only to mutual funds, trusts, and other accounts managed by GI and/or its affiliates, and are not available to the public. The Cash Management Funds pay no investment management fees. The Cash Management Funds’ annual report on Form N-CSR dated September 30, 2015, is available publicly or upon request. This information is available from the EDGAR database on the SEC’s website at http://www.sec.gov/Archives/edgar/data/1601445/000089180415000857/gug63224-ncsr.htm.
194 | THE RYDEX FUNDS SEMI-ANNUAL REPORT | |
NOTES TO FINANCIAL STATEMENTS (Unaudited)(continued) |
Transactions during the period ended September 30, 2016, in which the portfolio company is an “affiliated person,” were as follows:
Affiliated issuers by Fund | | Value
03/31/16 | | | Additions | | | Reductions | | | Value
09/30/16 | | | Shares
09/30/16 | | | Investment
Income | | | Realized
Gain (Loss) | |
Nova Fund | | | | | | | | | | | | | | | | | | | | | |
Guggenheim Strategy Fund I | | $ | 761,374 | | | $ | 58,305,132 | | | $ | (47,129,992 | ) | | $ | 12,044,643 | | | | 481,979 | | | $ | 109,845 | | | $ | 54,026 | |
Guggenheim Strategy Fund II | | | — | | | | 14,680,500 | | | | (4,202,000 | ) | | | 10,534,842 | | | | 422,407 | | | | 69,271 | | | | 686 | |
| | | $ | 761,374 | | | $ | 72,985,632 | | | $ | (51,331,992 | ) | | $ | 22,579,485 | | | | | | | $ | 179,116 | | | $ | 54,712 | |
| | | | | | | | | | | | | | | | | | | | | | | | | | | | | |
Inverse S&P 500® Strategy Fund | | | | | | | | | | | | | | | | | | | | | | | | | | | | |
Guggenheim Strategy Fund I | | $ | 57,103,957 | | | $ | 5,151,654 | | | $ | (54,050,000 | ) | | $ | 8,450,262 | | | | 338,146 | | | $ | 218,122 | | | $ | 69,676 | |
Guggenheim Strategy Fund II | | | — | | | | 9,350,204 | | | | (500,000 | ) | | | 8,900,469 | | | | 356,875 | | | | 64,289 | | | | 101 | |
| | | $ | 57,103,957 | | | $ | 14,501,858 | | | $ | (54,550,000 | ) | | $ | 17,350,731 | | | | | | | $ | 282,411 | | | $ | 69,777 | |
| | | | | | | | | | | | | | | | | | | | | | | | | | | | | |
Monthly Rebalance NASDAQ-100® 2x Strategy Fund | | | | | | | | | | | | | | | | | | | | | | | | | |
Guggenheim Strategy Fund I | | $ | 633,522 | | | $ | 2,919,752 | | | $ | (445,000 | ) | | $ | 3,114,537 | | | | 124,631 | | | $ | 7,867 | | | $ | 705 | |
Guggenheim Strategy Fund II | | | — | | | | 3,168,018 | | | | (58,000 | ) | | | 3,114,907 | | | | 124,896 | | | | 8,265 | | | | 51 | |
| | | $ | 633,522 | | | $ | 6,087,770 | | | $ | (503,000 | ) | | $ | 6,229,444 | | | | | | | $ | 16,132 | | | $ | 756 | |
| | | | | | | | | | | | | | | | | | | | | | | | | | | | | |
Inverse NASDAQ-100® Strategy Fund | | | | | | | | | | | | | | | | | | | | | | | | | | | | |
Guggenheim Strategy Fund I | | $ | 5,940,393 | | | $ | 22,699,746 | | | $ | (26,050,000 | ) | | $ | 2,614,361 | | | | 104,616 | | | $ | 39,022 | | | $ | 16,893 | |
Guggenheim Strategy Fund II | | | — | | | | 5,157,803 | | | | (2,550,000 | ) | | | 2,618,643 | | | | 104,998 | | | | 16,628 | | | | (786 | ) |
| | | $ | 5,940,393 | | | $ | 27,857,549 | | | $ | (28,600,000 | ) | | | 5,233,004 | | | | | | | $ | 55,650 | | | $ | 16,107 | |
| | | | | | | | | | | | | | | | | | | | | | | | | | | | | |
Mid-Cap 1.5x Strategy Fund | | | | | | | | | | | | | | | | | | | | | | | | | | | | |
Guggenheim Strategy Fund I | | $ | 1,948,249 | | | $ | 3,455,463 | | | $ | (3,280,000 | ) | | $ | 2,136,164 | | | | 85,481 | | | $ | 11,868 | | | $ | 3,390 | |
Guggenheim Strategy Fund II | | | — | | | | 2,411,045 | | | | (279,000 | ) | | | 2,138,806 | | | | 85,758 | | | | 8,525 | | | | 164 | |
| | | $ | 1,948,249 | | | $ | 5,866,508 | | | $ | (3,559,000 | ) | | $ | 4,274,970 | | | | | | | $ | 20,393 | | | $ | 3,554 | |
| | | | | | | | | | | | | | | | | | | | | | | | | | | | | |
Inverse Mid-Cap Strategy Fund | | | | | | | | | | | | | | | | | | | | | | | | | | | | |
Guggenheim Strategy Fund I | | $ | 980,068 | | | $ | 252,593 | | | $ | (1,100,000 | ) | | $ | 135,946 | | | | 5,440 | | | $ | 3,326 | | | $ | 466 | |
Guggenheim Strategy Fund II | | | — | | | | 274,045 | | | | (139,000 | ) | | | 135,813 | | | | 5,446 | | | | 994 | | | | 11 | |
| | | $ | 980,068 | | | $ | 526,638 | | | $ | (1,239,000 | ) | | $ | 271,759 | | | | | | | $ | 4,320 | | | $ | 477 | |
| | | | | | | | | | | | | | | | | | | | | | | | | | | | | |
Russell 2000® 1.5x Strategy Fund | | | | | | | | | | | | | | | | | | | | | | | | | | | | |
Guggenheim Strategy Fund I | | $ | 57,101 | | | $ | 4,843,937 | | | $ | (4,400,000 | ) | | $ | 507,856 | | | | 20,322 | | | $ | 6,661 | | | $ | 4,411 | |
Guggenheim Strategy Fund II | | | — | | | | 1,305,204 | | | | (800,000 | ) | | | 507,996 | | | | 20,369 | | | | 3,736 | | | | 525 | |
| | | $ | 57,101 | | | $ | 6,149,141 | | | $ | (5,200,000 | ) | | $ | 1,015,852 | | | | | | | $ | 10,397 | | | $ | 4,936 | |
| | | | | | | | | | | | | | | | | | | | | | | | | | | | | |
Inverse Russell 2000® Strategy Fund | | | | | | | | | | | | | | | | | | | | | | | | | | | | |
Guggenheim Strategy Fund I | | $ | 6,610,653 | | | $ | 611,919 | | | $ | (6,630,000 | ) | | $ | 609,191 | | | | 24,377 | | | $ | 15,740 | | | $ | 14,645 | |
Guggenheim Strategy Fund II | | | — | | | | 1,050,204 | | | | (450,000 | ) | | | 604,038 | | | | 24,220 | | | | 5,016 | | | | 242 | |
| | | $ | 6,610,653 | | | $ | 1,662,123 | | | $ | (7,080,000 | ) | | $ | 1,213,229 | | | | | | | $ | 20,756 | | | $ | 14,887 | |
| | | | | | | | | | | | | | | | | | | | | | | | | | | | | |
Dow Jones Industrial Average® Fund | | | | | | | | | | | | | | | | | | | | | | | | | | | | |
Guggenheim Strategy Fund I | | $ | 3,861,421 | | | $ | 3,407,058 | | | $ | (5,360,000 | ) | | $ | 1,922,170 | | | | 76,918 | | | $ | 15,660 | | | $ | 3,402 | |
Guggenheim Strategy Fund II | | | — | | | | 2,575,401 | | | | (660,000 | ) | | | 1,924,408 | | | | 77,162 | | | | 11,577 | | | | (153 | ) |
| | | $ | 3,861,421 | | | $ | 5,982,459 | | | $ | (6,020,000 | ) | | $ | 3,846,578 | | | | | | | $ | 27,237 | | | $ | 3,249 | |
| | | | | | | | | | | | | | | | | | | | | | | | | | | | | |
Government Long Bond 1.2x Strategy Fund | | | | | | | | | | | | | | | | | | | | | | | | | |
Guggenheim Strategy Fund I | | $ | 31,234,529 | | | $ | 39,811,023 | | | $ | (66,605,000 | ) | | $ | 4,545,237 | | | | 181,882 | | | $ | 88,815 | | | $ | 94,238 | |
Guggenheim Strategy Fund II | | | — | | | | 23,047,417 | | | | (15,555,000 | ) | | | 7,554,969 | | | | 302,926 | | | | 67,940 | | | | 15,695 | |
| | | $ | 31,234,529 | | | $ | 62,858,440 | | | $ | (82,160,000 | ) | | $ | 12,100,206 | | | | | | | $ | 156,755 | | | $ | 109,933 | |
| | | | | | | | | | | | | | | | | | | | | | | | | | | | | |
Inverse Government Long Bond Strategy Fund | | | | | | | | | | | | | | | | | | | | | | | | | |
Guggenheim Strategy Fund I | | $ | 40,271,414 | | | $ | 67,366,659 | | | $ | (95,680,000 | ) | | $ | 12,087,171 | | | | 483,680 | | | $ | 127,871 | | | $ | 54,094 | |
Guggenheim Strategy Fund II | | | — | | | | 30,917,160 | | | | (20,425,000 | ) | | | 10,579,660 | | | | 424,204 | | | | 108,235 | | | | 29,806 | |
| | | $ | 40,271,414 | | | $ | 98,283,819 | | | $ | (116,105,000 | ) | | $ | 22,666,831 | | | | | | | $ | 236,106 | | | $ | 83,900 | |
| | THE RYDEX FUNDS SEMI-ANNUAL REPORT | 195 |
NOTES TO FINANCIAL STATEMENTS (Unaudited)(continued) |
Affiliated issuers by Fund | | Value
03/31/16 | | | Additions | | | Reductions | | | Value
09/30/16 | | | Shares
09/30/16 | | | Investment
Income | | | Realized
Gain (Loss) | |
High Yield Strategy Fund | | | | | | | | | | | | | | | | | | | | | |
Guggenheim Strategy Fund I | | $ | 169,920,842 | | | $ | 16,744,106 | | | $ | (174,877,987 | ) | | $ | 12,063,914 | | | | 482,750 | | | $ | 254,434 | | | $ | 342,654 | |
Guggenheim Strategy Fund II | | | 57,405,255 | | | | 5,314,414 | | | | (52,404,000 | ) | | | 10,581,556 | | | | 424,281 | | | | 241,734 | | | | 226,365 | |
Guggenheim Strategy Fund III | | | — | | | | 6,001,000 | | | | — | | | | 6,037,272 | | | | 241,684 | | | | 42,476 | | | | — | |
| | | $ | 227,326,097 | | | $ | 28,059,520 | | | $ | (227,281,987 | ) | | $ | 28,682,742 | | | | | | | $ | 538,644 | | | $ | 569,019 | |
| | | | | | | | | | | | | | | | | | | | | | | | | | | | | |
Inverse High Yield Strategy Fund | | | | | | | | | | | | | | | | | | | | | | | | | | | | |
Guggenheim Strategy Fund I | | $ | 2,056,929 | | | $ | 7,105,041 | | | $ | (7,950,000 | ) | | $ | 1,224,497 | | | | 48,999 | | | $ | 13,401 | | | $ | 6,161 | |
Guggenheim Strategy Fund II | | | 2,033,059 | | | | 5,406,012 | | | | (6,210,000 | ) | | | 1,246,572 | | | | 49,983 | | | | 16,662 | | | | 8,009 | |
| | | $ | 4,089,988 | | | $ | 12,511,053 | | | $ | (14,160,000 | ) | | $ | 2,471,069 | | | | | | | $ | 30,063 | | | $ | 14,170 | |
10. Line of Credit
The Trust, along with other affiliated trusts, secured an uncommitted $75,000,000 line of credit from U.S. Bank, N.A., which expires June 11, 2017. This line of credit is reserved for emergency or temporary purposes. Borrowings, if any, under this arrangement bear interest equal to the Prime Rate, minus 2%, which shall be paid monthly, averaging 1.25% for the period ended September 30, 2016. The Funds did not have any borrowings outstanding under this agreement at September 30, 2016.
The average daily balances borrowed for the period ended September 30, 2016, were as follows:
Fund | | Average Daily Balance | |
Nova Fund | | $ | 99,785 | |
Inverse NASDAQ-100® Strategy Fund | | | 12,006 | |
Mid Cap 1.5x Strategy Fund | | | 439 | |
Russell 2000® 1.5X Strategy Fund | | | 8,287 | |
Russell 2000® Fund | | | 21,148 | |
Dow Jones Industrial Average® Fund | | | 1,522 | |
Government Long Bond 1.2x Strategy Fund | | | 279,693 | |
Inverse Government Long Bond Strategy Fund | | | 144,977 | |
High Yield Strategy Fund | | | 65,948 | |
U.S. Government Money Market Fund | | | 222,610 | |
11. Conversion of Advisor Class Shares and Class H Shares
Effective following the close of business on September 30, 2015, all outstanding Advisor Class shares of the Nova Fund, Inverse S&P 500® Strategy Fund, Inverse NASDAQ-100® Strategy Fund, Government Long Bond 1.2x Strategy Fund and Inverse Government Long Bond Strategy Fund converted into Class H shares of the Funds and the Funds no longer offer Advisor Class shares. The conversion of all outstanding Advisor Class shares was effected by exchanging shareholders Advisor Class shares for Class H shares. Advisor Class shareholders of the Funds received Class H shares of the Fund with a value equal to the value of their investment in Advisor Class shares of the Funds on September 30, 2015.
12. Subsequent Event
Reverse Share Splits
Share splits occurred for the following Funds at the close of business:
Fund | Effective Date | Split Type |
Inverse S&P 500® Strategy Fund | October 28, 2016 | One-for-Six Reverse Share Split |
Inverse NASDAQ-100® Strategy Fund | November 4, 2016 | One-for-Four Reverse Share Split |
Inverse High Yield Strategy Fund | November 4, 2016 | One-for-Four Reverse Share Split |
196 | THE RYDEX FUNDS SEMI-ANNUAL REPORT | |
NOTES TO FINANCIAL STATEMENTS (Unaudited)(continued) |
The effect of these transactions was to multiply the number of outstanding shares of the to divide the number of outstanding shares of the Inverse S&P 500® Strategy Fund, Inverse NASDAQ-100® Strategy Fund and the Inverse High Yield Strategy Fund by their respective reverse split ratio, resulting in a corresponding increase in the NAV. The share transactions presented in the statements of changes in net assets and the per share data in the financial highlights for each of the periods presented through September 30, 2016, have been restated to reflect these respective share splits. There were no changes in net assets, results of operations or total return as a result of these transactions.
Portfolio Securities Loaned
Effective October 6, 2016, each Fund may lend portfolio securities to certain creditworthy borrowers, including the Funds’ securities lending agent. The loans would be collateralized at all times by cash and/or high grade debt obligations in an amount at least equal to 102% of the market value of securities loaned as determined at the close of business on the preceding business day. The cash collateral received would be held in a separately managed account established for each respective Fund and maintained by the lending agent exclusively for the investment of securities lending cash collateral on behalf of each Fund. The separately managed accounts will invest in short-term investments valued at amortized cost, which approximates market value. Each Fund will receive compensation for lending securities from interest or dividends earned on the cash, cash equivalents or U.S. government securities held as collateral, net of fee rebates paid to the borrower plus reasonable administrative and custody fees paid to the lending agent. Such compensation will be accrued daily and payable to the Fund monthly. The dividend and interest income earned on the securities loaned will be accounted for in the same manner as other dividend and interest income. The borrower will pay to the Funds an amount equal to any dividends or interest received on loaned securities. These payments from the borrower are not eligible for reduced tax rates as “qualified dividend income” under the Jobs and Growth Tax Reconciliation Act of 2003. The Funds would retain all or a portion of the interest received on investment of cash collateral or receives a fee from the borrower.
Although the collateral mitigates risk, the Funds could experience a delay in recovering its securities and a possible loss of income or value if the borrower fails to return the securities. The Funds have the right under the securities lending agreement to recover the securities from the borrower on demand.
13. Legal Proceedings
Tribune Company
Rydex Series Funds has been named as a defendant and a putative member of the proposed defendant class of shareholders in the case entitled Kirschner v. FitzSimons, No. 12-2652 (S.D.N.Y.) (formerly Official Committee of Unsecured Creditors of Tribune Co. v. FitzSimons, Adv. Pro. No. 10-54010 (Bankr. D. Del.)) (the “FitzSimons action”), as a result of ownership by certain series of the Rydex Series Funds of shares in the Tribune Company (“Tribune”) in 2007, when Tribune effected a leveraged buyout transaction (“LBO”) by which Tribune converted to a privately-held company. In his complaint, the plaintiff has alleged that, in connection with the LBO, Tribune insiders and shareholders were overpaid for their Tribune stock using financing that the insiders knew would, and ultimately did, leave Tribune insolvent. The plaintiff has asserted claims against certain insiders, major shareholders, professional advisers, and others involved in the LBO. The plaintiff is also attempting to obtain from former Tribune shareholders, including the Rydex Series Funds, the proceeds they received in connection with the LBO.
In June 2011, a group of Tribune creditors filed multiple actions against former Tribune shareholders involving state law constructive fraudulent conveyance claims arising out of the 2007 LBO (the “SLCFC actions”). Rydex Series Funds has been named as a defendant in one or more of these suits. In those actions, the creditors seek to recover from Tribune’s former shareholders the proceeds received in connection with the 2007 LBO.
The FitzSimons action and the SLCFC actions have been consolidated with the majority of the other Tribune LBO-related lawsuits in a multidistrict litigation proceeding captioned In re Tribune Company Fraudulent Conveyance Litig., No. 11-md-2696 (S.D.N.Y.) (the “MDL Proceeding”).
On September 23, 2013, the District Court granted the defendants’ omnibus motion to dismiss the SLCFC actions, on the basis that the creditors lacked standing. On September 30, 2013, the creditors filed a notice of appeal of the September 23 order. On October 28, 2013, the defendants filed a joint notice of cross-appeal of that same order.
On March 29, 2016, the U.S. Court of Appeals for the Second Circuit issued its opinion on the appeal of the SLCFC actions. The appeals court affirmed the district court’s dismissal of those lawsuits, but on different grounds than the district court. The appeals court held that while the plaintiffs have standing under the U.S. Bankruptcy Code, their claims were preempted by Section 546(e) of the Bankruptcy Code—the statutory safe harbor for settlement payments. On April 12, 2016, the Plaintiffs in the SLCFC actions filed a petition seeking rehearing en banc before the appeals court. On July 22, 2016,
| | THE RYDEX FUNDS SEMI-ANNUAL REPORT | 197 |
NOTES TO FINANCIAL STATEMENTS (Unaudited)(continued) |
the appeals court denied the petition. On September 9, 2016, the plaintiffs filed a petition for writ of certiorari in the U.S. Supreme Court challenging the Second Circuit’s decision that the safe harbor of Section 546(e) applied to their claims. The shareholder defendants, including the Funds, filed a joint brief in opposition to the petition for certiorari on October 24, 2016. The Supreme Court has not yet granted or denied the petition for certiorari.
On May 23, 2014, the defendants filed motions to dismiss the FitzSimons action, including a global motion to dismiss Count I, which is the claim brought against former Tribune shareholders for intentional fraudulent conveyance under U.S. federal law. The Court has not yet issued a decision on any of these motions.
None of these lawsuits alleges any wrongdoing on the part of Rydex Series Funds. The following series of Rydex Series Funds held shares of Tribune and tendered these shares as part of Tribune’s LBO: Nova Fund, S&P 500® Pure Value Fund, Multi-Cap Core Equity Fund, S&P 500® Fund, Multi-Hedge Strategies Fund and Hedged Equity Fund (the “Funds”). The value of the proceeds received by the foregoing Funds was $28,220, $109,242, $9,860, $3,400, $1,181,160, and $10,880, respectively. At this stage of the proceedings, Rydex Series Funds is not able to make a reliable predication as to the outcome of these lawsuits or the effect, if any, on a Fund’s net asset value.
Lyondell Chemical Company
In December 2011, Rydex Series Funds was named as a defendant in Weisfelner, as Trustee of the LB Creditor Trust, v. Fund 1 (In re Lyondell Chemical Co.), Adv. Pro. No. 10-4609 (Bankr. S.D.N.Y.) (the “Creditor Trust Action”). Its funds may also be putative members of the proposed defendant classes in Weisfelner, as Trustee of the LB Litigation Trust v. A. Holmes & H. Holmes TTEE (In re Lyondell Co.), Adv. Pro. No. 10-5525 (Bankr. S.D.N.Y.) (the “Litigation Trust Action”) and Weisfelner, as Trustee of the LB Creditor Trust, v. Reichman (In re Lyondell Chemical Co.), Adv. Pro. No. 12-1570 (Bankr. S.D.N.Y.).
Similar to the claims made in the Tribune matter, the Weisfelner complaints seek to have set aside and recovered as fraudulent transfers from former Lyondell Chemical Company (“Lyondell”) shareholders the consideration paid to them pursuant to the cash out merger of Lyondell shareholders in connection with the combination of Lyondell and Basell AF in 2007. Lyondell filed for bankruptcy in 2008. The Creditor Trust Action and Reichman allege claims against the former Lyondell shareholders under state law for both constructive fraudulent transfer and intentional fraudulent transfer. The Litigation Trust Action alleges a claim against the former Lyondell shareholders under federal law for intentional fraudulent transfer.
On April 7, 2014, the plaintiff filed a Third Amended Complaint in the Creditor Trust Action, a Second Amended Complaint in the Litigation Trust Action, and an Amended Complaint in Reichman.
On May 8, 2014, the plaintiff in the Litigation Trust Action filed a motion to certify a defendant class generally comprised of all former Lyondell shareholders that received proceeds in exchange for their shares in the 2007 merger transaction.
On July 30, 2014, the defendants filed a motion to dismiss these lawsuits. The Bankruptcy Court held oral argument on the motion to dismiss and on the motion for class certification on January 14 and January 15, 2015. On September 15, 2015, the Bankruptcy Court denied the motion for class certification without prejudice to the plaintiff’s right to file a renewed motion. On November 18, 2015, the Bankruptcy Court granted the defendants’ motion to dismiss the intentional fraudulent transfer claims in the Creditor Trust Action, the Litigation Trust Action, and in Reichman, but denied the motion to dismiss the constructive fraudulent transfer claims in the Creditor Trust Action and in Reichman. The Bankruptcy Court entered final judgment dismissing the Litigation Trust Action, but the plaintiff appealed the dismissal to the U.S. District Court for the Southern District of New York.
On July 27, 2016, the District Court reversed the Bankruptcy Court and reinstated the federal law intentional fraudulent transfer claim in the Litigation Trust Action and remanded to the Bankruptcy Court for further proceedings. The District Court found that the fraudulent intent that mattered was that of Lyondell’s CEO, not its board, because the CEO’s intent could be imputed to Lyondell under Delaware law agency principles. The District Court did note, however, that plaintiff faces a high standard for proving “actual intent” to harm creditors, and that it remains to be seen whether plaintiff will be able to make this showing. On August 11, 2016, the shareholder defendants filed a motion for reconsideration and/or to certify an interlocutory appeal of the District Court’s opinion. On October 5, 2016, the District Court denied the motion for reconsideration and/or to certify an interlocutory appeal. In light of this ruling, the federal intentional fraudulent conveyance claim will move forward before the Bankruptcy Court, but a schedule for that case has not yet been set.
198 | THE RYDEX FUNDS SEMI-ANNUAL REPORT | |
NOTES TO FINANCIAL STATEMENTS (Unaudited)(concluded) |
On May 4, 2016, the defendants filed a motion to dismiss, or in the alternative, for a stay of, the Creditor Trust Action and Reichman in light of the U.S. Court of Appeals for the Second Circuit’s opinion in the appeal of the Tribune SLCFC actions. On July 20, 2016, the Bankruptcy Court issued a report and recommendation granting the defendants’ motion to dismiss. The U.S. District Court for the Southern District of New York has not yet accepted the Bankruptcy Court’s recommendation or entered a final judgment.
These lawsuits do not allege any wrongdoing on the part of Rydex Series Funds. The following series of Rydex Series Funds received cash proceeds from the cash out merger in the following amounts: Basic Materials Fund - $1,725,168; Long Short Equity Fund f/k/a U.S. Long Short Momentum Fund - $2,193,600; Global 130/30 Strategy Fund - $37,920; Hedged Equity Fund - $1,440; and Multi-Hedge Strategies Fund - $1,116,480. At this stage of the proceedings, Rydex Series Funds is not able to make a reliable predication as to the outcome of these lawsuits or the effect, if any, on a Fund’s net asset value.
| | THE RYDEX FUNDS SEMI-ANNUAL REPORT | 199 |
OTHER INFORMATION (Unaudited) |
Proxy Voting Information
A description of the policies and procedures that the Trust uses to determine how to vote proxies relating to securities held in the Funds’ portfolios is available, without charge and upon request, by calling 800.820.0888. This information is also available from the EDGAR database on the SEC’s website at https://www.sec.gov.
Information regarding how the Funds voted proxies relating to portfolio securities during the most recent 12-month period ended June 30 is available without charge, upon request, by calling 800.820.0888. This information is also available from the EDGAR database on the SEC’s website at https://www.sec.gov.
Sector Classification
Information in the Schedule of Investments is categorized by sectors using sector-level Classifications defined by the Bloomberg Industry Classification System, a widely recognized industry classification system provider. Each Fund’s registration statement has investment policies relating to concentration in specific sectors/industries. For purposes of these investment policies, the Funds usually classify sectors/industries based on industry-level Classifications used by widely recognized industry classification system providers such as Bloomberg Industry Classification System, Global Industry Classification Standards and Barclays Global Classification Scheme.
Quarterly Portfolio Schedules Information
The Trust files its complete schedule of portfolio holdings with the SEC for the first and third quarters of each fiscal year on Form N-Q, which are available on the SEC’s website at https://www.sec.gov. The Funds’ Forms N-Q may be reviewed and copied at the SEC’s Public Reference Room in Washington, DC, and that information on the operation of the Public Reference Room may be obtained by calling 800-SEC-0330. Copies of the portfolio holdings are also available to shareholders, without charge and upon request, by calling 800.820.0888.
Board Considerations in Approving the Continuation of the Investment Advisory Agreement
The Board of Trustees (the “Board”) of Rydex Series Funds (the “Trust”), including the Trustees who are not “interested persons,” as defined by the Investment Company Act of 1940, of the Trust (“Independent Trustees”), attended an in-person meeting held on May 19, 2016, called for the purpose of, among other things, the consideration of, and voting on, the approval and continuation of the investment advisory agreement (the “Investment Advisory Agreement”) between the Trust and the Advisor applicable to each series of the Trust (each, a “Fund” and, collectively, the “Funds”). The Board unanimously approved the continuation of the Investment Advisory Agreement for an additional one-year period based on the Board’s review of qualitative and quantitative information provided by the Advisor. The Board had previously considered information pertaining to the renewal of the Investment Advisory Agreement at an in-person meeting held on April 26, 2016 (together, with the May 19 meeting, the “Meetings”).
Prior to reaching the conclusion to approve the continuation of the Investment Advisory Agreement, the Independent Trustees requested and obtained from the Advisor such information as the Independent Trustees deemed reasonably necessary to evaluate the Investment Advisory Agreement. In addition, the Board received a memorandum from Fund counsel regarding the responsibilities of the Board with respect to the approval of investment advisory agreements and participated in question and answer sessions with representatives of the Advisor. The Independent Trustees also carefully considered information that they had received throughout the year as part of their regular oversight of the Funds. At the Meetings, the Board obtained and reviewed a wide variety of information, including certain comparative information regarding the Funds’ fees, expenses, and performance relative to the fees, expenses, and performance of other comparable funds (the “FUSE reports”). The Independent Trustees carefully evaluated this information, met in executive session outside the presence of fund management, and were advised by independent legal counsel with respect to their deliberations.
At the Meetings, the Board, including the Independent Trustees, evaluated a number of factors, including among others: (a) the nature, extent and quality of the Advisor’s investment advisory and other services; (b) the Advisor’s investment management personnel; (c) the Advisor’s operations and financial condition; (d) the Advisor’s brokerage practices (including any soft dollar arrangements) and the variety and complexity of its investment strategies; (e) a comparison of the Funds’ advisory fees to the advisory fees charged to comparable funds or accounts, giving special attention to the existence of economies of scale and the absence of breakpoints in these fees and the Advisor’s rationale for not providing for breakpoints at this point in time; (f) each Fund’s overall fees and operating expenses compared with those of similar funds; (g) the level of the Advisor’s profitability from its Fund-related operations; (h) the Advisor’s compliance processes and systems; (i) the Advisor’s compliance
200 | THE RYDEX FUNDS SEMI-ANNUAL REPORT | |
OTHER INFORMATION (Unaudited)(continued) |
policies and procedures; (j) the Advisor’s reputation, expertise and resources in the financial markets; and (k) Fund performance compared with that of similar funds and/or appropriate benchmarks. In its deliberations, the Trustees did not identify any single piece of information that was all-important or controlling, noting that each Trustee could attribute different weights to the various factors considered.
Based on the Board’s deliberations at the Meetings, the Board, including all of the Independent Trustees, unanimously: (a) concluded that the terms of the Investment Advisory Agreement are fair and reasonable; (b) concluded that the Advisor’s fees are reasonable in light of the services that it provides to the Funds; and (c) agreed to approve and continue the Investment Advisory Agreement based upon the following considerations, among others:
| | ● | Nature, Extent and Quality of Services Provided by the Advisor. The Board evaluated, among other things, the Advisor’s business, financial resources, quality and quantity of personnel, experience, past performance, the variety and complexity of its investment strategies (including the extent to which the Funds use derivatives), Fund risk management process, brokerage practices, and the adequacy of its compliance systems and processes, proxy voting policies and practices, and cybersecurity programs. The Board reviewed the scope of services to be provided by the Advisor under the Investment Advisory Agreement and noted that there would be no significant differences between the scope of services required to be provided by the Advisor for the past year and the scope of services required to be provided during the upcoming year. The Board also considered the Advisor’s representations to the Board that the Advisor would continue to provide investment and related services that were of materially the same quality and quantity as services provided to the Funds in the past, and whether these services are appropriate in scope and extent in light of the Funds’ operations, the competitive landscape of the investment company business and investor needs. Based on the foregoing, the Trustees determined that the approval of the Investment Advisory Agreement would enable shareholders of the Funds to receive high quality services at a cost that was appropriate and reasonable. |
| | ● | Fund Expenses and Performance of the Funds and the Advisor. The Board reviewed statistical information provided by the Advisor regarding the expense ratio components and performance of each Fund. The Advisor engaged FUSE Research Network LLC (“FUSE”), an independent, third party research provider, to prepare reports to help the Board compare the Funds’ fees, expenses, and total return performance with those of a peer group and peer universe of funds selected by FUSE. In the reports, each Fund’s expense ratio components, including actual advisory fees, waivers/reimbursements, and gross and net total expenses, are compared to those of other funds with shared key characteristics (e.g., asset size, fee structure, sector or industry investment focus) determined by FUSE to comprise a Fund’s applicable peer group. The Board considered the Advisor’s representation that it found the peer groups compiled by FUSE to be appropriate, but also acknowledged the existence of certain differences between the Funds and their peer funds (e.g., specific differences in principal investment strategies and, if applicable, tradability) that should be reviewed in context. With respect to tradability, in particular, the Board considered that non-tradable funds incur lower expense ratios than tradable funds because non-tradable funds experience less shareholder activity and lower transaction volumes than tradable funds. The statistical information related to the performance of each Fund included three-month and one-, three-, and five-year performance for the Fund compared to that of its peers. Based on the foregoing, the Board determined that the proposed advisory fees paid by the Funds are reasonable in relation to the nature and quality of the services provided by the Advisor. |
| | ● | Costs of Services Provided to the Funds and Profits Realized by the Advisor and its Affiliates. The Board reviewed information about the profitability of the Funds to the Advisor based on the advisory fees payable under the current Investment Advisory Agreement for the last calendar year. The Board analyzed the Funds’ expenses, including the investment advisory fees paid to the Advisor, and reviewed the FUSE reports. The Board also reviewed information regarding the direct revenue received by the Advisor and ancillary revenue, if any, received by the Advisor and/or its affiliates in connection with the services provided to the Funds by the Advisor and/or its affiliates. The Board also discussed the Advisor’s profit margin, including the expense allocation methodology used in the Advisor’s profitability analysis. Based on the foregoing, the Board determined that the profit to the Advisor on the fees paid by the Funds is not excessive in view of the nature and quality of the services provided by the Advisor. |
| | ● | Economies of Scale. The Board considered the absence of breakpoints in the Advisor’s fee schedule and reviewed information regarding the extent to which economies of scale or other efficiencies may result from increases in the Funds’ asset levels. In light of the relatively small size of many of the Funds and the fact that the size of individual Funds in the complex often increase and decrease significantly due to the unlimited trading that is permitted among most of the Funds in the complex, the Board concluded that the Funds have not yet achieved sufficient asset levels to realize meaningful economies of scale. The Board noted that it intends to continue to monitor fees as each Fund grows in size and assess whether fee breakpoints may be warranted. |
| | THE RYDEX FUNDS SEMI-ANNUAL REPORT | 201 |
OTHER INFORMATION (Unaudited)(concluded) |
| | ● | Other Benefits to the Advisor and/or its Affiliates. In addition to evaluating the Advisor’s services, the Board considered the nature and amount of other benefits to be received by the Advisor and its affiliates as a result of their relationship with the Fund, including any soft dollar usage by the Advisor and any intangible benefits. In particular, the Board considered the nature, extent, quality, and cost of certain administrative, distribution, and shareholder services performed by the Advisor’s affiliates under separate agreements and the Distribution and Shareholders Services Plan pursuant to Rule 12b-1 of the 1940 Act. In light of the costs of providing services pursuant to the separate agreements as well as the Advisor’s and its affiliates’ commitment to the Funds, the Board concluded the ancillary benefits the Advisor and its affiliates received were reasonable. |
On the basis of the information provided to it and its evaluation of that information, the Board, including the Independent Trustees, concluded that the terms of the Investment Advisory Agreement were reasonable, and that approval of the continuation of the Investment Advisory Agreement was in the best interests of the Funds and their shareholders.
202 | THE RYDEX FUNDS SEMI-ANNUAL REPORT | |
INFORMATION ON BOARD OF TRUSTEES AND OFFICERS (Unaudited) |
A Board of Trustees oversees the Trust, as well as other trusts of GI, in which its members have no stated term of service, and continue to serve after election until resignation. The Statement of Additional Information includes further information about Fund Trustees and Officers, and can be obtained without charge by visiting guggenheiminvestments.com or by calling 800.820.0888.
Name, Address*
and Year of Birth
of Trustee | Position(s) Held with the
Trust, Term of Office and
Length of Time Served | Principal Occupation(s)
During Past 5 Years | Number of
Portfolios in
Fund Complex
Overseen
by Trustee*** | Other
Directorships
Held by
Trustee**** |
INTERESTED TRUSTEE | | | |
Donald C. Cacciapaglia**
(1951) | Trustee from 2012 to present. | Current: President and CEO, certain other funds in the Fund Complex (2012-present); Vice Chairman, Guggenheim Investments (2010-present). Former: Chairman and CEO, Channel Capital Group, Inc. (2002-2010). | 232 | Clear Spring Life Insurance Company (2015-present); Guggenheim Partners Japan, Ltd. (2014-present); Guggenheim Partners Investment Management Holdings, LLC (2014-present); Delaware Life (2013-present); Guggenheim Life and Annuity Company (2011-present); Paragon Life Insurance Company of Indiana (2011-present). |
INDEPENDENT TRUSTEES | | | |
Angela Brock-Kyle*****
(1959) | Trustee from August 2016 to present. | Current: Founder and Chief Executive Officer, B.O.A.R.D.S (consulting firm). Former: Senior Leader, TIAA (financial services firm) (1987-2012). | 135 | Infinity Property & Casualty Corporation (2014-present). |
Corey A. Colehour
(1945) | Trustee from 1993 to present; Member of the Audit Committee from 1994 to present; Member of the Governance Committee from 2014 to present; and Member of the Investment and Performance Committee from 2014 to present. | Retired. | 135 | None. |
J. Kenneth Dalton
(1941) | Trustee from 1995 to present; Chairman and Member of the Audit Committee from 1997 to present; and Member of the Compliance and Risk Oversight Committee from 2010 to present. | Retired. | 135 | Epiphany Funds (4) (2009-present). |
| | THE RYDEX FUNDS SEMI-ANNUAL REPORT | 203 |
INFORMATION ON BOARD OF TRUSTEES AND OFFICERS (Unaudited)(continued) |
Name, Address*
and Year of Birth
of Trustee | Position(s) Held with the
Trust, Term of Office and
Length of Time Served | Principal Occupation(s)
During Past 5 Years | Number of
Portfolios in
Fund Complex
Overseen
by Trustee*** | Other
Directorships
Held by
Trustee**** |
INDEPENDENT TRUSTEES - concluded | | | |
John O. Demaret
(1940) | Vice Chairman of the Board from 2014 to present (Chairman of the Board from 2006 to 2014); Trustee and Member of the Audit Committee from 1997 to present; Chairman (since 2014) and Member of the Compliance and Risk Oversight Committee from 2010 to present; Chairman and Member of the Investment and Performance Committee from 2014 to present; and Member of the Nominating Committee from 2014 to present. | Retired. | 135 | None. |
Werner E. Keller
(1940) | Chairman of the Board from 2014 to present (Vice Chairman of the Board from 2010 to 2014); Trustee and Member of the Audit Committee from 2005 to present; and Member of the Investment and Performance Committee from 2014 to present. | Current: Founder and President, Keller Partners, LLC (investment research firm) (2005-present). | 135 | None. |
Thomas F. Lydon, Jr.
(1960) | Trustee and Member of the Audit Committee from 2005 to present; Member of the Nominating Committee from 2005 to present; and Member of the Governance Committee from 2007 to present. | Current: President, Global Trends Investments (registered investment adviser) (1996-present). | 135 | US Global Investors (GROW) (1995-present). |
Patrick T. McCarville
(1942) | Trustee from 1997 to present; Member of the Audit Committee from 1997 to present; Chairman and Member of the Nominating Committee from 2004 to present; Chairman and Member of the Governance Committee from 2007 to present; and Member of the Compliance and Risk Oversight Committee from 2014 to present. | Retired. Former: Chief Executive Officer, Par Industries, Inc., d/b/a Par Leasing (1977-2010). | 135 | None. |
Sandra G. Sponem*****
(1958) | Trustee from August 2016 to present. | Current: Senior Vice President and Chief Financial Officer, M.A. Mortenson Companies, Inc. (general contracting firm) (2007-present). | 135 | None. |
204 | THE RYDEX FUNDS SEMI-ANNUAL REPORT | |
INFORMATION ON BOARD OF TRUSTEES AND OFFICERS (Unaudited)(continued) |
Name, Address*
and Year of Birth | Position(s) Held with the
Trust, Term of Office and
Length of Time Served | Principal Occupation(s)
During Past 5 Years |
OFFICERS | | |
Donald C. Cacciapaglia
(1951) | President (2012-present). | Current: President and CEO, certain other funds in the Fund Complex (2012-present); Vice Chairman, Guggenheim Investments (2010-present). Former: Chairman and CEO, Channel Capital Group Inc. (2002-2010). |
Michael P. Byrum
(1970) | Vice President (1999-present). | Current: Senior Vice President, Security Investors, LLC (2010-present); President and Chief Investment Officer, Rydex Holdings, LLC (2008-present); Director and Chairman, Advisory Research Center, Inc. (2006-present); Manager, Guggenheim Specialized Products, LLC (2005-present). Former: Vice President, Guggenheim Distributors, LLC (2009); Director (2009-2010) and Secretary (2002-2010), Rydex Fund Services, LLC; Director (2008-2010), Chief Investment Officer (2006-2010), President (2004-2010) and Secretary (2002-2010), Rydex Advisors, LLC; Director (2008-2010), Chief Investment Officer (2006-2010), President (2004-2010) and Secretary (2002-2010), Rydex Advisors II, LLC. |
Elisabeth Miller
(1968) | Chief Compliance Officer (2012-present). | Current: CCO, certain other funds in the Fund Complex (2012-present); CCO, Security Investors, LLC (2012-present); CCO, Guggenheim Funds Investment Advisors, LLC (2012-present); Managing Director, Guggenheim Investments (2012-present); Vice President, Guggenheim Funds Distributors, LLC (2014-present). Former: CCO, Guggenheim Distributors, LLC (2009-2014); Senior Manager, Security Investors, LLC (2004-2009); Senior Manager, Guggenheim Distributors, LLC (2004-2009). |
Amy J. Lee
(1961) | Vice President (2009-present) and Secretary (2012-present). | Current: Chief Legal Officer, certain other funds in the Fund Complex (2013-present); Senior Managing Director, Guggenheim Investments (2012-present). Former: Vice President, Associate General Counsel and Assistant Secretary, Security Benefit Life Insurance Company and Security Benefit Corporation (2004-2012). |
James M. Howley (1972) | Assistant Treasurer (2016-present) | Current: Director, Guggenheim Investments (2004-present); Assistant Treasurer, certain other funds in the Fund Complex (2006-present). Former: Manager, Mutual Fund Administration of Van Kampen Investments, Inc. (1996-2004). |
| | THE RYDEX FUNDS SEMI-ANNUAL REPORT | 205 |
INFORMATION ON BOARD OF TRUSTEES AND OFFICERS (Unaudited)(concluded) |
Name, Address*
and Year of Birth | Position(s) Held with the
Trust, Term of Office and
Length of Time Served | Principal Occupation(s)
During Past 5 Years |
OFFICERS - concluded | | |
Keith D. Kemp
(1960) | Assistant Treasurer (2016-present). | Current: Managing Director of Transparent Value, LLC (2015-present); Managing Director of Guggenheim Investments (2015-present). Former: Director, Transparent Value, LLC (2010-2015); Director, Guggenheim Investments (2010-2015); Chief Operating Officer, Macquarie Capital Investment Management (2007-2009). |
Glenn McWhinnie (1969) | Assistant Treasurer (2016-present). | Current: Vice President, Guggenheim Investments (2009-present). Former: Tax Compliance Manager, Ernst & Young LLP (1996-2009). |
Adam J. Nelson (1979) | Assistant Treasurer (2016-present). | Current: Vice President, Guggenheim Investments (2015-present); Assistant Treasurer, certain other funds in the Fund Complex (2015-present). Former: Assistant Vice President and Fund Administration Director, State Street Corporation (2013-2015); Fund Administration Assistant Director, State Street (2011-2013); Fund Administration Manager, State Street (2009-2011). |
Kimberly J. Scott (1974) | Assistant Treasurer (2016-present). | Current: Vice President, Guggenheim Investments (2012-present); Assistant Treasurer, certain other funds in the Fund Complex (2012-present). Former: Financial Reporting Manager, Invesco, Ltd. (2010-2011); Vice President/Assistant Treasurer, Mutual Fund Administration for Van Kampen Investments, Inc./Morgan Stanley Investment Management (2009-2010); Manager of Mutual Fund Administration, Van Kampen Investments, Inc./Morgan Stanley Investment Management (2005-2009). |
John L. Sullivan (1955) | Chief Financial Officer and Treasurer (2016-present). | Current: CFO, Chief Accounting Officer and Treasurer, certain other funds in the Fund Complex (2010-present); Senior Managing Director, Guggenheim Investments (2010-present). Former: Managing Director and CCO, each of the funds in the Van Kampen Investments fund complex (2004-2010); Managing Director and Head of Fund Accounting and Administration, Morgan Stanley Investment Management (2002-2004); CFO and Treasurer, Van Kampen Funds (1996-2004). |
* | All Trustees and Officers may be reached c/o Guggenheim Investments, 227 West Monroe Street, Chicago, Illinois 60606. |
** | Mr. Cacciapaglia is an “interested” person of the Trust, as that term is defined in the 1940 Act by virtue of his affiliation with the Adviser’s parent company. |
*** | The “Fund Complex” includes all closed-end and open-end funds (including all of their portfolios) advised by the Adviser and any funds that have an investment adviser or servicing agent that is an affiliated person of the Adviser. Information provided is as of the date of this report. |
**** | Some of the Trustees may serve as directors on the boards of companies not required to be disclosed above, including certain non-profit companies and charitable foundations. |
***** | Mses. Brock-Kyle and Sponem commenced serving as independent Trustees effective August 18, 2016. |
206 | THE RYDEX FUNDS SEMI-ANNUAL REPORT | |
GUGGENHEIM INVESTMENTS PRIVACY POLICIES (Unaudited) |
Guggenheim Investments as used herein refers to Guggenheim Partners, LLC, Guggenheim Funds Investment Advisors, LLC, Guggenheim Partners Investment Management, LLC, Guggenheim Funds Distributors, LLC and Security Investors, LLC as well as the funds in the Guggenheim Funds complex (the “funds”).
Our Commitment to You
When you become a Guggenheim Investments investor, you entrust us with not only your hard-earned money but also with personal and financial information about you. We recognize that your relationship with us is based on trust and that you expect us to act responsibly and in your best interests. Because we have access to personal information about you, we hold ourselves to high standards in its safekeeping and use. This means, most importantly, that we do not sell client or account information to anyone—whether you are a current or former Guggenheim Investments client.
The Information We Collect About You and How We Collect It
In the course of doing business with shareholders and investors, we collect nonpublic personal information about you. You typically provide personal information when you complete a Guggenheim Investments account application or when you request a transaction that involves Rydex and Guggenheim Funds or one of the Guggenheim affiliated companies. “Nonpublic personal information” is personally identifiable information about you. For example it includes your name and address, Social Security or taxpayer identification number, assets, income, account balance, bank account information and investment activity (e.g. purchase and redemption history).
How We Share Your Personal Information
As a matter of policy, we do not disclose your nonpublic personal information to nonaffiliated third parties except as required or permitted by law. As emphasized above, we do not sell information about current or former clients or their accounts to third parties. Nor do we share such information, except when necessary to complete transactions at your request or to make you aware of related investment products and services that we offer. Additional details about how we handle your personal information are provided below.
To complete certain transactions or account changes that you direct, it may be necessary to provide your personal information to companies, individuals or groups that are not affiliated with Guggenheim Investments. For example if you ask to transfer assets from another financial institution to Guggenheim Investments, we will need to provide certain information about you to that company to complete the transaction. In connection with servicing your accounts or to alert you to other Guggenheim Investments investment products and services, we may share your information within the Guggenheim Investments family of affiliated companies. This would include, for example, sharing your information within Guggenheim Investments so we can make you aware of new funds or the services offered through another Guggenheim Investments affiliated company. In certain instances, we may contract with nonaffiliated companies to perform services for us. Where necessary, we will disclose information we have about you to these third parties. In all such cases, we provide the third party with only the information necessary to carry out its assigned responsibilities and only for that purpose. And we require these third parties to treat your personal information with the same high degree of confidentiality that we do. In certain instances, we may share information with other financial institutions regarding individuals and entities in response to the U.S.A. Patriot Act. Finally we will share personal information about you if we are compelled by law to do so, if you direct us to do so with your consent, or in other circumstances as permitted by law.
How We Safeguard Your Personal Information
We maintain physical, electronic and procedural safeguards to protect your personal information. Within Guggenheim Investments, access to such information is limited to those who need it to perform their jobs such as servicing your account, resolving problems or informing you of new products and services.
| | THE RYDEX FUNDS SEMI-ANNUAL REPORT | 207 |
This page intentionally left blank.
This page intentionally left blank.
This page intentionally left blank.
This page intentionally left blank.
This page intentionally left blank.
This page intentionally left blank.
9.30.2016
Rydex Funds Semi-Annual Report
Domestic Equity Funds | | |
S&P 500® Pure Growth Fund | | |
S&P 500® Pure Value Fund | | |
S&P MidCap 400® Pure Growth Fund | | |
S&P MidCap 400® Pure Value Fund | | |
S&P SmallCap 600® Pure Growth Fund | | |
S&P SmallCap 600® Pure Value Fund | | |
International Equity Funds |
Europe 1.25x Strategy Fund |
Japan 2x Strategy Fund |
Specialty Funds |
Strengthening Dollar 2x Strategy Fund |
Weakening Dollar 2x Strategy Fund |
GuggenheimInvestments.com | RBENF2-SEMI-0916x0317 |
DEAR SHAREHOLDER | 2 |
ECONOMIC AND MARKET OVERVIEW | 3 |
A BRIEF NOTE ON THE COMPOUNDING OF RETURNS | 4 |
ABOUT SHAREHOLDERS’ FUND EXPENSES | 5 |
S&P 500® PURE GROWTH FUND | 8 |
S&P 500® PURE VALUE FUND | 15 |
S&P MIDCAP 400® PURE GROWTH FUND | 22 |
S&P MIDCAP 400® PURE VALUE FUND | 29 |
S&P SMALLCAP 600® PURE GROWTH FUND | 36 |
S&P SMALLCAP 600® PURE VALUE FUND | 44 |
EUROPE 1.25x STRATEGY FUND | 52 |
JAPAN 2x STRATEGY FUND | 59 |
STRENGTHENING DOLLAR 2x STRATEGY FUND | 65 |
WEAKENING DOLLAR 2x STRATEGY FUND | 72 |
NOTES TO FINANCIAL STATEMENTS | 79 |
OTHER INFORMATION | 92 |
INFORMATION ON BOARD OF TRUSTEES AND OFFICERS | 95 |
GUGGENHEIM INVESTMENTS PRIVACY POLICIES | 99 |
| | THE RYDEX FUNDS SEMI-ANNUAL REPORT | 1 |
Dear Shareholder:
Security Investors, LLC (the “Investment Adviser”) is pleased to present the semi-annual shareholder report for a selection of our Funds (the “Funds”) for the six-month period ended September 30, 2016.
The Investment Adviser is part of Guggenheim Investments, which represents the investment management businesses of Guggenheim Partners, LLC (“Guggenheim”), a global, diversified financial services firm.
Guggenheim Funds Distributors, LLC is the distributor of the Funds. Guggenheim Funds Distributors, LLC is affiliated with Guggenheim and the Investment Adviser.
We encourage you to read the Economic and Market Overview section of the report, which follows this letter.
We are committed to providing innovative investment solutions and appreciate the trust you place in us.
Sincerely,

Donald C. Cacciapaglia
President and Chief Executive Officer
October 31, 2016
Read a prospectus and summary prospectus (if available) carefully before investing. It contains the investment objectives, risks, charges, expenses, and other information, which should be considered carefully before investing. Obtain a prospectus and summary prospectus (if available) at guggenheiminvestments.com or call 800.820.0888.
There can be no assurance that any investment product will achieve its investment objective(s). There are risks associated with investing, including the entire loss of principal invested. Investing involves market risks. The investment return and principal value of any investment product will fluctuate with changes in market conditions.
2 | THE RYDEX FUNDS SEMI-ANNUAL REPORT | |
ECONOMIC AND MARKET OVERVIEW (Unaudited) | September 30, 2016 |
Economic growth continues to rebound, even though the rise in U.S. Gross Domestic Product (“GDP”) disappointed in the first half of 2016. There was a large headwind from inventory drawdowns, which should soon reverse after five quarters of dragging on growth. Real GDP growth is expected to be around 2.5 percent in the second half of the year, driven by consumption, housing, and a fading trade drag, and supporting the view that U.S. economic growth remains resilient to global weakness.
The euro zone economy is slowly improving, but inflation will likely persist well below the European Central Bank’s (“ECB”) target in the coming quarters due to substantial slack. The ECB has indicated that more quantitative easing is possible, but will soon need to alter the quantitative easing program in order to keep up their purchase pace. Both China and Japan need weaker currencies. Chinese growth and capital flows have stabilized for now, but surging construction and a credit boom raise the prospect of future instability. Japan’s economic prospects are weak, and inflation remains far from the Bank of Japan’s (“BOJ”) target. The surging yen could drive further policy easing, including an increase in fiscal stimulus.
It appears the U.S. Federal Reserve (the “Fed”) will move forward with raising rates in December, absent any economic or geopolitical surprise or a meaningful tightening of financial conditions over the fourth quarter. But key events could influence risk asset performance for the balance of the year: A continued recovery in oil prices following the Organization of Petroleum Exporting Countries (“OPEC”) agreement to keep production between 32.5 to 33 million barrels per day would help sustain the rally (although we are skeptical that they will adhere to any quota based on historical production levels). Global oil inventories remain high, but supply and demand are moving toward balance. A rebound in GDP growth would also lift U.S. equity and corporate bond prices higher.
The macroeconomic picture remains the same; we are not on the verge of a recession. But despite our positive outlook on the U.S. economy, valuations across risk assets argue for caution. Ongoing accommodation from central bankers across the globe has alleviated much of the initial macroeconomic tail risk posed by Brexit but may not be enough to dampen the seasonal volatility typically observed in the fourth quarter. Ongoing troubles in the banking sector, such as the woes afflicting Deutsche Bank and Wells Fargo, coupled with uncertainty surrounding upcoming political events, which include the U.S. presidential election, the Italian constitutional referendum, and key European elections, may create volatility for risk assets for the balance of the year.
For the six months ended September 30, 2016, the Standard & Poor’s 500® (“S&P 500®”) Index* returned 6.40%. The MSCI Europe-Australasia-Far East (“EAFE”) Index* returned 4.88%. The return of the MSCI Emerging Markets Index* was 9.75%.
In the bond market, the Bloomberg Barclays U.S. Aggregate Bond Index* posted a 2.68% return for the period, while the Bloomberg Barclays U.S. Corporate High Yield Index* returned 11.38%. The return of the Bank of America (“BofA”) Merrill Lynch 3-Month U.S. Treasury Bill Index* was 0.17% for the six-month period.
The opinions and forecasts expressed may not actually come to pass. This information is subject to change at any time, based on market and other conditions, and should not be construed as a recommendation of any specific security or strategy.
*Index Definitions:
The following indices are referenced throughout this report. Indices are unmanaged and not available for direct investment. Index performance does not reflect transaction costs, fees, or expenses.
BofA Merrill Lynch 3-Month U.S. Treasury Bill Index is an unmanaged market Index of U.S. Treasury securities maturing in 90 days that assumes reinvestment of all income.
Bloomberg Barclays U.S. Aggregate Bond Index is a broad-based flagship benchmark that measures the investment grade, U.S. dollar denominated, fixed-rate taxable bond market, including U.S. Treasuries, government-related and corporate securities, mortgage-backed securities or “MBS” (agency fixed-rate and hybrid adjustable-rate mortgage, or “ARM”, pass-throughs), asset-backed securities (“ABS”), and commercial mortgage-backed securities (“CMBS”) (agency and non-agency).
Bloomberg Barclays U.S. Corporate High Yield Index measures the U.S. dollar denominated, high yield, fixed-rate corporate bond market. Securities are classified as high yield if the middle rating of Moody’s, Fitch, and S&P is Ba1/BB +/BB + or below.
MSCI EAFE Index is a capitalization-weighted measure of stock markets in Europe, Australasia, and the Far East.
MSCI Emerging Markets Index is a free float-adjusted market capitalization-weighted index that is designed to measure equity market performance in the global emerging markets.
S&P 500® Indexis a broad-based index, the performance of which is based on the performance of 500 widely held common stocks chosen for market size, liquidity, and industry group representation.
| | THE RYDEX FUNDS SEMI-ANNUAL REPORT | 3 |
A BRIEF NOTE ON THE COMPOUNDING OF RETURNS (Unaudited) | |
Many of the Funds described in this report are benchmarked daily to leveraged and/or inverse leveraged versions of published indices. To properly evaluate the performance of these funds, it is essential to understand the effect of mathematical compounding on their respective returns.
Because of the nonlinear effects of leverage applied over time, it is possible for a fund to perform in line with its benchmark for several individual periods in a row, yet seem to trail the benchmark over the entire period. It is also possible that a fund that performs in-line with its benchmark on a daily basis may seem to outperform its benchmark over longer periods.
An Example of Compounding
For example, consider a hypothetical fund that is designed to produce returns that correspond to 150% of an index. On the first day of a period, the index rises from a level of 100 to a level of 106, producing a 6.0% gain and an expectation that the fund will rise by 9.0%. On the same day, the fund’s net asset value per share (“NAV”) increases from $10.00 to $10.90 for a gain of 9.0% — in line with its benchmark.
On day two, assume the index falls from 106 to 99 for a loss of about 6.6%. The fund, as expected, falls 9.9% to a price of $9.82. On each day, the fund performed exactly in line with its benchmark, but for the two-day period, the fund was down 1.8%, while the index was down only 1.0%. Without taking into account the daily compounding of returns, one would expect the fund to lose 1.5% and would see the fund as trailing by 0.3% when in fact it had performed perfectly. This example is summarized in the table below.
| | Index
Level | Index
Performance | Fund
Expectation | Fund
NAV | Fund
Performance | Assessment |
Start | 100 | | | $ 10.00 | | |
Day 1 | 106 | 6.0% | 9.0% | $ 10.90 | 9.0% | In line |
Day 2 | 99 | -6.6% | -9.9% | $ 9.82 | -9.9% | In line |
Cumulative | | -1.0% | -1.5% | | -1.8% | -0.3% |
As illustrated by this simple example, the effect of leverage can make it difficult to form expectations or judgments about fund performance given only the returns of the unleveraged index.
Because certain funds seek to track the performance of their benchmark on a daily basis, mathematical compounding, especially with respect to those funds that use leverage as part of their investment strategy, may prevent a fund from correlating with the monthly, quarterly, annual or other period performance of its benchmark. Due to the compounding of daily returns, leveraged and inverse funds’ returns over periods other than one day will likely differ in amount and possibly direction from the benchmark return for the same period. Investors should monitor their leveraged and inverse funds’ holdings consistent with their strategies, as frequently as daily. For those funds that consistently apply leverage, the value of the fund’s shares will tend to increase or decrease more than the value of any increase or decrease in its benchmark index. For more on correlation, leverage and other risks, please read the prospectus.
In general, any change in direction in an index will produce compounding that seems to work against an investor. Were the index to move in the same direction (either up or down) for two or more periods in a row, the compounding of those returns would work in an investor’s favor, causing the fund to seemingly beat its benchmark.
As a general rule of thumb, more leverage in a fund will magnify the compounding effect, while less leverage will generally produce results that are more in line with expectations. In addition, periods of high volatility in an underlying index will also cause the effects of compounding to be more pronounced, while lower volatility will produce a more muted effect.
4 | THE RYDEX FUNDS SEMI-ANNUAL REPORT | |
ABOUT SHAREHOLDERS’ FUND EXPENSES (Unaudited) | |
All mutual funds have operating expenses, and it is important for our shareholders to understand the impact of costs on their investments. Shareholders of a fund incur two types of costs: (i) transaction costs, including sales charges (loads) on purchase payments, reinvested dividends, other distributions, and exchange fees, and (ii) ongoing costs, including management fees, administrative services, and shareholder reports, among others. These ongoing costs, or operating expenses, are deducted from a fund’s gross income and reduce the investment return of the fund.
A fund’s expenses are expressed as a percentage of its average net assets, which is known as the expense ratio. The following examples are intended to help investors understand the ongoing costs (in dollars) of investing in a fund and to compare these costs with the ongoing costs of investing in other mutual funds.
The examples are based on an investment of $1,000 made at the beginning of the period and held for the entire six-month period beginning March 31, 2016 and ending September 30, 2016.
The following tables illustrate the Funds’ costs in two ways:
Table 1. Based on actual Fund return: This section helps investors estimate the actual expenses paid over the period. The “Ending Account Value” shown is derived from the Fund’s actual return, and the fifth column shows the dollar amount that would have been paid by an investor who started with $1,000 in the Fund. Investors may use the information here, together with the amount invested, to estimate the expenses paid over the period. Simply divide the Fund’s account value by $1,000 (for example, an $8,600 account value divided by $1,000 = 8.6), then multiply the result by the number provided under the heading “Expenses Paid During Period.”
Table 2. Based on hypothetical 5% return: This section is intended to help investors compare a Fund’s cost with those of other mutual funds. The table provides information about hypothetical account values and hypothetical expenses based on the Fund’s actual expense ratio and an assumed rate of return of 5% per year before expenses, which is not the Fund’s actual return. The hypothetical account values and expenses may not be used to estimate the actual ending account balance or expenses paid during the period. The example is useful in making comparisons because the U.S. Securities and Exchange Commission (the “SEC”) requires all mutual funds to calculate expenses based on the 5% return. Investors can assess a Fund’s costs by comparing this hypothetical example with the hypothetical examples that appear in shareholder reports of other funds.
The calculations illustrated above assume no shares were bought or sold during the period. Actual costs may have been higher or lower, depending on the amount of investment and the timing of any purchases or redemptions.
Please note that the expenses shown in the table are meant to highlight your ongoing costs only and do not reflect any transactional costs, such as sales charges (loads) on purchase payments, and contingent deferred sales charges (“CDSC”) on redemptions, if any. Therefore, the second table is useful in comparing ongoing costs only, and will not help you determine the relative total costs of owning different funds. In addition, if these transactional costs were included, your costs would have been higher.
More information about the Funds’ expenses, including annual expense ratios for periods up to five years (subject to the Fund’s inception date), can be found in the Financial Highlights section of this report. For additional information on operating expenses and other shareholder costs, please refer to the appropriate Fund prospectus.
| | THE RYDEX FUNDS SEMI-ANNUAL REPORT | 5 |
ABOUT SHAREHOLDERS’ FUND EXPENSES (Unaudited)(continued) | |
| | Expense
Ratio1 | Fund
Return | Beginning
Account Value
March 31, 2016 | Ending
Account Value
September 30, 2016 | Expenses
Paid During
Period2 |
Table 1. Based on actual Fund return3 | |
S&P 500® Pure Growth Fund | | | | | |
A-Class | 1.52% | 5.43% | $ 1,000.00 | $ 1,054.30 | $ 7.83 |
C-Class | 2.27% | 5.02% | 1,000.00 | 1,050.20 | 11.67 |
H-Class | 1.52% | 5.43% | 1,000.00 | 1,054.30 | 7.83 |
S&P 500® Pure Value Fund | | | | | |
A-Class | 1.52% | 4.78% | 1,000.00 | 1,047.80 | 7.80 |
C-Class | 2.27% | 4.38% | 1,000.00 | 1,043.80 | 11.63 |
H-Class | 1.52% | 4.78% | 1,000.00 | 1,047.80 | 7.80 |
S&P MidCap 400® Pure Growth Fund | | | | |
A-Class | 1.52% | 2.60% | 1,000.00 | 1,026.00 | 7.72 |
C-Class | 2.27% | 2.22% | 1,000.00 | 1,022.20 | 11.51 |
H-Class | 1.52% | 2.60% | 1,000.00 | 1,026.00 | 7.72 |
S&P MidCap 400® Pure Value Fund | | | | |
A-Class | 1.52% | 8.23% | 1,000.00 | 1,082.30 | 7.93 |
C-Class | 2.27% | 7.83% | 1,000.00 | 1,078.30 | 11.83 |
H-Class | 1.52% | 8.23% | 1,000.00 | 1,082.30 | 7.93 |
S&P SmallCap 600® Pure Growth Fund | | | | |
A-Class | 1.52% | 12.03% | 1,000.00 | 1,120.30 | 8.08 |
C-Class | 2.27% | 11.61% | 1,000.00 | 1,116.10 | 12.04 |
H-Class | 1.52% | 12.03% | 1,000.00 | 1,120.30 | 8.08 |
S&P SmallCap 600® Pure Value Fund | | | | |
A-Class | 1.52% | 8.29% | 1,000.00 | 1,082.90 | 7.94 |
C-Class | 2.27% | 7.89% | 1,000.00 | 1,078.90 | 11.83 |
H-Class | 1.52% | 8.19% | 1,000.00 | 1,081.90 | 7.93 |
Europe 1.25x Strategy Fund | | | | | |
A-Class | 1.68% | 2.30% | 1,000.00 | 1,023.00 | 8.52 |
C-Class | 2.43% | 2.01% | 1,000.00 | 1,020.10 | 12.31 |
H-Class | 1.68% | 2.17% | 1,000.00 | 1,021.70 | 8.51 |
Japan 2x Strategy Fund | | | | | |
A-Class | 1.51% | 20.15% | 1,000.00 | 1,201.50 | 8.33 |
C-Class | 2.26% | 19.72% | 1,000.00 | 1,197.20 | 12.45 |
H-Class | 1.51% | 20.11% | 1,000.00 | 1,201.10 | 8.33 |
Strengthening Dollar 2x Strategy Fund | | | | |
A-Class | 1.71% | 1.17% | 1,000.00 | 1,011.70 | 8.62 |
C-Class | 2.46% | 0.80% | 1,000.00 | 1,008.00 | 12.38 |
H-Class | 1.71% | 1.18% | 1,000.00 | 1,011.80 | 8.62 |
Weakening Dollar 2x Strategy Fund | | | | |
A-Class | 1.71% | (2.87%) | 1,000.00 | 971.30 | 8.45 |
C-Class | 2.46% | (3.32%) | 1,000.00 | 966.80 | 12.13 |
H-Class | 1.71% | (2.95%) | 1,000.00 | 970.50 | 8.45 |
6 | THE RYDEX FUNDS SEMI-ANNUAL REPORT | |
ABOUT SHAREHOLDERS’ FUND EXPENSES (Unaudited)(concluded) | |
| | Expense
Ratio1 | Fund
Return | Beginning
Account Value
March 31, 2016 | Ending
Account Value
September 30, 2016 | Expenses
Paid During
Period2 |
Table 2. Based on hypothetical 5% return (before expenses) | | | |
S&P 500® Pure Growth Fund | | | | | |
A-Class | 1.52% | 5.00% | $ 1,000.00 | $ 1,017.45 | $ 7.69 |
C-Class | 2.27% | 5.00% | 1,000.00 | 1,013.69 | 11.46 |
H-Class | 1.52% | 5.00% | 1,000.00 | 1,017.45 | 7.69 |
S&P 500® Pure Value Fund | | | | | |
A-Class | 1.52% | 5.00% | 1,000.00 | 1,017.45 | 7.69 |
C-Class | 2.27% | 5.00% | 1,000.00 | 1,013.69 | 11.46 |
H-Class | 1.52% | 5.00% | 1,000.00 | 1,017.45 | 7.69 |
S&P MidCap 400® Pure Growth Fund | | | | | |
A-Class | 1.52% | 5.00% | 1,000.00 | 1,017.45 | 7.69 |
C-Class | 2.27% | 5.00% | 1,000.00 | 1,013.69 | 11.46 |
H-Class | 1.52% | 5.00% | 1,000.00 | 1,017.45 | 7.69 |
S&P MidCap 400® Pure Value Fund | | | | | |
A-Class | 1.52% | 5.00% | 1,000.00 | 1,017.45 | 7.69 |
C-Class | 2.27% | 5.00% | 1,000.00 | 1,013.69 | 11.46 |
H-Class | 1.52% | 5.00% | 1,000.00 | 1,017.45 | 7.69 |
S&P SmallCap 600® Pure Growth Fund | | | | | |
A-Class | 1.52% | 5.00% | 1,000.00 | 1,017.45 | 7.69 |
C-Class | 2.27% | 5.00% | 1,000.00 | 1,013.69 | 11.46 |
H-Class | 1.52% | 5.00% | 1,000.00 | 1,017.45 | 7.69 |
S&P SmallCap 600® Pure Value Fund | | | | | |
A-Class | 1.52% | 5.00% | 1,000.00 | 1,017.45 | 7.69 |
C-Class | 2.27% | 5.00% | 1,000.00 | 1,013.69 | 11.46 |
H-Class | 1.52% | 5.00% | 1,000.00 | 1,017.45 | 7.69 |
Europe 1.25x Strategy Fund | | | | | |
A-Class | 1.68% | 5.00% | 1,000.00 | 1,016.65 | 8.49 |
C-Class | 2.43% | 5.00% | 1,000.00 | 1,012.89 | 12.26 |
H-Class | 1.68% | 5.00% | 1,000.00 | 1,016.65 | 8.49 |
Japan 2x Strategy Fund | | | | | |
A-Class | 1.51% | 5.00% | 1,000.00 | 1,017.50 | 7.64 |
C-Class | 2.26% | 5.00% | 1,000.00 | 1,013.74 | 11.41 |
H-Class | 1.51% | 5.00% | 1,000.00 | 1,017.50 | 7.64 |
Strengthening Dollar 2x Strategy Fund | | | | | |
A-Class | 1.71% | 5.00% | 1,000.00 | 1,016.50 | 8.64 |
C-Class | 2.46% | 5.00% | 1,000.00 | 1,012.73 | 12.41 |
H-Class | 1.71% | 5.00% | 1,000.00 | 1,016.50 | 8.64 |
Weakening Dollar 2x Strategy Fund | | | | | |
A-Class | 1.71% | 5.00% | 1,000.00 | 1,016.50 | 8.64 |
C-Class | 2.46% | 5.00% | 1,000.00 | 1,012.73 | 12.41 |
H-Class | 1.71% | 5.00% | 1,000.00 | 1,016.50 | 8.64 |
1 | Annualized and excludes expenses of the underlying funds in which the Funds invest. |
2 | Expenses are equal to the Fund's annualized expense ratio, net of any applicable fee waivers, multiplied by the average account value over the period, multiplied by 183/365 (to reflect the one-half year period). |
3 | Actual cumulative return at net asset value for the period March 31, 2016 to September 30, 2016. |
| | THE RYDEX FUNDS SEMI-ANNUAL REPORT | 7 |
FUND PROFILE (Unaudited) | September 30, 2016 |
S&P 500® PURE GROWTH FUND
OBJECTIVE: Seeks to provide investment results that match, before fees and expenses, the performance of a benchmark for large-cap growth securities on a daily basis. The Fund’s current benchmark is the S&P 500® Pure Growth Index (the “underlying index”).
Holdings Diversification (Market Exposure as % of Net Assets)
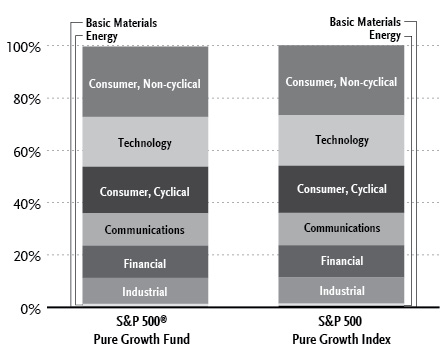
“Holdings Diversification (Market Exposure as % of Net Assets)” excludes any temporary cash investments.
Inception Dates: |
A-Class | September 1, 2004 |
C-Class | February 20, 2004 |
H-Class | February 20, 2004 |
Ten Largest Holdings (% of Total Net Assets) |
Facebook, Inc. — Class A | 2.0% |
NVIDIA Corp. | 1.9% |
Electronic Arts, Inc. | 1.9% |
Constellation Brands, Inc. — Class A | 1.8% |
Centene Corp. | 1.8% |
Broadcom Ltd. | 1.8% |
Amazon.com, Inc. | 1.8% |
Activision Blizzard, Inc. | 1.6% |
Ulta Salon Cosmetics & Fragrance, Inc. | 1.4% |
O’Reilly Automotive, Inc. | 1.3% |
Top Ten Total | 17.3% |
| | |
“Ten Largest Holdings” excludes any temporary cash investments. |
8 | THE RYDEX FUNDS SEMI-ANNUAL REPORT | |
SCHEDULE OF INVESTMENTS (Unaudited) | September 30, 2016 |
S&P 500® PURE GROWTH FUND | |
| | | Shares | | | Value | |
| | | | | | | |
COMMON STOCKS† - 99.6% | |
| | | | | | | |
Consumer, Non-cyclical - 26.8% | |
Constellation Brands, Inc. — Class A | | | 10,305 | | | $ | 1,715,679 | |
Centene Corp.* | | | 25,300 | | | | 1,694,088 | |
Edwards Lifesciences Corp.* | | | 9,020 | | | | 1,087,450 | |
S&P Global, Inc. | | | 8,590 | | | | 1,087,150 | |
Hologic, Inc.* | | | 26,100 | | | | 1,013,463 | |
Global Payments, Inc. | | | 13,000 | | | | 997,880 | |
Aetna, Inc. | | | 8,585 | | | | 991,138 | |
Regeneron Pharmaceuticals, Inc.* | | | 2,324 | | | | 934,294 | |
Mondelez International, Inc. — Class A | | | 21,173 | | | | 929,495 | |
Total System Services, Inc. | | | 18,807 | | | | 886,750 | |
Equifax, Inc. | | | 6,500 | | | | 874,770 | |
Cigna Corp. | | | 6,700 | | | | 873,144 | |
Boston Scientific Corp.* | | | 36,237 | | | | 862,441 | |
Biogen, Inc.* | | | 2,603 | | | | 814,817 | |
Gilead Sciences, Inc. | | | 10,282 | | | | 813,512 | |
Avery Dennison Corp. | | | 9,497 | | | | 738,772 | |
AmerisourceBergen Corp. — Class A | | | 8,770 | | | | 708,441 | |
Reynolds American, Inc. | | | 14,857 | | | | 700,508 | |
Celgene Corp.* | | | 6,410 | | | | 670,037 | |
Coty, Inc. — Class A* | | | 28,100 | | | | 660,350 | |
Monster Beverage Corp.* | | | 4,496 | | | | 660,058 | |
Illumina, Inc.* | | | 3,551 | | | | 645,075 | |
Laboratory Corporation of America Holdings* | | | 4,450 | | | | 611,786 | |
Hormel Foods Corp. | | | 15,688 | | | | 595,046 | |
Cintas Corp. | | | 5,230 | | | | 588,898 | |
Verisk Analytics, Inc. — Class A* | | | 6,890 | | | | 560,019 | |
Moody’s Corp. | | | 4,903 | | | | 530,897 | |
Alexion Pharmaceuticals, Inc.* | | | 3,763 | | | | 461,118 | |
CR Bard, Inc. | | | 1,930 | | | | 432,860 | |
Becton Dickinson and Co. | | | 2,300 | | | | 413,379 | |
Dr Pepper Snapple Group, Inc. | | | 3,300 | | | | 301,323 | |
Allergan plc* | | | 1,132 | | | | 260,711 | |
Total Consumer, Non-cyclical | | | | | | | 25,115,349 | |
| | | | | | | | | |
Technology - 19.1% | |
NVIDIA Corp. | | | 25,983 | | | | 1,780,355 | |
Electronic Arts, Inc.* | | | 20,487 | | | | 1,749,589 | |
Broadcom Ltd. | | | 9,765 | | | | 1,684,658 | |
Activision Blizzard, Inc. | | | 33,702 | | | | 1,492,999 | |
salesforce.com, Inc.* | | | 16,590 | | | | 1,183,364 | |
Skyworks Solutions, Inc. | | | 14,712 | | | | 1,120,172 | |
Lam Research Corp. | | | 10,442 | | | | 988,962 | |
Red Hat, Inc.* | | | 12,189 | | | | 985,237 | |
Fiserv, Inc.* | | | 8,186 | | | | 814,261 | |
Applied Materials, Inc. | | | 25,980 | | | | 783,297 | |
Cognizant Technology Solutions Corp. — Class A* | | | 15,366 | | | | 733,112 | |
Microchip Technology, Inc. | | | 11,191 | | | | 695,409 | |
Citrix Systems, Inc.* | | | 8,108 | | | | 690,964 | |
Qorvo, Inc.* | | | 10,544 | | | | 587,723 | |
Apple, Inc. | | | 5,085 | | | | 574,859 | |
Cerner Corp.* | | | 7,598 | | | | 469,177 | |
Akamai Technologies, Inc.* | | | 8,173 | | | | 433,087 | |
Accenture plc — Class A | | | 3,400 | | | | 415,378 | |
Microsoft Corp. | | | 6,800 | | | | 391,680 | |
Paychex, Inc. | | | 6,279 | | | | 363,366 | |
Total Technology | | | | | | | 17,937,649 | |
| | | | | | | | | |
Consumer, Cyclical - 17.7% | |
Ulta Salon Cosmetics & Fragrance, Inc.* | | | 5,400 | | | | 1,285,092 | |
O’Reilly Automotive, Inc.* | | | 4,401 | | | | 1,232,764 | |
DR Horton, Inc. | | | 36,700 | | | | 1,108,340 | |
Dollar Tree, Inc.* | | | 11,970 | | | | 944,792 | |
Starbucks Corp. | | | 16,700 | | | | 904,138 | |
AutoZone, Inc.* | | | 1,150 | | | | 883,591 | |
Lennar Corp. — Class A | | | 18,845 | | | | 797,897 | |
LKQ Corp.* | | | 22,500 | | | | 797,850 | |
Alaska Air Group, Inc. | | | 11,200 | | | | 737,632 | |
Home Depot, Inc. | | | 5,650 | | | | 727,042 | |
Advance Auto Parts, Inc. | | | 4,575 | | | | 682,224 | |
Lowe’s Companies, Inc. | | | 8,750 | | | | 631,838 | |
Mohawk Industries, Inc.* | | | 3,100 | | | | 621,054 | |
NIKE, Inc. — Class B | | | 11,600 | | | | 610,740 | |
Ross Stores, Inc. | | | 8,950 | | | | 575,485 | |
Under Armour, Inc. — Class A* | | | 12,890 | | | | 498,585 | |
Southwest Airlines Co. | | | 11,842 | | | | 460,535 | |
Signet Jewelers Ltd. | | | 6,100 | | | | 454,633 | |
Under Armour, Inc. — Class C* | | | 13,003 | | | | 440,282 | |
Chipotle Mexican Grill, Inc. — Class A* | | | 1,010 | | | | 427,735 | |
Tractor Supply Co. | | | 6,300 | | | | 424,305 | |
Newell Brands, Inc. | | | 7,180 | | | | 378,099 | |
TJX Companies, Inc. | | | 4,700 | | | | 351,466 | |
Delphi Automotive plc | | | 4,400 | | | | 313,808 | |
Hanesbrands, Inc. | | | 11,300 | | | | 285,325 | |
Total Consumer, Cyclical | | | | | | | 16,575,252 | |
| | | | | | | | | |
Communications - 12.5% | |
Facebook, Inc. — Class A* | | | 14,717 | | | | 1,887,750 | |
Amazon.com, Inc.* | | | 2,000 | | | | 1,674,621 | |
Expedia, Inc. | | | 10,489 | | | | 1,224,276 | |
VeriSign, Inc.* | | | 13,705 | | | | 1,072,279 | |
Netflix, Inc.* | | | 10,149 | | | | 1,000,184 | |
Priceline Group, Inc.* | | | 631 | | | | 928,510 | |
eBay, Inc.* | | | 23,958 | | | | 788,218 | |
TripAdvisor, Inc.* | | | 11,930 | | | | 753,737 | |
Alphabet, Inc. — Class A* | | | 702 | | | | 564,450 | |
Alphabet, Inc. — Class C* | | | 687 | | | | 533,998 | |
Walt Disney Co. | | | 5,000 | | | | 464,300 | |
Juniper Networks, Inc. | | | 17,146 | | | | 412,533 | |
Discovery Communications, Inc. — Class C* | | | 10,000 | | | | 263,100 | |
Discovery Communications, Inc. — Class A* | | | 5,870 | | | | 158,020 | |
Total Communications | | | | | | | 11,725,976 | |
| | | | | | | | | |
Financial - 12.3% | |
XL Group Ltd. | | | 30,100 | | | | 1,012,263 | |
Extra Space Storage, Inc. | | | 11,400 | | | | 905,274 | |
Visa, Inc. — Class A | | | 10,082 | | | | 833,781 | |
Prologis, Inc. | | | 15,536 | | | | 831,797 | |
SEE NOTES TO FINANCIAL STATEMENTS. | THE RYDEX FUNDS SEMI-ANNUAL REPORT | 9 |
SCHEDULE OF INVESTMENTS (Unaudited)(concluded) | September 30, 2016 |
S&P 500® PURE GROWTH FUND | |
| | | Shares | | | Value | |
| | | | | | | |
Equity Residential | | | 12,205 | | | $ | 785,148 | |
Intercontinental Exchange, Inc. | | | 2,840 | | | | 764,982 | |
E*TRADE Financial Corp.* | | | 22,304 | | | | 649,492 | |
Kimco Realty Corp. | | | 22,147 | | | | 641,156 | |
Equinix, Inc. | | | 1,776 | | | | 639,804 | |
Mastercard, Inc. — Class A | | | 6,006 | | | | 611,231 | |
CBRE Group, Inc. — Class A* | | | 21,727 | | | | 607,921 | |
Public Storage | | | 2,500 | | | | 557,850 | |
UDR, Inc. | | | 14,621 | | | | 526,210 | |
American Tower Corp. — Class A | | | 4,294 | | | | 486,639 | |
AvalonBay Communities, Inc. | | | 2,671 | | | | 475,011 | |
Crown Castle International Corp. | | | 4,900 | | | | 461,629 | |
Charles Schwab Corp. | | | 14,414 | | | | 455,050 | |
Alliance Data Systems Corp.* | | | 1,232 | | | | 264,301 | |
Total Financial | | | | | | | 11,509,539 | |
| | | | | | | | | |
Industrial - 9.9% | |
PerkinElmer, Inc. | | | 19,471 | | | | 1,092,518 | |
Vulcan Materials Co. | | | 8,797 | | | | 1,000,482 | |
Masco Corp. | | | 28,100 | | | | 964,112 | |
Fortune Brands Home & Security, Inc. | | | 15,400 | | | | 894,740 | |
Acuity Brands, Inc. | | | 3,300 | | | | 873,180 | |
TransDigm Group, Inc.* | | | 2,800 | | | | 809,536 | |
Martin Marietta Materials, Inc. | | | 4,460 | | | | 798,831 | |
Northrop Grumman Corp. | | | 3,200 | | | | 684,640 | |
Stanley Black & Decker, Inc. | | | 4,400 | | | | 541,112 | |
Amphenol Corp. — Class A | | | 7,300 | | | | 473,916 | |
Roper Technologies, Inc. | | | 2,200 | | | | 401,434 | |
Snap-on, Inc. | | | 2,640 | | | | 401,174 | |
Boeing Co. | | | 2,400 | | | | 316,176 | |
Total Industrial | | | | | | | 9,251,851 | |
| | | | | | | | | |
Energy - 0.9% | |
Pioneer Natural Resources Co. | | | 4,401 | | | | 817,046 | |
| | | | | | | | | |
Basic Materials - 0.4% | |
Sherwin-Williams Co. | | | 1,550 | | | | 428,823 | |
| | | | | | | | | |
Total Common Stocks | | | | | | | | |
(Cost $70,097,763) | | | | | | | 93,361,485 | |
| | | | | | | | | |
| | | Face
Amount | | | | | |
| | | | | | | | | |
REPURCHASE AGREEMENTS††,1 - 0.5% | |
HSBC Securities, Inc.
issued 09/30/16 at 0.38%
due 10/03/16 | | $ | 245,019 | | | | 245,019 | |
Royal Bank of Canada
issued 09/30/16 at 0.36%
due 10/03/16 | | | 194,547 | | | | 194,547 | |
Total Repurchase Agreements | | | | | | | | |
(Cost $439,566) | | | | | | | 439,566 | |
| | | | | | | | | |
Total Investments - 100.1% | | | | | | | | |
(Cost $70,537,329) | | | | | | $ | 93,801,051 | |
Other Assets & Liabilities, net - (0.1)% | | | | | | | (56,164 | ) |
Total Net Assets - 100.0% | | | | | | $ | 93,744,887 | |
* | Non-income producing security. |
† | Value determined based on Level 1 inputs — See Note 4. |
†† | Value determined based on Level 2 inputs — See Note 4. |
1 | Repurchase Agreements — See Note 5. |
| | plc — Public Limited Company |
| | |
| | See Sector Classification in Other Information section. |
The following table summarizes the inputs used to value the Fund’s investments at September 30, 2016 (See Note 4 in the Notes to Financial Statements):
Investments in Securities (Assets) | | Level 1 | | | Level 2 | | | Level 3 | | | Total | |
Common Stocks | | $ | 93,361,485 | | | $ | — | | | $ | — | | | $ | 93,361,485 | |
Repurchase Agreements | | | — | | | | 439,566 | | | | — | | | | 439,566 | |
Total | | $ | 93,361,485 | | | $ | 439,566 | | | $ | — | | | $ | 93,801,051 | |
Transfers between investment levels may occur as the markets fluctuate and/or the availability of data used in an investment’s valuation changes. Transfers between valuation levels, if any, are in comparison to the valuation levels at the end of the previous fiscal year, and are effective using the fair value as of the end of the previous fiscal period.
For the period ended September 30, 2016, there were no transfers between levels.
10 | THE RYDEX FUNDS SEMI-ANNUAL REPORT | SEE NOTES TO FINANCIAL STATEMENTS. |
S&P 500® PURE GROWTH FUND | |
STATEMENT OF ASSETS AND LIABILITIES (Unaudited) | |
September 30, 2016 | |
Assets: | |
Investments, at value (cost $70,097,763) | | $ | 93,361,485 | |
Repurchase agreements, at value (cost $439,566) | | | 439,566 | |
Total investments (cost $70,537,329) | | | 93,801,051 | |
Cash | | | 11,060 | |
Receivables: | |
Securities sold | | | 855,182 | |
Fund shares sold | | | 23,531 | |
Dividends | | | 68,072 | |
Total assets | | | 94,758,896 | |
| | | | | |
Liabilities: | |
Payable for: | |
Securities purchased | | | 660,182 | |
Fund shares redeemed | | | 192,635 | |
Management fees | | | 58,054 | |
Distribution and service fees | | | 29,273 | |
Transfer agent and administrative fees | | | 19,351 | |
Portfolio accounting fees | | | 7,741 | |
Miscellaneous | | | 46,773 | |
Total liabilities | | | 1,014,009 | |
Commitments and contingent liabilities (Note 11) | | | — | |
Net assets | | $ | 93,744,887 | |
| | | | | |
Net assets consist of: | |
Paid in capital | | $ | 74,094,542 | |
Accumulated net investment loss | | | (511,627 | ) |
Accumulated net realized loss on investments | | | (3,101,750 | ) |
Net unrealized appreciation on investments | | | 23,263,722 | |
Net assets | | $ | 93,744,887 | |
| | | | | |
A-Class: | |
Net assets | | $ | 15,531,738 | |
Capital shares outstanding | | | 284,693 | |
Net asset value per share | | $ | 54.56 | |
Maximum offering price per share (Net asset value divided by 95.25%) | | $ | 57.28 | |
| | | | | |
C-Class: | |
Net assets | | $ | 14,237,501 | |
Capital shares outstanding | | | 288,448 | |
Net asset value per share | | $ | 49.36 | |
| | | | | |
H-Class: | |
Net assets | | $ | 63,975,648 | |
Capital shares outstanding | | | 1,172,871 | |
Net asset value per share | | $ | 54.55 | |
STATEMENT OF OPERATIONS (Unaudited) | |
Period Ended September 30, 2016 | |
Investment Income: | |
Dividends | | $ | 463,967 | |
Interest | | | 781 | |
Total investment income | | | 464,748 | |
| | | | | |
Expenses: | |
Management fees | | | 425,710 | |
Transfer agent and administrative fees | | | 141,903 | |
Distribution and service fees: | | | | |
A-Class | | | 23,566 | |
C-Class | | | 83,217 | |
H-Class | | | 97,533 | |
Portfolio accounting fees | | | 56,760 | |
Custodian fees | | | 6,664 | |
Trustees’ fees* | | | 5,121 | |
Line of credit fees | | | 136 | |
Miscellaneous | | | 85,568 | |
Total expenses | | | 926,178 | |
Net investment loss | | | (461,430 | ) |
| | | | | |
Net Realized and Unrealized Gain (Loss): | |
Net realized gain (loss) on: | |
Investments | | | 9,173,445 | |
Net realized gain | | | 9,173,445 | |
Net change in unrealized appreciation (depreciation) on: | |
Investments | | | (2,501,569 | ) |
Net change in unrealized appreciation (depreciation) | | | (2,501,569 | ) |
Net realized and unrealized gain | | | 6,671,876 | |
Net increase in net assets resulting from operations | | $ | 6,210,446 | |
* | Relates to Trustees not deemed “interested persons” within the meaning of Section 2(a)(19) of the 1940 Act. |
SEE NOTES TO FINANCIAL STATEMENTS. | THE RYDEX FUNDS SEMI-ANNUAL REPORT | 11 |
S&P 500® PURE GROWTH FUND | |
STATEMENTS OF CHANGES IN NET ASSETS |
| | | Period Ended
September 30,
2016
(Unaudited) | | | Year Ended
March 31,
2016 | |
Increase (Decrease) in Net Assets from Operations: | | | | | | |
Net investment loss | | $ | (461,430 | ) | | $ | (747,485 | ) |
Net realized gain (loss) on investments | | | 9,173,445 | | | | (5,914,175 | ) |
Net change in unrealized appreciation (depreciation) on investments | | | (2,501,569 | ) | | | (4,755,558 | ) |
Net increase (decrease) in net assets resulting from operations | | | 6,210,446 | | | | (11,417,218 | ) |
| | | | | | | | | |
Distributions to shareholders from: | | | | | | | | |
Net realized gains | | | | | | | | |
A-Class | | | — | | | | (857,343 | ) |
C-Class | | | — | | | | (687,448 | ) |
H-Class | | | — | | | | (3,476,889 | ) |
Total distributions to shareholders | | | — | | | | (5,021,680 | ) |
| | | | | | | | | |
Capital share transactions: | | | | | | | | |
Proceeds from sale of shares | | | | | | | | |
A-Class | | | 8,885,652 | | | | 57,800,935 | |
C-Class | | | 504,342 | | | | 7,117,304 | |
H-Class | | | 131,333,735 | | | | 424,273,419 | |
Distributions reinvested | | | | | | | | |
A-Class | | | — | | | | 847,945 | |
C-Class | | | — | | | | 679,901 | |
H-Class | | | — | | | | 3,448,540 | |
Cost of shares redeemed | | | | | | | | |
A-Class | | | (18,369,877 | ) | | | (56,458,547 | ) |
C-Class | | | (4,619,082 | ) | | | (10,768,882 | ) |
H-Class | | | (185,005,363 | ) | | | (408,794,397 | ) |
Net increase (decrease) from capital share transactions | | | (67,270,593 | ) | | | 18,146,218 | |
Net increase (decrease) in net assets | | | (61,060,147 | ) | | | 1,707,320 | |
| | | | | | | | | |
Net assets: | | | | | | | | |
Beginning of period | | | 154,805,034 | | | | 153,097,714 | |
End of period | | $ | 93,744,887 | | | $ | 154,805,034 | |
Accumulated net investment loss at end of period | | $ | (511,627 | ) | | $ | (50,197 | ) |
| | | | | | | | | |
Capital share activity: | | | | | | | | |
Shares sold | | | | | | | | |
A-Class | | | 166,003 | | | | 1,065,419 | |
C-Class | | | 10,397 | | | | 144,257 | |
H-Class | | | 2,492,200 | | | | 8,047,777 | |
Shares issued from reinvestment of distributions | | | | | | | | |
A-Class | | | — | | | | 15,838 | |
C-Class | | | — | | | | 13,944 | |
H-Class | | | — | | | | 64,423 | |
Shares redeemed | | | | | | | | |
A-Class | | | (345,876 | ) | | | (1,078,093 | ) |
C-Class | | | (95,356 | ) | | | (227,917 | ) |
H-Class | | | (3,507,993 | ) | | | (7,797,307 | ) |
Net increase (decrease) in shares | | | (1,280,625 | ) | | | 248,341 | |
12 | THE RYDEX FUNDS SEMI-ANNUAL REPORT | SEE NOTES TO FINANCIAL STATEMENTS. |
S&P 500® PURE GROWTH FUND | |
This table is presented to show selected data for a share outstanding throughout each period and to assist shareholders in evaluating a Fund’s performance for the periods presented.
A-Class | | Period Ended
September 30,
2016a | | | Year Ended
March 31,
2016 | | | Year Ended
March 31,
2015 | | | Year Ended
March 31,
2014 | | | Year Ended
March 28,
2013 | | | Year Ended
March 31,
2012 | |
Per Share Data | | | | | | | | | | | | | | | | | | |
Net asset value, beginning of period | | $ | 51.74 | | | $ | 55.85 | | | $ | 50.81 | | | $ | 38.86 | | | $ | 34.54 | | | $ | 33.15 | |
Income (loss) from investment operations: | |
Net investment income (loss)b | | | (.19 | ) | | | (.22 | ) | | | (.33 | ) | | | (.23 | ) | | | (.13 | ) | | | (.20 | ) |
Net gain (loss) on investments (realized and unrealized) | | | 3.01 | | | | (2.47 | ) | | | 6.86 | | | | 12.18 | | | | 4.45 | | | | 1.82 | |
Total from investment operations | | | 2.82 | | | | (2.69 | ) | | | 6.53 | | | | 11.95 | | | | 4.32 | | | | 1.62 | |
Less distributions from: | |
Net realized gains | | | — | | | | (1.42 | ) | | | (1.49 | ) | | | — | | | | — | | | | (.23 | ) |
Total distributions | | | — | | | | (1.42 | ) | | | (1.49 | ) | | | — | | | | — | | | | (.23 | ) |
Net asset value, end of period | | $ | 54.56 | | | $ | 51.74 | | | $ | 55.85 | | | $ | 50.81 | | | $ | 38.86 | | | $ | 34.54 | |
| | |
Total Returnc | | | 5.43 | % | | | (4.90 | %) | | | 12.98 | % | | | 30.75 | % | | | 12.51 | % | | | 4.96 | % |
Ratios/Supplemental Data | |
Net assets, end of period (in thousands) | | $ | 15,532 | | | $ | 24,037 | | | $ | 25,768 | | | $ | 19,978 | | | $ | 15,001 | | | $ | 2,846 | |
Ratios to average net assets: | |
Net investment income (loss) | | | (0.71 | %) | | | (0.41 | %) | | | (0.62 | %) | | | (0.51 | %) | | | (0.38 | %) | | | (0.62 | %) |
Total expenses | | | 1.52 | % | | | 1.50 | % | | | 1.50 | % | | | 1.52 | % | | | 1.51 | % | | | 1.52 | % |
Portfolio turnover rate | | | 83 | % | | | 290 | % | | | 274 | % | | | 594 | % | | | 421 | % | | | 586 | % |
C-Class | | Period Ended
September 30,
2016a | | | Year Ended
March 31,
2016 | | | Year Ended
March 31,
2015 | | | Year Ended
March 31,
2014 | | | Year Ended
March 28,
2013 | | | Year Ended
March 31,
2012 | |
Per Share Data | | | | | | | | | | | | | | | | | | |
Net asset value, beginning of period | | $ | 46.99 | | | $ | 51.23 | | | $ | 47.07 | | | $ | 36.27 | | | $ | 32.48 | | | $ | 31.42 | |
Income (loss) from investment operations: | |
Net investment income (loss)b | | | (.35 | ) | | | (.57 | ) | | | (.67 | ) | | | (.52 | ) | | | (.38 | ) | | | (.41 | ) |
Net gain (loss) on investments (realized and unrealized) | | | 2.72 | | | | (2.25 | ) | | | 6.32 | | | | 11.32 | | | | 4.17 | | | | 1.70 | |
Total from investment operations | | | 2.37 | | | | (2.82 | ) | | | 5.65 | | | | 10.80 | | | | 3.79 | | | | 1.29 | |
Less distributions from: | |
Net realized gains | | | — | | | | (1.42 | ) | | | (1.49 | ) | | | — | | | | — | | | | (.23 | ) |
Total distributions | | | — | | | | (1.42 | ) | | | (1.49 | ) | | | — | | | | — | | | | (.23 | ) |
Net asset value, end of period | | $ | 49.36 | | | $ | 46.99 | | | $ | 51.23 | | | $ | 47.07 | | | $ | 36.27 | | | $ | 32.48 | |
| | |
Total Returnc | | | 5.02 | % | | | (5.61 | %) | | | 12.13 | % | | | 29.78 | % | | | 11.70 | % | | | 4.15 | % |
Ratios/Supplemental Data | |
Net assets, end of period (in thousands) | | $ | 14,238 | | | $ | 17,546 | | | $ | 22,701 | | | $ | 17,042 | | | $ | 8,692 | | | $ | 11,623 | |
Ratios to average net assets: | |
Net investment income (loss) | | | (1.43 | %) | | | (1.16 | %) | | | (1.37 | %) | | | (1.24 | %) | | | (1.19 | %) | | | (1.35 | %) |
Total expenses | | | 2.27 | % | | | 2.25 | % | | | 2.25 | % | | | 2.27 | % | | | 2.25 | % | | | 2.26 | % |
Portfolio turnover rate | | | 83 | % | | | 290 | % | | | 274 | % | | | 594 | % | | | 421 | % | | | 586 | % |
SEE NOTES TO FINANCIAL STATEMENTS. | THE RYDEX FUNDS SEMI-ANNUAL REPORT | 13 |
S&P 500® PURE GROWTH FUND | |
FINANCIAL HIGHLIGHTS (concluded) |
This table is presented to show selected data for a share outstanding throughout each period and to assist shareholders in evaluating a Fund’s performance for the periods presented.
H-Class | | Period Ended
September 30,
2016a | | | Year Ended
March 31,
2016 | | | Year Ended
March 31,
2015 | | | Year Ended
March 31,
2014 | | | Year Ended
March 28,
2013 | | | Year Ended
March 31,
2012 | |
Per Share Data | | | | | | | | | | | | | | | | | | |
Net asset value, beginning of period | | $ | 51.73 | | | $ | 55.84 | | | $ | 50.80 | | | $ | 38.84 | | | $ | 34.52 | | | $ | 33.13 | |
Income (loss) from investment operations: | |
Net investment income (loss)b | | | (.19 | ) | | | (.18 | ) | | | (.34 | ) | | | (.23 | ) | | | (.15 | ) | | | (.19 | ) |
Net gain (loss) on investments (realized and unrealized) | | | 3.01 | | | | (2.51 | ) | | | 6.87 | | | | 12.19 | | | | 4.47 | | | | 1.81 | |
Total from investment operations | | | 2.82 | | | | (2.69 | ) | | | 6.53 | | | | 11.96 | | | | 4.32 | | | | 1.62 | |
Less distributions from: | |
Net realized gains | | | — | | | | (1.42 | ) | | | (1.49 | ) | | | — | | | | — | | | | (.23 | ) |
Total distributions | | | — | | | | (1.42 | ) | | | (1.49 | ) | | | — | | | | — | | | | (.23 | ) |
Net asset value, end of period | | $ | 54.55 | | | $ | 51.73 | | | $ | 55.84 | | | $ | 50.80 | | | $ | 38.84 | | | $ | 34.52 | |
| | |
Total Returnc | | | 5.43 | % | | | (4.91 | %) | | | 12.98 | % | | | 30.79 | % | | | 12.51 | % | | | 4.96 | % |
Ratios/Supplemental Data | |
Net assets, end of period (in thousands) | | $ | 63,976 | | | $ | 113,223 | | | $ | 104,628 | | | $ | 103,502 | | | $ | 52,483 | | | $ | 36,627 | |
Ratios to average net assets: | |
Net investment income (loss) | | | (0.70 | %) | | | (0.35 | %) | | | (0.65 | %) | | | (0.50 | %) | | | (0.43 | %) | | | (0.59 | %) |
Total expenses | | | 1.52 | % | | | 1.51 | % | | | 1.50 | % | | | 1.52 | % | | | 1.50 | % | | | 1.51 | % |
Portfolio turnover rate | | | 83 | % | | | 290 | % | | | 274 | % | | | 594 | % | | | 421 | % | | | 586 | % |
a | Unaudited figures for the period ended September 30, 2016. Percentage amounts for the period, except total return and portfolio turnover rate, have been annualized. |
b | Net investment income (loss) per share was computed using average shares outstanding throughout the period. |
c | Total return does not reflect the impact of any applicable sales charges. |
14 | THE RYDEX FUNDS SEMI-ANNUAL REPORT | SEE NOTES TO FINANCIAL STATEMENTS. |
FUND PROFILE (Unaudited) | September 30, 2016 |
S&P 500® PURE VALUE FUND
OBJECTIVE: Seeks to provide investment results that match, before fees and expenses, the performance of a benchmark for large-cap value securities on a daily basis. The Fund’s current benchmark is the S&P 500® Pure Value Index (the “underlying index”).
Holdings Diversification (Market Exposure as % of Net Assets)
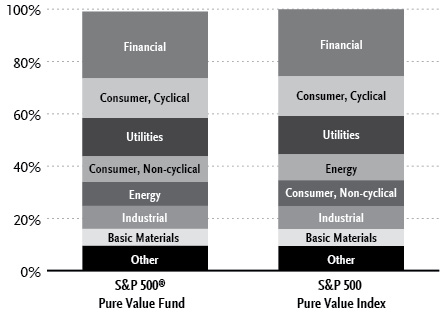
“Holdings Diversification (Market Exposure as % of Net Assets)” excludes any temporary cash investments.
Inception Dates: |
A-Class | September 1, 2004 |
C-Class | February 20, 2004 |
H-Class | February 20, 2004 |
Ten Largest Holdings (% of Total Net Assets) |
HP, Inc. | 3.0% |
Newmont Mining Corp. | 2.4% |
Archer-Daniels-Midland Co. | 2.2% |
NRG Energy, Inc. | 2.1% |
Alcoa, Inc. | 1.8% |
Leucadia National Corp. | 1.8% |
Jacobs Engineering Group, Inc. | 1.7% |
Quanta Services, Inc. | 1.7% |
AES Corp. | 1.7% |
Best Buy Company, Inc. | 1.7% |
Top Ten Total | 20.1% |
| | |
“Ten Largest Holdings” excludes any temporary cash investments. |
| | THE RYDEX FUNDS SEMI-ANNUAL REPORT | 15 |
SCHEDULE OF INVESTMENTS (Unaudited) | September 30, 2016 |
S&P 500® PURE VALUE FUND | |
| | | Shares | | | Value | |
| | | | | | | |
COMMON STOCKS† - 99.1% | |
| | | | | | | |
Financial - 25.6% | |
Prudential Financial, Inc. | | | 8,933 | | | $ | 729,380 | |
Loews Corp. | | | 16,085 | | | | 661,897 | |
MetLife, Inc. | | | 14,830 | | | | 658,897 | |
Allstate Corp. | | | 7,960 | | | | 550,673 | |
Lincoln National Corp. | | | 11,086 | | | | 520,820 | |
American International Group, Inc. | | | 8,708 | | | | 516,733 | |
Regions Financial Corp. | | | 51,180 | | | | 505,148 | |
Unum Group | | | 14,078 | | | | 497,094 | |
Hartford Financial Services Group, Inc. | | | 11,412 | | | | 488,662 | |
Bank of America Corp. | | | 30,399 | | | | 475,745 | |
Citigroup, Inc. | | | 9,767 | | | | 461,295 | |
Capital One Financial Corp. | | | 6,337 | | | | 455,187 | |
Navient Corp. | | | 31,060 | | | | 449,438 | |
Zions Bancorporation | | | 12,864 | | | | 399,041 | |
SunTrust Banks, Inc. | | | 9,037 | | | | 395,821 | |
Comerica, Inc. | | | 7,283 | | | | 344,632 | |
KeyCorp | | | 27,943 | | | | 340,066 | |
JPMorgan Chase & Co. | | | 4,937 | | | | 328,755 | |
Fifth Third Bancorp | | | 15,777 | | | | 322,797 | |
Travelers Companies, Inc. | | | 2,659 | | | | 304,588 | |
Chubb Ltd. | | | 2,417 | | | | 303,696 | |
Principal Financial Group, Inc. | | | 5,881 | | | | 302,930 | |
Berkshire Hathaway, Inc. — Class B* | | | 2,094 | | | | 302,520 | |
Goldman Sachs Group, Inc. | | | 1,862 | | | | 300,285 | |
Legg Mason, Inc. | | | 8,870 | | | | 296,967 | |
Aflac, Inc. | | | 4,119 | | | | 296,033 | |
PNC Financial Services Group, Inc. | | | 3,002 | | | | 270,450 | |
People’s United Financial, Inc. | | | 16,603 | | | | 262,659 | |
BB&T Corp. | | | 6,721 | | | | 253,516 | |
Bank of New York Mellon Corp. | | | 4,145 | | | | 165,303 | |
Total Financial | | | | | | | 12,161,028 | |
| | | | | | | | | |
Consumer, Cyclical - 15.2% | |
Best Buy Company, Inc. | | | 20,754 | | | | 792,389 | |
Wal-Mart Stores, Inc. | | | 9,833 | | | | 709,156 | |
General Motors Co. | | | 19,815 | | | | 629,523 | |
Staples, Inc. | | | 68,037 | | | | 581,716 | |
Ford Motor Co. | | | 44,811 | | | | 540,869 | |
Kohl’s Corp. | | | 12,147 | | | | 531,432 | |
AutoNation, Inc.* | | | 8,720 | | | | 424,751 | |
PVH Corp. | | | 3,780 | | | | 417,690 | |
Macy’s, Inc. | | | 10,820 | | | | 400,881 | |
Urban Outfitters, Inc.* | | | 11,358 | | | | 392,078 | |
United Continental Holdings, Inc.* | | | 6,811 | | | | 357,373 | |
Whirlpool Corp. | | | 2,008 | | | | 325,617 | |
PulteGroup, Inc. | | | 15,880 | | | | 318,235 | |
PACCAR, Inc. | | | 4,230 | | | | 248,639 | |
Target Corp. | | | 3,399 | | | | 233,443 | |
The Gap, Inc. | | | 7,680 | | | | 170,803 | |
Bed Bath & Beyond, Inc. | | | 3,540 | | | | 152,609 | |
Total Consumer, Cyclical | | | | | | | 7,227,204 | |
| | | | | | | | | |
Utilities - 14.6% | |
NRG Energy, Inc. | | | 90,919 | | | | 1,019,202 | |
AES Corp. | | | 62,037 | | | | 797,175 | |
Exelon Corp. | | | 23,426 | | | | 779,853 | |
FirstEnergy Corp. | | | 14,593 | | | | 482,736 | |
NiSource, Inc. | | | 16,439 | | | | 396,345 | |
Duke Energy Corp. | | | 4,119 | | | | 329,685 | |
Consolidated Edison, Inc. | | | 4,233 | | | | 318,745 | |
Entergy Corp. | | | 3,694 | | | | 283,441 | |
SCANA Corp. | | | 3,733 | | | | 270,157 | |
DTE Energy Co. | | | 2,846 | | | | 266,585 | |
Public Service Enterprise Group, Inc. | | | 5,968 | | | | 249,880 | |
Edison International | | | 3,453 | | | | 249,479 | |
American Electric Power Company, Inc. | | | 3,805 | | | | 244,319 | |
CenterPoint Energy, Inc. | | | 10,341 | | | | 240,221 | |
Ameren Corp. | | | 4,534 | | | | 222,982 | |
Pinnacle West Capital Corp. | | | 2,860 | | | | 217,331 | |
PG&E Corp. | | | 3,304 | | | | 202,106 | |
Xcel Energy, Inc. | | | 4,517 | | | | 185,829 | |
Eversource Energy | | | 3,278 | | | | 177,602 | |
Total Utilities | | | | | | | 6,933,673 | |
| | | | | | | | | |
Consumer, Non-cyclical - 9.8% | |
Archer-Daniels-Midland Co. | | | 24,560 | | | | 1,035,694 | |
Quanta Services, Inc.* | | | 28,921 | | | | 809,499 | |
Tyson Foods, Inc. — Class A | | | 8,698 | | | | 649,480 | |
Anthem, Inc. | | | 5,017 | | | | 628,680 | |
Cardinal Health, Inc. | | | 5,333 | | | | 414,374 | |
McKesson Corp. | | | 2,420 | | | | 403,535 | |
Sysco Corp. | | | 5,751 | | | | 281,857 | |
Whole Foods Market, Inc. | | | 7,770 | | | | 220,280 | |
Express Scripts Holding Co.* | | | 2,600 | | | | 183,378 | |
Total Consumer, Non-cyclical | | | | | | | 4,626,777 | |
| | | | | | | | | |
Energy - 9.1% | |
National Oilwell Varco, Inc. | | | 20,798 | | | | 764,119 | |
Valero Energy Corp. | | | 10,366 | | | | 549,398 | |
Chevron Corp. | | | 4,408 | | | | 453,671 | |
Phillips 66 | | | 5,443 | | | | 438,434 | |
Marathon Petroleum Corp. | | | 9,414 | | | | 382,114 | |
Transocean Ltd.* | | | 35,647 | | | | 379,997 | |
Helmerich & Payne, Inc. | | | 5,182 | | | | 348,749 | |
Hess Corp. | | | 5,310 | | | | 284,722 | |
First Solar, Inc.* | | | 7,175 | | | | 283,341 | |
Marathon Oil Corp. | | | 14,782 | | | | 233,703 | |
Baker Hughes, Inc. | | | 3,554 | | | | 179,370 | |
Total Energy | | | | | | | 4,297,618 | |
| | | | | | | | | |
Industrial - 8.8% | |
Jacobs Engineering Group, Inc.* | | | 15,693 | | | | 811,641 | |
Fluor Corp. | | | 13,781 | | | | 707,241 | |
Ryder System, Inc. | | | 8,289 | | | | 546,660 | |
WestRock Co. | | | 11,000 | | | | 533,280 | |
Corning, Inc. | | | 15,490 | | | | 366,339 | |
Cummins, Inc. | | | 2,550 | | | | 326,782 | |
Eaton Corporation plc | | | 4,290 | | | | 281,896 | |
Caterpillar, Inc. | | | 2,870 | | | | 254,769 | |
16 | THE RYDEX FUNDS SEMI-ANNUAL REPORT | SEE NOTES TO FINANCIAL STATEMENTS. |
SCHEDULE OF INVESTMENTS (Unaudited)(concluded) | September 30, 2016 |
S&P 500® PURE VALUE FUND | |
| | | Shares | | | Value | |
| | | | | | | |
Textron, Inc. | | | 4,530 | | | $ | 180,068 | |
Owens-Illinois, Inc.* | | | 9,263 | | | | 170,347 | |
Total Industrial | | | | | | | 4,179,023 | |
| | | | | | | | | |
Basic Materials - 6.5% | |
Newmont Mining Corp. | | | 28,958 | | | | 1,137,760 | |
Alcoa, Inc. | | | 85,944 | | | | 871,472 | |
Nucor Corp. | | | 8,200 | | | | 405,490 | |
Freeport-McMoRan, Inc. | | | 31,593 | | | | 343,100 | |
Mosaic Co. | | | 13,320 | | | | 325,807 | |
Total Basic Materials | | | | | | | 3,083,629 | |
| | | | | | | | | |
Technology - 4.8% | |
HP, Inc. | | | 90,535 | | | | 1,406,008 | |
Xerox Corp. | | | 54,897 | | | | 556,107 | |
Western Digital Corp. | | | 5,190 | | | | 303,459 | |
Total Technology | | | | | | | 2,265,574 | |
| | | | | | | | | |
Communications - 2.9% | |
CenturyLink, Inc. | | | 19,293 | | | | 529,207 | |
News Corp. — Class A | | | 29,386 | | | | 410,816 | |
Frontier Communications Corp. | | | 77,375 | | | | 321,880 | |
News Corp. — Class B | | | 8,300 | | | | 118,026 | |
Total Communications | | | | | | | 1,379,929 | |
| | | | | | | | | |
Diversified - 1.8% | |
Leucadia National Corp. | | | 44,847 | | | | 853,887 | |
| | | | | | | | | |
Total Common Stocks | | | | | | | | |
(Cost $35,741,674) | | | | | | | 47,008,342 | |
| | | | | | | | | |
| | | Face
Amount | | | | | |
| | | | | | | | | |
REPURCHASE AGREEMENTS††,1 - 0.4% | |
HSBC Securities, Inc.
issued 09/30/16 at 0.38%
due 10/03/16 | | $ | 102,806 | | | | 102,806 | |
Royal Bank of Canada
issued 09/30/16 at 0.36%
due 10/03/16 | | | 81,628 | | | | 81,628 | |
Total Repurchase Agreements | | | | | | | | |
(Cost $184,434) | | | | | | | 184,434 | |
| | | | | | | | | |
Total Investments - 99.5% | | | | | | | | |
(Cost $35,926,108) | | | | | | $ | 47,192,776 | |
Other Assets & Liabilities, net - 0.5% | | | | | | | 258,264 | |
Total Net Assets - 100.0% | | | | | | $ | 47,451,040 | |
* | Non-income producing security. |
† | Value determined based on Level 1 inputs — See Note 4. |
†† | Value determined based on Level 2 inputs — See Note 4. |
1 | Repurchase Agreements — See Note 5. |
| | plc — Public Limited Company |
| | |
| | See Sector Classification in Other Information section. |
The following table summarizes the inputs used to value the Fund’s investments at September 30, 2016 (See Note 4 in the Notes to Financial Statements):
Investments in Securities (Assets) | | Level 1 | | | Level 2 | | | Level 3 | | | Total | |
Common Stocks | | $ | 47,008,342 | | | $ | — | | | $ | — | | | $ | 47,008,342 | |
Repurchase Agreements | | | — | | | | 184,434 | | | | — | | | | 184,434 | |
Total | | $ | 47,008,342 | | | $ | 184,434 | | | $ | — | | | $ | 47,192,776 | |
Transfers between investment levels may occur as the markets fluctuate and/or the availability of data used in an investment’s valuation changes. Transfers between valuation levels, if any, are in comparison to the valuation levels at the end of the previous fiscal year, and are effective using the fair value as of the end of the previous fiscal period.
For the period ended September 30, 2016, there were no transfers between levels.
SEE NOTES TO FINANCIAL STATEMENTS. | THE RYDEX FUNDS SEMI-ANNUAL REPORT | 17 |
STATEMENT OF ASSETS AND LIABILITIES (Unaudited) | |
September 30, 2016 | |
Assets: | |
Investments, at value (cost $35,741,674) | | $ | 47,008,342 | |
Repurchase agreements, at value (cost $184,434) | | | 184,434 | |
Total investments (cost $35,926,108) | | | 47,192,776 | |
Receivables: | |
Securities sold | | | 449,891 | |
Fund shares sold | | | 12,736 | |
Dividends | | | 72,602 | |
Total assets | | | 47,728,005 | |
| | | | | |
Liabilities: | |
Payable for: | |
Fund shares redeemed | | | 197,655 | |
Management fees | | | 28,205 | |
Licensing fees | | | 21,852 | |
Distribution and service fees | | | 11,319 | |
Transfer agent and administrative fees | | | 9,402 | |
Portfolio accounting fees | | | 3,761 | |
Miscellaneous | | | 4,771 | |
Total liabilities | | | 276,965 | |
Commitments and contingent liabilities (Note 11) | | | — | |
Net assets | | $ | 47,451,040 | |
| | | | | |
Net assets consist of: | |
Paid in capital | | $ | 43,648,859 | |
Undistributed net investment income | | | 1,078,819 | |
Accumulated net realized loss on investments | | | (8,543,306 | ) |
Net unrealized appreciation on investments | | | 11,266,668 | |
Net assets | | $ | 47,451,040 | |
| | | | | |
A-Class: | |
Net assets | | $ | 6,367,771 | |
Capital shares outstanding* | | | 92,034 | |
Net asset value per share* | | $ | 69.19 | |
Maximum offering price per share (Net asset value divided by 95.25%)* | | $ | 72.64 | |
| | | | | |
C-Class: | |
Net assets | | $ | 3,135,902 | |
Capital shares outstanding* | | | 51,340 | |
Net asset value per share* | | $ | 61.08 | |
| | | | | |
H-Class: | |
Net assets | | $ | 37,947,367 | |
Capital shares outstanding* | | | 546,422 | |
Net asset value per share* | | $ | 69.45 | |
STATEMENT OF OPERATIONS (Unaudited) | |
Period Ended September 30, 2016 | |
Investment Income: | |
Dividends | | $ | 778,886 | |
Interest | | | 379 | |
Total investment income | | | 779,265 | |
| | | | | |
Expenses: | |
Management fees | | | 236,913 | |
Transfer agent and administrative fees | | | 78,971 | |
Distribution and service fees: | |
A-Class | | | 10,703 | |
C-Class | | | 16,950 | |
H-Class | | | 64,031 | |
Portfolio accounting fees | | | 31,588 | |
Registration fees | | | 25,659 | |
Custodian fees | | | 3,703 | |
Trustees’ fees** | | | 3,224 | |
Line of credit fees | | | 213 | |
Miscellaneous | | | 21,209 | |
Total expenses | | | 493,164 | |
Net investment income | | | 286,101 | |
| | | | | |
Net Realized and Unrealized Gain (Loss): | |
Net realized gain (loss) on: | |
Investments | | | 3,863,610 | |
Net realized gain | | | 3,863,610 | |
Net change in unrealized appreciation (depreciation) on: | |
Investments | | | (3,870,059 | ) |
Net change in unrealized appreciation (depreciation) | | | (3,870,059 | ) |
Net realized and unrealized loss | | | (6,449 | ) |
Net increase in net assets resulting from operations | | $ | 279,652 | |
* | The shares outstanding, net asset value per share and the maximum offering price per share have been restated to reflect a 2:1 share split effective October 28, 2016 — See Note 12. |
** | Relates to Trustees not deemed “interested persons” within the meaning of Section 2(a)(19) of the 1940 Act. |
18 | THE RYDEX FUNDS SEMI-ANNUAL REPORT | SEE NOTES TO FINANCIAL STATEMENTS. |
STATEMENTS OF CHANGES IN NET ASSETS |
| | | Period Ended
September 30,
2016
(Unaudited) | | | Year Ended
March 31,
2016 | |
Increase (Decrease) in Net Assets from Operations: | | | | | | |
Net investment income | | $ | 286,101 | | | $ | 792,718 | |
Net realized gain (loss) on investments | | | 3,863,610 | | | | (2,975,861 | ) |
Net change in unrealized appreciation (depreciation) on investments | | | (3,870,059 | ) | | | 540,213 | |
Net increase (decrease) in net assets resulting from operations | | | 279,652 | | | | (1,642,930 | ) |
| | | | | | | | | |
Distributions to shareholders from: | | | | | | | | |
Net investment income | | | | | | | | |
A-Class | | | — | | | | (230,654 | ) |
C-Class | | | — | | | | (81,084 | ) |
H-Class | | | — | | | | (773,153 | ) |
Net realized gains | | | | | | | | |
A-Class | | | — | | | | (381,595 | ) |
C-Class | | | — | | | | (134,145 | ) |
H-Class | | | — | | | | (1,279,106 | ) |
Total distributions to shareholders | | | — | | | | (2,879,737 | ) |
| | | | | | | | | |
Capital share transactions: | | | | | | | | |
Proceeds from sale of shares | | | | | | | | |
A-Class | | | 16,570,995 | | | | 21,610,017 | |
C-Class | | | 975,682 | | | | 5,196,156 | |
H-Class | | | 102,751,444 | | | | 283,243,022 | |
Distributions reinvested | | | | | | | | |
A-Class | | | — | | | | 607,532 | |
C-Class | | | — | | | | 214,297 | |
H-Class | | | — | | | | 2,039,461 | |
Cost of shares redeemed | | | | | | | | |
A-Class | | | (21,302,909 | ) | | | (25,025,972 | ) |
C-Class | | | (1,540,575 | ) | | | (7,319,303 | ) |
H-Class | | | (135,950,981 | ) | | | (261,907,569 | ) |
Net increase (decrease) from capital share transactions | | | (38,496,344 | ) | | | 18,657,641 | |
Net increase (decrease) in net assets | | | (38,216,692 | ) | | | 14,134,974 | |
| | | | | | | | | |
Net assets: | | | | | | | | |
Beginning of period | | | 85,667,732 | | | | 71,532,758 | |
End of period | | $ | 47,451,040 | | | $ | 85,667,732 | |
Undistributed net investment income at end of period | | $ | 1,078,819 | | | $ | 792,718 | |
| | | | | | | | | |
Capital share activity:* | | | | | | | | |
Shares sold | | | | | | | | |
A-Class | | | 242,916 | | | | 325,256 | |
C-Class | | | 16,490 | | | | 82,820 | |
H-Class | | | 1,516,818 | | | | 4,260,374 | |
Shares issued from reinvestment of distributions | | | | | | | | |
A-Class | | | — | | | | 9,084 | |
C-Class | | | — | | | | 3,606 | |
H-Class | | | — | | | | 30,384 | |
Shares redeemed | | | | | | | | |
A-Class | | | (319,518 | ) | | | (389,324 | ) |
C-Class | | | (25,816 | ) | | | (123,960 | ) |
H-Class | | | (2,041,410 | ) | | | (3,891,646 | ) |
Net increase (decrease) in shares | | | (610,520 | ) | | | 306,594 | |
* | Capital share activity for the periods presented through September 30, 2016, has been restated to reflect a 2:1 share split effective October 28, 2016 — See Note 12. |
SEE NOTES TO FINANCIAL STATEMENTS. | THE RYDEX FUNDS SEMI-ANNUAL REPORT | 19 |
This table is presented to show selected data for a share outstanding throughout each period and to assist shareholders in evaluating a Fund’s performance for the periods presented.
A-Class | | Period Ended
September 30,
2016a,d | | | Year Ended
March 31,
2016d | | | Year Ended
March 31,
2015d | | | Year Ended
March 31,
2014d | | | Year Ended
March 28,
2013d | | | Year Ended
March 31,
2012d | |
Per Share Data | | | | | | | | | | | | | | | | | | |
Net asset value, beginning of period | | $ | 66.03 | | | $ | 72.54 | | | $ | 70.69 | | | $ | 55.84 | | | $ | 46.75 | | | $ | 45.11 | |
Income (loss) from investment operations: | |
Net investment income (loss)b | | | .34 | | | | .73 | | | | .57 | | | | .31 | | | | .29 | | | | .15 | |
Net gain (loss) on investments (realized and unrealized) | | | 2.82 | | | | (4.63 | ) | | | 3.42 | | | | 17.50 | | | | 8.87 | | | | 1.49 | |
Total from investment operations | | | 3.16 | | | | (3.90 | ) | | | 3.99 | | | | 17.81 | | | | 9.16 | | | | 1.64 | |
Less distributions from: | |
Net investment income | | | — | | | | (.98 | ) | | | (.07 | ) | | | (.12 | ) | | | (.07 | ) | | | — | |
Net realized gains | | | — | | | | (1.63 | ) | | | (2.07 | ) | | | (2.84 | ) | | | — | | | | — | |
Total distributions | | | — | | | | (2.61 | ) | | | (2.14 | ) | | | (2.96 | ) | | | (.07 | ) | | | — | |
Net asset value, end of period | | $ | 69.19 | | | $ | 66.03 | | | $ | 72.54 | | | $ | 70.69 | | | $ | 55.84 | | | $ | 46.75 | |
| | |
Total Returnc | | | 4.78 | % | | | (5.44 | %) | | | 5.60 | % | | | 32.21 | % | | | 19.63 | % | | | 3.64 | % |
Ratios/Supplemental Data | |
Net assets, end of period (in thousands) | | $ | 6,368 | | | $ | 11,135 | | | $ | 16,222 | | | $ | 4,435 | | | $ | 1,303 | | | $ | 1,846 | |
Ratios to average net assets: | |
Net investment income (loss) | | | 1.00 | % | | | 1.08 | % | | | 0.78 | % | | | 0.47 | % | | | 0.61 | % | | | 0.34 | % |
Total expenses | | | 1.52 | % | | | 1.50 | % | | | 1.51 | % | | | 1.52 | % | | | 1.51 | % | | | 1.51 | % |
Portfolio turnover rate | | | 145 | % | | | 365 | % | | | 295 | % | | | 410 | % | | | 669 | % | | | 762 | % |
C-Class | | Period Ended
September 30,
2016a,d | | | Year Ended
March 31,
2016d | | | Year Ended
March 31,
2015d | | | Year Ended
March 31,
2014d | | | Year Ended
March 28,
2013d | | | Year Ended
March 31,
2012d | |
Per Share Data | | | | | | | | | | | | | | | | | | |
Net asset value, beginning of period | | $ | 58.51 | | | $ | 65.08 | | | $ | 64.10 | | | $ | 51.23 | | | $ | 43.21 | | | $ | 42.00 | |
Income (loss) from investment operations: | |
Net investment income (loss)b | | | .06 | | | | .17 | | | | .02 | | | | (.15 | ) | | | (.10 | ) | | | (.18 | ) |
Net gain (loss) on investments (realized and unrealized) | | | 2.51 | | | | (4.13 | ) | | | 3.10 | | | | 15.98 | | | | 8.19 | | | | 1.39 | |
Total from investment operations | | | 2.57 | | | | (3.96 | ) | | | 3.12 | | | | 15.83 | | | | 8.09 | | | | 1.21 | |
Less distributions from: | |
Net investment income | | | — | | | | (.98 | ) | | | (.07 | ) | | | (.12 | ) | | | (.07 | ) | | | — | |
Net realized gains | | | — | | | | (1.63 | ) | | | (2.07 | ) | | | (2.84 | ) | | | — | | | | — | |
Total distributions | | | — | | | | (2.61 | ) | | | (2.14 | ) | | | (2.96 | ) | | | (.07 | ) | | | — | |
Net asset value, end of period | | $ | 61.08 | | | $ | 58.51 | | | $ | 65.08 | | | $ | 64.10 | | | $ | 51.23 | | | $ | 43.21 | |
| | |
Total Returnc | | | 4.38 | % | | | (6.15 | %) | | | 4.81 | % | | | 31.21 | % | | | 18.76 | % | | | 2.88 | % |
Ratios/Supplemental Data | |
Net assets, end of period (in thousands) | | $ | 3,136 | | | $ | 3,550 | | | $ | 6,390 | | | $ | 5,090 | | | $ | 3,430 | | | $ | 2,128 | |
Ratios to average net assets: | |
Net investment income (loss) | | | 0.21 | % | | | 0.28 | % | | | 0.03 | % | | | (0.26 | %) | | | (0.22 | %) | | | (0.45 | %) |
Total expenses | | | 2.27 | % | | | 2.25 | % | | | 2.25 | % | | | 2.27 | % | | | 2.26 | % | | | 2.27 | % |
Portfolio turnover rate | | | 145 | % | | | 365 | % | | | 295 | % | | | 410 | % | | | 669 | % | | | 762 | % |
20 | THE RYDEX FUNDS SEMI-ANNUAL REPORT | SEE NOTES TO FINANCIAL STATEMENTS. |
FINANCIAL HIGHLIGHTS (concluded) |
This table is presented to show selected data for a share outstanding throughout each period and to assist shareholders in evaluating a Fund’s performance for the periods presented.
H-Class | | Period Ended
September 30,
2016a,d | | | Year Ended
March 31,
2016d | | | Year Ended
March 31,
2015d | | | Year Ended
March 31,
2014d | | | Year Ended
March 28,
2013d | | | Year Ended
March 31,
2012d | |
Per Share Data | | | | | | | | | | | | | | | | | | |
Net asset value, beginning of period | | $ | 66.28 | | | $ | 72.81 | | | $ | 70.94 | | | $ | 56.03 | | | $ | 46.90 | | | $ | 45.25 | |
Income (loss) from investment operations: | |
Net investment income (loss)b | | | .32 | | | | .80 | | | | .49 | | | | .26 | | | | .29 | | | | .17 | |
Net gain (loss) on investments (realized and unrealized) | | | 2.85 | | | | (4.72 | ) | | | 3.52 | | | | 17.61 | | | | 8.91 | | | | 1.48 | |
Total from investment operations | | | 3.17 | | | | (3.92 | ) | | | 4.01 | | | | 17.87 | | | | 9.20 | | | | 1.65 | |
Less distributions from: | |
Net investment income | | | — | | | | (.98 | ) | | | (.07 | ) | | | (.12 | ) | | | (.07 | ) | | | — | |
Net realized gains | | | — | | | | (1.63 | ) | | | (2.07 | ) | | | (2.84 | ) | | | — | | | | — | |
Total distributions | | | — | | | | (2.61 | ) | | | (2.14 | ) | | | (2.96 | ) | | | (.07 | ) | | | — | |
Net asset value, end of period | | $ | 69.45 | | | $ | 66.28 | | | $ | 72.81 | | | $ | 70.94 | | | $ | 56.03 | | | $ | 46.90 | |
| | |
Total Returnc | | | 4.78 | % | | | (5.44 | %) | | | 5.60 | % | | | 32.21 | % | | | 19.64 | % | | | 3.65 | % |
Ratios/Supplemental Data | |
Net assets, end of period (in thousands) | | $ | 37,947 | | | $ | 70,983 | | | $ | 48,920 | | | $ | 114,984 | | | $ | 78,480 | | | $ | 68,886 | |
Ratios to average net assets: | |
Net investment income (loss) | | | 0.93 | % | | | 1.17 | % | | | 0.66 | % | | | 0.40 | % | | | 0.58 | % | | | 0.38 | % |
Total expenses | | | 1.52 | % | | | 1.50 | % | | | 1.51 | % | | | 1.52 | % | | | 1.52 | % | | | 1.51 | % |
Portfolio turnover rate | | | 145 | % | | | 365 | % | | | 295 | % | | | 410 | % | | | 669 | % | | | 762 | % |
a | Unaudited figures for the period ended September 30, 2016. Percentage amounts for the period, except total return and portfolio turnover rate, have been annualized. |
b | Net investment income (loss) per share was computed using average shares outstanding throughout the period. |
c | Total return does not reflect the impact of any applicable sales charges. |
d | Share split — Per share amounts for the periods presented through September 30, 2016 have been restated to reflect a 2:1 share split effective October 28,2016 — See Note 12. |
SEE NOTES TO FINANCIAL STATEMENTS. | THE RYDEX FUNDS SEMI-ANNUAL REPORT | 21 |
FUND PROFILE (Unaudited) | September 30, 2016 |
S&P MIDCAP 400® PURE GROWTH FUND
OBJECTIVE: Seeks to provide investment results that match, before fees and expenses, the performance of a benchmark for mid-cap growth securities on a daily basis. The Fund’s current benchmark is the S&P MidCap 400® Pure Growth Index (the “underlying index”).
Holdings Diversification (Market Exposure as % of Net Assets)
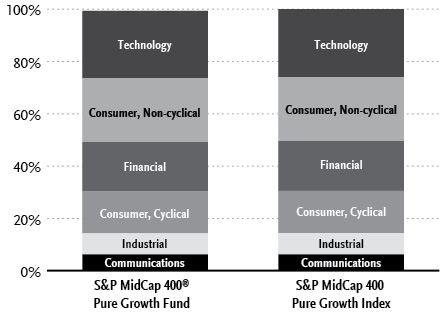
“Holdings Diversification (Market Exposure as % of Net Assets)” excludes any temporary cash investments.
Inception Dates: |
A-Class | September 1, 2004 |
C-Class | February 20, 2004 |
H-Class | February 20, 2004 |
Ten Largest Holdings (% of Total Net Assets) |
ABIOMED, Inc. | 2.8% |
Convergys Corp. | 2.4% |
MarketAxess Holdings, Inc. | 2.2% |
Alexander & Baldwin, Inc. | 2.1% |
WebMD Health Corp. — Class A | 1.9% |
Post Holdings, Inc. | 1.9% |
ARRIS International plc | 1.9% |
Skechers U.S.A., Inc. — Class A | 1.8% |
Cirrus Logic, Inc. | 1.7% |
Dycom Industries, Inc. | 1.7% |
Top Ten Total | 20.4% |
| | |
“Ten Largest Holdings” excludes any temporary cash investments. |
22 | THE RYDEX FUNDS SEMI-ANNUAL REPORT | |
SCHEDULE OF INVESTMENTS (Unaudited) | September 30, 2016 |
S&P MIDCAP 400® PURE GROWTH FUND | |
| | | Shares | | | Value | |
| | | | | | | |
COMMON STOCKS† - 99.4% | |
| | | | | | | |
Technology - 25.8% | |
Convergys Corp. | | | 96,375 | | | $ | 2,931,727 | |
Cirrus Logic, Inc.* | | | 38,900 | | | | 2,067,535 | |
Ultimate Software Group, Inc.* | | | 9,766 | | | | 1,996,072 | |
Fortinet, Inc.* | | | 49,767 | | | | 1,837,895 | |
j2 Global, Inc. | | | 27,504 | | | | 1,832,041 | |
ACI Worldwide, Inc.* | | | 88,605 | | | | 1,717,164 | |
Synaptics, Inc.* | | | 28,663 | | | | 1,679,079 | |
Fair Isaac Corp. | | | 12,941 | | | | 1,612,319 | |
Integrated Device Technology, Inc.* | | | 67,973 | | | | 1,570,176 | |
MAXIMUS, Inc. | | | 26,564 | | | | 1,502,460 | |
Tyler Technologies, Inc.* | | | 8,660 | | | | 1,482,852 | |
Microsemi Corp.* | | | 35,109 | | | | 1,473,876 | |
Manhattan Associates, Inc.* | | | 24,590 | | | | 1,416,876 | |
Monolithic Power Systems, Inc. | | | 17,400 | | | | 1,400,700 | |
MSCI, Inc. — Class A | | | 16,105 | | | | 1,351,854 | |
IPG Photonics Corp.* | | | 14,720 | | | | 1,212,192 | |
Jack Henry & Associates, Inc. | | | 12,270 | | | | 1,049,699 | |
Broadridge Financial Solutions, Inc. | | | 13,700 | | | | 928,723 | |
DST Systems, Inc. | | | 7,690 | | | | 906,805 | |
CDK Global, Inc. | | | 15,038 | | | | 862,580 | |
Cadence Design Systems, Inc.* | | | 32,182 | | | | 821,606 | |
Total Technology | | | | | | | 31,654,231 | |
| | | | | | | | | |
Consumer, Non-cyclical - 24.4% | |
ABIOMED, Inc.* | | | 26,359 | | | | 3,389,240 | |
MarketAxess Holdings, Inc. | | | 16,077 | | | | 2,662,190 | |
Post Holdings, Inc.* | | | 30,000 | | | | 2,315,100 | |
NuVasive, Inc.* | | | 25,500 | | | | 1,699,830 | |
Amsurg Corp. — Class A* | | | 24,620 | | | | 1,650,771 | |
WhiteWave Foods Co. — Class A* | | | 29,847 | | | | 1,624,572 | |
Align Technology, Inc.* | | | 16,060 | | | | 1,505,625 | |
Sprouts Farmers Market, Inc.* | | | 70,880 | | | | 1,463,672 | |
United Therapeutics Corp.* | | | 10,641 | | | | 1,256,489 | |
Prestige Brands Holdings, Inc.* | | | 25,290 | | | | 1,220,748 | |
Helen of Troy Ltd.* | | | 13,000 | | | | 1,120,210 | |
PAREXEL International Corp.* | | | 16,129 | | | | 1,120,159 | |
Service Corporation International | | | 37,620 | | | | 998,435 | |
VCA, Inc.* | | | 13,990 | | | | 979,020 | |
MEDNAX, Inc.* | | | 13,910 | | | | 921,538 | |
CEB, Inc. | | | 15,928 | | | | 867,598 | |
Gartner, Inc.* | | | 8,835 | | | | 781,456 | |
Rollins, Inc. | | | 25,031 | | | | 732,908 | |
STERIS plc | | | 9,090 | | | | 664,479 | |
Akorn, Inc.* | | | 23,183 | | | | 631,969 | |
Bio-Techne Corp. | | | 5,620 | | | | 615,390 | |
Charles River Laboratories International, Inc.* | | | 7,291 | | | | 607,632 | |
LivaNova plc* | | | 9,353 | | | | 562,209 | |
Flowers Foods, Inc. | | | 33,465 | | | | 505,991 | |
Total Consumer, Non-cyclical | | | | | | | 29,897,231 | |
| | | | | | | | | |
Financial - 18.9% | |
Alexander & Baldwin, Inc. | | | 65,460 | | | | 2,514,973 | |
WisdomTree Investments, Inc. | | | 187,180 | | | | 1,926,082 | |
Old Republic International Corp. | | | 94,790 | | | | 1,670,200 | |
PrivateBancorp, Inc. — Class A | | | 36,350 | | | | 1,669,193 | |
Lamar Advertising Co. — Class A | | | 23,605 | | | | 1,541,642 | |
Equity One, Inc. | | | 50,304 | | | | 1,539,806 | |
Bank of the Ozarks, Inc. | | | 35,447 | | | | 1,361,165 | |
SEI Investments Co. | | | 28,044 | | | | 1,279,087 | |
Education Realty Trust, Inc. | | | 29,120 | | | | 1,256,237 | |
Signature Bank* | | | 10,376 | | | | 1,229,037 | |
Weingarten Realty Investors | | | 30,440 | | | | 1,186,551 | |
First Horizon National Corp. | | | 72,565 | | | | 1,105,165 | |
Communications Sales & Leasing, Inc. | | | 32,290 | | | | 1,014,229 | |
SVB Financial Group* | | | 8,850 | | | | 978,279 | |
CBOE Holdings, Inc. | | | 13,224 | | | | 857,576 | |
Healthcare Realty Trust, Inc. | | | 22,830 | | | | 777,590 | |
Jones Lang LaSalle, Inc. | | | 5,860 | | | | 666,809 | |
Life Storage, Inc. | | | 6,977 | | | | 620,534 | |
Total Financial | | | | | | | 23,194,155 | |
| | | | | | | | | |
Consumer, Cyclical - 16.0% | |
Skechers U.S.A., Inc. — Class A* | | | 97,607 | | | | 2,235,200 | |
NVR, Inc.* | | | 1,200 | | | | 1,967,845 | |
Churchill Downs, Inc. | | | 12,600 | | | | 1,844,010 | |
Tempur Sealy International, Inc.* | | | 27,980 | | | | 1,587,585 | |
Vista Outdoor, Inc.* | | | 39,505 | | | | 1,574,669 | |
Pool Corp. | | | 14,460 | | | | 1,366,759 | |
Wendy’s Co. | | | 115,543 | | | | 1,247,865 | |
Toll Brothers, Inc.* | | | 38,940 | | | | 1,162,748 | |
JetBlue Airways Corp.* | | | 55,289 | | | | 953,182 | |
Restoration Hardware Holdings, Inc.* | | | 27,250 | | | | 942,305 | |
Domino’s Pizza, Inc. | | | 6,175 | | | | 937,674 | |
Toro Co. | | | 18,390 | | | | 861,388 | |
Buffalo Wild Wings, Inc.* | | | 5,995 | | | | 843,736 | |
Panera Bread Co. — Class A* | | | 3,800 | | | | 739,936 | |
Carter’s, Inc. | | | 7,654 | | | | 663,678 | |
Dunkin’ Brands Group, Inc. | | | 12,135 | | | | 631,991 | |
Total Consumer, Cyclical | | | | | | | 19,560,571 | |
| | | | | | | | | |
Industrial - 8.1% | |
Dycom Industries, Inc.* | | | 24,900 | | | | 2,036,323 | |
AO Smith Corp. | | | 18,100 | | | | 1,788,099 | |
Lennox International, Inc. | | | 9,680 | | | | 1,520,050 | |
Packaging Corporation of America | | | 17,607 | | | | 1,430,745 | |
Zebra Technologies Corp. — Class A* | | | 17,342 | | | | 1,207,177 | |
Eagle Materials, Inc. | | | 15,201 | | | | 1,175,037 | |
Cognex Corp. | | | 15,540 | | | | 821,444 | |
Total Industrial | | | | | | | 9,978,875 | |
| | | | | | | | | |
Communications - 6.2% | |
WebMD Health Corp. — Class A* | | | 46,740 | | | | 2,322,978 | |
ARRIS International plc* | | | 80,369 | | | | 2,276,853 | |
AMC Networks, Inc. — Class A* | | | 22,945 | | | | 1,189,928 | |
Ciena Corp.* | | | 45,027 | | | | 981,589 | |
FactSet Research Systems, Inc. | | | 4,980 | | | | 807,258 | |
Total Communications | | | | | | | 7,578,606 | |
| | | | | | | | | |
Total Common Stocks | | | | | | | | |
(Cost $109,267,209) | | | | | | | 121,863,669 | |
SEE NOTES TO FINANCIAL STATEMENTS. | THE RYDEX FUNDS SEMI-ANNUAL REPORT | 23 |
SCHEDULE OF INVESTMENTS (Unaudited)(concluded) | September 30, 2016 |
S&P MIDCAP 400® PURE GROWTH FUND | |
| | | Face
Amount | | | Value | |
| | | | | | | |
REPURCHASE AGREEMENTS††,1 - 0.5% | |
HSBC Securities, Inc.
issued 09/30/16 at 0.38%
due 10/03/16 | | $ | 360,354 | | | $ | 360,354 | |
Royal Bank of Canada
issued 09/30/16 at 0.36%
due 10/03/16 | | | 286,122 | | | | 286,122 | |
Total Repurchase Agreements | | | | | | | | |
(Cost $646,476) | | | | | | | 646,476 | |
| | | | | | | | | |
Total Investments - 99.9% | | | | | | | | |
(Cost $109,913,685) | | | | | | $ | 122,510,145 | |
Other Assets & Liabilities, net - 0.1% | | | | | | | 117,219 | |
Total Net Assets - 100.0% | | | | | | $ | 122,627,364 | |
* | Non-income producing security. |
† | Value determined based on Level 1 inputs — See Note 4. |
†† | Value determined based on Level 2 inputs — See Note 4. |
1 | Repurchase Agreements — See Note 5. |
| | plc — Public Limited Company |
| | |
| | See Sector Classification in Other Information section. |
The following table summarizes the inputs used to value the Fund’s investments at September 30, 2016 (See Note 4 in the Notes to Financial Statements):
Investments in Securities (Assets) | | Level 1 | | | Level 2 | | | Level 3 | | | Total | |
Common Stocks | | $ | 121,863,669 | | | $ | — | | | $ | — | | | $ | 121,863,669 | |
Repurchase Agreements | | | — | | | | 646,476 | | | | — | | | | 646,476 | |
Total | | $ | 121,863,669 | | | $ | 646,476 | | | $ | — | | | $ | 122,510,145 | |
Transfers between investment levels may occur as the markets fluctuate and/or the availability of data used in an investment’s valuation changes. Transfers between valuation levels, if any, are in comparison to the valuation levels at the end of the previous fiscal year, and are effective using the fair value as of the end of the previous fiscal period.
For the period ended September 30, 2016, there were no transfers between levels.
24 | THE RYDEX FUNDS SEMI-ANNUAL REPORT | SEE NOTES TO FINANCIAL STATEMENTS. |
S&P MIDCAP 400® PURE GROWTH FUND | |
STATEMENT OF ASSETS AND LIABILITIES (Unaudited) | |
September 30, 2016 | |
Assets: | |
Investments, at value (cost $109,267,209) | | $ | 121,863,669 | |
Repurchase agreements, at value (cost $646,476) | | | 646,476 | |
Total investments (cost $109,913,685) | | | 122,510,145 | |
Receivables: | |
Fund shares sold | | | 328,665 | |
Dividends | | | 60,544 | |
Interest | | | 7 | |
Total assets | | | 122,899,361 | |
| | | | | |
Liabilities: | |
Payable for: | |
Management fees | | | 75,470 | |
Licensing fees | | | 54,498 | |
Fund shares redeemed | | | 46,443 | |
Distribution and service fees | | | 36,454 | |
Transfer agent and administrative fees | | | 25,157 | |
Portfolio accounting fees | | | 10,062 | |
Miscellaneous | | | 23,913 | |
Total liabilities | | | 271,997 | |
Commitments and contingent liabilities (Note 11) | | | — | |
Net assets | | $ | 122,627,364 | |
| | | | | |
Net assets consist of: | |
Paid in capital | | $ | 115,357,585 | |
Accumulated net investment loss | | | (807,403 | ) |
Accumulated net realized loss on investments | | | (4,519,278 | ) |
Net unrealized appreciation on investments | | | 12,596,460 | |
Net assets | | $ | 122,627,364 | |
| | | | | |
A-Class: | |
Net assets | | $ | 17,717,823 | |
Capital shares outstanding | | | 371,236 | |
Net asset value per share | | $ | 47.73 | |
Maximum offering price per share (Net asset value divided by 95.25%) | | $ | 50.11 | |
| | | | | |
C-Class: | |
Net assets | | $ | 17,949,700 | |
Capital shares outstanding | | | 424,025 | |
Net asset value per share | | $ | 42.33 | |
| | | | | |
H-Class: | |
Net assets | | $ | 86,959,841 | |
Capital shares outstanding | | | 1,820,108 | |
Net asset value per share | | $ | 47.78 | |
STATEMENT OF OPERATIONS (Unaudited) | |
Period Ended September 30, 2016 | |
Investment Income: | |
Dividends | | $ | 523,260 | |
Interest | | | 788 | |
Total investment income | | | 524,048 | |
| | | | | |
Expenses: | |
Management fees | | | 488,636 | |
Transfer agent and administrative fees | | | 162,878 | |
Distribution and service fees: | |
A-Class | | | 29,599 | |
C-Class | | | 97,254 | |
H-Class | | | 108,966 | |
Portfolio accounting fees | | | 65,150 | |
Custodian fees | | | 7,672 | |
Trustees’ fees* | | | 5,615 | |
Line of credit fees | | | 113 | |
Miscellaneous | | | 98,395 | |
Total expenses | | | 1,064,278 | |
Net investment loss | | | (540,230 | ) |
| | | | | |
Net Realized and Unrealized Gain (Loss): | |
Net realized gain (loss) on: | |
Investments | | | 3,186,892 | |
Net realized gain | | | 3,186,892 | |
Net change in unrealized appreciation (depreciation) on: | |
Investments | | | 137,419 | |
Net change in unrealized appreciation (depreciation) | | | 137,419 | |
Net realized and unrealized gain | | | 3,324,311 | |
Net increase in net assets resulting from operations | | $ | 2,784,081 | |
* | Relates to Trustees not deemed “interested persons” within the meaning of Section 2(a)(19) of the 1940 Act. |
SEE NOTES TO FINANCIAL STATEMENTS. | THE RYDEX FUNDS SEMI-ANNUAL REPORT | 25 |
S&P MIDCAP 400® PURE GROWTH FUND | |
STATEMENTS OF CHANGES IN NET ASSETS |
| | | Period Ended
September 30,
2016
(Unaudited) | | | Year Ended
March 31,
2016 | |
Increase (Decrease) in Net Assets from Operations: | | | | | | |
Net investment loss | | $ | (540,230 | ) | | $ | (1,474,357 | ) |
Net realized gain on investments | | | 3,186,892 | | | | 618,071 | |
Net change in unrealized appreciation (depreciation) on investments | | | 137,419 | | | | (19,480,581 | ) |
Net increase (decrease) in net assets resulting from operations | | | 2,784,081 | | | | (20,336,867 | ) |
| | | | | | | | | |
Distributions to shareholders from: | | | | | | | | |
Net realized gains | | | | | | | | |
A-Class | | | — | | | | (2,228,224 | ) |
C-Class | | | — | | | | (1,333,119 | ) |
H-Class | | | — | | | | (6,095,021 | ) |
Total distributions to shareholders | | | — | | | | (9,656,364 | ) |
| | | | | | | | | |
Capital share transactions: | | | | | | | | |
Proceeds from sale of shares | | | | | | | | |
A-Class | | | 1,873,741 | | | | 53,831,940 | |
C-Class | | | 1,781,065 | | | | 8,486,478 | |
H-Class | | | 50,166,826 | | | | 132,856,460 | |
Distributions reinvested | | | | | | | | |
A-Class | | | — | | | | 2,217,738 | |
C-Class | | | — | | | | 1,326,118 | |
H-Class | | | — | | | | 6,025,101 | |
Cost of shares redeemed | | | | | | | | |
A-Class | | | (13,887,236 | ) | | | (60,087,772 | ) |
C-Class | | | (4,570,024 | ) | | | (12,136,902 | ) |
H-Class | | | (59,732,031 | ) | | | (150,323,558 | ) |
Net decrease from capital share transactions | | | (24,367,659 | ) | | | (17,804,397 | ) |
Net decrease in net assets | | | (21,583,578 | ) | | | (47,797,628 | ) |
| | | | | | | | | |
Net assets: | | | | | | | | |
Beginning of period | | | 144,210,942 | | | | 192,008,570 | |
End of period | | $ | 122,627,364 | | | $ | 144,210,942 | |
Accumulated net investment loss at end of period | | $ | (807,403 | ) | | $ | (267,173 | ) |
| | | | | | | | | |
Capital share activity: | | | | | | | | |
Shares sold | | | | | | | | |
A-Class | | | 39,532 | | | | 1,045,660 | |
C-Class | | | 42,356 | | | | 181,153 | |
H-Class | | | 1,054,158 | | | | 2,636,800 | |
Shares issued from reinvestment of distributions | | | | | | | | |
A-Class | | | — | | | | 45,094 | |
C-Class | | | — | | | | 30,201 | |
H-Class | | | — | | | | 122,362 | |
Shares redeemed | | | | | | | | |
A-Class | | | (292,152 | ) | | | (1,221,580 | ) |
C-Class | | | (108,046 | ) | | | (270,847 | ) |
H-Class | | | (1,272,520 | ) | | | (3,033,087 | ) |
Net decrease in shares | | | (536,672 | ) | | | (464,244 | ) |
26 | THE RYDEX FUNDS SEMI-ANNUAL REPORT | SEE NOTES TO FINANCIAL STATEMENTS. |
S&P MIDCAP 400® PURE GROWTH FUND | |
This table is presented to show selected data for a share outstanding throughout each period and to assist shareholders in evaluating a Fund’s performance for the periods presented.
A-Class | | Period Ended
September 30,
2016a | | | Year Ended
March 31,
2016 | | | Year Ended
March 31,
2015 | | | Year Ended
March 31,
2014 | | | Year Ended
March 28,
2013 | | | Year Ended
March 31,
2012 | |
Per Share Data | | | | | | | | | | | | | | | | | | |
Net asset value, beginning of period | | $ | 46.51 | | | $ | 53.86 | | | $ | 58.66 | | | $ | 49.76 | | | $ | 44.11 | | | $ | 42.76 | |
Income (loss) from investment operations: | |
Net investment income (loss)b | | | (.18 | ) | | | (.36 | ) | | | (.29 | ) | | | (.22 | ) | | | (.19 | ) | | | (.45 | ) |
Net gain (loss) on investments (realized and unrealized) | | | 1.40 | | | | (4.48 | ) | | | 3.88 | | | | 11.05 | | | | 5.84 | | | | 1.80 | |
Total from investment operations | | | 1.22 | | | | (4.84 | ) | | | 3.59 | | | | 10.83 | | | | 5.65 | | | | 1.35 | |
Less distributions from: | |
Net realized gains | | | — | | | | (2.51 | ) | | | (8.39 | ) | | | (1.93 | ) | | | — | | | | — | |
Total distributions | | | — | | | | (2.51 | ) | | | (8.39 | ) | | | (1.93 | ) | | | — | | | | — | |
Net asset value, end of period | | $ | 47.73 | | | $ | 46.51 | | | $ | 53.86 | | | $ | 58.66 | | | $ | 49.76 | | | $ | 44.11 | |
| | |
Total Returnc | | | 2.60 | % | | | (9.23 | %) | | | 7.18 | % | | | 21.90 | % | | | 12.81 | % | | | 3.16 | % |
Ratios/Supplemental Data | |
Net assets, end of period (in thousands) | | $ | 17,718 | | | $ | 29,017 | | | $ | 40,648 | | | $ | 59,293 | | | $ | 45,638 | | | $ | 36,052 | |
Ratios to average net assets: | |
Net investment income (loss) | | | (0.74 | %) | | | (0.71 | %) | | | (0.53 | %) | | | (0.40 | %) | | | (0.43 | %) | | | (1.09 | %) |
Total expenses | | | 1.52 | % | | | 1.50 | % | | | 1.51 | % | | | 1.52 | % | | | 1.50 | % | | | 1.50 | % |
Portfolio turnover rate | | | 41 | % | | | 143 | % | | | 134 | % | | | 131 | % | | | 188 | % | | | 226 | % |
C-Class | | Period Ended
September 30,
2016a | | | Year Ended
March 31,
2016 | | | Year Ended
March 31,
2015 | | | Year Ended
March 31,
2014 | | | Year Ended
March 28,
2013 | | | Year Ended
March 31,
2012 | |
Per Share Data | | | | | | | | | | | | | | | | | | |
Net asset value, beginning of period | | $ | 41.41 | | | $ | 48.60 | | | $ | 54.13 | | | $ | 46.39 | | | $ | 41.43 | | | $ | 40.47 | |
Income (loss) from investment operations: | |
Net investment income (loss)b | | | (.31 | ) | | | (.66 | ) | | | (.64 | ) | | | (.58 | ) | | | (.49 | ) | | | (.71 | ) |
Net gain (loss) on investments (realized and unrealized) | | | 1.23 | | | | (4.02 | ) | | | 3.50 | | | | 10.25 | | | | 5.45 | | | | 1.67 | |
Total from investment operations | | | .92 | | | | (4.68 | ) | | | 2.86 | | | | 9.67 | | | | 4.96 | | | | .96 | |
Less distributions from: | |
Net realized gains | | | — | | | | (2.51 | ) | | | (8.39 | ) | | | (1.93 | ) | | | — | | | | — | |
Total distributions | | | — | | | | (2.51 | ) | | | (8.39 | ) | | | (1.93 | ) | | | — | | | | — | |
Net asset value, end of period | | $ | 42.33 | | | $ | 41.41 | | | $ | 48.60 | | | $ | 54.13 | | | $ | 46.39 | | | $ | 41.43 | |
| | |
Total Returnc | | | 2.22 | % | | | (9.92 | %) | | | 6.39 | % | | | 20.98 | % | | | 12.00 | % | | | 2.35 | % |
Ratios/Supplemental Data | |
Net assets, end of period (in thousands) | | $ | 17,950 | | | $ | 20,279 | | | $ | 26,689 | | | $ | 28,567 | | | $ | 18,837 | | | $ | 16,228 | |
Ratios to average net assets: | |
Net investment income (loss) | | | (1.46 | %) | | | (1.46 | %) | | | (1.26 | %) | | | (1.15 | %) | | | (1.19 | %) | | | (1.83 | %) |
Total expenses | | | 2.27 | % | | | 2.25 | % | | | 2.26 | % | | | 2.27 | % | | | 2.25 | % | | | 2.25 | % |
Portfolio turnover rate | | | 41 | % | | | 143 | % | | | 134 | % | | | 131 | % | | | 188 | % | | | 226 | % |
SEE NOTES TO FINANCIAL STATEMENTS. | THE RYDEX FUNDS SEMI-ANNUAL REPORT | 27 |
S&P MIDCAP 400® PURE GROWTH FUND | |
FINANCIAL HIGHLIGHTS (concluded) |
This table is presented to show selected data for a share outstanding throughout each period and to assist shareholders in evaluating a Fund’s performance for the periods presented.
H-Class | | Period Ended
September 30,
2016a | | | Year Ended
March 31,
2016 | | | Year Ended
March 31,
2015 | | | Year Ended
March 31,
2014 | | | Year Ended
March 28,
2013 | | | Year Ended
March 31,
2012 | |
Per Share Data | | | | | | | | | | | | | | | | | | |
Net asset value, beginning of period | | $ | 46.56 | | | $ | 53.91 | | | $ | 58.71 | | | $ | 49.80 | | | $ | 44.14 | | | $ | 42.81 | |
Income (loss) from investment operations: | |
Net investment income (loss)b | | | (.17 | ) | | | (.36 | ) | | | (.29 | ) | | | (.18 | ) | | | (.20 | ) | | | (.44 | ) |
Net gain (loss) on investments (realized and unrealized) | | | 1.39 | | | | (4.48 | ) | | | 3.88 | | | | 11.02 | | | | 5.86 | | | | 1.77 | |
Total from investment operations | | | 1.22 | | | | (4.84 | ) | | | 3.59 | | | | 10.84 | | | | 5.66 | | | | 1.33 | |
Less distributions from: | |
Net realized gains | | | — | | | | (2.51 | ) | | | (8.39 | ) | | | (1.93 | ) | | | — | | | | — | |
Total distributions | | | — | | | | (2.51 | ) | | | (8.39 | ) | | | (1.93 | ) | | | — | | | | — | |
Net asset value, end of period | | $ | 47.78 | | | $ | 46.56 | | | $ | 53.91 | | | $ | 58.71 | | | $ | 49.80 | | | $ | 44.14 | |
| | |
Total Returnc | | | 2.60 | % | | | (9.22 | %) | | | 7.18 | % | | | 21.91 | % | | | 12.82 | % | | | 3.11 | % |
Ratios/Supplemental Data | |
Net assets, end of period (in thousands) | | $ | 86,960 | | | $ | 94,915 | | | $ | 124,672 | | | $ | 186,863 | | | $ | 242,157 | | | $ | 312,510 | |
Ratios to average net assets: | |
Net investment income (loss) | | | (0.71 | %) | | | (0.71 | %) | | | (0.52 | %) | | | (0.33 | %) | | | (0.45 | %) | | | (1.08 | %) |
Total expenses | | | 1.52 | % | | | 1.50 | % | | | 1.51 | % | | | 1.52 | % | | | 1.50 | % | | | 1.50 | % |
Portfolio turnover rate | | | 41 | % | | | 143 | % | | | 134 | % | | | 131 | % | | | 188 | % | | | 226 | % |
a | Unaudited figures for the period ended September 30, 2016. Percentage amounts for the period, except total return and portfolio turnover rate, have been annualized. |
b | Net investment income (loss) per share was computed using average shares outstanding throughout the period. |
c | Total return does not reflect the impact of any applicable sales charges. |
28 | THE RYDEX FUNDS SEMI-ANNUAL REPORT | SEE NOTES TO FINANCIAL STATEMENTS. |
FUND PROFILE (Unaudited) | September 30, 2016 |
S&P MIDCAP 400® PURE VALUE FUND
OBJECTIVE: Seeks to provide investment results that match, before fees and expenses, the performance of a benchmark for mid-cap value securities on a daily basis. The Fund’s current benchmark is the S&P MidCap 400® Pure Value Index (the “underlying index”).
Holdings Diversification (Market Exposure as % of Net Assets)
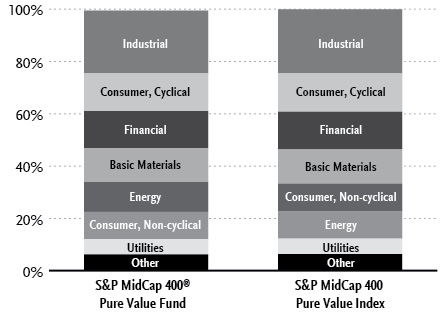
“Holdings Diversification (Market Exposure as % of Net Assets)” excludes any temporary cash investments.
Inception Dates: |
A-Class | September 1, 2004 |
C-Class | February 20, 2004 |
H-Class | February 20, 2004 |
Ten Largest Holdings (% of Total Net Assets) |
Joy Global, Inc. | 4.1% |
Talen Energy Corp. | 3.0% |
United States Steel Corp. | 2.7% |
Allegheny Technologies, Inc. | 2.2% |
KB Home | 2.2% |
WPX Energy, Inc. | 2.2% |
Terex Corp. | 2.2% |
Tech Data Corp. | 2.1% |
Computer Sciences Corp. | 1.9% |
Reliance Steel & Aluminum Co. | 1.8% |
Top Ten Total | 24.4% |
| | |
“Ten Largest Holdings” excludes any temporary cash investments. |
| | THE RYDEX FUNDS SEMI-ANNUAL REPORT | 29 |
SCHEDULE OF INVESTMENTS (Unaudited) | September 30, 2016 |
S&P MIDCAP 400® PURE VALUE FUND | |
| | | Shares | | | Value | |
| | | | | | | |
COMMON STOCKS† - 99.5% | |
| | | | | | | |
Industrial - 24.0% | |
Joy Global, Inc. | | | 41,688 | | | $ | 1,156,424 | |
Terex Corp. | | | 24,065 | | | | 611,492 | |
Tech Data Corp.* | | | 6,887 | | | | 583,398 | |
Arrow Electronics, Inc.* | | | 7,999 | | | | 511,696 | |
Greif, Inc. — Class A | | | 8,591 | | | | 426,028 | |
Avnet, Inc. | | | 9,970 | | | | 409,368 | |
KLX, Inc.* | | | 9,841 | | | | 346,403 | |
Triumph Group, Inc. | | | 12,248 | | | | 341,474 | |
Vishay Intertechnology, Inc. | | | 23,487 | | | | 330,932 | |
AECOM* | | | 10,381 | | | | 308,627 | |
Oshkosh Corp. | | | 5,448 | | | | 305,088 | |
Trinity Industries, Inc. | | | 12,319 | | | | 297,873 | |
Jabil Circuit, Inc. | | | 13,089 | | | | 285,602 | |
AGCO Corp. | | | 5,058 | | | | 249,461 | |
EMCOR Group, Inc. | | | 3,941 | | | | 234,962 | |
Granite Construction, Inc. | | | 2,925 | | | | 145,490 | |
Regal Beloit Corp. | | | 2,234 | | | | 132,901 | |
GATX Corp. | | | 2,589 | | | | 115,340 | |
Total Industrial | | | | | | | 6,792,559 | |
| | | | | | | | | |
Consumer, Cyclical - 14.5% | |
KB Home | | | 38,777 | | | | 625,084 | |
Ingram Micro, Inc. — Class A | | | 13,730 | | | | 489,612 | |
World Fuel Services Corp. | | | 9,119 | | | | 421,845 | |
CST Brands, Inc. | | | 7,520 | | | | 361,637 | |
GameStop Corp. — Class A | | | 12,023 | | | | 331,715 | |
Dana, Inc. | | | 16,625 | | | | 259,184 | |
Big Lots, Inc. | | | 4,760 | | | | 227,290 | |
Dick’s Sporting Goods, Inc. | | | 3,769 | | | | 213,778 | |
Fossil Group, Inc.* | | | 6,561 | | | | 182,199 | |
J.C. Penney Company, Inc.* | | | 17,158 | | | | 158,197 | |
Deckers Outdoor Corp.* | | | 2,587 | | | | 154,056 | |
Abercrombie & Fitch Co. — Class A | | | 9,593 | | | | 152,432 | |
Office Depot, Inc. | | | 40,849 | | | | 145,831 | |
Cabela’s, Inc.* | | | 2,480 | | | | 136,226 | |
Ascena Retail Group, Inc.* | | | 23,279 | | | | 130,130 | |
Guess?, Inc. | | | 8,144 | | | | 118,984 | |
Total Consumer, Cyclical | | | | | | | 4,108,200 | |
| | | | | | | | | |
Financial - 14.1% | |
Reinsurance Group of America, Inc. — Class A | | | 4,189 | | | | 452,161 | |
Genworth Financial, Inc. — Class A* | | | 59,458 | | | | 294,912 | |
Aspen Insurance Holdings Ltd. | | | 5,474 | | | | 255,035 | |
Endurance Specialty Holdings Ltd. | | | 3,823 | | | | 250,215 | |
Hancock Holding Co. | | | 7,661 | | | | 248,447 | |
Kemper Corp. | | | 6,147 | | | | 241,700 | |
Senior Housing Properties Trust | | | 10,458 | | | | 237,501 | |
Hanover Insurance Group, Inc. | | | 3,001 | | | | 226,335 | |
CNO Financial Group, Inc. | | | 14,234 | | | | 217,353 | |
Everest Re Group Ltd. | | | 1,120 | | | | 212,766 | |
Alleghany Corp.* | | | 364 | | | | 191,107 | |
First American Financial Corp. | | | 4,213 | | | | 165,487 | |
WR Berkley Corp. | | | 2,798 | | | | 161,612 | |
Trustmark Corp. | | | 4,965 | | | | 136,835 | |
Associated Banc-Corp. | | | 6,819 | | | | 133,584 | |
Umpqua Holdings Corp. | | | 8,012 | | | | 120,581 | |
Prosperity Bancshares, Inc. | | | 2,196 | | | | 120,538 | |
Stifel Financial Corp.* | | | 3,110 | | | | 119,580 | |
International Bancshares Corp. | | | 3,368 | | | | 100,299 | |
TCF Financial Corp. | | | 6,526 | | | | 94,692 | |
Huntington Bancshares, Inc. | | | 1 | | | | 6 | |
Total Financial | | | | | | | 3,980,746 | |
| | | | | | | | | |
Basic Materials - 13.0% | |
United States Steel Corp. | | | 40,814 | | | | 769,753 | |
Allegheny Technologies, Inc. | | | 34,948 | | | | 631,510 | |
Reliance Steel & Aluminum Co. | | | 7,196 | | | | 518,328 | |
Commercial Metals Co. | | | 30,779 | | | | 498,312 | |
Domtar Corp. | | | 10,379 | | | | 385,372 | |
Steel Dynamics, Inc. | | | 15,284 | | | | 381,947 | |
Carpenter Technology Corp. | | | 4,408 | | | | 181,874 | |
Worthington Industries, Inc. | | | 3,660 | | | | 175,790 | |
Olin Corp. | | | 6,731 | | | | 138,120 | |
Total Basic Materials | | | | | | | 3,681,006 | |
| | | | | | | | | |
Energy - 11.4% | |
WPX Energy, Inc.* | | | 47,219 | | | | 622,819 | |
SM Energy Co. | | | 12,311 | | | | 474,958 | |
CONSOL Energy, Inc. | | | 21,017 | | | | 403,526 | |
Diamond Offshore Drilling, Inc. | | | 18,820 | | | | 331,420 | |
Murphy USA, Inc.* | | | 4,277 | | | | 305,207 | |
Patterson-UTI Energy, Inc. | | | 11,479 | | | | 256,785 | |
NOW, Inc.* | | | 7,512 | | | | 160,982 | |
Oil States International, Inc.* | | | 5,036 | | | | 158,987 | |
Western Refining, Inc. | | | 5,877 | | | | 155,505 | |
Noble Corporation plc | | | 23,276 | | | | 147,570 | |
HollyFrontier Corp. | | | 4,543 | | | | 111,304 | |
Rowan Companies plc — Class A | | | 5,908 | | | | 89,565 | |
Total Energy | | | | | | | 3,218,628 | |
| | | | | | | | | |
Consumer, Non-cyclical - 10.4% | |
United Natural Foods, Inc.* | | | 9,735 | | | | 389,790 | |
Aaron’s, Inc. | | | 13,000 | | | | 330,460 | |
DeVry Education Group, Inc. | | | 13,067 | | | | 301,325 | |
Owens & Minor, Inc. | | | 7,583 | | | | 263,358 | |
ManpowerGroup, Inc. | | | 3,466 | | | | 250,453 | |
Community Health Systems, Inc.* | | | 21,309 | | | | 245,906 | |
Graham Holdings Co. — Class B | | | 458 | | | | 220,467 | |
FTI Consulting, Inc.* | | | 4,823 | | | | 214,913 | |
LifePoint Health, Inc.* | | | 3,281 | | | | 194,334 | |
Dean Foods Co. | | | 11,571 | | | | 189,764 | |
Tenet Healthcare Corp.* | | | 8,018 | | | | 181,688 | |
Avis Budget Group, Inc.* | | | 4,530 | | | | 154,971 | |
Total Consumer, Non-cyclical | | | | | | | 2,937,429 | |
| | | | | | | | | |
Utilities - 5.9% | |
Talen Energy Corp.* | | | 60,327 | | | | 835,530 | |
MDU Resources Group, Inc. | | | 12,985 | | | | 330,338 | |
Great Plains Energy, Inc. | | | 5,450 | | | | 148,730 | |
PNM Resources, Inc. | | | 3,894 | | | | 127,412 | |
30 | THE RYDEX FUNDS SEMI-ANNUAL REPORT | SEE NOTES TO FINANCIAL STATEMENTS. |
SCHEDULE OF INVESTMENTS (Unaudited)(concluded) | September 30, 2016 |
S&P MIDCAP 400® PURE VALUE FUND | |
| | | Shares | | | Value | |
| | | | | | | |
ONE Gas, Inc. | | | 1,857 | | | $ | 114,837 | |
Hawaiian Electric Industries, Inc. | | | 3,598 | | | | 107,400 | |
Total Utilities | | | | | | | 1,664,247 | |
| | | | | | | | | |
Technology - 4.7% | |
Computer Sciences Corp. | | | 10,400 | | | | 542,984 | |
SYNNEX Corp. | | | 3,027 | | | | 345,411 | |
3D Systems Corp.* | | | 16,798 | | | | 301,524 | |
Lexmark International, Inc. — Class A | | | 3,506 | | | | 140,100 | |
Total Technology | | | | | | | 1,330,019 | |
| | | | | | | | | |
Communications - 1.5% | |
Telephone & Data Systems, Inc. | | | 15,307 | | | | 416,044 | |
| | | | | | | | | |
Total Common Stocks | | | | | | | | |
(Cost $22,805,536) | | | | | | | 28,128,878 | |
| | | Face
Amount | | | | |
| | | | | | | |
REPURCHASE AGREEMENTS††,1 - 0.6% | |
HSBC Securities, Inc.
issued 09/30/16 at 0.38%
due 10/03/16 | | $ | 91,415 | | | | 91,415 | |
Royal Bank of Canada
issued 09/30/16 at 0.36%
due 10/03/16 | | | 72,584 | | | | 72,584 | |
Total Repurchase Agreements | | | | | | | | |
(Cost $163,999) | | | | | | | 163,999 | |
| | | | | | | | | |
Total Investments - 100.1% | | | | | | | | |
(Cost $22,969,535) | | | | | | $ | 28,292,877 | |
Other Assets & Liabilities, net - (0.1)% | | | | | | | (19,589 | ) |
Total Net Assets - 100.0% | | | | | | $ | 28,273,288 | |
* | Non-income producing security. |
† | Value determined based on Level 1 inputs — See Note 4. |
†† | Value determined based on Level 2 inputs — See Note 4. |
1 | Repurchase Agreements — See Note 5. |
| | plc — Public Limited Company |
| | |
| | See Sector Classification in Other Information section. |
The following table summarizes the inputs used to value the Fund’s investments at September 30, 2016 (See Note 4 in the Notes to Financial Statements):
Investments in Securities (Assets) | | Level 1 | | | Level 2 | | | Level 3 | | | Total | |
Common Stocks | | $ | 28,128,878 | | | $ | — | | | $ | — | | | $ | 28,128,878 | |
Repurchase Agreements | | | — | | | | 163,999 | | | | — | | | | 163,999 | |
Total | | $ | 28,128,878 | | | $ | 163,999 | | | $ | — | | | $ | 28,292,877 | |
Transfers between investment levels may occur as the markets fluctuate and/or the availability of data used in an investment’s valuation changes. Transfers between valuation levels, if any, are in comparison to the valuation levels at the end of the previous fiscal year, and are effective using the fair value as of the end of the previous fiscal period.
For the period ended September 30, 2016, there were no transfers between levels.
SEE NOTES TO FINANCIAL STATEMENTS. | THE RYDEX FUNDS SEMI-ANNUAL REPORT | 31 |
S&P MIDCAP 400® PURE VALUE FUND | |
STATEMENT OF ASSETS AND LIABILITIES (Unaudited) | |
September 30, 2016 | |
Assets: | |
Investments, at value (cost $22,805,536) | | $ | 28,128,878 | |
Repurchase agreements, at value (cost $163,999) | | | 163,999 | |
Total investments (cost $22,969,535) | | | 28,292,877 | |
Receivables: | |
Securities sold | | | 417,779 | |
Fund shares sold | | | 15,859 | |
Dividends | | | 23,056 | |
Total assets | | | 28,749,571 | |
| | | | | |
Liabilities: | |
Payable for: | |
Securities purchased | | | 332,383 | |
Fund shares redeemed | | | 97,998 | |
Management fees | | | 19,315 | |
Distribution and service fees | | | 8,070 | |
Transfer agent and administrative fees | | | 6,438 | |
Portfolio accounting fees | | | 2,575 | |
Miscellaneous | | | 9,504 | |
Total liabilities | | | 476,283 | |
Commitments and contingent liabilities (Note 11) | | | — | |
Net assets | | $ | 28,273,288 | |
| | | | | |
Net assets consist of: | |
Paid in capital | | $ | 27,198,343 | |
Undistributed net investment income | | | 20,173 | |
Accumulated net realized loss on investments | | | (4,268,570 | ) |
Net unrealized appreciation on investments | | | 5,323,342 | |
Net assets | | $ | 28,273,288 | |
| | | | | |
A-Class: | |
Net assets | | $ | 1,948,863 | |
Capital shares outstanding | | | 42,441 | |
Net asset value per share | | $ | 45.92 | |
Maximum offering price per share (Net asset value divided by 95.25%) | | $ | 48.21 | |
| | | | | |
C-Class: | |
Net assets | | $ | 2,682,313 | |
Capital shares outstanding | | | 64,891 | |
Net asset value per share | | $ | 41.34 | |
| | | | | |
H-Class: | |
Net assets | | $ | 23,642,112 | |
Capital shares outstanding | | | 515,355 | |
Net asset value per share | | $ | 45.88 | |
STATEMENT OF OPERATIONS (Unaudited) | |
Period Ended September 30, 2016 | |
Investment Income: | |
Dividends | | $ | 271,198 | |
Interest | | | 366 | |
Total investment income | | | 271,564 | |
| | | | | |
Expenses: | |
Management fees | | | 145,127 | |
Transfer agent and administrative fees | | | 48,376 | |
Distribution and service fees: | |
A-Class | | | 2,672 | |
C-Class | | | 12,363 | |
H-Class | | | 42,613 | |
Portfolio accounting fees | | | 19,350 | |
Custodian fees | | | 2,278 | |
Trustees’ fees* | | | 2,149 | |
Line of credit fees | | | 29 | |
Miscellaneous | | | 28,982 | |
Total expenses | | | 303,939 | |
Net investment loss | | | (32,375 | ) |
| | | | | |
Net Realized and Unrealized Gain (Loss): | |
Net realized gain (loss) on: | |
Investments | | | 606,420 | |
Net realized gain | | | 606,420 | |
Net change in unrealized appreciation (depreciation) on: | |
Investments | | | 405,831 | |
Net change in unrealized appreciation (depreciation) | | | 405,831 | |
Net realized and unrealized gain | | | 1,012,251 | |
Net increase in net assets resulting from operations | | $ | 979,876 | |
* | Relates to Trustees not deemed “interested persons” within the meaning of Section 2(a)(19) of the 1940 Act. |
32 | THE RYDEX FUNDS SEMI-ANNUAL REPORT | SEE NOTES TO FINANCIAL STATEMENTS. |
S&P MIDCAP 400® PURE VALUE FUND | |
STATEMENTS OF CHANGES IN NET ASSETS |
| | | Period Ended
September 30,
2016
(Unaudited) | | | Year Ended
March 31,
2016 | |
Increase (Decrease) in Net Assets from Operations: | | | | | | |
Net investment income (loss) | | $ | (32,375 | ) | | $ | 52,548 | |
Net realized gain (loss) on investments | | | 606,420 | | | | (1,107,050 | ) |
Net change in unrealized appreciation (depreciation) on investments | | | 405,831 | | | | 1,847,168 | |
Net increase in net assets resulting from operations | | | 979,876 | | | | 792,666 | |
| | | | | | | | | |
Distributions to shareholders from: | | | | | | | | |
Net investment income | | | | | | | | |
A-Class | | | — | | | | (2,509 | ) |
C-Class | | | — | | | | (4,545 | ) |
H-Class | | | — | | | | (21,661 | ) |
Total distributions to shareholders | | | — | | | | (28,715 | ) |
| | | | | | | | | |
Capital share transactions: | | | | | | | | |
Proceeds from sale of shares | | | | | | | | |
A-Class | | | 2,281,816 | | | | 7,839,706 | |
C-Class | | | 2,251,681 | | | | 1,496,883 | |
H-Class | | | 164,640,968 | | | | 117,775,736 | |
Distributions reinvested | | | | | | | | |
A-Class | | | — | | | | 2,473 | |
C-Class | | | — | | | | 4,535 | |
H-Class | | | — | | | | 21,374 | |
Cost of shares redeemed | | | | | | | | |
A-Class | | | (5,279,870 | ) | | | (4,655,658 | ) |
C-Class | | | (1,934,229 | ) | | | (2,314,575 | ) |
H-Class | | | (189,655,270 | ) | | | (79,851,430 | ) |
Net increase (decrease) from capital share transactions | | | (27,694,904 | ) | | | 40,319,044 | |
Net increase (decrease) in net assets | | | (26,715,028 | ) | | | 41,082,995 | |
| | | | | | | | | |
Net assets: | | | | | | | | |
Beginning of period | | | 54,988,316 | | | | 13,905,321 | |
End of period | | $ | 28,273,288 | | | $ | 54,988,316 | |
Undistributed net investment income at end of period | | $ | 20,173 | | | $ | 52,548 | |
| | | | | | | | | |
Capital share activity: | | | | | | | | |
Shares sold | | | | | | | | |
A-Class | | | 51,915 | | | | 185,812 | |
C-Class | | | 57,353 | | | | 42,699 | |
H-Class | | | 3,809,148 | | | | 2,852,823 | |
Shares issued from reinvestment of distributions | | | | | | | | |
A-Class | | | — | | | | 58 | |
C-Class | | | — | | | | 118 | |
H-Class | | | — | | | | 505 | |
Shares redeemed | | | | | | | | |
A-Class | | | (122,008 | ) | | | (115,018 | ) |
C-Class | | | (48,948 | ) | | | (59,256 | ) |
H-Class | | | (4,427,460 | ) | | | (1,916,239 | ) |
Net increase (decrease) in shares | | | (680,000 | ) | | | 991,502 | |
SEE NOTES TO FINANCIAL STATEMENTS. | THE RYDEX FUNDS SEMI-ANNUAL REPORT | 33 |
S&P MIDCAP 400® PURE VALUE FUND | |
This table is presented to show selected data for a share outstanding throughout each period and to assist shareholders in evaluating a Fund’s performance for the periods presented.
A-Class | | Period Ended
September 30,
2016a | | | Year Ended
March 31,
2016 | | | Year Ended
March 31,
2015 | | | Year Ended
March 31,
2014 | | | Year Ended
March 28,
2013 | | | Year Ended
March 31,
2012 | |
Per Share Data | | | | | | | | | | | | | | | | | | |
Net asset value, beginning of period | | $ | 42.43 | | | $ | 45.68 | | | $ | 43.04 | | | $ | 36.18 | | | $ | 30.88 | | | $ | 31.43 | |
Income (loss) from investment operations: | |
Net investment income (loss)b | | | (.06 | ) | | | .16 | | | | .11 | | | | (.03 | ) | | | .07 | | | | .06 | |
Net gain (loss) on investments (realized and unrealized) | | | 3.55 | | | | (3.30 | ) | | | 2.58 | | | | 7.08 | | | | 5.23 | | | | (.61 | ) |
Total from investment operations | | | 3.49 | | | | (3.14 | ) | | | 2.69 | | | | 7.05 | | | | 5.30 | | | | (.55 | ) |
Less distributions from: | |
Net investment income | | | — | | | | (.11 | ) | | | (.05 | ) | | | (.19 | ) | | | — | | | | — | |
Total distributions | | | — | | | | (.11 | ) | | | (.05 | ) | | | (.19 | ) | | | — | | | | — | |
Net asset value, end of period | | $ | 45.92 | | | $ | 42.43 | | | $ | 45.68 | | | $ | 43.04 | | | $ | 36.18 | | | $ | 30.88 | |
| | |
Total Returnc | | | 8.23 | % | | | (6.88 | %) | | | 6.25 | % | | | 19.49 | % | | | 17.16 | % | | | (1.75 | %) |
Ratios/Supplemental Data | |
Net assets, end of period (in thousands) | | $ | 1,949 | | | $ | 4,775 | | | $ | 1,904 | | | $ | 2,357 | | | $ | 1,571 | | | $ | 6,817 | |
Ratios to average net assets: | |
Net investment income (loss) | | | (0.26 | %) | | | 0.39 | % | | | 0.26 | % | | | (0.06 | %) | | | 0.23 | % | | | 0.22 | % |
Total expenses | | | 1.52 | % | | | 1.50 | % | | | 1.51 | % | | | 1.52 | % | | | 1.51 | % | | | 1.49 | % |
Portfolio turnover rate | | | 351 | % | | | 493 | % | | | 638 | % | | | 506 | % | | | 757 | % | | | 619 | % |
C-Class | | Period Ended
September 30,
2016a | | | Year Ended
March 31,
2016 | | | Year Ended
March 31,
2015 | | | Year Ended
March 31,
2014 | | | Year Ended
March 28,
2013 | | | Year Ended
March 31,
2012 | |
Per Share Data | | | | | | | | | | | | | | | | | | |
Net asset value, beginning of period | | $ | 38.33 | | | $ | 41.59 | | | $ | 39.48 | | | $ | 33.46 | | | $ | 28.78 | | | $ | 29.53 | |
Income (loss) from investment operations: | |
Net investment income (loss)b | | | (.15 | ) | | | (.12 | ) | | | (.18 | ) | | | (.25 | ) | | | (.13 | ) | | | (.16 | ) |
Net gain (loss) on investments (realized and unrealized) | | | 3.16 | | | | (3.03 | ) | | | 2.34 | | | | 6.46 | | | | 4.81 | | | | (.59 | ) |
Total from investment operations | | | 3.01 | | | | (3.15 | ) | | | 2.16 | | | | 6.21 | | | | 4.68 | | | | (.75 | ) |
Less distributions from: | |
Net investment income | | | — | | | | (.11 | ) | | | (.05 | ) | | | (.19 | ) | | | — | | | | — | |
Total distributions | | | — | | | | (.11 | ) | | | (.05 | ) | | | (.19 | ) | | | — | | | | — | |
Net asset value, end of period | | $ | 41.34 | | | $ | 38.33 | | | $ | 41.59 | | | $ | 39.48 | | | $ | 33.46 | | | $ | 28.78 | |
| | |
Total Returnc | | | 7.83 | % | | | (7.58 | %) | | | 5.47 | % | | | 18.57 | % | | | 16.26 | % | | | (2.54 | %) |
Ratios/Supplemental Data | |
Net assets, end of period (in thousands) | | $ | 2,682 | | | $ | 2,165 | | | $ | 3,033 | | | $ | 2,207 | | | $ | 3,413 | | | $ | 2,194 | |
Ratios to average net assets: | |
Net investment income (loss) | | | (0.78 | %) | | | (0.30 | %) | | | (0.44 | %) | | | (0.71 | %) | | | (0.45 | %) | | | (0.60 | %) |
Total expenses | | | 2.27 | % | | | 2.25 | % | | | 2.26 | % | | | 2.28 | % | | | 2.26 | % | | | 2.26 | % |
Portfolio turnover rate | | | 351 | % | | | 493 | % | | | 638 | % | | | 506 | % | | | 757 | % | | | 619 | % |
34 | THE RYDEX FUNDS SEMI-ANNUAL REPORT | SEE NOTES TO FINANCIAL STATEMENTS. |
S&P MIDCAP 400® PURE VALUE FUND | |
FINANCIAL HIGHLIGHTS (concluded) |
This table is presented to show selected data for a share outstanding throughout each period and to assist shareholders in evaluating a Fund’s performance for the periods presented.
H-Class | | Period Ended
September 30,
2016a | | | Year Ended
March 31,
2016 | | | Year Ended
March 31,
2015 | | | Year Ended
March 31,
2014 | | | Year Ended
March 28,
2013 | | | Year Ended
March 31,
2012 | |
Per Share Data | | | | | | | | | | | | | | | | | | |
Net asset value, beginning of period | | $ | 42.38 | | | $ | 45.62 | | | $ | 42.98 | | | $ | 36.16 | | | $ | 30.86 | | | $ | 31.42 | |
Income (loss) from investment operations: | |
Net investment income (loss)b | | | (.03 | ) | | | .20 | | | | .11 | | | | .06 | | | | .08 | | | | .01 | |
Net gain (loss) on investments (realized and unrealized) | | | 3.53 | | | | (3.33 | ) | | | 2.58 | | | | 6.95 | | | | 5.22 | | | | (.57 | ) |
Total from investment operations | | | 3.50 | | | | (3.13 | ) | | | 2.69 | | | | 7.01 | | | | 5.30 | | | | (.56 | ) |
Less distributions from: | |
Net investment income | | | — | | | | (.11 | ) | | | (.05 | ) | | | (.19 | ) | | | — | | | | — | |
Total distributions | | | — | | | | (.11 | ) | | | (.05 | ) | | | (.19 | ) | | | — | | | | — | |
Net asset value, end of period | | $ | 45.88 | | | $ | 42.38 | | | $ | 45.62 | | | $ | 42.98 | | | $ | 36.16 | | | $ | 30.86 | |
| | |
Total Returnc | | | 8.23 | % | | | (6.86 | %) | | | 6.26 | % | | | 19.39 | % | | | 17.17 | % | | | (1.78 | %) |
Ratios/Supplemental Data | |
Net assets, end of period (in thousands) | | $ | 23,642 | | | $ | 48,048 | | | $ | 8,968 | | | $ | 10,563 | | | $ | 78,237 | | | $ | 18,838 | |
Ratios to average net assets: | |
Net investment income (loss) | | | (0.12 | %) | | | 0.47 | % | | | 0.25 | % | | | 0.15 | % | | | 0.24 | % | | | 0.02 | % |
Total expenses | | | 1.52 | % | | | 1.51 | % | | | 1.51 | % | | | 1.52 | % | | | 1.52 | % | | | 1.51 | % |
Portfolio turnover rate | | | 351 | % | | | 493 | % | | | 638 | % | | | 506 | % | | | 757 | % | | | 619 | % |
a | Unaudited figures for the period ended September 30, 2016. Percentage amounts for the period, except total return and portfolio turnover rate, have been annualized. |
b | Net investment income (loss) per share was computed using average shares outstanding throughout the period. |
c | Total return does not reflect the impact of any applicable sales charges. |
SEE NOTES TO FINANCIAL STATEMENTS. | THE RYDEX FUNDS SEMI-ANNUAL REPORT | 35 |
FUND PROFILE (Unaudited) | September 30, 2016 |
S&P SMALLCAP 600® PURE GROWTH FUND
OBJECTIVE: Seeks to provide investment results that match, before fees and expenses, the performance of a benchmark for small-cap growth securities on a daily basis. The Fund’s current benchmark is the S&P SmallCap 600® Pure Growth Index (the “underlying index”).
Holdings Diversification (Market Exposure as % of Net Assets)
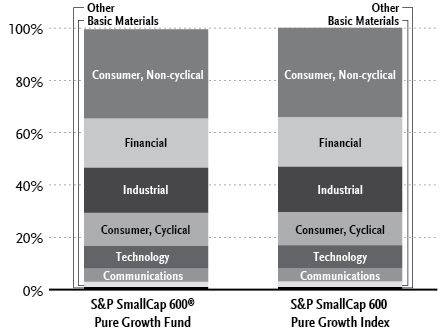
“Holdings Diversification (Market Exposure as % of Net Assets)” excludes any temporary cash investments.
Inception Dates: |
A-Class | September 1, 2004 |
C-Class | February 20, 2004 |
H-Class | February 20, 2004 |
Ten Largest Holdings (% of Total Net Assets) |
Supernus Pharmaceuticals, Inc. | 2.0% |
LGI Homes, Inc. | 1.8% |
Fabrinet | 1.7% |
Ligand Pharmaceuticals, Inc. — Class B | 1.5% |
Depomed, Inc. | 1.4% |
LogMeIn, Inc. | 1.4% |
TASER International, Inc. | 1.4% |
Eagle Pharmaceuticals, Inc. | 1.3% |
Nautilus, Inc. | 1.3% |
PGT, Inc. | 1.2% |
Top Ten Total | 15.0% |
| | |
“Ten Largest Holdings” excludes any temporary cash investments. |
36 | THE RYDEX FUNDS SEMI-ANNUAL REPORT | |
SCHEDULE OF INVESTMENTS (Unaudited) | September 30, 2016 |
S&P SMALLCAP 600® PURE GROWTH FUND | |
| | | Shares | | | Value | |
| | | | | | | |
COMMON STOCKS† - 99.5% | |
| | | | | | | |
Consumer, Non-cyclical - 34.1% | |
Supernus Pharmaceuticals, Inc.* | | | 18,892 | | | $ | 467,200 | |
Ligand Pharmaceuticals, Inc. — Class B* | | | 3,534 | | | | 360,680 | |
Depomed, Inc.* | | | 13,541 | | | | 338,390 | |
Eagle Pharmaceuticals, Inc.* | | | 4,559 | | | | 319,130 | |
Zeltiq Aesthetics, Inc.* | | | 7,373 | | | | 289,169 | |
LendingTree, Inc.* | | | 2,774 | | | | 268,828 | |
Masimo Corp.* | | | 4,239 | | | | 252,178 | |
NutriSystem, Inc. | | | 8,128 | | | | 241,320 | |
MiMedx Group, Inc.* | | | 26,645 | | | | 228,614 | |
AMN Healthcare Services, Inc.* | | | 6,907 | | | | 220,125 | |
BioTelemetry, Inc.* | | | 11,522 | | | | 213,964 | |
Vascular Solutions, Inc.* | | | 4,315 | | | | 208,112 | |
Cynosure, Inc. — Class A* | | | 3,711 | | | | 189,038 | |
On Assignment, Inc.* | | | 5,184 | | | | 188,128 | |
Cantel Medical Corp. | | | 2,399 | | | | 187,074 | |
Repligen Corp.* | | | 5,967 | | | | 180,144 | |
Cross Country Healthcare, Inc.* | | | 15,000 | | | | 176,700 | |
Emergent BioSolutions, Inc.* | | | 5,576 | | | | 175,811 | |
TrueBlue, Inc.* | | | 7,752 | | | | 175,660 | |
Surgical Care Affiliates, Inc.* | | | 3,400 | | | | 165,784 | |
Almost Family, Inc.* | | | 4,401 | | | | 161,825 | |
Merit Medical Systems, Inc.* | | | 6,343 | | | | 154,071 | |
Nektar Therapeutics* | | | 8,966 | | | | 154,036 | |
Cambrex Corp.* | | | 3,382 | | | | 150,364 | |
Albany Molecular Research, Inc.* | | | 9,081 | | | | 149,927 | |
Surmodics, Inc.* | | | 4,941 | | | | 148,675 | |
Lannett Company, Inc.* | | | 5,565 | | | | 147,862 | |
Calavo Growers, Inc. | | | 2,231 | | | | 145,974 | |
Cal-Maine Foods, Inc. | | | 3,687 | | | | 142,097 | |
US Physical Therapy, Inc. | | | 2,254 | | | | 141,326 | |
Neogen Corp.* | | | 2,508 | | | | 140,298 | |
B&G Foods, Inc. | | | 2,754 | | | | 135,442 | |
Amphastar Pharmaceuticals, Inc.* | | | 6,860 | | | | 130,134 | |
Natus Medical, Inc.* | | | 3,210 | | | | 126,121 | |
Matthews International Corp. — Class A | | | 2,022 | | | | 122,857 | |
Heidrick & Struggles International, Inc. | | | 6,315 | | | | 117,143 | |
LHC Group, Inc.* | | | 3,005 | | | | 110,824 | |
Luminex Corp.* | | | 4,814 | | | | 109,374 | |
Chemed Corp. | | | 768 | | | | 108,342 | |
Monro Muffler Brake, Inc. | | | 1,712 | | | | 104,723 | |
Integra LifeSciences Holdings Corp.* | | | 1,164 | | | | 96,088 | |
Healthcare Services Group, Inc. | | | 2,377 | | | | 94,082 | |
WD-40 Co. | | | 804 | | | | 90,394 | |
Korn/Ferry International | | | 3,926 | | | | 82,446 | |
CorVel Corp.* | | | 1,877 | | | | 72,077 | |
Phibro Animal Health Corp. — Class A | | | 1,759 | | | | 47,810 | |
Impax Laboratories, Inc.* | | | 2,003 | | | | 47,471 | |
Acorda Therapeutics, Inc.* | | | 1,945 | | | | 40,612 | |
Total Consumer, Non-cyclical | | | | | | | 8,118,444 | |
| | | | | | | | | |
Financial - 18.9% | |
First Midwest Bancorp, Inc. | | | 14,720 | | | | 284,980 | |
Universal Insurance Holdings, Inc. | | | 10,555 | | | | 265,986 | |
Opus Bank | | | 7,476 | | | | 264,426 | |
CoreSite Realty Corp. | | | 3,508 | | | | 259,732 | |
Ameris Bancorp | | | 6,748 | | | | 235,843 | |
Home BancShares, Inc. | | | 10,482 | | | | 218,130 | |
BofI Holding, Inc.* | | | 9,117 | | | | 204,221 | |
Walker & Dunlop, Inc.* | | | 7,996 | | | | 201,979 | |
Employers Holdings, Inc. | | | 6,243 | | | | 186,229 | |
Hanmi Financial Corp. | | | 6,976 | | | | 183,748 | |
Pinnacle Financial Partners, Inc. | | | 3,269 | | | | 176,788 | |
Simmons First National Corp. — Class A | | | 3,361 | | | | 167,714 | |
Acadia Realty Trust | | | 4,464 | | | | 161,775 | |
Four Corners Property Trust, Inc. | | | 7,334 | | | | 156,434 | |
Evercore Partners, Inc. — Class A | | | 2,779 | | | | 143,146 | |
Northfield Bancorp, Inc. | | | 8,878 | | | | 142,936 | |
Bank Mutual Corp. | | | 18,131 | | | | 139,246 | |
ServisFirst Bancshares, Inc. | | | 2,622 | | | | 136,108 | |
LegacyTexas Financial Group, Inc. | | | 4,286 | | | | 135,566 | |
AMERISAFE, Inc. | | | 2,112 | | | | 124,143 | |
Hope Bancorp, Inc. | | | 6,649 | | | | 115,493 | |
HFF, Inc. — Class A | | | 3,937 | | | | 109,016 | |
RLI Corp. | | | 1,555 | | | | 106,300 | |
Financial Engines, Inc. | | | 3,473 | | | | 103,183 | |
First Financial Bankshares, Inc. | | | 2,660 | | | | 96,930 | |
Banner Corp. | | | 2,152 | | | | 94,128 | |
Retail Opportunity Investments Corp. | | | 4,062 | | | | 89,202 | |
Total Financial | | | | | | | 4,503,382 | |
| | | | | | | | | |
Industrial - 17.2% | |
Fabrinet* | | | 8,914 | | | | 397,475 | |
TASER International, Inc.* | | | 11,618 | | | | 332,391 | |
PGT, Inc.* | | | 27,365 | | | | 291,986 | |
Lydall, Inc.* | | | 4,676 | | | | 239,083 | |
Drew Industries, Inc. | | | 2,404 | | | | 235,640 | |
II-VI, Inc.* | | | 9,657 | | | | 234,955 | |
Universal Forest Products, Inc. | | | 2,349 | | | | 231,353 | |
Headwaters, Inc.* | | | 13,349 | | | | 225,865 | |
AZZ, Inc. | | | 2,826 | | | | 184,453 | |
Griffon Corp. | | | 10,522 | | | | 178,979 | |
John Bean Technologies Corp. | | | 2,450 | | | | 172,848 | |
US Concrete, Inc.* | | | 3,732 | | | | 171,915 | |
US Ecology, Inc. | | | 3,260 | | | | 146,178 | |
Trex Company, Inc.* | | | 2,385 | | | | 140,047 | |
Comfort Systems USA, Inc. | | | 4,423 | | | | 129,638 | |
Methode Electronics, Inc. | | | 3,606 | | | | 126,102 | |
AAON, Inc. | | | 3,730 | | | | 107,499 | |
Matson, Inc. | | | 2,571 | | | | 102,531 | |
Sturm Ruger & Company, Inc. | | | 1,736 | | | | 100,271 | |
Apogee Enterprises, Inc. | | | 2,199 | | | | 98,273 | |
Exponent, Inc. | | | 1,867 | | | | 95,329 | |
Proto Labs, Inc.* | | | 1,569 | | | | 93,999 | |
OSI Systems, Inc.* | | | 973 | | | | 63,615 | |
Total Industrial | | | | | | | 4,100,425 | |
| | | | | | | | | |
Consumer, Cyclical - 12.7% | |
LGI Homes, Inc.* | | | 11,460 | | | | 422,186 | |
Nautilus, Inc.* | | | 13,630 | | | | 309,674 | |
Installed Building Products, Inc.* | | | 8,066 | | | | 289,327 | |
Meritage Homes Corp.* | | | 7,690 | | | | 266,843 | |
SEE NOTES TO FINANCIAL STATEMENTS. | THE RYDEX FUNDS SEMI-ANNUAL REPORT | 37 |
SCHEDULE OF INVESTMENTS (Unaudited)(continued) | September 30, 2016 |
S&P SMALLCAP 600® PURE GROWTH FUND | |
| | | Shares | | | Value | |
| | | | | | | |
Lithia Motors, Inc. — Class A | | | 2,026 | | | $ | 193,524 | |
American Woodmark Corp.* | | | 2,153 | | | | 173,467 | |
Fox Factory Holding Corp.* | | | 6,970 | | | | 160,101 | |
Hawaiian Holdings, Inc.* | | | 3,122 | | | | 151,729 | |
Monarch Casino & Resort, Inc.* | | | 5,962 | | | | 150,064 | |
Papa John’s International, Inc. | | | 1,801 | | | | 142,010 | |
Allegiant Travel Co. — Class A | | | 870 | | | | 114,901 | |
Interface, Inc. — Class A | | | 6,496 | | | | 108,418 | |
Boyd Gaming Corp.* | | | 5,435 | | | | 107,504 | |
Francesca’s Holdings Corp.* | | | 6,603 | | | | 101,884 | |
Popeyes Louisiana Kitchen, Inc.* | | | 1,852 | | | | 98,415 | |
Ruth’s Hospitality Group, Inc. | | | 6,737 | | | | 95,126 | |
Gentherm, Inc.* | | | 2,778 | | | | 87,285 | |
Sonic Corp. | | | 1,856 | | | | 48,590 | |
Total Consumer, Cyclical | | | | | | | 3,021,048 | |
| | | | | | | | | |
Technology - 8.6% | |
Ebix, Inc. | | | 4,676 | | | | 265,830 | |
Take-Two Interactive Software, Inc.* | | | 4,911 | | | | 221,388 | |
SPS Commerce, Inc.* | | | 2,420 | | | | 177,652 | |
Blackbaud, Inc. | | | 2,666 | | | | 176,862 | |
Tessera Technologies, Inc. | | | 4,216 | | | | 162,063 | |
ExlService Holdings, Inc.* | | | 3,169 | | | | 157,943 | |
Medidata Solutions, Inc.* | | | 2,711 | | | | 151,166 | |
Kopin Corp.* | | | 66,356 | | | | 144,656 | |
Synchronoss Technologies, Inc.* | | | 3,164 | | | | 130,294 | |
CEVA, Inc.* | | | 3,644 | | | | 127,795 | |
Omnicell, Inc.* | | | 2,644 | | | | 101,265 | |
Rambus, Inc.* | | | 7,628 | | | | 95,350 | |
Cray, Inc.* | | | 3,279 | | | | 77,188 | |
Virtusa Corp.* | | | 2,855 | | | | 70,461 | |
Total Technology | | | | | | | 2,059,913 | |
| | | | | | | | | |
Communications - 5.1% | |
LogMeIn, Inc. | | | 3,725 | | | | 336,702 | |
Stamps.com, Inc.* | | | 1,957 | | | | 184,956 | |
8x8, Inc.* | | | 11,779 | | | | 181,750 | |
World Wrestling Entertainment, Inc. — Class A | | | 7,532 | | | | 160,432 | |
NIC, Inc. | | | 5,331 | | | | 125,279 | |
HealthStream, Inc.* | | | 3,829 | | | | 105,680 | |
Blue Nile, Inc. | | | 2,446 | | | | 84,191 | |
General Communication, Inc. — Class A* | | | 2,830 | | | | 38,913 | |
Total Communications | | | | | | | 1,217,903 | |
| | | | | | | | | |
Basic Materials - 2.0% | |
Balchem Corp. | | | 2,302 | | | | 178,473 | |
Innospec, Inc. | | | 2,392 | | | | 145,458 | |
Deltic Timber Corp. | | | 1,390 | | | | 94,145 | |
Aceto Corp. | | | 3,645 | | | | 69,219 | |
Total Basic Materials | | | | | | | 487,295 | |
| | | | | | | | | |
Energy - 0.5% | |
Synergy Resources Corp.* | | | 15,895 | | | | 110,152 | |
| | | | | | | | | |
Utilities - 0.4% | |
Piedmont Natural Gas Company, Inc. | | | 1,758 | | | | 105,550 | |
| | | | | | | | | |
Total Common Stocks | | | | | | | | |
(Cost $19,255,695) | | | | | | | 23,724,112 | |
| | | | | | | | | |
| | | Face
Amount | | | | | |
| | | | | | | | | |
REPURCHASE AGREEMENTS††,1 - 0.3% | |
HSBC Securities, Inc.
issued 09/30/16 at 0.38%
due 10/03/16 | | $ | 34,622 | | | | 34,622 | |
Royal Bank of Canada
issued 09/30/16 at 0.36%
due 10/03/16 | | | 27,490 | | | | 27,490 | |
Total Repurchase Agreements | | | | | | | | |
(Cost $62,112) | | | | | | | 62,112 | |
| | | | | | | | | |
Total Investments - 99.8% | | | | | | | | |
(Cost $19,317,807) | | | | | | $ | 23,786,224 | |
Other Assets & Liabilities, net - 0.2% | | | | | | | 53,143 | |
Total Net Assets - 100.0% | | | | | | $ | 23,839,367 | |
* | Non-income producing security. |
† | Value determined based on Level 1 inputs — See Note 4. |
†† | Value determined based on Level 2 inputs — See Note 4. |
1 | Repurchase Agreements — See Note 5. |
| | |
| | See Sector Classification in Other Information section. |
38 | THE RYDEX FUNDS SEMI-ANNUAL REPORT | SEE NOTES TO FINANCIAL STATEMENTS. |
SCHEDULE OF INVESTMENTS (Unaudited)(concluded) | September 30, 2016 |
S&P SMALLCAP 600® PURE GROWTH FUND | |
The following table summarizes the inputs used to value the Fund’s investments at September 30, 2016 (See Note 4 in the Notes to Financial Statements):
Investments in Securities (Assets) | | Level 1 | | | Level 2 | | | Level 3 | | | Total | |
Common Stocks | | $ | 23,724,112 | | | $ | — | | | $ | — | | | $ | 23,724,112 | |
Repurchase Agreements | | | — | | | | 62,112 | | | | — | | | | 62,112 | |
Total | | $ | 23,724,112 | | | $ | 62,112 | | | $ | — | | | $ | 23,786,224 | |
Transfers between investment levels may occur as the markets fluctuate and/or the availability of data used in an investment’s valuation changes. Transfers between valuation levels, if any, are in comparison to the valuation levels at the end of the previous fiscal year, and are effective using the fair value as of the end of the previous fiscal period.
For the period ended September 30, 2016, there were no transfers between levels.
SEE NOTES TO FINANCIAL STATEMENTS. | THE RYDEX FUNDS SEMI-ANNUAL REPORT | 39 |
S&P SMALLCAP 600® PURE GROWTH FUND | |
STATEMENT OF ASSETS AND LIABILITIES (Unaudited) | |
September 30, 2016 | |
Assets: | |
Investments, at value (cost $19,255,695) | | $ | 23,724,112 | |
Repurchase agreements, at value (cost $62,112) | | | 62,112 | |
Total investments (cost $19,317,807) | | | 23,786,224 | |
Receivables: | |
Securities sold | | | 117,960 | |
Fund shares sold | | | 2,323 | |
Dividends | | | 12,014 | |
Total assets | | | 23,918,521 | |
| | | | | |
Liabilities: | |
Payable for: | |
Fund shares redeemed | | | 40,802 | |
Management fees | | | 14,077 | |
Licensing fees | | | 8,331 | |
Distribution and service fees | | | 6,251 | |
Transfer agent and administrative fees | | | 4,692 | |
Portfolio accounting fees | | | 1,877 | |
Miscellaneous | | | 3,124 | |
Total liabilities | | | 79,154 | |
Commitments and contingent liabilities (Note 11) | | | — | |
Net assets | | $ | 23,839,367 | |
| | | | | |
Net assets consist of: | |
Paid in capital | | $ | 23,274,872 | |
Accumulated net investment loss | | | (129,852 | ) |
Accumulated net realized loss on investments | | | (3,774,070 | ) |
Net unrealized appreciation on investments | | | 4,468,417 | |
Net assets | | $ | 23,839,367 | |
| | | | | |
A-Class: | |
Net assets | | $ | 1,626,486 | |
Capital shares outstanding | | | 27,766 | |
Net asset value per share | | $ | 58.58 | |
Maximum offering price per share (Net asset value divided by 95.25%) | | $ | 61.50 | |
| | | | | |
C-Class: | |
Net assets | | $ | 2,487,747 | |
Capital shares outstanding | | | 46,605 | |
Net asset value per share | | $ | 53.38 | |
| | | | | |
H-Class: | |
Net assets | | $ | 19,725,134 | |
Capital shares outstanding | | | 336,792 | |
Net asset value per share | | $ | 58.57 | |
STATEMENT OF OPERATIONS (Unaudited) | |
Period Ended September 30, 2016 | |
Investment Income: | |
Dividends | | $ | 119,484 | |
Interest | | | 234 | |
Total investment income | | | 119,718 | |
| | | | | |
Expenses: | |
Management fees | | | 118,559 | |
Transfer agent and administrative fees | | | 39,520 | |
Distribution and service fees: | |
A-Class | | | 3,473 | |
C-Class | | | 12,490 | |
H-Class | | | 32,924 | |
Portfolio accounting fees | | | 15,807 | |
Custodian fees | | | 1,861 | |
Trustees’ fees* | | | 1,563 | |
Line of credit fees | | | 78 | |
Miscellaneous | | | 23,295 | |
Total expenses | | | 249,570 | |
Net investment loss | | | (129,852 | ) |
| | | | | |
Net Realized and Unrealized Gain (Loss): | |
Net realized gain (loss) on: | |
Investments | | | 2,209,958 | |
Net realized gain | | | 2,209,958 | |
Net change in unrealized appreciation (depreciation) on: | |
Investments | | | 743,351 | |
Net change in unrealized appreciation (depreciation) | | | 743,351 | |
Net realized and unrealized gain | | | 2,953,309 | |
Net increase in net assets resulting from operations | | $ | 2,823,457 | |
* | Relates to Trustees not deemed “interested persons” within the meaning of Section 2(a)(19) of the 1940 Act. |
40 | THE RYDEX FUNDS SEMI-ANNUAL REPORT | SEE NOTES TO FINANCIAL STATEMENTS. |
S&P SMALLCAP 600® PURE GROWTH FUND | |
STATEMENTS OF CHANGES IN NET ASSETS |
| | | Period Ended
September 30,
2016
(Unaudited) | | | Year Ended
March 31,
2016 | |
Increase (Decrease) in Net Assets from Operations: | | | | | | |
Net investment loss | | $ | (129,852 | ) | | $ | (279,022 | ) |
Net realized gain (loss) on investments | | | 2,209,958 | | | | (3,903,116 | ) |
Net change in unrealized appreciation (depreciation) on investments | | | 743,351 | | | | (3,825,931 | ) |
Net increase (decrease) in net assets resulting from operations | | | 2,823,457 | | | | (8,008,069 | ) |
| | | | | | | | | |
Capital share transactions: | | | | | | | | |
Proceeds from sale of shares | | | | | | | | |
A-Class | | | 4,723,418 | | | | 6,933,578 | |
C-Class | | | 926,822 | | | | 4,477,038 | |
H-Class | | | 95,214,164 | | | | 162,349,042 | |
Cost of shares redeemed | | | | | | | | |
A-Class | | | (5,789,581 | ) | | | (6,602,316 | ) |
C-Class | | | (1,240,836 | ) | | | (6,727,877 | ) |
H-Class | | | (102,856,950 | ) | | | (181,452,955 | ) |
Net decrease from capital share transactions | | | (9,022,963 | ) | | | (21,023,490 | ) |
Net decrease in net assets | | | (6,199,506 | ) | | | (29,031,559 | ) |
| | | | | | | | | |
Net assets: | | | | | | | | |
Beginning of period | | | 30,038,873 | | | | 59,070,432 | |
End of period | | $ | 23,839,367 | | | $ | 30,038,873 | |
Accumulated net investment loss at end of period | | $ | (129,852 | ) | | $ | — | |
| | | | | | | | | |
Capital share activity: | | | | | | | | |
Shares sold | | | | | | | | |
A-Class | | | 87,373 | | | | 118,395 | |
C-Class | | | 17,992 | | | | 84,005 | |
H-Class | | | 1,736,861 | | | | 2,856,633 | |
Shares redeemed | | | | | | | | |
A-Class | | | (106,481 | ) | | | (119,475 | ) |
C-Class | | | (24,546 | ) | | | (130,988 | ) |
H-Class | | | (1,879,252 | ) | | | (3,240,197 | ) |
Net decrease in shares | | | (168,053 | ) | | | (431,627 | ) |
SEE NOTES TO FINANCIAL STATEMENTS. | THE RYDEX FUNDS SEMI-ANNUAL REPORT | 41 |
S&P SMALLCAP 600® PURE GROWTH FUND | |
This table is presented to show selected data for a share outstanding throughout each period and to assist shareholders in evaluating a Fund’s performance for the periods presented.
A-Class | | Period Ended
September 30,
2016a | | | Year Ended
March 31,
2016 | | | Year Ended
March 31,
2015 | | | Year Ended
March 31,
2014 | | | Year Ended
March 28,
2013 | | | Year Ended
March 31,
2012 | |
Per Share Data | | | | | | | | | | | | | | | | | | |
Net asset value, beginning of period | | $ | 52.28 | | | $ | 58.90 | | | $ | 52.99 | | | $ | 41.94 | | | $ | 37.97 | | | $ | 36.06 | |
Income (loss) from investment operations: | |
Net investment income (loss)b | | | (.20 | ) | | | (.20 | ) | | | (.46 | ) | | | (.31 | ) | | | (.12 | ) | | | (.35 | ) |
Net gain (loss) on investments (realized and unrealized) | | | 6.50 | | | | (6.42 | ) | | | 6.37 | | | | 11.36 | | | | 4.09 | | | | 2.26 | |
Total from investment operations | | | 6.30 | | | | (6.62 | ) | | | 5.91 | | | | 11.05 | | | | 3.97 | | | | 1.91 | |
Net asset value, end of period | | $ | 58.58 | | | $ | 52.28 | | | $ | 58.90 | | | $ | 52.99 | | | $ | 41.94 | | | $ | 37.97 | |
| | |
Total Returnc | | | 12.03 | % | | | (11.24 | %) | | | 11.15 | % | | | 26.35 | % | | | 10.46 | % | | | 5.30 | % |
Ratios/Supplemental Data | |
Net assets, end of period (in thousands) | | $ | 1,626 | | | $ | 2,451 | | | $ | 2,825 | | | $ | 7,265 | | | $ | 995 | | | $ | 1,018 | |
Ratios to average net assets: | |
Net investment income (loss) | | | (0.75 | %) | | | (0.36 | %) | | | (0.88 | %) | | | (0.60 | %) | | | (0.31 | %) | | | (1.00 | %) |
Total expenses | | | 1.52 | % | | | 1.50 | % | | | 1.51 | % | | | 1.53 | % | | | 1.51 | % | | | 1.52 | % |
Portfolio turnover rate | | | 278 | % | | | 309 | % | | | 380 | % | | | 677 | % | | | 645 | % | | | 500 | % |
C-Class | | Period Ended
September 30,
2016a | | | Year Ended
March 31,
2016 | | | Year Ended
March 31,
2015 | | | Year Ended
March 31,
2014 | | | Year Ended
March 28,
2013 | | | Year Ended
March 31,
2012 | |
Per Share Data | | | | | | | | | | | | | | | | | | |
Net asset value, beginning of period | | $ | 47.82 | | | $ | 54.28 | | | $ | 49.21 | | | $ | 39.24 | | | $ | 35.79 | | | $ | 34.25 | |
Income (loss) from investment operations: | |
Net investment income (loss)b | | | (.39 | ) | | | (.62 | ) | | | (.74 | ) | | | (.66 | ) | | | (.42 | ) | | | (.57 | ) |
Net gain (loss) on investments (realized and unrealized) | | | 5.95 | | | | (5.84 | ) | | | 5.81 | | | | 10.63 | | | | 3.87 | | | | 2.11 | |
Total from investment operations | | | 5.56 | | | | (6.46 | ) | | | 5.07 | | | | 9.97 | | | | 3.45 | | | | 1.54 | |
Net asset value, end of period | | $ | 53.38 | | | $ | 47.82 | | | $ | 54.28 | | | $ | 49.21 | | | $ | 39.24 | | | $ | 35.79 | |
| | |
Total Returnc | | | 11.61 | % | | | (11.90 | %) | | | 10.30 | % | | | 25.41 | % | | | 9.64 | % | | | 4.50 | % |
Ratios/Supplemental Data | |
Net assets, end of period (in thousands) | | $ | 2,488 | | | $ | 2,542 | | | $ | 5,436 | | | $ | 4,268 | | | $ | 3,122 | | | $ | 2,568 | |
Ratios to average net assets: | |
Net investment income (loss) | | | (1.55 | %) | | | (1.19 | %) | | | (1.50 | %) | | | (1.46 | %) | | | (1.17 | %) | | | (1.71 | %) |
Total expenses | | | 2.27 | % | | | 2.25 | % | | | 2.25 | % | | | 2.28 | % | | | 2.26 | % | | | 2.26 | % |
Portfolio turnover rate | | | 278 | % | | | 309 | % | | | 380 | % | | | 677 | % | | | 645 | % | | | 500 | % |
42 | THE RYDEX FUNDS SEMI-ANNUAL REPORT | SEE NOTES TO FINANCIAL STATEMENTS. |
S&P SMALLCAP 600® PURE GROWTH FUND | |
FINANCIAL HIGHLIGHTS (concluded) |
This table is presented to show selected data for a share outstanding throughout each period and to assist shareholders in evaluating a Fund’s performance for the periods presented.
H-Class | | Period Ended
September 30,
2016a | | | Year Ended
March 31,
2016 | | | Year Ended
March 31,
2015 | | | Year Ended
March 31,
2014 | | | Year Ended
March 28,
2013 | | | Year Ended
March 31,
2012 | |
Per Share Data | | | | | | | | | | | | | | | | | | |
Net asset value, beginning of period | | $ | 52.27 | | | $ | 58.89 | | | $ | 52.99 | | | $ | 41.94 | | | $ | 37.97 | | | $ | 36.07 | |
Income (loss) from investment operations: | |
Net investment income (loss)b | | | (.21 | ) | | | (.28 | ) | | | (.31 | ) | | | (.38 | ) | | | (.31 | ) | | | (.39 | ) |
Net gain (loss) on investments (realized and unrealized) | | | 6.51 | | | | (6.34 | ) | | | 6.21 | | | | 11.43 | | | | 4.28 | | | | 2.29 | |
Total from investment operations | | | 6.30 | | | | (6.62 | ) | | | 5.90 | | | | 11.05 | | | | 3.97 | | | | 1.90 | |
Net asset value, end of period | | $ | 58.57 | | | $ | 52.27 | | | $ | 58.89 | | | $ | 52.99 | | | $ | 41.94 | | | $ | 37.97 | |
| | |
Total Returnc | | | 12.03 | % | | | (11.24 | %) | | | 11.13 | % | | | 26.35 | % | | | 10.46 | % | | | 5.27 | % |
Ratios/Supplemental Data | |
Net assets, end of period (in thousands) | | $ | 19,725 | | | $ | 25,046 | | | $ | 50,810 | | | $ | 16,996 | | | $ | 5,844 | | | $ | 29,214 | |
Ratios to average net assets: | |
Net investment income (loss) | | | (0.76 | %) | | | (0.49 | %) | | | (0.58 | %) | | | (0.77 | %) | | | (0.81 | %) | | | (1.10 | %) |
Total expenses | | | 1.52 | % | | | 1.50 | % | | | 1.49 | % | | | 1.52 | % | | | 1.50 | % | | | 1.52 | % |
Portfolio turnover rate | | | 278 | % | | | 309 | % | | | 380 | % | | | 677 | % | | | 645 | % | | | 500 | % |
a | Unaudited figures for the period ended September 30, 2016. Percentage amounts for the period, except total return and portfolio turnover rate, have been annualized. |
b | Net investment income (loss) per share was computed using average shares outstanding throughout the period. |
c | Total return does not reflect the impact of any applicable sales charges. |
SEE NOTES TO FINANCIAL STATEMENTS. | THE RYDEX FUNDS SEMI-ANNUAL REPORT | 43 |
FUND PROFILE (Unaudited) | September 30, 2016 |
S&P SMALLCAP 600® PURE VALUE FUND
OBJECTIVE: Seeks to provide investment results that match, before fees and expenses, the performance of a benchmark for small-cap value securities on a daily basis. The Fund’s current benchmark is the S&P SmallCap 600® Pure Value Index (the “underlying index”).
Holdings Diversification (Market Exposure as % of Net Assets)
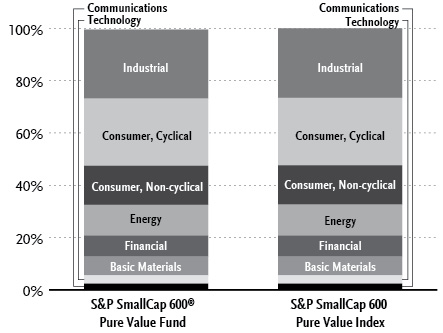
“Holdings Diversification (Market Exposure as % of Net Assets)” excludes any temporary cash investments.
Inception Dates: |
A-Class | September 1, 2004 |
C-Class | February 20, 2004 |
H-Class | February 20, 2004 |
Ten Largest Holdings (% of Total Net Assets) |
Century Aluminum Co. | 2.4% |
EZCORP, Inc. — Class A | 2.1% |
SPX Corp. | 1.9% |
Orion Group Holdings, Inc. | 1.6% |
Chemours Co. | 1.5% |
Archrock, Inc. | 1.5% |
Chart Industries, Inc. | 1.5% |
SkyWest, Inc. | 1.4% |
Big 5 Sporting Goods Corp. | 1.4% |
Kelly Services, Inc. — Class A | 1.4% |
Top Ten Total | 16.7% |
| | |
“Ten Largest Holdings” excludes any temporary cash investments. |
44 | THE RYDEX FUNDS SEMI-ANNUAL REPORT | |
SCHEDULE OF INVESTMENTS (Unaudited) | September 30, 2016 |
S&P SMALLCAP 600® PURE VALUE FUND | |
| | | Shares | | | Value | |
| | | | | | | |
COMMON STOCKS† - 99.5% | |
| | | | | | | |
Industrial - 26.4% | |
SPX Corp.* | | | 30,822 | | | $ | 620,755 | |
Orion Group Holdings, Inc.* | | | 76,301 | | | | 522,662 | |
Chart Industries, Inc.* | | | 14,763 | | | | 484,669 | |
TTM Technologies, Inc.* | | | 37,364 | | | | 427,817 | |
Sanmina Corp.* | | | 14,336 | | | | 408,146 | |
MYR Group, Inc.* | | | 13,174 | | | | 396,537 | |
Benchmark Electronics, Inc.* | | | 15,656 | | | | 390,617 | |
Bel Fuse, Inc. — Class B | | | 15,567 | | | | 375,787 | |
TimkenSteel Corp.* | | | 32,868 | | | | 343,471 | |
Greenbrier Companies, Inc. | | | 8,956 | | | | 316,147 | |
Atlas Air Worldwide Holdings, Inc.* | | | 7,139 | | | | 305,692 | |
Roadrunner Transportation Systems, Inc.* | | | 37,304 | | | | 297,685 | |
LSB Industries, Inc.* | | | 33,403 | | | | 286,598 | |
ArcBest Corp. | | | 14,626 | | | | 278,187 | |
Saia, Inc.* | | | 8,724 | | | | 261,371 | |
Celadon Group, Inc. | | | 29,638 | | | | 259,036 | |
Plexus Corp.* | | | 5,327 | | | | 249,197 | |
Olympic Steel, Inc. | | | 10,723 | | | | 236,978 | |
SPX FLOW, Inc.* | | | 6,908 | | | | 213,595 | |
Powell Industries, Inc. | | | 5,275 | | | | 211,264 | |
Briggs & Stratton Corp. | | | 10,056 | | | | 187,544 | |
Hub Group, Inc. — Class A* | | | 4,585 | | | | 186,885 | |
AAR Corp. | | | 5,915 | | | | 185,258 | |
Boise Cascade Co.* | | | 6,722 | | | | 170,739 | |
Echo Global Logistics, Inc.* | | | 6,866 | | | | 158,330 | |
Hornbeck Offshore Services, Inc.* | | | 23,593 | | | | 129,761 | |
Kaman Corp. | | | 2,574 | | | | 113,050 | |
Aegion Corp. — Class A* | | | 5,865 | | | | 111,846 | |
Marten Transport Ltd. | | | 4,981 | | | | 104,601 | |
Astec Industries, Inc. | | | 1,606 | | | | 96,151 | |
Haynes International, Inc. | | | 2,262 | | | | 83,943 | |
Tredegar Corp. | | | 4,339 | | | | 80,662 | |
Applied Industrial Technologies, Inc. | | | 1,721 | | | | 80,440 | |
Tidewater, Inc. | | | 14,902 | | | | 42,024 | |
Total Industrial | | | | | | | 8,617,445 | |
| | | | | | | | | |
Consumer, Cyclical - 25.7% | |
EZCORP, Inc. — Class A* | | | 62,262 | | | | 688,618 | |
SkyWest, Inc. | | | 17,464 | | | | 461,224 | |
Big 5 Sporting Goods Corp. | | | 33,477 | | | | 455,957 | |
Finish Line, Inc. — Class A | | | 15,468 | | | | 357,002 | |
Veritiv Corp.* | | | 6,419 | | | | 322,041 | |
Shoe Carnival, Inc. | | | 12,070 | | | | 321,787 | |
Barnes & Noble Education, Inc.* | | | 33,357 | | | | 319,226 | |
Iconix Brand Group, Inc.* | | | 35,559 | | | | 288,739 | |
Titan International, Inc. | | | 27,708 | | | | 280,405 | |
Tailored Brands, Inc. | | | 16,729 | | | | 262,645 | |
ScanSource, Inc.* | | | 7,006 | | | | 255,719 | |
Stage Stores, Inc. | | | 44,995 | | | | 252,422 | |
Tuesday Morning Corp.* | | | 38,561 | | | | 230,595 | |
Zumiez, Inc.* | | | 12,763 | | | | 229,734 | |
Genesco, Inc.* | | | 4,185 | | | | 227,915 | |
Anixter International, Inc.* | | | 3,492 | | | | 225,234 | |
Perry Ellis International, Inc.* | | | 10,966 | | | | 211,424 | |
Barnes & Noble, Inc. | | | 18,659 | | | | 210,847 | |
Lumber Liquidators Holdings, Inc.* | | | 10,377 | | | | 204,116 | |
Superior Industries International, Inc. | | | 6,588 | | | | 192,106 | |
Sonic Automotive, Inc. — Class A | | | 9,442 | | | | 177,509 | |
Group 1 Automotive, Inc. | | | 2,695 | | | | 172,157 | |
VOXX International Corp. — Class A* | | | 55,450 | | | | 165,796 | |
Children’s Place, Inc. | | | 1,985 | | | | 158,542 | |
Ruby Tuesday, Inc.* | | | 57,417 | | | | 143,543 | |
Biglari Holdings, Inc.* | | | 322 | | | | 140,398 | |
Essendant, Inc. | | | 6,804 | | | | 139,618 | |
Caleres, Inc. | | | 5,238 | | | | 132,469 | |
Stein Mart, Inc. | | | 20,171 | | | | 128,086 | |
Wolverine World Wide, Inc. | | | 5,396 | | | | 124,270 | |
Kirkland’s, Inc.* | | | 9,979 | | | | 121,544 | |
Fred’s, Inc. — Class A | | | 12,339 | | | | 111,791 | |
Arctic Cat, Inc. | | | 7,049 | | | | 109,189 | |
Regis Corp.* | | | 7,199 | | | | 90,347 | |
Vitamin Shoppe, Inc.* | | | 3,260 | | | | 87,531 | |
Daktronics, Inc. | | | 8,392 | | | | 80,060 | |
Vera Bradley, Inc.* | | | 5,244 | | | | 79,447 | |
Unifi, Inc.* | | | 2,629 | | | | 77,371 | |
Movado Group, Inc. | | | 3,273 | | | | 70,304 | |
Express, Inc.* | | | 4,860 | | | | 57,299 | |
Total Consumer, Cyclical | | | | | | | 8,365,027 | |
| | | | | | | | | |
Consumer, Non-cyclical - 14.9% | |
Kelly Services, Inc. — Class A | | | 22,952 | | | | 441,137 | |
SpartanNash Co. | | | 14,756 | | | | 426,744 | |
Rent-A-Center, Inc. | | | 30,448 | | | | 384,863 | |
Seneca Foods Corp. — Class A* | | | 13,326 | | | | 376,326 | |
Andersons, Inc. | | | 8,318 | | | | 300,945 | |
Darling Ingredients, Inc.* | | | 22,021 | | | | 297,504 | |
ABM Industries, Inc. | | | 7,124 | | | | 282,823 | |
Magellan Health, Inc.* | | | 4,637 | | | | 249,146 | |
Universal Corp. | | | 3,728 | | | | 217,044 | |
Central Garden & Pet Co. — Class A* | | | 7,964 | | | | 197,507 | |
Kindred Healthcare, Inc. | | | 18,229 | | | | 186,300 | |
Select Medical Holdings Corp.* | | | 13,757 | | | | 185,720 | |
AngioDynamics, Inc.* | | | 10,487 | | | | 183,942 | |
Sanderson Farms, Inc. | | | 1,830 | | | | 176,284 | |
CDI Corp. | | | 27,103 | | | | 153,674 | |
RR Donnelley & Sons Co.* | | | 9,590 | | | | 150,755 | |
Healthways, Inc.* | | | 5,619 | | | | 148,679 | |
Viad Corp. | | | 2,949 | | | | 108,730 | |
Green Dot Corp. — Class A* | | | 4,573 | | | | 105,453 | |
Universal Technical Institute, Inc. | | | 48,249 | | | | 85,883 | |
PharMerica Corp.* | | | 2,848 | | | | 79,943 | |
Invacare Corp. | | | 5,639 | | | | 62,988 | |
Central Garden & Pet Co.* | | | 2,410 | | | | 62,660 | |
Total Consumer, Non-cyclical | | | | | | | 4,865,050 | |
| | | | | | | | | |
Energy - 11.8% | |
Archrock, Inc. | | | 37,609 | | | | 491,925 | |
Exterran Corp.* | | | 24,604 | | | | 385,791 | |
Cloud Peak Energy, Inc.* | | | 65,255 | | | | 354,987 | |
Green Plains, Inc. | | | 13,472 | | | | 352,966 | |
Atwood Oceanics, Inc. | | | 36,523 | | | | 317,385 | |
SEE NOTES TO FINANCIAL STATEMENTS. | THE RYDEX FUNDS SEMI-ANNUAL REPORT | 45 |
SCHEDULE OF INVESTMENTS (Unaudited)(continued) | September 30, 2016 |
S&P SMALLCAP 600® PURE VALUE FUND | |
| | | Shares | | | Value | |
| | | | | | | |
Helix Energy Solutions Group, Inc.* | | | 37,119 | | | $ | 301,777 | |
Newpark Resources, Inc.* | | | 37,946 | | | | 279,283 | |
SunCoke Energy, Inc.* | | | 34,660 | | | | 277,973 | |
Gulf Island Fabrication, Inc. | | | 28,933 | | | | 266,184 | |
SEACOR Holdings, Inc.* | | | 3,329 | | | | 198,042 | |
Pioneer Energy Services Corp.* | | | 45,754 | | | | 184,846 | |
Era Group, Inc.* | | | 20,394 | | | | 164,172 | |
REX American Resources Corp.* | | | 1,846 | | | | 156,467 | |
Bristow Group, Inc. | | | 7,125 | | | | 99,893 | |
Basic Energy Services, Inc.* | | | 20,442 | | | | 16,955 | |
Total Energy | | | | | | | 3,848,646 | |
| | | | | | | | | |
Financial - 8.0% | |
Enova International, Inc.* | | | 39,976 | | | | 386,968 | |
First BanCorp* | | | 53,129 | | | | 276,271 | |
World Acceptance Corp.* | | | 5,093 | | | | 249,761 | |
International. FCStone, Inc.* | | | 6,351 | | | | 246,736 | |
Piper Jaffray Cos.* | | | 5,060 | | | | 244,398 | |
OFG Bancorp | | | 20,299 | | | | 205,223 | |
Calamos Asset Management, Inc. — Class A | | | 24,011 | | | | 163,755 | |
Infinity Property & Casualty Corp. | | | 1,620 | | | | 133,861 | |
Stewart Information Services Corp. | | | 2,981 | | | | 132,505 | |
Capstead Mortgage Corp. | | | 13,537 | | | | 127,654 | |
Navigators Group, Inc. | | | 1,214 | | | | 117,661 | |
Horace Mann Educators Corp. | | | 3,205 | | | | 117,463 | |
Encore Capital Group, Inc.* | | | 4,311 | | | | 96,911 | |
American Equity Investment Life Holding Co. | | | 5,341 | | | | 94,696 | |
Total Financial | | | | | | | 2,593,863 | |
| | | | | | | | | |
Basic Materials - 7.2% | |
Century Aluminum Co.* | | | 113,720 | | | | 790,354 | |
Chemours Co. | | | 31,320 | | | | 501,119 | |
PH Glatfelter Co. | | | 13,579 | | | | 294,393 | |
Materion Corp. | | | 6,939 | | | | 213,097 | |
Clearwater Paper Corp.* | | | 2,139 | | | | 138,329 | |
A. Schulman, Inc. | | | 4,162 | | | | 121,197 | |
Innophos Holdings, Inc. | | | 2,918 | | | | 113,890 | |
Stepan Co. | | | 1,498 | | | | 108,845 | |
Intrepid Potash, Inc.* | | | 49,624 | | | | 56,075 | |
Total Basic Materials | | | | | | | 2,337,299 | |
| | | | | | | | | |
Technology - 3.1% | |
Insight Enterprises, Inc.* | | | 9,801 | | | | 319,022 | |
ManTech International Corp. — Class A | | | 4,495 | | | | 169,416 | |
Engility Holdings, Inc.* | | | 4,119 | | | | 129,749 | |
Ciber, Inc.* | | | 95,183 | | | | 109,460 | |
Kulicke & Soffa Industries, Inc.* | | | 7,800 | | | | 100,854 | |
CACI International, Inc. — Class A* | | | 925 | | | | 93,333 | |
Brooks Automation, Inc. | | | 5,819 | | | | 79,197 | |
Total Technology | | | | | | | 1,001,031 | |
| | | | | | | | | |
Communications - 2.4% | |
Iridium Communications, Inc.* | | | 19,985 | | | | 162,078 | |
Black Box Corp. | | | 10,670 | | | | 148,314 | |
FTD Companies, Inc.* | | | 5,041 | | | | 103,693 | |
Comtech Telecommunications Corp. | | | 7,946 | | | | 101,788 | |
Blucora, Inc.* | | | 9,059 | | | | 101,461 | |
Scholastic Corp. | | | 2,190 | | | | 86,199 | |
Gannett Company, Inc. | | | 6,163 | | | | 71,737 | |
Total Communications | | | | | | | 775,270 | |
| | | | | | | | | |
Total Common Stocks | | | | | | | | |
(Cost $27,919,505) | | | | | | | 32,403,631 | |
| | | | | | | | | |
| | | Face
Amount | | | | | |
| | | | | | | | | |
REPURCHASE AGREEMENTS††,1 - 0.0% | |
HSBC Securities, Inc.
issued 09/30/16 at 0.38%
due 10/03/16 | | $ | 246 | | | | 246 | |
Royal Bank of Canada
issued 09/30/16 at 0.36%
due 10/03/16 | | | 196 | | | | 196 | |
Total Repurchase Agreements | | | | | | | | |
(Cost $442) | | | | | | | 442 | |
| | | | | | | | | |
Total Investments - 99.5% | | | | | | | | |
(Cost $27,919,947) | | | | | | $ | 32,404,073 | |
Other Assets & Liabilities, net - 0.5% | | | | | | | 162,721 | |
Total Net Assets - 100.0% | | | | | | $ | 32,566,794 | |
* | Non-income producing security. |
† | Value determined based on Level 1 inputs — See Note 4. |
†† | Value determined based on Level 2 inputs — See Note 4. |
1 | Repurchase Agreements — See Note 5. |
| | |
| | See Sector Classification in Other Information section. |
46 | THE RYDEX FUNDS SEMI-ANNUAL REPORT | SEE NOTES TO FINANCIAL STATEMENTS. |
SCHEDULE OF INVESTMENTS (Unaudited)(concluded) | September 30, 2016 |
S&P SMALLCAP 600® PURE VALUE FUND | |
The following table summarizes the inputs used to value the Fund’s investments at September 30, 2016 (See Note 4 in the Notes to Financial Statements):
Investments in Securities (Assets) | | Level 1 | | | Level 2 | | | Level 3 | | | Total | |
Common Stocks | | $ | 32,403,631 | | | $ | — | | | $ | — | | | $ | 32,403,631 | |
Repurchase Agreements | | | — | | | | 442 | | | | — | | | | 442 | |
Total | | $ | 32,403,631 | | | $ | 442 | | | $ | — | | | $ | 32,404,073 | |
Transfers between investment levels may occur as the markets fluctuate and/or the availability of data used in an investment’s valuation changes. Transfers between valuation levels, if any, are in comparison to the valuation levels at the end of the previous fiscal year, and are effective using the fair value as of the end of the previous fiscal period.
For the period ended September 30, 2016, there were no transfers between levels.
SEE NOTES TO FINANCIAL STATEMENTS. | THE RYDEX FUNDS SEMI-ANNUAL REPORT | 47 |
S&P SMALLCAP 600® PURE VALUE FUND | |
STATEMENT OF ASSETS AND LIABILITIES (Unaudited) | |
September 30, 2016 | |
Assets: | |
Investments, at value (cost $27,919,505) | | $ | 32,403,631 | |
Repurchase agreements, at value (cost $442) | | | 442 | |
Total investments (cost $27,919,947) | | | 32,404,073 | |
Cash | | | 20,893 | |
Receivables: | |
Securities sold | | | 210,765 | |
Fund shares sold | | | 6,756 | |
Dividends | | | 22,265 | |
Total assets | | | 32,664,752 | |
| | | | | |
Liabilities: | |
Payable for: | |
Fund shares redeemed | | | 48,896 | |
Management fees | | | 20,576 | |
Distribution and service fees | | | 8,247 | |
Transfer agent and administrative fees | | | 6,859 | |
Portfolio accounting fees | | | 2,743 | |
Miscellaneous | | | 10,637 | |
Total liabilities | | | 97,958 | |
Commitments and contingent liabilities (Note 11) | | | — | |
Net assets | | $ | 32,566,794 | |
| | | | | |
Net assets consist of: | |
Paid in capital | | $ | 58,656,088 | |
Accumulated net investment loss | | | (74,847 | ) |
Accumulated net realized loss on investments | | | (30,498,573 | ) |
Net unrealized appreciation on investments | | | 4,484,126 | |
Net assets | | $ | 32,566,794 | |
| | | | | |
A-Class: | |
Net assets | | $ | 1,058,315 | |
Capital shares outstanding | | | 42,199 | |
Net asset value per share | | $ | 25.08 | |
Maximum offering price per share (Net asset value divided by 95.25%) | | $ | 26.33 | |
| | | | | |
C-Class: | |
Net assets | | $ | 2,222,518 | |
Capital shares outstanding | | | 101,566 | |
Net asset value per share | | $ | 21.88 | |
| | | | | |
H-Class: | |
Net assets | | $ | 29,285,961 | |
Capital shares outstanding | | | 1,173,154 | |
Net asset value per share | | $ | 24.96 | |
STATEMENT OF OPERATIONS (Unaudited) | |
Period Ended September 30, 2016 | |
Investment Income: | |
Dividends (net of foreign withholding tax of $270) | | $ | 154,650 | |
Interest | | | 240 | |
Total investment income | | | 154,890 | |
| | | | | |
Expenses: | |
Management fees | | | 103,472 | |
Transfer agent and administrative fees | | | 34,491 | |
Distribution and service fees: | |
A-Class | | | 1,490 | |
C-Class | | | 12,402 | |
H-Class | | | 29,900 | |
Portfolio accounting fees | | | 13,796 | |
Custodian fees | | | 1,629 | |
Trustees’ fees* | | | 1,233 | |
Line of credit fees | | | 218 | |
Miscellaneous | | | 20,879 | |
Total expenses | | | 219,510 | |
Net investment loss | | | (64,620 | ) |
| | | | | |
Net Realized and Unrealized Gain (Loss): | |
Net realized gain (loss) on: | |
Investments | | | (644,831 | ) |
Net realized loss | | | (644,831 | ) |
Net change in unrealized appreciation (depreciation) on: | |
Investments | | | 529,853 | |
Net change in unrealized appreciation (depreciation) | | | 529,853 | |
Net realized and unrealized loss | | | (114,978 | ) |
Net decrease in net assets resulting from operations | | $ | (179,598 | ) |
* | Relates to Trustees not deemed “interested persons” within the meaning of Section 2(a)(19) of the 1940 Act. |
48 | THE RYDEX FUNDS SEMI-ANNUAL REPORT | SEE NOTES TO FINANCIAL STATEMENTS. |
S&P SMALLCAP 600® PURE VALUE FUND | |
STATEMENTS OF CHANGES IN NET ASSETS |
| | | Period Ended
September 30,
2016
(Unaudited) | | | Year Ended
March 31,
2016 | |
Increase (Decrease) in Net Assets from Operations: | | | | | | |
Net investment loss | | $ | (64,620 | ) | | $ | (74,791 | ) |
Net realized loss on investments | | | (644,831 | ) | | | (1,683,099 | ) |
Net change in unrealized appreciation (depreciation) on investments | | | 529,853 | | | | 635,355 | |
Net decrease in net assets resulting from operations | | | (179,598 | ) | | | (1,122,535 | ) |
| | | | | | | | | |
Capital share transactions: | | | | | | | | |
Proceeds from sale of shares | | | | | | | | |
A-Class | | | 1,563,607 | | | | 2,492,235 | |
C-Class | | | 1,743,477 | | | | 1,032,252 | |
H-Class | | | 223,382,690 | | | | 83,674,345 | |
Cost of shares redeemed | | | | | | | | |
A-Class | | | (1,695,216 | ) | | | (2,714,593 | ) |
C-Class | | | (1,540,401 | ) | | | (1,957,269 | ) |
H-Class | | | (211,738,190 | ) | | | (76,422,564 | ) |
Net increase from capital share transactions | | | 11,715,967 | | | | 6,104,406 | |
Net increase in net assets | | | 11,536,369 | | | | 4,981,871 | |
| | | | | | | | | |
Net assets: | | | | | | | | |
Beginning of period | | | 21,030,425 | | | | 16,048,554 | |
End of period | | $ | 32,566,794 | | | $ | 21,030,425 | |
Accumulated net investment loss at end of period | | $ | (74,847 | ) | | $ | (10,227 | ) |
| | | | | | | | | |
Capital share activity: | | | | | | | | |
Shares sold | | | | | | | | |
A-Class | | | 66,100 | | | | 99,870 | |
C-Class | | | 85,375 | | | | 48,000 | |
H-Class | | | 9,704,847 | | | | 3,744,799 | |
Shares redeemed | | | | | | | | |
A-Class | | | (71,956 | ) | | | (113,497 | ) |
C-Class | | | (74,859 | ) | | | (92,281 | ) |
H-Class | | | (9,315,023 | ) | | | (3,403,948 | ) |
Net increase in shares | | | 394,484 | | | | 282,943 | |
SEE NOTES TO FINANCIAL STATEMENTS. | THE RYDEX FUNDS SEMI-ANNUAL REPORT | 49 |
S&P SMALLCAP 600® PURE VALUE FUND | |
This table is presented to show selected data for a share outstanding throughout each period and to assist shareholders in evaluating a Fund’s performance for the periods presented.
A-Class | | Period Ended
September 30,
2016a | | | Year Ended
March 31,
2016 | | | Year Ended
March 31,
2015 | | | Year Ended
March 31,
2014 | | | Year Ended
March 28,
2013 | | | Year Ended
March 31,
2012 | |
Per Share Data | | | | | | | | | | | | | | | | | | |
Net asset value, beginning of period | | $ | 23.16 | | | $ | 25.81 | | | $ | 25.66 | | | $ | 19.55 | | | $ | 17.07 | | | $ | 17.42 | |
Income (loss) from investment operations: | |
Net investment income (loss)b | | | (.06 | ) | | | (.10 | ) | | | (.03 | ) | | | (.09 | ) | | | (.01 | ) | | | (.12 | ) |
Net gain (loss) on investments (realized and unrealized) | | | 1.98 | | | | (2.55 | ) | | | .18 | | | | 6.20 | | | | 2.49 | | | | (.23 | ) |
Total from investment operations | | | 1.92 | | | | (2.65 | ) | | | .15 | | | | 6.11 | | | | 2.48 | | | | (.35 | ) |
Net asset value, end of period | | $ | 25.08 | | | $ | 23.16 | | | $ | 25.81 | | | $ | 25.66 | | | $ | 19.55 | | | $ | 17.07 | |
| | |
Total Returnc | | | 8.29 | % | | | (10.27 | %) | | | 0.58 | % | | | 31.25 | % | | | 14.53 | % | | | (2.01 | %) |
Ratios/Supplemental Data | |
Net assets, end of period (in thousands) | | $ | 1,058 | | | $ | 1,113 | | | $ | 1,592 | | | $ | 1,016 | | | $ | 1,551 | | | $ | 961 | |
Ratios to average net assets: | |
Net investment income (loss) | | | (0.50 | %) | | | (0.42 | %) | | | (0.10 | %) | | | (0.39 | %) | | | (0.08 | %) | | | (0.71 | %) |
Total expenses | | | 1.52 | % | | | 1.50 | % | | | 1.50 | % | | | 1.52 | % | | | 1.51 | % | | | 1.53 | % |
Portfolio turnover rate | | | 696 | % | | | 417 | % | | | 579 | % | | | 658 | % | | | 655 | % | | | 744 | % |
C-Class | | Period Ended
September 30,
2016a | | | Year Ended
March 31,
2016 | | | Year Ended
March 31,
2015 | | | Year Ended
March 31,
2014 | | | Year Ended
March 28,
2013 | | | Year Ended
March 31,
2012 | |
Per Share Data | | | | | | | | | | | | | | | | | | |
Net asset value, beginning of period | | $ | 20.28 | | | $ | 22.78 | | | $ | 22.81 | | | $ | 17.51 | | | $ | 15.40 | | | $ | 15.85 | |
Income (loss) from investment operations: | |
Net investment income (loss)b | | | (.13 | ) | | | (.24 | ) | | | (.19 | ) | | | (.22 | ) | | | (.13 | ) | | | (.20 | ) |
Net gain (loss) on investments (realized and unrealized) | | | 1.73 | | | | (2.26 | ) | | | .16 | | | | 5.52 | | | | 2.24 | | | | (.25 | ) |
Total from investment operations | | | 1.60 | | | | (2.50 | ) | | | (.03 | ) | | | 5.30 | | | | 2.11 | | | | (.45 | ) |
Net asset value, end of period | | $ | 21.88 | | | $ | 20.28 | | | $ | 22.78 | | | $ | 22.81 | | | $ | 17.51 | | | $ | 15.40 | |
| | |
Total Returnc | | | 7.89 | % | | | (10.97 | %) | | | (0.13 | %) | | | 30.27 | % | | | 13.70 | % | | | (2.84 | %) |
Ratios/Supplemental Data | |
Net assets, end of period (in thousands) | | $ | 2,223 | | | $ | 1,847 | | | $ | 3,082 | | | $ | 4,514 | | | $ | 3,932 | | | $ | 1,955 | |
Ratios to average net assets: | |
Net investment income (loss) | | | (1.23 | %) | | | (1.17 | %) | | | (0.84 | %) | | | (1.10 | %) | | | (0.84 | %) | | | (1.39 | %) |
Total expenses | | | 2.27 | % | | | 2.25 | % | | | 2.25 | % | | | 2.27 | % | | | 2.26 | % | | | 2.26 | % |
Portfolio turnover rate | | | 696 | % | | | 417 | % | | | 579 | % | | | 658 | % | | | 655 | % | | | 744 | % |
50 | THE RYDEX FUNDS SEMI-ANNUAL REPORT | SEE NOTES TO FINANCIAL STATEMENTS. |
S&P SMALLCAP 600® PURE VALUE FUND | |
FINANCIAL HIGHLIGHTS (concluded) |
This table is presented to show selected data for a share outstanding throughout each period and to assist shareholders in evaluating a Fund’s performance for the periods presented.
H-Class | | Period Ended
September 30,
2016a | | | Year Ended
March 31,
2016 | | | Year Ended
March 31,
2015 | | | Year Ended
March 31,
2014 | | | Year Ended
March 28,
2013 | | | Year Ended
March 31,
2012 | |
Per Share Data | | | | | | | | | | | | | | | | | | |
Net asset value, beginning of period | | $ | 23.07 | | | $ | 25.71 | | | $ | 25.55 | | | $ | 19.47 | | | $ | 17.00 | | | $ | 17.38 | |
Income (loss) from investment operations: | |
Net investment income (loss)b | | | (.05 | ) | | | (.07 | ) | | | (.01 | ) | | | (.06 | ) | | | (.06 | ) | | | (.11 | ) |
Net gain (loss) on investments (realized and unrealized) | | | 1.94 | | | | (2.57 | ) | | | .17 | | | | 6.14 | | | | 2.53 | | | | (.27 | ) |
Total from investment operations | | | 1.89 | | | | (2.64 | ) | | | .16 | | | | 6.08 | | | | 2.47 | | | | (.38 | ) |
Net asset value, end of period | | $ | 24.96 | | | $ | 23.07 | | | $ | 25.71 | | | $ | 25.55 | | | $ | 19.47 | | | $ | 17.00 | |
| | |
Total Returnc | | | 8.19 | % | | | (10.27 | %) | | | 0.63 | % | | | 31.23 | % | | | 14.53 | % | | | (2.19 | %) |
Ratios/Supplemental Data | |
Net assets, end of period (in thousands) | | $ | 29,286 | | | $ | 18,071 | | | $ | 11,374 | | | $ | 22,380 | | | $ | 30,743 | | | $ | 24,298 | |
Ratios to average net assets: | |
Net investment income (loss) | | | (0.39 | %) | | | (0.32 | %) | | | (0.03 | %) | | | (0.25 | %) | | | (0.32 | %) | | | (0.69 | %) |
Total expenses | | | 1.52 | % | | | 1.50 | % | | | 1.50 | % | | | 1.53 | % | | | 1.51 | % | | | 1.49 | % |
Portfolio turnover rate | | | 696 | % | | | 417 | % | | | 579 | % | | | 658 | % | | | 655 | % | | | 744 | % |
a | Unaudited figures for the period ended September 30, 2016. Percentage amounts for the period, except total return and portfolio turnover rate, have been annualized. |
b | Net investment income (loss) per share was computed using average shares outstanding throughout the period. |
c | Total return does not reflect the impact of any applicable sales charges. |
SEE NOTES TO FINANCIAL STATEMENTS. | THE RYDEX FUNDS SEMI-ANNUAL REPORT | 51 |
FUND PROFILE (Unaudited) | September 30, 2016 |
EUROPE 1.25x STRATEGY FUND
OBJECTIVE: Seeks to provide investment results that correlate, before fees and expenses, to the performance of a specific benchmark. The Fund’s current benchmark is 125% of the fair value of the STOXX® Europe 50 Index (the “underlying index”).
Holdings Diversification (Market Exposure as % of Net Assets)
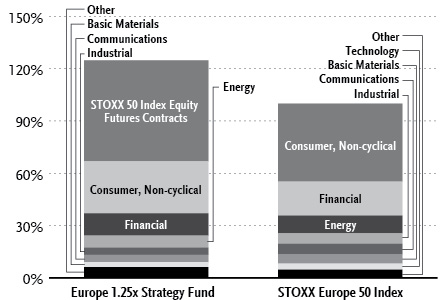
“Holdings Diversification (Market Exposure as % of Net Assets)” excludes any temporary cash investments or investments in Guggenheim Strategy Funds Trust mutual funds. Investments in those Funds do not provide “market exposure” to meet the Fund’s investment objective, but will significantly increase the portfolio’s exposure to certain other asset categories (and their associated risks), which may cause the Fund to deviate from its principal investment strategy, including: (i) high yield, high risk debt securities rated below the top four long-term rating categories by a nationally recognized statistical rating organization (also known as “junk bonds”); (ii) securities issued by the U.S. government or its agencies and instrumentalities; (iii) CLOs and similar investments; and (iv) other short-term fixed income securities.
Inception Dates: |
A-Class | March 31, 2004 |
C-Class | May 10, 2001 |
H-Class | May 8, 2000 |
INVESTMENT CONCENTRATION
At September 30, 2016, the investment diversification of the Fund by country was as follows:
Country | % of Common Stocks | Value |
United Kingdom | 35% | $873,890 |
Switzerland | 21% | 522,790 |
Germany | 15% | 373,212 |
France | 13% | 332,566 |
Netherlands | 5% | 111,023 |
Spain | 4% | 102,612 |
Belgium | 3% | 69,516 |
Other | 4% | 107,576 |
Total Securities | 100% | $2,493,185 |
Ten Largest Holdings (% of Total Net Assets) |
Guggenheim Strategy Fund II | 6.2% |
Guggenheim Strategy Fund I | 6.2% |
Nestle S.A. ADR | 4.7% |
Novartis AG ADR | 3.9% |
Roche Holding AG ADR | 3.3% |
HSBC Holdings plc ADR | 2.8% |
Total S.A. ADR | 2.2% |
British American Tobacco plc ADR | 2.2% |
BP plc ADR | 2.0% |
Royal Dutch Shell plc — Class A ADR | 2.0% |
Top Ten Total | 35.5% |
| | |
“Ten Largest Holdings” excludes any temporary cash or derivative investments. |
52 | THE RYDEX FUNDS SEMI-ANNUAL REPORT | |
SCHEDULE OF INVESTMENTS (Unaudited) | September 30, 2016 |
EUROPE 1.25x STRATEGY FUND | |
| | | Shares | | | Value | |
| | | | | | | |
COMMON STOCKS† - 66.8% | |
| | | | | | | |
Consumer, Non-cyclical - 29.8% | |
Nestle S.A. ADR | | | 2,207 | | | $ | 174,397 | |
Novartis AG ADR | | | 1,828 | | | | 144,338 | |
Roche Holding AG ADR | | | 3,973 | | | | 123,043 | |
British American Tobacco plc ADR | | | 642 | | | | 81,951 | |
GlaxoSmithKline plc ADR | | | 1,663 | | | | 71,725 | |
Anheuser-Busch InBev S.A. ADR | | | 529 | | | | 69,516 | |
Sanofi ADR | | | 1,605 | | | | 61,295 | |
AstraZeneca plc ADR | | | 1,814 | | | | 59,608 | |
Bayer AG ADR | | | 579 | | | | 58,190 | |
Unilever N.V. — Class Y | | | 1,088 | | | | 50,157 | |
Diageo plc ADR | | | 428 | | | | 49,665 | |
Novo Nordisk A/S ADR | | | 1,157 | | | | 48,120 | |
Unilever plc ADR | | | 927 | | | | 43,940 | |
Reckitt Benckiser Group plc ADR | | | 2,268 | | | | 43,478 | |
Imperial Brands plc ADR | | | 657 | | | | 33,816 | |
Total Consumer, Non-cyclical | | | | | | | 1,113,239 | |
| | | | | | | | | |
Financial - 12.7% | |
HSBC Holdings plc ADR | | | 2,762 | | | | 103,880 | |
Allianz SE ADR | | | 3,056 | | | | 45,320 | |
Banco Santander S.A. ADR | | | 10,065 | | | | 44,387 | |
BNP Paribas S.A. ADR | | | 1,571 | | | | 40,673 | |
UBS Group AG | | | 2,500 | | | | 34,050 | |
ING Groep N.V. ADR | | | 2,668 | | | | 32,923 | |
Prudential plc ADR | | | 887 | | | | 31,675 | |
AXA S.A. ADR | | | 1,454 | | | | 30,767 | |
Lloyds Banking Group plc ADR | | | 10,689 | | | | 30,677 | |
Banco Bilbao Vizcaya Argentaria S.A. ADR | | | 4,523 | | | | 26,957 | |
Zurich Insurance Group AG ADR | | | 1,044 | | | | 26,820 | |
Barclays plc ADR | | | 2,893 | | | | 25,140 | |
Total Financial | | | | | | | 473,269 | |
| | | | | | | | | |
Energy - 6.9% | |
Total S.A. ADR | | | 1,744 | | | | 83,189 | |
BP plc ADR | | | 2,158 | | | | 75,875 | |
Royal Dutch Shell plc — Class A ADR | | | 1,477 | | | | 73,953 | |
Eni SpA ADR | | | 880 | | | | 25,406 | |
Total Energy | | | | | | | 258,423 | |
| | | | | | | | | |
Industrial - 4.2% | |
Siemens AG ADR | | | 560 | | | | 65,699 | |
ABB Ltd. ADR* | | | 1,427 | | | | 32,122 | |
Vinci S.A. ADR | | | 1,542 | | | | 29,460 | |
Schneider Electric SE ADR | | | 2,055 | | | | 28,441 | |
Total Industrial | | | | | | | 155,722 | |
| | | | | | | | | |
Communications - 4.1% | |
Vodafone Group plc ADR | | | 1,806 | | | | 52,645 | |
Deutsche Telekom AG ADR | | | 2,230 | | | | 37,442 | |
Telefonica S.A. ADR | | | 3,102 | | | | 31,268 | |
BT Group plc ADR | | | 1,193 | | | | 30,338 | |
Total Communications | | | | | | | 151,693 | |
| | | | | | | | | |
Basic Materials - 2.9% | |
BASF SE ADR | | | 637 | | | | 54,495 | |
Rio Tinto plc ADR | | | 827 | | | | 27,622 | |
Air Liquide S.A. ADR | | | 1,200 | | | | 26,436 | |
Total Basic Materials | | | | | | | 108,553 | |
| | | | | | | | | |
Consumer, Cyclical - 2.8% | |
Daimler AG ADR | | | 704 | | | | 49,724 | |
LVMH Moet Hennessy Louis Vuitton SE ADR | | | 951 | | | | 32,305 | |
Cie Financiere Richemont S.A. ADR | | | 3,648 | | | | 22,070 | |
Total Consumer, Cyclical | | | | | | | 104,099 | |
| | | | | | | | | |
Technology - 2.4% | |
SAP SE ADR | | | 682 | | | | 62,342 | |
ASML Holding N.V. — Class G | | | 255 | | | | 27,943 | |
Total Technology | | | | | | | 90,285 | |
| | | | | | | | | |
Utilities - 1.0% | |
National Grid plc ADR | | | 533 | | | | 37,902 | |
| | | | | | | | | |
Total Common Stocks | | | | | | | | |
(Cost $2,217,248) | | | | | | | 2,493,185 | |
| | | | | | | | | |
MUTUAL FUNDS†,1 - 12.4% | |
Guggenheim Strategy Fund II | | | 9,292 | | | | 231,746 | |
Guggenheim Strategy Fund I | | | 9,254 | | | | 231,262 | |
Total Mutual Funds | | | | | | | | |
(Cost $460,443) | | | | | | | 463,008 | |
| | | | | | | | | |
| | | Face
Amount | | | | | |
| | | | | | | | | |
REPURCHASE AGREEMENTS††,2 - 14.8% | |
HSBC Securities, Inc.
issued 09/30/16 at 0.38%
due 10/03/16 | | $ | 306,986 | | | | 306,986 | |
Royal Bank of Canada
issued 09/30/16 at 0.36%
due 10/03/16 | | | 243,748 | | | | 243,748 | |
Total Repurchase Agreements | | | | | | | | |
(Cost $550,734) | | | | | | | 550,734 | |
| | | | | | | | | |
Total Investments - 94.0% | | | | | | | | |
(Cost $3,228,425) | | | | | | $ | 3,506,927 | |
Other Assets & Liabilities, net - 6.0% | | | | | | | 222,723 | |
Total Net Assets - 100.0% | | | | | | $ | 3,729,650 | |
SEE NOTES TO FINANCIAL STATEMENTS. | THE RYDEX FUNDS SEMI-ANNUAL REPORT | 53 |
SCHEDULE OF INVESTMENTS (Unaudited)(concluded) | September 30, 2016 |
EUROPE 1.25x STRATEGY FUND | |
| | | Contracts | | | Unrealized
Gain | |
| | | | | | | |
CURRENCY FUTURES CONTRACTS PURCHASED† | |
December 2016 Euro FX
Futures Contracts
(Aggregate Value of
Contracts $2,113,500) | | | 15 | | | $ | 8,343 | |
| | | | | | | | | |
EQUITY FUTURES CONTRACTS PURCHASED†† | |
December 2016 STOXX 50 Index
Futures Contracts
(Aggregate Value of
Contracts $2,160,112) | | | 68 | | | $ | 6,575 | |
* | Non-income producing security. |
† | Value determined based on Level 1 inputs — See Note 4. |
†† | Value determined based on Level 2 inputs — See Note 4. |
1 | Affiliated issuer — See Note 9. |
2 | Repurchase Agreements — See Note 5. |
| | ADR — American Depositary Receipt |
| | plc — Public Limited Company |
| | |
| | See Sector Classification in Other Information section. |
The following table summarizes the inputs used to value the Fund’s investments at September 30, 2016 (See Note 4 in the Notes to Financial Statements):
Investments in Securities (Assets) | | Level 1 | | | Level 1 -
Other* | | | Level 2 | | | Level 2 -
Other* | | | Level 3 | | | Total | |
Common Stocks | | $ | 2,493,185 | | | $ | — | | | $ | — | | | $ | — | | | $ | — | | | $ | 2,493,185 | |
Currency Futures Contracts | | | — | | | | 8,343 | | | | — | | | | — | | | | — | | | | 8,343 | |
Equity Futures Contracts | | | — | | | | — | | | | — | | | | 6,575 | | | | — | | | | 6,575 | |
Mutual Funds | | | 463,008 | | | | — | | | | — | | | | — | | | | — | | | | 463,008 | |
Repurchase Agreements | | | — | | | | — | | | | 550,734 | | | | — | | | | — | | | | 550,734 | |
Total | | $ | 2,956,193 | | | $ | 8,343 | | | $ | 550,734 | | | $ | 6,575 | | | $ | — | | | $ | 3,521,845 | |
* | Other financial instruments include futures contracts, which are reported as unrealized gain/loss at period end. |
Transfers between investment levels may occur as the markets fluctuate and/or the availability of data used in an investment’s valuation changes. Transfers between valuation levels, if any, are in comparison to the valuation levels at the end of the previous fiscal year, and are effective using the fair value as of the end of the previous fiscal period.
For the period ended September 30, 2016, there were no transfers between levels.
54 | THE RYDEX FUNDS SEMI-ANNUAL REPORT | SEE NOTES TO FINANCIAL STATEMENTS. |
EUROPE 1.25x STRATEGY FUND | |
STATEMENT OF ASSETS AND LIABILITIES (Unaudited) | |
September 30, 2016 | |
Assets: | |
Investments in unaffiliated issuers, at value (cost $2,217,248) | | $ | 2,493,185 | |
Investments in affiliated issuers, at value (cost $460,443) | | | 463,008 | |
Repurchase agreements, at value (cost $550,734) | | | 550,734 | |
Total investments (cost $3,228,425) | | | 3,506,927 | |
Segregated cash with broker | | | 267,087 | |
Receivables: | |
Swap settlement | | | 819 | |
Fund shares sold | | | 69,896 | |
Dividends | | | 6,694 | |
Foreign taxes reclaim | | | 25,755 | |
Interest | | | 6 | |
Total assets | | | 3,877,184 | |
| | | | | |
Liabilities: | |
Foreign currency, at value (cost $33,756) | | | 33,806 | |
Overdraft due to custodian bank | | | 692 | |
Payable for: | |
Fund shares redeemed | | | 103,464 | |
Legal fees | | | 8,522 | |
Management fees | | | 3,239 | |
Variation margin | | | 1,533 | |
Distribution and service fees | | | 1,093 | |
Transfer agent and administrative fees | | | 900 | |
Portfolio accounting fees | | | 360 | |
Miscellaneous | | | (6,075 | ) |
Total liabilities | | | 147,534 | |
Commitments and contingent liabilities (Note 11) | | | — | |
Net assets | | $ | 3,729,650 | |
| | | | | |
Net assets consist of: | |
Paid in capital | | $ | 16,146,912 | |
Undistributed net investment income | | | 75,038 | |
Accumulated net realized loss on investments | | | (12,785,654 | ) |
Net unrealized appreciation on investments | | | 293,354 | |
Net assets | | $ | 3,729,650 | |
| | | | | |
A-Class: | |
Net assets | | $ | 512,567 | |
Capital shares outstanding* | | | 6,412 | |
Net asset value per share* | | $ | 79.94 | |
Maximum offering price per share (Net asset value divided by 95.25%)* | | $ | 83.93 | |
| | | | | |
C-Class: | |
Net assets | | $ | 301,610 | |
Capital shares outstanding* | | | 4,307 | |
Net asset value per share* | | $ | 70.03 | |
| | | | | |
H-Class: | |
Net assets | | $ | 2,915,473 | |
Capital shares outstanding* | | | 36,872 | |
Net asset value per share* | | $ | 79.07 | |
STATEMENT OF OPERATIONS (Unaudited) | |
Period Ended September 30, 2016 | |
Investment Income: | |
Dividends from securities of unaffiliated issuers | | $ | 79,368 | |
Dividends from securities of affiliated issuers | | | 6,609 | |
Interest | | | 1,059 | |
Total investment income | | | 87,036 | |
| | | | | |
Expenses: | |
Management fees | | | 24,557 | |
Transfer agent and administrative fees | | | 6,822 | |
Distribution and service fees: | |
A-Class | | | 919 | |
C-Class | | | 1,949 | |
H-Class | | | 5,415 | |
Portfolio accounting fees | | | 2,729 | |
Custodian fees | | | 336 | |
Trustees’ fees** | | | 272 | |
Miscellaneous | | | 4,359 | |
Total expenses | | | 47,358 | |
Net investment income | | | 39,678 | |
| | | | | |
Net Realized and Unrealized Gain (Loss): | |
Net realized gain (loss) on: | |
Investments in unaffiliated issuers | | | 1,095,051 | |
Investments in affiliated issuers | | | 3,300 | |
Swap agreements | | | 1,754 | |
Futures contracts | | | 1,845,465 | |
Foreign currency | | | (4,794 | ) |
Net realized gain | | | 2,940,776 | |
Net change in unrealized appreciation (depreciation) on: | |
Investments in unaffiliated issuers | | | 25,475 | |
Investments in affiliated issuers | | | 2,436 | |
Futures contracts | | | (3,606 | ) |
Foreign currency | | | (50 | ) |
Net change in unrealized appreciation (depreciation) | | | 24,255 | |
Net realized and unrealized gain | | | 2,965,031 | |
Net increase in net assets resulting from operations | | $ | 3,004,709 | |
* | The shares outstanding, net asset value per share and the maximum offering price per share have been restated to reflect a 1:6 reverse share split effective October 28, 2016 — See Note 12. |
** | Relates to Trustees not deemed “interested persons” within the meaning of Section 2(a)(19) of the 1940 Act. |
SEE NOTES TO FINANCIAL STATEMENTS. | THE RYDEX FUNDS SEMI-ANNUAL REPORT | 55 |
EUROPE 1.25x STRATEGY FUND | |
STATEMENTS OF CHANGES IN NET ASSETS |
| | | Period Ended
September 30,
2016
(Unaudited) | | | Year Ended
March 31,
2016 | |
Increase (Decrease) in Net Assets from Operations: | | | | | | |
Net investment income | | $ | 39,678 | | | $ | 9,339 | |
Net realized gain (loss) on investments | | | 2,940,776 | | | | (3,897,084 | ) |
Net change in unrealized appreciation (depreciation) on investments | | | 24,255 | | | | (156,632 | ) |
Net increase (decrease) in net assets resulting from operations | | | 3,004,709 | | | | (4,044,377 | ) |
| | | | | | | | | |
Distributions to shareholders from: | | | | | | | | |
Net investment income | | | | | | | | |
A-Class | | | — | | | | (11,155 | ) |
C-Class | | | — | | | | (4,305 | ) |
H-Class | | | — | | | | (47,957 | ) |
Total distributions to shareholders | | | — | | | | (63,417 | ) |
| | | | | | | | | |
Capital share transactions: | | | | | | | | |
Proceeds from sale of shares | | | | | | | | |
A-Class | | | 1,147,039 | | | | 15,260,055 | |
C-Class | | | 562,457 | | | | 10,931,446 | |
H-Class | | | 84,935,000 | | | | 215,847,170 | |
Distributions reinvested | | | | | | | | |
A-Class | | | — | | | | 10,089 | |
C-Class | | | — | | | | 3,535 | |
H-Class | | | — | | | | 47,645 | |
Cost of shares redeemed | | | | | | | | |
A-Class | | | (1,463,127 | ) | | | (15,266,742 | ) |
C-Class | | | (709,385 | ) | | | (11,364,439 | ) |
H-Class | | | (89,579,253 | ) | | | (217,436,663 | ) |
Net decrease from capital share transactions | | | (5,107,269 | ) | | | (1,967,904 | ) |
Net decrease in net assets | | | (2,102,560 | ) | | | (6,075,698 | ) |
| | | | | | | | | |
Net assets: | | | | | | | | |
Beginning of period | | | 5,832,210 | | | | 11,907,908 | |
End of period | | $ | 3,729,650 | | | $ | 5,832,210 | |
Undistributed net investment income at end of period | | $ | 75,038 | | | $ | 35,360 | |
| | | | | | | | | |
Capital share activity:* | | | | | | | | |
Shares sold | | | | | | | | |
A-Class | | | 13,980 | | | | 165,579 | |
C-Class | | | 8,095 | | | | 135,145 | |
H-Class | | | 1,120,523 | | | | 2,381,873 | |
Shares issued from reinvestment of distributions | | | | | | | | |
A-Class | | | — | | | | 115 | |
C-Class | | | — | | | | 46 | |
H-Class | | | — | | | | 547 | |
Shares redeemed | | | | | | | | |
A-Class | | | (18,565 | ) | | | (167,183 | ) |
C-Class | | | (10,207 | ) | | | (141,158 | ) |
H-Class | | | (1,142,230 | ) | | | (2,428,913 | ) |
Net decrease in shares | | | (28,404 | ) | | | (53,949 | ) |
* | Capital share activity for the periods presented through September 30, 2016 has been restated to reflect a 1:6 reverse share split effective October 28, 2016 — See Note 12. |
56 | THE RYDEX FUNDS SEMI-ANNUAL REPORT | SEE NOTES TO FINANCIAL STATEMENTS. |
EUROPE 1.25x STRATEGY FUND | |
This table is presented to show selected data for a share outstanding throughout each period and to assist shareholders in evaluating a Fund’s performance for the periods presented.
A-Class | | Period Ended
September 30,
2016a,f | | | Year Ended
March 31,
2016f | | | Year Ended
March 31,
2015f | | | Year Ended
March 31,
2014f | | | Year Ended
March 28,
2013f | | | Year Ended
March 31,
2012f | |
Per Share Data | | | | | | | | | | | | | | | | | | |
Net asset value, beginning of period | | $ | 78.10 | | | $ | 93.32 | | | $ | 104.40 | | | $ | 84.97 | | | $ | 75.39 | | | $ | 84.36 | |
Income (loss) from investment operations: | |
Net investment income (loss)b | | | .84 | | | | (.06 | ) | | | .30 | | | | .96 | | | | (.18 | ) | | | .60 | |
Net gain (loss) on investments (realized and unrealized) | | | 1.00 | | | | (14.44 | ) | | | (11.08 | ) | | | 18.47 | | | | 9.94 | | | | (9.57 | ) |
Total from investment operations | | | 1.84 | | | | (14.50 | ) | | | (10.78 | ) | | | 19.43 | | | | 9.76 | | | | (8.97 | ) |
Less distributions from: | |
Net investment income | | | — | | | | (.72 | ) | | | (.30 | ) | | | — | | | | (.18 | ) | | | — | |
Total distributions | | | — | | | | (.72 | ) | | | (.30 | ) | | | — | | | | (.18 | ) | | | — | |
Net asset value, end of period | | $ | 79.94 | | | $ | 78.10 | | | $ | 93.32 | | | $ | 104.40 | | | $ | 84.97 | | | $ | 75.39 | |
| | |
Total Returnc | | | 2.30 | % | | | (15.58 | %) | | | (10.33 | %) | | | 22.88 | % | | | 12.92 | % | | | (10.60 | %) |
Ratios/Supplemental Data | |
Net assets, end of period (in thousands) | | $ | 513 | | | $ | 859 | | | $ | 1,165 | | | $ | 2,551 | | | $ | 3,916 | | | $ | 694 | |
Ratios to average net assets: | |
Net investment income (loss) | | | 2.08 | % | | | (0.08 | %) | | | 0.33 | % | | | 1.00 | % | | | (0.23 | %) | | | 0.77 | % |
Total expensesd | | | 1.67 | % | | | 1.67 | % | | | 1.72 | % | | | 1.72 | % | | | 1.67 | % | | | 1.67 | % |
Portfolio turnover rate | | | 897 | % | | | 920 | % | | | 608 | % | | | 654 | % | | | 903 | % | | | 318 | % |
C-Class | | Period Ended
September 30,
2016a,f | | | Year Ended
March 31,
2016f | | | Year Ended
March 31,
2015f | | | Year Ended
March 31,
2014f | | | Year Ended
March 28,
2013f | | | Year Ended
March 31,
2012f | |
Per Share Data | | | | | | | | | | | | | | | | | | |
Net asset value, beginning of period | | $ | 68.62 | | | $ | 82.63 | | | $ | 93.15 | | | $ | 77.34 | | | $ | 69.15 | | | $ | 77.84 | |
Income (loss) from investment operations: | |
Net investment income (loss)b | | | .48 | | | | (.54 | ) | | | (.48 | ) | | | (.42 | ) | | | (.60 | ) | | | — | e |
Net gain (loss) on investments (realized and unrealized) | | | .93 | | | | (12.75 | ) | | | (9.74 | ) | | | 16.23 | | | | 8.97 | | | | (8.69 | ) |
Total from investment operations | | | 1.41 | | | | (13.29 | ) | | | (10.22 | ) | | | 15.81 | | | | 8.37 | | | | (8.69 | ) |
Less distributions from: | |
Net investment income | | | — | | | | (.72 | ) | | | (.30 | ) | | | — | | | | (.18 | ) | | | — | |
Total distributions | | | — | | | | (.72 | ) | | | (.30 | ) | | | — | | | | (.18 | ) | | | — | |
Net asset value, end of period | | $ | 70.03 | | | $ | 68.62 | | | $ | 82.63 | | | $ | 93.15 | | | $ | 77.34 | | | $ | 69.15 | |
| | |
Total Returnc | | | 2.01 | % | | | (16.14 | %) | | | (10.94 | %) | | | 20.40 | % | | | 12.09 | % | | | (11.10 | %) |
Ratios/Supplemental Data | |
Net assets, end of period (in thousands) | | $ | 302 | | | $ | 440 | | | $ | 1,023 | | | $ | 535 | | | $ | 402 | | | $ | 439 | |
Ratios to average net assets: | |
Net investment income (loss) | | | 1.32 | % | | | (0.64 | %) | | | (0.50 | %) | | | (0.48 | %) | | | (0.83 | %) | | | 0.03 | % |
Total expensesd | | | 2.42 | % | | | 2.42 | % | | | 2.48 | % | | | 2.47 | % | | | 2.42 | % | | | 2.43 | % |
Portfolio turnover rate | | | 897 | % | | | 920 | % | | | 608 | % | | | 654 | % | | | 903 | % | | | 318 | % |
SEE NOTES TO FINANCIAL STATEMENTS. | THE RYDEX FUNDS SEMI-ANNUAL REPORT | 57 |
EUROPE 1.25x STRATEGY FUND | |
FINANCIAL HIGHLIGHTS (concluded) |
This table is presented to show selected data for a share outstanding throughout each period and to assist shareholders in evaluating a Fund’s performance for the periods presented.
H-Class | | Period Ended
September 30,
2016a,f | | | Year Ended
March 31,
2016f | | | Year Ended
March 31,
2015f | | | Year Ended
March 31,
2014f | | | Year Ended
March 28,
2013f | | | Year Ended
March 31,
2012f | |
Per Share Data | | | | | | | | | | | | | | | | | | |
Net asset value, beginning of period | | $ | 77.38 | | | $ | 92.50 | | | $ | 103.56 | | | $ | 85.18 | | | $ | 75.52 | | | $ | 84.37 | |
Income (loss) from investment operations: | |
Net investment income (loss)b | | | .54 | | | | .18 | | | | .60 | | | | .18 | | | | (.12 | ) | | | .96 | |
Net gain (loss) on investments (realized and unrealized) | | | 1.15 | | | | (14.58 | ) | | | (11.36 | ) | | | 18.20 | | | | 9.96 | | | | (9.81 | ) |
Total from investment operations | | | 1.69 | | | | (14.40 | ) | | | (10.76 | ) | | | 18.38 | | | | 9.84 | | | | (8.85 | ) |
Less distributions from: | |
Net investment income | | | — | | | | (.72 | ) | | | (.30 | ) | | | — | | | | (.18 | ) | | | — | |
Total distributions | | | — | | | | (.72 | ) | | | (.30 | ) | | | — | | | | (.18 | ) | | | — | |
Net asset value, end of period | | $ | 79.07 | | | $ | 77.38 | | | $ | 92.50 | | | $ | 103.56 | | | $ | 85.18 | | | $ | 75.52 | |
| | |
Total Returnc | | | 2.17 | % | | | (15.64 | %) | | | (10.36 | %) | | | 21.55 | % | | | 13.06 | % | | | (10.46 | %) |
Ratios/Supplemental Data | |
Net assets, end of period (in thousands) | | $ | 2,915 | | | $ | 4,533 | | | $ | 9,719 | | | $ | 11,553 | | | $ | 10,752 | | | $ | 7,759 | |
Ratios to average net assets: | |
Net investment income (loss) | | | 1.36 | % | | | 0.19 | % | | | 0.62 | % | | | 0.19 | % | | | (0.18 | %) | | | 1.22 | % |
Total expensesd | | | 1.67 | % | | | 1.66 | % | | | 1.72 | % | | | 1.71 | % | | | 1.67 | % | | | 1.68 | % |
Portfolio turnover rate | | | 897 | % | | | 920 | % | | | 608 | % | | | 654 | % | | | 903 | % | | | 318 | % |
a | Unaudited figures for the period ended September 30, 2016. Percentage amounts for the period, except total return and portfolio turnover rate, have been annualized. |
b | Net investment income (loss) per share was computed using average shares outstanding throughout the period. |
c | Total return does not reflect the impact of any applicable sales charges. |
d | Does not include expenses of the underlying funds in which the Fund invests. |
e | Net investment income is less than $0.01 per share. |
f | Reverse share split — Per share amounts for the periods presented through September 30, 2016 have been restated to reflect a 1:6 reverse share split effective October 28, 2016 — See Note 12. |
58 | THE RYDEX FUNDS SEMI-ANNUAL REPORT | SEE NOTES TO FINANCIAL STATEMENTS. |
FUND PROFILE (Unaudited) | September 30, 2016 |
JAPAN 2x STRATEGY FUND
OBJECTIVE: Seeks to provide investment results that correlate, before fees and expenses, to the performance of a specific benchmark. The Fund’s current benchmark is 200% of the fair value of the Nikkei 225 Stock Average (the “underlying index”).
Holdings Diversification (Market Exposure as % of Net Assets)
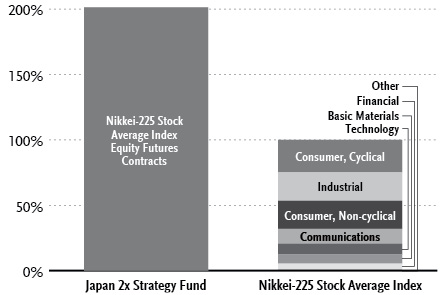
“Holdings Diversification (Market Exposure as % of Net Assets)” excludes any temporary cash investments or investments in Guggenheim Strategy Funds Trust mutual funds. Investments in those Funds do not provide “market exposure” to meet the Fund’s investment objective, but will significantly increase the portfolio’s exposure to certain other asset categories (and their associated risks), which may cause the Fund to deviate from its principal investment strategy, including: (i) high yield, high risk debt securities rated below the top four long-term rating categories by a nationally recognized statistical rating organization (also known as “junk bonds”); (ii) securities issued by the U.S. government or its agencies and instrumentalities; (iii) CLOs and similar investments; and (iv) other short-term fixed income securities.
Inception Dates: |
A-Class | February 22, 2008 |
C-Class | February 22, 2008 |
H-Class | February 22, 2008 |
The Fund invests principally in derivative investments such as swap agreements and futures contracts.
Largest Holdings (% of Total Net Assets) |
Guggenheim Strategy Fund II | 18.3% |
Guggenheim Strategy Fund I | 18.2% |
Total | 36.5% |
| | |
“Largest Holdings” excludes any temporary cash or derivative investments. |
| | THE RYDEX FUNDS SEMI-ANNUAL REPORT | 59 |
SCHEDULE OF INVESTMENTS (Unaudited) | September 30, 2016 |
JAPAN 2x STRATEGY FUND | |
| | | Shares | | | Value | |
| | | | | | | |
MUTUAL FUNDS†,1 - 36.5% | |
Guggenheim Strategy Fund II | | | 15,974 | | | $ | 398,394 | |
Guggenheim Strategy Fund I | | | 15,929 | | | | 398,066 | |
Total Mutual Funds | | | | | | | | |
(Cost $794,421) | | | | | | | 796,460 | |
| | | | | | | | | |
| | | Face
Amount | | | | | |
| | | | | | | | | |
U.S. TREASURY BILLS†† - 9.2% | |
U.S.Treasury Bill | | | | | | | | |
due 10/13/162,4 | | $ | 200,000 | | | | 199,991 | |
Total U.S. Treasury Bills | | | | | | | | |
(Cost $199,995) | | | | | | | 199,991 | |
| | | | | | | | | |
REPURCHASE AGREEMENTS††,3 - 52.5% | |
HSBC Securities, Inc.
issued 09/30/16 at 0.38%
due 10/03/16 | | | 639,549 | | | | 639,549 | |
Royal Bank of Canada
issued 09/30/16 at 0.36%
due 10/03/16 | | | 507,804 | | | | 507,804 | |
Total Repurchase Agreements | | | | | | | | |
(Cost $1,147,353) | | | | | | | 1,147,353 | |
| | | | | | | | | |
Total Investments - 98.2% | | | | | | | | |
(Cost $2,141,769) | | | | | | $ | 2,143,804 | |
Other Assets & Liabilities, net - 1.8% | | | | | | | 39,175 | |
Total Net Assets - 100.0% | | | | | | $ | 2,182,979 | |
| | | | | | | | | |
| | | Contracts | | | Unrealized
Gain | |
| | | | | | | | | |
EQUITY FUTURES CONTRACTS PURCHASED† | |
December 2016 Nikkei 225 (CME) Index
Futures Contracts
(Aggregate Value of
Contracts $4,396,350) | | | 53 | | | $ | 71,071 | |
| | | | | | | | | |
CURRENCY FUTURES CONTRACTS PURCHASED† | |
December 2016 Japanese Yen
Futures Contracts
(Aggregate Value of
Contracts $4,327,750) | | | 35 | | | $ | 49,982 | |
† | Value determined based on Level 1 inputs — See Note 4. |
†† | Value determined based on Level 2 inputs — See Note 4. |
1 | Affiliated issuer — See Note 9. |
2 | Zero coupon rate security. |
3 | Repurchase Agreements — See Note 5. |
4 | All or a portion of this security is pledged as futures collateral at September 30, 2016. |
| | |
| | See Sector Classification in Other Information section. |
The following table summarizes the inputs used to value the Fund’s investments at September 30, 2016 (See Note 4 in the Notes to Financial Statements):
Investments in Securities (Assets) | | Level 1 | | | Level 1 -
Other* | | | Level 2 | | | Level 3 | | | Total | |
Currency Futures Contracts | | $ | — | | | $ | 49,982 | | | $ | — | | | $ | — | | | $ | 49,982 | |
Equity Futures Contracts | | | — | | | | 71,071 | | | | — | | | | — | | | | 71,071 | |
Mutual Funds | | | 796,460 | | | | — | | | | — | | | | — | | | | 796,460 | |
Repurchase Agreements | | | — | | | | — | | | | 1,147,353 | | | | — | | | | 1,147,353 | |
U.S. Treasury Bills | | | — | | | | — | | | | 199,991 | | | | — | | | | 199,991 | |
Total | | $ | 796,460 | | | $ | 121,053 | | | $ | 1,347,344 | | | $ | — | | | $ | 2,264,857 | |
* | Other financial instruments include futures contracts, which are reported as unrealized gain/loss at period end. |
Transfers between investment levels may occur as the markets fluctuate and/or the availability of data used in an investment’s valuation changes. Transfers between valuation levels, if any, are in comparison to the valuation levels at the end of the previous fiscal year, and are effective using the fair value as of the end of the previous fiscal period.
For the period ended September 30, 2016, there were no transfers between levels.
60 | THE RYDEX FUNDS SEMI-ANNUAL REPORT | SEE NOTES TO FINANCIAL STATEMENTS. |
STATEMENT OF ASSETS AND LIABILITIES (Unaudited) | |
September 30, 2016 | |
Assets: | |
Investments in unaffiliated issuers, at value (cost $199,995) | | $ | 199,991 | |
Investments in affiliated issuers, at value (cost $794,421) | | | 796,460 | |
Repurchase agreements, at value (cost $1,147,353) | | | 1,147,353 | |
Total investments (cost $2,141,769) | | | 2,143,804 | |
Segregated cash with broker | | | 55,936 | |
Receivables: | |
Swap settlement | | | 995 | |
Fund shares sold | | | 1,148 | |
Dividends | | | 2,227 | |
Interest | | | 12 | |
Total assets | | | 2,204,122 | |
| | | | | |
Liabilities: | |
Payable for: | |
Variation margin | | | 6,706 | |
Fund shares redeemed | | | 4,884 | |
Management fees | | | 3,427 | |
Legal fees | | | 2,603 | |
Distribution and service fees | | | 1,184 | |
Transfer agent and administrative fees | | | 1,142 | |
Portfolio accounting fees | | | 457 | |
Miscellaneous | | | 740 | |
Total liabilities | | | 21,143 | |
Commitments and contingent liabilities (Note 11) | | | — | |
Net assets | | $ | 2,182,979 | |
| | | | | |
Net assets consist of: | |
Paid in capital | | $ | 3,886,737 | |
Accumulated net investment loss | | | (29,647 | ) |
Accumulated net realized loss on investments | | | (1,797,199 | ) |
Net unrealized appreciation on investments | | | 123,088 | |
Net assets | | $ | 2,182,979 | |
| | | | | |
A-Class: | |
Net assets | | $ | 366,003 | |
Capital shares outstanding* | | | 3,865 | |
Net asset value per share* | | $ | 94.70 | |
Maximum offering price per share (Net asset value divided by 95.25%)* | | $ | 99.42 | |
| | | | | |
C-Class: | |
Net assets | | $ | 57,446 | |
Capital shares outstanding* | | | 643 | |
Net asset value per share* | | $ | 89.34 | |
| | | | | |
H-Class: | |
Net assets | | $ | 1,759,530 | |
Capital shares outstanding* | | | 18,504 | |
Net asset value per share* | | $ | 95.09 | |
STATEMENT OF OPERATIONS (Unaudited) | |
Period Ended September 30, 2016 | |
Investment Income: | |
Dividends from securities of affiliated issuers | | $ | 6,029 | |
Interest | | | 4,226 | |
Total investment income | | | 10,255 | |
| | | | | |
Expenses: | |
Management fees | | | 16,260 | |
Transfer agent and administrative fees | | | 5,420 | |
Distribution and service fees: | |
A-Class | | | 469 | |
C-Class | | | 308 | |
H-Class | | | 4,874 | |
Portfolio accounting fees | | | 2,168 | |
Custodian fees | | | 256 | |
Trustees’ fees** | | | 199 | |
Miscellaneous | | | 3,097 | |
Total expenses | | | 33,051 | |
Net investment loss | | | (22,796 | ) |
| | | | | |
Net Realized and Unrealized Gain (Loss): | |
Net realized gain (loss) on: | |
Investments in affiliated issuers | | | 2,122 | |
Swap agreements | | | 2,129 | |
Futures contracts | | | 2,470,843 | |
Net realized gain | | | 2,475,094 | |
Net change in unrealized appreciation (depreciation) on: | |
Investments in unaffiliated issuers | | | (4 | ) |
Investments in affiliated issuers | | | 1,920 | |
Futures contracts | | | 28,313 | |
Net change in unrealized appreciation (depreciation) | | | 30,229 | |
Net realized and unrealized gain | | | 2,505,323 | |
Net increase in net assets resulting from operations | | $ | 2,482,527 | |
* | The shares outstanding, net asset value per share and the maximum offering price per share have been restated to reflect a 1:4 reverse share split effective November 4, 2016. — See Note 12. |
** | Relates to Trustees not deemed “interested persons” within the meaning of Section 2(a)(19) of the 1940 Act. |
SEE NOTES TO FINANCIAL STATEMENTS. | THE RYDEX FUNDS SEMI-ANNUAL REPORT | 61 |
STATEMENTS OF CHANGES IN NET ASSETS |
| | | Period Ended
September 30,
2016
(Unaudited) | | | Year Ended
March 31,
2016 | |
Increase (Decrease) in Net Assets from Operations: | | | | | | |
Net investment loss | | $ | (22,796 | ) | | $ | (99,978 | ) |
Net realized gain (loss) on investments | | | 2,475,094 | | | | (2,415,155 | ) |
Net change in unrealized appreciation (depreciation) on investments | | | 30,229 | | | | 76,456 | |
Net increase (decrease) in net assets resulting from operations | | | 2,482,527 | | | | (2,438,677 | ) |
| | | | | | | | | |
Capital share transactions: | | | | | | | | |
Proceeds from sale of shares | | | | | | | | |
A-Class | | | 175,113 | | | | 20,504,500 | |
C-Class | | | 166,033 | | | | 6,950,127 | |
H-Class | | | 173,728,937 | | | | 183,725,129 | |
Cost of shares redeemed | | | | | | | | |
A-Class | | | (229,879 | ) | | | (20,500,320 | ) |
C-Class | | | (171,326 | ) | | | (7,166,305 | ) |
H-Class | | | (176,788,618 | ) | | | (195,879,916 | ) |
Net decrease from capital share transactions | | | (3,119,740 | ) | | | (12,366,785 | ) |
Net decrease in net assets | | | (637,213 | ) | | | (14,805,462 | ) |
| | | | | | | | | |
Net assets: | | | | | | | | |
Beginning of period | | | 2,820,192 | | | | 17,625,654 | |
End of period | | $ | 2,182,979 | | | $ | 2,820,192 | |
Accumulated net investment loss at end of period | | $ | (29,647 | ) | | $ | (6,851 | ) |
| | | | | | | | | |
Capital share activity:* | | | | | | | | |
Shares sold | | | | | | | | |
A-Class | | | 2,114 | | | | 219,385 | |
C-Class | | | 2,295 | | | | 78,426 | |
H-Class | | | 1,991,063 | | | | 1,996,802 | |
Shares redeemed | | | | | | | | |
A-Class | | | (2,705 | ) | | | (219,725 | ) |
C-Class | | | (2,404 | ) | | | (81,242 | ) |
H-Class | | | (2,003,044 | ) | | | (2,146,624 | ) |
Net decrease in shares | | | (12,681 | ) | | | (152,978 | ) |
* | Capital share activity for the periods presented through September 30, 2016 has been restated to reflect a 1:4 reverse share split effective November 4, 2016. — See Note 12. |
62 | THE RYDEX FUNDS SEMI-ANNUAL REPORT | SEE NOTES TO FINANCIAL STATEMENTS. |
This table is presented to show selected data for a share outstanding throughout each period and to assist shareholders in evaluating a Fund’s performance for the periods presented.
A-Class | | Period Ended
September 30,
2016a,e | | | Year Ended
March 31,
2016e | | | Year Ended
March 31,
2015e | | | Year Ended
March 31,
2014e | | | Year Ended
March 28,
2013e | | | Year Ended
March 31,
2012e | |
Per Share Data | | | | | | | | | | | | | | | | | | |
Net asset value, beginning of period | | $ | 78.81 | | | $ | 93.15 | | | $ | 77.23 | | | $ | 69.56 | | | $ | 61.79 | | | $ | 59.80 | |
Income (loss) from investment operations: | |
Net investment income (loss)b | | | (.40 | ) | | | (1.12 | ) | | | (1.00 | ) | | | (1.24 | ) | | | (.80 | ) | | | (.88 | ) |
Net gain (loss) on investments (realized and unrealized) | | | 16.29 | | | | (13.22 | ) | | | 16.92 | | | | 8.91 | | | | 8.57 | | | | 2.87 | |
Total from investment operations | | | 15.89 | | | | (14.34 | ) | | | 15.92 | | | | 7.67 | | | | 7.77 | | | | 1.99 | |
Net asset value, end of period | | $ | 94.70 | | | $ | 78.81 | | | $ | 93.15 | | | $ | 77.23 | | | $ | 69.56 | | | $ | 61.79 | |
| | |
Total Returnc | | | 20.15 | % | | | (15.41 | %) | | | 20.61 | % | | | 11.04 | % | | | 12.56 | % | | | 3.34 | % |
Ratios/Supplemental Data | |
Net assets, end of period (in thousands) | | $ | 366 | | | $ | 351 | | | $ | 447 | | | $ | 624 | | | $ | 2,025 | | | $ | 1,428 | |
Ratios to average net assets: | |
Net investment income (loss) | | | (0.91 | %) | | | (1.22 | %) | | | (1.27 | %) | | | (1.50 | %) | | | (1.40 | %) | | | (1.49 | %) |
Total expensesd | | | 1.51 | % | | | 1.51 | % | | | 1.54 | % | | | 1.52 | % | | | 1.51 | % | | | 1.51 | % |
Portfolio turnover rate | | | 678 | % | | | 543 | % | | | 405 | % | | | — | | | | — | | | | — | |
C-Class | | Period Ended
September 30,
2016a,e | | | Year Ended
March 31,
2016e | | | Year Ended
March 31,
2015e | | | Year Ended
March 31,
2014e | | | Year Ended
March 28,
2013e | | | Year Ended
March 31,
2012e | |
Per Share Data | | | | | | | | | | | | | | | | | | |
Net asset value, beginning of period | | $ | 74.63 | | | $ | 88.92 | | | $ | 73.98 | | | $ | 67.04 | | | $ | 59.95 | | | $ | 58.40 | |
Income (loss) from investment operations: | |
Net investment income (loss)b | | | (.68 | ) | | | (1.68 | ) | | | (1.56 | ) | | | (1.72 | ) | | | (1.16 | ) | | | (1.24 | ) |
Net gain (loss) on investments (realized and unrealized) | | | 15.39 | | | | (12.61 | ) | | | 16.50 | | | | 8.66 | | | | 8.25 | | | | 2.79 | |
Total from investment operations | | | 14.71 | | | | (14.29 | ) | | | 14.94 | | | | 6.94 | | | | 7.09 | | | | 1.55 | |
Net asset value, end of period | | $ | 89.34 | | | $ | 74.63 | | | $ | 88.92 | | | $ | 73.98 | | | $ | 67.04 | | | $ | 59.95 | |
| | |
Total Returnc | | | 19.72 | % | | | (16.06 | %) | | | 20.23 | % | | | 10.32 | % | | | 11.81 | % | | | 2.67 | % |
Ratios/Supplemental Data | |
Net assets, end of period (in thousands) | | $ | 57 | | | $ | 56 | | | $ | 317 | | | $ | 104 | | | $ | 246 | | | $ | 140 | |
Ratios to average net assets: | |
Net investment income (loss) | | | (1.64 | %) | | | (1.91 | %) | | | (2.04 | %) | | | (2.25 | %) | | | (2.15 | %) | | | (2.23 | %) |
Total expensesd | | | 2.26 | % | | | 2.24 | % | | | 2.30 | % | | | 2.27 | % | | | 2.25 | % | | | 2.26 | % |
Portfolio turnover rate | | | 678 | % | | | 543 | % | | | 405 | % | | | — | | | | — | | | | — | |
SEE NOTES TO FINANCIAL STATEMENTS. | THE RYDEX FUNDS SEMI-ANNUAL REPORT | 63 |
FINANCIAL HIGHLIGHTS (concluded) |
This table is presented to show selected data for a share outstanding throughout each period and to assist shareholders in evaluating a Fund’s performance for the periods presented.
H-Class | | Period Ended
September 30,
2016a,e | | | Year Ended
March 31,
2016e | | | Year Ended
March 31,
2015e | | | Year Ended
March 31,
2014e | | | Year Ended
March 28,
2013e | | | Year Ended
March 31,
2012e | |
Per Share Data | | | | | | | | | | | | | | | | | | |
Net asset value, beginning of period | | $ | 79.15 | | | $ | 93.52 | | | $ | 77.52 | | | $ | 69.77 | | | $ | 61.96 | | | $ | 59.91 | |
Income (loss) from investment operations: | |
Net investment income (loss)b | | | (.44 | ) | | | (1.08 | ) | | | (1.04 | ) | | | (1.20 | ) | | | (.80 | ) | | | (.88 | ) |
Net gain (loss) on investments (realized and unrealized) | | | 16.38 | | | | (13.29 | ) | | | 17.04 | | | | 8.95 | | | | 8.61 | | | | 2.93 | |
Total from investment operations | | | 15.94 | | | | (14.37 | ) | | | 16.00 | | | | 7.75 | | | | 7.81 | | | | 2.05 | |
Net asset value, end of period | | $ | 95.09 | | | $ | 79.15 | | | $ | 93.52 | | | $ | 77.52 | | | $ | 69.77 | | | $ | 61.96 | |
| | |
Total Returnc | | | 20.11 | % | | | (15.36 | %) | | | 20.64 | % | | | 11.12 | % | | | 12.59 | % | | | 3.40 | % |
Ratios/Supplemental Data | |
Net assets, end of period (in thousands) | | $ | 1,760 | | | $ | 2,413 | | | $ | 16,862 | | | $ | 3,104 | | | $ | 9,020 | | | $ | 4,574 | |
Ratios to average net assets: | |
Net investment income (loss) | | | (1.06 | %) | | | (1.17 | %) | | | (1.28 | %) | | | (1.50 | %) | | | (1.40 | %) | | | (1.48 | %) |
Total expensesd | | | 1.51 | % | | | 1.49 | % | | | 1.54 | % | | | 1.52 | % | | | 1.50 | % | | | 1.51 | % |
Portfolio turnover rate | | | 678 | % | | | 543 | % | | | 405 | % | | | — | | | | — | | | | — | |
a | Unaudited figures for the period ended September 30, 2016. Percentage amounts for the period, except total return and portfolio turnover rate, have been annualized. |
b | Net investment income (loss) per share was computed using average shares outstanding throughout the period. |
c | Total return does not reflect the impact of any applicable sales charges. |
d | Does not include expenses of the underlying funds in which the Fund invests. |
e | Reverse share split — Per share amounts for the periods presented through September 30, 2016 have been restated to reflect a 1:4 reverse share split effective November 4, 2016. — See Note 12. |
64 | THE RYDEX FUNDS SEMI-ANNUAL REPORT | SEE NOTES TO FINANCIAL STATEMENTS. |
FUND PROFILE (Unaudited) | September 30, 2016 |
STRENGTHENING DOLLAR 2x STRATEGY FUND
OBJECTIVE: Seeks to provide investment results that match the performance of a specific benchmark, before fees and expenses, on a daily basis. The Fund’s current benchmark is 200% of the performance of the U.S. Dollar Index® (the “underlying index”). The Fund does not seek to achieve its investment objective over a period of time greater than one day.
Holdings Diversification (Market Exposure as % of Net Assets)
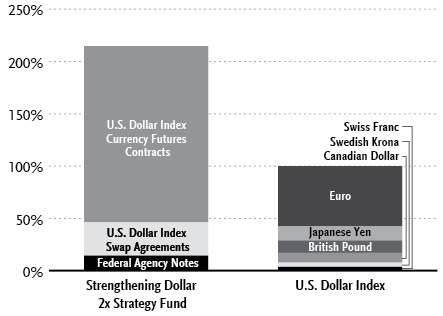
“Holdings Diversification (Market Exposure as % of Net Assets)” excludes any temporary cash investments or investments in Guggenheim Strategy Funds Trust mutual funds. Investments in those Funds do not provide “market exposure” to meet the Fund’s investment objective, but will significantly increase the portfolio’s exposure to certain other asset categories (and their associated risks), which may cause the Fund to deviate from its principal investment strategy, including: (i) high yield, high risk debt securities rated below the top four long-term rating categories by a nationally recognized statistical rating organization (also known as “junk bonds”); (ii) securities issued by the U.S. government or its agencies and instrumentalities; (iii) CLOs and similar investments; and (iv) other short-term fixed income securities.
Inception Dates: |
A-Class | May 25, 2005 |
C-Class | May 25, 2005 |
H-Class | May 25, 2005 |
The Fund invests principally in derivative investments such as swap agreements and futures contracts.
Largest Holdings (% of Total Net Assets) |
Federal Farm Credit Bank | 14.3% |
Guggenheim Strategy Fund II | 6.5% |
Guggenheim Strategy Fund I | 6.4% |
Total | 27.2% |
| | |
“Largest Holdings” excludes any temporary cash or derivative investments. |
| | THE RYDEX FUNDS SEMI-ANNUAL REPORT | 65 |
SCHEDULE OF INVESTMENTS (Unaudited) | September 30, 2016 |
STRENGTHENING DOLLAR 2x STRATEGY FUND | |
| | | Shares | | | Value | |
| | | | | | | |
MUTUAL FUNDS†,1 - 12.9% | |
Guggenheim Strategy Fund II | | | 54,062 | | | $ | 1,348,310 | |
Guggenheim Strategy Fund I | | | 53,910 | | | | 1,347,213 | |
Total Mutual Funds | | | | | | | | |
(Cost $2,680,049) | | | | | | | 2,695,523 | |
| | | | | | | | | |
| | | Face
Amount | | | | | |
| | | | | | | | | |
FEDERAL AGENCY NOTES†† - 14.3% | |
Federal Farm Credit Bank6 | | | | | | | | |
0.67% due 09/12/182 | | $ | 3,000,000 | | | | 2,997,672 | |
Total Federal Agency Notes | | | | | | | | |
(Cost $2,999,412) | | | | | | | 2,997,672 | |
| | | | | | | | | |
U.S. Treasury Bills†† - 2.9% | |
U.S. Treasury Bill | | | | | | | | |
due 10/13/163,8 | | | 600,000 | | | | 599,972 | |
Total U.S. Treasury Bills | | | | | | | | |
(Cost $599,985) | | | | | | | 599,972 | |
| | | | | | | | | |
REPURCHASE AGREEMENTS††,4 - 71.5% | |
HSBC Securities, Inc.
issued 09/30/16 at 0.38%
due 10/03/16 | | | 8,162,890 | | | | 8,162,890 | |
Royal Bank of Canada
issued 09/30/16 at 0.36%
due 10/03/165 | | | 6,819,330 | | | | 6,819,330 | |
Total Repurchase Agreements | | | | | | | | |
(Cost $14,982,220) | | | | | | | 14,982,220 | |
| | | | | | | | | |
Total Investments - 101.6% | | | | | | | | |
(Cost $21,261,666) | | | | | | $ | 21,275,387 | |
Other Assets & Liabilities, net - (1.6)% | | | | | | | (329,768 | ) |
Total Net Assets - 100.0% | | | | | | $ | 20,945,619 | |
| | | Contracts | | | Unrealized
Gain | |
| | | | | | | |
CURRENCY FUTURES CONTRACTS PURCHASED† | |
December 2016 U.S. Dollar Index
Futures Contracts
(Aggregate Value of
Contracts $35,309,100) | | | 370 | | | $ | 67,675 | |
| | | | | | | | | |
| | | Units | | | | | |
| | | | | | | | | |
OTC CURRENCY INDEX SWAP AGREEMENTS†† | |
Goldman Sachs International
December 2016 U.S. Dollar
Index Swap 0.84%7,
Terminating 12/14/16
(Notional Value $6,660,364) | | | 69,834 | | | $ | 1,253 | |
† | Value determined based on Level 1 inputs — See Note 4. |
†† | Value determined based on Level 2 inputs — See Note 4. |
1 | Affiliated issuer — See Note 9. |
2 | Variable rate security. Rate indicated is rate effective at September 30, 2016. |
3 | Zero coupon rate security. |
4 | Repurchase Agreements — See Note 5. |
5 | All or a portion of this security is pledged as currency index swap collateral at September 30, 2016. |
6 | The issuer operates under a Congressional charter; its securities are neither issued nor guaranteed by the U.S. Government. |
7 | Total Return based on U.S. Dollar Index +/- financing at a variable rate. Rate indicated is the rate effective at September 30, 2016. |
8 | All or a portion of this security is pledged as futures collateral at September 30, 2016. |
| | |
| | See Sector Classification in Other Information section. |
66 | THE RYDEX FUNDS SEMI-ANNUAL REPORT | SEE NOTES TO FINANCIAL STATEMENTS. |
SCHEDULE OF INVESTMENTS (Unaudited)(concluded) | September 30, 2016 |
STRENGTHENING DOLLAR 2x STRATEGY FUND | |
The following table summarizes the inputs used to value the Fund’s investments at September 30, 2016 (See Note 4 in the Notes to Financial Statements):
Investments in Securities (Assets) | | Level 1 | | | Level 1 -
Other* | | | Level 2 | | | Level 2 -
Other* | | | Level 3 | | | Total | |
U.S. Treasury Bills | | $ | — | | | $ | — | | | $ | 599,972 | | | $ | — | | | $ | — | | | $ | 599,972 | |
Currency Futures Contracts | | | — | | | | 67,675 | | | | — | | | | — | | | | — | | | | 67,675 | |
Currency Index Swap Agreements | | | — | | | | — | | | | — | | | | 1,253 | | | | — | | | | 1,253 | |
Federal Agency Notes | | | — | | | | — | | | | 2,997,672 | | | | — | | | | — | | | | 2,997,672 | |
Mutual Funds | | | 2,695,523 | | | | — | | | | — | | | | — | | | | — | | | | 2,695,523 | |
Repurchase Agreements | | | — | | | | — | | | | 14,982,220 | | | | — | | | | — | | | | 14,982,220 | |
Total | | $ | 2,695,523 | | | $ | 67,675 | | | $ | 18,579,864 | | | $ | 1,253 | | | $ | — | | | $ | 21,344,315 | |
* | Other financial instruments include futures contracts and/or swaps, which are reported as unrealized gain/loss at period end. |
Transfers between investment levels may occur as the markets fluctuate and/or the availability of data used in an investment’s valuation changes. Transfers between valuation levels, if any, are in comparison to the valuation levels at the end of the previous fiscal year, and are effective using the fair value as of the end of the previous fiscal period.
For the period ended September 30, 2016, there were no transfers between levels.
SEE NOTES TO FINANCIAL STATEMENTS. | THE RYDEX FUNDS SEMI-ANNUAL REPORT | 67 |
STRENGTHENING DOLLAR 2x STRATEGY FUND | |
STATEMENT OF ASSETS AND LIABILITIES (Unaudited) | |
September 30, 2016 | |
Assets: | |
Investments in unaffiliated issuers, at value (cost $3,599,397) | | $ | 3,597,644 | |
Investments in affiliated issuers, at value (cost $2,680,049) | | | 2,695,523 | |
Repurchase agreements, at value (cost $14,982,220) | | | 14,982,220 | |
Total investments (cost $21,261,666) | | | 21,275,387 | |
Segregated cash with broker | | | 78,012 | |
Unrealized appreciation on swap agreements | | | 1,253 | |
Receivables: | |
Swap settlement | | | 1,899 | |
Fund shares sold | | | 75,302 | |
Dividends | | | 4,162 | |
Interest | | | 1,215 | |
Total assets | | | 21,437,230 | |
| | | | | |
Liabilities: | |
Payable for: | |
Fund shares redeemed | | | 399,066 | |
Licensing fees | | | 43,042 | |
Management fees | | | 16,921 | |
Variation margin | | | 15,755 | |
Distribution and service fees | | | 5,939 | |
Transfer agent and administrative fees | | | 4,700 | |
Portfolio accounting fees | | | 1,880 | |
Miscellaneous | | | 4,308 | |
Total liabilities | | | 491,611 | |
Commitments and contingent liabilities (Note 11) | | | — | |
Net assets | | $ | 20,945,619 | |
| | | | | |
Net assets consist of: | |
Paid in capital | | $ | 43,227,169 | |
Accumulated net investment loss | | | (189,547 | ) |
Accumulated net realized loss on investments | | | (22,174,652 | ) |
Net unrealized appreciation on investments | | | 82,649 | |
Net assets | | $ | 20,945,619 | |
| | | | | |
A-Class: | |
Net assets | | $ | 2,487,887 | |
Capital shares outstanding | | | 51,574 | |
Net asset value per share | | $ | 48.24 | |
Maximum offering price per share (Net asset value divided by 95.25%) | | $ | 50.65 | |
| | | | | |
C-Class: | |
Net assets | | $ | 1,957,778 | |
Capital shares outstanding | | | 44,544 | |
Net asset value per share | | $ | 43.95 | |
| | | | | |
H-Class: | |
Net assets | | $ | 16,499,954 | |
Capital shares outstanding | | | 343,388 | |
Net asset value per share | | $ | 48.05 | |
STATEMENT OF OPERATIONS (Unaudited) | |
Period Ended September 30, 2016 | |
Investment Income: | |
Dividends from securities of affiliated issuers | | $ | 40,615 | |
Interest | | | 23,446 | |
Total investment income | | | 64,061 | |
| | | | | |
Expenses: | |
Management fees | | | 93,539 | |
Transfer agent and administrative fees | | | 25,983 | |
Distribution and service fees: | |
A-Class | | | 2,587 | |
C-Class | | | 9,991 | |
H-Class | | | 20,898 | |
Portfolio accounting fees | | | 10,393 | |
Custodian fees | | | 1,239 | |
Trustees’ fees* | | | 601 | |
Miscellaneous | | | 20,481 | |
Total expenses | | | 185,712 | |
Net investment loss | | | (121,651 | ) |
| | | | | |
Net Realized and Unrealized Gain (Loss): | |
Net realized gain (loss) on: | |
Investments in affiliated issuers | | | 8,531 | |
Investments in unffiliated issuers | | | 935 | |
Swap agreements | | | (100,865 | ) |
Futures contracts | | | (890,993 | ) |
Net realized loss | | | (982,392 | ) |
Net change in unrealized appreciation (depreciation) on: | |
Investments in unaffiliated issuers | | | (2,008 | ) |
Investments in affiliated issuers | | | 33,786 | |
Swap agreements | | | 130,213 | |
Futures contracts | | | 648,483 | |
Net change in unrealized appreciation (depreciation) | | | 810,474 | |
Net realized and unrealized loss | | | (171,918 | ) |
Net decrease in net assets resulting from operations | | $ | (293,569 | ) |
* | Relates to Trustees not deemed “interested persons” within the meaning of Section 2(a)(19) of the 1940 Act. |
68 | THE RYDEX FUNDS SEMI-ANNUAL REPORT | SEE NOTES TO FINANCIAL STATEMENTS. |
STRENGTHENING DOLLAR 2x STRATEGY FUND | |
STATEMENTS OF CHANGES IN NET ASSETS |
| | | Period Ended
September 30,
2016
(Unaudited) | | | Year Ended
March 31,
2016 | |
Increase (Decrease) in Net Assets from Operations: | | | | | | |
Net investment loss | | $ | (121,651 | ) | | $ | (805,154 | ) |
Net realized loss on investments | | | (982,392 | ) | | | (22,380,164 | ) |
Net change in unrealized appreciation (depreciation) on investments | | | 810,474 | | | | 390,248 | |
Net decrease in net assets resulting from operations | | | (293,569 | ) | | | (22,795,070 | ) |
| | | | | | | | | |
Distributions to shareholders from: | | | | | | | | |
Net realized gains | | | | | | | | |
A-Class | | | — | | | | (113,496 | ) |
C-Class | | | — | | | | (105,875 | ) |
H-Class | | | — | | | | (6,764,514 | ) |
Total distributions to shareholders | | | — | | | | (6,983,885 | ) |
| | | | | | | | | |
Capital share transactions: | | | | | | | | |
Proceeds from sale of shares | | | | | | | | |
A-Class | | | 1,661,536 | | | | 36,241,604 | |
C-Class | | | 2,677,216 | | | | 11,646,199 | |
H-Class | | | 87,738,669 | | | | 582,298,261 | |
Distributions reinvested | | | | | | | | |
A-Class | | | — | | | | 112,352 | |
C-Class | | | — | | | | 97,269 | |
H-Class | | | — | | | | 6,753,618 | |
Cost of shares redeemed | | | | | | | | |
A-Class | | | (1,089,169 | ) | | | (48,102,984 | ) |
C-Class | | | (2,645,624 | ) | | | (13,148,692 | ) |
H-Class | | | (81,549,943 | ) | | | (709,370,706 | ) |
Net increase (decrease) from capital share transactions | | | 6,792,685 | | | | (133,473,079 | ) |
Net increase (decrease) in net assets | | | 6,499,116 | | | | (163,252,034 | ) |
| | | | | | | | | |
Net assets: | | | | | | | | |
Beginning of period | | | 14,446,503 | | | | 177,698,537 | |
End of period | | $ | 20,945,619 | | | $ | 14,446,503 | |
Accumulated net investment loss at end of period | | $ | (189,547 | ) | | $ | (67,896 | ) |
| | | | | | | | | |
Capital share activity: | | | | | | | | |
Shares sold | | | | | | | | |
A-Class | | | 34,110 | | | | 685,083 | |
C-Class | | | 60,899 | | | | 238,619 | |
H-Class | | | 1,825,202 | | | | 10,937,592 | |
Shares issued from reinvestment of distributions | | | | | | | | |
A-Class | | | — | | | | 2,098 | |
C-Class | | | — | | | | 1,981 | |
H-Class | | | — | | | | 126,662 | |
Shares redeemed | | | | | | | | |
A-Class | | | (22,380 | ) | | | (930,136 | ) |
C-Class | | | (60,812 | ) | | | (270,556 | ) |
H-Class | | | (1,705,190 | ) | | | (13,687,898 | ) |
Net increase (decrease) in shares | | | 131,829 | | | | (2,896,555 | ) |
SEE NOTES TO FINANCIAL STATEMENTS. | THE RYDEX FUNDS SEMI-ANNUAL REPORT | 69 |
STRENGTHENING DOLLAR 2x STRATEGY FUND | |
This table is presented to show selected data for a share outstanding throughout each period and to assist shareholders in evaluating a Fund’s performance for the periods presented.
A-Class | | Period Ended
September 30,
2016a | | | Year Ended
March 31,
2016 | | | Year Ended
March 31,
2015 | | | Year Ended
March 31,
2014e | | | Year Ended
March 28,
2013e | | | Year Ended
March 31,
2012e | |
Per Share Data | | | | | | | | | | | | | | | | | | |
Net asset value, beginning of period | | $ | 47.68 | | | $ | 55.75 | | | $ | 38.36 | | | $ | 42.75 | | | $ | 40.35 | | | $ | 40.39 | |
Income (loss) from investment operations: | |
Net investment income (loss)b | | | (.26 | ) | | | (.58 | ) | | | (.56 | ) | | | (.69 | ) | | | (.63 | ) | | | (.66 | ) |
Net gain (loss) on investments (realized and unrealized) | | | .82 | | | | (5.32 | ) | | | 17.95 | | | | (3.70 | ) | | | 3.03 | | | | .62 | |
Total from investment operations | | | .56 | | | | (5.90 | ) | | | 17.39 | | | | (4.39 | ) | | | 2.40 | | | | (.04 | ) |
Less distributions from: | |
Net realized gains | | | — | | | | (2.17 | ) | | | — | | | | — | | | | — | | | | — | |
Total distributions | | | — | | | | (2.17 | ) | | | — | | | | — | | | | — | | | | — | |
Net asset value, end of period | | $ | 48.24 | | | $ | 47.68 | | | $ | 55.75 | | | $ | 38.36 | | | $ | 42.75 | | | $ | 40.35 | |
| | |
Total Returnc | | | 1.17 | % | | | (11.01 | %) | | | 45.33 | % | | | (10.27 | %) | | | 5.95 | % | | | (0.07 | %) |
Ratios/Supplemental Data | |
Net assets, end of period (in thousands) | | $ | 2,488 | | | $ | 1,900 | | | $ | 15,765 | | | $ | 3,547 | | | $ | 10,427 | | | $ | 6,875 | |
Ratios to average net assets: | |
Net investment income (loss) | | | (1.06 | %) | | | (1.10 | %) | | | (1.19 | %) | | | (1.72 | %) | | | (1.53 | %) | | | (1.62 | %) |
Total expensesd | | | 1.71 | % | | | 1.69 | % | | | 1.68 | % | | | 1.74 | % | | | 1.66 | % | | | 1.68 | % |
Portfolio turnover rate | | | 33 | % | | | 376 | % | | | 299 | % | | | — | | | | — | | | | — | |
C-Class | | Period Ended
September 30,
2016a | | | Year Ended
March 31,
2016 | | | Year Ended
March 31,
2015 | | | Year Ended
March 31,
2014e | | | Year Ended
March 28,
2013e | | | Year Ended
March 31,
2012e | |
Per Share Data | | | | | | | | | | | | | | | | | | |
Net asset value, beginning of period | | $ | 43.60 | | | $ | 51.55 | | | $ | 35.74 | | | $ | 40.15 | | | $ | 38.14 | | | $ | 38.48 | |
Income (loss) from investment operations: | |
Net investment income (loss)b | | | (.40 | ) | | | (.85 | ) | | | (.81 | ) | | | (.94 | ) | | | (.90 | ) | | | (.90 | ) |
Net gain (loss) on investments (realized and unrealized) | | | .75 | | | | (4.93 | ) | | | 16.62 | | | | (3.47 | ) | | | 2.91 | | | | .56 | |
Total from investment operations | | | .35 | | | | (5.78 | ) | | | 15.81 | | | | (4.41 | ) | | | 2.01 | | | | (.34 | ) |
Less distributions from: | |
Net realized gains | | | — | | | | (2.17 | ) | | | — | | | | — | | | | — | | | | — | |
Total distributions | | | — | | | | (2.17 | ) | | | — | | | | — | | | | — | | | | — | |
Net asset value, end of period | | $ | 43.95 | | | $ | 43.60 | | | $ | 51.55 | | | $ | 35.74 | | | $ | 40.15 | | | $ | 38.14 | |
| | |
Total Returnc | | | 0.80 | % | | | (11.69 | %) | | | 44.24 | % | | | (10.96 | %) | | | 5.27 | % | | | (0.94 | %) |
Ratios/Supplemental Data | |
Net assets, end of period (in thousands) | | $ | 1,958 | | | $ | 1,938 | | | $ | 3,836 | | | $ | 2,099 | | | $ | 3,530 | | | $ | 4,091 | |
Ratios to average net assets: | |
Net investment income (loss) | | | (1.80 | %) | | | (1.75 | %) | | | (1.96 | %) | | | (2.48 | %) | | | (2.29 | %) | | | (2.36 | %) |
Total expensesd | | | 2.46 | % | | | 2.45 | % | | | 2.44 | % | | | 2.50 | % | | | 2.42 | % | | | 2.44 | % |
Portfolio turnover rate | | | 33 | % | | | 376 | % | | | 299 | % | | | — | | | | — | | | | — | |
70 | THE RYDEX FUNDS SEMI-ANNUAL REPORT | SEE NOTES TO FINANCIAL STATEMENTS. |
STRENGTHENING DOLLAR 2x STRATEGY FUND | |
FINANCIAL HIGHLIGHTS (concluded) |
This table is presented to show selected data for a share outstanding throughout each period and to assist shareholders in evaluating a Fund’s performance for the periods presented.
H-Class | | Period Ended
September 30,
2016a | | | Year Ended
March 31,
2016 | | | Year Ended
March 31,
2015 | | | Year Ended
March 31,
2014e | | | Year Ended
March 28,
2013e | | | Year Ended
March 31,
2012e | |
Per Share Data | | | | | | | | | | | | | | | | | | |
Net asset value, beginning of period | | $ | 47.49 | | | $ | 55.53 | | | $ | 38.21 | | | $ | 42.60 | | | $ | 40.17 | | | $ | 40.20 | |
Income (loss) from investment operations: | |
Net investment income (loss)b | | | (.27 | ) | | | (.59 | ) | | | (.56 | ) | | | (.69 | ) | | | (.63 | ) | | | (.66 | ) |
Net gain (loss) on investments (realized and unrealized) | | | .83 | | | | (5.28 | ) | | | 17.88 | | | | (3.70 | ) | | | 3.06 | | | | .63 | |
Total from investment operations | | | .56 | | | | (5.87 | ) | | | 17.32 | | | | (4.39 | ) | | | 2.43 | | | | (.03 | ) |
Less distributions from: | |
Net realized gains | | | — | | | | (2.17 | ) | | | — | | | | — | | | | — | | | | — | |
Total distributions | | | — | | | | (2.17 | ) | | | — | | | | — | | | | — | | | | — | |
Net asset value, end of period | | $ | 48.05 | | | $ | 47.49 | | | $ | 55.53 | | | $ | 38.21 | | | $ | 42.60 | | | $ | 40.17 | |
| | |
Total Returnc | | | 1.18 | % | | | (11.00 | %) | | | 45.33 | % | | | (10.31 | %) | | | 6.05 | % | | | (0.07 | %) |
Ratios/Supplemental Data | |
Net assets, end of period (in thousands) | | $ | 16,500 | | | $ | 10,608 | | | $ | 158,098 | | | $ | 9,764 | | | $ | 11,979 | | | $ | 21,982 | |
Ratios to average net assets: | |
Net investment income (loss) | | | (1.11 | %) | | | (1.12 | %) | | | (1.19 | %) | | | (1.72 | %) | | | (1.53 | %) | | | (1.62 | %) |
Total expensesd | | | 1.71 | % | | | 1.70 | % | | | 1.68 | % | | | 1.74 | % | | | 1.66 | % | | | 1.69 | % |
Portfolio turnover rate | | | 33 | % | | | 376 | % | | | 299 | % | | | — | | | | — | | | | — | |
a | Unaudited figures for the period ended September 30, 2016. Percentage amounts for the period, except total return and portfolio turnover rate, have been annualized. |
b | Net investment income (loss) per share was computed using average shares outstanding throughout the period. |
c | Total return does not reflect the impact of any applicable sales charges. |
d | Does not include expenses of the underlying funds in which the Fund invests. |
e | Reverse share split — Per share amounts for the periods presented through February 7, 2014 have been restated to reflect a 1:3 reverse share split effective February 7, 2014. |
SEE NOTES TO FINANCIAL STATEMENTS. | THE RYDEX FUNDS SEMI-ANNUAL REPORT | 71 |
FUND PROFILE (Unaudited) | September 30, 2016 |
WEAKENING DOLLAR 2x STRATEGY FUND
OBJECTIVE: Seeks to provide investment results that match, before fees and expenses, the performance of a specific benchmark on a daily basis. The Fund’s current benchmark is 200% of the inverse (opposite) of the performance of the U.S. Dollar Index® (the “underlying index”). The Fund does not seek to achieve its investment objective over a period of time greater than one day.
Holdings Diversification (Market Exposure as % of Net Assets)
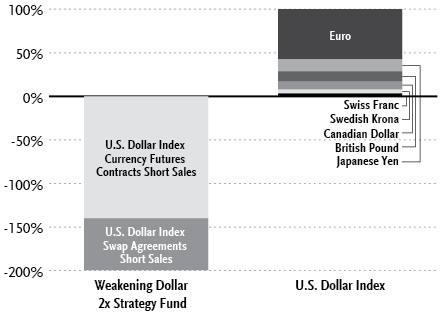
“Holdings Diversification (Market Exposure as % of Net Assets)” excludes any temporary cash investments or investments in Guggenheim Strategy Funds Trust mutual funds. Investments in those Funds do not provide “market exposure” to meet the Fund’s investment objective, but will significantly increase the portfolio’s exposure to certain other asset categories (and their associated risks), which may cause the Fund to deviate from its principal investment strategy, including: (i) high yield, high risk debt securities rated below the top four long-term rating categories by a nationally recognized statistical rating organization (also known as “junk bonds”); (ii) securities issued by the U.S. government or its agencies and instrumentalities; (iii) CLOs and similar investments; and (iv) other short-term fixed income securities.
Inception Dates: |
A-Class | May 25, 2005 |
C-Class | May 25, 2005 |
H-Class | May 25, 2005 |
The Fund invests principally in derivative investments such as swap agreements and futures contracts.
Largest Holdings (% of Total Net Assets) |
Federal Farm Credit Bank | 14.0% |
Guggenheim Strategy Fund I | 4.8% |
Guggenheim Strategy Fund II | 4.8% |
Total | 23.6% |
| | |
“Largest Holdings” excludes any temporary cash or derivative investments. |
72 | THE RYDEX FUNDS SEMI-ANNUAL REPORT | |
SCHEDULE OF INVESTMENTS (Unaudited) | September 30, 2016 |
WEAKENING DOLLAR 2x STRATEGY FUND | |
| | | Shares | | | Value | |
| | | | | | | |
MUTUAL FUNDS† - 9.6% | |
Guggenheim Strategy Fund I1 | | | 6,820 | | | $ | 170,438 | |
Guggenheim Strategy Fund II1 | | | 6,832 | | | | 170,382 | |
Total Mutual Funds | | | | | | | | |
(Cost $337,983) | | | | | | | 340,820 | |
| | | | | | | | | |
| | | Face
Amount | | | | | |
| | | | | | | | | |
FEDERAL AGENCY NOTES†† - 14.0% | |
Federal Farm Credit Bank2 | | | | | | | | |
0.67% due 09/12/183 | | $ | 500,000 | | | | 499,612 | |
Total Federal Agency Notes | | | | | | | | |
(Cost $499,902) | | | | | | | 499,612 | |
| | | | | | | | | |
REPURCHASE AGREEMENTS††,4 - 73.4% | |
Royal Bank of Canada
issued 09/30/16 at 0.36%
due 10/03/165 | | | 1,313,517 | | | | 1,313,517 | |
HSBC Securities, Inc.
issued 09/30/16 at 0.38%
due 10/03/16 | | | 1,295,706 | | | | 1,295,706 | |
Total Repurchase Agreements | | | | | | | | |
(Cost $2,609,223) | | | | | | | 2,609,223 | |
| | | | | | | | | |
Total Investments - 97.0% | | | | | | | | |
(Cost $3,447,108) | | | | | | $ | 3,449,655 | |
Other Assets & Liabilities, net - 3.0% | | | | | | | 105,546 | |
Total Net Assets - 100.0% | | | | | | $ | 3,555,201 | |
| | | Contracts | | | Unrealized
Gain (Loss) | |
| | | | | | | |
CURRENCY FUTURES CONTRACTS SOLD SHORT† | |
December 2016 U.S. Dollar Index
Futures Contracts
(Aggregate Value of
Contracts $4,962,360) | | | 52 | | | $ | (9,837 | ) |
| | | | | | | | | |
| | | Units | | | | | |
| | | | | | | | | |
OTC CURRENCY INDEX SWAP AGREEMENTS SOLD SHORT†† | |
Goldman Sachs International
December 2016 U.S. Dollar
Index Swap 0.84%6,
Terminating 12/14/16
(Notional Value $2,127,126) | | | 22,303 | | | $ | 1,507 | |
† | Value determined based on Level 1 inputs — See Note 4. |
†† | Value determined based on Level 2 inputs — See Note 4. |
1 | Affiliated issuer — See Note 9. |
2 | The issuer operates under a Congressional charter; its securities are neither issued nor guaranteed by the U.S. Government. |
3 | Variable rate security. Rate indicated is rate effective at September 30, 2016. |
4 | Repurchase Agreements — See Note 5. |
5 | All or a portion of this security is pledged as currency index swap collateral at September 30, 2016. |
6 | Total Return based on U.S. Dollar Index +/- financing at a variable rate. Rate indicated is the rate effective at September 30, 2016. |
| | |
| | See Sector Classification in Other Information section. |
SEE NOTES TO FINANCIAL STATEMENTS. | THE RYDEX FUNDS SEMI-ANNUAL REPORT | 73 |
SCHEDULE OF INVESTMENTS (Unaudited)(concluded) | September 30, 2016 |
WEAKENING DOLLAR 2x STRATEGY FUND | |
The following table summarizes the inputs used to value the Fund’s investments at September 30, 2016 (See Note 4 in the Notes to Financial Statements):
Investments in Securities (Assets) | | Level 1 | | | Level 1 -
Other* | | | Level 2 | | | Level 2 -
Other* | | | Level 3 | | | Total | |
Currency Index Swap Agreements | | $ | — | | | $ | — | | | $ | — | | | $ | 1,507 | | | $ | — | | | $ | 1,507 | |
Federal Agency Notes | | | — | | | | — | | | | 499,612 | | | | — | | | | — | | | | 499,612 | |
Mutual Funds | | | 340,820 | | | | — | | | | — | | | | — | | | | — | | | | 340,820 | |
Repurchase Agreements | | | — | | | | — | | | | 2,609,223 | | | | — | | | | — | | | | 2,609,223 | |
Total | | $ | 340,820 | | | $ | — | | | $ | 3,108,835 | | | $ | 1,507 | | | $ | — | | | $ | 3,451,162 | |
| | | | | | | | | | | | | | | | | | | | | | | | | |
Investments in Securities (Liabilities) | | Level 1 | | | Level 1 -
Other* | | | Level 2 | | | Level 2 -
Other* | | | Level 3 | | | Total | |
Currency Futures Contracts | | $ | — | | | $ | 9,837 | | | $ | — | | | $ | — | | | $ | — | | | $ | 9,837 | |
* | Other financial instruments include futures contracts and/or swaps, which are reported as unrealized gain/loss at period end. |
Transfers between investment levels may occur as the markets fluctuate and/or the availability of data used in an investment’s valuation changes. Transfers between valuation levels, if any, are in comparison to the valuation levels at the end of the previous fiscal year, and are effective using the fair value as of the end of the previous fiscal period.
For the period ended September 30, 2016, there were no transfers between levels.
74 | THE RYDEX FUNDS SEMI-ANNUAL REPORT | SEE NOTES TO FINANCIAL STATEMENTS. |
WEAKENING DOLLAR 2x STRATEGY FUND | |
STATEMENT OF ASSETS AND LIABILITIES (Unaudited) | |
September 30, 2016 | |
Assets: | |
Investments in unaffiliated issuers, at value (cost $499,902) | | $ | 499,612 | |
Investments in affiliated issuers, at value (cost $337,983) | | | 340,820 | |
Repurchase agreements, at value (cost $2,609,223) | | | 2,609,223 | |
Total investments (cost $3,447,108) | | | 3,449,655 | |
Segregated cash with broker | | | 93,600 | |
Unrealized appreciation on swap agreements | | | 1,507 | |
Receivables: | |
Variation margin | | | 2,184 | |
Fund shares sold | | | 12,716 | |
Dividends | | | 526 | |
Interest | | | 203 | |
Total assets | | | 3,560,391 | |
| | | | | |
Liabilities: | |
Payable for: | |
Fund shares redeemed | | | 3,000 | |
Management fees | | | 2,723 | |
Distribution and service fees | | | 1,039 | |
Transfer agent and administrative fees | | | 757 | |
Portfolio accounting fees | | | 303 | |
Miscellaneous | | | (2,632 | ) |
Total liabilities | | | 5,190 | |
Commitments and contingent liabilities (Note 11) | | | — | |
Net assets | | $ | 3,555,201 | |
| | | | | |
Net assets consist of: | |
Paid in capital | | $ | 23,670,343 | |
Accumulated net investment loss | | | (59,140 | ) |
Accumulated net realized loss on investments | | | (20,050,219 | ) |
Net unrealized depreciation on investments | | | (5,783 | ) |
Net assets | | $ | 3,555,201 | |
| | | | | |
A-Class: | |
Net assets | | $ | 536,208 | |
Capital shares outstanding* | | | 7,332 | |
Net asset value per share* | | $ | 73.13 | |
Maximum offering price per share (Net asset value divided by 95.25%)* | | $ | 76.78 | |
| | | | | |
C-Class: | |
Net assets | | $ | 541,282 | |
Capital shares outstanding* | | | 8,161 | |
Net asset value per share* | | $ | 66.33 | |
| | | | | |
H-Class: | |
Net assets | | $ | 2,477,711 | |
Capital shares outstanding* | | | 33,919 | |
Net asset value per share* | | $ | 73.05 | |
STATEMENT OF OPERATIONS (Unaudited) | |
Period Ended September 30, 2016 | |
Investment Income: | |
Dividends from securities of affiliated issuers | | $ | 10,341 | |
Interest | | | 7,701 | |
Total investment income | | | 18,042 | |
| | | | | |
Expenses: | |
Management fees | | | 32,253 | |
Transfer agent and administrative fees | | | 8,959 | |
Distribution and service fees: | |
A-Class | | | 1,093 | |
C-Class | | | 2,615 | |
H-Class | | | 7,213 | |
Portfolio accounting fees | | | 3,584 | |
Registration fees | | | 3,295 | |
Trustees’ fees** | | | 467 | |
Custodian fees | | | 420 | |
Miscellaneous | | | 3,418 | |
Total expenses | | | 63,317 | |
Net investment loss | | | (45,275 | ) |
| | | | | |
Net Realized and Unrealized Gain (Loss): | |
Net realized gain (loss) on: | |
Investments in affiliated issuers | | | 9,236 | |
Swap agreements | | | (146,018 | ) |
Futures contracts | | | (818,580 | ) |
Net realized loss | | | (955,362 | ) |
Net change in unrealized appreciation (depreciation) on: | |
Investments in unaffiliated issuers | | | (290 | ) |
Investments in affiliated issuers | | | 1,330 | |
Swap agreements | | | (9,386 | ) |
Futures contracts | | | (259,996 | ) |
Net change in unrealized appreciation (depreciation) | | | (268,342 | ) |
Net realized and unrealized loss | | | (1,223,704 | ) |
Net decrease in net assets resulting from operations | | $ | (1,268,979 | ) |
* | The shares outstanding, net asset value per share and the maximum offering price per share have been restated to reflect a 1:6 reverse share split effective October 28, 2016 — See Note 12. |
** | Relates to Trustees not deemed “interested persons” within the meaning of Section 2(a)(19) of the 1940 Act. |
SEE NOTES TO FINANCIAL STATEMENTS. | THE RYDEX FUNDS SEMI-ANNUAL REPORT | 75 |
WEAKENING DOLLAR 2x STRATEGY FUND | |
STATEMENTS OF CHANGES IN NET ASSETS |
| | | Period Ended
September 30,
2016
(Unaudited) | | | Year Ended
March 31,
2016 | |
Increase (Decrease) in Net Assets from Operations: | | | | | | |
Net investment loss | | $ | (45,275 | ) | | $ | (85,654 | ) |
Net realized loss on investments | | | (955,362 | ) | | | (1,286,932 | ) |
Net change in unrealized appreciation (depreciation) on investments | | | (268,342 | ) | | | 202,427 | |
Net decrease in net assets resulting from operations | | | (1,268,979 | ) | | | (1,170,159 | ) |
| | | | | | | | | |
Capital share transactions: | | | | | | | | |
Proceeds from sale of shares | | | | | | | | |
A-Class | | | 2,317,695 | | | | 8,961,442 | |
C-Class | | | 518,083 | | | | 5,359,174 | |
H-Class | | | 45,734,466 | | | | 95,822,345 | |
Cost of shares redeemed | | | | | | | | |
A-Class | | | (3,012,718 | ) | | | (8,222,299 | ) |
C-Class | | | (483,564 | ) | | | (4,968,724 | ) |
H-Class | | | (45,744,631 | ) | | | (94,608,486 | ) |
Net increase (decrease) from capital share transactions | | | (670,669 | ) | | | 2,343,452 | |
Net increase (decrease) in net assets | | | (1,939,648 | ) | | | 1,173,293 | |
| | | | | | | | | |
Net assets: | | | | | | | | |
Beginning of period | | | 5,494,849 | | | | 4,321,556 | |
End of period | | $ | 3,555,201 | | | $ | 5,494,849 | |
Accumulated net investment loss at end of period | | $ | (59,140 | ) | | $ | (13,865 | ) |
| | | | | | | | | |
Capital share activity:* | | | | | | | | |
Shares sold | | | | | | | | |
A-Class | | | 29,985 | | | | 123,137 | |
C-Class | | | 7,535 | | | | 77,717 | |
H-Class | | | 602,025 | | | | 1,315,899 | |
Shares redeemed | | | | | | | | |
A-Class | | | (40,098 | ) | | | (112,882 | ) |
C-Class | | | (7,184 | ) | | | (72,413 | ) |
H-Class | | | (616,562 | ) | | | (1,319,158 | ) |
Net increase (decrease) in shares | | | (24,299 | ) | | | 12,300 | |
* | Capital share activity for the periods presented through September 30, 2016 has been restated to reflect a 1:6 reverse share split effective October 28, 2016 — See Note 12. |
76 | THE RYDEX FUNDS SEMI-ANNUAL REPORT | SEE NOTES TO FINANCIAL STATEMENTS. |
WEAKENING DOLLAR 2x STRATEGY FUND | |
This table is presented to show selected data for a share outstanding throughout each period and to assist shareholders in evaluating a Fund’s performance for the periods presented.
A-Class | | Period Ended
September 30,
2016a,e | | | Year Ended
March 31,
2016e | | | Year Ended
March 31,
2015e | | | Year Ended
March 31,
2014e | | | Year Ended
March 28,
2013e | | | Year Ended
March 31,
2012e | |
Per Share Data | | | | | | | | | | | | | | | | | | |
Net asset value, beginning of period | | $ | 75.31 | | | $ | 70.69 | | | $ | 107.17 | | | $ | 101.72 | | | $ | 113.72 | | | $ | 122.04 | |
Income (loss) from investment operations: | |
Net investment income (loss)b | | | (.42 | ) | | | (.84 | ) | | | (1.20 | ) | | | (1.80 | ) | | | (1.68 | ) | | | (1.98 | ) |
Net gain (loss) on investments (realized and unrealized) | | | (1.76 | ) | | | 5.46 | | | | (35.28 | ) | | | 7.25 | | | | (10.32 | ) | | | (6.34 | ) |
Total from investment operations | | | (2.18 | ) | | | 4.62 | | | | (36.48 | ) | | | 5.45 | | | | (12.00 | ) | | | (8.32 | ) |
Net asset value, end of period | | $ | 73.13 | | | $ | 75.31 | | | $ | 70.69 | | | $ | 107.17 | | | $ | 101.72 | | | $ | 113.72 | |
| | |
Total Returnc | | | (2.87 | %) | | | 6.54 | % | | | (34.04 | %) | | | 5.37 | % | | | (10.55 | %) | | | (6.83 | %) |
Ratios/Supplemental Data | |
Net assets, end of period (in thousands) | | $ | 536 | | | $ | 1,314 | | | $ | 508 | | | $ | 1,129 | | | $ | 1,346 | | | $ | 2,881 | |
Ratios to average net assets: | |
Net investment income (loss) | | | (1.12 | %) | | | (1.13 | %) | | | (1.23 | %) | | | (1.73 | %) | | | (1.53 | %) | | | (1.62 | %) |
Total expensesd | | | 1.71 | % | | | 1.70 | % | | | 1.70 | % | | | 1.75 | % | | | 1.65 | % | | | 1.70 | % |
Portfolio turnover rate | | | 40 | % | | | 699 | % | | | 219 | % | | | — | | | | — | | | | — | |
C-Class | | Period Ended
September 30,
2016a,e | | | Year Ended
March 31,
2016e | | | Year Ended
March 31,
2015e | | | Year Ended
March 31,
2014e | | | Year Ended
March 28,
2013e | | | Year Ended
March 31,
2012e | |
Per Share Data | | | | | | | | | | | | | | | | | | |
Net asset value, beginning of period | | $ | 68.57 | | | $ | 64.88 | | | $ | 99.08 | | | $ | 94.76 | | | $ | 106.73 | | | $ | 115.35 | |
Income (loss) from investment operations: | |
Net investment income (loss)b | | | (.66 | ) | | | (1.20 | ) | | | (1.74 | ) | | | (2.40 | ) | | | (2.28 | ) | | | (2.64 | ) |
Net gain (loss) on investments (realized and unrealized) | | | (1.58 | ) | | | 4.89 | | | | (32.46 | ) | | | 6.72 | | | | (9.69 | ) | | | (5.98 | ) |
Total from investment operations | | | (2.24 | ) | | | 3.69 | | | | (34.20 | ) | | | 4.32 | | | | (11.97 | ) | | | (8.62 | ) |
Net asset value, end of period | | $ | 66.33 | | | $ | 68.57 | | | $ | 64.88 | | | $ | 99.08 | | | $ | 94.76 | | | $ | 106.73 | |
| | |
Total Returnc | | | (3.32 | %) | | | 5.74 | % | | | (34.52 | %) | | | 4.56 | % | | | (11.24 | %) | | | (7.49 | %) |
Ratios/Supplemental Data | |
Net assets, end of period (in thousands) | | $ | 541 | | | $ | 536 | | | $ | 163 | | | $ | 821 | | | $ | 1,687 | | | $ | 2,826 | |
Ratios to average net assets: | |
Net investment income (loss) | | | (1.90 | %) | | | (1.81 | %) | | | (1.94 | %) | | | (2.49 | %) | | | (2.27 | %) | | | (2.36 | %) |
Total expensesd | | | 2.46 | % | | | 2.45 | % | | | 2.46 | % | | | 2.52 | % | | | 2.39 | % | | | 2.44 | % |
Portfolio turnover rate | | | 40 | % | | | 699 | % | | | 219 | % | | | — | | | | — | | | | — | |
SEE NOTES TO FINANCIAL STATEMENTS. | THE RYDEX FUNDS SEMI-ANNUAL REPORT | 77 |
WEAKENING DOLLAR 2x STRATEGY FUND | |
FINANCIAL HIGHLIGHTS (concluded) |
This table is presented to show selected data for a share outstanding throughout each period and to assist shareholders in evaluating a Fund’s performance for the periods presented.
H-Class | | Period Ended
September 30,
2016a,e | | | Year Ended
March 31,
2016e | | | Year Ended
March 31,
2015e | | | Year Ended
March 31,
2014e | | | Year Ended
March 28,
2013e | | | Year Ended
March 31,
2012e | |
Per Share Data | | | | | | | | | | | | | | | | | | |
Net asset value, beginning of period | | $ | 75.23 | | | $ | 70.59 | | | $ | 106.99 | | | $ | 101.58 | | | $ | 113.59 | | | $ | 121.90 | |
Income (loss) from investment operations: | |
Net investment income (loss)b | | | (.48 | ) | | | (.78 | ) | | | (1.14 | ) | | | (1.80 | ) | | | (1.62 | ) | | | (1.92 | ) |
Net gain (loss) on investments (realized and unrealized) | | | (1.70 | ) | | | 5.42 | | | | (35.26 | ) | | | 7.21 | | | | (10.39 | ) | | | (6.39 | ) |
Total from investment operations | | | (2.18 | ) | | | 4.64 | | | | (36.40 | ) | | | 5.41 | | | | (12.01 | ) | | | (8.31 | ) |
Net asset value, end of period | | $ | 73.05 | | | $ | 75.23 | | | $ | 70.59 | | | $ | 106.99 | | | $ | 101.58 | | | $ | 113.59 | |
| | |
Total Returnc | | | (2.95 | %) | | | 6.54 | % | | | (33.99 | %) | | | 5.32 | % | | | (10.57 | %) | | | (6.84 | %) |
Ratios/Supplemental Data | |
Net assets, end of period (in thousands) | | $ | 2,478 | | | $ | 3,645 | | | $ | 3,651 | | | $ | 5,449 | | | $ | 10,058 | | | $ | 13,551 | |
Ratios to average net assets: | |
Net investment income (loss) | | | (1.23 | %) | | | (1.04 | %) | | | (1.20 | %) | | | (1.74 | %) | | | (1.52 | %) | | | (1.61 | %) |
Total expensesd | | | 1.72 | % | | | 1.70 | % | | | 1.70 | % | | | 1.76 | % | | | 1.64 | % | | | 1.69 | % |
Portfolio turnover rate | | | 40 | % | | | 699 | % | | | 219 | % | | | — | | | | — | | | | — | |
a | Unaudited figures for the period ended September 30, 2016. Percentage amounts for the period, except total return and portfolio turnover rate, have been annualized. |
b | Net investment income (loss) per share was computed using average shares outstanding throughout the period. |
c | Total return does not reflect the impact of any applicable sales charges. |
d | Does not include expenses of the underlying funds in which the Fund invests. |
e | Reverse share split — Per share amounts for the periods presented through September 30, 2016 have been restated to reflect a 1:6 reverse share split effective October 28, 2016 — See Note 12. |
78 | THE RYDEX FUNDS SEMI-ANNUAL REPORT | SEE NOTES TO FINANCIAL STATEMENTS. |
NOTES TO FINANCIAL STATEMENTS (Unaudited) |
1. Organization and Significant Accounting Policies
Organization
The Rydex Series Funds (the “Trust”), a Delaware statutory trust, is registered with the SEC under the Investment Company Act of 1940 (”1940 Act”), as an open-ended investment company of the series type. Each series, in effect, is representing a separate Fund. The Trust is authorized to issue an unlimited number of no par value shares. The Trust accounts for the assets of each fund separately.
The Trust offers a combination of seven separate classes of shares: Investor Class shares, A-Class shares, C-Class shares, H-Class shares, P-Class shares, Institutional Class shares and Money Market Class shares. Sales of shares of each Class are made without a front-end sales charge at the net asset value per share (“NAV”), with the exception of A-Class shares. A-Class shares are sold at the NAV, plus the applicable front-end sales charge. The sales charge varies depending on the amount purchased, but will not exceed 4.75%. A-Class share purchases of $1 million or more are exempt from the front-end sales charge but have a 1% contingent deferred sales charge (“CDSC”) if shares are redeemed within 12 months of purchase. C-Class shares have a 1% CDSC if shares are redeemed within 12 months of purchase. Institutional Class shares are offered primarily for direct investment by institutions such as pension and profit sharing plans, endowments, foundations and corporations. Institutional Class shares require a minimum initial investment of $2 million and a minimum account balance of $1 million. At September 30, 2016, the Trust consisted of fifty-three funds.
This report covers the S&P 500® Pure Growth Fund, S&P 500® Pure Value Fund, S&P MidCap 400® Pure Growth Fund, S&P MidCap 400® Pure Value Fund, S&P SmallCap 600® Pure Growth Fund, S&P SmallCap 600® Pure Value Fund, Europe 1.25x Strategy Fund, Japan 2x Strategy Fund, Strengthening Dollar 2x Strategy Fund and Weakening Dollar 2x Strategy Fund, (the “Funds”), each a non-diversified investment company. Only A-Class, C-Class and H-Class shares had been issued by the Funds.
The Funds are designed and operated to accommodate frequent trading by shareholders and, unlike most mutual funds, offer unlimited exchange privileges with no minimum holding periods or transactions fees, which may cause the Funds to experience high portfolio turnover.
Guggenheim Investments (“GI”) provides advisory services, and Rydex Fund Services, LLC (“RFS”) provides transfer agent, administrative and accounting services to the Trust. Guggenheim Funds Distributors, LLC (“GFD”) acts as principal underwriter for the Trust. GI and GFD are affiliated entities; RFS ceased to be an affiliate of GI as of October 4, 2016, when it was acquired by MUFG Investor Services. In connection with its acquisition, RFS changed its name to MUFG Investor Services (US), LLC (“MUIS”).This change has no impact on the financial statements of the Funds.
Significant Accounting Policies
The Funds operate as investment companies and, accordingly, follow the investment company accounting and reporting guidance of the Financial Accounting Standards Board (“FASB”) Accounting Standards Codification Topic 946 Financial Services – Investment Companies.
The following significant accounting policies are in conformity with U.S. generally accepted accounting principles (“U.S. GAAP”) and are consistently followed by the Trust. This requires management to make estimates and assumptions that affect the reported amount of assets and liabilities, contingent assets and liabilities at the date of the financial statements, and the reported amounts of revenues and expenses during the reporting period. Actual results could differ from these estimates. All time references are based on Eastern Time.
The NAV of each Class of the Funds is calculated by dividing the market value of the Fund’s securities and other assets, less all liabilities, attributable to the Class by the number of outstanding shares of the Class.
A. The Board of Trustees of the Funds (the “Board”) has adopted policies and procedures for the valuation of the Funds’ investments (the “Valuation Procedures”). Pursuant to the Valuation Procedures, the Board has delegated to a valuation committee, consisting of representatives from Guggenheim’s investment management, fund administration, legal and compliance departments (the “Valuation Committee”), the day-to-day responsibility for implementing the Valuation Procedures, including, under most circumstances, the responsibility for determining the fair value of the Funds’ securities and/or other assets.
Valuations of the Funds’ securities are supplied primarily by pricing services appointed pursuant to the processes set forth in the Valuation Procedures. The Valuation Committee convenes monthly, or more frequently as needed, to review the valuation of all assets which have been fair valued for reasonableness. The Funds’ officers, through the Valuation Committee and consistent with the monitoring and review responsibilities set forth in the Valuation Procedures, regularly review procedures used and valuations provided by the pricing services.
If the pricing service cannot or does not provide a valuation for a particular investment or such valuation is deemed unreliable, such investment is fair valued by the Valuation Committee.
| | THE RYDEX FUNDS SEMI-ANNUAL REPORT | 79 |
NOTES TO FINANCIAL STATEMENTS (Unaudited)(continued) |
Equity securities listed on an exchange (New York Stock Exchange (“NYSE”) or American Stock Exchange) are valued at the last quoted sales price as of the close of business on the NYSE, usually 4:00 p.m. on the valuation date. Equity securities listed on the NASDAQ market system are valued at the NASDAQ Official Closing Price on the valuation date, which may not necessarily represent the last sale price. If there has been no sale on such exchange or NASDAQ on a given day, the security is valued at the closing bid price on that day.
Open-end investment companies (“mutual funds”) are valued at their NAV as of the close of business, on the valuation date. Exchange-traded funds (“ETFs”) and closed-end investment companies (“CEFs”) are valued at the last quoted sales price.
Debt securities with a maturity of greater than 60 days at acquisition are valued at prices that reflect broker-dealer supplied valuations or are obtained from independent pricing services, which may consider the trade activity, treasury spreads, yields or price of bonds of comparable quality, coupon, maturity, and type, as well as prices quoted by dealers who make markets in such securities. Short-term debt securities with a maturity of 60 days or less at acquisition are valued at amortized cost, provided such amount approximates market value.
Repurchase agreements are valued at amortized cost, provided such amounts approximate market value.
The value of futures contracts is accounted for using the unrealized gain or loss on the contracts that is determined by marking the contracts to their current realized settlement prices. Financial futures contracts are valued at the 4:00 p.m. price on the valuation date. In the event that the exchange for a specific futures contract closes earlier than 4:00 p.m., the futures contract is valued at the Official Settlement Price of the exchange. However, the underlying securities from which the futures contract value is derived are monitored until 4:00 p.m. to determine if fair valuation would provide a more accurate valuation.
The value of currency index swap agreements entered into by a Fund is accounted for using the unrealized gain or loss on the agreements that is determined by marking the agreements to the broker quote.
Investments for which market quotations are not readily available are fair valued as determined in good faith by GI under the direction of the Board using methods established or ratified by the Board. Valuations in accordance with these methods are intended to reflect each security’s (or asset’s) “fair value.” Each such determination is based on a consideration of all relevant factors, which are likely to vary from one pricing context to another. Examples of such factors may include, but are not limited to: market prices; sale prices; broker quotes; and models which derive prices based on inputs such as prices of securities with comparable maturities and characteristics, or based on inputs such as anticipated cash flows or collateral, spread over Treasuries, and other information analysis.
In connection with futures contracts and other derivative investments, such factors may include obtaining information as to how (a) these contracts and other derivative investments trade in the futures or other derivative markets, respectively, and (b) the securities underlying these contracts and other derivative investments trade in the cash market.
B. Certain U.S. Government and Agency Obligations are traded on a discount basis; the interest rates shown on the Schedules of Investments reflect the effective rates paid at the time of purchase by the Funds. Other securities bear interest at the rates shown, payable at fixed dates through maturity.
C. Upon entering into a futures contract, a Fund deposits and maintains as collateral such initial margin as required by the exchange on which the transaction is affected. Pursuant to the contract, the Fund agrees to receive from or pay to the broker an amount of cash equal to the daily fluctuation in value of the contract. Such receipts or payments are known as variation margin and are recorded by the Fund as unrealized gains or losses. When the contract is closed, the Fund records a realized gain or loss equal to the difference between the value of the contract at the time it was opened and the value at the time it was closed.
D. Swap agreements are marked-to-market daily and the change, if any, is recorded as unrealized gain or loss. Payments received or made as a result of an agreement or termination of an agreement are recognized as realized gains or losses.
E. Investment securities and other assets and liabilities denominated in foreign currencies are translated into U.S. dollar amounts at the date of valuation. Purchases and sales of investment securities and income and expense items denominated in foreign currencies are translated into U.S. dollar amounts on the respective dates of such transactions. The Trust does not isolate that portion of the results of operations resulting from changes in foreign exchange rates on investments from the fluctuations arising from changes in market prices of securities held. Such fluctuations are included with the net realized and unrealized gain and loss from investments.
Reported net realized foreign exchange gains or losses arise from sales of foreign currencies and currency gains or losses realized between the trade and settlement dates on investment transactions. Net unrealized exchange gains and losses arise from changes in the fair values of assets and liabilities other than investments in securities at the fiscal period end, resulting from changes in exchange rates.
80 | THE RYDEX FUNDS SEMI-ANNUAL REPORT | |
NOTES TO FINANCIAL STATEMENTS (Unaudited)(continued) |
F. Security transactions are recorded on the trade date for financial reporting purposes. Realized gains and losses from securities transactions are recorded using the identified cost basis. Proceeds from lawsuits related to investment holdings are recorded as realized gains in the respective Fund. Dividend income is recorded on the ex-dividend date, net of applicable taxes withheld by foreign countries. Taxable non-cash dividends are recorded as dividend income. Interest income, including amortization of premiums and accretion of discounts, is accrued on a daily basis. Dividend income from REITs is recorded based on the income included in the distributions received from the REIT investments using published REIT classifications, including some management estimates when actual amounts are not available. Distributions received in excess of this estimated amount are recorded as a reduction of the cost of investments or reclassified to capital gains. The actual amounts of income, return of capital, and capital gains are only determined by each REIT after its fiscal year-end, and may differ from the estimated amounts.
G. Distributions of net investment income and net realized gains, if any, are declared and paid at least annually. Dividends are reinvested in additional shares unless shareholders request payment in cash. Distributions are recorded on the ex-dividend date and are determined in accordance with income tax regulations which may differ from U.S. GAAP.
H. Interest and dividend income, most expenses, all realized gains and losses, and all unrealized gains and losses are allocated to the classes based upon the value of the outstanding shares in each Class. Certain costs, such as distribution and service fees are charged directly to specific classes. In addition, certain expenses have been allocated to the individual Funds in the Trust on a pro rata basis upon the respective aggregate net assets of each Fund included in the Trust.
I. The Funds may leave cash overnight in their cash account with the custodian. Periodically, a Fund may have cash due to the custodian bank as an overdraft balance. A fee is incurred on this overdraft, calculated by multiplying the overdraft by a rate based on the federal funds rate, which was 0.29% at September 30, 2016.
J. Under the Funds’ organizational documents, the Trustees and Officers are indemnified against certain liabilities arising out of the performance of their duties to the Trust. In addition, throughout the normal course of business, the Funds enter into contracts that contain a variety of representations and warranties which provide general indemnifications. The Funds’ maximum exposure under these arrangements is unknown, as this would involve future claims that may be made against the Funds and/or their affiliates that have not yet occurred. However, based on experience, the Funds expect the risk of loss to be remote.
2. Financial Instruments and Derivatives
As part of their investment strategy, the Funds utilize a variety of derivative instruments. These investments involve, to varying degrees, elements of market risk and risks in excess of the amounts recognized in the Statements of Assets and Liabilities. Valuation and accounting treatment of these instruments can be found under Significant Accounting Policies in Note 1 of these Notes to Financial Statements.
Derivatives
Derivatives are instruments whose values depend on, or are derived from, in whole or in part, the value of one or more other assets, such as securities, currencies, commodities or indices. Derivative instruments may be used to increase investment flexibility (including to maintain cash reserves while maintaining exposure to certain other assets), for risk management (hedging) purposes, to facilitate trading, to reduce transaction costs and to pursue higher investment returns. Derivative instruments may also be used to mitigate certain investment risks, such as foreign currency exchange rate risk, interest rate risk and credit risk. U.S. GAAP requires disclosures to enable investors to better understand how and why a Fund uses derivative instruments, how these derivative instruments are accounted for and their effects on the Fund’s financial position and results of operations. The Funds may utilize derivatives for the following purposes:
Index Exposure: the use of an instrument to obtain exposure to a listed or other type of index.
Leverage: gaining total exposure to equities or other assets on the long and short sides at greater than 100% of invested capital.
Liquidity: the ability to buy or sell exposure with little price/market impact.
For any Fund whose investment strategy consistently involves applying leverage, the value of the Fund’s shares will tend to increase or decrease more than the value of any increase or decrease in the underlying index or other asset. In addition, because an investment in derivative instruments generally requires a small investment relative to the amount of investment exposure assumed, an opportunity for increased net income is created; but, at the same time, leverage risk will increase. The Fund’s use of leverage, through borrowings or instruments such as derivatives, may cause the Fund to be more volatile and riskier than if they had not been leveraged.
Futures
A futures contract is an agreement to purchase (long) or sell (short) an agreed amount of securities or other instruments at a set price for delivery at a future date. There are significant risks associated with a Fund’s use of futures contracts, including (i)
| | THE RYDEX FUNDS SEMI-ANNUAL REPORT | 81 |
NOTES TO FINANCIAL STATEMENTS (Unaudited)(continued) |
there may be an imperfect or no correlation between the changes in market value of the underlying asset and the prices of futures contracts; (ii) there may not be a liquid secondary market for a futures contract; (iii) trading restrictions or limitations may be imposed by an exchange; and (iv) government regulations may restrict trading in futures contracts. When investing in futures, there is minimal counterparty credit risk to a Fund because futures are exchange-traded and the exchange’s clearinghouse, as counterparty to all exchange-traded futures, guarantees against default. Cash deposits are shown as segregated cash with broker on the Statements of Assets and Liabilities; securities held as collateral are noted on the Schedules of Investments.
The following table represents the Funds’ use and volume of futures on a quarterly basis:
| | | | Average Notional | |
Fund | Use | | Long | | | Short | |
Europe 1.25x Strategy Fund | Index exposure, Leverage, Liquidity | | $ | 6,683,570 | | | $ | — | |
Japan 2x Strategy Fund | Index exposure, Leverage, Liquidity | | | 10,296,406 | | | | — | |
Strengthening Dollar 2x Strategy Fund | Index exposure, Leverage, Liquidity | | | 37,630,834 | | | | — | |
Weakening Dollar 2x Strategy Fund | Index exposure, Leverage, Liquidity | | | — | | | | 10,450,665 | |
Swaps
A swap is an agreement that obligates two parties to exchange a series of cash flows at specified intervals based upon or calculated by reference to changes in specified prices or rates for a specified amount of an underlying asset. A Fund utilizing OTC swaps bears the risk of loss of the amount expected to be received under a swap agreement in the event of the default or bankruptcy of a swap agreement counterparty or if the underlying asset declines in value. Certain standardized swaps are subject to mandatory central clearing. Central clearing generally reduces counterparty credit risk and increases liquidity, but central clearing does not make swap transactions risk-free. Additionally, there is no guarantee that a Fund or an underlying fund could eliminate its exposure under an outstanding swap agreement by entering into an offsetting swap agreement with the same or another party.
Currency swaps enable the Funds to gain exposure to currencies in a market without actually possessing a given currency, or to hedge a position. Currency swaps involve the exchange of the principal and interest in one currency for the principal and interest in another currency. As in other types of OTC swaps, the Funds may be at risk due to the counterparty’s inability to perform.
The following table represents the Funds’ use and volume of currency swaps on a quarterly basis:
| | | | Average Notional | |
Fund | Use | | Long | | | Short | |
Strengthening Dollar 2x Strategy Fund | Index exposure, Leverage, Liquidity | | $ | 7,768,801 | | | $ | — | |
Weakening Dollar 2x Strategy Fund | Index exposure, Leverage, Liquidity | | | — | | | | 1,923,210 | |
Derivative Investment Holdings Categorized by Risk Exposure
The following is a summary of the location of derivative investments on the Funds’ Statements of Assets and Liabilities as of September 30, 2016:
Derivative Investment Type | Asset Derivatives | Liability Derivatives |
Equity/Currency contracts | Variation margin | Variation margin |
| Unrealized appreciation on swap agreements | Unrealized depreciation on swap agreements |
82 | THE RYDEX FUNDS SEMI-ANNUAL REPORT | |
NOTES TO FINANCIAL STATEMENTS (Unaudited)(continued) |
The following table sets forth the fair value of the Funds’ derivative investments categorized by primary risk exposure at September 30, 2016:
Asset Derivative Investments Value | |
Fund | | Futures
Equity
Contracts* | | | Futures
Currency
Contracts* | | | Swaps
Currency
Contracts | | | Total Value at
September 30,
2016 | |
Europe 1.25x Strategy Fund | | $ | 6,575 | | | $ | 8,343 | | | $ | — | | | $ | 14,918 | |
Japan 2x Strategy Fund | | | 71,071 | | | | 49,982 | | | | — | | | | 121,053 | |
Strengthening Dollar 2x Strategy Fund | | | — | | | | 67,675 | | | | 1,253 | | | | 68,928 | |
Weakening Dollar 2x Strategy Fund | | | — | | | | — | | | | 1,507 | | | | 1,507 | |
Liability Derivative Investments Value | |
Fund | | Futures
Equity
Contracts* | | | Futures
Currency
Contracts* | | | Swaps
Currency
Contracts | | | Total Value at
September 30,
2016 | |
Weakening Dollar 2x Strategy Fund | | $ | — | | | $ | 9,837 | | | $ | — | | | $ | 9,837 | |
* | Includes cumulative appreciation (depreciation) of futures contracts as reported on the Schedules of Investments. Only current day’s variation margin is reported within the Statements of Assets and Liabilities. |
The following is a summary of the location of derivative investments on the Funds’ Statements of Operations for the period ended September 30, 2016:
Derivative Investment Type | Location of Gain (Loss) on Derivatives |
Equity/Currency contracts | Net realized gain (loss) on futures contracts |
| Net change in unrealized appreciation (depreciation) on futures contracts |
| Net realized gain (loss) on swap agreements |
| Net change in unrealized appreciation (depreciation) on swap agreements |
The following is a summary of the Funds’ realized gain (loss) and change in unrealized appreciation (depreciation) on derivative investments recognized on the Statements of Operations categorized by primary risk exposure for the period ended September 30, 2016:
Realized Gain (Loss) on Derivative Investments Recognized on the Statements of Operations | |
Fund | | Futures
Equity
Contracts | | | Swaps
Equity
Contracts | | | Futures
Currency
Contracts | | | Swaps
Currency
Contracts | | | Total | |
Europe 1.25x Strategy Fund | | $ | 1,665,549 | | | $ | 1,754 | | | $ | 179,916 | | | $ | — | | | $ | 1,847,219 | |
Japan 2x Strategy Fund | | | 1,001,697 | | | | 2,129 | | | | 1,469,146 | | | | — | | | | 2,472,972 | |
Strengthening Dollar 2x Strategy Fund | | | — | | | | — | | | | (890,993 | ) | | | (100,865 | ) | | | (991,858 | ) |
Weakening Dollar 2x Strategy Fund | | | — | | | | — | | | | (818,580 | ) | | | (146,018 | ) | | | (964,598 | ) |
Change in Unrealized Appreciation (Depreciation) on Derivative Investments Recognized on the Statements of Operations | |
Fund | | Futures
Equity
Contracts | | | Swaps
Equity
Contracts | | | Futures
Currency
Contracts | | | Swaps
Currency
Contracts | | | Total | |
Europe 1.25x Strategy Fund | | $ | 46,840 | | | $ | — | | | $ | (50,446 | ) | | $ | — | | | $ | (3,606 | ) |
Japan 2x Strategy Fund | | | 19,536 | | | | — | | | | 8,777 | | | | — | | | | 28,313 | |
Strengthening Dollar 2x Strategy Fund | | | — | | | | — | | | | 648,483 | | | | 130,213 | | | | 778,696 | |
Weakening Dollar 2x Strategy Fund | | | — | | | | — | �� | | | (259,996 | ) | | | (9,386 | ) | | | (269,382 | ) |
| | THE RYDEX FUNDS SEMI-ANNUAL REPORT | 83 |
NOTES TO FINANCIAL STATEMENTS (Unaudited)(continued) |
In conjunction with the use of derivative instruments, the Funds are required to maintain collateral in various forms. The Funds use, where appropriate, depending on the financial instrument utilized and the broker involved, margin deposits at the broker, cash and/or securities segregated at the custodian bank, discount notes or the repurchase agreements allocated to the Funds.
The Trust has established counterparty credit guidelines and enters into transactions only with financial institutions of investment grade or better. The Trust monitors the counterparty credit risk.
3. Fees and Other Transactions with Affiliates
Under the terms of an investment advisory contract, the Funds pay GI investment advisory fees calculated at the annualized rates below, based on the average daily net assets of the Funds:
Fund | Management Fees
(as a % of Net Assets) |
S&P 500® Pure Growth Fund | 0.75% |
S&P 500® Pure Value Fund | 0.75% |
S&P MidCap 400® Pure Growth Fund | 0.75% |
S&P MidCap 400® Pure Value Fund | 0.75% |
S&P SmallCap 600® Pure Growth Fund | 0.75% |
S&P SmallCap 600® Pure Value Fund | 0.75% |
Europe 1.25x Strategy Fund | 0.90% |
Japan 2x Strategy Fund | 0.75% |
Strengthening Dollar 2x Strategy Fund | 0.90% |
Weakening Dollar 2x Strategy Fund | 0.90% |
RFS provided transfer agent and administrative services to the Funds for fees calculated at the annualized rate of 0.25% based on the average daily net assets of each Fund.
RFS also provided accounting services to the Funds for fees calculated at annualized rates below, based on the average daily net assets of each Fund:
Fund Accounting Fees | (as a % of Net Assets) |
On the first $250 million | 0.10% |
On the next $250 million | 0.075% |
On the next $250 million | 0.05% |
Over $750 million | 0.03% |
GI engages external service providers to perform other necessary services for the Trust, such as audit and accounting related services, legal services, custody, printing and mailing, etc., on a pass-through basis. Such expenses are allocated to various Funds within the complex based on relative net assets.
The Trust has adopted a Distribution Plan applicable to A-Class shares and H-Class shares for which GFD and other firms that provide distribution and/or shareholder services (“Service Providers”) may receive compensation. If a Service Provider provides distribution services, the Funds will pay distribution fees to GFD at an annual rate not to exceed 0.25% of average daily net assets, pursuant to Rule 12b-1 of the 1940 Act. GFD, in turn, will pay the Service Provider out of its fees. GFD may, at its discretion, retain a portion of such payments to compensate itself for distribution services.
The Trust has adopted a separate Distribution and Shareholder Services Plan applicable to its C-Class shares that allows the Funds to pay annual distribution and service fees of 1.00% of the Funds’ C-Class shares average daily net assets. The annual 0.25% service fee compensates a shareholder’s financial adviser for providing ongoing services to the shareholder. The annual distribution fee of 0.75% reimburses GFD for paying the shareholder’s financial adviser an ongoing sales commission. GFD advances the first year’s service and distribution fees to the financial adviser. GFD retains the service and distribution fees on accounts with no authorized dealer of record.
For the period ended September 30, 2016, GFD retained sales charges of $145,031 relating to sales of A-Class shares of the Trust.
84 | THE RYDEX FUNDS SEMI-ANNUAL REPORT | |
NOTES TO FINANCIAL STATEMENTS (Unaudited)(continued) |
Certain trustees and officers of the Trust are also officers of GI and GFD.
4. Fair Value Measurement
In accordance with U.S. GAAP, fair value is defined as the price that the Funds would receive to sell an investment or pay to transfer a liability in an orderly transaction with an independent buyer in the principal market, or in the absence of a principal market, the most advantageous market for the investment or liability. U.S. GAAP establishes a three-tier fair value hierarchy based on the types of inputs used to value assets and liabilities and requires corresponding disclosure. The hierarchy and the corresponding inputs are summarized below:
Level 1 — | quoted prices in active markets for identical assets or liabilities. |
Level 2 — | significant other observable inputs (for example quoted prices for securities that are similar based on characteristics such as interest rates, prepayment speeds, credit risk, etc.). |
Level 3 — | significant unobservable inputs based on the best information available under the circumstances, to the extent observable inputs are not available, which may include assumptions. |
The types of inputs available depend on a variety of factors, such as the type of security and the characteristics of the markets in which it trades, if any. Fair valuation determinations that rely on fewer or no observable inputs require greater judgment. Accordingly, fair value determinations for Level 3 securities require the greatest amount of judgment.
The inputs or methodologies used for valuing securities are not necessarily an indication of the risk associated with investing in those securities. The suitability of the techniques and sources employed to determine fair valuation are regularly monitored and subject to change.
5. Repurchase Agreements
The Funds transfer uninvested cash balances into a single joint account, the daily aggregate balance of which is invested in one or more repurchase agreements collateralized by obligations of the U.S. Treasury and U.S. government agencies. The collateral is in the possession of the Funds’ custodian and is evaluated to ensure that its market value exceeds, at a minimum, 102% of the original face amount of the repurchase agreements. Each Fund holds a pro rata share of the collateral based on the dollar amount of the repurchase agreement entered into by each Fund.
At September 30, 2016, the repurchase agreements in the joint account were as follows:
Counterparty and
Terms of Agreement | | | Face Value | | | Repurchase Price | | | Collateral | | | Par Value | | | Fair Value | |
HSBC Securities, Inc. | | | | | | | | | U.S. Treasury Strips | | | | | | | |
0.38% | | | | | | | | | 0.00% | | | | | | | |
Due 10/03/16 | | | $ | 469,487,376 | | | $ | 469,502,243 | | | 11/15/39 | | | $ | 803,943,000 | | | $ | 478,877,146 | |
| | | | | | | | | | | | | | | | | | | | | |
Royal Bank of Canada | | | | | | | | | | | U.S. Treasury Notes | | | | | | | | | |
0.36% | | | | | | | | | | | 1.38% - 1.50% | | | | | | | | | |
Due 10/03/16 | | | | 432,837,985 | | | | 432,850,971 | | | 05/31/20 | | | | 370,488,200 | | | | 380,230,860 | |
| | | | | | | | | | | | U.S. TIP Notes | | | | | | | | | |
| | | | | | | | | | | | 0.13% - 0.25% | | | | | | | | | |
| | | | | | | | | | | | 07/15/22 - 01/15/25 | | | | 57,946,000 | | | | 61,263,965 | |
| | | | | | | | | | | | | | | | 428,434,200 | | | | 441,494,825 | |
In the event of counterparty default, the Funds have the right to collect the collateral to offset losses incurred. There is potential loss to the Funds in the event the Funds are delayed or prevented from exercising their rights to dispose of the collateral securities, including the risk of a possible decline in the value of the underlying securities during the period while the Funds seek to assert their rights. The Funds’ investment adviser, acting under the supervision of the Board, reviews the value of the collateral and the creditworthiness of those banks and dealers with which the Funds enter into repurchase agreements to evaluate potential risks.
| | THE RYDEX FUNDS SEMI-ANNUAL REPORT | 85 |
NOTES TO FINANCIAL STATEMENTS (Unaudited)(continued) |
6. Offsetting
In the normal course of business, the Funds enter into transactions subject to enforceable master netting arrangements or other similar arrangements. Generally, the right to offset in those agreements allows the Funds to counteract the exposure to a specific counterparty with collateral received from or delivered to that counterparty based on the terms of the arrangements. These arrangements provide for the right to liquidate upon the occurrence of an event of default, credit event upon merger or additional termination event.
In order to better define their contractual rights and to secure rights that will help the Funds mitigate their counterparty risk, the Funds may enter into an International Swaps and Derivatives Association, Inc. Master Agreement (“ISDA Master Agreement”) or similar agreement with their derivative contract counterparties. An ISDA Master Agreement is a bilateral agreement between a Fund and a counterparty that governs OTC derivatives, including foreign exchange contracts, and typically contains, among other things, collateral posting terms and netting provisions in the event of a default and/or termination event. The provisions of the ISDA Master Agreement typically permit a single net payment in the event of a default (close-out netting) or similar event, including the bankruptcy or insolvency of the counterparty.
For derivatives traded under an ISDA Master Agreement, the collateral requirements are typically calculated by netting the mark-to-market amount for each transaction under such agreement and comparing that amount to the value of any collateral currently pledged by the Funds and the counterparty. For financial reporting purposes, cash collateral that has been pledged to cover obligations of the Funds and cash collateral received from the counterparty, if any, are reported separately on the Statements of Assets and Liabilities as segregated cash with broker/receivable for variation margin, or payable for swap settlement/variation margin. Generally, the amount of collateral due from or to a counterparty must exceed a minimum transfer amount threshold (e.g., $300,000) before a transfer is required to be made. To the extent amounts due to the Funds from their counterparties are not fully collateralized, contractually or otherwise, the Funds bear the risk of loss from counterparty nonperformance. The Funds attempt to mitigate counterparty risk by only entering into agreements with counterparties that they believe to be of good standing and by monitoring the financial stability of those counterparties.
For financial reporting purposes, the Funds do not offset derivative assets and derivative liabilities that are subject to netting arrangements in the Statements of Assets and Liabilities.
The following tables present derivative financial instruments and secured financing transactions that are subject to enforceable netting arrangements and offset in the Statements of Assets and Liabilities in conformity with U.S. GAAP:
| | | | | | | | | | | | | Gross Amounts Not Offset
in the Statements of
Assets and Liabilities | | | | |
Fund | Instrument | | Gross Amounts of Recognized Assets1 | | | Gross Amounts Offset In the Statements of Assets and Liabilities | | | Net Amount of Assets Presented on the Statements of Assets and Liabilities | | | Financial Instruments | | | Cash Collateral Received | | | Net
Amount | |
Strengthening Dollar 2x Strategy Fund | Swap currency contracts | | $ | 1,253 | | | $ | — | | | $ | 1,253 | | | $ | — | | | $ | — | | | $ | 1,253 | |
Weakening Dollar 2x Strategy Fund | Swap currency contracts | | | 1,507 | | | | — | | | | 1,507 | | | | — | | | | — | | | | 1,507 | |
1 | Exchange-traded futures are excluded from these reported amounts. |
7. Federal Income Tax Information
The Funds intend to comply with the provisions of Subchapter M of the Internal Revenue Code applicable to regulated investment companies and will distribute substantially all taxable net investment income and capital gains sufficient to relieve the Funds from all, or substantially all, federal income, excise and state income taxes. Therefore, no provision for federal or state income tax is required.
86 | THE RYDEX FUNDS SEMI-ANNUAL REPORT | |
NOTES TO FINANCIAL STATEMENTS (Unaudited)(continued) |
Tax positions taken or expected to be taken in the course of preparing the Funds’ tax returns are evaluated to determine whether the tax positions are “more-likely-than-not” of being sustained by the applicable tax authority. Tax positions not deemed to meet the more-likely-than-not threshold would be recorded as a tax benefit or expense in the current year. Management has analyzed the Funds’ tax positions taken, or to be taken, on federal income tax returns for all open tax years, and has concluded that no provision for income tax is required in the Funds’ financial statements. The Funds’ federal tax returns are subject to examination by the Internal Revenue Service for a period of three years after they are filed.
At September 30, 2016, the cost of securities for federal income tax purposes, the aggregate gross unrealized gain for all securities for which there was an excess of value over tax cost, and the aggregate gross unrealized loss for all securities for which there was an excess of tax cost over value were as follows:
Fund | | Tax
Cost | | | Tax
Unrealized
Gain | | | Tax
Unrealized
Loss | | | Net
Unrealized
Gain (Loss) | |
S&P 500® Pure Growth Fund | | $ | 76,808,620 | | | $ | 17,659,521 | | | $ | (667,090 | ) | | $ | 16,992,431 | |
S&P 500® Pure Value Fund | | | 42,357,525 | | | | 5,011,007 | | | | (175,756 | ) | | | 4,835,251 | |
S&P MidCap 400® Pure Growth Fund | | | 117,123,266 | | | | 12,274,014 | | | | (6,887,135 | ) | | | 5,386,879 | |
S&P MidCap 400® Pure Value Fund | | | 27,008,028 | | | | 1,552,579 | | | | (267,730 | ) | | | 1,284,849 | |
S&P SmallCap 600® Pure Growth Fund | | | 26,431,650 | | | | 2,073,135 | | | | (250,144 | ) | | | 1,822,991 | |
S&P SmallCap 600® Pure Value Fund | | | 34,737,825 | | | | — | | | | (2,333,752 | ) | | | (2,333,752 | ) |
Europe 1.25x Strategy Fund | | | 3,479,025 | | | | 69,526 | | | | (41,624 | ) | | | 27,902 | |
Japan 2x Strategy Fund | | | 2,142,340 | | | | 1,469 | | | | (5 | ) | | | 1,464 | |
Strengthening Dollar 2x Strategy Fund | | | 21,261,666 | | | | 15,474 | | | | (1,753 | ) | | | 13,721 | |
Weakening Dollar 2x Strategy Fund | | | 2,609,223 | | | | 2,837 | | | | (290 | ) | | | 2,547 | |
8. Securities Transactions
For the period ended September 30, 2016, the cost of purchases and proceeds from sales of investment securities, excluding government securities, short-term investments and derivatives, were as follows:
Fund | | Purchases | | | Sales | |
S&P 500® Pure Growth Fund | | $ | 99,573,487 | | | $ | 166,947,850 | |
S&P 500® Pure Value Fund | | | 95,802,828 | | | | 133,943,248 | |
S&P MidCap 400® Pure Growth Fund | | | 53,543,515 | | | | 78,564,194 | |
S&P MidCap 400® Pure Value Fund | | | 142,571,926 | | | | 170,192,622 | |
S&P SmallCap 600® Pure Growth Fund | | | 88,249,891 | | | | 97,388,116 | |
S&P SmallCap 600® Pure Value Fund | | | 208,525,910 | | | | 196,828,074 | |
Europe 1.25x Strategy Fund | | | 33,326,013 | | | | 35,574,347 | |
Japan 2x Strategy Fund | | | 5,171,559 | | | | 5,411,000 | |
Strengthening Dollar 2x Strategy Fund | | | 1,458,385 | | | | 7,260,000 | |
Weakening Dollar 2x Strategy Fund | | | 468,747 | | | | 2,605,000 | |
The Funds are permitted to purchase or sell securities from or to certain affiliated funds under specified conditions outlined in procedures adopted by the Board of the Trust. The procedures have been designed to ensure that any purchase or sale of securities by a Fund from or to another fund or portfolio that is or could be considered an affiliate by virtue of having a common investment adviser (or affiliated investment advisers), common Trustees and/or common officers complies with Rule 17a-7 of the 1940 Act. Further, as defined under these procedures, each transaction is effected at the current market price to save costs, where permissible. For the period ended September 30, 2016, the Funds engaged in purchases and sales of securities, pursuant to Rule 17a-7 of the 1940 Act, as follows:
| | THE RYDEX FUNDS SEMI-ANNUAL REPORT | 87 |
NOTES TO FINANCIAL STATEMENTS (Unaudited)(continued) |
Fund | | Purchases | | | Sales | | | Realized
Gain (Loss) | |
S&P 500® Pure Value Fund | | $ | 16,270,660 | | | $ | 19,479,907 | | | $ | 353,524 | |
S&P 500® Pure Growth Fund | | | 15,504,800 | | | | 22,561,318 | | | | 1,279,953 | |
S&P MidCap 400® Pure Value Fund | | | 12,008,988 | | | | 19,524,018 | | | | 377,799 | |
S&P MidCap 400® Pure Growth Fund | | | 5,754,350 | | | | 9,724,217 | | | | (408,855 | ) |
S&P SmallCap 600® Pure Value Fund | | | 3,110,495 | | | | 2,426,457 | | | | (50,828 | ) |
S&P SmallCap 600® Pure Growth Fund | | | 4,755,627 | | | | 6,584,091 | | | | 155,915 | |
Europe 1.25x Strategy Fund | | | 2,347,468 | | | | 1,757,777 | | | | 77,518 | |
9. Affiliated Transactions
Investments representing 5% or more of the outstanding voting shares of a portfolio company of a fund, or control of or by, or common control under GI, result in that portfolio company being considered an affiliated company of such fund, as defined in the 1940 Act.
The Funds may invest in the Guggenheim Strategy Funds Trust consisting of Guggenheim Strategy Fund I, Guggenheim Strategy Fund II, Guggenheim Strategy Fund III, and Guggenheim Variable Insurance Strategy Fund III (collectively, the “Cash Management Funds”), open-end management investment companies managed by GI. The Cash Management Funds, which launched on March 11, 2014, are offered as cash management options only to mutual funds, trusts, and other accounts managed by GI and/or its affiliates, and are not available to the public. The Cash Management Funds pay no investment management fees. The Cash Management Funds’ annual report on Form N-CSR dated September 30, 2015, is available publicly or upon request. This information is available from the EDGAR database on the SEC’s website at http://www.sec.gov/Archives/edgar/data/1601445/000089180415000857/gug63224-ncsr.htm.
Transactions during the period ended September 30, 2016, in which the portfolio company is an “affiliated person,” were as follows:
Affiliated issuers by Fund | | Value
03/31/16 | | | Additions | | | Reductions | | | Value
09/30/16 | | | Shares
09/30/16 | | | Investment
Income | | | Realized
Gain (Loss) | |
Europe 1.25x Strategy Fund | | | | | | | | | | | | | | | | | | | | | |
Guggenheim Strategy Fund I | | $ | 829,184 | | | $ | 1,744,163 | | | $ | (2,345,000 | ) | | $ | 231,262 | | | | 9,254 | | | $ | 4,650 | | | $ | 2,863 | |
Guggenheim Strategy Fund II | | | — | | | | 1,540,045 | | | | (1,310,000 | ) | | | 231,746 | | | | 9,292 | | | | 1,959 | | | | 437 | |
| | | | 829,184 | | | | 3,284,208 | | | | (3,655,000 | ) | | | 463,008 | | | | | | | | 6,609 | | | | 3,300 | |
| | | | | | | | | | | | | | | | | | | | | | | | | | | | | |
Japan 2x Strategy Fund | | | | | | | | | | | | | | | | | | | | | | | | | | | | |
Guggenheim Strategy Fund I | | | 731,860 | | | | 2,976,513 | | | | (3,338,000 | ) | | | 398,066 | | | | 15,929 | | | | 3,598 | | | | 1,761 | |
Guggenheim Strategy Fund II | | | — | | | | 2,145,045 | | | | (1,773,000 | ) | | | 398,394 | | | | 15,974 | | | | 2,431 | | | | 361 | |
| | | | 731,860 | | | | 5,121,558 | | | | (5,111,000 | ) | | | 796,460 | | | | | | | | 6,029 | | | | 2,122 | |
| | | | | | | | | | | | | | | | | | | | | | | | | | | | | |
Strengthening Dollar 2x Strategy Fund | | | | | | | | | | | | | | | | | | | | | | | | | | | | |
Guggenheim Strategy Fund I | | | 4,256,077 | | | | 603,659 | | | | (3,530,000 | ) | | | 1,347,213 | | | | 53,910 | | | | 16,802 | | | | 5,170 | |
Guggenheim Strategy Fund II | | | 4,198,744 | | | | 854,726 | | | | (3,730,000 | ) | | | 1,348,310 | | | | 54,062 | | | | 23,813 | | | | 3,361 | |
| | | | 8,454,821 | | | | 1,458,385 | | | | (7,260,000 | ) | | | 2,695,523 | | | | | | | | 40,615 | | | | 8,531 | |
| | | | | | | | | | | | | | | | | | | | | | | | | | | | | |
Weakening Dollar 2x Strategy Fund | | | | | | | | | | | | | | | | | | | | | | | | | | | | |
Guggenheim Strategy Fund I | | | 1,227,757 | | | | 236,037 | | | | (1,295,000 | ) | | | 170,438 | | | | 6,820 | | | | 4,584 | | | | 3,628 | |
Guggenheim Strategy Fund II | | | 1,238,749 | | | | 235,352 | | | | (1,310,000 | ) | | | 170,382 | | | | 6,832 | | | | 5,757 | | | | 5,608 | |
| | | | 2,466,506 | | | | 471,389 | | | | (2,605,000 | ) | | | 340,820 | | | | | | | | 10,341 | | | | 9,236 | |
10. Line of Credit
The Trust, along with other affiliated trusts, secured an uncommitted $75,000,000 line of credit from U.S. Bank, N.A., which expires June 11, 2017. This line of credit is reserved for emergency or temporary purposes. Borrowings, if any, under this arrangement bear interest equal to the Prime Rate, minus 2%, which shall be paid monthly, averaging 1.25% for the period ended September 30, 2016. The Funds did not have any borrowings outstanding under this agreement at September 30, 2016.
88 | THE RYDEX FUNDS SEMI-ANNUAL REPORT | |
NOTES TO FINANCIAL STATEMENTS (Unaudited)(continued) |
The average daily balances borrowed for the period ended September 30, 2016, were as follows:
Fund | | Average Daily Balance | |
S&P 500® Pure Growth Fund | | $ | 21,395 | |
S&P MidCap 400® Pure Growth Fund | | | 17,721 | |
S&P MidCap 400® Pure Value Fund | | | 4,524 | |
S&P SmallCap 600® Pure Growth Fund | | | 12,223 | |
S&P SmallCap 600® Pure Value Fund | | | 34,670 | |
11. Legal Proceedings
Tribune Company
Rydex Series Funds has been named as a defendant and a putative member of the proposed defendant class of shareholders in the case entitled Kirschner v. FitzSimons, No. 12-2652 (S.D.N.Y.) (formerly Official Committee of Unsecured Creditors of Tribune Co. v. FitzSimons, Adv. Pro. No. 10-54010 (Bankr. D. Del.)) (the “FitzSimons action”), as a result of ownership by certain series of the Rydex Series Funds of shares in the Tribune Company (“Tribune”) in 2007, when Tribune effected a leveraged buyout transaction (“LBO”) by which Tribune converted to a privately-held company. In his complaint, the plaintiff has alleged that, in connection with the LBO, Tribune insiders and shareholders were overpaid for their Tribune stock using financing that the insiders knew would, and ultimately did, leave Tribune insolvent. The plaintiff has asserted claims against certain insiders, major shareholders, professional advisers, and others involved in the LBO. The plaintiff is also attempting to obtain from former Tribune shareholders, including the Rydex Series Funds, the proceeds they received in connection with the LBO.
In June 2011, a group of Tribune creditors filed multiple actions against former Tribune shareholders involving state law constructive fraudulent conveyance claims arising out of the 2007 LBO (the “SLCFC actions”). Rydex Series Funds has been named as a defendant in one or more of these suits. In those actions, the creditors seek to recover from Tribune’s former shareholders the proceeds received in connection with the 2007 LBO.
The FitzSimons action and the SLCFC actions have been consolidated with the majority of the other Tribune LBO-related lawsuits in a multidistrict litigation proceeding captioned In re Tribune Company Fraudulent Conveyance Litig., No. 11-md-2696 (S.D.N.Y.) (the “MDL Proceeding”).
On September 23, 2013, the District Court granted the defendants’ omnibus motion to dismiss the SLCFC actions, on the basis that the creditors lacked standing. On September 30, 2013, the creditors filed a notice of appeal of the September 23 order. On October 28, 2013, the defendants filed a joint notice of cross-appeal of that same order.
On March 29, 2016, the U.S. Court of Appeals for the Second Circuit issued its opinion on the appeal of the SLCFC actions. The appeals court affirmed the district court’s dismissal of those lawsuits, but on different grounds than the district court. The appeals court held that while the plaintiffs have standing under the U.S. Bankruptcy Code, their claims were preempted by Section 546(e) of the Bankruptcy Code—the statutory safe harbor for settlement payments. On April 12, 2016, the Plaintiffs in the SLCFC actions filed a petition seeking rehearing en banc before the appeals court. On July 22, 2016, the appeals court denied the petition. On September 9, 2016, the plaintiffs filed a petition for writ of certiorari in the U.S. Supreme Court challenging the Second Circuit’s decision that the safe harbor of Section 546(e) applied to their claims. The shareholder defendants, including the Funds, filed a joint brief in opposition to the petition for certiorari on October 24, 2016. The Supreme Court has not yet granted or denied the petition for certiorari.
On May 23, 2014, the defendants filed motions to dismiss the FitzSimons action, including a global motion to dismiss Count I, which is the claim brought against former Tribune shareholders for intentional fraudulent conveyance under U.S. federal law. The Court has not yet issued a decision on any of these motions.
| | THE RYDEX FUNDS SEMI-ANNUAL REPORT | 89 |
NOTES TO FINANCIAL STATEMENTS (Unaudited)(continued) |
None of these lawsuits alleges any wrongdoing on the part of Rydex Series Funds. The following series of Rydex Series Funds held shares of Tribune and tendered these shares as part of Tribune’s LBO: Nova Fund, S&P 500® Pure Value Fund, Multi-Cap Core Equity Fund, S&P 500® Fund, Multi-Hedge Strategies Fund and Hedged Equity Fund (the “Funds”). The value of the proceeds received by the foregoing Funds was $28,220, $109,242, $9,860, $3,400, $1,181,160, and $10,880, respectively. At this stage of the proceedings, Rydex Series Funds is not able to make a reliable predication as to the outcome of these lawsuits or the effect, if any, on a Fund’s net asset value.
Lyondell Chemical Company
In December 2011, Rydex Series Funds was named as a defendant in Weisfelner, as Trustee of the LB Creditor Trust, v. Fund 1 (In re Lyondell Chemical Co.), Adv. Pro. No. 10-4609 (Bankr. S.D.N.Y.) (the “Creditor Trust Action”). Its funds may also be putative members of the proposed defendant classes in Weisfelner, as Trustee of the LB Litigation Trust v. A. Holmes & H. Holmes TTEE (In re Lyondell Co.), Adv. Pro. No. 10-5525 (Bankr. S.D.N.Y.) (the “Litigation Trust Action”) and Weisfelner, as Trustee of the LB Creditor Trust, v. Reichman (In re Lyondell Chemical Co.), Adv. Pro. No. 12-1570 (Bankr. S.D.N.Y.).
Similar to the claims made in the Tribune matter, the Weisfelner complaints seek to have set aside and recovered as fraudulent transfers from former Lyondell Chemical Company (“Lyondell”) shareholders the consideration paid to them pursuant to the cash out merger of Lyondell shareholders in connection with the combination of Lyondell and Basell AF in 2007. Lyondell filed for bankruptcy in 2008. The Creditor Trust Action and Reichman allege claims against the former Lyondell shareholders under state law for both constructive fraudulent transfer and intentional fraudulent transfer. The Litigation Trust Action alleges a claim against the former Lyondell shareholders under federal law for intentional fraudulent transfer.
On April 7, 2014, the plaintiff filed a Third Amended Complaint in the Creditor Trust Action, a Second Amended Complaint in the Litigation Trust Action, and an Amended Complaint in Reichman.
On May 8, 2014, the plaintiff in the Litigation Trust Action filed a motion to certify a defendant class generally comprised of all former Lyondell shareholders that received proceeds in exchange for their shares in the 2007 merger transaction.
On July 30, 2014, the defendants filed a motion to dismiss these lawsuits. The Bankruptcy Court held oral argument on the motion to dismiss and on the motion for class certification on January 14 and January 15, 2015. On September 15, 2015, the Bankruptcy Court denied the motion for class certification without prejudice to the plaintiff’s right to file a renewed motion. On November 18, 2015, the Bankruptcy Court granted the defendants’ motion to dismiss the intentional fraudulent transfer claims in the Creditor Trust Action, the Litigation Trust Action, and in Reichman, but denied the motion to dismiss the constructive fraudulent transfer claims in the Creditor Trust Action and in Reichman. The Bankruptcy Court entered final judgment dismissing the Litigation Trust Action, but the plaintiff appealed the dismissal to the U.S. District Court for the Southern District of New York.
On July 27, 2016, the District Court reversed the Bankruptcy Court and reinstated the federal law intentional fraudulent transfer claim in the Litigation Trust Action and remanded to the Bankruptcy Court for further proceedings. The District Court found that the fraudulent intent that mattered was that of Lyondell’s CEO, not its board, because the CEO’s intent could be imputed to Lyondell under Delaware law agency principles. The District Court did note, however, that plaintiff faces a high standard for proving “actual intent” to harm creditors, and that it remains to be seen whether plaintiff will be able to make this showing. On August 11, 2016, the shareholder defendants filed a motion for reconsideration and/or to certify an interlocutory appeal of the District Court’s opinion. On October 5, 2016, the District Court denied the motion for reconsideration and/or to certify an interlocutory appeal. In light of this ruling, the federal intentional fraudulent conveyance claim will move forward before the Bankruptcy Court, but a schedule for that case has not yet been set.
On May 4, 2016, the defendants filed a motion to dismiss, or in the alternative, for a stay of, the Creditor Trust Action and Reichman in light of the U.S. Court of Appeals for the Second Circuit’s opinion in the appeal of the Tribune SLCFC actions. On July 20, 2016, the Bankruptcy Court issued a report and recommendation granting the defendants’ motion to dismiss. The U.S. District Court for the Southern District of New York has not yet accepted the Bankruptcy Court’s recommendation or entered a final judgment.
90 | THE RYDEX FUNDS SEMI-ANNUAL REPORT | |
NOTES TO FINANCIAL STATEMENTS (Unaudited)(concluded) |
These lawsuits do not allege any wrongdoing on the part of Rydex Series Funds. The following series of Rydex Series Funds received cash proceeds from the cash out merger in the following amounts: Basic Materials Fund - $1,725,168; Long Short Equity Fund f/k/a U.S. Long Short Momentum Fund - $2,193,600; Global 130/30 Strategy Fund - $37,920; Hedged Equity Fund - $1,440; and Multi-Hedge Strategies Fund - $1,116,480. At this stage of the proceedings, Rydex Series Funds is not able to make a reliable predication as to the outcome of these lawsuits or the effect, if any, on a Fund’s net asset value.
12. Subsequent Event
Share Splits
Share splits occurred for the following Funds at the close of business:
Fund | Effective Date | Split Type |
S&P 500® Pure Value Fund | October 28, 2016 | Two-for-One Share Split |
Europe 1.25x Strategy Fund | October 28, 2016 | One-for-Six Reverse Share Split |
Japan 2x Strategy Fund | November 4, 2016 | One-for-Four Reverse Share Split |
Weakening Dollar 2x Strategy Fund | October 28, 2016 | One-for-Six Reverse Share Split |
The effect of these transactions was to multiply the number of outstanding shares of the S&P 500® Pure Value Fund by its split ratio, resulting in a corresponding decrease in the NAV and to divide the number of outstanding shares of the Europe 1.25x Strategy Fund, Japan 2x Strategy Fund and the Weakening Dollar 2x Strategy Fund by their respective reverse split ratio, resulting in a corresponding increase in the NAV. The share transactions presented in the Statements of Changes in net assets and the per share data in the Financial Highlights for each of the periods presented through September 30, 2016, have been restated to reflect these respective share splits. There were no changes in net assets, results of operations or total return as a result of these transactions.
Portfolio Securities Loaned
Effective October 6, 2016, each Fund may lend portfolio securities to certain creditworthy borrowers, including the Funds’ securities lending agent. The loans would be collateralized at all times by cash and/or high grade debt obligations in an amount at least equal to 102% of the market value of securities loaned as determined at the close of business on the preceding business day. The cash collateral received would be held in a separately managed account established for each respective Fund and maintained by the lending agent exclusively for the investment of securities lending cash collateral on behalf of each Fund. The separately managed accounts will invest in short-term investments valued at amortized cost, which approximates market value. Each Fund will receive compensation for lending securities from interest or dividends earned on the cash, cash equivalents or U.S. government securities held as collateral, net of fee rebates paid to the borrower plus reasonable administrative and custody fees paid to the lending agent. Such compensation will be accrued daily and payable to the Fund monthly. The dividend and interest income earned on the securities loaned will be accounted for in the same manner as other dividend and interest income. The borrower will pay to the Funds an amount equal to any dividends or interest received on loaned securities. These payments from the borrower are not eligible for reduced tax rates as “qualified dividend income” under the Jobs and Growth Tax Reconciliation Act of 2003. The Funds would retain all or a portion of the interest received on investment of cash collateral or receives a fee from the borrower.
Although the collateral mitigates risk, the Funds could experience a delay in recovering its securities and a possible loss of income or value if the borrower fails to return the securities. The Funds have the right under the securities lending agreement to recover the securities from the borrower on demand.
| | THE RYDEX FUNDS SEMI-ANNUAL REPORT | 91 |
OTHER INFORMATION (Unaudited) |
Proxy Voting Information
A description of the policies and procedures that the Trust uses to determine how to vote proxies relating to securities held in the Funds’ portfolios is available, without charge and upon request, by calling 800.820.0888. This information is also available from the EDGAR database on the SEC’s website at https://www.sec.gov.
Information regarding how the Funds voted proxies relating to portfolio securities during the most recent 12-month period ended June 30 is available without charge, upon request, by calling 800.820.0888. This information is also available from the EDGAR database on the SEC’s website at https://www.sec.gov.
Sector Classification
Information in the Schedule of Investments is categorized by sectors using sector-level Classifications defined by the Bloomberg Industry Classification System, a widely recognized industry classification system provider. Each Fund’s registration statement has investment policies relating to concentration in specific sectors/industries. For purposes of these investment policies, the Funds usually classify sectors/industries based on industry-level Classifications used by widely recognized industry classification system providers such as Bloomberg Industry Classification System, Global Industry Classification Standards and Barclays Global Classification Scheme.
Quarterly Portfolio Schedules Information
The Trust files its complete schedule of portfolio holdings with the SEC for the first and third quarters of each fiscal year on Form N-Q, which are available on the SEC’s website at https://www.sec.gov. The Funds’ Forms N-Q may be reviewed and copied at the SEC’s Public Reference Room in Washington, DC, and that information on the operation of the Public Reference Room may be obtained by calling 800-SEC-0330. Copies of the portfolio holdings are also available to shareholders, without charge and upon request, by calling 800.820.0888.
Board Considerations in Approving the Continuation of the Investment Advisory Agreement
The Board of Trustees (the “Board”) of Rydex Series Funds (the “Trust”), including the Trustees who are not “interested persons,” as defined by the Investment Company Act of 1940, of the Trust (“Independent Trustees”), attended an in-person meeting held on May 19, 2016, called for the purpose of, among other things, the consideration of, and voting on, the approval and continuation of the investment advisory agreement (the “Investment Advisory Agreement”) between the Trust and the Advisor applicable to each series of the Trust (each, a “Fund” and, collectively, the “Funds”). The Board unanimously approved the continuation of the Investment Advisory Agreement for an additional one-year period based on the Board’s review of qualitative and quantitative information provided by the Advisor. The Board had previously considered information pertaining to the renewal of the Investment Advisory Agreement at an in-person meeting held on April 26, 2016 (together, with the May 19 meeting, the “Meetings”).
Prior to reaching the conclusion to approve the continuation of the Investment Advisory Agreement, the Independent Trustees requested and obtained from the Advisor such information as the Independent Trustees deemed reasonably necessary to evaluate the Investment Advisory Agreement. In addition, the Board received a memorandum from Fund counsel regarding the responsibilities of the Board with respect to the approval of investment advisory agreements and participated in question and answer sessions with representatives of the Advisor. The Independent Trustees also carefully considered information that they had received throughout the year as part of their regular oversight of the Funds. At the Meetings, the Board obtained and reviewed a wide variety of information, including certain comparative information regarding the Funds’ fees, expenses, and performance relative to the fees, expenses, and performance of other comparable funds (the “FUSE reports”). The Independent Trustees carefully evaluated this information, met in executive session outside the presence of fund management, and were advised by independent legal counsel with respect to their deliberations.
At the Meetings, the Board, including the Independent Trustees, evaluated a number of factors, including among others: (a) the nature, extent and quality of the Advisor’s investment advisory and other services; (b) the Advisor’s investment management personnel; (c) the Advisor’s operations and financial condition; (d) the Advisor’s brokerage practices (including any soft dollar arrangements) and the variety and complexity of its investment strategies; (e) a comparison of the Funds’ advisory fees to the advisory fees charged to comparable funds or accounts, giving special attention to the existence of economies of scale and the absence of breakpoints in these fees and the Advisor’s rationale for not providing for breakpoints at this point in time; (f) each Fund’s overall fees and operating expenses compared with those of similar funds; (g) the level of the Advisor’s profitability from its Fund-related operations; (h) the Advisor’s compliance processes and systems; (i) the Advisor’s compliance
92 | THE RYDEX FUNDS SEMI-ANNUAL REPORT | |
OTHER INFORMATION (Unaudited)(continued) |
policies and procedures; (j) the Advisor’s reputation, expertise and resources in the financial markets; and (k) Fund performance compared with that of similar funds and/or appropriate benchmarks. In its deliberations, the Trustees did not identify any single piece of information that was all-important or controlling, noting that each Trustee could attribute different weights to the various factors considered.
Based on the Board’s deliberations at the Meetings, the Board, including all of the Independent Trustees, unanimously: (a) concluded that the terms of the Investment Advisory Agreement are fair and reasonable; (b) concluded that the Advisor’s fees are reasonable in light of the services that it provides to the Funds; and (c) agreed to approve and continue the Investment Advisory Agreement based upon the following considerations, among others:
| | ● | Nature, Extent and Quality of Services Provided by the Advisor. The Board evaluated, among other things, the Advisor’s business, financial resources, quality and quantity of personnel, experience, past performance, the variety and complexity of its investment strategies (including the extent to which the Funds use derivatives), Fund risk management process, brokerage practices, and the adequacy of its compliance systems and processes, proxy voting policies and practices, and cybersecurity programs. The Board reviewed the scope of services to be provided by the Advisor under the Investment Advisory Agreement and noted that there would be no significant differences between the scope of services required to be provided by the Advisor for the past year and the scope of services required to be provided during the upcoming year. The Board also considered the Advisor’s representations to the Board that the Advisor would continue to provide investment and related services that were of materially the same quality and quantity as services provided to the Funds in the past, and whether these services are appropriate in scope and extent in light of the Funds’ operations, the competitive landscape of the investment company business and investor needs. Based on the foregoing, the Trustees determined that the approval of the Investment Advisory Agreement would enable shareholders of the Funds to receive high quality services at a cost that was appropriate and reasonable. |
| | ● | Fund Expenses and Performance of the Funds and the Advisor. The Board reviewed statistical information provided by the Advisor regarding the expense ratio components and performance of each Fund. The Advisor engaged FUSE Research Network LLC (“FUSE”), an independent, third party research provider, to prepare reports to help the Board compare the Funds’ fees, expenses, and total return performance with those of a peer group and peer universe of funds selected by FUSE. In the reports, each Fund’s expense ratio components, including actual advisory fees, waivers/reimbursements, and gross and net total expenses, are compared to those of other funds with shared key characteristics (e.g., asset size, fee structure, sector or industry investment focus) determined by FUSE to comprise a Fund’s applicable peer group. The Board considered the Advisor’s representation that it found the peer groups compiled by FUSE to be appropriate, but also acknowledged the existence of certain differences between the Funds and their peer funds (e.g., specific differences in principal investment strategies and, if applicable, tradability) that should be reviewed in context. With respect to tradability, in particular, the Board considered that non-tradable funds incur lower expense ratios than tradable funds because non-tradable funds experience less shareholder activity and lower transaction volumes than tradable funds. The statistical information related to the performance of each Fund included three-month and one-, three-, and five-year performance for the Fund compared to that of its peers. Based on the foregoing, the Board determined that the proposed advisory fees paid by the Funds are reasonable in relation to the nature and quality of the services provided by the Advisor. |
| | ● | Costs of Services Provided to the Funds and Profits Realized by the Advisor and its Affiliates. The Board reviewed information about the profitability of the Funds to the Advisor based on the advisory fees payable under the current Investment Advisory Agreement for the last calendar year. The Board analyzed the Funds’ expenses, including the investment advisory fees paid to the Advisor, and reviewed the FUSE reports. The Board also reviewed information regarding the direct revenue received by the Advisor and ancillary revenue, if any, received by the Advisor and/or its affiliates in connection with the services provided to the Funds by the Advisor and/or its affiliates. The Board also discussed the Advisor’s profit margin, including the expense allocation methodology used in the Advisor’s profitability analysis. Based on the foregoing, the Board determined that the profit to the Advisor on the fees paid by the Funds is not excessive in view of the nature and quality of the services provided by the Advisor. |
| | ● | Economies of Scale. The Board considered the absence of breakpoints in the Advisor’s fee schedule and reviewed information regarding the extent to which economies of scale or other efficiencies may result from increases in the Funds’ asset levels. In light of the relatively small size of many of the Funds and the fact that the size of individual Funds in the complex often increase and decrease significantly due to the unlimited trading that is permitted among most of the Funds in the complex, the Board concluded that the Funds have not yet achieved sufficient asset levels to realize meaningful economies of scale. The Board noted that it intends to continue to monitor fees as each Fund grows in size and assess whether fee breakpoints may be warranted. |
| | THE RYDEX FUNDS SEMI-ANNUAL REPORT | 93 |
OTHER INFORMATION (Unaudited)(concluded) |
| | ● | Other Benefits to the Advisor and/or its Affiliates. In addition to evaluating the Advisor’s services, the Board considered the nature and amount of other benefits to be received by the Advisor and its affiliates as a result of their relationship with the Fund, including any soft dollar usage by the Advisor and any intangible benefits. In particular, the Board considered the nature, extent, quality, and cost of certain administrative, distribution, and shareholder services performed by the Advisor’s affiliates under separate agreements and the Distribution and Shareholders Services Plan pursuant to Rule 12b-1 of the 1940 Act. In light of the costs of providing services pursuant to the separate agreements as well as the Advisor’s and its affiliates’ commitment to the Funds, the Board concluded the ancillary benefits the Advisor and its affiliates received were reasonable. |
On the basis of the information provided to it and its evaluation of that information, the Board, including the Independent Trustees, concluded that the terms of the Investment Advisory Agreement were reasonable, and that approval of the continuation of the Investment Advisory Agreement was in the best interests of the Funds and their shareholders.
94 | THE RYDEX FUNDS SEMI-ANNUAL REPORT | |
INFORMATION ON BOARD OF TRUSTEES AND OFFICERS (Unaudited) |
A Board of Trustees oversees the Trust, as well as other trusts of GI, in which its members have no stated term of service, and continue to serve after election until resignation. The Statement of Additional Information includes further information about Fund Trustees and Officers, and can be obtained without charge by visiting guggenheiminvestments.com or by calling 800.820.0888.
Name, Address*
and Year of Birth
of Trustee | Position(s) Held with the
Trust, Term of Office and
Length of Time Served | Principal Occupation(s)
During Past 5 Years | Number of
Portfolios in
Fund Complex
Overseen
by Trustee*** | Other
Directorships
Held by
Trustee**** |
INTERESTED TRUSTEE | | | |
Donald C. Cacciapaglia**
(1951) | Trustee from 2012 to present. | Current: President and CEO, certain other funds in the Fund Complex (2012-present); Vice Chairman, Guggenheim Investments (2010-present). Former: Chairman and CEO, Channel Capital Group, Inc. (2002-2010). | 232 | Clear Spring Life Insurance Company (2015-present); Guggenheim Partners Japan, Ltd. (2014-present); Guggenheim Partners Investment Management Holdings, LLC (2014-present); Delaware Life (2013-present); Guggenheim Life and Annuity Company (2011-present); Paragon Life Insurance Company of Indiana (2011-present). |
INDEPENDENT TRUSTEES | | | |
Angela Brock-Kyle*****
(1959) | Trustee from August 2016 to present. | Current: Founder and Chief Executive Officer, B.O.A.R.D.S (consulting firm) Former: Senior Leader, TIAA (financial services firm) (1987-2012). | 135 | Infinity Property & Casualty Corporation (2014-present). |
Corey A. Colehour
(1945) | Trustee from 1993 to present; Member of the Audit Committee from 1994 to present; Member of the Governance Committee from 2014 to present; and Member of the Investment and Performance Committee from 2014 to present. | Retired. | 135 | None. |
J. Kenneth Dalton
(1941) | Trustee from 1995 to present; Chairman and Member of the Audit Committee from 1997 to present; and Member of the Compliance and Risk Oversight Committee from 2010 to present. | Retired. | 135 | Epiphany Funds (4) (2009-present). |
| | THE RYDEX FUNDS SEMI-ANNUAL REPORT | 95 |
INFORMATION ON BOARD OF TRUSTEES AND OFFICERS (Unaudited)(continued) |
Name, Address*
and Year of Birth
of Trustee | Position(s) Held with the
Trust, Term of Office and
Length of Time Served | Principal Occupation(s)
During Past 5 Years | Number of
Portfolios in
Fund Complex
Overseen
by Trustee*** | Other
Directorships
Held by
Trustee**** |
INDEPENDENT TRUSTEES - concluded | | | |
John O. Demaret
(1940) | Vice Chairman of the Board from 2014 to present (Chairman of the Board from 2006 to 2014); Trustee and Member of the Audit Committee from 1997 to present; Chairman (since 2014) and Member of the Compliance and Risk Oversight Committee from 2010 to present; Chairman and Member of the Investment and Performance Committee from 2014 to present; and Member of the Nominating Committee from 2014 to present. | Retired. | 135 | None. |
Werner E. Keller
(1940) | Chairman of the Board from 2014 to present (Vice Chairman of the Board from 2010 to 2014); Trustee and Member of the Audit Committee from 2005 to present; and Member of the Investment and Performance Committee from 2014 to present. | Current: Founder and President, Keller Partners, LLC (investment research firm) (2005-present). | 135 | None. |
Thomas F. Lydon, Jr.
(1960) | Trustee and Member of the Audit Committee from 2005 to present; Member of the Nominating Committee from 2005 to present; and Member of the Governance Committee from 2007 to present. | Current: President, Global Trends Investments (registered investment adviser) (1996-present). | 135 | US Global Investors (GROW) (1995-present). |
Patrick T. McCarville
(1942) | Trustee from 1997 to present; Member of the Audit Committee from 1997 to present; Chairman and Member of the Nominating Committee from 2004 to present; Chairman and Member of the Governance Committee from 2007 to present; and Member of the Compliance and Risk Oversight Committee from 2014 to present. | Retired. Former: Chief Executive Officer, Par Industries, Inc., d/b/a Par Leasing (1977-2010). | 135 | None. |
Sandra G. Sponem*****
(1958) | Trustee from August 2016 to present. | Current: Senior Vice President and Chief Financial Officer, M.A. Mortenson Companies, Inc. (general contracting firm) (2007-present). | 135 | None. |
96 | THE RYDEX FUNDS SEMI-ANNUAL REPORT | |
INFORMATION ON BOARD OF TRUSTEES AND OFFICERS (Unaudited)(continued) |
Name, Address*
and Year of Birth | Position(s) Held with the
Trust, Term of Office and
Length of Time Served | Principal Occupation(s)
During Past 5 Years |
OFFICERS | | |
Donald C. Cacciapaglia
(1951) | President (2012-present). | Current: President and CEO, certain other funds in the Fund Complex (2012-present); Vice Chairman, Guggenheim Investments (2010-present). Former: Chairman and CEO, Channel Capital Group Inc. (2002-2010). |
Joanna M. Catalucci (1966) | AML Officer (2016-present) | Current: Chief Compliance Officer, certain funds in the Fund Complex (2012-present); Senior Managing Director, Guggenheim Investments (2012-present); AML Officer, certain funds in the Fund Complex (2016-present). Former: Chief Compliance Officer and Secretary, certain other funds in the Fund Complex (2008-2012); Senior Vice President & Chief Compliance Officer, Security Investors, LLC and certain affiliates (2010-2012); Chief Compliance Officer and Senior Vice President, Rydex Advisors, LLC and certain affiliates (2010-2011). |
Michael P. Byrum
(1970) | Vice President (1999-present). | Current: Senior Vice President, Security Investors, LLC (2010-present); President and Chief Investment Officer, Rydex Holdings, LLC (2008-present); Director and Chairman, Advisory Research Center, Inc. (2006-present); Manager, Guggenheim Specialized Products, LLC (2005-present). Former: Vice President, Guggenheim Distributors, LLC (2009); Director (2009-2010) and Secretary (2002-2010), Rydex Fund Services, LLC; Director (2008-2010), Chief Investment Officer (2006-2010), President (2004-2010) and Secretary (2002-2010), Rydex Advisors, LLC; Director (2008-2010), Chief Investment Officer (2006-2010), President (2004-2010) and Secretary (2002-2010), Rydex Advisors II, LLC. |
Elisabeth Miller
(1968) | Chief Compliance Officer (2012-present). | Current: CCO, certain other funds in the Fund Complex (2012-present); CCO, Security Investors, LLC (2012-present); CCO, Guggenheim Funds Investment Advisors, LLC (2012-present); Managing Director, Guggenheim Investments (2012-present); Vice President, Guggenheim Funds Distributors, LLC (2014-present). Former: CCO, Guggenheim Distributors, LLC (2009-2014); Senior Manager, Security Investors, LLC (2004-2009); Senior Manager, Guggenheim Distributors, LLC (2004-2009). |
Amy J. Lee
(1961) | Vice President (2009-present) and Secretary (2012-present). | Current: Chief Legal Officer, certain other funds in the Fund Complex (2013-present); Senior Managing Director, Guggenheim Investments (2012-present). Former: Vice President, Associate General Counsel and Assistant Secretary, Security Benefit Life Insurance Company and Security Benefit Corporation (2004-2012). |
James M. Howley
(1972) | Assistant Treasurer (2016-present). | Current: Director, Guggenheim Investments (2004-present); Assistant Treasurer, certain other funds in the Fund Complex (2006-present). Former: Manager, Mutual Fund Administration of Van Kampen Investments, Inc. (1996-2004). |
Keith D. Kemp
(1960) | Assistant Treasurer (2016-present). | Current: Managing Director of Transparent Value, LLC (2015-present); Managing Director of Guggenheim Investments (2015-present). Former: Director, Transparent Value, LLC (2010-2015); Director, Guggenheim Investments (2010-2015); Chief Operating Officer, Macquarie Capital Investment Management (2007-2009). |
| | THE RYDEX FUNDS SEMI-ANNUAL REPORT | 97 |
INFORMATION ON BOARD OF TRUSTEES AND OFFICERS (Unaudited)(concluded) |
Name, Address*
and Year of Birth | Position(s) Held with the
Trust, Term of Office and
Length of Time Served | Principal Occupation(s)
During Past 5 Years |
OFFICERS - concluded | |
GlennMcWhinnie
(1969) | Assistant Treasurer (2016-present). | Current: Vice President, Guggenheim Investments (2009-present). Former: Tax Compliance Manager, Ernst & Young LLP (1996-2009). |
Adam J. Nelson
(1979) | Assistant Treasurer (2016-present). | Current: Vice President, Guggenheim Investments (2015-present); Assistant Treasurer, certain other funds in the Fund Complex (2015-present). Former: Assistant Vice President and Fund Administration Director, State Street Corporation (2013-2015); Fund Administration Assistant Director, State Street (2011-2013); Fund Administration Manager, State Street (2009-2011). |
Kimberly J. Scott
(1974) | Assistant Treasurer (2016-present). | Current: Vice President, Guggenheim Investments (2012-present); Assistant Treasurer, certain other funds in the Fund Complex (2012-present). Former: Financial Reporting Manager, Invesco, Ltd. (2010-2011); Vice President/Assistant Treasurer, Mutual Fund Administration for Van Kampen Investments, Inc./Morgan Stanley Investment Management (2009-2010); Manager of Mutual Fund Administration, Van Kampen Investments, Inc./Morgan Stanley Investment Management (2005-2009). |
John L. Sullivan
(1955) | Chief Financial Officer and Treasurer (2016-present). | Current: CFO, Chief Accounting Officer and Treasurer, certain other funds in the Fund Complex (2010-present); Senior Managing Director, Guggenheim Investments (2010-present). Former: Managing Director and CCO, each of the funds in the Van Kampen Investments fund complex (2004-2010); Managing Director and Head of Fund Accounting and Administration, Morgan Stanley Investment Management (2002-2004); CFO and Treasurer, Van Kampen Funds (1996-2004). |
* | All Trustees and Officers may be reached c/o Guggenheim Investments, 227 West Monroe Street, Chicago, Illinois 60606. |
** | Mr. Cacciapaglia is an “interested” person of the Trust, as that term is defined in the 1940 Act by virtue of his affiliation with the Adviser’s parent company. |
*** | The “Fund Complex” includes all closed-end and open-end funds (including all of their portfolios) advised by the Adviser and any funds that have an investment adviser or servicing agent that is an affiliated person of the Adviser. Information provided is as of the date of this report. |
**** | Some of the Trustees may serve as directors on the boards of companies not required to be disclosed above, including certain non-profit companies and charitable foundations. |
***** | Mses. Brock-Kyle and Sponem commenced serving as independent Trustees effective August 18, 2016. |
98 | THE RYDEX FUNDS SEMI-ANNUAL REPORT | |
GUGGENHEIM INVESTMENTS PRIVACY POLICIES (Unaudited) |
Guggenheim Investments as used herein refers to Guggenheim Partners, LLC, Guggenheim Funds Investment Advisors, LLC, Guggenheim Partners Investment Management, LLC, Guggenheim Funds Distributors, LLC and Security Investors, LLC as well as the funds in the Guggenheim Funds complex (the “funds”).
Our Commitment to You
When you become a Guggenheim Investments investor, you entrust us with not only your hard-earned money but also with personal and financial information about you. We recognize that your relationship with us is based on trust and that you expect us to act responsibly and in your best interests. Because we have access to personal information about you, we hold ourselves to high standards in its safekeeping and use. This means, most importantly, that we do not sell client or account information to anyone—whether you are a current or former Guggenheim Investments client.
The Information We Collect About You and How We Collect It
In the course of doing business with shareholders and investors, we collect nonpublic personal information about you. You typically provide personal information when you complete a Guggenheim Investments account application or when you request a transaction that involves Rydex and Guggenheim Funds or one of the Guggenheim affiliated companies. “Nonpublic personal information” is personally identifiable information about you. For example it includes your name and address, Social Security or taxpayer identification number, assets, income, account balance, bank account information and investment activity (e.g. purchase and redemption history).
How We Share Your Personal Information
As a matter of policy, we do not disclose your nonpublic personal information to nonaffiliated third parties except as required or permitted by law. As emphasized above, we do not sell information about current or former clients or their accounts to third parties. Nor do we share such information, except when necessary to complete transactions at your request or to make you aware of related investment products and services that we offer. Additional details about how we handle your personal information are provided below.
To complete certain transactions or account changes that you direct, it may be necessary to provide your personal information to companies, individuals or groups that are not affiliated with Guggenheim Investments. For example if you ask to transfer assets from another financial institution to Guggenheim Investments, we will need to provide certain information about you to that company to complete the transaction. In connection with servicing your accounts or to alert you to other Guggenheim Investments investment products and services, we may share your information within the Guggenheim Investments family of affiliated companies. This would include, for example, sharing your information within Guggenheim Investments so we can make you aware of new funds or the services offered through another Guggenheim Investments affiliated company. In certain instances, we may contract with nonaffiliated companies to perform services for us. Where necessary, we will disclose information we have about you to these third parties. In all such cases, we provide the third party with only the information necessary to carry out its assigned responsibilities and only for that purpose. And we require these third parties to treat your personal information with the same high degree of confidentiality that we do. In certain instances, we may share information with other financial institutions regarding individuals and entities in response to the U.S.A. Patriot Act. Finally we will share personal information about you if we are compelled by law to do so, if you direct us to do so with your consent, or in other circumstances as permitted by law.
How We Safeguard Your Personal Information
We maintain physical, electronic and procedural safeguards to protect your personal information. Within Guggenheim Investments, access to such information is limited to those who need it to perform their jobs such as servicing your account, resolving problems or informing you of new products and services.
| | THE RYDEX FUNDS SEMI-ANNUAL REPORT | 99 |
This page intentionally left blank.
This page intentionally left blank.
9.30.2016
Rydex Funds Semi-Annual Report
Domestic Equity Fund |
NASDAQ-100® Fund | | |
GuggenheimInvestments.com | ROTCF-SEMI-0916x0317 |

DEAR SHAREHOLDER | 2 |
ECONOMIC AND MARKET OVERVIEW | 3 |
ABOUT SHAREHOLDERS’ FUND EXPENSES | 5 |
NASDAQ-100® FUND | 8 |
NOTES TO FINANCIAL STATEMENTS | 23 |
OTHER INFORMATION | 40 |
INFORMATION ON BOARD OF TRUSTEES AND OFFICERS | 44 |
GUGGENHEIM INVESTMENTS PRIVACY POLICIES | 50 |
| | THE RYDEX FUNDS SEMI-ANNUAL REPORT | 1 |
Dear Shareholder:
Security Investors, LLC (the “Investment Adviser”) is pleased to present the semi-annual shareholder report for one of our Rydex Funds (the “Fund”). This report covers performance for the six-month period ended September 30, 2016.
The Investment Adviser is part of Guggenheim Investments, which represents the investment management businesses of Guggenheim Partners, LLC, (“Guggenheim”) a global, diversified financial services firm.
Guggenheim Funds Distributors, LLC is the distributor of the Funds. Guggenheim Funds Distributors, LLC is affiliated with Guggenheim and the Investment Adviser.
We encourage you to read the Economic and Market Overview section of the report, which follows this letter.
We are committed to providing innovative investment solutions and appreciate the trust you place in us.
Sincerely,

Donald C. Cacciapaglia
President and Chief Executive Officer
October 31, 2016
Read a prospectus and summary prospectus (if available) carefully before investing. It contains the investment objectives, risks, charges, expense,s and other information, which should be considered carefully before investing. Obtain a prospectus and summary prospectus (if available) at guggenheiminvestments.com or call 800.820.0888.
There can be no assurance that any investment product will achieve its investment objective(s). There are risks associated with investing, including the entire loss of principal invested. Investing involves market risks. The investment return and principal value of any investment product will fluctuate with changes in market conditions.
2 | THE RYDEX FUNDS SEMI-ANNUAL REPORT | |
ECONOMIC AND MARKET OVERVIEW (Unaudited) | September 30, 2016 |
Economic growth continues to rebound, even though the rise in U.S. Gross Domestic Product (“GDP”) disappointed in the first half of 2016. There was a large headwind from inventory drawdowns, which should soon reverse after five quarters of dragging on growth. Real GDP growth is expected to be around 2.5 percent in the second half of the year, driven by consumption, housing, and a fading trade drag, and supporting the view that U.S. economic growth remains resilient to global weakness.
The euro zone economy is slowly improving, but inflation will likely persist well below the European Central Bank’s (“ECB”) target in the coming quarters due to substantial slack. The ECB has indicated that more quantitative easing is possible, but will soon need to alter the quantitative easing program in order to keep up their purchase pace. Both China and Japan need weaker currencies. Chinese growth and capital flows have stabilized for now, but surging construction and a credit boom raise the prospect of future instability. Japan’s economic prospects are weak, and inflation remains far from the Bank of Japan’s (“BOJ”) target. The surging yen could drive further policy easing, including an increase in fiscal stimulus.
It appears the U.S. Federal Reserve (the “Fed”) will move forward with raising rates in December, absent any economic or geopolitical surprise or a meaningful tightening of financial conditions over the fourth quarter. But key events could influence risk asset performance for the balance of the year: A continued recovery in oil prices following the Organization of Petroleum Exporting Countries (“OPEC”) agreement to keep production between 32.5 to 33 million barrels per day would help sustain the rally (although we are skeptical that they will adhere to any quota based on historical production levels). Global oil inventories remain high, but supply and demand are moving toward balance. A rebound in GDP growth would also lift U.S. equity and corporate bond prices higher.
The macroeconomic picture remains the same; we are not on the verge of a recession. But despite our positive outlook on the U.S. economy, valuations across risk assets argue for caution. Ongoing accommodation from central bankers across the globe has alleviated much of the initial macroeconomic tail risk posed by Brexit but may not be enough to dampen the seasonal volatility typically observed in the fourth quarter. Ongoing troubles in the banking sector, such as the woes afflicting Deutsche Bank and Wells Fargo, coupled with uncertainty surrounding upcoming political events, which include the new Trump administration, the Italian constitutional referendum, and key European elections, may create volatility for risk assets for the balance of the year.
For the six months ended September 30, 2016, the Standard & Poor’s 500® (“S&P 500®”) Index* returned 6.40%. The MSCI Europe-Australasia-Far East (“EAFE”) Index* returned 4.88%. The return of the MSCI Emerging Markets Index* was 9.75%.
| | THE RYDEX FUNDS SEMI-ANNUAL REPORT | 3 |
ECONOMIC AND MARKET OVERVIEW (Unaudited)(concluded) | September 30, 2016 |
In the bond market, the Bloomberg Barclays U.S. Aggregate Bond Index* posted a 2.68% return for the period, while the Bloomberg Barclays U.S. Corporate High Yield Index* returned 11.38%. The return of the Bank of America(“BofA”) Merrill Lynch 3-Month U.S. Treasury Bill Index* was 0.17% for the six-month period.
The opinions and forecasts expressed may not actually come to pass. This information is subject to change at any time, based on market and other conditions, and should not be construed as a recommendation of any specific security or strategy.
*Index Definitions:
The following indices are referenced throughout this report.
Indices are unmanaged and not available for direct investment. Index performance does not reflect transaction costs, fees, or expenses.
BofA Merrill Lynch 3-Month U.S. Treasury Bill Index is an unmanaged market Index of U.S. Treasury securities maturing in 90 days that assumes reinvestment of all income.
Bloomberg Barclays U.S. Aggregate Bond Index is a broad-based flagship benchmark that measures the investment grade, U.S. dollar denominated, fixed-rate taxable bond market, including U.S. Treasuries, government-related and corporate securities, mortgage-backed securities (“MBS”) (agency fixed-rate and hybrid adjustable-rate mortgage, or “ARM”, pass-throughs), asset-backed securities (“ABS”), and commercial mortgage-backed securities (“CMBS”) (agency and non-agency).
Bloomberg Barclays U.S. Corporate High Yield Index measures the U.S. dollar denominated, high yield, fixed-rate corporate bond market. Securities are classified as high yield if the middle rating of Moody’s, Fitch, and S&P is Ba1/BB +/BB + or below.
MSCI EAFE Index is a capitalization-weighted measure of stock markets in Europe, Australasia, and the Far East.
MSCI Emerging Markets Index is a free float-adjusted market capitalization-weighted index that is designed to measure equity market performance in the global emerging markets.
NASDAQ-100® Index includes 100 of the largest domestic and international non-financial securities listed on The Nasdaq Stock Market based on market capitalization. The index reflects companies across major industry groups including computer hardware and software, telecommunications, retail/wholesale trade, and biotechnology. It does not contain securities of financial companies, including investment companies.
S&P 500® Index is a broad-based index, the performance of which is based on the performance of 500 widely held common stocks chosen for market size, liquidity, and industry group representation.
4 | THE RYDEX FUNDS SEMI-ANNUAL REPORT | |
ABOUT SHAREHOLDERS’ FUND EXPENSES (Unaudited) |
All mutual funds have operating expenses, and it is important for our shareholders to understand the impact of costs on their investments. Shareholders of a fund incur two types of costs: (i) transaction costs, including sales charges (loads) on purchase payments, reinvested dividends, other distributions, and exchange fees, and (ii) ongoing costs, including management fees, administrative services, and shareholder reports, among others. These ongoing costs, or operating expenses, are deducted from a fund’s gross income and reduce the investment return of the fund.
A fund’s expenses are expressed as a percentage of its average net assets, which is known as the expense ratio. The following examples are intended to help investors understand the ongoing costs (in dollars) of investing in a fund and to compare these costs with the ongoing costs of investing in other mutual funds.
The examples are based on an investment of $1,000 made at the beginning of the period and held for the entire six-month period beginning March 31, 2016 and ending September 30, 2016.
The following tables illustrate the Fund’s costs in two ways:
Table 1. Based on actual Fund return: This section helps investors estimate the actual expenses paid over the period. The “Ending Account Value” shown is derived from the Fund’s actual return, and the fifth column shows the dollar amount that would have been paid by an investor who started with $1,000 in the Fund. Investors may use the information here, together with the amount invested, to estimate the expenses paid over the period. Simply divide the Fund’s account value by $1,000 (for example, an $8,600 account value divided by $1,000 = 8.6), then multiply the result by the number provided under the heading “Expenses Paid During Period.”
Table 2. Based on hypothetical 5% return: This section is intended to help investors compare a Fund’s cost with those of other mutual funds. The table provides information about hypothetical account values and hypothetical expenses based on the Fund’s actual expense ratio and an assumed rate of return of 5% per year before expenses, which is not the Fund’s actual return. The hypothetical account values and expenses may not be used to estimate the actual ending account balance or expenses paid during the period. The example is useful in making comparisons because the U.S. Securities and Exchange Commission (the “SEC”) requires all mutual funds to calculate expenses based on the 5% return. Investors can assess a Fund’s costs by comparing this hypothetical example with the hypothetical examples that appear in shareholder reports of other funds.
The calculations illustrated above assume no shares were bought or sold during the period. Actual costs may have been higher or lower, depending on the amount of investment and the timing of any purchases or redemptions.
| | THE RYDEX FUNDS SEMI-ANNUAL REPORT | 5 |
ABOUT SHAREHOLDERS’ FUND EXPENSES (Unaudited)(continued) |
Please note that the expenses shown in the table are meant to highlight your ongoing costs only and do not reflect any transactional costs, such as sales charges (loads) on purchase payments, and contingent deferred sales charges (“CDSC”) on redemptions, if any. Therefore, the second table is useful in comparing ongoing costs only, and will not help you determine the relative total costs of owning different funds. In addition, if these transactional costs were included, your costs would have been higher.
More information about the Fund’s expenses, including annual expense ratios for periods up to five years (subject to the Fund’s inception date), can be found in the Financial Highlights section of this report. For additional information on operating expenses and other shareholder costs, please refer to the Fund’s prospectus.
6 | THE RYDEX FUNDS SEMI-ANNUAL REPORT | |
ABOUT SHAREHOLDERS’ FUND EXPENSES (Unaudited)(concluded) |
| | Expense
Ratio1 | Fund
Return | Beginning
Account Value
March 31,
2016 | Ending
Account Value
September 30,
2016 | Expenses
Paid During
Period2 |
Table 1. Based on actual Fund return3 |
NASDAQ-100® Fund |
Investor Class | 1.28% | 8.82% | $ 1,000.00 | $ 1,088.20 | $ 6.70 |
A-Class | 1.52% | 8.53% | 1,000.00 | 1,085.30 | 7.95 |
C-Class | 2.27% | 8.23% | 1,000.00 | 1,082.30 | 11.85 |
H-Class | 1.53% | 8.67% | 1,000.00 | 1,086.70 | 8.00 |
| |
Table 2. Based on hypothetical 5% return (before expenses) |
NASDAQ-100® Fund |
Investor Class | 1.28% | 5.00% | $ 1,000.00 | $ 1,018.65 | $ 6.48 |
A-Class | 1.52% | 5.00% | 1,000.00 | 1,017.45 | 7.69 |
C-Class | 2.27% | 5.00% | 1,000.00 | 1,013.69 | 11.46 |
H-Class | 1.53% | 5.00% | 1,000.00 | 1,017.40 | 7.74 |
1 | Annualized and excludes expenses of the underlying funds in which the Fund invest. |
2 | Expenses are equal to the Fund's annualized expense ratio, net of any applicable fee waivers, multiplied by the average account value over the period, multiplied by 183/365 (to reflect the one-half year period). |
3 | Actual cumulative return at net asset value for the period March 31, 2016 to September 30, 2016. |
| | THE RYDEX FUNDS SEMI-ANNUAL REPORT | 7 |
FUND PROFILE (Unaudited) | September 30, 2016 |
NASDAQ-100® FUND
OBJECTIVE: Seeks to provide investment results that correspond, before fees and expenses, to a benchmark for over-the-counter securities on a daily basis. The Fund’s current benchmark is the NASDAQ-100 Index® (the “underlying index”).
Holdings Diversification (Market Exposure as % of Net Assets)
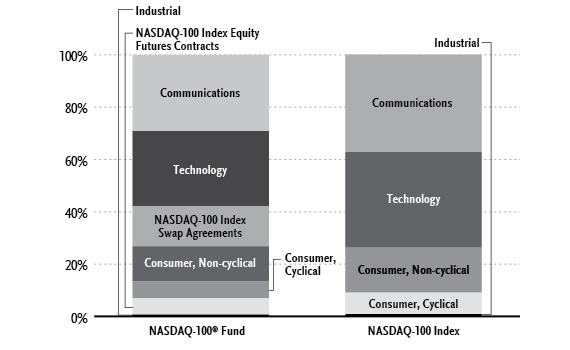
“Holdings Diversification (Market Exposure as % of Net Assets)” excludes any temporary cash investments or investments in Guggenheim Strategy Funds Trust mutual funds. Investments in those Funds do not provide “market exposure” to meet the Fund’s investment objective, but will significantly increase the portfolio’s exposure to certain other asset categories (and their associated risks), which may cause the Fund to deviate from its principal investment strategy, including: (i) high yield, high risk debt securities rated below the top four long-term rating categories by a nationally recognized statistical rating organization (also known as “junk bonds”); (ii) securities issued by the U.S. government or its agencies and instrumentalities; (iii) CLOs and similar investments; and (iv) other short-term fixed income securities.
8 | THE RYDEX FUNDS SEMI-ANNUAL REPORT | |
FUND PROFILE (Unaudited)(concluded) | September 30, 2016 |
Inception Dates: |
Investor Class | February 14, 1994 |
A-Class | March 31, 2004 |
C-Class | March 26, 2001 |
H-Class | September 18, 2014 |
Ten Largest Holdings (% of Total Net Assets) |
Apple, Inc. | 8.5% |
Microsoft Corp. | 6.2% |
Amazon.com, Inc. | 5.5% |
Facebook, Inc. — Class A | 4.1% |
Alphabet, Inc. — Class C | 3.7% |
Alphabet, Inc. — Class A | 3.3% |
Intel Corp. | 2.5% |
Cisco Systems, Inc. | 2.2% |
Comcast Corp. | 2.2% |
Amgen, Inc. | 1.7% |
Top Ten Total | 39.9% |
| | |
“Ten Largest Holdings” excludes any temporary cash or derivative investments. |
| | THE RYDEX FUNDS SEMI-ANNUAL REPORT | 9 |
SCHEDULE OF INVESTMENTS (Unaudited) | September 30, 2016 |
NASDAQ-100® FUND | |
| | | Shares | | | Value | |
| | | | | | | |
COMMON STOCKS† - 78.4% | |
| | | | | | | |
Communications - 29.3% | |
Amazon.com, Inc.* | | | 55,533 | | | $ | 46,498,336 | |
Facebook, Inc. — Class A* | | | 272,112 | | | | 34,903,806 | |
Alphabet, Inc. — Class C* | | | 40,250 | | | | 31,285,923 | |
Alphabet, Inc. — Class A* | | | 34,538 | | | | 27,770,624 | |
Cisco Systems, Inc. | | | 589,182 | | | | 18,688,853 | |
Comcast Corp. — Class A | | | 281,416 | | | | 18,669,137 | |
Charter Communications, Inc. — Class A* | | | 31,736 | | | | 8,567,768 | |
Priceline Group, Inc.* | | | 5,789 | | | | 8,518,456 | |
Baidu, Inc. ADR* | | | 32,099 | | | | 5,844,265 | |
Netflix, Inc.* | | | 50,221 | | | | 4,949,280 | |
Yahoo!, Inc.* | | | 111,492 | | | | 4,805,305 | |
T-Mobile US, Inc.* | | | 96,376 | | | | 4,502,687 | |
eBay, Inc.* | | | 132,253 | | | | 4,351,124 | |
Twenty-First Century Fox, Inc. — Class A | | | 124,638 | | | | 3,018,733 | |
JD.com, Inc. ADR* | | | 107,282 | | | | 2,798,987 | |
Liberty Global plc* | | | 75,527 | | | | 2,495,412 | |
Sirius XM Holdings, Inc.* | | | 571,398 | | | | 2,382,730 | |
Twenty-First Century Fox, Inc. — Class B | | | 93,538 | | | | 2,314,130 | |
Ctrip.com International Ltd. ADR* | | | 43,824 | | | | 2,040,884 | |
Expedia, Inc. | | | 16,058 | | | | 1,874,290 | |
Symantec Corp. | | | 72,110 | | | | 1,809,961 | |
Viacom, Inc. — Class B | | | 40,674 | | | | 1,549,679 | |
DISH Network Corp. — Class A* | | | 26,523 | | | | 1,452,930 | |
Vodafone Group plc ADR | | | 46,860 | | | | 1,365,969 | |
Liberty Global plc — Class A* | | | 30,967 | | | | 1,058,452 | |
TripAdvisor, Inc.* | | | 15,562 | | | | 983,207 | |
Discovery Communications, Inc. — Class C* | | | 27,942 | | | | 735,154 | |
Liberty Ventures* | | | 15,840 | | | | 631,541 | |
Discovery Communications, Inc. — Class A* | | | 17,675 | | | | 475,811 | |
Liberty Global plc LiLAC — Class C* | | | 882 | | | | 24,740 | |
Liberty Global plc LiLAC — Class A* | | | 575 | | | | 15,864 | |
Total Communications | | | | | | | 246,384,038 | |
| | | | | | | | | |
Technology - 28.6% | |
Apple, Inc. | | | 631,204 | | | | 71,357,611 | |
Microsoft Corp. | | | 912,819 | | | | 52,578,375 | |
Intel Corp. | | | 554,191 | | | | 20,920,711 | |
QUALCOMM, Inc. | | | 172,624 | | | | 11,824,744 | |
Texas Instruments, Inc. | | | 117,516 | | | | 8,247,273 | |
Broadcom Ltd. | | | 46,331 | | | | 7,993,024 | |
Adobe Systems, Inc.* | | | 58,369 | | | | 6,335,372 | |
NVIDIA Corp. | | | 62,670 | | | | 4,294,148 | |
NXP Semiconductor N.V.* | | | 39,735 | | | | 4,053,367 | |
Activision Blizzard, Inc. | | | 86,856 | | | | 3,847,721 | |
Applied Materials, Inc. | | | 126,616 | | | | 3,817,472 | |
Cognizant Technology Solutions Corp. — Class A* | | | 71,097 | | | | 3,392,038 | |
Intuit, Inc. | | | 29,972 | | | | 3,297,220 | |
Electronic Arts, Inc.* | | | 35,231 | | | | 3,008,727 | |
Fiserv, Inc.* | | | 25,749 | | | | 2,561,253 | |
Paychex, Inc. | | | 42,232 | | | | 2,443,966 | |
Cerner Corp.* | | | 39,559 | | | | 2,442,768 | |
Analog Devices, Inc. | | | 36,018 | | | | 2,321,360 | |
Micron Technology, Inc.* | | | 121,637 | | | | 2,162,706 | |
NetEase, Inc. ADR | | | 8,944 | | | | 2,153,537 | |
Western Digital Corp. | | | 33,299 | | | | 1,946,993 | |
Autodesk, Inc.* | | | 25,992 | | | | 1,880,001 | |
Lam Research Corp. | | | 18,773 | | | | 1,777,991 | |
Skyworks Solutions, Inc. | | | 21,963 | | | | 1,672,263 | |
Linear Technology Corp. | | | 28,081 | | | | 1,664,922 | |
CA, Inc. | | | 49,076 | | | | 1,623,434 | |
Xilinx, Inc. | | | 29,693 | | | | 1,613,518 | |
Microchip Technology, Inc. | | | 25,218 | | | | 1,567,047 | |
10 | THE RYDEX FUNDS SEMI-ANNUAL REPORT | SEE NOTES TO FINANCIAL STATEMENTS. |
SCHEDULE OF INVESTMENTS (Unaudited)(continued) | September 30, 2016 |
NASDAQ-100® FUND | |
| | | Shares | | | Value | |
| | | | | | | |
Check Point Software Technologies Ltd.* | | | 20,086 | | | $ | 1,558,874 | |
Citrix Systems, Inc.* | | | 18,242 | | | | 1,554,583 | |
Seagate Technology plc | | | 35,115 | | | | 1,353,683 | |
Maxim Integrated Products, Inc. | | | 33,211 | | | | 1,326,115 | |
NetApp, Inc. | | | 32,594 | | | | 1,167,517 | |
Akamai Technologies, Inc.* | | | 20,467 | | | | 1,084,546 | |
Total Technology | | | | | | | 240,844,880 | |
| | | | | | | | | |
Consumer, Non-cyclical - 13.4% | |
Amgen, Inc. | | | 87,663 | | | | 14,623,066 | |
Kraft Heinz Co. | | | 142,636 | | | | 12,767,349 | |
Gilead Sciences, Inc. | | | 154,586 | | | | 12,230,844 | |
Celgene Corp.* | | | 90,797 | | | | 9,491,010 | |
Biogen, Inc.* | | | 25,667 | | | | 8,034,541 | |
Mondelez International, Inc. — Class A | | | 182,216 | | | | 7,999,282 | |
PayPal Holdings, Inc.* | | | 141,379 | | | | 5,792,298 | |
Express Scripts Holding Co.* | | | 73,824 | | | | 5,206,807 | |
Regeneron Pharmaceuticals, Inc.* | | | 12,110 | | | | 4,868,462 | |
Automatic Data Processing, Inc. | | | 53,437 | | | | 4,713,143 | |
Monster Beverage Corp.* | | | 22,298 | | | | 3,273,569 | |
Intuitive Surgical, Inc.* | | | 4,509 | | | | 3,268,258 | |
Alexion Pharmaceuticals, Inc.* | | | 26,268 | | | | 3,218,881 | |
Illumina, Inc.* | | | 17,173 | | | | 3,119,647 | |
Vertex Pharmaceuticals, Inc.* | | | 29,025 | | | | 2,531,270 | |
Mylan N.V.* | | | 62,659 | | | | 2,388,561 | |
Incyte Corp.* | | | 22,023 | | | | 2,076,549 | |
BioMarin Pharmaceutical, Inc.* | | | 20,040 | | | | 1,854,101 | |
Dentsply Sirona, Inc. | | | 27,295 | | | | 1,622,142 | |
Verisk Analytics, Inc. — Class A* | | | 19,793 | | | | 1,608,775 | |
Henry Schein, Inc.* | | | 9,581 | | | | 1,561,511 | |
Whole Foods Market, Inc. | | | 37,345 | | | | 1,058,731 | |
Total Consumer, Non-cyclical | | | | 113,308,797 | |
| | | | | | | | | |
Consumer, Cyclical - 6.4% | |
Walgreens Boots Alliance, Inc. | | | 126,783 | | | | 10,221,245 | |
Starbucks Corp. | | | 171,799 | | | | 9,301,198 | |
Costco Wholesale Corp. | | | 51,315 | | | | 7,826,051 | |
Tesla Motors, Inc.* | | | 17,481 | | | | 3,566,648 | |
O’Reilly Automotive, Inc.* | | | 11,119 | | | | 3,114,543 | |
Ross Stores, Inc. | | | 46,799 | | | | 3,009,176 | |
PACCAR, Inc. | | | 41,061 | | | | 2,413,566 | |
American Airlines Group, Inc. | | | 62,074 | | | | 2,272,529 | |
Dollar Tree, Inc.* | | | 27,606 | | | | 2,178,942 | |
Marriott International, Inc. — Class A | | | 29,800 | | | | 2,006,434 | |
Ulta Salon Cosmetics & Fragrance, Inc.* | | | 7,306 | | | | 1,738,682 | |
Fastenal Co. | | | 33,850 | | | | 1,414,253 | |
Mattel, Inc. | | | 39,901 | | | | 1,208,202 | |
Tractor Supply Co. | | | 15,657 | | | | 1,054,499 | |
Liberty Interactive Corporation QVC Group — Class A* | | | 52,320 | | | | 1,046,923 | |
Norwegian Cruise Line Holdings Ltd.* | | | 26,604 | | | | 1,002,971 | |
Bed Bath & Beyond, Inc. | | | 18,094 | | | | 780,032 | |
Total Consumer, Cyclical | | | | | | | 54,155,894 | |
| | | | | | | | | |
Industrial - 0.7% | |
CSX Corp. | | | 110,814 | | | | 3,379,826 | |
SBA Communications Corp. — Class A* | | | 14,597 | | | | 1,637,200 | |
Stericycle, Inc.* | | | 9,961 | | | | 798,275 | |
Total Industrial | | | | | | | 5,815,301 | |
Total Common Stocks | | | | | | | | |
(Cost $366,228,532) | | | | | | | 660,508,910 | |
SEE NOTES TO FINANCIAL STATEMENTS. | THE RYDEX FUNDS SEMI-ANNUAL REPORT | 11 |
SCHEDULE OF INVESTMENTS (Unaudited)(continued) | September 30, 2016 |
NASDAQ-100® FUND | |
| | | Shares | | | Value | |
| | | | | | | |
MUTUAL FUNDS† - 2.7% | |
Guggenheim Strategy Fund I1 | | | 500,094 | | | $ | 12,497,340 | |
Guggenheim Strategy Fund II1 | | | 421,616 | | | | 10,515,099 | |
Total Mutual Funds | | | | | | | | |
(Cost $22,867,833) | | | | | | | 23,012,439 | |
| | | | | | | | | |
| | | Face
Amount | | | | | |
| | | | | | | | | |
FEDERAL AGENCY NOTES†† - 9.9% | |
Federal Farm Credit Bank2 | | | | | | | | |
0.67% due 09/12/183 | | $ | 27,000,000 | | | | 26,979,048 | |
0.73% due 09/14/173 | | | 10,000,000 | | | | 10,015,380 | |
Total Federal Farm Credit Bank | | | | 36,994,428 | |
Fannie Mae4 | | | | | | | | |
0.81% due 12/20/173 | | | 25,000,000 | | | | 25,010,500 | |
Farmer Mac2 | | | | | | | | |
5.13% due 04/19/175 | | | 13,534,000 | | | | 13,861,523 | |
Freddie Mac4 | | | | | | | | |
0.80% due 10/27/17 | | | 7,500,000 | | | | 7,497,345 | |
Total Federal Agency Notes | | | | | |
(Cost $83,387,635) | | | | | | | 83,363,796 | |
| | | | | | | | | |
FEDERAL AGENCY DISCOUNT NOTES†† - 1.2% | |
Federal Home Loan Bank2 | | | | | | | | |
0.53% due 03/10/17 | | | 10,000,000 | | | | 9,982,880 | |
Total Federal Agency Discount Notes | | | | | |
(Cost $9,976,533) | | | | | | | 9,982,880 | |
| | | | | | | | | |
U.S. TREASURY BILLS†† - 0.1% | |
U.S. Treasury Bill | | | | | | | | |
due 10/13/166,7 | | | 1,000,000 | | | | 999,953 | |
Total U.S. Treasury Bills | | | | | | | | |
(Cost $999,974) | | | | | | | 999,953 | |
REPURCHASE AGREEMENTS††,8 - 5.9% | |
HSBC Securities, Inc.
issued 09/30/16 at 0.38%
due 10/03/16 | | | 26,611,280 | | | | 26,611,280 | |
Royal Bank of Canada
issued 09/30/16 at 0.36%
due 10/03/169 | | | 23,452,660 | | | | 23,452,660 | |
Total Repurchase Agreements | | | | | |
(Cost $50,063,940) | | | | | | | 50,063,940 | |
| | | | | | | | | |
Total Investments - 98.2% | | | | | | | | |
(Cost $533,524,447) | | | | | | $ | 827,931,918 | |
Other Assets & Liabilities, net - 1.8% | | | | 15,067,606 | |
Total Net Assets - 100.0% | | | | | | $ | 842,999,524 | |
| | | Contracts | | | Unrealized
Gain | |
| | | | | | | |
EQUITY FUTURES CONTRACTS PURCHASED† | |
December 2016 NASDAQ-100 Index
Mini Futures Contracts
(Aggregate Value of
Contracts $52,782,670) | | | 542 | | | $ | 1,585,152 | |
| | | | | | | | | |
| | Units | | | | | |
| | | | | | | | | |
OTC EQUITY INDEX SWAP AGREEMENTS†† | |
BNP Paribas
November 2016 NASDAQ-100 Index Swap 0.78%10,
Terminating 11/01/16
(Notional Value $12,718,121) | | | 2,609 | | | $ | 96,747 | |
12 | THE RYDEX FUNDS SEMI-ANNUAL REPORT | SEE NOTES TO FINANCIAL STATEMENTS. |
SCHEDULE OF INVESTMENTS (Unaudited)(continued) | September 30, 2016 |
NASDAQ-100® FUND | |
| | | Units | | | Unrealized
Gain | |
| | | | | | | |
Goldman Sachs International
October 2016 NASDAQ-100 Index Swap 1.05%10,
Terminating 10/26/16
(Notional Value $2,661,534) | | | 546 | | | $ | 31,957 | |
Barclays Bank plc
October 2016 NASDAQ-100 Index Swap 0.75%10,
Terminating 10/31/16
(Notional Value $114,137,681) | | | 23,410 | | | | 1,336 | |
(Total Notional Value $129,517,336) | | | | | | $ | 130,040 | |
* | Non-income producing security. |
† | Value determined based on Level 1 inputs — See Note 4. |
†† | Value determined based on Level 2 inputs — See Note 4. |
1 | Affiliated issuer — See Note 9. |
2 | The issuer operates under a Congressional charter; its securities are neither issued nor guaranteed by the U.S. Government. |
3 | Variable rate security. Rate indicated is rate effective at September 30, 2016. |
4 | On September 7, 2008, the issuer was placed in conservatorship by the Federal Housing Finance Agency (FHFA). As conservator, the FHFA has full powers to control the assets and operations of the firm. |
5 | Security is a 144A or Section 4(a)(2) security. The total market value of 144A or Section 4(a)(2) securities is $13,861,523 (cost $13,867,934), or 1.6% of total net assets. These securities have been determined to be liquid under guidelines established by the Board of Trustees. |
6 | All or a portion of this security is pledged as futures collateral at September 30, 2016. |
7 | Zero coupon rate security. |
8 | Repurchase Agreements — See Note 5. |
9 | All or a portion of this security is pledged as equity index swap collateral at September 30, 2016. |
10 | Total Return based on NASDAQ-100 Index +/- financing at a variable rate. Rate indicated is the rate effective at September 30, 2016. |
| | ADR — American Depositary Receipt |
| | plc — Public Limited Company |
| | |
| | See Sector Classification in Other Information section. |
SEE NOTES TO FINANCIAL STATEMENTS. | THE RYDEX FUNDS SEMI-ANNUAL REPORT | 13 |
SCHEDULE OF INVESTMENTS (Unaudited)(concluded) | September 30, 2016 |
NASDAQ-100® FUND | |
The following table summarizes the inputs used to value the Fund’s investments at September 30, 2016 (See Note 4 in the Notes to Financial Statements):
Investments in Securities (Assets) | | Level 1 | | | Level 1 - Other* | | | Level 2 | | | Level 2 - Other* | | | Level 3 | | | Total | |
Common Stocks | | $ | 660,508,910 | | | $ | — | | | $ | — | | | $ | — | | | $ | — | | | $ | 660,508,910 | |
Equity Futures Contracts | | | — | | | | 1,585,152 | | | | — | | | | — | | | | — | | | | 1,585,152 | |
Equity Index Swap Agreements | | | — | | | | — | | | | — | | | | 130,040 | | | | — | | | | 130,040 | |
Federal Agency Discount Notes | | | — | | | | — | | | | 9,982,880 | | | | — | | | | — | | | | 9,982,880 | |
Federal Agency Notes | | | — | | | | — | | | | 83,363,796 | | | | — | | | | — | | | | 83,363,796 | |
Mutual Funds | | | 23,012,439 | | | | — | | | | — | | | | — | | | | — | | | | 23,012,439 | |
Repurchase Agreements | | | — | | | | — | | | | 50,063,940 | | | | — | | | | — | | | | 50,063,940 | |
U.S. Treasury Bills | | | — | | | | — | | | | 999,953 | | | | — | | | | — | | | | 999,953 | |
Total | | $ | 683,521,349 | | | $ | 1,585,152 | | | $ | 144,410,569 | | | $ | 130,040 | | | $ | — | | | $ | 829,647,110 | |
* | Other financial instruments include futures contracts and/or swaps, which are reported as unrealized gain/loss at period end. |
Transfers between investment levels may occur as the markets fluctuate and/or the availability of data used in an investment’s valuation changes. Transfers between valuation levels, if any, are in comparison to the valuation levels at the end of the previous fiscal year, and are effective using the fair value as of the end of the previous fiscal period.
For the period ended September 30, 2016, there were no transfers between levels.
14 | THE RYDEX FUNDS SEMI-ANNUAL REPORT | SEE NOTES TO FINANCIAL STATEMENTS. |
STATEMENT OF ASSETS AND LIABILITIES (Unaudited) |
NASDAQ-100® FUND |
September 30, 2016
Assets: | |
Investments in unaffiliated issuers, at value (cost $460,592,674) | | $ | 754,855,539 | |
Investments in affiliated issuers, at value (cost $22,867,833) | | | 23,012,439 | |
Repurchase agreements, at value (cost $50,063,940) | | | 50,063,940 | |
Total investments (cost $533,524,447) | | | 827,931,918 | |
Segregated cash with broker | | | 12,894,220 | |
Unrealized appreciation on swap agreements | | | 130,040 | |
Receivables: | |
Fund shares sold | | | 2,582,126 | |
Interest | | | 357,471 | |
Dividends | | | 281,131 | |
Variation margin | | | 197,950 | |
Swap settlement | | | 119,192 | |
Total assets | | | 844,494,048 | |
| | | | | |
Liabilities: | |
Overdraft due to custodian bank | | | 57,969 | |
Payable for: | |
Management fees | | | 514,969 | |
Fund shares redeemed | | | 391,910 | |
Transfer agent and administrative fees | | | 171,656 | |
Licensing fees | | | 82,656 | |
Distribution and service fees | | | 54,949 | |
Portfolio accounting fees | | | 48,263 | |
Miscellaneous | | | 172,152 | |
Total liabilities | | | 1,494,524 | |
Commitments and contingent liabilities (Note 12) | | | — | |
Net assets | | $ | 842,999,524 | |
| | | | | |
Net assets consist of: | |
Paid in capital | | $ | 524,231,956 | |
Accumulated net investment loss | | | (1,061,369 | ) |
Accumulated net realized gain on investments | | | 23,706,274 | |
Net unrealized appreciation on investments | | | 296,122,663 | |
Net assets | | $ | 842,999,524 | |
| | | | | |
Investor Class: | |
Net assets | | $ | 706,672,722 | |
Capital shares outstanding | | | 25,223,230 | |
Net asset value per share | | $ | 28.02 | |
| | | | | |
A-Class: | |
Net assets | | $ | 52,484,180 | |
Capital shares outstanding | | | 2,011,593 | |
Net asset value per share | | $ | 26.09 | |
Maximum offering price per share (Net asset value divided by 95.25%) | | $ | 27.39 | |
| | | | | |
C-Class: | |
Net assets | | $ | 44,032,033 | |
Capital shares outstanding | | | 1,881,468 | |
Net asset value per share | | $ | 23.40 | |
| | | | | |
H-Class: | |
Net assets | | $ | 39,810,589 | |
Capital shares outstanding | | | 1,526,311 | |
Net asset value per share | | $ | 26.08 | |
SEE NOTES TO FINANCIAL STATEMENTS. | THE RYDEX FUNDS SEMI-ANNUAL REPORT | 15 |
STATEMENT OF OPERATIONS (Unaudited) |
NASDAQ-100® FUND |
Period Ended September 30, 2016
Investment Income: | |
Dividends from securities of unaffiliated issuers (net of foreign withholding tax of $4,874) | | $ | 3,897,692 | |
Dividends from securities of affiliated issuers | | | 373,778 | |
Interest | | | 301,970 | |
Total investment income | | | 4,573,440 | |
| | | | | |
Expenses: | |
Management fees | | | 3,093,089 | |
Transfer agent and administrative fees | | | 1,031,030 | |
Distribution and service fees: | |
A-Class | | | 96,027 | |
C-Class | | | 202,020 | |
H-Class | | | 60,574 | |
Portfolio accounting fees | | | 291,842 | |
Custodian fees | | | 48,619 | |
Trustees’ fees* | | | 34,907 | |
Line of credit fees | | | 6,167 | |
Miscellaneous | | | 770,534 | |
Total expenses | | | 5,634,809 | |
Net investment loss | | | (1,061,369 | ) |
| | | | | |
Net Realized and Unrealized Gain (Loss): | |
Net realized gain (loss) on: | |
Investments in unaffiliated issuers | | | 32,674,642 | |
Investments in affiliated issuers | | | 166,752 | |
Swap agreements | | | 9,285,188 | |
Futures contracts | | | 2,274,078 | |
Net realized gain | | | 44,400,660 | |
Net change in unrealized appreciation (depreciation) on: | |
Investments in unaffiliated issuers | | | 13,946,143 | |
Investments in affiliated issuers | | | 287,226 | |
Swap agreements | | | (1,758,753 | ) |
Futures contracts | | | 1,184,715 | |
Net change in unrealized appreciation (depreciation) | | | 13,659,331 | |
Net realized and unrealized gain | | | 58,059,991 | |
Net increase in net assets resulting from operations | | $ | 56,998,622 | |
* | Relates to Trustees not deemed “interested persons” within the meaning of Section 2(a)(19) of the 1940 Act. |
16 | THE RYDEX FUNDS SEMI-ANNUAL REPORT | SEE NOTES TO FINANCIAL STATEMENTS. |
STATEMENTS OF CHANGES IN NET ASSETS |
NASDAQ-100® FUND | |
| | | Period Ended
September 30,
2016
(Unaudited) | | | Year Ended
March 31,
2016 | |
Increase (Decrease) in Net Assets from Operations: | | | | | | |
Net investment loss | | $ | (1,061,369 | ) | | $ | (2,733,517 | ) |
Net realized gain on investments | | | 44,400,660 | | | | 139,445,638 | |
Net change in unrealized appreciation (depreciation) on investments | | | 13,659,331 | | | | (127,049,372 | ) |
Net increase in net assets resulting from operations | | | 56,998,622 | | | | 9,662,749 | |
| | | | | | | | | |
Distributions to shareholders from: | | | | | | | | |
Net realized gains | | | | | | | | |
Investor Class | | | — | | | | (15,721,868 | ) |
A-Class | | | — | | | | (2,634,742 | ) |
C-Class | | | — | | | | (956,856 | ) |
H-Class | | | — | | | | (6,738,531 | )* |
Total distributions to shareholders | | | — | | | | (26,051,997 | ) |
| | | | | | | | | |
Capital share transactions: | | | | | | | | |
Proceeds from sale of shares | | | | | | | | |
Investor Class | | | 310,684,004 | | | | 1,011,361,829 | |
Advisor Class | | | — | | | | 94,137,245 | * |
A-Class | | | 335,350,395 | | | | 817,538,269 | |
C-Class | | | 8,391,706 | | | | 26,584,585 | |
H-Class | | | 94,122,087 | | | | 1,591,642,598 | * |
Distributions reinvested | | | | | | | | |
Investor Class | | | — | | | | 15,251,133 | |
A-Class | | | — | | | | 2,570,836 | |
C-Class | | | — | | | | 931,242 | |
H-Class | | | — | | | | 6,738,458 | * |
Cost of shares redeemed | | | | | | | | |
Investor Class | | | (322,689,751 | ) | | | (1,120,085,951 | ) |
Advisor Class | | | — | | | | (139,879,099 | )* |
A-Class | | | (347,277,599 | ) | | | (827,926,638 | ) |
C-Class | | | (6,532,783 | ) | | | (20,071,986 | ) |
H-Class | | | (226,100,955 | ) | | | (1,453,762,548 | )* |
Conversion activity* | | | | | | | | |
Advisor Class | | | — | | | | (20,538,756 | ) |
H-Class | | | — | | | | 20,538,756 | |
Net increase (decrease) from capital share transactions | | | (154,052,896 | ) | | | 5,029,973 | |
Net decrease in net assets | | | (97,054,274 | ) | | | (11,359,275 | ) |
| | | | | | | | | |
Net assets: | | | | | | | | |
Beginning of period | | | 940,053,798 | | | | 951,413,073 | |
End of period | | $ | 842,999,524 | | | $ | 940,053,798 | |
Accumulated net investment loss at end of period | | $ | (1,061,369 | ) | | $ | — | |
SEE NOTES TO FINANCIAL STATEMENTS. | THE RYDEX FUNDS SEMI-ANNUAL REPORT | 17 |
STATEMENTS OF CHANGES IN NET ASSETS (concluded) |
NASDAQ-100® FUND | |
| | | Period Ended
September 30,
2016
(Unaudited) | | | Year Ended
March 31,
2016 | |
Capital share activity: | | | | | | |
Shares sold | | | | | | |
Investor Class | | | 11,733,652 | | | | 38,934,513 | |
Advisor Class | | | — | | | | 4,004,926 | * |
A-Class | | | 13,826,920 | | | | 34,504,136 | |
C-Class | | | 383,982 | | | | 1,215,431 | |
H-Class | | | 3,897,961 | | | | 66,106,678 | * |
Shares issued from reinvestment of distributions | | | | | | | | |
Investor Class | | | — | | | | 569,923 | |
A-Class | | | — | | | | 102,833 | |
C-Class | | | — | | | | 41,297 | |
H-Class | | | — | | | | 269,863 | * |
Shares redeemed | | | | | | | | |
Investor Class | | | (12,410,290 | ) | | | (43,913,512 | ) |
Advisor Class | | | — | | | | (5,986,255 | )* |
A-Class | | | (14,332,262 | ) | | | (35,068,368 | ) |
C-Class | | | (301,661 | ) | | | (953,984 | ) |
H-Class | | | (9,606,174 | ) | | | (60,544,558 | )* |
Conversion activity* | | | | | | | | |
Advisor Class | | | — | | | | (924,136 | ) |
H-Class | | | — | | | | 897,086 | |
Net decrease in shares | | | (6,807,872 | ) | | | (744,127 | ) |
* | Effective September 30, 2015, all outstanding Advisor Class shares converted into H-Class shares — See Note 11. |
18 | THE RYDEX FUNDS SEMI-ANNUAL REPORT | SEE NOTES TO FINANCIAL STATEMENTS. |
FINANCIAL HIGHLIGHTS |
NASDAQ-100® FUND | |
This table is presented to show selected data for a share outstanding throughout each period and to assist shareholders in evaluating a Fund’s performance for the periods presented.
Investor Class | | Period Ended
Sept. 30,
2016a | | | Year Ended
March 31,
2016 | | | Year Ended
March 31,
2015 | | | Year Ended
March 31,
2014 | | | Year Ended
March 28,
2013 | | | Year Ended
March 31,
2012 | |
Per Share Data | | | | | | | | | | | | | | | | | | |
Net asset value, beginning of period | | $ | 25.75 | | | $ | 25.38 | | | $ | 21.38 | | | $ | 18.38 | | | $ | 17.92 | | | $ | 15.23 | |
Income (loss) from investment operations: | |
Net investment income (loss)b | | | (.02 | ) | | | (.05 | ) | | | (.01 | ) | | | .02 | | | | .02 | | | | (.05 | ) |
Net gain (loss) on investments (realized and unrealized) | | | 2.29 | | | | .96 | | | | 4.39 | | | | 5.01 | | | | .44 | | | | 2.74 | |
Total from investment operations | | | 2.27 | | | | .91 | | | | 4.38 | | | | 5.03 | | | | .46 | | | | 2.69 | |
Less distributions from: | |
Net realized gains | | | — | | | | (.54 | ) | | | (.38 | ) | | | (2.03 | ) | | | — | | | | — | |
Total distributions | | | — | | | | (.54 | ) | | | (.38 | ) | | | (2.03 | ) | | | — | | | | — | |
Net asset value, end of period | | $ | 28.02 | | | $ | 25.75 | | | $ | 25.38 | | | $ | 21.38 | | | $ | 18.38 | | | $ | 17.92 | |
| | |
Total Returnc | | | 8.82 | % | | | 3.49 | % | | | 20.53 | % | | | 27.74 | % | | | 2.57 | % | | | 17.66 | % |
Ratios/Supplemental Data | |
Net assets, end of period (in thousands) | | $ | 706,673 | | | $ | 667,018 | | | $ | 769,257 | | | $ | 632,598 | | | $ | 461,269 | | | $ | 770,626 | |
Ratios to average net assets: | |
Net investment income (loss) | | | (0.15 | %) | | | (0.19 | %) | | | (0.05 | %) | | | 0.10 | % | | | 0.13 | % | | | (0.34 | %) |
Total expensesd | | | 1.28 | % | | | 1.25 | % | | | 1.26 | % | | | 1.29 | % | | | 1.26 | % | | | 1.27 | % |
Portfolio turnover rate | | | 42 | % | | | 228 | % | | | 267 | % | | | 141 | % | | | 94 | % | | | 94 | % |
SEE NOTES TO FINANCIAL STATEMENTS. | THE RYDEX FUNDS SEMI-ANNUAL REPORT | 19 |
FINANCIAL HIGHLIGHTS (continued) |
NASDAQ-100® FUND | |
This table is presented to show selected data for a share outstanding throughout each period and to assist shareholders in evaluating a Fund’s performance for the periods presented.
A-Class | | Period Ended
Sept. 30,
2016a | | | Year Ended
March 31,
2016 | | | Year Ended
March 31,
2015 | | | Year Ended
March 31,
2014 | | | Year Ended
March 28,
2013 | | | Year Ended
March 31,
2012 | |
Per Share Data | | | | | | | | | | | | | | | | | | |
Net asset value, beginning of period | | $ | 24.04 | | | $ | 23.78 | | | $ | 20.10 | | | $ | 17.42 | | | $ | 17.03 | | | $ | 14.52 | |
Income (loss) from investment operations: | |
Net investment income (loss)b | | | (.06 | ) | | | (.10 | ) | | | (.06 | ) | | | (.03 | ) | | | (.02 | ) | | | (.09 | ) |
Net gain (loss) on investments (realized and unrealized) | | | 2.11 | | | | .90 | | | | 4.12 | | | | 4.74 | | | | .41 | | | | 2.60 | |
Total from investment operations | | | 2.05 | | | | .80 | | | | 4.06 | | | | 4.71 | | | | .39 | | | | 2.51 | |
Less distributions from: | |
Net realized gains | | | — | | | | (.54 | ) | | | (.38 | ) | | | (2.03 | ) | | | — | | | | — | |
Total distributions | | | — | | | | (.54 | ) | | | (.38 | ) | | | (2.03 | ) | | | — | | | | — | |
Net asset value, end of period | | $ | 26.09 | | | $ | 24.04 | | | $ | 23.78 | | | $ | 20.10 | | | $ | 17.42 | | | $ | 17.03 | |
| | |
Total Returnc | | | 8.53 | % | | | 3.26 | % | | | 20.24 | % | | | 27.42 | % | | | 2.29 | % | | | 17.29 | % |
Ratios/Supplemental Data | |
Net assets, end of period (in thousands) | | $ | 52,484 | | | $ | 60,499 | | | $ | 70,821 | | | $ | 21,751 | | | $ | 23,656 | | | $ | 14,553 | |
Ratios to average net assets: | |
Net investment income (loss) | | | (0.48 | %) | | | (0.42 | %) | | | (0.29 | %) | | | (0.14 | %) | | | (0.09 | %) | | | (0.61 | %) |
Total expensesd | | | 1.52 | % | | | 1.51 | % | | | 1.50 | % | | | 1.54 | % | | | 1.52 | % | | | 1.53 | % |
Portfolio turnover rate | | | 42 | % | | | 228 | % | | | 267 | % | | | 141 | % | | | 94 | % | | | 94 | % |
20 | THE RYDEX FUNDS SEMI-ANNUAL REPORT | SEE NOTES TO FINANCIAL STATEMENTS. |
FINANCIAL HIGHLIGHTS (continued) |
NASDAQ-100® FUND |
This table is presented to show selected data for a share outstanding throughout each period and to assist shareholders in evaluating a Fund’s performance for the periods presented.
C-Class | | Period Ended
Sept. 30,
2016a | | | Year Ended
March 31,
2016 | | | Year Ended
March 31,
2015 | | | Year Ended
March 31,
2014 | | | Year Ended
March 28,
2013 | | | Year Ended
March 31,
2012 | |
Per Share Data | | | | | | | | | | | | | | | | | | |
Net asset value, beginning of period | | $ | 21.62 | | | $ | 21.60 | | | $ | 18.42 | | | $ | 16.22 | | | $ | 15.97 | | | $ | 13.72 | |
Income (loss) from investment operations: | |
Net investment income (loss)b | | | (.13 | ) | | | (.26 | ) | | | (.21 | ) | | | (.16 | ) | | | (.13 | ) | | | (.19 | ) |
Net gain (loss) on investments (realized and unrealized) | | | 1.91 | | | | .82 | | | | 3.77 | | | | 4.39 | | | | .38 | | | | 2.44 | |
Total from investment operations | | | 1.78 | | | | .56 | | | | 3.56 | | | | 4.23 | | | | .25 | | | | 2.25 | |
Less distributions from: | |
Net realized gains | | | — | | | | (.54 | ) | | | (.38 | ) | | | (2.03 | ) | | | — | | | | — | |
Total distributions | | | — | | | | (.54 | ) | | | (.38 | ) | | | (2.03 | ) | | | — | | | | — | |
Net asset value, end of period | | $ | 23.40 | | | $ | 21.62 | | | $ | 21.60 | | | $ | 18.42 | | | $ | 16.22 | | | $ | 15.97 | |
| | |
Total Returnc | | | 8.23 | % | | | 2.48 | % | | | 19.37 | % | | | 26.46 | % | | | 1.57 | % | | | 16.40 | % |
Ratios/Supplemental Data | |
Net assets, end of period (in thousands) | | $ | 44,032 | | | $ | 38,900 | | | $ | 32,324 | | | $ | 19,175 | | | $ | 13,015 | | | $ | 15,177 | |
Ratios to average net assets: | |
Net investment income (loss) | | | (1.15 | %) | | | (1.19 | %) | | | (1.05 | %) | | | (0.89 | %) | | | (0.84 | %) | | | (1.35 | %) |
Total expensesd | | | 2.27 | % | | | 2.26 | % | | | 2.25 | % | | | 2.29 | % | | | 2.26 | % | | | 2.27 | % |
Portfolio turnover rate | | | 42 | % | | | 228 | % | | | 267 | % | | | 141 | % | | | 94 | % | | | 94 | % |
SEE NOTES TO FINANCIAL STATEMENTS. | THE RYDEX FUNDS SEMI-ANNUAL REPORT | 21 |
FINANCIAL HIGHLIGHTS (concluded) |
NASDAQ-100® FUND |
This table is presented to show selected data for a share outstanding throughout each period and to assist shareholders in evaluating a Fund’s performance for the periods presented.
H-Class | | Period Ended
Sept. 30,
2016a | | | Year Ended
March 31,
2016 | | | Period Ended
March 31,
2015e | |
Per Share Data | | | | | | | | | |
Net asset value, beginning of period | | $ | 24.00 | | | $ | 23.76 | | | $ | 22.91 | |
Income (loss) from investment operations: | |
Net investment income (loss)b | | | (.07 | ) | | | (.13 | ) | | | .01 | |
Net gain (loss) on investments (realized and unrealized) | | | 2.15 | | | | .91 | | | | 1.22 | |
Total from investment operations | | | 2.08 | | | | .78 | | | | 1.23 | |
Less distributions from: | |
Net realized gains | | | — | | | | (.54 | ) | | | (.38 | ) |
Total distributions | | | — | | | | (.54 | ) | | | (.38 | ) |
Net asset value, end of period | | $ | 26.08 | | | $ | 24.00 | | | $ | 23.76 | |
| | |
Total Returnc | | | 8.67 | % | | | 3.18 | % | | | 5.40 | % |
Ratios/Supplemental Data | |
Net assets, end of period (in thousands) | | $ | 39,811 | | | $ | 173,637 | | | $ | 12,009 | |
Ratios to average net assets: | |
Net investment income (loss) | | | (0.60 | %) | | | (0.51 | %) | | | 0.07 | % |
Total expensesd | | | 1.53 | % | | | 1.51 | % | | | 1.47 | % |
Portfolio turnover rate | | | 42 | % | | | 228 | % | | | 267 | % |
a | Unaudited figures for the period ended September 30, 2016. Percentage amounts for the period, except total return and portfolio turnover rate, have been annualized. |
b | Net investment income (loss) per share was computed using average shares outstanding throughout the period. |
c | Total return does not reflect the impact of any applicable sales charges. |
d | Does not include expenses of the underlying funds in which the Fund invests. |
e | Since commencement of operations: September 18, 2014. Percentage amounts for the period, except total return and portfolio turnover rate, have been annualized. The portfolio turnover rate stated is for the entire period of the Fund, not since commencement of operation of the Class. |
22 | THE RYDEX FUNDS SEMI-ANNUAL REPORT | SEE NOTES TO FINANCIAL STATEMENTS. |
NOTES TO FINANCIAL STATEMENTS (Unaudited) |
1. Organization and Significant Accounting Policies
Organization
The Rydex Series Funds (the “Trust”), a Delaware statutory trust, is registered with the SEC under the Investment Company Act of 1940 (”1940 Act”), as an open-ended investment company of the series type. Each series, in effect, is representing a separate Fund. The Trust is authorized to issue an unlimited number of no par value shares. The Trust accounts for the assets of each fund separately.
The Trust offers a combination of seven separate classes of shares: Investor Class shares, A-Class shares, C-Class shares, H-Class shares, P-Class shares, Institutional Class shares and Money Market Class shares. Sales of shares of each Class are made without a front-end sales charge at the net asset value per share (“NAV”), with the exception of A-Class shares. A-Class shares are sold at the NAV, plus the applicable front-end sales charge. The sales charge varies depending on the amount purchased, but will not exceed 4.75%. A-Class share purchases of $1 million or more are exempt from the front-end sales charge but have a 1% contingent deferred sales charge (“CDSC”) if shares are redeemed within 12 months of purchase. C-Class shares have a 1% CDSC if shares are redeemed within 12 months of purchase. Institutional Class shares are offered primarily for direct investment by institutions such as pension and profit sharing plans, endowments, foundations and corporations. Institutional Class shares require a minimum initial investment of $2 million and a minimum account balance of $1 million. At September 30, 2016, the Trust consisted of fifty-three funds (the “Funds”).
This report covers the NASDAQ-100® Fund (the “Fund”), a non-diversified investment company. Only Investor Class, A-Class, C-Class and H-Class shares had been issued by the Fund.
The Fund is designed and operated to accommodate frequent trading by shareholders and, unlike most mutual funds, offers unlimited exchange privileges with no minimum holding periods or transactions fees, which may cause the Fund to experience high portfolio turnover.
Guggenheim Investments (“GI”) provides advisory services, and Rydex Fund Services, LLC (“RFS”) provided transfer agent, administrative and accounting services to the Trust. Guggenheim Funds Distributors, LLC (“GFD”) acts as principal underwriter for the Trust. GI and GFD are affiliated entities; RFS ceased to be an affiliate of GI as of October 4, 2016, when it was acquired by MUFG Investor Services. In connection with its acquisition, RFS changed its name to MUFG Investor Services (US), LLC (“MUIS”). This change has no impact on the financial statements of the Fund.
Significant Accounting Policies
The Fund operates as an investment company and, accordingly, follows the investment company accounting and reporting guidance of the Financial Accounting Standards Board (“FASB”) Accounting Standards Codification Topic 946 Financial Services – Investment Companies.
| | THE RYDEX FUNDS SEMI-ANNUAL REPORT | 23 |
NOTES TO FINANCIAL STATEMENTS (Unaudited)(continued) |
The following significant accounting policies are in conformity with U.S. generally accepted accounting principles (“U.S. GAAP”) and are consistently followed by the Trust. This requires management to make estimates and assumptions that affect the reported amount of assets and liabilities, contingent assets and liabilities at the date of the financial statements, and the reported amounts of revenues and expenses during the reporting period. Actual results could differ from these estimates. All time references are based on Eastern Time.
The NAV of each Class of the Fund is calculated by dividing the market value of the Fund’s securities and other assets, less all liabilities, attributable to the Class by the number of outstanding shares of the Class.
A. The Board of Trustees of the Fund (the “Board”) has adopted policies and procedures for the valuation of the Fund’s investments (the “Valuation Procedures”). Pursuant to the Valuation Procedures, the Board has delegated to a valuation committee, consisting of representatives from Guggenheim’s investment management, fund administration, legal and compliance departments (the “Valuation Committee”), the day-to-day responsibility for implementing the Valuation Procedures, including, under most circumstances, the responsibility for determining the fair value of the Fund’s securities and/or other assets.
Valuations of the Fund’s securities are supplied primarily by pricing services appointed pursuant to the processes set forth in the Valuation Procedures. The Valuation Committee convenes monthly, or more frequently as needed, to review the valuation of all assets which have been fair valued for reasonableness. The Fund’s officers, through the Valuation Committee and consistent with the monitoring and review responsibilities set forth in the Valuation Procedures, regularly review procedures used and valuations provided by the pricing services.
If the pricing service cannot or does not provide a valuation for a particular investment or such valuation is deemed unreliable, such investment is fair valued by the Valuation Committee.
Equity securities listed on an exchange (New York Stock Exchange (“NYSE”) or American Stock Exchange) are valued at the last quoted sales price as of the close of business on the NYSE, usually 4:00 p.m. on the valuation date. Equity securities listed on the NASDAQ market system are valued at the NASDAQ Official Closing Price on the valuation date, which may not necessarily represent the last sale price. If there has been no sale on such exchange or NASDAQ on a given day, the security is valued at the closing bid price on that day.
Open-end investment companies (“mutual funds”) are valued at their NAV as of the close of business, on the valuation date. Exchange-traded funds (“ETFs”) and closed-end investment companies (“CEFs”) are valued at the last quoted sales price.
Debt securities with a maturity of greater than 60 days at acquisition are valued at prices that reflect broker-dealer supplied valuations or are obtained from independent pricing services, which may consider the trade activity, treasury spreads, yields or price of bonds of comparable
24 | THE RYDEX FUNDS SEMI-ANNUAL REPORT | |
NOTES TO FINANCIAL STATEMENTS (Unaudited)(continued) |
quality, coupon, maturity, and type, as well as prices quoted by dealers who make markets in such securities. Short-term debt securities with a maturity of 60 days or less at acquisition are valued at amortized cost, provided such amount approximates market value.
Repurchase agreements are valued at amortized cost, provided such amounts approximate market value.
The value of futures contracts is accounted for using the unrealized gain or loss on the contracts that is determined by marking the contracts to their current realized settlement prices. Financial futures contracts are valued at the 4:00 p.m. price on the valuation date. In the event that the exchange for a specific futures contract closes earlier than 4:00 p.m., the futures contract is valued at the Official Settlement Price of the exchange. However, the underlying securities from which the futures contract value is derived are monitored until 4:00 p.m. to determine if fair valuation would provide a more accurate valuation.
The values of OTC swap agreements entered into by a Fund are accounted for using the unrealized gains or losses on the agreements that are determined by marking the agreements to the last quoted value of the index that the swaps pertain to at the close of the NYSE. The swaps’ values are then adjusted to include dividends accrued, financing charges and/or interest associated with the swap agreements.
Investments for which market quotations are not readily available are fair- valued as determined in good faith by GI under the direction of the Board using methods established or ratified by the Board.
Valuations in accordance with these methods are intended to reflect each security’s (or asset’s) “fair value.” Each such determination is based on a consideration of all relevant factors, which are likely to vary from one pricing context to another. Examples of such factors may include, but are not limited to: market prices; sale prices; broker quotes; and models which derive prices based on inputs such as prices of securities with comparable maturities and characteristics, or based on inputs such as anticipated cash flows or collateral, spread over Treasuries, and other information analysis.
In connection with futures contracts and other derivative investments, such factors may include obtaining information as to how (a) these contracts and other derivative investments trade in the futures or other derivative markets, respectively, and (b) the securities underlying these contracts and other derivative investments trade in the cash market.
B. Certain U.S. Government and Agency Obligations are traded on a discount basis; the interest rates shown on the Schedule of Investments reflect the effective rates paid at the time of purchase by the Fund. Other securities bear interest at the rates shown, payable at fixed dates through maturity.
| | THE RYDEX FUNDS SEMI-ANNUAL REPORT | 25 |
NOTES TO FINANCIAL STATEMENTS (Unaudited)(continued) |
C. Upon entering into a futures contract, the Fund deposits and maintains as collateral such initial margin as required by the exchange on which the transaction is affected. Pursuant to the contract, the Fund agrees to receive from or pay to the broker an amount of cash equal to the daily fluctuation in value of the contract. Such receipts or payments are known as variation margin and are recorded by the Fund as unrealized gains or losses. When the contract is closed, the Fund records a realized gain or loss equal to the difference between the value of the contract at the time it was opened and the value at the time it was closed.
D. Swap agreements are marked-to-market daily and the change, if any, is recorded as unrealized gain or loss. Payments received or made as a result of an agreement or termination of an agreement are recognized as realized gains or losses.
E. Security transactions are recorded on the trade date for financial reporting purposes. Realized gains and losses from securities transactions are recorded using the identified cost basis. Proceeds from lawsuits related to investment holdings are recorded as realized gains in the Fund. Dividend income is recorded on the ex-dividend date, net of applicable taxes withheld by foreign countries. Taxable non-cash dividends are recorded as dividend income. Interest income, including amortization of premiums and accretion of discounts, is accrued on a daily basis. Dividend income from REITs is recorded based on the income included in the distributions received from the REIT investments using published REIT classifications, including some management estimates when actual amounts are not available. Distributions received in excess of this estimated amount are recorded as a reduction of the cost of investments or reclassified to capital gains. The actual amounts of income, return of capital, and capital gains are only determined by each REIT after its fiscal year-end, and may differ from the estimated amounts.
F. Distributions of net investment income and net realized gains, if any, are declared and paid at least annually. Dividends are reinvested in additional shares unless shareholders request payment in cash. Distributions are recorded on the ex-dividend date and are determined in accordance with income tax regulations which may differ from U.S. GAAP.
G. Interest and dividend income, most expenses, all realized gains and losses, and all unrealized gains and losses are allocated to the classes based upon the value of the outstanding shares in each Class. Certain costs, such as distribution and service fees are charged directly to specific classes. In addition, certain expenses have been allocated to the individual Funds in the Trust on a pro rata basis upon the respective aggregate net assets of each Fund included in the Trust.
H. The Fund may leave cash overnight in its cash account with the custodian. Periodically, the Fund may have cash due to the custodian bank as an overdraft balance. A fee is incurred on this overdraft, calculated by multiplying the overdraft by a rate based on the federal funds rate, which was 0.29% at September 30, 2016.
I. Under the Fund’s organizational documents, its Trustees and Officers are indemnified against certain liabilities arising out of the performance of their duties to the Trust. In addition, throughout the normal course of business, the Fund enters into contracts that contain a variety
26 | THE RYDEX FUNDS SEMI-ANNUAL REPORT | |
NOTES TO FINANCIAL STATEMENTS (Unaudited)(continued) |
of representations and warranties which provide general indemnifications. The Fund’s maximum exposure under these arrangements is unknown, as this would involve future claims that may be made against the Fund and/or its affiliates that have not yet occurred. However, based on experience, the Fund expects the risk of loss to be remote.
2. Financial Instruments and Derivatives
As part of its investment strategy, the Fund utilizes a variety of derivative instruments. These investments involve, to varying degrees, elements of market risk and risks in excess of the amounts recognized in the Statement of Assets and Liabilities. Valuation and accounting treatment of these instruments can be found under Significant Accounting Policies in Note 1 of these Notes to Financial Statements.
Derivatives
Derivatives are instruments whose values depend on, or are derived from, in whole or in part, the value of one or more other assets, such as securities, currencies, commodities or indices. Derivative instruments may be used to increase investment flexibility (including to maintain cash reserves while maintaining exposure to certain other assets), for risk management (hedging) purposes, to facilitate trading, to reduce transaction costs and to pursue higher investment returns. Derivative instruments may also be used to mitigate certain investment risks, such as foreign currency exchange rate risk, interest rate risk and credit risk. U.S. GAAP requires disclosures to enable investors to better understand how and why a Fund uses derivative instruments, how these derivative instruments are accounted for and their effects on the Fund’s financial position and results of operations.
The Fund may utilize derivatives for the following purposes:
Index Exposure: the use of an instrument to obtain exposure to a listed or other type of index.
Liquidity: the ability to buy or sell exposure with little price/market impact.
Futures
A futures contract is an agreement to purchase (long) or sell (short) an agreed amount of securities or other instruments at a set price for delivery at a future date. There are significant risks associated with a Fund’s use of futures contracts, including (i) there may be an imperfect or no correlation between the changes in market value of the underlying asset and the prices of futures contracts; (ii) there may not be a liquid secondary market for a futures contract; (iii) trading restrictions or limitations may be imposed by an exchange; and (iv) government regulations may restrict trading in futures contracts. When investing in futures, there is minimal counterparty credit risk to a Fund because futures are exchange-traded and the exchange’s clearinghouse, as counterparty to all exchange-traded futures, guarantees against default. Cash deposits are shown as segregated cash with broker on the Statement of Assets and Liabilities; securities held as collateral are noted on the Schedule of Investments.
| | THE RYDEX FUNDS SEMI-ANNUAL REPORT | 27 |
NOTES TO FINANCIAL STATEMENTS (Unaudited)(continued) |
The following table represents the Fund’s use and volume of futures on a quarterly basis:
| | | | Average Notional | |
Fund | Use | | Long | |
NASDAQ-100® Fund | Index exposure, Liquidity | | $ | 31,441,693 | |
Swaps
A swap is an agreement that obligates two parties to exchange a series of cash flows at specified intervals based upon or calculated by reference to changes in specified prices or rates for a specified amount of an underlying asset. A Fund utilizing OTC swaps bears the risk of loss of the amount expected to be received under a swap agreement in the event of the default or bankruptcy of a swap agreement counterparty or if the underlying asset declines in value. Certain standardized swaps are subject to mandatory central clearing. Central clearing generally reduces counterparty credit risk and increases liquidity, but central clearing does not make swap transactions risk-free. Additionally, there is no guarantee that a Fund or an underlying fund could eliminate its exposure under an outstanding swap agreement by entering into an offsetting swap agreement with the same or another party.
Total return swaps involve commitments where single or multiple cash flows are exchanged based on the price of an underlying reference asset (such as index or basket) or a fixed or variable interest rate. Index swaps will usually be computed based on the current index value as of the close of regular trading on the NYSE or other exchange, with the swap value being adjusted to include dividends accrued, financing charges and/or interest associated with the swap agreement. A fund utilizing a total return index swap bears the risk of loss of the amount expected to be received under a swap agreement in the event of the default or bankruptcy of a swap agreement counterparty or if the underlying index declines in value.
The following table represents the Fund’s use and volume of total return swaps on a quarterly basis:
| | | | Average Notional | |
Fund | Use | | Long | |
NASDAQ-100® Fund | Index exposure, Liquidity | | $ | 219,640,905 | |
Derivative Investment Holdings Categorized by Risk Exposure
The following is a summary of the location of derivative investments on the Fund’s Statement of Assets and Liabilities as of September 30, 2016:
Derivative Investment Type | Asset Derivatives |
Equity contracts | Variation margin |
| Unrealized appreciation on swap agreements |
28 | THE RYDEX FUNDS SEMI-ANNUAL REPORT | |
NOTES TO FINANCIAL STATEMENTS (Unaudited)(continued) |
The following table sets forth the fair value of the Fund’s derivative investments categorized by primary risk exposure at September 30, 2016:
Asset Derivative Investments Value | |
Fund | | Futures
Equity
Contracts* | | | Swaps
Equity
Contracts | | | Total Value at
September 30,
2016 | |
NASDAQ-100® Fund | | $ | 1,585,152 | | | $ | 130,040 | | | $ | 1,715,192 | |
* | Includes cumulative appreciation (depreciation) of futures contracts as reported on the Schedule of Investments. Only current day’s variation margin is reported within the Statement of Assets and Liabilities. |
The following is a summary of the location of derivative investments on the Fund’s Statement of Operations for the period ended September 30, 2016:
Derivative Investment Type | Location of Gain (Loss) on Derivatives |
Equity contracts | Net realized gain (loss) on futures contracts |
| Net change in unrealized appreciation (depreciation) on futures contracts |
| Net realized gain (loss) on swap agreements |
| Net change in unrealized appreciation (depreciation) on swap agreements |
The following is a summary of the Fund’s realized gain (loss) and change in unrealized appreciation (depreciation) on derivative investments recognized on the Statement of Operations categorized by primary risk exposure for the period ended September 30, 2016:
Realized Gain (Loss) on Derivative Investments Recognized on the Statement of Operations | |
Fund | | Futures
Equity
Contracts | | | Swaps
Equity
Contracts | | | Total | |
NASDAQ-100® Fund | | $ | 2,274,078 | | | $ | 9,285,188 | | | $ | 11,559,266 | |
Change in Unrealized Appreciation (Depreciation) on Derivative Investments Recognized on the Statement of Operations | |
Fund | | Futures
Equity
Contracts | | | Swaps
Equity
Contracts | | | Total | |
NASDAQ-100® Fund | | $ | 1,184,715 | | | $ | (1,758,753 | ) | | $ | (574,038 | ) |
| | THE RYDEX FUNDS SEMI-ANNUAL REPORT | 29 |
NOTES TO FINANCIAL STATEMENTS (Unaudited)(continued) |
In conjunction with the use of derivative instruments, the Fund is required to maintain collateral in various forms. The Fund uses, where appropriate, depending on the financial instrument utilized and the broker involved, margin deposits at the broker, cash and/or securities segregated at the custodian bank, discount notes or the repurchase agreements allocated to the Fund.
The Trust has established counterparty credit guidelines and enters into transactions only with financial institutions of investment grade or better. The Trust monitors the counterparty credit risk.
3. Fees and Other Transactions with Affiliates
Under the terms of an investment advisory contract, the Fund pays GI investment advisory fees calculated at an annualized rate of 0.75% of the average daily net assets of the Fund.
RFS provided transfer agent and administrative services to the Fund calculated at the annualized rate of 0.25% based on the average daily net assets of the Fund.
RFS also provided accounting services to the Fund for fees calculated at annualized rates below, based on the average daily net assets of the Fund:
Fund Accounting Fees | (as a % of Net Assets) |
On the first $250 million | 0.10% |
On the next $250 million | 0.075% |
On the next $250 million | 0.05% |
Over $750 million | 0.03% |
GI engages external service providers to perform other necessary services for the Trust, such as audit and accounting related services, legal services, custody, printing and mailing, etc., on a pass-through basis. Such expenses are allocated to various Funds within the complex based on relative net assets.
The Trust has adopted a Distribution Plan applicable to A-Class shares and H-Class shares for which GFD and other firms that provide distribution and/or shareholder services (“Service Providers”) may receive compensation. If a Service Provider provides distribution services, the Fund will pay distribution fees to GFD at an annual rate not to exceed 0.25% of average daily net assets, pursuant to Rule 12b-1 of the 1940 Act. GFD, in turn, will pay the Service Provider out of its fees. GFD may, at its discretion, retain a portion of such payments to compensate itself for distribution services.
The Trust has adopted a separate Distribution and Shareholder Services Plan applicable to its C-Class shares that allows the Fund to pay annual distribution and service fees of 1.00% of the Fund’s C-Class shares average daily net assets. The annual 0.25% service fee compensates a shareholder’s financial adviser for providing ongoing services to the shareholder. The annual distribution fee of 0.75% reimburses GFD for paying the shareholder’s financial adviser an
30 | THE RYDEX FUNDS SEMI-ANNUAL REPORT | |
NOTES TO FINANCIAL STATEMENTS (Unaudited)(continued) |
ongoing sales commission. GFD advances the first year’s service and distribution fees to the financial adviser. GFD retains the service and distribution fees on accounts with no authorized dealer of record.
For the period ended September 30, 2016, GFD retained sales charges of $145,031 relating to sales of A-Class shares of the Trust.
Certain trustees and officers of the Trust are also officers of GI and GFD.
4. Fair Value Measurement
In accordance with U.S. GAAP, fair value is defined as the price that the Fund would receive to sell an investment or pay to transfer a liability in an orderly transaction with an independent buyer in the principal market, or in the absence of a principal market, the most advantageous market for the investment or liability. U.S. GAAP establishes a three-tier fair value hierarchy based on the types of inputs used to value assets and liabilities and requires corresponding disclosure. The hierarchy and the corresponding inputs are summarized below:
Level 1 — | quoted prices in active markets for identical assets or liabilities. |
Level 2 — | significant other observable inputs (for example quoted prices for securities that are similar based on characteristics such as interest rates, prepayment speeds, credit risk, etc.). |
Level 3 — | significant unobservable inputs based on the best information available under the circumstances, to the extent observable inputs are not available, which may include assumptions. |
The types of inputs available depend on a variety of factors, such as the type of security and the characteristics of the markets in which it trades, if any. Fair valuation determinations that rely on fewer or no observable inputs require greater judgment. Accordingly, fair value determinations for Level 3 securities require the greatest amount of judgment.
The inputs or methodologies used for valuing securities are not necessarily an indication of the risk associated with investing in those securities. The suitability of the techniques and sources employed to determine fair valuation are regularly monitored and subject to change.
5. Repurchase Agreements
The Funds transfer uninvested cash balances into a single joint account, the daily aggregate balance of which is invested in one or more repurchase agreements collateralized by obligations of the U.S. Treasury and U.S. government agencies. The collateral is in the possession of the Funds’ custodian and is evaluated to ensure that its market value exceeds, at a minimum, 102% of the original face amount of the repurchase agreements. Each Fund holds a pro rata share of the collateral based on the dollar amount of the repurchase agreement entered into by each Fund.
| | THE RYDEX FUNDS SEMI-ANNUAL REPORT | 31 |
NOTES TO FINANCIAL STATEMENTS (Unaudited)(continued) |
At September 30, 2016, the repurchase agreements in the joint account were as follows:
Counterparty and
Terms of Agreement | | | Face
Value | | | Repurchase Price | | | Collateral | | | Par
Value | | | Fair
Value | |
HSBC Securities, Inc. | | | | | | | | | U.S. Treasury Strips | | | | | | | |
0.38% | | | | | | | | | 0.00% | | | | | | | |
Due 10/03/16 | | | $ | 469,487,376 | | | $ | 469,502,243 | | | 11/15/39 | | | $ | 803,943,000 | | | $ | 478,877,146 | |
| | | | | | | | | | | | | | | | | | | | | |
Royal Bank of Canada | | | | | | | | | | | U.S. Treasury Notes | | | | | | | | | |
0.36% | | | | | | | | | | | 1.38% - 1.50% | | | | | | | | | |
Due 10/03/16 | | | | 432,837,985 | | | | 432,850,971 | | | 05/31/20 | | | | 370,488,200 | | | | 380,230,860 | |
| | | | | | | | | | | | U.S. TIP Notes | | | | | | | | | |
| | | | | | | | | | | | 0.13% - 0.25% | | | | | | | | | |
| | | | | | | | | | | | 07/15/22 - 01/15/25 | | | | 57,946,000 | | | | 61,263,965 | |
| | | | | | | | | | | | | | | | 428,434,200 | | | | 441,494,825 | |
In the event of counterparty default, the Funds have the right to collect the collateral to offset losses incurred. There is potential loss to the Funds in the event the Funds are delayed or prevented from exercising their rights to dispose of the collateral securities, including the risk of a possible decline in the value of the underlying securities during the period while the Funds seek to assert their rights. The Funds’ investment adviser, acting under the supervision of the Board, reviews the value of the collateral and the creditworthiness of those banks and dealers with which the Funds enter into repurchase agreements to evaluate potential risks.
6. Offsetting
In the normal course of business, the Fund enters into transactions subject to enforceable master netting arrangements or other similar arrangements. Generally, the right to offset in those agreements allows the Fund to counteract the exposure to a specific counterparty with collateral received from or delivered to that counterparty based on the terms of the arrangements. These arrangements provide for the right to liquidate upon the occurrence of an event of default, credit event upon merger or additional termination event.
In order to better define their contractual rights and to secure rights that will help the Fund mitigate its counterparty risk, the Fund may enter into an International Swaps and Derivatives Association, Inc. Master Agreement (“ISDA Master Agreement”) or similar agreement with its derivative contract counterparties. An ISDA Master Agreement is a bilateral agreement between a Fund and a counterparty that governs OTC derivatives, including foreign exchange contracts, and typically contains, among other things, collateral posting terms and netting provisions in the event of a default and/or termination event. The provisions of the ISDA Master Agreement typically permit a single net payment in the event of a default (close-out netting) or similar event, including the bankruptcy or insolvency of the counterparty.
32 | THE RYDEX FUNDS SEMI-ANNUAL REPORT | |
NOTES TO FINANCIAL STATEMENTS (Unaudited)(continued) |
For derivatives traded under an ISDA Master Agreement, the collateral requirements are typically calculated by netting the mark-to-market amount for each transaction under such agreement and comparing that amount to the value of any collateral currently pledged by the Fund and the counterparty. For financial reporting purposes, cash collateral that has been pledged to cover obligations of the Fund and cash collateral received from the counterparty, if any, are reported separately on the Statement of Assets and Liabilities as segregated cash with broker/receivable for variation margin, or payable for swap settlement/variation margin. Generally, the amount of collateral due from or to a counterparty must exceed a minimum transfer amount threshold (e.g., $300,000) before a transfer is required to be made. To the extent amounts due to the Fund from its counterparties are not fully collateralized, contractually or otherwise, the Fund bears the risk of loss from counterparty nonperformance. The Fund attempts to mitigate counterparty risk by only entering into agreements with counterparties that they believe to be of good standing and by monitoring the financial stability of those counterparties.
For financial reporting purposes, the Fund does not offset derivative assets and derivative liabilities that are subject to netting arrangements in the Statement of Assets and Liabilities.
The following tables present derivative financial instruments and secured financing transactions that are subject to enforceable netting arrangements and offset in the Statement of Assets and Liabilities in conformity with U.S. GAAP:
| | | | | | | | | | | | | Gross Amounts Not Offset
in the Statement of
Assets and Liabilities | | | | |
Fund | Instrument | | Gross Amounts of Recognized Assets1 | | | Gross Amounts Offset In the Statement of Assets and Liabilities | | | Net Amount of Assets Presented on the Statement of Assets and Liabilities | | | Financial Instruments | | | Cash Collateral Received | | | Net
Amount | |
NASDAQ-100® Fund | Swap equity contracts | | $ | 130,040 | | | $ | — | | | $ | 130,040 | | | $ | — | | | $ | — | | | $ | 130,040 | |
1 | Exchange-traded futures are excluded from these reported amounts. |
7. Federal Income Tax Information
The Fund intends to comply with the provisions of Subchapter M of the Internal Revenue Code applicable to regulated investment companies and will distribute substantially all taxable net investment income and capital gains sufficient to relieve the Fund from all, or substantially all, federal income, excise and state income taxes. Therefore, no provision for federal or state income tax is required.
| | THE RYDEX FUNDS SEMI-ANNUAL REPORT | 33 |
NOTES TO FINANCIAL STATEMENTS (Unaudited)(continued) |
Tax positions taken or expected to be taken in the course of preparing the Fund’s tax returns are evaluated to determine whether the tax positions are “more-likely-than-not” of being sustained by the applicable tax authority. Tax positions not deemed to meet the more-likely-than-not threshold would be recorded as a tax benefit or expense in the current year. Management has analyzed the Fund’s tax positions taken, or to be taken, on federal income tax returns for all open tax years, and has concluded that no provision for income tax is required in the Fund’s financial statements. The Fund’s federal tax returns are subject to examination by the Internal Revenue Service for a period of three years after they are filed.
At September 30, 2016, the cost of securities for federal income tax purposes, the aggregate gross unrealized gain for all securities for which there was an excess of value over tax cost, and the aggregate gross unrealized loss for all securities for which there was an excess of tax cost over value were as follows:
Fund | | Tax
Cost | | | Tax
Unrealized
Gain | | | Tax
Unrealized
Loss | | | Net
Unrealized
Gain | |
NASDAQ-100® Fund | | $ | 571,633,461 | | | $ | 260,389,545 | | | $ | (4,091,089 | ) | | $ | 256,298,456 | |
8. Securities Transactions
For the period ended September 30, 2016, the cost of purchases and proceeds from sales of investment securities, excluding government securities, short-term investments and derivatives, were as follows:
Fund | | Purchases | | | Sales | |
NASDAQ-100® Fund | | $ | 302,792,463 | | | $ | 462,707,501 | |
The Fund is permitted to purchase or sell securities from or to certain affiliated funds under specified conditions outlined in procedures adopted by the Board of the Trust. The procedures have been designed to ensure that any purchase or sale of securities by a Fund from or to another fund or portfolio that is or could be considered an affiliate by virtue of having a common investment adviser (or affiliated investment advisers), common Trustees and/or common officers complies with Rule 17a-7 of the 1940 Act. Further, as defined under these procedures, each transaction is effected at the current market price to save costs, where permissible. For the period ended September 30, 2016, the Fund engaged in purchases and sales of securities, pursuant to Rule 17a-7 of the 1940 Act, as follows:
Fund | | Purchases | | | Sales | | | Realized
Gain | |
NASDAQ-100® Fund | | $ | 50,184,721 | | | $ | 86,797,344 | | | $ | 5,107,569 | |
34 | THE RYDEX FUNDS SEMI-ANNUAL REPORT | |
NOTES TO FINANCIAL STATEMENTS (Unaudited)(continued) |
9. Affiliated Transactions
Investments representing 5% or more of the outstanding voting shares of a portfolio company of a fund, or control of or by, or common control under GI, result in that portfolio company being considered an affiliated company of such fund, as defined in the 1940 Act.
The Fund may invest in the Guggenheim Strategy Funds Trust consisting of Guggenheim Strategy Fund I, Guggenheim Strategy Fund II, Guggenheim Strategy Fund III, and Guggenheim Variable Insurance Strategy Fund III (collectively, the “Cash Management Funds”), open-end management investment companies managed by GI. The Cash Management Funds, which launched on March 11, 2014, are offered as cash management options only to mutual funds, trusts, and other accounts managed by GI and/or its affiliates, and are not available to the public. The Cash Management Funds pay no investment management fees. The Cash Management Funds’ annual report on Form N-CSR dated September 30, 2015, is available publicly or upon request. This information is available from the EDGAR database on the SEC’s website at http://www.sec.gov/Archives/edgar/data/1601445/000089180415000857/gug63224-ncsr.htm.
Transactions during the period ended September 30, 2016, in which the portfolio company is an “affiliated person,” were as follows:
Affiliated issuers by Fund | | Value
03/31/16 | | | Additions | | | Reductions | | | Value
09/30/16 | | | Shares
09/30/16 | | | Investment
Income | | | Realized
Gain | |
Guggenheim Strategy Fund I | | $ | 63,012,120 | | | $ | 50,649,483 | | | $ | (101,445,000 | ) | | $ | 12,497,340 | | | | 500,094 | | | $ | 226,658 | | | $ | 132,030 | |
Guggenheim Strategy Fund II | | | 36,088,986 | | | | 11,752,872 | | | | (37,500,000 | ) | | | 10,515,099 | | | | 421,616 | | | | 147,120 | | | | 34,722 | |
| | | $ | 99,101,106 | | | $ | 62,402,355 | | | $ | (138,945,000 | ) | | $ | 23,012,439 | | | | | | | $ | 373,778 | | | $ | 166,752 | |
10. Line of Credit
The Trust, along with other affiliated trusts, secured an uncommitted $75,000,000 line of credit from U.S. Bank, N.A., which expires June 11, 2017. This line of credit is reserved for emergency or temporary purposes. Borrowings, if any, under this arrangement bear interest equal to the Prime Rate, minus 2%, which shall be paid monthly, averaging 1.25% for the period ended September 30, 2016. The Fund did not have any borrowings outstanding under this agreement at September 30, 2016.
Fund | | Average Daily Balance | |
NASDAQ-100® Fund | | $ | 970,559 | |
11. Conversion of Advisor Class Shares and Class H Shares
Effective following the close of business on September 30, 2015, all outstanding Advisor Class shares of the NASDAQ-100® Fund were converted into Class H shares of the Fund. The conversion of all outstanding Advisor Class shares was effected by exchanging shareholders’
| | THE RYDEX FUNDS SEMI-ANNUAL REPORT | 35 |
NOTES TO FINANCIAL STATEMENTS (Unaudited)(continued) |
Advisor Class shares for Class H shares. Advisor Class shareholders of the Fund received Class H shares of the Fund with a value equal to the value of their investment in Advisor Class shares of the Fund on September 30, 2015.
12. Legal Proceedings
Tribune Company
Rydex Series Funds has been named as a defendant and a putative member of the proposed defendant class of shareholders in the case entitled Kirschner v. FitzSimons, No. 12-2652 (S.D.N.Y.) (formerly Official Committee of Unsecured Creditors of Tribune Co. v. FitzSimons, Adv. Pro. No. 10-54010 (Bankr. D. Del.)) (the “FitzSimons action”), as a result of ownership by certain series of the Rydex Series Funds of shares in the Tribune Company (“Tribune”) in 2007, when Tribune effected a leveraged buyout transaction (“LBO”) by which Tribune converted to a privately-held company. In his complaint, the plaintiff has alleged that, in connection with the LBO, Tribune insiders and shareholders were overpaid for their Tribune stock using financing that the insiders knew would, and ultimately did, leave Tribune insolvent. The plaintiff has asserted claims against certain insiders, major shareholders, professional advisers, and others involved in the LBO. The plaintiff is also attempting to obtain from former Tribune shareholders, including the Rydex Series Funds, the proceeds they received in connection with the LBO.
In June 2011, a group of Tribune creditors filed multiple actions against former Tribune shareholders involving state law constructive fraudulent conveyance claims arising out of the 2007 LBO (the “SLCFC actions”). Rydex Series Funds has been named as a defendant in one or more of these suits. In those actions, the creditors seek to recover from Tribune’s former shareholders the proceeds received in connection with the 2007 LBO.
The FitzSimons action and the SLCFC actions have been consolidated with the majority of the other Tribune LBO-related lawsuits in a multidistrict litigation proceeding captioned In re Tribune Company Fraudulent Conveyance Litig., No. 11-md-2696 (S.D.N.Y.) (the “MDL Proceeding”).
On September 23, 2013, the District Court granted the defendants’ omnibus motion to dismiss the SLCFC actions, on the basis that the creditors lacked standing. On September 30, 2013, the creditors filed a notice of appeal of the September 23 order. On October 28, 2013, the defendants filed a joint notice of cross-appeal of that same order.
On March 29, 2016, the U.S. Court of Appeals for the Second Circuit issued its opinion on the appeal of the SLCFC actions. The appeals court affirmed the district court’s dismissal of those lawsuits, but on different grounds than the district court. The appeals court held that while the plaintiffs have standing under the U.S. Bankruptcy Code, their claims were preempted by Section 546(e) of the Bankruptcy Code—the statutory safe harbor for settlement payments. On April 12, 2016, the Plaintiffs in the SLCFC actions filed a petition seeking rehearing en banc before the
36 | THE RYDEX FUNDS SEMI-ANNUAL REPORT | |
NOTES TO FINANCIAL STATEMENTS (Unaudited)(continued) |
appeals court. On July 22, 2016, the appeals court denied the petition. On September 9, 2016, the plaintiffs filed a petition for writ of certiorari in the U.S. Supreme Court challenging the Second Circuit’s decision that the safe harbor of Section 546(e) applied to their claims. The shareholder defendants, including the Funds, filed a joint brief in opposition to the petition for certiorari on October 24, 2016. The Supreme Court has not yet granted or denied the petition for certiorari.
On May 23, 2014, the defendants filed motions to dismiss the FitzSimons action, including a global motion to dismiss Count I, which is the claim brought against former Tribune shareholders for intentional fraudulent conveyance under U.S. federal law. The Court has not yet issued a decision on any of these motions.
None of these lawsuits alleges any wrongdoing on the part of Rydex Series Funds. The following series of Rydex Series Funds held shares of Tribune and tendered these shares as part of Tribune’s LBO: Nova Fund, S&P 500® Pure Value Fund, Multi-Cap Core Equity Fund, S&P 500® Fund, Multi-Hedge Strategies Fund and Hedged Equity Fund (the “Funds”). The value of the proceeds received by the foregoing Funds was $28,220, $109,242, $9,860, $3,400, $1,181,160, and $10,880, respectively. At this stage of the proceedings, Rydex Series Funds is not able to make a reliable predication as to the outcome of these lawsuits or the effect, if any, on a Fund’s net asset value.
Lyondell Chemical Company
In December 2011, Rydex Series Funds was named as a defendant in Weisfelner, as Trustee of the LB Creditor Trust, v. Fund 1 (In re Lyondell Chemical Co.), Adv. Pro. No. 10-4609 (Bankr. S.D.N.Y.) (the “Creditor Trust Action”). Its funds may also be putative members of the proposed defendant classes in Weisfelner, as Trustee of the LB Litigation Trust v. A. Holmes & H. Holmes TTEE (In re Lyondell Co.), Adv. Pro. No. 10-5525 (Bankr. S.D.N.Y.) (the “Litigation Trust Action”) and Weisfelner, as Trustee of the LB Creditor Trust, v. Reichman (In re Lyondell Chemical Co.), Adv. Pro. No. 12-1570 (Bankr. S.D.N.Y.).
Similar to the claims made in the Tribune matter, the Weisfelner complaints seek to have set aside and recovered as fraudulent transfers from former Lyondell Chemical Company (“Lyondell”) shareholders the consideration paid to them pursuant to the cash out merger of Lyondell shareholders in connection with the combination of Lyondell and Basell AF in 2007. Lyondell filed for bankruptcy in 2008. The Creditor Trust Action and Reichman allege claims against the former Lyondell shareholders under state law for both constructive fraudulent transfer and intentional fraudulent transfer. The Litigation Trust Action alleges a claim against the former Lyondell shareholders under federal law for intentional fraudulent transfer.
On April 7, 2014, the plaintiff filed a Third Amended Complaint in the Creditor Trust Action, a Second Amended Complaint in the Litigation Trust Action, and an Amended Complaint in Reichman.
| | THE RYDEX FUNDS SEMI-ANNUAL REPORT | 37 |
NOTES TO FINANCIAL STATEMENTS (Unaudited)(continued) |
On May 8, 2014, the plaintiff in the Litigation Trust Action filed a motion to certify a defendant class generally comprised of all former Lyondell shareholders that received proceeds in exchange for their shares in the 2007 merger transaction.
On July 30, 2014, the defendants filed a motion to dismiss these lawsuits. The Bankruptcy Court held oral argument on the motion to dismiss and on the motion for class certification on January 14 and January 15, 2015. On September 15, 2015, the Bankruptcy Court denied the motion for class certification without prejudice to the plaintiff’s right to file a renewed motion. On November 18, 2015, the Bankruptcy Court granted the defendants’ motion to dismiss the intentional fraudulent transfer claims in the Creditor Trust Action, the Litigation Trust Action, and in Reichman, but denied the motion to dismiss the constructive fraudulent transfer claims in the Creditor Trust Action and in Reichman. The Bankruptcy Court entered final judgment dismissing the Litigation Trust Action, but the plaintiff appealed the dismissal to the U.S. District Court for the Southern District of New York.
On July 27, 2016, the District Court reversed the Bankruptcy Court and reinstated the federal law intentional fraudulent transfer claim in the Litigation Trust Action and remanded to the Bankruptcy Court for further proceedings. The District Court found that the fraudulent intent that mattered was that of Lyondell’s CEO, not its board, because the CEO’s intent could be imputed to Lyondell under Delaware law agency principles. The District Court did note, however, that plaintiff faces a high standard for proving “actual intent” to harm creditors, and that it remains to be seen whether plaintiff will be able to make this showing. On August 11, 2016, the shareholder defendants filed a motion for reconsideration and/or to certify an interlocutory appeal of the District Court’s opinion. On October 5, 2016, the District Court denied the motion for reconsideration and/or to certify an interlocutory appeal. In light of this ruling, the federal intentional fraudulent conveyance claim will move forward before the Bankruptcy Court, but a schedule for that case has not yet been set.
On May 4, 2016, the defendants filed a motion to dismiss, or in the alternative, for a stay of, the Creditor Trust Action and Reichman in light of the U.S. Court of Appeals for the Second Circuit’s opinion in the appeal of the Tribune SLCFC actions. On July 20, 2016, the Bankruptcy Court issued a report and recommendation granting the defendants’ motion to dismiss. The U.S. District Court for the Southern District of New York has not yet accepted the Bankruptcy Court’s recommendation or entered a final judgment.
These lawsuits do not allege any wrongdoing on the part of Rydex Series Funds. The following series of Rydex Series Funds received cash proceeds from the cash out merger in the following amounts: Basic Materials Fund - $1,725,168; Long Short Equity Fund f/k/a U.S. Long Short Momentum Fund - $2,193,600; Global 130/30 Strategy Fund - $37,920; Hedged Equity Fund - $1,440; and Multi-Hedge Strategies Fund - $1,116,480. At this stage of the proceedings, Rydex Series Funds is not able to make a reliable predication as to the outcome of these lawsuits or the effect, if any, on a Fund’s net asset value.
38 | THE RYDEX FUNDS SEMI-ANNUAL REPORT | |
NOTES TO FINANCIAL STATEMENTS (Unaudited)(concluded) |
13. Subsequent Event
Portfolio Securities Loaned
Effective October 6, 2016, each Fund may lend portfolio securities to certain creditworthy borrowers, including the Funds’ securities lending agent. The loans would be collateralized at all times by cash and/or high grade debt obligations in an amount at least equal to 102% of the market value of securities loaned as determined at the close of business on the preceding business day. The cash collateral received would be held in a separately managed account established for each respective Fund and maintained by the lending agent exclusively for the investment of securities lending cash collateral on behalf of each Fund. The separately managed accounts will invest in short-term investments valued at amortized cost, which approximates market value. Each Fund will receive compensation for lending securities from interest or dividends earned on the cash, cash equivalents or U.S. government securities held as collateral, net of fee rebates paid to the borrower plus reasonable administrative and custody fees paid to the lending agent. Such compensation will be accrued daily and payable to the Fund monthly. The dividend and interest income earned on the securities loaned will be accounted for in the same manner as other dividend and interest income. The borrower will pay to the Funds an amount equal to any dividends or interest received on loaned securities. These payments from the borrower are not eligible for reduced tax rates as “qualified dividend income” under the Jobs and Growth Tax Reconciliation Act of 2003. The Funds would retain all or a portion of the interest received on investment of cash collateral or receives a fee from the borrower.
Although the collateral mitigates risk, the Funds could experience a delay in recovering its securities and a possible loss of income or value if the borrower fails to return the securities. The Funds have the right under the securities lending agreement to recover the securities from the borrower on demand.
| | THE RYDEX FUNDS SEMI-ANNUAL REPORT | 39 |
OTHER INFORMATION (Unaudited) |
Proxy Voting Information
A description of the policies and procedures that the Trust uses to determine how to vote proxies relating to securities held in the Funds’ portfolios is available, without charge and upon request, by calling 800.820.0888. This information is also available from the EDGAR database on the SEC’s website at https://www.sec.gov.
Information regarding how the Funds voted proxies relating to portfolio securities during the most recent 12-month period ended June 30 is available without charge, upon request, by calling 800.820.0888. This information is also available from the EDGAR database on the SEC’s website at https://www.sec.gov.
Sector Classification
Information in the Schedule of Investments is categorized by sectors using sector-level Classifications defined by the Bloomberg Industry Classification System, a widely recognized industry classification system provider. Each Fund’s registration statement has investment policies relating to concentration in specific sectors/industries. For purposes of these investment policies, the Funds usually classify sectors/industries based on industry-level Classifications used by widely recognized industry classification system providers such as Bloomberg Industry Classification System, Global Industry Classification Standards and Barclays Global Classification Scheme.
Quarterly Portfolio Schedules Information
The Trust files its complete schedule of portfolio holdings with the SEC for the first and third quarters of each fiscal year on Form N-Q, which are available on the SEC’s website at https://www.sec.gov. The Funds’ Forms N-Q may be reviewed and copied at the SEC’s Public Reference Room in Washington, DC, and that information on the operation of the Public Reference Room may be obtained by calling 800-SEC-0330. Copies of the portfolio holdings are also available to shareholders, without charge and upon request, by calling 800.820.0888.
Board Considerations in Approving the Continuation of the Investment Advisory Agreement
The Board of Trustees (the “Board”) of Rydex Series Funds (the “Trust”), including the Trustees who are not “interested persons,” as defined by the Investment Company Act of 1940, of the Trust (“Independent Trustees”), attended an in-person meeting held on May 19, 2016, called for the purpose of, among other things, the consideration of, and voting on, the approval and continuation of the investment advisory agreement (the “Investment Advisory Agreement”) between the Trust and the Advisor applicable to each series of the Trust (each, a “Fund” and, collectively, the “Funds”). The Board unanimously approved the continuation of the Investment Advisory Agreement for an additional one-year period based on the Board’s review of qualitative and quantitative information provided by the Advisor. The Board had previously considered information pertaining to the renewal of the Investment Advisory Agreement at an in-person meeting held on April 26, 2016 (together, with the May 19 meeting, the “Meetings”).
40 | THE RYDEX FUNDS SEMI-ANNUAL REPORT | |
OTHER INFORMATION (Unaudited)(continued) |
Prior to reaching the conclusion to approve the continuation of the Investment Advisory Agreement, the Independent Trustees requested and obtained from the Advisor such information as the Independent Trustees deemed reasonably necessary to evaluate the Investment Advisory Agreement. In addition, the Board received a memorandum from Fund counsel regarding the responsibilities of the Board with respect to the approval of investment advisory agreements and participated in question and answer sessions with representatives of the Advisor. The Independent Trustees also carefully considered information that they had received throughout the year as part of their regular oversight of the Funds. At the Meetings, the Board obtained and reviewed a wide variety of information, including certain comparative information regarding the Funds’ fees, expenses, and performance relative to the fees, expenses, and performance of other comparable funds (the “FUSE reports”). The Independent Trustees carefully evaluated this information, met in executive session outside the presence of fund management, and were advised by independent legal counsel with respect to their deliberations.
At the Meetings, the Board, including the Independent Trustees, evaluated a number of factors, including among others: (a) the nature, extent and quality of the Advisor’s investment advisory and other services; (b) the Advisor’s investment management personnel; (c) the Advisor’s operations and financial condition; (d) the Advisor’s brokerage practices (including any soft dollar arrangements) and the variety and complexity of its investment strategies; (e) a comparison of the Funds’ advisory fees to the advisory fees charged to comparable funds or accounts, giving special attention to the existence of economies of scale and the absence of breakpoints in these fees and the Advisor’s rationale for not providing for breakpoints at this point in time; (f) each Fund’s overall fees and operating expenses compared with those of similar funds; (g) the level of the Advisor’s profitability from its Fund-related operations; (h) the Advisor’s compliance processes and systems; (i) the Advisor’s compliance policies and procedures; (j) the Advisor’s reputation, expertise and resources in the financial markets; and (k) Fund performance compared with that of similar funds and/or appropriate benchmarks. In its deliberations, the Trustees did not identify any single piece of information that was all-important or controlling, noting that each Trustee could attribute different weights to the various factors considered.
Based on the Board’s deliberations at the Meetings, the Board, including all of the Independent Trustees, unanimously: (a) concluded that the terms of the Investment Advisory Agreement are fair and reasonable; (b) concluded that the Advisor’s fees are reasonable in light of the services that it provides to the Funds; and (c) agreed to approve and continue the Investment Advisory Agreement based upon the following considerations, among others:
| | ● | Nature, Extent and Quality of Services Provided by the Advisor. The Board evaluated, among other things, the Advisor’s business, financial resources, quality and quantity of personnel, experience, past performance, the variety and complexity of its investment strategies (including the extent to which the Funds use derivatives), Fund risk management process, brokerage practices, and the adequacy of its compliance systems and processes, proxy voting policies and practices, and cybersecurity programs. The Board reviewed the scope of services to be provided by the Advisor under the Investment |
| | THE RYDEX FUNDS SEMI-ANNUAL REPORT | 41 |
OTHER INFORMATION (Unaudited)(continued) |
Advisory Agreement and noted that there would be no significant differences between the scope of services required to be provided by the Advisor for the past year and the scope of services required to be provided during the upcoming year. The Board also considered the Advisor’s representations to the Board that the Advisor would continue to provide investment and related services that were of materially the same quality and quantity as services provided to the Funds in the past, and whether these services are appropriate in scope and extent in light of the Funds’ operations, the competitive landscape of the investment company business and investor needs. Based on the foregoing, the Trustees determined that the approval of the Investment Advisory Agreement would enable shareholders of the Funds to receive high quality services at a cost that was appropriate and reasonable.
| | ● | Fund Expenses and Performance of the Funds and the Advisor. The Board reviewed statistical information provided by the Advisor regarding the expense ratio components and performance of each Fund. The Advisor engaged FUSE Research Network LLC (“FUSE”), an independent, third party research provider, to prepare reports to help the Board compare the Funds’ fees, expenses, and total return performance with those of a peer group and peer universe of funds selected by FUSE. In the reports, each Fund’s expense ratio components, including actual advisory fees, waivers/reimbursements, and gross and net total expenses, are compared to those of other funds with shared key characteristics (e.g., asset size, fee structure, sector or industry investment focus) determined by FUSE to comprise a Fund’s applicable peer group. The Board considered the Advisor’s representation that it found the peer groups compiled by FUSE to be appropriate, but also acknowledged the existence of certain differences between the Funds and their peer funds (e.g., specific differences in principal investment strategies and, if applicable, tradability) that should be reviewed in context. With respect to tradability, in particular, the Board considered that non-tradable funds incur lower expense ratios than tradable funds because non-tradable funds experience less shareholder activity and lower transaction volumes than tradable funds. The statistical information related to the performance of each Fund included three-month and one-, three-, and five-year performance for the Fund compared to that of its peers. Based on the foregoing, the Board determined that the proposed advisory fees paid by the Funds are reasonable in relation to the nature and quality of the services provided by the Advisor. |
| | ● | Costs of Services Provided to the Funds and Profits Realized by the Advisor and its Affiliates. The Board reviewed information about the profitability of the Funds to the Advisor based on the advisory fees payable under the current Investment Advisory Agreement for the last calendar year. The Board analyzed the Funds’ expenses, including the investment advisory fees paid to the Advisor, and reviewed the FUSE reports. The Board also reviewed information regarding the direct revenue received by the Advisor and ancillary revenue, if any, received by the Advisor and/or its affiliates in connection with the services provided to the Funds by the Advisor and/or its affiliates. The Board |
42 | THE RYDEX FUNDS SEMI-ANNUAL REPORT | |
OTHER INFORMATION (Unaudited)(concluded) |
also discussed the Advisor’s profit margin, including the expense allocation methodology used in the Advisor’s profitability analysis. Based on the foregoing, the Board determined that the profit to the Advisor on the fees paid by the Funds is not excessive in view of the nature and quality of the services provided by the Advisor.
| | ● | Economies of Scale. The Board considered the absence of breakpoints in the Advisor’s fee schedule and reviewed information regarding the extent to which economies of scale or other efficiencies may result from increases in the Funds’ asset levels. In light of the relatively small size of many of the Funds and the fact that the size of individual Funds in the complex often increase and decrease significantly due to the unlimited trading that is permitted among most of the Funds in the complex, the Board concluded that the Funds have not yet achieved sufficient asset levels to realize meaningful economies of scale. The Board noted that it intends to continue to monitor fees as each Fund grows in size and assess whether fee breakpoints may be warranted. |
| | ● | Other Benefits to the Advisor and/or its Affiliates. In addition to evaluating the Advisor’s services, the Board considered the nature and amount of other benefits to be received by the Advisor and its affiliates as a result of their relationship with the Fund, including any soft dollar usage by the Advisor and any intangible benefits. In particular, the Board considered the nature, extent, quality, and cost of certain administrative, distribution, and shareholder services performed by the Advisor’s affiliates under separate agreements and the Distribution and Shareholders Services Plan pursuant to Rule 12b-1 of the 1940 Act. In light of the costs of providing services pursuant to the separate agreements as well as the Advisor’s and its affiliates’ commitment to the Funds, the Board concluded the ancillary benefits the Advisor and its affiliates received were reasonable. |
On the basis of the information provided to it and its evaluation of that information, the Board, including the Independent Trustees, concluded that the terms of the Investment Advisory Agreement were reasonable, and that approval of the continuation of the Investment Advisory Agreement was in the best interests of the Funds and their shareholders.
| | THE RYDEX FUNDS SEMI-ANNUAL REPORT | 43 |
INFORMATION ON BOARD OF TRUSTEES AND OFFICERS (Unaudited) |
A Board of Trustees oversees the Trust, as well as other trusts of GI, in which its members have no stated term of service, and continue to serve after election until resignation. The Statement of Additional Information includes further information about Fund Trustees and Officers, and can be obtained without charge by visiting guggenheiminvestments.com or by calling 800.820.0888.
Name, Address* and Year of Birth of Trustee | Position(s) Held with the Trust, Term of Office and Length of Time Served | Principal Occupation(s)
During Past 5 Years | Number of Portfolios in Fund Complex Overseen by Trustee*** | Other
Directorships
Held by
Trustee**** |
INTERESTED TRUSTEE | | | |
Donald C. Cacciapaglia**
(1951) | Trustee from 2012 to present. | Current: President and CEO, certain other funds in the Fund Complex (2012-present); Vice Chairman, Guggenheim Investments (2010-present). Former: Chairman and CEO, Channel Capital Group, Inc. (2002-2010). | 232 | Clear Spring Life Insurance Company (2015-present); Guggenheim Partners Japan, Ltd. (2014-present); Guggenheim Partners Investment Management Holdings, LLC (2014-present); Delaware Life (2013-present); Guggenheim Life and Annuity Company (2011-present); Paragon Life Insurance Company of Indiana (2011-present). |
INDEPENDENT TRUSTEES | | | |
Angela
Brock-Kyle*****
(1959) | Trustee from August 2016 to present. | Current: Founder and Chief Executive Officer, B.O.A.R.D.S (consulting firm). Former: Senior Leader, TIAA (financial services firm) (1987-2012). | 135 | Infinity Property & Casualty Corporation (2014-present). |
44 | THE RYDEX FUNDS SEMI-ANNUAL REPORT | |
INFORMATION ON BOARD OF TRUSTEES AND OFFICERS (Unaudited)(continued) |
Name, Address* and Year of Birth of Trustee | Position(s) Held with the
Trust, Term of Office and
Length of Time Served | Principal Occupation(s)
During Past 5 Years | Number of Portfolios in Fund Complex Overseen by Trustee*** | Other
Directorships
Held by
Trustee**** |
INDEPENDENT TRUSTEES - continued |
Corey A. Colehour (1945) | Trustee from 1993 to present; Member of the Audit Committee from 1994 to present; Member of the Governance Committee from 2014 to present; and Member of the Investment and Performance Committee from 2014 to present. | Retired. | 135 | None. |
J. Kenneth Dalton (1941) | Trustee from 1995 to present; Chairman and Member of the Audit Committee from 1997 to present; and Member of the Compliance and Risk Oversight Committee from 2010 to present. | Retired. | 135 | Epiphany Funds (4) (2009-present). |
John O. Demaret (1940) | Vice Chairman of the Board from 2014 to present (Chairman of the Board from 2006 to 2014); Trustee and Member of the Audit Committee from 1997 to present; Chairman (since 2014) and Member of the Compliance and Risk Oversight Committee from 2010 to present; Chairman and Member of the Investment and Performance Committee from 2014 to present; and Member of the Nominating Committee from 2014 to present. | Retired. | 135 | None. |
Werner E. Keller (1940) | Chairman of the Board from 2014 to present (Vice Chairman of the Board from 2010 to 2014); Trustee and Member of the Audit Committee from 2005 to present; and Member of the Investment and Performance Committee from 2014 to present. | Current: Founder and President, Keller Partners, LLC (investment research firm) (2005-present). | 135 | None. |
| | THE RYDEX FUNDS SEMI-ANNUAL REPORT | 45 |
INFORMATION ON BOARD OF TRUSTEES AND OFFICERS (Unaudited)(continued) |
Name, Address* and Year of Birth of Trustee | Position(s) Held with the
Trust, Term of Office and
Length of Time Served | Principal Occupation(s)
During Past 5 Years | Number of Portfolios in Fund Complex Overseen by Trustee*** | Other
Directorships
Held by
Trustee**** |
INDEPENDENT TRUSTEES - concluded |
Thomas F.
Lydon, Jr.
(1960) | Trustee and Member of the Audit Committee from 2005 to present; Member of the Nominating Committee from 2005 to present; and Member of the Governance Committee from 2007 to present. | Current: President, Global Trends Investments (registered investment adviser) (1996-present). | 135 | US Global Investors (GROW) (1995-present). |
Patrick T. McCarville
(1942) | Trustee from 1997 to present; Member of the Audit Committee from 1997 to present; Chairman and Member of the Nominating Committee from 2004 to present; Chairman and Member of the Governance Committee from 2007 to present; and Member of the Compliance and Risk Oversight Committee from 2014 to present. | Retired. Former: Chief Executive Officer, Par Industries, Inc., d/b/a Par Leasing (1977-2010). | 135 | None. |
Sandra G. Sponem*****
(1958) | Trustee from August 2016 to present. | Current: Senior Vice President and Chief Financial Officer, M.A. Mortenson Companies, Inc. (general contracting firm) (2007-present). | 135 | None. |
46 | THE RYDEX FUNDS SEMI-ANNUAL REPORT | |
INFORMATION ON BOARD OF TRUSTEES AND OFFICERS (Unaudited)(continued) |
Name, Address*
and Year of Birth | Position(s) Held with the Trust, Term of Office and Length of Time Served | Principal Occupation(s)
During Past 5 Years |
OFFICERS | |
Donald C. Cacciapaglia
(1951) | President (2012-present). | Current: President and CEO, certain other funds in the Fund Complex (2012-present); Vice Chairman, Guggenheim Investments (2010-present). Former: Chairman and CEO, Channel Capital Group Inc. (2002-2010). |
Michael P. Byrum
(1970) | Vice President (1999-present). | Current: Senior Vice President, Security Investors, LLC (2010-present); President and Chief Investment Officer, Rydex Holdings, LLC (2008-present); Director and Chairman, Advisory Research Center, Inc. (2006-present); Manager, Guggenheim Specialized Products, LLC (2005-present). Former: Vice President, Guggenheim Distributors, LLC (2009); Director (2009-2010) and Secretary (2002-2010), Rydex Fund Services, LLC; Director (2008-2010), Chief Investment Officer (2006-2010), President (2004-2010) and Secretary (2002-2010), Rydex Advisors, LLC; Director (2008-2010), Chief Investment Officer (2006-2010), President (2004-2010) and Secretary (2002-2010), Rydex Advisors II, LLC. |
Joanna M. Catalucci (1966) | AML Officer (2016-present) | Current: Chief Compliance Officer, certain funds in the Fund Complex (2012-present); Senior Managing Director, Guggenheim Investments (2012-present); AML Officer, certain funds in the Fund Complex (2016-present). Former: Chief Compliance Officer and Secretary, certain other funds in the Fund Complex (2008-2012); Senior Vice President & Chief Compliance Officer, Security Investors, LLC and certain affiliates (2010-2012); Chief Compliance Officer and Senior Vice President, Rydex Advisors, LLC and certain affiliates (2010-2011). |
James M. Howley
(1972) | Assistant Treasurer (2016-present). | Current: Director, Guggenheim Investments (2004-present); Assistant Treasurer, certain other funds in the Fund Complex (2006-present). Former: Manager, Mutual Fund Administration of Van Kampen Investments, Inc. (1996-2004). |
| | THE RYDEX FUNDS SEMI-ANNUAL REPORT | 47 |
INFORMATION ON BOARD OF TRUSTEES AND OFFICERS (Unaudited)(continued) |
Name, Address* and Year of Birth | Position(s) Held with the Trust, Term of Office and Length of Time Served | Principal Occupation(s)
During Past 5 Years |
OFFICERS - continued |
Keith D. Kemp
(1960) | Assistant Treasurer (2016-present). | Current: Managing Director of Transparent Value, LLC (2015-present); Managing Director of Guggenheim Investments (2015-present). Former: Director, Transparent Value, LLC (2010-2015); Director, Guggenheim Investments (2010-2015); Chief Operating Officer, Macquarie Capital Investment Management (2007-2009). |
Amy J. Lee
(1961) | Vice President (2009-present) and Secretary (2012-present). | Current: Chief Legal Officer, certain other funds in the Fund Complex (2013-present); Senior Managing Director, Guggenheim Investments (2012-present). Former: Vice President, Associate General Counsel and Assistant Secretary, Security Benefit Life Insurance Company and Security Benefit Corporation (2004-2012). |
Glenn McWhinnie
(1969) | Assistant Treasurer (2016-present). | Current: Vice President, Guggenheim Investments (2009-present). Former: Tax Compliance Manager, Ernst & Young LLP (1996-2009). |
Elisabeth Miller
(1968) | Chief Compliance Officer (2012-present). | Current: CCO, certain other funds in the Fund Complex (2012-present); CCO, Security Investors, LLC (2012-present); CCO, Guggenheim Funds Investment Advisors, LLC (2012-present); Managing Director, Guggenheim Investments (2012-present); Vice President, Guggenheim Funds Distributors, LLC (2014-present). Former: CCO, Guggenheim Distributors, LLC (2009-2014); Senior Manager, Security Investors, LLC (2004-2009); Senior Manager, Guggenheim Distributors, LLC (2004-2009). |
Adam J. Nelson
(1979) | Assistant Treasurer (2016-present). | Current: Vice President, Guggenheim Investments (2015-present); Assistant Treasurer, certain other funds in the Fund Complex (2015-present). Former: Assistant Vice President and Fund Administration Director, State Street Corporation (2013-2015); Fund Administration Assistant Director, State Street (2011-2013); Fund Administration Manager, State Street (2009-2011). |
48 | THE RYDEX FUNDS SEMI-ANNUAL REPORT | |
INFORMATION ON BOARD OF TRUSTEES AND OFFICERS (Unaudited)(concluded) |
Name, Address* and Year of Birth | Position(s) Held with the Trust, Term of Office and Length of Time Served | Principal Occupation(s)
During Past 5 Years |
OFFICERS - concluded |
Kimberly J. Scott
(1974) | Assistant Treasurer (2016-present). | Current: Vice President, Guggenheim Investments (2012-present); Assistant Treasurer, certain other funds in the Fund Complex (2012-present). Former: Financial Reporting Manager, Invesco, Ltd. (2010-2011); Vice President/Assistant Treasurer, Mutual Fund Administration for Van Kampen Investments, Inc./Morgan Stanley Investment Management (2009-2010); Manager of Mutual Fund Administration, Van Kampen Investments, Inc./Morgan Stanley Investment Management (2005-2009). |
John L. Sullivan
(1955) | Chief Financial Officer and Treasurer (2016-present). | Current: CFO, Chief Accounting Officer and Treasurer, certain other funds in the Fund Complex (2010-present); Senior Managing Director, Guggenheim Investments (2010-present). Former: Managing Director and CCO, each of the funds in the Van Kampen Investments fund complex (2004-2010); Managing Director and Head of Fund Accounting and Administration, Morgan Stanley Investment Management (2002-2004); CFO and Treasurer, Van Kampen Funds (1996-2004). |
* | All Trustees and Officers may be reached c/o Guggenheim Investments, 227 West Monroe Street, Chicago, Illinois 60606. |
** | Mr. Cacciapaglia is an “interested” person of the Trust, as that term is defined in the 1940 Act by virtue of his affiliation with the Adviser’s parent company. |
*** | The “Fund Complex” includes all closed-end and open-end funds (including all of their portfolios) advised by the Adviser and any funds that have an investment adviser or servicing agent that is an affiliated person of the Adviser. Information provided is as of the date of this report. |
**** | Some of the Trustees may serve as directors on the boards of companies not required to be disclosed above, including certain non-profit companies and charitable foundations. |
***** | Mses. Brock-Kyle and Sponem commenced serving as independent Trustees effective August 18, 2016. |
| | THE RYDEX FUNDS SEMI-ANNUAL REPORT | 49 |
GUGGENHEIM INVESTMENTS PRIVACY POLICIES (Unaudited) |
Guggenheim Investments as used herein refers to Guggenheim Partners, LLC, Guggenheim Funds Investment Advisors, LLC, Guggenheim Partners Investment Management, LLC, Guggenheim Funds Distributors, LLC and Security Investors, LLC as well as the funds in the Guggenheim Funds complex (the “funds”).
Our Commitment to You
When you become a Guggenheim Investments investor, you entrust us with not only your hard-earned money but also with personal and financial information about you. We recognize that your relationship with us is based on trust and that you expect us to act responsibly and in your best interests. Because we have access to personal information about you, we hold ourselves to high standards in its safekeeping and use. This means, most importantly, that we do not sell client or account information to anyone—whether you are a current or former Guggenheim Investments client.
The Information We Collect About You and How We Collect It
In the course of doing business with shareholders and investors, we collect nonpublic personal information about you. You typically provide personal information when you complete a Guggenheim Investments account application or when you request a transaction that involves Rydex and Guggenheim Funds or one of the Guggenheim affiliated companies. “Nonpublic personal information” is personally identifiable information about you. For example it includes your name and address, Social Security or taxpayer identification number, assets, income, account balance, bank account information and investment activity (e.g. purchase and redemption history).
How We Share Your Personal Information
As a matter of policy, we do not disclose your nonpublic personal information to nonaffiliated third parties except as required or permitted by law. As emphasized above, we do not sell information about current or former clients or their accounts to third parties. Nor do we share such information, except when necessary to complete transactions at your request or to make you aware of related investment products and services that we offer. Additional details about how we handle your personal information are provided below.
To complete certain transactions or account changes that you direct, it may be necessary to provide your personal information to companies, individuals or groups that are not affiliated with Guggenheim Investments. For example if you ask to transfer assets from another financial institution to Guggenheim Investments, we will need to provide certain information about you to that company to complete the transaction. In connection with servicing your accounts or to alert you to other Guggenheim Investments investment products and services, we may share your information within the Guggenheim Investments family of affiliated companies. This would include, for example, sharing your information within Guggenheim Investments so we can make you aware of new funds or the services offered through another Guggenheim Investments
50 | THE RYDEX FUNDS SEMI-ANNUAL REPORT | |
GUGGENHEIM INVESTMENTS PRIVACY POLICIES (Unaudited)(concluded) |
affiliated company. In certain instances, we may contract with nonaffiliated companies to perform services for us. Where necessary, we will disclose information we have about you to these third parties. In all such cases, we provide the third party with only the information necessary to carry out its assigned responsibilities and only for that purpose. And we require these third parties to treat your personal information with the same high degree of confidentiality that we do. In certain instances, we may share information with other financial institutions regarding individuals and entities in response to the U.S.A. Patriot Act. Finally we will share personal information about you if we are compelled by law to do so, if you direct us to do so with your consent, or in other circumstances as permitted by law.
How We Safeguard Your Personal Information
We maintain physical, electronic and procedural safeguards to protect your personal information. Within Guggenheim Investments, access to such information is limited to those who need it to perform their jobs such as servicing your account, resolving problems or informing you of new products and services.
| | THE RYDEX FUNDS SEMI-ANNUAL REPORT | 51 |
This page intentionally left blank.
This page intentionally left blank.
This page intentionally left blank.
This page intentionally left blank.
This page intentionally left blank.
This page intentionally left blank.
9.30.2016
Rydex Funds Semi-Annual Report
Guggenheim Alternatives Funds |
Guggenheim Long Short Equity Fund | | |
Guggenheim Event Driven and Distressed Strategies Fund | | |
Rydex International Equity Funds |
Rydex Emerging Markets 2x Strategy Fund | | |
Rydex Inverse Emerging Markets 2x Strategy Fund | | |
Rydex Fixed Income Fund |
Rydex Emerging Markets Bond Strategy Fund | | |
GuggenheimInvestments.com | RSTF-SEMI-0916x0317 |
DEAR SHAREHOLDER | 2 |
ECONOMIC AND MARKET OVERVIEW | 3 |
A BRIEF NOTE ON THE COMPOUNDING OF RETURNS | 4 |
ABOUT SHAREHOLDERS’ FUND EXPENSES | 5 |
LONG SHORT EQUITY FUND | 8 |
EVENT DRIVEN AND DISTRESSED STRATEGIES FUND | 19 |
EMERGING MARKETS 2x STRATEGY FUND | 27 |
INVERSE EMERGING MARKETS 2x STRATEGY FUND | 34 |
EMERGING MARKETS BOND STRATEGY FUND | 40 |
NOTES TO FINANCIAL STATEMENTS | 47 |
OTHER INFORMATION | 62 |
INFORMATION ON BOARD OF TRUSTEES AND OFFICERS | 65 |
GUGGENHEIM INVESTMENTS PRIVACY POLICIES | 69 |
| | THE RYDEX FUNDS SEMI-ANNUAL REPORT | 1 |
Dear Shareholder:
Security Investors, LLC (the “Investment Adviser”) is pleased to present the semi-annual shareholder report for a selection of our alternative strategy Funds (the “Funds”) for the six-month period ended September 30, 2016.
The Investment Adviser is part of Guggenheim Investments, which represents the investment management businesses of Guggenheim Partners, LLC (“Guggenheim”), a global, diversified financial services firm.
Guggenheim Funds Distributors, LLC is the distributor of the Funds. Guggenheim Funds Distributors, LLC is affiliated with Guggenheim and the Investment Adviser.
We encourage you to read the Economic and Market Overview section of the report, which follows this letter.
We are committed to providing innovative investment solutions and appreciate the trust you place in us.
Sincerely,

Donald C. Cacciapaglia
President and Chief Executive Officer
October 31, 2016
Read a prospectus and summary prospectus (if available) carefully before investing. It contains the investment objectives, risks, charges, expenses and other information, which should be considered carefully before investing. Obtain a prospectus and summary prospectus (if available) at guggenheiminvestments.com or call 800.820.0888.
There can be no assurance that any investment product will achieve its investment objective(s). There are risks associated with investing, including the entire loss of principal invested. Investing involves market risks. The investment return and principal value of any investment product will fluctuate with changes in market conditions.
2 | THE RYDEX FUNDS SEMI-ANNUAL REPORT | |
ECONOMIC AND MARKET OVERVIEW (Unaudited) | September 30, 2016 |
Economic growth continues to rebound, even though the rise in U.S. Gross Domestic Product (“GDP”) disappointed in the first half of 2016. There was a large headwind from inventory drawdowns, which should soon reverse after five quarters of dragging on growth. Real GDP growth is expected to be around 2.5 percent in the second half of the year, driven by consumption, housing, and a fading trade drag, and supporting the view that U.S. economic growth remains resilient to global weakness.
The euro zone economy is slowly improving, but inflation will likely persist well below the European Central Bank’s (“ECB”) target in the coming quarters due to substantial slack. The ECB has indicated that more quantitative easing is possible, but will soon need to alter the quantitative easing program in order to keep up their purchase pace. Both China and Japan need weaker currencies. Chinese growth and capital flows have stabilized for now, but surging construction and a credit boom raise the prospect of future instability. Japan’s economic prospects are weak, and inflation remains far from the Bank of Japan’s (“BOJ”) target. The surging yen could drive further policy easing, including an increase in fiscal stimulus.
It appears the U.S. Federal Reserve (the “Fed”) will move forward with raising rates in December, absent any economic or geopolitical surprise or a meaningful tightening of financial conditions over the fourth quarter. But key events could influence risk asset performance for the balance of the year: A continued recovery in oil prices following the Organization of Petroleum Exporting Countries (“OPEC”) agreement to keep production between 32.5 to 33 million barrels per day would help sustain the rally (although we are skeptical that they will adhere to any quota based on historical production levels). Global oil inventories remain high, but supply and demand are moving toward balance. A rebound in GDP growth would also lift U.S. equity and corporate bond prices higher.
The macroeconomic picture remains the same; we are not on the verge of a recession. But despite our positive outlook on the U.S. economy, valuations across risk assets argue for caution. Ongoing accommodation from central bankers across the globe has alleviated much of the initial macroeconomic tail risk posed by Brexit but may not be enough to dampen the seasonal volatility typically observed in the fourth quarter. Ongoing troubles in the banking sector, such as the woes afflicting Deutsche Bank and Wells Fargo, coupled with uncertainty surrounding upcoming political events, which include the new Trump administration, the Italian constitutional referendum, and key European elections, may create volatility for risk assets for the balance of the year.
For the six months ended September 30, 2016, the Standard & Poor’s 500® (“S&P 500®”) Index* returned 6.40%. The MSCI Europe-Australasia-Far East (“EAFE”) Index* returned 4.88%. The return of the MSCI Emerging Markets Index* was 9.75%.
In the bond market, the Bloomberg Barclays U.S. Aggregate Bond Index* posted a 2.68% return for the period, while the Bloomberg Barclays U.S. Corporate High Yield Index* returned 11.38%. The return of the Bank of America (“BofA”) Merrill Lynch 3-Month U.S. Treasury Bill Index* was 0.17% for the six-month period.
The opinions and forecasts expressed may not actually come to pass. This information is subject to change at any time, based on market and other conditions, and should not be construed as a recommendation of any specific security or strategy.
*Index Definitions:
The following indices are referenced throughout this report. Indices are unmanaged and not available for direct investment. Index performance does not reflect transaction costs, fees, or expenses.
Bloomberg Barclays U.S. Aggregate Bond Index is a broad-based flagship benchmark that measures the investment grade, U.S. dollar-denominated, fixed-rate taxable bond market, including U.S. Treasuries, government-related and corporate securities, mortgage-backed securities or (“MBS”) (agency fixed-rate and hybrid adjustable-rate mortgage, or “ARM”, pass-throughs), asset-backed securities (“ABS”), and commercial mortgage-backed securities (“CMBS”) (agency and non-agency).
Bloomberg Barclays U.S. Corporate High Yield Index measures the U.S. dollar-denominated, high yield, fixed-rate corporate bond market. Securities are classified as high yield if the middle rating of Moody’s, Fitch, and S&P is Ba1/BB +/BB + or below.
BofA Merrill Lynch 3-Month U.S. Treasury Bill Index is an unmanaged market Index of U.S. Treasury securities maturing in 90 days that assumes reinvestment of all income.
MSCI EAFE Index is a capitalization-weighted measure of stock markets in Europe, Australasia, and the Far East.
MSCI Emerging Markets Index is a free float-adjusted market capitalization-weighted index that is designed to measure equity market performance in the global emerging markets.
S&P 500® Index is a broad-based index, the performance of which is based on the performance of 500 widely held common stocks chosen for market size, liquidity, and industry group representation.
| | THE RYDEX FUNDS SEMI-ANNUAL REPORT | 3 |
A BRIEF NOTE ON THE COMPOUNDING OF RETURNS (Unaudited) | |
Many of the Funds described in this report are benchmarked daily to leveraged and/or inverse leveraged versions of published indices. To properly evaluate the performance of these funds, it is essential to understand the effect of mathematical compounding on their respective returns.
Because of the nonlinear effects of leverage applied over time, it is possible for a fund to perform in line with its benchmark for several individual periods in a row, yet seem to trail the benchmark over the entire period. It is also possible that a fund that performs in-line with its benchmark on a daily basis may seem to outperform its benchmark over longer periods.
An Example of Compounding
For example, consider a hypothetical fund that is designed to produce returns that correspond to 150% of an index. On the first day of a period, the index rises from a level of 100 to a level of 106, producing a 6.0% gain and an expectation that the fund will rise by 9.0%. On the same day, the fund’s net asset value per share (“NAV”) increases from $10.00 to $10.90 for a gain of 9.0% — in line with its benchmark.
On day two, assume the index falls from 106 to 99 for a loss of about 6.6%. The fund, as expected, falls 9.9% to a price of $9.82. On each day, the fund performed exactly in line with its benchmark, but for the two-day period, the fund was down 1.8%, while the index was down only 1.0%. Without taking into account the daily compounding of returns, one would expect the fund to lose 1.5% and would see the fund as trailing by 0.3% when in fact it had performed perfectly. This example is summarized in the table below.
| | Index
Level | Index
Performance | Fund
Expectation | Fund
NAV | Fund
Performance | Assessment |
Start | 100 | | | $ 10.00 | | |
Day 1 | 106 | 6.0% | 9.0% | $ 10.90 | 9.0% | In line |
Day 2 | 99 | -6.6% | -9.9% | $ 9.82 | -9.9% | In line |
Cumulative | | -1.0% | -1.5% | | -1.8% | -0.3% |
As illustrated by this simple example, the effect of leverage can make it difficult to form expectations or judgments about fund performance given only the returns of the unleveraged index.
Because certain funds seek to track the performance of their benchmark on a daily basis, mathematical compounding, especially with respect to those funds that use leverage as part of their investment strategy, may prevent a fund from correlating with the monthly, quarterly, annual or other period performance of its benchmark. Due to the compounding of daily returns, leveraged and inverse funds’ returns over periods other than one day will likely differ in amount and possibly direction from the benchmark return for the same period. Investors should monitor their leveraged and inverse funds’ holdings consistent with their strategies, as frequently as daily. For those funds that consistently apply leverage, the value of the fund’s shares will tend to increase or decrease more than the value of any increase or decrease in its benchmark index. For more on correlation, leverage and other risks, please read the prospectus.
In general, any change in direction in an index will produce compounding that seems to work against an investor. Were the index to move in the same direction (either up or down) for two or more periods in a row, the compounding of those returns would work in an investor’s favor, causing the fund to seemingly beat its benchmark.
As a general rule of thumb, more leverage in a fund will magnify the compounding effect, while less leverage will generally produce results that are more in line with expectations. In addition, periods of high volatility in an underlying index will also cause the effects of compounding to be more pronounced, while lower volatility will produce a more muted effect.
4 | THE RYDEX FUNDS SEMI-ANNUAL REPORT | |
ABOUT SHAREHOLDERS’ FUND EXPENSES (Unaudited) | |
All mutual funds have operating expenses, and it is important for our shareholders to understand the impact of costs on their investments. Shareholders of a fund incur two types of costs: (i) transaction costs, including sales charges (loads) on purchase payments, reinvested dividends, other distributions, and exchange fees, and (ii) ongoing costs, including management fees, administrative services, and shareholder reports, among others. These ongoing costs, or operating expenses, are deducted from a fund’s gross income and reduce the investment return of the fund.
A fund’s expenses are expressed as a percentage of its average net assets, which is known as the expense ratio. The following examples are intended to help investors understand the ongoing costs (in dollars) of investing in a fund and to compare these costs with the ongoing costs of investing in other mutual funds.
The examples are based on an investment of $1,000 made at the beginning of the period and held for the entire six-month period beginning March 31, 2016 and ending September 30, 2016.
The following tables illustrate the Funds’ costs in two ways:
Table 1. Based on actual Fund return: This section helps investors estimate the actual expenses paid over the period. The “Ending Account Value” shown is derived from the Fund’s actual return, and the fifth column shows the dollar amount that would have been paid by an investor who started with $1,000 in the Fund. Investors may use the information here, together with the amount invested, to estimate the expenses paid over the period. Simply divide the Fund’s account value by $1,000 (for example, an $8,600 account value divided by $1,000 = 8.6), then multiply the result by the number provided under the heading “Expenses Paid During Period.”
Table 2. Based on hypothetical 5% return: This section is intended to help investors compare a Fund’s cost with those of other mutual funds. The table provides information about hypothetical account values and hypothetical expenses based on the Fund’s actual expense ratio and an assumed rate of return of 5% per year before expenses, which is not the Fund’s actual return. The hypothetical account values and expenses may not be used to estimate the actual ending account balance or expenses paid during the period. The example is useful in making comparisons because the U.S. Securities and Exchange Commission (the “SEC”) requires all mutual funds to calculate expenses based on the 5% return. Investors can assess a Fund’s costs by comparing this hypothetical example with the hypothetical examples that appear in shareholder reports of other funds.
The calculations illustrated above assume no shares were bought or sold during the period. Actual costs may have been higher or lower, depending on the amount of investment and the timing of any purchases or redemptions.
Please note that the expenses shown in the table are meant to highlight your ongoing costs only and do not reflect any transactional costs, such as sales charges (loads) on purchase payments, and contingent deferred sales charges (“CDSC”) on redemptions, if any. Therefore, the second table is useful in comparing ongoing costs only, and will not help you determine the relative total costs of owning different funds. In addition, if these transactional costs were included, your costs would have been higher.
More information about the Funds’ expenses, including annual expense ratios for periods up to five years (subject to the Fund’s inception date), can be found in the Financial Highlights section of this report. For additional information on operating expenses and other shareholder costs, please refer to the appropriate Fund prospectus.
| | THE RYDEX FUNDS SEMI-ANNUAL REPORT | 5 |
ABOUT SHAREHOLDERS’ FUND EXPENSES (Unaudited)(continued) | |
| | Expense
Ratio1 | Fund
Return | Beginning
Account Value
March 31, 2016 | Ending
Account Value
September 30, 2016 | Expenses
Paid During
Period2 |
Table 1. Based on actual Fund return3 | | | | |
Long Short Equity Fund | | | | | |
A-Class | 2.33% | 1.97% | $ 1,000.00 | $ 1,019.70 | $ 11.80 |
C-Class | 3.06% | 1.60% | 1,000.00 | 1,016.00 | 15.46 |
P-Class | 2.31% | 1.96% | 1,000.00 | 1,019.60 | 11.70 |
Institutional Class | 2.04% | 2.19% | 1,000.00 | 1,021.90 | 10.34 |
Event Driven and Distressed Strategies Fund | | | |
A-Class | 1.90% | 4.66% | 1,000.00 | 1,046.60 | 9.75 |
C-Class | 2.64% | 4.24% | 1,000.00 | 1,042.40 | 13.52 |
P-Class | 1.90% | 4.66% | 1,000.00 | 1,046.60 | 9.75 |
Institutional Class | 1.65% | 4.74% | 1,000.00 | 1,047.40 | 8.47 |
Emerging Markets 2x Strategy Fund | | | | |
A-Class | 1.76% | 24.02% | 1,000.00 | 1,240.20 | 9.88 |
C-Class | 2.48% | 23.58% | 1,000.00 | 1,235.80 | 13.90 |
H-Class | 1.76% | 24.02% | 1,000.00 | 1,240.20 | 9.88 |
Inverse Emerging Markets 2x Strategy Fund | | | |
A-Class | 1.74% | (26.87%) | 1,000.00 | 731.30 | 7.55 |
C-Class | 2.49% | (27.15%) | 1,000.00 | 728.50 | 10.79 |
H-Class | 1.75% | (27.01%) | 1,000.00 | 729.90 | 7.59 |
Emerging Markets Bond Strategy Fund | | | |
A-Class | 1.57% | 6.34% | 1,000.00 | 1,063.40 | 8.12 |
C-Class | 2.32% | 6.20% | 1,000.00 | 1,062.00 | 11.99 |
H-Class | 1.54% | 6.61% | 1,000.00 | 1,066.10 | 7.98 |
6 | THE RYDEX FUNDS SEMI-ANNUAL REPORT | |
ABOUT SHAREHOLDERS’ FUND EXPENSES (Unaudited)(concluded) | |
| | Expense
Ratio1 | Fund
Return | Beginning
Account Value
March 31, 2016 | Ending
Account Value
September 30, 2016 | Expenses
Paid During
Period2 |
Table 2.Based on hypothetical 5% return (before expenses) | | | |
Long Short Equity Fund | | | | | |
A-Class | 2.33% | 5.00% | $ 1,000.00 | $ 1,013.39 | $ 11.76 |
C-Class | 3.06% | 5.00% | 1,000.00 | 1,009.73 | 15.42 |
P-Class | 2.31% | 5.00% | 1,000.00 | 1,013.49 | 11.66 |
Institutional Class | 2.04% | 5.00% | 1,000.00 | 1,014.84 | 10.30 |
Event Driven and Distressed Strategies Fund | | | | |
A-Class | 1.90% | 5.00% | 1,000.00 | 1,015.54 | 9.60 |
C-Class | 2.64% | 5.00% | 1,000.00 | 1,011.83 | 13.31 |
P-Class | 1.90% | 5.00% | 1,000.00 | 1,015.54 | 9.60 |
Institutional Class | 1.65% | 5.00% | 1,000.00 | 1,016.80 | 8.34 |
Emerging Markets 2x Strategy Fund | | | | |
A-Class | 1.76% | 5.00% | 1,000.00 | 1,016.24 | 8.90 |
C-Class | 2.48% | 5.00% | 1,000.00 | 1,012.63 | 12.51 |
H-Class | 1.76% | 5.00% | 1,000.00 | 1,016.24 | 8.90 |
Inverse Emerging Markets 2x Strategy Fund | | | |
A-Class | 1.74% | 5.00% | 1,000.00 | 1,016.34 | 8.80 |
C-Class | 2.49% | 5.00% | 1,000.00 | 1,012.58 | 12.56 |
H-Class | 1.75% | 5.00% | 1,000.00 | 1,016.29 | 8.85 |
Emerging Markets Bond Strategy Fund | | | |
A-Class | 1.57% | 5.00% | 1,000.00 | 1,017.20 | 7.94 |
C-Class | 2.32% | 5.00% | 1,000.00 | 1,013.44 | 11.71 |
H-Class | 1.54% | 5.00% | 1,000.00 | 1,017.35 | 7.79 |
1 | Annualized and excludes expenses of the underlying funds in which the Funds invest. This ratio represents Net Expenses, which includes interest and dividend expense related to securities sold short. Excluding these expenses, the operating expense ratios would be: |
| | Long Short Equity Fund |
A-Class | 1.67% |
C-Class | 2.41% |
P-Class | 1.67% |
Institutional Class | 1.42% |
2 | Expenses are equal to the Fund's annualized expense ratio, net of any applicable fee waivers, multiplied by the average account value over the period, multiplied by 183/365 (to reflect the one-half year period). |
3 | Actual cumulative return at net asset value for the period March 31, 2016 to September 30, 2016. |
| | THE RYDEX FUNDS SEMI-ANNUAL REPORT | 7 |
FUND PROFILE (Unaudited) | September 30, 2016 |
LONG SHORT EQUITY FUND
OBJECTIVE: Seeks long-term capital appreciation.
Holdings Diversification (Market Exposure as % of Net Assets)
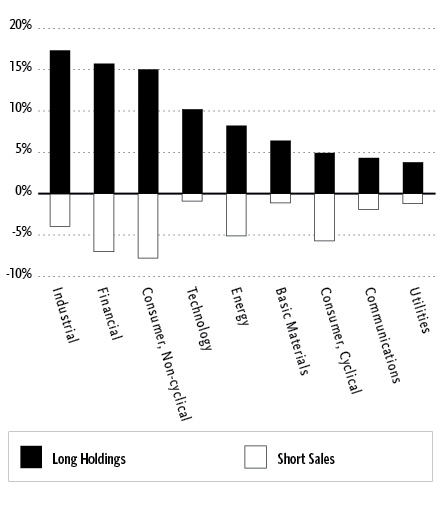
“Holdings Diversification (Market Exposure as % of Net Assets)” excludes any temporary cash investments or investments in Guggenheim Strategy Funds Trust mutual funds. Investments in those Funds do not provide “market exposure” to meet the Fund’s investment objective, but will significantly increase the portfolio’s exposure to certain other asset categories (and their associated risks), which may cause the Fund to deviate from its principal investment strategy, including: (i) high yield, high risk debt securities rated below the top four long-term rating categories by a nationally recognized statistical rating organization (also known as “junk bonds”); (ii) securities issued by the U.S. government or its agencies and instrumentalities; (iii) CLOs and similar investments; and (iv) other short-term fixed income securities.
Inception Dates: |
A-Class | March 31, 2004 |
C-Class | March 22, 2002 |
P-Class | March 22, 2002 |
Institutional Class | November 30, 2011 |
Ten Largest Holdings (% of Total Net Assets) |
Guggenheim Strategy Fund I | 5.0% |
QUALCOMM, Inc. | 0.6% |
NVIDIA Corp. | 0.6% |
Murphy Oil Corp. | 0.6% |
Cooper Companies, Inc. | 0.6% |
ABIOMED, Inc. | 0.5% |
Cummins, Inc. | 0.5% |
CommerceHub, Inc. | 0.5% |
Northrop Grumman Corp. | 0.5% |
Edwards Lifesciences Corp. | 0.5% |
Top Ten Total | 9.9% |
| | |
“Ten Largest Holdings” excludes any temporary cash investments. |
8 | THE RYDEX FUNDS SEMI-ANNUAL REPORT | |
SCHEDULE OF INVESTMENTS (Unaudited) | September 30, 2016 |
LONG SHORT EQUITY FUND | |
| | | Shares | | | Value | |
| | | | | | | |
COMMON STOCKS† - 85.7% | |
| | | | | | | |
Industrial - 17.3% | |
Cummins, Inc.1 | | | 1,793 | | | $ | 229,773 | |
Northrop Grumman Corp.1 | | | 1,071 | | | | 229,140 | |
AO Smith Corp.1 | | | 2,300 | | | | 227,216 | |
Roper Technologies, Inc. 1 | | | 1,233 | | | | 224,986 | |
Timken Co.1 | | | 6,361 | | | | 223,526 | |
Raytheon Co.1 | | | 1,630 | | | | 221,892 | |
Rockwell Collins, Inc.1 | | | 2,616 | | | | 220,633 | |
AGCO Corp.1 | | | 4,468 | | | | 220,362 | |
Carlisle Companies, Inc.1 | | | 2,146 | | | | 220,115 | |
Energizer Holdings, Inc.1 | | | 4,400 | | | | 219,824 | |
Lennox International, Inc.1 | | | 1,399 | | | | 219,685 | |
Terex Corp.1 | | | 8,616 | | | | 218,933 | |
Ingersoll-Rand plc1 | | | 3,201 | | | | 217,476 | |
Parker-Hannifin Corp.1 | | | 1,730 | | | | 217,167 | |
Flowserve Corp.1 | | | 4,476 | | | | 215,922 | |
Stanley Black & Decker, Inc.1 | | | 1,750 | | | | 215,215 | |
ITT, Inc.1 | | | 5,993 | | | | 214,789 | |
Sonoco Products Co.1 | | | 4,063 | | | | 214,648 | |
Trinity Industries, Inc.1 | | | 8,832 | | | | 213,558 | |
B/E Aerospace, Inc.1 | | | 4,124 | | | | 213,045 | |
Owens Corning1 | | | 3,925 | | | | 209,555 | |
BWX Technologies, Inc.1 | | | 5,450 | | | | 209,117 | |
Masco Corp.1 | | | 6,060 | | | | 207,919 | |
Graphic Packaging Holding Co.1 | | | 14,735 | | | | 206,143 | |
Huntington Ingalls Industries, Inc. | | | 1,329 | | | | 203,895 | |
USG Corp.*,1 | | | 7,862 | | | | 203,233 | |
Garmin Ltd.1 | | | 4,013 | | | | 193,065 | |
Orbital ATK, Inc.1 | | | 2,484 | | | | 189,355 | |
SunPower Corp. — Class A*,1 | | | 20,882 | | | | 186,267 | |
Fortune Brands Home & Security, Inc.1 | | | 3,200 | | | | 185,920 | |
Spirit AeroSystems Holdings, Inc. — Class A*,1 | | | 3,940 | | | | 175,488 | |
United Technologies Corp.1 | | | 1,183 | | | | 120,193 | |
Lincoln Electric Holdings, Inc.1 | | | 1,846 | | | | 115,597 | |
L-3 Communications Holdings, Inc.1 | | | 766 | | | | 115,459 | |
Boeing Co.1 | | | 803 | | | | 105,787 | |
Berry Plastics Group, Inc.*,1 | | | 1,854 | | | | 81,298 | |
Armstrong World Industries, Inc.*,1 | | | 1,748 | | | | 72,227 | |
Stericycle, Inc.*,1 | | | 818 | | | | 65,555 | |
General Dynamics Corp.1 | | | 228 | | | | 35,376 | |
Allegion plc1 | | | 300 | | | | 20,673 | |
Total Industrial | | | | | | | 7,300,027 | |
| | | | | | | | | |
Financial - 15.7% | |
Lamar Advertising Co. — Class A1 | | | 3,431 | | | | 224,079 | |
Genworth Financial, Inc. — Class A* | | | 45,144 | | | | 223,913 | |
Mastercard, Inc. — Class A1 | | | 2,200 | | | | 223,894 | |
Assurant, Inc.1 | | | 2,382 | | | | 219,740 | |
PacWest Bancorp1 | | | 5,023 | | | | 215,537 | |
AmTrust Financial Services, Inc.1 | | | 7,996 | | | | 214,533 | |
East West Bancorp, Inc.1 | | | 5,840 | | | | 214,386 | |
Assured Guaranty Ltd.1 | | | 7,690 | | | | 213,398 | |
White Mountains Insurance Group Ltd.1 | | | 257 | | | | 213,310 | |
Mercury General Corp.1 | | | 3,865 | | | | 211,995 | |
AGNC Investment Corp. | | | 10,800 | | | | 211,033 | |
Reinsurance Group of America, Inc. — Class A1 | | | 1,951 | | | | 210,591 | |
Equity Residential1 | | | 3,268 | | | | 210,230 | |
Popular, Inc.1 | | | 5,480 | | | | 209,446 | |
Everest Re Group Ltd.1 | | | 1,101 | | | | 209,157 | |
Starwood Property Trust, Inc.1 | | | 9,243 | | | | 208,152 | |
Senior Housing Properties Trust1 | | | 9,087 | | | | 206,365 | |
Rayonier, Inc.1 | | | 7,726 | | | | 205,048 | |
MFA Financial, Inc.1 | | | 27,358 | | | | 204,638 | |
Axis Capital Holdings Ltd.1 | | | 3,746 | | | | 203,520 | |
Chimera Investment Corp.1 | | | 12,750 | | | | 203,363 | |
Iron Mountain, Inc.1 | | | 5,400 | | | | 202,662 | |
Two Harbors Investment Corp.1 | | | 23,462 | | | | 200,131 | |
Old Republic International Corp.1 | | | 11,222 | | | | 197,732 | |
Host Hotels & Resorts, Inc.1 | | | 12,625 | | | | 196,572 | |
Corrections Corporation of America1 | | | 13,415 | | | | 186,066 | |
HCP, Inc.1 | | | 4,787 | | | | 181,667 | |
Lazard Ltd. — Class A1 | | | 4,866 | | | | 176,928 | |
Aspen Insurance Holdings Ltd.1 | | | 2,602 | | | | 121,227 | |
BOK Financial Corp.1 | | | 1,717 | | | | 118,421 | |
Hospitality Properties Trust1 | | | 3,913 | | | | 116,294 | |
NorthStar Realty Europe Corp.1 | | | 9,977 | | | | 109,248 | |
First American Financial Corp.1 | | | 2,644 | | | | 103,856 | |
NorthStar Realty Finance Corp.1 | | | 7,767 | | | | 102,291 | |
Equinix, Inc.1 | | | 137 | | | | 49,354 | |
Weyerhaeuser Co.1 | | | 1,508 | | | | 48,166 | |
Highwoods Properties, Inc.1 | | | 288 | | | | 15,011 | |
Validus Holdings Ltd.1 | | | 244 | | | | 12,156 | |
Total Financial | | | | | | | 6,594,110 | |
| | | | | | | | | |
Consumer, Non-cyclical - 15.0% | |
Cooper Companies, Inc.1 | | | 1,300 | | | | 233,037 | |
ABIOMED, Inc.*,1 | | | 1,801 | | | | 231,572 | |
Edwards Lifesciences Corp.*,1 | | | 1,900 | | | | 229,064 | |
IDEXX Laboratories, Inc.*,1 | | | 1,981 | | | | 223,318 | |
Baxter International, Inc.1 | | | 4,679 | | | | 222,720 | |
Procter & Gamble Co.1 | | | 2,464 | | | | 221,143 | |
Hill-Rom Holdings, Inc.1 | | | 3,562 | | | | 220,773 | |
Colgate-Palmolive Co.1 | | | 2,961 | | | | 219,529 | |
Medtronic plc1 | | | 2,530 | | | | 218,592 | |
Macquarie Infrastructure Corp.1 | | | 2,604 | | | | 216,757 | |
Kraft Heinz Co.1 | | | 2,420 | | | | 216,614 | |
Mondelez International, Inc. — Class A1 | | | 4,901 | | | | 215,154 | |
Charles River Laboratories International, Inc.*,1 | | | 2,547 | | | | 212,267 | |
Church & Dwight Company, Inc.1 | | | 4,416 | | | | 211,615 | |
Kimberly-Clark Corp.1 | | | 1,672 | | | | 210,906 | |
Archer-Daniels-Midland Co.1 | | | 4,897 | | | | 206,506 | |
Pinnacle Foods, Inc.1 | | | 4,110 | | | | 206,199 | |
Align Technology, Inc.*,1 | | | 2,199 | | | | 206,156 | |
DexCom, Inc.*,1 | | | 2,305 | | | | 202,056 | |
ResMed, Inc.1 | | | 3,118 | | | | 202,015 | |
Bunge Ltd.1 | | | 3,355 | | | | 198,717 | |
Pilgrim’s Pride Corp. | | | 9,393 | | | | 198,380 | |
Blue Buffalo Pet Products, Inc.*,1 | | | 8,321 | | | | 197,707 | |
SEE NOTES TO FINANCIAL STATEMENTS. | THE RYDEX FUNDS SEMI-ANNUAL REPORT | 9 |
SCHEDULE OF INVESTMENTS (Unaudited)(continued) | September 30, 2016 |
LONG SHORT EQUITY FUND | |
| | | Shares | | | Value | |
| | | | | | | |
West Pharmaceutical Services, Inc.1 | | | 2,604 | | | $ | 193,998 | |
Flowers Foods, Inc.1 | | | 12,358 | | | | 186,853 | |
Teleflex, Inc.1 | | | 1,091 | | | | 183,343 | |
Automatic Data Processing, Inc.1 | | | 1,700 | | | | 149,940 | |
Boston Scientific Corp.*,1 | | | 6,210 | | | | 147,798 | |
Endo International plc*,1 | | | 6,566 | | | | 132,306 | |
DENTSPLY SIRONA, Inc.1 | | | 2,216 | | | | 131,697 | |
TreeHouse Foods, Inc.*,1 | | | 1,461 | | | | 127,385 | |
Coty, Inc. — Class A*,1 | | | 4,741 | | | | 111,414 | |
Zimmer Biomet Holdings, Inc.1 | | | 383 | | | | 49,798 | |
Square, Inc. — Class A*,1 | | | 632 | | | | 7,369 | |
Total Consumer, Non-cyclical | | | | | | | 6,342,698 | |
| | | | | | | | | |
Technology - 10.2% | |
QUALCOMM, Inc.1 | | | 3,488 | | | | 238,928 | |
NVIDIA Corp.1 | | | 3,471 | | | | 237,834 | |
CommerceHub, Inc.*,1 | | | 14,417 | | | | 229,375 | |
HP, Inc.1 | | | 14,621 | | | | 227,064 | |
CommerceHub, Inc.*,1 | | | 14,360 | | | | 226,888 | |
Skyworks Solutions, Inc.1 | | | 2,964 | | | | 225,679 | |
Marvell Technology Group Ltd.1 | | | 16,863 | | | | 223,772 | |
Intel Corp.1 | | | 5,891 | | | | 222,385 | |
Cypress Semiconductor Corp.1 | | | 17,934 | | | | 218,077 | |
Rackspace Hosting, Inc.*,1 | | | 6,844 | | | | 216,886 | |
Xilinx, Inc.1 | | | 3,954 | | | | 214,860 | |
Maxim Integrated Products, Inc.1 | | | 5,359 | | | | 213,985 | |
Broadcom Ltd.1 | | | 1,238 | | | | 213,579 | |
Qorvo, Inc.*,1 | | | 3,798 | | | | 211,701 | |
Akamai Technologies, Inc.*,1 | | | 3,994 | | | | 211,642 | |
DST Systems, Inc.1 | | | 1,756 | | | | 207,067 | |
Applied Materials, Inc.1 | | | 6,377 | | | | 192,266 | |
Tableau Software, Inc. — Class A*,1 | | | 2,800 | | | | 154,756 | |
Microchip Technology, Inc.1 | | | 2,225 | | | | 138,262 | |
Paychex, Inc.1 | | | 1,500 | | | | 86,805 | |
Teradyne, Inc.1 | | | 3,184 | | | | 68,711 | |
ON Semiconductor Corp.*,1 | | | 4,581 | | | | 56,438 | |
Leidos Holdings, Inc.1 | | | 889 | | | | 38,476 | |
Jack Henry & Associates, Inc.1 | | | 200 | | | | 17,110 | |
Total Technology | | | | | | | 4,292,546 | |
| | | | | | | | | |
Energy - 8.2% | |
Murphy Oil Corp.1 | | | 7,712 | | | | 234,445 | |
Targa Resources Corp.1 | | | 4,568 | | | | 224,335 | |
PBF Energy, Inc. — Class A1 | | | 9,839 | | | | 222,755 | |
First Solar, Inc.*,1 | | | 5,581 | | | | 220,394 | |
Phillips 661 | | | 2,699 | | | | 217,404 | |
Marathon Oil Corp.1 | | | 13,690 | | | | 216,439 | |
Chevron Corp.1 | | | 2,087 | | | | 214,794 | |
Exxon Mobil Corp.1 | | | 2,434 | | | | 212,440 | |
Tesoro Corp.1 | | | 2,649 | | | | 210,754 | |
HollyFrontier Corp.1 | | | 8,575 | | | | 210,088 | |
Occidental Petroleum Corp.1 | | | 2,785 | | | | 203,081 | |
Valero Energy Corp.1 | | | 3,804 | | | | 201,612 | |
Marathon Petroleum Corp.1 | | | 4,945 | | | | 200,718 | |
Chesapeake Energy Corp.*,1 | | | 31,541 | | | | 197,762 | |
Kinder Morgan, Inc.1 | | | 8,403 | | | | 194,361 | |
Cheniere Energy, Inc.*,1 | | | 2,135 | | | | 93,086 | |
Southwestern Energy Co.*,1 | | | 6,204 | | | | 85,863 | |
SM Energy Co.1 | | | 1,101 | | | | 42,477 | |
Murphy USA, Inc.*,1 | | | 346 | | | | 24,691 | |
Hess Corp.1 | | | 458 | | | | 24,558 | |
Total Energy | | | | | | | 3,452,057 | |
| | | | | | | | | |
Basic Materials - 6.3% | |
Freeport-McMoRan, Inc.1 | | | 20,263 | | | | 220,056 | |
Southern Copper Corp. | | | 8,264 | | | | 217,343 | |
Steel Dynamics, Inc.1 | | | 8,601 | | | | 214,939 | |
Alcoa, Inc.1 | | | 21,044 | | | | 213,386 | |
Nucor Corp.1 | | | 4,298 | | | | 212,536 | |
United States Steel Corp.1 | | | 11,210 | | | | 211,421 | |
Reliance Steel & Aluminum Co.1 | | | 2,931 | | | | 211,120 | |
Compass Minerals International, Inc.1 | | | 2,855 | | | | 210,414 | |
Huntsman Corp.1 | | | 12,422 | | | | 202,106 | |
Newmont Mining Corp.1 | | | 5,103 | | | | 200,497 | |
Royal Gold, Inc.1 | | | 2,588 | | | | 200,389 | |
Tahoe Resources, Inc.1 | | | 14,552 | | | | 186,702 | |
LyondellBasell Industries N.V. — Class A1 | | | 2,237 | | | | 180,436 | |
Total Basic Materials | | | | | | | 2,681,345 | |
| | | | | | | | | |
Consumer, Cyclical - 4.9% | |
Genuine Parts Co.1 | | | 2,154 | | | | 216,370 | |
World Fuel Services Corp.1 | | | 4,652 | | | | 215,202 | |
GameStop Corp. — Class A | | | 7,635 | | | | 210,650 | |
LKQ Corp.*,1 | | | 5,900 | | | | 209,213 | |
Pool Corp.1 | | | 2,209 | | | | 208,794 | |
Gaming and Leisure Properties, Inc.1 | | | 6,200 | | | | 207,390 | |
Nu Skin Enterprises, Inc. — Class A | | | 3,168 | | | | 205,223 | |
Extended Stay America, Inc.1 | | | 11,195 | | | | 158,969 | |
General Motors Co.1 | | | 4,760 | | | | 151,225 | |
The Gap, Inc.1 | | | 4,731 | | | | 105,217 | |
Harman International Industries, Inc.1 | | | 1,242 | | | | 104,887 | |
Penske Automotive Group, Inc.1 | | | 1,765 | | | | 85,038 | |
Total Consumer, Cyclical | | | | | | | 2,078,178 | |
| | | | | | | | | |
Communications - 4.3% | |
Yelp, Inc. — Class A*,1 | | | 5,453 | | | | 227,390 | |
IAC/InterActiveCorp1 | | | 3,633 | | | | 226,954 | |
Sprint Corp.*,1 | | | 32,395 | | | | 214,779 | |
T-Mobile US, Inc.*,1 | | | 4,596 | | | | 214,725 | |
Pandora Media, Inc.*,1 | | | 14,637 | | | | 209,748 | |
Telephone & Data Systems, Inc.1 | | | 7,566 | | | | 205,644 | |
United States Cellular Corp.*,1 | | | 5,563 | | | | 202,159 | |
FireEye, Inc.*,1 | | | 11,856 | | | | 174,639 | |
Zillow Group, Inc. — Class A*,1 | | | 2,780 | | | | 95,771 | |
Match Group, Inc.*,1 | | | 3,222 | | | | 57,319 | |
Total Communications | | | | | | | 1,829,128 | |
| | | | | | | | | |
Utilities - 3.8% | |
Atmos Energy Corp.1 | | | 2,816 | | | | 209,709 | |
Public Service Enterprise Group, Inc.1 | | | 5,000 | | | | 209,349 | |
NiSource, Inc.1 | | | 8,603 | | | | 207,418 | |
UGI Corp.1 | | | 4,578 | | | | 207,109 | |
Ameren Corp.1 | | | 4,200 | | | | 206,556 | |
National Fuel Gas Co.1 | | | 3,675 | | | | 198,707 | |
10 | THE RYDEX FUNDS SEMI-ANNUAL REPORT | SEE NOTES TO FINANCIAL STATEMENTS. |
SCHEDULE OF INVESTMENTS (Unaudited)(continued) | September 30, 2016 |
LONG SHORT EQUITY FUND | |
| | | Shares | | | Value | |
| | | | | | | |
Vectren Corp.1 | | | 2,891 | | | $ | 145,128 | |
DTE Energy Co.1 | | | 1,184 | | | | 110,905 | |
MDU Resources Group, Inc.1 | | | 2,356 | | | | 59,937 | |
Consolidated Edison, Inc.1 | | | 465 | | | | 35,015 | |
Total Utilities | | | | | | | 1,589,833 | |
| | | | | | | | | |
Total Common Stocks | | | | | | | | |
(Cost $34,850,637) | | | | | | | 36,159,922 | |
| | | | | | | | | |
MUTUAL FUNDS† - 5.0% | |
Guggenheim Strategy Fund I2 | | | 83,518 | | | | 2,087,117 | |
Guggenheim Strategy Fund II2 | | | 577 | | | | 14,386 | |
Total Mutual Funds | | | | | | | | |
(Cost $2,099,535) | | | | | | | 2,101,503 | |
| | | | | | | | | |
| | | Face
Amount | | | | | |
| | | | | | | | | |
REPURCHASE AGREEMENTS††,3 - 9.4% | |
HSBC Securities, Inc.
issued 09/30/16 at 0.38%
due 10/03/16 | | $ | 2,200,310 | | | | 2,200,310 | |
Royal Bank of Canada
issued 09/30/16 at 0.36%
due 10/03/16 | | | 1,747,057 | | | | 1,747,057 | |
Total Repurchase Agreements | | | | | | | | |
(Cost $3,947,367) | | | | | | | 3,947,367 | |
| | | | | | | | | |
Total Investments - 100.5% | | | | | | | | |
(Cost $40,897,539) | | | | | | $ | 42,208,792 | |
| | | | | | | | | |
| | | Shares | | | | | |
| | |
COMMON STOCKS SOLD SHORT† - (34.5)% | |
| | |
Technology - (0.8)% | |
SS&C Technologies Holdings, Inc. | | | 1,738 | | | | (55,877 | ) |
Cerner Corp.* | | | 1,579 | | | | (97,503 | ) |
IPG Photonics Corp.* | | | 1,232 | | | | (101,455 | ) |
Hewlett Packard Enterprise Co. | | | 4,864 | | | | (110,656 | ) |
Total Technology | | | | | | | (365,491 | ) |
| | | | | | | | | |
Basic Materials - (1.1)% | |
Sherwin-Williams Co. | | | 160 | | | | (44,266 | ) |
Domtar Corp. | | | 2,794 | | | | (103,741 | ) |
Praxair, Inc. | | | 881 | | | | (106,451 | ) |
NewMarket Corp. | | | 248 | | | | (106,471 | ) |
International Flavors & Fragrances, Inc. | | | 770 | | | | (110,087 | ) |
Total Basic Materials | | | | | | | (471,016 | ) |
| | | | | | | | | |
Utilities - (1.2)% | |
NextEra Energy, Inc. | | | 245 | | | | (29,968 | ) |
NRG Energy, Inc. | | | 7,904 | | | | (88,604 | ) |
Eversource Energy | | | 1,708 | | | | (92,539 | ) |
Calpine Corp.* | | | 8,000 | | | | (101,120 | ) |
Avangrid, Inc. | | | 2,529 | | | | (105,662 | ) |
AES Corp. | | | 8,243 | | | | (105,923 | ) |
Total Utilities | | | | | | | (523,816 | ) |
| | | | | | | | | |
Communications - (1.9)% | |
DISH Network Corp. — Class A* | | | 394 | | | | (21,583 | ) |
Thomson Reuters Corp. | | | 1,141 | | | | (47,215 | ) |
CommScope Holding Company, Inc.* | | | 1,750 | | | | (52,693 | ) |
Cisco Systems, Inc. | | | 3,376 | | | | (107,087 | ) |
Comcast Corp. — Class A | | | 1,624 | | | | (107,736 | ) |
Time Warner, Inc. | | | 1,366 | | | | (108,747 | ) |
CDW Corp. | | | 2,381 | | | | (108,883 | ) |
Priceline Group, Inc.* | | | 78 | | | | (114,776 | ) |
EchoStar Corp. — Class A* | | | 2,734 | | | | (119,831 | ) |
Total Communications | | | | | | | (788,551 | ) |
| | | | | | | | | |
Industrial - (3.9)% | |
Zebra Technologies Corp. — Class A* | | | 216 | | | | (15,036 | ) |
CSX Corp. | | | 1,140 | | | | (34,770 | ) |
AECOM* | | | 3,121 | | | | (92,787 | ) |
AMERCO | | | 297 | | | | (96,296 | ) |
Kansas City Southern | | | 1,109 | | | | (103,492 | ) |
Sealed Air Corp. | | | 2,261 | | | | (103,599 | ) |
Ryder System, Inc. | | | 1,582 | | | | (104,333 | ) |
Landstar System, Inc. | | | 1,536 | | | | (104,571 | ) |
Old Dominion Freight Line, Inc.* | | | 1,525 | | | | (104,630 | ) |
AMETEK, Inc. | | | 2,204 | | | | (105,307 | ) |
Hubbell, Inc. | | | 997 | | | | (107,417 | ) |
J.B. Hunt Transport Services, Inc. | | | 1,338 | | | | (108,565 | ) |
Union Pacific Corp. | | | 1,115 | | | | (108,746 | ) |
Pentair plc | | | 1,696 | | | | (108,951 | ) |
Ball Corp. | | | 1,331 | | | | (109,075 | ) |
Amphenol Corp. — Class A | | | 1,712 | | | | (111,143 | ) |
Kirby Corp.* | | | 1,924 | | | | (119,596 | ) |
Total Industrial | | | | | | | (1,638,314 | ) |
| | |
Energy - (5.1)% | |
WPX Energy, Inc.* | | | 647 | | | | (8,534 | ) |
Newfield Exploration Co.* | | | 942 | | | | (40,939 | ) |
Diamondback Energy, Inc.* | | | 687 | | | | (66,323 | ) |
Gulfport Energy Corp.* | | | 3,655 | | | | (103,254 | ) |
Weatherford International plc* | | | 18,509 | | | | (104,021 | ) |
Energen Corp. | | | 1,846 | | | | (106,551 | ) |
Equities Corp. | | | 1,476 | | | | (107,187 | ) |
Schlumberger Ltd. | | | 1,365 | | | | (107,344 | ) |
Kosmos Energy Ltd.* | | | 16,880 | | | | (108,201 | ) |
QEP Resources, Inc. | | | 5,553 | | | | (108,450 | ) |
Continental Resources, Inc.* | | | 2,124 | | | | (110,363 | ) |
Halliburton Co. | | | 2,463 | | | | (110,539 | ) |
Concho Resources, Inc.* | | | 807 | | | | (110,841 | ) |
Helmerich & Payne, Inc. | | | 1,708 | | | | (114,948 | ) |
Superior Energy Services, Inc. | | | 6,435 | | | | (115,187 | ) |
National Oilwell Varco, Inc. | | | 3,154 | | | | (115,878 | ) |
Frank’s International N.V. | | | 9,021 | | | | (117,273 | ) |
Diamond Offshore Drilling, Inc. | | | 6,721 | | | | (118,357 | ) |
RPC, Inc.* | | | 7,048 | | | | (118,406 | ) |
Nabors Industries Ltd. | | | 10,146 | | | | (123,375 | ) |
SEE NOTES TO FINANCIAL STATEMENTS. | THE RYDEX FUNDS SEMI-ANNUAL REPORT | 11 |
SCHEDULE OF INVESTMENTS (Unaudited)(continued) | September 30, 2016 |
LONG SHORT EQUITY FUND | |
| | | Shares | | | Value | |
| | | | | | | |
Ensco plc — Class A | | | 14,624 | | | $ | (124,305 | ) |
Total Energy | | | | | | | (2,140,276 | ) |
| | | | | | | | | |
Consumer, Cyclical - (5.7)% | |
Tempur Sealy International, Inc.* | | | 846 | | | | (48,002 | ) |
Newell Brands, Inc. | | | 920 | | | | (48,447 | ) |
Foot Locker, Inc. | | | 749 | | | | (50,722 | ) |
Dollar General Corp. | | | 1,170 | | | | (81,888 | ) |
Dollar Tree, Inc.* | | | 1,133 | | | | (89,428 | ) |
Advance Auto Parts, Inc. | | | 640 | | | | (95,437 | ) |
Harley-Davidson, Inc. | | | 1,842 | | | | (96,871 | ) |
HD Supply Holdings, Inc.* | | | 3,089 | | | | (98,786 | ) |
J.C. Penney Company, Inc.* | | | 10,750 | | | | (99,115 | ) |
TJX Companies, Inc. | | | 1,340 | | | | (100,205 | ) |
Michael Kors Holdings Ltd.* | | | 2,149 | | | | (100,552 | ) |
Target Corp. | | | 1,473 | | | | (101,166 | ) |
American Airlines Group, Inc. | | | 2,770 | | | | (101,410 | ) |
Home Depot, Inc. | | | 803 | | | | (103,330 | ) |
Hanesbrands, Inc. | | | 4,104 | | | | (103,626 | ) |
United Continental Holdings, Inc.* | | | 1,996 | | | | (104,730 | ) |
Spirit Airlines, Inc.* | | | 2,501 | | | | (106,367 | ) |
Kohl’s Corp. | | | 2,432 | | | | (106,400 | ) |
AutoNation, Inc.* | | | 2,190 | | | | (106,675 | ) |
Macy’s, Inc. | | | 2,889 | | | | (107,037 | ) |
Scotts Miracle-Gro Co. — Class A | | | 1,297 | | | | (108,001 | ) |
Ross Stores, Inc. | | | 1,708 | | | | (109,824 | ) |
Dillard’s, Inc. — Class A | | | 1,765 | | | | (111,214 | ) |
Goodyear Tire & Rubber Co. | | | 3,464 | | | | (111,887 | ) |
Cabela’s, Inc.* | | | 2,140 | | | | (117,550 | ) |
Total Consumer, Cyclical | | | | | | | (2,408,670 | ) |
| | | | | | | | | |
Financial - (7.0)% | |
Cullen/Frost Bankers, Inc. | | | 100 | | | | (7,194 | ) |
Air Lease Corp. — Class A | | | 3,190 | | | | (91,170 | ) |
LendingClub Corp.* | | | 15,766 | | | | (97,434 | ) |
CBRE Group, Inc. — Class A* | | | 3,595 | | | | (100,588 | ) |
Jones Lang LaSalle, Inc. | | | 886 | | | | (100,818 | ) |
Discover Financial Services | | | 1,804 | | | | (102,016 | ) |
Goldman Sachs Group, Inc. | | | 635 | | | | (102,406 | ) |
T. Rowe Price Group, Inc. | | | 1,544 | | | | (102,676 | ) |
Berkshire Hathaway, Inc. — Class B* | | | 715 | | | | (103,296 | ) |
American Express Co. | | | 1,617 | | | | (103,553 | ) |
Howard Hughes Corp.* | | | 905 | | | | (103,623 | ) |
Bank of New York Mellon Corp. | | | 2,601 | | | | (103,728 | ) |
Realogy Holdings Corp. | | | 4,032 | | | | (104,268 | ) |
Ally Financial, Inc. | | | 5,363 | | | | (104,418 | ) |
Franklin Resources, Inc. | | | 2,940 | | | | (104,576 | ) |
Eaton Vance Corp. | | | 2,683 | | | | (104,771 | ) |
BlackRock, Inc. — Class A | | | 290 | | | | (105,113 | ) |
Santander Consumer USA Holdings, Inc.* | | | 8,674 | | | | (105,476 | ) |
Navient Corp. | | | 7,302 | | | | (105,660 | ) |
TCF Financial Corp. | | | 7,310 | | | | (106,068 | ) |
SEI Investments Co. | | | 2,337 | | | | (106,591 | ) |
TFS Financial Corp. | | | 5,993 | | | | (106,735 | ) |
Citigroup, Inc. | | | 2,260 | | | | (106,740 | ) |
M&T Bank Corp. | | | 920 | | | | (106,812 | ) |
Capital One Financial Corp. | | | 1,493 | | | | (107,242 | ) |
Synchrony Financial | | | 3,856 | | | | (107,968 | ) |
Morgan Stanley | | | 3,392 | | | | (108,748 | ) |
OneMain Holdings, Inc.* | | | 3,589 | | | | (111,079 | ) |
E*TRADE Financial Corp.* | | | 4,111 | | | | (119,712 | ) |
Total Financial | | | | | | | (2,940,479 | ) |
| | | | | | | | | |
Consumer, Non-cyclical - (7.8)% | |
McKesson Corp. | | | 78 | | | | (13,007 | ) |
Universal Health Services, Inc. — Class B | | | 157 | | | | (19,346 | ) |
United Therapeutics Corp.* | | | 271 | | | | (32,000 | ) |
H&R Block, Inc. | | | 2,920 | | | | (67,598 | ) |
Bristol-Myers Squibb Co. | | | 1,450 | | | | (78,184 | ) |
Mylan N.V.* | | | 2,112 | | | | (80,509 | ) |
Vertex Pharmaceuticals, Inc.* | | | 1,086 | | | | (94,710 | ) |
Akorn, Inc.* | | | 3,491 | | | | (95,165 | ) |
ServiceMaster Global Holdings, Inc.* | | | 2,847 | | | | (95,887 | ) |
Avis Budget Group, Inc.* | | | 2,820 | | | | (96,472 | ) |
Celgene Corp.* | | | 933 | | | | (97,526 | ) |
Alexion Pharmaceuticals, Inc.* | | | 799 | | | | (97,909 | ) |
Allergan plc* | | | 426 | | | | (98,112 | ) |
AmerisourceBergen Corp. — Class A | | | 1,228 | | | | (99,197 | ) |
Acadia Healthcare Company, Inc.* | | | 2,022 | | | | (100,190 | ) |
Regeneron Pharmaceuticals, Inc.* | | | 250 | | | | (100,505 | ) |
Graham Holdings Co. — Class B | | | 210 | | | | (101,088 | ) |
Express Scripts Holding Co.* | | | 1,436 | | | | (101,281 | ) |
MEDNAX, Inc.* | | | 1,537 | | | | (101,826 | ) |
Johnson & Johnson | | | 880 | | | | (103,954 | ) |
AbbVie, Inc. | | | 1,650 | | | | (104,066 | ) |
Pfizer, Inc. | | | 3,080 | | | | (104,320 | ) |
VCA, Inc.* | | | 1,492 | | | | (104,410 | ) |
Gilead Sciences, Inc. | | | 1,324 | | | | (104,755 | ) |
Henry Schein, Inc.* | | | 644 | | | | (104,959 | ) |
Amgen, Inc. | | | 634 | | | | (105,758 | ) |
Eli Lilly & Co. | | | 1,320 | | | | (105,943 | ) |
Ecolab, Inc. | | | 872 | | | | (106,140 | ) |
Merck & Company, Inc. | | | 1,710 | | | | (106,721 | ) |
Service Corporation International | | | 4,023 | | | | (106,770 | ) |
Aramark | | | 2,810 | | | | (106,864 | ) |
Biogen, Inc.* | | | 342 | | | | (107,056 | ) |
Zoetis, Inc. | | | 2,059 | | | | (107,089 | ) |
DaVita, Inc.* | | | 1,668 | | | | (110,205 | ) |
Incyte Corp.* | | | 1,206 | | | | (113,714 | ) |
Total Consumer, Non-cyclical | | | | | | | (3,273,236 | ) |
| | | | | | | | | |
Total Common Stocks Sold Short | | | | | | | | |
(Proceeds $14,415,607) | | | | | | | (14,549,849 | ) |
Total Securities Sold Short - (34.5)% | | | | | | | | |
(Proceeds $14,415,607) | | | | | | $ | (14,549,849 | ) |
Other Assets & Liabilities, net - 34.4% | | | | | | | 14,488,548 | |
Total Net Assets - 100.0% | | | | | | $ | 42,147,491 | |
12 | THE RYDEX FUNDS SEMI-ANNUAL REPORT | SEE NOTES TO FINANCIAL STATEMENTS. |
SCHEDULE OF INVESTMENTS (Unaudited)(concluded) | September 30, 2016 |
LONG SHORT EQUITY FUND | |
* | Non-income producing security. |
† | Value determined based on Level 1 inputs — See Note 4. |
†† | Value determined based on Level 2 inputs — See Note 4. |
1 | All or a portion of this security is pledged as short security collateral at September 30, 2016. |
2 | Affiliated issuer — See Note 9. |
3 | Repurchase Agreements — See Note 5. |
| | plc — Public Limited Company |
| | |
| | See Sector Classification in Other Information section. |
The following table summarizes the inputs used to value the Fund’s investments at September 30, 2016 (See Note 4 in the Notes to Financial Statements):
Investments in Securities (Assets) | | Level 1 | | | Level 2 | | | Level 3 | | | Total | |
Common Stocks | | $ | 36,159,922 | | | $ | — | | | $ | — | | | $ | 36,159,922 | |
Mutual Funds | | | 2,101,503 | | | | — | | | | — | | | | 2,101,503 | |
Repurchase Agreements | | | — | | | | 3,947,367 | | | | — | | | | 3,947,367 | |
Total | | $ | 38,261,425 | | | $ | 3,947,367 | | | $ | — | | | $ | 42,208,792 | |
| | | | | | | | | | | | | | | | | |
Investments in Securities (Liabilities) | | Level 1 | | | Level 2 | | | Level 3 | | | Total | |
Common Stocks | | $ | 14,549,849 | | | $ | — | | | $ | — | | | $ | 14,549,849 | |
Transfers between investment levels may occur as the markets fluctuate and/or the availability of data used in an investment’s valuation changes. Transfers between valuation levels, if any, are in comparison to the valuation levels at the end of the previous fiscal year, and are effective using the fair value as of the end of the previous fiscal period.
For the period ended September 30, 2016, there were no transfers between levels.
SEE NOTES TO FINANCIAL STATEMENTS. | THE RYDEX FUNDS SEMI-ANNUAL REPORT | 13 |
STATEMENT OF ASSETS AND LIABILITIES (Unaudited) | |
September 30, 2016 | |
Assets: | |
Investments in unaffiliated issuers, at value (cost $34,850,637) | | $ | 36,159,922 | |
Investments in affiliated issuers, at value (cost $2,099,535) | | | 2,101,503 | |
Repurchase agreements, at value (cost $3,947,367) | | | 3,947,367 | |
Total investments (cost $40,897,539) | | | 42,208,792 | |
Segregated cash with broker | | | 14,494,412 | |
Receivables: | |
Fund shares sold | | | 81,806 | |
Dividends | | | 77,484 | |
Interest | | | 41 | |
Total assets | | | 56,862,535 | |
| | | | | |
Liabilities: | |
Securities sold short, at value (proceeds $14,415,607) | | | 14,549,849 | |
Overdraft due to custodian bank | | | 40,833 | |
Payable for: | |
Fund shares redeemed | | | 34,289 | |
Management fees | | | 31,310 | |
Distribution and service fees | | | 17,657 | |
Transfer agent and administrative fees | | | 8,697 | |
Portfolio accounting fees | | | 3,479 | |
Miscellaneous | | | 28,930 | |
Total liabilities | | | 14,715,044 | |
Commitments and contingent liabilities (Note 11) | | | — | |
Net assets | | $ | 42,147,491 | |
| | | | | |
Net assets consist of: | |
Paid in capital | | $ | 107,486,624 | |
Accumulated net investment loss | | | (119,237 | ) |
Accumulated net realized loss on investments | | | (66,396,907 | ) |
Net unrealized appreciation on investments | | | 1,177,011 | |
Net assets | | $ | 42,147,491 | |
| | | | | |
A-Class: | |
Net assets | | $ | 7,135,202 | |
Capital shares outstanding | | | 458,531 | |
Net asset value per share | | $ | 15.56 | |
Maximum offering price per share (Net asset value divided by 95.25%) | | $ | 16.34 | |
| | | | | |
C-Class: | |
Net assets | | $ | 14,719,750 | |
Capital shares outstanding | | | 1,055,882 | |
Net asset value per share | | $ | 13.94 | |
| | | | | |
P-Class: | |
Net assets | | $ | 19,356,291 | |
Capital shares outstanding | | | 1,239,883 | |
Net asset value per share | | $ | 15.61 | |
| | | | | |
Institutional Class: | |
Net assets | | $ | 936,248 | |
Capital shares outstanding | | | 59,109 | |
Net asset value per share | | $ | 15.84 | |
STATEMENT OF OPERATIONS (Unaudited) | |
Period Ended September 30, 2016 | |
Investment Income: | |
Dividends from securities of unaffiliated issuers (net of foreign withholding tax of $129) | | $ | 458,815 | |
Dividends from securities of affiliated issuers | | | 17,335 | |
Interest | | | 4,180 | |
Total investment income | | | 480,330 | |
| | | | | |
Expenses: | |
Management fees | | | 209,702 | |
Transfer agent and administrative fees | | | 58,251 | |
Distribution and service fees: | |
A-Class | | | 11,278 | |
C-Class | | | 78,897 | |
P-Class | | | 26,243 | |
Portfolio accounting fees | | | 23,300 | |
Short sales dividend expense | | | 130,237 | |
Prime broker interest expense | | | 21,735 | |
Custodian fees | | | 2,743 | |
Trustees’ fees* | | | 2,073 | |
Miscellaneous | | | 35,108 | |
Total expenses | | | 599,567 | |
Net investment loss | | | (119,237 | ) |
| | | | | |
Net Realized and Unrealized Gain (Loss): | |
Net realized gain (loss) on: | |
Investments in unaffiliated issuers | | | 2,370,253 | |
Futures contracts | | | (97,858 | ) |
Securities sold short | | | (494,328 | ) |
Net realized gain | | | 1,778,067 | |
Net change in unrealized appreciation (depreciation) on: | |
Investments in unaffiliated issuers | | | 440,301 | |
Investments in affiliated issuers | | | 12,783 | |
Securities sold short | | | (1,172,691 | ) |
Futures contracts | | | (5,937 | ) |
Net change in unrealized appreciation (depreciation) | | | (725,544 | ) |
Net realized and unrealized gain | | | 1,052,523 | |
Net increase in net assets resulting from operations | | $ | 933,286 | |
* | Relates to Trustees not deemed “interested persons” within the meaning of Section 2(a)(19) of the 1940 Act. |
14 | THE RYDEX FUNDS SEMI-ANNUAL REPORT | SEE NOTES TO FINANCIAL STATEMENTS. |
STATEMENTS OF CHANGES IN NET ASSETS |
| | | Period Ended
September 30,
2016
(Unaudited) | | | Year Ended
March 31,
2016 | |
Increase (Decrease) in Net Assets from Operations: | | | | | | |
Net investment loss | | $ | (119,237 | ) | | $ | (483,912 | ) |
Net realized gain (loss) on investments | | | 1,778,067 | | | | (1,957,832 | ) |
Net change in unrealized appreciation (depreciation) on investments | | | (725,544 | ) | | | (644,249 | ) |
Net increase (decrease) in net assets resulting from operations | | | 933,286 | | | | (3,085,993 | ) |
| | | | | | | | | |
Capital share transactions: | | | | | | | | |
Proceeds from sale of shares | | | | | | | | |
A-Class | | | 1,054,716 | | | | 11,165,376 | |
C-Class | | | 84,244 | | | | 909,384 | |
P-Class | | | 1,631,449 | | | | 16,740,494 | * |
Institutional Class | | | 2,393,963 | | | | 305,681 | |
Cost of shares redeemed | | | | | | | | |
A-Class | | | (4,929,343 | ) | | | (5,781,828 | ) |
C-Class | | | (2,390,075 | ) | | | (2,910,089 | ) |
P-Class | | | (6,191,138 | ) | | | (12,054,766 | )* |
Institutional Class | | | (2,004,507 | ) | | | (60,140 | ) |
Net increase (decrease) from capital share transactions | | | (10,350,691 | ) | | | 8,314,112 | |
Net increase (decrease) in net assets | | | (9,417,405 | ) | | | 5,228,119 | |
| | | | | | | | | |
Net assets: | | | | | | | | |
Beginning of period | | | 51,564,896 | | | | 46,336,777 | |
End of period | | $ | 42,147,491 | | | $ | 51,564,896 | |
Accumulated net investment loss at end of period | | $ | (119,237 | ) | | $ | — | |
| | | | | | | | | |
Capital share activity: | | | | | | | | |
Shares sold | | | | | | | | |
A-Class | | | 68,306 | | | | 702,460 | |
C-Class | | | 6,093 | | | | 63,821 | |
P-Class | | | 105,026 | | | | 1,069,799 | * |
Institutional Class | | | 150,932 | | | | 19,194 | |
Shares redeemed | | | | | | | | |
A-Class | | | (317,782 | ) | | | (369,701 | ) |
C-Class | | | (171,832 | ) | | | (205,085 | ) |
P-Class | | | (398,863 | ) | | | (771,059 | )* |
Institutional Class | | | (125,718 | ) | | | (3,751 | ) |
Net increase (decrease) in shares | | | (683,838 | ) | | | 505,678 | |
* | H-Class shares redesignated as P-Class shares effective following the close of business on April 30, 2015 — See Note 12. |
SEE NOTES TO FINANCIAL STATEMENTS. | THE RYDEX FUNDS SEMI-ANNUAL REPORT | 15 |
This table is presented to show selected data for a share outstanding throughout each period and to assist shareholders in evaluating a Fund’s performance for the periods presented.
A-Class | | Period Ended
September 30,
2016a | | | Year Ended
March 31,
2016 | | | Year Ended
March 31,
2015 | | | Year Ended
March 31,
2014 | | | Year Ended
March 28,
2013 | | | Year Ended
March 31,
2012 | |
Per Share Data | | | | | | | | | | | | | | | | | | |
Net asset value, beginning of period | | $ | 15.26 | | | $ | 16.16 | | | $ | 15.07 | | | $ | 13.48 | | | $ | 13.28 | | | $ | 14.28 | |
Income (loss) from investment operations: | |
Net investment income (loss)b | | | (.02 | ) | | | (.10 | ) | | | (.06 | ) | | | (.13 | ) | | | (.05 | ) | | | .03 | |
Net gain (loss) on investments (realized and unrealized) | | | .32 | | | | (.80 | ) | | | 1.15 | | | | 1.72 | | | | .30 | | | | (1.03 | ) |
Total from investment operations | | | .30 | | | | (.90 | ) | | | 1.09 | | | | 1.59 | | | | .25 | | | | (1.00 | ) |
Less distributions from: | |
Net investment income | | | — | | | | — | | | | — | | | | — | | | | (.05 | ) | | | — | |
Total distributions | | | — | | | | — | | | | — | | | | — | | | | (.05 | ) | | | — | |
Net asset value, end of period | | $ | 15.56 | | | $ | 15.26 | | | $ | 16.16 | | | $ | 15.07 | | | $ | 13.48 | | | $ | 13.28 | |
| | |
Total Returnc | | | 1.97 | % | | | (5.57 | %) | | | 7.23 | % | | | 11.80 | % | | | 1.89 | % | | | (7.00 | %) |
Ratios/Supplemental Data | |
Net assets, end of period (in thousands) | | $ | 7,135 | | | $ | 10,803 | | | $ | 6,063 | | | $ | 7,552 | | | $ | 13,106 | | | $ | 16,510 | |
Ratios to average net assets: | |
Net investment income (loss) | | | (0.28 | %) | | | (0.66 | %) | | | (0.42 | %) | | | (0.91 | %) | | | (0.35 | %) | | | 0.21 | % |
Total expensesd,g | | | 2.33 | % | | | 2.53 | % | | | 2.17 | % | | | 2.34 | % | | | 1.92 | % | | | 1.66 | % |
Portfolio turnover rate | | | 109 | % | | | 224 | % | | | 331 | % | | | 256 | % | | | 183 | % | | | 190 | % |
C-Class | | Period Ended
September 30,
2016a | | | Year Ended
March 31,
2016 | | | Year Ended
March 31,
2015 | | | Year Ended
March 31,
2014 | | | Year Ended
March 28,
2013 | | | Year Ended
March 31,
2012 | |
Per Share Data | | | | | | | | | | | | | | | | | | |
Net asset value, beginning of period | | $ | 13.72 | | | $ | 14.64 | | | $ | 13.76 | | | $ | 12.40 | | | $ | 12.31 | | | $ | 13.33 | |
Income (loss) from investment operations: | |
Net investment income (loss)b | | | (.07 | ) | | | (.21 | ) | | | (.16 | ) | | | (.24 | ) | | | (.14 | ) | | | (.07 | ) |
Net gain (loss) on investments (realized and unrealized) | | | .29 | | | | (.71 | ) | | | 1.04 | | | | 1.60 | | | | .28 | | | | (.95 | ) |
Total from investment operations | | | .22 | | | | (.92 | ) | | | .88 | | | | 1.36 | | | | .14 | | | | (1.02 | ) |
Less distributions from: | |
Net investment income | | | — | | | | — | | | | — | | | | — | | | | (.05 | ) | | | — | |
Total distributions | | | — | | | | — | | | | — | | | | — | | | | (.05 | ) | | | — | |
Net asset value, end of period | | $ | 13.94 | | | $ | 13.72 | | | $ | 14.64 | | | $ | 13.76 | | | $ | 12.40 | | | $ | 12.31 | |
| | |
Total Returnc | | | 1.60 | % | | | (6.28 | %) | | | 6.40 | % | | | 10.97 | % | | | 1.14 | % | | | (7.65 | %) |
Ratios/Supplemental Data | |
Net assets, end of period (in thousands) | | $ | 14,720 | | | $ | 16,760 | | | $ | 19,952 | | | $ | 22,354 | | | $ | 23,554 | | | $ | 32,503 | |
Ratios to average net assets: | |
Net investment income (loss) | | | (1.00 | %) | | | (1.45 | %) | | | (1.16 | %) | | | (1.79 | %) | | | (1.12 | %) | | | (0.54 | %) |
Total expensesd,g | | | 3.06 | % | | | 3.24 | % | | | 2.92 | % | | | 3.11 | % | | | 2.69 | % | | | 2.41 | % |
Portfolio turnover rate | | | 109 | % | | | 224 | % | | | 331 | % | | | 256 | % | | | 183 | % | | | 190 | % |
16 | THE RYDEX FUNDS SEMI-ANNUAL REPORT | SEE NOTES TO FINANCIAL STATEMENTS. |
FINANCIAL HIGHLIGHTS (continued) |
This table is presented to show selected data for a share outstanding throughout each period and to assist shareholders in evaluating a Fund’s performance for the periods presented.
P-Class* | | Period Ended
September 30,
2016a | | | Year Ended
March 31,
2016 | | | Year Ended
March 31,
2015 | | | Year Ended
March 31,
2014 | | | Year Ended
March 28,
2013 | | | Year Ended
March 31,
2012 | |
Per Share Data | | | | | | | | | | | | | | | | | | |
Net asset value, beginning of period | | $ | 15.31 | | | $ | 16.21 | | | $ | 15.12 | | | $ | 13.53 | | | $ | 13.33 | | | $ | 14.32 | |
Income (loss) from investment operations: | |
Net investment income (loss)b | | | (.02 | ) | | | (.11 | ) | | | (.07 | ) | | | (.16 | ) | | | (.04 | ) | | | .03 | |
Net gain (loss) on investments (realized and unrealized) | | | .32 | | | | (.79 | ) | | | 1.16 | | | | 1.75 | | | | .29 | | | | (1.02 | ) |
Total from investment operations | | | .30 | | | | (.90 | ) | | | 1.09 | | | | 1.59 | | | | .25 | | | | (.99 | ) |
Less distributions from: | |
Net investment income | | | — | | | | — | | | | — | | | | — | | | | (.05 | ) | | | — | |
Total distributions | | | — | | | | — | | | | — | | | | — | | | | (.05 | ) | | | — | |
Net asset value, end of period | | $ | 15.61 | | | $ | 15.31 | | | $ | 16.21 | | | $ | 15.12 | | | $ | 13.53 | | | $ | 13.33 | |
| | |
Total Returnc | | | 1.96 | % | | | (5.55 | %) | | | 7.21 | % | | | 11.75 | % | | | 1.88 | % | | | (6.91 | %) |
Ratios/Supplemental Data | |
Net assets, end of period (in thousands) | | $ | 19,356 | | | $ | 23,477 | | | $ | 20,020 | | | $ | 29,287 | | | $ | 26,257 | | | $ | 54,589 | |
Ratios to average net assets: | |
Net investment income (loss) | | | (0.26 | %) | | | (0.67 | %) | | | (0.43 | %) | | | (1.07 | %) | | | (0.29 | %) | | | 0.20 | % |
Total expensesd,g | | | 2.31 | % | | | 2.50 | % | | | 2.17 | % | | | 2.36 | % | | | 1.88 | % | | | 1.66 | % |
Portfolio turnover rate | | | 109 | % | | | 224 | % | | | 331 | % | | | 256 | % | | | 183 | % | | | 190 | % |
SEE NOTES TO FINANCIAL STATEMENTS. | THE RYDEX FUNDS SEMI-ANNUAL REPORT | 17 |
FINANCIAL HIGHLIGHTS (concluded) |
This table is presented to show selected data for a share outstanding throughout each period and to assist shareholders in evaluating a Fund’s performance for the periods presented.
Institutional Class | | Period Ended
September 30,
2016a | | | Year Ended
March 31,
2016 | | | Year Ended
March 31,
2015 | | | Year Ended
March 31,
2014 | | | Year Ended
March 28,
2013 | | | Period Ended
March 31,
2012e | |
Per Share Data | | | | | | | | | | | | | | | | | | |
Net asset value, beginning of period | | $ | 15.50 | | | $ | 16.38 | | | $ | 15.24 | | | $ | 13.60 | | | $ | 13.33 | | | $ | 12.39 | |
Income (loss) from investment operations: | |
Net investment income (loss)b | | | — | f | | | (.05 | ) | | | (— | )f | | | (.12 | ) | | | (.02 | ) | | | .06 | |
Net gain (loss) on investments (realized and unrealized) | | | .34 | | | | (.83 | ) | | | 1.14 | | | | 1.76 | | | | .31 | | | | .88 | |
Total from investment operations | | | .34 | | | | (.88 | ) | | | 1.14 | | | | 1.64 | | | | .29 | | | | .94 | |
Less distributions from: | |
Net investment income | | | — | | | | — | | | | — | | | | — | | | | (.02 | ) | | | — | |
Total distributions | | | — | | | | — | | | | — | | | | — | | | | (.02 | ) | | | — | |
Net asset value, end of period | | $ | 15.84 | | | $ | 15.50 | | | $ | 16.38 | | | $ | 15.24 | | | $ | 13.60 | | | $ | 13.33 | |
| | |
Total Returnc | | | 2.19 | % | | | (5.37 | %) | | | 7.48 | % | | | 12.06 | % | | | 2.15 | % | | | 7.59 | % |
Ratios/Supplemental Data | |
Net assets, end of period (in thousands) | | $ | 936 | | | $ | 525 | | | $ | 302 | | | $ | 12 | | | $ | 11 | | | $ | 11 | |
Ratios to average net assets: | |
Net investment income (loss) | | | 0.01 | % | | | (0.29 | %) | | | (0.01 | %) | | | (0.82 | %) | | | (0.17 | %) | | | 1.29 | % |
Total expensesd,g | | | 2.04 | % | | | 2.27 | % | | | 1.95 | % | | | 2.11 | % | | | 1.72 | % | | | 1.36 | % |
Portfolio turnover rate | | | 109 | % | | | 224 | % | | | 331 | % | | | 256 | % | | | 183 | % | | | 190 | % |
a | Unaudited figures for the period ended September 30, 2016. Percentage amounts for the period, except total return and portfolio turnover rate, have been annualized. |
b | Net investment income (loss) per share was computed using average shares outstanding throughout the period. |
c | Total return does not reflect the impact of any applicable sales charges and has not been annualized. |
d | Does not include expenses of the underlying funds in which the Fund invests. |
e | Since commencement of operations: November 30, 2011. Percentage amounts for the period, except total return and portfolio turnover rate, have been annualized. |
f | Net investment income is less than $0.01 per share. |
g | Excluding interest and dividend expense related to short sales, the operating expense ratios for the years or periods would be: |
| | 09/30/16 | 03/31/16 | 03/31/15 | 03/31/14 | 03/28/13 | 03/31/12 |
A-Class | 1.67% | 1.66% | 1.66% | 1.68% | 1.65% | 1.66% |
C-Class | 2.41% | 2.41% | 2.41% | 2.42% | 2.40% | 2.41% |
P-Class | 1.67% | 1.66% | 1.66% | 1.67% | 1.65% | 1.66% |
Institutional Class | 1.42% | 1.41% | 1.40% | 1.42% | 1.41% | N/A |
* | H-Class shares redesignated as P-Class shares effective following the close of business on April 30, 2015 — See Note 12. |
18 | THE RYDEX FUNDS SEMI-ANNUAL REPORT | SEE NOTES TO FINANCIAL STATEMENTS. |
FUND PROFILE (Unaudited) | September 30, 2016 |
EVENT DRIVEN AND DISTRESSED STRATEGIES FUND
OBJECTIVE: Seeks to achieve capital growth.
Holdings Diversification (Market Exposure as % of Net Assets)
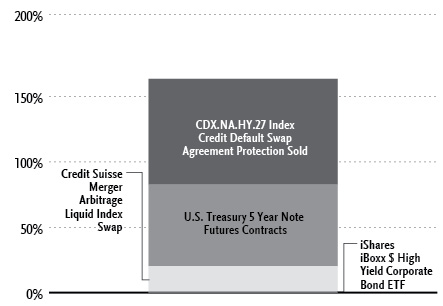
“Holdings Diversification (Market Exposure as % of Net Assets)” excludes any temporary cash investments or investments in Guggenheim Strategy Funds Trust mutual funds. Investments in those Funds do not provide “market exposure” to meet the Fund’s investment objective, but will significantly increase the portfolio’s exposure to certain other asset categories (and their associated risks), which may cause the Fund to deviate from its principal investment strategy, including: (i) high yield, high risk debt securities rated below the top four long-term rating categories by a nationally recognized statistical rating organization (also known as “junk bonds”); (ii) securities issued by the U.S. government or its agencies and instrumentalities; (iii) CLOs and similar investments; and (iv) other short-term fixed income securities.
Inception Dates: |
Institutional Class | June 30, 2010 |
A-Class | June 30, 2010 |
C-Class | June 30, 2010 |
P-Class | June 30, 2010 |
The Fund invests principally in derivative investments such as swap agreements and futures contracts.
Largest Holdings (% of Total Net Assets) |
Guggenheim Strategy Fund II | 37.3% |
Guggenheim Strategy Fund I | 37.0% |
iShares iBoxx $ High Yield Corporate Bond ETF | 0.9% |
Total | 75.2% |
| | |
“Largest Holdings” excludes any temporary cash or derivative investments. |
| | THE RYDEX FUNDS SEMI-ANNUAL REPORT | 19 |
SCHEDULE OF INVESTMENTS (Unaudited) | September 30, 2016 |
EVENT DRIVEN AND DISTRESSED STRATEGIES FUND | |
| | | Shares | | | Value | |
| | | | | | | |
COMMON STOCKS† - 0.0% | |
| | | | | | | |
Communications - 0.0% | |
Tribune Media Co. — Class A | | | 14 | | | $ | 511 | |
Gannett Company, Inc. | | | 18 | | | | 210 | |
Total Communications | | | | | | | 721 | |
| | | | | | | | | |
Financial - 0.0% | |
American Capital Ltd.* | | | 33 | | | | 558 | |
| | | | | | | | | |
Energy - 0.0% | |
Whiting Petroleum Corp.* | | | 38 | | | | 332 | |
| | | | | | | | | |
Industrial - 0.0% | |
Hornbeck Offshore Services, Inc.* | | | 6 | | | | 33 | |
| | | | | | | | | |
Total Common Stocks | | | | | | | | |
(Cost $1,453) | | | | | | | 1,644 | |
| | | | | | | | | |
EXCHANGE-TRADED FUNDS† - 0.9% | |
iShares iBoxx $ High Yield Corporate Bond ETF | | | 700 | | | | 61,082 | |
Total Exchange-Traded Funds | | | | | | | | |
(Cost $60,823) | | | | | | | 61,082 | |
| | | | | | | | | |
MUTUAL FUNDS† - 74.2% | |
Guggenheim Strategy Fund II1 | | | 107,991 | | | | 2,693,287 | |
Guggenheim Strategy Fund I1 | | | 106,881 | | | | 2,670,956 | |
Total Mutual Funds | | | | | | | | |
(Cost $5,349,196) | | | | | | | 5,364,243 | |
| | | | | | | | | |
| | | Face
Amount | | | | | |
| | | | | | | | | |
REPURCHASE AGREEMENTS††,2 - 20.3% | |
HSBC Securities, Inc.
issued 09/30/16 at 0.38%
due 10/03/16 | | $ | 816,671 | | | | 816,671 | |
Royal Bank of Canada
issued 09/30/16 at 0.36%
due 10/03/16 | | | 648,441 | | | | 648,441 | |
Total Repurchase Agreements | | | | | | | | |
(Cost $1,465,112) | | | | | | | 1,465,112 | |
| | | | | | | | | |
Total Investments - 95.4% | | | | | | | | |
(Cost $6,876,584) | | | | | | $ | 6,892,081 | |
Other Assets & Liabilities, net - 4.6% | | | | | | | 334,149 | |
Total Net Assets - 100.0% | | | | | | $ | 7,226,230 | |
| | | Contracts | | | Unrealized
Gain | |
| | | | | | | |
INTEREST RATE FUTURES CONTRACTS PURCHASED† | |
December 2016 U.S. Treasury 5 Year Note
Futures Contracts
(Aggregate Value of
Contracts $4,496,945) | | | 37 | | | $ | 20,398 | |
| | | | | | | | | |
| | Units | | | | | |
| | | | | | | | | |
OTC EQUITY INDEX SWAP AGREEMENTS†† | |
Credit Suisse International, LLC
November 2016, Credit Suisse Merger Arbitrage Liquid Index Swap 1.61%3,
Terminating 11/17/16
(Notional Value $1,405,585) | | | 1,276 | | | $ | 3,356 | |
20 | THE RYDEX FUNDS SEMI-ANNUAL REPORT | SEE NOTES TO FINANCIAL STATEMENTS. |
SCHEDULE OF INVESTMENTS (Unaudited)(concluded) | September 30, 2016 |
EVENT DRIVEN AND DISTRESSED STRATEGIES FUND | |
CENTRALLY CLEARED CREDIT DEFAULT SWAP AGREEMENT PROTECTION SOLD†† | |
Index | Counterparty | Exchange | Protection
Premium
Rate | Maturity
Date | | Notional
Principal | | | Notional
Value | | | Upfront
Premiums
Paid | | | Unrealized
Appreciation | |
CDX.NA.HY.27 Index | Goldman Sachs International | ICE | 5.00% | 12/20/21 | | $ | 2,000,000 | | | $ | (2,088,700 | ) | | $ | 67,586 | | | $ | 21,114 | |
CDX.NA.HY.27 Index | Barclays Bank plc | ICE | 5.00% | 12/20/21 | | | 3,600,000 | | | | (3,759,660 | ) | | | 121,654 | | | | 38,006 | |
| | | | | | | | | | | | | | | $ | 189,240 | | | $ | 59,120 | |
* | Non-income producing security. |
† | Value determined based on Level 1 inputs — See Note 4. |
†† | Value determined based on Level 2 inputs — See Note 4. |
1 | Affiliated issuer — See Note 9. |
2 | Repurchase Agreements — See Note 5. |
3 | Total Return based on Credit Suisse Merger Arbitrage Liquid Index +/- financing at a variable rate. Rate indicated is rate effective September 30, 2016. |
| | ICE — Intercontinental Exchange |
| | CDX.NA.HY.27 Index — Credit Default Swap High Yield Series 27 Index |
| | |
| | See Sector Classification in Other Information section. |
The following table summarizes the inputs used to value the Fund’s investments at September 30, 2016 (See Note 4 in the Notes to Financial Statements):
Investments in Securities (Assets) | | Level 1 | | | Level 1 -
Other* | | | Level 2 | | | Level 2 -
Other* | | | Level 3 | | | Total | |
Common Stocks | | $ | 1,644 | | | $ | — | | | $ | — | | | $ | — | | | $ | — | | | $ | 1,644 | |
Credit Default Swaps | | | — | | | | — | | | | — | | | | 59,120 | | | | — | | | | 59,120 | |
Equity Index Swap Agreements | | | — | | | | — | | | | — | | | | 3,356 | | | | — | | | | 3,356 | |
Exchange-Traded Funds | | | 61,082 | | | | — | | | | — | | | | — | | | | — | | | | 61,082 | |
Interest Rate Futures Contracts | | | — | | | | 20,398 | | | | — | | | | — | | | | — | | | | 20,398 | |
Mutual Funds | | | 5,364,243 | | | | — | | | | — | | | | — | | | | — | | | | 5,364,243 | |
Repurchase Agreements | | | — | | | | — | | | | 1,465,112 | | | | — | | | | — | | | | 1,465,112 | |
Total | | $ | 5,426,969 | | | $ | 20,398 | | | $ | 1,465,112 | | | $ | 62,476 | | | $ | — | | | $ | 6,974,955 | |
* | Other financial instruments include futures contracts and/or swaps, which are reported as unrealized gain/loss at period end. |
Transfers between investment levels may occur as the markets fluctuate and/or the availability of data used in an investment’s valuation changes. Transfers between valuation levels, if any, are in comparison to the valuation levels at the end of the previous fiscal year, and are effective using the fair value as of the end of the previous fiscal period.
For the period ended September 30, 2016, there were no transfers between levels.
SEE NOTES TO FINANCIAL STATEMENTS. | THE RYDEX FUNDS SEMI-ANNUAL REPORT | 21 |
EVENT DRIVEN AND DISTRESSED STRATEGIES FUND | |
STATEMENT OF ASSETS AND LIABILITIES (Unaudited) | |
September 30, 2016 | |
Assets: | |
Investments in unaffiliated issuers, at value (cost $62,276) | | $ | 62,726 | |
Investments in affiliated issuers, at value (cost $5,349,196) | | | 5,364,243 | |
Repurchase agreements, at value (cost $1,465,112) | | | 1,465,112 | |
Total investments (cost $6,876,584) | | | 6,892,081 | |
Unamortized upfront premiums paid on credit default swaps | | | 189,240 | |
Segregated cash with broker | | | 124,252 | |
Unrealized appreciation on swap agreements | | | 62,476 | |
Receivables: | |
Dividends | | | 8,275 | |
Foreign taxes reclaim | | | 21 | |
Interest | | | 8,571 | |
Investment adviser | | | 753 | |
Total assets | | | 7,285,669 | |
| | | | | |
Liabilities: | |
Payable for: | |
Fund shares redeemed | | | 27,396 | |
Securities purchased | | | 8,736 | |
Variation margin | | | 6,937 | |
Licensing fees | | | 6,491 | |
Management fees | | | 5,339 | |
Transfer agent and administrative fees | | | 1,483 | |
Distribution and service fees | | | 1,047 | |
Portfolio accounting fees | | | 593 | |
Miscellaneous | | | 1,417 | |
Total liabilities | | | 59,439 | |
Commitments and contingent liabilities (Note 11) | | | — | |
Net assets | | $ | 7,226,230 | |
| | | | | |
Net assets consist of: | |
Paid in capital | | $ | 7,594,709 | |
Undistributed net investment income | | | 258,245 | |
Accumulated net realized loss on investments | | | (725,095 | ) |
Net unrealized appreciation on investments | | | 98,371 | |
Net assets | | $ | 7,226,230 | |
| | | | | |
A-Class: | |
Net assets | | $ | 925,918 | |
Capital shares outstanding | | | 34,355 | |
Net asset value per share | | $ | 26.95 | |
Maximum offering price per share (Net asset value divided by 95.25%) | | $ | 28.29 | |
| | | | | |
C-Class: | |
Net assets | | $ | 629,409 | |
Capital shares outstanding | | | 24,628 | |
Net asset value per share | | $ | 25.56 | |
| | | | | |
P-Class: | |
Net assets | | $ | 1,453,934 | |
Capital shares outstanding | | | 53,948 | |
Net asset value per share | | $ | 26.95 | |
| | | | | |
Institutional Class: | |
Net assets | | $ | 4,216,969 | |
Capital shares outstanding | | | 153,820 | |
Net asset value per share | | $ | 27.41 | |
STATEMENT OF OPERATIONS (Unaudited) | |
Period Ended September 30, 2016 | |
Investment Income: | |
Dividends from securities of affiliated issuers | | $ | 48,612 | |
Dividends from securities of unaffiliated issuers (net of foreign withholding tax of $122) | | | 13,613 | |
Interest | | | 1,979 | |
Total investment income | | | 64,204 | |
| | | | | |
Expenses: | |
Management fees | | | 33,786 | |
Transfer agent and administrative fees | | | 9,385 | |
Distribution and service fees: | |
A-Class | | | 1,127 | |
C-Class | | | 4,104 | |
P-Class | | | 1,917 | |
Portfolio accounting fees | | | 3,754 | |
Licensing fees | | | 13,139 | |
Custodian fees | | | 464 | |
Trustees’ fees* | | | 319 | |
Line of credit fees | | | 21 | |
Miscellaneous | | | 5,468 | |
Total expenses | | | 73,484 | |
Less: | |
Expenses waived by Adviser | | | (4,361 | ) |
Net expenses | | | 69,123 | |
Net investment loss | | | (4,919 | ) |
| | | | | |
Net Realized and Unrealized Gain (Loss): | |
Net realized gain (loss) on: | |
Investments in unaffiliated issuers | | | (24,918 | ) |
Investments in affiliated issuers | | | (2,419 | ) |
Swap agreements | | | 217,975 | |
Futures contracts | | | 110,414 | |
Net realized gain | | | 301,052 | |
Net change in unrealized appreciation (depreciation) on: | |
Investments in unaffiliated issuers | | | 88,530 | |
Investments in affiliated issuers | | | 44,964 | |
Swap agreements | | | (71,286 | ) |
Futures contracts | | | (19,269 | ) |
Net change in unrealized appreciation (depreciation) | | | 42,939 | |
Net realized and unrealized gain | | | 343,991 | |
Net increase in net assets resulting from operations | | $ | 339,072 | |
* | Relates to Trustees not deemed “interested persons” within the meaning of Section 2(a)(19) of the 1940 Act. |
22 | THE RYDEX FUNDS SEMI-ANNUAL REPORT | SEE NOTES TO FINANCIAL STATEMENTS. |
EVENT DRIVEN AND DISTRESSED STRATEGIES FUND | |
STATEMENTS OF CHANGES IN NET ASSETS |
| | | Period Ended
September 30,
2016
(Unaudited) | | | Year Ended
March 31,
2016 | |
Increase (Decrease) in Net Assets from Operations: | | | | | | |
Net investment income (loss) | | $ | (4,919 | ) | | $ | 11,992 | |
Net realized gain (loss) on investments | | | 301,052 | | | | (141,050 | ) |
Net change in unrealized appreciation (depreciation) on investments | | | 42,939 | | | | (166,643 | ) |
Net increase (decrease) in net assets resulting from operations | | | 339,072 | | | | (295,701 | ) |
| | | | | | | | | |
Distributions to shareholders from: | | | | | | | | |
Net investment income | | | | | | | | |
A-Class | | | — | | | | (12,552 | ) |
C-Class | | | — | | | | (14,515 | ) |
P-Class | | | — | | | | (34,475 | )* |
Institutional Class | | | — | | | | (60,688 | ) |
Total distributions to shareholders | | | — | | | | (122,230 | ) |
| | | | | | | | | |
Capital share transactions: | | | | | | | | |
Proceeds from sale of shares | | | | | | | | |
A-Class | | | 195,127 | | | | 271,562 | |
C-Class | | | 51,666 | | | | 18,599 | |
P-Class | | | 198,204 | | | | 592,653 | * |
Institutional Class | | | 85,328 | | | | 2,069,459 | |
Distributions reinvested | | | | | | | | |
A-Class | | | — | | | | 11,362 | |
C-Class | | | — | | | | 14,503 | |
P-Class | | | — | | | | 33,768 | * |
Institutional Class | | | — | | | | 60,495 | |
Cost of shares redeemed | | | | | | | | |
A-Class | | | (237,721 | ) | | | (682,794 | ) |
C-Class | | | (333,979 | ) | | | (331,230 | ) |
P-Class | | | (479,045 | ) | | | (2,108,872 | )* |
Institutional Class | | | (354,340 | ) | | | (1,434,110 | ) |
Net decrease from capital share transactions | | | (874,760 | ) | | | (1,484,605 | ) |
Net decrease in net assets | | | (535,688 | ) | | | (1,902,536 | ) |
| | | | | | | | | |
Net assets: | | | | | | | | |
Beginning of period | | | 7,761,918 | | | | 9,664,454 | |
End of period | | $ | 7,226,230 | | | $ | 7,761,918 | |
Undistributed net investment income at end of period | | $ | 258,245 | | | $ | 263,164 | |
| | | | | | | | | |
Capital share activity: | | | | | | | | |
Shares sold | | | | | | | | |
A-Class | | | 7,374 | | | | 10,542 | |
C-Class | | | 2,046 | | | | 741 | |
P-Class | | | 7,544 | | | | 22,446 | * |
Institutional Class | | | 3,190 | | | | 78,280 | |
Shares issued from reinvestment of distributions | | | | | | | | |
A-Class | | | — | | | | 455 | |
C-Class | | | — | | | | 609 | |
P-Class | | | — | | | | 1,353 | * |
Institutional Class | | | — | | | | 2,387 | |
Shares redeemed | | | | | | | | |
A-Class | | | (9,011 | ) | | | (26,123 | ) |
C-Class | | | (13,270 | ) | | | (13,297 | ) |
P-Class | | | (18,280 | ) | | | (82,826 | )* |
Institutional Class | | | (13,223 | ) | | | (54,656 | ) |
Net decrease in shares | | | (33,630 | ) | | | (60,089 | ) |
* | H-Class shares redesignated as P-Class shares effective following the close of business on April 30, 2015 – See Note 12. |
SEE NOTES TO FINANCIAL STATEMENTS. | THE RYDEX FUNDS SEMI-ANNUAL REPORT | 23 |
EVENT DRIVEN AND DISTRESSED STRATEGIES FUND | |
This table is presented to show selected data for a share outstanding throughout each period and to assist shareholders in evaluating a Fund’s performance for the periods presented.
A-Class | | Period Ended
September 30,
2016a | | | Year Ended
March 31,
2016 | | | Year Ended
March 31,
2015 | | | Year Ended
March 31,
2014 | | | Year Ended
March 28,
2013 | | | Year Ended
March 31,
2012 | |
Per Share Data | | | | | | | | | | | | | | | | | | |
Net asset value, beginning of period | | $ | 25.76 | | | $ | 26.82 | | | $ | 28.42 | | | $ | 27.56 | | | $ | 25.37 | | | $ | 26.86 | |
Income (loss) from investment operations: | |
Net investment income (loss)b | | | (.03 | ) | | | .03 | | | | (.31 | ) | | | (.49 | ) | | | (.21 | ) | | | (.37 | ) |
Net gain (loss) on investments (realized and unrealized) | | | 1.22 | | | | (.72 | ) | | | (.09 | ) | | | 3.09 | | | | 2.40 | | | | (.36 | ) |
Total from investment operations | | | 1.19 | | | | (.69 | ) | | | (.40 | ) | | | 2.60 | | | | 2.19 | | | | (.73 | ) |
Less distributions from: | |
Net investment income | | | — | | | | (.37 | ) | | | (.06 | ) | | | — | | | | — | | | | — | |
Net realized gains | | | — | | | | — | | | | (1.14 | ) | | | (1.74 | ) | | | — | | | | (.76 | ) |
Total distributions | | | — | | | | (.37 | ) | | | (1.20 | ) | | | (1.74 | ) | | | — | | | | (.76 | ) |
Net asset value, end of period | | $ | 26.95 | | | $ | 25.76 | | | $ | 26.82 | | | $ | 28.42 | | | $ | 27.56 | | | $ | 25.37 | |
| | |
Total Returnc | | | 4.66 | % | | | (2.52 | %) | | | (1.18 | %) | | | 9.58 | % | | | 8.63 | % | | | (2.60 | %) |
Ratios/Supplemental Data | |
Net assets, end of period (in thousands) | | $ | 926 | | | $ | 927 | | | $ | 1,371 | | | $ | 4,303 | | | $ | 2,080 | | | $ | 2,595 | |
Ratios to average net assets: | |
Net investment income (loss) | | | (0.19 | %) | | | 0.11 | % | | | (1.10 | %) | | | (1.73 | %) | | | (0.80 | %) | | | (1.43 | %) |
Total expensesd | | | 2.01 | % | | | 2.00 | % | | | 2.01 | % | | | 2.02 | % | | | 2.03 | % | | | 1.93 | % |
Net expensese | | | 1.90 | % | | | 1.90 | % | | | 1.90 | % | | | 1.90 | % | | | 1.91 | % | | | 1.85 | % |
Portfolio turnover rate | | | 29 | % | | | 32 | % | | | 107 | % | | | 161 | % | | | 228 | % | | | 513 | % |
C-Class | | Period Ended
September 30,
2016a | | | Year Ended
March 31,
2016 | | | Year Ended
March 31,
2015 | | | Year Ended
March 31,
2014 | | | Year Ended
March 28,
2013 | | | Year Ended
March 31,
2012 | |
Per Share Data | | | | | | | | | | | | | | | | | | |
Net asset value, beginning of period | | $ | 24.52 | | | $ | 25.74 | | | $ | 27.53 | | | $ | 26.95 | | | $ | 24.99 | | | $ | 26.67 | |
Income (loss) from investment operations: | |
Net investment income (loss)b | | | (.12 | ) | | | (.16 | ) | | | (.45 | ) | | | (.67 | ) | | | (.43 | ) | | | (.52 | ) |
Net gain (loss) on investments (realized and unrealized) | | | 1.16 | | | | (.69 | ) | | | (.14 | ) | | | 2.99 | | | | 2.39 | | | | (.40 | ) |
Total from investment operations | | | 1.04 | | | | (.85 | ) | | | (.59 | ) | | | 2.32 | | | | 1.96 | | | | (.92 | ) |
Less distributions from: | |
Net investment income | | | — | | | | (.37 | ) | | | (.06 | ) | | | — | | | | — | | | | — | |
Net realized gains | | | — | | | | — | | | | (1.14 | ) | | | (1.74 | ) | | | — | | | | (.76 | ) |
Total distributions | | | — | | | | (.37 | ) | | | (1.20 | ) | | | (1.74 | ) | | | — | | | | (.76 | ) |
Net asset value, end of period | | $ | 25.56 | | | $ | 24.52 | | | $ | 25.74 | | | $ | 27.53 | | | $ | 26.95 | | | $ | 24.99 | |
| | |
Total Returnc | | | 4.24 | % | | | (3.25 | %) | | | (1.92 | %) | | | 8.74 | % | | | 7.89 | % | | | (3.38 | %) |
Ratios/Supplemental Data | |
Net assets, end of period (in thousands) | | $ | 629 | | | $ | 879 | | | $ | 1,230 | | | $ | 1,253 | | | $ | 1,038 | | | $ | 1,022 | |
Ratios to average net assets: | |
Net investment income (loss) | | | (0.93 | %) | | | (0.64 | %) | | | (1.68 | %) | | | (2.45 | %) | | | (1.67 | %) | | | (2.04 | %) |
Total expensesd | | | 2.76 | % | | | 2.75 | % | | | 2.75 | % | | | 2.77 | % | | | 2.79 | % | | | 2.66 | % |
Net expensese | | | 2.64 | % | | | 2.65 | % | | | 2.65 | % | | | 2.65 | % | | | 2.66 | % | | | 2.60 | % |
Portfolio turnover rate | | | 29 | % | | | 32 | % | | | 107 | % | | | 161 | % | | | 228 | % | | | 513 | % |
24 | THE RYDEX FUNDS SEMI-ANNUAL REPORT | SEE NOTES TO FINANCIAL STATEMENTS. |
EVENT DRIVEN AND DISTRESSED STRATEGIES FUND | |
FINANCIAL HIGHLIGHTS (continued) |
This table is presented to show selected data for a share outstanding throughout each period and to assist shareholders in evaluating a Fund’s performance for the periods presented.
P-Class* | | Period Ended
September 30,
2016a | | | Year Ended
March 31,
2016 | | | Year Ended
March 31,
2015 | | | Year Ended
March 31,
2014 | | | Year Ended
March 28,
2013 | | | Year Ended
March 31,
2012 | |
Per Share Data | | | | | | | | | | | | | | | | | | |
Net asset value, beginning of period | | $ | 25.76 | | | $ | 26.82 | | | $ | 28.42 | | | $ | 27.57 | | | $ | 25.37 | | | $ | 26.86 | |
Income (loss) from investment operations: | |
Net investment income (loss)b | | | (.02 | ) | | | .02 | | | | (.29 | ) | | | (.49 | ) | | | (.23 | ) | | | (.34 | ) |
Net gain (loss) on investments (realized and unrealized) | | | 1.21 | | | | (.71 | ) | | | (.11 | ) | | | 3.08 | | | | 2.43 | | | | (.39 | ) |
Total from investment operations | | | 1.19 | | | | (.69 | ) | | | (.40 | ) | | | 2.59 | | | | 2.20 | | | | (.73 | ) |
Less distributions from: | |
Net investment income | | | — | | | | (.37 | ) | | | (.06 | ) | | | — | | | | — | | | | — | |
Net realized gains | | | — | | | | — | | | | (1.14 | ) | | | (1.74 | ) | | | — | | | | (.76 | ) |
Total distributions | | | — | | | | (.37 | ) | | | (1.20 | ) | | | (1.74 | ) | | | — | | | | (.76 | ) |
Net asset value, end of period | | $ | 26.95 | | | $ | 25.76 | | | $ | 26.82 | | | $ | 28.42 | | | $ | 27.57 | | | $ | 25.37 | |
| | |
Total Returnc | | | 4.66 | % | | | (2.52 | %) | | | (1.18 | %) | | | 9.54 | % | | | 8.67 | % | | | (2.60 | %) |
Ratios/Supplemental Data | |
Net assets, end of period (in thousands) | | $ | 1,454 | | | $ | 1,667 | | | $ | 3,318 | | | $ | 6,809 | | | $ | 6,134 | | | $ | 6,183 | |
Ratios to average net assets: | |
Net investment income (loss) | | | (0.18 | %) | | | 0.09 | % | | | (1.05 | %) | | | (1.72 | %) | | | (0.88 | %) | | | (1.33 | %) |
Total expensesd | | | 2.01 | % | | | 2.00 | % | | | 2.01 | % | | | 2.02 | % | | | 2.03 | % | | | 1.91 | % |
Net expensese | | | 1.90 | % | | | 1.90 | % | | | 1.90 | % | | | 1.90 | % | | | 1.91 | % | | | 1.85 | % |
Portfolio turnover rate | | | 29 | % | | | 32 | % | | | 107 | % | | | 161 | % | | | 228 | % | | | 513 | % |
SEE NOTES TO FINANCIAL STATEMENTS. | THE RYDEX FUNDS SEMI-ANNUAL REPORT | 25 |
EVENT DRIVEN AND DISTRESSED STRATEGIES FUND | |
FINANCIAL HIGHLIGHTS (concluded) |
This table is presented to show selected data for a share outstanding throughout each period and to assist shareholders in evaluating a Fund’s performance for the periods presented.
Institutional Class | | Period Ended
September 30,
2016a | | | Year Ended
March 31,
2016 | | | Year Ended
March 31,
2015 | | | Year Ended
March 31,
2014 | | | Year Ended
March 28,
2013 | | | Year Ended
March 31,
2012 | |
Per Share Data | | | | | | | | | | | | | | | | | | |
Net asset value, beginning of period | | $ | 26.18 | | | $ | 27.17 | | | $ | 28.71 | | | $ | 27.76 | | | $ | 25.49 | | | $ | 26.91 | |
Income (loss) from investment operations: | |
Net investment income (loss)b | | | .01 | | | | .10 | | | | (.16 | ) | | | (.42 | ) | | | (.19 | ) | | | (.23 | ) |
Net gain (loss) on investments (realized and unrealized) | | | 1.22 | | | | (.72 | ) | | | (.18 | ) | | | 3.11 | | | | 2.46 | | | | (.43 | ) |
Total from investment operations | | | 1.23 | | | | (.62 | ) | | | (.34 | ) | | | 2.69 | | | | 2.27 | | | | (.66 | ) |
Less distributions from: | |
Net investment income | | | — | | | | (.37 | ) | | | (.06 | ) | | | — | | | | — | | | | — | |
Net realized gains | | | — | | | | — | | | | (1.14 | ) | | | (1.74 | ) | | | — | | | | (.76 | ) |
Total distributions | | | — | | | | (.37 | ) | | | (1.20 | ) | | | (1.74 | ) | | | — | | | | (.76 | ) |
Net asset value, end of period | | $ | 27.41 | | | $ | 26.18 | | | $ | 27.17 | | | $ | 28.71 | | | $ | 27.76 | | | $ | 25.49 | |
| | |
Total Returnc | | | 4.74 | % | | | (2.23 | %) | | | (0.96 | %) | | | 9.84 | % | | | 8.91 | % | | | (2.34 | %) |
Ratios/Supplemental Data | |
Net assets, end of period (in thousands) | | $ | 4,217 | | | $ | 4,289 | | | $ | 3,746 | | | $ | 975 | | | $ | 891 | | | $ | 329 | |
Ratios to average net assets: | |
Net investment income (loss) | | | 0.05 | % | | | 0.37 | % | | | (0.57 | %) | | | (1.46 | %) | | | (0.70 | %) | | | (0.90 | %) |
Total expensesd | | | 1.76 | % | | | 1.75 | % | | | 1.75 | % | | | 1.77 | % | | | 1.80 | % | | | 1.61 | % |
Net expensese | | | 1.65 | % | | | 1.65 | % | | | 1.65 | % | | | 1.65 | % | | | 1.67 | % | | | 1.58 | % |
Portfolio turnover rate | | | 29 | % | | | 32 | % | | | 107 | % | | | 161 | % | | | 228 | % | | | 513 | % |
a | Unaudited figures for the period ended September 30, 2016. Percentage amounts for the period, except total return and portfolio turnover rate, have been annualized. |
b | Net investment income (loss) per share was computed using average shares outstanding throughout the period. |
c | Total return does not reflect the impact of any applicable sales charges and has not been annualized. |
d | Does not include expenses of the underlying funds in which the Fund invests. |
e | Net expense information reflects the expense ratios after expense waivers. |
* | H-Class shares redesignated as P-Class shares effective following close of business on April 30, 2015 — See Note 12. |
26 | THE RYDEX FUNDS SEMI-ANNUAL REPORT | SEE NOTES TO FINANCIAL STATEMENTS. |
FUND PROFILE (Unaudited) | September 30, 2016 |
EMERGING MARKETS 2x STRATEGY FUND
OBJECTIVE: Seeks to provide investment results that correlate, before fees and expenses, to the performance of a specific benchmark on a daily basis. The Fund’s current benchmark is 200% of the performance of the BNY Mellon Emerging Markets 50 ADR Index (the “underlying index”). The Fund does not seek to achieve its investment objective over a period of time greater than one day.
Holdings Diversification (Market Exposure as % of Net Assets)
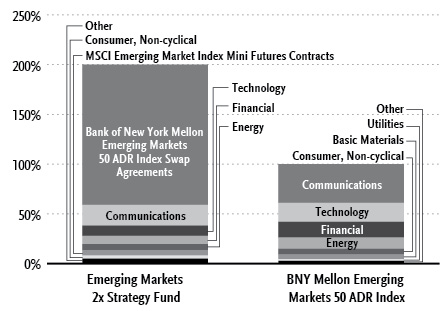
“Holdings Diversification (Market Exposure as % of Net Assets)” excludes any temporary cash investments.
Inception Dates: |
A-Class | October 29, 2010 |
C-Class | October 29, 2010 |
H-Class | October 29, 2010 |
Ten Largest Holdings (% of Total Net Assets) |
Alibaba Group Holding Ltd. ADR | 6.7% |
Taiwan Semiconductor Manufacturing Company Ltd. ADR | 6.4% |
China Mobile Ltd. ADR | 3.8% |
Baidu, Inc. ADR | 2.8% |
Itau Unibanco Holding S.A. ADR | 1.8% |
Infosys Ltd. ADR | 1.8% |
HDFC Bank Ltd. ADR | 1.7% |
Ambev S.A. ADR | 1.5% |
Banco Bradesco S.A. ADR | 1.4% |
JD.com, Inc. ADR | 1.4% |
Top Ten Total | 29.3% |
| | |
“Ten Largest Holdings” excludes any temporary cash or derivative investments. |
COUNTRY DIVERSIFICATION
At September 30, 2016, the investment diversification of the Fund by country was as follows:
Country | | % of Common Stocks | | | Value | |
China | | | 34 | % | | $ | 3,796,211 | |
Brazil | | | 17 | % | | | 1,860,425 | |
Taiwan, Province of China | | | 15 | % | | | 1,601,613 | |
India | | | 9 | % | | | 988,814 | |
Republic of Korea | | | 8 | % | | | 843,616 | |
Cayman Islands | | | 7 | % | | | 768,576 | |
Mexico | | | 5 | % | | | 564,505 | |
Other | | | 5 | % | | | 561,596 | |
Total Common Stocks | | | 100 | % | | $ | 10,985,356 | |
| | THE RYDEX FUNDS SEMI-ANNUAL REPORT | 27 |
SCHEDULE OF INVESTMENTS (Unaudited) | September 30, 2016 |
EMERGING MARKETS 2x STRATEGY FUND | |
| | | Shares | | | Value | |
| | | | | | | |
COMMON STOCKS† - 50.2% | |
| | | | | | | |
Communications - 20.9% | |
Alibaba Group Holding Ltd. ADR* | | | 12,960 | | | $ | 1,371,039 | |
China Mobile Ltd. ADR | | | 12,707 | | | | 781,735 | |
Baidu, Inc. ADR* | | | 3,124 | | | | 568,787 | |
JD.com, Inc. ADR* | | | 11,065 | | | | 288,686 | |
Ctrip.com International Ltd. ADR* | | | 4,363 | | | | 203,185 | |
Telekomunikasi Indonesia Persero Tbk PT ADR | | | 2,850 | | | | 188,328 | |
Chunghwa Telecom Company Ltd. ADR | | | 4,387 | | | | 153,677 | |
America Movil SAB de CV — Class L ADR | | | 13,216 | | | | 151,191 | |
Grupo Televisa SAB ADR | | | 5,644 | | | | 144,994 | |
SK Telecom Company Ltd. ADR | | | 4,109 | | | | 92,863 | |
China Unicom Hong Kong Ltd. ADR | | | 6,899 | | | | 84,030 | |
China Telecom Corporation Ltd. ADR | | | 1,602 | | | | 81,766 | |
Vipshop Holdings Ltd. ADR* | | | 4,796 | | | | 70,357 | |
Telefonica Brasil S.A. ADR | | | 4,780 | | | | 69,167 | |
Mobile TeleSystems PJSC ADR | | | 5,962 | | | | 45,490 | |
Total Communications | | | | | | | 4,295,295 | |
| | | | | | | | | |
Technology - 10.1% | |
Taiwan Semiconductor Manufacturing Company Ltd. ADR | | | 43,082 | | | | 1,317,879 | |
Infosys Ltd. ADR | | | 23,045 | | | | 363,650 | |
NetEase, Inc. ADR | | | 857 | | | | 206,348 | |
Advanced Semiconductor Engineering, Inc. ADR | | | 13,412 | | | | 79,265 | |
Wipro Ltd. ADR | | | 6,733 | | | | 65,377 | |
United Microelectronics Corp. ADR | | | 27,455 | | | | 50,792 | |
Total Technology | | | | | | | 2,083,311 | |
| | | | | | | | | |
Financial - 6.7% | |
HDFC Bank Ltd. ADR | | | 4,785 | | | | 343,994 | |
Banco Bradesco S.A. ADR | | | 32,083 | | | | 290,993 | |
China Life Insurance Company Ltd. ADR | | | 17,175 | | | | 224,649 | |
Shinhan Financial Group Company Ltd. ADR | | | 5,473 | | | | 199,436 | |
KB Financial Group, Inc. ADR | | | 4,459 | | | | 152,542 | |
ICICI Bank Ltd. ADR | | | 16,407 | | | | 122,560 | |
Bancolombia S.A. ADR | | | 1,304 | | | | 50,908 | |
Total Financial | | | | | | | 1,385,082 | |
| | | | | | | | | |
Energy - 5.1% | |
CNOOC Ltd. ADR | | | 1,855 | | | | 234,639 | |
China Petroleum & Chemical Corp. ADR | | | 2,944 | | | | 217,414 | |
PetroChina Company Ltd. ADR | | | 2,435 | | | | 162,658 | |
Petroleo Brasileiro S.A. ADR* | | | 17,178 | | | | 160,271 | |
Sasol Ltd. ADR | | | 5,858 | | | | 160,041 | |
Ultrapar Participacoes S.A. ADR | | | 4,890 | | | | 107,042 | |
Total Energy | | | | | | | 1,042,065 | |
| | | | | | | | | |
Consumer, Non-cyclical - 3.1% | |
Ambev S.A. ADR | | | 50,769 | | | | 309,183 | |
Fomento Economico Mexicano SAB de CV ADR | | | 1,521 | | | | 139,993 | |
BRF S.A. ADR | | | 7,008 | | | | 119,556 | |
New Oriental Education & Technology Group, Inc. ADR* | | | 1,499 | | | | 69,494 | |
Total Consumer, Non-cyclical | | | | | | | 638,226 | |
| | | | | | | | | |
Basic Materials - 1.9% | |
POSCO ADR | | | 3,703 | | | | 189,149 | |
Vale S.A. ADR | | | 14,851 | | | | 81,681 | |
AngloGold Ashanti Ltd. ADR* | | | 4,710 | | | | 74,983 | |
Gold Fields Ltd. ADR | | | 8,628 | | | | 41,846 | |
Total Basic Materials | | | | | | | 387,659 | |
| | | | | | | | | |
Utilities - 1.0% | |
Korea Electric Power Corp. ADR | | | 5,927 | | | | 144,500 | |
CPFL Energia S.A. ADR | | | 3,759 | | | | 55,633 | |
Total Utilities | | | | | | | 200,133 | |
| | | | | | | | | |
Industrial - 0.9% | |
Cemex SAB de CV ADR* | | | 16,162 | | | | 128,327 | |
LG Display Company Ltd. ADR | | | 5,120 | | | | 65,126 | |
Total Industrial | | | | | | | 193,453 | |
| | | | | | | | | |
Consumer, Cyclical - 0.5% | |
Tata Motors Ltd. ADR | | | 2,332 | | | | 93,233 | |
| | | | | | | | | |
Total Common Stocks | | | | | | | | |
(Cost $9,337,444) | | | | | | | 10,318,457 | |
| | | | | | | | | |
PREFERRED STOCKS† - 3.2% | |
Financial - 1.7% | |
Itau Unibanco Holding S.A. ADR | | | 33,259 | | | | 363,853 | |
| | | | | | | | | |
Energy - 1.0% | |
Petroleo Brasileiro S.A. ADR* | | | 23,597 | | | | 196,091 | |
| | | | | | | | | |
Basic Materials - 0.5% | |
Vale S.A. ADR | | | 22,708 | | | | 106,955 | |
Total Preferred Stocks | | | | | | | | |
(Cost $569,339) | | | | | | | 666,899 | |
| | | | | | | | | |
| | Face
Amount | | | | | |
| | | | | | | | | |
REPURCHASE AGREEMENTS††,1 - 46.0% | |
Royal Bank of Canada
issued 09/30/16 at 0.36%
due 10/03/162 | | $ | 5,568,615 | | | | 5,568,615 | |
HSBC Securities, Inc.
issued 09/30/16 at 0.38%
due 10/03/16 | | | 3,880,272 | | | | 3,880,272 | |
Total Repurchase Agreements | | | | | | | | |
(Cost $9,448,887) | | | | | | | 9,448,887 | |
| | | | | | | | | |
Total Investments - 99.4% | | | | | | | | |
(Cost $19,355,670) | | | | | | $ | 20,434,243 | |
Other Assets & Liabilities, net - 0.6% | | | | | | | 121,282 | |
Total Net Assets - 100.0% | | | | | | $ | 20,555,525 | |
28 | THE RYDEX FUNDS SEMI-ANNUAL REPORT | SEE NOTES TO FINANCIAL STATEMENTS. |
SCHEDULE OF INVESTMENTS (Unaudited)(concluded) | September 30, 2016 |
EMERGING MARKETS 2x STRATEGY FUND | |
| | | Contracts | | | Unrealized
Gain | |
| | | | | | | |
EQUITY FUTURES CONTRACTS PURCHASED† | |
December 2016 MSCI Emerging
Markets Index
Mini Futures Contracts
(Aggregate Value of
Contracts $1,139,625) | | | 25 | | | $ | 17,206 | |
| | | | | | | | | |
| | Units | | | | |
| | | | | | | |
OTC EQUITY INDEX SWAP AGREEMENTS†† | |
Goldman Sachs International
October 2016 Bank of New York
Mellon Emerging Markets 50 ADR Index Swap 1.00%3,
Terminating 10/26/16
(Notional Value $9,463,073) | | | 4,275 | | | $ | 35,596 | |
BNP Paribas
November 2016 Bank of New York Mellon Emerging Markets 50 ADR Index Swap 0.78%3,
Terminating 11/01/16
(Notional Value $19,562,733) | | | 8,838 | | | | 22,828 | |
(Total Notional Value $29,025,806) | | | | | | $ | 58,424 | |
* | Non-income producing security. |
† | Value determined based on Level 1 inputs — See Note 4. |
†† | Value determined based on Level 2 inputs — See Note 4. |
1 | Repurchase Agreements — See Note 5. |
2 | All or a portion of this security is pledged as equity index swap collateral at September 30, 2016. |
3 | Total Return based on Bank of New York Mellon Emerging Markets 50 ADR Index +/- financing at a variable rate. Rate indicated is rate effective at September 30, 2016. |
| | ADR — American Depositary Receipt |
| | |
| | See Sector Classification in Other Information section. |
The following table summarizes the inputs used to value the Fund’s investments at September 30, 2016 (See Note 4 in the Notes to Financial Statements):
Investments in Securities (Assets) | | Level 1 | | | Level 1 -
Other* | | | Level 2 | | | Level 2 -
Other* | | | Level 3 | | | Total | |
Common Stocks | | $ | 10,318,457 | | | $ | — | | | $ | — | | | $ | — | | | $ | — | | | $ | 10,318,457 | |
Equity Futures Contracts | | | — | | | | 17,206 | | | | — | | | | — | | | | — | | | | 17,206 | |
Equity Index Swap Agreements | | | — | | | | — | | | | — | | | | 58,424 | | | | — | | | | 58,424 | |
Preferred Stocks | | | 666,899 | | | | — | | | | — | | | | — | | | | — | | | | 666,899 | |
Repurchase Agreements | | | — | | | | — | | | | 9,448,887 | | | | — | | | | — | | | | 9,448,887 | |
Total | | $ | 10,985,356 | | | $ | 17,206 | | | $ | 9,448,887 | | | $ | 58,424 | | | $ | — | | | $ | 20,509,873 | |
* | Other financial instruments include futures contracts and/or swaps, which are reported as unrealized gain/loss at period end. |
Transfers between investment levels may occur as the markets fluctuate and/or the availability of data used in an investment’s valuation changes. Transfers between valuation levels, if any, are in comparison to the valuation levels at the end of the previous fiscal year, and are effective using the fair value as of the end of the previous fiscal period.
For the period ended September 30, 2016, there were no transfers between levels.
SEE NOTES TO FINANCIAL STATEMENTS. | THE RYDEX FUNDS SEMI-ANNUAL REPORT | 29 |
EMERGING MARKETS 2x STRATEGY FUND | |
STATEMENT OF ASSETS AND LIABILITIES (Unaudited) | |
September 30, 2016 | |
Assets: | |
Investments, at value (cost $9,906,783) | | $ | 10,985,356 | |
Repurchase agreements, at value (cost $9,448,887) | | | 9,448,887 | |
Total investments (cost $19,355,670) | | | 20,434,243 | |
Unrealized appreciation on swap agreements | | | 58,424 | |
Segregated cash with broker | | | 22,000 | |
Cash | | | 885 | |
Receivables: | |
Swap settlement | | | 6,048 | |
Variation margin | | | 2,187 | |
Fund shares sold | | | 202,675 | |
Dividends | | | 38,789 | |
Interest | | | 97 | |
Total assets | | | 20,765,348 | |
| | | | | |
Liabilities: | |
Payable for: | |
Fund shares redeemed | | | 167,477 | |
Management fees | | | 19,955 | |
Distribution and service fees | | | 5,867 | |
Transfer agent and administrative fees | | | 5,543 | |
Portfolio accounting fees | | | 3,326 | |
Miscellaneous | | | 7,655 | |
Total liabilities | | | 209,823 | |
Commitments and contingent liabilities (Note 11) | | | — | |
Net assets | | $ | 20,555,525 | |
| | | | | |
Net assets consist of: | |
Paid in capital | | $ | 32,366,337 | |
Accumulated net investment loss | | | (100,083 | ) |
Accumulated net realized loss on investments | | | (12,864,932 | ) |
Net unrealized appreciation on investments | | | 1,154,203 | |
Net assets | | $ | 20,555,525 | |
| | | | | |
A-Class: | |
Net assets | | $ | 716,217 | |
Capital shares outstanding | | | 12,892 | |
Net asset value per share | | $ | 55.56 | |
Maximum offering price per share (Net asset value divided by 95.25%) | | $ | 58.33 | |
| | | | | |
C-Class: | |
Net assets | | $ | 426,971 | |
Capital shares outstanding | | | 7,930 | |
Net asset value per share | | $ | 53.84 | |
| | | | | |
H-Class: | |
Net assets | | $ | 19,412,337 | |
Capital shares outstanding | | | 349,078 | |
Net asset value per share | | $ | 55.61 | |
STATEMENT OF OPERATIONS (Unaudited) | |
Period Ended September 30, 2016 | |
Investment Income: | |
Dividends (net of foreign withholding tax of $3,809) | | $ | 87,173 | |
Interest | | | 9,873 | |
Total investment income | | | 97,046 | |
| | | | | |
Expenses: | |
Management fees | | | 82,533 | |
Transfer agent and administrative fees | | | 22,927 | |
Distribution and service fees: | |
A-Class | | | 1,071 | |
C-Class | | | 2,148 | |
H-Class | | | 21,320 | |
Portfolio accounting fees | | | 13,756 | |
Custodian fees | | | 1,082 | |
Trustees’ fees* | | | 755 | |
Line of credit fees | | | 110 | |
Miscellaneous | | | 17,528 | |
Total expenses | | | 163,230 | |
Net investment loss | | | (66,184 | ) |
| | | | | |
Net Realized and Unrealized Gain (Loss): | |
Net realized gain (loss) on: | |
Investments | | | 292,282 | |
Swap agreements | | | 2,109,899 | |
Futures contracts | | | 271,862 | |
Net realized gain | | | 2,674,043 | |
Net change in unrealized appreciation (depreciation) on: | |
Investments | | | 93,766 | |
Swap agreements | | | (312,533 | ) |
Futures contracts | | | (17,226 | ) |
Net change in unrealized appreciation (depreciation) | | | (235,993 | ) |
Net realized and unrealized gain | | | 2,438,050 | |
Net increase in net assets resulting from operations | | $ | 2,371,866 | |
* | Relates to Trustees not deemed “interested persons” within the meaning of Section 2(a)(19) of the 1940 Act. |
30 | THE RYDEX FUNDS SEMI-ANNUAL REPORT | SEE NOTES TO FINANCIAL STATEMENTS. |
EMERGING MARKETS 2x STRATEGY FUND | |
STATEMENTS OF CHANGES IN NET ASSETS |
| | | Period Ended
September 30,
2016
(Unaudited) | | | Year Ended
March 31,
2016 | |
Increase (Decrease) in Net Assets from Operations: | | | | | | |
Net investment loss | | $ | (66,184 | ) | | $ | (78,148 | ) |
Net realized gain (loss) on investments | | | 2,674,043 | | | | (4,039,656 | ) |
Net change in unrealized appreciation (depreciation) on investments | | | (235,993 | ) | | | 1,263,242 | |
Net increase (decrease) in net assets resulting from operations | | | 2,371,866 | | | | (2,854,562 | ) |
| | | | | | | | | |
Distributions to shareholders from: | | | | | | | | |
Net investment income | | | | | | | | |
A-Class | | | — | | | | (12,572 | ) |
C-Class | | | — | | | | (4,644 | ) |
H-Class | | | — | | | | (35,994 | ) |
Total distributions to shareholders | | | — | | | | (53,210 | ) |
| | | | | | | | | |
Capital share transactions: | | | | | | | | |
Proceeds from sale of shares | | | | | | | | |
A-Class | | | 5,623,942 | | | | 43,678,611 | |
C-Class | | | 4,230,479 | | | | 20,590,651 | |
H-Class | | | 313,816,159 | | | | 334,036,652 | |
Distributions reinvested | | | | | | | | |
A-Class | | | — | | | | 12,352 | |
C-Class | | | — | | | | 4,644 | |
H-Class | | | — | | | | 35,584 | |
Cost of shares redeemed | | | | | | | | |
A-Class | | | (8,834,922 | ) | | | (40,616,785 | ) |
C-Class | | | (4,147,161 | ) | | | (21,571,134 | ) |
H-Class | | | (310,002,748 | ) | | | (319,569,790 | ) |
Net increase from capital share transactions | | | 685,749 | | | | 16,600,785 | |
Net increase in net assets | | | 3,057,615 | | | | 13,693,013 | |
| | | | | | | | | |
Net assets: | | | | | | | | |
Beginning of period | | | 17,497,910 | | | | 3,804,897 | |
End of period | | $ | 20,555,525 | | | $ | 17,497,910 | |
Accumulated net investment loss at end of period | | $ | (100,083 | ) | | $ | (33,899 | ) |
| | | | | | | | | |
Capital share activity: | | | | | | | | |
Shares sold | | | | | | | | |
A-Class | | | 120,948 | | | | 896,183 | |
C-Class | | | 84,873 | | | | 401,507 | |
H-Class | | | 6,778,081 | | | | 6,540,164 | |
Shares issued from reinvestment of distributions | | | | | | | | |
A-Class | | | — | | | | 288 | |
C-Class | | | — | | | | 111 | |
H-Class | | | — | | | | 830 | |
Shares redeemed | | | | | | | | |
A-Class | | | (197,096 | ) | | | (813,738 | ) |
C-Class | | | (83,176 | ) | | | (417,067 | ) |
H-Class | | | (6,724,210 | ) | | | (6,281,031 | ) |
Net increase (decrease) in shares | | | (20,580 | ) | | | 327,247 | |
SEE NOTES TO FINANCIAL STATEMENTS. | THE RYDEX FUNDS SEMI-ANNUAL REPORT | 31 |
EMERGING MARKETS 2x STRATEGY FUND | |
This table is presented to show selected data for a share outstanding throughout each period and to assist shareholders in evaluating a Fund’s performance for the periods presented.
A-Class | | Period Ended
September 30,
2016a | | | Year Ended
March 31,
2016 | | | Year Ended
March 31,
2015 | | | Year Ended
March 31,
2014e | | | Year Ended
March 28,
2013e | | | Year Ended
March 31,
2012e | |
Per Share Data | | | | | | | | | | | | | | | | | | |
Net asset value, beginning of period | | $ | 44.79 | | | $ | 60.50 | | | $ | 66.27 | | | $ | 73.59 | | | $ | 87.40 | | | $ | 134.76 | |
Income (loss) from investment operations: | |
Net investment income (loss)b | | | (.20 | ) | | | (.23 | ) | | | (.37 | ) | | | (.54 | ) | | | (.35 | ) | | | (— | )c |
Net gain (loss) on investments (realized and unrealized) | | | 10.97 | | | | (14.83 | ) | | | (5.40 | ) | | | (6.78 | ) | | | (13.46 | ) | | | (41.76 | ) |
Total from investment operations | | | 10.77 | | | | (15.06 | ) | | | (5.77 | ) | | | (7.32 | ) | | | (13.81 | ) | | | (41.76 | ) |
Less distributions from: | |
Net investment income | | | — | | | | (.65 | ) | | | — | | | | — | | | | — | | | | — | |
Net realized gains | | | — | | | | — | | | | — | | | | — | | | | — | | | | (5.60 | ) |
Total distributions | | | — | | | | (.65 | ) | | | — | | | | — | | | | — | | | | (5.60 | ) |
Net asset value, end of period | | $ | 55.56 | | | $ | 44.79 | | | $ | 60.50 | | | $ | 66.27 | | | $ | 73.59 | | | $ | 87.40 | |
| | |
Total Returnd | | | 24.02 | % | | | (24.84 | %) | | | (8.72 | %) | | | (9.96 | %) | | | (15.79 | %) | | | (30.00 | %) |
Ratios/Supplemental Data | |
Net assets, end of period (in thousands) | | $ | 716 | | | $ | 3,988 | | | $ | 382 | | | $ | 744 | | | $ | 106 | | | $ | 363 | |
Ratios to average net assets: | |
Net investment income (loss) | | | (0.86 | %) | | | (0.48 | %) | | | (0.53 | %) | | | (0.82 | %) | | | (0.51 | %) | | | (0.01 | %) |
Total expenses | | | 1.76 | % | | | 1.75 | % | | | 1.75 | % | | | 1.81 | % | | | 1.88 | % | | | 1.77 | % |
Net expenses | | | 1.76 | % | | | 1.75 | % | | | 1.75 | % | | | 1.76 | %f | | | 1.75 | %f | | | 1.69 | %f |
Portfolio turnover rate | | | 1,482 | % | | | 2,874 | % | | | 1,085 | % | | | 1,412 | % | | | 730 | % | | | 883 | % |
C-Class | | Period Ended
September 30,
2016a | | | Year Ended
March 31,
2016 | | | Year Ended
March 31,
2015 | | | Year Ended
March 31,
2014e | | | Year Ended
March 28,
2013e | | | Year Ended
March 31,
2012e | |
Per Share Data | | | | | | | | | | | | | | | | | | |
Net asset value, beginning of period | | $ | 43.56 | | | $ | 59.37 | | | $ | 65.46 | | | $ | 72.92 | | | $ | 87.31 | | | $ | 134.13 | |
Income (loss) from investment operations: | |
Net investment income (loss)b | | | (.30 | ) | | | (.74 | ) | | | (.73 | ) | | | (1.04 | ) | | | (1.25 | ) | | | (.90 | ) |
Net gain (loss) on investments (realized and unrealized) | | | 10.58 | | | | (14.42 | ) | | | (5.36 | ) | | | (6.42 | ) | | | (13.14 | ) | | | (40.32 | ) |
Total from investment operations | | | 10.28 | | | | (15.16 | ) | | | (6.09 | ) | | | (7.46 | ) | | | (14.39 | ) | | | (41.22 | ) |
Less distributions from: | |
Net investment income | | | — | | | | (.65 | ) | | | — | | | | — | | | | — | | | | — | |
Net realized gains | | | — | | | | — | | | | — | | | | — | | | | — | | | | (5.60 | ) |
Total distributions | | | — | | | | (.65 | ) | | | — | | | | — | | | | — | | | | (5.60 | ) |
Net asset value, end of period | | $ | 53.84 | | | $ | 43.56 | | | $ | 59.37 | | | $ | 65.46 | | | $ | 72.92 | | | $ | 87.31 | |
| | |
Total Returnd | | | 23.58 | % | | | (25.48 | %) | | | (9.32 | %) | | | (10.21 | %) | | | (16.49 | %) | | | (29.75 | %) |
Ratios/Supplemental Data | |
Net assets, end of period (in thousands) | | $ | 427 | | | $ | 271 | | | $ | 1,287 | | | $ | 409 | | | $ | 108 | | | $ | 62 | |
Ratios to average net assets: | |
Net investment income (loss) | | | (1.21 | %) | | | (1.49 | %) | | | (0.99 | %) | | | (1.73 | %) | | | (1.61 | %) | | | (0.87 | %) |
Total expenses | | | 2.48 | % | | | 2.46 | % | | | 2.48 | % | | | 2.66 | % | | | 2.59 | % | | | 2.54 | % |
Net expenses | | | 2.48 | % | | | 2.46 | % | | | 2.48 | % | | | 2.61 | %f | | | 2.46 | %f | | | 2.46 | %f |
Portfolio turnover rate | | | 1,482 | % | | | 2,874 | % | | | 1,085 | % | | | 1,412 | % | | | 730 | % | | | 883 | % |
32 | THE RYDEX FUNDS SEMI-ANNUAL REPORT | SEE NOTES TO FINANCIAL STATEMENTS. |
EMERGING MARKETS 2x STRATEGY FUND | |
FINANCIAL HIGHLIGHTS (concluded) |
This table is presented to show selected data for a share outstanding throughout each period and to assist shareholders in evaluating a Fund’s performance for the periods presented.
H-Class | | Period Ended
September 30,
2016a | | | Year Ended
March 31,
2016 | | | Year Ended
March 31,
2015 | | | Year Ended
March 31,
2014e | | | Year Ended
March 28,
2013e | | | Year Ended
March 31,
2012e | |
Per Share Data | | | | | | | | | | | | | | | | | | |
Net asset value, beginning of period | | $ | 44.84 | | | $ | 60.61 | | | $ | 66.37 | | | $ | 73.87 | | | $ | 87.74 | | | $ | 134.69 | |
Income (loss) from investment operations: | |
Net investment income (loss)b | | | (.17 | ) | | | (.41 | ) | | | .20 | | | | (.34 | ) | | | (.35 | ) | | | (.35 | ) |
Net gain (loss) on investments (realized and unrealized) | | | 10.94 | | | | (14.71 | ) | | | (5.96 | ) | | | (7.16 | ) | | | (13.52 | ) | | | (41.00 | ) |
Total from investment operations | | | 10.77 | | | | (15.12 | ) | | | (5.76 | ) | | | (7.50 | ) | | | (13.87 | ) | | | (41.35 | ) |
Less distributions from: | |
Net investment income | | | — | | | | (.65 | ) | | | — | | | | — | | | | — | | | | — | |
Net realized gains | | | — | | | | — | | | | — | | | | — | | | | — | | | | (5.60 | ) |
Total distributions | | | — | | | | (.65 | ) | | | — | | | | — | | | | — | | | | (5.60 | ) |
Net asset value, end of period | | $ | 55.61 | | | $ | 44.84 | | | $ | 60.61 | | | $ | 66.37 | | | $ | 73.87 | | | $ | 87.74 | |
| | |
Total Returnd | | | 24.02 | % | | | (24.88 | %) | | | (8.71 | %) | | | (10.19 | %) | | | (15.78 | %) | | | (29.70 | %) |
Ratios/Supplemental Data | |
Net assets, end of period (in thousands) | | $ | 19,412 | | | $ | 13,238 | | | $ | 2,136 | | | $ | 4,719 | | | $ | 2,087 | | | $ | 4,713 | |
Ratios to average net assets: | |
Net investment income (loss) | | | (0.70 | %) | | | (0.76 | %) | | | 0.25 | % | | | (0.51 | %) | | | (0.49 | %) | | | (0.37 | %) |
Total expenses | | | 1.76 | % | | | 1.74 | % | | | 1.75 | % | | | 1.80 | % | | | 1.83 | % | | | 1.77 | % |
Net expenses | | | 1.76 | % | | | 1.74 | % | | | 1.75 | % | | | 1.74 | %f | | | 1.69 | %f | | | 1.69 | %f |
Portfolio turnover rate | | | 1,482 | % | | | 2,874 | % | | | 1,085 | % | | | 1,412 | % | | | 730 | % | | | 883 | % |
a | Unaudited figures for the period ended September 30, 2016. Percentage amounts for the period, except total return and portfolio turnover rate, have been annualized. |
b | Net investment income (loss) per share was computed using average shares outstanding throughout the period. |
c | Net investment income is less than $0.01 per share. |
d | Total return does not reflect the impact of any applicable sales charges and has not been annualized. |
e | Reverse share split — Per share amounts for the periods presented through February 21, 2014 have been restated to reflect a 1:5 reverse share split effective February 21, 2014. |
f | Net expense information reflects the expense ratios after expense waivers. |
SEE NOTES TO FINANCIAL STATEMENTS. | THE RYDEX FUNDS SEMI-ANNUAL REPORT | 33 |
FUND PROFILE (Unaudited) | September 30, 2016 |
INVERSE EMERGING MARKETS 2x STRATEGY FUND
OBJECTIVE: Seeks to provide investment results that correlate, before fees and expenses, to the performance of a specific benchmark on a daily basis. The Fund’s current benchmark is 200% of the inverse (opposite) of the performance of the BNY Mellon Emerging Markets 50 ADR Index (the “underlying index”). The Fund does not seek to achieve its investment objective over a period of time greater than one day.
Holdings Diversification (Market Exposure as % of Net Assets)
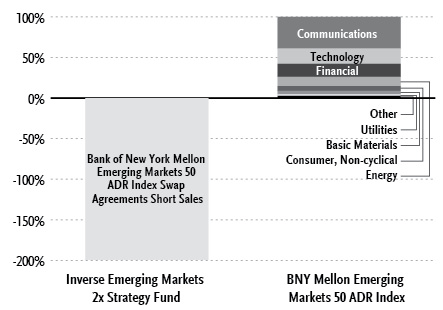
“Holdings Diversification (Market Exposure as % of Net Assets)” excludes any temporary cash investments.
Inception Dates: |
A-Class | October 29, 2010 |
C-Class | October 29, 2010 |
H-Class | October 29, 2010 |
The Fund invests principally in derivative investments such as swap agreements and futures contracts.
34 | THE RYDEX FUNDS SEMI-ANNUAL REPORT | |
SCHEDULE OF INVESTMENTS (Unaudited) | September 30, 2016 |
INVERSE EMERGING MARKETS 2x STRATEGY FUND | |
| | | Face
Amount | | | Value | |
| | | | | | | |
REPURCHASE AGREEMENTS††,1 - 98.8% | |
Royal Bank of Canada
issued 09/30/16 at 0.36%
due 10/03/162 | | $ | 836,123 | | | $ | 836,123 | |
HSBC Securities, Inc.
issued 09/30/16 at 0.38%
due 10/03/16 | | | 614,967 | | | | 614,967 | |
Total Repurchase Agreements | | | | | | | | |
(Cost $1,451,090) | | | | | | | 1,451,090 | |
| | | | | | | | | |
Total Investments - 98.8% | | | | | | | | |
(Cost $1,451,090) | | | | | | $ | 1,451,090 | |
Other Assets & Liabilities, net - 1.2% | | | | | | | 18,363 | |
Total Net Assets - 100.0% | | | | | | $ | 1,469,453 | |
| | | Units | | | Unrealized
Gain (Loss) | |
| | | | | | | |
OTC EQUITY INDEX SWAP AGREEMENTS SOLD SHORT†† | |
Goldman Sachs International
October 2016 Bank of New York Mellon Emerging Markets 50 ADR Index Swap 0.00%3,
Terminating 10/26/16
(Notional Value $1,077,861) | | | 487 | | | $ | 14,181 | |
BNP Paribas
November 2016 Bank of New York Mellon Emerging Markets 50 ADR Index Swap (0.12)%3,
Terminating 11/01/16
(Notional Value $1,851,462) | | | 836 | | | | (2,232 | ) |
(Total Notional Value $2,929,323) | | | | | | $ | 11,949 | |
†† | Value determined based on Level 2 inputs — See Note 4. |
1 | Repurchase Agreements — See Note 5. |
2 | All or a portion of this security is pledged as equity index swap collateral at September 30, 2016. |
3 | Total Return based on Bank of New York Mellon Emerging Markets 50 ADR Index +/- financing at a variable rate. Rate indicated is rate effective at September 30, 2016. |
| | |
| | See Sector Classification in Other Information section. |
The following table summarizes the inputs used to value the Fund’s investments at September 30, 2016 (See Note 4 in the Notes to Financial Statements):
Investments in Securities (Assets) | | Level 1 | | | Level 1 -
Other* | | | Level 2 | | | Level 2 -
Other* | | | Level 3 | | | Total | |
Equity Index Swap Agreements | | $ | — | | | $ | — | | | $ | — | | | $ | 14,181 | | | $ | — | | | $ | 14,181 | |
Repurchase Agreements | | | — | | | | — | | | | 1,451,090 | | | | — | | | | — | | | | 1,451,090 | |
Total | | $ | — | | | $ | — | | | $ | 1,451,090 | | | $ | 14,181 | | | $ | — | | | $ | 1,465,271 | |
| | | | | | | | | | | | | | | | | | | | | | | | |
Investments in Securities (Liabilities) | | Level 1 | | | Level 1 -
Other* | | | Level 2 | | | Level 2 -
Other* | | | Level 3 | | | Total | |
Equity Index Swap Agreements | | $ | — | | | $ | — | | | $ | — | | | $ | 2,232 | | | $ | — | | | $ | 2,232 | |
* | Other financial instruments include swaps, which are reported as unrealized gain/loss at period end. |
Transfers between investment levels may occur as the markets fluctuate and/or the availability of data used in an investment’s valuation changes. Transfers between valuation levels, if any, are in comparison to the valuation levels at the end of the previous fiscal year, and are effective using the fair value as of the end of the previous fiscal period.
For the period ended September 30, 2016, there were no transfers between levels.
SEE NOTES TO FINANCIAL STATEMENTS. | THE RYDEX FUNDS SEMI-ANNUAL REPORT | 35 |
INVERSE EMERGING MARKETS 2x STRATEGY FUND | |
STATEMENT OF ASSETS AND LIABILITIES (Unaudited) | |
September 30, 2016 | |
Assets: | |
Repurchase agreements, at value (cost $1,451,090) | | $ | 1,451,090 | |
Unrealized appreciation on swap agreements | | | 14,181 | |
Segregated cash with broker | | | 2,000 | |
Receivables: | |
Swap settlement | | | 40,602 | |
Variation margin | | | 679 | |
Fund shares sold | | | 152,611 | |
Interest | | | 15 | |
Total assets | | | 1,661,178 | |
| | | | | |
Liabilities: | |
Unrealized depreciation on swap agreements | | | 2,232 | |
Overdraft due to custodian bank | | | 940 | |
Payable for: | |
Fund shares redeemed | | | 188,692 | |
Management fees | | | 1,307 | |
Distribution and service fees | | | 498 | |
Transfer agent and administrative fees | | | 363 | |
Portfolio accounting fees | | | 218 | |
Miscellaneous | | | (2,525 | ) |
Total liabilities | | | 191,725 | |
Commitments and contingent liabilities (Note 11) | | | — | |
Net assets | | $ | 1,469,453 | |
| | | | | |
Net assets consist of: | |
Paid in capital | | $ | 18,704,067 | |
Accumulated net investment loss | | | (129,696 | ) |
Accumulated net realized loss on investments | | | (17,116,867 | ) |
Net unrealized appreciation on investments | | | 11,949 | |
Net assets | | $ | 1,469,453 | |
| | | | | |
A-Class: | |
Net assets | | $ | 252,271 | |
Capital shares outstanding* | | | 3,388 | |
Net asset value per share* | | $ | 74.46 | |
Maximum offering price per share (Net asset value divided by 95.25%)* | | $ | 78.17 | |
| | | | | |
C-Class: | |
Net assets | | $ | 180,767 | |
Capital shares outstanding* | | | 2,389 | |
Net asset value per share* | | $ | 75.67 | |
| | | | | |
H-Class: | |
Net assets | | $ | 1,036,415 | |
Capital shares outstanding* | | | 14,024 | |
Net asset value per share* | | $ | 73.90 | |
STATEMENT OF OPERATIONS (Unaudited) | |
Period Ended September 30, 2016 | |
Investment Income: | |
Interest | | $ | 6,106 | |
Total investment income | | | 6,106 | |
| | | | | |
Expenses: | |
Management fees | | | 21,856 | |
Transfer agent and administrative fees | | | 6,072 | |
Distribution and service fees: | |
A-Class | | | 1,182 | |
C-Class | | | 2,323 | |
H-Class | | | 4,311 | |
Portfolio accounting fees | | | 3,644 | |
Registration fees | | | 4,761 | |
Professional fees | | | 2,857 | |
Pricing service expense | | | 2,374 | |
Trustees’ fees** | | | 389 | |
Custodian fees | | | 280 | |
Miscellaneous | | | (5,691 | ) |
Total expenses | | | 44,358 | |
Net investment loss | | | (38,252 | ) |
| | | | | |
Net Realized and Unrealized Gain (Loss): | |
Net realized gain (loss) on: | |
Swap agreements | | | 141,845 | |
Futures contracts | | | 15,127 | |
Net realized gain | | | 156,972 | |
Net change in unrealized appreciation (depreciation) on: | |
Swap agreements | | | 55,996 | |
Futures contracts | | | (140 | ) |
Net change in unrealized appreciation (depreciation) | | | 55,856 | |
Net realized and unrealized gain | | | 212,828 | |
Net increase in net assets resulting from operations | | $ | 174,576 | |
* | The shares outstanding, net asset value per share and the maximum offering price per share have been restated to reflect a 1:6 reverse share split effective October 31, 2016 — See Note 13. |
** | Relates to Trustees not deemed “interested persons” within the meaning of Section 2(a)(19) of the 1940 Act. |
36 | THE RYDEX FUNDS SEMI-ANNUAL REPORT | SEE NOTES TO FINANCIAL STATEMENTS. |
INVERSE EMERGING MARKETS 2x STRATEGY FUND | |
STATEMENTS OF CHANGES IN NET ASSETS |
| | | Period Ended
September 30,
2016
(Unaudited) | | | Year Ended
March 31,
2016 | |
Increase (Decrease) in Net Assets from Operations: | | | | | | |
Net investment loss | | $ | (38,252 | ) | | $ | (314,989 | ) |
Net realized gain (loss) on investments | | | 156,972 | | | | (5,074,320 | ) |
Net change in unrealized appreciation (depreciation) on investments | | | 55,856 | | | | 538,806 | |
Net increase (decrease) in net assets resulting from operations | | | 174,576 | | | | (4,850,503 | ) |
| | | | | | | | | |
Capital share transactions: | | | | | | | | |
Proceeds from sale of shares | | | | | | | | |
A-Class | | | 12,248,199 | | | | 6,224,104 | |
C-Class | | | 2,987,739 | | | | 26,363,997 | |
H-Class | | | 73,314,720 | | | | 537,108,862 | |
Cost of shares redeemed | | | | | | | | |
A-Class | | | (12,018,813 | ) | | | (5,365,150 | ) |
C-Class | | | (3,043,303 | ) | | | (26,282,809 | ) |
H-Class | | | (99,348,859 | ) | | | (529,298,402 | ) |
Net increase (decrease) from capital share transactions | | | (25,860,317 | ) | | | 8,750,602 | |
Net increase (decrease) in net assets | | | (25,685,741 | ) | | | 3,900,099 | |
| | | | | | | | | |
Net assets: | | | | | | | | |
Beginning of period | | | 27,155,194 | | | | 23,255,095 | |
End of period | | $ | 1,469,453 | | | $ | 27,155,194 | |
Accumulated net investment loss at end of period | | $ | (129,696 | ) | | $ | (91,444 | ) |
| | | | | | | | | |
Capital share activity:* | | | | | | | | |
Shares sold | | | | | | | | |
A-Class | | | 115,711 | | | | 55,718 | |
C-Class | | | 35,233 | | | | 232,722 | |
H-Class | | | 793,248 | | | | 4,499,527 | |
Shares redeemed | | | | | | | | |
A-Class | | | (116,719 | ) | | | (51,934 | ) |
C-Class | | | (36,421 | ) | | | (230,126 | ) |
H-Class | | | (1,039,260 | ) | | | (4,468,573 | ) |
Net increase (decrease) in shares | | | (248,208 | ) | | | 37,334 | |
* | Capital share activity for the periods presented through September 30, 2016, has been restated to reflect a 1:6 reverse share split effective October 31, 2016 — See Note 13. |
SEE NOTES TO FINANCIAL STATEMENTS. | THE RYDEX FUNDS SEMI-ANNUAL REPORT | 37 |
INVERSE EMERGING MARKETS 2x STRATEGY FUND | |
This table is presented to show selected data for a share outstanding throughout each period and to assist shareholders in evaluating a Fund’s performance for the periods presented.
A-Class | | Period Ended
September 30,
2016a,f | | | Year Ended
March 31,
2016f | | | Year Ended
March 31,
2015f | | | Year Ended
March 31,
2014f | | | Year Ended
March 28,
2013f | | | Year Ended
March 31,
2012f | |
Per Share Data | | | | | | | | | | | | | | | | | | |
Net asset value, beginning of period | | $ | 101.83 | | | $ | 101.26 | | | $ | 110.02 | | | $ | 115.35 | | | $ | 115.71 | | | $ | 126.90 | |
Income (loss) from investment operations: | |
Net investment income (loss)b | | | (.78 | ) | | | (1.92 | ) | | | (1.74 | ) | | | (2.10 | ) | | | (1.98 | ) | | | (2.34 | ) |
Net gain (loss) on investments (realized and unrealized) | | | (26.59 | ) | | | 2.49 | | | | (7.02 | ) | | | (3.23 | ) | | | 1.62 | | | | (8.85 | ) |
Total from investment operations | | | (27.37 | ) | | | .57 | | | | (8.76 | ) | | | (5.33 | ) | | | (.36 | ) | | | (11.19 | ) |
Net asset value, end of period | | $ | 74.46 | | | $ | 101.83 | | | $ | 101.26 | | | $ | 110.02 | | | $ | 115.35 | | | $ | 115.71 | |
| | |
Total Returnc | | | (26.87 | %) | | | 0.53 | % | | | (7.96 | %) | | | (4.63 | %) | | | (0.26 | %) | | | (8.84 | %) |
Ratios/Supplemental Data | |
Net assets, end of period (in thousands) | | $ | 252 | | | $ | 448 | | | $ | 62 | | | $ | 4,859 | | | $ | 258 | | | $ | 8 | |
Ratios to average net assets: | |
Net investment income (loss) | | | (1.49 | %) | | | (1.59 | %) | | | (1.74 | %) | | | (1.74 | %) | | | (1.60 | %) | | | (1.66 | %) |
Total expenses | | | 1.74 | % | | | 1.75 | % | | | 1.75 | % | | | 1.78 | % | | | 1.85 | % | | | 1.78 | % |
Net expenses | | | 1.74 | % | | | 1.75 | % | | | 1.75 | % | | | 1.75 | %d | | | 1.71 | %d | | | 1.69 | %d |
Portfolio turnover rate | | | — | | | | — | | | | — | | | | — | | | | — | | | | — | |
C-Class | | Period Ended
September 30,
2016a,f | | | Year Ended
March 31,
2016f | | | Year Ended
March 31,
2015f | | | Year Ended
March 31,
2014f | | | Year Ended
March 28,
2013f | | | Year Ended
March 31,
2012f | |
Per Share Data | | | | | | | | | | | | | | | | | | |
Net asset value, beginning of period | | $ | 103.83 | | | $ | 104.23 | | | $ | 114.21 | | | $ | 120.45 | | | $ | 121.50 | | | $ | 128.01 | |
Income (loss) from investment operations: | |
Net investment income (loss)b | | | (1.02 | ) | | | (2.82 | ) | | | (2.34 | ) | | | (3.12 | ) | | | (2.94 | ) | | | (3.30 | ) |
Net gain (loss) on investments (realized and unrealized) | | | (27.14 | ) | | | 2.42 | | | | (7.64 | ) | | | (3.12 | ) | | | 1.89 | | | | (3.21 | ) |
Total from investment operations | | | (28.16 | ) | | | (.40 | ) | | | (9.98 | ) | | | (6.24 | ) | | | (1.05 | ) | | | (6.51 | ) |
Net asset value, end of period | | $ | 75.67 | | | $ | 103.83 | | | $ | 104.23 | | | $ | 114.21 | | | $ | 120.45 | | | $ | 121.50 | |
| | |
Total Returnc | | | (27.15 | %) | | | (0.29 | %) | | | (8.78 | %) | | | (5.23 | %) | | | (0.84 | %) | | | (5.06 | %)e |
Ratios/Supplemental Data | |
Net assets, end of period (in thousands) | | $ | 181 | | | $ | 371 | | | $ | 102 | | | $ | 262 | | | $ | 115 | | | $ | 1,261 | |
Ratios to average net assets: | |
Net investment income (loss) | | | (2.24 | %) | | | (2.44 | %) | | | (2.47 | %) | | | (2.44 | %) | | | (2.41 | %) | | | (2.41 | %) |
Total expenses | | | 2.49 | % | | | 2.50 | % | | | 2.48 | % | | | 2.48 | % | | | 2.65 | % | | | 2.53 | % |
Net expenses | | | 2.49 | % | | | 2.50 | % | | | 2.48 | % | | | 2.46 | %d | | | 2.51 | %d | | | 2.44 | %d |
Portfolio turnover rate | | | — | | | | — | | | | — | | | | — | | | | — | | | | — | |
38 | THE RYDEX FUNDS SEMI-ANNUAL REPORT | SEE NOTES TO FINANCIAL STATEMENTS. |
INVERSE EMERGING MARKETS 2x STRATEGY FUND | |
FINANCIAL HIGHLIGHTS (concluded) |
This table is presented to show selected data for a share outstanding throughout each period and to assist shareholders in evaluating a Fund’s performance for the periods presented.
H-Class | | Period Ended
September 30,
2016a,f | | | Year Ended
March 31,
2016f | | | Year Ended
March 31,
2015f | | | Year Ended
March 31,
2014f | | | Year Ended
March 28,
2013f | | | Year Ended
March 31,
2012f | |
Per Share Data | | | | | | | | | | | | | | | | | | |
Net asset value, beginning of period | | $ | 101.28 | | | $ | 100.80 | | | $ | 109.97 | | | $ | 115.31 | | | $ | 115.73 | | | $ | 126.87 | |
Income (loss) from investment operations: | |
Net investment income (loss)b | | | (.72 | ) | | | (2.04 | ) | | | (1.68 | ) | | | (2.10 | ) | | | (1.98 | ) | | | (2.28 | ) |
Net gain (loss) on investments (realized and unrealized) | | | (26.66 | ) | | �� | 2.52 | | | | (7.49 | ) | | | (3.24 | ) | | | 1.56 | | | | (8.86 | ) |
Total from investment operations | | | (27.38 | ) | | | .48 | | | | (9.17 | ) | | | (5.34 | ) | | | (.42 | ) | | | (11.14 | ) |
Net asset value, end of period | | $ | 73.90 | | | $ | 101.28 | | | $ | 100.80 | | | $ | 109.97 | | | $ | 115.31 | | | $ | 115.73 | |
| | |
Total Returnc | | | (27.01 | %) | | | 0.48 | % | | | (8.35 | %) | | | (4.63 | %) | | | (0.36 | %) | | | (8.79 | %) |
Ratios/Supplemental Data | |
Net assets, end of period (in thousands) | | $ | 1,036 | | | $ | 26,336 | | | $ | 23,091 | | | $ | 5,815 | | | $ | 1,942 | | | $ | 2,215 | |
Ratios to average net assets: | |
Net investment income (loss) | | | (1.50 | %) | | | (1.65 | %) | | | (1.71 | %) | | | (1.74 | %) | | | (1.56 | %) | | | (1.67 | %) |
Total expenses | | | 1.75 | % | | | 1.74 | % | | | 1.73 | % | | | 1.78 | % | | | 1.82 | % | | | 1.79 | % |
Net expenses | | | 1.75 | % | | | 1.74 | % | | | 1.73 | % | | | 1.76 | %d | | | 1.68 | %d | | | 1.70 | %d |
Portfolio turnover rate | | | — | | | | — | | | | — | | | | — | | | | — | | | | — | |
a | Unaudited figures for the period ended September 30, 2016. Percentage amounts for the period, except total return and portfolio turnover rate, have been annualized. |
b | Net investment income (loss) per share was computed using average shares outstanding throughout the period. |
c | Total return does not reflect the impact of any applicable sales charges and has not been annualized. |
d | Net Expense information reflects the expense ratios after expense waivers. |
e | Generally, the performance of the Fund’s C-Class shares will underperform the Fund’s H-Class shares and A-Class shares due to the C-Class shares’ higher expense ratio. However, the performance of the Fund’s C-Class shares is greater than that of the H-Class shares and A-Class shares due to the impact large redemptions of C-Class shares had on the expense accruals for C-Class shares. The effect of the expense accruals on the performance of the C-Class shares of the Fund was magnified by the small asset base of the C-Class shares. |
f | Reverse share split — Per share amounts for the periods presented through September 30 , 2016 have been restated to reflect a 1:6 reverse share split effective October 31, 2016 — See Note 13. |
SEE NOTES TO FINANCIAL STATEMENTS. | THE RYDEX FUNDS SEMI-ANNUAL REPORT | 39 |
FUND PROFILE (Unaudited) | September 30, 2016 |
EMERGING MARKETS BOND STRATEGY FUND
OBJECTIVE: Seeks to provide investment results that correlate, before fees and expenses, to the performance of the emerging markets bond market as defined by the Adviser.
Holdings Diversification (Market Exposure as % of Net Assets)
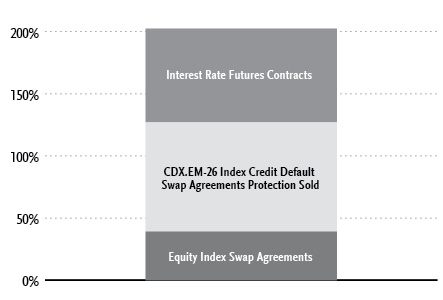
“Holdings Diversification (Market Exposure as % of Net Assets)” excludes any temporary cash investments.
Inception Dates: |
A-Class | October 8, 2013 |
C-Class | October 8, 2013 |
H-Class | October 8, 2013 |
40 | THE RYDEX FUNDS SEMI-ANNUAL REPORT | |
SCHEDULE OF INVESTMENTS (Unaudited) | September 30, 2016 |
EMERGING MARKETS BOND STRATEGY FUND | |
| | | Face
Amount | | | Value | |
| | | | | | | |
REPURCHASE AGREEMENTS††,1 - 76.1% | |
HSBC Securities, Inc.
issued 09/30/16 at 0.38%
due 10/03/16 | | $ | 631,455 | | | $ | 631,455 | |
Royal Bank of Canada
issued 09/30/16 at 0.36%
due 10/03/16 | | | 501,379 | | | | 501,379 | |
Total Repurchase Agreements | | | | | | | | |
(Cost $1,132,834) | | | | | | | 1,132,834 | |
| | | | | | | | | |
Total Investments - 76.1% | | | | | | | | |
(Cost $1,132,834) | | | | | | $ | 1,132,834 | |
Other Assets & Liabilities, net - 23.9% | | | | | | | 356,321 | |
Total Net Assets - 100.0% | | | | | | $ | 1,489,155 | |
| | | Contracts | | | Unrealized
Gain | |
| | | | | | | |
INTEREST RATE FUTURES CONTRACTS PURCHASED† | |
December 2016 U.S. Treasury 5 Year Note
Futures Contracts
(Aggregate Value of
Contracts $729,234) | | | 6 | | | $ | 3,311 | |
December 2016 U.S. Treasury 10 Year Note
Futures Contracts
(Aggregate Value of
Contracts $393,563) | | | 3 | | | | 1,807 | |
(Total Aggregate Value of Contracts $1,122,797) | | | | | | $ | 5,118 | |
| | | | | | | | | |
| | Units | | | | | |
| | | | | | | | | |
OTC EQUITY INDEX SWAP AGREEMENTS†† | |
Goldman Sachs International
November 2016 iShares JP Morgan USD
Emerging Markets Bond ETF swap 0.88%2,
Terminating 11/03/16
(Notional Value $291,384) | | | 2,486 | | | $ | 870 | |
Goldman Sachs International
November 2016 PowerShares
Emerging Markets Sovereign Debt Portfolio swap 0.98%3,
Terminating 11/03/16
(Notional Value $289,300) | | | 9,445 | | | | 661 | |
(Total Notional Value $580,684) | | | | | | $ | 1,531 | |
CENTRALLY CLEARED CREDIT DEFAULT SWAP AGREEMENT PROTECTION SOLD†† | |
Index | Counterparty | | Exchange | Protection
Premium
Rate | | Maturity
Date | | Notional
Principal | | | Notional
Value | | | Upfront
Premiums
Received | | | Unrealized
Appreciation | |
CDX.EM-26 Index | Barclays Bank plc | | ICE | 1.00% | | 12/20/21 | | $ | 1,400,000 | | | $ | (1,309,703 | ) | | $ | (91,844 | ) | | $ | 1,547 | |
† | Value determined based on Level 1 inputs — See Note 4. |
†† | Value determined based on Level 2 inputs — See Note 4. |
1 | Repurchase Agreements — See Note 5. |
2 | Total Return based on iShares JP Morgan USD Emerging Markets Bond ETF +/- financing at a variable rate. Rate indicated is rate effective at September 30, 2016. |
3 | Total Return based on Power Shares Emerging Markets Sovereign Debt Portfolio +/- financing at a variable rate. Rate indicated is rate effective at September 30, 2016. |
| | ICE — Intercontinental Exchange |
| | plc — Public Limited Company |
| | CDX.EM-26 Index — Credit Default Swap Emerging Markets Series 26 Index |
| | |
| | See Sector Classification in Other Information section. |
SEE NOTES TO FINANCIAL STATEMENTS. | THE RYDEX FUNDS SEMI-ANNUAL REPORT | 41 |
SCHEDULE OF INVESTMENTS (Unaudited)(concluded) | September 30, 2016 |
EMERGING MARKETS BOND STRATEGY FUND | |
The following table summarizes the inputs used to value the Fund’s investments at September 30, 2016 (See Note 4 in the Notes to Financial Statements):
Investments in Securities (Assets) | | Level 1 | | | Level 1 -
Other* | | | Level 2 | | | Level 2 -
Other* | | | Level 3 | | | Total | |
Credit Default Swaps | | $ | — | | | $ | — | | | $ | — | | | $ | 1,547 | | | $ | — | | | $ | 1,547 | |
Equity Index Swap Agreements | | | — | | | | — | | | | — | | | | 1,531 | | | | — | | | | 1,531 | |
Interest Rate Futures Contracts | | | — | | | | 5,118 | | | | — | | | | — | | | | — | | | | 5,118 | |
Repurchase Agreements | | | — | | | | — | | | | 1,132,834 | | | | — | | | | — | | | | 1,132,834 | |
Total | | $ | — | | | $ | 5,118 | | | $ | 1,132,834 | | | $ | 3,078 | | | $ | — | | | $ | 1,141,030 | |
* | Other financial instruments include futures contracts and/or swaps, which are reported as unrealized gain/loss at period end. |
Transfers between investment levels may occur as the markets fluctuate and/or the availability of data used in an investment’s valuation changes. Transfers between valuation levels, if any, are in comparison to the valuation levels at the end of the previous fiscal year, and are effective using the fair value as of the end of the previous fiscal period.
For the period ended September 30, 2016, there were no transfers between levels.
42 | THE RYDEX FUNDS SEMI-ANNUAL REPORT | SEE NOTES TO FINANCIAL STATEMENTS. |
EMERGING MARKETS BOND STRATEGY FUND | |
STATEMENT OF ASSETS AND LIABILITIES (Unaudited) | |
September 30, 2016 | |
Assets: | |
Repurchase agreements, at value (cost $1,132,834) | | $ | 1,132,834 | |
Segregated cash with broker | | | 596,955 | |
Unrealized appreciation on swap agreements | | | 3,078 | |
Receivables: | |
Fund shares sold | | | 27,577 | |
Interest | | | 440 | |
Total assets | | | 1,760,884 | |
| | | | | |
Liabilities: | |
Payable for: | |
Swap settlement | | | 148,426 | |
Unamortized upfront premiums paid on credit default swaps | | | 91,844 | |
Management fees | | | 9,458 | |
Fund shares redeemed | | | 4,169 | |
Distribution and service fees | | | 3,235 | |
Transfer agent and administrative fees | | | 3,153 | |
Variation margin | | | 2,203 | |
Portfolio accounting fees | | | 1,892 | |
Miscellaneous | | | 7,349 | |
Total liabilities | | | 271,729 | |
Commitments and contingent liabilities (Note 11) | | | — | |
Net assets | | $ | 1,489,155 | |
| | | | | |
Net assets consist of: | |
Paid in capital | | $ | 1,414,509 | |
Accumulated net investment loss | | | (58,170 | ) |
Accumulated net realized gain on investments | | | 124,620 | |
Net unrealized appreciation on investments | | | 8,196 | |
Net assets | | $ | 1,489,155 | |
| | | | | |
A-Class: | |
Net assets | | $ | 906,679 | |
Capital shares outstanding* | | | 11,767 | |
Net asset value per share* | | $ | 77.05 | |
Maximum offering price per share (Net asset value divided by 95.25%)* | | $ | 80.89 | |
| | | | | |
C-Class: | |
Net assets | | $ | 132,433 | |
Capital shares outstanding* | | | 1,776 | |
Net asset value per share* | | $ | 74.57 | |
| | | | | |
H-Class: | |
Net assets | | $ | 450,043 | |
Capital shares outstanding* | | | 5,873 | |
Net asset value per share* | | $ | 76.63 | |
STATEMENT OF OPERATIONS (Unaudited) | |
Period Ended September 30, 2016 | |
Investment Income: | |
Dividends | | $ | 31,747 | |
Interest | | | 13,910 | |
Total investment income | | | 45,657 | |
| | | | | |
Expenses: | |
Management fees | | | 54,434 | |
Transfer agent and administrative fees | | | 18,145 | |
Distribution and service fees: | |
A-Class | | | 13,585 | |
C-Class | | | 676 | |
H-Class | | | 4,393 | |
Portfolio accounting fees | | | 10,888 | |
Custodian fees | | | 908 | |
Trustees’ fees** | | | 285 | |
Miscellaneous | | | 11,116 | |
Total expenses | | | 114,430 | |
Net investment loss | | | (68,773 | ) |
| | | | | |
Net Realized and Unrealized Gain (Loss): | |
Net realized gain (loss) on: | |
Investments | | | 53,802 | |
Swap agreements | | | 287,535 | |
Futures contracts | | | (203,541 | ) |
Net realized gain | | | 137,796 | |
Net change in unrealized appreciation (depreciation) on: | |
Investments | | | (9,545 | ) |
Swap agreements | | | 4,586 | |
Futures contracts | | | 1,967 | |
Net change in unrealized appreciation (depreciation) | | | (2,992 | ) |
Net realized and unrealized gain | | | 134,804 | |
Net increase in net assets resulting from operations | | $ | 66,031 | |
* | The shares outstanding, net asset value per share and the maximum offering price per share have been restated to reflect a 1:4 reverse share split effective November 7, 2016 — See Note 13. |
** | Relates to Trustees not deemed “interested persons” within the meaning of Section 2(a)(19) of the 1940 Act. |
SEE NOTES TO FINANCIAL STATEMENTS. | THE RYDEX FUNDS SEMI-ANNUAL REPORT | 43 |
EMERGING MARKETS BOND STRATEGY FUND | |
STATEMENTS OF CHANGES IN NET ASSETS |
| | | Period Ended
September 30,
2016
(Unaudited) | | | Year Ended
March 31,
2016 | |
Increase (Decrease) in Net Assets from Operations: | | | | | | |
Net investment income (loss) | | $ | (68,773 | ) | | $ | 27,754 | |
Net realized gain on investments | | | 137,796 | | | | 728,098 | |
Net change in unrealized appreciation (depreciation) on investments | | | (2,992 | ) | | | 10,676 | |
Net increase in net assets resulting from operations | | | 66,031 | | | | 766,528 | |
| | | | | | | | | |
Distributions to shareholders from: | | | | | | | | |
Net investment income | | | | | | | | |
A-Class | | | — | | | | (4,095 | ) |
C-Class | | | — | | | | (6,486 | ) |
H-Class | | | — | | | | (18,553 | ) |
Net realized gains | | | | | | | | |
A-Class | | | (8,051 | ) | | | — | |
C-Class | | | (642 | ) | | | — | |
H-Class | | | (24,807 | ) | | | — | |
Total distributions to shareholders | | | (33,500 | ) | | | (29,134 | ) |
| | | | | | | | | |
Capital share transactions: | | | | | | | | |
Proceeds from sale of shares | | | | | | | | |
A-Class | | | 44,673,535 | | | | 33,166,270 | |
C-Class | | | 83,632 | | | | 183,968 | |
H-Class | | | 18,261,246 | | | | 4,344,437 | |
Distributions reinvested | | | | | | | | |
A-Class | | | 8,051 | | | | 4,095 | |
C-Class | | | 536 | | | | 4,976 | |
H-Class | | | 24,701 | | | | 18,553 | |
Cost of shares redeemed | | | | | | | | |
A-Class | | | (43,908,877 | ) | | | (33,725,205 | ) |
C-Class | | | (89,239 | ) | | | (90,538 | ) |
H-Class | | | (18,196,911 | ) | | | (4,269,575 | ) |
Net increase (decrease) from capital share transactions | | | 856,674 | | | | (363,019 | ) |
Net increase in net assets | | | 889,205 | | | | 374,375 | |
| | | | | | | | | |
Net assets: | | | | | | | | |
Beginning of period | | | 599,950 | | | | 225,575 | |
End of period | | $ | 1,489,155 | | | $ | 599,950 | |
Accumulated net investment loss/Undistributed net investment income at end of period | | $ | (58,170 | ) | | $ | 10,603 | |
| | | | | | | | | |
Capital share activity:* | | | | | | | | |
Shares sold | | | | | | | | |
A-Class | | | 582,312 | | | | 473,665 | |
C-Class | | | 1,163 | | | | 2,515 | |
H-Class | | | 245,211 | | | | 57,824 | |
Shares issued from reinvestment of distributions | | | | | | | | |
A-Class | | | 109 | | | | 60 | |
C-Class | | | 8 | | | | 75 | |
H-Class | | | 336 | | | | 273 | |
Shares redeemed | | | | | | | | |
A-Class | | | (574,210 | ) | | | (470,644 | ) |
C-Class | | | (1,230 | ) | | | (1,173 | ) |
H-Class | | | (242,608 | ) | | | (57,052 | ) |
Net increase in shares | | | 11,091 | | | | 5,543 | |
* | Capital share activity for the periods presented through September 30, 2016, has been restated to reflect a 1:4 reverse share split effective November 7, 2016 — See Note 13. |
44 | THE RYDEX FUNDS SEMI-ANNUAL REPORT | SEE NOTES TO FINANCIAL STATEMENTS. |
EMERGING MARKETS BOND STRATEGY FUND | |
This table is presented to show selected data for a share outstanding throughout each period and to assist shareholders in evaluating a Fund’s performance for the periods presented.
A-Class | | Period Ended
September 30,
2016a,d | | | Year Ended
March 31,
2016d | | | Year Ended
March 31,
2015d | | | Period Ended
March 31,
2014b,d | |
Per Share Data | | | | | | | | | | | | |
Net asset value, beginning of period | | $ | 72.75 | | | $ | 81.52 | | | $ | 100.68 | | | $ | 100.00 | |
Income (loss) from investment operations: | |
Net investment income (loss)c | | | (.44 | ) | | | 1.12 | | | | (1.44 | ) | | | (.84 | ) |
Net gain (loss) on investments (realized and unrealized) | | | 5.06 | | | | 2.23 | | | | (3.76 | ) | | | 1.52 | |
Total from investment operations | | | 4.62 | | | | 3.35 | | | | (5.20 | ) | | | .68 | |
Less distributions from: | |
Net investment income | | | — | | | | (12.12 | ) | | | (13.96 | ) | | | — | |
Net realized gains | | | (.32 | ) | | | — | | | | — | | | | — | |
Total distributions | | | (.32 | ) | | | (12.12 | ) | | | (13.96 | ) | | | — | |
Net asset value, end of period | | $ | 77.05 | | | $ | 72.75 | | | $ | 81.52 | | | $ | 100.68 | |
| | |
Total Returne | | | 6.34 | % | | | 5.13 | % | | | (5.31 | %) | | | 0.72 | % |
Ratios/Supplemental Data | |
Net assets, end of period (in thousands) | | $ | 907 | | | $ | 259 | | | $ | 39 | | | $ | 499 | |
Ratios to average net assets: | |
Net investment income (loss) | | | (1.17 | %) | | | 1.59 | % | | | (1.50 | %) | | | (1.78 | %) |
Total expenses | | | 1.57 | % | | | 1.58 | % | | | 1.71 | % | | | 1.83 | % |
Portfolio turnover rate | | | 392 | % | | | 21,555 | % | | | 655 | % | | | — | |
C-Class | | Period Ended
September 30,
2016a,d | | | Year Ended
March 31,
2016d | | | Year Ended
March 31,
2015d | | | Period Ended
March 31,
2014b,d | |
Per Share Data | | | | | | | | | | | | |
Net asset value, beginning of period | | $ | 70.54 | | | $ | 80.35 | | | $ | 100.37 | | | $ | 100.00 | |
Income (loss) from investment operations: | |
Net investment income (loss)c | | | (.40 | ) | | | (1.00 | ) | | | (1.80 | ) | | | (1.12 | ) |
Net gain (loss) on investments (realized and unrealized) | | | 4.75 | | | | 3.31 | | | | (4.26 | ) | | | 1.49 | |
Total from investment operations | | | 4.35 | | | | 2.31 | | | | (6.06 | ) | | | .37 | |
Less distributions from: | |
Net investment income | | | — | | | | (12.12 | ) | | | (13.96 | ) | | | — | |
Net realized gains | | | (.32 | ) | | | — | | | | — | | | | — | |
Total distributions | | | (.32 | ) | | | (12.12 | ) | | | (13.96 | ) | | | — | |
Net asset value, end of period | | $ | 74.57 | | | $ | 70.54 | | | $ | 80.35 | | | $ | 100.37 | |
| | |
Total Returne | | | 6.20 | % | | | 3.73 | % | | | (6.19 | %) | | | 0.40 | % |
Ratios/Supplemental Data | |
Net assets, end of period (in thousands) | | $ | 132 | | | $ | 129 | | | $ | 34 | | | $ | 10 | |
Ratios to average net assets: | |
Net investment income (loss) | | | (1.05 | %) | | | (1.33 | %) | | | (1.85 | %) | | | (2.34 | %) |
Total expenses | | | 2.32 | % | | | 2.32 | % | | | 2.24 | % | | | 2.39 | % |
Portfolio turnover rate | | | 392 | % | | | 21,555 | % | | | 655 | % | | | — | |
SEE NOTES TO FINANCIAL STATEMENTS. | THE RYDEX FUNDS SEMI-ANNUAL REPORT | 45 |
EMERGING MARKETS BOND STRATEGY FUND | |
FINANCIAL HIGHLIGHTS (concluded) |
This table is presented to show selected data for a share outstanding throughout each period and to assist shareholders in evaluating a Fund’s performance for the periods presented.
H-Class | | Period Ended
September 30,
2016a,d | | | Year Ended
March 31,
2016d | | | Year Ended
March 31,
2015d | | | Period Ended
March 31,
2014b,d | |
Per Share Data | | | | | | | | | | | | |
Net asset value, beginning of period | | $ | 72.19 | | | $ | 81.18 | | | $ | 100.73 | | | $ | 100.00 | |
Income (loss) from investment operations: | |
Net investment income (loss)c | | | (.08 | ) | | | (.44 | ) | | | (1.56 | ) | | | (.76 | ) |
Net gain (loss) on investments (realized and unrealized) | | | 4.84 | | | | 3.57 | | | | (4.03 | ) | | | 1.49 | |
Total from investment operations | | | 4.76 | | | | 3.13 | | | | (5.59 | ) | | | .73 | |
Less distributions from: | |
Net investment income | | | — | | | | (12.12 | ) | | | (13.96 | ) | | | — | |
Net realized gains | | | (.32 | ) | | | — | | | | — | | | | — | |
Total distributions | | | (.32 | ) | | | (12.12 | ) | | | (13.96 | ) | | | — | |
Net asset value, end of period | | $ | 76.63 | | | $ | 72.19 | | | $ | 81.18 | | | $ | 100.73 | |
| | |
Total Returne | | | 6.61 | % | | | 4.82 | % | | | (5.74 | %) | | | 0.80 | % |
Ratios/Supplemental Data | |
Net assets, end of period (in thousands) | | $ | 450 | | | $ | 212 | | | $ | 153 | | | $ | 5,580 | |
Ratios to average net assets: | |
Net investment income (loss) | | | (0.23 | %) | | | (0.55 | %) | | | (1.64 | %) | | | (1.62 | %) |
Total expenses | | | 1.54 | % | | | 1.56 | % | | | 1.74 | % | | | 1.64 | % |
Portfolio turnover rate | | | 392 | % | | | 21,555 | % | | | 655 | % | | | — | |
a | Unaudited figures for the period ended September 30, 2016. Percentage amounts for the period, except total return and portfolio turnover rate, have been annualized. |
b | Since commencement of operations: October 8, 2013. Percentage amounts for the period, except total return and portfolio turnover rate, have been annualized. |
c | Net investment income (loss) per share was computed using average shares outstanding throughout the period. |
d | Reverse share split — Per share amounts for the periods presented through September 30 , 2016 have been restated to reflect a 1:4 reverse share split effective November 7, 2016 — See Note 13. |
e | Total return does not reflect the impact of any applicable sales charges and has not been annualized. |
46 | THE RYDEX FUNDS SEMI-ANNUAL REPORT | SEE NOTES TO FINANCIAL STATEMENTS. |
NOTES TO FINANCIAL STATEMENTS (Unaudited) |
1. Organization and Significant Accounting Policies
Organization
The Rydex Series Funds (the “Trust”), a Delaware statutory trust, is registered with the SEC under the Investment Company Act of 1940 (”1940 Act”), as an open-ended investment company of the series type. Each series, in effect, is representing a separate Fund. The Trust is authorized to issue an unlimited number of no par value shares. The Trust accounts for the assets of each fund separately.
The Trust offers a combination of seven separate classes of shares: Investor Class shares, A-Class shares, C-Class shares, H-Class shares, P-Class shares, Institutional Class shares and Money Market Class shares. Sales of shares of each Class are made without a front-end sales charge at the net asset value per share (“NAV”), with the exception of A-Class shares. A-Class shares are sold at the NAV, plus the applicable front-end sales charge. The sales charge varies depending on the amount purchased, but will not exceed 4.75%. A-Class share purchases of $1 million or more are exempt from the front-end sales charge but have a 1% contingent deferred sales charge (“CDSC”) if shares are redeemed within 12 months of purchase. C-Class shares have a 1% CDSC if shares are redeemed within 12 months of purchase. Institutional Class shares are offered primarily for direct investment by institutions such as pension and profit sharing plans, endowments, foundations and corporations. Institutional Class shares require a minimum initial investment of $2 million and a minimum account balance of $1 million. At September 30, 2016, the Trust consisted of fifty-three funds.
This report covers the Long Short Equity Fund, Event Driven and Distressed Strategies Fund, Emerging Markets 2x Strategy Fund, Inverse Emerging Markets 2x Strategy Fund and Emerging Markets Bond Strategy Fund (the “Funds”), each a non-diversified investment company. Only A-Class, C-Class, H-Class, P-Class and Institutional Class shares had been issued by the Funds.
The International Equity Funds and Fixed Income Fund are designed and operated to accommodate frequent trading by shareholders and, unlike most mutual funds, offer unlimited exchange privileges with no minimum holding periods or transactions fees, which may cause the Funds to experience high portfolio turnover.
Guggenheim Investments (“GI”) provides advisory services, and Rydex Fund Services, LLC (“RFS”) provided transfer agent, administrative and accounting services to the Trust. Guggenheim Funds Distributors, LLC (“GFD”) acts as principal underwriter for the Trust. GI and GFD are affiliated entities; RFS ceased to be an affiliate of GI as of October 4, 2016, when it was acquired by MUFG Investor Services. In connection with its acquisition, RFS changed its name to MUFG Investors Services (US), LLC (“MUIS”). This change has no impact on the financial statements of the Funds.
Significant Accounting Policies
The Funds operate as investment companies and, accordingly, follow the investment company accounting and reporting guidance of the Financial Accounting Standards Board (“FASB”) Accounting Standards Codification Topic 946 Financial Services – Investment Companies.
The following significant accounting policies are in conformity with U.S. generally accepted accounting principles (“U.S. GAAP”) and are consistently followed by the Trust. This requires management to make estimates and assumptions that affect the reported amount of assets and liabilities, contingent assets and liabilities at the date of the financial statements, and the reported amounts of revenues and expenses during the reporting period. Actual results could differ from these estimates. All time references are based on Eastern Time.
The NAV of each Class of the Funds is calculated by dividing the market value of the Fund’s securities and other assets, less all liabilities, attributable to the Class by the number of outstanding shares of the Class.
The Trust calculates a NAV twice each business day; at 10:45 a.m. and at the close of the New York Stock Exchange (“NYSE”), usually 4:00 p.m. for the Emerging Markets 2x Strategy Fund, Inverse Emerging Markets 2x Strategy Fund and Emerging Markets Bond Strategy Fund. All other Funds in this report will price at the afternoon NAV. The NAV is calculated using the current market value of each Fund’s total assets as of the respective time of calculation. These financial statements are based on the September 30, 2016, afternoon NAV.
A. The Board of Trustees of the Funds (the “Board”) has adopted policies and procedures for the valuation of the Funds’ investments (the “Valuation Procedures”). Pursuant to the Valuation Procedures, the Board has delegated to a valuation committee, consisting of representatives from Guggenheim’s investment management, fund administration, legal and compliance departments (the “Valuation Committee”), the day-to-day responsibility for implementing the Valuation Procedures, including, under most circumstances, the responsibility for determining the fair value of the Funds’ securities and/or other assets.
Valuations of the Funds’ securities are supplied primarily by pricing services appointed pursuant to the processes set forth in the Valuation Procedures. The Valuation Committee convenes monthly, or more frequently as needed, to review the valuation of all assets which have been fair valued for reasonableness. The Funds’ officers, through the Valuation Committee and consistent with the monitoring and review responsibilities set forth in the Valuation Procedures, regularly review procedures used and valuations provided by the pricing services.
| | THE RYDEX FUNDS SEMI-ANNUAL REPORT | 47 |
NOTES TO FINANCIAL STATEMENTS (Unaudited)(continued) |
If the pricing service cannot or does not provide a valuation for a particular investment or such valuation is deemed unreliable, such investment is fair valued by the Valuation Committee.
Equity securities listed on an exchange (NYSE or American Stock Exchange) are valued at the last quoted sales price as of the close of business on the NYSE, usually 4:00 p.m. on the valuation date. Equity securities listed on the NASDAQ market system are valued at the NASDAQ Official Closing Price on the valuation date, which may not necessarily represent the last sale price. If there has been no sale on such exchange or NASDAQ on a given day, the security is valued at the closing bid price on that day.
Open-end investment companies (“Mutual Funds”) are valued at their NAV as of the close of business, on the valuation date. Exchange-traded funds (“ETFs”) and closed-end investment companies (“CEFs”) are valued at the last quoted sales price.
Repurchase agreements are valued at amortized cost, provided such amounts approximate market value.
The value of futures contracts is accounted for using the unrealized gain or loss on the contracts that is determined by marking the contracts to their current realized settlement prices. Financial futures contracts are valued at the 4:00 p.m. price on the valuation date. In the event that the exchange for a specific futures contract closes earlier than 4:00 p.m., the futures contract is valued at the Official Settlement Price of the exchange. However, the underlying securities from which the futures contract value is derived are monitored until 4:00 p.m. to determine if fair valuation would provide a more accurate valuation.
The values of OTC swap agreements and credit default swap agreements entered into by a Fund are accounted for using the unrealized gains or losses on the agreements that are determined by marking the agreements to the last quoted value of the index that the swaps pertain to at the close of the NYSE. The swaps’ values are then adjusted to include dividends accrued, financing charges and/or interest associated with the swap agreements.
Investments for which market quotations are not readily available are fair-valued as determined in good faith by GI under the direction of the Board of Trustees using methods established or ratified by the Board of Trustees.
Valuations in accordance with these methods are intended to reflect each security’s (or asset’s) “fair value.” Each such determination is based on a consideration of all relevant factors, which are likely to vary from one pricing context to another. Examples of such factors may include, but are not limited to: market prices; sale prices; broker quotes; and models which derive prices based on inputs such as prices of securities with comparable maturities and characteristics, or based on inputs such as anticipated cash flows or collateral, spread over Treasuries, and other information analysis.
In connection with futures contracts and other derivative investments, such factors may include obtaining information as to how (a) these contracts and other derivative investments trade in the futures or other derivative markets, respectively, and (b) the securities underlying these contracts and other derivative investments trade in the cash market.
B. When a Fund engages in a short sale of a security, an amount equal to the proceeds is reflected as an asset and an equivalent liability. The amount of the liability is subsequently marked-to-market to reflect the market value of the short sale. The Fund maintains a segregated account of cash and/or securities as collateral for short sales.
Fees, if any, paid to brokers to borrow securities in connection with short sales are recorded as interest expense. In addition, the Fund must pay out the dividend rate of the equity or coupon rate of the obligation to the lender and record this as an expense. Short dividend or interest expense is a cost associated with the investment objective of short sales transactions, rather than an operational cost associated with the day-to-day management of any mutual fund. The Fund may also receive rebate income from the broker resulting from the investment of the proceeds from securities sold short.
C. Upon entering into a futures contract, a Fund deposits and maintains as collateral such initial margin as required by the exchange on which the transaction is affected. Pursuant to the contract, the Fund agrees to receive from or pay to the broker an amount of cash equal to the daily fluctuation in value of the contract. Such receipts or payments are known as variation margin and are recorded by the Fund as unrealized gains or losses. When the contract is closed, the Fund records a realized gain or loss equal to the difference between the value of the contract at the time it was opened and the value at the time it was closed.
D. Swap agreements are marked-to-market daily and the change, if any, is recorded as unrealized gain or loss. Payments received or made as a result of an agreement or termination of an agreement are recognized as realized gains or losses.
Credit default swap agreements are marked-to-market daily and the change, if any, is recorded as unrealized gain or loss. Upfront payments received or made by a Fund on credit default swap agreements are amortized over the expected life of the agreement. Periodic payments received or paid by a Fund are recorded as realized gains or losses. Payments received or made as a result of
48 | THE RYDEX FUNDS SEMI-ANNUAL REPORT | |
NOTES TO FINANCIAL STATEMENTS (Unaudited)(continued) |
a credit event or termination of the contract are recognized, net of a proportional amount of the upfront payment, as realized gains or losses.
E. The accounting records of the Funds are maintained in U.S. dollars. All assets and liabilities initially expressed in foreign currencies are converted into U.S. dollars at prevailing exchange rates. Purchases and sales of investment securities, dividend and interest income, and certain expenses are translated at the rates of exchange prevailing on the respective dates of such transactions. Changes in the relationship of these foreign currencies to the U.S. dollar can significantly affect the value of the investments and earnings of the Funds. Foreign investments may also subject the Funds to foreign government exchange restrictions, expropriation, taxation or other political, social or economic developments, all of which could affect the market and/or credit risk of the investments. The Funds do not isolate that portion of the results of operations resulting from changes in the foreign exchange rates on investments from the fluctuations arising from changes in the market prices of securities held. Such fluctuations are included with the net realized and unrealized gain or loss on investments.
Reported net realized foreign exchange gains and losses arise from sales of foreign currencies and currency gains or losses realized between the trade and settlement dates on investment transactions. Net unrealized exchange gains and losses arise from changes in the fair values of assets and liabilities other than investments in securities at the fiscal period end, resulting from changes in exchange rates.
F. Security transactions are recorded on the trade date for financial reporting purposes. Realized gains and losses from securities transactions are recorded using the identified cost basis. Proceeds from lawsuits related to investment holdings are recorded as realized gains in the respective Fund. Dividend income is recorded on the ex-dividend date, net of applicable taxes withheld by foreign countries. Taxable non-cash dividends are recorded as dividend income. Interest income, including amortization of premiums and accretion of discounts, is accrued on a daily basis. Dividend income from REITs is recorded based on the income included in the distributions received from the REIT investments using published REIT classifications, including some management estimates when actual amounts are not available. Distributions received in excess of this estimated amount are recorded as a reduction of the cost of investments or reclassified to capital gains. The actual amounts of income, return of capital, and capital gains are only determined by each REIT after its fiscal year-end, and may differ from the estimated amounts.
G. Distributions of net investment income and net realized gains, if any, are declared and paid at least annually. Dividends are reinvested in additional shares unless shareholders request payment in cash. Distributions are recorded on the ex-dividend date and are determined in accordance with income tax regulations which may differ from U.S. GAAP.
H. Interest and dividend income, most expenses, all realized gains and losses, and all unrealized gains and losses are allocated to the classes based upon the value of the outstanding shares in each Class. Certain costs, such as distribution and service fees are charged directly to specific classes. In addition, certain expenses have been allocated to the individual Funds in the Trust on a pro rata basis upon the respective aggregate net assets of each Fund included in the Trust.
I. The Funds may leave cash overnight in their cash account with the custodian. Periodically, a Fund may have cash due to the custodian bank as an overdraft balance. A fee is incurred on this overdraft, calculated by multiplying the overdraft by a rate based on the federal funds rate, which was 0.29% at September 30, 2016.
J. Under the Funds’ organizational documents, the Trustees and Officers are indemnified against certain liabilities arising out of the performance of their duties to the Trust. In addition, throughout the normal course of business, the Funds enter into contracts that contain a variety of representations and warranties which provide general indemnifications. The Funds’ maximum exposure under these arrangements is unknown, as this would involve future claims that may be made against the Funds and/or their affiliates that have not yet occurred. However, based on experience, the Funds expect the risk of loss to be remote.
2. Financial Instruments and Derivatives
As part of their investment strategy, the Funds utilize short sales and a variety of derivative instruments. These investments involve, to varying degrees, elements of market risk and risks in excess of the amounts recognized in the Statements of Assets and Liabilities. Valuation and accounting treatment of these instruments can be found under Significant Accounting Policies in Note 1 of these Notes to Financial Statements.
Short Sales
A short sale is a transaction in which a Fund sells a security it does not own. If the security sold short decreases in price between the time the Fund sells the security and closes its short position, the Fund will realize a gain on the transaction. Conversely, if the security increases in price during the period, the Fund will realize a loss on the transaction. The risk of such price increases is the principal risk of engaging in short sales.
| | THE RYDEX FUNDS SEMI-ANNUAL REPORT | 49 |
NOTES TO FINANCIAL STATEMENTS (Unaudited)(continued) |
Derivatives
Derivatives are instruments whose values depend on, or are derived from, in whole or in part, the value of one or more other assets, such as securities, currencies, commodities or indices. Derivative instruments may be used to increase investment flexibility (including to maintain cash reserves while maintaining exposure to certain other assets), for risk management (hedging) purposes, to facilitate trading, to reduce transaction costs and to pursue higher investment returns. Derivative instruments may also be used to mitigate certain investment risks, such as foreign currency exchange rate risk, interest rate risk and credit risk. U.S. GAAP requires disclosures to enable investors to better understand how and why a Fund uses derivative instruments, how these derivative instruments are accounted for and their effects on the Fund’s financial position and results of operations.
The Funds may utilize derivatives for the following purposes:
Duration: the use of an instrument to manage the interest rate risk of a portfolio.
Index Exposure: the use of an instrument to obtain exposure to a listed or other type of index.
Leverage: gaining total exposure to equities or other assets on the long and short sides at greater than 100% of invested capital.
Liquidity: the ability to buy or sell exposure with little price/market impact.
For any Fund whose investment strategy consistently involves applying leverage, the value of the Fund’s shares will tend to increase or decrease more than the value of any increase or decrease in the underlying index or other asset. In addition, because an investment in derivative instruments generally requires a small investment relative to the amount of investment exposure assumed, an opportunity for increased net income is created; but, at the same time, leverage risk will increase. The Fund’s use of leverage, through borrowings or instruments such as derivatives, may cause the Fund to be more volatile and riskier than if they had not been leveraged.
Futures
A futures contract is an agreement to purchase (long) or sell (short) an agreed amount of securities or other instruments at a set price for delivery at a future date. There are significant risks associated with a Fund’s use of futures contracts, including (i) there may be an imperfect or no correlation between the changes in market value of the underlying asset and the prices of futures contracts; (ii) there may not be a liquid secondary market for a futures contract; (iii) trading restrictions or limitations may be imposed by an exchange; and (iv) government regulations may restrict trading in futures contracts. When investing in futures, there is minimal counterparty credit risk to a Fund because futures are exchange-traded and the exchange’s clearinghouse, as counterparty to all exchange-traded futures, guarantees against default. Cash deposits are shown as segregated cash with broker on the Statements of Assets and Liabilities; securities held as collateral are noted on the Schedules of Investments.
The following table represents the Funds’ use and volume of futures on a quarterly basis:
| | | | Average Notional | |
Fund | Use | | Long | | | Short | |
Long Short Equity Fund | Index exposure, Liquidity | | $ | 76,894 | | | $ | 287,100 | |
Event Driven and Distressed Strategies Fund | Index exposure, Liquidity, Duration | | | 4,723,072 | | | | — | |
Emerging Markets 2x Strategy Fund | Index exposure, Leverage, Liquidity | | | 1,442,524 | | | | — | |
Inverse Emerging Markets 2x Strategy Fund | Index exposure, Leverage, Liquidity | | | — | | | | 1,461,598 | |
Emerging Markets Bond Strategy Fund | Index exposure, Leverage, Liquidity, Duration | | | 784,994 | | | | — | |
Swaps
A swap is an agreement that obligates two parties to exchange a series of cash flows at specified intervals based upon or calculated by reference to changes in specified prices or rates for a specified amount of an underlying asset. A Fund utilizing OTC swaps bears the risk of loss of the amount expected to be received under a swap agreement in the event of the default or bankruptcy of a swap agreement counterparty or if the underlying asset declines in value. Certain standardized swaps are subject to mandatory central clearing. Central clearing generally reduces
50 | THE RYDEX FUNDS SEMI-ANNUAL REPORT | |
NOTES TO FINANCIAL STATEMENTS (Unaudited)(continued) |
counterparty credit risk and increases liquidity, but central clearing does not make swap transactions risk-free. Additionally, there is no guarantee that a Fund or an underlying fund could eliminate its exposure under an outstanding swap agreement by entering into an offsetting swap agreement with the same or another party.
Total return swaps involve commitments where single or multiple cash flows are exchanged based on the price of an underlying reference asset (such as index or basket) or a fixed or variable interest rate. Index swaps will usually be computed based on the current index value as of the close of regular trading on the NYSE or other exchange, with the swap value being adjusted to include dividends accrued, financing charges and/or interest associated with the swap agreement. A fund utilizing a total return index swap bears the risk of loss of the amount expected to be received under a swap agreement in the event of the default or bankruptcy of a swap agreement counterparty or if the underlying index declines in value.
The following table represents the Funds’ use and volume of total return swaps on a quarterly basis:
| | | | Average Notional | |
Fund | Use | | Long | | | Short | |
Event Driven and Distressed Strategies Fund | Index exposure, Liquidity | | $ | 1,223,888 | | | $ | — | |
Emerging Markets 2x Strategy Fund | Index exposure, Leverage, Liquidity | | | 29,363,871 | | | | — | |
Inverse Emerging Markets 2x Strategy Fund | Index exposure, Leverage, Liquidity | | | — | | | | 31,751,689 | |
Emerging Markets Bond Strategy Fund | Index exposure, Leverage, Liquidity, Duration | | | 1,008,387 | | | | — | |
Credit default swaps are instruments which allow for the full or partial transfer of third party credit risk, with respect to a particular entity or entities, from one counterparty to the other. In accordance with its principal investment strategy, the Funds enter into credit default swaps as a seller of protection primarily to gain exposure similar to the high yield bond market. A seller of credit default swaps is selling credit protection or assuming credit risk with respect to the underlying entity or entities. If a credit event occurs, as defined under the terms of the swap agreement, the Fund will either (i) pay to the buyer of protection an amount equal to the notional amount of the swap and take delivery of the referenced obligation or underlying securities comprising the referenced index or (ii) pay a net settlement amount in the form of cash or securities equal to the notional amount of the swap less the recovery value of the referenced obligation or underlying securities comprising the referenced index. The Notional Principal reflects the maximum potential amount the Fund could be required to pay as a seller of credit protection if a credit event occurs. As the seller of protection, the Fund receives periodic premium payments from the counterparty and may also receive or pay an upfront premium adjustment to the stated periodic premium. In the event a credit event occurs, an adjustment will be made to any upfront premiums that were received by a reduction of 1.00% per credit event.
The quoted market prices and resulting market values for credit default swap agreements on securities and credit indices serve as an indicator of the current status of the payment/performance risk and represent the likelihood of an expected liability (or profit) for the credit derivative had the notional amount of the swap agreement been closed/sold as of the period end. Increasing market values, in absolute terms when compared to the notional amount of the swap, represent a deterioration of the referenced entity’s credit soundness and a greater likelihood or risk of default or other credit event occurring as defined under the terms of the agreement.
The following table represents the Funds’ use and volume of credit default swaps on a quarterly basis:
| | | | Average Notional | |
Fund | Use | | Long | |
Event Driven and Distressed Strategies Fund | Index exposure, Liquidity, Duration | | $ | 5,013,376 | |
Emerging Markets Bond Strategy Fund | Index exposure, Leverage, Liquidity, Duration | | | 958,521 | |
A credit default swap enables a Fund to buy or sell protection against a defined credit event of an issuer or a basket of securities. Generally, the seller of credit protection against an issuer or basket of securities receives a periodic payment from the buyer to compensate against potential default events. If a default event occurs, the seller must pay the buyer the full notional value of the reference obligation in exchange for the reference obligation. If no default occurs, the counterparty will pay the stream of payments and have no further obligations to the Fund selling the credit protection. A Fund bears the risk of loss of the amount expected to be received under a swap agreement in the event of the default or bankruptcy of a swap agreement counterparty, or in the case of a credit default swap in which the Fund is selling credit protection, the default of a third party issuer.
| | THE RYDEX FUNDS SEMI-ANNUAL REPORT | 51 |
NOTES TO FINANCIAL STATEMENTS (Unaudited)(continued) |
Derivative Investment Holdings Categorized by Risk Exposure
The following is a summary of the location of derivative investments on the Funds’ Statements of Assets and Liabilities as of September 30, 2016:
Derivative Investment Type | Asset Derivatives | Liability Derivatives |
Equity/Interest Rate contracts | Variation margin | Variation margin |
Equity/Credit contracts | Unrealized appreciation on swap agreements | Unrealized depreciation on swap agreements |
The following table sets forth the fair value of the Funds’ derivative investments categorized by primary risk exposure at September 30, 2016:
Asset Derivative Investments Value | |
Fund | | Futures
Equity
Contracts* | | | Swaps
Equity
Contracts | | | Futures
Interest Rate
Contracts* | | | Swaps
Credit Default
Contracts | | | Total Value at
September 30,
2016 | |
Event Driven and Distressed Strategies Fund | | $ | — | | | $ | 3,356 | | | $ | 20,398 | | | $ | 59,120 | | | $ | 82,874 | |
Emerging Markets 2x Strategy Fund | | | 17,206 | | | | 58,424 | | | | — | | | | — | | | | 75,630 | |
Inverse Emerging Markets 2x Strategy Fund | | | — | | | | 14,181 | | | | — | | | | — | | | | 14,181 | |
Emerging Markets Bond Strategy Fund | | | — | | | | 1,531 | | | | 5,118 | | | | 1,547 | | | | 8,196 | |
Liability Derivative Investments Value | |
Fund | | Futures
Equity
Contracts* | | | Swaps
Equity
Contracts | | | Futures
Interest Rate
Contracts* | | | Swaps
Credit Default
Contracts | | | Total Value at
September 30,
2016 | |
Inverse Emerging Markets 2x Strategy Fund | | $ | — | | | $ | 2,232 | | | $ | — | | | $ | — | | | $ | 2,232 | |
* | Includes cumulative appreciation (depreciation) of futures contracts as reported on the Schedules of Investments. Only current day’s variation margin is reported within the Statements of Assets and Liabilities. |
The following is a summary of the location of derivative investments on the Funds’ Statements of Operations for the period ended September 30, 2016:
Derivative Investment Type | Location of Gain (Loss) on Derivatives |
Equity/Interest Rate contracts | Net realized gain (loss) on futures contracts |
| | Net change in unrealized appreciation (depreciation) on futures contracts |
Equity/Credit contracts | Net realized gain (loss) on swap agreements |
| | Net change in unrealized appreciation (depreciation) on swap agreements |
The following is a summary of the Funds’ realized gain (loss) and change in unrealized appreciation (depreciation) on derivative investments recognized on the Statements of Operations categorized by primary risk exposure for the period ended September 30, 2016.
Realized Gain (Loss) on Derivative Investments Recognized on the Statements of Operations | |
Fund | | Futures
Equity
Contracts | | | Swaps
Equity
Contracts | | | Futures
Interest Rate
Contracts | | | Swaps
Credit Default
Contracts | | | Total | |
Long Short Equity Fund | | $ | (97,858 | ) | | $ | — | | | $ | — | | | $ | — | | | $ | (97,858 | ) |
Event Driven and Distressed Strategies Fund | | | 97,933 | | | | (16,755 | ) | | | 12,481 | | | | 234,730 | | | | 328,389 | |
Emerging Markets 2x Strategy Fund | | | 271,862 | | | | 2,109,899 | | | | — | | | | — | | | | 2,381,761 | |
Inverse Emerging Markets 2x Strategy Fund | | | 15,127 | | | | 141,845 | | | | — | | | | — | | | | 156,972 | |
Emerging Markets Bond Strategy Fund | | | — | | | | 205,774 | | | | (203,541 | ) | | | 81,761 | | | | 83,994 | |
52 | THE RYDEX FUNDS SEMI-ANNUAL REPORT | |
NOTES TO FINANCIAL STATEMENTS (Unaudited)(continued) |
Change in Unrealized Appreciation (Depreciation) on Derivative Investments Recognized on the Statements of Operations | |
Fund | | Futures
Equity
Contracts | | | Swaps
Equity
Contracts | | | Futures
Interest Rate
Contracts | | | Swaps
Credit Default
Contracts | | | Total | |
Long Short Equity Fund | | $ | (5,937 | ) | | $ | — | | | $ | — | | | $ | — | | | $ | (5,937 | ) |
Event Driven and Distressed Strategies Fund | | | (29,249 | ) | | | (64,544 | ) | | | 9,980 | | | | (6,742 | ) | | | (90,555 | ) |
Emerging Markets 2x Strategy Fund | | | (17,226 | ) | | | (312,533 | ) | | | — | | | | — | | | | (329,759 | ) |
Inverse Emerging Markets 2x Strategy Fund | | | (140 | ) | | | 55,996 | | | | — | | | | — | | | | 55,856 | |
Emerging Markets Bond Strategy Fund | | | — | | | | 1,531 | | | | 1,967 | | | | 3,055 | | | | 6,553 | |
In conjunction with the use of short sales and derivative instruments, the Funds are required to maintain collateral in various forms. The Funds use, where appropriate, depending on the financial instrument utilized and the broker involved, margin deposits at the broker, cash and/or securities segregated at the custodian bank, discount notes or the repurchase agreements allocated to the Funds.
There are several risks associated with exposure to foreign currencies, foreign issuers and emerging markets. A Fund’s indirect and direct exposure to foreign currencies subjects the Fund to the risk that those currencies will decline in value relative to the U.S. dollar, or in the case of short positions, that the U.S. dollar will decline in value relative to the currency being hedged. Currency rates in foreign countries may fluctuate significantly over short periods of time for a number of reasons, including changes in interest rates and the imposition of currency controls or other political developments in the U.S. or abroad. In addition, the Fund may incur transaction costs in connection with conversions between various currencies. The Fund may, but is not obligated to, engage in currency hedging transactions, which generally involve buying currency forward, options or futures contracts. However, not all currency risks may be effectively hedged, and in some cases the costs of hedging techniques may outweigh expected benefits. In such instances, the value of securities denominated in foreign currencies can change significantly when foreign currencies strengthen or weaken relative to the U.S. dollar.
Certain Funds may invest in securities of foreign companies directly, or in financial instruments, such as ADRs and exchange-traded funds, which are indirectly linked to the performance of foreign issuers. Foreign markets can be more volatile than the U.S. market due to increased risks of adverse issuer, political, regulatory, market, or economic developments and can perform differently from the U.S. market. Investing in securities of foreign companies directly, or in financial instruments that are indirectly linked to the performance of foreign issuers, may involve risks not typically associated with investing in U.S. issuers. The value of securities denominated in foreign currencies, and of dividends from such securities, can change significantly when foreign currencies strengthen or weaken relative to the U.S. dollar. Foreign securities markets generally have less trading volume and less liquidity than U.S. markets, and prices in some foreign markets may fluctuate more than those of securities traded on U.S. markets. Many foreign countries lack accounting and disclosure standards comparable to those that apply to U.S. companies, and it may be more difficult to obtain reliable information regarding a foreign issuer’s financial condition and operations. Transaction costs and costs associated with custody services are generally higher for foreign securities than they are for U.S. securities. Some foreign governments levy withholding taxes against dividend and interest income. Although in some countries portions of these taxes are recoverable, the non-recovered portion will reduce the income received by the Fund.
The Trust has established counterparty credit guidelines and enters into transactions only with financial institutions of investment grade or better. The Trust monitors the counterparty credit risk.
Emerging markets, which consist of countries that have an emerging stock market as defined by Standard & Poor’s®, countries or markets with low-to middle-income economies as classified by the World Bank, and other countries or markets with similar characteristics as determined by GI, can be more volatile than the U.S. market due to increased risks of adverse issuer, political, regulatory, market, or economic developments and can perform differently from the U.S. market. Emerging markets can be subject to greater social, economic, regulatory, and political uncertainties and can be extremely volatile. As a result, the securities of emerging market issuers may present market, credit, currency, liquidity, legal, political and other risks different from, or greater than, the risks of investing in securities of developed foreign countries. In addition, the risks associated with investing in a narrowly defined geographic area are generally more pronounced with respect to investments in emerging market countries. The Fund may also be subject to this risk with respect to its investments in derivatives or other securities or financial instruments whose returns are related to the returns of emerging market securities.
The Trust has established counterparty credit guidelines and enters into transactions only with financial institutions of investment grade or better. The Trust monitors the counterparty credit risk.
| | THE RYDEX FUNDS SEMI-ANNUAL REPORT | 53 |
NOTES TO FINANCIAL STATEMENTS (Unaudited)(continued) |
3. Fees and Other Transactions with Affiliates
Under the terms of an investment advisory contract, the Funds pay GI investment advisory fees calculated at the annualized rates below, based on the average daily net assets of the Funds:
Fund | Management Fees
(as a % of Net Assets) |
Long Short Equity Fund | 0.90% |
Event Driven and Distressed Strategies Fund | 0.90% |
Emerging Markets 2x Strategy Fund | 0.90% |
Inverse Emerging Markets 2x Strategy Fund | 0.90% |
Emerging Markets Bond Strategy Fund | 0.75% |
RFS provided transfer agent and administrative services to the Funds for fees calculated at the annualized rate of 0.25% based on the average daily net assets of each Fund.
RFS also provided accounting services to the Funds for fees calculated at annualized rates below, based on the average daily net assets of each Fund.
Fund | Accounting Fees
(as a % of Net Assets) |
Emerging Markets 2x Strategy Fund | 0.15% |
Inverse Emerging Markets 2x Strategy Fund | 0.15% |
Emerging Markets Bond Strategy Fund | 0.15% |
Remaining Funds | |
On the first $250 million | 0.10% |
On the next $250 million | 0.075% |
On the next $250 million | 0.05% |
Over $750 million | 0.03% |
GI engages external service providers to perform other necessary services for the Trust, such as audit and accounting related services, legal services, custody, printing and mailing, etc., on a pass-through basis. Such expenses are allocated to various Funds within the complex based on relative net assets.
The Trust has adopted a Distribution Plan applicable to A-Class shares and H-Class shares for which GFD and other firms that provide distribution and/or shareholder services (“Service Providers”) may receive compensation. If a Service Provider provides distribution services, the Funds will pay distribution fees to GFD at an annual rate not to exceed 0.25% of average daily net assets, pursuant to Rule 12b-1 of the 1940 Act. GFD, in turn, will pay the Service Provider out of its fees. GFD may, at its discretion, retain a portion of such payments to compensate itself for distribution services.
The Trust has adopted a separate Distribution and Shareholder Services Plan applicable to its C-Class shares that allows the Funds to pay annual distribution and service fees of 1.00% of the Funds’ C-Class shares average daily net assets. The annual 0.25% service fee compensates a shareholder’s financial adviser for providing ongoing services to the shareholder. The annual distribution fee of 0.75% reimburses GFD for paying the shareholder’s financial adviser an ongoing sales commission. GFD advances the first year’s service and distribution fees to the financial adviser. GFD retains the service and distribution fees on accounts with no authorized dealer of record.
GI has contractually agreed to reduce fees and/or reimburse expenses for the Event Driven and Distressed Strategies Fund to the extent necessary to keep net operating expenses relative to the average daily net assets of A-Class, C-Class, H-Class, and Institutional Class shares (excluding interest, taxes, brokerage commissions, acquired fund fees and expenses, dividends on securities sold short, and extraordinary expenses) from exceeding 1.90%, 2.65%, 1.90%, and 1.65%, respectively. The total annual fund operating expenses after fee waiver and/or expense reimbursement includes excluded expenses and, thus, from time to time may be higher than 1.90%, 2.65%, 1.90% and 1.65%, respectively. This agreement may be terminated only with the approval of the Fund’s Board.
For the period ended September 30, 2016, GFD retained sales charges of $145,031 relating to sales of A-Class shares of the Trust.
54 | THE RYDEX FUNDS SEMI-ANNUAL REPORT | |
NOTES TO FINANCIAL STATEMENTS (Unaudited)(continued) |
Certain trustees and officers of the Trust are also officers of GI and GFD.
4. Fair Value Measurement
In accordance with U.S. GAAP, fair value is defined as the price that the Funds would receive to sell an investment or pay to transfer a liability in an orderly transaction with an independent buyer in the principal market, or in the absence of a principal market, the most advantageous market for the investment or liability. U.S. GAAP establishes a three-tier fair value hierarchy based on the types of inputs used to value assets and liabilities and requires corresponding disclosure. The hierarchy and the corresponding inputs are summarized below:
Level 1 — | quoted prices in active markets for identical assets or liabilities. |
Level 2 — | significant other observable inputs (for example quoted prices for securities that are similar based on characteristics such as interest rates, prepayment speeds, credit risk, etc.). |
Level 3 — | significant unobservable inputs based on the best information available under the circumstances, to the extent observable inputs are not available, which may include assumptions. |
The types of inputs available depend on a variety of factors, such as the type of security and the characteristics of the markets in which it trades, if any. Fair valuation determinations that rely on fewer or no observable inputs require greater judgment. Accordingly, fair value determinations for Level 3 securities require the greatest amount of judgment.
The inputs or methodologies used for valuing securities are not necessarily an indication of the risk associated with investing in those securities. The suitability of the techniques and sources employed to determine fair valuation are regularly monitored and subject to change.
5. Repurchase Agreements
The Funds transfer uninvested cash balances into a single joint account, the daily aggregate balance of which is invested in one or more repurchase agreements collateralized by obligations of the U.S. Treasury and U.S. government agencies. The collateral is in the possession of the Funds’ custodian and is evaluated to ensure that its market value exceeds, at a minimum, 102% of the original face amount of the repurchase agreements. Each Fund holds a pro rata share of the collateral based on the dollar amount of the repurchase agreement entered into by each Fund.
At September 30, 2016, the repurchase agreements in the joint account were as follows:
Counterparty and
Terms of Agreement | | | Face Value | | | Repurchase Price | | | Collateral | | | Par Value | | | Fair Value | |
HSBC Securities, Inc. | | | | | | | | | U.S. Treasury Strips | | | | | | | |
0.38% | | | | | | | | | 0.00% | | | | | | | |
Due 10/03/16 | | | $ | 469,487,376 | | | $ | 469,502,243 | | | 11/15/39 | | | $ | 803,943,000 | | | $ | 478,877,146 | |
| | | | | | | | | | | | | | | | | | | | | |
Royal Bank of Canada | | | | | | | | | | | U.S. Treasury Notes | | | | | | | | | |
0.36% | | | | | | | | | | | 1.38%-1.50% | | | | | | | | | |
Due 10/03/16 | | | | 419,594,468 | | | | 419,607,056 | | | 05/31/20 | | | | 370,488,200 | | | | 380,230,860 | |
| | | | | | | | | | | | U.S. TIP Notes | | | | | | | | | |
| | | | | | | | | | | | 0.25% | | | | | | | | | |
| | | | | | | | | | | | 01/15/25 | | | | 46,061,100 | | | | 47,755,613 | |
| | | | | | | | | | | | | | | | 416,549,300 | | | | 427,986,473 | |
In the event of counterparty default, the Funds have the right to collect the collateral to offset losses incurred. There is potential loss to the Funds in the event the Funds are delayed or prevented from exercising their rights to dispose of the collateral securities, including the risk of a possible decline in the value of the underlying securities during the period while the Funds seek to assert their rights. The Funds’ investment adviser, acting under the supervision of the Board, reviews the value of the collateral and the creditworthiness of those banks and dealers with which the Funds enter into repurchase agreements to evaluate potential risks.
| | THE RYDEX FUNDS SEMI-ANNUAL REPORT | 55 |
NOTES TO FINANCIAL STATEMENTS (Unaudited)(continued) |
6. Offsetting
In the normal course of business, the Funds enter into transactions subject to enforceable master netting arrangements or other similar arrangements. Generally, the right to offset in those agreements allows the Funds to counteract the exposure to a specific counterparty with collateral received from or delivered to that counterparty based on the terms of the arrangements. These arrangements provide for the right to liquidate upon the occurrence of an event of default, credit event upon merger or additional termination event.
In order to better define their contractual rights and to secure rights that will help the Funds mitigate their counterparty risk, the Funds may enter into an International Swaps and Derivatives Association, Inc. Master Agreement (“ISDA Master Agreement”) or similar agreement with their derivative contract counterparties. An ISDA Master Agreement is a bilateral agreement between a Fund and a counterparty that governs OTC derivatives, including foreign exchange contracts, and typically contains, among other things, collateral posting terms and netting provisions in the event of a default and/or termination event. The provisions of the ISDA Master Agreement typically permit a single net payment in the event of a default (close-out netting) or similar event, including the bankruptcy or insolvency of the counterparty.
For derivatives traded under an ISDA Master Agreement, the collateral requirements are typically calculated by netting the mark-to-market amount for each transaction under such agreement and comparing that amount to the value of any collateral currently pledged by the Funds and the counterparty. For financial reporting purposes, cash collateral that has been pledged to cover obligations of the Funds and cash collateral received from the counterparty, if any, are reported separately on the Statements of Assets and Liabilities as segregated cash with broker/receivable for variation margin, or payable for swap settlement/variation margin. Generally, the amount of collateral due from or to a counterparty must exceed a minimum transfer amount threshold (e.g., $300,000) before a transfer is required to be made. To the extent amounts due to the Funds from their counterparties are not fully collateralized, contractually or otherwise, the Funds bear the risk of loss from counterparty nonperformance. The Funds attempt to mitigate counterparty risk by only entering into agreements with counterparties that they believe to be of good standing and by monitoring the financial stability of those counterparties.
For financial reporting purposes, the Funds do not offset derivative assets and derivative liabilities that are subject to netting arrangements in the Statements of Assets and Liabilities.
The following tables present derivative financial instruments and secured financing transactions that are subject to enforceable netting arrangements and offset in the Statements of Assets and Liabilities in conformity with U.S. GAAP:
| | | | | | | | | | | | | Gross Amounts Not Offset
in the Statements of
Assets and Liabilities | | | | |
Fund | Instrument | | Gross
Amount of
Recognized
Assets1 | | | Gross
Amounts
Offset In the
Statements of
Assets and
Liabilities | | | Net Amount
of Asset
Presented on the Statements
of Assets and
Liabilities | | | Financial
Instruments | | | Cash
Collateral
Received | | | Net
Amount | |
Event Driven and Distressed Strategies Fund | Swap equity contracts | | $ | 3,356 | | | $ | — | | | $ | 3,356 | | | $ | — | | | $ | — | | | $ | 3,356 | |
Emerging Markets 2x Strategy Fund | Swap equity contracts | | | 58,424 | | | | — | | | | 58,424 | | | | — | | | | — | | | | 58,424 | |
Inverse Emerging Markets 2x Strategy Fund | Swap equity contracts | | | 14,181 | | | | — | | | | 14,181 | | | | — | | | | — | | | | 14,181 | |
Emerging Markets Bond Strategy Fund | Swap equity contracts | | | 1,531 | | | | — | | | | 1,531 | | | | — | | | | — | | | | 1,531 | |
56 | THE RYDEX FUNDS SEMI-ANNUAL REPORT | |
NOTES TO FINANCIAL STATEMENTS (Unaudited)(continued) |
| | | | | | | | | | | | | Gross Amounts Not Offset
in the Statements of
Assets and Liabilities | | | | |
Fund | Instrument | | Gross
Amounts of
Recognized
Liabilities1 | | | Gross
Amounts
Offset In the
Statements
of Assets and
Liabilities | | | Net Amount
of Liabilities
Presented on the Statements
of Assets and
Liabilities | | | Financial
Instruments | | | Cash
Collateral
Pledged | | | Net
Amount | |
Event Driven and Distressed Strategies Fund | Swap equity contracts | | $ | 2,232 | | | $ | — | | | $ | 2,232 | | | $ | 2,232 | | | $ | — | | | $ | — | |
1 | Centrally cleared swaps and exchange-traded futures are excluded from these reported amounts. |
7. Federal Income Tax Information
The Funds intend to comply with the provisions of Subchapter M of the Internal Revenue Code applicable to regulated investment companies and will distribute substantially all taxable net investment income and capital gains sufficient to relieve the Funds from all, or substantially all, federal income, excise and state income taxes. Therefore, no provision for federal or state income tax is required.
Tax positions taken or expected to be taken in the course of preparing the Funds’ tax returns are evaluated to determine whether the tax positions are “more-likely-than-not” of being sustained by the applicable tax authority. Tax positions not deemed to meet the more-likely-than-not threshold would be recorded as a tax benefit or expense in the current year. Management has analyzed the Funds’ tax positions taken, or to be taken, on federal income tax returns for all open tax years, and has concluded that no provision for income tax is required in the Funds’ financial statements. The Funds’ federal tax returns are subject to examination by the Internal Revenue Service for a period of three years after they are filed.
At September 30, 2016, the cost of securities for federal income tax purposes, the aggregate gross unrealized gain for all securities for which there was an excess of value over tax cost, and the aggregate gross unrealized loss for all securities for which there was an excess of tax cost over value were as follows:
Fund | | Tax
Cost | | | Tax
Unrealized
Gain | | | Tax
Unrealized
Loss | | | Net
Unrealized
Gain | |
Long Short Equity Fund | | $ | 40,986,262 | | | $ | 2,461,140 | | | $ | (1,238,610 | ) | | $ | 1,222,530 | |
Event Driven and Distressed Strategies Fund | | | 6,880,117 | | | | 13,221 | | | | (1,257 | ) | | | 11,964 | |
Emerging Markets 2x Strategy Fund | | | 19,705,227 | | | | 747,277 | | | | (18,262 | ) | | | 729,015 | |
Inverse Emerging Markets 2x Strategy Fund | | | 1,451,090 | | | | — | | | | — | | | | — | |
Emerging Markets Bond Strategy Fund | | | 1,132,834 | | | | — | | | | — | | | | — | |
8. Securities Transactions
For the period ended September 30, 2016, the cost of purchases and proceeds from sales of investment securities, excluding government securities, short-term investments and derivatives, were as follows:
Fund | | Purchases | | | Sales | |
Long Short Equity Fund | | $ | 71,109,091 | | | $ | 68,185,896 | |
Event Driven and Distressed Strategies Fund | | | 1,676,769 | | | | 3,069,786 | |
Emerging Markets 2x Strategy Fund | | | 115,924,153 | | | | 118,245,140 | |
Emerging Markets Bond Strategy Fund | | | 3,913,708 | | | | 4,197,709 | |
The Funds are permitted to purchase or sell securities from or to certain affiliated funds under specified conditions outlined in procedures adopted by the Board of the Trust. The procedures have been designed to ensure that any purchase or sale of securities by a Fund from or to another fund or portfolio that is or could be considered an affiliate by virtue of having a common investment adviser (or affiliated investment
| | THE RYDEX FUNDS SEMI-ANNUAL REPORT | 57 |
NOTES TO FINANCIAL STATEMENTS (Unaudited)(continued) |
advisers), common Trustees and/or common officers complies with Rule 17a-7 of the 1940 Act. Further, as defined under these procedures, each transaction is effected at the current market price to save costs, where permissible. For the period ended September 30, 2016, the Funds engaged in purchases and sales of securities, pursuant to Rule 17a-7 of the 1940 Act, as follows:
Fund | | Purchases | | | Sales | | | Realized
Loss | |
Event Driven and Distressed Strategies Fund | | $ | — | | | $ | 1,825,120 | | | $ | (98,870 | ) |
Emerging Markets 2x Strategy Fund | | | 1,095,745 | | | | 105,645 | | | | (8,731 | ) |
9. Affiliated Transactions
Investments representing 5% or more of the outstanding voting shares of a portfolio company of a fund, or control of or by, or common control under GI, result in that portfolio company being considered an affiliated company of such fund, as defined in the 1940 Act.
The Funds may invest in the Guggenheim Strategy Funds Trust consisting of Guggenheim Strategy Fund I, Guggenheim Strategy Fund II, Guggenheim Strategy Fund III, and Guggenheim Variable Insurance Strategy Fund III (collectively, the “Cash Management Funds”), open-end management investment companies managed by GI. The Cash Management Funds, which launched on March 11, 2014, are offered as cash management options only to mutual funds, trusts, and other accounts managed by GI and/or its affiliates, and are not available to the public. The Cash Management Funds pay no investment management fees. The Cash Management Funds’ annual report on Form N-CSR dated September 30, 2015, is available publicly or upon request. This information is available from the EDGAR database on the SEC’s website at http://www.sec.gov/Archives/edgar/data/1601445/000089180415000857/gug63224-ncsr.htm.
Transactions during the period ended September 30, 2016, in which the portfolio company is an “affiliated person,” were as follows:
Affiliated issuers by Fund | | Value
03/31/16 | | | Additions | | | Reductions | | | Value
09/30/16 | | | Shares
09/30/16 | | | Investment
Income | | | Realized
Gain (Loss) | |
Long Short Equity Fund | | | | | | | | | | | | | | | | | | | | | |
Guggenheim Strategy Fund I | | $ | 2,054,852 | | | $ | 17,314 | | | $ | — | | | $ | 2,087,117 | | | | 83,518 | | | $ | 17,182 | | | $ | — | |
Guggenheim Strategy Fund II | | | 14,088 | | | | 154 | | | | — | | | | 14,386 | | | | 577 | | | | 153 | | | | — | |
| | | $ | 2,068,940 | | | $ | 17,468 | | | $ | — | | | $ | 2,101,503 | | | | | | | $ | 17,335 | | | $ | — | |
| | | | | | | | | | | | | | | | | | | | | | | | | | | | | |
Event Driven and Distressed Strategies Fund | | | | | | | | | | | | | | | | | | | | | | | | | | | | |
Guggenheim Strategy Fund I | | $ | 2,031,647 | | | $ | 821,298 | | | $ | (200,000 | ) | | $ | 2,670,956 | | | | 106,881 | | | $ | 21,129 | | | $ | (804 | ) |
Guggenheim Strategy Fund II | | | 2,039,748 | | | | 827,774 | | | | (200,000 | ) | | | 2,693,287 | | | | 107,991 | | | | 27,483 | | | | (1,615 | ) |
| | | $ | 4,071,395 | | | $ | 1,649,072 | | | $ | (400,000 | ) | | $ | 5,364,243 | | | | | | | $ | 48,612 | | | $ | (2,419 | ) |
10. Line of Credit
The Trust, along with other affiliated trusts, secured an uncommitted $75,000,000 line of credit from U.S. Bank, N.A., which expires June 11, 2017. This line of credit is reserved for emergency or temporary purposes. Borrowings, if any, under this arrangement bear interest equal to the Prime Rate, minus 2%, which shall be paid monthly, averaging 1.31% for the period ended September 30, 2016. The Funds did not have any borrowings outstanding under this agreement at September 30, 2016.
The average daily balances borrowed for the period ended September 30, 2016, were as follows:
Fund | | Average Daily Balance | |
Event Driven and Distressed Strategies Fund | | $ | 3,278 | |
Emerging Markets 2x Strategy Fund | | | 17,286 | |
58 | THE RYDEX FUNDS SEMI-ANNUAL REPORT | |
NOTES TO FINANCIAL STATEMENTS (Unaudited)(continued) |
11. Legal Proceedings
Tribune Company
Rydex Series Funds has been named as a defendant and a putative member of the proposed defendant class of shareholders in the case entitled Kirschner v. FitzSimons, No. 12-2652 (S.D.N.Y.) (formerly Official Committee of Unsecured Creditors of Tribune Co. v. FitzSimons, Adv. Pro. No. 10-54010 (Bankr. D. Del.)) (the “FitzSimons action”), as a result of ownership by certain series of the Rydex Series Funds of shares in the Tribune Company (“Tribune”) in 2007, when Tribune effected a leveraged buyout transaction (“LBO”) by which Tribune converted to a privately-held company. In his complaint, the plaintiff has alleged that, in connection with the LBO, Tribune insiders and shareholders were overpaid for their Tribune stock using financing that the insiders knew would, and ultimately did, leave Tribune insolvent. The plaintiff has asserted claims against certain insiders, major shareholders, professional advisers, and others involved in the LBO. The plaintiff is also attempting to obtain from former Tribune shareholders, including the Rydex Series Funds, the proceeds they received in connection with the LBO.
In June 2011, a group of Tribune creditors filed multiple actions against former Tribune shareholders involving state law constructive fraudulent conveyance claims arising out of the 2007 LBO (the “SLCFC actions”). Rydex Series Funds has been named as a defendant in one or more of these suits. In those actions, the creditors seek to recover from Tribune’s former shareholders the proceeds received in connection with the 2007 LBO.
The FitzSimons action and the SLCFC actions have been consolidated with the majority of the other Tribune LBO-related lawsuits in a multidistrict litigation proceeding captioned In re Tribune Company Fraudulent Conveyance Litig., No. 11-md-2696 (S.D.N.Y.) (the “MDL Proceeding”).
On September 23, 2013, the District Court granted the defendants’ omnibus motion to dismiss the SLCFC actions, on the basis that the creditors lacked standing. On September 30, 2013, the creditors filed a notice of appeal of the September 23 order. On October 28, 2013, the defendants filed a joint notice of cross-appeal of that same order.
On March 29, 2016, the U.S. Court of Appeals for the Second Circuit issued its opinion on the appeal of the SLCFC actions. The appeals court affirmed the district court’s dismissal of those lawsuits, but on different grounds than the district court. The appeals court held that while the plaintiffs have standing under the U.S. Bankruptcy Code, their claims were preempted by Section 546(e) of the Bankruptcy Code—the statutory safe harbor for settlement payments. On April 12, 2016, the Plaintiffs in the SLCFC actions filed a petition seeking rehearing en banc before the appeals court. On July 22, 2016, the appeals court denied the petition. On September 9, 2016, the plaintiffs filed a petition for writ of certiorari in the U.S. Supreme Court challenging the Second Circuit’s decision that the safe harbor of Section 546(e) applied to their claims. The shareholder defendants, including the Funds, filed a joint brief in opposition to the petition for certiorari on October 24, 2016. The Supreme Court has not yet granted or denied the petition for certiorari.
On May 23, 2014, the defendants filed motions to dismiss the FitzSimons action, including a global motion to dismiss Count I, which is the claim brought against former Tribune shareholders for intentional fraudulent conveyance under U.S. federal law. The Court has not yet issued a decision on any of these motions.
None of these lawsuits alleges any wrongdoing on the part of Rydex Series Funds. The following series of Rydex Series Funds held shares of Tribune and tendered these shares as part of Tribune’s LBO: Nova Fund, S&P 500® Pure Value Fund, Multi-Cap Core Equity Fund, S&P 500® Fund, Multi-Hedge Strategies Fund and Hedged Equity Fund (the “Funds”). The value of the proceeds received by the foregoing Funds was $28,220, $109,242, $9,860, $3,400, $1,181,160, and $10,880, respectively. At this stage of the proceedings, Rydex Series Funds is not able to make a reliable predication as to the outcome of these lawsuits or the effect, if any, on a Fund’s net asset value.
Lyondell Chemical Company
In December 2011, Rydex Series Funds was named as a defendant in Weisfelner, as Trustee of the LB Creditor Trust, v. Fund 1 (In re Lyondell Chemical Co.), Adv. Pro. No. 10-4609 (Bankr. S.D.N.Y.) (the “Creditor Trust Action”). Its funds may also be putative members of the proposed defendant classes in Weisfelner, as Trustee of the LB Litigation Trust v. A. Holmes & H. Holmes TTEE (In re Lyondell Co.), Adv. Pro. No. 10-5525 (Bankr. S.D.N.Y.) (the “Litigation Trust Action”) and Weisfelner, as Trustee of the LB Creditor Trust, v. Reichman (In re Lyondell Chemical Co.), Adv. Pro. No. 12-1570 (Bankr. S.D.N.Y.).
| | THE RYDEX FUNDS SEMI-ANNUAL REPORT | 59 |
NOTES TO FINANCIAL STATEMENTS (Unaudited)(continued) |
Similar to the claims made in the Tribune matter, the Weisfelner complaints seek to have set aside and recovered as fraudulent transfers from former Lyondell Chemical Company (“Lyondell”) shareholders the consideration paid to them pursuant to the cash out merger of Lyondell shareholders in connection with the combination of Lyondell and Basell AF in 2007. Lyondell filed for bankruptcy in 2008. The Creditor Trust Action and Reichman allege claims against the former Lyondell shareholders under state law for both constructive fraudulent transfer and intentional fraudulent transfer. The Litigation Trust Action alleges a claim against the former Lyondell shareholders under federal law for intentional fraudulent transfer.
On April 7, 2014, the plaintiff filed a Third Amended Complaint in the Creditor Trust Action, a Second Amended Complaint in the Litigation Trust Action, and an Amended Complaint in Reichman.
On May 8, 2014, the plaintiff in the Litigation Trust Action filed a motion to certify a defendant class generally comprised of all former Lyondell shareholders that received proceeds in exchange for their shares in the 2007 merger transaction.
On July 30, 2014, the defendants filed a motion to dismiss these lawsuits. The Bankruptcy Court held oral argument on the motion to dismiss and on the motion for class certification on January 14 and January 15, 2015. On September 15, 2015, the Bankruptcy Court denied the motion for class certification without prejudice to the plaintiff’s right to file a renewed motion. On November 18, 2015, the Bankruptcy Court granted the defendants’ motion to dismiss the intentional fraudulent transfer claims in the Creditor Trust Action, the Litigation Trust Action, and in Reichman, but denied the motion to dismiss the constructive fraudulent transfer claims in the Creditor Trust Action and in Reichman. The Bankruptcy Court entered final judgment dismissing the Litigation Trust Action, but the plaintiff appealed the dismissal to the U.S. District Court for the Southern District of New York.
On July 27, 2016, the District Court reversed the Bankruptcy Court and reinstated the federal law intentional fraudulent transfer claim in the Litigation Trust Action and remanded to the Bankruptcy Court for further proceedings. The District Court found that the fraudulent intent that mattered was that of Lyondell’s CEO, not its board, because the CEO’s intent could be imputed to Lyondell under Delaware law agency principles. The District Court did note, however, that plaintiff faces a high standard for proving “actual intent” to harm creditors, and that it remains to be seen whether plaintiff will be able to make this showing. On August 11, 2016, the shareholder defendants filed a motion for reconsideration and/or to certify an interlocutory appeal of the District Court’s opinion. On October 5, 2016, the District Court denied the motion for reconsideration and/or to certify an interlocutory appeal. In light of this ruling, the federal intentional fraudulent conveyance claim will move forward before the Bankruptcy Court, but a schedule for that case has not yet been set.
On May 4, 2016, the defendants filed a motion to dismiss, or in the alternative, for a stay of, the Creditor Trust Action and Reichman in light of the U.S. Court of Appeals for the Second Circuit’s opinion in the appeal of the Tribune SLCFC actions. On July 20, 2016, the Bankruptcy Court issued a report and recommendation granting the defendants’ motion to dismiss. The U.S. District Court for the Southern District of New York has not yet accepted the Bankruptcy Court’s recommendation or entered a final judgment.
These lawsuits do not allege any wrongdoing on the part of Rydex Series Funds. The following series of Rydex Series Funds received cash proceeds from the cash out merger in the following amounts: Basic Materials Fund - $1,725,168; Long Short Equity Fund f/k/a U.S. Long Short Momentum Fund - $2,193,600; Global 130/30 Strategy Fund - $37,920; Hedged Equity Fund - $1,440; and Multi-Hedge Strategies Fund - $1,116,480. At this stage of the proceedings, Rydex Series Funds is not able to make a reliable predication as to the outcome of these lawsuits or the effect, if any, on a Fund’s net asset value.
12. H-Class Shares Redesignated as P-Class Shares
Effective following the close of business on April 30, 2015, (the “Redesignation Date”), all outstanding H-Class shares of the Guggenheim Event Driven and Distressed Strategies Fund and Guggenheim Long Short Equity Fund (collectively, the “Funds”) were redesignated as P-Class shares, and the Funds will no longer offer H-Class shares.
P-Class shares of the Funds are offered primarily through broker/dealers and other financial intermediaries with which Guggenheim Funds Distributors, LLC has an agreement for the use of P-Class shares of the Funds in investment products, programs or accounts. P-Class shares do not have a minimum initial investment amount, subsequent investment amount or a minimum account balance. The Funds reserve the right to modify their minimum investment amount and account balance requirements at any time, with or without prior notice to you.
60 | THE RYDEX FUNDS SEMI-ANNUAL REPORT | |
NOTES TO FINANCIAL STATEMENTS (Unaudited)(concluded) |
13. Subsequent Events
Share Splits
Share Splits occurred for the following Funds at the close of business:
Fund | Effective Date | Split Type |
Inverse Emerging Markets 2x Strategy Fund | October 31, 2016 | One-for-Six Reverse Split |
Emerging Markets Bond Strategy Fund | November 07, 2016 | One-for-Four Reverse Split |
The effect of these transactions was to divide the number of outstanding shares of Inverse Emerging Markets 2x Strategy Fund and Emerging Markets Bond Strategy Fund by their respective reverse split ratios, resulting in corresponding increases in the NAVs. The share transactions presented in the Statements of Changes in net assets and the per share data in the Financial Highlights for each of the periods presented through September 30, 2016, have been restated to reflect these respective share splits. There were no changes in net assets, results of operations or total return as a result of these transactions.
Portfolio Securities Loaned
Effective October 6, 2016, each Fund may lend portfolio securities to certain creditworthy borrowers, including the Funds’ securities lending agent. The loans would be collateralized at all times by cash and/or high grade debt obligations in an amount at least equal to 102% of the market value of securities loaned as determined at the close of business on the preceding business day. The cash collateral received would be held in a separately managed account established for each respective Fund and maintained by the lending agent exclusively for the investment of securities lending cash collateral on behalf of each Fund. The separately managed accounts will invest in short-term investments valued at amortized cost, which approximates market value. Each Fund will receive compensation for lending securities from interest or dividends earned on the cash, cash equivalents or U.S. government securities held as collateral, net of fee rebates paid to the borrower plus reasonable administrative and custody fees paid to the lending agent. Such compensation will be accrued daily and payable to the Fund monthly. The dividend and interest income earned on the securities loaned will be accounted for in the same manner as other dividend and interest income. The borrower will pay to the Funds an amount equal to any dividends or interest received on loaned securities. These payments from the borrower are not eligible for reduced tax rates as “qualified dividend income” under the Jobs and Growth Tax Reconciliation Act of 2003. The Funds would retain all or a portion of the interest received on investment of cash collateral or receives a fee from the borrower.
Although the collateral mitigates risk, the Funds could experience a delay in recovering its securities and a possible loss of income or value if the borrower fails to return the securities. The Funds have the right under the securities lending agreement to recover the securities from the borrower on demand.
| | THE RYDEX FUNDS SEMI-ANNUAL REPORT | 61 |
OTHER INFORMATION (Unaudited) |
Proxy Voting Information
A description of the policies and procedures that the Trust uses to determine how to vote proxies relating to securities held in the Funds’ portfolios is available, without charge and upon request, by calling 800.820.0888. This information is also available from the EDGAR database on the SEC’s website at https://www.sec.gov.
Information regarding how the Funds voted proxies relating to portfolio securities during the most recent 12-month period ended June 30 is available without charge, upon request, by calling 800.820.0888. This information is also available from the EDGAR database on the SEC’s website at https://www.sec.gov.
Sector Classification
Information in the Schedule of Investments is categorized by sectors using sector-level Classifications defined by the Bloomberg Industry Classification System, a widely recognized industry classification system provider. Each Fund’s registration statement has investment policies relating to concentration in specific sectors/industries. For purposes of these investment policies, the Funds usually classify sectors/industries based on industry-level Classifications used by widely recognized industry classification system providers such as Bloomberg Industry Classification System, Global Industry Classification Standards and Barclays Global Classification Scheme.
Quarterly Portfolio Schedules Information
The Trust files its complete schedule of portfolio holdings with the SEC for the first and third quarters of each fiscal year on Form N-Q, which are available on the SEC’s website at https://www.sec.gov. The Funds’ Forms N-Q may be reviewed and copied at the SEC’s Public Reference Room in Washington, DC, and that information on the operation of the Public Reference Room may be obtained by calling 800-SEC-0330. Copies of the portfolio holdings are also available to shareholders, without charge and upon request, by calling 800.820.0888.
Board Considerations in Approving the Continuation of the Investment Advisory Agreement
The Board of Trustees (the “Board”) of Rydex Series Funds (the “Trust”), including the Trustees who are not “interested persons,” as defined by the Investment Company Act of 1940, of the Trust (“Independent Trustees”), attended an in-person meeting held on May 19, 2016, called for the purpose of, among other things, the consideration of, and voting on, the approval and continuation of the investment advisory agreement (the “Investment Advisory Agreement”) between the Trust and the Advisor applicable to each series of the Trust (each, a “Fund” and, collectively, the “Funds”). The Board unanimously approved the continuation of the Investment Advisory Agreement for an additional one-year period based on the Board’s review of qualitative and quantitative information provided by the Advisor. The Board had previously considered information pertaining to the renewal of the Investment Advisory Agreement at an in-person meeting held on April 26, 2016 (together, with the May 19 meeting, the “Meetings”).
Prior to reaching the conclusion to approve the continuation of the Investment Advisory Agreement, the Independent Trustees requested and obtained from the Advisor such information as the Independent Trustees deemed reasonably necessary to evaluate the Investment Advisory Agreement. In addition, the Board received a memorandum from Fund counsel regarding the responsibilities of the Board with respect to the approval of investment advisory agreements and participated in question and answer sessions with representatives of the Advisor. The Independent Trustees also carefully considered information that they had received throughout the year as part of their regular oversight of the Funds. At the Meetings, the Board obtained and reviewed a wide variety of information, including certain comparative information regarding the Funds’ fees, expenses, and performance relative to the fees, expenses, and performance of other comparable funds (the “FUSE reports”). The Independent Trustees carefully evaluated this information, met in executive session outside the presence of fund management, and were advised by independent legal counsel with respect to their deliberations.
At the Meetings, the Board, including the Independent Trustees, evaluated a number of factors, including among others: (a) the nature, extent and quality of the Advisor’s investment advisory and other services; (b) the Advisor’s investment management personnel; (c) the Advisor’s operations and financial condition; (d) the Advisor’s brokerage practices (including any soft dollar arrangements) and the variety and complexity of its investment strategies; (e) a comparison of the Funds’ advisory fees to the advisory fees charged to comparable funds or accounts, giving special attention to the existence of economies of scale and the absence of breakpoints in these fees and the Advisor’s rationale for not providing for breakpoints at this point in time; (f) each Fund’s overall fees and operating expenses compared with those of similar funds; (g) the level of the Advisor’s profitability from its Fund-related operations; (h) the Advisor’s compliance processes and systems; (i) the Advisor’s compliance
62 | THE RYDEX FUNDS SEMI-ANNUAL REPORT | |
OTHER INFORMATION (Unaudited) (continued) |
policies and procedures; (j) the Advisor’s reputation, expertise and resources in the financial markets; and (k) Fund performance compared with that of similar funds and/or appropriate benchmarks. In its deliberations, the Trustees did not identify any single piece of information that was all-important or controlling, noting that each Trustee could attribute different weights to the various factors considered.
Based on the Board’s deliberations at the Meetings, the Board, including all of the Independent Trustees, unanimously: (a) concluded that the terms of the Investment Advisory Agreement are fair and reasonable; (b) concluded that the Advisor’s fees are reasonable in light of the services that it provides to the Funds; and (c) agreed to approve and continue the Investment Advisory Agreement based upon the following considerations, among others:
| | ● | Nature, Extent and Quality of Services Provided by the Advisor. The Board evaluated, among other things, the Advisor’s business, financial resources, quality and quantity of personnel, experience, past performance, the variety and complexity of its investment strategies (including the extent to which the Funds use derivatives), Fund risk management process, brokerage practices, and the adequacy of its compliance systems and processes, proxy voting policies and practices, and cybersecurity programs. The Board reviewed the scope of services to be provided by the Advisor under the Investment Advisory Agreement and noted that there would be no significant differences between the scope of services required to be provided by the Advisor for the past year and the scope of services required to be provided during the upcoming year. The Board also considered the Advisor’s representations to the Board that the Advisor would continue to provide investment and related services that were of materially the same quality and quantity as services provided to the Funds in the past, and whether these services are appropriate in scope and extent in light of the Funds’ operations, the competitive landscape of the investment company business and investor needs. Based on the foregoing, the Trustees determined that the approval of the Investment Advisory Agreement would enable shareholders of the Funds to receive high quality services at a cost that was appropriate and reasonable. |
| | ● | Fund Expenses and Performance of the Funds and the Advisor. The Board reviewed statistical information provided by the Advisor regarding the expense ratio components and performance of each Fund. The Advisor engaged FUSE Research Network LLC (“FUSE”), an independent, third party research provider, to prepare reports to help the Board compare the Funds’ fees, expenses, and total return performance with those of a peer group and peer universe of funds selected by FUSE. In the reports, each Fund’s expense ratio components, including actual advisory fees, waivers/reimbursements, and gross and net total expenses, are compared to those of other funds with shared key characteristics (e.g., asset size, fee structure, sector or industry investment focus) determined by FUSE to comprise a Fund’s applicable peer group. The Board considered the Advisor’s representation that it found the peer groups compiled by FUSE to be appropriate, but also acknowledged the existence of certain differences between the Funds and their peer funds (e.g., specific differences in principal investment strategies and, if applicable, tradability) that should be reviewed in context. With respect to tradability, in particular, the Board considered that non-tradable funds incur lower expense ratios than tradable funds because non-tradable funds experience less shareholder activity and lower transaction volumes than tradable funds. The statistical information related to the performance of each Fund included three-month and one-, three-, and five-year performance for the Fund compared to that of its peers. Based on the foregoing, the Board determined that the proposed advisory fees paid by the Funds are reasonable in relation to the nature and quality of the services provided by the Advisor. |
| | ● | Costs of Services Provided to the Funds and Profits Realized by the Advisor and its Affiliates. The Board reviewed information about the profitability of the Funds to the Advisor based on the advisory fees payable under the current Investment Advisory Agreement for the last calendar year. The Board analyzed the Funds’ expenses, including the investment advisory fees paid to the Advisor, and reviewed the FUSE reports. The Board also reviewed information regarding the direct revenue received by the Advisor and ancillary revenue, if any, received by the Advisor and/or its affiliates in connection with the services provided to the Funds by the Advisor and/or its affiliates. The Board also discussed the Advisor’s profit margin, including the expense allocation methodology used in the Advisor’s profitability analysis. Based on the foregoing, the Board determined that the profit to the Advisor on the fees paid by the Funds is not excessive in view of the nature and quality of the services provided by the Advisor. |
| | ● | Economies of Scale. The Board considered the absence of breakpoints in the Advisor’s fee schedule and reviewed information regarding the extent to which economies of scale or other efficiencies may result from increases in the Funds’ asset levels. In light of the relatively small size of many of the Funds and the fact that the size of individual Funds in the complex often increase and decrease significantly due to the unlimited trading that is permitted among most of the Funds in the complex, the Board concluded that the Funds have not yet achieved sufficient asset levels to realize meaningful economies of scale. The Board noted that it intends to continue to monitor fees as each Fund grows in size and assess whether fee breakpoints may be warranted. |
| | THE RYDEX FUNDS SEMI-ANNUAL REPORT | 63 |
OTHER INFORMATION (Unaudited) (concluded) |
| | ● | Other Benefits to the Advisor and/or its Affiliates. In addition to evaluating the Advisor’s services, the Board considered the nature and amount of other benefits to be received by the Advisor and its affiliates as a result of their relationship with the Fund, including any soft dollar usage by the Advisor and any intangible benefits. In particular, the Board considered the nature, extent, quality, and cost of certain administrative, distribution, and shareholder services performed by the Advisor’s affiliates under separate agreements and the Distribution and Shareholders Services Plan pursuant to Rule 12b-1 of the 1940 Act. In light of the costs of providing services pursuant to the separate agreements as well as the Advisor’s and its affiliates’ commitment to the Funds, the Board concluded the ancillary benefits the Advisor and its affiliates received were reasonable. |
On the basis of the information provided to it and its evaluation of that information, the Board, including the Independent Trustees, concluded that the terms of the Investment Advisory Agreement were reasonable, and that approval of the continuation of the Investment Advisory Agreement was in the best interests of the Funds and their shareholders.
64 | THE RYDEX FUNDS SEMI-ANNUAL REPORT | |
INFORMATION ON BOARD OF TRUSTEES AND OFFICERS (Unaudited) |
A Board of Trustees oversees the Trust, as well as other trusts of GI, in which its members have no stated term of service, and continue to serve after election until resignation. The Statement of Additional Information includes further information about Fund Trustees and Officers, and can be obtained without charge by visiting guggenheiminvestments.com or by calling 800.820.0888.
Name, Address*
and Year of Birth
of Trustee | Position(s) Held with the
Trust, Term of Office and
Length of Time Served | Principal Occupation(s)
During Past 5 Years | Number of
Portfolios in
Fund Complex
Overseen
by Trustee*** | Other
Directorships
Held by
Trustee**** |
INTERESTED TRUSTEE | | | |
Donald C. Cacciapaglia**
(1951) | Trustee from 2012 to present. | Current: President and CEO, certain other funds in the Fund Complex (2012-present); Vice Chairman, Guggenheim Investments (2010-present). Former: Chairman and CEO, Channel Capital Group, Inc. (2002-2010). | 232 | Clear Spring Life Insurance Company (2015-present); Guggenheim Partners Japan, Ltd. (2014-present); Guggenheim Partners Investment Management Holdings, LLC (2014-present); Delaware Life (2013-present); Guggenheim Life and Annuity Company (2011-present); Paragon Life Insurance Company of Indiana (2011-present). |
INDEPENDENT TRUSTEES | | | |
Angela Brock-Kyle*****
(1959) | Trustee from August 2016 to present. | Current: Founder and Chief Executive Officer, B.O.A.R.D.S (consulting firm) Former: Senior Leader, TIAA (financial services firm) (1987-2012). | 135 | Infinity Property & Casualty Corporation (2014-present). |
Corey A. Colehour
(1945) | Trustee from 1993 to present; Member of the Audit Committee from 1994 to present; Member of the Governance Committee from 2014 to present; and Member of the Investment and Performance Committee from 2014 to present. | Retired. | 135 | None. |
J. Kenneth Dalton
(1941) | Trustee from 1995 to present; Chairman and Member of the Audit Committee from 1997 to present; and Member of the Compliance and Risk Oversight Committee from 2010 to present. | Retired. | 135 | Epiphany Funds (4) (2009-present). |
| | THE RYDEX FUNDS SEMI-ANNUAL REPORT | 65 |
INFORMATION ON BOARD OF TRUSTEES AND OFFICERS (Unaudited)(continued) |
Name, Address*
and Year of Birth
of Trustee | Position(s) Held with the
Trust, Term of Office and
Length of Time Served | Principal Occupation(s)
During Past 5 Years | Number of
Portfolios in
Fund Complex
Overseen
by Trustee*** | Other
Directorships
Held by
Trustee**** |
INDEPENDENT TRUSTEES - concluded | | | |
John O. Demaret
(1940) | Vice Chairman of the Board from 2014 to present (Chairman of the Board from 2006 to 2014); Trustee and Member of the Audit Committee from 1997 to present; Chairman (since 2014) and Member of the Compliance and Risk Oversight Committee from 2010 to present; Chairman and Member of the Investment and Performance Committee from 2014 to present; and Member of the Nominating Committee from 2014 to present. | Retired. | 135 | None. |
Werner E. Keller
(1940) | Chairman of the Board from 2014 to present (Vice Chairman of the Board from 2010 to 2014); Trustee and Member of the Audit Committee from 2005 to present; and Member of the Investment and Performance Committee from 2014 to present. | Current: Founder and President, Keller Partners, LLC (investment research firm) (2005-present). | 135 | None. |
Thomas F. Lydon, Jr.
(1960) | Trustee and Member of the Audit Committee from 2005 to present; Member of the Nominating Committee from 2005 to present; and Member of the Governance Committee from 2007 to present. | Current: President, Global Trends Investments (registered investment adviser) (1996-present). | 135 | US Global Investors (GROW) (1995-present). |
Patrick T. McCarville
(1942) | Trustee from 1997 to present; Member of the Audit Committee from 1997 to present; Chairman and Member of the Nominating Committee from 2004 to present; Chairman and Member of the Governance Committee from 2007 to present; and Member of the Compliance and Risk Oversight Committee from 2014 to present. | Retired. Former: Chief Executive Officer, Par Industries, Inc., d/b/a Par Leasing (1977-2010). | 135 | None. |
Sandra G. Sponem*****
(1958) | Trustee from August 2016 to present. | Current: Senior Vice President and Chief Financial Officer, M.A. Mortenson Companies, Inc. (general contracting firm) (2007-present). | 135 | None. |
66 | THE RYDEX FUNDS SEMI-ANNUAL REPORT | |
INFORMATION ON BOARD OF TRUSTEES AND OFFICERS (Unaudited)(continued) |
Name, Address*
and Year of Birth | Position(s) Held with the
Trust, Term of Office and
Length of Time Served | Principal Occupation(s)
During Past 5 Years |
OFFICERS | | |
Donald C. Cacciapaglia
(1951) | President (2012-present). | Current: President and CEO, certain other funds in the Fund Complex (2012-present); Vice Chairman, Guggenheim Investments (2010-present). Former: Chairman and CEO, Channel Capital Group Inc. (2002-2010). |
Joanna M. Catalucci (1966) | AML Officer (2016-present) | Current: Chief Compliance Officer, certain funds in the Fund Complex (2012-present); Senior Managing Director, Guggenheim Investments (2012-present); AML Officer, certain funds in the Fund Complex (2016-present). Former: Chief Compliance Officer and Secretary, certain other funds in the Fund Complex (2008-2012); Senior Vice President & Chief Compliance Officer, Security Investors, LLC and certain affiliates (2010-2012); Chief Compliance Officer and Senior Vice President, Rydex Advisors, LLC and certain affiliates (2010-2011). |
Michael P. Byrum
(1970) | Vice President (1999-present). | Current: Senior Vice President, Security Investors, LLC (2010-present); President and Chief Investment Officer, Rydex Holdings, LLC (2008-present); Director and Chairman, Advisory Research Center, Inc. (2006-present); Manager, Guggenheim Specialized Products, LLC (2005-present). Former: Vice President, Guggenheim Distributors, LLC (2009); Director (2009-2010) and Secretary (2002-2010), Rydex Fund Services, LLC; Director (2008-2010), Chief Investment Officer (2006-2010), President (2004-2010) and Secretary (2002-2010), Rydex Advisors, LLC; Director (2008-2010), Chief Investment Officer (2006-2010), President (2004-2010) and Secretary (2002-2010), Rydex Advisors II, LLC. |
James M. Howley
(1972) | Assistant Treasurer (2016-present) | Current: Director, Guggenheim Investments (2004-present); Assistant Treasurer, certain other funds in the Fund Complex (2006-present). Former: Manager, Mutual Fund Administration of Van Kampen Investments, Inc. (1996-2004). |
Keith D. Kemp
(1960) | Assistant Treasurer (2016-present) | Current: Managing Director of Transparent Value, LLC (2015-present); Managing Director of Guggenheim Investments (2015-present). Former: Director, Transparent Value, LLC (2010-2015); Director, Guggenheim Investments (2010-2015); Chief Operating Officer, Macquarie Capital Investment Management (2007-2009). |
Amy J. Lee
(1961) | Vice President (2009-present) and Secretary (2012-present). | Current: Chief Legal Officer, certain other funds in the Fund Complex (2013-present); Senior Managing Director, Guggenheim Investments (2012-present). Former: Vice President, Associate General Counsel and Assistant Secretary, Security Benefit Life Insurance Company and Security Benefit Corporation (2004-2012). |
Glenn McWhinnie
(1969) | Assistant Treasurer (2016-present) | Current: Vice President, Guggenheim Investments (2009-present). Former: Tax Compliance Manager, Ernst & Young LLP (1996-2009). |
| | THE RYDEX FUNDS SEMI-ANNUAL REPORT | 67 |
INFORMATION ON BOARD OF TRUSTEES AND OFFICERS (Unaudited)(concluded) |
Name, Address*
and Year of Birth | Position(s) Held with the
Trust, Term of Office and
Length of Time Served | Principal Occupation(s)
During Past 5 Years |
OFFICERS - concluded | |
Elisabeth Miller
(1968) | Chief Compliance Officer (2012-present). | Current: CCO, certain other funds in the Fund Complex (2012-present); CCO, Security Investors, LLC (2012-present); CCO, Guggenheim Funds Investment Advisors, LLC (2012-present); Managing Director, Guggenheim Investments (2012-present); Vice President, Guggenheim Funds Distributors, LLC (2014-present). Former: CCO, Guggenheim Distributors, LLC (2009-2014); Senior Manager, Security Investors, LLC (2004-2009); Senior Manager, Guggenheim Distributors, LLC (2004-2009). |
Adam J. Nelson
(1979) | Assistant Treasurer (2016-present) | Current: Vice President, Guggenheim Investments (2015-present); Assistant Treasurer, certain other funds in the Fund Complex (2015-present). Former: Assistant Vice President and Fund Administration Director, State Street Corporation (2013-2015); Fund Administration Assistant Director, State Street (2011-2013); Fund Administration Manager, State Street (2009-2011). |
Kimberly J. Scott
(1974) | Assistant Treasurer (2016-present) | Current: Vice President, Guggenheim Investments (2012-present); Assistant Treasurer, certain other funds in the Fund Complex (2012-present). Former: Financial Reporting Manager, Invesco, Ltd. (2010-2011); Vice President/Assistant Treasurer, Mutual Fund Administration for Van Kampen Investments, Inc./Morgan Stanley Investment Management (2009-2010); Manager of Mutual Fund Administration, Van Kampen Investments, Inc./Morgan Stanley Investment Management (2005-2009). |
John L. Sullivan
(1955) | Chief Financial Officer and Treasurer (2016-present) | Current: CFO, Chief Accounting Officer and Treasurer, certain other funds in the Fund Complex (2010-present); Senior Managing Director, Guggenheim Investments (2010-present). Former: Managing Director and CCO, each of the funds in the Van Kampen Investments fund complex (2004-2010); Managing Director and Head of Fund Accounting and Administration, Morgan Stanley Investment Management (2002-2004); CFO and Treasurer, Van Kampen Funds (1996-2004). |
* | All Trustees and Officers may be reached c/o Guggenheim Investments, 227 West Monroe Street, Chicago, Illinois 60606. |
** | Mr. Cacciapaglia is an “interested” person of the Trust, as that term is defined in the 1940 Act by virtue of his affiliation with the Adviser’s parent company. |
*** | The “Fund Complex” includes all closed-end and open-end funds (including all of their portfolios) advised by the Adviser and any funds that have an investment adviser or servicing agent that is an affiliated person of the Adviser. Information provided is as of the date of this report. |
**** | Some of the Trustees may serve as directors on the boards of companies not required to be disclosed above, including certain non-profit companies and charitable foundations. |
***** | Mses. Brock-Kyle and Sponem commenced serving as independent Trustees effective August 18, 2016. |
68 | THE RYDEX FUNDS SEMI-ANNUAL REPORT | |
GUGGENHEIM INVESTMENTS PRIVACY POLICIES (Unaudited) |
Guggenheim Investments as used herein refers to Guggenheim Partners, LLC, Guggenheim Funds Investment Advisors, LLC, Guggenheim Partners Investment Management, LLC, Guggenheim Funds Distributors, LLC and Security Investors, LLC as well as the funds in the Guggenheim Funds complex (the “funds”).
Our Commitment to You
When you become a Guggenheim Investments investor, you entrust us with not only your hard-earned money but also with personal and financial information about you. We recognize that your relationship with us is based on trust and that you expect us to act responsibly and in your best interests. Because we have access to personal information about you, we hold ourselves to high standards in its safekeeping and use. This means, most importantly, that we do not sell client or account information to anyone—whether you are a current or former Guggenheim Investments client.
The Information We Collect About You and How We Collect It
In the course of doing business with shareholders and investors, we collect nonpublic personal information about you. You typically provide personal information when you complete a Guggenheim Investments account application or when you request a transaction that involves Rydex and Guggenheim Funds or one of the Guggenheim affiliated companies. “Nonpublic personal information” is personally identifiable information about you. For example it includes your name and address, Social Security or taxpayer identification number, assets, income, account balance, bank account information and investment activity (e.g. purchase and redemption history).
How We Share Your Personal Information
As a matter of policy, we do not disclose your nonpublic personal information to nonaffiliated third parties except as required or permitted by law. As emphasized above, we do not sell information about current or former clients or their accounts to third parties. Nor do we share such information, except when necessary to complete transactions at your request or to make you aware of related investment products and services that we offer. Additional details about how we handle your personal information are provided below.
To complete certain transactions or account changes that you direct, it may be necessary to provide your personal information to companies, individuals or groups that are not affiliated with Guggenheim Investments. For example if you ask to transfer assets from another financial institution to Guggenheim Investments, we will need to provide certain information about you to that company to complete the transaction. In connection with servicing your accounts or to alert you to other Guggenheim Investments investment products and services, we may share your information within the Guggenheim Investments family of affiliated companies. This would include, for example, sharing your information within Guggenheim Investments so we can make you aware of new funds or the services offered through another Guggenheim Investments affiliated company. In certain instances, we may contract with nonaffiliated companies to perform services for us. Where necessary, we will disclose information we have about you to these third parties. In all such cases, we provide the third party with only the information necessary to carry out its assigned responsibilities and only for that purpose. And we require these third parties to treat your personal information with the same high degree of confidentiality that we do. In certain instances, we may share information with other financial institutions regarding individuals and entities in response to the U.S.A. Patriot Act. Finally we will share personal information about you if we are compelled by law to do so, if you direct us to do so with your consent, or in other circumstances as permitted by law.
How We Safeguard Your Personal Information
We maintain physical, electronic and procedural safeguards to protect your personal information. Within Guggenheim Investments, access to such information is limited to those who need it to perform their jobs such as servicing your account, resolving problems or informing you of new products and services.
| | THE RYDEX FUNDS SEMI-ANNUAL REPORT | 69 |
Item 2. Code of Ethics.
Not applicable at this time.
Item 3. Audit Committee Financial Expert.
Not applicable at this time.
Item 4. Principal Accountant Fees and Services.
Not applicable at this time.
Item 5. Audit Committee of Listed Registrants.
Not applicable.
Item 6. Investments.
Schedule of Investments is included as part of the report to shareholders filed under Item 1 of this form.
Item 7. Disclosure of Proxy Voting Policies and Procedures for Closed-End Management Investment Companies.
Not applicable.
Item 8. Portfolio Managers of Closed-End Management Investment Companies.
Not applicable.
Item 9. Purchases of Equity Securities by Closed-End Management Investment Company and Affiliated Purchasers.
Not applicable.
Item 10. Submission of Matters to a Vote of Security Holders.
Not applicable.
Item 11. Controls and Procedures.
| (a) | The registrant’s President (principal executive officer) and Treasurer (principal financial officer) have evaluated the registrant’s disclosure controls and procedures within 90 days of this filing and have concluded that the registrant’s disclosure controls and procedures were effective as of that date in ensuring that information required to be disclosed by the registrant in this Form N-CSR was recorded, processed, summarized, and reported timely. |
| (b) | The registrant’s principal executive officer and principal financial officer are aware of no change in the registrant’s internal control over financial reporting that occurred during the registrant’s second fiscal quarter covered by this report that has materially affected, or is reasonably likely to materially affect, the registrant’s internal control over financial reporting. |
Item 12. Exhibits.
(a)(2) Separate certifications by the President (principal executive officer) and Treasurer (principal financial officer) of the registrant as required by Rule 30a-2(a) under the Act (17 CFR 270.30a-2(a)) are attached.
(b) A certification by the registrant’s President (principal executive officer) and Treasurer (principal financial officer) as required by Rule 30a-2(b) under the Act (17 CFR 270.30a-2(b)) is attached.
SIGNATURES
Pursuant to the requirements of the Securities Exchange Act of 1934 and the Investment Company Act of 1940, the registrant has duly caused this report to be signed on its behalf by the undersigned, thereunto duly authorized.
| (Registrant) | Rydex Series Funds | |
| | | |
| By (Signature and Title)* | /s/ Donald C. Cacciapaglia | |
| | Donald C. Cacciapaglia, President and Chief Executive Officer | |
| | | |
| Date | December 8, 2016 | |
Pursuant to the requirements of the Securities Exchange Act of 1934 and the Investment Company Act of 1940, this report has been signed below by the following persons on behalf of the registrant and in the capacities and on the dates indicated.
| By (Signature and Title)* | /s/ Donald C. Cacciapaglia | |
| | Donald C. Cacciapaglia, President and Chief Executive Officer | |
| | | |
| Date | December 8, 2016 | |
| | | |
| By (Signature and Title)* | /s/ John L. Sullivan | |
| | John L. Sullivan, Chief Financial Officer and Treasurer | |
| | | |
| Date | December 8, 2016 | |
| * | Print the name and title of each signing officer under his or her signature. |

