UNITED STATES
SECURITIES AND EXCHANGE COMMISSION
Washington, D.C. 20549
FORM N-CSR
CERTIFIED SHAREHOLDER REPORT OF REGISTERED
MANAGEMENT INVESTMENT COMPANIES
Investment Company Act file number 811- 07584
Rydex Series Funds
(Exact name of registrant as specified in charter)
702 King Farm Boulevard, Suite 200 Rockville, Maryland 20850
(Address of principal executive offices) (Zip code)
Amy J. Lee
Rydex Series Funds
702 King Farm Boulevard, Suite 200
Rockville, Maryland 20850
(Name and address of agent for service)
Registrant's telephone number, including area code: 1-301-296-5100
Date of fiscal year end: December 31
Date of reporting period: January 1, 2018 through June 30, 2018
Form N-CSR is to be used by management investment companies to file reports with the Commission not later than 10 days after the transmission to stockholders of any report that is required to be transmitted to stockholders under Rule 30e-1 under the Investment Company Act of 1940 (17 CFR 270.30e-1). The Commission may use the information provided on Form N-CSR in its regulatory, disclosure review, inspection, and policymaking roles.
A registrant is required to disclose the information specified by Form N-CSR, and the Commission will make this information public. A registrant is not required to respond to the collection of information contained in Form N-CSR unless the Form displays a currently valid Office of Management and Budget ("OMB") control number. Please direct comments concerning the accuracy of the information collection burden estimate and any suggestions for reducing the burden to Secretary, Securities and Exchange Commission, 450 Fifth Street, NW, Washington, DC 20549-0609. The OMB has reviewed this collection of information under the clearance requirements of 44 U.S.C. § 3507.
Item 1. Reports to Stockholders.
The registrant’s semi-annual report transmitted to shareholders pursuant to Rule 30e-1 under the Investment Company Act of 1940, as amended (the “Investment Company Act”), is as follows:
6.30.2018
Guggenheim Funds Semi-Annual Report
Guggenheim Alternative Fund |
Guggenheim Multi-Hedge Strategies Fund | | |
Rydex Commodities Fund |
Rydex Commodities Strategy Fund | | |
GuggenheimInvestments.com | RDXSGIALT-SEMI-0618x1218 |

DEAR SHAREHOLDER | 2 |
ECONOMIC AND MARKET OVERVIEW | 4 |
ABOUT SHAREHOLDERS’ FUND EXPENSES | 6 |
ALTERNATIVE FUND | |
MULTI-HEDGE STRATEGIES FUND | 9 |
COMMODITIES FUND | |
COMMODITIES STRATEGY FUND | 42 |
NOTES TO CONSOLIDATED FINANCIAL STATEMENTS | 54 |
OTHER INFORMATION | 75 |
INFORMATION ON BOARD OF TRUSTEES AND OFFICERS | 80 |
GUGGENHEIM INVESTMENTS PRIVACY NOTICE | 86 |
| | THE GUGGENHEIM FUNDS SEMI-ANNUAL REPORT | 1 |
Dear Shareholder:
Security Investors, LLC (the “Investment Adviser”) is pleased to present the semiannual shareholder report for two alternative strategy funds (the “Funds”) that are part of the Rydex Series Funds. This report covers performance of the Funds for the semiannual period ended June 30, 2018.
The Investment Adviser is a part of Guggenheim Investments, which represents the investment management businesses of Guggenheim Partners, LLC (“Guggenheim”), a global, diversified financial services firm.
Guggenheim Funds Distributors, LLC is the distributor of the Funds. Guggenheim Funds Distributors, LLC is affiliated with Guggenheim and the Investment Adviser.
We encourage you to read the Economic and Market Overview section of the report, which follows this letter, and then the Performance Report and Fund Profile for each Fund.
We are committed to providing innovative investment solutions and appreciate the trust you place in us.
Sincerely,
Security Investors, LLC
July 31, 2018
Read a prospectus and summary prospectus (if available) carefully before investing. It contains the investment objectives, risks, charges, expenses and other information, which should be considered carefully before investing. Obtain a prospectus and summary prospectus (if available) at guggenheiminvestments.com or call 800.820.0888.
This material is not intended as a recommendation or as investment advice of any kind, including in connection with rollovers, transfers, and distributions. Such material is not provided in a fiduciary capacity, may not be relied upon for or in connection with the making of investment decisions, and does not constitute a solicitation of an offer to buy or sell securities. All content has been provided for informational or educational purposes only and is not intended to be and should not be construed as legal or tax advice and/or a legal opinion. Always consult a financial, tax and/or legal professional regarding your specific situation.
The Multi-Hedge Strategies Fund is subject to a number of risks and may not be suitable for all investors. ● The Fund’s use of derivatives such as futures, options and swap agreements may expose the Fund to additional risks that it would not be subject to if it invested directly in the securities underlying those derivatives. ● The more the Fund invests in leveraged instruments, the more the leverage will magnify any gains or losses on those investments. ● The Fund’s use of short selling involves increased risks and costs. The Fund risks paying more for a security than it received from its sale. ● The Fund’s investments in high yield securities and unrated securities of similar credit quality (“junk bonds”) may be subject to greater levels of interest rate, credit and liquidity risk than funds that do not invest in such securities. ● The Fund’s fixed income investments will change in value in response to interest rate changes and other factors. ● The Fund’s exposure to the commodity and currency markets may subject the Fund to greater volatility as commodity- and currency-linked derivative investments may be affected by changes in overall market movements, commodity index volatility, changes
2 | THE GUGGENHEIM FUNDS SEMI-ANNUAL REPORT | |
in interest rates or factors affecting a particular industry, commodity or currency—such as droughts, floods, weather, livestock disease, embargoes, tariffs and international economic, political and regulatory developments. The Fund may also incur transaction costs with the conversion between various currencies. ● The Fund’s exposure to foreign currencies subjects the Fund to the risk that those currencies will decline in value relative to the U.S. dollar, or, in the case of short positions, that the U.S. dollar will decline in value relative to the currency being hedged. ● These risks may cause the Fund to experience higher losses and/or volatility than a fund that does not invest in derivatives, use leverage or short sales or have exposure to high yield/fixed income securities, foreign currencies and/or securities. ● This Fund is considered non-diversified and can invest a greater portion of its assets in securities of individual issuers than a diversified fund. As a result, changes in the market value of a single security could cause greater fluctuations in the value of Fund shares than would occur in a more diversified Fund. ● Please read the prospectus for more detailed information regarding these and other risks.
The Commodities Strategy Fund may not be suitable for all investors. ● The Fund’s exposure to the commodity markets may subject the Fund to greater volatility as commodity-linked investments may be affected by changes in overall market movements, commodity index volatility, changes in interest rates or factors affecting a particular industry or commodity—such as droughts, floods, weather, embargos, tariffs and international economic, political and regulatory developments. ● To the extent that the Fund’s investments are concentrated in energy-related commodities, the Fund is subject to the risk that this sector will underperform the market as a whole. ● The Fund’s use of derivatives, such as futures, options, structured notes and swap agreements, may expose the Fund to additional risks that it would not be subject to if it invested directly in the securities or investments underlying those derivatives. ● The more the Fund invests in leveraged instruments, the more the leverage will magnify any gains or losses on those investments. ● The Fund is subject to tracking error risks, which may cause the Fund’s performance not to match that of or be lower than the Fund’s underlying benchmark. ● The Fund’s investments in other investment companies subjects the Fund to those risks affecting the investment company, including the possibility that the value of the underlying securities held by the investment company could decrease. Moreover, the Fund will incur its pro rata share of the expenses of the underlying investment companies’ expenses. ●This Fund is considered non-diversified and can invest a greater portion of its assets in securities of individual issuers than a diversified fund. As a result, changes in the market value of a single security could cause greater fluctuations in the value of Fund shares than would occur in a more diversified fund. ● See the prospectus for more information on these and additional risks.
| | THE GUGGENHEIM FUNDS SEMI-ANNUAL REPORT | 3 |
ECONOMIC AND MARKET OVERVIEW (Unaudited) | June 30, 2018 |
As the U.S. economy powers along, with second quarter 2018 gross domestic product (“GDP”) coming in at 4.1% annualized, geopolitical risk continues to weigh on the market. Positive headlines surrounding growth and the labor market are offset by the trade war launched by the U.S. against both its rivals and its allies. In May, the Trump administration allowed the aluminum and steel tariff exemptions to expire for Canada, Mexico, and the European Union, instituting 25% tariffs on steel and 10% tariffs on aluminum imported from these regions. In June, the U.S. administration announced it would also impose 25% tariffs on $50 billion worth of Chinese imports ($34 billion of which would be tariffed beginning in July), followed by the publication of a list of $200 billion in additional Chinese goods to be targeted, to which China promised retaliation. The European Union has also announced retaliation, approving tariffs of 25% on a long list of American goods. Over this period, 10-year U.S. Treasury yields peaked at 3.1% and finished the quarter at 2.9%.
The bond market’s reaction to trade rhetoric indicates that there is a tug of war at hand. While fiscal stimulus pushed up bond yields initially, tariffs are weighing them down. Markets are right to be concerned about the consequences of a trade war in which no one wins. Outside of the U.S., this trade war will have the intended impact of squeezing economic growth in export-heavy regions, but among the losers will also be U.S. consumers. Some corporations may slow or postpone hiring as they manage for rising input costs. Others will pass higher prices on to the consumer, causing disposable incomes to suffer. In either case, tariffs reduce the benefit of the fiscal stimulus.
The U.S. Federal Reserve’s (the “Fed”) confidence in the U.S. economy seems to have sharpened in recent weeks despite trade war uncertainty. In the June Summary of Economic Projections (“SEP”), the U.S. Federal Reserve Open Market Committee’s (“FOMC”) median expectations for 2018 GDP growth rose from 2.7% to 2.8%. The FOMC now expects a lower unemployment rate, higher personal consumption expenditures inflation and a higher federal funds rate for 2018 and 2019 than previously expected. The Fed is determined to tighten financial conditions until economic growth and hiring slow to a more sustainable pace.
We believe that the net effect of all factors affecting rates—fiscal stimulus, trade war, and monetary policy tightening—will keep long-term interest rates from moving much higher than current levels. The market is currently pricing this in to the yield curve; in July the difference between 30-year and two-year U.S. Treasury yields hit its lowest level since July 2007. The bond market is sending a warning signal that makes us wary of taking on too much credit risk at this stage.
We maintain our view that a recession could come in 2020 and markets may discount this as early as 2019. In the meantime, we are watching for exogenous factors that could cause a recession to come sooner.
For the six months ended June 30, 2018, the Standard & Poor’s 500® (“S&P 500”) Index* returned 2.65%. The MSCI Europe-Australasia-Far East (“EAFE”) Index* returned -2.37%. The return of the MSCI Emerging Markets Index* was -6.51%.
4 | THE GUGGENHEIM FUNDS SEMI-ANNUAL REPORT | |
ECONOMIC AND MARKET OVERVIEW (Unaudited)(concluded) | June 30, 2018 |
In the bond market, the Bloomberg Barclays U.S. Aggregate Bond Index* posted a -1.62% return for the period, while the Bloomberg Barclays U.S. Corporate High Yield Index* returned 0.16%. The return of the ICE Bank of America (“BofA”) Merrill Lynch 3-Month U.S. Treasury Bill Index* was 0.81% for the six-month period.
The opinions and forecasts expressed may not actually come to pass. This information is subject to change at any time, based on market and other conditions, and should not be construed as a recommendation of any specific security or strategy.
*Index Definitions:
The following indices are referenced throughout this report. Indices are unmanaged and not available for direct investment. Index performance does not reflect transaction costs, fees, or expenses.
Bloomberg Barclays U.S. Aggregate Bond Index is a broad-based flagship benchmark that measures the investment grade, U.S. dollar-denominated, fixed-rate taxable bond market, including U.S. Treasuries, government-related and corporate securities, mortgage-backed securities or “MBS” (agency fixed-rate and hybrid adjustable-rate mortgage, or “ARM”, pass-throughs), asset-backed securities (“ABS”), and commercial mortgage-backed securities (“CMBS”) (agency and non-agency).
Bloomberg Barclays U.S. Corporate High Yield Index measures the U.S. dollar-denominated, high yield, fixed-rate corporate bond market. Securities are classified as high yield if the middle rating of Moody’s, Fitch, and S&P is Ba1/BB +/BB + or below.
ICE BofA Merrill Lynch 3-Month U.S. Treasury Bill Index is an unmanaged market Index of U.S. Treasury securities maturing in 90 days that assumes reinvestment of all income.
MSCI EAFE Index is a free float-adjusted market capitalization index that is designed to measure the equity market performance of developed markets, excluding the U.S. & Canada.
MSCI Emerging Markets Index is a free float-adjusted market capitalization weighted index that is designed to measure equity market performance in the global emerging markets.
S&P 500® is a broad-based index, the performance of which is based on the performance of 500 widely held common stocks chosen for market size, liquidity, and industry group representation.
S&P Goldman Sachs Commodity Index (S&P GSCI®), a benchmark for investment performance in the commodity markets, measures investable commodity price movements and inflation in the world economy. The index is calculated primarily on a world production weighted basis and is comprised of the principal physical commodities that are the subject of active, liquid futures markets.
HFRX Global Hedge Fund Index is designed to be representative of the overall composition of the hedge fund universe. It is comprised of all eligible hedge fund strategies, including, but not limited to, convertible arbitrage, distressed securities, equity hedge, equity market neutral, event driven, macro, merger arbitrage and relative-value arbitrage. The strategies are asset weighted based on the distribution of assets in the hedge fund industry.
| | THE GUGGENHEIM FUNDS SEMI-ANNUAL REPORT | 5 |
ABOUT SHAREHOLDERS’ FUND EXPENSES (Unaudited) |
All mutual funds have operating expenses, and it is important for our shareholders to understand the impact of costs on their investments. Shareholders of a fund incur two types of costs: (i) transaction costs, including sales charges (loads) on purchase payments, reinvested dividends, other distributions, and exchange fees, and (ii) ongoing costs, including management fees, administrative services, and shareholder reports, among others. These ongoing costs, or operating expenses, are deducted from a fund’s gross income and reduce the investment return of the fund.
A fund’s expenses are expressed as a percentage of its average net assets, which is known as the expense ratio. The following examples are intended to help investors understand the ongoing costs (in dollars) of investing in a fund and to compare these costs with the ongoing costs of investing in other mutual funds.
The examples are based on an investment of $1,000 made at the beginning of the period and held for the entire six-month period beginning December 31, 2017 and ending June 30, 2018.
The following tables illustrate the Funds’ costs in two ways:
Table 1. Based on actual Fund return: This section helps investors estimate the actual expenses paid over the period. The “Ending Account Value” shown is derived from the fund’s actual return, and the fifth column shows the dollar amount that would have been paid by an investor who started with $1,000 in the Fund. Investors may use the information here, together with the amount invested, to estimate the expenses paid over the period. Simply divide the fund’s account value by $1,000 (for example, an $8,600 account value divided by $1,000 = 8.6), then multiply the result by the number provided under the heading “Expenses Paid During Period.”
Table 2. Based on hypothetical 5% return: This section is intended to help investors compare a fund’s cost with those of other mutual funds. The table provides information about hypothetical account values and hypothetical expenses based on the Fund’s actual expense ratio and an assumed rate of return of 5% per year before expenses, which is not the Fund’s actual return. The hypothetical account values and expenses may not be used to estimate the actual ending account balance or expenses paid during the period. The example is useful in making comparisons because the U.S. Securities and Exchange Commission (the “SEC”) requires all mutual funds to calculate expenses based on the 5% return. Investors can assess a fund’s costs by comparing this hypothetical example with the hypothetical examples that appear in shareholder reports of other funds.
The calculations illustrated above assume no shares were bought or sold during the period. Actual costs may have been higher or lower, depending on the amount of investment and the timing of any purchases or redemptions.
6 | THE GUGGENHEIM FUNDS SEMI-ANNUAL REPORT | |
ABOUT SHAREHOLDERS’ FUND EXPENSES (Unaudited)(continued) |
Please note that the expenses shown in the table are meant to highlight your ongoing costs only and do not reflect any transactional costs, such as sales charges (loads) on purchase payments, and contingent deferred sales charges (“CDSC”) on redemptions, if any. Therefore, the second table is useful in comparing ongoing costs only, and will not help you determine the relative total costs of owning different funds. In addition, if these transactional costs were included, your costs would have been higher.
More information about a Fund’s expenses, including annual expense ratios for the past five years, can be found in the Financial Highlights section of this report. For additional information on operating expenses and other shareholder costs, please refer to the appropriate Fund prospectus.
| | THE GUGGENHEIM FUNDS SEMI-ANNUAL REPORT | 7 |
ABOUT SHAREHOLDERS’ FUND EXPENSES (Unaudited)(concluded) |
| Expense
Ratio1 | Fund
Return | Beginning
Account Value
December 31,
2017 | Ending
Account Value
June 30,
2018 | Expenses
Paid During
Period2 |
Table 1. Based on actual Fund return3 |
Multi-Hedge Strategies Fund |
A-Class | 1.67% | (4.30%) | $ 1,000.00 | $ 957.00 | $ 8.10 |
C-Class | 2.47% | (4.67%) | 1,000.00 | 953.30 | 11.96 |
P-Class | 1.71% | (4.21%) | 1,000.00 | 957.90 | 8.30 |
Institutional Class | 1.51% | (4.29%) | 1,000.00 | 957.10 | 7.33 |
Commodities Strategy Fund |
A-Class | 1.64% | 9.28% | 1,000.00 | 1,092.80 | 8.51 |
C-Class | 2.39% | 8.85% | 1,000.00 | 1,088.50 | 12.38 |
H-Class | 1.66% | 9.30% | 1,000.00 | 1,093.00 | 8.61 |
|
|
Table 2. Based on hypothetical 5% return (before expenses) |
Multi-Hedge Strategies Fund |
A-Class | 1.67% | 5.00% | $ 1,000.00 | $ 1,016.51 | $ 8.35 |
C-Class | 2.47% | 5.00% | 1,000.00 | 1,012.55 | 12.33 |
P-Class | 1.71% | 5.00% | 1,000.00 | 1,016.31 | 8.55 |
Institutional Class | 1.51% | 5.00% | 1,000.00 | 1,017.31 | 7.55 |
Commodities Strategy Fund |
A-Class | 1.64% | 5.00% | 1,000.00 | 1,016.66 | 8.20 |
C-Class | 2.39% | 5.00% | 1,000.00 | 1,012.94 | 11.93 |
H-Class | 1.66% | 5.00% | 1,000.00 | 1,016.56 | 8.30 |
1 | Annualized and excludes expenses of the underlying funds in which the Funds invest. This ratio represents net expenses which include interest and dividend expenses related to securities sold short. Excluding short interest and dividend expenses, the net expense ratio of the Multi-Hedge Strategies Fund would be 1.41%, 2.16%, 1.41% and 1.16% for the A-Class, C-Class, P-Class and Institutional Class, respectively. |
2 | Expenses are equal to the Fund's annualized expense ratio, net of any applicable fee waivers, multiplied by the average account value over the period, multiplied by 181/365 (to reflect the one-half year period). |
3 | Actual cumulative return at net asset value for the period December 31, 2017 to June 30, 2018. |
8 | THE GUGGENHEIM FUNDS SEMI-ANNUAL REPORT | |
PERFORMANCE REPORT AND FUND PROFILE (Unaudited) | June 30, 2018 |
MULTI-HEDGE STRATEGIES FUND
OBJECTIVE: Seeks to provide long-term capital appreciation with less risk than traditional equity funds.
Consolidated Holdings Diversification (Market Exposure as % of Net Assets)
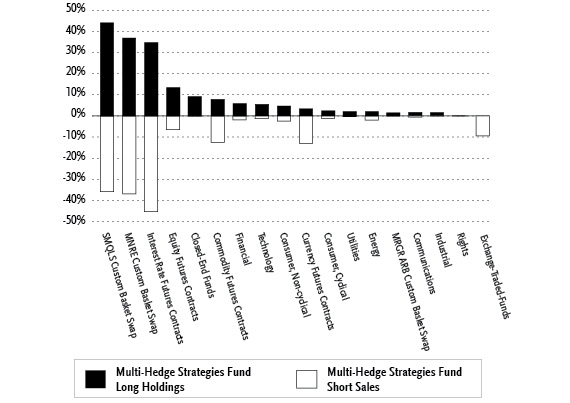
“Consolidated Holdings Diversification (Market Exposure as % of Net Assets)” excludes any temporary cash investments or investments in Guggenheim Strategy Funds Trust mutual funds. Investments in those Funds do not provide “market exposure” to meet the Fund’s investment objective, but will significantly increase the portfolio’s exposure to certain other asset categories (and their associated risks), which may cause the Fund to deviate from its principal investment strategy, including: (i) high yield, high risk debt securities rated below the top four long-term rating categories by a nationally recognized statistical rating organization (also known as “junk bonds”); (ii) securities issued by the U.S. government or its agencies and instrumentalities; (iii) CLOs, other asset-backed securities (including mortgage-backed securities) and similarly structured debt investments; and (iv) other short-term fixed income securities.
| | THE GUGGENHEIM FUNDS SEMI-ANNUAL REPORT | 9 |
PERFORMANCE REPORT AND FUND PROFILE (Unaudited)(concluded) | June 30, 2018 |
Inception Dates: |
A-Class | September 19, 2005 |
C-Class | September 19, 2005 |
P-Class | September 19, 2005 |
Institutional Class | May 3, 2010 |
Ten Largest Holdings (% of Total Net Assets) |
Guggenheim Strategy Fund II | 8.5% |
Guggenheim Strategy Fund III | 8.3% |
NXP Semiconductor N.V. | 2.3% |
Cavium, Inc. | 1.6% |
Capella Education Co. | 1.6% |
Infinity Property & Casualty Corp. | 1.5% |
Aetna, Inc. | 1.4% |
Pinnacle Entertainment, Inc. | 1.4% |
Validus Holdings Ltd. | 1.3% |
Xcerra Corp. | 1.0% |
Top Ten Total | 28.9% |
| | |
“Ten Largest Holdings” excludes any temporary cash or derivative investments. |
Average Annual Returns*
Periods Ended June 30, 2018
| 6 month† | 1 Year | 5 Year | 10 Year |
A-Class Shares | (4.30%) | (1.12%) | 0.79% | (0.44%) |
A-Class Shares with sales charge‡ | (8.87%) | (5.81%) | (0.18%) | (0.92%) |
C-Class Shares | (4.67%) | (1.86%) | 0.04% | (1.18%) |
C-Class Shares with CDSC§ | (5.63%) | (2.84%) | 0.04% | (1.18%) |
P-Class Shares | (4.21%) | (0.99%) | 0.82% | (0.43%) |
S&P 500 Index | 2.65% | 14.37% | 13.42% | 10.17% |
HFRX Global Hedge Fund Index | (0.85%) | 2.47% | 1.32% | (0.40%) |
| 6 month† | 1 Year | 5 Year | Since
Inception
(05/03/10) |
Institutional Class Shares | (4.29%) | (0.94%) | 1.03% | 2.26% |
S&P 500 Index | 2.65% | 14.37% | 13.42% | 13.04% |
HFRX Global Hedge Fund Index | (0.85%) | 2.47% | 1.32% | 0.80% |
* | The performance data above represents past performance that is not predictive of future results. The investment return and principal value of an investment in the Fund will fluctuate so that an investor’s shares, when redeemed, may be worth more or less than their original cost. Returns are historical and include changes in principal and reinvested dividends and capital gains and do not reflect the effect of taxes. The S&P 500 Index and the HFRX Global Hedge Fund Index are unmanaged indices and, unlike the Fund, have no management fees or operating expenses to reduce their reported returns. |
† | 6 month returns are not annualized. |
‡ | Fund returns are calculated using the maximum sales charge of 4.75%. |
§ | Fund returns include a CDSC of 1% if redeemed within 12 months of purchase. |
10 | THE GUGGENHEIM FUNDS SEMI-ANNUAL REPORT | |
CONSOLIDATED SCHEDULE OF INVESTMENTS (Unaudited) | June 30, 2018 |
MULTI-HEDGE STRATEGIES FUND | |
| | Shares | | | Value | |
| | | | | | | | | |
COMMON STOCKS† - 25.2% |
| | | | | | | | | |
Financial - 5.9% |
Infinity Property & Casualty Corp. | | | 5,212 | | | $ | 741,928 | |
Validus Holdings Ltd.1 | | | 9,902 | | | | 669,375 | |
MTGE Investment Corp. REIT | | | 25,400 | | | | 497,840 | |
XL Group Ltd. | | | 7,112 | | | | 397,916 | |
PHH Corp.* | | | 26,261 | | | | 285,195 | |
CoBiz Financial, Inc. | | | 13,032 | | | | 279,927 | |
Genworth Financial, Inc. — Class A* | | | 19,752 | | | | 88,884 | |
Total Financial | | | | | | | 2,961,065 | |
| | | | | | | | | |
Technology - 5.5% |
NXP Semiconductor N.V.* | | | 10,717 | | | | 1,171,047 | |
Cavium, Inc.*,1 | | | 9,275 | | | | 802,287 | |
Xcerra Corp.* | | | 37,115 | | | | 518,496 | |
VeriFone Systems, Inc.* | | | 11,298 | | | | 257,821 | |
Total Technology | | | | | | | 2,749,651 | |
| | | | | | | | | |
Consumer, Non-cyclical - 4.7% |
Capella Education Co.1 | | | 8,090 | | | | 798,483 | |
Aetna, Inc. | | | 3,908 | | | | 717,118 | |
Pinnacle Foods, Inc. | | | 7,111 | | | | 462,642 | |
NxStage Medical, Inc.*,1 | | | 7,196 | | | | 200,768 | |
Envision Healthcare Corp.* | | | 4,345 | | | | 191,223 | |
Total Consumer, Non-cyclical | | | 2,370,234 | |
| | | | | | | | | |
Consumer, Cyclical - 2.4% |
Pinnacle Entertainment, Inc.*,1 | | | 21,133 | | | | 712,816 | |
ILG, Inc. | | | 14,480 | | | | 478,274 | |
Total Consumer, Cyclical | | | | | | | 1,191,090 | |
| | | | | | | | | |
Utilities - 2.0% |
WGL Holdings, Inc.1 | | | 4,721 | | | | 418,989 | |
Vectren Corp. | | | 3,558 | | | | 254,219 | |
Avista Corp.1 | | | 3,544 | | | | 186,627 | |
Connecticut Water Service, Inc. | | | 2,112 | | | | 137,956 | |
Total Utilities | | | | | | | 997,791 | |
| | | | | | | | | |
Energy - 2.0% |
RSP Permian, Inc.* | | | 11,561 | | | | 508,915 | |
Rice Midstream Partners, LP | | | 27,721 | | | | 471,812 | |
Total Energy | | | | | | | 980,727 | |
| | | | | | | | | |
Communications - 1.4% |
Hawaiian Telcom Holdco, Inc.*,1 | | | 9,139 | | | | 264,304 | |
Tribune Media Co. — Class A1 | | | 4,621 | | | | 176,846 | |
Sprint Corp.*,2 | | | 29,713 | | | | 161,639 | |
Oclaro, Inc.* | | | 10,964 | | | | 97,909 | |
Total Communications | | | | | | | 700,698 | |
| | | | | | | | | |
Industrial - 1.3% |
KapStone Paper and Packaging Corp.1 | | | 9,737 | | | | 335,927 | |
Rockwell Collins, Inc.1 | | | 2,351 | | | | 316,632 | |
Total Industrial | | | | | | | 652,559 | |
| | | | | | | | | |
Total Common Stocks | | | | | | | | |
(Cost $12,157,980) | | | | | | | 12,603,815 | |
| | | | | | | | | |
RIGHTS† - 0.0% |
Royce Value Trust | | | | | | | | |
Expires 07/03/18 | | | 1,080 | | | | 27 | |
Total Rights | | | | | | | | |
(Cost $—) | | | | | | | 27 | |
| | | | | | | | | |
MUTUAL FUNDS† - 17.4% |
Guggenheim Strategy Fund II3 | | | 169,901 | | | | 4,245,827 | |
Guggenheim Strategy Fund III3 | | | 165,697 | | | | 4,140,758 | |
Guggenheim Strategy Fund I3 | | | 11,865 | | | | 297,098 | |
Total Mutual Funds | | | | | | | | |
(Cost $8,700,416) | | | | | | | 8,683,683 | |
| | | | | | | | | |
CLOSED-END FUNDS† - 9.2% |
Dividend and Income Fund | | | 17,096 | | | | 210,794 | |
RMR Real Estate Income Fund | | | 10,575 | | | | 193,417 | |
SEE NOTES TO FINANCIAL STATEMENTS. | THE GUGGENHEIM FUNDS SEMI-ANNUAL REPORT | 11 |
CONSOLIDATED SCHEDULE OF INVESTMENTS (Unaudited)(continued) | June 30, 2018 |
MULTI-HEDGE STRATEGIES FUND | |
| | Shares | | | Value | |
| | | | | | | | | |
GDL Fund | | | 16,324 | | | $ | 149,854 | |
Eagle Growth & Income Opportunities Fund2 | | | 8,834 | | | | 135,867 | |
Herzfeld Caribbean Basin Fund, Inc. | | | 13,360 | | | | 88,310 | |
Boulder Growth & Income Fund, Inc. | | | 7,112 | | | | 73,111 | |
Adams Natural Resources Fund, Inc. | | | 3,557 | | | | 71,460 | |
First Trust High Income Long/Short Fund | | | 4,570 | | | | 67,320 | |
Gabelli Healthcare & WellnessRx Trust | | | 6,407 | | | | 64,198 | |
Nuveen New Jersey Quality Municipal Income Fund | | | 4,919 | | | | 64,193 | |
General American Investors Company, Inc. | | | 1,850 | | | | 63,529 | |
Eaton Vance California Municipal Income Trust | | | 4,991 | | | | 57,209 | |
BrandywineGLOBAL Global Income Opportunities Fund, Inc. | | | 4,071 | | | | 46,369 | |
Adams Diversified Equity Fund, Inc. | | | 2,981 | | | | 45,967 | |
Franklin Universal Trust | | | 6,776 | | | | 45,264 | |
Neuberger Berman California Intermediate Municipal Fund, Inc. | | | 3,609 | | | | 45,185 | |
Cushing Energy Income Fund | | | 4,805 | | | | 44,494 | |
Neuberger Berman High Yield Strategies Fund, Inc. | | | 3,936 | | | | 42,587 | |
PGIM Global Short Duration High Yield Fund, Inc. | | | 3,100 | | | | 42,346 | |
Bancroft Fund Ltd. | | | 1,806 | | | | 39,515 | |
Nuveen Connecticut Quality Municipal Income Fund | | | 3,197 | | | | 37,980 | |
Templeton Dragon Fund, Inc. | | | 1,712 | | | | 36,483 | |
Mexico Fund, Inc. | | | 2,400 | | | | 36,336 | |
PGIM Short Duration High Yield Fund, Inc. | | | 2,528 | | | | 35,392 | |
Nuveen Texas Quality Municipal Income Fund | | | 2,746 | | | | 35,094 | |
Mexico Equity & Income Fund, Inc. | | | 3,377 | | | | 34,884 | |
Brookfield Global Listed Infrastructure Income Fund, Inc. | | | 2,874 | | | | 34,747 | |
Morgan Stanley Emerging Markets Domestic Debt Fund, Inc. | | | 5,185 | | | | 34,739 | |
Eaton Vance Limited Duration Income Fund | | | 2,707 | | | | 34,054 | |
Western Asset Emerging Markets Debt Fund, Inc. | | | 2,562 | | | | 33,998 | |
Latin American Discovery Fund, Inc. | | | 3,528 | | | | 33,657 | |
Invesco High Income Trust II | | | 2,479 | | | | 33,442 | |
Morgan Stanley Asia-Pacific Fund, Inc. | | | 1,934 | | | | 33,033 | |
Taiwan Fund, Inc. | | | 1,611 | | | | 32,413 | |
Eaton Vance New York Municipal Income Trust | | | 2,650 | | | | 32,330 | |
Morgan Stanley Emerging Markets Fund, Inc. | | | 1,987 | | | | 32,269 | |
Nuveen Global High Income Fund | | | 2,087 | | | | 32,223 | |
Morgan Stanley Emerging Markets Debt Fund, Inc. | | | 3,653 | | | | 31,964 | |
AllianceBernstein Global High Income Fund, Inc. | | | 2,755 | | | | 31,793 | |
12 | THE GUGGENHEIM FUNDS SEMI-ANNUAL REPORT | SEE NOTES TO FINANCIAL STATEMENTS. |
CONSOLIDATED SCHEDULE OF INVESTMENTS (Unaudited)(continued) | June 30, 2018 |
MULTI-HEDGE STRATEGIES FUND | |
| | Shares | | | Value | |
| | | | | | | | | |
Western Asset Global High Income Fund, Inc. | | | 3,472 | | | $ | 31,665 | |
Western Asset Inflation - Linked Securities & Income Fund3 | | | 2,736 | | | | 31,272 | |
First Trust Aberdeen Global Opportunity Income Fund | | | 3,117 | | | | 31,264 | |
BlackRock Credit Allocation Income Trust | | | 2,564 | | | | 30,973 | |
Templeton Emerging Markets Fund/United States | | | 2,105 | | | | 30,965 | |
Principal Real Estate Income Fund | | | 1,730 | | | | 30,708 | |
Western Asset Inflation-Linked Opportunities & Income Fund3 | | | 2,723 | | | | 30,361 | |
Central and Eastern Europe Fund, Inc. | | | 1,307 | | | | 30,296 | |
Aberdeen Asia-Pacific Income Fund, Inc. | | | 6,972 | | | | 30,119 | |
India Fund, Inc. | | | 1,239 | | | | 30,108 | |
Ellsworth Growth and Income Fund Ltd. | | | 3,185 | | | | 30,066 | |
Macquarie Global Infrastructure Total Return Fund, Inc. | | | 1,330 | | | | 29,978 | |
Nuveen AMT-Free Quality Municipal Income Fund | | | 2,284 | | | | 29,715 | |
AllianzGI NFJ Dividend Interest & Premium Strategy Fund | | | 2,351 | | | | 29,670 | |
First Trust Aberdeen Emerging Opportunity Fund | | | 2,161 | | | | 29,390 | |
Nuveen Real Asset Income and Growth Fund | | | 1,794 | | | | 28,991 | |
CBRE Clarion Global Real Estate Income Fund | | | 3,833 | | | | 28,901 | |
Templeton Emerging Markets Income Fund | | | 2,803 | | | | 28,787 | |
Cohen & Steers REIT and Preferred Income Fund, Inc. | | | 1,466 | | | | 28,470 | |
Cushing Renaissance Fund | | | 1,550 | | | | 28,055 | |
Japan Smaller Capitalization Fund, Inc. | | | 2,408 | | | | 28,053 | |
Tri-Continental Corp. | | | 1,054 | | | | 27,942 | |
BlackRock Corporate High Yield Fund, Inc. | | | 2,669 | | | | 27,918 | |
Western Asset High Income Fund II, Inc. | | | 4,313 | | | | 27,776 | |
Source Capital, Inc. | | | 692 | | | | 27,652 | |
Aberdeen Japan Equity Fund, Inc. | | | 3,103 | | | | 27,431 | |
Salient Midstream & MLP Fund | | | 2,754 | | | | 27,430 | |
Nuveen Multi-Market Income Fund | | | 3,916 | | | | 27,373 | |
Nuveen Credit Strategies Income Fund | | | 3,434 | | | | 27,300 | |
Eaton Vance New York Municipal Bond Fund II | | | 2,537 | | | | 27,247 | |
BlackRock Limited Duration Income Trust | | | 1,825 | | | | 27,138 | |
Wells Fargo Income Opportunities Fund | | | 3,376 | | | | 26,974 | |
Tortoise Power and Energy Infrastructure Fund, Inc. | | | 1,433 | | | | 26,969 | |
European Equity Fund, Inc. | | | 2,867 | | | | 26,921 | |
Aberdeen Total Dynamic Dividend Fund | | | 3,076 | | | | 26,915 | |
Western Asset High Income Opportunity Fund, Inc. | | | 5,574 | | | | 26,867 | |
SEE NOTES TO FINANCIAL STATEMENTS. | THE GUGGENHEIM FUNDS SEMI-ANNUAL REPORT | 13 |
CONSOLIDATED SCHEDULE OF INVESTMENTS (Unaudited)(continued) | June 30, 2018 |
MULTI-HEDGE STRATEGIES FUND | |
| | Shares | | | Value | |
| | | | | | | | | |
Gabelli Global Utility & Income Trust | | | 1,437 | | | $ | 26,771 | |
Duff & Phelps Global Utility Income Fund, Inc. | | | 1,857 | | | | 26,685 | |
Tekla Healthcare Opportunities Fund | | | 1,552 | | | | 26,446 | |
MFS Multimarket Income Trust | | | 4,663 | | | | 26,346 | |
Voya Asia Pacific High Dividend Equity Income Fund | | | 2,620 | | | | 26,200 | |
Western Asset High Yield Defined Opportunity Fund, Inc. | | | 1,793 | | | | 26,160 | |
Ivy High Income Opportunities Fund | | | 1,824 | | | | 26,138 | |
Korea Fund, Inc. | | | 674 | | | | 25,652 | |
New Germany Fund, Inc. | | | 1,406 | | | | 25,645 | |
BlackRock Debt Strategies Fund, Inc. | | | 2,286 | | | | 25,557 | |
BlackRock Resources & Commodities Strategy Trust | | | 2,750 | | | | 25,547 | |
Pioneer High Income Trust | | | 2,741 | | | | 25,464 | |
MFS Charter Income Trust | | | 3,199 | | | | 25,368 | |
Clough Global Opportunities Fund | | | 2,284 | | | | 25,078 | |
LMP Capital and Income Fund, Inc. | | | 1,931 | | | | 24,813 | |
Western Asset Global Corporate Defined Opportunity Fund, Inc. | | | 1,473 | | | | 24,673 | |
BlackRock Enhanced International Dividend Trust | | | 4,262 | | | | 24,464 | |
Royce Value Trust, Inc.2 | | | 1,548 | | | | 24,456 | |
AllianzGI Equity & Convertible Income Fund | | | 1,093 | | | | 24,319 | |
Swiss Helvetia Fund, Inc. | | | 1,936 | | | | 23,910 | |
Aberdeen Global Dynamic Dividend Fund | | | 2,312 | | | | 23,698 | |
China Fund, Inc. | | | 1,131 | | | | 23,638 | |
Ares Dynamic Credit Allocation Fund, Inc. | | | 1,459 | | | | 23,475 | |
Lazard World Dividend & Income Fund, Inc. | | | 2,261 | | | | 23,424 | |
Morgan Stanley India Investment Fund, Inc. | | | 904 | | | | 23,414 | |
Sprott Focus Trust, Inc. | | | 2,991 | | | | 23,330 | |
BlackRock Multi-Sector Income Trust | | | 1,365 | | | | 23,328 | |
Clough Global Equity Fund | | | 1,630 | | | | 23,325 | |
Royce Micro-Capital Trust, Inc. | | | 2,319 | | | | 23,159 | |
Aberdeen Global Premier Properties Fund | | | 3,622 | | | | 23,108 | |
BlackRock Enhanced Global Dividend Trust | | | 2,053 | | | | 22,829 | |
Wells Fargo Multi-Sector Income Fund | | | 1,821 | | | | 22,726 | |
Cohen & Steers Global Income Builder, Inc. | | | 2,376 | | | | 22,572 | |
Aberdeen Income Credit Strategies Fund | | | 1,623 | | | | 22,414 | |
Gabelli Dividend & Income Trust | | | 992 | | | | 22,380 | |
Clough Global Dividend and Income Fund | | | 1,769 | | | | 22,024 | |
BlackRock Enhanced Equity Dividend Trust | | | 2,386 | | | | 21,903 | |
Morgan Stanley China A Share Fund, Inc. | | | 949 | | | | 21,903 | |
Eaton Vance Tax-Advantaged Global Dividend Income Fund | | | 1,286 | | | | 21,862 | |
14 | THE GUGGENHEIM FUNDS SEMI-ANNUAL REPORT | SEE NOTES TO FINANCIAL STATEMENTS. |
CONSOLIDATED SCHEDULE OF INVESTMENTS (Unaudited)(continued) | June 30, 2018 |
MULTI-HEDGE STRATEGIES FUND | |
| | Shares | | | Value | |
| | | | | | | | | |
Brookfield Real Assets Income Fund, Inc. | | | 960 | | | $ | 21,792 | |
Cohen & Steers Closed-End Opportunity Fund, Inc. | | | 1,691 | | | | 21,729 | |
Lazard Global Total Return and Income Fund, Inc. | | | 1,173 | | | | 21,536 | |
ClearBridge American Energy MLP Fund, Inc. | | | 2,851 | | | | 21,525 | |
Voya Global Advantage and Premium Opportunity Fund | | | 1,842 | | | | 21,330 | |
BlackRock Enhanced Capital and Income Fund, Inc. | | | 1,303 | | | | 21,135 | |
Neuberger Berman Real Estate Securities Income Fund, Inc. | | | 4,086 | | | | 21,002 | |
Cohen & Steers Infrastructure Fund, Inc. | | | 924 | | | | 20,975 | |
First Trust Enhanced Equity Income Fund | | | 1,332 | | | | 20,966 | |
Wells Fargo Global Dividend Opportunity Fund | | | 3,727 | | | | 20,834 | |
Asia Pacific Fund, Inc. | | | 1,503 | | | | 20,802 | |
Liberty All-Star Equity Fund | | | 3,242 | | | | 20,749 | |
Putnam High Income Securities Fund | | | 2,212 | | | | 20,638 | |
Nuveen Tax-Advantaged Total Return Strategy Fund | | | 1,594 | | | | 20,515 | |
Delaware Enhanced Global Dividend & Income Fund | | | 1,803 | | | | 20,428 | |
Nuveen Tax-Advantaged Dividend Growth Fund | | | 1,226 | | | | 20,217 | |
Aberdeen Emerging Markets Equity Income Fund, Inc. | | | 2,875 | | | | 20,125 | |
Advent Claymore Convertible Securities and Income Fund II3 | | | 2,787 | | | | 15,579 | |
Advent Claymore Convertible Securities and Income Fund3 | | | 1,018 | | | | 15,565 | |
Advent/Claymore Enhanced Growth & Income Fund3 | | | 1,943 | | | | 15,058 | |
Total Closed-End Funds | | | | | | | | |
(Cost $4,334,539) | | | | | | | 4,622,184 | |
| | | | | | | | | |
| | | Face
Amount | | | | | |
| | | | | | | | | |
U.S. TREASURY BILLS†† - 27.6% |
U.S. Treasury Bills | | | | | | | | |
1.87% due 09/13/184,5 | | $ | 12,000,000 | | | | 11,954,253 | |
1.72% due 07/12/184,5,14 | | | 1,826,000 | | | | 1,825,150 | |
Total U.S. Treasury Bills | | | | | | | | |
(Cost $13,778,261) | | | | | | | 13,779,403 | |
| | | | | | | | | |
REPURCHASE AGREEMENTS††,6 - 10.3% |
JPMorgan Chase & Co.
issued 06/29/18 at 2.10%
due 07/02/18 | | | 2,840,038 | | | | 2,840,038 | |
Barclays Capital
issued 06/29/18 at 2.07%
due 07/02/18 | | | 1,394,593 | | | | 1,394,593 | |
Bank of America Merrill Lynch
issued 06/29/18 at 2.08%
due 07/02/18 | | | 929,729 | | | | 929,729 | |
Total Repurchase Agreements | | | | |
(Cost $5,164,360) | | | | | | | 5,164,360 | |
SEE NOTES TO FINANCIAL STATEMENTS. | THE GUGGENHEIM FUNDS SEMI-ANNUAL REPORT | 15 |
CONSOLIDATED SCHEDULE OF INVESTMENTS (Unaudited)(continued) | June 30, 2018 |
MULTI-HEDGE STRATEGIES FUND | |
| | Shares | | | Value | |
| | | | | | | | | |
SECURITIES LENDING COLLATERAL†,7 - 0.5% |
Money Market Fund | | | | | | | | |
First American Government Obligations Fund — Class Z, 1.77%8 | | | 234,935 | | | $ | 234,935 | |
Total Securities Lending Collateral | | | | |
(Cost $234,935) | | | | | | | 234,935 | |
| | | | | | | | | |
Total Investments - 90.2% | | | | | | | | |
(Cost $44,370,491) | | | | | | $ | 45,088,407 | |
| | | | | | | | | |
COMMON STOCKS SOLD SHORT† - (9.8)% |
| | | | | | | | | |
Industrial - (0.2)% |
United Technologies Corp. | | | 677 | | | | (84,645 | ) |
| | | | | | | | | |
Utilities - (0.3)% |
Vistra Energy Corp.* | | | 1 | | | | (24 | ) |
SJW Group | | | 2,482 | | | | (164,358 | ) |
Total Utilities | | | | | | | (164,382 | ) |
| | | | | | | | | |
Communications - (0.6)% |
Sinclair Broadcast Group, Inc. — Class A | | | 1,063 | | | | (34,176 | ) |
Cincinnati Bell, Inc.* | | | 5,960 | | | | (93,572 | ) |
T-Mobile US, Inc.* | | | 3,049 | | | | (182,178 | ) |
Total Communications | | | | | | | (309,926 | ) |
| | | | | | | | | |
Consumer, Cyclical - (1.1)% |
Marriott Vacations Worldwide Corp. | | | 2,389 | | | | (269,861 | ) |
Penn National Gaming, Inc.* | | | 8,876 | | | | (298,145 | ) |
Total Consumer, Cyclical | | | | | | | (568,006 | ) |
| | | | | | | | | |
Technology - (1.3)% |
salesforce.com, Inc.* | | | 37 | | | | (5,047 | ) |
Lumentum Holdings, Inc.* | | | 700 | | | | (40,530 | ) |
Cohu, Inc. | | | 7,828 | | | | (191,864 | ) |
Marvell Technology Group Ltd. | | | 20,180 | | | | (432,659 | ) |
Total Technology | | | | | | | (670,100 | ) |
| | | | | | | | | |
Financial - (1.9)% |
BOK Financial Corp. | | | 2,215 | | | | (208,232 | ) |
Annaly Capital Management, Inc. | | | 24,000 | | | | (246,960 | ) |
Kemper Corp. | | | 6,264 | | | | (473,871 | ) |
Total Financial | | | | | | | (929,063 | ) |
| | | | | | | | | |
Energy - (2.0)% |
Equities Midstream Partners, LP | | | 9,201 | | | | (474,680 | ) |
Concho Resources, Inc.* | | | 3,700 | | | | (511,895 | ) |
Total Energy | | | | | | | (986,575 | ) |
| | | | | | | | | |
Consumer, Non-cyclical - (2.4)% |
Conagra Brands, Inc. | | | 4,618 | | | | (165,001 | ) |
CVS Health Corp. | | | 3,274 | | | | (210,682 | ) |
Strayer Education, Inc. | | | 7,079 | | | | (799,998 | ) |
Total Consumer, Non-cyclical | | | (1,175,681 | ) |
| | | | | | | | | |
Total Common Stocks Sold Short | | | | |
(Proceeds $4,640,823) | | | | | | | (4,888,378 | ) |
| | | | | | | | | |
EXCHANGE-TRADED FUNDS SOLD SHORT† - (9.4)% |
iShares Russell 1000 Growth ETF | | | 70 | | | | (10,066 | ) |
iShares MSCI South Korea ETF | | | 287 | | | | (19,433 | ) |
Technology Select Sector SPDR Fund | | | 359 | | | | (24,940 | ) |
iShares MSCI Japan ETF | | | 745 | | | | (43,143 | ) |
iShares MSCI Taiwan ETF | | | 1,464 | | | | (52,704 | ) |
iShares China Large-Capital ETF | | | 1,340 | | | | (57,580 | ) |
VanEck Vectors Gold Miners ETF | | | 3,116 | | | | (69,518 | ) |
Industrial Select Sector SPDR Fund | | | 1,090 | | | | (78,077 | ) |
iShares MSCI Emerging Markets ETF | | | 1,862 | | | | (80,681 | ) |
iShares Russell 1000 Value ETF | | | 672 | | | | (81,567 | ) |
iShares 20+ Year Treasury Bond ETF | | | 727 | | | | (88,490 | ) |
16 | THE GUGGENHEIM FUNDS SEMI-ANNUAL REPORT | SEE NOTES TO FINANCIAL STATEMENTS. |
CONSOLIDATED SCHEDULE OF INVESTMENTS (Unaudited)(continued) | June 30, 2018 |
MULTI-HEDGE STRATEGIES FUND | |
| | Shares | | | Value | |
| | | | | | | | | |
Utilities Select Sector SPDR Fund | | | 1,984 | | | $ | (103,089 | ) |
VanEck Vectors Russia ETF | | | 5,146 | | | | (109,301 | ) |
iShares MSCI United Kingdom ETF | | | 3,176 | | | | (110,461 | ) |
iShares MSCI Australia ETF | | | 4,994 | | | | (112,914 | ) |
Invesco QQQ Trust Series 1 | | | 658 | | | | (112,946 | ) |
Materials Select Sector SPDR Fund | | | 2,006 | | | | (116,488 | ) |
Consumer Staples Select Sector SPDR Fund | | | 2,361 | | | | (121,662 | ) |
Consumer Discretionary Select Sector SPDR Fund | | | 1,269 | | | | (138,702 | ) |
iShares iBoxx $ Investment Grade Corporate Bond ETF | | | 1,225 | | | | (140,348 | ) |
Health Care Select Sector SPDR Fund | | | 2,004 | | | | (167,254 | ) |
iShares Core U.S. Aggregate Bond ETF | | | 1,622 | | | | (172,451 | ) |
iShares MSCI EAFE ETF | | | 2,674 | | | | (179,078 | ) |
Financial Select Sector SPDR Fund | | | 7,224 | | | | (192,086 | ) |
iShares MSCI Mexico ETF | | | 4,560 | | | | (214,958 | ) |
iShares Russell 2000 Index ETF | | | 1,322 | | | | (216,504 | ) |
iShares TIPS Bond ETF | | | 1,958 | | | | (221,000 | ) |
Energy Select Sector SPDR Fund | | | 3,388 | | | | (257,285 | ) |
iShares U.S. Real Estate ETF | | | 4,302 | | | | (346,655 | ) |
iShares 7-10 Year Treasury Bond ETF | | | 4,440 | | | | (455,144 | ) |
SPDR Bloomberg Barclays High Yield Bond ETF | | | 16,871 | | | | (598,583 | ) |
Total Exchange-Traded Funds Sold Short |
(Proceeds $4,849,099) | | | | | | | (4,693,108 | ) |
Total Securities Sold Short - (19.2)% | | | | |
(Proceeds $9,489,922) | | | | | | $ | (9,581,486 | ) |
Other Assets & Liabilities, net - 29.0% | | | 14,480,285 | |
Total Net Assets - 100.0% | | | | | | $ | 49,987,206 | |
Futures Contracts |
Description | | Number of
Contracts | | | Expiration
Date | | | Notional
Amount | | | Value and
Unrealized
Gain (Loss) | |
Interest Rate Futures Contracts Purchased† |
Euro - OATS Futures Contracts†† | | | 71 | | | | Sep 2018 | | | $ | 12,788,954 | | | $ | 152,219 | |
Euro - 30 year Bond Futures Contracts | | | 5 | | | | Sep 2018 | | | | 1,035,614 | | | | 12,436 | |
Euro - Bund Futures Contracts | | | 5 | | | | Sep 2018 | | | | 948,272 | | | | 5,223 | |
Canadian Government 10 Year Bond Futures Contracts†† | | | 25 | | | | Sep 2018 | | | | 2,598,830 | | | | (1,883 | ) |
| | | | | | | | | | | $ | 17,371,670 | | | $ | 167,995 | |
Equity Futures Contracts Purchased† | | | | | | | | | | | | | | | | |
CBOE Volatility Index Futures Contracts | | | 115 | | | | Nov 2018 | | | $ | 1,961,900 | | | $ | 78,458 | |
CBOE Volatility Index Futures Contracts | | | 22 | | | | Aug 2018 | | | | 361,900 | | | | 46,924 | |
SPI 200 Index Futures Contracts | | | 7 | | | | Sep 2018 | | | | 800,070 | | | | 13,086 | |
CBOE Volatility Index Futures Contracts | | | 18 | | | | Dec 2018 | | | | 306,180 | | | | 8,114 | |
S&P/TSX 60 IX Index Futures Contracts | | | 4 | | | | Sep 2018 | | | | 586,507 | | | | 2,311 | |
FTSE MIB Index Futures Contracts†† | | | 1 | | | | Sep 2018 | | | | 125,467 | | | | 1,276 | |
SEE NOTES TO FINANCIAL STATEMENTS. | THE GUGGENHEIM FUNDS SEMI-ANNUAL REPORT | 17 |
CONSOLIDATED SCHEDULE OF INVESTMENTS (Unaudited)(continued) | June 30, 2018 |
MULTI-HEDGE STRATEGIES FUND | |
Futures Contracts |
Description | | Number of
Contracts | | | Expiration
Date | | | Notional
Amount | | | Value and
Unrealized
Gain (Loss) | |
Equity Futures Contracts Purchased† (continued) | | | | | | | | | | | | | | | | |
Russell 2000 Index Mini Futures Contracts | | | 5 | | | | Sep 2018 | | | $ | 411,675 | | | $ | (22 | ) |
S&P 500 Index Mini Futures Contracts | | | 2 | | | | Sep 2018 | | | | 272,075 | | | | (89 | ) |
Nikkei 225 (OSE) Index Futures Contracts | | | 1 | | | | Sep 2018 | | | | 200,705 | | | | (98 | ) |
NASDAQ-100 Index Mini Futures Contracts | | | 2 | | | | Sep 2018 | | | | 282,490 | | | | (150 | ) |
Hang Seng Index Futures Contracts†† | | | 1 | | | | Jul 2018 | | | | 182,284 | | | | (903 | ) |
OMX Stockholm 30 Index Futures Contracts†† | | | 14 | | | | Jul 2018 | | | | 241,843 | | | | (975 | ) |
FTSE 100 Index Futures Contracts | | | 3 | | | | Sep 2018 | | | | 299,557 | | | | (1,376 | ) |
CBOE Volatility Index Futures Contracts | | | 4 | | | | Jul 2018 | | | | 64,400 | | | | (1,441 | ) |
Tokyo Stock Price Index Futures Contracts | | | 1 | | | | Sep 2018 | | | | 155,541 | | | | (4,455 | ) |
CAC 40 10 Euro Index Futures Contracts | | | 4 | | | | Jul 2018 | | | | 247,501 | | | | (7,149 | ) |
Amsterdam Index Futures Contracts | | | 2 | | | | Jul 2018 | | | | 256,422 | | | | (7,831 | ) |
| | | | | | | | | | | $ | 6,756,517 | | | $ | 125,680 | |
Commodity Futures Contracts Purchased† | | | | | | | | | | | | | | | | |
WTI Crude Futures Contracts | | | 8 | | | | Aug 2018 | | | $ | 594,400 | | | $ | 50,328 | |
Brent Crude Futures Contracts | | | 8 | | | | Sep 2018 | | | | 632,640 | | | | 18,885 | |
Cattle Feeder Futures Contracts | | | 6 | | | | Aug 2018 | | | | 453,975 | | | | 16,624 | |
Gasoline RBOB Futures Contracts | | | 7 | | | | Aug 2018 | | | | 631,277 | | | | 12,129 | |
Lean Hogs Futures Contracts | | | 11 | | | | Aug 2018 | | | | 336,050 | | | | 4,418 | |
Wheat Futures Contracts | | | 1 | | | | Sep 2018 | | | | 25,100 | | | | 664 | |
Cocoa Futures Contracts | | | 4 | | | | Sep 2018 | | | | 100,280 | | | | (1,568 | ) |
Cotton #2 Futures Contracts | | | 6 | | | | Dec 2018 | | | | 252,150 | | | | (2,424 | ) |
LME Nickel Futures Contracts | | | 2 | | | | Aug 2018 | | | | 178,386 | | | | (8,863 | ) |
LME Primary Aluminum Futures Contracts | | | 3 | | | | Aug 2018 | | | | 159,525 | | | | (11,032 | ) |
Soybean Meal Futures Contracts | | | 18 | | | | Dec 2018 | | | | 592,560 | | | | (15,752 | ) |
| | | | | | | | | | | $ | 3,956,343 | | | $ | 63,409 | |
Currency Futures Contracts Purchased† | | | | | | | | | | | | | | | | |
Canadian Dollar Futures Contracts | | | 15 | | | | Sep 2018 | | | $ | 1,142,400 | | | $ | 13,896 | |
New Zealand Dollar Futures Contracts | | | 1 | | | | Sep 2018 | | | | 67,730 | | | | (1,611 | ) |
Japanese Yen Futures Contracts | | | 4 | | | | Sep 2018 | | | | 453,975 | | | | (2,181 | ) |
| | | | | | | | | | | $ | 1,664,105 | | | $ | 10,104 | |
Commodity Futures Contracts Sold Short† | | | | | | | | | | | | | | | | |
Soybean Futures Contracts | | | 20 | | | | Nov 2018 | | | $ | 879,500 | | | $ | 56,847 | |
Soybean Oil Futures Contracts | | | 62 | | | | Dec 2018 | | | | 1,107,444 | | | | 29,274 | |
Corn Futures Contracts | | | 13 | | | | Sep 2018 | | | | 233,512 | | | | 17,017 | |
Silver Futures Contracts | | | 3 | | | | Sep 2018 | | | | 242,175 | | | | 13,881 | |
Coffee 'C' Futures Contracts | | | 8 | | | | Sep 2018 | | | | 344,700 | | | | 11,072 | |
Sugar #11 Futures Contracts | | | 13 | | | | Oct 2018 | | | | 177,632 | | | | 8,111 | |
Natural Gas Futures Contracts | | | 17 | | | | Aug 2018 | | | | 497,080 | | | | 6,992 | |
Hard Red Winter Wheat Futures Contracts | | | 2 | | | | Sep 2018 | | | | 48,750 | | | | 6,743 | |
LME Zinc Futures Contracts | | | 3 | | | | Aug 2018 | | | | 214,688 | | | | 4,399 | |
Copper Futures Contracts | | | 2 | | | | Sep 2018 | | | | 148,325 | | | | (11 | ) |
18 | THE GUGGENHEIM FUNDS SEMI-ANNUAL REPORT | SEE NOTES TO FINANCIAL STATEMENTS. |
CONSOLIDATED SCHEDULE OF INVESTMENTS (Unaudited)(continued) | June 30, 2018 |
MULTI-HEDGE STRATEGIES FUND | |
Futures Contracts |
Description | | Number of
Contracts | | | Expiration
Date | | | Notional
Amount | | | Value and
Unrealized
Gain (Loss) | |
Commodity Futures Contracts Sold Short† (continued) | | | | | | | | | | | | | | | | |
Gold 100 oz. Futures Contracts | | | 4 | | | | Aug 2018 | | | $ | 501,520 | | | $ | (1,008 | ) |
NY Harbor ULSD Futures Contracts | | | 5 | | | | Aug 2018 | | | | 463,302 | | | | (5,943 | ) |
Low Sulphur Gas Oil Futures Contracts | | | 6 | | | | Aug 2018 | | | | 406,050 | | | | (5,972 | ) |
Live Cattle Futures Contracts | | | 23 | | | | Aug 2018 | | | | 981,870 | | | | (31,946 | ) |
| | | | | | | | | | | $ | 6,246,548 | | | $ | 109,456 | |
Currency Futures Contracts Sold Short† | | | | | | | | | | | | | | | | |
Australian Dollar Futures Contracts | | | 48 | | | | Sep 2018 | | | $ | 3,553,440 | | | $ | 70,486 | |
British Pound Futures Contracts | | | 23 | | | | Sep 2018 | | | | 1,903,681 | | | | 11,092 | |
Euro FX Futures Contracts | | | 7 | | | | Sep 2018 | | | | 1,027,600 | | | | (8,832 | ) |
| | | | | | | | | | | $ | 6,484,721 | | | $ | 72,746 | |
Equity Futures Contracts Sold Short† | | | | | | | | | | | | | | | | |
DAX Index Futures Contracts | | | 1 | | | | Sep 2018 | | | $ | 358,156 | | | $ | 16,061 | |
IBEX 35 Index Futures Contracts†† | | | 2 | | | | Jul 2018 | | | | 222,710 | | | | 6,330 | |
Euro STOXX 50 Index Futures Contracts | | | 3 | | | | Sep 2018 | | | | 118,192 | | | | 3,672 | |
CBOE Volatility Index Futures Contracts | | | 126 | | | | Oct 2018 | | | | 2,154,600 | | | | (9,605 | ) |
CBOE Volatility Index Futures Contracts | | | 23 | | | | Sep 2018 | | | | 385,250 | | | | (16,564 | ) |
| | | | | | | | | | | $ | 3,238,908 | | | $ | (106 | ) |
Interest Rate Futures Contracts Sold Short† | | | | | | | | | | | | | | | | |
U.S. Treasury 10 Year Note Futures Contracts | | | 57 | | | | Sep 2018 | | | $ | 6,849,797 | | | $ | 5,933 | |
Long Gilt Futures Contracts†† | | | 40 | | | | Sep 2018 | | | | 6,492,537 | | | | 1,583 | |
U.S. Treasury Ultra Long Bond Futures Contracts | | | 3 | | | | Sep 2018 | | | | 478,031 | | | | 276 | |
U.S. Treasury Long Bond Futures Contracts | | | 7 | | | | Sep 2018 | | | | 1,014,125 | | | | 207 | |
Euro - BTP Italian Government Bond Futures Contracts†† | | | 1 | | | | Sep 2018 | | | | 148,517 | | | | 55 | |
Australian Government 10 Year Bond Futures Contracts | | | 80 | | | | Sep 2018 | | | | 7,662,497 | | | | (8,504 | ) |
| | | | | | | | | | | $ | 22,645,504 | | | $ | (450 | ) |
SEE NOTES TO FINANCIAL STATEMENTS. | THE GUGGENHEIM FUNDS SEMI-ANNUAL REPORT | 19 |
CONSOLIDATED SCHEDULE OF INVESTMENTS (Unaudited)(continued) | June 30, 2018 |
MULTI-HEDGE STRATEGIES FUND | |
Custom Basket Swap Agreements |
Counterparty | Index | | Financing
Rate Pay
(Receive) | | | Payment
Frequency | | | Maturity
Date | | | Notional
Amount | | | Value and
Unrealized
Gain (Loss) | |
OTC Custom Basket Swap Agreements†† |
Morgan Stanley | Multi-Hedge Portfolio Long Custom Basket Swap9 | | | 2.37 | % | | | At Maturity | | | | 08/31/18 | | | $ | 18,467,165 | | | $ | 541,906 | |
Morgan Stanley | Multi-Hedge Portfolio Long Custom Basket Swap10 | | | 2.37 | % | | | At Maturity | | | | 08/31/18 | | | | 22,068,439 | | | | 435,080 | |
Morgan Stanley | Multi-Hedge Portfolio Long Custom Basket Swap11 | | | 2.37 | % | | | At Maturity | | | | 09/06/19 | | | | 754,388 | | | | 17,866 | |
| | | | | | | | | | | | | | | | $ | 41,289,992 | | | $ | 994,852 | |
OTC Custom Basket Agreements Swap Sold Short†† |
Morgan Stanley | Multi-Hedge Portfolio Short Custom Basket Swap12 | | | (1.54 | %) | | | At Maturity | | | | 08/31/18 | | | $ | 17,906,991 | | | $ | (929,992 | ) |
Morgan Stanley | Multi-Hedge Portfolio Short Custom Basket Swap13 | | | (1.48 | %) | | | At Maturity | | | | 08/31/18 | | | | 18,444,851 | | | | (329,012 | ) |
| | | | | | | | | | | | | | | | $ | 36,351,842 | | | $ | (1,259,004 | ) |
| | Shares | | | Percentage
Value | | | Value and
Unrealized
Gain | |
| | | | | | | | | | | | | |
CUSTOM BASKET OF LONG SECURITIES10 |
Boston Beer Company, Inc. — Class A* | | | 347 | | | | 11.3 | % | | $ | 49,150 | |
US Foods Holding Corp.* | | | 3,277 | | | | 8.2 | % | | | 35,618 | |
Valero Energy Corp. | | | 1,200 | | | | 7.9 | % | | | 34,542 | |
El Paso Electric Co. | | | 3,717 | | | | 7.9 | % | | | 34,214 | |
Travelport Worldwide Ltd. | | | 5,433 | | | | 6.6 | % | | | 28,792 | |
Senior Housing Properties Trust | | | 12,842 | | | | 6.4 | % | | | 27,739 | |
UGI Corp. | | | 3,436 | | | | 6.4 | % | | | 27,660 | |
NetApp, Inc. | | | 679 | | | | 6.3 | % | | | 27,391 | |
Archer-Daniels-Midland Co. | | | 4,552 | | | | 5.9 | % | | | 25,486 | |
Genesee & Wyoming, Inc. — Class A* | | | 2,459 | | | | 5.5 | % | | | 23,722 | |
HP, Inc. | | | 7,087 | | | | 5.4 | % | | | 23,361 | |
Cisco Systems, Inc. | | | 2,071 | | | | 5.2 | % | | | 22,526 | |
Greenbrier Companies, Inc. | | | 3,398 | | | | 4.9 | % | | | 21,165 | |
Regal Beloit Corp. | | | 2,984 | | | | 4.6 | % | | | 20,042 | |
Gray Television, Inc.* | | | 5,186 | | | | 4.4 | % | | | 19,187 | |
Ameren Corp. | | | 3,253 | | | | 4.3 | % | | | 18,751 | |
Chevron Corp. | | | 1,519 | | | | 4.3 | % | | | 18,646 | |
Vishay Intertechnology, Inc. | | | 3,640 | | | | 4.3 | % | | | 18,547 | |
Exelon Corp. | | | 4,742 | | | | 4.1 | % | | | 17,793 | |
Performance Food Group Co.* | | | 1,980 | | | | 3.9 | % | | | 16,765 | |
PNM Resources, Inc. | | | 5,732 | | | | 3.7 | % | | | 16,134 | |
Amgen, Inc. | | | 1,115 | | | | 3.6 | % | | | 15,723 | |
Sabre Corp. | | | 2,564 | | | | 3.6 | % | | | 15,504 | |
EMCOR Group, Inc. | | | 2,140 | | | | 3.5 | % | | | 15,323 | |
20 | THE GUGGENHEIM FUNDS SEMI-ANNUAL REPORT | SEE NOTES TO FINANCIAL STATEMENTS. |
CONSOLIDATED SCHEDULE OF INVESTMENTS (Unaudited)(continued) | June 30, 2018 |
MULTI-HEDGE STRATEGIES FUND | |
| | Shares | | | Percentage
Value | | | Value and
Unrealized
Gain | |
| | | | | | | | | | | | | |
AMC Networks, Inc. — Class A* | | | 1,284 | | | | 3.4 | % | | $ | 14,646 | |
TreeHouse Foods, Inc.* | | | 1,319 | | | | 3.4 | % | | | 14,593 | |
Exxon Mobil Corp. | | | 1,751 | | | | 3.3 | % | | | 14,318 | |
InterDigital, Inc. | | | 1,566 | | | | 3.3 | % | | | 14,301 | |
ON Semiconductor Corp.* | | | 3,733 | | | | 3.0 | % | | | 13,152 | |
Occidental Petroleum Corp. | | | 717 | | | | 3.0 | % | | | 13,026 | |
Dean Foods Co. | | | 6,122 | | | | 3.0 | % | | | 12,968 | |
CoreLogic, Inc.* | | | 1,893 | | | | 3.0 | % | | | 12,905 | |
EnerSys | | | 1,554 | | | | 3.0 | % | | | 12,860 | |
Dell Technologies Incorporated Class V — Class V* | | | 727 | | | | 3.0 | % | | | 12,848 | |
Park Hotels & Resorts, Inc. | | | 3,304 | | | | 2.9 | % | | | 12,400 | |
Telephone & Data Systems, Inc. | | | 6,441 | | | | 2.8 | % | | | 12,269 | |
WellCare Health Plans, Inc.* | | | 215 | | | | 2.8 | % | | | 12,251 | |
Verizon Communications, Inc. | | | 3,876 | | | | 2.8 | % | | | 12,105 | |
HollyFrontier Corp. | | | 519 | | | | 2.7 | % | | | 11,915 | |
Snap-on, Inc. | | | 848 | | | | 2.7 | % | | | 11,885 | |
Medtronic plc | | | 1,906 | | | | 2.7 | % | | | 11,555 | |
Allison Transmission Holdings, Inc. | | | 4,041 | | | | 2.6 | % | | | 11,292 | |
Merck & Company, Inc. | | | 1,823 | | | | 2.5 | % | | | 10,911 | |
Procter & Gamble Co. | | | 1,807 | | | | 2.5 | % | | | 10,809 | |
Gibraltar Industries, Inc.* | | | 1,979 | | | | 2.5 | % | | | 10,785 | |
Charles River Laboratories International, Inc.* | | | 840 | | | | 2.5 | % | | | 10,733 | |
Cardtronics plc — Class A* | | | 2,112 | | | | 2.4 | % | | | 10,289 | |
Darling Ingredients, Inc.* | | | 4,050 | | | | 2.3 | % | | | 10,137 | |
PBF Energy, Inc. — Class A | | | 802 | | | | 2.3 | % | | | 10,114 | |
New Media Investment Group, Inc. | | | 3,535 | | | | 2.3 | % | | | 9,818 | |
AES Corp. | | | 7,374 | | | | 2.0 | % | | | 8,525 | |
VEREIT, Inc. | | | 23,146 | | | | 1.9 | % | | | 8,454 | |
Rexnord Corp.* | | | 1,968 | | | | 1.9 | % | | | 8,230 | |
Western Union Co. | | | 6,867 | | | | 1.9 | % | | | 8,195 | |
Scholastic Corp. | | | 1,352 | | | | 1.8 | % | | | 7,900 | |
F5 Networks, Inc.* | | | 321 | | | | 1.8 | % | | | 7,798 | |
Norfolk Southern Corp. | | | 618 | | | | 1.7 | % | | | 7,527 | |
Kroger Co. | | | 2,132 | | | | 1.7 | % | | | 7,462 | |
Juniper Networks, Inc. | | | 2,995 | | | | 1.7 | % | | | 7,450 | |
Teradyne, Inc. | | | 1,886 | | | | 1.7 | % | | | 7,437 | |
Jabil, Inc. | | | 3,355 | | | | 1.6 | % | | | 7,134 | |
Convergys Corp. | | | 6,172 | | | | 1.6 | % | | | 6,982 | |
STERIS plc | | | 1,127 | | | | 1.5 | % | | | 6,643 | |
Pinnacle West Capital Corp. | | | 1,207 | | | | 1.5 | % | | | 6,616 | |
Pfizer, Inc. | | | 5,212 | | | | 1.5 | % | | | 6,530 | |
Skyworks Solutions, Inc. | | | 1,214 | | | | 1.4 | % | | | 6,087 | |
Fidelity National Information Services, Inc. | | | 795 | | | | 1.4 | % | | | 5,984 | |
Omnicom Group, Inc. | | | 1,452 | | | | 1.4 | % | | | 5,958 | |
Kulicke & Soffa Industries, Inc. | | | 2,277 | | | | 1.3 | % | | | 5,858 | |
SEE NOTES TO FINANCIAL STATEMENTS. | THE GUGGENHEIM FUNDS SEMI-ANNUAL REPORT | 21 |
CONSOLIDATED SCHEDULE OF INVESTMENTS (Unaudited)(continued) | June 30, 2018 |
MULTI-HEDGE STRATEGIES FUND | |
| | Shares | | | Percentage
Value | | | Value and
Unrealized
Gain | |
| | | | | | | | | | | | | |
Prestige Brands Holdings, Inc.* | | | 2,108 | | | | 1.3 | % | | $ | 5,738 | |
Kraft Heinz Co. | | | 2,582 | | | | 1.2 | % | | | 5,360 | |
PG&E Corp. | | | 1,545 | | | | 1.2 | % | | | 5,291 | |
Allergan plc | | | 401 | | | | 1.2 | % | | | 5,029 | |
Regeneron Pharmaceuticals, Inc.* | | | 166 | | | | 1.1 | % | | | 4,861 | |
Ventas, Inc. | | | 2,079 | | | | 1.1 | % | | | 4,804 | |
Motorola Solutions, Inc. | | | 603 | | | | 1.1 | % | | | 4,787 | |
Bristol-Myers Squibb Co. | | | 1,370 | | | | 1.1 | % | | | 4,650 | |
Union Pacific Corp. | | | 546 | | | | 1.1 | % | | | 4,639 | |
Gannett Company, Inc. | | | 7,598 | | | | 1.0 | % | | | 4,165 | |
Domtar Corp. | | | 1,564 | | | | 0.9 | % | | | 4,079 | |
Portland General Electric Co. | | | 5,713 | | | | 0.9 | % | | | 3,923 | |
Avnet, Inc. | | | 1,449 | | | | 0.9 | % | | | 3,869 | |
Vonage Holdings Corp.* | | | 7,028 | | | | 0.8 | % | | | 3,598 | |
FirstEnergy Corp. | | | 2,026 | | | | 0.8 | % | | | 3,537 | |
Entergy Corp. | | | 844 | | | | 0.8 | % | | | 3,414 | |
United Natural Foods, Inc.* | | | 1,537 | | | | 0.8 | % | | | 3,400 | |
Brandywine Realty Trust | | | 4,510 | | | | 0.8 | % | | | 3,373 | |
PepsiCo, Inc. | | | 842 | | | | 0.8 | % | | | 3,320 | |
Tyson Foods, Inc. — Class A | | | 2,783 | | | | 0.8 | % | | | 3,313 | |
Kellogg Co. | | | 992 | | | | 0.7 | % | | | 3,209 | |
CA, Inc. | | | 2,362 | | | | 0.7 | % | | | 3,163 | |
Casey's General Stores, Inc. | | | 568 | | | | 0.7 | % | | | 2,992 | |
CSX Corp. | | | 775 | | | | 0.7 | % | | | 2,880 | |
Fluor Corp. | | | 1,035 | | | | 0.6 | % | | | 2,726 | |
TEGNA, Inc. | | | 10,889 | | | | 0.6 | % | | | 2,647 | |
KBR, Inc. | | | 3,049 | | | | 0.6 | % | | | 2,493 | |
Tailored Brands, Inc. | | | 1,153 | | | | 0.6 | % | | | 2,477 | |
Church & Dwight Company, Inc. | | | 693 | | | | 0.5 | % | | | 2,351 | |
Apartment Investment & Management Co. — Class A | | | 2,998 | | | | 0.5 | % | | | 2,209 | |
MSG Networks, Inc. — Class A* | | | 2,500 | | | | 0.5 | % | | | 2,091 | |
Equity Commonwealth* | | | 3,322 | | | | 0.5 | % | | | 1,976 | |
J.B. Hunt Transport Services, Inc. | | | 394 | | | | 0.5 | % | | | 1,965 | |
Mylan N.V.* | | | 2,323 | | | | 0.4 | % | | | 1,923 | |
LyondellBasell Industries N.V. — Class A | | | 665 | | | | 0.4 | % | | | 1,732 | |
Humana, Inc. | | | 186 | | | | 0.4 | % | | | 1,730 | |
Interpublic Group of Companies, Inc. | | | 2,200 | | | | 0.4 | % | | | 1,703 | |
Colgate-Palmolive Co. | | | 1,173 | | | | 0.4 | % | | | 1,673 | |
Sysco Corp. | | | 784 | | | | 0.4 | % | | | 1,610 | |
Lamb Weston Holdings, Inc. | | | 525 | | | | 0.3 | % | | | 1,378 | |
Eaton Corporation plc | | | 1,498 | | | | 0.3 | % | | | 1,260 | |
Consolidated Edison, Inc. | | | 2,174 | | | | 0.3 | % | | | 1,099 | |
OGE Energy Corp. | | | 1,631 | | | | 0.2 | % | | | 1,071 | |
Crane Co. | | | 990 | | | | 0.2 | % | | | 1,040 | |
ConocoPhillips | | | 867 | | | | 0.2 | % | | | 913 | |
Acuity Brands, Inc. | | | 536 | | | | 0.2 | % | | | 681 | |
Cognizant Technology Solutions Corp. — Class A | | | 1,269 | | | | 0.2 | % | | | 663 | |
Altria Group, Inc. | | | 1,253 | | | | 0.1 | % | | | 593 | |
Hershey Co. | | | 375 | | | | 0.1 | % | | | 352 | |
Accenture plc — Class A | | | 329 | | | | 0.1 | % | | | 317 | |
22 | THE GUGGENHEIM FUNDS SEMI-ANNUAL REPORT | SEE NOTES TO FINANCIAL STATEMENTS. |
CONSOLIDATED SCHEDULE OF INVESTMENTS (Unaudited)(continued) | June 30, 2018 |
MULTI-HEDGE STRATEGIES FUND | |
| | Shares | | | Percentage
Value | | | Value and
Unrealized
Gain (Loss) | |
| | | | | | | | | | | | | |
Philip Morris International, Inc. | | | 665 | | | | 0.0 | % | | $ | 23 | |
Broadridge Financial Solutions, Inc. | | | 463 | | | | 0.0 | % | | | 5 | |
ORBCOMM, Inc.* | | | 5,320 | | | | 0.0 | % | | | — | |
Perspecta, Inc. | | | 1 | | | | 0.0 | % | | | (2 | ) |
Cousins Properties, Inc. | | | 9,425 | | | | 0.0 | % | | | (89 | ) |
Gilead Sciences, Inc. | | | 1,965 | | | | 0.0 | % | | | (114 | ) |
Hologic, Inc.* | | | 1,511 | | | | 0.0 | % | | | (121 | ) |
Spirit AeroSystems Holdings, Inc. — Class A | | | 713 | | | | (0.1 | %) | | | (252 | ) |
Trinity Industries, Inc. | | | 2,472 | | | | (0.1 | %) | | | (505 | ) |
CBRE Group, Inc. — Class A* | | | 1,135 | | | | (0.1 | %) | | | (587 | ) |
Comcast Corp. — Class A | | | 2,741 | | | | (0.2 | %) | | | (663 | ) |
Conagra Brands, Inc. | | | 3,367 | | | | (0.2 | %) | | | (813 | ) |
Paychex, Inc. | | | 803 | | | | (0.2 | %) | | | (843 | ) |
Johnson & Johnson | | | 942 | | | | (0.2 | %) | | | (855 | ) |
Eli Lilly & Co. | | | 1,356 | | | | (0.3 | %) | | | (1,214 | ) |
Host Hotels & Resorts, Inc. | | | 3,670 | | | | (0.3 | %) | | | (1,305 | ) |
Mettler-Toledo International, Inc.* | | | 99 | | | | (0.3 | %) | | | (1,316 | ) |
Baxter International, Inc. | | | 923 | | | | (0.3 | %) | | | (1,343 | ) |
Werner Enterprises, Inc. | | | 1,317 | | | | (0.3 | %) | | | (1,392 | ) |
Alcoa Corp.* | | | 1,047 | | | | (0.3 | %) | | | (1,400 | ) |
Quanta Services, Inc.* | | | 2,100 | | | | (0.3 | %) | | | (1,446 | ) |
Seagate Technology plc | | | 904 | | | | (0.4 | %) | | | (1,550 | ) |
Waters Corp.* | | | 284 | | | | (0.4 | %) | | | (1,559 | ) |
ResMed, Inc. | | | 482 | | | | (0.4 | %) | | | (1,563 | ) |
Visa, Inc. — Class A | | | 625 | | | | (0.4 | %) | | | (1,616 | ) |
Microsoft Corp. | | | 576 | | | | (0.4 | %) | | | (1,638 | ) |
Lions Gate Entertainment Corp. — Class A | | | 4,351 | | | | (0.4 | %) | | | (1,659 | ) |
Leidos Holdings, Inc. | | | 835 | | | | (0.4 | %) | | | (1,692 | ) |
Alphabet, Inc. — Class C* | | | 45 | | | | (0.4 | %) | | | (1,696 | ) |
Zoetis, Inc. | | | 649 | | | | (0.4 | %) | | | (1,704 | ) |
Fiserv, Inc.* | | | 716 | | | | (0.4 | %) | | | (1,749 | ) |
Newmont Mining Corp. | | | 1,330 | | | | (0.4 | %) | | | (1,759 | ) |
Allstate Corp. | | | 1,270 | | | | (0.4 | %) | | | (1,773 | ) |
DXC Technology Co. | | | 1,375 | | | | (0.4 | %) | | | (1,817 | ) |
Western Digital Corp. | | | 684 | | | | (0.4 | %) | | | (1,872 | ) |
Phillips 66 | | | 468 | | | | (0.4 | %) | | | (1,872 | ) |
Franklin Resources, Inc. | | | 1,515 | | | | (0.4 | %) | | | (1,880 | ) |
Apple, Inc. | | | 331 | | | | (0.4 | %) | | | (1,937 | ) |
CDW Corp. | | | 623 | | | | (0.5 | %) | | | (1,964 | ) |
Oshkosh Corp. | | | 886 | | | | (0.5 | %) | | | (2,156 | ) |
Kansas City Southern | | | 1,317 | | | | (0.5 | %) | | | (2,211 | ) |
Louisiana-Pacific Corp. | | | 2,125 | | | | (0.5 | %) | | | (2,242 | ) |
Thermo Fisher Scientific, Inc. | | | 263 | | | | (0.5 | %) | | | (2,275 | ) |
Abbott Laboratories | | | 1,290 | | | | (0.6 | %) | | | (2,422 | ) |
Corning, Inc. | | | 1,820 | | | | (0.6 | %) | | | (2,456 | ) |
Bank of America Corp. | | | 2,013 | | | | (0.6 | %) | | | (2,639 | ) |
Oracle Corp. | | | 1,251 | | | | (0.6 | %) | | | (2,648 | ) |
SEE NOTES TO FINANCIAL STATEMENTS. | THE GUGGENHEIM FUNDS SEMI-ANNUAL REPORT | 23 |
CONSOLIDATED SCHEDULE OF INVESTMENTS (Unaudited)(continued) | June 30, 2018 |
MULTI-HEDGE STRATEGIES FUND | |
| | Shares | | | Percentage
Value | | | Value and
Unrealized
Loss | |
| | | | | | | | | | | | | |
ARRIS International plc* | | | 3,164 | | | | (0.6 | %) | | $ | (2,778 | ) |
International Business Machines Corp. | | | 682 | | | | (0.7 | %) | | | (2,835 | ) |
Pentair plc | | | 2,096 | | | | (0.7 | %) | | | (2,990 | ) |
Caterpillar, Inc. | | | 331 | | | | (0.7 | %) | | | (3,033 | ) |
Yum! Brands, Inc. | | | 621 | | | | (0.7 | %) | | | (3,163 | ) |
Huntsman Corp. | | | 1,957 | | | | (0.8 | %) | | | (3,309 | ) |
Danaher Corp. | | | 883 | | | | (0.8 | %) | | | (3,426 | ) |
United Therapeutics Corp.* | | | 734 | | | | (0.8 | %) | | | (3,586 | ) |
Amdocs Ltd. | | | 1,021 | | | | (0.9 | %) | | | (3,732 | ) |
Williams Companies, Inc. | | | 2,033 | | | | (0.9 | %) | | | (3,758 | ) |
Varian Medical Systems, Inc.* | | | 421 | | | | (0.9 | %) | | | (3,775 | ) |
Dover Corp. | | | 1,240 | | | | (0.9 | %) | | | (3,870 | ) |
Zimmer Biomet Holdings, Inc. | | | 1,092 | | | | (0.9 | %) | | | (3,910 | ) |
Summit Hotel Properties, Inc. | | | 4,694 | | | | (0.9 | %) | | | (3,937 | ) |
Hill-Rom Holdings, Inc. | | | 797 | | | | (0.9 | %) | | | (4,007 | ) |
JPMorgan Chase & Co. | | | 1,069 | | | | (1.0 | %) | | | (4,217 | ) |
JetBlue Airways Corp.* | | | 6,078 | | | | (1.0 | %) | | | (4,326 | ) |
Delta Air Lines, Inc. | | | 1,937 | | | | (1.0 | %) | | | (4,373 | ) |
Applied Materials, Inc. | | | 1,181 | | | | (1.0 | %) | | | (4,411 | ) |
Benchmark Electronics, Inc. | | | 2,737 | | | | (1.1 | %) | | | (4,647 | ) |
Arrow Electronics, Inc.* | | | 1,259 | | | | (1.1 | %) | | | (4,660 | ) |
Aflac, Inc. | | | 1,779 | | | | (1.1 | %) | | | (4,687 | ) |
KLA-Tencor Corp. | | | 455 | | | | (1.1 | %) | | | (4,764 | ) |
General Motors Co. | | | 1,169 | | | | (1.1 | %) | | | (4,812 | ) |
Travelers Companies, Inc. | | | 727 | | | | (1.1 | %) | | | (4,820 | ) |
Biogen, Inc.* | | | 398 | | | | (1.1 | %) | | | (4,861 | ) |
International Paper Co. | | | 1,023 | | | | (1.1 | %) | | | (4,940 | ) |
Alaska Air Group, Inc. | | | 934 | | | | (1.1 | %) | | | (4,951 | ) |
Bruker Corp. | | | 1,598 | | | | (1.2 | %) | | | (5,158 | ) |
Broadcom, Inc. | | | 205 | | | | (1.2 | %) | | | (5,174 | ) |
Meritor, Inc.* | | | 4,140 | | | | (1.2 | %) | | | (5,318 | ) |
Tech Data Corp.* | | | 594 | | | | (1.2 | %) | | | (5,334 | ) |
Masco Corp. | | | 2,565 | | | | (1.2 | %) | | | (5,398 | ) |
Walgreens Boots Alliance, Inc. | | | 1,079 | | | | (1.3 | %) | | | (5,463 | ) |
Lam Research Corp. | | | 314 | | | | (1.3 | %) | | | (5,519 | ) |
Lear Corp. | | | 355 | | | | (1.4 | %) | | | (5,939 | ) |
TE Connectivity Ltd. | | | 657 | | | | (1.4 | %) | | | (6,100 | ) |
Icad, Inc.* | | | 8,287 | | | | (1.4 | %) | | | (6,242 | ) |
Perrigo Company plc | | | 852 | | | | (1.5 | %) | | | (6,516 | ) |
MAXIMUS, Inc. | | | 1,458 | | | | (1.6 | %) | | | (6,767 | ) |
United Rentals, Inc.* | | | 424 | | | | (1.6 | %) | | | (7,159 | ) |
Celgene Corp.* | | | 806 | | | | (1.7 | %) | | | (7,208 | ) |
Prudential Financial, Inc. | | | 843 | | | | (1.7 | %) | | | (7,382 | ) |
Kimberly-Clark Corp. | | | 2,491 | | | | (1.7 | %) | | | (7,476 | ) |
Intel Corp. | | | 1,353 | | | | (1.8 | %) | | | (7,725 | ) |
Parker-Hannifin Corp. | | | 591 | | | | (1.8 | %) | | | (7,781 | ) |
News Corp. — Class A | | | 8,947 | | | | (1.9 | %) | | | (8,337 | ) |
JM Smucker Co. | | | 1,283 | | | | (2.0 | %) | | | (8,682 | ) |
Southwest Airlines Co. | | | 2,882 | | | | (2.2 | %) | | | (9,668 | ) |
AGCO Corp. | | | 1,415 | | | | (2.4 | %) | | | (10,392 | ) |
National Fuel Gas Co. | | | 4,722 | | | | (2.4 | %) | | | (10,504 | ) |
24 | THE GUGGENHEIM FUNDS SEMI-ANNUAL REPORT | SEE NOTES TO FINANCIAL STATEMENTS. |
CONSOLIDATED SCHEDULE OF INVESTMENTS (Unaudited)(continued) | June 30, 2018 |
MULTI-HEDGE STRATEGIES FUND | |
| | Shares | | | Percentage
Value | | | Value and
Unrealized
Gain (Loss) | |
| | | | | | | | | | | | | |
Belden, Inc. | | | 962 | | | | (2.5 | %) | | $ | (10,874 | ) |
Cirrus Logic, Inc.* | | | 2,934 | | | | (2.6 | %) | | | (11,316 | ) |
AECOM* | | | 4,919 | | | | (2.6 | %) | | | (11,425 | ) |
Sanderson Farms, Inc. | | | 858 | | | | (2.8 | %) | | | (11,967 | ) |
Coherent, Inc.* | | | 308 | | | | (2.9 | %) | | | (12,702 | ) |
FedEx Corp. | | | 356 | | | | (3.0 | %) | | | (12,947 | ) |
CVS Health Corp. | | | 2,592 | | | | (3.0 | %) | | | (13,172 | ) |
Principal Financial Group, Inc. | | | 1,521 | | | | (3.2 | %) | | | (13,883 | ) |
Owens-Illinois, Inc.* | | | 2,788 | | | | (3.2 | %) | | | (13,911 | ) |
Edgewell Personal Care Co.* | | | 3,703 | | | | (3.3 | %) | | | (14,378 | ) |
PACCAR, Inc. | | | 2,041 | | | | (3.4 | %) | | | (14,887 | ) |
McKesson Corp. | | | 1,181 | | | | (4.0 | %) | | | (17,539 | ) |
Owens Corning | | | 1,047 | | | | (4.8 | %) | | | (21,079 | ) |
Molson Coors Brewing Co. — Class B | | | 2,780 | | | | (5.6 | %) | | | (24,244 | ) |
Copa Holdings S.A. — Class A | | | 1,172 | | | | (6.9 | %) | | | (30,175 | ) |
Cummins, Inc. | | | 1,179 | | | | (7.3 | %) | | | (31,788 | ) |
Pilgrim's Pride Corp.* | | | 5,826 | | | | (8.7 | %) | | | (38,052 | ) |
Cardinal Health, Inc. | | | 3,212 | | | | (9.7 | %) | | | (42,077 | ) |
Ingredion, Inc. | | | 2,180 | | | | (10.0 | %) | | | (43,606 | ) |
Total Custom Basket of Long Securities | | $ | 435,080 | |
| | | | | | | | | | | | | |
CUSTOM BASKET OF SHORT SECURITIES12 |
Healthcare Services Group, Inc. | | | (3,554 | ) | | | (3.6 | %) | | $ | 33,011 | |
Goldman Sachs Group, Inc. | | | (692 | ) | | | (2.5 | %) | | | 22,798 | |
ABM Industries, Inc. | | | (4,449 | ) | | | (2.2 | %) | | | 20,111 | |
LendingTree, Inc.* | | | (194 | ) | | | (1.9 | %) | | | 18,038 | |
Albemarle Corp. | | | (542 | ) | | | (1.4 | %) | | | 12,724 | |
National Instruments Corp. | | | (1,828 | ) | | | (1.4 | %) | | | 12,607 | |
Compass Minerals International, Inc. | | | (2,060 | ) | | | (1.2 | %) | | | 10,813 | |
CyrusOne, Inc. | | | (1,706 | ) | | | (0.9 | %) | | | 8,073 | |
Charles Schwab Corp. | | | (2,090 | ) | | | (0.7 | %) | | | 6,853 | |
SEI Investments Co. | | | (841 | ) | | | (0.7 | %) | | | 6,511 | |
Nucor Corp. | | | (1,026 | ) | | | (0.6 | %) | | | 6,027 | |
Allegheny Technologies, Inc.* | | | (4,131 | ) | | | (0.6 | %) | | | 5,836 | |
Robert Half International, Inc. | | | (1,174 | ) | | | (0.6 | %) | | | 5,525 | |
Texas Capital Bancshares, Inc.* | | | (685 | ) | | | (0.6 | %) | | | 5,399 | |
Marriott International, Inc. — Class A | | | (433 | ) | | | (0.6 | %) | | | 5,345 | |
Halliburton Co. | | | (1,793 | ) | | | (0.5 | %) | | | 4,992 | |
Markel Corp.* | | | (214 | ) | | | (0.5 | %) | | | 4,802 | |
Workday, Inc. — Class A* | | | (434 | ) | | | (0.5 | %) | | | 4,682 | |
First Horizon National Corp. | | | (3,576 | ) | | | (0.4 | %) | | | 4,167 | |
Pinnacle Financial Partners, Inc. | | | (1,495 | ) | | | (0.4 | %) | | | 3,973 | |
Ball Corp. | | | (1,342 | ) | | | (0.4 | %) | | | 3,829 | |
Air Products & Chemicals, Inc. | | | (353 | ) | | | (0.4 | %) | | | 3,446 | |
Sterling Bancorp | | | (3,226 | ) | | | (0.4 | %) | | | 3,348 | |
Valley National Bancorp | | | (7,193 | ) | | | (0.4 | %) | | | 3,266 | |
Investors Bancorp, Inc. | | | (7,112 | ) | | | (0.3 | %) | | | 2,952 | |
NewMarket Corp. | | | (545 | ) | | | (0.3 | %) | | | 2,893 | |
SEE NOTES TO FINANCIAL STATEMENTS. | THE GUGGENHEIM FUNDS SEMI-ANNUAL REPORT | 25 |
CONSOLIDATED SCHEDULE OF INVESTMENTS (Unaudited)(continued) | June 30, 2018 |
MULTI-HEDGE STRATEGIES FUND | |
| | Shares | | | Percentage
Value | | | Value and
Unrealized
Gain | |
| | | | | | | | | | | | | |
Palo Alto Networks, Inc.* | | | (250 | ) | | | (0.3 | %) | | $ | 2,834 | |
Sealed Air Corp. | | | (1,611 | ) | | | (0.3 | %) | | | 2,646 | |
salesforce.com, Inc.* | | | (988 | ) | | | (0.3 | %) | | | 2,632 | |
Summit Materials, Inc. — Class A* | | | (1,901 | ) | | | (0.3 | %) | | | 2,494 | |
Mosaic Co. | | | (1,752 | ) | | | (0.3 | %) | | | 2,442 | |
New York Community Bancorp, Inc. | | | (4,382 | ) | | | (0.2 | %) | | | 2,285 | |
BB&T Corp. | | | (1,086 | ) | | | (0.2 | %) | | | 2,246 | |
McDonald's Corp. | | | (414 | ) | | | (0.2 | %) | | | 2,234 | |
Avery Dennison Corp. | | | (509 | ) | | | (0.2 | %) | | | 2,026 | |
Aon plc | | | (376 | ) | | | (0.2 | %) | | | 2,015 | |
Huntington Bancshares, Inc. | | | (3,410 | ) | | | (0.2 | %) | | | 1,986 | |
RenaissanceRe Holdings Ltd. | | | (580 | ) | | | (0.2 | %) | | | 1,826 | |
JBG SMITH Properties | | | (1,495 | ) | | | (0.2 | %) | | | 1,639 | |
TripAdvisor, Inc.* | | | (886 | ) | | | (0.2 | %) | | | 1,561 | |
Crown Castle International Corp. | | | (1,212 | ) | | | (0.2 | %) | | | 1,539 | |
Associated Banc-Corp. | | | (2,310 | ) | | | (0.2 | %) | | | 1,420 | |
Schlumberger Ltd. | | | (1,008 | ) | | | (0.1 | %) | | | 1,342 | |
Waste Management, Inc. | | | (673 | ) | | | (0.1 | %) | | | 1,255 | |
Washington Federal, Inc. | | | (1,606 | ) | | | (0.1 | %) | | | 903 | |
Capitol Federal Financial, Inc. | | | (11,779 | ) | | | (0.1 | %) | | | 899 | |
MarketAxess Holdings, Inc. | | | (441 | ) | | | (0.1 | %) | | | 827 | |
FireEye, Inc.* | | | (2,968 | ) | | | (0.1 | %) | | | 796 | |
Nielsen Holdings plc | | | (1,641 | ) | | | (0.1 | %) | | | 787 | |
Intercontinental Exchange, Inc. | | | (685 | ) | | | (0.1 | %) | | | 653 | |
American Tower Corp. — Class A | | | (644 | ) | | | (0.1 | %) | | | 605 | |
Sensient Technologies Corp. | | | (1,063 | ) | | | (0.1 | %) | | | 546 | |
Duke Energy Corp. | | | (713 | ) | | | (0.1 | %) | | | 513 | |
SBA Communications Corp.* | | | (590 | ) | | | 0.0 | % | | | 410 | |
Charter Communications, Inc. — Class A* | | | (237 | ) | | | 0.0 | % | | | 301 | |
Alleghany Corp. | | | (89 | ) | | | 0.0 | % | | | 270 | |
First Republic Bank | | | (1,289 | ) | | | 0.0 | % | | | 246 | |
Aramark | | | (3,457 | ) | | | 0.0 | % | | | 85 | |
People's United Financial, Inc. | | | (2,881 | ) | | | 0.0 | % | | | 82 | |
Eaton Vance Corp. | | | (1,072 | ) | | | 0.0 | % | | | 13 | |
Camden Property Trust | | | (1,363 | ) | | | 0.0 | % | | | (30 | ) |
Royal Gold, Inc. | | | (560 | ) | | | 0.0 | % | | | (49 | ) |
IBERIABANK Corp. | | | (740 | ) | | | 0.0 | % | | | (83 | ) |
Platform Specialty Products Corp.* | | | (4,280 | ) | | | 0.0 | % | | | (101 | ) |
Wendy's Co. | | | (6,441 | ) | | | 0.0 | % | | | (133 | ) |
PPG Industries, Inc. | | | (501 | ) | | | 0.0 | % | | | (137 | ) |
Multi-Color Corp. | | | (1,065 | ) | | | 0.0 | % | | | (181 | ) |
WR Grace & Co. | | | (1,426 | ) | | | 0.0 | % | | | (213 | ) |
Essex Property Trust, Inc. | | | (334 | ) | | | 0.0 | % | | | (402 | ) |
ServiceNow, Inc.* | | | (334 | ) | | | 0.1 | % | | | (501 | ) |
26 | THE GUGGENHEIM FUNDS SEMI-ANNUAL REPORT | SEE NOTES TO FINANCIAL STATEMENTS. |
CONSOLIDATED SCHEDULE OF INVESTMENTS (Unaudited)(continued) | June 30, 2018 |
MULTI-HEDGE STRATEGIES FUND | |
| | Shares | | | Percentage
Value | | | Value and
Unrealized
Loss | |
| | | | | | | | | | | | | |
Republic Services, Inc. — Class A | | | (807 | ) | | | 0.1 | % | | $ | (663 | ) |
Signature Bank* | | | (441 | ) | | | 0.1 | % | | | (850 | ) |
AptarGroup, Inc. | | | (1,312 | ) | | | 0.1 | % | | | (933 | ) |
KAR Auction Services, Inc. | | | (1,351 | ) | | | 0.1 | % | | | (950 | ) |
Everest Re Group Ltd. | | | (228 | ) | | | 0.1 | % | | | (1,046 | ) |
Marsh & McLennan Companies, Inc. | | | (633 | ) | | | 0.1 | % | | | (1,070 | ) |
Martin Marietta Materials, Inc. | | | (372 | ) | | | 0.1 | % | | | (1,170 | ) |
Commercial Metals Co. | | | (5,204 | ) | | | 0.1 | % | | | (1,346 | ) |
Equifax, Inc. | | | (468 | ) | | | 0.2 | % | | | (1,434 | ) |
MSA Safety, Inc. | | | (1,200 | ) | | | 0.2 | % | | | (1,437 | ) |
Vulcan Materials Co. | | | (890 | ) | | | 0.2 | % | | | (1,527 | ) |
Alliant Energy Corp. | | | (1,536 | ) | | | 0.2 | % | | | (2,268 | ) |
National Oilwell Varco, Inc. | | | (1,706 | ) | | | 0.2 | % | | | (2,272 | ) |
FactSet Research Systems, Inc. | | | (400 | ) | | | 0.3 | % | | | (2,366 | ) |
NiSource, Inc. | | | (2,465 | ) | | | 0.3 | % | | | (2,732 | ) |
Sherwin-Williams Co. | | | (333 | ) | | | 0.3 | % | | | (2,762 | ) |
Equinix, Inc. | | | (215 | ) | | | 0.3 | % | | | (2,778 | ) |
Tesla, Inc.* | | | (101 | ) | | | 0.3 | % | | | (2,798 | ) |
Texas Roadhouse, Inc. — Class A | | | (852 | ) | | | 0.3 | % | | | (2,893 | ) |
Alexandria Real Estate Equities, Inc. | | | (1,339 | ) | | | 0.3 | % | | | (2,955 | ) |
Dominion Energy, Inc. | | | (1,985 | ) | | | 0.3 | % | | | (3,002 | ) |
Invitation Homes, Inc. | | | (4,783 | ) | | | 0.3 | % | | | (3,205 | ) |
Vornado Realty Trust | | | (1,629 | ) | | | 0.4 | % | | | (3,359 | ) |
Terreno Realty Corp. | | | (4,997 | ) | | | 0.4 | % | | | (3,454 | ) |
DTE Energy Co. | | | (539 | ) | | | 0.4 | % | | | (3,638 | ) |
Costco Wholesale Corp. | | | (253 | ) | | | 0.4 | % | | | (3,748 | ) |
Glacier Bancorp, Inc. | | | (1,516 | ) | | | 0.4 | % | | | (3,768 | ) |
Amazon.com, Inc.* | | | (33 | ) | | | 0.4 | % | | | (3,861 | ) |
Realty Income Corp. | | | (1,565 | ) | | | 0.4 | % | | | (4,090 | ) |
FMC Corp. | | | (1,254 | ) | | | 0.5 | % | | | (4,225 | ) |
WEC Energy Group, Inc. | | | (874 | ) | | | 0.5 | % | | | (4,326 | ) |
Cannae Holdings, Inc.* | | | (4,058 | ) | | | 0.5 | % | | | (4,514 | ) |
Eversource Energy | | | (990 | ) | | | 0.5 | % | | | (4,723 | ) |
Rexford Industrial Realty, Inc. | | | (3,877 | ) | | | 0.5 | % | | | (4,732 | ) |
Douglas Emmett, Inc. | | | (3,332 | ) | | | 0.5 | % | | | (4,736 | ) |
Parsley Energy, Inc. — Class A* | | | (1,852 | ) | | | 0.5 | % | | | (4,914 | ) |
IHS Markit Ltd.* | | | (4,864 | ) | | | 0.5 | % | | | (4,924 | ) |
Federal Realty Investment Trust | | | (444 | ) | | | 0.5 | % | | | (5,079 | ) |
Extraction Oil & Gas, Inc.* | | | (4,833 | ) | | | 0.6 | % | | | (5,233 | ) |
Covanta Holding Corp. | | | (15,011 | ) | | | 0.6 | % | | | (5,251 | ) |
Diamondback Energy, Inc. | | | (550 | ) | | | 0.6 | % | | | (5,316 | ) |
TransDigm Group, Inc. | | | (227 | ) | | | 0.6 | % | | | (5,749 | ) |
AvalonBay Communities, Inc. | | | (425 | ) | | | 0.6 | % | | | (5,824 | ) |
Southern Copper Corp. | | | (4,021 | ) | | | 0.7 | % | | | (6,112 | ) |
Equity Residential | | | (845 | ) | | | 0.7 | % | | | (6,854 | ) |
HCP, Inc. | | | (3,401 | ) | | | 0.7 | % | | | (6,872 | ) |
SEE NOTES TO FINANCIAL STATEMENTS. | THE GUGGENHEIM FUNDS SEMI-ANNUAL REPORT | 27 |
CONSOLIDATED SCHEDULE OF INVESTMENTS (Unaudited)(continued) | June 30, 2018 |
MULTI-HEDGE STRATEGIES FUND | |
| | Shares | | | Percentage
Value | | | Value and
Unrealized
Loss | |
| | | | | | | | | | | | | |
Equity LifeStyle Properties, Inc. | | | (2,074 | ) | | | 0.8 | % | | $ | (7,171 | ) |
RPM International, Inc. | | | (1,012 | ) | | | 0.8 | % | | | (7,434 | ) |
Ellie Mae, Inc.* | | | (465 | ) | | | 0.8 | % | | | (7,530 | ) |
Booking Holdings, Inc.* | | | (39 | ) | | | 0.8 | % | | | (7,662 | ) |
Gartner, Inc.* | | | (651 | ) | | | 0.8 | % | | | (7,801 | ) |
Ashland Global Holdings, Inc. | | | (1,065 | ) | | | 0.9 | % | | | (7,933 | ) |
Boston Properties, Inc. | | | (1,145 | ) | | | 0.9 | % | | | (8,056 | ) |
Hudson Pacific Properties, Inc. | | | (2,632 | ) | | | 0.9 | % | | | (8,092 | ) |
Redwood Trust, Inc. | | | (4,701 | ) | | | 0.9 | % | | | (8,447 | ) |
SL Green Realty Corp. | | | (1,037 | ) | | | 0.9 | % | | | (8,491 | ) |
Moody's Corp. | | | (693 | ) | | | 0.9 | % | | | (8,659 | ) |
American Campus Communities, Inc. | | | (3,122 | ) | | | 0.9 | % | | | (8,751 | ) |
American Water Works Company, Inc. | | | (1,505 | ) | | | 1.0 | % | | | (8,930 | ) |
Digital Realty Trust, Inc. | | | (1,320 | ) | | | 1.0 | % | | | (9,180 | ) |
Howard Hughes Corp.* | | | (1,031 | ) | | | 1.0 | % | | | (9,235 | ) |
South Jersey Industries, Inc. | | | (2,287 | ) | | | 1.0 | % | | | (9,494 | ) |
Pegasystems, Inc. | | | (1,276 | ) | | | 1.0 | % | | | (9,548 | ) |
Axis Capital Holdings Ltd. | | | (2,312 | ) | | | 1.1 | % | | | (9,779 | ) |
Healthcare Trust of America, Inc. — Class A | | | (7,596 | ) | | | 1.1 | % | | | (9,975 | ) |
Ecolab, Inc. | | | (1,610 | ) | | | 1.1 | % | | | (10,572 | ) |
PriceSmart, Inc. | | | (1,669 | ) | | | 1.1 | % | | | (10,669 | ) |
Cornerstone OnDemand, Inc.* | | | (1,205 | ) | | | 1.2 | % | | | (10,931 | ) |
Under Armour, Inc. — Class A* | | | (2,868 | ) | | | 1.2 | % | | | (11,429 | ) |
White Mountains Insurance Group Ltd. | | | (146 | ) | | | 1.2 | % | | | (11,592 | ) |
Tyler Technologies, Inc.* | | | (407 | ) | | | 1.2 | % | | | (11,608 | ) |
Semtech Corp.* | | | (1,302 | ) | | | 1.4 | % | | | (12,751 | ) |
RLI Corp. | | | (2,315 | ) | | | 1.4 | % | | | (12,843 | ) |
Ingevity Corp.* | | | (885 | ) | | | 1.4 | % | | | (12,862 | ) |
WD-40 Co. | | | (409 | ) | | | 1.4 | % | | | (12,871 | ) |
Monolithic Power Systems, Inc. | | | (817 | ) | | | 1.4 | % | | | (12,875 | ) |
Ultimate Software Group, Inc.* | | | (279 | ) | | | 1.4 | % | | | (13,028 | ) |
Public Storage | | | (558 | ) | | | 1.4 | % | | | (13,251 | ) |
SPS Commerce, Inc.* | | | (989 | ) | | | 1.4 | % | | | (13,352 | ) |
Ollie's Bargain Outlet Holdings, Inc.* | | | (691 | ) | | | 1.5 | % | | | (14,336 | ) |
PTC, Inc.* | | | (646 | ) | | | 1.5 | % | | | (14,351 | ) |
Duke Realty Corp. | | | (3,906 | ) | | | 1.6 | % | | | (14,416 | ) |
Pool Corp. | | | (505 | ) | | | 1.6 | % | | | (14,986 | ) |
Crocs, Inc.* | | | (2,669 | ) | | | 1.7 | % | | | (15,494 | ) |
MSCI, Inc. — Class A | | | (588 | ) | | | 1.7 | % | | | (15,748 | ) |
Hess Corp. | | | (1,794 | ) | | | 1.7 | % | | | (15,863 | ) |
Sun Communities, Inc. | | | (2,353 | ) | | | 1.8 | % | | | (16,401 | ) |
HB Fuller Co. | | | (4,660 | ) | | | 1.8 | % | | | (16,686 | ) |
Vail Resorts, Inc. | | | (275 | ) | | | 1.9 | % | | | (17,399 | ) |
Kilroy Realty Corp. | | | (1,743 | ) | | | 1.9 | % | | | (17,420 | ) |
Retail Opportunity Investments Corp. | | | (8,099 | ) | | | 1.9 | % | | | (17,812 | ) |
UDR, Inc. | | | (4,380 | ) | | | 2.0 | % | | | (18,343 | ) |
Tetra Tech, Inc. | | | (2,223 | ) | | | 2.0 | % | | | (18,935 | ) |
ASGN, Inc.* | | | (2,912 | ) | | | 2.1 | % | | | (19,695 | ) |
28 | THE GUGGENHEIM FUNDS SEMI-ANNUAL REPORT | SEE NOTES TO FINANCIAL STATEMENTS. |
CONSOLIDATED SCHEDULE OF INVESTMENTS (Unaudited)(continued) | June 30, 2018 |
MULTI-HEDGE STRATEGIES FUND | |
| | Shares | | | Percentage
Value | | | Value and
Unrealized
Gain (Loss) | |
| | | | | | | | | | | | | |
CarMax, Inc.* | | | (2,289 | ) | | | 2.1 | % | | $ | (19,816 | ) |
Mobile Mini, Inc. | | | (4,551 | ) | | | 2.1 | % | | | (19,881 | ) |
EastGroup Properties, Inc. | | | (1,587 | ) | | | 2.2 | % | | | (20,679 | ) |
TransUnion | | | (1,608 | ) | | | 2.3 | % | | | (21,345 | ) |
Shake Shack, Inc. — Class A* | | | (1,074 | ) | | | 3.0 | % | | | (27,775 | ) |
Rollins, Inc. | | | (4,888 | ) | | | 3.1 | % | | | (28,590 | ) |
Verisk Analytics, Inc. — Class A* | | | (2,358 | ) | | | 3.5 | % | | | (32,408 | ) |
Insperity, Inc. | | | (987 | ) | | | 3.7 | % | | | (34,570 | ) |
Copart, Inc.* | | | (2,522 | ) | | | 3.8 | % | | | (35,587 | ) |
Cintas Corp. | | | (1,315 | ) | | | 4.0 | % | | | (37,048 | ) |
Balchem Corp. | | | (1,946 | ) | | | 4.2 | % | | | (38,674 | ) |
Exponent, Inc. | | | (4,225 | ) | | | 4.7 | % | | | (43,853 | ) |
Team, Inc.* | | | (5,098 | ) | | | 4.9 | % | | | (45,686 | ) |
CoStar Group, Inc.* | | | (610 | ) | | | 5.4 | % | | | (50,183 | ) |
Total Custom Basket of Short Securities | | $ | (929,992 | ) |
| | | | | | | | | | | | | |
CUSTOM BASKET OF LONG SECURITIES9 |
HCP, Inc. | | | 26,719 | | | | 14.7 | % | | $ | 79,549 | |
EastGroup Properties, Inc. | | | 8,022 | | | | 13.0 | % | | | 70,505 | |
Sun Communities, Inc. | | | 7,351 | | | | 11.5 | % | | | 62,209 | |
Corporate Office Properties Trust | | | 23,036 | | | | 9.4 | % | | | 51,176 | |
MGM Growth Properties LLC — Class A | | | 30,160 | | | | 9.1 | % | | | 49,503 | |
JBG SMITH Properties | | | 17,756 | | | | 7.7 | % | | | 41,901 | |
Rexford Industrial Realty, Inc. | | | 23,297 | | | | 7.4 | % | | | 40,147 | |
Healthcare Realty Trust, Inc. | | | 23,261 | | | | 5.9 | % | | | 31,915 | |
Equity LifeStyle Properties, Inc. | | | 6,063 | | | | 4.7 | % | | | 25,562 | |
Alexandria Real Estate Equities, Inc. | | | 5,199 | | | | 4.2 | % | | | 22,615 | |
Sunstone Hotel Investors, Inc. | | | 26,059 | | | | 3.5 | % | | | 19,131 | |
Regency Centers Corp. | | | 11,332 | | | | 3.0 | % | | | 16,085 | |
American Tower Corp. — Class A | | | 3,073 | | | | 2.6 | % | | | 14,001 | |
Crown Castle International Corp. | | | 4,222 | | | | 2.0 | % | | | 10,784 | |
Alexander & Baldwin, Inc. | | | 19,536 | | | | 1.6 | % | | | 8,439 | |
Ventas, Inc. | | | 11,731 | | | | 1.5 | % | | | 8,134 | |
Weyerhaeuser Co. | | | 12,234 | | | | 1.4 | % | | | 7,638 | |
STORE Capital Corp. | | | 24,136 | | | | 1.4 | % | | | 7,333 | |
Life Storage, Inc. | | | 6,821 | | | | 0.7 | % | | | 3,877 | |
CoreCivic, Inc. | | | 18,936 | | | | 0.6 | % | | | 3,189 | |
Equinix, Inc. | | | 1,564 | | | | 0.4 | % | | | 2,091 | |
Healthcare Trust of America, Inc. — Class A | | | 25,226 | | | | 0.1 | % | | | 347 | |
Liberty Property Trust | | | 14,836 | | | | (0.1 | %) | | | (442 | ) |
Empire State Realty Trust, Inc. — Class A | | | 25,548 | | | | (0.2 | %) | | | (1,045 | ) |
Urban Edge Properties | | | 28,727 | | | | (0.3 | %) | | | (1,468 | ) |
Apartment Investment & Management Co. — Class A | | | 15,420 | | | | (0.4 | %) | | | (1,928 | ) |
GEO Group, Inc. | | | 16,525 | | | | (0.4 | %) | | | (2,208 | ) |
Apple Hospitality REIT, Inc. | | | 24,079 | | | | (0.8 | %) | | | (4,277 | ) |
Essex Property Trust, Inc. | | | 1,856 | | | | (0.8 | %) | | | (4,343 | ) |
Taubman Centers, Inc. | | | 5,480 | | | | (1.4 | %) | | | (7,317 | ) |
Retail Properties of America, Inc. — Class A | | | 50,324 | | | | (2.1 | %) | | | (11,197 | ) |
Total Custom Basket of Long Securities | | $ | 541,906 | |
SEE NOTES TO FINANCIAL STATEMENTS. | THE GUGGENHEIM FUNDS SEMI-ANNUAL REPORT | 29 |
CONSOLIDATED SCHEDULE OF INVESTMENTS (Unaudited)(continued) | June 30, 2018 |
MULTI-HEDGE STRATEGIES FUND | |
| | Shares | | | Percentage
Value | | | Value and
Unrealized
Gain (Loss) | |
| | | | | | | | | | | | | |
CUSTOM BASKET OF SHORT SECURITIES13 |
Lexington Realty Trust | | | (48,902 | ) | | | (17.8 | %) | | $ | 58,542 | |
VEREIT, Inc. | | | (57,882 | ) | | | (15.7 | %) | | | 51,576 | |
Senior Housing Properties Trust | | | (47,370 | ) | | | (9.6 | %) | | | 31,706 | |
Government Properties Income Trust | | | (7,628 | ) | | | (5.4 | %) | | | 17,820 | |
Jones Lang LaSalle, Inc. | | | (2,711 | ) | | | (3.2 | %) | | | 10,506 | |
Kimco Realty Corp. | | | (44,062 | ) | | | (2.3 | %) | | | 7,711 | |
Realogy Holdings Corp. | | | (18,039 | ) | | | (1.9 | %) | | | 6,407 | |
iShares U.S. Real Estate ETF | | | (30,387 | ) | | | (0.7 | %) | | | 2,181 | |
Omega Healthcare Investors, Inc. | | | (24,170 | ) | | | (0.4 | %) | | | 1,417 | |
Paramount Group, Inc. | | | (49,264 | ) | | | (0.3 | %) | | | 961 | |
Sabra Health Care REIT, Inc. | | | (19,596 | ) | | | (0.2 | %) | | | 508 | |
Howard Hughes Corp.* | | | (3,303 | ) | | | 0.2 | % | | | (803 | ) |
Chesapeake Lodging Trust | | | (13,928 | ) | | | 0.5 | % | | | (1,632 | ) |
UDR, Inc. | | | (11,669 | ) | | | 0.6 | % | | | (2,051 | ) |
Industrial Logistics Properties Trust | | | (23,759 | ) | | | 0.9 | % | | | (2,853 | ) |
Mid-America Apartment Communities, Inc. | | | (6,568 | ) | | | 1.8 | % | | | (5,788 | ) |
Piedmont Office Realty Trust, Inc. — Class A | | | (41,222 | ) | | | 2.4 | % | | | (7,942 | ) |
PS Business Parks, Inc. | | | (5,157 | ) | | | 2.5 | % | | | (8,143 | ) |
Americold Realty Trust | | | (20,865 | ) | | | 2.8 | % | | | (9,289 | ) |
CBRE Group, Inc. — Class A* | | | (9,464 | ) | | | 4.3 | % | | | (14,103 | ) |
Global Net Lease, Inc. | | | (27,209 | ) | | | 7.4 | % | | | (24,186 | ) |
Welltower, Inc. | | | (6,857 | ) | | | 7.4 | % | | | (24,468 | ) |
Digital Realty Trust, Inc. | | | (6,067 | ) | | | 10.2 | % | | | (33,405 | ) |
STAG Industrial, Inc. | | | (16,629 | ) | | | 10.5 | % | | | (34,633 | ) |
American Assets Trust, Inc. | | | (19,606 | ) | | | 10.6 | % | | | (34,902 | ) |
Acadia Realty Trust | | | (23,029 | ) | | | 12.4 | % | | | (40,867 | ) |
Washington Prime Group, Inc. | | | (40,170 | ) | | | 15.9 | % | | | (52,431 | ) |
Hersha Hospitality Trust | | | (20,305 | ) | | | 20.6 | % | | | (67,761 | ) |
Hospitality Properties Trust | | | (22,100 | ) | | | 22.2 | % | | | (72,882 | ) |
Columbia Property Trust, Inc. | | | (36,240 | ) | | | 24.4 | % | | | (80,208 | ) |
Total Custom Basket of Short Securities | | $ | (329,012 | ) |
| | | | | | | | | | | | | |
CUSTOM BASKET OF LONG SECURITIES11 |
Avista Corp. | | | 7,585 | | | | 55.8 | % | | $ | 9,978 | |
magicJack VocalTec Ltd.* | | | 41,516 | | | | 44.2 | % | | | 7,888 | |
Total Custom Basket of Long Securities | | $ | 17,866 | |
30 | THE GUGGENHEIM FUNDS SEMI-ANNUAL REPORT | SEE NOTES TO FINANCIAL STATEMENTS. |
CONSOLIDATED SCHEDULE OF INVESTMENTS (Unaudited)(continued) | June 30, 2018 |
MULTI-HEDGE STRATEGIES FUND | |
* | Non-income producing security. |
† | Value determined based on Level 1 inputs, unless otherwise noted — See Note 4. |
†† | Value determined based on Level 2 inputs — See Note 4. |
1 | All or a portion of this security is pledged as short security collateral at June 30, 2018. |
2 | All or a portion of this security is on loan at June 30, 2018 — See Note 7. |
3 | Affiliated issuer. |
4 | Rate indicated is the effective yield at the time of purchase. |
5 | Zero coupon rate security. |
6 | Repurchase Agreements — See Note 6. |
7 | Securities lending collateral — See Note 7. |
8 | Rate indicated is the 7 day yield as of June 30, 2018. |
9 | Total Return based on the return of the custom Equity Market Neutral (“MNRE”) long basket of securities +/- financing at a variable rate. Rate indicated is rate effective at June 30, 2018. |
10 | Total Return based on the return of the custom Long/Short Equity (“SMQLS”) long basket of securities +/- financing at a variable rate. Rate indicated is rate effective at June 30, 2018. |
11 | Total Return based on the return of the custom Merger Arbitrage (“MRGR”) long basket of securities +/- financing at a variable rate. Rate indicated is rate effective at June 30, 2018. |
12 | Total Return based on the return of the custom SMQLS short basket of securities +/- financing at a variable rate. Rate indicated is rate effective at June 30, 2018. |
13 | Total Return based on the return of the custom MNRE short basket of securities +/- financing at a variable rate. Rate indicated is rate effective at June 30, 2018. |
14 | All or a portion of this security is pledged as futures collateral at June 30, 2018. |
| | REIT — Real Estate Investment Trust |
| | plc — Public Limited Corporation |
| | |
| | See Sector Classification in Other Information section. |
SEE NOTES TO FINANCIAL STATEMENTS. | THE GUGGENHEIM FUNDS SEMI-ANNUAL REPORT | 31 |
CONSOLIDATED SCHEDULE OF INVESTMENTS (Unaudited)(continued) | June 30, 2018 |
MULTI-HEDGE STRATEGIES FUND | |
The following table summarizes the inputs used to value the Fund’s investments at June 30, 2018 (See Note 4 in the Notes to Financial Statements):
Investments in
Securities (Assets) | | Level 1
Quoted
Prices | | | Level 2
Significant
Observable
Inputs | | | Level 3
Significant
Unobservable
Inputs | | | Total | |
Common Stocks | | $ | 12,603,815 | | | $ | — | | | $ | — | | | $ | 12,603,815 | |
Rights | | | 27 | | | | — | | | | — | | | | 27 | |
Mutual Funds | | | 8,683,683 | | | | — | | | | — | | | | 8,683,683 | |
Closed-End Funds | | | 4,622,184 | | | | — | | | | — | | | | 4,622,184 | |
U.S. Treasury Bills | | | — | | | | 13,779,403 | | | | — | | | | 13,779,403 | |
Repurchase Agreements | | | — | | | | 5,164,360 | | | | — | | | | 5,164,360 | |
Securities Lending Collateral | | | 234,935 | | | | — | | | | — | | | | 234,935 | |
Commodity Futures Contracts* | | | 257,384 | | | | — | | | | — | | | | 257,384 | |
Interest Rate Futures Contracts* | | | 24,075 | | | | 153,857 | | | | — | | | | 177,932 | |
Equity Futures Contracts* | | | 168,626 | | | | 7,606 | | | | — | | | | 176,232 | |
Currency Futures Contracts* | | | 95,474 | | | | — | | | | — | | | | 95,474 | |
Custom Basket Swap Agreements* | | | — | | | | 994,852 | | | | — | | | | 994,852 | |
Total Assets | | $ | 26,690,203 | | | $ | 20,100,078 | | | $ | — | | | $ | 46,790,281 | |
| | | | | | | | | | | | | | | | |
Investments in
Securities (Liabilities) | | Level 1
Quoted
Prices | | | Level 2
Significant
Observable
Inputs | | | Level 3
Significant
Unobservable
Inputs | | | Total | |
Common Stocks | | $ | 4,888,378 | | | $ | — | | | $ | — | | | $ | 4,888,378 | |
Exchange-Traded Funds | | | 4,693,108 | | | | — | | | | — | | | | 4,693,108 | |
Commodity Futures Contracts* | | | 84,519 | | | | — | | | | — | | | | 84,519 | |
Equity Futures Contracts* | | | 48,780 | | | | 1,878 | | | | — | | | | 50,658 | |
Currency Futures Contracts* | | | 12,624 | | | | — | | | | — | | | | 12,624 | |
Interest Rate Futures Contracts* | | | 8,504 | | | | 1,883 | | | | — | | | | 10,387 | |
Custom Basket Swap Agreements* | | | — | | | | 1,259,004 | | | | — | | | | 1,259,004 | |
Total Liabilities | | $ | 9,735,913 | | | $ | 1,262,765 | | | $ | — | | | $ | 10,998,678 | |
* | This derivative is reported as unrealized gain/loss at period end. |
Transfers between investment levels may occur as the markets fluctuate and/or the availability of data used in an investment’s valuation changes. Transfers between valuation levels, if any, are in comparison to the valuation levels at the end of the previous fiscal year, and are effective using the fair value as of the end of the current fiscal period.
For the period ended June 30, 2018, there were no transfers between levels.
32 | THE GUGGENHEIM FUNDS SEMI-ANNUAL REPORT | SEE NOTES TO FINANCIAL STATEMENTS. |
CONSOLIDATED SCHEDULE OF INVESTMENTS (Unaudited)(continued) | June 30, 2018 |
MULTI-HEDGE STRATEGIES FUND | |
Affiliated Transactions
Investments representing 5% or more of the outstanding voting shares of a portfolio company of a fund, or control of or by, or common control under the Guggenheim Investments (“GI”), result in that portfolio company being considered an affiliated company of such fund, as defined in the 1940 Act.
The Fund may invest in certain of the underlying series of Guggenheim Strategy Funds Trust, including Guggenheim Strategy Fund I, Guggenheim Strategy Fund II and Guggenheim Strategy Fund III, (collectively, the “Cash Management Funds”), each of which are open-end management investment companies managed by GI. The Cash Management Funds, which launched on March 11, 2014, are offered as cash management options only to mutual funds, trusts, and other accounts managed by GI and/or its affiliates, and are not available to the public. The Cash Management Funds pay no investment management fees. The Cash Management Funds’ annual report on Form N-CSR dated September 30, 2017, is available publicly or upon request. This information is available from the EDGAR database on the SEC’s website at https://www.sec.gov/Archives/edgar/data/1601445/000089180417000715/gug72218.htm.
Transactions during the period ended June 30, 2018, in which the portfolio company is an “affiliated person”, were as follows:
Security Name | | Value
12/31/17 | | | Additions | | | Reductions | | | Realized
Gain (Loss) | | | Change in
Unrealized | | | Value
6/30/18 | |
Closed-End Funds | | | | | | | | | | | | | | | | | | | | | | | | |
Advent Claymore Convertible Securities and Income Fund | | $ | 32,776 | | | $ | 14,606 | | | $ | (30,653 | ) | | $ | (1,488 | ) | | $ | 324 | | | $ | 15,565 | |
Advent Claymore Convertible Securities and Income Fund II | | | 32,562 | | | | 15,696 | | | | (30,516 | ) | | | (2,384 | ) | | | 221 | | | | 15,579 | |
Advent/Claymore Enhanced Growth & Income Fund | | | 32,393 | | | | 16,689 | | | | (31,921 | ) | | | (2,219 | ) | | | 117 | | | | 15,058 | |
Guggenheim Enhanced Equity Income Fund | | | 31,551 | | | | — | | | | (29,712 | ) | | | (509 | ) | | | (1,330 | ) | | | — | |
Western Asset Inflation - Linked Securities & Income Fund | | | 34,781 | | | | 23,221 | | | | (25,503 | ) | | | 690 | | | | (1,917 | ) | | | 31,272 | |
Western Asset Inflation-Linked Opportunities & Income Fund | | | 34,523 | | | | 23,457 | | | | (26,762 | ) | | | 1,027 | | | | (1,884 | ) | | | 30,361 | |
Mutual Funds | | | | | | | | | | | | | | | | | | | | | | | | |
Guggenheim Strategy Fund I | | | 77,859 | | | | 7,525,058 | | | | (7,300,000 | ) | | | (5,437 | ) | | | (382 | ) | | | 297,098 | |
Guggenheim Strategy Fund II | | | 7,566,260 | | | | 81,779 | | | | (3,400,000 | ) | | | (4,237 | ) | | | 2,025 | | | | 4,245,827 | |
Guggenheim Strategy Fund III | | | 8,062,077 | | | | 82,082 | | | | (4,000,000 | ) | | | (46 | ) | | | (3,355 | ) | | | 4,140,758 | |
| | | $ | 15,904,782 | | | $ | 7,782,588 | | | $ | (14,875,067 | ) | | $ | (14,603 | ) | | $ | (6,182 | ) | | $ | 8,791,518 | |
SEE NOTES TO FINANCIAL STATEMENTS. | THE GUGGENHEIM FUNDS SEMI-ANNUAL REPORT | 33 |
CONSOLIDATED SCHEDULE OF INVESTMENTS (Unaudited)(concluded) | June 30, 2018 |
MULTI-HEDGE STRATEGIES FUND | |
Security Name | | Shares
06/30/18 | | | Investment
Income | |
Closed-End Funds | | | | | | | | |
Advent Claymore Convertible Securities and Income Fund | | | 1,018 | | | $ | 1,580 | |
Advent Claymore Convertible Securities and Income Fund II | | | 2,787 | | | | 1,703 | |
Advent/Claymore Enhanced Growth & Income Fund | | | 1,943 | | | | 1,857 | |
Guggenheim Enhanced Equity Income Fund | | | — | | | | — | |
Western Asset Inflation - Linked Securities & Income Fund | | | 2,736 | | | | 645 | |
Western Asset Inflation-Linked Opportunities & Income Fund | | | 2,723 | | | | 668 | |
Mutual Funds | | | | | | | | |
Guggenheim Strategy Fund I | | | 11,865 | | | | 25,038 | |
Guggenheim Strategy Fund II | | | 169,901 | | | | 81,804 | |
Guggenheim Strategy Fund III | | | 165,697 | | | | 82,119 | |
| | | | | | | $ | 195,414 | |
34 | THE GUGGENHEIM FUNDS SEMI-ANNUAL REPORT | SEE NOTES TO FINANCIAL STATEMENTS. |
CONSOLIDATED STATEMENT OF ASSETS AND LIABILITIES (Unaudited) |
MULTI-HEDGE STRATEGIES FUND |
June 30, 2018
Assets: |
Investments in unaffiliated issuers, at value - including $225,468 of securities loaned (cost $30,400,519) | | $ | 31,132,529 | |
Investments in affiliated issuers, at value (cost $8,805,612) | | | 8,791,518 | |
Repurchase agreements, at value (cost $5,164,360) | | | 5,164,360 | |
Foreign currency, at value (cost $31,586) | | | 31,588 | |
Cash | | | 17,105,359 | |
Segregated cash with broker | | | 81,507 | |
Unrealized appreciation on swap agreements | | | 994,852 | |
Receivables: |
Securities sold | | | 412,082 | |
Dividends | | | 46,861 | |
Fund shares sold | | | 16,516 | |
Interest | | | 599 | |
Securities lending income | | | 318 | |
Other assets | | | 16,524 | |
Total assets | | | 63,794,613 | |
| | | | | |
Liabilities: |
Securities sold short, at value (proceeds $9,489,922) | | | 9,581,486 | |
Unrealized depreciation on swap agreements | | | 1,259,004 | |
Payable for: |
Swap settlement | | | 1,647,058 | |
Securities purchased | | | 860,675 | |
Return of securities loaned | | | 234,934 | |
Fund shares redeemed | | | 140,553 | |
Management fees | | | 48,969 | |
Distribution and service fees | | | 7,648 | |
Variation margin | | | 2,307 | |
Miscellaneous | | | 24,773 | |
Total liabilities | | | 13,807,407 | |
Commitments and contingent liabilities (Note 12) | | | — | |
Net assets | | $ | 49,987,206 | |
| | | | | |
Net assets consist of: |
Paid in capital | | $ | 56,692,685 | |
Accumulated net investment loss | | | (3,694,643 | ) |
Accumulated net realized loss on investments | | | (3,921,913 | ) |
Net unrealized appreciation on investments | | | 911,077 | |
Net assets | | $ | 49,987,206 | |
| | | | | |
A-Class: |
Net assets | | $ | 2,540,593 | |
Capital shares outstanding | | | 106,578 | |
Net asset value per share | | $ | 23.84 | |
Maximum offering price per share (Net asset value divided by 95.25%) | | $ | 25.03 | |
| | | | | |
C-Class: |
Net assets | | $ | 5,560,607 | |
Capital shares outstanding | | | 257,205 | |
Net asset value per share | | $ | 21.62 | |
| | | | | |
P-Class: |
Net assets | | $ | 9,526,118 | |
Capital shares outstanding | | | 398,884 | |
Net asset value per share | | $ | 23.88 | |
| | | | | |
Institutional Class: |
Net assets | | $ | 32,359,888 | |
Capital shares outstanding | | | 1,329,991 | |
Net asset value per share | | $ | 24.33 | |
SEE NOTES TO FINANCIAL STATEMENTS. | THE GUGGENHEIM FUNDS SEMI-ANNUAL REPORT | 35 |
CONSOLIDATED STATEMENT OF OPERATIONS (Unaudited) |
MULTI-HEDGE STRATEGIES FUND |
Period Ended June 30, 2018
Investment Income: |
Dividends from securities of unaffiliated issuers | | $ | 262,498 | |
Dividends from securities of affiliated issuers | | | 195,414 | |
Interest | | | 272,229 | |
Income from securities lending, net | | | 2,211 | |
Total investment income | | | 732,352 | |
| | | | | |
Expenses: |
Management fees | | | 374,894 | |
Distribution and service fees: |
A-Class | | | 13,298 | |
C-Class | | | 33,185 | |
P-Class | | | 26,222 | |
Short sales dividend expense | | | 100,802 | |
Custodian fees | | | 218 | |
Line of credit fees | | | 77 | |
Miscellaneous | | | 2,254 | |
Total expenses | | | 550,949 | |
Less: | | | — | |
Expenses waived by Adviser | | | (6,815 | ) |
Net expenses | | | 544,134 | |
Net investment income | | | 188,218 | |
| | | | | |
Net Realized and Unrealized Gain (Loss): |
Net realized gain (loss) on: |
Investments in unaffiliated issuers | | | 519,497 | |
Investments in affiliated issuers | | | (14,603 | ) |
Swap agreements | | | (1,591,610 | ) |
Futures contracts | | | 1,059,112 | |
Foreign currency transactions | | | 2,844 | |
Securities sold short | | | (862,157 | ) |
Net realized loss | | | (886,917 | ) |
Net change in unrealized appreciation (depreciation) on: |
Investments in unaffiliated issuers | | | (572,995 | ) |
Investments in affiliated issuers | | | (6,182 | ) |
Securities sold short | | | 426,311 | |
Swap agreements | | | (1,085,315 | ) |
Futures contracts | | | (1,878,227 | ) |
Foreign currency translations | | | 390 | |
Net change in unrealized appreciation (depreciation) | | | (3,116,018 | ) |
Net realized and unrealized loss | | | (4,002,935 | ) |
Net decrease in net assets resulting from operations | | $ | (3,814,717 | ) |
36 | THE GUGGENHEIM FUNDS SEMI-ANNUAL REPORT | SEE NOTES TO FINANCIAL STATEMENTS. |
CONSOLIDATED STATEMENTS OF CHANGES IN NET ASSETS |
MULTI-HEDGE STRATEGIES FUND | |
| | Period Ended
June 30,
2018
(Unaudited) | | | Year Ended
December 31,
2017 | |
Increase (Decrease) in Net Assets from Operations: | | | | | | | | |
Net investment income (loss) | | $ | 188,218 | | | $ | (403,200 | ) |
Net realized gain (loss) on investments | | | (886,917 | ) | | | 4,186,553 | |
Net change in unrealized appreciation (depreciation) on investments | | | (3,116,018 | ) | | | (1,079,945 | ) |
Net increase (decrease) in net assets resulting from operations | | | (3,814,717 | ) | | | 2,703,408 | |
| | | | | | | | | |
Capital share transactions: | | | | | | | | |
Proceeds from sale of shares | | | | | | | | |
A-Class | | | 1,617,579 | | | | 2,850,883 | |
C-Class | | | 223,056 | | | | 1,628,637 | |
P-Class | | | 23,944,058 | | | | 3,125,112 | |
Institutional Class | | | 16,650,950 | | | | 15,878,460 | |
Cost of shares redeemed | | | | | | | | |
A-Class | | | (10,684,720 | ) | | | (3,503,508 | ) |
C-Class | | | (1,931,550 | ) | | | (2,841,065 | ) |
P-Class | | | (26,616,532 | ) | | | (20,356,262 | ) |
Institutional Class | | | (8,583,758 | ) | | | (42,500,227 | ) |
Net decrease from capital share transactions | | | (5,380,917 | ) | | | (45,717,970 | ) |
Net decrease in net assets | | | (9,195,634 | ) | | | (43,014,562 | ) |
| | | | | | | | | |
Net assets: | | | | | | | | |
Beginning of period | | | 59,182,840 | | | | 102,197,402 | |
End of period | | $ | 49,987,206 | | | $ | 59,182,840 | |
Accumulated net investment loss at end of period | | $ | (3,694,643 | ) | | $ | (3,882,861 | ) |
| | | | | | | | | |
Capital share activity: | | | | | | | | |
Shares sold | | | | | | | | |
A-Class | | | 65,667 | | | | 117,556 | |
C-Class | | | 9,591 | | | | 73,750 | |
P-Class | | | 933,954 | | | | 129,187 | |
Institutional Class | | | 673,959 | | | | 647,744 | |
Shares redeemed | | | | | | | | |
A-Class | | | (446,915 | ) | | | (145,028 | ) |
C-Class | | | (86,882 | ) | | | (128,450 | ) |
P-Class | | | (1,099,268 | ) | | | (843,272 | ) |
Institutional Class | | | (342,421 | ) | | | (1,706,155 | ) |
Net decrease in shares | | | (292,315 | ) | | | (1,854,668 | ) |
SEE NOTES TO FINANCIAL STATEMENTS. | THE GUGGENHEIM FUNDS SEMI-ANNUAL REPORT | 37 |
CONSOLIDATED FINANCIAL HIGHLIGHTS |
MULTI-HEDGE STRATEGIES FUND | |
This table is presented to show selected data for a share outstanding throughout each period and to assist shareholders in evaluating a Fund’s performance for the periods presented.
A-Class | | Period
Ended
June 30,
2018a | | | Year
Ended
Dec. 31,
2017 | | | Year
Ended
Dec. 31,
2016 | | | Year
Ended
Dec. 31,
2015 | | | Year
Ended
Dec. 31,
2014 | | | Year
Ended
Dec. 31,
2013 | |
Per Share Data | | | | | | | | | | | | | | | | | | | | | | | | |
Net asset value, beginning of period | | $ | 24.91 | | | $ | 24.08 | | | $ | 24.22 | | | $ | 23.94 | | | $ | 23.03 | | | $ | 22.68 | |
Income (loss) from investment operations: |
Net investment income (loss)b | | | .07 | | | | (.13 | ) | | | (.24 | ) | | | (.23 | ) | | | (.26 | ) | | | (.18 | ) |
Net gain (loss) on investments (realized and unrealized) | | | (1.14 | ) | | | .96 | | | | .14 | | | | .51 | | | | 1.36 | | | | .53 | |
Total from investment operations | | | (1.07 | ) | | | .83 | | | | (.10 | ) | | | .28 | | | | 1.10 | | | | .35 | |
Less distributions from: |
Net investment income | | | — | | | | — | | | | (.04 | ) | | | — | | | | (.19 | ) | | | — | |
Total distributions | | | — | | | | — | | | | (.04 | ) | | | — | | | | (.19 | ) | | | — | |
Net asset value, end of period | | $ | 23.84 | | | $ | 24.91 | | | $ | 24.08 | | | $ | 24.22 | | | $ | 23.94 | | | $ | 23.03 | |
|
Total Returnc | | | (4.30 | %) | | | 3.49 | % | | | (0.43 | %) | | | 1.21 | % | | | 4.73 | % | | | 1.54 | % |
Ratios/Supplemental Data |
Net assets, end of period (in thousands) | | $ | 2,541 | | | $ | 12,154 | | | $ | 12,407 | | | $ | 15,620 | | | $ | 11,620 | | | $ | 18,307 | |
Ratios to average net assets: |
Net investment income (loss) | | | 0.53 | % | | | (0.53 | %) | | | (1.00 | %) | | | (0.96 | %) | | | (1.13 | %) | | | (0.79 | %) |
Total expensesd | | | 1.69 | % | | | 2.18 | % | | | 2.54 | % | | | 2.72 | % | | | 2.86 | % | | | 2.74 | % |
Net expensese,f | | | 1.67 | % | | | 2.14 | % | | | 2.49 | % | | | 2.65 | % | | | 2.81 | % | | | 2.69 | % |
Portfolio turnover rate | | | 81 | % | | | 172 | % | | | 123 | % | | | 163 | % | | | 304 | % | | | 302 | % |
38 | THE GUGGENHEIM FUNDS SEMI-ANNUAL REPORT | SEE NOTES TO FINANCIAL STATEMENTS. |
CONSOLIDATED FINANCIAL HIGHLIGHTS (continued) |
MULTI-HEDGE STRATEGIES FUND | |
This table is presented to show selected data for a share outstanding throughout each period and to assist shareholders in evaluating a Fund’s performance for the periods presented.
C-Class | | Period
Ended
June 30,
2018a | | | Year
Ended
Dec. 31,
2017 | | | Year
Ended
Dec. 31,
2016 | | | Year
Ended
Dec. 31,
2015 | | | Year
Ended
Dec. 31,
2014 | | | Year
Ended
Dec. 31,
2013 | |
Per Share Data | | | | | | | | | | | | | | | | | | | | | | | | |
Net asset value, beginning of period | | $ | 22.68 | | | $ | 22.08 | | | $ | 22.38 | | | $ | 22.29 | | | $ | 21.62 | | | $ | 21.45 | |
Income (loss) from investment operations: |
Net investment income (loss)b | | | (.02 | ) | | | (.29 | ) | | | (.39 | ) | | | (.39 | ) | | | (.40 | ) | | | (.35 | ) |
Net gain (loss) on investments (realized and unrealized) | | | (1.04 | ) | | | .89 | | | | .13 | | | | .48 | | | | 1.26 | | | | .52 | |
Total from investment operations | | | (1.06 | ) | | | .60 | | | | (.26 | ) | | | .09 | | | | .86 | | | | .17 | |
Less distributions from: |
Net investment income | | | — | | | | — | | | | (.04 | ) | | | — | | | | (.19 | ) | | | — | |
Total distributions | | | — | | | | — | | | | (.04 | ) | | | — | | | | (.19 | ) | | | — | |
Net asset value, end of period | | $ | 21.62 | | | $ | 22.68 | | | $ | 22.08 | | | $ | 22.38 | | | $ | 22.29 | | | $ | 21.62 | |
|
Total Returnc | | | (4.67 | %) | | | 2.72 | % | | | (1.18 | %) | | | 0.45 | % | | | 3.97 | % | | | 0.79 | % |
Ratios/Supplemental Data |
Net assets, end of period (in thousands) | | $ | 5,561 | | | $ | 7,586 | | | $ | 8,595 | | | $ | 9,342 | | | $ | 9,627 | | | $ | 12,705 | |
Ratios to average net assets: |
Net investment income (loss) | | | (0.20 | %) | | | (1.30 | %) | | | (1.76 | %) | | | (1.73 | %) | | | (1.84 | %) | | | (1.60 | %) |
Total expensesd | | | 2.49 | % | | | 2.94 | % | | | 3.30 | % | | | 3.47 | % | | | 3.62 | % | | | 3.50 | % |
Net expensese,f | | | 2.47 | % | | | 2.90 | % | | | 3.25 | % | | | 3.40 | % | | | 3.57 | % | | | 3.45 | % |
Portfolio turnover rate | | | 81 | % | | | 172 | % | | | 123 | % | | | 163 | % | | | 304 | % | | | 302 | % |
SEE NOTES TO FINANCIAL STATEMENTS. | THE GUGGENHEIM FUNDS SEMI-ANNUAL REPORT | 39 |
CONSOLIDATED FINANCIAL HIGHLIGHTS (continued) |
MULTI-HEDGE STRATEGIES FUND | |
This table is presented to show selected data for a share outstanding throughout each period and to assist shareholders in evaluating a Fund’s performance for the periods presented.
P-Class | | Period
Ended
June 30,
2018a | | | Year
Ended
Dec. 31,
2017 | | | Year
Ended
Dec. 31,
2016 | | | Year
Ended
Dec. 31,
2015 | | | Year
Ended
Dec. 31,
2014 | | | Year
Ended
Dec. 31,
2013 | |
Per Share Data | | | | | | | | | | | | | | | | | | | | | | | | |
Net asset value, beginning of period | | $ | 24.93 | | | $ | 24.10 | | | $ | 24.24 | | | $ | 23.96 | | | $ | 23.04 | | | $ | 22.69 | |
Income (loss) from investment operations: |
Net investment income (loss)b | | | .07 | | | | (.14 | ) | | | (.24 | ) | | | (.23 | ) | | | (.25 | ) | | | (.19 | ) |
Net gain (loss) on investments (realized and unrealized) | | | (1.12 | ) | | | .97 | | | | .14 | | | | .51 | | | | 1.36 | | | | .54 | |
Total from investment operations | | | (1.05 | ) | | | .83 | | | | (.10 | ) | | | .28 | | | | 1.11 | | | | .35 | |
Less distributions from: |
Net investment income | | | — | | | | — | | | | (.04 | ) | | | — | | | | (.19 | ) | | | — | |
Total distributions | | | — | | | | — | | | | (.04 | ) | | | — | | | | (.19 | ) | | | — | |
Net asset value, end of period | | $ | 23.88 | | | $ | 24.93 | | | $ | 24.10 | | | $ | 24.24 | | | $ | 23.96 | | | $ | 23.04 | |
|
Total Returnc | | | (4.21 | %) | | | 3.49 | % | | | (0.47 | %) | | | 1.21 | % | | | 4.77 | % | | | 1.54 | % |
Ratios/Supplemental Data |
Net assets, end of period (in thousands) | | $ | 9,526 | | | $ | 14,066 | | | $ | 30,801 | | | $ | 49,539 | | | $ | 36,411 | | | $ | 50,990 | |
Ratios to average net assets: |
Net investment income (loss) | | | 0.56 | % | | | (0.56 | %) | | | (1.00 | %) | | | (0.95 | %) | | | (1.09 | %) | | | (0.82 | %) |
Total expensesd | | | 1.73 | % | | | 2.20 | % | | | 2.52 | % | | | 2.72 | % | | | 2.87 | % | | | 2.75 | % |
Net expensese,f | | | 1.71 | % | | | 2.16 | % | | | 2.47 | % | | | 2.65 | % | | | 2.82 | % | | | 2.71 | % |
Portfolio turnover rate | | | 81 | % | | | 172 | % | | | 123 | % | | | 163 | % | | | 304 | % | | | 302 | % |
40 | THE GUGGENHEIM FUNDS SEMI-ANNUAL REPORT | SEE NOTES TO FINANCIAL STATEMENTS. |
CONSOLIDATED FINANCIAL HIGHLIGHTS (concluded) |
MULTI-HEDGE STRATEGIES FUND |
This table is presented to show selected data for a share outstanding throughout each period and to assist shareholders in evaluating a Fund’s performance for the periods presented.
Institutional Class | | Period
Ended
June 30,
2018a | | | Year
Ended
Dec. 31,
2017 | | | Year
Ended
Dec. 31,
2016 | | | Year
Ended
Dec. 31,
2015 | | | Year
Ended
Dec. 31,
2014 | | | Year
Ended
Dec. 31,
2013 | |
Per Share Data | | | | | | | | | | | | | | | | | | | | | | | | |
Net asset value, beginning of period | | $ | 25.42 | | | $ | 24.50 | | | $ | 24.58 | | | $ | 24.24 | | | $ | 23.26 | | | $ | 22.84 | |
Income (loss) from investment operations: |
Net investment income (loss)b | | | .10 | | | | (.07 | ) | | | (.18 | ) | | | (.18 | ) | | | (.18 | ) | | | (.13 | ) |
Net gain (loss) on investments (realized and unrealized) | | | (1.19 | ) | | | .99 | | | | .14 | | | | .52 | | | | 1.35 | | | | .55 | |
Total from investment operations | | | (1.09 | ) | | | .92 | | | | (.04 | ) | | | .34 | | | | 1.17 | | | | .42 | |
Less distributions from: |
Net investment income | | | — | | | | — | | | | (.04 | ) | | | — | | | | (.19 | ) | | | — | |
Total distributions | | | — | | | | — | | | | (.04 | ) | | | — | | | | (.19 | ) | | | — | |
Net asset value, end of period | | $ | 24.33 | | | $ | 25.42 | | | $ | 24.50 | | | $ | 24.58 | | | $ | 24.24 | | | $ | 23.26 | |
|
Total Returnc | | | (4.29 | %) | | | 3.76 | % | | | (0.18 | %) | | | 1.44 | % | | | 4.98 | % | | | 1.84 | % |
Ratios/Supplemental Data |
Net assets, end of period (in thousands) | | $ | 32,360 | | | $ | 25,376 | | | $ | 50,395 | | | $ | 49,742 | | | $ | 42,204 | | | $ | 25,435 | |
Ratios to average net assets: |
Net investment income (loss) | | | 0.84 | % | | | (0.30 | %) | | | (0.74 | %) | | | (0.71 | %) | | | (0.79 | %) | | | (0.54 | %) |
Total expensesd | | | 1.53 | % | | | 1.92 | % | | | 2.30 | % | | | 2.47 | % | | | 2.67 | % | | | 2.56 | % |
Net expensese,f | | | 1.51 | % | | | 1.88 | % | | | 2.25 | % | | | 2.40 | % | | | 2.62 | % | | | 2.51 | % |
Portfolio turnover rate | | | 81 | % | | | 172 | % | | | 123 | % | | | 163 | % | | | 304 | % | | | 302 | % |
a | Unaudited figures for the period ended June 30, 2018. Percentage amounts for the period, except total return and portfolio turnover rate, have been annualized. |
b | Net investment income (loss) per share was computed using average shares outstanding throughout the period. |
c | Total return does not reflect the impact of any applicable sales charges and has not been annualized. |
d | Does not include expenses of the underlying funds in which the Fund invests. |
e | Net expense information reflects the expense ratios after expense waivers. |
f | Excluding interest and dividend expense related to short sales, the net expense ratios for the periods presented would be: |
| | | 06/30/18 | 12/31/17 | 12/31/16 | 12/31/15 | 12/31/14 | 12/31/13 |
| | A-Class | 1.41% | 1.42% | 1.43% | 1.44% | 1.42% | 1.40% |
| | C-Class | 2.16% | 2.17% | 2.18% | 2.19% | 2.17% | 2.15% |
| | P-Class | 1.41% | 1.42% | 1.43% | 1.45% | 1.42% | 1.40% |
| | Institutional Class | 1.16% | 1.17% | 1.18% | 1.19% | 1.17% | 1.15% |
SEE NOTES TO FINANCIAL STATEMENTS. | THE GUGGENHEIM FUNDS SEMI-ANNUAL REPORT | 41 |
PERFORMANCE REPORT AND FUND PROFILE (Unaudited) | June 30, 2018 |
COMMODITIES STRATEGY FUND
OBJECTIVE: Seeks to provide investment results that correlate, before fees and expenses, to the performance of a benchmark for commodities. The Fund’s current benchmark is the S&P Goldman Sachs Commodity Index (“GSCI” or “Index”).
Consolidated Holdings Diversification (Market Exposure as % of Net Assets)
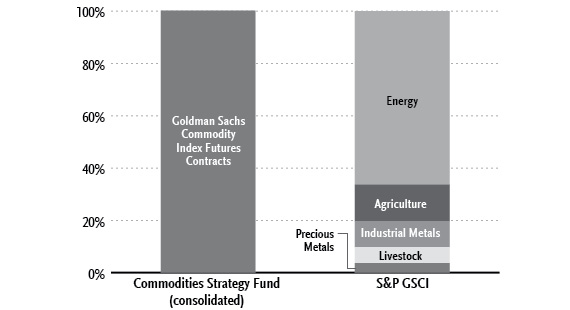
“Consolidated Holdings Diversification (Market Exposure as % of Net Assets)” excludes any temporary cash investments or investments in Guggenheim Strategy Funds Trust mutual funds. Investments in those Funds do not provide “market exposure” to meet the Fund’s investment objective, but will significantly increase the portfolio’s exposure to certain other asset categories (and their associated risks), which may cause the Fund to deviate from its principal investment strategy, including: (i) high yield, high risk debt securities rated below the top four long-term rating categories by a nationally recognized statistical rating organization (also known as “junk bonds”); (ii) securities issued by the U.S. government or its agencies and instrumentalities; (iii) CLOs, other asset-backed securities (including mortgage-backed securities) and similarly structured debt investments; and (iv) other short-term fixed income securities.
42 | THE GUGGENHEIM FUNDS SEMI-ANNUAL REPORT | |
PERFORMANCE REPORT AND FUND PROFILE (Unaudited)(concluded) | June 30, 2018 |
Inception Dates: |
A-Class | May 25, 2005 |
C-Class | May 25, 2005 |
H-Class | May 25, 2005 |
The Fund invests principally in derivative investments such as swap agreements and futures contracts.
Largest Holdings (% of Total Net Assets) |
Guggenheim Strategy Fund I | 6.6% |
Guggenheim Strategy Fund II | 6.6% |
Total | 13.2% |
| | |
“Largest Holdings” excludes any temporary cash or derivative investments. |
Average Annual Returns*
Periods Ended June 30, 2018
| 6 month† | 1 Year | 5 Year | 10 Year |
A-Class Shares | 9.28% | 27.61% | (10.73%) | (14.10%) |
A-Class Shares with sales charge‡ | 4.10% | 21.55% | (11.60%) | (14.52%) |
C-Class Shares | 8.85% | 26.64% | (11.39%) | (14.73%) |
C-Class Shares with CDSC§ | 7.88% | 25.64% | (11.39%) | (14.73%) |
H-Class Shares | 9.30% | 27.62% | (10.74%) | (14.09%) |
S&P GSCI | 10.36% | 30.04% | (9.41%) | (12.36%) |
* | The performance data above represents past performance that is not predictive of future results. The investment return and principal value of an investment in the Fund will fluctuate so that an investor’s shares, when redeemed, may be worth more or less than their original cost. Returns are historical and include changes in principal and reinvested dividends and capital gains and do not reflect the effect of taxes. The S&P GSCI is an unmanaged index and, unlike the Fund, has no management fees or operating expenses to reduce its reported return. |
† | 6 month returns are not annualized. |
‡ | Fund returns are calculated using the maximum sales charge of 4.75%. |
§ | Fund returns include a CDSC of 1% if redeemed within 12 months of purchase. |
| | THE GUGGENHEIM FUNDS SEMI-ANNUAL REPORT | 43 |
CONSOLIDATED SCHEDULE OF INVESTMENTS (Unaudited) | June 30, 2018 |
COMMODITIES STRATEGY FUND | |
| | Shares | | | Value | |
| | | | | | | | | |
MUTUAL FUNDS† - 13.2% |
Guggenheim Strategy Fund I1 | | | 99,973 | | | $ | 2,503,320 | |
Guggenheim Strategy Fund II1 | | | 100,163 | | | | 2,503,085 | |
Total Mutual Funds | | | | | | | | |
(Cost $4,997,591) | | | | | | | 5,006,405 | |
| | | | | | | | | |
| | | Face
Amount | | | | | |
| | | | | | | | | |
FEDERAL AGENCY DISCOUNT NOTES†† - 21.1% |
Federal Home Loan Bank2 | | | | | | | | |
1.36% due 07/03/183,4 | | $ | 4,000,000 | | | | 3,999,622 | |
1.46% due 07/05/183,4 | | | 4,000,000 | | | | 3,999,245 | |
Total Federal Agency Discount Notes | | | | |
(Cost $7,998,867) | | | | | | | 7,998,867 | |
| | | | | | | | | |
FEDERAL AGENCY NOTES†† - 17.6% |
Fannie Mae5 | | | | | | | | |
0.85% due 07/13/18 | | | 6,705,000 | | | | 6,702,968 | |
Total Federal Agency Notes | | | | |
(Cost $6,702,816) | | | | | | | 6,702,968 | |
| | | | | | | | | |
U.S. TREASURY BILLS†† - 4.9% |
U.S. Treasury Bills | | | | | | | | |
1.72% due 07/12/183,4,6 | | | 1,866,000 | | | | 1,865,131 | |
Total U.S. Treasury Bills | | | | | | | | |
(Cost $1,864,982) | | | | | | | 1,865,131 | |
| | | | | | | | | |
REPURCHASE AGREEMENTS††,7 - 41.9% |
JPMorgan Chase & Co.
issued 06/29/18 at 2.10%
due 07/02/18 | | | 8,732,229 | | | | 8,732,229 | |
Barclays Capital
issued 06/29/18 at 2.07%
due 07/02/18 | | | 4,287,937 | | | | 4,287,937 | |
Bank of America Merrill Lynch
issued 06/29/18 at 2.08%
due 07/02/18 | | | 2,858,625 | | | | 2,858,625 | |
Total Repurchase Agreements | | | | |
(Cost $15,878,791) | | | | | | | 15,878,791 | |
| | | | | | | | | |
Total Investments - 98.7% | | | | | | | | |
(Cost $37,443,047) | | | | | | $ | 37,452,162 | |
Other Assets & Liabilities, net - 1.3% | | | 476,736 | |
Total Net Assets - 100.0% | | | | | | $ | 37,928,898 | |
Futures Contracts |
Description | | Number of
Contracts | | | Expiration
Date | | | Notional
Amount | | | Value and
Unrealized
Gain | |
Commodity Futures Contracts Purchased† |
Goldman Sachs Commodity Index Futures Contracts | | | 312 | | | | Jul 2018 | | | $ | 38,001,600 | | | $ | 1,145,746 | |
44 | THE GUGGENHEIM FUNDS SEMI-ANNUAL REPORT | SEE NOTES TO FINANCIAL STATEMENTS. |
CONSOLIDATED SCHEDULE OF INVESTMENTS (Unaudited)(continued) | June 30, 2018 |
COMMODITIES STRATEGY FUND | |
† | Value determined based on Level 1 inputs — See Note 4. |
†† | Value determined based on Level 2 inputs — See Note 4. |
1 | Affiliated issuer. |
2 | The issuer operates under a Congressional charter; its securities are neither issued nor guaranteed by the U.S. Government. |
3 | Rate indicated is the effective yield at the time of purchase. |
4 | Zero coupon rate security. |
5 | On September 7, 2008, the issuer was placed in conservatorship by the Federal Housing Finance Agency (FHFA). As conservator, the FHFA has full powers to control the assets and operations of the firm. |
6 | All or a portion of this security is pledged as futures collateral at June 30, 2018. |
7 | Repurchase Agreements — See Note 6. |
| | |
| | See Sector Classification in Other Information section. |
The following table summarizes the inputs used to value the Fund’s investments at June 30, 2018 (See Note 4 in the Notes to Consolidated Financial Statements):
Investments in
Securities (Assets) | | Level 1
Quoted
Prices | | | Level 2
Significant
Observable
Inputs | | | Level 3
Significant
Unobservable
Inputs | | | Total | |
Mutual Funds | | $ | 5,006,405 | | | $ | — | | | $ | — | | | $ | 5,006,405 | |
Federal Agency Discount Notes | | | — | | | | 7,998,867 | | | | — | | | | 7,998,867 | |
Federal Agency Notes | | | — | | | | 6,702,968 | | | | — | | | | 6,702,968 | |
U.S. Treasury Bills | | | — | | | | 1,865,131 | | | | — | | | | 1,865,131 | |
Repurchase Agreements | | | — | | | | 15,878,791 | | | | — | | | | 15,878,791 | |
Commodity Futures Contracts* | | | 1,145,746 | | | | — | | | | — | | | | 1,145,746 | |
Total Assets | | $ | 6,152,151 | | | $ | 32,445,757 | | | $ | — | | | $ | 38,597,908 | |
* | This derivative is reported as unrealized gain/loss at period end. |
Transfers between investment levels may occur as the markets fluctuate and/or the availability of data used in an investment’s valuation changes. Transfers between valuation levels, if any, are in comparison to the valuation levels at the end of the previous fiscal year, and are effective using the fair value as of the end of the current fiscal period.
For the period ended June 30, 2018, there were no transfers between levels.
SEE NOTES TO FINANCIAL STATEMENTS. | THE GUGGENHEIM FUNDS SEMI-ANNUAL REPORT | 45 |
CONSOLIDATED SCHEDULE OF INVESTMENTS (Unaudited)(concluded) | June 30, 2018 |
COMMODITIES STRATEGY FUND | |
Affiliated Transactions
Investments representing 5% or more of the outstanding voting shares of a portfolio company of a fund, or control of or by, or common control under the GI, result in that portfolio company being considered an affiliated company of such fund, as defined in the 1940 Act.
The Fund may invest in certain of the underlying series of Guggenheim Strategy Funds Trust, including Guggenheim Strategy Fund I, Guggenheim Strategy Fund II and Guggenheim Strategy Fund III, (collectively, the “Cash Management Funds”), each of which are open-end management investment companies managed by GI. The Cash Management Funds, which launched on March 11, 2014, are offered as cash management options only to mutual funds, trusts, and other accounts managed by GI and/or its affiliates, and are not available to the public. The Cash Management Funds pay no investment management fees. The Cash Management Funds’ annual report on Form N-CSR dated September 30, 2017, is available publicly or upon request. This information is available from the EDGAR database on the SEC’s website at https://www.sec.gov/Archives/edgar/data/1601445/000089180417000715/gug72218.htm.
Transactions during the period ended June 30, 2018, in which the portfolio company is an “affiliated person”, were as follows:
Security Name | | Value
12/31/17 | | | Additions | | | Reductions | | | Realized
Gain | | | Change in
Unrealized | | | Value
06/30/18 | | | Shares
06/30/18 | | | Investment
Income | |
Mutual Funds | | | | | | | | | | | | | | | | | | | | | | | | | | | | | | | | |
Guggenheim Strategy Fund I | | $ | 1,355,439 | | | $ | 1,149,999 | | | $ | — | | | $ | — | | | $ | (2,118 | ) | | $ | 2,503,320 | | | | 99,973 | | | $ | 21,312 | |
Guggenheim Strategy Fund II | | | 1,355,548 | | | | 1,150,000 | | | | — | | | | — | | | | (2,463 | ) | | | 2,503,085 | | | | 100,163 | | | | 22,113 | |
| | | $ | 2,710,987 | | | $ | 2,299,999 | | | $ | — | | | $ | — | | | $ | (4,581 | ) | | $ | 5,006,405 | | | | | | | $ | 43,425 | |
46 | THE GUGGENHEIM FUNDS SEMI-ANNUAL REPORT | SEE NOTES TO FINANCIAL STATEMENTS. |
CONSOLIDATED STATEMENT OF ASSETS AND LIABILITIES (Unaudited) |
COMMODITIES STRATEGY FUND |
June 30, 2018
Assets: |
Investments in unaffiliated issuers, at value (cost $16,566,665) | | $ | 16,566,966 | |
Investments in affiliated issuers, at value (cost $4,997,591) | | | 5,006,405 | |
Repurchase agreements, at value (cost $15,878,791) | | | 15,878,791 | |
Segregated cash with broker | | | 16,444 | |
Receivables: |
Variation margin | | | 479,700 | |
Fund shares sold | | | 93,141 | |
Interest | | | 28,439 | |
Dividends | | | 12,251 | |
Total assets | | | 38,082,137 | |
| | | | | |
Liabilities: |
Payable for: |
Fund shares redeemed | | | 82,196 | |
Management fees | | | 23,691 | |
Distribution and service fees | | | 7,876 | |
Transfer agent and administrative fees | | | 7,624 | |
Portfolio accounting fees | | | 3,049 | |
Trustees’ fees* | | | 945 | |
Miscellaneous | | | 27,858 | |
Total liabilities | | | 153,239 | |
Commitments and contingent liabilities (Note 12) | | | — | |
Net assets | | $ | 37,928,898 | |
| | | | | |
Net assets consist of: |
Paid in capital | | $ | 38,109,817 | |
Accumulated net investment loss | | | (2,014,865 | ) |
Accumulated net realized gain on investments | | | 679,085 | |
Net unrealized appreciation on investments | | | 1,154,861 | |
Net assets | | $ | 37,928,898 | |
| | | | | |
A-Class: |
Net assets | | $ | 1,326,991 | |
Capital shares outstanding | | | 13,745 | |
Net asset value per share | | $ | 96.54 | |
Maximum offering price per share (Net asset value divided by 95.25%) | | $ | 101.36 | |
| | | | | |
C-Class: |
Net assets | | $ | 413,767 | |
Capital shares outstanding | | | 4,758 | |
Net asset value per share | | $ | 86.96 | |
| | | | | |
H-Class: |
Net assets | | $ | 36,188,140 | |
Capital shares outstanding | | | 374,597 | |
Net asset value per share | | $ | 96.61 | |
* | Relates to Trustees not deemed “interested persons” within the meaning of Section 2(a)(19) of the 1940 Act. |
SEE NOTES TO FINANCIAL STATEMENTS. | THE GUGGENHEIM FUNDS SEMI-ANNUAL REPORT | 47 |
CONSOLIDATED STATEMENT OF OPERATIONS (Unaudited) |
COMMODITIES STRATEGY FUND |
Period Ended June 30, 2018
Investment Income: |
Dividends from securities of affiliated issuers | | $ | 43,425 | |
Interest | | | 159,863 | |
Total investment income | | | 203,288 | |
| | | | | |
Expenses: |
Management fees | | | 101,492 | |
Distribution and service fees: | | | | |
A-Class | | | 1,584 | |
C-Class | | | 2,919 | |
H-Class | | | 26,762 | |
Transfer agent and administrative fees | | | 29,075 | |
Portfolio accounting fees | | | 11,630 | |
Custodian fees | | | 1,701 | |
Trustees’ fees* | | | 1,358 | |
Miscellaneous | | | 32,470 | |
Total expenses | | | 208,990 | |
Less: |
Expenses waived by Adviser | | | (13,741 | ) |
Net expenses | | | 195,250 | |
Net investment income | | | 8,038 | |
| | | | | |
Net Realized and Unrealized Gain (Loss): |
Net realized gain (loss) on: |
Investments | | | 13 | |
Futures contracts | | | 684,357 | |
Net realized gain | | | 684,370 | |
Net change in unrealized appreciation (depreciation) on: |
Investments in unaffiliated issuers | | | 352 | |
Investments in affiliated issuers | | | (4,581 | ) |
Futures contracts | | | 772,610 | |
Net change in unrealized appreciation (depreciation) | | | 768,381 | |
Net realized and unrealized gain | | | 1,452,751 | |
Net increase in net assets resulting from operations | | $ | 1,460,789 | |
* | Relates to Trustees not deemed “interested persons” within the meaning of Section 2(a)(19) of the 1940 Act. |
48 | THE GUGGENHEIM FUNDS SEMI-ANNUAL REPORT | SEE NOTES TO FINANCIAL STATEMENTS. |
CONSOLIDATED STATEMENTS OF CHANGES IN NET ASSETS |
COMMODITIES STRATEGY FUND | |
| | Period Ended
June 30,
2018
(Unaudited) | | | Year Ended
December 31,
2017 | |
Increase (Decrease) in Net Assets from Operations: | | | | | | | | |
Net investment income (loss) | | $ | 8,038 | | | $ | (22,069 | ) |
Net realized gain on investments | | | 684,370 | | | | 17,965 | |
Net change in unrealized appreciation (depreciation) on investments | | | 768,381 | | | | 176,391 | |
Net increase in net assets resulting from operations | | | 1,460,789 | | | | 172,287 | |
| | | | | | | | | |
Distributions to shareholders from: | | | | | | | | |
Net investment income | | | | | | | | |
A-Class | | | — | | | | (12,479 | ) |
C-Class | | | — | | | | (6,216 | ) |
H-Class | | | — | | | | (87,310 | ) |
Total distributions to shareholders | | | — | | | | (106,005 | ) |
| | | | | | | | | |
Capital share transactions: | | | | | | | | |
Proceeds from sale of shares | | | | | | | | |
A-Class | | | 2,272,033 | | | | 49,012,472 | |
C-Class | | | 1,456,618 | | | | 175,636 | |
H-Class | | | 168,656,795 | | | | 135,745,728 | |
Distributions reinvested | | | | | | | | |
A-Class | | | — | | | | 11,926 | |
C-Class | | | — | | | | 6,197 | |
H-Class | | | — | | | | 86,139 | |
Cost of shares redeemed | | | | | | | | |
A-Class | | | (1,831,410 | ) | | | (48,862,185 | ) |
C-Class | | | (1,411,365 | ) | | | (327,223 | ) |
H-Class | | | (139,828,316 | ) | | | (137,504,288 | ) |
Net increase (decrease) from capital share transactions | | | 29,314,355 | | | | (1,655,598 | ) |
Net increase (decrease) in net assets | | | 30,775,144 | | | | (1,589,316 | ) |
| | | | | | | | | |
Net assets: | | | | | | | | |
Beginning of period | | | 7,153,754 | | | | 8,743,070 | |
End of period | | $ | 37,928,898 | | | $ | 7,153,754 | |
Accumulated net investment loss at end of period | | $ | (2,014,865 | ) | | $ | (2,022,903 | ) |
SEE NOTES TO FINANCIAL STATEMENTS. | THE GUGGENHEIM FUNDS SEMI-ANNUAL REPORT | 49 |
CONSOLIDATED STATEMENTS OF CHANGES IN NET ASSETS (concluded) |
COMMODITIES STRATEGY FUND | |
| | Period Ended
June 30,
2018
(Unaudited) | | | Year Ended
December 31,
2017 | |
Capital share activity: | | | | | | | | |
Shares sold | | | | | | | | |
A-Class | | | 24,457 | | | | 631,518 | |
C-Class | | | 17,271 | | | | 2,261 | |
H-Class | | | 1,813,976 | | | | 1,732,105 | |
Shares issued from reinvestment of distributions | | | | | | | | |
A-Class | | | — | | | | 143 | |
C-Class | | | — | | | | 82 | |
H-Class | | | — | | | | 1,034 | |
Shares redeemed | | | | | | | | |
A-Class | | | (19,986 | ) | | | (632,591 | ) |
C-Class | | | (16,673 | ) | | | (4,338 | ) |
H-Class | | | (1,507,281 | ) | | | (1,751,301 | ) |
Net increase (decrease) in shares | | | 311,764 | | | | (21,087 | ) |
50 | THE GUGGENHEIM FUNDS SEMI-ANNUAL REPORT | SEE NOTES TO FINANCIAL STATEMENTS. |
CONSOLIDATED FINANCIAL HIGHLIGHTS |
COMMODITIES STRATEGY FUND | |
This table is presented to show selected data for a share outstanding throughout each period and to assist shareholders in evaluating a Fund’s performance for the periods presented.
A-Class | | Period
Ended
June 30,
2018a | | | Year
Ended
Dec. 31,
2017 | | | Year
Ended
Dec. 31,
2016f | | | Year
Ended
Dec. 31,
2015f | | | Year
Ended
Dec. 31,
2014f | | | Year
Ended
Dec. 31,
2013f | |
Per Share Data | | | | | | | | | | | | | | | | | | | | | | | | |
Net asset value, beginning of period | | $ | 88.34 | | | $ | 85.75 | | | $ | 77.58 | | | $ | 118.46 | | | $ | 179.18 | | | $ | 185.89 | |
Income (loss) from investment operations: |
Net investment income (loss)b | | | .04 | | | | (.22 | ) | | | (.09 | ) | | | (1.32 | ) | | | (1.80 | ) | | | (2.76 | ) |
Net gain (loss) on investments (realized and unrealized) | | | 8.16 | | | | 4.13 | | | | 8.26 | | | | (39.56 | ) | | | (58.92 | ) | | | (3.95 | ) |
Total from investment operations | | | 8.20 | | | | 3.91 | | | | 8.17 | | | | (40.88 | ) | | | (60.72 | ) | | | (6.71 | ) |
Less distributions from: |
Net investment income | | | — | | | | (1.32 | ) | | | — | | | | — | | | | — | | | | — | |
Total distributions | | | — | | | | (1.32 | ) | | | — | | | | — | | | | — | | | | — | |
Net asset value, end of period | | $ | 96.54 | | | $ | 88.34 | | | $ | 85.75 | | | $ | 77.58 | | | $ | 118.46 | | | $ | 179.18 | |
|
Total Returnc | | | 9.28 | % | | | 4.68 | % | | | 10.59 | % | | | (34.55 | %) | | | (33.89 | %) | | | (3.62 | %) |
Ratios/Supplemental Data |
Net assets, end of period (in thousands) | | $ | 1,327 | | | $ | 819 | | | $ | 875 | | | $ | 621 | | | $ | 3,419 | | | $ | 1,990 | |
Ratios to average net assets: |
Net investment income (loss) | | | 0.09 | % | | | (0.28 | %) | | | (1.02 | %) | | | (1.26 | %) | | | (1.03 | %) | | | (1.50 | %) |
Total expensesd | | | 1.77 | % | | | 1.73 | % | | | 1.77 | % | | | 1.75 | % | | | 1.64 | % | | | 1.63 | % |
Net expensese | | | 1.64 | % | | | 1.63 | % | | | 1.65 | % | | | 1.62 | % | | | 1.56 | % | | | 1.53 | % |
Portfolio turnover rate | | | — | | | | 25 | % | | | 208 | % | | | 486 | % | | | 238 | % | | | — | |
SEE NOTES TO FINANCIAL STATEMENTS. | THE GUGGENHEIM FUNDS SEMI-ANNUAL REPORT | 51 |
CONSOLIDATED FINANCIAL HIGHLIGHTS (continued) |
COMMODITIES STRATEGY FUND | |
This table is presented to show selected data for a share outstanding throughout each period and to assist shareholders in evaluating a Fund’s performance for the periods presented.
C-Class | | Period
Ended
June 30,
2018a | | | Year
Ended
Dec. 31,
2017 | | | Year
Ended
Dec. 31,
2016f | | | Year
Ended
Dec. 31,
2015f | | | Year
Ended
Dec. 31,
2014f | | | Year
Ended
Dec. 31,
2013f | |
Per Share Data | | | | | | | | | | | | | | | | | | | | | | | | |
Net asset value, beginning of period | | $ | 79.89 | | | $ | 78.32 | | | $ | 71.38 | | | $ | 109.79 | | | $ | 167.19 | | | $ | 174.69 | |
Income (loss) from investment operations: |
Net investment income (loss)b | | | (.28 | ) | | | (.70 | ) | | | (.11 | ) | | | (1.92 | ) | | | (2.76 | ) | | | (3.84 | ) |
Net gain (loss) on investments (realized and unrealized) | | | 7.35 | | | | 3.59 | | | | 7.05 | | | | (36.49 | ) | | | (54.64 | ) | | | (3.66 | ) |
Total from investment operations | | | 7.07 | | | | 2.89 | | | | 6.94 | | | | (38.41 | ) | | | (57.40 | ) | | | (7.50 | ) |
Less distributions from: |
Net investment income | | | — | | | | (1.32 | ) | | | — | | | | — | | | | — | | | | — | |
Total distributions | | | — | | | | (1.32 | ) | | | — | | | | — | | | | — | | | | — | |
Net asset value, end of period | | $ | 86.96 | | | $ | 79.89 | | | $ | 78.32 | | | $ | 71.38 | | | $ | 109.79 | | | $ | 167.19 | |
|
Total Returnc | | | 8.85 | % | | | 3.80 | % | | | 9.66 | % | | | (34.97 | %) | | | (34.31 | %) | | | (4.33 | %) |
Ratios/Supplemental Data |
Net assets, end of period (in thousands) | | $ | 414 | | | $ | 332 | | | $ | 482 | | | $ | 502 | | | $ | 1,135 | | | $ | 1,947 | |
Ratios to average net assets: |
Net investment income (loss) | | | (0.66 | %) | | | (0.94 | %) | | | (1.48 | %) | | | (1.95 | %) | | | (1.77 | %) | | | (2.25 | %) |
Total expensesd | | | 2.52 | % | | | 2.48 | % | | | 2.51 | % | | | 2.49 | % | | | 2.39 | % | | | 2.39 | % |
Net expensese | | | 2.39 | % | | | 2.36 | % | | | 2.38 | % | | | 2.35 | % | | | 2.32 | % | | | 2.28 | % |
Portfolio turnover rate | | | — | | | | 25 | % | | | 208 | % | | | 486 | % | | | 238 | % | | | — | |
52 | THE GUGGENHEIM FUNDS SEMI-ANNUAL REPORT | SEE NOTES TO FINANCIAL STATEMENTS. |
CONSOLIDATED FINANCIAL HIGHLIGHTS (concluded) |
COMMODITIES STRATEGY FUND |
This table is presented to show selected data for a share outstanding throughout each period and to assist shareholders in evaluating a Fund’s performance for the periods presented.
H-Class | | Period
Ended
June 30,
2018a | | | Year
Ended
Dec. 31,
2017 | | | Year
Ended
Dec. 31,
2016f | | | Year
Ended
Dec. 31,
2015f | | | Year
Ended
Dec. 31,
2014f | | | Year
Ended
Dec. 31,
2013f | |
Per Share Data | | | | | | | | | | | | | | | | | | | | | | | | |
Net asset value, beginning of period | | $ | 88.39 | | | $ | 85.82 | | | $ | 77.69 | | | $ | 118.68 | | | $ | 179.41 | | | $ | 185.95 | |
Income (loss) from investment operations: |
Net investment income (loss)b | | | .04 | | | | (.25 | ) | | | (.07 | ) | | | (1.32 | ) | | | (1.80 | ) | | | (2.76 | ) |
Net gain (loss) on investments (realized and unrealized) | | | 8.18 | | | | 4.14 | | | | 8.20 | | | | (39.67 | ) | | | (58.93 | ) | | | (3.78 | ) |
Total from investment operations | | | 8.22 | | | | 3.89 | | | | 8.13 | | | | (40.99 | ) | | | (60.73 | ) | | | (6.54 | ) |
Less distributions from: |
Net investment income | | | — | | | | (1.32 | ) | | | — | | | | — | | | | — | | | | — | |
Total distributions | | | — | | | | (1.32 | ) | | | — | | | | — | | | | — | | | | — | |
Net asset value, end of period | | $ | 96.61 | | | $ | 88.39 | | | $ | 85.82 | | | $ | 77.69 | | | $ | 118.68 | | | $ | 179.41 | |
|
Total Returnc | | | 9.30 | % | | | 4.65 | % | | | 10.52 | % | | | (34.58 | %) | | | (33.85 | %) | | | (3.55 | %) |
Ratios/Supplemental Data |
Net assets, end of period (in thousands) | | $ | 36,188 | | | $ | 6,002 | | | $ | 7,386 | | | $ | 8,555 | | | $ | 8,160 | | | $ | 12,042 | |
Ratios to average net assets: |
Net investment income (loss) | | | 0.09 | % | | | (0.31 | %) | | | (0.87 | %) | | | (1.33 | %) | | | (1.05 | %) | | | (1.50 | %) |
Total expensesd | | | 1.78 | % | | | 1.74 | % | | | 1.74 | % | | | 1.75 | % | | | 1.65 | % | | | 1.63 | % |
Net expensese | | | 1.66 | % | | | 1.65 | % | | | 1.62 | % | | | 1.63 | % | | | 1.57 | % | | | 1.53 | % |
Portfolio turnover rate | | | — | | | | 25 | % | | | 208 | % | | | 486 | % | | | 238 | % | | | — | |
a | Unaudited figures for the period ended June 30, 2018. Percentage amounts for the period, except total return and portfolio turnover rate, have been annualized. |
b | Net investment income (loss) per share was computed using average shares outstanding throughout the period. |
c | Total return does not reflect the impact of any applicable sales charges and has not been annualized. |
d | Does not include expenses of the underlying funds in which the Fund invests. |
e | Net expense information reflects the expense ratios after expense waivers. |
f | Reverse share split — Per share amounts for the periods presented through December 31, 2016 have been restated to reflect a 1:12 reverse share split effective October 28, 2016. |
SEE NOTES TO FINANCIAL STATEMENTS. | THE GUGGENHEIM FUNDS SEMI-ANNUAL REPORT | 53 |
NOTES TO CONSOLIDATED FINANCIAL STATEMENTS (Unaudited) |
Note 1 – Organization and Significant Accounting Policies
Organization
The Rydex Series Funds (the “Trust”), a Delaware statutory trust, is registered with the SEC under the Investment Company Act of 1940 (“1940 Act”), as an open-ended investment company of the series type. Each series, in effect, is representing a separate Fund. The Trust is authorized to issue an unlimited number of no par value shares. The Trust accounts for the assets of each fund separately.
The Trust offers a combination of seven separate classes of shares: Investor Class shares, A-Class shares, C-Class shares, H-Class shares, P-Class shares, Institutional Class shares and Money Market Class shares. Sales of shares of each Class are made without a front-end sales charge at the net asset value per share (“NAV”), with the exception of A-Class shares. A-Class shares are sold at the NAV, plus the applicable front-end sales charge. The sales charge varies depending on the amount purchased, but will not exceed 4.75%. A-Class share purchases of $1 million or more are exempt from the front-end sales charge but have a 1% contingent deferred sales charge (“CDSC”) if shares are redeemed within 12 months of purchase. C-Class shares have a 1% CDSC if shares are redeemed within 12 months of purchase. Institutional Class shares are offered primarily for direct investment by institutions such as pension and profit sharing plans, endowments, foundations and corporations. Institutional Class shares require a minimum initial investment of $2 million and a minimum account balance of $1 million. At June 30, 2018, the Trust consisted of fifty-three funds.
This report covers the Multi-Hedge Strategies Fund and Commodities Strategy Fund (the “Funds”), each a non-diversified investment company. Only A-Class, C-Class, H-Class, P-Class and Institutional Class shares had been issued by the Funds.
Security Investors, LLC, which operates under the name Guggenheim Investments (“GI”), provides advisory services. Guggenheim Funds Distributors, LLC (“GFD”) acts as principal underwriter for the Trust. GI and GFD are affiliated entities.
Consolidation of Subsidiary
Each of the consolidated financial statements of the Funds includes the accounts of a wholly-owned and controlled Cayman Islands subsidiary (the “Subsidiary”). Significant inter-company accounts and transactions have been eliminated in consolidation for the Funds.
Each Fund may invest up to 25% of its total assets in its Subsidiary which acts as an investment vehicle in order to effect certain investments consistent with the Fund’s investment objectives and policies.
54 | THE GUGGENHEIM FUNDS SEMI-ANNUAL REPORT | |
NOTES TO CONSOLIDATED FINANCIAL STATEMENTS (Unaudited)(continued) |
A summary of each Fund’s investment in its respective Subsidiary is as follows:
Fund | | Inception
Date of
Subsidiary | | | Subsidiary
Net Assets at
June 30, 2018 | | | % of Net Assets
of the Fund at
June 30, 2018 | |
Multi-Hedge Strategies Fund | | | 09/18/09 | | | $ | 1,138,287 | | | | 2.3 | % |
Commodities Strategy Fund | | | 09/08/09 | | | | 6,651,222 | | | | 17.5 | % |
Significant Accounting Policies
The Funds operate as investment companies and, accordingly, follow the investment company accounting and reporting guidance of the Financial Accounting Standards Board (“FASB”) Accounting Standards Codification Topic 946 Financial Services – Investment Companies.
The following significant accounting policies are in conformity with U.S. generally accepted accounting principles (“U.S. GAAP”) and are consistently followed by the Trust. This requires management to make estimates and assumptions that affect the reported amount of assets and liabilities, contingent assets and liabilities at the date of the consolidated financial statements, and the reported amounts of revenues and expenses during the reporting period. Actual results could differ from these estimates. All time references are based on Eastern Time.
The NAV of each Class of a fund is calculated by dividing the market value of the fund’s securities and other assets, less all liabilities, attributable to the Class by the number of outstanding shares of the Class.
(a) Valuation of Investments
The Board of Trustees of the Funds (the “Board”) has adopted policies and procedures for the valuation of the Funds’ investments (the “Valuation Procedures”). Pursuant to the Valuation Procedures, the Board has delegated to a valuation committee, consisting of representatives from Guggenheim’s investment management, fund administration, legal and compliance departments (the “Valuation Committee”), the day-to-day responsibility for implementing the Valuation Procedures, including, under most circumstances, the responsibility for determining the fair value of the Funds’ securities and/or other assets.
Valuations of the Funds’ securities are supplied primarily by pricing services appointed pursuant to the processes set forth in the Valuation Procedures. The Valuation Committee convenes monthly, or more frequently as needed, to review the valuation of all assets which have been fair valued for reasonableness. The Funds’ officers, through the Valuation Committee and consistent with the monitoring and review responsibilities set forth in the Valuation Procedures, regularly review procedures used and valuations provided by the pricing services.
If the pricing service cannot or does not provide a valuation for a particular investment or such valuation is deemed unreliable, such investment is fair valued by the Valuation Committee.
| | THE GUGGENHEIM FUNDS SEMI-ANNUAL REPORT | 55 |
NOTES TO CONSOLIDATED FINANCIAL STATEMENTS (Unaudited)(continued) |
Open-end investment companies (“mutual funds”) are valued at their NAV as of the close of business, on the valuation date. Exchange-traded funds (“ETFs”) and closed-end investment companies (“CEFs”) are valued at the last quoted sales price.
U.S. Government securities are valued by either independent pricing services, the last traded fill price, or at the reported bid price at the close of business.
Repurchase agreements are valued at amortized cost, provided such amounts approximate market value.
Equity securities listed on an exchange (New York Stock Exchange (“NYSE”) or American Stock Exchange) are valued at the last quoted sales price as of the close of business on the NYSE, usually 4:00 p.m. on the valuation date. Equity securities listed on the NASDAQ market system are valued at the NASDAQ Official Closing Price on the valuation date, which may not necessarily represent the last sale price. If there has been no sale on such exchange or NASDAQ on a given day, the security is valued at the closing bid price on that day.
Generally, trading in foreign securities markets is substantially completed each day at various times prior to the close of the NYSE. The values of foreign securities are determined as of the close of such foreign markets or the close of the NYSE, if earlier. All investments quoted in foreign currencies are valued in U.S. dollars on the basis of the foreign currency exchange rates prevailing at the close of business. Investments in foreign securities may involve risks not present in domestic investments. The Valuation Committee will determine the current value of such foreign securities by taking into consideration certain factors which may include those discussed above, as well as the following factors, among others: the value of the securities traded on other foreign markets, ADR trading, closed-end fund trading, foreign currency exchange activity, and the trading prices of financial products that are tied to foreign securities. In addition, the Board has authorized the Valuation Committee and GI to use prices and other information supplied by a third party pricing vendor in valuing foreign securities.
The value of futures contracts is accounted for using the unrealized gain or loss on the contracts that is determined by marking the contracts to their current realized settlement prices. Financial futures contracts are valued at the 4:00 p.m. price on the valuation date. In the event that the exchange for a specific futures contract closes earlier than 4:00 p.m., the futures contract is valued at the Official Settlement Price of the exchange. However, the underlying securities from which the futures contract value is derived are monitored until 4:00 p.m. to determine if fair valuation would provide a more accurate valuation.
The values of OTC swap agreements entered into by a Fund are accounted for using the unrealized gains or losses on the agreements that are determined by marking the agreements to the last quoted value of the index that the swaps pertain to at the close of the NYSE.
56 | THE GUGGENHEIM FUNDS SEMI-ANNUAL REPORT | |
NOTES TO CONSOLIDATED FINANCIAL STATEMENTS (Unaudited)(continued) |
Investments for which market quotations are not readily available are fair-valued as determined in good faith by GI, under the direction of the Board, using methods established or ratified by the Board. Valuations in accordance with these methods are intended to reflect each security’s (or asset’s or liability’s) “fair value”. Each such determination is based on a consideration of all relevant factors, which are likely to vary from one pricing context to another. Examples of such factors may include, but are not limited to market prices; sale prices; broker quotes; and models which derive prices based on inputs such as prices of securities with comparable maturities and characteristics, or based on inputs such as anticipated cash flows or collateral, spread over Treasuries, and other information analysis.
In connection with futures contracts and other derivative investments, such factors may include obtaining information as to how (a) these contracts and other derivative investments trade in the futures or other derivative markets, respectively, and (b) the securities underlying these contracts and other derivative investments trade in the cash market.
(b) U.S. Government and Agency Obligations
Certain U.S. Government and Agency Obligations are traded on a discount basis; the interest rates shown on the Consolidated Schedules of Investments reflect the effective rates paid at the time of purchase by the Funds. Other securities bear interest at the rates shown, payable at fixed dates through maturity.
(c) Short Sales
When a Fund engages in a short sale of a security, an amount equal to the proceeds is reflected as an asset and an equivalent liability. The amount of the liability is subsequently marked-to-market to reflect the market value of the short sale. The Fund maintains a segregated account of cash and/or securities as collateral for short sales.
Fees, if any, paid to brokers to borrow securities in connection with short sales are recorded as interest expense. In addition, the Fund must pay out the dividend rate of the equity or coupon rate of the obligation to the lender and record this as an expense. Short dividend or interest expense is a cost associated with the investment objective of short sales transactions, rather than an operational cost associated with the day-to-day management of any mutual fund. The Fund may also receive rebate income from the broker resulting from the investment of the proceeds from securities sold short.
(d) Futures Contracts
Upon entering into a futures contract, a Fund deposits and maintains as collateral such initial margin as required by the exchange on which the transaction is affected. Pursuant to the contract, the Fund agrees to receive from or pay to the broker an amount of cash equal to the daily fluctuation in value of the contract. Such receipts or payments are known as variation margin and
| | THE GUGGENHEIM FUNDS SEMI-ANNUAL REPORT | 57 |
NOTES TO CONSOLIDATED FINANCIAL STATEMENTS (Unaudited)(continued) |
are recorded by the Fund as unrealized gains or losses. When the contract is closed, the Fund records a realized gain or loss equal to the difference between the value of the contract at the time it was opened and the value at the time it was closed.
(e) Swap Agreements
Swap agreements are marked-to-market daily and the change, if any, is recorded as unrealized gain or loss. Payments received or made as a result of an agreement or termination of an agreement are recognized as realized gains or losses.
(f) Currency Translations
The accounting records of the Funds are maintained in U.S. dollars. All assets and liabilities initially expressed in foreign currencies are converted into U.S. dollars at prevailing exchange rates. Purchases and sales of investment securities, dividend and interest income, and certain expenses are translated at the rates of exchange prevailing on the respective dates of such transactions. Changes in the relationship of these foreign currencies to the U.S. dollar can significantly affect the value of the investments and earnings of the Funds. Foreign investments may also subject the Funds to foreign government exchange restrictions, expropriation, taxation, or other political, social or economic developments, all of which could affect the market and/or credit risk of the investments.
The Funds do not isolate that portion of the results of operations resulting from changes in the foreign exchange rates on investments from the fluctuations arising from changes in the market prices of securities held. Such fluctuations are included with the net realized and unrealized gain or loss on investments.
Reported net realized foreign exchange gains and losses arise from sales of foreign currencies and currency gains or losses realized between the trade and settlement dates on investment transactions. Net unrealized exchange gains and losses arise from changes in the fair values of assets and liabilities other than investments in securities at the fiscal period end, resulting from changes in exchange rates.
(g) Security Transactions
Security transactions are recorded on the trade date for financial reporting purposes. Realized gains and losses from securities transactions are recorded using the identified cost basis. Proceeds from lawsuits related to investment holdings are recorded as realized gains in the respective Fund. Taxable non-cash dividends are recorded as dividend income. Interest income, including amortization of premiums and accretion of discounts, is accrued on a daily basis. Amendment fees are earned as compensation for evaluating and accepting changes to the original loan agreement and are recognized when received. Dividend income from Real Estate Investment Trusts (“REITs”) is recorded based on the income included in the distributions received from the REIT investments using published REIT classifications, including some management estimates when actual amounts are not available. Distributions received in excess of this estimated amount
58 | THE GUGGENHEIM FUNDS SEMI-ANNUAL REPORT | |
NOTES TO CONSOLIDATED FINANCIAL STATEMENTS (Unaudited)(continued) |
are recorded as a reduction of the cost of investments or reclassified to capital gains. The actual amounts of income, return of capital, and capital gains are only determined by each REIT after its fiscal year-end, and may differ from the estimated amounts.
(h) Distributions
Distributions of net investment income and net realized gains, if any, are declared and paid at least annually. Dividends are reinvested in additional shares unless shareholders request payment in cash. Distributions are recorded on the ex-dividend date and are determined in accordance with income tax regulations which may differ from U.S. GAAP.
(i) Class Allocations
Interest and dividend income, most expenses, all realized gains and losses, and all unrealized gains and losses are allocated to the classes based upon the value of the outstanding shares in each Class. Certain costs, such as distribution and service fees are charged directly to specific classes. In addition, certain expenses have been allocated to the individual Funds in the Trust on a pro rata basis upon the respective aggregate net assets of each Fund included in the Trust.
(j) Cash
The Funds may leave cash overnight in their cash account with the custodian. Periodically, a Fund may have cash due to the custodian bank as an overdraft balance. A fee is incurred on this overdraft, calculated by multiplying the overdraft by a rate based on the federal funds rate, which was 1.91% at June 30, 2018.
(k) Indemnifications
Under the Funds’ organizational documents, the Trustees and Officers are indemnified against certain liabilities arising out of the performance of their duties to the Trust. In addition, throughout the normal course of business, the Funds enter into contracts that contain a variety of representations and warranties which provide general indemnifications. The Funds’ maximum exposure under these arrangements is unknown, as this would involve future claims that may be made against the Funds and/or their affiliates that have not yet occurred. However, based on experience, the Funds expect the risk of loss to be remote.
Note 2 – Financial Instruments and Derivatives
As part of their investment strategy, the Funds utilize short sales and a variety of derivative instruments. These investments involve, to varying degrees, elements of market risk and risks in excess of the amounts recognized in the Consolidated Statements of Assets and Liabilities. Valuation and accounting treatment of these instruments can be found under Significant Accounting Policies in Note 1 of these Consolidated Notes to Financial Statements.
| | THE GUGGENHEIM FUNDS SEMI-ANNUAL REPORT | 59 |
NOTES TO CONSOLIDATED FINANCIAL STATEMENTS (Unaudited)(continued) |
Short Sales
A short sale is a transaction in which a Fund sells a security it does not own. If the security sold short decreases in price between the time the Fund sells the security and closes its short position, the Fund will realize a gain on the transaction. Conversely, if the security increases in price during the period, the Fund will realize a loss on the transaction. The risk of such price increases is the principal risk of engaging in short sales.
Derivatives
Derivatives are instruments whose values depend on, or are derived from, in whole or in part, the value of one or more other assets, such as securities, currencies, commodities or indices. Derivative instruments may be used to increase investment flexibility (including to maintain cash reserves while maintaining exposure to certain other assets), for risk management (hedging) purposes, to facilitate trading, to reduce transaction costs and to pursue higher investment returns. Derivative instruments may also be used to mitigate certain investment risks, such as foreign currency exchange rate risk, interest rate risk and credit risk. U.S. GAAP requires disclosures to enable investors to better understand how and why a Fund uses derivative instruments, how these derivative instruments are accounted for and their effects on the Fund’s financial position and results of operations.
The Funds utilized derivatives for the following purposes:
Duration: the use of an instrument to manage the interest rate risk of a portfolio.
Hedge: an investment made in order to reduce the risk of adverse price movements in a security, by taking an offsetting position to protect against broad market moves.
Income: the use of any instrument that distributes cash flows typically based upon some rate of interest.
Index Exposure: the use of an instrument to obtain exposure to a listed or other type of index.
Leverage: gaining total exposure to equities or other assets on the long and short sides at greater than 100% of invested capital.
Liquidity: the ability to buy or sell exposure with little price/market impact.
Speculation: the use of an instrument to express macro-economic and other investment views.
For any Fund whose investment strategy consistently involves applying leverage, the value of the Fund’s shares will tend to increase or decrease more than the value of any increase or decrease in the underlying index or other asset. In addition, because an investment in derivative instruments generally requires a small investment relative to the amount of investment exposure assumed, an opportunity for increased net income is created; but, at the same time, leverage risk will increase. The Fund’s use of leverage, through borrowings or instruments such as derivatives, may cause the Fund to be more volatile and riskier than if they had not been leveraged.
60 | THE GUGGENHEIM FUNDS SEMI-ANNUAL REPORT | |
NOTES TO CONSOLIDATED FINANCIAL STATEMENTS (Unaudited)(continued) |
Futures
A futures contract is an agreement to purchase (long) or sell (short) an agreed amount of securities or other instruments at a set price for delivery at a future date. There are significant risks associated with a Fund’s use of futures contracts, including (i) there may be an imperfect or no correlation between the changes in market value of the underlying asset and the prices of futures contracts; (ii) there may not be a liquid secondary market for a futures contract; (iii) trading restrictions or limitations may be imposed by an exchange; and (iv) government regulations may restrict trading in futures contracts. When investing in futures, there is minimal counterparty credit risk to a Fund because futures are exchange-traded and the exchange’s clearinghouse, as counterparty to all exchange-traded futures, guarantees against default. Cash deposits are shown as segregated cash with broker on the Consolidated Statements of Assets and Liabilities; securities held as collateral are noted on the Consolidated Schedules of Investments.
The following table represents the Funds’ use and volume of futures on a quarterly basis, for the period ended June 30, 2018:
| | | | Average Notional Amount | |
Fund | Use | | Long | | | Short | |
Multi-Hedge Strategies Fund | Duration, Hedge, Index exposure, Leverage, Liquidity, Speculation, Income | | $ | 36,826,053 | | | $ | 41,924,292 | |
Commodities Strategy Fund | Index exposure, Liquidity | | | 24,942,488 | | | | — | |
Swaps
A swap is an agreement that obligates two parties to exchange a series of cash flows at specified intervals based upon or calculated by reference to changes in specified prices or rates for a specified amount of an underlying asset. A Fund utilizing OTC swaps bears the risk of loss of the amount expected to be received under a swap agreement in the event of the default or bankruptcy of a swap agreement counterparty or if the underlying asset declines in value. Certain standardized swaps are subject to mandatory central clearing and are executed on a multi-lateral of other trade facility platform, such as a registered exchange. There is limited counterparty credit risk with respect to centrally-cleared swaps as the transaction is facilitated through a central clearinghouse, much like an exchange-traded futures contract. Upon entering into certain centrally-cleared swap transactions, a Fund is required to deposit with its clearing broker an amount of cash or securities as an initial margin. Subsequent variation margin payments or receipts are made or received by the Fund, depending on fluctuations in the fair value of the reference entity. The exchange bears the risk of loss for interest rate swaps.
Total return swaps and custom basket swaps involve commitments where single or multiple cash flows are exchanged based on the price of an underlying reference asset (such as index or basket) or a fixed or variable interest rate. Index swaps will usually be computed based on the current index value as of the close of regular trading on the NYSE or other exchange, with the swap value being adjusted to include dividends accrued, financing charges and/or interest associated with
| | THE GUGGENHEIM FUNDS SEMI-ANNUAL REPORT | 61 |
NOTES TO CONSOLIDATED FINANCIAL STATEMENTS (Unaudited)(continued) |
the swap agreement. A fund utilizing a total return index swap bears the risk of loss of the amount expected to be received under a swap agreement in the event of the default or bankruptcy of a swap agreement counterparty or if the underlying index declines in value.
The following table represents the Funds’ use and volume of total return swaps on a quarterly basis.
| | | | Average Notional Amount | |
Fund | Use | | Long | | | Short | |
Multi-Hedge Strategies Fund | Hedge, Index Exposure, Leverage, Liquidity, Speculation | | $ | 47,544,706 | | | $ | 41,493,716 | |
Derivative Investment Holdings Categorized by Risk Exposure
The following is a summary of the location of derivative investments on the Funds’ Consolidated Statements of Assets and Liabilities as of June 30, 2018:
Derivative Investment Type | Asset Derivatives | Liability Derivatives |
Equity/Currency/Interest Rate/Commodity contracts | Variation margin | Variation margin |
Equity contracts | Unrealized appreciation on swap agreements | Unrealized depreciation on swap agreements |
The following table sets forth the fair value of the Funds’ derivative investments categorized by primary risk exposure at June 30, 2018:
Asset Derivative Investments Value |
Fund | | Futures
Equity
Risk* | | | Swaps
Equity
Risk* | | | Futures
Currency
Risk* | | | Futures
Interest Rate
Risk* | | | Futures
Commodity
Risk* | | | Total Value at
June 30,
2018 | |
Multi-Hedge Strategies Fund | | $ | 176,232 | | | $ | 994,852 | | | $ | 95,474 | | | $ | 177,932 | | | $ | 257,384 | | | $ | 1,701,874 | |
Commodities Strategy Fund | | | — | | | | — | | | | — | | | | — | | | | 1,145,746 | | | | 1,145,746 | |
Liability Derivative Investments Value |
Fund | | Futures
Equity
Risk* | | | Swaps
Equity
Risk* | | | Futures
Currency
Risk* | | | Futures
Interest Rate
Risk* | | | Futures
Commodity
Risk* | | | Total Value at
June 30,
2018 | |
Multi-Hedge Strategies Fund | | $ | 50,658 | | | $ | 1,259,004 | | | $ | 12,624 | | | $ | 10,387 | | | $ | 84,519 | | | $ | 1,417,192 | |
* | Includes cumulative appreciation (depreciation) of futures contracts as reported on the Consolidated Schedules of Investments. Only current day’s variation margin is reported within the Consolidated Statements of Assets and Liabilities. |
62 | THE GUGGENHEIM FUNDS SEMI-ANNUAL REPORT | |
NOTES TO CONSOLIDATED FINANCIAL STATEMENTS (Unaudited)(continued) |
The following is a summary of the location of derivative investments on the Funds’ Consolidated Statements of Operations for the period ended June 30, 2018:
Derivative Investment Type | Location of Gain (Loss) on Derivatives |
Equity/Currency/Interest Rate/Commodity contracts | Net realized gain (loss) on futures contracts |
| Net change in unrealized appreciation (depreciation) on futures contracts |
Equity contacts | Net realized gain (loss) on swap agreements |
| Net change in unrealized appreciation (depreciation) on swap agreements |
The following is a summary of the Funds’ realized gain (loss) and change in unrealized appreciation (depreciation) on derivative investments recognized on the Consolidated Statements of Operations categorized by primary risk exposure for the period ended June 30, 2018:
Realized Gain (Loss) on Derivative Investments Recognized on the Consolidated Statements of Operations |
Fund | | Futures
Equity
Risk | | | Swaps
Equity
Risk | | | Futures
Currency
Risk | | | Futures
Interest
Rate
Risk | | | Futures
Commodity
Risk | | | Total at
June 30,
2018 | |
Multi-Hedge Strategies Fund | | $ | 583,814 | | | $ | (1,591,610 | ) | | $ | 59,176 | | | $ | 555,519 | | | $ | (139,397 | ) | | $ | 532,498 | |
Commodities Strategy Fund | | | — | | | | — | | | | — | | | | — | | | | 684,357 | | | | 684,357 | |
Change in Unrealized Appreciation (Depreciation) on Derivative Investments
Recognized on the Consolidated Statements of Operations |
Fund | | Futures
Equity
Risk | | | Swaps
Equity
Risk | | | Futures
Currency
Risk | | | Futures
Interest
Rate
Risk | | | Futures
Commodity
Risk | | | Total at
June 30,
2018 | |
Multi-Hedge Strategies Fund | | $ | (2,050,177 | ) | | $ | — | | | $ | 35,651 | | | $ | 186,826 | | | $ | (50,527 | ) | | $ | (1,878,227 | ) |
Commodities Strategy Fund | | | — | | | | — | | | | — | | | | — | | | | 772,610 | | | | 772,610 | |
In conjunction with the use of short sales and derivative instruments, the Funds are required to maintain collateral in various forms. The Funds use, where appropriate, depending on the financial instrument utilized and the broker involved, margin deposits at the broker, cash and/or securities segregated at the custodian bank, discount notes or repurchase agreements allocated to the Funds.
| | THE GUGGENHEIM FUNDS SEMI-ANNUAL REPORT | 63 |
NOTES TO CONSOLIDATED FINANCIAL STATEMENTS (Unaudited)(continued) |
The Trust has established counterparty credit guidelines and enters into transactions only with financial institutions of investment grade or better. The Trust monitors the counterparty credit risk.
Note 3 – Offsetting
In the normal course of business, the Funds enter into transactions subject to enforceable master netting arrangements or other similar arrangements. Generally, the right to offset in those agreements allows the Funds to counteract the exposure to a specific counterparty with collateral received from or delivered to that counterparty based on the terms of the arrangements. These arrangements provide for the right to liquidate upon the occurrence of an event of default, credit event upon merger or additional termination event.
In order to better define their contractual rights and to secure rights that will help the Funds mitigate their counterparty risk, the Funds may enter into an International Swaps and Derivatives Association, Inc. Master Agreement (“ISDA Master Agreement”) or similar agreement with their derivative contract counterparties. An ISDA Master Agreement is a bilateral agreement between a fund and a counterparty that governs OTC derivatives, including foreign exchange contracts, and typically contains, among other things, collateral posting terms and netting provisions in the event of a default and/or termination event. The provisions of the ISDA Master Agreement typically permit a single net payment in the event of a default (close-out netting) or similar event, including the bankruptcy or insolvency of the counterparty.
For derivatives traded under an ISDA Master Agreement, the collateral requirements are typically calculated by netting the mark-to-market amount for each transaction under such agreement and comparing that amount to the value of any collateral currently pledged by the Funds and the counterparty. For financial reporting purposes, cash collateral that has been pledged to cover obligations of the Funds and cash collateral received from the counterparty, if any, are reported separately on the Consolidated Statements of Assets and Liabilities as segregated cash with broker/receivable for variation margin, or payable for swap settlement/variation margin. Cash and/or securities pledged or received as collateral by the Funds in connection with an OTC derivative subject to an ISDA Master Agreement generally may not be invested, sold or rehypothecated by the counterparty or the Funds, as applicable, absent an event of default under such agreement, in which case such collateral generally may be applied towards obligations due to and payable by such counterparty or the Funds, as applicable. Generally, the amount of collateral due from or to a counterparty must exceed a minimum transfer amount threshold (e.g., $300,000) before a transfer is required to be made. To the extent amounts due to the Funds from their counterparties are not fully collateralized, contractually or otherwise, the Funds bear the risk of loss from counterparty nonperformance. The Funds attempt to mitigate counterparty risk by only entering into agreements with counterparties that they believe to be of good standing and by monitoring the financial stability of those counterparties.
For financial reporting purposes, the Funds do not offset derivative assets and derivative liabilities that are subject to netting arrangements in the Consolidated Statements of Assets and Liabilities.
64 | THE GUGGENHEIM FUNDS SEMI-ANNUAL REPORT | |
NOTES TO CONSOLIDATED FINANCIAL STATEMENTS (Unaudited)(continued) |
The following tables present derivative financial instruments and secured financing transactions that are subject to enforceable netting arrangements and offset in the Consolidated Statements of Assets and Liabilities in conformity with U.S. GAAP:
| | | | Gross | | | Gross
Amounts
Offset In the
Consolidated | | | Net Amount
of Assets
Presented
on the
Consolidated | | | Gross Amounts Not Offset
in the Consolidated
Statements of
Assets and Liabilities | | | | | |
Fund | Instrument | | Amounts of
Recognized
Assets1 | | | Statements
of Assets and
Liabilities | | | Statements
of Assets and
Liabilities | | | Financial
Instruments | | | Cash
Collateral
Received | | | Net
Amount | |
Multi-Hedge Strategies Fund | Equity
Swap
Agreements | | $ | 994,852 | | | $ | — | | | $ | 994,852 | | | $ | (994,852 | ) | | $ | — | | | $ | — | |
| | | | Gross | | | Gross
Amounts
Offset In the
Consolidated | | | Net Amount
of Liabilities
Presented
on the
Consolidated | | | Gross Amounts Not Offset
in the Consolidated
Statements of
Assets and Liabilities | | | | | |
Fund | Instrument | | Amounts of
Recognized
Liabilities1 | | | Statements
of Assets and
Liabilities | | | Statements
of Assets and
Liabilities | | | Financial
Instruments | | | Cash
Collateral
Pledged | | | Net
Amount | |
Multi-Hedge Strategies Fund | Equity
Swap
Agreements | | $ | 1,259,004 | | | $ | — | | | $ | 1,259,004 | | | $ | (994,852 | ) | | $ | — | | | $ | 264,152 | |
1 | Exchange-traded futures are excluded from these reported amounts. |
The following table presents deposits held by others in connection with derivative investments as of June 30, 2018. The derivatives tables following the Consolidated Schedules of Investments list each counterparty for which cash collateral may have been pledged or received at period end. The Funds have the right to offset these deposits against any related liabilities outstanding with each counterparty.
Fund | Counterparty | Asset Type | | Cash
Pledged | | | Cash
Received | |
Multi-Hedge Strategies Fund | Goldman Sachs Group | Futures contracts | | $ | 81,507 | | | $ | — | |
Multi-Hedge Strategies Fund Total | | | | | 81,507 | | | | — | |
Commodities Strategy Fund | Goldman Sachs Group | Futures contracts | | | 16,444 | | | | — | |
Commodities Strategy Fund Total | | | | | 16,444 | | | | — | |
| | THE GUGGENHEIM FUNDS SEMI-ANNUAL REPORT | 65 |
NOTES TO CONSOLIDATED FINANCIAL STATEMENTS (Unaudited)(continued) |
Note 4 – Fair Value Measurement
In accordance with U.S. GAAP, fair value is defined as the price that the Funds would receive to sell an investment or pay to transfer a liability in an orderly transaction with an independent buyer in the principal market, or in the absence of a principal market, the most advantageous market for the investment or liability. U.S. GAAP establishes a three-tier fair value hierarchy based on the types of inputs used to value assets and liabilities and requires corresponding disclosure. The hierarchy and the corresponding inputs are summarized below:
| Level 1 | — | quoted prices in active markets for identical assets or liabilities. |
| Level 2 | — | significant other observable inputs (for example quoted prices for securities that are similar based on characteristics such as interest rates, prepayment speeds, credit risk, etc.). |
| Level 3 | — | significant unobservable inputs based on the best information available under the circumstances, to the extent observable inputs are not available, which may include assumptions. |
The types of inputs available depend on a variety of factors, such as the type of security and the characteristics of the markets in which it trades, if any. Fair valuation determinations that rely on fewer or no observable inputs require greater judgment. Accordingly, fair value determinations for Level 3 securities require the greatest amount of judgment.
The inputs or methodologies used for valuing securities are not necessarily an indication of the risk associated with investing in those securities. The suitability of the techniques and sources employed to determine fair valuation are regularly monitored and subject to change.
Note 5 – Investment Advisory Agreement and Other Agreements
Under the terms of an investment advisory contract, the Funds pay GI investment advisory fees calculated at the annualized rates below, based on the average daily net assets of the Funds:
Fund | Management Fees
(as a % of Net Assets) |
Multi-Hedge Strategies Fund | 1.15% |
Commodities Strategy Fund | 0.75% |
66 | THE GUGGENHEIM FUNDS SEMI-ANNUAL REPORT | |
NOTES TO CONSOLIDATED FINANCIAL STATEMENTS (Unaudited)(continued) |
Effective June 1, 2018, when the aggregate assets of the Funds (except for the Event Driven and Distressed Strategies Fund, Long Short Equity Fund, Managed Futures Strategy Fund, and Multi-Hedge Strategies Fund, as applicable to the Funds included in each Prospectus) and the Rydex Dynamic Funds series equal or exceed $10 billion, the advisory fee rate paid by each individual Fund (except for the Event Driven and Distressed Strategies Fund, Long Short Equity Fund, Managed Futures Strategy Fund, and Multi-Hedge Strategies Fund, as applicable to the Funds included in each Prospectus) will be reduced in accordance with the asset level and breakpoint schedule set forth below.
Fund Assets Under Management | Fund Asset-Based
Breakpoint Reductions |
$500 million - $1 billion | 0.025% |
$1 billion - $2 billion | 0.05% |
$2 billion | 0.075% |
GI has contractually agreed to waive the management fee it receives from each Subsidiary in an amount equal to the management fee paid to GI by the Subsidiary. This undertaking will continue in effect for so long as the Funds invest in the Subsidiaries, and may not be terminated by GI unless GI obtains the prior approval of the Funds’ Board of Trustees for such termination. For the period ended June 30, 2018, Multi-Hedge Strategies Fund and Commodities Strategy Fund waived $6,717 and $13,741 respectively, related to investments in the Subsidiary.
As part of its agreement with the Trust, GI will pay all expenses of the Multi-Hedge Strategies Fund, including the cost of transfer agency, custody, fund administration, legal, audit and other services, except interest expense, taxes (expected to be de minimis), brokerage commissions and other expenses connected with execution of portfolio transactions, short dividend expenses, subsidiary expenses and extraordinary expenses.
GI engages external service providers to perform other necessary services for the Trust, such as audit and accounting related services, legal services, custody, printing and mailing, etc., on a pass-through basis. Such expenses are allocated to various Funds within the complex based on relative net assets.
The Trust has adopted a Distribution Plan applicable to A-Class shares, P-Class Shares and H-Class shares for which GFD and other firms that provide distribution and/or shareholder services (“Service Providers”) may receive compensation. If a Service Provider provides distribution services, the Funds will pay distribution fees to GFD at an annual rate not to exceed 0.25% of average daily net assets, pursuant to Rule 12b-1 of the 1940 Act. GFD, in turn, will pay the Service Provider out of its fees. GFD may, at its discretion, retain a portion of such payments to compensate itself for distribution services.
The Trust has adopted a separate Distribution and Shareholder Services Plan applicable to its C-Class shares that allows the Funds to pay annual distribution and service fees of 1.00% of the Funds’ C-Class shares average daily net assets. The annual 0.25% service fee compensates
| | THE GUGGENHEIM FUNDS SEMI-ANNUAL REPORT | 67 |
NOTES TO CONSOLIDATED FINANCIAL STATEMENTS (Unaudited)(continued) |
a shareholder’s financial adviser for providing ongoing services to the shareholder. The annual distribution fee of 0.75% reimburses GFD for paying the shareholder’s financial adviser an ongoing sales commission. GFD advances the first year’s service and distribution fees to the financial adviser. GFD retains the service and distribution fees on accounts with no authorized dealer of record.
For the period ended June 30, 2018, GFD retained sales charges of $74,349 relating to sales of A-Class shares of the Trust.
If a Fund invests in an affiliated fund, the investing Fund’s adviser has agreed to waive fees at the investing fund level. Fee waivers will be calculated at the investing Fund level without regard to any expense cap, if any, in effect for the investing Fund. Fees waived under this arrangement are not subject to reimbursement to GI. For the periodended June 30, 2018, the following Funds waived $98 related to investments in affiliated funds.
Certain officers of the Trust are also officers of GI and GFD. The Trust does not compensate its officers or trustees who are officers, directors, and/or employees of GI and GDF.
MUFG Investor Services (US), LLC (“MUIS”) acts as the Fund’s administrator, transfer agent and accounting agent. As administrator, transfer agent and accounting agent, MUIS is responsible for maintaining the books and records of the Trust’s securities and cash. The U.S Bank, N.A. (“U.S. Bank”) acts as the Funds’ custodian. As custodian, U.S. Bank is responsible for the custody of the Funds’ assets. As securities lending agent, U.S. Bank is responsible for executing the lending of portfolio securities to creditworthy borrowers. For providing the aforementioned services, MUIS and U.S. Bank are entitled to receive a monthly fee equal to an annual percentage of each Fund’s average daily net assets and out of pocket expenses.
Note 6 – Repurchase Agreements
The Funds transfer uninvested cash balances into a single joint account, the daily aggregate balance of which is invested in one or more repurchase agreements collateralized by obligations of the U.S. Treasury and U.S. government agencies. The joint account includes other Funds in the Guggenheim complex not covered in this report. The collateral is in the possession of the Funds’ custodian and is evaluated to ensure that its market value exceeds, at a minimum, 102% of the original face amount of the repurchase agreements. Each Fund holds a pro rata share of the collateral based on the dollar amount of the repurchase agreement entered into by each Fund.
68 | THE GUGGENHEIM FUNDS SEMI-ANNUAL REPORT | |
NOTES TO CONSOLIDATED FINANCIAL STATEMENTS (Unaudited)(continued) |
At June 30, 2018, the repurchase agreements in the joint account were as follows:
Counterparty and
Terms of Agreement | | Face
Value | | | Repurchase
Price | | | Collateral | | Par
Value | | | Fair
Value | |
JPMorgan Chase & Co. | | | | | | | | | | U.S. Treasury Notes | | | | | | | | |
2.10% | | | | | | | | | | 1.88% - 2.38% | | | | | | | | |
Due 07/02/18 | | $ | 209,070,256 | | | | 209,106,843 | | | 08/31/22 - 08/15/25 | | $ | 131,797,800 | | | $ | 128,085,441 | |
| | | | | | | | | | | U.S. Treasury Bonds | | | | | | | | |
| | | | | | | | | | | 2.50% - 2.38% | | | | | | | | |
| | | | | | | | | | | 02/15/45 - 05/15/47 | | | 85,113,600 | | | | 85,181,130 | |
| | | | | | | | | | | | | | | | | $ | 213,266,571 | |
| | | | | | | | | | | | | | | | | | | |
Barclays Capital | | | | | | | | | | U.S. TIP Notes | | | | | | | | |
2.07% | | | | | | | | | | 0.39% - 1.00% | | | | | | | | |
Due 07/02/18 | | | 102,663,372 | | | | 102,681,081 | | | 07/15/23 - 02/15/48 | | $ | 104,507,998 | | | $ | 104,281,274 | |
| | | | | | | | | | | U.S. Treasury Note | | | | | | | | |
| | | | | | | | | | | 1.88% | | | | | | | | |
| | | | | | | | | | | 03/31/22 | | | 462,300 | | | | 451,164 | |
| | | | | | | | | | | | | | | | | $ | 104,732,438 | |
| | | | | | | | | | | | | | | | | | | |
Bank of America Merrill Lynch | | | | | | | | | | U.S. TIP Notes | | | | | | | | |
2.08% | | | | | | | | | | 0.63% | | | | | | | | |
Due 07/02/18 | | | 68,442,248 | | | | 68,454,111 | | | 04/15/23 | | $ | 49,893,303 | | | $ | 49,865,753 | |
| | | | | | | | | | | U.S. Treasury Note | | | | | | | | |
| | | | | | | | | | | 2.63% | | | | | | | | |
| | | | | | | | | | | 06/15/21 | | | 19,923,800 | | | | 19,954,579 | |
| | | | | | | | | | | | | | | | | $ | 69,820,332 | |
In the event of counterparty default, the Funds have the right to collect the collateral to offset losses incurred. There is potential loss to the Funds in the event the Funds are delayed or prevented from exercising their rights to dispose of the collateral securities, including the risk of a possible decline in the value of the underlying securities during the period while the Funds seek to assert their rights. The Funds’ investment adviser, acting under the supervision of the Board, reviews the value of the collateral and the creditworthiness of those banks and dealers with which the Funds enter into repurchase agreements to evaluate potential risks.
Note 7 – Portfolio Securities Loaned
The Funds may lend their securities to approved brokers to earn additional income. Security lending income shown on the Consolidated Statements of Operations is shown net of rebates paid to the borrowers and earnings on cash collateral investments shared with the lending agent. Within this arrangement, the Funds act as the lender, U.S. Bank acts as the lending agent, and other approved registered broker dealers act as the borrowers. The Funds receive cash collateral, valued at 102% of the value of the securities on loan. Under the terms of the Funds’ securities lending agreement with U.S. Bank, cash collateral and proceeds are invested in the First American Government Obligations Fund - Class Z. The Funds bear the risk of loss on cash collateral
| | THE GUGGENHEIM FUNDS SEMI-ANNUAL REPORT | 69 |
NOTES TO CONSOLIDATED FINANCIAL STATEMENTS (Unaudited)(continued) |
investments. Collateral is maintained over the life of the loan in an amount not less than the value of loaned securities, as determined at the close of fund business each day; any additional collateral required due to changes in security values is delivered to the Funds the next business day. Although the collateral mitigates the risk, the Funds could experience a delay in recovering their securities and a possible loss of income or value if the borrower fails to return the securities. The Funds have the right under the securities lending agreement to recover the securities from the borrower on demand. Securities lending transactions are accounted for as secured borrowings. The remaining contractual maturity of the securities lending agreement is overnight and continuous.
At June 30, 2018, the Funds participated in securities lending transactions, which are subject to enforceable netting arrangements, as follows:
| | | Gross Amounts Not Offset in the Consolidated
Statements of Assets and Liabilities | | | | Securities Lending Collateral | |
Fund | | Value of
Securities
Loaned | | | Collateral
Received(a) | | | Net
Amount | | | | Cash
Collateral
Invested | | | Cash
Collateral
Uninvested | | | Total
Collateral | |
Multi-Hedge Strategies Fund | | $ | 225,468 | | | $ | (225,468 | ) | | $ | — | | | | $ | 234,935 | | | $ | — | | | $ | 234,935 | |
(a) | Actual collateral received by the Fund is greater than the amount shown due to overcollateralization. |
In the event of counterparty default, the Funds have the right to collect the collateral to offset losses incurred. There is potential loss to the Funds in the event the Funds are delayed or prevented from exercising their rights to dispose of the collateral securities, including the risk of a possible decline in the value of the underlying securities during the period while the Funds seek to assert their rights. GI, acting under the supervision of the Board, reviews the value of the collateral and the creditworthiness of those banks and dealers to evaluate potential risks.
Note 8 – Federal Income Tax Information
The Funds intend to comply with the provisions of Subchapter M of the Internal Revenue Code applicable to regulated investment companies and will distribute substantially all taxable net investment income and capital gains sufficient to relieve the Funds from all, or substantially all, federal income, excise and state income taxes. Therefore, no provision for federal or state income tax or federal excise tax is required.
Tax positions taken or expected to be taken in the course of preparing the Funds’ tax returns are evaluated to determine whether the tax positions are “more-likely-than-not” of being sustained by the applicable tax authority. Tax positions not deemed to meet the more-likely-than-not threshold would be recorded as a tax benefit or expense in the current year. Management has analyzed the Funds’ tax positions taken, or to be taken, on federal income tax returns for all open tax years, and
70 | THE GUGGENHEIM FUNDS SEMI-ANNUAL REPORT | |
NOTES TO CONSOLIDATED FINANCIAL STATEMENTS (Unaudited)(continued) |
has concluded that no provision for income tax is required in the Funds’ financial statements. The Funds’ federal tax returns are subject to examination by the Internal Revenue Service for a period of three years after they are filed.
The Funds intend to invest up to 25% of their assets in the Subsidiary which is expected to provide the Funds with exposure to the commodities markets within the limitations of the federal tax requirements under Subchapter M of the Internal Revenue Code. The Funds have received a private letter ruling from the IRS that concludes that the income the Funds receive from the Subsidiary will constitute qualifying income for purposes of Subchapter M of the Internal Revenue Code. The Subsidiary will be classified as a corporation for U.S. federal income tax purposes. A foreign corporation, such as the Subsidiary, will generally not be subject to U.S. federal income taxation unless it is deemed to be engaged in a U.S. trade or business.
At June 30, 2018, the cost of securities for federal income tax purposes, the aggregate gross unrealized gain for all securities for which there was an excess of value over tax cost, and the aggregate gross unrealized loss for all securities for which there was an excess of tax cost over value were as follows:
Fund | | Tax
Cost | | | Tax
Unrealized
Gain | | | Tax
Unrealized
Loss | | | Net
Unrealized
Gain | |
Commodities Strategy Fund | | $ | 38,301,460 | | | $ | 296,448 | | | $ | — | | | $ | 296,448 | |
Multi-Hedge Strategies Fund | | | 35,297,492 | | | | 2,605,628 | | | | (2,111,517 | ) | | | 494,111 | |
Note 9 – Securities Transactions
For the period ended June 30, 2018, the cost of purchases and proceeds from sales of investment securities, excluding government securities, short-term investments and derivatives, were as follows:
Fund | | Purchases | | | Sales | |
Multi-Hedge Strategies Fund | | $ | 39,382,364 | | | $ | 48,211,814 | |
Commodities Strategy Fund | | | 2,300,000 | | | | — | |
The Funds are permitted to purchase or sell securities from or to certain affiliated funds under specified conditions outlined in procedures adopted by the Board of the Trust. The procedures have been designed to ensure that any purchase or sale of securities by a Fund from or to another fund or portfolio that is or could be considered an affiliate by virtue of having a common investment adviser (or affiliated investment advisers), common Trustees and/or common officers complies with Rule 17a-7 of the 1940 Act. Further, as defined under these procedures, each transaction is effected at the current market price to save costs, where permissible. For the period ended June 30, 2018, the Funds did not engage in purchases and sales of securities, pursuant to Rule 17a-7 of the 1940 Act.
| | THE GUGGENHEIM FUNDS SEMI-ANNUAL REPORT | 71 |
NOTES TO CONSOLIDATED FINANCIAL STATEMENTS (Unaudited)(continued) |
Note 10 – Line of Credit
The Trust, along with other affiliated trusts, secured an uncommitted $75,000,000 line of credit from U.S. Bank, N.A., which expires June 9, 2019. This line of credit is reserved for emergency or temporary purposes. Borrowings, if any, under this arrangement bear interest equal to the Prime Rate, minus 2%, which shall be paid monthly, averaging 2.66% for the period ended June 30, 2018. The Funds did not have any borrowings outstanding under this agreement at June 30, 2018.
The average daily balances borrowed for the period ended June 30, 2018, were as follows:
Fund | | Average Daily Balance | |
Multi-Hedge Strategies Fund | | $ | 3,030 | |
Note 11 – Subsequent Event
Effective August 10, 2018, Class C shares of each Fund will automatically convert to Class A shares of the same Fund on or about the 10th day of the month following the 10-year anniversary date of the purchase of the Class C shares. This conversion will be executed without any sales charge, fee or other charge. After the conversion is completed, the shares will be subject to all features and expenses of Class A shares.
Note 12 – Legal Proceedings
Tribune Company
Rydex Series Funds has been named as a defendant and a putative member of the proposed defendant class of shareholders in the case entitled Kirschner v. FitzSimons, No. 12-2652 (S.D.N.Y.) (formerly Official Committee of Unsecured Creditors of Tribune Co. v. FitzSimons, Adv. Pro. No. 10-54010 (Bankr. D. Del.)) (the “FitzSimons action”), as a result of ownership by certain series of the Rydex Series Funds of shares in the Tribune Company (“Tribune”) in 2007, when Tribune effected a leveraged buyout transaction (“LBO”) by which Tribune converted to a privately-held company. In his complaint, the plaintiff has alleged that, in connection with the LBO, Tribune insiders and shareholders were overpaid for their Tribune stock using financing that the insiders knew would, and ultimately did, leave Tribune insolvent. The plaintiff has asserted claims against certain insiders, major shareholders, professional advisers, and others involved in the LBO. The plaintiff is also attempting to obtain from former Tribune shareholders, including the Rydex Series Funds, the proceeds they received in connection with the LBO.
In June 2011, a group of Tribune creditors filed multiple actions against former Tribune shareholders involving state law constructive fraudulent conveyance claims arising out of the 2007 LBO (the “SLCFC actions”). Rydex Series Funds has been named as a defendant in one or more of these suits. In those actions, the creditors seek to recover from Tribune’s former shareholders the proceeds received in connection with the 2007 LBO.
72 | THE GUGGENHEIM FUNDS SEMI-ANNUAL REPORT | |
NOTES TO CONSOLIDATED FINANCIAL STATEMENTS (Unaudited)(continued) |
The FitzSimons action and the SLCFC actions have been consolidated with the majority of the other Tribune LBO-related lawsuits in a multidistrict litigation proceeding captioned In re Tribune Company Fraudulent Conveyance Litig., No. 11-md-2696 (S.D.N.Y.) (the “MDL Proceeding”).
On September 23, 2013, the District Court granted the defendants’ omnibus motion to dismiss the SLCFC actions, on the basis that the creditors lacked standing. On September 30, 2013, the creditors filed a notice of appeal of the September 23 order. On October 28, 2013, the defendants filed a joint notice of cross-appeal of that same order.
On March 29, 2016, the U.S. Court of Appeals for the Second Circuit issued its opinion on the appeal of the SLCFC actions. The appeals court affirmed the district court’s dismissal of those lawsuits, but on different grounds than the district court. The appeals court held that while the plaintiffs have standing under the U.S. Bankruptcy Code, their claims were preempted by Section 546(e) of the Bankruptcy Code—the statutory safe harbor for settlement payments. On April 12, 2016, the Plaintiffs in the SLCFC actions filed a petition seeking rehearing en banc before the appeals court. On July 22, 2016, the appeals court denied the petition. On September 9, 2016, the plaintiffs filed a petition for writ of certiorari in the U.S. Supreme Court challenging the Second Circuit’s decision that the safe harbor of Section 546(e) applied to their claims. The shareholder defendants, including the Funds, filed a joint brief in opposition to the petition for certiorari on October 24, 2016. On April 3, 2018, Justice Kennedy and Justice Thomas issued a “Statement” related to the petition for certiorari suggesting that the Second Circuit and/or District Court may want to take steps to reexamine the application of the Section 546(e) safe harbor to the previously dismissed state law constructive fraudulent transfer claims based on the Supreme Court’s decision in Merit Management Group LP v. FTI Consulting, Inc. On April 10, 2018, Plaintiffs filed in the Second Circuit a motion for that court to recall its mandate, vacate its prior decision, and remand to the district court for further proceedings consistent with Merit Management. On April 20, 2018, the shareholder defendants filed an opposition to Plaintiffs’ motion to recall the mandate. On May 15, 2018, the Second Circuit issued an order recalling the mandate “in anticipation of further panel review.”
On May 23, 2014, the defendants filed motions to dismiss the FitzSimons action, including a global motion to dismiss Count I, which is the claim brought against former Tribune shareholders for intentional fraudulent conveyance under U.S. federal law. On January 6, 2017, the United States District Court for the Southern District of New York granted the shareholder defendants’ motion to dismiss the intentional fraudulent conveyance claim in the FitzSimons action. In dismissing the intentional fraudulent conveyance claim, the Court denied the plaintiff’s request to amend the complaint. The plaintiff requested that the Court direct entry of a final judgment in order to make the order immediately appealable. On February 23, 2017, the Court issued an order stating that it intends to permit an interlocutory appeal of the dismissal order, but will wait to do so until it has resolved outstanding motions to dismiss filed by other defendants. Accordingly, the timing of the appeal is uncertain.
| | THE GUGGENHEIM FUNDS SEMI-ANNUAL REPORT | 73 |
NOTES TO CONSOLIDATED FINANCIAL STATEMENTS (Unaudited)(concluded) |
On July 18, 2017, the plaintiff submitted a letter to the District Court seeking leave to amend its complaint to add a constructive fraudulent transfer claim. The shareholder defendants opposed that request. On August 24, 2017, the Court denied the plaintiff’s request without prejudice to renewal of the request in the event of an intervening change in the law. On March 8, 2018, the plaintiff renewed his request for leave to file a motion to amend the complaint to assert a constructive fraudulent transfer claim based on the Supreme Court’s ruling in Merit Management Group LP v. FTI Consulting, Inc. The shareholder defendants opposed that request. On June 18, 2018 the District Court ordered that the request would be stayed pending further action by the Second Circuit in the SLCFC actions.
None of these lawsuits alleges any wrongdoing on the part of Rydex Series Funds. The following series of Rydex Series Funds held shares of Tribune and tendered these shares as part of Tribune’s LBO: Nova Fund, S&P 500® Pure Value Fund, Multi-Cap Core Equity Fund, S&P 500® Fund, Multi-Hedge Strategies Fund and Hedged Equity Fund (the “Funds”). The value of the proceeds received by the foregoing Funds was $28,220, $109,242, $9,860, $3,400, $1,181,160, and $10,880, respectively. At this stage of the proceedings, Rydex Series Funds is not able to make a reliable predication as to the outcome of these lawsuits or the effect, if any, on a Fund’s net asset value.
74 | THE GUGGENHEIM FUNDS SEMI-ANNUAL REPORT | |
OTHER INFORMATION (Unaudited) |
Proxy Voting Information
A description of the policies and procedures that the Trust uses to determine how to vote proxies relating to securities held in the Funds’ portfolios is available, without charge and upon request, by calling 800.820.0888. This information is also available from the EDGAR database on the SEC’s website at https://www.sec.gov.
Information regarding how the Funds voted proxies relating to portfolio securities during the most recent 12-month period ended June 30 is available without charge, upon request, by calling 800.820.0888. This information is also available from the EDGAR database on the SEC’s website at https://www.sec.gov.
Sector Classification
Information in the Schedule of Investments is categorized by sectors using sector-level Classifications defined by the Bloomberg Industry Classification System, a widely recognized industry classification system provider. Each Fund’s registration statement has investment policies relating to concentration in specific sectors/industries. For purposes of these investment policies, the Funds usually classify sectors/industries based on industry-level Classifications used by widely recognized industry classification system providers such as Bloomberg Industry Classification System, Global Industry Classification Standards and Barclays Global Classification Scheme.
Quarterly Portfolio Schedules Information
The Trust files its complete schedule of portfolio holdings with the SEC for the first and third quarters of each fiscal year on Form N-Q, which are available on the SEC’s website at https://www.sec.gov. The Funds’ Forms N-Q may be reviewed and copied at the SEC’s Public Reference Room in Washington, DC, and that information on the operation of the Public Reference Room may be obtained by calling 800-SEC-0330. Copies of the portfolio holdings are also available to shareholders, without charge and upon request, by calling 800.820.0888.
Board Considerations in Approving the Investment Advisory Agreement
The Board of Trustees (the “Board”) of Rydex Series Funds (the “Trust”), including the Trustees who are not “interested persons,” as defined by the Investment Company Act of 1940, of the Trust (“Independent Trustees”), attended an in-person meeting held on May 21, 2018, called for the purpose of, among other things, the consideration of, and voting on, the approval of an amended investment advisory agreement (the “Investment Advisory Agreement”) between the Trust and Security Investors, LLC (the “Advisor”) applicable to each series of the Trust (each, a “Fund” and, collectively, the “Funds”). The Advisor proposed to amend the Trust’s Investment Advisory Agreement to provide for the addition of asset-based breakpoints to the advisory fees charged by each Fund, except for the Managed Futures Strategy Fund and Multi-Hedge Strategies Fund (together, the “Alternative Funds”). The introduction of asset-based breakpoints would reduce the advisory fee rate for each Fund (except the Alternative Funds) in accordance with a specified schedule disclosed in the Funds’ Prospectus when the aggregate daily net assets of the Funds
| | THE GUGGENHEIM FUNDS SEMI-ANNUAL REPORT | 75 |
OTHER INFORMATION (Unaudited)(continued) |
(excluding the Alternative Funds) and the series of Rydex Dynamic Funds, an affiliated investment company advised by the Advisor, equal or exceed $10 billion. The Board unanimously approved the Investment Advisory Agreement, as amended, for an additional one-year period based on the Board’s review of qualitative and quantitative information provided by the Advisor. The Board had previously considered information pertaining to the renewal of the Investment Advisory Agreement at an in-person meeting held on April 25, 2018 (together, with the May 21st meeting, the “Meetings”). The Board considered the materials provided by the Advisor and the review conducted at the April 25th meeting to be an integral part of the Trustees’ deliberations and their process in considering the renewal of the Investment Advisory Agreement, as amended.
Prior to reaching the conclusion to approve the Investment Advisory Agreement, as amended, the Independent Trustees requested and obtained from the Advisor such information as the Independent Trustees deemed reasonably necessary to evaluate the Investment Advisory Agreement. In addition, the Board received a memorandum from the independent legal counsel to the Independent Trustees regarding the Board’s fiduciary responsibilities under state and federal law with respect to the Board’s consideration of the renewal or approval of investment advisory agreements, and participated in discussions with representatives of the Advisor during which the representatives answered the Independent Trustees’ questions and agreed to provide certain additional information for their consideration. The Independent Trustees also carefully considered information that they had received throughout the year as part of their regular oversight of the Funds. At the Meetings, the Board obtained and reviewed a wide variety of information, including certain comparative information regarding the Funds’ fees, expenses, and performance relative to the fees, expenses, and performance of other comparable funds (the “FUSE reports”). The Independent Trustees carefully evaluated this information, met in executive session outside the presence of fund management, and were advised by independent legal counsel with respect to their deliberations.
At the Meetings, the Board, including the Independent Trustees, evaluated a number of factors, including among others: (a) the nature, extent and quality of the Advisor’s investment advisory and other services; (b) the Advisor’s substantial commitment to the recruitment and retention of high quality personnel; (c) a comparison of the Funds’ advisory fees to the advisory fees charged to comparable funds or accounts, giving special attention to the existence of economies of scale; (d) each Fund’s overall fees and operating expenses compared with those of similar funds; (e) the level of the Advisor’s profitability from its Fund-related operations; (f) the Advisor’s compliance processes and systems; (g) the Advisor’s compliance policies and procedures; (h) the Advisor’s reputation, expertise and resources in the financial markets; (i) Fund performance compared with that of similar funds and/or appropriate benchmarks; (j) other benefits to the Advisor and/or its affiliates from their relationship to the Funds; and (k) the Advisor’s maintenance of operational resources necessary to manage the Funds in a professional manner consistent with the best interests of the Funds and their shareholders. In its deliberations, the Trustees did not identify any particular factor or factors as controlling, noting that each Trustee could attribute different weights to the various factors considered.
76 | THE GUGGENHEIM FUNDS SEMI-ANNUAL REPORT | |
OTHER INFORMATION (Unaudited)(continued) |
Based on the Board’s deliberations at the Meetings, the Board, including all of the Independent Trustees, unanimously: (a) concluded that the terms of the Investment Advisory Agreement, as amended, are fair and reasonable; (b) concluded that the Advisor’s fees for each Fund are reasonable in light of, and not so disproportionately large as to bear no reasonable relationship to, the services that it provides to each Fund; and (c) agreed to approve and continue the Investment Advisory Agreement, as amended, based upon the following considerations, among others:
Nature, Extent and Quality of Services Provided by the Advisor. The Board evaluated, among other things, the Advisor’s business, financial resources, quality and quantity of personnel, experience, past performance, the variety and complexity of its investment strategies (including the extent to which the Funds use derivatives), Fund risk management process, brokerage practices, and the adequacy of its compliance systems and processes, proxy voting policies and practices, and cybersecurity programs. The Board reviewed the scope of services to be provided by the Advisor under the Investment Advisory Agreement and noted that there would be no significant differences between the scope of services required to be provided by the Advisor for the past year and the scope of services required to be provided during the upcoming year. The Board, however, examined whether the loss of certain advisory personnel in connection with the recent sale of the Guggenheim ETF business might affect the services provided by the Advisor to the remaining Funds. The Board was assured that such personnel were not previously involved in the management of the Funds and that their departure would not affect the nature, extent or quality of the services provided by the Advisor. The Board also considered the Advisor’s representations to the Board that the Advisor would continue to provide investment and related services that were of materially the same quality and quantity as services provided to the Funds in the past, and whether these services are appropriate in scope and extent in light of the Funds’ operations, the competitive landscape of the investment company business and investor needs. Based on the foregoing, the Trustees determined that the approval of the Investment Advisory Agreement, as amended, would enable shareholders of the Funds to receive high quality services at a cost that was appropriate and reasonable.
Fund Expenses and Performance of the Funds and the Advisor. The Board reviewed statistical information provided by the Advisor regarding the expense ratio components and performance of each Fund. The Advisor engaged FUSE Research Network LLC (“FUSE”), an independent, third-party research provider, to prepare reports to help the Board compare the Funds’ fees, expenses, and total return performance with those of a peer group and peer universe of funds selected by FUSE. In the FUSE reports, each Fund’s expense ratio components, including actual advisory fees, waivers/reimbursements, and gross and net total expenses, are compared to those of other funds with shared key characteristics (e.g., asset size, fee structure, sector or industry investment focus) determined by FUSE to comprise a Fund’s applicable peer group. The Board considered the Advisor’s representation that it found the peer groups compiled by FUSE to be appropriate, but also acknowledged the existence of certain differences between the Funds and their peer funds (e.g., specific differences in principal investment strategies, index rebalance frequency, and, in certain cases, the Fund’s tradability feature) that should be reviewed in context. With respect
| | THE GUGGENHEIM FUNDS SEMI-ANNUAL REPORT | 77 |
OTHER INFORMATION (Unaudited)(continued) |
to tradability, in particular, the Board considered that non-tradable funds incur lower expense ratios than tradable funds because non-tradable funds experience less shareholder activity and lower transaction volumes than tradable funds. The statistical information related to the performance of each Fund included three-month and one-, three-, and five-year performance for the Fund compared to that of its peers. With respect to the Funds that track an underlying index (“Index Funds”), the Board also discussed the correlation between an Index Fund’s assets under management and tracking error, noting that an Index Fund’s ability to replicate an underlying index rather than employ representative sampling depends, in part, upon the Index Fund’s size. The Board also considered and requested information detailing the effect of the recent sale of the Guggenheim ETF business on the expense allocation methodology employed by the Advisor. After reviewing the additional information provided by the Advisor, the Board determined the impact on the Funds would be minimal. Based on the foregoing, the Board determined that the proposed advisory fees paid by the Funds are reasonable in relation to the nature and quality of the services provided by the Advisor.
Costs of Services Provided to the Funds and Profits Realized by the Advisor and its Affiliates. The Board reviewed information about the profitability of the Funds to the Advisor based on the advisory fees payable under the current Investment Advisory Agreement for the last calendar year. The Board analyzed the Funds’ expenses, including the investment advisory fees paid to the Advisor, and reviewed the FUSE reports. The Board also reviewed information regarding the direct revenue received by the Advisor and ancillary revenue, if any, received by the Advisor and/or its affiliates in connection with the services provided to the Funds by the Advisor and/or its affiliates. The Board also discussed the Advisor’s profit margin, including the expense allocation methodology used in the Advisor’s profitability analysis. The Board also considered the effect of the recent sale of the Guggenheim ETF business on the Advisor’s and its affiliates’ profitability, and similar to its conclusion with respect to expenses, determined that the impact would be minimal. Based on the foregoing, the Board determined that the profit to the Advisor on the fees paid by the Funds is not excessive in view of the nature and quality of the services provided by the Advisor.
Economies of Scale. During its April 25th meeting with management, the Board and the Advisor discussed the possible implementation of asset-based advisory fee breakpoints to help ensure any economies of scale would be shared with the Funds’ shareholders. At the May 21st meeting, the Advisor proposed to amend the Investment Advisory Agreement to implement the asset-based breakpoints described herein. The Board considered the potential effect of the proposed asset-based breakpoints as well as the absence of breakpoints for the Alternative Funds. The Board noted that many of the Funds had not yet achieved sufficient asset levels to realize meaningful economies of scale, and noted that the Alternative Funds, in particular, had not achieved sufficient asset levels to generate economies of scale and were not likely to realize meaningful economies of scale given their specialized investment strategies. The Board noted that the breakpoints would benefit shareholders in the long term and that it intends to monitor the asset levels at which the breakpoints are set to determine if they continue to be appropriate in the future.
78 | THE GUGGENHEIM FUNDS SEMI-ANNUAL REPORT | |
OTHER INFORMATION (Unaudited)(concluded) |
Other Benefits to the Advisor and/or its Affiliates. In addition to evaluating the Advisor’s services, the Board considered the nature and amount of other benefits to be derived by the Advisor and its affiliates as a result of their relationship with the Funds, including any intangible benefits to the Advisor. In particular, the Board considered the nature, extent, quality, and cost of certain distribution and shareholder services performed by the Advisor’s affiliate, Guggenheim Funds Distributors, LLC, under separate distribution agreements, Distribution Plans and Distribution and Shareholder Services Plans pursuant to Rule 12b-1 of the 1940 Act, and, with respect to the Rydex Variable Trust, the investor services agreement and Investor Services Plan. In light of the costs of providing services pursuant to the separate agreements as well as the Advisor’s and its affiliate’s commitment to the Funds, the Board concluded the ancillary benefits the Advisor and its affiliates received were reasonable.
On the basis of the information provided to it and its evaluation of that information, the Board, including the Independent Trustees, concluded that the terms of the Investment Advisory Agreement, as amended, were reasonable, and that approval of the Investment Advisory Agreement, as amended, was in the best interests of each Fund and its shareholders.
| | THE GUGGENHEIM FUNDS SEMI-ANNUAL REPORT | 79 |
INFORMATION ON BOARD OF TRUSTEES AND OFFICERS (Unaudited) |
A Board of Trustees oversees the Trust, as well as other trusts of GI, in which its members have no stated term of service, and continue to serve after election until resignation. The Statement of Additional Information includes further information about Fund Trustees and Officers, and can be obtained without charge by visiting guggenheiminvestments.com or by calling 800.820.0888.
Name, Address*
and Year of Birth
of Trustee | Position(s) Held with the
Trust, Term of Office and
Length of Time Served | Principal Occupation(s)
During Past 5 Years | Number of
Portfolios in
Fund Complex
Overseen by
Trustee*** | Other
Directorships
Held by
Trustee**** |
INTERESTED TRUSTEE | | | |
Amy J. Lee** (1961) | Trustee (February 2018-present) and President (2017-present) | Current: Interested Trustee, certain other funds in the Fund Complex (February 2018-present); Chief Legal Officer and Vice President, certain other funds in the Fund Complex (2013-present); Senior Managing Director, Guggenheim Investments (2012-present). Former: President and Chief Executive Officer, certain other funds in the Fund Complex (2017-February 2018); and Vice President, Associate General Counsel and Assistant Secretary, Security Benefit Life Insurance Company and Security Benefit Corporation (2004-2012). | 165 | None. |
80 | THE GUGGENHEIM FUNDS SEMI-ANNUAL REPORT | |
INFORMATION ON BOARD OF TRUSTEES AND OFFICERS (Unaudited)(continued) |
Name, Address*
and Year of Birth
of Trustee | Position(s) Held with the
Trust, Term of Office and
Length of Time Served | Principal Occupation(s)
During Past 5 Years | Number of
Portfolios in
Fund Complex
Overseen by
Trustee*** | Other
Directorships
Held by
Trustee**** |
INDEPENDENT TRUSTEES | | | |
Angela
Brock-Kyle (1959) | Trustee, Member of the Audit Committee, and Member of the Compliance and Risk Oversight Committee from 2016 to present; and Member of the Governance and Nominating Committee and Chairwoman of the Compliance and Risk Oversight Committee from 2017 to present. | Current: Founder and Chief Executive Officer, B.O.A.R.D.S (consulting firm) Former: Senior Leader, TIAA (financial services firm) (1987-2012). | 110 | Infinity Property & Casualty Corporation (2014-present). |
Corey A. Colehour (1945) | Trustee from 1993 to present; Member of the Audit Committee from 1994 to present; Member of the Governance and Nominating Committee from 2017 to present; and Member of the Investment and Performance Committee from 2014 to present. | Retired. | 110 | None. |
J. Kenneth Dalton (1941) | Trustee from 1995 to present; Chairman and Member of the Audit Committee from 1997 to present; and Member of the Compliance and Risk Oversight Committee from 2010 to present. | Retired. | 110 | Epiphany Funds (2) (2009-present). |
John O. Demaret (1940) | Trustee and Member of the Audit Committee from 1997 to present; Member of the Compliance and Risk Oversight Committee from 2010 to present. | Retired. | 110 | None. |
| | THE GUGGENHEIM FUNDS SEMI-ANNUAL REPORT | 81 |
INFORMATION ON BOARD OF TRUSTEES AND OFFICERS (Unaudited)(continued) |
Name, Address*
and Year of Birth
of Trustee | Position(s) Held with the
Trust, Term of Office and
Length of Time Served | Principal Occupation(s)
During Past 5 Years | Number of
Portfolios in
Fund Complex
Overseen by
Trustee*** | Other
Directorships
Held by
Trustee**** |
INDEPENDENT TRUSTEES - concluded |
Werner E. Keller (1940) | Chairman of the Board from 2014 to present; Trustee and Member of the Audit Committee from 2005 to present. | Current: Founder and President, Keller Partners, LLC (investment research firm) (2005-present). | 110 | None. |
Thomas F. Lydon, Jr. (1960) | Trustee and Member of the Audit Committee from 2005 to present; Chairman and Member of the Governance and Nominating Committee from 2017 to present; and Member of the Investment and Performance Committee from 2018 to present. | Current: President, Global Trends Investments (registered investment adviser) (1996-present). | 110 | US Global Investors (GROW) (1995-present) and Harvest Volatility Edge Trust (3) (2017-present). |
Patrick T. McCarville (1942) | Trustee and Member of the Audit Committee from 1998 to present; and Member of the Governance and Nominating Committee from 2017 to present. | Retired. Former: Chief Executive Officer, Par Industries, Inc., d/b/a Par Leasing (1977-2010). | 110 | None. |
Sandra G. Sponem (1958) | Trustee, Member of the Audit Committee and Chairwoman and Member of the Investment and Performance Committee from 2016 to present; and Member of the Governance and Nominating Committee from 2017 to present. | Retired. Former: Senior Vice President and Chief Financial Officer, M.A. Mortenson Companies, Inc. (general contracting firm) (2007-2017). | 110 | None. |
82 | THE GUGGENHEIM FUNDS SEMI-ANNUAL REPORT | |
INFORMATION ON BOARD OF TRUSTEES AND OFFICERS (Unaudited)(continued) |
Name, Address*
and Year of Birth | Position(s) Held with the
Trust, Term of Office and
Length of Time Served | Principal Occupation(s)
During Past 5 Years |
OFFICERS | | |
Michael P. Byrum (1970) | Vice President (1999-present) | Current: Senior Vice President, Security Investors, LLC (2010-present); Senior Managing Director, Guggenheim Investments (2010-present); President and Chief Investment Officer, Rydex Holdings, LLC (2008-present) and Director and Chairman, Advisory Research Center, Inc. (2006-present). Former: Manager, Guggenheim Specialized Products, LLC (2005-April 2018); Vice President, Guggenheim Distributors, LLC (2009); Director (2009-2010) and Secretary (2002-2010), Rydex Fund Services, LLC (now MUFG Investor Services (US), LLC); Director (2008-2010), Chief Investment Officer (2006-2010), President (2004-2010) and Secretary (2002-2010), Rydex Advisors, LLC; Director (2008-2010), Chief Investment Officer (2006-2010), President (2004-2010) and Secretary (2002-2010), Rydex Advisors II, LLC. |
James M. Howley (1972) | Assistant Treasurer (2016-present) | Current: Managing Director, Guggenheim Investments (2004-present); Assistant Treasurer, certain other funds in the Fund Complex (2006-present). Former: Manager of Mutual Fund Administration, Van Kampen Investments, Inc. (1996-2004). |
Keith D. Kemp (1960) | Assistant Treasurer (2016-present) | Current: Treasurer and Assistant Treasurer, certain other funds in the Fund Complex (2010-present); Managing Director of Guggenheim Partners Investment Management, LLC (2015-present) Former: Chief Financial Officer, Guggenheim Specialized Products, LLC (2016-April 2018); Managing Director and Director, Transparent Value, LLC (2010-2016); Director, Guggenheim Partners Investment Management, LLC (2010-2015); Chief Operating Officer, Macquarie Capital Investment Management (2007-2009). |
Mark E. Mathiasen (1978) | Secretary (2017-present) | Current: Secretary, certain other funds in the Fund Complex (2007-present); Managing Director, Guggenheim Investments (2007-present). |
| | THE GUGGENHEIM FUNDS SEMI-ANNUAL REPORT | 83 |
INFORMATION ON BOARD OF TRUSTEES AND OFFICERS (Unaudited)(continued) |
Name, Address*
and Year of Birth | Position(s) Held with the
Trust, Term of Office and
Length of Time Served | Principal Occupation(s)
During Past 5 Years |
OFFICERS - continued | |
Glenn McWhinnie (1969) | Assistant Treasurer (2016-present) | Current: Vice President, Guggenheim Investments (2009-present); Assistant Treasurer, certain other funds in the Fund Complex (2007-present). Former: Tax Compliance Manager, Ernst & Young, LLP (1996-2009). |
Elisabeth Miller (1968) | Chief Compliance Officer (2012-present) | Current: CCO, certain other funds in the Fund Complex (2012-present); Managing Director, Guggenheim Investments (2012-present); Vice President, Guggenheim Funds Distributors, LLC (2014-present). Former: CCO, Security Investors, LLC (2012-2018); CCO, Guggenheim Funds Investment Advisors, LLC (2012-2018); CCO, Guggenheim Distributors, LLC (2009-2014); Senior Manager, Security Investors, LLC (2004-2009); Senior Manager, Guggenheim Distributors, LLC (2004-2009). |
Adam J. Nelson (1979) | Assistant Treasurer (2016-present) | Current: Vice President, Guggenheim Investments (2015-present); Assistant Treasurer, certain other funds in the Fund Complex (2015-present). Former: Assistant Vice President and Fund Administration Director, State Street Corporation (2013-2015); Fund Administration Assistant Director, State Street (2011-2013); Fund Administration Manager, State Street (2009-2011). |
Kimberly J. Scott (1974) | Assistant Treasurer (2016-present) | Current: Director, Guggenheim Investments (2012-present); Assistant Treasurer, certain other funds in the Fund Complex (2012-present). Former: Financial Reporting Manager, Invesco, Ltd. (2010-2011); Vice President/Assistant Treasurer of Mutual Fund Administration, Van Kampen Investments, Inc./Morgan Stanley Investment Management (2009-2010); Manager of Mutual Fund Administration, Van Kampen Investments, Inc./Morgan Stanley Investment Management (2005-2009). |
84 | THE GUGGENHEIM FUNDS SEMI-ANNUAL REPORT | |
INFORMATION ON BOARD OF TRUSTEES AND OFFICERS (Unaudited)(concluded) |
Name, Address*
and Year of Birth | Position(s) Held with the
Trust, Term of Office and
Length of Time Served | Principal Occupation(s)
During Past 5 Years |
OFFICERS - concluded | |
John L. Sullivan (1955) | Chief Financial Officer and Treasurer (2016-present) | Current: CFO, Chief Accounting Officer and Treasurer, certain other funds in the Fund Complex (2010-present); Senior Managing Director, Guggenheim Investments (2010-present). Former: Managing Director and CCO, each of the funds in the Van Kampen Investments fund complex (2004-2010); Managing Director and Head of Fund Accounting and Administration, Morgan Stanley Investment Management (2002-2004); CFO and Treasurer, Van Kampen Funds (1996-2004). |
Jon Szafran (1989) | Assistant Treasurer (November 2017-present) | Current: Vice President, Guggenheim Investments (2017-present); Assistant Treasurer, certain other funds in the Fund Complex (2017-present). Former: Assistant Treasurer of Henderson Global Funds and Manager of US Fund Administration, Henderson Global Investors (North America) Inc. (“HGINA”) (2017); Senior Analyst of US Fund Administration, HGINA (2014-2017); Senior Associate of Fund Administration, Cortland Capital Market Services, LLC (2013-2014); Experienced Associate, PricewaterhouseCoopers LLP (2012-2013). |
* | All Trustees and Officers may be reached c/o Guggenheim Investments, 227 West Monroe Street, Chicago, Illinois 60606. |
** | This Trustee is an “interested person” (as defined in Section 2(a)(19) of the 1940 Act) (“Interested Trustee”) of the Trust because of her affiliation with Guggenheim Investments. |
*** | The “Fund Complex” includes all closed-end and open-end funds (including all of their portfolios) advised by the Adviser and any funds that have an investment adviser or servicing agent that is an affiliated person of the Adviser. Information provided is as of the date of this report. |
**** | Certain of the Trustees may serve as directors on the boards of companies not required to be disclosed above, including certain non-profit companies and charitable foundations. |
| | THE GUGGENHEIM FUNDS SEMI-ANNUAL REPORT | 85 |
GUGGENHEIM INVESTMENTS PRIVACY NOTICE (Unaudited) |
Who We Are
This Privacy Notice describes the data protection practices of Guggenheim Investments. Guggenheim Investments as used herein refers to the affiliated investment management businesses of Guggenheim Partners, LLC: Guggenheim Funds Investment Advisors, LLC, Guggenheim Partners Investment Management, LLC, Guggenheim Funds Distributors, LLC, Security Investors, LLC, Guggenheim Investment Advisors (Europe) Limited, Guggenheim Real Estate, LLC, GS Gamma Advisors, LLC, Guggenheim Partners India Management, LLC, Guggenheim Partners Europe Limited, as well as the funds in the Guggenheim Funds complex (the “Funds”) (“Guggenheim Investments,” “we,” “us,” or “our”).
Guggenheim Partners Investment Management Holdings, LLC, located at 330 Madison Avenue, New York, New York 10017 is the data controller for your information. The Affiliates who are also controllers of certain of your information are: Guggenheim Investment Advisors (Europe) Limited, Guggenheim Partners Europe Limited, Guggenheim Partners, LLC, Guggenheim Funds Investment Advisors, LLC, Guggenheim Partners Investment Management, LLC, Guggenheim Funds Distributors, LLC and Security Investors, LLC, as well as the Funds.
Our Commitment to You
Guggenheim Investments considers your privacy our utmost concern. When you become our client or investor, you entrust us with not only your hard-earned money but also with your personal and financial information. Because we have access to your private information, we hold ourselves to the highest standards in its safekeeping and use. We strictly limit how we share your information with others, whether you are a current or former Guggenheim Investments client or investor.
The Information We Collect About You
We collect certain nonpublic personal information about you from information you provide on applications, other forms, our website, and/or from third parties including investment advisors. This information includes Social Security or other tax identification number, assets, income, tax information, retirement and estate plan information, transaction history, account balance, payment history, bank account information, marital status, family relationships, information that we collect on our website through the use of “cookies,” and other personal information that you or others provide to us. We may also collect such information through your inquiries by mail, e-mail or telephone. We may also collect customer due diligence information, as required by applicable law and regulation, through third party service providers.
How We Handle Your Personal Information
The legal basis for using your information as set out in this Privacy Notice is as follows: (a) use of your personal data is necessary to perform our obligations under any contract with you (such as a contract for us to provide financial services to you); or (b) where use of your personal data is not necessary for performance of a contract, use of your personal data is necessary for our legitimate interests or the legitimate interests of others (for example, to enforce the legal terms governing our
86 | THE GUGGENHEIM FUNDS SEMI-ANNUAL REPORT | |
GUGGENHEIM INVESTMENTS PRIVACY NOTICE (Unaudited)(continued) |
services, operate and market our website and other services we offer, ensure safe environments for our personnel and others, make and receive payments, prevent fraud and to know the customer to whom we are providing the services). Some processing is done to comply with applicable law.
In addition to the specific uses described above, we also use your information in the following manner:
| | ● | We use your information in connection with servicing your accounts. |
| | ● | We use information to respond to your requests or questions. For example, we might use your information to respond to your customer feedback. |
| | ● | We use information to improve our products and services. We may use your information to make our website and products better. We may use your information to customize your experience with us. |
| | ● | We use information for security purposes. We may use your information to protect our company and our customers. |
| | ● | We use information to communicate with you. For example, we will communicate with you about your account or our relationship. We may contact you about your feedback. We might also contact you about this Privacy Notice. We may also enroll you in our email newsletter. |
| | ● | We use information as otherwise permitted by law, as we may notify you. |
| | ● | Aggregate/Anonymous Data. We may aggregate and/or anonymize any information collected through the website so that such information can no longer be linked to you or your device (“Aggregate/Anonymous Information”). We may use Aggregate/Anonymous Information for any purpose, including without limitation for research and marketing purposes, and may also share such data with any third parties, including advertisers, promotional partners, and sponsors. |
We do not sell information about current or former clients or their accounts to third parties. Nor do we share this information, except when necessary to complete transactions at your request, to make you aware of investment products and services that we or our affiliates offer, or as permitted or required by law.
We provide information about you to companies and individuals not affiliated with Guggenheim Investments to complete certain transactions or account changes, or to perform services for us related to your account. For example, if you ask to transfer assets from another financial institution to Guggenheim Investments, we must provide certain information about you to that company to complete the transaction. We provide the third party with only the information necessary to carry out its responsibilities and only for that purpose. And we require these third parties to treat your private information with the same high degree of confidentiality that we do. To alert you to other Guggenheim Investments products and services, we share your information
| | THE GUGGENHEIM FUNDS SEMI-ANNUAL REPORT | 87 |
GUGGENHEIM INVESTMENTS PRIVACY NOTICE (Unaudited)(continued) |
within our family of affiliated companies. You may limit our sharing with affiliated companies as set out below. We may also share information with any successor to all or part of our business, or in connection with steps leading up to a merger or acquisition. For example, if part of our business was sold we may give customer information as part of that transaction. We may also share information about you with your consent.
We will release information about you if you direct us to do so, if we are compelled by law to do so, or in other circumstances as permitted by law (for example, to protect your account from fraud).
If you close your account(s) or become an inactive client or investor, we will continue to adhere to the privacy policies and practices described in this notice.
Opt-Out Provisions and Your Data Choices
The law allows you to “opt out” of certain kinds of information sharing with third parties. We do not share personal information about you with any third parties that triggers this opt-out right. This means YOU ARE ALREADY OPTED OUT.
When you are no longer our client or investor, we continue to share your information as described in this notice, and you may contact us at any time to limit our sharing by sending an email to CorporateDataPrivacy@GuggenheimPartners.com.
European Union Data Subjects and certain others: In addition to the choices set forth above, residents of the European Union and certain other jurisdictions have certain rights to (1) request access to or rectification or deletion of information we collect about them, (2) request a restriction on the processing of their information, (3) object to the processing of their information, or (4) request the portability of certain information. To exercise these or other rights, please contact us using the contact information below. We will consider all requests and provide our response within the time period stated by applicable law. Please note, however, that certain information may be exempt from such requests in some circumstances, which may include if we need to keep processing your information for our legitimate interests or to comply with a legal obligation. We may request you provide us with information necessary to confirm your identity before responding to your request.
Residents of France and certain other jurisdictions may also provide us with instructions regarding the manner in which we may continue to store, erase and share your information after your death, and where applicable, the person you have designated to exercise these rights after your death.
How We Protect Privacy Online
We take steps to protect your privacy when you use our web site – www.guggenheiminvestments.com – by using secure forms of online communication, including encryption technology, Secure Socket Layer (SSL) protocol, firewalls and user names and passwords. These safeguards vary based on the sensitivity of the information that we collect and store. However, we cannot and do not guarantee that these measures will prevent every unauthorized attempt to access, use, or disclose your information since despite our efforts, no Internet and/or other electronic transmissions
88 | THE GUGGENHEIM FUNDS SEMI-ANNUAL REPORT | |
GUGGENHEIM INVESTMENTS PRIVACY NOTICE (Unaudited)(concluded) |
can be completely secure. Our web site uses “http cookies”—tiny pieces of information that we ask your browser to store. We use cookies for session management and security features on the Guggenheim Investments web site. We do not use them to pull data from your hard drive, to learn your e-mail address, or to view data in cookies created by other web sites. We will not share the information in our cookies or give others access to it. See the legal information area on our web site for more details about web site security and privacy features.
How We Safeguard Your Personal Information and Data Retention
We restrict access to nonpublic personal information about you to our employees and in some cases to third parties (for example, the service providers described above) as permitted by law. We maintain strict physical, electronic and procedural safeguards that comply with federal standards to guard your nonpublic personal information.
We keep your information for no longer than necessary for the purposes for which it is processed. The length of time for which we retain information depends on the purposes for which we collected and use it and/or as required to comply with applicable laws. Information may persist in copies made for backup and business continuity purposes for additional time.
International Visitors
If you are not a resident of the United States, please be aware that your information may be transferred to, stored and processed in the United States where our servers are located and our databases are operated. The data protection and other laws of the United States and other countries might not be as comprehensive as those in your country.
In such cases, we ensure that a legal basis for such a transfer exists and that adequate protection is provided as required by applicable law, for example, by using standard contractual clauses or by transferring your data to a jurisdiction that has obtained an adequacy finding. Individuals whose data may be transferred on the basis of standard contractual clauses may contact us as described below.
We’ll Keep You Informed
If you have any questions or concerns about how we treat your personal data, we encourage you to consult with us first. You may also contact the relevant supervisory authority.
We reserve the right to modify this policy at any time and will inform you promptly of material changes. You may access our privacy policy from our web site at www.guggenheiminvestments.com. Should you have any questions regarding our privacy policy, contact us by email at CorporateDataPrivacy@GuggenheimPartners.com.
| | THE GUGGENHEIM FUNDS SEMI-ANNUAL REPORT | 89 |
6.30.2018
Guggenheim Funds Semi-Annual Report
Guggenheim Alternative Fund |
Guggenheim Managed Futures Strategy Fund | | |
GuggenheimInvestments.com | RMFSF-SEMI-0618x1218 |
DEAR SHAREHOLDER | 2 |
ECONOMIC AND MARKET OVERVIEW | 4 |
ABOUT SHAREHOLDERS’ FUND EXPENSES | 6 |
MANAGED FUTURES STRATEGY FUND | 9 |
NOTES TO CONSOLIDATED FINANCIAL STATEMENTS | 25 |
OTHER INFORMATION | 42 |
INFORMATION ON BOARD OF TRUSTEES AND OFFICERS | 47 |
GUGGENHEIM INVESTMENTS PRIVACY NOTICE | 53 |
| | THE GUGGENHEIM FUNDS SEMI-ANNUAL REPORT | 1 |
Dear Shareholder:
Security Investors, LLC (the “Investment Adviser”), is pleased to present the semi-annual shareholder report for the Managed Futures Strategy Fund (the “Fund”) that is part of the Rydex Series Funds. This report covers performance of the Fund for the semi-annual period ended June 30, 2018.
The Investment Adviser is a part of Guggenheim Investments, which represents the investment management businesses of Guggenheim Partners, LLC (“Guggenheim”), a global, diversified financial services firm.
Guggenheim Funds Distributors, LLC is the distributor of the Fund. Guggenheim Funds Distributors, LLC is affiliated with Guggenheim and the Investment Adviser.
We encourage you to read the Economic and Market Overview section of the report, which follows this letter, and then the Performance Report and Fund Profile for the Fund.
We are committed to providing innovative investment solutions and appreciate the trust you place in us.
Sincerely,
Security Investors, LLC
July 31, 2018
Read a prospectus and summary prospectus (if available) carefully before investing. It contains the investment objectives, risks, charges, expenses and other information, which should be considered carefully before investing. Obtain a prospectus and summary prospectus (if available) at guggenheiminvestments.com or call 800.820.0888.
This material is not intended as a recommendation or as investment advice of any kind, including in connection with rollovers, transfers, and distributions. Such material is not provided in a fiduciary capacity, may not be relied upon for or in connection with the making of investment decisions, and does not constitute a solicitation of an offer to buy or sell securities. All content has been provided for informational or educational purposes only and is not intended to be and should not be construed as legal or tax advice and/or a legal opinion. Always consult a financial, tax and/or legal professional regarding your specific situation.
2 | THE GUGGENHEIM FUNDS SEMI-ANNUAL REPORT | |
The Managed Futures Strategy Fund may not be suitable for all investors. ●The Fund’s investments in securities and derivatives, in general, are subject to market risks that may cause their prices, and therefore the Fund’s value, to fluctuate over time. An investment in the Fund may lose money. ● The Fund’s investments in derivatives may pose risks in addition to those associated with investing directly in securities or other investments, including illiquidity of the derivatives, imperfect correlations with underlying investments or the Fund’s other portfolio holdings, lack of availability and counterparty risk. To the extent the Fund invests in derivatives to seek to hedge risk or limit leveraged exposure created by other investments, there is no guarantee that such hedging strategies will be effective at managing risk or limiting exposure to leveraged investments. ● The Fund’s use of leverage will exaggerate the effect on net asset value of any increase or decrease in the market value of the Fund’s portfolio. ●The Fund’s use of short selling involves increased risk and costs. The Fund risks paying more for a security than it received from its sale. Theoretically, securities sold short have the risk of unlimited losses. ●The Fund’s investments in fixed income securities will change in value in response to interest rate changes and other factors. In general, bond prices rise when interest rates fall and vice versa. ● The Fund’s exposure to high yield, asset backed and mortgaged backed securities may subject the Fund to greater volatility. ●The Fund’s indirect and direct exposure to foreign currencies subjects the Fund to the risk that those currencies will decline in value relative to the U.S. dollar, or, in the case of short positions, that the U.S. dollar will decline in value relative to the currency being hedged. ●The Fund’s exposure to the commodity markets may subject the Fund to greater volatility as commodity-linked investments may be affected by changes in overall market movements, commodity index volatility, changes in interest rates or factors affecting a particular industry or commodity such as droughts, floods, weather, embargos, tariffs and international economic, political and regulatory developments. ●The Fund may invest in securities of foreign companies directly, or indirectly through the use of other investment companies and financial instruments that are linked to the performance of foreign issuers. Foreign securities markets generally have less trading volume and less liquidity than U.S. markets, and prices in some foreign markets may fluctuate more than those of securities traded on U.S. markets. ●This Fund is considered nondiversified and can invest a greater portion of its assets in securities of individual issuers than a diversified fund. As a result, changes in the market value of a single security could cause greater fluctuations in the value of Fund shares than would occur in a more diversified fund. ●See the prospectus for more information on these and other risks.
| | THE GUGGENHEIM FUNDS SEMI-ANNUAL REPORT | 3 |
ECONOMIC AND MARKET OVERVIEW (Unaudited) | June 30, 2018 |
As the U.S. economy powers along, with second quarter 2018 gross domestic product (“GDP”) coming in at 4.1% annualized, geopolitical risk continues to weigh on the market. Positive headlines surrounding growth and the labor market are offset by the trade war launched by the U.S. against both its rivals and its allies. In May, the Trump administration allowed the aluminum and steel tariff exemptions to expire for Canada, Mexico, and the European Union, instituting 25% tariffs on steel and 10% tariffs on aluminum imported from these regions. In June, the U.S. administration announced it would also impose 25% tariffs on $50 billion worth of Chinese imports ($34 billion of which would be tariffed beginning in July), followed by the publication of a list of $200 billion in additional Chinese goods to be targeted, to which China promised retaliation. The European Union has also announced retaliation, approving tariffs of 25% on a long list of American goods. Over this period, 10-year U.S. Treasury yields peaked at 3.1% and finished the quarter at 2.9%.
The bond market’s reaction to trade rhetoric indicates that there is a tug of war at hand. While fiscal stimulus pushed up bond yields initially, tariffs are weighing them down. Markets are right to be concerned about the consequences of a trade war in which no one wins. Outside of the U.S., this trade war will have the intended impact of squeezing economic growth in export-heavy regions, but among the losers will also be U.S. consumers. Some corporations may slow or postpone hiring as they manage for rising input costs. Others will pass higher prices on to the consumer, causing disposable incomes to suffer. In either case, tariffs reduce the benefit of the fiscal stimulus.
The U.S. Federal Reserve’s (the “Fed”) confidence in the U.S. economy seems to have sharpened in recent weeks despite trade war uncertainty. In the June Summary of Economic Projections (“SEP”), the U.S. Federal Reserve Open Market Committee’s (“FOMC”) median expectations for 2018 GDP growth rose from 2.7% to 2.8%. The FOMC now expects a lower unemployment rate, higher personal consumption expenditures inflation and a higher federal funds rate for 2018 and 2019 than previously expected. The Fed is determined to tighten financial conditions until economic growth and hiring slow to a more sustainable pace.
We believe that the net effect of all factors affecting rates—fiscal stimulus, trade war, and monetary policy tightening—will keep long-term interest rates from moving much higher than current levels. The market is currently pricing this in to the yield curve; in July the difference between 30-year and 2-year U.S. Treasury yields hit its lowest level since July 2007. The bond market is sending a warning signal that makes us wary of taking on too much credit risk at this stage.
We maintain our view that a recession could likely come in 2020 and markets may discount this as early as 2019. In the meantime, we are watching for exogenous factors that could cause a recession to come sooner.
For the six months ended June 30, 2018, the Standard & Poor’s 500® (“S&P 500”) Index* returned 2.65%. The MSCI Europe-Australasia-Far East (“EAFE”) Index* returned -2.37%. The return of the MSCI Emerging Markets Index* was -6.51%.
4 | THE GUGGENHEIM FUNDS SEMI-ANNUAL REPORT | |
ECONOMIC AND MARKET OVERVIEW (Unaudited)(concluded) | June 30, 2018 |
In the bond market, the Bloomberg Barclays U.S. Aggregate Bond Index* posted a -1.62% return for the period, while the Bloomberg Barclays U.S. Corporate High Yield Index* returned 0.16%. The return of the ICE Bank of America (“BofA”) Merrill Lynch 3-Month U.S. Treasury Bill Index* was 0.81% for the six-month period.
The opinions and forecasts expressed may not actually come to pass. This information is subject to change at any time, based on market and other conditions, and should not be construed as a recommendation of any specific security or strategy.
*Index Definitions:
The following indices are referenced throughout this report. Indices are unmanaged and not available for direct investment. Index performance does not reflect transaction costs, fees, or expenses.
Bloomberg Barclays U.S. Aggregate Bond Index is a broad-based flagship benchmark that measures the investment grade, U.S. dollar-denominated, fixed-rate taxable bond market, including U.S. Treasuries, government-related and corporate securities, mortgage-backed securities or “MBS” (agency fixed-rate and hybrid adjustable-rate mortgage, or “ARM”, pass-throughs), asset-backed securities (“ABS”), and commercial mortgage-backed securities (“CMBS”) (agency and non-agency).
Bloomberg Barclays U.S. Corporate High Yield Index measures the U.S. dollar-denominated, high yield, fixed-rate corporate bond market. Securities are classified as high yield if the middle rating of Moody��s, Fitch, and S&P is Ba1/BB +/BB + or below.
ICE BofA Merrill Lynch 3-Month U.S. Treasury Bill Index is an unmanaged market Index of U.S. Treasury securities maturing in 90 days that assumes reinvestment of all income.
MSCI EAFE Index is a free float-adjusted market capitalization index that is designed to measure the equity market performance of developed markets, excluding the U.S. & Canada.
MSCI Emerging Markets Index is a free float-adjusted market capitalization weighted index that is designed to measure equity market performance in the global emerging markets.
S&P 500® Index is a broad-based index, the performance of which is based on the performance of 500 widely held common stocks chosen for market size, liquidity, and industry group representation.
| | THE GUGGENHEIM FUNDS SEMI-ANNUAL REPORT | 5 |
ABOUT SHAREHOLDERS’ FUND EXPENSES (Unaudited) |
All mutual funds have operating expenses, and it is important for our shareholders to understand the impact of costs on their investments. Shareholders of a fund incur two types of costs: (i) transaction costs, including sales charges (loads) on purchase payments, reinvested dividends, other distributions, and exchange fees, and (ii) ongoing costs, including management fees, administrative services, and shareholder reports, among others. These ongoing costs, or operating expenses, are deducted from a fund’s gross income and reduce the investment return of the fund.
A fund’s expenses are expressed as a percentage of its average net assets, which is known as the expense ratio. The following examples are intended to help investors understand the ongoing costs (in dollars) of investing in a fund and to compare these costs with the ongoing costs of investing in other mutual funds.
The examples are based on an investment of $1,000 made at the beginning of the period and held for the entire six-month period beginning December 31, 2017 and ending June 30, 2018.
The following tables illustrate the Fund’s costs in two ways:
Table 1. Based on actual Fund return: This section helps investors estimate the actual expenses paid over the period. The “Ending Account Value” shown is derived from the Fund’s actual return, and the fifth column shows the dollar amount that would have been paid by an investor who started with $1,000 in the Fund. Investors may use the information here, together with the amount invested, to estimate the expenses paid over the period. Simply divide the Fund’s account value by $1,000 (for example, an $8,600 account value divided by $1,000 = 8.6), then multiply the result by the number provided under the heading “Expenses Paid During Period.”
Table 2. Based on hypothetical 5% return: This section is intended to help investors compare a fund’s cost with those of other mutual funds. The table provides information about hypothetical account values and hypothetical expenses based on the Fund’s actual expense ratio and an assumed rate of return of 5% per year before expenses, which is not the Fund’s actual return. The hypothetical account values and expenses may not be used to estimate the actual ending account balance or expenses paid during the period. The example is useful in making comparisons because the U.S. Securities and Exchange Commission (the “SEC”) requires all mutual funds to calculate expenses based on the 5% return. Investors can assess a fund’s costs by comparing this hypothetical example with the hypothetical examples that appear in shareholder reports of other funds.
The calculations illustrated above assume no shares were bought or sold during the period. Actual costs may have been higher or lower, depending on the amount of investment and the timing of any purchases or redemptions.
6 | THE GUGGENHEIM FUNDS SEMI-ANNUAL REPORT | |
ABOUT SHAREHOLDERS’ FUND EXPENSES (Unaudited)(continued) |
Please note that the expenses shown in the table are meant to highlight your ongoing costs only and do not reflect any transactional costs, such as sales charges (loads) on purchase payments, and contingent deferred sales charges (“CDSC”) on redemptions, if any. Therefore, the second table is useful in comparing ongoing costs only, and will not help you determine the relative total costs of owning different funds. In addition, if these transactional costs were included, your costs would have been higher.
More information about the Fund’s expenses, including annual expense ratios for periods up to five years (subject to the Fund’s inception date), can be found in the Consolidated Financial Highlights section of this report. For additional information on operating expenses and other shareholder costs, please refer to the Fund’s prospectus.
| | THE GUGGENHEIM FUNDS SEMI-ANNUAL REPORT | 7 |
ABOUT SHAREHOLDERS’ FUND EXPENSES (Unaudited)(concluded) |
| Expense
Ratio1 | Fund
Return | Beginning
Account Value
December 31,
2017 | Ending
Account Value
June 30,
2018 | Expenses
Paid During
Period2 |
Table 1. Based on actual Fund return3 |
Managed Futures Strategy Fund |
A-Class | 1.75% | (2.92%) | $ 1,000.00 | $ 970.80 | $ 8.55 |
C-Class | 2.50% | (3.26%) | 1,000.00 | 967.40 | 12.20 |
P-Class | 1.75% | (2.86%) | 1,000.00 | 971.40 | 8.55 |
Institutional Class | 1.50% | (2.75%) | 1,000.00 | 972.50 | 7.34 |
|
|
Table 2. Based on hypothetical 5% return (before expenses) |
Managed Futures Strategy Fund |
A-Class | 1.75% | 5.00% | $ 1,000.00 | $ 1,016.12 | $ 8.75 |
C-Class | 2.50% | 5.00% | 1,000.00 | 1,012.40 | 12.47 |
P-Class | 1.75% | 5.00% | 1,000.00 | 1,016.12 | 8.75 |
Institutional Class | 1.50% | 5.00% | 1,000.00 | 1,017.36 | 7.50 |
1 | Annualized and excludes expenses of the underlying funds in which the Fund invests. |
2 | Expenses are equal to the Fund's annualized expense ratio, net of any applicable fee waivers, multiplied by the average account value over the period, multiplied by 181/365 (to reflect the one-half year period). |
3 | Actual cumulative return at net asset value for the period December 31, 2017 to June 30, 2018. |
8 | THE GUGGENHEIM FUNDS SEMI-ANNUAL REPORT | |
PERFORMANCE REPORT AND FUND PROFILE (Unaudited) | June 30, 2018 |
MANAGED FUTURES STRATEGY FUND
OBJECTIVE: Seeks to achieve positive absolute returns.
Consolidated Holdings Diversification (Market Exposure as % of Net Assets)
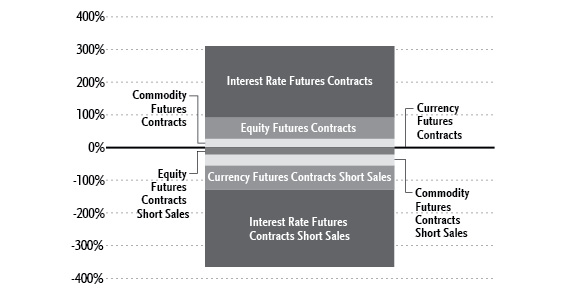
“Consolidated Holdings Diversification (Market Exposure as % of Net Assets)” excludes any temporary cash investments or investments in Guggenheim Strategy Funds Trust mutual funds. Investments in those Funds will significantly increase the portfolio’s exposure to certain other asset categories (and their associated risks), which may cause the Fund to deviate from its principal investment strategy, including: (i) high yield, high risk debt securities rated below the top four long-term rating categories by a nationally recognized statistical rating organization (also known as “junk bonds”); (ii) securities issued by the U.S. government or its agencies and instrumentalities; (iii) CLOs and similar investments; and (iv) other short-term fixed income securities.
Inception Dates: |
A-Class | March 2, 2007 |
C-Class | March 2, 2007 |
P-Class | March 2, 2007 |
Institutional Class | May 3, 2010 |
Largest Holdings (% of Total Net Assets) |
Guggenheim Strategy Fund III | 37.3% |
Guggenheim Strategy Fund II | 27.7% |
Guggenheim Strategy Fund I | 10.9% |
Total | 75.9% |
| | |
“Largest Holdings” excludes any temporary cash or derivative investments. |
| | THE GUGGENHEIM FUNDS SEMI-ANNUAL REPORT | 9 |
PERFORMANCE REPORT AND FUND PROFILE (Unaudited)(concluded) | June 30, 2018 |
Average Annual Returns*
Periods Ended June 30, 2018
| 6 Month† | 1 Year | 5 Year | 10 Year |
A-Class Shares | (2.92%) | 5.51% | (0.05%) | (2.57%) |
A-Class Shares with sales charge‡ | (7.54%) | 0.51% | (1.02%) | (3.04%) |
C-Class Shares | (3.26%) | 4.74% | (0.80%) | (3.30%) |
C-Class Shares with CDSC§ | (4.23%) | 3.75% | (0.80%) | (3.30%) |
P-Class Shares | (2.86%) | 5.56% | 0.00% | (2.54%) |
ICE BofA Merrill Lynch 3-Month U.S. Treasury Bill Index | 0.81% | 1.36% | 0.42% | 0.35% |
| | | | | |
| 6 Month† | 1 Year | 5 Year | Since
Inception
(05/03/10) |
Institutional Class Shares | (2.75%) | 5.84% | 0.20% | (1.95%) |
ICE BofA Merrill Lynch 3-Month U.S. Treasury Bill Index | 0.81% | 1.36% | 0.42% | 0.30% |
* | The performance data above represents past performance that is not predictive of future results. The investment return and principal value of an investment in the Fund will fluctuate so that an investor’s shares, when redeemed, may be worth more or less than their original cost. Returns are historical and include changes in principal and reinvested dividends and capital gains and do not reflect the effect of taxes. The ICE BofA Merrill Lynch 3-Month U.S. Treasury Bill Index is an unmanaged index and, unlike the Fund, has no management fees or operating expenses to reduce its reported return. |
† | 6 month returns are not annualized. |
‡ | Fund returns are calculated using the maximum sales charge of 4.75%. |
§ | Fund returns include a CDSC of 1% if redeemed within 12 months of purchase. |
10 | THE GUGGENHEIM FUNDS SEMI-ANNUAL REPORT | |
CONSOLIDATED SCHEDULE OF INVESTMENTS (Unaudited) | June 30, 2018 |
MANAGED FUTURES STRATEGY FUND | |
| | Shares | | | Value | |
| | | | | | | | | |
MUTUAL FUNDS† - 75.9% |
Guggenheim Strategy Fund III1 | | | 625,341 | | | $ | 15,627,265 | |
Guggenheim Strategy Fund II1 | | | 464,996 | | | | 11,620,259 | |
Guggenheim Strategy Fund I1 | | | 182,914 | | | | 4,580,156 | |
Total Mutual Funds | | | | | | | | |
(Cost $31,806,758) | | | | | | | 31,827,680 | |
| | | | | | | | | |
| | | Face
Amount | | | | | |
| | | | | | | | | |
U.S. TREASURY BILLS†† - 12.5% |
U.S. Treasury Bills | | | | | | | | |
1.72% due 07/12/182,3,4 | | $ | 5,271,000 | | | | 5,268,546 | |
Total U.S. Treasury Bills | | | | | | | | |
(Cost $5,268,125) | | | | | | | 5,268,546 | |
REPURCHASE AGREEMENTS††,5 - 12.4% |
JPMorgan Chase & Co.
issued 06/29/18 at 2.10%
due 07/02/18 | | | 2,854,039 | | | | 2,854,039 | |
Barclays Capital
issued 06/29/18 at 2.07%
due 07/02/18 | | | 1,401,468 | | | | 1,401,468 | |
Bank of America Merrill Lynch
issued 06/29/18 at 2.08%
due 07/02/18 | | | 934,312 | | | | 934,312 | |
Total Repurchase Agreements | | | | |
(Cost $5,189,819) | | | | | | | 5,189,819 | |
| | | | | | | | | |
Total Investments - 100.8% | | | | |
(Cost $42,264,702) | | | | | | $ | 42,286,045 | |
Other Assets & Liabilities, net - (0.8)% | | | (344,634 | ) |
Total Net Assets - 100.0% | | $ | 41,941,411 | |
Futures Contracts
Description | | Number of
Contracts | | | Expiration
Date | | | Notional
Amount | | | Value and
Unrealized
Gain (Loss) | |
Interest Rate Futures Contracts Purchased† | | | | | | | | | | | | | | | | |
Euro - OATS Futures Contracts†† | | | 75 | | | | Sep 2018 | | | $ | 13,509,458 | | | $ | 157,923 | |
Euro - Bund Futures Contracts | | | 34 | | | | Sep 2018 | | | | 6,448,248 | | | | 32,436 | |
U.S. Treasury Ultra Long Bond Futures Contracts | | | 12 | | | | Sep 2018 | | | | 1,912,125 | | | | 26,392 | |
Euro - Bobl Futures Contracts | | | 116 | | | | Sep 2018 | | | | 17,895,750 | | | | 26,152 | |
Australian Government 10 Year Bond Futures Contracts | | | 24 | | | | Sep 2018 | | | | 2,298,749 | | | | 14,679 | |
Euro - Schatz Futures Contracts | | | 323 | | | | Sep 2018 | | | | 42,272,116 | | | | 13,493 | |
Euro - 30 year Bond Futures Contracts | | | 5 | | | | Sep 2018 | | | | 1,035,614 | | | | 12,436 | |
Australian Government 3 Year Bond Futures Contracts | | | 24 | | | | Sep 2018 | | | | 1,977,766 | | | | 950 | |
Long Gilt Futures Contracts†† | | | 9 | | | | Sep 2018 | | | | 1,460,821 | | | | (505 | ) |
Canadian Government 10 Year Bond Futures Contracts†† | | | 29 | | | | Sep 2018 | | | | 3,014,643 | | | | (2,339 | ) |
| | | | | | | | | | | $ | 91,825,290 | | | $ | 281,617 | |
Commodity Futures Contracts Purchased† | | | | | | | | | | | | | | | | |
WTI Crude Futures Contracts | | | 25 | | | | Aug 2018 | | | $ | 1,857,500 | | | $ | 153,998 | |
Brent Crude Futures Contracts | | | 21 | | | | Sep 2018 | | | | 1,660,680 | | | | 51,713 | |
Cattle Feeder Futures Contracts | | | 7 | | | | Aug 2018 | | | | 529,637 | | | | 17,983 | |
SEE NOTES TO FINANCIAL STATEMENTS. | THE GUGGENHEIM FUNDS SEMI-ANNUAL REPORT | 11 |
CONSOLIDATED SCHEDULE OF INVESTMENTS (Unaudited)(continued) | June 30, 2018 |
MANAGED FUTURES STRATEGY FUND | |
Description | | Number of
Contracts | | | Expiration
Date | | | Notional
Amount | | | Value and
Unrealized
Gain (Loss) | |
Commodity Futures Contracts Purchased† (continued) | | | | | | | | | | | | | | | | |
Low Sulphur Gas Oil Futures Contracts | | | 14 | | | | Aug 2018 | | | $ | 947,450 | | | $ | 15,585 | |
Gasoline RBOB Futures Contracts | | | 9 | | | | Aug 2018 | | | | 811,642 | | | | 15,390 | |
Cocoa Futures Contracts | | | 14 | | | | Sep 2018 | | | | 350,980 | | | | 8,450 | |
Lean Hogs Futures Contracts | | | 11 | | | | Aug 2018 | | | | 336,050 | | | | 4,418 | |
NY Harbor ULSD Futures Contracts | | | 3 | | | | Aug 2018 | | | | 277,981 | | | | 2,347 | |
Gold 100 oz. Futures Contracts | | | 3 | | | | Aug 2018 | | | | 376,140 | | | | 1,301 | |
Sugar #11 Futures Contracts | | | 23 | | | | Oct 2018 | | | | 314,272 | | | | (3,420 | ) |
Copper Futures Contracts | | | 1 | | | | Sep 2018 | | | | 74,163 | | | | (7,674 | ) |
LME Primary Aluminum Futures Contracts | | | 4 | | | | Aug 2018 | | | | 212,700 | | | | (14,709 | ) |
Soybean Meal Futures Contracts | | | 19 | | | | Dec 2018 | | | | 625,480 | | | | (21,484 | ) |
Hard Red Winter Wheat Futures Contracts | | | 10 | | | | Sep 2018 | | | | 243,750 | | | | (33,785 | ) |
LME Nickel Futures Contracts | | | 10 | | | | Aug 2018 | | | | 891,930 | | | | (44,315 | ) |
LME Zinc Futures Contracts | | | 5 | | | | Aug 2018 | | | | 357,813 | | | | (44,668 | ) |
Cotton #2 Futures Contracts | | | 26 | | | | Dec 2018 | | | | 1,092,650 | | | | (75,510 | ) |
| | | | | | | | | | | $ | 10,960,818 | | | $ | 25,620 | |
Currency Futures Contracts Purchased† | | | | | | | | | | | | | | | | |
Canadian Dollar Futures Contracts | | | 1 | | | | Sep 2018 | | | $ | 76,160 | | | $ | 925 | |
New Zealand Dollar Futures Contracts | | | 1 | | | | Sep 2018 | | | | 67,730 | | | | (1,611 | ) |
Japanese Yen Futures Contracts | | | 5 | | | | Sep 2018 | | | | 567,469 | | | | (2,726 | ) |
| | | | | | | | | | | $ | 711,359 | | | $ | (3,412 | ) |
Equity Futures Contracts Purchased† | | | | | | | | | | | | | | | | |
SPI 200 Index Futures Contracts | | | 44 | | | | Sep 2018 | | | $ | 5,029,013 | | | $ | 74,023 | |
S&P/TSX 60 IX Index Futures Contracts | | | 11 | | | | Sep 2018 | | | | 1,612,895 | | | | 6,061 | |
MSCI Taiwan Stock Index Futures Contracts | | | 3 | | | | Jul 2018 | | | | 116,310 | | | | 140 | |
OMX Stockholm 30 Index Futures Contracts†† | | | 14 | | | | Jul 2018 | | | | 241,843 | | | | (1,679 | ) |
S&P MidCap 400 Index Mini Futures Contracts | | | 2 | | | | Sep 2018 | | | | 391,220 | | | | (4,433 | ) |
S&P 500 Index Mini Futures Contracts | | | 14 | | | | Sep 2018 | | | | 1,904,525 | | | | (10,517 | ) |
FTSE 100 Index Futures Contracts | | | 17 | | | | Sep 2018 | | | | 1,697,487 | | | | (20,228 | ) |
Russell 2000 Index Mini Futures Contracts | | | 27 | | | | Sep 2018 | | | | 2,223,045 | | | | (23,708 | ) |
Hang Seng Index Futures Contracts†† | | | 8 | | | | Jul 2018 | | | | 1,458,275 | | | | (30,512 | ) |
NASDAQ-100 Index Mini Futures Contracts | | | 17 | | | | Sep 2018 | | | | 2,401,165 | | | | (44,074 | ) |
CAC 40 10 Euro Index Futures Contracts | | | 29 | | | | Jul 2018 | | | | 1,794,383 | | | | (51,774 | ) |
Dow Jones Industrial Average Index Mini Futures Contracts | | | 22 | | | | Sep 2018 | | | | 2,668,600 | | | | (68,643 | ) |
Tokyo Stock Price Index Futures Contracts | | | 17 | | | | Sep 2018 | | | | 2,644,205 | | | | (78,600 | ) |
Amsterdam Index Futures Contracts | | | 24 | | | | Jul 2018 | | | | 3,077,067 | | | | (80,991 | ) |
| | | | | | | | | | | $ | 27,260,033 | | | $ | (334,935 | ) |
Commodity Futures Contracts Sold Short† | | | | | | | | | | | | | | | | |
Soybean Futures Contracts | | | 31 | | | | Nov 2018 | | | $ | 1,363,225 | | | $ | 74,429 | |
Corn Futures Contracts | | | 54 | | | | Sep 2018 | | | | 969,975 | | | | 60,487 | |
Soybean Oil Futures Contracts | | | 117 | | | | Dec 2018 | | | | 2,089,854 | | | | 55,977 | |
Coffee 'C' Futures Contracts | | | 27 | | | | Sep 2018 | | | | 1,163,363 | | | | 33,204 | |
Silver Futures Contracts | | | 6 | | | | Sep 2018 | | | | 484,350 | | | | 27,762 | |
Platinum Futures Contracts | | | 12 | | | | Oct 2018 | | | | 514,020 | | | | 20,854 | |
Wheat Futures Contracts | | | 15 | | | | Sep 2018 | | | | 376,500 | | | | 20,099 | |
12 | THE GUGGENHEIM FUNDS SEMI-ANNUAL REPORT | SEE NOTES TO FINANCIAL STATEMENTS. |
CONSOLIDATED SCHEDULE OF INVESTMENTS (Unaudited)(continued) | June 30, 2018 |
MANAGED FUTURES STRATEGY FUND | |
Description | | Number of
Contracts | | | Expiration
Date | | | Notional
Amount | | | Value and
Unrealized
Gain (Loss) | |
Commodity Futures Contracts Sold Short† (continued) | | | | | | | | | | | | | | | | |
Lean Hogs Futures Contracts | | | 16 | | | | Aug 2018 | | | $ | 488,800 | | | $ | 17,723 | |
Sugar #11 Futures Contracts | | | 22 | | | | Oct 2018 | | | | 300,608 | | | | 12,594 | |
LME Lead Futures Contracts | | | 8 | | | | Aug 2018 | | | | 482,150 | | | | 11,270 | |
LME Zinc Futures Contracts | | | 6 | | | | Aug 2018 | | | | 429,375 | | | | 6,824 | |
Hard Red Winter Wheat Futures Contracts | | | 3 | | | | Sep 2018 | | | | 73,125 | | | | 6,068 | |
Natural Gas Futures Contracts | | | 25 | | | | Aug 2018 | | | | 731,000 | | | | 4,567 | |
LME Primary Aluminum Futures Contracts | | | 2 | | | | Aug 2018 | | | | 106,350 | | | | 1,996 | |
Soybean Meal Futures Contracts | | | 2 | | | | Dec 2018 | | | | 65,840 | | | | 621 | |
Copper Futures Contracts | | | 2 | | | | Sep 2018 | | | | 148,325 | | | | (11 | ) |
Gold 100 oz. Futures Contracts | | | 7 | | | | Aug 2018 | | | | 877,660 | | | | (826 | ) |
Cattle Feeder Futures Contracts | | | 1 | | | | Aug 2018 | | | | 75,663 | | | | (3,841 | ) |
Low Sulphur Gas Oil Futures Contracts | | | 8 | | | | Aug 2018 | | | | 541,400 | | | | (7,963 | ) |
NY Harbor ULSD Futures Contracts | | | 8 | | | | Aug 2018 | | | | 741,283 | | | | (20,433 | ) |
Live Cattle Futures Contracts | | | 45 | | | | Aug 2018 | | | | 1,921,050 | | | | (58,752 | ) |
| | | | | | | | | | | $ | 13,943,916 | | | $ | 262,649 | |
Equity Futures Contracts Sold Short† | | | | | | | | | | | | | | | | |
DAX Index Futures Contracts | | | 6 | | | | Sep 2018 | | | $ | 2,148,937 | | | $ | 101,215 | |
IBEX 35 Index Futures Contracts†† | | | 25 | | | | Jul 2018 | | | | 2,783,877 | | | | 67,630 | |
HSCEI Index Futures Contracts†† | | | 15 | | | | Jul 2018 | | | | 1,035,897 | | | | 33,358 | |
S&P MidCap 400 Index Mini Futures Contracts | | | 3 | | | | Sep 2018 | | | | 586,830 | | | | 8,156 | |
Nikkei 225 (OSE) Index Futures Contracts | | | 3 | | | | Sep 2018 | | | | 602,114 | | | | 6,518 | |
Euro STOXX 50 Index Futures Contracts | | | 3 | | | | Sep 2018 | | | | 118,192 | | | | 3,066 | |
MSCI EAFE Index Mini Futures Contracts | | | 6 | | | | Sep 2018 | | | | 318,990 | | | | 1,635 | |
MSCI EAFE Index Mini Futures Contracts | | | 2 | | | | Sep 2018 | | | | 195,530 | | | | 37 | |
MSCI Taiwan Stock Index Futures Contracts | | | 6 | | | | Jul 2018 | | | | 232,620 | | | | (2,381 | ) |
FTSE/JSE TOP 40 Index Futures Contracts†† | | | 8 | | | | Sep 2018 | | | | 299,406 | | | | (3,153 | ) |
| | | | | | | | | | | $ | 8,322,393 | | | $ | 216,081 | |
Currency Futures Contracts Sold Short† | | | | | | | | | | | | | | | | |
Australian Dollar Futures Contracts | | | 153 | | | | Sep 2018 | | | $ | 11,326,590 | | | $ | 147,566 | |
Canadian Dollar Futures Contracts | | | 112 | | | | Sep 2018 | | | | 8,529,920 | | | | 46,143 | |
British Pound Futures Contracts | | | 68 | | | | Sep 2018 | | | | 5,628,275 | | | | 23,896 | |
Japanese Yen Futures Contracts | | | 11 | | | | Sep 2018 | | | | 1,248,431 | | | | 4,524 | |
Euro FX Futures Contracts | | | 21 | | | | Sep 2018 | | | | 3,082,800 | | | | (90 | ) |
Mexican Peso Futures Contracts | | | 58 | | | | Sep 2018 | | | | 1,442,170 | | | | (60,581 | ) |
| | | | | | | | | | | $ | 31,258,186 | | | $ | 161,458 | |
Interest Rate Futures Contracts Sold Short† | | | | | | | | | | | | | | | | |
U.S. Treasury 2 Year Note Futures Contracts | | | 159 | | | | Sep 2018 | | | $ | 33,683,156 | | | $ | 5,458 | |
Euro - BTP Italian Government Bond Futures Contracts†† | | | 2 | | | | Sep 2018 | | | | 297,034 | | | | 109 | |
Long Gilt Futures Contracts†† | | | 40 | | | | Sep 2018 | | | | 6,492,536 | | | | 59 | |
Canadian Government 10 Year Bond Futures Contracts†† | | | 7 | | | | Sep 2018 | | | | 727,672 | | | | (7,901 | ) |
U.S. Treasury Ultra Long Bond Futures Contracts | | | 6 | | | | Sep 2018 | | | | 956,063 | | | | (8,330 | ) |
Australian Government 10 Year Bond Futures Contracts | | | 82 | | | | Sep 2018 | | | | 7,854,060 | | | | (8,693 | ) |
U.S. Treasury Long Bond Futures Contracts | | | 18 | | | | Sep 2018 | | | | 2,607,750 | | | | (20,234 | ) |
Australian Government 3 Year Bond Futures Contracts | | | 101 | | | | Sep 2018 | | | | 8,323,100 | | | | (32,301 | ) |
SEE NOTES TO FINANCIAL STATEMENTS. | THE GUGGENHEIM FUNDS SEMI-ANNUAL REPORT | 13 |
CONSOLIDATED SCHEDULE OF INVESTMENTS (Unaudited)(continued) | June 30, 2018 |
MANAGED FUTURES STRATEGY FUND | |
| Description | | Number of
Contracts | | | Expiration
Date | | Notional
Amount | | | Value and
Unrealized
Loss | |
Interest Rate Futures Contracts Sold Short† (continued) | | | | | | | | | | | |
| U.S. Treasury 5 Year Note Futures Contracts | | | 208 | | | Sep 2018 | | $ | 23,629,125 | | | $ | (34,135 | ) |
| U.S. Treasury 10 Year Note Futures Contracts | | | 121 | | | Sep 2018 | | | 14,540,797 | | | | (37,264 | ) |
| | | | | | | | | $ | 99,111,293 | | | $ | (143,232 | ) |
† | Value determined based on Level 1 inputs, unless otherwise noted — See Note 4. |
†† | Value determined based on Level 2 inputs — See Note 4. |
1 | Affiliated issuer. |
2 | All or a portion of this security is pledged as futures collateral at June 30, 2018. |
3 | Rate indicated is the effective yield at the time of purchase. |
4 | Zero coupon rate security. |
5 | Repurchase Agreements — See Note 6. |
| | |
| | See Sector Classification in Other Information section. |
14 | THE GUGGENHEIM FUNDS SEMI-ANNUAL REPORT | SEE NOTES TO FINANCIAL STATEMENTS. |
CONSOLIDATED SCHEDULE OF INVESTMENTS (Unaudited)(continued) | June 30, 2018 |
MANAGED FUTURES STRATEGY FUND | |
The following table summarizes the inputs used to value the Fund’s investments at June 30, 2018 (See Note 4 in the Notes to Consolidated Financial Statements):
Investments in Securities (Assets) | | Level 1
Quoted
Prices | | | Level 2
Significant
Observable
Inputs | | | Level 3
Significant
Unobservable
Inputs | | | Total | |
Mutual Funds | | $ | 31,827,680 | | | $ | — | | | $ | — | | | $ | 31,827,680 | |
U.S. Treasury Bills | | | — | | | | 5,268,546 | | | | — | | | | 5,268,546 | |
Repurchase Agreements | | | — | | | | 5,189,819 | | | | — | | | | 5,189,819 | |
Interest Rate Futures Contracts* | | | 131,996 | | | | 158,091 | | | | — | | | | 290,087 | |
Commodity Futures Contracts* | | | 625,660 | | | | — | | | | — | | | | 625,660 | |
Currency Futures Contracts* | | | 223,054 | | | | — | | | | — | | | | 223,054 | |
Equity Futures Contracts* | | | 200,851 | | | | 100,988 | | | | — | | | | 301,839 | |
Total Assets | | $ | 33,009,241 | | | $ | 10,717,444 | | | $ | — | | | $ | 43,726,685 | |
| | | | | | | | | | | | | | | | |
Investments in Securities (Liabilities) | | Level 1
Quoted
Prices | | | Level 2
Significant
Observable
Inputs | | | Level 3
Significant
Unobservable
Inputs | | | Total | |
Commodity Futures Contracts* | | $ | 337,391 | | | $ | — | | | $ | — | | | $ | 337,391 | |
Equity Futures Contracts* | | | 385,349 | | | | 35,344 | | | | — | | | | 420,693 | |
Currency Futures Contracts* | | | 65,008 | | | | — | | | | — | | | | 65,008 | |
Interest Rate Futures Contracts* | | | 140,957 | | | | 10,745 | | | | — | | | | 151,702 | |
Total Liabilities | | $ | 928,705 | | | $ | 46,089 | | | $ | — | | | $ | 974,794 | |
* | | This derivative is reported as unrealized gain/loss at period end. |
Transfers between investment levels may occur as the markets fluctuate and/or the availability of data used in an investment’s valuation changes. Transfers between valuation levels, if any, are in comparison to the valuation levels at the end of the previous fiscal year, and are effective using the fair value as of the end of the current fiscal period.
For the period ended June 30, 2018, there were no transfers between levels.
SEE NOTES TO FINANCIAL STATEMENTS. | THE GUGGENHEIM FUNDS SEMI-ANNUAL REPORT | 15 |
CONSOLIDATED SCHEDULE OF INVESTMENTS (Unaudited)(concluded) | June 30, 2018 |
MANAGED FUTURES STRATEGY FUND | |
Affiliated Transactions
Investments representing 5% or more of the outstanding voting shares of a portfolio company of a fund, or control of or by, or common control under the Guggenheim Investments (“GI”), result in that portfolio company being considered an affiliated company of such fund, as defined in the 1940 Act.
The Fund may invest in certain of the underlying series of Guggenheim Strategy Funds Trust, including Guggenheim Strategy Fund I, Guggenheim Strategy Fund II and Guggenheim Strategy Fund III, (collectively, the “Cash Management Funds”), each of which are open-end management investment companies managed by GI. The Cash Management Funds, which launched on March 11, 2014, are offered as cash management options only to mutual funds, trusts, and other accounts managed by GI and/or its affiliates, and are not available to the public. The Cash Management Funds pay no investment management fees. The Cash Management Funds’ annual report on Form N-CSR dated September 30, 2017, is available publicly or upon request. This information is available from the EDGAR database on the SEC’s website at https://www.sec.gov/Archives/edgar/data/1601445/000089180417000715/gug72218.htm.
Transactions during the period ended June 30, 2018, in which the portfolio company is an “affiliated person”, were as follows:
Security Name | | Value
12/31/17 | | | Additions | | | Reductions | | | Realized
Gain (Loss) | | | Change in
Unrealized | | | Value
06/30/18 | | | Shares
06/30/18 | | | Investment
Income | |
Mutual Funds | | | | | | | | | | | | | | | | | | | | | | | | | | | | | | | | |
Guggenheim Strategy Fund I | | $ | 8,986,940 | | | $ | 1,098,267 | | | $ | (5,500,000 | ) | | $ | 1,907 | | | $ | (6,958 | ) | | $ | 4,580,156 | | | | 182,914 | | | $ | 98,339 | |
Guggenheim Strategy Fund II | | | 9,576,692 | | | | 3,154,077 | | | | (1,100,000 | ) | | | (44 | ) | | | (10,466 | ) | | | 11,620,259 | | | | 464,996 | | | | 153,582 | |
Guggenheim Strategy Fund III | | | 15,453,598 | | | | 192,457 | | | | — | | | | — | | | | (18,790 | ) | | | 15,627,265 | | | | 625,341 | | | | 191,870 | |
Exchange-Traded Fund | | | | | | | | | | | | | | | | | | | | | | | | | | | | | | | | |
Guggenheim Ultra Short Duration ETF | | | 5,435,176 | | | | — | | | | (5,439,795 | ) | | | 10,245 | | | | (5,626 | ) | | | — | | | | — | | | | — | |
| | | $ | 39,452,406 | | | $ | 4,444,801 | | | $ | (12,039,795 | ) | | $ | 12,108 | | | $ | (41,840 | ) | | $ | 31,827,680 | | | | | | | $ | 443,791 | |
16 | THE GUGGENHEIM FUNDS SEMI-ANNUAL REPORT | SEE NOTES TO FINANCIAL STATEMENTS. |
CONSOLIDATED STATEMENT OF ASSETS AND LIABILITIES (Unaudited) |
MANAGED FUTURES STRATEGY FUND |
June 30, 2018
Assets: |
Investments in unaffiliated issuers, at value (cost $5,268,125) | | $ | 5,268,546 | |
Investments in affiliated issuers, at value (cost $31,806,758) | | | 31,827,680 | |
Repurchase agreements, at value (cost $5,189,819) | | | 5,189,819 | |
Foreign currency, at value (cost $44,799) | | | 44,815 | |
Segregated cash with broker | | | 96,662 | |
Receivables: |
Dividends | | | 79,084 | |
Fund shares sold | | | 12,502 | |
Interest | | | 602 | |
Total assets | | | 42,519,710 | |
| | | | | |
Liabilities: |
Overdraft due to custodian bank | | | 38,307 | |
Payable for: |
Variation margin on futures contracts | | | 281,732 | |
Securities purchased | | | 81,761 | |
Fund shares redeemed | | | 80,250 | |
Management fees | | | 31,234 | |
Distribution and service fees | | | 11,259 | |
Transfer agent and administrative fees | | | 8,672 | |
Portfolio accounting fees | | | 3,469 | |
Trustees’ fees* | | | 1,117 | |
Miscellaneous | | | 40,498 | |
Total liabilities | | | 578,299 | |
Commitments and contingent liabilities (Note 12) | | | — | |
Net assets | | $ | 41,941,411 | |
| | | | | |
Net assets consist of: |
Paid in capital | | | 129,781,727 | |
Accumulated net investment loss | | | (15,623,731 | ) |
Accumulated net realized loss on investments | | | (72,703,868 | ) |
Net unrealized appreciation on investments | | | 487,283 | |
Net assets | | $ | 41,941,411 | |
| | | | | |
A-Class: |
Net assets | | $ | 6,609,012 | |
Capital shares outstanding | | | 354,702 | |
Net asset value per share | | $ | 18.63 | |
Maximum offering price per share (Net asset value divided by 95.25%) | | $ | 19.56 | |
| | | | | |
C-Class: |
Net assets | | $ | 7,107,055 | |
Capital shares outstanding | | | 420,011 | |
Net asset value per share | | $ | 16.92 | |
| | | | | |
P-Class: |
Net assets | | $ | 19,159,398 | |
Capital shares outstanding | | | 1,025,802 | |
Net asset value per share | | $ | 18.68 | |
| | | | | |
Institutional Class: |
Net assets | | $ | 9,065,946 | |
Capital shares outstanding | | | 475,430 | |
Net asset value per share | | $ | 19.07 | |
* | Relates to Trustees not deemed “interested persons” within the meaning of Section 2(a)(19) of the 1940 Act. |
SEE NOTES TO FINANCIAL STATEMENTS. | THE GUGGENHEIM FUNDS SEMI-ANNUAL REPORT | 17 |
CONSOLIDATED STATEMENT OF OPERATIONS (Unaudited) |
MANAGED FUTURES STRATEGY FUND |
Period Ended June 30, 2018
Investment Income: |
Dividends from securities of affiliated issuers | | $ | 443,791 | |
Interest | | | 86,629 | |
Income from securities lending, net | | | 5,529 | |
Total investment income | | | 535,949 | |
| | | | | |
Expenses: |
Management fees | | | 228,748 | |
Distribution and service fees: |
A-Class | | | 10,515 | |
C-Class | | | 38,934 | |
P-Class | | | 26,695 | |
Transfer agent and administrative fees | | | 59,824 | |
Registration fees | | | 29,719 | |
Portfolio accounting fees | | | 23,930 | |
Trustees’ fees* | | | 5,189 | |
Custodian fees | | | 3,192 | |
Miscellaneous | | | 22,655 | |
Total expenses | | | 449,401 | |
Less: |
Expenses waived by Adviser | | | (13,895 | ) |
Net expenses | | | 435,506 | |
Net investment income | | | 100,443 | |
| | | | | |
Net Realized and Unrealized Gain (Loss): |
Net realized gain (loss) on: |
Investments in affiliated issuers | | | 12,108 | |
Futures contracts | | | (871,006 | ) |
Foreign currency transactions | | | 15,947 | |
Net realized loss | | | (842,951 | ) |
Net change in unrealized appreciation (depreciation) on: |
Investments in unaffiliated issuers | | | 1,239 | |
Investments in affiliated issuers | | | (41,840 | ) |
Futures contracts | | | (598,057 | ) |
Foreign currency translations | | | 358 | |
Net change in unrealized appreciation (depreciation) | | | (638,300 | ) |
Net realized and unrealized loss | | | (1,481,251 | ) |
Net decrease in net assets resulting from operations | | $ | (1,380,808 | ) |
* | Relates to Trustees not deemed “interested persons” within the meaning of Section 2(a)(19) of the 1940 Act. |
18 | THE GUGGENHEIM FUNDS SEMI-ANNUAL REPORT | SEE NOTES TO FINANCIAL STATEMENTS. |
CONSOLIDATED STATEMENTS OF CHANGES IN NET ASSETS |
MANAGED FUTURES STRATEGY FUND | |
| | Period Ended
June 30,
2018
(Unaudited) | | | Year Ended
December 31,
2017 | |
Increase (Decrease) in Net Assets from Operations: | | | | | | | | |
Net investment income | | $ | 100,443 | | | $ | 125,726 | |
Net realized gain (loss) on investments | | | (842,951 | ) | | | 6,212,574 | |
Net change in unrealized appreciation (depreciation) on investments | | | (638,300 | ) | | | (2,006,590 | ) |
Net increase (decrease) in net assets resulting from operations | | | (1,380,808 | ) | | | 4,331,710 | |
| | | | | | | | | |
Distributions to shareholders from: | | | | | | | | |
Net investment income | | | | | | | | |
A-Class | | | — | | | | (493,552 | ) |
C-Class | | | — | | | | (399,421 | ) |
P-Class | | | — | | | | (991,652 | ) |
Institutional Class | | | — | | | | (452,612 | ) |
Total distributions to shareholders | | | — | | | | (2,337,237 | ) |
| | | | | | | | | |
Capital share transactions: | | | | | | | | |
Proceeds from sale of shares | | | | | | | | |
A-Class | | | 135,654 | | | | 1,330,048 | |
C-Class | | | 375,211 | | | | 468,001 | |
P-Class | | | 4,047,761 | | | | 9,193,253 | |
Institutional Class | | | 2,936,197 | | | | 7,382,823 | |
Distributions reinvested | | | | | | | | |
A-Class | | | — | | | | 461,064 | |
C-Class | | | — | | | | 387,451 | |
P-Class | | | — | | | | 938,994 | |
Institutional Class | | | — | | | | 452,127 | |
Cost of shares redeemed | | | | | | | | |
A-Class | | | (3,977,472 | ) | | | (14,404,320 | ) |
C-Class | | | (1,271,387 | ) | | | (4,014,402 | ) |
P-Class | | | (5,647,226 | ) | | | (67,689,687 | ) |
Institutional Class | | | (3,896,602 | ) | | | (3,868,163 | ) |
Net decrease from capital share transactions | | | (7,297,864 | ) | | | (69,362,811 | ) |
Net decrease in net assets | | | (8,678,672 | ) | | | (67,368,338 | ) |
| | | | | | | | | |
Net assets: | | | | | | | | |
Beginning of period | | | 50,620,083 | | | | 117,988,421 | |
End of period | | $ | 41,941,411 | | | $ | 50,620,083 | |
Accumulated net investment loss at end of period | | $ | (15,623,731 | ) | | $ | (15,724,174 | ) |
SEE NOTES TO FINANCIAL STATEMENTS. | THE GUGGENHEIM FUNDS SEMI-ANNUAL REPORT | 19 |
CONSOLIDATED STATEMENTS OF CHANGES IN NET ASSETS (concluded) |
MANAGED FUTURES STRATEGY FUND | |
| | Period Ended
June 30,
2018
(Unaudited) | | | Year Ended
December 31,
2017 | |
Capital share activity: | | | | | | | | |
Shares sold | | | | | | | | |
A-Class | | | 6,900 | | | | 69,574 | |
C-Class | | | 21,000 | | | | 26,149 | |
P-Class | | | 204,279 | | | | 484,607 | |
Institutional Class | | | 151,109 | | | | 379,958 | |
Shares issued from reinvestment of distributions | | | | | | | | |
A-Class | | | — | | | | 24,127 | |
C-Class | | | — | | | | 22,229 | |
P-Class | | | — | | | | 48,992 | |
Institutional Class | | | — | | | | 23,139 | |
Shares redeemed | | | | | | | | |
A-Class | | | (205,722 | ) | | | (755,054 | ) |
C-Class | | | (71,767 | ) | | | (229,159 | ) |
P-Class | | | (292,399 | ) | | | (3,580,641 | ) |
Institutional Class | | | (202,777 | ) | | | (198,586 | ) |
Net decrease in shares | | | (389,377 | ) | | | (3,684,665 | ) |
20 | THE GUGGENHEIM FUNDS SEMI-ANNUAL REPORT | SEE NOTES TO FINANCIAL STATEMENTS. |
CONSOLIDATED FINANCIAL HIGHLIGHTS |
MANAGED FUTURES STRATEGY FUND | |
This table is presented to show selected data for a share outstanding throughout each period and to assist shareholders in evaluating a Fund’s performance for the periods presented.
A-Class | | Period
Ended
June 30,
2018a | | | Year
Ended
Dec. 31,
2017 | | | Year
Ended
Dec. 31,
2016 | | | Year
Ended
Dec. 31,
2015 | | | Year
Ended
Dec. 31,
2014 | | | Year
Ended
Dec. 31,
2013 | |
Per Share Data | | | | | | | | | | | | | | | | | | | | | | | | |
Net asset value, beginning of period | | $ | 19.19 | | | $ | 18.71 | | | $ | 23.21 | | | $ | 24.12 | | | $ | 22.15 | | | $ | 21.23 | |
Income (loss) from investment operations: |
Net investment income (loss)b | | | .05 | | | | .04 | | | | — | c | | | (.14 | ) | | | .02 | | | | (.19 | ) |
Net gain (loss) on investments (realized and unrealized) | | | (.61 | ) | | | 1.34 | | | | (3.53 | ) | | | (.15 | ) | | | 2.23 | | | | 1.11 | |
Total from investment operations | | | (.56 | ) | | | 1.38 | | | | (3.53 | ) | | | (.29 | ) | | | 2.25 | | | | .92 | |
Less distributions from: |
Net investment income | | | — | | | | (.90 | ) | | | (.97 | ) | | | (.62 | ) | | | (.28 | ) | | | — | |
Total distributions | | | — | | | | (.90 | ) | | | (.97 | ) | | | (.62 | ) | | | (.28 | ) | | | — | |
Net asset value, end of period | | $ | 18.63 | | | $ | 19.19 | | | $ | 18.71 | | | $ | 23.21 | | | $ | 24.12 | | | $ | 22.15 | |
|
Total Returnd | | | (2.92 | %) | | | 7.41 | % | | | (15.18 | %) | | | (1.06 | %) | | | 10.06 | % | | | 4.33 | % |
Ratios/Supplemental Data |
Net assets, end of period (in thousands) | | $ | 6,609 | | | $ | 10,621 | | | $ | 22,734 | | | $ | 27,828 | | | $ | 27,514 | | | $ | 76,900 | |
Ratios to average net assets: |
Net investment income (loss) | | | 0.48 | % | | | 0.21 | % | | | (0.02 | %) | | | (0.57 | %) | | | 0.07 | % | | | (0.89 | %) |
Total expensese | | | 1.81 | % | | | 1.78 | % | | | 1.84 | % | | | 1.77 | % | | | 1.74 | % | | | 1.74 | % |
Net expensesf | | | 1.75 | % | | | 1.72 | % | | | 1.76 | % | | | 1.69 | % | | | 1.68 | % | | | 1.67 | % |
Portfolio turnover rate | | | 12 | % | | | 68 | % | | | 16 | % | | | 24 | % | | | 83 | % | | | 102 | % |
SEE NOTES TO FINANCIAL STATEMENTS. | THE GUGGENHEIM FUNDS SEMI-ANNUAL REPORT | 21 |
CONSOLIDATED FINANCIAL HIGHLIGHTS (continued) |
MANAGED FUTURES STRATEGY FUND | |
This table is presented to show selected data for a share outstanding throughout each period and to assist shareholders in evaluating a Fund’s performance for the periods presented.
C-Class | | Period
Ended
June 30,
2018a | | | Year
Ended
Dec. 31,
2017 | | | Year
Ended
Dec. 31,
2016 | | | Year
Ended
Dec. 31,
2015 | | | Year
Ended
Dec. 31,
2014 | | | Year
Ended
Dec. 31,
2013 | |
Per Share Data | | | | | | | | | | | | | | | | | | | | | | | | |
Net asset value, beginning of period | | $ | 17.49 | | | $ | 17.26 | | | $ | 21.65 | | | $ | 22.71 | | | $ | 21.04 | | | $ | 20.31 | |
Income (loss) from investment operations: |
Net investment income (loss)b | | | (.02 | ) | | | (.10 | ) | | | (.16 | ) | | | (.30 | ) | | | (.15 | ) | | | (.33 | ) |
Net gain (loss) on investments (realized and unrealized) | | | (.55 | ) | | | 1.23 | | | | (3.26 | ) | | | (.14 | ) | | | 2.10 | | | | 1.06 | |
Total from investment operations | | | (.57 | ) | | | 1.13 | | | | (3.42 | ) | | | (.44 | ) | | | 1.95 | | | | .73 | |
Less distributions from: |
Net investment income | | | — | | | | (.90 | ) | | | (.97 | ) | | | (.62 | ) | | | (.28 | ) | | | — | |
Total distributions | | | — | | | | (.90 | ) | | | (.97 | ) | | | (.62 | ) | | | (.28 | ) | | | — | |
Net asset value, end of period | | $ | 16.92 | | | $ | 17.49 | | | $ | 17.26 | | | $ | 21.65 | | | $ | 22.71 | | | $ | 21.04 | |
| |
Total Returnd | | | (3.26 | %) | | | 6.64 | % | | | (15.81 | %) | | | (1.84 | %) | | | 9.22 | % | | | 3.59 | % |
Ratios/Supplemental Data |
Net assets, end of period (in thousands) | | $ | 7,107 | | | $ | 8,234 | | | $ | 11,245 | | | $ | 21,272 | | | $ | 24,066 | | | $ | 29,637 | |
Ratios to average net assets: |
Net investment income (loss) | | | (0.26 | %) | | | (0.56 | %) | | | (0.81 | %) | | | (1.32 | %) | | | (0.72 | %) | | | (1.63 | %) |
Total expensese | | | 2.56 | % | | | 2.53 | % | | | 2.61 | % | | | 2.52 | % | | | 2.50 | % | | | 2.48 | % |
Net expensesf | | | 2.50 | % | | | 2.47 | % | | | 2.54 | % | | | 2.44 | % | | | 2.43 | % | | | 2.42 | % |
Portfolio turnover rate | | | 12 | % | | | 68 | % | | | 16 | % | | | 24 | % | | | 83 | % | | | 102 | % |
22 | THE GUGGENHEIM FUNDS SEMI-ANNUAL REPORT | SEE NOTES TO FINANCIAL STATEMENTS. |
CONSOLIDATED FINANCIAL HIGHLIGHTS (continued) |
MANAGED FUTURES STRATEGY FUND |
This table is presented to show selected data for a share outstanding throughout each period and to assist shareholders in evaluating a Fund’s performance for the periods presented.
P-Class | | Period
Ended
June 30,
2018a | | | Year
Ended
Dec. 31,
2017 | | | Year
Ended
Dec. 31,
2016 | | | Year
Ended
Dec. 31,
2015 | | | Year
Ended
Dec. 31,
2014 | | | Year
Ended
Dec. 31,
2013 | |
Per Share Data | | | | | | | | | | | | | | | | | | | | | | | | |
Net asset value, beginning of period | | $ | 19.23 | | | $ | 18.71 | | | $ | 23.20 | | | $ | 24.11 | | | $ | 22.15 | | | $ | 21.23 | |
Income (loss) from investment operations: |
Net investment income (loss)b | | | .05 | | | | .06 | | | | (.01 | ) | | | (.14 | ) | | | — | c | | | (.20 | ) |
Net gain (loss) on investments (realized and unrealized) | | | (.60 | ) | | | 1.36 | | | | (3.51 | ) | | | (.15 | ) | | | 2.24 | | | | 1.12 | |
Total from investment operations | | | (.55 | ) | | | 1.42 | | | | (3.52 | ) | | | (.29 | ) | | | 2.24 | | | | .92 | |
Less distributions from: |
Net investment income | | | — | | | | (.90 | ) | | | (.97 | ) | | | (.62 | ) | | | (.28 | ) | | | — | |
Total distributions | | | — | | | | (.90 | ) | | | (.97 | ) | | | (.62 | ) | | | (.28 | ) | | | — | |
Net asset value, end of period | | $ | 18.68 | | | $ | 19.23 | | | $ | 18.71 | | | $ | 23.20 | | | $ | 24.11 | | | $ | 22.15 | |
|
Total Returnd | | | (2.86 | %) | | | 7.68 | % | | | (15.18 | %) | | | (1.06 | %) | | | 10.06 | % | | | 4.33 | % |
Ratios/Supplemental Data |
Net assets, end of period (in thousands) | | $ | 19,159 | | | $ | 21,426 | | | $ | 77,859 | | | $ | 165,086 | | | $ | 180,872 | | | $ | 191,400 | |
Ratios to average net assets: |
Net investment income (loss) | | | 0.49 | % | | | 0.29 | % | | | (0.07 | %) | | | (0.57 | %) | | | 0.01 | % | | | (0.94 | %) |
Total expensese | | | 1.81 | % | | | 1.78 | % | | | 1.87 | % | | | 1.77 | % | | | 1.75 | % | | | 1.75 | % |
Net expensesf | | | 1.75 | % | | | 1.72 | % | | | 1.79 | % | | | 1.69 | % | | | 1.68 | % | | | 1.68 | % |
Portfolio turnover rate | | | 12 | % | | | 68 | % | | | 16 | % | | | 24 | % | | | 83 | % | | | 102 | % |
SEE NOTES TO FINANCIAL STATEMENTS. | THE GUGGENHEIM FUNDS SEMI-ANNUAL REPORT | 23 |
CONSOLIDATED FINANCIAL HIGHLIGHTS (concluded) |
MANAGED FUTURES STRATEGY FUND |
This table is presented to show selected data for a share outstanding throughout each period and to assist shareholders in evaluating a Fund’s performance for the periods presented.
Institutional Class | | Period
Ended
June 30,
2018a | | | Year
Ended
Dec. 31,
2017 | | | Year
Ended
Dec. 31,
2016 | | | Year
Ended
Dec. 31,
2015 | | | Year
Ended
Dec. 31,
2014 | | | Year
Ended
Dec. 31,
2013 | |
Per Share Data | | | | | | | | | | | | | | | | | | | | | | | | |
Net asset value, beginning of period | | $ | 19.61 | | | $ | 19.07 | | | $ | 23.56 | | | $ | 24.41 | | | $ | 22.36 | | | $ | 21.38 | |
Income (loss) from investment operations: |
Net investment income (loss)b | | | .07 | | | | .08 | | | | .04 | | | | (.08 | ) | | | .05 | | | | (.19 | ) |
Net gain (loss) on investments (realized and unrealized) | | | (.61 | ) | | | 1.36 | | | | (3.56 | ) | | | (.15 | ) | | | 2.28 | | | | 1.17 | |
Total from investment operations | | | (.54 | ) | | | 1.44 | | | | (3.52 | ) | | | (.23 | ) | | | 2.33 | | | | .98 | |
Less distributions from: |
Net investment income | | | — | | | | (.90 | ) | | | (.97 | ) | | | (.62 | ) | | | (.28 | ) | | | — | |
Total distributions | | | — | | | | (.90 | ) | | | (.97 | ) | | | (.62 | ) | | | (.28 | ) | | | — | |
Net asset value, end of period | | $ | 19.07 | | | $ | 19.61 | | | $ | 19.07 | | | $ | 23.56 | | | $ | 24.41 | | | $ | 22.36 | |
| |
Total Returnd | | | (2.75 | %) | | | 7.69 | % | | | (14.95 | %) | | | (0.80 | %) | | | 10.28 | % | | | 4.63 | % |
Ratios/Supplemental Data |
Net assets, end of period (in thousands) | | $ | 9,066 | | | $ | 10,339 | | | $ | 6,151 | | | $ | 9,029 | | | $ | 11,007 | | | $ | 2,464 | |
Ratios to average net assets: |
Net investment income (loss) | | | 0.74 | % | | | 0.41 | % | | | 0.20 | % | | | (0.32 | %) | | | 0.21 | % | | | (0.86 | %) |
Total expensese | | | 1.56 | % | | | 1.53 | % | | | 1.61 | % | | | 1.52 | % | | | 1.50 | % | | | 1.52 | % |
Net expensesf | | | 1.50 | % | | | 1.46 | % | | | 1.54 | % | | | 1.44 | % | | | 1.44 | % | | | 1.45 | % |
Portfolio turnover rate | | | 12 | % | | | 68 | % | | | 16 | % | | | 24 | % | | | 83 | % | | | 102 | % |
a | Unaudited figures for the period ended June 30, 2018. Percentage amounts for the period, except total return and portfolio turnover rate, have been annualized. |
b | Net investment income (loss) per share was computed using average shares outstanding throughout the period. |
c | Net investment income is less than $0.01 per share. |
d | Total return does not reflect the impact of any applicable sales charges. |
e | Does not include expenses of the underlying funds in which the Fund invests. |
f | Net expense information reflects the expense ratios after expense waivers. |
24 | THE GUGGENHEIM FUNDS SEMI-ANNUAL REPORT | SEE NOTES TO FINANCIAL STATEMENTS. |
NOTES TO CONSOLIDATED FINANCIAL STATEMENTS (Unaudited) |
Note 1 – Organization, Consolidation of Subsidiary and Significant Accounting Policies
Organization
The Rydex Series Funds (the “Trust”), a Delaware statutory trust, is registered with the SEC under the Investment Company Act of 1940 (“1940 Act”), as an open-ended investment company of the series type. Each series, in effect, is representing a separate Fund. The Trust is authorized to issue an unlimited number of no par value shares. The Trust accounts for the assets of each fund separately.
The Trust offers a combination of seven separate classes of shares: Investor Class shares, A-Class shares, C-Class shares, H-Class shares, P-Class shares, Institutional Class shares and Money Market Class shares. Sales of shares of each Class are made without a front-end sales charge at the net asset value per share (“NAV”), with the exception of A-Class shares. A-Class shares are sold at the NAV, plus the applicable front-end sales charge. The sales charge varies depending on the amount purchased, but will not exceed 4.75%. A-Class share purchases of $1 million or more are exempt from the front-end sales charge but have a 1% contingent deferred sales charge (“CDSC”) if shares are redeemed within 12 months of purchase. C-Class shares have a 1% CDSC if shares are redeemed within 12 months of purchase. Institutional Class shares are offered primarily for direct investment by institutions such as pension and profit sharing plans, endowments, foundations and corporations. Institutional Class shares require a minimum initial investment of $2 million and a minimum account balance of $1 million. At June 30, 2018, the Trust consisted of fifty-three funds (the “Funds”).
This report covers the Managed Futures Strategy Fund (the “Fund”), a non-diversified investment company. Only A-Class, C-Class, P-Class and Institutional Class shares had been issued by the Fund.
Security Investors, LLC which operates under the name Guggenheim Investments (“GI”), provides advisory services. Guggenheim Funds Distributors, LLC (“GFD”) acts as principal underwriter for the Trust. GI and GFD are affiliated entities.
Consolidation of Subsidiary
The consolidated financial statements of the Fund include the accounts of a wholly-owned and controlled Cayman Islands subsidiary (the “Subsidiary”). Significant inter-company accounts and transactions have been eliminated in consolidation for the Fund.
The Fund may invest up to 25% of its total assets in its Subsidiary which acts as an investment vehicle in order to effect certain investments consistent with the Fund’s investment objective and policies.
| | THE GUGGENHEIM FUNDS SEMI-ANNUAL REPORT | 25 |
NOTES TO CONSOLIDATED FINANCIAL STATEMENTS (Unaudited)(continued) |
A summary of the Fund’s investment in its Subsidiary is as follows:
| | Inception
Date of
Subsidiary | | | Subsidiary
Net Assets at
June 30, 2018 | | | % of Net Assets
of the Fund at
June 30, 2018 | |
| | | | 05/01/08 | | | $ | 3,806,770 | | | | 9.1 | % |
Significant Accounting Policies
The Fund operates as an investment company and, accordingly, follows the investment company accounting and reporting guidance of the Financial Accounting Standards Board (“FASB”) Accounting Standards Codification Topic 946 Financial Services – Investment Companies.
The following significant accounting policies are in conformity with U.S. generally accepted accounting principles (“U.S. GAAP”) and are consistently followed by the Trust. This requires management to make estimates and assumptions that affect the reported amount of assets and liabilities, contingent assets and liabilities at the date of the financial statements, and the reported amounts of revenues and expenses during the reporting period. Actual results could differ from these estimates. All time references are based on Eastern Time.
The NAV of each Class of the Fund is calculated by dividing the market value of the Fund’s securities and other assets, less all liabilities, attributable to the Class by the number of outstanding shares of the Class.
(a) Valuation of Investments
The Board of Trustees of the Fund (the “Board”) has adopted policies and procedures for the valuation of the Fund’s investments (the “Valuation Procedures”). Pursuant to the Valuation Procedures, the Board has delegated to a valuation committee, consisting of representatives from Guggenheim’s investment management, fund administration, legal and compliance departments (the “Valuation Committee”), the day-to-day responsibility for implementing the Valuation Procedures, including, under most circumstances, the responsibility for determining the fair value of the Fund’s securities and/or other assets.
Valuations of the Fund’s securities are supplied primarily by pricing services appointed pursuant to the processes set forth in the Valuation Procedures. The Valuation Committee convenes monthly, or more frequently as needed, to review the valuation of all assets which have been fair valued for reasonableness. The Fund’s officers, through the Valuation Committee and consistent with the monitoring and review responsibilities set forth in the Valuation Procedures, regularly review procedures used and valuations provided by the pricing services.
If the pricing service cannot or does not provide a valuation for a particular investment or such valuation is deemed unreliable, such investment is fair valued by the Valuation Committee.
26 | THE GUGGENHEIM FUNDS SEMI-ANNUAL REPORT | |
NOTES TO CONSOLIDATED FINANCIAL STATEMENTS (Unaudited)(continued) |
Open-end investment companies (“mutual funds”) are valued at their NAV as of the close of business, on the valuation date. Exchange-traded funds (“ETFs”) are valued at the last quoted sales price.
U.S. Government securities are valued by either independent pricing services, the last traded fill price, or at the reported bid price at the close of business.
Debt securities with a maturity of greater than 60 days at acquisition are valued at prices that reflect broker-dealer supplied valuations or are obtained from independent pricing services, which may consider the trade activity, treasury spreads, yields or price of bonds of comparable quality, coupon, maturity, and type, as well as prices quoted by dealers who make markets in such securities. Short-term debt securities with a maturity of 60 days or less at acquisition are valued at amortized cost, provided such amount approximates market value. Money market funds are valued at their NAV.
Repurchase agreements are valued at amortized cost, provided such amounts approximate market value.
The value of futures contracts is accounted for using the unrealized gain or loss on the contracts that is determined by marking the contracts to their current realized settlement prices. Financial futures contracts are valued at the 4:00 p.m. price on the valuation date. In the event that the exchange for a specific futures contract closes earlier than 4:00 p.m., the futures contract is valued at the Official Settlement Price of the exchange. However, the underlying securities from which the futures contract value is derived are monitored until 4:00 p.m. to determine if fair valuation would provide a more accurate valuation.
Investments for which market quotations are not readily available are fair valued as determined in good faith by GI, subject to review and approval by the Valuation Committee, pursuant to methods established or ratified by the Board. Valuations in accordance with these methods are intended to reflect each security’s (or asset’s or liability’s) “fair value”. Each such determination is based on a consideration of all relevant factors, which are likely to vary from one pricing context to another. Examples of such factors may include, but are not limited to market prices; sale prices; broker quotes; and models which derive prices based on inputs such as prices of securities with comparable maturities and characteristics, or based on inputs such as anticipated cash flows or collateral, spread over Treasuries, and other information analysis.
In connection with futures contracts and other derivative investments, such factors may include obtaining information as to how (a) these contracts and other derivative investments trade in the futures or other derivative markets, respectively, and (b) the securities underlying these contracts and other derivative investments trade in the cash market.
| | THE GUGGENHEIM FUNDS SEMI-ANNUAL REPORT | 27 |
NOTES TO CONSOLIDATED FINANCIAL STATEMENTS (Unaudited)(continued) |
(b) U.S. Government and Agency Obligations
Certain U.S. Government and Agency Obligations are traded on a discount basis; the interest rates shown on the Schedule of Investments reflect the effective rates paid at the time of purchase by the Fund. Other securities bear interest at the rates shown, payable at fixed dates through maturity.
(c) Futures Contracts
Upon entering into a futures contract, the Fund deposits and maintains as collateral such initial margin as required by the exchange on which the transaction is affected. Pursuant to the contract, the Fund agrees to receive from or pay to the broker an amount of cash equal to the daily fluctuation in value of the contract. Such receipts or payments are known as variation margin and are recorded by the Fund as unrealized gains or losses. When the contract is closed, the Fund records a realized gain or loss equal to the difference between the value of the contract at the time it was opened and the value at the time it was closed.
(d) Currency Translations
The accounting records of the Fund are maintained in U.S. dollars. All assets and liabilities initially expressed in foreign currencies are converted into U.S. dollars at prevailing exchange rates. Purchases and sales of investment securities, dividend and interest income, and certain expenses are translated at the rates of exchange prevailing on the respective dates of such transactions.
Changes in the relationship of these foreign currencies to the U.S. dollar can significantly affect the value of the investments and earnings of the Fund. Foreign investments may also subject the Fund to foreign government exchange restrictions, expropriation, taxation, or other political, social or economic developments, all of which could affect the market and/or credit risk of the investments.
The Fund does not isolate that portion of the results of operations resulting from changes in the foreign exchange rates on investments from the fluctuations arising from changes in the market prices of securities held. Such fluctuations are included with the net realized and unrealized gain or loss on investments.
Reported net realized foreign exchange gains and losses arise from sales of foreign currencies and currency gains or losses realized between the trade and settlement dates on investment transactions. Net unrealized exchange gains and losses arise from changes in the fair values of assets and liabilities other than investments in securities at the fiscal period end, resulting from changes in exchange rates.
(e) Security Transactions
Security transactions are recorded on the trade date for financial reporting purposes. Realized gains and losses from securities transactions are recorded using the identified cost basis. Proceeds from lawsuits related to investment holdings are recorded as realized gains in the
28 | THE GUGGENHEIM FUNDS SEMI-ANNUAL REPORT | |
NOTES TO CONSOLIDATED FINANCIAL STATEMENTS (Unaudited)(continued) |
Fund. Dividend income is recorded on the ex-dividend date, net of applicable taxes withheld by foreign countries. Taxable non-cash dividends are recorded as dividend income. Interest income, including amortization of premiums and accretion of discounts, is accrued on a daily basis. Dividend income from Real Estate Investment Trusts (“REITs”) is recorded based on the income included in the distributions received from the REIT investments using published REIT classifications, including some management estimates when actual amounts are not available. Distributions received in excess of this estimated amount are recorded as a reduction of the cost of investments or reclassified to capital gains. The actual amounts of income, return of capital, and capital gains are only determined by each REIT after its fiscal year-end, and may differ from the estimated amounts.
(f) Distributions
Distributions of net investment income and net realized gains, if any, are declared and paid at least annually. Dividends are reinvested in additional shares unless shareholders request payment in cash. Distributions are recorded on the ex-dividend date and are determined in accordance with income tax regulations which may differ from U.S. GAAP.
(g) Class Allocations
Interest and dividend income, most expenses, all realized gains and losses, and all unrealized gains and losses are allocated to the classes based upon the value of the outstanding shares in each Class. Certain costs, such as distribution and service fees are charged directly to specific classes. In addition, certain expenses have been allocated to the individual Funds in the Trust on a pro rata basis upon the respective aggregate net assets of each Fund included in the Trust.
(h) Cash
The Fund may leave cash overnight in its cash account with the custodian. Periodically, the Fund may have cash due to the custodian bank as an overdraft balance. A fee is incurred on this overdraft, calculated by multiplying the overdraft by a rate based on the federal funds rate, which was 1.91% at June 30, 2018.
(i) Indemnifications
Under the Fund’s organizational documents, its Trustees and Officers are indemnified against certain liabilities arising out of the performance of their duties to the Trust. In addition, throughout the normal course of business, the Fund enters into contracts that contain a variety of representations and warranties which provide general indemnifications. The Fund’s maximum exposure under these arrangements is unknown, as this would involve future claims that may be made against the Fund and/or its affiliates that have not yet occurred. However, based on experience, the Fund expects the risk of loss to be remote.
| | THE GUGGENHEIM FUNDS SEMI-ANNUAL REPORT | 29 |
NOTES TO CONSOLIDATED FINANCIAL STATEMENTS (Unaudited)(continued) |
Note 2 – Financial Instruments and Derivatives
As part of its investment strategy, the Fund utilizes derivative instruments. These investments involve, to varying degrees, elements of market risk and risks in excess of the amounts recognized in the Consolidated Statement of Assets and Liabilities. Valuation and accounting treatment of these instruments can be found under Significant Accounting Policies in Note 1 of these Notes to Consolidated Financial Statements.
Derivatives
Derivatives are instruments whose values depend on, or are derived from, in whole or in part, the value of one or more other assets, such as securities, currencies, commodities or indices. Derivative instruments may be used to increase investment flexibility (including to maintain cash reserves while maintaining exposure to certain other assets), for risk management (hedging) purposes, to facilitate trading, to reduce transaction costs and to pursue higher investment returns. Derivative instruments may also be used to mitigate certain investment risks, such as foreign currency exchange rate risk, interest rate risk and credit risk. U.S. GAAP requires disclosures to enable investors to better understand how and why a Fund uses derivative instruments, how these derivative instruments are accounted for and their effects on the Fund’s financial position and results of operations.
The Fund may utilize derivatives for the following purposes:
Hedge: an investment made in order to reduce the risk of adverse price movements in a security, by taking an offsetting position to protect against broad market moves.
Leverage: gaining total exposure to equities or other assets on the long and short sides at greater than 100% of invested capital.
Liquidity: the ability to buy or sell exposure with little price/market impact.
Speculation: the use of an instrument to express macro-economic and other investment views.
For any Fund whose investment strategy consistently involves applying leverage, the value of the Fund’s shares will tend to increase or decrease more than the value of any increase or decrease in the underlying index or other asset. In addition, because an investment in derivative instruments generally requires a small investment relative to the amount of investment exposure assumed, an opportunity for increased net income is created; but, at the same time, leverage risk will increase. The Fund’s use of leverage, through borrowings or instruments such as derivatives, may cause the Fund to be more volatile and riskier than if they had not been leveraged.
Futures
A futures contract is an agreement to purchase (long) or sell (short) an agreed amount of securities or other instruments at a set price for delivery at a future date. There are significant risks associated with a Fund’s use of futures contracts, including (i) there may be an imperfect
30 | THE GUGGENHEIM FUNDS SEMI-ANNUAL REPORT | |
NOTES TO CONSOLIDATED FINANCIAL STATEMENTS (Unaudited)(continued) |
or no correlation between the changes in market value of the underlying asset and the prices of futures contracts; (ii) there may not be a liquid secondary market for a futures contract; (iii) trading restrictions or limitations may be imposed by an exchange; and (iv) government regulations may restrict trading in futures contracts. When investing in futures, there is minimal counterparty credit risk to a Fund because futures are exchange-traded and the exchange’s clearinghouse, as counterparty to all exchange-traded futures, guarantees against default. Cash deposits are shown as segregated cash with broker on the Consolidated Statement of Assets and Liabilities; securities held as collateral are noted on the Consolidated Schedule of Investments.
The following table represents the Fund’s use and volume of futures on a quarterly basis:
| | | Average Notional Amount | |
Use | | Long | | | Short | |
Hedge, Leverage, Liquidity, Speculation | | $ | 141,084,091 | | | $ | 175,844,570 | |
Derivative Investment Holdings Categorized by Risk Exposure
The following is a summary of the location of derivative investments on the Fund’s Consolidated Statement of Assets and Liabilities as of June 30, 2018:
Derivative Investment Type | Asset Derivatives | Liability Derivatives |
Equity/Interest Rate/Currency/Commodity contracts | — | Variation margin |
The following table sets forth the fair value of the Fund’s derivative investments categorized by primary risk exposure at June 30, 2018:
| | Asset Derivative Investments Value | |
| | Futures
Equity
Risk* | | | Futures
Currency
Risk* | | | Futures
Interest Rate
Risk* | | | Futures
Commodity
Risk* | | | Total Value at
June 30, 2018 | |
| | $ | 301,839 | | | $ | 223,054 | | | $ | 290,087 | | | $ | 625,660 | | | $ | 1,440,640 | |
| | Liability Derivative Investments Value | |
| | Futures
Equity
Risk* | | | Futures
Currency
Risk* | | | Futures
Interest Rate
Risk* | | | Futures
Commodity
Risk* | | | Total Value at
June 30, 2018 | |
| | $ | 420,693 | | | $ | 65,008 | | | $ | 151,702 | | | $ | 337,391 | | | $ | 974,794 | |
| * | | Includes cumulative appreciation (depreciation) of futures contracts as reported on the Consolidated Schedule of Investments. Only current day’s variation margin is reported within the Consolidated Statement of Assets and Liabilities. |
| | THE GUGGENHEIM FUNDS SEMI-ANNUAL REPORT | 31 |
NOTES TO CONSOLIDATED FINANCIAL STATEMENTS (Unaudited)(continued) |
The following is a summary of the location of derivative investments on the Fund’s Consolidated Statement of Operations for the period ended June 30, 2018:
Derivative Investment Type | Location of Gain (Loss) on Derivatives |
Equity/Interest Rate/Currency/Commodity contracts | Net realized gain (loss) on futures contracts |
| Net change in unrealized appreciation (depreciation) on futures contracts |
The following is a summary of the Fund’s realized gain (loss) and change in unrealized appreciation (depreciation) on derivative investments recognized on the Consolidated Statement of Operations categorized by primary risk exposure for the period ended June 30, 2018:
| | Realized Gain (Loss) on Derivative Investments Recognized on the Consolidated Statement of Operations | |
| | Futures
Equity
Risk | | | Futures
Currency
Risk | | | Futures
Interest Rate
Risk | | | Futures
Commodity
Risk | | | Total | |
| | $ | (60,329 | ) | | $ | (623,155 | ) | | $ | 478,784 | | | $ | (666,306 | ) | | $ | (871,006 | ) |
| | Change in Unrealized Appreciation (Depreciation) on Derivative Investments
Recognized on the Consolidated Statement of Operations | |
| | Futures
Equity
Risk | | | Futures
Currency
Risk | | | Futures
Interest Rate
Risk | | | Futures
Commodity
Risk | | | Total | |
| | $ | (402,188 | ) | | $ | (15,868 | ) | | $ | 49,261 | | | $ | (229,262 | ) | | $ | (598,057 | ) |
In conjunction with the use of derivative instruments, the Fund is required to maintain collateral in various forms. The Fund uses, where appropriate, depending on the financial instrument utilized and the broker involved, margin deposits at the broker, cash and/or securities segregated at the custodian bank, discount notes or repurchase agreements allocated to the Fund.
The Trust has established counterparty credit guidelines and enters into transactions only with financial institutions of investment grade or better. The Trust monitors the counterparty credit risk.
Note 3 – Offsetting
In the normal course of business, the Fund enters into transactions subject to enforceable master netting arrangements or other similar arrangements. Generally, the right to offset in those agreements allows the Fund to counteract the exposure to a specific counterparty with collateral received from or delivered to that counterparty based on the terms of the arrangements. These arrangements provide for the right to liquidate upon the occurrence of an event of default, credit event upon merger or additional termination event.
32 | THE GUGGENHEIM FUNDS SEMI-ANNUAL REPORT | |
NOTES TO CONSOLIDATED FINANCIAL STATEMENTS (Unaudited)(continued) |
In order to better define their contractual rights and to secure rights that will help the Fund mitigate its counterparty risk, the Fund may enter into an International Swaps and Derivatives Association, Inc. Master Agreement (“ISDA Master Agreement”) or similar agreement with its derivative contract counterparties. An ISDA Master Agreement is a bilateral agreement between a fund and a counterparty that governs OTC derivatives, including foreign exchange contracts, and typically contains, among other things, collateral posting terms and netting provisions in the event of a default and/or termination event. The provisions of the ISDA Master Agreement typically permit a single net payment in the event of a default (close-out netting) or similar event, including the bankruptcy or insolvency of the counterparty.
For derivatives traded under an ISDA Master Agreement, the collateral requirements are typically calculated by netting the mark-to-market amount for each transaction under such agreement and comparing that amount to the value of any collateral currently pledged by the Fund and the counterparty. For financial reporting purposes, cash collateral that has been pledged to cover obligations of the Fund and cash collateral received from the counterparty, if any, are reported separately on the Consolidated Statement of Assets and Liabilities as segregated cash with broker/receivable for variation margin, or payable for swap settlement/variation margin. Cash and/or securities pledged or received as collateral by the Fund in connection with an OTC derivative subject to an ISDA Master Agreement generally may not be invested, sold or rehypothecated by the counterparty or the Fund, as applicable, absent an event of default under such agreement, in which case such collateral generally may be applied towards obligations due to and payable by such counterparty or the Fund, as applicable. Generally, the amount of collateral due from or to a counterparty must exceed a minimum transfer amount threshold (e.g., $300,000) before a transfer is required to be made. To the extent amounts due to the Fund from its counterparties are not fully collateralized, contractually or otherwise, the Fund bear the risk of loss from counterparty nonperformance. The Fund attempts to mitigate counterparty risk by only entering into agreements with counterparties that they believe to be of good standing and by monitoring the financial stability of those counterparties.
For financial reporting purposes, the Fund does not offset derivative assets and derivative liabilities that are subject to netting arrangements in the Consolidated Statement of Assets and Liabilities.
Futures are excluded from these reported amounts.
The following table presents deposits held by others in connection with derivative investments as of June 30, 2018. The derivatives tables following the Consolidated Schedule of Investments list each counterparty for which cash collateral may have been pledged or received at period end. The Fund has the right to offset these deposits against any related liabilities outstanding with each counterparty.
| Counterparty/Clearing Agent | | Asset Type | | Cash Pledged | | | Cash Received | |
| Goldman Sachs Group | | Futures contracts | | $ | 96,662 | | | $ | — | |
| | THE GUGGENHEIM FUNDS SEMI-ANNUAL REPORT | 33 |
NOTES TO CONSOLIDATED FINANCIAL STATEMENTS (Unaudited)(continued) |
Note 4 – Fair Value Measurement
In accordance with U.S. GAAP, fair value is defined as the price that the Fund would receive to sell an investment or pay to transfer a liability in an orderly transaction with an independent buyer in the principal market, or in the absence of a principal market, the most advantageous market for the investment or liability. U.S. GAAP establishes a three-tier fair value hierarchy based on the types of inputs used to value assets and liabilities and requires corresponding disclosure. The hierarchy and the corresponding inputs are summarized below:
Level 1 — | quoted prices in active markets for identical assets or liabilities. |
Level 2 — | significant other observable inputs (for example quoted prices for securities that are similar based on characteristics such as interest rates, prepayment speeds, credit risk, etc.). |
Level 3 — | significant unobservable inputs based on the best information available under the circumstances, to the extent observable inputs are not available, which may include assumptions. |
The types of inputs available depend on a variety of factors, such as the type of security and the characteristics of the markets in which it trades, if any. Fair valuation determinations that rely on fewer or no observable inputs require greater judgment. Accordingly, fair value determinations for Level 3 securities require the greatest amount of judgment.
The inputs or methodologies used for valuing securities are not necessarily an indication of the risk associated with investing in those securities. The suitability of the techniques and sources employed to determine fair valuation are regularly monitored and subject to change.
Note 5 – Investment Advisory Agreement and Other Agreements
Under the terms of an investment advisory contract, the Fund pays GI investment advisory fees calculated at an annualized rate of 0.90% of the average daily net assets of the Fund.
GI has contractually agreed to waive the management fee it receives from the Subsidiary in an amount equal to the management fee paid to GI by the Subsidiary. This undertaking will continue in effect for so long as the Fund invests in the Subsidiary, and may not be terminated by GI unless GI obtains the prior approval of the Fund’s Board for such termination. For the period ended June 30, 2018, the Fund waived $13,413 related to advisory fees in the Subsidiary.
GI engages external service providers to perform other necessary services for the Trust, such as audit and accounting related services, legal services, custody, printing and mailing, etc., on a pass-through basis. Such expenses are allocated to various Funds within the complex based on relative net assets.
34 | THE GUGGENHEIM FUNDS SEMI-ANNUAL REPORT | |
NOTES TO CONSOLIDATED FINANCIAL STATEMENTS (Unaudited)(continued) |
The Trust has adopted a Distribution Plan applicable to A-Class and P-Class shares for which GFD and other firms that provide distribution and/or shareholder services (“Service Providers”) may receive compensation. If a Service Provider provides distribution services, the Fund will pay distribution fees to GFD at an annual rate not to exceed 0.25% of average daily net assets, pursuant to Rule 12b-1 of the 1940 Act. GFD, in turn, will pay the Service Provider out of its fees. GFD may, at its discretion, retain a portion of such payments to compensate itself for distribution services.
The Trust has adopted a separate Distribution and Shareholder Services Plan applicable to its C-Class shares that allows the Fund to pay annual distribution and service fees of 1.00% of the Fund’s C-Class shares average daily net assets. The annual 0.25% service fee compensates a shareholder’s financial adviser for providing ongoing services to the shareholder. The annual distribution fee of 0.75% reimburses GFD for paying the shareholder’s financial adviser an ongoing sales commission. GFD advances the first year’s service and distribution fees to the financial adviser. GFD retains the service and distribution fees on accounts with no authorized dealer of record.
If the Fund invests in an affiliated fund, the investing Fund’s adviser has agreed to waive fees at the investing fund level. Fee waivers will be calculated at the investing Fund level without regard to any expense cap, if any, in effect for the investing Fund. Fees waived under this arrangement are not subject to reimbursement to GI. For the period ended June 30, 2018, the Fund waived $482 related to investments in affiliated funds.
For the period ended June 30, 2018, GFD retained sales charges of $74,349 relating to sales of A-Class shares of the Trust.
Certain trustees and officers of the Trust are also officers of GI and/or GFD. The Trust does not compensate its officers or trustees who are officers, directors, and/or employees of GI and/or GFD.
MUFG Investor Services (US), LLC (“MUIS”) acts as the Fund’s administrator, transfer agent and accounting agent. As administrator, transfer agent and accounting agent, MUIS is responsible for maintaining the books and records of the Trust’s securities and cash. U.S Bank, N.A. (“U.S. Bank”) acts as the Fund’s custodian. As custodian, U.S. Bank is responsible for the custody of the Fund’s assets. For providing the aforementioned services, MUIS and U.S. Bank are entitled to receive a monthly fee equal to an annual percentage of the Fund’s average daily net assets and out of pocket expenses.
Note 6 – Repurchase Agreements
The Funds transfer uninvested cash balances into a single joint account, the daily aggregate balance of which is invested in one or more repurchase agreements collateralized by obligations of the U.S. Treasury and U.S. government agencies. The joint account includes other Funds in the Guggenheim complex not covered in this report. The collateral is in the possession of the
| | THE GUGGENHEIM FUNDS SEMI-ANNUAL REPORT | 35 |
NOTES TO CONSOLIDATED FINANCIAL STATEMENTS (Unaudited)(continued) |
Funds’ custodian and is evaluated to ensure that its market value exceeds, at a minimum, 102% of the original face amount of the repurchase agreements. Each Fund holds a pro rata share of the collateral based on the dollar amount of the repurchase agreement entered into by each Fund.
At June 30, 2018, the repurchase agreements in the joint account were as follows:
Counterparty and
Terms of Agreement | | Face
Value | | | Repurchase
Price | | | Collateral | | Par
Value | | | Fair
Value | |
JPMorgan Chase & Co. | | | | | | | | | | U.S. Treasury Notes | | | | | | | | |
2.10% | | | | | | | | | | 1.88% - 2.38% | | | | | | | | |
Due 07/02/18 | | $ | 209,070,256 | | | $ | 209,106,843 | | | 08/31/22 - 08/15/25 | | $ | 131,797,800 | | | $ | 128,085,441 | |
| | | | | | | | | | | U.S. Treasury Bonds | | | | | | | | |
| | | | | | | | | | | 2.50% - 2.38% | | | | | | | | |
| | | | | | | | | | | 02/15/45 - 05/15/47 | | | 85,113,600 | | | | 85,181,130 | |
| | | | | | | | | | | | | | | | | $ | 213,266,571 | |
| | | | | | | | | | | | | | | | | | | |
Barclays Capital | | | | | | | | | | U.S. TIP Notes | | | | | | | | |
2.07% | | | | | | | | | | 0.38% - 1.00% | | | | | | | | |
Due 07/02/18 | | | 102,663,372 | | | | 102,681,081 | | | 07/15/23 - 02/15/48 | | $ | 104,507,998 | | | $ | 104,281,274 | |
| | | | | | | | | | | U.S. Treasury Note | | | | | | | | |
| | | | | | | | | | | 1.88% | | | | | | | | |
| | | | | | | | | | | 03/31/22 | | | 462,300 | | | | 451,164 | |
| | | | | | | | | | | | | | | | | $ | 104,732,438 | |
| | | | | | | | | | | | | | | | | | | |
Bank of America Merrill Lynch | | | | | | | | | | U.S. TIP Notes | | | | | | | | |
2.08% | | | | | | | | | | 0.63% | | | | | | | | |
Due 07/02/18 | | | 68,442,248 | | | | 68,454,111 | | | 04/15/23 | | $ | 49,893,303 | | | $ | 49,865,753 | |
| | | | | | | | | | | U.S. Treasury Note | | | | | | | | |
| | | | | | | | | | | 2.63% | | | | | | | | |
| | | | | | | | | | | 06/15/21 | | | 19,923,800 | | | | 19,954,579 | |
| | | | | | | | | | | | | | | | | $ | 69,820,332 | |
In the event of counterparty default, the Funds have the right to collect the collateral to offset losses incurred. There is potential loss to the Funds in the event the Funds are delayed or prevented from exercising their rights to dispose of the collateral securities, including the risk of a possible decline in the value of the underlying securities during the period while the Funds seek to assert their rights. The Funds’ investment adviser, acting under the supervision of the Board, reviews the value of the collateral and the creditworthiness of those banks and dealers with which the Funds enter into repurchase agreements to evaluate potential risks.
Note 7 – Portfolio Securities Loaned
The Fund may lend its securities to approved brokers to earn additional income. Security lending income shown on the Statement of Operations is shown net of rebates paid to the borrowers and earnings on cash collateral investments shared with the lending agent. Within this arrangement, the Fund acts as the lender, U.S. Bank acts as the lending agent, and other approved registered
36 | THE GUGGENHEIM FUNDS SEMI-ANNUAL REPORT | |
NOTES TO CONSOLIDATED FINANCIAL STATEMENTS (Unaudited)(continued) |
broker dealers act as the borrowers. The Fund receives cash collateral, valued at 102% of the value of the securities on loan. Under the terms of the Fund’s securities lending agreement with U.S. Bank, cash collateral and proceeds are invested in the First American Government Obligations Fund — Class Z. The Fund bears the risk of loss on cash collateral investments. Collateral is maintained over the life of the loan in an amount not less than the value of loaned securities, as determined at the close of fund business each day; any additional collateral required due to changes in security values is delivered to the Fund the next business day. Although the collateral mitigates the risk, the Fund could experience a delay in recovering its securities and a possible loss of income or value if the borrower fails to return the securities. The Fund has the right under the securities lending agreement to recover the securities from the borrower on demand. Securities lending transactions are accounted for as secured borrowings. The remaining contractual maturity of the securities lending agreement is overnight and continuous.
At June 30, 2018, the Fund did not participate in securities lending transactions.
In the event of counterparty default, the Fund has the right to collect the collateral to offset losses incurred. There is potential loss to the Fund in the event the Fund is delayed or prevented from exercising its rights to dispose of the collateral securities, including the risk of a possible decline in the value of the underlying securities during the period while the Fund seeks to assert its rights. GI, acting under the supervision of the Board, reviews the value of the collateral and the creditworthiness of those banks and dealers to evaluate potential risks.
Note 8 – Federal Income Tax Information
The Fund intends to comply with the provisions of Subchapter M of the Internal Revenue Code applicable to regulated investment companies and will distribute substantially all taxable net investment income and capital gains sufficient to relieve the Fund from all, or substantially all, federal income, excise and state income taxes. Therefore, no provision for federal or state income tax is required.
Tax positions taken or expected to be taken in the course of preparing the Fund’s tax returns are evaluated to determine whether the tax positions are “more-likely-than-not” of being sustained by the applicable tax authority. Tax positions not deemed to meet the more-likely-than-not threshold would be recorded as a tax benefit or expense in the current year. Management has analyzed the Fund’s tax positions taken, or to be taken, on federal income tax returns for all open tax years, and has concluded that no provision for income tax is required in the Fund’s financial statements. The Fund’s federal tax returns are subject to examination by the Internal Revenue Service for a period of three years after they are filed.
The Fund intends to invest up to 25% of their assets in the Subsidiary which is expected to provide the Funds with exposure to the commodities markets within the limitations of the federal tax requirements under Subchapter M of the Internal Revenue Code. The Fund has received a private letter ruling from the IRS that concludes that the income the Fund receives from the Subsidiary will constitute qualifying income for purposes of Subchapter M of the Internal Revenue Code.
| | THE GUGGENHEIM FUNDS SEMI-ANNUAL REPORT | 37 |
NOTES TO CONSOLIDATED FINANCIAL STATEMENTS (Unaudited)(continued) |
The Subsidiary will be classified as a corporation for U.S. federal income tax purposes. A foreign corporation, such as the Subsidiary, will generally not be subject to U.S. federal income taxation unless it is deemed to be engaged in a U.S. trade or business.
At June 30, 2018, the cost of securities for federal income tax purposes, the aggregate gross unrealized gain for all securities for which there was an excess of value over tax cost, and the aggregate gross unrealized loss for all securities for which there was an excess of tax cost over value were as follows:
| | Tax
Cost | | | Tax
Unrealized
Gain | | | Tax
Unrealized
Loss | | | Net
Unrealized
Loss | |
| | $ | 47,790,618 | | | $ | — | | | $ | (5,038,727 | ) | | $ | (5,038,727 | ) |
Note 9 – Securities Transactions
For the period ended June 30, 2018, the cost of purchases and proceeds from sales of investment securities, excluding government securities, short-term investments and derivatives, were as follows:
| | Purchases | | | Sales | |
| | | $ | 4,444,801 | | | $ | 12,039,795 | |
The Fund is permitted to purchase or sell securities from or to certain affiliated funds under specified conditions outlined in procedures adopted by the Board of the Trust. The procedures have been designed to ensure that any purchase or sale of securities by the Fund from or to another fund or portfolio that is or could be considered an affiliate by virtue of having a common investment adviser (or affiliated investment advisers), common Trustees and/or common officers complies with Rule 17a-7 of the 1940 Act. Further, as defined under these procedures, each transaction is effected at the current market price to save costs, where permissible. For the period ended June 30, 2018, the Fund did not engage in purchases and sales of securities, pursuant to Rule 17a-7 of the 1940 Act.
Note 10 – Line of Credit
The Trust, along with other affiliated trusts, secured an uncommitted $75,000,000 line of credit from U.S. Bank, N.A., which expires June 9, 2019. This line of credit is reserved for emergency or temporary purposes. Borrowings, if any, under this arrangement bear interest equal to the Prime Rate, minus 2%, which shall be paid monthly, averaging 2.66% for the period ended June 30, 2018. The Fund did not have any borrowings outstanding under this agreement at June 30, 2018.
38 | THE GUGGENHEIM FUNDS SEMI-ANNUAL REPORT | |
NOTES TO CONSOLIDATED FINANCIAL STATEMENTS (Unaudited)(continued) |
Note 11 – Subsequent Event
Effective August 10, 2018, Class C shares of each Fund will automatically convert to Class A shares of the same Fund on or about the 10th day of the month following the 10-year anniversary date of the purchase of the Class C shares. This conversion will be executed without any sales charge, fee or other charge. After the conversion is completed, the shares will be subject to all features and expenses of Class A shares.
Note 12 – Legal Proceedings
Tribune Company
Rydex Series Funds has been named as a defendant and a putative member of the proposed defendant class of shareholders in the case entitled Kirschner v. FitzSimons, No. 12-2652 (S.D.N.Y.) (formerly Official Committee of Unsecured Creditors of Tribune Co. v. FitzSimons, Adv. Pro. No. 10-54010 (Bankr. D. Del.)) (the “FitzSimons action”), as a result of ownership by certain series of the Rydex Series Funds of shares in the Tribune Company (“Tribune”) in 2007, when Tribune effected a leveraged buyout transaction (“LBO”) by which Tribune converted to a privately-held company. In his complaint, the plaintiff has alleged that, in connection with the LBO, Tribune insiders and shareholders were overpaid for their Tribune stock using financing that the insiders knew would, and ultimately did, leave Tribune insolvent. The plaintiff has asserted claims against certain insiders, major shareholders, professional advisers, and others involved in the LBO. The plaintiff is also attempting to obtain from former Tribune shareholders, including the Rydex Series Funds, the proceeds they received in connection with the LBO.
In June 2011, a group of Tribune creditors filed multiple actions against former Tribune shareholders involving state law constructive fraudulent conveyance claims arising out of the 2007 LBO (the “SLCFC actions”). Rydex Series Funds has been named as a defendant in one or more of these suits. In those actions, the creditors seek to recover from Tribune’s former shareholders the proceeds received in connection with the 2007 LBO.
The FitzSimons action and the SLCFC actions have been consolidated with the majority of the other Tribune LBO-related lawsuits in a multidistrict litigation proceeding captioned In re Tribune Company Fraudulent Conveyance Litig., No. 11-md-2696 (S.D.N.Y.) (the “MDL Proceeding”).
On September 23, 2013, the District Court granted the defendants’ omnibus motion to dismiss the SLCFC actions, on the basis that the creditors lacked standing. On September 30, 2013, the creditors filed a notice of appeal of the September 23 order. On October 28, 2013, the defendants filed a joint notice of cross-appeal of that same order.
On March 29, 2016, the U.S. Court of Appeals for the Second Circuit issued its opinion on the appeal of the SLCFC actions. The appeals court affirmed the district court’s dismissal of those lawsuits, but on different grounds than the district court. The appeals court held that while the
| | THE GUGGENHEIM FUNDS SEMI-ANNUAL REPORT | 39 |
NOTES TO CONSOLIDATED FINANCIAL STATEMENTS (Unaudited)(continued) |
plaintiffs have standing under the U.S. Bankruptcy Code, their claims were preempted by Section 546(e) of the Bankruptcy Code—the statutory safe harbor for settlement payments. On April 12, 2016, the Plaintiffs in the SLCFC actions filed a petition seeking rehearing en banc before the appeals court. On July 22, 2016, the appeals court denied the petition. On September 9, 2016, the plaintiffs filed a petition for writ of certiorari in the U.S. Supreme Court challenging the Second Circuit’s decision that the safe harbor of Section 546(e) applied to their claims. The shareholder defendants, including the Funds, filed a joint brief in opposition to the petition for certiorari on October 24, 2016. On April 3, 2018, Justice Kennedy and Justice Thomas issued a “Statement” related to the petition for certiorari suggesting that the Second Circuit and/or District Court may want to take steps to reexamine the application of the Section 546(e) safe harbor to the previously dismissed state law constructive fraudulent transfer claims based on the Supreme Court’s decision in Merit Management Group LP v. FTI Consulting, Inc. On April 10, 2018, Plaintiffs filed in the Second Circuit a motion for that court to recall its mandate, vacate its prior decision, and remand to the district court for further proceedings consistent with Merit Management. On April 20, 2018, the shareholder defendants filed an opposition to Plaintiffs’ motion to recall the mandate. On May 15, 2018, the Second Circuit issued an order recalling the mandate “in anticipation of further panel review.”
On May 23, 2014, the defendants filed motions to dismiss the FitzSimons action, including a global motion to dismiss Count I, which is the claim brought against former Tribune shareholders for intentional fraudulent conveyance under U.S. federal law. On January 6, 2017, the United States District Court for the Southern District of New York granted the shareholder defendants’ motion to dismiss the intentional fraudulent conveyance claim in the FitzSimons action. In dismissing the intentional fraudulent conveyance claim, the Court denied the plaintiff’s request to amend the complaint. The plaintiff requested that the Court direct entry of a final judgment in order to make the order immediately appealable. On February 23, 2017, the Court issued an order stating that it intends to permit an interlocutory appeal of the dismissal order, but will wait to do so until it has resolved outstanding motions to dismiss filed by other defendants. Accordingly, the timing of the appeal is uncertain.
On July 18, 2017, the plaintiff submitted a letter to the District Court seeking leave to amend its complaint to add a constructive fraudulent transfer claim. The shareholder defendants opposed that request. On August 24, 2017, the Court denied the plaintiff’s request without prejudice to renewal of the request in the event of an intervening change in the law. On March 8, 2018, the plaintiff renewed his request for leave to file a motion to amend the complaint to assert a constructive fraudulent transfer claim based on the Supreme Court’s ruling in Merit Management Group LP v. FTI Consulting, Inc. The shareholder defendants opposed that request. On June 18, 2018 the District Court ordered that the request would be stayed pending further action by the Second Circuit in the SLCFC actions.
None of these lawsuits alleges any wrongdoing on the part of Rydex Series Funds. The following series of Rydex Series Funds held shares of Tribune and tendered these shares as part of Tribune’s LBO: Nova Fund, S&P 500® Pure Value Fund, Multi-Cap Core Equity Fund, S&P 500® Fund,
��
40 | THE GUGGENHEIM FUNDS SEMI-ANNUAL REPORT | |
NOTES TO CONSOLIDATED FINANCIAL STATEMENTS (Unaudited)(concluded) |
Multi-Hedge Strategies Fund and Hedged Equity Fund (the “Funds”). The value of the proceeds received by the foregoing Funds was $28,220, $109,242, $9,860, $3,400, $1,181,160, and $10,880, respectively. At this stage of the proceedings, Rydex Series Funds is not able to make a reliable predication as to the outcome of these lawsuits or the effect, if any, on a Fund’s net asset value.
| | THE GUGGENHEIM FUNDS SEMI-ANNUAL REPORT | 41 |
OTHER INFORMATION (Unaudited) |
Proxy Voting Information
A description of the policies and procedures that the Trust uses to determine how to vote proxies relating to securities held in the Funds’ portfolios is available, without charge and upon request, by calling 800.820.0888. This information is also available from the EDGAR database on the SEC’s website at https://www.sec.gov.
Information regarding how the Funds voted proxies relating to portfolio securities during the most recent 12-month period ended June 30 is available without charge, upon request, by calling 800.820.0888. This information is also available from the EDGAR database on the SEC’s website at https://www.sec.gov.
Sector Classification
Information in the Schedule of Investments is categorized by sectors using sector-level Classifications defined by the Bloomberg Industry Classification System, a widely recognized industry classification system provider. Each Fund’s registration statement has investment policies relating to concentration in specific sectors/industries. For purposes of these investment policies, the Funds usually classify sectors/industries based on industry-level Classifications used by widely recognized industry classification system providers such as Bloomberg Industry Classification System, Global Industry Classification Standards and Barclays Global Classification Scheme.
Quarterly Portfolio Schedules Information
The Trust files its complete schedule of portfolio holdings with the SEC for the first and third quarters of each fiscal year on Form N-Q, which are available on the SEC’s website at https://www.sec.gov. The Funds’ Forms N-Q may be reviewed and copied at the SEC’s Public Reference Room in Washington, DC, and that information on the operation of the Public Reference Room may be obtained by calling 800-SEC-0330. Copies of the portfolio holdings are also available to shareholders, without charge and upon request, by calling 800.820.0888.
Board Considerations in Approving the Investment Advisory Agreement
The Board of Trustees (the “Board”) of Rydex Series Funds (the “Trust”), including the Trustees who are not “interested persons,” as defined by the Investment Company Act of 1940, of the Trust (“Independent Trustees”), attended an in-person meeting held on May 21, 2018, called for the purpose of, among other things, the consideration of, and voting on, the approval of an amended investment advisory agreement (the “Investment Advisory Agreement”) between the Trust and Security Investors, LLC (the “Advisor”) applicable to each series of the Trust (each, a “Fund” and, collectively, the “Funds”). The Advisor proposed to amend the Trust’s Investment Advisory Agreement to provide for the addition of asset-based breakpoints to the advisory fees charged by each Fund, except for the Managed Futures Strategy Fund and Multi-Hedge Strategies Fund (together, the “Alternative Funds”). The introduction of asset-based breakpoints would reduce the advisory fee rate for each Fund (except the Alternative Funds) in accordance with a specified schedule disclosed in the Funds’ Prospectus when the aggregate daily net assets of the Funds
42 | THE GUGGENHEIM FUNDS SEMI-ANNUAL REPORT | |
OTHER INFORMATION (Unaudited)(continued) |
(excluding the Alternative Funds) and the series of Rydex Dynamic Funds, an affiliated investment company advised by the Advisor, equal or exceed $10 billion. The Board unanimously approved the Investment Advisory Agreement, as amended, for an additional one-year period based on the Board’s review of qualitative and quantitative information provided by the Advisor. The Board had previously considered information pertaining to the renewal of the Investment Advisory Agreement at an in-person meeting held on April 25, 2018 (together, with the May 21st meeting, the “Meetings”). The Board considered the materials provided by the Advisor and the review conducted at the April 25th meeting to be an integral part of the Trustees’ deliberations and their process in considering the renewal of the Investment Advisory Agreement, as amended.
Prior to reaching the conclusion to approve the Investment Advisory Agreement, as amended, the Independent Trustees requested and obtained from the Advisor such information as the Independent Trustees deemed reasonably necessary to evaluate the Investment Advisory Agreement. In addition, the Board received a memorandum from the independent legal counsel to the Independent Trustees regarding the Board’s fiduciary responsibilities under state and federal law with respect to the Board’s consideration of the renewal or approval of investment advisory agreements, and participated in discussions with representatives of the Advisor during which the representatives answered the Independent Trustees’ questions and agreed to provide certain additional information for their consideration. The Independent Trustees also carefully considered information that they had received throughout the year as part of their regular oversight of the Funds. At the Meetings, the Board obtained and reviewed a wide variety of information, including certain comparative information regarding the Funds’ fees, expenses, and performance relative to the fees, expenses, and performance of other comparable funds (the “FUSE reports”). The Independent Trustees carefully evaluated this information, met in executive session outside the presence of fund management, and were advised by independent legal counsel with respect to their deliberations.
At the Meetings, the Board, including the Independent Trustees, evaluated a number of factors, including among others: (a) the nature, extent and quality of the Advisor’s investment advisory and other services; (b) the Advisor’s substantial commitment to the recruitment and retention of high quality personnel; (c) a comparison of the Funds’ advisory fees to the advisory fees charged to comparable funds or accounts, giving special attention to the existence of economies of scale; (d) each Fund’s overall fees and operating expenses compared with those of similar funds; (e) the level of the Advisor’s profitability from its Fund-related operations; (f) the Advisor’s compliance processes and systems; (g) the Advisor’s compliance policies and procedures; (h) the Advisor’s reputation, expertise and resources in the financial markets; (i) Fund performance compared with that of similar funds and/or appropriate benchmarks; (j) other benefits to the Advisor and/or its affiliates from their relationship to the Funds; and (k) the Advisor’s maintenance of operational resources necessary to manage the Funds in a professional manner consistent with the best interests of the Funds and their shareholders. In its deliberations, the Trustees did not identify any particular factor or factors as controlling, noting that each Trustee could attribute different weights to the various factors considered.
| | THE GUGGENHEIM FUNDS SEMI-ANNUAL REPORT | 43 |
OTHER INFORMATION (Unaudited)(continued) |
Based on the Board’s deliberations at the Meetings, the Board, including all of the Independent Trustees, unanimously: (a) concluded that the terms of the Investment Advisory Agreement, as amended, are fair and reasonable; (b) concluded that the Advisor’s fees for each Fund are reasonable in light of, and not so disproportionately large as to bear no reasonable relationship to, the services that it provides to each Fund; and (c) agreed to approve and continue the Investment Advisory Agreement, as amended, based upon the following considerations, among others:
Nature, Extent and Quality of Services Provided by the Advisor. The Board evaluated, among other things, the Advisor’s business, financial resources, quality and quantity of personnel, experience, past performance, the variety and complexity of its investment strategies (including the extent to which the Funds use derivatives), Fund risk management process, brokerage practices, and the adequacy of its compliance systems and processes, proxy voting policies and practices, and cybersecurity programs. The Board reviewed the scope of services to be provided by the Advisor under the Investment Advisory Agreement and noted that there would be no significant differences between the scope of services required to be provided by the Advisor for the past year and the scope of services required to be provided during the upcoming year. The Board, however, examined whether the loss of certain advisory personnel in connection with the recent sale of the Guggenheim ETF business might affect the services provided by the Advisor to the remaining Funds. The Board was assured that such personnel were not previously involved in the management of the Funds and that their departure would not affect the nature, extent or quality of the services provided by the Advisor. The Board also considered the Advisor’s representations to the Board that the Advisor would continue to provide investment and related services that were of materially the same quality and quantity as services provided to the Funds in the past, and whether these services are appropriate in scope and extent in light of the Funds’ operations, the competitive landscape of the investment company business and investor needs. Based on the foregoing, the Trustees determined that the approval of the Investment Advisory Agreement, as amended, would enable shareholders of the Funds to receive high quality services at a cost that was appropriate and reasonable.
Fund Expenses and Performance of the Funds and the Advisor. The Board reviewed statistical information provided by the Advisor regarding the expense ratio components and performance of each Fund. The Advisor engaged FUSE Research Network LLC (“FUSE”), an independent, third-party research provider, to prepare reports to help the Board compare the Funds’ fees, expenses, and total return performance with those of a peer group and peer universe of funds selected by FUSE. In the FUSE reports, each Fund’s expense ratio components, including actual advisory fees, waivers/reimbursements, and gross and net total expenses, are compared to those of other funds with shared key characteristics (e.g., asset size, fee structure, sector or industry investment focus) determined by FUSE to comprise a Fund’s applicable peer group. The Board considered the Advisor’s representation that it found the peer groups compiled by FUSE to be appropriate, but also acknowledged the existence of certain differences between the Funds and their peer funds (e.g., specific differences in principal investment strategies, index rebalance frequency, and, in certain cases, the Fund’s tradability feature) that should be reviewed in context. With respect
44 | THE GUGGENHEIM FUNDS SEMI-ANNUAL REPORT | |
OTHER INFORMATION (Unaudited)(continued) |
to tradability, in particular, the Board considered that non-tradable funds incur lower expense ratios than tradable funds because non-tradable funds experience less shareholder activity and lower transaction volumes than tradable funds. The statistical information related to the performance of each Fund included three-month and one-, three-, and five-year performance for the Fund compared to that of its peers. With respect to the Funds that track an underlying index (“Index Funds”), the Board also discussed the correlation between an Index Fund’s assets under management and tracking error, noting that an Index Fund’s ability to replicate an underlying index rather than employ representative sampling depends, in part, upon the Index Fund’s size. The Board also considered and requested information detailing the effect of the recent sale of the Guggenheim ETF business on the expense allocation methodology employed by the Advisor. After reviewing the additional information provided by the Advisor, the Board determined the impact on the Funds would be minimal. Based on the foregoing, the Board determined that the proposed advisory fees paid by the Funds are reasonable in relation to the nature and quality of the services provided by the Advisor.
Costs of Services Provided to the Funds and Profits Realized by the Advisor and its Affiliates. The Board reviewed information about the profitability of the Funds to the Advisor based on the advisory fees payable under the current Investment Advisory Agreement for the last calendar year. The Board analyzed the Funds’ expenses, including the investment advisory fees paid to the Advisor, and reviewed the FUSE reports. The Board also reviewed information regarding the direct revenue received by the Advisor and ancillary revenue, if any, received by the Advisor and/or its affiliates in connection with the services provided to the Funds by the Advisor and/or its affiliates. The Board also discussed the Advisor’s profit margin, including the expense allocation methodology used in the Advisor’s profitability analysis. The Board also considered the effect of the recent sale of the Guggenheim ETF business on the Advisor’s and its affiliates’ profitability, and similar to its conclusion with respect to expenses, determined that the impact would be minimal. Based on the foregoing, the Board determined that the profit to the Advisor on the fees paid by the Funds is not excessive in view of the nature and quality of the services provided by the Advisor.
Economies of Scale. During its April 25th meeting with management, the Board and the Advisor discussed the possible implementation of asset-based advisory fee breakpoints to help ensure any economies of scale would be shared with the Funds’ shareholders. At the May 21st meeting, the Advisor proposed to amend the Investment Advisory Agreement to implement the asset-based breakpoints described herein. The Board considered the potential effect of the proposed asset-based breakpoints as well as the absence of breakpoints for the Alternative Funds. The Board noted that many of the Funds had not yet achieved sufficient asset levels to realize meaningful economies of scale, and noted that the Alternative Funds, in particular, had not achieved sufficient asset levels to generate economies of scale and were not likely to realize meaningful economies of scale given their specialized investment strategies. The Board noted that the breakpoints would benefit shareholders in the long term and that it intends to monitor the asset levels at which the breakpoints are set to determine if they continue to be appropriate in the future.
| | THE GUGGENHEIM FUNDS SEMI-ANNUAL REPORT | 45 |
OTHER INFORMATION (Unaudited)(concluded) |
Other Benefits to the Advisor and/or its Affiliates. In addition to evaluating the Advisor’s services, the Board considered the nature and amount of other benefits to be derived by the Advisor and its affiliates as a result of their relationship with the Funds, including any intangible benefits to the Advisor. In particular, the Board considered the nature, extent, quality, and cost of certain distribution and shareholder services performed by the Advisor’s affiliate, Guggenheim Funds Distributors, LLC, under separate distribution agreements, Distribution Plans and Distribution and Shareholder Services Plans pursuant to Rule 12b-1 of the 1940 Act, and, with respect to the Rydex Variable Trust, the investor services agreement and Investor Services Plan. In light of the costs of providing services pursuant to the separate agreements as well as the Advisor’s and its affiliate’s commitment to the Funds, the Board concluded the ancillary benefits the Advisor and its affiliates received were reasonable.
On the basis of the information provided to it and its evaluation of that information, the Board, including the Independent Trustees, concluded that the terms of the Investment Advisory Agreement, as amended, were reasonable, and that approval of the Investment Advisory Agreement, as amended, was in the best interests of each Fund and its shareholders.
46 | THE GUGGENHEIM FUNDS SEMI-ANNUAL REPORT | |
INFORMATION ON BOARD OF TRUSTEES AND OFFICERS (Unaudited) |
A Board of Trustees oversees the Trust, as well as other trusts of GI, in which its members have no stated term of service, and continue to serve after election until resignation. The Statement of Additional Information includes further information about Fund Trustees and Officers, and can be obtained without charge by visiting guggenheiminvestments.com or by calling 800.820.0888.
Name, Address*
and Year of Birth
of Trustee | Position(s) Held with the
Trust, Term of Office and
Length of Time Served | Principal Occupation(s)
During Past 5 Years | Number of
Portfolios in
Fund Complex
Overseen by
Trustee*** | Other
Directorships
Held by
Trustee**** |
INTERESTED Trustee | | | |
Amy J. Lee** (1961) | Trustee (February 2018-present) and President (2017-present) | Current: Interested Trustee, certain other funds in the Fund Complex (February 2018-present); Chief Legal Officer and Vice President, certain other funds in the Fund Complex (2013-present); Senior Managing Director, Guggenheim Investments (2012-present). Former: President and Chief Executive Officer, certain other funds in the Fund Complex (2017-February 2018); and Vice President, Associate General Counsel and Assistant Secretary, Security Benefit Life Insurance Company and Security Benefit Corporation (2004-2012). | 165 | None. |
| | THE GUGGENHEIM FUNDS SEMI-ANNUAL REPORT | 47 |
INFORMATION ON BOARD OF TRUSTEES AND OFFICERS (Unaudited)(continued) |
Name, Address*
and Year of Birth
of Trustee | Position(s) Held with the
Trust, Term of Office and
Length of Time Served | Principal Occupation(s)
During Past 5 Years | Number of
Portfolios in
Fund Complex
Overseen by
Trustee*** | Other
Directorships
Held by
Trustee**** |
INDEPENDENT TRUSTEES |
Angela Brock-Kyle (1959) | Trustee, Member of the Audit Committee, and Member of the Compliance and Risk Oversight Committee from 2016 to present; and Member of the Governance and Nominating Committee and Chairwoman of the Compliance and Risk Oversight Committee from 2017 to present. | Current: Founder and Chief Executive Officer, B.O.A.R.D.S (consulting firm). Former: Senior Leader, TIAA (financial services firm) (1987-2012). | 110 | Infinity Property & Casualty Corporation (2014-present). |
Corey A. Colehour (1945) | Trustee from 1993 to present; Member of the Audit Committee from 1994 to present; Member of the Governance and Nominating Committee from 2017 to present; and Member of the Investment and Performance Committee from 2014 to present. | Retired. | 110 | None. |
J. Kenneth Dalton (1941) | Trustee from 1995 to present; Chairman and Member of the Audit Committee from 1997 to present; and Member of the Compliance and Risk Oversight Committee from 2010 to present. | Retired. | 110 | Epiphany Funds (2) (2009-present). |
John O. Demaret (1940) | Trustee and Member of the Audit Committee from 1997 to present; Member of the Compliance and Risk Oversight Committee from 2010 to present. | Retired. | 110 | None. |
Werner E. Keller (1940) | Chairman of the Board from 2014 to present; Trustee and Member of the Audit Committee from 2005 to present. | Current: Founder and President, Keller Partners, LLC (investment research firm) (2005-present). | 110 | None. |
48 | THE GUGGENHEIM FUNDS SEMI-ANNUAL REPORT | |
INFORMATION ON BOARD OF TRUSTEES AND OFFICERS (Unaudited)(continued) |
Name, Address*
and Year of Birth
of Trustee | Position(s) Held with the
Trust, Term of Office and
Length of Time Served | Principal Occupation(s)
During Past 5 Years | Number of
Portfolios in
Fund Complex
Overseen by
Trustee*** | Other
Directorships
Held by
Trustee**** |
INDEPENDENT TRUSTEES - concluded |
Thomas F.
Lydon, Jr. (1960) | Trustee and Member of the Audit Committee from 2005 to present; Chairman and Member of the Governance and Nominating Committee from 2017 to present; and Member of the Investment and Performance Committee from 2018 to present. | Current: President, Global Trends Investments (registered investment adviser) (1996-present). | 110 | US Global Investors (GROW) (1995-present) and Harvest Volatility Edge Trust (3) (2017-present). |
Patrick T. McCarville (1942) | Trustee and Member of the Audit Committee from 1997 to present; and Member of the Governance and Nominating Committee from 2017 to present. | Current: Retired. Former: Chief Executive Officer, Par Industries, Inc., d/b/a Par Leasing (1977-2010). | 110 | None. |
Sandra G. Sponem (1958) | Trustee, Member of the Audit Committee and Chairwoman and Member of the Investment and Performance Committee from 2016 to present; and Member of the Governance and Nominating Committee from 2017 to present. | Current: Retired. Former: Senior Vice President and Chief Financial Officer, M.A. Mortenson Companies, Inc. (general contracting firm) (2007-2017). | 110 | None. |
| | THE GUGGENHEIM FUNDS SEMI-ANNUAL REPORT | 49 |
INFORMATION ON BOARD OF TRUSTEES AND OFFICERS (Unaudited)(continued) |
Name, Address*
and Year of Birth | Position(s) Held with the
Trust, Term of Office and
Length of Time Served | Principal Occupation(s)
During Past 5 Years |
OFFICERS | | |
Michael P. Byrum (1970) | Vice President (2000-present) | Current: Senior Vice President, Security Investors, LLC (2010-present); Senior Managing Director, Guggenheim Investments (2010-present); President and Chief Investment Officer, Rydex Holdings, LLC (2008-present) and Director and Chairman, Advisory Research Center, Inc. (2006-present). Former: Manager, Guggenheim Specialized Products, LLC (2005-April 2018); Vice President, Guggenheim Distributors, LLC (2009); Director (2009-2010) and Secretary (2002-2010), Rydex Fund Services, LLC (now MUFG Investor Services (US), LLC); Director (2008-2010), Chief Investment Officer (2006-2010), President (2004-2010) and Secretary (2002-2010), Rydex Advisors, LLC; Director (2008-2010), Chief Investment Officer (2006-2010), President (2004-2010) and Secretary (2002-2010), Rydex Advisors II, LLC. |
James M. Howley (1972) | Assistant Treasurer (2016-present) | Current: Managing Director, Guggenheim Investments (2004-present); Assistant Treasurer, certain other funds in the Fund Complex (2006-present). Former: Manager of Mutual Fund Administration, Van Kampen Investments, Inc. (1996-2004). |
Keith D. Kemp (1960) | Assistant Treasurer (2016-present) | Current: Treasurer and Assistant Treasurer, certain other funds in the Fund Complex (2010-present); Managing Director of Guggenheim Partners Investment Management, LLC (2015-present). Former: Chief Financial Officer, Guggenheim Specialized Products, LLC (2016-April 2018); Managing Director and Director, Transparent Value, LLC (2010-2016); Director, Guggenheim Partners Investment Management, LLC (2010-2015); Chief Operating Officer, Macquarie Capital Investment Management (2007-2009). |
Mark E. Mathiasen (1978) | Secretary (2017-present) | Current: Secretary, certain other funds in the Fund Complex (2007-present); Managing Director, Guggenheim Investments (2007-present). |
50 | THE GUGGENHEIM FUNDS SEMI-ANNUAL REPORT | |
INFORMATION ON BOARD OF TRUSTEES AND OFFICERS (Unaudited)(continued) |
Name, Address*
and Year of Birth | Position(s) Held with the
Trust, Term of Office and
Length of Time Served | Principal Occupation(s)
During Past 5 Years |
OFFICERS - continued | |
Glenn McWhinnie (1969) | Assistant Treasurer (2016-present) | Current: Vice President, Guggenheim Investments (2009-present); Assistant Treasurer, certain other funds in the Fund Complex (2007-present). Former: Tax Compliance Manager, Ernst & Young LLP (1996-2009). |
Elisabeth Miller (1968) | Chief Compliance Officer (2012-present) | Current: CCO, certain other funds in the Fund Complex (2012-present); Managing Director, Guggenheim Investments (2012-present); Vice President, Guggenheim Funds Distributors, LLC (2014-present). Former: CCO, Security Investors, LLC (2012-2018); CCO, Guggenheim Funds Investment Advisors, LLC (2012-2018); CCO, Guggenheim Distributors, LLC (2009-2014); Senior Manager, Security Investors, LLC (2004-2009); Senior Manager, Guggenheim Distributors, LLC (2004-2009). |
Adam J. Nelson (1979) | Assistant Treasurer (2016-present) | Current: Vice President, Guggenheim Investments (2015-present); Assistant Treasurer, certain other funds in the Fund Complex (2015-present). Former: Assistant Vice President and Fund Administration Director, State Street Corporation (2013-2015); Fund Administration Assistant Director, State Street (2011-2013); Fund Administration Manager, State Street (2009-2011). |
Kimberly J. Scott (1974) | Assistant Treasurer (2016-present) | Current: Director, Guggenheim Investments (2012-present); Assistant Treasurer, certain other funds in the Fund Complex (2012-present). Former: Financial Reporting Manager, Invesco, Ltd. (2010-2011); Vice President/Assistant Treasurer of Mutual Fund Administration, Van Kampen Investments, Inc./Morgan Stanley Investment Management (2009-2010); Manager of Mutual Fund Administration, Van Kampen Investments, Inc./Morgan Stanley Investment Management (2005-2009). |
| | THE GUGGENHEIM FUNDS SEMI-ANNUAL REPORT | 51 |
INFORMATION ON BOARD OF TRUSTEES AND OFFICERS (Unaudited)(concluded) |
Name, Address*
and Year of Birth | Position(s) Held with the
Trust, Term of Office and
Length of Time Served | Principal Occupation(s)
During Past 5 Years |
OFFICERS - concluded | |
John L. Sullivan (1955) | Chief Financial Officer and Treasurer (2016-present) | Current: CFO, Chief Accounting Officer and Treasurer, certain other funds in the Fund Complex (2010-present); Senior Managing Director, Guggenheim Investments (2010-present). Former: Managing Director and CCO, each of the funds in the Van Kampen Investments fund complex (2004-2010); Managing Director and Head of Fund Accounting and Administration, Morgan Stanley Investment Management (2002-2004); CFO and Treasurer, Van Kampen Funds (1996-2004). |
Jon Szafran (1989) | Assistant Treasurer (November 2017-Present) | Current: Vice President, Guggenheim Investments (2017-present); Assistant Treasurer, certain other funds in the Fund Complex (2017-present). Former: Assistant Treasurer of Henderson Global Funds and Manager of US Fund Administration, Henderson Global Investors (North America) Inc. (“HGINA”) (2017); Senior Analyst of US Fund Administration, HGINA (2014-2017); Senior Associate of Fund Administration, Cortland Capital Market Services, LLC (2013-2014); Experienced Associate, PricewaterhouseCoopers LLP (2012-2013). |
* | All Trustees and Officers may be reached c/o Guggenheim Investments, 227 West Monroe Street, Chicago, Illinois 60606. |
** | This Trustee is an “interested person” (as defined in Section 2(a)(19) of the 1940 Act) (“Interested Trustee”) of the Trust because of her affiliation with Guggenheim Investments. |
*** | The “Fund Complex” includes all closed-end and open-end funds (including all of their portfolios) advised by the Adviser and any funds that have an investment adviser or servicing agent that is an affiliated person of the Adviser. Information provided is as of the date of this report. |
**** | Certain of the Trustees may serve as directors on the boards of companies not required to be disclosed above, including certain non-profit companies and charitable foundations. |
52 | THE GUGGENHEIM FUNDS SEMI-ANNUAL REPORT | |
GUGGENHEIM INVESTMENTS PRIVACY NOTICE (Unaudited) |
Who We Are
This Privacy Notice describes the data protection practices of Guggenheim Investments. Guggenheim Investments as used herein refers to the affiliated investment management businesses of Guggenheim Partners, LLC: Guggenheim Funds Investment Advisors, LLC, Guggenheim Partners Investment Management, LLC, Guggenheim Funds Distributors, LLC, Security Investors, LLC, Guggenheim Investment Advisors (Europe) Limited, Guggenheim Real Estate, LLC, GS Gamma Advisors, LLC, Guggenheim Partners India Management, LLC, Guggenheim Partners Europe Limited, as well as the funds in the Guggenheim Funds complex (the “Funds”) (“Guggenheim Investments,” “we,” “us,” or “our”).
Guggenheim Partners Investment Management Holdings, LLC, located at 330 Madison Avenue, New York, New York 10017 is the data controller for your information. The Affiliates who are also controllers of certain of your information are: Guggenheim Investment Advisors (Europe) Limited, Guggenheim Partners Europe Limited, Guggenheim Partners, LLC, Guggenheim Funds Investment Advisors, LLC, Guggenheim Partners Investment Management, LLC, Guggenheim Funds Distributors, LLC and Security Investors, LLC, as well as the Funds.
Our Commitment to You
Guggenheim Investments considers your privacy our utmost concern. When you become our client or investor, you entrust us with not only your hard-earned money but also with your personal and financial information. Because we have access to your private information, we hold ourselves to the highest standards in its safekeeping and use. We strictly limit how we share your information with others, whether you are a current or former Guggenheim Investments client or investor.
The Information We Collect About You
We collect certain nonpublic personal information about you from information you provide on applications, other forms, our website, and/or from third parties including investment advisors. This information includes Social Security or other tax identification number, assets, income, tax information, retirement and estate plan information, transaction history, account balance, payment history, bank account information, marital status, family relationships, information that we collect on our website through the use of “cookies,” and other personal information that you or others provide to us. We may also collect such information through your inquiries by mail, e-mail or telephone. We may also collect customer due diligence information, as required by applicable law and regulation, through third party service providers.
How We Handle Your Personal Information
The legal basis for using your information as set out in this Privacy Notice is as follows: (a) use of your personal data is necessary to perform our obligations under any contract with you (such as a contract for us to provide financial services to you); or (b) where use of your personal data is not necessary for performance of a contract, use of your personal data is necessary for our legitimate interests or the legitimate interests of others (for example, to enforce the legal terms
| | THE GUGGENHEIM FUNDS SEMI-ANNUAL REPORT | 53 |
GUGGENHEIM INVESTMENTS PRIVACY NOTICE (Unaudited)(continued) |
governing our services, operate and market our website and other services we offer, ensure safe environments for our personnel and others, make and receive payments, prevent fraud and to know the customer to whom we are providing the services). Some processing is done to comply with applicable law.
In addition to the specific uses described above, we also use your information in the following manner:
| | ● | We use your information in connection with servicing your accounts. |
| | ● | We use information to respond to your requests or questions. For example, we might use your information to respond to your customer feedback. |
| | ● | We use information to improve our products and services. We may use your information to make our website and products better. We may use your information to customize your experience with us. |
| | ● | We use information for security purposes. We may use your information to protect our company and our customers. |
| | ● | We use information to communicate with you. For example, we will communicate with you about your account or our relationship. We may contact you about your feedback. We might also contact you about this Privacy Notice. We may also enroll you in our email newsletter. |
| | ● | We use information as otherwise permitted by law, as we may notify you. |
| | ● | Aggregate/Anonymous Data. We may aggregate and/or anonymize any information collected through the website so that such information can no longer be linked to you or your device (“Aggregate/Anonymous Information”). We may use Aggregate/Anonymous Information for any purpose, including without limitation for research and marketing purposes, and may also share such data with any third parties, including advertisers, promotional partners, and sponsors. |
We do not sell information about current or former clients or their accounts to third parties. Nor do we share this information, except when necessary to complete transactions at your request, to make you aware of investment products and services that we or our affiliates offer, or as permitted or required by law.
We provide information about you to companies and individuals not affiliated with Guggenheim Investments to complete certain transactions or account changes, or to perform services for us related to your account. For example, if you ask to transfer assets from another financial institution to Guggenheim Investments, we must provide certain information about you to that company to complete the transaction. We provide the third party with only the information necessary to carry out its responsibilities and only for that purpose. And we require these third parties to treat your private information with the same high degree of confidentiality that we do.
54 | THE GUGGENHEIM FUNDS SEMI-ANNUAL REPORT | |
GUGGENHEIM INVESTMENTS PRIVACY NOTICE (Unaudited)(continued) |
To alert you to other Guggenheim Investments products and services, we share your information within our family of affiliated companies. You may limit our sharing with affiliated companies as set out below. We may also share information with any successor to all or part of our business, or in connection with steps leading up to a merger or acquisition. For example, if part of our business was sold we may give customer information as part of that transaction. We may also share information about you with your consent.
We will release information about you if you direct us to do so, if we are compelled by law to do so, or in other circumstances as permitted by law (for example, to protect your account from fraud).
If you close your account(s) or become an inactive client or investor, we will continue to adhere to the privacy policies and practices described in this notice.
Opt-Out Provisions and Your Data Choices
The law allows you to “opt out” of certain kinds of information sharing with third parties. We do not share personal information about you with any third parties that triggers this opt-out right. This means YOU ARE ALREADY OPTED OUT.
When you are no longer our client or investor, we continue to share your information as described in this notice, and you may contact us at any time to limit our sharing by sending an email to CorporateDataPrivacy@GuggenheimPartners.com.
European Union Data Subjects and certain others: In addition to the choices set forth above, residents of the European Union and certain other jurisdictions have certain rights to (1) request access to or rectification or deletion of information we collect about them, (2) request a restriction on the processing of their information, (3) object to the processing of their information, or (4) request the portability of certain information. To exercise these or other rights, please contact us using the contact information below. We will consider all requests and provide our response within the time period stated by applicable law. Please note, however, that certain information may be exempt from such requests in some circumstances, which may include if we need to keep processing your information for our legitimate interests or to comply with a legal obligation. We may request you provide us with information necessary to confirm your identity before responding to your request.
Residents of France and certain other jurisdictions may also provide us with instructions regarding the manner in which we may continue to store, erase and share your information after your death, and where applicable, the person you have designated to exercise these rights after your death.
How We Protect Privacy Online
We take steps to protect your privacy when you use our web site – www.guggenheiminvestments.com – by using secure forms of online communication, including encryption technology, Secure Socket Layer (SSL) protocol, firewalls and user names and passwords. These safeguards vary
| | THE GUGGENHEIM FUNDS SEMI-ANNUAL REPORT | 55 |
GUGGENHEIM INVESTMENTS PRIVACY NOTICE (Unaudited)(concluded) |
based on the sensitivity of the information that we collect and store. However, we cannot and do not guarantee that these measures will prevent every unauthorized attempt to access, use, or disclose your information since despite our efforts, no Internet and/or other electronic transmissions can be completely secure. Our web site uses “http cookies”—tiny pieces of information that we ask your browser to store. We use cookies for session management and security features on the Guggenheim Investments web site. We do not use them to pull data from your hard drive, to learn your e-mail address, or to view data in cookies created by other web sites. We will not share the information in our cookies or give others access to it. See the legal information area on our web site for more details about web site security and privacy features.
How We Safeguard Your Personal Information and Data Retention
We restrict access to nonpublic personal information about you to our employees and in some cases to third parties (for example, the service providers described above) as permitted by law. We maintain strict physical, electronic and procedural safeguards that comply with federal standards to guard your nonpublic personal information.
We keep your information for no longer than necessary for the purposes for which it is processed. The length of time for which we retain information depends on the purposes for which we collected and use it and/or as required to comply with applicable laws. Information may persist in copies made for backup and business continuity purposes for additional time.
International Visitors
If you are not a resident of the United States, please be aware that your information may be transferred to, stored and processed in the United States where our servers are located and our databases are operated. The data protection and other laws of the United States and other countries might not be as comprehensive as those in your country.
In such cases, we ensure that a legal basis for such a transfer exists and that adequate protection is provided as required by applicable law, for example, by using standard contractual clauses or by transferring your data to a jurisdiction that has obtained an adequacy finding. Individuals whose data may be transferred on the basis of standard contractual clauses may contact us as described below.
We’ll Keep You Informed
If you have any questions or concerns about how we treat your personal data, we encourage you to consult with us first. You may also contact the relevant supervisory authority.
We reserve the right to modify this policy at any time and will inform you promptly of material changes. You may access our privacy policy from our web site at www.guggenheiminvestments.com. Should you have any questions regarding our privacy policy, contact us by email at CorporateDataPrivacy@GuggenheimPartners.com.
56 | THE GUGGENHEIM FUNDS SEMI-ANNUAL REPORT | |
This page intentionally left blank.
Item 2. Code of Ethics.
Not applicable at this time.
Item 3. Audit Committee Financial Expert.
Not applicable at this time.
Item 4. Principal Accountant Fees and Services.
Not applicable at this time.
Item 5. Audit Committee of Listed Registrants.
Not applicable.
Item 6. Investments.
Schedule of Investments is included as part of the report to shareholders filed under Item 1 of this form.
Item 7. Disclosure of Proxy Voting Policies and Procedures for Closed-End Management Investment Companies.
Not applicable.
Item 8. Portfolio Managers of Closed-End Management Investment Companies.
Not applicable.
Item 9. Purchases of Equity Securities by Closed-End Management Investment Company and Affiliated Purchasers.
Not applicable.
Item 10. Submission of Matters to a Vote of Security Holders.
Not applicable.
Item 11. Controls and Procedures.
(a) The registrant’s President (principal executive officer) and Treasurer (principal financial officer) have evaluated the registrant’s disclosure controls and procedures within 90 days of this filing and have concluded that the registrant’s disclosure controls and procedures were effective as of that date in ensuring that information required to be disclosed by the registrant in this Form N-CSR was recorded, processed, summarized, and reported timely.
(b) The registrant’s principal executive officer and principal financial officer are aware of no change in the registrant’s internal control over financial reporting that occurred during the registrant’s second fiscal quarter covered by this report that has materially affected, or is reasonably likely to materially affect, the registrant’s internal control over financial reporting.
Item 12. Disclosure of Securities Lending Activities for Closed End Management Investment Companies.
Not applicable
Item 13. Exhibits.
(a)(1) Not applicable.
(a)(2) Separate certifications by the President (principal executive officer) and Treasurer (principal financial officer) of the registrant as required by Rule 30a-2(a) under the Act (17 CFR 270.30a-2(a)) are attached.
(b) A certification by the registrant’s President (principal executive officer) and Treasurer (principal financial officer) as required by Rule 30a-2(b) under the Act (17 CFR 270.30a-2(b)) is attached.
SIGNATURES
Pursuant to the requirements of the Securities Exchange Act of 1934 and the Investment Company Act of 1940, the registrant has duly caused this report to be signed on its behalf by the undersigned, thereunto duly authorized.
| (Registrant) | Rydex Series Funds | |
| | | |
| By (Signature and Title)* | /s/ Amy J. Lee | |
| | Amy J. Lee, President | |
| | | |
| Date | September 7, 2018 | |
Pursuant to the requirements of the Securities Exchange Act of 1934 and the Investment Company Act of 1940, this report has been signed below by the following persons on behalf of the registrant and in the capacities and on the dates indicated.
| By (Signature and Title)* | /s/ Amy J. Lee | |
| | Amy J. Lee, President | |
| | | |
| Date | September 7, 2018 | |
| | | |
| By (Signature and Title)* | /s/ John L. Sullivan | |
| | John L. Sullivan, Chief Financial Officer and Treasurer | |
| | | |
| Date | September 7, 2018 | |
| | * | Print the name and title of each signing officer under his or her signature. |

