UNITED STATES
SECURITIES AND EXCHANGE COMMISSION
Washington, D.C. 20549
FORM N-CSR
CERTIFIED SHAREHOLDER REPORT OF REGISTERED MANAGEMENT
INVESTMENT COMPANIES
Investment Company Act file number 811- 07584
Rydex Series Funds
(Exact name of registrant as specified in charter)
702 King Farm Boulevard, Suite 200
Rockville, Maryland 20850
(Address of principal executive offices) (Zip code)
Amy J. Lee
Rydex Series Funds
702 King Farm Boulevard, Suite 200
Rockville, Maryland 20850
(Name and address of agent for service)
Registrant's telephone number, including area code: (301) 296-5100
Date of fiscal year end: December 31
Date of reporting period: January 1, 2023 – June 30, 2023
Item 1. Reports to Stockholders.
The registrant’s semi-annual report transmitted to shareholders pursuant to Rule 30e-1 under the Investment Company Act of 1940, as amended (the “Investment Company Act”), is as follows:
6.30.2023
Guggenheim Funds Semi-Annual Report
Guggenheim Alternative Fund |
Guggenheim Multi-Hedge Strategies Fund | | |
Rydex Commodities Fund |
Rydex Commodities Strategy Fund | | |
GuggenheimInvestments.com | RDXSGIALT-SEMI-0623x1223 |

| | |
DEAR SHAREHOLDER | 2 |
ECONOMIC AND MARKET OVERVIEW | 4 |
ABOUT SHAREHOLDERS’ FUND EXPENSES | 6 |
MULTI-HEDGE STRATEGIES FUND | 9 |
COMMODITIES STRATEGY FUND | 53 |
NOTES TO CONSOLIDATED FINANCIAL STATEMENTS | 64 |
OTHER INFORMATION | 85 |
INFORMATION ON BOARD OF TRUSTEES AND OFFICERS | 99 |
GUGGENHEIM INVESTMENTS PRIVACY NOTICE | 108 |
LIQUIDITY RISK MANAGEMENT PROGRAM | 112 |
| | THE GUGGENHEIM FUNDS SEMI-ANNUAL REPORT | 1 |
Dear Shareholder:
Security Investors, LLC (the “Investment Adviser”) is pleased to present the semi-annual shareholder report for two alternative strategy funds (each a “Fund”) that are part of the Rydex Series Funds. This report covers performance of the Funds for the semi-annual period ended June 30, 2023 (the “Reporting Period”).
The Investment Adviser is a part of Guggenheim Investments, which represents the investment management businesses of Guggenheim Partners, LLC (“Guggenheim”), a global, diversified financial services firm.
Guggenheim Funds Distributors, LLC is the distributor of the Funds. Guggenheim Funds Distributors, LLC is affiliated with Guggenheim and the Investment Adviser.
We encourage you to read the Economic and Market Overview section of the report, which follows this letter.
We are committed to providing innovative investment solutions and appreciate the trust you place in us.
Sincerely,
Security Investors, LLC
July 31, 2023
Read a prospectus and summary prospectus (if available) carefully before investing. It contains the investment objectives, risks, charges, expenses and other information, which should be considered carefully before investing. Obtain a prospectus and summary prospectus (if available) at guggenheiminvestments.com or call 800.820.0888.
This material is not intended as a recommendation or as investment advice of any kind, including in connection with rollovers, transfers, and distributions. Such material is not provided in a fiduciary capacity, may not be relied upon for or in connection with the making of investment decisions, and does not constitute a solicitation of an offer to buy or sell securities. All content has been provided for informational or educational purposes only and is not intended to be and should not be construed as legal or tax advice and/or a legal opinion. Always consult a financial, tax and/or legal professional regarding your specific situation.
2 | THE GUGGENHEIM FUNDS SEMI-ANNUAL REPORT | |
The Multi-Hedge Strategies Fund is subject to a number of risks and may not be suitable for all investors. ● The Fund’s use of derivatives such as futures, options and swap agreements may expose the Fund to additional risks that it would not be subject to if it invested directly in the securities underlying those derivatives. ● The more the Fund invests in leveraged instruments, the more the leverage will magnify any gains or losses on those investments. ● The Fund’s use of short selling involves increased risks and costs. The Fund risks paying more for a security than it received from its sale. ● The Fund’s investments in high yield securities and unrated securities of similar credit quality (“junk bonds”) may be subject to greater levels of interest rate, credit and liquidity risk than funds that do not invest in such securities. ● The Fund’s fixed income investments will change in value in response to interest rate changes and other factors. ● The Fund’s exposure to the commodity and currency markets may subject the Fund to greater volatility as commodity- and currency-linked derivative investments may be affected by changes in overall market movements, commodity index volatility, changes in interest rates or factors affecting a particular industry, commodity or currency—such as droughts, floods, weather, livestock disease, embargoes, tariffs and international economic, political and regulatory developments. The Fund may also incur transaction costs with the conversion between various currencies. ● The Fund’s exposure to foreign currencies subjects the Fund to the risk that those currencies will decline in value relative to the U.S. dollar, or, in the case of short positions, that the U.S. dollar will decline in value relative to the currency being hedged. ● These risks may cause the Fund to experience higher losses and/or volatility than a fund that does not invest in derivatives, use leverage or short sales or have exposure to high yield/fixed income securities, foreign currencies and/or securities. ● See the prospectus for more detailed information regarding these and additional risks.
The Commodities Strategy Fund is subject to a number of risks and may not be suitable for all investors. ● The Fund’s exposure to the commodity markets may subject the Fund to greater volatility as commodity-linked investments may be affected by changes in overall market movements, commodity index volatility, changes in interest rates or factors affecting a particular industry or commodity—such as droughts, floods, weather, embargos, tariffs and international economic, political and regulatory developments. ● To the extent that the Fund’s investments are concentrated in energy-related commodities, the Fund is subject to the risk that this sector will underperform the market as a whole. ● The Fund’s use of derivatives, such as futures, options, structured notes and swap agreements, may expose the Fund to additional risks that it would not be subject to if it invested directly in the securities or investments underlying those derivatives. ● The more the Fund invests in leveraged instruments, the more the leverage will magnify any gains or losses on those investments. ● The Fund is subject to tracking error risks, which may cause the Fund’s performance not to match that of or be lower than the Fund’s underlying benchmark. ● The Fund’s investments in other investment companies subjects the Fund to those risks affecting the investment company, including the possibility that the value of the underlying securities held by the investment company could decrease. Moreover, the Fund will incur its pro rata share of the expenses of the underlying investment companies’ expenses. ●This Fund is considered non-diversified and can invest a greater portion of its assets in securities of individual issuers than a diversified fund. As a result, changes in the market value of a single security could cause greater fluctuations in the value of Fund shares than would occur in a more diversified fund. ● See the prospectus for more detailed information on these and additional risks.
| | THE GUGGENHEIM FUNDS SEMI-ANNUAL REPORT | 3 |
ECONOMIC AND MARKET OVERVIEW (Unaudited) | June 30, 2023 |
The fundamental backdrop we see for the economy is that inflation, while making some progress, continues to run well above target while the labor market appears overheated. As a result, the U.S. Federal Reserve (the “Fed”) is employing a deliberate and forceful strategy which has the effect of weakening the economy. The Fed believes this strategy is required to meaningfully reduce inflation. We expect Fed policymakers to deliver an additional rate hike in September 2023 as they try to limit an undue easing of financial conditions that could risk a resurgence in inflation. Quantitative tightening appears likely to continue at least into early 2024.
Despite the abrupt tightening of Fed policy seen over recent quarters, growth of real gross domestic product has been resilient, aided by a significant fiscal expansion and easing inflation pressures that have boosted real personal consumption. Indeed, headline personal consumption expenditures inflation has slowed to 2.5% on an annualized basis in the three months ended May 2023, down from 7.3% in the corresponding period a year earlier, helping to lift real income growth and support consumer spending.
Notwithstanding recent stronger-than-expected economic activity, we continue to believe the Fed’s policy measures will likely result in a higher unemployment rate and may ultimately lead to a recession. A range of leading indicators, including a low unemployment rate, an inverted yield curve, a declining leading economic index, and falling consumer confidence, suggest a downturn may be approaching.
While a recession understandably provokes fear among investors, in this environment it is arguably not the worst outcome from a medium-term perspective, as we see signs a recession could be moderate in its severity. Moreover, we expect inflation to be brought under control as spending and demand for labor cool, in turn allowing the Fed to start to ease its monetary policy stance as we progress through 2024.
For the Reporting Period, the S&P 500® Index* returned 16.89%. The MSCI Europe-Australasia-Far East (“EAFE”) Index* returned 11.67%. The return of the MSCI Emerging Markets Index* was 4.89%.
In the bond market, the Bloomberg U.S. Aggregate Bond Index* posted a 2.09% return for the Reporting Period, while the Bloomberg U.S. Corporate High Yield Index* returned 5.38%. The return of the ICE Bank of America (“BofA”) 3-Month U.S. Treasury Bill Index* was 2.27% for the Reporting Period.
4 | THE GUGGENHEIM FUNDS SEMI-ANNUAL REPORT | |
ECONOMIC AND MARKET OVERVIEW (Unaudited)(concluded) | June 30, 2023 |
The opinions and forecasts expressed may not actually come to pass. This information is subject to change at any time, based on market and other conditions, and should not be construed as a recommendation of any specific security or strategy.
*Index Definitions:
The following indices are referenced throughout this report. Indices are unmanaged and not available for direct investment. Index performance does not reflect transaction costs, fees, or expenses.
Bloomberg U.S. Aggregate Bond Index is a broad-based flagship benchmark that measures the investment grade, U.S. dollar-denominated, fixed-rate taxable bond market, including U.S. Treasuries, government-related and corporate securities, mortgage-backed securities or “MBS” (agency fixed-rate and hybrid adjustable-rate mortgage, or “ARM”, pass-throughs), asset-backed securities (“ABS”), and commercial mortgage-backed securities (“CMBS”) (agency and non-agency).
Bloomberg U.S. Corporate High Yield Index measures the U.S. dollar-denominated, high yield, fixed-rate corporate bond market. Securities are classified as high yield if the middle rating of Moody’s, Fitch, and S&P is Ba1/BB +/BB + or below.
HFRX Global Hedge Fund Index is designed to be representative of the overall composition of the hedge fund universe. It is comprised of all eligible hedge fund strategies, including, but not limited to, convertible arbitrage, distressed securities, equity hedge, equity market neutral, event driven, macro, merger arbitrage and relative-value arbitrage. The strategies are asset weighted based on the distribution of assets in the hedge fund industry.
ICE BofA 3-Month U.S. Treasury Bill Index is an unmanaged market index of U.S. Treasury securities maturing in 90 days that assumes reinvestment of all income.
MSCI EAFE Index is a free float-adjusted market capitalization index that is designed to measure the equity market performance of developed markets, excluding the U.S. & Canada.
MSCI Emerging Markets Index is a free float-adjusted market capitalization weighted index that is designed to measure equity market performance in the global emerging markets.
S&P 500® Index is a broad-based index, the performance of which is based on the performance of 500 widely held common stocks chosen for market size, liquidity, and industry group representation.
S&P Goldman Sachs Commodity Index (S&P GSCI®), a benchmark for investment performance in the commodity markets, measures investable commodity price movements and inflation in the world economy. The index is calculated primarily on a world production weighted basis and is comprised of the principal physical commodities that are the subject of active, liquid futures markets.
| | THE GUGGENHEIM FUNDS SEMI-ANNUAL REPORT | 5 |
ABOUT SHAREHOLDERS’ FUND EXPENSES (Unaudited) |
All mutual funds have operating expenses, and it is important for our shareholders to understand the impact of costs on their investments. Shareholders of a fund incur two types of costs: (i) transaction costs, including sales charges (loads) on purchase payments, reinvested dividends, other distributions, and exchange fees, and (ii) ongoing costs, including management fees, administrative services, and shareholder reports, among others. These ongoing costs, or operating expenses, are deducted from a fund’s gross income and reduce the investment return of the fund.
A fund’s expenses are expressed as a percentage of its average net assets, which is known as the expense ratio. The following examples are intended to help investors understand the ongoing costs (in dollars) of investing in a fund and to compare these costs with the ongoing costs of investing in other mutual funds.
The examples are based on an investment of $1,000 made at the beginning of the period and held for the entire six-month period beginning December 31, 2022 and ending June 30, 2023.
The following tables illustrate the Funds’ costs in two ways:
Table 1. Based on actual Fund return: This section helps investors estimate the actual expenses paid over the period. The “Ending Account Value” shown is derived from the Fund’s actual return, and the fifth column shows the dollar amount that would have been paid by an investor who started with $1,000 in the Fund. Investors may use the information here, together with the amount invested, to estimate the expenses paid over the period. Simply divide the Fund’s account value by $1,000 (for example, an $8,600 account value divided by $1,000 = 8.6), then multiply the result by the number provided under the heading “Expenses Paid During Period.”
Table 2. Based on hypothetical 5% return: This section is intended to help investors compare a fund’s cost with those of other mutual funds. The table provides information about hypothetical account values and hypothetical expenses based on the Fund’s actual expense ratio and an assumed rate of return of 5% per year before expenses, which is not the Fund’s actual return. The hypothetical account values and expenses may not be used to estimate the actual ending account balance or expenses paid during the period. The example is useful in making comparisons because the U.S. Securities and Exchange Commission (the “SEC”) requires all mutual funds to calculate expenses based on the 5% return. Investors can assess a fund’s costs by comparing this hypothetical example with the hypothetical examples that appear in shareholder reports of other funds.
The calculations illustrated above assume no shares were bought or sold during the period. Actual costs may have been higher or lower, depending on the amount of investment and the timing of any purchases or redemptions.
6 | THE GUGGENHEIM FUNDS SEMI-ANNUAL REPORT | |
ABOUT SHAREHOLDERS’ FUND EXPENSES (Unaudited)(continued) |
Please note that the expenses shown in the table are meant to highlight your ongoing costs only and do not reflect any transactional costs, such as sales charges (loads) on purchase payments, and contingent deferred sales charges (“CDSC”) on redemptions, if any. Therefore, the second table is useful in comparing ongoing costs only, and will not help you determine the relative total costs of owning different funds. In addition, if these transactional costs were included, your costs would have been higher.
More information about the Funds’ expenses, including annual expense ratios for periods up to five years (subject to the Fund’s inception date), can be found in the Financial Highlights section of this report. For additional information on operating expenses and other shareholder costs, please refer to the appropriate Fund prospectus.
| | THE GUGGENHEIM FUNDS SEMI-ANNUAL REPORT | 7 |
ABOUT SHAREHOLDERS’ FUND EXPENSES (Unaudited)(concluded) |
| Expense
Ratio1 | Fund
Return | Beginning
Account Value
December 31,
2022 | Ending
Account Value
June 30,
2023 | Expenses
Paid During
Period2 |
Table 1. Based on actual Fund return3 |
Multi-Hedge Strategies Fund |
A-Class | 1.72% | 1.57% | $ 1,000.00 | $ 1,015.70 | $ 8.60 |
C-Class | 2.47% | 1.21% | 1,000.00 | 1,012.10 | 12.32 |
P-Class | 1.72% | 1.60% | 1,000.00 | 1,016.00 | 8.60 |
Institutional Class | 1.47% | 1.72% | 1,000.00 | 1,017.20 | 7.35 |
Commodities Strategy Fund |
A-Class | 1.54% | (8.68%) | 1,000.00 | 913.20 | 7.31 |
C-Class | 2.29% | (9.03%) | 1,000.00 | 909.70 | 10.84 |
H-Class | 1.55% | (8.66%) | 1,000.00 | 913.40 | 7.35 |
|
Table 2. Based on hypothetical 5% return (before expenses) |
Multi-Hedge Strategies Fund |
A-Class | 1.72% | 5.00% | $ 1,000.00 | $ 1,016.27 | $ 8.60 |
C-Class | 2.47% | 5.00% | 1,000.00 | 1,012.55 | 12.33 |
P-Class | 1.72% | 5.00% | 1,000.00 | 1,016.27 | 8.60 |
Institutional Class | 1.47% | 5.00% | 1,000.00 | 1,017.50 | 7.35 |
Commodities Strategy Fund |
A-Class | 1.54% | 5.00% | 1,000.00 | 1,017.16 | 7.70 |
C-Class | 2.29% | 5.00% | 1,000.00 | 1,013.44 | 11.43 |
H-Class | 1.55% | 5.00% | 1,000.00 | 1,017.11 | 7.75 |
1 | Annualized and excludes expenses of the underlying funds in which the Funds invest. This ratio represents net expenses which includes dividends on short sales and interest expenses. Excluding these expenses, the net expense ratio of the Multi-Hedge Strategies Fund would be 1.39%, 2.14%, 1.39% and 1.14% for the A-Class, C-Class, P-Class and Institutional Class, respectively. |
2 | Expenses are equal to the Fund’s annualized expense ratio, net of any applicable fee waivers, multiplied by the average account value over the period, multiplied by 181/365 (to reflect the one-half year period). |
3 | Actual cumulative return at net asset value for the period December 31, 2022 to June 30, 2023. |
8 | THE GUGGENHEIM FUNDS SEMI-ANNUAL REPORT | |
PERFORMANCE REPORT AND FUND PROFILE (Unaudited) | June 30, 2023 |
MULTI-HEDGE STRATEGIES FUND
OBJECTIVE: Seeks to provide long-term capital appreciation with less risk than traditional equity funds.
Consolidated Holdings Diversification (Market Exposure as % of Net Assets)
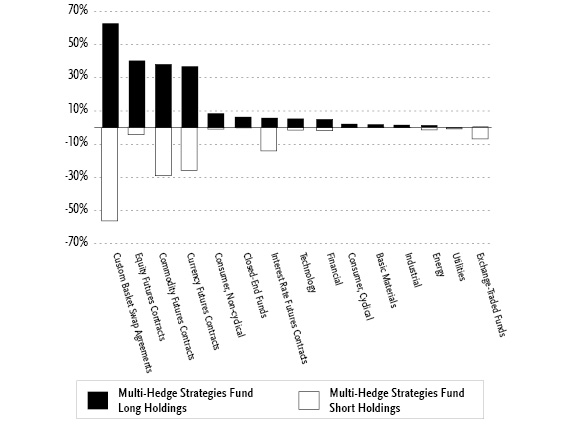
“Consolidated Holdings Diversification (Market Exposure as % of Net Assets)” excludes any temporary cash investments, investments in Guggenheim Strategy Funds Trust mutual funds, or investments in Guggenheim Ultra Short Duration Fund. Investments in those Funds do not provide “market exposure” to meet the Fund’s investment objective, but will significantly increase the portfolio’s exposure to certain other asset categories (and their associated risks), which may cause the Fund to deviate from its principal investment strategy, including: (i) high yield, high risk debt securities rated below the top four long-term rating categories by a nationally recognized statistical rating organization (also known as “junk bonds”); (ii) securities issued by the U.S. government or its agencies and instrumentalities; (iii) CLOs and similar investments; and (iv) other short-term fixed income securities.
| | THE GUGGENHEIM FUNDS SEMI-ANNUAL REPORT | 9 |
PERFORMANCE REPORT AND FUND PROFILE (Unaudited)(concluded) | June 30, 2023 |
Inception Dates: |
A-Class | September 19, 2005 |
C-Class | September 19, 2005 |
P-Class | September 19, 2005 |
Institutional Class | May 3, 2010 |
Ten Largest Holdings | % of Total Net Assets |
Guggenheim Ultra Short Duration Fund — Institutional Class | 7.5% |
Guggenheim Strategy Fund II | 7.5% |
Guggenheim Strategy Fund III | 2.2% |
VMware, Inc. — Class A | 2.1% |
Horizon Therapeutics plc | 1.8% |
ForgeRock, Inc. — Class A | 1.5% |
Focus Financial Partners, Inc. — Class A | 1.2% |
Radius Global Infrastructure, Inc. — Class A | 1.1% |
Syneos Health, Inc. | 1.1% |
Life Storage, Inc. | 1.0% |
Top Ten Total | 27.0% |
| | |
“Ten Largest Holdings” excludes any temporary cash or derivative investments. |
Average Annual Returns*
Periods Ended June 30, 2023
| 6 Month† | 1 Year | 5 Year | 10 Year |
A-Class Shares | 1.57% | (0.03%) | 3.38% | 2.08% |
A-Class Shares with sales charge‡ | (3.25%) | (4.78%) | 2.37% | 1.58% |
C-Class Shares | 1.21% | (0.80%) | 2.63% | 1.33% |
C-Class Shares with CDSC§ | 0.21% | (1.78%) | 2.63% | 1.33% |
P-Class Shares | 1.60% | (0.01%) | 3.39% | 2.10% |
Institutional Class Shares | 1.72% | 0.24% | 3.65% | 2.33% |
S&P 500 Index | 16.89% | 19.59% | 12.31% | 12.86% |
HFRX Global Hedge Fund Index | 0.63% | 1.31% | 1.71% | 1.51% |
* | The performance data above represents past performance that is not predictive of future results. The investment return and principal value of an investment in the Fund will fluctuate so that an investor’s shares, when redeemed, may be worth more or less than their original cost. Returns are historical and include changes in principal and reinvested dividends and capital gains and do not reflect the effect of taxes. The S&P 500 Index and the HFRX Global Hedge Fund Index are unmanaged indices and, unlike the Fund, have no management fees or operating expenses to reduce their reported returns. |
† | 6 month returns are not annualized. |
‡ | Fund returns are calculated using the maximum sales charge of 4.75%. |
§ | Fund returns include a CDSC of 1% if redeemed within 12 months of purchase. |
10 | THE GUGGENHEIM FUNDS SEMI-NNUAL REPORT | |
CONSOLIDATED SCHEDULE OF INVESTMENTS (Unaudited) | June 30, 2023 |
MULTI-HEDGE STRATEGIES FUND | |
| | Shares | | | Value | |
COMMON STOCKS† - 24.4% |
| | | | | | | | | |
Consumer, Non-cyclical - 8.5% |
Horizon Therapeutics plc*,8 | | | 14,874 | | | $ | 1,529,791 | |
Syneos Health, Inc.* | | | 22,656 | | | | 954,724 | |
IVERIC bio, Inc.* | | | 21,233 | | | | 835,306 | |
Amedisys, Inc.*,8 | | | 8,570 | | | | 783,641 | |
Triton International Ltd.8 | | | 9,197 | | | | 765,742 | |
DICE Therapeutics, Inc.* | | | 15,449 | | | | 717,761 | |
NuVasive, Inc.* | | | 14,543 | | | | 604,843 | |
VectivBio Holding AG*,8 | | | 31,692 | | | | 534,644 | |
Chinook Therapeutics, Inc.* | | | 9,562 | | | | 367,372 | |
Seagen, Inc.*,8 | | | 1,594 | | | | 306,781 | |
Total Consumer, Non-cyclical | | | 7,400,605 | |
| | | | | | | | | |
Technology - 5.2% |
VMware, Inc. — Class A*,8 | | | 12,601 | | | | 1,810,506 | |
ForgeRock, Inc. — Class A* | | | 65,591 | | | | 1,347,239 | |
Tower Semiconductor Ltd.* | | | 22,123 | | | | 830,055 | |
Activision Blizzard, Inc.*,8 | | | 6,659 | | | | 561,354 | |
Total Technology | | | 4,549,154 | |
| | | | | | | | | |
Financial - 5.0% |
Focus Financial Partners, Inc. — Class A* | | | 19,855 | | | | 1,042,586 | |
Radius Global Infrastructure, Inc. — Class A*,8 | | | 66,769 | | | | 994,858 | |
Life Storage, Inc. REIT8 | | | 6,392 | | | | 849,880 | |
Lakeland Bancorp, Inc. | | | 36,286 | | | | 485,869 | |
Greenhill & Company, Inc. | | | 29,350 | | | | 429,978 | |
Urstadt Biddle Properties, Inc. — Class A REIT | | | 11,308 | | | | 240,408 | |
Argo Group International Holdings Ltd. | | | 5,511 | | | | 163,181 | |
Necessity Retail REIT, Inc. | | | 13,747 | | | | 92,930 | |
Total Financial | | | 4,299,690 | |
| | | | | | | | | |
Consumer, Cyclical - 2.1% |
Univar Solutions, Inc.*,8 | | | 18,233 | | | | 653,471 | |
iRobot Corp.* | | | 12,316 | | | | 557,299 | |
Spirit Airlines, Inc. | | | 21,083 | | | | 361,784 | |
NEOGAMES S.A.* | | | 9,427 | | | | 246,233 | |
Total Consumer, Cyclical | | | 1,818,787 | |
| | | | | | | | | |
Basic Materials - 1.7% |
Diversey Holdings Ltd.*,1 | | | 99,422 | | | | 834,150 | |
Arconic Corp.*,8 | | | 22,322 | | | | 660,285 | |
Total Basic Materials | | | 1,494,435 | |
| | | | | | | | | |
Industrial - 1.5% |
National Instruments Corp.8 | | | 14,539 | | | | 834,539 | |
Aerojet Rocketdyne Holdings, Inc.* | | | 8,700 | | | | 477,369 | |
Total Industrial | | | 1,311,908 | |
| | | | | | | | | |
Energy - 0.4% |
PDC Energy, Inc.8 | | | 5,547 | | | | 394,614 | |
| | | | | | | | | |
Total Common Stocks |
(Cost $21,197,389) | | | | | | | 21,269,193 | |
| | | | | | | | | |
MASTER LIMITED PARTNERSHIPS† - 0.6% |
Energy - 0.6% |
Magellan Midstream Partners, LP8 | | | 8,246 | | | | 513,891 | |
Total Master Limited Partnerships |
(Cost $515,606) | | | | | | | 513,891 | |
| | | | | | | | | |
SEE NOTES TO CONSOLIDATED FINANCIAL STATEMENTS. | THE GUGGENHEIM FUNDS SEMI-ANNUAL REPORT | 11 |
CONSOLIDATED SCHEDULE OF INVESTMENTS (Unaudited)(continued) | June 30, 2023 |
MULTI-HEDGE STRATEGIES FUND | |
| | Shares | | | Value | |
RIGHTS††† - 0.0% |
Consumer, Non-cyclical - 0.0% |
Lantheus Holdings, Inc.* | | | 42,000 | | | $ | — | |
Alexion Pharmaceuticals, Inc.* | | | 34,843 | | | | — | |
Viatris, Inc.* | | | 31,686 | | | | — | |
Johnson & Johnson* | | | 3,841 | | | | — | |
Total Consumer, Non-cyclical | | | — | |
| | | | | | | | | |
Total Rights |
(Cost $5,387) | | | | | | | — | |
| | | | | | | | | |
MUTUAL FUNDS† - 17.2% |
Guggenheim Ultra Short Duration Fund — Institutional Class2 | | | 674,462 | | | | 6,562,518 | |
Guggenheim Strategy Fund II2 | | | 269,618 | | | | 6,530,150 | |
Guggenheim Strategy Fund III2 | | | 79,031 | | | | 1,916,508 | |
Total Mutual Funds |
(Cost $15,386,814) | | | | | | | 15,009,176 | |
| | | | | | | | | |
CLOSED-END FUNDS† - 6.4% |
Nuveen California Quality Municipal Income Fund | | | 15,399 | | | | 168,157 | |
BlackRock MuniHoldings California Quality Fund, Inc. | | | 15,332 | | | | 166,352 | |
SRH Total Return Fund, Inc. | | | 12,448 | | | | 165,309 | |
Adams Diversified Equity Fund, Inc. | | | 9,810 | | | | 164,906 | |
Gabelli Dividend & Income Trust | | | 7,793 | | | | 164,666 | |
General American Investors Company, Inc. | | | 3,931 | | | | 164,001 | |
Nuveen New Jersey Quality Municipal Income Fund | | | 13,868 | | | | 159,066 | |
Tekla Life Sciences Investors | | | 11,633 | | | | 157,511 | |
Nuveen Real Asset Income and Growth Fund | | | 13,740 | | | | 156,911 | |
Nuveen Pennsylvania Quality Municipal Income Fund | | | 12,665 | | | | 142,355 | |
Ellsworth Growth and Income Fund Ltd. | | | 13,091 | | | | 112,583 | |
DWS Municipal Income Trust | | | 12,906 | | | | 111,121 | |
Clough Global Equity Fund | | | 17,457 | | | | 108,932 | |
Voya Infrastructure Industrials and Materials Fund | | | 10,483 | | | | 103,467 | |
BlackRock New York Municipal Income Trust | | | 9,653 | | | | 99,812 | |
Tekla Healthcare Investors | | | 5,842 | | | | 99,606 | |
BrandywineGLOBAL Global Income Opportunities Fund, Inc. | | | 9,164 | | | | 73,679 | |
Pioneer Municipal High Income Fund Trust | | | 8,497 | | | | 72,479 | |
Gabelli Healthcare & WellnessRx Trust | | | 6,833 | | | | 68,057 | |
Bancroft Fund Ltd. | | | 3,889 | | | | 66,463 | |
Western Asset Emerging Markets Debt Fund, Inc. | | | 7,592 | | | | 65,443 | |
Invesco Trust for Investment Grade New York Municipals | | | 6,338 | | | | 64,774 | |
12 | THE GUGGENHEIM FUNDS SEMI-ANNUAL REPORT | SEE NOTES TO CONSOLIDATED FINANCIAL STATEMENTS. |
CONSOLIDATED SCHEDULE OF INVESTMENTS (Unaudited)(continued) | June 30, 2023 |
MULTI-HEDGE STRATEGIES FUND | |
| | Shares | | | Value | |
Western Asset Inflation-Linked Opportunities & Income Fund | | | 7,180 | | | $ | 63,615 | |
Aberdeen Total Dynamic Dividend Fund | | | 7,613 | | | | 62,883 | |
AllianceBernstein National Municipal Income Fund, Inc. | | | 5,745 | | | | 61,644 | |
CBRE Global Real Estate Income Fund | | | 11,535 | | | | 60,328 | |
Mexico Fund, Inc. | | | 3,497 | | | | 58,680 | |
BNY Mellon Municipal Income, Inc. | | | 8,592 | | | | 54,044 | |
Swiss Helvetia Fund, Inc. | | | 6,017 | | | | 49,460 | |
Tortoise Power and Energy Infrastructure Fund, Inc. | | | 3,601 | | | | 47,569 | |
Invesco Pennsylvania Value Municipal Income Trust | | | 4,485 | | | | 44,222 | |
LMP Capital and Income Fund, Inc. | | | 3,360 | | | | 43,042 | |
MFS High Yield Municipal Trust | | | 12,937 | | | | 41,657 | |
Eaton Vance California Municipal Bond Fund | | | 4,485 | | | | 39,916 | |
abrdn Japan Equity Fund, Inc. | | | 6,477 | | | | 39,315 | |
Nuveen AMT-Free Quality Municipal Income Fund | | | 3,478 | | | | 38,015 | |
DWS Strategic Municipal Income Trust | | | 3,785 | | | | 32,116 | |
Blackstone Long-Short Credit Income Fund | | | 2,790 | | | | 31,639 | |
Principal Real Estate Income Fund | | | 3,031 | | | | 28,673 | |
First Trust Specialty Finance and Financial Opportunities Fund | | | 8,735 | | | | 28,476 | |
MFS Municipal Income Trust | | | 5,349 | | | | 27,280 | |
BNY Mellon High Yield Strategies Fund | | | 11,930 | | | | 26,485 | |
Neuberger Berman California Municipal Fund, Inc. | | | 2,440 | | | | 25,986 | |
Western Asset Municipal Partners Fund, Inc. | | | 2,139 | | | | 25,030 | |
John Hancock Tax-Advantaged Global Shareholder Yield Fund | | | 4,591 | | | | 21,532 | |
BlackRock California Municipal Income Trust | | | 1,740 | | | | 20,636 | |
Virtus Convertible & Income Fund | | | 5,683 | | | | 19,777 | |
Nuveen AMT-Free Municipal Credit Income Fund | | | 1,650 | | | | 19,305 | |
Nuveen Municipal Credit Income Fund | | | 1,652 | | | | 19,262 | |
Nuveen Quality Municipal Income Fund | | | 1,706 | | | | 19,227 | |
Nuveen Credit Strategies Income Fund | | | 3,585 | | | | 18,104 | |
SEE NOTES TO CONSOLIDATED FINANCIAL STATEMENTS. | THE GUGGENHEIM FUNDS SEMI-ANNUAL REPORT | 13 |
CONSOLIDATED SCHEDULE OF INVESTMENTS (Unaudited)(continued) | June 30, 2023 |
MULTI-HEDGE STRATEGIES FUND | |
| | Shares | | | Value | |
abrdn Global Dynamic Dividend | | | 1,857 | | | $ | 17,716 | |
BlackRock Municipal 2030 Target Term Trust | | | 832 | | | | 17,289 | |
BlackRock MuniYield Quality Fund III, Inc. | | | 1,558 | | | | 17,045 | |
Nuveen Floating Rate Income Fund/Closed-end Fund | | | 2,108 | | | | 16,632 | |
Virtus Convertible & Income Fund II | | | 5,181 | | | | 16,113 | |
Royce Global Value Trust, Inc. | | | 1,700 | | | | 15,708 | |
BlackRock MuniYield Quality Fund, Inc. | | | 1,357 | | | | 15,700 | |
BlackRock Municipal Income Fund, Inc. | | | 1,355 | | | | 15,501 | |
Nuveen Floating Rate Income Opportunity Fund | | | 1,945 | | | | 15,171 | |
Nuveen Dow 30sm Dynamic Overwrite Fund | | | 1,073 | | | | 15,140 | |
BlackRock MuniHoldings Fund, Inc. | | | 1,297 | | | | 15,084 | |
Nuveen New York Quality Municipal Income Fund | | | 1,374 | | | | 14,771 | |
abrdn Emerging Markets Equity | | | 2,803 | | | | 14,548 | |
BlackRock Municipal Income Trust | | | 1,459 | | | | 14,502 | |
Nuveen New York AMT-Free Quality Municipal Income Fund | | | 1,389 | | | | 14,376 | |
Nuveen California AMT-Free Quality Municipal Income Fund | | | 1,238 | | | | 14,287 | |
Putnam Municipal Opportunities Trust | | | 1,379 | | | | 14,080 | |
Allspring Income Opportunities | | | 2,180 | | | | 14,061 | |
BlackRock MuniHoldings New Jersey Quality Fund, Inc. | | | 1,230 | | | | 13,739 | |
BlackRock Municipal Income Trust II | | | 1,311 | | | | 13,648 | |
MFS Investment Grade Municipal Trust | | | 1,846 | | | | 13,577 | |
Putnam Managed Municipal Income Trust | | | 2,206 | | | | 13,435 | |
Neuberger Berman New York Municipal Fund, Inc. | | | 1,405 | | | | 13,390 | |
BlackRock MuniVest Fund, Inc. | | | 1,980 | | | | 13,325 | |
BlackRock MuniYield Fund, Inc. | | | 1,273 | | | | 13,290 | |
Blackrock Investment Quality Municipal Trust, Inc. | | | 1,137 | | | | 13,223 | |
BlackRock MuniYield New York Quality Fund, Inc. | | | 1,303 | | | | 13,199 | |
BlackRock Municipal Income Quality Trust | | | 1,159 | | | | 13,039 | |
Nuveen Senior Income Fund | | | 2,829 | | | | 12,957 | |
Nuveen Real Estate Income Fund | | | 1,737 | | | | 12,906 | |
Western Asset High Income Opportunity Fund, Inc. | | | 3,402 | | | | 12,860 | |
Herzfeld Caribbean Basin Fund, Inc. | | | 3,246 | | | | 12,788 | |
14 | THE GUGGENHEIM FUNDS SEMI-ANNUAL REPORT | SEE NOTES TO CONSOLIDATED FINANCIAL STATEMENTS. |
CONSOLIDATED SCHEDULE OF INVESTMENTS (Unaudited)(continued) | June 30, 2023 |
MULTI-HEDGE STRATEGIES FUND | |
| | Shares | | | Value | |
Allspring Multi-Sector Income | | | 1,369 | | | $ | 12,677 | |
BlackRock MuniAssets Fund, Inc. | | | 1,242 | | | | 12,644 | |
Western Asset Managed Municipals Fund, Inc. | | | 1,272 | | | | 12,631 | |
BNY Mellon Strategic Municipal Bond Fund, Inc. | | | 2,208 | | | | 12,586 | |
BlackRock MuniYield Michigan Quality Fund, Inc. | | | 1,137 | | | | 12,564 | |
BlackRock MuniHoldings Quality Fund II, Inc. | | | 1,276 | | | | 12,390 | |
Nuveen Short Duration Credit Opportunities Fund | | | 1,066 | | | | 12,312 | |
Voya Emerging Markets High Dividend Equity Fund | | | 2,347 | | | | 12,251 | |
BlackRock MuniHoldings New York Quality Fund, Inc. | | | 1,156 | | | | 12,115 | |
Allspring Global Dividend Oppo | | | 2,744 | | | | 11,936 | |
Nuveen California Municipal Value Fund, Inc. | | | 1,395 | | | | 11,927 | |
BlackRock MuniYield Quality Fund II, Inc. | | | 1,184 | | | | 11,911 | |
Nuveen AMT-Free Municipal Value Fund | | | 856 | | | | 11,753 | |
BlackRock MuniVest Fund II, Inc. | | | 1,105 | | | | 11,746 | |
Western Asset High Yield Defined Opportunity Fund, Inc. | | | 997 | | | | 11,715 | |
Western Asset Municipal High Income Fund, Inc. | | | 1,767 | | | | 11,574 | |
PIMCO California Municipal Income Fund II | | | 1,943 | | | | 11,561 | |
Western Asset Premier Bond Fund | | | 1,131 | | | | 11,525 | |
Cohen & Steers Infrastructure Fund, Inc. | | | 487 | | | | 11,503 | |
Western Asset Inflation - Linked Securities & Income Fund | | | 1,388 | | | | 11,465 | |
BlackRock Long-Term Municipal Advantage Trust | | | 1,183 | | | | 11,440 | |
MFS High Income Municipal Trust | | | 3,249 | | | | 11,307 | |
Western Asset Global High Income Fund, Inc. | | | 1,550 | | | | 11,300 | |
Royce Value Trust, Inc. | | | 814 | | | | 11,233 | |
Nuveen Global High Income Fund | | | 1,003 | | | | 11,203 | |
Lazard Global Total Return and Income Fund, Inc. | | | 713 | | | | 11,130 | |
Virtus Diversified Income & Co. | | | 557 | | | | 11,129 | |
Nuveen Arizona Quality Municipal Income Fund | | | 1,034 | | | | 11,115 | |
Neuberger Berman Real Estate Securities Income Fund, Inc. | | | 3,655 | | | | 11,111 | |
SEE NOTES TO CONSOLIDATED FINANCIAL STATEMENTS. | THE GUGGENHEIM FUNDS SEMI-ANNUAL REPORT | 15 |
CONSOLIDATED SCHEDULE OF INVESTMENTS (Unaudited)(continued) | June 30, 2023 |
MULTI-HEDGE STRATEGIES FUND | |
| | Shares | | | Value | |
Sprott Focus Trust, Inc. | | | 1,393 | | | $ | 11,088 | |
Nuveen Virginia Quality Municipal Income Fund | | | 1,027 | | | | 11,081 | |
Eaton Vance Enhanced Equity Income Fund II | | | 619 | | | | 11,074 | |
Delaware Investments National Municipal Income Fund | | | 1,102 | | | | 11,064 | |
Eaton Vance Tax-Managed Buy-Write Income Fund | | | 795 | | | | 11,043 | |
Royce Micro-Capital Trust, Inc. | | | 1,262 | | | | 11,043 | |
Eaton Vance Tax-Advantaged Dividend Income Fund | | | 483 | | | | 10,988 | |
BlackRock MuniYield Pennsylvania Quality Fund | | | 938 | | | | 10,965 | |
Nuveen Massachusetts Quality Municipal Income Fund | | | 1,047 | | | | 10,931 | |
John Hancock Hedged Equity & Income Fund | | | 1,012 | | | | 10,909 | |
PIMCO New York Municipal Income Fund II | | | 1,436 | | | | 10,899 | |
Allspring Utilities and High I | | | 1,077 | | | | 10,899 | |
Western Asset Investment Grade Income Fund, Inc. | | | 937 | | | | 10,897 | |
abrdn Global Premier Propertie | | | 2,778 | | | | 10,890 | |
abrdn Australia Equity Fund In | | | 2,526 | | | | 10,887 | |
Federated Hermes Premier Municipal Income Fund | | | 1,024 | | | | 10,885 | |
Eaton Vance Risk-Managed Diversified Equity Income Fund | | | 1,323 | | | | 10,875 | |
Gabelli Global Small and Mid Capital Value Trust | | | 907 | | | | 10,869 | |
New Germany Fund, Inc. | | | 1,210 | | | | 10,866 | |
Gabelli Global Utility & Income Trust | | | 764 | | | | 10,865 | |
Tri-Continental Corp. | | | 396 | | | | 10,858 | |
Eaton Vance Tax-Advantaged Global Dividend Income Fund | | | 650 | | | | 10,855 | |
Templeton Emerging Markets Fund/United States | | | 916 | | | | 10,845 | |
Voya Global Advantage and Premium Opportunity Fund | | | 1,269 | | | | 10,837 | |
BlackRock Floating Rate Income Trust | | | 929 | | | | 10,832 | |
Flaherty & Crumrine Preferred and Income Opportunity Fund, Inc. | | | 1,351 | | | | 10,822 | |
Cohen & Steers REIT and Preferred and Income Fund, Inc. | | | 569 | | | | 10,805 | |
First Trust Enhanced Equity Income Fund | | | 616 | | | | 10,798 | |
Western Asset Intermediate Muni Fund, Inc. | | | 1,415 | | | | 10,782 | |
BlackRock Debt Strategies Fund, Inc. | | | 1,101 | | | | 10,779 | |
16 | THE GUGGENHEIM FUNDS SEMI-ANNUAL REPORT | SEE NOTES TO CONSOLIDATED FINANCIAL STATEMENTS. |
CONSOLIDATED SCHEDULE OF INVESTMENTS (Unaudited)(continued) | June 30, 2023 |
MULTI-HEDGE STRATEGIES FUND | |
| | Shares | | | Value | |
Blackstone Strategic Credit Fund | | | 986 | | | $ | 10,777 | |
Eaton Vance Tax-Managed Buy-Write Opportunities Fund | | | 843 | | | | 10,774 | |
BlackRock Floating Rate Income Strategies Fund, Inc. | | | 881 | | | | 10,757 | |
Cohen & Steers Quality Income Realty Fund, Inc. | | | 926 | | | | 10,742 | |
BlackRock Corporate High Yield Fund, Inc. | | | 1,204 | | | | 10,740 | |
Apollo Senior Floating Rate Fund, Inc. | | | 831 | | | | 10,728 | |
BlackRock Enhanced Global Dividend Trust | | | 1,065 | | | | 10,725 | |
BlackRock Resources & Commodities Strategy Trust | | | 1,182 | | | | 10,721 | |
European Equity Fund, Inc. | | | 1,245 | | | | 10,719 | |
Tekla Healthcare Opportunities Fund | | | 562 | | | | 10,717 | |
MFS Charter Income Trust | | | 1,698 | | | | 10,714 | |
Eaton Vance Tax-Advantaged Global Dividend Opportunities Fund | | | 466 | | | | 10,699 | |
RiverNorth Opportunities Fund, Inc. | | | 934 | | | | 10,685 | |
First Trust Senior Floating Rate Income Fund II | | | 1,078 | | | | 10,672 | |
PIMCO New York Municipal Income Fund III | | | 1,696 | | | | 10,668 | |
Nuveen Minnesota Quality Municipal Income Fund | | | 954 | | | | 10,666 | |
Miller/Howard High Dividend Fund | | | 1,052 | | | | 10,657 | |
Nuveen Select Maturities Municipal Fund | | | 1,182 | | | | 10,638 | |
First Trust High Income Long/Short Fund | | | 929 | | | | 10,628 | |
Invesco High Income Trust II | | | 1,011 | | | | 10,615 | |
Source Capital, Inc. | | | 277 | | | | 10,615 | |
BNY Mellon Strategic Municipals, Inc. | | | 1,706 | | | | 10,611 | |
Macquarie/First Trust Global Infrastructure/Utilities Dividend & Income Fund | | | 1,356 | | | | 10,577 | |
PGIM High Yield Bond Fund, Inc. | | | 850 | | | | 10,557 | |
Eaton Vance Tax Managed Global Buy Write Opportunities Fund | | | 1,284 | | | | 10,554 | |
Invesco Quality Municipal Income Trust | | | 1,104 | | | | 10,554 | |
Pioneer Municipal High Income Advantage Fund, Inc. | | | 1,335 | | | | 10,547 | |
Invesco Value Municipal Income Trust | | | 892 | | | | 10,543 | |
Neuberger Berman Municipal Fund, Inc. | | | 1,024 | | | | 10,527 | |
SEE NOTES TO CONSOLIDATED FINANCIAL STATEMENTS. | THE GUGGENHEIM FUNDS SEMI-ANNUAL REPORT | 17 |
CONSOLIDATED SCHEDULE OF INVESTMENTS (Unaudited)(continued) | June 30, 2023 |
MULTI-HEDGE STRATEGIES FUND | |
| | Shares | | | Value | |
BlackRock Limited Duration Income Trust | | | 817 | | | $ | 10,523 | |
BlackRock Enhanced International Dividend Trust | | | 1,934 | | | | 10,521 | |
Invesco California Value Municipal Income Trust | | | 1,098 | | | | 10,519 | |
Eaton Vance New York Municipal Bond Fund | | | 1,119 | | | | 10,519 | |
Eaton Vance Tax-Managed Global Diversified Equity Income Fund | | | 1,328 | | | | 10,518 | |
Eaton Vance Municipal Income Trust | | | 1,051 | | | | 10,457 | |
PGIM Global High Yield Fund, Inc. | | | 953 | | | | 10,454 | |
MFS Multimarket Income Trust | | | 2,316 | | | | 10,445 | |
Flaherty & Crumrine Preferred and Income Securities Fund, Inc. | | | 760 | | | | 10,442 | |
BNY Mellon Municipal Bond Infrastructure Fund, Inc. | | | 969 | | | | 10,436 | |
Franklin Limited Duration Income Trust | | | 1,687 | | | | 10,426 | |
Franklin Universal Trust | | | 1,548 | | | | 10,418 | |
Eaton Vance California Municipal Income Trust | | | 1,043 | | | | 10,414 | |
Eaton Vance Municipal Bond Fund | | | 1,044 | | | | 10,388 | |
Invesco Advantage Municipal Income Trust II | | | 1,234 | | | | 10,378 | |
Invesco Municipal Opportunity Trust | | | 1,097 | | | | 10,377 | |
Invesco Municipal Trust | | | 1,100 | | | | 10,373 | |
Invesco Trust for Investment Grade Municipals | | | 1,068 | | | | 10,370 | |
MFS Intermediate High Income Fund | | | 6,362 | | | | 10,370 | |
Flaherty & Crumrine Preferred & Income Fund, Inc. | | | 1,051 | | | | 10,363 | |
Virtus Total Return Fund, Inc. | | | 1,704 | | | | 10,360 | |
Pioneer High Income Fund, Inc. | | | 1,541 | | | | 10,356 | |
John Hancock Investors Trust | | | 819 | | | | 10,352 | |
DTF Tax-Free Income 2028 Term Fund, Inc. | | | 960 | | | | 10,339 | |
Flaherty & Crumrine Total Return Fund, Inc. | | | 717 | | | | 10,303 | |
Credit Suisse High Yield Bond Fund | | | 5,425 | | | | 10,253 | |
Invesco Bond Fund | | | 689 | | | | 10,252 | |
Insight Select Income Fund | | | 655 | | | | 10,243 | |
Neuberger Berman High Yield Strategies Fund, Inc.1 | | | 1,367 | | | | 10,239 | |
John Hancock Income Securities Trust | | | 947 | | | | 10,199 | |
MFS Intermediate Income Trust | | | 3,708 | | | | 10,160 | |
BlackRock Taxable Municipal Bond Trust | | | 612 | | | | 10,153 | |
18 | THE GUGGENHEIM FUNDS SEMI-ANNUAL REPORT | SEE NOTES TO CONSOLIDATED FINANCIAL STATEMENTS. |
CONSOLIDATED SCHEDULE OF INVESTMENTS (Unaudited)(continued) | June 30, 2023 |
MULTI-HEDGE STRATEGIES FUND | |
| | Shares | | | Value | |
Morgan Stanley Emerging Markets Debt Fund, Inc. | | | 1,574 | | | $ | 10,137 | |
Eaton Vance Municipal Income 2028 Term Trust | | | 576 | | | | 10,126 | |
MFS Government Markets Income Trust | | | 3,142 | | | | 10,086 | |
Saba Capital Income & Opportunities Fund | | | 1,306 | | | | 10,056 | |
Nuveen Preferred & Income Securities Fund | | | 1,391 | | | | 8,875 | |
Kayne Anderson Energy Infrastructure Fund | | | 1,079 | | | | 8,783 | |
Nuveen Municipal Value Fund, Inc. | | | 1,004 | | | | 8,735 | |
Nuveen California Select Tax-Free Income Portfolio | | | 566 | | | | 7,375 | |
BlackRock Enhanced Government Fund, Inc. | | | 752 | | | | 7,182 | |
Nuveen Preferred & Income Opportunities Fund | | | 968 | | | | 6,273 | |
Nuveen Multi-Market Income Fund | | | 1,011 | | | | 5,864 | |
BlackRock Virginia Municipal Bond Trust | | | 432 | | | | 4,632 | |
Kayne Anderson NextGen Energy & Infrastructure, Inc. | | | 564 | | | | 4,004 | |
Nuveen Missouri Quality Municipal Income Fund | | | 319 | | | | 3,177 | |
Nuveen Multi-Asset Income Fund | | | 267 | | | | 3,113 | |
Nuveen Preferred & Income Term Fund | | | 185 | | | | 3,106 | |
Putnam Premier Income Trust | | | 750 | | | | 2,640 | |
Barings Global Short Duration High Yield Fund | | | 200 | | | | 2,608 | |
Western Asset Mortgage Opportunity Fund, Inc. | | | 177 | | | | 1,873 | |
PIMCO California Municipal Income Fund | | | 175 | | | | 1,715 | |
Putnam Master Intermediate Income Trust | | | 304 | | | | 961 | |
Nuveen New York Municipal Value Fund | | | 76 | | | | 642 | |
Nuveen Preferred and Income Fund | | | 24 | | | | 387 | |
Nuveen Mortgage and Income Fund | | | 23 | | | | 371 | |
Nuveen New York Select Tax-Free Income Portfolio | | | 14 | | | | 166 | |
Nuveen Intermediate Duration Municipal Term Fund Liquidating Trust | | | 955 | | | | — | |
Total Closed-End Funds |
(Cost $5,425,833) | | | | | | | 5,619,587 | |
SEE NOTES TO CONSOLIDATED FINANCIAL STATEMENTS. | THE GUGGENHEIM FUNDS SEMI-ANNUAL REPORT | 19 |
CONSOLIDATED SCHEDULE OF INVESTMENTS (Unaudited)(continued) | June 30, 2023 |
MULTI-HEDGE STRATEGIES FUND | |
| | Face
Amount | | | Value | |
U.S. TREASURY BILLS†† - 10.6% |
U.S. Treasury Bills |
5.02% due 08/03/233 | | $ | 4,700,000 | | | $ | 4,679,304 | |
5.11% due 07/18/233,4,8 | | | 4,586,000 | | | | 4,576,402 | |
Total U.S. Treasury Bills |
(Cost $9,252,841) | | | | | | | 9,255,706 | |
| | | | | | | | | |
REPURCHASE AGREEMENTS††,5 - 27.2% |
J.P. Morgan Securities LLC
issued 06/30/23 at 5.05%
due 07/03/23 | | | 12,905,446 | | | | 12,905,446 | |
Barclays Capital, Inc.
issued 06/30/23 at 5.06%
due 07/03/23 | | | 5,677,745 | | | | 5,677,745 | |
BofA Securities, Inc.
issued 06/30/23 at 5.06%
due 07/03/23 | | | 5,161,587 | | | | 5,161,587 | |
Total Repurchase Agreements |
(Cost $23,744,778) | | | | | | | 23,744,778 | |
| | | Shares | | | | | |
SECURITIES LENDING COLLATERAL†,6 - 0.7% |
Money Market Fund |
First American Government Obligations Fund — Class X, 5.01%7 | | | 660,141 | | | | 660,141 | |
Total Securities Lending Collateral |
(Cost $660,141) | | | | | | | 660,141 | |
| | | | | | | | | |
Total Investments - 87.1% |
(Cost $76,188,789) | | | 76,072,472 | |
| |
COMMON STOCKS SOLD SHORT† - (5.2)% |
Utilities - (0.1)% |
Brookfield Infrastructure Corp. — Class A | | | 2,483 | | | | (113,175 | ) |
| | | | | | | | | |
Consumer, Non-cyclical - (0.7)% |
Globus Medical, Inc. — Class A* | | | 10,907 | | | | (649,403 | ) |
| | | | | | | | | |
Energy - (0.9)% |
ONEOK, Inc. | | | 5,500 | | | | (339,460 | ) |
Chevron Corp. | | | 2,573 | | | | (404,862 | ) |
Total Energy | | | (744,322 | ) |
| | | | | | | | | |
Technology - (1.6)% |
Broadcom, Inc. | | | 1,588 | | | | (1,377,479 | ) |
| | | | | | | | | |
Financial - (1.9)% |
Global Net Lease, Inc. | | | 9,196 | | | | (94,535 | ) |
Regency Centers Corp. | | | 3,833 | | | | (236,764 | ) |
Provident Financial Services, Inc. | | | 30,186 | | | | (493,239 | ) |
Extra Space Storage, Inc. | | | 5,721 | | | | (851,571 | ) |
Total Financial | | | (1,676,109 | ) |
| | | | | | | | | |
Total Common Stocks Sold Short |
(Proceeds $3,926,863) | | | | | | | (4,560,488 | ) |
| | | | | | | | | |
EXCHANGE-TRADED FUNDS SOLD SHORT† - (6.9)% |
SPDR Gold Shares — Class D | | | 20 | | | | (3,565 | ) |
iShares MSCI All Country Asia ex Japan ETF | | | 102 | | | | (6,777 | ) |
iShares Mortgage Real Estate ETF | | | 309 | | | | (7,292 | ) |
iShares 7-10 Year Treasury Bond ETF | | | 120 | | | | (11,592 | ) |
iShares Agency Bond ETF | | | 109 | | | | (11,659 | ) |
20 | THE GUGGENHEIM FUNDS SEMI-ANNUAL REPORT | SEE NOTES TO CONSOLIDATED FINANCIAL STATEMENTS. |
CONSOLIDATED SCHEDULE OF INVESTMENTS (Unaudited)(continued) | June 30, 2023 |
MULTI-HEDGE STRATEGIES FUND | |
| | Shares | | |
Value
| |
Financial Select Sector SPDR Fund | | | 371 | | | $ | (12,506 | ) |
Energy Select Sector SPDR Fund | | | 202 | | | | (16,396 | ) |
Utilities Select Sector SPDR Fund | | | 272 | | | | (17,800 | ) |
VanEck Gold Miners ETF | | | 595 | | | | (17,915 | ) |
iShares Latin America 40 ETF | | | 956 | | | | (25,975 | ) |
iShares MSCI Emerging Markets ETF | | | 694 | | | | (27,455 | ) |
iShares Preferred & Income Securities ETF | | | 1,644 | | | | (50,849 | ) |
iShares Floating Rate Bond ETF | | | 1,030 | | | | (52,345 | ) |
iShares iBoxx $ Investment Grade Corporate Bond ETF | | | 581 | | | | (62,829 | ) |
iShares Core High Dividend ETF | | | 654 | | | | (65,917 | ) |
iShares TIPS Bond ETF | | | 693 | | | | (74,581 | ) |
iShares Russell 1000 Growth ETF | | | 319 | | | | (87,782 | ) |
iShares MBS ETF | | | 964 | | | | (89,907 | ) |
SPDR S&P Biotech ETF | | | 1,219 | | | | (101,421 | ) |
iShares Russell 2000 Index ETF | | | 864 | | | | (161,801 | ) |
Schwab U.S. Aggregate Bond ETF | | | 4,032 | | | | (186,117 | ) |
Health Care Select Sector SPDR Fund | | | 1,417 | | | | (188,079 | ) |
SPDR Bloomberg Convertible Securities ETF | | | 2,742 | | | | (191,803 | ) |
iShares U.S. Real Estate ETF | | | 2,328 | | | | (201,465 | ) |
iShares JP Morgan USD Emerging Markets Bond ETF | | | 2,501 | | | | (216,437 | ) |
VanEck High Yield Muni ETF | | | 4,592 | | | | (235,753 | ) |
Invesco Senior Loan ETF | | | 12,080 | | | | (254,163 | ) |
SPDR Nuveen Bloomberg High Yield Municipal Bond ETF | | | 14,736 | | | | (368,547 | ) |
iShares National Muni Bond ETF | | | 3,668 | | | | (391,486 | ) |
iShares Russell 1000 Value ETF | | | 2,675 | | | | (422,195 | ) |
iShares MSCI EAFE ETF | | | 5,917 | | | | (428,982 | ) |
SPDR S&P 500 ETF Trust | | | 1,207 | | | | (535,039 | ) |
SPDR Nuveen Bloomberg Municipal Bond ETF | | | 15,653 | | | | (722,543 | ) |
iShares iBoxx High Yield Corporate Bond ETF | | | 10,451 | | | | (784,557 | ) |
Total Exchange-Traded Funds Sold Short |
(Proceeds $6,412,853) | | | | | | | (6,033,530 | ) |
| | | | | | | | | |
Total Securities Sold Short - (12.1)% |
(Proceeds $10,339,716) | | $ | (10,594,018 | ) |
Other Assets & Liabilities, net - 25.0% | | | 21,852,897 | |
Total Net Assets - 100.0% | | $ | 87,331,351 | |
SEE NOTES TO CONSOLIDATED FINANCIAL STATEMENTS. | THE GUGGENHEIM FUNDS SEMI-ANNUAL REPORT | 21 |
CONSOLIDATED SCHEDULE OF INVESTMENTS (Unaudited)(continued) | June 30, 2023 |
MULTI-HEDGE STRATEGIES FUND | |
Futures Contracts |
Description | | Number of
Contracts | | | Expiration
Date | | | Notional
Amount | | | Value and
Unrealized
Appreciation
(Depreciation)** | |
Interest Rate Futures Contracts Purchased† |
Canadian Government 10 Year Bond Futures Contracts | | | 25 | | | | Sep 2023 | | | $ | 2,312,868 | | | $ | 16,901 | |
U.S. Treasury 10 Year Note Futures Contracts | | | 16 | | | | Sep 2023 | | | | 1,797,000 | | | | 2,933 | |
Euro - OATS Futures Contracts | | | 5 | | | | Sep 2023 | | | | 700,829 | | | | 500 | |
| | | | | | | | | | | $ | 4,810,697 | | | $ | 20,334 | |
Commodity Futures Contracts Purchased† |
Live Cattle Futures Contracts | | | 123 | | | | Aug 2023 | | | $ | 8,704,710 | | | $ | 443,947 | |
Natural Gas Futures Contracts | | | 107 | | | | Aug 2023 | | | | 2,957,480 | | | | 123,427 | |
Cattle Feeder Futures Contracts | | | 8 | | | | Aug 2023 | | | | 989,200 | | | | 100,483 | |
Cocoa Futures Contracts | | | 38 | | | | Sep 2023 | | | | 1,275,660 | | | | 90,115 | |
Soybean Oil Futures Contracts | | | 22 | | | | Dec 2023 | | | | 778,404 | | | | 64,139 | |
NY Harbor ULSD Futures Contracts | | | 7 | | | | Jul 2023 | | | | 718,859 | | | | 10,512 | |
Brent Crude Futures Contracts | | | 9 | | | | Jul 2023 | | | | 677,790 | | | | 6,265 | |
Low Sulphur Gas Oil Futures Contracts | | | 9 | | | | Aug 2023 | | | | 634,275 | | | | (3,265 | ) |
Hard Red Winter Wheat Futures Contracts | | | 23 | | | | Sep 2023 | | | | 912,237 | | | | (15,235 | ) |
WTI Crude Futures Contracts | | | 11 | | | | Jul 2023 | | | | 776,050 | | | | (16,418 | ) |
Silver Futures Contracts | | | 4 | | | | Sep 2023 | | | | 459,500 | | | | (26,972 | ) |
Soybean Meal Futures Contracts | | | 50 | | | | Mar 2024 | | | | 1,928,500 | | | | (40,595 | ) |
Gasoline RBOB Futures Contracts | | | 52 | | | | Sep 2023 | | | | 4,841,710 | | | | (42,842 | ) |
Coffee ‘C’ Futures Contracts | | | 9 | | | | Sep 2023 | | | | 536,625 | | | | (43,135 | ) |
Gold 100 oz. Futures Contracts | | | 5 | | | | Aug 2023 | | | | 963,900 | | | | (55,733 | ) |
Sugar #11 Futures Contracts | | | 254 | | | | Apr 2024 | | | | 6,164,682 | | | | (631,102 | ) |
| | | | | | | | | | | $ | 33,319,582 | | | $ | (36,409 | ) |
Currency Futures Contracts Purchased† |
Euro FX Futures Contracts | | | 50 | | | | Sep 2023 | | | $ | 6,846,875 | | | $ | 77,048 | |
British Pound Futures Contracts | | | 153 | | | | Sep 2023 | | | | 12,145,331 | | | | 45,435 | |
New Zealand Dollar Futures Contracts | | | 25 | | | | Sep 2023 | | | | 1,533,625 | | | | 6,014 | |
Canadian Dollar Futures Contracts | | | 74 | | | | Sep 2023 | | | | 5,592,920 | | | | (16,750 | ) |
Japanese Yen Futures Contracts | | | 69 | | | | Sep 2023 | | | | 6,049,144 | | | | (171,401 | ) |
| | | | | | | | | | | $ | 32,167,895 | | | $ | (59,654 | ) |
Equity Futures Contracts Purchased† |
Tokyo Stock Price Index Futures Contracts | | | 9 | | | | Sep 2023 | | | $ | 1,435,384 | | | $ | 89,216 | |
Nikkei 225 (OSE) Index Futures Contracts | | | 5 | | | | Sep 2023 | | | | 1,158,551 | | | | 78,537 | |
IBEX 35 Index Futures Contracts†† | | | 9 | | | | Jul 2023 | | | | 939,622 | | | | 29,452 | |
FTSE MIB Index Futures Contracts | | | 5 | | | | Sep 2023 | | | | 775,759 | | | | 27,133 | |
CAC 40 10 Euro Index Futures Contracts | | | 9 | | | | Jul 2023 | | | | 730,255 | | | | 19,142 | |
SPI 200 Index Futures Contracts | | | 9 | | | | Sep 2023 | | | | 1,077,638 | | | | 18,755 | |
OMX Stockholm 30 Index Futures Contracts†† | | | 31 | | | | Jul 2023 | | | | 666,870 | | | | 3,874 | |
Euro STOXX 50 Index Futures Contracts | | | 17 | | | | Sep 2023 | | | | 823,652 | | | | 2,158 | |
DAX Index Futures Contracts | | | 2 | | | | Sep 2023 | | | | 889,980 | | | | 1,951 | |
FTSE 100 Index Futures Contracts | | | 6 | | | | Sep 2023 | | | | 576,104 | | | | 1,465 | |
Russell 2000 Index Mini Futures Contracts | | | 30 | | | | Sep 2023 | | | | 2,854,650 | | | | (1,635 | ) |
22 | THE GUGGENHEIM FUNDS SEMI-ANNUAL REPORT | SEE NOTES TO CONSOLIDATED FINANCIAL STATEMENTS. |
CONSOLIDATED SCHEDULE OF INVESTMENTS (Unaudited)(continued) | June 30, 2023 |
MULTI-HEDGE STRATEGIES FUND | |
Futures Contracts (continued) |
Description | | Number of
Contracts | | | Expiration
Date | | | Notional
Amount | | | Value and
Unrealized
Appreciation
(Depreciation)** | |
Equity Futures Contracts Purchased† (continued) |
NASDAQ-100 Index Mini Futures Contracts | | | 15 | | | | Sep 2023 | | | $ | 4,599,375 | | | $ | (2,298 | ) |
Dow Jones Industrial Average Index Mini Futures Contracts | | | 30 | | | | Sep 2023 | | | | 5,194,200 | | | | (2,524 | ) |
S&P 500 Index Mini Futures Contracts | | | 25 | | | | Sep 2023 | | | | 5,608,125 | | | | (2,878 | ) |
CBOE Volatility Index Futures Contracts | | | 172 | | | | Sep 2023 | | | | 3,035,800 | | | | (196,399 | ) |
CBOE Volatility Index Futures Contracts | | | 247 | | | | Dec 2023 | | | | 4,730,050 | | | | (359,821 | ) |
| | | | | | | | | | | $ | 35,096,015 | | | $ | (293,872 | ) |
Equity Futures Contracts Sold Short† |
CBOE Volatility Index Futures Contracts | | | 256 | | | | Jul 2023 | | | $ | 3,840,000 | | | $ | 402,004 | |
S&P/TSX 60 IX Index Futures Contracts | | | 1 | | | | Sep 2023 | | | | 183,957 | | | | (2,345 | ) |
| | | | | | | | | | | $ | 4,023,957 | | | $ | 399,659 | |
Interest Rate Futures Contracts Sold Short† |
Long Gilt Futures Contracts†† | | | 47 | | | | Sep 2023 | | | $ | 5,689,590 | | | $ | 14,489 | |
Euro - Bund Futures Contracts | | | 12 | | | | Sep 2023 | | | | 1,752,063 | | | | (489 | ) |
Euro - BTP Italian Government Bond Futures Contracts†† | | | 14 | | | | Sep 2023 | | | | 1,774,678 | | | | (588 | ) |
U.S. Treasury Long Bond Futures Contracts | | | 3 | | | | Sep 2023 | | | | 381,375 | | | | (631 | ) |
Euro - 30 year Bond Futures Contracts | | | 6 | | | | Sep 2023 | | | | 914,997 | | | | (808 | ) |
Australian Government 10 Year Bond Futures Contracts | | | 7 | | | | Sep 2023 | | | | 542,952 | | | | (1,471 | ) |
U.S. Treasury Ultra Long Bond Futures Contracts | | | 9 | | | | Sep 2023 | | | | 1,229,344 | | | | (3,456 | ) |
| | | | | | | | | | | $ | 12,284,999 | | | $ | 7,046 | |
Currency Futures Contracts Sold Short† |
Australian Dollar Futures Contracts | | | 61 | | | | Sep 2023 | | | $ | 4,071,140 | | | $ | 56,081 | |
Swiss Franc Futures Contracts | | | 131 | | | | Sep 2023 | | | | 18,443,981 | | | | (77,669 | ) |
| | | | | | | | | | | $ | 22,515,121 | | | $ | (21,588 | ) |
Commodity Futures Contracts Sold Short† |
Sugar #11 Futures Contracts | | | 58 | | | | Sep 2023 | | | $ | 1,482,387 | | | $ | 185,634 | |
Corn Futures Contracts | | | 22 | | | | Sep 2023 | | | | 537,900 | | | | 136,136 | |
Sugar #11 Futures Contracts | | | 87 | | | | Feb 2024 | | | | 2,233,325 | | | | 91,219 | |
Wheat Futures Contracts | | | 38 | | | | Sep 2023 | | | | 1,228,350 | | | | 32,024 | |
LME Primary Aluminum Futures Contracts | | | 13 | | | | Aug 2023 | | | | 693,794 | | | | 23,883 | |
Copper Futures Contracts | | | 5 | | | | Sep 2023 | | | | 470,375 | | | | 15,022 | |
LME Nickel Futures Contracts | | | 3 | | | | Aug 2023 | | | | 368,064 | | | | 12,746 | |
LME Zinc Futures Contracts | | | 9 | | | | Aug 2023 | | | | 537,581 | | | | 1,626 | |
LME Lead Futures Contracts | | | 2 | | | | Aug 2023 | | | | 105,073 | | | | 371 | |
Soybean Futures Contracts | | | 14 | | | | Nov 2023 | | | | 939,750 | | | | 131 | |
Soybean Meal Futures Contracts | | | 2 | | | | Dec 2023 | | | | 79,320 | | | | (3,296 | ) |
Gasoline RBOB Futures Contracts | | | 11 | | | | Jul 2023 | | | | 1,176,945 | | | | (4,371 | ) |
Cotton #2 Futures Contracts | | | 15 | | | | Dec 2023 | | | | 603,150 | | | | (9,622 | ) |
Gasoline RBOB Futures Contracts | | | 21 | | | | Aug 2023 | | | | 2,171,660 | | | | (16,728 | ) |
Natural Gas Futures Contracts | | | 31 | | | | Jul 2023 | | | | 863,040 | | | | (36,039 | ) |
Lean Hogs Futures Contracts | | | 18 | | | | Aug 2023 | | | | 665,820 | | | | (50,137 | ) |
SEE NOTES TO CONSOLIDATED FINANCIAL STATEMENTS. | THE GUGGENHEIM FUNDS SEMI-ANNUAL REPORT | 23 |
CONSOLIDATED SCHEDULE OF INVESTMENTS (Unaudited)(continued) | June 30, 2023 |
MULTI-HEDGE STRATEGIES FUND | |
Futures Contracts (continued) |
Description | | Number of
Contracts | | | Expiration
Date | | | Notional
Amount | | | Value and
Unrealized
Appreciation
(Depreciation)** | |
Commodity Futures Contracts Sold Short† (continued) |
Live Cattle Futures Contracts | | | 110 | | | | Dec 2023 | | | $ | 8,069,600 | | | $ | (277,435 | ) |
Natural Gas Futures Contracts | | | 112 | | | | Sep 2023 | | | | 3,186,400 | | | | (323,175 | ) |
| | | | | | | | | | | $ | 25,412,534 | | | $ | (222,011 | ) |
Custom Basket Swap Agreements |
Counterparty | Reference
Obligation | Type | Financing
Rate | | Payment
Frequency | | | Maturity
Date | | | Notional
Amount | | | Value and
Unrealized
Appreciation
(Depreciation) | |
OTC Custom Basket Swap Agreements†† |
Goldman Sachs International | GS Long/Short Equity Custom Basket | Pay | 5.52% (Federal Funds Rate + 0.45%) | | | At Maturity | | | | 05/06/24 | | | $ | 13,181,537 | | | $ | 905,553 | |
Morgan Stanley Capital Services LLC | MS Long/Short Equity Custom Basket | Pay | 5.47% (Federal Funds Rate + 0.40%) | | | At Maturity | | | | 08/31/23 | | | | 13,181,579 | | | | 897,005 | |
Morgan Stanley Capital Services LLC | MS Equity Market Neutral Custom Basket | Pay | 5.47% (Federal Funds Rate + 0.40%) | | | At Maturity | | | | 08/31/23 | | | | 14,204,022 | | | | 366,470 | |
Goldman Sachs International | GS Equity Market Neutral Custom Basket | Pay | 5.52% (Federal Funds Rate + 0.45%) | | | At Maturity | | | | 05/06/24 | | | | 14,204,030 | | | | 363,537 | |
| | | | | | | | | | | | | | $ | 54,771,168 | | | $ | 2,532,565 | |
24 | THE GUGGENHEIM FUNDS SEMI-ANNUAL REPORT | SEE NOTES TO CONSOLIDATED FINANCIAL STATEMENTS. |
CONSOLIDATED SCHEDULE OF INVESTMENTS (Unaudited)(continued) | June 30, 2023 |
MULTI-HEDGE STRATEGIES FUND | |
Custom Basket Swap Agreements (concluded) |
Counterparty | Reference
Obligation | Type | Financing
Rate | | Payment
Frequency | | | Maturity
Date | | | Notional
Amount | | | Value and
Unrealized
Appreciation
(Depreciation) | |
OTC Custom Basket Swap Agreements Sold Short†† |
Goldman Sachs International | GS Equity Market Neutral Custom Basket | Receive | 4.86% (Federal Funds Rate - 0.21%) | | | At Maturity | | | | 05/06/24 | | | $ | 14,999,612 | | | $ | 1,765,451 | |
Morgan Stanley Capital Services LLC | MS Equity Market Neutral Custom Basket | Receive | 4.75% (Federal Funds Rate - 0.32%) | | | At Maturity | | | | 08/31/23 | | | | 14,999,603 | | | | 1,756,605 | |
Goldman Sachs International | GS Long/Short Equity Custom Basket | Receive | 4.86% (Federal Funds Rate - 0.21%) | | | At Maturity | | | | 05/06/24 | | | | 9,422,430 | | | | (264,965 | ) |
Morgan Stanley Capital Services LLC | MS Long/Short Equity Custom Basket | Receive | 4.77% (Federal Funds Rate - 0.30%) | | | At Maturity | | | | 08/31/23 | | | | 9,527,904 | | | | (265,877 | ) |
| | | | | | | | | | | | | | $ | 48,949,549 | | | $ | 2,991,214 | |
SEE NOTES TO CONSOLIDATED FINANCIAL STATEMENTS. | THE GUGGENHEIM FUNDS SEMI-ANNUAL REPORT | 25 |
CONSOLIDATED SCHEDULE OF INVESTMENTS (Unaudited)(continued) | June 30, 2023 |
MULTI-HEDGE STRATEGIES FUND | |
| | Shares | | | Percentage
Notional
Amount | | | Value and
Unrealized
Appreciation
(Depreciation) | |
MS LONG/SHORT EQUITY LONG CUSTOM BASKET |
Consumer, Non-cyclical |
John B Sanfilippo & Son, Inc. | | | 560 | | | | 0.49 | % | | $ | 24,146 | |
Vertex Pharmaceuticals, Inc. | | | 176 | | | | 0.46 | % | | | 23,455 | |
Perdoceo Education Corp. | | | 8,233 | | | | 0.76 | % | | | 12,498 | |
Quanex Building Products Corp. | | | 2,181 | | | | 0.43 | % | | | 10,789 | |
Kimberly-Clark Corp. | | | 1,001 | | | | 1.05 | % | | | 10,007 | |
AMN Healthcare Services, Inc. | | | 433 | | | | 0.36 | % | | | 9,942 | |
Hackett Group, Inc. | | | 3,176 | | | | 0.54 | % | | | 9,839 | |
Viatris, Inc. | | | 14,597 | | | | 1.11 | % | | | 9,352 | |
USANA Health Sciences, Inc. | | | 1,049 | | | | 0.50 | % | | | 6,693 | |
Dynavax Technologies Corp. | | | 4,722 | | | | 0.46 | % | | | 6,436 | |
Exelixis, Inc. | | | 3,830 | | | | 0.56 | % | | | 6,360 | |
Innoviva, Inc. | | | 8,283 | | | | 0.80 | % | | | 4,458 | |
Edwards Lifesciences Corp. | | | 430 | | | | 0.31 | % | | | 4,456 | |
Vector Group Ltd. | | | 7,075 | | | | 0.69 | % | | | 4,384 | |
H&R Block, Inc. | | | 4,451 | | | | 1.08 | % | | | 3,341 | |
Johnson & Johnson | | | 268 | | | | 0.34 | % | | | 3,256 | |
Merck & Company, Inc. | | | 1,212 | | | | 1.06 | % | | | 2,077 | |
United Therapeutics Corp. | | | 455 | | | | 0.76 | % | | | 870 | |
Molina Healthcare, Inc. | | | 94 | | | | 0.21 | % | | | 838 | |
Quest Diagnostics, Inc. | | | 203 | | | | 0.22 | % | | | 808 | |
Perrigo Company plc | | | 836 | | | | 0.22 | % | | | 729 | |
Altria Group, Inc. | | | 1,135 | | | | 0.39 | % | | | 345 | |
Abbott Laboratories | | | 1,321 | | | | 1.09 | % | | | (293 | ) |
QIAGEN N.V. | | | 598 | | | | 0.20 | % | | | (547 | ) |
Moderna, Inc. | | | 228 | | | | 0.21 | % | | | (1,873 | ) |
Bristol-Myers Squibb Co. | | | 2,071 | | | | 1.00 | % | | | (2,320 | ) |
Vir Biotechnology, Inc. | | | 1,392 | | | | 0.26 | % | | | (3,103 | ) |
Neurocrine Biosciences, Inc. | | | 566 | | | | 0.40 | % | | | (3,808 | ) |
Supernus Pharmaceuticals, Inc. | | | 1,126 | | | | 0.26 | % | | | (4,072 | ) |
Hershey Co. | | | 527 | | | | 1.00 | % | | | (4,318 | ) |
Premier, Inc. — Class A | | | 1,588 | | | | 0.33 | % | | | (5,320 | ) |
Amgen, Inc. | | | 619 | | | | 1.04 | % | | | (5,704 | ) |
Grand Canyon Education, Inc. | | | 587 | | | | 0.46 | % | | | (6,311 | ) |
Gilead Sciences, Inc. | | | 1,296 | | | | 0.76 | % | | | (9,583 | ) |
Campbell Soup Co. | | | 1,080 | | | | 0.37 | % | | | (9,718 | ) |
Humana, Inc. | | | 128 | | | | 0.43 | % | | | (9,951 | ) |
Eagle Pharmaceuticals, Inc. | | | 1,569 | | | | 0.23 | % | | | (17,999 | ) |
Incyte Corp. | | | 2,071 | | | | 0.98 | % | | | (18,922 | ) |
Royalty Pharma plc — Class A | | | 2,620 | | | | 0.61 | % | | | (29,714 | ) |
Total Consumer, Non-cyclical | | | 21,523 | |
| | | | | | | | | | | | | |
Communications |
Yelp, Inc. — Class A | | | 2,779 | | | | 0.77 | % | | | 23,300 | |
Cisco Systems, Inc. | | | 2,725 | | | | 1.07 | % | | | 12,245 | |
Extreme Networks, Inc. | | | 1,367 | | | | 0.27 | % | | | 9,292 | |
26 | THE GUGGENHEIM FUNDS SEMI-ANNUAL REPORT | SEE NOTES TO CONSOLIDATED FINANCIAL STATEMENTS. |
CONSOLIDATED SCHEDULE OF INVESTMENTS (Unaudited)(continued) | June 30, 2023 |
MULTI-HEDGE STRATEGIES FUND | |
| | Shares | | | Percentage
Notional
Amount | | | Value and
Unrealized
Appreciation
(Depreciation) | |
InterDigital, Inc. | | | 639 | | | | 0.47 | % | | $ | 7,727 | |
Nexstar Media Group, Inc. — Class A | | | 437 | | | | 0.55 | % | | | 4,253 | |
Motorola Solutions, Inc. | | | 134 | | | | 0.30 | % | | | 1,046 | |
T-Mobile US, Inc. | | | 345 | | | | 0.36 | % | | | 831 | |
VeriSign, Inc. | | | 606 | | | | 1.04 | % | | | 291 | |
TEGNA, Inc. | | | 2,909 | | | | 0.36 | % | | | 32 | |
Verizon Communications, Inc. | | | 1,310 | | | | 0.37 | % | | | (183 | ) |
A10 Networks, Inc. | | | 4,747 | | | | 0.53 | % | | | (1,174 | ) |
Total Communications | | | 57,660 | |
| | | | | | | | | | | | | |
Consumer, Cyclical |
Allison Transmission Holdings, Inc. | | | 2,292 | | | | 0.98 | % | | | 43,496 | |
PulteGroup, Inc. | | | 1,586 | | | | 0.93 | % | | | 31,038 | |
DR Horton, Inc. | | | 792 | | | | 0.73 | % | | | 23,026 | |
MDC Holdings, Inc. | | | 2,520 | | | | 0.89 | % | | | 20,957 | |
Taylor Morrison Home Corp. — Class A | | | 1,342 | | | | 0.50 | % | | | 16,393 | |
Boyd Gaming Corp. | | | 1,151 | | | | 0.61 | % | | | 16,261 | |
Brunswick Corp. | | | 1,158 | | | | 0.76 | % | | | 14,479 | |
Patrick Industries, Inc. | | | 951 | | | | 0.58 | % | | | 12,707 | |
Tri Pointe Homes, Inc. | | | 3,552 | | | | 0.89 | % | | | 12,541 | |
MSC Industrial Direct Company, Inc. — Class A | | | 1,481 | | | | 1.07 | % | | | 12,500 | |
Meritage Homes Corp. | | | 378 | | | | 0.41 | % | | | 7,853 | |
NVR, Inc. | | | 8 | | | | 0.39 | % | | | 5,282 | |
Cavco Industries, Inc. | | | 173 | | | | 0.39 | % | | | 4,706 | |
Academy Sports & Outdoors, Inc. | | | 556 | | | | 0.23 | % | | | 3,094 | |
Green Brick Partners, Inc. | | | 556 | | | | 0.24 | % | | | 2,817 | |
Gentex Corp. | | | 4,411 | | | | 0.98 | % | | | 2,593 | |
Monarch Casino & Resort, Inc. | | | 884 | | | | 0.47 | % | | | 2,235 | |
Home Depot, Inc. | | | 94 | | | | 0.22 | % | | | 1,964 | |
Dolby Laboratories, Inc. — Class A | | | 1,151 | | | | 0.73 | % | | | 1,085 | |
Steven Madden Ltd. | | | 1 | | | | 0.00 | % | | | 16 | |
Buckle, Inc. | | | 1,425 | | | | 0.37 | % | | | (3,065 | ) |
PetMed Express, Inc. | | | 5,353 | | | | 0.56 | % | | | (4,947 | ) |
Total Consumer, Cyclical | | | 227,015 | |
| | | | | | | | | | | | | |
Industrial |
Standex International Corp. | | | 813 | | | | 0.87 | % | | | 42,906 | |
Vishay Intertechnology, Inc. | | | 3,159 | | | | 0.70 | % | | | 42,426 | |
Snap-on, Inc. | | | 529 | | | | 1.16 | % | | | 38,211 | |
Eagle Materials, Inc. | | | 558 | | | | 0.79 | % | | | 35,353 | |
Mueller Industries, Inc. | | | 1,429 | | | | 0.95 | % | | | 30,439 | |
Louisiana-Pacific Corp. | | | 1,087 | | | | 0.62 | % | | | 23,998 | |
Boise Cascade Co. | | | 1,304 | | | | 0.89 | % | | | 20,829 | |
Builders FirstSource, Inc. | | | 1,005 | | | | 1.04 | % | | | 20,805 | |
Fortive Corp. | | | 2,050 | | | | 1.16 | % | | | 19,921 | |
Simpson Manufacturing Company, Inc. | | | 650 | | | | 0.68 | % | | | 17,704 | |
SEE NOTES TO CONSOLIDATED FINANCIAL STATEMENTS. | THE GUGGENHEIM FUNDS SEMI-ANNUAL REPORT | 27 |
CONSOLIDATED SCHEDULE OF INVESTMENTS (Unaudited)(continued) | June 30, 2023 |
MULTI-HEDGE STRATEGIES FUND | |
| | Shares | | | Percentage
Notional
Amount | | | Value and
Unrealized
Appreciation
(Depreciation) | |
UFP Industries, Inc. | | | 1,360 | | | | 1.00 | % | | $ | 17,499 | |
Dorian LPG Ltd. | | | 1,262 | | | | 0.25 | % | | | 16,467 | |
ITT, Inc. | | | 1,676 | | | | 1.19 | % | | | 12,110 | |
Donaldson Company, Inc. | | | 1,628 | | | | 0.77 | % | | | 6,872 | |
Masco Corp. | | | 1,183 | | | | 0.51 | % | | | 6,745 | |
Landstar System, Inc. | | | 451 | | | | 0.66 | % | | | 6,575 | |
Armstrong World Industries, Inc. | | | 1,112 | | | | 0.62 | % | | | 6,178 | |
Dover Corp. | | | 832 | | | | 0.93 | % | | | 4,697 | |
Expeditors International of Washington, Inc. | | | 432 | | | | 0.40 | % | | | 2,946 | |
Keysight Technologies, Inc. | | | 240 | | | | 0.30 | % | | | 2,913 | |
International Seaways, Inc. | | | 1,015 | | | | 0.29 | % | | | 2,095 | |
Ardmore Shipping Corp. | | | 3,581 | | | | 0.34 | % | | | 1,068 | |
GrafTech International Ltd. | | | 6,080 | | | | 0.23 | % | | | 872 | |
Scorpio Tankers, Inc. | | | 928 | | | | 0.33 | % | | | 770 | |
Toro Co. | | | 481 | | | | 0.37 | % | | | 136 | |
Garmin Ltd. | | | 430 | | | | 0.34 | % | | | (519 | ) |
Argan, Inc. | | | 1,214 | | | | 0.36 | % | | | (1,696 | ) |
Golar LNG Ltd. | | | 2,904 | | | | 0.44 | % | | | (3,872 | ) |
Acuity Brands, Inc. | | | 566 | | | | 0.70 | % | | | (6,040 | ) |
Lindsay Corp. | | | 240 | | | | 0.22 | % | | | (7,352 | ) |
3M Co. | | | 1,379 | | | | 1.05 | % | | | (9,640 | ) |
Sturm Ruger & Company, Inc. | | | 1,693 | | | | 0.68 | % | | | (10,231 | ) |
Total Industrial | | | 341,185 | |
| | | | | | | | | | | | | |
Basic Materials |
NewMarket Corp. | | | 242 | | | | 0.74 | % | | | 20,530 | |
Livent Corp. | | | 1 | | | | 0.00 | % | | | 25 | |
CF Industries Holdings, Inc. | | | 642 | | | | 0.34 | % | | | (57 | ) |
LyondellBasell Industries N.V. — Class A | | | 541 | | | | 0.38 | % | | | (812 | ) |
Westlake Corp. | | | 761 | | | | 0.69 | % | | | (1,913 | ) |
AdvanSix, Inc. | | | 949 | | | | 0.25 | % | | | (4,303 | ) |
Olin Corp. | | | 1,314 | | | | 0.51 | % | | | (5,049 | ) |
Total Basic Materials | | | 8,396 | |
| | | | | | | | | | | | | |
Technology |
NetApp, Inc. | | | 1,688 | | | | 0.98 | % | | | 20,588 | |
Dropbox, Inc. — Class A | | | 4,706 | | | | 0.95 | % | | | 19,937 | |
Kulicke & Soffa Industries, Inc. | | | 1,904 | | | | 0.86 | % | | | 17,891 | |
KLA Corp. | | | 207 | | | | 0.76 | % | | | 13,666 | |
Diodes, Inc. | | | 735 | | | | 0.52 | % | | | 13,255 | |
Microsoft Corp. | | | 219 | | | | 0.57 | % | | | 12,417 | |
Teradata Corp. | | | 589 | | | | 0.24 | % | | | 11,379 | |
Teradyne, Inc. | | | 533 | | | | 0.45 | % | | | 10,100 | |
Photronics, Inc. | | | 1,958 | | | | 0.38 | % | | | 8,396 | |
Applied Materials, Inc. | | | 700 | | | | 0.77 | % | | | 7,708 | |
Cirrus Logic, Inc. | | | 562 | | | | 0.35 | % | | | 7,675 | |
Apple, Inc. | | | 441 | | | | 0.65 | % | | | 5,769 | |
Cognizant Technology Solutions Corp. — Class A | | | 1,028 | | | | 0.51 | % | | | 3,609 | |
QUALCOMM, Inc. | | | 240 | | | | 0.22 | % | | | 3,395 | |
Qualys, Inc. | | | 221 | | | | 0.22 | % | | | 1,923 | |
NetScout Systems, Inc. | | | 2,556 | | | | 0.60 | % | | | 1,712 | |
Veradigm, Inc. | | | 3,329 | | | | 0.32 | % | | | 347 | |
Akamai Technologies, Inc. | | | 710 | | | | 0.48 | % | | | (2,900 | ) |
Total Technology | | | 156,867 | |
| | | | | | | | | | | | | |
Financial |
MGIC Investment Corp. | | | 8,920 | | | | 1.07 | % | | | 13,844 | |
28 | THE GUGGENHEIM FUNDS SEMI-ANNUAL REPORT | SEE NOTES TO CONSOLIDATED FINANCIAL STATEMENTS. |
CONSOLIDATED SCHEDULE OF INVESTMENTS (Unaudited)(continued) | June 30, 2023 |
MULTI-HEDGE STRATEGIES FUND | |
| | Shares | | | Percentage
Notional
Amount | | | Value and
Unrealized
Appreciation
(Depreciation) | |
Essent Group Ltd. | | | 2,269 | | | | 0.81 | % | | $ | 12,813 | |
NMI Holdings, Inc. — Class A | | | 2,384 | | | | 0.47 | % | | | 12,609 | |
Weyerhaeuser Co. | | | 3,266 | | | | 0.83 | % | | | 12,547 | |
Radian Group, Inc. | | | 2,729 | | | | 0.52 | % | | | 9,108 | |
Evercore, Inc. — Class A | | | 487 | | | | 0.46 | % | | | 8,981 | |
Mr Cooper Group, Inc. | | | 1,433 | | | | 0.55 | % | | | 4,976 | |
Hilltop Holdings, Inc. | | | 921 | | | | 0.22 | % | | | 2,935 | |
Preferred Bank/Los Angeles CA | | | 1,826 | | | | 0.76 | % | | | 2,122 | |
SouthState Corp. | | | 2,077 | | | | 1.04 | % | | | 610 | |
SEI Investments Co. | | | 2,367 | | | | 1.07 | % | | | 430 | |
International Bancshares Corp. | | | 658 | | | | 0.22 | % | | | 407 | |
Raymond James Financial, Inc. | | | 1 | | | | 0.00 | % | | | 8 | |
Allstate Corp. | | | 249 | | | | 0.21 | % | | | (169 | ) |
Travelers Companies, Inc. | | | 157 | | | | 0.21 | % | | | (189 | ) |
S&T Bancorp, Inc. | | | 1,511 | | | | 0.31 | % | | | (1,396 | ) |
Equity Commonwealth | | | 6,680 | | | | 1.03 | % | | | (2,488 | ) |
Renasant Corp. | | | 1,565 | | | | 0.31 | % | | | (9,798 | ) |
FB Financial Corp. | | | 1,812 | | | | 0.39 | % | | | (15,398 | ) |
Total Financial | | | 51,944 | |
| | | | | | | | | | | | | |
Utilities |
MGE Energy, Inc. | | | 1,701 | | | | 1.02 | % | | | 11,708 | |
ONE Gas, Inc. | | | 1,488 | | | | 0.87 | % | | | 2,900 | |
Chesapeake Utilities Corp. | | | 520 | | | | 0.47 | % | | | 2,097 | |
Atmos Energy Corp. | | | 1,189 | | | | 1.05 | % | | | 1,912 | |
Ameren Corp. | | | 1,674 | | | | 1.04 | % | | | (433 | ) |
Consolidated Edison, Inc. | | | 972 | | | | 0.67 | % | | | (2,462 | ) |
Black Hills Corp. | | | 2,215 | | | | 1.01 | % | | | (3,698 | ) |
National Fuel Gas Co. | | | 1,500 | | | | 0.58 | % | | | (10,300 | ) |
OGE Energy Corp. | | | 3,849 | | | | 1.05 | % | | | (11,880 | ) |
Clearway Energy, Inc. — Class C | | | 2,806 | | | | 0.61 | % | | | (13,485 | ) |
Total Utilities | | | (23,641 | ) |
| | | | | | | | | | | | | |
Energy |
Marathon Petroleum Corp. | | | 1,268 | | | | 1.12 | % | | | 17,213 | |
Exxon Mobil Corp. | | | 1,302 | | | | 1.06 | % | | | 10,602 | |
REX American Resources Corp. | | | 1,379 | | | | 0.36 | % | | | 8,015 | |
California Resources Corp. | | | 1,214 | | | | 0.42 | % | | | 5,906 | |
SM Energy Co. | | | 1,208 | | | | 0.29 | % | | | 5,739 | |
PBF Energy, Inc. — Class A | | | 1,201 | | | | 0.37 | % | | | 5,303 | |
Cheniere Energy, Inc. | | | 566 | | | | 0.65 | % | | | 4,818 | |
Valero Energy Corp. | | | 1,202 | | | | 1.07 | % | | | 2,929 | |
Phillips 66 | | | 654 | | | | 0.47 | % | | | (588 | ) |
Occidental Petroleum Corp. | | | 690 | | | | 0.31 | % | | | (3,881 | ) |
Total Energy | | | 56,056 | |
Total MS Long/Short Equity Long Custom Basket | | | 897,005 | |
| | | | | | | | | |
MS LONG/SHORT EQUITY SHORT CUSTOM BASKET |
Consumer, Non-cyclical |
Driven Brands Holdings, Inc. | | | 4,340 | | | | (1.24 | )% | | | 10,664 | |
Clarivate plc | | | 4,116 | | | | (0.42 | )% | | | 5,663 | |
SEE NOTES TO CONSOLIDATED FINANCIAL STATEMENTS. | THE GUGGENHEIM FUNDS SEMI-ANNUAL REPORT | 29 |
CONSOLIDATED SCHEDULE OF INVESTMENTS (Unaudited)(continued) | June 30, 2023 |
MULTI-HEDGE STRATEGIES FUND | |
| | Shares | | | Percentage
Notional
Amount | | | Value and
Unrealized
Appreciation
(Depreciation) | |
Global Payments, Inc. | | | 924 | | | | (0.96 | )% | | $ | 4,749 | |
ABM Industries, Inc. | | | 2,556 | | | | (1.14 | )% | | | 3,974 | |
Utz Brands, Inc. | | | 2,649 | | | | (0.45 | )% | | | 2,287 | |
Equifax, Inc. | | | 533 | | | | (1.32 | )% | | | (2,341 | ) |
TreeHouse Foods, Inc. | | | 1,461 | | | | (0.77 | )% | | | (4,140 | ) |
FTI Consulting, Inc. | | | 426 | | | | (0.85 | )% | | | (4,989 | ) |
Estee Lauder Companies, Inc. — Class A | | | 433 | | | | (0.89 | )% | | | (6,370 | ) |
Quanta Services, Inc. | | | 483 | | | | (1.00 | )% | | | (8,531 | ) |
Booz Allen Hamilton Holding Corp. | | | 491 | | | | (0.58 | )% | | | (9,362 | ) |
ICF International, Inc. | | | 825 | | | | (1.08 | )% | | | (16,523 | ) |
CoStar Group, Inc. | | | 1,423 | | | | (1.33 | )% | | | (18,791 | ) |
GXO Logistics, Inc. | | | 1,479 | | | | (0.98 | )% | | | (22,995 | ) |
TransUnion | | | 1,617 | | | | (1.33 | )% | | | (23,581 | ) |
Neogen Corp. | | | 5,901 | | | | (1.35 | )% | | | (25,433 | ) |
Total Consumer, Non-cyclical | | | (115,719 | ) |
| | | | | | | | | | | | | |
Financial |
Sun Communities, Inc. | | | 905 | | | | (1.24 | )% | | | 36,774 | |
American Tower Corp. — Class A | | | 723 | | | | (1.47 | )% | | | 20,050 | |
Rexford Industrial Realty, Inc. | | | 2,229 | | | | (1.22 | )% | | | 19,537 | |
Howard Hughes Corp. | | | 1,195 | | | | (0.99 | )% | | | 16,353 | |
Kennedy-Wilson Holdings, Inc. | | | 7,389 | | | | (1.27 | )% | | | 12,455 | |
Outfront Media, Inc. | | | 4,043 | | | | (0.67 | )% | | | 12,217 | |
Kemper Corp. | | | 1,406 | | | | (0.71 | )% | | | 10,037 | |
Healthcare Realty Trust, Inc. | | | 4,823 | | | | (0.95 | )% | | | 9,973 | |
Equitable Holdings, Inc. | | | 4,904 | | | | (1.40 | )% | | | 9,264 | |
Raymond James Financial, Inc. | | | 1,456 | | | | (1.59 | )% | | | 7,430 | |
TFS Financial Corp. | | | 3,652 | | | | (0.48 | )% | | | 4,098 | |
Prologis, Inc. | | | 880 | | | | (1.13 | )% | | | 3,847 | |
Assured Guaranty Ltd. | | | 1,868 | | | | (1.09 | )% | | | 3,461 | |
Americold Realty Trust, Inc. | | | 3,707 | | | | (1.26 | )% | | | 1,862 | |
Progressive Corp. | | | 702 | | | | (0.98 | )% | | | 1,722 | |
Stellar Bancorp, Inc. | | | 2,639 | | | | (0.63 | )% | | | 878 | |
Rayonier, Inc. | | | 3,770 | | | | (1.24 | )% | | | 680 | |
Popular, Inc. | | | 744 | | | | (0.47 | )% | | | 507 | |
Northern Trust Corp. | | | 1,066 | | | | (0.83 | )% | | | 332 | |
KKR & Company, Inc. — Class A | | | 2,196 | | | | (1.29 | )% | | | 256 | |
Hanover Insurance Group, Inc. | | | 548 | | | | (0.65 | )% | | | (33 | ) |
Crown Castle, Inc. | | | 288 | | | | (0.34 | )% | | | (214 | ) |
Voya Financial, Inc. | | | 483 | | | | (0.36 | )% | | | (372 | ) |
Annaly Capital Management, Inc. | | | 3,074 | | | | (0.65 | )% | | | (1,415 | ) |
State Street Corp. | | | 1,049 | | | | (0.81 | )% | | | (1,602 | ) |
Equinix, Inc. | | | 157 | | | | (1.29 | )% | | | (1,864 | ) |
Omega Healthcare Investors, Inc. | | | 1,532 | | | | (0.49 | )% | | | (2,188 | ) |
Boston Properties, Inc. | | | 547 | | | | (0.33 | )% | | | (3,444 | ) |
Medical Properties Trust, Inc. | | | 5,426 | | | | (0.53 | )% | | | (3,795 | ) |
30 | THE GUGGENHEIM FUNDS SEMI-ANNUAL REPORT | SEE NOTES TO CONSOLIDATED FINANCIAL STATEMENTS. |
CONSOLIDATED SCHEDULE OF INVESTMENTS (Unaudited)(continued) | June 30, 2023 |
MULTI-HEDGE STRATEGIES FUND | |
| | Shares | | | Percentage
Notional
Amount | | | Value and
Unrealized
Appreciation
(Depreciation) | |
AGNC Investment Corp. | | | 5,725 | | | | (0.61 | )% | | $ | (3,872 | ) |
UDR, Inc. | | | 2,877 | | | | (1.30 | )% | | | (5,004 | ) |
Jones Lang LaSalle, Inc. | | | 430 | | | | (0.70 | )% | | | (5,338 | ) |
Brighthouse Financial, Inc. | | | 3,168 | | | | (1.57 | )% | | | (5,459 | ) |
UMH Properties, Inc. | | | 5,859 | | | | (0.98 | )% | | | (5,725 | ) |
Ellington Financial, Inc. | | | 6,037 | | | | (0.87 | )% | | | (6,099 | ) |
Welltower, Inc. | | | 1,204 | | | | (1.02 | )% | | | (6,966 | ) |
PennyMac Mortgage Investment Trust | | | 5,813 | | | | (0.82 | )% | | | (7,294 | ) |
Carlyle Group, Inc. | | | 1,605 | | | | (0.54 | )% | | | (8,122 | ) |
Apollo Global Management, Inc. | | | 836 | | | | (0.67 | )% | | | (9,258 | ) |
Iron Mountain, Inc. | | | 2,334 | | | | (1.39 | )% | | | (10,159 | ) |
PennyMac Financial Services, Inc. | | | 1,739 | | | | (1.28 | )% | | | (12,961 | ) |
Ares Management Corp. — Class A | | | 1,193 | | | | (1.21 | )% | | | (17,455 | ) |
Digital Realty Trust, Inc. | | | 1,132 | | | | (1.35 | )% | | | (21,228 | ) |
Total Financial | | | 31,866 | |
| | | | | | | | | | | | | |
Utilities |
Avista Corp. | | | 2,666 | | | | (1.10 | )% | | | 11,505 | |
Spire, Inc. | | | 1,546 | | | | (1.03 | )% | | | 10,449 | |
Dominion Energy, Inc. | | | 2,110 | | | | (1.15 | )% | | | 8,257 | |
Sempra Energy | | | 932 | | | | (1.42 | )% | | | 6,401 | |
CMS Energy Corp. | | | 1,866 | | | | (1.15 | )% | | | 1,813 | |
UGI Corp. | | | 2,886 | | | | (0.82 | )% | | | 1,647 | |
PG&E Corp. | | | 6,503 | | | | (1.18 | )% | | | 266 | |
American Electric Power Company, Inc. | | | 1,632 | | | | (1.44 | )% | | | (587 | ) |
Alliant Energy Corp. | | | 2,096 | | | | (1.15 | )% | | | (589 | ) |
DTE Energy Co. | | | 840 | | | | (0.97 | )% | | | (665 | ) |
Exelon Corp. | | | 1,872 | | | | (0.80 | )% | | | (1,610 | ) |
Edison International | | | 1,628 | | | | (1.19 | )% | | | (4,438 | ) |
Total Utilities | | | 32,449 | |
| | | | | | | | | | | | | |
Technology |
Evolent Health, Inc. — Class A | | | 1,931 | | | | (0.61 | )% | | | 5,476 | |
Procore Technologies, Inc. | | | 836 | | | | (0.57 | )% | | | (370 | ) |
KBR, Inc. | | | 777 | | | | (0.53 | )% | | | (2,680 | ) |
Guidewire Software, Inc. | | | 637 | | | | (0.51 | )% | | | (2,845 | ) |
Alteryx, Inc. — Class A | | | 934 | | | | (0.45 | )% | | | (3,412 | ) |
Paycor HCM, Inc. | | | 3,057 | | | | (0.76 | )% | | | (4,597 | ) |
Privia Health Group, Inc. | | | 4,038 | | | | (1.11 | )% | | | (7,767 | ) |
Ceridian HCM Holding, Inc. | | | 1,690 | | | | (1.19 | )% | | | (12,870 | ) |
Total Technology | | | (29,065 | ) |
| | | | | | | | | | | | | |
Industrial |
Waste Management, Inc. | | | 320 | | | | (0.58 | )% | | | (12 | ) |
General Electric Co. | | | 1 | | | | 0.00 | % | | | (23 | ) |
Boeing Co. | | | 412 | | | | (0.91 | )% | | | (4,789 | ) |
Vulcan Materials Co. | | | 222 | | | | (0.53 | )% | | | (5,082 | ) |
Casella Waste Systems, Inc. — Class A | | | 907 | | | | (0.86 | )% | | | (6,234 | ) |
SEE NOTES TO CONSOLIDATED FINANCIAL STATEMENTS. | THE GUGGENHEIM FUNDS SEMI-ANNUAL REPORT | 31 |
CONSOLIDATED SCHEDULE OF INVESTMENTS (Unaudited)(continued) | June 30, 2023 |
MULTI-HEDGE STRATEGIES FUND | |
| | Shares | | | Percentage
Notional
Amount | | | Value and
Unrealized
Appreciation
(Depreciation) | |
Kirby Corp. | | | 759 | | | | (0.61 | )% | | $ | (6,335 | ) |
Tetra Tech, Inc. | | | 251 | | | | (0.43 | )% | | | (7,589 | ) |
Clean Harbors, Inc. | | | 286 | | | | (0.49 | )% | | | (8,667 | ) |
NV5 Global, Inc. | | | 604 | | | | (0.70 | )% | | | (9,536 | ) |
MasTec, Inc. | | | 470 | | | | (0.58 | )% | | | (14,273 | ) |
MSA Safety, Inc. | | | 642 | | | | (1.17 | )% | | | (30,378 | ) |
Total Industrial | | | (92,895 | ) |
| | | | | | | | | | | | | |
Consumer, Cyclical |
UniFirst Corp. | | | 535 | | | | (0.87 | )% | | | 24,280 | |
Ollie’s Bargain Outlet Holdings, Inc. | | | 472 | | | | (0.29 | )% | | | 342 | |
Steven Madden Ltd. | | | 1 | | | | 0.00 | % | | | 3 | |
Newell Brands, Inc. | | | 10,180 | | | | (0.93 | )% | | | (105 | ) |
OPENLANE, Inc. | | | 6,363 | | | | (1.02 | )% | | | (610 | ) |
Burlington Stores, Inc. | | | 274 | | | | (0.45 | )% | | | (2,265 | ) |
Five Below, Inc. | | | 251 | | | | (0.52 | )% | | | (3,014 | ) |
Shake Shack, Inc. — Class A | | | 723 | | | | (0.59 | )% | | | (6,570 | ) |
VF Corp. | | | 5,792 | | | | (1.16 | )% | | | (7,202 | ) |
Tesla, Inc. | | | 209 | | | | (0.57 | )% | | | (14,414 | ) |
Floor & Decor Holdings, Inc. — Class A | | | 767 | | | | (0.84 | )% | | | (15,957 | ) |
Copart, Inc. | | | 1,241 | | | | (1.19 | )% | | | (30,107 | ) |
Total Consumer, Cyclical | | | (55,622 | ) |
| | | | | | | | | | | | | |
Basic Materials |
Hecla Mining Co. | | | 10,368 | | | | (0.56 | )% | | | 9,887 | |
Royal Gold, Inc. | | | 487 | | | | (0.59 | )% | | | 5,164 | |
Piedmont Lithium, Inc. | | | 798 | | | | (0.48 | )% | | | 2,940 | |
Livent Corp. | | | 1 | | | | 0.00 | % | | | (14 | ) |
Carpenter Technology Corp. | | | 1,231 | | | | (0.73 | )% | | | (20,369 | ) |
Total Basic Materials | | | (2,378 | ) |
| | | | | | | | | | | | | |
| |
Communications |
Robinhood Markets, Inc. — Class A | | | 2,516 | | | | (0.26 | )% | | | (802 | ) |
Palo Alto Networks, Inc. | | �� | 114 | | | | (0.31 | )% | | | (1,021 | ) |
Chewy, Inc. — Class A | | | 1,133 | | | | (0.47 | )% | | | (3,842 | ) |
DoorDash, Inc. — Class A | | | 865 | | | | (0.69 | )% | | | (9,243 | ) |
Uber Technologies, Inc. | | | 786 | | | | (0.36 | )% | | | (11,194 | ) |
Total Communications | | | (26,102 | ) |
| | | | | | | | | | | | | |
Energy |
NOV, Inc. | | | 4,938 | | | | (0.83 | )% | | | 24,061 | |
Hess Corp. | | | 1,045 | | | | (1.49 | )% | | | (2,720 | ) |
Valaris Ltd. | | | 788 | | | | (0.52 | )% | | | (4,974 | ) |
Schlumberger N.V. | | | 2,499 | | | | (1.29 | )% | | | (11,301 | ) |
Tidewater, Inc. | | | 1,103 | | | | (0.64 | )% | | | (13,477 | ) |
Total Energy | | | (8,411 | ) |
Total MS Long/Short Equity Short Custom Basket | | | (265,877 | ) |
GS LONG/SHORT EQUITY LONG CUSTOM BASKET |
Consumer, Non-cyclical |
John B Sanfilippo & Son, Inc. | | | 560 | | | | 0.49 | % | | | 24,214 | |
Vertex Pharmaceuticals, Inc. | | | 176 | | | | 0.46 | % | | | 23,373 | |
Perdoceo Education Corp. | | | 8,233 | | | | 0.76 | % | | | 12,493 | |
Quanex Building Products Corp. | | | 2,181 | | | | 0.43 | % | | | 10,788 | |
Kimberly-Clark Corp. | | | 1,001 | | | | 1.05 | % | | | 10,061 | |
AMN Healthcare Services, Inc. | | | 433 | | | | 0.36 | % | | | 10,033 | |
Hackett Group, Inc. | | | 3,176 | | | | 0.54 | % | | | 9,832 | |
32 | THE GUGGENHEIM FUNDS SEMI-ANNUAL REPORT | SEE NOTES TO CONSOLIDATED FINANCIAL STATEMENTS. |
CONSOLIDATED SCHEDULE OF INVESTMENTS (Unaudited)(continued) | June 30, 2023 |
MULTI-HEDGE STRATEGIES FUND | |
| | Shares | | | Percentage
Notional
Amount | | | Value and
Unrealized
Appreciation
(Depreciation) | |
Viatris, Inc. | | | 14,597 | | | | 1.11 | % | | $ | 9,271 | |
USANA Health Sciences, Inc. | | | 1,049 | | | | 0.50 | % | | | 6,787 | |
Exelixis, Inc. | | | 3,830 | | | | 0.56 | % | | | 6,505 | |
Dynavax Technologies Corp. | | | 4,722 | | | | 0.46 | % | | | 6,493 | |
Edwards Lifesciences Corp. | | | 430 | | | | 0.31 | % | | | 4,503 | |
Innoviva, Inc. | | | 8,283 | | | | 0.80 | % | | | 4,478 | |
Vector Group Ltd. | | | 7,075 | | | | 0.69 | % | | | 4,459 | |
Johnson & Johnson | | | 268 | | | | 0.34 | % | | | 3,240 | |
H&R Block, Inc. | | | 4,451 | | | | 1.08 | % | | | 2,941 | |
Merck & Company, Inc. | | | 1,212 | | | | 1.06 | % | | | 2,125 | |
United Therapeutics Corp. | | | 455 | | | | 0.76 | % | | | 888 | |
Quest Diagnostics, Inc. | | | 203 | | | | 0.22 | % | | | 841 | |
Molina Healthcare, Inc. | | | 94 | | | | 0.21 | % | | | 788 | |
Perrigo Company plc | | | 836 | | | | 0.22 | % | | | 701 | |
Altria Group, Inc. | | | 1,135 | | | | 0.39 | % | | | 280 | |
Abbott Laboratories | | | 1,321 | | | | 1.09 | % | | | (327 | ) |
QIAGEN N.V. | | | 598 | | | | 0.20 | % | | | (578 | ) |
Moderna, Inc. | | | 228 | | | | 0.21 | % | | | (1,900 | ) |
Bristol-Myers Squibb Co. | | | 2,071 | | | | 1.00 | % | | | (2,172 | ) |
Vir Biotechnology, Inc. | | | 1,392 | | | | 0.26 | % | | | (3,217 | ) |
Neurocrine Biosciences, Inc. | | | 566 | | | | 0.40 | % | | | (3,865 | ) |
Supernus Pharmaceuticals, Inc. | | | 1,126 | | | | 0.26 | % | | | (4,007 | ) |
Hershey Co. | | | 527 | | | | 1.00 | % | | | (4,464 | ) |
Amgen, Inc. | | | 619 | | | | 1.04 | % | | | (5,174 | ) |
Premier, Inc. — Class A | | | 1,588 | | | | 0.33 | % | | | (5,349 | ) |
Grand Canyon Education, Inc. | | | 587 | | | | 0.46 | % | | | (6,403 | ) |
Gilead Sciences, Inc. | | | 1,296 | | | | 0.76 | % | | | (9,485 | ) |
Campbell Soup Co. | | | 1,080 | | | | 0.37 | % | | | (9,672 | ) |
Humana, Inc. | | | 128 | | | | 0.43 | % | | | (9,913 | ) |
Eagle Pharmaceuticals, Inc. | | | 1,569 | | | | 0.23 | % | | | (17,953 | ) |
Incyte Corp. | | | 2,071 | | | | 0.98 | % | | | (18,441 | ) |
Royalty Pharma plc — Class A | | | 2,620 | | | | 0.61 | % | | | (29,355 | ) |
Total Consumer, Non-cyclical | | | 22,816 | |
| | | | | | | | | | | | | |
Communications |
Yelp, Inc. — Class A | | | 2,779 | | | | 0.77 | % | | | 23,467 | |
Cisco Systems, Inc. | | | 2,725 | | | | 1.07 | % | | | 12,293 | |
Extreme Networks, Inc. | | | 1,367 | | | | 0.27 | % | | | 9,315 | |
InterDigital, Inc. | | | 639 | | | | 0.47 | % | | | 7,832 | |
Nexstar Media Group, Inc. — Class A | | | 437 | | | | 0.55 | % | | | 4,266 | |
Motorola Solutions, Inc. | | | 134 | | | | 0.30 | % | | | 1,033 | |
T-Mobile US, Inc. | | | 345 | | | | 0.36 | % | | | 886 | |
VeriSign, Inc. | | | 606 | | | | 1.04 | % | | | 275 | |
TEGNA, Inc. | | | 2,909 | | | | 0.36 | % | | | 47 | |
Verizon Communications, Inc. | | | 1,310 | | | | 0.37 | % | | | (45 | ) |
A10 Networks, Inc. | | | 4,747 | | | | 0.53 | % | | | (1,285 | ) |
Total Communications | | | 58,084 | |
SEE NOTES TO CONSOLIDATED FINANCIAL STATEMENTS. | THE GUGGENHEIM FUNDS SEMI-ANNUAL REPORT | 33 |
CONSOLIDATED SCHEDULE OF INVESTMENTS (Unaudited)(continued) | June 30, 2023 |
MULTI-HEDGE STRATEGIES FUND | |
| | Shares | | | Percentage
Notional
Amount | | | Value and
Unrealized
Appreciation
(Depreciation) | |
Consumer, Cyclical |
Allison Transmission Holdings, Inc. | | | 2,292 | | | | 0.98 | % | | $ | 43,425 | |
PulteGroup, Inc. | | | 1,586 | | | | 0.93 | % | | | 31,117 | |
DR Horton, Inc. | | | 792 | | | | 0.73 | % | | | 23,124 | |
MDC Holdings, Inc. | | | 2,520 | | | | 0.89 | % | | | 20,960 | |
Taylor Morrison Home Corp. — Class A | | | 1,342 | | | | 0.50 | % | | | 16,448 | |
Boyd Gaming Corp. | | | 1,151 | | | | 0.61 | % | | | 16,396 | |
Brunswick Corp. | | | 1,158 | | | | 0.76 | % | | | 14,646 | |
Tri Pointe Homes, Inc. | | | 3,552 | | | | 0.89 | % | | | 12,779 | |
Patrick Industries, Inc. | | | 951 | | | | 0.58 | % | | | 12,746 | |
MSC Industrial Direct Company, Inc. — Class A | | | 1,481 | | | | 1.07 | % | | | 12,503 | |
Meritage Homes Corp. | | | 378 | | | | 0.41 | % | | | 7,899 | |
NVR, Inc. | | | 8 | | | | 0.39 | % | | | 5,301 | |
Cavco Industries, Inc. | | | 173 | | | | 0.39 | % | | | 4,691 | |
Academy Sports & Outdoors, Inc. | | | 556 | | | | 0.23 | % | | | 3,146 | |
Green Brick Partners, Inc. | | | 556 | | | | 0.24 | % | | | 2,841 | |
Gentex Corp. | | | 4,411 | | | | 0.98 | % | | | 2,606 | |
Monarch Casino & Resort, Inc. | | | 884 | | | | 0.47 | % | | | 2,180 | |
Home Depot, Inc. | | | 94 | | | | 0.22 | % | | | 1,978 | |
Dolby Laboratories, Inc. — Class A | | | 1,151 | | | | 0.73 | % | | | 1,119 | |
Buckle, Inc. | | | 1,425 | | | | 0.37 | % | | | (3,014 | ) |
PetMed Express, Inc. | | | 5,353 | | | | 0.56 | % | | | (4,941 | ) |
Total Consumer, Cyclical | | | 227,950 | |
| | | | | | | | | | | | | |
Industrial |
Standex International Corp. | | | 813 | | | | 0.87 | % | | | 42,867 | |
Vishay Intertechnology, Inc. | | | 3,159 | | | | 0.70 | % | | | 42,354 | |
Snap-on, Inc. | | | 529 | | | | 1.16 | % | | | 38,193 | |
Eagle Materials, Inc. | | | 558 | | | | 0.79 | % | | | 35,354 | |
Mueller Industries, Inc. | | | 1,429 | | | | 0.95 | % | | | 30,498 | |
Louisiana-Pacific Corp. | | | 1,087 | | | | 0.62 | % | | | 24,504 | |
Builders FirstSource, Inc. | | | 1,005 | | | | 1.04 | % | | | 21,042 | |
Boise Cascade Co. | | | 1,304 | | | | 0.89 | % | | | 20,912 | |
Fortive Corp. | | | 2,050 | | | | 1.16 | % | | | 19,928 | |
Simpson Manufacturing Company, Inc. | | | 650 | | | | 0.68 | % | | | 17,767 | |
UFP Industries, Inc. | | | 1,360 | | | | 1.00 | % | | | 17,486 | |
Dorian LPG Ltd. | | | 1,262 | | | | 0.25 | % | | | 16,460 | |
ITT, Inc. | | | 1,676 | | | | 1.19 | % | | | 12,527 | |
Donaldson Company, Inc. | | | 1,628 | | | | 0.77 | % | | | 6,981 | |
Masco Corp. | | | 1,183 | | | | 0.51 | % | | | 6,677 | |
Landstar System, Inc. | | | 451 | | | | 0.66 | % | | | 6,481 | |
Armstrong World Industries, Inc. | | | 1,112 | | | | 0.62 | % | | | 6,248 | |
Dover Corp. | | | 832 | | | | 0.93 | % | | | 4,772 | |
Expeditors International of Washington, Inc. | | | 432 | | | | 0.40 | % | | | 2,945 | |
Keysight Technologies, Inc. | | | 240 | | | | 0.30 | % | | | 2,911 | |
34 | THE GUGGENHEIM FUNDS SEMI-ANNUAL REPORT | SEE NOTES TO CONSOLIDATED FINANCIAL STATEMENTS. |
CONSOLIDATED SCHEDULE OF INVESTMENTS (Unaudited)(continued) | June 30, 2023 |
MULTI-HEDGE STRATEGIES FUND | |
| | Shares | | | Percentage
Notional
Amount | | | Value and
Unrealized
Appreciation
(Depreciation) | |
International Seaways, Inc. | | | 1,015 | | | | 0.29 | % | | $ | 2,057 | |
Ardmore Shipping Corp. | | | 3,581 | | | | 0.34 | % | | | 947 | |
GrafTech International Ltd. | | | 6,080 | | | | 0.23 | % | | | 856 | |
Scorpio Tankers, Inc. | | | 928 | | | | 0.33 | % | | | 780 | |
Toro Co. | | | 481 | | | | 0.37 | % | | | 291 | |
Garmin Ltd. | | | 430 | | | | 0.34 | % | | | (525 | ) |
Argan, Inc. | | | 1,214 | | | | 0.36 | % | | | (1,490 | ) |
Golar LNG Ltd. | | | 2,904 | | | | 0.44 | % | | | (3,900 | ) |
Acuity Brands, Inc. | | | 566 | | | | 0.70 | % | | | (5,792 | ) |
Lindsay Corp. | | | 240 | | | | 0.22 | % | | | (7,311 | ) |
3M Co. | | | 1,379 | | | | 1.05 | % | | | (9,315 | ) |
Sturm Ruger & Company, Inc. | | | 1,693 | | | | 0.68 | % | | | (10,211 | ) |
Total Industrial | | | 343,294 | |
| | | | | | | | | | | | | |
Basic Materials |
NewMarket Corp. | | | 242 | | | | 0.74 | % | | | 20,715 | |
CF Industries Holdings, Inc. | | | 642 | | | | 0.34 | % | | | 135 | |
LyondellBasell Industries N.V. — Class A | | | 541 | | | | 0.38 | % | | | (645 | ) |
Westlake Corp. | | | 761 | | | | 0.69 | % | | | (1,992 | ) |
AdvanSix, Inc. | | | 949 | | | | 0.25 | % | | | (4,281 | ) |
Olin Corp. | | | 1,314 | | | | 0.51 | % | | | (4,987 | ) |
Total Basic Materials | | | 8,945 | |
| | | | | | | | | | | | | |
Technology |
NetApp, Inc. | | | 1,688 | | | | 0.98 | % | | | 20,575 | |
Dropbox, Inc. — Class A | | | 4,706 | | | | 0.95 | % | | | 19,799 | |
Kulicke & Soffa Industries, Inc. | | | 1,904 | | | | 0.86 | % | | | 17,976 | |
KLA Corp. | | | 207 | | | | 0.76 | % | | | 13,876 | |
Diodes, Inc. | | | 735 | | | | 0.52 | % | | | 13,286 | |
Microsoft Corp. | | | 219 | | | | 0.57 | % | | | 12,459 | |
Teradata Corp. | | | 589 | | | | 0.24 | % | | | 11,371 | |
Teradyne, Inc. | | | 533 | | | | 0.45 | % | | | 10,350 | |
Photronics, Inc. | | | 1,958 | | | | 0.38 | % | | | 8,466 | |
Cirrus Logic, Inc. | | | 562 | | | | 0.35 | % | | | 7,775 | |
Applied Materials, Inc. | | | 700 | | | | 0.77 | % | | | 7,600 | |
Apple, Inc. | | | 441 | | | | 0.65 | % | | | 5,013 | |
Cognizant Technology Solutions Corp. — Class A | | | 1,028 | | | | 0.51 | % | | | 3,638 | |
QUALCOMM, Inc. | | | 240 | | | | 0.22 | % | | | 3,427 | |
Qualys, Inc. | | | 221 | | | | 0.22 | % | | | 1,834 | |
NetScout Systems, Inc. | | | 2,556 | | | | 0.60 | % | | | 1,788 | |
Veradigm, Inc. | | | 3,329 | | | | 0.32 | % | | | 285 | |
Akamai Technologies, Inc. | | | 710 | | | | 0.48 | % | | | (2,926 | ) |
Total Technology | | | 156,592 | |
| | | | | | | | | | | | | |
Financial |
MGIC Investment Corp. | | | 8,920 | | | | 1.07 | % | | | 13,838 | |
Weyerhaeuser Co. | | | 3,266 | | | | 0.83 | % | | | 12,879 | |
Essent Group Ltd. | | | 2,269 | | | | 0.81 | % | | | 12,797 | |
NMI Holdings, Inc. — Class A | | | 2,384 | | | | 0.47 | % | | | 12,656 | |
Evercore, Inc. — Class A | | | 487 | | | | 0.46 | % | | | 9,447 | |
Radian Group, Inc. | | | 2,729 | | | | 0.52 | % | | | 8,976 | |
Mr Cooper Group, Inc. | | | 1,433 | | | | 0.55 | % | | | 5,151 | |
Hilltop Holdings, Inc. | | | 921 | | | | 0.22 | % | | | 2,938 | |
Preferred Bank/Los Angeles CA | | | 1,826 | | | | 0.76 | % | | | 2,207 | |
SouthState Corp. | | | 2,077 | | | | 1.04 | % | | | 1,480 | |
SEI Investments Co. | | | 2,367 | | | | 1.07 | % | | | 675 | |
SEE NOTES TO CONSOLIDATED FINANCIAL STATEMENTS. | THE GUGGENHEIM FUNDS SEMI-ANNUAL REPORT | 35 |
CONSOLIDATED SCHEDULE OF INVESTMENTS (Unaudited)(continued) | June 30, 2023 |
MULTI-HEDGE STRATEGIES FUND | |
| | Shares | | | Percentage
Notional
Amount | | | Value and
Unrealized
Appreciation
(Depreciation) | |
International Bancshares Corp. | | | 658 | | | | 0.22 | % | | $ | 383 | |
Raymond James Financial, Inc. | | | 1 | | | | 0.00 | % | | | 8 | |
Allstate Corp. | | | 249 | | | | 0.21 | % | | | (159 | ) |
Travelers Companies, Inc. | | | 157 | | | | 0.21 | % | | | (207 | ) |
S&T Bancorp, Inc. | | | 1,511 | | | | 0.31 | % | | | (1,411 | ) |
Equity Commonwealth | | | 6,680 | | | | 1.03 | % | | | (2,532 | ) |
Renasant Corp. | | | 1,565 | | | | 0.31 | % | | | (9,766 | ) |
FB Financial Corp. | | | 1,812 | | | | 0.39 | % | | | (15,429 | ) |
Total Financial | | | 53,923 | |
| | | | | | | | | | | | | |
Utilities |
MGE Energy, Inc. | | | 1,701 | | | | 1.02 | % | | | 11,648 | |
ONE Gas, Inc. | | | 1,488 | | | | 0.87 | % | | | 3,106 | |
Atmos Energy Corp. | | | 1,189 | | | | 1.05 | % | | | 2,102 | |
Chesapeake Utilities Corp. | | | 520 | | | | 0.47 | % | | | 2,005 | |
Ameren Corp. | | | 1,674 | | | | 1.04 | % | | | (227 | ) |
Consolidated Edison, Inc. | | | 972 | | | | 0.67 | % | | | (2,364 | ) |
Black Hills Corp. | | | 2,215 | | | | 1.01 | % | | | (3,582 | ) |
National Fuel Gas Co. | | | 1,500 | | | | 0.58 | % | | | (10,280 | ) |
OGE Energy Corp. | | | 3,849 | | | | 1.05 | % | | | (11,614 | ) |
Clearway Energy, Inc. — Class C | | | 2,806 | | | | 0.61 | % | | | (13,490 | ) |
Total Utilities | | | (22,696 | ) |
| | | | | | | | | | | | | |
Energy |
Marathon Petroleum Corp. | | | 1,268 | | | | 1.12 | % | | | 17,251 | |
Exxon Mobil Corp. | | | 1,302 | | | | 1.06 | % | | | 10,943 | |
REX American Resources Corp. | | | 1,379 | | | | 0.36 | % | | | 8,269 | |
California Resources Corp. | | | 1,214 | | | | 0.42 | % | | | 5,865 | |
SM Energy Co. | | | 1,208 | | | | 0.29 | % | | | 5,843 | |
PBF Energy, Inc. — Class A | | | 1,201 | | | | 0.37 | % | | | 5,111 | |
Cheniere Energy, Inc. | | | 566 | | | | 0.65 | % | | | 4,642 | |
Valero Energy Corp. | | | 1,202 | | | | 1.07 | % | | | 3,147 | |
Phillips 66 | | | 654 | | | | 0.47 | % | | | (637 | ) |
Occidental Petroleum Corp. | | | 690 | | | | 0.31 | % | | | (3,789 | ) |
Total Energy | | | 56,645 | |
Total GS Long/Short Equity Long Custom Basket | | | 905,553 | |
| | | | | | | | | |
GS LONG/SHORT EQUITY SHORT CUSTOM BASKET |
Consumer, Non-cyclical |
Driven Brands Holdings, Inc. | | | 4,340 | | | | (1.25 | )% | | | 10,860 | |
Clarivate plc | | | 4,116 | | | | (0.42 | )% | | | 5,630 | |
Global Payments, Inc. | | | 924 | | | | (0.97 | )% | | | 4,755 | |
ABM Industries, Inc. | | | 2,556 | | | | (1.16 | )% | | | 3,951 | |
Utz Brands, Inc. | | | 2,649 | | | | (0.46 | )% | | | 2,345 | |
Equifax, Inc. | | | 533 | | | | (1.33 | )% | | | (2,403 | ) |
TreeHouse Foods, Inc. | | | 1,461 | | | | (0.78 | )% | | | (4,307 | ) |
FTI Consulting, Inc. | | | 426 | | | | (0.86 | )% | | | (4,605 | ) |
Estee Lauder Companies, Inc. — Class A | | | 433 | | | | (0.90 | )% | | | (6,280 | ) |
Quanta Services, Inc. | | | 483 | | | | (1.01 | )% | | | (8,667 | ) |
36 | THE GUGGENHEIM FUNDS SEMI-ANNUAL REPORT | SEE NOTES TO CONSOLIDATED FINANCIAL STATEMENTS. |
CONSOLIDATED SCHEDULE OF INVESTMENTS (Unaudited)(continued) | June 30, 2023 |
MULTI-HEDGE STRATEGIES FUND | |
| | Shares | | | Percentage
Notional
Amount | | | Value and
Unrealized
Appreciation
(Depreciation) | |
Booz Allen Hamilton Holding Corp. | | | 491 | | | | (0.58 | )% | | $ | (9,469 | ) |
ICF International, Inc. | | | 825 | | | | (1.09 | )% | | | (16,517 | ) |
CoStar Group, Inc. | | | 1,423 | | | | (1.34 | )% | | | (18,959 | ) |
GXO Logistics, Inc. | | | 1,479 | | | | (0.99 | )% | | | (23,023 | ) |
TransUnion | | | 1,617 | | | | (1.34 | )% | | | (23,741 | ) |
Neogen Corp. | | | 5,901 | | | | (1.36 | )% | | | (25,509 | ) |
Total Consumer, Non-cyclical | | | (115,939 | ) |
| | | | | | | | | | | | | |
Financial |
Sun Communities, Inc. | | | 905 | | | | (1.25 | )% | | | 36,656 | |
American Tower Corp. — Class A | | | 723 | | | | (1.49 | )% | | | 20,168 | |
Rexford Industrial Realty, Inc. | | | 2,229 | | | | (1.24 | )% | | | 19,358 | |
Howard Hughes Corp. | | | 1,195 | | | | (1.00 | )% | | | 16,311 | |
Outfront Media, Inc. | | | 4,043 | | | | (0.67 | )% | | | 12,402 | |
Kennedy-Wilson Holdings, Inc. | | | 7,389 | | | | (1.28 | )% | | | 12,132 | |
Kemper Corp. | | | 1,406 | | | | (0.72 | )% | | | 10,118 | |
Healthcare Realty Trust, Inc. | | | 4,823 | | | | (0.97 | )% | | | 10,062 | |
Equitable Holdings, Inc. | | | 4,904 | | | | (1.41 | )% | | | 9,048 | |
Raymond James Financial, Inc. | | | 1,456 | | | | (1.60 | )% | | | 7,210 | |
TFS Financial Corp. | | | 3,652 | | | | (0.49 | )% | | | 4,103 | |
Assured Guaranty Ltd. | | | 1,868 | | | | (1.11 | )% | | | 3,357 | |
Prologis, Inc. | | | 880 | | | | (1.15 | )% | | | 3,307 | |
Progressive Corp. | | | 702 | | | | (0.99 | )% | | | 1,768 | |
Americold Realty Trust, Inc. | | | 3,707 | | | | (1.27 | )% | | | 1,662 | |
Stellar Bancorp, Inc. | | | 2,639 | | | | (0.64 | )% | | | 915 | |
Rayonier, Inc. | | | 3,770 | | | | (1.26 | )% | | | 820 | |
Popular, Inc. | | | 744 | | | | (0.48 | )% | | | 491 | |
Northern Trust Corp. | | | 1,066 | | | | (0.84 | )% | | | 375 | |
KKR & Company, Inc. — Class A | | | 2,196 | | | | (1.31 | )% | | | 187 | |
Hanover Insurance Group, Inc. | | | 548 | | | | (0.66 | )% | | | (86 | ) |
Crown Castle, Inc. | | | 288 | | | | (0.35 | )% | | | (190 | ) |
Voya Financial, Inc. | | | 483 | | | | (0.37 | )% | | | (312 | ) |
Annaly Capital Management, Inc. | | | 3,074 | | | | (0.65 | )% | | | (1,405 | ) |
State Street Corp. | | | 1,049 | | | | (0.81 | )% | | | (1,625 | ) |
Equinix, Inc. | | | 157 | | | | (1.31 | )% | | | (1,883 | ) |
Omega Healthcare Investors, Inc. | | | 1,532 | | | | (0.50 | )% | | | (2,276 | ) |
Boston Properties, Inc. | | | 547 | | | | (0.33 | )% | | | (3,547 | ) |
Medical Properties Trust, Inc. | | | 5,426 | | | | (0.53 | )% | | | (3,878 | ) |
AGNC Investment Corp. | | | 5,725 | | | | (0.62 | )% | | | (4,175 | ) |
UDR, Inc. | | | 2,877 | | | | (1.31 | )% | | | (4,894 | ) |
Jones Lang LaSalle, Inc. | | | 430 | | | | (0.71 | )% | | | (5,404 | ) |
Brighthouse Financial, Inc. | | | 3,168 | | | | (1.59 | )% | | | (5,624 | ) |
UMH Properties, Inc. | | | 5,859 | | | | (0.99 | )% | | | (5,672 | ) |
Ellington Financial, Inc. | | | 6,037 | | | | (0.88 | )% | | | (6,096 | ) |
Welltower, Inc. | | | 1,204 | | | | (1.03 | )% | | | (7,137 | ) |
SEE NOTES TO CONSOLIDATED FINANCIAL STATEMENTS. | THE GUGGENHEIM FUNDS SEMI-ANNUAL REPORT | 37 |
CONSOLIDATED SCHEDULE OF INVESTMENTS (Unaudited)(continued) | June 30, 2023 |
MULTI-HEDGE STRATEGIES FUND | |
| | Shares | | | Percentage
Notional
Amount | | | Value and
Unrealized
Appreciation
(Depreciation) | |
PennyMac Mortgage Investment Trust | | | 5,813 | | | | (0.83 | )% | | $ | (7,357 | ) |
Carlyle Group, Inc. | | | 1,605 | | | | (0.54 | )% | | | (8,472 | ) |
Apollo Global Management, Inc. | | | 836 | | | | (0.68 | )% | | | (9,438 | ) |
Iron Mountain, Inc. | | | 2,334 | | | | (1.41 | )% | | | (10,134 | ) |
PennyMac Financial Services, Inc. | | | 1,739 | | | | (1.30 | )% | | | (13,050 | ) |
Ares Management Corp. — Class A | | | 1,193 | | | | (1.22 | )% | | | (18,125 | ) |
Digital Realty Trust, Inc. | | | 1,132 | | | | (1.37 | )% | | | (21,564 | ) |
Total Financial | | | 28,106 | |
| | | | | | | | | | | | | |
Utilities |
Avista Corp. | | | 2,666 | | | | (1.11 | )% | | | 11,400 | |
Spire, Inc. | | | 1,546 | | | | (1.04 | )% | | | 10,306 | |
Dominion Energy, Inc. | | | 2,110 | | | | (1.16 | )% | | | 7,862 | |
Sempra Energy | | | 932 | | | | (1.44 | )% | | | 6,620 | |
UGI Corp. | | | 2,886 | | | | (0.83 | )% | | | 1,546 | |
CMS Energy Corp. | | | 1,866 | | | | (1.16 | )% | | | 1,459 | |
PG&E Corp. | | | 6,503 | | | | (1.19 | )% | | | 389 | |
American Electric Power Company, Inc. | | | 1,632 | | | | (1.46 | )% | | | (652 | ) |
Alliant Energy Corp. | | | 2,096 | | | | (1.17 | )% | | | (732 | ) |
DTE Energy Co. | | | 840 | | | | (0.98 | )% | | | (749 | ) |
Exelon Corp. | | | 1,872 | | | | (0.81 | )% | | | (1,619 | ) |
Edison International | | | 1,628 | | | | (1.20 | )% | | | (4,572 | ) |
Total Utilities | | | 31,258 | |
Technology |
Evolent Health, Inc. — Class A | | | 1,931 | | | | (0.62 | )% | | | 5,131 | |
Procore Technologies, Inc. | | | 836 | | | | (0.58 | )% | | | (450 | ) |
KBR, Inc. | | | 777 | | | | (0.54 | )% | | | (2,727 | ) |
Guidewire Software, Inc. | | | 637 | | | | (0.51 | )% | | | (2,833 | ) |
Alteryx, Inc. — Class A | | | 934 | | | | (0.45 | )% | | | (3,303 | ) |
Paycor HCM, Inc. | | | 3,057 | | | | (0.77 | )% | | | (4,682 | ) |
Ceridian HCM Holding, Inc. | | | 1,690 | | | | (1.20 | )% | | | (13,320 | ) |
Total Technology | | | (22,184 | ) |
| | | | | | | | | | | | | |
Industrial |
General Electric Co. | | | 1 | | | | 0.00 | % | | | (23 | ) |
Waste Management, Inc. | | | 320 | | | | (0.59 | )% | | | (133 | ) |
Boeing Co. | | | 412 | | | | (0.92 | )% | | | (4,973 | ) |
Vulcan Materials Co. | | | 222 | | | | (0.53 | )% | | | (5,045 | ) |
Kirby Corp. | | | 759 | | | | (0.62 | )% | | | (6,144 | ) |
Casella Waste Systems, Inc. — Class A | | | 907 | | | | (0.87 | )% | | | (6,252 | ) |
Tetra Tech, Inc. | | | 251 | | | | (0.44 | )% | | | (7,641 | ) |
Clean Harbors, Inc. | | | 286 | | | | (0.50 | )% | | | (8,733 | ) |
NV5 Global, Inc. | | | 604 | | | | (0.71 | )% | | | (9,533 | ) |
MasTec, Inc. | | | 470 | | | | (0.59 | )% | | | (14,425 | ) |
MSA Safety, Inc. | | | 642 | | | | (1.19 | )% | | | (30,359 | ) |
Total Industrial | | | (93,238 | ) |
| | | | | | | | | | | | | |
Consumer, Cyclical |
UniFirst Corp. | | | 535 | | | | (0.88 | )% | | | 24,363 | |
Newell Brands, Inc. | | | 10,180 | | | | (0.94 | )% | | | 330 | |
Ollie’s Bargain Outlet Holdings, Inc. | | | 472 | | | | (0.29 | )% | | | 277 | |
38 | THE GUGGENHEIM FUNDS SEMI-ANNUAL REPORT | SEE NOTES TO CONSOLIDATED FINANCIAL STATEMENTS. |
CONSOLIDATED SCHEDULE OF INVESTMENTS (Unaudited)(continued) | June 30, 2023 |
MULTI-HEDGE STRATEGIES FUND | |
| | Shares | | | Percentage
Notional
Amount | | | Value and
Unrealized
Appreciation
(Depreciation) | |
OPENLANE, Inc. | | | 6,363 | | | | (1.03 | )% | | $ | (604 | ) |
Burlington Stores, Inc. | | | 274 | | | | (0.46 | )% | | | (2,244 | ) |
Five Below, Inc. | | | 251 | | | | (0.52 | )% | | | (3,071 | ) |
Shake Shack, Inc. — Class A | | | 723 | | | | (0.60 | )% | | | (6,639 | ) |
VF Corp. | | | 5,792 | | | | (1.17 | )% | | | (7,130 | ) |
Tesla, Inc. | | | 209 | | | | (0.58 | )% | | | (14,493 | ) |
Floor & Decor Holdings, Inc. — Class A | | | 767 | | | | (0.85 | )% | | | (16,127 | ) |
Copart, Inc. | | | 1,241 | | | | (1.20 | )% | | | (30,260 | ) |
Total Consumer, Cyclical | | | (55,598 | ) |
| | | | | | | | | | | | | |
Basic Materials |
Hecla Mining Co. | | | 10,368 | | | | (0.57 | )% | | | 9,940 | |
Royal Gold, Inc. | | | 487 | | | | (0.59 | )% | | | 5,177 | |
Piedmont Lithium, Inc. | | | 798 | | | | (0.49 | )% | | | 2,785 | |
Carpenter Technology Corp. | | | 1,231 | | | | (0.73 | )% | | | (20,368 | ) |
Total Basic Materials | | | (2,466 | ) |
| | | | | | | | | | | | | |
Communications |
Robinhood Markets, Inc. — Class A | | | 2,516 | | | | (0.27 | )% | | | (909 | ) |
Palo Alto Networks, Inc. | | | 114 | | | | (0.31 | )% | | | (1,018 | ) |
Chewy, Inc. — Class A | | | 1,133 | | | | (0.47 | )% | | | (3,958 | ) |
DoorDash, Inc. — Class A | | | 865 | | | | (0.70 | )% | | | (9,389 | ) |
Uber Technologies, Inc. | | | 786 | | | | (0.36 | )% | | | (11,172 | ) |
Total Communications | | | (26,446 | ) |
| | | | | | | | | | | | | |
Energy |
NOV, Inc. | | | 4,938 | | | | (0.84 | )% | | | 24,213 | |
Hess Corp. | | | 1,045 | | | | (1.51 | )% | | | (2,637 | ) |
Valaris Ltd. | | | 788 | | | | (0.53 | )% | | | (5,066 | ) |
Schlumberger N.V. | | | 2,499 | | | | (1.30 | )% | | | (11,421 | ) |
Tidewater, Inc. | | | 1,103 | | | | (0.65 | )% | | | (13,550 | ) |
Total Energy | | | (8,458 | ) |
Total GS Long/Short Equity Short Custom Basket | | | (264,965 | ) |
MS EQUITY MARKET NEUTRAL LONG CUSTOM BASKET |
Financial |
Ryman Hospitality Properties, Inc. | | | 13,176 | | | | 8.63 | % | | | 189,321 | |
CareTrust REIT, Inc. | | | 55,123 | | | | 7.71 | % | | | 95,181 | |
Gaming and Leisure Properties, Inc. | | | 19,675 | | | | 6.71 | % | | | 93,704 | |
Ventas, Inc. | | | 15,678 | | | | 5.22 | % | | | 92,353 | |
Digital Realty Trust, Inc. | | | 4,359 | | | | 3.49 | % | | | 86,945 | |
AvalonBay Communities, Inc. | | | 4,697 | | | | 6.26 | % | | | 62,287 | |
Brixmor Property Group, Inc. | | | 30,284 | | | | 4.69 | % | | | 49,137 | |
Kite Realty Group Trust | | | 25,781 | | | | 4.05 | % | | | 40,266 | |
Simon Property Group, Inc. | | | 4,820 | | | | 3.92 | % | | | 23,712 | |
Equity Residential | | | 12,425 | | | | 5.77 | % | | | 22,799 | |
Invitation Homes, Inc. | | | 19,891 | | | | 4.82 | % | | | 5,783 | |
Four Corners Property Trust, Inc. | | | 27,892 | | | | 4.99 | % | | | 5,272 | |
InvenTrust Properties Corp. | | | 30,714 | | | | 5.00 | % | | | 1,605 | |
SEE NOTES TO CONSOLIDATED FINANCIAL STATEMENTS. | THE GUGGENHEIM FUNDS SEMI-ANNUAL REPORT | 39 |
CONSOLIDATED SCHEDULE OF INVESTMENTS (Unaudited)(continued) | June 30, 2023 |
MULTI-HEDGE STRATEGIES FUND | |
| | Shares | | | Percentage
Notional
Amount | | | Value and
Unrealized
Appreciation
(Depreciation) | |
VICI Properties, Inc. | | | 1 | | | | 0.00 | % | | $ | 8 | |
Agree Realty Corp. | | | 12,020 | | | | 5.53 | % | | | (603 | ) |
NETSTREIT Corp. | | | 22,491 | | | | 2.83 | % | | | (4,706 | ) |
American Tower Corp. — Class A | | | 1,455 | | | | 1.99 | % | | | (32,338 | ) |
Rexford Industrial Realty, Inc. | | | 22,535 | | | | 8.28 | % | | | (49,210 | ) |
Boston Properties, Inc. | | | 4,585 | | | | 1.86 | % | | | (49,939 | ) |
SBA Communications Corp. | | | 1,152 | | | | 1.88 | % | | | (52,640 | ) |
Piedmont Office Realty Trust, Inc. — Class A | | | 34,750 | | | | 1.78 | % | | | (81,507 | ) |
Alexandria Real Estate Equities, Inc. | | | 5,750 | | | | 4.59 | % | | | (130,952 | ) |
Total Financial | | | 366,470 | |
Total MS Equity Market Neutral Long Custom Basket | | | 366,470 | |
| | | | | | | | | |
MS EQUITY MARKET NEUTRAL SHORT CUSTOM BASKET |
Financial |
Douglas Emmett, Inc. | | | 70,966 | | | | (5.94 | )% | | | 665,041 | |
Broadstone Net Lease, Inc. | | | 23,003 | | | | (2.36 | )% | | | 231,598 | |
Mid-America Apartment Communities, Inc. | | | 4,910 | | | | (4.97 | )% | | | 168,798 | |
Realty Income Corp. | | | 22,708 | | | | (9.05 | )% | | | 160,727 | |
Camden Property Trust | | | 3,813 | | | | (2.77 | )% | | | 141,051 | |
JBG SMITH Properties | | | 51,326 | | | | (5.15 | )% | | | 136,166 | |
Essex Property Trust, Inc. | | | 4,143 | | | | (6.47 | )% | | | 131,622 | |
Apartment Income REIT Corp. | | | 12,011 | | | | (2.89 | )% | | | 112,382 | |
Necessity Retail REIT, Inc. | | | 84,453 | | | | (3.81 | )% | | | 85,407 | |
Apple Hospitality REIT, Inc. | | | 17,321 | | | | (1.74 | )% | | | 41,508 | |
Federal Realty Investment Trust | | | 9,061 | | | | (5.85 | )% | | | 28,537 | |
Pebblebrook Hotel Trust | | | 35,226 | | | | (3.27 | )% | | | 8,063 | |
Service Properties Trust | | | 61,206 | | | | (3.55 | )% | | | 3,348 | |
Sunstone Hotel Investors, Inc. | | | 20,077 | | | | (1.35 | )% | | | (11,642 | ) |
Macerich Co. | | | 47,462 | | | | (3.57 | )% | | | (17,452 | ) |
Phillips Edison & Company, Inc. | | | 42,235 | | | | (9.60 | )% | | | (49,159 | ) |
Omega Healthcare Investors, Inc. | | | 17,140 | | | | (3.51 | )% | | | (49,374 | ) |
Equinix, Inc. | | | 698 | | | | (3.65 | )% | | | (50,053 | ) |
STAG Industrial, Inc. | | | 38,035 | | | | (9.10 | )% | | | (52,879 | ) |
Welltower, Inc. | | | 10,048 | | | | (5.42 | )% | | | (167,995 | ) |
Total Financial | | | 1,515,694 | |
| | | | | | | | | | | | | |
Exchange Traded Funds |
Vanguard Real Estate ETF | | | 10,738 | | | | (5.98 | )% | | | 240,911 | |
Total MS Equity Market Neutral Short Custom Basket | | | 1,756,605 | |
GS EQUITY MARKET NEUTRAL LONG CUSTOM BASKET |
Financial |
Ryman Hospitality Properties, Inc. | | | 13,176 | | | | 8.63 | % | | | 190,489 | |
40 | THE GUGGENHEIM FUNDS SEMI-ANNUAL REPORT | SEE NOTES TO CONSOLIDATED FINANCIAL STATEMENTS. |
CONSOLIDATED SCHEDULE OF INVESTMENTS (Unaudited)(continued) | June 30, 2023 |
MULTI-HEDGE STRATEGIES FUND | |
| | Shares | | | Percentage
Notional
Amount | | | Value and
Unrealized
Appreciation
(Depreciation) | |
CareTrust REIT, Inc. | | | 55,123 | | | | 7.71 | % | | | 94,977 | |
Gaming and Leisure Properties, Inc. | | | 19,675 | | | | 6.71 | % | | | 93,563 | |
Ventas, Inc. | | | 15,678 | | | | 5.22 | % | | | 92,398 | |
Digital Realty Trust, Inc. | | | 4,359 | | | | 3.49 | % | | | 86,694 | |
AvalonBay Communities, Inc. | | | 4,697 | | | | 6.26 | % | | | 61,896 | |
Brixmor Property Group, Inc. | | | 30,284 | | | | 4.69 | % | | | 49,159 | |
Kite Realty Group Trust | | | 25,781 | | | | 4.05 | % | | | 44,057 | |
Equity Residential | | | 12,425 | | | | 5.77 | % | | | 22,127 | |
Simon Property Group, Inc. | | | 4,820 | | | | 3.92 | % | | | 15,469 | |
Four Corners Property Trust, Inc. | | | 27,892 | | | | 4.99 | % | | | 5,346 | |
InvenTrust Properties Corp. | | | 30,714 | | | | 5.00 | % | | | 2,984 | |
Invitation Homes, Inc. | | | 19,891 | | | | 4.82 | % | | | 2,742 | |
VICI Properties, Inc. | | | 1 | | | | 0.00 | % | | | 8 | |
Agree Realty Corp. | | | 12,020 | | | | 5.53 | % | | | (1,558 | ) |
NETSTREIT Corp. | | | 22,491 | | | | 2.83 | % | | | (4,447 | ) |
American Tower Corp. — Class A | | | 1,455 | | | | 1.99 | % | | | (32,206 | ) |
Rexford Industrial Realty, Inc. | | | 22,535 | | | | 8.28 | % | | | (47,070 | ) |
Boston Properties, Inc. | | | 4,585 | | | | 1.86 | % | | | (49,805 | ) |
SBA Communications Corp. | | | 1,152 | | | | 1.88 | % | | | (52,539 | ) |
Piedmont Office Realty Trust, Inc. — Class A | | | 34,750 | | | | 1.78 | % | | | (79,991 | ) |
Alexandria Real Estate Equities, Inc. | | | 5,750 | | | | 4.59 | % | | | (130,756 | ) |
Total Financial | | | 363,537 | |
Total GS Equity Market Neutral Long Custom Basket | | | 363,537 | |
| | | | | | | | | |
GS EQUITY MARKET NEUTRAL SHORT CUSTOM BASKET |
Financial |
Douglas Emmett, Inc. | | | 70,966 | | | | (5.94 | )% | | | 666,772 | |
Broadstone Net Lease, Inc. | | | 23,003 | | | | (2.36 | )% | | | 226,079 | |
Mid-America Apartment Communities, Inc. | | | 4,910 | | | | (4.97 | )% | | | 168,748 | |
Realty Income Corp. | | | 22,708 | | | | (9.05 | )% | | | 160,262 | |
Camden Property Trust | | | 3,813 | | | | (2.77 | )% | | | 141,081 | |
JBG SMITH Properties | | | 51,326 | | | | (5.15 | )% | | | 136,392 | |
Essex Property Trust, Inc. | | | 4,143 | | | | (6.47 | )% | | | 128,210 | |
Apartment Income REIT Corp. | | | 12,011 | | | | (2.89 | )% | | | 113,012 | |
Necessity Retail REIT, Inc. | | | 84,453 | | | | (3.81 | )% | | | 84,985 | |
Apple Hospitality REIT, Inc. | | | 17,321 | | | | (1.74 | )% | | | 36,904 | |
Federal Realty Investment Trust | | | 9,061 | | | | (5.85 | )% | | | 27,794 | |
Service Properties Trust | | | 61,206 | | | | (3.55 | )% | | | 10,484 | |
Pebblebrook Hotel Trust | | | 35,226 | | | | (3.27 | )% | | | 9,865 | |
SEE NOTES TO CONSOLIDATED FINANCIAL STATEMENTS. | THE GUGGENHEIM FUNDS SEMI-ANNUAL REPORT | 41 |
CONSOLIDATED SCHEDULE OF INVESTMENTS (Unaudited)(continued) | June 30, 2023 |
MULTI-HEDGE STRATEGIES FUND | |
| | Shares | | | Percentage
Notional
Amount | | | Value and
Unrealized
Appreciation
(Depreciation) | |
Macerich Co. | | | 47,462 | | | | (3.57 | )% | | $ | 926 | |
Sunstone Hotel Investors, Inc. | | | 20,077 | | | | (1.35 | )% | | | (10,009 | ) |
Omega Healthcare Investors, Inc. | | | 17,140 | | | | (3.51 | )% | | | (49,899 | ) |
Equinix, Inc. | | | 698 | | | | (3.65 | )% | | | (49,992 | ) |
Phillips Edison & Company, Inc. | | | 42,235 | | | | (9.60 | )% | | | (52,445 | ) |
STAG Industrial, Inc. | | | 38,035 | | | | (9.10 | )% | | | (55,401 | ) |
Welltower, Inc. | | | 10,048 | | | | (5.42 | )% | | | (169,171 | ) |
Total Financial | | | 1,524,597 | |
| | | | | | | | | | | | | |
Exchange Traded Funds |
Vanguard Real Estate ETF | | | 10,738 | | | | (5.98 | )% | | | 240,854 | |
Total GS Equity Market Neutral Short Custom Basket | | | 1,765,451 | |
* | Non-income producing security. |
** | Includes cumulative appreciation (depreciation). Variation margin is reported within the Consolidated Statement of Assets and Liabilities. |
† | Value determined based on Level 1 inputs, unless otherwise noted — See Note 4. |
†† | Value determined based on Level 2 inputs — See Note 4. |
††† | Value determined based on Level 3 inputs — See Note 4. |
1 | All or a portion of this security is on loan at June 30, 2023 — See Note 7. |
2 | Affiliated issuer. |
3 | Rate indicated is the effective yield at the time of purchase. |
4 | All or a portion of this security is pledged as futures collateral at June 30, 2023. |
5 | Repurchase Agreements — See Note 6. |
6 | Securities lending collateral — See Note 7. |
7 | Rate indicated is the 7-day yield as of June 30, 2023. |
8 | All or a portion of this security is pledged as short security and equity custom basket swap collateral at June 30, 2023. |
| | GS — Goldman Sachs International |
| | MS — Morgan Stanley Capital Services LLC |
| | plc — Public Limited Company |
| | REIT — Real Estate Investment Trust |
| | |
| | See Sector Classification in Other Information section. |
42 | THE GUGGENHEIM FUNDS SEMI-ANNUAL REPORT | SEE NOTES TO CONSOLIDATED FINANCIAL STATEMENTS. |
CONSOLIDATED SCHEDULE OF INVESTMENTS (Unaudited)(continued) | June 30, 2023 |
MULTI-HEDGE STRATEGIES FUND | |
The following table summarizes the inputs used to value the Fund’s investments at June 30, 2023 (See Note 4 in the Notes to Consolidated Financial Statements):
Investments in Securities (Assets) | | Level 1
Quoted
Prices | | | Level 2
Significant
Observable
Inputs | | | Level 3
Significant
Unobservable
Inputs | | | Total | |
Common Stocks | | $ | 21,269,193 | | | $ | — | | | $ | — | | | $ | 21,269,193 | |
Master Limited Partnership | | | 513,891 | | | | — | | | | — | | | | 513,891 | |
Rights | | | — | | | | — | | | | — | * | | | — | |
Mutual Funds | | | 15,009,176 | | | | — | | | | — | | | | 15,009,176 | |
Closed-End Funds | | | 5,619,587 | | | | — | | | | — | | | | 5,619,587 | |
U.S. Treasury Bills | | | — | | | | 9,255,706 | | | | — | | | | 9,255,706 | |
Repurchase Agreements | | | — | | | | 23,744,778 | | | | — | | | | 23,744,778 | |
Securities Lending Collateral | | | 660,141 | | | | — | | | | — | | | | 660,141 | |
Commodity Futures Contracts** | | | 1,337,680 | | | | — | | | | — | | | | 1,337,680 | |
Equity Futures Contracts** | | | 640,361 | | | | 33,326 | | | | — | | | | 673,687 | |
Currency Futures Contracts** | | | 184,578 | | | | — | | | | — | | | | 184,578 | |
Interest Rate Futures Contracts** | | | 20,334 | | | | 14,489 | | | | — | | | | 34,823 | |
Equity Custom Basket Swap Agreements** | | | — | | | | 6,054,621 | | | | — | | | | 6,054,621 | |
Total Assets | | $ | 45,254,941 | | | $ | 39,102,920 | | | $ | — | | | $ | 84,357,861 | |
Investments in Securities (Liabilities) | | Level 1
Quoted
Prices | | | Level 2
Significant
Observable
Inputs | | | Level 3
Significant
Unobservable
Inputs | | | Total | |
Common Stocks Sold Short | | $ | 4,560,488 | | | $ | — | | | $ | — | | | $ | 4,560,488 | |
Exchange-Traded Funds Sold Short | | | 6,033,530 | | | | — | | | | — | | | | 6,033,530 | |
Commodity Futures Contracts** | | | 1,596,100 | | | | — | | | | — | | | | 1,596,100 | |
Equity Futures Contracts** | | | 567,900 | | | | — | | | | — | | | | 567,900 | |
Currency Futures Contracts** | | | 265,820 | | | | — | | | | — | | | | 265,820 | |
Interest Rate Futures Contracts** | | | 6,855 | | | | 588 | | | | — | | | | 7,443 | |
Equity Custom Basket Swap Agreements** | | | — | | | | 530,842 | | | | — | | | | 530,842 | |
Total Liabilities | | $ | 13,030,693 | | | $ | 531,430 | | | $ | — | | | $ | 13,562,123 | |
* | Includes securities with a market value of $0. |
** | This derivative is reported as unrealized appreciation/depreciation at period end. |
SEE NOTES TO CONSOLIDATED FINANCIAL STATEMENTS. | THE GUGGENHEIM FUNDS SEMI-ANNUAL REPORT | 43 |
CONSOLIDATED SCHEDULE OF INVESTMENTS (Unaudited)(concluded) | June 30, 2023 |
MULTI-HEDGE STRATEGIES FUND | |
Affiliated Transactions
Investments representing 5% or more of the outstanding voting shares of a company, or control of or by, or common control under Guggenheim Investments (“GI”), result in that company being considered an affiliated issuer, as defined in the 1940 Act.
The Fund may invest in certain of the underlying series of Guggenheim Strategy Funds Trust, including Guggenheim Strategy Fund II and Guggenheim Strategy Fund III, (collectively, the “Short Term Investment Vehicles”), each of which are open-end management investment companies managed by GI. The Short Term Investment Vehicles, which launched on March 11, 2014, are offered as short term investment options only to mutual funds, trusts, and other accounts managed by GI and/or its affiliates, and are not available to the public. The Short Term Investment Vehicles pay no investment management fees. The Short Term Investment Vehicles’ annual report on Form N-CSR dated September 30, 2022, is available publicly or upon request. This information is available from the EDGAR database on the SEC’s website at https://www.sec.gov/Archives/edgar/data/1601445/000182126822000340/gug84768.htm. The Fund may invest in certain of the underlying series of Guggenheim Funds Trust, which are open-end management investment companies managed by GI, are available to the public and whose most recent annual report on Form N-CSR is available publicly or upon request.
Transactions during the period ended June 30, 2023, in which the company is an affiliated issuer, were as follows:
Security Name | | Value
12/31/22 | | | Additions | | | Reductions | | | Realized
Gain (Loss) | | | Change in
Unrealized
Appreciation
(Depreciation) | | | Value
06/30/23 | | | Shares
06/30/23 | | | Investment
Income | |
Mutual Funds | | | | | | | | | | | | | | | | | | | | | | | | | | | | | | | | |
Guggenheim Strategy Fund II | | $ | 6,481,618 | | | $ | — | | | $ | — | | | $ | — | | | $ | 48,532 | | | $ | 6,530,150 | | | | 269,618 | | | $ | 169,563 | |
Guggenheim Strategy Fund III | | | 1,901,492 | | | | — | | | | — | | | | — | | | | 15,016 | | | | 1,916,508 | | | | 79,031 | | | | 49,054 | |
Guggenheim Ultra Short Duration Fund — Institutional Class | | | 6,501,817 | | | | — | | | | — | | | | — | | | | 60,701 | | | | 6,562,518 | | | | 674,462 | | | | 167,071 | |
| | | $ | 14,884,927 | | | $ | — | | | $ | — | | | $ | — | | | $ | 124,249 | | | $ | 15,009,176 | | | | | | | $ | 385,688 | |
44 | THE GUGGENHEIM FUNDS SEMI-ANNUAL REPORT | SEE NOTES TO CONSOLIDATED FINANCIAL STATEMENTS. |
CONSOLIDATED STATEMENT OF ASSETS AND LIABILITIES (Unaudited) |
MULTI-HEDGE STRATEGIES FUND |
June 30, 2023
Assets: |
Investments in unaffiliated issuers, at value - including $633,039 of securities loaned (cost $37,057,197) | | $ | 37,318,518 | |
Investments in affiliated issuers, at value (cost $15,386,814) | | | 15,009,176 | |
Repurchase agreements, at value (cost $23,744,778) | | | 23,744,778 | |
Cash | | | 14,003,288 | |
Segregated cash with broker | | | 2,084,263 | |
Unrealized appreciation on OTC swap agreements | | | 6,054,621 | |
Receivables: |
Securities sold | | | 3,133,784 | |
Swap settlement | | | 511,155 | |
Variation margin on futures contracts | | | 109,742 | |
Dividends | | | 93,633 | |
Fund shares sold | | | 13,831 | |
Interest | | | 3,334 | |
Securities lending income | | | 824 | |
Other assets | | | 27,767 | |
Total assets | | | 102,108,714 | |
| | | | | |
Liabilities: |
Securities sold short, at value (proceeds $10,339,716) | | | 10,594,018 | |
Unrealized depreciation on OTC swap agreements | | | 530,842 | |
Payable for: |
Securities purchased | | | 2,882,935 | |
Return of securities lending collateral | | | 660,141 | |
Management fees | | | 51,119 | |
Fund shares redeemed | | | 45,055 | |
Distribution and service fees | | | 2,528 | |
Trustees’ fees* | | | 1,324 | |
Miscellaneous | | | 9,401 | |
Total liabilities | | | 14,777,363 | |
Net assets | | $ | 87,331,351 | |
| | | | | |
Net assets consist of: |
Paid in capital | | $ | 94,167,962 | |
Total distributable earnings (loss) | | | (6,836,611 | ) |
Net assets | | $ | 87,331,351 | |
| | | | | |
A-Class: |
Net assets | | $ | 3,520,774 | |
Capital shares outstanding | | | 132,494 | |
Net asset value per share | | $ | 26.57 | |
Maximum offering price per share (Net asset value divided by 95.25%) | | $ | 27.90 | |
| | | | | |
C-Class: |
Net assets | | $ | 629,969 | |
Capital shares outstanding | | | 26,043 | |
Net asset value per share | | $ | 24.19 | |
| | | | | |
P-Class: |
Net assets | | $ | 6,323,271 | |
Capital shares outstanding | | | 237,076 | |
Net asset value per share | | $ | 26.67 | |
| | | | | |
Institutional Class: |
Net assets | | $ | 76,857,337 | |
Capital shares outstanding | | | 2,828,729 | |
Net asset value per share | | $ | 27.17 | |
* | Relates to Trustees not deemed “interested persons” within the meaning of Section 2(a)(19) of the 1940 Act. |
SEE NOTES TO CONSOLIDATED FINANCIAL STATEMENTS. | THE GUGGENHEIM FUNDS SEMI-ANNUAL REPORT | 45 |
CONSOLIDATED STATEMENT OF OPERATIONS (Unaudited) |
MULTI-HEDGE STRATEGIES FUND |
Six Months Ended June 30, 2023
Investment Income: |
Dividends from securities of unaffiliated issuers | | $ | 309,412 | |
Dividends from securities of affiliated issuers | | | 385,688 | |
Interest | | | 1,000,817 | |
Income from securities lending, net | | | 5,916 | |
Interest related to securities sold short | | | 119,825 | |
Total investment income | | | 1,821,658 | |
| | | | | |
Expenses: |
Management fees | | | 594,292 | |
Distribution and service fees: |
A-Class | | | 4,539 | |
C-Class | | | 2,906 | |
P-Class | | | 10,014 | |
Short sales dividend expense | | | 164,620 | |
Miscellaneous | | | 5,218 | |
Total expenses | | | 781,589 | |
Less: |
Expenses waived by Adviser | | | (25,584 | ) |
Net expenses | | | 756,005 | |
Net investment income | | | 1,065,653 | |
| | | | | |
Net Realized and Unrealized Gain (Loss): |
Net realized gain (loss) on: |
Investments in unaffiliated issuers | | $ | (552,959 | ) |
Investments in unaffiliated issuers sold short | | | (39,117 | ) |
Swap agreements | | | 483,413 | |
Futures contracts | | | 1,527,209 | |
Foreign currency transactions | | | (4,056 | ) |
Net realized gain | | | 1,414,490 | |
Net change in unrealized appreciation (depreciation) on: |
Investments in unaffiliated issuers | | | 259,509 | |
Investments in affiliated issuers | | | 124,249 | |
Investments in unaffiliated issuers sold short | | | (840,082 | ) |
Swap agreements | | | 4,093 | |
Futures contracts | | | (674,784 | ) |
Foreign currency translations | | | 2,807 | |
Net change in unrealized appreciation (depreciation) | | | (1,124,208 | ) |
Net realized and unrealized gain | | | 290,282 | |
Net increase in net assets resulting from operations | | $ | 1,355,935 | |
46 | THE GUGGENHEIM FUNDS SEMI- ANNUAL REPORT | SEE NOTES TO CONSOLIDATED FINANCIAL STATEMENTS. |
CONSOLIDATED STATEMENTS OF CHANGES IN NET ASSETS |
MULTI-HEDGE STRATEGIES FUND | |
| | Six Months Ended
June 30, 2023
(Unaudited) | | | Year Ended
December 31,
2022 | |
Increase (Decrease) in Net Assets from Operations: | | | | | | | | |
Net investment income | | $ | 1,065,653 | | | $ | 681,879 | |
Net realized gain (loss) on investments | | | 1,414,490 | | | | (7,160,468 | ) |
Net change in unrealized appreciation (depreciation) on investments | | | (1,124,208 | ) | | | 2,245,877 | |
Net increase (decrease) in net assets resulting from operations | | | 1,355,935 | | | | (4,232,712 | ) |
| | | | | | | | | |
Distributions to shareholders: | | | | | | | | |
A-Class | | | — | | | | (64,618 | ) |
C-Class | | | — | | | | (8,214 | ) |
P-Class | | | — | | | | (146,350 | ) |
Institutional Class | | | — | | | | (2,026,121 | ) |
Total distributions to shareholders | | | — | | | | (2,245,303 | ) |
| | | | | | | | | |
Capital share transactions: | | | | | | | | |
Proceeds from sale of shares | | | | | | | | |
A-Class | | | 126,656 | | | | 542,921 | |
C-Class | | | 90,500 | | | | 626,154 | |
P-Class | | | 610,354 | | | | 9,484,918 | |
Institutional Class | | | 9,512,467 | | | | 100,372,725 | |
Distributions reinvested | | | | | | | | |
A-Class | | | — | | | | 56,992 | |
C-Class | | | — | | | | 7,668 | |
P-Class | | | — | | | | 144,149 | |
Institutional Class | | | — | | | | 2,026,121 | |
Cost of shares redeemed | | | | | | | | |
A-Class | | | (576,215 | ) | | | (1,065,975 | ) |
C-Class | | | (88,296 | ) | | | (463,253 | ) |
P-Class | | | (3,533,078 | ) | | | (10,011,852 | ) |
Institutional Class | | | (43,213,860 | ) | | | (42,837,229 | ) |
Net increase (decrease) from capital share transactions | | | (37,071,472 | ) | | | 58,883,339 | |
Net increase (decrease) in net assets | | | (35,715,537 | ) | | | 52,405,324 | |
| | | | | | | | | |
Net assets: | | | | | | | | |
Beginning of period | | | 123,046,888 | | | | 70,641,564 | |
End of period | | $ | 87,331,351 | | | $ | 123,046,888 | |
| | | | | | | | | |
SEE NOTES TO CONSOLIDATED FINANCIAL STATEMENTS. | THE GUGGENHEIM FUNDS SEMI-ANNUAL REPORT | 47 |
CONSOLIDATED STATEMENTS OF CHANGES IN NET ASSETS (concluded) |
MULTI-HEDGE STRATEGIES FUND | |
| | Six Months Ended
June 30, 2023
(Unaudited) | | | Year Ended
December 31,
2022 | |
Capital share activity: | | | | | | | | |
Shares sold | | | | | | | | |
A-Class | | | 4,834 | | | | 19,818 | |
C-Class | | | 3,723 | | | | 25,338 | |
P-Class | | | 23,164 | | | | 347,219 | |
Institutional Class | | | 354,290 | | | | 3,596,742 | |
Shares issued from reinvestment of distributions | | | | | | | | |
A-Class | | | — | | | | 2,178 | |
C-Class | | | — | | | | 321 | |
P-Class | | | — | | | | 5,487 | |
Institutional Class | | | — | | | | 75,828 | |
Shares redeemed | | | | | | | | |
A-Class | | | (22,015 | ) | | | (39,184 | ) |
C-Class | | | (3,679 | ) | | | (18,974 | ) |
P-Class | | | (132,904 | ) | | | (371,723 | ) |
Institutional Class | | | (1,621,365 | ) | | | (1,551,157 | ) |
Net increase (decrease) in shares | | | (1,393,952 | ) | | | 2,091,893 | |
48 | THE GUGGENHEIM FUNDS SEMI-ANNUAL REPORT | SEE NOTES TO CONSOLIDATED FINANCIAL STATEMENTS. |
CONSOLIDATED FINANCIAL HIGHLIGHTS |
MULTI-HEDGE STRATEGIES FUND | |
This table is presented to show selected data for a share outstanding throughout each period and to assist shareholders in evaluating a Fund’s performance for the periods presented.
A-Class | | Six Months Ended
June 30, 2023a | | | Year
Ended
Dec. 31,
2022 | | | Year
Ended
Dec. 31,
2021 | | | Year
Ended
Dec. 31,
2020 | | | Year
Ended
Dec. 31,
2019 | | | Year
Ended
Dec. 31,
2018 | |
Per Share Data |
Net asset value, beginning of period | | $ | 26.16 | | | $ | 27.52 | | | $ | 25.89 | | | $ | 24.36 | | | $ | 23.69 | | | $ | 24.91 | |
Income (loss) from investment operations: |
Net investment income (loss)b | | | .25 | | | | .09 | | | | (.14 | ) | | | (.10 | ) | | | .16 | | | | .08 | |
Net gain (loss) on investments (realized and unrealized) | | | .16 | | | | (1.01 | ) | | | 1.98 | | | | 1.90 | | | | 1.02 | | | | (1.26 | ) |
Total from investment operations | | | .41 | | | | (.92 | ) | | | 1.84 | | | | 1.80 | | | | 1.18 | | | | (1.18 | ) |
Less distributions from: |
Net investment income | | | — | | | | (.44 | ) | | | (.21 | ) | | | (.27 | ) | | | (.51 | ) | | | (.04 | ) |
Total distributions | | | — | | | | (.44 | ) | | | (.21 | ) | | | (.27 | ) | | | (.51 | ) | | | (.04 | ) |
Net asset value, end of period | | $ | 26.57 | | | $ | 26.16 | | | $ | 27.52 | | | $ | 25.89 | | | $ | 24.36 | | | $ | 23.69 | |
|
Total Returnc | | | 1.57 | % | | | (3.47 | %) | | | 7.17 | % | | | 7.39 | % | | | 4.97 | % | | | (4.78 | %) |
Ratios/Supplemental Data |
Net assets, end of period (in thousands) | | $ | 3,521 | | | $ | 3,915 | | | $ | 4,593 | | | $ | 4,019 | | | $ | 3,570 | | | $ | 3,622 | |
Ratios to average net assets: |
Net investment income (loss) | | | 1.91 | % | | | 0.32 | % | | | (0.52 | %) | | | (0.40 | %) | | | 0.64 | % | | | 0.32 | % |
Total expensesd | | | 1.77 | % | | | 1.80 | % | | | 2.18 | % | | | 1.93 | % | | | 1.96 | % | | | 1.75 | % |
Net expensese,f | | | 1.72 | % | | | 1.76 | % | | | 2.11 | % | | | 1.87 | % | | | 1.93 | % | | | 1.73 | % |
Portfolio turnover rate | | | 83 | % | | | 203 | % | | | 205 | % | | | 248 | % | | | 156 | % | | | 212 | % |
SEE NOTES TO CONSOLIDATED FINANCIAL STATEMENTS. | THE GUGGENHEIM FUNDS SEMI-ANNUAL REPORT | 49 |
CONSOLIDATED FINANCIAL HIGHLIGHTS (continued) |
MULTI-HEDGE STRATEGIES FUND | |
This table is presented to show selected data for a share outstanding throughout each period and to assist shareholders in evaluating a Fund’s performance for the periods presented.
C-Class | | Six Months Ended
June 30, 2023a | | | Year
Ended
Dec. 31,
2022 | | | Year
Ended
Dec. 31,
2021 | | | Year
Ended
Dec. 31,
2020 | | | Year
Ended
Dec. 31,
2019 | | | Year
Ended
Dec. 31,
2018 | |
Per Share Data |
Net asset value, beginning of period | | $ | 23.90 | | | $ | 25.25 | | | $ | 23.75 | | | $ | 22.36 | | | $ | 21.46 | | | $ | 22.68 | |
Income (loss) from investment operations: |
Net investment income (loss)b | | | .14 | | | | (.09 | ) | | | (.32 | ) | | | (.27 | ) | | | (.02 | ) | | | (.09 | ) |
Net gain (loss) on investments (realized and unrealized) | | | .15 | | | | (.94 | ) | | | 1.82 | | | | 1.75 | | | | .92 | | | | (1.13 | ) |
Total from investment operations | | | .29 | | | | (1.03 | ) | | | 1.50 | | | | 1.48 | | | | .90 | | | | (1.22 | ) |
Less distributions from: |
Net investment income | | | — | | | | (.32 | ) | | | — | | | | (.09 | ) | | | — | | | | — | |
Total distributions | | | — | | | | (.32 | ) | | | — | | | | (.09 | ) | | | — | | | | — | |
Net asset value, end of period | | $ | 24.19 | | | $ | 23.90 | | | $ | 25.25 | | | $ | 23.75 | | | $ | 22.36 | | | $ | 21.46 | |
|
Total Returnc | | | 1.21 | % | | | (4.16 | %) | | | 6.32 | % | | | 6.57 | % | | | 4.19 | % | | | (5.38 | %) |
Ratios/Supplemental Data |
Net assets, end of period (in thousands) | | $ | 630 | | | $ | 621 | | | $ | 488 | | | $ | 1,206 | | | $ | 1,435 | | | $ | 2,657 | |
Ratios to average net assets: |
Net investment income (loss) | | | 1.16 | % | | | (0.35 | %) | | | (1.26 | %) | | | (1.18 | %) | | | (0.08 | %) | | | (0.42 | %) |
Total expensesd | | | 2.52 | % | | | 2.56 | % | | | 2.93 | % | | | 2.68 | % | | | 2.70 | % | | | 2.53 | % |
Net expensese,f | | | 2.47 | % | | | 2.51 | % | | | 2.86 | % | | | 2.62 | % | | | 2.67 | % | | | 2.51 | % |
Portfolio turnover rate | | | 83 | % | | | 203 | % | | | 205 | % | | | 248 | % | | | 156 | % | | | 212 | % |
50 | THE GUGGENHEIM FUNDS SEMI- ANNUAL REPORT | SEE NOTES TO CONSOLIDATED FINANCIAL STATEMENTS. |
CONSOLIDATED FINANCIAL HIGHLIGHTS (continued) |
MULTI-HEDGE STRATEGIES FUND |
This table is presented to show selected data for a share outstanding throughout each period and to assist shareholders in evaluating a Fund’s performance for the periods presented.
P-Class | | Six Months Ended
June 30, 2023a | | | Year
Ended
Dec. 31,
2022 | | | Year
Ended
Dec. 31,
2021 | | | Year
Ended
Dec. 31,
2020 | | | Year
Ended
Dec. 31,
2019 | | | Year
Ended
Dec. 31,
2018 | |
Per Share Data |
Net asset value, beginning of period | | $ | 26.25 | | | $ | 27.61 | | | $ | 25.97 | | | $ | 24.42 | | | $ | 23.74 | | | $ | 24.93 | |
Income (loss) from investment operations: |
Net investment income (loss)b | | | .25 | | | | .10 | | | | (.15 | ) | | | (.10 | ) | | | .16 | | | | .08 | |
Net gain (loss) on investments (realized and unrealized) | | | .17 | | | | (1.04 | ) | | | 2.00 | | | | 1.90 | | | | 1.03 | | | | (1.23 | ) |
Total from investment operations | | | .42 | | | | (.94 | ) | | | 1.85 | | | | 1.80 | | | | 1.19 | | | | (1.15 | ) |
Less distributions from: |
Net investment income | | | — | | | | (.42 | ) | | | (.21 | ) | | | (.25 | ) | | | (.51 | ) | | | (.04 | ) |
Total distributions | | | — | | | | (.42 | ) | | | (.21 | ) | | | (.25 | ) | | | (.51 | ) | | | (.04 | ) |
Net asset value, end of period | | $ | 26.67 | | | $ | 26.25 | | | $ | 27.61 | | | $ | 25.97 | | | $ | 24.42 | | | $ | 23.74 | |
|
Total Return | | | 1.60 | % | | | (3.44 | %) | | | 7.16 | % | | | 7.40 | % | | | 5.00 | % | | | (4.61 | %) |
Ratios/Supplemental Data |
Net assets, end of period (in thousands) | | $ | 6,323 | | | $ | 9,105 | | | $ | 10,100 | | | $ | 7,676 | | | $ | 7,442 | | | $ | 7,892 | |
Ratios to average net assets: |
Net investment income (loss) | | | 1.90 | % | | | 0.38 | % | | | (0.53 | %) | | | (0.39 | %) | | | 0.65 | % | | | 0.34 | % |
Total expensesd | | | 1.77 | % | | | 1.80 | % | | | 2.18 | % | | | 1.93 | % | | | 1.96 | % | | | 1.77 | % |
Net expensese,f | | | 1.72 | % | | | 1.76 | % | | | 2.12 | % | | | 1.87 | % | | | 1.93 | % | | | 1.75 | % |
Portfolio turnover rate | | | 83 | % | | | 203 | % | | | 205 | % | | | 248 | % | | | 156 | % | | | 212 | % |
SEE NOTES TO CONSOLIDATED FINANCIAL STATEMENTS. | THE GUGGENHEIM FUNDS SEMI-ANNUAL REPORT | 51 |
CONSOLIDATED FINANCIAL HIGHLIGHTS (concluded) |
MULTI-HEDGE STRATEGIES FUND |
This table is presented to show selected data for a share outstanding throughout each period and to assist shareholders in evaluating a Fund’s performance for the periods presented.
Institutional Class | | Six Months Ended
June 30, 2023a | | | Year
Ended
Dec. 31,
2022 | | | Year
Ended
Dec. 31,
2021 | | | Year
Ended
Dec. 31,
2020 | | | Year
Ended
Dec. 31,
2019 | | | Year
Ended
Dec. 31,
2018 | |
Per Share Data |
Net asset value, beginning of period | | $ | 26.71 | | | $ | 28.09 | | | $ | 26.41 | | | $ | 24.83 | | | $ | 24.12 | | | $ | 25.42 | |
Income (loss) from investment operations: |
Net investment income (loss)b | | | .29 | | | | .18 | | | | (.08 | ) | | | (.04 | ) | | | .22 | | | | .17 | |
Net gain (loss) on investments (realized and unrealized) | | | .17 | | | | (1.06 | ) | | | 2.03 | | | | 1.94 | | | | 1.05 | | | | (1.33 | ) |
Total from investment operations | | | .46 | | | | (.88 | ) | | | 1.95 | | | | 1.90 | | | | 1.27 | | | | (1.16 | ) |
Less distributions from: |
Net investment income | | | — | | | | (.50 | ) | | | (.27 | ) | | | (.32 | ) | | | (.56 | ) | | | (.14 | ) |
Total distributions | | | — | | | | (.50 | ) | | | (.27 | ) | | | (.32 | ) | | | (.56 | ) | | | (.14 | ) |
Net asset value, end of period | | $ | 27.17 | | | $ | 26.71 | | | $ | 28.09 | | | $ | 26.41 | | | $ | 24.83 | | | $ | 24.12 | |
|
Total Return | | | 1.72 | % | | | (3.22 | %) | | | 7.43 | % | | | 7.70 | % | | | 5.26 | % | | | (4.56 | %) |
Ratios/Supplemental Data |
Net assets, end of period (in thousands) | | $ | 76,857 | | | $ | 109,405 | | | $ | 55,461 | | | $ | 37,470 | | | $ | 24,854 | | | $ | 23,539 | |
Ratios to average net assets: |
Net investment income (loss) | | | 2.16 | % | | | 0.66 | % | | | (0.27 | %) | | | (0.15 | %) | | | 0.90 | % | | | 0.68 | % |
Total expensesd | | | 1.52 | % | | | 1.55 | % | | | 1.92 | % | | | 1.68 | % | | | 1.72 | % | | | 1.58 | % |
Net expensese,f | | | 1.47 | % | | | 1.51 | % | | | 1.87 | % | | | 1.62 | % | | | 1.69 | % | | | 1.56 | % |
Portfolio turnover rate | | | 83 | % | | | 203 | % | | | 205 | % | | | 248 | % | | | 156 | % | | | 212 | % |
a | Unaudited figures for the period ended June 30, 2023. Percentage amounts for the period, except total return and portfolio turnover rate, have been annualized. |
b | Net investment income (loss) per share was computed using average shares outstanding throughout the period. |
c | Total return does not reflect the impact of any applicable sales charges. |
d | Does not include expenses of the underlying funds in which the Fund invests. |
e | Net expense information reflects the expense ratios after expense waivers and reimbursements, as applicable. |
f | Excluding interest and/or dividend expense related to short sales, the net expense ratios for the years presented would be: |
| | | 06/30/23a | 12/31/22 | 12/31/21 | 12/31/20 | 12/31/19 | 12/31/18 |
| | A-Class | 1.39% | 1.40% | 1.41% | 1.37% | 1.41% | 1.41% |
| | C-Class | 2.14% | 2.15% | 2.16% | 2.12% | 2.16% | 2.16% |
| | P-Class | 1.39% | 1.40% | 1.41% | 1.37% | 1.41% | 1.41% |
| | Institutional Class | 1.14% | 1.15% | 1.16% | 1.12% | 1.16% | 1.16% |
52 | THE GUGGENHEIM FUNDS SEMI- ANNUAL REPORT | SEE NOTES TO CONSOLIDATED FINANCIAL STATEMENTS. |
PERFORMANCE REPORT AND FUND PROFILE (Unaudited) | June 30, 2023 |
COMMODITIES STRATEGY FUND
OBJECTIVE: Seeks to provide investment results that correlate, before fees and expenses, to the performance of a benchmark for commodities. The Fund’s current benchmark is the S&P Goldman Sachs Commodity Index (“GSCI” or “Index”).
Consolidated Holdings Diversification (Market Exposure as % of Net Assets)
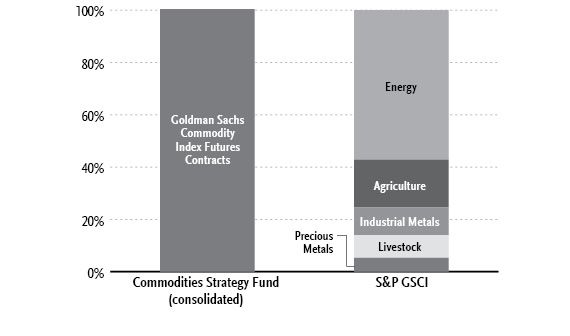
“Consolidated Holdings Diversification (Market Exposure as % of Net Assets)” excludes any temporary cash investments, investments in Guggenheim Strategy Funds Trust mutual funds, or investments in Guggenheim Ultra Short Duration Fund. Investments in those Funds do not provide “market exposure” to meet the Fund’s investment objective, but will significantly increase the portfolio’s exposure to certain other asset categories (and their associated risks), which may cause the Fund to deviate from its principal investment strategy, including: (i) high yield, high risk debt securities rated below the top four long-term rating categories by a nationally recognized statistical rating organization (also known as “junk bonds”); (ii) securities issued by the U.S. government or its agencies and instrumentalities; (iii) CLOs and similar investments; and (iv) other short-term fixed income securities.
| | THE GUGGENHEIM FUNDS SEMI-ANNUAL REPORT | 53 |
PERFORMANCE REPORT AND FUND PROFILE (Unaudited)(concluded) | June 30, 2023 |
Inception Dates: |
A-Class | May 25, 2005 |
C-Class | May 25, 2005 |
H-Class | May 25, 2005 |
Largest Holdings | % of Total Net Assets |
Guggenheim Ultra Short Duration Fund — Institutional Class | 23.3% |
Guggenheim Strategy Fund II | 23.1% |
Total | 46.4% |
| | |
The Fund invests principally in derivative investments such as futures contracts. “Largest Holdings” excludes any temporary cash or derivative investments. |
Average Annual Returns*
Periods Ended June 30, 2023
| 6 Month† | 1 Year | 5 Year | 10 Year |
A-Class Shares | (8.68%) | (16.04%) | 1.37% | (4.87%) |
A-Class Shares with sales charge‡ | (13.02%) | (20.02%) | 0.39% | (5.33%) |
C-Class Shares | (9.03%) | (16.65%) | 0.62% | (5.57%) |
C-Class Shares with CDSC§ | (9.94%) | (17.29%) | 0.62% | (5.57%) |
H-Class Shares | (8.66%) | (16.01%) | 1.37% | (4.87%) |
S&P Goldman Sachs Commodity Index | (7.54%) | (14.22%) | 2.76% | (3.52%) |
* | The performance data above represents past performance that is not predictive of future results. The investment return and principal value of an investment in the Fund will fluctuate so that an investor’s shares, when redeemed, may be worth more or less than their original cost. Returns are historical and include changes in principal and reinvested dividends and capital gains and do not reflect the effect of taxes. The S&P Goldman Sachs Commodity Index is an unmanaged index and, unlike the Fund, has no management fees or operating expenses to reduce its reported return. |
† | 6 month returns are not annualized. |
‡ | Fund returns are calculated using the maximum sales charge of 4.75%. |
§ | Fund returns include a CDSC of 1% if redeemed within 12 months of purchase. |
54 | THE GUGGENHEIM FUNDS SEMI-NNUAL REPORT | |
CONSOLIDATED SCHEDULE OF INVESTMENTS (Unaudited) | June 30, 2023 |
COMMODITIES STRATEGY FUND | |
| | Shares | | | Value | |
MUTUAL FUNDS† - 46.4% |
Guggenheim Ultra Short Duration Fund — Institutional Class1 | | | 141,704 | | | $ | 1,378,779 | |
Guggenheim Strategy Fund II1 | | | 56,518 | | | | 1,368,874 | |
Total Mutual Funds | | | | |
(Cost $2,822,291) | | | | | | | 2,747,653 | |
| | | | | | | | | |
| | | Face
Amount | | | | | |
U.S. TREASURY BILLS†† - 5.0% |
U.S. Treasury Bills |
5.11% due 07/18/232,3 | | $ | 300,000 | | | | 299,372 | |
Total U.S. Treasury Bills | | | | |
(Cost $299,263) | | | | | | | 299,372 | |
REPURCHASE AGREEMENTS††,4 - 41.7% |
J.P. Morgan Securities LLC
issued 06/30/23 at 5.05%
due 07/03/23 | | | 1,343,841 | | | | 1,343,841 | |
Barclays Capital, Inc.
issued 06/30/23 at 5.06%
due 07/03/23 | | | 591,222 | | | | 591,222 | |
BofA Securities, Inc.
issued 06/30/23 at 5.06%
due 07/03/23 | | | 537,475 | | | | 537,475 | |
Total Repurchase Agreements | | | | |
(Cost $2,472,538) | | | | | | | 2,472,538 | |
| | | | | | | | | |
Total Investments - 93.1% | | | | |
(Cost $5,594,092) | | $ | 5,519,563 | |
Other Assets & Liabilities, net - 6.9% | | | 406,050 | |
Total Net Assets - 100.0% | | $ | 5,925,613 | |
| | | | | |
Futures Contracts |
Description | | Number of
Contracts | | | Expiration
Date | | | Notional
Amount | | | Value and
Unrealized
Appreciation** | |
Commodity Futures Contracts Purchased† |
Goldman Sachs Commodity Index Futures Contracts | | | 44 | | | | Jul 2023 | | | $ | 5,951,000 | | | $ | 43,490 | |
** | Includes cumulative appreciation (depreciation). Variation margin is reported within the Consolidated Statement of Assets and Liabilities. |
† | Value determined based on Level 1 inputs — See Note 4. |
†† | Value determined based on Level 2 inputs — See Note 4. |
1 | Affiliated issuer. |
2 | All or a portion of this security is pledged as futures collateral at June 30, 2023. |
3 | Rate indicated is the effective yield at the time of purchase. |
4 | Repurchase Agreements — See Note 6. |
| | |
| | See Sector Classification in Other Information section. |
| | THE GUGGENHEIM FUNDS SEMI-ANNUAL REPORT | 55 |
CONSOLIDATED SCHEDULE OF INVESTMENTS (Unaudited)(continued) | June 30, 2023 |
COMMODITIES STRATEGY FUND | |
The following table summarizes the inputs used to value the Fund’s investments at June 30, 2023 (See Note 4 in the Notes to Consolidated Financial Statements):
Investments in Securities (Assets) | | Level 1
Quoted
Prices | | | Level 2
Significant
Observable
Inputs | | | Level 3
Significant
Unobservable
Inputs | | | Total | |
Mutual Funds | | $ | 2,747,653 | | | $ | — | | | $ | — | | | $ | 2,747,653 | |
U.S. Treasury Bills | | | — | | | | 299,372 | | | | — | | | | 299,372 | |
Repurchase Agreements | | | — | | | | 2,472,538 | | | | — | | | | 2,472,538 | |
Commodity Futures Contracts** | | | 43,490 | | | | — | | | | — | | | | 43,490 | |
Total Assets | | $ | 2,791,143 | | | $ | 2,771,910 | | | $ | — | | | $ | 5,563,053 | |
** | This derivative is reported as unrealized appreciation/depreciation at period end. |
Affiliated Transactions
Investments representing 5% or more of the outstanding voting shares of a company, or control of or by, or common control under Guggenheim Investments (“GI”), result in that company being considered an affiliated issuer, as defined in the 1940 Act.
The Fund may invest in certain of the underlying series of Guggenheim Strategy Funds Trust, including Guggenheim Strategy Fund II and Guggenheim Strategy Fund III, (collectively, the “Short Term Investment Vehicles”), each of which are open-end management investment companies managed by GI. The Short Term Investment Vehicles, which launched on March 11, 2014, are offered as short term investment options only to mutual funds, trusts, and other accounts managed by GI and/or its affiliates, and are not available to the public. The Short Term Investment Vehicles pay no investment management fees. The Short Term Investment Vehicles’ annual report on Form N-CSR dated September 30, 2022, is available publicly or upon request. This information is available from the EDGAR database on the SEC’s website at https://www.sec.gov/Archives/edgar/data/1601445/000182126821000490/gugg84768-ncsr.htm. The Fund may invest in certain of the underlying series of Guggenheim Funds Trust, which are open-end management investment companies managed by GI, are available to the public and whose most recent annual report on Form N-CSR is available publicly or upon request.
Transactions during the period ended June 30, 2023, in which the company is an affiliated issuer, were as follows:
Security Name | | Value
12/31/22 | | | Additions | | | Reductions | | | Realized
Gain (Loss) | | | Change in
Unrealized
Appreciation
(Depreciation) | | | Value
06/30/23 | | | Shares
06/30/23 | | | Investment
Income | |
Mutual Funds | | | | | | | | | | | | | | | | | | | | | | | | | | | | | | | | |
Guggenheim Strategy Fund II | | $ | 1,358,701 | | | $ | — | | | $ | — | | | $ | — | | | $ | 10,173 | | | $ | 1,368,874 | | | | 56,518 | | | $ | 35,544 | |
Guggenheim Ultra Short Duration Fund — Institutional Class | | | 1,366,026 | | | | — | | | | — | | | | — | | | | 12,753 | | | | 1,378,779 | | | | 141,704 | | | | 35,102 | |
| | | $ | 2,724,727 | | | $ | — | | | $ | — | | | $ | — | | | $ | 22,926 | | | $ | 2,747,653 | | | | | | | $ | 70,646 | |
56 | THE GUGGENHEIM FUNDS SEMI-ANNUAL REPORT | SEE NOTES TO CONSOLIDATED FINANCIAL STATEMENTS. |
CONSOLIDATED STATEMENT OF ASSETS AND LIABILITIES (Unaudited) |
COMMODITIES STRATEGY FUND |
June 30, 2023
Assets: |
Investments in unaffiliated issuers, at value (cost $299,263) | | $ | 299,372 | |
Investments in affiliated issuers, at value (cost $2,822,291) | | | 2,747,653 | |
Repurchase agreements, at value (cost $2,472,538) | | | 2,472,538 | |
Cash | | | 729 | |
Segregated cash with broker | | | 362,252 | |
Receivables: |
Variation margin on futures contracts | | | 68,200 | |
Fund shares sold | | | 15,274 | |
Dividends | | | 12,592 | |
Interest | | | 347 | |
Other assets | | | 1,302 | |
Total assets | | | 5,980,259 | |
| | | | | |
Liabilities: |
Payable for: |
Fund shares redeemed | | | 36,541 | |
Management fees | | | 3,266 | |
Transfer agent fees | | | 1,951 | |
Distribution and service fees | | | 1,449 | |
Portfolio accounting and administration fees | | | 722 | |
Trustees’ fees* | | | 92 | |
Miscellaneous | | | 10,625 | |
Total liabilities | | | 54,646 | |
Net assets | | $ | 5,925,613 | |
| | | | | |
Net assets consist of: |
Paid in capital | | $ | 18,165,456 | |
Total distributable earnings (loss) | | | (12,239,843 | ) |
Net assets | | $ | 5,925,613 | |
| | | | | |
A-Class: |
Net assets | | $ | 1,098,108 | |
Capital shares outstanding | | | 38,643 | |
Net asset value per share | | $ | 28.42 | |
Maximum offering price per share (Net asset value divided by 95.25%) | | $ | 29.83 | |
| | | | | |
C-Class: |
Net assets | | $ | 427,741 | |
Capital shares outstanding | | | 25,898 | |
Net asset value per share | | $ | 16.52 | |
| | | | | |
H-Class: |
Net assets | | $ | 4,399,764 | |
Capital shares outstanding | | | 154,589 | |
Net asset value per share | | $ | 28.46 | |
* | Relates to Trustees not deemed “interested persons” within the meaning of Section 2(a)(19) of the 1940 Act. |
SEE NOTES TO CONSOLIDATED FINANCIAL STATEMENTS. | THE GUGGENHEIM FUNDS SEMI-ANNUAL REPORT | 57 |
CONSOLIDATED STATEMENT OF OPERATIONS (Unaudited) |
COMMODITIES STRATEGY FUND |
Six Months Ended June 30, 2023
Investment Income: |
Dividends from securities of affiliated issuers | | $ | 70,646 | |
Interest | | | 117,562 | |
Total investment income | | | 188,208 | |
| | | | | |
Expenses: |
Management fees | | | 34,704 | |
Distribution and service fees: |
A-Class | | | 1,566 | |
C-Class | | | 2,745 | |
H-Class | | | 7,541 | |
Transfer agent fees | | | 8,330 | |
Portfolio accounting and administration fees | | | 5,974 | |
Professional fees | | | 4,474 | |
Trustees’ fees* | | | 1,307 | |
Custodian fees | | | 621 | |
Miscellaneous | | | 2,577 | |
Total expenses | | | 69,839 | |
Less: |
Expenses waived by Adviser | | | (7,230 | ) |
Net expenses | | | 62,609 | |
Net investment income | | | 125,599 | |
| | | | | |
Net Realized and Unrealized Gain (Loss): |
Net realized gain (loss) on: |
Investments in unaffiliated issuers | | $ | 292 | |
Futures contracts | | | (767,917 | ) |
Net realized loss | | | (767,625 | ) |
Net change in unrealized appreciation (depreciation) on: |
Investments in unaffiliated issuers | | | (710 | ) |
Investments in affiliated issuers | | | 22,926 | |
Futures contracts | | | (522,610 | ) |
Net change in unrealized appreciation (depreciation) | | | (500,394 | ) |
Net realized and unrealized loss | | | (1,268,019 | ) |
Net decrease in net assets resulting from operations | | $ | (1,142,420 | ) |
* | Relates to Trustees not deemed “interested persons” within the meaning of Section 2(a)(19) of the 1940 Act. |
58 | THE GUGGENHEIM FUNDS SEMI- ANNUAL REPORT | SEE NOTES TO CONSOLIDATED FINANCIAL STATEMENTS. |
CONSOLIDATED STATEMENTS OF CHANGES IN NET ASSETS |
COMMODITIES STRATEGY FUND | |
| | Six Months Ended
June 30, 2023
(Unaudited) | | | Year Ended
December 31,
2022 | |
Increase (Decrease) in Net Assets from Operations: | | | | | | | | |
Net investment income (loss) | | $ | 125,599 | | | $ | (173,595 | ) |
Net realized gain (loss) on investments | | | (767,625 | ) | | | 5,399,664 | |
Net change in unrealized appreciation (depreciation) on investments | | | (500,394 | ) | | | (356,811 | ) |
Net increase (decrease) in net assets resulting from operations | | | (1,142,420 | ) | | | 4,869,258 | |
| | | | | | | | | |
Distributions to shareholders: | | | | | | | | |
A-Class | | | — | | | | (219,005 | ) |
C-Class | | | — | | | | (172,741 | ) |
H-Class | | | — | | | | (1,133,847 | ) |
Total distributions to shareholders | | | — | | | | (1,525,593 | ) |
| | | | | | | | | |
Capital share transactions: | | | | | | | | |
Proceeds from sale of shares | | | | | | | | |
A-Class | | | 184,359 | | | | 3,237,040 | |
C-Class | | | 2,150 | | | | 954,727 | |
H-Class | | | 15,364,777 | | | | 195,107,548 | |
Distributions reinvested | | | | | | | | |
A-Class | | | — | | | | 214,121 | |
C-Class | | | — | | | | 151,621 | |
H-Class | | | — | | | | 1,092,822 | |
Cost of shares redeemed | | | | | | | | |
A-Class | | | (427,181 | ) | | | (2,584,515 | ) |
C-Class | | | (235,353 | ) | | | (423,915 | ) |
H-Class | | | (17,344,723 | ) | | | (213,373,909 | ) |
Net decrease from capital share transactions | | | (2,455,971 | ) | | | (15,624,460 | ) |
Net decrease in net assets | | | (3,598,391 | ) | | | (12,280,795 | ) |
| | | | | | | | | |
Net assets: | | | | | | | | |
Beginning of period | | | 9,524,004 | | | | 21,804,799 | |
End of period | | $ | 5,925,613 | | | $ | 9,524,004 | |
SEE NOTES TO CONSOLIDATED FINANCIAL STATEMENTS. | THE GUGGENHEIM FUNDS SEMI-ANNUAL REPORT | 59 |
CONSOLIDATED STATEMENTS OF CHANGES IN NET ASSETS (concluded) |
COMMODITIES STRATEGY FUND | |
| | Six Months Ended
June 30, 2023
(Unaudited) | | | Year Ended
December 31,
2022 | |
Capital share activity: | | | | | | | | |
Shares sold | | | | | | | | |
A-Class | | | 6,212 | | | | 81,976 | |
C-Class | | | 125 | | | | 38,976 | |
H-Class | | | 504,034 | | | | 5,022,099 | |
Shares issued from reinvestment of distributions | | | | | | | | |
A-Class | | | — | | | | 6,986 | |
C-Class | | | — | | | | 8,475 | |
H-Class | | | — | | | | 35,608 | |
Shares redeemed | | | | | | | | |
A-Class | | | (14,590 | ) | | | (66,418 | ) |
C-Class | | | (14,301 | ) | | | (16,898 | ) |
H-Class | | | (584,746 | ) | | | (5,527,844 | ) |
Net decrease in shares | | | (103,266 | ) | | | (417,040 | ) |
60 | THE GUGGENHEIM FUNDS SEMI-ANNUAL REPORT | SEE NOTES TO CONSOLIDATED FINANCIAL STATEMENTS. |
CONSOLIDATED FINANCIAL HIGHLIGHTS |
COMMODITIES STRATEGY FUND |
This table is presented to show selected data for a share outstanding throughout each period and to assist shareholders in evaluating a Fund’s performance for the periods presented.
A-Class | | Six Months Ended
June 30, 2023a | | | Year
Ended
Dec. 31,
2022 | | | Year
Ended
Dec. 31,
2021 | | | Year
Ended
Dec. 31,
2020 | | | Year
Ended
Dec. 31,
2019 | | | Year
Ended
Dec. 31,
2018 | |
Per Share Data |
Net asset value, beginning of period | | $ | 31.12 | | | $ | 29.59 | | | $ | 21.93 | | | $ | 61.06 | | | $ | 53.27 | | | $ | 88.34 | |
Income (loss) from investment operations: |
Net investment income (loss)b | | | .48 | | | | (.02 | ) | | | (.40 | ) | | | (.28 | ) | | | .36 | | | | .39 | |
Net gain (loss) on investments (realized and unrealized) | | | (3.18 | ) | | | 6.89 | | | | 8.94 | | | | (14.84 | ) | | | 7.88 | | | | (11.90 | ) |
Total from investment operations | | | (2.70 | ) | | | 6.87 | | | | 8.54 | | | | (15.12 | ) | | | 8.24 | | | | (11.51 | ) |
Less distributions from: |
Net investment income | | | — | | | | (5.34 | ) | | | (.88 | ) | | | (24.01 | ) | | | (.45 | ) | | | (23.56 | ) |
Total distributions | | | — | | | | (5.34 | ) | | | (.88 | ) | | | (24.01 | ) | | | (.45 | ) | | | (23.56 | ) |
Net asset value, end of period | | $ | 28.42 | | | $ | 31.12 | | | $ | 29.59 | | | $ | 21.93 | | | $ | 61.06 | | | $ | 53.27 | |
|
Total Returnc | | | (8.68 | %) | | | 23.52 | % | | | 39.06 | % | | | (23.58 | %) | | | 15.47 | % | | | (15.47 | %) |
Ratios/Supplemental Data |
Net assets, end of period (in thousands) | | $ | 1,098 | | | $ | 1,463 | | | $ | 724 | | | $ | 211 | | | $ | 592 | | | $ | 830 | |
Ratios to average net assets: |
Net investment income (loss) | | | 3.28 | % | | | (0.05 | %) | | | (1.43 | %) | | | (0.65 | %) | | | 0.60 | % | | | 0.44 | % |
Total expensesd | | | 1.73 | % | | | 1.74 | % | | | 1.78 | % | | | 1.79 | % | | | 1.88 | % | | | 1.81 | % |
Net expensese | | | 1.54 | % | | | 1.60 | % | | | 1.63 | % | | | 1.61 | % | | | 1.73 | % | | | 1.68 | % |
Portfolio turnover rate | | | — | | | | — | | | | — | | | | 5 | % | | | — | | | | 65 | % |
SEE NOTES TO CONSOLIDATED FINANCIAL STATEMENTS. | THE GUGGENHEIM FUNDS SEMI-ANNUAL REPORT | 61 |
CONSOLIDATED FINANCIAL HIGHLIGHTS (continued) |
COMMODITIES STRATEGY FUND |
This table is presented to show selected data for a share outstanding throughout each period and to assist shareholders in evaluating a Fund’s performance for the periods presented.
C-Class | | Six Months Ended
June 30, 2023a | | | Year
Ended
Dec. 31,
2022 | | | Year
Ended
Dec. 31,
2021 | | | Year
Ended
Dec. 31,
2020 | | | Year
Ended
Dec. 31,
2019 | | | Year
Ended
Dec. 31,
2018 | |
Per Share Data |
Net asset value, beginning of period | | $ | 18.16 | | | $ | 19.23 | | | $ | 14.59 | | | $ | 51.84 | | | $ | 45.63 | | | $ | 79.89 | |
Income (loss) from investment operations: |
Net investment income (loss)b | | | .21 | | | | (.17 | ) | | | (.41 | ) | | | (.50 | ) | | | (.07 | ) | | | (.41 | ) |
Net gain (loss) on investments (realized and unrealized) | | | (1.85 | ) | | | 4.44 | | | | 5.93 | | | | (12.74 | ) | | | 6.73 | | | | (10.29 | ) |
Total from investment operations | | | (1.64 | ) | | | 4.27 | | | | 5.52 | | | | (13.24 | ) | | | 6.66 | | | | (10.70 | ) |
Less distributions from: |
Net investment income | | | — | | | | (5.34 | ) | | | (.88 | ) | | | (24.01 | ) | | | (.45 | ) | | | (23.56 | ) |
Total distributions | | | — | | | | (5.34 | ) | | | (.88 | ) | | | (24.01 | ) | | | (.45 | ) | | | (23.56 | ) |
Net asset value, end of period | | $ | 16.52 | | | $ | 18.16 | | | $ | 19.23 | | | $ | 14.59 | | | $ | 51.84 | | | $ | 45.63 | |
|
Total Returnc | | | (9.03 | %) | | | 22.60 | % | | | 38.08 | % | | | (24.15 | %) | | | 14.61 | % | | | (16.11 | %) |
Ratios/Supplemental Data |
Net assets, end of period (in thousands) | | $ | 428 | | | $ | 728 | | | $ | 183 | | | $ | 55 | | | $ | 111 | | | $ | 110 | |
Ratios to average net assets: |
Net investment income (loss) | | | 2.51 | % | | | (0.68 | %) | | | (2.18 | %) | | | (1.44 | %) | | | (0.13 | %) | | | (0.49 | %) |
Total expensesd | | | 2.48 | % | | | 2.49 | % | | | 2.53 | % | | | 2.54 | % | | | 2.63 | % | | | 2.55 | % |
Net expensese | | | 2.29 | % | | | 2.35 | % | | | 2.38 | % | | | 2.36 | % | | | 2.48 | % | | | 2.42 | % |
Portfolio turnover rate | | | — | | | | — | | | | — | | | | 5 | % | | | — | | | | 65 | % |
62 | THE GUGGENHEIM FUNDS SEMI- ANNUAL REPORT | SEE NOTES TO CONSOLIDATED FINANCIAL STATEMENTS. |
CONSOLIDATED FINANCIAL HIGHLIGHTS (concluded) |
COMMODITIES STRATEGY FUND |
This table is presented to show selected data for a share outstanding throughout each period and to assist shareholders in evaluating a Fund’s performance for the periods presented.
H-Class | | Six Months Ended
June 30, 2023a | | | Year
Ended
Dec. 31,
2022 | | | Year
Ended
Dec. 31,
2021 | | | Year
Ended
Dec. 31,
2020 | | | Year
Ended
Dec. 31,
2019 | | | Year
Ended
Dec. 31,
2018 | |
Per Share Data |
Net asset value, beginning of period | | $ | 31.16 | | | $ | 29.62 | | | $ | 21.96 | | | $ | 61.10 | | | $ | 53.31 | | | $ | 88.39 | |
Income (loss) from investment operations: |
Net investment income (loss)b | | | .48 | | | | (.23 | ) | | | (.41 | ) | | | (.34 | ) | | | .35 | | | | .25 | |
Net gain (loss) on investments (realized and unrealized) | | | (3.18 | ) | | | 7.11 | | | | 8.95 | | | | (14.79 | ) | | | 7.89 | | | | (11.77 | ) |
Total from investment operations | | | (2.70 | ) | | | 6.88 | | | | 8.54 | | | | (15.13 | ) | | | 8.24 | | | | (11.52 | ) |
Less distributions from: |
Net investment income | | | — | | | | (5.34 | ) | | | (.88 | ) | | | (24.01 | ) | | | (.45 | ) | | | (23.56 | ) |
Total distributions | | | — | | | | (5.34 | ) | | | (.88 | ) | | | (24.01 | ) | | | (.45 | ) | | | (23.56 | ) |
Net asset value, end of period | | $ | 28.46 | | | $ | 31.16 | | | $ | 29.62 | | | $ | 21.96 | | | $ | 61.10 | | | $ | 53.31 | |
|
Total Return | | | (8.66 | %) | | | 23.53 | % | | | 39.06 | % | | | (23.58 | %) | | | 15.48 | % | | | (15.50 | %) |
Ratios/Supplemental Data |
Net assets, end of period (in thousands) | | $ | 4,400 | | | $ | 7,333 | | | $ | 20,898 | | | $ | 855 | | | $ | 4,911 | | | $ | 8,744 | |
Ratios to average net assets: |
Net investment income (loss) | | | 3.25 | % | | | (0.58 | %) | | | (1.44 | %) | | | (0.77 | %) | | | 0.59 | % | | | 0.27 | % |
Total expensesd | | | 1.73 | % | | | 1.75 | % | | | 1.77 | % | | | 1.78 | % | | | 1.89 | % | | | 1.81 | % |
Net expensese | | | 1.55 | % | | | 1.61 | % | | | 1.63 | % | | | 1.61 | % | | | 1.74 | % | | | 1.68 | % |
Portfolio turnover rate | | | — | | | | — | | | | — | | | | 5 | % | | | — | | | | 65 | % |
a | Unaudited figures for the period ended June 30, 2023. Percentage amounts for the period, except total return and portfolio turnover rate, have been annualized. |
b | Net investment income (loss) per share was computed using average shares outstanding throughout the period. |
c | Total return does not reflect the impact of any applicable sales charges. |
d | Does not include expenses of the underlying funds in which the Fund invests. |
e | Net expense information reflects the expense ratios after expense waivers and reimbursements, as applicable. |
SEE NOTES TO CONSOLIDATED FINANCIAL STATEMENTS. | THE GUGGENHEIM FUNDS SEMI-ANNUAL REPORT | 63 |
NOTES TO CONSOLIDATED FINANCIAL STATEMENTS (Unaudited) |
Note 1 – Organization, Consolidation of Subsidiaries and Significant Accounting Policies
Organization
The Rydex Series Funds (the “Trust”), a Delaware statutory trust, is registered with the U.S. Securities and Exchange Commission (the “SEC”) under the Investment Company Act of 1940 (the ”1940 Act”), as an open-ended investment company of the series type. Each series, in effect, is representing a separate fund (each, a “Fund”). The Trust may issue an unlimited number of authorized shares. The Trust accounts for the assets of each Fund separately.
The Trust offers a combination of seven separate classes of shares: Investor Class shares, A-Class shares, C-Class shares, H-Class shares, P-Class shares, Institutional Class shares and Money Market Class shares. Sales of shares of each Class are made without a front-end sales charge at the net asset value per share (“NAV”), with the exception of A-Class shares. A-Class shares are sold at the NAV, plus the applicable front-end sales charge. The sales charge varies depending on the amount purchased, but will not exceed 4.75%. A-Class share purchases of $1 million or more are exempt from the front-end sales charge but have a 1% contingent deferred sales charge (“CDSC”) if shares are redeemed within 12 months of purchase. C-Class shares have a 1% CDSC if shares are redeemed within 12 months of purchase. C-Class shares of each Fund automatically convert to A-Class shares of the same Fund on or about the 10th day of the month following the 8-year anniversary of the purchase of the C-Class shares. This conversion will be executed without any sales charge, fee or other charge. After the conversion is completed, the shares will be subject to all features and expenses of A-Class shares. Institutional Class shares are offered primarily for direct investment by institutions such as pension and profit sharing plans, endowments, foundations and corporations. Institutional Class shares require a minimum initial investment of $2 million and a minimum account balance of $1 million. At June 30, 2023, the Trust consisted of fifty-two funds.
This report covers the following funds (collectively, the “Funds”):
Fund Name | | Investment
Company Type | |
Multi-Hedge Strategies Fund | | | Diversified | |
Commodities Strategy Fund | | | Non-diversified | |
At June 30, 2023, A-Class, C-Class, H-Class, P-Class and Institutional Class shares have been issued by the Funds.
The Commodities Strategy Fund is designed and operated to accommodate frequent trading by shareholders and, unlike most mutual funds, offers unlimited exchange privileges with no minimum holding periods or transactions fees, which may cause the Fund to experience high portfolio turnover.
64 | THE GUGGENHEIM FUNDS SEMI-ANNUAL REPORT | |
NOTES TO CONSOLIDATED FINANCIAL STATEMENTS (Unaudited)(continued) |
Security Investors, LLC (the “Adviser”), which operates under the name Guggenheim Investments (“GI”), provides advisory services. Guggenheim Funds Distributors, LLC (“GFD”) acts as principal underwriter for the Trust. GI and GFD are affiliated entities.
Consolidation of Subsidiaries
The consolidated financial statements of the Multi-Hedge Strategies Fund and Commodities Strategy Fund include the accounts of a wholly-owned and controlled Cayman Islands subsidiary (each, a “Subsidiary” and collectively, the “Subsidiaries”). Significant inter-company accounts and transactions have been eliminated in consolidation for the Funds.
Each Fund may invest up to 25% of its total assets in its Subsidiary, which acts as an investment vehicle in order to effect certain investments consistent with the Fund’s investment objectives and policies.
A summary of each Fund’s investment in its respective Subsidiary is as follows:
Fund | | Inception
Date of
Subsidiary | | | Subsidiary
Net Assets at
June 30, 2023 | | | % of Net Assets
of the Fund at
June 30, 2023 | |
Multi-Hedge Strategies Fund | | | 09/18/09 | | | $ | 3,359,473 | | | | 3.85 | % |
Commodities Strategy Fund | | | 09/08/09 | | | | 969,170 | | | | 16.36 | % |
Significant Accounting Policies
The Funds operate as investment companies and, accordingly, follow the investment company accounting and reporting guidance of the Financial Accounting Standards Board (“FASB”) Accounting Standards Codification Topic 946 Financial Services – Investment Companies.
The following significant accounting policies are in conformity with U.S. generally accepted accounting principles (“U.S. GAAP”) and are consistently followed by the Trust. This requires management to make estimates and assumptions that affect the reported amount of assets and liabilities, contingent assets and liabilities at the date of the consolidated financial statements, and the reported amounts of revenues and expenses during the reporting period. Actual results could differ from these estimates. All time references are based on Eastern Time.
The NAV of each Class of a Fund is calculated by dividing the market value of a Fund’s securities and other assets, less all liabilities, attributable to the Class by the number of outstanding shares of the Class.
(a) Valuation of Investments
The Board of Trustees of the Funds (the “Board”) has adopted policies and procedures for the valuation of the Funds’ investments (the “Valuation Procedures”). The SEC adopted Rule 2a-5 under the 1940 Act (“Rule 2a-5”) which establishes requirements for determining fair value in
| | THE GUGGENHEIM FUNDS SEMI-ANNUAL REPORT | 65 |
NOTES TO CONSOLIDATED FINANCIAL STATEMENTS (Unaudited)(continued) |
good faith and became effective September 8, 2022. Rule 2a-5 also defines “readily available market quotations” for purposes of the 1940 Act and establishes requirements for determining whether a fund must fair value a security in good faith.
Pursuant to Rule 2a-5, the Board has designated the Adviser as the valuation designee to perform fair valuation determinations for the Funds with respect to all Fund investments and other assets. As the Funds’ valuation designee pursuant to Rule 2a-5, the Adviser has adopted separate procedures (the “Valuation Designee Procedures”) reasonably designed to prevent violations of the requirements of Rule 2a-5 and Rule 31a-4. The Adviser, in its role as valuation designee, utilizes the assistance of a valuation committee, consisting of representatives from Guggenheim’s investment management, fund administration, legal and compliance departments (the “Valuation Committee”), in determining the fair value of the Funds’ securities and other assets.
Valuations of the Funds’ securities and other assets are supplied primarily by pricing services appointed pursuant to the processes set forth in the Valuation Procedures. The Adviser, with the assistance of the Valuation Committee, convenes monthly, or more frequently as needed, to review the valuation of all assets which have been fair valued for reasonableness. The Adviser, consistent with the monitoring and review responsibilities set forth in the Valuation Designee Procedures, regularly reviews the appropriateness of the inputs, methods, models and assumptions employed by the pricing services.
If the pricing service cannot or does not provide a valuation for a particular investment or such valuation is deemed unreliable, such investment is fair valued by the Adviser.
Equity securities listed or traded on a recognized U.S. securities exchange or the National Association of Securities Dealers Automated Quotations (“NASDAQ”) National Market System shall generally be valued on the basis of the last sale price on the primary U.S. exchange or market on which the security is listed or traded; provided, however, that securities listed on NASDAQ will be valued at the NASDAQ official closing price, which may not necessarily represent the last sale price.
Open-end investment companies are valued at their NAV as of the close of business, on the valuation date. Exchange-traded funds and closed-end investment companies are generally valued at the last quoted sale price.
U.S. Government securities are valued by independent pricing services, the last traded fill price, or at the reported bid price at the close of business.
Repurchase agreements are generally valued at amortized cost, provided such amounts approximate market value.
Commercial paper and discount notes with a maturity of greater than 60 days at acquisition are valued at prices that reflect broker-dealer supplied valuations or are obtained from independent pricing services, which may consider the trade activity, treasury spreads, yields or price of bonds of comparable quality, coupon, maturity, and type, as well as prices quoted by dealers who make
66 | THE GUGGENHEIM FUNDS SEMI-ANNUAL REPORT | |
NOTES TO CONSOLIDATED FINANCIAL STATEMENTS (Unaudited)(continued) |
markets in such securities. Commercial paper and discount notes with a maturity of 60 days or less at acquisition are valued at amortized cost, unless the Adviser concludes that amortized cost does not represent the fair value of the applicable asset in which case it will be valued using an independent pricing service.
The value of futures contracts are valued on the basis of the last sale price at the 4:00 p.m. price on the valuation date. In the event that the exchange for a specific futures contract closes earlier than 4:00 p.m., the futures contract is valued at the official settlement price of the exchange. However, the underlying securities from which the futures contract value is derived are monitored until 4:00 p.m. to determine if fair valuation would provide a more accurate valuation.
The value of swap agreements entered into by a Fund are generally valued using an evaluated price provided by a third party pricing vendor.
Investments for which market quotations are not readily available are fair valued as determined in good faith by the Adviser. Valuations in accordance with these methods are intended to reflect each security’s (or asset’s or liability’s) “fair value”. Each such determination is based on a consideration of all relevant factors, which are likely to vary from one pricing context to another. Examples of such factors may include, but are not limited to market prices; sale prices; broker quotes; and models which derive prices based on inputs such as prices of securities with comparable maturities and characteristics, or based on inputs such as anticipated cash flows or collateral, spread over U.S. Treasury securities, and other information analysis. In connection with futures contracts and other derivative investments, such factors may include obtaining information as to how (a) these contracts and other derivative investments trade in the futures or other derivative markets, respectively, and (b) the securities underlying these contracts and other derivative investments trade in the cash market.
(b) U.S. Government and Agency Obligations
Certain U.S. Government and Agency Obligations are traded on a discount basis; the interest rates shown on the Consolidated Schedules of Investments reflect the effective rates paid at the time of purchase by the Funds. Other securities bear interest at the rates shown, payable at fixed dates through maturity.
(c) Short Sales
When a Fund engages in a short sale of a security, an amount equal to the proceeds is reflected as an asset and an equivalent liability. The amount of the liability is subsequently marked-to-market to reflect the market value of the short sale.
Fees, if any, paid to brokers to borrow securities in connection with short sales are recorded as interest expense. In addition, the Fund must pay out the dividend rate of the equity or coupon rate of the obligation to the lender and record this as an expense. Short dividend or interest expense is a cost associated with the investment objective of short sales transactions, rather than an
| | THE GUGGENHEIM FUNDS SEMI-ANNUAL REPORT | 67 |
NOTES TO CONSOLIDATED FINANCIAL STATEMENTS (Unaudited)(continued) |
operational cost associated with the day-to-day management of any mutual fund. The Fund may also receive rebate income from the broker resulting from the investment of the proceeds from securities sold short.
(d) Futures Contracts
Upon entering into a futures contract, a Fund deposits and maintains as collateral such initial margin as required by the exchange on which the transaction is affected. Pursuant to the contract, the Fund agrees to receive from or pay to the broker an amount of cash equal to the daily fluctuation in value of the contract. Such receipts or payments are known as variation margin and are recorded by the Fund as unrealized appreciation or depreciation. When the contract is closed, the Fund records a realized gain or loss equal to the difference between the value of the contract at the time it was opened and the value at the time it was closed.
(e) Swap Agreements
Swap agreements are marked-to-market daily and the change, if any, is recorded as unrealized appreciation or depreciation. Payments received or made as a result of an agreement or termination of an agreement are recognized as realized gains or losses.
Upon entering into certain centrally-cleared swap transactions, a Fund is required to deposit with its clearing broker an amount of cash or securities as an initial margin. Subsequent variation margin receipts or payments are received or made by the Fund depending on fluctuations in the fair value of the reference entity and are recorded by the Fund as unrealized appreciation or depreciation. When the contract is closed, the Fund records a realized gain or loss equal to the difference between the value of the contract at the time it was opened and the value at the time it was closed.
(f) Currency Translations
The accounting records of the Funds are maintained in U.S. dollars. All assets and liabilities initially expressed in foreign currencies are converted into U.S. dollars at prevailing exchange rates. Purchases and sales of investment securities, dividend and interest income, and certain expenses are translated at the rates of exchange prevailing on the respective dates of such transactions. Changes in the relationship of these foreign currencies to the U.S. dollar can significantly affect the value of the investments and earnings of the Funds. Foreign investments may also subject the Funds to foreign government exchange restrictions, expropriation, taxation, or other political, social or economic developments, all of which could affect the market and/or credit risk of the investments.
The Funds do not isolate that portion of the results of operations resulting from changes in the foreign exchange rates on investments from the fluctuations arising from changes in the market prices of securities held. Such fluctuations are included with the net realized gain or loss and unrealized appreciation or depreciation on investments.
68 | THE GUGGENHEIM FUNDS SEMI-ANNUAL REPORT | |
NOTES TO CONSOLIDATED FINANCIAL STATEMENTS (Unaudited)(continued) |
Reported net realized foreign exchange gains and losses arise from sales of foreign currencies and currency gains or losses realized between the trade and settlement dates on investment transactions. Net unrealized appreciation and depreciation arise from changes in the fair values of assets and liabilities other than investments in securities at the fiscal period end, resulting from changes in exchange rates.
(g) Foreign Taxes
The Funds may be subject to foreign taxes (a portion of which may be reclaimable) on income, stock dividends, capital gains on investments or certain foreign currency transactions. All foreign taxes are recorded in accordance with the applicable foreign tax regulations and rates that exist in the foreign jurisdictions in which the Funds invest. These foreign taxes, if any, are paid by the Funds and reflected in their Consolidated Statements of Operations as follows: foreign taxes withheld at source are presented as a reduction of income and foreign taxes on capital gains from sales of investments are included with the net realized gain (loss) on investments. Foreign taxes payable or deferred as of June 30, 2023, if any, are disclosed in the Funds’ Consolidated Statements of Assets and Liabilities.
(h) Security Transactions
Security transactions are recorded on the trade date for financial reporting purposes. Realized gains and losses from securities transactions are recorded using the identified cost basis. Proceeds from lawsuits related to investment holdings are recorded as a reduction to cost if the securities are still held and as realized gains if no longer held in the respective Fund. Dividend income is recorded on the ex-dividend date, net of applicable taxes withheld by foreign countries, if any. Taxable non-cash dividends are recorded as dividend income. Interest income, including amortization of premiums and accretion of discounts, is accrued on a daily basis. Dividend income from Real Estate Investment Trusts (“REITs”) is recorded based on the income included in the distributions received from the REIT investments using published REIT classifications, including some management estimates when actual amounts are not available. Distributions received in excess of this estimated amount are recorded as a reduction of the cost of investments or reclassified to realized gains. The actual amounts of income, return of capital, and realized gains are only determined by each REIT after its fiscal year-end, and may differ from the estimated amounts.
(i) Distributions
Distributions of net investment income and net realized gains, if any, are declared and paid at least annually. Dividends are reinvested in additional shares, unless shareholders request payment in cash. Distributions are recorded on the ex-dividend date and are determined in accordance with U.S. federal income tax regulations which may differ from U.S. GAAP.
| | THE GUGGENHEIM FUNDS SEMI-ANNUAL REPORT | 69 |
NOTES TO CONSOLIDATED FINANCIAL STATEMENTS (Unaudited)(continued) |
(j) Class Allocations
Interest and dividend income, most expenses, all realized gains and losses, and all unrealized appreciation and depreciation are allocated to the classes based upon the value of the outstanding shares in each Class. Certain costs, such as distribution and service fees are charged directly to specific classes. In addition, certain expenses have been allocated to the individual Funds in the Trust based on the respective net assets of each Fund included in the Trust.
(k) Cash
The Funds may leave cash overnight in their cash account with the custodian. Periodically, a Fund may have cash due to the custodian bank as an overdraft balance. A fee is incurred on this overdraft, calculated by multiplying the overdraft by a rate based on the federal funds rate, which was 5.08% at June 30, 2023.
(l) Indemnifications
Under the Funds’ organizational documents, the Trustees and Officers are indemnified against certain liabilities arising out of the performance of their duties to the Trust. In addition, throughout the normal course of business, the Funds enter into contracts that contain a variety of representations and warranties which provide general indemnifications. The Funds’ maximum exposure under these arrangements is unknown, as this would involve future claims that may be made against the Funds and/or their affiliates that have not yet occurred. However, based on experience, the Funds expect the risk of loss to be remote.
Note 2 – Financial Instruments and Derivatives
As part of their investment strategies, the Funds may utilize short sales and a variety of derivative instruments. These investments involve, to varying degrees, elements of market risk and risks in excess of amounts recognized on the Funds’ Consolidated Statements of Assets and Liabilities. Valuation and accounting treatment of these instruments can be found under Significant Accounting Policies in Note 1 of these Notes to Consolidated Financial Statements.
Short Sales
A short sale is a transaction in which a Fund sells a security it does not own. If the security sold short decreases in price between the time the Fund sells the security and closes its short position, the Fund will realize a gain on the transaction. Conversely, if the security increases in price during the period, the Fund will realize a loss on the transaction. The risk of such price increases is the principal risk of engaging in short sales.
Derivatives
Derivatives are instruments whose values depend on, or are derived from, in whole or in part, the value of one or more other assets, such as securities, currencies, commodities or indices. Derivative instruments may be used to increase investment flexibility (including to maintain cash
70 | THE GUGGENHEIM FUNDS SEMI-ANNUAL REPORT | |
NOTES TO CONSOLIDATED FINANCIAL STATEMENTS (Unaudited)(continued) |
reserves while maintaining exposure to certain other assets), for risk management (hedging) purposes, to facilitate trading, to reduce transaction costs and to pursue higher investment returns. Derivative instruments may also be used to mitigate certain investment risks, such as foreign currency exchange rate risk, interest rate risk and credit risk. U.S. GAAP requires disclosures to enable investors to better understand how and why a Fund uses derivative instruments, how these derivative instruments are accounted for and their effects on the Fund’s financial position and results of operations.
The Funds may utilize derivatives for the following purposes:
Duration: the use of an instrument to manage the interest rate risk of a portfolio.
Hedge: an investment made in order to reduce the risk of adverse price movements in a security, by taking an offsetting position to protect against broad market moves.
Index Exposure: the use of an instrument to obtain exposure to a listed or other type of index.
Leverage: gaining total exposure to equities or other assets on the long and short sides at greater than 100% of invested capital.
Liquidity: the ability to buy or sell exposure with little price/market impact.
Speculation: the use of an instrument to express macro-economic and other investment views.
For any Fund whose investment strategy consistently involves applying leverage, the value of the Fund’s shares will tend to increase or decrease more than the value of any increase or decrease in the underlying index or other asset. In addition, because an investment in derivative instruments generally requires a small investment relative to the amount of investment exposure assumed, an opportunity for increased net income is created; but, at the same time, leverage risk will increase. The Fund’s use of leverage, through borrowings or instruments such as derivatives, may cause an investment in the Fund to be more volatile and riskier than if the Fund had not been leveraged.
Futures Contracts
A futures contract is an agreement to purchase (long) or sell (short) an agreed amount of securities or other instruments at a set price for delivery at a future date. There are significant risks associated with a Fund’s use of futures contracts, including (i) there may be an imperfect or no correlation between the changes in market value of the underlying asset and the prices of futures contracts; (ii) there may not be a liquid secondary market for a futures contract; (iii) trading restrictions or limitations may be imposed by an exchange; and (iv) government regulations may restrict trading in futures contracts. When investing in futures, there is minimal counterparty credit risk to a Fund because futures are exchange-traded and the exchange’s clearinghouse, as counterparty to all exchange-traded futures, guarantees against default. Cash deposits are shown as segregated cash with broker on the Funds’ Consolidated Statements of Assets and Liabilities; securities held as collateral are noted on the Consolidated Schedules of Investments.
| | THE GUGGENHEIM FUNDS SEMI-ANNUAL REPORT | 71 |
NOTES TO CONSOLIDATED FINANCIAL STATEMENTS (Unaudited)(continued) |
The following table represents the Funds’ use and volume of futures on a monthly basis:
| | | | Average Notional Amount | |
Fund | Use | | Long | | | Short | |
Multi-Hedge Strategies Fund | Duration, Hedge, Index exposure, Leverage, Liquidity, Speculation | | $ | 104,429,639 | | | $ | 65,156,506 | |
Commodities Strategy Fund | Index exposure, Liquidity | | | 7,828,466 | | | | — | |
Swap Agreements
A swap is an agreement that obligates two parties to exchange a series of cash flows at specified intervals based upon or calculated by reference to changes in specified prices or rates for a specified amount of an underlying asset. When utilizing over-the-counter (“OTC”) swaps, a Fund bears the risk of loss of the amount expected to be received under a swap agreement in the event of the default or bankruptcy of a swap agreement counterparty or if the underlying asset declines in value. Certain standardized swaps are subject to mandatory central clearing and are executed on a multi-lateral or other trade facility platform, such as a registered exchange. There is limited counterparty credit risk with respect to centrally-cleared swaps as the transaction is facilitated through a central clearinghouse, much like exchange-traded futures contracts. For a Fund utilizing centrally-cleared swaps, the exchange bears the risk of loss resulting from a counterparty not being able to pay. There is no guarantee that a Fund or an underlying fund could eliminate its exposure under an outstanding swap agreement by entering into an offsetting swap agreement with the same or another party.
Custom basket swaps involve commitments where single or multiple cash flows are exchanged based on the price of an underlying reference asset (such as a custom basket of securities) for a fixed or variable interest rate. Custom basket swaps will usually be computed based on the current value of the reference asset as of the close of regular trading on the NYSE or other exchange, with the swap value being adjusted to include dividends accrued, financing charges and/or interest associated with the swap agreement. When utilizing custom basket swaps, a Fund bears the risk of loss of the amount expected to be received under a swap agreement in the event of the default or bankruptcy of a swap agreement counterparty or if the underlying reference asset declines in value.
The following table represents the Funds’ use and volume of custom basket swaps on a monthly basis:
| | | | Average Notional Amount | |
Fund | Use | | Long | | | Short | |
Multi-Hedge Strategies Fund | Hedge, Index exposure, Leverage, Liquidity, Speculation | | $ | 57,709,364 | | | $ | 49,393,767 | |
72 | THE GUGGENHEIM FUNDS SEMI-ANNUAL REPORT | |
NOTES TO CONSOLIDATED FINANCIAL STATEMENTS (Unaudited)(continued) |
Derivative Investment Holdings Categorized by Risk Exposure
The following is a summary of the location of derivative investments on the Funds’ Consolidated Statements of Assets and Liabilities as of June 30, 2023:
Derivative Investment Type | Asset Derivatives | Liability Derivatives |
Commodity/currency/equity/interest rate futures contracts | Variation margin on futures contracts | — |
Equity swap contracts | Unrealized appreciation on OTC swap agreements | Unrealized depreciation on OTC swap agreements |
The following tables set forth the fair value of the Funds’ derivative investments categorized by primary risk exposure at June 30, 2023:
Asset Derivative Investments Value |
Fund | | Futures
Equity
Risk* | | | Swaps
Equity
Risk | | | Futures
Foreign
Currency
Exchange
Risk* | | | Futures
Interest Rate
Risk* | | | Futures
Commodity
Risk* | | | Total
Value at
June 30,
2023 | |
Multi-Hedge Strategies Fund | | $ | 673,687 | | | $ | 6,054,621 | | | $ | 184,578 | | | $ | 34,823 | | | $ | 1,337,680 | | | $ | 8,285,389 | |
Commodities Strategy Fund | | | — | | | | — | | | | — | | | | — | | | | 43,490 | | | | 43,490 | |
Liability Derivative Investments Value |
Fund | | Futures
Equity Risk* | | | Swaps
Equity Risk | | | Futures
Foreign
Currency
Exchange
Risk* | | | Futures
Interest
Rate Risk* | | | Futures
Commodity
Risk* | | | Total
Value at
June 30,
2023 | |
Multi-Hedge Strategies Fund | | $ | 567,900 | | | $ | 530,842 | | | $ | 265,820 | | | $ | 7,443 | | | $ | 1,596,100 | | | $ | 2,968,105 | |
* | Includes cumulative appreciation (depreciation) of exchange-traded, OTC and centrally-cleared derivatives contracts as reported on the Funds’ Consolidated Schedules of Investments. For exchange-traded and centrally-cleared derivatives, variation margin is reported within the Funds’ Consolidated Statements of Assets and Liabilities. |
| | THE GUGGENHEIM FUNDS SEMI-ANNUAL REPORT | 73 |
NOTES TO CONSOLIDATED FINANCIAL STATEMENTS (Unaudited)(continued) |
The following is a summary of the location of derivative investments on the Funds’ Consolidated Statements of Operations for the period ended June 30, 2023:
Derivative Investment Type | Location of Gain (Loss) on Derivatives |
Commodity/currency/equity/interest rate futures contracts | Net realized gain (loss) on futures contracts |
| | Net change in unrealized appreciation (depreciation) on futures contracts |
Equity swap contracts | Net realized gain (loss) on swap agreements |
| | Net change in unrealized appreciation (depreciation) on swap agreements |
The following is a summary of the Funds’ realized gain (loss) and change in unrealized appreciation (depreciation) on derivative investments recognized on the Funds’ Consolidated Statements of Operations categorized by primary risk exposure for the period ended June 30, 2023:
Realized Gain (Loss) on Derivative Investments Recognized on the Consolidated Statements of Operations |
Fund | | Futures
Equity
Risk | | | Swaps
Equity
Risk | | | Futures
Foreign
Currency
Exchange
Risk | | | Futures
Interest Rate
Risk | | | Futures
Commodity
Risk | | | Total | |
Multi-Hedge Strategies Fund | | $ | 1,312,088 | | | $ | 483,413 | | | $ | (1,511,417 | ) | | $ | 550,460 | | | $ | 1,176,078 | | | $ | 2,010,622 | |
Commodities Strategy Fund | | | — | | | | — | | | | — | | | | — | | | | (767,917 | ) | | | (767,917 | ) |
Change in Unrealized Appreciation (Depreciation) on Derivative Investments
Recognized on the Consolidated Statements of Operations |
Fund | | Futures
Equity
Risk | | | Swaps
Equity
Risk | | | Futures
Foreign
Currency
Exchange
Risk | | | Futures
Interest Rate
Risk | | | Futures
Commodity
Risk | | | Total | |
Multi-Hedge Strategies Fund | | $ | 480,136 | | | $ | 4,093 | | | $ | 20,399 | | | $ | (186,716 | ) | | $ | (988,603 | ) | | $ | (670,691 | ) |
Commodities Strategy Fund | | | — | | | | — | | | | — | | | | — | | | | (522,610 | ) | | | (522,610 | ) |
In conjunction with short sales and the use of derivative instruments, the Funds are required to maintain collateral in various forms. Depending on the financial instrument utilized and the broker involved, the Funds use margin deposits at the broker, cash and/or securities segregated at the custodian bank, discount notes or repurchase agreements allocated to the Funds as collateral.
74 | THE GUGGENHEIM FUNDS SEMI-ANNUAL REPORT | |
NOTES TO CONSOLIDATED FINANCIAL STATEMENTS (Unaudited)(continued) |
The Trust has established counterparty credit guidelines and enters into transactions only with financial institutions rated/identified as investment grade or better. The Trust monitors the counterparty credit risk associated with each such financial institution.
Note 3 – Offsetting
In the normal course of business, the Funds enter into transactions subject to enforceable master netting arrangements or other similar arrangements. Generally, the right to offset in those agreements allows the Funds to counteract the exposure to a specific counterparty with collateral received from or delivered to that counterparty based on the terms of the arrangements. These arrangements provide for the right to liquidate upon the occurrence of an event of default, credit event upon merger or additional termination event.
In order to better define their contractual rights and to secure rights that will help the Funds mitigate their counterparty risk, the Funds may enter into an International Swaps and Derivatives Association, Inc. Master Agreement (“ISDA Master Agreement”) or similar agreement with their derivative contract counterparties. An ISDA Master Agreement is a bilateral agreement between a fund and a counterparty that governs OTC derivatives, including foreign exchange contracts, and typically contains, among other things, collateral posting terms and netting provisions in the event of a default and/or termination event. The provisions of the ISDA Master Agreement typically permit a single net payment in the event of a default (close-out netting) or similar event, including the bankruptcy or insolvency of the counterparty.
For derivatives traded under an ISDA Master Agreement, the collateral requirements are typically calculated by netting the mark-to-market amount for each transaction under such agreement and comparing that amount to the value of any collateral currently pledged by the Funds and the counterparty. For financial reporting purposes, cash collateral that has been pledged to cover obligations of the Funds and cash collateral received from the counterparty, if any, are reported separately on the Funds’ Consolidated Statements of Assets and Liabilities as segregated cash with broker/receivable for variation margin, or payable for swap settlement/variation margin. Cash and/or securities pledged or received as collateral by the Funds in connection with an OTC derivative subject to an ISDA Master Agreement generally may not be invested, sold or rehypothecated by the counterparty or the Funds, as applicable, absent an event of default under such agreement, in which case such collateral generally may be applied towards obligations due to and payable by such counterparty or the Funds, as applicable. Generally, the amount of collateral due from or to a counterparty must exceed a minimum transfer amount threshold (e.g., $300,000) before a transfer is required to be made. To the extent amounts due to the Funds from their counterparties are not fully collateralized, contractually or otherwise, the Funds bear the risk of loss from counterparty nonperformance. The Funds attempt to mitigate counterparty risk by only entering into agreements with counterparties that they believe to be of good standing and by monitoring the financial stability of those counterparties.
| | THE GUGGENHEIM FUNDS SEMI-ANNUAL REPORT | 75 |
NOTES TO CONSOLIDATED FINANCIAL STATEMENTS (Unaudited)(continued) |
For financial reporting purposes, the Funds do not offset derivative assets and derivative liabilities that are subject to netting arrangements in the Funds’ Consolidated Statements of Assets and Liabilities.
The following tables present derivative financial instruments and secured financing transactions that are subject to enforceable netting arrangements:
| | | | | | | | | | | | | | | | Gross Amounts Not
Offset in the Consolidated
Statements of Assets
and Liabilities | | | | | |
Fund | Instrument | | Gross
Amounts of
Recognized
Assets1 | | | Gross
Amounts
Offset in the
Consolidated
Statements
of Assets and
Liabilities | | | Net Amount
of Assets
Presented
on the
Consolidated
Statements
of Assets and
Liabilities | | | Financial
Instruments | | | Cash
Collateral
Received | | | Net
Amount | |
Multi-Hedge Strategies Fund | Custom basket swap agreements | | $ | 6,054,621 | | | $ | — | | | $ | 6,054,621 | | | $ | (530,842 | ) | | $ | — | | | $ | 5,523,779 | |
| | | | | | | | | | | | | | | | Gross Amounts Not
Offset in the Consolidated
Statements of Assets
and Liabilities | | | | | |
Fund | Instrument | | Gross
Amounts of
Recognized
Liabilities1 | | | Gross
Amounts
Offset in the
Consolidated
Statements
of Assets and
Liabilities | | | Net Amount
of Liabilities
Presented
on the
Consolidated
Statements
of Assets and
Liabilities | | | Financial
Instruments | | | Cash
Collateral
Pledged | | | Net
Amount | |
Multi-Hedge Strategies Fund | Custom basket swap agreements | | $ | 530,842 | | | $ | — | | | $ | 530,842 | | | $ | (530,842 | ) | | $ | — | | | $ | — | |
1 | Exchange-traded or centrally-cleared derivatives are excluded from these reported amounts. |
76 | THE GUGGENHEIM FUNDS SEMI-ANNUAL REPORT | |
NOTES TO CONSOLIDATED FINANCIAL STATEMENTS (Unaudited)(continued) |
The Funds have the right to offset deposits against any related derivative liabilities outstanding with each counterparty with the exception of exchange-traded or centrally-cleared derivatives. The following table presents deposits held by others in connection with derivative investments as of June 30, 2023.
Fund | Counterparty | Asset Type | | Cash Pledged | | | Cash Received | |
Multi-Hedge Strategies Fund | Goldman Sachs International | Futures contracts | | $ | 2,084,263 | | | $ | — | |
Commodities Strategy Fund | Goldman Sachs International | Futures contracts | | | 362,252 | | | | — | |
Note 4 – Fair Value Measurement
In accordance with U.S. GAAP, fair value is defined as the price that the Funds would receive to sell an investment or pay to transfer a liability in an orderly transaction between market participants at the measurement date. U.S. GAAP establishes a three-tier fair value hierarchy based on the types of inputs used to value assets and liabilities and requires corresponding disclosure. The hierarchy and the corresponding inputs are summarized below:
Level 1 — | unadjusted quoted prices in active markets for identical assets or liabilities. |
Level 2 — | significant other observable inputs (for example quoted prices for securities that are similar based on characteristics such as interest rates, prepayment speeds, credit risk, etc.). |
Level 3 — | significant unobservable inputs based on the best information available under the circumstances, to the extent observable inputs are not available, which may include assumptions. |
Rule 2a-5 sets forth a definition of “readily available market quotations,” which is consistent with the definition of a Level 1 input under U.S. GAAP. Rule 2a-5 provides that “a market quotation is readily available only when that quotation is a quoted price (unadjusted) in active markets for identical investments that the fund can access at the measurement date, provided that a quotation will not be readily available if it is not reliable.”
Securities for which market quotations are not readily available must be valued at fair value as determined in good faith. Accordingly, any security priced using inputs other than Level 1 inputs will be subject to fair value requirements. The types of inputs available depend on a variety of factors, such as the type of security and the characteristics of the markets in which it trades, if any. Fair valuation determinations that rely on fewer or no observable inputs require greater judgment. Accordingly, fair value determinations for Level 3 securities require the greatest amount of judgment.
| | THE GUGGENHEIM FUNDS SEMI-ANNUAL REPORT | 77 |
NOTES TO CONSOLIDATED FINANCIAL STATEMENTS (Unaudited)(continued) |
The inputs or methodologies selected and applied for valuing securities are not necessarily an indication of the risk associated with investing in those securities. The suitability, appropriateness and accuracy of the techniques, methodologies and sources employed to determine fair valuation are periodically reviewed and subject to change.
Note 5 – Investment Advisory Agreement and Other Agreements
Under the terms of an investment advisory contract, the Funds pay GI investment advisory fees calculated at the annualized rates below, based on the average daily net assets of the Funds:
Fund | | Management Fees
(as a % of Net Assets) | |
Multi-Hedge Strategies Fund | | | 1.15 | % |
Commodities Strategy Fund | | | 0.75 | % |
When the aggregate assets of each series of the Trust (excluding the Long Short Equity Fund, Managed Futures Strategy Fund and Multi-Hedge Strategies Fund) and each series of Rydex Dynamic Funds equal or exceed $10 billion, the advisory fee rate paid by each individual Fund (excluding the Long Short Equity Fund, Managed Futures Strategy Fund and Multi-Hedge Strategies Fund) will be reduced in accordance with the asset level and breakpoint schedule set forth below.
Fund Assets Under Management | | Fund Asset-Based
Breakpoint Reductions | |
$500 million - $1 billion | | | 0.025 | % |
>$1 billion - $2 billion | | | 0.050 | % |
>$2 billion | | | 0.075 | % |
GI has contractually agreed to waive the management fee it receives from each Subsidiary in an amount equal to the management fee paid to GI by the Subsidiary. This undertaking will continue in effect for so long as the Funds invest in the Subsidiaries, and may not be terminated by GI unless GI obtains the prior approval of the Funds’ Board for such termination. Fees waived under this arrangement are not subject to reimbursement to GI. For the period ended June 30, 2023, the Multi-Hedge Strategies Fund and Commodities Strategy Fund waived $17,455 and $5,522, respectively, related to advisory fees in it’s respective Subsidiary.
As part of its agreement with the Trust, GI will pay all expenses of the Multi-Hedge Strategies Fund, including the cost of transfer agency, custody, fund administration, legal, audit and other services, except interest expense, taxes (expected to be de minimis), brokerage commissions and other expenses connected with execution of portfolio transactions, short dividend expenses, subsidiary expenses and extraordinary expenses.
78 | THE GUGGENHEIM FUNDS SEMI-ANNUAL REPORT | |
NOTES TO CONSOLIDATED FINANCIAL STATEMENTS (Unaudited)(continued) |
GI pays operating expenses on behalf of the Trust, such as audit and accounting related services, legal services, custody, printing and mailing, among others, on a pass-through basis. Such expenses are allocated to various Funds within the complex based on relative net assets.
The Board has adopted separate Distribution Plans applicable to A-Class shares, P-Class shares and H-Class shares, for which GFD and other firms that provide distribution and/or shareholder services (“Service Providers”) may receive compensation. If a Service Provider provides distribution services, the Funds will pay distribution fees to GFD at an annual rate not to exceed 0.25% of average daily net assets, pursuant to Rule 12b-1 of the 1940 Act. GFD, in turn, will pay the Service Provider out of its fees. GFD may, at its discretion, retain a portion of such payments to compensate itself for distribution services it performs.
The Board has adopted a separate Distribution and Shareholder Services Plan applicable to C-Class shares that allows the Funds to pay annual distribution and service fees of 1.00% of the Funds’ C-Class shares average daily net assets. The annual 0.25% service fee compensates a shareholder’s financial adviser for providing ongoing services to the shareholder. The annual distribution fee of 0.75% reimburses GFD for paying the shareholder’s financial adviser an ongoing sales commission. GFD advances the first year’s service and distribution fees to the financial adviser. GFD retains the service and distribution fees on accounts with no authorized dealer of record.
For the period ended June 30, 2023, GFD retained sales charges of $32,189 relating to sales of A-Class shares of the Trust.
If a Fund invests in a fund that is advised by the same adviser or an affiliated adviser, the investing Fund’s adviser has agreed to waive fees at the investing fund level to the extent necessary to offset the proportionate share of any management fee paid by each Fund with respect to its investment in such affiliated fund. Fee waivers will be calculated at the investing fund level without regard to any expense cap in effect for the investing fund. Fees waived under this arrangement are not subject to reimbursement to GI. For the period ended June 30, 2023, the Multi-Hedge Strategies Fund and Commodities Strategy Fund waived $8,129 and $1,708, respectively, related to investments in affiliated funds.
Certain trustees and officers of the Trust are also officers of GI and/or GFD. The Trust does not compensate its officers or trustees who are officers, directors and/or employees of GI or GFD.
MUFG Investor Services (US), LLC (“MUIS”) acts as the Funds’ administrator, transfer agent and accounting agent. As administrator, transfer agent and accounting agent, MUIS maintains the books and records of the Funds’ securities and cash. U.S. Bank, N.A. (“U.S. Bank”) acts as the Funds’ custodian. As custodian, U.S. Bank is responsible for the custody of the Funds’ assets. For providing the aforementioned services, MUIS and U.S. Bank are entitled to receive a monthly fee equal to an annual percentage of each Fund’s average daily net assets and out of pocket expenses.
| | THE GUGGENHEIM FUNDS SEMI-ANNUAL REPORT | 79 |
NOTES TO CONSOLIDATED FINANCIAL STATEMENTS (Unaudited)(continued) |
Note 6 – Repurchase Agreements
The Funds transfer uninvested cash balances into a single joint account, the daily aggregate balance of which is invested in one or more repurchase agreements collateralized by obligations of the U.S. Treasury and U.S. government agencies. The joint account includes other Funds in the Guggenheim complex not covered in this report. The collateral is in the possession of the Funds’ custodian and is evaluated to ensure that its market value exceeds, at a minimum, 102% of the original face amount of the repurchase agreements. Each Fund holds a pro rata share of the collateral based on the dollar amount of the repurchase agreement entered into by each Fund.
At June 30, 2023, the repurchase agreements in the joint account were as follows:
Counterparty and
Terms of Agreement | | Face
Value | | | Repurchase
Price | | | Collateral | | Par
Value | | | Fair
Value | |
J.P. Morgan Securities LLC | | | | | | | | | | U.S. Treasury Inflation Indexed Bond | | | | | | | | |
5.05% | | | | | | | | | | 3.63% | | | | | | | | |
Due 07/03/23 | | $ | 137,286,751 | | | $ | 137,344,526 | | | Due 04/15/28 | | $ | 129,694,939 | | | $ | 140,030,466 | |
| | | | | | | | | | | | | | | | | | | |
| | | | | | | | | | | U.S. Treasury Notes | | | | | | | | |
| | | | | | | | | | | 0.25% - 2.75% | | | | | | | | |
| | | | | | | | | | | Due 09/30/23 - 03/31/27 | | | 2,100 | | | | 2,022 | |
| | | | | | | | | | | | | | 129,697,039 | | | | 140,032,488 | |
| | | | | | | | | | | | | | | | | | | |
Barclays Capital, Inc. | | | | | | | | | | U.S. Treasury Inflation Indexed Bond | | | | | | | | |
5.06% | | | | | | | | | | 0.13% - 0.75% | | | | | | | | |
Due 07/03/23 | | | 60,399,250 | | | | 60,424,719 | | | Due 10/15/26 - 02/15/45 | | | 68,592,589 | | | | 61,607,304 | |
| | | | | | | | | | | | | | | | | | | |
BofA Securities, Inc. | | | | | | | | | | U.S. Treasury Inflation Indexed Bond | | | | | | | | |
5.06% | | | | | | | | | | 0.50% | | | | | | | | |
Due 07/03/23 | | | 54,908,410 | | | | 54,931,563 | | | Due 01/15/28 | | | 59,873,011 | | | | 56,006,594 | |
In the event of counterparty default, the Funds have the right to collect the collateral to offset losses incurred. There is potential loss to the Funds in the event the Funds are delayed or prevented from exercising their rights to dispose of the collateral securities, including the risk of a possible decline in the value of the underlying securities during the period while the Funds seek to assert their rights. GI, acting under the supervision of the Board, reviews the value of the collateral and the creditworthiness of those banks and dealers with which the Funds enter into repurchase agreements to evaluate potential risks.
Note 7 – Portfolio Securities Loaned
The Funds may lend their securities to approved brokers to earn additional income. Security lending income shown on the Funds’ Consolidated Statements of Operations is shown net of rebates paid to the borrowers and earnings on cash collateral investments shared with the lending
80 | THE GUGGENHEIM FUNDS SEMI-ANNUAL REPORT | |
NOTES TO CONSOLIDATED FINANCIAL STATEMENTS (Unaudited)(continued) |
agent. Within this arrangement, the Funds act as the lender, U.S. Bank acts as the lending agent, and other approved registered broker dealers act as the borrowers. The Funds receive cash collateral, valued at 102% of the value of the securities on loan. Under the terms of the Funds’ securities lending agreement with U.S. Bank, cash collateral and proceeds are invested in the First American Government Obligations Fund — Class X. The Funds bear the risk of loss on cash collateral investments. Collateral is maintained over the life of the loan in an amount not less than the value of loaned securities, as determined at the close of fund business each day; any additional collateral required due to changes in security values is delivered to the Funds the next business day. Although the collateral mitigates the risk, the Funds could experience a delay in recovering their securities and a possible loss of income or value if the borrower fails to return the securities. The Funds have the right under the securities lending agreement to recover the securities from the borrower on demand. Securities lending transactions are accounted for as secured borrowings. The remaining contractual maturity of the securities lending agreement is overnight and continuous.
At June 30, 2023, the Funds participated in securities lending transactions, which are subject to enforceable netting arrangements, as follows:
| | | Gross Amounts Not Offset in the Consolidated
Statements of Assets and Liabilities | | | | Securities Lending Collateral | |
Fund | | Value of
Securities
Loaned | | | Collateral
Received(a) | | | Net
Amount | | | | Cash
Collateral
Invested | | | Cash
Collateral
Uninvested | | | Total
Collateral | |
Multi-Hedge Strategies Fund | | $ | 633,039 | | | $ | (633,039 | ) | | $ | — | | | | $ | 660,141 | | | $ | — | | | $ | 660,141 | |
(a) | Actual collateral received by the Fund is generally greater than the amount shown due to overcollateralization. |
In the event of counterparty default, the Funds have the right to collect the collateral to offset losses incurred. There is potential loss to the Funds in the event the Funds are delayed or prevented from exercising their rights to dispose of the collateral securities, including the risk of a possible decline in the value of the underlying securities during the period while the Funds seek to assert their rights. GI, acting under the supervision of the Board, reviews the value of the collateral and the creditworthiness of those banks and dealers to evaluate potential risks.
Note 8 – Federal Income Tax Information
The Funds intend to comply with the provisions of Subchapter M of the Internal Revenue Code of 1986, as amended (the “Internal Revenue Code”), applicable to regulated investment companies and will distribute substantially all taxable net investment income and capital gains sufficient to relieve the Funds from all, or substantially all, federal income, excise and state income taxes. Therefore, no provision for federal or state income tax or federal excise tax is required.
| | THE GUGGENHEIM FUNDS SEMI-ANNUAL REPORT | 81 |
NOTES TO CONSOLIDATED FINANCIAL STATEMENTS (Unaudited)(continued) |
Tax positions taken or expected to be taken in the course of preparing the Funds’ tax returns are evaluated to determine whether the tax positions are “more-likely-than-not” of being sustained by the applicable tax authority. Tax positions not deemed to meet the more-likely-than-not threshold would be recorded as a tax benefit or expense in the current year. Management has analyzed the Funds’ tax positions taken, or to be taken, on U.S. federal income tax returns for all open tax years, and has concluded that no provision for income tax is required in the Funds’ consolidated financial statements. The Funds’ U.S. federal income tax returns are subject to examination by the Internal Revenue Service (“IRS”) for a period of three years after they are filed.
The Funds intend to invest up to 25% of their assets in the respective Subsidiary which is expected to provide the Funds with exposure to the commodities markets within the limitations of the U.S. federal income tax requirements under Subchapter M of the Internal Revenue Code. The Funds have received a private letter ruling from the IRS that concludes that the income the Funds receive from the Subsidiary will constitute qualifying income for purposes of Subchapter M of the Internal Revenue Code. The Subsidiary will be classified as a corporation for U.S. federal income tax purposes. A foreign corporation, such as the Subsidiary, will generally not be subject to U.S. federal income taxation unless it is deemed to be engaged in a U.S. trade or business. If, during a taxable year, the Subsidiary’s taxable losses (and other deductible items) exceed its income and gains, the net loss will not pass through to the Fund as a deductible amount for U.S. federal income tax purposes and cannot be carried forward to reduce future income from the Subsidiary in subsequent years.
At June 30, 2023, the cost of investments for U.S. federal income tax purposes, the aggregate gross unrealized appreciation for all investments for which there was an excess of value over tax cost, and the aggregate gross unrealized depreciation for all investments for which there was an excess of tax cost over value, were as follows:
Fund | | Tax
Cost | | | Tax
Unrealized
Appreciation | | | Tax
Unrealized
Depreciation | | | Net Tax
Unrealized
Appreciation
(Depreciation) | |
Multi-Hedge Strategies Fund | | $ | 65,963,391 | | | $ | 9,690,453 | | | $ | (4,858,106 | ) | | $ | 4,832,347 | |
Commodities Strategy Fund | | | 6,021,352 | | | | 42,976 | | | | (501,275 | ) | | | (458,299 | ) |
Note 9 – Securities Transactions
For the period ended June 30, 2023, the cost of purchases and proceeds from sales of investment securities, excluding government securities, short-term investments and derivatives, were as follows:
Fund | | Purchases | | | Sales | |
Multi-Hedge Strategies Fund | | $ | 50,795,266 | | | $ | 64,962,122 | |
Commodities Strategy Fund | | | — | | | | — | |
82 | THE GUGGENHEIM FUNDS SEMI-ANNUAL REPORT | |
NOTES TO CONSOLIDATED FINANCIAL STATEMENTS (Unaudited)(continued) |
The Funds are permitted to purchase or sell securities from or to certain affiliated funds under specified conditions outlined in procedures adopted by the Board. The procedures have been designed to ensure that any purchase or sale of securities by a Fund from or to another fund or portfolio that is or could be considered an affiliate by virtue of having a common investment adviser (or affiliated investment advisers), common trustees and/or common officers complies with Rule 17a-7 of the 1940 Act. Further, as defined under these procedures, each transaction is effected at the current market price to save costs, where permissible. For the period ended June 30, 2023, the Funds did not engage in purchases and sales of securities, pursuant to Rule 17a-7 of the 1940 Act.
Note 10 – Line of Credit
The Trust, along with other affiliated trusts, secured an uncommitted $200,000,000 line of credit from U.S. Bank, N.A. On June 5, 2023, the line of credit agreement was renewed and expires on June 3, 2024. This line of credit is reserved for emergency or temporary purposes. Borrowings, if any, under this arrangement bear interest equal to the Prime Rate, minus 2%, which shall be paid monthly, averaging 5.83% for the period ended June 30, 2023. The Funds did not have any borrowings outstanding under this agreement at June 30, 2023.
The average daily balances borrowed for the period ended June 30, 2023, were as follows:
Fund | | Average Daily Balance | |
Multi-Hedge Strategies Fund | | $ | 2,099 | |
Note 11 – Market Risks
The value of, or income generated by, the investments held by the Funds are subject to the possibility of rapid and unpredictable fluctuation, and loss that may result from various factors. These factors include, among others, developments affecting individual companies, or from broader influences, including real or perceived changes in prevailing interest rates (which have since risen and may continue to rise), changes in inflation rates or expectations about inflation rates (which are currently elevated relative to normal conditions), adverse investor confidence or sentiment, changing economic, political (including geopolitical), social or financial market conditions, increased instability or general uncertainty, environmental disasters, governmental actions, public health emergencies (such as the spread of infectious diseases, pandemics and epidemics), debt crises, actual or threatened wars or other armed conflicts (such as the current Russia-Ukraine conflict and its risk of expansion or collateral economic and other effects) or ratings downgrades, and other similar events, each of which may be temporary or last for extended periods. Moreover, changing economic, political, geopolitical, social, financial market or other conditions in one country or geographic region could adversely affect the value, yield and return of the investments held by the Funds in a different country or geographic region, economy, and market because of the increasingly interconnected global economies and financial markets. The duration and extent of the foregoing types of factors or conditions are highly uncertain and
| | THE GUGGENHEIM FUNDS SEMI-ANNUAL REPORT | 83 |
NOTES TO CONSOLIDATED FINANCIAL STATEMENTS (Unaudited)(concluded) |
difficult to predict and have in the past, and may in the future, cause volatility and distress in economies and financial markets or other adverse circumstances, which may negatively affect the value of the Funds’ investments and performance of the Funds.
Note 12 – Subsequent Events
On May 24, 2023, the Board approved a waiver and/or expense reimbursement arrangement whereby GI has agreed to waive and/or reimburse expenses for Commodities Strategy Fund in an amount equal to an annual percentage rate of 0.05% of the Fund’s average daily net assets. This arrangement will take effect on August 1, 2023 and the end of the initial term is August 1, 2024. This agreement shall automatically renew for one-year terms, unless GI provides written notice to the Fund of the termination at least thirty days prior to the end of the then-current term. This agreement may be terminated at any time by the Fund’s Board of Trustees upon sixty days’ written notice.
The Funds evaluated subsequent events through the date the consolidated financial statements are issued and determined there were no additional material events that would require adjustment to or disclosure in the Funds’ consolidated financial statements.
84 | THE GUGGENHEIM FUNDS SEMI-ANNUAL REPORT | |
OTHER INFORMATION (Unaudited) |
Delivery of Shareholder Reports
Paper copies of the Funds’ annual and semi-annual shareholder reports are not sent by mail, unless you specifically request paper copies of the reports from a fund or from your financial intermediary. Instead, the reports are made available on a website, and you are notified by mail each time a report is posted and provided with a website link to access the report.
You may elect to receive all future shareholder reports in paper free of charge. If you hold shares of a fund directly, you can inform the Fund that you wish to receive paper copies of reports by calling 800.820.0888. If you hold shares of a fund through a financial intermediary, please contact the financial intermediary to make this election. Your election to receive reports in paper may apply to all Guggenheim Funds in which you are invested and may apply to all Guggenheim funds held with your financial intermediary.
Proxy Voting Information
A description of the policies and procedures that the Trust uses to determine how to vote proxies relating to securities held in the Funds’ portfolios is available, without charge and upon request, by calling 800.820.0888. This information is also available from the EDGAR database on the SEC’s website at https://www.sec.gov.
Information regarding how the Funds voted proxies relating to portfolio securities during the most recent 12-month period ended June 30 is available without charge, upon request, by calling 800.820.0888. This information is also available from the EDGAR database on the SEC’s website at https://www.sec.gov.
Sector Classification
Information in the Consolidated Schedule of Investments is categorized by sectors using sector-level Classifications defined by the Bloomberg Industry Classification System, a widely recognized industry classification system provider. Each Fund’s registration statement has investment policies relating to concentration in specific sectors/industries. For purposes of these investment policies, the Funds usually classify sectors/industries based on industry-level Classifications used by widely recognized industry classification system providers such as Bloomberg Industry Classification System, Global Industry Classification Standards and Barclays Global Classification Scheme.
Quarterly Portfolio Schedules Information
The Trust files its complete schedule of portfolio holdings with the SEC for the first and third quarters of each fiscal year as an exhibit to its reports on Form N-PORT, and for reporting periods ended prior to March 31, 2019, filed such information on Form N-Q. The Funds’ Forms N-PORT and N-Q are available on the SEC’s website at https://www.sec.gov. Copies of the portfolio holdings are also available to shareholders, without charge and upon request, by calling 800.820.0888.
| | THE GUGGENHEIM FUNDS SEMI-ANNUAL REPORT | 85 |
OTHER INFORMATION (Unaudited)(continued) |
Report of the Rydex Series Funds Board of Trustees
The Board of Trustees of Rydex Series Funds (the “Trust”), including the Independent Trustees, unanimously approved the renewal of the investment management agreement (the “Advisory Agreement”) with Security Investors, LLC (“Security Investors” or the “Adviser”) on behalf of the series of the Trust listed below (each a “Fund” and collectively, the “Funds”):
Tradable Funds (Including Sector Funds*)
● | Banking Fund* | ● | Basic Materials Fund* |
● | Biotechnology Fund* | ● | Commodities Strategy Fund |
● | Consumer Products Fund* | ● | Dow Jones Industrial Average Fund |
● | Electronics Fund* | ● | Emerging Markets 2x Strategy Fund |
● | Emerging Markets Bond Strategy Fund | ● | Energy Fund* |
● | Energy Services Fund* | ● | Europe 1.25x Strategy Fund |
● | Financial Services Fund* | ● | Government Long Bond 1.2x Strategy Fund |
● | Health Care Fund* | ● | High Yield Strategy Fund |
● | Internet Fund* | ● | Inverse Emerging Markets 2x Strategy Fund |
● | Inverse Government Long Bond Strategy Fund | ● | Inverse High Yield Strategy Fund |
● | Inverse Mid-Cap Strategy Fund | ● | Inverse NASDAQ-100 Strategy Fund |
● | Inverse Russell 2000 Strategy Fund | ● | Inverse S&P 500 Strategy Fund |
● | Japan 2x Strategy Fund | ● | Leisure Fund* |
● | Mid-Cap 1.5x Strategy Fund | ● | Monthly Rebalance NASDAQ-100 2x Strategy Fund |
● | NASDAQ-100 Fund | ● | Nova Fund |
● | Precious Metals Fund* | ● | Real Estate Fund |
● | Retailing Fund* | ● | Russell 2000 1.5x Strategy Fund |
● | Russell 2000 Fund | ● | S&P 500 Fund |
● | S&P 500 Pure Growth Fund | ● | S&P 500 Pure Value Fund |
● | S&P MidCap 400 Pure Growth Fund | ● | S&P MidCap 400 Pure Value Fund |
● | S&P SmallCap 600 Pure Growth Fund | ● | S&P SmallCap 600 Pure Value Fund |
● | Strengthening Dollar 2x Strategy Fund | ● | Technology Fund* |
● | Telecommunications Fund* | ● | Transportation Fund* |
● | Utilities Fund* | ● | U.S. Government Money Market Fund |
● | Weakening Dollar 2x Strategy Fund | | |
86 | THE GUGGENHEIM FUNDS SEMI-ANNUAL REPORT | |
OTHER INFORMATION (Unaudited)(continued) |
Alternative Funds** (i.e., Non-Tradable Funds)
● | Long Short Equity Fund** | ● | Managed Futures Strategy Fund** |
● | Multi-Hedge Strategies Fund** | | |
* | Each a “Sector Fund” and collectively, the “Sector Funds.” |
** | Each an “Alternative Fund” and collectively, the “Alternative Funds.” Each Fund other than the Alternative Funds is referred to herein as a “Tradable Fund” and collectively, the “Tradable Funds.” |
Security Investors1 is an indirect subsidiary of Guggenheim Partners, LLC, a privately-held, global investment and advisory firm (“Guggenheim Partners”). Guggenheim Partners, Security Investors and their affiliates may be referred to herein collectively as “Guggenheim.” “Guggenheim Investments” refers to the global asset management and investment advisory division of Guggenheim Partners and includes Security Investors, Guggenheim Partners Investment Management, LLC, Guggenheim Funds Investment Advisors, LLC and other affiliated investment management businesses of Guggenheim Partners.
At meetings held in person on April 17-18, 2023 (the “April Meeting”) and meetings held by videoconference on May 15, 2023 and in person on May 24, 2023 (the “May Meeting”), the Contracts Review Committee of the Board (the “Committee”), consisting solely of the Independent Trustees, met separately from Guggenheim to consider the proposed renewal of the Advisory Agreement. As part of its review process, the Committee was represented by independent legal counsel to the Independent Trustees (“Independent Legal Counsel”), from whom the Independent Trustees received separate legal advice and with whom they met separately. Independent Legal Counsel reviewed and discussed with the Committee various key aspects of the Trustees’ legal responsibilities relating to the proposed renewal of the Advisory Agreement and other principal contracts. The Committee took into account various materials received from Guggenheim and Independent Legal Counsel. The Committee also considered the variety of written materials, reports and oral presentations the Board received throughout the year regarding performance and operating results of the Funds, and other information relevant to its evaluation of the Advisory Agreement.
1 | Security Investors also serves as investment adviser to each of Rydex Series Funds Commodities Strategy CFC, Rydex Managed Futures Strategy CFC and Rydex Series Funds Multi-Hedge Strategies CFC (each a “Subsidiary” and collectively, the “Subsidiaries”), wholly-owned subsidiaries of the Trust that are organized as limited companies under the laws of the Cayman Islands and used by Commodities Strategy Fund, Managed Futures Strategy Fund and Multi-Hedge Strategies Fund, respectively, to obtain commodities exposure. Pursuant to a separate investment management agreement for each Subsidiary (each a “Subsidiary Advisory Agreement” and collectively, the “Subsidiary Advisory Agreements”), the Subsidiary pays Security Investors an advisory fee at the same rate that the respective Fund pays Security Investors under the Advisory Agreement. The Subsidiary Advisory Agreements do not require annual renewal by the Board and will continue until they are terminated as provided in the Agreements. In addition, Security Investors has entered into a separate waiver agreement with respect to each applicable Fund pursuant to which Security Investors has contractually agreed to waive the advisory fee it receives from the Fund in an amount equal to the advisory fee paid to Security Investors by the respective Subsidiary. This undertaking will continue with respect to each applicable Fund for so long as the Fund invests in the respective Subsidiary, and may be terminated only with the approval of the Board. |
| | THE GUGGENHEIM FUNDS SEMI-ANNUAL REPORT | 87 |
OTHER INFORMATION (Unaudited)(continued) |
In connection with the contract review process, FUSE Research Network LLC (“FUSE”), an independent, third-party research provider, was engaged to prepare advisory contract renewal reports designed specifically to help the Board fulfill its advisory contract renewal responsibilities. The objective of the FUSE reports is to present the subject funds’ relative position regarding fees, expenses and total return performance, with peer group and universe comparisons. The Committee assessed the data provided in the FUSE reports as well as commentary presented by Guggenheim, including, among other things, a list of Funds for which no peer funds were identified, a summary of notable distinctions between certain Funds and the applicable peer group identified in the FUSE reports and explanations for custom peer groups created for certain Funds that do not fit well into any particular category.
As part of its evaluation of the Adviser and the proposed renewal of the Advisory Agreement, the Committee took into account that the beneficial owners of the Funds are clients of tactical advisors who are engaged to provide tactical asset allocation investment advisory services. Each Tradable Fund is designed to provide such tactical advisors with specific exposures (with the exception of the U.S. Government Money Market Fund which is designed to support tactical advisors seeking to avoid market exposure or preserve capital) while also providing for unlimited trading privileges, and that the Tradable Funds offer a unique set of product features. The Committee noted that each Tradable Fund (other than the U.S. Government Money Market Fund) seeks to track, or correlate to, the performance (before fees and expenses) of a specific benchmark index over certain time periods or a specific market, noting that, because appropriate published indices are not available for many of the Sector Funds and the Real Estate Fund, the Adviser has developed its own methodology to construct internal performance benchmarks for the Sector Funds and the Real Estate Fund. In this regard, the Committee received information regarding the Adviser’s proprietary methodology for constructing internal performance benchmarks for such Funds, including the personnel with primary responsibility for the maintenance and execution of the methodology. The Committee also noted that, in addition to the performance information included in the FUSE reports, the Adviser provided tracking error data for each Tradable Fund (other than the U.S. Government Money Market Fund) relative to the applicable benchmark index or Guggenheim-constructed internal performance benchmark. The Committee took into account the limitations of the peer group and universe comparisons provided by FUSE with respect to the Tradable Funds in light of their unique features and the limited size of the marketplace for tradable funds designed to support tactical advisors, noting that there are only two direct competitor product suites.
In addition, Guggenheim provided materials and data in response to formal requests for information sent by Independent Legal Counsel on behalf of the Committee. Guggenheim also made a presentation at the April Meeting. Throughout the process, the Committee asked questions of management and requested certain additional information, which Guggenheim provided (collectively with the foregoing reports and materials, the “Contract Review Materials”).
88 | THE GUGGENHEIM FUNDS SEMI-ANNUAL REPORT | |
OTHER INFORMATION (Unaudited)(continued) |
The Committee considered the Contract Review Materials in the context of its accumulated experience governing the Trust and other Guggenheim funds and weighed the factors and standards discussed with Independent Legal Counsel.
Following an analysis and discussion of relevant factors, including those identified below, and in the exercise of its business judgment, the Committee concluded that the Advisory Agreement represented a reasonable business arrangement negotiated at arm’s length and that it was in the best interest of each Fund to recommend that the Board approve the renewal of the Advisory Agreement for an additional annual term. Following its review of the Committee’s recommendation, the Board approved the renewal of the Advisory Agreement for each Fund for a one-year period ending August 1, 2024 at a meeting held on May 23-24, 2023 (the “May Board Meeting” and together with the May Meeting, the “May Meetings”) and determined to adopt the Committee’s considerations and conclusions, which follow.
Nature, Extent and Quality of Services Provided by the Adviser: With respect to the nature, extent and quality of services currently provided by the Adviser, the Committee considered the qualifications, experience and skills of key personnel performing services for the Funds, including those personnel providing compliance and risk oversight, as well as the supervisors and reporting lines for such personnel. The Committee also considered other information, including Guggenheim’s resources and related efforts to retain, attract and motivate capable personnel to serve the Funds. In evaluating Guggenheim’s resources and capabilities, the Committee considered Guggenheim’s commitment to focusing on, and investing resources in support of, funds in the Guggenheim fund complex, including the Funds. The Committee also considered Guggenheim’s discussion of its ongoing review of the Guggenheim fund line-up at the April Meeting and the May Board Meeting. In addition, the Committee considered the acceptability of the terms of the Advisory Agreement, including the scope of services required to be performed by the Adviser.
The Committee’s review of the services provided by Guggenheim to the Funds included consideration of Guggenheim’s investment processes and index methodologies and resulting performance, portfolio oversight and risk management, and the related regular quarterly reports and presentations received by the Board. The Committee took into account the risks borne by Guggenheim in sponsoring and providing services to the Funds, including regulatory, operational, legal and entrepreneurial risks. The Committee considered the resources dedicated by Guggenheim to compliance functions and the reporting made to the Board by Guggenheim compliance personnel regarding Guggenheim’s adherence to regulatory requirements. The Committee also considered the regular reports the Board receives from the Trust’s Chief Compliance Officer regarding compliance policies and procedures established pursuant to Rule 38a-1 under the Investment Company Act of 1940, as amended.
With respect to the Tradable Funds, the Committee considered their unique product features, including their tradability, the real time cash process employed for such Funds, twice-daily pricing for certain Tradable Funds on select trading platforms, and the leveraged and inverse strategies
| | THE GUGGENHEIM FUNDS SEMI-ANNUAL REPORT | 89 |
OTHER INFORMATION (Unaudited)(continued) |
offered, the Adviser’s assessment of the value to shareholders provided by the Funds’ structure and the services required by the Adviser to provide the Funds’ unique features, as well as the personnel responsible for such services. The Committee noted that the Tradable Funds allow frequent trading and unlimited exchange privileges among like share classes and noted the magnitude of changes in each Fund’s assets during 2022, 2021 and 2020. The Committee also considered additional information regarding trading activity in the Tradable Funds during 2022, including monthly purchases and redemptions in dollar value and in number of transactions as well as transaction volume relative to the assets in the Tradable Funds. In this regard, the Committee noted that the real time cash process is utilized by the Adviser to aggregate shareholder flow data to estimate daily net subscriptions or redemptions in order to mitigate the costs associated with the tradability feature, improve tracking and keep the Funds fully invested. The Committee took into account the infrastructure developed by the Adviser to manage the significant volume and size of trading that typically occurs near the end of each business day, as well as the unique considerations required in the portfolio construction process to determine the optimal way to obtain the applicable exposures, including leveraged and inverse exposures, while allowing for high turnover. In addition, the Committee considered information provided by the Adviser analyzing the potential costs to shareholders of investing in tradable mutual funds, such as the Tradable Funds, compared to those of investing in exchange-traded funds, including expense ratios, brokerage commissions and spread costs, as well as the relative advantages and disadvantages of each investment product. The Committee considered that, at the April Meeting, the Adviser’s Head of Quantitative Strategies with investment management responsibility for the Tradable Funds met with the Committee to discuss the Tradable Funds, including the value to shareholders of the tradability and other unique features, the personnel, operations and infrastructure required to provide those features, the reasons why tactical advisors invest in the Tradable Funds rather than other tradable products, such as exchange-traded funds, for their clients, and the level of trading activity in the Tradable Funds. With respect to the Sector Funds and the Real Estate Fund, the Committee also considered the Adviser’s proprietary methodology for constructing internal performance benchmarks for such Funds, noting the Adviser’s statement that it uses a quantitative portfolio investment process that also requires investment discretion in implementing adjustments for factors that affect tradability and liquidity, changing dynamics within a sector, and corporate actions such as spin-offs, among other adjustments.
In connection with the Committee’s evaluation of the overall package of services provided by Guggenheim, the Committee considered Guggenheim’s administrative services, including its role in supervising, monitoring, coordinating and evaluating the various services provided by the fund administrator, transfer agent, distributor, custodian and other service providers to the Funds. The Committee evaluated the Office of Chief Financial Officer (the “OCFO”), established to oversee the fund administration, accounting and transfer agency services provided to the Funds and other Guggenheim funds, including the OCFO’s resources, personnel and services provided.
90 | THE GUGGENHEIM FUNDS SEMI-ANNUAL REPORT | |
OTHER INFORMATION (Unaudited)(continued) |
With respect to Guggenheim’s resources and the ability of the Adviser to carry out its responsibilities under the Advisory Agreement, the Chief Financial Officer of Guggenheim Investments reviewed with the Committee financial information concerning the holding company for Guggenheim Investments, Guggenheim Partners Investment Management Holdings, LLC (“GPIMH”), and the various entities comprising Guggenheim Investments, and provided the audited consolidated financial statements of GPIMH.
Based on the foregoing, and based on other information received (both oral and written) at the April Meeting and the May Meetings, as well as other considerations, including the Committee’s knowledge of how the Adviser performs its duties obtained through Board meetings, discussions and reports throughout the year, the Committee concluded that the Adviser and its personnel were qualified to serve the Funds in such capacity and may reasonably be expected to continue to provide a high quality of services under the Advisory Agreement with respect to the Funds.
Investment Performance: Except as otherwise noted, the Committee received, for each Fund, investment returns for the since-inception, ten-year, five-year, three-year, one-year and three-month periods ended December 31, 2022, as applicable. For certain Tradable Funds with only one or two identified peer funds, if any, from the two direct competitor product suites, only investment returns for the five-year, three-year and one-year periods ended December 31, 2022, as applicable, were received. In addition, the Committee received a comparison of each Fund’s performance to the performance of a benchmark and a peer group of similar funds based on asset levels as identified by FUSE, and for certain Funds, a broader universe of funds, in each case for the same periods, as applicable. The Committee also received from FUSE a description of the methodology for identifying each Fund’s peer group and universe, if any, for performance and expense comparisons. For the Tradable Funds (other than the U.S. Government Money Market Fund), the Committee received tracking error data for such Funds relative to the applicable benchmark index or Guggenheim-constructed internal performance benchmark for the five-year, three-year and one-year periods ended December 31, 2022, as applicable. For certain Tradable Funds with only one or two identified peer funds from the two direct competitor product suites, the Committee received a comparison of the tracking error of each Fund’s Class H shares to the tracking error of a peer fund, in each case for the same periods, as applicable. The Committee also received certain performance information for the Alternative Funds (i.e., the non-Tradable Funds) as of March 31, 2023. In assessing each Fund’s performance, the Committee considered that the Board receives regular reporting from Guggenheim regarding performance and evaluates performance throughout the year.
With respect to the Tradable Funds (other than the U.S. Government Money Market Fund), the Committee considered the Adviser’s statement that such Funds are designed as a suite of products seeking to provide a number of broad and specific exposures for tactical advisors and also considered that the Funds have a unique set of product features designed to meet the needs of those tactical advisors, which has an impact on performance. The Committee considered the Adviser’s statement that, in circumstances where there are significant deviations from expected returns, management seeks to understand the cause of such deviations and determine if any
| | THE GUGGENHEIM FUNDS SEMI-ANNUAL REPORT | 91 |
OTHER INFORMATION (Unaudited)(continued) |
remedial actions should be considered, noting that no such remedial actions were currently deemed necessary by the Adviser to address performance. The Committee also considered the Adviser’s discussion of factors that contribute to such deviations, including shareholder activity, financing costs associated with leverage and investment instruments used to achieve certain exposures, noting the Adviser’s statement that expenses and transaction costs based on shareholder activity are the primary drivers of performance differences. In this connection, the Committee considered the tracking error of each Fund’s Class H shares relative to its applicable benchmark index or Guggenheim-constructed internal performance benchmark and, for certain Tradable Funds, compared to the tracking error of a peer fund. The Committee considered the Adviser’s commentary explaining the higher levels of tracking error for certain Funds.
With respect to certain Tradable Funds with only one or two identified peer funds, if any, from the two direct competitor product suites, the Committee considered the Adviser’s summary of notable distinctions between the Tradable Funds and the peer funds in the two direct competitor product suites and noted the Adviser’s statement that certain Tradable Funds do not have any peer funds that provide the same index, leverage or inverse exposure. The Committee also considered management’s commentary explaining instances of significant underperformance (defined as greater than 100 basis points) of such Funds’ Class H shares over the five-year, three-year and/or one-year periods ended December 31, 2022, relative to their respective peer funds, attributing such relative underperformance to, among other factors, differences in portfolio construction methodologies and exposures. The Committee noted that the two direct competitor product suites do not offer a fund comparable to either the Commodities Strategy Fund or the Emerging Markets Bond Strategy Fund. The Committee considered, for each of the Commodities Strategy Fund and the Emerging Markets Bond Strategy Fund, a comparison to a peer group identified in the FUSE report that includes actively-managed funds, in each case noting the limitations in the comparability of such peer group.
With respect to the U.S. Government Money Market Fund, the Committee noted the Adviser’s statement that the Fund is designed to support tactical advisors seeking to avoid market exposure or preserve capital and that only one other fund in its peer group identified in the FUSE report has product features that make it comparable in this regard. The Committee considered that the Fund performed in line with the comparable peer fund over the five-year and three-year periods ended December 31, 2022, while, in contrast, its performance ranked in the fourth quartile of the broader peer group over the five-year, three-year and one-year time periods.
With respect to the Sector Funds and the Real Estate Fund, the Committee considered the Adviser’s summary of notable distinctions between each Fund and the applicable peer group identified in the FUSE reports. The Committee considered that the peer groups are comprised of actively-managed funds seeking similar exposures but that do not offer the same product features, including unlimited trading privileges, noting the Adviser’s statement that certain peer funds also cover a narrower or wider market segment than the applicable Fund. The Committee considered management’s commentary explaining the underperformance, as applicable, of such Funds’ Class H shares over the five-year, three-year and one-year periods ended December 31, 2022, relative
92 | THE GUGGENHEIM FUNDS SEMI-ANNUAL REPORT | |
OTHER INFORMATION (Unaudited)(continued) |
to their respective peer groups, attributing such underperformance to, among other factors, high turnover associated with daily shareholder flows, differences in exposures and the Funds’ modified cap weighting approach to portfolio construction.
With respect to the Alternative Funds (i.e., the non-Tradable Funds), in seeking to evaluate Fund performance over a full market cycle, the Committee focused its attention on five-year and three-year performance rankings as compared to the relevant universe of funds. The Committee observed that the returns of the Multi-Hedge Strategies Fund’s Institutional Class shares ranked in the second quartile of its performance universe for each of the relevant periods considered. In addition, the Committee made the following observations:
Long Short Equity Fund: The returns of the Fund’s Institutional Class shares ranked in the 87th and 49th percentiles of its performance universe for the five-year and three-year periods ended December 31, 2022, respectively. The Committee noted management’s explanation that the Fund’s relative underperformance over the five-year time period was primarily due to the Fund’s fundamental factor tilts. The Committee noted management’s statement that the Fund’s long exposure to value detracted from investment performance from early 2018 through early 2020 as growth stocks outperformed during that period. The Committee also noted management’s statement that the Fund’s net short exposure to oil prices within the energy sector following the onset of the Russia-Ukraine war in early 2022 also contributed to relative underperformance.
Managed Futures Strategy Fund: The returns of the Fund’s Institutional Class shares ranked in the 82nd and 83rd percentiles of its performance universe for the five-year and three-year periods ended December 31, 2022, respectively. The Committee noted management’s explanation that the Fund’s relative underperformance over the five-year and three-year time periods was primarily due to the Fund targeting a lower level of risk relative to its performance universe. The Committee took into account management’s statements that the portfolio management team increased the Fund’s risk target in 2021 to be more in line with peers and the Fund experienced a performance ranking that compared more favorably relative to its performance universe for the one-year period ended December 31, 2022. The Committee also noted management’s further explanation of the Fund’s performance at the April Meeting.
Based on the foregoing, and based on other information received (both oral and written) at the April Meeting and the May Meetings, as well as other considerations, the Committee concluded that: (i) each Fund’s performance was acceptable; or (ii) it was satisfied with Guggenheim’s responses and/or efforts to improve investment performance.
Comparative Fees, Costs of Services Provided and the Benefits Realized by the Adviser from Its Relationship with the Funds: The Committee compared each Fund’s contractual advisory fee, net effective management fee2 and total net expense ratio to the applicable peer group, if any. The Committee also reviewed the median advisory fees and expense
2 | The “net effective management fee” for each Fund represents the combined effective advisory fee and administration fee as a percentage of average net assets for the latest fiscal year, after any waivers and/or reimbursements. |
| | THE GUGGENHEIM FUNDS SEMI-ANNUAL REPORT | 93 |
OTHER INFORMATION (Unaudited)(continued) |
ratios, including expense ratio components (e.g., transfer agency fees, administration fees, other operating expenses, distribution fees and fee waivers/reimbursements), of the peer group of funds. In addition, the Committee considered information regarding Guggenheim’s process for evaluating the competitiveness of each Fund’s fees and expenses, noting Guggenheim’s statement that evaluations seek to incorporate a variety of factors with a general focus on ensuring fees and expenses: (i) are competitive; (ii) give consideration to resource support requirements; and (iii) ensure Funds are able to deliver on shareholder return expectations. The Committee also considered Guggenheim’s discussion of information regarding fee and expense trends across the open-end fund industry and its response to those trends with respect to the funds in the Guggenheim fund complex, including the Funds.
As part of its evaluation of each Fund’s advisory fee, the Committee considered how such fees compared to the advisory fee charged by Guggenheim to one or more other clients that it manages pursuant to similar investment strategies, to the extent applicable. The Committee noted Guggenheim’s statement that it does not provide advisory services to other clients that have investment strategies similar to those of the Funds, other than variable insurance fund counterparts to certain Funds and certain other clients with respect to Long Short Equity Fund, each of which is charged the same advisory fee as the corresponding Fund.
With respect to the Tradable Funds that are designed to track a widely available index, which have only one or two identified peer funds, if any, from the two direct competitor product suites, the Committee considered the Adviser’s summary of notable distinctions between the Tradable Funds and the peer funds, noting the Adviser’s statement that only one of the two direct competitor product suites (which also employs a daily rebalance feature) is directly comparable for purposes of assessing such Funds’ advisory fees, with the exception of the Monthly Rebalance NASDAQ-100 2x Strategy Fund for which the other competitor product suite (which employs a monthly rebalance feature) is directly comparable. The Committee noted that the contractual advisory fee for each Fund’s Class H shares, other than the Monthly Rebalance NASDAQ-100 2x Strategy Fund, was equal to or lower than the contractual advisory fee charged to the comparable peer fund. The Committee also considered the net effective management fee and total net expense ratio for each such Fund’s Class H shares as compared to the peer fund. For the Monthly Rebalance NASDAQ-100 2x Strategy Fund, the Committee considered that, although the contractual advisory fee for the Fund’s Class H shares is higher than the contractual advisory fee charged to the peer fund, the Adviser has contractually agreed to cap Fund expenses to ensure that total net expenses are competitive. The Committee noted that the net effective management fee and the total net expense ratio for the Fund’s Class H shares were lower than and equal to those of the peer fund, respectively.
With respect to the U.S. Government Money Market Fund, the Committee noted the Adviser’s statement that the Fund is designed to support tactical advisors seeking to avoid market exposure or preserve capital and that only one other fund in its peer group identified in the FUSE report is directly comparable in terms of product features offered. The Committee considered that, as of the Fund’s and the peer fund’s respective fiscal year ends, the Fund’s contractual advisory
94 | THE GUGGENHEIM FUNDS SEMI-ANNUAL REPORT | |
OTHER INFORMATION (Unaudited)(continued) |
fee and total net expense ratio were higher than those of the comparable peer fund, but noted management’s statement that it believes that the peer fund’s unique structural arrangement of investing in a master portfolio managed by an unaffiliated investment adviser may result in the peer fund’s stated advisory fees being understated.
With respect to the Sector Funds and the Real Estate Fund, the Committee considered the Adviser’s summary of notable distinctions between each Fund and the applicable peer group identified in the FUSE reports. The Committee considered that the peer groups are comprised of actively-managed funds seeking similar exposures but that do not offer the same product features, such as unlimited trading privileges. As a result, the fee and expense comparisons are more difficult given the uniqueness of both the Funds’ structure and the portfolio management needed to meet client requirements.
The Committee considered management’s agreement, as part of the 2023 annual contract review process, to reduce the total net expense ratio of each Tradable Fund (other than the U.S. Government Money Market Fund) by 0.05% of its average daily net assets through an expense reimbursement and/or waiver agreement effective August 1, 2023 for an initial term ending August 1, 2024 for each Fund (other than Commodities Strategy Fund for which the initial term will end May 1, 2025), with such reduction to apply in addition to any other contractual waiver and/or reimbursement arrangements already in place. The Committee also noted the continuation through August 1, 2024 of management’s separate agreement, implemented as part of the 2022 annual contract review process, to reduce the total net expense ratio of each Tradable Fund with a contractual advisory fee of 0.90% of its average daily net assets3 by 0.05% of its average daily net assets and, with respect to NASDAQ-100 Fund, to reduce the total net expense ratio of the Fund by 0.05% of its average daily net assets in excess of $500 million, through expense reimbursement and/or waiver agreements.
With respect to the Alternative Funds (i.e., the non-Tradable Funds), except as to the individual Fund discussed below, the Committee observed that the contractual advisory fee, net effective management fee and total net expense ratio for each Fund’s Institutional Class shares each rank in the third quartile or better of such Fund’s peer group. In addition, the Committee made the following observations:
Multi-Hedge Strategies Fund: The contractual advisory fee for the Fund’s Institutional Class shares ranks in the second quartile (27th percentile) of its peer group. Although the net effective management fee for the Fund’s Institutional Class shares ranks in the fourth quartile (87th percentile), the Committee considered that the total net expense ratio for the Fund’s Institutional Class shares ranks in the first quartile (13th percentile) of its peer group.
3 | Emerging Markets 2x Strategy Fund, Europe 1.25x Strategy Fund, Inverse Emerging Markets 2x Strategy Fund, Inverse Government Long Bond Strategy Fund, Inverse Mid-Cap Strategy Fund, Inverse NASDAQ-100 Strategy Fund, Inverse Russell 2000 Strategy Fund, Inverse S&P 500 Strategy Fund, Mid-Cap 1.5x Strategy Fund, Monthly Rebalance NASDAQ-100 2x Strategy Fund, Russell 2000 1.5x Strategy Fund, Strengthening Dollar 2x Strategy Fund and Weakening Dollar 2x Strategy Fund. |
| | THE GUGGENHEIM FUNDS SEMI-ANNUAL REPORT | 95 |
OTHER INFORMATION (Unaudited)(continued) |
With respect to the costs of services provided and benefits realized by Guggenheim Investments from its relationship with the Funds, the Committee reviewed a profitability analysis and data from management for each Fund setting forth the average assets under management for the twelve months ended December 31, 2022, gross revenues received, and expenses incurred directly or through allocations, by Guggenheim Investments, expense waivers (as applicable), earnings and the operating margin/profitability rate, including variance information relative to the foregoing amounts as of December 31, 2021. In addition, the Chief Financial Officer of Guggenheim Investments reviewed with, and addressed questions from, the Committee concerning the expense allocation methodology employed in producing the profitability analysis. In the course of its review of Guggenheim Investments’ profitability, the Committee took into account the methods used by Guggenheim Investments to determine expenses and profit and the representation by the Chief Financial Officer of Guggenheim Investments that such methods provided a reasonable basis for determining the profitability of the Adviser with respect to each Fund. The Committee considered all of the foregoing, among other things, in evaluating the costs of services provided, the profitability to Guggenheim Investments and the profitability rates presented.
The Committee also considered other benefits available to the Adviser because of its relationship with the Funds and noted Guggenheim’s statement that it does not believe the Adviser derives any such “fall-out” benefits. In this regard, the Committee noted Guggenheim’s statement that, although it does not consider such benefits to be fall-out benefits, the Adviser may benefit from certain economies of scale and synergies, such as enhanced visibility of the Adviser, enhanced leverage in fee negotiations and other synergies arising from offering a broad spectrum of products, including the Funds.
Based on the foregoing, and based on other information received (both oral and written) at the April Meeting and the May Meetings, as well as other considerations, the Committee concluded that the comparative fees and the benefits realized by the Adviser from its relationship with the Funds reflected reasonable business arrangements negotiated at arm’s length and that the Adviser’s profitability from its relationship with the Funds was not unreasonable.
Economies of Scale: The Committee received and considered information regarding whether there have been economies of scale with respect to the management of the Funds as Fund assets grow, whether the Funds have appropriately benefited from any economies of scale, and whether there is potential for realization of any further economies of scale. The Committee considered whether economies of scale in the provision of services to the Funds were being passed along to and shared with the shareholders. The Committee considered that Guggenheim believes it is appropriately sharing potential economies of scale and that Guggenheim’s decrease in 2022 in overall expenses was attributable to decreased product costs driven by lower average assets under management and lower non-recurring costs related to closed-end fund matters as well as a decrease in compensation and benefits. The Committee also considered that although expenses related to investment resources decreased in 2022, Guggenheim’s shared services expenses and certain other expenses increased in 2022.
96 | THE GUGGENHEIM FUNDS SEMI-ANNUAL REPORT | |
OTHER INFORMATION (Unaudited)(continued) |
With respect to the Tradable Funds, the Committee noted that, in addition to the expense reimbursement and/or waiver arrangement implemented in August 2022 for the NASDAQ-100 Fund on average daily net assets in excess of $500 million, the Adviser has agreed to a contractual advisory fee breakpoint schedule for the Funds that is applied at the product-suite level, rather than on a Fund level, as the Funds are designed for tactical advisors and provide unlimited trading privileges, with individual Fund assets fluctuating significantly throughout the year. Under the breakpoint schedule adopted in June 2018 to reflect product-suite level economies of scale, each Fund’s advisory fee would be subject to a uniform fee breakpoint reduction schedule that would take effect if the aggregate assets of the Tradable Funds and the tradable series of Rydex Dynamic Funds, a separate trust, equal or exceed $10 billion.
The Committee also noted the process employed by the Adviser to evaluate whether it would be appropriate to institute a new breakpoint for an Alternative Fund (i.e., a non-Tradable Fund), with consideration given to, among other things: (i) the Fund’s size and trends in asset levels over recent years; (ii) the competitiveness of the expense levels; (iii) whether expense waivers are in place; (iv) changes and trends in revenue and expenses; (v) whether there are any anticipated expenditures that may benefit the Fund in the future; (vi) Fund profit level margins; (vii) relative Fund performance; (viii) the nature, extent and quality of services management provides to the Fund; and (ix) the complexity of the Fund’s investment strategy and the resources required to support the Fund.
As part of its assessment of economies of scale, the Committee took into account Guggenheim’s representation that it seeks to share economies of scale through a number of means, including breakpoints, advisory fees set at competitive rates pre-assuming future asset growth, expense waivers and limitations, and investments in personnel, operations and infrastructure to support the fund business. The Committee also received information regarding amounts that had been shared with shareholders through such expense waivers and limitations and considered that the newly agreed expense reimbursement and/or waiver arrangement would produce additional savings to shareholders. Thus, the Committee considered the size of the Funds and the competitiveness of and/or other determinations made regarding the current advisory fee for each Fund, as well as whether a Fund is subject to an expense limitation.
Based on the foregoing, and based on other information received (both oral and written) at the April Meeting and May Meetings, as well as other considerations, the Committee concluded that the advisory fee for each Fund reflected a reasonable business arrangement negotiated at arm’s length.
Overall Conclusions
The Committee concluded that the investment advisory fees reflect reasonable business arrangements negotiated at arm’s length in light of the extent and quality of the services provided and other benefits received and that the renewal of the Advisory Agreement is in the best interest
| | THE GUGGENHEIM FUNDS SEMI-ANNUAL REPORT | 97 |
OTHER INFORMATION (Unaudited)(concluded) |
of each Fund. In reaching this conclusion, no single factor was determinative or conclusive and each Committee member, in the exercise of his or her informed business judgment, may afford different weights to different factors.
Following its review of the Committee’s analysis and determinations, the Board adopted the considerations and conclusions of the Committee and determined to approve the renewal of the Advisory Agreement.
98 | THE GUGGENHEIM FUNDS SEMI-ANNUAL REPORT | |
INFORMATION ON BOARD OF TRUSTEES AND OFFICERS (Unaudited) |
A Board of Trustees oversees the Trust, as well as other trusts of GI, in which its members have no stated term of service, and continue to serve after election until resignation. The Funds’ Statement of Additional Information includes further information about Fund Trustees and Officers, and can be obtained without charge by visiting guggenheiminvestments.com or by calling 800.820.0888.
Name, Address*
and Year of Birth | Position(s)
Held with
Trust | Term of Office
and Length of
Time Served** | Principal Occupation(s)
During Past Five Years | Number of
Portfolios
in Fund
Complex
Overseen | Other
Directorships Held
by Trustees*** |
INDEPENDENT TRUSTEES | | | |
Randall C. Barnes (1951) | Trustee and Chair of the Valuation Oversight Committee | Since 2019 (Trustee) Since 2020 (Chair of the Valuation Oversight Committee) | Current: Private Investor (2001-present).
Former: Senior Vice President and Treasurer, PepsiCo, Inc. (1993-1997); President, Pizza Hut International (1991-1993); Senior Vice President, Strategic Planning and New Business Development, PepsiCo, Inc. (1987-1990). | 155 | Current: Advent Convertible and Income Fund (2005-present); Purpose Investments Funds (2013-present).
Former: Fiduciary/Claymore Energy Infrastructure Fund (2004-2022); Guggenheim Enhanced Equity Income Fund (2005-2021); Guggenheim Credit Allocation Fund (2013-2021). |
Angela Brock-Kyle (1959) | Trustee | Since 2016 | Current: Founder and Chief Executive Officer, B.O.A.R.D.S. (2013-present); Director, Mutual Fund Directors Forum (2022-present).
Former: Senior Leader, TIAA (financial services firm) (1987-2012). | 154 | Current: Bowhead Insurance GP, LLC (2020-present); Hunt Companies, Inc. (2019-present).
Former: Fiduciary/Claymore Energy Infrastructure Fund (2019-2022); Guggenheim Enhanced Equity Income Fund (2019-2021); Guggenheim Credit Allocation Fund (2019-2021); Infinity Property & Casualty Corp. (2014-2018). |
| | THE GUGGENHEIM FUNDS SEMI-ANNUAL REPORT | 99 |
INFORMATION ON BOARD OF TRUSTEES AND OFFICERS (Unaudited)(continued) |
Name, Address*
and Year of Birth | Position(s)
Held with
Trust | Term of Office
and Length of
Time Served** | Principal Occupation(s)
During Past Five Years | Number of
Portfolios
in Fund
Complex
Overseen | Other
Directorships Held
by Trustees*** |
INDEPENDENT TRUSTEES - continued | | |
Thomas F. Lydon, Jr. (1960) | Trustee and Chair of the Contracts Review Committee | Since 2005 (Trustee) Since 2020 (Chair of the Contracts Review Committee) | Current: President, Global Trends Investments (registered investment adviser) (1996-present); Chief Executive Officer, ETF Flows, LLC (financial advisor education and research provider) (2019-present); Chief Executive Officer, Lydon Media (2016-present); Director, GDX Index Partners, LLC (index provider) (2021-present); Vice Chairman, VettaFi (financial advisor content, research and digital distribution provider) (2022-present). | 154 | Current: US Global Investors, Inc. (GROW) (1995-present).
Former: Fiduciary/Claymore Energy Infrastructure Fund (2019-2022); Guggenheim Enhanced Equity Income Fund (2019-2021); Guggenheim Credit Allocation Fund (2019-2021); Harvest Volatility Edge Trust (3) (2017-2019). |
100 | THE GUGGENHEIM FUNDS SEMI-ANNUAL REPORT | |
INFORMATION ON BOARD OF TRUSTEES AND OFFICERS (Unaudited)(continued) |
Name, Address*
and Year of Birth | Position(s)
Held with
Trust | Term of Office
and Length of
Time Served** | Principal Occupation(s)
During Past Five Years | Number of
Portfolios
in Fund
Complex
Overseen | Other
Directorships Held
by Trustees*** |
INDEPENDENT TRUSTEES - continued | | |
Ronald A. Nyberg (1953) | Trustee and Chair of the Nominating and Governance Committee | Since 2019 | Current: Of Counsel, Momkus LLP (law firm) (2016-present).
Former: Partner, Nyberg & Cassioppi, LLC (law firm) (2000-2016); Executive Vice President, General Counsel, and Corporate Secretary, Van Kampen Investments (1982-1999). | 155 | Current: Advent Convertible and Income Fund (2003-present); PPM Funds (2) (2018-present); NorthShore-Edward-Elmhurst Health (2012-present).
Former: Fiduciary/Claymore Energy Infrastructure Fund (2004-2022); Guggenheim Enhanced Equity Income Fund (2005-2021); Guggenheim Credit Allocation Fund (2013-2021); Western Asset Inflation-Linked Opportunities & Income Fund (2004-2020); Western Asset Inflation-Linked Income Fund (2003-2020). |
| | THE GUGGENHEIM FUNDS SEMI-ANNUAL REPORT | 101 |
INFORMATION ON BOARD OF TRUSTEES AND OFFICERS (Unaudited)(continued) |
Name, Address*
and Year of Birth | Position(s)
Held with
Trust | Term of Office
and Length of
Time Served** | Principal Occupation(s)
During Past Five Years | Number of
Portfolios
in Fund
Complex
Overseen | Other
Directorships Held
by Trustees*** |
INDEPENDENT TRUSTEES - continued | | |
Sandra G. Sponem (1958) | Trustee and Chair of the Audit Committee | Since 2016 (Trustee) Since 2019 (Chair of the Audit Committee) | Current: Retired.
Former: Senior Vice President and Chief Financial Officer, M.A. Mortenson-Companies, Inc. (construction and real estate development company) (2007-2017). | 154 | Current: SPDR Series Trust (81) (2018-present); SPDR Index Shares Funds (30) (2018-present); SSGA Active Trust (14) (2018-present). Former: Fiduciary/Claymore Energy Infrastructure Fund (2019-2022); Guggenheim Enhanced Equity Income Fund (2019-2021); Guggenheim Credit Allocation Fund (2019-2021); SSGA Master Trust (1) (2018-2020). |
102 | THE GUGGENHEIM FUNDS SEMI-ANNUAL REPORT | |
INFORMATION ON BOARD OF TRUSTEES AND OFFICERS (Unaudited)(continued) |
Name, Address*
and Year of Birth | Position(s)
Held with
Trust | Term of Office
and Length of
Time Served** | Principal Occupation(s)
During Past Five Years | Number of
Portfolios
in Fund
Complex
Overseen | Other
Directorships Held
by Trustees*** |
INDEPENDENT TRUSTEES - concluded | | |
Ronald E. Toupin, Jr. (1958) | Trustee, Chair of the Board and Chair of the Executive Committee | Since 2019 | Current: Portfolio Consultant (2010-present); Member, Governing Council, Independent Directors Council (2013-present); Governor, Board of Governors, Investment Company Institute (2018-present).
Former: Member, Executive Committee, Independent Directors Council (2016-2018); Vice President, Manager and Portfolio Manager, Nuveen Asset Management (1998-1999); Vice President, Nuveen Investment Advisory Corp. (1992-1999); Vice President and Manager, Nuveen Unit Investment Trusts (1991-1999); and Assistant Vice President and Portfolio Manager, Nuveen Unit Investment Trusts (1988-1999), each of John Nuveen & Co., Inc. (registered broker dealer) (1982-1999). | 154 | Former: Fiduciary/Claymore Energy Infrastructure Fund (2004-2022); Guggenheim Enhanced Equity Income Fund (2005-2021); Guggenheim Credit Allocation Fund (2013-2021); Western Asset Inflation-Linked Opportunities & Income Fund (2004-2020); Western Asset Inflation-Linked Income Fund (2003-2020). |
| | THE GUGGENHEIM FUNDS SEMI-ANNUAL REPORT | 103 |
INFORMATION ON BOARD OF TRUSTEES AND OFFICERS (Unaudited)(continued) |
Name, Address*
and Year of Birth | Position(s)
Held with
Trust | Term of Office
and Length of
Time Served** | Principal Occupation(s)
During Past Five Years | Number of
Portfolios
in Fund
Complex
Overseen | Other
Directorships Held
by Trustees*** |
INTERESTED TRUSTEE | |
Amy J. Lee**** (1961) | Trustee, Vice President and Chief Legal Officer | Since 2019 | Current: Interested Trustee, certain other funds in the Fund Complex (2018-present); Chief Legal Officer, certain other funds in the Fund Complex (2014-present); Vice President, certain other funds in the Fund Complex (2007-present); Senior Managing Director, Guggenheim Investments (2012-present).
Former: President and Chief Executive Officer, certain other funds in the Fund Complex (2017-2019); Vice President, Associate General Counsel and Assistant Secretary, Security Benefit Life Insurance Company and Security Benefit Corporation (2004-2012). | 154 | Former: Fiduciary/Claymore Energy Infrastructure Fund (2018-2022); Guggenheim Enhanced Equity Income Fund (2018-2021); Guggenheim Credit Allocation Fund (2018-2021). |
* | The business address of each Trustee is c/o Guggenheim Investments, 227 West Monroe Street, Chicago, Illinois 60606. |
** | Each Trustee serves an indefinite term, until his or her successor is elected and qualified. |
*** | Each Trustee also serves on the Boards of Trustees of Guggenheim Funds Trust, Guggenheim Variable Funds Trust, Guggenheim Strategy Funds Trust, Guggenheim Taxable Municipal Bond & Investment Grade Debt Trust, Guggenheim Strategic Opportunities Fund, Guggenheim Energy & Income Fund, Guggenheim Active Allocation Fund, Rydex Series Funds, Rydex Dynamic Funds, Rydex Variable Trust and Transparent Value Trust. Messrs. Barnes and Nyberg also serve on the Board of Trustees of Advent Convertible & Income Fund. |
**** | This Trustee is deemed to be an “interested person” of the Funds under the 1940 Act by reason of her position with the Funds’ Adviser and/or the parent of the Adviser. |
104 | THE GUGGENHEIM FUNDS SEMI-ANNUAL REPORT | |
INFORMATION ON BOARD OF TRUSTEES AND OFFICERS (Unaudited)(continued) |
Name, Address*
and Year of Birth | Position(s)
Held with
Trust | Term of Office
and Length of
Time Served** | Principal Occupation(s)
During Past Five Years |
OFFICERS | | | |
Brian E. Binder (1972) | President and Chief Executive Officer | Since 2019 | Current: President, Mutual Funds Boards, Guggenheim Investments (2022-present);President and Chief Executive Officer, certain other funds in the Fund Complex (2018-present); President, Mutual Funds Boards, Guggenheim Funds Investment Advisors, LLC and Security Investors, LLC (2018-present); Board Member, Guggenheim Partners Investments Funds plc (2022-present); Board Member, Guggenheim Global Investments plc (2022-present); Board Member, Guggenheim Partners Fund Management (Europe) Limited (2018-present).
Former: Senior Managing Director and Chief Administrative Officer, Guggenheim Investments (2018-2022); Managing Director and President, Deutsche Funds, and Head of US Product, Trading and Fund Administration, Deutsche Asset Management (2013-2018); Managing Director, Chairman of North American Executive Committee and Head of Business Management and Consulting, Invesco Ltd. (2010-2012). |
James Howley (1972) | Chief Financial Officer, Chief Accounting Officer and Treasurer | Since 2022 | Current: Managing Director, Guggenheim Investments (2004-present); Chief Financial Officer, Chief Accounting Officer, and Treasurer, certain other funds in the Fund Complex (2022-present).
Former: Assistant Treasurer, certain other funds in the Fund Complex (2006-2022); Manager, Mutual Fund Administration of Van Kampen Investments, Inc. (1996-2004). |
Mark E. Mathiasen (1978) | Secretary | Since 2017 | Current: Secretary, certain other funds in the Fund Complex (2007-present); Managing Director, Guggenheim Investments (2007-present). |
Glenn McWhinnie (1969) | Assistant Treasurer | Since 2016 | Current: Vice President, Guggenheim Investments (2009-present); Assistant Treasurer, certain other funds in the Fund Complex (2016-present). |
Michael P. Megaris (1984) | Assistant
Secretary | Since 2018 | Current: Assistant Secretary, certain other funds in the Fund Complex (2014-present); Managing Director, Guggenheim Investments (2012-present). |
| | THE GUGGENHEIM FUNDS SEMI-ANNUAL REPORT | 105 |
INFORMATION ON BOARD OF TRUSTEES AND OFFICERS (Unaudited)(continued) |
Name, Address*
and Year of Birth | Position(s)
Held with
Trust | Term of Office
and Length of
Time Served** | Principal Occupation(s)
During Past Five Years |
OFFICERS - continued | |
Elisabeth Miller (1968) | Chief Compliance Officer | Since 2012 | Current: Chief Compliance Officer, certain other funds in the Fund Complex (2012-present); Senior Managing Director, Guggenheim Investments (2012-present); Senior Managing Director, Guggenheim Funds Distributors, LLC (2014-present).
Former: Chief Compliance Officer, Security Investors, LLC and Guggenheim Funds Investment Advisors, LLC (2012-2018); Chief Compliance Officer, Guggenheim Distributors, LLC (2009-2014); Senior Manager, Security Investors, LLC (2004-2014); Senior Manager, Guggenheim Distributors, LLC (2004-2014). |
Margaux Misantone (1978) | AML Officer | Since 2017 | Current: Chief Compliance Officer, Security Investors, LLC and Guggenheim Funds Investment Advisors, LLC (2018-present); AML Officer, Security Investors, LLC and certain other funds in the Fund Complex (2017-present); Managing Director, Guggenheim Investments (2015-present).
Former: Assistant Chief Compliance Officer, Security Investors, LLC and Guggenheim Funds Investments Advisors, LLC (2015-2018). |
Kimberly J. Scott (1974) | Assistant Treasurer | Since 2016 | Current: Director, Guggenheim Investments (2012-present); Assistant Treasurer, certain other funds in the Fund Complex (2012-present).
Former: Financial Reporting Manager, Invesco, Ltd. (2010-2011); Vice President/Assistant Treasurer, Mutual Fund Administration for Van Kampen Investments, Inc./Morgan Stanley Investment Management (2009-2010); Manager of Mutual Fund Administration, Van Kampen Investments, Inc./Morgan Stanley Investment Management (2005-2009).
|
Bryan Stone (1979) | Vice President | Since 2019 | Current: Vice President, certain other funds in the Fund Complex (2014-present); Managing Director, Guggenheim Investments (2013-present).
Former: Senior Vice President, Neuberger Berman Group LLC (2009-2013); Vice President, Morgan Stanley (2002-2009).
|
106 | THE GUGGENHEIM FUNDS SEMI-ANNUAL REPORT | |
INFORMATION ON BOARD OF TRUSTEES AND OFFICERS (Unaudited)(concluded) |
Name, Address*
and Year of Birth | Position(s)
Held with
Trust | Term of Office
and Length of
Time Served** | Principal Occupation(s)
During Past Five Years |
OFFICERS - concluded | |
Jon Szafran (1989) | Assistant Treasurer | Since 2017 | Current: Director, Guggenheim Investments (2017-present); Assistant Treasurer, certain other funds in the Fund Complex (2017-present).
Former: Assistant Treasurer of Henderson Global Funds and Manager of US Fund Administration, Henderson Global Investors (North America) Inc. (“HGINA”), (2017); Senior Analyst of US Fund Administration, HGINA (2014–2017); Senior Associate of Fund Administration, Cortland Capital Market Services, LLC (2013-2014); Experienced Associate, PricewaterhouseCoopers LLP (2012-2013). |
* | The business address of each officer is c/o Guggenheim Investments, 227 West Monroe Street, Chicago, Illinois 60606. |
** | Each officer serves an indefinite term, until his or her successor is duly elected and qualified. |
| | THE GUGGENHEIM FUNDS SEMI-ANNUAL REPORT | 107 |
GUGGENHEIM INVESTMENTS PRIVACY NOTICE (Unaudited) |
Who We Are
This Privacy Notice describes the data protection practices of Guggenheim Investments. Guggenheim Investments as used herein refers to the affiliated investment management businesses of Guggenheim Partners, LLC: Guggenheim Funds Investment Advisors, LLC, Guggenheim Partners Investment Management, LLC, Guggenheim Funds Distributors, LLC, Security Investors, LLC, Guggenheim Investment Advisors (Europe) Limited, Guggenheim Real Estate, LLC, GS Gamma Advisors, LLC, Guggenheim Partners India Management, LLC, Guggenheim Partners Europe Limited, as well as the funds in the Guggenheim Funds complex (the “Funds”) (“Guggenheim Investments,” “we,” “us,” or “our”).
Guggenheim Partners Investment Management Holdings, LLC, located at 330 Madison Avenue, New York, New York, 10017, is the data controller for your information. The affiliates who are also controllers of certain of your information are: Guggenheim Investment Advisors (Europe) Limited, Guggenheim Partners Europe Limited, Guggenheim Partners, LLC, Guggenheim Funds Investment Advisors, LLC, Guggenheim Partners Investment Management, LLC, Guggenheim Funds Distributors, LLC and Security Investors, LLC, as well as the Funds.
Our Commitment to You
Guggenheim Investments considers your privacy our utmost concern. When you become our client or investor, you entrust us with not only your hard-earned money but also with your personal and financial information. Because we have access to your private information, we hold ourselves to the highest standards in its safekeeping and use. We strictly limit how we share your information with others, whether you are a current or former Guggenheim Investments client or investor.
The Information We Collect About You
We collect certain nonpublic personal information about you from information you provide on applications, other forms, our website, and/or from third parties including investment advisors. This information includes Social Security or other tax identification number, assets, income, tax information, retirement and estate plan information, transaction history, account balance, payment history, bank account information, marital status, family relationships, information that we collect on our website through the use of “cookies,” and other personal information that you or others provide to us. We may also collect such information through your inquiries by mail, e-mail or telephone. We may also collect customer due diligence information, as required by applicable law and regulation, through third party service providers.
How We Handle Your Personal Information
The legal basis for using your information as set out in this Privacy Notice is as follows: (a) use of your personal data is necessary to perform our obligations under any contract with you (such as a contract for us to provide financial services to you); or (b) where use of your personal data is not necessary for performance of a contract, use of your personal data is necessary for our legitimate interests or the legitimate interests of others (for example, to enforce the legal terms
108 | THE GUGGENHEIM FUNDS SEMI-ANNUAL REPORT | |
GUGGENHEIM INVESTMENTS PRIVACY NOTICE (Unaudited)(continued) |
governing our services, operate and market our website and other services we offer, ensure safe environments for our personnel and others, make and receive payments, prevent fraud and to know the customer to whom we are providing the services). Some processing is done to comply with applicable law.
In addition to the specific uses described above, we also use your information in the following manner:
| | ● | We use your information in connection with servicing your accounts. |
| | ● | We use information to respond to your requests or questions. For example, we might use your information to respond to your customer feedback. |
| | ● | We use information to improve our products and services. We may use your information to make our website and products better. We may use your information to customize your experience with us. |
| | ● | We use information for security purposes. We may use your information to protect our company and our customers. |
| | ● | We use information to communicate with you. For example, we will communicate with you about your account or our relationship. We may contact you about your feedback. We might also contact you about this Privacy Notice. We may also enroll you in our email newsletter. |
| | ● | We use information as otherwise permitted by law, as we may notify you. |
| | ● | Aggregate/Anonymous Data. We may aggregate and/or anonymize any information collected through the website so that such information can no longer be linked to you or your device (“Aggregate/Anonymous Information”). We may use Aggregate/Anonymous Information for any purpose, including without limitation for research and marketing purposes, and may also share such data with any third parties, including advertisers, promotional partners, and sponsors. |
We do not sell information about current or former clients or their accounts to third parties. Nor do we share this information, except when necessary to complete transactions at your request, to make you aware of investment products and services that we or our affiliates offer, or as permitted or required by law.
We provide information about you to companies and individuals not affiliated with Guggenheim Investments to complete certain transactions or account changes, or to perform services for us related to your account. For example, if you ask to transfer assets from another financial institution to Guggenheim Investments, we must provide certain information about you to that company to complete the transaction. We provide the third party with only the information necessary to carry out its responsibilities and only for that purpose. And we require these third parties to treat your private information with the same high degree of confidentiality that we do.
| | THE GUGGENHEIM FUNDS SEMI-ANNUAL REPORT | 109 |
GUGGENHEIM INVESTMENTS PRIVACY NOTICE (Unaudited)(continued) |
To alert you to other Guggenheim Investments products and services, we share your information within our family of affiliated companies. You may limit our sharing with affiliated companies as set out below. We may also share information with any successor to all or part of our business, or in connection with steps leading up to a merger or acquisition. For example, if part of our business was sold we may give customer information as part of that transaction. We may also share information about you with your consent.
We will release information about you if you direct us to do so, if we are compelled by law to do so, or in other circumstances as permitted by law (for example, to protect your account from fraud).
If you close your account(s) or become an inactive client or investor, we will continue to adhere to the privacy policies and practices described in this notice.
Opt-Out Provisions and Your Data Choices
The law allows you to “opt out” of certain kinds of information sharing with third parties. We do not share personal information about you with any third parties that triggers this opt-out right. This means YOU ARE ALREADY OPTED OUT.
When you are no longer our client or investor, we continue to share your information as described in this notice, and you may contact us at any time to limit our sharing by sending an email to CorporateDataPrivacy@GuggenheimPartners.com.
European Union Data Subjects and certain others: In addition to the choices set forth above, residents of the European Union and certain other jurisdictions have certain rights to (1) request access to or rectification or deletion of information we collect about them, (2) request a restriction on the processing of their information, (3) object to the processing of their information, or (4) request the portability of certain information. To exercise these or other rights, please contact us using the contact information below. We will consider all requests and provide our response within the time period stated by applicable law. Please note, however, that certain information may be exempt from such requests in some circumstances, which may include if we need to keep processing your information for our legitimate interests or to comply with a legal obligation. We may request you provide us with information necessary to confirm your identity before responding to your request.
Residents of France and certain other jurisdictions may also provide us with instructions regarding the manner in which we may continue to store, erase and share your information after your death, and where applicable, the person you have designated to exercise these rights after your death.
How We Protect Privacy Online
We take steps to protect your privacy when you use our web site – www.guggenheiminvestments.com – by using secure forms of online communication, including encryption technology, Secure Socket Layer (SSL) protocol, firewalls and user names and
110 | THE GUGGENHEIM FUNDS SEMI-ANNUAL REPORT | |
GUGGENHEIM INVESTMENTS PRIVACY NOTICE (Unaudited)(concluded) |
passwords. These safeguards vary based on the sensitivity of the information that we collect and store. However, we cannot and do not guarantee that these measures will prevent every unauthorized attempt to access, use, or disclose your information since despite our efforts, no Internet and/or other electronic transmissions can be completely secure. Our web site uses “http cookies”—tiny pieces of information that we ask your browser to store. We use cookies for session management and security features on the Guggenheim Investments web site. We do not use them to pull data from your hard drive, to learn your e-mail address, or to view data in cookies created by other web sites. We will not share the information in our cookies or give others access to it. See the legal information area on our web site for more details about web site security and privacy features.
How We Safeguard Your Personal Information and Data Retention
We restrict access to nonpublic personal information about you to our employees and in some cases to third parties (for example, the service providers described above) as permitted by law. We maintain strict physical, electronic and procedural safeguards that comply with federal standards to guard your nonpublic personal information.
We keep your information for no longer than necessary for the purposes for which it is processed. The length of time for which we retain information depends on the purposes for which we collected and use it and/or as required to comply with applicable laws. Information may persist in copies made for backup and business continuity purposes for additional time.
International Visitors
If you are not a resident of the United States, please be aware that your information may be transferred to, stored and processed in the United States where our servers are located and our databases are operated. The data protection and other laws of the United States and other countries might not be as comprehensive as those in your country.
In such cases, we ensure that a legal basis for such a transfer exists and that adequate protection is provided as required by applicable law, for example, by using standard contractual clauses or by transferring your data to a jurisdiction that has obtained an adequacy finding. Individuals whose data may be transferred on the basis of standard contractual clauses may contact us as described below.
We’ll Keep You Informed
If you have any questions or concerns about how we treat your personal data, we encourage you to consult with us first. You may also contact the relevant supervisory authority.
We reserve the right to modify this policy at any time and will inform you promptly of material changes. You may access our privacy policy from our web site at www.guggenheiminvestments.com. Should you have any questions regarding our privacy policy, contact us by email at CorporateDataPrivacy@GuggenheimPartners.com.
| | THE GUGGENHEIM FUNDS SEMI-ANNUAL REPORT | 111 |
LIQUIDITY RISK MANAGEMENT PROGRAM (Unaudited) |
In compliance with SEC Rule 22e-4 under the U.S. Investment Company Act of 1940 (the “Liquidity Rule”), the Rydex Series Funds (the “Trust”) has adopted and implemented a written liquidity risk management program (the “Program”) for each series of the Trust (each, a “Fund” and, collectively, the “Funds”). The Trust’s Board of Trustees (the “Board”) has also designated a Program administrator (the “Administrator”).
The Liquidity Rule requires that the Program be reasonably designed to assess and manage each Fund’s liquidity risk. A Fund’s “liquidity risk” (as defined in the Liquidity Rule) is the risk that the Fund could not meet requests to redeem shares issued by the Fund without significant dilution of the remaining investors’ interests in the Fund. The Program includes a number of elements that support the assessment, management and periodic review of liquidity risk. In accordance with the Program, each Fund’s liquidity risk is assessed, managed, and periodically reviewed no less frequently than annually taking into consideration a variety of factors, including, as applicable, the Fund’s investment strategy and liquidity of portfolio investments, short-term and long-term cash flow projections, and holdings of cash and cash equivalents, as well as borrowing arrangements and other funding sources. Certain factors are considered under both normal and reasonably foreseeable stressed conditions. There is no guarantee that the Program will achieve its objective under all circumstances.
Under the Program, each Fund portfolio investment is classified into one of four liquidity categories. The classification is based on a determination of the number of days a Fund reasonably expects to take to convert the investment into cash, or sell or dispose of the investment, in current market conditions without significantly changing the investment’s market value. The Program is reasonably designed to meet Liquidity Rule requirements relating to “highly liquid investment minimums” (i.e., the minimum amount of a Fund’s net assets to be invested in highly liquid investments that are assets) and to monitor compliance with the Liquidity Rule’s limitations on a Fund’s investments in “illiquid investments” (as defined in the Liquidity Rule). Under the Liquidity Rule, a Fund is prohibited from acquiring any illiquid investment if, immediately after the acquisition, the Fund would have invested more than 15% of its net assets in illiquid investments that are assets.
During the period covered by this shareholder report, the Board received a written report (the “Report”) prepared by the Administrator addressing the Program’s operation and assessing the adequacy and effectiveness of its implementation for the period from March 31, 2022, to March 31, 2023. The Report summarized the Administrator’s assessment of the Program’s implementation and concluded that the Program operated effectively, the Program had been and continued to be reasonably designed to assess and manage each Fund’s liquidity risk, and the Program has been adequately and effectively implemented to monitor and respond to the Funds’ liquidity developments, as applicable.
Please refer to the Fund’s prospectus for more information regarding the Fund’s exposure to liquidity risk and other risks to which an investment in the Fund may be subject.
112 | THE GUGGENHEIM FUNDS SEMI-ANNUAL REPORT | |
This page intentionally left blank.
6.30.2023
Guggenheim Funds Semi-Annual Report
| Guggenheim Alternative Fund |
| Guggenheim Managed Futures Strategy Fund | | |
| GuggenheimInvestments.com | Rmfsf-SEMI-0623x1223 |

| | |
| DEAR SHAREHOLDER | 2 |
| ECONOMIC AND MARKET OVERVIEW | 4 |
| ABOUT SHAREHOLDERS’ FUND EXPENSES | 6 |
| MANAGED FUTURES STRATEGY FUND | 9 |
| NOTES TO CONSOLIDATED FINANCIAL STATEMENTS | 25 |
| OTHER INFORMATION | 40 |
| INFORMATION ON BOARD OF TRUSTEES AND OFFICERS | 54 |
| GUGGENHEIM INVESTMENTS PRIVACY NOTICE | 63 |
| LIQUIDITY RISK MANAGEMENT PROGRAM | 67 |
| | THE GUGGENHEIM FUNDS SEMI-ANNUAL REPORT | 1 |
Dear Shareholder:
Security Investors, LLC (the “Investment Adviser”), is pleased to present the semi-annual shareholder report for the Managed Futures Strategy Fund (the “Fund”) that is part of the Rydex Series Funds. This report covers performance of the Fund for the semi-annual period ended June 30, 2023 (the “Reporting Period”).
The Investment Adviser is a part of Guggenheim Investments, which represents the investment management businesses of Guggenheim Partners, LLC (“Guggenheim”), a global, diversified financial services firm.
Guggenheim Funds Distributors, LLC is the distributor of the Fund. Guggenheim Funds Distributors, LLC is affiliated with Guggenheim and the Investment Adviser.
We encourage you to read the Economic and Market Overview section of the report, which follows this letter.
We are committed to providing innovative investment solutions and appreciate the trust you place in us.
Sincerely,
Security Investors, LLC
July 31, 2023
Read a prospectus and summary prospectus (if available) carefully before investing. It contains the investment objectives, risks, charges, expenses and other information, which should be considered carefully before investing. Obtain a prospectus and summary prospectus (if available) at guggenheiminvestments.com or call 800.820.0888.
This material is not intended as a recommendation or as investment advice of any kind, including in connection with rollovers, transfers, and distributions. Such material is not provided in a fiduciary capacity, may not be relied upon for or in connection with the making of investment decisions, and does not constitute a solicitation of an offer to buy or sell securities. All content has been provided for informational or educational purposes only and is not intended to be and should not be construed as legal or tax advice and/or a legal opinion. Always consult a financial, tax and/or legal professional regarding your specific situation.
The Managed Futures Strategy Fund may not be suitable for all investors. ●The Fund’s investments in securities and derivatives, in general, are subject to market risks that may cause their prices, and therefore the Fund’s value, to fluctuate over time. An investment in the Fund may lose money. ● The Fund’s investments in derivatives may pose risks in addition to those associated with investing directly in securities or other investments, including illiquidity of the derivatives, imperfect correlations with underlying investments or the Fund’s other portfolio holdings, lack of availability and
| 2 | THE GUGGENHEIM FUNDS SEMI-ANNUAL REPORT | |
counterparty risk. To the extent the Fund invests in derivatives to seek to hedge risk or limit leveraged exposure created by other investments, there is no guarantee that such hedging strategies will be effective at managing risk or limiting exposure to leveraged investments. ● The Fund’s use of leverage will exaggerate the effect on net asset value of any increase or decrease in the market value of the Fund’s portfolio. ●The Fund’s use of short selling involves increased risk and costs. The Fund risks paying more for a security than it received from its sale. Theoretically, securities sold short have the risk of unlimited losses. ●The Fund’s investments in fixed income securities will change in value in response to interest rate changes and other factors. In general, bond prices rise when interest rates fall and vice versa. ● The Fund‘s exposure to high yield, asset backed and mortgaged backed securities may subject the Fund to greater volatility. ●The Fund’s indirect and direct exposure to foreign currencies subjects the Fund to the risk that those currencies will decline in value relative to the U.S. dollar, or, in the case of short positions, that the U.S. dollar will decline in value relative to the currency being hedged. ●The Fund’s exposure to the commodity markets may subject the fund to greater volatility as commodity-linked investments may be affected by changes in overall market movements, commodity index volatility, changes in interest rates or factors affecting a particular industry or commodity such as droughts, floods, weather, embargos, tariffs and international economic, political and regulatory developments. ●The Fund may invest in securities of foreign companies directly, or indirectly through the use of other investment companies and financial instruments that are linked to the performance of foreign issuers. Foreign securities markets generally have less trading volume and less liquidity than U.S. markets, and prices in some foreign markets may fluctuate more than those of securities traded on U.S. markets. ●See the prospectus for more information on these and other risks.
| | THE GUGGENHEIM FUNDS SEMI-ANNUAL REPORT | 3 |
| ECONOMIC AND MARKET OVERVIEW (Unaudited) | June 30, 2023 |
The fundamental backdrop we see for the economy is that inflation, while making some progress, continues to run well above target while the labor market appears overheated. As a result, the U.S. Federal Reserve (the “Fed”) is employing a deliberate and forceful strategy which has the effect of weakening the economy. The Fed believes this strategy is required to meaningfully reduce inflation. We expect Fed policymakers to deliver an additional rate hike in September 2023 as they try to limit an undue easing of financial conditions that could risk a resurgence in inflation. Quantitative tightening appears likely to continue at least into early 2024.
Despite the abrupt tightening of Fed policy seen over recent quarters, growth of real gross domestic product has been resilient, aided by a significant fiscal expansion and easing inflation pressures that have boosted real personal consumption. Indeed, headline personal consumption expenditures inflation has slowed to 2.5% on an annualized basis in the three months ended May 2023, down from 7.3% in the corresponding period a year earlier, helping to lift real income growth and support consumer spending.
Notwithstanding recent stronger-than-expected economic activity, we continue to believe the Fed’s policy measures will likely result in a higher unemployment rate and may ultimately lead to a recession. A range of leading indicators, including a low unemployment rate, an inverted yield curve, a declining leading economic index, and falling consumer confidence, suggest a downturn may be approaching.
While a recession understandably provokes fear among investors, in this environment it is arguably not the worst outcome from a medium-term perspective, as we see signs a recession could be moderate in its severity. Moreover, we expect inflation to be brought under control as spending and demand for labor cool, in turn allowing the Fed to start to ease its monetary policy stance as we progress through 2024.
For the Reporting Period, the S&P 500® Index* returned 16.89%. The MSCI Europe-Australasia-Far East (“EAFE”) Index* returned 11.67%. The return of the MSCI Emerging Markets Index* was 4.89%.
In the bond market, the Bloomberg U.S. Aggregate Bond Index* posted a 2.09% return for the Reporting Period, while the Bloomberg U.S. Corporate High Yield Index* returned 5.38%. The return of the ICE Bank of America (“BofA”) 3-Month U.S. Treasury Bill Index* was 2.27% for the Reporting Period.
| 4 | THE GUGGENHEIM FUNDS SEMI-ANNUAL REPORT | |
| ECONOMIC AND MARKET OVERVIEW (Unaudited)(concluded) | June 30, 2023 |
The opinions and forecasts expressed may not actually come to pass. This information is subject to change at any time, based on market and other conditions, and should not be construed as a recommendation of any specific security or strategy.
*Index Definitions:
The following indices are referenced throughout this report. Indices are unmanaged and not available for direct investment. Index performance does not reflect transaction costs, fees, or expenses.
Bloomberg U.S. Aggregate Bond Index is a broad-based flagship benchmark that measures the investment grade, U.S. dollar-denominated, fixed-rate taxable bond market, including U.S. Treasuries, government-related and corporate securities, mortgage-backed securities or “MBS” (agency fixed-rate and hybrid adjustable-rate mortgage, or “ARM”, pass-throughs), asset-backed securities (“ABS”), and commercial mortgage-backed securities (“CMBS”) (agency and non-agency).
Bloomberg U.S. Corporate High Yield Index measures the U.S. dollar-denominated, high yield, fixed-rate corporate bond market. Securities are classified as high yield if the middle rating of Moody’s, Fitch, and S&P is Ba1/BB +/BB + or below.
ICE BofA 3-Month U.S. Treasury Bill Index is an unmanaged market index of U.S. Treasury securities maturing in 90 days that assumes reinvestment of all income.
MSCI EAFE Index is a free float-adjusted market capitalization index that is designed to measure the equity market performance of developed markets, excluding the U.S. & Canada.
MSCI Emerging Markets Index is a free float-adjusted market capitalization weighted index that is designed to measure equity market performance in the global emerging markets.
S&P 500® Index is a broad-based index, the performance of which is based on the performance of 500 widely held common stocks chosen for market size, liquidity, and industry group representation.
| | THE GUGGENHEIM FUNDS SEMI-ANNUAL REPORT | 5 |
| ABOUT SHAREHOLDERS’ FUND EXPENSES (Unaudited) |
All mutual funds have operating expenses, and it is important for our shareholders to understand the impact of costs on their investments. Shareholders of a fund incur two types of costs: (i) transaction costs, including sales charges (loads) on purchase payments, reinvested dividends, other distributions, and exchange fees, and (ii) ongoing costs, including management fees, administrative services, and shareholder reports, among others. These ongoing costs, or operating expenses, are deducted from a fund’s gross income and reduce the investment return of the fund.
A fund’s expenses are expressed as a percentage of its average net assets, which is known as the expense ratio. The following examples are intended to help investors understand the ongoing costs (in dollars) of investing in a fund and to compare these costs with the ongoing costs of investing in other mutual funds.
The examples are based on an investment of $1,000 made at the beginning of the period and held for the entire six-month period beginning December 31, 2022 and ending June 30, 2023.
The following tables illustrate the Fund’s costs in two ways:
Table 1. Based on actual Fund return: This section helps investors estimate the actual expenses paid over the period. The “Ending Account Value” shown is derived from the Fund’s actual return, and the fifth column shows the dollar amount that would have been paid by an investor who started with $1,000 in the Fund. Investors may use the information here, together with the amount invested, to estimate the expenses paid over the period. Simply divide the Fund’s account value by $1,000 (for example, an $8,600 account value divided by $1,000 = 8.6), then multiply the result by the number provided under the heading “Expenses Paid During Period.”
Table 2. Based on hypothetical 5% return: This section is intended to help investors compare a fund’s cost with those of other mutual funds. The table provides information about hypothetical account values and hypothetical expenses based on the Fund’s actual expense ratio and an assumed rate of return of 5% per year before expenses, which is not the Fund’s actual return. The hypothetical account values and expenses may not be used to estimate the actual ending account balance or expenses paid during the period. The example is useful in making comparisons because the U.S. Securities and Exchange Commission (the “SEC”) requires all mutual funds to calculate expenses based on the 5% return. Investors can assess a Fund’s costs by comparing this hypothetical example with the hypothetical examples that appear in shareholder reports of other funds.
The calculations illustrated above assume no shares were bought or sold during the period. Actual costs may have been higher or lower, depending on the amount of investment and the timing of any purchases or redemptions.
| 6 | THE GUGGENHEIM FUNDS SEMI-ANNUAL REPORT | |
| ABOUT SHAREHOLDERS’ FUND EXPENSES (Unaudited)(continued) |
Please note that the expenses shown in the table are meant to highlight your ongoing costs only and do not reflect any transactional costs, such as sales charges (loads) on purchase payments, and contingent deferred sales charges (“CDSC”) on redemptions, if any. Therefore, the second table is useful in comparing ongoing costs only, and will not help you determine the relative total costs of owning different funds. In addition, if these transactional costs were included, your costs would have been higher.
More information about the Fund’s expenses, including annual expense ratios for periods up to five years (subject to the Fund’s inception date), can be found in the Financial Highlights section of this report. For additional information on operating expenses and other shareholder costs, please refer to the Fund’s prospectus.
| | THE GUGGENHEIM FUNDS SEMI-ANNUAL REPORT | 7 |
| ABOUT SHAREHOLDERS’ FUND EXPENSES (Unaudited)(concluded) |
| | Expense
Ratio1 | Fund
Return | Beginning
Account Value
December 31,
2022 | Ending
Account Value
June 30,
2023 | Expenses
Paid During
Period2 |
| Table 1. Based on actual Fund return3 |
| A-Class | 1.72% | 3.47% | $ 1,000.00 | $ 1,034.70 | $ 8.68 |
| C-Class | 2.45% | 3.06% | 1,000.00 | 1,030.60 | 12.34 |
| P-Class | 1.70% | 3.40% | 1,000.00 | 1,034.00 | 8.57 |
| Institutional Class | 1.43% | 3.60% | 1,000.00 | 1,036.00 | 7.22 |
| |
| Table 2. Based on hypothetical 5% return (before expenses) |
| A-Class | 1.72% | 5.00% | $ 1,000.00 | $ 1,016.27 | $ 8.60 |
| C-Class | 2.45% | 5.00% | 1,000.00 | 1,012.65 | 12.23 |
| P-Class | 1.70% | 5.00% | 1,000.00 | 1,016.36 | 8.50 |
| Institutional Class | 1.43% | 5.00% | 1,000.00 | 1,017.70 | 7.15 |
| 1 | Annualized and excludes expenses of the underlying funds in which the Fund invests, if any. |
| 2 | Expenses are equal to the Fund’s annualized expense ratio, net of any applicable fee waivers, multiplied by the average account value over the period, multiplied by 181/365 (to reflect the one-half year period). |
| 3 | Actual cumulative return at net asset value for the period December 31, 2022 to June 30, 2023. |
| 8 | THE GUGGENHEIM FUNDS SEMI-ANNUAL REPORT | |
| PERFORMANCE REPORT AND FUND PROFILE (Unaudited) | June 30, 2023 |
MANAGED FUTURES STRATEGY FUND
OBJECTIVE: Seeks to achieve absolute returns.
Consolidated Holdings Diversification (Market Exposure as % of Net Assets)

“Consolidated Holdings Diversification (Market Exposure as % of Net Assets)” excludes any temporary cash investments, investments in Guggenheim Strategy Funds Trust mutual funds, or investments in Guggenheim Ultra Short Duration Fund. Investments in those Funds do not provide “market exposure” to meet the Fund’s investment objective, but will significantly increase the portfolio’s exposure to certain other asset categories (and their associated risks), which may cause the Fund to deviate from its principal investment strategy, including: (i) high yield, high risk debt securities rated below the top four long-term rating categories by a nationally recognized statistical rating organization (also known as “junk bonds”); (ii) securities issued by the U.S. government or its agencies and instrumentalities; (iii) CLOs and similar investments; and (iv) other short-term fixed income securities.
| Inception Dates: |
| A-Class | March 2, 2007 |
| C-Class | March 2, 2007 |
| P-Class | March 2, 2007 |
| Institutional Class | May 3, 2010 |
The Fund invests principally in derivative investments such as futures contracts.
| Largest Holdings | % of Total Net Assets |
| Guggenheim Strategy Fund III | 13.0% |
| Guggenheim Strategy Fund II | 9.2% |
| Guggenheim Ultra Short Duration Fund — Institutional Class | 5.7% |
| Total | 27.9% |
| | |
| “Largest Holdings” excludes any temporary cash or derivative investments. |
| | THE GUGGENHEIM FUNDS SEMI-ANNUAL REPORT | 9 |
| PERFORMANCE REPORT AND FUND PROFILE (Unaudited)(concluded) | June 30, 2023 |
Average Annual Returns*
Periods Ended June 30, 2023
| | 6 Month† | 1 Year | 5 Year | 10 Year |
| A-Class Shares | 3.47% | 3.47% | 4.82% | 2.36% |
| A-Class Shares with sales charge‡ | (1.44%) | (1.47%) | 3.81% | 1.86% |
| C-Class Shares | 3.06% | 2.70% | 4.05% | 1.60% |
| C-Class Shares with CDSC§ | 2.06% | 1.73% | 4.05% | 1.60% |
| P-Class Shares | 3.40% | 3.39% | 4.81% | 2.38% |
| Institutional Class Shares | 3.60% | 3.79% | 5.10% | 2.62% |
| ICE BofA 3-Month U.S. Treasury Bill Index | 2.27% | 3.62% | 1.56% | 0.99% |
| * | The performance data above represents past performance that is not predictive of future results. The investment return and principal value of an investment in the Fund will fluctuate so that an investor’s shares, when redeemed, may be worth more or less than their original cost. Returns are historical and include changes in principal and reinvested dividends and capital gains and do not reflect the effect of taxes. The ICE BofA 3-Month U.S. Treasury Bill Index is an unmanaged index and, unlike the Fund, has no management fees or operating expenses to reduce its reported return. |
| † | 6 month returns are not annualized. |
| ‡ | Fund returns are calculated using the maximum sales charge of 4.75%. |
| § | Fund returns include a CDSC of 1% if redeemed within 12 months of purchase. |
| 10 | THE GUGGENHEIM FUNDS SEMI-ANNUAL REPORT | |
| CONSOLIDATED SCHEDULE OF INVESTMENTS (Unaudited) | June 30, 2023 |
| MANAGED FUTURES STRATEGY FUND | |
| | | Shares | | | Value | |
| MUTUAL FUNDS† - 27.9% |
| Guggenheim Strategy Fund III1 | | | 235,195 | | | $ | 5,703,484 | |
| Guggenheim Strategy Fund II1 | | | 166,856 | | | | 4,041,249 | |
| Guggenheim Ultra Short Duration Fund — Institutional Class1 | | | 257,497 | | | | 2,505,443 | |
| Total Mutual Funds | | | | |
| (Cost $12,548,781) | | | | | | | 12,250,176 | |
| | | | | | | | | |
| | | Face
Amount | | | | | |
| U.S. TREASURY BILLS†† - 17.3% |
| U.S. Treasury Bills |
| 5.11% due 07/18/232,3 | | $ | 7,605,000 | | | | 7,589,085 | |
| Total U.S. Treasury Bills | | | | |
| (Cost $7,586,326) | | | | | | | 7,589,085 | |
| REPURCHASE AGREEMENTS††,4 - 52.7% |
J.P. Morgan Securities LLC
issued 06/30/23 at 5.05%
due 07/03/23 | | | 12,559,940 | | | | 12,559,940 | |
Barclays Capital, Inc.
issued 06/30/23 at 5.06%
due 07/03/23 | | | 5,525,741 | | | | 5,525,741 | |
BofA Securities, Inc.
issued 06/30/23 at 5.06%
due 07/03/23 | | | 5,023,401 | | | | 5,023,401 | |
| Total Repurchase Agreements | | | | |
| (Cost $23,109,082) | | | | | | | 23,109,082 | |
| | | | | | | | | |
| Total Investments - 97.9% | | | | |
| (Cost $43,244,189) | | $ | 42,948,343 | |
| Other Assets & Liabilities, net - 2.1% | | | 930,269 | |
| Total Net Assets - 100.0% | | $ | 43,878,612 | |
| | | | | |
| Futures Contracts |
| Description | | Number of
Contracts | | | Expiration
Date | | | Notional
Amount | | | Value and
Unrealized
Appreciation
(Depreciation)** | |
| Equity Futures Contracts Purchased† |
| Tokyo Stock Price Index Futures Contracts | | | 22 | | | | Sep 2023 | | | $ | 3,508,716 | | | $ | 211,960 | |
| NASDAQ-100 Index Mini Futures Contracts | | | 14 | | | | Sep 2023 | | | | 4,292,750 | | | | 136,392 | |
| Nikkei 225 (OSE) Index Futures Contracts | | | 7 | | | | Sep 2023 | | | | 1,621,972 | | | | 110,078 | |
| S&P 500 Index Mini Futures Contracts | | | 17 | | | | Sep 2023 | | | | 3,813,525 | | | | 68,402 | |
| Dow Jones Industrial Average Index Mini Futures Contracts | | | 29 | | | | Sep 2023 | | | | 5,021,060 | | | | 65,073 | |
| IBEX 35 Index Futures Contracts†† | | | 14 | | | | Jul 2023 | | | | 1,461,634 | | | | 46,545 | |
| Euro STOXX 50 Index Futures Contracts | | | 30 | | | | Sep 2023 | | | | 1,453,504 | | | | 36,646 | |
| DAX Index Futures Contracts | | | 5 | | | | Sep 2023 | | | | 2,224,951 | | | | 25,859 | |
| MSCI EAFE Index Futures Contracts | | | 13 | | | | Sep 2023 | | | | 1,400,425 | | | | 12,905 | |
| SPI 200 Index Futures Contracts | | | 3 | | | | Sep 2023 | | | | 359,213 | | | | 5,508 | |
| CAC 40 10 Euro Index Futures Contracts | | | 1 | | | | Jul 2023 | | | | 81,139 | | | | 2,206 | |
| Russell 2000 Index Mini Futures Contracts | | | 7 | | | | Sep 2023 | | | | 666,085 | | | | 1,984 | |
| OMX Stockholm 30 Index Futures Contracts†† | | | 4 | | | | Jul 2023 | | | | 86,048 | | | | 290 | |
| SEE NOTES TO CONSOLIDATED FINANCIAL STATEMENTS. | THE GUGGENHEIM FUNDS SEMI-ANNUAL REPORT | 11 |
| CONSOLIDATED SCHEDULE OF INVESTMENTS (Unaudited)(continued) | June 30, 2023 |
| MANAGED FUTURES STRATEGY FUND | |
| Futures Contracts (continued) |
| Description | | Number of
Contracts | | | Expiration
Date | | | Notional
Amount | | | Value and
Unrealized
Appreciation
(Depreciation)** | |
| FTSE 100 Index Futures Contracts | | | 18 | | | | Sep 2023 | | | $ | 1,728,312 | | | $ | (4,526 | ) |
| FTSE Taiwan Index Futures Contracts | | | 45 | | | | Jul 2023 | | | | 2,607,300 | | | | (20,793 | ) |
| CBOE Volatility Index Futures Contracts | | | 42 | | | | Sep 2023 | | | | 741,300 | | | | (47,495 | ) |
| CBOE Volatility Index Futures Contracts | | | 60 | | | | Dec 2023 | | | | 1,149,000 | | | | (84,579 | ) |
| | | | | | | | | | | $ | 32,216,934 | | | $ | 566,455 | |
| Commodity Futures Contracts Purchased† |
| Cocoa Futures Contracts | | | 52 | | | | Sep 2023 | | | $ | 1,745,640 | | | $ | 128,851 | |
| Cattle Feeder Futures Contracts | | | 9 | | | | Aug 2023 | | | | 1,112,850 | | | | 100,098 | |
| Live Cattle Futures Contracts | | | 33 | | | | Aug 2023 | | | | 2,335,410 | | | | 99,085 | |
| Oat Futures Contracts | | | 27 | | | | Sep 2023 | | | | 525,825 | | | | 46,145 | |
| Soybean Futures Contracts | | | 10 | | | | Nov 2023 | | | | 671,250 | | | | 30,084 | |
| LME Tin Futures Contracts | | | 5 | | | | Aug 2023 | | | | 674,045 | | | | 29,735 | |
| Natural Gas Futures Contracts | | | 29 | | | | Aug 2023 | | | | 801,560 | | | | 26,036 | |
| Low Sulphur Gas Oil Futures Contracts | | | 19 | | | | Aug 2023 | | | | 1,339,025 | | | | 22,067 | |
| Canadian Canola (WCE) Futures Contracts | | | 32 | | | | Nov 2023 | | | | 355,875 | | | | 13,196 | |
| ECX Emission Futures Contracts | | | 4 | | | | Dec 2023 | | | | 388,911 | | | | 12,643 | |
| Gasoline RBOB Futures Contracts | | | 3 | | | | Jul 2023 | | | | 320,985 | | | | 12,240 | |
| Soybean Oil Futures Contracts | | | 4 | | | | Dec 2023 | | | | 141,528 | | | | 11,010 | |
| LME Lead Futures Contracts | | | 2 | | | | Aug 2023 | | | | 105,073 | | | | 2,879 | |
| Copper Futures Contracts | | | 14 | | | | Sep 2023 | | | | 1,317,050 | | | | 1,103 | |
| Hard Red Winter Wheat Futures Contracts | | | 1 | | | | Sep 2023 | | | | 39,662 | | | | 547 | |
| Soybean Meal Futures Contracts | | | 1 | | | | Dec 2023 | | | | 39,660 | | | | (148 | ) |
| Natural Gas Futures Contracts | | | 8 | | | | Jul 2023 | | | | 222,720 | | | | (350 | ) |
| Gasoline RBOB Futures Contracts | | | 14 | | | | Sep 2023 | | | | 1,303,537 | | | | (939 | ) |
| Soybean Meal Futures Contracts | | | 14 | | | | Mar 2024 | | | | 539,980 | | | | (2,238 | ) |
| SGX Iron Ore 62% Futures Contracts | | | 59 | | | | Aug 2023 | | | | 641,625 | | | | (17,583 | ) |
| Corn Futures Contracts | | | 8 | | | | Sep 2023 | | | | 195,600 | | | | (37,579 | ) |
| Sugar #11 Futures Contracts | | | 69 | | | | Apr 2024 | | | | 1,674,658 | | | | (117,142 | ) |
| | | | | | | | | | | $ | 16,492,469 | | | $ | 359,740 | |
| Currency Futures Contracts Purchased† |
| Mexican Peso Futures Contracts | | | 256 | | | | Sep 2023 | | | $ | 7,367,680 | | | $ | 97,331 | |
| Euro FX Futures Contracts | | | 41 | | | | Sep 2023 | | | | 5,614,438 | | | | 36,509 | |
| British Pound Futures Contracts | | | 30 | | | | Sep 2023 | | | | 2,381,437 | | | | 11,955 | |
| New Zealand Dollar Futures Contracts | | | 8 | | | | Sep 2023 | | | | 490,760 | | | | 707 | |
| Canadian Dollar Futures Contracts | | | 32 | | | | Sep 2023 | | | | 2,418,560 | | | | (12,220 | ) |
| Japanese Yen Futures Contracts | | | 14 | | | | Sep 2023 | | | | 1,227,363 | | | | (44,943 | ) |
| | | | | | | | | | | $ | 19,500,238 | | | $ | 89,339 | |
| 12 | THE GUGGENHEIM FUNDS SEMI-ANNUAL REPORT | SEE NOTES TO CONSOLIDATED FINANCIAL STATEMENTS. |
| CONSOLIDATED SCHEDULE OF INVESTMENTS (Unaudited)(continued) | June 30, 2023 |
| MANAGED FUTURES STRATEGY FUND | |
| Futures Contracts (continued) |
| Description | | Number of
Contracts | | | Expiration
Date | | | Notional
Amount | | | Value and
Unrealized
Appreciation
(Depreciation)** | |
| Interest Rate Futures Contracts Purchased† |
| Euro - OATS Futures Contracts | | | 3 | | | | Sep 2023 | | | $ | 420,498 | | | $ | (396 | ) |
| Euro - BTP Italian Government Bond Futures Contracts†† | | | 2 | | | | Sep 2023 | | | | 253,525 | | | | (844 | ) |
| U.S. Treasury Ultra Long Bond Futures Contracts | | | 22 | | | | Sep 2023 | | | | 3,005,063 | | | | (1,183 | ) |
| U.S. Treasury 10 Year Note Futures Contracts | | | 71 | | | | Sep 2023 | | | | 7,974,188 | | | | (10,599 | ) |
| U.S. Treasury 2 Year Note Futures Contracts | | | 54 | | | | Sep 2023 | | | | 10,982,672 | | | | (10,873 | ) |
| U.S. Treasury 5 Year Note Futures Contracts | | | 96 | | | | Sep 2023 | | | | 10,284,750 | | | | (18,435 | ) |
| | | | | | | | | | | $ | 32,920,696 | | | $ | (42,330 | ) |
| Interest Rate Futures Contracts Sold Short† |
| Euro - Schatz Futures Contracts | | | 236 | | | | Sep 2023 | | | $ | 27,007,859 | | | $ | 185,814 | |
| U.S. Treasury 2 Year Note Futures Contracts | | | 45 | | | | Sep 2023 | | | | 9,152,227 | | | | 100,874 | |
| Long Gilt Futures Contracts†† | | | 30 | | | | Sep 2023 | | | | 3,631,653 | | | | 54,626 | |
| Euro - Bund Futures Contracts | | | 23 | | | | Sep 2023 | | | | 3,358,120 | | | | 39,229 | |
| Euro - Bobl Futures Contracts | | | 26 | | | | Sep 2023 | | | | 3,284,196 | | | | 39,114 | |
| U.S. Treasury 5 Year Note Futures Contracts | | | 13 | | | | Sep 2023 | | | | 1,392,727 | | | | 19,755 | |
| Canadian Government 10 Year Bond Futures Contracts | | | 26 | | | | Sep 2023 | | | | 2,405,382 | | | | 19,753 | |
| Australian Government 3 Year Bond Futures Contracts | | | 44 | | | | Sep 2023 | | | | 3,096,882 | | | | 11,698 | |
| U.S. Treasury 10 Year Note Futures Contracts | | | 11 | | | | Sep 2023 | | | | 1,235,438 | | | | 5,914 | |
| Australian Government 10 Year Bond Futures Contracts | | | 10 | | | | Sep 2023 | | | | 775,646 | | | | 590 | |
| Euro - 30 year Bond Futures Contracts | | | 1 | | | | Sep 2023 | | | | 152,499 | | | | (135 | ) |
| U.S. Treasury Long Bond Futures Contracts | | | 13 | | | | Sep 2023 | | | | 1,652,625 | | | | (860 | ) |
| U.S. Treasury Ultra Long Bond Futures Contracts | | | 2 | | | | Sep 2023 | | | | 273,188 | | | | (933 | ) |
| | | | | | | | | | | $ | 57,418,442 | | | $ | 475,439 | |
| Currency Futures Contracts Sold Short† |
| Japanese Yen Futures Contracts | | | 88 | | | | Sep 2023 | | | $ | 7,714,850 | | | $ | 153,905 | |
| Australian Dollar Futures Contracts | | | 23 | | | | Sep 2023 | | | | 1,535,020 | | | | 10,114 | |
| New Zealand Dollar Futures Contracts | | | 3 | | | | Sep 2023 | | | | 184,035 | | | | (169 | ) |
| British Pound Futures Contracts | | | 6 | | | | Sep 2023 | | | | 476,288 | | | | (3,355 | ) |
| Swiss Franc Futures Contracts | | | 29 | | | | Sep 2023 | | | | 4,083,019 | | | | (20,461 | ) |
| | | | | | | | | | | $ | 13,993,212 | | | $ | 140,034 | |
| Commodity Futures Contracts Sold Short† |
| Palladium Futures Contracts | | | 7 | | | | Sep 2023 | | | $ | 858,200 | | | $ | 101,082 | |
| Wheat Futures Contracts | | | 15 | | | | Sep 2023 | | | | 484,875 | | | | 53,815 | |
| Sugar #11 Futures Contracts | | | 38 | | | | Sep 2023 | | | | 971,219 | | | | 50,770 | |
| LME Nickel Futures Contracts | | | 9 | | | | Aug 2023 | | | | 1,104,192 | | | | 40,531 | |
| LME Primary Aluminum Futures Contracts | | | 15 | | | | Aug 2023 | | | | 800,531 | | | | 17,354 | |
| Sugar #11 Futures Contracts | | | 24 | | | | Feb 2024 | | | | 616,090 | | | | 14,727 | |
| Corn Futures Contracts | | | 2 | | | | Sep 2023 | | | | 48,900 | | | | 6,603 | |
| Coffee ‘C’ Futures Contracts | | | 9 | | | | Sep 2023 | | | | 536,625 | | | | 5,915 | |
| SEE NOTES TO CONSOLIDATED FINANCIAL STATEMENTS. | THE GUGGENHEIM FUNDS SEMI-ANNUAL REPORT | 13 |
| CONSOLIDATED SCHEDULE OF INVESTMENTS (Unaudited)(continued) | June 30, 2023 |
| MANAGED FUTURES STRATEGY FUND | |
| Futures Contracts (continued) |
| Description | | Number of
Contracts | | | Expiration
Date | | | Notional
Amount | | | Value and
Unrealized
Appreciation
(Depreciation)** | |
| LME Zinc Futures Contracts | | | 9 | | | | Aug 2023 | | | $ | 537,581 | | | $ | 5,837 | |
| Soybean Meal Futures Contracts | | | 5 | | | | Dec 2023 | | | | 198,300 | | | | 2,089 | |
| Hard Red Winter Wheat Futures Contracts | | | 9 | | | | Sep 2023 | | | | 356,963 | | | | 1,715 | |
| CME Nonfat Dry Milk Futures Contracts | | | 2 | | | | Aug 2023 | | | | 101,376 | | | | 996 | |
| Red Spring Wheat Futures Contracts | | | 11 | | | | Sep 2023 | | | | 447,013 | | | | 640 | |
| Brent Crude Futures Contracts | | | 1 | | | | Sep 2023 | | | | 75,310 | | | | 98 | |
| Soybean Futures Contracts | | | 1 | | | | Nov 2023 | | | | 67,125 | | | | 34 | |
| Low Sulphur Gas Oil Futures Contracts | | | 1 | | | | Aug 2023 | | | | 70,475 | | | | (227 | ) |
| Gold 100 oz. Futures Contracts | | | 2 | | | | Aug 2023 | | | | 385,560 | | | | (826 | ) |
| Gasoline RBOB Futures Contracts | | | 3 | | | | Jul 2023 | | | | 320,985 | | | | (1,192 | ) |
| Copper Futures Contracts | | | 2 | | | | Sep 2023 | | | | 188,150 | | | | (1,781 | ) |
| Cotton #2 Futures Contracts | | | 11 | | | | Dec 2023 | | | | 442,310 | | | | (2,020 | ) |
| Silver Futures Contracts | | | 26 | | | | Sep 2023 | | | | 2,986,750 | | | | (4,737 | ) |
| Gasoline RBOB Futures Contracts | | | 6 | | | | Aug 2023 | | | | 620,474 | | | | (9,251 | ) |
| Soybean Oil Futures Contracts | | | 14 | | | | Dec 2023 | | | | 495,348 | | | | (11,864 | ) |
| Natural Gas Futures Contracts | | | 8 | | | | Jul 2023 | | | | 222,720 | | | | (19,047 | ) |
| Lean Hogs Futures Contracts | | | 10 | | | | Aug 2023 | | | | 369,900 | | | | (23,021 | ) |
| NY Harbor ULSD Futures Contracts | | | 7 | | | | Jul 2023 | | | | 718,859 | | | | (23,080 | ) |
| Live Cattle Futures Contracts | | | 30 | | | | Dec 2023 | | | | 2,200,800 | | | | (55,326 | ) |
| Natural Gas Futures Contracts | | | 31 | | | | Sep 2023 | | | | 881,950 | | | | (61,966 | ) |
| | | | | | | | | | | $ | 17,108,581 | | | $ | 87,868 | |
| Equity Futures Contracts Sold Short† |
| CBOE Volatility Index Futures Contracts | | | 63 | | | | Jul 2023 | | | $ | 945,000 | | | $ | 97,949 | |
| Russell 2000 Index Mini Futures Contracts | | | 15 | | | | Sep 2023 | | | | 1,427,325 | | | | (219 | ) |
| CAC 40 10 Euro Index Futures Contracts | | | 1 | | | | Jul 2023 | | | | 81,140 | | | | (1,219 | ) |
| FTSE/JSE TOP 40 Index Futures Contracts†† | | | 25 | | | | Sep 2023 | | | | 944,658 | | | | (7,130 | ) |
| S&P MidCap 400 Index Mini Futures Contracts | | | 9 | | | | Sep 2023 | | | | 2,379,600 | | | | (11,548 | ) |
| S&P/TSX 60 IX Index Futures Contracts | | | 10 | | | | Sep 2023 | | | | 1,839,572 | | | | (21,497 | ) |
| | | | | | | | | | | $ | 7,617,295 | | | $ | 56,336 | |
| 14 | THE GUGGENHEIM FUNDS SEMI-ANNUAL REPORT | SEE NOTES TO CONSOLIDATED FINANCIAL STATEMENTS. |
| CONSOLIDATED SCHEDULE OF INVESTMENTS (Unaudited)(continued) | June 30, 2023 |
| MANAGED FUTURES STRATEGY FUND | |
| ** | Includes cumulative appreciation (depreciation). Variation margin is reported within the Consolidated Statement of Assets and Liabilities. |
| † | Value determined based on Level 1 inputs, unless otherwise noted — See Note 4. |
| †† | Value determined based on Level 2 inputs — See Note 4. |
| 1 | Affiliated issuer. |
| 2 | All or a portion of this security is pledged as futures collateral at June 30, 2023. |
| 3 | Rate indicated is the effective yield at the time of purchase. |
| 4 | Repurchase Agreements — See Note 6. |
| | CME — Chicago Mercantile Exchange |
| | |
| | See Sector Classification in Other Information section. |
The following table summarizes the inputs used to value the Fund’s investments at June 30, 2023 (See Note 4 in the Notes to Consolidated Financial Statements):
| Investments in Securities (Assets) | | Level 1
Quoted
Prices | | | Level 2
Significant
Observable
Inputs | | | Level 3
Significant
Unobservable
Inputs | | | Total | |
| Mutual Funds | | $ | 12,250,176 | | | $ | — | | | $ | — | | | $ | 12,250,176 | |
| U.S. Treasury Bills | | | — | | | | 7,589,085 | | | | — | | | | 7,589,085 | |
| Repurchase Agreements | | | — | | | | 23,109,082 | | | | — | | | | 23,109,082 | |
| Commodity Futures Contracts** | | | 837,925 | | | | — | | | | — | | | | 837,925 | |
| Equity Futures Contracts** | | | 774,962 | | | | 46,835 | | | | — | | | | 821,797 | |
| Interest Rate Futures Contracts** | | | 422,741 | | | | 54,626 | | | | — | | | | 477,367 | |
| Currency Futures Contracts** | | | 310,521 | | | | — | | | | — | | | | 310,521 | |
| Total Assets | | $ | 14,596,325 | | | $ | 30,799,628 | | | $ | — | | | $ | 45,395,953 | |
| Investments in Securities (Liabilities) | | Level 1
Quoted
Prices | | | Level 2
Significant
Observable
Inputs | | | Level 3
Significant
Unobservable
Inputs | | | Total | |
| Commodity Futures Contracts** | | $ | 390,317 | | | $ | — | | | $ | — | | | $ | 390,317 | |
| Equity Futures Contracts** | | | 191,876 | | | | 7,130 | | | | — | | | | 199,006 | |
| Currency Futures Contracts** | | | 81,148 | | | �� | — | | | | — | | | | 81,148 | |
| Interest Rate Futures Contracts** | | | 43,414 | | | | 844 | | | | — | | | | 44,258 | |
| Total Liabilities | | $ | 706,755 | | | $ | 7,974 | | | $ | — | | | $ | 714,729 | |
| ** | This derivative is reported as unrealized appreciation/depreciation at period end. |
| SEE NOTES TO CONSOLIDATED FINANCIAL STATEMENTS. | THE GUGGENHEIM FUNDS SEMI-ANNUAL REPORT | 15 |
| CONSOLIDATED SCHEDULE OF INVESTMENTS (Unaudited)(concluded) | June 30, 2023 |
| MANAGED FUTURES STRATEGY FUND | |
Affiliated Transactions
Investments representing 5% or more of the outstanding voting shares of a company, or control of or by, or common control under Guggenheim Investments (“GI”), result in that company being considered an affiliated issuer, as defined in the 1940 Act.
The Fund may invest in certain of the underlying series of Guggenheim Strategy Funds Trust, including Guggenheim Strategy Fund II and Guggenheim Strategy Fund III, (collectively, the “Short Term Investment Vehicles”), each of which are open-end management investment companies managed by GI. The Short Term Investment Vehicles, which launched on March 11, 2014, are offered as short term investment options only to mutual funds, trusts, and other accounts managed by GI and/or its affiliates, and are not available to the public. The Short Term Investment Vehicles pay no investment management fees. The Short Term Investment Vehicles’ annual report on Form N-CSR dated September 30, 2022, is available publicly or upon request. This information is available from the EDGAR database on the SEC’s website at https://www.sec.gov/Archives/edgar/data/1601445/000182126822000340/gug84768.htm. The Fund may invest in certain of the underlying series of Guggenheim Funds Trust, which are open-end management investment companies managed by GI, are available to the public and whose most recent annual report on Form N-CSR is available publicly or upon request.
Transactions during the period ended June 30, 2023, in which the company is an affiliated issuer, were as follows:
| Security Name | | Value
12/31/22 | | | Additions | | | Reductions | | | Realized
Gain (Loss) | | | Change in
Unrealized
Appreciation
(Depreciation) | | | Value
06/30/23 | | | Shares
06/30/23 | | | Investment
Income | |
| Mutual Funds | | | | | | | | | | | | | | | | | | | | | | | | | | | | | | | | |
| Guggenheim Strategy Fund II | | $ | 4,011,215 | | | $ | — | | | $ | — | | | $ | — | | | $ | 30,034 | | | $ | 4,041,249 | | | | 166,856 | | | $ | 104,936 | |
| Guggenheim Strategy Fund III | | | 5,658,797 | | | | — | | | | — | | | | — | | | | 44,687 | | | | 5,703,484 | | | | 235,195 | | | | 145,983 | |
| Guggenheim Ultra Short Duration Fund — Institutional Class | | | 2,482,268 | | | | — | | | | — | | | | — | | | | 23,175 | | | | 2,505,443 | | | | 257,497 | | | | 63,784 | |
| | | $ | 12,152,280 | | | $ | — | | | $ | — | | | $ | — | | | $ | 97,896 | | | $ | 12,250,176 | | | | | | | $ | 314,703 | |
| 16 | THE GUGGENHEIM FUNDS SEMI-ANNUAL REPORT | SEE NOTES TO CONSOLIDATED FINANCIAL STATEMENTS. |
| CONSOLIDATED STATEMENT OF ASSETS AND LIABILITIES (Unaudited) |
| MANAGED FUTURES STRATEGY FUND |
June 30, 2023
| Assets: |
| Investments in unaffiliated issuers, at value (cost $7,586,326) | | $ | 7,589,085 | |
| Investments in affiliated issuers, at value (cost $12,548,781) | | | 12,250,176 | |
| Repurchase agreements, at value (cost $23,109,082) | | | 23,109,082 | |
| Cash | | | 9,252 | |
| Segregated cash with broker | | | 427,530 | |
| Receivables: |
| Variation margin on futures contracts | | | 501,255 | |
| Dividends | | | 56,213 | |
| Fund shares sold | | | 40,961 | |
| Interest | | | 3,245 | |
| Other assets | | | 1,082 | |
| Total assets | | | 43,987,881 | |
| | | | | |
| Liabilities: |
| Payable for: |
| Management fees | | | 32,859 | |
| Fund shares redeemed | | | 21,772 | |
| Transfer agent fees | | | 11,546 | |
| Printing fees | | | 9,188 | |
| Portfolio accounting and administration fees | | | 5,655 | |
| Distribution and service fees | | | 4,930 | |
| Professional fees | | | 4,606 | |
| Trustees’ fees* | | | 596 | |
| Miscellaneous | | | 18,117 | |
| Total liabilities | | | 109,269 | |
| Net assets | | $ | 43,878,612 | |
| | | | | |
| Net assets consist of: |
| Paid in capital | | $ | 85,187,774 | |
| Total distributable earnings (loss) | | | (41,309,162 | ) |
| Net assets | | $ | 43,878,612 | |
| | | | | |
| A-Class: |
| Net assets | | $ | 6,532,931 | |
| Capital shares outstanding | | | 313,189 | |
| Net asset value per share | | $ | 20.86 | |
| Maximum offering price per share (Net asset value divided by 95.25%) | | $ | 21.90 | |
| | | | | |
| C-Class: |
| Net assets | | $ | 2,135,498 | |
| Capital shares outstanding | | | 117,514 | |
| Net asset value per share | | $ | 18.17 | |
| | | | | |
| P-Class: |
| Net assets | | $ | 7,907,232 | |
| Capital shares outstanding | | | 376,628 | |
| Net asset value per share | | $ | 20.99 | |
| | | | | |
| Institutional Class: |
| Net assets | | $ | 27,302,951 | |
| Capital shares outstanding | | | 1,263,505 | |
| Net asset value per share | | $ | 21.61 | |
| * | Relates to Trustees not deemed “interested persons” within the meaning of Section 2(a)(19) of the 1940 Act. |
| SEE NOTES TO CONSOLIDATED FINANCIAL STATEMENTS. | THE GUGGENHEIM FUNDS SEMI-ANNUAL REPORT | 17 |
| CONSOLIDATED STATEMENT OF OPERATIONS (Unaudited) |
| MANAGED FUTURES STRATEGY FUND |
Six Months Ended June 30, 2023
| Investment Income: |
| Dividends from securities of affiliated issuers | | $ | 314,703 | |
| Interest | | | 647,608 | |
| Total investment income | | | 962,311 | |
| | | | | |
| Expenses: |
| Management fees | | | 205,606 | |
| Distribution and service fees: |
| A-Class | | | 7,733 | |
| C-Class | | | 10,631 | |
| P-Class | | | 12,265 | |
| Transfer agent fees | | | 35,549 | |
| Portfolio accounting and administration fees | | | 30,265 | |
| Professional fees | | | 20,828 | |
| Trustees’ fees* | | | 3,785 | |
| Custodian fees | | | 2,911 | |
| Miscellaneous | | | 17,777 | |
| Total expenses | | | 347,350 | |
| Less: |
| Expenses waived by Adviser | | | (30,469 | ) |
| Net expenses | | | 316,881 | |
| Net investment income | | | 645,430 | |
| | | | | |
| Net Realized and Unrealized Gain (Loss): |
| Net realized gain (loss) on: |
| Investments in unaffiliated issuers | | $ | 39,382 | |
| Futures contracts | | | (278,939 | ) |
| Foreign currency transactions | | | (34,851 | ) |
| Net realized loss | | | (274,408 | ) |
| Net change in unrealized appreciation (depreciation) on: |
| Investments in unaffiliated issuers | | | 1,204 | |
| Investments in affiliated issuers | | | 97,896 | |
| Futures contracts | | | 309,499 | |
| Foreign currency translations | | | (724 | ) |
| Net change in unrealized appreciation (depreciation) | | | 407,875 | |
| Net realized and unrealized gain | | | 133,467 | |
| Net increase in net assets resulting from operations | | $ | 778,897 | |
| * | Relates to Trustees not deemed “interested persons” within the meaning of Section 2(a)(19) of the 1940 Act. |
| 18 | THE GUGGENHEIM FUNDS SEMI-ANNUAL REPORT | SEE NOTES TO CONSOLIDATED FINANCIAL STATEMENTS. |
| CONSOLIDATED STATEMENTS OF CHANGES IN NET ASSETS |
| MANAGED FUTURES STRATEGY FUND | |
| | | Six Months Ended
June 30, 2023
(Unaudited) | | | Year Ended
December 31,
2022 | |
| Increase (Decrease) in Net Assets from Operations: | | | | | | | | |
| Net investment income | | $ | 645,430 | | | $ | 118,179 | |
| Net realized gain (loss) on investments | | | (274,408 | ) | | | 2,034,368 | |
| Net change in unrealized appreciation (depreciation) on investments | | | 407,875 | | | | 1,087,050 | |
| Net increase in net assets resulting from operations | | | 778,897 | | | | 3,239,597 | |
| | | | | | | | | |
| Distributions to shareholders: | | | | | | | | |
| A-Class | | | — | | | | (290,823 | ) |
| C-Class | | | — | | | | (105,236 | ) |
| P-Class | | | — | | | | (376,691 | ) |
| Institutional Class | | | — | | | | (1,029,250 | ) |
| Total distributions to shareholders | | | — | | | | (1,802,000 | ) |
| | | | | | | | | |
| Capital share transactions: | | | | | | | | |
| Proceeds from sale of shares | | | | | | | | |
| A-Class | | | 469,896 | | | | 1,054,342 | |
| C-Class | | | 327,624 | | | | 2,333,140 | |
| P-Class | | | 19,247,109 | | | | 38,401,599 | |
| Institutional Class | | | 13,366,076 | | | | 27,909,131 | |
| Distributions reinvested | | | | | | | | |
| A-Class | | | — | | | | 282,405 | |
| C-Class | | | — | | | | 103,217 | |
| P-Class | | | — | | | | 369,009 | |
| Institutional Class | | | — | | | | 1,026,092 | |
| Cost of shares redeemed | | | | | | | | |
| A-Class | | | (623,220 | ) | | | (1,183,747 | ) |
| C-Class | | | (372,645 | ) | | | (778,290 | ) |
| P-Class | | | (19,389,185 | ) | | | (38,944,183 | ) |
| Institutional Class | | | (8,220,236 | ) | | | (14,913,234 | ) |
| Net increase from capital share transactions | | | 4,805,419 | | | | 15,659,481 | |
| Net increase in net assets | | | 5,584,316 | | | | 17,097,078 | |
| | | | | | | | | |
| Net assets: | | | | | | | | |
| Beginning of period | | | 38,294,296 | | | | 21,197,218 | |
| End of period | | $ | 43,878,612 | | | $ | 38,294,296 | |
| | | | | | | | | |
| SEE NOTES TO CONSOLIDATED FINANCIAL STATEMENTS. | THE GUGGENHEIM FUNDS SEMI-ANNUAL REPORT | 19 |
| CONSOLIDATED STATEMENTS OF CHANGES IN NET ASSETS (concluded) |
| MANAGED FUTURES STRATEGY FUND | |
| | | Six Months Ended
June 30, 2023
(Unaudited) | | | Year Ended
December 31,
2022 | |
| Capital share activity: | | | | | | | | |
| Shares sold | | | | | | | | |
| A-Class | | | 22,825 | | | | 50,726 | |
| C-Class | | | 18,341 | | | | 121,236 | |
| P-Class | | | 928,628 | | | | 1,893,070 | |
| Institutional Class | | | 640,841 | | | | 1,237,422 | |
| Shares issued from reinvestment of distributions | | | | | | | | |
| A-Class | | | — | | | | 14,328 | |
| C-Class | | | — | | | | 5,987 | |
| P-Class | | | — | | | | 18,599 | |
| Institutional Class | | | — | | | | 50,348 | |
| Shares redeemed | | | | | | | | |
| A-Class | | | (30,886 | ) | | | (56,772 | ) |
| C-Class | | | (21,153 | ) | | | (41,924 | ) |
| P-Class | | | (966,986 | ) | | | (1,859,103 | ) |
| Institutional Class | | | (397,242 | ) | | | (697,841 | ) |
| Net increase in shares | | | 194,368 | | | | 736,076 | |
| 20 | THE GUGGENHEIM FUNDS SEMI-ANNUAL REPORT | SEE NOTES TO CONSOLIDATED FINANCIAL STATEMENTS. |
| CONSOLIDATED FINANCIAL HIGHLIGHTS |
| MANAGED FUTURES STRATEGY FUND | |
This table is presented to show selected data for a share outstanding throughout each period and to assist shareholders in evaluating a Fund’s performance for the periods presented.
| A-Class | | Six Months Ended
June 30, 2023a | | | Year
Ended
Dec. 31,
2022 | | | Year
Ended
Dec. 31,
2021 | | | Year
Ended
Dec. 31,
2020 | | | Year
Ended
Dec. 31,
2019 | | | Year
Ended
Dec. 31,
2018 | |
| Per Share Data |
| Net asset value, beginning of period | | $ | 20.16 | | | $ | 18.41 | | | $ | 17.96 | | | $ | 18.96 | | | $ | 17.65 | | | $ | 19.19 | |
| Income (loss) from investment operations: |
| Net investment income (loss)b | | | .31 | | | | .05 | | | | (.18 | ) | | | (.12 | ) | | | .15 | | | | .15 | |
| Net gain (loss) on investments (realized and unrealized) | | | .39 | | | | 2.67 | | | | .63 | | | | .48 | | | | 1.16 | | | | (1.69 | ) |
| Total from investment operations | | | .70 | | | | 2.72 | | | | .45 | | | | .36 | | | | 1.31 | | | | (1.54 | ) |
| Less distributions from: |
| Net investment income | | | — | | | | (.97 | ) | | | — | | | | (1.36 | ) | | | — | | | | — | |
| Total distributions | | | — | | | | (.97 | ) | | | — | | | | (1.36 | ) | | | — | | | | — | |
| Net asset value, end of period | | $ | 20.86 | | | $ | 20.16 | | | $ | 18.41 | | | $ | 17.96 | | | $ | 18.96 | | | $ | 17.65 | |
| |
| Total Returnc | | | 3.47 | % | | | 14.76 | % | | | 2.51 | % | | | 2.01 | % | | | 7.42 | % | | | (8.03 | %) |
| Ratios/Supplemental Data |
| Net assets, end of period (in thousands) | | $ | 6,533 | | | $ | 6,478 | | | $ | 5,760 | | | $ | 6,306 | | | $ | 7,033 | | | $ | 6,793 | |
| Ratios to average net assets: |
| Net investment income (loss) | | | 3.12 | % | | | 0.22 | % | | | (0.99 | %) | | | (0.62 | %) | | | 0.82 | % | | | 0.80 | % |
| Total expensesd | | | 1.88 | % | | | 1.91 | % | | | 1.88 | % | | | 1.87 | % | | | 1.90 | % | | | 1.84 | % |
| Net expensese | | | 1.72 | % | | | 1.75 | % | | | 1.73 | % | | | 1.75 | % | | | 1.80 | % | | | 1.79 | % |
| Portfolio turnover rate | | | — | | | | 7 | % | | | 27 | % | | | 111 | % | | | 26 | % | | | 21 | % |
| SEE NOTES TO CONSOLIDATED FINANCIAL STATEMENTS. | THE GUGGENHEIM FUNDS SEMI-ANNUAL REPORT | 21 |
| CONSOLIDATED FINANCIAL HIGHLIGHTS (continued) |
| MANAGED FUTURES STRATEGY FUND | |
This table is presented to show selected data for a share outstanding throughout each period and to assist shareholders in evaluating a Fund’s performance for the periods presented.
| C-Class | | Six Months Ended
June 30, 2023a | | | Year
Ended
Dec. 31,
2022 | | | Year
Ended
Dec. 31,
2021 | | | Year
Ended
Dec. 31,
2020 | | | Year
Ended
Dec. 31,
2019 | | | Year
Ended
Dec. 31,
2018 | |
| Per Share Data |
| Net asset value, beginning of period | | $ | 17.63 | | | $ | 16.28 | | | $ | 16.00 | | | $ | 17.03 | | | $ | 15.97 | | | $ | 17.49 | |
| Income (loss) from investment operations: |
| Net investment income (loss)b | | | .21 | | | | (.06 | ) | | | (.29 | ) | | | (.23 | ) | | | .01 | | | | .01 | |
| Net gain (loss) on investments (realized and unrealized) | | | .33 | | | | 2.33 | | | | .57 | | | | .41 | | | | 1.05 | | | | (1.53 | ) |
| Total from investment operations | | | .54 | | | | 2.27 | | | | .28 | | | | .18 | | | | 1.06 | | | | (1.52 | ) |
| Less distributions from: |
| Net investment income | | | — | | | | (.92 | ) | | | — | | | | (1.21 | ) | | | — | | | | — | |
| Total distributions | | | — | | | | (.92 | ) | | | — | | | | (1.21 | ) | | | — | | | | — | |
| Net asset value, end of period | | $ | 18.17 | | | $ | 17.63 | | | $ | 16.28 | | | $ | 16.00 | | | $ | 17.03 | | | $ | 15.97 | |
| |
| Total Returnc | | | 3.06 | % | | | 13.96 | % | | | 1.75 | % | | | 1.25 | % | | | 6.64 | % | | | (8.69 | %) |
| Ratios/Supplemental Data |
| Net assets, end of period (in thousands) | | $ | 2,135 | | | $ | 2,121 | | | $ | 570 | | | $ | 1,121 | | | $ | 1,815 | | | $ | 4,485 | |
| Ratios to average net assets: |
| Net investment income (loss) | | | 2.39 | % | | | (0.31 | %) | | | (1.74 | %) | | | (1.37 | %) | | | 0.06 | % | | | 0.04 | % |
| Total expensesd | | | 2.60 | % | | | 2.65 | % | | | 2.63 | % | | | 2.62 | % | | | 2.65 | % | | | 2.59 | % |
| Net expensese | | | 2.45 | % | | | 2.49 | % | | | 2.49 | % | | | 2.50 | % | | | 2.57 | % | | | 2.53 | % |
| Portfolio turnover rate | | | — | | | | 7 | % | | | 27 | % | | | 111 | % | | | 26 | % | | | 21 | % |
| 22 | THE GUGGENHEIM FUNDS SEMI-ANNUAL REPORT | SEE NOTES TO CONSOLIDATED FINANCIAL STATEMENTS. |
| CONSOLIDATED FINANCIAL HIGHLIGHTS (continued) |
| MANAGED FUTURES STRATEGY FUND |
This table is presented to show selected data for a share outstanding throughout each period and to assist shareholders in evaluating a Fund’s performance for the periods presented.
| P-Class | | Six Months Ended
June 30, 2023a | | | Year
Ended
Dec. 31,
2022 | | | Year
Ended
Dec. 31,
2021 | | | Year
Ended
Dec. 31,
2020 | | | Year
Ended
Dec. 31,
2019 | | | Year
Ended
Dec. 31,
2018 | |
| Per Share Data |
| Net asset value, beginning of period | | $ | 20.30 | | | $ | 18.48 | | | $ | 18.03 | | | $ | 19.00 | | | $ | 17.70 | | | $ | 19.23 | |
| Income (loss) from investment operations: |
| Net investment income (loss)b | | | .32 | | | | .01 | | | | (.18 | ) | | | (.12 | ) | | | .15 | | | | .15 | |
| Net gain (loss) on investments (realized and unrealized) | | | .37 | | | | 2.73 | | | | .63 | | | | .49 | | | | 1.15 | | | | (1.68 | ) |
| Total from investment operations | | | .69 | | | | 2.74 | | | | .45 | | | | .37 | | | | 1.30 | | | | (1.53 | ) |
| Less distributions from: |
| Net investment income | | | — | | | | (.92 | ) | | | — | | | | (1.34 | ) | | | — | | | | — | |
| Total distributions | | | — | | | | (.92 | ) | | | — | | | | (1.34 | ) | | | — | | | | — | |
| Net asset value, end of period | | $ | 20.99 | | | $ | 20.30 | | | $ | 18.48 | | | $ | 18.03 | | | $ | 19.00 | | | $ | 17.70 | |
| |
| Total Return | | | 3.40 | % | | | 14.75 | % | | | 2.50 | % | | | 2.05 | % | | | 7.34 | % | | | (7.96 | %) |
| Ratios/Supplemental Data |
| Net assets, end of period (in thousands) | | $ | 7,907 | | | $ | 8,423 | | | $ | 6,697 | | | $ | 7,741 | | | $ | 10,946 | | | $ | 13,669 | |
| Ratios to average net assets: |
| Net investment income (loss) | | | 3.14 | % | | | 0.07 | % | | | (0.99 | %) | | | (0.63 | %) | | | 0.82 | % | | | 0.80 | % |
| Total expensesd | | | 1.85 | % | | | 1.91 | % | | | 1.88 | % | | | 1.88 | % | | | 1.90 | % | | | 1.84 | % |
| Net expensese | | | 1.70 | % | | | 1.74 | % | | | 1.73 | % | | | 1.77 | % | | | 1.81 | % | | | 1.78 | % |
| Portfolio turnover rate | | | — | | | | 7 | % | | | 27 | % | | | 111 | % | | | 26 | % | | | 21 | % |
| SEE NOTES TO CONSOLIDATED FINANCIAL STATEMENTS. | THE GUGGENHEIM FUNDS SEMI-ANNUAL REPORT | 23 |
| CONSOLIDATED FINANCIAL HIGHLIGHTS (concluded) |
| MANAGED FUTURES STRATEGY FUND |
This table is presented to show selected data for a share outstanding throughout each period and to assist shareholders in evaluating a Fund’s performance for the periods presented.
| Institutional Class | | Six Months Ended
June 30, 2023a | | | Year
Ended
Dec. 31,
2022 | | | Year
Ended
Dec. 31,
2021 | | | Year
Ended
Dec. 31,
2020 | | | Year
Ended
Dec. 31,
2019 | | | Year
Ended
Dec. 31,
2018 | |
| Per Share Data |
| Net asset value, beginning of period | | $ | 20.86 | | | $ | 19.00 | | | $ | 18.49 | | | $ | 19.48 | | | $ | 18.09 | | | $ | 19.61 | |
| Income (loss) from investment operations: |
| Net investment income (loss)b | | | .36 | | | | .14 | | | | (.14 | ) | | | (.08 | ) | | | .21 | | | | .20 | |
| Net gain (loss) on investments (realized and unrealized) | | | .39 | | | | 2.74 | | | | .65 | | | | .49 | | | | 1.18 | | | | (1.72 | ) |
| Total from investment operations | | | .75 | | | | 2.88 | | | | .51 | | | | .41 | | | | 1.39 | | | | (1.52 | ) |
| Less distributions from: |
| Net investment income | | | — | | | | (1.02 | ) | | | — | | | | (1.40 | ) | | | — | | | | — | |
| Total distributions | | | — | | | | (1.02 | ) | | | — | | | | (1.40 | ) | | | — | | | | — | |
| Net asset value, end of period | | $ | 21.61 | | | $ | 20.86 | | | $ | 19.00 | | | $ | 18.49 | | | $ | 19.48 | | | $ | 18.09 | |
| |
| Total Return | | | 3.60 | % | | | 15.03 | % | | | 2.76 | % | | | 2.29 | % | | | 7.68 | % | | | (7.75 | %) |
| Ratios/Supplemental Data |
| Net assets, end of period (in thousands) | | $ | 27,303 | | | $ | 21,272 | | | $ | 8,169 | | | $ | 7,802 | | | $ | 7,195 | | | $ | 7,711 | |
| Ratios to average net assets: |
| Net investment income (loss) | | | 3.43 | % | | | 0.63 | % | | | (0.73 | %) | | | (0.38 | %) | | | 1.07 | % | | | 1.05 | % |
| Total expensesd | | | 1.58 | % | | | 1.64 | % | | | 1.63 | % | | | 1.61 | % | | | 1.65 | % | | | 1.59 | % |
| Net expensese | | | 1.43 | % | | | 1.48 | % | | | 1.48 | % | | | 1.49 | % | | | 1.55 | % | | | 1.54 | % |
| Portfolio turnover rate | | | — | | | | 7 | % | | | 27 | % | | | 111 | % | | | 26 | % | | | 21 | % |
| a | Unaudited figures for the period ended June 30, 2023. Percentage amounts for the period, except total return and portfolio turnover rate, have been annualized. |
| b | Net investment income (loss) per share was computed using average shares outstanding throughout the period. |
| c | Total return does not reflect the impact of any applicable sales charges. |
| d | Does not include expenses of the underlying funds in which the Fund invests. |
| e | Net expense information reflects the expense ratios after expense waivers and reimbursements, as applicable. |
| 24 | THE GUGGENHEIM FUNDS SEMI-ANNUAL REPORT | SEE NOTES TO CONSOLIDATED FINANCIAL STATEMENTS. |
| NOTES TO CONSOLIDATED FINANCIAL STATEMENTS (Unaudited) |
Note 1 – Organization, Consolidation of Subsidiary and Significant Accounting Policies
Organization
The Rydex Series Funds (the “Trust”), a Delaware statutory trust, is registered with the U.S. Securities and Exchange Commission (the “SEC”) under the Investment Company Act of 1940 (the “1940 Act”), as an open-ended investment company of the series type. Each series, in effect, is representing a separate fund. The Trust may issue an unlimited number of authorized shares. The Trust accounts for the assets of each fund separately.
The Trust offers a combination of seven separate classes of shares: Investor Class shares, A-Class shares, C-Class shares, H-Class shares, P-Class shares, Institutional Class shares and Money Market Class shares. Sales of shares of each Class are made without a front-end sales charge at the net asset value per share (“NAV”), with the exception of A-Class shares. A-Class shares are sold at the NAV, plus the applicable front-end sales charge. The sales charge varies depending on the amount purchased, but will not exceed 4.75%. A-Class share purchases of $1 million or more are exempt from the front-end sales charge but have a 1% contingent deferred sales charge (“CDSC”) if shares are redeemed within 12 months of purchase. C-Class shares have a 1% CDSC if shares are redeemed within 12 months of purchase. C-Class shares automatically convert to A-Class shares on or about the 10th day of the month following the 8-year anniversary of the purchase of the C-Class shares. This conversion will be executed without any sales charge, fee or other charge. After the conversion is completed, the shares will be subject to all features and expenses of A-Class shares. Institutional Class shares are offered primarily for direct investment by institutions such as pension and profit sharing plans, endowments, foundations and corporations. Institutional Class shares require a minimum initial investment of $2 million and a minimum account balance of $1 million. At June 30, 2023, the Trust consisted of fifty-two funds (each, a “Fund” and collectively, the “Funds”)
This report covers the Managed Futures Strategy Fund, a diversified investment company. At June 30, 2023, only A-Class, C-Class, P-Class, and Institutional Class shares have been issued by the Fund.
Security Investors, LLC (the “Adviser”), which operates under the name Guggenheim Investments (“GI”), provides advisory services. Guggenheim Funds Distributors, LLC (“GFD”) acts as principal underwriter for the Trust. GI and GFD are affiliated entities.
Consolidation of Subsidiary
The consolidated financial statements of the Fund include the accounts of a wholly-owned and controlled Cayman Islands subsidiary (the “Subsidiary”). Significant inter-company accounts and transactions have been eliminated in consolidation for the Fund.
The Fund may invest up to 25% of its total assets in its Subsidiary which acts as an investment vehicle in order to effect certain investments consistent with the Fund’s investment objectives and policies.
| | THE GUGGENHEIM FUNDS SEMI-ANNUAL REPORT | 25 |
| NOTES TO CONSOLIDATED FINANCIAL STATEMENTS (Unaudited)(continued) |
A summary of the Fund’s investment in its Subsidiary is as follows:
| | | Inception
Date of
Subsidiary | | | Subsidiary
Net Assets at
June 30,
2023 | | | % of Net Assets
of the Fund at
June 30,
2023 | |
| | | | 05/01/08 | | | $ | 5,231,640 | | | | 11.9 | % |
Significant Accounting Policies
The Fund operates as an investment company and, accordingly, follows the investment company accounting and reporting guidance of the Financial Accounting Standards Board (“FASB”) Accounting Standards Codification Topic 946 Financial Services – Investment Companies.
The following significant accounting policies are in conformity with U.S. generally accepted accounting principles (“U.S. GAAP”) and are consistently followed by the Trust. This requires management to make estimates and assumptions that affect the reported amount of assets and liabilities, contingent assets and liabilities at the date of the consolidated financial statements, and the reported amounts of revenues and expenses during the reporting period. Actual results could differ from these estimates. All time references are based on Eastern Time.
The NAV of each Class of the Fund is calculated by dividing the market value of the Fund’s securities and other assets, less all liabilities, attributable to the Class by the number of outstanding shares of the Class.
(a) Valuation of Investments
The Board of Trustees of the Fund (the “Board”) has adopted policies and procedures for the valuation of the Fund’s investments (the “Valuation Procedures”). The SEC adopted Rule 2a-5 under the 1940 Act (“Rule 2a-5”) which establishes requirements for determining fair value in good faith and became effective September 8, 2022. Rule 2a-5 also defines “readily available market quotations” for purposes of the 1940 Act and establishes requirements for determining whether a fund must fair value a security in good faith.
Pursuant to Rule 2a-5, the Board has designated the Adviser as the valuation designee to perform fair valuation determinations for the Fund with respect to all Fund investments and other assets. As the Fund’s valuation designee pursuant to Rule 2a-5, the Adviser has adopted separate procedures (the “Valuation Designee Procedures”) reasonably designed to prevent violations of the requirements of Rule 2a-5 and Rule 31a-4. The Adviser, in its role as valuation designee, utilizes the assistance of a valuation committee, consisting of representatives from Guggenheim’s investment management, fund administration, legal and compliance departments (the “Valuation Committee”), in determining the fair value of the Fund’s securities and other assets.
| 26 | THE GUGGENHEIM FUNDS SEMI-ANNUAL REPORT | |
| NOTES TO CONSOLIDATED FINANCIAL STATEMENTS (Unaudited)(continued) |
Valuations of the Fund’s securities and other assets are supplied primarily by pricing services appointed pursuant to the processes set forth in the Valuation Procedures. The Adviser, with the assistance of the Valuation Committee, convenes monthly, or more frequently as needed, to review the valuation of all assets which have been fair valued for reasonableness. The Adviser, consistent with the monitoring and review responsibilities set forth in the Valuation Designee Procedures, regularly review the appropriateness of the inputs, methods, models and assumptions employed by the pricing services.
If the pricing service cannot or does not provide a valuation for a particular investment or such valuation is deemed unreliable, such investment is fair valued by the Adviser.
Open-end investment companies are valued at their NAV as of the close of business, on the valuation date. Exchange-traded funds and closed-end investment companies are generally valued at the last quoted sale price.
U.S. Government securities are valued by independent pricing services, the last traded fill price, or at the reported bid price at the close of business.
Commercial paper and discount notes with a maturity of greater than 60 days at acquisition are valued at prices that reflect broker-dealer supplied valuations or are obtained from independent pricing services, which may consider the trade activity, treasury spreads, yields or price of bonds of comparable quality, coupon, maturity, and type, as well as prices quoted by dealers who make markets in such securities. Commercial paper and discount notes with a maturity of 60 days or less at acquisition are valued at amortized cost, unless the Adviser concludes that amortized cost does not represent the fair value of the applicable asset in which case it will be valued using an independent pricing service.
Repurchase agreements are generally valued at amortized cost, provided such amounts approximate market value.
The value of futures contracts are valued on the basis of the last sale price at the 4:00 p.m. price on the valuation date. In the event that the exchange for a specific futures contract closes earlier than 4:00 p.m., the futures contract is valued at the official settlement price of the exchange. However, the underlying securities from which the futures contract value is derived are monitored until 4:00 p.m. to determine if fair valuation would provide a more accurate valuation.
Investments for which market quotations are not readily available are fair valued as determined in good faith by the Adviser. Valuations in accordance with these methods are intended to reflect each security’s (or asset’s or liability’s) “fair value”. Each such determination is based on a consideration of all relevant factors, which are likely to vary from one pricing context to another. Examples of such factors may include, but are not limited to market prices; sale prices; broker quotes; and models which derive prices based on inputs such as prices of securities with comparable maturities and characteristics, or based on inputs such as anticipated cash flows or collateral, spread over U.S. Treasury securities, and other information analysis. In connection
| | THE GUGGENHEIM FUNDS SEMI-ANNUAL REPORT | 27 |
| NOTES TO CONSOLIDATED FINANCIAL STATEMENTS (Unaudited)(continued) |
with futures contracts and other derivative investments, such factors may include obtaining information as to how (a) these contracts and other derivative investments trade in the futures or other derivative markets, respectively, and (b) the securities underlying these contracts and other derivative investments trade in the cash market.
(b) U.S. Government and Agency Obligations
Certain U.S. Government and Agency Obligations are traded on a discount basis; the interest rates shown on the Consolidated Schedule of Investments reflect the effective rates paid at the time of purchase by the Fund. Other securities bear interest at the rates shown, payable at fixed dates through maturity.
(c) Futures Contracts
Upon entering into a futures contract, the Fund deposits and maintains as collateral such initial margin as required by the exchange on which the transaction is affected. Pursuant to the contract, the Fund agrees to receive from or pay to the broker an amount of cash equal to the daily fluctuation in value of the contract. Such receipts or payments are known as variation margin and are recorded by the Fund as unrealized appreciation or depreciation. When the contract is closed, the Fund records a realized gain or loss equal to the difference between the value of the contract at the time it was opened and the value at the time it was closed.
(d) Currency Translations
The accounting records of the Fund are maintained in U.S. dollars. All assets and liabilities initially expressed in foreign currencies are converted into U.S. dollars at prevailing exchange rates. Purchases and sales of investment securities, dividend and interest income, and certain expenses are translated at the rates of exchange prevailing on the respective dates of such transactions. Changes in the relationship of these foreign currencies to the U.S. dollar can significantly affect the value of the investments and earnings of the Fund. Foreign investments may also subject the Fund to foreign government exchange restrictions, expropriation, taxation, or other political, social or economic developments, all of which could affect the market and/or credit risk of the investments.
The Fund does not isolate that portion of the results of operations resulting from changes in the foreign exchange rates on investments from the fluctuations arising from changes in the market prices of securities held. Such fluctuations are included with the net realized gain or loss and unrealized appreciation or depreciation on investments.
Reported net realized foreign exchange gains and losses arise from sales of foreign currencies and currency gains or losses realized between the trade and settlement dates on investment transactions. Net unrealized appreciation and depreciation arise from changes in the fair values of assets and liabilities other than investments in securities at the fiscal period end, resulting from changes in exchange rates.
| 28 | THE GUGGENHEIM FUNDS SEMI-ANNUAL REPORT | |
| NOTES TO CONSOLIDATED FINANCIAL STATEMENTS (Unaudited)(continued) |
(e) Security Transactions
Security transactions are recorded on the trade date for financial reporting purposes. Realized gains and losses from securities transactions are recorded using the identified cost basis. Proceeds from lawsuits related to investment holdings are recorded as a reduction to cost if the securities are still held and as realized gains if no longer held in the Fund. Dividend income is recorded on the ex-dividend date, net of applicable taxes withheld by foreign countries, if any. Taxable non-cash dividends are recorded as dividend income. Interest income, including amortization of premiums and accretion of discounts, is accrued on a daily basis.
(f) Distributions
Distributions of net investment income and net realized gains, if any, are declared and paid at least annually. Dividends are reinvested in additional shares, unless shareholders request payment in cash. Distributions are recorded on the ex-dividend date and are determined in accordance with U.S. federal income tax regulations which may differ from U.S. GAAP.
(g) Class Allocations
Interest and dividend income, most expenses, all realized gains and losses, and all unrealized appreciation and depreciation are allocated to the classes based upon the value of the outstanding shares in each Class. Certain costs, such as distribution and service fees are charged directly to specific classes. In addition, certain expenses have been allocated to the individual Funds in the Trust based on the respective net assets of each Fund included in the Trust.
(h) Cash
The Fund may leave cash overnight in its cash account with the custodian. Periodically, the Fund may have cash due to the custodian bank as an overdraft balance. A fee is incurred on this overdraft, calculated by multiplying the overdraft by a rate based on the federal funds rate, which was 5.08% at June 30, 2023.
(i) Indemnifications
Under the Fund’s organizational documents, its Trustees and Officers are indemnified against certain liabilities arising out of the performance of their duties to the Trust. In addition, throughout the normal course of business, the Fund enters into contracts that contain a variety of representations and warranties which provide general indemnifications. The Fund’s maximum exposure under these arrangements is unknown, as this would involve future claims that may be made against the Fund and/or its affiliates that have not yet occurred. However, based on experience, the Fund expects the risk of loss to be remote.
| | THE GUGGENHEIM FUNDS SEMI-ANNUAL REPORT | 29 |
| NOTES TO CONSOLIDATED FINANCIAL STATEMENTS (Unaudited)(continued) |
Note 2 – Derivatives
As part of its investment strategies, the Fund utilizes a variety of derivative instruments. These investments involve, to varying degrees, elements of market risk and risks in excess of amounts recognized on the Fund’s Consolidated Statement of Assets and Liabilities. Valuation and accounting treatment of these instruments can be found under Significant Accounting Policies in Note 1 of these Notes to Consolidated Financial Statements.
Derivatives are instruments whose values depend on, or are derived from, in whole or in part, the value of one or more other assets, such as securities, currencies, commodities or indices. Derivative instruments may be used to increase investment flexibility (including to maintain cash reserves while maintaining exposure to certain other assets), for risk management (hedging) purposes, to facilitate trading, to reduce transaction costs and to pursue higher investment returns. Derivative instruments may also be used to mitigate certain investment risks, such as foreign currency exchange rate risk, interest rate risk and credit risk. U.S. GAAP requires disclosures to enable investors to better understand how and why a Fund uses derivative instruments, how these derivative instruments are accounted for and their effects on the Fund’s financial position and results of operations.
The Fund utilized derivatives for the following purposes:
Hedge: an investment made in order to reduce the risk of adverse price movements in a security, by taking an offsetting position to protect against broad market moves.
Leverage: gaining total exposure to equities or other assets on the long and short sides at greater than 100% of invested capital.
Liquidity: the ability to buy or sell exposure with little price/market impact.
Speculation: the use of an instrument to express macro-economic and other investment views.
To the extent the Fund’s investment strategy consistently involves applying leverage, the value of the Fund’s shares will tend to increase or decrease more than the value of any increase or decrease in the underlying index or other asset. In addition, because an investment in derivative instruments generally requires a small investment relative to the amount of investment exposure assumed, an opportunity for increased net income is created; but, at the same time, leverage risk will increase. The Fund’s use of leverage, through borrowings or instruments such as derivatives, may cause the Fund to be more volatile and riskier than if they had not been leveraged.
Futures Contracts
A futures contract is an agreement to purchase (long) or sell (short) an agreed amount of securities or other instruments at a set price for delivery at a future date. There are significant risks associated with the Fund’s use of futures contracts, including (i) there may be an imperfect or no correlation between the changes in market value of the underlying asset and the prices of futures contracts; (ii) there may not be a liquid secondary market for a futures contract;
| 30 | THE GUGGENHEIM FUNDS SEMI-ANNUAL REPORT | |
| NOTES TO CONSOLIDATED FINANCIAL STATEMENTS (Unaudited)(continued) |
(iii) trading restrictions or limitations may be imposed by an exchange; and (iv) government regulations may restrict trading in futures contracts. When investing in futures, there is minimal counterparty credit risk to the Fund because futures are exchange-traded and the exchange’s clearinghouse, as counterparty to all exchange-traded futures, guarantees against default. Cash deposits are shown as segregated cash with broker on the Fund’s Consolidated Statement of Assets and Liabilities; securities held as collateral are noted on the Fund’s Consolidated Schedule of Investments.
The following table represents the Fund’s use and volume of futures on a monthly basis:
| | | Average Notional Amount | |
| Use | | Long | | | Short | |
| Hedge, Leverage, Liquidity, Speculation | | $ | 69,670,114 | | | $ | 101,473,645 | |
Derivative Investment Holdings Categorized by Risk Exposure
The following is a summary of the location of derivative investments on the Fund’s Consolidated Statement of Assets and Liabilities as of June 30, 2023:
| Derivative Investment Type | Asset Derivatives | Liability Derivatives |
| Equity/interest rate/currency/commodity futures contracts | Variation margin on futures contracts | — |
The following tables set forth the fair value of the Fund’s derivative investments categorized by primary risk exposure at June 30, 2023:
| Asset Derivative Investments Value |
| | | Futures
Equity
Risk* | | | Futures
Foreign
Currency
Exchange
Risk* | | | Futures
Interest
Rate
Risk* | | | Futures
Commodity
Risk* | | | Total Value at
June 30,
2023 | |
| | | $ | 821,797 | | | $ | 310,521 | | | $ | 477,367 | | | $ | 837,925 | | | $ | 2,447,610 | |
| | THE GUGGENHEIM FUNDS SEMI-ANNUAL REPORT | 31 |
| NOTES TO CONSOLIDATED FINANCIAL STATEMENTS (Unaudited)(continued) |
| Liability Derivative Investments Value |
| | | Futures
Equity
Risk* | | | Futures
Foreign
Currency
Exchange
Risk* | | | Futures
Interest
Rate
Risk* | | | Futures
Commodity
Risk* | | | Total Value at
June 30,
2023 | |
| | | $ | 199,006 | | | $ | 81,148 | | | $ | 44,258 | | | $ | 390,317 | | | $ | 714,729 | |
| * | Includes cumulative appreciation (depreciation) of futures contracts as reported on the Consolidated Schedule of Investments. For exchange-traded and centrally-cleared derivatives, variation margin is reported within the Fund’s Consolidated Statement of Assets and Liabilities. |
The following is a summary of the location of derivative investments on the Fund’s Consolidated Statement of Operations for the period ended June 30, 2023:
| Derivative Investment Type | Location of Gain (Loss) on Derivatives |
| Equity/interest rate/currency/commodity futures contracts | Net realized gain (loss) on futures contracts |
| | Net change in unrealized appreciation (depreciation) on futures contracts |
The following is a summary of the Fund’s realized gain (loss) and change in unrealized appreciation (depreciation) on derivative investments recognized on the Fund’s Consolidated Statement of Operations categorized by primary risk exposure for the period ended June 30, 2023:
| Realized Gain (Loss) on Derivative Investments Recognized on the Consolidated Statement of Operations |
| | | Futures
Equity
Risk | | | Futures
Foreign
Currency
Exchange
Risk | | | Futures
Interest
Rate
Risk | | | Futures
Commodity
Risk | | | Total | |
| | | $ | 1,057,543 | | | $ | 219,212 | | | $ | (1,021,508 | ) | | $ | (534,186 | ) | | $ | (278,939 | ) |
Change in Unrealized Appreciation (Depreciation) on Derivative Investments
Recognized on the Consolidated Statement of Operations |
| | | Futures
Equity
Risk | | | Futures
Foreign
Currency
Exchange
Risk | | | Futures
Interest
Rate
Risk | | | Futures
Commodity
Risk | | | Total | |
| | | $ | 728,921 | | | $ | 259,432 | | | $ | (518,286 | ) | | $ | (160,568 | ) | | $ | 309,499 | |
| 32 | THE GUGGENHEIM FUNDS SEMI-ANNUAL REPORT | |
| NOTES TO CONSOLIDATED FINANCIAL STATEMENTS (Unaudited)(continued) |
In conjunction with the use of derivative instruments, the Fund is required to maintain collateral in various forms. Depending on the financial instrument utilized and the broker involved, the Fund uses margin deposits at the broker, cash and/or securities segregated at the custodian bank, discount notes or repurchase agreements allocated to the Fund as collateral.
The Trust has established counterparty credit guidelines and enters into transactions only with financial institutions rated/identified as investment grade or better. The Trust monitors the counterparty credit risk associated with each such financial institution.
Note 3 – Offsetting
In the normal course of business, the Fund enters into transactions subject to enforceable master netting arrangements or other similar arrangements. Generally, the right to offset in those agreements allows the Fund to counteract the exposure to a specific counterparty with collateral received from or delivered to that counterparty based on the terms of the arrangements. These arrangements provide for the right to liquidate upon the occurrence of an event of default, credit event upon merger or additional termination event.
In order to better define its contractual rights and to secure rights that will help the Fund mitigate its counterparty risk, the Fund may enter into an International Swaps and Derivatives Association, Inc. Master Agreement (“ISDA Master Agreement”) or similar agreement with its derivative contract counterparties. An ISDA Master Agreement is a bilateral agreement between a fund and a counterparty that governs over-the-counter (“OTC”) derivatives, including foreign exchange contracts, and typically contains, among other things, collateral posting terms and netting provisions in the event of a default and/or termination event. The provisions of the ISDA Master Agreement typically permit a single net payment in the event of a default (close-out netting) or similar event, including the bankruptcy or insolvency of the counterparty.
For derivatives traded under an ISDA Master Agreement, the collateral requirements are typically calculated by netting the mark-to-market amount for each transaction under such agreement and comparing that amount to the value of any collateral currently pledged by the Fund and the counterparty. For financial reporting purposes, cash collateral that has been pledged to cover obligations of the Fund and cash collateral received from the counterparty, if any, are reported separately on the Fund’s Consolidated Statement of Assets and Liabilities as segregated cash with broker/receivable for variation margin, or payable for swap settlement/variation margin. Cash and/or securities pledged or received as collateral by the Fund in connection with an OTC derivative subject to an ISDA Master Agreement generally may not be invested, sold or rehypothecated by the counterparty or the Fund, as applicable, absent an event of default under such agreement, in which case such collateral generally may be applied towards obligations due to and payable by such counterparty or the Fund, as applicable. Generally, the amount of collateral due from or to a counterparty must exceed a minimum transfer amount threshold (e.g., $300,000) before a transfer is required to be made. To the extent amounts due to the Fund from its counterparties are not fully collateralized, contractually or otherwise, the Fund bears the risk
| | THE GUGGENHEIM FUNDS SEMI-ANNUAL REPORT | 33 |
| NOTES TO CONSOLIDATED FINANCIAL STATEMENTS (Unaudited)(continued) |
of loss from counterparty nonperformance. The Fund attempts to mitigate counterparty risk by only entering into agreements with counterparties that it believes to be of good standing and by monitoring the financial stability of those counterparties.
For financial reporting purposes, the Fund does not offset derivative assets and derivative liabilities that are subject to netting arrangements in the Fund’s Consolidated Statement of Assets and Liabilities. The Fund does not have any derivative financial instruments that are subject to enforceable master netting arrangements as of June 30, 2023.
The Fund has the right to offset deposits against any related derivative liabilities outstanding with each counterparty with the exception of exchange-traded or centrally-cleared derivatives. The following table presents deposits held by others in connection with derivative investments as of June 30, 2023.
| Counterparty | Asset Type | | Cash Pledged | | | Cash Received | |
| Goldman Sachs International | Futures contracts | | $ | 427,530 | | | $ | — | |
Note 4 – Fair Value Measurement
In accordance with U.S. GAAP, fair value is defined as the price that the Fund would receive to sell an investment or pay to transfer a liability in an orderly transaction between market participants at the measurement date. U.S. GAAP establishes a three-tier fair value hierarchy based on the types of inputs used to value assets and liabilities and requires corresponding disclosure. The hierarchy and the corresponding inputs are summarized below:
| Level 1 — | unadjusted quoted prices in active markets for identical assets or liabilities. |
| Level 2 — | significant other observable inputs (for example quoted prices for securities that are similar based on characteristics such as interest rates, prepayment speeds, credit risk, etc.). |
| Level 3 — | significant unobservable inputs based on the best information available under the circumstances, to the extent observable inputs are not available, which may include assumptions. |
Rule 2a-5 sets forth a definition of “readily available market quotations,” which is consistent with the definition of a Level 1 input under U.S. GAAP. Rule 2a-5 provides that “a market quotation is readily available only when that quotation is a quoted price (unadjusted) in active markets for identical investments that the fund can access at the measurement date, provided that a quotation will not be readily available if it is not reliable.”
Securities for which market quotations are not readily available must be valued at fair value as determined in good faith. Accordingly, any security priced using inputs other than Level 1 inputs will be subject to fair value requirements. The types of inputs available depend on a variety of factors, such as the type of security and the characteristics of the markets in which it trades,
| 34 | THE GUGGENHEIM FUNDS SEMI-ANNUAL REPORT | |
| NOTES TO CONSOLIDATED FINANCIAL STATEMENTS (Unaudited)(continued) |
if any. Fair valuation determinations that rely on fewer or no observable inputs require greater judgment. Accordingly, fair value determinations for Level 3 securities require the greatest amount of judgment.
The inputs or methodologies selected and applied for valuing securities are not necessarily an indication of the risk associated with investing in those securities. The suitability, appropriateness and accuracy of the techniques, methodologies and sources employed to determine fair valuation are periodically reviewed and subject to change.
Note 5 – Investment Advisory Agreement and Other Agreements
Under the terms of an investment advisory contract, the Fund pays GI investment advisory fees calculated at an annualized rate of 0.90% of the average daily net assets of the Fund.
GI has contractually agreed to waive the management fee it receives from the Subsidiary in an amount equal to the management fee paid to GI by the Subsidiary. This undertaking will continue in effect for so long as the Fund invests in the Subsidiary, and may not be terminated by GI unless GI obtains the prior approval of the Fund’s Board for such termination. Fees waived under this arrangement are not subject to reimbursement to GI. For the period ended June 30, 2023, the Fund waived $27,366 related to advisory fees in the Subsidiary.
GI pays operating expenses on behalf of the Trust, such as audit and accounting related services, legal services, custody, printing and mailing, among others, on a pass-through basis. Such expenses are allocated to various Funds within the complex based on relative net assets.
The Board has adopted separate Distribution Plans applicable to A-Class and P-Class shares, under which GFD and other firms that provide distribution and/or shareholder services (“Service Providers”) may receive compensation. If a Service Provider provides distribution services, the Fund will pay distribution fees to GFD at an annual rate not to exceed 0.25% of average daily net assets, pursuant to Rule 12b-1 of the 1940 Act. GFD, in turn, will pay the Service Provider out of its fees. GFD may, at its discretion, retain a portion of such payments to compensate itself for distribution services.
The Board has adopted a separate Distribution and Shareholder Services Plan applicable to C-Class shares that allows the Fund to pay annual distribution and service fees of 1.00% of the Fund’s C-Class shares average daily net assets. The annual 0.25% service fee compensates a shareholder’s financial adviser for providing ongoing services to the shareholder. The annual distribution fee of 0.75% reimburses GFD for paying the shareholder’s financial adviser an ongoing sales commission. GFD advances the first year’s service and distribution fees to the financial adviser. GFD retains the service and distribution fees on accounts with no authorized dealer of record.
For the period ended June 30, 2023, GFD retained sales charges of $32,189 relating to sales of A-Class shares of the Trust.
| | THE GUGGENHEIM FUNDS SEMI-ANNUAL REPORT | 35 |
| NOTES TO CONSOLIDATED FINANCIAL STATEMENTS (Unaudited)(continued) |
If the Fund invests in a fund that is advised by the same adviser or an affiliated adviser, the investing Fund’s adviser has agreed to waive fees at the investing fund level to the extent necessary to offset the proportionate share of any management fee paid by the Fund with respect to its investment in such affiliated fund. Fee waivers will be calculated at the investing Fund level without regard to any expense cap, if any, in effect for the investing Fund. Fees waived under this arrangement are not subject to reimbursement to GI. For the period ended June 30, 2023, the Fund waived $3,103 related to investments in affiliated funds.
Certain trustees and officers of the Trust are also officers of GI and/or GFD. The Trust does not compensate its officers or trustees who are officers, directors and/or employees of GI or GFD.
MUFG Investor Services (US), LLC (“MUIS”) acts as the Fund’s administrator, transfer agent and accounting agent. As administrator, transfer agent and accounting agent, MUIS maintains the books and records of the Fund’s securities and cash. U.S. Bank, N.A. (“U.S. Bank”) acts as the Fund’s custodian. As custodian, U.S. Bank is responsible for the custody of the Fund’s assets. For providing the aforementioned services, MUIS and U.S. Bank are entitled to receive a monthly fee equal to an annual percentage of the Fund’s average daily net assets and out of pocket expenses.
Note 6 – Repurchase Agreements
The Fund transfers uninvested cash balances into a single joint account, the daily aggregate balance of which is invested in one or more repurchase agreements collateralized by obligations of the U.S. Treasury and U.S. government agencies. The joint account includes other Funds in the Guggenheim complex not covered in this report. The collateral is in the possession of the Funds’ custodian and is evaluated to ensure that its market value exceeds, at a minimum, 102% of the original face amount of the repurchase agreements. Each Fund holds a pro rata share of the collateral based on the dollar amount of the repurchase agreement entered into by each Fund.
| 36 | THE GUGGENHEIM FUNDS SEMI-ANNUAL REPORT | |
| NOTES TO CONSOLIDATED FINANCIAL STATEMENTS (Unaudited)(continued) |
At June 30, 2023, the repurchase agreements in the joint account were as follows:
Counterparty and
Terms of Agreement | | Face
Value | | | Repurchase
Price | | | Collateral | | Par
Value | | | Fair
Value | |
| J.P. Morgan Securities LLC | | | | | | | | | | U.S. Treasury Inflation Indexed Bond | | | | | | | | |
| 5.05% | | | | | | | | | | 3.63% | | | | | | | | |
| Due 07/03/23 | | $ | 137,286,751 | | | $ | 137,344,526 | | | Due 04/15/28 | | $ | 129,694,939 | | | $ | 140,030,466 | |
| | | | | | | | | | | | | | | | | | | |
| | | | | | | | | | | U.S. Treasury Notes | | | | | | | | |
| | | | | | | | | | | 0.25% - 2.75% | | | | | | | | |
| | | | | | | | | | | Due 09/30/23 - 03/31/27 | | | 2,100 | | | | 2,022 | |
| | | | | | | | | | | | | | 129,697,039 | | | | 140,032,488 | |
| Barclays Capital, Inc. | | | | | | | | | | U.S. Treasury Inflation Indexed Bond | | | | | | | | |
| 5.06% | | | | | | | | | | 0.13% - 0.75% | | | | | | | | |
| Due 07/03/23 | | | 60,399,250 | | | | 60,424,719 | | | Due 10/15/26 - 02/15/45 | | | 68,592,589 | | | | 61,607,304 | |
| | | | | | | | | | | | | | | | | | | |
| BofA Securities, Inc. | | | | | | | | | | U.S. Treasury Inflation Indexed Bond | | | | | | | | |
| 5.06% | | | | | | | | | | 0.50% | | | | | | | | |
| Due 07/03/23 | | | 54,908,410 | | | | 54,931,563 | | | Due 01/15/28 | | | 59,873,011 | | | | 56,006,594 | |
In the event of counterparty default, the Funds have the right to collect the collateral to offset losses incurred. There is potential loss to the Funds in the event the Funds are delayed or prevented from exercising their rights to dispose of the collateral securities, including the risk of a possible decline in the value of the underlying securities during the period while the Funds seek to assert their rights. GI, acting under the supervision of the Board, reviews the value of the collateral and the creditworthiness of those banks and dealers with which the Funds enter into repurchase agreements to evaluate potential risks.
Note 7 – Federal Income Tax Information
The Fund intends to comply with the provisions of Subchapter M of the Internal Revenue Code 1986, as amended (the “Internal Revenue Code”), applicable to regulated investment companies and will distribute substantially all taxable net investment income and capital gains sufficient to relieve the Fund from all, or substantially all, federal income, excise and state income taxes. Therefore, no provision for federal or state income tax or federal excise tax is required.
Tax positions taken or expected to be taken in the course of preparing the Fund’s tax returns are evaluated to determine whether the tax positions are “more-likely-than-not” of being sustained by the applicable tax authority. Tax positions not deemed to meet the more-likely-than-not threshold would be recorded as a tax benefit or expense in the current year. Management has analyzed the Fund’s tax positions taken, or to be taken, on U.S. federal income tax returns for all open tax
| | THE GUGGENHEIM FUNDS SEMI-ANNUAL REPORT | 37 |
| NOTES TO CONSOLIDATED FINANCIAL STATEMENTS (Unaudited)(continued) |
years, and has concluded that no provision for income tax is required in the Fund’s consolidated financial statements. The Fund’s U.S. federal income tax returns are subject to examination by the Internal Revenue Service (“IRS”) for a period of three years after they are filed.
The Fund intends to invest up to 25% of its assets in the Subsidiary which is expected to provide the Fund with exposure to the commodities markets within the limitations of the U.S. federal income tax requirements under Subchapter M of the Internal Revenue Code. The Fund has received a private letter ruling from the IRS that concludes that the income the Fund receives from the Subsidiary will constitute qualifying income for purposes of Subchapter M of the Internal Revenue Code. The Subsidiary will be classified as a corporation for U.S. federal income tax purposes. A foreign corporation, such as the Subsidiary, will generally not be subject to U.S. federal income taxation unless it is deemed to be engaged in a U.S. trade or business. If, during a taxable year, the Subsidiary’s taxable losses (and other deductible items) exceed its income and gains, the net loss will not pass through to the Fund as a deductible amount for U.S. federal income tax purposes and cannot be carried forward to reduce future income from the Subsidiary in subsequent years.
At June 30, 2023, the cost of investments for U.S. federal income tax purposes, the aggregate gross unrealized appreciation for all investments for which there was an excess of value over tax cost, and the aggregate gross unrealized depreciation for all investments for which there was an excess of tax cost over value, were as follows:
| | | Tax
Cost | | | Tax
Unrealized
Appreciation | | | Tax
Unrealized
Depreciation | | | Net Tax
Unrealized
Appreciation
(Depreciation) | |
| | | $ | 43,356,743 | | | $ | 2,449,339 | | | $ | (1,124,858 | ) | | $ | 1,324,481 | |
Note 8 – Securities Transactions
For the period ended June 30, 2023, the cost of purchases and proceeds from sales of investment securities, excluding government securities, short-term investments and derivatives, were as follows:
The Fund is permitted to purchase or sell securities from or to certain affiliated funds under specified conditions outlined in procedures adopted by the Board. The procedures have been designed to ensure that any purchase or sale of securities by the Fund from or to another fund or portfolio that is or could be considered an affiliate by virtue of having a common investment adviser (or affiliated investment advisers), common trustees and/or common officers complies with Rule 17a-7 of the 1940 Act. Further, as defined under these procedures, each transaction is
| 38 | THE GUGGENHEIM FUNDS SEMI-ANNUAL REPORT | |
| NOTES TO CONSOLIDATED FINANCIAL STATEMENTS (Unaudited)(concluded) |
effected at the current market price to save costs, where permissible. For the period ended June 30, 2023, the Fund did not engage in purchases and sales of securities, pursuant to Rule 17a-7 of the 1940 Act.
Note 9 – Line of Credit
The Trust, along with other affiliated trusts, secured an uncommitted $200,000,000 line of credit from U.S. Bank, N.A. On June 5, 2023, the line of credit agreement was renewed and expires on June 3, 2024. This line of credit is reserved for emergency or temporary purposes. Borrowings, if any, under this arrangement bear interest equal to the Prime Rate, minus 2%, which shall be paid monthly, averaging 5.83% for the period ended June 30, 2023. The Fund did not have any borrowings outstanding under this agreement at June 30, 2023.
Note 10 – Market Risks
The value of, or income generated by, the investments held by the Fund are subject to the possibility of rapid and unpredictable fluctuation, and loss that may result from various factors. These factors include, among others, developments affecting individual companies, or from broader influences, including real or perceived changes in prevailing interest rates (which have since risen and may continue to rise), changes in inflation rates or expectations about inflation rates (which are currently elevated relative to normal conditions), adverse investor confidence or sentiment, changing economic, political (including geopolitical), social or financial market conditions, increased instability or general uncertainty, environmental disasters, governmental actions, public health emergencies (such as the spread of infectious diseases, pandemics and epidemics), debt crises, actual or threatened wars or other armed conflicts (such as the current Russia-Ukraine conflict and its risk of expansion or collateral economic and other effects) or ratings downgrades, and other similar events, each of which may be temporary or last for extended periods. Moreover, changing economic, political, geopolitical, social, financial market or other conditions in one country or geographic region could adversely affect the value, yield and return of the investments held by the Fund in a different country or geographic region, economy, and market because of the increasingly interconnected global economies and financial markets. The duration and extent of the foregoing types of factors or conditions are highly uncertain and difficult to predict and have in the past, and may in the future, cause volatility and distress in economies and financial markets or other adverse circumstances, which may negatively affect the value of the Fund’s investments and performance of the Fund.
Note 11 – Subsequent Events
The Fund evaluated subsequent events through the date the consolidated financial statements are issued and determined there were no material events that would require adjustment to or disclosure in the Fund’s consolidated financial statements.
| | THE GUGGENHEIM FUNDS SEMI-ANNUAL REPORT | 39 |
| OTHER INFORMATION (Unaudited) |
Delivery of Shareholder Reports
Paper copies of the Fund’s annual and semi-annual shareholder reports are not sent by mail, unless you specifically request paper copies of the reports from the Fund or from your financial intermediary. Instead, the reports are made available on a website, and you are notified by mail each time a report is posted and provided with a website link to access the report.
You may elect to receive all future shareholder reports in paper free of charge. If you hold shares of the Fund directly, you can inform the Fund that you wish to receive paper copies of reports by calling 800.820.0888. If you hold shares of the Fund through a financial intermediary, please contact the financial intermediary to make this election. Your election to receive reports in paper may apply to all Guggenheim Funds in which you are invested and may apply to all Guggenheim Funds held with your financial intermediary.
Proxy Voting Information
A description of the policies and procedures that the Trust uses to determine how to vote proxies relating to securities held in the Fund’s portfolio is available, without charge and upon request, by calling 800.820.0888. This information is also available from the EDGAR database on the SEC’s website at https://www.sec.gov.
Information regarding how the Fund voted proxies relating to portfolio securities during the most recent 12-month period ended June 30 is available without charge, upon request, by calling 800.820.0888. This information is also available from the EDGAR database on the SEC’s website at https://www.sec.gov.
Sector Classification
Information in the Consolidated Schedule of Investments is categorized by sectors using sector-level Classifications defined by the Bloomberg Industry Classification System, a widely recognized industry classification system provider. The Fund’s registration statement has investment policies relating to concentration in specific sectors/industries. For purposes of these investment policies, the Fund usually classifies sectors/industries based on industry-level Classifications used by widely recognized industry classification system providers such as Bloomberg Industry Classification System, Global Industry Classification Standards and Barclays Global Classification Scheme.
Quarterly Portfolio Schedules Information
The Trust files its complete schedule of portfolio holdings with the SEC for the first and third quarters of each fiscal year as an exhibit to its reports on Form N-PORT, and for reporting periods ended prior to March 31, 2019, filed such information on Form N-Q. The Fund’s Forms N-PORT and N-Q are available on the SEC’s website at https://www.sec.gov. Copies of the portfolio holdings are also available to shareholders, without charge and upon request, by calling 800.820.0888.
| 40 | THE GUGGENHEIM FUNDS SEMI-ANNUAL REPORT | |
| OTHER INFORMATION (Unaudited)(continued) |
Report of the Rydex Series Funds Board of Trustees
The Board of Trustees of Rydex Series Funds (the “Trust”), including the Independent Trustees, unanimously approved the renewal of the investment management agreement (the “Advisory Agreement”) with Security Investors, LLC (“Security Investors” or the “Adviser”) on behalf of the series of the Trust listed below (each a “Fund” and collectively, the “Funds”):
Tradable Funds (Including Sector Funds*) |
| ● | Banking Fund* | ● | Basic Materials Fund* |
| ● | Biotechnology Fund* | ● | Commodities Strategy Fund |
| ● | Consumer Products Fund* | ● | Dow Jones Industrial Average Fund |
| ● | Electronics Fund* | ● | Emerging Markets 2x Strategy Fund |
| ● | Emerging Markets Bond Strategy Fund | ● | Energy Fund* |
| ● | Energy Services Fund* | ● | Europe 1.25x Strategy Fund |
| ● | Financial Services Fund* | ● | Government Long Bond 1.2x Strategy Fund |
| ● | Health Care Fund* | ● | High Yield Strategy Fund |
| ● | Internet Fund* | ● | Inverse Emerging Markets 2x Strategy Fund |
| ● | Inverse Government Long Bond Strategy Fund | ● | Inverse High Yield Strategy Fund |
| ● | Inverse Mid-Cap Strategy Fund | ● | Inverse NASDAQ-100 Strategy Fund |
| ● | Inverse Russell 2000 Strategy Fund | ● | Inverse S&P 500 Strategy Fund |
| ● | Japan 2x Strategy Fund | ● | Leisure Fund* |
| ● | Mid-Cap 1.5x Strategy Fund | ● | Monthly Rebalance NASDAQ-100 2x Strategy Fund |
| ● | NASDAQ-100 Fund | ● | Nova Fund |
| ● | Precious Metals Fund* | ● | Real Estate Fund |
| ● | Retailing Fund* | ● | Russell 2000 1.5x Strategy Fund |
| ● | Russell 2000 Fund | ● | S&P 500 Fund |
| ● | S&P 500 Pure Growth Fund | ● | S&P 500 Pure Value Fund |
| ● | S&P MidCap 400 Pure Growth Fund | ● | S&P MidCap 400 Pure Value Fund |
| ● | S&P SmallCap 600 Pure Growth Fund | ● | S&P SmallCap 600 Pure Value Fund |
| ● | Strengthening Dollar 2x Strategy Fund | ● | Technology Fund* |
| ● | Telecommunications Fund* | ● | Transportation Fund* |
| ● | Utilities Fund* | ● | U.S. Government Money Market Fund |
| ● | Weakening Dollar 2x Strategy Fund | | |
| | THE GUGGENHEIM FUNDS SEMI-ANNUAL REPORT | 41 |
| OTHER INFORMATION (Unaudited)(continued) |
| Alternative Funds** (i.e., Non-Tradable Funds) |
| ● | Long Short Equity Fund** | ● | Managed Futures Strategy Fund** |
| ● | Multi-Hedge Strategies Fund** | | |
| * | Each a “Sector Fund” and collectively, the “Sector Funds.” |
| ** | Each an “Alternative Fund” and collectively, the “Alternative Funds.” Each Fund other than the Alternative Funds is referred to herein as a “Tradable Fund” and collectively, the “Tradable Funds.” |
Security Investors1 is an indirect subsidiary of Guggenheim Partners, LLC, a privately-held, global investment and advisory firm (“Guggenheim Partners”). Guggenheim Partners, Security Investors and their affiliates may be referred to herein collectively as “Guggenheim.” “Guggenheim Investments” refers to the global asset management and investment advisory division of Guggenheim Partners and includes Security Investors, Guggenheim Partners Investment Management, LLC, Guggenheim Funds Investment Advisors, LLC and other affiliated investment management businesses of Guggenheim Partners.
At meetings held in person on April 17-18, 2023 (the “April Meeting”) and meetings held by videoconference on May 15, 2023 and in person on May 24, 2023 (the “May Meeting”), the Contracts Review Committee of the Board (the “Committee”), consisting solely of the Independent Trustees, met separately from Guggenheim to consider the proposed renewal of the Advisory Agreement. As part of its review process, the Committee was represented by independent legal counsel to the Independent Trustees (“Independent Legal Counsel”), from whom the Independent Trustees received separate legal advice and with whom they met separately. Independent Legal Counsel reviewed and discussed with the Committee various key aspects of the Trustees’ legal responsibilities relating to the proposed renewal of the Advisory Agreement and other principal contracts. The Committee took into account various materials received from Guggenheim and Independent Legal Counsel. The Committee also considered the variety of written materials, reports and oral presentations the Board received throughout the year regarding performance and operating results of the Funds, and other information relevant to its evaluation of the Advisory Agreement.
| 1 | Security Investors also serves as investment adviser to each of Rydex Series Funds Commodities Strategy CFC, Rydex Managed Futures Strategy CFC and Rydex Series Funds Multi-Hedge Strategies CFC (each a “Subsidiary” and collectively, the “Subsidiaries”), wholly-owned subsidiaries of the Trust that are organized as limited companies under the laws of the Cayman Islands and used by Commodities Strategy Fund, Managed Futures Strategy Fund and Multi-Hedge Strategies Fund, respectively, to obtain commodities exposure. Pursuant to a separate investment management agreement for each Subsidiary (each a “Subsidiary Advisory Agreement” and collectively, the “Subsidiary Advisory Agreements”), the Subsidiary pays Security Investors an advisory fee at the same rate that the respective Fund pays Security Investors under the Advisory Agreement. The Subsidiary Advisory Agreements do not require annual renewal by the Board and will continue until they are terminated as provided in the Agreements. In addition, Security Investors has entered into a separate waiver agreement with respect to each applicable Fund pursuant to which Security Investors has contractually agreed to waive the advisory fee it receives from the Fund in an amount equal to the advisory fee paid to Security Investors by the respective Subsidiary. This undertaking will continue with respect to each applicable Fund for so long as the Fund invests in the respective Subsidiary, and may be terminated only with the approval of the Board. |
| 42 | THE GUGGENHEIM FUNDS SEMI-ANNUAL REPORT | |
| OTHER INFORMATION (Unaudited)(continued) |
In connection with the contract review process, FUSE Research Network LLC (“FUSE”), an independent, third-party research provider, was engaged to prepare advisory contract renewal reports designed specifically to help the Board fulfill its advisory contract renewal responsibilities. The objective of the FUSE reports is to present the subject funds’ relative position regarding fees, expenses and total return performance, with peer group and universe comparisons. The Committee assessed the data provided in the FUSE reports as well as commentary presented by Guggenheim, including, among other things, a list of Funds for which no peer funds were identified, a summary of notable distinctions between certain Funds and the applicable peer group identified in the FUSE reports and explanations for custom peer groups created for certain Funds that do not fit well into any particular category.
As part of its evaluation of the Adviser and the proposed renewal of the Advisory Agreement, the Committee took into account that the beneficial owners of the Funds are clients of tactical advisors who are engaged to provide tactical asset allocation investment advisory services. Each Tradable Fund is designed to provide such tactical advisors with specific exposures (with the exception of the U.S. Government Money Market Fund which is designed to support tactical advisors seeking to avoid market exposure or preserve capital) while also providing for unlimited trading privileges, and that the Tradable Funds offer a unique set of product features. The Committee noted that each Tradable Fund (other than the U.S. Government Money Market Fund) seeks to track, or correlate to, the performance (before fees and expenses) of a specific benchmark index over certain time periods or a specific market, noting that, because appropriate published indices are not available for many of the Sector Funds and the Real Estate Fund, the Adviser has developed its own methodology to construct internal performance benchmarks for the Sector Funds and the Real Estate Fund. In this regard, the Committee received information regarding the Adviser’s proprietary methodology for constructing internal performance benchmarks for such Funds, including the personnel with primary responsibility for the maintenance and execution of the methodology. The Committee also noted that, in addition to the performance information included in the FUSE reports, the Adviser provided tracking error data for each Tradable Fund (other than the U.S. Government Money Market Fund) relative to the applicable benchmark index or Guggenheim-constructed internal performance benchmark. The Committee took into account the limitations of the peer group and universe comparisons provided by FUSE with respect to the Tradable Funds in light of their unique features and the limited size of the marketplace for tradable funds designed to support tactical advisors, noting that there are only two direct competitor product suites.
In addition, Guggenheim provided materials and data in response to formal requests for information sent by Independent Legal Counsel on behalf of the Committee. Guggenheim also made a presentation at the April Meeting. Throughout the process, the Committee asked questions of management and requested certain additional information, which Guggenheim provided (collectively with the foregoing reports and materials, the “Contract Review Materials”).
| | THE GUGGENHEIM FUNDS SEMI-ANNUAL REPORT | 43 |
| OTHER INFORMATION (Unaudited)(continued) |
The Committee considered the Contract Review Materials in the context of its accumulated experience governing the Trust and other Guggenheim funds and weighed the factors and standards discussed with Independent Legal Counsel.
Following an analysis and discussion of relevant factors, including those identified below, and in the exercise of its business judgment, the Committee concluded that the Advisory Agreement represented a reasonable business arrangement negotiated at arm’s length and that it was in the best interest of each Fund to recommend that the Board approve the renewal of the Advisory Agreement for an additional annual term. Following its review of the Committee’s recommendation, the Board approved the renewal of the Advisory Agreement for each Fund for a one-year period ending August 1, 2024 at a meeting held on May 23-24, 2023 (the “May Board Meeting” and together with the May Meeting, the “May Meetings”) and determined to adopt the Committee’s considerations and conclusions, which follow.
Nature, Extent and Quality of Services Provided by the Adviser: With respect to the nature, extent and quality of services currently provided by the Adviser, the Committee considered the qualifications, experience and skills of key personnel performing services for the Funds, including those personnel providing compliance and risk oversight, as well as the supervisors and reporting lines for such personnel. The Committee also considered other information, including Guggenheim’s resources and related efforts to retain, attract and motivate capable personnel to serve the Funds. In evaluating Guggenheim’s resources and capabilities, the Committee considered Guggenheim’s commitment to focusing on, and investing resources in support of, funds in the Guggenheim fund complex, including the Funds. The Committee also considered Guggenheim’s discussion of its ongoing review of the Guggenheim fund line-up at the April Meeting and the May Board Meeting. In addition, the Committee considered the acceptability of the terms of the Advisory Agreement, including the scope of services required to be performed by the Adviser.
The Committee’s review of the services provided by Guggenheim to the Funds included consideration of Guggenheim’s investment processes and index methodologies and resulting performance, portfolio oversight and risk management, and the related regular quarterly reports and presentations received by the Board. The Committee took into account the risks borne by Guggenheim in sponsoring and providing services to the Funds, including regulatory, operational, legal and entrepreneurial risks. The Committee considered the resources dedicated by Guggenheim to compliance functions and the reporting made to the Board by Guggenheim compliance personnel regarding Guggenheim’s adherence to regulatory requirements. The Committee also considered the regular reports the Board receives from the Trust’s Chief Compliance Officer regarding compliance policies and procedures established pursuant to Rule 38a-1 under the Investment Company Act of 1940, as amended.
With respect to the Tradable Funds, the Committee considered their unique product features, including their tradability, the real time cash process employed for such Funds, twice-daily pricing for certain Tradable Funds on select trading platforms, and the leveraged and inverse strategies
| 44 | THE GUGGENHEIM FUNDS SEMI-ANNUAL REPORT | |
| OTHER INFORMATION (Unaudited)(continued) |
offered, the Adviser’s assessment of the value to shareholders provided by the Funds’ structure and the services required by the Adviser to provide the Funds’ unique features, as well as the personnel responsible for such services. The Committee noted that the Tradable Funds allow frequent trading and unlimited exchange privileges among like share classes and noted the magnitude of changes in each Fund’s assets during 2022, 2021 and 2020. The Committee also considered additional information regarding trading activity in the Tradable Funds during 2022, including monthly purchases and redemptions in dollar value and in number of transactions as well as transaction volume relative to the assets in the Tradable Funds. In this regard, the Committee noted that the real time cash process is utilized by the Adviser to aggregate shareholder flow data to estimate daily net subscriptions or redemptions in order to mitigate the costs associated with the tradability feature, improve tracking and keep the Funds fully invested. The Committee took into account the infrastructure developed by the Adviser to manage the significant volume and size of trading that typically occurs near the end of each business day, as well as the unique considerations required in the portfolio construction process to determine the optimal way to obtain the applicable exposures, including leveraged and inverse exposures, while allowing for high turnover. In addition, the Committee considered information provided by the Adviser analyzing the potential costs to shareholders of investing in tradable mutual funds, such as the Tradable Funds, compared to those of investing in exchange-traded funds, including expense ratios, brokerage commissions and spread costs, as well as the relative advantages and disadvantages of each investment product. The Committee considered that, at the April Meeting, the Adviser’s Head of Quantitative Strategies with investment management responsibility for the Tradable Funds met with the Committee to discuss the Tradable Funds, including the value to shareholders of the tradability and other unique features, the personnel, operations and infrastructure required to provide those features, the reasons why tactical advisors invest in the Tradable Funds rather than other tradable products, such as exchange-traded funds, for their clients, and the level of trading activity in the Tradable Funds. With respect to the Sector Funds and the Real Estate Fund, the Committee also considered the Adviser’s proprietary methodology for constructing internal performance benchmarks for such Funds, noting the Adviser’s statement that it uses a quantitative portfolio investment process that also requires investment discretion in implementing adjustments for factors that affect tradability and liquidity, changing dynamics within a sector, and corporate actions such as spin-offs, among other adjustments.
In connection with the Committee’s evaluation of the overall package of services provided by Guggenheim, the Committee considered Guggenheim’s administrative services, including its role in supervising, monitoring, coordinating and evaluating the various services provided by the fund administrator, transfer agent, distributor, custodian and other service providers to the Funds. The Committee evaluated the Office of Chief Financial Officer (the “OCFO”), established to oversee the fund administration, accounting and transfer agency services provided to the Funds and other Guggenheim funds, including the OCFO’s resources, personnel and services provided.
| | THE GUGGENHEIM FUNDS SEMI-ANNUAL REPORT | 45 |
| OTHER INFORMATION (Unaudited)(continued) |
With respect to Guggenheim’s resources and the ability of the Adviser to carry out its responsibilities under the Advisory Agreement, the Chief Financial Officer of Guggenheim Investments reviewed with the Committee financial information concerning the holding company for Guggenheim Investments, Guggenheim Partners Investment Management Holdings, LLC (“GPIMH”), and the various entities comprising Guggenheim Investments, and provided the audited consolidated financial statements of GPIMH.
Based on the foregoing, and based on other information received (both oral and written) at the April Meeting and the May Meetings, as well as other considerations, including the Committee’s knowledge of how the Adviser performs its duties obtained through Board meetings, discussions and reports throughout the year, the Committee concluded that the Adviser and its personnel were qualified to serve the Funds in such capacity and may reasonably be expected to continue to provide a high quality of services under the Advisory Agreement with respect to the Funds.
Investment Performance: Except as otherwise noted, the Committee received, for each Fund, investment returns for the since-inception, ten-year, five-year, three-year, one-year and three-month periods ended December 31, 2022, as applicable. For certain Tradable Funds with only one or two identified peer funds, if any, from the two direct competitor product suites, only investment returns for the five-year, three-year and one-year periods ended December 31, 2022, as applicable, were received. In addition, the Committee received a comparison of each Fund’s performance to the performance of a benchmark and a peer group of similar funds based on asset levels as identified by FUSE, and for certain Funds, a broader universe of funds, in each case for the same periods, as applicable. The Committee also received from FUSE a description of the methodology for identifying each Fund’s peer group and universe, if any, for performance and expense comparisons. For the Tradable Funds (other than the U.S. Government Money Market Fund), the Committee received tracking error data for such Funds relative to the applicable benchmark index or Guggenheim-constructed internal performance benchmark for the five-year, three-year and one-year periods ended December 31, 2022, as applicable. For certain Tradable Funds with only one or two identified peer funds from the two direct competitor product suites, the Committee received a comparison of the tracking error of each Fund’s Class H shares to the tracking error of a peer fund, in each case for the same periods, as applicable. The Committee also received certain performance information for the Alternative Funds (i.e., the non-Tradable Funds) as of March 31, 2023. In assessing each Fund’s performance, the Committee considered that the Board receives regular reporting from Guggenheim regarding performance and evaluates performance throughout the year.
With respect to the Tradable Funds (other than the U.S. Government Money Market Fund), the Committee considered the Adviser’s statement that such Funds are designed as a suite of products seeking to provide a number of broad and specific exposures for tactical advisors and also considered that the Funds have a unique set of product features designed to meet the needs of those tactical advisors, which has an impact on performance. The Committee considered the Adviser’s statement that, in circumstances where there are significant deviations from expected returns, management seeks to understand the cause of such deviations and determine if any
| 46 | THE GUGGENHEIM FUNDS SEMI-ANNUAL REPORT | |
| OTHER INFORMATION (Unaudited)(continued) |
remedial actions should be considered, noting that no such remedial actions were currently deemed necessary by the Adviser to address performance. The Committee also considered the Adviser’s discussion of factors that contribute to such deviations, including shareholder activity, financing costs associated with leverage and investment instruments used to achieve certain exposures, noting the Adviser’s statement that expenses and transaction costs based on shareholder activity are the primary drivers of performance differences. In this connection, the Committee considered the tracking error of each Fund’s Class H shares relative to its applicable benchmark index or Guggenheim-constructed internal performance benchmark and, for certain Tradable Funds, compared to the tracking error of a peer fund. The Committee considered the Adviser’s commentary explaining the higher levels of tracking error for certain Funds.
With respect to certain Tradable Funds with only one or two identified peer funds, if any, from the two direct competitor product suites, the Committee considered the Adviser’s summary of notable distinctions between the Tradable Funds and the peer funds in the two direct competitor product suites and noted the Adviser’s statement that certain Tradable Funds do not have any peer funds that provide the same index, leverage or inverse exposure. The Committee also considered management’s commentary explaining instances of significant underperformance (defined as greater than 100 basis points) of such Funds’ Class H shares over the five-year, three-year and/or one-year periods ended December 31, 2022, relative to their respective peer funds, attributing such relative underperformance to, among other factors, differences in portfolio construction methodologies and exposures. The Committee noted that the two direct competitor product suites do not offer a fund comparable to either the Commodities Strategy Fund or the Emerging Markets Bond Strategy Fund. The Committee considered, for each of the Commodities Strategy Fund and the Emerging Markets Bond Strategy Fund, a comparison to a peer group identified in the FUSE report that includes actively-managed funds, in each case noting the limitations in the comparability of such peer group.
With respect to the U.S. Government Money Market Fund, the Committee noted the Adviser’s statement that the Fund is designed to support tactical advisors seeking to avoid market exposure or preserve capital and that only one other fund in its peer group identified in the FUSE report has product features that make it comparable in this regard. The Committee considered that the Fund performed in line with the comparable peer fund over the five-year and three-year periods ended December 31, 2022, while, in contrast, its performance ranked in the fourth quartile of the broader peer group over the five-year, three-year and one-year time periods.
With respect to the Sector Funds and the Real Estate Fund, the Committee considered the Adviser’s summary of notable distinctions between each Fund and the applicable peer group identified in the FUSE reports. The Committee considered that the peer groups are comprised of actively-managed funds seeking similar exposures but that do not offer the same product features, including unlimited trading privileges, noting the Adviser’s statement that certain peer funds also cover a narrower or wider market segment than the applicable Fund. The Committee considered management’s commentary explaining the underperformance, as applicable, of such Funds’ Class H shares over the five-year, three-year and one-year periods ended December 31, 2022, relative
| | THE GUGGENHEIM FUNDS SEMI-ANNUAL REPORT | 47 |
| OTHER INFORMATION (Unaudited)(continued) |
to their respective peer groups, attributing such underperformance to, among other factors, high turnover associated with daily shareholder flows, differences in exposures and the Funds’ modified cap weighting approach to portfolio construction.
With respect to the Alternative Funds (i.e., the non-Tradable Funds), in seeking to evaluate Fund performance over a full market cycle, the Committee focused its attention on five-year and three-year performance rankings as compared to the relevant universe of funds. The Committee observed that the returns of the Multi-Hedge Strategies Fund’s Institutional Class shares ranked in the second quartile of its performance universe for each of the relevant periods considered. In addition, the Committee made the following observations:
Long Short Equity Fund: The returns of the Fund’s Institutional Class shares ranked in the 87th and 49th percentiles of its performance universe for the five-year and three-year periods ended December 31, 2022, respectively. The Committee noted management’s explanation that the Fund’s relative underperformance over the five-year time period was primarily due to the Fund’s fundamental factor tilts. The Committee noted management’s statement that the Fund’s long exposure to value detracted from investment performance from early 2018 through early 2020 as growth stocks outperformed during that period. The Committee also noted management’s statement that the Fund’s net short exposure to oil prices within the energy sector following the onset of the Russia-Ukraine war in early 2022 also contributed to relative underperformance.
Managed Futures Strategy Fund: The returns of the Fund’s Institutional Class shares ranked in the 82nd and 83rd percentiles of its performance universe for the five-year and three-year periods ended December 31, 2022, respectively. The Committee noted management’s explanation that the Fund’s relative underperformance over the five-year and three-year time periods was primarily due to the Fund targeting a lower level of risk relative to its performance universe. The Committee took into account management’s statements that the portfolio management team increased the Fund’s risk target in 2021 to be more in line with peers and the Fund experienced a performance ranking that compared more favorably relative to its performance universe for the one-year period ended December 31, 2022. The Committee also noted management’s further explanation of the Fund’s performance at the April Meeting.
Based on the foregoing, and based on other information received (both oral and written) at the April Meeting and the May Meetings, as well as other considerations, the Committee concluded that: (i) each Fund’s performance was acceptable; or (ii) it was satisfied with Guggenheim’s responses and/or efforts to improve investment performance.
| 48 | THE GUGGENHEIM FUNDS SEMI-ANNUAL REPORT | |
| OTHER INFORMATION (Unaudited)(continued) |
Comparative Fees, Costs of Services Provided and the Benefits Realized by the Adviser from Its Relationship with the Funds: The Committee compared each Fund’s contractual advisory fee, net effective management fee2 and total net expense ratio to the applicable peer group, if any. The Committee also reviewed the median advisory fees and expense ratios, including expense ratio components (e.g., transfer agency fees, administration fees, other operating expenses, distribution fees and fee waivers/reimbursements), of the peer group of funds. In addition, the Committee considered information regarding Guggenheim’s process for evaluating the competitiveness of each Fund’s fees and expenses, noting Guggenheim’s statement that evaluations seek to incorporate a variety of factors with a general focus on ensuring fees and expenses: (i) are competitive; (ii) give consideration to resource support requirements; and (iii) ensure Funds are able to deliver on shareholder return expectations. The Committee also considered Guggenheim’s discussion of information regarding fee and expense trends across the open-end fund industry and its response to those trends with respect to the funds in the Guggenheim fund complex, including the Funds.
As part of its evaluation of each Fund’s advisory fee, the Committee considered how such fees compared to the advisory fee charged by Guggenheim to one or more other clients that it manages pursuant to similar investment strategies, to the extent applicable. The Committee noted Guggenheim’s statement that it does not provide advisory services to other clients that have investment strategies similar to those of the Funds, other than variable insurance fund counterparts to certain Funds and certain other clients with respect to Long Short Equity Fund, each of which is charged the same advisory fee as the corresponding Fund.
With respect to the Tradable Funds that are designed to track a widely available index, which have only one or two identified peer funds, if any, from the two direct competitor product suites, the Committee considered the Adviser’s summary of notable distinctions between the Tradable Funds and the peer funds, noting the Adviser’s statement that only one of the two direct competitor product suites (which also employs a daily rebalance feature) is directly comparable for purposes of assessing such Funds’ advisory fees, with the exception of the Monthly Rebalance NASDAQ-100 2x Strategy Fund for which the other competitor product suite (which employs a monthly rebalance feature) is directly comparable. The Committee noted that the contractual advisory fee for each Fund’s Class H shares, other than the Monthly Rebalance NASDAQ-100 2x Strategy Fund, was equal to or lower than the contractual advisory fee charged to the comparable peer fund. The Committee also considered the net effective management fee and total net expense ratio for each such Fund’s Class H shares as compared to the peer fund. For the Monthly Rebalance NASDAQ-100 2x Strategy Fund, the Committee considered that, although the contractual advisory fee for the Fund’s Class H shares is higher than the contractual advisory fee charged to the peer fund, the Adviser has contractually agreed to cap Fund expenses to ensure that total net expenses
| 2 | The “net effective management fee” for each Fund represents the combined effective advisory fee and administration fee as a percentage of average net assets for the latest fiscal year, after any waivers and/or reimbursements. |
| | THE GUGGENHEIM FUNDS SEMI-ANNUAL REPORT | 49 |
| OTHER INFORMATION (Unaudited)(continued) |
are competitive. The Committee noted that the net effective management fee and the total net expense ratio for the Fund’s Class H shares were lower than and equal to those of the peer fund, respectively.
With respect to the U.S. Government Money Market Fund, the Committee noted the Adviser’s statement that the Fund is designed to support tactical advisors seeking to avoid market exposure or preserve capital and that only one other fund in its peer group identified in the FUSE report is directly comparable in terms of product features offered. The Committee considered that, as of the Fund’s and the peer fund’s respective fiscal year ends, the Fund’s contractual advisory fee and total net expense ratio were higher than those of the comparable peer fund, but noted management’s statement that it believes that the peer fund’s unique structural arrangement of investing in a master portfolio managed by an unaffiliated investment adviser may result in the peer fund’s stated advisory fees being understated.
With respect to the Sector Funds and the Real Estate Fund, the Committee considered the Adviser’s summary of notable distinctions between each Fund and the applicable peer group identified in the FUSE reports. The Committee considered that the peer groups are comprised of actively-managed funds seeking similar exposures but that do not offer the same product features, such as unlimited trading privileges. As a result, the fee and expense comparisons are more difficult given the uniqueness of both the Funds’ structure and the portfolio management needed to meet client requirements.
The Committee considered management’s agreement, as part of the 2023 annual contract review process, to reduce the total net expense ratio of each Tradable Fund (other than the U.S. Government Money Market Fund) by 0.05% of its average daily net assets through an expense reimbursement and/or waiver agreement effective August 1, 2023 for an initial term ending August 1, 2024 for each Fund (other than Commodities Strategy Fund for which the initial term will end May 1, 2025), with such reduction to apply in addition to any other contractual waiver and/or reimbursement arrangements already in place. The Committee also noted the continuation through August 1, 2024 of management’s separate agreement, implemented as part of the 2022 annual contract review process, to reduce the total net expense ratio of each Tradable Fund with a contractual advisory fee of 0.90% of its average daily net assets3 by 0.05% of its average daily net assets and, with respect to NASDAQ-100 Fund, to reduce the total net expense ratio of the Fund by 0.05% of its average daily net assets in excess of $500 million, through expense reimbursement and/or waiver agreements.
| 3 | Emerging Markets 2x Strategy Fund, Europe 1.25x Strategy Fund, Inverse Emerging Markets 2x Strategy Fund, Inverse Government Long Bond Strategy Fund, Inverse Mid-Cap Strategy Fund, Inverse NASDAQ-100 Strategy Fund, Inverse Russell 2000 Strategy Fund, Inverse S&P 500 Strategy Fund, Mid-Cap 1.5x Strategy Fund, Monthly Rebalance NASDAQ-100 2x Strategy Fund, Russell 2000 1.5x Strategy Fund, Strengthening Dollar 2x Strategy Fund and Weakening Dollar 2x Strategy Fund. |
| 50 | THE GUGGENHEIM FUNDS SEMI-ANNUAL REPORT | |
| OTHER INFORMATION (Unaudited)(continued) |
With respect to the Alternative Funds (i.e., the non-Tradable Funds), except as to the individual Fund discussed below, the Committee observed that the contractual advisory fee, net effective management fee and total net expense ratio for each Fund’s Institutional Class shares each rank in the third quartile or better of such Fund’s peer group. In addition, the Committee made the following observations:
Multi-Hedge Strategies Fund: The contractual advisory fee for the Fund’s Institutional Class shares ranks in the second quartile (27th percentile) of its peer group. Although the net effective management fee for the Fund’s Institutional Class shares ranks in the fourth quartile (87th percentile), the Committee considered that the total net expense ratio for the Fund’s Institutional Class shares ranks in the first quartile (13th percentile) of its peer group.
With respect to the costs of services provided and benefits realized by Guggenheim Investments from its relationship with the Funds, the Committee reviewed a profitability analysis and data from management for each Fund setting forth the average assets under management for the twelve months ended December 31, 2022, gross revenues received, and expenses incurred directly or through allocations, by Guggenheim Investments, expense waivers (as applicable), earnings and the operating margin/profitability rate, including variance information relative to the foregoing amounts as of December 31, 2021. In addition, the Chief Financial Officer of Guggenheim Investments reviewed with, and addressed questions from, the Committee concerning the expense allocation methodology employed in producing the profitability analysis. In the course of its review of Guggenheim Investments’ profitability, the Committee took into account the methods used by Guggenheim Investments to determine expenses and profit and the representation by the Chief Financial Officer of Guggenheim Investments that such methods provided a reasonable basis for determining the profitability of the Adviser with respect to each Fund. The Committee considered all of the foregoing, among other things, in evaluating the costs of services provided, the profitability to Guggenheim Investments and the profitability rates presented.
The Committee also considered other benefits available to the Adviser because of its relationship with the Funds and noted Guggenheim’s statement that it does not believe the Adviser derives any such “fall-out” benefits. In this regard, the Committee noted Guggenheim’s statement that, although it does not consider such benefits to be fall-out benefits, the Adviser may benefit from certain economies of scale and synergies, such as enhanced visibility of the Adviser, enhanced leverage in fee negotiations and other synergies arising from offering a broad spectrum of products, including the Funds.
Based on the foregoing, and based on other information received (both oral and written) at the April Meeting and the May Meetings, as well as other considerations, the Committee concluded that the comparative fees and the benefits realized by the Adviser from its relationship with the Funds reflected reasonable business arrangements negotiated at arm’s length and that the Adviser’s profitability from its relationship with the Funds was not unreasonable.
| | THE GUGGENHEIM FUNDS SEMI-ANNUAL REPORT | 51 |
| OTHER INFORMATION (Unaudited)(continued) |
Economies of Scale: The Committee received and considered information regarding whether there have been economies of scale with respect to the management of the Funds as Fund assets grow, whether the Funds have appropriately benefited from any economies of scale, and whether there is potential for realization of any further economies of scale. The Committee considered whether economies of scale in the provision of services to the Funds were being passed along to and shared with the shareholders. The Committee considered that Guggenheim believes it is appropriately sharing potential economies of scale and that Guggenheim’s decrease in 2022 in overall expenses was attributable to decreased product costs driven by lower average assets under management and lower non-recurring costs related to closed-end fund matters as well as a decrease in compensation and benefits. The Committee also considered that although expenses related to investment resources decreased in 2022, Guggenheim’s shared services expenses and certain other expenses increased in 2022.
With respect to the Tradable Funds, the Committee noted that, in addition to the expense reimbursement and/or waiver arrangement implemented in August 2022 for the NASDAQ-100 Fund on average daily net assets in excess of $500 million, the Adviser has agreed to a contractual advisory fee breakpoint schedule for the Funds that is applied at the product-suite level, rather than on a Fund level, as the Funds are designed for tactical advisors and provide unlimited trading privileges, with individual Fund assets fluctuating significantly throughout the year. Under the breakpoint schedule adopted in June 2018 to reflect product-suite level economies of scale, each Fund’s advisory fee would be subject to a uniform fee breakpoint reduction schedule that would take effect if the aggregate assets of the Tradable Funds and the tradable series of Rydex Dynamic Funds, a separate trust, equal or exceed $10 billion.
The Committee also noted the process employed by the Adviser to evaluate whether it would be appropriate to institute a new breakpoint for an Alternative Fund (i.e., a non-Tradable Fund), with consideration given to, among other things: (i) the Fund’s size and trends in asset levels over recent years; (ii) the competitiveness of the expense levels; (iii) whether expense waivers are in place; (iv) changes and trends in revenue and expenses; (v) whether there are any anticipated expenditures that may benefit the Fund in the future; (vi) Fund profit level margins; (vii) relative Fund performance; (viii) the nature, extent and quality of services management provides to the Fund; and (ix) the complexity of the Fund’s investment strategy and the resources required to support the Fund.
As part of its assessment of economies of scale, the Committee took into account Guggenheim’s representation that it seeks to share economies of scale through a number of means, including breakpoints, advisory fees set at competitive rates pre-assuming future asset growth, expense waivers and limitations, and investments in personnel, operations and infrastructure to support the fund business. The Committee also received information regarding amounts that had been shared with shareholders through such expense waivers and limitations and considered that the newly agreed expense reimbursement and/or waiver arrangement would produce additional
| 52 | THE GUGGENHEIM FUNDS SEMI-ANNUAL REPORT | |
| OTHER INFORMATION (Unaudited)(concluded) |
savings to shareholders. Thus, the Committee considered the size of the Funds and the competitiveness of and/or other determinations made regarding the current advisory fee for each Fund, as well as whether a Fund is subject to an expense limitation.
Based on the foregoing, and based on other information received (both oral and written) at the April Meeting and May Meetings, as well as other considerations, the Committee concluded that the advisory fee for each Fund reflected a reasonable business arrangement negotiated at arm’s length.
Overall Conclusions
The Committee concluded that the investment advisory fees reflect reasonable business arrangements negotiated at arm’s length in light of the extent and quality of the services provided and other benefits received and that the renewal of the Advisory Agreement is in the best interest of each Fund. In reaching this conclusion, no single factor was determinative or conclusive and each Committee member, in the exercise of his or her informed business judgment, may afford different weights to different factors.
Following its review of the Committee’s analysis and determinations, the Board adopted the considerations and conclusions of the Committee and determined to approve the renewal of the Advisory Agreement.
| | THE GUGGENHEIM FUNDS SEMI-ANNUAL REPORT | 53 |
| INFORMATION ON BOARD OF TRUSTEES AND OFFICERS (Unaudited) |
A Board of Trustees oversees the Trust, as well as other trusts of GI, in which its members have no stated term of service, and continue to serve after election until resignation. The Statement of Additional Information includes further information about Fund Trustees and Officers, and can be obtained without charge by visiting guggenheiminvestments.com or by calling 800.820.0888.
Name, Address*
and Year of Birth | Position(s)
Held
with Trust | Term of Office
and Length of
Time Served** | Principal Occupation(s)
During Past Five Years | Number of
Portfolios
in Fund
Complex
Overseen | Other
Directorships Held
by Trustees*** |
| INDEPENDENT TRUSTEES | | |
Randall C. Barnes (1951) | Trustee and Chair of the Valuation Oversight Committee | Since 2019 (Trustee) Since 2020 (Chair of the Valuation Oversight Committee) | Current: Private Investor (2001-present).
Former: Senior Vice President and Treasurer, PepsiCo, Inc. (1993-1997); President, Pizza Hut International (1991-1993); Senior Vice President, Strategic Planning and New Business Development, PepsiCo, Inc. (1987-1990). | 155 | Current: Advent Convertible and Income Fund (2005-present); Purpose Investments Funds (2013-present).
Former: Fiduciary/Claymore Energy Infrastructure Fund (2004-2022); Guggenheim Enhanced Equity Income Fund (2005-2021); Guggenheim Credit Allocation Fund (2013-2021). |
Angela Brock-Kyle (1959) | Trustee | Since 2016 | Current: Founder and Chief Executive Officer, B.O.A.R.D.S. (2013-present); Director, Mutual Fund Directors Forum (2022-present).
Former: Senior Leader, TIAA (financial services firm) (1987-2012). | 154 | Current: Bowhead Insurance GP, LLC (2020-present); Hunt Companies, Inc. (2019-present).
Former: Fiduciary/Claymore Energy Infrastructure Fund (2019-2022); Guggenheim Enhanced Equity Income Fund (2019-2021); Guggenheim Credit Allocation Fund (2019-2021); Infinity Property & Casualty Corp. (2014-2018). |
| 54 | THE GUGGENHEIM FUNDS SEMI-ANNUAL REPORT | |
| INFORMATION ON BOARD OF TRUSTEES AND OFFICERS (Unaudited)(continued) |
Name, Address*
and Year of Birth | Position(s)
Held
with Trust | Term of Office
and Length of
Time Served** | Principal Occupation(s)
During Past Five Years | Number of
Portfolios
in Fund
Complex
Overseen | Other
Directorships Held
by Trustees*** |
| INDEPENDENT TRUSTEES - continued | | |
Thomas F. Lydon, Jr. (1960) | Trustee and Chair of the Contracts Review Committee | Since 2005 (Trustee) Since 2020 (Chair of the Contracts Review Committee) | Current: President, Global Trends Investments (registered investment adviser) (1996-present); CEO, ETF Flows, LLC (financial advisor education and research provider) (2019-present); CEO, Lydon Media (2016-present). Director, GDX Index Partners, LLC (index provider) (2021-present); Vice Chairman, VettaFi (financial advisor content, research and digital distribution provider) (2022-present). | 154 | Current: US Global Investors, Inc. (GROW) (1995-present). Former: Fiduciary/Claymore Energy Infrastructure Fund (2019-2022); Guggenheim Enhanced Equity Income Fund (2019-2021); Guggenheim Credit Allocation Fund (2019-2021); Harvest Volatility Edge Trust (3) (2017-2019). |
| | THE GUGGENHEIM FUNDS SEMI-ANNUAL REPORT | 55 |
| INFORMATION ON BOARD OF TRUSTEES AND OFFICERS (Unaudited)(continued) |
Name, Address*
and Year of Birth | Position(s)
Held
with Trust | Term of Office
and Length of
Time Served** | Principal Occupation(s)
During Past Five Years | Number of
Portfolios
in Fund
Complex
Overseen | Other
Directorships Held
by Trustees*** |
| INDEPENDENT TRUSTEES - continued | | |
Ronald A. Nyberg (1953) | Trustee and Chair of the Nominating and Governance Committee | Since 2019 | Current: Of Counsel, Momkus LLP (law firm) (2016-present). Former: Partner, Nyberg & Cassioppi, LLC (law firm) (2000-2016); Executive Vice President, General Counsel, and Corporate Secretary, Van Kampen Investments (1982-1999). | 155 | Current: Advent Convertible and Income Fund (2003-present); PPM Funds (2) (2018-present); NorthShore-Edward-Elmhurst Health (2012-present). Former: Fiduciary/Claymore Energy Infrastructure Fund (2004-2022); Guggenheim Enhanced Equity Income Fund (2005-2021); Guggenheim Credit Allocation Fund (2013-2021); Western Asset Inflation-Linked Opportunities & Income Fund (2004-2020); Western Asset Inflation-Linked Income Fund (2003-2020). |
| 56 | THE GUGGENHEIM FUNDS SEMI-ANNUAL REPORT | |
| INFORMATION ON BOARD OF TRUSTEES AND OFFICERS (Unaudited)(continued) |
Name, Address*
and Year of Birth | Position(s)
Held
with Trust | Term of Office
and Length of
Time Served** | Principal Occupation(s)
During Past Five Years | Number of
Portfolios
in Fund
Complex
Overseen | Other
Directorships Held
by Trustees*** |
| INDEPENDENT TRUSTEES - continued | | |
Sandra G. Sponem (1958) | Trustee and Chair of the Audit Committee | Since 2016 (Trustee) Since 2019 (Chair of the Audit Committee) | Current: Retired. Former: Senior Vice President and Chief Financial Officer, M.A. Mortenson-Companies, Inc. (construction and real estate development company) (2007-2017). | 154 | Current: SPDR Series Trust (81) (2018-present); SPDR Index Shares Funds (30) (2018-present); SSGA Active Trust (14) (2018-present). Former: Fiduciary/Claymore Energy Infrastructure Fund (2019-2022); Guggenheim Enhanced Equity Income Fund (2019-2021); Guggenheim Credit Allocation Fund (2019-2021); SSGA Master Trust (1) (2018-2020). |
| | THE GUGGENHEIM FUNDS SEMI-ANNUAL REPORT | 57 |
| INFORMATION ON BOARD OF TRUSTEES AND OFFICERS (Unaudited)(continued) |
Name, Address*
and Year of Birth | Position(s)
Held
with Trust | Term of Office
and Length of
Time Served** | Principal Occupation(s)
During Past Five Years | Number of
Portfolios
in Fund
Complex
Overseen | Other
Directorships Held
by Trustees*** |
| INDEPENDENT TRUSTEES - concluded | | |
Ronald E. Toupin, Jr. (1958) | Trustee, Chair of the Board and Chair of the Executive Committee | Since 2019 | Current: Portfolio Consultant (2010-present); Member, Governing Council, Independent Directors Council (2013-present); Governor, Board of Governors, Investment Company Institute (2018-present).
Former: Member, Executive Committee, Independent Directors Council (2016-2018); Vice President, Manager and Portfolio Manager, Nuveen Asset Management (1998-1999); Vice President, Nuveen Investment Advisory Corp. (1992-1999); Vice President and Manager, Nuveen Unit Investment Trusts (1991-1999); and Assistant Vice President and Portfolio Manager, Nuveen Unit Investment Trusts (1988-1999), each of John Nuveen & Co., Inc. (registered broker dealer) (1982-1999). | 154 | Former: Fiduciary/Claymore Energy Infrastructure Fund (2004-2022); Guggenheim Enhanced Equity Income Fund (2005-2021); Guggenheim Credit Allocation Fund (2013-2021); Western Asset Inflation-Linked Opportunities & Income Fund (2004-2020); Western Asset Inflation-Linked Income Fund (2003-2020). |
| 58 | THE GUGGENHEIM FUNDS SEMI-ANNUAL REPORT | |
| INFORMATION ON BOARD OF TRUSTEES AND OFFICERS (Unaudited)(continued) |
Name, Address*
and Year of Birth | Position(s)
Held
with Trust | Term of Office
and Length of
Time Served** | Principal Occupation(s)
During Past Five Years | Number of
Portfolios
in Fund
Complex
Overseen | Other
Directorships Held
by Trustees*** |
| INTERESTED TRUSTEE | | |
Amy J. Lee**** (1961) | Trustee, Vice President and Chief Legal Officer | Since 2019 | Current: Interested Trustee, certain other funds in the Fund Complex (2018-present); Chief Legal Officer, certain other funds in the Fund Complex (2014-present); Vice President, certain other funds in the Fund Complex (2007-present); Senior Managing Director, Guggenheim Investments (2012-present).
Former: President and Chief Executive Officer, certain other funds in the Fund Complex (2017-2019); Vice President, Associate General Counsel and Assistant Secretary, Security Benefit Life Insurance Company and Security Benefit Corporation (2004-2012). | 154 | Former: Fiduciary/Claymore Energy Infrastructure Fund (2018-2022); Guggenheim Enhanced Equity Income Fund (2018-2021); Guggenheim Credit Allocation Fund (2018-2021). |
| * | The business address of each Trustee is c/o Guggenheim Investments, 227 West Monroe Street, Chicago, Illinois 60606. |
| ** | Each Trustee serves an indefinite term, until his or her successor is elected and qualified. |
| *** | Each Trustee also serves on the Boards of Trustees of Guggenheim Funds Trust, Guggenheim Variable Funds Trust, Guggenheim Strategy Funds Trust, Guggenheim Taxable Municipal Bond & Investment Grade Debt Trust, Guggenheim Strategic Opportunities Fund, Guggenheim Energy & Income Fund, Guggenheim Active Allocation Fund, Rydex Series Funds, Rydex Dynamic Funds, Rydex Variable Trust and Transparent Value Trust. Messrs. Barnes and Nyberg also serve on the Board of Trustees of Advent Convertible & Income Fund. |
| **** | This Trustee is deemed to be an “interested person” of the Fund under the 1940 Act by reason of her position with the Fund’s Adviser and/or the parent of the Adviser. |
| | THE GUGGENHEIM FUNDS SEMI-ANNUAL REPORT | 59 |
| INFORMATION ON BOARD OF TRUSTEES AND OFFICERS (Unaudited)(continued) |
Name, Address*
and Year of Birth | Position(s)
Held with
Trust | Term of Office
and Length of
Time Served** | Principal Occupation(s) During Past Five Years |
| Officers | | | |
Brian E. Binder (1972) | President and Chief Executive Officer | Since 2019 | Current: President, Mutual Funds Boards, Guggenheim Investments (2022-present); President and Chief Executive Officer, certain other funds in the Fund Complex (2018-present); President, Mutual Funds Boards, Guggenheim Funds Investment Advisors, LLC and Security Investors, LLC (2018-present); Board Member, Guggenheim Partners Investments Funds plc (2022-present); Board Member, Guggenheim Global Investments plc (2022-present); Board Member, Guggenheim Partners Fund Management (Europe) Limited (2018-present). Former: Senior Managing Director and Chief Administrative Officer, Guggenheim Investments (2018-2022); Managing Director and President, Deutsche Funds, and Head of US Product, Trading and Fund Administration, Deutsche Asset Management (2013-2018); Managing Director, Chairman of North American Executive Committee and Head of Business Management and Consulting, Invesco Ltd. (2010-2012). |
James Howley (1972) | Chief Financial Officer, Chief Accounting Officer and Treasurer | Since 2022 | Current: Managing Director, Guggenheim Investments (2004-present); Chief Financial Officer, Chief Accounting Officer, and Treasurer, certain other funds in the Fund Complex (2022-present). Former: Assistant Treasurer, certain other funds in the Fund Complex (2006-2022); Manager, Mutual Fund Administration of Van Kampen Investments, Inc. (1996-2004). |
Mark E. Mathiasen (1978) | Secretary | Since 2017 | Current: Secretary, certain other funds in the Fund Complex (2007-present); Managing Director, Guggenheim Investments (2007-present). |
Glenn McWhinnie (1969) | Assistant Treasurer | Since 2016 | Current: Vice President, Guggenheim Investments (2009-present); Assistant Treasurer, certain other funds in the Fund Complex (2016-present). |
Michael P. Megaris (1984) | Assistant Secretary | Since 2018 | Current: Assistant Secretary, certain other funds in the Fund Complex (2014-present); Managing Director, Guggenheim Investments (2012-present). |
| 60 | THE GUGGENHEIM FUNDS SEMI-ANNUAL REPORT | |
| INFORMATION ON BOARD OF TRUSTEES AND OFFICERS (Unaudited)(continued) |
Name, Address*
and Year of Birth | Position(s)
Held with
Trust | Term of Office
and Length of
Time Served** | Principal Occupation(s) During Past Five Years |
| OFFICERS - continued | | |
Elisabeth Miller (1968) | Chief Compliance Officer | Since 2012 | Current: Chief Compliance Officer, certain other funds in the Fund Complex (2012-present); Senior Managing Director, Guggenheim Investments (2012-present); Senior Managing Director, Guggenheim Funds Distributors, LLC (2014-present). Former: Chief Compliance Officer, Security Investors, LLC and Guggenheim Funds Investment Advisors, LLC (2012-2018); Chief Compliance Officer, Guggenheim Distributors, LLC (2009-2014); Senior Manager, Security Investors, LLC (2004-2014); Senior Manager, Guggenheim Distributors, LLC (2004-2014). |
Margaux Misantone (1978) | AML Officer | Since 2017 | Current: Chief Compliance Officer, Security Investors, LLC and Guggenheim Funds Investment Advisors, LLC (2018-present); AML Officer, Security Investors, LLCand certain other funds in the Fund Complex (2017-present); Managing Director, Guggenheim Investments (2015-present). Former: Assistant Chief Compliance Officer, Security Investors, LLC and Guggenheim Funds Investments Advisors, LLC (2015-2018). |
Kimberly J. Scott (1974) | Assistant Treasurer | Since 2016 | Current: Director, Guggenheim Investments (2012-present); Assistant Treasurer, certain other funds in the Fund Complex (2012-present). Former: Financial Reporting Manager, Invesco, Ltd. (2010-2011); Vice President/Assistant Treasurer, Mutual Fund Administration for Van Kampen Investments, Inc./Morgan Stanley Investment Management (2009-2010); Manager of Mutual Fund Administration, Van Kampen Investments, Inc./Morgan Stanley Investment Management (2005-2009). |
Bryan Stone (1979) | Vice President | Since 2019 | Current: Vice President, certain other funds in the Fund Complex (2014-present); Managing Director, Guggenheim Investments (2013-present). Former: Senior Vice President, Neuberger Berman Group LLC (2009-2013); Vice President, Morgan Stanley (2002-2009). |
| | THE GUGGENHEIM FUNDS SEMI-ANNUAL REPORT | 61 |
| INFORMATION ON BOARD OF TRUSTEES AND OFFICERS (Unaudited)(concluded) |
Name, Address*
and Year of Birth | Position(s)
Held with
Trust | Term of Office
and Length of
Time Served** | Principal Occupation(s) During Past Five Years |
| OFFICERS - concluded | | |
Jon Szafran (1989) | Assistant Treasurer | Since 2017 | Current: Director, Guggenheim Investments (2017-present); Assistant Treasurer, certain other funds in the Fund Complex (2017-present). Former: Assistant Treasurer of Henderson Global Funds and Manager of US Fund Administration, Henderson Global Investors (North America) Inc. (“HGINA”), (2017); Senior Analyst of US Fund Administration, HGINA (2014–2017); Senior Associate of Fund Administration, Cortland Capital Market Services, LLC (2013-2014); Experienced Associate, PricewaterhouseCoopers LLP (2012-2013). |
| * | The business address of each officer is c/o Guggenheim Investments, 227 West Monroe Street, Chicago, Illinois 60606. |
| ** | Each officer serves an indefinite term, until his or her successor is duly elected and qualified. |
| 62 | THE GUGGENHEIM FUNDS SEMI-ANNUAL REPORT | |
| GUGGENHEIM INVESTMENTS PRIVACY NOTICE (Unaudited) |
Who We Are
This Privacy Notice describes the data protection practices of Guggenheim Investments. Guggenheim Investments as used herein refers to the affiliated investment management businesses of Guggenheim Partners, LLC: Guggenheim Funds Investment Advisors, LLC, Guggenheim Partners Investment Management, LLC, Guggenheim Funds Distributors, LLC, Security Investors, LLC, Guggenheim Investment Advisors (Europe) Limited, Guggenheim Real Estate, LLC, GS Gamma Advisors, LLC, Guggenheim Partners India Management, LLC, Guggenheim Partners Europe Limited, as well as the funds in the Guggenheim Funds complex (the “Funds”) (“Guggenheim Investments,” “we,” “us,” or “our”).
Guggenheim Partners Investment Management Holdings, LLC, located at 330 Madison Avenue, New York, New York, 10017 is the data controller for your information. The affiliates who are also controllers of certain of your information are: Guggenheim Investment Advisors (Europe) Limited, Guggenheim Partners Europe Limited, Guggenheim Partners, LLC, Guggenheim Funds Investment Advisors, LLC, Guggenheim Partners Investment Management, LLC, Guggenheim Funds Distributors, LLC and Security Investors, LLC, as well as the Funds.
Our Commitment to You
Guggenheim Investments considers your privacy our utmost concern. When you become our client or investor, you entrust us with not only your hard-earned money but also with your personal and financial information. Because we have access to your private information, we hold ourselves to the highest standards in its safekeeping and use. We strictly limit how we share your information with others, whether you are a current or former Guggenheim Investments client or investor.
The Information We Collect About You
We collect certain nonpublic personal information about you from information you provide on applications, other forms, our website, and/or from third parties including investment advisors. This information includes Social Security or other tax identification number, assets, income, tax information, retirement and estate plan information, transaction history, account balance, payment history, bank account information, marital status, family relationships, information that we collect on our website through the use of “cookies,” and other personal information that you or others provide to us. We may also collect such information through your inquiries by mail, e-mail or telephone. We may also collect customer due diligence information, as required by applicable law and regulation, through third party service providers.
How We Handle Your Personal Information
The legal basis for using your information as set out in this Privacy Notice is as follows: (a) use of your personal data is necessary to perform our obligations under any contract with you (such as a contract for us to provide financial services to you); or (b) where use of your personal data is not necessary for performance of a contract, use of your personal data is necessary for our
| | THE GUGGENHEIM FUNDS SEMI-ANNUAL REPORT | 63 |
| GUGGENHEIM INVESTMENTS PRIVACY NOTICE (Unaudited)(continued) |
legitimate interests or the legitimate interests of others (for example, to enforce the legal terms governing our services, operate and market our website and other services we offer, ensure safe environments for our personnel and others, make and receive payments, prevent fraud and to know the customer to whom we are providing the services). Some processing is done to comply with applicable law.
In addition to the specific uses described above, we also use your information in the following manner:
| | ● | We use your information in connection with servicing your accounts. |
| | ● | We use information to respond to your requests or questions. For example, we might use your information to respond to your customer feedback. |
| | ● | We use information to improve our products and services. We may use your information to make our website and products better. We may use your information to customize your experience with us. |
| | ● | We use information for security purposes. We may use your information to protect our company and our customers. |
| | ● | We use information to communicate with you. For example, we will communicate with you about your account or our relationship. We may contact you about your feedback. We might also contact you about this Privacy Notice. We may also enroll you in our email newsletter. |
| | ● | We use information as otherwise permitted by law, as we may notify you. |
| | ● | Aggregate/Anonymous Data. We may aggregate and/or anonymize any information collected through the website so that such information can no longer be linked to you or your device (“Aggregate/Anonymous Information”). We may use Aggregate/Anonymous Information for any purpose, including without limitation for research and marketing purposes, and may also share such data with any third parties, including advertisers, promotional partners, and sponsors. |
We do not sell information about current or former clients or their accounts to third parties. Nor do we share this information, except when necessary to complete transactions at your request, to make you aware of investment products and services that we or our affiliates offer, or as permitted or required by law.
We provide information about you to companies and individuals not affiliated with Guggenheim Investments to complete certain transactions or account changes, or to perform services for us related to your account. For example, if you ask to transfer assets from another financial institution to Guggenheim Investments, we must provide certain information about you to that company to complete the transaction. We provide the third party with only the information necessary to carry out its responsibilities and only for that purpose. And we require these third
| 64 | THE GUGGENHEIM FUNDS SEMI-ANNUAL REPORT | |
| GUGGENHEIM INVESTMENTS PRIVACY NOTICE (Unaudited)(continued) |
parties to treat your private information with the same high degree of confidentiality that we do. To alert you to other Guggenheim Investments products and services, we share your information within our family of affiliated companies. You may limit our sharing with affiliated companies as set out below. We may also share information with any successor to all or part of our business, or in connection with steps leading up to a merger or acquisition. For example, if part of our business was sold we may give customer information as part of that transaction. We may also share information about you with your consent.
We will release information about you if you direct us to do so, if we are compelled by law to do so, or in other circumstances as permitted by law (for example, to protect your account from fraud).
If you close your account(s) or become an inactive client or investor, we will continue to adhere to the privacy policies and practices described in this notice.
Opt-Out Provisions and Your Data Choices
The law allows you to “opt out” of certain kinds of information sharing with third parties. We do not share personal information about you with any third parties that triggers this opt-out right. This means YOU ARE ALREADY OPTED OUT.
When you are no longer our client or investor, we continue to share your information as described in this notice, and you may contact us at any time to limit our sharing by sending an email to CorporateDataPrivacy@GuggenheimPartners.com.
European Union Data Subjects and certain others: In addition to the choices set forth above, residents of the European Union and certain other jurisdictions have certain rights to (1) request access to or rectification or deletion of information we collect about them, (2) request a restriction on the processing of their information, (3) object to the processing of their information, or (4) request the portability of certain information. To exercise these or other rights, please contact us using the contact information below. We will consider all requests and provide our response within the time period stated by applicable law. Please note, however, that certain information may be exempt from such requests in some circumstances, which may include if we need to keep processing your information for our legitimate interests or to comply with a legal obligation. We may request you provide us with information necessary to confirm your identity before responding to your request.
Residents of France and certain other jurisdictions may also provide us with instructions regarding the manner in which we may continue to store, erase and share your information after your death, and where applicable, the person you have designated to exercise these rights after your death.
How We Protect Privacy Online
We take steps to protect your privacy when you use our web site – www.guggenheiminvestments.com – by using secure forms of online communication, including encryption technology, Secure Socket Layer (SSL) protocol, firewalls and user names and passwords. These safeguards vary based
| | THE GUGGENHEIM FUNDS SEMI-ANNUAL REPORT | 65 |
| GUGGENHEIM INVESTMENTS PRIVACY NOTICE (Unaudited)(concluded) |
on the sensitivity of the information that we collect and store. However, we cannot and do not guarantee that these measures will prevent every unauthorized attempt to access, use, or disclose your information since despite our efforts, no Internet and/or other electronic transmissions can be completely secure. Our web site uses “http cookies”—tiny pieces of information that we ask your browser to store. We use cookies for session management and security features on the Guggenheim Investments web site. We do not use them to pull data from your hard drive, to learn your e-mail address, or to view data in cookies created by other web sites. We will not share the information in our cookies or give others access to it. See the legal information area on our web site for more details about web site security and privacy features.
How We Safeguard Your Personal Information and Data Retention
We restrict access to nonpublic personal information about you to our employees and in some cases to third parties (for example, the service providers described above) as permitted by law. We maintain strict physical, electronic and procedural safeguards that comply with federal standards to guard your nonpublic personal information.
We keep your information for no longer than necessary for the purposes for which it is processed. The length of time for which we retain information depends on the purposes for which we collected and use it and/or as required to comply with applicable laws. Information may persist in copies made for backup and business continuity purposes for additional time.
International Visitors
If you are not a resident of the United States, please be aware that your information may be transferred to, stored and processed in the United States where our servers are located and our databases are operated. The data protection and other laws of the United States and other countries might not be as comprehensive as those in your country.
In such cases, we ensure that a legal basis for such a transfer exists and that adequate protection is provided as required by applicable law, for example, by using standard contractual clauses or by transferring your data to a jurisdiction that has obtained an adequacy finding. Individuals whose data may be transferred on the basis of standard contractual clauses may contact us as described below.
We’ll Keep You Informed
If you have any questions or concerns about how we treat your personal data, we encourage you to consult with us first. You may also contact the relevant supervisory authority.
We reserve the right to modify this policy at any time and will inform you promptly of material changes. You may access our privacy policy from our web site at www.guggenheiminvestments.com. Should you have any questions regarding our privacy policy, contact us by email at CorporateDataPrivacy@GuggenheimPartners.com.
| 66 | THE GUGGENHEIM FUNDS SEMI-ANNUAL REPORT | |
| LIQUIDITY RISK MANAGEMENT PROGRAM (Unaudited) |
In compliance with SEC Rule 22e-4 under the U.S. Investment Company Act of 1940 (the “Liquidity Rule”), the Rydex Series Funds (the “Trust”) has adopted and implemented a written liquidity risk management program (the “Program”) for each series of the Trust (each, a “Fund” and, collectively, the “Funds”). The Trust’s Board of Trustees (the “Board”) has also designated a Program administrator (the “Administrator”).
The Liquidity Rule requires that the Program be reasonably designed to assess and manage each Fund’s liquidity risk. A Fund’s “liquidity risk” (as defined in the Liquidity Rule) is the risk that the Fund could not meet requests to redeem shares issued by the Fund without significant dilution of the remaining investors’ interests in the Fund. The Program includes a number of elements that support the assessment, management and periodic review of liquidity risk. In accordance with the Program, each Fund’s liquidity risk is assessed, managed, and periodically reviewed no less frequently than annually taking into consideration a variety of factors, including, as applicable, the Fund’s investment strategy and liquidity of portfolio investments, short-term and long-term cash flow projections, and holdings of cash and cash equivalents, as well as borrowing arrangements and other funding sources. Certain factors are considered under both normal and reasonably foreseeable stressed conditions. There is no guarantee that the Program will achieve its objective under all circumstances.
Under the Program, each Fund portfolio investment is classified into one of four liquidity categories. The classification is based on a determination of the number of days a Fund reasonably expects to take to convert the investment into cash, or sell or dispose of the investment, in current market conditions without significantly changing the investment’s market value. The Program is reasonably designed to meet Liquidity Rule requirements relating to “highly liquid investment minimums” (i.e., the minimum amount of a Fund’s net assets to be invested in highly liquid investments that are assets) and to monitor compliance with the Liquidity Rule’s limitations on a Fund’s investments in “illiquid investments” (as defined in the Liquidity Rule). Under the Liquidity Rule, a Fund is prohibited from acquiring any illiquid investment if, immediately after the acquisition, the Fund would have invested more than 15% of its net assets in illiquid investments that are assets.
During the period covered by this shareholder report, the Board received a written report (the “Report”) prepared by the Administrator addressing the Program’s operation and assessing the adequacy and effectiveness of its implementation for the period from March 31, 2022, to March 31, 2023. The Report summarized the Administrator’s assessment of the Program’s implementation and concluded that the Program operated effectively, the Program had been and continued to be reasonably designed to assess and manage each Fund’s liquidity risk, and the Program has been adequately and effectively implemented to monitor and respond to the Funds’ liquidity developments, as applicable.
Please refer to the Fund’s prospectus for more information regarding the Fund’s exposure to liquidity risk and other risks to which an investment in the Fund may be subject.
| | THE GUGGENHEIM FUNDS SEMI-ANNUAL REPORT | 67 |
This page intentionally left blank.
This page intentionally left blank.
This page intentionally left blank.
This page intentionally left blank.
This page intentionally left blank.
This page intentionally left blank.
Item 2. Code of Ethics.
Not required at this time.
Item 3. Audit Committee Financial Expert.
Not required at this time.
Item 4. Principal Accountant Fees and Services.
Not required at this time.
Item 5. Audit Committee of Listed Registrants.
Not applicable.
Item 6. Investments.
(a) The Schedule of Investments is included under Item 1 of this Form.
(b) Not applicable.
Item 7. Disclosure of Proxy Voting Policies and Procedures for Closed-End Management Investment Companies.
Not applicable.
Item 8. Portfolio Managers of Closed-End Management Investment Companies.
Not applicable.
Item 9. Purchases of Equity Securities by Closed-End Management Investment Company and Affiliated Purchasers.
Not applicable.
Item 10. Submission of Matters to a Vote of Security Holders.
The registrant does not currently have in place procedures by which shareholders may recommend nominees to the registrant’s board.
There have been no changes to the procedures by which shareholders may recommend nominees to the registrant’s board.
Item 11. Controls and Procedures.
(a) The registrant’s President (principal executive officer) and Treasurer (principal financial officer) have evaluated the registrant’s disclosure controls and procedures (as defined in Rule 30a-3(c) under the Investment Company Act) as of a date within 90 days of this filing and have concluded that based on such evaluation as required by Rule 30a-3(b) under the Investment Company Act, that the registrant’s disclosure controls and procedures were effective as of that date in ensuring that information required to be disclosed by the registrant in this Form N-CSR was recorded, processed, summarized, and reported within the time periods specified in the Securities and Exchange Commission’s rules and forms.
(b) There were no changes in the registrant’s internal control over financial reporting (as defined in Rule 30a-3(d) under the Investment Company Act) that occurred during the period covered by this report that have materially affected, or are reasonably likely to materially affect, the registrant’s internal control over financial reporting. Item 12. Disclosure of Securities Lending Activities for Closed-End Management Investment Companies.
Not Applicable.
Item 13. Exhibits.
(a)(1) Not applicable.
(a)(2) Separate certifications by the President (principal executive officer) and Treasurer (principal financial officer) of the registrant as required by Rule 30a-2(a) under the Investment Company Act (17 CFR 270.30a-2(a)) are attached.
(a)(3) Not applicable.
(a)(4) Not applicable.
(b) A certification by the registrant’s President (principal executive officer) and Treasurer (principal financial officer) as required by Rule 30a-2(b) under the Investment Company Act (17 CFR 270.30a-2(b)) is attached.
SIGNATURES
Pursuant to the requirements of the Securities Exchange Act of 1934 and the Investment Company Act of 1940, the registrant has duly caused this report to be signed on its behalf by the undersigned, thereunto duly authorized.
| (Registrant) | Rydex Series Funds | |
| | | |
| By (Signature and Title)* | /s/ Brian E. Binder | |
| | Brian E. Binder, President and Chief Executive Officer | |
| | | |
| Date | September 1, 2023 | |
Pursuant to the requirements of the Securities Exchange Act of 1934 and the Investment Company Act of 1940, this report has been signed below by the following persons on behalf of the registrant and in the capacities and on the dates indicated.
| By (Signature and Title)* | /s/ Brian E. Binder | |
| | Brian E. Binder, President and Chief Executive Officer | |
| | | |
| Date | September 1, 2023 | |
| | | |
| By (Signature and Title)* | /s/ James Howley | |
| | James Howley, Chief Financial Officer, Chief Accounting Officer, and Treasurer | |
| | | |
| Date | September 1, 2023 | |
| * | Print the name and title of each signing officer under his or her signature. |

