0000899148 rsf:BasicMaterialsFundClassCSampP500IndexMember 2020-03-31 0000899148 rsf:C000010630Member rsf:AgricultureMember 2024-09-30 0000899148 rsf:C000010599Member 2017-03-31 0000899148 rsf:EnergyServicesFundClassASampP500IndexMember 2023-06-30 0000899148 rsf:HealthCareFundInvestorClassSampP500HealthCareIndexMember 2014-09-30 0000899148 rsf:InternetFundClassCSampP500InformationTechnologyIndexMember 2019-09-30 0000899148 rsf:PreciousMetalsFundInvestorClassSampP500IndexMember 2024-03-31 0000899148 rsf:RetailingFundInvestorClassSampP500IndexMember 2018-06-30 0000899148 rsf:TechnologyFundClassCSampP500IndexMember 2023-09-30 0000899148 rsf:C000010586Member rsf:OtherMember 2024-09-30 0000899148 rsf:UtilitiesFundClassHSampP500IndexMember 2018-09-30 0000899148 rsf:C000033368Member 2024-04-01 2024-09-30 0000899148 rsf:MonthlyRebalanceNASDAQ1001742xStrategyFundClassANASDAQ100IndexMember 2023-06-30 0000899148 rsf:C000010342Member rsf:NASDAQ100IndexEquityMiniFuturesContractsShortSalesMember 2024-09-30 0000899148 rsf:Russell2000174FundClassARussell2000IndexMember 2020-06-30 0000899148 rsf:SampP500174PureGrowthFundClassASampP500IndexMember 2014-10-01 2024-09-30 0000899148 rsf:C000010452Member 2016-12-31 0000899148 rsf:SampPSmallCap600174PureValueFundClassASampP500IndexMember 2018-06-30 0000899148 rsf:MidCap15xStrategyFundClassASampP500IndexMember 2019-12-31 0000899148 rsf:EmergingMarketsBondStrategyFundClassHICEBofABBBampLowerSovereignUSDExternalDebtIndexMember 2014-10-01 2024-09-30 0000899148 rsf:InverseGovernmentLongBondStrategyFundClassABloombergUSTreasury30YearBellwetherIndexMember 2019-12-31 0000899148 rsf:C000043618Member rsf:GuggenheimStrategyFundIIMember 2024-09-30 0000899148 rsf:C000050426Member 2016-09-30 0000899148 rsf:C000010434Member 2020-09-30
UNITED STATES
SECURITIES AND EXCHANGE COMMISSION
Washington, D.C. 20549
FORM N-CSR
CERTIFIED SHAREHOLDER REPORT OF REGISTERED MANAGEMENT
INVESTMENT COMPANIES
Investment Company Act file number 811- 07584
Rydex Series Funds
(Exact name of registrant as specified in charter)
702 King Farm Boulevard, Suite 200
Rockville, Maryland 20850
(Address of principal executive offices) (Zip code)
Amy J. Lee
Rydex Series Funds
702 King Farm Boulevard, Suite 200
Rockville, Maryland 20850
(Name and address of agent for service)
Registrant's telephone number, including area code: (301) 296-5100
Date of fiscal year end: March 31
Date of reporting period: April 1, 2024 - September 30, 2024
| Item 1. | Reports to Stockholders. |
| (a) | The registrant’s semi-annual report transmitted to shareholders pursuant to Rule 30e-1 under the Investment Company Act of 1940, as amended (the “Investment Company Act”), is as follows: |

Semi-Annual Shareholder Report | 9.30.24
This semi-annual shareholder report contains important information about the Banking Fund for the period of April 1, 2024 to September 30, 2024. You can find additional information about the fund at GuggenheimInvestments.com/mutual-funds/literature. You can also request this information by contacting 800 820 0888 or GuggenheimClientServices@mufg-is.com.
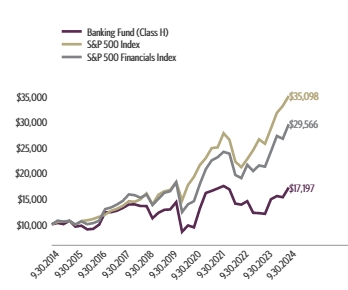
For the period of April 1, 2024 to September 30, 2024, the fund (Investor Class shares) returned 10.94%, outperforming the fund's benchmark, the S&P 500 Index, which returned 10.42% for the same period and outperforming the fund's secondary index, the S&P 500 Financials Index, which returned 8.41% for the same period.
What factors materially affected the fund's performance over the last six months?
The industries that contributed the most to performance were regional banks, diversified banks, and asset management & custody banks. No industry detracted from performance. The holdings that contributed the most to performance were Bank of New York Mellon Corp., PNC Financial Services Group, Inc., and M&T Bank Corp. Those that detracted the most were Webster Financial Corp., Bank of Montreal, and Bank OZK.
Cumulative performance* for the fund's most recently completed 10 years (as of 9.30.24), assuming a $10,000 initial investment.
| 09/30/2014 | 10000 | 10000 | 10000 |
| 12/31/2014 | 10278 | 10493 | 10725 |
| 03/31/2015 | 10071 | 10593 | 10504 |
| 06/30/2015 | 10720 | 10622 | 10685 |
| 09/30/2015 | 9599 | 9939 | 9967 |
| 12/31/2015 | 9778 | 10638 | 10561 |
| 03/31/2016 | 9054 | 10782 | 10027 |
| 06/30/2016 | 9162 | 11047 | 10239 |
| 09/30/2016 | 9998 | 11472 | 10709 |
| 12/31/2016 | 12445 | 11911 | 12969 |
| 03/31/2017 | 12452 | 12633 | 13296 |
| 06/30/2017 | 12756 | 13023 | 13861 |
| 09/30/2017 | 13310 | 13607 | 14587 |
| 12/31/2017 | 13997 | 14511 | 15845 |
| 03/31/2018 | 14025 | 14401 | 15694 |
| 06/30/2018 | 13716 | 14896 | 15198 |
| 09/30/2018 | 13721 | 16044 | 15860 |
| 12/31/2018 | 11314 | 13875 | 13781 |
| 03/31/2019 | 12394 | 15769 | 14961 |
| 06/30/2019 | 12999 | 16447 | 16157 |
| 09/30/2019 | 13084 | 16727 | 16482 |
| 12/31/2019 | 14539 | 18244 | 18208 |
| 03/31/2020 | 8671 | 14668 | 12395 |
| 06/30/2020 | 9958 | 17682 | 13908 |
| 09/30/2020 | 9600 | 19260 | 14526 |
| 12/31/2020 | 13397 | 21600 | 17899 |
| 03/31/2021 | 16479 | 22934 | 20762 |
| 06/30/2021 | 16911 | 24895 | 22498 |
| 09/30/2021 | 17405 | 25040 | 23115 |
| 12/31/2021 | 17912 | 27801 | 24171 |
| 03/31/2022 | 17241 | 26522 | 23813 |
| 06/30/2022 | 14397 | 22252 | 19645 |
| 09/30/2022 | 14210 | 21165 | 19035 |
| 12/31/2022 | 14899 | 22766 | 21625 |
| 03/31/2023 | 12584 | 24473 | 20422 |
| 06/30/2023 | 12518 | 26612 | 21512 |
| 09/30/2023 | 12394 | 25741 | 21269 |
| 12/31/2023 | 15340 | 28750 | 24252 |
| 03/31/2024 | 15980 | 31785 | 27273 |
| 06/30/2024 | 15758 | 33147 | 26719 |
| 09/30/2024 | 17728 | 35098 | 29566 |
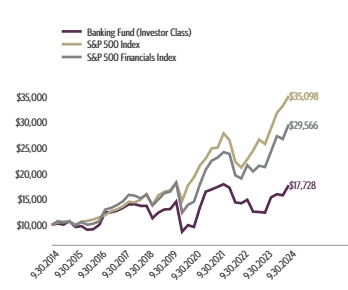
| Investor Class | 10.94% | 43.03% | 6.26% | 5.89% |
| S&P 500 Index | 10.42% | 36.35% | 15.98% | 13.38% |
| S&P 500 Financials Index | 8.41% | 39.01% | 12.40% | 11.45% |
The fund's past performance is not a good predictor of the fund's future performance. Visit GuggenheimInvestments.com/mutual-funds/performance for more recent performance information.
| Net Assets | $5,061,863 |
| Total Number of Portfolio Holdings | 82 |
| Portfolio Turnover Rate | 76% |
| Banking Fund | Investor Class | RYKIX | Semi-Annual Shareholder Report | September 30, 2024 |
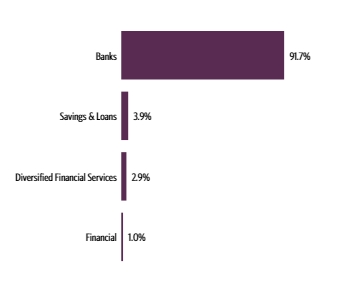
| Banks | 91.7% |
| Savings & Loans | 3.9% |
| Diversified Financial Services | 2.9% |
| Financial | 1.0% |
| Citigroup, Inc. | 4.1% |
| Wells Fargo & Co. | 4.0% |
| JPMorgan Chase & Co. | 3.9% |
| Bank of America Corp. | 3.9% |
| PNC Financial Services Group, Inc. | 3.3% |
| U.S. Bancorp | 3.2% |
| Capital One Financial Corp. | 2.9% |
| Truist Financial Corp. | 2.9% |
| Bank of New York Mellon Corp. | 2.8% |
| NU Holdings Limited/Cayman Islands — Class A | 2.2% |
| Top 10 Total | 33.2% |
| |
1 | "Holdings Diversification (Market Exposure as a % of Net Assets)" excludes any temporary cash investments, investments in Guggenheim Strategy Funds Trust mutual funds, or investments in Guggenheim Ultra Short Duration Fund. |
| |
2 | "10 Largest Holdings (as a % of Net Assets)" excludes any temporary cash investments. |
| Citigroup, Inc. | 4.1% |
| Wells Fargo & Co. | 4.0% |
| JPMorgan Chase & Co. | 3.9% |
| Bank of America Corp. | 3.9% |
| PNC Financial Services Group, Inc. | 3.3% |
| U.S. Bancorp | 3.2% |
| Capital One Financial Corp. | 2.9% |
| Truist Financial Corp. | 2.9% |
| Bank of New York Mellon Corp. | 2.8% |
| NU Holdings Limited/Cayman Islands — Class A | 2.2% |
| Top 10 Total | 33.2% |
| |
2 | "10 Largest Holdings (as a % of Net Assets)" excludes any temporary cash investments. |
There were no changes in or disagreements with fund accountants for the period.
| |  | Availability of Additional Information. For additional information, including the fund's prospectus, financial information, holdings and proxy voting information, go to GuggenheimInvestments.com/mutual-funds/literature or, call 800 820 0888. |
SAR-RYKIX-093024
Semi-Annual Shareholder Report | 9.30.24
This semi-annual shareholder report contains important information about the Banking Fund for the period of April 1, 2024 to September 30, 2024. You can find additional information about the fund at GuggenheimInvestments.com/mutual-funds/literature. You can also request this information by contacting 800 820 0888 or GuggenheimClientServices@mufg-is.com.
For the period of April 1, 2024 to September 30, 2024, the fund (Class A shares) returned 10.79%, outperforming the fund's benchmark, the S&P 500 Index, which returned 10.42% for the same period and outperforming the fund's secondary index, the S&P 500 Financials Index, which returned 8.41% for the same period.
What factors materially affected the fund's performance over the last six months?
The industries that contributed the most to performance were regional banks, diversified banks, and asset management & custody banks. No industry detracted from performance. The holdings that contributed the most to performance were Bank of New York Mellon Corp., PNC Financial Services Group, Inc., and M&T Bank Corp. Those that detracted the most were Webster Financial Corp., Bank of Montreal, and Bank OZK.
Cumulative performance* for the fund's most recently completed 10 years (as of 9.30.24), assuming a $10,000 initial investment.
| 09/30/2014 | 9526 | 10000 | 10000 |
| 12/31/2014 | 9783 | 10493 | 10725 |
| 03/31/2015 | 9579 | 10593 | 10504 |
| 06/30/2015 | 10191 | 10622 | 10685 |
| 09/30/2015 | 9120 | 9939 | 9967 |
| 12/31/2015 | 9284 | 10638 | 10561 |
| 03/31/2016 | 8592 | 10782 | 10027 |
| 06/30/2016 | 8689 | 11047 | 10239 |
| 09/30/2016 | 9479 | 11472 | 10709 |
| 12/31/2016 | 11791 | 11911 | 12969 |
| 03/31/2017 | 11789 | 12633 | 13296 |
| 06/30/2017 | 12070 | 13023 | 13861 |
| 09/30/2017 | 12588 | 13607 | 14587 |
| 12/31/2017 | 13229 | 14511 | 15845 |
| 03/31/2018 | 13248 | 14401 | 15694 |
| 06/30/2018 | 12947 | 14896 | 15198 |
| 09/30/2018 | 12943 | 16044 | 15860 |
| 12/31/2018 | 10667 | 13875 | 13781 |
| 03/31/2019 | 11677 | 15769 | 14961 |
| 06/30/2019 | 12239 | 16447 | 16157 |
| 09/30/2019 | 12311 | 16727 | 16482 |
| 12/31/2019 | 13671 | 18244 | 18208 |
| 03/31/2020 | 8148 | 14668 | 12395 |
| 06/30/2020 | 9327 | 17682 | 13908 |
| 09/30/2020 | 8971 | 19260 | 14526 |
| 12/31/2020 | 12509 | 21600 | 17899 |
| 03/31/2021 | 15377 | 22934 | 20762 |
| 06/30/2021 | 15771 | 24895 | 22498 |
| 09/30/2021 | 16222 | 25040 | 23115 |
| 12/31/2021 | 16682 | 27801 | 24171 |
| 03/31/2022 | 16048 | 26522 | 23813 |
| 06/30/2022 | 13392 | 22252 | 19645 |
| 09/30/2022 | 13214 | 21165 | 19035 |
| 12/31/2022 | 13844 | 22766 | 21625 |
| 03/31/2023 | 11686 | 24473 | 20422 |
| 06/30/2023 | 11617 | 26612 | 21512 |
| 09/30/2023 | 11494 | 25741 | 21269 |
| 12/31/2023 | 14215 | 28750 | 24252 |
| 03/31/2024 | 14801 | 31785 | 27273 |
| 06/30/2024 | 14587 | 33147 | 26719 |
| 09/30/2024 | 16398 | 35098 | 29566 |
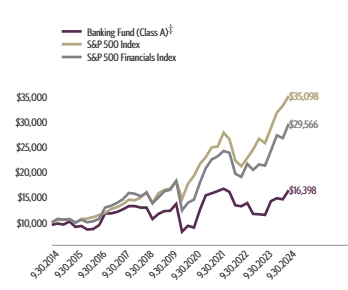
| Class A (without sales charge) | 10.79% | 42.67% | 5.90% | 5.58% |
| Class A (with sales charge)‡ | 5.52% | 35.90% | 4.87% | 5.07% |
| S&P 500 Index | 10.42% | 36.35% | 15.98% | 13.38% |
| S&P 500 Financials Index | 8.41% | 39.01% | 12.40% | 11.45% |
The fund's past performance is not a good predictor of the fund's future performance. Visit GuggenheimInvestments.com/mutual-funds/performance for more recent performance information.
| Net Assets | $5,061,863 |
| Total Number of Portfolio Holdings | 82 |
| Portfolio Turnover Rate | 76% |
| Banking Fund | Class A | RYBKX | Semi-Annual Shareholder Report | September 30, 2024 |
| Banks | 91.7% |
| Savings & Loans | 3.9% |
| Diversified Financial Services | 2.9% |
| Financial | 1.0% |

| Citigroup, Inc. | 4.1% |
| Wells Fargo & Co. | 4.0% |
| JPMorgan Chase & Co. | 3.9% |
| Bank of America Corp. | 3.9% |
| PNC Financial Services Group, Inc. | 3.3% |
| U.S. Bancorp | 3.2% |
| Capital One Financial Corp. | 2.9% |
| Truist Financial Corp. | 2.9% |
| Bank of New York Mellon Corp. | 2.8% |
| NU Holdings Limited/Cayman Islands — Class A | 2.2% |
| Top 10 Total | 33.2% |
| |
1 | "Holdings Diversification (Market Exposure as a % of Net Assets)" excludes any temporary cash investments, investments in Guggenheim Strategy Funds Trust mutual funds, or investments in Guggenheim Ultra Short Duration Fund. |
| |
2 | "10 Largest Holdings (as a % of Net Assets)" excludes any temporary cash investments. |
| Citigroup, Inc. | 4.1% |
| Wells Fargo & Co. | 4.0% |
| JPMorgan Chase & Co. | 3.9% |
| Bank of America Corp. | 3.9% |
| PNC Financial Services Group, Inc. | 3.3% |
| U.S. Bancorp | 3.2% |
| Capital One Financial Corp. | 2.9% |
| Truist Financial Corp. | 2.9% |
| Bank of New York Mellon Corp. | 2.8% |
| NU Holdings Limited/Cayman Islands — Class A | 2.2% |
| Top 10 Total | 33.2% |
| |
2 | "10 Largest Holdings (as a % of Net Assets)" excludes any temporary cash investments. |
There were no changes in or disagreements with fund accountants for the period.
| | | Availability of Additional Information. For additional information, including the fund's prospectus, financial information, holdings and proxy voting information, go to GuggenheimInvestments.com/mutual-funds/literature or, call 800 820 0888. |
SAR-RYBKX-093024
Semi-Annual Shareholder Report | 9.30.24
This semi-annual shareholder report contains important information about the Banking Fund for the period of April 1, 2024 to September 30, 2024. You can find additional information about the fund at GuggenheimInvestments.com/mutual-funds/literature. You can also request this information by contacting 800 820 0888 or GuggenheimClientServices@mufg-is.com.
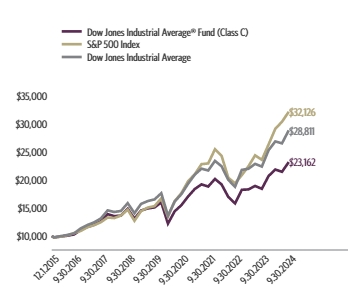
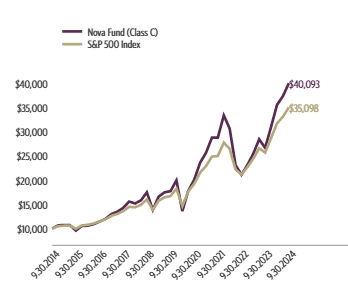
For the period of April 1, 2024 to September 30, 2024, the fund (Class C shares) returned 10.36%, underperforming the fund's benchmark, the S&P 500 Index, which returned 10.42% for the same period and outperforming the fund's secondary index, the S&P 500 Financials Index, which returned 8.41% for the same period.
What factors materially affected the fund's performance over the last six months?
The industries that contributed the most to performance were regional banks, diversified banks, and asset management & custody banks. No industry detracted from performance. The holdings that contributed the most to performance were Bank of New York Mellon Corp., PNC Financial Services Group, Inc., and M&T Bank Corp. Those that detracted the most were Webster Financial Corp., Bank of Montreal, and Bank OZK.
Cumulative performance* for the fund's most recently completed 10 years (as of 9.30.24), assuming a $10,000 initial investment.
| 09/30/2014 | 10000 | 10000 | 10000 |
| 12/31/2014 | 10252 | 10493 | 10725 |
| 03/31/2015 | 10021 | 10593 | 10504 |
| 06/30/2015 | 10643 | 10622 | 10685 |
| 09/30/2015 | 9504 | 9939 | 9967 |
| 12/31/2015 | 9656 | 10638 | 10561 |
| 03/31/2016 | 8919 | 10782 | 10027 |
| 06/30/2016 | 9004 | 11047 | 10239 |
| 09/30/2016 | 9802 | 11472 | 10709 |
| 12/31/2016 | 12171 | 11911 | 12969 |
| 03/31/2017 | 12146 | 12633 | 13296 |
| 06/30/2017 | 12414 | 13023 | 13861 |
| 09/30/2017 | 12921 | 13607 | 14587 |
| 12/31/2017 | 13555 | 14511 | 15845 |
| 03/31/2018 | 13547 | 14401 | 15694 |
| 06/30/2018 | 13215 | 14896 | 15198 |
| 09/30/2018 | 13187 | 16044 | 15860 |
| 12/31/2018 | 10846 | 13875 | 13781 |
| 03/31/2019 | 11853 | 15769 | 14961 |
| 06/30/2019 | 12400 | 16447 | 16157 |
| 09/30/2019 | 12449 | 16727 | 16482 |
| 12/31/2019 | 13798 | 18244 | 18208 |
| 03/31/2020 | 8208 | 14668 | 12395 |
| 06/30/2020 | 9379 | 17682 | 13908 |
| 09/30/2020 | 9004 | 19260 | 14526 |
| 12/31/2020 | 12532 | 21600 | 17899 |
| 03/31/2021 | 15377 | 22934 | 20762 |
| 06/30/2021 | 15740 | 24895 | 22498 |
| 09/30/2021 | 16160 | 25040 | 23115 |
| 12/31/2021 | 16587 | 27801 | 24171 |
| 03/31/2022 | 15927 | 26522 | 23813 |
| 06/30/2022 | 13267 | 22252 | 19645 |
| 09/30/2022 | 13065 | 21165 | 19035 |
| 12/31/2022 | 13662 | 22766 | 21625 |
| 03/31/2023 | 11511 | 24473 | 20422 |
| 06/30/2023 | 11421 | 26612 | 21512 |
| 09/30/2023 | 11281 | 25741 | 21269 |
| 12/31/2023 | 13926 | 28750 | 24252 |
| 03/31/2024 | 14472 | 31785 | 27273 |
| 06/30/2024 | 14237 | 33147 | 26719 |
| 09/30/2024 | 15973 | 35098 | 29566 |
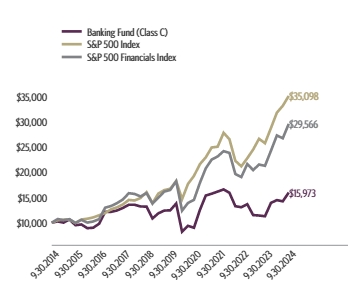
| Class C (without CDSC) | 10.36% | 41.59% | 5.11% | 4.79% |
| Class C (with CDSC)§ | 9.36% | 40.59% | 5.11% | 4.79% |
| S&P 500 Index | 10.42% | 36.35% | 15.98% | 13.38% |
| S&P 500 Financials Index | 8.41% | 39.01% | 12.40% | 11.45% |
The fund's past performance is not a good predictor of the fund's future performance. Visit GuggenheimInvestments.com/mutual-funds/performance for more recent performance information.
| Net Assets | $5,061,863 |
| Total Number of Portfolio Holdings | 82 |
| Portfolio Turnover Rate | 76% |
| Banking Fund | Class C | RYKCX | Semi-Annual Shareholder Report | September 30, 2024 |
| Banks | 91.7% |
| Savings & Loans | 3.9% |
| Diversified Financial Services | 2.9% |
| Financial | 1.0% |

| Citigroup, Inc. | 4.1% |
| Wells Fargo & Co. | 4.0% |
| JPMorgan Chase & Co. | 3.9% |
| Bank of America Corp. | 3.9% |
| PNC Financial Services Group, Inc. | 3.3% |
| U.S. Bancorp | 3.2% |
| Capital One Financial Corp. | 2.9% |
| Truist Financial Corp. | 2.9% |
| Bank of New York Mellon Corp. | 2.8% |
| NU Holdings Limited/Cayman Islands — Class A | 2.2% |
| Top 10 Total | 33.2% |
| |
1 | "Holdings Diversification (Market Exposure as a % of Net Assets)" excludes any temporary cash investments, investments in Guggenheim Strategy Funds Trust mutual funds, or investments in Guggenheim Ultra Short Duration Fund. |
| |
2 | "10 Largest Holdings (as a % of Net Assets)" excludes any temporary cash investments. |
| Citigroup, Inc. | 4.1% |
| Wells Fargo & Co. | 4.0% |
| JPMorgan Chase & Co. | 3.9% |
| Bank of America Corp. | 3.9% |
| PNC Financial Services Group, Inc. | 3.3% |
| U.S. Bancorp | 3.2% |
| Capital One Financial Corp. | 2.9% |
| Truist Financial Corp. | 2.9% |
| Bank of New York Mellon Corp. | 2.8% |
| NU Holdings Limited/Cayman Islands — Class A | 2.2% |
| Top 10 Total | 33.2% |
| |
2 | "10 Largest Holdings (as a % of Net Assets)" excludes any temporary cash investments. |
There were no changes in or disagreements with fund accountants for the period.
| | | Availability of Additional Information. For additional information, including the fund's prospectus, financial information, holdings and proxy voting information, go to GuggenheimInvestments.com/mutual-funds/literature or, call 800 820 0888. |
SAR-RYKCX-093024
Semi-Annual Shareholder Report | 9.30.24
This semi-annual shareholder report contains important information about the Banking Fund for the period of April 1, 2024 to September 30, 2024. You can find additional information about the fund at GuggenheimInvestments.com/mutual-funds/literature. You can also request this information by contacting 800 820 0888 or GuggenheimClientServices@mufg-is.com.
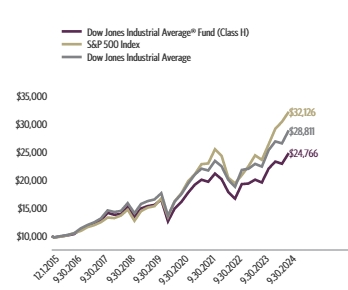
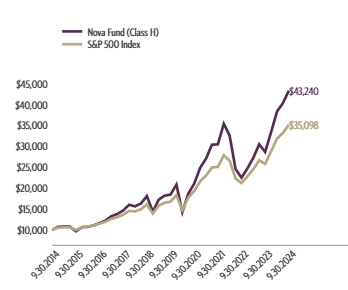
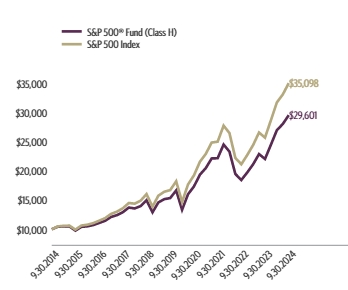
For the period of April 1, 2024 to September 30, 2024, the fund (Class H shares) returned 10.76%, outperforming the fund's benchmark, the S&P 500 Index, which returned 10.42% for the same period and outperforming the fund's secondary index, the S&P 500 Financials Index, which returned 8.41% for the same period.
What factors materially affected the fund's performance over the last six months?
The industries that contributed the most to performance were regional banks, diversified banks, and asset management & custody banks. No industry detracted from performance. The holdings that contributed the most to performance were Bank of New York Mellon Corp., PNC Financial Services Group, Inc., and M&T Bank Corp. Those that detracted the most were Webster Financial Corp., Bank of Montreal, and Bank OZK.
Cumulative performance* for the fund's most recently completed 10 years (as of 9.30.24), assuming a $10,000 initial investment.
| 09/30/2014 | 10000 | 10000 | 10000 |
| 12/31/2014 | 10263 | 10493 | 10725 |
| 03/31/2015 | 10047 | 10593 | 10504 |
| 06/30/2015 | 10682 | 10622 | 10685 |
| 09/30/2015 | 9560 | 9939 | 9967 |
| 12/31/2015 | 9732 | 10638 | 10561 |
| 03/31/2016 | 9008 | 10782 | 10027 |
| 06/30/2016 | 9110 | 11047 | 10239 |
| 09/30/2016 | 9939 | 11472 | 10709 |
| 12/31/2016 | 12366 | 11911 | 12969 |
| 03/31/2017 | 12364 | 12633 | 13296 |
| 06/30/2017 | 12658 | 13023 | 13861 |
| 09/30/2017 | 13200 | 13607 | 14587 |
| 12/31/2017 | 13874 | 14511 | 15845 |
| 03/31/2018 | 13894 | 14401 | 15694 |
| 06/30/2018 | 13576 | 14896 | 15198 |
| 09/30/2018 | 13572 | 16044 | 15860 |
| 12/31/2018 | 11185 | 13875 | 13781 |
| 03/31/2019 | 12242 | 15769 | 14961 |
| 06/30/2019 | 12832 | 16447 | 16157 |
| 09/30/2019 | 12910 | 16727 | 16482 |
| 12/31/2019 | 14336 | 18244 | 18208 |
| 03/31/2020 | 8546 | 14668 | 12395 |
| 06/30/2020 | 9781 | 17682 | 13908 |
| 09/30/2020 | 9407 | 19260 | 14526 |
| 12/31/2020 | 13118 | 21600 | 17899 |
| 03/31/2021 | 16123 | 22934 | 20762 |
| 06/30/2021 | 16534 | 24895 | 22498 |
| 09/30/2021 | 17009 | 25040 | 23115 |
| 12/31/2021 | 17493 | 27801 | 24171 |
| 03/31/2022 | 16829 | 26522 | 23813 |
| 06/30/2022 | 14042 | 22252 | 19645 |
| 09/30/2022 | 13856 | 21165 | 19035 |
| 12/31/2022 | 14518 | 22766 | 21625 |
| 03/31/2023 | 12255 | 24473 | 20422 |
| 06/30/2023 | 12182 | 26612 | 21512 |
| 09/30/2023 | 12054 | 25741 | 21269 |
| 12/31/2023 | 14907 | 28750 | 24252 |
| 03/31/2024 | 15522 | 31785 | 27273 |
| 06/30/2024 | 15298 | 33147 | 26719 |
| 09/30/2024 | 17197 | 35098 | 29566 |
| Class H ** | 10.76% | 42.67% | 5.90% | 5.57% |
| S&P 500 Index | 10.42% | 36.35% | 15.98% | 13.38% |
| S&P 500 Financials Index | 8.41% | 39.01% | 12.40% | 11.45% |
The fund's past performance is not a good predictor of the fund's future performance. Visit GuggenheimInvestments.com/mutual-funds/performance for more recent performance information.
| Net Assets | $5,061,863 |
| Total Number of Portfolio Holdings | 82 |
| Portfolio Turnover Rate | 76% |
| Banking Fund | Class H | RYKAX | Semi-Annual Shareholder Report | September 30, 2024 |
| Banks | 91.7% |
| Savings & Loans | 3.9% |
| Diversified Financial Services | 2.9% |
| Financial | 1.0% |

| Citigroup, Inc. | 4.1% |
| Wells Fargo & Co. | 4.0% |
| JPMorgan Chase & Co. | 3.9% |
| Bank of America Corp. | 3.9% |
| PNC Financial Services Group, Inc. | 3.3% |
| U.S. Bancorp | 3.2% |
| Capital One Financial Corp. | 2.9% |
| Truist Financial Corp. | 2.9% |
| Bank of New York Mellon Corp. | 2.8% |
| NU Holdings Limited/Cayman Islands — Class A | 2.2% |
| Top 10 Total | 33.2% |
| |
1 | "Holdings Diversification (Market Exposure as a % of Net Assets)" excludes any temporary cash investments, investments in Guggenheim Strategy Funds Trust mutual funds, or investments in Guggenheim Ultra Short Duration Fund. |
| |
2 | "10 Largest Holdings (as a % of Net Assets)" excludes any temporary cash investments. |
| Citigroup, Inc. | 4.1% |
| Wells Fargo & Co. | 4.0% |
| JPMorgan Chase & Co. | 3.9% |
| Bank of America Corp. | 3.9% |
| PNC Financial Services Group, Inc. | 3.3% |
| U.S. Bancorp | 3.2% |
| Capital One Financial Corp. | 2.9% |
| Truist Financial Corp. | 2.9% |
| Bank of New York Mellon Corp. | 2.8% |
| NU Holdings Limited/Cayman Islands — Class A | 2.2% |
| Top 10 Total | 33.2% |
| |
2 | "10 Largest Holdings (as a % of Net Assets)" excludes any temporary cash investments. |
There were no changes in or disagreements with fund accountants for the period.
| | | Availability of Additional Information. For additional information, including the fund's prospectus, financial information, holdings and proxy voting information, go to GuggenheimInvestments.com/mutual-funds/literature or, call 800 820 0888. |
SAR-RYKAX-093024
Semi-Annual Shareholder Report | 9.30.24
This semi-annual shareholder report contains important information about the Basic Materials Fund for the period of April 1, 2024 to September 30, 2024. You can find additional information about the fund at GuggenheimInvestments.com/mutual-funds/literature. You can also request this information by contacting 800 820 0888 or GuggenheimClientServices@mufg-is.com.
For the period of April 1, 2024 to September 30, 2024, the fund (Investor Class shares) returned 5.06%, underperforming the fund's benchmark, the S&P 500 Index, which returned 10.42% for the same period and outperforming the fund's secondary index, the S&P 500 Materials Index, which returned 4.77% for the same period.
What factors materially affected the fund's performance over the last six months?
The industries that contributed the most to performance were gold, paper & plastic packaging products & materials, and industrial gases. Those that detracted the most were steel, construction materials, and diversified chemicals. The holdings that contributed the most to performance were Newmont Corp., Kinross Gold Corp., and Air Products and Chemicals, Inc. Those that detracted the most were Nucor Corp., Cleveland-Cliffs Inc., and Arcadium Lithium plc.
Cumulative performance* for the fund's most recently completed 10 years (as of 9.30.24), assuming a $10,000 initial investment.
| 09/30/2014 | 10000 | 10000 | 10000 |
| 12/31/2014 | 9615 | 10493 | 9820 |
| 03/31/2015 | 9696 | 10593 | 9917 |
| 06/30/2015 | 9447 | 10622 | 9870 |
| 09/30/2015 | 7650 | 9939 | 8202 |
| 12/31/2015 | 7963 | 10638 | 8997 |
| 03/31/2016 | 8914 | 10782 | 9322 |
| 06/30/2016 | 9638 | 11047 | 9668 |
| 09/30/2016 | 10125 | 11472 | 10027 |
| 12/31/2016 | 10445 | 11911 | 10499 |
| 03/31/2017 | 11129 | 12633 | 11114 |
| 06/30/2017 | 11261 | 13023 | 11466 |
| 09/30/2017 | 11939 | 13607 | 12159 |
| 12/31/2017 | 12723 | 14511 | 13002 |
| 03/31/2018 | 12091 | 14401 | 12285 |
| 06/30/2018 | 12379 | 14896 | 12601 |
| 09/30/2018 | 12229 | 16044 | 12646 |
| 12/31/2018 | 10526 | 13875 | 11090 |
| 03/31/2019 | 11806 | 15769 | 12232 |
| 06/30/2019 | 12217 | 16447 | 13004 |
| 09/30/2019 | 11946 | 16727 | 12988 |
| 12/31/2019 | 12826 | 18244 | 13816 |
| 03/31/2020 | 9018 | 14668 | 10205 |
| 06/30/2020 | 11686 | 17682 | 12860 |
| 09/30/2020 | 12896 | 19260 | 14571 |
| 12/31/2020 | 15463 | 21600 | 16680 |
| 03/31/2021 | 17044 | 22934 | 18195 |
| 06/30/2021 | 18110 | 24895 | 19099 |
| 09/30/2021 | 17059 | 25040 | 18429 |
| 12/31/2021 | 19082 | 27801 | 21231 |
| 03/31/2022 | 19894 | 26522 | 20727 |
| 06/30/2022 | 16276 | 22252 | 17432 |
| 09/30/2022 | 15129 | 21165 | 16190 |
| 12/31/2022 | 17337 | 22766 | 18627 |
| 03/31/2023 | 18184 | 24473 | 19425 |
| 06/30/2023 | 18081 | 26612 | 20068 |
| 09/30/2023 | 17149 | 25741 | 19112 |
| 12/31/2023 | 18985 | 28750 | 20963 |
| 03/31/2024 | 19921 | 31785 | 22839 |
| 06/30/2024 | 19061 | 33147 | 21812 |
| 09/30/2024 | 20929 | 35098 | 23928 |

| Investor Class | 5.06% | 22.04% | 11.87% | 7.66% |
| S&P 500 Index | 10.42% | 36.35% | 15.98% | 13.38% |
| S&P 500 Materials Index | 4.77% | 25.20% | 13.00% | 9.12% |
The fund's past performance is not a good predictor of the fund's future performance. Visit GuggenheimInvestments.com/mutual-funds/performance for more recent performance information.
| Net Assets | $27,742,614 |
| Total Number of Portfolio Holdings | 93 |
| Portfolio Turnover Rate | 27% |
| Basic Materials Fund | Investor Class | RYBIX | Semi-Annual Shareholder Report | September 30, 2024 |
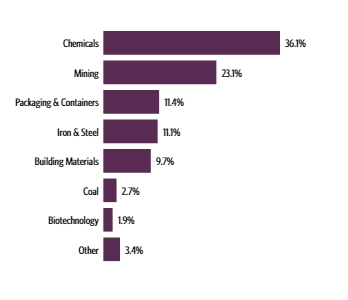
| Chemicals | 36.1% |
| Mining | 23.1% |
| Packaging & Containers | 11.4% |
| Iron & Steel | 11.1% |
| Building Materials | 9.7% |
| Coal | 2.7% |
| Biotechnology | 1.9% |
| Other | 3.4% |

| Linde plc | 4.5% |
| Sherwin-Williams Co. | 2.8% |
| Freeport-McMoRan, Inc. | 2.7% |
| Air Products and Chemicals, Inc. | 2.5% |
| CRH plc | 2.4% |
| Ecolab, Inc. | 2.4% |
| Newmont Corp. | 2.3% |
| Dow, Inc. | 1.9% |
| Corteva, Inc. | 1.9% |
| Nucor Corp. | 1.8% |
| Top 10 Total | 25.2% |
| |
1 | "Holdings Diversification (Market Exposure as a % of Net Assets)" excludes any temporary cash investments, investments in Guggenheim Strategy Funds Trust mutual funds, or investments in Guggenheim Ultra Short Duration Fund. |
| |
2 | "10 Largest Holdings (as a % of Net Assets)" excludes any temporary cash investments. |
| Linde plc | 4.5% |
| Sherwin-Williams Co. | 2.8% |
| Freeport-McMoRan, Inc. | 2.7% |
| Air Products and Chemicals, Inc. | 2.5% |
| CRH plc | 2.4% |
| Ecolab, Inc. | 2.4% |
| Newmont Corp. | 2.3% |
| Dow, Inc. | 1.9% |
| Corteva, Inc. | 1.9% |
| Nucor Corp. | 1.8% |
| Top 10 Total | 25.2% |
| |
2 | "10 Largest Holdings (as a % of Net Assets)" excludes any temporary cash investments. |
There were no changes in or disagreements with fund accountants for the period.
| | | Availability of Additional Information. For additional information, including the fund's prospectus, financial information, holdings and proxy voting information, go to GuggenheimInvestments.com/mutual-funds/literature or, call 800 820 0888. |
SAR-RYBIX-093024
Semi-Annual Shareholder Report | 9.30.24
This semi-annual shareholder report contains important information about the Basic Materials Fund for the period of April 1, 2024 to September 30, 2024. You can find additional information about the fund at GuggenheimInvestments.com/mutual-funds/literature. You can also request this information by contacting 800 820 0888 or GuggenheimClientServices@mufg-is.com.
For the period of April 1, 2024 to September 30, 2024, the fund (Class A shares) returned 4.92%, underperforming the fund's benchmark, the S&P 500 Index, which returned 10.42% for the same period and outperforming the fund's secondary index, the S&P 500 Materials Index, which returned 4.77% for the same period.
What factors materially affected the fund's performance over the last six months?
The industries that contributed the most to performance were gold, paper & plastic packaging products & materials, and industrial gases. Those that detracted the most were steel, construction materials, and diversified chemicals. The holdings that contributed the most to performance were Newmont Corp., Kinross Gold Corp., and Air Products and Chemicals, Inc. Those that detracted the most were Nucor Corp., Cleveland-Cliffs Inc., and Arcadium Lithium plc.
Cumulative performance* for the fund's most recently completed 10 years (as of 9.30.24), assuming a $10,000 initial investment.
| 09/30/2014 | 9525 | 10000 | 10000 |
| 12/31/2014 | 9152 | 10493 | 9820 |
| 03/31/2015 | 9222 | 10593 | 9917 |
| 06/30/2015 | 8979 | 10622 | 9870 |
| 09/30/2015 | 7268 | 9939 | 8202 |
| 12/31/2015 | 7559 | 10638 | 8997 |
| 03/31/2016 | 8457 | 10782 | 9322 |
| 06/30/2016 | 9137 | 11047 | 9668 |
| 09/30/2016 | 9595 | 11472 | 10027 |
| 12/31/2016 | 9889 | 11911 | 10499 |
| 03/31/2017 | 10531 | 12633 | 11114 |
| 06/30/2017 | 10650 | 13023 | 11466 |
| 09/30/2017 | 11285 | 13607 | 12159 |
| 12/31/2017 | 12018 | 14511 | 13002 |
| 03/31/2018 | 11414 | 14401 | 12285 |
| 06/30/2018 | 11680 | 14896 | 12601 |
| 09/30/2018 | 11531 | 16044 | 12646 |
| 12/31/2018 | 9919 | 13875 | 11090 |
| 03/31/2019 | 11117 | 15769 | 12232 |
| 06/30/2019 | 11498 | 16447 | 13004 |
| 09/30/2019 | 11236 | 16727 | 12988 |
| 12/31/2019 | 12056 | 18244 | 13816 |
| 03/31/2020 | 8471 | 14668 | 10205 |
| 06/30/2020 | 10971 | 17682 | 12860 |
| 09/30/2020 | 12099 | 19260 | 14571 |
| 12/31/2020 | 14499 | 21600 | 16680 |
| 03/31/2021 | 15969 | 22934 | 18195 |
| 06/30/2021 | 16958 | 24895 | 19099 |
| 09/30/2021 | 15963 | 25040 | 18429 |
| 12/31/2021 | 17845 | 27801 | 21231 |
| 03/31/2022 | 18594 | 26522 | 20727 |
| 06/30/2022 | 15202 | 22252 | 17432 |
| 09/30/2022 | 14124 | 21165 | 16190 |
| 12/31/2022 | 16174 | 22766 | 18627 |
| 03/31/2023 | 16953 | 24473 | 19425 |
| 06/30/2023 | 16845 | 26612 | 20068 |
| 09/30/2023 | 15971 | 25741 | 19112 |
| 12/31/2023 | 17667 | 28750 | 20963 |
| 03/31/2024 | 18528 | 31785 | 22839 |
| 06/30/2024 | 17714 | 33147 | 21812 |
| 09/30/2024 | 19440 | 35098 | 23928 |
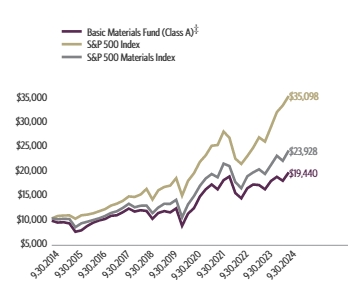
| Class A (without sales charge) | 4.92% | 21.73% | 11.59% | 7.40% |
| Class A (with sales charge)‡ | -0.06% | 15.94% | 10.51% | 6.87% |
| S&P 500 Index | 10.42% | 36.35% | 15.98% | 13.38% |
| S&P 500 Materials Index | 4.77% | 25.20% | 13.00% | 9.12% |
The fund's past performance is not a good predictor of the fund's future performance. Visit GuggenheimInvestments.com/mutual-funds/performance for more recent performance information.
| Net Assets | $27,742,614 |
| Total Number of Portfolio Holdings | 93 |
| Portfolio Turnover Rate | 27% |
| Basic Materials Fund | Class A | RYBMX | Semi-Annual Shareholder Report | September 30, 2024 |
| Chemicals | 36.1% |
| Mining | 23.1% |
| Packaging & Containers | 11.4% |
| Iron & Steel | 11.1% |
| Building Materials | 9.7% |
| Coal | 2.7% |
| Biotechnology | 1.9% |
| Other | 3.4% |
| Linde plc | 4.5% |
| Sherwin-Williams Co. | 2.8% |
| Freeport-McMoRan, Inc. | 2.7% |
| Air Products and Chemicals, Inc. | 2.5% |
| CRH plc | 2.4% |
| Ecolab, Inc. | 2.4% |
| Newmont Corp. | 2.3% |
| Dow, Inc. | 1.9% |
| Corteva, Inc. | 1.9% |
| Nucor Corp. | 1.8% |
| Top 10 Total | 25.2% |
| |
1 | "Holdings Diversification (Market Exposure as a % of Net Assets)" excludes any temporary cash investments, investments in Guggenheim Strategy Funds Trust mutual funds, or investments in Guggenheim Ultra Short Duration Fund. |
| |
2 | "10 Largest Holdings (as a % of Net Assets)" excludes any temporary cash investments. |
| Linde plc | 4.5% |
| Sherwin-Williams Co. | 2.8% |
| Freeport-McMoRan, Inc. | 2.7% |
| Air Products and Chemicals, Inc. | 2.5% |
| CRH plc | 2.4% |
| Ecolab, Inc. | 2.4% |
| Newmont Corp. | 2.3% |
| Dow, Inc. | 1.9% |
| Corteva, Inc. | 1.9% |
| Nucor Corp. | 1.8% |
| Top 10 Total | 25.2% |
| |
2 | "10 Largest Holdings (as a % of Net Assets)" excludes any temporary cash investments. |
There were no changes in or disagreements with fund accountants for the period.
| | | Availability of Additional Information. For additional information, including the fund's prospectus, financial information, holdings and proxy voting information, go to GuggenheimInvestments.com/mutual-funds/literature or, call 800 820 0888. |
SAR-RYBMX-093024
Semi-Annual Shareholder Report | 9.30.24
This semi-annual shareholder report contains important information about the Basic Materials Fund for the period of April 1, 2024 to September 30, 2024. You can find additional information about the fund at GuggenheimInvestments.com/mutual-funds/literature. You can also request this information by contacting 800 820 0888 or GuggenheimClientServices@mufg-is.com.
For the period of April 1, 2024 to September 30, 2024, the fund (Class C shares) returned 4.53%, underperforming the fund's benchmark, the S&P 500 Index, which returned 10.42% for the same period and underperforming the fund's secondary index, the S&P 500 Materials Index, which returned 4.77% for the same period.
What factors materially affected the fund's performance over the last six months?
The industries that contributed the most to performance were gold, paper & plastic packaging products & materials, and industrial gases. Those that detracted the most were steel, construction materials, and diversified chemicals. The holdings that contributed the most to performance were Newmont Corp., Kinross Gold Corp., and Air Products and Chemicals, Inc. Those that detracted the most were Nucor Corp., Cleveland-Cliffs Inc., and Arcadium Lithium plc.
Cumulative performance* for the fund's most recently completed 10 years (as of 9.30.24), assuming a $10,000 initial investment.
| 09/30/2014 | 10000 | 10000 | 10000 |
| 12/31/2014 | 9591 | 10493 | 9820 |
| 03/31/2015 | 9646 | 10593 | 9917 |
| 06/30/2015 | 9375 | 10622 | 9870 |
| 09/30/2015 | 7573 | 9939 | 8202 |
| 12/31/2015 | 7861 | 10638 | 8997 |
| 03/31/2016 | 8780 | 10782 | 9322 |
| 06/30/2016 | 9468 | 11047 | 9668 |
| 09/30/2016 | 9924 | 11472 | 10027 |
| 12/31/2016 | 10212 | 11911 | 10499 |
| 03/31/2017 | 10853 | 12633 | 11114 |
| 06/30/2017 | 10953 | 13023 | 11466 |
| 09/30/2017 | 11585 | 13607 | 12159 |
| 12/31/2017 | 12315 | 14511 | 13002 |
| 03/31/2018 | 11675 | 14401 | 12285 |
| 06/30/2018 | 11923 | 14896 | 12601 |
| 09/30/2018 | 11747 | 16044 | 12646 |
| 12/31/2018 | 10088 | 13875 | 11090 |
| 03/31/2019 | 11284 | 15769 | 12232 |
| 06/30/2019 | 11651 | 16447 | 13004 |
| 09/30/2019 | 11362 | 16727 | 12988 |
| 12/31/2019 | 12169 | 18244 | 13816 |
| 03/31/2020 | 8537 | 14668 | 10205 |
| 06/30/2020 | 11033 | 17682 | 12860 |
| 09/30/2020 | 12144 | 19260 | 14571 |
| 12/31/2020 | 14524 | 21600 | 16680 |
| 03/31/2021 | 15970 | 22934 | 18195 |
| 06/30/2021 | 16925 | 24895 | 19099 |
| 09/30/2021 | 15903 | 25040 | 18429 |
| 12/31/2021 | 17745 | 27801 | 21231 |
| 03/31/2022 | 18456 | 26522 | 20727 |
| 06/30/2022 | 15060 | 22252 | 17432 |
| 09/30/2022 | 13965 | 21165 | 16190 |
| 12/31/2022 | 15962 | 22766 | 18627 |
| 03/31/2023 | 16701 | 24473 | 19425 |
| 06/30/2023 | 16564 | 26612 | 20068 |
| 09/30/2023 | 15671 | 25741 | 19112 |
| 12/31/2023 | 17307 | 28750 | 20963 |
| 03/31/2024 | 18115 | 31785 | 22839 |
| 06/30/2024 | 17287 | 33147 | 21812 |
| 09/30/2024 | 18935 | 35098 | 23928 |
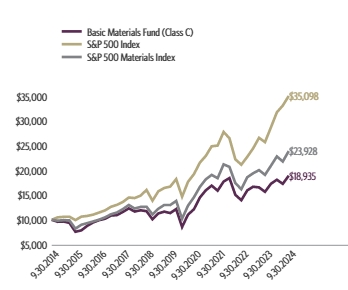
| Class C (without CDSC) | 4.53% | 20.83% | 10.75% | 6.59% |
| Class C (with CDSC)§ | 3.53% | 19.83% | 10.75% | 6.59% |
| S&P 500 Index | 10.42% | 36.35% | 15.98% | 13.38% |
| S&P 500 Materials Index | 4.77% | 25.20% | 13.00% | 9.12% |
The fund's past performance is not a good predictor of the fund's future performance. Visit GuggenheimInvestments.com/mutual-funds/performance for more recent performance information.
| Net Assets | $27,742,614 |
| Total Number of Portfolio Holdings | 93 |
| Portfolio Turnover Rate | 27% |
| Basic Materials Fund | Class C | RYBCX | Semi-Annual Shareholder Report | September 30, 2024 |
| Chemicals | 36.1% |
| Mining | 23.1% |
| Packaging & Containers | 11.4% |
| Iron & Steel | 11.1% |
| Building Materials | 9.7% |
| Coal | 2.7% |
| Biotechnology | 1.9% |
| Other | 3.4% |

| Linde plc | 4.5% |
| Sherwin-Williams Co. | 2.8% |
| Freeport-McMoRan, Inc. | 2.7% |
| Air Products and Chemicals, Inc. | 2.5% |
| CRH plc | 2.4% |
| Ecolab, Inc. | 2.4% |
| Newmont Corp. | 2.3% |
| Dow, Inc. | 1.9% |
| Corteva, Inc. | 1.9% |
| Nucor Corp. | 1.8% |
| Top 10 Total | 25.2% |
| |
1 | "Holdings Diversification (Market Exposure as a % of Net Assets)" excludes any temporary cash investments, investments in Guggenheim Strategy Funds Trust mutual funds, or investments in Guggenheim Ultra Short Duration Fund. |
| |
2 | "10 Largest Holdings (as a % of Net Assets)" excludes any temporary cash investments. |
| Linde plc | 4.5% |
| Sherwin-Williams Co. | 2.8% |
| Freeport-McMoRan, Inc. | 2.7% |
| Air Products and Chemicals, Inc. | 2.5% |
| CRH plc | 2.4% |
| Ecolab, Inc. | 2.4% |
| Newmont Corp. | 2.3% |
| Dow, Inc. | 1.9% |
| Corteva, Inc. | 1.9% |
| Nucor Corp. | 1.8% |
| Top 10 Total | 25.2% |
| |
2 | "10 Largest Holdings (as a % of Net Assets)" excludes any temporary cash investments. |
There were no changes in or disagreements with fund accountants for the period.
| | | Availability of Additional Information. For additional information, including the fund's prospectus, financial information, holdings and proxy voting information, go to GuggenheimInvestments.com/mutual-funds/literature or, call 800 820 0888. |
SAR-RYBCX-093024
Semi-Annual Shareholder Report | 9.30.24
This semi-annual shareholder report contains important information about the Basic Materials Fund for the period of April 1, 2024 to September 30, 2024. You can find additional information about the fund at GuggenheimInvestments.com/mutual-funds/literature. You can also request this information by contacting 800 820 0888 or GuggenheimClientServices@mufg-is.com.
For the period of April 1, 2024 to September 30, 2024, the fund (Class H shares) returned 4.92%, underperforming the fund's benchmark, the S&P 500 Index, which returned 10.42% for the same period and outperforming the fund's secondary index, the S&P 500 Materials Index, which returned 4.77% for the same period.
What factors materially affected the fund's performance over the last six months?
The industries that contributed the most to performance were gold, paper & plastic packaging products & materials, and industrial gases. Those that detracted the most were steel, construction materials, and diversified chemicals. The holdings that contributed the most to performance were Newmont Corp., Kinross Gold Corp., and Air Products and Chemicals, Inc. Those that detracted the most were Nucor Corp., Cleveland-Cliffs Inc., and Arcadium Lithium plc.
Cumulative performance* for the fund's most recently completed 10 years (as of 9.30.24), assuming a $10,000 initial investment.
| 09/30/2014 | 10000 | 10000 | 10000 |
| 12/31/2014 | 9602 | 10493 | 9820 |
| 03/31/2015 | 9667 | 10593 | 9917 |
| 06/30/2015 | 9408 | 10622 | 9870 |
| 09/30/2015 | 7611 | 9939 | 8202 |
| 12/31/2015 | 7917 | 10638 | 8997 |
| 03/31/2016 | 8859 | 10782 | 9322 |
| 06/30/2016 | 9572 | 11047 | 9668 |
| 09/30/2016 | 10054 | 11472 | 10027 |
| 12/31/2016 | 10362 | 11911 | 10499 |
| 03/31/2017 | 11036 | 12633 | 11114 |
| 06/30/2017 | 11158 | 13023 | 11466 |
| 09/30/2017 | 11823 | 13607 | 12159 |
| 12/31/2017 | 12593 | 14511 | 13002 |
| 03/31/2018 | 11961 | 14401 | 12285 |
| 06/30/2018 | 12240 | 14896 | 12601 |
| 09/30/2018 | 12085 | 16044 | 12646 |
| 12/31/2018 | 10396 | 13875 | 11090 |
| 03/31/2019 | 11652 | 15769 | 12232 |
| 06/30/2019 | 12050 | 16447 | 13004 |
| 09/30/2019 | 11774 | 16727 | 12988 |
| 12/31/2019 | 12634 | 18244 | 13816 |
| 03/31/2020 | 8878 | 14668 | 10205 |
| 06/30/2020 | 11496 | 17682 | 12860 |
| 09/30/2020 | 12680 | 19260 | 14571 |
| 12/31/2020 | 15192 | 21600 | 16680 |
| 03/31/2021 | 16735 | 22934 | 18195 |
| 06/30/2021 | 17768 | 24895 | 19099 |
| 09/30/2021 | 16726 | 25040 | 18429 |
| 12/31/2021 | 18699 | 27801 | 21231 |
| 03/31/2022 | 19484 | 26522 | 20727 |
| 06/30/2022 | 15928 | 22252 | 17432 |
| 09/30/2022 | 14800 | 21165 | 16190 |
| 12/31/2022 | 16943 | 22766 | 18627 |
| 03/31/2023 | 17760 | 24473 | 19425 |
| 06/30/2023 | 17648 | 26612 | 20068 |
| 09/30/2023 | 16730 | 25741 | 19112 |
| 12/31/2023 | 18508 | 28750 | 20963 |
| 03/31/2024 | 19410 | 31785 | 22839 |
| 06/30/2024 | 18559 | 33147 | 21812 |
| 09/30/2024 | 20367 | 35098 | 23928 |

| Class H** | 4.92% | 21.74% | 11.58% | 7.37% |
| S&P 500 Index | 10.42% | 36.35% | 15.98% | 13.38% |
| S&P 500 Materials Index | 4.77% | 25.20% | 13.00% | 9.12% |
The fund's past performance is not a good predictor of the fund's future performance. Visit GuggenheimInvestments.com/mutual-funds/performance for more recent performance information.
| Net Assets | $27,742,614 |
| Total Number of Portfolio Holdings | 93 |
| Portfolio Turnover Rate | 27% |
| Basic Materials Fund | Class H | RYBAX | Semi-Annual Shareholder Report | September 30, 2024 |
| Chemicals | 36.1% |
| Mining | 23.1% |
| Packaging & Containers | 11.4% |
| Iron & Steel | 11.1% |
| Building Materials | 9.7% |
| Coal | 2.7% |
| Biotechnology | 1.9% |
| Other | 3.4% |

| Linde plc | 4.5% |
| Sherwin-Williams Co. | 2.8% |
| Freeport-McMoRan, Inc. | 2.7% |
| Air Products and Chemicals, Inc. | 2.5% |
| CRH plc | 2.4% |
| Ecolab, Inc. | 2.4% |
| Newmont Corp. | 2.3% |
| Dow, Inc. | 1.9% |
| Corteva, Inc. | 1.9% |
| Nucor Corp. | 1.8% |
| Top 10 Total | 25.2% |
| |
1 | "Holdings Diversification (Market Exposure as a % of Net Assets)" excludes any temporary cash investments, investments in Guggenheim Strategy Funds Trust mutual funds, or investments in Guggenheim Ultra Short Duration Fund. |
| |
2 | "10 Largest Holdings (as a % of Net Assets)" excludes any temporary cash investments. |
| Linde plc | 4.5% |
| Sherwin-Williams Co. | 2.8% |
| Freeport-McMoRan, Inc. | 2.7% |
| Air Products and Chemicals, Inc. | 2.5% |
| CRH plc | 2.4% |
| Ecolab, Inc. | 2.4% |
| Newmont Corp. | 2.3% |
| Dow, Inc. | 1.9% |
| Corteva, Inc. | 1.9% |
| Nucor Corp. | 1.8% |
| Top 10 Total | 25.2% |
| |
2 | "10 Largest Holdings (as a % of Net Assets)" excludes any temporary cash investments. |
There were no changes in or disagreements with fund accountants for the period.
| | | Availability of Additional Information. For additional information, including the fund's prospectus, financial information, holdings and proxy voting information, go to GuggenheimInvestments.com/mutual-funds/literature or, call 800 820 0888. |
SAR-RYBAX-093024
Semi-Annual Shareholder Report | 9.30.24
This semi-annual shareholder report contains important information about the Biotechnology Fund for the period of April 1, 2024 to September 30, 2024. You can find additional information about the fund at GuggenheimInvestments.com/mutual-funds/literature. You can also request this information by contacting 800 820 0888 or GuggenheimClientServices@mufg-is.com.
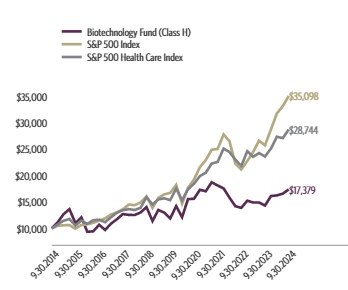
For the period of April 1, 2024 to September 30, 2024, the fund (Investor Class shares) returned 7.10%, underperforming the fund's benchmark, the S&P 500 Index, which returned 10.42% for the same period and outperforming the fund's secondary index, the S&P 500 Health Care Index, which returned 5.06% for the same period.
What factors materially affected the fund's performance over the last six months?
The industries that contributed the most to performance were biotechnology, pharmaceuticals, and health care services. The only industry that detracted was life sciences tools & services. The holdings that contributed the most to performance were Insmed, Inc., Alnylam Pharmaceuticals, Inc., and Amgen Inc. Those that detracted the most were Apellis Pharmaceuticals, Inc., CRISPR Therapeutics AG, and Cytokinetics, Inc.
Cumulative performance* for the fund's most recently completed 10 years (as of 9.30.24), assuming a $10,000 initial investment.
| 09/30/2014 | 10000 | 10000 | 10000 |
| 12/31/2014 | 11164 | 10493 | 10748 |
| 03/31/2015 | 12718 | 10593 | 11450 |
| 06/30/2015 | 13692 | 10622 | 11775 |
| 09/30/2015 | 11036 | 9939 | 10519 |
| 12/31/2015 | 12147 | 10638 | 11488 |
| 03/31/2016 | 9414 | 10782 | 10856 |
| 06/30/2016 | 9506 | 11047 | 11537 |
| 09/30/2016 | 10764 | 11472 | 11645 |
| 12/31/2016 | 9778 | 11911 | 11179 |
| 03/31/2017 | 10986 | 12633 | 12115 |
| 06/30/2017 | 11835 | 13023 | 12975 |
| 09/30/2017 | 12835 | 13607 | 13449 |
| 12/31/2017 | 12684 | 14511 | 13647 |
| 03/31/2018 | 12671 | 14401 | 13480 |
| 06/30/2018 | 13170 | 14896 | 13897 |
| 09/30/2018 | 14199 | 16044 | 15917 |
| 12/31/2018 | 11546 | 13875 | 14530 |
| 03/31/2019 | 13677 | 15769 | 15488 |
| 06/30/2019 | 13178 | 16447 | 15702 |
| 09/30/2019 | 12060 | 16727 | 15349 |
| 12/31/2019 | 14434 | 18244 | 17555 |
| 03/31/2020 | 12322 | 14668 | 15331 |
| 06/30/2020 | 15807 | 17682 | 17414 |
| 09/30/2020 | 15880 | 19260 | 18436 |
| 12/31/2020 | 17622 | 21600 | 19916 |
| 03/31/2021 | 17349 | 22934 | 20549 |
| 06/30/2021 | 19097 | 24895 | 22276 |
| 09/30/2021 | 18490 | 25040 | 22595 |
| 12/31/2021 | 17939 | 27801 | 25120 |
| 03/31/2022 | 16168 | 26522 | 24473 |
| 06/30/2022 | 14512 | 22252 | 23026 |
| 09/30/2022 | 14201 | 21165 | 21834 |
| 12/31/2022 | 15598 | 22766 | 24629 |
| 03/31/2023 | 15256 | 24473 | 23568 |
| 06/30/2023 | 15272 | 26612 | 24264 |
| 09/30/2023 | 14684 | 25741 | 23621 |
| 12/31/2023 | 16543 | 28750 | 25136 |
| 03/31/2024 | 16675 | 31785 | 27360 |
| 06/30/2024 | 17023 | 33147 | 27098 |
| 09/30/2024 | 17859 | 35098 | 28744 |
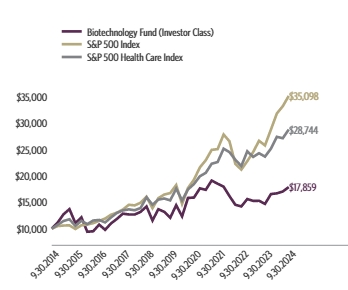
| Investor Class | 7.10% | 21.62% | 8.17% | 5.97% |
| S&P 500 Index | 10.42% | 36.35% | 15.98% | 13.38% |
| S&P 500 Health Care Index | 5.06% | 21.69% | 13.37% | 11.14% |
The fund's past performance is not a good predictor of the fund's future performance. Visit GuggenheimInvestments.com/mutual-funds/performance for more recent performance information.
| Net Assets | $111,096,545 |
| Total Number of Portfolio Holdings | 70 |
| Portfolio Turnover Rate | 32% |
| Biotechnology Fund | Investor Class | RYOIX | Semi-Annual Shareholder Report | September 30, 2024 |
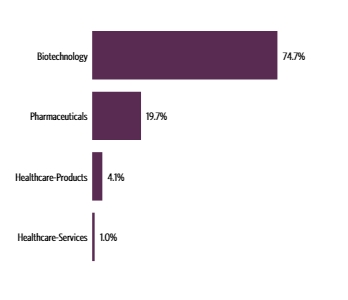
| Biotechnology | 74.7% |
| Pharmaceuticals | 19.7% |
| Healthcare-Products | 4.1% |
| Healthcare-Services | 1.0% |
| AbbVie, Inc. | 8.8% |
| Amgen, Inc. | 6.0% |
| Gilead Sciences, Inc. | 4.7% |
| Vertex Pharmaceuticals, Inc. | 4.0% |
| Regeneron Pharmaceuticals, Inc. | 3.7% |
| Corteva, Inc. | 3.0% |
| Alnylam Pharmaceuticals, Inc. | 2.8% |
| AstraZeneca plc ADR | 2.7% |
| Biogen, Inc. | 2.4% |
| Moderna, Inc. | 2.4% |
| Top 10 Total | 40.5% |
| |
1 | "Holdings Diversification (Market Exposure as a % of Net Assets)" excludes any temporary cash investments, investments in Guggenheim Strategy Funds Trust mutual funds, or investments in Guggenheim Ultra Short Duration Fund. |
| |
2 | "10 Largest Holdings (as a % of Net Assets)" excludes any temporary cash investments. |
| AbbVie, Inc. | 8.8% |
| Amgen, Inc. | 6.0% |
| Gilead Sciences, Inc. | 4.7% |
| Vertex Pharmaceuticals, Inc. | 4.0% |
| Regeneron Pharmaceuticals, Inc. | 3.7% |
| Corteva, Inc. | 3.0% |
| Alnylam Pharmaceuticals, Inc. | 2.8% |
| AstraZeneca plc ADR | 2.7% |
| Biogen, Inc. | 2.4% |
| Moderna, Inc. | 2.4% |
| Top 10 Total | 40.5% |
| |
2 | "10 Largest Holdings (as a % of Net Assets)" excludes any temporary cash investments. |
There were no changes in or disagreements with fund accountants for the period.
| | | Availability of Additional Information. For additional information, including the fund's prospectus, financial information, holdings and proxy voting information, go to GuggenheimInvestments.com/mutual-funds/literature or, call 800 820 0888. |
SAR-RYOIX-093024
Semi-Annual Shareholder Report | 9.30.24
This semi-annual shareholder report contains important information about the Biotechnology Fund for the period of April 1, 2024 to September 30, 2024. You can find additional information about the fund at GuggenheimInvestments.com/mutual-funds/literature. You can also request this information by contacting 800 820 0888 or GuggenheimClientServices@mufg-is.com.
For the period of April 1, 2024 to September 30, 2024, the fund (Class A shares) returned 6.95%, underperforming the fund's benchmark, the S&P 500 Index, which returned 10.42% for the same period and outperforming the fund's secondary index, the S&P 500 Health Care Index, which returned 5.06% for the same period.
What factors materially affected the fund's performance over the last six months?
The industries that contributed the most to performance were biotechnology, pharmaceuticals, and health care services. The only industry that detracted was life sciences tools & services. The holdings that contributed the most to performance were Insmed, Inc., Alnylam Pharmaceuticals, Inc., and Amgen Inc. Those that detracted the most were Apellis Pharmaceuticals, Inc., CRISPR Therapeutics AG, and Cytokinetics, Inc.
Cumulative performance* for the fund's most recently completed 10 years (as of 9.30.24), assuming a $10,000 initial investment.
| 09/30/2014 | 9525 | 10000 | 10000 |
| 12/31/2014 | 10626 | 10493 | 10748 |
| 03/31/2015 | 12098 | 10593 | 11450 |
| 06/30/2015 | 13016 | 10622 | 11775 |
| 09/30/2015 | 10484 | 9939 | 10519 |
| 12/31/2015 | 11531 | 10638 | 11488 |
| 03/31/2016 | 8931 | 10782 | 10856 |
| 06/30/2016 | 9014 | 11047 | 11537 |
| 09/30/2016 | 10201 | 11472 | 11645 |
| 12/31/2016 | 9260 | 11911 | 11179 |
| 03/31/2017 | 10398 | 12633 | 12115 |
| 06/30/2017 | 11195 | 13023 | 12975 |
| 09/30/2017 | 12133 | 13607 | 13449 |
| 12/31/2017 | 11983 | 14511 | 13647 |
| 03/31/2018 | 11962 | 14401 | 13480 |
| 06/30/2018 | 12425 | 14896 | 13897 |
| 09/30/2018 | 13389 | 16044 | 15917 |
| 12/31/2018 | 10880 | 13875 | 14530 |
| 03/31/2019 | 12880 | 15769 | 15488 |
| 06/30/2019 | 12404 | 16447 | 15702 |
| 09/30/2019 | 11343 | 16727 | 15349 |
| 12/31/2019 | 13566 | 18244 | 17555 |
| 03/31/2020 | 11575 | 14668 | 15331 |
| 06/30/2020 | 14839 | 17682 | 17414 |
| 09/30/2020 | 14900 | 19260 | 18436 |
| 12/31/2020 | 16522 | 21600 | 19916 |
| 03/31/2021 | 16256 | 22934 | 20549 |
| 06/30/2021 | 17883 | 24895 | 22276 |
| 09/30/2021 | 17304 | 25040 | 22595 |
| 12/31/2021 | 16778 | 27801 | 25120 |
| 03/31/2022 | 15111 | 26522 | 24473 |
| 06/30/2022 | 13556 | 22252 | 23026 |
| 09/30/2022 | 13257 | 21165 | 21834 |
| 12/31/2022 | 14552 | 22766 | 24629 |
| 03/31/2023 | 14224 | 24473 | 23568 |
| 06/30/2023 | 14228 | 26612 | 24264 |
| 09/30/2023 | 13675 | 25741 | 23621 |
| 12/31/2023 | 15395 | 28750 | 25136 |
| 03/31/2024 | 15508 | 31785 | 27360 |
| 06/30/2024 | 15822 | 33147 | 27098 |
| 09/30/2024 | 16587 | 35098 | 28744 |
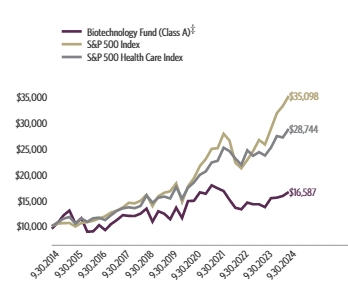
| Class A (without sales charge) | 6.95% | 21.29% | 7.90% | 5.70% |
| Class A (with sales charge)‡ | 1.87% | 15.52% | 6.85% | 5.19% |
| S&P 500 Index | 10.42% | 36.35% | 15.98% | 13.38% |
| S&P 500 Health Care Index | 5.06% | 21.69% | 13.37% | 11.14% |
The fund's past performance is not a good predictor of the fund's future performance. Visit GuggenheimInvestments.com/mutual-funds/performance for more recent performance information.
| Net Assets | $111,096,545 |
| Total Number of Portfolio Holdings | 70 |
| Portfolio Turnover Rate | 32% |
| Biotechnology Fund | Class A | RYBOX | Semi-Annual Shareholder Report | September 30, 2024 |
| Biotechnology | 74.7% |
| Pharmaceuticals | 19.7% |
| Healthcare-Products | 4.1% |
| Healthcare-Services | 1.0% |

| AbbVie, Inc. | 8.8% |
| Amgen, Inc. | 6.0% |
| Gilead Sciences, Inc. | 4.7% |
| Vertex Pharmaceuticals, Inc. | 4.0% |
| Regeneron Pharmaceuticals, Inc. | 3.7% |
| Corteva, Inc. | 3.0% |
| Alnylam Pharmaceuticals, Inc. | 2.8% |
| AstraZeneca plc ADR | 2.7% |
| Biogen, Inc. | 2.4% |
| Moderna, Inc. | 2.4% |
| Top 10 Total | 40.5% |
| |
1 | "Holdings Diversification (Market Exposure as a % of Net Assets)" excludes any temporary cash investments, investments in Guggenheim Strategy Funds Trust mutual funds, or investments in Guggenheim Ultra Short Duration Fund. |
| |
2 | "10 Largest Holdings (as a % of Net Assets)" excludes any temporary cash investments. |
| AbbVie, Inc. | 8.8% |
| Amgen, Inc. | 6.0% |
| Gilead Sciences, Inc. | 4.7% |
| Vertex Pharmaceuticals, Inc. | 4.0% |
| Regeneron Pharmaceuticals, Inc. | 3.7% |
| Corteva, Inc. | 3.0% |
| Alnylam Pharmaceuticals, Inc. | 2.8% |
| AstraZeneca plc ADR | 2.7% |
| Biogen, Inc. | 2.4% |
| Moderna, Inc. | 2.4% |
| Top 10 Total | 40.5% |
| |
2 | "10 Largest Holdings (as a % of Net Assets)" excludes any temporary cash investments. |
There were no changes in or disagreements with fund accountants for the period.
| | | Availability of Additional Information. For additional information, including the fund's prospectus, financial information, holdings and proxy voting information, go to GuggenheimInvestments.com/mutual-funds/literature or, call 800 820 0888. |
SAR-RYBOX-093024
Semi-Annual Shareholder Report | 9.30.24
This semi-annual shareholder report contains important information about the Biotechnology Fund for the period of April 1, 2024 to September 30, 2024. You can find additional information about the fund at GuggenheimInvestments.com/mutual-funds/literature. You can also request this information by contacting 800 820 0888 or GuggenheimClientServices@mufg-is.com.
For the period of April 1, 2024 to September 30, 2024, the fund (Class C shares) returned 6.56%, underperforming the fund's benchmark, the S&P 500 Index, which returned 10.42% for the same period and outperforming the fund's secondary index, the S&P 500 Health Care Index, which returned 5.06% for the same period.
What factors materially affected the fund's performance over the last six months?
The industries that contributed the most to performance were biotechnology, pharmaceuticals, and health care services. The only industry that detracted was life sciences tools & services. The holdings that contributed the most to performance were Insmed, Inc., Alnylam Pharmaceuticals, Inc., and Amgen Inc. Those that detracted the most were Apellis Pharmaceuticals, Inc., CRISPR Therapeutics AG, and Cytokinetics, Inc.
Cumulative performance* for the fund's most recently completed 10 years (as of 9.30.24), assuming a $10,000 initial investment.
| 09/30/2014 | 10000 | 10000 | 10000 |
| 12/31/2014 | 11135 | 10493 | 10748 |
| 03/31/2015 | 12652 | 10593 | 11450 |
| 06/30/2015 | 13587 | 10622 | 11775 |
| 09/30/2015 | 10925 | 9939 | 10519 |
| 12/31/2015 | 11993 | 10638 | 11488 |
| 03/31/2016 | 9272 | 10782 | 10856 |
| 06/30/2016 | 9340 | 11047 | 11537 |
| 09/30/2016 | 10548 | 11472 | 11645 |
| 12/31/2016 | 9558 | 11911 | 11179 |
| 03/31/2017 | 10713 | 12633 | 12115 |
| 06/30/2017 | 11512 | 13023 | 12975 |
| 09/30/2017 | 12454 | 13607 | 13449 |
| 12/31/2017 | 12277 | 14511 | 13647 |
| 03/31/2018 | 12233 | 14401 | 13480 |
| 06/30/2018 | 12682 | 14896 | 13897 |
| 09/30/2018 | 13641 | 16044 | 15917 |
| 12/31/2018 | 11063 | 13875 | 14530 |
| 03/31/2019 | 13074 | 15769 | 15488 |
| 06/30/2019 | 12565 | 16447 | 15702 |
| 09/30/2019 | 11470 | 16727 | 15349 |
| 12/31/2019 | 13693 | 18244 | 17555 |
| 03/31/2020 | 11662 | 14668 | 15331 |
| 06/30/2020 | 14923 | 17682 | 17414 |
| 09/30/2020 | 14954 | 19260 | 18436 |
| 12/31/2020 | 16550 | 21600 | 19916 |
| 03/31/2021 | 16254 | 22934 | 20549 |
| 06/30/2021 | 17848 | 24895 | 22276 |
| 09/30/2021 | 17238 | 25040 | 22595 |
| 12/31/2021 | 16683 | 27801 | 25120 |
| 03/31/2022 | 14997 | 26522 | 24473 |
| 06/30/2022 | 13428 | 22252 | 23026 |
| 09/30/2022 | 13106 | 21165 | 21834 |
| 12/31/2022 | 14359 | 22766 | 24629 |
| 03/31/2023 | 14009 | 24473 | 23568 |
| 06/30/2023 | 13989 | 26612 | 24264 |
| 09/30/2023 | 13418 | 25741 | 23621 |
| 12/31/2023 | 15079 | 28750 | 25136 |
| 03/31/2024 | 15162 | 31785 | 27360 |
| 06/30/2024 | 15440 | 33147 | 27098 |
| 09/30/2024 | 16157 | 35098 | 28744 |
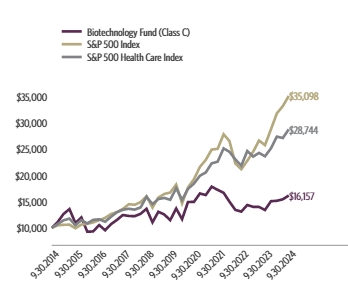
| Class C (without CDSC) | 6.56% | 20.41% | 7.09% | 4.91% |
| Class C (with CDSC)§ | 5.56% | 19.41% | 7.09% | 4.91% |
| S&P 500 Index | 10.42% | 36.35% | 15.98% | 13.38% |
| S&P 500 Health Care Index | 5.06% | 21.69% | 13.37% | 11.14% |
The fund's past performance is not a good predictor of the fund's future performance. Visit GuggenheimInvestments.com/mutual-funds/performance for more recent performance information.
| Net Assets | $111,096,545 |
| Total Number of Portfolio Holdings | 70 |
| Portfolio Turnover Rate | 32% |
| Biotechnology Fund | Class C | RYCFX | Semi-Annual Shareholder Report | September 30, 2024 |
| Biotechnology | 74.7% |
| Pharmaceuticals | 19.7% |
| Healthcare-Products | 4.1% |
| Healthcare-Services | 1.0% |

| AbbVie, Inc. | 8.8% |
| Amgen, Inc. | 6.0% |
| Gilead Sciences, Inc. | 4.7% |
| Vertex Pharmaceuticals, Inc. | 4.0% |
| Regeneron Pharmaceuticals, Inc. | 3.7% |
| Corteva, Inc. | 3.0% |
| Alnylam Pharmaceuticals, Inc. | 2.8% |
| AstraZeneca plc ADR | 2.7% |
| Biogen, Inc. | 2.4% |
| Moderna, Inc. | 2.4% |
| Top 10 Total | 40.5% |
| |
1 | "Holdings Diversification (Market Exposure as a % of Net Assets)" excludes any temporary cash investments, investments in Guggenheim Strategy Funds Trust mutual funds, or investments in Guggenheim Ultra Short Duration Fund. |
| |
2 | "10 Largest Holdings (as a % of Net Assets)" excludes any temporary cash investments. |
| AbbVie, Inc. | 8.8% |
| Amgen, Inc. | 6.0% |
| Gilead Sciences, Inc. | 4.7% |
| Vertex Pharmaceuticals, Inc. | 4.0% |
| Regeneron Pharmaceuticals, Inc. | 3.7% |
| Corteva, Inc. | 3.0% |
| Alnylam Pharmaceuticals, Inc. | 2.8% |
| AstraZeneca plc ADR | 2.7% |
| Biogen, Inc. | 2.4% |
| Moderna, Inc. | 2.4% |
| Top 10 Total | 40.5% |
| |
2 | "10 Largest Holdings (as a % of Net Assets)" excludes any temporary cash investments. |
There were no changes in or disagreements with fund accountants for the period.
| | | Availability of Additional Information. For additional information, including the fund's prospectus, financial information, holdings and proxy voting information, go to GuggenheimInvestments.com/mutual-funds/literature or, call 800 820 0888. |
SAR-RYCFX-093024
Semi-Annual Shareholder Report | 9.30.24
This semi-annual shareholder report contains important information about the Biotechnology Fund for the period of April 1, 2024 to September 30, 2024. You can find additional information about the fund at GuggenheimInvestments.com/mutual-funds/literature. You can also request this information by contacting 800 820 0888 or GuggenheimClientServices@mufg-is.com.
For the period of April 1, 2024 to September 30, 2024, the fund (Class H shares) returned 6.96%, underperforming the fund's benchmark, the S&P 500 Index, which returned 10.42% for the same period and outperforming the fund's secondary index, the S&P 500 Health Care Index, which returned 5.06% for the same period.
What factors materially affected the fund's performance over the last six months?
The industries that contributed the most to performance were biotechnology, pharmaceuticals, and health care services. The only industry that detracted was life sciences tools & services. The holdings that contributed the most to performance were Insmed, Inc., Alnylam Pharmaceuticals, Inc., and Amgen Inc. Those that detracted the most were Apellis Pharmaceuticals, Inc., CRISPR Therapeutics AG, and Cytokinetics, Inc.
Cumulative performance* for the fund's most recently completed 10 years (as of 9.30.24), assuming a $10,000 initial investment.
| 09/30/2014 | 10000 | 10000 | 10000 |
| 12/31/2014 | 11149 | 10493 | 10748 |
| 03/31/2015 | 12686 | 10593 | 11450 |
| 06/30/2015 | 13640 | 10622 | 11775 |
| 09/30/2015 | 10987 | 9939 | 10519 |
| 12/31/2015 | 12084 | 10638 | 11488 |
| 03/31/2016 | 9360 | 10782 | 10856 |
| 06/30/2016 | 9443 | 11047 | 11537 |
| 09/30/2016 | 10686 | 11472 | 11645 |
| 12/31/2016 | 9700 | 11911 | 11179 |
| 03/31/2017 | 10894 | 12633 | 12115 |
| 06/30/2017 | 11728 | 13023 | 12975 |
| 09/30/2017 | 12711 | 13607 | 13449 |
| 12/31/2017 | 12555 | 14511 | 13647 |
| 03/31/2018 | 12533 | 14401 | 13480 |
| 06/30/2018 | 13018 | 14896 | 13897 |
| 09/30/2018 | 14027 | 16044 | 15917 |
| 12/31/2018 | 11398 | 13875 | 14530 |
| 03/31/2019 | 13492 | 15769 | 15488 |
| 06/30/2019 | 12992 | 16447 | 15702 |
| 09/30/2019 | 11883 | 16727 | 15349 |
| 12/31/2019 | 14213 | 18244 | 17555 |
| 03/31/2020 | 12126 | 14668 | 15331 |
| 06/30/2020 | 15546 | 17682 | 17414 |
| 09/30/2020 | 15609 | 19260 | 18436 |
| 12/31/2020 | 17309 | 21600 | 19916 |
| 03/31/2021 | 17032 | 22934 | 20549 |
| 06/30/2021 | 18735 | 24895 | 22276 |
| 09/30/2021 | 18128 | 25040 | 22595 |
| 12/31/2021 | 17579 | 27801 | 25120 |
| 03/31/2022 | 15832 | 26522 | 24473 |
| 06/30/2022 | 14202 | 22252 | 23026 |
| 09/30/2022 | 13888 | 21165 | 21834 |
| 12/31/2022 | 15245 | 22766 | 24629 |
| 03/31/2023 | 14903 | 24473 | 23568 |
| 06/30/2023 | 14908 | 26612 | 24264 |
| 09/30/2023 | 14327 | 25741 | 23621 |
| 12/31/2023 | 16129 | 28750 | 25136 |
| 03/31/2024 | 16248 | 31785 | 27360 |
| 06/30/2024 | 16577 | 33147 | 27098 |
| 09/30/2024 | 17379 | 35098 | 28744 |
| Class H** | 6.96% | 21.31% | 7.90% | 5.68% |
| S&P 500 Index | 10.42% | 36.35% | 15.98% | 13.38% |
| S&P 500 Health Care Index | 5.06% | 21.69% | 13.37% | 11.14% |
The fund's past performance is not a good predictor of the fund's future performance. Visit GuggenheimInvestments.com/mutual-funds/performance for more recent performance information.
| Net Assets | $111,096,545 |
| Total Number of Portfolio Holdings | 70 |
| Portfolio Turnover Rate | 32% |
| Biotechnology Fund | Class H | RYOAX | Semi-Annual Shareholder Report | September 30, 2024 |
| Biotechnology | 74.7% |
| Pharmaceuticals | 19.7% |
| Healthcare-Products | 4.1% |
| Healthcare-Services | 1.0% |

| AbbVie, Inc. | 8.8% |
| Amgen, Inc. | 6.0% |
| Gilead Sciences, Inc. | 4.7% |
| Vertex Pharmaceuticals, Inc. | 4.0% |
| Regeneron Pharmaceuticals, Inc. | 3.7% |
| Corteva, Inc. | 3.0% |
| Alnylam Pharmaceuticals, Inc. | 2.8% |
| AstraZeneca plc ADR | 2.7% |
| Biogen, Inc. | 2.4% |
| Moderna, Inc. | 2.4% |
| Top 10 Total | 40.5% |
| |
1 | "Holdings Diversification (Market Exposure as a % of Net Assets)" excludes any temporary cash investments, investments in Guggenheim Strategy Funds Trust mutual funds, or investments in Guggenheim Ultra Short Duration Fund. |
| |
2 | "10 Largest Holdings (as a % of Net Assets)" excludes any temporary cash investments. |
| AbbVie, Inc. | 8.8% |
| Amgen, Inc. | 6.0% |
| Gilead Sciences, Inc. | 4.7% |
| Vertex Pharmaceuticals, Inc. | 4.0% |
| Regeneron Pharmaceuticals, Inc. | 3.7% |
| Corteva, Inc. | 3.0% |
| Alnylam Pharmaceuticals, Inc. | 2.8% |
| AstraZeneca plc ADR | 2.7% |
| Biogen, Inc. | 2.4% |
| Moderna, Inc. | 2.4% |
| Top 10 Total | 40.5% |
| |
2 | "10 Largest Holdings (as a % of Net Assets)" excludes any temporary cash investments. |
There were no changes in or disagreements with fund accountants for the period.
| | | Availability of Additional Information. For additional information, including the fund's prospectus, financial information, holdings and proxy voting information, go to GuggenheimInvestments.com/mutual-funds/literature or, call 800 820 0888. |
SAR-RYOAX-093024
Semi-Annual Shareholder Report | 9.30.24
This semi-annual shareholder report contains important information about the Consumer Products Fund for the period of April 1, 2024 to September 30, 2024. You can find additional information about the fund at GuggenheimInvestments.com/mutual-funds/literature. You can also request this information by contacting 800 820 0888 or GuggenheimClientServices@mufg-is.com.
For the period of April 1, 2024 to September 30, 2024, the fund (Investor Class shares) returned 4.53%, underperforming the fund's benchmark, the S&P 500 Index, which returned 10.42% for the same period and underperforming the fund's secondary index, the S&P 500 Consumer Staples Index, which returned 10.43% for the same period.
What factors materially affected the fund's performance over the last six months?
The industries that contributed the most to performance were tobacco, household products, and packaged foods & meats. Those that detracted the most were personal care products, distillers & vintners, and agricultural products & services. The holdings that contributed the most to performance were Philip Morris International, Inc., Coca-Cola Co., and Altria Group, Inc. Those that detracted the most were Celsius Holdings, Inc., Estee Lauder Companies, Inc. - Class A, and Lamb Weston Holdings, Inc.
Cumulative performance* for the fund's most recently completed 10 years (as of 9.30.24), assuming a $10,000 initial investment.
| 09/30/2014 | 10000 | 10000 | 10000 |
| 12/31/2014 | 10595 | 10493 | 10815 |
| 03/31/2015 | 10820 | 10593 | 10922 |
| 06/30/2015 | 10778 | 10622 | 10732 |
| 09/30/2015 | 10595 | 9939 | 10710 |
| 12/31/2015 | 11288 | 10638 | 11529 |
| 03/31/2016 | 11864 | 10782 | 12171 |
| 06/30/2016 | 12610 | 11047 | 12735 |
| 09/30/2016 | 12242 | 11472 | 12399 |
| 12/31/2016 | 11941 | 11911 | 12149 |
| 03/31/2017 | 12650 | 12633 | 12921 |
| 06/30/2017 | 12694 | 13023 | 13124 |
| 09/30/2017 | 12562 | 13607 | 12947 |
| 12/31/2017 | 13370 | 14511 | 13788 |
| 03/31/2018 | 12645 | 14401 | 12806 |
| 06/30/2018 | 12558 | 14896 | 12609 |
| 09/30/2018 | 12730 | 16044 | 13327 |
| 12/31/2018 | 11785 | 13875 | 12632 |
| 03/31/2019 | 13162 | 15769 | 14149 |
| 06/30/2019 | 13356 | 16447 | 14676 |
| 09/30/2019 | 13964 | 16727 | 15573 |
| 12/31/2019 | 14475 | 18244 | 16120 |
| 03/31/2020 | 12002 | 14668 | 14066 |
| 06/30/2020 | 13463 | 17682 | 15208 |
| 09/30/2020 | 14487 | 19260 | 16786 |
| 12/31/2020 | 15675 | 21600 | 17852 |
| 03/31/2021 | 16415 | 22934 | 18057 |
| 06/30/2021 | 16821 | 24895 | 18749 |
| 09/30/2021 | 15980 | 25040 | 18690 |
| 12/31/2021 | 17417 | 27801 | 21178 |
| 03/31/2022 | 17218 | 26522 | 20964 |
| 06/30/2022 | 16669 | 22252 | 19997 |
| 09/30/2022 | 15372 | 21165 | 18673 |
| 12/31/2022 | 17346 | 22766 | 21047 |
| 03/31/2023 | 17459 | 24473 | 21221 |
| 06/30/2023 | 17471 | 26612 | 21317 |
| 09/30/2023 | 16275 | 25741 | 20045 |
| 12/31/2023 | 16853 | 28750 | 21156 |
| 03/31/2024 | 17932 | 31785 | 22747 |
| 06/30/2024 | 17323 | 33147 | 23055 |
| 09/30/2024 | 18745 | 35098 | 25121 |
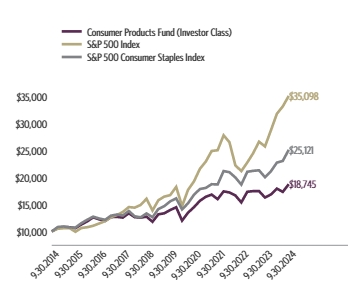
| Investor Class | 4.53% | 15.17% | 6.07% | 6.48% |
| S&P 500 Index | 10.42% | 36.35% | 15.98% | 13.38% |
| S&P 500 Consumer Staples Index | 10.43% | 25.32% | 10.04% | 9.65% |
The fund's past performance is not a good predictor of the fund's future performance. Visit GuggenheimInvestments.com/mutual-funds/performance for more recent performance information.
| Net Assets | $54,831,241 |
| Total Number of Portfolio Holdings | 61 |
| Portfolio Turnover Rate | 43% |
| Consumer Products Fund | Investor Class | RYCIX | Semi-Annual Shareholder Report | September 30, 2024 |
| Food | 34.0% |
| Beverages | 25.4% |
| Cosmetics & Personal Care | 16.7% |
| Agriculture | 13.0% |
| Household Products & Housewares | 6.5% |
| Retail | 2.1% |
| Pharmaceuticals | 1.0% |
| Internet | 0.9% |

| Procter & Gamble Co. | 6.9% |
| Coca-Cola Co. | 5.5% |
| PepsiCo, Inc. | 5.1% |
| Philip Morris International, Inc. | 4.7% |
| Mondelez International, Inc. — Class A | 3.4% |
| Altria Group, Inc. | 3.1% |
| Colgate-Palmolive Co. | 3.1% |
| Kimberly-Clark Corp. | 2.4% |
| Kenvue, Inc. | 2.3% |
| Constellation Brands, Inc. — Class A | 2.2% |
| Top 10 Total | 38.7% |
| |
1 | "Holdings Diversification (Market Exposure as a % of Net Assets)" excludes any temporary cash investments, investments in Guggenheim Strategy Funds Trust mutual funds, or investments in Guggenheim Ultra Short Duration Fund. |
| |
2 | "10 Largest Holdings (as a % of Net Assets)" excludes any temporary cash investments. |
| Procter & Gamble Co. | 6.9% |
| Coca-Cola Co. | 5.5% |
| PepsiCo, Inc. | 5.1% |
| Philip Morris International, Inc. | 4.7% |
| Mondelez International, Inc. — Class A | 3.4% |
| Altria Group, Inc. | 3.1% |
| Colgate-Palmolive Co. | 3.1% |
| Kimberly-Clark Corp. | 2.4% |
| Kenvue, Inc. | 2.3% |
| Constellation Brands, Inc. — Class A | 2.2% |
| Top 10 Total | 38.7% |
| |
2 | "10 Largest Holdings (as a % of Net Assets)" excludes any temporary cash investments. |
There were no changes in or disagreements with fund accountants for the period.
| | | Availability of Additional Information. For additional information, including the fund's prospectus, financial information, holdings and proxy voting information, go to GuggenheimInvestments.com/mutual-funds/literature or, call 800 820 0888. |
SAR-RYCIX-093024
Semi-Annual Shareholder Report | 9.30.24
This semi-annual shareholder report contains important information about the Consumer Products Fund for the period of April 1, 2024 to September 30, 2024. You can find additional information about the fund at GuggenheimInvestments.com/mutual-funds/literature. You can also request this information by contacting 800 820 0888 or GuggenheimClientServices@mufg-is.com.
For the period of April 1, 2024 to September 30, 2024, the fund (Class A shares) returned 4.41%, underperforming the fund's benchmark, the S&P 500 Index, which returned 10.42% for the same period and underperforming the fund's secondary index, the S&P 500 Consumer Staples Index, which returned 10.43% for the same period.
What factors materially affected the fund's performance over the last six months?
The industries that contributed the most to performance were tobacco, household products, and packaged foods & meats. Those that detracted the most were personal care products, distillers & vintners, and agricultural products & services. The holdings that contributed the most to performance were Philip Morris International, Inc., Coca-Cola Co., and Altria Group, Inc. Those that detracted the most were Celsius Holdings, Inc., Estee Lauder Companies, Inc. - Class A, and Lamb Weston Holdings, Inc.
Cumulative performance* for the fund's most recently completed 10 years (as of 9.30.24), assuming a $10,000 initial investment.
| 09/30/2014 | 9524 | 10000 | 10000 |
| 12/31/2014 | 10083 | 10493 | 10815 |
| 03/31/2015 | 10290 | 10593 | 10922 |
| 06/30/2015 | 10245 | 10622 | 10732 |
| 09/30/2015 | 10064 | 9939 | 10710 |
| 12/31/2015 | 10716 | 10638 | 11529 |
| 03/31/2016 | 11256 | 10782 | 12171 |
| 06/30/2016 | 11957 | 11047 | 12735 |
| 09/30/2016 | 11600 | 11472 | 12399 |
| 12/31/2016 | 11307 | 11911 | 12149 |
| 03/31/2017 | 11970 | 12633 | 12921 |
| 06/30/2017 | 12005 | 13023 | 13124 |
| 09/30/2017 | 11872 | 13607 | 12947 |
| 12/31/2017 | 12629 | 14511 | 13788 |
| 03/31/2018 | 11937 | 14401 | 12806 |
| 06/30/2018 | 11848 | 14896 | 12609 |
| 09/30/2018 | 12003 | 16044 | 13327 |
| 12/31/2018 | 11104 | 13875 | 12632 |
| 03/31/2019 | 12393 | 15769 | 14149 |
| 06/30/2019 | 12569 | 16447 | 14676 |
| 09/30/2019 | 13134 | 16727 | 15573 |
| 12/31/2019 | 13606 | 18244 | 16120 |
| 03/31/2020 | 11273 | 14668 | 14066 |
| 06/30/2020 | 12638 | 17682 | 15208 |
| 09/30/2020 | 13592 | 19260 | 16786 |
| 12/31/2020 | 14694 | 21600 | 17852 |
| 03/31/2021 | 15379 | 22934 | 18057 |
| 06/30/2021 | 15753 | 24895 | 18749 |
| 09/30/2021 | 14954 | 25040 | 18690 |
| 12/31/2021 | 16288 | 27801 | 21178 |
| 03/31/2022 | 16094 | 26522 | 20964 |
| 06/30/2022 | 15572 | 22252 | 19997 |
| 09/30/2022 | 14350 | 21165 | 18673 |
| 12/31/2022 | 16181 | 22766 | 21047 |
| 03/31/2023 | 16277 | 24473 | 21221 |
| 06/30/2023 | 16277 | 26612 | 21317 |
| 09/30/2023 | 15156 | 25741 | 20045 |
| 12/31/2023 | 15683 | 28750 | 21156 |
| 03/31/2024 | 16676 | 31785 | 22747 |
| 06/30/2024 | 16101 | 33147 | 23055 |
| 09/30/2024 | 17412 | 35098 | 25121 |
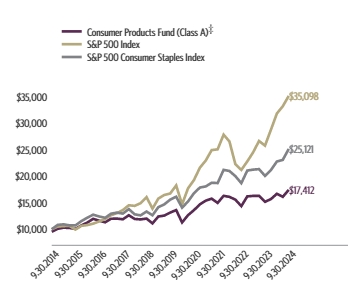
| Class A (without sales charge) | 4.41% | 14.89% | 5.80% | 6.22% |
| Class A (with sales charge)‡ | -0.55% | 9.43% | 4.78% | 5.70% |
| S&P 500 Index | 10.42% | 36.35% | 15.98% | 13.38% |
| S&P 500 Consumer Staples Index | 10.43% | 25.32% | 10.04% | 9.65% |
The fund's past performance is not a good predictor of the fund's future performance. Visit GuggenheimInvestments.com/mutual-funds/performance for more recent performance information.
| Net Assets | $54,831,241 |
| Total Number of Portfolio Holdings | 61 |
| Portfolio Turnover Rate | 43% |
| Consumer Products Fund | Class A | RYPDX | Semi-Annual Shareholder Report | September 30, 2024 |
| Food | 34.0% |
| Beverages | 25.4% |
| Cosmetics & Personal Care | 16.7% |
| Agriculture | 13.0% |
| Household Products & Housewares | 6.5% |
| Retail | 2.1% |
| Pharmaceuticals | 1.0% |
| Internet | 0.9% |
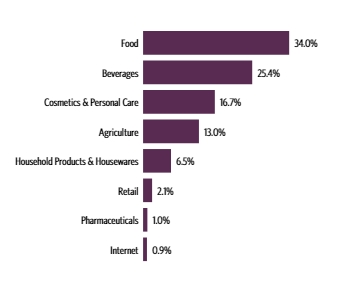
| Procter & Gamble Co. | 6.9% |
| Coca-Cola Co. | 5.5% |
| PepsiCo, Inc. | 5.1% |
| Philip Morris International, Inc. | 4.7% |
| Mondelez International, Inc. — Class A | 3.4% |
| Altria Group, Inc. | 3.1% |
| Colgate-Palmolive Co. | 3.1% |
| Kimberly-Clark Corp. | 2.4% |
| Kenvue, Inc. | 2.3% |
| Constellation Brands, Inc. — Class A | 2.2% |
| Top 10 Total | 38.7% |
| |
1 | "Holdings Diversification (Market Exposure as a % of Net Assets)" excludes any temporary cash investments, investments in Guggenheim Strategy Funds Trust mutual funds, or investments in Guggenheim Ultra Short Duration Fund. |
| |
2 | "10 Largest Holdings (as a % of Net Assets)" excludes any temporary cash investments. |
| Procter & Gamble Co. | 6.9% |
| Coca-Cola Co. | 5.5% |
| PepsiCo, Inc. | 5.1% |
| Philip Morris International, Inc. | 4.7% |
| Mondelez International, Inc. — Class A | 3.4% |
| Altria Group, Inc. | 3.1% |
| Colgate-Palmolive Co. | 3.1% |
| Kimberly-Clark Corp. | 2.4% |
| Kenvue, Inc. | 2.3% |
| Constellation Brands, Inc. — Class A | 2.2% |
| Top 10 Total | 38.7% |
| |
2 | "10 Largest Holdings (as a % of Net Assets)" excludes any temporary cash investments. |
There were no changes in or disagreements with fund accountants for the period.
| | | Availability of Additional Information. For additional information, including the fund's prospectus, financial information, holdings and proxy voting information, go to GuggenheimInvestments.com/mutual-funds/literature or, call 800 820 0888. |
SAR-RYPDX-093024
Semi-Annual Shareholder Report | 9.30.24
This semi-annual shareholder report contains important information about the Consumer Products Fund for the period of April 1, 2024 to September 30, 2024. You can find additional information about the fund at GuggenheimInvestments.com/mutual-funds/literature. You can also request this information by contacting 800 820 0888 or GuggenheimClientServices@mufg-is.com.
For the period of April 1, 2024 to September 30, 2024, the fund (Class C shares) returned 4.00%, underperforming the fund's benchmark, the S&P 500 Index, which returned 10.42% for the same period and underperforming the fund's secondary index, the S&P 500 Consumer Staples Index, which returned 10.43% for the same period.
What factors materially affected the fund's performance over the last six months?
The industries that contributed the most to performance were tobacco, household products, and packaged foods & meats. Those that detracted the most were personal care products, distillers & vintners, and agricultural products & services. The holdings that contributed the most to performance were Philip Morris International, Inc., Coca-Cola Co., and Altria Group, Inc. Those that detracted the most were Celsius Holdings, Inc., Estee Lauder Companies, Inc. - Class A, and Lamb Weston Holdings, Inc.
Cumulative performance* for the fund's most recently completed 10 years (as of 9.30.24), assuming a $10,000 initial investment.
| 09/30/2014 | 10000 | 10000 | 10000 |
| 12/31/2014 | 10567 | 10493 | 10815 |
| 03/31/2015 | 10764 | 10593 | 10922 |
| 06/30/2015 | 10696 | 10622 | 10732 |
| 09/30/2015 | 10488 | 9939 | 10710 |
| 12/31/2015 | 11147 | 10638 | 11529 |
| 03/31/2016 | 11686 | 10782 | 12171 |
| 06/30/2016 | 12391 | 11047 | 12735 |
| 09/30/2016 | 11998 | 11472 | 12399 |
| 12/31/2016 | 11674 | 11911 | 12149 |
| 03/31/2017 | 12334 | 12633 | 12921 |
| 06/30/2017 | 12348 | 13023 | 13124 |
| 09/30/2017 | 12188 | 13607 | 12947 |
| 12/31/2017 | 12941 | 14511 | 13788 |
| 03/31/2018 | 12209 | 14401 | 12806 |
| 06/30/2018 | 12093 | 14896 | 12609 |
| 09/30/2018 | 12229 | 16044 | 13327 |
| 12/31/2018 | 11291 | 13875 | 12632 |
| 03/31/2019 | 12582 | 15769 | 14149 |
| 06/30/2019 | 12736 | 16447 | 14676 |
| 09/30/2019 | 13283 | 16727 | 15573 |
| 12/31/2019 | 13733 | 18244 | 16120 |
| 03/31/2020 | 11358 | 14668 | 14066 |
| 06/30/2020 | 12710 | 17682 | 15208 |
| 09/30/2020 | 13642 | 19260 | 16786 |
| 12/31/2020 | 14722 | 21600 | 17852 |
| 03/31/2021 | 15379 | 22934 | 18057 |
| 06/30/2021 | 15723 | 24895 | 18749 |
| 09/30/2021 | 14896 | 25040 | 18690 |
| 12/31/2021 | 16195 | 27801 | 21178 |
| 03/31/2022 | 15974 | 26522 | 20964 |
| 06/30/2022 | 15427 | 22252 | 19997 |
| 09/30/2022 | 14188 | 21165 | 18673 |
| 12/31/2022 | 15969 | 22766 | 21047 |
| 03/31/2023 | 16033 | 24473 | 21221 |
| 06/30/2023 | 16003 | 26612 | 21317 |
| 09/30/2023 | 14873 | 25741 | 20045 |
| 12/31/2023 | 15361 | 28750 | 21156 |
| 03/31/2024 | 16306 | 31785 | 22747 |
| 06/30/2024 | 15715 | 33147 | 23055 |
| 09/30/2024 | 16959 | 35098 | 25121 |
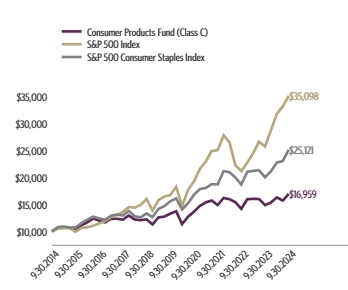
| Class C (without CDSC) | 4.00% | 14.02% | 5.01% | 5.42% |
| Class C (with CDSC)§ | 3.00% | 13.07% | 5.01% | 5.42% |
| S&P 500 Index | 10.42% | 36.35% | 15.98% | 13.38% |
| S&P 500 Consumer Staples Index | 10.43% | 25.32% | 10.04% | 9.65% |
The fund's past performance is not a good predictor of the fund's future performance. Visit GuggenheimInvestments.com/mutual-funds/performance for more recent performance information.
| Net Assets | $54,831,241 |
| Total Number of Portfolio Holdings | 61 |
| Portfolio Turnover Rate | 43% |
| Consumer Products Fund | Class C | RYCPX | Semi-Annual Shareholder Report | September 30, 2024 |
| Food | 34.0% |
| Beverages | 25.4% |
| Cosmetics & Personal Care | 16.7% |
| Agriculture | 13.0% |
| Household Products & Housewares | 6.5% |
| Retail | 2.1% |
| Pharmaceuticals | 1.0% |
| Internet | 0.9% |

| Procter & Gamble Co. | 6.9% |
| Coca-Cola Co. | 5.5% |
| PepsiCo, Inc. | 5.1% |
| Philip Morris International, Inc. | 4.7% |
| Mondelez International, Inc. — Class A | 3.4% |
| Altria Group, Inc. | 3.1% |
| Colgate-Palmolive Co. | 3.1% |
| Kimberly-Clark Corp. | 2.4% |
| Kenvue, Inc. | 2.3% |
| Constellation Brands, Inc. — Class A | 2.2% |
| Top 10 Total | 38.7% |
| |
1 | "Holdings Diversification (Market Exposure as a % of Net Assets)" excludes any temporary cash investments, investments in Guggenheim Strategy Funds Trust mutual funds, or investments in Guggenheim Ultra Short Duration Fund. |
| |
2 | "10 Largest Holdings (as a % of Net Assets)" excludes any temporary cash investments. |
| Procter & Gamble Co. | 6.9% |
| Coca-Cola Co. | 5.5% |
| PepsiCo, Inc. | 5.1% |
| Philip Morris International, Inc. | 4.7% |
| Mondelez International, Inc. — Class A | 3.4% |
| Altria Group, Inc. | 3.1% |
| Colgate-Palmolive Co. | 3.1% |
| Kimberly-Clark Corp. | 2.4% |
| Kenvue, Inc. | 2.3% |
| Constellation Brands, Inc. — Class A | 2.2% |
| Top 10 Total | 38.7% |
| |
2 | "10 Largest Holdings (as a % of Net Assets)" excludes any temporary cash investments. |
There were no changes in or disagreements with fund accountants for the period.
| | | Availability of Additional Information. For additional information, including the fund's prospectus, financial information, holdings and proxy voting information, go to GuggenheimInvestments.com/mutual-funds/literature or, call 800 820 0888. |
SAR-RYCPX-093024
Semi-Annual Shareholder Report | 9.30.24
This semi-annual shareholder report contains important information about the Consumer Products Fund for the period of April 1, 2024 to September 30, 2024. You can find additional information about the fund at GuggenheimInvestments.com/mutual-funds/literature. You can also request this information by contacting 800 820 0888 or GuggenheimClientServices@mufg-is.com.
For the period of April 1, 2024 to September 30, 2024, the fund (Class H shares) returned 4.40%, underperforming the fund's benchmark, the S&P 500 Index, which returned 10.42% for the same period and underperforming the fund's secondary index, the S&P 500 Consumer Staples Index, which returned 10.43% for the same period.
What factors materially affected the fund's performance over the last six months?
The industries that contributed the most to performance were tobacco, household products, and packaged foods & meats. Those that detracted the most were personal care products, distillers & vintners, and agricultural products & services. The holdings that contributed the most to performance were Philip Morris International, Inc., Coca-Cola Co., and Altria Group, Inc. Those that detracted the most were Celsius Holdings, Inc., Estee Lauder Companies, Inc. - Class A, and Lamb Weston Holdings, Inc.
Cumulative performance* for the fund's most recently completed 10 years (as of 9.30.24), assuming a $10,000 initial investment.
| 09/30/2014 | 10000 | 10000 | 10000 |
| 12/31/2014 | 10581 | 10493 | 10815 |
| 03/31/2015 | 10793 | 10593 | 10922 |
| 06/30/2015 | 10738 | 10622 | 10732 |
| 09/30/2015 | 10548 | 9939 | 10710 |
| 12/31/2015 | 11232 | 10638 | 11529 |
| 03/31/2016 | 11795 | 10782 | 12171 |
| 06/30/2016 | 12530 | 11047 | 12735 |
| 09/30/2016 | 12157 | 11472 | 12399 |
| 12/31/2016 | 11849 | 11911 | 12149 |
| 03/31/2017 | 12545 | 12633 | 12921 |
| 06/30/2017 | 12581 | 13023 | 13124 |
| 09/30/2017 | 12441 | 13607 | 12947 |
| 12/31/2017 | 13232 | 14511 | 13788 |
| 03/31/2018 | 12505 | 14401 | 12806 |
| 06/30/2018 | 12412 | 14896 | 12609 |
| 09/30/2018 | 12574 | 16044 | 13327 |
| 12/31/2018 | 11633 | 13875 | 12632 |
| 03/31/2019 | 12985 | 15769 | 14149 |
| 06/30/2019 | 13169 | 16447 | 14676 |
| 09/30/2019 | 13760 | 16727 | 15573 |
| 12/31/2019 | 14252 | 18244 | 16120 |
| 03/31/2020 | 11810 | 14668 | 14066 |
| 06/30/2020 | 13239 | 17682 | 15208 |
| 09/30/2020 | 14240 | 19260 | 16786 |
| 12/31/2020 | 15395 | 21600 | 17852 |
| 03/31/2021 | 16112 | 22934 | 18057 |
| 06/30/2021 | 16502 | 24895 | 18749 |
| 09/30/2021 | 15666 | 25040 | 18690 |
| 12/31/2021 | 17063 | 27801 | 21178 |
| 03/31/2022 | 16862 | 26522 | 20964 |
| 06/30/2022 | 16315 | 22252 | 19997 |
| 09/30/2022 | 15034 | 21165 | 18673 |
| 12/31/2022 | 16952 | 22766 | 21047 |
| 03/31/2023 | 17054 | 24473 | 21221 |
| 06/30/2023 | 17054 | 26612 | 21317 |
| 09/30/2023 | 15878 | 25741 | 20045 |
| 12/31/2023 | 16431 | 28750 | 21156 |
| 03/31/2024 | 17472 | 31785 | 22747 |
| 06/30/2024 | 16870 | 33147 | 23055 |
| 09/30/2024 | 18242 | 35098 | 25121 |

| Class H ** | 4.40% | 14.89% | 5.80% | 6.20% |
| S&P 500 Index | 10.42% | 36.35% | 15.98% | 13.38% |
| S&P 500 Consumer Staples Index | 10.43% | 25.32% | 10.04% | 9.65% |
The fund's past performance is not a good predictor of the fund's future performance. Visit GuggenheimInvestments.com/mutual-funds/performance for more recent performance information.
| Net Assets | $54,831,241 |
| Total Number of Portfolio Holdings | 61 |
| Portfolio Turnover Rate | 43% |
| Consumer Products Fund | Class H | RYCAX | Semi-Annual Shareholder Report | September 30, 2024 |
| Food | 34.0% |
| Beverages | 25.4% |
| Cosmetics & Personal Care | 16.7% |
| Agriculture | 13.0% |
| Household Products & Housewares | 6.5% |
| Retail | 2.1% |
| Pharmaceuticals | 1.0% |
| Internet | 0.9% |

| Procter & Gamble Co. | 6.9% |
| Coca-Cola Co. | 5.5% |
| PepsiCo, Inc. | 5.1% |
| Philip Morris International, Inc. | 4.7% |
| Mondelez International, Inc. — Class A | 3.4% |
| Altria Group, Inc. | 3.1% |
| Colgate-Palmolive Co. | 3.1% |
| Kimberly-Clark Corp. | 2.4% |
| Kenvue, Inc. | 2.3% |
| Constellation Brands, Inc. — Class A | 2.2% |
| Top 10 Total | 38.7% |
| |
1 | "Holdings Diversification (Market Exposure as a % of Net Assets)" excludes any temporary cash investments, investments in Guggenheim Strategy Funds Trust mutual funds, or investments in Guggenheim Ultra Short Duration Fund. |
| |
2 | "10 Largest Holdings (as a % of Net Assets)" excludes any temporary cash investments. |
| Procter & Gamble Co. | 6.9% |
| Coca-Cola Co. | 5.5% |
| PepsiCo, Inc. | 5.1% |
| Philip Morris International, Inc. | 4.7% |
| Mondelez International, Inc. — Class A | 3.4% |
| Altria Group, Inc. | 3.1% |
| Colgate-Palmolive Co. | 3.1% |
| Kimberly-Clark Corp. | 2.4% |
| Kenvue, Inc. | 2.3% |
| Constellation Brands, Inc. — Class A | 2.2% |
| Top 10 Total | 38.7% |
| |
2 | "10 Largest Holdings (as a % of Net Assets)" excludes any temporary cash investments. |
There were no changes in or disagreements with fund accountants for the period.
| | | Availability of Additional Information. For additional information, including the fund's prospectus, financial information, holdings and proxy voting information, go to GuggenheimInvestments.com/mutual-funds/literature or, call 800 820 0888. |
SAR-RYCAX-093024
Semi-Annual Shareholder Report | 9.30.24
This semi-annual shareholder report contains important information about the Electronics Fund for the period of April 1, 2024 to September 30, 2024. You can find additional information about the fund at GuggenheimInvestments.com/mutual-funds/literature. You can also request this information by contacting 800 820 0888 or GuggenheimClientServices@mufg-is.com.
For the period of April 1, 2024 to September 30, 2024, the fund (Investor Class shares) returned 4.55%, underperforming the fund's benchmark, the S&P 500 Index, which returned 10.42% for the same period and underperforming the fund's secondary index, the S&P 500 Information Technology Index, which returned 15.64% for the same period.
What factors materially affected the fund's performance over the last six months?
The only industry that contributed to performance was semiconductors. The only industry that detracted from performance was semiconductor materials & equipment. The holdings that contributed the most to performance were NVIDIA Corp., Broadcom, Inc. and Texas Instruments, Inc. Those that detracted the most were Intel Corp., SolarEdge Technologies, Inc., and Lam Research Corp.
Cumulative performance* for the fund's most recently completed 10 years (as of 9.30.24), assuming a $10,000 initial investment.
| 09/30/2014 | 10000 | 10000 | 10000 |
| 12/31/2014 | 10455 | 10493 | 10524 |
| 03/31/2015 | 11139 | 10593 | 10585 |
| 06/30/2015 | 10992 | 10622 | 10604 |
| 09/30/2015 | 9524 | 9939 | 10211 |
| 12/31/2015 | 10723 | 10638 | 11148 |
| 03/31/2016 | 10848 | 10782 | 11438 |
| 06/30/2016 | 10788 | 11047 | 11113 |
| 09/30/2016 | 12768 | 11472 | 12542 |
| 12/31/2016 | 13343 | 11911 | 12692 |
| 03/31/2017 | 14689 | 12633 | 14287 |
| 06/30/2017 | 14871 | 13023 | 14878 |
| 09/30/2017 | 16539 | 13607 | 16164 |
| 12/31/2017 | 17563 | 14511 | 17620 |
| 03/31/2018 | 18301 | 14401 | 18241 |
| 06/30/2018 | 18113 | 14896 | 19535 |
| 09/30/2018 | 18165 | 16044 | 21254 |
| 12/31/2018 | 15375 | 13875 | 17569 |
| 03/31/2019 | 18549 | 15769 | 21059 |
| 06/30/2019 | 19511 | 16447 | 22335 |
| 09/30/2019 | 20822 | 16727 | 23081 |
| 12/31/2019 | 24570 | 18244 | 26405 |
| 03/31/2020 | 20216 | 14668 | 23254 |
| 06/30/2020 | 26766 | 17682 | 30353 |
| 09/30/2020 | 30167 | 19260 | 33981 |
| 12/31/2020 | 38536 | 21600 | 37994 |
| 03/31/2021 | 42261 | 22934 | 38744 |
| 06/30/2021 | 45403 | 24895 | 43222 |
| 09/30/2021 | 44247 | 25040 | 43802 |
| 12/31/2021 | 53437 | 27801 | 51113 |
| 03/31/2022 | 47174 | 26522 | 46841 |
| 06/30/2022 | 35546 | 22252 | 37360 |
| 09/30/2022 | 33009 | 21165 | 35041 |
| 12/31/2022 | 36093 | 22766 | 36703 |
| 03/31/2023 | 45511 | 24473 | 44710 |
| 06/30/2023 | 50993 | 26612 | 52402 |
| 09/30/2023 | 47134 | 25741 | 49445 |
| 12/31/2023 | 56194 | 28750 | 57932 |
| 03/31/2024 | 65445 | 31785 | 65282 |
| 06/30/2024 | 72365 | 33147 | 74294 |
| 09/30/2024 | 68420 | 35098 | 75490 |
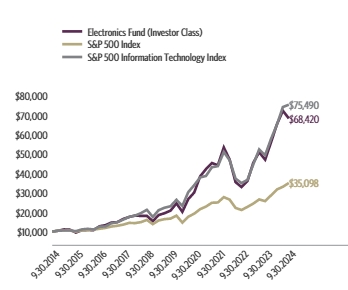
| Investor Class | 4.55% | 45.16% | 26.86% | 21.20% |
| S&P 500 Index | 10.42% | 36.35% | 15.98% | 13.38% |
| S&P 500 Information Technology Index | 15.64% | 52.68% | 26.74% | 22.40% |
The fund's past performance is not a good predictor of the fund's future performance. Visit GuggenheimInvestments.com/mutual-funds/performance for more recent performance information.
| Net Assets | $132,452,381 |
| Total Number of Portfolio Holdings | 57 |
| Portfolio Turnover Rate | 32% |
| Electronics Fund | Investor Class | RYSIX | Semi-Annual Shareholder Report | September 30, 2024 |
| Semiconductors | 93.0% |
| Energy-Alternate Sources | 5.2% |
| Electrical Components & Equipment | 0.9% |
| Telecommunications | 0.6% |

| NVIDIA Corp. | 15.6% |
| Broadcom, Inc. | 8.2% |
| Advanced Micro Devices, Inc. | 4.9% |
| Texas Instruments, Inc. | 4.1% |
| QUALCOMM, Inc. | 4.1% |
| Applied Materials, Inc. | 4.0% |
| Micron Technology, Inc. | 3.5% |
| Intel Corp. | 3.2% |
| Analog Devices, Inc. | 3.2% |
| Lam Research Corp. | 3.1% |
| Top 10 Total | 53.9% |
| |
1 | "Holdings Diversification (Market Exposure as a % of Net Assets)" excludes any temporary cash investments, investments in Guggenheim Strategy Funds Trust mutual funds, or investments in Guggenheim Ultra Short Duration Fund. |
| |
2 | "10 Largest Holdings (as a % of Net Assets)" excludes any temporary cash investments. |
| NVIDIA Corp. | 15.6% |
| Broadcom, Inc. | 8.2% |
| Advanced Micro Devices, Inc. | 4.9% |
| Texas Instruments, Inc. | 4.1% |
| QUALCOMM, Inc. | 4.1% |
| Applied Materials, Inc. | 4.0% |
| Micron Technology, Inc. | 3.5% |
| Intel Corp. | 3.2% |
| Analog Devices, Inc. | 3.2% |
| Lam Research Corp. | 3.1% |
| Top 10 Total | 53.9% |
| |
2 | "10 Largest Holdings (as a % of Net Assets)" excludes any temporary cash investments. |
There were no changes in or disagreements with fund accountants for the period.
| | | Availability of Additional Information. For additional information, including the fund's prospectus, financial information, holdings and proxy voting information, go to GuggenheimInvestments.com/mutual-funds/literature or, call 800 820 0888. |
SAR-RYSIX-093024
Semi-Annual Shareholder Report | 9.30.24
This semi-annual shareholder report contains important information about the Electronics Fund for the period of April 1, 2024 to September 30, 2024. You can find additional information about the fund at GuggenheimInvestments.com/mutual-funds/literature. You can also request this information by contacting 800 820 0888 or GuggenheimClientServices@mufg-is.com.
For the period of April 1, 2024 to September 30, 2024, the fund (Class A shares) returned 4.41%, underperforming the fund's benchmark, the S&P 500 Index, which returned 10.42% for the same period and underperforming the fund's secondary index, the S&P 500 Information Technology Index, which returned 15.64% for the same period.
What factors materially affected the fund's performance over the last six months?
The only industry that contributed to performance was semiconductors. The only industry that detracted from performance was semiconductor materials & equipment. The holdings that contributed the most to performance were NVIDIA Corp., Broadcom, Inc. and Texas Instruments, Inc. Those that detracted the most were Intel Corp., SolarEdge Technologies, Inc., and Lam Research Corp.
Cumulative performance* for the fund's most recently completed 10 years (as of 9.30.24), assuming a $10,000 initial investment.
| 09/30/2014 | 9525 | 10000 | 10000 |
| 12/31/2014 | 9953 | 10493 | 10524 |
| 03/31/2015 | 10599 | 10593 | 10585 |
| 06/30/2015 | 10453 | 10622 | 10604 |
| 09/30/2015 | 9050 | 9939 | 10211 |
| 12/31/2015 | 10182 | 10638 | 11148 |
| 03/31/2016 | 10297 | 10782 | 11438 |
| 06/30/2016 | 10238 | 11047 | 11113 |
| 09/30/2016 | 12108 | 11472 | 12542 |
| 12/31/2016 | 12645 | 11911 | 12692 |
| 03/31/2017 | 13912 | 12633 | 14287 |
| 06/30/2017 | 14076 | 13023 | 14878 |
| 09/30/2017 | 15645 | 13607 | 16164 |
| 12/31/2017 | 16603 | 14511 | 17620 |
| 03/31/2018 | 17292 | 14401 | 18241 |
| 06/30/2018 | 17102 | 14896 | 19535 |
| 09/30/2018 | 17140 | 16044 | 21254 |
| 12/31/2018 | 14500 | 13875 | 17569 |
| 03/31/2019 | 17481 | 15769 | 21059 |
| 06/30/2019 | 18377 | 16447 | 22335 |
| 09/30/2019 | 19599 | 16727 | 23081 |
| 12/31/2019 | 23114 | 18244 | 26405 |
| 03/31/2020 | 19006 | 14668 | 23254 |
| 06/30/2020 | 25147 | 17682 | 30353 |
| 09/30/2020 | 28326 | 19260 | 33981 |
| 12/31/2020 | 36161 | 21600 | 37994 |
| 03/31/2021 | 39633 | 22934 | 38744 |
| 06/30/2021 | 42553 | 24895 | 43222 |
| 09/30/2021 | 41443 | 25040 | 43802 |
| 12/31/2021 | 50018 | 27801 | 51113 |
| 03/31/2022 | 44131 | 26522 | 46841 |
| 06/30/2022 | 33231 | 22252 | 37360 |
| 09/30/2022 | 30841 | 21165 | 35041 |
| 12/31/2022 | 33700 | 22766 | 36703 |
| 03/31/2023 | 42466 | 24473 | 44710 |
| 06/30/2023 | 47553 | 26612 | 52402 |
| 09/30/2023 | 43928 | 25741 | 49445 |
| 12/31/2023 | 52338 | 28750 | 57932 |
| 03/31/2024 | 60917 | 31785 | 65282 |
| 06/30/2024 | 67317 | 33147 | 74294 |
| 09/30/2024 | 63607 | 35098 | 75490 |
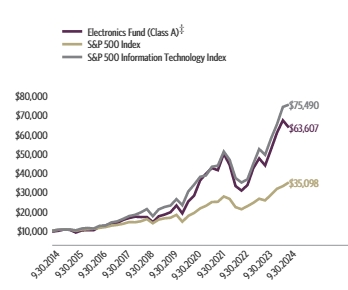
| Class A (without sales charge) | 4.41% | 44.80% | 26.55% | 20.91% |
| Class A (with sales charge)‡ | -0.54% | 37.92% | 25.32% | 20.32% |
| S&P 500 Index | 10.42% | 36.35% | 15.98% | 13.38% |
| S&P 500 Information Technology Index | 15.64% | 52.68% | 26.74% | 22.40% |
The fund's past performance is not a good predictor of the fund's future performance. Visit GuggenheimInvestments.com/mutual-funds/performance for more recent performance information.
| Net Assets | $132,452,381 |
| Total Number of Portfolio Holdings | 57 |
| Portfolio Turnover Rate | 32% |
| Electronics Fund | Class A | RYELX | Semi-Annual Shareholder Report | September 30, 2024 |
| Semiconductors | 93.0% |
| Energy-Alternate Sources | 5.2% |
| Electrical Components & Equipment | 0.9% |
| Telecommunications | 0.6% |

| NVIDIA Corp. | 15.6% |
| Broadcom, Inc. | 8.2% |
| Advanced Micro Devices, Inc. | 4.9% |
| Texas Instruments, Inc. | 4.1% |
| QUALCOMM, Inc. | 4.1% |
| Applied Materials, Inc. | 4.0% |
| Micron Technology, Inc. | 3.5% |
| Intel Corp. | 3.2% |
| Analog Devices, Inc. | 3.2% |
| Lam Research Corp. | 3.1% |
| Top 10 Total | 53.9% |
| |
1 | "Holdings Diversification (Market Exposure as a % of Net Assets)" excludes any temporary cash investments, investments in Guggenheim Strategy Funds Trust mutual funds, or investments in Guggenheim Ultra Short Duration Fund. |
| |
2 | "10 Largest Holdings (as a % of Net Assets)" excludes any temporary cash investments. |
| NVIDIA Corp. | 15.6% |
| Broadcom, Inc. | 8.2% |
| Advanced Micro Devices, Inc. | 4.9% |
| Texas Instruments, Inc. | 4.1% |
| QUALCOMM, Inc. | 4.1% |
| Applied Materials, Inc. | 4.0% |
| Micron Technology, Inc. | 3.5% |
| Intel Corp. | 3.2% |
| Analog Devices, Inc. | 3.2% |
| Lam Research Corp. | 3.1% |
| Top 10 Total | 53.9% |
| |
2 | "10 Largest Holdings (as a % of Net Assets)" excludes any temporary cash investments. |
There were no changes in or disagreements with fund accountants for the period.
| | | Availability of Additional Information. For additional information, including the fund's prospectus, financial information, holdings and proxy voting information, go to GuggenheimInvestments.com/mutual-funds/literature or, call 800 820 0888. |
SAR-RYELX-093024
Semi-Annual Shareholder Report | 9.30.24
This semi-annual shareholder report contains important information about the Electronics Fund for the period of April 1, 2024 to September 30, 2024. You can find additional information about the fund at GuggenheimInvestments.com/mutual-funds/literature. You can also request this information by contacting 800 820 0888 or GuggenheimClientServices@mufg-is.com.
For the period of April 1, 2024 to September 30, 2024, the fund (Class C shares) returned 4.02%, underperforming the fund's benchmark, the S&P 500 Index, which returned 10.42% for the same period and underperforming the fund's secondary index, the S&P 500 Information Technology Index, which returned 15.64% for the same period.
What factors materially affected the fund's performance over the last six months?
The only industry that contributed to performance was semiconductors. The only industry that detracted from performance was semiconductor materials & equipment. The holdings that contributed the most to performance were NVIDIA Corp., Broadcom, Inc. and Texas Instruments, Inc. Those that detracted the most were Intel Corp., SolarEdge Technologies, Inc., and Lam Research Corp.
Cumulative performance* for the fund's most recently completed 10 years (as of 9.30.24), assuming a $10,000 initial investment.
| 09/30/2014 | 10000 | 10000 | 10000 |
| 12/31/2014 | 10428 | 10493 | 10524 |
| 03/31/2015 | 11086 | 10593 | 10585 |
| 06/30/2015 | 10913 | 10622 | 10604 |
| 09/30/2015 | 9432 | 9939 | 10211 |
| 12/31/2015 | 10590 | 10638 | 11148 |
| 03/31/2016 | 10689 | 10782 | 11438 |
| 06/30/2016 | 10605 | 11047 | 11113 |
| 09/30/2016 | 12520 | 11472 | 12542 |
| 12/31/2016 | 13051 | 11911 | 12692 |
| 03/31/2017 | 14333 | 12633 | 14287 |
| 06/30/2017 | 14474 | 13023 | 14878 |
| 09/30/2017 | 16057 | 13607 | 16164 |
| 12/31/2017 | 17008 | 14511 | 17620 |
| 03/31/2018 | 17682 | 14401 | 18241 |
| 06/30/2018 | 17456 | 14896 | 19535 |
| 09/30/2018 | 17462 | 16044 | 21254 |
| 12/31/2018 | 14744 | 13875 | 17569 |
| 03/31/2019 | 17742 | 15769 | 21059 |
| 06/30/2019 | 18618 | 16447 | 22335 |
| 09/30/2019 | 19817 | 16727 | 23081 |
| 12/31/2019 | 23328 | 18244 | 26405 |
| 03/31/2020 | 19145 | 14668 | 23254 |
| 06/30/2020 | 25286 | 17682 | 30353 |
| 09/30/2020 | 28428 | 19260 | 33981 |
| 12/31/2020 | 36219 | 21600 | 37994 |
| 03/31/2021 | 39627 | 22934 | 38744 |
| 06/30/2021 | 42467 | 24895 | 43222 |
| 09/30/2021 | 41282 | 25040 | 43802 |
| 12/31/2021 | 49727 | 27801 | 51113 |
| 03/31/2022 | 43793 | 26522 | 46841 |
| 06/30/2022 | 32916 | 22252 | 37360 |
| 09/30/2022 | 30488 | 21165 | 35041 |
| 12/31/2022 | 33253 | 22766 | 36703 |
| 03/31/2023 | 41826 | 24473 | 44710 |
| 06/30/2023 | 46748 | 26612 | 52402 |
| 09/30/2023 | 43104 | 25741 | 49445 |
| 12/31/2023 | 51260 | 28750 | 57932 |
| 03/31/2024 | 59552 | 31785 | 65282 |
| 06/30/2024 | 65687 | 33147 | 74294 |
| 09/30/2024 | 61949 | 35098 | 75490 |
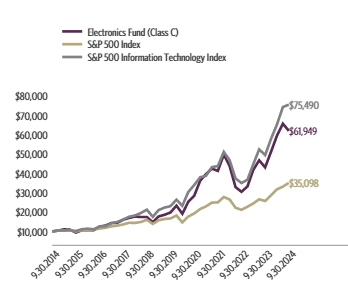
| Class C (without CDSC) | 4.02% | 43.72% | 25.60% | 20.01% |
| Class C (with CDSC)§ | 3.02% | 42.72% | 25.60% | 20.01% |
| S&P 500 Index | 10.42% | 36.35% | 15.98% | 13.38% |
| S&P 500 Information Technology Index | 15.64% | 52.68% | 26.74% | 22.40% |
The fund's past performance is not a good predictor of the fund's future performance. Visit GuggenheimInvestments.com/mutual-funds/performance for more recent performance information.
| Net Assets | $132,452,381 |
| Total Number of Portfolio Holdings | 57 |
| Portfolio Turnover Rate | 32% |
| Electronics Fund | Class C | RYSCX | Semi-Annual Shareholder Report | September 30, 2024 |
| Semiconductors | 93.0% |
| Energy-Alternate Sources | 5.2% |
| Electrical Components & Equipment | 0.9% |
| Telecommunications | 0.6% |
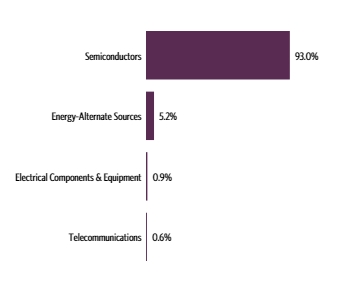
| NVIDIA Corp. | 15.6% |
| Broadcom, Inc. | 8.2% |
| Advanced Micro Devices, Inc. | 4.9% |
| Texas Instruments, Inc. | 4.1% |
| QUALCOMM, Inc. | 4.1% |
| Applied Materials, Inc. | 4.0% |
| Micron Technology, Inc. | 3.5% |
| Intel Corp. | 3.2% |
| Analog Devices, Inc. | 3.2% |
| Lam Research Corp. | 3.1% |
| Top 10 Total | 53.9% |
| |
1 | "Holdings Diversification (Market Exposure as a % of Net Assets)" excludes any temporary cash investments, investments in Guggenheim Strategy Funds Trust mutual funds, or investments in Guggenheim Ultra Short Duration Fund. |
| |
2 | "10 Largest Holdings (as a % of Net Assets)" excludes any temporary cash investments. |
| NVIDIA Corp. | 15.6% |
| Broadcom, Inc. | 8.2% |
| Advanced Micro Devices, Inc. | 4.9% |
| Texas Instruments, Inc. | 4.1% |
| QUALCOMM, Inc. | 4.1% |
| Applied Materials, Inc. | 4.0% |
| Micron Technology, Inc. | 3.5% |
| Intel Corp. | 3.2% |
| Analog Devices, Inc. | 3.2% |
| Lam Research Corp. | 3.1% |
| Top 10 Total | 53.9% |
| |
2 | "10 Largest Holdings (as a % of Net Assets)" excludes any temporary cash investments. |
There were no changes in or disagreements with fund accountants for the period.
| | | Availability of Additional Information. For additional information, including the fund's prospectus, financial information, holdings and proxy voting information, go to GuggenheimInvestments.com/mutual-funds/literature or, call 800 820 0888. |
SAR-RYSCX-093024
Semi-Annual Shareholder Report | 9.30.24
This semi-annual shareholder report contains important information about the Electronics Fund for the period of April 1, 2024 to September 30, 2024. You can find additional information about the fund at GuggenheimInvestments.com/mutual-funds/literature. You can also request this information by contacting 800 820 0888 or GuggenheimClientServices@mufg-is.com.
For the period of April 1, 2024 to September 30, 2024, the fund (Class H shares) returned 4.42%, underperforming the fund's benchmark, the S&P 500 Index, which returned 10.42% for the same period and underperforming the fund's secondary index, the S&P 500 Information Technology Index, which returned 15.64% for the same period.
What factors materially affected the fund's performance over the last six months?
The only industry that contributed to performance was semiconductors. The only industry that detracted from performance was semiconductor materials & equipment. The holdings that contributed the most to performance were NVIDIA Corp., Broadcom, Inc. and Texas Instruments, Inc. Those that detracted the most were Intel Corp., SolarEdge Technologies, Inc., and Lam Research Corp.
Cumulative performance* for the fund's most recently completed 10 years (as of 9.30.24), assuming a $10,000 initial investment.
| 09/30/2014 | 10000 | 10000 | 10000 |
| 12/31/2014 | 10439 | 10493 | 10524 |
| 03/31/2015 | 11109 | 10593 | 10585 |
| 06/30/2015 | 10951 | 10622 | 10604 |
| 09/30/2015 | 9484 | 9939 | 10211 |
| 12/31/2015 | 10670 | 10638 | 11148 |
| 03/31/2016 | 10789 | 10782 | 11438 |
| 06/30/2016 | 10713 | 11047 | 11113 |
| 09/30/2016 | 12673 | 11472 | 12542 |
| 12/31/2016 | 13238 | 11911 | 12692 |
| 03/31/2017 | 14563 | 12633 | 14287 |
| 06/30/2017 | 14736 | 13023 | 14878 |
| 09/30/2017 | 16376 | 13607 | 16164 |
| 12/31/2017 | 17380 | 14511 | 17620 |
| 03/31/2018 | 18100 | 14401 | 18241 |
| 06/30/2018 | 17903 | 14896 | 19535 |
| 09/30/2018 | 17940 | 16044 | 21254 |
| 12/31/2018 | 15175 | 13875 | 17569 |
| 03/31/2019 | 18295 | 15769 | 21059 |
| 06/30/2019 | 19234 | 16447 | 22335 |
| 09/30/2019 | 20511 | 16727 | 23081 |
| 12/31/2019 | 24189 | 18244 | 26405 |
| 03/31/2020 | 19890 | 14668 | 23254 |
| 06/30/2020 | 26316 | 17682 | 30353 |
| 09/30/2020 | 29643 | 19260 | 33981 |
| 12/31/2020 | 37842 | 21600 | 37994 |
| 03/31/2021 | 41475 | 22934 | 38744 |
| 06/30/2021 | 44531 | 24895 | 43222 |
| 09/30/2021 | 43371 | 25040 | 43802 |
| 12/31/2021 | 52343 | 27801 | 51113 |
| 03/31/2022 | 46183 | 26522 | 46841 |
| 06/30/2022 | 34775 | 22252 | 37360 |
| 09/30/2022 | 32274 | 21165 | 35041 |
| 12/31/2022 | 35267 | 22766 | 36703 |
| 03/31/2023 | 44441 | 24473 | 44710 |
| 06/30/2023 | 49764 | 26612 | 52402 |
| 09/30/2023 | 45970 | 25741 | 49445 |
| 12/31/2023 | 54772 | 28750 | 57932 |
| 03/31/2024 | 63750 | 31785 | 65282 |
| 06/30/2024 | 70448 | 33147 | 74294 |
| 09/30/2024 | 66565 | 35098 | 75490 |
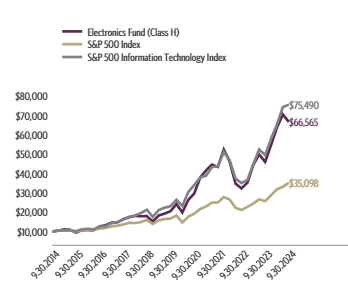
| Class H** | 4.42% | 44.80% | 26.55% | 20.87% |
| S&P 500 Index | 10.42% | 36.35% | 15.98% | 13.38% |
| S&P 500 Information Technology Index | 15.64% | 52.68% | 26.74% | 22.40% |
The fund's past performance is not a good predictor of the fund's future performance. Visit GuggenheimInvestments.com/mutual-funds/performance for more recent performance information.
| Net Assets | $132,452,381 |
| Total Number of Portfolio Holdings | 57 |
| Portfolio Turnover Rate | 32% |
| Electronics Fund | Class H | RYSAX | Semi-Annual Shareholder Report | September 30, 2024 |
| Semiconductors | 93.0% |
| Energy-Alternate Sources | 5.2% |
| Electrical Components & Equipment | 0.9% |
| Telecommunications | 0.6% |

| NVIDIA Corp. | 15.6% |
| Broadcom, Inc. | 8.2% |
| Advanced Micro Devices, Inc. | 4.9% |
| Texas Instruments, Inc. | 4.1% |
| QUALCOMM, Inc. | 4.1% |
| Applied Materials, Inc. | 4.0% |
| Micron Technology, Inc. | 3.5% |
| Intel Corp. | 3.2% |
| Analog Devices, Inc. | 3.2% |
| Lam Research Corp. | 3.1% |
| Top 10 Total | 53.9% |
| |
1 | "Holdings Diversification (Market Exposure as a % of Net Assets)" excludes any temporary cash investments, investments in Guggenheim Strategy Funds Trust mutual funds, or investments in Guggenheim Ultra Short Duration Fund. |
| |
2 | "10 Largest Holdings (as a % of Net Assets)" excludes any temporary cash investments. |
| NVIDIA Corp. | 15.6% |
| Broadcom, Inc. | 8.2% |
| Advanced Micro Devices, Inc. | 4.9% |
| Texas Instruments, Inc. | 4.1% |
| QUALCOMM, Inc. | 4.1% |
| Applied Materials, Inc. | 4.0% |
| Micron Technology, Inc. | 3.5% |
| Intel Corp. | 3.2% |
| Analog Devices, Inc. | 3.2% |
| Lam Research Corp. | 3.1% |
| Top 10 Total | 53.9% |
| |
2 | "10 Largest Holdings (as a % of Net Assets)" excludes any temporary cash investments. |
There were no changes in or disagreements with fund accountants for the period.
| | | Availability of Additional Information. For additional information, including the fund's prospectus, financial information, holdings and proxy voting information, go to GuggenheimInvestments.com/mutual-funds/literature or, call 800 820 0888. |
SAR-RYSAX-093024
Semi-Annual Shareholder Report | 9.30.24
This semi-annual shareholder report contains important information about the Energy Fund for the period of April 1, 2024 to September 30, 2024. You can find additional information about the fund at GuggenheimInvestments.com/mutual-funds/literature. You can also request this information by contacting 800 820 0888 or GuggenheimClientServices@mufg-is.com.
For the period of April 1, 2024 to September 30, 2024, the fund (Investor Class shares) returned -7.36%, underperforming the fund's benchmark, the S&P 500 Index, which returned 10.42% for the same period and underperforming the fund's secondary index, the S&P 500 Energy Index, which returned -4.68% for the same period.
What factors materially affected the fund's performance over the last six months?
The industries that contributed the most to performance were oil & gas storage & transportation, semiconductors, and coal & consumable fuels. Those that detracted the most were oil & gas exploration & production, oil & gas refining & marketing, and oil & gas equipment & services. The holdings that contributed the most to performance were First Solar, Inc., Targa Resources Corp., and Williams Companies, Inc. Those that detracted the most were SolarEdge Technologies, Inc., ConocoPhillips, and Schlumberger N.V.
Cumulative performance* for the fund's most recently completed 10 years (as of 9.30.24), assuming a $10,000 initial investment.
| 09/30/2014 | 10000 | 10000 | 10000 |
| 12/31/2014 | 7974 | 10493 | 8932 |
| 03/31/2015 | 7853 | 10593 | 8677 |
| 06/30/2015 | 7738 | 10622 | 8514 |
| 09/30/2015 | 5886 | 9939 | 7032 |
| 12/31/2015 | 5568 | 10638 | 7046 |
| 03/31/2016 | 5709 | 10782 | 7329 |
| 06/30/2016 | 6398 | 11047 | 8181 |
| 09/30/2016 | 6813 | 11472 | 8365 |
| 12/31/2016 | 7295 | 11911 | 8974 |
| 03/31/2017 | 6793 | 12633 | 8374 |
| 06/30/2017 | 5967 | 13023 | 7842 |
| 09/30/2017 | 6404 | 13607 | 8378 |
| 12/31/2017 | 6846 | 14511 | 8883 |
| 03/31/2018 | 6468 | 14401 | 8361 |
| 06/30/2018 | 7403 | 14896 | 9488 |
| 09/30/2018 | 7391 | 16044 | 9546 |
| 12/31/2018 | 5113 | 13875 | 7276 |
| 03/31/2019 | 5955 | 15769 | 8471 |
| 06/30/2019 | 5647 | 16447 | 8231 |
| 09/30/2019 | 5068 | 16727 | 7712 |
| 12/31/2019 | 5445 | 18244 | 8135 |
| 03/31/2020 | 2405 | 14668 | 4031 |
| 06/30/2020 | 3279 | 17682 | 5260 |
| 09/30/2020 | 2684 | 19260 | 4223 |
| 12/31/2020 | 3581 | 21600 | 5395 |
| 03/31/2021 | 4604 | 22934 | 7060 |
| 06/30/2021 | 5294 | 24895 | 7858 |
| 09/30/2021 | 5189 | 25040 | 7727 |
| 12/31/2021 | 5396 | 27801 | 8344 |
| 03/31/2022 | 7259 | 26522 | 11600 |
| 06/30/2022 | 6668 | 22252 | 11000 |
| 09/30/2022 | 7036 | 21165 | 11259 |
| 12/31/2022 | 8067 | 22766 | 13827 |
| 03/31/2023 | 7646 | 24473 | 13181 |
| 06/30/2023 | 7721 | 26612 | 13064 |
| 09/30/2023 | 8568 | 25741 | 14660 |
| 12/31/2023 | 8222 | 28750 | 13643 |
| 03/31/2024 | 9046 | 31785 | 15510 |
| 06/30/2024 | 8783 | 33147 | 15135 |
| 09/30/2024 | 8380 | 35098 | 14784 |
| Investor Class | -7.36% | -2.19% | 10.58% | -1.75% |
| S&P 500 Index | 10.42% | 36.35% | 15.98% | 13.38% |
| S&P 500 Energy Index | -4.68% | 0.84% | 13.90% | 3.99% |
The fund's past performance is not a good predictor of the fund's future performance. Visit GuggenheimInvestments.com/mutual-funds/performance for more recent performance information.
| Net Assets | $20,684,238 |
| Total Number of Portfolio Holdings | 86 |
| Portfolio Turnover Rate | 219% |
| Energy Fund | Investor Class | RYEIX | Semi-Annual Shareholder Report | September 30, 2024 |
| Oil & Gas | 64.5% |
| Pipelines | 15.0% |
| Oil & Gas Services | 9.3% |
| Energy-Alternate Sources | 5.2% |
| Mining | 1.7% |
| Transportation | 1.2% |
| Coal | 0.9% |
| Other | 1.5% |
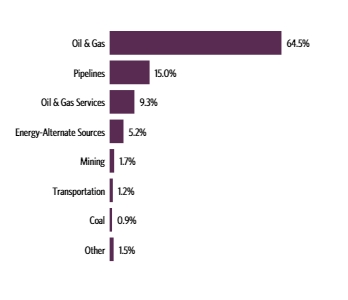
| Exxon Mobil Corp. | 7.2% |
| Chevron Corp. | 5.0% |
| ConocoPhillips | 3.4% |
| EOG Resources, Inc. | 2.6% |
| Schlumberger N.V. | 2.4% |
| Phillips 66 | 2.3% |
| Williams Companies, Inc. | 2.3% |
| Marathon Petroleum Corp. | 2.2% |
| ONEOK, Inc. | 2.2% |
| Diamondback Energy, Inc. | 2.1% |
| Top 10 Total | 31.7% |
| |
1 | "Holdings Diversification (Market Exposure as a % of Net Assets)" excludes any temporary cash investments, investments in Guggenheim Strategy Funds Trust mutual funds, or investments in Guggenheim Ultra Short Duration Fund. |
| |
2 | "10 Largest Holdings (as a % of Net Assets)" excludes any temporary cash investments. |
| Exxon Mobil Corp. | 7.2% |
| Chevron Corp. | 5.0% |
| ConocoPhillips | 3.4% |
| EOG Resources, Inc. | 2.6% |
| Schlumberger N.V. | 2.4% |
| Phillips 66 | 2.3% |
| Williams Companies, Inc. | 2.3% |
| Marathon Petroleum Corp. | 2.2% |
| ONEOK, Inc. | 2.2% |
| Diamondback Energy, Inc. | 2.1% |
| Top 10 Total | 31.7% |
| |
2 | "10 Largest Holdings (as a % of Net Assets)" excludes any temporary cash investments. |
There were no changes in or disagreements with fund accountants for the period.
| | | Availability of Additional Information. For additional information, including the fund's prospectus, financial information, holdings and proxy voting information, go to GuggenheimInvestments.com/mutual-funds/literature or, call 800 820 0888. |
SAR-RYEIX-093024
Semi-Annual Shareholder Report | 9.30.24
This semi-annual shareholder report contains important information about the Energy Fund for the period of April 1, 2024 to September 30, 2024. You can find additional information about the fund at GuggenheimInvestments.com/mutual-funds/literature. You can also request this information by contacting 800 820 0888 or GuggenheimClientServices@mufg-is.com.
For the period of April 1, 2024 to September 30, 2024, the fund (Class A shares) returned -7.48%, underperforming the fund's benchmark, the S&P 500 Index, which returned 10.42% for the same period and underperforming the fund's secondary index, the S&P 500 Energy Index, which returned -4.68% for the same period.
What factors materially affected the fund's performance over the last six months?
The industries that contributed the most to performance were oil & gas storage & transportation, semiconductors, and coal & consumable fuels. Those that detracted the most were oil & gas exploration & production, oil & gas refining & marketing, and oil & gas equipment & services. The holdings that contributed the most to performance were First Solar, Inc., Targa Resources Corp., and Williams Companies, Inc. Those that detracted the most were SolarEdge Technologies, Inc., ConocoPhillips, and Schlumberger N.V.
Cumulative performance* for the fund's most recently completed 10 years (as of 9.30.24), assuming a $10,000 initial investment.
| 09/30/2014 | 9525 | 10000 | 10000 |
| 12/31/2014 | 7590 | 10493 | 8932 |
| 03/31/2015 | 7481 | 10593 | 8677 |
| 06/30/2015 | 7365 | 10622 | 8514 |
| 09/30/2015 | 5602 | 9939 | 7032 |
| 12/31/2015 | 5295 | 10638 | 7046 |
| 03/31/2016 | 5427 | 10782 | 7329 |
| 06/30/2016 | 6078 | 11047 | 8181 |
| 09/30/2016 | 6465 | 11472 | 8365 |
| 12/31/2016 | 6919 | 11911 | 8974 |
| 03/31/2017 | 6438 | 12633 | 8374 |
| 06/30/2017 | 5652 | 13023 | 7842 |
| 09/30/2017 | 6063 | 13607 | 8378 |
| 12/31/2017 | 6477 | 14511 | 8883 |
| 03/31/2018 | 6117 | 14401 | 8361 |
| 06/30/2018 | 6997 | 14896 | 9488 |
| 09/30/2018 | 6981 | 16044 | 9546 |
| 12/31/2018 | 4827 | 13875 | 7276 |
| 03/31/2019 | 5618 | 15769 | 8471 |
| 06/30/2019 | 5325 | 16447 | 8231 |
| 09/30/2019 | 4775 | 16727 | 7712 |
| 12/31/2019 | 5128 | 18244 | 8135 |
| 03/31/2020 | 2265 | 14668 | 4031 |
| 06/30/2020 | 3084 | 17682 | 5260 |
| 09/30/2020 | 2523 | 19260 | 4223 |
| 12/31/2020 | 3364 | 21600 | 5395 |
| 03/31/2021 | 4323 | 22934 | 7060 |
| 06/30/2021 | 4967 | 24895 | 7858 |
| 09/30/2021 | 4866 | 25040 | 7727 |
| 12/31/2021 | 5057 | 27801 | 8344 |
| 03/31/2022 | 6798 | 26522 | 11600 |
| 06/30/2022 | 6240 | 22252 | 11000 |
| 09/30/2022 | 6580 | 21165 | 11259 |
| 12/31/2022 | 7540 | 22766 | 13827 |
| 03/31/2023 | 7143 | 24473 | 13181 |
| 06/30/2023 | 7208 | 26612 | 13064 |
| 09/30/2023 | 7994 | 25741 | 14660 |
| 12/31/2023 | 7666 | 28750 | 13643 |
| 03/31/2024 | 8430 | 31785 | 15510 |
| 06/30/2024 | 8179 | 33147 | 15135 |
| 09/30/2024 | 7800 | 35098 | 14784 |
| Class A (without sales charge) | -7.48% | -2.44% | 10.31% | -1.98% |
| Class A (with sales charge)‡ | -11.87% | -7.07% | 9.24% | -2.45% |
| S&P 500 Index | 10.42% | 36.35% | 15.98% | 13.38% |
| S&P 500 Energy Index | -4.68% | 0.84% | 13.90% | 3.99% |
The fund's past performance is not a good predictor of the fund's future performance. Visit GuggenheimInvestments.com/mutual-funds/performance for more recent performance information.
| Net Assets | $20,684,238 |
| Total Number of Portfolio Holdings | 86 |
| Portfolio Turnover Rate | 219% |
| Energy Fund | Class A | RYENX | Semi-Annual Shareholder Report | September 30, 2024 |
| Oil & Gas | 64.5% |
| Pipelines | 15.0% |
| Oil & Gas Services | 9.3% |
| Energy-Alternate Sources | 5.2% |
| Mining | 1.7% |
| Transportation | 1.2% |
| Coal | 0.9% |
| Other | 1.5% |

| Exxon Mobil Corp. | 7.2% |
| Chevron Corp. | 5.0% |
| ConocoPhillips | 3.4% |
| EOG Resources, Inc. | 2.6% |
| Schlumberger N.V. | 2.4% |
| Phillips 66 | 2.3% |
| Williams Companies, Inc. | 2.3% |
| Marathon Petroleum Corp. | 2.2% |
| ONEOK, Inc. | 2.2% |
| Diamondback Energy, Inc. | 2.1% |
| Top 10 Total | 31.7% |
| |
1 | "Holdings Diversification (Market Exposure as a % of Net Assets)" excludes any temporary cash investments, investments in Guggenheim Strategy Funds Trust mutual funds, or investments in Guggenheim Ultra Short Duration Fund. |
| |
2 | "10 Largest Holdings (as a % of Net Assets)" excludes any temporary cash investments. |
| Exxon Mobil Corp. | 7.2% |
| Chevron Corp. | 5.0% |
| ConocoPhillips | 3.4% |
| EOG Resources, Inc. | 2.6% |
| Schlumberger N.V. | 2.4% |
| Phillips 66 | 2.3% |
| Williams Companies, Inc. | 2.3% |
| Marathon Petroleum Corp. | 2.2% |
| ONEOK, Inc. | 2.2% |
| Diamondback Energy, Inc. | 2.1% |
| Top 10 Total | 31.7% |
| |
2 | "10 Largest Holdings (as a % of Net Assets)" excludes any temporary cash investments. |
There were no changes in or disagreements with fund accountants for the period.
| | | Availability of Additional Information. For additional information, including the fund's prospectus, financial information, holdings and proxy voting information, go to GuggenheimInvestments.com/mutual-funds/literature or, call 800 820 0888. |
SAR-RYENX-093024
Semi-Annual Shareholder Report | 9.30.24
This semi-annual shareholder report contains important information about the Energy Fund for the period of April 1, 2024 to September 30, 2024. You can find additional information about the fund at GuggenheimInvestments.com/mutual-funds/literature. You can also request this information by contacting 800 820 0888 or GuggenheimClientServices@mufg-is.com.
For the period of April 1, 2024 to September 30, 2024, the fund (Class C shares) returned -7.82%, underperforming the fund's benchmark, the S&P 500 Index, which returned 10.42% for the same period and underperforming the fund's secondary index, the S&P 500 Energy Index, which returned -4.68% for the same period.
What factors materially affected the fund's performance over the last six months?
The industries that contributed the most to performance were oil & gas storage & transportation, semiconductors, and coal & consumable fuels. Those that detracted the most were oil & gas exploration & production, oil & gas refining & marketing, and oil & gas equipment & services. The holdings that contributed the most to performance were First Solar, Inc., Targa Resources Corp., and Williams Companies, Inc. Those that detracted the most were SolarEdge Technologies, Inc., ConocoPhillips, and Schlumberger N.V.
Cumulative performance* for the fund's most recently completed 10 years (as of 9.30.24), assuming a $10,000 initial investment.
| 09/30/2014 | 10000 | 10000 | 10000 |
| 12/31/2014 | 7953 | 10493 | 8932 |
| 03/31/2015 | 7813 | 10593 | 8677 |
| 06/30/2015 | 7676 | 10622 | 8514 |
| 09/30/2015 | 5826 | 9939 | 7032 |
| 12/31/2015 | 5497 | 10638 | 7046 |
| 03/31/2016 | 5625 | 10782 | 7329 |
| 06/30/2016 | 6285 | 11047 | 8181 |
| 09/30/2016 | 6679 | 11472 | 8365 |
| 12/31/2016 | 7131 | 11911 | 8974 |
| 03/31/2017 | 6624 | 12633 | 8374 |
| 06/30/2017 | 5803 | 13023 | 7842 |
| 09/30/2017 | 6214 | 13607 | 8378 |
| 12/31/2017 | 6625 | 14511 | 8883 |
| 03/31/2018 | 6244 | 14401 | 8361 |
| 06/30/2018 | 7129 | 14896 | 9488 |
| 09/30/2018 | 7100 | 16044 | 9546 |
| 12/31/2018 | 4899 | 13875 | 7276 |
| 03/31/2019 | 5693 | 15769 | 8471 |
| 06/30/2019 | 5385 | 16447 | 8231 |
| 09/30/2019 | 4820 | 16727 | 7712 |
| 12/31/2019 | 5166 | 18244 | 8135 |
| 03/31/2020 | 2277 | 14668 | 4031 |
| 06/30/2020 | 3095 | 17682 | 5260 |
| 09/30/2020 | 2527 | 19260 | 4223 |
| 12/31/2020 | 3363 | 21600 | 5395 |
| 03/31/2021 | 4314 | 22934 | 7060 |
| 06/30/2021 | 4948 | 24895 | 7858 |
| 09/30/2021 | 4838 | 25040 | 7727 |
| 12/31/2021 | 5018 | 27801 | 8344 |
| 03/31/2022 | 6733 | 26522 | 11600 |
| 06/30/2022 | 6170 | 22252 | 11000 |
| 09/30/2022 | 6493 | 21165 | 11259 |
| 12/31/2022 | 7427 | 22766 | 13827 |
| 03/31/2023 | 7022 | 24473 | 13181 |
| 06/30/2023 | 7073 | 26612 | 13064 |
| 09/30/2023 | 7830 | 25741 | 14660 |
| 12/31/2023 | 7495 | 28750 | 13643 |
| 03/31/2024 | 8226 | 31785 | 15510 |
| 06/30/2024 | 7966 | 33147 | 15135 |
| 09/30/2024 | 7582 | 35098 | 14784 |
| Class C (without CDSC) | -7.82% | -3.17% | 9.49% | -2.73% |
| Class C (with CDSC)§ | -8.74% | -4.10% | 9.49% | -2.73% |
| S&P 500 Index | 10.42% | 36.35% | 15.98% | 13.38% |
| S&P 500 Energy Index | -4.68% | 0.84% | 13.90% | 3.99% |
The fund's past performance is not a good predictor of the fund's future performance. Visit GuggenheimInvestments.com/mutual-funds/performance for more recent performance information.
| Net Assets | $20,684,238 |
| Total Number of Portfolio Holdings | 86 |
| Portfolio Turnover Rate | 219% |
| Energy Fund | Class C | RYECX | Semi-Annual Shareholder Report | September 30, 2024 |
| Oil & Gas | 64.5% |
| Pipelines | 15.0% |
| Oil & Gas Services | 9.3% |
| Energy-Alternate Sources | 5.2% |
| Mining | 1.7% |
| Transportation | 1.2% |
| Coal | 0.9% |
| Other | 1.5% |

| Exxon Mobil Corp. | 7.2% |
| Chevron Corp. | 5.0% |
| ConocoPhillips | 3.4% |
| EOG Resources, Inc. | 2.6% |
| Schlumberger N.V. | 2.4% |
| Phillips 66 | 2.3% |
| Williams Companies, Inc. | 2.3% |
| Marathon Petroleum Corp. | 2.2% |
| ONEOK, Inc. | 2.2% |
| Diamondback Energy, Inc. | 2.1% |
| Top 10 Total | 31.7% |
| |
1 | "Holdings Diversification (Market Exposure as a % of Net Assets)" excludes any temporary cash investments, investments in Guggenheim Strategy Funds Trust mutual funds, or investments in Guggenheim Ultra Short Duration Fund. |
| |
2 | "10 Largest Holdings (as a % of Net Assets)" excludes any temporary cash investments. |
| Exxon Mobil Corp. | 7.2% |
| Chevron Corp. | 5.0% |
| ConocoPhillips | 3.4% |
| EOG Resources, Inc. | 2.6% |
| Schlumberger N.V. | 2.4% |
| Phillips 66 | 2.3% |
| Williams Companies, Inc. | 2.3% |
| Marathon Petroleum Corp. | 2.2% |
| ONEOK, Inc. | 2.2% |
| Diamondback Energy, Inc. | 2.1% |
| Top 10 Total | 31.7% |
| |
2 | "10 Largest Holdings (as a % of Net Assets)" excludes any temporary cash investments. |
There were no changes in or disagreements with fund accountants for the period.
| | | Availability of Additional Information. For additional information, including the fund's prospectus, financial information, holdings and proxy voting information, go to GuggenheimInvestments.com/mutual-funds/literature or, call 800 820 0888. |
SAR-RYECX-093024
Semi-Annual Shareholder Report | 9.30.24
This semi-annual shareholder report contains important information about the Energy Fund for the period of April 1, 2024 to September 30, 2024. You can find additional information about the fund at GuggenheimInvestments.com/mutual-funds/literature. You can also request this information by contacting 800 820 0888 or GuggenheimClientServices@mufg-is.com.
For the period of April 1, 2024 to September 30, 2024, the fund (Class H shares) returned -7.49%, underperforming the fund's benchmark, the S&P 500 Index, which returned 10.42% for the same period and underperforming the fund's secondary index, the S&P 500 Energy Index, which returned -4.68% for the same period.
What factors materially affected the fund's performance over the last six months?
The industries that contributed the most to performance were oil & gas storage & transportation, semiconductors, and coal & consumable fuels. Those that detracted the most were oil & gas exploration & production, oil & gas refining & marketing, and oil & gas equipment & services. The holdings that contributed the most to performance were First Solar, Inc., Targa Resources Corp., and Williams Companies, Inc. Those that detracted the most were SolarEdge Technologies, Inc., ConocoPhillips, and Schlumberger N.V.
Cumulative performance* for the fund's most recently completed 10 years (as of 9.30.24), assuming a $10,000 initial investment.
| 09/30/2014 | 10000 | 10000 | 10000 |
| 12/31/2014 | 7967 | 10493 | 8932 |
| 03/31/2015 | 7839 | 10593 | 8677 |
| 06/30/2015 | 7710 | 10622 | 8514 |
| 09/30/2015 | 5866 | 9939 | 7032 |
| 12/31/2015 | 5546 | 10638 | 7046 |
| 03/31/2016 | 5681 | 10782 | 7329 |
| 06/30/2016 | 6360 | 11047 | 8181 |
| 09/30/2016 | 6767 | 11472 | 8365 |
| 12/31/2016 | 7239 | 11911 | 8974 |
| 03/31/2017 | 6736 | 12633 | 8374 |
| 06/30/2017 | 5912 | 13023 | 7842 |
| 09/30/2017 | 6342 | 13607 | 8378 |
| 12/31/2017 | 6775 | 14511 | 8883 |
| 03/31/2018 | 6397 | 14401 | 8361 |
| 06/30/2018 | 7316 | 14896 | 9488 |
| 09/30/2018 | 7299 | 16044 | 9546 |
| 12/31/2018 | 5047 | 13875 | 7276 |
| 03/31/2019 | 5875 | 15769 | 8471 |
| 06/30/2019 | 5565 | 16447 | 8231 |
| 09/30/2019 | 4989 | 16727 | 7712 |
| 12/31/2019 | 5358 | 18244 | 8135 |
| 03/31/2020 | 2366 | 14668 | 4031 |
| 06/30/2020 | 3222 | 17682 | 5260 |
| 09/30/2020 | 2636 | 19260 | 4223 |
| 12/31/2020 | 3514 | 21600 | 5395 |
| 03/31/2021 | 4516 | 22934 | 7060 |
| 06/30/2021 | 5189 | 24895 | 7858 |
| 09/30/2021 | 5083 | 25040 | 7727 |
| 12/31/2021 | 5282 | 27801 | 8344 |
| 03/31/2022 | 7101 | 26522 | 11600 |
| 06/30/2022 | 6519 | 22252 | 11000 |
| 09/30/2022 | 6874 | 21165 | 11259 |
| 12/31/2022 | 7877 | 22766 | 13827 |
| 03/31/2023 | 7462 | 24473 | 13181 |
| 06/30/2023 | 7530 | 26612 | 13064 |
| 09/30/2023 | 8351 | 25741 | 14660 |
| 12/31/2023 | 8009 | 28750 | 13643 |
| 03/31/2024 | 8806 | 31785 | 15510 |
| 06/30/2024 | 8545 | 33147 | 15135 |
| 09/30/2024 | 8148 | 35098 | 14784 |
| Class H** | -7.49% | -2.44% | 10.31% | -2.03% |
| S&P 500 Index | 10.42% | 36.35% | 15.98% | 13.38% |
| S&P 500 Energy Index | -4.68% | 0.84% | 13.90% | 3.99% |
The fund's past performance is not a good predictor of the fund's future performance. Visit GuggenheimInvestments.com/mutual-funds/performance for more recent performance information.
| Net Assets | $20,684,238 |
| Total Number of Portfolio Holdings | 86 |
| Portfolio Turnover Rate | 219% |
| Energy Fund | Class H | RYEAX | Semi-Annual Shareholder Report | September 30, 2024 |
| Oil & Gas | 64.5% |
| Pipelines | 15.0% |
| Oil & Gas Services | 9.3% |
| Energy-Alternate Sources | 5.2% |
| Mining | 1.7% |
| Transportation | 1.2% |
| Coal | 0.9% |
| Other | 1.5% |

| Exxon Mobil Corp. | 7.2% |
| Chevron Corp. | 5.0% |
| ConocoPhillips | 3.4% |
| EOG Resources, Inc. | 2.6% |
| Schlumberger N.V. | 2.4% |
| Phillips 66 | 2.3% |
| Williams Companies, Inc. | 2.3% |
| Marathon Petroleum Corp. | 2.2% |
| ONEOK, Inc. | 2.2% |
| Diamondback Energy, Inc. | 2.1% |
| Top 10 Total | 31.7% |
| |
1 | "Holdings Diversification (Market Exposure as a % of Net Assets)" excludes any temporary cash investments, investments in Guggenheim Strategy Funds Trust mutual funds, or investments in Guggenheim Ultra Short Duration Fund. |
| |
2 | "10 Largest Holdings (as a % of Net Assets)" excludes any temporary cash investments. |
| Exxon Mobil Corp. | 7.2% |
| Chevron Corp. | 5.0% |
| ConocoPhillips | 3.4% |
| EOG Resources, Inc. | 2.6% |
| Schlumberger N.V. | 2.4% |
| Phillips 66 | 2.3% |
| Williams Companies, Inc. | 2.3% |
| Marathon Petroleum Corp. | 2.2% |
| ONEOK, Inc. | 2.2% |
| Diamondback Energy, Inc. | 2.1% |
| Top 10 Total | 31.7% |
| |
2 | "10 Largest Holdings (as a % of Net Assets)" excludes any temporary cash investments. |
There were no changes in or disagreements with fund accountants for the period.
| | | Availability of Additional Information. For additional information, including the fund's prospectus, financial information, holdings and proxy voting information, go to GuggenheimInvestments.com/mutual-funds/literature or, call 800 820 0888. |
SAR-RYEAX-093024
Semi-Annual Shareholder Report | 9.30.24
This semi-annual shareholder report contains important information about the Energy Services Fund for the period of April 1, 2024 to September 30, 2024. You can find additional information about the fund at GuggenheimInvestments.com/mutual-funds/literature. You can also request this information by contacting 800 820 0888 or GuggenheimClientServices@mufg-is.com.
For the period of April 1, 2024 to September 30, 2024, the fund (Investor Class shares) returned -13.84%, underperforming the fund's benchmark, the S&P 500 Index, which returned 10.42% for the same period and underperforming the fund's secondary index, the S&P 500 Energy Index, which returned -4.68% for the same period.
What factors materially affected the fund's performance over the last six months?
No industry contributed to performance. The industries that detracted the most were oil & gas equipment & services and oil & gas drilling. The holdings that contributed the most to performance were Baker Hughes Co., Cactus, Inc. – Class A, and U.S. Silica Holdings, Inc. Those that detracted the most were Schlumberger N.V., Halliburton Co., and Patterson-UTI Energy, Inc.
Cumulative performance* for the fund's most recently completed 10 years (as of 9.30.24), assuming a $10,000 initial investment.
| 09/30/2014 | 10000 | 10000 | 10000 |
| 12/31/2014 | 7273 | 10493 | 8932 |
| 03/31/2015 | 6734 | 10593 | 8677 |
| 06/30/2015 | 6895 | 10622 | 8514 |
| 09/30/2015 | 5032 | 9939 | 7032 |
| 12/31/2015 | 4963 | 10638 | 7046 |
| 03/31/2016 | 4912 | 10782 | 7329 |
| 06/30/2016 | 5321 | 11047 | 8181 |
| 09/30/2016 | 5302 | 11472 | 8365 |
| 12/31/2016 | 6133 | 11911 | 8974 |
| 03/31/2017 | 5619 | 12633 | 8374 |
| 06/30/2017 | 4505 | 13023 | 7842 |
| 09/30/2017 | 4803 | 13607 | 8378 |
| 12/31/2017 | 4976 | 14511 | 8883 |
| 03/31/2018 | 4433 | 14401 | 8361 |
| 06/30/2018 | 4829 | 14896 | 9488 |
| 09/30/2018 | 4707 | 16044 | 9546 |
| 12/31/2018 | 2708 | 13875 | 7276 |
| 03/31/2019 | 3350 | 15769 | 8471 |
| 06/30/2019 | 2963 | 16447 | 8231 |
| 09/30/2019 | 2400 | 16727 | 7712 |
| 12/31/2019 | 2697 | 18244 | 8135 |
| 03/31/2020 | 897 | 14668 | 4031 |
| 06/30/2020 | 1297 | 17682 | 5260 |
| 09/30/2020 | 1114 | 19260 | 4223 |
| 12/31/2020 | 1701 | 21600 | 5395 |
| 03/31/2021 | 2037 | 22934 | 7060 |
| 06/30/2021 | 2285 | 24895 | 7858 |
| 09/30/2021 | 2105 | 25040 | 7727 |
| 12/31/2021 | 1992 | 27801 | 8344 |
| 03/31/2022 | 2800 | 26522 | 11600 |
| 06/30/2022 | 2247 | 22252 | 11000 |
| 09/30/2022 | 2056 | 21165 | 11259 |
| 12/31/2022 | 2849 | 22766 | 13827 |
| 03/31/2023 | 2583 | 24473 | 13181 |
| 06/30/2023 | 2698 | 26612 | 13064 |
| 09/30/2023 | 3252 | 25741 | 14660 |
| 12/31/2023 | 2976 | 28750 | 13643 |
| 03/31/2024 | 3239 | 31785 | 15510 |
| 06/30/2024 | 3118 | 33147 | 15135 |
| 09/30/2024 | 2790 | 35098 | 14784 |
| Investor Class | -13.84% | -14.20% | 3.06% | -11.98% |
| S&P 500 Index | 10.42% | 36.35% | 15.98% | 13.38% |
| S&P 500 Energy Index | -4.68% | 0.84% | 13.90% | 3.99% |
The fund's past performance is not a good predictor of the fund's future performance. Visit GuggenheimInvestments.com/mutual-funds/performance for more recent performance information.
| Net Assets | $6,748,377 |
| Total Number of Portfolio Holdings | 33 |
| Portfolio Turnover Rate | 95% |
| Energy Services Fund | Investor Class | RYVIX | Semi-Annual Shareholder Report | September 30, 2024 |
| Oil & Gas Services | 68.4% |
| Oil & Gas | 24.0% |
| Machinery-Diversified | 3.6% |
| Metal Fabricate & Hardware | 3.3% |
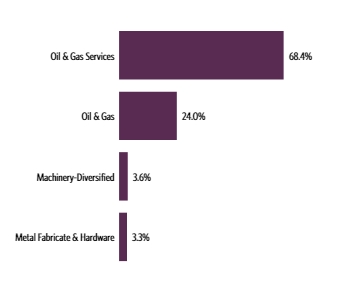
| Schlumberger N.V. | 13.0% |
| Baker Hughes Co. | 10.1% |
| Halliburton Co. | 8.0% |
| TechnipFMC plc | 4.2% |
| NOV, Inc. | 4.0% |
| ChampionX Corp. | 4.0% |
| Weatherford International plc | 3.8% |
| Noble Corporation plc | 3.8% |
| Cactus, Inc. — Class A | 3.6% |
| Tenaris S.A. ADR | 3.3% |
| Top 10 Total | 57.8% |
| |
1 | "Holdings Diversification (Market Exposure as a % of Net Assets)" excludes any temporary cash investments, investments in Guggenheim Strategy Funds Trust mutual funds, or investments in Guggenheim Ultra Short Duration Fund. |
| |
2 | "10 Largest Holdings (as a % of Net Assets)" excludes any temporary cash investments. |
| Schlumberger N.V. | 13.0% |
| Baker Hughes Co. | 10.1% |
| Halliburton Co. | 8.0% |
| TechnipFMC plc | 4.2% |
| NOV, Inc. | 4.0% |
| ChampionX Corp. | 4.0% |
| Weatherford International plc | 3.8% |
| Noble Corporation plc | 3.8% |
| Cactus, Inc. — Class A | 3.6% |
| Tenaris S.A. ADR | 3.3% |
| Top 10 Total | 57.8% |
| |
2 | "10 Largest Holdings (as a % of Net Assets)" excludes any temporary cash investments. |
There were no changes in or disagreements with fund accountants for the period.
| | | Availability of Additional Information. For additional information, including the fund's prospectus, financial information, holdings and proxy voting information, go to GuggenheimInvestments.com/mutual-funds/literature or, call 800 820 0888. |
SAR-RYVIX-093024
Semi-Annual Shareholder Report | 9.30.24
This semi-annual shareholder report contains important information about the Energy Services Fund for the period of April 1, 2024 to September 30, 2024. You can find additional information about the fund at GuggenheimInvestments.com/mutual-funds/literature. You can also request this information by contacting 800 820 0888 or GuggenheimClientServices@mufg-is.com.
For the period of April 1, 2024 to September 30, 2024, the fund (Class A shares) returned -13.95%, underperforming the fund's benchmark, the S&P 500 Index, which returned 10.42% for the same period and underperforming the fund's secondary index, the S&P 500 Energy Index, which returned -4.68% for the same period.
What factors materially affected the fund's performance over the last six months?
No industry contributed to performance. The industries that detracted the most were oil & gas equipment & services and oil & gas drilling. The holdings that contributed the most to performance were Baker Hughes Co., Cactus, Inc. – Class A, and U.S. Silica Holdings, Inc. Those that detracted the most were Schlumberger N.V., Halliburton Co., and Patterson-UTI Energy, Inc.
Cumulative performance* for the fund's most recently completed 10 years (as of 9.30.24), assuming a $10,000 initial investment.
| 09/30/2014 | 9525 | 10000 | 10000 |
| 12/31/2014 | 6923 | 10493 | 8932 |
| 03/31/2015 | 6405 | 10593 | 8677 |
| 06/30/2015 | 6554 | 10622 | 8514 |
| 09/30/2015 | 4779 | 9939 | 7032 |
| 12/31/2015 | 4712 | 10638 | 7046 |
| 03/31/2016 | 4662 | 10782 | 7329 |
| 06/30/2016 | 5045 | 11047 | 8181 |
| 09/30/2016 | 5021 | 11472 | 8365 |
| 12/31/2016 | 5808 | 11911 | 8974 |
| 03/31/2017 | 5318 | 12633 | 8374 |
| 06/30/2017 | 4263 | 13023 | 7842 |
| 09/30/2017 | 4541 | 13607 | 8378 |
| 12/31/2017 | 4701 | 14511 | 8883 |
| 03/31/2018 | 4185 | 14401 | 8361 |
| 06/30/2018 | 4556 | 14896 | 9488 |
| 09/30/2018 | 4440 | 16044 | 9546 |
| 12/31/2018 | 2552 | 13875 | 7276 |
| 03/31/2019 | 3154 | 15769 | 8471 |
| 06/30/2019 | 2788 | 16447 | 8231 |
| 09/30/2019 | 2258 | 16727 | 7712 |
| 12/31/2019 | 2535 | 18244 | 8135 |
| 03/31/2020 | 843 | 14668 | 4031 |
| 06/30/2020 | 1218 | 17682 | 5260 |
| 09/30/2020 | 1046 | 19260 | 4223 |
| 12/31/2020 | 1595 | 21600 | 5395 |
| 03/31/2021 | 1909 | 22934 | 7060 |
| 06/30/2021 | 2140 | 24895 | 7858 |
| 09/30/2021 | 1969 | 25040 | 7727 |
| 12/31/2021 | 1863 | 27801 | 8344 |
| 03/31/2022 | 2617 | 26522 | 11600 |
| 06/30/2022 | 2098 | 22252 | 11000 |
| 09/30/2022 | 1919 | 21165 | 11259 |
| 12/31/2022 | 2658 | 22766 | 13827 |
| 03/31/2023 | 2408 | 24473 | 13181 |
| 06/30/2023 | 2513 | 26612 | 13064 |
| 09/30/2023 | 3028 | 25741 | 14660 |
| 12/31/2023 | 2769 | 28750 | 13643 |
| 03/31/2024 | 3011 | 31785 | 15510 |
| 06/30/2024 | 2897 | 33147 | 15135 |
| 09/30/2024 | 2591 | 35098 | 14784 |
| Class A (without sales charge) | -13.95% | -14.42% | 2.79% | -12.21% |
| Class A (with sales charge)‡ | -18.04% | -18.48% | 1.80% | -12.63% |
| S&P 500 Index | 10.42% | 36.35% | 15.98% | 13.38% |
| S&P 500 Energy Index | -4.68% | 0.84% | 13.90% | 3.99% |
The fund's past performance is not a good predictor of the fund's future performance. Visit GuggenheimInvestments.com/mutual-funds/performance for more recent performance information.
| Net Assets | $6,748,377 |
| Total Number of Portfolio Holdings | 33 |
| Portfolio Turnover Rate | 95% |
| Energy Services Fund | Class A | RYESX | Semi-Annual Shareholder Report | September 30, 2024 |
| Oil & Gas Services | 68.4% |
| Oil & Gas | 24.0% |
| Machinery-Diversified | 3.6% |
| Metal Fabricate & Hardware | 3.3% |

| Schlumberger N.V. | 13.0% |
| Baker Hughes Co. | 10.1% |
| Halliburton Co. | 8.0% |
| TechnipFMC plc | 4.2% |
| NOV, Inc. | 4.0% |
| ChampionX Corp. | 4.0% |
| Weatherford International plc | 3.8% |
| Noble Corporation plc | 3.8% |
| Cactus, Inc. — Class A | 3.6% |
| Tenaris S.A. ADR | 3.3% |
| Top 10 Total | 57.8% |
| |
1 | "Holdings Diversification (Market Exposure as a % of Net Assets)" excludes any temporary cash investments, investments in Guggenheim Strategy Funds Trust mutual funds, or investments in Guggenheim Ultra Short Duration Fund. |
| |
2 | "10 Largest Holdings (as a % of Net Assets)" excludes any temporary cash investments. |
| Schlumberger N.V. | 13.0% |
| Baker Hughes Co. | 10.1% |
| Halliburton Co. | 8.0% |
| TechnipFMC plc | 4.2% |
| NOV, Inc. | 4.0% |
| ChampionX Corp. | 4.0% |
| Weatherford International plc | 3.8% |
| Noble Corporation plc | 3.8% |
| Cactus, Inc. — Class A | 3.6% |
| Tenaris S.A. ADR | 3.3% |
| Top 10 Total | 57.8% |
| |
2 | "10 Largest Holdings (as a % of Net Assets)" excludes any temporary cash investments. |
There were no changes in or disagreements with fund accountants for the period.
| | | Availability of Additional Information. For additional information, including the fund's prospectus, financial information, holdings and proxy voting information, go to GuggenheimInvestments.com/mutual-funds/literature or, call 800 820 0888. |
SAR-RYESX-093024
Semi-Annual Shareholder Report | 9.30.24
This semi-annual shareholder report contains important information about the Energy Services Fund for the period of April 1, 2024 to September 30, 2024. You can find additional information about the fund at GuggenheimInvestments.com/mutual-funds/literature. You can also request this information by contacting 800 820 0888 or GuggenheimClientServices@mufg-is.com.
For the period of April 1, 2024 to September 30, 2024, the fund (Class C shares) returned -14.27%, underperforming the fund's benchmark, the S&P 500 Index, which returned 10.42% for the same period and underperforming the fund's secondary index, the S&P 500 Energy Index, which returned -4.68% for the same period.
What factors materially affected the fund's performance over the last six months?
No industry contributed to performance. The industries that detracted the most were oil & gas equipment & services and oil & gas drilling. The holdings that contributed the most to performance were Baker Hughes Co., Cactus, Inc. – Class A, and U.S. Silica Holdings, Inc. Those that detracted the most were Schlumberger N.V., Halliburton Co., and Patterson-UTI Energy, Inc.
Cumulative performance* for the fund's most recently completed 10 years (as of 9.30.24), assuming a $10,000 initial investment.
| 09/30/2014 | 10000 | 10000 | 10000 |
| 12/31/2014 | 7254 | 10493 | 8932 |
| 03/31/2015 | 6699 | 10593 | 8677 |
| 06/30/2015 | 6842 | 10622 | 8514 |
| 09/30/2015 | 4979 | 9939 | 7032 |
| 12/31/2015 | 4901 | 10638 | 7046 |
| 03/31/2016 | 4839 | 10782 | 7329 |
| 06/30/2016 | 5227 | 11047 | 8181 |
| 09/30/2016 | 5193 | 11472 | 8365 |
| 12/31/2016 | 5996 | 11911 | 8974 |
| 03/31/2017 | 5479 | 12633 | 8374 |
| 06/30/2017 | 4383 | 13023 | 7842 |
| 09/30/2017 | 4660 | 13607 | 8378 |
| 12/31/2017 | 4815 | 14511 | 8883 |
| 03/31/2018 | 4280 | 14401 | 8361 |
| 06/30/2018 | 4651 | 14896 | 9488 |
| 09/30/2018 | 4522 | 16044 | 9546 |
| 12/31/2018 | 2594 | 13875 | 7276 |
| 03/31/2019 | 3202 | 15769 | 8471 |
| 06/30/2019 | 2825 | 16447 | 8231 |
| 09/30/2019 | 2284 | 16727 | 7712 |
| 12/31/2019 | 2560 | 18244 | 8135 |
| 03/31/2020 | 850 | 14668 | 4031 |
| 06/30/2020 | 1226 | 17682 | 5260 |
| 09/30/2020 | 1049 | 19260 | 4223 |
| 12/31/2020 | 1598 | 21600 | 5395 |
| 03/31/2021 | 1909 | 22934 | 7060 |
| 06/30/2021 | 2136 | 24895 | 7858 |
| 09/30/2021 | 1962 | 25040 | 7727 |
| 12/31/2021 | 1853 | 27801 | 8344 |
| 03/31/2022 | 2598 | 26522 | 11600 |
| 06/30/2022 | 2079 | 22252 | 11000 |
| 09/30/2022 | 1898 | 21165 | 11259 |
| 12/31/2022 | 2624 | 22766 | 13827 |
| 03/31/2023 | 2372 | 24473 | 13181 |
| 06/30/2023 | 2472 | 26612 | 13064 |
| 09/30/2023 | 2972 | 25741 | 14660 |
| 12/31/2023 | 2713 | 28750 | 13643 |
| 03/31/2024 | 2945 | 31785 | 15510 |
| 06/30/2024 | 2828 | 33147 | 15135 |
| 09/30/2024 | 2525 | 35098 | 14784 |
| Class C (without CDSC) | -14.27% | -15.05% | 2.03% | -12.86% |
| Class C (with CDSC)§ | -15.14% | -15.90% | 2.03% | -12.86% |
| S&P 500 Index | 10.42% | 36.35% | 15.98% | 13.38% |
| S&P 500 Energy Index | -4.68% | 0.84% | 13.90% | 3.99% |
The fund's past performance is not a good predictor of the fund's future performance. Visit GuggenheimInvestments.com/mutual-funds/performance for more recent performance information.
| Net Assets | $6,748,377 |
| Total Number of Portfolio Holdings | 33 |
| Portfolio Turnover Rate | 95% |
| Energy Services Fund | Class C | RYVCX | Semi-Annual Shareholder Report | September 30, 2024 |
| Oil & Gas Services | 68.4% |
| Oil & Gas | 24.0% |
| Machinery-Diversified | 3.6% |
| Metal Fabricate & Hardware | 3.3% |

| Schlumberger N.V. | 13.0% |
| Baker Hughes Co. | 10.1% |
| Halliburton Co. | 8.0% |
| TechnipFMC plc | 4.2% |
| NOV, Inc. | 4.0% |
| ChampionX Corp. | 4.0% |
| Weatherford International plc | 3.8% |
| Noble Corporation plc | 3.8% |
| Cactus, Inc. — Class A | 3.6% |
| Tenaris S.A. ADR | 3.3% |
| Top 10 Total | 57.8% |
| |
1 | "Holdings Diversification (Market Exposure as a % of Net Assets)" excludes any temporary cash investments, investments in Guggenheim Strategy Funds Trust mutual funds, or investments in Guggenheim Ultra Short Duration Fund. |
| |
2 | "10 Largest Holdings (as a % of Net Assets)" excludes any temporary cash investments. |
| Schlumberger N.V. | 13.0% |
| Baker Hughes Co. | 10.1% |
| Halliburton Co. | 8.0% |
| TechnipFMC plc | 4.2% |
| NOV, Inc. | 4.0% |
| ChampionX Corp. | 4.0% |
| Weatherford International plc | 3.8% |
| Noble Corporation plc | 3.8% |
| Cactus, Inc. — Class A | 3.6% |
| Tenaris S.A. ADR | 3.3% |
| Top 10 Total | 57.8% |
| |
2 | "10 Largest Holdings (as a % of Net Assets)" excludes any temporary cash investments. |
There were no changes in or disagreements with fund accountants for the period.
| | | Availability of Additional Information. For additional information, including the fund's prospectus, financial information, holdings and proxy voting information, go to GuggenheimInvestments.com/mutual-funds/literature or, call 800 820 0888. |
SAR-RYVCX-093024
Semi-Annual Shareholder Report | 9.30.24
This semi-annual shareholder report contains important information about the Energy Services Fund for the period of April 1, 2024 to September 30, 2024. You can find additional information about the fund at GuggenheimInvestments.com/mutual-funds/literature. You can also request this information by contacting 800 820 0888 or GuggenheimClientServices@mufg-is.com.
For the period of April 1, 2024 to September 30, 2024, the fund (Class H shares) returned -13.96%, underperforming the fund's benchmark, the S&P 500 Index, which returned 10.42% for the same period and underperforming the fund's secondary index, the S&P 500 Energy Index, which returned -4.68% for the same period.
What factors materially affected the fund's performance over the last six months?
No industry contributed to performance. The industries that detracted the most were oil & gas equipment & services and oil & gas drilling. The holdings that contributed the most to performance were Baker Hughes Co., Cactus, Inc. – Class A, and U.S. Silica Holdings, Inc. Those that detracted the most were Schlumberger N.V., Halliburton Co., and Patterson-UTI Energy, Inc.
Cumulative performance* for the fund's most recently completed 10 years (as of 9.30.24), assuming a $10,000 initial investment.
| 09/30/2014 | 10000 | 10000 | 10000 |
| 12/31/2014 | 7262 | 10493 | 8932 |
| 03/31/2015 | 6711 | 10593 | 8677 |
| 06/30/2015 | 6861 | 10622 | 8514 |
| 09/30/2015 | 5002 | 9939 | 7032 |
| 12/31/2015 | 4929 | 10638 | 7046 |
| 03/31/2016 | 4879 | 10782 | 7329 |
| 06/30/2016 | 5279 | 11047 | 8181 |
| 09/30/2016 | 5253 | 11472 | 8365 |
| 12/31/2016 | 6078 | 11911 | 8974 |
| 03/31/2017 | 5562 | 12633 | 8374 |
| 06/30/2017 | 4456 | 13023 | 7842 |
| 09/30/2017 | 4745 | 13607 | 8378 |
| 12/31/2017 | 4912 | 14511 | 8883 |
| 03/31/2018 | 4372 | 14401 | 8361 |
| 06/30/2018 | 4763 | 14896 | 9488 |
| 09/30/2018 | 4641 | 16044 | 9546 |
| 12/31/2018 | 2663 | 13875 | 7276 |
| 03/31/2019 | 3294 | 15769 | 8471 |
| 06/30/2019 | 2913 | 16447 | 8231 |
| 09/30/2019 | 2363 | 16727 | 7712 |
| 12/31/2019 | 2653 | 18244 | 8135 |
| 03/31/2020 | 883 | 14668 | 4031 |
| 06/30/2020 | 1274 | 17682 | 5260 |
| 09/30/2020 | 1094 | 19260 | 4223 |
| 12/31/2020 | 1669 | 21600 | 5395 |
| 03/31/2021 | 1998 | 22934 | 7060 |
| 06/30/2021 | 2239 | 24895 | 7858 |
| 09/30/2021 | 2061 | 25040 | 7727 |
| 12/31/2021 | 1950 | 27801 | 8344 |
| 03/31/2022 | 2739 | 26522 | 11600 |
| 06/30/2022 | 2196 | 22252 | 11000 |
| 09/30/2022 | 2008 | 21165 | 11259 |
| 12/31/2022 | 2781 | 22766 | 13827 |
| 03/31/2023 | 2520 | 24473 | 13181 |
| 06/30/2023 | 2631 | 26612 | 13064 |
| 09/30/2023 | 3169 | 25741 | 14660 |
| 12/31/2023 | 2898 | 28750 | 13643 |
| 03/31/2024 | 3152 | 31785 | 15510 |
| 06/30/2024 | 3032 | 33147 | 15135 |
| 09/30/2024 | 2712 | 35098 | 14784 |
| Class H** | -13.96% | -14.42% | 2.79% | -12.23% |
| S&P 500 Index | 10.42% | 36.35% | 15.98% | 13.38% |
| S&P 500 Energy Index | -4.68% | 0.84% | 13.90% | 3.99% |
The fund's past performance is not a good predictor of the fund's future performance. Visit GuggenheimInvestments.com/mutual-funds/performance for more recent performance information.
| Net Assets | $6,748,377 |
| Total Number of Portfolio Holdings | 33 |
| Portfolio Turnover Rate | 95% |
| Energy Services Fund | Class H | RYVAX | Semi-Annual Shareholder Report | September 30, 2024 |
| Oil & Gas Services | 68.4% |
| Oil & Gas | 24.0% |
| Machinery-Diversified | 3.6% |
| Metal Fabricate & Hardware | 3.3% |

| Schlumberger N.V. | 13.0% |
| Baker Hughes Co. | 10.1% |
| Halliburton Co. | 8.0% |
| TechnipFMC plc | 4.2% |
| NOV, Inc. | 4.0% |
| ChampionX Corp. | 4.0% |
| Weatherford International plc | 3.8% |
| Noble Corporation plc | 3.8% |
| Cactus, Inc. — Class A | 3.6% |
| Tenaris S.A. ADR | 3.3% |
| Top 10 Total | 57.8% |
| |
1 | "Holdings Diversification (Market Exposure as a % of Net Assets)" excludes any temporary cash investments, investments in Guggenheim Strategy Funds Trust mutual funds, or investments in Guggenheim Ultra Short Duration Fund. |
| |
2 | "10 Largest Holdings (as a % of Net Assets)" excludes any temporary cash investments. |
| Schlumberger N.V. | 13.0% |
| Baker Hughes Co. | 10.1% |
| Halliburton Co. | 8.0% |
| TechnipFMC plc | 4.2% |
| NOV, Inc. | 4.0% |
| ChampionX Corp. | 4.0% |
| Weatherford International plc | 3.8% |
| Noble Corporation plc | 3.8% |
| Cactus, Inc. — Class A | 3.6% |
| Tenaris S.A. ADR | 3.3% |
| Top 10 Total | 57.8% |
| |
2 | "10 Largest Holdings (as a % of Net Assets)" excludes any temporary cash investments. |
There were no changes in or disagreements with fund accountants for the period.
| | | Availability of Additional Information. For additional information, including the fund's prospectus, financial information, holdings and proxy voting information, go to GuggenheimInvestments.com/mutual-funds/literature or, call 800 820 0888. |
SAR-RYVAX-093024
Semi-Annual Shareholder Report | 9.30.24
This semi-annual shareholder report contains important information about the Financial Services Fund for the period of April 1, 2024 to September 30, 2024. You can find additional information about the fund at GuggenheimInvestments.com/mutual-funds/literature. You can also request this information by contacting 800 820 0888 or GuggenheimClientServices@mufg-is.com.
For the period of April 1, 2024 to September 30, 2024, the fund (Investor Class shares) returned 9.49%, underperforming the fund's benchmark, the S&P 500 Index, which returned 10.42% for the same period and outperforming the fund's secondary index, the S&P 500 Financials Index, which returned 8.41% for the same period.
What factors materially affected the fund's performance over the last six months?
The industries that contributed the most to performance were diversified banks, asset management & custody banks, and property & casualty insurance. Those that detracted the most were transaction & payment processing services, hotel & resort REITs, and timber REITs. The holdings that contributed the most to performance were Welltower, Inc., Berkshire Hathaway, Inc. – Class B, and Goldman Sachs Group, Inc. Those that detracted the most were Coinbase Global, Inc. – Class A, XP, Inc. – Class A, and StoneCo Ltd. – Class A.
Cumulative performance* for the fund's most recently completed 10 years (as of 9.30.24), assuming a $10,000 initial investment.
| 09/30/2014 | 10000 | 10000 | 10000 |
| 12/31/2014 | 10702 | 10493 | 10725 |
| 03/31/2015 | 10696 | 10593 | 10504 |
| 06/30/2015 | 10620 | 10622 | 10685 |
| 09/30/2015 | 9920 | 9939 | 9967 |
| 12/31/2015 | 10301 | 10638 | 10561 |
| 03/31/2016 | 10060 | 10782 | 10027 |
| 06/30/2016 | 10322 | 11047 | 10239 |
| 09/30/2016 | 10788 | 11472 | 10709 |
| 12/31/2016 | 11946 | 11911 | 12969 |
| 03/31/2017 | 12245 | 12633 | 13296 |
| 06/30/2017 | 12641 | 13023 | 13861 |
| 09/30/2017 | 13140 | 13607 | 14587 |
| 12/31/2017 | 13826 | 14511 | 15845 |
| 03/31/2018 | 13637 | 14401 | 15694 |
| 06/30/2018 | 13579 | 14896 | 15198 |
| 09/30/2018 | 13796 | 16044 | 15860 |
| 12/31/2018 | 12164 | 13875 | 13781 |
| 03/31/2019 | 13618 | 15769 | 14961 |
| 06/30/2019 | 14387 | 16447 | 16157 |
| 09/30/2019 | 14752 | 16727 | 16482 |
| 12/31/2019 | 15610 | 18244 | 18208 |
| 03/31/2020 | 10915 | 14668 | 12395 |
| 06/30/2020 | 12701 | 17682 | 13908 |
| 09/30/2020 | 12922 | 19260 | 14526 |
| 12/31/2020 | 15651 | 21600 | 17899 |
| 03/31/2021 | 17688 | 22934 | 20762 |
| 06/30/2021 | 19395 | 24895 | 22498 |
| 09/30/2021 | 19677 | 25040 | 23115 |
| 12/31/2021 | 21258 | 27801 | 24171 |
| 03/31/2022 | 20469 | 26522 | 23813 |
| 06/30/2022 | 16980 | 22252 | 19645 |
| 09/30/2022 | 16111 | 21165 | 19035 |
| 12/31/2022 | 17418 | 22766 | 21625 |
| 03/31/2023 | 16713 | 24473 | 20422 |
| 06/30/2023 | 17547 | 26612 | 21512 |
| 09/30/2023 | 17054 | 25741 | 21269 |
| 12/31/2023 | 19951 | 28750 | 24252 |
| 03/31/2024 | 21521 | 31785 | 27273 |
| 06/30/2024 | 20985 | 33147 | 26719 |
| 09/30/2024 | 23563 | 35098 | 29566 |
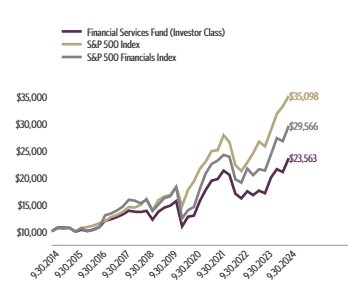
| Investor Class | 9.49% | 38.17% | 9.82% | 8.95% |
| S&P 500 Index | 10.42% | 36.35% | 15.98% | 13.38% |
| S&P 500 Financials Index | 8.41% | 39.01% | 12.40% | 11.45% |
The fund's past performance is not a good predictor of the fund's future performance. Visit GuggenheimInvestments.com/mutual-funds/performance for more recent performance information.
| Net Assets | $16,478,980 |
| Total Number of Portfolio Holdings | 157 |
| Portfolio Turnover Rate | 122% |
| Financial Services Fund | Investor Class | RYFIX | Semi-Annual Shareholder Report | September 30, 2024 |
| Banks | 23.8% |
| Diversified Financial Services | 21.6% |
| REITs | 20.6% |
| Insurance | 18.5% |
| Commercial Services | 7.4% |
| Private Equity | 3.5% |
| Software | 2.8% |
| Other | 1.7% |

| Berkshire Hathaway, Inc. — Class B | 3.2% |
| JPMorgan Chase & Co. | 2.5% |
| Visa, Inc. — Class A | 2.4% |
| Mastercard, Inc. — Class A | 2.1% |
| Bank of America Corp. | 1.7% |
| Wells Fargo & Co. | 1.5% |
| Blackstone, Inc. — Class A | 1.4% |
| Goldman Sachs Group, Inc. | 1.3% |
| S&P Global, Inc. | 1.3% |
| Progressive Corp. | 1.3% |
| Top 10 Total | 18.7% |
| |
1 | "Holdings Diversification (Market Exposure as a % of Net Assets)" excludes any temporary cash investments, investments in Guggenheim Strategy Funds Trust mutual funds, or investments in Guggenheim Ultra Short Duration Fund. |
| |
2 | "10 Largest Holdings (as a % of Net Assets)" excludes any temporary cash investments. |
| Berkshire Hathaway, Inc. — Class B | 3.2% |
| JPMorgan Chase & Co. | 2.5% |
| Visa, Inc. — Class A | 2.4% |
| Mastercard, Inc. — Class A | 2.1% |
| Bank of America Corp. | 1.7% |
| Wells Fargo & Co. | 1.5% |
| Blackstone, Inc. — Class A | 1.4% |
| Goldman Sachs Group, Inc. | 1.3% |
| S&P Global, Inc. | 1.3% |
| Progressive Corp. | 1.3% |
| Top 10 Total | 18.7% |
| |
2 | "10 Largest Holdings (as a % of Net Assets)" excludes any temporary cash investments. |
There were no changes in or disagreements with fund accountants for the period.
| | | Availability of Additional Information. For additional information, including the fund's prospectus, financial information, holdings and proxy voting information, go to GuggenheimInvestments.com/mutual-funds/literature or, call 800 820 0888. |
SAR-RYFIX-093024
Semi-Annual Shareholder Report | 9.30.24
This semi-annual shareholder report contains important information about the Financial Services Fund for the period of April 1, 2024 to September 30, 2024. You can find additional information about the fund at GuggenheimInvestments.com/mutual-funds/literature. You can also request this information by contacting 800 820 0888 or GuggenheimClientServices@mufg-is.com.
For the period of April 1, 2024 to September 30, 2024, the fund (Class A shares) returned 9.36%, underperforming the fund's benchmark, the S&P 500 Index, which returned 10.42% for the same period and outperforming the fund's secondary index, the S&P 500 Financials Index, which returned 8.41% for the same period.
What factors materially affected the fund's performance over the last six months?
The industries that contributed the most to performance were diversified banks, asset management & custody banks, and property & casualty insurance. Those that detracted the most were transaction & payment processing services, hotel & resort REITs, and timber REITs. The holdings that contributed the most to performance were Welltower, Inc., Berkshire Hathaway, Inc. – Class B, and Goldman Sachs Group, Inc. Those that detracted the most were Coinbase Global, Inc. – Class A, XP, Inc. – Class A, and StoneCo Ltd. – Class A.
Cumulative performance* for the fund's most recently completed 10 years (as of 9.30.24), assuming a $10,000 initial investment.
| 09/30/2014 | 9525 | 10000 | 10000 |
| 12/31/2014 | 10187 | 10493 | 10725 |
| 03/31/2015 | 10176 | 10593 | 10504 |
| 06/30/2015 | 10097 | 10622 | 10685 |
| 09/30/2015 | 9426 | 9939 | 9967 |
| 12/31/2015 | 9783 | 10638 | 10561 |
| 03/31/2016 | 9548 | 10782 | 10027 |
| 06/30/2016 | 9790 | 11047 | |
| 09/30/2016 | 10226 | 11472 | 10709 |
| 12/31/2016 | 11315 | 11911 | 12969 |
| 03/31/2017 | 11593 | 12633 | 13296 |
| 06/30/2017 | 11959 | 13023 | 13861 |
| 09/30/2017 | 12423 | 13607 | 14587 |
| 12/31/2017 | 13063 | 14511 | 15845 |
| 03/31/2018 | 12877 | 14401 | 15694 |
| 06/30/2018 | 12812 | 14896 | 15198 |
| 09/30/2018 | 13010 | 16044 | 15860 |
| 12/31/2018 | 11464 | 13875 | 13781 |
| 03/31/2019 | 12824 | 15769 | 14961 |
| 06/30/2019 | 13541 | 16447 | 16157 |
| 09/30/2019 | 13877 | 16727 | 16482 |
| 12/31/2019 | 14673 | 18244 | 18208 |
| 03/31/2020 | 10254 | 14668 | 12395 |
| 06/30/2020 | 11925 | 17682 | 13908 |
| 09/30/2020 | 12125 | 19260 | 14526 |
| 12/31/2020 | 14677 | 21600 | 17899 |
| 03/31/2021 | 16578 | 22934 | 20762 |
| 06/30/2021 | 18165 | 24895 | 22498 |
| 09/30/2021 | 18418 | 25040 | 23115 |
| 12/31/2021 | 19886 | 27801 | 24171 |
| 03/31/2022 | 19135 | 26522 | 23813 |
| 06/30/2022 | 15865 | 22252 | 19645 |
| 09/30/2022 | 15043 | 21165 | 19035 |
| 12/31/2022 | 16251 | 22766 | 21625 |
| 03/31/2023 | 15584 | 24473 | 20422 |
| 06/30/2023 | 16352 | 26612 | 21512 |
| 09/30/2023 | 15884 | 25741 | 21269 |
| 12/31/2023 | 18569 | 28750 | 24252 |
| 03/31/2024 | 20019 | 31785 | 27273 |
| 06/30/2024 | 19512 | 33147 | 26719 |
| 09/30/2024 | 21893 | 35098 | 29566 |
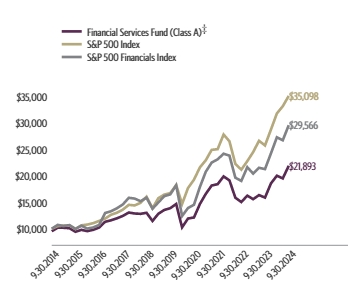
| Class A (without sales charge) | 9.36% | 37.83% | 9.55% | 8.68% |
| Class A (with sales charge)‡ | 4.17% | 31.29% | 8.49% | 8.15% |
| S&P 500 Index | 10.42% | 36.35% | 15.98% | 13.38% |
| S&P 500 Financials Index | 8.41% | 39.01% | 12.40% | 11.45% |
The fund's past performance is not a good predictor of the fund's future performance. Visit GuggenheimInvestments.com/mutual-funds/performance for more recent performance information.
| Net Assets | $16,478,980 |
| Total Number of Portfolio Holdings | 157 |
| Portfolio Turnover Rate | 122% |
| Financial Services Fund | Class A | RYFNX | Semi-Annual Shareholder Report | September 30, 2024 |
| Banks | 23.8% |
| Diversified Financial Services | 21.6% |
| REITs | 20.6% |
| Insurance | 18.5% |
| Commercial Services | 7.4% |
| Private Equity | 3.5% |
| Software | 2.8% |
| Other | 1.7% |

| Berkshire Hathaway, Inc. — Class B | 3.2% |
| JPMorgan Chase & Co. | 2.5% |
| Visa, Inc. — Class A | 2.4% |
| Mastercard, Inc. — Class A | 2.1% |
| Bank of America Corp. | 1.7% |
| Wells Fargo & Co. | 1.5% |
| Blackstone, Inc. — Class A | 1.4% |
| Goldman Sachs Group, Inc. | 1.3% |
| S&P Global, Inc. | 1.3% |
| Progressive Corp. | 1.3% |
| Top 10 Total | 18.7% |
| |
1 | "Holdings Diversification (Market Exposure as a % of Net Assets)" excludes any temporary cash investments, investments in Guggenheim Strategy Funds Trust mutual funds, or investments in Guggenheim Ultra Short Duration Fund. |
| |
2 | "10 Largest Holdings (as a % of Net Assets)" excludes any temporary cash investments. |
| Berkshire Hathaway, Inc. — Class B | 3.2% |
| JPMorgan Chase & Co. | 2.5% |
| Visa, Inc. — Class A | 2.4% |
| Mastercard, Inc. — Class A | 2.1% |
| Bank of America Corp. | 1.7% |
| Wells Fargo & Co. | 1.5% |
| Blackstone, Inc. — Class A | 1.4% |
| Goldman Sachs Group, Inc. | 1.3% |
| S&P Global, Inc. | 1.3% |
| Progressive Corp. | 1.3% |
| Top 10 Total | 18.7% |
| |
2 | "10 Largest Holdings (as a % of Net Assets)" excludes any temporary cash investments. |
There were no changes in or disagreements with fund accountants for the period.
| | | Availability of Additional Information. For additional information, including the fund's prospectus, financial information, holdings and proxy voting information, go to GuggenheimInvestments.com/mutual-funds/literature or, call 800 820 0888. |
SAR-RYFNX-093024
Semi-Annual Shareholder Report | 9.30.24
This semi-annual shareholder report contains important information about the Financial Services Fund for the period of April 1, 2024 to September 30, 2024. You can find additional information about the fund at GuggenheimInvestments.com/mutual-funds/literature. You can also request this information by contacting 800 820 0888 or GuggenheimClientServices@mufg-is.com.
For the period of April 1, 2024 to September 30, 2024, the fund (Class C shares) returned 8.94%, underperforming the fund's benchmark, the S&P 500 Index, which returned 10.42% for the same period and outperforming the fund's secondary index, the S&P 500 Financials Index, which returned 8.41% for the same period.
What factors materially affected the fund's performance over the last six months?
The industries that contributed the most to performance were diversified banks, asset management & custody banks, and property & casualty insurance. Those that detracted the most were transaction & payment processing services, hotel & resort REITs, and timber REITs. The holdings that contributed the most to performance were Welltower, Inc., Berkshire Hathaway, Inc. – Class B, and Goldman Sachs Group, Inc. Those that detracted the most were Coinbase Global, Inc. – Class A, XP, Inc. – Class A, and StoneCo Ltd. – Class A.
Cumulative performance* for the fund's most recently completed 10 years (as of 9.30.24), assuming a $10,000 initial investment.
| 09/30/2014 | 10000 | 10000 | 10000 |
| 12/31/2014 | 10674 | 10493 | 10725 |
| 03/31/2015 | 10644 | 10593 | 10504 |
| 06/30/2015 | 10540 | 10622 | 10685 |
| 09/30/2015 | 9820 | 9939 | 9967 |
| 12/31/2015 | 10173 | 10638 | 10561 |
| 03/31/2016 | 9910 | 10782 | 10027 |
| 06/30/2016 | 10144 | 11047 | 10239 |
| 09/30/2016 | 10574 | 11472 | 10709 |
| 12/31/2016 | 11679 | 11911 | 12969 |
| 03/31/2017 | 11943 | 12633 | 13296 |
| 06/30/2017 | 12297 | 13023 | 13861 |
| 09/30/2017 | 12751 | 13607 | 14587 |
| 12/31/2017 | 13383 | 14511 | 15845 |
| 03/31/2018 | 13170 | 14401 | 15694 |
| 06/30/2018 | 13081 | 14896 | 15198 |
| 09/30/2018 | 13257 | 16044 | 15860 |
| 12/31/2018 | 11659 | 13875 | 13781 |
| 03/31/2019 | 13019 | 15769 | 14961 |
| 06/30/2019 | 13722 | 16447 | 16157 |
| 09/30/2019 | 14035 | 16727 | 16482 |
| 12/31/2019 | 14811 | 18244 | 18208 |
| 03/31/2020 | 10331 | 14668 | 12395 |
| 06/30/2020 | 11992 | 17682 | 13908 |
| 09/30/2020 | 12173 | 19260 | 14526 |
| 12/31/2020 | 14702 | 21600 | 17899 |
| 03/31/2021 | 16578 | 22934 | 20762 |
| 06/30/2021 | 18130 | 24895 | 22498 |
| 09/30/2021 | 18348 | 25040 | 23115 |
| 12/31/2021 | 19773 | 27801 | 24171 |
| 03/31/2022 | 18991 | 26522 | 23813 |
| 06/30/2022 | 15716 | 22252 | 19645 |
| 09/30/2022 | 14874 | 21165 | 19035 |
| 12/31/2022 | 16037 | 22766 | 21625 |
| 03/31/2023 | 15351 | 24473 | 20422 |
| 06/30/2023 | 16075 | 26612 | 21512 |
| 09/30/2023 | 15588 | 25741 | 21269 |
| 12/31/2023 | 18190 | 28750 | 24252 |
| 03/31/2024 | 19573 | 31785 | 27273 |
| 06/30/2024 | 19041 | 33147 | 26719 |
| 09/30/2024 | 21326 | 35098 | 29566 |
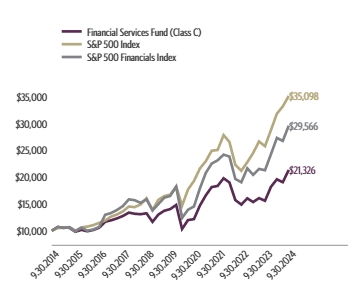
| Class C (without CDSC) | 8.94% | 36.81% | 8.73% | 7.87% |
| Class C (with CDSC)§ | 7.94% | 35.81% | 8.73% | 7.87% |
| S&P 500 Index | 10.42% | 36.35% | 15.98% | 13.38% |
| S&P 500 Financials Index | 8.41% | 39.01% | 12.40% | 11.45% |
The fund's past performance is not a good predictor of the fund's future performance. Visit GuggenheimInvestments.com/mutual-funds/performance for more recent performance information.
| Net Assets | $16,478,980 |
| Total Number of Portfolio Holdings | 157 |
| Portfolio Turnover Rate | 122% |
| Financial Services Fund | Class C | RYFCX | Semi-Annual Shareholder Report | September 30, 2024 |
| Banks | 23.8% |
| Diversified Financial Services | 21.6% |
| REITs | 20.6% |
| Insurance | 18.5% |
| Commercial Services | 7.4% |
| Private Equity | 3.5% |
| Software | 2.8% |
| Other | 1.7% |

| Berkshire Hathaway, Inc. — Class B | 3.2% |
| JPMorgan Chase & Co. | 2.5% |
| Visa, Inc. — Class A | 2.4% |
| Mastercard, Inc. — Class A | 2.1% |
| Bank of America Corp. | 1.7% |
| Wells Fargo & Co. | 1.5% |
| Blackstone, Inc. — Class A | 1.4% |
| Goldman Sachs Group, Inc. | 1.3% |
| S&P Global, Inc. | 1.3% |
| Progressive Corp. | 1.3% |
| Top 10 Total | 18.7% |
| |
1 | "Holdings Diversification (Market Exposure as a % of Net Assets)" excludes any temporary cash investments, investments in Guggenheim Strategy Funds Trust mutual funds, or investments in Guggenheim Ultra Short Duration Fund. |
| |
2 | "10 Largest Holdings (as a % of Net Assets)" excludes any temporary cash investments. |
| Berkshire Hathaway, Inc. — Class B | 3.2% |
| JPMorgan Chase & Co. | 2.5% |
| Visa, Inc. — Class A | 2.4% |
| Mastercard, Inc. — Class A | 2.1% |
| Bank of America Corp. | 1.7% |
| Wells Fargo & Co. | 1.5% |
| Blackstone, Inc. — Class A | 1.4% |
| Goldman Sachs Group, Inc. | 1.3% |
| S&P Global, Inc. | 1.3% |
| Progressive Corp. | 1.3% |
| Top 10 Total | 18.7% |
| |
2 | "10 Largest Holdings (as a % of Net Assets)" excludes any temporary cash investments. |
There were no changes in or disagreements with fund accountants for the period.
| | | Availability of Additional Information. For additional information, including the fund's prospectus, financial information, holdings and proxy voting information, go to GuggenheimInvestments.com/mutual-funds/literature or, call 800 820 0888. |
SAR-RYFCX-093024
Semi-Annual Shareholder Report | 9.30.24
This semi-annual shareholder report contains important information about the Financial Services Fund for the period of April 1, 2024 to September 30, 2024. You can find additional information about the fund at GuggenheimInvestments.com/mutual-funds/literature. You can also request this information by contacting 800 820 0888 or GuggenheimClientServices@mufg-is.com.
For the period of April 1, 2024 to September 30, 2024, the fund (Class H shares) returned 9.37%, underperforming the fund's benchmark, the S&P 500 Index, which returned 10.42% for the same period and outperforming the fund's secondary index, the S&P 500 Financials Index, which returned 8.41% for the same period.
What factors materially affected the fund's performance over the last six months?
The industries that contributed the most to performance were diversified banks, asset management & custody banks, and property & casualty insurance. Those that detracted the most were transaction & payment processing services, hotel & resort REITs, and timber REITs. The holdings that contributed the most to performance were Welltower, Inc., Berkshire Hathaway, Inc. – Class B, and Goldman Sachs Group, Inc. Those that detracted the most were Coinbase Global, Inc. – Class A, XP, Inc. – Class A, and StoneCo Ltd. – Class A.
Cumulative performance* for the fund's most recently completed 10 years (as of 9.30.24), assuming a $10,000 initial investment.
| 09/30/2014 | 10000 | 10000 | 10000 |
| 12/31/2014 | 10688 | 10493 | 10725 |
| 03/31/2015 | 10670 | 10593 | 10504 |
| 06/30/2015 | 10581 | 10622 | 10685 |
| 09/30/2015 | 9877 | 9939 | 9967 |
| 12/31/2015 | 10250 | 10638 | 10561 |
| 03/31/2016 | 10003 | 10782 | 10027 |
| 06/30/2016 | 10258 | 11047 | 10239 |
| 09/30/2016 | 10714 | 11472 | 10709 |
| 12/31/2016 | 11856 | 11911 | 12969 |
| 03/31/2017 | 12147 | 12633 | 13296 |
| 06/30/2017 | 12534 | 13023 | 13861 |
| 09/30/2017 | 13020 | 13607 | 14587 |
| 12/31/2017 | 13693 | 14511 | 15845 |
| 03/31/2018 | 13496 | 14401 | 15694 |
| 06/30/2018 | 13431 | 14896 | 15198 |
| 09/30/2018 | 13637 | 16044 | 15860 |
| 12/31/2018 | 12015 | 13875 | 13781 |
| 03/31/2019 | 13439 | 15769 | 14961 |
| 06/30/2019 | 14193 | 16447 | 16157 |
| 09/30/2019 | 14542 | 16727 | 16482 |
| 12/31/2019 | 15377 | 18244 | 18208 |
| 03/31/2020 | 10745 | 14668 | 12395 |
| 06/30/2020 | 12495 | 17682 | 13908 |
| 09/30/2020 | 12705 | 19260 | 14526 |
| 12/31/2020 | 15379 | 21600 | 17899 |
| 03/31/2021 | 17370 | 22934 | 20762 |
| 06/30/2021 | 19033 | 24895 | 22498 |
| 09/30/2021 | 19302 | 25040 | 23115 |
| 12/31/2021 | 20838 | 27801 | 24171 |
| 03/31/2022 | 20056 | 26522 | 23813 |
| 06/30/2022 | 16626 | 22252 | 19645 |
| 09/30/2022 | 15766 | 21165 | 19035 |
| 12/31/2022 | 17033 | 22766 | 21625 |
| 03/31/2023 | 16334 | 24473 | 20422 |
| 06/30/2023 | 17138 | 26612 | 21512 |
| 09/30/2023 | 16647 | 25741 | 21269 |
| 12/31/2023 | 19464 | 28750 | 24252 |
| 03/31/2024 | 20981 | 31785 | 27273 |
| 06/30/2024 | 20447 | 33147 | 26719 |
| 09/30/2024 | 22944 | 35098 | 29566 |
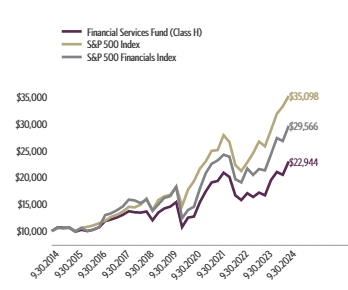
| Class H** | 9.37% | 37.83% | 9.55% | 8.66% |
| S&P 500 Index | 10.42% | 36.35% | 15.98% | 13.38% |
| S&P 500 Financials Index | 8.41% | 39.01% | 12.40% | 11.45% |
The fund's past performance is not a good predictor of the fund's future performance. Visit GuggenheimInvestments.com/mutual-funds/performance for more recent performance information.
| Net Assets | $16,478,980 |
| Total Number of Portfolio Holdings | 157 |
| Portfolio Turnover Rate | 122% |
| Financial Services Fund | Class H | RYFAX | Semi-Annual Shareholder Report | September 30, 2024 |
| Banks | 23.8% |
| Diversified Financial Services | 21.6% |
| REITs | 20.6% |
| Insurance | 18.5% |
| Commercial Services | 7.4% |
| Private Equity | 3.5% |
| Software | 2.8% |
| Other | 1.7% |
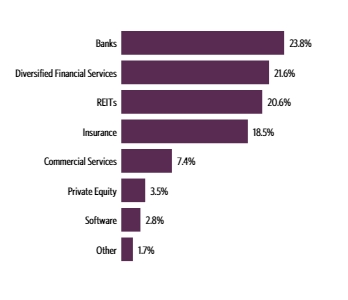
| Berkshire Hathaway, Inc. — Class B | 3.2% |
| JPMorgan Chase & Co. | 2.5% |
| Visa, Inc. — Class A | 2.4% |
| Mastercard, Inc. — Class A | 2.1% |
| Bank of America Corp. | 1.7% |
| Wells Fargo & Co. | 1.5% |
| Blackstone, Inc. — Class A | 1.4% |
| Goldman Sachs Group, Inc. | 1.3% |
| S&P Global, Inc. | 1.3% |
| Progressive Corp. | 1.3% |
| Top 10 Total | 18.7% |
| |
1 | "Holdings Diversification (Market Exposure as a % of Net Assets)" excludes any temporary cash investments, investments in Guggenheim Strategy Funds Trust mutual funds, or investments in Guggenheim Ultra Short Duration Fund. |
| |
2 | "10 Largest Holdings (as a % of Net Assets)" excludes any temporary cash investments. |
| Berkshire Hathaway, Inc. — Class B | 3.2% |
| JPMorgan Chase & Co. | 2.5% |
| Visa, Inc. — Class A | 2.4% |
| Mastercard, Inc. — Class A | 2.1% |
| Bank of America Corp. | 1.7% |
| Wells Fargo & Co. | 1.5% |
| Blackstone, Inc. — Class A | 1.4% |
| Goldman Sachs Group, Inc. | 1.3% |
| S&P Global, Inc. | 1.3% |
| Progressive Corp. | 1.3% |
| Top 10 Total | 18.7% |
| |
2 | "10 Largest Holdings (as a % of Net Assets)" excludes any temporary cash investments. |
There were no changes in or disagreements with fund accountants for the period.
| | | Availability of Additional Information. For additional information, including the fund's prospectus, financial information, holdings and proxy voting information, go to GuggenheimInvestments.com/mutual-funds/literature or, call 800 820 0888. |
SAR-RYFAX-093024
Semi-Annual Shareholder Report | 9.30.24
This semi-annual shareholder report contains important information about the Health Care Fund for the period of April 1, 2024 to September 30, 2024. You can find additional information about the fund at GuggenheimInvestments.com/mutual-funds/literature. You can also request this information by contacting 800 820 0888 or GuggenheimClientServices@mufg-is.com.
For the period of April 1, 2024 to September 30, 2024, the fund (Investor Class shares) returned 3.00%, underperforming the fund's benchmark, the S&P 500 Index, which returned 10.42% for the same period and underperforming the fund's secondary index, the S&P 500 Health Care Index, which returned 5.06% for the same period.
What factors materially affected the fund's performance over the last six months?
The industries that contributed the most to performance were biotechnology, pharmaceuticals, and health care facilities. Those that detracted the most were life sciences tools & services, health care equipment, and health care technology. The holdings that contributed the most to performance were UnitedHealth Group, Inc., Eli Lilly and Co., and Alnylam Pharmaceuticals, Inc. Those that detracted the most were DexCom, Inc., Edwards Lifesciences Corp., and Merck & Company, Inc.
Cumulative performance* for the fund's most recently completed 10 years (as of 9.30.24), assuming a $10,000 initial investment.
| 09/30/2014 | 10000 | 10000 | 10000 |
| 12/31/2014 | 10875 | 10493 | 10748 |
| 03/31/2015 | 12004 | 10593 | 11450 |
| 06/30/2015 | 12473 | 10622 | 11775 |
| 09/30/2015 | 10637 | 9939 | 10519 |
| 12/31/2015 | 11328 | 10638 | 11488 |
| 03/31/2016 | 10225 | 10782 | 10856 |
| 06/30/2016 | 10607 | 11047 | 11537 |
| 09/30/2016 | 10999 | 11472 | 11645 |
| 12/31/2016 | 10267 | 11911 | 11179 |
| 03/31/2017 | 11267 | 12633 | 12115 |
| 06/30/2017 | 12223 | 13023 | 12975 |
| 09/30/2017 | 12450 | 13607 | 13449 |
| 12/31/2017 | 12677 | 14511 | 13647 |
| 03/31/2018 | 12775 | 14401 | 13480 |
| 06/30/2018 | 13496 | 14896 | 13897 |
| 09/30/2018 | 15035 | 16044 | 15917 |
| 12/31/2018 | 12874 | 13875 | 14530 |
| 03/31/2019 | 14403 | 15769 | 15488 |
| 06/30/2019 | 14516 | 16447 | 15702 |
| 09/30/2019 | 13864 | 16727 | 15349 |
| 12/31/2019 | 15806 | 18244 | 17555 |
| 03/31/2020 | 13612 | 14668 | 15331 |
| 06/30/2020 | 16153 | 17682 | 17414 |
| 09/30/2020 | 17110 | 19260 | 18436 |
| 12/31/2020 | 18799 | 21600 | 19916 |
| 03/31/2021 | 19225 | 22934 | 20549 |
| 06/30/2021 | 21116 | 24895 | 22276 |
| 09/30/2021 | 21254 | 25040 | 22595 |
| 12/31/2021 | 22415 | 27801 | 25120 |
| 03/31/2022 | 21033 | 26522 | 24473 |
| 06/30/2022 | 18781 | 22252 | 23026 |
| 09/30/2022 | 17692 | 21165 | 21834 |
| 12/31/2022 | 19816 | 22766 | 24629 |
| 03/31/2023 | 19739 | 24473 | 23568 |
| 06/30/2023 | 20258 | 26612 | 24264 |
| 09/30/2023 | 19342 | 25741 | 23621 |
| 12/31/2023 | 20974 | 28750 | 25136 |
| 03/31/2024 | 22481 | 31785 | 27360 |
| 06/30/2024 | 21879 | 33147 | 27098 |
| 09/30/2024 | 23155 | 35098 | 28744 |
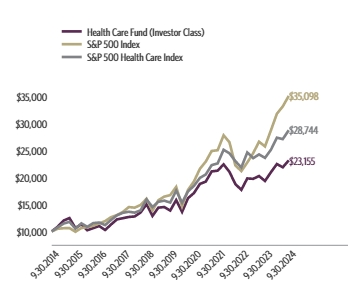
| Investor Class | 3.00% | 19.71% | 10.80% | 8.76% |
| S&P 500 Index | 10.42% | 36.35% | 15.98% | 13.38% |
| S&P 500 Health Care Index | 5.06% | 21.69% | 13.37% | 11.14% |
The fund's past performance is not a good predictor of the fund's future performance. Visit GuggenheimInvestments.com/mutual-funds/performance for more recent performance information.
| Net Assets | $23,688,931 |
| Total Number of Portfolio Holdings | 120 |
| Portfolio Turnover Rate | 67% |
| Health Care Fund | Investor Class | RYHIX | Semi-Annual Shareholder Report | September 30, 2024 |
| Pharmaceuticals | 31.9% |
| Healthcare-Products | 29.3% |
| Biotechnology | 20.4% |
| Healthcare-Services | 17.0% |
| Software | 0.8% |
| Electronics | 0.7% |
| Commercial Services | 0.2% |
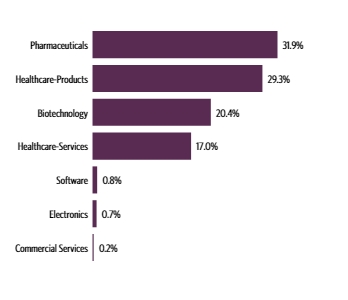
| Eli Lilly & Co. | 4.0% |
| UnitedHealth Group, Inc. | 3.5% |
| Johnson & Johnson | 3.0% |
| AbbVie, Inc. | 2.9% |
| Merck & Company, Inc. | 2.5% |
| Thermo Fisher Scientific, Inc. | 2.4% |
| Abbott Laboratories | 2.1% |
| Danaher Corp. | 2.1% |
| Intuitive Surgical, Inc. | 2.0% |
| Amgen, Inc. | 2.0% |
| Top 10 Total | 26.5% |
| |
1 | "Holdings Diversification (Market Exposure as a % of Net Assets)" excludes any temporary cash investments, investments in Guggenheim Strategy Funds Trust mutual funds, or investments in Guggenheim Ultra Short Duration Fund. |
| |
2 | "10 Largest Holdings (as a % of Net Assets)" excludes any temporary cash investments. |
| Eli Lilly & Co. | 4.0% |
| UnitedHealth Group, Inc. | 3.5% |
| Johnson & Johnson | 3.0% |
| AbbVie, Inc. | 2.9% |
| Merck & Company, Inc. | 2.5% |
| Thermo Fisher Scientific, Inc. | 2.4% |
| Abbott Laboratories | 2.1% |
| Danaher Corp. | 2.1% |
| Intuitive Surgical, Inc. | 2.0% |
| Amgen, Inc. | 2.0% |
| Top 10 Total | 26.5% |
| |
2 | "10 Largest Holdings (as a % of Net Assets)" excludes any temporary cash investments. |
There were no changes in or disagreements with fund accountants for the period.
| | | Availability of Additional Information. For additional information, including the fund's prospectus, financial information, holdings and proxy voting information, go to GuggenheimInvestments.com/mutual-funds/literature or, call 800 820 0888. |
SAR-RYHIX-093024
Semi-Annual Shareholder Report | 9.30.24
This semi-annual shareholder report contains important information about the Health Care Fund for the period of April 1, 2024 to September 30, 2024. You can find additional information about the fund at GuggenheimInvestments.com/mutual-funds/literature. You can also request this information by contacting 800 820 0888 or GuggenheimClientServices@mufg-is.com.
For the period of April 1, 2024 to September 30, 2024, the fund (Class A shares) returned 2.86%, underperforming the fund's benchmark, the S&P 500 Index, which returned 10.42% for the same period and underperforming the fund's secondary index, the S&P 500 Health Care Index, which returned 5.06% for the same period.
What factors materially affected the fund's performance over the last six months?
The industries that contributed the most to performance were biotechnology, pharmaceuticals, and health care facilities. Those that detracted the most were life sciences tools & services, health care equipment, and health care technology. The holdings that contributed the most to performance were UnitedHealth Group, Inc., Eli Lilly and Co., and Alnylam Pharmaceuticals, Inc. Those that detracted the most were DexCom, Inc., Edwards Lifesciences Corp., and Merck & Company, Inc.
Cumulative performance* for the fund's most recently completed 10 years (as of 9.30.24), assuming a $10,000 initial investment.
| 09/30/2014 | 9526 | 10000 | 10000 |
| 12/31/2014 | 10350 | 10493 | 10748 |
| 03/31/2015 | 11420 | 10593 | 11450 |
| 06/30/2015 | 11859 | 10622 | 11775 |
| 09/30/2015 | 10105 | 9939 | 10519 |
| 12/31/2015 | 10750 | 10638 | 11488 |
| 03/31/2016 | 9703 | 10782 | 10856 |
| 06/30/2016 | 10056 | 11047 | 11537 |
| 09/30/2016 | 10419 | 11472 | 11645 |
| 12/31/2016 | 9720 | 11911 | 11179 |
| 03/31/2017 | 10658 | 12633 | 12115 |
| 06/30/2017 | 11559 | 13023 | 12975 |
| 09/30/2017 | 11763 | 13607 | 13449 |
| 12/31/2017 | 11972 | 14511 | 13647 |
| 03/31/2018 | 12059 | 14401 | 13480 |
| 06/30/2018 | 12734 | 14896 | 13897 |
| 09/30/2018 | 14176 | 16044 | 15917 |
| 12/31/2018 | 12131 | 13875 | 14530 |
| 03/31/2019 | 13561 | 15769 | 15488 |
| 06/30/2019 | 13655 | 16447 | 15702 |
| 09/30/2019 | 13033 | 16727 | 15349 |
| 12/31/2019 | 14852 | 18244 | 17555 |
| 03/31/2020 | 12781 | 14668 | 15331 |
| 06/30/2020 | 15156 | 17682 | 17414 |
| 09/30/2020 | 16045 | 19260 | 18436 |
| 12/31/2020 | 17613 | 21600 | 19916 |
| 03/31/2021 | 18004 | 22934 | 20549 |
| 06/30/2021 | 19764 | 24895 | 22276 |
| 09/30/2021 | 19877 | 25040 | 22595 |
| 12/31/2021 | 20952 | 27801 | 25120 |
| 03/31/2022 | 19650 | 26522 | 24473 |
| 06/30/2022 | 17536 | 22252 | 23026 |
| 09/30/2022 | 16511 | 21165 | 21834 |
| 12/31/2022 | 18478 | 22766 | 24629 |
| 03/31/2023 | 18397 | 24473 | 23568 |
| 06/30/2023 | 18870 | 26612 | 24264 |
| 09/30/2023 | 18005 | 25741 | 23621 |
| 12/31/2023 | 19511 | 28750 | 25136 |
| 03/31/2024 | 20898 | 31785 | 27360 |
| 06/30/2024 | 20327 | 33147 | 27098 |
| 09/30/2024 | 21496 | 35098 | 28744 |
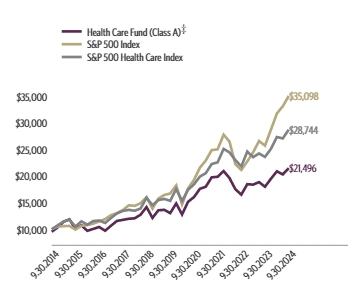
| Class A (without sales charge) | 2.86% | 19.39% | 10.53% | 8.48% |
| Class A (with sales charge)‡ | -2.03% | 13.72% | 9.46% | 7.95% |
| S&P 500 Index | 10.42% | 36.35% | 15.98% | 13.38% |
| S&P 500 Health Care Index | 5.06% | 21.69% | 13.37% | 11.14% |
The fund's past performance is not a good predictor of the fund's future performance. Visit GuggenheimInvestments.com/mutual-funds/performance for more recent performance information.
| Net Assets | $23,688,931 |
| Total Number of Portfolio Holdings | 120 |
| Portfolio Turnover Rate | 67% |
| Health Care Fund | Class A | RYHEX | Semi-Annual Shareholder Report | September 30, 2024 |
| Pharmaceuticals | 31.9% |
| Healthcare-Products | 29.3% |
| Biotechnology | 20.4% |
| Healthcare-Services | 17.0% |
| Software | 0.8% |
| Electronics | 0.7% |
| Commercial Services | 0.2% |

| Eli Lilly & Co. | 4.0% |
| UnitedHealth Group, Inc. | 3.5% |
| Johnson & Johnson | 3.0% |
| AbbVie, Inc. | 2.9% |
| Merck & Company, Inc. | 2.5% |
| Thermo Fisher Scientific, Inc. | 2.4% |
| Abbott Laboratories | 2.1% |
| Danaher Corp. | 2.1% |
| Intuitive Surgical, Inc. | 2.0% |
| Amgen, Inc. | 2.0% |
| Top 10 Total | 26.5% |
| |
1 | "Holdings Diversification (Market Exposure as a % of Net Assets)" excludes any temporary cash investments, investments in Guggenheim Strategy Funds Trust mutual funds, or investments in Guggenheim Ultra Short Duration Fund. |
| |
2 | "10 Largest Holdings (as a % of Net Assets)" excludes any temporary cash investments. |
| Eli Lilly & Co. | 4.0% |
| UnitedHealth Group, Inc. | 3.5% |
| Johnson & Johnson | 3.0% |
| AbbVie, Inc. | 2.9% |
| Merck & Company, Inc. | 2.5% |
| Thermo Fisher Scientific, Inc. | 2.4% |
| Abbott Laboratories | 2.1% |
| Danaher Corp. | 2.1% |
| Intuitive Surgical, Inc. | 2.0% |
| Amgen, Inc. | 2.0% |
| Top 10 Total | 26.5% |
| |
2 | "10 Largest Holdings (as a % of Net Assets)" excludes any temporary cash investments. |
There were no changes in or disagreements with fund accountants for the period.
| | | Availability of Additional Information. For additional information, including the fund's prospectus, financial information, holdings and proxy voting information, go to GuggenheimInvestments.com/mutual-funds/literature or, call 800 820 0888. |
SAR-RYHEX-093024
Semi-Annual Shareholder Report | 9.30.24
This semi-annual shareholder report contains important information about the Health Care Fund for the period of April 1, 2024 to September 30, 2024. You can find additional information about the fund at GuggenheimInvestments.com/mutual-funds/literature. You can also request this information by contacting 800 820 0888 or GuggenheimClientServices@mufg-is.com.
For the period of April 1, 2024 to September 30, 2024, the fund (Class C shares) returned 2.47%, underperforming the fund's benchmark, the S&P 500 Index, which returned 10.42% for the same period and underperforming the fund's secondary index, the S&P 500 Health Care Index, which returned 5.06% for the same period.
What factors materially affected the fund's performance over the last six months?
The industries that contributed the most to performance were biotechnology, pharmaceuticals, and health care facilities. Those that detracted the most were life sciences tools & services, health care equipment, and health care technology. The holdings that contributed the most to performance were UnitedHealth Group, Inc., Eli Lilly and Co., and Alnylam Pharmaceuticals, Inc. Those that detracted the most were DexCom, Inc., Edwards Lifesciences Corp., and Merck & Company, Inc.
Cumulative performance* for the fund's most recently completed 10 years (as of 9.30.24), assuming a $10,000 initial investment.
| 09/30/2014 | 10000 | 10000 | 10000 |
| 12/31/2014 | 10846 | 10493 | 10748 |
| 03/31/2015 | 11947 | 10593 | 11450 |
| 06/30/2015 | 12385 | 10622 | 11775 |
| 09/30/2015 | 10532 | 9939 | 10519 |
| 12/31/2015 | 11186 | 10638 | 11488 |
| 03/31/2016 | 10075 | 10782 | 10856 |
| 06/30/2016 | 10422 | 11047 | 11537 |
| 09/30/2016 | 10781 | 11472 | 11645 |
| 12/31/2016 | 10035 | 11911 | 11179 |
| 03/31/2017 | 10989 | 12633 | 12115 |
| 06/30/2017 | 11889 | 13023 | 12975 |
| 09/30/2017 | 12079 | 13607 | 13449 |
| 12/31/2017 | 12274 | 14511 | 13647 |
| 03/31/2018 | 12334 | 14401 | 13480 |
| 06/30/2018 | 13002 | 14896 | 13897 |
| 09/30/2018 | 14448 | 16044 | 15917 |
| 12/31/2018 | 12336 | 13875 | 14530 |
| 03/31/2019 | 13774 | 15769 | 15488 |
| 06/30/2019 | 13847 | 16447 | 15702 |
| 09/30/2019 | 13186 | 16727 | 15349 |
| 12/31/2019 | 15001 | 18244 | 17555 |
| 03/31/2020 | 12886 | 14668 | 15331 |
| 06/30/2020 | 15257 | 17682 | 17414 |
| 09/30/2020 | 16117 | 19260 | 18436 |
| 12/31/2020 | 17663 | 21600 | 19916 |
| 03/31/2021 | 18017 | 22934 | 20549 |
| 06/30/2021 | 19747 | 24895 | 22276 |
| 09/30/2021 | 19822 | 25040 | 22595 |
| 12/31/2021 | 20855 | 27801 | 25120 |
| 03/31/2022 | 19521 | 26522 | 24473 |
| 06/30/2022 | 17392 | 22252 | 23026 |
| 09/30/2022 | 16344 | 21165 | 21834 |
| 12/31/2022 | 18254 | 22766 | 24629 |
| 03/31/2023 | 18141 | 24473 | 23568 |
| 06/30/2023 | 18574 | 26612 | 24264 |
| 09/30/2023 | 17688 | 25741 | 23621 |
| 12/31/2023 | 19133 | 28750 | 25136 |
| 03/31/2024 | 20459 | 31785 | 27360 |
| 06/30/2024 | 19859 | 33147 | 27098 |
| 09/30/2024 | 20965 | 35098 | 28744 |
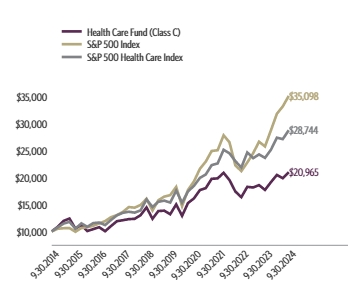
| Class C (without CDSC) | 2.47% | 18.52% | 9.72% | 7.68% |
| Class C (with CDSC)§ | 1.47% | 17.52% | 9.72% | 7.68% |
| S&P 500 Index | 10.42% | 36.35% | 15.98% | 13.38% |
| S&P 500 Health Care Index | 5.06% | 21.69% | 13.37% | 11.14% |
The fund's past performance is not a good predictor of the fund's future performance. Visit GuggenheimInvestments.com/mutual-funds/performance for more recent performance information.
| Net Assets | $23,688,931 |
| Total Number of Portfolio Holdings | 120 |
| Portfolio Turnover Rate | 67% |
| Health Care Fund | Class C | RYHCX | Semi-Annual Shareholder Report | September 30, 2024 |
| Pharmaceuticals | 31.9% |
| Healthcare-Products | 29.3% |
| Biotechnology | 20.4% |
| Healthcare-Services | 17.0% |
| Software | 0.8% |
| Electronics | 0.7% |
| Commercial Services | 0.2% |

| Eli Lilly & Co. | 4.0% |
| UnitedHealth Group, Inc. | 3.5% |
| Johnson & Johnson | 3.0% |
| AbbVie, Inc. | 2.9% |
| Merck & Company, Inc. | 2.5% |
| Thermo Fisher Scientific, Inc. | 2.4% |
| Abbott Laboratories | 2.1% |
| Danaher Corp. | 2.1% |
| Intuitive Surgical, Inc. | 2.0% |
| Amgen, Inc. | 2.0% |
| Top 10 Total | 26.5% |
| |
1 | "Holdings Diversification (Market Exposure as a % of Net Assets)" excludes any temporary cash investments, investments in Guggenheim Strategy Funds Trust mutual funds, or investments in Guggenheim Ultra Short Duration Fund. |
| |
2 | "10 Largest Holdings (as a % of Net Assets)" excludes any temporary cash investments. |
| Eli Lilly & Co. | 4.0% |
| UnitedHealth Group, Inc. | 3.5% |
| Johnson & Johnson | 3.0% |
| AbbVie, Inc. | 2.9% |
| Merck & Company, Inc. | 2.5% |
| Thermo Fisher Scientific, Inc. | 2.4% |
| Abbott Laboratories | 2.1% |
| Danaher Corp. | 2.1% |
| Intuitive Surgical, Inc. | 2.0% |
| Amgen, Inc. | 2.0% |
| Top 10 Total | 26.5% |
| |
2 | "10 Largest Holdings (as a % of Net Assets)" excludes any temporary cash investments. |
There were no changes in or disagreements with fund accountants for the period.
| | | Availability of Additional Information. For additional information, including the fund's prospectus, financial information, holdings and proxy voting information, go to GuggenheimInvestments.com/mutual-funds/literature or, call 800 820 0888. |
SAR-RYHCX-093024
Semi-Annual Shareholder Report | 9.30.24
This semi-annual shareholder report contains important information about the Health Care Fund for the period of April 1, 2024 to September 30, 2024. You can find additional information about the fund at GuggenheimInvestments.com/mutual-funds/literature. You can also request this information by contacting 800 820 0888 or GuggenheimClientServices@mufg-is.com.
For the period of April 1, 2024 to September 30, 2024, the fund (Class H shares) returned 2.85%, underperforming the fund's benchmark, the S&P 500 Index, which returned 10.42% for the same period and underperforming the fund's secondary index, the S&P 500 Health Care Index, which returned 5.06% for the same period.
What factors materially affected the fund's performance over the last six months?
The industries that contributed the most to performance were biotechnology, pharmaceuticals, and health care facilities. Those that detracted the most were life sciences tools & services, health care equipment, and health care technology. The holdings that contributed the most to performance were UnitedHealth Group, Inc., Eli Lilly and Co., and Alnylam Pharmaceuticals, Inc. Those that detracted the most were DexCom, Inc., Edwards Lifesciences Corp., and Merck & Company, Inc.
Cumulative performance* for the fund's most recently completed 10 years (as of 9.30.24), assuming a $10,000 initial investment.
| 09/30/2014 | 10000 | 10000 | 10000 |
| 12/31/2014 | 10861 | 10493 | 10748 |
| 03/31/2015 | 11974 | 10593 | 11450 |
| 06/30/2015 | 12424 | 10622 | 11775 |
| 09/30/2015 | 10587 | 9939 | 10519 |
| 12/31/2015 | 11271 | 10638 | 11488 |
| 03/31/2016 | 10169 | 10782 | 10856 |
| 06/30/2016 | 10537 | 11047 | 11537 |
| 09/30/2016 | 10922 | 11472 | 11645 |
| 12/31/2016 | 10187 | 11911 | 11179 |
| 03/31/2017 | 11172 | 12633 | 12115 |
| 06/30/2017 | 12112 | 13023 | 12975 |
| 09/30/2017 | 12324 | 13607 | 13449 |
| 12/31/2017 | 12546 | 14511 | 13647 |
| 03/31/2018 | 12631 | 14401 | 13480 |
| 06/30/2018 | 13336 | 14896 | 13897 |
| 09/30/2018 | 14849 | 16044 | 15917 |
| 12/31/2018 | 12699 | 13875 | 14530 |
| 03/31/2019 | 14205 | 15769 | 15488 |
| 06/30/2019 | 14307 | 16447 | 15702 |
| 09/30/2019 | 13656 | 16727 | 15349 |
| 12/31/2019 | 15559 | 18244 | 17555 |
| 03/31/2020 | 13391 | 14668 | 15331 |
| 06/30/2020 | 15885 | 17682 | 17414 |
| 09/30/2020 | 16816 | 19260 | 18436 |
| 12/31/2020 | 18462 | 21600 | 19916 |
| 03/31/2021 | 18872 | 22934 | 20549 |
| 06/30/2021 | 20716 | 24895 | 22276 |
| 09/30/2021 | 20829 | 25040 | 22595 |
| 12/31/2021 | 21965 | 27801 | 25120 |
| 03/31/2022 | 20598 | 26522 | 24473 |
| 06/30/2022 | 18384 | 22252 | 23026 |
| 09/30/2022 | 17309 | 21165 | 21834 |
| 12/31/2022 | 19368 | 22766 | 24629 |
| 03/31/2023 | 19285 | 24473 | 23568 |
| 06/30/2023 | 19779 | 26612 | 24264 |
| 09/30/2023 | 18874 | 25741 | 23621 |
| 12/31/2023 | 20452 | 28750 | 25136 |
| 03/31/2024 | 21911 | 31785 | 27360 |
| 06/30/2024 | 21310 | 33147 | 27098 |
| 09/30/2024 | 22537 | 35098 | 28744 |

| Class H** | 2.85% | 19.41% | 10.54% | 8.46% |
| S&P 500 Index | 10.42% | 36.35% | 15.98% | 13.38% |
| S&P 500 Health Care Index | 5.06% | 21.69% | 13.37% | 11.14% |
The fund's past performance is not a good predictor of the fund's future performance. Visit GuggenheimInvestments.com/mutual-funds/performance for more recent performance information.
| Net Assets | $23,688,931 |
| Total Number of Portfolio Holdings | 120 |
| Portfolio Turnover Rate | 67% |
| Health Care Fund | Class H | RYHAX | Semi-Annual Shareholder Report | September 30, 2024 |
| Pharmaceuticals | 31.9% |
| Healthcare-Products | 29.3% |
| Biotechnology | 20.4% |
| Healthcare-Services | 17.0% |
| Software | 0.8% |
| Electronics | 0.7% |
| Commercial Services | 0.2% |

| Eli Lilly & Co. | 4.0% |
| UnitedHealth Group, Inc. | 3.5% |
| Johnson & Johnson | 3.0% |
| AbbVie, Inc. | 2.9% |
| Merck & Company, Inc. | 2.5% |
| Thermo Fisher Scientific, Inc. | 2.4% |
| Abbott Laboratories | 2.1% |
| Danaher Corp. | 2.1% |
| Intuitive Surgical, Inc. | 2.0% |
| Amgen, Inc. | 2.0% |
| Top 10 Total | 26.5% |
| |
1 | "Holdings Diversification (Market Exposure as a % of Net Assets)" excludes any temporary cash investments, investments in Guggenheim Strategy Funds Trust mutual funds, or investments in Guggenheim Ultra Short Duration Fund. |
| |
2 | "10 Largest Holdings (as a % of Net Assets)" excludes any temporary cash investments. |
| Eli Lilly & Co. | 4.0% |
| UnitedHealth Group, Inc. | 3.5% |
| Johnson & Johnson | 3.0% |
| AbbVie, Inc. | 2.9% |
| Merck & Company, Inc. | 2.5% |
| Thermo Fisher Scientific, Inc. | 2.4% |
| Abbott Laboratories | 2.1% |
| Danaher Corp. | 2.1% |
| Intuitive Surgical, Inc. | 2.0% |
| Amgen, Inc. | 2.0% |
| Top 10 Total | 26.5% |
| |
2 | "10 Largest Holdings (as a % of Net Assets)" excludes any temporary cash investments. |
There were no changes in or disagreements with fund accountants for the period.
| | | Availability of Additional Information. For additional information, including the fund's prospectus, financial information, holdings and proxy voting information, go to GuggenheimInvestments.com/mutual-funds/literature or, call 800 820 0888. |
SAR-RYHAX-093024
Semi-Annual Shareholder Report | 9.30.24
This semi-annual shareholder report contains important information about the Internet Fund for the period of April 1, 2024 to September 30, 2024. You can find additional information about the fund at GuggenheimInvestments.com/mutual-funds/literature. You can also request this information by contacting 800 820 0888 or GuggenheimClientServices@mufg-is.com.
For the period of April 1, 2024 to September 30, 2024, the fund (Investor Class shares) returned 7.59%, underperforming the fund's benchmark, the S&P 500 Index, which returned 10.42% for the same period and underperforming the fund's secondary index, the S&P 500 Information Technology Index, which returned 15.64% for the same period.
What factors materially affected the fund's performance over the last six months?
The industries that contributed the most to performance were communications equipment, broadline retail, and interactive home entertainment. Those that detracted the most were internet services & infrastructure, health care technology, and passenger ground transportation. The holdings that contributed the most to performance were Meta Platforms, Inc. – Class A, Alphabet, Inc. – Class A, and Bilibili, Inc. ADR. Those that detracted the most were Airbnb, Inc. – Class A, Snowflake, Inc. – Class A, and CoStar Group, Inc.
Cumulative performance* for the fund's most recently completed 10 years (as of 9.30.24), assuming a $10,000 initial investment.
| 09/30/2014 | 10000 | 10000 | 10000 |
| 12/31/2014 | 10004 | 10493 | 10524 |
| 03/31/2015 | 10259 | 10593 | 10585 |
| 06/30/2015 | 10540 | 10622 | 10604 |
| 09/30/2015 | 9751 | 9939 | 10211 |
| 12/31/2015 | 10878 | 10638 | 11148 |
| 03/31/2016 | 10306 | 10782 | 11438 |
| 06/30/2016 | 10342 | 11047 | 11113 |
| 09/30/2016 | 11844 | 11472 | 12542 |
| 12/31/2016 | 11399 | 11911 | 12692 |
| 03/31/2017 | 12611 | 12633 | 14287 |
| 06/30/2017 | 13619 | 13023 | 14878 |
| 09/30/2017 | 14533 | 13607 | 16164 |
| 12/31/2017 | 15323 | 14511 | 17620 |
| 03/31/2018 | 16509 | 14401 | 18241 |
| 06/30/2018 | 17896 | 14896 | 19535 |
| 09/30/2018 | 18251 | 16044 | 21254 |
| 12/31/2018 | 14871 | 13875 | 17569 |
| 03/31/2019 | 18060 | 15769 | 21059 |
| 06/30/2019 | 18425 | 16447 | 22335 |
| 09/30/2019 | 17445 | 16727 | 23081 |
| 12/31/2019 | 18744 | 18244 | 26405 |
| 03/31/2020 | 16571 | 14668 | 23254 |
| 06/30/2020 | 23177 | 17682 | 30353 |
| 09/30/2020 | 25588 | 19260 | 33981 |
| 12/31/2020 | 30205 | 21600 | 37994 |
| 03/31/2021 | 30800 | 22934 | 38744 |
| 06/30/2021 | 33392 | 24895 | 43222 |
| 09/30/2021 | 30729 | 25040 | 43802 |
| 12/31/2021 | 28908 | 27801 | 51113 |
| 03/31/2022 | 23568 | 26522 | 46841 |
| 06/30/2022 | 16750 | 22252 | 37360 |
| 09/30/2022 | 16163 | 21165 | 35041 |
| 12/31/2022 | 16032 | 22766 | 36703 |
| 03/31/2023 | 19327 | 24473 | 44710 |
| 06/30/2023 | 21011 | 26612 | 52402 |
| 09/30/2023 | 20454 | 25741 | 49445 |
| 12/31/2023 | 23719 | 28750 | 57932 |
| 03/31/2024 | 25209 | 31785 | 65282 |
| 06/30/2024 | 25368 | 33147 | 74294 |
| 09/30/2024 | 27124 | 35098 | 75490 |
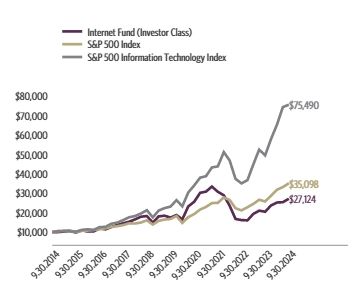
| Investor Class | 7.59% | 32.61% | 9.23% | 10.49% |
| S&P 500 Index | 10.42% | 36.35% | 15.98% | 13.38% |
| S&P 500 Information Technology Index | 15.64% | 52.68% | 26.74% | 22.40% |
The fund's past performance is not a good predictor of the fund's future performance. Visit GuggenheimInvestments.com/mutual-funds/performance for more recent performance information.
| Net Assets | $12,234,793 |
| Total Number of Portfolio Holdings | 82 |
| Portfolio Turnover Rate | 43% |
| Internet Fund | Investor Class | RYIIX | Semi-Annual Shareholder Report | September 30, 2024 |
| Internet | 57.3% |
| Software | 25.5% |
| Telecommunications | 11.0% |
| Commercial Services | 2.5% |
| Real Estate | 1.2% |
| Entertainment | 0.9% |
| Computers | 0.5% |
| Other | 0.6% |
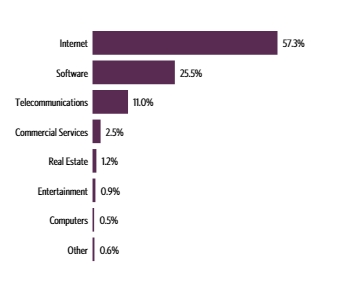
| Alphabet, Inc. — Class A | 6.8% |
| Amazon.com, Inc. | 6.5% |
| Meta Platforms, Inc. — Class A | 6.0% |
| Netflix, Inc. | 3.8% |
| Salesforce, Inc. | 3.6% |
| Cisco Systems, Inc. | 3.1% |
| Adobe, Inc. | 3.1% |
| Uber Technologies, Inc. | 2.8% |
| Arista Networks, Inc. | 2.2% |
| PayPal Holdings, Inc. | 2.0% |
| Top 10 Total | 39.9% |
| |
1 | "Holdings Diversification (Market Exposure as a % of Net Assets)" excludes any temporary cash investments, investments in Guggenheim Strategy Funds Trust mutual funds, or investments in Guggenheim Ultra Short Duration Fund. |
| |
2 | "10 Largest Holdings (as a % of Net Assets)" excludes any temporary cash investments. |
| Alphabet, Inc. — Class A | 6.8% |
| Amazon.com, Inc. | 6.5% |
| Meta Platforms, Inc. — Class A | 6.0% |
| Netflix, Inc. | 3.8% |
| Salesforce, Inc. | 3.6% |
| Cisco Systems, Inc. | 3.1% |
| Adobe, Inc. | 3.1% |
| Uber Technologies, Inc. | 2.8% |
| Arista Networks, Inc. | 2.2% |
| PayPal Holdings, Inc. | 2.0% |
| Top 10 Total | 39.9% |
| |
2 | "10 Largest Holdings (as a % of Net Assets)" excludes any temporary cash investments. |
There were no changes in or disagreements with fund accountants for the period.
| | | Availability of Additional Information. For additional information, including the fund's prospectus, financial information, holdings and proxy voting information, go to GuggenheimInvestments.com/mutual-funds/literature or, call 800 820 0888. |
SAR-RYIIX-093024
Semi-Annual Shareholder Report | 9.30.24
This semi-annual shareholder report contains important information about the Internet Fund for the period of April 1, 2024 to September 30, 2024. You can find additional information about the fund at GuggenheimInvestments.com/mutual-funds/literature. You can also request this information by contacting 800 820 0888 or GuggenheimClientServices@mufg-is.com.
For the period of April 1, 2024 to September 30, 2024, the fund (Class A shares) returned 7.47%, underperforming the fund's benchmark, the S&P 500 Index, which returned 10.42% for the same period and underperforming the fund's secondary index, the S&P 500 Information Technology Index, which returned 15.64% for the same period.
What factors materially affected the fund's performance over the last six months?
The industries that contributed the most to performance were communications equipment, broadline retail, and interactive home entertainment. Those that detracted the most were internet services & infrastructure, health care technology, and passenger ground transportation. The holdings that contributed the most to performance were Meta Platforms, Inc. – Class A, Alphabet, Inc. – Class A, and Bilibili, Inc. ADR. Those that detracted the most were Airbnb, Inc. – Class A, Snowflake, Inc. – Class A, and CoStar Group, Inc.
Cumulative performance* for the fund's most recently completed 10 years (as of 9.30.24), assuming a $10,000 initial investment.
| 09/30/2014 | 9525 | 10000 | 10000 |
| 12/31/2014 | 9523 | 10493 | 10524 |
| 03/31/2015 | 9760 | 10593 | 10585 |
| 06/30/2015 | 10021 | 10622 | 10604 |
| 09/30/2015 | 9263 | 9939 | 10211 |
| 12/31/2015 | 10328 | 10638 | 11148 |
| 03/31/2016 | 9779 | 10782 | 11438 |
| 06/30/2016 | 9807 | 11047 | 11113 |
| 09/30/2016 | 11223 | 11472 | 12542 |
| 12/31/2016 | 10794 | 11911 | 12692 |
| 03/31/2017 | 11935 | 12633 | 14287 |
| 06/30/2017 | 12881 | 13023 | 14878 |
| 09/30/2017 | 13738 | 13607 | 16164 |
| 12/31/2017 | 14475 | 14511 | 17620 |
| 03/31/2018 | 15584 | 14401 | 18241 |
| 06/30/2018 | 16884 | 14896 | 19535 |
| 09/30/2018 | 17209 | 16044 | 21254 |
| 12/31/2018 | 14010 | 13875 | 17569 |
| 03/31/2019 | 17006 | 15769 | 21059 |
| 06/30/2019 | 17338 | 16447 | 22335 |
| 09/30/2019 | 16406 | 16727 | 23081 |
| 12/31/2019 | 17617 | 18244 | 26405 |
| 03/31/2020 | 15565 | 14668 | 23254 |
| 06/30/2020 | 21757 | 17682 | 30353 |
| 09/30/2020 | 24006 | 19260 | 33981 |
| 12/31/2020 | 28319 | 21600 | 37994 |
| 03/31/2021 | 28859 | 22934 | 38744 |
| 06/30/2021 | 31269 | 24895 | 43222 |
| 09/30/2021 | 28757 | 25040 | 43802 |
| 12/31/2021 | 27036 | 27801 | 51113 |
| 03/31/2022 | 22028 | 26522 | 46841 |
| 06/30/2022 | 15645 | 22252 | 37360 |
| 09/30/2022 | 15087 | 21165 | 35041 |
| 12/31/2022 | 14955 | 22766 | 36703 |
| 03/31/2023 | 18020 | 24473 | 44710 |
| 06/30/2023 | 19576 | 26612 | 52402 |
| 09/30/2023 | 19046 | 25741 | 49445 |
| 12/31/2023 | 22071 | 28750 | 57932 |
| 03/31/2024 | 23443 | 31785 | 65282 |
| 06/30/2024 | 23578 | 33147 | 74294 |
| 09/30/2024 | 25196 | 35098 | 75490 |
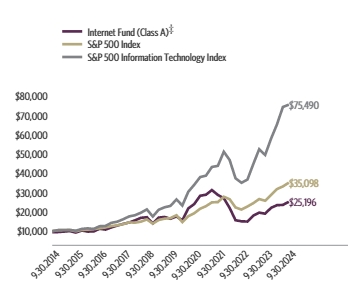
| Class A (without sales charge) | 7.47% | 32.29% | 8.96% | 10.22% |
| Class A (with sales charge)‡ | 2.37% | 26.00% | 7.90% | 9.68% |
| S&P 500 Index | 10.42% | 36.35% | 15.98% | 13.38% |
| S&P 500 Information Technology Index | 15.64% | 52.68% | 26.74% | 22.40% |
The fund's past performance is not a good predictor of the fund's future performance. Visit GuggenheimInvestments.com/mutual-funds/performance for more recent performance information.
| Net Assets | $12,234,793 |
| Total Number of Portfolio Holdings | 82 |
| Portfolio Turnover Rate | 43% |
| Internet Fund | Class A | RYINX | Semi-Annual Shareholder Report | September 30, 2024 |
| Internet | 57.3% |
| Software | 25.5% |
| Telecommunications | 11.0% |
| Commercial Services | 2.5% |
| Real Estate | 1.2% |
| Entertainment | 0.9% |
| Computers | 0.5% |
| Other | 0.6% |

| Alphabet, Inc. — Class A | 6.8% |
| Amazon.com, Inc. | 6.5% |
| Meta Platforms, Inc. — Class A | 6.0% |
| Netflix, Inc. | 3.8% |
| Salesforce, Inc. | 3.6% |
| Cisco Systems, Inc. | 3.1% |
| Adobe, Inc. | 3.1% |
| Uber Technologies, Inc. | 2.8% |
| Arista Networks, Inc. | 2.2% |
| PayPal Holdings, Inc. | 2.0% |
| Top 10 Total | 39.9% |
| |
1 | "Holdings Diversification (Market Exposure as a % of Net Assets)" excludes any temporary cash investments, investments in Guggenheim Strategy Funds Trust mutual funds, or investments in Guggenheim Ultra Short Duration Fund. |
| |
2 | "10 Largest Holdings (as a % of Net Assets)" excludes any temporary cash investments. |
| Alphabet, Inc. — Class A | 6.8% |
| Amazon.com, Inc. | 6.5% |
| Meta Platforms, Inc. — Class A | 6.0% |
| Netflix, Inc. | 3.8% |
| Salesforce, Inc. | 3.6% |
| Cisco Systems, Inc. | 3.1% |
| Adobe, Inc. | 3.1% |
| Uber Technologies, Inc. | 2.8% |
| Arista Networks, Inc. | 2.2% |
| PayPal Holdings, Inc. | 2.0% |
| Top 10 Total | 39.9% |
| |
2 | "10 Largest Holdings (as a % of Net Assets)" excludes any temporary cash investments. |
There were no changes in or disagreements with fund accountants for the period.
| | | Availability of Additional Information. For additional information, including the fund's prospectus, financial information, holdings and proxy voting information, go to GuggenheimInvestments.com/mutual-funds/literature or, call 800 820 0888. |
SAR-RYINX-093024
Semi-Annual Shareholder Report | 9.30.24
This semi-annual shareholder report contains important information about the Internet Fund for the period of April 1, 2024 to September 30, 2024. You can find additional information about the fund at GuggenheimInvestments.com/mutual-funds/literature. You can also request this information by contacting 800 820 0888 or GuggenheimClientServices@mufg-is.com.
For the period of April 1, 2024 to September 30, 2024, the fund (Class C shares) returned 7.07%, underperforming the fund's benchmark, the S&P 500 Index, which returned 10.42% for the same period and underperforming the fund's secondary index, the S&P 500 Information Technology Index, which returned 15.64% for the same period.
What factors materially affected the fund's performance over the last six months?
The industries that contributed the most to performance were communications equipment, broadline retail, and interactive home entertainment. Those that detracted the most were internet services & infrastructure, health care technology, and passenger ground transportation. The holdings that contributed the most to performance were Meta Platforms, Inc. – Class A, Alphabet, Inc. – Class A, and Bilibili, Inc. ADR. Those that detracted the most were Airbnb, Inc. – Class A, Snowflake, Inc. – Class A, and CoStar Group, Inc.
Cumulative performance* for the fund's most recently completed 10 years (as of 9.30.24), assuming a $10,000 initial investment.
| 09/30/2014 | 10000 | 10000 | 10000 |
| 12/31/2014 | 9978 | 10493 | 10524 |
| 03/31/2015 | 10207 | 10593 | 10585 |
| 06/30/2015 | 10459 | 10622 | 10604 |
| 09/30/2015 | 9652 | 9939 | 10211 |
| 12/31/2015 | 10741 | 10638 | 11148 |
| 03/31/2016 | 10151 | 10782 | 11438 |
| 06/30/2016 | 10161 | 11047 | 11113 |
| 09/30/2016 | 11607 | 11472 | 12542 |
| 12/31/2016 | 11142 | 11911 | 12692 |
| 03/31/2017 | 12297 | 12633 | 14287 |
| 06/30/2017 | 13246 | 13023 | 14878 |
| 09/30/2017 | 14101 | 13607 | 16164 |
| 12/31/2017 | 14830 | 14511 | 17620 |
| 03/31/2018 | 15939 | 14401 | 18241 |
| 06/30/2018 | 17236 | 14896 | 19535 |
| 09/30/2018 | 17533 | 16044 | 21254 |
| 12/31/2018 | 14249 | 13875 | 17569 |
| 03/31/2019 | 17263 | 15769 | 21059 |
| 06/30/2019 | 17569 | 16447 | 22335 |
| 09/30/2019 | 16592 | 16727 | 23081 |
| 12/31/2019 | 17782 | 18244 | 26405 |
| 03/31/2020 | 15682 | 14668 | 23254 |
| 06/30/2020 | 21879 | 17682 | 30353 |
| 09/30/2020 | 24094 | 19260 | 33981 |
| 12/31/2020 | 28370 | 21600 | 37994 |
| 03/31/2021 | 28860 | 22934 | 38744 |
| 06/30/2021 | 31211 | 24895 | 43222 |
| 09/30/2021 | 28650 | 25040 | 43802 |
| 12/31/2021 | 26882 | 27801 | 51113 |
| 03/31/2022 | 21864 | 26522 | 46841 |
| 06/30/2022 | 15498 | 22252 | 37360 |
| 09/30/2022 | 14917 | 21165 | 35041 |
| 12/31/2022 | 14759 | 22766 | 36703 |
| 03/31/2023 | 17749 | 24473 | 44710 |
| 06/30/2023 | 19247 | 26612 | 52402 |
| 09/30/2023 | 18692 | 25741 | 49445 |
| 12/31/2023 | 21620 | 28750 | 57932 |
| 03/31/2024 | 22922 | 31785 | 65282 |
| 06/30/2024 | 23011 | 33147 | 74294 |
| 09/30/2024 | 24543 | 35098 | 75490 |
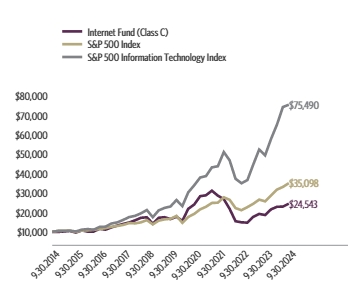
| Class C (without CDSC) | 7.07% | 31.30% | 8.14% | 9.39% |
| Class C (with CDSC)§ | 6.07% | 30.30% | 8.14% | 9.39% |
| S&P 500 Index | 10.42% | 36.35% | 15.98% | 13.38% |
| S&P 500 Information Technology Index | 15.64% | 52.68% | 26.74% | 22.40% |
The fund's past performance is not a good predictor of the fund's future performance. Visit GuggenheimInvestments.com/mutual-funds/performance for more recent performance information.
| Net Assets | $12,234,793 |
| Total Number of Portfolio Holdings | 82 |
| Portfolio Turnover Rate | 43% |
| Internet Fund | Class C | RYICX | Semi-Annual Shareholder Report | September 30, 2024 |
| Internet | 57.3% |
| Software | 25.5% |
| Telecommunications | 11.0% |
| Commercial Services | 2.5% |
| Real Estate | 1.2% |
| Entertainment | 0.9% |
| Computers | 0.5% |
| Other | 0.6% |

| Alphabet, Inc. — Class A | 6.8% |
| Amazon.com, Inc. | 6.5% |
| Meta Platforms, Inc. — Class A | 6.0% |
| Netflix, Inc. | 3.8% |
| Salesforce, Inc. | 3.6% |
| Cisco Systems, Inc. | 3.1% |
| Adobe, Inc. | 3.1% |
| Uber Technologies, Inc. | 2.8% |
| Arista Networks, Inc. | 2.2% |
| PayPal Holdings, Inc. | 2.0% |
| Top 10 Total | 39.9% |
| |
1 | "Holdings Diversification (Market Exposure as a % of Net Assets)" excludes any temporary cash investments, investments in Guggenheim Strategy Funds Trust mutual funds, or investments in Guggenheim Ultra Short Duration Fund. |
| |
2 | "10 Largest Holdings (as a % of Net Assets)" excludes any temporary cash investments. |
| Alphabet, Inc. — Class A | 6.8% |
| Amazon.com, Inc. | 6.5% |
| Meta Platforms, Inc. — Class A | 6.0% |
| Netflix, Inc. | 3.8% |
| Salesforce, Inc. | 3.6% |
| Cisco Systems, Inc. | 3.1% |
| Adobe, Inc. | 3.1% |
| Uber Technologies, Inc. | 2.8% |
| Arista Networks, Inc. | 2.2% |
| PayPal Holdings, Inc. | 2.0% |
| Top 10 Total | 39.9% |
| |
2 | "10 Largest Holdings (as a % of Net Assets)" excludes any temporary cash investments. |
There were no changes in or disagreements with fund accountants for the period.
| | | Availability of Additional Information. For additional information, including the fund's prospectus, financial information, holdings and proxy voting information, go to GuggenheimInvestments.com/mutual-funds/literature or, call 800 820 0888. |
SAR-RYICX-093024
Semi-Annual Shareholder Report | 9.30.24
This semi-annual shareholder report contains important information about the Internet Fund for the period of April 1, 2024 to September 30, 2024. You can find additional information about the fund at GuggenheimInvestments.com/mutual-funds/literature. You can also request this information by contacting 800 820 0888 or GuggenheimClientServices@mufg-is.com.
For the period of April 1, 2024 to September 30, 2024, the fund (Class H shares) returned 7.47%, underperforming the fund's benchmark, the S&P 500 Index, which returned 10.42% for the same period and underperforming the fund's secondary index, the S&P 500 Information Technology Index, which returned 15.64% for the same period.
What factors materially affected the fund's performance over the last six months?
The industries that contributed the most to performance were communications equipment, broadline retail, and interactive home entertainment. Those that detracted the most were internet services & infrastructure, health care technology, and passenger ground transportation. The holdings that contributed the most to performance were Meta Platforms, Inc. – Class A, Alphabet, Inc. – Class A, and Bilibili, Inc. ADR. Those that detracted the most were Airbnb, Inc. – Class A, Snowflake, Inc. – Class A, and CoStar Group, Inc.
Cumulative performance* for the fund's most recently completed 10 years (as of 9.30.24), assuming a $10,000 initial investment.
| 09/30/2014 | 10000 | 10000 | 10000 |
| 12/31/2014 | 9989 | 10493 | 10524 |
| 03/31/2015 | 10232 | 10593 | 10585 |
| 06/30/2015 | 10497 | 10622 | 10604 |
| 09/30/2015 | 9705 | 9939 | 10211 |
| 12/31/2015 | 10819 | 10638 | 11148 |
| 03/31/2016 | 10242 | 10782 | 11438 |
| 06/30/2016 | 10272 | 11047 | 11113 |
| 09/30/2016 | 11757 | 11472 | 12542 |
| 12/31/2016 | 11310 | 11911 | 12692 |
| 03/31/2017 | 12505 | 12633 | 14287 |
| 06/30/2017 | 13497 | 13023 | 14878 |
| 09/30/2017 | 14394 | 13607 | 16164 |
| 12/31/2017 | 15167 | 14511 | 17620 |
| 03/31/2018 | 16330 | 14401 | 18241 |
| 06/30/2018 | 17692 | 14896 | 19535 |
| 09/30/2018 | 18032 | 16044 | 21254 |
| 12/31/2018 | 14681 | 13875 | 17569 |
| 03/31/2019 | 17820 | 15769 | 21059 |
| 06/30/2019 | 18166 | 16447 | 22335 |
| 09/30/2019 | 17189 | 16727 | 23081 |
| 12/31/2019 | 18457 | 18244 | 26405 |
| 03/31/2020 | 16307 | 14668 | 23254 |
| 06/30/2020 | 22794 | 17682 | 30353 |
| 09/30/2020 | 25150 | 19260 | 33981 |
| 12/31/2020 | 29668 | 21600 | 37994 |
| 03/31/2021 | 30234 | 22934 | 38744 |
| 06/30/2021 | 32759 | 24895 | 43222 |
| 09/30/2021 | 30128 | 25040 | 43802 |
| 12/31/2021 | 28324 | 27801 | 51113 |
| 03/31/2022 | 23079 | 26522 | 46841 |
| 06/30/2022 | 16391 | 22252 | 37360 |
| 09/30/2022 | 15804 | 21165 | 35041 |
| 12/31/2022 | 15668 | 22766 | 36703 |
| 03/31/2023 | 18876 | 24473 | 44710 |
| 06/30/2023 | 20506 | 26612 | 52402 |
| 09/30/2023 | 19951 | 25741 | 49445 |
| 12/31/2023 | 23121 | 28750 | 57932 |
| 03/31/2024 | 24559 | 31785 | 65282 |
| 06/30/2024 | 24699 | 33147 | 74294 |
| 09/30/2024 | 26395 | 35098 | 75490 |
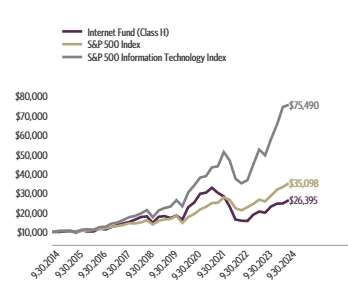
| Class H** | 7.47% | 32.30% | 8.96% | 10.19% |
| S&P 500 Index | 10.42% | 36.35% | 15.98% | 13.38% |
| S&P 500 Information Technology Index | 15.64% | 52.68% | 26.74% | 22.40% |
The fund's past performance is not a good predictor of the fund's future performance. Visit GuggenheimInvestments.com/mutual-funds/performance for more recent performance information.
| Net Assets | $12,234,793 |
| Total Number of Portfolio Holdings | 82 |
| Portfolio Turnover Rate | 43% |
| Internet Fund | Class H | RYIAX | Semi-Annual Shareholder Report | September 30, 2024 |
| Internet | 57.3% |
| Software | 25.5% |
| Telecommunications | 11.0% |
| Commercial Services | 2.5% |
| Real Estate | 1.2% |
| Entertainment | 0.9% |
| Computers | 0.5% |
| Other | 0.6% |

| Alphabet, Inc. — Class A | 6.8% |
| Amazon.com, Inc. | 6.5% |
| Meta Platforms, Inc. — Class A | 6.0% |
| Netflix, Inc. | 3.8% |
| Salesforce, Inc. | 3.6% |
| Cisco Systems, Inc. | 3.1% |
| Adobe, Inc. | 3.1% |
| Uber Technologies, Inc. | 2.8% |
| Arista Networks, Inc. | 2.2% |
| PayPal Holdings, Inc. | 2.0% |
| Top 10 Total | 39.9% |
| |
1 | "Holdings Diversification (Market Exposure as a % of Net Assets)" excludes any temporary cash investments, investments in Guggenheim Strategy Funds Trust mutual funds, or investments in Guggenheim Ultra Short Duration Fund. |
| |
2 | "10 Largest Holdings (as a % of Net Assets)" excludes any temporary cash investments. |
| Alphabet, Inc. — Class A | 6.8% |
| Amazon.com, Inc. | 6.5% |
| Meta Platforms, Inc. — Class A | 6.0% |
| Netflix, Inc. | 3.8% |
| Salesforce, Inc. | 3.6% |
| Cisco Systems, Inc. | 3.1% |
| Adobe, Inc. | 3.1% |
| Uber Technologies, Inc. | 2.8% |
| Arista Networks, Inc. | 2.2% |
| PayPal Holdings, Inc. | 2.0% |
| Top 10 Total | 39.9% |
| |
2 | "10 Largest Holdings (as a % of Net Assets)" excludes any temporary cash investments. |
There were no changes in or disagreements with fund accountants for the period.
| | | Availability of Additional Information. For additional information, including the fund's prospectus, financial information, holdings and proxy voting information, go to GuggenheimInvestments.com/mutual-funds/literature or, call 800 820 0888. |
SAR-RYIAX-093024
Semi-Annual Shareholder Report | 9.30.24
This semi-annual shareholder report contains important information about the Leisure Fund for the period of April 1, 2024 to September 30, 2024. You can find additional information about the fund at GuggenheimInvestments.com/mutual-funds/literature. You can also request this information by contacting 800 820 0888 or GuggenheimClientServices@mufg-is.com.
For the period of April 1, 2024 to September 30, 2024, the fund (Investor Class shares) returned 5.78%, underperforming the fund's benchmark, the S&P 500 Index, which returned 10.42% for the same period and underperforming the fund's secondary index, the S&P 500 Consumer Discretionary Index, which returned 8.50% for the same period.
What factors materially affected the fund's performance over the last six months?
The industries that contributed the most to performance were tobacco, interactive home entertainment, and restaurants. Those that detracted the most were casinos & gaming, leisure facilities, and distillers & vintners. The holdings that contributed the most to performance were Philip Morris International, Inc., Bilibili, Inc. ADR, and Netflix, Inc. Those that detracted the most were Walt Disney Co., Airbnb, Inc. – Class A, and Dave & Buster's Entertainment, Inc.
Cumulative performance* for the fund's most recently completed 10 years (as of 9.30.24), assuming a $10,000 initial investment.
| 09/30/2014 | 10000 | 10000 | 10000 |
| 12/31/2014 | 10591 | 10493 | 10874 |
| 03/31/2015 | 10886 | 10593 | 11396 |
| 06/30/2015 | 11071 | 10622 | 11615 |
| 09/30/2015 | 10304 | 9939 | 11318 |
| 12/31/2015 | 10673 | 10638 | 11973 |
| 03/31/2016 | 11074 | 10782 | 12165 |
| 06/30/2016 | 11034 | 11047 | 12054 |
| 09/30/2016 | 11265 | 11472 | 12409 |
| 12/31/2016 | 11722 | 11911 | 12695 |
| 03/31/2017 | 12868 | 12633 | 13768 |
| 06/30/2017 | 13298 | 13023 | 14091 |
| 09/30/2017 | 13319 | 13607 | 14210 |
| 12/31/2017 | 14126 | 14511 | 15612 |
| 03/31/2018 | 13731 | 14401 | 16095 |
| 06/30/2018 | 14130 | 14896 | 17410 |
| 09/30/2018 | 14533 | 16044 | 18834 |
| 12/31/2018 | 12251 | 13875 | 15742 |
| 03/31/2019 | 14289 | 15769 | 18218 |
| 06/30/2019 | 14929 | 16447 | 19180 |
| 09/30/2019 | 14546 | 16727 | 19278 |
| 12/31/2019 | 15912 | 18244 | 20140 |
| 03/31/2020 | 11009 | 14668 | 16255 |
| 06/30/2020 | 13858 | 17682 | 21596 |
| 09/30/2020 | 15806 | 19260 | 24848 |
| 12/31/2020 | 19295 | 21600 | 26847 |
| 03/31/2021 | 20963 | 22934 | 27681 |
| 06/30/2021 | 21685 | 24895 | 29604 |
| 09/30/2021 | 20173 | 25040 | 29606 |
| 12/31/2021 | 19494 | 27801 | 33406 |
| 03/31/2022 | 17709 | 26522 | 30391 |
| 06/30/2022 | 13751 | 22252 | 22441 |
| 09/30/2022 | 13056 | 21165 | 23420 |
| 12/31/2022 | 14235 | 22766 | 21035 |
| 03/31/2023 | 16088 | 24473 | 24429 |
| 06/30/2023 | 16847 | 26612 | 27990 |
| 09/30/2023 | 15918 | 25741 | 26645 |
| 12/31/2023 | 17488 | 28750 | 29956 |
| 03/31/2024 | 18433 | 31785 | 31447 |
| 06/30/2024 | 17956 | 33147 | 31652 |
| 09/30/2024 | 19499 | 35098 | 34121 |
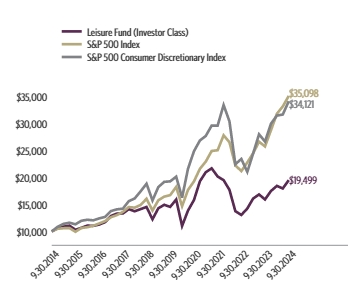
| Investor Class | 5.78% | 22.50% | 6.04% | 6.91% |
| S&P 500 Index | 10.42% | 36.35% | 15.98% | 13.38% |
| S&P 500 Consumer Discretionary Index | 8.50% | 28.06% | 12.10% | 13.06% |
The fund's past performance is not a good predictor of the fund's future performance. Visit GuggenheimInvestments.com/mutual-funds/performance for more recent performance information.
| Net Assets | $7,154,930 |
| Total Number of Portfolio Holdings | 97 |
| Portfolio Turnover Rate | 37% |
| Leisure Fund | Investor Class | RYLIX | Semi-Annual Shareholder Report | September 30, 2024 |
| Retail | 20.8% |
| Internet | 17.9% |
| Media | 15.2% |
| Entertainment | 10.8% |
| Lodging | 9.2% |
| Leisure Time | 7.3% |
| Agriculture | 6.5% |
| Other | 11.9% |
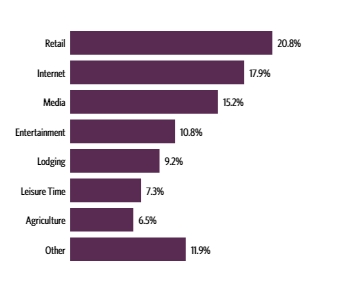
| Netflix, Inc. | 4.4% |
| McDonald's Corp. | 3.7% |
| Philip Morris International, Inc. | 3.4% |
| Walt Disney Co. | 3.4% |
| Comcast Corp. — Class A | 3.3% |
| Starbucks Corp. | 2.6% |
| Booking Holdings, Inc. | 2.4% |
| Altria Group, Inc. | 2.3% |
| Chipotle Mexican Grill, Inc. — Class A | 2.2% |
| Airbnb, Inc. — Class A | 2.2% |
| Top 10 Total | 29.9% |
| |
1 | "Holdings Diversification (Market Exposure as a % of Net Assets)" excludes any temporary cash investments, investments in Guggenheim Strategy Funds Trust mutual funds, or investments in Guggenheim Ultra Short Duration Fund. |
| |
2 | "10 Largest Holdings (as a % of Net Assets)" excludes any temporary cash investments. |
| Netflix, Inc. | 4.4% |
| McDonald's Corp. | 3.7% |
| Philip Morris International, Inc. | 3.4% |
| Walt Disney Co. | 3.4% |
| Comcast Corp. — Class A | 3.3% |
| Starbucks Corp. | 2.6% |
| Booking Holdings, Inc. | 2.4% |
| Altria Group, Inc. | 2.3% |
| Chipotle Mexican Grill, Inc. — Class A | 2.2% |
| Airbnb, Inc. — Class A | 2.2% |
| Top 10 Total | 29.9% |
| |
2 | "10 Largest Holdings (as a % of Net Assets)" excludes any temporary cash investments. |
There were no changes in or disagreements with fund accountants for the period.
| | | Availability of Additional Information. For additional information, including the fund's prospectus, financial information, holdings and proxy voting information, go to GuggenheimInvestments.com/mutual-funds/literature or, call 800 820 0888. |
SAR-RYLIX-093024
Semi-Annual Shareholder Report | 9.30.24
This semi-annual shareholder report contains important information about the Leisure Fund for the period of April 1, 2024 to September 30, 2024. You can find additional information about the fund at GuggenheimInvestments.com/mutual-funds/literature. You can also request this information by contacting 800 820 0888 or GuggenheimClientServices@mufg-is.com.
For the period of April 1, 2024 to September 30, 2024, the fund (Class A shares) returned 5.67%, underperforming the fund's benchmark, the S&P 500 Index, which returned 10.42% for the same period and underperforming the fund's secondary index, the S&P 500 Consumer Discretionary Index, which returned 8.50% for the same period.
What factors materially affected the fund's performance over the last six months?
The industries that contributed the most to performance were tobacco, interactive home entertainment, and restaurants. Those that detracted the most were casinos & gaming, leisure facilities, and distillers & vintners. The holdings that contributed the most to performance were Philip Morris International, Inc., Bilibili, Inc. ADR, and Netflix, Inc. Those that detracted the most were Walt Disney Co., Airbnb, Inc. – Class A, and Dave & Buster's Entertainment, Inc.
Cumulative performance* for the fund's most recently completed 10 years (as of 9.30.24), assuming a $10,000 initial investment.
| 09/30/2014 | 9525 | 10000 | 10000 |
| 12/31/2014 | 10083 | 10493 | 10874 |
| 03/31/2015 | 10356 | 10593 | 11396 |
| 06/30/2015 | 10524 | 10622 | 11615 |
| 09/30/2015 | 9790 | 9939 | 11318 |
| 12/31/2015 | 10132 | 10638 | 11973 |
| 03/31/2016 | 10506 | 10782 | 12165 |
| 06/30/2016 | 10462 | 11047 | 12054 |
| 09/30/2016 | 10675 | 11472 | 12409 |
| 12/31/2016 | 11101 | 11911 | 12695 |
| 03/31/2017 | 12178 | 12633 | 13768 |
| 06/30/2017 | 12576 | 13023 | 14091 |
| 09/30/2017 | 12589 | 13607 | 14210 |
| 12/31/2017 | 13345 | 14511 | 15612 |
| 03/31/2018 | 12964 | 14401 | 16095 |
| 06/30/2018 | 13331 | 14896 | 17410 |
| 09/30/2018 | 13703 | 16044 | 18834 |
| 12/31/2018 | 11542 | 13875 | 15742 |
| 03/31/2019 | 13455 | 15769 | 18218 |
| 06/30/2019 | 14052 | 16447 | 19180 |
| 09/30/2019 | 13681 | 16727 | 19278 |
| 12/31/2019 | 14954 | 18244 | 20140 |
| 03/31/2020 | 10340 | 14668 | 16255 |
| 06/30/2020 | 13008 | 17682 | 21596 |
| 09/30/2020 | 14828 | 19260 | 24848 |
| 12/31/2020 | 18089 | 21600 | 26847 |
| 03/31/2021 | 19642 | 22934 | 27681 |
| 06/30/2021 | 20306 | 24895 | 29604 |
| 09/30/2021 | 18879 | 25040 | 29606 |
| 12/31/2021 | 18232 | 27801 | 33406 |
| 03/31/2022 | 16554 | 26522 | 30391 |
| 06/30/2022 | 12846 | 22252 | 22441 |
| 09/30/2022 | 12188 | 21165 | 23420 |
| 12/31/2022 | 13279 | 22766 | 21035 |
| 03/31/2023 | 14999 | 24473 | 24429 |
| 06/30/2023 | 15695 | 26612 | 27990 |
| 09/30/2023 | 14821 | 25741 | 26645 |
| 12/31/2023 | 16272 | 28750 | 29956 |
| 03/31/2024 | 17140 | 31785 | 31447 |
| 06/30/2024 | 16688 | 33147 | 31652 |
| 09/30/2024 | 18109 | 35098 | 34121 |
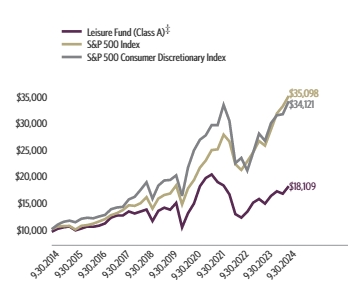
| Class A (without sales charge) | 5.67% | 22.19% | 5.77% | 6.64% |
| Class A (with sales charge)‡ | 0.65% | 16.38% | 4.74% | 6.12% |
| S&P 500 Index | 10.42% | 36.35% | 15.98% | 13.38% |
| S&P 500 Consumer Discretionary Index | 8.50% | 28.06% | 12.10% | 13.06% |
The fund's past performance is not a good predictor of the fund's future performance. Visit GuggenheimInvestments.com/mutual-funds/performance for more recent performance information.
| Net Assets | $7,154,930 |
| Total Number of Portfolio Holdings | 97 |
| Portfolio Turnover Rate | 37% |
| Leisure Fund | Class A | RYLSX | Semi-Annual Shareholder Report | September 30, 2024 |
| Retail | 20.8% |
| Internet | 17.9% |
| Media | 15.2% |
| Entertainment | 10.8% |
| Lodging | 9.2% |
| Leisure Time | 7.3% |
| Agriculture | 6.5% |
| Other | 11.9% |

| Netflix, Inc. | 4.4% |
| McDonald's Corp. | 3.7% |
| Philip Morris International, Inc. | 3.4% |
| Walt Disney Co. | 3.4% |
| Comcast Corp. — Class A | 3.3% |
| Starbucks Corp. | 2.6% |
| Booking Holdings, Inc. | 2.4% |
| Altria Group, Inc. | 2.3% |
| Chipotle Mexican Grill, Inc. — Class A | 2.2% |
| Airbnb, Inc. — Class A | 2.2% |
| Top 10 Total | 29.9% |
| |
1 | "Holdings Diversification (Market Exposure as a % of Net Assets)" excludes any temporary cash investments, investments in Guggenheim Strategy Funds Trust mutual funds, or investments in Guggenheim Ultra Short Duration Fund. |
| |
2 | "10 Largest Holdings (as a % of Net Assets)" excludes any temporary cash investments. |
| Netflix, Inc. | 4.4% |
| McDonald's Corp. | 3.7% |
| Philip Morris International, Inc. | 3.4% |
| Walt Disney Co. | 3.4% |
| Comcast Corp. — Class A | 3.3% |
| Starbucks Corp. | 2.6% |
| Booking Holdings, Inc. | 2.4% |
| Altria Group, Inc. | 2.3% |
| Chipotle Mexican Grill, Inc. — Class A | 2.2% |
| Airbnb, Inc. — Class A | 2.2% |
| Top 10 Total | 29.9% |
| |
2 | "10 Largest Holdings (as a % of Net Assets)" excludes any temporary cash investments. |
There were no changes in or disagreements with fund accountants for the period.
| | | Availability of Additional Information. For additional information, including the fund's prospectus, financial information, holdings and proxy voting information, go to GuggenheimInvestments.com/mutual-funds/literature or, call 800 820 0888. |
SAR-RYLSX-093024
Semi-Annual Shareholder Report | 9.30.24
This semi-annual shareholder report contains important information about the Leisure Fund for the period of April 1, 2024 to September 30, 2024. You can find additional information about the fund at GuggenheimInvestments.com/mutual-funds/literature. You can also request this information by contacting 800 820 0888 or GuggenheimClientServices@mufg-is.com.
For the period of April 1, 2024 to September 30, 2024, the fund (Class C shares) returned 5.24%, underperforming the fund's benchmark, the S&P 500 Index, which returned 10.42% for the same period and underperforming the fund's secondary index, the S&P 500 Consumer Discretionary Index, which returned 8.50% for the same period.
What factors materially affected the fund's performance over the last six months?
The industries that contributed the most to performance were tobacco, interactive home entertainment, and restaurants. Those that detracted the most were casinos & gaming, leisure facilities, and distillers & vintners. The holdings that contributed the most to performance were Philip Morris International, Inc., Bilibili, Inc. ADR, and Netflix, Inc. Those that detracted the most were Walt Disney Co., Airbnb, Inc. – Class A, and Dave & Buster's Entertainment, Inc.
Cumulative performance* for the fund's most recently completed 10 years (as of 9.30.24), assuming a $10,000 initial investment.
| 09/30/2014 | 10000 | 10000 | 10000 |
| 12/31/2014 | 10565 | 10493 | 10874 |
| 03/31/2015 | 10834 | 10593 | 11396 |
| 06/30/2015 | 10988 | 10622 | 11615 |
| 09/30/2015 | 10201 | 9939 | 11318 |
| 12/31/2015 | 10540 | 10638 | 11973 |
| 03/31/2016 | 10908 | 10782 | 12165 |
| 06/30/2016 | 10842 | 11047 | 12054 |
| 09/30/2016 | 11041 | 11472 | 12409 |
| 12/31/2016 | 11460 | 11911 | 12695 |
| 03/31/2017 | 12550 | 12633 | 13768 |
| 06/30/2017 | 12935 | 13023 | 14091 |
| 09/30/2017 | 12925 | 13607 | 14210 |
| 12/31/2017 | 13674 | 14511 | 15612 |
| 03/31/2018 | 13259 | 14401 | 16095 |
| 06/30/2018 | 13609 | 14896 | 17410 |
| 09/30/2018 | 13963 | 16044 | 18834 |
| 12/31/2018 | 11739 | 13875 | 15742 |
| 03/31/2019 | 13660 | 15769 | 18218 |
| 06/30/2019 | 14238 | 16447 | 19180 |
| 09/30/2019 | 13837 | 16727 | 19278 |
| 12/31/2019 | 15096 | 18244 | 20140 |
| 03/31/2020 | 10419 | 14668 | 16255 |
| 06/30/2020 | 13083 | 17682 | 21596 |
| 09/30/2020 | 14884 | 19260 | 24848 |
| 12/31/2020 | 18123 | 21600 | 26847 |
| 03/31/2021 | 19642 | 22934 | 27681 |
| 06/30/2021 | 20271 | 24895 | 29604 |
| 09/30/2021 | 18810 | 25040 | 29606 |
| 12/31/2021 | 18129 | 27801 | 33406 |
| 03/31/2022 | 16431 | 26522 | 30391 |
| 06/30/2022 | 12725 | 22252 | 22441 |
| 09/30/2022 | 12051 | 21165 | 23420 |
| 12/31/2022 | 13107 | 22766 | 21035 |
| 03/31/2023 | 14776 | 24473 | 24429 |
| 06/30/2023 | 15434 | 26612 | 27990 |
| 09/30/2023 | 14548 | 25741 | 26645 |
| 12/31/2023 | 15942 | 28750 | 29956 |
| 03/31/2024 | 16760 | 31785 | 31447 |
| 06/30/2024 | 16287 | 33147 | 31652 |
| 09/30/2024 | 17641 | 35098 | 34121 |

| Class C (without CDSC) | 5.24% | 21.26% | 4.98% | 5.84% |
| Class C (with CDSC)§ | 4.24% | 20.26% | 4.98% | 5.84% |
| S&P 500 Index | 10.42% | 36.35% | 15.98% | 13.38% |
| S&P 500 Consumer Discretionary Index | 8.50% | 28.06% | 12.10% | 13.06% |
The fund's past performance is not a good predictor of the fund's future performance. Visit GuggenheimInvestments.com/mutual-funds/performance for more recent performance information.
| Net Assets | $7,154,930 |
| Total Number of Portfolio Holdings | 97 |
| Portfolio Turnover Rate | 37% |
| Leisure Fund | Class C | RYLCX | Semi-Annual Shareholder Report | September 30, 2024 |
| Retail | 20.8% |
| Internet | 17.9% |
| Media | 15.2% |
| Entertainment | 10.8% |
| Lodging | 9.2% |
| Leisure Time | 7.3% |
| Agriculture | 6.5% |
| Other | 11.9% |

| Netflix, Inc. | 4.4% |
| McDonald's Corp. | 3.7% |
| Philip Morris International, Inc. | 3.4% |
| Walt Disney Co. | 3.4% |
| Comcast Corp. — Class A | 3.3% |
| Starbucks Corp. | 2.6% |
| Booking Holdings, Inc. | 2.4% |
| Altria Group, Inc. | 2.3% |
| Chipotle Mexican Grill, Inc. — Class A | 2.2% |
| Airbnb, Inc. — Class A | 2.2% |
| Top 10 Total | 29.9% |
| |
1 | "Holdings Diversification (Market Exposure as a % of Net Assets)" excludes any temporary cash investments, investments in Guggenheim Strategy Funds Trust mutual funds, or investments in Guggenheim Ultra Short Duration Fund. |
| |
2 | "10 Largest Holdings (as a % of Net Assets)" excludes any temporary cash investments. |
| Netflix, Inc. | 4.4% |
| McDonald's Corp. | 3.7% |
| Philip Morris International, Inc. | 3.4% |
| Walt Disney Co. | 3.4% |
| Comcast Corp. — Class A | 3.3% |
| Starbucks Corp. | 2.6% |
| Booking Holdings, Inc. | 2.4% |
| Altria Group, Inc. | 2.3% |
| Chipotle Mexican Grill, Inc. — Class A | 2.2% |
| Airbnb, Inc. — Class A | 2.2% |
| Top 10 Total | 29.9% |
| |
2 | "10 Largest Holdings (as a % of Net Assets)" excludes any temporary cash investments. |
There were no changes in or disagreements with fund accountants for the period.
| | | Availability of Additional Information. For additional information, including the fund's prospectus, financial information, holdings and proxy voting information, go to GuggenheimInvestments.com/mutual-funds/literature or, call 800 820 0888. |
SAR-RYLCX-093024
Semi-Annual Shareholder Report | 9.30.24
This semi-annual shareholder report contains important information about the Leisure Fund for the period of April 1, 2024 to September 30, 2024. You can find additional information about the fund at GuggenheimInvestments.com/mutual-funds/literature. You can also request this information by contacting 800 820 0888 or GuggenheimClientServices@mufg-is.com.
For the period of April 1, 2024 to September 30, 2024, the fund (Class H shares) returned 5.67%, underperforming the fund's benchmark, the S&P 500 Index, which returned 10.42% for the same period and underperforming the fund's secondary index, the S&P 500 Consumer Discretionary Index, which returned 8.50% for the same period.
What factors materially affected the fund's performance over the last six months?
The industries that contributed the most to performance were tobacco, interactive home entertainment, and restaurants. Those that detracted the most were casinos & gaming, leisure facilities, and distillers & vintners. The holdings that contributed the most to performance were Philip Morris International, Inc., Bilibili, Inc. ADR, and Netflix, Inc. Those that detracted the most were Walt Disney Co., Airbnb, Inc. – Class A, and Dave & Buster's Entertainment, Inc.
Cumulative performance* for the fund's most recently completed 10 years (as of 9.30.24), assuming a $10,000 initial investment.
| 09/30/2014 | 10000 | 10000 | 10000 |
| 12/31/2014 | 10583 | 10493 | 10874 |
| 03/31/2015 | 10865 | 10593 | 11396 |
| 06/30/2015 | 11035 | 10622 | 11615 |
| 09/30/2015 | 10264 | 9939 | 11318 |
| 12/31/2015 | 10623 | 10638 | 11973 |
| 03/31/2016 | 11018 | 10782 | 12165 |
| 06/30/2016 | 10973 | 11047 | 12054 |
| 09/30/2016 | 11194 | 11472 | 12409 |
| 12/31/2016 | 11642 | 11911 | 12695 |
| 03/31/2017 | 12770 | 12633 | 13768 |
| 06/30/2017 | 13189 | 13023 | 14091 |
| 09/30/2017 | 13203 | 13607 | 14210 |
| 12/31/2017 | 13996 | 14511 | 15612 |
| 03/31/2018 | 13595 | 14401 | 16095 |
| 06/30/2018 | 13981 | 14896 | 17410 |
| 09/30/2018 | 14371 | 16044 | 18834 |
| 12/31/2018 | 12107 | 13875 | 15742 |
| 03/31/2019 | 14113 | 15769 | 18218 |
| 06/30/2019 | 14738 | 16447 | 19180 |
| 09/30/2019 | 14345 | 16727 | 19278 |
| 12/31/2019 | 15682 | 18244 | 20140 |
| 03/31/2020 | 10843 | 14668 | 16255 |
| 06/30/2020 | 13641 | 17682 | 21596 |
| 09/30/2020 | 15548 | 19260 | 24848 |
| 12/31/2020 | 18969 | 21600 | 26847 |
| 03/31/2021 | 20598 | 22934 | 27681 |
| 06/30/2021 | 21296 | 24895 | 29604 |
| 09/30/2021 | 19797 | 25040 | 29606 |
| 12/31/2021 | 19119 | 27801 | 33406 |
| 03/31/2022 | 17359 | 26522 | 30391 |
| 06/30/2022 | 13470 | 22252 | 22441 |
| 09/30/2022 | 12781 | 21165 | 23420 |
| 12/31/2022 | 13925 | 22766 | 21035 |
| 03/31/2023 | 15731 | 24473 | 24429 |
| 06/30/2023 | 16460 | 26612 | 27990 |
| 09/30/2023 | 15543 | 25741 | 26645 |
| 12/31/2023 | 17064 | 28750 | 29956 |
| 03/31/2024 | 17974 | 31785 | 31447 |
| 06/30/2024 | 17500 | 33147 | 31652 |
| 09/30/2024 | 18993 | 35098 | 34121 |
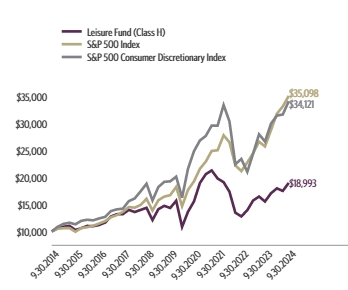
| Class H** | 5.67% | 22.19% | 5.77% | 6.63% |
| S&P 500 Index | 10.42% | 36.35% | 15.98% | 13.38% |
| S&P 500 Consumer Discretionary Index | 8.50% | 28.06% | 12.10% | 13.06% |
The fund's past performance is not a good predictor of the fund's future performance. Visit GuggenheimInvestments.com/mutual-funds/performance for more recent performance information.
| Net Assets | $7,154,930 |
| Total Number of Portfolio Holdings | 97 |
| Portfolio Turnover Rate | 37% |
| Leisure Fund | Class H | RYLAX | Semi-Annual Shareholder Report | September 30, 2024 |
| Retail | 20.8% |
| Internet | 17.9% |
| Media | 15.2% |
| Entertainment | 10.8% |
| Lodging | 9.2% |
| Leisure Time | 7.3% |
| Agriculture | 6.5% |
| Other | 11.9% |

| Netflix, Inc. | 4.4% |
| McDonald's Corp. | 3.7% |
| Philip Morris International, Inc. | 3.4% |
| Walt Disney Co. | 3.4% |
| Comcast Corp. — Class A | 3.3% |
| Starbucks Corp. | 2.6% |
| Booking Holdings, Inc. | 2.4% |
| Altria Group, Inc. | 2.3% |
| Chipotle Mexican Grill, Inc. — Class A | 2.2% |
| Airbnb, Inc. — Class A | 2.2% |
| Top 10 Total | 29.9% |
| |
1 | "Holdings Diversification (Market Exposure as a % of Net Assets)" excludes any temporary cash investments, investments in Guggenheim Strategy Funds Trust mutual funds, or investments in Guggenheim Ultra Short Duration Fund. |
| |
2 | "10 Largest Holdings (as a % of Net Assets)" excludes any temporary cash investments. |
| Netflix, Inc. | 4.4% |
| McDonald's Corp. | 3.7% |
| Philip Morris International, Inc. | 3.4% |
| Walt Disney Co. | 3.4% |
| Comcast Corp. — Class A | 3.3% |
| Starbucks Corp. | 2.6% |
| Booking Holdings, Inc. | 2.4% |
| Altria Group, Inc. | 2.3% |
| Chipotle Mexican Grill, Inc. — Class A | 2.2% |
| Airbnb, Inc. — Class A | 2.2% |
| Top 10 Total | 29.9% |
| |
2 | "10 Largest Holdings (as a % of Net Assets)" excludes any temporary cash investments. |
There were no changes in or disagreements with fund accountants for the period.
| | | Availability of Additional Information. For additional information, including the fund's prospectus, financial information, holdings and proxy voting information, go to GuggenheimInvestments.com/mutual-funds/literature or, call 800 820 0888. |
SAR-RYLAX-093024
Semi-Annual Shareholder Report | 9.30.24
This semi-annual shareholder report contains important information about the Precious Metals Fund for the period of April 1, 2024 to September 30, 2024. You can find additional information about the fund at GuggenheimInvestments.com/mutual-funds/literature. You can also request this information by contacting 800 820 0888 or GuggenheimClientServices@mufg-is.com.
For the period of April 1, 2024 to September 30, 2024, the fund (Investor Class shares) returned 25.15%, outperforming the fund's benchmark, the S&P 500 Index, which returned 10.42% for the same period and outperforming the fund's secondary index, the S&P 500 Materials Index, which returned 4.77% for the same period.
What factors materially affected the fund's performance over the last six months?
The industries that contributed the most to performance were gold, silver, and copper. No industry detracted from performance. The holdings that contributed the most to performance were Newmont Corp., Agnico Eagle Mines Ltd., and Kinross Gold Corp. Those that detracted the most were Sibanye Stillwater Ltd. ADR and McEwen Mining, Inc.
Cumulative performance* for the fund's most recently completed 10 years (as of 9.30.24), assuming a $10,000 initial investment.
| 09/30/2014 | 10000 | 10000 | 10000 |
| 12/31/2014 | 8444 | 10493 | 9820 |
| 03/31/2015 | 8032 | 10593 | 9917 |
| 06/30/2015 | 7744 | 10622 | 9870 |
| 09/30/2015 | 5892 | 9939 | 8202 |
| 12/31/2015 | 5870 | 10638 | 8997 |
| 03/31/2016 | 8808 | 10782 | 9322 |
| 06/30/2016 | 12384 | 11047 | 9668 |
| 09/30/2016 | 11849 | 11472 | 10027 |
| 12/31/2016 | 9666 | 11911 | 10499 |
| 03/31/2017 | 10378 | 12633 | 11114 |
| 06/30/2017 | 9967 | 13023 | 11466 |
| 09/30/2017 | 10208 | 13607 | 12159 |
| 12/31/2017 | 10350 | 14511 | 13002 |
| 03/31/2018 | 9579 | 14401 | 12285 |
| 06/30/2018 | 9738 | 14896 | 12601 |
| 09/30/2018 | 7912 | 16044 | 12646 |
| 12/31/2018 | 8633 | 13875 | 11090 |
| 03/31/2019 | 9379 | 15769 | 12232 |
| 06/30/2019 | 10406 | 16447 | 13004 |
| 09/30/2019 | 10919 | 16727 | 12988 |
| 12/31/2019 | 13192 | 18244 | 13816 |
| 03/31/2020 | 9721 | 14668 | 10205 |
| 06/30/2020 | 15892 | 17682 | 12860 |
| 09/30/2020 | 17825 | 19260 | 14571 |
| 12/31/2020 | 17710 | 21600 | 16680 |
| 03/31/2021 | 16401 | 22934 | 18195 |
| 06/30/2021 | 17102 | 24895 | 19099 |
| 09/30/2021 | 14468 | 25040 | 18429 |
| 12/31/2021 | 16156 | 27801 | 21231 |
| 03/31/2022 | 18999 | 26522 | 20727 |
| 06/30/2022 | 13146 | 22252 | 17432 |
| 09/30/2022 | 11907 | 21165 | 16190 |
| 12/31/2022 | 14406 | 22766 | 18627 |
| 03/31/2023 | 15895 | 24473 | 19425 |
| 06/30/2023 | 14427 | 26612 | 20068 |
| 09/30/2023 | 12887 | 25741 | 19112 |
| 12/31/2023 | 15033 | 28750 | 20963 |
| 03/31/2024 | 15345 | 31785 | 22839 |
| 06/30/2024 | 16632 | 33147 | 21812 |
| 09/30/2024 | 19205 | 35098 | 23928 |
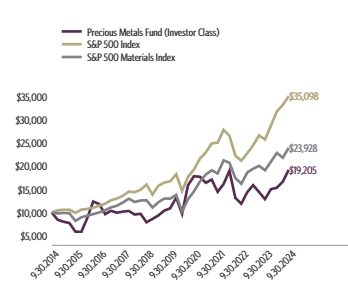
| Investor Class | 25.15% | 49.03% | 11.96% | 6.74% |
| S&P 500 Index | 10.42% | 36.35% | 15.98% | 13.38% |
| S&P 500 Materials Index | 4.77% | 25.20% | 13.00% | 9.12% |
The fund's past performance is not a good predictor of the fund's future performance. Visit GuggenheimInvestments.com/mutual-funds/performance for more recent performance information.
| Net Assets | $99,503,552 |
| Total Number of Portfolio Holdings | 37 |
| Portfolio Turnover Rate | 250% |
| Precious Metals Fund | Investor Class | RYPMX | Semi-Annual Shareholder Report | September 30, 2024 |
| Freeport-McMoRan, Inc. | 10.8% |
| Newmont Corp. | 9.2% |
| Agnico Eagle Mines Ltd. | 7.1% |
| Barrick Gold Corp. | 6.7% |
| Wheaton Precious Metals Corp. | 6.1% |
| Gold Fields Ltd. ADR | 4.4% |
| Franco-Nevada Corp. | 4.1% |
| Kinross Gold Corp. | 3.9% |
| Anglogold Ashanti plc | 3.6% |
| Royal Gold, Inc. | 3.5% |
| Top 10 Total | 59.4% |
| |
1 | "Holdings Diversification (Market Exposure as a % of Net Assets)" excludes any temporary cash investments, investments in Guggenheim Strategy Funds Trust mutual funds, or investments in Guggenheim Ultra Short Duration Fund. |
| |
2 | "10 Largest Holdings (as a % of Net Assets)" excludes any temporary cash investments. |
| Freeport-McMoRan, Inc. | 10.8% |
| Newmont Corp. | 9.2% |
| Agnico Eagle Mines Ltd. | 7.1% |
| Barrick Gold Corp. | 6.7% |
| Wheaton Precious Metals Corp. | 6.1% |
| Gold Fields Ltd. ADR | 4.4% |
| Franco-Nevada Corp. | 4.1% |
| Kinross Gold Corp. | 3.9% |
| Anglogold Ashanti plc | 3.6% |
| Royal Gold, Inc. | 3.5% |
| Top 10 Total | 59.4% |
| |
2 | "10 Largest Holdings (as a % of Net Assets)" excludes any temporary cash investments. |
There were no changes in or disagreements with fund accountants for the period.
| | | Availability of Additional Information. For additional information, including the fund's prospectus, financial information, holdings and proxy voting information, go to GuggenheimInvestments.com/mutual-funds/literature or, call 800 820 0888. |
SAR-RYPMX-093024
Semi-Annual Shareholder Report | 9.30.24
This semi-annual shareholder report contains important information about the Precious Metals Fund for the period of April 1, 2024 to September 30, 2024. You can find additional information about the fund at GuggenheimInvestments.com/mutual-funds/literature. You can also request this information by contacting 800 820 0888 or GuggenheimClientServices@mufg-is.com.
For the period of April 1, 2024 to September 30, 2024, the fund (Class A shares) returned 24.96%, outperforming the fund's benchmark, the S&P 500 Index, which returned 10.42% for the same period and outperforming the fund's secondary index, the S&P 500 Materials Index, which returned 4.77% for the same period.
What factors materially affected the fund's performance over the last six months?
The industries that contributed the most to performance were gold, silver, and copper. No industry detracted from performance. The holdings that contributed the most to performance were Newmont Corp., Agnico Eagle Mines Ltd., and Kinross Gold Corp. Those that detracted the most were Sibanye Stillwater Ltd. ADR and McEwen Mining, Inc.
Cumulative performance* for the fund's most recently completed 10 years (as of 9.30.24), assuming a $10,000 initial investment.
| 09/30/2014 | 9526 | 10000 | 10000 |
| 12/31/2014 | 8041 | 10493 | 9820 |
| 03/31/2015 | 7635 | 10593 | 9917 |
| 06/30/2015 | 7359 | 10622 | 9870 |
| 09/30/2015 | 5594 | 9939 | 8202 |
| 12/31/2015 | 5566 | 10638 | 8997 |
| 03/31/2016 | 8351 | 10782 | 9322 |
| 06/30/2016 | 11731 | 11047 | 9668 |
| 09/30/2016 | 11218 | 11472 | 10027 |
| 12/31/2016 | 9144 | 11911 | 10499 |
| 03/31/2017 | 9812 | 12633 | 11114 |
| 06/30/2017 | 9414 | 13023 | 11466 |
| 09/30/2017 | 9638 | 13607 | 12159 |
| 12/31/2017 | 9765 | 14511 | 13002 |
| 03/31/2018 | 9031 | 14401 | 12285 |
| 06/30/2018 | 9178 | 14896 | 12601 |
| 09/30/2018 | 7452 | 16044 | 12646 |
| 12/31/2018 | 8126 | 13875 | 11090 |
| 03/31/2019 | 8824 | 15769 | 12232 |
| 06/30/2019 | 9781 | 16447 | 13004 |
| 09/30/2019 | 10260 | 16727 | 12988 |
| 12/31/2019 | 12385 | 18244 | 13816 |
| 03/31/2020 | 9123 | 14668 | 10205 |
| 06/30/2020 | 14904 | 17682 | 12860 |
| 09/30/2020 | 16707 | 19260 | 14571 |
| 12/31/2020 | 16586 | 21600 | 16680 |
| 03/31/2021 | 15352 | 22934 | 18195 |
| 06/30/2021 | 15998 | 24895 | 19099 |
| 09/30/2021 | 13528 | 25040 | 18429 |
| 12/31/2021 | 15095 | 27801 | 21231 |
| 03/31/2022 | 17743 | 26522 | 20727 |
| 06/30/2022 | 12269 | 22252 | 17432 |
| 09/30/2022 | 11104 | 21165 | 16190 |
| 12/31/2022 | 13430 | 22766 | 18627 |
| 03/31/2023 | 14807 | 24473 | 19425 |
| 06/30/2023 | 13430 | 26612 | 20068 |
| 09/30/2023 | 11990 | 25741 | 19112 |
| 12/31/2023 | 13980 | 28750 | 20963 |
| 03/31/2024 | 14262 | 31785 | 22839 |
| 06/30/2024 | 15445 | 33147 | 21812 |
| 09/30/2024 | 17822 | 35098 | 23928 |
| Class A (without sales charge) | 24.96% | 48.64% | 11.68% | 6.46% |
| Class A (with sales charge)‡ | 19.03% | 41.59% | 10.60% | 5.95% |
| S&P 500 Index | 10.42% | 36.35% | 15.98% | 13.38% |
| S&P 500 Materials Index | 4.77% | 25.20% | 13.00% | 9.12% |
The fund's past performance is not a good predictor of the fund's future performance. Visit GuggenheimInvestments.com/mutual-funds/performance for more recent performance information.
| Net Assets | $99,503,552 |
| Total Number of Portfolio Holdings | 37 |
| Portfolio Turnover Rate | 250% |
| Precious Metals Fund | Class A | RYMNX | Semi-Annual Shareholder Report | September 30, 2024 |
| Freeport-McMoRan, Inc. | 10.8% |
| Newmont Corp. | 9.2% |
| Agnico Eagle Mines Ltd. | 7.1% |
| Barrick Gold Corp. | 6.7% |
| Wheaton Precious Metals Corp. | 6.1% |
| Gold Fields Ltd. ADR | 4.4% |
| Franco-Nevada Corp. | 4.1% |
| Kinross Gold Corp. | 3.9% |
| Anglogold Ashanti plc | 3.6% |
| Royal Gold, Inc. | 3.5% |
| Top 10 Total | 59.4% |
| |
1 | "Holdings Diversification (Market Exposure as a % of Net Assets)" excludes any temporary cash investments, investments in Guggenheim Strategy Funds Trust mutual funds, or investments in Guggenheim Ultra Short Duration Fund. |
| |
2 | "10 Largest Holdings (as a % of Net Assets)" excludes any temporary cash investments. |
| Freeport-McMoRan, Inc. | 10.8% |
| Newmont Corp. | 9.2% |
| Agnico Eagle Mines Ltd. | 7.1% |
| Barrick Gold Corp. | 6.7% |
| Wheaton Precious Metals Corp. | 6.1% |
| Gold Fields Ltd. ADR | 4.4% |
| Franco-Nevada Corp. | 4.1% |
| Kinross Gold Corp. | 3.9% |
| Anglogold Ashanti plc | 3.6% |
| Royal Gold, Inc. | 3.5% |
| Top 10 Total | 59.4% |
| |
2 | "10 Largest Holdings (as a % of Net Assets)" excludes any temporary cash investments. |
There were no changes in or disagreements with fund accountants for the period.
| | | Availability of Additional Information. For additional information, including the fund's prospectus, financial information, holdings and proxy voting information, go to GuggenheimInvestments.com/mutual-funds/literature or, call 800 820 0888. |
SAR-RYMNX-093024
Semi-Annual Shareholder Report | 9.30.24
This semi-annual shareholder report contains important information about the Precious Metals Fund for the period of April 1, 2024 to September 30, 2024. You can find additional information about the fund at GuggenheimInvestments.com/mutual-funds/literature. You can also request this information by contacting 800 820 0888 or GuggenheimClientServices@mufg-is.com.
For the period of April 1, 2024 to September 30, 2024, the fund (Class C shares) returned 24.55%, outperforming the fund's benchmark, the S&P 500 Index, which returned 10.42% for the same period and outperforming the fund's secondary index, the S&P 500 Materials Index, which returned 4.77% for the same period.
What factors materially affected the fund's performance over the last six months?
The industries that contributed the most to performance were gold, silver, and copper. No industry detracted from performance. The holdings that contributed the most to performance were Newmont Corp., Agnico Eagle Mines Ltd., and Kinross Gold Corp. Those that detracted the most were Sibanye Stillwater Ltd. ADR and McEwen Mining, Inc.
Cumulative performance* for the fund's most recently completed 10 years (as of 9.30.24), assuming a $10,000 initial investment.
| 09/30/2014 | 10000 | 10000 | 10000 |
| 12/31/2014 | 8425 | 10493 | 9820 |
| 03/31/2015 | 7987 | 10593 | 9917 |
| 06/30/2015 | 7688 | 10622 | 9870 |
| 09/30/2015 | 5834 | 9939 | 8202 |
| 12/31/2015 | 5798 | 10638 | 8997 |
| 03/31/2016 | 8678 | 10782 | 9322 |
| 06/30/2016 | 12171 | 11047 | 9668 |
| 09/30/2016 | 11618 | 11472 | 10027 |
| 12/31/2016 | 9453 | 11911 | 10499 |
| 03/31/2017 | 10124 | 12633 | 11114 |
| 06/30/2017 | 9693 | 13023 | 11466 |
| 09/30/2017 | 9907 | 13607 | 12159 |
| 12/31/2017 | 10017 | 14511 | 13002 |
| 03/31/2018 | 9248 | 14401 | 12285 |
| 06/30/2018 | 9381 | 14896 | 12601 |
| 09/30/2018 | 7601 | 16044 | 12646 |
| 12/31/2018 | 8270 | 13875 | 11090 |
| 03/31/2019 | 8963 | 15769 | 12232 |
| 06/30/2019 | 9919 | 16447 | 13004 |
| 09/30/2019 | 10389 | 16727 | 12988 |
| 12/31/2019 | 12514 | 18244 | 13816 |
| 03/31/2020 | 9201 | 14668 | 10205 |
| 06/30/2020 | 15006 | 17682 | 12860 |
| 09/30/2020 | 16789 | 19260 | 14571 |
| 12/31/2020 | 16639 | 21600 | 16680 |
| 03/31/2021 | 15369 | 22934 | 18195 |
| 06/30/2021 | 15986 | 24895 | 19099 |
| 09/30/2021 | 13491 | 25040 | 18429 |
| 12/31/2021 | 15028 | 27801 | 21231 |
| 03/31/2022 | 17628 | 26522 | 20727 |
| 06/30/2022 | 12170 | 22252 | 17432 |
| 09/30/2022 | 10994 | 21165 | 16190 |
| 12/31/2022 | 13268 | 22766 | 18627 |
| 03/31/2023 | 14604 | 24473 | 19425 |
| 06/30/2023 | 13221 | 26612 | 20068 |
| 09/30/2023 | 11780 | 25741 | 19112 |
| 12/31/2023 | 13708 | 28750 | 20963 |
| 03/31/2024 | 13957 | 31785 | 22839 |
| 06/30/2024 | 15092 | 33147 | 21812 |
| 09/30/2024 | 17384 | 35098 | 23928 |
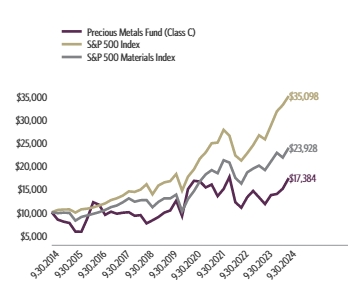
| Class C (without CDSC) | 24.55% | 47.57% | 10.85% | 5.69% |
| Class C (with CDSC)§ | 23.55% | 46.57% | 10.85% | 5.69% |
| S&P 500 Index | 10.42% | 36.35% | 15.98% | 13.38% |
| S&P 500 Materials Index | 4.77% | 25.20% | 13.00% | 9.12% |
The fund's past performance is not a good predictor of the fund's future performance. Visit GuggenheimInvestments.com/mutual-funds/performance for more recent performance information.
| Net Assets | $99,503,552 |
| Total Number of Portfolio Holdings | 37 |
| Portfolio Turnover Rate | 250% |
| Precious Metals Fund | Class C | RYZCX | Semi-Annual Shareholder Report | September 30, 2024 |
| Freeport-McMoRan, Inc. | 10.8% |
| Newmont Corp. | 9.2% |
| Agnico Eagle Mines Ltd. | 7.1% |
| Barrick Gold Corp. | 6.7% |
| Wheaton Precious Metals Corp. | 6.1% |
| Gold Fields Ltd. ADR | 4.4% |
| Franco-Nevada Corp. | 4.1% |
| Kinross Gold Corp. | 3.9% |
| Anglogold Ashanti plc | 3.6% |
| Royal Gold, Inc. | 3.5% |
| Top 10 Total | 59.4% |
| |
1 | "Holdings Diversification (Market Exposure as a % of Net Assets)" excludes any temporary cash investments, investments in Guggenheim Strategy Funds Trust mutual funds, or investments in Guggenheim Ultra Short Duration Fund. |
| |
2 | "10 Largest Holdings (as a % of Net Assets)" excludes any temporary cash investments. |
| Freeport-McMoRan, Inc. | 10.8% |
| Newmont Corp. | 9.2% |
| Agnico Eagle Mines Ltd. | 7.1% |
| Barrick Gold Corp. | 6.7% |
| Wheaton Precious Metals Corp. | 6.1% |
| Gold Fields Ltd. ADR | 4.4% |
| Franco-Nevada Corp. | 4.1% |
| Kinross Gold Corp. | 3.9% |
| Anglogold Ashanti plc | 3.6% |
| Royal Gold, Inc. | 3.5% |
| Top 10 Total | 59.4% |
| |
2 | "10 Largest Holdings (as a % of Net Assets)" excludes any temporary cash investments. |
There were no changes in or disagreements with fund accountants for the period.
| | | Availability of Additional Information. For additional information, including the fund's prospectus, financial information, holdings and proxy voting information, go to GuggenheimInvestments.com/mutual-funds/literature or, call 800 820 0888. |
SAR-RYZCX-093024
Semi-Annual Shareholder Report | 9.30.24
This semi-annual shareholder report contains important information about the Precious Metals Fund for the period of April 1, 2024 to September 30, 2024. You can find additional information about the fund at GuggenheimInvestments.com/mutual-funds/literature. You can also request this information by contacting 800 820 0888 or GuggenheimClientServices@mufg-is.com.
For the period of April 1, 2024 to September 30, 2024, the fund (Class H shares) returned 24.99%, outperforming the fund's benchmark, the S&P 500 Index, which returned 10.42% for the same period and outperforming the fund's secondary index, the S&P 500 Materials Index, which returned 4.77% for the same period.
What factors materially affected the fund's performance over the last six months?
The industries that contributed the most to performance were gold, silver, and copper. No industry detracted from performance. The holdings that contributed the most to performance were Newmont Corp., Agnico Eagle Mines Ltd., and Kinross Gold Corp. Those that detracted the most were Sibanye Stillwater Ltd. ADR and McEwen Mining, Inc.
Cumulative performance* for the fund's most recently completed 10 years (as of 9.30.24), assuming a $10,000 initial investment.
| 09/30/2014 | 10000 | 10000 | 10000 |
| 12/31/2014 | 8434 | 10493 | 9820 |
| 03/31/2015 | 8010 | 10593 | 9917 |
| 06/30/2015 | 7715 | 10622 | 9870 |
| 09/30/2015 | 5862 | 9939 | 8202 |
| 12/31/2015 | 5835 | 10638 | 8997 |
| 03/31/2016 | 8744 | 10782 | 9322 |
| 06/30/2016 | 12291 | 11047 | 9668 |
| 09/30/2016 | 11752 | 11472 | 10027 |
| 12/31/2016 | 9579 | 11911 | 10499 |
| 03/31/2017 | 10278 | 12633 | 11114 |
| 06/30/2017 | 9856 | 13023 | 11466 |
| 09/30/2017 | 10090 | 13607 | 12159 |
| 12/31/2017 | 10220 | 14511 | 13002 |
| 03/31/2018 | 9446 | 14401 | 12285 |
| 06/30/2018 | 9604 | 14896 | 12601 |
| 09/30/2018 | 7799 | 16044 | 12646 |
| 12/31/2018 | 8497 | 13875 | 11090 |
| 03/31/2019 | 9225 | 15769 | 12232 |
| 06/30/2019 | 10234 | 16447 | 13004 |
| 09/30/2019 | 10736 | 16727 | 12988 |
| 12/31/2019 | 12962 | 18244 | 13816 |
| 03/31/2020 | 9545 | 14668 | 10205 |
| 06/30/2020 | 15593 | 17682 | 12860 |
| 09/30/2020 | 17483 | 19260 | 14571 |
| 12/31/2020 | 17356 | 21600 | 16680 |
| 03/31/2021 | 16064 | 22934 | 18195 |
| 06/30/2021 | 16739 | 24895 | 19099 |
| 09/30/2021 | 14156 | 25040 | 18429 |
| 12/31/2021 | 15797 | 27801 | 21231 |
| 03/31/2022 | 18565 | 26522 | 20727 |
| 06/30/2022 | 12841 | 22252 | 17432 |
| 09/30/2022 | 11619 | 21165 | 16190 |
| 12/31/2022 | 14050 | 22766 | 18627 |
| 03/31/2023 | 15494 | 24473 | 19425 |
| 06/30/2023 | 14050 | 26612 | 20068 |
| 09/30/2023 | 12546 | 25741 | 19112 |
| 12/31/2023 | 14625 | 28750 | 20963 |
| 03/31/2024 | 14919 | 31785 | 22839 |
| 06/30/2024 | 16160 | 33147 | 21812 |
| 09/30/2024 | 18647 | 35098 | 23928 |
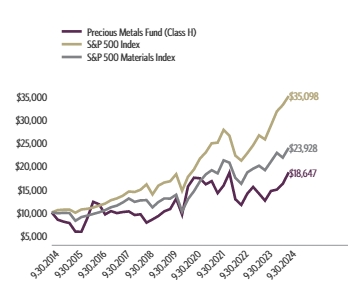
| Class H** | 24.99% | 48.63% | 11.67% | 6.43% |
| S&P 500 Index | 10.42% | 36.35% | 15.98% | 13.38% |
| S&P 500 Materials Index | 4.77% | 25.20% | 13.00% | 9.12% |
The fund's past performance is not a good predictor of the fund's future performance. Visit GuggenheimInvestments.com/mutual-funds/performance for more recent performance information.
| Net Assets | $99,503,552 |
| Total Number of Portfolio Holdings | 37 |
| Portfolio Turnover Rate | 250% |
| Precious Metals Fund | Class H | RYMPX | Semi-Annual Shareholder Report | September 30, 2024 |
| Freeport-McMoRan, Inc. | 10.8% |
| Newmont Corp. | 9.2% |
| Agnico Eagle Mines Ltd. | 7.1% |
| Barrick Gold Corp. | 6.7% |
| Wheaton Precious Metals Corp. | 6.1% |
| Gold Fields Ltd. ADR | 4.4% |
| Franco-Nevada Corp. | 4.1% |
| Kinross Gold Corp. | 3.9% |
| Anglogold Ashanti plc | 3.6% |
| Royal Gold, Inc. | 3.5% |
| Top 10 Total | 59.4% |
| |
1 | "Holdings Diversification (Market Exposure as a % of Net Assets)" excludes any temporary cash investments, investments in Guggenheim Strategy Funds Trust mutual funds, or investments in Guggenheim Ultra Short Duration Fund. |
| |
2 | "10 Largest Holdings (as a % of Net Assets)" excludes any temporary cash investments. |
| Freeport-McMoRan, Inc. | 10.8% |
| Newmont Corp. | 9.2% |
| Agnico Eagle Mines Ltd. | 7.1% |
| Barrick Gold Corp. | 6.7% |
| Wheaton Precious Metals Corp. | 6.1% |
| Gold Fields Ltd. ADR | 4.4% |
| Franco-Nevada Corp. | 4.1% |
| Kinross Gold Corp. | 3.9% |
| Anglogold Ashanti plc | 3.6% |
| Royal Gold, Inc. | 3.5% |
| Top 10 Total | 59.4% |
| |
2 | "10 Largest Holdings (as a % of Net Assets)" excludes any temporary cash investments. |
There were no changes in or disagreements with fund accountants for the period.
| | | Availability of Additional Information. For additional information, including the fund's prospectus, financial information, holdings and proxy voting information, go to GuggenheimInvestments.com/mutual-funds/literature or, call 800 820 0888. |
SAR-RYMPX-093024
Semi-Annual Shareholder Report | 9.30.24
This semi-annual shareholder report contains important information about the Real Estate Fund for the period of April 1, 2024 to September 30, 2024. You can find additional information about the fund at GuggenheimInvestments.com/mutual-funds/literature. You can also request this information by contacting 800 820 0888 or GuggenheimClientServices@mufg-is.com.
For the period of April 1, 2024 to September 30, 2024, the fund (Class A shares) returned 14.86%, outperforming the fund's benchmark, the S&P 500 Index, which returned 10.42% for the same period and underperforming the fund's secondary index, the MSCI U.S. REIT Index, which returned 16.21% for the same period.
What factors materially affected the fund's performance over the last six months?
The industries that contributed the most to performance were health care REITs, retail REITs, and multi-family residential REITs. Those that detracted the most were hotel & resort REITs, real estate operating companies, and timber REITs. The holdings that contributed the most to performance were Welltower Inc., Iron Mountain, Inc., and Ventas, Inc. Those that detracted the most were CoStar Group, Inc., Host Hotels & Resorts, Inc., and DigitalBridge Group, Inc.
Cumulative performance* for the fund's most recently completed 10 years (as of 9.30.24), assuming a $10,000 initial investment.
| 09/30/2014 | 9524 | 10000 | 10000 |
| 12/31/2014 | 10505 | 10493 | 11434 |
| 03/31/2015 | 10839 | 10593 | 11977 |
| 06/30/2015 | 9900 | 10622 | 10726 |
| 09/30/2015 | 9654 | 9939 | 10947 |
| 12/31/2015 | 10191 | 10638 | 11722 |
| 03/31/2016 | 10680 | 10782 | 12462 |
| 06/30/2016 | 11401 | 11047 | 13311 |
| 09/30/2016 | 11373 | 11472 | 13119 |
| 12/31/2016 | 11174 | 11911 | 12730 |
| 03/31/2017 | 11445 | 12633 | 12857 |
| 06/30/2017 | 11601 | 13023 | 13069 |
| 09/30/2017 | 11671 | 13607 | 13190 |
| 12/31/2017 | 11874 | 14511 | 13376 |
| 03/31/2018 | | 14401 | 12294 |
| 06/30/2018 | 11951 | 14896 | 13535 |
| 09/30/2018 | 11954 | 16044 | 13683 |
| 12/31/2018 | 10976 | 13875 | 12764 |
| 03/31/2019 | 12719 | 15769 | 14841 |
| 06/30/2019 | 12728 | 16447 | 15033 |
| 09/30/2019 | 13499 | 16727 | 16188 |
| 12/31/2019 | 13655 | 18244 | 16062 |
| 03/31/2020 | 9630 | 14668 | 11726 |
| 06/30/2020 | 11105 | 17682 | 13099 |
| 09/30/2020 | 11183 | 19260 | 13313 |
| 12/31/2020 | 12934 | 21600 | 14846 |
| 03/31/2021 | 14040 | 22934 | 16146 |
| 06/30/2021 | 15414 | 24895 | 18083 |
| 09/30/2021 | 15394 | 25040 | 18260 |
| 12/31/2021 | 17300 | 27801 | 21239 |
| 03/31/2022 | 16338 | 26522 | 20376 |
| 06/30/2022 | 13538 | 22252 | 16923 |
| 09/30/2022 | 12010 | 21165 | 15237 |
| 12/31/2022 | 12536 | 22766 | 16033 |
| 03/31/2023 | 12571 | 24473 | 16470 |
| 06/30/2023 | 12869 | 26612 | 16908 |
| 09/30/2023 | 11830 | 25741 | 15721 |
| 12/31/2023 | 13867 | 28750 | 18236 |
| 03/31/2024 | 13746 | 31785 | 18179 |
| 06/30/2024 | 13509 | 33147 | 18193 |
| 09/30/2024 | 15788 | 35098 | 21126 |
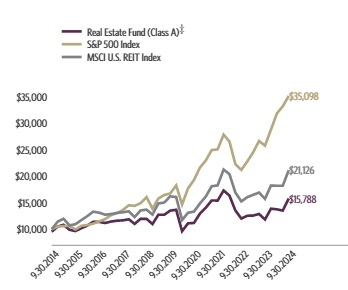
| Class A (without sales charge) | 14.86% | 33.45% | 3.18% | 5.18% |
| Class A (with sales charge)‡ | 9.39% | 27.11% | 2.18% | 4.67% |
| S&P 500 Index | 10.42% | 36.35% | 15.98% | 13.38% |
| MSCI U.S. REIT Index | 16.21% | 34.38% | 5.47% | 7.77% |
The fund's past performance is not a good predictor of the fund's future performance. Visit GuggenheimInvestments.com/mutual-funds/performance for more recent performance information.
| Net Assets | $7,638,431 |
| Total Number of Portfolio Holdings | 90 |
| Portfolio Turnover Rate | 114% |
| Real Estate Fund | Class A | RYREX | Semi-Annual Shareholder Report | September 30, 2024 |
| REITs-Diversified | 23.7% |
| REITs-Apartments | 11.8% |
| REITs-Health Care | 9.7% |
| REITs-Warehouse/Industries | 9.1% |
| REITs-Storage | 7.6% |
| REITs-Office Property | 7.1% |
| REITs-Shopping Centers | 6.8% |
| Other | 23.5% |

| Prologis, Inc. | 3.5% |
| American Tower Corp. — Class A | 3.4% |
| Equinix, Inc. | 3.0% |
| Welltower, Inc. | 2.9% |
| Public Storage | 2.5% |
| Realty Income Corp. | 2.4% |
| Digital Realty Trust, Inc. | 2.4% |
| Simon Property Group, Inc. | 2.4% |
| Crown Castle, Inc. | 2.3% |
| CBRE Group, Inc. — Class A | 2.0% |
| Top 10 Total | 26.8% |
| |
1 | "Holdings Diversification (Market Exposure as a % of Net Assets)" excludes any temporary cash investments, investments in Guggenheim Strategy Funds Trust mutual funds, or investments in Guggenheim Ultra Short Duration Fund. |
| |
2 | "10 Largest Holdings (as a % of Net Assets)" excludes any temporary cash investments. |
| Prologis, Inc. | 3.5% |
| American Tower Corp. — Class A | 3.4% |
| Equinix, Inc. | 3.0% |
| Welltower, Inc. | 2.9% |
| Public Storage | 2.5% |
| Realty Income Corp. | 2.4% |
| Digital Realty Trust, Inc. | 2.4% |
| Simon Property Group, Inc. | 2.4% |
| Crown Castle, Inc. | 2.3% |
| CBRE Group, Inc. — Class A | 2.0% |
| Top 10 Total | 26.8% |
| |
2 | "10 Largest Holdings (as a % of Net Assets)" excludes any temporary cash investments. |
There were no changes in or disagreements with fund accountants for the period.
| | | Availability of Additional Information. For additional information, including the fund's prospectus, financial information, holdings and proxy voting information, go to GuggenheimInvestments.com/mutual-funds/literature or, call 800 820 0888. |
SAR-RYREX-093024
Semi-Annual Shareholder Report | 9.30.24
This semi-annual shareholder report contains important information about the Real Estate Fund for the period of April 1, 2024 to September 30, 2024. You can find additional information about the fund at GuggenheimInvestments.com/mutual-funds/literature. You can also request this information by contacting 800 820 0888 or GuggenheimClientServices@mufg-is.com.
For the period of April 1, 2024 to September 30, 2024, the fund (Class C shares) returned 14.46%, outperforming the fund's benchmark, the S&P 500 Index, which returned 10.42% for the same period and underperforming the fund's secondary index, the MSCI U.S. REIT Index, which returned 16.21% for the same period.
What factors materially affected the fund's performance over the last six months?
The industries that contributed the most to performance were health care REITs, retail REITs, and multi-family residential REITs. Those that detracted the most were hotel & resort REITs, real estate operating companies, and timber REITs. The holdings that contributed the most to performance were Welltower Inc., Iron Mountain, Inc., and Ventas, Inc. Those that detracted the most were CoStar Group, Inc., Host Hotels & Resorts, Inc., and DigitalBridge Group, Inc.
Cumulative performance* for the fund's most recently completed 10 years (as of 9.30.24), assuming a $10,000 initial investment.
| 09/30/2014 | 10000 | 10000 | 10000 |
| 12/31/2014 | 11010 | 10493 | 11434 |
| 03/31/2015 | 11339 | 10593 | 11977 |
| 06/30/2015 | 10336 | 10622 | 10726 |
| 09/30/2015 | 10059 | 9939 | 10947 |
| 12/31/2015 | 10596 | 10638 | 11722 |
| 03/31/2016 | 11085 | 10782 | 12462 |
| 06/30/2016 | 11811 | 11047 | 13311 |
| 09/30/2016 | 11762 | 11472 | 13119 |
| 12/31/2016 | 11531 | 11911 | 12730 |
| 03/31/2017 | 11790 | 12633 | 12857 |
| 06/30/2017 | 11928 | 13023 | 13069 |
| 09/30/2017 | 11978 | 13607 | 13190 |
| 12/31/2017 | 12165 | 14511 | 13376 |
| 03/31/2018 | 11252 | 14401 | 12294 |
| 06/30/2018 | 12197 | 14896 | 13535 |
| 09/30/2018 | 12176 | 16044 | 13683 |
| 12/31/2018 | 11160 | 13875 | 12764 |
| 03/31/2019 | 12909 | 15769 | 14841 |
| 06/30/2019 | 12891 | 16447 | 15033 |
| 09/30/2019 | 13649 | 16727 | 16188 |
| 12/31/2019 | 13780 | 18244 | 16062 |
| 03/31/2020 | 9699 | 14668 | 11726 |
| 06/30/2020 | 11164 | 17682 | 13099 |
| 09/30/2020 | 11223 | 19260 | 13313 |
| 12/31/2020 | 12952 | 21600 | 14846 |
| 03/31/2021 | 14036 | 22934 | 16146 |
| 06/30/2021 | 15499 | 24895 | 18083 |
| 09/30/2021 | 15446 | 25040 | 18260 |
| 12/31/2021 | 17324 | 27801 | 21239 |
| 03/31/2022 | 16333 | 26522 | 20376 |
| 06/30/2022 | 13505 | 22252 | 16923 |
| 09/30/2022 | 11961 | 21165 | 15237 |
| 12/31/2022 | 12458 | 22766 | 16033 |
| 03/31/2023 | 12471 | 24473 | 16470 |
| 06/30/2023 | 12745 | 26612 | 16908 |
| 09/30/2023 | 11696 | 25741 | 15721 |
| 12/31/2023 | 13677 | 28750 | 18236 |
| 03/31/2024 | 13537 | 31785 | 18179 |
| 06/30/2024 | 13278 | 33147 | 18193 |
| 09/30/2024 | 15490 | 35098 | 21126 |
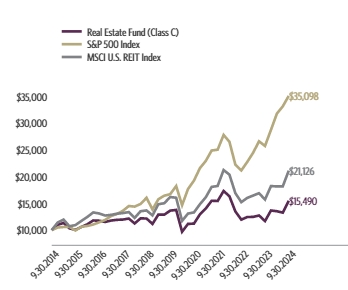
| Class C (without CDSC) | 14.46% | 32.43% | 2.56% | 4.47% |
| Class C (with CDSC)§ | 13.46% | 31.43% | 2.56% | 4.47% |
| S&P 500 Index | 10.42% | 36.35% | 15.98% | 13.38% |
| MSCI U.S. REIT Index | 16.21% | 34.38% | 5.47% | 7.77% |
The fund's past performance is not a good predictor of the fund's future performance. Visit GuggenheimInvestments.com/mutual-funds/performance for more recent performance information.
| Net Assets | $7,638,431 |
| Total Number of Portfolio Holdings | 90 |
| Portfolio Turnover Rate | 114% |
| Real Estate Fund | Class C | RYCRX | Semi-Annual Shareholder Report | September 30, 2024 |
| REITs-Diversified | 23.7% |
| REITs-Apartments | 11.8% |
| REITs-Health Care | 9.7% |
| REITs-Warehouse/Industries | 9.1% |
| REITs-Storage | 7.6% |
| REITs-Office Property | 7.1% |
| REITs-Shopping Centers | 6.8% |
| Other | 23.5% |

| Prologis, Inc. | 3.5% |
| American Tower Corp. — Class A | 3.4% |
| Equinix, Inc. | 3.0% |
| Welltower, Inc. | 2.9% |
| Public Storage | 2.5% |
| Realty Income Corp. | 2.4% |
| Digital Realty Trust, Inc. | 2.4% |
| Simon Property Group, Inc. | 2.4% |
| Crown Castle, Inc. | 2.3% |
| CBRE Group, Inc. — Class A | 2.0% |
| Top 10 Total | 26.8% |
| |
1 | "Holdings Diversification (Market Exposure as a % of Net Assets)" excludes any temporary cash investments, investments in Guggenheim Strategy Funds Trust mutual funds, or investments in Guggenheim Ultra Short Duration Fund. |
| |
2 | "10 Largest Holdings (as a % of Net Assets)" excludes any temporary cash investments. |
| Prologis, Inc. | 3.5% |
| American Tower Corp. — Class A | 3.4% |
| Equinix, Inc. | 3.0% |
| Welltower, Inc. | 2.9% |
| Public Storage | 2.5% |
| Realty Income Corp. | 2.4% |
| Digital Realty Trust, Inc. | 2.4% |
| Simon Property Group, Inc. | 2.4% |
| Crown Castle, Inc. | 2.3% |
| CBRE Group, Inc. — Class A | 2.0% |
| Top 10 Total | 26.8% |
| |
2 | "10 Largest Holdings (as a % of Net Assets)" excludes any temporary cash investments. |
There were no changes in or disagreements with fund accountants for the period.
| | | Availability of Additional Information. For additional information, including the fund's prospectus, financial information, holdings and proxy voting information, go to GuggenheimInvestments.com/mutual-funds/literature or, call 800 820 0888. |
SAR-RYCRX-093024
Semi-Annual Shareholder Report | 9.30.24
This semi-annual shareholder report contains important information about the Real Estate Fund for the period of April 1, 2024 to September 30, 2024. You can find additional information about the fund at GuggenheimInvestments.com/mutual-funds/literature. You can also request this information by contacting 800 820 0888 or GuggenheimClientServices@mufg-is.com.
For the period of April 1, 2024 to September 30, 2024, the fund (Class H shares) returned 14.86%, outperforming the fund's benchmark, the S&P 500 Index, which returned 10.42% for the same period and underperforming the fund's secondary index, the MSCI U.S. REIT Index, which returned 16.21% for the same period.
What factors materially affected the fund's performance over the last six months?
The industries that contributed the most to performance were health care REITs, retail REITs, and multi-family residential REITs. Those that detracted the most were hotel & resort REITs, real estate operating companies, and timber REITs. The holdings that contributed the most to performance were Welltower Inc., Iron Mountain, Inc., and Ventas, Inc. Those that detracted the most were CoStar Group, Inc., Host Hotels & Resorts, Inc., and DigitalBridge Group, Inc.
Cumulative performance* for the fund's most recently completed 10 years (as of 9.30.24), assuming a $10,000 initial investment.
| 09/30/2014 | 10000 | 10000 | 10000 |
| 12/31/2014 | 11030 | 10493 | 11434 |
| 03/31/2015 | 11381 | 10593 | 11977 |
| 06/30/2015 | 10396 | 10622 | 10726 |
| 09/30/2015 | 10134 | 9939 | 10947 |
| 12/31/2015 | 10696 | 10638 | 11722 |
| 03/31/2016 | 11211 | 10782 | 12462 |
| 06/30/2016 | 11967 | 11047 | 13311 |
| 09/30/2016 | 11940 | 11472 | 13119 |
| 12/31/2016 | 11731 | 11911 | 12730 |
| 03/31/2017 | 12016 | 12633 | 12857 |
| 06/30/2017 | 12174 | 13023 | 13069 |
| 09/30/2017 | 12254 | 13607 | 13190 |
| 12/31/2017 | 12465 | 14511 | 13376 |
| 03/31/2018 | 11552 | 14401 | 12294 |
| 06/30/2018 | 12549 | 14896 | 13535 |
| 09/30/2018 | 12549 | 16044 | 13683 |
| 12/31/2018 | 11529 | 13875 | 12764 |
| 03/31/2019 | 13357 | 15769 | 14841 |
| 06/30/2019 | 13367 | 16447 | 15033 |
| 09/30/2019 | 14179 | 16727 | 16188 |
| 12/31/2019 | 14343 | 18244 | 16062 |
| 03/31/2020 | 10116 | 14668 | 11726 |
| 06/30/2020 | 11664 | 17682 | 13099 |
| 09/30/2020 | 11747 | 19260 | 13313 |
| 12/31/2020 | 13587 | 21600 | 14846 |
| 03/31/2021 | 14752 | 22934 | 16146 |
| 06/30/2021 | 16195 | 24895 | 18083 |
| 09/30/2021 | 16174 | 25040 | 18260 |
| 12/31/2021 | 18177 | 27801 | 21239 |
| 03/31/2022 | 17168 | 26522 | 20376 |
| 06/30/2022 | 14230 | 22252 | 16923 |
| 09/30/2022 | 12625 | 21165 | 15237 |
| 12/31/2022 | 13175 | 22766 | 16033 |
| 03/31/2023 | 13212 | 24473 | 16470 |
| 06/30/2023 | 13525 | 26612 | 16908 |
| 09/30/2023 | 12432 | 25741 | 15721 |
| 12/31/2023 | 14573 | 28750 | 18236 |
| 03/31/2024 | 14446 | 31785 | 18179 |
| 06/30/2024 | 14196 | 33147 | 18193 |
| 09/30/2024 | 16592 | 35098 | 21126 |
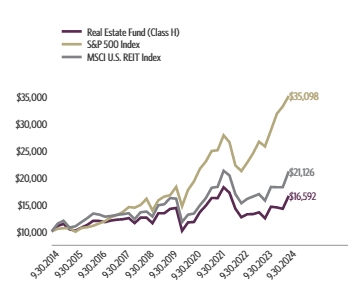
| Class H | 14.86% | 33.46% | 3.19% | 5.19% |
| S&P 500 Index | 10.42% | 36.35% | 15.98% | 13.38% |
| MSCI U.S. REIT Index | 16.21% | 34.38% | 5.47% | 7.77% |
The fund's past performance is not a good predictor of the fund's future performance. Visit GuggenheimInvestments.com/mutual-funds/performance for more recent performance information.
| Net Assets | $7,638,431 |
| Total Number of Portfolio Holdings | 90 |
| Portfolio Turnover Rate | 114% |
| Real Estate Fund | Class H | RYHRX | Semi-Annual Shareholder Report | September 30, 2024 |
| REITs-Diversified | 23.7% |
| REITs-Apartments | 11.8% |
| REITs-Health Care | 9.7% |
| REITs-Warehouse/Industries | 9.1% |
| REITs-Storage | 7.6% |
| REITs-Office Property | 7.1% |
| REITs-Shopping Centers | 6.8% |
| Other | 23.5% |
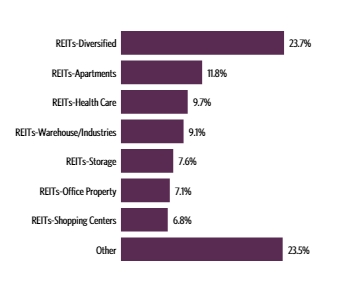
| Prologis, Inc. | 3.5% |
| American Tower Corp. — Class A | 3.4% |
| Equinix, Inc. | 3.0% |
| Welltower, Inc. | 2.9% |
| Public Storage | 2.5% |
| Realty Income Corp. | 2.4% |
| Digital Realty Trust, Inc. | 2.4% |
| Simon Property Group, Inc. | 2.4% |
| Crown Castle, Inc. | 2.3% |
| CBRE Group, Inc. — Class A | 2.0% |
| Top 10 Total | 26.8% |
| |
1 | "Holdings Diversification (Market Exposure as a % of Net Assets)" excludes any temporary cash investments, investments in Guggenheim Strategy Funds Trust mutual funds, or investments in Guggenheim Ultra Short Duration Fund. |
| |
2 | "10 Largest Holdings (as a % of Net Assets)" excludes any temporary cash investments. |
| Prologis, Inc. | 3.5% |
| American Tower Corp. — Class A | 3.4% |
| Equinix, Inc. | 3.0% |
| Welltower, Inc. | 2.9% |
| Public Storage | 2.5% |
| Realty Income Corp. | 2.4% |
| Digital Realty Trust, Inc. | 2.4% |
| Simon Property Group, Inc. | 2.4% |
| Crown Castle, Inc. | 2.3% |
| CBRE Group, Inc. — Class A | 2.0% |
| Top 10 Total | 26.8% |
| |
2 | "10 Largest Holdings (as a % of Net Assets)" excludes any temporary cash investments. |
There were no changes in or disagreements with fund accountants for the period.
| | | Availability of Additional Information. For additional information, including the fund's prospectus, financial information, holdings and proxy voting information, go to GuggenheimInvestments.com/mutual-funds/literature or, call 800 820 0888. |
SAR-RYHRX-093024
Semi-Annual Shareholder Report | 9.30.24
This semi-annual shareholder report contains important information about the Retailing Fund for the period of April 1, 2024 to September 30, 2024. You can find additional information about the fund at GuggenheimInvestments.com/mutual-funds/literature. You can also request this information by contacting 800 820 0888 or GuggenheimClientServices@mufg-is.com.
For the period of April 1, 2024 to September 30, 2024, the fund (Investor Class shares) returned 4.45%, underperforming the fund's benchmark, the S&P 500 Index, which returned 10.42% for the same period and underperforming the fund's secondary index, the S&P 500 Consumer Discretionary Index, which returned 8.50% for the same period.
What factors materially affected the fund's performance over the last six months?
The industries that contributed the most to performance were broadline retail, apparel retail, and computer & electronics retail. Those that detracted the most were other specialty retail, drug retail, and home furnishing retail. The holdings that contributed the most to performance were Walmart, Inc., Costco Wholesale Corp., and Alibaba Group Holding Ltd. ADR. Those that detracted the most were Dollar General Corp., Dollar Tree, Inc., and Walgreens Boots Alliance, Inc.
Cumulative performance* for the fund's most recently completed 10 years (as of 9.30.24), assuming a $10,000 initial investment.
| 09/30/2014 | 10000 | 10000 | 10000 |
| 12/31/2014 | 11132 | 10493 | 10874 |
| 03/31/2015 | 11839 | 10593 | 11396 |
| 06/30/2015 | 11684 | 10622 | 11615 |
| 09/30/2015 | 10947 | 9939 | 11318 |
| 12/31/2015 | 11010 | 10638 | 11973 |
| 03/31/2016 | 11364 | 10782 | 12165 |
| 06/30/2016 | 10753 | 11047 | 12054 |
| 09/30/2016 | 11107 | 11472 | 12409 |
| 12/31/2016 | 11073 | 11911 | 12695 |
| 03/31/2017 | 11280 | 12633 | 13768 |
| 06/30/2017 | 11191 | 13023 | 14091 |
| 09/30/2017 | 11469 | 13607 | 14210 |
| 12/31/2017 | 12493 | 14511 | 15612 |
| 03/31/2018 | 12708 | 14401 | 16095 |
| 06/30/2018 | 13853 | 14896 | 17410 |
| 09/30/2018 | 14624 | 16044 | 18834 |
| 12/31/2018 | 12106 | 13875 | 15742 |
| 03/31/2019 | 14114 | 15769 | 18218 |
| 06/30/2019 | 14135 | 16447 | 19180 |
| 09/30/2019 | 14354 | 16727 | 19278 |
| 12/31/2019 | 15185 | 18244 | 20140 |
| 03/31/2020 | 12072 | 14668 | 16255 |
| 06/30/2020 | 16733 | 17682 | 21596 |
| 09/30/2020 | 19184 | 19260 | 24848 |
| 12/31/2020 | 21976 | 21600 | 26847 |
| 03/31/2021 | 24089 | 22934 | 27681 |
| 06/30/2021 | 25279 | 24895 | 29604 |
| 09/30/2021 | 23959 | 25040 | 29606 |
| 12/31/2021 | 24693 | 27801 | 33406 |
| 03/31/2022 | 21453 | 26522 | 30391 |
| 06/30/2022 | 17043 | 22252 | 22441 |
| 09/30/2022 | 17057 | 21165 | 23420 |
| 12/31/2022 | 18296 | 22766 | 21035 |
| 03/31/2023 | 19447 | 24473 | 24429 |
| 06/30/2023 | 19911 | 26612 | 27990 |
| 09/30/2023 | 18456 | 25741 | 26645 |
| 12/31/2023 | 21425 | 28750 | 29956 |
| 03/31/2024 | 23600 | 31785 | 31447 |
| 06/30/2024 | 22990 | 33147 | 31652 |
| 09/30/2024 | 24651 | 35098 | 34121 |
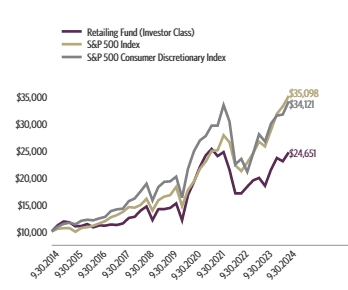
| Investor Class | 4.45% | 33.57% | 11.42% | 9.44% |
| S&P 500 Index | 10.42% | 36.35% | 15.98% | 13.38% |
| S&P 500 Consumer Discretionary Index | 8.50% | 28.06% | 12.10% | 13.06% |
The fund's past performance is not a good predictor of the fund's future performance. Visit GuggenheimInvestments.com/mutual-funds/performance for more recent performance information.
| Net Assets | $7,856,003 |
| Total Number of Portfolio Holdings | 63 |
| Portfolio Turnover Rate | 135% |
| Retailing Fund | Investor Class | RYRIX | Semi-Annual Shareholder Report | September 30, 2024 |
| Retail | 68.1% |
| Internet | 26.9% |
| Distribution & Wholesale | 2.5% |
| Software | 1.4% |
| Commercial Services | 0.8% |
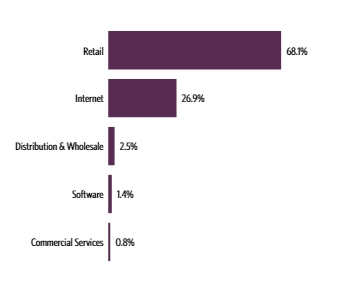
| Amazon.com, Inc. | 9.3% |
| Walmart, Inc. | 4.8% |
| Costco Wholesale Corp. | 4.5% |
| Home Depot, Inc. | 4.4% |
| Lowe's Companies, Inc. | 4.4% |
| TJX Companies, Inc. | 3.9% |
| PDD Holdings, Inc. ADR | 3.6% |
| Target Corp. | 2.9% |
| O'Reilly Automotive, Inc. | 2.8% |
| JD.com, Inc. ADR | 2.5% |
| Top 10 Total | 43.1% |
| |
1 | "Holdings Diversification (Market Exposure as a % of Net Assets)" excludes any temporary cash investments, investments in Guggenheim Strategy Funds Trust mutual funds, or investments in Guggenheim Ultra Short Duration Fund. |
| |
2 | "10 Largest Holdings (as a % of Net Assets)" excludes any temporary cash investments. |
| Amazon.com, Inc. | 9.3% |
| Walmart, Inc. | 4.8% |
| Costco Wholesale Corp. | 4.5% |
| Home Depot, Inc. | 4.4% |
| Lowe's Companies, Inc. | 4.4% |
| TJX Companies, Inc. | 3.9% |
| PDD Holdings, Inc. ADR | 3.6% |
| Target Corp. | 2.9% |
| O'Reilly Automotive, Inc. | 2.8% |
| JD.com, Inc. ADR | 2.5% |
| Top 10 Total | 43.1% |
| |
2 | "10 Largest Holdings (as a % of Net Assets)" excludes any temporary cash investments. |
There were no changes in or disagreements with fund accountants for the period.
| | | Availability of Additional Information. For additional information, including the fund's prospectus, financial information, holdings and proxy voting information, go to GuggenheimInvestments.com/mutual-funds/literature or, call 800 820 0888. |
SAR-RYRIX-093024
Semi-Annual Shareholder Report | 9.30.24
This semi-annual shareholder report contains important information about the Retailing Fund for the period of April 1, 2024 to September 30, 2024. You can find additional information about the fund at GuggenheimInvestments.com/mutual-funds/literature. You can also request this information by contacting 800 820 0888 or GuggenheimClientServices@mufg-is.com.
For the period of April 1, 2024 to September 30, 2024, the fund (Class A shares) returned 4.33%, underperforming the fund's benchmark, the S&P 500 Index, which returned 10.42% for the same period and underperforming the fund's secondary index, the S&P 500 Consumer Discretionary Index, which returned 8.50% for the same period.
What factors materially affected the fund's performance over the last six months?
The industries that contributed the most to performance were broadline retail, apparel retail, and computer & electronics retail. Those that detracted the most were other specialty retail, drug retail, and home furnishing retail. The holdings that contributed the most to performance were Walmart, Inc., Costco Wholesale Corp., and Alibaba Group Holding Ltd. ADR. Those that detracted the most were Dollar General Corp., Dollar Tree, Inc., and Walgreens Boots Alliance, Inc.
Cumulative performance* for the fund's most recently completed 10 years (as of 9.30.24), assuming a $10,000 initial investment.
| 09/30/2014 | 9526 | 10000 | 10000 |
| 12/31/2014 | 10600 | 10493 | 10874 |
| 03/31/2015 | 11267 | 10593 | 11396 |
| 06/30/2015 | 11116 | 10622 | 11615 |
| 09/30/2015 | 10407 | 9939 | 11318 |
| 12/31/2015 | 10457 | 10638 | 11973 |
| 03/31/2016 | 10789 | 10782 | 12165 |
| 06/30/2016 | 10206 | 11047 | 12054 |
| 09/30/2016 | 10533 | 11472 | 12409 |
| 12/31/2016 | 10495 | 11911 | 12695 |
| 03/31/2017 | 10684 | 12633 | 13768 |
| 06/30/2017 | 10596 | 13023 | 14091 |
| 09/30/2017 | 10852 | 13607 | 14210 |
| 12/31/2017 | 11818 | 14511 | 15612 |
| 03/31/2018 | 12011 | 14401 | 16095 |
| 06/30/2018 | 13087 | 14896 | 17410 |
| 09/30/2018 | 13805 | 16044 | 18834 |
| 12/31/2018 | 11420 | 13875 | 15742 |
| 03/31/2019 | 13308 | 15769 | 18218 |
| 06/30/2019 | 13321 | 16447 | 19180 |
| 09/30/2019 | 13519 | 16727 | 19278 |
| 12/31/2019 | 14293 | 18244 | 20140 |
| 03/31/2020 | 11357 | 14668 | 16255 |
| 06/30/2020 | 15731 | 17682 | 21596 |
| 09/30/2020 | 18028 | 19260 | 24848 |
| 12/31/2020 | 20635 | 21600 | 26847 |
| 03/31/2021 | 22608 | 22934 | 27681 |
| 06/30/2021 | 23710 | 24895 | 29604 |
| 09/30/2021 | 22453 | 25040 | 29606 |
| 12/31/2021 | 23130 | 27801 | 33406 |
| 03/31/2022 | 20083 | 26522 | 30391 |
| 06/30/2022 | 15941 | 22252 | 22441 |
| 09/30/2022 | 15946 | 21165 | 23420 |
| 12/31/2022 | 17092 | 22766 | 21035 |
| 03/31/2023 | 18159 | 24473 | 24429 |
| 06/30/2023 | 18578 | 26612 | 27990 |
| 09/30/2023 | 17211 | 25741 | 26645 |
| 12/31/2023 | 19968 | 28750 | 29956 |
| 03/31/2024 | 21979 | 31785 | 31447 |
| 06/30/2024 | 21399 | 33147 | 31652 |
| 09/30/2024 | 22932 | 35098 | 34121 |
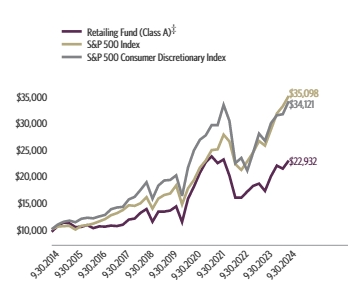
| Class A (without sales charge) | 4.33% | 33.24% | 11.15% | 9.18% |
| Class A (with sales charge)‡ | -0.62% | 26.89% | 10.07% | 8.65% |
| S&P 500 Index | 10.42% | 36.35% | 15.98% | 13.38% |
| S&P 500 Consumer Discretionary Index | 8.50% | 28.06% | 12.10% | 13.06% |
The fund's past performance is not a good predictor of the fund's future performance. Visit GuggenheimInvestments.com/mutual-funds/performance for more recent performance information.
| Net Assets | $7,856,003 |
| Total Number of Portfolio Holdings | 63 |
| Portfolio Turnover Rate | 135% |
| Retailing Fund | Class A | RYRTX | Semi-Annual Shareholder Report | September 30, 2024 |
| Retail | 68.1% |
| Internet | 26.9% |
| Distribution & Wholesale | 2.5% |
| Software | 1.4% |
| Commercial Services | 0.8% |

| Amazon.com, Inc. | 9.3% |
| Walmart, Inc. | 4.8% |
| Costco Wholesale Corp. | 4.5% |
| Home Depot, Inc. | 4.4% |
| Lowe's Companies, Inc. | 4.4% |
| TJX Companies, Inc. | 3.9% |
| PDD Holdings, Inc. ADR | 3.6% |
| Target Corp. | 2.9% |
| O'Reilly Automotive, Inc. | 2.8% |
| JD.com, Inc. ADR | 2.5% |
| Top 10 Total | 43.1% |
| |
1 | "Holdings Diversification (Market Exposure as a % of Net Assets)" excludes any temporary cash investments, investments in Guggenheim Strategy Funds Trust mutual funds, or investments in Guggenheim Ultra Short Duration Fund. |
| |
2 | "10 Largest Holdings (as a % of Net Assets)" excludes any temporary cash investments. |
| Amazon.com, Inc. | 9.3% |
| Walmart, Inc. | 4.8% |
| Costco Wholesale Corp. | 4.5% |
| Home Depot, Inc. | 4.4% |
| Lowe's Companies, Inc. | 4.4% |
| TJX Companies, Inc. | 3.9% |
| PDD Holdings, Inc. ADR | 3.6% |
| Target Corp. | 2.9% |
| O'Reilly Automotive, Inc. | 2.8% |
| JD.com, Inc. ADR | 2.5% |
| Top 10 Total | 43.1% |
| |
2 | "10 Largest Holdings (as a % of Net Assets)" excludes any temporary cash investments. |
There were no changes in or disagreements with fund accountants for the period.
| | | Availability of Additional Information. For additional information, including the fund's prospectus, financial information, holdings and proxy voting information, go to GuggenheimInvestments.com/mutual-funds/literature or, call 800 820 0888. |
SAR-RYRTX-093024
Semi-Annual Shareholder Report | 9.30.24
This semi-annual shareholder report contains important information about the Retailing Fund for the period of April 1, 2024 to September 30, 2024. You can find additional information about the fund at GuggenheimInvestments.com/mutual-funds/literature. You can also request this information by contacting 800 820 0888 or GuggenheimClientServices@mufg-is.com.
For the period of April 1, 2024 to September 30, 2024, the fund (Class C shares) returned 3.92%, underperforming the fund's benchmark, the S&P 500 Index, which returned 10.42% for the same period and underperforming the fund's secondary index, the S&P 500 Consumer Discretionary Index, which returned 8.50% for the same period.
What factors materially affected the fund's performance over the last six months?
The industries that contributed the most to performance were broadline retail, apparel retail, and computer & electronics retail. Those that detracted the most were other specialty retail, drug retail, and home furnishing retail. The holdings that contributed the most to performance were Walmart, Inc., Costco Wholesale Corp., and Alibaba Group Holding Ltd. ADR. Those that detracted the most were Dollar General Corp., Dollar Tree, Inc., and Walgreens Boots Alliance, Inc.
Cumulative performance* for the fund's most recently completed 10 years (as of 9.30.24), assuming a $10,000 initial investment.
| 09/30/2014 | 10000 | 10000 | 10000 |
| 12/31/2014 | 11103 | 10493 | 10874 |
| 03/31/2015 | 11777 | 10593 | 11396 |
| 06/30/2015 | 11598 | 10622 | 11615 |
| 09/30/2015 | 10838 | 9939 | 11318 |
| 12/31/2015 | 10872 | 10638 | 11973 |
| 03/31/2016 | 11194 | 10782 | 12165 |
| 06/30/2016 | 10568 | 11047 | 12054 |
| 09/30/2016 | 10886 | 11472 | 12409 |
| 12/31/2016 | 10823 | 11911 | 12695 |
| 03/31/2017 | 10997 | 12633 | 13768 |
| 06/30/2017 | 10886 | 13023 | 14091 |
| 09/30/2017 | 11132 | 13607 | 14210 |
| 12/31/2017 | 12096 | 14511 | 15612 |
| 03/31/2018 | 12269 | 14401 | 16095 |
| 06/30/2018 | 13344 | 14896 | 17410 |
| 09/30/2018 | 14052 | 16044 | 18834 |
| 12/31/2018 | 11600 | 13875 | 15742 |
| 03/31/2019 | 13492 | 15769 | 18218 |
| 06/30/2019 | 13478 | 16447 | 19180 |
| 09/30/2019 | 13651 | 16727 | 19278 |
| 12/31/2019 | 14404 | 18244 | 20140 |
| 03/31/2020 | 11426 | 14668 | 16255 |
| 06/30/2020 | 15795 | 17682 | 21596 |
| 09/30/2020 | 18063 | 19260 | 24848 |
| 12/31/2020 | 20636 | 21600 | 26847 |
| 03/31/2021 | 22567 | 22934 | 27681 |
| 06/30/2021 | 23620 | 24895 | 29604 |
| 09/30/2021 | 22331 | 25040 | 29606 |
| 12/31/2021 | 22957 | 27801 | 33406 |
| 03/31/2022 | 19896 | 26522 | 30391 |
| 06/30/2022 | 15764 | 22252 | 22441 |
| 09/30/2022 | 15737 | 21165 | 23420 |
| 12/31/2022 | 16836 | 22766 | 21035 |
| 03/31/2023 | 17854 | 24473 | 24429 |
| 06/30/2023 | 18229 | 26612 | 27990 |
| 09/30/2023 | 16857 | 25741 | 26645 |
| 12/31/2023 | 19521 | 28750 | 29956 |
| 03/31/2024 | 21445 | 31785 | 31447 |
| 06/30/2024 | 20845 | 33147 | 31652 |
| 09/30/2024 | 22292 | 35098 | 34121 |
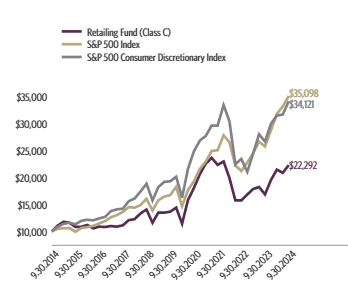
| Class C (without CDSC) | 3.92% | 32.24% | 10.31% | 8.35% |
| Class C (with CDSC)§ | 2.92% | 31.24% | 10.31% | 8.35% |
| S&P 500 Index | 10.42% | 36.35% | 15.98% | 13.38% |
| S&P 500 Consumer Discretionary Index | 8.50% | 28.06% | 12.10% | 13.06% |
The fund's past performance is not a good predictor of the fund's future performance. Visit GuggenheimInvestments.com/mutual-funds/performance for more recent performance information.
| Net Assets | $7,856,003 |
| Total Number of Portfolio Holdings | 63 |
| Portfolio Turnover Rate | 135% |
| Retailing Fund | Class C | RYRCX | Semi-Annual Shareholder Report | September 30, 2024 |
| Retail | 68.1% |
| Internet | 26.9% |
| Distribution & Wholesale | 2.5% |
| Software | 1.4% |
| Commercial Services | 0.8% |

| Amazon.com, Inc. | 9.3% |
| Walmart, Inc. | 4.8% |
| Costco Wholesale Corp. | 4.5% |
| Home Depot, Inc. | 4.4% |
| Lowe's Companies, Inc. | 4.4% |
| TJX Companies, Inc. | 3.9% |
| PDD Holdings, Inc. ADR | 3.6% |
| Target Corp. | 2.9% |
| O'Reilly Automotive, Inc. | 2.8% |
| JD.com, Inc. ADR | 2.5% |
| Top 10 Total | 43.1% |
| |
1 | "Holdings Diversification (Market Exposure as a % of Net Assets)" excludes any temporary cash investments, investments in Guggenheim Strategy Funds Trust mutual funds, or investments in Guggenheim Ultra Short Duration Fund. |
| |
2 | "10 Largest Holdings (as a % of Net Assets)" excludes any temporary cash investments. |
| Amazon.com, Inc. | 9.3% |
| Walmart, Inc. | 4.8% |
| Costco Wholesale Corp. | 4.5% |
| Home Depot, Inc. | 4.4% |
| Lowe's Companies, Inc. | 4.4% |
| TJX Companies, Inc. | 3.9% |
| PDD Holdings, Inc. ADR | 3.6% |
| Target Corp. | 2.9% |
| O'Reilly Automotive, Inc. | 2.8% |
| JD.com, Inc. ADR | 2.5% |
| Top 10 Total | 43.1% |
| |
2 | "10 Largest Holdings (as a % of Net Assets)" excludes any temporary cash investments. |
There were no changes in or disagreements with fund accountants for the period.
| | | Availability of Additional Information. For additional information, including the fund's prospectus, financial information, holdings and proxy voting information, go to GuggenheimInvestments.com/mutual-funds/literature or, call 800 820 0888. |
SAR-RYRCX-093024
Semi-Annual Shareholder Report | 9.30.24
This semi-annual shareholder report contains important information about the Retailing Fund for the period of April 1, 2024 to September 30, 2024. You can find additional information about the fund at GuggenheimInvestments.com/mutual-funds/literature. You can also request this information by contacting 800 820 0888 or GuggenheimClientServices@mufg-is.com.
For the period of April 1, 2024 to September 30, 2024, the fund (Class H shares) returned 4.33%, underperforming the fund's benchmark, the S&P 500 Index, which returned 10.42% for the same period and underperforming the fund's secondary index, the S&P 500 Consumer Discretionary Index, which returned 8.50% for the same period.
What factors materially affected the fund's performance over the last six months?
The industries that contributed the most to performance were broadline retail, apparel retail, and computer & electronics retail. Those that detracted the most were other specialty retail, drug retail, and home furnishing retail. The holdings that contributed the most to performance were Walmart, Inc., Costco Wholesale Corp., and Alibaba Group Holding Ltd. ADR. Those that detracted the most were Dollar General Corp., Dollar Tree, Inc., and Walgreens Boots Alliance, Inc.
Cumulative performance* for the fund's most recently completed 10 years (as of 9.30.24), assuming a $10,000 initial investment.
| 09/30/2014 | 10000 | 10000 | 10000 |
| 12/31/2014 | 11122 | 10493 | 10874 |
| 03/31/2015 | 11816 | 10593 | 11396 |
| 06/30/2015 | 11649 | 10622 | 11615 |
| 09/30/2015 | 10906 | 9939 | 11318 |
| 12/31/2015 | 10965 | 10638 | 11973 |
| 03/31/2016 | 11307 | 10782 | 12165 |
| 06/30/2016 | 10698 | 11047 | 12054 |
| 09/30/2016 | 11037 | 11472 | 12409 |
| 12/31/2016 | 11001 | 11911 | 12695 |
| 03/31/2017 | 11199 | 12633 | 13768 |
| 06/30/2017 | 11104 | 13023 | 14091 |
| 09/30/2017 | 11375 | 13607 | 14210 |
| 12/31/2017 | 12385 | 14511 | 15612 |
| 03/31/2018 | 12588 | 14401 | 16095 |
| 06/30/2018 | 13711 | 14896 | 17410 |
| 09/30/2018 | 14464 | 16044 | 18834 |
| 12/31/2018 | 11962 | 13875 | 15742 |
| 03/31/2019 | 13949 | 15769 | 18218 |
| 06/30/2019 | 13958 | 16447 | 19180 |
| 09/30/2019 | 14166 | 16727 | 19278 |
| 12/31/2019 | 14979 | 18244 | 20140 |
| 03/31/2020 | 11903 | 14668 | 16255 |
| 06/30/2020 | 16484 | 17682 | 21596 |
| 09/30/2020 | 18891 | 19260 | 24848 |
| 12/31/2020 | 21624 | 21600 | 26847 |
| 03/31/2021 | 23689 | 22934 | 27681 |
| 06/30/2021 | 24841 | 24895 | 29604 |
| 09/30/2021 | 23522 | 25040 | 29606 |
| 12/31/2021 | 24230 | 27801 | 33406 |
| 03/31/2022 | 21040 | 26522 | 30391 |
| 06/30/2022 | 16700 | 22252 | 22441 |
| 09/30/2022 | 16700 | 21165 | 23420 |
| 12/31/2022 | 17904 | 22766 | 21035 |
| 03/31/2023 | 19019 | 24473 | 24429 |
| 06/30/2023 | 19460 | 26612 | 27990 |
| 09/30/2023 | 18028 | 25741 | 26645 |
| 12/31/2023 | 20916 | 28750 | 29956 |
| 03/31/2024 | 23022 | 31785 | 31447 |
| 06/30/2024 | 22412 | 33147 | 31652 |
| 09/30/2024 | 24017 | 35098 | 34121 |
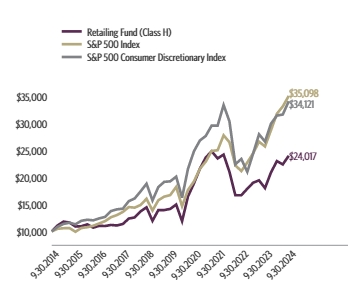
| Class H** | 4.33% | 33.22% | 11.14% | 9.16% |
| S&P 500 Index | 10.42% | 36.35% | 15.98% | 13.38% |
| S&P 500 Consumer Discretionary Index | 8.50% | 28.06% | 12.10% | 13.06% |
The fund's past performance is not a good predictor of the fund's future performance. Visit GuggenheimInvestments.com/mutual-funds/performance for more recent performance information.
| Net Assets | $7,856,003 |
| Total Number of Portfolio Holdings | 63 |
| Portfolio Turnover Rate | 135% |
| Retailing Fund | Class H | RYRAX | Semi-Annual Shareholder Report | September 30, 2024 |
| Retail | 68.1% |
| Internet | 26.9% |
| Distribution & Wholesale | 2.5% |
| Software | 1.4% |
| Commercial Services | 0.8% |

| Amazon.com, Inc. | 9.3% |
| Walmart, Inc. | 4.8% |
| Costco Wholesale Corp. | 4.5% |
| Home Depot, Inc. | 4.4% |
| Lowe's Companies, Inc. | 4.4% |
| TJX Companies, Inc. | 3.9% |
| PDD Holdings, Inc. ADR | 3.6% |
| Target Corp. | 2.9% |
| O'Reilly Automotive, Inc. | 2.8% |
| JD.com, Inc. ADR | 2.5% |
| Top 10 Total | 43.1% |
| |
1 | "Holdings Diversification (Market Exposure as a % of Net Assets)" excludes any temporary cash investments, investments in Guggenheim Strategy Funds Trust mutual funds, or investments in Guggenheim Ultra Short Duration Fund. |
| |
2 | "10 Largest Holdings (as a % of Net Assets)" excludes any temporary cash investments. |
| Amazon.com, Inc. | 9.3% |
| Walmart, Inc. | 4.8% |
| Costco Wholesale Corp. | 4.5% |
| Home Depot, Inc. | 4.4% |
| Lowe's Companies, Inc. | 4.4% |
| TJX Companies, Inc. | 3.9% |
| PDD Holdings, Inc. ADR | 3.6% |
| Target Corp. | 2.9% |
| O'Reilly Automotive, Inc. | 2.8% |
| JD.com, Inc. ADR | 2.5% |
| Top 10 Total | 43.1% |
| |
2 | "10 Largest Holdings (as a % of Net Assets)" excludes any temporary cash investments. |
There were no changes in or disagreements with fund accountants for the period.
| | | Availability of Additional Information. For additional information, including the fund's prospectus, financial information, holdings and proxy voting information, go to GuggenheimInvestments.com/mutual-funds/literature or, call 800 820 0888. |
SAR-RYRAX-093024
Semi-Annual Shareholder Report | 9.30.24
This semi-annual shareholder report contains important information about the Technology Fund for the period of April 1, 2024 to September 30, 2024. You can find additional information about the fund at GuggenheimInvestments.com/mutual-funds/literature. You can also request this information by contacting 800 820 0888 or GuggenheimClientServices@mufg-is.com.
For the period of April 1, 2024 to September 30, 2024, the fund (Investor Class shares) returned 6.34%, underperforming the fund's benchmark, the S&P 500 Index, which returned 10.42% for the same period and underperforming the fund's secondary index, the S&P 500 Information Technology Index, which returned 15.64% for the same period.
What factors materially affected the fund's performance over the last six months?
The industries that contributed the most to performance were semiconductors, technology hardware storage & peripherals, and systems software. Those that detracted the most were semiconductor materials & equipment, internet services & infrastructure, and application software. The holdings that contributed the most to performance were Apple Inc., NVIDIA Corp., and Broadcom Inc. Those that detracted the most were Intel Corp., Super Micro Computer, Inc., and SolarEdge Technologies, Inc.
Cumulative performance* for the fund's most recently completed 10 years (as of 9.30.24), assuming a $10,000 initial investment.
| 09/30/2014 | 10000 | 10000 | 10000 |
| 12/31/2014 | 10372 | 10493 | 10524 |
| 03/31/2015 | 10544 | 10593 | 10585 |
| 06/30/2015 | 10603 | 10622 | 10604 |
| 09/30/2015 | 9719 | 9939 | 10211 |
| 12/31/2015 | 10501 | 10638 | 11148 |
| 03/31/2016 | 10424 | 10782 | 11438 |
| 06/30/2016 | 10410 | 11047 | 11113 |
| 09/30/2016 | 11744 | 11472 | 12542 |
| 12/31/2016 | 11705 | 11911 | 12692 |
| 03/31/2017 | 12991 | 12633 | 14287 |
| 06/30/2017 | 13620 | 13023 | 14878 |
| 09/30/2017 | 14717 | 13607 | 16164 |
| 12/31/2017 | 15576 | 14511 | 17620 |
| 03/31/2018 | 16513 | 14401 | 18241 |
| 06/30/2018 | 17234 | 14896 | 19535 |
| 09/30/2018 | 18470 | 16044 | 21254 |
| 12/31/2018 | 15401 | 13875 | 17569 |
| 03/31/2019 | 18667 | 15769 | 21059 |
| 06/30/2019 | 19407 | 16447 | 22335 |
| 09/30/2019 | 19476 | 16727 | 23081 |
| 12/31/2019 | 21580 | 18244 | 26405 |
| 03/31/2020 | 18469 | 14668 | 23254 |
| 06/30/2020 | 24507 | 17682 | 30353 |
| 09/30/2020 | 27174 | 19260 | 33981 |
| 12/31/2020 | 32338 | 21600 | 37994 |
| 03/31/2021 | 33302 | 22934 | 38744 |
| 06/30/2021 | 36866 | 24895 | 43222 |
| 09/30/2021 | 36426 | 25040 | 43802 |
| 12/31/2021 | 39162 | 27801 | 51113 |
| 03/31/2022 | 33946 | 26522 | 46841 |
| 06/30/2022 | 25907 | 22252 | 37360 |
| 09/30/2022 | 24359 | 21165 | 35041 |
| 12/31/2022 | 24990 | 22766 | 36703 |
| 03/31/2023 | 29893 | 24473 | 44710 |
| 06/30/2023 | 33472 | 26612 | 52402 |
| 09/30/2023 | 32119 | 25741 | 49445 |
| 12/31/2023 | 37376 | 28750 | 57932 |
| 03/31/2024 | 41570 | 31785 | 65282 |
| 06/30/2024 | 43840 | 33147 | 74294 |
| 09/30/2024 | 44207 | 35098 | 75490 |

| Investor Class | 6.34% | 37.63% | 17.81% | 16.02% |
| S&P 500 Index | 10.42% | 36.35% | 15.98% | 13.38% |
| S&P 500 Information Technology Index | 15.64% | 52.68% | 26.74% | 22.40% |
The fund's past performance is not a good predictor of the fund's future performance. Visit GuggenheimInvestments.com/mutual-funds/performance for more recent performance information.
| Net Assets | $64,153,122 |
| Total Number of Portfolio Holdings | 125 |
| Portfolio Turnover Rate | 53% |
| Technology Fund | Investor Class | RYTIX | Semi-Annual Shareholder Report | September 30, 2024 |
| Software | 30.2% |
| Semiconductors | 28.0% |
| Computers | 17.7% |
| Internet | 14.8% |
| Telecommunications | 3.8% |
| Electronics | 2.5% |
| Energy-Alternate Sources | 1.6% |
| Other | 0.9% |
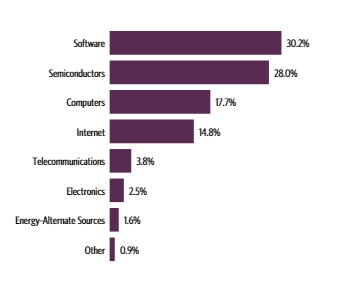
| Apple, Inc. | 5.8% |
| Microsoft Corp. | 5.6% |
| NVIDIA Corp. | 5.2% |
| Alphabet, Inc. — Class A | 4.5% |
| Meta Platforms, Inc. — Class A | 3.9% |
| Broadcom, Inc. | 2.8% |
| Advanced Micro Devices, Inc. | 1.7% |
| Oracle Corp. | 1.7% |
| Salesforce, Inc. | 1.6% |
| International Business Machines Corp. | 1.4% |
| Top 10 Total | 34.2% |
| |
1 | "Holdings Diversification (Market Exposure as a % of Net Assets)" excludes any temporary cash investments, investments in Guggenheim Strategy Funds Trust mutual funds, or investments in Guggenheim Ultra Short Duration Fund. |
| |
2 | "10 Largest Holdings (as a % of Net Assets)" excludes any temporary cash investments. |
| Apple, Inc. | 5.8% |
| Microsoft Corp. | 5.6% |
| NVIDIA Corp. | 5.2% |
| Alphabet, Inc. — Class A | 4.5% |
| Meta Platforms, Inc. — Class A | 3.9% |
| Broadcom, Inc. | 2.8% |
| Advanced Micro Devices, Inc. | 1.7% |
| Oracle Corp. | 1.7% |
| Salesforce, Inc. | 1.6% |
| International Business Machines Corp. | 1.4% |
| Top 10 Total | 34.2% |
| |
2 | "10 Largest Holdings (as a % of Net Assets)" excludes any temporary cash investments. |
There were no changes in or disagreements with fund accountants for the period.
| | | Availability of Additional Information. For additional information, including the fund's prospectus, financial information, holdings and proxy voting information, go to GuggenheimInvestments.com/mutual-funds/literature or, call 800 820 0888. |
SAR-RYTIX-093024
Semi-Annual Shareholder Report | 9.30.24
This semi-annual shareholder report contains important information about the Technology Fund for the period of April 1, 2024 to September 30, 2024. You can find additional information about the fund at GuggenheimInvestments.com/mutual-funds/literature. You can also request this information by contacting 800 820 0888 or GuggenheimClientServices@mufg-is.com.
For the period of April 1, 2024 to September 30, 2024, the fund (Class A shares) returned 6.21%, underperforming the fund's benchmark, the S&P 500 Index, which returned 10.42% for the same period and underperforming the fund's secondary index, the S&P 500 Information Technology Index, which returned 15.64% for the same period.
What factors materially affected the fund's performance over the last six months?
The industries that contributed the most to performance were semiconductors, technology hardware storage & peripherals, and systems software. Those that detracted the most were semiconductor materials & equipment, internet services & infrastructure, and application software. The holdings that contributed the most to performance were Apple Inc., NVIDIA Corp., and Broadcom Inc. Those that detracted the most were Intel Corp., Super Micro Computer, Inc., and SolarEdge Technologies, Inc.
Cumulative performance* for the fund's most recently completed 10 years (as of 9.30.24), assuming a $10,000 initial investment.
| 09/30/2014 | 9525 | 10000 | 10000 |
| 12/31/2014 | 9875 | 10493 | 10524 |
| 03/31/2015 | 10033 | 10593 | 10585 |
| 06/30/2015 | 10080 | 10622 | 10604 |
| 09/30/2015 | 9237 | 9939 | 10211 |
| 12/31/2015 | 9972 | 10638 | 11148 |
| 03/31/2016 | 9892 | 10782 | 11438 |
| 06/30/2016 | 9875 | 11047 | 11113 |
| 09/30/2016 | 11134 | 11472 | 12542 |
| 12/31/2016 | 11090 | 11911 | 12692 |
| 03/31/2017 | 12303 | 12633 | 14287 |
| 06/30/2017 | 12887 | 13023 | 14878 |
| 09/30/2017 | 13917 | 13607 | 16164 |
| 12/31/2017 | 14720 | 14511 | 17620 |
| 03/31/2018 | 15596 | 14401 | 18241 |
| 06/30/2018 | 16267 | 14896 | 19535 |
| 09/30/2018 | 17423 | 16044 | 21254 |
| 12/31/2018 | 14520 | 13875 | 17569 |
| 03/31/2019 | 17588 | 15769 | 21059 |
| 06/30/2019 | 18273 | 16447 | 22335 |
| 09/30/2019 | 18327 | 16727 | 23081 |
| 12/31/2019 | 20294 | 18244 | 26405 |
| 03/31/2020 | 17358 | 14668 | 23254 |
| 06/30/2020 | 23018 | 17682 | 30353 |
| 09/30/2020 | 25506 | 19260 | 33981 |
| 12/31/2020 | 30334 | 21600 | 37994 |
| 03/31/2021 | 31220 | 22934 | 38744 |
| 06/30/2021 | 34540 | 24895 | 43222 |
| 09/30/2021 | 34105 | 25040 | 43802 |
| 12/31/2021 | 36646 | 27801 | 51113 |
| 03/31/2022 | 31746 | 26522 | 46841 |
| 06/30/2022 | 24213 | 22252 | 37360 |
| 09/30/2022 | 22751 | 21165 | 35041 |
| 12/31/2022 | 23326 | 22766 | 36703 |
| 03/31/2023 | 27885 | 24473 | 44710 |
| 06/30/2023 | 31205 | 26612 | 52402 |
| 09/30/2023 | 29925 | 25741 | 49445 |
| 12/31/2023 | 34800 | 28750 | 57932 |
| 03/31/2024 | 38682 | 31785 | 65282 |
| 06/30/2024 | 40769 | 33147 | 74294 |
| 09/30/2024 | 41084 | 35098 | 75490 |
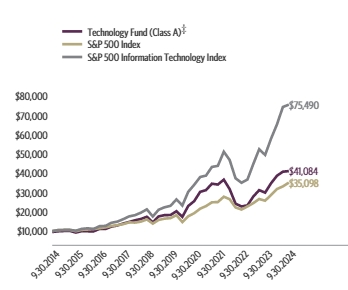
| Class A (without sales charge) | 6.21% | 37.29% | 17.52% | 15.74% |
| Class A (with sales charge)‡ | 1.17% | 30.77% | 16.38% | 15.18% |
| S&P 500 Index | 10.42% | 36.35% | 15.98% | 13.38% |
| S&P 500 Information Technology Index | 15.64% | 52.68% | 26.74% | 22.40% |
The fund's past performance is not a good predictor of the fund's future performance. Visit GuggenheimInvestments.com/mutual-funds/performance for more recent performance information.
| Net Assets | $64,153,122 |
| Total Number of Portfolio Holdings | 125 |
| Portfolio Turnover Rate | 53% |
| Technology Fund | Class A | RYTHX | Semi-Annual Shareholder Report | September 30, 2024 |
| Software | 30.2% |
| Semiconductors | 28.0% |
| Computers | 17.7% |
| Internet | 14.8% |
| Telecommunications | 3.8% |
| Electronics | 2.5% |
| Energy-Alternate Sources | 1.6% |
| Other | 0.9% |

| Apple, Inc. | 5.8% |
| Microsoft Corp. | 5.6% |
| NVIDIA Corp. | 5.2% |
| Alphabet, Inc. — Class A | 4.5% |
| Meta Platforms, Inc. — Class A | 3.9% |
| Broadcom, Inc. | 2.8% |
| Advanced Micro Devices, Inc. | 1.7% |
| Oracle Corp. | 1.7% |
| Salesforce, Inc. | 1.6% |
| International Business Machines Corp. | 1.4% |
| Top 10 Total | 34.2% |
| |
1 | "Holdings Diversification (Market Exposure as a % of Net Assets)" excludes any temporary cash investments, investments in Guggenheim Strategy Funds Trust mutual funds, or investments in Guggenheim Ultra Short Duration Fund. |
| |
2 | "10 Largest Holdings (as a % of Net Assets)" excludes any temporary cash investments. |
| Apple, Inc. | 5.8% |
| Microsoft Corp. | 5.6% |
| NVIDIA Corp. | 5.2% |
| Alphabet, Inc. — Class A | 4.5% |
| Meta Platforms, Inc. — Class A | 3.9% |
| Broadcom, Inc. | 2.8% |
| Advanced Micro Devices, Inc. | 1.7% |
| Oracle Corp. | 1.7% |
| Salesforce, Inc. | 1.6% |
| International Business Machines Corp. | 1.4% |
| Top 10 Total | 34.2% |
| |
2 | "10 Largest Holdings (as a % of Net Assets)" excludes any temporary cash investments. |
There were no changes in or disagreements with fund accountants for the period.
| | | Availability of Additional Information. For additional information, including the fund's prospectus, financial information, holdings and proxy voting information, go to GuggenheimInvestments.com/mutual-funds/literature or, call 800 820 0888. |
SAR-RYTHX-093024
Semi-Annual Shareholder Report | 9.30.24
This semi-annual shareholder report contains important information about the Technology Fund for the period of April 1, 2024 to September 30, 2024. You can find additional information about the fund at GuggenheimInvestments.com/mutual-funds/literature. You can also request this information by contacting 800 820 0888 or GuggenheimClientServices@mufg-is.com.
For the period of April 1, 2024 to September 30, 2024, the fund (Class C shares) returned 5.82%, underperforming the fund's benchmark, the S&P 500 Index, which returned 10.42% for the same period and underperforming the fund's secondary index, the S&P 500 Information Technology Index, which returned 15.64% for the same period.
What factors materially affected the fund's performance over the last six months?
The industries that contributed the most to performance were semiconductors, technology hardware storage & peripherals, and systems software. Those that detracted the most were semiconductor materials & equipment, internet services & infrastructure, and application software. The holdings that contributed the most to performance were Apple Inc., NVIDIA Corp., and Broadcom Inc. Those that detracted the most were Intel Corp., Super Micro Computer, Inc., and SolarEdge Technologies, Inc.
Cumulative performance* for the fund's most recently completed 10 years (as of 9.30.24), assuming a $10,000 initial investment.
| 09/30/2014 | 10000 | 10000 | 10000 |
| 12/31/2014 | 10345 | 10493 | 10524 |
| 03/31/2015 | 10492 | 10593 | 10585 |
| 06/30/2015 | 10524 | 10622 | 10604 |
| 09/30/2015 | 9625 | 9939 | 10211 |
| 12/31/2015 | 10373 | 10638 | 11148 |
| 03/31/2016 | 10271 | 10782 | 11438 |
| 06/30/2016 | 10231 | 11047 | 11113 |
| 09/30/2016 | 11514 | 11472 | 12542 |
| 12/31/2016 | 11447 | 11911 | 12692 |
| 03/31/2017 | 12675 | 12633 | 14287 |
| 06/30/2017 | 13254 | 13023 | 14878 |
| 09/30/2017 | 14287 | 13607 | 16164 |
| 12/31/2017 | 15081 | 14511 | 17620 |
| 03/31/2018 | 15952 | 14401 | 18241 |
| 06/30/2018 | 16605 | 14896 | 19535 |
| 09/30/2018 | 17753 | 16044 | 21254 |
| 12/31/2018 | 14765 | 13875 | 17569 |
| 03/31/2019 | 17854 | 15769 | 21059 |
| 06/30/2019 | 18514 | 16447 | 22335 |
| 09/30/2019 | 18533 | 16727 | 23081 |
| 12/31/2019 | 20484 | 18244 | 26405 |
| 03/31/2020 | 17488 | 14668 | 23254 |
| 06/30/2020 | 23147 | 17682 | 30353 |
| 09/30/2020 | 25601 | 19260 | 33981 |
| 12/31/2020 | 30388 | 21600 | 37994 |
| 03/31/2021 | 31220 | 22934 | 38744 |
| 06/30/2021 | 34474 | 24895 | 43222 |
| 09/30/2021 | 33977 | 25040 | 43802 |
| 12/31/2021 | 36436 | 27801 | 51113 |
| 03/31/2022 | 31506 | 26522 | 46841 |
| 06/30/2022 | 23985 | 22252 | 37360 |
| 09/30/2022 | 22493 | 21165 | 35041 |
| 12/31/2022 | 23019 | 22766 | 36703 |
| 03/31/2023 | 27466 | 24473 | 44710 |
| 06/30/2023 | 30679 | 26612 | 52402 |
| 09/30/2023 | 29366 | 25741 | 49445 |
| 12/31/2023 | 34087 | 28750 | 57932 |
| 03/31/2024 | 37819 | 31785 | 65282 |
| 06/30/2024 | 39786 | 33147 | 74294 |
| 09/30/2024 | 40019 | 35098 | 75490 |
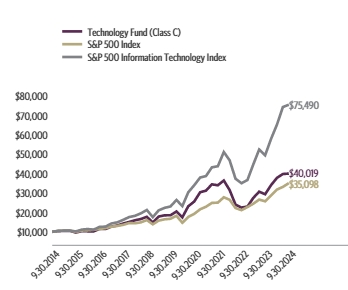
| Class C (without CDSC) | 5.82% | 36.28% | 16.64% | 14.88% |
| Class C (with CDSC)§ | 4.82% | 35.28% | 16.64% | 14.88% |
| S&P 500 Index | 10.42% | 36.35% | 15.98% | 13.38% |
| S&P 500 Information Technology Index | 15.64% | 52.68% | 26.74% | 22.40% |
The fund's past performance is not a good predictor of the fund's future performance. Visit GuggenheimInvestments.com/mutual-funds/performance for more recent performance information.
| Net Assets | $64,153,122 |
| Total Number of Portfolio Holdings | 125 |
| Portfolio Turnover Rate | 53% |
| Technology Fund | Class C | RYCHX | Semi-Annual Shareholder Report | September 30, 2024 |
| Software | 30.2% |
| Semiconductors | 28.0% |
| Computers | 17.7% |
| Internet | 14.8% |
| Telecommunications | 3.8% |
| Electronics | 2.5% |
| Energy-Alternate Sources | 1.6% |
| Other | 0.9% |

| Apple, Inc. | 5.8% |
| Microsoft Corp. | 5.6% |
| NVIDIA Corp. | 5.2% |
| Alphabet, Inc. — Class A | 4.5% |
| Meta Platforms, Inc. — Class A | 3.9% |
| Broadcom, Inc. | 2.8% |
| Advanced Micro Devices, Inc. | 1.7% |
| Oracle Corp. | 1.7% |
| Salesforce, Inc. | 1.6% |
| International Business Machines Corp. | 1.4% |
| Top 10 Total | 34.2% |
| |
1 | "Holdings Diversification (Market Exposure as a % of Net Assets)" excludes any temporary cash investments, investments in Guggenheim Strategy Funds Trust mutual funds, or investments in Guggenheim Ultra Short Duration Fund. |
| |
2 | "10 Largest Holdings (as a % of Net Assets)" excludes any temporary cash investments. |
| Apple, Inc. | 5.8% |
| Microsoft Corp. | 5.6% |
| NVIDIA Corp. | 5.2% |
| Alphabet, Inc. — Class A | 4.5% |
| Meta Platforms, Inc. — Class A | 3.9% |
| Broadcom, Inc. | 2.8% |
| Advanced Micro Devices, Inc. | 1.7% |
| Oracle Corp. | 1.7% |
| Salesforce, Inc. | 1.6% |
| International Business Machines Corp. | 1.4% |
| Top 10 Total | 34.2% |
| |
2 | "10 Largest Holdings (as a % of Net Assets)" excludes any temporary cash investments. |
There were no changes in or disagreements with fund accountants for the period.
| | | Availability of Additional Information. For additional information, including the fund's prospectus, financial information, holdings and proxy voting information, go to GuggenheimInvestments.com/mutual-funds/literature or, call 800 820 0888. |
SAR-RYCHX-093024
Semi-Annual Shareholder Report | 9.30.24
This semi-annual shareholder report contains important information about the Technology Fund for the period of April 1, 2024 to September 30, 2024. You can find additional information about the fund at GuggenheimInvestments.com/mutual-funds/literature. You can also request this information by contacting 800 820 0888 or GuggenheimClientServices@mufg-is.com.
For the period of April 1, 2024 to September 30, 2024, the fund (Class H shares) returned 6.20%, underperforming the fund's benchmark, the S&P 500 Index, which returned 10.42% for the same period and underperforming the fund's secondary index, the S&P 500 Information Technology Index, which returned 15.64% for the same period.
What factors materially affected the fund's performance over the last six months?
The industries that contributed the most to performance were semiconductors, technology hardware storage & peripherals, and systems software. Those that detracted the most were semiconductor materials & equipment, internet services & infrastructure, and application software. The holdings that contributed the most to performance were Apple Inc., NVIDIA Corp., and Broadcom Inc. Those that detracted the most were Intel Corp., Super Micro Computer, Inc., and SolarEdge Technologies, Inc.
Cumulative performance* for the fund's most recently completed 10 years (as of 9.30.24), assuming a $10,000 initial investment.
| 09/30/2014 | 10000 | 10000 | 10000 |
| 12/31/2014 | 10359 | 10493 | 10524 |
| 03/31/2015 | 10517 | 10593 | 10585 |
| 06/30/2015 | 10562 | 10622 | 10604 |
| 09/30/2015 | 9676 | 9939 | 10211 |
| 12/31/2015 | 10448 | 10638 | 11148 |
| 03/31/2016 | 10365 | 10782 | 11438 |
| 06/30/2016 | 10342 | 11047 | 11113 |
| 09/30/2016 | 11659 | 11472 | 12542 |
| 12/31/2016 | 11615 | 11911 | 12692 |
| 03/31/2017 | 12885 | 12633 | 14287 |
| 06/30/2017 | 13497 | 13023 | 14878 |
| 09/30/2017 | 14576 | 13607 | 16164 |
| 12/31/2017 | 15416 | 14511 | 17620 |
| 03/31/2018 | 16336 | 14401 | 18241 |
| 06/30/2018 | 17036 | 14896 | 19535 |
| 09/30/2018 | 18248 | 16044 | 21254 |
| 12/31/2018 | 15206 | 13875 | 17569 |
| 03/31/2019 | 18419 | 15769 | 21059 |
| 06/30/2019 | 19139 | 16447 | 22335 |
| 09/30/2019 | 19195 | 16727 | 23081 |
| 12/31/2019 | 21256 | 18244 | 26405 |
| 03/31/2020 | 18180 | 14668 | 23254 |
| 06/30/2020 | 24108 | 17682 | 30353 |
| 09/30/2020 | 26715 | 19260 | 33981 |
| 12/31/2020 | 31771 | 21600 | 37994 |
| 03/31/2021 | 32698 | 22934 | 38744 |
| 06/30/2021 | 36177 | 24895 | 43222 |
| 09/30/2021 | 35721 | 25040 | 43802 |
| 12/31/2021 | 38379 | 27801 | 51113 |
| 03/31/2022 | 33247 | 26522 | 46841 |
| 06/30/2022 | 25358 | 22252 | 37360 |
| 09/30/2022 | 23825 | 21165 | 35041 |
| 12/31/2022 | 24427 | 22766 | 36703 |
| 03/31/2023 | 29201 | 24473 | 44710 |
| 06/30/2023 | 32678 | 26612 | 52402 |
| 09/30/2023 | 31337 | 25741 | 49445 |
| 12/31/2023 | 36443 | 28750 | 57932 |
| 03/31/2024 | 40507 | 31785 | 65282 |
| 06/30/2024 | 42696 | 33147 | 74294 |
| 09/30/2024 | 43023 | 35098 | 75490 |
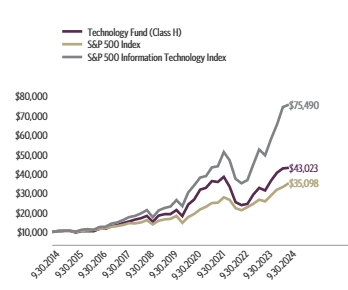
| Class H** | 6.20% | 37.29% | 17.52% | 15.71% |
| S&P 500 Index | 10.42% | 36.35% | 15.98% | 13.38% |
| S&P 500 Information Technology Index | 15.64% | 52.68% | 26.74% | 22.40% |
The fund's past performance is not a good predictor of the fund's future performance. Visit GuggenheimInvestments.com/mutual-funds/performance for more recent performance information.
| Net Assets | $64,153,122 |
| Total Number of Portfolio Holdings | 125 |
| Portfolio Turnover Rate | 53% |
| Technology Fund | Class H | RYTAX | Semi-Annual Shareholder Report | September 30, 2024 |
| Software | 30.2% |
| Semiconductors | 28.0% |
| Computers | 17.7% |
| Internet | 14.8% |
| Telecommunications | 3.8% |
| Electronics | 2.5% |
| Energy-Alternate Sources | 1.6% |
| Other | 0.9% |

| Apple, Inc. | 5.8% |
| Microsoft Corp. | 5.6% |
| NVIDIA Corp. | 5.2% |
| Alphabet, Inc. — Class A | 4.5% |
| Meta Platforms, Inc. — Class A | 3.9% |
| Broadcom, Inc. | 2.8% |
| Advanced Micro Devices, Inc. | 1.7% |
| Oracle Corp. | 1.7% |
| Salesforce, Inc. | 1.6% |
| International Business Machines Corp. | 1.4% |
| Top 10 Total | 34.2% |
| |
1 | "Holdings Diversification (Market Exposure as a % of Net Assets)" excludes any temporary cash investments, investments in Guggenheim Strategy Funds Trust mutual funds, or investments in Guggenheim Ultra Short Duration Fund. |
| |
2 | "10 Largest Holdings (as a % of Net Assets)" excludes any temporary cash investments. |
| Apple, Inc. | 5.8% |
| Microsoft Corp. | 5.6% |
| NVIDIA Corp. | 5.2% |
| Alphabet, Inc. — Class A | 4.5% |
| Meta Platforms, Inc. — Class A | 3.9% |
| Broadcom, Inc. | 2.8% |
| Advanced Micro Devices, Inc. | 1.7% |
| Oracle Corp. | 1.7% |
| Salesforce, Inc. | 1.6% |
| International Business Machines Corp. | 1.4% |
| Top 10 Total | 34.2% |
| |
2 | "10 Largest Holdings (as a % of Net Assets)" excludes any temporary cash investments. |
There were no changes in or disagreements with fund accountants for the period.
| | | Availability of Additional Information. For additional information, including the fund's prospectus, financial information, holdings and proxy voting information, go to GuggenheimInvestments.com/mutual-funds/literature or, call 800 820 0888. |
SAR-RYTAX-093024
Semi-Annual Shareholder Report | 9.30.24
This semi-annual shareholder report contains important information about the Telecommunications Fund for the period of April 1, 2024 to September 30, 2024. You can find additional information about the fund at GuggenheimInvestments.com/mutual-funds/literature. You can also request this information by contacting 800 820 0888 or GuggenheimClientServices@mufg-is.com.
For the period of April 1, 2024 to September 30, 2024, the fund (Investor Class shares) returned 16.67%, outperforming the fund's benchmark, the S&P 500 Index, which returned 10.42% for the same period and underperforming the fund's secondary index, the S&P 500 Telecommunication Services Index, which returned 20.22% for the same period.
What factors materially affected the fund's performance over the last six months?
The industries that contributed the most to performance were communications equipment, integrated telecommunication services, and alternative carriers. The only industry that detracted was application software. The holdings that contributed the most to performance were AT&T, Inc., T-Mobile US, Inc., and Lumen Technologies, Inc. Those that detracted the most were Nice Ltd. ADR, Comcast Corp. – Class A, and Viasat, Inc.
Cumulative performance* for the fund's most recently completed 10 years (as of 9.30.24), assuming a $10,000 initial investment.
| 09/30/2014 | 10000 | 10000 | 10000 |
| 12/31/2014 | 9957 | 10493 | 9583 |
| 03/31/2015 | 10008 | 10593 | 9731 |
| 06/30/2015 | 9922 | 10622 | 9886 |
| 09/30/2015 | 9034 | 9939 | 9209 |
| 12/31/2015 | 9267 | 10638 | 9909 |
| 03/31/2016 | 9758 | 10782 | 11555 |
| 06/30/2016 | 9983 | 11047 | 12371 |
| 09/30/2016 | 10715 | 11472 | 11678 |
| 12/31/2016 | 10912 | 11911 | 12236 |
| 03/31/2017 | 11145 | 12633 | 11750 |
| 06/30/2017 | 10924 | 13023 | 10922 |
| 09/30/2017 | 11108 | 13607 | 11662 |
| 12/31/2017 | 11548 | 14511 | 12083 |
| 03/31/2018 | 11516 | 14401 | 11179 |
| 06/30/2018 | 11640 | 14896 | 11074 |
| 09/30/2018 | 12577 | 16044 | 11866 |
| 12/31/2018 | 10941 | 13875 | 11266 |
| 03/31/2019 | 12152 | 15769 | 12164 |
| 06/30/2019 | 12159 | 16447 | 12509 |
| 09/30/2019 | 12181 | 16727 | 13789 |
| 12/31/2019 | 12409 | 18244 | 14298 |
| 03/31/2020 | 10847 | 14668 | 11803 |
| 06/30/2020 | 12170 | 17682 | 12475 |
| 09/30/2020 | 11904 | 19260 | 12925 |
| 12/31/2020 | 13656 | 21600 | 13343 |
| 03/31/2021 | 14377 | 22934 | 13663 |
| 06/30/2021 | 15306 | 24895 | 13631 |
| 09/30/2021 | 14680 | 25040 | 12971 |
| 12/31/2021 | 14943 | 27801 | 12296 |
| 03/31/2022 | 13750 | 26522 | 12327 |
| 06/30/2022 | 11902 | 22252 | 13150 |
| 09/30/2022 | 10332 | 21165 | 10431 |
| 12/31/2022 | 11112 | 22766 | 11442 |
| 03/31/2023 | 11705 | 24473 | 11704 |
| 06/30/2023 | 11391 | 26612 | 10793 |
| 09/30/2023 | 10978 | 25741 | 10124 |
| 12/31/2023 | 11830 | 28750 | 11768 |
| 03/31/2024 | 11599 | 31785 | 12765 |
| 06/30/2024 | 11588 | 33147 | 13425 |
| 09/30/2024 | 13533 | 35098 | 15346 |
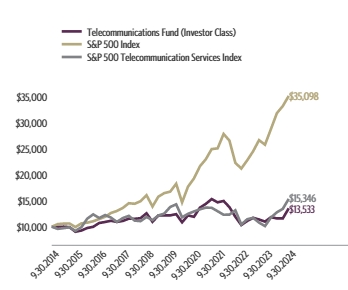
| Investor Class | 16.67% | 23.27% | 2.13% | 3.07% |
| S&P 500 Index | 10.42% | 36.35% | 15.98% | 13.38% |
| S&P 500 Telecommunication Services Index | 20.22% | 51.57% | 2.16% | 4.38% |
The fund's past performance is not a good predictor of the fund's future performance. Visit GuggenheimInvestments.com/mutual-funds/performance for more recent performance information.
| Net Assets | $7,252,780 |
| Total Number of Portfolio Holdings | 47 |
| Portfolio Turnover Rate | 243% |
| Telecommunications Fund | Investor Class | RYMIX | Semi-Annual Shareholder Report | September 30, 2024 |
| Telecommunications | 71.9% |
| Media | 16.4% |
| Internet | 5.9% |
| Computers | 2.5% |
| Software | 2.2% |
| Electronics | 0.4% |
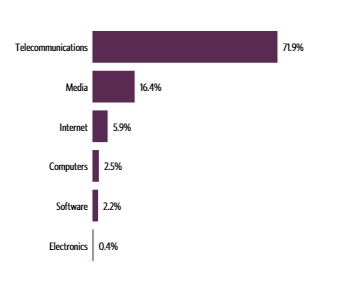
| Cisco Systems, Inc. | 8.1% |
| Verizon Communications, Inc. | 7.5% |
| Comcast Corp. — Class A | 7.4% |
| AT&T, Inc. | 7.3% |
| T-Mobile US, Inc. | 5.7% |
| Arista Networks, Inc. | 4.4% |
| Motorola Solutions, Inc. | 4.1% |
| Charter Communications, Inc. — Class A | 3.7% |
| F5, Inc. | 2.6% |
| Liberty Broadband Corp. — Class C | 2.5% |
| Top 10 Total | 53.3% |
| |
1 | "Holdings Diversification (Market Exposure as a % of Net Assets)" excludes any temporary cash investments, investments in Guggenheim Strategy Funds Trust mutual funds, or investments in Guggenheim Ultra Short Duration Fund. |
| |
2 | "10 Largest Holdings (as a % of Net Assets)" excludes any temporary cash investments. |
| Cisco Systems, Inc. | 8.1% |
| Verizon Communications, Inc. | 7.5% |
| Comcast Corp. — Class A | 7.4% |
| AT&T, Inc. | 7.3% |
| T-Mobile US, Inc. | 5.7% |
| Arista Networks, Inc. | 4.4% |
| Motorola Solutions, Inc. | 4.1% |
| Charter Communications, Inc. — Class A | 3.7% |
| F5, Inc. | 2.6% |
| Liberty Broadband Corp. — Class C | 2.5% |
| Top 10 Total | 53.3% |
| |
2 | "10 Largest Holdings (as a % of Net Assets)" excludes any temporary cash investments. |
There were no changes in or disagreements with fund accountants for the period.
| | | Availability of Additional Information. For additional information, including the fund's prospectus, financial information, holdings and proxy voting information, go to GuggenheimInvestments.com/mutual-funds/literature or, call 800 820 0888. |
SAR-RYMIX-093024
Semi-Annual Shareholder Report | 9.30.24
This semi-annual shareholder report contains important information about the Telecommunications Fund for the period of April 1, 2024 to September 30, 2024. You can find additional information about the fund at GuggenheimInvestments.com/mutual-funds/literature. You can also request this information by contacting 800 820 0888 or GuggenheimClientServices@mufg-is.com.
For the period of April 1, 2024 to September 30, 2024, the fund (Class A shares) returned 16.53%, outperforming the fund's benchmark, the S&P 500 Index, which returned 10.42% for the same period and underperforming the fund's secondary index, the S&P 500 Telecommunication Services Index, which returned 20.22% for the same period.
What factors materially affected the fund's performance over the last six months?
The industries that contributed the most to performance were communications equipment, integrated telecommunication services, and alternative carriers. The only industry that detracted was application software. The holdings that contributed the most to performance were AT&T, Inc., T-Mobile US, Inc., and Lumen Technologies, Inc. Those that detracted the most were Nice Ltd. ADR, Comcast Corp. – Class A, and Viasat, Inc.
Cumulative performance* for the fund's most recently completed 10 years (as of 9.30.24), assuming a $10,000 initial investment.
| 09/30/2014 | 9525 | 10000 | 10000 |
| 12/31/2014 | 9477 | 10493 | 9583 |
| 03/31/2015 | 9522 | 10593 | 9731 |
| 06/30/2015 | 9432 | 10622 | 9886 |
| 09/30/2015 | 8572 | 9939 | 9209 |
| 12/31/2015 | 8786 | 10638 | 9909 |
| 03/31/2016 | 9245 | 10782 | 11555 |
| 06/30/2016 | 9454 | 11047 | 12371 |
| 09/30/2016 | 10136 | 11472 | 11678 |
| 12/31/2016 | 10315 | 11911 | 12236 |
| 03/31/2017 | 10529 | 12633 | 11750 |
| 06/30/2017 | 10313 | 13023 | 10922 |
| 09/30/2017 | 10481 | 13607 | 11662 |
| 12/31/2017 | 10888 | 14511 | 12083 |
| 03/31/2018 | 10854 | 14401 | 11179 |
| 06/30/2018 | 10962 | 14896 | 11074 |
| 09/30/2018 | 11839 | 16044 | 11866 |
| 12/31/2018 | 10294 | 13875 | 11266 |
| 03/31/2019 | 11425 | 15769 | 12164 |
| 06/30/2019 | 11425 | 16447 | 12509 |
| 09/30/2019 | 11440 | 16727 | 13789 |
| 12/31/2019 | 11647 | 18244 | 14298 |
| 03/31/2020 | 10175 | 14668 | 11803 |
| 06/30/2020 | 11407 | 17682 | 12475 |
| 09/30/2020 | 11153 | 19260 | 12925 |
| 12/31/2020 | 12784 | 21600 | 13343 |
| 03/31/2021 | 13451 | 22934 | 13663 |
| 06/30/2021 | 14313 | 24895 | 13631 |
| 09/30/2021 | 13715 | 25040 | 12971 |
| 12/31/2021 | 13952 | 27801 | 12296 |
| 03/31/2022 | 12833 | 26522 | 12327 |
| 06/30/2022 | 11098 | 22252 | 13150 |
| 09/30/2022 | 9624 | 21165 | 10431 |
| 12/31/2022 | 10345 | 22766 | 11442 |
| 03/31/2023 | 10893 | 24473 | 11704 |
| 06/30/2023 | 10593 | 26612 | 10793 |
| 09/30/2023 | 10210 | 25741 | 10124 |
| 12/31/2023 | 10994 | 28750 | 11768 |
| 03/31/2024 | 10775 | 31785 | 12765 |
| 06/30/2024 | 10761 | 33147 | 13425 |
| 09/30/2024 | 12555 | 35098 | 15346 |
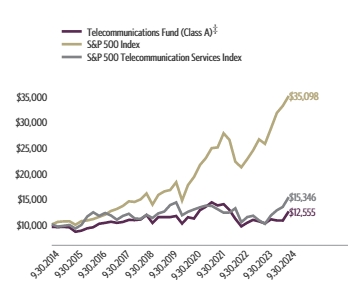
| Class A (without sales charge) | 16.53% | 22.97% | 1.88% | 2.80% |
| Class A (with sales charge)‡ | 11.00% | 17.12% | 0.89% | 2.30% |
| S&P 500 Index | 10.42% | 36.35% | 15.98% | 13.38% |
| S&P 500 Telecommunication Services Index | 20.22% | 51.57% | 2.16% | 4.38% |
The fund's past performance is not a good predictor of the fund's future performance. Visit GuggenheimInvestments.com/mutual-funds/performance for more recent performance information.
| Net Assets | $7,252,780 |
| Total Number of Portfolio Holdings | 47 |
| Portfolio Turnover Rate | 243% |
| Telecommunications Fund | Class A | RYTLX | Semi-Annual Shareholder Report | September 30, 2024 |
| Telecommunications | 71.9% |
| Media | 16.4% |
| Internet | 5.9% |
| Computers | 2.5% |
| Software | 2.2% |
| Electronics | 0.4% |

| Cisco Systems, Inc. | 8.1% |
| Verizon Communications, Inc. | 7.5% |
| Comcast Corp. — Class A | 7.4% |
| AT&T, Inc. | 7.3% |
| T-Mobile US, Inc. | 5.7% |
| Arista Networks, Inc. | 4.4% |
| Motorola Solutions, Inc. | 4.1% |
| Charter Communications, Inc. — Class A | 3.7% |
| F5, Inc. | 2.6% |
| Liberty Broadband Corp. — Class C | 2.5% |
| Top 10 Total | 53.3% |
| |
1 | "Holdings Diversification (Market Exposure as a % of Net Assets)" excludes any temporary cash investments, investments in Guggenheim Strategy Funds Trust mutual funds, or investments in Guggenheim Ultra Short Duration Fund. |
| |
2 | "10 Largest Holdings (as a % of Net Assets)" excludes any temporary cash investments. |
| Cisco Systems, Inc. | 8.1% |
| Verizon Communications, Inc. | 7.5% |
| Comcast Corp. — Class A | 7.4% |
| AT&T, Inc. | 7.3% |
| T-Mobile US, Inc. | 5.7% |
| Arista Networks, Inc. | 4.4% |
| Motorola Solutions, Inc. | 4.1% |
| Charter Communications, Inc. — Class A | 3.7% |
| F5, Inc. | 2.6% |
| Liberty Broadband Corp. — Class C | 2.5% |
| Top 10 Total | 53.3% |
| |
2 | "10 Largest Holdings (as a % of Net Assets)" excludes any temporary cash investments. |
There were no changes in or disagreements with fund accountants for the period.
| | | Availability of Additional Information. For additional information, including the fund's prospectus, financial information, holdings and proxy voting information, go to GuggenheimInvestments.com/mutual-funds/literature or, call 800 820 0888. |
SAR-RYTLX-093024
Semi-Annual Shareholder Report | 9.30.24
This semi-annual shareholder report contains important information about the Telecommunications Fund for the period of April 1, 2024 to September 30, 2024. You can find additional information about the fund at GuggenheimInvestments.com/mutual-funds/literature. You can also request this information by contacting 800 820 0888 or GuggenheimClientServices@mufg-is.com.
For the period of April 1, 2024 to September 30, 2024, the fund (Class C shares) returned 16.21%, outperforming the fund's benchmark, the S&P 500 Index, which returned 10.42% for the same period and underperforming the fund's secondary index, the S&P 500 Telecommunication Services Index, which returned 20.22% for the same period.
What factors materially affected the fund's performance over the last six months?
The industries that contributed the most to performance were communications equipment, integrated telecommunication services, and alternative carriers. The only industry that detracted was application software. The holdings that contributed the most to performance were AT&T, Inc., T-Mobile US, Inc., and Lumen Technologies, Inc. Those that detracted the most were Nice Ltd. ADR, Comcast Corp. – Class A, and Viasat, Inc.
Cumulative performance* for the fund's most recently completed 10 years (as of 9.30.24), assuming a $10,000 initial investment.
| 09/30/2014 | 10000 | 10000 | 10000 |
| 12/31/2014 | 9928 | 10493 | 9583 |
| 03/31/2015 | 9956 | 10593 | 9731 |
| 06/30/2015 | 9847 | 10622 | 9886 |
| 09/30/2015 | 8936 | 9939 | 9209 |
| 12/31/2015 | 9140 | 10638 | 9909 |
| 03/31/2016 | 9599 | 10782 | 11555 |
| 06/30/2016 | 9796 | 11047 | 12371 |
| 09/30/2016 | 10487 | 11472 | 11678 |
| 12/31/2016 | 10651 | 11911 | 12236 |
| 03/31/2017 | 10851 | 12633 | 11750 |
| 06/30/2017 | 10611 | 13023 | 10922 |
| 09/30/2017 | 10762 | 13607 | 11662 |
| 12/31/2017 | 11161 | 14511 | 12083 |
| 03/31/2018 | 11101 | 14401 | 11179 |
| 06/30/2018 | 11192 | 14896 | 11074 |
| 09/30/2018 | 12065 | 16044 | 11866 |
| 12/31/2018 | 10468 | 13875 | 11266 |
| 03/31/2019 | 11600 | 15769 | 12164 |
| 06/30/2019 | 11577 | 16447 | 12509 |
| 09/30/2019 | 11571 | 16727 | 13789 |
| 12/31/2019 | 11756 | 18244 | 14298 |
| 03/31/2020 | 10252 | 14668 | 11803 |
| 06/30/2020 | 11474 | 17682 | 12475 |
| 09/30/2020 | 11194 | 19260 | 12925 |
| 12/31/2020 | 12807 | 21600 | 13343 |
| 03/31/2021 | 13452 | 22934 | 13663 |
| 06/30/2021 | 14286 | 24895 | 13631 |
| 09/30/2021 | 13666 | 25040 | 12971 |
| 12/31/2021 | 13875 | 27801 | 12296 |
| 03/31/2022 | 12738 | 26522 | 12327 |
| 06/30/2022 | 10996 | 22252 | 13150 |
| 09/30/2022 | 9515 | 21165 | 10431 |
| 12/31/2022 | 10208 | 22766 | 11442 |
| 03/31/2023 | 10730 | 24473 | 11704 |
| 06/30/2023 | 10414 | 26612 | 10793 |
| 09/30/2023 | 10020 | 25741 | 10124 |
| 12/31/2023 | 10767 | 28750 | 11768 |
| 03/31/2024 | 10534 | 31785 | 12765 |
| 06/30/2024 | 10498 | 33147 | 13425 |
| 09/30/2024 | 12228 | 35098 | 15346 |

| Class C (without CDSC) | 16.21% | 22.04% | 1.11% | 2.03% |
| Class C (with CDSC)§ | 15.21% | 21.04% | 1.11% | 2.03% |
| S&P 500 Index | 10.42% | 36.35% | 15.98% | 13.38% |
| S&P 500 Telecommunication Services Index | 20.22% | 51.57% | 2.16% | 4.38% |
The fund's past performance is not a good predictor of the fund's future performance. Visit GuggenheimInvestments.com/mutual-funds/performance for more recent performance information.
| Net Assets | $7,252,780 |
| Total Number of Portfolio Holdings | 47 |
| Portfolio Turnover Rate | 243% |
| Telecommunications Fund | Class C | RYCSX | Semi-Annual Shareholder Report | September 30, 2024 |
| Telecommunications | 71.9% |
| Media | 16.4% |
| Internet | 5.9% |
| Computers | 2.5% |
| Software | 2.2% |
| Electronics | 0.4% |

| Cisco Systems, Inc. | 8.1% |
| Verizon Communications, Inc. | 7.5% |
| Comcast Corp. — Class A | 7.4% |
| AT&T, Inc. | 7.3% |
| T-Mobile US, Inc. | 5.7% |
| Arista Networks, Inc. | 4.4% |
| Motorola Solutions, Inc. | 4.1% |
| Charter Communications, Inc. — Class A | 3.7% |
| F5, Inc. | 2.6% |
| Liberty Broadband Corp. — Class C | 2.5% |
| Top 10 Total | 53.3% |
| |
1 | "Holdings Diversification (Market Exposure as a % of Net Assets)" excludes any temporary cash investments, investments in Guggenheim Strategy Funds Trust mutual funds, or investments in Guggenheim Ultra Short Duration Fund. |
| |
2 | "10 Largest Holdings (as a % of Net Assets)" excludes any temporary cash investments. |
| Cisco Systems, Inc. | 8.1% |
| Verizon Communications, Inc. | 7.5% |
| Comcast Corp. — Class A | 7.4% |
| AT&T, Inc. | 7.3% |
| T-Mobile US, Inc. | 5.7% |
| Arista Networks, Inc. | 4.4% |
| Motorola Solutions, Inc. | 4.1% |
| Charter Communications, Inc. — Class A | 3.7% |
| F5, Inc. | 2.6% |
| Liberty Broadband Corp. — Class C | 2.5% |
| Top 10 Total | 53.3% |
| |
2 | "10 Largest Holdings (as a % of Net Assets)" excludes any temporary cash investments. |
There were no changes in or disagreements with fund accountants for the period.
| | | Availability of Additional Information. For additional information, including the fund's prospectus, financial information, holdings and proxy voting information, go to GuggenheimInvestments.com/mutual-funds/literature or, call 800 820 0888. |
SAR-RYCSX-093024
Semi-Annual Shareholder Report | 9.30.24
This semi-annual shareholder report contains important information about the Telecommunications Fund for the period of April 1, 2024 to September 30, 2024. You can find additional information about the fund at GuggenheimInvestments.com/mutual-funds/literature. You can also request this information by contacting 800 820 0888 or GuggenheimClientServices@mufg-is.com.
For the period of April 1, 2024 to September 30, 2024, the fund (Class H shares) returned 16.53%, outperforming the fund's benchmark, the S&P 500 Index, which returned 10.42% for the same period and underperforming the fund's secondary index, the S&P 500 Telecommunication Services Index, which returned 20.22% for the same period.
What factors materially affected the fund's performance over the last six months?
The industries that contributed the most to performance were communications equipment, integrated telecommunication services, and alternative carriers. The only industry that detracted was application software. The holdings that contributed the most to performance were AT&T, Inc., T-Mobile US, Inc., and Lumen Technologies, Inc. Those that detracted the most were Nice Ltd. ADR, Comcast Corp. – Class A, and Viasat, Inc.
Cumulative performance* for the fund's most recently completed 10 years (as of 9.30.24), assuming a $10,000 initial investment.
| 09/30/2014 | 10000 | 10000 | 10000 |
| 12/31/2014 | 9946 | 10493 | 9583 |
| 03/31/2015 | 9984 | 10593 | 9731 |
| 06/30/2015 | 9888 | 10622 | 9886 |
| 09/30/2015 | 8986 | 9939 | 9209 |
| 12/31/2015 | 9211 | 10638 | 9909 |
| 03/31/2016 | 9690 | 10782 | 11555 |
| 06/30/2016 | 9907 | 11047 | 12371 |
| 09/30/2016 | 10625 | 11472 | 11678 |
| 12/31/2016 | 10813 | 11911 | 12236 |
| 03/31/2017 | 11041 | 12633 | 11750 |
| 06/30/2017 | 10816 | 13023 | 10922 |
| 09/30/2017 | 10992 | 13607 | 11662 |
| 12/31/2017 | 11417 | 14511 | 12083 |
| 03/31/2018 | 11380 | 14401 | 11179 |
| 06/30/2018 | 11495 | 14896 | 11074 |
| 09/30/2018 | 12413 | 16044 | 11866 |
| 12/31/2018 | 10814 | 13875 | 11266 |
| 03/31/2019 | 12007 | 15769 | 12164 |
| 06/30/2019 | 12004 | 16447 | 12509 |
| 09/30/2019 | 12021 | 16727 | 13789 |
| 12/31/2019 | 12238 | 18244 | 14298 |
| 03/31/2020 | 10688 | 14668 | 11803 |
| 06/30/2020 | 11984 | 17682 | 12475 |
| 09/30/2020 | 11717 | 19260 | 12925 |
| 12/31/2020 | 13432 | 21600 | 13343 |
| 03/31/2021 | 14134 | 22934 | 13663 |
| 06/30/2021 | 15036 | 24895 | 13631 |
| 09/30/2021 | 14411 | 25040 | 12971 |
| 12/31/2021 | 14658 | 27801 | 12296 |
| 03/31/2022 | 13485 | 26522 | 12327 |
| 06/30/2022 | 11660 | 22252 | 13150 |
| 09/30/2022 | 10111 | 21165 | 10431 |
| 12/31/2022 | 10866 | 22766 | 11442 |
| 03/31/2023 | 11443 | 24473 | 11704 |
| 06/30/2023 | 11128 | 26612 | 10793 |
| 09/30/2023 | 10726 | 25741 | 10124 |
| 12/31/2023 | 11547 | 28750 | 11768 |
| 03/31/2024 | 11316 | 31785 | 12765 |
| 06/30/2024 | 11304 | 33147 | 13425 |
| 09/30/2024 | 13187 | 35098 | 15346 |
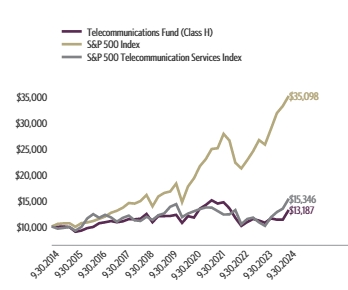
| Class H** | 16.53% | 22.94% | 1.87% | 2.81% |
| S&P 500 Index | 10.42% | 36.35% | 15.98% | 13.38% |
| S&P 500 Telecommunication Services Index | 20.22% | 51.57% | 2.16% | 4.38% |
The fund's past performance is not a good predictor of the fund's future performance. Visit GuggenheimInvestments.com/mutual-funds/performance for more recent performance information.
| Net Assets | $7,252,780 |
| Total Number of Portfolio Holdings | 47 |
| Portfolio Turnover Rate | 243% |
| Telecommunications Fund | Class H | RYMAX | Semi-Annual Shareholder Report | September 30, 2024 |
| Telecommunications | 71.9% |
| Media | 16.4% |
| Internet | 5.9% |
| Computers | 2.5% |
| Software | 2.2% |
| Electronics | 0.4% |

| Cisco Systems, Inc. | 8.1% |
| Verizon Communications, Inc. | 7.5% |
| Comcast Corp. — Class A | 7.4% |
| AT&T, Inc. | 7.3% |
| T-Mobile US, Inc. | 5.7% |
| Arista Networks, Inc. | 4.4% |
| Motorola Solutions, Inc. | 4.1% |
| Charter Communications, Inc. — Class A | 3.7% |
| F5, Inc. | 2.6% |
| Liberty Broadband Corp. — Class C | 2.5% |
| Top 10 Total | 53.3% |
| |
1 | "Holdings Diversification (Market Exposure as a % of Net Assets)" excludes any temporary cash investments, investments in Guggenheim Strategy Funds Trust mutual funds, or investments in Guggenheim Ultra Short Duration Fund. |
| |
2 | "10 Largest Holdings (as a % of Net Assets)" excludes any temporary cash investments. |
| Cisco Systems, Inc. | 8.1% |
| Verizon Communications, Inc. | 7.5% |
| Comcast Corp. — Class A | 7.4% |
| AT&T, Inc. | 7.3% |
| T-Mobile US, Inc. | 5.7% |
| Arista Networks, Inc. | 4.4% |
| Motorola Solutions, Inc. | 4.1% |
| Charter Communications, Inc. — Class A | 3.7% |
| F5, Inc. | 2.6% |
| Liberty Broadband Corp. — Class C | 2.5% |
| Top 10 Total | 53.3% |
| |
2 | "10 Largest Holdings (as a % of Net Assets)" excludes any temporary cash investments. |
There were no changes in or disagreements with fund accountants for the period.
| | | Availability of Additional Information. For additional information, including the fund's prospectus, financial information, holdings and proxy voting information, go to GuggenheimInvestments.com/mutual-funds/literature or, call 800 820 0888. |
SAR-RYMAX-093024
Semi-Annual Shareholder Report | 9.30.24
This semi-annual shareholder report contains important information about the Transportation Fund for the period of April 1, 2024 to September 30, 2024. You can find additional information about the fund at GuggenheimInvestments.com/mutual-funds/literature. You can also request this information by contacting 800 820 0888 or GuggenheimClientServices@mufg-is.com.
For the period of April 1, 2024 to September 30, 2024, the fund (Investor Class shares) returned -2.14%, underperforming the fund's benchmark, the S&P 500 Index, which returned 10.42% for the same period and underperforming the fund's secondary index, the S&P 500 Industrials Index, which returned 8.31% for the same period.
What factors materially affected the fund's performance over the last six months?
The industries that contributed the most to performance were automobile manufacturers, air freight & logistics, and marine transportation. Those that detracted the most were automotive parts & equipment, cargo ground transportation, and passenger ground transportation. The holdings that contributed the most to performance were Tesla Inc., NIO Inc. ADR, and CH Robinson Worldwide, Inc. Those that detracted the most were Stellantis N.V., Mobileye Global, Inc. – Class A, and Ford Motor Co.
Cumulative performance* for the fund's most recently completed 10 years (as of 9.30.24), assuming a $10,000 initial investment.
| 09/30/2014 | 10000 | 10000 | 10000 |
| 12/31/2014 | 11234 | 10493 | 10676 |
| 03/31/2015 | 11138 | 10593 | 10585 |
| 06/30/2015 | 10394 | 10622 | 10349 |
| 09/30/2015 | 9626 | 9939 | 9635 |
| 12/31/2015 | 9680 | 10638 | 10406 |
| 03/31/2016 | 9935 | 10782 | 10925 |
| 06/30/2016 | 9194 | 11047 | 11078 |
| 09/30/2016 | 10152 | 11472 | 11537 |
| 12/31/2016 | 11166 | 11911 | 12368 |
| 03/31/2017 | 11539 | 12633 | 12933 |
| 06/30/2017 | 12143 | 13023 | 13545 |
| 09/30/2017 | 12922 | 13607 | 14116 |
| 12/31/2017 | 13670 | 14511 | 14970 |
| 03/31/2018 | 13001 | 14401 | 14737 |
| 06/30/2018 | 12997 | 14896 | 14268 |
| 09/30/2018 | 13254 | 16044 | 15694 |
| 12/31/2018 | 10924 | 13875 | 12981 |
| 03/31/2019 | 12178 | 15769 | 15213 |
| 06/30/2019 | 12429 | 16447 | 15756 |
| 09/30/2019 | 12361 | 16727 | 15912 |
| 12/31/2019 | 13414 | 18244 | 16793 |
| 03/31/2020 | 9428 | 14668 | 12251 |
| 06/30/2020 | 12355 | 17682 | 14334 |
| 09/30/2020 | 14906 | 19260 | 16123 |
| 12/31/2020 | 18946 | 21600 | 18650 |
| 03/31/2021 | 21250 | 22934 | 20779 |
| 06/30/2021 | 21560 | 24895 | 21709 |
| 09/30/2021 | 20345 | 25040 | 20792 |
| 12/31/2021 | 23190 | 27801 | 22589 |
| 03/31/2022 | 21100 | 26522 | 22055 |
| 06/30/2022 | 16287 | 22252 | 18796 |
| 09/30/2022 | 15598 | 21165 | 17908 |
| 12/31/2022 | 15102 | 22766 | 21351 |
| 03/31/2023 | 17218 | 24473 | 22092 |
| 06/30/2023 | 18962 | 26612 | 23526 |
| 09/30/2023 | 17833 | 25741 | 22311 |
| 12/31/2023 | 18874 | 28750 | 25223 |
| 03/31/2024 | 18852 | 31785 | 27991 |
| 06/30/2024 | 17431 | 33147 | 27179 |
| 09/30/2024 | 18450 | 35098 | 30318 |
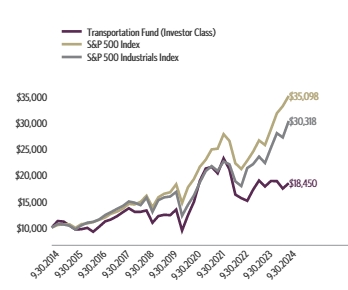
| Investor Class | -2.14% | 3.46% | 8.34% | 6.32% |
| S&P 500 Index | 10.42% | 36.35% | 15.98% | 13.38% |
| S&P 500 Industrials Index | 8.31% | 35.89% | 13.76% | 11.73% |
The fund's past performance is not a good predictor of the fund's future performance. Visit GuggenheimInvestments.com/mutual-funds/performance for more recent performance information.
| Net Assets | $8,671,765 |
| Total Number of Portfolio Holdings | 70 |
| Portfolio Turnover Rate | 34% |
| Transportation Fund | Investor Class | RYPIX | Semi-Annual Shareholder Report | September 30, 2024 |
| Transportation | 37.2% |
| Auto Manufacturers | 26.1% |
| Auto Parts & Equipment | 12.1% |
| Airlines | 11.8% |
| Internet | 7.1% |
| Commercial Services | 1.7% |
| Home Builders | 1.4% |
| Other | 2.4% |

| Tesla, Inc. | 10.7% |
| Uber Technologies, Inc. | 4.8% |
| Union Pacific Corp. | 4.5% |
| United Parcel Service, Inc. — Class B | 4.1% |
| CSX Corp. | 3.1% |
| FedEx Corp. | 2.8% |
| Norfolk Southern Corp. | 2.7% |
| General Motors Co. | 2.6% |
| Ford Motor Co. | 2.4% |
| Old Dominion Freight Line, Inc. | 2.4% |
| Top 10 Total | 40.1% |
| |
1 | "Holdings Diversification (Market Exposure as a % of Net Assets)" excludes any temporary cash investments, investments in Guggenheim Strategy Funds Trust mutual funds, or investments in Guggenheim Ultra Short Duration Fund. |
| |
2 | "10 Largest Holdings (as a % of Net Assets)" excludes any temporary cash investments. |
| Tesla, Inc. | 10.7% |
| Uber Technologies, Inc. | 4.8% |
| Union Pacific Corp. | 4.5% |
| United Parcel Service, Inc. — Class B | 4.1% |
| CSX Corp. | 3.1% |
| FedEx Corp. | 2.8% |
| Norfolk Southern Corp. | 2.7% |
| General Motors Co. | 2.6% |
| Ford Motor Co. | 2.4% |
| Old Dominion Freight Line, Inc. | 2.4% |
| Top 10 Total | 40.1% |
| |
2 | "10 Largest Holdings (as a % of Net Assets)" excludes any temporary cash investments. |
There were no changes in or disagreements with fund accountants for the period.
| | | Availability of Additional Information. For additional information, including the fund's prospectus, financial information, holdings and proxy voting information, go to GuggenheimInvestments.com/mutual-funds/literature or, call 800 820 0888. |
SAR-RYPIX-093024
Semi-Annual Shareholder Report | 9.30.24
This semi-annual shareholder report contains important information about the Transportation Fund for the period of April 1, 2024 to September 30, 2024. You can find additional information about the fund at GuggenheimInvestments.com/mutual-funds/literature. You can also request this information by contacting 800 820 0888 or GuggenheimClientServices@mufg-is.com.
For the period of April 1, 2024 to September 30, 2024, the fund (Class A shares) returned -2.26%, underperforming the fund's benchmark, the S&P 500 Index, which returned 10.42% for the same period and underperforming the fund's secondary index, the S&P 500 Industrials Index, which returned 8.31% for the same period.
What factors materially affected the fund's performance over the last six months?
The industries that contributed the most to performance were automobile manufacturers, air freight & logistics, and marine transportation. Those that detracted the most were automotive parts & equipment, cargo ground transportation, and passenger ground transportation. The holdings that contributed the most to performance were Tesla Inc., NIO Inc. ADR, and CH Robinson Worldwide, Inc. Those that detracted the most were Stellantis N.V., Mobileye Global, Inc. – Class A, and Ford Motor Co.
Cumulative performance* for the fund's most recently completed 10 years (as of 9.30.24), assuming a $10,000 initial investment.
| 09/30/2014 | 9525 | 10000 | 10000 |
| 12/31/2014 | 10696 | 10493 | 10676 |
| 03/31/2015 | 10595 | 10593 | 10585 |
| 06/30/2015 | 9882 | 10622 | 10349 |
| 09/30/2015 | 9146 | 9939 | 9635 |
| 12/31/2015 | 9193 | 10638 | 10406 |
| 03/31/2016 | 9428 | 10782 | 10925 |
| 06/30/2016 | 8720 | 11047 | 11078 |
| 09/30/2016 | 9624 | 11472 | 11537 |
| 12/31/2016 | 10578 | 11911 | 12368 |
| 03/31/2017 | 10925 | 12633 | 12933 |
| 06/30/2017 | 11490 | 13023 | 13545 |
| 09/30/2017 | 12218 | 13607 | 14116 |
| 12/31/2017 | 12916 | 14511 | 14970 |
| 03/31/2018 | 12277 | 14401 | 14737 |
| 06/30/2018 | 12266 | 14896 | 14268 |
| 09/30/2018 | 12501 | 16044 | 15694 |
| 12/31/2018 | 10296 | 13875 | 12981 |
| 03/31/2019 | 11471 | 15769 | 15213 |
| 06/30/2019 | 11700 | 16447 | 15756 |
| 09/30/2019 | 11627 | 16727 | 15912 |
| 12/31/2019 | 12608 | 18244 | 16793 |
| 03/31/2020 | 8858 | 14668 | 12251 |
| 06/30/2020 | 11597 | 17682 | 14334 |
| 09/30/2020 | 13986 | 19260 | 16123 |
| 12/31/2020 | 17763 | 21600 | 18650 |
| 03/31/2021 | 19913 | 22934 | 20779 |
| 06/30/2021 | 20191 | 24895 | 21709 |
| 09/30/2021 | 19044 | 25040 | 20792 |
| 12/31/2021 | 21689 | 27801 | 22589 |
| 03/31/2022 | 19724 | 26522 | 22055 |
| 06/30/2022 | 15216 | 22252 | 18796 |
| 09/30/2022 | 14565 | 21165 | 17908 |
| 12/31/2022 | 14090 | 22766 | 21351 |
| 03/31/2023 | 16055 | 24473 | 22092 |
| 06/30/2023 | 17670 | 26612 | 23526 |
| 09/30/2023 | 16609 | 25741 | 22311 |
| 12/31/2023 | 17569 | 28750 | 25223 |
| 03/31/2024 | 17536 | 31785 | 27991 |
| 06/30/2024 | 16202 | 33147 | 27179 |
| 09/30/2024 | 17140 | 35098 | 30318 |

| Class A (without sales charge) | -2.26% | 3.20% | 8.07% | 6.05% |
| Class A (with sales charge)‡ | -6.90% | -1.70% | 7.03% | 5.54% |
| S&P 500 Index | 10.42% | 36.35% | 15.98% | 13.38% |
| S&P 500 Industrials Index | 8.31% | 35.89% | 13.76% | 11.73% |
The fund's past performance is not a good predictor of the fund's future performance. Visit GuggenheimInvestments.com/mutual-funds/performance for more recent performance information.
| Net Assets | $8,671,765 |
| Total Number of Portfolio Holdings | 70 |
| Portfolio Turnover Rate | 34% |
| Transportation Fund | Class A | RYTSX | Semi-Annual Shareholder Report | September 30, 2024 |
| Transportation | 37.2% |
| Auto Manufacturers | 26.1% |
| Auto Parts & Equipment | 12.1% |
| Airlines | 11.8% |
| Internet | 7.1% |
| Commercial Services | 1.7% |
| Home Builders | 1.4% |
| Other | 2.4% |
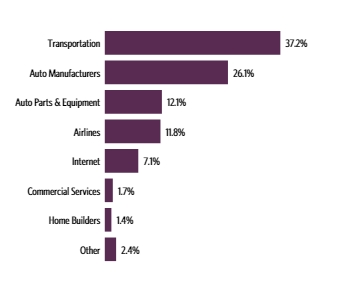
| Tesla, Inc. | 10.7% |
| Uber Technologies, Inc. | 4.8% |
| Union Pacific Corp. | 4.5% |
| United Parcel Service, Inc. — Class B | 4.1% |
| CSX Corp. | 3.1% |
| FedEx Corp. | 2.8% |
| Norfolk Southern Corp. | 2.7% |
| General Motors Co. | 2.6% |
| Ford Motor Co. | 2.4% |
| Old Dominion Freight Line, Inc. | 2.4% |
| Top 10 Total | 40.1% |
| |
1 | "Holdings Diversification (Market Exposure as a % of Net Assets)" excludes any temporary cash investments, investments in Guggenheim Strategy Funds Trust mutual funds, or investments in Guggenheim Ultra Short Duration Fund. |
| |
2 | "10 Largest Holdings (as a % of Net Assets)" excludes any temporary cash investments. |
| Tesla, Inc. | 10.7% |
| Uber Technologies, Inc. | 4.8% |
| Union Pacific Corp. | 4.5% |
| United Parcel Service, Inc. — Class B | 4.1% |
| CSX Corp. | 3.1% |
| FedEx Corp. | 2.8% |
| Norfolk Southern Corp. | 2.7% |
| General Motors Co. | 2.6% |
| Ford Motor Co. | 2.4% |
| Old Dominion Freight Line, Inc. | 2.4% |
| Top 10 Total | 40.1% |
| |
2 | "10 Largest Holdings (as a % of Net Assets)" excludes any temporary cash investments. |
There were no changes in or disagreements with fund accountants for the period.
| | | Availability of Additional Information. For additional information, including the fund's prospectus, financial information, holdings and proxy voting information, go to GuggenheimInvestments.com/mutual-funds/literature or, call 800 820 0888. |
SAR-RYTSX-093024
Semi-Annual Shareholder Report | 9.30.24
This semi-annual shareholder report contains important information about the Transportation Fund for the period of April 1, 2024 to September 30, 2024. You can find additional information about the fund at GuggenheimInvestments.com/mutual-funds/literature. You can also request this information by contacting 800 820 0888 or GuggenheimClientServices@mufg-is.com.
For the period of April 1, 2024 to September 30, 2024, the fund (Class C shares) returned -2.62%, underperforming the fund's benchmark, the S&P 500 Index, which returned 10.42% for the same period and underperforming the fund's secondary index, the S&P 500 Industrials Index, which returned 8.31% for the same period.
What factors materially affected the fund's performance over the last six months?
The industries that contributed the most to performance were automobile manufacturers, air freight & logistics, and marine transportation. Those that detracted the most were automotive parts & equipment, cargo ground transportation, and passenger ground transportation. The holdings that contributed the most to performance were Tesla Inc., NIO Inc. ADR, and CH Robinson Worldwide, Inc. Those that detracted the most were Stellantis N.V., Mobileye Global, Inc. – Class A, and Ford Motor Co.
Cumulative performance* for the fund's most recently completed 10 years (as of 9.30.24), assuming a $10,000 initial investment.
| 09/30/2014 | 10000 | 10000 | 10000 |
| 12/31/2014 | 11204 | 10493 | 10676 |
| 03/31/2015 | 11081 | 10593 | 10585 |
| 06/30/2015 | 10316 | 10622 | 10349 |
| 09/30/2015 | 9529 | 9939 | 9635 |
| 12/31/2015 | 9559 | 10638 | 10406 |
| 03/31/2016 | 9786 | 10782 | 10925 |
| 06/30/2016 | 9034 | 11047 | 11078 |
| 09/30/2016 | 9952 | 11472 | 11537 |
| 12/31/2016 | 10915 | 11911 | 12368 |
| 03/31/2017 | 11253 | 12633 | 12933 |
| 06/30/2017 | 11812 | 13023 | 13545 |
| 09/30/2017 | 12537 | 13607 | 14116 |
| 12/31/2017 | 13231 | 14511 | 14970 |
| 03/31/2018 | 12554 | 14401 | 14737 |
| 06/30/2018 | 12519 | 14896 | 14268 |
| 09/30/2018 | 12734 | 16044 | 15694 |
| 12/31/2018 | 10467 | 13875 | 12981 |
| 03/31/2019 | 11641 | 15769 | 15213 |
| 06/30/2019 | 11853 | 16447 | 15756 |
| 09/30/2019 | 11754 | 16727 | 15912 |
| 12/31/2019 | 12722 | 18244 | 16793 |
| 03/31/2020 | 8920 | 14668 | 12251 |
| 06/30/2020 | 11660 | 17682 | 14334 |
| 09/30/2020 | 14032 | 19260 | 16123 |
| 12/31/2020 | 17790 | 21600 | 18650 |
| 03/31/2021 | 19908 | 22934 | 20779 |
| 06/30/2021 | 20148 | 24895 | 21709 |
| 09/30/2021 | 18967 | 25040 | 20792 |
| 12/31/2021 | 21561 | 27801 | 22589 |
| 03/31/2022 | 19573 | 26522 | 22055 |
| 06/30/2022 | 15070 | 22252 | 18796 |
| 09/30/2022 | 14396 | 21165 | 17908 |
| 12/31/2022 | 13901 | 22766 | 21351 |
| 03/31/2023 | 15813 | 24473 | 22092 |
| 06/30/2023 | 17369 | 26612 | 23526 |
| 09/30/2023 | 16295 | 25741 | 22311 |
| 12/31/2023 | 17205 | 28750 | 25223 |
| 03/31/2024 | 17139 | 31785 | 27991 |
| 06/30/2024 | 15808 | 33147 | 27179 |
| 09/30/2024 | 16690 | 35098 | 30318 |

| Class C (without CDSC) | -2.62% | 2.42% | 7.26% | 5.26% |
| Class C (with CDSC)§ | -3.59% | 1.42% | 7.26% | 5.26% |
| S&P 500 Index | 10.42% | 36.35% | 15.98% | 13.38% |
| S&P 500 Industrials Index | 8.31% | 35.89% | 13.76% | 11.73% |
The fund's past performance is not a good predictor of the fund's future performance. Visit GuggenheimInvestments.com/mutual-funds/performance for more recent performance information.
| Net Assets | $8,671,765 |
| Total Number of Portfolio Holdings | 70 |
| Portfolio Turnover Rate | 34% |
| Transportation Fund | Class C | RYCNX | Semi-Annual Shareholder Report | September 30, 2024 |
| Transportation | 37.2% |
| Auto Manufacturers | 26.1% |
| Auto Parts & Equipment | 12.1% |
| Airlines | 11.8% |
| Internet | 7.1% |
| Commercial Services | 1.7% |
| Home Builders | 1.4% |
| Other | 2.4% |

| Tesla, Inc. | 10.7% |
| Uber Technologies, Inc. | 4.8% |
| Union Pacific Corp. | 4.5% |
| United Parcel Service, Inc. — Class B | 4.1% |
| CSX Corp. | 3.1% |
| FedEx Corp. | 2.8% |
| Norfolk Southern Corp. | 2.7% |
| General Motors Co. | 2.6% |
| Ford Motor Co. | 2.4% |
| Old Dominion Freight Line, Inc. | 2.4% |
| Top 10 Total | 40.1% |
| |
1 | "Holdings Diversification (Market Exposure as a % of Net Assets)" excludes any temporary cash investments, investments in Guggenheim Strategy Funds Trust mutual funds, or investments in Guggenheim Ultra Short Duration Fund. |
| |
2 | "10 Largest Holdings (as a % of Net Assets)" excludes any temporary cash investments. |
| Tesla, Inc. | 10.7% |
| Uber Technologies, Inc. | 4.8% |
| Union Pacific Corp. | 4.5% |
| United Parcel Service, Inc. — Class B | 4.1% |
| CSX Corp. | 3.1% |
| FedEx Corp. | 2.8% |
| Norfolk Southern Corp. | 2.7% |
| General Motors Co. | 2.6% |
| Ford Motor Co. | 2.4% |
| Old Dominion Freight Line, Inc. | 2.4% |
| Top 10 Total | 40.1% |
| |
2 | "10 Largest Holdings (as a % of Net Assets)" excludes any temporary cash investments. |
There were no changes in or disagreements with fund accountants for the period.
| | | Availability of Additional Information. For additional information, including the fund's prospectus, financial information, holdings and proxy voting information, go to GuggenheimInvestments.com/mutual-funds/literature or, call 800 820 0888. |
SAR-RYCNX-093024
Semi-Annual Shareholder Report | 9.30.24
This semi-annual shareholder report contains important information about the Transportation Fund for the period of April 1, 2024 to September 30, 2024. You can find additional information about the fund at GuggenheimInvestments.com/mutual-funds/literature. You can also request this information by contacting 800 820 0888 or GuggenheimClientServices@mufg-is.com.
For the period of April 1, 2024 to September 30, 2024, the fund (Class H shares) returned -2.28%, underperforming the fund's benchmark, the S&P 500 Index, which returned 10.42% for the same period and underperforming the fund's secondary index, the S&P 500 Industrials Index, which returned 8.31% for the same period.
What factors materially affected the fund's performance over the last six months?
The industries that contributed the most to performance were automobile manufacturers, air freight & logistics, and marine transportation. Those that detracted the most were automotive parts & equipment, cargo ground transportation, and passenger ground transportation. The holdings that contributed the most to performance were Tesla Inc., NIO Inc. ADR, and CH Robinson Worldwide, Inc. Those that detracted the most were Stellantis N.V., Mobileye Global, Inc. – Class A, and Ford Motor Co.
Cumulative performance* for the fund's most recently completed 10 years (as of 9.30.24), assuming a $10,000 initial investment.
| 09/30/2014 | 10000 | 10000 | 10000 |
| 12/31/2014 | 11221 | 10493 | 10676 |
| 03/31/2015 | 11108 | 10593 | 10585 |
| 06/30/2015 | 10354 | 10622 | 10349 |
| 09/30/2015 | 9583 | 9939 | 9635 |
| 12/31/2015 | 9633 | 10638 | 10406 |
| 03/31/2016 | 9882 | 10782 | 10925 |
| 06/30/2016 | 9138 | 11047 | 11078 |
| 09/30/2016 | 10085 | 11472 | 11537 |
| 12/31/2016 | 11085 | 11911 | 12368 |
| 03/31/2017 | 11451 | 12633 | 12933 |
| 06/30/2017 | 12041 | 13023 | 13545 |
| 09/30/2017 | 12802 | 13607 | 14116 |
| 12/31/2017 | 13534 | 14511 | 14970 |
| 03/31/2018 | 12863 | 14401 | 14737 |
| 06/30/2018 | 12851 | 14896 | 14268 |
| 09/30/2018 | 13094 | 16044 | 15694 |
| 12/31/2018 | 10782 | 13875 | 12981 |
| 03/31/2019 | 12013 | 15769 | 15213 |
| 06/30/2019 | 12255 | 16447 | 15756 |
| 09/30/2019 | 12176 | 16727 | 15912 |
| 12/31/2019 | 13205 | 18244 | 16793 |
| 03/31/2020 | 9276 | 14668 | 12251 |
| 06/30/2020 | 12147 | 17682 | 14334 |
| 09/30/2020 | 14649 | 19260 | 16123 |
| 12/31/2020 | 18609 | 21600 | 18650 |
| 03/31/2021 | 20859 | 22934 | 20779 |
| 06/30/2021 | 21151 | 24895 | 21709 |
| 09/30/2021 | 19948 | 25040 | 20792 |
| 12/31/2021 | 22720 | 27801 | 22589 |
| 03/31/2022 | 20662 | 26522 | 22055 |
| 06/30/2022 | 15938 | 22252 | 18796 |
| 09/30/2022 | 15256 | 21165 | 17908 |
| 12/31/2022 | 14759 | 22766 | 21351 |
| 03/31/2023 | 16819 | 24473 | 22092 |
| 06/30/2023 | 18512 | 26612 | 23526 |
| 09/30/2023 | 17399 | 25741 | 22311 |
| 12/31/2023 | 18406 | 28750 | 25223 |
| 03/31/2024 | 18373 | 31785 | 27991 |
| 06/30/2024 | 16977 | 33147 | 27179 |
| 09/30/2024 | 17958 | 35098 | 30318 |
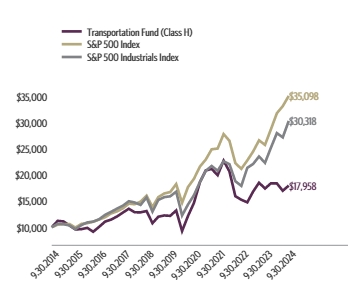
| Class H** | -2.28% | 3.21% | 8.08% | 6.03% |
| S&P 500 Index | 10.42% | 36.35% | 15.98% | 13.38% |
| S&P 500 Industrials Index | 8.31% | 35.89% | 13.76% | 11.73% |
The fund's past performance is not a good predictor of the fund's future performance. Visit GuggenheimInvestments.com/mutual-funds/performance for more recent performance information.
| Net Assets | $8,671,765 |
| Total Number of Portfolio Holdings | 70 |
| Portfolio Turnover Rate | 34% |
| Transportation Fund | Class H | RYPAX | Semi-Annual Shareholder Report | September 30, 2024 |
| Transportation | 37.2% |
| Auto Manufacturers | 26.1% |
| Auto Parts & Equipment | 12.1% |
| Airlines | 11.8% |
| Internet | 7.1% |
| Commercial Services | 1.7% |
| Home Builders | 1.4% |
| Other | 2.4% |

| Tesla, Inc. | 10.7% |
| Uber Technologies, Inc. | 4.8% |
| Union Pacific Corp. | 4.5% |
| United Parcel Service, Inc. — Class B | 4.1% |
| CSX Corp. | 3.1% |
| FedEx Corp. | 2.8% |
| Norfolk Southern Corp. | 2.7% |
| General Motors Co. | 2.6% |
| Ford Motor Co. | 2.4% |
| Old Dominion Freight Line, Inc. | 2.4% |
| Top 10 Total | 40.1% |
| |
1 | "Holdings Diversification (Market Exposure as a % of Net Assets)" excludes any temporary cash investments, investments in Guggenheim Strategy Funds Trust mutual funds, or investments in Guggenheim Ultra Short Duration Fund. |
| |
2 | "10 Largest Holdings (as a % of Net Assets)" excludes any temporary cash investments. |
| Tesla, Inc. | 10.7% |
| Uber Technologies, Inc. | 4.8% |
| Union Pacific Corp. | 4.5% |
| United Parcel Service, Inc. — Class B | 4.1% |
| CSX Corp. | 3.1% |
| FedEx Corp. | 2.8% |
| Norfolk Southern Corp. | 2.7% |
| General Motors Co. | 2.6% |
| Ford Motor Co. | 2.4% |
| Old Dominion Freight Line, Inc. | 2.4% |
| Top 10 Total | 40.1% |
| |
2 | "10 Largest Holdings (as a % of Net Assets)" excludes any temporary cash investments. |
There were no changes in or disagreements with fund accountants for the period.
| | | Availability of Additional Information. For additional information, including the fund's prospectus, financial information, holdings and proxy voting information, go to GuggenheimInvestments.com/mutual-funds/literature or, call 800 820 0888. |
SAR-RYPAX-093024
Semi-Annual Shareholder Report | 9.30.24
This semi-annual shareholder report contains important information about the Utilities Fund for the period of April 1, 2024 to September 30, 2024. You can find additional information about the fund at GuggenheimInvestments.com/mutual-funds/literature. You can also request this information by contacting 800 820 0888 or GuggenheimClientServices@mufg-is.com.
For the period of April 1, 2024 to September 30, 2024, the fund (Investor Class shares) returned 21.68%, outperforming the fund's benchmark, the S&P 500 Index, which returned 10.42% for the same period and underperforming the fund's secondary index, the S&P 500 Utilities Index, which returned 24.93% for the same period.
What factors materially affected the fund's performance over the last six months?
The industries that contributed the most to performance were electric utilities, multi-utilities, and independent power producers & energy traders. No industry detracted from performance. The holdings that contributed the most to performance were NextEra Energy, Inc., Vistra Corp., and Constellation Energy Corp. Those that detracted the most were Otter Tail Corp., NextEra Energy Partners, LP, and Hawaiian Electric Industries, Inc.
Cumulative performance* for the fund's most recently completed 10 years (as of 9.30.24), assuming a $10,000 initial investment.
| 09/30/2014 | 10000 | 10000 | 10000 |
| 12/31/2014 | 11201 | 10493 | 11319 |
| 03/31/2015 | 10751 | 10593 | 10733 |
| 06/30/2015 | 10027 | 10622 | 10111 |
| 09/30/2015 | 10166 | 9939 | 10657 |
| 12/31/2015 | 10393 | 10638 | 10771 |
| 03/31/2016 | 11891 | 10782 | 12447 |
| 06/30/2016 | 12837 | 11047 | 13293 |
| 09/30/2016 | 12098 | 11472 | 12508 |
| 12/31/2016 | 12129 | 11911 | 12525 |
| 03/31/2017 | 12847 | 12633 | 13326 |
| 06/30/2017 | 13066 | 13023 | 13621 |
| 09/30/2017 | 13464 | 13607 | 14012 |
| 12/31/2017 | 13507 | 14511 | 14041 |
| 03/31/2018 | 13069 | 14401 | 13578 |
| 06/30/2018 | 13725 | 14896 | 14086 |
| 09/30/2018 | 14033 | 16044 | 14422 |
| 12/31/2018 | 14057 | 13875 | 14618 |
| 03/31/2019 | 15480 | 15769 | 16203 |
| 06/30/2019 | 15851 | 16447 | 16766 |
| 09/30/2019 | 16869 | 16727 | 18331 |
| 12/31/2019 | 16780 | 18244 | 18469 |
| 03/31/2020 | 14127 | 14668 | 15976 |
| 06/30/2020 | 14448 | 17682 | 16412 |
| 09/30/2020 | 14871 | 19260 | 17420 |
| 12/31/2020 | 16018 | 21600 | 18559 |
| 03/31/2021 | 16553 | 22934 | 19078 |
| 06/30/2021 | 16487 | 24895 | 19001 |
| 09/30/2021 | 16405 | 25040 | 19338 |
| 12/31/2021 | 18434 | 27801 | 21838 |
| 03/31/2022 | 19290 | 26522 | 22881 |
| 06/30/2022 | 18303 | 22252 | 21717 |
| 09/30/2022 | 17153 | 21165 | 20416 |
| 12/31/2022 | 18677 | 22766 | 22180 |
| 03/31/2023 | 18162 | 24473 | 21460 |
| 06/30/2023 | 17676 | 26612 | 20918 |
| 09/30/2023 | 16012 | 25741 | 18984 |
| 12/31/2023 | 17414 | 28750 | 20609 |
| 03/31/2024 | 18137 | 31785 | 21550 |
| 06/30/2024 | 18680 | 33147 | 22555 |
| 09/30/2024 | 22070 | 35098 | 26922 |
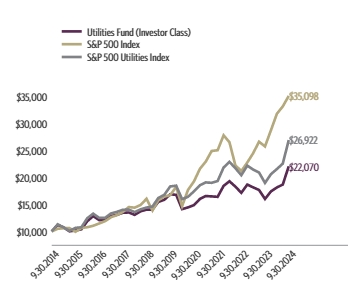
| Investor Class | 21.68% | 37.83% | 5.52% | 8.24% |
| S&P 500 Index | 10.42% | 36.35% | 15.98% | 13.38% |
| S&P 500 Utilities Index | 24.93% | 41.82% | 7.99% | 10.41% |
The fund's past performance is not a good predictor of the fund's future performance. Visit GuggenheimInvestments.com/mutual-funds/performance for more recent performance information.
| Net Assets | $29,842,810 |
| Total Number of Portfolio Holdings | 54 |
| Portfolio Turnover Rate | 116% |
| Utilities Fund | Investor Class | RYUIX | Semi-Annual Shareholder Report | September 30, 2024 |
| Electric | 85.6% |
| Gas | 9.1% |
| Water | 3.6% |
| Energy-Alternate Sources | 1.2% |

| NextEra Energy, Inc. | 5.7% |
| Constellation Energy Corp. | 4.5% |
| Southern Co. | 4.3% |
| Duke Energy Corp. | 4.0% |
| Vistra Corp. | 3.3% |
| American Electric Power Company, Inc. | 3.2% |
| Sempra | 3.2% |
| Dominion Energy, Inc. | 3.0% |
| Public Service Enterprise Group, Inc. | 3.0% |
| PG&E Corp. | 2.8% |
| Top 10 Total | 37.0% |
| |
1 | "Holdings Diversification (Market Exposure as a % of Net Assets)" excludes any temporary cash investments, investments in Guggenheim Strategy Funds Trust mutual funds, or investments in Guggenheim Ultra Short Duration Fund. |
| |
2 | "10 Largest Holdings (as a % of Net Assets)" excludes any temporary cash investments. |
| NextEra Energy, Inc. | 5.7% |
| Constellation Energy Corp. | 4.5% |
| Southern Co. | 4.3% |
| Duke Energy Corp. | 4.0% |
| Vistra Corp. | 3.3% |
| American Electric Power Company, Inc. | 3.2% |
| Sempra | 3.2% |
| Dominion Energy, Inc. | 3.0% |
| Public Service Enterprise Group, Inc. | 3.0% |
| PG&E Corp. | 2.8% |
| Top 10 Total | 37.0% |
| |
2 | "10 Largest Holdings (as a % of Net Assets)" excludes any temporary cash investments. |
There were no changes in or disagreements with fund accountants for the period.
| | | Availability of Additional Information. For additional information, including the fund's prospectus, financial information, holdings and proxy voting information, go to GuggenheimInvestments.com/mutual-funds/literature or, call 800 820 0888. |
SAR-RYUIX-093024
Semi-Annual Shareholder Report | 9.30.24
This semi-annual shareholder report contains important information about the Utilities Fund for the period of April 1, 2024 to September 30, 2024. You can find additional information about the fund at GuggenheimInvestments.com/mutual-funds/literature. You can also request this information by contacting 800 820 0888 or GuggenheimClientServices@mufg-is.com.
For the period of April 1, 2024 to September 30, 2024, the fund (Class A shares) returned 21.54%, outperforming the fund's benchmark, the S&P 500 Index, which returned 10.42% for the same period and underperforming the fund's secondary index, the S&P 500 Utilities Index, which returned 24.93% for the same period.
What factors materially affected the fund's performance over the last six months?
The industries that contributed the most to performance were electric utilities, multi-utilities, and independent power producers & energy traders. No industry detracted from performance. The holdings that contributed the most to performance were NextEra Energy, Inc., Vistra Corp., and Constellation Energy Corp. Those that detracted the most were Otter Tail Corp., NextEra Energy Partners, LP, and Hawaiian Electric Industries, Inc.
Cumulative performance* for the fund's most recently completed 10 years (as of 9.30.24), assuming a $10,000 initial investment.
| 09/30/2014 | 9525 | 10000 | 10000 |
| 12/31/2014 | 10659 | 10493 | 11319 |
| 03/31/2015 | 10223 | 10593 | 10733 |
| 06/30/2015 | 9537 | 10622 | 10111 |
| 09/30/2015 | 9661 | 9939 | 10657 |
| 12/31/2015 | 9870 | 10638 | 10771 |
| 03/31/2016 | 11285 | 10782 | 12447 |
| 06/30/2016 | 12176 | 11047 | 13293 |
| 09/30/2016 | 11465 | 11472 | 12508 |
| 12/31/2016 | 11489 | 11911 | 12525 |
| 03/31/2017 | 12160 | 12633 | 13326 |
| 06/30/2017 | 12361 | 13023 | 13621 |
| 09/30/2017 | 12728 | 13607 | 14012 |
| 12/31/2017 | 12758 | 14511 | 14041 |
| 03/31/2018 | 12336 | 14401 | 13578 |
| 06/30/2018 | 12954 | 14896 | 14086 |
| 09/30/2018 | 13235 | 16044 | 14422 |
| 12/31/2018 | 13245 | 13875 | 14618 |
| 03/31/2019 | 14576 | 15769 | 16203 |
| 06/30/2019 | 14922 | 16447 | 16766 |
| 09/30/2019 | 15866 | 16727 | 18331 |
| 12/31/2019 | 15774 | 18244 | 18469 |
| 03/31/2020 | 13270 | 14668 | 15976 |
| 06/30/2020 | 13564 | 17682 | 16412 |
| 09/30/2020 | 13952 | 19260 | 17420 |
| 12/31/2020 | 15017 | 21600 | 18559 |
| 03/31/2021 | 15513 | 22934 | 19078 |
| 06/30/2021 | 15443 | 24895 | 19001 |
| 09/30/2021 | 15350 | 25040 | 19338 |
| 12/31/2021 | 17240 | 27801 | 21838 |
| 03/31/2022 | 18033 | 26522 | 22881 |
| 06/30/2022 | 17098 | 22252 | 21717 |
| 09/30/2022 | 16016 | 21165 | 20416 |
| 12/31/2022 | 17425 | 22766 | 22180 |
| 03/31/2023 | 16934 | 24473 | 21460 |
| 06/30/2023 | 16470 | 26612 | 20918 |
| 09/30/2023 | 14913 | 25741 | 18984 |
| 12/31/2023 | 16206 | 28750 | 20609 |
| 03/31/2024 | 16867 | 31785 | 21550 |
| 06/30/2024 | 17364 | 33147 | 22555 |
| 09/30/2024 | 20500 | 35098 | 26922 |

| Class A (without sales charge) | 21.54% | 37.46% | 5.26% | 7.97% |
| Class A (with sales charge)‡ | 15.77% | 30.92% | 4.24% | 7.44% |
| S&P 500 Index | 10.42% | 36.35% | 15.98% | 13.38% |
| S&P 500 Utilities Index | 24.93% | 41.82% | 7.99% | 10.41% |
The fund's past performance is not a good predictor of the fund's future performance. Visit GuggenheimInvestments.com/mutual-funds/performance for more recent performance information.
| Net Assets | $29,842,810 |
| Total Number of Portfolio Holdings | 54 |
| Portfolio Turnover Rate | 116% |
| Utilities Fund | Class A | RYUTX | Semi-Annual Shareholder Report | September 30, 2024 |
| Electric | 85.6% |
| Gas | 9.1% |
| Water | 3.6% |
| Energy-Alternate Sources | 1.2% |

| NextEra Energy, Inc. | 5.7% |
| Constellation Energy Corp. | 4.5% |
| Southern Co. | 4.3% |
| Duke Energy Corp. | 4.0% |
| Vistra Corp. | 3.3% |
| American Electric Power Company, Inc. | 3.2% |
| Sempra | 3.2% |
| Dominion Energy, Inc. | 3.0% |
| Public Service Enterprise Group, Inc. | 3.0% |
| PG&E Corp. | 2.8% |
| Top 10 Total | 37.0% |
| |
1 | "Holdings Diversification (Market Exposure as a % of Net Assets)" excludes any temporary cash investments, investments in Guggenheim Strategy Funds Trust mutual funds, or investments in Guggenheim Ultra Short Duration Fund. |
| |
2 | "10 Largest Holdings (as a % of Net Assets)" excludes any temporary cash investments. |
| NextEra Energy, Inc. | 5.7% |
| Constellation Energy Corp. | 4.5% |
| Southern Co. | 4.3% |
| Duke Energy Corp. | 4.0% |
| Vistra Corp. | 3.3% |
| American Electric Power Company, Inc. | 3.2% |
| Sempra | 3.2% |
| Dominion Energy, Inc. | 3.0% |
| Public Service Enterprise Group, Inc. | 3.0% |
| PG&E Corp. | 2.8% |
| Top 10 Total | 37.0% |
| |
2 | "10 Largest Holdings (as a % of Net Assets)" excludes any temporary cash investments. |
There were no changes in or disagreements with fund accountants for the period.
| | | Availability of Additional Information. For additional information, including the fund's prospectus, financial information, holdings and proxy voting information, go to GuggenheimInvestments.com/mutual-funds/literature or, call 800 820 0888. |
SAR-RYUTX-093024
Semi-Annual Shareholder Report | 9.30.24
This semi-annual shareholder report contains important information about the Utilities Fund for the period of April 1, 2024 to September 30, 2024. You can find additional information about the fund at GuggenheimInvestments.com/mutual-funds/literature. You can also request this information by contacting 800 820 0888 or GuggenheimClientServices@mufg-is.com.
For the period of April 1, 2024 to September 30, 2024, the fund (Class C shares) returned 21.09%, outperforming the fund's benchmark, the S&P 500 Index, which returned 10.42% for the same period and underperforming the fund's secondary index, the S&P 500 Utilities Index, which returned 24.93% for the same period.
What factors materially affected the fund's performance over the last six months?
The industries that contributed the most to performance were electric utilities, multi-utilities, and independent power producers & energy traders. No industry detracted from performance. The holdings that contributed the most to performance were NextEra Energy, Inc., Vistra Corp., and Constellation Energy Corp. Those that detracted the most were Otter Tail Corp., NextEra Energy Partners, LP, and Hawaiian Electric Industries, Inc.
Cumulative performance* for the fund's most recently completed 10 years (as of 9.30.24), assuming a $10,000 initial investment.
| 09/30/2014 | 10000 | 10000 | 10000 |
| 12/31/2014 | 11175 | 10493 | 11319 |
| 03/31/2015 | 10698 | 10593 | 10733 |
| 06/30/2015 | 9955 | 10622 | 10111 |
| 09/30/2015 | 10067 | 9939 | 10657 |
| 12/31/2015 | 10265 | 10638 | 10771 |
| 03/31/2016 | 11719 | 10782 | 12447 |
| 06/30/2016 | 12619 | 11047 | 13293 |
| 09/30/2016 | 11862 | 11472 | 12508 |
| 12/31/2016 | 11864 | 11911 | 12525 |
| 03/31/2017 | 12536 | 12633 | 13326 |
| 06/30/2017 | 12718 | 13023 | 13621 |
| 09/30/2017 | 13072 | 13607 | 14012 |
| 12/31/2017 | 13080 | 14511 | 14041 |
| 03/31/2018 | 12623 | 14401 | 13578 |
| 06/30/2018 | 13230 | 14896 | 14086 |
| 09/30/2018 | 13492 | 16044 | 14422 |
| 12/31/2018 | 13475 | 13875 | 14618 |
| 03/31/2019 | 14805 | 15769 | 16203 |
| 06/30/2019 | 15125 | 16447 | 16766 |
| 09/30/2019 | 16051 | 16727 | 18331 |
| 12/31/2019 | 15928 | 18244 | 18469 |
| 03/31/2020 | 13375 | 14668 | 15976 |
| 06/30/2020 | 13644 | 17682 | 16412 |
| 09/30/2020 | 14010 | 19260 | 17420 |
| 12/31/2020 | 15050 | 21600 | 18559 |
| 03/31/2021 | 15518 | 22934 | 19078 |
| 06/30/2021 | 15418 | 24895 | 19001 |
| 09/30/2021 | 15301 | 25040 | 19338 |
| 12/31/2021 | 17148 | 27801 | 21838 |
| 03/31/2022 | 17902 | 26522 | 22881 |
| 06/30/2022 | 16946 | 22252 | 21717 |
| 09/30/2022 | 15837 | 21165 | 20416 |
| 12/31/2022 | 17200 | 22766 | 22180 |
| 03/31/2023 | 16687 | 24473 | 21460 |
| 06/30/2023 | 16201 | 26612 | 20918 |
| 09/30/2023 | 14639 | 25741 | 18984 |
| 12/31/2023 | 15881 | 28750 | 20609 |
| 03/31/2024 | 16498 | 31785 | 21550 |
| 06/30/2024 | 16949 | 33147 | 22555 |
| 09/30/2024 | 19977 | 35098 | 26922 |
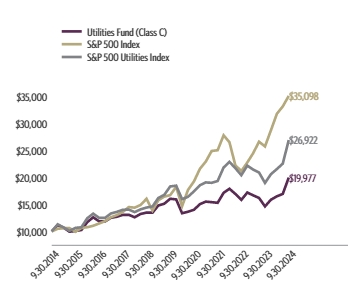
| Class C (without CDSC) | 21.09% | 36.47% | 4.47% | 7.17% |
| Class C (with CDSC)§ | 20.09% | 35.47% | 4.47% | 7.17% |
| S&P 500 Index | 10.42% | 36.35% | 15.98% | 13.38% |
| S&P 500 Utilities Index | 24.93% | 41.82% | 7.99% | 10.41% |
The fund's past performance is not a good predictor of the fund's future performance. Visit GuggenheimInvestments.com/mutual-funds/performance for more recent performance information.
| Net Assets | $29,842,810 |
| Total Number of Portfolio Holdings | 54 |
| Portfolio Turnover Rate | 116% |
| Utilities Fund | Class C | RYCUX | Semi-Annual Shareholder Report | September 30, 2024 |
| Electric | 85.6% |
| Gas | 9.1% |
| Water | 3.6% |
| Energy-Alternate Sources | 1.2% |
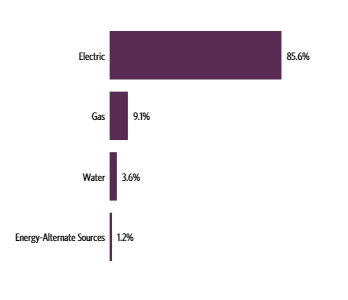
| NextEra Energy, Inc. | 5.7% |
| Constellation Energy Corp. | 4.5% |
| Southern Co. | 4.3% |
| Duke Energy Corp. | 4.0% |
| Vistra Corp. | 3.3% |
| American Electric Power Company, Inc. | 3.2% |
| Sempra | 3.2% |
| Dominion Energy, Inc. | 3.0% |
| Public Service Enterprise Group, Inc. | 3.0% |
| PG&E Corp. | 2.8% |
| Top 10 Total | 37.0% |
| |
1 | "Holdings Diversification (Market Exposure as a % of Net Assets)" excludes any temporary cash investments, investments in Guggenheim Strategy Funds Trust mutual funds, or investments in Guggenheim Ultra Short Duration Fund. |
| |
2 | "10 Largest Holdings (as a % of Net Assets)" excludes any temporary cash investments. |
| NextEra Energy, Inc. | 5.7% |
| Constellation Energy Corp. | 4.5% |
| Southern Co. | 4.3% |
| Duke Energy Corp. | 4.0% |
| Vistra Corp. | 3.3% |
| American Electric Power Company, Inc. | 3.2% |
| Sempra | 3.2% |
| Dominion Energy, Inc. | 3.0% |
| Public Service Enterprise Group, Inc. | 3.0% |
| PG&E Corp. | 2.8% |
| Top 10 Total | 37.0% |
| |
2 | "10 Largest Holdings (as a % of Net Assets)" excludes any temporary cash investments. |
There were no changes in or disagreements with fund accountants for the period.
| | | Availability of Additional Information. For additional information, including the fund's prospectus, financial information, holdings and proxy voting information, go to GuggenheimInvestments.com/mutual-funds/literature or, call 800 820 0888. |
SAR-RYCUX-093024
Semi-Annual Shareholder Report | 9.30.24
This semi-annual shareholder report contains important information about the Utilities Fund for the period of April 1, 2024 to September 30, 2024. You can find additional information about the fund at GuggenheimInvestments.com/mutual-funds/literature. You can also request this information by contacting 800 820 0888 or GuggenheimClientServices@mufg-is.com.
For the period of April 1, 2024 to September 30, 2024, the fund (Class H shares) returned 21.55%, outperforming the fund's benchmark, the S&P 500 Index, which returned 10.42% for the same period and underperforming the fund's secondary index, the S&P 500 Utilities Index, which returned 24.93% for the same period.
What factors materially affected the fund's performance over the last six months?
The industries that contributed the most to performance were electric utilities, multi-utilities, and independent power producers & energy traders. No industry detracted from performance. The holdings that contributed the most to performance were NextEra Energy, Inc., Vistra Corp., and Constellation Energy Corp. Those that detracted the most were Otter Tail Corp., NextEra Energy Partners, LP, and Hawaiian Electric Industries, Inc.
Cumulative performance* for the fund's most recently completed 10 years (as of 9.30.24), assuming a $10,000 initial investment.
| 09/30/2014 | 10000 | 10000 | 10000 |
| 12/31/2014 | 11188 | 10493 | 11319 |
| 03/31/2015 | 10725 | 10593 | 10733 |
| 06/30/2015 | 9994 | 10622 | 10111 |
| 09/30/2015 | 10122 | 9939 | 10657 |
| 12/31/2015 | 10345 | 10638 | 10771 |
| 03/31/2016 | 11830 | 10782 | 12447 |
| 06/30/2016 | 12766 | 11047 | 13293 |
| 09/30/2016 | 12022 | 11472 | 12508 |
| 12/31/2016 | 12045 | 11911 | 12525 |
| 03/31/2017 | 12753 | 12633 | 13326 |
| 06/30/2017 | 12964 | 13023 | 13621 |
| 09/30/2017 | 13349 | 13607 | 14012 |
| 12/31/2017 | 13386 | 14511 | 14041 |
| 03/31/2018 | 12938 | 14401 | 13578 |
| 06/30/2018 | 13584 | 14896 | 14086 |
| 09/30/2018 | 13879 | 16044 | 14422 |
| 12/31/2018 | 13886 | 13875 | 14618 |
| 03/31/2019 | 15283 | 15769 | 16203 |
| 06/30/2019 | 15642 | 16447 | 16766 |
| 09/30/2019 | 16635 | 16727 | 18331 |
| 12/31/2019 | 16536 | 18244 | 18469 |
| 03/31/2020 | 13913 | 14668 | 15976 |
| 06/30/2020 | 14222 | 17682 | 16412 |
| 09/30/2020 | 14630 | 19260 | 17420 |
| 12/31/2020 | 15748 | 21600 | 18559 |
| 03/31/2021 | 16267 | 22934 | 19078 |
| 06/30/2021 | 16189 | 24895 | 19001 |
| 09/30/2021 | 16097 | 25040 | 19338 |
| 12/31/2021 | 18072 | 27801 | 21838 |
| 03/31/2022 | 18906 | 26522 | 22881 |
| 06/30/2022 | 17924 | 22252 | 21717 |
| 09/30/2022 | 16791 | 21165 | 20416 |
| 12/31/2022 | 18270 | 22766 | 22180 |
| 03/31/2023 | 17754 | 24473 | 21460 |
| 06/30/2023 | 17267 | 26612 | 20918 |
| 09/30/2023 | 15632 | 25741 | 18984 |
| 12/31/2023 | 16992 | 28750 | 20609 |
| 03/31/2024 | 17685 | 31785 | 21550 |
| 06/30/2024 | 18203 | 33147 | 22555 |
| 09/30/2024 | 21495 | 35098 | 26922 |
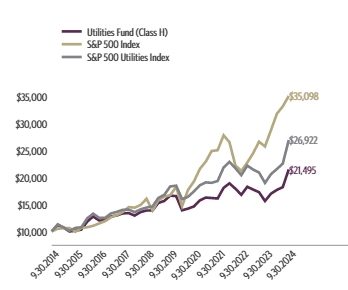
| Class H** | 21.55% | 37.51% | 5.26% | 7.95% |
| S&P 500 Index | 10.42% | 36.35% | 15.98% | 13.38% |
| S&P 500 Utilities Index | 24.93% | 41.82% | 7.99% | 10.41% |
The fund's past performance is not a good predictor of the fund's future performance. Visit GuggenheimInvestments.com/mutual-funds/performance for more recent performance information.
| Net Assets | $29,842,810 |
| Total Number of Portfolio Holdings | 54 |
| Portfolio Turnover Rate | 116% |
| Utilities Fund | Class H | RYAUX | Semi-Annual Shareholder Report | September 30, 2024 |
| Electric | 85.6% |
| Gas | 9.1% |
| Water | 3.6% |
| Energy-Alternate Sources | 1.2% |

| NextEra Energy, Inc. | 5.7% |
| Constellation Energy Corp. | 4.5% |
| Southern Co. | 4.3% |
| Duke Energy Corp. | 4.0% |
| Vistra Corp. | 3.3% |
| American Electric Power Company, Inc. | 3.2% |
| Sempra | 3.2% |
| Dominion Energy, Inc. | 3.0% |
| Public Service Enterprise Group, Inc. | 3.0% |
| PG&E Corp. | 2.8% |
| Top 10 Total | 37.0% |
| |
1 | "Holdings Diversification (Market Exposure as a % of Net Assets)" excludes any temporary cash investments, investments in Guggenheim Strategy Funds Trust mutual funds, or investments in Guggenheim Ultra Short Duration Fund. |
| |
2 | "10 Largest Holdings (as a % of Net Assets)" excludes any temporary cash investments. |
| NextEra Energy, Inc. | 5.7% |
| Constellation Energy Corp. | 4.5% |
| Southern Co. | 4.3% |
| Duke Energy Corp. | 4.0% |
| Vistra Corp. | 3.3% |
| American Electric Power Company, Inc. | 3.2% |
| Sempra | 3.2% |
| Dominion Energy, Inc. | 3.0% |
| Public Service Enterprise Group, Inc. | 3.0% |
| PG&E Corp. | 2.8% |
| Top 10 Total | 37.0% |
| |
2 | "10 Largest Holdings (as a % of Net Assets)" excludes any temporary cash investments. |
There were no changes in or disagreements with fund accountants for the period.
| | | Availability of Additional Information. For additional information, including the fund's prospectus, financial information, holdings and proxy voting information, go to GuggenheimInvestments.com/mutual-funds/literature or, call 800 820 0888. |
SAR-RYAUX-093024
Semi-Annual Shareholder Report | 9.30.24
This semi-annual shareholder report contains important information about the Dow Jones Industrial Average® Fund for the period of April 1, 2024 to September 30, 2024. You can find additional information about the fund at GuggenheimInvestments.com/mutual-funds/literature. You can also request this information by contacting 800 820 0888 or GuggenheimClientServices@mufg-is.com.
For the period of April 1, 2024 to September 30, 2024, the fund (Class A shares) returned 6.52%, underperforming the fund's benchmark, the S&P 500 Index, which returned 10.42% for the same period and underperforming the fund's secondary index, the Dow Jones Industrial Average, which returned 7.35% for the same period.
The fund's broad-based securities market index was changed from the Dow Jones Industrial Average to the S&P 500 Index to comply with the regulation that requires the fund's broad-based securities market index to represent the overall applicable market.
What factors materially affected the fund's performance over the last six months?
The sectors that contributed the most to the return of the Dow Jones Industrial Average (the "Index) were Financials, Health Care, and Information Technology. Those that detracted the most were Communication Services, Energy, and Materials. The holdings that contributed the most to return of the Index were UnitedHealth Group, Inc., Goldman Sachs Group, Inc., and Apple, Inc. Those that detracted the most were Boeing Co., Salesforce, Inc., and Walt Disney Co. The fund maintained a daily correlation of over 99% to its benchmark of 100% of the daily price movement of the Dow Jones Industrial Average.
Cumulative performance* for the fund since inception (as of 9.30.24), assuming a $10,000 initial investment.
| 12/01/2015 | 9526 | 10000 | 10000 |
| 12/31/2015 | 9274 | 9737 | 9753 |
| 03/31/2016 | 9449 | 9869 | 9968 |
| 06/30/2016 | 9609 | 10111 | 10174 |
| 09/30/2016 | 9840 | 10501 | 10457 |
| 12/31/2016 | 10650 | 10902 | 11362 |
| 03/31/2017 | 11159 | 11563 | 11952 |
| 06/30/2017 | 11556 | 11921 | 12424 |
| 09/30/2017 | 12156 | 12455 | 13118 |
| 12/31/2017 | 13436 | 13282 | 14556 |
| 03/31/2018 | 13118 | 13181 | 14270 |
| 06/30/2018 | 13229 | 13634 | 14450 |
| 09/30/2018 | 14446 | 14685 | 15842 |
| 12/31/2018 | 12745 | 12700 | 14049 |
| 03/31/2019 | 14187 | 14433 | 15709 |
| 06/30/2019 | 14582 | 15054 | 16213 |
| 09/30/2019 | 14783 | 15310 | 16509 |
| 12/31/2019 | 15695 | 16699 | 17610 |
| 03/31/2020 | 12005 | 13426 | 13607 |
| 06/30/2020 | 14181 | 16184 | 16125 |
| 09/30/2020 | 15295 | 17629 | 17450 |
| 12/31/2020 | 16869 | 19771 | 19323 |
| 03/31/2021 | 18201 | 20992 | 20924 |
| 06/30/2021 | 19054 | 22786 | 21986 |
| 09/30/2021 | 18713 | 22919 | 21665 |
| 12/31/2021 | 20092 | 25446 | 23370 |
| 03/31/2022 | 19154 | 24276 | 22411 |
| 06/30/2022 | 16967 | 20367 | 19996 |
| 09/30/2022 | 15845 | 19373 | 18762 |
| 12/31/2022 | 18307 | 20838 | 21766 |
| 03/31/2023 | 18406 | 22400 | 21968 |
| 06/30/2023 | 19060 | 24358 | 22840 |
| 09/30/2023 | 18585 | 23561 | 22361 |
| 12/31/2023 | 20936 | 26315 | 25288 |
| 03/31/2024 | 22128 | 29093 | 26840 |
| 06/30/2024 | 21762 | 30340 | 26500 |
| 09/30/2024 | 23571 | 32126 | 28811 |
| Class A (without sales charge) | 6.52% | 26.83% | 9.78% | 10.80% |
| Class A (with sales charge)‡ | 1.46% | 20.80% | 8.72% | 10.19% |
| S&P 500 Index | 10.42% | 36.35% | 15.98% | 14.13% |
| Dow Jones Industrial Average | 7.35% | 28.85% | 11.78% | 12.73% |
The fund's past performance is not a good predictor of the fund's future performance. Visit GuggenheimInvestments.com/mutual-funds/performance for more recent performance information.
| Net Assets | $19,720,259 |
| Total Number of Portfolio Holdings | 39 |
| Portfolio Turnover Rate | 14% |
| Dow Jones Industrial Average® Fund | Class A | RYDAX | Semi-Annual Shareholder Report | September 30, 2024 |
| Financial | 20.0% |
| Consumer, Non-cyclical | 19.2% |
| Technology | 15.9% |
| Dow Jones Industrial Average Equity Swap Agreements | 12.6% |
| Industrial | 11.9% |
| Consumer, Cyclical | 11.8% |
| Communications | 5.1% |
| Other | 3.8% |

| UnitedHealth Group, Inc. | 7.9% |
| Goldman Sachs Group, Inc. | 6.7% |
| Microsoft Corp. | 5.8% |
| Home Depot, Inc. | 5.4% |
| Caterpillar, Inc. | 5.3% |
| Amgen, Inc. | 4.3% |
| McDonald's Corp. | 4.1% |
| Visa, Inc. — Class A | 3.7% |
| Salesforce, Inc. | 3.7% |
| American Express Co. | 3.6% |
| Top 10 Total | 50.5% |
| |
1 | "Holdings Diversification (Market Exposure as a % of Net Assets)" excludes any temporary cash investments, investments in Guggenheim Strategy Funds Trust mutual funds, or investments in Guggenheim Ultra Short Duration Fund. |
| |
2 | "10 Largest Holdings (as a % of Net Assets)" excludes any temporary cash or derivative investments. |
| UnitedHealth Group, Inc. | 7.9% |
| Goldman Sachs Group, Inc. | 6.7% |
| Microsoft Corp. | 5.8% |
| Home Depot, Inc. | 5.4% |
| Caterpillar, Inc. | 5.3% |
| Amgen, Inc. | 4.3% |
| McDonald's Corp. | 4.1% |
| Visa, Inc. — Class A | 3.7% |
| Salesforce, Inc. | 3.7% |
| American Express Co. | 3.6% |
| Top 10 Total | 50.5% |
| |
2 | "10 Largest Holdings (as a % of Net Assets)" excludes any temporary cash or derivative investments. |
There were no changes in or disagreements with fund accountants for the period.
| |  | Availability of Additional Information. For additional information, including the fund's prospectus, financial information, holdings and proxy voting information, go to GuggenheimInvestments.com/mutual-funds/literature or, call 800 820 0888. |
SAR-RYDAX-093024
Semi-Annual Shareholder Report | 9.30.24
This semi-annual shareholder report contains important information about the Dow Jones Industrial Average® Fund for the period of April 1, 2024 to September 30, 2024. You can find additional information about the fund at GuggenheimInvestments.com/mutual-funds/literature. You can also request this information by contacting 800 820 0888 or GuggenheimClientServices@mufg-is.com.
For the period of April 1, 2024 to September 30, 2024, the fund (Class C shares) returned 6.12%, underperforming the fund's benchmark, the S&P 500 Index, which returned 10.42% for the same period and underperforming the fund's secondary index, the Dow Jones Industrial Average, which returned 7.35% for the same period.
The fund's broad-based securities market index was changed from the Dow Jones Industrial Average to the S&P 500 Index to comply with the regulation that requires the fund's broad-based securities market index to represent the overall applicable market.
What factors materially affected the fund's performance over the last six months?
The sectors that contributed the most to the return of the Dow Jones Industrial Average (the "Index) were Financials, Health Care, and Information Technology. Those that detracted the most were Communication Services, Energy, and Materials. The holdings that contributed the most to return of the Index were UnitedHealth Group, Inc., Goldman Sachs Group, Inc., and Apple, Inc. Those that detracted the most were Boeing Co., Salesforce, Inc., and Walt Disney Co. The fund maintained a daily correlation of over 99% to its benchmark of 100% of the daily price movement of the Dow Jones Industrial Average.
Cumulative performance* for the fund since inception (as of 9.30.24), assuming a $10,000 initial investment.
| 12/01/2015 | 10000 | 10000 | 10000 |
| 12/31/2015 | 9730 | 9737 | 9753 |
| 03/31/2016 | 9894 | 9869 | 9968 |
| 06/30/2016 | 10042 | 10111 | 10174 |
| 09/30/2016 | 10264 | 10501 | 10457 |
| 12/31/2016 | 11086 | 10902 | 11362 |
| 03/31/2017 | 11597 | 11563 | 11952 |
| 06/30/2017 | 11985 | 11921 | 12424 |
| 09/30/2017 | 12585 | 12455 | 13118 |
| 12/31/2017 | 13884 | 13282 | 14556 |
| 03/31/2018 | 13529 | 13181 | 14270 |
| 06/30/2018 | 13621 | 13634 | 14450 |
| 09/30/2018 | 14845 | 14685 | 15842 |
| 12/31/2018 | 13073 | 12700 | 14049 |
| 03/31/2019 | 14527 | 14433 | 15709 |
| 06/30/2019 | 14903 | 15054 | 16213 |
| 09/30/2019 | 15081 | 15310 | 16509 |
| 12/31/2019 | 15979 | 16699 | 17610 |
| 03/31/2020 | 12199 | 13426 | 13607 |
| 06/30/2020 | 14384 | 16184 | 16125 |
| 09/30/2020 | 15488 | 17629 | 17450 |
| 12/31/2020 | 17047 | 19771 | 19323 |
| 03/31/2021 | 18361 | 20992 | 20924 |
| 06/30/2021 | 19186 | 22786 | 21986 |
| 09/30/2021 | 18806 | 22919 | 21665 |
| 12/31/2021 | 20153 | 25446 | 23370 |
| 03/31/2022 | 19175 | 24276 | 22411 |
| 06/30/2022 | 16954 | 20367 | 19996 |
| 09/30/2022 | 15802 | 19373 | 18762 |
| 12/31/2022 | 18223 | 20838 | 21766 |
| 03/31/2023 | 18291 | 22400 | 21968 |
| 06/30/2023 | 18905 | 24358 | 22840 |
| 09/30/2023 | 18400 | 23561 | 22361 |
| 12/31/2023 | 20688 | 26315 | 25288 |
| 03/31/2024 | 21826 | 29093 | 26840 |
| 06/30/2024 | 21425 | 30340 | 26500 |
| 09/30/2024 | 23162 | 32126 | 28811 |
| Class C (without CDSC) | 6.12% | 25.88% | 8.96% | 9.98% |
| Class C (with CDSC)§ | 5.12% | 24.88% | 8.96% | 9.98% |
| S&P 500 Index | 10.42% | 36.35% | 15.98% | 14.13% |
| Dow Jones Industrial Average | 7.35% | 28.85% | 11.78% | 12.73% |
The fund's past performance is not a good predictor of the fund's future performance. Visit GuggenheimInvestments.com/mutual-funds/performance for more recent performance information.
| Net Assets | $19,720,259 |
| Total Number of Portfolio Holdings | 39 |
| Portfolio Turnover Rate | 14% |
| Dow Jones Industrial Average® Fund | Class C | RYDKX | Semi-Annual Shareholder Report | September 30, 2024 |
| Financial | 20.0% |
| Consumer, Non-cyclical | 19.2% |
| Technology | 15.9% |
| Dow Jones Industrial Average Equity Swap Agreements | 12.6% |
| Industrial | 11.9% |
| Consumer, Cyclical | 11.8% |
| Communications | 5.1% |
| Other | 3.8% |

| UnitedHealth Group, Inc. | 7.9% |
| Goldman Sachs Group, Inc. | 6.7% |
| Microsoft Corp. | 5.8% |
| Home Depot, Inc. | 5.4% |
| Caterpillar, Inc. | 5.3% |
| Amgen, Inc. | 4.3% |
| McDonald's Corp. | 4.1% |
| Visa, Inc. — Class A | 3.7% |
| Salesforce, Inc. | 3.7% |
| American Express Co. | 3.6% |
| Top 10 Total | 50.5% |
| |
1 | "Holdings Diversification (Market Exposure as a % of Net Assets)" excludes any temporary cash investments, investments in Guggenheim Strategy Funds Trust mutual funds, or investments in Guggenheim Ultra Short Duration Fund. |
| |
2 | "10 Largest Holdings (as a % of Net Assets)" excludes any temporary cash or derivative investments. |
| UnitedHealth Group, Inc. | 7.9% |
| Goldman Sachs Group, Inc. | 6.7% |
| Microsoft Corp. | 5.8% |
| Home Depot, Inc. | 5.4% |
| Caterpillar, Inc. | 5.3% |
| Amgen, Inc. | 4.3% |
| McDonald's Corp. | 4.1% |
| Visa, Inc. — Class A | 3.7% |
| Salesforce, Inc. | 3.7% |
| American Express Co. | 3.6% |
| Top 10 Total | 50.5% |
| |
2 | "10 Largest Holdings (as a % of Net Assets)" excludes any temporary cash or derivative investments. |
There were no changes in or disagreements with fund accountants for the period.
| |  | Availability of Additional Information. For additional information, including the fund's prospectus, financial information, holdings and proxy voting information, go to GuggenheimInvestments.com/mutual-funds/literature or, call 800 820 0888. |
SAR-RYDKX-093024
Semi-Annual Shareholder Report | 9.30.24
This semi-annual shareholder report contains important information about the Dow Jones Industrial Average® Fund for the period of April 1, 2024 to September 30, 2024. You can find additional information about the fund at GuggenheimInvestments.com/mutual-funds/literature. You can also request this information by contacting 800 820 0888 or GuggenheimClientServices@mufg-is.com.
For the period of April 1, 2024 to September 30, 2024, the fund (Class H shares) returned 6.53%, underperforming the fund's benchmark, the S&P 500 Index, which returned 10.42% for the same period and underperforming the fund's secondary index, the Dow Jones Industrial Average, which returned 7.35% for the same period.
The fund's broad-based securities market index was changed from the Dow Jones Industrial Average to the S&P 500 Index to comply with the regulation that requires the fund's broad-based securities market index to represent the overall applicable market.
What factors materially affected the fund's performance over the last six months?
The sectors that contributed the most to the return of the Dow Jones Industrial Average (the "Index) were Financials, Health Care, and Information Technology. Those that detracted the most were Communication Services, Energy, and Materials. The holdings that contributed the most to return of the Index were UnitedHealth Group, Inc., Goldman Sachs Group, Inc., and Apple, Inc. Those that detracted the most were Boeing Co., Salesforce, Inc., and Walt Disney Co. The fund maintained a daily correlation of over 99% to its benchmark of 100% of the daily price movement of the Dow Jones Industrial Average.
Cumulative performance* for the fund since inception (as of 9.30.24), assuming a $10,000 initial investment.
| 12/01/2015 | 10000 | 10000 | 10000 |
| 12/31/2015 | 9734 | 9737 | 9753 |
| 03/31/2016 | 9918 | 9869 | 9968 |
| 06/30/2016 | 10086 | 10111 | 10174 |
| 09/30/2016 | 10336 | 10501 | 10457 |
| 12/31/2016 | 11186 | 10902 | 11362 |
| 03/31/2017 | 11723 | 11563 | 11952 |
| 06/30/2017 | 12138 | 11921 | 12424 |
| 09/30/2017 | 12769 | 12455 | 13118 |
| 12/31/2017 | 14113 | 13282 | 14556 |
| 03/31/2018 | 13779 | 13181 | 14270 |
| 06/30/2018 | 13898 | 13634 | 14450 |
| 09/30/2018 | 15175 | 14685 | 15842 |
| 12/31/2018 | 13386 | 12700 | 14049 |
| 03/31/2019 | 14904 | 14433 | 15709 |
| 06/30/2019 | 15318 | 15054 | 16213 |
| 09/30/2019 | 15529 | 15310 | 16509 |
| 12/31/2019 | 16486 | 16699 | 17610 |
| 03/31/2020 | 12609 | 13426 | 13607 |
| 06/30/2020 | 14895 | 16184 | 16125 |
| 09/30/2020 | 16069 | 17629 | 17450 |
| 12/31/2020 | 17722 | 19771 | 19323 |
| 03/31/2021 | 19120 | 20992 | 20924 |
| 06/30/2021 | 20017 | 22786 | 21986 |
| 09/30/2021 | 19657 | 22919 | 21665 |
| 12/31/2021 | 21107 | 25446 | 23370 |
| 03/31/2022 | 20119 | 24276 | 22411 |
| 06/30/2022 | 17824 | 20367 | 19996 |
| 09/30/2022 | 16647 | 19373 | 18762 |
| 12/31/2022 | 19234 | 20838 | 21766 |
| 03/31/2023 | 19340 | 22400 | 21968 |
| 06/30/2023 | 20026 | 24358 | 22840 |
| 09/30/2023 | 19528 | 23561 | 22361 |
| 12/31/2023 | 21997 | 26315 | 25288 |
| 03/31/2024 | 23248 | 29093 | 26840 |
| 06/30/2024 | 22864 | 30340 | 26500 |
| 09/30/2024 | 24766 | 32126 | 28811 |
| Class H | 6.53% | 26.83% | 9.78% | 10.81% |
| S&P 500 Index | 10.42% | 36.35% | 15.98% | 14.13% |
| Dow Jones Industrial Average | 7.35% | 28.85% | 11.78% | 12.73% |
The fund's past performance is not a good predictor of the fund's future performance. Visit GuggenheimInvestments.com/mutual-funds/performance for more recent performance information.
| Net Assets | $19,720,259 |
| Total Number of Portfolio Holdings | 39 |
| Portfolio Turnover Rate | 14% |
| Dow Jones Industrial Average® Fund | Class H | RYDHX | Semi-Annual Shareholder Report | September 30, 2024 |
| Financial | 20.0% |
| Consumer, Non-cyclical | 19.2% |
| Technology | 15.9% |
| Dow Jones Industrial Average Equity Swap Agreements | 12.6% |
| Industrial | 11.9% |
| Consumer, Cyclical | 11.8% |
| Communications | 5.1% |
| Other | 3.8% |
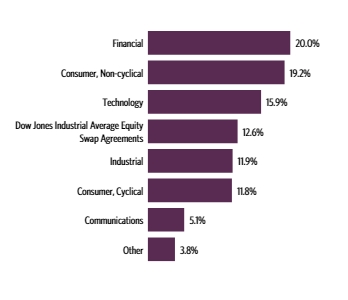
| UnitedHealth Group, Inc. | 7.9% |
| Goldman Sachs Group, Inc. | 6.7% |
| Microsoft Corp. | 5.8% |
| Home Depot, Inc. | 5.4% |
| Caterpillar, Inc. | 5.3% |
| Amgen, Inc. | 4.3% |
| McDonald's Corp. | 4.1% |
| Visa, Inc. — Class A | 3.7% |
| Salesforce, Inc. | 3.7% |
| American Express Co. | 3.6% |
| Top 10 Total | 50.5% |
| |
1 | "Holdings Diversification (Market Exposure as a % of Net Assets)" excludes any temporary cash investments, investments in Guggenheim Strategy Funds Trust mutual funds, or investments in Guggenheim Ultra Short Duration Fund. |
| |
2 | "10 Largest Holdings (as a % of Net Assets)" excludes any temporary cash or derivative investments. |
| UnitedHealth Group, Inc. | 7.9% |
| Goldman Sachs Group, Inc. | 6.7% |
| Microsoft Corp. | 5.8% |
| Home Depot, Inc. | 5.4% |
| Caterpillar, Inc. | 5.3% |
| Amgen, Inc. | 4.3% |
| McDonald's Corp. | 4.1% |
| Visa, Inc. — Class A | 3.7% |
| Salesforce, Inc. | 3.7% |
| American Express Co. | 3.6% |
| Top 10 Total | 50.5% |
| |
2 | "10 Largest Holdings (as a % of Net Assets)" excludes any temporary cash or derivative investments. |
There were no changes in or disagreements with fund accountants for the period.
| |  | Availability of Additional Information. For additional information, including the fund's prospectus, financial information, holdings and proxy voting information, go to GuggenheimInvestments.com/mutual-funds/literature or, call 800 820 0888. |
SAR-RYDHX-093024
Semi-Annual Shareholder Report | 9.30.24
This semi-annual shareholder report contains important information about the Nova Fund for the period of April 1, 2024 to September 30, 2024.You can find additional information about the fund at GuggenheimInvestments.com/mutual-funds/literature. You can also request this information by contacting 800 820 0888 or GuggenheimClientServices@mufg-is.com.
For the period of April 1, 2024 to September 30, 2024, the fund (Investor Class shares) returned 13.18%, outperforming the fund's benchmark, the S&P 500 Index, which returned 10.42% for the same period.
What factors materially affected the fund's performance over the last six months?
The sectors that contributed the most to the return of the S&P 500 Index (the "Index") were Information Technology, Financials, and Communication Services. The only sector that detracted was Energy. The holdings that contributed the most to the return of the Index were Apple, Inc., NVIDIA Corp., and Tesla, Inc. Those that detracted the most were Intel Corp., Walt Disney Co., and Merck & Co., Inc. The Fund maintained a daily correlation of over 99% to its benchmark of 150% of the daily price movement of the S&P 500 Index.
Cumulative performance* for the fund's most recently completed 10 years (as of 9.30.24), assuming a $10,000 initial investment.
| 09/30/2014 | 10000 | 10000 |
| 12/31/2014 | 10687 | 10493 |
| 03/31/2015 | 10792 | 10593 |
| 06/30/2015 | 10785 | 10622 |
| 09/30/2015 | 9669 | 9939 |
| 12/31/2015 | 10645 | 10638 |
| 03/31/2016 | 10752 | 10782 |
| 06/30/2016 | 11080 | 11047 |
| 09/30/2016 | 11666 | 11472 |
| 12/31/2016 | 12271 | 11911 |
| 03/31/2017 | 13316 | 12633 |
| 06/30/2017 | 13849 | 13023 |
| 09/30/2017 | 14708 | 13607 |
| 12/31/2017 | 16097 | 14511 |
| 03/31/2018 | 15725 | 14401 |
| 06/30/2018 | 16414 | 14896 |
| 09/30/2018 | 18202 | 16044 |
| 12/31/2018 | 14449 | 13875 |
| 03/31/2019 | 17351 | 15769 |
| 06/30/2019 | 18329 | 16447 |
| 09/30/2019 | 18622 | 16727 |
| 12/31/2019 | 21034 | 18244 |
| 03/31/2020 | 14368 | 14668 |
| 06/30/2020 | 18837 | 17682 |
| 09/30/2020 | 21321 | 19260 |
| 12/31/2020 | 25166 | 21600 |
| 03/31/2021 | 27365 | 22934 |
| 06/30/2021 | 30787 | 24895 |
| 09/30/2021 | 30893 | 25040 |
| 12/31/2021 | 35913 | 27801 |
| 03/31/2022 | 33065 | 26522 |
| 06/30/2022 | 24985 | 22252 |
| 09/30/2022 | 22857 | 21165 |
| 12/31/2022 | 25145 | 22766 |
| 03/31/2023 | 27713 | 24473 |
| 06/30/2023 | 31043 | 26612 |
| 09/30/2023 | 29185 | 25741 |
| 12/31/2023 | 34023 | 28750 |
| 03/31/2024 | 39090 | 31785 |
| 06/30/2024 | 41170 | 33147 |
| 09/30/2024 | 44243 | 35098 |
| Investor Class | 13.18% | 51.59% | 18.89% | 16.03% |
| S&P 500 Index | 10.42% | 36.35% | 15.98% | 13.38% |
The fund's past performance is not a good predictor of the fund's future performance. Visit GuggenheimInvestments.com/mutual-funds/performance for more recent performance information.
| Net Assets | $239,931,905 |
| Total Number of Portfolio Holdings | 516 |
| Portfolio Turnover Rate | 113% |
| Nova Fund | Investor Class | RYNVX | Semi-Annual Shareholder Report | September 30, 2024 |
| S&P 500 Index Equity Swap Agreements | 48.7% |
| Technology | 24.5% |
| Equity Futures Contracts | 22.1% |
| Consumer, Non-cyclical | 13.8% |
| Communications | 11.5% |
| Financial | 11.2% |
| Consumer, Cyclical | 6.6% |
| Other | 12.0% |

| Apple, Inc. | 5.8% |
| Microsoft Corp. | 5.2% |
| NVIDIA Corp. | 4.9% |
| Guggenheim Ultra Short Duration Fund — Institutional Class | 3.1% |
| Amazon.com, Inc. | 2.9% |
| Guggenheim Strategy Fund II | 2.3% |
| Meta Platforms, Inc. — Class A | 2.1% |
| Guggenheim Strategy Fund III | 1.9% |
| Alphabet, Inc. — Class A | 1.6% |
| Berkshire Hathaway, Inc. — Class B | 1.4% |
| Top 10 Total | 31.2% |
| |
1 | "Holdings Diversification (Market Exposure as a % of Net Assets)" excludes any temporary cash investments, investments in Guggenheim Strategy Funds Trust mutual funds, or investments in Guggenheim Ultra Short Duration Fund. |
| |
2 | "10 Largest Holdings (as a % of Net Assets)" excludes any temporary cash or derivative investments. |
| Apple, Inc. | 5.8% |
| Microsoft Corp. | 5.2% |
| NVIDIA Corp. | 4.9% |
| Guggenheim Ultra Short Duration Fund — Institutional Class | 3.1% |
| Amazon.com, Inc. | 2.9% |
| Guggenheim Strategy Fund II | 2.3% |
| Meta Platforms, Inc. — Class A | 2.1% |
| Guggenheim Strategy Fund III | 1.9% |
| Alphabet, Inc. — Class A | 1.6% |
| Berkshire Hathaway, Inc. — Class B | 1.4% |
| Top 10 Total | 31.2% |
| |
2 | "10 Largest Holdings (as a % of Net Assets)" excludes any temporary cash or derivative investments. |
There were no changes in or disagreements with fund accountants for the period.
| |  | Availability of Additional Information. For additional information, including the fund's prospectus, financial information, holdings and proxy voting information, go to GuggenheimInvestments.com/mutual-funds/literature or, call 800 820 0888. |
SAR-RYNVX-093024
Semi-Annual Shareholder Report | 9.30.24
This semi-annual shareholder report contains important information about the Nova Fund for the period of April 1, 2024 to September 30, 2024. You can find additional information about the fund at GuggenheimInvestments.com/mutual-funds/literature. You can also request this information by contacting 800 820 0888 or GuggenheimClientServices@mufg-is.com.
For the period of April 1, 2024 to September 30, 2024, the fund (Class A shares) returned 13.04%, outperforming the fund's benchmark, the S&P 500 Index, which returned 10.42% for the same period.
What factors materially affected the fund's performance over the last six months?
The sectors that contributed the most to the return of the S&P 500 Index (the "Index") were Information Technology, Financials, and Communication Services. The only sector that detracted was Energy. The holdings that contributed the most to the return of the Index were Apple, Inc., NVIDIA Corp., and Tesla, Inc. Those that detracted the most were Intel Corp., Walt Disney Co., and Merck & Co., Inc. The Fund maintained a daily correlation of over 99% to its benchmark of 150% of the daily price movement of the S&P 500 Index.
Cumulative performance* for the fund's most recently completed 10 years (as of 9.30.24), assuming a $10,000 initial investment.
| 09/30/2014 | 9525 | 10000 |
| 12/31/2014 | 10174 | 10493 |
| 03/31/2015 | 10267 | 10593 |
| 06/30/2015 | 10254 | 10622 |
| 09/30/2015 | 9187 | 9939 |
| 12/31/2015 | 10108 | 10638 |
| 03/31/2016 | 10210 | 10782 |
| 06/30/2016 | 10520 | 11047 |
| 09/30/2016 | 11069 | 11472 |
| 12/31/2016 | 11633 | 11911 |
| 03/31/2017 | 12617 | 12633 |
| 06/30/2017 | 13108 | 13023 |
| 09/30/2017 | 13901 | 13607 |
| 12/31/2017 | 15205 | 14511 |
| 03/31/2018 | 14847 | 14401 |
| 06/30/2018 | 15487 | 14896 |
| 09/30/2018 | 17164 | 16044 |
| 12/31/2018 | 13624 | 13875 |
| 03/31/2019 | 16352 | 15769 |
| 06/30/2019 | 17267 | 16447 |
| 09/30/2019 | 17531 | 16727 |
| 12/31/2019 | 19788 | 18244 |
| 03/31/2020 | 13509 | 14668 |
| 06/30/2020 | 17698 | 17682 |
| 09/30/2020 | 20020 | 19260 |
| 12/31/2020 | 23616 | 21600 |
| 03/31/2021 | 25668 | 22934 |
| 06/30/2021 | 28859 | 24895 |
| 09/30/2021 | 28942 | 25040 |
| 12/31/2021 | 33623 | 27801 |
| 03/31/2022 | 30939 | 26522 |
| 06/30/2022 | 23364 | 22252 |
| 09/30/2022 | 21357 | 21165 |
| 12/31/2022 | 23479 | 22766 |
| 03/31/2023 | 25859 | 24473 |
| 06/30/2023 | 28958 | 26612 |
| 09/30/2023 | 27207 | 25741 |
| 12/31/2023 | 31697 | 28750 |
| 03/31/2024 | 36398 | 31785 |
| 06/30/2024 | 38309 | 33147 |
| 09/30/2024 | 41145 | 35098 |
| Class A (without sales charge) | 13.04% | 51.23% | 18.61% | 15.76% |
| Class A (with sales charge)‡ | 7.67% | 44.04% | 17.46% | 15.19% |
| S&P 500 Index | 10.42% | 36.35% | 15.98% | 13.38% |
The fund's past performance is not a good predictor of the fund's future performance. Visit GuggenheimInvestments.com/mutual-funds/performance for more recent performance information.
| Net Assets | $239,931,905 |
| Total Number of Portfolio Holdings | 516 |
| Portfolio Turnover Rate | 113% |
| Nova Fund | Class A | RYANX | Semi-Annual Shareholder Report | September 30, 2024 |
| S&P 500 Index Equity Swap Agreements | 48.7% |
| Technology | 24.5% |
| Equity Futures Contracts | 22.1% |
| Consumer, Non-cyclical | 13.8% |
| Communications | 11.5% |
| Financial | 11.2% |
| Consumer, Cyclical | 6.6% |
| Other | 12.0% |
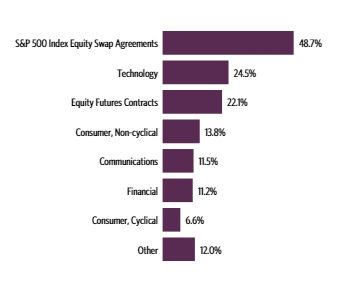
| Apple, Inc. | 5.8% |
| Microsoft Corp. | 5.2% |
| NVIDIA Corp. | 4.9% |
| Guggenheim Ultra Short Duration Fund — Institutional Class | 3.1% |
| Amazon.com, Inc. | 2.9% |
| Guggenheim Strategy Fund II | 2.3% |
| Meta Platforms, Inc. — Class A | 2.1% |
| Guggenheim Strategy Fund III | 1.9% |
| Alphabet, Inc. — Class A | 1.6% |
| Berkshire Hathaway, Inc. — Class B | 1.4% |
| Top 10 Total | 31.2% |
| |
1 | "Holdings Diversification (Market Exposure as a % of Net Assets)" excludes any temporary cash investments, investments in Guggenheim Strategy Funds Trust mutual funds, or investments in Guggenheim Ultra Short Duration Fund. |
| |
2 | "10 Largest Holdings (as a % of Net Assets)" excludes any temporary cash or derivative investments. |
| Apple, Inc. | 5.8% |
| Microsoft Corp. | 5.2% |
| NVIDIA Corp. | 4.9% |
| Guggenheim Ultra Short Duration Fund — Institutional Class | 3.1% |
| Amazon.com, Inc. | 2.9% |
| Guggenheim Strategy Fund II | 2.3% |
| Meta Platforms, Inc. — Class A | 2.1% |
| Guggenheim Strategy Fund III | 1.9% |
| Alphabet, Inc. — Class A | 1.6% |
| Berkshire Hathaway, Inc. — Class B | 1.4% |
| Top 10 Total | 31.2% |
| |
2 | "10 Largest Holdings (as a % of Net Assets)" excludes any temporary cash or derivative investments. |
There were no changes in or disagreements with fund accountants for the period.
| |  | Availability of Additional Information. For additional information, including the fund's prospectus, financial information, holdings and proxy voting information, go to GuggenheimInvestments.com/mutual-funds/literature or, call 800 820 0888. |
SAR-RYANX-093024
Semi-Annual Shareholder Report | 9.30.24
This semi-annual shareholder report contains important information about the Nova Fund for the period of April 1, 2024 to September 30, 2024. You can find additional information about the fund at GuggenheimInvestments.com/mutual-funds/literature. You can also request this information by contacting 800 820 0888 or GuggenheimClientServices@mufg-is.com.
For the period of April 1, 2024 to September 30, 2024, the fund (Class C shares) returned 12.62%, outperforming the fund's benchmark, the S&P 500 Index, which returned 10.42% for the same period.
What factors materially affected the fund's performance over the last six months?
The sectors that contributed the most to the return of the S&P 500 Index (the "Index") were Information Technology, Financials, and Communication Services. The only sector that detracted was Energy. The holdings that contributed the most to the return of the Index were Apple, Inc., NVIDIA Corp., and Tesla, Inc. Those that detracted the most were Intel Corp., Walt Disney Co., and Merck & Co., Inc. The Fund maintained a daily correlation of over 99% to its benchmark of 150% of the daily price movement of the S&P 500 Index.
Cumulative performance* for the fund's most recently completed 10 years (as of 9.30.24), assuming a $10,000 initial investment.
| 09/30/2014 | 10000 | 10000 |
| 12/31/2014 | 10661 | 10493 |
| 03/31/2015 | 10739 | 10593 |
| 06/30/2015 | 10704 | 10622 |
| 09/30/2015 | 9574 | 9939 |
| 12/31/2015 | 10512 | 10638 |
| 03/31/2016 | 10593 | 10782 |
| 06/30/2016 | 10891 | 11047 |
| 09/30/2016 | 11438 | 11472 |
| 12/31/2016 | 11998 | 11911 |
| 03/31/2017 | 12987 | 12633 |
| 06/30/2017 | 13482 | 13023 |
| 09/30/2017 | 14279 | 13607 |
| 12/31/2017 | 15590 | 14511 |
| 03/31/2018 | 15195 | 14401 |
| 06/30/2018 | 15821 | 14896 |
| 09/30/2018 | 17504 | 16044 |
| 12/31/2018 | 13861 | 13875 |
| 03/31/2019 | 16610 | 15769 |
| 06/30/2019 | 17504 | 16447 |
| 09/30/2019 | 17738 | 16727 |
| 12/31/2019 | 19985 | 18244 |
| 03/31/2020 | 13617 | 14668 |
| 06/30/2020 | 17807 | 17682 |
| 09/30/2020 | 20103 | 19260 |
| 12/31/2020 | 23669 | 21600 |
| 03/31/2021 | 25676 | 22934 |
| 06/30/2021 | 28817 | 24895 |
| 09/30/2021 | 28844 | 25040 |
| 12/31/2021 | 33445 | 27801 |
| 03/31/2022 | 30720 | 26522 |
| 06/30/2022 | 23155 | 22252 |
| 09/30/2022 | 21127 | 21165 |
| 12/31/2022 | 23181 | 22766 |
| 03/31/2023 | 25486 | 24473 |
| 06/30/2023 | 28485 | 26612 |
| 09/30/2023 | 26712 | 25741 |
| 12/31/2023 | 31064 | 28750 |
| 03/31/2024 | 35604 | 31785 |
| 06/30/2024 | 37404 | 33147 |
| 09/30/2024 | 40093 | 35098 |
| Class C (without CDSC) | 12.62% | 50.09% | 17.71% | 14.90% |
| Class C (with CDSC)§ | 11.62% | 49.09% | 17.71% | 14.90% |
| S&P 500 Index | 10.42% | 36.35% | 15.98% | 13.38% |
The fund's past performance is not a good predictor of the fund's future performance. Visit GuggenheimInvestments.com/mutual-funds/performance for more recent performance information.
| Net Assets | $239,931,905 |
| Total Number of Portfolio Holdings | 516 |
| Portfolio Turnover Rate | 113% |
| Nova Fund | Class C | RYNCX | Semi-Annual Shareholder Report | September 30, 2024 |
| S&P 500 Index Equity Swap Agreements | 48.7% |
| Technology | 24.5% |
| Equity Futures Contracts | 22.1% |
| Consumer, Non-cyclical | 13.8% |
| Communications | 11.5% |
| Financial | 11.2% |
| Consumer, Cyclical | 6.6% |
| Other | 12.0% |

| Apple, Inc. | 5.8% |
| Microsoft Corp. | 5.2% |
| NVIDIA Corp. | 4.9% |
| Guggenheim Ultra Short Duration Fund — Institutional Class | 3.1% |
| Amazon.com, Inc. | 2.9% |
| Guggenheim Strategy Fund II | 2.3% |
| Meta Platforms, Inc. — Class A | 2.1% |
| Guggenheim Strategy Fund III | 1.9% |
| Alphabet, Inc. — Class A | 1.6% |
| Berkshire Hathaway, Inc. — Class B | 1.4% |
| Top 10 Total | 31.2% |
| |
1 | "Holdings Diversification (Market Exposure as a % of Net Assets)" excludes any temporary cash investments, investments in Guggenheim Strategy Funds Trust mutual funds, or investments in Guggenheim Ultra Short Duration Fund. |
| |
2 | "10 Largest Holdings (as a % of Net Assets)" excludes any temporary cash or derivative investments. |
| Apple, Inc. | 5.8% |
| Microsoft Corp. | 5.2% |
| NVIDIA Corp. | 4.9% |
| Guggenheim Ultra Short Duration Fund — Institutional Class | 3.1% |
| Amazon.com, Inc. | 2.9% |
| Guggenheim Strategy Fund II | 2.3% |
| Meta Platforms, Inc. — Class A | 2.1% |
| Guggenheim Strategy Fund III | 1.9% |
| Alphabet, Inc. — Class A | 1.6% |
| Berkshire Hathaway, Inc. — Class B | 1.4% |
| Top 10 Total | 31.2% |
| |
2 | "10 Largest Holdings (as a % of Net Assets)" excludes any temporary cash or derivative investments. |
There were no changes in or disagreements with fund accountants for the period.
| |  | Availability of Additional Information. For additional information, including the fund's prospectus, financial information, holdings and proxy voting information, go to GuggenheimInvestments.com/mutual-funds/literature or, call 800 820 0888. |
SAR-RYNCX-093024
Semi-Annual Shareholder Report | 9.30.24
This semi-annual shareholder report contains important information about the Nova Fund for the period of April 1, 2024 to September 30, 2024. You can find additional information about the fund at GuggenheimInvestments.com/mutual-funds/literature. You can also request this information by contacting 800 820 0888 or GuggenheimClientServices@mufg-is.com.
For the period of April 1, 2024 to September 30, 2024, the fund (Class H shares) returned 13.04%, outperforming the fund's benchmark, the S&P 500 Index, which returned 10.42% for the same period.
What factors materially affected the fund's performance over the last six months?
The sectors that contributed the most to the return of the S&P 500 Index (the "Index") were Information Technology, Financials, and Communication Services. The only sector that detracted was Energy. The holdings that contributed the most to the return of the Index were Apple, Inc., NVIDIA Corp., and Tesla, Inc. Those that detracted the most were Intel Corp., Walt Disney Co., and Merck & Co., Inc. The Fund maintained a daily correlation of over 99% to its benchmark of 150% of the daily price movement of the S&P 500 Index.
Cumulative performance* for the fund's most recently completed 10 years (as of 9.30.24), assuming a $10,000 initial investment.
| 09/30/2014 | 10000 | 10000 |
| 12/31/2014 | 10684 | 10493 |
| 03/31/2015 | 10779 | 10593 |
| 06/30/2015 | 10765 | 10622 |
| 09/30/2015 | 9646 | 9939 |
| 12/31/2015 | 10615 | 10638 |
| 03/31/2016 | 10715 | 10782 |
| 06/30/2016 | 11038 | 11047 |
| 09/30/2016 | 11610 | 11472 |
| 12/31/2016 | 12206 | 11911 |
| 03/31/2017 | 13239 | 12633 |
| 06/30/2017 | 13772 | 13023 |
| 09/30/2017 | 14614 | 13607 |
| 12/31/2017 | 15985 | 14511 |
| 03/31/2018 | 15606 | 14401 |
| 06/30/2018 | 16281 | 14896 |
| 09/30/2018 | 18046 | 16044 |
| 12/31/2018 | 14318 | 13875 |
| 03/31/2019 | 17184 | 15769 |
| 06/30/2019 | 18145 | 16447 |
| 09/30/2019 | 18424 | 16727 |
| 12/31/2019 | 20797 | 18244 |
| 03/31/2020 | 14195 | 14668 |
| 06/30/2020 | 18598 | 17682 |
| 09/30/2020 | 21037 | 19260 |
| 12/31/2020 | 24821 | 21600 |
| 03/31/2021 | 26974 | 22934 |
| 06/30/2021 | 30327 | 24895 |
| 09/30/2021 | 30412 | 25040 |
| 12/31/2021 | 35331 | 27801 |
| 03/31/2022 | 32506 | 26522 |
| 06/30/2022 | 24546 | 22252 |
| 09/30/2022 | 22441 | 21165 |
| 12/31/2022 | 24677 | 22766 |
| 03/31/2023 | 27182 | 24473 |
| 06/30/2023 | 30431 | 26612 |
| 09/30/2023 | 28593 | 25741 |
| 12/31/2023 | 33315 | 28750 |
| 03/31/2024 | 38252 | 31785 |
| 06/30/2024 | 40260 | 33147 |
| 09/30/2024 | 43240 | 35098 |
| Class H | 13.04% | 51.23% | 18.60% | 15.77% |
| S&P 500 Index | 10.42% | 36.35% | 15.98% | 13.38% |
The fund's past performance is not a good predictor of the fund's future performance. Visit GuggenheimInvestments.com/mutual-funds/performance for more recent performance information.
| Net Assets | $239,931,905 |
| Total Number of Portfolio Holdings | 516 |
| Portfolio Turnover Rate | 113% |
| Nova Fund | Class H | RYNHX | Semi-Annual Shareholder Report | September 30, 2024 |
| S&P 500 Index Equity Swap Agreements | 48.7% |
| Technology | 24.5% |
| Equity Futures Contracts | 22.1% |
| Consumer, Non-cyclical | 13.8% |
| Communications | 11.5% |
| Financial | 11.2% |
| Consumer, Cyclical | 6.6% |
| Other | 12.0% |

| Apple, Inc. | 5.8% |
| Microsoft Corp. | 5.2% |
| NVIDIA Corp. | 4.9% |
| Guggenheim Ultra Short Duration Fund — Institutional Class | 3.1% |
| Amazon.com, Inc. | 2.9% |
| Guggenheim Strategy Fund II | 2.3% |
| Meta Platforms, Inc. — Class A | 2.1% |
| Guggenheim Strategy Fund III | 1.9% |
| Alphabet, Inc. — Class A | 1.6% |
| Berkshire Hathaway, Inc. — Class B | 1.4% |
| Top 10 Total | 31.2% |
| |
1 | "Holdings Diversification (Market Exposure as a % of Net Assets)" excludes any temporary cash investments, investments in Guggenheim Strategy Funds Trust mutual funds, or investments in Guggenheim Ultra Short Duration Fund. |
| |
2 | "10 Largest Holdings (as a % of Net Assets)" excludes any temporary cash or derivative investments. |
| Apple, Inc. | 5.8% |
| Microsoft Corp. | 5.2% |
| NVIDIA Corp. | 4.9% |
| Guggenheim Ultra Short Duration Fund — Institutional Class | 3.1% |
| Amazon.com, Inc. | 2.9% |
| Guggenheim Strategy Fund II | 2.3% |
| Meta Platforms, Inc. — Class A | 2.1% |
| Guggenheim Strategy Fund III | 1.9% |
| Alphabet, Inc. — Class A | 1.6% |
| Berkshire Hathaway, Inc. — Class B | 1.4% |
| Top 10 Total | 31.2% |
| |
2 | "10 Largest Holdings (as a % of Net Assets)" excludes any temporary cash or derivative investments. |
There were no changes in or disagreements with fund accountants for the period.
| |  | Availability of Additional Information. For additional information, including the fund's prospectus, financial information, holdings and proxy voting information, go to GuggenheimInvestments.com/mutual-funds/literature or, call 800 820 0888. |
SAR-RYNHX-093024
Semi-Annual Shareholder Report | 9.30.24
This semi-annual shareholder report contains important information about the S&P 500® Fund for the period of April 1, 2024 to September 30, 2024. You can find additional information about the fund at GuggenheimInvestments.com/mutual-funds/literature. You can also request this information by contacting 800 820 0888 or GuggenheimClientServices@mufg-is.com.
For the period of April 1, 2024 to September 30, 2024, the fund (Class A shares) returned 9.54%, underperforming the fund's benchmark, the S&P 500 Index, which returned 10.42% for the same period.
What factors materially affected the fund's performance over the last six months?
The sectors that contributed the most to the return of the S&P 500 Index (the "Index") were Information Technology, Financials, and Communication Services. The only sector that detracted was Energy. The holdings that contributed the most to the return of the Index were Apple, Inc., NVIDIA Corp., and Tesla, Inc. Those that detracted the most were Intel Corp., Walt Disney Co., and Merck & Co., Inc. The Fund maintained a daily correlation of over 99% to its benchmark of 100% of the daily price movement of the S&P 500 Index.
Cumulative performance* for the fund's most recently completed 10 years (as of 9.30.24), assuming a $10,000 initial investment.
| 09/30/2014 | 9525 | 10000 |
| 12/31/2014 | 9941 | 10493 |
| 03/31/2015 | 10007 | 10593 |
| 06/30/2015 | 9999 | 10622 |
| 09/30/2015 | 9313 | 9939 |
| 12/31/2015 | 9922 | 10638 |
| 03/31/2016 | 10015 | 10782 |
| 06/30/2016 | 10213 | 11047 |
| 09/30/2016 | 10565 | 11472 |
| 12/31/2016 | 10921 | 11911 |
| 03/31/2017 | 11534 | 12633 |
| 06/30/2017 | 11844 | 13023 |
| 09/30/2017 | 12323 | 13607 |
| 12/31/2017 | 13088 | 14511 |
| 03/31/2018 | 12937 | 14401 |
| 06/30/2018 | 13322 | 14896 |
| 09/30/2018 | 14292 | 16044 |
| 12/31/2018 | 12301 | 13875 |
| 03/31/2019 | 13919 | 15769 |
| 06/30/2019 | 14453 | 16447 |
| 09/30/2019 | 14637 | 16727 |
| 12/31/2019 | 15887 | 18244 |
| 03/31/2020 | 12712 | 14668 |
| 06/30/2020 | 15246 | 17682 |
| 09/30/2020 | 16536 | 19260 |
| 12/31/2020 | 18465 | 21600 |
| 03/31/2021 | 19530 | 22934 |
| 06/30/2021 | 21115 | 24895 |
| 09/30/2021 | 21149 | 25040 |
| 12/31/2021 | 23386 | 27801 |
| 03/31/2022 | 22229 | 26522 |
| 06/30/2022 | 18579 | 22252 |
| 09/30/2022 | 17585 | 21165 |
| 12/31/2022 | 18833 | 22766 |
| 03/31/2023 | 20156 | 24473 |
| 06/30/2023 | 21828 | 26612 |
| 09/30/2023 | 21025 | 25741 |
| 12/31/2023 | 23380 | 28750 |
| 03/31/2024 | 25742 | 31785 |
| 06/30/2024 | 26742 | 33147 |
| 09/30/2024 | 28197 | 35098 |
| Class A (without sales charge) | 9.54% | 34.11% | 14.01% | 11.46% |
| Class A (with sales charge)‡ | 4.34% | 27.75% | 12.91% | 10.92% |
| S&P 500 Index | 10.42% | 36.35% | 15.98% | 13.38% |
The fund's past performance is not a good predictor of the fund's future performance. Visit GuggenheimInvestments.com/mutual-funds/performance for more recent performance information.
| Net Assets | $239,541,929 |
| Total Number of Portfolio Holdings | 513 |
| Portfolio Turnover Rate | 50% |
| S&P 500® Fund | Class A | RYSOX | Semi-Annual Shareholder Report | September 30, 2024 |
| Technology | 29.4% |
| Consumer, Non-cyclical | 16.5% |
| Communications | 13.8% |
| Financial | 13.4% |
| Consumer, Cyclical | 8.0% |
| Industrial | 7.0% |
| S&P 500 Index Equity Swap Agreements | 3.3% |
| Other | 8.7% |
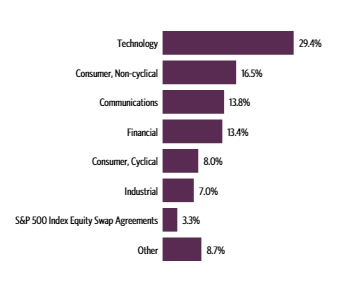
| Apple, Inc. | 6.9% |
| Microsoft Corp. | 6.3% |
| NVIDIA Corp. | 5.9% |
| Amazon.com, Inc. | 3.4% |
| Meta Platforms, Inc. — Class A | 2.5% |
| Alphabet, Inc. — Class A | 1.9% |
| Berkshire Hathaway, Inc. — Class B | 1.7% |
| Alphabet, Inc. — Class C | 1.6% |
| Broadcom, Inc. | 1.6% |
| Tesla, Inc. | 1.4% |
| Top 10 Total | 33.2% |
| |
1 | "Holdings Diversification (Market Exposure as a % of Net Assets)" excludes any temporary cash investments, investments in Guggenheim Strategy Funds Trust mutual funds, or investments in Guggenheim Ultra Short Duration Fund. |
| |
2 | "10 Largest Holdings (as a % of Net Assets)" excludes any temporary cash or derivative investments. |
| Apple, Inc. | 6.9% |
| Microsoft Corp. | 6.3% |
| NVIDIA Corp. | 5.9% |
| Amazon.com, Inc. | 3.4% |
| Meta Platforms, Inc. — Class A | 2.5% |
| Alphabet, Inc. — Class A | 1.9% |
| Berkshire Hathaway, Inc. — Class B | 1.7% |
| Alphabet, Inc. — Class C | 1.6% |
| Broadcom, Inc. | 1.6% |
| Tesla, Inc. | 1.4% |
| Top 10 Total | 33.2% |
| |
2 | "10 Largest Holdings (as a % of Net Assets)" excludes any temporary cash or derivative investments. |
There were no changes in or disagreements with fund accountants for the period.
| |  | Availability of Additional Information. For additional information, including the fund's prospectus, financial information, holdings and proxy voting information, go to GuggenheimInvestments.com/mutual-funds/literature or, call 800 820 0888. |
SAR-RYSOX-093024
Semi-Annual Shareholder Report | 9.30.24
This semi-annual shareholder report contains important information about the S&P 500® Fund for the period of April 1, 2024 to September 30, 2024. You can find additional information about the fund at GuggenheimInvestments.com/mutual-funds/literature. You can also request this information by contacting 800 820 0888 or GuggenheimClientServices@mufg-is.com.
For the period of April 1, 2024 to September 30, 2024, the fund (Class C shares) returned 9.13%, underperforming the fund's benchmark, the S&P 500 Index, which returned 10.42% for the same period.
What factors materially affected the fund's performance over the last six months?
The sectors that contributed the most to the return of the S&P 500 Index (the "Index") were Information Technology, Financials, and Communication Services. The only sector that detracted was Energy. The holdings that contributed the most to the return of the Index were Apple, Inc., NVIDIA Corp., and Tesla, Inc. Those that detracted the most were Intel Corp., Walt Disney Co., and Merck & Co., Inc. The Fund maintained a daily correlation of over 99% to its benchmark of 100% of the daily price movement of the S&P 500 Index.
Cumulative performance* for the fund's most recently completed 10 years (as of 9.30.24), assuming a $10,000 initial investment.
| 09/30/2014 | 10000 | 10000 |
| 12/31/2014 | 10416 | 10493 |
| 03/31/2015 | 10465 | 10593 |
| 06/30/2015 | 10438 | 10622 |
| 09/30/2015 | 9703 | 9939 |
| 12/31/2015 | 10318 | 10638 |
| 03/31/2016 | 10394 | 10782 |
| 06/30/2016 | 10581 | 11047 |
| 09/30/2016 | 10924 | 11472 |
| 12/31/2016 | 11270 | 11911 |
| 03/31/2017 | 11884 | 12633 |
| 06/30/2017 | 12176 | 13023 |
| 09/30/2017 | 12647 | 13607 |
| 12/31/2017 | 13407 | 14511 |
| 03/31/2018 | 13226 | 14401 |
| 06/30/2018 | 13596 | 14896 |
| 09/30/2018 | 14558 | 16044 |
| 12/31/2018 | 12506 | 13875 |
| 03/31/2019 | 14123 | 15769 |
| 06/30/2019 | 14641 | 16447 |
| 09/30/2019 | 14797 | 16727 |
| 12/31/2019 | 16028 | 18244 |
| 03/31/2020 | 12803 | 14668 |
| 06/30/2020 | 15328 | 17682 |
| 09/30/2020 | 16594 | 19260 |
| 12/31/2020 | 18493 | 21600 |
| 03/31/2021 | 19524 | 22934 |
| 06/30/2021 | 21071 | 24895 |
| 09/30/2021 | 21067 | 25040 |
| 12/31/2021 | 23253 | 27801 |
| 03/31/2022 | 22061 | 26522 |
| 06/30/2022 | 18402 | 22252 |
| 09/30/2022 | 17384 | 21165 |
| 12/31/2022 | 18583 | 22766 |
| 03/31/2023 | 19851 | 24473 |
| 06/30/2023 | 21457 | 26612 |
| 09/30/2023 | 20632 | 25741 |
| 12/31/2023 | 22898 | 28750 |
| 03/31/2024 | 25166 | 31785 |
| 06/30/2024 | 26094 | 33147 |
| 09/30/2024 | 27463 | 35098 |
| Class C (without CDSC) | 9.13% | 33.11% | 13.17% | 10.63% |
| Class C (with CDSC)§ | 8.13% | 32.11% | 13.17% | 10.63% |
| S&P 500 Index | 10.42% | 36.35% | 15.98% | 13.38% |
The fund's past performance is not a good predictor of the fund's future performance. Visit GuggenheimInvestments.com/mutual-funds/performance for more recent performance information.
| Net Assets | $239,541,929 |
| Total Number of Portfolio Holdings | 513 |
| Portfolio Turnover Rate | 50% |
| S&P 500® Fund | Class C | RYSYX | Semi-Annual Shareholder Report | September 30, 2024 |
| Technology | 29.4% |
| Consumer, Non-cyclical | 16.5% |
| Communications | 13.8% |
| Financial | 13.4% |
| Consumer, Cyclical | 8.0% |
| Industrial | 7.0% |
| S&P 500 Index Equity Swap Agreements | 3.3% |
| Other | 8.7% |

| Apple, Inc. | 6.9% |
| Microsoft Corp. | 6.3% |
| NVIDIA Corp. | 5.9% |
| Amazon.com, Inc. | 3.4% |
| Meta Platforms, Inc. — Class A | 2.5% |
| Alphabet, Inc. — Class A | 1.9% |
| Berkshire Hathaway, Inc. — Class B | 1.7% |
| Alphabet, Inc. — Class C | 1.6% |
| Broadcom, Inc. | 1.6% |
| Tesla, Inc. | 1.4% |
| Top 10 Total | 33.2% |
| |
1 | "Holdings Diversification (Market Exposure as a % of Net Assets)" excludes any temporary cash investments, investments in Guggenheim Strategy Funds Trust mutual funds, or investments in Guggenheim Ultra Short Duration Fund. |
| |
2 | "10 Largest Holdings (as a % of Net Assets)" excludes any temporary cash or derivative investments. |
| Apple, Inc. | 6.9% |
| Microsoft Corp. | 6.3% |
| NVIDIA Corp. | 5.9% |
| Amazon.com, Inc. | 3.4% |
| Meta Platforms, Inc. — Class A | 2.5% |
| Alphabet, Inc. — Class A | 1.9% |
| Berkshire Hathaway, Inc. — Class B | 1.7% |
| Alphabet, Inc. — Class C | 1.6% |
| Broadcom, Inc. | 1.6% |
| Tesla, Inc. | 1.4% |
| Top 10 Total | 33.2% |
| |
2 | "10 Largest Holdings (as a % of Net Assets)" excludes any temporary cash or derivative investments. |
There were no changes in or disagreements with fund accountants for the period.
| |  | Availability of Additional Information. For additional information, including the fund's prospectus, financial information, holdings and proxy voting information, go to GuggenheimInvestments.com/mutual-funds/literature or, call 800 820 0888. |
SAR-RYSYX-093024
Semi-Annual Shareholder Report | 9.30.24
This semi-annual shareholder report contains important information about the S&P 500® Fund for the period of April 1, 2024 to September 30, 2024. You can find additional information about the fund at GuggenheimInvestments.com/mutual-funds/literature. You can also request this information by contacting 800 820 0888 or GuggenheimClientServices@mufg-is.com.
For the period of April 1, 2024 to September 30, 2024, the fund (Class H shares) returned 9.54%, underperforming the fund's benchmark, the S&P 500 Index, which returned 10.42% for the same period.
What factors materially affected the fund's performance over the last six months?
The sectors that contributed the most to the return of the S&P 500 Index (the "Index") were Information Technology, Financials, and Communication Services. The only sector that detracted was Energy. The holdings that contributed the most to the return of the Index were Apple, Inc., NVIDIA Corp., and Tesla, Inc. Those that detracted the most were Intel Corp., Walt Disney Co., and Merck & Co., Inc. The Fund maintained a daily correlation of over 99% to its benchmark of 100% of the daily price movement of the S&P 500 Index.
Cumulative performance* for the fund's most recently completed 10 years (as of 9.30.24), assuming a $10,000 initial investment.
| 09/30/2014 | 10000 | 10000 |
| 12/31/2014 | 10435 | 10493 |
| 03/31/2015 | 10503 | 10593 |
| 06/30/2015 | 10496 | 10622 |
| 09/30/2015 | 9775 | 9939 |
| 12/31/2015 | 10414 | 10638 |
| 03/31/2016 | 10509 | 10782 |
| 06/30/2016 | 10720 | 11047 |
| 09/30/2016 | 11087 | 11472 |
| 12/31/2016 | 11460 | 11911 |
| 03/31/2017 | 12107 | 12633 |
| 06/30/2017 | 12429 | 13023 |
| 09/30/2017 | 12934 | 13607 |
| 12/31/2017 | 13735 | 14511 |
| 03/31/2018 | 13577 | 14401 |
| 06/30/2018 | 13981 | 14896 |
| 09/30/2018 | 14998 | 16044 |
| 12/31/2018 | 12909 | 13875 |
| 03/31/2019 | 14607 | 15769 |
| 06/30/2019 | 15171 | 16447 |
| 09/30/2019 | 15361 | 16727 |
| 12/31/2019 | 16670 | 18244 |
| 03/31/2020 | 13343 | 14668 |
| 06/30/2020 | 16003 | 17682 |
| 09/30/2020 | 17359 | 19260 |
| 12/31/2020 | 19382 | 21600 |
| 03/31/2021 | 20500 | 22934 |
| 06/30/2021 | 22164 | 24895 |
| 09/30/2021 | 22203 | 25040 |
| 12/31/2021 | 24550 | 27801 |
| 03/31/2022 | 23336 | 26522 |
| 06/30/2022 | 19501 | 22252 |
| 09/30/2022 | 18461 | 21165 |
| 12/31/2022 | 19768 | 22766 |
| 03/31/2023 | 21160 | 24473 |
| 06/30/2023 | 22915 | 26612 |
| 09/30/2023 | 22073 | 25741 |
| 12/31/2023 | 24544 | 28750 |
| 03/31/2024 | 27024 | 31785 |
| 06/30/2024 | 28073 | 33147 |
| 09/30/2024 | 29601 | 35098 |
| Class H | 9.54% | 34.11% | 14.02% | 11.46% |
| S&P 500 Index | 10.42% | 36.35% | 15.98% | 13.38% |
The fund's past performance is not a good predictor of the fund's future performance. Visit GuggenheimInvestments.com/mutual-funds/performance for more recent performance information.
| Net Assets | $239,541,929 |
| Total Number of Portfolio Holdings | 513 |
| Portfolio Turnover Rate | 50% |
| S&P 500® Fund | Class H | RYSPX | Semi-Annual Shareholder Report | September 30, 2024 |
| Technology | 29.4% |
| Consumer, Non-cyclical | 16.5% |
| Communications | 13.8% |
| Financial | 13.4% |
| Consumer, Cyclical | 8.0% |
| Industrial | 7.0% |
| S&P 500 Index Equity Swap Agreements | 3.3% |
| Other | 8.7% |

| Apple, Inc. | 6.9% |
| Microsoft Corp. | 6.3% |
| NVIDIA Corp. | 5.9% |
| Amazon.com, Inc. | 3.4% |
| Meta Platforms, Inc. — Class A | 2.5% |
| Alphabet, Inc. — Class A | 1.9% |
| Berkshire Hathaway, Inc. — Class B | 1.7% |
| Alphabet, Inc. — Class C | 1.6% |
| Broadcom, Inc. | 1.6% |
| Tesla, Inc. | 1.4% |
| Top 10 Total | 33.2% |
| |
1 | "Holdings Diversification (Market Exposure as a % of Net Assets)" excludes any temporary cash investments, investments in Guggenheim Strategy Funds Trust mutual funds, or investments in Guggenheim Ultra Short Duration Fund. |
| |
2 | "10 Largest Holdings (as a % of Net Assets)" excludes any temporary cash or derivative investments. |
| Apple, Inc. | 6.9% |
| Microsoft Corp. | 6.3% |
| NVIDIA Corp. | 5.9% |
| Amazon.com, Inc. | 3.4% |
| Meta Platforms, Inc. — Class A | 2.5% |
| Alphabet, Inc. — Class A | 1.9% |
| Berkshire Hathaway, Inc. — Class B | 1.7% |
| Alphabet, Inc. — Class C | 1.6% |
| Broadcom, Inc. | 1.6% |
| Tesla, Inc. | 1.4% |
| Top 10 Total | 33.2% |
| |
2 | "10 Largest Holdings (as a % of Net Assets)" excludes any temporary cash or derivative investments. |
There were no changes in or disagreements with fund accountants for the period.
| |  | Availability of Additional Information. For additional information, including the fund's prospectus, financial information, holdings and proxy voting information, go to GuggenheimInvestments.com/mutual-funds/literature or, call 800 820 0888. |
SAR-RYSPX-093024
Semi-Annual Shareholder Report | 9.30.24
This semi-annual shareholder report contains important information about the Inverse S&P 500® Strategy Fund for the period of April 1, 2024 to September 30, 2024. You can find additional information about the fund at GuggenheimInvestments.com/mutual-funds/literature. You can also request this information by contacting 800 820 0888 or GuggenheimClientServices@mufg-is.com.
For the period of April 1, 2024 to September 30, 2024, the fund (Investor Class shares) returned -5.57%, underperforming the fund's benchmark, the S&P 500 Index, which returned 10.42% for the same period.
What factors materially affected the fund's performance over the last six months?
The sectors that contributed the most to the return of the S&P 500 Index (the "Index") were Information Technology, Financials, and Communication Services. The only sector that detracted was Energy. The holdings that contributed the most to the return of the Index were Apple, Inc., NVIDIA Corp., and Tesla, Inc. Those that detracted the most were Intel Corp., Walt Disney Co., and Merck & Co., Inc. The Fund maintained a daily correlation of over 99% to its benchmark of -100% of the daily price movement of the S&P 500 Index.
Cumulative performance* for the fund's most recently completed 10 years (as of 9.30.24), assuming a $10,000 initial investment.
| 09/30/2014 | 10000 | 10000 |
| 12/31/2014 | 9457 | 10493 |
| 03/31/2015 | 9317 | 10593 |
| 06/30/2015 | 9259 | 10622 |
| 09/30/2015 | 9764 | 9939 |
| 12/31/2015 | 9042 | 10638 |
| 03/31/2016 | 8844 | 10782 |
| 06/30/2016 | 8602 | 11047 |
| 09/30/2016 | 8257 | 11472 |
| 12/31/2016 | 7936 | 11911 |
| 03/31/2017 | 7487 | 12633 |
| 06/30/2017 | 7267 | 13023 |
| 09/30/2017 | 6973 | 13607 |
| 12/31/2017 | 6557 | 14511 |
| 03/31/2018 | 6573 | 14401 |
| 06/30/2018 | 6372 | 14896 |
| 09/30/2018 | 5950 | 16044 |
| 12/31/2018 | 6841 | 13875 |
| 03/31/2019 | 6042 | 15769 |
| 06/30/2019 | 5831 | 16447 |
| 09/30/2019 | 5748 | 16727 |
| 12/31/2019 | 5292 | 18244 |
| 03/31/2020 | 6108 | 14668 |
| 06/30/2020 | 4937 | 17682 |
| 09/30/2020 | 4495 | 19260 |
| 12/31/2020 | 3974 | 21600 |
| 03/31/2021 | 3713 | 22934 |
| 06/30/2021 | 3407 | 24895 |
| 09/30/2021 | 3369 | 25040 |
| 12/31/2021 | 3013 | 27801 |
| 03/31/2022 | 3112 | 26522 |
| 06/30/2022 | 3632 | 22252 |
| 09/30/2022 | 3805 | 21165 |
| 12/31/2022 | 3542 | 22766 |
| 03/31/2023 | 3341 | 24473 |
| 06/30/2023 | 3129 | 26612 |
| 09/30/2023 | 3306 | 25741 |
| 12/31/2023 | 3026 | 28750 |
| 03/31/2024 | 2800 | 31785 |
| 06/30/2024 | 2745 | 33147 |
| 09/30/2024 | 2644 | 35098 |
| Investor Class | -5.57% | -20.01% | -14.38% | -12.45% |
| S&P 500 Index | 10.42% | 36.35% | 15.98% | 13.38% |
The fund's past performance is not a good predictor of the fund's future performance. Visit GuggenheimInvestments.com/mutual-funds/performance for more recent performance information.
| Net Assets | $44,963,314 |
| Total Number of Portfolio Holdings | 21 |
| Portfolio Turnover Rate | 0% |
| Inverse S&P 500® Strategy Fund | Investor Class | RYURX | Semi-Annual Shareholder Report | September 30, 2024 |
| S&P 500 Index Equity Mini Futures Contracts Short Sales | -18.1% |
| S&P 500 Index Equity Swap Agreements Short Sales | -81.9% |

| Guggenheim Strategy Fund II | 14.5% |
| Guggenheim Ultra Short Duration Fund — Institutional Class | 9.5% |
| Total | 24.0% |
| |
1 | "Holdings Diversification (Market Exposure as a % of Net Assets)" excludes any temporary cash investments, investments in Guggenheim Strategy Funds Trust mutual funds, or investments in Guggenheim Ultra Short Duration Fund. |
| |
2 | "Largest Holdings (as a % of Net Assets)" excludes any temporary cash or derivative investments. |
| Guggenheim Strategy Fund II | 14.5% |
| Guggenheim Ultra Short Duration Fund — Institutional Class | 9.5% |
| Total | 24.0% |
| |
2 | "Largest Holdings (as a % of Net Assets)" excludes any temporary cash or derivative investments. |
There were no changes in or disagreements with fund accountants for the period.
| |  | Availability of Additional Information. For additional information, including the fund's prospectus, financial information, holdings and proxy voting information, go to GuggenheimInvestments.com/mutual-funds/literature or, call 800 820 0888. |
SAR-RYURX-093024
Semi-Annual Shareholder Report | 9.30.24
This semi-annual shareholder report contains important information about the Inverse S&P 500® Strategy Fund for the period of April 1, 2024 to September 30, 2024. You can find additional information about the fund at GuggenheimInvestments.com/mutual-funds/literature. You can also request this information by contacting 800 820 0888 or GuggenheimClientServices@mufg-is.com.
For the period of April 1, 2024 to September 30, 2024, the fund (Class A shares) returned -5.66%, underperforming the fund's benchmark, the S&P 500 Index, which returned 10.42% for the same period.
What factors materially affected the fund's performance over the last six months?
The sectors that contributed the most to the return of the S&P 500 Index (the "Index") were Information Technology, Financials, and Communication Services. The only sector that detracted was Energy. The holdings that contributed the most to the return of the Index were Apple, Inc., NVIDIA Corp., and Tesla, Inc. Those that detracted the most were Intel Corp., Walt Disney Co., and Merck & Co., Inc. The Fund maintained a daily correlation of over 99% to its benchmark of -100% of the daily price movement of the S&P 500 Index.
Cumulative performance* for the fund's most recently completed 10 years (as of 9.30.24), assuming a $10,000 initial investment.
| 09/30/2014 | 9524 | 10000 |
| 12/31/2014 | 8996 | 10493 |
| 03/31/2015 | 8859 | 10593 |
| 06/30/2015 | 8801 | 10622 |
| 09/30/2015 | 9276 | 9939 |
| 12/31/2015 | 8585 | 10638 |
| 03/31/2016 | 8390 | 10782 |
| 06/30/2016 | 8155 | 11047 |
| 09/30/2016 | 7823 | 11472 |
| 12/31/2016 | 7515 | 11911 |
| 03/31/2017 | 7086 | 12633 |
| 06/30/2017 | 6873 | 13023 |
| 09/30/2017 | 6591 | 13607 |
| 12/31/2017 | 6194 | 14511 |
| 03/31/2018 | 6205 | 14401 |
| 06/30/2018 | 6012 | 14896 |
| 09/30/2018 | 5611 | 16044 |
| 12/31/2018 | 6445 | 13875 |
| 03/31/2019 | 5689 | 15769 |
| 06/30/2019 | 5487 | 16447 |
| 09/30/2019 | 5405 | 16727 |
| 12/31/2019 | 4973 | 18244 |
| 03/31/2020 | 5737 | 14668 |
| 06/30/2020 | 4633 | 17682 |
| 09/30/2020 | 4216 | 19260 |
| 12/31/2020 | 3724 | 21600 |
| 03/31/2021 | 3477 | 22934 |
| 06/30/2021 | 3189 | 24895 |
| 09/30/2021 | 3153 | 25040 |
| 12/31/2021 | 2817 | 27801 |
| 03/31/2022 | 2907 | 26522 |
| 06/30/2022 | 3392 | 22252 |
| 09/30/2022 | 3550 | 21165 |
| 12/31/2022 | 3302 | 22766 |
| 03/31/2023 | 3113 | 24473 |
| 06/30/2023 | 2915 | 26612 |
| 09/30/2023 | 3076 | 25741 |
| 12/31/2023 | 2815 | 28750 |
| 03/31/2024 | 2603 | 31785 |
| 06/30/2024 | 2550 | 33147 |
| 09/30/2024 | 2456 | 35098 |
| Class A (without sales charge) | -5.66% | -20.15% | -14.60% | -12.68% |
| Class A (with sales charge)‡ | -10.13% | -23.94% | -15.42% | -13.10% |
| S&P 500 Index | 10.42% | 36.35% | 15.98% | 13.38% |
The fund's past performance is not a good predictor of the fund's future performance. Visit GuggenheimInvestments.com/mutual-funds/performance for more recent performance information.
| Net Assets | $44,963,314 |
| Total Number of Portfolio Holdings | 21 |
| Portfolio Turnover Rate | 0% |
| Inverse S&P 500® Strategy Fund | Class A | RYARX | Semi-Annual Shareholder Report | September 30, 2024 |
| S&P 500 Index Equity Mini Futures Contracts Short Sales | -18.1% |
| S&P 500 Index Equity Swap Agreements Short Sales | -81.9% |

| Guggenheim Strategy Fund II | 14.5% |
| Guggenheim Ultra Short Duration Fund — Institutional Class | 9.5% |
| Total | 24.0% |
| |
1 | "Holdings Diversification (Market Exposure as a % of Net Assets)" excludes any temporary cash investments, investments in Guggenheim Strategy Funds Trust mutual funds, or investments in Guggenheim Ultra Short Duration Fund. |
| |
2 | "Largest Holdings (as a % of Net Assets)" excludes any temporary cash or derivative investments. |
| Guggenheim Strategy Fund II | 14.5% |
| Guggenheim Ultra Short Duration Fund — Institutional Class | 9.5% |
| Total | 24.0% |
| |
2 | "Largest Holdings (as a % of Net Assets)" excludes any temporary cash or derivative investments. |
There were no changes in or disagreements with fund accountants for the period.
| |  | Availability of Additional Information. For additional information, including the fund's prospectus, financial information, holdings and proxy voting information, go to GuggenheimInvestments.com/mutual-funds/literature or, call 800 820 0888. |
SAR-RYARX-093024
Semi-Annual Shareholder Report | 9.30.24
This semi-annual shareholder report contains important information about the Inverse S&P 500® Strategy Fund for the period of April 1, 2024 to September 30, 2024. You can find additional information about the fund at GuggenheimInvestments.com/mutual-funds/literature. You can also request this information by contacting 800 820 0888 or GuggenheimClientServices@mufg-is.com.
For the period of April 1, 2024 to September 30, 2024, the fund (Class C shares) returned -6.04%, underperforming the fund's benchmark, the S&P 500 Index, which returned 10.42% for the same period.
What factors materially affected the fund's performance over the last six months?
The sectors that contributed the most to the return of the S&P 500 Index (the "Index") were Information Technology, Financials, and Communication Services. The only sector that detracted was Energy. The holdings that contributed the most to the return of the Index were Apple, Inc., NVIDIA Corp., and Tesla, Inc. Those that detracted the most were Intel Corp., Walt Disney Co., and Merck & Co., Inc. The Fund maintained a daily correlation of over 99% to its benchmark of -100% of the daily price movement of the S&P 500 Index.
Cumulative performance* for the fund's most recently completed 10 years (as of 9.30.24), assuming a $10,000 initial investment.
| 09/30/2014 | 10000 | 10000 |
| 12/31/2014 | 9424 | 10493 |
| 03/31/2015 | 9269 | 10593 |
| 06/30/2015 | 9188 | 10622 |
| 09/30/2015 | 9661 | 9939 |
| 12/31/2015 | 8930 | 10638 |
| 03/31/2016 | 8708 | 10782 |
| 06/30/2016 | 8443 | 11047 |
| 09/30/2016 | 8089 | 11472 |
| 12/31/2016 | 7754 | 11911 |
| 03/31/2017 | 7298 | 12633 |
| 06/30/2017 | 7066 | 13023 |
| 09/30/2017 | 6763 | 13607 |
| 12/31/2017 | 6343 | 14511 |
| 03/31/2018 | 6342 | 14401 |
| 06/30/2018 | 6133 | 14896 |
| 09/30/2018 | 5713 | 16044 |
| 12/31/2018 | 6550 | 13875 |
| 03/31/2019 | 5771 | 15769 |
| 06/30/2019 | 5556 | 16447 |
| 09/30/2019 | 5464 | 16727 |
| 12/31/2019 | 5016 | 18244 |
| 03/31/2020 | 5776 | 14668 |
| 06/30/2020 | 4657 | 17682 |
| 09/30/2020 | 4229 | 19260 |
| 12/31/2020 | 3729 | 21600 |
| 03/31/2021 | 3477 | 22934 |
| 06/30/2021 | 3182 | 24895 |
| 09/30/2021 | 3139 | 25040 |
| 12/31/2021 | 2800 | 27801 |
| 03/31/2022 | 2885 | 26522 |
| 06/30/2022 | 3359 | 22252 |
| 09/30/2022 | 3509 | 21165 |
| 12/31/2022 | 3258 | 22766 |
| 03/31/2023 | 3066 | 24473 |
| 06/30/2023 | 2865 | 26612 |
| 09/30/2023 | 3018 | 25741 |
| 12/31/2023 | 2757 | 28750 |
| 03/31/2024 | 2545 | 31785 |
| 06/30/2024 | 2488 | 33147 |
| 09/30/2024 | 2391 | 35098 |
| Class C (without CDSC) | -6.04% | -20.78% | -15.23% | -13.33% |
| Class C (with CDSC)§ | -6.98% | -21.55% | -15.23% | -13.33% |
| S&P 500 Index | 10.42% | 36.35% | 15.98% | 13.38% |
The fund's past performance is not a good predictor of the fund's future performance. Visit GuggenheimInvestments.com/mutual-funds/performance for more recent performance information.
| Net Assets | $44,963,314 |
| Total Number of Portfolio Holdings | 21 |
| Portfolio Turnover Rate | 0% |
| Inverse S&P 500® Strategy Fund | Class C | RYUCX | Semi-Annual Shareholder Report | September 30, 2024 |
| S&P 500 Index Equity Mini Futures Contracts Short Sales | -18.1% |
| S&P 500 Index Equity Swap Agreements Short Sales | -81.9% |
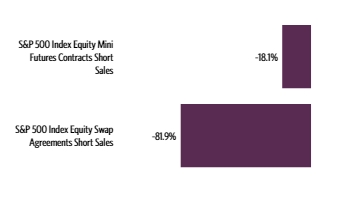
| Guggenheim Strategy Fund II | 14.5% |
| Guggenheim Ultra Short Duration Fund — Institutional Class | 9.5% |
| Total | 24.0% |
| |
1 | "Holdings Diversification (Market Exposure as a % of Net Assets)" excludes any temporary cash investments, investments in Guggenheim Strategy Funds Trust mutual funds, or investments in Guggenheim Ultra Short Duration Fund. |
| |
2 | "Largest Holdings (as a % of Net Assets)" excludes any temporary cash or derivative investments. |
| Guggenheim Strategy Fund II | 14.5% |
| Guggenheim Ultra Short Duration Fund — Institutional Class | 9.5% |
| Total | 24.0% |
| |
2 | "Largest Holdings (as a % of Net Assets)" excludes any temporary cash or derivative investments. |
There were no changes in or disagreements with fund accountants for the period.
| |  | Availability of Additional Information. For additional information, including the fund's prospectus, financial information, holdings and proxy voting information, go to GuggenheimInvestments.com/mutual-funds/literature or, call 800 820 0888. |
SAR-RYUCX-093024
Semi-Annual Shareholder Report | 9.30.24
This semi-annual shareholder report contains important information about the Inverse S&P 500® Strategy Fund for the period of April 1, 2024 to September 30, 2024. You can find additional information about the fund at GuggenheimInvestments.com/mutual-funds/literature. You can also request this information by contacting 800 820 0888 or GuggenheimClientServices@mufg-is.com.
For the period of April 1, 2024 to September 30, 2024, the fund (Class H shares) returned -5.70%, underperforming the fund's benchmark, the S&P 500 Index, which returned 10.42% for the same period.
What factors materially affected the fund's performance over the last six months?
The sectors that contributed the most to the return of the S&P 500 Index (the "Index") were Information Technology, Financials, and Communication Services. The only sector that detracted was Energy. The holdings that contributed the most to the return of the Index were Apple, Inc., NVIDIA Corp., and Tesla, Inc. Those that detracted the most were Intel Corp., Walt Disney Co., and Merck & Co., Inc. The Fund maintained a daily correlation of over 99% to its benchmark of -100% of the daily price movement of the S&P 500 Index.
Cumulative performance* for the fund's most recently completed 10 years (as of 9.30.24), assuming a $10,000 initial investment.
| 09/30/2014 | 10000 | 10000 |
| 12/31/2014 | 9446 | 10493 |
| 03/31/2015 | 9295 | 10593 |
| 06/30/2015 | 9241 | 10622 |
| 09/30/2015 | 9733 | 9939 |
| 12/31/2015 | 9008 | 10638 |
| 03/31/2016 | 8796 | 10782 |
| 06/30/2016 | 8550 | 11047 |
| 09/30/2016 | 8215 | 11472 |
| 12/31/2016 | 7885 | 11911 |
| 03/31/2017 | 7435 | 12633 |
| 06/30/2017 | 7212 | 13023 |
| 09/30/2017 | 6915 | 13607 |
| 12/31/2017 | 6499 | 14511 |
| 03/31/2018 | 6510 | 14401 |
| 06/30/2018 | 6306 | 14896 |
| 09/30/2018 | 5886 | 16044 |
| 12/31/2018 | 6762 | 13875 |
| 03/31/2019 | 5968 | 15769 |
| 06/30/2019 | 5756 | 16447 |
| 09/30/2019 | 5670 | 16727 |
| 12/31/2019 | 5217 | 18244 |
| 03/31/2020 | 6018 | 14668 |
| 06/30/2020 | 4861 | 17682 |
| 09/30/2020 | 4423 | 19260 |
| 12/31/2020 | 3909 | 21600 |
| 03/31/2021 | 3649 | 22934 |
| 06/30/2021 | 3345 | 24895 |
| 09/30/2021 | 3308 | 25040 |
| 12/31/2021 | 2956 | 27801 |
| 03/31/2022 | 3051 | 26522 |
| 06/30/2022 | 3560 | 22252 |
| 09/30/2022 | 3726 | 21165 |
| 12/31/2022 | 3467 | 22766 |
| 03/31/2023 | 3270 | 24473 |
| 06/30/2023 | 3061 | 26612 |
| 09/30/2023 | 3232 | 25741 |
| 12/31/2023 | 2957 | 28750 |
| 03/31/2024 | 2735 | 31785 |
| 06/30/2024 | 2679 | 33147 |
| 09/30/2024 | 2579 | 35098 |
| Class H | -5.70% | -20.20% | -14.58% | -12.67% |
| S&P 500 Index | 10.42% | 36.35% | 15.98% | 13.38% |
The fund's past performance is not a good predictor of the fund's future performance. Visit GuggenheimInvestments.com/mutual-funds/performance for more recent performance information.
| Net Assets | $44,963,314 |
| Total Number of Portfolio Holdings | 21 |
| Portfolio Turnover Rate | 0% |
| Inverse S&P 500® Strategy Fund | Class H | RYUHX | Semi-Annual Shareholder Report | September 30, 2024 |
| S&P 500 Index Equity Mini Futures Contracts Short Sales | -18.1% |
| S&P 500 Index Equity Swap Agreements Short Sales | -81.9% |

| Guggenheim Strategy Fund II | 14.5% |
| Guggenheim Ultra Short Duration Fund — Institutional Class | 9.5% |
| Total | 24.0% |
| |
1 | "Holdings Diversification (Market Exposure as a % of Net Assets)" excludes any temporary cash investments, investments in Guggenheim Strategy Funds Trust mutual funds, or investments in Guggenheim Ultra Short Duration Fund. |
| |
2 | "Largest Holdings (as a % of Net Assets)" excludes any temporary cash or derivative investments. |
| Guggenheim Strategy Fund II | 14.5% |
| Guggenheim Ultra Short Duration Fund — Institutional Class | 9.5% |
| Total | 24.0% |
| |
2 | "Largest Holdings (as a % of Net Assets)" excludes any temporary cash or derivative investments. |
There were no changes in or disagreements with fund accountants for the period.
| |  | Availability of Additional Information. For additional information, including the fund's prospectus, financial information, holdings and proxy voting information, go to GuggenheimInvestments.com/mutual-funds/literature or, call 800 820 0888. |
SAR-RYUHX-093024
Semi-Annual Shareholder Report | 9.30.24
This semi-annual shareholder report contains important information about the Monthly Rebalance NASDAQ-100® 2x Strategy Fund for the period of April 1, 2024 to September 30, 2024. You can find additional information about the fund at GuggenheimInvestments.com/mutual-funds/literature. You can also request this information by contacting 800 820 0888 or GuggenheimClientServices@mufg-is.com.
For the period of April 1, 2024 to September 30, 2024, the fund (Class A shares) returned 16.17%, outperforming the fund's benchmark, the S&P 500 Index, which returned 10.42% for the same period and outperforming the fund's secondary index, the NASDAQ-100 Index, which returned 10.34% for the same period.
The fund's broad-based securities market index was changed from the NASDAQ-100 Index to the S&P 500 Index to comply with the regulation that requires the fund's broad-based securities market index to represent the overall applicable market.
What factors materially affected the fund's performance over the last six months?
The sectors that contributed the most to the return of the Nasdaq-100 Index (the "Index") were Information Technology, Communication Services, and Consumer Discretionary. Those that detracted the most were Real Estate, Energy, and Industrials. The holdings that contributed the most to the return of the Index were Apple, Inc., NVIDIA Corp., and Broadcom, Inc. Those that detracted the most were Intel Corp., Advanced Micro Devices, Inc., and DexCom, Inc. The Fund maintained a daily correlation of over 99% to its benchmark of 200% of the monthly price movement of the NASDAQ-100 Index.
Cumulative performance* for the fund since inception (as of 9.30.24), assuming a $10,000 initial investment.
| 11/28/2014 | 9526 | 10000 | 10000 |
| 12/31/2014 | 9070 | 9975 | 9769 |
| 03/31/2015 | 9846 | 10070 | 10026 |
| 06/30/2015 | 10131 | 10098 | 10200 |
| 09/30/2015 | 9112 | 9447 | 9729 |
| 12/31/2015 | 10892 | 10113 | 10722 |
| 03/31/2016 | 10375 | 10249 | 10501 |
| 06/30/2016 | 10057 | 10501 | 10381 |
| 09/30/2016 | 12204 | 10905 | 11493 |
| 12/31/2016 | 12149 | 11322 | 11502 |
| 03/31/2017 | 15111 | 12009 | 12892 |
| 06/30/2017 | 16235 | 12380 | 13432 |
| 09/30/2017 | 18120 | 12935 | 14260 |
| 12/31/2017 | 20629 | 13794 | 15296 |
| 03/31/2018 | 21585 | 13689 | 15778 |
| 06/30/2018 | 24532 | 14160 | 16925 |
| 09/30/2018 | 28508 | 15251 | 18383 |
| 12/31/2018 | 19127 | 13189 | 15302 |
| 03/31/2019 | 25632 | 14989 | 17886 |
| 06/30/2019 | 27095 | 15635 | 18646 |
| 09/30/2019 | 27480 | 15900 | 18886 |
| 12/31/2019 | 34582 | 17342 | 21339 |
| 03/31/2020 | 27056 | 13944 | 19143 |
| 06/30/2020 | 44658 | 16808 | 24944 |
| 09/30/2020 | 55384 | 18309 | 28093 |
| 12/31/2020 | 69505 | 20533 | 31769 |
| 03/31/2021 | 71654 | 21801 | 32329 |
| 06/30/2021 | 87891 | 23665 | 36008 |
| 09/30/2021 | 88837 | 23802 | 36402 |
| 12/31/2021 | 108747 | 26427 | 40508 |
| 03/31/2022 | 88479 | 25212 | 36899 |
| 06/30/2022 | 51159 | 21152 | 28670 |
| 09/30/2022 | 44888 | 20120 | 27402 |
| 12/31/2022 | 43571 | 21641 | 27390 |
| 03/31/2023 | 61586 | 23263 | 33080 |
| 06/30/2023 | 79937 | 25297 | 38169 |
| 09/30/2023 | 73731 | 24469 | 37078 |
| 12/31/2023 | 94014 | 27330 | 42490 |
| 03/31/2024 | 108860 | 30215 | 46196 |
| 06/30/2024 | 123719 | 31509 | 49914 |
| 09/30/2024 | 126457 | 33364 | 50974 |
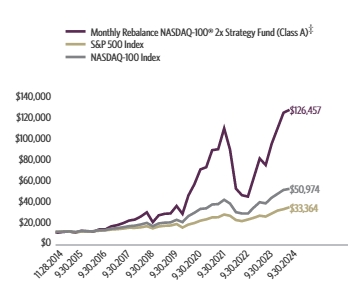
| Class A (without sales charge) | 16.17% | 71.51% | 35.70% | 30.06% |
| Class A (with sales charge)‡ | 10.65% | 63.36% | 34.39% | 29.42% |
| S&P 500 Index | 10.42% | 36.35% | 15.98% | 13.03% |
| NASDAQ-100 Index | 10.34% | 37.48% | 21.97% | 18.00% |
The fund's past performance is not a good predictor of the fund's future performance. Visit GuggenheimInvestments.com/mutual-funds/performance for more recent performance information.
| Net Assets | $791,202,446 |
| Total Number of Portfolio Holdings | 112 |
| Portfolio Turnover Rate | 248% |
| Monthly Rebalance NASDAQ-100® 2x Strategy Fund | Class A | RMQAX | Semi-Annual Shareholder Report | September 30, 2024 |
| NASDAQ-100 Index Equity Swap Agreements | 86.2% |
| Technology | 39.8% |
| Futures Contracts | 32.1% |
| Communications | 21.0% |
| Consumer, Non-cyclical | 9.4% |
| Consumer, Cyclical | 7.4% |
| Industrial | 1.3% |
| Other | 2.9% |

| Apple, Inc. | 7.4% |
| Microsoft Corp. | 6.7% |
| NVIDIA Corp. | 6.2% |
| Broadcom, Inc. | 4.3% |
| Meta Platforms, Inc. — Class A | 4.2% |
| Amazon.com, Inc. | 4.1% |
| Tesla, Inc. | 2.6% |
| Costco Wholesale Corp. | 2.1% |
| Alphabet, Inc. — Class A | 2.0% |
| Alphabet, Inc. — Class C | 2.0% |
| Top 10 Total | 41.6% |
| |
1 | "Holdings Diversification (Market Exposure as a % of Net Assets)" excludes any temporary cash investments, investments in Guggenheim Strategy Funds Trust mutual funds, or investments in Guggenheim Ultra Short Duration Fund. |
| |
2 | "10 Largest Holdings (as a % of Net Assets)" excludes any temporary cash or derivative investments. |
| Apple, Inc. | 7.4% |
| Microsoft Corp. | 6.7% |
| NVIDIA Corp. | 6.2% |
| Broadcom, Inc. | 4.3% |
| Meta Platforms, Inc. — Class A | 4.2% |
| Amazon.com, Inc. | 4.1% |
| Tesla, Inc. | 2.6% |
| Costco Wholesale Corp. | 2.1% |
| Alphabet, Inc. — Class A | 2.0% |
| Alphabet, Inc. — Class C | 2.0% |
| Top 10 Total | 41.6% |
| |
2 | "10 Largest Holdings (as a % of Net Assets)" excludes any temporary cash or derivative investments. |
There were no changes in or disagreements with fund accountants for the period.
| |  | Availability of Additional Information. For additional information, including the fund's prospectus, financial information, holdings and proxy voting information, go to GuggenheimInvestments.com/mutual-funds/literature or, call 800 820 0888. |
SAR-RMQAX-093024
Semi-Annual Shareholder Report | 9.30.24
This semi-annual shareholder report contains important information about the Monthly Rebalance NASDAQ-100® 2x Strategy Fund for the period of April 1, 2024 to September 30, 2024. You can find additional information about the fund at GuggenheimInvestments.com/mutual-funds/literature. You can also request this information by contacting 800 820 0888 or GuggenheimClientServices@mufg-is.com.
For the period of April 1, 2024 to September 30, 2024, the fund (Class C shares) returned 15.71%, outperforming the fund's benchmark, the S&P 500 Index, which returned 10.42% for the same period and outperforming the fund's secondary index, the NASDAQ-100 Index, which returned 10.34% for the same period.
The fund's broad-based securities market index was changed from the NASDAQ-100 Index to the S&P 500 Index to comply with the regulation that requires the fund's broad-based securities market index to represent the overall applicable market.
What factors materially affected the fund's performance over the last six months?
The sectors that contributed the most to the return of the Nasdaq-100 Index (the "Index") were Information Technology, Communication Services, and Consumer Discretionary. Those that detracted the most were Real Estate, Energy, and Industrials. The holdings that contributed the most to the return of the Index were Apple, Inc., NVIDIA Corp., and Broadcom, Inc. Those that detracted the most were Intel Corp., Advanced Micro Devices, Inc., and DexCom, Inc. The Fund maintained a daily correlation of over 99% to its benchmark of 200% of the monthly price movement of the NASDAQ-100 Index.
Cumulative performance* for the fund since inception (as of 9.30.24), assuming a $10,000 initial investment.
| 11/28/2014 | 10000 | 10000 | 10000 |
| 12/31/2014 | 9516 | 9975 | 9769 |
| 03/31/2015 | 10310 | 10070 | 10026 |
| 06/30/2015 | 10588 | 10098 | 10200 |
| 09/30/2015 | 9490 | 9447 | 9729 |
| 12/31/2015 | 11320 | 10113 | 10722 |
| 03/31/2016 | 10764 | 10249 | 10501 |
| 06/30/2016 | 10416 | 10501 | 10381 |
| 09/30/2016 | 12614 | 10905 | 11493 |
| 12/31/2016 | 12534 | 11322 | 11502 |
| 03/31/2017 | 15556 | 12009 | 12892 |
| 06/30/2017 | 16686 | 12380 | 13432 |
| 09/30/2017 | 18588 | 12935 | 14260 |
| 12/31/2017 | 21122 | 13794 | 15296 |
| 03/31/2018 | 22062 | 13689 | 15778 |
| 06/30/2018 | 25028 | 14160 | 16925 |
| 09/30/2018 | 29030 | 15251 | 18383 |
| 12/31/2018 | 19440 | 13189 | 15302 |
| 03/31/2019 | 26002 | 14989 | 17886 |
| 06/30/2019 | 27436 | 15635 | 18646 |
| 09/30/2019 | 27772 | 15900 | 18886 |
| 12/31/2019 | 34882 | 17342 | 21339 |
| 03/31/2020 | 27241 | 13944 | 19143 |
| 06/30/2020 | 44882 | 16808 | 24944 |
| 09/30/2020 | 55556 | 18309 | 28093 |
| 12/31/2020 | 69583 | 20533 | 31769 |
| 03/31/2021 | 71606 | 21801 | 32329 |
| 06/30/2021 | 87668 | 23665 | 36008 |
| 09/30/2021 | 88445 | 23802 | 36402 |
| 12/31/2021 | 108058 | 26427 | 40508 |
| 03/31/2022 | 87759 | 25212 | 36899 |
| 06/30/2022 | 50617 | 21152 | 28670 |
| 09/30/2022 | 44326 | 20120 | 27402 |
| 12/31/2022 | 42944 | 21641 | 27390 |
| 03/31/2023 | 60589 | 23263 | 33080 |
| 06/30/2023 | 78495 | 25297 | 38169 |
| 09/30/2023 | 72266 | 24469 | 37078 |
| 12/31/2023 | 91975 | 27330 | 42490 |
| 03/31/2024 | 106301 | 30215 | 46196 |
| 06/30/2024 | 120583 | 31509 | 49914 |
| 09/30/2024 | 123020 | 33364 | 50974 |
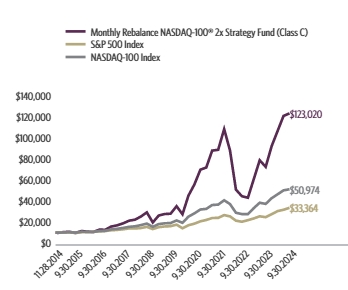
| Class C (without CDSC) | 15.71% | 70.23% | 34.67% | 29.06% |
| Class C (with CDSC)§ | 14.72% | 69.23% | 34.67% | 29.06% |
| S&P 500 Index | 10.42% | 36.35% | 15.98% | 13.03% |
| NASDAQ-100 Index | 10.34% | 37.48% | 21.97% | 18.00% |
The fund's past performance is not a good predictor of the fund's future performance. Visit GuggenheimInvestments.com/mutual-funds/performance for more recent performance information.
| Net Assets | $791,202,446 |
| Total Number of Portfolio Holdings | 112 |
| Portfolio Turnover Rate | 248% |
| Monthly Rebalance NASDAQ-100® 2x Strategy Fund | Class C | RMQCX | Semi-Annual Shareholder Report | September 30, 2024 |
| NASDAQ-100 Index Equity Swap Agreements | 86.2% |
| Technology | 39.8% |
| Futures Contracts | 32.1% |
| Communications | 21.0% |
| Consumer, Non-cyclical | 9.4% |
| Consumer, Cyclical | 7.4% |
| Industrial | 1.3% |
| Other | 2.9% |
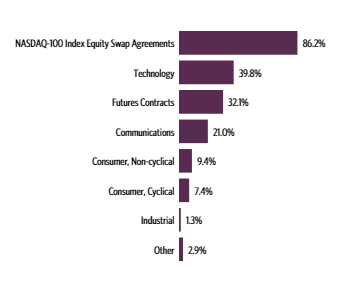
| Apple, Inc. | 7.4% |
| Microsoft Corp. | 6.7% |
| NVIDIA Corp. | 6.2% |
| Broadcom, Inc. | 4.3% |
| Meta Platforms, Inc. — Class A | 4.2% |
| Amazon.com, Inc. | 4.1% |
| Tesla, Inc. | 2.6% |
| Costco Wholesale Corp. | 2.1% |
| Alphabet, Inc. — Class A | 2.0% |
| Alphabet, Inc. — Class C | 2.0% |
| Top 10 Total | 41.6% |
| |
1 | "Holdings Diversification (Market Exposure as a % of Net Assets)" excludes any temporary cash investments, investments in Guggenheim Strategy Funds Trust mutual funds, or investments in Guggenheim Ultra Short Duration Fund. |
| |
2 | "10 Largest Holdings (as a % of Net Assets)" excludes any temporary cash or derivative investments. |
| Apple, Inc. | 7.4% |
| Microsoft Corp. | 6.7% |
| NVIDIA Corp. | 6.2% |
| Broadcom, Inc. | 4.3% |
| Meta Platforms, Inc. — Class A | 4.2% |
| Amazon.com, Inc. | 4.1% |
| Tesla, Inc. | 2.6% |
| Costco Wholesale Corp. | 2.1% |
| Alphabet, Inc. — Class A | 2.0% |
| Alphabet, Inc. — Class C | 2.0% |
| Top 10 Total | 41.6% |
| |
2 | "10 Largest Holdings (as a % of Net Assets)" excludes any temporary cash or derivative investments. |
There were no changes in or disagreements with fund accountants for the period.
| |  | Availability of Additional Information. For additional information, including the fund's prospectus, financial information, holdings and proxy voting information, go to GuggenheimInvestments.com/mutual-funds/literature or, call 800 820 0888. |
SAR-RMQCX-093024
Semi-Annual Shareholder Report | 9.30.24
This semi-annual shareholder report contains important information about the Monthly Rebalance NASDAQ-100® 2x Strategy Fund for the period of April 1, 2024 to September 30, 2024. You can find additional information about the fund at GuggenheimInvestments.com/mutual-funds/literature. You can also request this information by contacting 800 820 0888 or GuggenheimClientServices@mufg-is.com.
For the period of April 1, 2024 to September 30, 2024, the fund (Class H shares) returned 16.15%, outperforming the fund's benchmark, the S&P 500 Index, which returned 10.42% for the same period and outperforming the fund's secondary index, the NASDAQ-100 Index, which returned 10.34% for the same period.
The fund's broad-based securities market index was changed from the NASDAQ-100 Index to the S&P 500 Index to comply with the regulation that requires the fund's broad-based securities market index to represent the overall applicable market.
What factors materially affected the fund's performance over the last six months?
The sectors that contributed the most to the return of the Nasdaq-100 Index (the "Index") were Information Technology, Communication Services, and Consumer Discretionary. Those that detracted the most were Real Estate, Energy, and Industrials. The holdings that contributed the most to the return of the Index were Apple, Inc., NVIDIA Corp., and Broadcom, Inc. Those that detracted the most were Intel Corp., Advanced Micro Devices, Inc., and DexCom, Inc. The Fund maintained a daily correlation of over 99% to its benchmark of 200% of the monthly price movement of the NASDAQ-100 Index.
Cumulative performance* for the fund since inception (as of 9.30.24), assuming a $10,000 initial investment.
| 11/28/2014 | 10000 | 10000 | 10000 |
| 12/31/2014 | 9522 | 9975 | 9769 |
| 03/31/2015 | 10314 | 10070 | 10026 |
| 06/30/2015 | 10612 | 10098 | 10200 |
| 09/30/2015 | 9760 | 9447 | 9729 |
| 12/31/2015 | 11666 | 10113 | 10722 |
| 03/31/2016 | 11158 | 10249 | 10501 |
| 06/30/2016 | 10816 | 10501 | 10381 |
| 09/30/2016 | 13128 | 10905 | 11493 |
| 12/31/2016 | 13064 | 11322 | 11502 |
| 03/31/2017 | 16250 | 12009 | 12892 |
| 06/30/2017 | 17458 | 12380 | 13432 |
| 09/30/2017 | 19484 | 12935 | 14260 |
| 12/31/2017 | 22182 | 13794 | 15296 |
| 03/31/2018 | 23212 | 13689 | 15778 |
| 06/30/2018 | 26380 | 14160 | 16925 |
| 09/30/2018 | 30654 | 15251 | 18383 |
| 12/31/2018 | 20568 | 13189 | 15302 |
| 03/31/2019 | 27560 | 14989 | 17886 |
| 06/30/2019 | 29116 | 15635 | 18646 |
| 09/30/2019 | 29536 | 15900 | 18886 |
| 12/31/2019 | 37166 | 17342 | 21339 |
| 03/31/2020 | 29079 | 13944 | 19143 |
| 06/30/2020 | 47998 | 16808 | 24944 |
| 09/30/2020 | 59526 | 18309 | 28093 |
| 12/31/2020 | 74702 | 20533 | 31769 |
| 03/31/2021 | 77006 | 21801 | 32329 |
| 06/30/2021 | 94453 | 23665 | 36008 |
| 09/30/2021 | 95468 | 23802 | 36402 |
| 12/31/2021 | 116857 | 26427 | 40508 |
| 03/31/2022 | 95072 | 25212 | 36899 |
| 06/30/2022 | 54938 | 21152 | 28670 |
| 09/30/2022 | 48202 | 20120 | 27402 |
| 12/31/2022 | 46786 | 21641 | 27390 |
| 03/31/2023 | 66130 | 23263 | 33080 |
| 06/30/2023 | 85834 | 25297 | 38169 |
| 09/30/2023 | 79167 | 24469 | 37078 |
| 12/31/2023 | 100942 | 27330 | 42490 |
| 03/31/2024 | 116876 | 30215 | 46196 |
| 06/30/2024 | 132823 | 31509 | 49914 |
| 09/30/2024 | 135756 | 33364 | 50974 |
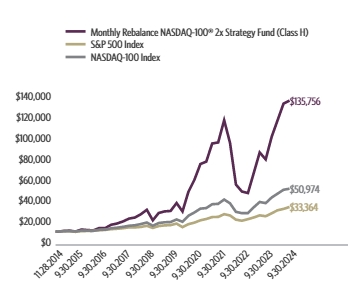
| Class H | 16.15% | 71.48% | 35.67% | 30.36% |
| S&P 500 Index | 10.42% | 36.35% | 15.98% | 13.03% |
| NASDAQ-100 Index | 10.34% | 37.48% | 21.97% | 18.00% |
The fund's past performance is not a good predictor of the fund's future performance. Visit GuggenheimInvestments.com/mutual-funds/performance for more recent performance information.
| Net Assets | $791,202,446 |
| Total Number of Portfolio Holdings | 112 |
| Portfolio Turnover Rate | 248% |
| Monthly Rebalance NASDAQ-100® 2x Strategy Fund | Class H | RMQHX | Semi-Annual Shareholder Report | September 30, 2024 |
| NASDAQ-100 Index Equity Swap Agreements | 86.2% |
| Technology | 39.8% |
| Futures Contracts | 32.1% |
| Communications | 21.0% |
| Consumer, Non-cyclical | 9.4% |
| Consumer, Cyclical | 7.4% |
| Industrial | 1.3% |
| Other | 2.9% |

| Apple, Inc. | 7.4% |
| Microsoft Corp. | 6.7% |
| NVIDIA Corp. | 6.2% |
| Broadcom, Inc. | 4.3% |
| Meta Platforms, Inc. — Class A | 4.2% |
| Amazon.com, Inc. | 4.1% |
| Tesla, Inc. | 2.6% |
| Costco Wholesale Corp. | 2.1% |
| Alphabet, Inc. — Class A | 2.0% |
| Alphabet, Inc. — Class C | 2.0% |
| Top 10 Total | 41.6% |
| |
1 | "Holdings Diversification (Market Exposure as a % of Net Assets)" excludes any temporary cash investments, investments in Guggenheim Strategy Funds Trust mutual funds, or investments in Guggenheim Ultra Short Duration Fund. |
| |
2 | "10 Largest Holdings (as a % of Net Assets)" excludes any temporary cash or derivative investments. |
| Apple, Inc. | 7.4% |
| Microsoft Corp. | 6.7% |
| NVIDIA Corp. | 6.2% |
| Broadcom, Inc. | 4.3% |
| Meta Platforms, Inc. — Class A | 4.2% |
| Amazon.com, Inc. | 4.1% |
| Tesla, Inc. | 2.6% |
| Costco Wholesale Corp. | 2.1% |
| Alphabet, Inc. — Class A | 2.0% |
| Alphabet, Inc. — Class C | 2.0% |
| Top 10 Total | 41.6% |
| |
2 | "10 Largest Holdings (as a % of Net Assets)" excludes any temporary cash or derivative investments. |
There were no changes in or disagreements with fund accountants for the period.
| |  | Availability of Additional Information. For additional information, including the fund's prospectus, financial information, holdings and proxy voting information, go to GuggenheimInvestments.com/mutual-funds/literature or, call 800 820 0888. |
SAR-RMQHX-093024
Semi-Annual Shareholder Report | 9.30.24
This semi-annual shareholder report contains important information about the NASDAQ-100 Fund for the period of April 1, 2024 to September 30, 2024. You can find additional information about the fund at GuggenheimInvestments.com/mutual-funds/literature. You can also request this information by contacting 800 820 0888 or GuggenheimClientServices@mufg-is.com.
For the period of April 1, 2024 to September 30, 2024, the fund (Investor Class shares) returned 9.69%, underperforming the fund's benchmark, the S&P 500 Index, which returned 10.42% for the same period and underperforming the fund's secondary index, the NASDAQ-100 Index, which returned 10.34% for the same period.
The fund's broad-based securities market index was changed from the NASDAQ-100 Index to the S&P 500 Index to comply with the regulation that requires the fund's broad-based securities market index to represent the overall applicable market.
What factors materially affected the fund's performance over the last six months?
The sectors that contributed the most to the return of the NASDAQ-100 Index (the "Index") were Information Technology, Communication Services, and Consumer Discretionary. Those that detracted the most were Real Estate, Energy, and Industrials. The holdings that contributed the most to the return of the Index were Apple, Inc., NVIDIA Corp., and Broadcom, Inc. Those that detracted the most were Intel Corp., Advanced Micro Devices, Inc., and DexCom, Inc. The Fund maintained a daily correlation of over 99% to its benchmark of 100% of the daily price movement of the NASDAQ-100 Index.
Cumulative performance* for the fund's most recently completed 10 years (as of 9.30.24), assuming a $10,000 initial investment.
| 09/30/2014 | 10000 | 10000 | 10000 |
| 12/31/2014 | 10448 | 10493 | 10490 |
| 03/31/2015 | 10701 | 10593 | 10765 |
| 06/30/2015 | 10857 | 10622 | 10953 |
| 09/30/2015 | 10330 | 9939 | 10446 |
| 12/31/2015 | 11346 | 10638 | 11513 |
| 03/31/2016 | 11075 | 10782 | 11276 |
| 06/30/2016 | 10920 | 11047 | 11147 |
| 09/30/2016 | 12052 | 11472 | 12341 |
| 12/31/2016 | 12019 | 11911 | 12350 |
| 03/31/2017 | 13424 | 12633 | 13843 |
| 06/30/2017 | 13941 | 13023 | 14423 |
| 09/30/2017 | 14750 | 13607 | 15312 |
| 12/31/2017 | 15770 | 14511 | 16424 |
| 03/31/2018 | 16211 | 14401 | 16942 |
| 06/30/2018 | 17333 | 14896 | 18174 |
| 09/30/2018 | 18762 | 16044 | 19739 |
| 12/31/2018 | 15554 | 13875 | 16430 |
| 03/31/2019 | 18122 | 15769 | 19205 |
| 06/30/2019 | 18825 | 16447 | 20021 |
| 09/30/2019 | 19000 | 16727 | 20279 |
| 12/31/2019 | 21391 | 18244 | 22913 |
| 03/31/2020 | 19100 | 14668 | 20555 |
| 06/30/2020 | 24814 | 17682 | 26784 |
| 09/30/2020 | 27865 | 19260 | 30165 |
| 12/31/2020 | 31398 | 21600 | 34113 |
| 03/31/2021 | 31855 | 22934 | 34713 |
| 06/30/2021 | 35376 | 24895 | 38664 |
| 09/30/2021 | 35652 | 25040 | 39087 |
| 12/31/2021 | 39541 | 27801 | 43496 |
| 03/31/2022 | 35898 | 26522 | 39621 |
| 06/30/2022 | 27778 | 22252 | 30785 |
| 09/30/2022 | 26455 | 21165 | 29424 |
| 12/31/2022 | 26361 | 22766 | 29410 |
| 03/31/2023 | 31748 | 24473 | 35520 |
| 06/30/2023 | 36524 | 26612 | 40985 |
| 09/30/2023 | 35371 | 25741 | 39813 |
| 12/31/2023 | 40415 | 28750 | 45624 |
| 03/31/2024 | 43816 | 31785 | 49603 |
| 06/30/2024 | 47205 | 33147 | 53596 |
| 09/30/2024 | 48061 | 35098 | 54734 |
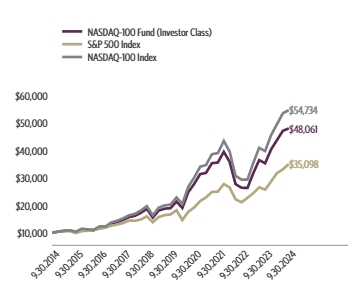
| Investor Class | 9.69% | 35.88% | 20.40% | 17.00% |
| S&P 500 Index | 10.42% | 36.35% | 15.98% | 13.38% |
| NASDAQ-100 Index | 10.34% | 37.48% | 21.97% | 18.53% |
The fund's past performance is not a good predictor of the fund's future performance. Visit GuggenheimInvestments.com/mutual-funds/performance for more recent performance information.
| Net Assets | $1,862,640,189 |
| Total Number of Portfolio Holdings | 115 |
| Portfolio Turnover Rate | 14% |
| NASDAQ-100 Fund | Investor Class | RYOCX | Semi-Annual Shareholder Report | September 30, 2024 |
| Technology | 46.6% |
| Communications | 24.5% |
| Consumer, Non-cyclical | 11.0% |
| Consumer, Cyclical | 8.7% |
| NASDAQ-100 Index Equity Swap Agreements | 4.0% |
| Industrial | 1.6% |
| Basic Materials | 1.4% |
| Utilities | 1.3% |
| Energy | 0.4% |
| NASDAQ-100 Index Equity Futures Contracts | 0.3% |
| Financial | 0.2% |

| Apple, Inc. | 8.7% |
| Microsoft Corp. | 7.8% |
| NVIDIA Corp. | 7.3% |
| Broadcom, Inc. | 5.0% |
| Meta Platforms, Inc. — Class A | 4.9% |
| Amazon.com, Inc. | 4.8% |
| Tesla, Inc. | 3.1% |
| Costco Wholesale Corp. | 2.5% |
| Alphabet, Inc. — Class A | 2.4% |
| Alphabet, Inc. — Class C | 2.3% |
| Top 10 Total | 48.8% |
| |
1 | "Holdings Diversification (Market Exposure as a % of Net Assets)" excludes any temporary cash investments, investments in Guggenheim Strategy Funds Trust mutual funds, or investments in Guggenheim Ultra Short Duration Fund. |
| |
2 | "10 Largest Holdings (as a % of Net Assets)" excludes any temporary cash or derivative investments. |
| Apple, Inc. | 8.7% |
| Microsoft Corp. | 7.8% |
| NVIDIA Corp. | 7.3% |
| Broadcom, Inc. | 5.0% |
| Meta Platforms, Inc. — Class A | 4.9% |
| Amazon.com, Inc. | 4.8% |
| Tesla, Inc. | 3.1% |
| Costco Wholesale Corp. | 2.5% |
| Alphabet, Inc. — Class A | 2.4% |
| Alphabet, Inc. — Class C | 2.3% |
| Top 10 Total | 48.8% |
| |
2 | "10 Largest Holdings (as a % of Net Assets)" excludes any temporary cash or derivative investments. |
There were no changes in or disagreements with fund accountants for the period.
| |  | Availability of Additional Information. For additional information, including the fund's prospectus, financial information, holdings and proxy voting information, go to GuggenheimInvestments.com/mutual-funds/literature or, call 800 820 0888. |
SAR-RYOCX-093024
Semi-Annual Shareholder Report | 9.30.24
This semi-annual shareholder report contains important information about the NASDAQ-100 Fund for the period of April 1, 2024 to September 30, 2024. You can find additional information about the fund at GuggenheimInvestments.com/mutual-funds/literature. You can also request this information by contacting 800 820 0888 or GuggenheimClientServices@mufg-is.com.
For the period of April 1, 2024 to September 30, 2024, the fund (Class A shares) returned 9.57%, underperforming the fund's benchmark, the S&P 500 Index, which returned 10.42% for the same period and underperforming the fund's secondary index, the NASDAQ-100 Index, which returned 10.34% for the same period.
The fund's broad-based securities market index was changed from the NASDAQ-100 Index to the S&P 500 Index to comply with the regulation that requires the fund's broad-based securities market index to represent the overall applicable market.
What factors materially affected the fund's performance over the last six months?
The sectors that contributed the most to the return of the NASDAQ-100 Index (the "Index") were Information Technology, Communication Services, and Consumer Discretionary. Those that detracted the most were Real Estate, Energy, and Industrials. The holdings that contributed the most to the return of the Index were Apple, Inc., NVIDIA Corp., and Broadcom, Inc. Those that detracted the most were Intel Corp., Advanced Micro Devices, Inc., and DexCom, Inc. The Fund maintained a daily correlation of over 99% to its benchmark of 100% of the daily price movement of the NASDAQ-100 Index.
Cumulative performance* for the fund's most recently completed 10 years (as of 9.30.24), assuming a $10,000 initial investment.
| 09/30/2014 | 9524 | 10000 | 10000 |
| 12/31/2014 | 9945 | 10493 | 10490 |
| 03/31/2015 | 10181 | 10593 | 10765 |
| 06/30/2015 | 10318 | 10622 | 10953 |
| 09/30/2015 | 9812 | 9939 | 10446 |
| 12/31/2015 | 10771 | 10638 | 11513 |
| 03/31/2016 | 10513 | 10782 | 11276 |
| 06/30/2016 | 10351 | 11047 | 11147 |
| 09/30/2016 | 11409 | 11472 | 12341 |
| 12/31/2016 | 11372 | 11911 | 12350 |
| 03/31/2017 | 12695 | 12633 | 13843 |
| 06/30/2017 | 13177 | 13023 | 14423 |
| 09/30/2017 | 13930 | 13607 | 15312 |
| 12/31/2017 | 14888 | 14511 | 16424 |
| 03/31/2018 | 15291 | 14401 | 16942 |
| 06/30/2018 | 16340 | 14896 | 18174 |
| 09/30/2018 | 17673 | 16044 | 19739 |
| 12/31/2018 | 14643 | 13875 | 16430 |
| 03/31/2019 | 17051 | 15769 | 19205 |
| 06/30/2019 | 17704 | 16447 | 20021 |
| 09/30/2019 | 17854 | 16727 | 20279 |
| 12/31/2019 | 20086 | 18244 | 22913 |
| 03/31/2020 | 17927 | 14668 | 20555 |
| 06/30/2020 | 23277 | 17682 | 26784 |
| 09/30/2020 | 26118 | 19260 | 30165 |
| 12/31/2020 | 29412 | 21600 | 34113 |
| 03/31/2021 | 29826 | 22934 | 34713 |
| 06/30/2021 | 33097 | 24895 | 38664 |
| 09/30/2021 | 33335 | 25040 | 39087 |
| 12/31/2021 | 36949 | 27801 | 43496 |
| 03/31/2022 | 33525 | 26522 | 39621 |
| 06/30/2022 | 25922 | 22252 | 30785 |
| 09/30/2022 | 24673 | 21165 | 29424 |
| 12/31/2022 | 24570 | 22766 | 29410 |
| 03/31/2023 | 29575 | 24473 | 35520 |
| 06/30/2023 | 34001 | 26612 | 40985 |
| 09/30/2023 | 32909 | 25741 | 39813 |
| 12/31/2023 | 37580 | 28750 | 45624 |
| 03/31/2024 | 40712 | 31785 | 49603 |
| 06/30/2024 | 43838 | 33147 | 53596 |
| 09/30/2024 | 44607 | 35098 | 54734 |
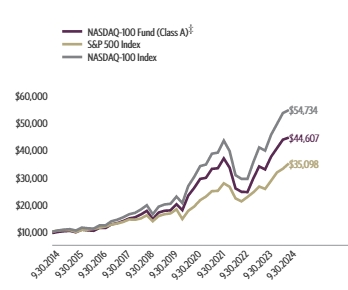
| Class A (without sales charge) | 9.57% | 35.54% | 20.10% | 16.70% |
| Class A (with sales charge)‡ | 4.37% | 29.11% | 18.94% | 16.13% |
| S&P 500 Index | 10.42% | 36.35% | 15.98% | 13.38% |
| NASDAQ-100 Index | 10.34% | 37.48% | 21.97% | 18.53% |
The fund's past performance is not a good predictor of the fund's future performance. Visit GuggenheimInvestments.com/mutual-funds/performance for more recent performance information.
| Net Assets | $1,862,640,189 |
| Total Number of Portfolio Holdings | 115 |
| Portfolio Turnover Rate | 14% |
| NASDAQ-100 Fund | Class A | RYATX | Semi-Annual Shareholder Report | September 30, 2024 |
| Technology | 46.6% |
| Communications | 24.5% |
| Consumer, Non-cyclical | 11.0% |
| Consumer, Cyclical | 8.7% |
| NASDAQ-100 Index Equity Swap Agreements | 4.0% |
| Industrial | 1.6% |
| Basic Materials | 1.4% |
| Utilities | 1.3% |
| Energy | 0.4% |
| NASDAQ-100 Index Equity Futures Contracts | 0.3% |
| Financial | 0.2% |

| Apple, Inc. | 8.7% |
| Microsoft Corp. | 7.8% |
| NVIDIA Corp. | 7.3% |
| Broadcom, Inc. | 5.0% |
| Meta Platforms, Inc. — Class A | 4.9% |
| Amazon.com, Inc. | 4.8% |
| Tesla, Inc. | 3.1% |
| Costco Wholesale Corp. | 2.5% |
| Alphabet, Inc. — Class A | 2.4% |
| Alphabet, Inc. — Class C | 2.3% |
| Top 10 Total | 48.8% |
| |
1 | "Holdings Diversification (Market Exposure as a % of Net Assets)" excludes any temporary cash investments, investments in Guggenheim Strategy Funds Trust mutual funds, or investments in Guggenheim Ultra Short Duration Fund. |
| |
2 | "10 Largest Holdings (as a % of Net Assets)" excludes any temporary cash or derivative investments. |
| Apple, Inc. | 8.7% |
| Microsoft Corp. | 7.8% |
| NVIDIA Corp. | 7.3% |
| Broadcom, Inc. | 5.0% |
| Meta Platforms, Inc. — Class A | 4.9% |
| Amazon.com, Inc. | 4.8% |
| Tesla, Inc. | 3.1% |
| Costco Wholesale Corp. | 2.5% |
| Alphabet, Inc. — Class A | 2.4% |
| Alphabet, Inc. — Class C | 2.3% |
| Top 10 Total | 48.8% |
| |
2 | "10 Largest Holdings (as a % of Net Assets)" excludes any temporary cash or derivative investments. |
There were no changes in or disagreements with fund accountants for the period.
| |  | Availability of Additional Information. For additional information, including the fund's prospectus, financial information, holdings and proxy voting information, go to GuggenheimInvestments.com/mutual-funds/literature or, call 800 820 0888. |
SAR-RYATX-093024
Semi-Annual Shareholder Report | 9.30.24
This semi-annual shareholder report contains important information about the NASDAQ-100 Fund for the period of April 1, 2024 to September 30, 2024. You can find additional information about the fund at GuggenheimInvestments.com/mutual-funds/literature. You can also request this information by contacting 800 820 0888 or GuggenheimClientServices@mufg-is.com.
For the period of April 1, 2024 to September 30, 2024, the fund (Class C shares) returned 9.14%, underperforming the fund's benchmark, the S&P 500 Index, which returned 10.42% for the same period and underperforming the fund's secondary index, the NASDAQ-100 Index, which returned 10.34% for the same period.
The fund's broad-based securities market index was changed from the NASDAQ-100 Index to the S&P 500 Index to comply with the regulation that requires the fund's broad-based securities market index to represent the overall applicable market.
What factors materially affected the fund's performance over the last six months?
The sectors that contributed the most to the return of the NASDAQ-100 Index (the "Index") were Information Technology, Communication Services, and Consumer Discretionary. Those that detracted the most were Real Estate, Energy, and Industrials. The holdings that contributed the most to the return of the Index were Apple, Inc., NVIDIA Corp., and Broadcom, Inc. Those that detracted the most were Intel Corp., Advanced Micro Devices, Inc., and DexCom, Inc. The Fund maintained a daily correlation of over 99% to its benchmark of 100% of the daily price movement of the NASDAQ-100 Index.
Cumulative performance* for the fund's most recently completed 10 years (as of 9.30.24), assuming a $10,000 initial investment.
| 09/30/2014 | 10000 | 10000 | 10000 |
| 12/31/2014 | 10421 | 10493 | 10490 |
| 03/31/2015 | 10648 | 10593 | 10765 |
| 06/30/2015 | 10776 | 10622 | 10953 |
| 09/30/2015 | 10229 | 9939 | 10446 |
| 12/31/2015 | 11204 | 10638 | 11513 |
| 03/31/2016 | 10911 | 10782 | 11276 |
| 06/30/2016 | 10730 | 11047 | 11147 |
| 09/30/2016 | 11810 | 11472 | 12341 |
| 12/31/2016 | 11751 | 11911 | 12350 |
| 03/31/2017 | 13091 | 12633 | 13843 |
| 06/30/2017 | 13565 | 13023 | 14423 |
| 09/30/2017 | 14318 | 13607 | 15312 |
| 12/31/2017 | 15265 | 14511 | 16424 |
| 03/31/2018 | 15653 | 14401 | 16942 |
| 06/30/2018 | 16699 | 14896 | 18174 |
| 09/30/2018 | 18027 | 16044 | 19739 |
| 12/31/2018 | 14907 | 13875 | 16430 |
| 03/31/2019 | 17328 | 15769 | 19205 |
| 06/30/2019 | 17956 | 16447 | 20021 |
| 09/30/2019 | 18074 | 16727 | 20279 |
| 12/31/2019 | 20295 | 18244 | 22913 |
| 03/31/2020 | 18075 | 14668 | 20555 |
| 06/30/2020 | 23431 | 17682 | 26784 |
| 09/30/2020 | 26242 | 19260 | 30165 |
| 12/31/2020 | 29493 | 21600 | 34113 |
| 03/31/2021 | 29855 | 22934 | 34713 |
| 06/30/2021 | 33069 | 24895 | 38664 |
| 09/30/2021 | 33240 | 25040 | 39087 |
| 12/31/2021 | 36773 | 27801 | 43496 |
| 03/31/2022 | 33308 | 26522 | 39621 |
| 06/30/2022 | 25708 | 22252 | 30785 |
| 09/30/2022 | 24416 | 21165 | 29424 |
| 12/31/2022 | 24274 | 22766 | 29410 |
| 03/31/2023 | 29161 | 24473 | 35520 |
| 06/30/2023 | 33466 | 26612 | 40985 |
| 09/30/2023 | 32331 | 25741 | 39813 |
| 12/31/2023 | 36847 | 28750 | 45624 |
| 03/31/2024 | 39850 | 31785 | 49603 |
| 06/30/2024 | 42825 | 33147 | 53596 |
| 09/30/2024 | 43494 | 35098 | 54734 |

| Class C (without CDSC) | 9.14% | 34.53% | 19.20% | 15.84% |
| Class C (with CDSC)§ | 8.14% | 33.53% | 19.20% | 15.84% |
| S&P 500 Index | 10.42% | 36.35% | 15.98% | 13.38% |
| NASDAQ-100 Index | 10.34% | 37.48% | 21.97% | 18.53% |
The fund's past performance is not a good predictor of the fund's future performance. Visit GuggenheimInvestments.com/mutual-funds/performance for more recent performance information.
| Net Assets | $1,862,640,189 |
| Total Number of Portfolio Holdings | 115 |
| Portfolio Turnover Rate | 14% |
| NASDAQ-100 Fund | Class C | RYCOX | Semi-Annual Shareholder Report | September 30, 2024 |
| Technology | 46.6% |
| Communications | 24.5% |
| Consumer, Non-cyclical | 11.0% |
| Consumer, Cyclical | 8.7% |
| NASDAQ-100 Index Equity Swap Agreements | 4.0% |
| Industrial | 1.6% |
| Basic Materials | 1.4% |
| Utilities | 1.3% |
| Energy | 0.4% |
| NASDAQ-100 Index Equity Futures Contracts | 0.3% |
| Financial | 0.2% |
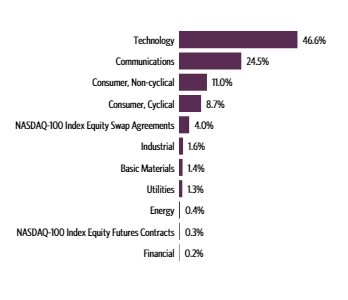
| Apple, Inc. | 8.7% |
| Microsoft Corp. | 7.8% |
| NVIDIA Corp. | 7.3% |
| Broadcom, Inc. | 5.0% |
| Meta Platforms, Inc. — Class A | 4.9% |
| Amazon.com, Inc. | 4.8% |
| Tesla, Inc. | 3.1% |
| Costco Wholesale Corp. | 2.5% |
| Alphabet, Inc. — Class A | 2.4% |
| Alphabet, Inc. — Class C | 2.3% |
| Top 10 Total | 48.8% |
| |
1 | "Holdings Diversification (Market Exposure as a % of Net Assets)" excludes any temporary cash investments, investments in Guggenheim Strategy Funds Trust mutual funds, or investments in Guggenheim Ultra Short Duration Fund. |
| |
2 | "10 Largest Holdings (as a % of Net Assets)" excludes any temporary cash or derivative investments. |
| Apple, Inc. | 8.7% |
| Microsoft Corp. | 7.8% |
| NVIDIA Corp. | 7.3% |
| Broadcom, Inc. | 5.0% |
| Meta Platforms, Inc. — Class A | 4.9% |
| Amazon.com, Inc. | 4.8% |
| Tesla, Inc. | 3.1% |
| Costco Wholesale Corp. | 2.5% |
| Alphabet, Inc. — Class A | 2.4% |
| Alphabet, Inc. — Class C | 2.3% |
| Top 10 Total | 48.8% |
| |
2 | "10 Largest Holdings (as a % of Net Assets)" excludes any temporary cash or derivative investments. |
There were no changes in or disagreements with fund accountants for the period.
| |  | Availability of Additional Information. For additional information, including the fund's prospectus, financial information, holdings and proxy voting information, go to GuggenheimInvestments.com/mutual-funds/literature or, call 800 820 0888. |
SAR-RYCOX-093024
Semi-Annual Shareholder Report | 9.30.24
This semi-annual shareholder report contains important information about the NASDAQ-100 Fund for the period of April 1, 2024 to September 30, 2024. You can find additional information about the fund at GuggenheimInvestments.com/mutual-funds/literature. You can also request this information by contacting 800 820 0888 or GuggenheimClientServices@mufg-is.com.
For the period of April 1, 2024 to September 30, 2024, the fund (Class H shares) returned 9.55%, underperforming the fund's benchmark, the S&P 500 Index, which returned 10.42% for the same period and underperforming the fund's secondary index, the NASDAQ-100 Index, which returned 10.34% for the same period.
The fund's broad-based securities market index was changed from the NASDAQ-100 Index to the S&P 500 Index to comply with the regulation that requires the fund's broad-based securities market index to represent the overall applicable market.
What factors materially affected the fund's performance over the last six months?
The sectors that contributed the most to the return of the NASDAQ-100 Index (the "Index") were Information Technology, Communication Services, and Consumer Discretionary. Those that detracted the most were Real Estate, Energy, and Industrials. The holdings that contributed the most to the return of the Index were Apple, Inc., NVIDIA Corp., and Broadcom, Inc. Those that detracted the most were Intel Corp., Advanced Micro Devices, Inc., and DexCom, Inc. The Fund maintained a daily correlation of over 99% to its benchmark of 100% of the daily price movement of the NASDAQ-100 Index.
Cumulative performance* for the fund's most recently completed 10 years (as of 9.30.24), assuming a $10,000 initial investment.
| 09/30/2014 | 10000 | 10000 | 10000 |
| 12/31/2014 | 10433 | 10493 | 10490 |
| 03/31/2015 | 10676 | 10593 | 10765 |
| 06/30/2015 | 10819 | 10622 | 10953 |
| 09/30/2015 | 10285 | 9939 | 10446 |
| 12/31/2015 | 11291 | 10638 | 11513 |
| 03/31/2016 | 11015 | 10782 | 11276 |
| 06/30/2016 | 10855 | 11047 | 11147 |
| 09/30/2016 | 11970 | 11472 | 12341 |
| 12/31/2016 | 11931 | 11911 | 12350 |
| 03/31/2017 | 13320 | 12633 | 13843 |
| 06/30/2017 | 13825 | 13023 | 14423 |
| 09/30/2017 | 14620 | 13607 | 15312 |
| 12/31/2017 | 15620 | 14511 | 16424 |
| 03/31/2018 | 16049 | 14401 | 16942 |
| 06/30/2018 | 17145 | 14896 | 18174 |
| 09/30/2018 | 18549 | 16044 | 19739 |
| 12/31/2018 | 15368 | 13875 | 16430 |
| 03/31/2019 | 17896 | 15769 | 19205 |
| 06/30/2019 | 18576 | 16447 | 20021 |
| 09/30/2019 | 18738 | 16727 | 20279 |
| 12/31/2019 | 21081 | 18244 | 22913 |
| 03/31/2020 | 18811 | 14668 | 20555 |
| 06/30/2020 | 24426 | 17682 | 26784 |
| 09/30/2020 | 27407 | 19260 | 30165 |
| 12/31/2020 | 30865 | 21600 | 34113 |
| 03/31/2021 | 31294 | 22934 | 34713 |
| 06/30/2021 | 34733 | 24895 | 38664 |
| 09/30/2021 | 34977 | 25040 | 39087 |
| 12/31/2021 | 38770 | 27801 | 43496 |
| 03/31/2022 | 35176 | 26522 | 39621 |
| 06/30/2022 | 27202 | 22252 | 30785 |
| 09/30/2022 | 25890 | 21165 | 29424 |
| 12/31/2022 | 25783 | 22766 | 29410 |
| 03/31/2023 | 31036 | 24473 | 35520 |
| 06/30/2023 | 35681 | 26612 | 40985 |
| 09/30/2023 | 34529 | 25741 | 39813 |
| 12/31/2023 | 39432 | 28750 | 45624 |
| 03/31/2024 | 42725 | 31785 | 49603 |
| 06/30/2024 | 46000 | 33147 | 53596 |
| 09/30/2024 | 46807 | 35098 | 54734 |

| Class H | 9.55% | 35.56% | 20.09% | 16.69% |
| S&P 500 Index | 10.42% | 36.35% | 15.98% | 13.38% |
| NASDAQ-100 Index | 10.34% | 37.48% | 21.97% | 18.53% |
The fund's past performance is not a good predictor of the fund's future performance. Visit GuggenheimInvestments.com/mutual-funds/performance for more recent performance information.
| Net Assets | $1,862,640,189 |
| Total Number of Portfolio Holdings | 115 |
| Portfolio Turnover Rate | 14% |
| NASDAQ-100 Fund | Class H | RYHOX | Semi-Annual Shareholder Report | September 30, 2024 |
| Technology | 46.6% |
| Communications | 24.5% |
| Consumer, Non-cyclical | 11.0% |
| Consumer, Cyclical | 8.7% |
| NASDAQ-100 Index Equity Swap Agreements | 4.0% |
| Industrial | 1.6% |
| Basic Materials | 1.4% |
| Utilities | 1.3% |
| Energy | 0.4% |
| NASDAQ-100 Index Equity Futures Contracts | 0.3% |
| Financial | 0.2% |

| Apple, Inc. | 8.7% |
| Microsoft Corp. | 7.8% |
| NVIDIA Corp. | 7.3% |
| Broadcom, Inc. | 5.0% |
| Meta Platforms, Inc. — Class A | 4.9% |
| Amazon.com, Inc. | 4.8% |
| Tesla, Inc. | 3.1% |
| Costco Wholesale Corp. | 2.5% |
| Alphabet, Inc. — Class A | 2.4% |
| Alphabet, Inc. — Class C | 2.3% |
| Top 10 Total | 48.8% |
| |
1 | "Holdings Diversification (Market Exposure as a % of Net Assets)" excludes any temporary cash investments, investments in Guggenheim Strategy Funds Trust mutual funds, or investments in Guggenheim Ultra Short Duration Fund. |
| |
2 | "10 Largest Holdings (as a % of Net Assets)" excludes any temporary cash or derivative investments. |
| Apple, Inc. | 8.7% |
| Microsoft Corp. | 7.8% |
| NVIDIA Corp. | 7.3% |
| Broadcom, Inc. | 5.0% |
| Meta Platforms, Inc. — Class A | 4.9% |
| Amazon.com, Inc. | 4.8% |
| Tesla, Inc. | 3.1% |
| Costco Wholesale Corp. | 2.5% |
| Alphabet, Inc. — Class A | 2.4% |
| Alphabet, Inc. — Class C | 2.3% |
| Top 10 Total | 48.8% |
| |
2 | "10 Largest Holdings (as a % of Net Assets)" excludes any temporary cash or derivative investments. |
There were no changes in or disagreements with fund accountants for the period.
| |  | Availability of Additional Information. For additional information, including the fund's prospectus, financial information, holdings and proxy voting information, go to GuggenheimInvestments.com/mutual-funds/literature or, call 800 820 0888. |
SAR-RYHOX-093024
Semi-Annual Shareholder Report | 9.30.24
This semi-annual shareholder report contains important information about the Inverse NASDAQ-100® Strategy Fund for the period of April 1, 2024 to September 30, 2024. You can find additional information about the fund at GuggenheimInvestments.com/mutual-funds/literature. You can also request this information by contacting 800 820 0888 or GuggenheimClientServices@mufg-is.com.
For the period of April 1, 2024 to September 30, 2024, the fund (Investor Class shares) returned -6.80%, underperforming the fund's benchmark, the S&P 500 Index, which returned 10.42% for the same period and underperforming the fund's secondary index, the NASDAQ-100 Index, which returned 10.34% for the same period.
The fund's broad-based securities market index was changed from the NASDAQ-100 Index to the S&P 500 Index to comply with the regulation that requires the fund's broad-based securities market index to represent the overall applicable market.
What factors materially affected the fund's performance over the last six months?
The sectors that contributed the most to the return of the NASDAQ-100 Index (the "Index") were Information Technology, Communication Services, and Consumer Discretionary. Those that detracted the most were Real Estate, Energy, and Industrials. The holdings that contributed the most to the return of the Index were Apple, Inc., NVIDIA Corp., and Broadcom, Inc. Those that detracted the most were Intel Corp., Advanced Micro Devices, Inc., and DexCom, Inc. The Fund maintained a daily correlation of over 99% to its benchmark of -100% of the daily price movement of the NASDAQ-100 Index.
Cumulative performance* for the fund's most recently completed 10 years (as of 9.30.24), assuming a $10,000 initial investment.
| 09/30/2014 | 10000 | 10000 | 10000 |
| 12/31/2014 | 9444 | 10493 | 10490 |
| 03/31/2015 | 9156 | 10593 | 10765 |
| 06/30/2015 | 8958 | 10622 | 10953 |
| 09/30/2015 | 9264 | 9939 | 10446 |
| 12/31/2015 | 8323 | 10638 | 11513 |
| 03/31/2016 | 8368 | 10782 | 11276 |
| 06/30/2016 | 8410 | 11047 | 11147 |
| 09/30/2016 | 7573 | 11472 | 12341 |
| 12/31/2016 | 7548 | 11911 | 12350 |
| 03/31/2017 | 6743 | 12633 | 13843 |
| 06/30/2017 | 6474 | 13023 | 14423 |
| 09/30/2017 | 6104 | 13607 | 15312 |
| 12/31/2017 | 5701 | 14511 | 16424 |
| 03/31/2018 | 5473 | 14401 | 16942 |
| 06/30/2018 | 5099 | 14896 | 18174 |
| 09/30/2018 | 4711 | 16044 | 19739 |
| 12/31/2018 | 5550 | 13875 | 16430 |
| 03/31/2019 | 4750 | 15769 | 19205 |
| 06/30/2019 | 4570 | 16447 | 20021 |
| 09/30/2019 | 4523 | 16727 | 20279 |
| 12/31/2019 | 4015 | 18244 | 22913 |
| 03/31/2020 | 4165 | 14668 | 20555 |
| 06/30/2020 | 3125 | 17682 | 26784 |
| 09/30/2020 | 2720 | 19260 | 30165 |
| 12/31/2020 | 2370 | 21600 | 34113 |
| 03/31/2021 | 2289 | 22934 | 34713 |
| 06/30/2021 | 2038 | 24895 | 38664 |
| 09/30/2021 | 2004 | 25040 | 39087 |
| 12/31/2021 | 1780 | 27801 | 43496 |
| 03/31/2022 | 1901 | 26522 | 39621 |
| 06/30/2022 | 2360 | 22252 | 30785 |
| 09/30/2022 | 2443 | 21165 | 29424 |
| 12/31/2022 | 2420 | 22766 | 29410 |
| 03/31/2023 | 2017 | 24473 | 35520 |
| 06/30/2023 | 1775 | 26612 | 40985 |
| 09/30/2023 | 1860 | 25741 | 39813 |
| 12/31/2023 | 1653 | 28750 | 45624 |
| 03/31/2024 | 1548 | 31785 | 49603 |
| 06/30/2024 | 1458 | 33147 | 53596 |
| 09/30/2024 | 1443 | 35098 | 54734 |
| Investor Class | -6.80% | -22.44% | -20.43% | -17.60% |
| S&P 500 Index | 10.42% | 36.35% | 15.98% | 13.38% |
| NASDAQ-100 Index | 10.34% | 37.48% | 21.97% | 18.53% |
The fund's past performance is not a good predictor of the fund's future performance. Visit GuggenheimInvestments.com/mutual-funds/performance for more recent performance information.
| Net Assets | $14,879,719 |
| Total Number of Portfolio Holdings | 13 |
| Portfolio Turnover Rate | 0% |
| Inverse NASDAQ-100® Strategy Fund | Investor Class | RYAIX | Semi-Annual Shareholder Report | September 30, 2024 |
| NASDAQ-100 Index Equity Mini Futures Contracts Short Sales | -16.3% |
| NASDAQ-100 Index Equity Swap Agreements Short Sales | -83.9% |

| Guggenheim Strategy Fund II | 8.2% |
| Guggenheim Ultra Short Duration Fund — Institutional Class | 5.9% |
| Total | 14.1% |
| |
1 | "Holdings Diversification (Market Exposure as a % of Net Assets)" excludes any temporary cash investments, investments in Guggenheim Strategy Funds Trust mutual funds, or investments in Guggenheim Ultra Short Duration Fund. |
| |
2 | "Largest Holdings (as a % of Net Assets)" excludes any temporary cash or derivative investments. |
| Guggenheim Strategy Fund II | 8.2% |
| Guggenheim Ultra Short Duration Fund — Institutional Class | 5.9% |
| Total | 14.1% |
| |
2 | "Largest Holdings (as a % of Net Assets)" excludes any temporary cash or derivative investments. |
There were no changes in or disagreements with fund accountants for the period.
| |  | Availability of Additional Information. For additional information, including the fund's prospectus, financial information, holdings and proxy voting information, go to GuggenheimInvestments.com/mutual-funds/literature or, call 800 820 0888. |
SAR-RYAIX-093024
Semi-Annual Shareholder Report | 9.30.24
This semi-annual shareholder report contains important information about the Inverse NASDAQ-100® Strategy Fund for the period of April 1, 2024 to September 30, 2024. You can find additional information about the fund at GuggenheimInvestments.com/mutual-funds/literature. You can also request this information by contacting 800 820 0888 or GuggenheimClientServices@mufg-is.com.
For the period of April 1, 2024 to September 30, 2024, the fund (Class A shares) returned -6.89%, underperforming the fund's benchmark, the S&P 500 Index, which returned 10.42% for the same period and underperforming the fund's secondary index, the NASDAQ-100 Index, which returned 10.34% for the same period.
The fund's broad-based securities market index was changed from the NASDAQ-100 Index to the S&P 500 Index to comply with the regulation that requires the fund's broad-based securities market index to represent the overall applicable market.
What factors materially affected the fund's performance over the last six months?
The sectors that contributed the most to the return of the NASDAQ-100 Index (the "Index") were Information Technology, Communication Services, and Consumer Discretionary. Those that detracted the most were Real Estate, Energy, and Industrials. The holdings that contributed the most to the return of the Index were Apple, Inc., NVIDIA Corp., and Broadcom, Inc. Those that detracted the most were Intel Corp., Advanced Micro Devices, Inc., and DexCom, Inc. The Fund maintained a daily correlation of over 99% to its benchmark of -100% of the daily price movement of the NASDAQ-100 Index.
Cumulative performance* for the fund's most recently completed 10 years (as of 9.30.24), assuming a $10,000 initial investment.
| 09/30/2014 | 9524 | 10000 | 10000 |
| 12/31/2014 | 8987 | 10493 | 10490 |
| 03/31/2015 | 8709 | 10593 | 10765 |
| 06/30/2015 | 8514 | 10622 | 10953 |
| 09/30/2015 | 8867 | 9939 | 10446 |
| 12/31/2015 | 8004 | 10638 | 11513 |
| 03/31/2016 | 8045 | 10782 | 11276 |
| 06/30/2016 | 8083 | 11047 | 11147 |
| 09/30/2016 | 7282 | 11472 | 12341 |
| 12/31/2016 | 7250 | 11911 | 12350 |
| 03/31/2017 | 6473 | 12633 | 13843 |
| 06/30/2017 | 6211 | 13023 | 14423 |
| 09/30/2017 | 5853 | 13607 | 15312 |
| 12/31/2017 | 5462 | 14511 | 16424 |
| 03/31/2018 | 5241 | 14401 | 16942 |
| 06/30/2018 | 4880 | 14896 | 18174 |
| 09/30/2018 | 4506 | 16044 | 19739 |
| 12/31/2018 | 5306 | 13875 | 16430 |
| 03/31/2019 | 4537 | 15769 | 19205 |
| 06/30/2019 | 4363 | 16447 | 20021 |
| 09/30/2019 | 4315 | 16727 | 20279 |
| 12/31/2019 | 3828 | 18244 | 22913 |
| 03/31/2020 | 3969 | 14668 | 20555 |
| 06/30/2020 | 2975 | 17682 | 26784 |
| 09/30/2020 | 2589 | 19260 | 30165 |
| 12/31/2020 | 2254 | 21600 | 34113 |
| 03/31/2021 | 2176 | 22934 | 34713 |
| 06/30/2021 | 1935 | 24895 | 38664 |
| 09/30/2021 | 1902 | 25040 | 39087 |
| 12/31/2021 | 1688 | 27801 | 43496 |
| 03/31/2022 | 1802 | 26522 | 39621 |
| 06/30/2022 | 2236 | 22252 | 30785 |
| 09/30/2022 | 2312 | 21165 | 29424 |
| 12/31/2022 | 2290 | 22766 | 29410 |
| 03/31/2023 | 1908 | 24473 | 35520 |
| 06/30/2023 | 1677 | 26612 | 40985 |
| 09/30/2023 | 1757 | 25741 | 39813 |
| 12/31/2023 | 1561 | 28750 | 45624 |
| 03/31/2024 | 1459 | 31785 | 49603 |
| 06/30/2024 | 1375 | 33147 | 53596 |
| 09/30/2024 | 1359 | 35098 | 54734 |
| Class A (without sales charge) | -6.89% | -22.66% | -20.64% | -17.69% |
| Class A (with sales charge)‡ | -11.31% | -26.35% | -21.40% | -18.09% |
| S&P 500 Index | 10.42% | 36.35% | 15.98% | 13.38% |
| NASDAQ-100 Index | 10.34% | 37.48% | 21.97% | 18.53% |
The fund's past performance is not a good predictor of the fund's future performance. Visit GuggenheimInvestments.com/mutual-funds/performance for more recent performance information.
| Net Assets | $14,879,719 |
| Total Number of Portfolio Holdings | 13 |
| Portfolio Turnover Rate | 0% |
| Inverse NASDAQ-100® Strategy Fund | Class A | RYAPX | Semi-Annual Shareholder Report | September 30, 2024 |
| NASDAQ-100 Index Equity Mini Futures Contracts Short Sales | -16.3% |
| NASDAQ-100 Index Equity Swap Agreements Short Sales | -83.9% |

| Guggenheim Strategy Fund II | 8.2% |
| Guggenheim Ultra Short Duration Fund — Institutional Class | 5.9% |
| Total | 14.1% |
| |
1 | "Holdings Diversification (Market Exposure as a % of Net Assets)" excludes any temporary cash investments, investments in Guggenheim Strategy Funds Trust mutual funds, or investments in Guggenheim Ultra Short Duration Fund. |
| |
2 | "Largest Holdings (as a % of Net Assets)" excludes any temporary cash or derivative investments. |
| Guggenheim Strategy Fund II | 8.2% |
| Guggenheim Ultra Short Duration Fund — Institutional Class | 5.9% |
| Total | 14.1% |
| |
2 | "Largest Holdings (as a % of Net Assets)" excludes any temporary cash or derivative investments. |
There were no changes in or disagreements with fund accountants for the period.
| |  | Availability of Additional Information. For additional information, including the fund's prospectus, financial information, holdings and proxy voting information, go to GuggenheimInvestments.com/mutual-funds/literature or, call 800 820 0888. |
SAR-RYAPX-093024
Semi-Annual Shareholder Report | 9.30.24
This semi-annual shareholder report contains important information about the Inverse NASDAQ-100® Strategy Fund for the period of April 1, 2024 to September 30, 2024. You can find additional information about the fund at GuggenheimInvestments.com/mutual-funds/literature. You can also request this information by contacting 800 820 0888 or GuggenheimClientServices@mufg-is.com.
For the period of April 1, 2024 to September 30, 2024, the fund (Class C shares) returned -7.29%, underperforming the fund's benchmark, the S&P 500 Index, which returned 10.42% for the same period and underperforming the fund's secondary index, the NASDAQ-100 Index, which returned 10.34% for the same period.
The fund's broad-based securities market index was changed from the NASDAQ-100 Index to the S&P 500 Index to comply with the regulation that requires the fund's broad-based securities market index to represent the overall applicable market.
What factors materially affected the fund's performance over the last six months?
The sectors that contributed the most to the return of the NASDAQ-100 Index (the "Index") were Information Technology, Communication Services, and Consumer Discretionary. Those that detracted the most were Real Estate, Energy, and Industrials. The holdings that contributed the most to the return of the Index were Apple, Inc., NVIDIA Corp., and Broadcom, Inc. Those that detracted the most were Intel Corp., Advanced Micro Devices, Inc., and DexCom, Inc. The Fund maintained a daily correlation of over 99% to its benchmark of -100% of the daily price movement of the NASDAQ-100 Index.
Cumulative performance* for the fund's most recently completed 10 years (as of 9.30.24), assuming a $10,000 initial investment.
| 09/30/2014 | 10000 | 10000 | 10000 |
| 12/31/2014 | 9419 | 10493 | 10490 |
| 03/31/2015 | 9109 | 10593 | 10765 |
| 06/30/2015 | 8891 | 10622 | 10953 |
| 09/30/2015 | 9177 | 9939 | 10446 |
| 12/31/2015 | 8221 | 10638 | 11513 |
| 03/31/2016 | 8249 | 10782 | 11276 |
| 06/30/2016 | 8269 | 11047 | 11147 |
| 09/30/2016 | 7426 | 11472 | 12341 |
| 12/31/2016 | 7382 | 11911 | 12350 |
| 03/31/2017 | 6578 | 12633 | 13843 |
| 06/30/2017 | 6301 | 13023 | 14423 |
| 09/30/2017 | 5927 | 13607 | 15312 |
| 12/31/2017 | 5520 | 14511 | 16424 |
| 03/31/2018 | 5287 | 14401 | 16942 |
| 06/30/2018 | 4914 | 14896 | 18174 |
| 09/30/2018 | 4529 | 16044 | 19739 |
| 12/31/2018 | 5321 | 13875 | 16430 |
| 03/31/2019 | 4541 | 15769 | 19205 |
| 06/30/2019 | 4359 | 16447 | 20021 |
| 09/30/2019 | 4303 | 16727 | 20279 |
| 12/31/2019 | 3810 | 18244 | 22913 |
| 03/31/2020 | 3942 | 14668 | 20555 |
| 06/30/2020 | 2950 | 17682 | 26784 |
| 09/30/2020 | 2562 | 19260 | 30165 |
| 12/31/2020 | 2226 | 21600 | 34113 |
| 03/31/2021 | 2145 | 22934 | 34713 |
| 06/30/2021 | 1905 | 24895 | 38664 |
| 09/30/2021 | 1868 | 25040 | 39087 |
| 12/31/2021 | 1656 | 27801 | 43496 |
| 03/31/2022 | 1762 | 26522 | 39621 |
| 06/30/2022 | 2183 | 22252 | 30785 |
| 09/30/2022 | 2254 | 21165 | 29424 |
| 12/31/2022 | 2229 | 22766 | 29410 |
| 03/31/2023 | 1853 | 24473 | 35520 |
| 06/30/2023 | 1626 | 26612 | 40985 |
| 09/30/2023 | 1699 | 25741 | 39813 |
| 12/31/2023 | 1508 | 28750 | 45624 |
| 03/31/2024 | 1407 | 31785 | 49603 |
| 06/30/2024 | 1323 | 33147 | 53596 |
| 09/30/2024 | 1305 | 35098 | 54734 |
| Class C (without CDSC) | -7.29% | -23.23% | -21.23% | -18.43% |
| Class C (with CDSC)§ | -8.22% | -23.95% | -21.23% | -18.43% |
| S&P 500 Index | 10.42% | 36.35% | 15.98% | 13.38% |
| NASDAQ-100 Index | 10.34% | 37.48% | 21.97% | 18.53% |
The fund's past performance is not a good predictor of the fund's future performance. Visit GuggenheimInvestments.com/mutual-funds/performance for more recent performance information.
| Net Assets | $14,879,719 |
| Total Number of Portfolio Holdings | 13 |
| Portfolio Turnover Rate | 0% |
| Inverse NASDAQ-100® Strategy Fund | Class C | RYACX | Semi-Annual Shareholder Report | September 30, 2024 |
| NASDAQ-100 Index Equity Mini Futures Contracts Short Sales | -16.3% |
| NASDAQ-100 Index Equity Swap Agreements Short Sales | -83.9% |

| Guggenheim Strategy Fund II | 8.2% |
| Guggenheim Ultra Short Duration Fund — Institutional Class | 5.9% |
| Total | 14.1% |
| |
1 | "Holdings Diversification (Market Exposure as a % of Net Assets)" excludes any temporary cash investments, investments in Guggenheim Strategy Funds Trust mutual funds, or investments in Guggenheim Ultra Short Duration Fund. |
| |
2 | "Largest Holdings (as a % of Net Assets)" excludes any temporary cash or derivative investments. |
| Guggenheim Strategy Fund II | 8.2% |
| Guggenheim Ultra Short Duration Fund — Institutional Class | 5.9% |
| Total | 14.1% |
| |
2 | "Largest Holdings (as a % of Net Assets)" excludes any temporary cash or derivative investments. |
There were no changes in or disagreements with fund accountants for the period.
| |  | Availability of Additional Information. For additional information, including the fund's prospectus, financial information, holdings and proxy voting information, go to GuggenheimInvestments.com/mutual-funds/literature or, call 800 820 0888. |
SAR-RYACX-093024
Semi-Annual Shareholder Report | 9.30.24
This semi-annual shareholder report contains important information about the Inverse NASDAQ-100® Strategy Fund for the period of April 1, 2024 to September 30, 2024. You can find additional information about the fund at GuggenheimInvestments.com/mutual-funds/literature. You can also request this information by contacting 800 820 0888 or GuggenheimClientServices@mufg-is.com.
For the period of April 1, 2024 to September 30, 2024, the fund (Class H shares) returned -6.93%, underperforming the fund's benchmark, the S&P 500 Index, which returned 10.42% for the same period and underperforming the fund's secondary index, the NASDAQ-100 Index, which returned 10.34% for the same period.
The fund's broad-based securities market index was changed from the NASDAQ-100 Index to the S&P 500 Index to comply with the regulation that requires the fund's broad-based securities market index to represent the overall applicable market.
What factors materially affected the fund's performance over the last six months?
The sectors that contributed the most to the return of the NASDAQ-100 Index (the "Index") were Information Technology, Communication Services, and Consumer Discretionary. Those that detracted the most were Real Estate, Energy, and Industrials. The holdings that contributed the most to the return of the Index were Apple, Inc., NVIDIA Corp., and Broadcom, Inc. Those that detracted the most were Intel Corp., Advanced Micro Devices, Inc., and DexCom, Inc. The Fund maintained a daily correlation of over 99% to its benchmark of -100% of the daily price movement of the NASDAQ-100 Index.
Cumulative performance* for the fund's most recently completed 10 years (as of 9.30.24), assuming a $10,000 initial investment.
| 09/30/2014 | 10000 | 10000 | 10000 |
| 12/31/2014 | 9439 | 10493 | 10490 |
| 03/31/2015 | 9148 | 10593 | 10765 |
| 06/30/2015 | 8943 | 10622 | 10953 |
| 09/30/2015 | 9245 | 9939 | 10446 |
| 12/31/2015 | 8296 | 10638 | 11513 |
| 03/31/2016 | 8342 | 10782 | 11276 |
| 06/30/2016 | 8375 | 11047 | 11147 |
| 09/30/2016 | 7537 | 11472 | 12341 |
| 12/31/2016 | 7509 | 11911 | 12350 |
| 03/31/2017 | 6703 | 12633 | 13843 |
| 06/30/2017 | 6431 | 13023 | 14423 |
| 09/30/2017 | 6060 | 13607 | 15312 |
| 12/31/2017 | 5656 | 14511 | 16424 |
| 03/31/2018 | 5427 | 14401 | 16942 |
| 06/30/2018 | 5052 | 14896 | 18174 |
| 09/30/2018 | 4665 | 16044 | 19739 |
| 12/31/2018 | 5493 | 13875 | 16430 |
| 03/31/2019 | 4696 | 15769 | 19205 |
| 06/30/2019 | 4516 | 16447 | 20021 |
| 09/30/2019 | 4467 | 16727 | 20279 |
| 12/31/2019 | 3961 | 18244 | 22913 |
| 03/31/2020 | 4107 | 14668 | 20555 |
| 06/30/2020 | 3079 | 17682 | 26784 |
| 09/30/2020 | 2678 | 19260 | 30165 |
| 12/31/2020 | 2331 | 21600 | 34113 |
| 03/31/2021 | 2250 | 22934 | 34713 |
| 06/30/2021 | 2002 | 24895 | 38664 |
| 09/30/2021 | 1968 | 25040 | 39087 |
| 12/31/2021 | 1747 | 27801 | 43496 |
| 03/31/2022 | 1864 | 26522 | 39621 |
| 06/30/2022 | 2313 | 22252 | 30785 |
| 09/30/2022 | 2394 | 21165 | 29424 |
| 12/31/2022 | 2369 | 22766 | 29410 |
| 03/31/2023 | 1973 | 24473 | 35520 |
| 06/30/2023 | 1735 | 26612 | 40985 |
| 09/30/2023 | 1817 | 25741 | 39813 |
| 12/31/2023 | 1615 | 28750 | 45624 |
| 03/31/2024 | 1511 | 31785 | 49603 |
| 06/30/2024 | 1423 | 33147 | 53596 |
| 09/30/2024 | 1405 | 35098 | 54734 |
| Class H | -6.93% | -22.66% | -20.65% | -17.82% |
| S&P 500 Index | 10.42% | 36.35% | 15.98% | 13.38% |
| NASDAQ-100 Index | 10.34% | 37.48% | 21.97% | 18.53% |
The fund's past performance is not a good predictor of the fund's future performance. Visit GuggenheimInvestments.com/mutual-funds/performance for more recent performance information.
| Net Assets | $14,879,719 |
| Total Number of Portfolio Holdings | 13 |
| Portfolio Turnover Rate | 0% |
| Inverse NASDAQ-100® Strategy Fund | Class H | RYALX | Semi-Annual Shareholder Report | September 30, 2024 |
| NASDAQ-100 Index Equity Mini Futures Contracts Short Sales | -16.3% |
| NASDAQ-100 Index Equity Swap Agreements Short Sales | -83.9% |
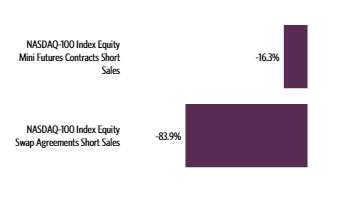
| Guggenheim Strategy Fund II | 8.2% |
| Guggenheim Ultra Short Duration Fund — Institutional Class | 5.9% |
| Total | 14.1% |
| |
1 | "Holdings Diversification (Market Exposure as a % of Net Assets)" excludes any temporary cash investments, investments in Guggenheim Strategy Funds Trust mutual funds, or investments in Guggenheim Ultra Short Duration Fund. |
| |
2 | "Largest Holdings (as a % of Net Assets)" excludes any temporary cash or derivative investments. |
| Guggenheim Strategy Fund II | 8.2% |
| Guggenheim Ultra Short Duration Fund — Institutional Class | 5.9% |
| Total | 14.1% |
| |
2 | "Largest Holdings (as a % of Net Assets)" excludes any temporary cash or derivative investments. |
There were no changes in or disagreements with fund accountants for the period.
| |  | Availability of Additional Information. For additional information, including the fund's prospectus, financial information, holdings and proxy voting information, go to GuggenheimInvestments.com/mutual-funds/literature or, call 800 820 0888. |
SAR-RYALX-093024
Semi-Annual Shareholder Report | 9.30.24
This semi-annual shareholder report contains important information about the Russell 2000® 1.5x Strategy Fund for the period of April 1, 2024 to September 30, 2024. You can find additional information about the fund at GuggenheimInvestments.com/mutual-funds/literature. You can also request this information by contacting 800 820 0888 or GuggenheimClientServices@mufg-is.com.
For the period of April 1, 2024 to September 30, 2024, the fund (Class A shares) returned 5.46%, underperforming the fund's benchmark, the S&P 500 Index, which returned 10.42% for the same period and underperforming the fund's secondary index, the Russell 2000 Index, which returned 5.69% for the same period.
The fund's broad-based securities market index was changed from the Russell 2000 Index to the S&P 500 Index to comply with the regulation that requires the fund's broad-based securities market index to represent the overall applicable market.
What factors materially affected the fund's performance over the last six months?
The sectors that contributed the most to the return of the underlying Russell 2000 Index (the "Index") were Financials, Health Care, and Real Estate. The only sector that detracted was Energy. The holdings that contributed the most to the Index were Insmed, Inc., FTAI Aviation Ltd., and Lumen Technologies, Inc. Those that detracted the most were Super Micro Computer, Inc., MicroStrategy, Inc. - Class A, and Atkore, Inc. The Fund maintained a daily correlation of over 99% to its benchmark of 150% of the daily price movement of the Russell 2000 Index.
Cumulative performance* for the fund's most recently completed 10 years (as of 9.30.24), assuming a $10,000 initial investment.
| 09/30/2014 | 9524 | 10000 | 10000 |
| 12/31/2014 | 10859 | 10493 | 10611 |
| 03/31/2015 | 11505 | 10593 | 10803 |
| 06/30/2015 | 11515 | 10622 | 10685 |
| 09/30/2015 | 9446 | 9939 | 9879 |
| 12/31/2015 | 9900 | 10638 | 10377 |
| 03/31/2016 | 9579 | 10782 | 10658 |
| 06/30/2016 | 10056 | 11047 | 11062 |
| 09/30/2016 | 11382 | 11472 | 12063 |
| 12/31/2016 | 12802 | 11911 | 13128 |
| 03/31/2017 | 13220 | 12633 | 13452 |
| 06/30/2017 | 13643 | 13023 | 13783 |
| 09/30/2017 | 14748 | 13607 | 14565 |
| 12/31/2017 | 15387 | 14511 | 15051 |
| 03/31/2018 | 15227 | 14401 | 15039 |
| 06/30/2018 | 16910 | 14896 | 16205 |
| 09/30/2018 | 17697 | 16044 | 16784 |
| 12/31/2018 | 12363 | 13875 | 13393 |
| 03/31/2019 | 15021 | 15769 | 15347 |
| 06/30/2019 | 15354 | 16447 | 15668 |
| 09/30/2019 | 14663 | 16727 | 15292 |
| 12/31/2019 | 16750 | 18244 | 16812 |
| 03/31/2020 | 9246 | 14668 | 11665 |
| 06/30/2020 | 12708 | 17682 | 14630 |
| 09/30/2020 | 13576 | 19260 | 15352 |
| 12/31/2020 | 20253 | 21600 | 20168 |
| 03/31/2021 | 23971 | 22934 | 22729 |
| 06/30/2021 | 25364 | 24895 | 23705 |
| 09/30/2021 | 23543 | 25040 | 22671 |
| 12/31/2021 | 24086 | 27801 | 23157 |
| 03/31/2022 | 21131 | 26522 | 21414 |
| 06/30/2022 | 15648 | 22252 | 17732 |
| 09/30/2022 | 14927 | 21165 | 17344 |
| 12/31/2022 | 16100 | 22766 | 18424 |
| 03/31/2023 | 16570 | 24473 | 18929 |
| 06/30/2023 | 17646 | 26612 | 19914 |
| 09/30/2023 | 16107 | 25741 | 18893 |
| 12/31/2023 | 19330 | 28750 | 21543 |
| 03/31/2024 | 20558 | 31785 | 22659 |
| 06/30/2024 | 19297 | 33147 | 21917 |
| 09/30/2024 | 21682 | 35098 | 23949 |

| Class A (without sales charge) | 5.46% | 34.61% | 8.14% | 8.57% |
| Class A (with sales charge)‡ | 0.45% | 28.22% | 7.09% | 8.05% |
| S&P 500 Index | 10.42% | 36.35% | 15.98% | 13.38% |
| Russell 2000 Index | 5.69% | 26.76% | 9.39% | 9.13% |
The fund's past performance is not a good predictor of the fund's future performance. Visit GuggenheimInvestments.com/mutual-funds/performance for more recent performance information.
| Net Assets | $6,507,881 |
| Total Number of Portfolio Holdings | 1,992 |
| Portfolio Turnover Rate | 9% |
| Russell 2000® 1.5x Strategy Fund | Class A | RYAKX | Semi-Annual Shareholder Report | September 30, 2024 |
| Russell 2000 Index Equity Swap Agreements | 85.5% |
| Financial | 15.6% |
| Consumer, Non-cyclical | 15.5% |
| Industrial | 10.2% |
| Consumer, Cyclical | 7.2% |
| Technology | 6.1% |
| Energy | 3.3% |
| Other | 6.7% |
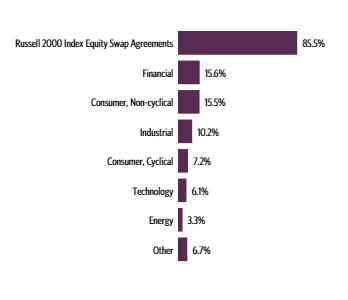
| Guggenheim Strategy Fund II | 9.8% |
| Guggenheim Ultra Short Duration Fund — Institutional Class | 8.6% |
| Vaxcyte, Inc. | 0.3% |
| FTAI Aviation Ltd. | 0.3% |
| Insmed, Inc. | 0.3% |
| Sprouts Farmers Market, Inc. | 0.3% |
| Fabrinet | 0.2% |
| Applied Industrial Technologies, Inc. | 0.2% |
| Mueller Industries, Inc. | 0.2% |
| Fluor Corp. | 0.2% |
| Top 10 Total | 20.4% |
| |
1 | "Holdings Diversification (Market Exposure as a % of Net Assets)" excludes any temporary cash investments, investments in Guggenheim Strategy Funds Trust mutual funds, or investments in Guggenheim Ultra Short Duration Fund. |
| |
2 | "10 Largest Holdings (as a % of Net Assets)" excludes any temporary cash or derivative investments. |
| Guggenheim Strategy Fund II | 9.8% |
| Guggenheim Ultra Short Duration Fund — Institutional Class | 8.6% |
| Vaxcyte, Inc. | 0.3% |
| FTAI Aviation Ltd. | 0.3% |
| Insmed, Inc. | 0.3% |
| Sprouts Farmers Market, Inc. | 0.3% |
| Fabrinet | 0.2% |
| Applied Industrial Technologies, Inc. | 0.2% |
| Mueller Industries, Inc. | 0.2% |
| Fluor Corp. | 0.2% |
| Top 10 Total | 20.4% |
| |
2 | "10 Largest Holdings (as a % of Net Assets)" excludes any temporary cash or derivative investments. |
There were no changes in or disagreements with fund accountants for the period.
| |  | Availability of Additional Information. For additional information, including the fund's prospectus, financial information, holdings and proxy voting information, go to GuggenheimInvestments.com/mutual-funds/literature or, call 800 820 0888. |
SAR-RYAKX-093024
Semi-Annual Shareholder Report | 9.30.24
This semi-annual shareholder report contains important information about the Russell 2000® 1.5x Strategy Fund for the period of April 1, 2024 to September 30, 2024. You can find additional information about the fund at GuggenheimInvestments.com/mutual-funds/literature. You can also request this information by contacting 800 820 0888 or GuggenheimClientServices@mufg-is.com.
For the period of April 1, 2024 to September 30, 2024, the fund (Class C shares) returned 5.06%, underperforming the fund's benchmark, the S&P 500 Index, which returned 10.42% for the same period and underperforming the fund's secondary index, the Russell 2000 Index, which returned 5.69% for the same period.
The fund's broad-based securities market index was changed from the Russell 2000 Index to the S&P 500 Index to comply with the regulation that requires the fund's broad-based securities market index to represent the overall applicable market.
What factors materially affected the fund's performance over the last six months?
The sectors that contributed the most to the return of the underlying Russell 2000 Index (the "Index") were Financials, Health Care, and Real Estate. The only sector that detracted was Energy. The holdings that contributed the most to the Index were Insmed, Inc., FTAI Aviation Ltd., and Lumen Technologies, Inc. Those that detracted the most were Super Micro Computer, Inc., MicroStrategy, Inc. - Class A, and Atkore, Inc. The Fund maintained a daily correlation of over 99% to its benchmark of 150% of the daily price movement of the Russell 2000 Index.
Cumulative performance* for the fund's most recently completed 10 years (as of 9.30.24), assuming a $10,000 initial investment.
| 09/30/2014 | 10000 | 10000 | 10000 |
| 12/31/2014 | 11380 | 10493 | 10611 |
| 03/31/2015 | 12033 | 10593 | 10803 |
| 06/30/2015 | 12021 | 10622 | 10685 |
| 09/30/2015 | 9844 | 9939 | 9879 |
| 12/31/2015 | 10294 | 10638 | 10377 |
| 03/31/2016 | 9944 | 10782 | 10658 |
| 06/30/2016 | 10418 | 11047 | 11062 |
| 09/30/2016 | 11771 | 11472 | 12063 |
| 12/31/2016 | 13214 | 11911 | 13128 |
| 03/31/2017 | 13621 | 12633 | 13452 |
| 06/30/2017 | 14030 | 13023 | 13783 |
| 09/30/2017 | 15137 | 13607 | 14565 |
| 12/31/2017 | 15764 | 14511 | 15051 |
| 03/31/2018 | 15572 | 14401 | 15039 |
| 06/30/2018 | 17261 | 14896 | 16205 |
| 09/30/2018 | 18029 | 16044 | 16784 |
| 12/31/2018 | 12573 | 13875 | 13393 |
| 03/31/2019 | 15250 | 15769 | 15347 |
| 06/30/2019 | 15558 | 16447 | 15668 |
| 09/30/2019 | 14829 | 16727 | 15292 |
| 12/31/2019 | 16905 | 18244 | 16812 |
| 03/31/2020 | 9314 | 14668 | 11665 |
| 06/30/2020 | 12779 | 17682 | 14630 |
| 09/30/2020 | 13629 | 19260 | 15352 |
| 12/31/2020 | 20288 | 21600 | 20168 |
| 03/31/2021 | 23972 | 22934 | 22729 |
| 06/30/2021 | | 24895 | 23705 |
| 09/30/2021 | 23454 | 25040 | 22671 |
| 12/31/2021 | 23948 | 27801 | 23157 |
| 03/31/2022 | 20970 | 26522 | 21414 |
| 06/30/2022 | 15501 | 22252 | 17732 |
| 09/30/2022 | 14757 | 21165 | 17344 |
| 12/31/2022 | 15886 | 22766 | 18424 |
| 03/31/2023 | 16322 | 24473 | 18929 |
| 06/30/2023 | 17350 | 26612 | 19914 |
| 09/30/2023 | 15805 | 25741 | 18893 |
| 12/31/2023 | 18934 | 28750 | 21543 |
| 03/31/2024 | 20097 | 31785 | 22659 |
| 06/30/2024 | 18827 | 33147 | 21917 |
| 09/30/2024 | 21113 | 35098 | 23949 |
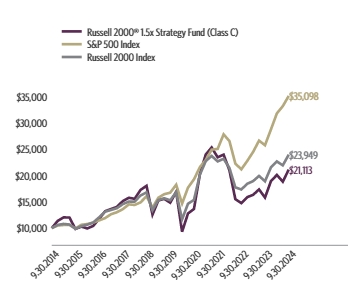
| Class C (without CDSC) | 5.06% | 33.59% | 7.32% | 7.76% |
| Class C (with CDSC)§ | 4.06% | 32.59% | 7.32% | 7.76% |
| S&P 500 Index | 10.42% | 36.35% | 15.98% | 13.38% |
| Russell 2000 Index | 5.69% | 26.76% | 9.39% | 9.13% |
The fund's past performance is not a good predictor of the fund's future performance. Visit GuggenheimInvestments.com/mutual-funds/performance for more recent performance information.
| Net Assets | $6,507,881 |
| Total Number of Portfolio Holdings | 1,992 |
| Portfolio Turnover Rate | 9% |
| Russell 2000® 1.5x Strategy Fund | Class C | RYCMX | Semi-Annual Shareholder Report | September 30, 2024 |
| Russell 2000 Index Equity Swap Agreements | 85.5% |
| Financial | 15.6% |
| Consumer, Non-cyclical | 15.5% |
| Industrial | 10.2% |
| Consumer, Cyclical | 7.2% |
| Technology | 6.1% |
| Energy | 3.3% |
| Other | 6.7% |

| Guggenheim Strategy Fund II | 9.8% |
| Guggenheim Ultra Short Duration Fund — Institutional Class | 8.6% |
| Vaxcyte, Inc. | 0.3% |
| FTAI Aviation Ltd. | 0.3% |
| Insmed, Inc. | 0.3% |
| Sprouts Farmers Market, Inc. | 0.3% |
| Fabrinet | 0.2% |
| Applied Industrial Technologies, Inc. | 0.2% |
| Mueller Industries, Inc. | 0.2% |
| Fluor Corp. | 0.2% |
| Top 10 Total | 20.4% |
| |
1 | "Holdings Diversification (Market Exposure as a % of Net Assets)" excludes any temporary cash investments, investments in Guggenheim Strategy Funds Trust mutual funds, or investments in Guggenheim Ultra Short Duration Fund. |
| |
2 | "10 Largest Holdings (as a % of Net Assets)" excludes any temporary cash or derivative investments. |
| Guggenheim Strategy Fund II | 9.8% |
| Guggenheim Ultra Short Duration Fund — Institutional Class | 8.6% |
| Vaxcyte, Inc. | 0.3% |
| FTAI Aviation Ltd. | 0.3% |
| Insmed, Inc. | 0.3% |
| Sprouts Farmers Market, Inc. | 0.3% |
| Fabrinet | 0.2% |
| Applied Industrial Technologies, Inc. | 0.2% |
| Mueller Industries, Inc. | 0.2% |
| Fluor Corp. | 0.2% |
| Top 10 Total | 20.4% |
| |
2 | "10 Largest Holdings (as a % of Net Assets)" excludes any temporary cash or derivative investments. |
There were no changes in or disagreements with fund accountants for the period.
| |  | Availability of Additional Information. For additional information, including the fund's prospectus, financial information, holdings and proxy voting information, go to GuggenheimInvestments.com/mutual-funds/literature or, call 800 820 0888. |
SAR-RYCMX-093024
Semi-Annual Shareholder Report | 9.30.24
This semi-annual shareholder report contains important information about the Russell 2000® 1.5x Strategy Fund for the period of April 1, 2024 to September 30, 2024. You can find additional information about the fund at GuggenheimInvestments.com/mutual-funds/literature. You can also request this information by contacting 800 820 0888 or GuggenheimClientServices@mufg-is.com.
For the period of April 1, 2024 to September 30, 2024, the fund (Class H shares) returned 5.46%, underperforming the fund's benchmark, the S&P 500 Index, which returned 10.42% for the same period and underperforming the fund's secondary index, the Russell 2000 Index, which returned 5.69% for the same period.
The fund's broad-based securities market index was changed from the Russell 2000 Index to the S&P 500 Index to comply with the regulation that requires the fund's broad-based securities market index to represent the overall applicable market.
What factors materially affected the fund's performance over the last six months?
The sectors that contributed the most to the return of the underlying Russell 2000 Index (the "Index") were Financials, Health Care, and Real Estate. The only sector that detracted was Energy. The holdings that contributed the most to the Index were Insmed, Inc., FTAI Aviation Ltd., and Lumen Technologies, Inc. Those that detracted the most were Super Micro Computer, Inc., MicroStrategy, Inc. - Class A, and Atkore, Inc. The Fund maintained a daily correlation of over 99% to its benchmark of 150% of the daily price movement of the Russell 2000 Index.
Cumulative performance* for the fund's most recently completed 10 years (as of 9.30.24), assuming a $10,000 initial investment.
| 09/30/2014 | 10000 | 10000 | 10000 |
| 12/31/2014 | 11405 | 10493 | 10611 |
| 03/31/2015 | 12080 | 10593 | 10803 |
| 06/30/2015 | 12090 | 10622 | 10685 |
| 09/30/2015 | 9918 | 9939 | 9879 |
| 12/31/2015 | 10395 | 10638 | 10377 |
| 03/31/2016 | 10071 | 10782 | 10658 |
| 06/30/2016 | 10571 | 11047 | 11062 |
| 09/30/2016 | 11961 | 11472 | 12063 |
| 12/31/2016 | 13433 | 11911 | 13128 |
| 03/31/2017 | 13878 | 12633 | 13452 |
| 06/30/2017 | 14323 | 13023 | 13783 |
| 09/30/2017 | 15478 | 13607 | 14565 |
| 12/31/2017 | 16129 | 14511 | 15051 |
| 03/31/2018 | 15955 | 14401 | 15039 |
| 06/30/2018 | 17719 | 14896 | 16205 |
| 09/30/2018 | 18541 | 16044 | 16784 |
| 12/31/2018 | 12964 | 13875 | 13393 |
| 03/31/2019 | 15744 | 15769 | 15347 |
| 06/30/2019 | 16092 | 16447 | 15668 |
| 09/30/2019 | 15366 | 16727 | 15292 |
| 12/31/2019 | 17550 | 18244 | 16812 |
| 03/31/2020 | 9689 | 14668 | 11665 |
| 06/30/2020 | 13316 | 17682 | 14630 |
| 09/30/2020 | 14228 | 19260 | 15352 |
| 12/31/2020 | 21224 | 21600 | 20168 |
| 03/31/2021 | 25121 | 22934 | 22729 |
| 06/30/2021 | 26581 | 24895 | 23705 |
| 09/30/2021 | 24670 | 25040 | 22671 |
| 12/31/2021 | 25239 | 27801 | 23157 |
| 03/31/2022 | 22142 | 26522 | 21414 |
| 06/30/2022 | 16402 | 22252 | 17732 |
| 09/30/2022 | 15641 | 21165 | 17344 |
| 12/31/2022 | 16871 | 22766 | 18424 |
| 03/31/2023 | 17363 | 24473 | 18929 |
| 06/30/2023 | 18494 | 26612 | 19914 |
| 09/30/2023 | 16878 | 25741 | 18893 |
| 12/31/2023 | 20255 | 28750 | 21543 |
| 03/31/2024 | 21542 | 31785 | 22659 |
| 06/30/2024 | 20223 | 33147 | 21917 |
| 09/30/2024 | 22719 | 35098 | 23949 |

| Class H | 5.46% | 34.60% | 8.13% | 8.55% |
| S&P 500 Index | 10.42% | 36.35% | 15.98% | 13.38% |
| Russell 2000 Index | 5.69% | 26.76% | 9.39% | 9.13% |
The fund's past performance is not a good predictor of the fund's future performance. Visit GuggenheimInvestments.com/mutual-funds/performance for more recent performance information.
| Net Assets | $6,507,881 |
| Total Number of Portfolio Holdings | 1,992 |
| Portfolio Turnover Rate | 9% |
| Russell 2000® 1.5x Strategy Fund | Class H | RYMKX | Semi-Annual Shareholder Report | September 30, 2024 |
| Russell 2000 Index Equity Swap Agreements | 85.5% |
| Financial | 15.6% |
| Consumer, Non-cyclical | 15.5% |
| Industrial | 10.2% |
| Consumer, Cyclical | 7.2% |
| Technology | 6.1% |
| Energy | 3.3% |
| Other | 6.7% |

| Guggenheim Strategy Fund II | 9.8% |
| Guggenheim Ultra Short Duration Fund — Institutional Class | 8.6% |
| Vaxcyte, Inc. | 0.3% |
| FTAI Aviation Ltd. | 0.3% |
| Insmed, Inc. | 0.3% |
| Sprouts Farmers Market, Inc. | 0.3% |
| Fabrinet | 0.2% |
| Applied Industrial Technologies, Inc. | 0.2% |
| Mueller Industries, Inc. | 0.2% |
| Fluor Corp. | 0.2% |
| Top 10 Total | 20.4% |
| |
1 | "Holdings Diversification (Market Exposure as a % of Net Assets)" excludes any temporary cash investments, investments in Guggenheim Strategy Funds Trust mutual funds, or investments in Guggenheim Ultra Short Duration Fund. |
| |
2 | "10 Largest Holdings (as a % of Net Assets)" excludes any temporary cash or derivative investments. |
| Guggenheim Strategy Fund II | 9.8% |
| Guggenheim Ultra Short Duration Fund — Institutional Class | 8.6% |
| Vaxcyte, Inc. | 0.3% |
| FTAI Aviation Ltd. | 0.3% |
| Insmed, Inc. | 0.3% |
| Sprouts Farmers Market, Inc. | 0.3% |
| Fabrinet | 0.2% |
| Applied Industrial Technologies, Inc. | 0.2% |
| Mueller Industries, Inc. | 0.2% |
| Fluor Corp. | 0.2% |
| Top 10 Total | 20.4% |
| |
2 | "10 Largest Holdings (as a % of Net Assets)" excludes any temporary cash or derivative investments. |
There were no changes in or disagreements with fund accountants for the period.
| |  | Availability of Additional Information. For additional information, including the fund's prospectus, financial information, holdings and proxy voting information, go to GuggenheimInvestments.com/mutual-funds/literature or, call 800 820 0888. |
SAR-RYMKX-093024
Semi-Annual Shareholder Report | 9.30.24
This semi-annual shareholder report contains important information about the Russell 2000® Fund for the period of April 1, 2024 to September 30, 2024. You can find additional information about the fund at GuggenheimInvestments.com/mutual-funds/literature. You can also request this information by contacting 800 820 0888 or GuggenheimClientServices@mufg-is.com.
For the period of April 1, 2024 to September 30, 2024, the fund (Class A shares) returned 4.92%, underperforming the fund's benchmark, the S&P 500 Index, which returned 10.42% for the same period and underperforming the fund's secondary index, the Russell 2000 Index, which returned 5.69% for the same period.
The fund's broad-based securities market index was changed from the Russell 2000 Index to the S&P 500 Index to comply with the regulation that requires the fund's broad-based securities market index to represent the overall applicable market.
What factors materially affected the fund's performance over the last six months?
The sectors that contributed the most to the return of the Russell 2000 Index (the "Index) were Financials, Health Care, and Real Estate. The only sector that detracted was Energy. The holdings that contributed the most to the Index were Insmed, Inc., FTAI Aviation Ltd., and Lumen Technologies, Inc. Those that detracted the most were Super Micro Computer, Inc., MicroStrategy, Inc. - Class A, and Atkore, Inc. The Fund maintained a daily correlation of over 99% to its benchmark of 100% of the daily price movement of the Russell 2000 Index.
Cumulative performance* for the fund's most recently completed 10 years (as of 9.30.24), assuming a $10,000 initial investment.
| 09/30/2014 | 9525 | 10000 | 10000 |
| 12/31/2014 | 10396 | 10493 | 10611 |
| 03/31/2015 | 10802 | 10593 | 10803 |
| 06/30/2015 | 10804 | 10622 | 10685 |
| 09/30/2015 | 9457 | 9939 | 9879 |
| 12/31/2015 | 9758 | 10638 | 10377 |
| 03/31/2016 | 9567 | 10782 | 10658 |
| 06/30/2016 | 9880 | 11047 | 11062 |
| 09/30/2016 | 10727 | 11472 | 12063 |
| 12/31/2016 | 11614 | 11911 | 13128 |
| 03/31/2017 | 11859 | 12633 | 13452 |
| 06/30/2017 | 12104 | 13023 | 13783 |
| 09/30/2017 | 12745 | 13607 | 14565 |
| 12/31/2017 | 13114 | 14511 | 15051 |
| 03/31/2018 | 13048 | 14401 | 15039 |
| 06/30/2018 | 13998 | 14896 | 16205 |
| 09/30/2018 | 14432 | 16044 | 16784 |
| 12/31/2018 | 11465 | 13875 | 13393 |
| 03/31/2019 | 13090 | 15769 | 15347 |
| 06/30/2019 | 13317 | 16447 | 15668 |
| 09/30/2019 | 12941 | 16727 | 15292 |
| 12/31/2019 | 14165 | 18244 | 16812 |
| 03/31/2020 | 9775 | 14668 | 11665 |
| 06/30/2020 | 12201 | 17682 | 14630 |
| 09/30/2020 | 12762 | 19260 | 15352 |
| 12/31/2020 | 16688 | 21600 | 20168 |
| 03/31/2021 | 18744 | 22934 | 22729 |
| 06/30/2021 | 19459 | 24895 | 23705 |
| 09/30/2021 | 18541 | 25040 | 22671 |
| 12/31/2021 | 18855 | 27801 | 23157 |
| 03/31/2022 | 17376 | 26522 | 21414 |
| 06/30/2022 | 14327 | 22252 | 17732 |
| 09/30/2022 | 13953 | 21165 | 17344 |
| 12/31/2022 | 14763 | 22766 | 18424 |
| 03/31/2023 | 15120 | 24473 | 18929 |
| 06/30/2023 | 15840 | 26612 | 19914 |
| 09/30/2023 | 14969 | 25741 | 18893 |
| 12/31/2023 | 17003 | 28750 | 21543 |
| 03/31/2024 | 17807 | 31785 | 22659 |
| 06/30/2024 | 17154 | 33147 | 21917 |
| 09/30/2024 | 18683 | 35098 | 23949 |

| Class A (without sales charge) | 4.92% | 24.82% | 7.62% | 6.97% |
| Class A (with sales charge)‡ | -0.06% | 18.88% | 6.58% | 6.45% |
| S&P 500 Index | 10.42% | 36.35% | 15.98% | 13.38% |
| Russell 2000 Index | 5.69% | 26.76% | 9.39% | 9.13% |
The fund's past performance is not a good predictor of the fund's future performance. Visit GuggenheimInvestments.com/mutual-funds/performance for more recent performance information.
| Net Assets | $16,707,395 |
| Total Number of Portfolio Holdings | 1,995 |
| Portfolio Turnover Rate | 8% |
| Russell 2000® Fund | Class A | RYRRX | Semi-Annual Shareholder Report | September 30, 2024 |
| Russell 2000 Index Swap Agreements | 25.8% |
| Exchange-Traded Funds | 16.8% |
| Financial | 13.3% |
| Consumer, Non-cyclical | 13.2% |
| Industrial | 8.7% |
| Consumer, Cyclical | 6.2% |
| Technology | 5.2% |
| Other | 10.5% |

| Vanguard Russell 2000 ETF | 8.4% |
| iShares Russell 2000 Index ETF | 8.4% |
| Vaxcyte, Inc. | 0.3% |
| FTAI Aviation Ltd. | 0.3% |
| Insmed, Inc. | 0.2% |
| Sprouts Farmers Market, Inc. | 0.2% |
| Fabrinet | 0.2% |
| Applied Industrial Technologies, Inc. | 0.2% |
| Mueller Industries, Inc. | 0.2% |
| Fluor Corp. | 0.2% |
| Top 10 Total | 18.6% |
| |
1 | "Holdings Diversification (Market Exposure as a % of Net Assets)" excludes any temporary cash investments, investments in Guggenheim Strategy Funds Trust mutual funds, or investments in Guggenheim Ultra Short Duration Fund. |
| |
2 | "10 Largest Holdings (as a % of Net Assets)" excludes any temporary cash or derivative investments. |
| Vanguard Russell 2000 ETF | 8.4% |
| iShares Russell 2000 Index ETF | 8.4% |
| Vaxcyte, Inc. | 0.3% |
| FTAI Aviation Ltd. | 0.3% |
| Insmed, Inc. | 0.2% |
| Sprouts Farmers Market, Inc. | 0.2% |
| Fabrinet | 0.2% |
| Applied Industrial Technologies, Inc. | 0.2% |
| Mueller Industries, Inc. | 0.2% |
| Fluor Corp. | 0.2% |
| Top 10 Total | 18.6% |
| |
2 | "10 Largest Holdings (as a % of Net Assets)" excludes any temporary cash or derivative investments. |
There were no changes in or disagreements with fund accountants for the period.
| |  | Availability of Additional Information. For additional information, including the fund's prospectus, financial information, holdings and proxy voting information, go to GuggenheimInvestments.com/mutual-funds/literature or, call 800 820 0888. |
SAR-RYRRX-093024
Semi-Annual Shareholder Report | 9.30.24
This semi-annual shareholder report contains important information about the Russell 2000® Fund for the period of April 1, 2024 to September 30, 2024. You can find additional information about the fund at GuggenheimInvestments.com/mutual-funds/literature. You can also request this information by contacting 800 820 0888 or GuggenheimClientServices@mufg-is.com.
For the period of April 1, 2024 to September 30, 2024, the fund (Class C shares) returned 4.55%, underperforming the fund's benchmark, the S&P 500 Index, which returned 10.42% for the same period and underperforming the fund's secondary index, the Russell 2000 Index, which returned 5.69% for the same period.
The fund's broad-based securities market index was changed from the Russell 2000 Index to the S&P 500 Index to comply with the regulation that requires the fund's broad-based securities market index to represent the overall applicable market.
What factors materially affected the fund's performance over the last six months?
The sectors that contributed the most to the return of the Russell 2000 Index (the "Index) were Financials, Health Care, and Real Estate. The only sector that detracted was Energy. The holdings that contributed the most to the Index were Insmed, Inc., FTAI Aviation Ltd., and Lumen Technologies, Inc. Those that detracted the most were Super Micro Computer, Inc., MicroStrategy, Inc. - Class A, and Atkore, Inc. The Fund maintained a daily correlation of over 99% to its benchmark of 100% of the daily price movement of the Russell 2000 Index.
Cumulative performance* for the fund's most recently completed 10 years (as of 9.30.24), assuming a $10,000 initial investment.
| 09/30/2014 | 10000 | 10000 | 10000 |
| 12/31/2014 | 10887 | 10493 | 10611 |
| 03/31/2015 | 11295 | 10593 | 10803 |
| 06/30/2015 | 11276 | 10622 | 10685 |
| 09/30/2015 | 9852 | 9939 | 9879 |
| 12/31/2015 | 10145 | 10638 | 10377 |
| 03/31/2016 | 9932 | 10782 | 10658 |
| 06/30/2016 | 10238 | 11047 | 11062 |
| 09/30/2016 | 11093 | 11472 | 12063 |
| 12/31/2016 | 11990 | 11911 | 13128 |
| 03/31/2017 | 12219 | 12633 | 13452 |
| 06/30/2017 | 12449 | 13023 | 13783 |
| 09/30/2017 | 13081 | 13607 | 14565 |
| 12/31/2017 | 13437 | 14511 | 15051 |
| 03/31/2018 | 13345 | 14401 | 15039 |
| 06/30/2018 | 14286 | 14896 | 16205 |
| 09/30/2018 | 14704 | 16044 | 16784 |
| 12/31/2018 | 11659 | 13875 | 13393 |
| 03/31/2019 | 13287 | 15769 | 15347 |
| 06/30/2019 | 13494 | 16447 | 15668 |
| 09/30/2019 | 13086 | 16727 | 15292 |
| 12/31/2019 | 14296 | 18244 | 16812 |
| 03/31/2020 | 9849 | 14668 | 11665 |
| 06/30/2020 | 12268 | 17682 | 14630 |
| 09/30/2020 | 12807 | 19260 | 15352 |
| 12/31/2020 | 16719 | 21600 | 20168 |
| 03/31/2021 | 18744 | 22934 | 22729 |
| 06/30/2021 | 19421 | 24895 | 23705 |
| 09/30/2021 | 18467 | 25040 | 22671 |
| 12/31/2021 | 18738 | 27801 | 23157 |
| 03/31/2022 | 17235 | 26522 | 21414 |
| 06/30/2022 | 14182 | 22252 | 17732 |
| 09/30/2022 | 13791 | 21165 | 17344 |
| 12/31/2022 | 14561 | 22766 | 18424 |
| 03/31/2023 | 14884 | 24473 | 18929 |
| 06/30/2023 | 15565 | 26612 | 19914 |
| 09/30/2023 | 14680 | 25741 | 18893 |
| 12/31/2023 | 16645 | 28750 | 21543 |
| 03/31/2024 | 17401 | 31785 | 22659 |
| 06/30/2024 | 16729 | 33147 | 21917 |
| 09/30/2024 | 18192 | 35098 | 23949 |

| Class C (without CDSC) | 4.55% | 23.92% | 6.81% | 6.17% |
| Class C (with CDSC)§ | 3.55% | 22.92% | 6.81% | 6.17% |
| S&P 500 Index | 10.42% | 36.35% | 15.98% | 13.38% |
| Russell 2000 Index | 5.69% | 26.76% | 9.39% | 9.13% |
The fund's past performance is not a good predictor of the fund's future performance. Visit GuggenheimInvestments.com/mutual-funds/performance for more recent performance information.
| Net Assets | $16,707,395 |
| Total Number of Portfolio Holdings | 1,995 |
| Portfolio Turnover Rate | 8% |
| Russell 2000® Fund | Class C | RYROX | Semi-Annual Shareholder Report | September 30, 2024 |
| Russell 2000 Index Swap Agreements | 25.8% |
| Exchange-Traded Funds | 16.8% |
| Financial | 13.3% |
| Consumer, Non-cyclical | 13.2% |
| Industrial | 8.7% |
| Consumer, Cyclical | 6.2% |
| Technology | 5.2% |
| Other | 10.5% |

| Vanguard Russell 2000 ETF | 8.4% |
| iShares Russell 2000 Index ETF | 8.4% |
| Vaxcyte, Inc. | 0.3% |
| FTAI Aviation Ltd. | 0.3% |
| Insmed, Inc. | 0.2% |
| Sprouts Farmers Market, Inc. | 0.2% |
| Fabrinet | 0.2% |
| Applied Industrial Technologies, Inc. | 0.2% |
| Mueller Industries, Inc. | 0.2% |
| Fluor Corp. | 0.2% |
| Top 10 Total | 18.6% |
| |
1 | "Holdings Diversification (Market Exposure as a % of Net Assets)" excludes any temporary cash investments, investments in Guggenheim Strategy Funds Trust mutual funds, or investments in Guggenheim Ultra Short Duration Fund. |
| |
2 | "10 Largest Holdings (as a % of Net Assets)" excludes any temporary cash or derivative investments. |
| Vanguard Russell 2000 ETF | 8.4% |
| iShares Russell 2000 Index ETF | 8.4% |
| Vaxcyte, Inc. | 0.3% |
| FTAI Aviation Ltd. | 0.3% |
| Insmed, Inc. | 0.2% |
| Sprouts Farmers Market, Inc. | 0.2% |
| Fabrinet | 0.2% |
| Applied Industrial Technologies, Inc. | 0.2% |
| Mueller Industries, Inc. | 0.2% |
| Fluor Corp. | 0.2% |
| Top 10 Total | 18.6% |
| |
2 | "10 Largest Holdings (as a % of Net Assets)" excludes any temporary cash or derivative investments. |
There were no changes in or disagreements with fund accountants for the period.
| |  | Availability of Additional Information. For additional information, including the fund's prospectus, financial information, holdings and proxy voting information, go to GuggenheimInvestments.com/mutual-funds/literature or, call 800 820 0888. |
SAR-RYROX-093024
Semi-Annual Shareholder Report | 9.30.24
This semi-annual shareholder report contains important information about the Russell 2000® Fund for the period of April 1, 2024 to September 30, 2024. You can find additional information about the fund at GuggenheimInvestments.com/mutual-funds/literature. You can also request this information by contacting 800 820 0888 or GuggenheimClientServices@mufg-is.com.
For the period of April 1, 2024 to September 30, 2024, the fund (Class H shares) returned 4.93%, underperforming the fund's benchmark, the S&P 500 Index, which returned 10.42% for the same period and underperforming the fund's secondary index, the Russell 2000 Index, which returned 5.69% for the same period.
The fund's broad-based securities market index was changed from the Russell 2000 Index to the S&P 500 Index to comply with the regulation that requires the fund's broad-based securities market index to represent the overall applicable market.
What factors materially affected the fund's performance over the last six months?
The sectors that contributed the most to the return of the Russell 2000 Index (the "Index) were Financials, Health Care, and Real Estate. The only sector that detracted was Energy. The holdings that contributed the most to the Index were Insmed, Inc., FTAI Aviation Ltd., and Lumen Technologies, Inc. Those that detracted the most were Super Micro Computer, Inc., MicroStrategy, Inc. - Class A, and Atkore, Inc. The Fund maintained a daily correlation of over 99% to its benchmark of 100% of the daily price movement of the Russell 2000 Index.
Cumulative performance* for the fund's most recently completed 10 years (as of 9.30.24), assuming a $10,000 initial investment.
| 09/30/2014 | 10000 | 10000 | 10000 |
| 12/31/2014 | 10914 | 10493 | 10611 |
| 03/31/2015 | 11338 | 10593 | 10803 |
| 06/30/2015 | 11338 | 10622 | 10685 |
| 09/30/2015 | 9923 | 9939 | 9879 |
| 12/31/2015 | 10243 | 10638 | 10377 |
| 03/31/2016 | 10042 | 10782 | 10658 |
| 06/30/2016 | 10369 | 11047 | 11062 |
| 09/30/2016 | 11256 | 11472 | 12063 |
| 12/31/2016 | 12192 | 11911 | 13128 |
| 03/31/2017 | 12447 | 12633 | 13452 |
| 06/30/2017 | 12705 | 13023 | 13783 |
| 09/30/2017 | 13377 | 13607 | 14565 |
| 12/31/2017 | 13765 | 14511 | 15051 |
| 03/31/2018 | 13695 | 14401 | 15039 |
| 06/30/2018 | 14692 | 14896 | 16205 |
| 09/30/2018 | 15151 | 16044 | 16784 |
| 12/31/2018 | 12032 | 13875 | 13393 |
| 03/31/2019 | 13739 | 15769 | 15347 |
| 06/30/2019 | 13978 | 16447 | 15668 |
| 09/30/2019 | 13585 | 16727 | 15292 |
| 12/31/2019 | 14874 | 18244 | 16812 |
| 03/31/2020 | 10264 | 14668 | 11665 |
| 06/30/2020 | 12810 | 17682 | 14630 |
| 09/30/2020 | 13397 | 19260 | 15352 |
| 12/31/2020 | 17522 | 21600 | 20168 |
| 03/31/2021 | 19679 | 22934 | 22729 |
| 06/30/2021 | 20432 | 24895 | 23705 |
| 09/30/2021 | 19465 | 25040 | 22671 |
| 12/31/2021 | 19796 | 27801 | 23157 |
| 03/31/2022 | 18244 | 26522 | 21414 |
| 06/30/2022 | 15041 | 22252 | 17732 |
| 09/30/2022 | 14651 | 21165 | 17344 |
| 12/31/2022 | 15500 | 22766 | 18424 |
| 03/31/2023 | 15875 | 24473 | 18929 |
| 06/30/2023 | 16630 | 26612 | 19914 |
| 09/30/2023 | 15716 | 25741 | 18893 |
| 12/31/2023 | 17854 | 28750 | 21543 |
| 03/31/2024 | 18697 | 31785 | 22659 |
| 06/30/2024 | 18009 | 33147 | 21917 |
| 09/30/2024 | 19619 | 35098 | 23949 |
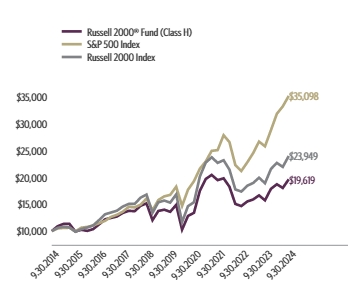
| Class H ** | 4.93% | 24.83% | 7.63% | 6.97% |
| S&P 500 Index | 10.42% | 36.35% | 15.98% | 13.38% |
| Russell 2000 Index | 5.69% | 26.76% | 9.39% | 9.13% |
The fund's past performance is not a good predictor of the fund's future performance. Visit GuggenheimInvestments.com/mutual-funds/performance for more recent performance information.
| Net Assets | $16,707,395 |
| Total Number of Portfolio Holdings | 1,995 |
| Portfolio Turnover Rate | 8% |
| Russell 2000® Fund | Class H | RYRHX | Semi-Annual Shareholder Report | September 30, 2024 |
| Russell 2000 Index Swap Agreements | 25.8% |
| Exchange-Traded Funds | 16.8% |
| Financial | 13.3% |
| Consumer, Non-cyclical | 13.2% |
| Industrial | 8.7% |
| Consumer, Cyclical | 6.2% |
| Technology | 5.2% |
| Other | 10.5% |
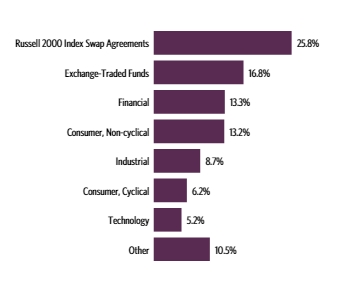
| Vanguard Russell 2000 ETF | 8.4% |
| iShares Russell 2000 Index ETF | 8.4% |
| Vaxcyte, Inc. | 0.3% |
| FTAI Aviation Ltd. | 0.3% |
| Insmed, Inc. | 0.2% |
| Sprouts Farmers Market, Inc. | 0.2% |
| Fabrinet | 0.2% |
| Applied Industrial Technologies, Inc. | 0.2% |
| Mueller Industries, Inc. | 0.2% |
| Fluor Corp. | 0.2% |
| Top 10 Total | 18.6% |
| |
1 | "Holdings Diversification (Market Exposure as a % of Net Assets)" excludes any temporary cash investments, investments in Guggenheim Strategy Funds Trust mutual funds, or investments in Guggenheim Ultra Short Duration Fund. |
| |
2 | "10 Largest Holdings (as a % of Net Assets)" excludes any temporary cash or derivative investments. |
| Vanguard Russell 2000 ETF | 8.4% |
| iShares Russell 2000 Index ETF | 8.4% |
| Vaxcyte, Inc. | 0.3% |
| FTAI Aviation Ltd. | 0.3% |
| Insmed, Inc. | 0.2% |
| Sprouts Farmers Market, Inc. | 0.2% |
| Fabrinet | 0.2% |
| Applied Industrial Technologies, Inc. | 0.2% |
| Mueller Industries, Inc. | 0.2% |
| Fluor Corp. | 0.2% |
| Top 10 Total | 18.6% |
| |
2 | "10 Largest Holdings (as a % of Net Assets)" excludes any temporary cash or derivative investments. |
There were no changes in or disagreements with fund accountants for the period.
| |  | Availability of Additional Information. For additional information, including the fund's prospectus, financial information, holdings and proxy voting information, go to GuggenheimInvestments.com/mutual-funds/literature or, call 800 820 0888. |
SAR-RYRHX-093024
Semi-Annual Shareholder Report | 9.30.24
This semi-annual shareholder report contains important information about the Inverse Russell 2000® Strategy Fund for the period of April 1, 2024 to September 30, 2024. You can find additional information about the fund at GuggenheimInvestments.com/mutual-funds/literature. You can also request this information by contacting 800 820 0888 or GuggenheimClientServices@mufg-is.com.
For the period of April 1, 2024 to September 30, 2024, the fund (Class A shares) returned -2.66%, underperforming the fund's benchmark, the S&P 500 Index, which returned 10.42% for the same period and underperforming the fund's secondary index, the Russell 2000 Index, which returned 5.69% for the same period.
The fund's broad-based securities market index was changed from the Russell 2000 Index to the S&P 500 Index to comply with the regulation that requires the fund's broad-based securities market index to represent the overall applicable market.
What factors materially affected the fund's performance over the last six months?
The sectors that contributed the most to the return of the Russell 2000 Index (the "Index") were Financials, Health Care, and Real Estate. The only sector that detracted was Energy. The holdings that contributed the most to the Index were Insmed, Inc., FTAI Aviation Ltd., and Lumen Technologies, Inc. Those that detracted the most were Super Micro Computer, Inc., MicroStrategy, Inc. - Class A, and Atkore, Inc. The Fund maintained a daily correlation of over 99% to its benchmark of -100% of the daily price movement of the Russell 2000 Index.
Cumulative performance* for the fund's most recently completed 10 years (as of 9.30.24), assuming a $10,000 initial investment.
| 09/30/2014 | 9524 | 10000 | 10000 |
| 12/31/2014 | 8561 | 10493 | 10611 |
| 03/31/2015 | 8135 | 10593 | 10803 |
| 06/30/2015 | 8035 | 10622 | 10685 |
| 09/30/2015 | 9001 | 9939 | 9879 |
| 12/31/2015 | 8572 | 10638 | 10377 |
| 03/31/2016 | 8563 | 10782 | 10658 |
| 06/30/2016 | 8168 | 11047 | 11062 |
| 09/30/2016 | 7439 | 11472 | 12063 |
| 12/31/2016 | 6762 | 11911 | 13128 |
| 03/31/2017 | 6576 | 12633 | 13452 |
| 06/30/2017 | 6398 | 13023 | 13783 |
| 09/30/2017 | 6047 | 13607 | 14565 |
| 12/31/2017 | 5846 | 14511 | 15051 |
| 03/31/2018 | 5818 | 14401 | 15039 |
| 06/30/2018 | 5401 | 14896 | 16205 |
| 09/30/2018 | 5234 | 16044 | 16784 |
| 12/31/2018 | 6506 | 13875 | 13393 |
| 03/31/2019 | 5685 | 15769 | 15347 |
| 06/30/2019 | 5571 | 16447 | 15668 |
| 09/30/2019 | 5702 | 16727 | 15292 |
| 12/31/2019 | 5189 | 18244 | 16812 |
| 03/31/2020 | 6765 | 14668 | 11665 |
| 06/30/2020 | 5088 | 17682 | 14630 |
| 09/30/2020 | 4780 | 19260 | 15352 |
| 12/31/2020 | 3577 | 21600 | 20168 |
| 03/31/2021 | 3103 | 22934 | 22729 |
| 06/30/2021 | 2946 | 24895 | 23705 |
| 09/30/2021 | 3045 | 25040 | 22671 |
| 12/31/2021 | 2933 | 27801 | 23157 |
| 03/31/2022 | 3095 | 26522 | 21414 |
| 06/30/2022 | 3632 | 22252 | 17732 |
| 09/30/2022 | 3674 | 21165 | 17344 |
| 12/31/2022 | 3444 | 22766 | 18424 |
| 03/31/2023 | 3376 | 24473 | 18929 |
| 06/30/2023 | 3249 | 26612 | 19914 |
| 09/30/2023 | 3485 | 25741 | 18893 |
| 12/31/2023 | 3098 | 28750 | 21543 |
| 03/31/2024 | 2981 | 31785 | 22659 |
| 06/30/2024 | 3136 | 33147 | 21917 |
| 09/30/2024 | 2903 | 35098 | 23949 |
| Class A (without sales charge) | -2.66% | -16.70% | -12.63% | -11.20% |
| Class A (with sales charge)‡ | -7.27% | -20.66% | -13.48% | -11.63% |
| S&P 500 Index | 10.42% | 36.35% | 15.98% | 13.38% |
| Russell 2000 Index | 5.69% | 26.76% | 9.39% | 9.13% |
The fund's past performance is not a good predictor of the fund's future performance. Visit GuggenheimInvestments.com/mutual-funds/performance for more recent performance information.
| Net Assets | $1,937,657 |
| Total Number of Portfolio Holdings | 10 |
| Portfolio Turnover Rate | 0% |
| Inverse Russell 2000® Strategy Fund | Class A | RYAFX | Semi-Annual Shareholder Report | September 30, 2024 |
| Russell 2000 Index Equity Mini Futures Contracts Short Sales | -11.6% |
| Russell 2000 Index Equity Swap Agreements Short Sales | -88.9% |

| Guggenheim Ultra Short Duration Fund — Institutional Class | 23.1% |
| Guggenheim Strategy Fund II | 22.9% |
| Total | 46.0% |
| |
1 | "Holdings Diversification (Market Exposure as a % of Net Assets)" excludes any temporary cash investments, investments in Guggenheim Strategy Funds Trust mutual funds, or investments in Guggenheim Ultra Short Duration Fund. |
| |
2 | "Largest Holdings (as a % of Net Assets)" excludes any temporary cash or derivative investments. |
| Guggenheim Ultra Short Duration Fund — Institutional Class | 23.1% |
| Guggenheim Strategy Fund II | 22.9% |
| Total | 46.0% |
| |
2 | "Largest Holdings (as a % of Net Assets)" excludes any temporary cash or derivative investments. |
There were no changes in or disagreements with fund accountants for the period.
| |  | Availability of Additional Information. For additional information, including the fund's prospectus, financial information, holdings and proxy voting information, go to GuggenheimInvestments.com/mutual-funds/literature or, call 800 820 0888. |
SAR-RYAFX-093024
Semi-Annual Shareholder Report | 9.30.24
This semi-annual shareholder report contains important information about the Inverse Russell 2000® Strategy Fund for the period of April 1, 2024 to September 30, 2024. You can find additional information about the fund at GuggenheimInvestments.com/mutual-funds/literature. You can also request this information by contacting 800 820 0888 or GuggenheimClientServices@mufg-is.com.
For the period of April 1, 2024 to September 30, 2024, the fund (Class C shares) returned -3.02%, underperforming the fund's benchmark, the S&P 500 Index, which returned 10.42% for the same period and underperforming the fund's secondary index, the Russell 2000 Index, which returned 5.69% for the same period.
The fund's broad-based securities market index was changed from the Russell 2000 Index to the S&P 500 Index to comply with the regulation that requires the fund's broad-based securities market index to represent the overall applicable market.
What factors materially affected the fund's performance over the last six months?
The sectors that contributed the most to the return of the Russell 2000 Index (the "Index") were Financials, Health Care, and Real Estate. The only sector that detracted was Energy. The holdings that contributed the most to the Index were Insmed, Inc., FTAI Aviation Ltd., and Lumen Technologies, Inc. Those that detracted the most were Super Micro Computer, Inc., MicroStrategy, Inc. - Class A, and Atkore, Inc. The Fund maintained a daily correlation of over 99% to its benchmark of -100% of the daily price movement of the Russell 2000 Index.
Cumulative performance* for the fund's most recently completed 10 years (as of 9.30.24), assuming a $10,000 initial investment.
| 09/30/2014 | 10000 | 10000 | 10000 |
| 12/31/2014 | 8971 | 10493 | 10611 |
| 03/31/2015 | 8505 | 10593 | 10803 |
| 06/30/2015 | 8388 | 10622 | 10685 |
| 09/30/2015 | 9376 | 9939 | 9879 |
| 12/31/2015 | 8914 | 10638 | 10377 |
| 03/31/2016 | 8889 | 10782 | 10658 |
| 06/30/2016 | 8467 | 11047 | 11062 |
| 09/30/2016 | 7692 | 11472 | 12063 |
| 12/31/2016 | 6982 | 11911 | 13128 |
| 03/31/2017 | 6780 | 12633 | 13452 |
| 06/30/2017 | 6583 | 13023 | 13783 |
| 09/30/2017 | 6206 | 13607 | 14565 |
| 12/31/2017 | 5991 | 14511 | 15051 |
| 03/31/2018 | 5950 | 14401 | 15039 |
| 06/30/2018 | 5516 | 14896 | 16205 |
| 09/30/2018 | 5329 | 16044 | 16784 |
| 12/31/2018 | 6615 | 13875 | 13393 |
| 03/31/2019 | 5766 | 15769 | 15347 |
| 06/30/2019 | 5643 | 16447 | 15668 |
| 09/30/2019 | 5763 | 16727 | 15292 |
| 12/31/2019 | 5237 | 18244 | 16812 |
| 03/31/2020 | 6817 | 14668 | 11665 |
| 06/30/2020 | 5115 | 17682 | 14630 |
| 09/30/2020 | 4797 | 19260 | 15352 |
| 12/31/2020 | 3582 | 21600 | 20168 |
| 03/31/2021 | 3102 | 22934 | 22729 |
| 06/30/2021 | 2939 | 24895 | 23705 |
| 09/30/2021 | 3033 | 25040 | 22671 |
| 12/31/2021 | 2916 | 27801 | 23157 |
| 03/31/2022 | 3071 | 26522 | 21414 |
| 06/30/2022 | 3597 | 22252 | 17732 |
| 09/30/2022 | 3631 | 21165 | 17344 |
| 12/31/2022 | 3398 | 22766 | 18424 |
| 03/31/2023 | 3325 | 24473 | 18929 |
| 06/30/2023 | 3194 | 26612 | 19914 |
| 09/30/2023 | 3418 | 25741 | 18893 |
| 12/31/2023 | 3033 | 28750 | 21543 |
| 03/31/2024 | 2914 | 31785 | 22659 |
| 06/30/2024 | 3061 | 33147 | 21917 |
| 09/30/2024 | 2826 | 35098 | 23949 |
| Class C (without CDSC) | -3.02% | -17.31% | -13.28% | -11.87% |
| Class C (with CDSC)§ | -3.99% | -18.07% | -13.28% | -11.87% |
| S&P 500 Index | 10.42% | 36.35% | 15.98% | 13.38% |
| Russell 2000 Index | 5.69% | 26.76% | 9.39% | 9.13% |
The fund's past performance is not a good predictor of the fund's future performance. Visit GuggenheimInvestments.com/mutual-funds/performance for more recent performance information.
| Net Assets | $1,937,657 |
| Total Number of Portfolio Holdings | 10 |
| Portfolio Turnover Rate | 0% |
| Inverse Russell 2000® Strategy Fund | Class C | RYCQX | Semi-Annual Shareholder Report | September 30, 2024 |
| Russell 2000 Index Equity Mini Futures Contracts Short Sales | -11.6% |
| Russell 2000 Index Equity Swap Agreements Short Sales | -88.9% |
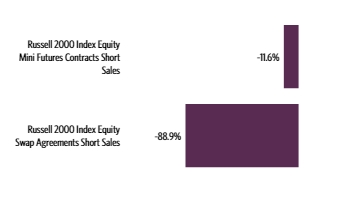
| Guggenheim Ultra Short Duration Fund — Institutional Class | 23.1% |
| Guggenheim Strategy Fund II | 22.9% |
| Total | 46.0% |
| |
1 | "Holdings Diversification (Market Exposure as a % of Net Assets)" excludes any temporary cash investments, investments in Guggenheim Strategy Funds Trust mutual funds, or investments in Guggenheim Ultra Short Duration Fund. |
| |
2 | "Largest Holdings (as a % of Net Assets)" excludes any temporary cash or derivative investments. |
| Guggenheim Ultra Short Duration Fund — Institutional Class | 23.1% |
| Guggenheim Strategy Fund II | 22.9% |
| Total | 46.0% |
| |
2 | "Largest Holdings (as a % of Net Assets)" excludes any temporary cash or derivative investments. |
There were no changes in or disagreements with fund accountants for the period.
| |  | Availability of Additional Information. For additional information, including the fund's prospectus, financial information, holdings and proxy voting information, go to GuggenheimInvestments.com/mutual-funds/literature or, call 800 820 0888. |
SAR-RYCQX-093024
Semi-Annual Shareholder Report | 9.30.24
This semi-annual shareholder report contains important information about the Inverse Russell 2000® Strategy Fund for the period of April 1, 2024 to September 30, 2024. You can find additional information about the fund at GuggenheimInvestments.com/mutual-funds/literature. You can also request this information by contacting 800 820 0888 or GuggenheimClientServices@mufg-is.com.
For the period of April 1, 2024 to September 30, 2024, the fund (Class H shares) returned -2.67%, underperforming the fund's benchmark, the S&P 500 Index, which returned 10.42% for the same period and underperforming the fund's secondary index, the Russell 2000 Index, which returned 5.69% for the same period.
The fund's broad-based securities market index was changed from the Russell 2000 Index to the S&P 500 Index to comply with the regulation that requires the fund's broad-based securities market index to represent the overall applicable market.
What factors materially affected the fund's performance over the last six months?
The sectors that contributed the most to the return of the Russell 2000 Index (the "Index") were Financials, Health Care, and Real Estate. The only sector that detracted was Energy. The holdings that contributed the most to the Index were Insmed, Inc., FTAI Aviation Ltd., and Lumen Technologies, Inc. Those that detracted the most were Super Micro Computer, Inc., MicroStrategy, Inc. - Class A, and Atkore, Inc. The Fund maintained a daily correlation of over 99% to its benchmark of -100% of the daily price movement of the Russell 2000 Index.
Cumulative performance* for the fund's most recently completed 10 years (as of 9.30.24), assuming a $10,000 initial investment.
| 09/30/2014 | 10000 | 10000 | 10000 |
| 12/31/2014 | 8989 | 10493 | 10611 |
| 03/31/2015 | 8540 | 10593 | 10803 |
| 06/30/2015 | 8435 | 10622 | 10685 |
| 09/30/2015 | 9446 | 9939 | 9879 |
| 12/31/2015 | 8997 | 10638 | 10377 |
| 03/31/2016 | 8986 | 10782 | 10658 |
| 06/30/2016 | 8578 | 11047 | 11062 |
| 09/30/2016 | 7808 | 11472 | 12063 |
| 12/31/2016 | 7100 | 11911 | 13128 |
| 03/31/2017 | 6905 | 12633 | 13452 |
| 06/30/2017 | 6715 | 13023 | 13783 |
| 09/30/2017 | 6342 | 13607 | 14565 |
| 12/31/2017 | 6138 | 14511 | 15051 |
| 03/31/2018 | 6109 | 14401 | 15039 |
| 06/30/2018 | 5669 | 14896 | 16205 |
| 09/30/2018 | 5494 | 16044 | 16784 |
| 12/31/2018 | 6832 | 13875 | 13393 |
| 03/31/2019 | 5972 | 15769 | 15347 |
| 06/30/2019 | 5853 | 16447 | 15668 |
| 09/30/2019 | 5990 | 16727 | 15292 |
| 12/31/2019 | 5452 | 18244 | 16812 |
| 03/31/2020 | 7111 | 14668 | 11665 |
| 06/30/2020 | 5344 | 17682 | 14630 |
| 09/30/2020 | 5024 | 19260 | 15352 |
| 12/31/2020 | 3759 | 21600 | 20168 |
| 03/31/2021 | 3262 | 22934 | 22729 |
| 06/30/2021 | 3096 | 24895 | 23705 |
| 09/30/2021 | 3201 | 25040 | 22671 |
| 12/31/2021 | 3084 | 27801 | 23157 |
| 03/31/2022 | 3253 | 26522 | 21414 |
| 06/30/2022 | 3817 | 22252 | 17732 |
| 09/30/2022 | 3861 | 21165 | 17344 |
| 12/31/2022 | 3620 | 22766 | 18424 |
| 03/31/2023 | 3549 | 24473 | 18929 |
| 06/30/2023 | 3415 | 26612 | 19914 |
| 09/30/2023 | 3662 | 25741 | 18893 |
| 12/31/2023 | 3256 | 28750 | 21543 |
| 03/31/2024 | 3134 | 31785 | 22659 |
| 06/30/2024 | 3297 | 33147 | 21917 |
| 09/30/2024 | 3051 | 35098 | 23949 |
| Class H | -2.67% | -16.70% | -12.62% | -11.19% |
| S&P 500 Index | 10.42% | 36.35% | 15.98% | 13.38% |
| Russell 2000 Index | 5.69% | 26.76% | 9.39% | 9.13% |
The fund's past performance is not a good predictor of the fund's future performance. Visit GuggenheimInvestments.com/mutual-funds/performance for more recent performance information.
| Net Assets | $1,937,657 |
| Total Number of Portfolio Holdings | 10 |
| Portfolio Turnover Rate | 0% |
| Inverse Russell 2000® Strategy Fund | Class H | RYSHX | Semi-Annual Shareholder Report | September 30, 2024 |
| Russell 2000 Index Equity Mini Futures Contracts Short Sales | -11.6% |
| Russell 2000 Index Equity Swap Agreements Short Sales | -88.9% |

| Guggenheim Ultra Short Duration Fund — Institutional Class | 23.1% |
| Guggenheim Strategy Fund II | 22.9% |
| Total | 46.0% |
| |
1 | "Holdings Diversification (Market Exposure as a % of Net Assets)" excludes any temporary cash investments, investments in Guggenheim Strategy Funds Trust mutual funds, or investments in Guggenheim Ultra Short Duration Fund. |
| |
2 | "Largest Holdings (as a % of Net Assets)" excludes any temporary cash or derivative investments. |
| Guggenheim Ultra Short Duration Fund — Institutional Class | 23.1% |
| Guggenheim Strategy Fund II | 22.9% |
| Total | 46.0% |
| |
2 | "Largest Holdings (as a % of Net Assets)" excludes any temporary cash or derivative investments. |
There were no changes in or disagreements with fund accountants for the period.
| |  | Availability of Additional Information. For additional information, including the fund's prospectus, financial information, holdings and proxy voting information, go to GuggenheimInvestments.com/mutual-funds/literature or, call 800 820 0888. |
SAR-RYSHX-093024
Semi-Annual Shareholder Report | 9.30.24
This semi-annual shareholder report contains important information about the S&P 500® Pure Growth Fund for the period of April 1, 2024 to September 30, 2024. You can find additional information about the fund at GuggenheimInvestments.com/mutual-funds/literature. You can also request this information by contacting 800 820 0888 or GuggenheimClientServices@mufg-is.com.
For the period of April 1, 2024 to September 30, 2024, the fund (Class A shares) returned 6.33%, underperforming the fund's benchmark, the S&P 500 Index, which returned 10.42% for the same period and underperforming the fund's secondary index, the S&P 500 Pure Growth Index, which returned 7.11% for the same period.
The fund's broad-based securities market index was changed from the S&P 500 Pure Growth Index to the S&P 500 Index to comply with the regulation that requires the fund's broad-based securities market index to represent the overall applicable market.
What factors materially affected the fund's performance over the last six months?
The sectors that contributed the most to the return of the S&P 500 Pure Growth Index (the "Index") were Information Technology, Consumer Discretionary, and Financials. Those that detracted the most were Materials, Energy, and Industrials. The holdings that contributed the most to the return of the Index were NVIDIA Corp., Monolithic Power Systems, Inc., and Arista Networks, Inc. Those that detracted the most were Super Micro Computer, Inc., CrowdStrike Holdings, Inc. – Class A, and Celanese Corp. The Fund maintained a daily correlation of over 99% to the S&P 500 Pure Growth Index for the Reporting Period.
Cumulative performance* for the fund's most recently completed 10 years (as of 9.30.24), assuming a $10,000 initial investment.
| 09/30/2014 | 9525 | 10000 | 10000 |
| 12/31/2014 | 9785 | 10493 | 10312 |
| 03/31/2015 | 10211 | 10593 | 10801 |
| 06/30/2015 | 9969 | 10622 | 10584 |
| 09/30/2015 | 9477 | 9939 | 10115 |
| 12/31/2015 | 9879 | 10638 | 10592 |
| 03/31/2016 | 9710 | 10782 | 10449 |
| 06/30/2016 | 9865 | 11047 | 10659 |
| 09/30/2016 | 10237 | 11472 | 11112 |
| 12/31/2016 | 10125 | 11911 | 11039 |
| 03/31/2017 | 10859 | 12633 | 11885 |
| 06/30/2017 | 11381 | 13023 | 12509 |
| 09/30/2017 | 12076 | 13607 | 13330 |
| 12/31/2017 | 12625 | 14511 | 13993 |
| 03/31/2018 | 13182 | 14401 | 14671 |
| 06/30/2018 | 13749 | 14896 | 15361 |
| 09/30/2018 | 14382 | 16044 | 16135 |
| 12/31/2018 | 11915 | 13875 | 13403 |
| 03/31/2019 | 13825 | 15769 | 15626 |
| 06/30/2019 | 14237 | 16447 | 16164 |
| 09/30/2019 | 14113 | 16727 | 16086 |
| 12/31/2019 | 15096 | 18244 | 17288 |
| 03/31/2020 | 11922 | 14668 | 13704 |
| 06/30/2020 | 15372 | 17682 | 17763 |
| 09/30/2020 | 16759 | 19260 | 19454 |
| 12/31/2020 | 19215 | 21600 | 22416 |
| 03/31/2021 | 19305 | 22934 | 22602 |
| 06/30/2021 | 21577 | 24895 | 25375 |
| 09/30/2021 | 22489 | 25040 | 26562 |
| 12/31/2021 | 24522 | 27801 | 29097 |
| 03/31/2022 | 21337 | 26522 | 25362 |
| 06/30/2022 | 17161 | 22252 | 20454 |
| 09/30/2022 | 16794 | 21165 | 20093 |
| 12/31/2022 | 17615 | 22766 | 21162 |
| 03/31/2023 | 17593 | 24473 | 21220 |
| 06/30/2023 | 17781 | 26612 | 21521 |
| 09/30/2023 | 17553 | 25741 | 21323 |
| 12/31/2023 | 18774 | 28750 | 22920 |
| 03/31/2024 | 21321 | 31785 | 26146 |
| 06/30/2024 | 21582 | 33147 | 26565 |
| 09/30/2024 | 22671 | 35098 | 28028 |
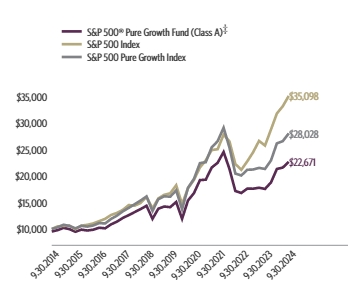
| Class A (without sales charge) | 6.33% | 29.15% | 9.94% | 9.06% |
| Class A (with sales charge)‡ | 1.28% | 23.02% | 8.88% | 8.53% |
| S&P 500 Index | 10.42% | 36.35% | 15.98% | 13.38% |
| S&P 500 Pure Growth Index | 7.11% | 31.35% | 11.73% | 10.86% |
The fund's past performance is not a good predictor of the fund's future performance. Visit GuggenheimInvestments.com/mutual-funds/performance for more recent performance information.
| Net Assets | $148,364,907 |
| Total Number of Portfolio Holdings | 68 |
| Portfolio Turnover Rate | 147% |
| S&P 500® Pure Growth Fund | Class A | RYLGX | Semi-Annual Shareholder Report | September 30, 2024 |
| Technology | 34.2% |
| Consumer, Cyclical | 23.7% |
| Communications | 17.2% |
| Industrial | 6.6% |
| Energy | 5.4% |
| Consumer, Non-cyclical | 4.6% |
| Financial | 4.2% |
| Other | 3.5% |
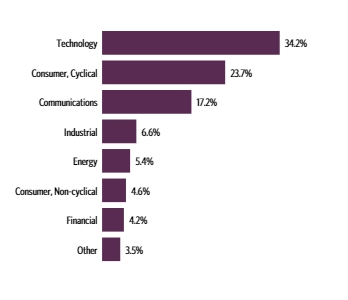
| NVIDIA Corp. | 4.4% |
| Arista Networks, Inc. | 3.0% |
| Royal Caribbean Cruises Ltd. | 2.8% |
| Monolithic Power Systems, Inc. | 2.7% |
| KKR & Company, Inc. — Class A | 2.5% |
| Targa Resources Corp. | 2.3% |
| PulteGroup, Inc. | 2.3% |
| Booking Holdings, Inc. | 2.3% |
| Meta Platforms, Inc. — Class A | 2.2% |
| Uber Technologies, Inc. | 2.2% |
| Top 10 Total | 26.7% |
| |
1 | "Holdings Diversification (Market Exposure as a % of Net Assets)" excludes any temporary cash investments, investments in Guggenheim Strategy Funds Trust mutual funds, or investments in Guggenheim Ultra Short Duration Fund. |
| |
2 | "10 Largest Holdings (as a % of Net Assets)" excludes any temporary cash investments. |
| NVIDIA Corp. | 4.4% |
| Arista Networks, Inc. | 3.0% |
| Royal Caribbean Cruises Ltd. | 2.8% |
| Monolithic Power Systems, Inc. | 2.7% |
| KKR & Company, Inc. — Class A | 2.5% |
| Targa Resources Corp. | 2.3% |
| PulteGroup, Inc. | 2.3% |
| Booking Holdings, Inc. | 2.3% |
| Meta Platforms, Inc. — Class A | 2.2% |
| Uber Technologies, Inc. | 2.2% |
| Top 10 Total | 26.7% |
| |
2 | "10 Largest Holdings (as a % of Net Assets)" excludes any temporary cash investments. |
There were no changes in or disagreements with fund accountants for the period.
| |  | Availability of Additional Information. For additional information, including the fund's prospectus, financial information, holdings and proxy voting information, go to GuggenheimInvestments.com/mutual-funds/literature or, call 800 820 0888. |
SAR-RYLGX-093024
Semi-Annual Shareholder Report | 9.30.24
This semi-annual shareholder report contains important information about the S&P 500® Pure Growth Fund for the period of April 1, 2024 to September 30, 2024. You can find additional information about the fund at GuggenheimInvestments.com/mutual-funds/literature. You can also request this information by contacting 800 820 0888 or GuggenheimClientServices@mufg-is.com.
For the period of April 1, 2024 to September 30, 2024, the fund (Class C shares) returned 5.93%, underperforming the fund's benchmark, the S&P 500 Index, which returned 10.42% for the same period and underperforming the fund's secondary index, the S&P 500 Pure Growth Index, which returned 7.11% for the same period.
The fund's broad-based securities market index was changed from the S&P 500 Pure Growth Index to the S&P 500 Index to comply with the regulation that requires the fund's broad-based securities market index to represent the overall applicable market.
What factors materially affected the fund's performance over the last six months?
The sectors that contributed the most to the return of the S&P 500 Pure Growth Index (the "Index") were Information Technology, Consumer Discretionary, and Financials. Those that detracted the most were Materials, Energy, and Industrials. The holdings that contributed the most to the return of the Index were NVIDIA Corp., Monolithic Power Systems, Inc., and Arista Networks, Inc. Those that detracted the most were Super Micro Computer, Inc., CrowdStrike Holdings, Inc. – Class A, and Celanese Corp. The Fund maintained a daily correlation of over 99% to the S&P 500 Pure Growth Index for the Reporting Period.
Cumulative performance* for the fund's most recently completed 10 years (as of 9.30.24), assuming a $10,000 initial investment.
| 09/30/2014 | 10000 | 10000 | 10000 |
| 12/31/2014 | 10252 | 10493 | 10312 |
| 03/31/2015 | 10680 | 10593 | 10801 |
| 06/30/2015 | 10409 | 10622 | 10584 |
| 09/30/2015 | 9875 | 9939 | 10115 |
| 12/31/2015 | 10274 | 10638 | 10592 |
| 03/31/2016 | 10081 | 10782 | 10449 |
| 06/30/2016 | 10224 | 11047 | 10659 |
| 09/30/2016 | 10587 | 11472 | 11112 |
| 12/31/2016 | 10450 | 11911 | 11039 |
| 03/31/2017 | 11189 | 12633 | 11885 |
| 06/30/2017 | 11704 | 13023 | 12509 |
| 09/30/2017 | 12395 | 13607 | 13330 |
| 12/31/2017 | 12935 | 14511 | 13993 |
| 03/31/2018 | 13482 | 14401 | 14671 |
| 06/30/2018 | 14034 | 14896 | 15361 |
| 09/30/2018 | 14653 | 16044 | 16135 |
| 12/31/2018 | 12115 | 13875 | 13403 |
| 03/31/2019 | 14033 | 15769 | 15626 |
| 06/30/2019 | 14425 | 16447 | 16164 |
| 09/30/2019 | 14272 | 16727 | 16086 |
| 12/31/2019 | 15236 | 18244 | 17288 |
| 03/31/2020 | 12012 | 14668 | 13704 |
| 06/30/2020 | 15458 | 17682 | 17763 |
| 09/30/2020 | 16821 | 19260 | 19454 |
| 12/31/2020 | 19246 | 21600 | 22416 |
| 03/31/2021 | 19303 | 22934 | 22602 |
| 06/30/2021 | 21536 | 24895 | 25375 |
| 09/30/2021 | 22403 | 25040 | 26562 |
| 12/31/2021 | 24381 | 27801 | 29097 |
| 03/31/2022 | 21177 | 26522 | 25362 |
| 06/30/2022 | 17001 | 22252 | 20454 |
| 09/30/2022 | 16603 | 21165 | 20093 |
| 12/31/2022 | 17381 | 22766 | 21162 |
| 03/31/2023 | 17328 | 24473 | 21220 |
| 06/30/2023 | 17484 | 26612 | 21521 |
| 09/30/2023 | 17226 | 25741 | 21323 |
| 12/31/2023 | 18390 | 28750 | 22920 |
| 03/31/2024 | 20846 | 31785 | 26146 |
| 06/30/2024 | 21063 | 33147 | 26565 |
| 09/30/2024 | 22083 | 35098 | 28028 |
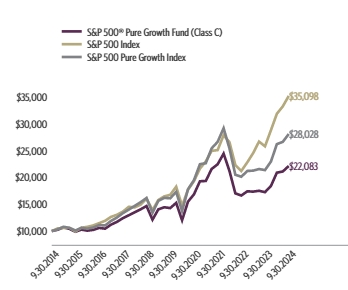
| Class C (without CDSC) | 5.93% | 28.20% | 9.12% | 8.24% |
| Class C (with CDSC)§ | 4.93% | 27.20% | 9.12% | 8.24% |
| S&P 500 Index | 10.42% | 36.35% | 15.98% | 13.38% |
| S&P 500 Pure Growth Index | 7.11% | 31.35% | 11.73% | 10.86% |
The fund's past performance is not a good predictor of the fund's future performance. Visit GuggenheimInvestments.com/mutual-funds/performance for more recent performance information.
| Net Assets | $148,364,907 |
| Total Number of Portfolio Holdings | 68 |
| Portfolio Turnover Rate | 147% |
| S&P 500® Pure Growth Fund | Class C | RYGRX | Semi-Annual Shareholder Report | September 30, 2024 |
| Technology | 34.2% |
| Consumer, Cyclical | 23.7% |
| Communications | 17.2% |
| Industrial | 6.6% |
| Energy | 5.4% |
| Consumer, Non-cyclical | 4.6% |
| Financial | 4.2% |
| Other | 3.5% |

| NVIDIA Corp. | 4.4% |
| Arista Networks, Inc. | 3.0% |
| Royal Caribbean Cruises Ltd. | 2.8% |
| Monolithic Power Systems, Inc. | 2.7% |
| KKR & Company, Inc. — Class A | 2.5% |
| Targa Resources Corp. | 2.3% |
| PulteGroup, Inc. | 2.3% |
| Booking Holdings, Inc. | 2.3% |
| Meta Platforms, Inc. — Class A | 2.2% |
| Uber Technologies, Inc. | 2.2% |
| Top 10 Total | 26.7% |
| |
1 | "Holdings Diversification (Market Exposure as a % of Net Assets)" excludes any temporary cash investments, investments in Guggenheim Strategy Funds Trust mutual funds, or investments in Guggenheim Ultra Short Duration Fund. |
| |
2 | "10 Largest Holdings (as a % of Net Assets)" excludes any temporary cash investments. |
| NVIDIA Corp. | 4.4% |
| Arista Networks, Inc. | 3.0% |
| Royal Caribbean Cruises Ltd. | 2.8% |
| Monolithic Power Systems, Inc. | 2.7% |
| KKR & Company, Inc. — Class A | 2.5% |
| Targa Resources Corp. | 2.3% |
| PulteGroup, Inc. | 2.3% |
| Booking Holdings, Inc. | 2.3% |
| Meta Platforms, Inc. — Class A | 2.2% |
| Uber Technologies, Inc. | 2.2% |
| Top 10 Total | 26.7% |
| |
2 | "10 Largest Holdings (as a % of Net Assets)" excludes any temporary cash investments. |
There were no changes in or disagreements with fund accountants for the period.
| |  | Availability of Additional Information. For additional information, including the fund's prospectus, financial information, holdings and proxy voting information, go to GuggenheimInvestments.com/mutual-funds/literature or, call 800 820 0888. |
SAR-RYGRX-093024
Semi-Annual Shareholder Report | 9.30.24
This semi-annual shareholder report contains important information about the S&P 500® Pure Growth Fund for the period of April 1, 2024 to September 30, 2024. You can find additional information about the fund at GuggenheimInvestments.com/mutual-funds/literature. You can also request this information by contacting 800 820 0888 or GuggenheimClientServices@mufg-is.com.
For the period of April 1, 2024 to September 30, 2024, the fund (Class H shares) returned 6.32%, underperforming the fund's benchmark, the S&P 500 Index, which returned 10.42% for the same period and underperforming the fund's secondary index, the S&P 500 Pure Growth Index, which returned 7.11% for the same period.
The fund's broad-based securities market index was changed from the S&P 500 Pure Growth Index to the S&P 500 Index to comply with the regulation that requires the fund's broad-based securities market index to represent the overall applicable market.
What factors materially affected the fund's performance over the last six months?
The sectors that contributed the most to the return of the S&P 500 Pure Growth Index (the "Index") were Information Technology, Consumer Discretionary, and Financials. Those that detracted the most were Materials, Energy, and Industrials. The holdings that contributed the most to the return of the Index were NVIDIA Corp., Monolithic Power Systems, Inc., and Arista Networks, Inc. Those that detracted the most were Super Micro Computer, Inc., CrowdStrike Holdings, Inc. – Class A, and Celanese Corp. The Fund maintained a daily correlation of over 99% to the S&P 500 Pure Growth Index for the Reporting Period.
Cumulative performance* for the fund's most recently completed 10 years (as of 9.30.24), assuming a $10,000 initial investment.
| 09/30/2014 | 10000 | 10000 | 10000 |
| 12/31/2014 | 10272 | 10493 | 10312 |
| 03/31/2015 | 10720 | 10593 | 10801 |
| 06/30/2015 | 10466 | 10622 | 10584 |
| 09/30/2015 | 9950 | 9939 | 10115 |
| 12/31/2015 | 10371 | 10638 | 10592 |
| 03/31/2016 | 10194 | 10782 | 10449 |
| 06/30/2016 | 10357 | 11047 | 10659 |
| 09/30/2016 | 10748 | 11472 | 11112 |
| 12/31/2016 | 10630 | 11911 | 11039 |
| 03/31/2017 | 11401 | 12633 | 11885 |
| 06/30/2017 | 11949 | 13023 | 12509 |
| 09/30/2017 | 12678 | 13607 | 13330 |
| 12/31/2017 | 13255 | 14511 | 13993 |
| 03/31/2018 | 13840 | 14401 | 14671 |
| 06/30/2018 | 14436 | 14896 | 15361 |
| 09/30/2018 | 15100 | 16044 | 16135 |
| 12/31/2018 | 12510 | 13875 | 13403 |
| 03/31/2019 | 14513 | 15769 | 15626 |
| 06/30/2019 | 14945 | 16447 | 16164 |
| 09/30/2019 | 14815 | 16727 | 16086 |
| 12/31/2019 | 15848 | 18244 | 17288 |
| 03/31/2020 | 12515 | 14668 | 13704 |
| 06/30/2020 | 16138 | 17682 | 17763 |
| 09/30/2020 | 17592 | 19260 | 19454 |
| 12/31/2020 | 20168 | 21600 | 22416 |
| 03/31/2021 | 20265 | 22934 | 22602 |
| 06/30/2021 | 22651 | 24895 | 25375 |
| 09/30/2021 | 23609 | 25040 | 26562 |
| 12/31/2021 | 25743 | 27801 | 29097 |
| 03/31/2022 | 22400 | 26522 | 25362 |
| 06/30/2022 | 18016 | 22252 | 20454 |
| 09/30/2022 | 17631 | 21165 | 20093 |
| 12/31/2022 | 18493 | 22766 | 21162 |
| 03/31/2023 | 18468 | 24473 | 21220 |
| 06/30/2023 | 18668 | 26612 | 21521 |
| 09/30/2023 | 18428 | 25741 | 21323 |
| 12/31/2023 | 19713 | 28750 | 22920 |
| 03/31/2024 | 22387 | 31785 | 26146 |
| 06/30/2024 | 22661 | 33147 | 26565 |
| 09/30/2024 | 23802 | 35098 | 28028 |
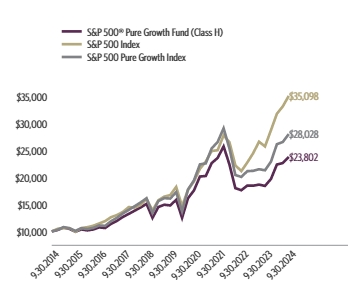
| Class H | 6.32% | 29.16% | 9.95% | 9.06% |
| S&P 500 Index | 10.42% | 36.35% | 15.98% | 13.38% |
| S&P 500 Pure Growth Index | 7.11% | 31.35% | 11.73% | 10.86% |
The fund's past performance is not a good predictor of the fund's future performance. Visit GuggenheimInvestments.com/mutual-funds/performance for more recent performance information.
| Net Assets | $148,364,907 |
| Total Number of Portfolio Holdings | 68 |
| Portfolio Turnover Rate | 147% |
| S&P 500® Pure Growth Fund | Class H | RYAWX | Semi-Annual Shareholder Report | September 30, 2024 |
| Technology | 34.2% |
| Consumer, Cyclical | 23.7% |
| Communications | 17.2% |
| Industrial | 6.6% |
| Energy | 5.4% |
| Consumer, Non-cyclical | 4.6% |
| Financial | 4.2% |
| Other | 3.5% |

| NVIDIA Corp. | 4.4% |
| Arista Networks, Inc. | 3.0% |
| Royal Caribbean Cruises Ltd. | 2.8% |
| Monolithic Power Systems, Inc. | 2.7% |
| KKR & Company, Inc. — Class A | 2.5% |
| Targa Resources Corp. | 2.3% |
| PulteGroup, Inc. | 2.3% |
| Booking Holdings, Inc. | 2.3% |
| Meta Platforms, Inc. — Class A | 2.2% |
| Uber Technologies, Inc. | 2.2% |
| Top 10 Total | 26.7% |
| |
1 | "Holdings Diversification (Market Exposure as a % of Net Assets)" excludes any temporary cash investments, investments in Guggenheim Strategy Funds Trust mutual funds, or investments in Guggenheim Ultra Short Duration Fund. |
| |
2 | "10 Largest Holdings (as a % of Net Assets)" excludes any temporary cash investments. |
| NVIDIA Corp. | 4.4% |
| Arista Networks, Inc. | 3.0% |
| Royal Caribbean Cruises Ltd. | 2.8% |
| Monolithic Power Systems, Inc. | 2.7% |
| KKR & Company, Inc. — Class A | 2.5% |
| Targa Resources Corp. | 2.3% |
| PulteGroup, Inc. | 2.3% |
| Booking Holdings, Inc. | 2.3% |
| Meta Platforms, Inc. — Class A | 2.2% |
| Uber Technologies, Inc. | 2.2% |
| Top 10 Total | 26.7% |
| |
2 | "10 Largest Holdings (as a % of Net Assets)" excludes any temporary cash investments. |
There were no changes in or disagreements with fund accountants for the period.
| |  | Availability of Additional Information. For additional information, including the fund's prospectus, financial information, holdings and proxy voting information, go to GuggenheimInvestments.com/mutual-funds/literature or, call 800 820 0888. |
SAR-RYAWX-093024
Semi-Annual Shareholder Report | 9.30.24
This semi-annual shareholder report contains important information about the S&P 500® Pure Value Fund for the period of April 1, 2024 to September 30, 2024. You can find additional information about the fund at GuggenheimInvestments.com/mutual-funds/literature. You can also request this information by contacting 800 820 0888 or GuggenheimClientServices@mufg-is.com.
For the period of April 1, 2024 to September 30, 2024, the fund (Class A shares) returned 0.78%, underperforming the fund's benchmark, the S&P 500 Index, which returned 10.42% for the same period and underperforming the fund's secondary index, the S&P 500 Pure Value Index, which returned 1.78% for the same period.
The fund's broad-based securities market index was changed from the S&P 500 Pure Value Index to the S&P 500 Index to comply with the regulation that requires the fund's broad-based securities market index to represent the overall applicable market.
What factors materially affected the fund's performance over the last six months?
The sectors that contributed the most to the return of the S&P 500 Pure Value Index (the "Index") were Financials, Utilities, and Materials. Those that detracted the most were Consumer Staples, Energy, and Health Care. The holdings that contributed the most to the return of the Index were Mohawk Industries, Inc., United Airlines Holdings, Inc., and NRG Energy, Inc. Those that detracted the most were Walgreens Boots Alliance, Inc., Ford Motor Co., and Valero Energy Corp. The Fund maintained a daily correlation of over 99% to the S&P 500 Pure Value Index for the Reporting Period.
Cumulative performance* for the fund's most recently completed 10 years (as of 9.30.24), assuming a $10,000 initial investment.
| 09/30/2014 | 9525 | 10000 | 10000 |
| 12/31/2014 | 9894 | 10493 | 10423 |
| 03/31/2015 | 9746 | 10593 | 10306 |
| 06/30/2015 | 9701 | 10622 | 10291 |
| 09/30/2015 | 8676 | 9939 | 9237 |
| 12/31/2015 | 8949 | 10638 | 9575 |
| 03/31/2016 | 9216 | 10782 | 9906 |
| 06/30/2016 | 9302 | 11047 | 10051 |
| 09/30/2016 | 9656 | 11472 | 10481 |
| 12/31/2016 | 10505 | 11911 | 11453 |
| 03/31/2017 | 10765 | 12633 | 11790 |
| 06/30/2017 | 10910 | 13023 | 11995 |
| 09/30/2017 | 11308 | 13607 | 12463 |
| 12/31/2017 | 12180 | 14511 | 13484 |
| 03/31/2018 | 11892 | 14401 | 13216 |
| 06/30/2018 | 12126 | 14896 | 13529 |
| 09/30/2018 | 12696 | 16044 | 14229 |
| 12/31/2018 | 10558 | 13875 | 11866 |
| 03/31/2019 | 11743 | 15769 | 13265 |
| 06/30/2019 | 12140 | 16447 | 13772 |
| 09/30/2019 | 12155 | 16727 | 13839 |
| 12/31/2019 | 13010 | 18244 | 14886 |
| 03/31/2020 | 7588 | 14668 | 8665 |
| 06/30/2020 | 9081 | 17682 | 10445 |
| 09/30/2020 | 9328 | 19260 | 10795 |
| 12/31/2020 | 11672 | 21600 | 13589 |
| 03/31/2021 | 14046 | 22934 | 16446 |
| 06/30/2021 | 14669 | 24895 | 17255 |
| 09/30/2021 | 14452 | 25040 | 17059 |
| 12/31/2021 | 15417 | 27801 | 18295 |
| 03/31/2022 | 16329 | 26522 | 19463 |
| 06/30/2022 | 14370 | 22252 | 17199 |
| 09/30/2022 | 13409 | 21165 | 16114 |
| 12/31/2022 | 15018 | 22766 | 18141 |
| 03/31/2023 | 14663 | 24473 | 17797 |
| 06/30/2023 | 15028 | 26612 | 18302 |
| 09/30/2023 | 14305 | 25741 | 17486 |
| 12/31/2023 | 15999 | 28750 | 19634 |
| 03/31/2024 | 17293 | 31785 | 21325 |
| 06/30/2024 | 16319 | 33147 | 20204 |
| 09/30/2024 | 17427 | 35098 | 21684 |
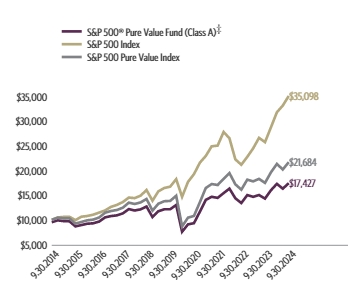
| Class A (without sales charge) | 0.78% | 21.83% | 7.47% | 6.23% |
| Class A (with sales charge)‡ | -4.01% | 16.04% | 6.43% | 5.71% |
| S&P 500 Index | 10.42% | 36.35% | 15.98% | 13.38% |
| S&P 500 Pure Value Index | 1.78% | 24.05% | 9.39% | 8.05% |
The fund's past performance is not a good predictor of the fund's future performance. Visit GuggenheimInvestments.com/mutual-funds/performance for more recent performance information.
| Net Assets | $10,323,235 |
| Total Number of Portfolio Holdings | 96 |
| Portfolio Turnover Rate | 1,071% |
1071%
| S&P 500® Pure Value Fund | Class A | RYLVX | Semi-Annual Shareholder Report | September 30, 2024 |
| Financial | 32.9% |
| Consumer, Non-cyclical | 23.9% |
| Consumer, Cyclical | 16.1% |
| Industrial | 6.1% |
| Communications | 6.0% |
| Basic Materials | 5.0% |
| Energy | 4.8% |
| Utilities | 3.2% |
| Technology | 2.0% |
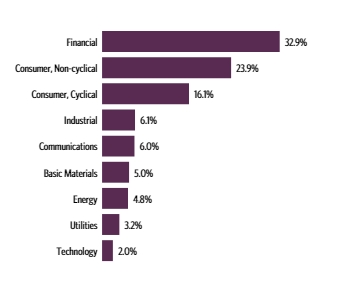
| General Motors Co. | 4.0% |
| Berkshire Hathaway, Inc. — Class B | 3.8% |
| Mohawk Industries, Inc. | 2.8% |
| United Airlines Holdings, Inc. | 2.6% |
| Ford Motor Co. | 2.3% |
| Viatris, Inc. | 2.2% |
| Tyson Foods, Inc. — Class A | 2.2% |
| Citigroup, Inc. | 2.2% |
| Citizens Financial Group, Inc. | 2.0% |
| Kroger Co. | 1.9% |
| Top 10 Total | 26.0% |
| |
1 | "Holdings Diversification (Market Exposure as a % of Net Assets)" excludes any temporary cash investments, investments in Guggenheim Strategy Funds Trust mutual funds, or investments in Guggenheim Ultra Short Duration Fund. |
| |
2 | "10 Largest Holdings (as a % of Net Assets)" excludes any temporary cash investments. |
| General Motors Co. | 4.0% |
| Berkshire Hathaway, Inc. — Class B | 3.8% |
| Mohawk Industries, Inc. | 2.8% |
| United Airlines Holdings, Inc. | 2.6% |
| Ford Motor Co. | 2.3% |
| Viatris, Inc. | 2.2% |
| Tyson Foods, Inc. — Class A | 2.2% |
| Citigroup, Inc. | 2.2% |
| Citizens Financial Group, Inc. | 2.0% |
| Kroger Co. | 1.9% |
| Top 10 Total | 26.0% |
| |
2 | "10 Largest Holdings (as a % of Net Assets)" excludes any temporary cash investments. |
There were no changes in or disagreements with fund accountants for the period.
| |  | Availability of Additional Information. For additional information, including the fund's prospectus, financial information, holdings and proxy voting information, go to GuggenheimInvestments.com/mutual-funds/literature or, call 800 820 0888. |
SAR-RYLVX-093024
Semi-Annual Shareholder Report | 9.30.24
This semi-annual shareholder report contains important information about the S&P 500® Pure Value Fund for the period of April 1, 2024 to September 30, 2024. You can find additional information about the fund at GuggenheimInvestments.com/mutual-funds/literature. You can also request this information by contacting 800 820 0888 or GuggenheimClientServices@mufg-is.com.
For the period of April 1, 2024 to September 30, 2024, the fund (Class C shares) returned 0.40%, underperforming the fund's benchmark, the S&P 500 Index, which returned 10.42% for the same period and underperforming the fund's secondary index, the S&P 500 Pure Value Index, which returned 1.78% for the same period.
The fund's broad-based securities market index was changed from the S&P 500 Pure Value Index to the S&P 500 Index to comply with the regulation that requires the fund's broad-based securities market index to represent the overall applicable market.
What factors materially affected the fund's performance over the last six months?
The sectors that contributed the most to the return of the S&P 500 Pure Value Index (the "Index") were Financials, Utilities, and Materials. Those that detracted the most were Consumer Staples, Energy, and Health Care. The holdings that contributed the most to the return of the Index were Mohawk Industries, Inc., United Airlines Holdings, Inc., and NRG Energy, Inc. Those that detracted the most were Walgreens Boots Alliance, Inc., Ford Motor Co., and Valero Energy Corp. The Fund maintained a daily correlation of over 99% to the S&P 500 Pure Value Index for the Reporting Period.
Cumulative performance* for the fund's most recently completed 10 years (as of 9.30.24), assuming a $10,000 initial investment.
| 09/30/2014 | 10000 | 10000 | 10000 |
| 12/31/2014 | 10368 | 10493 | 10423 |
| 03/31/2015 | 10193 | 10593 | 10306 |
| 06/30/2015 | 10127 | 10622 | 10291 |
| 09/30/2015 | 9040 | 9939 | 9237 |
| 12/31/2015 | 9307 | 10638 | 9575 |
| 03/31/2016 | 9566 | 10782 | 9906 |
| 06/30/2016 | 9639 | 11047 | 10051 |
| 09/30/2016 | 9986 | 11472 | 10481 |
| 12/31/2016 | 10843 | 11911 | 11453 |
| 03/31/2017 | 11091 | 12633 | 11790 |
| 06/30/2017 | 11220 | 13023 | 11995 |
| 09/30/2017 | 11606 | 13607 | 12463 |
| 12/31/2017 | 12479 | 14511 | 13484 |
| 03/31/2018 | 12162 | 14401 | 13216 |
| 06/30/2018 | 12378 | 14896 | 13529 |
| 09/30/2018 | 12936 | 16044 | 14229 |
| 12/31/2018 | 10734 | 13875 | 11866 |
| 03/31/2019 | 11919 | 15769 | 13265 |
| 06/30/2019 | 12298 | 16447 | 13772 |
| 09/30/2019 | 12290 | 16727 | 13839 |
| 12/31/2019 | 13131 | 18244 | 14886 |
| 03/31/2020 | 7644 | 14668 | 8665 |
| 06/30/2020 | 9130 | 17682 | 10445 |
| 09/30/2020 | 9362 | 19260 | 10795 |
| 12/31/2020 | 11690 | 21600 | 13589 |
| 03/31/2021 | 14044 | 22934 | 16446 |
| 06/30/2021 | 14640 | 24895 | 17255 |
| 09/30/2021 | 14396 | 25040 | 17059 |
| 12/31/2021 | 15328 | 27801 | 18295 |
| 03/31/2022 | 16207 | 26522 | 19463 |
| 06/30/2022 | 14234 | 22252 | 17199 |
| 09/30/2022 | 13257 | 21165 | 16114 |
| 12/31/2022 | 14820 | 22766 | 18141 |
| 03/31/2023 | 14442 | 24473 | 17797 |
| 06/30/2023 | 14774 | 26612 | 18302 |
| 09/30/2023 | 14038 | 25741 | 17486 |
| 12/31/2023 | 15669 | 28750 | 19634 |
| 03/31/2024 | 16907 | 31785 | 21325 |
| 06/30/2024 | 15924 | 33147 | 20204 |
| 09/30/2024 | 16974 | 35098 | 21684 |
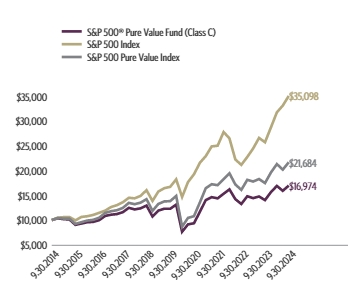
| Class C (without CDSC) | 0.40% | 20.92% | 6.67% | 5.43% |
| Class C (with CDSC)§ | -0.60% | 19.92% | 6.67% | 5.43% |
| S&P 500 Index | 10.42% | 36.35% | 15.98% | 13.38% |
| S&P 500 Pure Value Index | 1.78% | 24.05% | 9.39% | 8.05% |
The fund's past performance is not a good predictor of the fund's future performance. Visit GuggenheimInvestments.com/mutual-funds/performance for more recent performance information.
| Net Assets | $10,323,235 |
| Total Number of Portfolio Holdings | 96 |
| Portfolio Turnover Rate | 1,071% |
1071%
| S&P 500® Pure Value Fund | Class C | RYVVX | Semi-Annual Shareholder Report | September 30, 2024 |
| Financial | 32.9% |
| Consumer, Non-cyclical | 23.9% |
| Consumer, Cyclical | 16.1% |
| Industrial | 6.1% |
| Communications | 6.0% |
| Basic Materials | 5.0% |
| Energy | 4.8% |
| Utilities | 3.2% |
| Technology | 2.0% |

| General Motors Co. | 4.0% |
| Berkshire Hathaway, Inc. — Class B | 3.8% |
| Mohawk Industries, Inc. | 2.8% |
| United Airlines Holdings, Inc. | 2.6% |
| Ford Motor Co. | 2.3% |
| Viatris, Inc. | 2.2% |
| Tyson Foods, Inc. — Class A | 2.2% |
| Citigroup, Inc. | 2.2% |
| Citizens Financial Group, Inc. | 2.0% |
| Kroger Co. | 1.9% |
| Top 10 Total | 26.0% |
| |
1 | "Holdings Diversification (Market Exposure as a % of Net Assets)" excludes any temporary cash investments, investments in Guggenheim Strategy Funds Trust mutual funds, or investments in Guggenheim Ultra Short Duration Fund. |
| |
2 | "10 Largest Holdings (as a % of Net Assets)" excludes any temporary cash investments. |
| General Motors Co. | 4.0% |
| Berkshire Hathaway, Inc. — Class B | 3.8% |
| Mohawk Industries, Inc. | 2.8% |
| United Airlines Holdings, Inc. | 2.6% |
| Ford Motor Co. | 2.3% |
| Viatris, Inc. | 2.2% |
| Tyson Foods, Inc. — Class A | 2.2% |
| Citigroup, Inc. | 2.2% |
| Citizens Financial Group, Inc. | 2.0% |
| Kroger Co. | 1.9% |
| Top 10 Total | 26.0% |
| |
2 | "10 Largest Holdings (as a % of Net Assets)" excludes any temporary cash investments. |
There were no changes in or disagreements with fund accountants for the period.
| |  | Availability of Additional Information. For additional information, including the fund's prospectus, financial information, holdings and proxy voting information, go to GuggenheimInvestments.com/mutual-funds/literature or, call 800 820 0888. |
SAR-RYVVX-093024
Semi-Annual Shareholder Report | 9.30.24
This semi-annual shareholder report contains important information about the S&P 500® Pure Value Fund for the period of April 1, 2024 to September 30, 2024. You can find additional information about the fund at GuggenheimInvestments.com/mutual-funds/literature. You can also request this information by contacting 800 820 0888 or GuggenheimClientServices@mufg-is.com.
For the period of April 1, 2024 to September 30, 2024, the fund (Class H shares) returned 0.78%, underperforming the fund's benchmark, the S&P 500 Index, which returned 10.42% for the same period and underperforming the fund's secondary index, the S&P 500 Pure Value Index, which returned 1.78% for the same period.
The fund's broad-based securities market index was changed from the S&P 500 Pure Value Index to the S&P 500 Index to comply with the regulation that requires the fund's broad-based securities market index to represent the overall applicable market.
What factors materially affected the fund's performance over the last six months?
The sectors that contributed the most to the return of the S&P 500 Pure Value Index (the "Index") were Financials, Utilities, and Materials. Those that detracted the most were Consumer Staples, Energy, and Health Care. The holdings that contributed the most to the return of the Index were Mohawk Industries, Inc., United Airlines Holdings, Inc., and NRG Energy, Inc. Those that detracted the most were Walgreens Boots Alliance, Inc., Ford Motor Co., and Valero Energy Corp. The Fund maintained a daily correlation of over 99% to the S&P 500 Pure Value Index for the Reporting Period.
Cumulative performance* for the fund's most recently completed 10 years (as of 9.30.24), assuming a $10,000 initial investment.
| 09/30/2014 | 10000 | 10000 | 10000 |
| 12/31/2014 | 10388 | 10493 | 10423 |
| 03/31/2015 | 10233 | 10593 | 10306 |
| 06/30/2015 | 10185 | 10622 | 10291 |
| 09/30/2015 | 9109 | 9939 | 9237 |
| 12/31/2015 | 9397 | 10638 | 9575 |
| 03/31/2016 | 9675 | 10782 | 9906 |
| 06/30/2016 | 9767 | 11047 | 10051 |
| 09/30/2016 | 10138 | 11472 | 10481 |
| 12/31/2016 | 11029 | 11911 | 11453 |
| 03/31/2017 | 11302 | 12633 | 11790 |
| 06/30/2017 | 11454 | 13023 | 11995 |
| 09/30/2017 | 11872 | 13607 | 12463 |
| 12/31/2017 | 12787 | 14511 | 13484 |
| 03/31/2018 | 12486 | 14401 | 13216 |
| 06/30/2018 | 12730 | 14896 | 13529 |
| 09/30/2018 | 13330 | 16044 | 14229 |
| 12/31/2018 | 11084 | 13875 | 11866 |
| 03/31/2019 | 12330 | 15769 | 13265 |
| 06/30/2019 | 12746 | 16447 | 13772 |
| 09/30/2019 | 12763 | 16727 | 13839 |
| 12/31/2019 | 13663 | 18244 | 14886 |
| 03/31/2020 | 7968 | 14668 | 8665 |
| 06/30/2020 | 9533 | 17682 | 10445 |
| 09/30/2020 | 9797 | 19260 | 10795 |
| 12/31/2020 | 12257 | 21600 | 13589 |
| 03/31/2021 | 14752 | 22934 | 16446 |
| 06/30/2021 | 15407 | 24895 | 17255 |
| 09/30/2021 | 15178 | 25040 | 17059 |
| 12/31/2021 | 16192 | 27801 | 18295 |
| 03/31/2022 | 17151 | 26522 | 19463 |
| 06/30/2022 | 15091 | 22252 | 17199 |
| 09/30/2022 | 14082 | 21165 | 16114 |
| 12/31/2022 | 15772 | 22766 | 18141 |
| 03/31/2023 | 15399 | 24473 | 17797 |
| 06/30/2023 | 15784 | 26612 | 18302 |
| 09/30/2023 | 15025 | 25741 | 17486 |
| 12/31/2023 | 16803 | 28750 | 19634 |
| 03/31/2024 | 18163 | 31785 | 21325 |
| 06/30/2024 | 17140 | 33147 | 20204 |
| 09/30/2024 | 18306 | 35098 | 21684 |

| Class H | 0.78% | 21.84% | 7.48% | 6.23% |
| S&P 500 Index | 10.42% | 36.35% | 15.98% | 13.38% |
| S&P 500 Pure Value Index | 1.78% | 24.05% | 9.39% | 8.05% |
The fund's past performance is not a good predictor of the fund's future performance. Visit GuggenheimInvestments.com/mutual-funds/performance for more recent performance information.
| Net Assets | $10,323,235 |
| Total Number of Portfolio Holdings | 96 |
| Portfolio Turnover Rate | 1,071% |
1071%
| S&P 500® Pure Value Fund | Class H | RYZAX | Semi-Annual Shareholder Report | September 30, 2024 |
| Financial | 32.9% |
| Consumer, Non-cyclical | 23.9% |
| Consumer, Cyclical | 16.1% |
| Industrial | 6.1% |
| Communications | 6.0% |
| Basic Materials | 5.0% |
| Energy | 4.8% |
| Utilities | 3.2% |
| Technology | 2.0% |

| General Motors Co. | 4.0% |
| Berkshire Hathaway, Inc. — Class B | 3.8% |
| Mohawk Industries, Inc. | 2.8% |
| United Airlines Holdings, Inc. | 2.6% |
| Ford Motor Co. | 2.3% |
| Viatris, Inc. | 2.2% |
| Tyson Foods, Inc. — Class A | 2.2% |
| Citigroup, Inc. | 2.2% |
| Citizens Financial Group, Inc. | 2.0% |
| Kroger Co. | 1.9% |
| Top 10 Total | 26.0% |
| |
1 | "Holdings Diversification (Market Exposure as a % of Net Assets)" excludes any temporary cash investments, investments in Guggenheim Strategy Funds Trust mutual funds, or investments in Guggenheim Ultra Short Duration Fund. |
| |
2 | "10 Largest Holdings (as a % of Net Assets)" excludes any temporary cash investments. |
| General Motors Co. | 4.0% |
| Berkshire Hathaway, Inc. — Class B | 3.8% |
| Mohawk Industries, Inc. | 2.8% |
| United Airlines Holdings, Inc. | 2.6% |
| Ford Motor Co. | 2.3% |
| Viatris, Inc. | 2.2% |
| Tyson Foods, Inc. — Class A | 2.2% |
| Citigroup, Inc. | 2.2% |
| Citizens Financial Group, Inc. | 2.0% |
| Kroger Co. | 1.9% |
| Top 10 Total | 26.0% |
| |
2 | "10 Largest Holdings (as a % of Net Assets)" excludes any temporary cash investments. |
There were no changes in or disagreements with fund accountants for the period.
| |  | Availability of Additional Information. For additional information, including the fund's prospectus, financial information, holdings and proxy voting information, go to GuggenheimInvestments.com/mutual-funds/literature or, call 800 820 0888. |
SAR-RYZAX-093024
Semi-Annual Shareholder Report | 9.30.24
This semi-annual shareholder report contains important information about the S&P MidCap 400® Pure Growth Fund for the period of April 1, 2024 to September 30, 2024. You can find additional information about the fund at GuggenheimInvestments.com/mutual-funds/literature. You can also request this information by contacting 800 820 0888 or GuggenheimClientServices@mufg-is.com.
For the period of April 1, 2024 to September 30, 2024, the fund (Class A shares) returned -3.45%, underperforming the fund's benchmark, the S&P 500 Index, which returned 10.42% for the same period and underperforming the fund's secondary index, the S&P MidCap 400 Pure Growth Index, which returned -2.68% for the same period.
The fund's broad-based securities market index was changed from the S&P MidCap 400 Pure Growth Index to the S&P 500 Index to comply with the regulation that requires the fund's broad-based securities market index to represent the overall applicable market.
What factors materially affected the fund's performance over the last six months?
The sectors that contributed the most to the return of the S&P MidCap 400 Pure Growth Index (the "Index") were Consumer Discretionary, Industrials, and Utilities. Those that detracted the most were Consumer Staples, Energy, and Materials. The holdings that contributed the most to the return of the Index were Duolingo, Inc. – Class A, CNX Resources Corp., and Lantheus Holdings, Inc. Those that detracted the most were Celsius Holdings, Inc., e.l.f. Beauty, Inc., and Weatherford International Plc. The Fund maintained a daily correlation of over 99% to the S&P MidCap 400 Pure Growth Index for the Reporting Period.
Cumulative performance* for the fund's most recently completed 10 years (as of 9.30.24), assuming a $10,000 initial investment.
| 09/30/2014 | 9525 | 10000 | 10001 |
| 12/31/2014 | 9488 | 10493 | 9981 |
| 03/31/2015 | 10324 | 10593 | 10901 |
| 06/30/2015 | 10265 | 10622 | 10874 |
| 09/30/2015 | 9594 | 9939 | 10197 |
| 12/31/2015 | 9625 | 10638 | 10267 |
| 03/31/2016 | 9371 | 10782 | 10038 |
| 06/30/2016 | 9397 | 11047 | 10106 |
| 09/30/2016 | 9615 | 11472 | 10383 |
| 12/31/2016 | 9901 | 11911 | 10734 |
| 03/31/2017 | 10400 | 12633 | 11313 |
| 06/30/2017 | 10746 | 13023 | 11731 |
| 09/30/2017 | 11055 | 13607 | 12118 |
| 12/31/2017 | 11777 | 14511 | 12963 |
| 03/31/2018 | 11995 | 14401 | 13249 |
| 06/30/2018 | 12294 | 14896 | 13635 |
| 09/30/2018 | 12597 | 16044 | 14028 |
| 12/31/2018 | 10047 | 13875 | 11223 |
| 03/31/2019 | 11492 | 15769 | 12899 |
| 06/30/2019 | 11249 | 16447 | 12677 |
| 09/30/2019 | 10731 | 16727 | 12119 |
| 12/31/2019 | 11600 | 18244 | 13165 |
| 03/31/2020 | 8459 | 14668 | 9604 |
| 06/30/2020 | 11310 | 17682 | 12921 |
| 09/30/2020 | 12642 | 19260 | 14490 |
| 12/31/2020 | 15162 | 21600 | 17463 |
| 03/31/2021 | 16372 | 22934 | 18924 |
| 06/30/2021 | 16869 | 24895 | 19563 |
| 09/30/2021 | 16372 | 25040 | 19059 |
| 12/31/2021 | 17053 | 27801 | 19935 |
| 03/31/2022 | 15051 | 26522 | 17646 |
| 06/30/2022 | 12062 | 22252 | 14181 |
| 09/30/2022 | 12326 | 21165 | 14558 |
| 12/31/2022 | 13208 | 22766 | 15668 |
| 03/31/2023 | 13498 | 24473 | 16078 |
| 06/30/2023 | 14374 | 26612 | 17191 |
| 09/30/2023 | 14408 | 25741 | 17306 |
| 12/31/2023 | 15165 | 28750 | 18285 |
| 03/31/2024 | 18563 | 31785 | 22508 |
| 06/30/2024 | 17819 | 33147 | 21703 |
| 09/30/2024 | 17922 | 35098 | 21921 |

| Class A (without sales charge) | -3.45% | 24.39% | 10.80% | 6.52% |
| Class A (with sales charge)‡ | -8.04% | 18.47% | 9.73% | 6.01% |
| S&P 500 Index | 10.42% | 36.35% | 15.98% | 13.38% |
| S&P MidCap 400 Pure Growth Index | -2.68% | 26.75% | 12.59% | 8.16% |
The fund's past performance is not a good predictor of the fund's future performance. Visit GuggenheimInvestments.com/mutual-funds/performance for more recent performance information.
| Net Assets | $32,826,126 |
| Total Number of Portfolio Holdings | 90 |
| Portfolio Turnover Rate | 498% |
| S&P MidCap 400® Pure Growth Fund | Class A | RYMGX | Semi-Annual Shareholder Report | September 30, 2024 |
| Industrial | 28.2% |
| Consumer, Cyclical | 21.5% |
| Consumer, Non-cyclical | 15.8% |
| Technology | 12.4% |
| Energy | 11.9% |
| Financial | 6.6% |
| Basic Materials | 3.1% |

| CNX Resources Corp. | 3.1% |
| Duolingo, Inc. | 3.0% |
| Comfort Systems USA, Inc. | 2.4% |
| Toll Brothers, Inc. | 2.2% |
| Ryan Specialty Holdings, Inc. | 2.2% |
| AAON, Inc. | 2.1% |
| Wingstop, Inc. | 2.0% |
| TopBuild Corp. | 1.9% |
| Lantheus Holdings, Inc. | 1.9% |
| EMCOR Group, Inc. | 1.8% |
| Top 10 Total | 22.6% |
| |
1 | "Holdings Diversification (Market Exposure as a % of Net Assets)" excludes any temporary cash investments, investments in Guggenheim Strategy Funds Trust mutual funds, or investments in Guggenheim Ultra Short Duration Fund. |
| |
2 | "10 Largest Holdings (as a % of Net Assets)" excludes any temporary cash investments. |
| CNX Resources Corp. | 3.1% |
| Duolingo, Inc. | 3.0% |
| Comfort Systems USA, Inc. | 2.4% |
| Toll Brothers, Inc. | 2.2% |
| Ryan Specialty Holdings, Inc. | 2.2% |
| AAON, Inc. | 2.1% |
| Wingstop, Inc. | 2.0% |
| TopBuild Corp. | 1.9% |
| Lantheus Holdings, Inc. | 1.9% |
| EMCOR Group, Inc. | 1.8% |
| Top 10 Total | 22.6% |
| |
2 | "10 Largest Holdings (as a % of Net Assets)" excludes any temporary cash investments. |
There were no changes in or disagreements with fund accountants for the period.
| |  | Availability of Additional Information. For additional information, including the fund's prospectus, financial information, holdings and proxy voting information, go to GuggenheimInvestments.com/mutual-funds/literature or, call 800 820 0888. |
SAR-RYMGX-093024
Semi-Annual Shareholder Report | 9.30.24
This semi-annual shareholder report contains important information about the S&P MidCap 400® Pure Growth Fund for the period of April 1, 2024 to September 30, 2024. You can find additional information about the fund at GuggenheimInvestments.com/mutual-funds/literature. You can also request this information by contacting 800 820 0888 or GuggenheimClientServices@mufg-is.com.
For the period of April 1, 2024 to September 30, 2024, the fund (Class C shares) returned -3.80%, underperforming the fund's benchmark, the S&P 500 Index, which returned 10.42% for the same period and underperforming the fund's secondary index, the S&P MidCap 400 Pure Growth Index, which returned -2.68% for the same period.
The fund's broad-based securities market index was changed from the S&P MidCap 400 Pure Growth Index to the S&P 500 Index to comply with the regulation that requires the fund's broad-based securities market index to represent the overall applicable market.
What factors materially affected the fund's performance over the last six months?
The sectors that contributed the most to the return of the S&P MidCap 400 Pure Growth Index (the "Index") were Consumer Discretionary, Industrials, and Utilities. Those that detracted the most were Consumer Staples, Energy, and Materials. The holdings that contributed the most to the return of the Index were Duolingo, Inc. – Class A, CNX Resources Corp., and Lantheus Holdings, Inc. Those that detracted the most were Celsius Holdings, Inc., e.l.f. Beauty, Inc., and Weatherford International Plc. The Fund maintained a daily correlation of over 99% to the S&P MidCap 400 Pure Growth Index for the Reporting Period.
Cumulative performance* for the fund's most recently completed 10 years (as of 9.30.24), assuming a $10,000 initial investment.
| 09/30/2014 | 10000 | 10000 | 10001 |
| 12/31/2014 | | 10493 | 9981 |
| 03/31/2015 | 10799 | 10593 | 10901 |
| 06/30/2015 | 10717 | 10622 | 10874 |
| 09/30/2015 | 9997 | 9939 | 10197 |
| 12/31/2015 | 10008 | 10638 | 10267 |
| 03/31/2016 | 9728 | 10782 | 10038 |
| 06/30/2016 | 9735 | 11047 | 10106 |
| 09/30/2016 | 9944 | 11472 | 10383 |
| 12/31/2016 | 10219 | 11911 | 10734 |
| 03/31/2017 | 10716 | 12633 | 11313 |
| 06/30/2017 | 11051 | 13023 | 11731 |
| 09/30/2017 | 11347 | 13607 | 12118 |
| 12/31/2017 | 12066 | 14511 | 12963 |
| 03/31/2018 | 12267 | 14401 | 13249 |
| 06/30/2018 | 12547 | 14896 | 13635 |
| 09/30/2018 | 12833 | 16044 | 14028 |
| 12/31/2018 | 10216 | 13875 | 11223 |
| 03/31/2019 | 11665 | 15769 | 12899 |
| 06/30/2019 | 11399 | 16447 | 12677 |
| 09/30/2019 | 10852 | 16727 | 12119 |
| 12/31/2019 | 11708 | 18244 | 13165 |
| 03/31/2020 | 8522 | 14668 | 9604 |
| 06/30/2020 | 11372 | 17682 | 12921 |
| 09/30/2020 | 12688 | 19260 | 14490 |
| 12/31/2020 | 15186 | 21600 | 17463 |
| 03/31/2021 | 16373 | 22934 | 18924 |
| 06/30/2021 | 16836 | 24895 | 19563 |
| 09/30/2021 | 16308 | 25040 | 19059 |
| 12/31/2021 | 16953 | 27801 | 19935 |
| 03/31/2022 | 14938 | 26522 | 17646 |
| 06/30/2022 | 11949 | 22252 | 14181 |
| 09/30/2022 | 12186 | 21165 | 14558 |
| 12/31/2022 | 13031 | 22766 | 15668 |
| 03/31/2023 | 13294 | 24473 | 16078 |
| 06/30/2023 | 14132 | 26612 | 17191 |
| 09/30/2023 | 14140 | 25741 | 17306 |
| 12/31/2023 | 14851 | 28750 | 18285 |
| 03/31/2024 | 18147 | 31785 | 22508 |
| 06/30/2024 | 17389 | 33147 | 21703 |
| 09/30/2024 | 17457 | 35098 | 21921 |
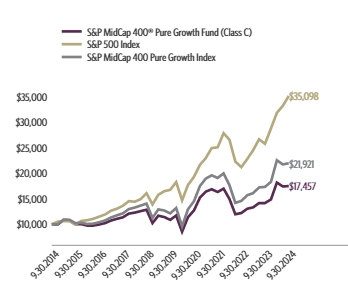
| Class C (without CDSC) | -3.80% | 23.45% | 9.98% | 5.73% |
| Class C (with CDSC)§ | -4.77% | 22.45% | 9.98% | 5.73% |
| S&P 500 Index | 10.42% | 36.35% | 15.98% | 13.38% |
| S&P MidCap 400 Pure Growth Index | -2.68% | 26.75% | 12.59% | 8.16% |
The fund's past performance is not a good predictor of the fund's future performance. Visit GuggenheimInvestments.com/mutual-funds/performance for more recent performance information.
| Net Assets | $32,826,126 |
| Total Number of Portfolio Holdings | 90 |
| Portfolio Turnover Rate | 498% |
| S&P MidCap 400® Pure Growth Fund | Class C | RYCKX | Semi-Annual Shareholder Report | September 30, 2024 |
| Industrial | 28.2% |
| Consumer, Cyclical | 21.5% |
| Consumer, Non-cyclical | 15.8% |
| Technology | 12.4% |
| Energy | 11.9% |
| Financial | 6.6% |
| Basic Materials | 3.1% |

| CNX Resources Corp. | 3.1% |
| Duolingo, Inc. | 3.0% |
| Comfort Systems USA, Inc. | 2.4% |
| Toll Brothers, Inc. | 2.2% |
| Ryan Specialty Holdings, Inc. | 2.2% |
| AAON, Inc. | 2.1% |
| Wingstop, Inc. | 2.0% |
| TopBuild Corp. | 1.9% |
| Lantheus Holdings, Inc. | 1.9% |
| EMCOR Group, Inc. | 1.8% |
| Top 10 Total | 22.6% |
| |
1 | "Holdings Diversification (Market Exposure as a % of Net Assets)" excludes any temporary cash investments, investments in Guggenheim Strategy Funds Trust mutual funds, or investments in Guggenheim Ultra Short Duration Fund. |
| |
2 | "10 Largest Holdings (as a % of Net Assets)" excludes any temporary cash investments. |
| CNX Resources Corp. | 3.1% |
| Duolingo, Inc. | 3.0% |
| Comfort Systems USA, Inc. | 2.4% |
| Toll Brothers, Inc. | 2.2% |
| Ryan Specialty Holdings, Inc. | 2.2% |
| AAON, Inc. | 2.1% |
| Wingstop, Inc. | 2.0% |
| TopBuild Corp. | 1.9% |
| Lantheus Holdings, Inc. | 1.9% |
| EMCOR Group, Inc. | 1.8% |
| Top 10 Total | 22.6% |
| |
2 | "10 Largest Holdings (as a % of Net Assets)" excludes any temporary cash investments. |
There were no changes in or disagreements with fund accountants for the period.
| |  | Availability of Additional Information. For additional information, including the fund's prospectus, financial information, holdings and proxy voting information, go to GuggenheimInvestments.com/mutual-funds/literature or, call 800 820 0888. |
SAR-RYCKX-093024
Semi-Annual Shareholder Report | 9.30.24
This semi-annual shareholder report contains important information about the S&P MidCap 400® Pure Growth Fund for the period of April 1, 2024 to September 30, 2024. You can find additional information about the fund at GuggenheimInvestments.com/mutual-funds/literature. You can also request this information by contacting 800 820 0888 or GuggenheimClientServices@mufg-is.com.
For the period of April 1, 2024 to September 30, 2024, the fund (Class H shares) returned -3.42%, underperforming the fund's benchmark, the S&P 500 Index, which returned 10.42% for the same period and underperforming the fund's secondary index, the S&P MidCap 400 Pure Growth Index, which returned -2.68% for the same period.
The fund's broad-based securities market index was changed from the S&P MidCap 400 Pure Growth Index to the S&P 500 Index to comply with the regulation that requires the fund's broad-based securities market index to represent the overall applicable market.
What factors materially affected the fund's performance over the last six months?
The sectors that contributed the most to the return of the S&P MidCap 400 Pure Growth Index (the "Index") were Consumer Discretionary, Industrials, and Utilities. Those that detracted the most were Consumer Staples, Energy, and Materials. The holdings that contributed the most to the return of the Index were Duolingo, Inc. – Class A, CNX Resources Corp., and Lantheus Holdings, Inc. Those that detracted the most were Celsius Holdings, Inc., e.l.f. Beauty, Inc., and Weatherford International Plc. The Fund maintained a daily correlation of over 99% to the S&P MidCap 400 Pure Growth Index for the Reporting Period.
Cumulative performance* for the fund's most recently completed 10 years (as of 9.30.24), assuming a $10,000 initial investment.
| 09/30/2014 | 10000 | 10000 | 10001 |
| 12/31/2014 | 9961 | 10493 | 9981 |
| 03/31/2015 | 10838 | 10593 | 10901 |
| 06/30/2015 | 10775 | 10622 | 10874 |
| 09/30/2015 | 10072 | 9939 | 10197 |
| 12/31/2015 | 10104 | 10638 | 10267 |
| 03/31/2016 | 9838 | 10782 | 10038 |
| 06/30/2016 | 9866 | 11047 | 10106 |
| 09/30/2016 | 10094 | 11472 | 10383 |
| 12/31/2016 | 10394 | 11911 | 10734 |
| 03/31/2017 | 10920 | 12633 | 11313 |
| 06/30/2017 | 11282 | 13023 | 11731 |
| 09/30/2017 | 11606 | 13607 | 12118 |
| 12/31/2017 | 12363 | 14511 | 12963 |
| 03/31/2018 | 12592 | 14401 | 13249 |
| 06/30/2018 | 12905 | 14896 | 13635 |
| 09/30/2018 | 13226 | 16044 | 14028 |
| 12/31/2018 | 10547 | 13875 | 11223 |
| 03/31/2019 | 12065 | 15769 | 12899 |
| 06/30/2019 | 11810 | 16447 | 12677 |
| 09/30/2019 | 11266 | 16727 | 12119 |
| 12/31/2019 | 12180 | 18244 | 13165 |
| 03/31/2020 | 8882 | 14668 | 9604 |
| 06/30/2020 | 11873 | 17682 | 12921 |
| 09/30/2020 | 13273 | 19260 | 14490 |
| 12/31/2020 | 15917 | 21600 | 17463 |
| 03/31/2021 | 17189 | 22934 | 18924 |
| 06/30/2021 | 17709 | 24895 | 19563 |
| 09/30/2021 | 17189 | 25040 | 19059 |
| 12/31/2021 | 17902 | 27801 | 19935 |
| 03/31/2022 | 15798 | 26522 | 17646 |
| 06/30/2022 | 12661 | 22252 | 14181 |
| 09/30/2022 | 12939 | 21165 | 14558 |
| 12/31/2022 | 13863 | 22766 | 15668 |
| 03/31/2023 | 14167 | 24473 | 16078 |
| 06/30/2023 | 15085 | 26612 | 17191 |
| 09/30/2023 | 15118 | 25741 | 17306 |
| 12/31/2023 | 15907 | 28750 | 18285 |
| 03/31/2024 | 19472 | 31785 | 22508 |
| 06/30/2024 | 18699 | 33147 | 21703 |
| 09/30/2024 | 18807 | 35098 | 21921 |
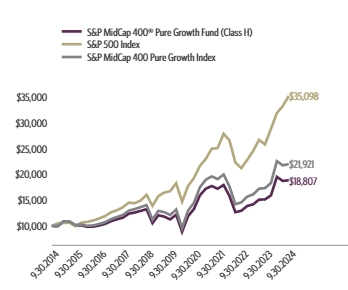
| Class H | -3.42% | 24.40% | 10.79% | 6.52% |
| S&P 500 Index | 10.42% | 36.35% | 15.98% | 13.38% |
| S&P MidCap 400 Pure Growth Index | -2.68% | 26.75% | 12.59% | 8.16% |
The fund's past performance is not a good predictor of the fund's future performance. Visit GuggenheimInvestments.com/mutual-funds/performance for more recent performance information.
| Net Assets | $32,826,126 |
| Total Number of Portfolio Holdings | 90 |
| Portfolio Turnover Rate | 498% |
| S&P MidCap 400® Pure Growth Fund | Class H | RYBHX | Semi-Annual Shareholder Report | September 30, 2024 |
| Industrial | 28.2% |
| Consumer, Cyclical | 21.5% |
| Consumer, Non-cyclical | 15.8% |
| Technology | 12.4% |
| Energy | 11.9% |
| Financial | 6.6% |
| Basic Materials | 3.1% |
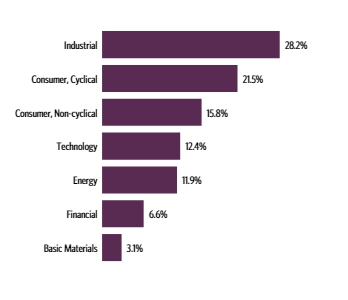
| CNX Resources Corp. | 3.1% |
| Duolingo, Inc. | 3.0% |
| Comfort Systems USA, Inc. | 2.4% |
| Toll Brothers, Inc. | 2.2% |
| Ryan Specialty Holdings, Inc. | 2.2% |
| AAON, Inc. | 2.1% |
| Wingstop, Inc. | 2.0% |
| TopBuild Corp. | 1.9% |
| Lantheus Holdings, Inc. | 1.9% |
| EMCOR Group, Inc. | 1.8% |
| Top 10 Total | 22.6% |
| |
1 | "Holdings Diversification (Market Exposure as a % of Net Assets)" excludes any temporary cash investments, investments in Guggenheim Strategy Funds Trust mutual funds, or investments in Guggenheim Ultra Short Duration Fund. |
| |
2 | "10 Largest Holdings (as a % of Net Assets)" excludes any temporary cash investments. |
| CNX Resources Corp. | 3.1% |
| Duolingo, Inc. | 3.0% |
| Comfort Systems USA, Inc. | 2.4% |
| Toll Brothers, Inc. | 2.2% |
| Ryan Specialty Holdings, Inc. | 2.2% |
| AAON, Inc. | 2.1% |
| Wingstop, Inc. | 2.0% |
| TopBuild Corp. | 1.9% |
| Lantheus Holdings, Inc. | 1.9% |
| EMCOR Group, Inc. | 1.8% |
| Top 10 Total | 22.6% |
| |
2 | "10 Largest Holdings (as a % of Net Assets)" excludes any temporary cash investments. |
There were no changes in or disagreements with fund accountants for the period.
| |  | Availability of Additional Information. For additional information, including the fund's prospectus, financial information, holdings and proxy voting information, go to GuggenheimInvestments.com/mutual-funds/literature or, call 800 820 0888. |
SAR-RYBHX-093024
Semi-Annual Shareholder Report | 9.30.24
This semi-annual shareholder report contains important information about the S&P MidCap 400® Pure Value Fund for the period of April 1, 2024 to September 30, 2024. You can find additional information about the fund at GuggenheimInvestments.com/mutual-funds/literature. You can also request this information by contacting 800 820 0888 or GuggenheimClientServices@mufg-is.com.
For the period of April 1, 2024 to September 30, 2024, the fund (Class A shares) returned -0.58%, underperforming the fund's benchmark, the S&P 500 Index, which returned 10.42% for the same period and underperforming the fund's secondary index, the S&P MidCap 400 Pure Value Index, which returned 0.03% for the same period.
The fund's broad-based securities market index was changed from the S&P MidCap 400 Pure Value Index to the S&P 500 Index to comply with the regulation that requires the fund's broad-based securities market index to represent the overall applicable market.
What factors materially affected the fund's performance over the last six months?
The sectors that contributed the most to the return of the S&P MidCap 400 Pure Value Index (the "Index") were Financials, Real Estate, and Consumer Staples. Those that detracted the most were Energy, Consumer Discretionary, and Materials. The holdings that contributed the most to the return of the Index were Tenet Healthcare Corp., Jones Lang LaSalle, Inc., and MasTec, Inc. Those that detracted the most were PBF Energy, Inc. – Class A, Hertz Global Holdings, Inc., and Cleveland-Cliffs, Inc. The Fund maintained a daily correlation of over 99% to the S&P MidCap 400 Pure Value Index for the Reporting Period.
Cumulative performance* for the fund's most recently completed 10 years (as of 9.30.24), assuming a $10,000 initial investment.
| 09/30/2014 | 9525 | 10000 | 10000 |
| 12/31/2014 | 10109 | 10493 | 10675 |
| 03/31/2015 | 10190 | 10593 | 10807 |
| 06/30/2015 | 10156 | 10622 | 10811 |
| 09/30/2015 | 8932 | 9939 | 9548 |
| 12/31/2015 | 8878 | 10638 | 9551 |
| 03/31/2016 | 9489 | 10782 | 10276 |
| 06/30/2016 | 9549 | 11047 | 10396 |
| 09/30/2016 | 10269 | 11472 | 11250 |
| 12/31/2016 | 11388 | 11911 | 12546 |
| 03/31/2017 | 11514 | 12633 | 12737 |
| 06/30/2017 | 11659 | 13023 | 12948 |
| 09/30/2017 | 11944 | 13607 | 13333 |
| 12/31/2017 | 12885 | 14511 | 14443 |
| 03/31/2018 | 12162 | 14401 | 13682 |
| 06/30/2018 | 12963 | 14896 | 14662 |
| 09/30/2018 | 13191 | 16044 | 14979 |
| 12/31/2018 | 10428 | 13875 | 11885 |
| 03/31/2019 | 12143 | 15769 | 13926 |
| 06/30/2019 | 12308 | 16447 | 14202 |
| 09/30/2019 | 11720 | 16727 | 13591 |
| 12/31/2019 | 12698 | 18244 | 14792 |
| 03/31/2020 | 7182 | 14668 | 8422 |
| 06/30/2020 | 9355 | 17682 | 11043 |
| 09/30/2020 | 10035 | 19260 | 11947 |
| 12/31/2020 | 13525 | 21600 | 16223 |
| 03/31/2021 | 16511 | 22934 | 19910 |
| 06/30/2021 | 16883 | 24895 | 20445 |
| 09/30/2021 | 16719 | 25040 | 20326 |
| 12/31/2021 | 17734 | 27801 | 21681 |
| 03/31/2022 | 17612 | 26522 | 21636 |
| 06/30/2022 | 15371 | 22252 | 18975 |
| 09/30/2022 | 14713 | 21165 | 18259 |
| 12/31/2022 | 16779 | 22766 | 20910 |
| 03/31/2023 | 17380 | 24473 | 21804 |
| 06/30/2023 | 19074 | 26612 | 24031 |
| 09/30/2023 | 18183 | 25741 | 23009 |
| 12/31/2023 | 21429 | 28750 | 27272 |
| 03/31/2024 | 21987 | 31785 | 28089 |
| 06/30/2024 | 20646 | 33147 | 26446 |
| 09/30/2024 | 21861 | 35098 | 28122 |
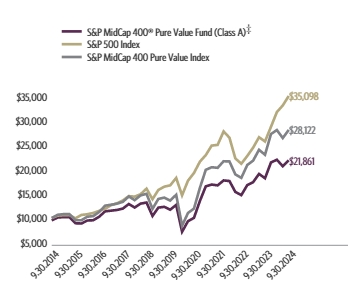
| Class A (without sales charge) | -0.58% | 20.23% | 13.28% | 8.66% |
| Class A (with sales charge)‡ | -5.30% | 14.52% | 12.18% | 8.14% |
| S&P 500 Index | 10.42% | 36.35% | 15.98% | 13.38% |
| S&P MidCap 400 Pure Value Index | 0.03% | 22.29% | 15.66% | 10.89% |
The fund's past performance is not a good predictor of the fund's future performance. Visit GuggenheimInvestments.com/mutual-funds/performance for more recent performance information.
| Net Assets | $5,397,960 |
| Total Number of Portfolio Holdings | 89 |
| Portfolio Turnover Rate | 46% |
| S&P MidCap 400® Pure Value Fund | Class A | RYMVX | Semi-Annual Shareholder Report | September 30, 2024 |
| Consumer, Cyclical | 25.5% |
| Financial | 23.8% |
| Industrial | 19.1% |
| Consumer, Non-cyclical | 14.9% |
| Basic Materials | 5.9% |
| Energy | 5.4% |
| Utilities | 2.5% |
| Other | 2.8% |
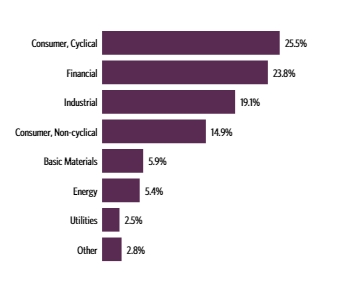
| Avnet, Inc. | 2.8% |
| TD SYNNEX Corp. | 2.6% |
| Jones Lang LaSalle, Inc. | 2.4% |
| MasTec, Inc. | 2.4% |
| Tenet Healthcare Corp. | 2.4% |
| Lithia Motors, Inc. — Class A | 2.4% |
| Arrow Electronics, Inc. | 2.3% |
| Macy's, Inc. | 2.2% |
| Nordstrom, Inc. | 2.0% |
| US Foods Holding Corp. | 2.0% |
| Top 10 Total | 23.5% |
| |
1 | "Holdings Diversification (Market Exposure as a % of Net Assets)" excludes any temporary cash investments, investments in Guggenheim Strategy Funds Trust mutual funds, or investments in Guggenheim Ultra Short Duration Fund. |
| |
2 | "10 Largest Holdings (as a % of Net Assets)" excludes any temporary cash investments. |
| Avnet, Inc. | 2.8% |
| TD SYNNEX Corp. | 2.6% |
| Jones Lang LaSalle, Inc. | 2.4% |
| MasTec, Inc. | 2.4% |
| Tenet Healthcare Corp. | 2.4% |
| Lithia Motors, Inc. — Class A | 2.4% |
| Arrow Electronics, Inc. | 2.3% |
| Macy's, Inc. | 2.2% |
| Nordstrom, Inc. | 2.0% |
| US Foods Holding Corp. | 2.0% |
| Top 10 Total | 23.5% |
| |
2 | "10 Largest Holdings (as a % of Net Assets)" excludes any temporary cash investments. |
There were no changes in or disagreements with fund accountants for the period.
| |  | Availability of Additional Information. For additional information, including the fund's prospectus, financial information, holdings and proxy voting information, go to GuggenheimInvestments.com/mutual-funds/literature or, call 800 820 0888. |
SAR-RYMVX-093024
Semi-Annual Shareholder Report | 9.30.24
This semi-annual shareholder report contains important information about the S&P MidCap 400® Pure Value Fund for the period of April 1, 2024 to September 30, 2024. You can find additional information about the fund at GuggenheimInvestments.com/mutual-funds/literature. You can also request this information by contacting 800 820 0888 or GuggenheimClientServices@mufg-is.com.
For the period of April 1, 2024 to September 30, 2024, the fund (Class C shares) returned -0.97%, underperforming the fund's benchmark, the S&P 500 Index, which returned 10.42% for the same period and underperforming the fund's secondary index, the S&P MidCap 400 Pure Value Index, which returned 0.03% for the same period.
The fund's broad-based securities market index was changed from the S&P MidCap 400 Pure Value Index to the S&P 500 Index to comply with the regulation that requires the fund's broad-based securities market index to represent the overall applicable market.
What factors materially affected the fund's performance over the last six months?
The sectors that contributed the most to the return of the S&P MidCap 400 Pure Value Index (the "Index") were Financials, Real Estate, and Consumer Staples. Those that detracted the most were Energy, Consumer Discretionary, and Materials. The holdings that contributed the most to the return of the Index were Tenet Healthcare Corp., Jones Lang LaSalle, Inc., and MasTec, Inc. Those that detracted the most were PBF Energy, Inc. – Class A, Hertz Global Holdings, Inc., and Cleveland-Cliffs, Inc. The Fund maintained a daily correlation of over 99% to the S&P MidCap 400 Pure Value Index for the Reporting Period.
Cumulative performance* for the fund's most recently completed 10 years (as of 9.30.24), assuming a $10,000 initial investment.
| 09/30/2014 | 10000 | 10000 | 10000 |
| 12/31/2014 | 10594 | 10493 | 10675 |
| 03/31/2015 | 10658 | 10593 | 10807 |
| 06/30/2015 | 10604 | 10622 | 10811 |
| 09/30/2015 | 9307 | 9939 | 9548 |
| 12/31/2015 | 9234 | 10638 | 9551 |
| 03/31/2016 | 9850 | 10782 | 10276 |
| 06/30/2016 | 9897 | 11047 | 10396 |
| 09/30/2016 | 10621 | 11472 | 11250 |
| 12/31/2016 | 11758 | 11911 | 12546 |
| 03/31/2017 | 11866 | 12633 | 12737 |
| 06/30/2017 | 11992 | 13023 | 12948 |
| 09/30/2017 | 12263 | 13607 | 13333 |
| 12/31/2017 | 13206 | 14511 | 14443 |
| 03/31/2018 | 12438 | 14401 | 13682 |
| 06/30/2018 | 13235 | 14896 | 14662 |
| 09/30/2018 | 13442 | 16044 | 14979 |
| 12/31/2018 | 10606 | 13875 | 11885 |
| 03/31/2019 | 12329 | 15769 | 13926 |
| 06/30/2019 | 12473 | 16447 | 14202 |
| 09/30/2019 | 11855 | 16727 | 13591 |
| 12/31/2019 | 12816 | 18244 | 14792 |
| 03/31/2020 | 7235 | 14668 | 8422 |
| 06/30/2020 | 9406 | 17682 | 11043 |
| 09/30/2020 | 10073 | 19260 | 11947 |
| 12/31/2020 | 13552 | 21600 | 16223 |
| 03/31/2021 | 16513 | 22934 | 19910 |
| 06/30/2021 | 16851 | 24895 | 20445 |
| 09/30/2021 | 16658 | 25040 | 20326 |
| 12/31/2021 | 17633 | 27801 | 21681 |
| 03/31/2022 | 17482 | 26522 | 21636 |
| 06/30/2022 | 15228 | 22252 | 18975 |
| 09/30/2022 | 14547 | 21165 | 18259 |
| 12/31/2022 | 16557 | 22766 | 20910 |
| 03/31/2023 | 17121 | 24473 | 21804 |
| 06/30/2023 | 18752 | 26612 | 24031 |
| 09/30/2023 | 17844 | 25741 | 23009 |
| 12/31/2023 | 20992 | 28750 | 27272 |
| 03/31/2024 | 21501 | 31785 | 28089 |
| 06/30/2024 | 20148 | 33147 | 26446 |
| 09/30/2024 | 21293 | 35098 | 28122 |
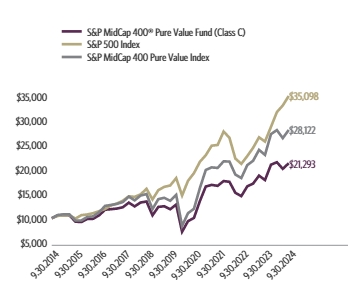
| Class C (without CDSC) | -0.97% | 19.33% | 12.43% | 7.85% |
| Class C (with CDSC)§ | -1.96% | 18.33% | 12.43% | 7.85% |
| S&P 500 Index | 10.42% | 36.35% | 15.98% | 13.38% |
| S&P MidCap 400 Pure Value Index | 0.03% | 22.29% | 15.66% | 10.89% |
The fund's past performance is not a good predictor of the fund's future performance. Visit GuggenheimInvestments.com/mutual-funds/performance for more recent performance information.
| Net Assets | $5,397,960 |
| Total Number of Portfolio Holdings | 89 |
| Portfolio Turnover Rate | 46% |
| S&P MidCap 400® Pure Value Fund | Class C | RYMMX | Semi-Annual Shareholder Report | September 30, 2024 |
| Consumer, Cyclical | 25.5% |
| Financial | 23.8% |
| Industrial | 19.1% |
| Consumer, Non-cyclical | 14.9% |
| Basic Materials | 5.9% |
| Energy | 5.4% |
| Utilities | 2.5% |
| Other | 2.8% |

| Avnet, Inc. | 2.8% |
| TD SYNNEX Corp. | 2.6% |
| Jones Lang LaSalle, Inc. | 2.4% |
| MasTec, Inc. | 2.4% |
| Tenet Healthcare Corp. | 2.4% |
| Lithia Motors, Inc. — Class A | 2.4% |
| Arrow Electronics, Inc. | 2.3% |
| Macy's, Inc. | 2.2% |
| Nordstrom, Inc. | 2.0% |
| US Foods Holding Corp. | 2.0% |
| Top 10 Total | 23.5% |
| |
1 | "Holdings Diversification (Market Exposure as a % of Net Assets)" excludes any temporary cash investments, investments in Guggenheim Strategy Funds Trust mutual funds, or investments in Guggenheim Ultra Short Duration Fund. |
| |
2 | "10 Largest Holdings (as a % of Net Assets)" excludes any temporary cash investments. |
| Avnet, Inc. | 2.8% |
| TD SYNNEX Corp. | 2.6% |
| Jones Lang LaSalle, Inc. | 2.4% |
| MasTec, Inc. | 2.4% |
| Tenet Healthcare Corp. | 2.4% |
| Lithia Motors, Inc. — Class A | 2.4% |
| Arrow Electronics, Inc. | 2.3% |
| Macy's, Inc. | 2.2% |
| Nordstrom, Inc. | 2.0% |
| US Foods Holding Corp. | 2.0% |
| Top 10 Total | 23.5% |
| |
2 | "10 Largest Holdings (as a % of Net Assets)" excludes any temporary cash investments. |
There were no changes in or disagreements with fund accountants for the period.
| |  | Availability of Additional Information. For additional information, including the fund's prospectus, financial information, holdings and proxy voting information, go to GuggenheimInvestments.com/mutual-funds/literature or, call 800 820 0888. |
SAR-RYMMX-093024
Semi-Annual Shareholder Report | 9.30.24
This semi-annual shareholder report contains important information about the S&P MidCap 400® Pure Value Fund for the period of April 1, 2024 to September 30, 2024. You can find additional information about the fund at GuggenheimInvestments.com/mutual-funds/literature. You can also request this information by contacting 800 820 0888 or GuggenheimClientServices@mufg-is.com.
For the period of April 1, 2024 to September 30, 2024, the fund (Class H shares) returned -0.59%, underperforming the fund's benchmark, the S&P 500 Index, which returned 10.42% for the same period and underperforming the fund's secondary index, the S&P MidCap 400 Pure Value Index, which returned 0.03% for the same period.
The fund's broad-based securities market index was changed from the S&P MidCap 400 Pure Value Index to the S&P 500 Index to comply with the regulation that requires the fund's broad-based securities market index to represent the overall applicable market.
What factors materially affected the fund's performance over the last six months?
The sectors that contributed the most to the return of the S&P MidCap 400 Pure Value Index (the "Index") were Financials, Real Estate, and Consumer Staples. Those that detracted the most were Energy, Consumer Discretionary, and Materials. The holdings that contributed the most to the return of the Index were Tenet Healthcare Corp., Jones Lang LaSalle, Inc., and MasTec, Inc. Those that detracted the most were PBF Energy, Inc. – Class A, Hertz Global Holdings, Inc., and Cleveland-Cliffs, Inc. The Fund maintained a daily correlation of over 99% to the S&P MidCap 400 Pure Value Index for the Reporting Period.
Cumulative performance* for the fund's most recently completed 10 years (as of 9.30.24), assuming a $10,000 initial investment.
| 09/30/2014 | 10000 | 10000 | 10000 |
| 12/31/2014 | 10614 | 10493 | 10675 |
| 03/31/2015 | 10698 | 10593 | 10807 |
| 06/30/2015 | 10663 | 10622 | 10811 |
| 09/30/2015 | 9378 | 9939 | 9548 |
| 12/31/2015 | 9322 | 10638 | 9551 |
| 03/31/2016 | 9964 | 10782 | 10276 |
| 06/30/2016 | 10030 | 11047 | 10396 |
| 09/30/2016 | 10784 | 11472 | 11250 |
| 12/31/2016 | 11961 | 11911 | 12546 |
| 03/31/2017 | 12093 | 12633 | 12737 |
| 06/30/2017 | 12243 | 13023 | 12948 |
| 09/30/2017 | 12543 | 13607 | 13333 |
| 12/31/2017 | 13530 | 14511 | 14443 |
| 03/31/2018 | 12767 | 14401 | 13682 |
| 06/30/2018 | 13607 | 14896 | 14662 |
| 09/30/2018 | 13844 | 16044 | 14979 |
| 12/31/2018 | 10944 | 13875 | 11885 |
| 03/31/2019 | 12747 | 15769 | 13926 |
| 06/30/2019 | 12918 | 16447 | 14202 |
| 09/30/2019 | 12304 | 16727 | 13591 |
| 12/31/2019 | 13326 | 18244 | 14792 |
| 03/31/2020 | 7538 | 14668 | 8422 |
| 06/30/2020 | 9819 | 17682 | 11043 |
| 09/30/2020 | 10534 | 19260 | 11947 |
| 12/31/2020 | 14198 | 21600 | 16223 |
| 03/31/2021 | 17333 | 22934 | 19910 |
| 06/30/2021 | 17721 | 24895 | 20445 |
| 09/30/2021 | 17550 | 25040 | 20326 |
| 12/31/2021 | 18616 | 27801 | 21681 |
| 03/31/2022 | 18490 | 26522 | 21636 |
| 06/30/2022 | 16139 | 22252 | 18975 |
| 09/30/2022 | 15444 | 21165 | 18259 |
| 12/31/2022 | 17616 | 22766 | 20910 |
| 03/31/2023 | 18249 | 24473 | 21804 |
| 06/30/2023 | 20027 | 26612 | 24031 |
| 09/30/2023 | 19093 | 25741 | 23009 |
| 12/31/2023 | 22510 | 28750 | 27272 |
| 03/31/2024 | 23097 | 31785 | 28089 |
| 06/30/2024 | 21687 | 33147 | 26446 |
| 09/30/2024 | 22961 | 35098 | 28122 |
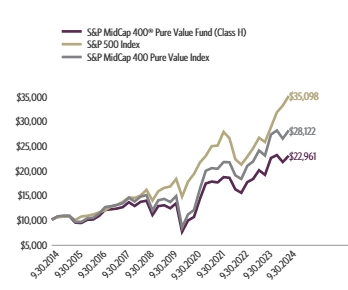
| Class H | -0.59% | 20.26% | 13.29% | 8.67% |
| S&P 500 Index | 10.42% | 36.35% | 15.98% | 13.38% |
| S&P MidCap 400 Pure Value Index | 0.03% | 22.29% | 15.66% | 10.89% |
The fund's past performance is not a good predictor of the fund's future performance. Visit GuggenheimInvestments.com/mutual-funds/performance for more recent performance information.
| Net Assets | $5,397,960 |
| Total Number of Portfolio Holdings | 89 |
| Portfolio Turnover Rate | 46% |
| S&P MidCap 400® Pure Value Fund | Class H | RYAVX | Semi-Annual Shareholder Report | September 30, 2024 |
| Consumer, Cyclical | 25.5% |
| Financial | 23.8% |
| Industrial | 19.1% |
| Consumer, Non-cyclical | 14.9% |
| Basic Materials | 5.9% |
| Energy | 5.4% |
| Utilities | 2.5% |
| Other | 2.8% |

| Avnet, Inc. | 2.8% |
| TD SYNNEX Corp. | 2.6% |
| Jones Lang LaSalle, Inc. | 2.4% |
| MasTec, Inc. | 2.4% |
| Tenet Healthcare Corp. | 2.4% |
| Lithia Motors, Inc. — Class A | 2.4% |
| Arrow Electronics, Inc. | 2.3% |
| Macy's, Inc. | 2.2% |
| Nordstrom, Inc. | 2.0% |
| US Foods Holding Corp. | 2.0% |
| Top 10 Total | 23.5% |
| |
1 | "Holdings Diversification (Market Exposure as a % of Net Assets)" excludes any temporary cash investments, investments in Guggenheim Strategy Funds Trust mutual funds, or investments in Guggenheim Ultra Short Duration Fund. |
| |
2 | "10 Largest Holdings (as a % of Net Assets)" excludes any temporary cash investments. |
| Avnet, Inc. | 2.8% |
| TD SYNNEX Corp. | 2.6% |
| Jones Lang LaSalle, Inc. | 2.4% |
| MasTec, Inc. | 2.4% |
| Tenet Healthcare Corp. | 2.4% |
| Lithia Motors, Inc. — Class A | 2.4% |
| Arrow Electronics, Inc. | 2.3% |
| Macy's, Inc. | 2.2% |
| Nordstrom, Inc. | 2.0% |
| US Foods Holding Corp. | 2.0% |
| Top 10 Total | 23.5% |
| |
2 | "10 Largest Holdings (as a % of Net Assets)" excludes any temporary cash investments. |
There were no changes in or disagreements with fund accountants for the period.
| |  | Availability of Additional Information. For additional information, including the fund's prospectus, financial information, holdings and proxy voting information, go to GuggenheimInvestments.com/mutual-funds/literature or, call 800 820 0888. |
SAR-RYAVX-093024
Semi-Annual Shareholder Report | 9.30.24
This semi-annual shareholder report contains important information about the S&P SmallCap 600® Pure Value Fund for the period of April 1, 2024 to September 30, 2024. You can find additional information about the fund at GuggenheimInvestments.com/mutual-funds/literature. You can also request this information by contacting 800 820 0888 or GuggenheimClientServices@mufg-is.com.
For the period of April 1, 2024 to September 30, 2024, the fund (Class A shares) returned 1.39%, underperforming the fund's benchmark, the S&P 500 Index, which returned 10.42% for the same period and underperforming the fund's secondary index, the S&P SmallCap 600 Pure Value Index, which returned 2.44% for the same period.
The fund's broad-based securities market index was changed from the S&P SmallCap 600 Pure Value Index to the S&P 500 Index to comply with the regulation that requires the fund's broad-based securities market index to represent the overall applicable market.
What factors materially affected the fund's performance over the last six months?
The sectors that contributed the most to the return of the S&P SmallCap 600 Pure Value Index (the "Index") were Financials, Communication Services, and Consumer Staples. Those that detracted the most were Consumer Discretionary, Materials, and Industrials. The holdings that contributed the most to the return of the Index were Lumen Technologies, Inc., EchoStar Corp. – Class A, and Benchmark Electronics, Inc. Those that detracted the most were Advance Auto Parts, Inc., Xerox Holdings Corp., and Clearwater Paper Corp. The Fund maintained a daily correlation of over 99% to the S&P SmallCap 600 Pure Value Index for the Reporting Period.
Cumulative performance* for the fund's most recently completed 10 years (as of 9.30.24), assuming a $10,000 initial investment.
| 09/30/2014 | 9526 | 10000 | 10000 |
| 12/31/2014 | 10273 | 10493 | 10875 |
| 03/31/2015 | 10365 | 10593 | 10998 |
| 06/30/2015 | 10390 | 10622 | 11064 |
| 09/30/2015 | 8695 | 9939 | 9305 |
| 12/31/2015 | 8880 | 10638 | 9547 |
| 03/31/2016 | 9301 | 10782 | 10039 |
| 06/30/2016 | 9157 | 11047 | 9966 |
| 09/30/2016 | 10072 | 11472 | 10997 |
| 12/31/2016 | 11659 | 11911 | 12799 |
| 03/31/2017 | 10940 | 12633 | 12068 |
| 06/30/2017 | 10554 | 13023 | 11688 |
| 09/30/2017 | 11092 | 13607 | 12393 |
| 12/31/2017 | 11550 | 14511 | 12964 |
| 03/31/2018 | 11100 | 14401 | 12511 |
| 06/30/2018 | 12253 | 14896 | 13845 |
| 09/30/2018 | 12193 | 16044 | 13838 |
| 12/31/2018 | 9189 | 13875 | 10465 |
| 03/31/2019 | 10386 | 15769 | 11905 |
| 06/30/2019 | 9884 | 16447 | 11415 |
| 09/30/2019 | 10100 | 16727 | 11732 |
| 12/31/2019 | 11004 | 18244 | 12880 |
| 03/31/2020 | 5418 | 14668 | 6397 |
| 06/30/2020 | 7313 | 17682 | 8702 |
| 09/30/2020 | 7800 | 19260 | 9357 |
| 12/31/2020 | 10210 | 21600 | 12345 |
| 03/31/2021 | 13492 | 22934 | 16433 |
| 06/30/2021 | 14478 | 24895 | 17716 |
| 09/30/2021 | 14161 | 25040 | 17404 |
| 12/31/2021 | 14621 | 27801 | 18093 |
| 03/31/2022 | 14657 | 26522 | 18252 |
| 06/30/2022 | 12638 | 22252 | 15797 |
| 09/30/2022 | 11557 | 21165 | 14531 |
| 12/31/2022 | 13382 | 22766 | 16931 |
| 03/31/2023 | 13716 | 24473 | 17450 |
| 06/30/2023 | 14152 | 26612 | 18059 |
| 09/30/2023 | 13769 | 25741 | 17655 |
| 12/31/2023 | 16228 | 28750 | 20881 |
| 03/31/2024 | 16274 | 31785 | 21032 |
| 06/30/2024 | 15019 | 33147 | 19485 |
| 09/30/2024 | 16499 | 35098 | 21537 |
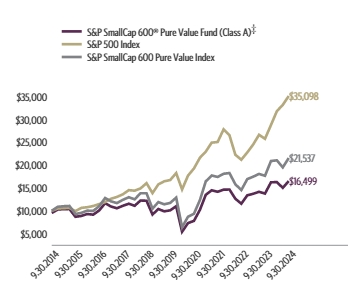
| Class A (without sales charge) | 1.39% | 19.82% | 10.31% | 5.65% |
| Class A (with sales charge)‡ | -3.43% | 14.13% | 9.25% | 5.13% |
| S&P 500 Index | 10.42% | 36.35% | 15.98% | 13.38% |
| S&P SmallCap 600 Pure Value Index | 2.44% | 21.93% | 12.92% | 7.97% |
The fund's past performance is not a good predictor of the fund's future performance. Visit GuggenheimInvestments.com/mutual-funds/performance for more recent performance information.
| Net Assets | $5,590,615 |
| Total Number of Portfolio Holdings | 138 |
| Portfolio Turnover Rate | 901% |
| S&P SmallCap 600® Pure Value Fund | Class A | RYSVX | Semi-Annual Shareholder Report | September 30, 2024 |
| Consumer, Cyclical | 25.7% |
| Financial | 24.3% |
| Consumer, Non-cyclical | 20.4% |
| Industrial | 12.6% |
| Communications | 5.2% |
| Technology | 4.8% |
| Energy | 3.7% |
| Basic Materials | 3.0% |
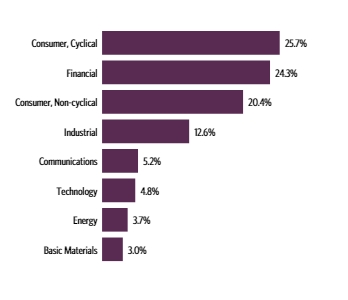
| EchoStar Corp. — Class A | 2.2% |
| World Kinect Corp. | 2.1% |
| Phinia, Inc. | 2.0% |
| JetBlue Airways Corp. | 1.9% |
| Fresh Del Monte Produce, Inc. | 1.8% |
| Green Dot Corp. — Class A | 1.8% |
| Lumen Technologies, Inc. | 1.8% |
| Benchmark Electronics, Inc. | 1.7% |
| Bread Financial Holdings, Inc. | 1.7% |
| United Natural Foods, Inc. | 1.6% |
| Top 10 Total | 18.6% |
| |
1 | "Holdings Diversification (Market Exposure as a % of Net Assets)" excludes any temporary cash investments, investments in Guggenheim Strategy Funds Trust mutual funds, or investments in Guggenheim Ultra Short Duration Fund. |
| |
2 | "10 Largest Holdings (as a % of Net Assets)" excludes any temporary cash investments. |
| EchoStar Corp. — Class A | 2.2% |
| World Kinect Corp. | 2.1% |
| Phinia, Inc. | 2.0% |
| JetBlue Airways Corp. | 1.9% |
| Fresh Del Monte Produce, Inc. | 1.8% |
| Green Dot Corp. — Class A | 1.8% |
| Lumen Technologies, Inc. | 1.8% |
| Benchmark Electronics, Inc. | 1.7% |
| Bread Financial Holdings, Inc. | 1.7% |
| United Natural Foods, Inc. | 1.6% |
| Top 10 Total | 18.6% |
| |
2 | "10 Largest Holdings (as a % of Net Assets)" excludes any temporary cash investments. |
There were no changes in or disagreements with fund accountants for the period.
| |  | Availability of Additional Information. For additional information, including the fund's prospectus, financial information, holdings and proxy voting information, go to GuggenheimInvestments.com/mutual-funds/literature or, call 800 820 0888. |
SAR-RYSVX-093024
Semi-Annual Shareholder Report | 9.30.24
This semi-annual shareholder report contains important information about the S&P SmallCap 600® Pure Value Fund for the period of April 1, 2024 to September 30, 2024. You can find additional information about the fund at GuggenheimInvestments.com/mutual-funds/literature. You can also request this information by contacting 800 820 0888 or GuggenheimClientServices@mufg-is.com.
For the period of April 1, 2024 to September 30, 2024, the fund (Class C shares) returned 1.01%, underperforming the fund's benchmark, the S&P 500 Index, which returned 10.42% for the same period and underperforming the fund's secondary index, the S&P SmallCap 600 Pure Value Index, which returned 2.44% for the same period.
The fund's broad-based securities market index was changed from the S&P SmallCap 600 Pure Value Index to the S&P 500 Index to comply with the regulation that requires the fund's broad-based securities market index to represent the overall applicable market.
What factors materially affected the fund's performance over the last six months?
The sectors that contributed the most to the return of the S&P SmallCap 600 Pure Value Index (the "Index") were Financials, Communication Services, and Consumer Staples. Those that detracted the most were Consumer Discretionary, Materials, and Industrials. The holdings that contributed the most to the return of the Index were Lumen Technologies, Inc., EchoStar Corp. – Class A, and Benchmark Electronics, Inc. Those that detracted the most were Advance Auto Parts, Inc., Xerox Holdings Corp., and Clearwater Paper Corp. The Fund maintained a daily correlation of over 99% to the S&P SmallCap 600 Pure Value Index for the Reporting Period.
Cumulative performance* for the fund's most recently completed 10 years (as of 9.30.24), assuming a $10,000 initial investment.
| 09/30/2014 | 10000 | 10000 | 10000 |
| 12/31/2014 | 10766 | 10493 | 10875 |
| 03/31/2015 | 10842 | 10593 | 10998 |
| 06/30/2015 | 10842 | 10622 | 11064 |
| 09/30/2015 | 9058 | 9939 | 9305 |
| 12/31/2015 | 9234 | 10638 | 9547 |
| 03/31/2016 | 9653 | 10782 | 10039 |
| 06/30/2016 | 9486 | 11047 | 9966 |
| 09/30/2016 | 10414 | 11472 | 10997 |
| 12/31/2016 | 12032 | 11911 | 12799 |
| 03/31/2017 | 11271 | 12633 | 12068 |
| 06/30/2017 | 10852 | 13023 | 11688 |
| 09/30/2017 | 11385 | 13607 | 12393 |
| 12/31/2017 | 11828 | 14511 | 12964 |
| 03/31/2018 | 11347 | 14401 | 12511 |
| 06/30/2018 | 12504 | 14896 | 13845 |
| 09/30/2018 | 12413 | 16044 | 13838 |
| 12/31/2018 | 9338 | 13875 | 10465 |
| 03/31/2019 | 10538 | 15769 | 11905 |
| 06/30/2019 | 10010 | 16447 | 11415 |
| 09/30/2019 | 10209 | 16727 | 11732 |
| 12/31/2019 | 11099 | 18244 | 12880 |
| 03/31/2020 | 5455 | 14668 | 6397 |
| 06/30/2020 | 7354 | 17682 | 8702 |
| 09/30/2020 | 7830 | 19260 | 9357 |
| 12/31/2020 | 10228 | 21600 | 12345 |
| 03/31/2021 | 13494 | 22934 | 16433 |
| 06/30/2021 | 14452 | 24895 | 17716 |
| 09/30/2021 | 14109 | 25040 | 17404 |
| 12/31/2021 | 14539 | 27801 | 18093 |
| 03/31/2022 | 14549 | 26522 | 18252 |
| 06/30/2022 | 12521 | 22252 | 15797 |
| 09/30/2022 | 11428 | 21165 | 14531 |
| 12/31/2022 | 13208 | 22766 | 16931 |
| 03/31/2023 | 13513 | 24473 | 17450 |
| 06/30/2023 | 13916 | 26612 | 18059 |
| 09/30/2023 | 13515 | 25741 | 17655 |
| 12/31/2023 | 15898 | 28750 | 20881 |
| 03/31/2024 | 15913 | 31785 | 21032 |
| 06/30/2024 | 14658 | 33147 | 19485 |
| 09/30/2024 | 16074 | 35098 | 21537 |
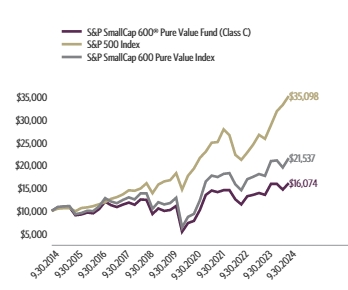
| Class C (without CDSC) | 1.01% | 18.94% | 9.50% | 4.86% |
| Class C (with CDSC)§ | 0.01% | 17.94% | 9.50% | 4.86% |
| S&P 500 Index | 10.42% | 36.35% | 15.98% | 13.38% |
| S&P SmallCap 600 Pure Value Index | 2.44% | 21.93% | 12.92% | 7.97% |
The fund's past performance is not a good predictor of the fund's future performance. Visit GuggenheimInvestments.com/mutual-funds/performance for more recent performance information.
| Net Assets | $5,590,615 |
| Total Number of Portfolio Holdings | 138 |
| Portfolio Turnover Rate | 901% |
| S&P SmallCap 600® Pure Value Fund | Class C | RYYCX | Semi-Annual Shareholder Report | September 30, 2024 |
| Consumer, Cyclical | 25.7% |
| Financial | 24.3% |
| Consumer, Non-cyclical | 20.4% |
| Industrial | 12.6% |
| Communications | 5.2% |
| Technology | 4.8% |
| Energy | 3.7% |
| Basic Materials | 3.0% |

| EchoStar Corp. — Class A | 2.2% |
| World Kinect Corp. | 2.1% |
| Phinia, Inc. | 2.0% |
| JetBlue Airways Corp. | 1.9% |
| Fresh Del Monte Produce, Inc. | |
| Green Dot Corp. — Class A | 1.8% |
| Lumen Technologies, Inc. | 1.8% |
| Benchmark Electronics, Inc. | 1.7% |
| Bread Financial Holdings, Inc. | 1.7% |
| United Natural Foods, Inc. | 1.6% |
| Top 10 Total | 18.6% |
| |
1 | "Holdings Diversification (Market Exposure as a % of Net Assets)" excludes any temporary cash investments, investments in Guggenheim Strategy Funds Trust mutual funds, or investments in Guggenheim Ultra Short Duration Fund. |
| |
2 | "10 Largest Holdings (as a % of Net Assets)" excludes any temporary cash investments. |
| EchoStar Corp. — Class A | 2.2% |
| World Kinect Corp. | 2.1% |
| Phinia, Inc. | 2.0% |
| JetBlue Airways Corp. | 1.9% |
| Fresh Del Monte Produce, Inc. | 1.8% |
| Green Dot Corp. — Class A | 1.8% |
| Lumen Technologies, Inc. | 1.8% |
| Benchmark Electronics, Inc. | 1.7% |
| Bread Financial Holdings, Inc. | 1.7% |
| United Natural Foods, Inc. | 1.6% |
| Top 10 Total | 18.6% |
| |
2 | "10 Largest Holdings (as a % of Net Assets)" excludes any temporary cash investments. |
There were no changes in or disagreements with fund accountants for the period.
| |  | Availability of Additional Information. For additional information, including the fund's prospectus, financial information, holdings and proxy voting information, go to GuggenheimInvestments.com/mutual-funds/literature or, call 800 820 0888. |
SAR-RYYCX-093024
Semi-Annual Shareholder Report | 9.30.24
This semi-annual shareholder report contains important information about the S&P SmallCap 600® Pure Value Fund for the period of April 1, 2024 to September 30, 2024. You can find additional information about the fund at GuggenheimInvestments.com/mutual-funds/literature. You can also request this information by contacting 800 820 0888 or GuggenheimClientServices@mufg-is.com.
For the period of April 1, 2024 to September 30, 2024, the fund (Class H shares) returned 1.38%, underperforming the fund's benchmark, the S&P 500 Index, which returned 10.42% for the same period and underperforming the fund's secondary index, the S&P SmallCap 600 Pure Value Index, which returned 2.44% for the same period.
The fund's broad-based securities market index was changed from the S&P SmallCap 600 Pure Value Index to the S&P 500 Index to comply with the regulation that requires the fund's broad-based securities market index to represent the overall applicable market.
What factors materially affected the fund's performance over the last six months?
The sectors that contributed the most to the return of the S&P SmallCap 600 Pure Value Index (the "Index") were Financials, Communication Services, and Consumer Staples. Those that detracted the most were Consumer Discretionary, Materials, and Industrials. The holdings that contributed the most to the return of the Index were Lumen Technologies, Inc., EchoStar Corp. – Class A, and Benchmark Electronics, Inc. Those that detracted the most were Advance Auto Parts, Inc., Xerox Holdings Corp., and Clearwater Paper Corp. The Fund maintained a daily correlation of over 99% to the S&P SmallCap 600 Pure Value Index for the Reporting Period.
Cumulative performance* for the fund's most recently completed 10 years (as of 9.30.24), assuming a $10,000 initial investment.
| 09/30/2014 | 10000 | 10000 | 10000 |
| 12/31/2014 | 10787 | 10493 | 10875 |
| 03/31/2015 | 10885 | 10593 | 10998 |
| 06/30/2015 | 10906 | 10622 | 11064 |
| 09/30/2015 | 9128 | 9939 | 9305 |
| 12/31/2015 | 9327 | 10638 | 9547 |
| 03/31/2016 | 9767 | 10782 | 10039 |
| 06/30/2016 | 9610 | 11047 | 9966 |
| 09/30/2016 | 10567 | 11472 | 10997 |
| 12/31/2016 | 12240 | 11911 | 12799 |
| 03/31/2017 | 11486 | 12633 | 12068 |
| 06/30/2017 | 11080 | 13023 | 11688 |
| 09/30/2017 | 11668 | 13607 | 12393 |
| 12/31/2017 | 12151 | 14511 | 12964 |
| 03/31/2018 | 11672 | 14401 | 12511 |
| 06/30/2018 | 12883 | 14896 | 13845 |
| 09/30/2018 | 12815 | 16044 | 13838 |
| 12/31/2018 | 9661 | 13875 | 10465 |
| 03/31/2019 | 10923 | 15769 | 11905 |
| 06/30/2019 | 10394 | 16447 | 11415 |
| 09/30/2019 | 10622 | 16727 | 11732 |
| 12/31/2019 | 11566 | 18244 | 12880 |
| 03/31/2020 | 5694 | 14668 | 6397 |
| 06/30/2020 | 7693 | 17682 | 8702 |
| 09/30/2020 | 8203 | 19260 | 9357 |
| 12/31/2020 | 10737 | 21600 | 12345 |
| 03/31/2021 | 14188 | 22934 | 16433 |
| 06/30/2021 | 15224 | 24895 | 17716 |
| 09/30/2021 | 14891 | 25040 | 17404 |
| 12/31/2021 | 15375 | 27801 | 18093 |
| 03/31/2022 | 15414 | 26522 | 18252 |
| 06/30/2022 | 13290 | 22252 | 15797 |
| 09/30/2022 | 12154 | 21165 | 14531 |
| 12/31/2022 | 14072 | 22766 | 16931 |
| 03/31/2023 | 14423 | 24473 | 17450 |
| 06/30/2023 | 14881 | 26612 | 18059 |
| 09/30/2023 | 14478 | 25741 | 17655 |
| 12/31/2023 | 17061 | 28750 | 20881 |
| 03/31/2024 | 17109 | 31785 | 21032 |
| 06/30/2024 | 15790 | 33147 | 19485 |
| 09/30/2024 | 17344 | 35098 | 21537 |
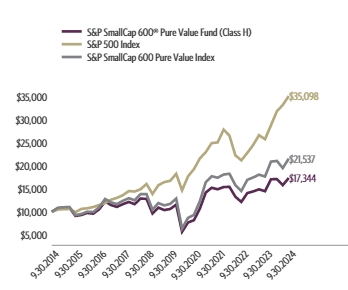
| Class H | 1.38% | 19.80% | 10.30% | 5.66% |
| S&P 500 Index | 10.42% | 36.35% | 15.98% | 13.38% |
| S&P SmallCap 600 Pure Value Index | 2.44% | 21.93% | 12.92% | 7.97% |
The fund's past performance is not a good predictor of the fund's future performance. Visit GuggenheimInvestments.com/mutual-funds/performance for more recent performance information.
| Net Assets | $5,590,615 |
| Total Number of Portfolio Holdings | 138 |
| Portfolio Turnover Rate | 901% |
| S&P SmallCap 600® Pure Value Fund | Class H | RYAZX | Semi-Annual Shareholder Report | September 30, 2024 |
| Consumer, Cyclical | 25.7% |
| Financial | 24.3% |
| Consumer, Non-cyclical | 20.4% |
| Industrial | 12.6% |
| Communications | 5.2% |
| Technology | 4.8% |
| Energy | 3.7% |
| Basic Materials | 3.0% |

| EchoStar Corp. — Class A | 2.2% |
| World Kinect Corp. | 2.1% |
| Phinia, Inc. | 2.0% |
| JetBlue Airways Corp. | 1.9% |
| Fresh Del Monte Produce, Inc. | 1.8% |
| Green Dot Corp. — Class A | 1.8% |
| Lumen Technologies, Inc. | 1.8% |
| Benchmark Electronics, Inc. | 1.7% |
| Bread Financial Holdings, Inc. | 1.7% |
| United Natural Foods, Inc. | 1.6% |
| Top 10 Total | 18.6% |
| |
1 | "Holdings Diversification (Market Exposure as a % of Net Assets)" excludes any temporary cash investments, investments in Guggenheim Strategy Funds Trust mutual funds, or investments in Guggenheim Ultra Short Duration Fund. |
| |
2 | "10 Largest Holdings (as a % of Net Assets)" excludes any temporary cash investments. |
| EchoStar Corp. — Class A | 2.2% |
| World Kinect Corp. | 2.1% |
| Phinia, Inc. | 2.0% |
| JetBlue Airways Corp. | 1.9% |
| Fresh Del Monte Produce, Inc. | 1.8% |
| Green Dot Corp. — Class A | 1.8% |
| Lumen Technologies, Inc. | 1.8% |
| Benchmark Electronics, Inc. | 1.7% |
| Bread Financial Holdings, Inc. | 1.7% |
| United Natural Foods, Inc. | 1.6% |
| Top 10 Total | 18.6% |
| |
2 | "10 Largest Holdings (as a % of Net Assets)" excludes any temporary cash investments. |
There were no changes in or disagreements with fund accountants for the period.
| |  | Availability of Additional Information. For additional information, including the fund's prospectus, financial information, holdings and proxy voting information, go to GuggenheimInvestments.com/mutual-funds/literature or, call 800 820 0888. |
SAR-RYAZX-093024
Semi-Annual Shareholder Report | 9.30.24
This semi-annual shareholder report contains important information about the S&P SmallCap 600® Pure Growth Fund for the period of April 1, 2024 to September 30, 2024. You can find additional information about the fund at GuggenheimInvestments.com/mutual-funds/literature. You can also request this information by contacting 800 820 0888 or GuggenheimClientServices@mufg-is.com.
For the period of April 1, 2024 to September 30, 2024, the fund (Class A shares) returned 5.33%, underperforming the fund's benchmark, the S&P 500 Index, which returned 10.42% for the same period and underperforming the fund's secondary index, the S&P SmallCap 600 Pure Growth Index, which returned 6.47% for the same period.
The fund's broad-based securities market index was changed from the S&P SmallCap 600 Pure Growth Index to the S&P 500 Index to comply with the regulation that requires the fund's broad-based securities market index to represent the overall applicable market.
What factors materially affected the fund's performance over the last six months?
The sectors that contributed the most to the return of the S&P SmallCap 600 Pure Growth Index (the "Index") were Consumer Discretionary, Financials, and Materials. The only sectors that detracted were Energy and Utilities. The holdings that contributed the most to the return of the Index were Boot Barn Holdings, Inc., Carpenter Technology Corp., and Cinemark Holdings, Inc. Those that detracted the most were Par Pacific Holdings, Inc., Dave & Buster's Entertainment, Inc., and TripAdvisor, Inc. The Fund maintained a daily correlation of over 99% to the S&P SmallCap 600 Pure Growth Index for the Reporting Period.
Cumulative performance* for the fund's most recently completed 10 years (as of 9.30.24), assuming a $10,000 initial investment.
| 09/30/2014 | 9525 | 10000 | 10000 |
| 12/31/2014 | 10122 | 10493 | 10684 |
| 03/31/2015 | 11069 | 10593 | 11736 |
| 06/30/2015 | 11242 | 10622 | 11964 |
| 09/30/2015 | 10064 | 9939 | 10764 |
| 12/31/2015 | 10070 | 10638 | 10814 |
| 03/31/2016 | 9825 | 10782 | 10607 |
| 06/30/2016 | 10209 | 11047 | 11078 |
| 09/30/2016 | 11007 | 11472 | 12001 |
| 12/31/2016 | 11919 | 11911 | 13070 |
| 03/31/2017 | 12325 | 12633 | 13577 |
| 06/30/2017 | 12612 | 13023 | 13948 |
| 09/30/2017 | 13441 | 13607 | 14927 |
| 12/31/2017 | 13845 | 14511 | 15448 |
| 03/31/2018 | 13977 | 14401 | 15646 |
| 06/30/2018 | 15377 | 14896 | 17295 |
| 09/30/2018 | 16210 | 16044 | 18314 |
| 12/31/2018 | 12607 | 13875 | 14296 |
| 03/31/2019 | 13650 | 15769 | 15569 |
| 06/30/2019 | 13396 | 16447 | 15345 |
| 09/30/2019 | 12814 | 16727 | 14742 |
| 12/31/2019 | 14173 | 18244 | 16400 |
| 03/31/2020 | 9177 | 14668 | 10635 |
| 06/30/2020 | 12051 | 17682 | 14013 |
| 09/30/2020 | 12733 | 19260 | 14878 |
| 12/31/2020 | 16454 | 21600 | 19363 |
| 03/31/2021 | 18674 | 22934 | 22079 |
| 06/30/2021 | 19235 | 24895 | 22893 |
| 09/30/2021 | 18785 | 25040 | 22463 |
| 12/31/2021 | 19565 | 27801 | 23490 |
| 03/31/2022 | 16606 | 26522 | 19998 |
| 06/30/2022 | 13520 | 22252 | 16328 |
| 09/30/2022 | 12914 | 21165 | 15667 |
| 12/31/2022 | 13732 | 22766 | 16741 |
| 03/31/2023 | 13976 | 24473 | 17080 |
| 06/30/2023 | 15026 | 26612 | 18427 |
| 09/30/2023 | 14329 | 25741 | 17622 |
| 12/31/2023 | 16194 | 28750 | 20006 |
| 03/31/2024 | 17293 | 31785 | 21442 |
| 06/30/2024 | 16794 | 33147 | 20938 |
| 09/30/2024 | 18215 | 35098 | 22833 |
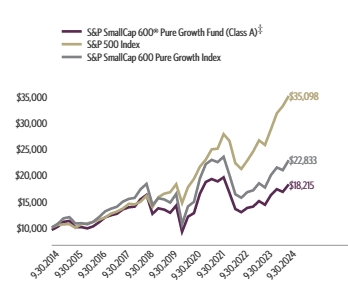
| Class A (without sales charge) | 5.33% | 27.12% | 7.29% | 6.70% |
| Class A (with sales charge)‡ | 0.33% | 21.08% | 6.25% | 6.18% |
| S&P 500 Index | 10.42% | 36.35% | 15.98% | 13.38% |
| S&P SmallCap 600 Pure Growth Index | 6.47% | 29.59% | 9.15% | 8.60% |
The fund's past performance is not a good predictor of the fund's future performance. Visit GuggenheimInvestments.com/mutual-funds/performance for more recent performance information.
| Net Assets | $4,083,898 |
| Total Number of Portfolio Holdings | 139 |
| Portfolio Turnover Rate | 1,548% |
1548%
| S&P SmallCap 600® Pure Growth Fund | Class A | RYSGX | Semi-Annual Shareholder Report | September 30, 2024 |
| Consumer, Non-cyclical | 21.6% |
| Consumer, Cyclical | 19.3% |
| Financial | 18.6% |
| Industrial | 15.1% |
| Energy | 11.2% |
| Communications | 4.7% |
| Technology | 4.1% |
| Other | 4.8% |

| PROG Holdings, Inc. | 1.8% |
| UFP Technologies, Inc. | 1.7% |
| Cinemark Holdings, Inc. | 1.7% |
| Green Brick Partners, Inc. | 1.7% |
| Boot Barn Holdings, Inc. | 1.6% |
| Hawkins, Inc. | 1.6% |
| Two Harbors Investment Corp. | 1.5% |
| SiriusPoint Ltd. | 1.4% |
| Group 1 Automotive, Inc. | 1.4% |
| TG Therapeutics, Inc. | 1.3% |
| Top 10 Total | 15.7% |
| |
1 | "Holdings Diversification (Market Exposure as a % of Net Assets)" excludes any temporary cash investments, investments in Guggenheim Strategy Funds Trust mutual funds, or investments in Guggenheim Ultra Short Duration Fund. |
| |
2 | "10 Largest Holdings (as a % of Net Assets)" excludes any temporary cash investments. |
| PROG Holdings, Inc. | 1.8% |
| UFP Technologies, Inc. | 1.7% |
| Cinemark Holdings, Inc. | 1.7% |
| Green Brick Partners, Inc. | 1.7% |
| Boot Barn Holdings, Inc. | 1.6% |
| Hawkins, Inc. | 1.6% |
| Two Harbors Investment Corp. | 1.5% |
| SiriusPoint Ltd. | 1.4% |
| Group 1 Automotive, Inc. | 1.4% |
| TG Therapeutics, Inc. | 1.3% |
| Top 10 Total | 15.7% |
| |
2 | "10 Largest Holdings (as a % of Net Assets)" excludes any temporary cash investments. |
There were no changes in or disagreements with fund accountants for the period.
| |  | Availability of Additional Information. For additional information, including the fund's prospectus, financial information, holdings and proxy voting information, go to GuggenheimInvestments.com/mutual-funds/literature or, call 800 820 0888. |
SAR-RYSGX-093024
Semi-Annual Shareholder Report | 9.30.24
This semi-annual shareholder report contains important information about the S&P SmallCap 600® Pure Growth Fund for the period of April 1, 2024 to September 30, 2024. You can find additional information about the fund at GuggenheimInvestments.com/mutual-funds/literature. You can also request this information by contacting 800 820 0888 or GuggenheimClientServices@mufg-is.com.
For the period of April 1, 2024 to September 30, 2024, the fund (Class C shares) returned 4.90%, underperforming the fund's benchmark, the S&P 500 Index, which returned 10.42% for the same period and underperforming the fund's secondary index, the S&P SmallCap 600 Pure Growth Index, which returned 6.47% for the same period.
The fund's broad-based securities market index was changed from the S&P SmallCap 600 Pure Growth Index to the S&P 500 Index to comply with the regulation that requires the fund's broad-based securities market index to represent the overall applicable market.
What factors materially affected the fund's performance over the last six months?
The sectors that contributed the most to the return of the S&P SmallCap 600 Pure Growth Index (the "Index") were Consumer Discretionary, Financials, and Materials. The only sectors that detracted were Energy and Utilities. The holdings that contributed the most to the return of the Index were Boot Barn Holdings, Inc., Carpenter Technology Corp., and Cinemark Holdings, Inc. Those that detracted the most were Par Pacific Holdings, Inc., Dave & Buster's Entertainment, Inc., and TripAdvisor, Inc. The Fund maintained a daily correlation of over 99% to the S&P SmallCap 600 Pure Growth Index for the Reporting Period.
Cumulative performance* for the fund's most recently completed 10 years (as of 9.30.24), assuming a $10,000 initial investment.
| 09/30/2014 | 10000 | 10000 | 10000 |
| 12/31/2014 | 10606 | 10493 | 10684 |
| 03/31/2015 | 11578 | 10593 | 11736 |
| 06/30/2015 | 11736 | 10622 | 11964 |
| 09/30/2015 | 10486 | 9939 | 10764 |
| 12/31/2015 | 10471 | 10638 | 10814 |
| 03/31/2016 | 10201 | 10782 | 10607 |
| 06/30/2016 | 10578 | 11047 | 11078 |
| 09/30/2016 | 11384 | 11472 | 12001 |
| 12/31/2016 | 12304 | 11911 | 13070 |
| 03/31/2017 | 12701 | 12633 | 13577 |
| 06/30/2017 | 12969 | 13023 | 13948 |
| 09/30/2017 | 13797 | 13607 | 14927 |
| 12/31/2017 | 14182 | 14511 | 15448 |
| 03/31/2018 | 14291 | 14401 | 15646 |
| 06/30/2018 | 15693 | 14896 | 17295 |
| 09/30/2018 | 16511 | 16044 | 18314 |
| 12/31/2018 | 12818 | 13875 | 14296 |
| 03/31/2019 | 13853 | 15769 | 15569 |
| 06/30/2019 | 13572 | 16447 | 15345 |
| 09/30/2019 | 12956 | 16727 | 14742 |
| 12/31/2019 | 14303 | 18244 | 16400 |
| 03/31/2020 | 9243 | 14668 | 10635 |
| 06/30/2020 | 12116 | 17682 | 14013 |
| 09/30/2020 | 12780 | 19260 | 14878 |
| 12/31/2020 | 16481 | 21600 | 19363 |
| 03/31/2021 | 18671 | 22934 | 22079 |
| 06/30/2021 | 19195 | 24895 | 22893 |
| 09/30/2021 | 18712 | 25040 | 22463 |
| 12/31/2021 | 19450 | 27801 | 23490 |
| 03/31/2022 | 16477 | 26522 | 19998 |
| 06/30/2022 | 13392 | 22252 | 16328 |
| 09/30/2022 | 12765 | 21165 | 15667 |
| 12/31/2022 | 13551 | 22766 | 16741 |
| 03/31/2023 | 13765 | 24473 | 17080 |
| 06/30/2023 | 14773 | 26612 | 18427 |
| 09/30/2023 | 14061 | 25741 | 17622 |
| 12/31/2023 | 15859 | 28750 | 20006 |
| 03/31/2024 | 16905 | 31785 | 21442 |
| 06/30/2024 | 16388 | 33147 | 20938 |
| 09/30/2024 | 17738 | 35098 | 22833 |
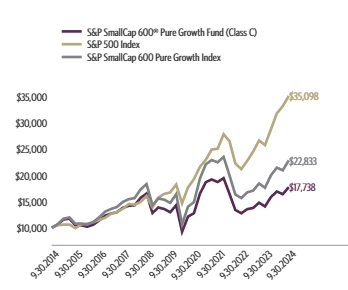
| Class C (without CDSC) | 4.90% | 26.15% | 6.48% | 5.90% |
| Class C (with CDSC)§ | 3.90% | 25.15% | 6.48% | 5.90% |
| S&P 500 Index | 10.42% | 36.35% | 15.98% | 13.38% |
| S&P SmallCap 600 Pure Growth Index | 6.47% | 29.59% | 9.15% | 8.60% |
The fund's past performance is not a good predictor of the fund's future performance. Visit GuggenheimInvestments.com/mutual-funds/performance for more recent performance information.
| Net Assets | $4,083,898 |
| Total Number of Portfolio Holdings | 139 |
| Portfolio Turnover Rate | 1,548% |
1548%
| S&P SmallCap 600® Pure Growth Fund | Class C | RYWCX | Semi-Annual Shareholder Report | September 30, 2024 |
| Consumer, Non-cyclical | 21.6% |
| Consumer, Cyclical | 19.3% |
| Financial | 18.6% |
| Industrial | 15.1% |
| Energy | 11.2% |
| Communications | 4.7% |
| Technology | 4.1% |
| Other | 4.8% |

| PROG Holdings, Inc. | 1.8% |
| UFP Technologies, Inc. | 1.7% |
| Cinemark Holdings, Inc. | 1.7% |
| Green Brick Partners, Inc. | 1.7% |
| Boot Barn Holdings, Inc. | 1.6% |
| Hawkins, Inc. | 1.6% |
| Two Harbors Investment Corp. | 1.5% |
| SiriusPoint Ltd. | 1.4% |
| Group 1 Automotive, Inc. | 1.4% |
| TG Therapeutics, Inc. | 1.3% |
| Top 10 Total | 15.7% |
| |
1 | "Holdings Diversification (Market Exposure as a % of Net Assets)" excludes any temporary cash investments, investments in Guggenheim Strategy Funds Trust mutual funds, or investments in Guggenheim Ultra Short Duration Fund. |
| |
2 | "10 Largest Holdings (as a % of Net Assets)" excludes any temporary cash investments. |
| PROG Holdings, Inc. | 1.8% |
| UFP Technologies, Inc. | 1.7% |
| Cinemark Holdings, Inc. | 1.7% |
| Green Brick Partners, Inc. | 1.7% |
| Boot Barn Holdings, Inc. | 1.6% |
| Hawkins, Inc. | 1.6% |
| Two Harbors Investment Corp. | 1.5% |
| SiriusPoint Ltd. | 1.4% |
| Group 1 Automotive, Inc. | 1.4% |
| TG Therapeutics, Inc. | 1.3% |
| Top 10 Total | 15.7% |
| |
2 | "10 Largest Holdings (as a % of Net Assets)" excludes any temporary cash investments. |
There were no changes in or disagreements with fund accountants for the period.
| |  | Availability of Additional Information. For additional information, including the fund's prospectus, financial information, holdings and proxy voting information, go to GuggenheimInvestments.com/mutual-funds/literature or, call 800 820 0888. |
SAR-RYWCX-093024
Semi-Annual Shareholder Report | 9.30.24
This semi-annual shareholder report contains important information about the S&P SmallCap 600® Pure Growth Fund for the period of April 1, 2024 to September 30, 2024. You can find additional information about the fund at GuggenheimInvestments.com/mutual-funds/literature. You can also request this information by contacting 800 820 0888 or GuggenheimClientServices@mufg-is.com.
For the period of April 1, 2024 to September 30, 2024, the fund (Class H shares) returned 5.26%, underperforming the fund's benchmark, the S&P 500 Index, which returned 10.42% for the same period and underperforming the fund's secondary index, the S&P SmallCap 600 Pure Growth Index, which returned 6.47% for the same period.
The fund's broad-based securities market index was changed from the S&P SmallCap 600 Pure Growth Index to the S&P 500 Index to comply with the regulation that requires the fund's broad-based securities market index to represent the overall applicable market.
What factors materially affected the fund's performance over the last six months?
The sectors that contributed the most to the return of the S&P SmallCap 600 Pure Growth Index (the "Index") were Consumer Discretionary, Financials, and Materials. The only sectors that detracted were Energy and Utilities. The holdings that contributed the most to the return of the Index were Boot Barn Holdings, Inc., Carpenter Technology Corp., and Cinemark Holdings, Inc. Those that detracted the most were Par Pacific Holdings, Inc., Dave & Buster's Entertainment, Inc., and TripAdvisor, Inc. The Fund maintained a daily correlation of over 99% to the S&P SmallCap 600 Pure Growth Index for the Reporting Period.
Cumulative performance* for the fund's most recently completed 10 years (as of 9.30.24), assuming a $10,000 initial investment.
| 09/30/2014 | 10000 | 10000 | 10000 |
| 12/31/2014 | 10628 | 10493 | 10684 |
| 03/31/2015 | 11622 | 10593 | 11736 |
| 06/30/2015 | 11804 | 10622 | 11964 |
| 09/30/2015 | 10566 | 9939 | 10764 |
| 12/31/2015 | 10572 | 10638 | 10814 |
| 03/31/2016 | 10316 | 10782 | 10607 |
| 06/30/2016 | 10718 | 11047 | 11078 |
| 09/30/2016 | 11557 | 11472 | 12001 |
| 12/31/2016 | 12514 | 11911 | 13070 |
| 03/31/2017 | 12943 | 12633 | 13577 |
| 06/30/2017 | 13245 | 13023 | 13948 |
| 09/30/2017 | 14113 | 13607 | 14927 |
| 12/31/2017 | 14535 | 14511 | 15448 |
| 03/31/2018 | 14674 | 14401 | 15646 |
| 06/30/2018 | 16146 | 14896 | 17295 |
| 09/30/2018 | 17019 | 16044 | 18314 |
| 12/31/2018 | 13237 | 13875 | 14296 |
| 03/31/2019 | 14332 | 15769 | 15569 |
| 06/30/2019 | 14066 | 16447 | 15345 |
| 09/30/2019 | 13455 | 16727 | 14742 |
| 12/31/2019 | 14883 | 18244 | 16400 |
| 03/31/2020 | 9635 | 14668 | 10635 |
| 06/30/2020 | 12650 | 17682 | 14013 |
| 09/30/2020 | 13367 | 19260 | 14878 |
| 12/31/2020 | 17275 | 21600 | 19363 |
| 03/31/2021 | 19604 | 22934 | 22079 |
| 06/30/2021 | 20193 | 24895 | 22893 |
| 09/30/2021 | 19727 | 25040 | 22463 |
| 12/31/2021 | 20543 | 27801 | 23490 |
| 03/31/2022 | 17437 | 26522 | 19998 |
| 06/30/2022 | 14195 | 22252 | 16328 |
| 09/30/2022 | 13549 | 21165 | 15667 |
| 12/31/2022 | 14409 | 22766 | 16741 |
| 03/31/2023 | 14655 | 24473 | 17080 |
| 06/30/2023 | 15757 | 26612 | 18427 |
| 09/30/2023 | 15029 | 25741 | 17622 |
| 12/31/2023 | 16984 | 28750 | 20006 |
| 03/31/2024 | 18139 | 31785 | 21442 |
| 06/30/2024 | 17604 | 33147 | 20938 |
| 09/30/2024 | 19093 | 35098 | 22833 |
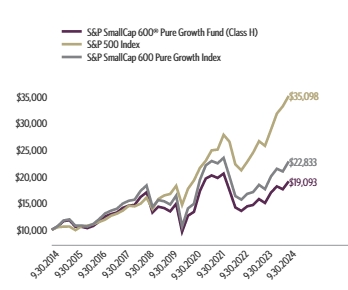
| Class H | 5.26% | 27.05% | 7.25% | 6.68% |
| S&P 500 Index | 10.42% | 36.35% | 15.98% | 13.38% |
| S&P SmallCap 600 Pure Growth Index | 6.47% | 29.59% | 9.15% | 8.60% |
The fund's past performance is not a good predictor of the fund's future performance. Visit GuggenheimInvestments.com/mutual-funds/performance for more recent performance information.
| Net Assets | $4,083,898 |
| Total Number of Portfolio Holdings | 139 |
| Portfolio Turnover Rate | 1,548% |
1548%
| S&P SmallCap 600® Pure Growth Fund | Class H | RYWAX | Semi-Annual Shareholder Report | September 30, 2024 |
| Consumer, Non-cyclical | 21.6% |
| Consumer, Cyclical | 19.3% |
| Financial | 18.6% |
| Industrial | 15.1% |
| Energy | 11.2% |
| Communications | 4.7% |
| Technology | 4.1% |
| Other | 4.8% |
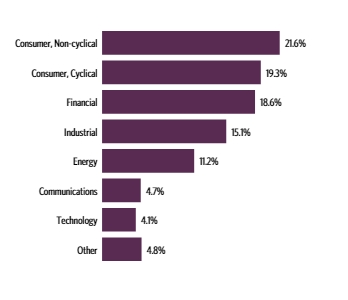
| PROG Holdings, Inc. | 1.8% |
| UFP Technologies, Inc. | 1.7% |
| Cinemark Holdings, Inc. | 1.7% |
| Green Brick Partners, Inc. | 1.7% |
| Boot Barn Holdings, Inc. | 1.6% |
| Hawkins, Inc. | 1.6% |
| Two Harbors Investment Corp. | 1.5% |
| SiriusPoint Ltd. | 1.4% |
| Group 1 Automotive, Inc. | 1.4% |
| TG Therapeutics, Inc. | 1.3% |
| Top 10 Total | 15.7% |
| |
1 | "Holdings Diversification (Market Exposure as a % of Net Assets)" excludes any temporary cash investments, investments in Guggenheim Strategy Funds Trust mutual funds, or investments in Guggenheim Ultra Short Duration Fund. |
| |
2 | "10 Largest Holdings (as a % of Net Assets)" excludes any temporary cash investments. |
| PROG Holdings, Inc. | 1.8% |
| UFP Technologies, Inc. | 1.7% |
| Cinemark Holdings, Inc. | 1.7% |
| Green Brick Partners, Inc. | 1.7% |
| Boot Barn Holdings, Inc. | 1.6% |
| Hawkins, Inc. | 1.6% |
| Two Harbors Investment Corp. | 1.5% |
| SiriusPoint Ltd. | 1.4% |
| Group 1 Automotive, Inc. | 1.4% |
| TG Therapeutics, Inc. | 1.3% |
| Top 10 Total | 15.7% |
| |
2 | "10 Largest Holdings (as a % of Net Assets)" excludes any temporary cash investments. |
There were no changes in or disagreements with fund accountants for the period.
| |  | Availability of Additional Information. For additional information, including the fund's prospectus, financial information, holdings and proxy voting information, go to GuggenheimInvestments.com/mutual-funds/literature or, call 800 820 0888. |
SAR-RYWAX-093024
Semi-Annual Shareholder Report | 9.30.24
This semi-annual shareholder report contains important information about the Mid-Cap 1.5x Strategy Fund for the period of April 1, 2024 to September 30, 2024. You can find additional information about the fund at GuggenheimInvestments.com/mutual-funds/literature. You can also request this information by contacting 800 820 0888 or GuggenheimClientServices@mufg-is.com.
For the period of April 1, 2024 to September 30, 2024, the fund (Class A shares) returned 2.10%, underperforming the fund's benchmark, the S&P 500 Index, which returned 10.42% for the same period and underperforming the fund's secondary index, the S&P MidCap 400 Index, which returned 3.26% for the same period.
The fund's broad-based securities market index was changed from the S&P MidCap 400 Index to the S&P 500 Index to comply with the regulation that requires the fund's broad-based securities market index to represent the overall applicable market.
What factors materially affected the fund's performance over the last six months?
The sectors that contributed the most to the return of the S&P MidCap 400 Index (the "Index") were Financials, Real Estate, and Industrials. Those that detracted the most were Energy, Consumer Discretionary, and Materials. The holdings that contributed the most to the return of the Index were Tenet Healthcare Corp., United Therapeutics Corp., and Sprouts Farmers Market, Inc. Those that detracted the most were Celsius Holdings, Inc., Cleveland-Cliffs, Inc., and Five Below, Inc. The Fund maintained a correlation of more than 99% to its benchmark of 150% of the daily price movement of the S&P MidCap 400 Index.
Cumulative performance* for the fund's most recently completed 10 years (as of 9.30.24), assuming a $10,000 initial investment.
| 09/30/2014 | 9526 | 10000 | 10000 |
| 12/31/2014 | 10362 | 10493 | 10635 |
| 03/31/2015 | 11123 | 10593 | 11200 |
| 06/30/2015 | 10887 | 10622 | 11081 |
| 09/30/2015 | 9440 | 9939 | 10140 |
| 12/31/2015 | 9776 | 10638 | 10404 |
| 03/31/2016 | 10249 | 10782 | 10797 |
| 06/30/2016 | 10787 | 11047 | 11228 |
| 09/30/2016 | 11398 | 11472 | 11694 |
| 12/31/2016 | 12621 | 11911 | 12561 |
| 03/31/2017 | 13311 | 12633 | 13056 |
| 06/30/2017 | 13624 | 13023 | 13313 |
| 09/30/2017 | 14209 | 13607 | 13742 |
| 12/31/2017 | 15473 | 14511 | 14602 |
| 03/31/2018 | 15140 | 14401 | 14489 |
| 06/30/2018 | 15989 | 14896 | 15111 |
| 09/30/2018 | 16815 | 16044 | 15695 |
| 12/31/2018 | 12463 | 13875 | 12983 |
| 03/31/2019 | 15123 | 15769 | 14864 |
| 06/30/2019 | 15657 | 16447 | 15317 |
| 09/30/2019 | 15468 | 16727 | 15304 |
| 12/31/2019 | 16984 | 18244 | 16385 |
| 03/31/2020 | 9449 | 14668 | 11518 |
| 06/30/2020 | 12747 | 17682 | 14291 |
| 09/30/2020 | 13582 | 19260 | 14973 |
| 12/31/2020 | 18661 | 21600 | 18623 |
| 03/31/2021 | 22339 | 22934 | 21131 |
| 06/30/2021 | 23416 | 24895 | 21899 |
| 09/30/2021 | 22649 | 25040 | 21514 |
| 12/31/2021 | 25215 | 27801 | 23234 |
| 03/31/2022 | 23118 | 26522 | 22101 |
| 06/30/2022 | 17717 | 22252 | 18694 |
| 09/30/2022 | 16831 | 21165 | 18233 |
| 12/31/2022 | 19336 | 22766 | 20199 |
| 03/31/2023 | 20183 | 24473 | 20968 |
| 06/30/2023 | 21385 | 26612 | 21985 |
| 09/30/2023 | 19794 | 25741 | 21062 |
| 12/31/2023 | 23030 | 28750 | 23519 |
| 03/31/2024 | 26268 | 31785 | 25860 |
| 06/30/2024 | 24605 | 33147 | 24969 |
| 09/30/2024 | 26818 | 35098 | 26703 |
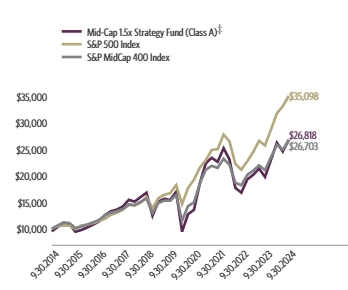
| Class A (without sales charge) | 2.10% | 35.49% | 11.63% | 10.91% |
| Class A (with sales charge)‡ | -2.75% | 29.05% | 10.55% | 10.37% |
| S&P 500 Index | 10.42% | 36.35% | 15.98% | 13.38% |
| S&P MidCap 400 Index | 3.26% | 26.79% | 11.78% | 10.32% |
The fund's past performance is not a good predictor of the fund's future performance. Visit GuggenheimInvestments.com/mutual-funds/performance for more recent performance information.
| Net Assets | $12,554,017 |
| Total Number of Portfolio Holdings | 413 |
| Portfolio Turnover Rate | 29% |
| Mid-Cap 1.5x Strategy Fund | Class A | RYAHX | Semi-Annual Shareholder Report | September 30, 2024 |
| S&P MidCap 400 Index Equity Swap Agreements | 55.5% |
| Industrial | 18.5% |
| Financial | 18.4% |
| Equity Futures Contracts | 15.1% |
| Consumer, Non-cyclical | 13.2% |
| Consumer, Cyclical | 12.5% |
| Technology | 6.5% |
| Other | 10.1% |
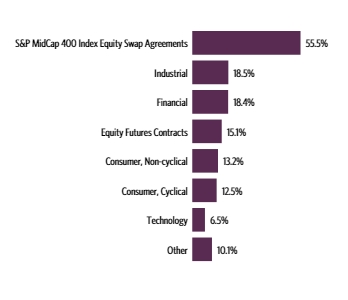
| Guggenheim Ultra Short Duration Fund — Institutional Class | 7.1% |
| Guggenheim Strategy Fund II | 1.9% |
| Carlisle Companies, Inc. | 0.6% |
| Illumina, Inc. | 0.6% |
| EMCOR Group, Inc. | 0.5% |
| Williams-Sonoma, Inc. | 0.5% |
| Lennox International, Inc. | 0.5% |
| Avantor, Inc. | 0.5% |
| Manhattan Associates, Inc. | 0.5% |
| Watsco, Inc. | 0.5% |
| Top 10 Total | 13.2% |
| |
1 | "Holdings Diversification (Market Exposure as a % of Net Assets)" excludes any temporary cash investments, investments in Guggenheim Strategy Funds Trust mutual funds, or investments in Guggenheim Ultra Short Duration Fund. |
| |
2 | "10 Largest Holdings (as a % of Net Assets)" excludes any temporary cash or derivative investments. |
| Guggenheim Ultra Short Duration Fund — Institutional Class | 7.1% |
| Guggenheim Strategy Fund II | 1.9% |
| Carlisle Companies, Inc. | 0.6% |
| Illumina, Inc. | 0.6% |
| EMCOR Group, Inc. | 0.5% |
| Williams-Sonoma, Inc. | 0.5% |
| Lennox International, Inc. | 0.5% |
| Avantor, Inc. | 0.5% |
| Manhattan Associates, Inc. | 0.5% |
| Watsco, Inc. | 0.5% |
| Top 10 Total | 13.2% |
| |
2 | "10 Largest Holdings (as a % of Net Assets)" excludes any temporary cash or derivative investments. |
There were no changes in or disagreements with fund accountants for the period.
| |  | Availability of Additional Information. For additional information, including the fund's prospectus, financial information, holdings and proxy voting information, go to GuggenheimInvestments.com/mutual-funds/literature or, call 800 820 0888. |
SAR-RYAHX-093024
Semi-Annual Shareholder Report | 9.30.24
This semi-annual shareholder report contains important information about the Mid-Cap 1.5x Strategy Fund for the period of April 1, 2024 to September 30, 2024. You can find additional information about the fund at GuggenheimInvestments.com/mutual-funds/literature. You can also request this information by contacting 800 820 0888 or GuggenheimClientServices@mufg-is.com.
For the period of April 1, 2024 to September 30, 2024, the fund (Class C shares) returned 1.72%, underperforming the fund's benchmark, the S&P 500 Index, which returned 10.42% for the same period and underperforming the fund's secondary index, the S&P MidCap 400 Index, which returned 3.26% for the same period.
The fund's broad-based securities market index was changed from the S&P MidCap 400 Index to the S&P 500 Index to comply with the regulation that requires the fund's broad-based securities market index to represent the overall applicable market.
What factors materially affected the fund's performance over the last six months?
The sectors that contributed the most to the return of the S&P MidCap 400 Index (the "Index") were Financials, Real Estate, and Industrials. Those that detracted the most were Energy, Consumer Discretionary, and Materials. The holdings that contributed the most to the return of the Index were Tenet Healthcare Corp., United Therapeutics Corp., and Sprouts Farmers Market, Inc. Those that detracted the most were Celsius Holdings, Inc., Cleveland-Cliffs, Inc., and Five Below, Inc. The Fund maintained a correlation of more than 99% to its benchmark of 150% of the daily price movement of the S&P MidCap 400 Index.
Cumulative performance* for the fund's most recently completed 10 years (as of 9.30.24), assuming a $10,000 initial investment.
| 09/30/2014 | 10000 | 10000 | 10000 |
| 12/31/2014 | 10859 | 10493 | 10635 |
| 03/31/2015 | 11635 | 10593 | 11200 |
| 06/30/2015 | 11367 | 10622 | 11081 |
| 09/30/2015 | 9836 | 9939 | 10140 |
| 12/31/2015 | 10167 | 10638 | 10404 |
| 03/31/2016 | 10640 | 10782 | 10797 |
| 06/30/2016 | 11178 | 11047 | 11228 |
| 09/30/2016 | 11787 | 11472 | 11694 |
| 12/31/2016 | 13029 | 11911 | 12561 |
| 03/31/2017 | 13719 | 12633 | 13056 |
| 06/30/2017 | 14015 | 13023 | 13313 |
| 09/30/2017 | 14590 | 13607 | 13742 |
| 12/31/2017 | 15858 | 14511 | 14602 |
| 03/31/2018 | 15487 | 14401 | 14489 |
| 06/30/2018 | 16324 | 14896 | 15111 |
| 09/30/2018 | 17136 | 16044 | 15695 |
| 12/31/2018 | 12678 | 13875 | 12983 |
| 03/31/2019 | 15354 | 15769 | 14864 |
| 06/30/2019 | 15867 | 16447 | 15317 |
| 09/30/2019 | 15646 | 16727 | 15304 |
| 12/31/2019 | 17147 | 18244 | 16385 |
| 03/31/2020 | 9522 | 14668 | 11518 |
| 06/30/2020 | 12823 | 17682 | 14291 |
| 09/30/2020 | 13635 | 19260 | 14973 |
| 12/31/2020 | 18699 | 21600 | 18623 |
| 03/31/2021 | 22346 | 22934 | 21131 |
| 06/30/2021 | 23379 | 24895 | 21899 |
| 09/30/2021 | 22571 | 25040 | 21514 |
| 12/31/2021 | 25078 | 27801 | 23234 |
| 03/31/2022 | 22952 | 26522 | 22101 |
| 06/30/2022 | 17558 | 22252 | 18694 |
| 09/30/2022 | 16646 | 21165 | 18233 |
| 12/31/2022 | 19090 | 22766 | 20199 |
| 03/31/2023 | 19885 | 24473 | 20968 |
| 06/30/2023 | 21032 | 26612 | 21985 |
| 09/30/2023 | 19432 | 25741 | 21062 |
| 12/31/2023 | 22567 | 28750 | 23519 |
| 03/31/2024 | 25693 | 31785 | 25860 |
| 06/30/2024 | 24019 | 33147 | 24969 |
| 09/30/2024 | 26131 | 35098 | 26703 |
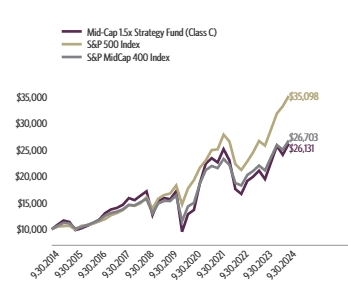
| Class C (without CDSC) | 1.72% | 34.47% | 10.80% | 10.08% |
| Class C (with CDSC)§ | 0.72% | 33.47% | 10.80% | 10.08% |
| S&P 500 Index | 10.42% | 36.35% | 15.98% | 13.38% |
| S&P MidCap 400 Index | 3.26% | 26.79% | 11.78% | 10.32% |
The fund's past performance is not a good predictor of the fund's future performance. Visit GuggenheimInvestments.com/mutual-funds/performance for more recent performance information.
| Net Assets | $12,554,017 |
| Total Number of Portfolio Holdings | 413 |
| Portfolio Turnover Rate | 29% |
| Mid-Cap 1.5x Strategy Fund | Class C | RYDCX | Semi-Annual Shareholder Report | September 30, 2024 |
| S&P MidCap 400 Index Equity Swap Agreements | 55.5% |
| Industrial | 18.5% |
| Financial | 18.4% |
| Equity Futures Contracts | 15.1% |
| Consumer, Non-cyclical | 13.2% |
| Consumer, Cyclical | 12.5% |
| Technology | 6.5% |
| Other | 10.1% |

| Guggenheim Ultra Short Duration Fund — Institutional Class | 7.1% |
| Guggenheim Strategy Fund II | 1.9% |
| Carlisle Companies, Inc. | 0.6% |
| Illumina, Inc. | 0.6% |
| EMCOR Group, Inc. | 0.5% |
| Williams-Sonoma, Inc. | 0.5% |
| Lennox International, Inc. | 0.5% |
| Avantor, Inc. | 0.5% |
| Manhattan Associates, Inc. | 0.5% |
| Watsco, Inc. | 0.5% |
| Top 10 Total | 13.2% |
| |
1 | "Holdings Diversification (Market Exposure as a % of Net Assets)" excludes any temporary cash investments, investments in Guggenheim Strategy Funds Trust mutual funds, or investments in Guggenheim Ultra Short Duration Fund. |
| |
2 | "10 Largest Holdings (as a % of Net Assets)" excludes any temporary cash or derivative investments. |
| Guggenheim Ultra Short Duration Fund — Institutional Class | 7.1% |
| Guggenheim Strategy Fund II | 1.9% |
| Carlisle Companies, Inc. | 0.6% |
| Illumina, Inc. | 0.6% |
| EMCOR Group, Inc. | 0.5% |
| Williams-Sonoma, Inc. | 0.5% |
| Lennox International, Inc. | 0.5% |
| Avantor, Inc. | 0.5% |
| Manhattan Associates, Inc. | 0.5% |
| Watsco, Inc. | 0.5% |
| Top 10 Total | 13.2% |
| |
2 | "10 Largest Holdings (as a % of Net Assets)" excludes any temporary cash or derivative investments. |
There were no changes in or disagreements with fund accountants for the period.
| |  | Availability of Additional Information. For additional information, including the fund's prospectus, financial information, holdings and proxy voting information, go to GuggenheimInvestments.com/mutual-funds/literature or, call 800 820 0888. |
SAR-RYDCX-093024
Semi-Annual Shareholder Report | 9.30.24
This semi-annual shareholder report contains important information about the Mid-Cap 1.5x Strategy Fund for the period of April 1, 2024 to September 30, 2024. You can find additional information about the fund at GuggenheimInvestments.com/mutual-funds/literature. You can also request this information by contacting 800 820 0888 or GuggenheimClientServices@mufg-is.com.
For the period of April 1, 2024 to September 30, 2024, the fund (Class H shares) returned 2.09%, underperforming the fund's benchmark, the S&P 500 Index, which returned 10.42% for the same period and underperforming the fund's secondary index, the S&P MidCap 400 Index, which returned 3.26% for the same period.
The fund's broad-based securities market index was changed from the S&P MidCap 400 Index to the S&P 500 Index to comply with the regulation that requires the fund's broad-based securities market index to represent the overall applicable market.
What factors materially affected the fund's performance over the last six months?
The sectors that contributed the most to the return of the S&P MidCap 400 Index (the "Index") were Financials, Real Estate, and Industrials. Those that detracted the most were Energy, Consumer Discretionary, and Materials. The holdings that contributed the most to the return of the Index were Tenet Healthcare Corp., United Therapeutics Corp., and Sprouts Farmers Market, Inc. Those that detracted the most were Celsius Holdings, Inc., Cleveland-Cliffs, Inc., and Five Below, Inc. The Fund maintained a correlation of more than 99% to its benchmark of 150% of the daily price movement of the S&P MidCap 400 Index.
Cumulative performance* for the fund's most recently completed 10 years (as of 9.30.24), assuming a $10,000 initial investment.
| 09/30/2014 | 10000 | 10000 | 10000 |
| 12/31/2014 | 10878 | 10493 | 10635 |
| 03/31/2015 | 11686 | 10593 | 11200 |
| 06/30/2015 | 11436 | 10622 | 11081 |
| 09/30/2015 | 9917 | 9939 | 10140 |
| 12/31/2015 | 10272 | 10638 | 10404 |
| 03/31/2016 | 10782 | 10782 | 10797 |
| 06/30/2016 | 11349 | 11047 | 11228 |
| 09/30/2016 | 11990 | 11472 | 11694 |
| 12/31/2016 | 13277 | 11911 | 12561 |
| 03/31/2017 | 14014 | 12633 | 13056 |
| 06/30/2017 | 14344 | 13023 | 13313 |
| 09/30/2017 | 14959 | 13607 | 13742 |
| 12/31/2017 | 16288 | 14511 | 14602 |
| 03/31/2018 | 15951 | 14401 | 14489 |
| 06/30/2018 | 16847 | 14896 | 15111 |
| 09/30/2018 | 17718 | 16044 | 15695 |
| 12/31/2018 | 13132 | 13875 | 12983 |
| 03/31/2019 | 15918 | 15769 | 14864 |
| 06/30/2019 | 16479 | 16447 | 15317 |
| 09/30/2019 | 16281 | 16727 | 15304 |
| 12/31/2019 | 17878 | 18244 | 16385 |
| 03/31/2020 | 9946 | 14668 | 11518 |
| 06/30/2020 | 13417 | 17682 | 14291 |
| 09/30/2020 | 14295 | 19260 | 14973 |
| 12/31/2020 | 19641 | 21600 | 18623 |
| 03/31/2021 | 23511 | 22934 | 21131 |
| 06/30/2021 | 24644 | 24895 | 21899 |
| 09/30/2021 | 23838 | 25040 | 21514 |
| 12/31/2021 | 26537 | 27801 | 23234 |
| 03/31/2022 | 24332 | 26522 | 22101 |
| 06/30/2022 | 18646 | 22252 | 18694 |
| 09/30/2022 | 17714 | 21165 | 18233 |
| 12/31/2022 | 20351 | 22766 | 20199 |
| 03/31/2023 | 21242 | 24473 | 20968 |
| 06/30/2023 | 22508 | 26612 | 21985 |
| 09/30/2023 | 20833 | 25741 | 21062 |
| 12/31/2023 | 24240 | 28750 | 23519 |
| 03/31/2024 | 27649 | 31785 | 25860 |
| 06/30/2024 | 25896 | 33147 | 24969 |
| 09/30/2024 | 28225 | 35098 | 26703 |
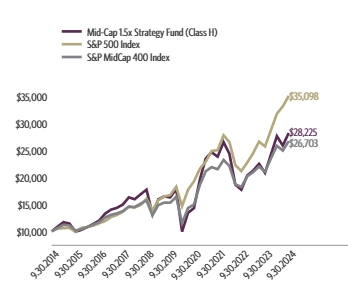
| Class H | 2.09% | 35.48% | 11.63% | 10.93% |
| S&P 500 Index | 10.42% | 36.35% | 15.98% | 13.38% |
| S&P MidCap 400 Index | 3.26% | 26.79% | 11.78% | 10.32% |
The fund's past performance is not a good predictor of the fund's future performance. Visit GuggenheimInvestments.com/mutual-funds/performance for more recent performance information.
| Net Assets | $12,554,017 |
| Total Number of Portfolio Holdings | 413 |
| Portfolio Turnover Rate | 29% |
| Mid-Cap 1.5x Strategy Fund | Class H | RYMDX | Semi-Annual Shareholder Report | September 30, 2024 |
| S&P MidCap 400 Index Equity Swap Agreements | 55.5% |
| Industrial | 18.5% |
| Financial | 18.4% |
| Equity Futures Contracts | 15.1% |
| Consumer, Non-cyclical | 13.2% |
| Consumer, Cyclical | 12.5% |
| Technology | 6.5% |
| Other | 10.1% |

| Guggenheim Ultra Short Duration Fund — Institutional Class | 7.1% |
| Guggenheim Strategy Fund II | 1.9% |
| Carlisle Companies, Inc. | 0.6% |
| Illumina, Inc. | 0.6% |
| EMCOR Group, Inc. | 0.5% |
| Williams-Sonoma, Inc. | 0.5% |
| Lennox International, Inc. | 0.5% |
| Avantor, Inc. | 0.5% |
| Manhattan Associates, Inc. | 0.5% |
| Watsco, Inc. | 0.5% |
| Top 10 Total | 13.2% |
| |
1 | "Holdings Diversification (Market Exposure as a % of Net Assets)" excludes any temporary cash investments, investments in Guggenheim Strategy Funds Trust mutual funds, or investments in Guggenheim Ultra Short Duration Fund. |
| |
2 | "10 Largest Holdings (as a % of Net Assets)" excludes any temporary cash or derivative investments. |
| Guggenheim Ultra Short Duration Fund — Institutional Class | 7.1% |
| Guggenheim Strategy Fund II | 1.9% |
| Carlisle Companies, Inc. | 0.6% |
| Illumina, Inc. | 0.6% |
| EMCOR Group, Inc. | 0.5% |
| Williams-Sonoma, Inc. | 0.5% |
| Lennox International, Inc. | 0.5% |
| Avantor, Inc. | 0.5% |
| Manhattan Associates, Inc. | 0.5% |
| Watsco, Inc. | 0.5% |
| Top 10 Total | 13.2% |
| |
2 | "10 Largest Holdings (as a % of Net Assets)" excludes any temporary cash or derivative investments. |
There were no changes in or disagreements with fund accountants for the period.
| |  | Availability of Additional Information. For additional information, including the fund's prospectus, financial information, holdings and proxy voting information, go to GuggenheimInvestments.com/mutual-funds/literature or, call 800 820 0888. |
SAR-RYMDX-093024
Semi-Annual Shareholder Report | 9.30.24
This semi-annual shareholder report contains important information about the Inverse Mid-Cap Strategy Fund for the period of April 1, 2024 to September 30, 2024. You can find additional information about the fund at GuggenheimInvestments.com/mutual-funds/literature. You can also request this information by contacting 800 820 0888 or GuggenheimClientServices@mufg-is.com.
For the period of April 1, 2024 to September 30, 2024, the fund (Class A shares) returned 0.04%, underperforming the fund's benchmark, the S&P 500 Index, which returned 10.42% for the same period and underperforming the fund's secondary index, the S&P MidCap 400 Index, which returned 3.26% for the same period.
The fund's broad-based securities market index was changed from the S&P MidCap 400 Index to the S&P 500 Index to comply with the regulation that requires the fund's broad-based securities market index to represent the overall applicable market.
What factors materially affected the fund's performance over the last six months?
The sectors that contributed the most to the return of the S&P MidCap 400 Index (the "Index") were Financials, Real Estate, and Industrials. Those that detracted the most were Energy, Consumer Discretionary, and Materials. The holdings that contributed the most to the return of the Index were Tenet Healthcare Corp., United Therapeutics Corp., and Sprouts Farmers Market, Inc. Those that detracted the most were Celsius Holdings, Inc., Cleveland-Cliffs, Inc., and Five Below, Inc. The Fund maintained a daily correlation of 99% to its benchmark of -100% of the daily price movement of the S&P MidCap 400 Index.
Cumulative performance* for the fund's most recently completed 10 years (as of 9.30.24), assuming a $10,000 initial investment.
| 09/30/2014 | 9524 | 10000 | 10000 |
| 12/31/2014 | 8868 | 10493 | 10635 |
| 03/31/2015 | 8368 | 10593 | 11200 |
| 06/30/2015 | 8422 | 10622 | 11081 |
| 09/30/2015 | 9083 | 9939 | 10140 |
| 12/31/2015 | 8779 | 10638 | 10404 |
| 03/31/2016 | 8354 | 10782 | 10797 |
| 06/30/2016 | 7971 | 11047 | 11228 |
| 09/30/2016 | 7614 | 11472 | 11694 |
| 12/31/2016 | 7059 | 11911 | 12561 |
| 03/31/2017 | 6776 | 12633 | 13056 |
| 06/30/2017 | 6629 | 13023 | 13313 |
| 09/30/2017 | 6431 | 13607 | 13742 |
| 12/31/2017 | 6055 | 14511 | 14602 |
| 03/31/2018 | 6069 | 14401 | 14489 |
| 06/30/2018 | 5827 | 14896 | 15111 |
| 09/30/2018 | 5639 | 16044 | 15695 |
| 12/31/2018 | 6776 | 13875 | 12983 |
| 03/31/2019 | 5936 | 15769 | 14864 |
| 06/30/2019 | 5778 | 16447 | 15317 |
| 09/30/2019 | 5794 | 16727 | 15304 |
| 12/31/2019 | 5419 | 18244 | 16385 |
| 03/31/2020 | 7012 | 14668 | 11518 |
| 06/30/2020 | 5375 | 17682 | 14291 |
| 09/30/2020 | 5084 | 19260 | 14973 |
| 12/31/2020 | 4045 | 21600 | 18623 |
| 03/31/2021 | 3510 | 22934 | 21131 |
| 06/30/2021 | 3359 | 24895 | 21899 |
| 09/30/2021 | 3386 | 25040 | 21514 |
| 12/31/2021 | 3088 | 27801 | 23234 |
| 03/31/2022 | 3177 | 26522 | 22101 |
| 06/30/2022 | 3672 | 22252 | 18694 |
| 09/30/2022 | 3741 | 21165 | 18233 |
| 12/31/2022 | 3373 | 22766 | 20199 |
| 03/31/2023 | 3278 | 24473 | 20968 |
| 06/30/2023 | 3172 | 26612 | 21985 |
| 09/30/2023 | 3372 | 25741 | 21062 |
| 12/31/2023 | 3067 | 28750 | 23519 |
| 03/31/2024 | 2841 | 31785 | 25860 |
| 06/30/2024 | 2998 | 33147 | 24969 |
| 09/30/2024 | 2842 | 35098 | 26703 |
| Class A (without sales charge) | 0.04% | -15.70% | -13.28% | -11.39% |
| Class A (with sales charge)‡ | -4.71% | -19.71% | -14.11% | -11.82% |
| S&P 500 Index | 10.42% | 36.35% | 15.98% | 13.38% |
| S&P MidCap 400 Index | 3.26% | 26.79% | 11.78% | 10.32% |
The fund's past performance is not a good predictor of the fund's future performance. Visit GuggenheimInvestments.com/mutual-funds/performance for more recent performance information.
| Net Assets | $264,430 |
| Total Number of Portfolio Holdings | 7 |
| Portfolio Turnover Rate | 0% |
| Inverse Mid-Cap Strategy Fund | Class A | RYAGX | Semi-Annual Shareholder Report | September 30, 2024 |
| S&P MidCap 400 Index Equity Swap Agreements Short Sales | -100.4% |

| Guggenheim Strategy Fund II | 19.0% |
| Guggenheim Ultra Short Duration Fund — Institutional Class | 17.5% |
| Total | 36.5% |
| |
1 | "Holdings Diversification (Market Exposure as a % of Net Assets)" excludes any temporary cash investments, investments in Guggenheim Strategy Funds Trust mutual funds, or investments in Guggenheim Ultra Short Duration Fund. |
| |
2 | "Largest Holdings (as a % of Net Assets)" excludes any temporary cash or derivative investments. |
| Guggenheim Strategy Fund II | 19.0% |
| Guggenheim Ultra Short Duration Fund — Institutional Class | 17.5% |
| Total | 36.5% |
| |
2 | "Largest Holdings (as a % of Net Assets)" excludes any temporary cash or derivative investments. |
There were no changes in or disagreements with fund accountants for the period.
| |  | Availability of Additional Information. For additional information, including the fund's prospectus, financial information, holdings and proxy voting information, go to GuggenheimInvestments.com/mutual-funds/literature or, call 800 820 0888. |
SAR-RYAGX-093024
Semi-Annual Shareholder Report | 9.30.24
This semi-annual shareholder report contains important information about the Inverse Mid-Cap Strategy Fund for the period of April 1, 2024 to September 30, 2024. You can find additional information about the fund at GuggenheimInvestments.com/mutual-funds/literature. You can also request this information by contacting 800 820 0888 or GuggenheimClientServices@mufg-is.com.
For the period of April 1, 2024 to September 30, 2024, the fund (Class C shares) returned 0.41%, underperforming the fund's benchmark, the S&P 500 Index, which returned 10.42% for the same period and underperforming the fund's secondary index, the S&P MidCap 400 Index, which returned 3.26% for the same period.
The fund's broad-based securities market index was changed from the S&P MidCap 400 Index to the S&P 500 Index to comply with the regulation that requires the fund's broad-based securities market index to represent the overall applicable market.
What factors materially affected the fund's performance over the last six months?
The sectors that contributed the most to the return of the S&P MidCap 400 Index (the "Index") were Financials, Real Estate, and Industrials. Those that detracted the most were Energy, Consumer Discretionary, and Materials. The holdings that contributed the most to the return of the Index were Tenet Healthcare Corp., United Therapeutics Corp., and Sprouts Farmers Market, Inc. Those that detracted the most were Celsius Holdings, Inc., Cleveland-Cliffs, Inc., and Five Below, Inc. The Fund maintained a daily correlation of 99% to its benchmark of -100% of the daily price movement of the S&P MidCap 400 Index.
Cumulative performance* for the fund's most recently completed 10 years (as of 9.30.24), assuming a $10,000 initial investment.
| 09/30/2014 | 10000 | 10000 | 10000 |
| 12/31/2014 | 9294 | 10493 | 10635 |
| 03/31/2015 | 8756 | 10593 | 11200 |
| 06/30/2015 | 8794 | 10622 | 11081 |
| 09/30/2015 | 9468 | 9939 | 10140 |
| 12/31/2015 | 9129 | 10638 | 10404 |
| 03/31/2016 | 8672 | 10782 | 10797 |
| 06/30/2016 | 8259 | 11047 | 11228 |
| 09/30/2016 | 7873 | 11472 | 11694 |
| 12/31/2016 | 7285 | 11911 | 12561 |
| 03/31/2017 | 6981 | 12633 | 13056 |
| 06/30/2017 | 6813 | 13023 | 13313 |
| 09/30/2017 | 6595 | 13607 | 13742 |
| 12/31/2017 | 6197 | 14511 | 14602 |
| 03/31/2018 | 6200 | 14401 | 14489 |
| 06/30/2018 | 5942 | 14896 | 15111 |
| 09/30/2018 | 5756 | 16044 | 15695 |
| 12/31/2018 | 6903 | 13875 | 12983 |
| 03/31/2019 | 6032 | 15769 | 14864 |
| 06/30/2019 | 5858 | 16447 | 15317 |
| 09/30/2019 | 5830 | 16727 | 15304 |
| 12/31/2019 | 5451 | 18244 | 16385 |
| 03/31/2020 | 7045 | 14668 | 11518 |
| 06/30/2020 | 5411 | 17682 | 14291 |
| 09/30/2020 | 5112 | 19260 | 14973 |
| 12/31/2020 | 4060 | 21600 | 18623 |
| 03/31/2021 | 3517 | 22934 | 21131 |
| 06/30/2021 | 3359 | 24895 | 21899 |
| 09/30/2021 | 3380 | 25040 | 21514 |
| 12/31/2021 | 3077 | 27801 | 23234 |
| 03/31/2022 | 3163 | 26522 | 22101 |
| 06/30/2022 | 3648 | 22252 | 18694 |
| 09/30/2022 | 3720 | 21165 | 18233 |
| 12/31/2022 | 3352 | 22766 | 20199 |
| 03/31/2023 | 3261 | 24473 | 20968 |
| 06/30/2023 | 3153 | 26612 | 21985 |
| 09/30/2023 | 3366 | 25741 | 21062 |
| 12/31/2023 | 3058 | 28750 | 23519 |
| 03/31/2024 | 2846 | 31785 | 25860 |
| 06/30/2024 | 3013 | 33147 | 24969 |
| 09/30/2024 | 2858 | 35098 | 26703 |
| Class C (without CDSC) | 0.41% | -15.08% | -13.29% | -11.77% |
| Class C (with CDSC)§ | -0.59% | -15.86% | -13.29% | -11.77% |
| S&P 500 Index | 10.42% | 36.35% | 15.98% | 13.38% |
| S&P MidCap 400 Index | 3.26% | 26.79% | 11.78% | 10.32% |
The fund's past performance is not a good predictor of the fund's future performance. Visit GuggenheimInvestments.com/mutual-funds/performance for more recent performance information.
| Net Assets | $264,430 |
| Total Number of Portfolio Holdings | 7 |
| Portfolio Turnover Rate | 0% |
| Inverse Mid-Cap Strategy Fund | Class C | RYCLX | Semi-Annual Shareholder Report | September 30, 2024 |
| S&P MidCap 400 Index Equity Swap Agreements Short Sales | -100.4% |

| Guggenheim Strategy Fund II | 19.0% |
| Guggenheim Ultra Short Duration Fund — Institutional Class | 17.5% |
| Total | 36.5% |
| |
1 | "Holdings Diversification (Market Exposure as a % of Net Assets)" excludes any temporary cash investments, investments in Guggenheim Strategy Funds Trust mutual funds, or investments in Guggenheim Ultra Short Duration Fund. |
| |
2 | "Largest Holdings (as a % of Net Assets)" excludes any temporary cash or derivative investments. |
| Guggenheim Strategy Fund II | 19.0% |
| Guggenheim Ultra Short Duration Fund — Institutional Class | 17.5% |
| Total | 36.5% |
| |
2 | "Largest Holdings (as a % of Net Assets)" excludes any temporary cash or derivative investments. |
There were no changes in or disagreements with fund accountants for the period.
| |  | Availability of Additional Information. For additional information, including the fund's prospectus, financial information, holdings and proxy voting information, go to GuggenheimInvestments.com/mutual-funds/literature or, call 800 820 0888. |
SAR-RYCLX-093024
Semi-Annual Shareholder Report | 9.30.24
This semi-annual shareholder report contains important information about the Inverse Mid-Cap Strategy Fund for the period of April 1, 2024 to September 30, 2024. You can find additional information about the fund at GuggenheimInvestments.com/mutual-funds/literature. You can also request this information by contacting 800 820 0888 or GuggenheimClientServices@mufg-is.com.
For the period of April 1, 2024 to September 30, 2024, the fund (Class H shares) returned 0.02%, underperforming the fund's benchmark, the S&P 500 Index, which returned 10.42% for the same period and underperforming the fund's secondary index, the S&P MidCap 400 Index, which returned 3.26% for the same period.
The fund's broad-based securities market index was changed from the S&P MidCap 400 Index to the S&P 500 Index to comply with the regulation that requires the fund's broad-based securities market index to represent the overall applicable market.
What factors materially affected the fund's performance over the last six months?
The sectors that contributed the most to the return of the S&P MidCap 400 Index (the "Index") were Financials, Real Estate, and Industrials. Those that detracted the most were Energy, Consumer Discretionary, and Materials. The holdings that contributed the most to the return of the Index were Tenet Healthcare Corp., United Therapeutics Corp., and Sprouts Farmers Market, Inc. Those that detracted the most were Celsius Holdings, Inc., Cleveland-Cliffs, Inc., and Five Below, Inc. The Fund maintained a daily correlation of 99% to its benchmark of -100% of the daily price movement of the S&P MidCap 400 Index.
Cumulative performance* for the fund's most recently completed 10 years (as of 9.30.24), assuming a $10,000 initial investment.
| 09/30/2014 | 10000 | 10000 | 10000 |
| 12/31/2014 | 9313 | 10493 | 10635 |
| 03/31/2015 | 8789 | 10593 | 11200 |
| 06/30/2015 | 8844 | 10622 | 11081 |
| 09/30/2015 | 9539 | 9939 | 10140 |
| 12/31/2015 | 9219 | 10638 | 10404 |
| 03/31/2016 | 8784 | 10782 | 10797 |
| 06/30/2016 | 8380 | 11047 | 11228 |
| 09/30/2016 | 8008 | 11472 | 11694 |
| 12/31/2016 | 7421 | 11911 | 12561 |
| 03/31/2017 | 7127 | 12633 | 13056 |
| 06/30/2017 | 6969 | 13023 | 13313 |
| 09/30/2017 | 6763 | 13607 | 13742 |
| 12/31/2017 | 6368 | 14511 | 14602 |
| 03/31/2018 | 6380 | 14401 | 14489 |
| 06/30/2018 | 6125 | 14896 | 15111 |
| 09/30/2018 | 5930 | 16044 | 15695 |
| 12/31/2018 | 7124 | 13875 | 12983 |
| 03/31/2019 | 6251 | 15769 | 14864 |
| 06/30/2019 | 6085 | 16447 | 15317 |
| 09/30/2019 | 6099 | 16727 | 15304 |
| 12/31/2019 | 5707 | 18244 | 16385 |
| 03/31/2020 | 7383 | 14668 | 11518 |
| 06/30/2020 | 5661 | 17682 | 14291 |
| 09/30/2020 | 5352 | 19260 | 14973 |
| 12/31/2020 | 4259 | 21600 | 18623 |
| 03/31/2021 | 3696 | 22934 | 21131 |
| 06/30/2021 | 3536 | 24895 | 21899 |
| 09/30/2021 | 3564 | 25040 | 21514 |
| 12/31/2021 | 3251 | 27801 | 23234 |
| 03/31/2022 | 3345 | 26522 | 22101 |
| 06/30/2022 | 3865 | 22252 | 18694 |
| 09/30/2022 | 3938 | 21165 | 18233 |
| 12/31/2022 | 3551 | 22766 | 20199 |
| 03/31/2023 | 3451 | 24473 | 20968 |
| 06/30/2023 | 3340 | 26612 | 21985 |
| 09/30/2023 | 3551 | 25741 | 21062 |
| 12/31/2023 | 3229 | 28750 | 23519 |
| 03/31/2024 | 2992 | 31785 | 25860 |
| 06/30/2024 | 3157 | 33147 | 24969 |
| 09/30/2024 | 2993 | 35098 | 26703 |
| Class H | 0.02% | -15.72% | -13.27% | -11.36% |
| S&P 500 Index | 10.42% | 36.35% | 15.98% | 13.38% |
| S&P MidCap 400 Index | 3.26% | 26.79% | 11.78% | 10.32% |
The fund's past performance is not a good predictor of the fund's future performance. Visit GuggenheimInvestments.com/mutual-funds/performance for more recent performance information.
| Net Assets | $264,430 |
| Total Number of Portfolio Holdings | 7 |
| Portfolio Turnover Rate | 0% |
| Inverse Mid-Cap Strategy Fund | Class H | RYMHX | Semi-Annual Shareholder Report | September 30, 2024 |
| S&P MidCap 400 Index Equity Swap Agreements Short Sales | -100.4% |

| Guggenheim Strategy Fund II | 19.0% |
| Guggenheim Ultra Short Duration Fund — Institutional Class | 17.5% |
| Total | 36.5% |
| |
1 | "Holdings Diversification (Market Exposure as a % of Net Assets)" excludes any temporary cash investments, investments in Guggenheim Strategy Funds Trust mutual funds, or investments in Guggenheim Ultra Short Duration Fund. |
| |
2 | "Largest Holdings (as a % of Net Assets)" excludes any temporary cash or derivative investments. |
| Guggenheim Strategy Fund II | 19.0% |
| Guggenheim Ultra Short Duration Fund — Institutional Class | 17.5% |
| Total | 36.5% |
| |
2 | "Largest Holdings (as a % of Net Assets)" excludes any temporary cash or derivative investments. |
There were no changes in or disagreements with fund accountants for the period.
| |  | Availability of Additional Information. For additional information, including the fund's prospectus, financial information, holdings and proxy voting information, go to GuggenheimInvestments.com/mutual-funds/literature or, call 800 820 0888. |
SAR-RYMHX-093024
Semi-Annual Shareholder Report | 9.30.24
This semi-annual shareholder report contains important information about the Emerging Markets Bond Strategy Fund for the period of April 1, 2024 to September 30, 2024. You can find additional information about the fund at GuggenheimInvestments.com/mutual-funds/literature. You can also request this information by contacting 800 820 0888 or GuggenheimClientServices@mufg-is.com.
For the period of April 1, 2024 to September 30, 2024, the fund (Class A shares) returned 6.03%, underperforming the fund's benchmark, the Bloomberg Emerging Markets USD Aggregate Bond Index, which returned 6.54% for the same period and underperforming the fund's secondary index, the ICE BofA BBB & Lower Sovereign USD External Debt Index, which returned 7.23% for the same period.
The fund's broad-based securities market index was changed from the ICE Bank of America BBB & Lower Sovereign USD External Debt Index to the Bloomberg Emerging Markets USD Aggregate Bond Index to comply with the regulation that requires the fund's broad-based securities market index to represent the overall applicable market.
What factors materially affected the fund's performance over the last six months?
The Fund underperformed the ICE BofA BBB & Lower Sovereign External Debt Index (its ancillary index). The credit default swap spreads of the emerging markets countries were mixed during the period, with the majority of countries experiencing modest moves. Some countries did experience wider credit default swap spreads as economic risks remained elevated. The emerging markets countries that experienced some of the larger increases in credit default swap spreads were Nigeria, Egypt and Mexico. Argentina, South Africa and Türkiye experienced some of the larger decreases in credit default swap spreads, benefitting from improving monetary positions and increased confidence in political leadership.
Cumulative performance* for the fund's most recently completed 10 years (as of 9.30.24), assuming a $10,000 initial investment.
| 09/30/2014 | 9526 | 10000 | 10000 |
| 12/31/2014 | 9238 | 9828 | 9941 |
| 03/31/2015 | 9188 | 10054 | 10144 |
| 06/30/2015 | 9202 | 10098 | 10064 |
| 09/30/2015 | 8882 | 9857 | 9910 |
| 12/31/2015 | 8970 | 9954 | 10004 |
| 03/31/2016 | 9660 | 10404 | 10521 |
| 06/30/2016 | 10086 | 10890 | 11061 |
| 09/30/2016 | 10272 | 11230 | 11474 |
| 12/31/2016 | 9759 | 10938 | 10952 |
| 03/31/2017 | 10106 | 11297 | 11394 |
| 06/30/2017 | 10282 | 11497 | 11657 |
| 09/30/2017 | 10515 | 11758 | 11975 |
| 12/31/2017 | 10549 | 11831 | 12049 |
| 03/31/2018 | 10326 | 11656 | 11820 |
| 06/30/2018 | 9899 | 11377 | 11327 |
| 09/30/2018 | 9983 | 11561 | 11592 |
| 12/31/2018 | 10025 | 11540 | 11491 |
| 03/31/2019 | 10543 | 12167 | 12229 |
| 06/30/2019 | 10935 | 12623 | 12793 |
| 09/30/2019 | 10920 | 12785 | 12853 |
| 12/31/2019 | 11117 | 13053 | 13135 |
| 03/31/2020 | 9762 | 11815 | 11297 |
| 06/30/2020 | 10729 | 12997 | 12595 |
| 09/30/2020 | 10862 | 13305 | 12921 |
| 12/31/2020 | 11498 | 13904 | 13764 |
| 03/31/2021 | 10828 | 13420 | 13020 |
| 06/30/2021 | 11151 | 13821 | 13611 |
| 09/30/2021 | 10955 | 13746 | 13464 |
| 12/31/2021 | 10904 | 13674 | 13403 |
| 03/31/2022 | 9643 | 12412 | 11965 |
| 06/30/2022 | 8575 | 11331 | 10448 |
| 09/30/2022 | 8073 | 10871 | 10023 |
| 12/31/2022 | 8766 | 11587 | 10946 |
| 03/31/2023 | 9052 | 11836 | 11166 |
| 06/30/2023 | 9183 | 11969 | 11407 |
| 09/30/2023 | 8941 | 11693 | 11141 |
| 12/31/2023 | 9852 | 12640 | 12323 |
| 03/31/2024 | 9831 | 12834 | 12563 |
| 06/30/2024 | 9796 | 12921 | 12612 |
| 09/30/2024 | 10423 | 13673 | 13472 |
| Class A (without sales charge) | 6.03% | 16.58% | -0.93% | 0.90% |
| Class A (with sales charge)‡ | 0.99% | 11.03% | -1.89% | 0.41% |
| Bloomberg Emerging Markets USD Aggregate Bond Index | 6.54% | 16.93% | 1.35% | 3.18% |
| ICE BofA BBB & Lower Sovereign USD External Debt Index | 7.23% | 20.93% | 0.95% | 3.03% |
The fund's past performance is not a good predictor of the fund's future performance. Visit GuggenheimInvestments.com/mutual-funds/performance for more recent performance information.
| Net Assets | $696,130 |
| Total Number of Portfolio Holdings | 6 |
| Portfolio Turnover Rate | 0% |
| Emerging Markets Bond Strategy Fund | Class A | RYIEX | Semi-Annual Shareholder Report | September 30, 2024 |
| Invesco Emerging Markets Sovereign Debt ETF Swap Agreement | 37.6% |
| CDX EM-42 Index V1 Credit Default Swap Agreements Protection Sold | 67.5% |
| Interest Rate Futures Contracts | 63.2% |

| |
1 | "Holdings Diversification (Market Exposure as a % of Net Assets)" excludes any temporary cash investments. The Fund's target exposure is achieved through a combination of total return swaps, credit default swaps, and interest rate futures contracts. |
There were no changes in or disagreements with fund accountants for the period.
| |  | Availability of Additional Information. For additional information, including the fund's prospectus, financial information, holdings and proxy voting information, go to GuggenheimInvestments.com/mutual-funds/literature or, call 800 820 0888. |
SAR-RYIEX-093024
Semi-Annual Shareholder Report | 9.30.24
This semi-annual shareholder report contains important information about the Emerging Markets Bond Strategy Fund for the period of April 1, 2024 to September 30, 2024. You can find additional information about the fund at GuggenheimInvestments.com/mutual-funds/literature. You can also request this information by contacting 800 820 0888 or GuggenheimClientServices@mufg-is.com.
For the period of April 1, 2024 to September 30, 2024, the fund (Class C shares) returned 5.58%, underperforming the fund's benchmark, the Bloomberg Emerging Markets USD Aggregate Bond Index, which returned 6.54% for the same period and underperforming the fund's secondary index, the ICE BofA BBB & Lower Sovereign USD External Debt Index, which returned 7.23% for the same period.
The fund's broad-based securities market index was changed from the ICE Bank of America BBB & Lower Sovereign USD External Debt Index to the Bloomberg Emerging Markets USD Aggregate Bond Index to comply with the regulation that requires the fund's broad-based securities market index to represent the overall applicable market.
What factors materially affected the fund's performance over the last six months?
The Fund underperformed the ICE BofA BBB & Lower Sovereign External Debt Index (its ancillary index). The credit default swap spreads of the emerging markets countries were mixed during the period, with the majority of countries experiencing modest moves. Some countries did experience wider credit default swap spreads as economic risks remained elevated. The emerging markets countries that experienced some of the larger increases in credit default swap spreads were Nigeria, Egypt and Mexico. Argentina, South Africa and Türkiye experienced some of the larger decreases in credit default swap spreads, benefitting from improving monetary positions and increased confidence in political leadership.
Cumulative performance* for the fund's most recently completed 10 years (as of 9.30.24), assuming a $10,000 initial investment.
| 09/30/2014 | 10000 | 10000 | 10000 |
| 12/31/2014 | 9678 | 9828 | 9941 |
| 03/31/2015 | 9611 | 10054 | 10144 |
| 06/30/2015 | 9606 | 10098 | 10064 |
| 09/30/2015 | 9257 | 9857 | 9910 |
| 12/31/2015 | 9325 | 9954 | 10004 |
| 03/31/2016 | 9970 | 10404 | 10521 |
| 06/30/2016 | 10394 | 10890 | 11061 |
| 09/30/2016 | 10588 | 11230 | 11474 |
| 12/31/2016 | 10040 | 10938 | 10952 |
| 03/31/2017 | 10377 | 11297 | 11394 |
| 06/30/2017 | 10537 | 11497 | 11657 |
| 09/30/2017 | 10756 | 11758 | 11975 |
| 12/31/2017 | 10769 | 11831 | 12049 |
| 03/31/2018 | 10523 | 11656 | 11820 |
| 06/30/2018 | 10067 | 11377 | 11327 |
| 09/30/2018 | 10134 | 11561 | 11592 |
| 12/31/2018 | 10160 | 11540 | 11491 |
| 03/31/2019 | 10664 | 12167 | 12229 |
| 06/30/2019 | 11040 | 12623 | 12793 |
| 09/30/2019 | 11002 | 12785 | 12853 |
| 12/31/2019 | 11178 | 13053 | 13135 |
| 03/31/2020 | 9798 | 11815 | 11297 |
| 06/30/2020 | 10749 | 12997 | 12595 |
| 09/30/2020 | 10861 | 13305 | 12921 |
| 12/31/2020 | 11475 | 13904 | 13764 |
| 03/31/2021 | 10787 | 13420 | 13020 |
| 06/30/2021 | 11089 | 13821 | 13611 |
| 09/30/2021 | 10873 | 13746 | 13464 |
| 12/31/2021 | 10800 | 13674 | 13403 |
| 03/31/2022 | 9537 | 12412 | 11965 |
| 06/30/2022 | 8464 | 11331 | 10448 |
| 09/30/2022 | 7953 | 10871 | 10023 |
| 12/31/2022 | 8620 | 11587 | 10946 |
| 03/31/2023 | 8883 | 11836 | 11166 |
| 06/30/2023 | 8994 | 11969 | 11407 |
| 09/30/2023 | 8741 | 11693 | 11141 |
| 12/31/2023 | 9614 | 12640 | 12323 |
| 03/31/2024 | 9575 | 12834 | 12563 |
| 06/30/2024 | 9522 | 12921 | 12612 |
| 09/30/2024 | 10113 | 13673 | 13472 |

| Class C (without CDSC) | 5.58% | 15.70% | -1.67% | 0.11% |
| Class C (with CDSC)§ | 4.58% | 14.70% | -1.67% | 0.11% |
| Bloomberg Emerging Markets USD Aggregate Bond Index | 6.54% | 16.93% | 1.35% | 3.18% |
| ICE BofA BBB & Lower Sovereign USD External Debt Index | 7.23% | 20.93% | 0.95% | 3.03% |
The fund's past performance is not a good predictor of the fund's future performance. Visit GuggenheimInvestments.com/mutual-funds/performance for more recent performance information.
| Net Assets | $696,130 |
| Total Number of Portfolio Holdings | 6 |
| Portfolio Turnover Rate | 0% |
| Emerging Markets Bond Strategy Fund | Class C | RYFTX | Semi-Annual Shareholder Report | September 30, 2024 |
| Invesco Emerging Markets Sovereign Debt ETF Swap Agreement | 37.6% |
| CDX EM-42 Index V1 Credit Default Swap Agreements Protection Sold | 67.5% |
| Interest Rate Futures Contracts | 63.2% |
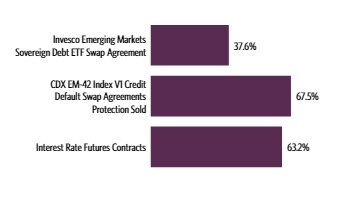
| |
1 | "Holdings Diversification (Market Exposure as a % of Net Assets)" excludes any temporary cash investments. The Fund's target exposure is achieved through a combination of total return swaps, credit default swaps, and interest rate futures contracts. |
There were no changes in or disagreements with fund accountants for the period.
| |  | Availability of Additional Information. For additional information, including the fund's prospectus, financial information, holdings and proxy voting information, go to GuggenheimInvestments.com/mutual-funds/literature or, call 800 820 0888. |
SAR-RYFTX-093024
Semi-Annual Shareholder Report | 9.30.24
This semi-annual shareholder report contains important information about the Emerging Markets Bond Strategy Fund for the period of April 1, 2024 to September 30, 2024. You can find additional information about the fund at GuggenheimInvestments.com/mutual-funds/literature. You can also request this information by contacting 800 820 0888 or GuggenheimClientServices@mufg-is.com.
For the period of April 1, 2024 to September 30, 2024, the fund (Class H shares) returned 6.01%, underperforming the fund's benchmark, the Bloomberg Emerging Markets USD Aggregate Bond Index, which returned 6.54% for the same period and underperforming the fund's secondary index, the ICE BofA BBB & Lower Sovereign USD External Debt Index, which returned 7.23% for the same period.
The fund's broad-based securities market index was changed from the ICE Bank of America BBB & Lower Sovereign USD External Debt Index to the Bloomberg Emerging Markets USD Aggregate Bond Index to comply with the regulation that requires the fund's broad-based securities market index to represent the overall applicable market.
What factors materially affected the fund's performance over the last six months?
The Fund underperformed the ICE BofA BBB & Lower Sovereign External Debt Index (its ancillary index). The credit default swap spreads of the emerging markets countries were mixed during the period, with the majority of countries experiencing modest moves. Some countries did experience wider credit default swap spreads as economic risks remained elevated. The emerging markets countries that experienced some of the larger increases in credit default swap spreads were Nigeria, Egypt and Mexico. Argentina, South Africa and Türkiye experienced some of the larger decreases in credit default swap spreads, benefitting from improving monetary positions and increased confidence in political leadership.
Cumulative performance* for the fund's most recently completed 10 years (as of 9.30.24), assuming a $10,000 initial investment.
| 09/30/2014 | 10000 | 10000 | 10000 |
| 12/31/2014 | 9697 | 9828 | 9941 |
| 03/31/2015 | 9644 | 10054 | 10144 |
| 06/30/2015 | 9659 | 10098 | 10064 |
| 09/30/2015 | 9326 | 9857 | 9910 |
| 12/31/2015 | 9437 | 9954 | 10004 |
| 03/31/2016 | 10109 | 10404 | 10521 |
| 06/30/2016 | 10558 | 10890 | 11061 |
| 09/30/2016 | 10778 | 11230 | 11474 |
| 12/31/2016 | 10237 | 10938 | 10952 |
| 03/31/2017 | 10600 | 11297 | 11394 |
| 06/30/2017 | 10785 | 11497 | 11657 |
| 09/30/2017 | 11028 | 11758 | 11975 |
| 12/31/2017 | 11064 | 11831 | 12049 |
| 03/31/2018 | 10832 | 11656 | 11820 |
| 06/30/2018 | 10382 | 11377 | 11327 |
| 09/30/2018 | 10470 | 11561 | 11592 |
| 12/31/2018 | 10517 | 11540 | 11491 |
| 03/31/2019 | 11059 | 12167 | 12229 |
| 06/30/2019 | 11470 | 12623 | 12793 |
| 09/30/2019 | 11454 | 12785 | 12853 |
| 12/31/2019 | 11660 | 13053 | 13135 |
| 03/31/2020 | 10235 | 11815 | 11297 |
| 06/30/2020 | 11250 | 12997 | 12595 |
| 09/30/2020 | 11389 | 13305 | 12921 |
| 12/31/2020 | 12056 | 13904 | 13764 |
| 03/31/2021 | 11353 | 13420 | 13020 |
| 06/30/2021 | 11693 | 13821 | 13611 |
| 09/30/2021 | 11487 | 13746 | 13464 |
| 12/31/2021 | 11433 | 13674 | 13403 |
| 03/31/2022 | 10113 | 12412 | 11965 |
| 06/30/2022 | 9003 | 11331 | 10448 |
| 09/30/2022 | 8476 | 10871 | 10023 |
| 12/31/2022 | 9205 | 11587 | 10946 |
| 03/31/2023 | 9506 | 11836 | 11166 |
| 06/30/2023 | 9643 | 11969 | 11407 |
| 09/30/2023 | 9387 | 11693 | 11141 |
| 12/31/2023 | 10346 | 12640 | 12323 |
| 03/31/2024 | 10322 | 12834 | 12563 |
| 06/30/2024 | 10286 | 12921 | 12612 |
| 09/30/2024 | 10947 | 13673 | 13472 |
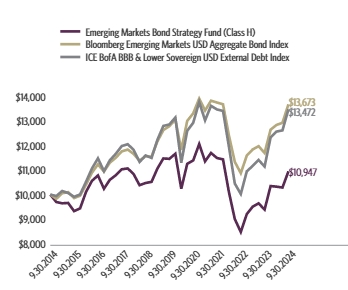
| Class H | 6.01% | 16.61% | -0.90% | 0.91% |
| Bloomberg Emerging Markets USD Aggregate Bond Index | 6.54% | 16.93% | 1.35% | 3.18% |
| ICE BofA BBB & Lower Sovereign USD External Debt Index | 7.23% | 20.93% | 0.95% | 3.03% |
The fund's past performance is not a good predictor of the fund's future performance. Visit GuggenheimInvestments.com/mutual-funds/performance for more recent performance information.
| Net Assets | $696,130 |
| Total Number of Portfolio Holdings | 6 |
| Portfolio Turnover Rate | 0% |
| Emerging Markets Bond Strategy Fund | Class H | RYGTX | Semi-Annual Shareholder Report | September 30, 2024 |
| Invesco Emerging Markets Sovereign Debt ETF Swap Agreement | 37.6% |
| CDX EM-42 Index V1 Credit Default Swap Agreements Protection Sold | 67.5% |
| Interest Rate Futures Contracts | 63.2% |

| |
1 | "Holdings Diversification (Market Exposure as a % of Net Assets)" excludes any temporary cash investments. The Fund's target exposure is achieved through a combination of total return swaps, credit default swaps, and interest rate futures contracts. |
There were no changes in or disagreements with fund accountants for the period.
| |  | Availability of Additional Information. For additional information, including the fund's prospectus, financial information, holdings and proxy voting information, go to GuggenheimInvestments.com/mutual-funds/literature or, call 800 820 0888. |
SAR-RYGTX-093024
Semi-Annual Shareholder Report | 9.30.24
This semi-annual shareholder report contains important information about the Government Long Bond 1.2x Strategy Fund for the period of April 1, 2024 to September 30, 2024. You can find additional information about the fund at GuggenheimInvestments.com/mutual-funds/literature. You can also request this information by contacting 800 820 0888 or GuggenheimClientServices@mufg-is.com.
For the period of April 1, 2024 to September 30, 2024, the fund (Investor Class shares) returned 5.29%, outperforming the fund's benchmark, the Bloomberg U.S. Aggregate Bond Index, which returned 5.26% for the same period and underperforming the fund's secondary index, the Bloomberg U.S. Treasury Bellwether 30 Year Index, which returned 5.71% for the same period.
The fund's broad-based securities market index was changed from the Bloomberg U.S. Treasury 30 Year Bellwether Index to the Bloomberg U.S. Aggregate Bond Index to comply with the regulation that requires the fund's broad-based securities market index to represent the overall applicable market.
What factors materially affected the fund's performance over the last six months?
The Fund underperformed the Bloomberg U.S. Treasury 30 Year Bellwether Index (its ancillary index), but had a positive return as yields of long-term Treasury bond prices fell slightly during the reporting period. Inflation moderated over the period, except for the housing sector, amid steady economic growth, which led the U.S. Federal Reserve (the "Fed") to cut its key lending rate of a half percentage point to a range of 4.75–5.00 percent in late September. The Fed released an updated Summary of Economic Projections ("SEP") report which lays out where committee members anticipate interest rates, economic growth, unemployment, and inflation are headed over the next couple years. According to the so-called "dot plot" within the report, the committee anticipates potentially cutting rates by up to another 150 basis points by the end of next year.
Cumulative performance* for the fund's most recently completed 10 years (as of 9.30.24), assuming a $10,000 initial investment.
| 09/30/2014 | 10000 | 10000 | 10000 |
| 12/31/2014 | 11205 | 10179 | 11006 |
| 03/31/2015 | 11822 | 10343 | 11562 |
| 06/30/2015 | 10283 | 10169 | 10355 |
| 09/30/2015 | 10982 | 10294 | 10883 |
| 12/31/2015 | 10690 | 10235 | 10657 |
| 03/31/2016 | 11859 | 10546 | 11608 |
| 06/30/2016 | 12969 | 10779 | 12449 |
| 09/30/2016 | 12916 | 10829 | 12464 |
| 12/31/2016 | 10730 | 10506 | 10751 |
| 03/31/2017 | 10864 | 10592 | 10891 |
| 06/30/2017 | 11432 | 10745 | 11354 |
| 09/30/2017 | 11417 | 10836 | 11392 |
| 12/31/2017 | 11795 | 10879 | 11733 |
| 03/31/2018 | 11191 | 10720 | 11277 |
| 06/30/2018 | 11190 | 10703 | 11335 |
| 09/30/2018 | 10714 | 10705 | 10964 |
| 12/31/2018 | 11218 | 10880 | 11414 |
| 03/31/2019 | 11854 | 11200 | 11983 |
| 06/30/2019 | 12717 | 11545 | 12794 |
| 09/30/2019 | 14112 | 11807 | 13971 |
| 12/31/2019 | 13180 | 11828 | 13290 |
| 03/31/2020 | 17288 | 12200 | 16719 |
| 06/30/2020 | 17055 | 12554 | 16600 |
| 09/30/2020 | 16909 | 12632 | 16467 |
| 12/31/2020 | 16114 | 12716 | 15778 |
| 03/31/2021 | 13014 | 12287 | 13279 |
| 06/30/2021 | 14216 | 12512 | 14319 |
| 09/30/2021 | 14247 | 12518 | 14374 |
| 12/31/2021 | 14958 | 12520 | 15049 |
| 03/31/2022 | 12791 | 11777 | 13333 |
| 06/30/2022 | 10604 | 11224 | 11502 |
| 09/30/2022 | 9206 | 10691 | 10310 |
| 12/31/2022 | 8890 | 10891 | 10039 |
| 03/31/2023 | 9509 | 11214 | 10640 |
| 06/30/2023 | 9172 | 11119 | 10389 |
| 09/30/2023 | 7708 | 10760 | 9067 |
| 12/31/2023 | 8850 | 11493 | 10233 |
| 03/31/2024 | 8395 | 11404 | 9818 |
| 06/30/2024 | 8111 | 11411 | 9599 |
| 09/30/2024 | 8839 | 12004 | 10378 |
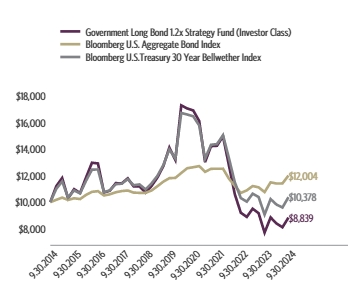
| Investor Class | 5.29% | 14.67% | -8.93% | -1.23% |
| Bloomberg U.S. Aggregate Bond Index | 5.26% | 11.57% | 0.33% | 1.84% |
| Bloomberg U.S. Treasury Bellwether 30 Year Index | 5.71% | 14.46% | -5.77% | 0.37% |
The fund's past performance is not a good predictor of the fund's future performance. Visit GuggenheimInvestments.com/mutual-funds/performance for more recent performance information.
| Net Assets | $27,547,338 |
| Total Number of Portfolio Holdings | 7 |
| Portfolio Turnover Rate | 760% |
| Government Long Bond 1.2x Strategy Fund | Investor Class | RYGBX | Semi-Annual Shareholder Report | September 30, 2024 |
| U.S Government Securities | 86.0% |
| U.S. Treasury Ultra Long Bond Interest Rate Futures Contracts | 34.8% |

| U.S. Treasury Bond | 86.0% |
| Guggenheim Ultra Short Duration Fund — Institutional Class | 3.0% |
| Guggenheim Strategy Fund II | 2.9% |
| Total | 91.9% |
| |
1 | "Holdings Diversification (Market Exposure as a % of Net Assets)" excludes any temporary cash investments, investments in Guggenheim Strategy Funds Trust mutual funds, or investments in Guggenheim Ultra Short Duration Fund. |
| |
2 | "Largest Holdings (as a % of Net Assets)" excludes any temporary cash or derivative investments. |
| U.S. Treasury Bond | 86.0% |
| Guggenheim Ultra Short Duration Fund — Institutional Class | 3.0% |
| Guggenheim Strategy Fund II | 2.9% |
| Total | 91.9% |
| |
2 | "Largest Holdings (as a % of Net Assets)" excludes any temporary cash or derivative investments. |
There were no changes in or disagreements with fund accountants for the period.
| |  | Availability of Additional Information. For additional information, including the fund's prospectus, financial information, holdings and proxy voting information, go to GuggenheimInvestments.com/mutual-funds/literature or, call 800 820 0888. |
SAR-RYGBX-093024
Semi-Annual Shareholder Report | 9.30.24
This semi-annual shareholder report contains important information about the Government Long Bond 1.2x Strategy Fund for the period of April 1, 2024 to September 30, 2024. You can find additional information about the fund at GuggenheimInvestments.com/mutual-funds/literature. You can also request this information by contacting 800 820 0888 or GuggenheimClientServices@mufg-is.com.
For the period of April 1, 2024 to September 30, 2024, the fund (Class A shares) returned 5.17%, underperforming the fund's benchmark, the Bloomberg U.S. Aggregate Bond Index, which returned 5.26% for the same period and underperforming the fund's secondary index, the Bloomberg U.S. Treasury Bellwether 30 Year Index, which returned 5.71% for the same period.
The fund's broad-based securities market index was changed from the Bloomberg U.S. Treasury 30 Year Bellwether Index to the Bloomberg U.S. Aggregate Bond Index to comply with the regulation that requires the fund's broad-based securities market index to represent the overall applicable market.
What factors materially affected the fund's performance over the last six months?
The Fund underperformed the Bloomberg U.S. Treasury 30 Year Bellwether Index (its ancillary index), but had a positive return as yields of long-term Treasury bond prices fell slightly during the reporting period. Inflation moderated over the period, except for the housing sector, amid steady economic growth, which led the U.S. Federal Reserve (the "Fed") to cut its key lending rate of a half percentage point to a range of 4.75–5.00 percent in late September. The Fed released an updated Summary of Economic Projections ("SEP") report which lays out where committee members anticipate interest rates, economic growth, unemployment, and inflation are headed over the next couple years. According to the so-called "dot plot" within the report, the committee anticipates potentially cutting rates by up to another 150 basis points by the end of next year.
Cumulative performance* for the fund's most recently completed 10 years (as of 9.30.24), assuming a $10,000 initial investment.
| 09/30/2014 | 9525 | 10000 | 10000 |
| 12/31/2014 | 10666 | 10179 | 11006 |
| 03/31/2015 | 11250 | 10343 | 11562 |
| 06/30/2015 | 9780 | 10169 | 10355 |
| 09/30/2015 | 10440 | 10294 | 10883 |
| 12/31/2015 | 10160 | 10235 | 10657 |
| 03/31/2016 | 11264 | 10546 | 11608 |
| 06/30/2016 | 12310 | 10779 | 12449 |
| 09/30/2016 | 12253 | 10829 | 12464 |
| 12/31/2016 | 10180 | 10506 | 10751 |
| 03/31/2017 | 10302 | 10592 | 10891 |
| 06/30/2017 | 10836 | 10745 | 11354 |
| 09/30/2017 | 10817 | 10836 | 11392 |
| 12/31/2017 | 11167 | 10879 | 11733 |
| 03/31/2018 | 10589 | 10720 | 11277 |
| 06/30/2018 | 10580 | 10703 | 11335 |
| 09/30/2018 | 10126 | 10705 | 10964 |
| 12/31/2018 | 10591 | 10880 | 11414 |
| 03/31/2019 | 11185 | 11200 | 11983 |
| 06/30/2019 | 11995 | 11545 | 12794 |
| 09/30/2019 | 13301 | 11807 | 13971 |
| 12/31/2019 | 12415 | 11828 | 13290 |
| 03/31/2020 | 16273 | 12200 | 16719 |
| 06/30/2020 | 16045 | 12554 | 16600 |
| 09/30/2020 | 15902 | 12632 | 16467 |
| 12/31/2020 | 15139 | 12716 | 15778 |
| 03/31/2021 | 12208 | 12287 | 13279 |
| 06/30/2021 | 13336 | 12512 | 14319 |
| 09/30/2021 | 13350 | 12518 | 14374 |
| 12/31/2021 | 14006 | 12520 | 15049 |
| 03/31/2022 | 11970 | 11777 | 13333 |
| 06/30/2022 | 9914 | 11224 | 11502 |
| 09/30/2022 | 8602 | 10691 | 10310 |
| 12/31/2022 | 8298 | 10891 | 10039 |
| 03/31/2023 | 8872 | 11214 | 10640 |
| 06/30/2023 | 8546 | 11119 | 10389 |
| 09/30/2023 | 7175 | 10760 | 9067 |
| 12/31/2023 | 8234 | 11493 | 10233 |
| 03/31/2024 | 7804 | 11404 | 9818 |
| 06/30/2024 | 7539 | 11411 | 9599 |
| 09/30/2024 | 8207 | 12004 | 10378 |
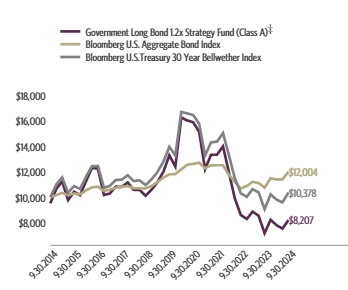
| Class A (without sales charge) | 5.17% | 14.38% | -9.20% | -1.48% |
| Class A (with sales charge)‡ | 0.18% | 8.93% | -10.08% | -1.96% |
| Bloomberg U.S. Aggregate Bond Index | 5.26% | 11.57% | 0.33% | 1.84% |
| Bloomberg U.S. Treasury Bellwether 30 Year Index | 5.71% | 14.46% | -5.77% | 0.37% |
The fund's past performance is not a good predictor of the fund's future performance. Visit GuggenheimInvestments.com/mutual-funds/performance for more recent performance information.
| Net Assets | $27,547,338 |
| Total Number of Portfolio Holdings | 7 |
| Portfolio Turnover Rate | 760% |
| Government Long Bond 1.2x Strategy Fund | Class A | RYABX | Semi-Annual Shareholder Report | September 30, 2024 |
| U.S Government Securities | 86.0% |
| U.S. Treasury Ultra Long Bond Interest Rate Futures Contracts | 34.8% |

| U.S. Treasury Bond | 86.0% |
| Guggenheim Ultra Short Duration Fund — Institutional Class | 3.0% |
| Guggenheim Strategy Fund II | 2.9% |
| Total | 91.9% |
| |
1 | "Holdings Diversification (Market Exposure as a % of Net Assets)" excludes any temporary cash investments, investments in Guggenheim Strategy Funds Trust mutual funds, or investments in Guggenheim Ultra Short Duration Fund. |
| |
2 | "Largest Holdings (as a % of Net Assets)" excludes any temporary cash or derivative investments. |
| U.S. Treasury Bond | 86.0% |
| Guggenheim Ultra Short Duration Fund — Institutional Class | 3.0% |
| Guggenheim Strategy Fund II | 2.9% |
| Total | 91.9% |
| |
2 | "Largest Holdings (as a % of Net Assets)" excludes any temporary cash or derivative investments. |
There were no changes in or disagreements with fund accountants for the period.
| |  | Availability of Additional Information. For additional information, including the fund's prospectus, financial information, holdings and proxy voting information, go to GuggenheimInvestments.com/mutual-funds/literature or, call 800 820 0888. |
SAR-RYABX-093024
Semi-Annual Shareholder Report | 9.30.24
This semi-annual shareholder report contains important information about the Government Long Bond 1.2x Strategy Fund for the period of April 1, 2024 to September 30, 2024. You can find additional information about the fund at GuggenheimInvestments.com/mutual-funds/literature. You can also request this information by contacting 800 820 0888 or GuggenheimClientServices@mufg-is.com.
For the period of April 1, 2024 to September 30, 2024, the fund (Class C shares) returned 4.78%, underperforming the fund's benchmark, the Bloomberg U.S. Aggregate Bond Index, which returned 5.26% for the same period and underperforming the fund's secondary index, the Bloomberg U.S. Treasury Bellwether 30 Year Index, which returned 5.71% for the same period.
The fund's broad-based securities market index was changed from the Bloomberg U.S. Treasury 30 Year Bellwether Index to the Bloomberg U.S. Aggregate Bond Index to comply with the regulation that requires the fund's broad-based securities market index to represent the overall applicable market.
What factors materially affected the fund's performance over the last six months?
The Fund underperformed the Bloomberg U.S. Treasury 30 Year Bellwether Index (its ancillary index), but had a positive return as yields of long-term Treasury bond prices fell slightly during the reporting period. Inflation moderated over the period, except for the housing sector, amid steady economic growth, which led the U.S. Federal Reserve (the "Fed") to cut its key lending rate of a half percentage point to a range of 4.75–5.00 percent in late September. The Fed released an updated Summary of Economic Projections ("SEP") report which lays out where committee members anticipate interest rates, economic growth, unemployment, and inflation are headed over the next couple years. According to the so-called "dot plot" within the report, the committee anticipates potentially cutting rates by up to another 150 basis points by the end of next year.
Cumulative performance* for the fund's most recently completed 10 years (as of 9.30.24), assuming a $10,000 initial investment.
| 09/30/2014 | 10000 | 10000 | 10000 |
| 12/31/2014 | 11175 | 10179 | 11006 |
| 03/31/2015 | 11765 | 10343 | 11562 |
| 06/30/2015 | 10207 | 10169 | 10355 |
| 09/30/2015 | 10876 | 10294 | 10883 |
| 12/31/2015 | 10563 | 10235 | 10657 |
| 03/31/2016 | 11692 | 10546 | 11608 |
| 06/30/2016 | 12754 | 10779 | 12449 |
| 09/30/2016 | 12670 | 10829 | 12464 |
| 12/31/2016 | 10507 | 10506 | 10751 |
| 03/31/2017 | 10612 | 10592 | 10891 |
| 06/30/2017 | 11140 | 10745 | 11354 |
| 09/30/2017 | 11099 | 10836 | 11392 |
| 12/31/2017 | 11435 | 10879 | 11733 |
| 03/31/2018 | 10821 | 10720 | 11277 |
| 06/30/2018 | 10793 | 10703 | 11335 |
| 09/30/2018 | 10315 | 10705 | 10964 |
| 12/31/2018 | 10770 | 10880 | 11414 |
| 03/31/2019 | 11353 | 11200 | 11983 |
| 06/30/2019 | 12151 | 11545 | 12794 |
| 09/30/2019 | 13449 | 11807 | 13971 |
| 12/31/2019 | 12528 | 11828 | 13290 |
| 03/31/2020 | 16395 | 12200 | 16719 |
| 06/30/2020 | 16134 | 12554 | 16600 |
| 09/30/2020 | 15959 | 12632 | 16467 |
| 12/31/2020 | 15164 | 12716 | 15778 |
| 03/31/2021 | 12206 | 12287 | 13279 |
| 06/30/2021 | 13309 | 12512 | 14319 |
| 09/30/2021 | 13296 | 12518 | 14374 |
| 12/31/2021 | 13925 | 12520 | 15049 |
| 03/31/2022 | 11875 | 11777 | 13333 |
| 06/30/2022 | 9819 | 11224 | 11502 |
| 09/30/2022 | 8502 | 10691 | 10310 |
| 12/31/2022 | 8184 | 10891 | 10039 |
| 03/31/2023 | 8735 | 11214 | 10640 |
| 06/30/2023 | 8398 | 11119 | 10389 |
| 09/30/2023 | 7039 | 10760 | 9067 |
| 12/31/2023 | 8062 | 11493 | 10233 |
| 03/31/2024 | 7629 | 11404 | 9818 |
| 06/30/2024 | 7353 | 11411 | 9599 |
| 09/30/2024 | 7993 | 12004 | 10378 |
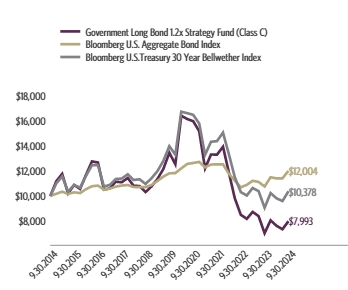
| Class C (without CDSC) | 4.78% | 13.56% | -9.88% | -2.22% |
| Class C (with CDSC)§ | 3.78% | 12.56% | -9.88% | -2.22% |
| Bloomberg U.S. Aggregate Bond Index | 5.26% | 11.57% | 0.33% | 1.84% |
| Bloomberg U.S. Treasury Bellwether 30 Year Index | 5.71% | 14.46% | -5.77% | 0.37% |
The fund's past performance is not a good predictor of the fund's future performance. Visit GuggenheimInvestments.com/mutual-funds/performance for more recent performance information.
| Net Assets | $27,547,338 |
| Total Number of Portfolio Holdings | 7 |
| Portfolio Turnover Rate | 760% |
| Government Long Bond 1.2x Strategy Fund | Class C | RYCGX | Semi-Annual Shareholder Report | September 30, 2024 |
| U.S Government Securities | 86.0% |
| U.S. Treasury Ultra Long Bond Interest Rate Futures Contracts | 34.8% |

| U.S. Treasury Bond | 86.0% |
| Guggenheim Ultra Short Duration Fund — Institutional Class | 3.0% |
| Guggenheim Strategy Fund II | 2.9% |
| Total | 91.9% |
| |
1 | "Holdings Diversification (Market Exposure as a % of Net Assets)" excludes any temporary cash investments, investments in Guggenheim Strategy Funds Trust mutual funds, or investments in Guggenheim Ultra Short Duration Fund. |
| |
2 | "Largest Holdings (as a % of Net Assets)" excludes any temporary cash or derivative investments. |
| U.S. Treasury Bond | 86.0% |
| Guggenheim Ultra Short Duration Fund — Institutional Class | 3.0% |
| Guggenheim Strategy Fund II | 2.9% |
| Total | 91.9% |
| |
2 | "Largest Holdings (as a % of Net Assets)" excludes any temporary cash or derivative investments. |
There were no changes in or disagreements with fund accountants for the period.
| |  | Availability of Additional Information. For additional information, including the fund's prospectus, financial information, holdings and proxy voting information, go to GuggenheimInvestments.com/mutual-funds/literature or, call 800 820 0888. |
SAR-RYCGX-093024
Semi-Annual Shareholder Report | 9.30.24
This semi-annual shareholder report contains important information about the Government Long Bond 1.2x Strategy Fund for the period of April 1, 2024 to September 30, 2024. You can find additional information about the fund at GuggenheimInvestments.com/mutual-funds/literature. You can also request this information by contacting 800 820 0888 or GuggenheimClientServices@mufg-is.com.
For the period of April 1, 2024 to September 30, 2024, the fund (Class H shares) returned 5.07%, underperforming the fund's benchmark, the Bloomberg U.S. Aggregate Bond Index, which returned 5.26% for the same period and underperforming the fund's secondary index, the Bloomberg U.S. Treasury Bellwether 30 Year Index, which returned 5.71% for the same period.
The fund's broad-based securities market index was changed from the Bloomberg U.S. Treasury 30 Year Bellwether Index to the Bloomberg U.S. Aggregate Bond Index to comply with the regulation that requires the fund's broad-based securities market index to represent the overall applicable market.
What factors materially affected the fund's performance over the last six months?
The Fund underperformed the Bloomberg U.S. Treasury 30 Year Bellwether Index (its ancillary index), but had a positive return as yields of long-term Treasury bond prices fell slightly during the reporting period. Inflation moderated over the period, except for the housing sector, amid steady economic growth, which led the U.S. Federal Reserve (the "Fed") to cut its key lending rate of a half percentage point to a range of 4.75–5.00 percent in late September. The Fed released an updated Summary of Economic Projections ("SEP") report which lays out where committee members anticipate interest rates, economic growth, unemployment, and inflation are headed over the next couple years. According to the so-called "dot plot" within the report, the committee anticipates potentially cutting rates by up to another 150 basis points by the end of next year.
Cumulative performance* for the fund's most recently completed 10 years (as of 9.30.24), assuming a $10,000 initial investment.
| 09/30/2014 | 10000 | 10000 | 10000 |
| 12/31/2014 | 11198 | 10179 | 11006 |
| 03/31/2015 | 11807 | 10343 | 11562 |
| 06/30/2015 | 10277 | 10169 | 10355 |
| 09/30/2015 | 10969 | 10294 | 10883 |
| 12/31/2015 | 10676 | 10235 | 10657 |
| 03/31/2016 | 11838 | 10546 | 11608 |
| 06/30/2016 | 12941 | 10779 | 12449 |
| 09/30/2016 | 12882 | 10829 | 12464 |
| 12/31/2016 | 10700 | 10506 | 10751 |
| 03/31/2017 | 10826 | 10592 | 10891 |
| 06/30/2017 | 11385 | 10745 | 11354 |
| 09/30/2017 | 11364 | 10836 | 11392 |
| 12/31/2017 | 11729 | 10879 | 11733 |
| 03/31/2018 | 11123 | 10720 | 11277 |
| 06/30/2018 | 11113 | 10703 | 11335 |
| 09/30/2018 | 10636 | 10705 | 10964 |
| 12/31/2018 | 11125 | 10880 | 11414 |
| 03/31/2019 | 11749 | 11200 | 11983 |
| 06/30/2019 | 12601 | 11545 | 12794 |
| 09/30/2019 | 13974 | 11807 | 13971 |
| 12/31/2019 | 13042 | 11828 | 13290 |
| 03/31/2020 | 17099 | 12200 | 16719 |
| 06/30/2020 | 16858 | 12554 | 16600 |
| 09/30/2020 | 16705 | 12632 | 16467 |
| 12/31/2020 | 15904 | 12716 | 15778 |
| 03/31/2021 | 12827 | 12287 | 13279 |
| 06/30/2021 | 14011 | 12512 | 14319 |
| 09/30/2021 | 14022 | 12518 | 14374 |
| 12/31/2021 | 14714 | 12520 | 15049 |
| 03/31/2022 | 12577 | 11777 | 13333 |
| 06/30/2022 | 10416 | 11224 | 11502 |
| 09/30/2022 | 9036 | 10691 | 10310 |
| 12/31/2022 | 8725 | 10891 | 10039 |
| 03/31/2023 | 9323 | 11214 | 10640 |
| 06/30/2023 | 8978 | 11119 | 10389 |
| 09/30/2023 | 7542 | 10760 | 9067 |
| 12/31/2023 | 8661 | 11493 | 10233 |
| 03/31/2024 | 8217 | 11404 | 9818 |
| 06/30/2024 | 7931 | 11411 | 9599 |
| 09/30/2024 | 8633 | 12004 | 10378 |
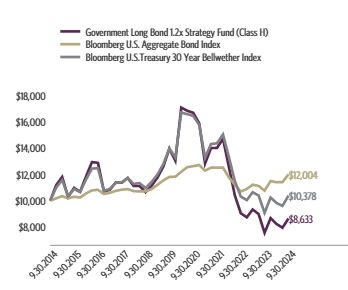
| Class H | 5.07% | 14.46% | -9.18% | -1.46% |
| Bloomberg U.S. Aggregate Bond Index | 5.26% | 11.57% | 0.33% | 1.84% |
| Bloomberg U.S. Treasury Bellwether 30 Year Index | 5.71% | 14.46% | -5.77% | 0.37% |
The fund's past performance is not a good predictor of the fund's future performance. Visit GuggenheimInvestments.com/mutual-funds/performance for more recent performance information.
| Net Assets | $27,547,338 |
| Total Number of Portfolio Holdings | 7 |
| Portfolio Turnover Rate | 760% |
| Government Long Bond 1.2x Strategy Fund | Class H | RYHBX | Semi-Annual Shareholder Report | September 30, 2024 |
| U.S Government Securities | 86.0% |
| U.S. Treasury Ultra Long Bond Interest Rate Futures Contracts | 34.8% |

| U.S. Treasury Bond | 86.0% |
| Guggenheim Ultra Short Duration Fund — Institutional Class | 3.0% |
| Guggenheim Strategy Fund II | 2.9% |
| Total | 91.9% |
| |
1 | "Holdings Diversification (Market Exposure as a % of Net Assets)" excludes any temporary cash investments, investments in Guggenheim Strategy Funds Trust mutual funds, or investments in Guggenheim Ultra Short Duration Fund. |
| |
2 | "Largest Holdings (as a % of Net Assets)" excludes any temporary cash or derivative investments. |
| U.S. Treasury Bond | 86.0% |
| Guggenheim Ultra Short Duration Fund — Institutional Class | 3.0% |
| Guggenheim Strategy Fund II | 2.9% |
| Total | 91.9% |
| |
2 | "Largest Holdings (as a % of Net Assets)" excludes any temporary cash or derivative investments. |
There were no changes in or disagreements with fund accountants for the period.
| |  | Availability of Additional Information. For additional information, including the fund's prospectus, financial information, holdings and proxy voting information, go to GuggenheimInvestments.com/mutual-funds/literature or, call 800 820 0888. |
SAR-RYHBX-093024
Semi-Annual Shareholder Report | 9.30.24
This semi-annual shareholder report contains important information about the Inverse Government Long Bond Strategy Fund for the period of April 1, 2024 to September 30, 2024. You can find additional information about the fund at GuggenheimInvestments.com/mutual-funds/literature. You can also request this information by contacting 800 820 0888 or GuggenheimClientServices@mufg-is.com.
For the period of April 1, 2024 to September 30, 2024, the fund (Investor Class shares) returned -1.23%, underperforming the fund's benchmark, the Bloomberg U.S. Aggregate Bond Index, which returned 5.26% for the same period and underperforming the fund's secondary index, the Bellwether 30 Yr Index, which returned 5.71% for the same period.
The fund's broad-based securities market index was changed from the Bloomberg U.S. Treasury 30 Year Bellwether Index to the Bloomberg U.S. Aggregate Bond Index to comply with the regulation that requires the fund's broad-based securities market index to represent the overall applicable market.
What factors materially affected the fund's performance over the last six months?
The Fund underperformed the Bloomberg U.S. Treasury 30 Year Bellwether Index (its ancillary index), and had a negative return as yields of long-term Treasury bond prices fell slightly during the reporting period. Inflation moderated over the period, except for the housing sector, amid steady economic growth, which led the U.S. Federal Reserve (the "Fed") to cut its key lending rate of a half percentage point to a range of 4.75–5.00 percent in late September. The Fed released an updated Summary of Economic Projections ("SEP") report which lays out where committee members anticipate interest rates, economic growth, unemployment, and inflation are headed over the next couple years. According to the so-called "dot plot" within the report, the committee anticipates potentially cutting rates by up to another 150 basis points by the end of next year.
Cumulative performance* for the fund's most recently completed 10 years (as of 9.30.24), assuming a $10,000 initial investment.
| 09/30/2014 | 10000 | 10000 | 10000 |
| 12/31/2014 | 9025 | 10179 | 11006 |
| 03/31/2015 | 8548 | 10343 | 11562 |
| 06/30/2015 | 9498 | 10169 | 10355 |
| 09/30/2015 | 8870 | 10294 | 10883 |
| 12/31/2015 | 8982 | 10235 | 10657 |
| 03/31/2016 | 8187 | 10546 | 11608 |
| 06/30/2016 | 7563 | 10779 | 12449 |
| 09/30/2016 | 7549 | 10829 | 12464 |
| 12/31/2016 | 8731 | 10506 | 10751 |
| 03/31/2017 | 8602 | 10592 | 10891 |
| 06/30/2017 | 8215 | 10745 | 11354 |
| 09/30/2017 | 8199 | 10836 | 11392 |
| 12/31/2017 | 7948 | 10879 | 11733 |
| 03/31/2018 | 8275 | 10720 | 11277 |
| 06/30/2018 | 8263 | 10703 | 11335 |
| 09/30/2018 | 8579 | 10705 | 10964 |
| 12/31/2018 | 8268 | 10880 | 11414 |
| 03/31/2019 | 7905 | 11200 | 11983 |
| 06/30/2019 | 7475 | 11545 | 12794 |
| 09/30/2019 | 6828 | 11807 | 13971 |
| 12/31/2019 | 7198 | 11828 | 13290 |
| 03/31/2020 | 5475 | 12200 | 16719 |
| 06/30/2020 | 5497 | 12554 | 16600 |
| 09/30/2020 | 5504 | 12632 | 16467 |
| 12/31/2020 | 5677 | 12716 | 15778 |
| 03/31/2021 | 6691 | 12287 | 13279 |
| 06/30/2021 | 6165 | 12512 | 14319 |
| 09/30/2021 | 6089 | 12518 | 14374 |
| 12/31/2021 | 5752 | 12520 | 15049 |
| 03/31/2022 | 6392 | 11777 | 13333 |
| 06/30/2022 | 7336 | 11224 | 11502 |
| 09/30/2022 | 8154 | 10691 | 10310 |
| 12/31/2022 | 8397 | 10891 | 10039 |
| 03/31/2023 | 8000 | 11214 | 10640 |
| 06/30/2023 | 8336 | 11119 | 10389 |
| 09/30/2023 | 9747 | 10760 | 9067 |
| 12/31/2023 | 8781 | 11493 | 10233 |
| 03/31/2024 | 9338 | 11404 | 9818 |
| 06/30/2024 | 9740 | 11411 | 9599 |
| 09/30/2024 | 9223 | 12004 | 10378 |
| Investor Class | -1.23% | -5.37% | 6.20% | -0.81% |
| Bloomberg U.S. Aggregate Bond Index | 5.26% | 11.57% | 0.33% | 1.84% |
| Bloomberg U.S.Treasury Bellwether 30 Yr Index | 5.71% | 14.46% | -5.77% | 0.37% |
The fund's past performance is not a good predictor of the fund's future performance. Visit GuggenheimInvestments.com/mutual-funds/performance for more recent performance information.
| Net Assets | $15,372,722 |
| Total Number of Portfolio Holdings | 11 |
| Portfolio Turnover Rate | 264% |
| Inverse Government Long Bond Strategy Fund | Investor Class | RYJUX | Semi-Annual Shareholder Report | September 30, 2024 |
| U.S. Treasury Ultra Long Bond Interest Rate Futures Contracts Sold Short | -14.7% |
| U.S Government Securities Sold Short | -85.7% |

| Guggenheim Strategy Fund II | 22.2% |
| Guggenheim Ultra Short Duration Fund — Institutional Class | 21.3% |
| Total | 43.5% |
| |
1 | "Holdings Diversification (Market Exposure as a % of Net Assets)" excludes any temporary cash investments, investments in Guggenheim Strategy Funds Trust mutual funds, or investments in Guggenheim Ultra Short Duration Fund. |
| |
2 | "Largest Holdings (as a % of Net Assets)" excludes any temporary cash or derivative investments. |
| Guggenheim Strategy Fund II | 22.2% |
| Guggenheim Ultra Short Duration Fund — Institutional Class | 21.3% |
| Total | 43.5% |
| |
2 | "Largest Holdings (as a % of Net Assets)" excludes any temporary cash or derivative investments. |
There were no changes in or disagreements with fund accountants for the period.
| |  | Availability of Additional Information. For additional information, including the fund's prospectus, financial information, holdings and proxy voting information, go to GuggenheimInvestments.com/mutual-funds/literature or, call 800 820 0888. |
SAR-RYJUX-093024
Semi-Annual Shareholder Report | 9.30.24
This semi-annual shareholder report contains important information about the Inverse Government Long Bond Strategy Fund for the period of April 1, 2024 to September 30, 2024. You can find additional information about the fund at GuggenheimInvestments.com/mutual-funds/literature. You can also request this information by contacting 800 820 0888 or GuggenheimClientServices@mufg-is.com.
For the period of April 1, 2024 to September 30, 2024, the fund (Class A shares) returned -1.35%, underperforming the fund's benchmark, the Bloomberg U.S. Aggregate Bond Index, which returned 5.26% for the same period and underperforming the fund's secondary index, the Bellwether 30 Yr Index, which returned 5.71% for the same period.
The fund's broad-based securities market index was changed from the Bloomberg U.S. Treasury 30 Year Bellwether Index to the Bloomberg U.S. Aggregate Bond Index to comply with the regulation that requires the fund's broad-based securities market index to represent the overall applicable market.
What factors materially affected the fund's performance over the last six months?
The Fund underperformed the Bloomberg U.S. Treasury 30 Year Bellwether Index (its ancillary index), and had a negative return as yields of long-term Treasury bond prices fell slightly during the reporting period. Inflation moderated over the period, except for the housing sector, amid steady economic growth, which led the U.S. Federal Reserve (the "Fed") to cut its key lending rate of a half percentage point to a range of 4.75–5.00 percent in late September. The Fed released an updated Summary of Economic Projections ("SEP") report which lays out where committee members anticipate interest rates, economic growth, unemployment, and inflation are headed over the next couple years. According to the so-called "dot plot" within the report, the committee anticipates potentially cutting rates by up to another 150 basis points by the end of next year.
Cumulative performance* for the fund's most recently completed 10 years (as of 9.30.24), assuming a $10,000 initial investment.
| 09/30/2014 | 9526 | 10000 | 10000 |
| 12/31/2014 | 8594 | 10179 | 11006 |
| 03/31/2015 | 8134 | 10343 | 11562 |
| 06/30/2015 | 9033 | 10169 | 10355 |
| 09/30/2015 | 8430 | 10294 | 10883 |
| 12/31/2015 | 8531 | 10235 | 10657 |
| 03/31/2016 | 7770 | 10546 | 11608 |
| 06/30/2016 | 7174 | 10779 | 12449 |
| 09/30/2016 | 7156 | 10829 | 12464 |
| 12/31/2016 | 8270 | 10506 | 10751 |
| 03/31/2017 | 8146 | 10592 | 10891 |
| 06/30/2017 | 7773 | 10745 | 11354 |
| 09/30/2017 | 7752 | 10836 | 11392 |
| 12/31/2017 | 7512 | 10879 | 11733 |
| 03/31/2018 | 7815 | 10720 | 11277 |
| 06/30/2018 | 7799 | 10703 | 11335 |
| 09/30/2018 | 8090 | 10705 | 10964 |
| 12/31/2018 | 7792 | 10880 | 11414 |
| 03/31/2019 | 7444 | 11200 | 11983 |
| 06/30/2019 | 7038 | 11545 | 12794 |
| 09/30/2019 | 6423 | 11807 | 13971 |
| 12/31/2019 | 6768 | 11828 | 13290 |
| 03/31/2020 | 5144 | 12200 | 16719 |
| 06/30/2020 | 5163 | 12554 | 16600 |
| 09/30/2020 | 5167 | 12632 | 16467 |
| 12/31/2020 | 5326 | 12716 | 15778 |
| 03/31/2021 | 6273 | 12287 | 13279 |
| 06/30/2021 | 5778 | 12512 | 14319 |
| 09/30/2021 | 5702 | 12518 | 14374 |
| 12/31/2021 | 5382 | 12520 | 15049 |
| 03/31/2022 | 5978 | 11777 | 13333 |
| 06/30/2022 | 6856 | 11224 | 11502 |
| 09/30/2022 | 7616 | 10691 | 10310 |
| 12/31/2022 | 7838 | 10891 | 10039 |
| 03/31/2023 | 7463 | 11214 | 10640 |
| 06/30/2023 | 7772 | 11119 | 10389 |
| 09/30/2023 | 9082 | 10760 | 9067 |
| 12/31/2023 | 8177 | 11493 | 10233 |
| 03/31/2024 | 8689 | 11404 | 9818 |
| 06/30/2024 | 9059 | 11411 | 9599 |
| 09/30/2024 | 8572 | 12004 | 10378 |
| Class A (without sales charge) | -1.35% | -5.61% | 5.94% | -1.05% |
| Class A (with sales charge)‡ | -6.04% | -10.10% | 4.92% | -1.53% |
| Bloomberg U.S. Aggregate Bond Index | 5.26% | 11.57% | 0.33% | 1.84% |
| Bloomberg U.S.Treasury Bellwether 30 Yr Index | 5.71% | 14.46% | -5.77% | 0.37% |
The fund's past performance is not a good predictor of the fund's future performance. Visit GuggenheimInvestments.com/mutual-funds/performance for more recent performance information.
| Net Assets | $15,372,722 |
| Total Number of Portfolio Holdings | 11 |
| Portfolio Turnover Rate | 264% |
| Inverse Government Long Bond Strategy Fund | Class A | RYAQX | Semi-Annual Shareholder Report | September 30, 2024 |
| U.S. Treasury Ultra Long Bond Interest Rate Futures Contracts Sold Short | -14.7% |
| U.S Government Securities Sold Short | -85.7% |

| Guggenheim Strategy Fund II | 22.2% |
| Guggenheim Ultra Short Duration Fund — Institutional Class | 21.3% |
| Total | 43.5% |
| |
1 | "Holdings Diversification (Market Exposure as a % of Net Assets)" excludes any temporary cash investments, investments in Guggenheim Strategy Funds Trust mutual funds, or investments in Guggenheim Ultra Short Duration Fund. |
| |
2 | "Largest Holdings (as a % of Net Assets)" excludes any temporary cash or derivative investments. |
| Guggenheim Strategy Fund II | 22.2% |
| Guggenheim Ultra Short Duration Fund — Institutional Class | 21.3% |
| Total | 43.5% |
| |
2 | "Largest Holdings (as a % of Net Assets)" excludes any temporary cash or derivative investments. |
There were no changes in or disagreements with fund accountants for the period.
| |  | Availability of Additional Information. For additional information, including the fund's prospectus, financial information, holdings and proxy voting information, go to GuggenheimInvestments.com/mutual-funds/literature or, call 800 820 0888. |
SAR-RYAQX-093024
Semi-Annual Shareholder Report | 9.30.24
This semi-annual shareholder report contains important information about the Inverse Government Long Bond Strategy Fund for the period of April 1, 2024 to September 30, 2024. You can find additional information about the fund at GuggenheimInvestments.com/mutual-funds/literature. You can also request this information by contacting 800 820 0888 or GuggenheimClientServices@mufg-is.com.
For the period of April 1, 2024 to September 30, 2024, the fund (Class C shares) returned -1.73%, underperforming the fund's benchmark, the Bloomberg U.S. Aggregate Bond Index, which returned 5.26% for the same period and underperforming the fund's secondary index, the Bellwether 30 Yr Index, which returned 5.71% for the same period.
The fund's broad-based securities market index was changed from the Bloomberg U.S. Treasury 30 Year Bellwether Index to the Bloomberg U.S. Aggregate Bond Index to comply with the regulation that requires the fund's broad-based securities market index to represent the overall applicable market.
What factors materially affected the fund's performance over the last six months?
The Fund underperformed the Bloomberg U.S. Treasury 30 Year Bellwether Index (its ancillary index), and had a negative return as yields of long-term Treasury bond prices fell slightly during the reporting period. Inflation moderated over the period, except for the housing sector, amid steady economic growth, which led the U.S. Federal Reserve (the "Fed") to cut its key lending rate of a half percentage point to a range of 4.75–5.00 percent in late September. The Fed released an updated Summary of Economic Projections ("SEP") report which lays out where committee members anticipate interest rates, economic growth, unemployment, and inflation are headed over the next couple years. According to the so-called "dot plot" within the report, the committee anticipates potentially cutting rates by up to another 150 basis points by the end of next year.
Cumulative performance* for the fund's most recently completed 10 years (as of 9.30.24), assuming a $10,000 initial investment.
| 09/30/2014 | 10000 | 10000 | 10000 |
| 12/31/2014 | 9004 | 10179 | 11006 |
| 03/31/2015 | 8505 | 10343 | 11562 |
| 06/30/2015 | 9428 | 10169 | 10355 |
| 09/30/2015 | 8782 | 10294 | 10883 |
| 12/31/2015 | 8869 | 10235 | 10657 |
| 03/31/2016 | 8065 | 10546 | 11608 |
| 06/30/2016 | 7432 | 10779 | 12449 |
| 09/30/2016 | 7399 | 10829 | 12464 |
| 12/31/2016 | 8535 | 10506 | 10751 |
| 03/31/2017 | 8390 | 10592 | 10891 |
| 06/30/2017 | 7991 | 10745 | 11354 |
| 09/30/2017 | 7955 | 10836 | 11392 |
| 12/31/2017 | 7695 | 10879 | 11733 |
| 03/31/2018 | 7991 | 10720 | 11277 |
| 06/30/2018 | 7958 | 10703 | 11335 |
| 09/30/2018 | 8240 | 10705 | 10964 |
| 12/31/2018 | 7922 | 10880 | 11414 |
| 03/31/2019 | 7555 | 11200 | 11983 |
| 06/30/2019 | 7128 | 11545 | 12794 |
| 09/30/2019 | 6493 | 11807 | 13971 |
| 12/31/2019 | 6830 | 11828 | 13290 |
| 03/31/2020 | 5182 | 12200 | 16719 |
| 06/30/2020 | 5190 | 12554 | 16600 |
| 09/30/2020 | 5185 | 12632 | 16467 |
| 12/31/2020 | 5333 | 12716 | 15778 |
| 03/31/2021 | 6271 | 12287 | 13279 |
| 06/30/2021 | 5765 | 12512 | 14319 |
| 09/30/2021 | 5679 | 12518 | 14374 |
| 12/31/2021 | 5349 | 12520 | 15049 |
| 03/31/2022 | 5931 | 11777 | 13333 |
| 06/30/2022 | 6790 | 11224 | 11502 |
| 09/30/2022 | 7527 | 10691 | 10310 |
| 12/31/2022 | 7732 | 10891 | 10039 |
| 03/31/2023 | 7350 | 11214 | 10640 |
| 06/30/2023 | 7639 | 11119 | 10389 |
| 09/30/2023 | 8909 | 10760 | 9067 |
| 12/31/2023 | 8007 | 11493 | 10233 |
| 03/31/2024 | 8493 | 11404 | 9818 |
| 06/30/2024 | 8837 | 11411 | 9599 |
| 09/30/2024 | 8347 | 12004 | 10378 |
| Class C (without CDSC) | -1.73% | -6.32% | 5.15% | -1.79% |
| Class C (with CDSC)§ | -2.70% | -7.24% | 5.15% | -1.79% |
| Bloomberg U.S. Aggregate Bond Index | 5.26% | 11.57% | 0.33% | 1.84% |
| Bloomberg U.S.Treasury Bellwether 30 Yr Index | 5.71% | 14.46% | -5.77% | 0.37% |
The fund's past performance is not a good predictor of the fund's future performance. Visit GuggenheimInvestments.com/mutual-funds/performance for more recent performance information.
| Net Assets | $15,372,722 |
| Total Number of Portfolio Holdings | 11 |
| Portfolio Turnover Rate | 264% |
| Inverse Government Long Bond Strategy Fund | Class C | RYJCX | Semi-Annual Shareholder Report | September 30, 2024 |
| U.S. Treasury Ultra Long Bond Interest Rate Futures Contracts Sold Short | -14.7% |
| U.S Government Securities Sold Short | -85.7% |
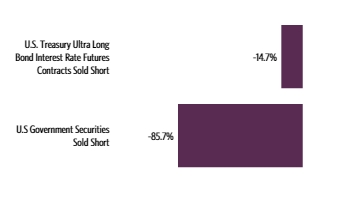
| Guggenheim Strategy Fund II | 22.2% |
| Guggenheim Ultra Short Duration Fund — Institutional Class | 21.3% |
| Total | 43.5% |
| |
1 | "Holdings Diversification (Market Exposure as a % of Net Assets)" excludes any temporary cash investments, investments in Guggenheim Strategy Funds Trust mutual funds, or investments in Guggenheim Ultra Short Duration Fund. |
| |
2 | "Largest Holdings (as a % of Net Assets)" excludes any temporary cash or derivative investments. |
| Guggenheim Strategy Fund II | 22.2% |
| Guggenheim Ultra Short Duration Fund — Institutional Class | 21.3% |
| Total | 43.5% |
| |
2 | "Largest Holdings (as a % of Net Assets)" excludes any temporary cash or derivative investments. |
There were no changes in or disagreements with fund accountants for the period.
| |  | Availability of Additional Information. For additional information, including the fund's prospectus, financial information, holdings and proxy voting information, go to GuggenheimInvestments.com/mutual-funds/literature or, call 800 820 0888. |
SAR-RYJCX-093024
Semi-Annual Shareholder Report | 9.30.24
This semi-annual shareholder report contains important information about the Inverse Government Long Bond Strategy Fund for the period of April 1, 2024 to September 30, 2024. You can find additional information about the fund at GuggenheimInvestments.com/mutual-funds/literature. You can also request this information by contacting 800 820 0888 or GuggenheimClientServices@mufg-is.com.
For the period of April 1, 2024 to September 30, 2024, the fund (Class H shares) returned -1.35%, underperforming the fund's benchmark, the Bloomberg U.S. Aggregate Bond Index, which returned 5.26% for the same period and underperforming the fund's secondary index, the Bellwether 30 Yr Index, which returned 5.71% for the same period.
The fund's broad-based securities market index was changed from the Bloomberg U.S. Treasury 30 Year Bellwether Index to the Bloomberg U.S. Aggregate Bond Index to comply with the regulation that requires the fund's broad-based securities market index to represent the overall applicable market.
What factors materially affected the fund's performance over the last six months?
The Fund underperformed the Bloomberg U.S. Treasury 30 Year Bellwether Index (its ancillary index), and had a negative return as yields of long-term Treasury bond prices fell slightly during the reporting period. Inflation moderated over the period, except for the housing sector, amid steady economic growth, which led the U.S. Federal Reserve (the "Fed") to cut its key lending rate of a half percentage point to a range of 4.75–5.00 percent in late September. The Fed released an updated Summary of Economic Projections ("SEP") report which lays out where committee members anticipate interest rates, economic growth, unemployment, and inflation are headed over the next couple years. According to the so-called "dot plot" within the report, the committee anticipates potentially cutting rates by up to another 150 basis points by the end of next year.
Cumulative performance* for the fund's most recently completed 10 years (as of 9.30.24), assuming a $10,000 initial investment.
| 09/30/2014 | 10000 | 10000 | 10000 |
| 12/31/2014 | 9022 | 10179 | 11006 |
| 03/31/2015 | 8544 | 10343 | 11562 |
| 06/30/2015 | 9485 | 10169 | 10355 |
| 09/30/2015 | 8849 | 10294 | 10883 |
| 12/31/2015 | 8960 | 10235 | 10657 |
| 03/31/2016 | 8162 | 10546 | 11608 |
| 06/30/2016 | 7538 | 10779 | 12449 |
| 09/30/2016 | 7538 | 10829 | 12464 |
| 12/31/2016 | 8711 | 10506 | 10751 |
| 03/31/2017 | 8581 | 10592 | 10891 |
| 06/30/2017 | 8191 | 10745 | 11354 |
| 09/30/2017 | 8164 | 10836 | 11392 |
| 12/31/2017 | 7910 | 10879 | 11733 |
| 03/31/2018 | 8226 | 10720 | 11277 |
| 06/30/2018 | 8211 | 10703 | 11335 |
| 09/30/2018 | 8514 | 10705 | 10964 |
| 12/31/2018 | 8201 | 10880 | 11414 |
| 03/31/2019 | 7839 | 11200 | 11983 |
| 06/30/2019 | 7408 | 11545 | 12794 |
| 09/30/2019 | 6762 | 11807 | 13971 |
| 12/31/2019 | 7122 | 11828 | 13290 |
| 03/31/2020 | 5414 | 12200 | 16719 |
| 06/30/2020 | 5441 | 12554 | 16600 |
| 09/30/2020 | 5449 | 12632 | 16467 |
| 12/31/2020 | 5616 | 12716 | 15778 |
| 03/31/2021 | 6615 | 12287 | 13279 |
| 06/30/2021 | 6093 | 12512 | 14319 |
| 09/30/2021 | 6013 | 12518 | 14374 |
| 12/31/2021 | 5675 | 12520 | 15049 |
| 03/31/2022 | 6304 | 11777 | 13333 |
| 06/30/2022 | 7230 | 11224 | 11502 |
| 09/30/2022 | 8031 | 10691 | 10310 |
| 12/31/2022 | 8266 | 10891 | 10039 |
| 03/31/2023 | 7871 | 11214 | 10640 |
| 06/30/2023 | 8197 | 11119 | 10389 |
| 09/30/2023 | 9578 | 10760 | 9067 |
| 12/31/2023 | 8624 | 11493 | 10233 |
| 03/31/2024 | 9164 | 11404 | 9818 |
| 06/30/2024 | 9554 | 11411 | 9599 |
| 09/30/2024 | 9041 | 12004 | 10378 |
| Class H | -1.35% | -5.61% | 5.98% | -1.00% |
| Bloomberg U.S. Aggregate Bond Index | 5.26% | 11.57% | 0.33% | 1.84% |
| Bloomberg U.S.Treasury Bellwether 30 Yr Index | 5.71% | 14.46% | -5.77% | 0.37% |
The fund's past performance is not a good predictor of the fund's future performance. Visit GuggenheimInvestments.com/mutual-funds/performance for more recent performance information.
| Net Assets | $15,372,722 |
| Total Number of Portfolio Holdings | 11 |
| Portfolio Turnover Rate | 264% |
| Inverse Government Long Bond Strategy Fund | Class H | RYHJX | Semi-Annual Shareholder Report | September 30, 2024 |
| U.S. Treasury Ultra Long Bond Interest Rate Futures Contracts Sold Short | -14.7% |
| U.S Government Securities Sold Short | -85.7% |

| Guggenheim Strategy Fund II | 22.2% |
| Guggenheim Ultra Short Duration Fund — Institutional Class | 21.3% |
| Total | 43.5% |
| |
1 | "Holdings Diversification (Market Exposure as a % of Net Assets)" excludes any temporary cash investments, investments in Guggenheim Strategy Funds Trust mutual funds, or investments in Guggenheim Ultra Short Duration Fund. |
| |
2 | "Largest Holdings (as a % of Net Assets)" excludes any temporary cash or derivative investments. |
| Guggenheim Strategy Fund II | 22.2% |
| Guggenheim Ultra Short Duration Fund — Institutional Class | 21.3% |
| Total | 43.5% |
| |
2 | "Largest Holdings (as a % of Net Assets)" excludes any temporary cash or derivative investments. |
There were no changes in or disagreements with fund accountants for the period.
| |  | Availability of Additional Information. For additional information, including the fund's prospectus, financial information, holdings and proxy voting information, go to GuggenheimInvestments.com/mutual-funds/literature or, call 800 820 0888. |
SAR-RYHJX-093024
Semi-Annual Shareholder Report | 9.30.24
This semi-annual shareholder report contains important information about the High Yield Strategy Fund for the period of April 1, 2024 to September 30, 2024. You can find additional information about the fund at GuggenheimInvestments.com/mutual-funds/literature. You can also request this information by contacting 800 820 0888 or GuggenheimClientServices@mufg-is.com.
For the period of April 1, 2024 to September 30, 2024, the fund (Class A shares) returned 6.66%, outperforming the fund's benchmark, the Bloomberg U.S. Aggregate Bond Index, which returned 5.26% for the same period and outperforming the fund's secondary index, the Bloomberg U.S. Corporate High Yield Index, which returned 6.44% for the same period.
The fund's broad-based securities market index was changed from the Bloomberg U.S. Corporate High Yield Index to the Bloomberg U.S. Aggregate Bond Index to comply with the regulation that requires the fund's broad-based securities market index to represent the overall applicable market.
What factors materially affected the fund's performance over the last six months?
The Fund outperformed the Bloomberg U.S. Corporate High Yield Index (its ancillary index) and maintained a daily correlation of over 94% to its benchmark of 100% of the daily price movement of that Index. Overall, lower financing costs spurred heavy new issuance volume while strong market conditions resulted in tightening credit spreads. The Bloomberg U.S. Corporate High Yield Index generated a strong return for the period. All five of the largest sectors in the index contributed to return, with the Consumer Cyclical sector and the Communications sector contributing the most, and Capital Goods contributing the least. From a ratings perspective, the BB sector contributed the most to the return of the benchmark, followed by the B sector.
Cumulative performance* for the fund's most recently completed 10 years (as of 9.30.24), assuming a $10,000 initial investment.
| 09/30/2014 | 9526 | 10000 | 10000 |
| 12/31/2014 | 9676 | 10179 | 9900 |
| 03/31/2015 | 9909 | 10343 | 10149 |
| 06/30/2015 | 9830 | 10169 | 10150 |
| 09/30/2015 | 9593 | 10294 | 9657 |
| 12/31/2015 | 9671 | 10235 | 9457 |
| 03/31/2016 | 10073 | 10546 | 9775 |
| 06/30/2016 | 10379 | 10779 | 10314 |
| 09/30/2016 | 10658 | 10829 | 10887 |
| 12/31/2016 | 10669 | 10506 | 11077 |
| 03/31/2017 | 10903 | 10592 | 11377 |
| 06/30/2017 | 11048 | 10745 | 11624 |
| 09/30/2017 | 11246 | 10836 | 11853 |
| 12/31/2017 | 11316 | 10879 | 11909 |
| 03/31/2018 | 11129 | 10720 | 11807 |
| 06/30/2018 | 11182 | 10703 | 11928 |
| 09/30/2018 | 11464 | 10705 | 12215 |
| 12/31/2018 | 11211 | 10880 | 11661 |
| 03/31/2019 | 11929 | 11200 | 12507 |
| 06/30/2019 | 12369 | 11545 | |
| 09/30/2019 | 12478 | 11807 | 12991 |
| 12/31/2019 | 12787 | 11828 | 13331 |
| 03/31/2020 | 11241 | 12200 | 11640 |
| 06/30/2020 | 11593 | 12554 | 12824 |
| 09/30/2020 | 12021 | 12632 | 13414 |
| 12/31/2020 | 12757 | 12716 | 14279 |
| 03/31/2021 | 12679 | 12287 | 14400 |
| 06/30/2021 | 12993 | 12512 | 14795 |
| 09/30/2021 | 12962 | 12518 | 14926 |
| 12/31/2021 | 12956 | 12520 | 15032 |
| 03/31/2022 | 12111 | 11777 | 14305 |
| 06/30/2022 | 10948 | 11224 | 12899 |
| 09/30/2022 | 10728 | 10691 | 12816 |
| 12/31/2022 | 11451 | 10891 | 13351 |
| 03/31/2023 | 11882 | 11214 | 13827 |
| 06/30/2023 | 11970 | 11119 | 14068 |
| 09/30/2023 | 11837 | 10760 | 14133 |
| 12/31/2023 | 12920 | 11493 | 15146 |
| 03/31/2024 | 13109 | 11404 | 15369 |
| 06/30/2024 | 13150 | 11411 | 15537 |
| 09/30/2024 | 13981 | 12004 | 16358 |
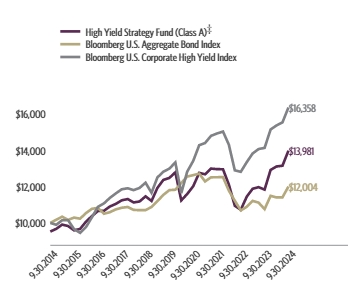
| Class A (without sales charge) | 6.66% | 18.12% | 2.30% | 3.91% |
| Class A (with sales charge)‡ | 1.59% | 12.50% | 1.31% | 3.41% |
| Bloomberg U.S. Aggregate Bond Index | 5.26% | 11.57% | 0.33% | 1.84% |
| Bloomberg U.S. Corporate High Yield Index | 6.44% | 15.74% | 4.72% | 5.04% |
The fund's past performance is not a good predictor of the fund's future performance. Visit GuggenheimInvestments.com/mutual-funds/performance for more recent performance information.
| Net Assets | $61,712,879 |
| Total Number of Portfolio Holdings | 22 |
| Portfolio Turnover Rate | 0% |
| High Yield Strategy Fund | Class A | RYHDX | Semi-Annual Shareholder Report | September 30, 2024 |
| Interest Rate Futures Contracts | 101.2% |
| CDX.NA.HY.43.V1 Index Credit Default Swap Agreements Protection Sold | 91.2% |
| iShares iBoxx $ High Yield Corporate Bond ETF Swap Agreements | 2.3% |
| SPDR Bloomberg High Yield Bond ETF Swap Agreement | 0.3% |
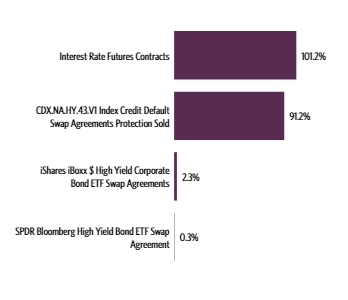
| Guggenheim Strategy Fund III | 3.2% |
| Guggenheim Ultra Short Duration Fund — Institutional Class | 2.2% |
| Guggenheim Strategy Fund II | 2.1% |
| Total | 7.5% |
| |
1 | "Holdings Diversification (Market Exposure as a % of Net Assets)" excludes any temporary cash investments, investments in Guggenheim Strategy Funds Trust mutual funds, or investments in Guggenheim Ultra Short Duration Fund. The Fund's target exposure is achieved through a combination of total return swaps, credit default swaps, and interest rate futures contracts. |
| |
2 | "Largest Holdings (as a % of Net Assets)" excludes any temporary cash or derivative investments. |
| Guggenheim Strategy Fund III | 3.2% |
| Guggenheim Ultra Short Duration Fund — Institutional Class | 2.2% |
| Guggenheim Strategy Fund II | 2.1% |
| Total | 7.5% |
| |
2 | "Largest Holdings (as a % of Net Assets)" excludes any temporary cash or derivative investments. |
There were no changes in or disagreements with fund accountants for the period.
| |  | Availability of Additional Information. For additional information, including the fund's prospectus, financial information, holdings and proxy voting information, go to GuggenheimInvestments.com/mutual-funds/literature or, call 800 820 0888. |
SAR-RYHDX-093024
Semi-Annual Shareholder Report | 9.30.24
This semi-annual shareholder report contains important information about the High Yield Strategy Fund for the period of April 1, 2024 to September 30, 2024. You can find additional information about the fund at GuggenheimInvestments.com/mutual-funds/literature. You can also request this information by contacting 800 820 0888 or GuggenheimClientServices@mufg-is.com.
For the period of April 1, 2024 to September 30, 2024, the fund (Class C shares) returned 6.24%, outperforming the fund's benchmark, the Bloomberg U.S. Aggregate Bond Index, which returned 5.26% for the same period and underperforming the fund's secondary index, the Bloomberg U.S. Corporate High Yield Index, which returned 6.44% for the same period.
The fund's broad-based securities market index was changed from the Bloomberg U.S. Corporate High Yield Index to the Bloomberg U.S. Aggregate Bond Index to comply with the regulation that requires the fund's broad-based securities market index to represent the overall applicable market.
What factors materially affected the fund's performance over the last six months?
The Fund underperformed the Bloomberg U.S. Corporate High Yield Index (its ancillary index) and maintained a daily correlation of over 94% to its benchmark of 100% of the daily price movement of that Index. Overall, lower financing costs spurred heavy new issuance volume while strong market conditions resulted in tightening credit spreads. The Bloomberg U.S. Corporate High Yield Index generated a strong return for the period. All five of the largest sectors in the index contributed to return, with the Consumer Cyclical sector and the Communications sector contributing the most, and Capital Goods contributing the least. From a ratings perspective, the BB sector contributed the most to the return of the benchmark, followed by the B sector.
Cumulative performance* for the fund's most recently completed 10 years (as of 9.30.24), assuming a $10,000 initial investment.
| 09/30/2014 | 10000 | 10000 | 10000 |
| 12/31/2014 | 10146 | 10179 | 9900 |
| 03/31/2015 | 10367 | 10343 | 10149 |
| 06/30/2015 | 10245 | 10169 | 10150 |
| 09/30/2015 | 9976 | 10294 | 9657 |
| 12/31/2015 | 10042 | 10235 | 9457 |
| 03/31/2016 | 10440 | 10546 | 9775 |
| 06/30/2016 | 10734 | 10779 | 10314 |
| 09/30/2016 | 11002 | 10829 | 10887 |
| 12/31/2016 | 10989 | 10506 | 11077 |
| 03/31/2017 | 11210 | 10592 | 11377 |
| 06/30/2017 | 11341 | 10745 | 11624 |
| 09/30/2017 | 11522 | 10836 | 11853 |
| 12/31/2017 | 11576 | 10879 | 11909 |
| 03/31/2018 | 11361 | 10720 | 11807 |
| 06/30/2018 | 11394 | 10703 | 11928 |
| 09/30/2018 | 11669 | 10705 | 12215 |
| 12/31/2018 | 11384 | 10880 | 11661 |
| 03/31/2019 | 12087 | 11200 | 12507 |
| 06/30/2019 | 12517 | 11545 | 12820 |
| 09/30/2019 | 12603 | 11807 | 12991 |
| 12/31/2019 | 12891 | 11828 | 13331 |
| 03/31/2020 | 11308 | 12200 | 11640 |
| 06/30/2020 | 11645 | 12554 | 12824 |
| 09/30/2020 | 12052 | 12632 | 13414 |
| 12/31/2020 | 12766 | 12716 | 14279 |
| 03/31/2021 | 12664 | 12287 | 14400 |
| 06/30/2021 | 12955 | 12512 | 14795 |
| 09/30/2021 | 12900 | 12518 | 14926 |
| 12/31/2021 | 12868 | 12520 | 15032 |
| 03/31/2022 | 12006 | 11777 | 14305 |
| 06/30/2022 | 10833 | 11224 | 12899 |
| 09/30/2022 | 10596 | 10691 | 12816 |
| 12/31/2022 | 11289 | 10891 | 13351 |
| 03/31/2023 | 11691 | 11214 | 13827 |
| 06/30/2023 | 11757 | 11119 | 14068 |
| 09/30/2023 | 11604 | 10760 | 14133 |
| 12/31/2023 | 12643 | 11493 | 15146 |
| 03/31/2024 | 12803 | 11404 | 15369 |
| 06/30/2024 | 12819 | 11411 | 15537 |
| 09/30/2024 | 13603 | 12004 | 16358 |
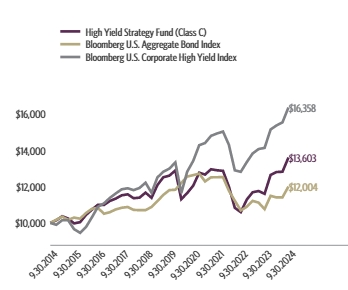
| Class C (without CDSC) | 6.24% | 17.23% | 1.54% | 3.13% |
| Class C (with CDSC)§ | 5.24% | 16.23% | 1.54% | 3.13% |
| Bloomberg U.S. Aggregate Bond Index | 5.26% | 11.57% | 0.33% | 1.84% |
| Bloomberg U.S. Corporate High Yield Index | 6.44% | 15.74% | 4.72% | 5.04% |
The fund's past performance is not a good predictor of the fund's future performance. Visit GuggenheimInvestments.com/mutual-funds/performance for more recent performance information.
| Net Assets | $61,712,879 |
| Total Number of Portfolio Holdings | 22 |
| Portfolio Turnover Rate | 0% |
| High Yield Strategy Fund | Class C | RYHHX | Semi-Annual Shareholder Report | September 30, 2024 |
| Interest Rate Futures Contracts | 101.2% |
| CDX.NA.HY.43.V1 Index Credit Default Swap Agreements Protection Sold | 91.2% |
| iShares iBoxx $ High Yield Corporate Bond ETF Swap Agreements | 2.3% |
| SPDR Bloomberg High Yield Bond ETF Swap Agreement | 0.3% |

| Guggenheim Strategy Fund III | 3.2% |
| Guggenheim Ultra Short Duration Fund — Institutional Class | 2.2% |
| Guggenheim Strategy Fund II | 2.1% |
| Total | 7.5% |
| |
1 | "Holdings Diversification (Market Exposure as a % of Net Assets)" excludes any temporary cash investments, investments in Guggenheim Strategy Funds Trust mutual funds, or investments in Guggenheim Ultra Short Duration Fund. The Fund's target exposure is achieved through a combination of total return swaps, credit default swaps, and interest rate futures contracts. |
| |
2 | "Largest Holdings (as a % of Net Assets)" excludes any temporary cash or derivative investments. |
| Guggenheim Strategy Fund III | 3.2% |
| Guggenheim Ultra Short Duration Fund — Institutional Class | 2.2% |
| Guggenheim Strategy Fund II | 2.1% |
| Total | 7.5% |
| |
2 | "Largest Holdings (as a % of Net Assets)" excludes any temporary cash or derivative investments. |
There were no changes in or disagreements with fund accountants for the period.
| |  | Availability of Additional Information. For additional information, including the fund's prospectus, financial information, holdings and proxy voting information, go to GuggenheimInvestments.com/mutual-funds/literature or, call 800 820 0888. |
SAR-RYHHX-093024
Semi-Annual Shareholder Report | 9.30.24
This semi-annual shareholder report contains important information about the High Yield Strategy Fund for the period of April 1, 2024 to September 30, 2024. You can find additional information about the fund at GuggenheimInvestments.com/mutual-funds/literature. You can also request this information by contacting 800 820 0888 or GuggenheimClientServices@mufg-is.com.
For the period of April 1, 2024 to September 30, 2024, the fund (Class H shares) returned 6.66%, outperforming the fund's benchmark, the Bloomberg U.S. Aggregate Bond Index, which returned 5.26% for the same period and outperforming the fund's secondary index, the Bloomberg U.S. Corporate High Yield Index, which returned 6.44% for the same period.
The fund's broad-based securities market index was changed from the Bloomberg U.S. Corporate High Yield Index to the Bloomberg U.S. Aggregate Bond Index to comply with the regulation that requires the fund's broad-based securities market index to represent the overall applicable market.
What factors materially affected the fund's performance over the last six months?
The Fund outperformed the Bloomberg U.S. Corporate High Yield Index (its ancillary index) and maintained a daily correlation of over 94% to its benchmark of 100% of the daily price movement of that Index. Overall, lower financing costs spurred heavy new issuance volume while strong market conditions resulted in tightening credit spreads. The Bloomberg U.S. Corporate High Yield Index generated a strong return for the period. All five of the largest sectors in the index contributed to return, with the Consumer Cyclical sector and the Communications sector contributing the most, and Capital Goods contributing the least. From a ratings perspective, the BB sector contributed the most to the return of the benchmark, followed by the B sector.
Cumulative performance* for the fund's most recently completed 10 years (as of 9.30.24), assuming a $10,000 initial investment.
| 09/30/2014 | 10000 | 10000 | 10000 |
| 12/31/2014 | 10165 | 10179 | 9900 |
| 03/31/2015 | 10405 | 10343 | 10149 |
| 06/30/2015 | 10309 | 10169 | 10150 |
| 09/30/2015 | 10057 | 10294 | 9657 |
| 12/31/2015 | 10139 | 10235 | 9457 |
| 03/31/2016 | 10546 | 10546 | 9775 |
| 06/30/2016 | 10862 | 10779 | 10314 |
| 09/30/2016 | 11154 | 10829 | 10887 |
| 12/31/2016 | 11161 | 10506 | 11077 |
| 03/31/2017 | 11406 | 10592 | 11377 |
| 06/30/2017 | 11563 | 10745 | 11624 |
| 09/30/2017 | 11766 | 10836 | 11853 |
| 12/31/2017 | 11843 | 10879 | 11909 |
| 03/31/2018 | 11643 | 10720 | 11807 |
| 06/30/2018 | 11703 | 10703 | 11928 |
| 09/30/2018 | 12009 | 10705 | 12215 |
| 12/31/2018 | 11728 | 10880 | 11661 |
| 03/31/2019 | 12475 | 11200 | 12507 |
| 06/30/2019 | 12942 | 11545 | 12820 |
| 09/30/2019 | 13056 | 11807 | 12991 |
| 12/31/2019 | 13380 | 11828 | 13331 |
| 03/31/2020 | 11760 | 12200 | 11640 |
| 06/30/2020 | 12139 | 12554 | 12824 |
| 09/30/2020 | 12585 | 12632 | 13414 |
| 12/31/2020 | 13356 | 12716 | 14279 |
| 03/31/2021 | 13273 | 12287 | 14400 |
| 06/30/2021 | 13602 | 12512 | 14795 |
| 09/30/2021 | 13569 | 12518 | 14926 |
| 12/31/2021 | 13564 | 12520 | 15032 |
| 03/31/2022 | 12679 | 11777 | 14305 |
| 06/30/2022 | 11462 | 11224 | 12899 |
| 09/30/2022 | 11233 | 10691 | 12816 |
| 12/31/2022 | 11990 | 10891 | 13351 |
| 03/31/2023 | 12441 | 11214 | 13827 |
| 06/30/2023 | 12532 | 11119 | 14068 |
| 09/30/2023 | 12394 | 10760 | 14133 |
| 12/31/2023 | 13528 | 11493 | 15146 |
| 03/31/2024 | 13725 | 11404 | 15369 |
| 06/30/2024 | 13769 | 11411 | 15537 |
| 09/30/2024 | 14638 | 12004 | 16358 |
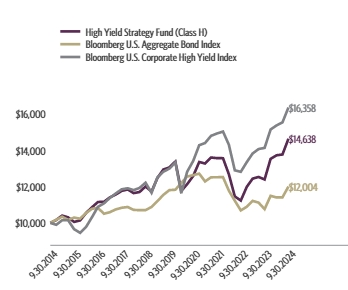
| Class H | 6.66% | 18.11% | 2.31% | 3.88% |
| Bloomberg U.S. Aggregate Bond Index | 5.26% | 11.57% | 0.33% | 1.84% |
| Bloomberg U.S. Corporate High Yield Index | 6.44% | 15.74% | 4.72% | 5.04% |
The fund's past performance is not a good predictor of the fund's future performance. Visit GuggenheimInvestments.com/mutual-funds/performance for more recent performance information.
| Net Assets | $61,712,879 |
| Total Number of Portfolio Holdings | 22 |
| Portfolio Turnover Rate | 0% |
| High Yield Strategy Fund | Class H | RYHGX | Semi-Annual Shareholder Report | September 30, 2024 |
| Interest Rate Futures Contracts | 101.2% |
| CDX.NA.HY.43.V1 Index Credit Default Swap Agreements Protection Sold | 91.2% |
| iShares iBoxx $ High Yield Corporate Bond ETF Swap Agreements | 2.3% |
| SPDR Bloomberg High Yield Bond ETF Swap Agreement | 0.3% |

| Guggenheim Strategy Fund III | 3.2% |
| Guggenheim Ultra Short Duration Fund — Institutional Class | 2.2% |
| Guggenheim Strategy Fund II | 2.1% |
| Total | 7.5% |
| |
1 | "Holdings Diversification (Market Exposure as a % of Net Assets)" excludes any temporary cash investments, investments in Guggenheim Strategy Funds Trust mutual funds, or investments in Guggenheim Ultra Short Duration Fund. The Fund's target exposure is achieved through a combination of total return swaps, credit default swaps, and interest rate futures contracts. |
| |
2 | "Largest Holdings (as a % of Net Assets)" excludes any temporary cash or derivative investments. |
| Guggenheim Strategy Fund III | 3.2% |
| Guggenheim Ultra Short Duration Fund — Institutional Class | 2.2% |
| Guggenheim Strategy Fund II | 2.1% |
| Total | 7.5% |
| |
2 | "Largest Holdings (as a % of Net Assets)" excludes any temporary cash or derivative investments. |
There were no changes in or disagreements with fund accountants for the period.
| |  | Availability of Additional Information. For additional information, including the fund's prospectus, financial information, holdings and proxy voting information, go to GuggenheimInvestments.com/mutual-funds/literature or, call 800 820 0888. |
SAR-RYHGX-093024
Semi-Annual Shareholder Report | 9.30.24
This semi-annual shareholder report contains important information about the Inverse High Yield Strategy Fund for the period of April 1, 2024 to September 30, 2024. You can find additional information about the fund at GuggenheimInvestments.com/mutual-funds/literature. You can also request this information by contacting 800 820 0888 or GuggenheimClientServices@mufg-is.com.
For the period of April 1, 2024 to September 30, 2024, the fund (Class A shares) returned -2.62%, underperforming the fund's benchmark, the Bloomberg U.S. Aggregate Bond Index, which returned 5.26% for the same period and underperforming the fund's secondary index, the Bloomberg U.S. Corporate High Yield Index, which returned 6.44% for the same period.
The fund's broad-based securities market index was changed from the Bloomberg U.S. Corporate High Yield Index to the Bloomberg U.S. Aggregate Bond Index to comply with the regulation that requires the fund's broad-based securities market index to represent the overall applicable market.
What factors materially affected the fund's performance over the last six months?
The Fund underperformed the Bloomberg U.S. Corporate High Yield Index (its ancillary index) and maintained a daily correlation of over 94% to its benchmark of -100% of the daily price movement of that Index. Overall, lower financing costs spurred heavy new issuance volume while strong market conditions resulted in tightening credit spreads. The Bloomberg U.S. Corporate High Yield Index generated a strong return for the period. All five of the largest sectors in the index contributed to return, with the Consumer Cyclical sector and the Communications sector contributing the most, and Capital Goods contributing the least. From a ratings perspective, the BB sector contributed the most to the return of the benchmark, followed by the B sector.
Cumulative performance* for the fund's most recently completed 10 years (as of 9.30.24), assuming a $10,000 initial investment.
| 09/30/2014 | 9524 | 10000 | 10000 |
| 12/31/2014 | 9099 | 10179 | 9900 |
| 03/31/2015 | 8797 | 10343 | 10149 |
| 06/30/2015 | 8824 | 10169 | 10150 |
| 09/30/2015 | 8843 | 10294 | 9657 |
| 12/31/2015 | 8678 | 10235 | 9457 |
| 03/31/2016 | 8198 | 10546 | 9775 |
| 06/30/2016 | 7946 | 10779 | 10314 |
| 09/30/2016 | 7754 | 10829 | 10887 |
| 12/31/2016 | 7691 | 10506 | 11077 |
| 03/31/2017 | 7521 | 10592 | 11377 |
| 06/30/2017 | 7412 | 10745 | 11624 |
| 09/30/2017 | 7293 | 10836 | 11853 |
| 12/31/2017 | 7239 | 10879 | 11909 |
| 03/31/2018 | 7350 | 10720 | 11807 |
| 06/30/2018 | 7328 | 10703 | 11928 |
| 09/30/2018 | 7166 | 10705 | 12215 |
| 12/31/2018 | 7311 | 10880 | 11661 |
| 03/31/2019 | 6916 | 11200 | 12507 |
| 06/30/2019 | 6688 | 11545 | 12820 |
| 09/30/2019 | 6647 | 11807 | 12991 |
| 12/31/2019 | 6499 | 11828 | 13331 |
| 03/31/2020 | 7092 | 12200 | 11640 |
| 06/30/2020 | 6791 | 12554 | 12824 |
| 09/30/2020 | 6535 | 12632 | 13414 |
| 12/31/2020 | 6116 | 12716 | 14279 |
| 03/31/2021 | 6178 | 12287 | 14400 |
| 06/30/2021 | 5994 | 12512 | 14795 |
| 09/30/2021 | 5962 | 12518 | 14926 |
| 12/31/2021 | 5897 | 12520 | 15032 |
| 03/31/2022 | 6207 | 11777 | 14305 |
| 06/30/2022 | 6733 | 11224 | 12899 |
| 09/30/2022 | 6822 | 10691 | 12816 |
| 12/31/2022 | 6410 | 10891 | 13351 |
| 03/31/2023 | 6284 | 11214 | 13827 |
| 06/30/2023 | 6340 | 11119 | 14068 |
| 09/30/2023 | 6525 | 10760 | 14133 |
| 12/31/2023 | 6090 | 11493 | 15146 |
| 03/31/2024 | 6118 | 11404 | 15369 |
| 06/30/2024 | 6214 | 11411 | 15537 |
| 09/30/2024 | 5959 | 12004 | 16358 |
| Class A (without sales charge) | -2.62% | -8.68% | -2.16% | -4.58% |
| Class A (with sales charge)‡ | -7.25% | -13.02% | -3.11% | -5.05% |
| Bloomberg U.S. Aggregate Bond Index | 5.26% | 11.57% | 0.33% | 1.84% |
| Bloomberg U.S. Corporate High Yield Index | 6.44% | 15.74% | 4.72% | 5.04% |
The fund's past performance is not a good predictor of the fund's future performance. Visit GuggenheimInvestments.com/mutual-funds/performance for more recent performance information.
| Net Assets | $5,553,220 |
| Total Number of Portfolio Holdings | 8 |
| Portfolio Turnover Rate | 0% |
| Inverse High Yield Strategy Fund | Class A | RYILX | Semi-Annual Shareholder Report | September 30, 2024 |
| CDX.NA.HY.43.V1 Credit Default Swap Agreements Protection Purchased | -94.5% |
| Interest Rate Futures Contracts Short Sales | -103.0% |

| Guggenheim Strategy Fund II | 13.1% |
| Guggenheim Ultra Short Duration Fund — Institutional Class | 6.8% |
| Total | 19.9% |
| |
1 | "Holdings Diversification (Market Exposure as a % of Net Assets)" excludes any temporary cash investments, investments in Guggenheim Strategy Funds Trust mutual funds, or investments in Guggenheim Ultra Short Duration Fund. The Fund's target exposure is achieved through a combination of credit default swaps and interest rate futures contracts. |
| |
2 | "Largest Holdings (as a % of Net Assets)" excludes any temporary cash or derivative investments. |
| Guggenheim Strategy Fund II | 13.1% |
| Guggenheim Ultra Short Duration Fund — Institutional Class | 6.8% |
| Total | 19.9% |
| |
2 | "Largest Holdings (as a % of Net Assets)" excludes any temporary cash or derivative investments. |
There were no changes in or disagreements with fund accountants for the period.
| |  | Availability of Additional Information. For additional information, including the fund's prospectus, financial information, holdings and proxy voting information, go to GuggenheimInvestments.com/mutual-funds/literature or, call 800 820 0888. |
SAR-RYILX-093024
Semi-Annual Shareholder Report | 9.30.24
This semi-annual shareholder report contains important information about the Inverse High Yield Strategy Fund for the period of April 1, 2024 to September 30, 2024. You can find additional information about the fund at GuggenheimInvestments.com/mutual-funds/literature. You can also request this information by contacting 800 820 0888 or GuggenheimClientServices@mufg-is.com.
For the period of April 1, 2024 to September 30, 2024, the fund (Class C shares) returned -2.96%, underperforming the fund's benchmark, the Bloomberg U.S. Aggregate Bond Index, which returned 5.26% for the same period and underperforming the fund's secondary index, the Bloomberg U.S. Corporate High Yield Index, which returned 6.44% for the same period.
The fund's broad-based securities market index was changed from the Bloomberg U.S. Corporate High Yield Index to the Bloomberg U.S. Aggregate Bond Index to comply with the regulation that requires the fund's broad-based securities market index to represent the overall applicable market.
What factors materially affected the fund's performance over the last six months?
The Fund underperformed the Bloomberg U.S. Corporate High Yield Index (its ancillary index) and maintained a daily correlation of over 94% to its benchmark of -100% of the daily price movement of that Index. Overall, lower financing costs spurred heavy new issuance volume while strong market conditions resulted in tightening credit spreads. The Bloomberg U.S. Corporate High Yield Index generated a strong return for the period. All five of the largest sectors in the index contributed to return, with the Consumer Cyclical sector and the Communications sector contributing the most, and Capital Goods contributing the least. From a ratings perspective, the BB sector contributed the most to the return of the benchmark, followed by the B sector.
Cumulative performance* for the fund's most recently completed 10 years (as of 9.30.24), assuming a $10,000 initial investment.
| 09/30/2014 | 10000 | 10000 | 10000 |
| 12/31/2014 | 9574 | 10179 | 9900 |
| 03/31/2015 | 9285 | 10343 | 10149 |
| 06/30/2015 | 9295 | 10169 | 10150 |
| 09/30/2015 | 9295 | 10294 | 9657 |
| 12/31/2015 | 9102 | 10235 | 9457 |
| 03/31/2016 | 8580 | 10546 | 9775 |
| 06/30/2016 | 8301 | 10779 | 10314 |
| 09/30/2016 | 8078 | 10829 | 10887 |
| 12/31/2016 | 8003 | 10506 | 11077 |
| 03/31/2017 | 7811 | 10592 | 11377 |
| 06/30/2017 | 7677 | 10745 | 11624 |
| 09/30/2017 | 7541 | 10836 | 11853 |
| 12/31/2017 | 7471 | 10879 | 11909 |
| 03/31/2018 | 7571 | 10720 | 11807 |
| 06/30/2018 | 7534 | 10703 | 11928 |
| 09/30/2018 | 7354 | 10705 | 12215 |
| 12/31/2018 | 7487 | 10880 | 11661 |
| 03/31/2019 | 7069 | 11200 | 12507 |
| 06/30/2019 | 6812 | 11545 | 12820 |
| 09/30/2019 | 6752 | 11807 | 12991 |
| 12/31/2019 | 6590 | 11828 | 13331 |
| 03/31/2020 | 7178 | 12200 | 11640 |
| 06/30/2020 | 6861 | 12554 | 12824 |
| 09/30/2020 | 6591 | 12632 | 13414 |
| 12/31/2020 | 6157 | 12716 | 14279 |
| 03/31/2021 | 6157 | 12287 | 14400 |
| 06/30/2021 | 5969 | 12512 | 14795 |
| 09/30/2021 | 5925 | 12518 | 14926 |
| 12/31/2021 | 5875 | 12520 | 15032 |
| 03/31/2022 | 6184 | 11777 | 14305 |
| 06/30/2022 | 6699 | 11224 | 12899 |
| 09/30/2022 | 6774 | 10691 | 12816 |
| 12/31/2022 | 6356 | 10891 | 13351 |
| 03/31/2023 | 6218 | 11214 | 13827 |
| 06/30/2023 | 6262 | 11119 | 14068 |
| 09/30/2023 | 6433 | 10760 | 14133 |
| 12/31/2023 | 5992 | 11493 | 15146 |
| 03/31/2024 | 6009 | 11404 | 15369 |
| 06/30/2024 | 6093 | 11411 | 15537 |
| 09/30/2024 | 5831 | 12004 | 16358 |
| Class C (without CDSC) | -2.96% | -9.36% | -2.89% | -5.25% |
| Class C (with CDSC)§ | -3.94% | -10.27% | -2.89% | -5.25% |
| Bloomberg U.S. Aggregate Bond Index | 5.26% | 11.57% | 0.33% | 1.84% |
| Bloomberg U.S. Corporate High Yield Index | 6.44% | 15.74% | 4.72% | 5.04% |
The fund's past performance is not a good predictor of the fund's future performance. Visit GuggenheimInvestments.com/mutual-funds/performance for more recent performance information.
| Net Assets | $5,553,220 |
| Total Number of Portfolio Holdings | 8 |
| Portfolio Turnover Rate | 0% |
| Inverse High Yield Strategy Fund | Class C | RYIYX | Semi-Annual Shareholder Report | September 30, 2024 |
| CDX.NA.HY.43.V1 Credit Default Swap Agreements Protection Purchased | -94.5% |
| Interest Rate Futures Contracts Short Sales | -103.0% |

| Guggenheim Strategy Fund II | 13.1% |
| Guggenheim Ultra Short Duration Fund — Institutional Class | 6.8% |
| Total | 19.9% |
| |
1 | "Holdings Diversification (Market Exposure as a % of Net Assets)" excludes any temporary cash investments, investments in Guggenheim Strategy Funds Trust mutual funds, or investments in Guggenheim Ultra Short Duration Fund. The Fund's target exposure is achieved through a combination of credit default swaps and interest rate futures contracts. |
| |
2 | "Largest Holdings (as a % of Net Assets)" excludes any temporary cash or derivative investments. |
| Guggenheim Strategy Fund II | 13.1% |
| Guggenheim Ultra Short Duration Fund — Institutional Class | 6.8% |
| Total | 19.9% |
| |
2 | "Largest Holdings (as a % of Net Assets)" excludes any temporary cash or derivative investments. |
There were no changes in or disagreements with fund accountants for the period.
| |  | Availability of Additional Information. For additional information, including the fund's prospectus, financial information, holdings and proxy voting information, go to GuggenheimInvestments.com/mutual-funds/literature or, call 800 820 0888. |
SAR-RYIYX-093024
Semi-Annual Shareholder Report | 9.30.24
This semi-annual shareholder report contains important information about the Inverse High Yield Strategy Fund for the period of April 1, 2024 to September 30, 2024. You can find additional information about the fund at GuggenheimInvestments.com/mutual-funds/literature. You can also request this information by contacting 800 820 0888 or GuggenheimClientServices@mufg-is.com.
For the period of April 1, 2024 to September 30, 2024, the fund (Class H shares) returned -2.59%, underperforming the fund's benchmark, the Bloomberg U.S. Aggregate Bond Index, which returned 5.26% for the same period and underperforming the fund's secondary index, the Bloomberg U.S. Corporate High Yield Index, which returned 6.44% for the same period.
The fund's broad-based securities market index was changed from the Bloomberg U.S. Corporate High Yield Index to the Bloomberg U.S. Aggregate Bond Index to comply with the regulation that requires the fund's broad-based securities market index to represent the overall applicable market.
What factors materially affected the fund's performance over the last six months?
The Fund underperformed the Bloomberg U.S. Corporate High Yield Index (its ancillary index) and maintained a daily correlation of over 94% to its benchmark of -100% of the daily price movement of that Index. Overall, lower financing costs spurred heavy new issuance volume while strong market conditions resulted in tightening credit spreads. The Bloomberg U.S. Corporate High Yield Index generated a strong return for the period. All five of the largest sectors in the index contributed to return, with the Consumer Cyclical sector and the Communications sector contributing the most, and Capital Goods contributing the least. From a ratings perspective, the BB sector contributed the most to the return of the benchmark, followed by the B sector.
Cumulative performance* for the fund's most recently completed 10 years (as of 9.30.24), assuming a $10,000 initial investment.
| 09/30/2014 | 10000 | 10000 | 10000 |
| 12/31/2014 | 9589 | 10179 | 9900 |
| 03/31/2015 | 9316 | 10343 | 10149 |
| 06/30/2015 | 9354 | 10169 | 10150 |
| 09/30/2015 | 9369 | 10294 | 9657 |
| 12/31/2015 | 9187 | 10235 | 9457 |
| 03/31/2016 | 8694 | 10546 | 9775 |
| 06/30/2016 | 8431 | 10779 | 10314 |
| 09/30/2016 | 8278 | 10829 | 10887 |
| 12/31/2016 | 8223 | 10506 | 11077 |
| 03/31/2017 | 8094 | 10592 | 11377 |
| 06/30/2017 | 7966 | 10745 | 11624 |
| 09/30/2017 | 7818 | 10836 | 11853 |
| 12/31/2017 | 7761 | 10879 | 11909 |
| 03/31/2018 | 7877 | 10720 | 11807 |
| 06/30/2018 | 7853 | 10703 | 11928 |
| 09/30/2018 | 7678 | 10705 | 12215 |
| 12/31/2018 | 7834 | 10880 | 11661 |
| 03/31/2019 | 7409 | 11200 | 12507 |
| 06/30/2019 | 7153 | 11545 | 12820 |
| 09/30/2019 | 7101 | 11807 | 12991 |
| 12/31/2019 | 6949 | 11828 | 13331 |
| 03/31/2020 | 7586 | 12200 | 11640 |
| 06/30/2020 | 7264 | 12554 | 12824 |
| 09/30/2020 | 6993 | 12632 | 13414 |
| 12/31/2020 | 6536 | 12716 | 14279 |
| 03/31/2021 | 6556 | 12287 | 14400 |
| 06/30/2021 | 6364 | 12512 | 14795 |
| 09/30/2021 | 6334 | 12518 | 14926 |
| 12/31/2021 | 6293 | 12520 | 15032 |
| 03/31/2022 | 6639 | 11777 | 14305 |
| 06/30/2022 | 7206 | 11224 | 12899 |
| 09/30/2022 | 7301 | 10691 | 12816 |
| 12/31/2022 | 6861 | 10891 | 13351 |
| 03/31/2023 | 6727 | 11214 | 13827 |
| 06/30/2023 | 6786 | 11119 | 14068 |
| 09/30/2023 | 6985 | 10760 | 14133 |
| 12/31/2023 | 6518 | 11493 | 15146 |
| 03/31/2024 | 6548 | 11404 | 15369 |
| 06/30/2024 | 6652 | 11411 | 15537 |
| 09/30/2024 | 6378 | 12004 | 16358 |
| Class H | -2.59% | -8.69% | -2.12% | -4.40% |
| Bloomberg U.S. Aggregate Bond Index | 5.26% | 11.57% | 0.33% | 1.84% |
| Bloomberg U.S. Corporate High Yield Index | 6.44% | 15.74% | 4.72% | 5.04% |
The fund's past performance is not a good predictor of the fund's future performance. Visit GuggenheimInvestments.com/mutual-funds/performance for more recent performance information.
| Net Assets | $5,553,220 |
| Total Number of Portfolio Holdings | 8 |
| Portfolio Turnover Rate | 0% |
| Inverse High Yield Strategy Fund | Class H | RYIHX | Semi-Annual Shareholder Report | September 30, 2024 |
| CDX.NA.HY.43.V1 Credit Default Swap Agreements Protection Purchased | -94.5% |
| Interest Rate Futures Contracts Short Sales | -103.0% |
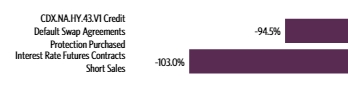
| Guggenheim Strategy Fund II | 13.1% |
| Guggenheim Ultra Short Duration Fund — Institutional Class | 6.8% |
| Total | 19.9% |
| |
1 | "Holdings Diversification (Market Exposure as a % of Net Assets)" excludes any temporary cash investments, investments in Guggenheim Strategy Funds Trust mutual funds, or investments in Guggenheim Ultra Short Duration Fund. The Fund's target exposure is achieved through a combination of credit default swaps and interest rate futures contracts. |
| |
2 | "Largest Holdings (as a % of Net Assets)" excludes any temporary cash or derivative investments. |
| Guggenheim Strategy Fund II | 13.1% |
| Guggenheim Ultra Short Duration Fund — Institutional Class | 6.8% |
| Total | 19.9% |
| |
2 | "Largest Holdings (as a % of Net Assets)" excludes any temporary cash or derivative investments. |
There were no changes in or disagreements with fund accountants for the period.
| |  | Availability of Additional Information. For additional information, including the fund's prospectus, financial information, holdings and proxy voting information, go to GuggenheimInvestments.com/mutual-funds/literature or, call 800 820 0888. |
SAR-RYIHX-093024
Semi-Annual Shareholder Report | 9.30.24
This semi-annual shareholder report contains important information about the Emerging Markets 2x Strategy Fund for the period of April 1, 2024 to September 30, 2024. You can find additional information about the fund at GuggenheimInvestments.com/mutual-funds/literature. You can also request this information by contacting 800 820 0888 or GuggenheimClientServices@mufg-is.com.
For the period of April 1, 2024 to September 30, 2024, the fund (Class A shares) returned 26.43%, outperforming the fund's benchmark, the MSCI World ex US Index, which returned 5.53% for the same period and outperforming the fund's secondary index, the S&P Emerging 50 ADR Index, which returned 16.45% for the same period.
The fund's broad-based securities market index was changed from the S&P Emerging 50 ADR Index to the MSCI World ex US Index to comply with the regulation that requires the fund's broad-based securities market index to represent the overall applicable market.
What factors materially affected the fund's performance over the last six months?
The industries that contributed the most to the return of the S&P Emerging 50 ADR Index (the "Index") were broadline retail, semiconductors & semiconductor equipment, and banks. Those that detracted were beverages, construction materials, and metals and mining. The holdings that contributed the most to the return of the Index were Taiwan Semiconductor Manufacturing Co. Ltd. ADR, Alibaba Group Holding Ltd ADR, and PDD Holdings, Inc. ADR – Class A. Those that detracted the most were Fomento Economico Mexicano SAB de CV ADR – Class B, Cemex SAB de CV ADR, and Li Auto, Inc. ADR – Class A. The Fund maintained a daily correlation of over 99% to its benchmark of 200% of the daily price movement of the S&P Emerging 50 ADR Index.
Cumulative performance* for the fund's most recently completed 10 years (as of 9.30.24), assuming a $10,000 initial investment.
| 09/30/2014 | 9525 | 10000 | 10000 |
| 12/31/2014 | 7953 | 9600 | 9195 |
| 03/31/2015 | 7554 | 9904 | 9013 |
| 06/30/2015 | 7537 | 9858 | 9100 |
| 09/30/2015 | 4775 | 8766 | 7352 |
| 12/31/2015 | 5149 | 9077 | 7718 |
| 03/31/2016 | 5678 | 8834 | 8214 |
| 06/30/2016 | 5732 | 8641 | 8335 |
| 09/30/2016 | 7042 | 9131 | 9318 |
| 12/31/2016 | 6040 | 9066 | 8686 |
| 03/31/2017 | 7731 | 9615 | 9885 |
| 06/30/2017 | 8423 | 10056 | 10393 |
| 09/30/2017 | 10173 | 10563 | 11492 |
| 12/31/2017 | 10553 | 10972 | 11769 |
| 03/31/2018 | 11054 | 10660 | 12197 |
| 06/30/2018 | 9246 | 10483 | 11272 |
| 09/30/2018 | 9152 | 10559 | 11321 |
| 12/31/2018 | 7091 | 9173 | 10137 |
| 03/31/2019 | 9003 | 10048 | 11539 |
| 06/30/2019 | 8431 | 10315 | 11274 |
| 09/30/2019 | 7772 | 10153 | 10954 |
| 12/31/2019 | 10518 | 10913 | 12715 |
| 03/31/2020 | 5647 | 8309 | 9599 |
| 06/30/2020 | 7728 | 9525 | 11399 |
| 09/30/2020 | 10625 | 9936 | 13555 |
| 12/31/2020 | 15273 | 11478 | 16350 |
| 03/31/2021 | 14833 | 11868 | 16358 |
| 06/30/2021 | 15680 | 12446 | 16954 |
| 09/30/2021 | 10637 | 12293 | 14132 |
| 12/31/2021 | 9711 | 12640 | 13638 |
| 03/31/2022 | 8705 | 11946 | 13165 |
| 06/30/2022 | 6704 | 10098 | 11786 |
| 09/30/2022 | 5296 | 9104 | 10633 |
| 12/31/2022 | 6034 | 10543 | 11600 |
| 03/31/2023 | 6934 | 11304 | 12658 |
| 06/30/2023 | 6669 | 11529 | 12602 |
| 09/30/2023 | 6137 | 10986 | 12279 |
| 12/31/2023 | 7336 | 12100 | 13598 |
| 03/31/2024 | 7345 | 12678 | 13799 |
| 06/30/2024 | 7855 | 12486 | 14484 |
| 09/30/2024 | 9289 | 13379 | 16068 |
| Class A (without sales charge) | 26.43% | 51.36% | 3.63% | -0.25% |
| Class A (with sales charge)‡ | 20.42% | 44.17% | 2.63% | -0.73% |
| MSCI World ex US Index | 5.53% | 21.78% | 5.67% | 2.95% |
| S&P Emerging 50 ADR Index | 16.45% | 30.86% | 7.96% | 4.86% |
The fund's past performance is not a good predictor of the fund's future performance. Visit GuggenheimInvestments.com/mutual-funds/performance for more recent performance information.
| Net Assets | $3,069,904 |
| Total Number of Portfolio Holdings | 55 |
| Portfolio Turnover Rate | 469% |
| Emerging Markets 2x Strategy Fund | Class A | RYWTX | Semi-Annual Shareholder Report | September 30, 2024 |
| S&P Emerging 50 ADR Index Swap Agreements | 156.2% |
| Communications | 13.9% |
| Technology | 12.7% |
| Financial | 7.7% |
| Basic Materials | 3.0% |
| Consumer, Non-cyclical | 2.0% |
| Energy | 1.7% |
| Other | 3.3% |

| United States | 55.9% |
| Taiwan, Province of China | 9.7% |
| Cayman Islands | 9.1% |
| India | 7.7% |
| China | 6.7% |
| Brazil | 5.6% |
| Republic of Korea | 2.2% |
| Other | 3.1% |
| Total Investments | 100.0% |
| Taiwan Semiconductor Manufacturing Company Ltd. ADR | 8.2% |
| Alibaba Group Holding Ltd. ADR | 5.8% |
| HDFC Bank Ltd. ADR | 3.2% |
| PDD Holdings, Inc. ADR – Class A | 2.6% |
| Infosys Ltd. ADR | 2.2% |
| ICICI Bank Ltd. ADR | 1.8% |
| JD.com, Inc. ADR | 1.7% |
| Vale S.A. ADR | 1.3% |
| Trip.com Group Ltd. ADR | 1.0% |
| NetEase, Inc. ADR | 1.0% |
| Top 10 Total | 28.8% |
| |
1 | "Holdings Diversification (Market Exposure as a % of Net Assets)" excludes any temporary cash investments, investments in Guggenheim Strategy Funds Trust mutual funds, or investments in Guggenheim Ultra Short Duration Fund. |
| |
2 | "10 Largest Holdings (as a % of Net Assets)" excludes any temporary cash or derivative investments. |
3 | Country Diversification (% of Total Investments) includes temporary cash investments. |
| Taiwan Semiconductor Manufacturing Company Ltd. ADR | 8.2% |
| Alibaba Group Holding Ltd. ADR | 5.8% |
| HDFC Bank Ltd. ADR | 3.2% |
| PDD Holdings, Inc. ADR – Class A | 2.6% |
| Infosys Ltd. ADR | 2.2% |
| ICICI Bank Ltd. ADR | 1.8% |
| JD.com, Inc. ADR | 1.7% |
| Vale S.A. ADR | 1.3% |
| Trip.com Group Ltd. ADR | 1.0% |
| NetEase, Inc. ADR | 1.0% |
| Top 10 Total | 28.8% |
| |
2 | "10 Largest Holdings (as a % of Net Assets)" excludes any temporary cash or derivative investments. |
3 | Country Diversification (% of Total Investments) includes temporary cash investments. |
There were no changes in or disagreements with fund accountants for the period.
| |  | Availability of Additional Information. For additional information, including the fund's prospectus, financial information, holdings and proxy voting information, go to GuggenheimInvestments.com/mutual-funds/literature or, call 800 820 0888. |
SAR-RYWTX-093024
Semi-Annual Shareholder Report | 9.30.24
This semi-annual shareholder report contains important information about the Emerging Markets 2x Strategy Fund for the period of April 1, 2024 to September 30, 2024. You can find additional information about the fund at GuggenheimInvestments.com/mutual-funds/literature. You can also request this information by contacting 800 820 0888 or GuggenheimClientServices@mufg-is.com.
For the period of April 1, 2024 to September 30, 2024, the fund (Class C shares) returned 25.94%, outperforming the fund's benchmark, the MSCI World ex US Index, which returned 5.53% for the same period and outperforming the fund's secondary index, the S&P Emerging 50 ADR Index, which returned 16.45% for the same period.
The fund's broad-based securities market index was changed from the S&P Emerging 50 ADR Index to the MSCI World ex US Index to comply with the regulation that requires the fund's broad-based securities market index to represent the overall applicable market.
What factors materially affected the fund's performance over the last six months?
The industries that contributed the most to the return of the S&P Emerging 50 ADR Index (the "Index") were broadline retail, semiconductors & semiconductor equipment, and banks. Those that detracted were beverages, construction materials, and metals and mining. The holdings that contributed the most to the return of the Index were Taiwan Semiconductor Manufacturing Co. Ltd. ADR, Alibaba Group Holding Ltd ADR, and PDD Holdings, Inc. ADR – Class A. Those that detracted the most were Fomento Economico Mexicano SAB de CV ADR – Class B, Cemex SAB de CV ADR, and Li Auto, Inc. ADR – Class A. The Fund maintained a daily correlation of over 99% to its benchmark of 200% of the daily price movement of the S&P Emerging 50 ADR Index.
Cumulative performance* for the fund's most recently completed 10 years (as of 9.30.24), assuming a $10,000 initial investment.
| 09/30/2014 | 10000 | 10000 | 10000 |
| 12/31/2014 | 8334 | 9600 | 9195 |
| 03/31/2015 | 7904 | 9904 | 9013 |
| 06/30/2015 | 7871 | 9858 | 9100 |
| 09/30/2015 | 4975 | 8766 | 7352 |
| 12/31/2015 | 5352 | 9077 | 7718 |
| 03/31/2016 | 5890 | 8834 | 8214 |
| 06/30/2016 | 5935 | 8641 | 8335 |
| 09/30/2016 | 7279 | 9131 | 9318 |
| 12/31/2016 | 6234 | 9066 | 8686 |
| 03/31/2017 | 7963 | 9615 | 9885 |
| 06/30/2017 | 8658 | 10056 | 10393 |
| 09/30/2017 | 10438 | 10563 | 11492 |
| 12/31/2017 | 10808 | 10972 | 11769 |
| 03/31/2018 | 11298 | 10660 | 12197 |
| 06/30/2018 | 9433 | 10483 | 11272 |
| 09/30/2018 | 9319 | 10559 | 11321 |
| 12/31/2018 | 7206 | 9173 | 10137 |
| 03/31/2019 | 9131 | 10048 | 11539 |
| 06/30/2019 | 8536 | 10315 | 11274 |
| 09/30/2019 | 7854 | 10153 | 10954 |
| 12/31/2019 | 10610 | 10913 | 12715 |
| 03/31/2020 | 5686 | 8309 | 9599 |
| 06/30/2020 | 7767 | 9525 | 11399 |
| 09/30/2020 | 10658 | 9936 | 13555 |
| 12/31/2020 | 15288 | 11478 | 16350 |
| 03/31/2021 | 14821 | 11868 | 16358 |
| 06/30/2021 | 15638 | 12446 | 16954 |
| 09/30/2021 | 10590 | 12293 | 14132 |
| 12/31/2021 | 9650 | 12640 | 13638 |
| 03/31/2022 | 8635 | 11946 | 13165 |
| 06/30/2022 | 6637 | 10098 | 11786 |
| 09/30/2022 | 5230 | 9104 | 10633 |
| 12/31/2022 | 5950 | 10543 | 11600 |
| 03/31/2023 | 6824 | 11304 | 12658 |
| 06/30/2023 | 6550 | 11529 | 12602 |
| 09/30/2023 | 6014 | 10986 | 12279 |
| 12/31/2023 | 7174 | 12100 | 13598 |
| 03/31/2024 | 7169 | 12678 | 13799 |
| 06/30/2024 | 7654 | 12486 | 14484 |
| 09/30/2024 | 9032 | 13379 | 16068 |
| Class C (without CDSC) | 25.94% | 50.18% | 2.84% | -1.01% |
| Class C (with CDSC)§ | 24.94% | 49.18% | 2.84% | -1.01% |
| MSCI World ex US Index | 5.53% | 21.78% | 5.67% | 2.95% |
| S&P Emerging 50 ADR Index | 16.45% | 30.86% | 7.96% | 4.86% |
The fund's past performance is not a good predictor of the fund's future performance. Visit GuggenheimInvestments.com/mutual-funds/performance for more recent performance information.
| Net Assets | $3,069,904 |
| Total Number of Portfolio Holdings | 55 |
| Portfolio Turnover Rate | 469% |
| Emerging Markets 2x Strategy Fund | Class C | RYWUX | Semi-Annual Shareholder Report | September 30, 2024 |
| S&P Emerging 50 ADR Index Swap Agreements | 156.2% |
| Communications | 13.9% |
| Technology | 12.7% |
| Financial | 7.7% |
| Basic Materials | 3.0% |
| Consumer, Non-cyclical | 2.0% |
| Energy | 1.7% |
| Other | 3.3% |

| United States | 55.9% |
| Taiwan, Province of China | 9.7% |
| Cayman Islands | 9.1% |
| India | 7.7% |
| China | 6.7% |
| Brazil | 5.6% |
| Republic of Korea | 2.2% |
| Other | 3.1% |
| Total Investments | 100.0% |
| Taiwan Semiconductor Manufacturing Company Ltd. ADR | 8.2% |
| Alibaba Group Holding Ltd. ADR | 5.8% |
| HDFC Bank Ltd. ADR | 3.2% |
| PDD Holdings, Inc. ADR – Class A | 2.6% |
| Infosys Ltd. ADR | 2.2% |
| ICICI Bank Ltd. ADR | 1.8% |
| JD.com, Inc. ADR | 1.7% |
| Vale S.A. ADR | 1.3% |
| Trip.com Group Ltd. ADR | 1.0% |
| NetEase, Inc. ADR | 1.0% |
| Top 10 Total | 28.8% |
| |
1 | "Holdings Diversification (Market Exposure as a % of Net Assets)" excludes any temporary cash investments, investments in Guggenheim Strategy Funds Trust mutual funds, or investments in Guggenheim Ultra Short Duration Fund. |
| |
2 | "10 Largest Holdings (as a % of Net Assets)" excludes any temporary cash or derivative investments. |
3 | Country Diversification (% of Total Investments) includes temporary cash investments. |
| Taiwan Semiconductor Manufacturing Company Ltd. ADR | 8.2% |
| Alibaba Group Holding Ltd. ADR | 5.8% |
| HDFC Bank Ltd. ADR | 3.2% |
| PDD Holdings, Inc. ADR – Class A | 2.6% |
| Infosys Ltd. ADR | 2.2% |
| ICICI Bank Ltd. ADR | 1.8% |
| JD.com, Inc. ADR | 1.7% |
| Vale S.A. ADR | 1.3% |
| Trip.com Group Ltd. ADR | 1.0% |
| NetEase, Inc. ADR | 1.0% |
| Top 10 Total | 28.8% |
| |
2 | "10 Largest Holdings (as a % of Net Assets)" excludes any temporary cash or derivative investments. |
3 | Country Diversification (% of Total Investments) includes temporary cash investments. |
There were no changes in or disagreements with fund accountants for the period.
| |  | Availability of Additional Information. For additional information, including the fund's prospectus, financial information, holdings and proxy voting information, go to GuggenheimInvestments.com/mutual-funds/literature or, call 800 820 0888. |
SAR-RYWUX-093024
Semi-Annual Shareholder Report | 9.30.24
This semi-annual shareholder report contains important information about the Emerging Markets 2x Strategy Fund for the period of April 1, 2024 to September 30, 2024. You can find additional information about the fund at GuggenheimInvestments.com/mutual-funds/literature. You can also request this information by contacting 800 820 0888 or GuggenheimClientServices@mufg-is.com.
For the period of April 1, 2024 to September 30, 2024, the fund (Class H shares) returned 26.32%, outperforming the fund's benchmark, the MSCI World ex US Index, which returned 5.53% for the same period and outperforming the fund's secondary index, the S&P Emerging 50 ADR Index, which returned 16.45% for the same period.
The fund's broad-based securities market index was changed from the S&P Emerging 50 ADR Index to the MSCI World ex US Index to comply with the regulation that requires the fund's broad-based securities market index to represent the overall applicable market.
What factors materially affected the fund's performance over the last six months?
The industries that contributed the most to the return of the S&P Emerging 50 ADR Index (the "Index") were broadline retail, semiconductors & semiconductor equipment, and banks. Those that detracted were beverages, construction materials, and metals and mining. The holdings that contributed the most to the return of the Index were Taiwan Semiconductor Manufacturing Co. Ltd. ADR, Alibaba Group Holding Ltd ADR, and PDD Holdings, Inc. ADR – Class A. Those that detracted the most were Fomento Economico Mexicano SAB de CV ADR – Class B, Cemex SAB de CV ADR, and Li Auto, Inc. ADR – Class A. The Fund maintained a daily correlation of over 99% to its benchmark of 200% of the daily price movement of the S&P Emerging 50 ADR Index.
Cumulative performance* for the fund's most recently completed 10 years (as of 9.30.24), assuming a $10,000 initial investment.
| 09/30/2014 | 10000 | 10000 | 10000 |
| 12/31/2014 | 8349 | 9600 | 9195 |
| 03/31/2015 | 7928 | 9904 | 9013 |
| 06/30/2015 | 7908 | 9858 | 9100 |
| 09/30/2015 | 5007 | 8766 | 7352 |
| 12/31/2015 | 5400 | 9077 | 7718 |
| 03/31/2016 | 5955 | 8834 | 8214 |
| 06/30/2016 | 6012 | 8641 | 8335 |
| 09/30/2016 | 7386 | 9131 | 9318 |
| 12/31/2016 | 6330 | 9066 | 8686 |
| 03/31/2017 | 8102 | 9615 | 9885 |
| 06/30/2017 | 8827 | 10056 | 10393 |
| 09/30/2017 | 10660 | 10563 | 11492 |
| 12/31/2017 | 11058 | 10972 | 11769 |
| 03/31/2018 | 11581 | 10660 | 12197 |
| 06/30/2018 | 9690 | 10483 | 11272 |
| 09/30/2018 | 9589 | 10559 | 11321 |
| 12/31/2018 | 7430 | 9173 | 10137 |
| 03/31/2019 | 9432 | 10048 | 11539 |
| 06/30/2019 | 8836 | 10315 | 11274 |
| 09/30/2019 | 8145 | 10153 | 10954 |
| 12/31/2019 | 11022 | 10913 | 12715 |
| 03/31/2020 | 5917 | 8309 | 9599 |
| 06/30/2020 | 8096 | 9525 | 11399 |
| 09/30/2020 | 11131 | 9936 | 13555 |
| 12/31/2020 | 16000 | 11478 | 16350 |
| 03/31/2021 | 15538 | 11868 | 16358 |
| 06/30/2021 | 16425 | 12446 | 16954 |
| 09/30/2021 | 11142 | 12293 | 14132 |
| 12/31/2021 | 10172 | 12640 | 13638 |
| 03/31/2022 | 9119 | 11946 | 13165 |
| 06/30/2022 | 7022 | 10098 | 11786 |
| 09/30/2022 | 5544 | 9104 | 10633 |
| 12/31/2022 | 6317 | 10543 | 11600 |
| 03/31/2023 | 7258 | 11304 | 12658 |
| 06/30/2023 | 6981 | 11529 | 12602 |
| 09/30/2023 | 6419 | 10986 | 12279 |
| 12/31/2023 | 7674 | 12100 | 13598 |
| 03/31/2024 | 7678 | 12678 | 13799 |
| 06/30/2024 | 8207 | 12486 | 14484 |
| 09/30/2024 | 9699 | 13379 | 16068 |
| Class H | 26.32% | 51.09% | 3.55% | -0.31% |
| MSCI World ex US Index | 5.53% | 21.78% | 5.67% | 2.95% |
| S&P Emerging 50 ADR Index | 16.45% | 30.86% | 7.96% | 4.86% |
The fund's past performance is not a good predictor of the fund's future performance. Visit GuggenheimInvestments.com/mutual-funds/performance for more recent performance information.
| Net Assets | $3,069,904 |
| Total Number of Portfolio Holdings | 55 |
| Portfolio Turnover Rate | 469% |
| Emerging Markets 2x Strategy Fund | Class H | RYWVX | Semi-Annual Shareholder Report | September 30, 2024 |
| S&P Emerging 50 ADR Index Swap Agreements | 156.2% |
| Communications | 13.9% |
| Technology | 12.7% |
| Financial | 7.7% |
| Basic Materials | 3.0% |
| Consumer, Non-cyclical | 2.0% |
| Energy | 1.7% |
| Other | 3.3% |
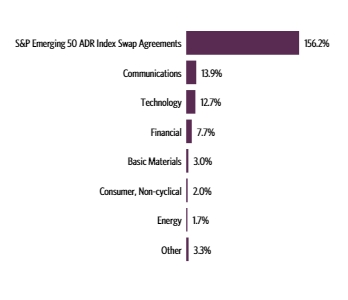
| United States | 55.9% |
| Taiwan, Province of China | 9.7% |
| Cayman Islands | 9.1% |
| India | 7.7% |
| China | 6.7% |
| Brazil | 5.6% |
| Republic of Korea | 2.2% |
| Other | 3.1% |
| Total Investments | 100.0% |
| Taiwan Semiconductor Manufacturing Company Ltd. ADR | 8.2% |
| Alibaba Group Holding Ltd. ADR | 5.8% |
| HDFC Bank Ltd. ADR | 3.2% |
| PDD Holdings, Inc. ADR – Class A | 2.6% |
| Infosys Ltd. ADR | 2.2% |
| ICICI Bank Ltd. ADR | 1.8% |
| JD.com, Inc. ADR | 1.7% |
| Vale S.A. ADR | 1.3% |
| Trip.com Group Ltd. ADR | 1.0% |
| NetEase, Inc. ADR | 1.0% |
| Top 10 Total | 28.8% |
| |
1 | "Holdings Diversification (Market Exposure as a % of Net Assets)" excludes any temporary cash investments, investments in Guggenheim Strategy Funds Trust mutual funds, or investments in Guggenheim Ultra Short Duration Fund. |
| |
2 | "10 Largest Holdings (as a % of Net Assets)" excludes any temporary cash or derivative investments. |
3 | Country Diversification (% of Total Investments) includes temporary cash investments. |
| Taiwan Semiconductor Manufacturing Company Ltd. ADR | 8.2% |
| Alibaba Group Holding Ltd. ADR | 5.8% |
| HDFC Bank Ltd. ADR | 3.2% |
| PDD Holdings, Inc. ADR – Class A | 2.6% |
| Infosys Ltd. ADR | 2.2% |
| ICICI Bank Ltd. ADR | 1.8% |
| JD.com, Inc. ADR | 1.7% |
| Vale S.A. ADR | 1.3% |
| Trip.com Group Ltd. ADR | 1.0% |
| NetEase, Inc. ADR | 1.0% |
| Top 10 Total | 28.8% |
| |
2 | "10 Largest Holdings (as a % of Net Assets)" excludes any temporary cash or derivative investments. |
3 | Country Diversification (% of Total Investments) includes temporary cash investments. |
There were no changes in or disagreements with fund accountants for the period.
| |  | Availability of Additional Information. For additional information, including the fund's prospectus, financial information, holdings and proxy voting information, go to GuggenheimInvestments.com/mutual-funds/literature or, call 800 820 0888. |
SAR-RYWVX-093024
Semi-Annual Shareholder Report | 9.30.24
This semi-annual shareholder report contains important information about the Inverse Emerging Markets 2x Strategy Fund for the period of April 1, 2024 to September 30, 2024. You can find additional information about the fund at GuggenheimInvestments.com/mutual-funds/literature. You can also request this information by contacting 800 820 0888 or GuggenheimClientServices@mufg-is.com.
For the period of April 1, 2024 to September 30, 2024, the fund (Class A shares) returned -26.82%, underperforming the fund's benchmark, the MSCI World ex US Index, which returned 5.53% for the same period and underperforming the fund's secondary index, the S&P Emerging 50 ADR Index, which returned 16.45% for the same period.
The fund's broad-based securities market index was changed from the S&P Emerging 50 ADR Index to the MSCI World ex US Index to comply with the regulation that requires the fund's broad-based securities market index to represent the overall applicable market.
What factors materially affected the fund's performance over the last six months?
The industries that contributed the most to the return of the S&P Emerging 50 ADR Index (the "Index") were broadline retail, semiconductors & semiconductor equipment, and banks. Those that detracted were beverages, construction materials, and metals and mining. The holdings that contributed the most to the return of the Index were Taiwan Semiconductor Manufacturing Co. Ltd. ADR, Alibaba Group Holding Ltd ADR, and PDD Holdings, Inc. ADR – Class A. Those that detracted the most were Fomento Economico Mexicano SAB de CV ADR – Class B, Cemex SAB de CV ADR, and Li Auto, Inc. ADR – Class A. The Fund maintained a daily correlation of over 99% to its benchmark of -200% of the daily price movement of the S&P Emerging 50 ADR Index.
Cumulative performance* for the fund's most recently completed 10 years (as of 9.30.24), assuming a $10,000 initial investment.
| 09/30/2014 | 9525 | 10000 | 10000 |
| 12/31/2014 | 10783 | 9600 | 9195 |
| 03/31/2015 | 10827 | 9904 | 9013 |
| 06/30/2015 | 10404 | 9858 | 9100 |
| 09/30/2015 | 14881 | 8766 | 7352 |
| 12/31/2015 | 13098 | 9077 | 7718 |
| 03/31/2016 | 10885 | 8834 | 8214 |
| 06/30/2016 | 10205 | 8641 | 8335 |
| 09/30/2016 | 7960 | 9131 | 9318 |
| 12/31/2016 | 8910 | 9066 | 8686 |
| 03/31/2017 | 6779 | 9615 | 9885 |
| 06/30/2017 | 6030 | 10056 | 10393 |
| 09/30/2017 | 4924 | 10563 | 11492 |
| 12/31/2017 | 4634 | 10972 | 11769 |
| 03/31/2018 | 4179 | 10660 | 12197 |
| 06/30/2018 | 4835 | 10483 | 11272 |
| 09/30/2018 | 4773 | 10559 | 11321 |
| 12/31/2018 | 5701 | 9173 | 10137 |
| 03/31/2019 | 4337 | 10048 | 11539 |
| 06/30/2019 | 4482 | 10315 | 11274 |
| 09/30/2019 | 4650 | 10153 | 10954 |
| 12/31/2019 | 3422 | 10913 | 12715 |
| 03/31/2020 | 5044 | 8309 | 9599 |
| 06/30/2020 | 3308 | 9525 | 11399 |
| 09/30/2020 | 2216 | 9936 | 13555 |
| 12/31/2020 | 1447 | 11478 | 16350 |
| 03/31/2021 | 1344 | 11868 | 16358 |
| 06/30/2021 | 1210 | 12446 | 16954 |
| 09/30/2021 | 1650 | 12293 | 14132 |
| 12/31/2021 | 1695 | 12640 | 13638 |
| 03/31/2022 | 1623 | 11946 | 13165 |
| 06/30/2022 | 1849 | 10098 | 11786 |
| 09/30/2022 | 2201 | 9104 | 10633 |
| 12/31/2022 | 1738 | 10543 | 11600 |
| 03/31/2023 | 1435 | 11304 | 12658 |
| 06/30/2023 | 1453 | 11529 | 12602 |
| 09/30/2023 | 1525 | 10986 | 12279 |
| 12/31/2023 | 1250 | 12100 | 13598 |
| 03/31/2024 | 1219 | 12678 | 13799 |
| 06/30/2024 | 1115 | 12486 | 14484 |
| 09/30/2024 | 892 | 13379 | 16068 |
| Class A (without sales charge) | -26.82% | -41.50% | -28.12% | -21.09% |
| Class A (with sales charge)‡ | -30.30% | -44.26% | -28.82% | -21.47% |
| MSCI World ex US Index | 5.53% | 21.78% | 5.67% | 2.95% |
| S&P Emerging 50 ADR Index | 16.45% | 30.86% | 7.96% | 4.86% |
The fund's past performance is not a good predictor of the fund's future performance. Visit GuggenheimInvestments.com/mutual-funds/performance for more recent performance information.
| Net Assets | $382,753 |
| Total Number of Portfolio Holdings | 4 |
| Portfolio Turnover Rate | 0% |
| Inverse Emerging Markets 2x Strategy Fund | Class A | RYWWX | Semi-Annual Shareholder Report | September 30, 2024 |
| S&P Emerging 50 ADR Index Swap Agreements Sold Short | -199.3% |

| |
1 | "Holdings Diversification (Market Exposure as a % of Net Assets)" excludes any temporary cash investments, investments in Guggenheim Strategy Funds Trust mutual funds, or investments in Guggenheim Ultra Short Duration Fund. |
There were no changes in or disagreements with fund accountants for the period.
| |  | Availability of Additional Information. For additional information, including the fund's prospectus, financial information, holdings and proxy voting information, go to GuggenheimInvestments.com/mutual-funds/literature or, call 800 820 0888. |
SAR-RYWWX-093024
Semi-Annual Shareholder Report | 9.30.24
This semi-annual shareholder report contains important information about the Inverse Emerging Markets 2x Strategy Fund for the period of April 1, 2024 to September 30, 2024. You can find additional information about the fund at GuggenheimInvestments.com/mutual-funds/literature. You can also request this information by contacting 800 820 0888 or GuggenheimClientServices@mufg-is.com.
For the period of April 1, 2024 to September 30, 2024, the fund (Class C shares) returned -27.11%, underperforming the fund's benchmark, the MSCI World ex US Index, which returned 5.53% for the same period and underperforming the fund's secondary index, the S&P Emerging 50 ADR Index, which returned 16.45% for the same period.
The fund's broad-based securities market index was changed from the S&P Emerging 50 ADR Index to the MSCI World ex US Index to comply with the regulation that requires the fund's broad-based securities market index to represent the overall applicable market.
What factors materially affected the fund's performance over the last six months?
The industries that contributed the most to the return of the S&P Emerging 50 ADR Index (the "Index") were broadline retail, semiconductors & semiconductor equipment, and banks. Those that detracted were beverages, construction materials, and metals and mining. The holdings that contributed the most to the return of the Index were Taiwan Semiconductor Manufacturing Co. Ltd. ADR, Alibaba Group Holding Ltd ADR, and PDD Holdings, Inc. ADR – Class A. Those that detracted the most were Fomento Economico Mexicano SAB de CV ADR – Class B, Cemex SAB de CV ADR, and Li Auto, Inc. ADR – Class A. The Fund maintained a daily correlation of over 99% to its benchmark of -200% of the daily price movement of the S&P Emerging 50 ADR Index.
Cumulative performance* for the fund's most recently completed 10 years (as of 9.30.24), assuming a $10,000 initial investment.
| 09/30/2014 | 10000 | 10000 | 10000 |
| 12/31/2014 | 11276 | 9600 | 9195 |
| 03/31/2015 | 11302 | 9904 | 9013 |
| 06/30/2015 | 10833 | 9858 | 9100 |
| 09/30/2015 | 15469 | 8766 | 7352 |
| 12/31/2015 | 13574 | 9077 | 7718 |
| 03/31/2016 | 11270 | 8834 | 8214 |
| 06/30/2016 | 10553 | 8641 | 8335 |
| 09/30/2016 | 8210 | 9131 | 9318 |
| 12/31/2016 | 9178 | 9066 | 8686 |
| 03/31/2017 | 6968 | 9615 | 9885 |
| 06/30/2017 | 6187 | 10056 | 10393 |
| 09/30/2017 | 5042 | 10563 | 11492 |
| 12/31/2017 | 4739 | 10972 | 11769 |
| 03/31/2018 | 4266 | 10660 | 12197 |
| 06/30/2018 | 4923 | 10483 | 11272 |
| 09/30/2018 | 4852 | 10559 | 11321 |
| 12/31/2018 | 5783 | 9173 | 10137 |
| 03/31/2019 | 4389 | 10048 | 11539 |
| 06/30/2019 | 4521 | 10315 | 11274 |
| 09/30/2019 | 4685 | 10153 | 10954 |
| 12/31/2019 | 3490 | 10913 | 12715 |
| 03/31/2020 | 5133 | 8309 | 9599 |
| 06/30/2020 | 3359 | 9525 | 11399 |
| 09/30/2020 | 2249 | 9936 | 13555 |
| 12/31/2020 | 1465 | 11478 | 16350 |
| 03/31/2021 | 1360 | 11868 | 16358 |
| 06/30/2021 | 1224 | 12446 | 16954 |
| 09/30/2021 | 1679 | 12293 | 14132 |
| 12/31/2021 | 1722 | 12640 | 13638 |
| 03/31/2022 | 1647 | 11946 | 13165 |
| 06/30/2022 | 1869 | 10098 | 11786 |
| 09/30/2022 | 2217 | 9104 | 10633 |
| 12/31/2022 | 1747 | 10543 | 11600 |
| 03/31/2023 | 1442 | 11304 | 12658 |
| 06/30/2023 | 1455 | 11529 | 12602 |
| 09/30/2023 | 1527 | 10986 | 12279 |
| 12/31/2023 | 1250 | 12100 | 13598 |
| 03/31/2024 | 1217 | 12678 | 13799 |
| 06/30/2024 | 1111 | 12486 | 14484 |
| 09/30/2024 | 887 | 13379 | 16068 |
| Class C (without CDSC) | -27.11% | -41.93% | -28.32% | -21.51% |
| Class C (with CDSC)§ | -27.84% | -42.49% | -28.32% | -21.51% |
| MSCI World ex US Index | 5.53% | 21.78% | 5.67% | 2.95% |
| S&P Emerging 50 ADR Index | 16.45% | 30.86% | 7.96% | 4.86% |
The fund's past performance is not a good predictor of the fund's future performance. Visit GuggenheimInvestments.com/mutual-funds/performance for more recent performance information.
| Net Assets | $382,753 |
| Total Number of Portfolio Holdings | 4 |
| Portfolio Turnover Rate | 0% |
| Inverse Emerging Markets 2x Strategy Fund | Class C | RYWZX | Semi-Annual Shareholder Report | September 30, 2024 |
| S&P Emerging 50 ADR Index Swap Agreements Sold Short | -199.3% |

| |
1 | "Holdings Diversification (Market Exposure as a % of Net Assets)" excludes any temporary cash investments, investments in Guggenheim Strategy Funds Trust mutual funds, or investments in Guggenheim Ultra Short Duration Fund. |
There were no changes in or disagreements with fund accountants for the period.
| |  | Availability of Additional Information. For additional information, including the fund's prospectus, financial information, holdings and proxy voting information, go to GuggenheimInvestments.com/mutual-funds/literature or, call 800 820 0888. |
SAR-RYWZX-093024
Semi-Annual Shareholder Report | 9.30.24
This semi-annual shareholder report contains important information about the Inverse Emerging Markets 2x Strategy Fund for the period of April 1, 2024 to September 30, 2024. You can find additional information about the fund at GuggenheimInvestments.com/mutual-funds/literature. You can also request this information by contacting 800 820 0888 or GuggenheimClientServices@mufg-is.com.
For the period of April 1, 2024 to September 30, 2024, the fund (Class H shares) returned -26.99%, underperforming the fund's benchmark, the MSCI World ex US Index, which returned 5.53% for the same period and underperforming the fund's secondary index, the S&P Emerging 50 ADR Index, which returned 16.45% for the same period.
The fund's broad-based securities market index was changed from the S&P Emerging 50 ADR Index to the MSCI World ex US Index to comply with the regulation that requires the fund's broad-based securities market index to represent the overall applicable market.
What factors materially affected the fund's performance over the last six months?
The industries that contributed the most to the return of the S&P Emerging 50 ADR Index (the "Index") were broadline retail, semiconductors & semiconductor equipment, and banks. Those that detracted were beverages, construction materials, and metals and mining. The holdings that contributed the most to the return of the Index were Taiwan Semiconductor Manufacturing Co. Ltd. ADR, Alibaba Group Holding Ltd ADR, and PDD Holdings, Inc. ADR – Class A. Those that detracted the most were Fomento Economico Mexicano SAB de CV ADR – Class B, Cemex SAB de CV ADR, and Li Auto, Inc. ADR – Class A. The Fund maintained a daily correlation of over 99% to its benchmark of -200% of the daily price movement of the S&P Emerging 50 ADR Index.
Cumulative performance* for the fund's most recently completed 10 years (as of 9.30.24), assuming a $10,000 initial investment.
| 09/30/2014 | 10000 | 10000 | 10000 |
| 12/31/2014 | 11266 | 9600 | 9195 |
| 03/31/2015 | 11313 | 9904 | 9013 |
| 06/30/2015 | 10828 | 9858 | 9100 |
| 09/30/2015 | 15488 | 8766 | 7352 |
| 12/31/2015 | 13650 | 9077 | 7718 |
| 03/31/2016 | 11367 | 8834 | 8214 |
| 06/30/2016 | 10646 | 8641 | 8335 |
| 09/30/2016 | 8296 | 9131 | 9318 |
| 12/31/2016 | 9297 | 9066 | 8686 |
| 03/31/2017 | 7071 | 9615 | 9885 |
| 06/30/2017 | 6287 | 10056 | 10393 |
| 09/30/2017 | 5134 | 10563 | 11492 |
| 12/31/2017 | 4824 | 10972 | 11769 |
| 03/31/2018 | 4351 | 10660 | 12197 |
| 06/30/2018 | 5035 | 10483 | 11272 |
| 09/30/2018 | 4972 | 10559 | 11321 |
| 12/31/2018 | 5934 | 9173 | 10137 |
| 03/31/2019 | 4520 | 10048 | 11539 |
| 06/30/2019 | 4669 | 10315 | 11274 |
| 09/30/2019 | 4847 | 10153 | 10954 |
| 12/31/2019 | 3568 | 10913 | 12715 |
| 03/31/2020 | 5261 | 8309 | 9599 |
| 06/30/2020 | 3451 | 9525 | 11399 |
| 09/30/2020 | 2311 | 9936 | 13555 |
| 12/31/2020 | 1531 | 11478 | 16350 |
| 03/31/2021 | 1422 | 11868 | 16358 |
| 06/30/2021 | 1276 | 12446 | 16954 |
| 09/30/2021 | 1748 | 12293 | 14132 |
| 12/31/2021 | 1795 | 12640 | 13638 |
| 03/31/2022 | 1720 | 11946 | 13165 |
| 06/30/2022 | 1961 | 10098 | 11786 |
| 09/30/2022 | 2337 | 9104 | 10633 |
| 12/31/2022 | 1844 | 10543 | 11600 |
| 03/31/2023 | 1526 | 11304 | 12658 |
| 06/30/2023 | 1543 | 11529 | 12602 |
| 09/30/2023 | 1618 | 10986 | 12279 |
| 12/31/2023 | 1325 | 12100 | 13598 |
| 03/31/2024 | 1294 | 12678 | 13799 |
| 06/30/2024 | 1182 | 12486 | 14484 |
| 09/30/2024 | 945 | 13379 | 16068 |
| Class H | -26.99% | -41.63% | -27.90% | -21.02% |
| MSCI World ex US Index | 5.53% | 21.78% | 5.67% | 2.95% |
| S&P Emerging 50 ADR Index | 16.45% | 30.86% | 7.96% | 4.86% |
The fund's past performance is not a good predictor of the fund's future performance. Visit GuggenheimInvestments.com/mutual-funds/performance for more recent performance information.
| Net Assets | $382,753 |
| Total Number of Portfolio Holdings | 4 |
| Portfolio Turnover Rate | 0% |
| Inverse Emerging Markets 2x Strategy Fund | Class H | RYWYX | Semi-Annual Shareholder Report | September 30, 2024 |
| S&P Emerging 50 ADR Index Swap Agreements Sold Short | -199.3% |

| |
1 | "Holdings Diversification (Market Exposure as a % of Net Assets)" excludes any temporary cash investments, investments in Guggenheim Strategy Funds Trust mutual funds, or investments in Guggenheim Ultra Short Duration Fund. |
There were no changes in or disagreements with fund accountants for the period.
| |  | Availability of Additional Information. For additional information, including the fund's prospectus, financial information, holdings and proxy voting information, go to GuggenheimInvestments.com/mutual-funds/literature or, call 800 820 0888. |
SAR-RYWYX-093024
Semi-Annual Shareholder Report | 9.30.24
This semi-annual shareholder report contains important information about the Europe 1.25x Strategy Fund for the period of April 1, 2024 to September 30, 2024. You can find additional information about the fund at GuggenheimInvestments.com/mutual-funds/literature. You can also request this information by contacting 800 820 0888 or GuggenheimClientServices@mufg-is.com.
For the period of April 1, 2024 to September 30, 2024, the fund (Class A shares) returned 5.52%, underperforming the fund's benchmark, the MSCI World ex US Index, which returned 5.53% for the same period and underperforming the fund's secondary index, the STOXX Europe 50 Index, which returned 5.70% for the same period.
The fund's broad-based securities market index was changed from the STOXX Europe 50 Index to the MSCI World ex US Index to comply with the regulation that requires the fund's broad-based securities market index to represent the overall applicable market.
What factors materially affected the fund's performance over the last six months?
The sectors that contributed the most to the return of the STOXX Europe 50 Index (the "Index") were Financials, Utilities, and Health Care. Those that detracted the most were Consumer Discretionary, Information Technology, and Energy. The holdings that contributed the most to the return of the Index were SAP SE, Sanofi, and Schneider Electric SE. Those that detracted the most were ASML Holding NV, LVMH Moet Hennessy Louis Vuitton SE, and Stellantis NV. The Fund maintained a daily correlation of over 99% to its benchmark of 125% of the daily price movement of the fair value of the STOXX Europe 50 Index.
Cumulative performance* for the fund's most recently completed 10 years (as of 9.30.24), assuming a $10,000 initial investment.
| 09/30/2014 | 9527 | 10000 | 10000 |
| 12/31/2014 | 8597 | 9600 | 9420 |
| 03/31/2015 | 8900 | 9904 | 9645 |
| 06/30/2015 | 8952 | 9858 | 9694 |
| 09/30/2015 | 7973 | 8766 | 8851 |
| 12/31/2015 | 8027 | 9077 | 9008 |
| 03/31/2016 | 7514 | 8834 | 8587 |
| 06/30/2016 | 7531 | 8641 | 8576 |
| 09/30/2016 | 7687 | 9131 | 8818 |
| 12/31/2016 | 7505 | 9066 | 8803 |
| 03/31/2017 | 8252 | 9615 | 9466 |
| 06/30/2017 | 8953 | 10056 | 10100 |
| 09/30/2017 | 9493 | 10563 | 10695 |
| 12/31/2017 | 9617 | 10972 | 10924 |
| 03/31/2018 | 9203 | 10660 | 10524 |
| 06/30/2018 | 8941 | 10483 | 10415 |
| 09/30/2018 | 9069 | 10559 | 10498 |
| 12/31/2018 | 7811 | 9173 | 9338 |
| 03/31/2019 | 8989 | 10048 | 10450 |
| 06/30/2019 | 9501 | 10315 | 10972 |
| 09/30/2019 | 9272 | 10153 | 10809 |
| 12/31/2019 | 10144 | 10913 | 11678 |
| 03/31/2020 | 7351 | 8309 | 9244 |
| 06/30/2020 | 8694 | 9525 | 10450 |
| 09/30/2020 | 8812 | 9936 | 10655 |
| 12/31/2020 | 10176 | 11478 | 11933 |
| 03/31/2021 | 10540 | 11868 | 12355 |
| 06/30/2021 | 11605 | 12446 | 13304 |
| 09/30/2021 | 11132 | 12293 | 13024 |
| 12/31/2021 | 12117 | 12640 | 13980 |
| 03/31/2022 | 11277 | 11946 | 13398 |
| 06/30/2022 | 9732 | 10098 | 11835 |
| 09/30/2022 | 8357 | 9104 | 10767 |
| 12/31/2022 | 10604 | 10543 | 12884 |
| 03/31/2023 | 11896 | 11304 | 14261 |
| 06/30/2023 | 12316 | 11529 | 14723 |
| 09/30/2023 | 11368 | 10986 | 14056 |
| 12/31/2023 | 12677 | 12100 | 15354 |
| 03/31/2024 | 13603 | 12678 | 16360 |
| 06/30/2024 | 13856 | 12486 | 16673 |
| 09/30/2024 | 14354 | 13379 | 17286 |
| Class A (without sales charge) | 5.52% | 26.27% | 9.13% | 4.19% |
| Class A (with sales charge)‡ | 0.50% | 20.26% | 8.08% | 3.68% |
| MSCI World ex US Index | 5.53% | 21.78% | 5.67% | 2.95% |
| STOXX Europe 50 Index | 5.70% | 23.02% | 9.84% | 5.63% |
The fund's past performance is not a good predictor of the fund's future performance. Visit GuggenheimInvestments.com/mutual-funds/performance for more recent performance information.
| Net Assets | $1,673,951 |
| Total Number of Portfolio Holdings | 58 |
| Portfolio Turnover Rate | 1,496%1496% |
| Europe 1.25x Strategy Fund | Class A | RYAEX | Semi-Annual Shareholder Report | September 30, 2024 |
| Currency Futures Contracts | 83.4% |
| Equity Futures Contracts | 80.6% |
| Consumer, Non-cyclical | 16.8% |
| Financial | 8.0% |
| Industrial | 4.9% |
| Technology | 4.3% |
| Energy | 3.4% |
| Consumer, Cyclical | 3.1% |
| Basic Materials | 2.2% |
| Utilities | 1.7% |
| Communications | 1.3% |
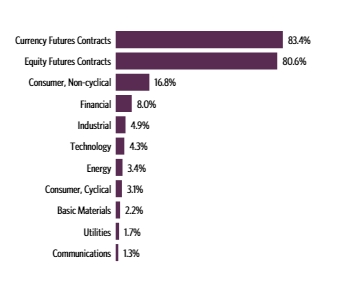
| United States | 56.9% |
| France | 10.2% |
| United Kingdom | 8.1% |
| Switzerland | 7.9% |
| Germany | 5.7% |
| Netherlands | 4.4% |
| Denmark | 2.8% |
| Other | 4.0% |
| Total Investments | 100.0% |
| Guggenheim Ultra Short Duration Fund — Institutional Class | 4.2% |
| Guggenheim Strategy Fund II | 4.1% |
| Novo Nordisk A/S ADR | 2.9% |
| ASML Holding N.V. — Class G | 2.5% |
| Nestle S.A. ADR | 2.0% |
| AstraZeneca plc ADR | 1.8% |
| SAP SE ADR | 1.8% |
| Novartis AG ADR | 1.7% |
| Roche Holding AG ADR | 1.7% |
| Shell plc ADR | 1.6% |
| Top 10 Total | 24.3% |
| |
1 | "Holdings Diversification (Market Exposure as a % of Net Assets)" excludes any temporary cash investments, investments in Guggenheim Strategy Funds Trust mutual funds, or investments in Guggenheim Ultra Short Duration Fund. The Fund's target exposure is achieved through a combination of equity futures contracts and currency futures contracts. |
| |
2 | "10 Largest Holdings (as a % of Net Assets)" excludes any temporary cash or derivative investments. |
3 | Country Diversification (% of Total Investments) includes temporary cash investments. |
| Guggenheim Ultra Short Duration Fund — Institutional Class | 4.2% |
| Guggenheim Strategy Fund II | 4.1% |
| Novo Nordisk A/S ADR | 2.9% |
| ASML Holding N.V. — Class G | 2.5% |
| Nestle S.A. ADR | 2.0% |
| AstraZeneca plc ADR | 1.8% |
| SAP SE ADR | 1.8% |
| Novartis AG ADR | 1.7% |
| Roche Holding AG ADR | 1.7% |
| Shell plc ADR | 1.6% |
| Top 10 Total | 24.3% |
| |
2 | "10 Largest Holdings (as a % of Net Assets)" excludes any temporary cash or derivative investments. |
3 | Country Diversification (% of Total Investments) includes temporary cash investments. |
There were no changes in or disagreements with fund accountants for the period.
| |  | Availability of Additional Information. For additional information, including the fund's prospectus, financial information, holdings and proxy voting information, go to GuggenheimInvestments.com/mutual-funds/literature or, call 800 820 0888. |
SAR-RYAEX-093024
Semi-Annual Shareholder Report | 9.30.24
This semi-annual shareholder report contains important information about the Europe 1.25x Strategy Fund for the period of April 1, 2024 to September 30, 2024. You can find additional information about the fund at GuggenheimInvestments.com/mutual-funds/literature. You can also request this information by contacting 800 820 0888 or GuggenheimClientServices@mufg-is.com.
For the period of April 1, 2024 to September 30, 2024, the fund (Class C shares) returned 5.18%, underperforming the fund's benchmark, the MSCI World ex US Index, which returned 5.53% for the same period and underperforming the fund's secondary index, the STOXX Europe 50 Index, which returned 5.70% for the same period.
The fund's broad-based securities market index was changed from the STOXX Europe 50 Index to the MSCI World ex US Index to comply with the regulation that requires the fund's broad-based securities market index to represent the overall applicable market.
What factors materially affected the fund's performance over the last six months?
The sectors that contributed the most to the return of the STOXX Europe 50 Index (the "Index") were Financials, Utilities, and Health Care. Those that detracted the most were Consumer Discretionary, Information Technology, and Energy. The holdings that contributed the most to the return of the Index were SAP SE, Sanofi, and Schneider Electric SE. Those that detracted the most were ASML Holding NV, LVMH Moet Hennessy Louis Vuitton SE, and Stellantis NV. The Fund maintained a daily correlation of over 99% to its benchmark of 125% of the daily price movement of the fair value of the STOXX Europe 50 Index.
Cumulative performance* for the fund's most recently completed 10 years (as of 9.30.24), assuming a $10,000 initial investment.
| 09/30/2014 | 10000 | 10000 | 10000 |
| 12/31/2014 | 9009 | 9600 | 9420 |
| 03/31/2015 | 9314 | 9904 | 9645 |
| 06/30/2015 | 9354 | 9858 | 9694 |
| 09/30/2015 | 8319 | 8766 | 8851 |
| 12/31/2015 | 8364 | 9077 | 9008 |
| 03/31/2016 | 7811 | 8834 | 8587 |
| 06/30/2016 | 7811 | 8641 | 8576 |
| 09/30/2016 | 7968 | 9131 | 8818 |
| 12/31/2016 | 7763 | 9066 | 8803 |
| 03/31/2017 | 8520 | 9615 | 9466 |
| 06/30/2017 | 9228 | 10056 | 10100 |
| 09/30/2017 | 9766 | 10563 | 10695 |
| 12/31/2017 | 9873 | 10972 | 10924 |
| 03/31/2018 | 9432 | 10660 | 10524 |
| 06/30/2018 | 9145 | 10483 | 10415 |
| 09/30/2018 | 9259 | 10559 | 10498 |
| 12/31/2018 | 7961 | 9173 | 9338 |
| 03/31/2019 | 9145 | 10048 | 10450 |
| 06/30/2019 | 9647 | 10315 | 10972 |
| 09/30/2019 | 9396 | 10153 | 10809 |
| 12/31/2019 | 10259 | 10913 | 11678 |
| 03/31/2020 | 7429 | 8309 | 9244 |
| 06/30/2020 | 8772 | 9525 | 10450 |
| 09/30/2020 | 8874 | 9936 | 10655 |
| 12/31/2020 | 10228 | 11478 | 11933 |
| 03/31/2021 | 10543 | 11868 | 12355 |
| 06/30/2021 | 11588 | 12446 | 13304 |
| 09/30/2021 | 11094 | 12293 | 13024 |
| 12/31/2021 | 12054 | 12640 | 13980 |
| 03/31/2022 | 11199 | 11946 | 13398 |
| 06/30/2022 | 9621 | 10098 | 11835 |
| 09/30/2022 | 8231 | 9104 | 10767 |
| 12/31/2022 | 10423 | 10543 | 12884 |
| 03/31/2023 | 11671 | 11304 | 14261 |
| 06/30/2023 | 12058 | 11529 | 14723 |
| 09/30/2023 | 11112 | 10986 | 14056 |
| 12/31/2023 | 12366 | 12100 | 15354 |
| 03/31/2024 | 13245 | 12678 | 16360 |
| 06/30/2024 | 13467 | 12486 | 16673 |
| 09/30/2024 | 13923 | 13379 | 17286 |
| Class C (without CDSC) | 5.18% | 25.30% | 8.18% | 3.37% |
| Class C (with CDSC)§ | 4.18% | 24.30% | 8.18% | 3.37% |
| MSCI World ex US Index | 5.53% | 21.78% | 5.67% | 2.95% |
| STOXX Europe 50 Index | 5.70% | 23.02% | 9.84% | 5.63% |
The fund's past performance is not a good predictor of the fund's future performance. Visit GuggenheimInvestments.com/mutual-funds/performance for more recent performance information.
| Net Assets | $1,673,951 |
| Total Number of Portfolio Holdings | 58 |
| Portfolio Turnover Rate | 1,496%1496% |
| Europe 1.25x Strategy Fund | Class C | RYCEX | Semi-Annual Shareholder Report | September 30, 2024 |
| Currency Futures Contracts | 83.4% |
| Equity Futures Contracts | 80.6% |
| Consumer, Non-cyclical | 16.8% |
| Financial | 8.0% |
| Industrial | 4.9% |
| Technology | 4.3% |
| Energy | 3.4% |
| Consumer, Cyclical | 3.1% |
| Basic Materials | 2.2% |
| Utilities | 1.7% |
| Communications | 1.3% |

| United States | 56.9% |
| France | 10.2% |
| United Kingdom | 8.1% |
| Switzerland | 7.9% |
| Germany | 5.7% |
| Netherlands | 4.4% |
| Denmark | 2.8% |
| Other | 4.0% |
| Total Investments | 100.0% |
| Guggenheim Ultra Short Duration Fund — Institutional Class | 4.2% |
| Guggenheim Strategy Fund II | 4.1% |
| Novo Nordisk A/S ADR | 2.9% |
| ASML Holding N.V. — Class G | 2.5% |
| Nestle S.A. ADR | 2.0% |
| AstraZeneca plc ADR | 1.8% |
| SAP SE ADR | 1.8% |
| Novartis AG ADR | 1.7% |
| Roche Holding AG ADR | 1.7% |
| Shell plc ADR | 1.6% |
| Top 10 Total | 24.3% |
| |
1 | "Holdings Diversification (Market Exposure as a % of Net Assets)" excludes any temporary cash investments, investments in Guggenheim Strategy Funds Trust mutual funds, or investments in Guggenheim Ultra Short Duration Fund. The Fund's target exposure is achieved through a combination of equity futures contracts and currency futures contracts. |
| |
2 | "10 Largest Holdings (as a % of Net Assets)" excludes any temporary cash or derivative investments. |
3 | Country Diversification (% of Total Investments) includes temporary cash investments. |
| Guggenheim Ultra Short Duration Fund — Institutional Class | 4.2% |
| Guggenheim Strategy Fund II | 4.1% |
| Novo Nordisk A/S ADR | 2.9% |
| ASML Holding N.V. — Class G | 2.5% |
| Nestle S.A. ADR | 2.0% |
| AstraZeneca plc ADR | 1.8% |
| SAP SE ADR | 1.8% |
| Novartis AG ADR | 1.7% |
| Roche Holding AG ADR | 1.7% |
| Shell plc ADR | 1.6% |
| Top 10 Total | 24.3% |
| |
2 | "10 Largest Holdings (as a % of Net Assets)" excludes any temporary cash or derivative investments. |
3 | Country Diversification (% of Total Investments) includes temporary cash investments. |
There were no changes in or disagreements with fund accountants for the period.
| |  | Availability of Additional Information. For additional information, including the fund's prospectus, financial information, holdings and proxy voting information, go to GuggenheimInvestments.com/mutual-funds/literature or, call 800 820 0888. |
SAR-RYCEX-093024
Semi-Annual Shareholder Report | 9.30.24
This semi-annual shareholder report contains important information about the Europe 1.25x Strategy Fund for the period of April 1, 2024 to September 30, 2024. You can find additional information about the fund at GuggenheimInvestments.com/mutual-funds/literature. You can also request this information by contacting 800 820 0888 or GuggenheimClientServices@mufg-is.com.
For the period of April 1, 2024 to September 30, 2024, the fund (Class H shares) returned 5.50%, underperforming the fund's benchmark, the MSCI World ex US Index, which returned 5.53% for the same period and underperforming the fund's secondary index, the STOXX Europe 50 Index, which returned 5.70% for the same period.
The fund's broad-based securities market index was changed from the STOXX Europe 50 Index to the MSCI World ex US Index to comply with the regulation that requires the fund's broad-based securities market index to represent the overall applicable market.
What factors materially affected the fund's performance over the last six months?
The sectors that contributed the most to the return of the STOXX Europe 50 Index (the "Index") were Financials, Utilities, and Health Care. Those that detracted the most were Consumer Discretionary, Information Technology, and Energy. The holdings that contributed the most to the return of the Index were SAP SE, Sanofi, and Schneider Electric SE. Those that detracted the most were ASML Holding NV, LVMH Moet Hennessy Louis Vuitton SE, and Stellantis NV. The Fund maintained a daily correlation of over 99% to its benchmark of 125% of the daily price movement of the fair value of the STOXX Europe 50 Index.
Cumulative performance* for the fund's most recently completed 10 years (as of 9.30.24), assuming a $10,000 initial investment.
| 09/30/2014 | 10000 | 10000 | 10000 |
| 12/31/2014 | 9022 | 9600 | 9420 |
| 03/31/2015 | 9343 | 9904 | 9645 |
| 06/30/2015 | 9391 | 9858 | 9694 |
| 09/30/2015 | 8367 | 8766 | 8851 |
| 12/31/2015 | 8425 | 9077 | 9008 |
| 03/31/2016 | 7881 | 8834 | 8587 |
| 06/30/2016 | 7881 | 8641 | 8576 |
| 09/30/2016 | 8052 | 9131 | 8818 |
| 12/31/2016 | 7890 | 9066 | 8803 |
| 03/31/2017 | 8674 | 9615 | 9466 |
| 06/30/2017 | 9414 | 10056 | 10100 |
| 09/30/2017 | 9982 | 10563 | 10695 |
| 12/31/2017 | 10110 | 10972 | 10924 |
| 03/31/2018 | 9676 | 10660 | 10524 |
| 06/30/2018 | 9403 | 10483 | 10415 |
| 09/30/2018 | 9540 | 10559 | 10498 |
| 12/31/2018 | 8216 | 9173 | 9338 |
| 03/31/2019 | 9456 | 10048 | 10450 |
| 06/30/2019 | 9994 | 10315 | 10972 |
| 09/30/2019 | 9751 | 10153 | 10809 |
| 12/31/2019 | 10664 | 10913 | 11678 |
| 03/31/2020 | 7729 | 8309 | 9244 |
| 06/30/2020 | 9142 | 9525 | 10450 |
| 09/30/2020 | 9267 | 9936 | 10655 |
| 12/31/2020 | 10701 | 11478 | 11933 |
| 03/31/2021 | 11049 | 11868 | 12355 |
| 06/30/2021 | 12166 | 12446 | 13304 |
| 09/30/2021 | 11672 | 12293 | 13024 |
| 12/31/2021 | 12705 | 12640 | 13980 |
| 03/31/2022 | 11825 | 11946 | 13398 |
| 06/30/2022 | 10180 | 10098 | 11835 |
| 09/30/2022 | 8726 | 9104 | 10767 |
| 12/31/2022 | 11070 | 10543 | 12884 |
| 03/31/2023 | 12418 | 11304 | 14261 |
| 06/30/2023 | 12854 | 11529 | 14723 |
| 09/30/2023 | 11868 | 10986 | 14056 |
| 12/31/2023 | 13232 | 12100 | 15354 |
| 03/31/2024 | 14196 | 12678 | 16360 |
| 06/30/2024 | 14465 | 12486 | 16673 |
| 09/30/2024 | 14978 | 13379 | 17286 |
| Class H | 5.50% | 26.21% | 8.96% | 4.12% |
| MSCI World ex US Index | 5.53% | 21.78% | 5.67% | 2.95% |
| STOXX Europe 50 Index | 5.70% | 23.02% | 9.84% | 5.63% |
The fund's past performance is not a good predictor of the fund's future performance. Visit GuggenheimInvestments.com/mutual-funds/performance for more recent performance information.
| Net Assets | $1,673,951 |
| Total Number of Portfolio Holdings | 58 |
| Portfolio Turnover Rate | 1,496%1496% |
| Europe 1.25x Strategy Fund | Class H | RYEUX | Semi-Annual Shareholder Report | September 30, 2024 |
| Currency Futures Contracts | 83.4% |
| Equity Futures Contracts | 80.6% |
| Consumer, Non-cyclical | 16.8% |
| Financial | 8.0% |
| Industrial | 4.9% |
| Technology | 4.3% |
| Energy | 3.4% |
| Consumer, Cyclical | 3.1% |
| Basic Materials | 2.2% |
| Utilities | 1.7% |
| Communications | 1.3% |

| United States | 56.9% |
| France | 10.2% |
| United Kingdom | 8.1% |
| Switzerland | 7.9% |
| Germany | 5.7% |
| Netherlands | 4.4% |
| Denmark | 2.8% |
| Other | 4.0% |
| Total Investments | 100.0% |
| Guggenheim Ultra Short Duration Fund — Institutional Class | 4.2% |
| Guggenheim Strategy Fund II | 4.1% |
| Novo Nordisk A/S ADR | 2.9% |
| ASML Holding N.V. — Class G | 2.5% |
| Nestle S.A. ADR | 2.0% |
| AstraZeneca plc ADR | 1.8% |
| SAP SE ADR | 1.8% |
| Novartis AG ADR | 1.7% |
| Roche Holding AG ADR | 1.7% |
| Shell plc ADR | 1.6% |
| Top 10 Total | 24.3% |
| |
1 | "Holdings Diversification (Market Exposure as a % of Net Assets)" excludes any temporary cash investments, investments in Guggenheim Strategy Funds Trust mutual funds, or investments in Guggenheim Ultra Short Duration Fund. The Fund's target exposure is achieved through a combination of equity futures contracts and currency futures contracts. |
| |
2 | "10 Largest Holdings (as a % of Net Assets)" excludes any temporary cash or derivative investments. |
3 | Country Diversification (% of Total Investments) includes temporary cash investments. |
| Guggenheim Ultra Short Duration Fund — Institutional Class | 4.2% |
| Guggenheim Strategy Fund II | 4.1% |
| Novo Nordisk A/S ADR | 2.9% |
| ASML Holding N.V. — Class G | 2.5% |
| Nestle S.A. ADR | 2.0% |
| AstraZeneca plc ADR | 1.8% |
| SAP SE ADR | 1.8% |
| Novartis AG ADR | 1.7% |
| Roche Holding AG ADR | 1.7% |
| Shell plc ADR | 1.6% |
| Top 10 Total | 24.3% |
| |
2 | "10 Largest Holdings (as a % of Net Assets)" excludes any temporary cash or derivative investments. |
3 | Country Diversification (% of Total Investments) includes temporary cash investments. |
There were no changes in or disagreements with fund accountants for the period.
| |  | Availability of Additional Information. For additional information, including the fund's prospectus, financial information, holdings and proxy voting information, go to GuggenheimInvestments.com/mutual-funds/literature or, call 800 820 0888. |
SAR-RYEUX-093024
Semi-Annual Shareholder Report | 9.30.24
This semi-annual shareholder report contains important information about the Japan 2x Strategy Fund for the period of April 1, 2024 to September 30, 2024. You can find additional information about the fund at GuggenheimInvestments.com/mutual-funds/literature. You can also request this information by contacting 800 820 0888 or GuggenheimClientServices@mufg-is.com.
For the period of April 1, 2024 to September 30, 2024, the fund (Class A shares) returned -5.79%, underperforming the fund's benchmark, the MSCI World ex US Index, which returned 5.53% for the same period and underperforming the fund's secondary index, the Nikkei-225 Stock Average Index, which returned -0.14% for the same period.
The fund's broad-based securities market index was changed from the Nikkei-225 Stock Average Index to the MSCI World ex US Index to comply with the regulation that requires the fund's broad-based securities market index to represent the overall applicable market.
What factors materially affected the fund's performance over the last six months?
The sectors that contributed the most to the return of the Nikkei-225 Stock Average Index (the "Index") were Health Care, Communication Services, and Industrials. Those that detracted the most were Information Technology, Materials, and Real Estate. The holdings that contributed the most to the return of the Index were FAST RETAILING Co. Ltd., Recruit Holdings Co. Ltd., and TDK Corp. Those that detracted the most were Tokyo Electron Ltd., Lasertec Corp., and Toyota Motor Corp. The Fund maintained a daily correlation of over 99% to its benchmark of 200% of the daily price movement of the fair value of the Nikkei-225 Stock Average Index.
Cumulative performance* for the fund's most recently completed 10 years (as of 9.30.24), assuming a $10,000 initial investment.
| 09/30/2014 | 9526 | 10000 | 10000 |
| 12/31/2014 | 9023 | 9600 | 9904 |
| 03/31/2015 | 11048 | 9904 | 10856 |
| 06/30/2015 | 11565 | 9858 | 11235 |
| 09/30/2015 | 9250 | 8766 | 9852 |
| 12/31/2015 | 10332 | 9077 | 10700 |
| 03/31/2016 | 9345 | 8834 | 10100 |
| 06/30/2016 | 9810 | 8641 | 10234 |
| 09/30/2016 | 11229 | 9131 | 10996 |
| 12/31/2016 | 11095 | 9066 | 11111 |
| 03/31/2017 | 12124 | 9615 | 11518 |
| 06/30/2017 | 13274 | 10056 | 12090 |
| 09/30/2017 | 13673 | 10563 | 12255 |
| 12/31/2017 | 16749 | 10972 | 13710 |
| 03/31/2018 | 16724 | 10660 | 13481 |
| 06/30/2018 | 16359 | 10483 | 13651 |
| 09/30/2018 | 18276 | 10559 | 14408 |
| 12/31/2018 | 13076 | 9173 | 12291 |
| 03/31/2019 | 14752 | 10048 | 12980 |
| 06/30/2019 | 15328 | 10315 | 13372 |
| 09/30/2019 | 16099 | 10153 | 13639 |
| 12/31/2019 | 18125 | 10913 | 14730 |
| 03/31/2020 | 11781 | 8309 | 11900 |
| 06/30/2020 | 15557 | 9525 | 14015 |
| 09/30/2020 | 17753 | 9936 | 14896 |
| 12/31/2020 | 25512 | 11478 | 18022 |
| 03/31/2021 | 25083 | 11868 | 17886 |
| 06/30/2021 | 23670 | 12446 | 17572 |
| 09/30/2021 | 24552 | 12293 | 17919 |
| 12/31/2021 | 21897 | 12640 | 16948 |
| 03/31/2022 | 17822 | 11946 | 15518 |
| 06/30/2022 | 12959 | 10098 | 13190 |
| 09/30/2022 | 10782 | 9104 | 12151 |
| 12/31/2022 | 12556 | 10543 | 13505 |
| 03/31/2023 | 14625 | 11304 | 14320 |
| 06/30/2023 | 16920 | 11529 | 15591 |
| 09/30/2023 | 14075 | 10986 | 14457 |
| 12/31/2023 | 16871 | 12100 | 16110 |
| 03/31/2024 | 21109 | 12678 | 17990 |
| 06/30/2024 | 17658 | 12486 | 16685 |
| 09/30/2024 | 19888 | 13379 | 17964 |

| Class A (without sales charge) | -5.79% | 41.30% | 4.32% | 7.64% |
| Class A (with sales charge)‡ | -10.25% | 34.58% | 3.31% | 7.12% |
| MSCI World ex US Index | 5.53% | 21.78% | 5.67% | 2.95% |
| Nikkei-225 Stock Average Index | -0.14% | 24.26% | 5.66% | 6.03% |
The fund's past performance is not a good predictor of the fund's future performance. Visit GuggenheimInvestments.com/mutual-funds/performance for more recent performance information.
| Net Assets | $1,738,588 |
| Total Number of Portfolio Holdings | 5 |
| Portfolio Turnover Rate | 0% |
| Japan 2x Strategy Fund | Class A | RYJSX | Semi-Annual Shareholder Report | September 30, 2024 |
| Equity Futures Contracts | 198.1% |
| Currency Futures Contracts | 197.1% |
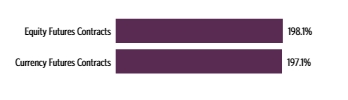
| |
1 | "Holdings Diversification (Market Exposure as a % of Net Assets)" excludes any temporary cash investments, investments in Guggenheim Strategy Funds Trust mutual funds, or investments in Guggenheim Ultra Short Duration Fund. The Fund's target exposure is achieved through a combination of equity futures contracts and currency futures contracts. |
There were no changes in or disagreements with fund accountants for the period.
| |  | Availability of Additional Information. For additional information, including the fund's prospectus, financial information, holdings and proxy voting information, go to GuggenheimInvestments.com/mutual-funds/literature or, call 800 820 0888. |
SAR-RYJSX-093024
Semi-Annual Shareholder Report | 9.30.24
This semi-annual shareholder report contains important information about the Japan 2x Strategy Fund for the period of April 1, 2024 to September 30, 2024. You can find additional information about the fund at GuggenheimInvestments.com/mutual-funds/literature. You can also request this information by contacting 800 820 0888 or GuggenheimClientServices@mufg-is.com.
For the period of April 1, 2024 to September 30, 2024, the fund (Class C shares) returned -6.18%, underperforming the fund's benchmark, the MSCI World ex US Index, which returned 5.53% for the same period and underperforming the fund's secondary index, the Nikkei-225 Stock Average Index, which returned -0.14% for the same period.
The fund's broad-based securities market index was changed from the Nikkei-225 Stock Average Index to the MSCI World ex US Index to comply with the regulation that requires the fund's broad-based securities market index to represent the overall applicable market.
What factors materially affected the fund's performance over the last six months?
The sectors that contributed the most to the return of the Nikkei-225 Stock Average Index (the "Index") were Health Care, Communication Services, and Industrials. Those that detracted the most were Information Technology, Materials, and Real Estate. The holdings that contributed the most to the return of the Index were FAST RETAILING Co. Ltd., Recruit Holdings Co. Ltd., and TDK Corp. Those that detracted the most were Tokyo Electron Ltd., Lasertec Corp., and Toyota Motor Corp. The Fund maintained a daily correlation of over 99% to its benchmark of 200% of the daily price movement of the fair value of the Nikkei-225 Stock Average Index.
Cumulative performance* for the fund's most recently completed 10 years (as of 9.30.24), assuming a $10,000 initial investment.
| 09/30/2014 | 10000 | 10000 | 10000 |
| 12/31/2014 | 9454 | 9600 | 9904 |
| 03/31/2015 | 11566 | 9904 | 10856 |
| 06/30/2015 | 12097 | 9858 | 11235 |
| 09/30/2015 | 9646 | 8766 | 9852 |
| 12/31/2015 | 10744 | 9077 | 10700 |
| 03/31/2016 | 9709 | 8834 | 10100 |
| 06/30/2016 | 10172 | 8641 | 10234 |
| 09/30/2016 | 11623 | 9131 | 10996 |
| 12/31/2016 | 11459 | 9066 | 11111 |
| 03/31/2017 | 12499 | 9615 | 11518 |
| 06/30/2017 | 13659 | 10056 | 12090 |
| 09/30/2017 | 14043 | 10563 | 12255 |
| 12/31/2017 | 17169 | 10972 | 13710 |
| 03/31/2018 | 17110 | 10660 | 13481 |
| 06/30/2018 | 16706 | 10483 | 13651 |
| 09/30/2018 | 18631 | 10559 | 14408 |
| 12/31/2018 | 13305 | 9173 | 12291 |
| 03/31/2019 | 14984 | 10048 | 12980 |
| 06/30/2019 | 15539 | 10315 | 13372 |
| 09/30/2019 | 16290 | 10153 | 13639 |
| 12/31/2019 | 18305 | 10913 | 14730 |
| 03/31/2020 | 11875 | | 11900 |
| 06/30/2020 | 15653 | 9525 | 14015 |
| 09/30/2020 | 17829 | 9936 | 14896 |
| 12/31/2020 | 25571 | 11478 | 18022 |
| 03/31/2021 | 25096 | 11868 | 17886 |
| 06/30/2021 | 23637 | 12446 | 17572 |
| 09/30/2021 | 24469 | 12293 | 17919 |
| 12/31/2021 | 21781 | 12640 | 16948 |
| 03/31/2022 | 17694 | 11946 | 15518 |
| 06/30/2022 | 12840 | 10098 | 13190 |
| 09/30/2022 | 10662 | 9104 | 12151 |
| 12/31/2022 | 12393 | 10543 | 13505 |
| 03/31/2023 | 14409 | 11304 | 14320 |
| 06/30/2023 | 16638 | 11529 | 15591 |
| 09/30/2023 | 13815 | 10986 | 14457 |
| 12/31/2023 | 16537 | 12100 | 16110 |
| 03/31/2024 | 20652 | 12678 | 17990 |
| 06/30/2024 | 17237 | 12486 | 16685 |
| 09/30/2024 | 19376 | 13379 | 17964 |
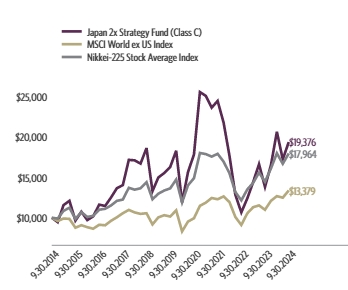
| Class C (without CDSC) | -6.18% | 40.25% | 3.53% | 6.84% |
| Class C (with CDSC)§ | -7.12% | 39.25% | 3.53% | 6.84% |
| MSCI World ex US Index | 5.53% | 21.78% | 5.67% | 2.95% |
| Nikkei-225 Stock Average Index | -0.14% | 24.26% | 5.66% | 6.03% |
The fund's past performance is not a good predictor of the fund's future performance. Visit GuggenheimInvestments.com/mutual-funds/performance for more recent performance information.
| Net Assets | $1,738,588 |
| Total Number of Portfolio Holdings | 5 |
| Portfolio Turnover Rate | 0% |
| Japan 2x Strategy Fund | Class C | RYJTX | Semi-Annual Shareholder Report | September 30, 2024 |
| Equity Futures Contracts | 198.1% |
| Currency Futures Contracts | 197.1% |

| |
1 | "Holdings Diversification (Market Exposure as a % of Net Assets)" excludes any temporary cash investments, investments in Guggenheim Strategy Funds Trust mutual funds, or investments in Guggenheim Ultra Short Duration Fund. The Fund's target exposure is achieved through a combination of equity futures contracts and currency futures contracts. |
There were no changes in or disagreements with fund accountants for the period.
| |  | Availability of Additional Information. For additional information, including the fund's prospectus, financial information, holdings and proxy voting information, go to GuggenheimInvestments.com/mutual-funds/literature or, call 800 820 0888. |
SAR-RYJTX-093024
Semi-Annual Shareholder Report | 9.30.24
This semi-annual shareholder report contains important information about the Japan 2x Strategy Fund for the period of April 1, 2024 to September 30, 2024. You can find additional information about the fund at GuggenheimInvestments.com/mutual-funds/literature. You can also request this information by contacting 800 820 0888 or GuggenheimClientServices@mufg-is.com.
For the period of April 1, 2024 to September 30, 2024, the fund (Class H shares) returned -5.79%, underperforming the fund's benchmark, the MSCI World ex US Index, which returned 5.53% for the same period and underperforming the fund's secondary index, the Nikkei-225 Stock Average Index, which returned -0.14% for the same period.
The fund's broad-based securities market index was changed from the Nikkei-225 Stock Average Index to the MSCI World ex US Index to comply with the regulation that requires the fund's broad-based securities market index to represent the overall applicable market.
What factors materially affected the fund's performance over the last six months?
The sectors that contributed the most to the return of the Nikkei-225 Stock Average Index (the "Index") were Health Care, Communication Services, and Industrials. Those that detracted the most were Information Technology, Materials, and Real Estate. The holdings that contributed the most to the return of the Index were FAST RETAILING Co. Ltd., Recruit Holdings Co. Ltd., and TDK Corp. Those that detracted the most were Tokyo Electron Ltd., Lasertec Corp., and Toyota Motor Corp. The Fund maintained a daily correlation of over 99% to its benchmark of 200% of the daily price movement of the fair value of the Nikkei-225 Stock Average Index.
Cumulative performance* for the fund's most recently completed 10 years (as of 9.30.24), assuming a $10,000 initial investment.
| 09/30/2014 | 10000 | 10000 | 10000 |
| 12/31/2014 | 9474 | 9600 | 9904 |
| 03/31/2015 | 11603 | 9904 | 10856 |
| 06/30/2015 | 12154 | 9858 | 11235 |
| 09/30/2015 | 9712 | 8766 | 9852 |
| 12/31/2015 | 10854 | 9077 | 10700 |
| 03/31/2016 | 9821 | 8834 | 10100 |
| 06/30/2016 | 10333 | 8641 | 10234 |
| 09/30/2016 | 11797 | 9131 | 10996 |
| 12/31/2016 | 11685 | 9066 | 11111 |
| 03/31/2017 | 12775 | 9615 | 11518 |
| 06/30/2017 | 13983 | 10056 | 12090 |
| 09/30/2017 | 14411 | 10563 | 12255 |
| 12/31/2017 | 17651 | 10972 | 13710 |
| 03/31/2018 | 17623 | 10660 | 13481 |
| 06/30/2018 | 17240 | 10483 | 13651 |
| 09/30/2018 | 19264 | 10559 | 14408 |
| 12/31/2018 | 13784 | 9173 | 12291 |
| 03/31/2019 | 15550 | 10048 | 12980 |
| 06/30/2019 | 16156 | 10315 | 13372 |
| 09/30/2019 | 16965 | 10153 | 13639 |
| 12/31/2019 | 19099 | 10913 | 14730 |
| 03/31/2020 | 12413 | 8309 | 11900 |
| 06/30/2020 | 16393 | 9525 | 14015 |
| 09/30/2020 | 18708 | 9936 | 14896 |
| 12/31/2020 | 26885 | 11478 | 18022 |
| 03/31/2021 | 26433 | 11868 | 17886 |
| 06/30/2021 | 24944 | 12446 | 17572 |
| 09/30/2021 | 25872 | 12293 | 17919 |
| 12/31/2021 | 23075 | 12640 | 16948 |
| 03/31/2022 | 18781 | 11946 | 15518 |
| 06/30/2022 | 13655 | 10098 | 13190 |
| 09/30/2022 | 11362 | 9104 | 12151 |
| 12/31/2022 | 13230 | 10543 | 13505 |
| 03/31/2023 | 15410 | 11304 | 14320 |
| 06/30/2023 | 17829 | 11529 | 15591 |
| 09/30/2023 | 14831 | 10986 | 14457 |
| 12/31/2023 | 17778 | 12100 | 16110 |
| 03/31/2024 | 22243 | 12678 | 17990 |
| 06/30/2024 | 18607 | 12486 | 16685 |
| 09/30/2024 | 20955 | 13379 | 17964 |
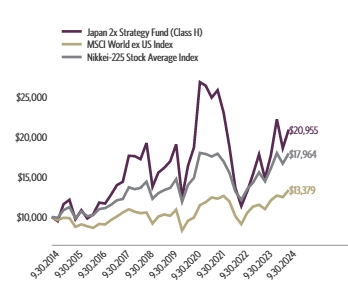
| Class H | -5.79% | 41.29% | 4.32% | 7.68% |
| MSCI World ex US Index | 5.53% | 21.78% | 5.67% | 2.95% |
| Nikkei-225 Stock Average Index | -0.14% | 24.26% | 5.66% | 6.03% |
The fund's past performance is not a good predictor of the fund's future performance. Visit GuggenheimInvestments.com/mutual-funds/performance for more recent performance information.
| Net Assets | $1,738,588 |
| Total Number of Portfolio Holdings | 5 |
| Portfolio Turnover Rate | 0% |
| Japan 2x Strategy Fund | Class H | RYJHX | Semi-Annual Shareholder Report | September 30, 2024 |
| Equity Futures Contracts | 198.1% |
| Currency Futures Contracts | 197.1% |

| |
1 | "Holdings Diversification (Market Exposure as a % of Net Assets)" excludes any temporary cash investments, investments in Guggenheim Strategy Funds Trust mutual funds, or investments in Guggenheim Ultra Short Duration Fund. The Fund's target exposure is achieved through a combination of equity futures contracts and currency futures contracts. |
There were no changes in or disagreements with fund accountants for the period.
| |  | Availability of Additional Information. For additional information, including the fund's prospectus, financial information, holdings and proxy voting information, go to GuggenheimInvestments.com/mutual-funds/literature or, call 800 820 0888. |
SAR-RYJHX-093024
Semi-Annual Shareholder Report | 9.30.24
This semi-annual shareholder report contains important information about the Strengthening Dollar 2x Strategy Fund for the period of April 1, 2024 to September 30, 2024. You can find additional information about the fund at GuggenheimInvestments.com/mutual-funds/literature. You can also request this information by contacting 800 820 0888 or GuggenheimClientServices@mufg-is.com.
For the period of April 1, 2024 to September 30, 2024, the fund (Class A shares) returned -4.25%, underperforming the fund's benchmark, the Bloomberg U.S. Aggregate Bond Index, which returned 5.26% for the same period and underperforming the fund's secondary index, the U.S. Dollar Index, which returned -3.61% for the same period.
The fund's broad-based securities market index was changed from the U.S. Dollar Index to the Bloomberg U.S. Aggregate Bond Index to comply with the regulation that requires the fund's broad-based securities market index to represent the overall applicable market.
What factors materially affected the fund's performance over the last six months?
No currency contributed to the return of the U.S. Dollar Index (the "Index") for the period. The currencies detracting the least were the Canadian dollar, Swedish krona, and Swiss Franc. Those that detracted the most were the euro, Japanese yen, and British pound. The Fund maintained a daily correlation of over 99% to its benchmark of 200% of the daily price movement of the U.S. Dollar Index.
Cumulative performance* for the fund's most recently completed 10 years (as of 9.30.24), assuming a $10,000 initial investment.
| 09/30/2014 | 9524 | 10000 | 10000 |
| 12/31/2014 | 10445 | 10179 | 10504 |
| 03/31/2015 | 12229 | 10343 | 11445 |
| 06/30/2015 | 11377 | 10169 | 11111 |
| 09/30/2015 | 11443 | 10294 | 11211 |
| 12/31/2015 | 11909 | 10235 | 11477 |
| 03/31/2016 | 10882 | 10546 | 11007 |
| 06/30/2016 | 11172 | 10779 | 11187 |
| 09/30/2016 | 11010 | 10829 | 11108 |
| 12/31/2016 | 12646 | 10506 | 11893 |
| 03/31/2017 | 12149 | 10592 | 11677 |
| 06/30/2017 | 11035 | 10745 | 11128 |
| 09/30/2017 | 10487 | 10836 | 10831 |
| 12/31/2017 | 10352 | 10879 | 10719 |
| 03/31/2018 | 9916 | 10720 | 10490 |
| 06/30/2018 | 11014 | 10703 | 10993 |
| 09/30/2018 | 11224 | 10705 | 11069 |
| 12/31/2018 | 11564 | 10880 | 11190 |
| 03/31/2019 | 11973 | 11200 | 11320 |
| 06/30/2019 | 11829 | 11545 | 11186 |
| 09/30/2019 | 12776 | 11807 | 11564 |
| 12/31/2019 | 12139 | 11828 | 11216 |
| 03/31/2020 | 12737 | 12200 | 11525 |
| 06/30/2020 | 12337 | 12554 | 11332 |
| 09/30/2020 | 11460 | 12632 | 10925 |
| 12/31/2020 | 10480 | 12716 | 10465 |
| 03/31/2021 | 11224 | 12287 | 10848 |
| 06/30/2021 | 10969 | 12512 | 10756 |
| 09/30/2021 | 11376 | 12518 | 10965 |
| 12/31/2021 | 11652 | 12520 | 11132 |
| 03/31/2022 | 12187 | 11777 | 11439 |
| 06/30/2022 | 13692 | 11224 | 12182 |
| 09/30/2022 | 15806 | 10691 | 13046 |
| 12/31/2022 | 13532 | 10891 | 12046 |
| 03/31/2023 | 13447 | 11214 | 11928 |
| 06/30/2023 | 13743 | 11119 | 11975 |
| 09/30/2023 | 14857 | 10760 | 12354 |
| 12/31/2023 | 13729 | 11493 | 11791 |
| 03/31/2024 | 14840 | 11404 | 12165 |
| 06/30/2024 | 15436 | 11411 | 12319 |
| 09/30/2024 | 14209 | 12004 | 11727 |
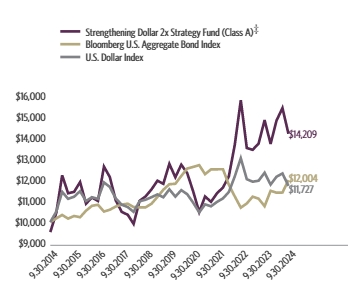
| Class A (without sales charge) | -4.25% | -4.36% | 2.15% | 4.08% |
| Class A (with sales charge)‡ | -8.80% | -8.90% | 1.16% | 3.58% |
| Bloomberg U.S. Aggregate Bond Index | 5.26% | 11.57% | 0.33% | 1.84% |
| U.S. Dollar Index | -3.61% | -5.08% | 0.28% | 1.61% |
The fund's past performance is not a good predictor of the fund's future performance. Visit GuggenheimInvestments.com/mutual-funds/performance for more recent performance information.
| Net Assets | $2,306,570 |
| Total Number of Portfolio Holdings | 5 |
| Portfolio Turnover Rate | 0% |
| Strengthening Dollar 2x Strategy Fund | Class A | RYSDX | Semi-Annual Shareholder Report | September 30, 2024 |
| U.S. Dollar Index Currency Futures Contracts | 170.0% |
| U.S. Dollar Index Swap Agreements | 27.7% |

| |
1 | "Holdings Diversification (Market Exposure as a % of Net Assets)" excludes any temporary cash investments, investments in Guggenheim Strategy Funds Trust mutual funds, or investments in Guggenheim Ultra Short Duration Fund. The Fund's target exposure is achieved through a combination of total return swaps and futures contracts. |
There were no changes in or disagreements with fund accountants for the period.
| |  | Availability of Additional Information. For additional information, including the fund's prospectus, financial information, holdings and proxy voting information, go to GuggenheimInvestments.com/mutual-funds/literature or, call 800 820 0888. |
SAR-RYSDX-093024
Semi-Annual Shareholder Report | 9.30.24
This semi-annual shareholder report contains important information about the Strengthening Dollar 2x Strategy Fund for the period of April 1, 2024 to September 30, 2024. You can find additional information about the fund at GuggenheimInvestments.com/mutual-funds/literature. You can also request this information by contacting 800 820 0888 or GuggenheimClientServices@mufg-is.com.
For the period of April 1, 2024 to September 30, 2024, the fund (Class C shares) returned -4.61%, underperforming the fund's benchmark, the Bloomberg U.S. Aggregate Bond Index, which returned 5.26% for the same period and underperforming the fund's secondary index, the U.S. Dollar Index, which returned -3.61% for the same period.
The fund's broad-based securities market index was changed from the U.S. Dollar Index to the Bloomberg U.S. Aggregate Bond Index to comply with the regulation that requires the fund's broad-based securities market index to represent the overall applicable market.
What factors materially affected the fund's performance over the last six months?
No currency contributed to the return of the U.S. Dollar Index (the "Index") for the period. The currencies detracting the least were the Canadian dollar, Swedish krona, and Swiss Franc. Those that detracted the most were the euro, Japanese yen, and British pound. The Fund maintained a daily correlation of over 99% to its benchmark of 200% of the daily price movement of the U.S. Dollar Index.
Cumulative performance* for the fund's most recently completed 10 years (as of 9.30.24), assuming a $10,000 initial investment.
| 09/30/2014 | 10000 | 10000 | 10000 |
| 12/31/2014 | 10945 | 10179 | 10504 |
| 03/31/2015 | 12792 | 10343 | 11445 |
| 06/30/2015 | 11881 | 10169 | 11111 |
| 09/30/2015 | 11926 | 10294 | 11211 |
| 12/31/2015 | 12388 | 10235 | 11477 |
| 03/31/2016 | 11297 | 10546 | 11007 |
| 06/30/2016 | 11577 | 10779 | 11187 |
| 09/30/2016 | 11387 | 10829 | 11108 |
| 12/31/2016 | 13056 | 10506 | 11893 |
| 03/31/2017 | 12517 | 10592 | 11677 |
| 06/30/2017 | 11349 | 10745 | 11128 |
| 09/30/2017 | 10766 | 10836 | 10831 |
| 12/31/2017 | 10608 | 10879 | 10719 |
| 03/31/2018 | 10141 | 10720 | 10490 |
| 06/30/2018 | 11245 | 10703 | 10993 |
| 09/30/2018 | 11439 | 10705 | 11069 |
| 12/31/2018 | 11763 | 10880 | 11190 |
| 03/31/2019 | 12154 | 11200 | 11320 |
| 06/30/2019 | 11989 | 11545 | 11186 |
| 09/30/2019 | 12924 | 11807 | 11564 |
| 12/31/2019 | 12255 | 11828 | 11216 |
| 03/31/2020 | 12838 | 12200 | 11525 |
| 06/30/2020 | 12412 | 12554 | 11332 |
| 09/30/2020 | 11507 | 12632 | 10925 |
| 12/31/2020 | 10501 | 12716 | 10465 |
| 03/31/2021 | 11225 | 12287 | 10848 |
| 06/30/2021 | 10951 | 12512 | 10756 |
| 09/30/2021 | 11335 | 12518 | 10965 |
| 12/31/2021 | 11588 | 12520 | 11132 |
| 03/31/2022 | 12099 | 11777 | 11439 |
| 06/30/2022 | 13569 | 11224 | 12182 |
| 09/30/2022 | 15634 | 10691 | 13046 |
| 12/31/2022 | 13361 | 10891 | 12046 |
| 03/31/2023 | 13250 | 11214 | 11928 |
| 06/30/2023 | 13519 | 11119 | 11975 |
| 09/30/2023 | 14593 | 10760 | 12354 |
| 12/31/2023 | 13458 | 11493 | 11791 |
| 03/31/2024 | 14518 | 11404 | 12165 |
| 06/30/2024 | 15074 | 11411 | 12319 |
| 09/30/2024 | 13849 | 12004 | 11727 |
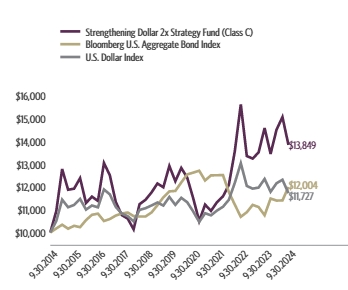
| Class C (without CDSC) | -4.61% | -5.10% | 1.39% | 3.31% |
| Class C (with CDSC)§ | -5.56% | -6.03% | 1.39% | 3.31% |
| Bloomberg U.S. Aggregate Bond Index | 5.26% | 11.57% | 0.33% | 1.84% |
| U.S. Dollar Index | -3.61% | -5.08% | 0.28% | 1.61% |
The fund's past performance is not a good predictor of the fund's future performance. Visit GuggenheimInvestments.com/mutual-funds/performance for more recent performance information.
| Net Assets | $2,306,570 |
| Total Number of Portfolio Holdings | 5 |
| Portfolio Turnover Rate | 0% |
| Strengthening Dollar 2x Strategy Fund | Class C | RYSJX | Semi-Annual Shareholder Report | September 30, 2024 |
| U.S. Dollar Index Currency Futures Contracts | 170.0% |
| U.S. Dollar Index Swap Agreements | 27.7% |
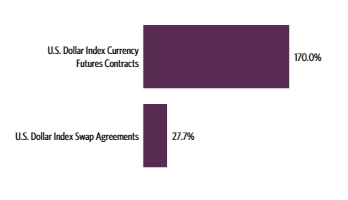
| |
1 | "Holdings Diversification (Market Exposure as a % of Net Assets)" excludes any temporary cash investments, investments in Guggenheim Strategy Funds Trust mutual funds, or investments in Guggenheim Ultra Short Duration Fund. The Fund's target exposure is achieved through a combination of total return swaps and futures contracts. |
There were no changes in or disagreements with fund accountants for the period.
| |  | Availability of Additional Information. For additional information, including the fund's prospectus, financial information, holdings and proxy voting information, go to GuggenheimInvestments.com/mutual-funds/literature or, call 800 820 0888. |
SAR-RYSJX-093024
Semi-Annual Shareholder Report | 9.30.24
This semi-annual shareholder report contains important information about the Strengthening Dollar 2x Strategy Fund for the period of April 1, 2024 to September 30, 2024. You can find additional information about the fund at GuggenheimInvestments.com/mutual-funds/literature. You can also request this information by contacting 800 820 0888 or GuggenheimClientServices@mufg-is.com.
For the period of April 1, 2024 to September 30, 2024, the fund (Class H shares) returned -4.25%, underperforming the fund's benchmark, the Bloomberg U.S. Aggregate Bond Index, which returned 5.26% for the same period and underperforming the fund's secondary index, the U.S. Dollar Index, which returned -3.61% for the same period.
The fund's broad-based securities market index was changed from the U.S. Dollar Index to the Bloomberg U.S. Aggregate Bond Index to comply with the regulation that requires the fund's broad-based securities market index to represent the overall applicable market.
What factors materially affected the fund's performance over the last six months?
No currency contributed to the return of the U.S. Dollar Index (the "Index") for the period. The currencies detracting the least were the Canadian dollar, Swedish krona, and Swiss Franc. Those that detracted the most were the euro, Japanese yen, and British pound. The Fund maintained a daily correlation of over 99% to its benchmark of 200% of the daily price movement of the U.S. Dollar Index.
Cumulative performance* for the fund's most recently completed 10 years (as of 9.30.24), assuming a $10,000 initial investment.
| 09/30/2014 | 10000 | 10000 | 10000 |
| 12/31/2014 | 10966 | 10179 | 10504 |
| 03/31/2015 | 12839 | 10343 | 11445 |
| 06/30/2015 | 11949 | 10169 | 11111 |
| 09/30/2015 | 12014 | 10294 | 11211 |
| 12/31/2015 | 12505 | 10235 | 11477 |
| 03/31/2016 | 11427 | 10546 | 11007 |
| 06/30/2016 | 11732 | 10779 | 11187 |
| 09/30/2016 | 11562 | 10829 | 11108 |
| 12/31/2016 | 13280 | 10506 | 11893 |
| 03/31/2017 | 12757 | 10592 | 11677 |
| 06/30/2017 | 11588 | 10745 | 11128 |
| 09/30/2017 | 11013 | 10836 | 10831 |
| 12/31/2017 | 10871 | 10879 | 10719 |
| 03/31/2018 | 10411 | 10720 | 10490 |
| 06/30/2018 | 11566 | 10703 | 10993 |
| 09/30/2018 | 11785 | 10705 | 11069 |
| 12/31/2018 | 12144 | 10880 | 11190 |
| 03/31/2019 | 12572 | 11200 | 11320 |
| 06/30/2019 | 12425 | 11545 | 11186 |
| 09/30/2019 | 13419 | 11807 | 11564 |
| 12/31/2019 | 12750 | 11828 | 11216 |
| 03/31/2020 | 13376 | 12200 | 11525 |
| 06/30/2020 | 12958 | 12554 | 11332 |
| 09/30/2020 | 12036 | 12632 | 10925 |
| 12/31/2020 | 11006 | 12716 | 10465 |
| 03/31/2021 | 11790 | 12287 | 10848 |
| 06/30/2021 | 11523 | 12512 | 10756 |
| 09/30/2021 | 11951 | 12518 | 10965 |
| 12/31/2021 | 12239 | 12520 | 11132 |
| 03/31/2022 | 12803 | 11777 | 11439 |
| 06/30/2022 | 14382 | 11224 | 12182 |
| 09/30/2022 | 16604 | 10691 | 13046 |
| 12/31/2022 | 14219 | 10891 | 12046 |
| 03/31/2023 | 14128 | 11214 | 11928 |
| 06/30/2023 | 14441 | 11119 | 11975 |
| 09/30/2023 | 15610 | 10760 | 12354 |
| 12/31/2023 | 14421 | 11493 | 11791 |
| 03/31/2024 | 15590 | 11404 | 12165 |
| 06/30/2024 | 16216 | 11411 | 12319 |
| 09/30/2024 | 14927 | 12004 | 11727 |
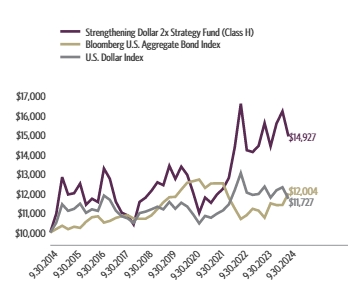
| Class H | -4.25% | -4.38% | 2.15% | 4.09% |
| Bloomberg U.S. Aggregate Bond Index | 5.26% | 11.57% | 0.33% | 1.84% |
| U.S. Dollar Index | -3.61% | -5.08% | 0.28% | 1.61% |
The fund's past performance is not a good predictor of the fund's future performance. Visit GuggenheimInvestments.com/mutual-funds/performance for more recent performance information.
| Net Assets | $2,306,570 |
| Total Number of Portfolio Holdings | 5 |
| Portfolio Turnover Rate | 0% |
| Strengthening Dollar 2x Strategy Fund | Class H | RYSBX | Semi-Annual Shareholder Report | September 30, 2024 |
| U.S. Dollar Index Currency Futures Contracts | 170.0% |
| U.S. Dollar Index Swap Agreements | 27.7% |

| |
1 | "Holdings Diversification (Market Exposure as a % of Net Assets)" excludes any temporary cash investments, investments in Guggenheim Strategy Funds Trust mutual funds, or investments in Guggenheim Ultra Short Duration Fund. The Fund's target exposure is achieved through a combination of total return swaps and futures contracts. |
There were no changes in or disagreements with fund accountants for the period.
| |  | Availability of Additional Information. For additional information, including the fund's prospectus, financial information, holdings and proxy voting information, go to GuggenheimInvestments.com/mutual-funds/literature or, call 800 820 0888. |
SAR-RYSBX-093024
Semi-Annual Shareholder Report | 9.30.24
This semi-annual shareholder report contains important information about the Weakening Dollar 2x Strategy Fund for the period of April 1, 2024 to September 30, 2024. You can find additional information about the fund at GuggenheimInvestments.com/mutual-funds/literature. You can also request this information by contacting 800 820 0888 or GuggenheimClientServices@mufg-is.com.
For the period of April 1, 2024 to September 30, 2024, the fund (Class A shares) returned 7.21%, outperforming the fund's benchmark, the Bloomberg U.S. Aggregate Bond Index, which returned 5.26% for the same period and outperforming the fund's secondary index, the U.S. Dollar Index, which returned -3.61% for the same period.
The fund's broad-based securities market index was changed from the U.S. Dollar Index to the Bloomberg U.S. Aggregate Bond Index to comply with the regulation that requires the fund's broad-based securities market index to represent the overall applicable market.
What factors materially affected the fund's performance over the last six months?
No currency contributed to the return of the U.S. Dollar Index (the "Index") for the period. The currencies detracting the least were the Canadian dollar, Swedish krona, and Swiss Franc. Those that detracted the most were the euro, Japanese yen, and British pound. The Fund maintained a daily correlation of over 99% to its benchmark of -200% of the daily price movement of the U.S. Dollar Index.
Cumulative performance* for the fund's most recently completed 10 years (as of 9.30.24), assuming a $10,000 initial investment.
| 09/30/2014 | 9527 | 10000 | 10000 |
| 12/31/2014 | 8606 | 10179 | 10504 |
| 03/31/2015 | 7236 | 10343 | 11445 |
| 06/30/2015 | 7660 | 10169 | 11111 |
| 09/30/2015 | 7518 | 10294 | 11211 |
| 12/31/2015 | 7119 | 10235 | 11477 |
| 03/31/2016 | 7709 | 10546 | 11007 |
| 06/30/2016 | 7445 | 10779 | 11187 |
| 09/30/2016 | 7488 | 10829 | 11108 |
| 12/31/2016 | 6452 | 10506 | 11893 |
| 03/31/2017 | 6653 | 10592 | 11677 |
| 06/30/2017 | 7276 | 10745 | 11128 |
| 09/30/2017 | 7605 | 10836 | 10831 |
| 12/31/2017 | 7669 | 10879 | 10719 |
| 03/31/2018 | 7951 | 10720 | 10490 |
| 06/30/2018 | 7138 | 10703 | 10993 |
| 09/30/2018 | 6987 | 10705 | 11069 |
| 12/31/2018 | 6762 | 10880 | 11190 |
| 03/31/2019 | 6525 | 11200 | 11320 |
| 06/30/2019 | 6608 | 11545 | 11186 |
| 09/30/2019 | 6111 | 11807 | 11564 |
| 12/31/2019 | 6417 | 11828 | 11216 |
| 03/31/2020 | 5942 | 12200 | 11525 |
| 06/30/2020 | 6115 | 12554 | 11332 |
| 09/30/2020 | 6551 | 12632 | 10925 |
| 12/31/2020 | 7097 | 12716 | 10465 |
| 03/31/2021 | 6556 | 12287 | 10848 |
| 06/30/2021 | 6641 | 12512 | 10756 |
| 09/30/2021 | 6343 | 12518 | 10965 |
| 12/31/2021 | 6102 | 12520 | 11132 |
| 03/31/2022 | 5708 | 11777 | 11439 |
| 06/30/2022 | 4975 | 11224 | 12182 |
| 09/30/2022 | 4278 | 10691 | 13046 |
| 12/31/2022 | 4974 | 10891 | 12046 |
| 03/31/2023 | 5038 | 11214 | 11928 |
| 06/30/2023 | 4989 | 11119 | 11975 |
| 09/30/2023 | 4681 | 10760 | 12354 |
| 12/31/2023 | 5117 | 11493 | 11791 |
| 03/31/2024 | 4803 | 11404 | 12165 |
| 06/30/2024 | 4681 | 11411 | 12319 |
| 09/30/2024 | 5150 | 12004 | 11727 |
| Class A (without sales charge) | 7.21% | 10.02% | -3.37% | -5.97% |
| Class A (with sales charge)‡ | 2.12% | 4.79% | -4.30% | -6.42% |
| Bloomberg U.S. Aggregate Bond Index | 5.26% | 11.57% | 0.33% | 1.84% |
| U.S. Dollar Index | -3.61% | -5.08% | 0.28% | 1.61% |
The fund's past performance is not a good predictor of the fund's future performance. Visit GuggenheimInvestments.com/mutual-funds/performance for more recent performance information.
| Net Assets | $1,369,895 |
| Total Number of Portfolio Holdings | 5 |
| Portfolio Turnover Rate | 0% |
| Weakening Dollar 2x Strategy Fund | Class A | RYWDX | Semi-Annual Shareholder Report | September 30, 2024 |
| U.S. Dollar Index Swap Agreements Short Sales | -80.7% |
| U.S. Dollar Index Currency Futures Contracts Short Sales | -117.4% |

| |
1 | "Holdings Diversification (Market Exposure as a % of Net Assets)" excludes any temporary cash investments, investments in Guggenheim Strategy Funds Trust mutual funds, or investments in Guggenheim Ultra Short Duration Fund. The Fund's target exposure is achieved through a combination of total return swaps and futures contracts. |
There were no changes in or disagreements with fund accountants for the period.
| |  | Availability of Additional Information. For additional information, including the fund's prospectus, financial information, holdings and proxy voting information, go to GuggenheimInvestments.com/mutual-funds/literature or, call 800 820 0888. |
SAR-RYWDX-093024
Semi-Annual Shareholder Report | 9.30.24
This semi-annual shareholder report contains important information about the Weakening Dollar 2x Strategy Fund for the period of April 1, 2024 to September 30, 2024. You can find additional information about the fund at GuggenheimInvestments.com/mutual-funds/literature. You can also request this information by contacting 800 820 0888 or GuggenheimClientServices@mufg-is.com.
For the period of April 1, 2024 to September 30, 2024, the fund (Class C shares) returned 6.79%, outperforming the fund's benchmark, the Bloomberg U.S. Aggregate Bond Index, which returned 5.26% for the same period and outperforming the fund's secondary index, the U.S. Dollar Index, which returned -3.61% for the same period.
The fund's broad-based securities market index was changed from the U.S. Dollar Index to the Bloomberg U.S. Aggregate Bond Index to comply with the regulation that requires the fund's broad-based securities market index to represent the overall applicable market.
What factors materially affected the fund's performance over the last six months?
No currency contributed to the return of the U.S. Dollar Index (the "Index") for the period. The currencies detracting the least were the Canadian dollar, Swedish krona, and Swiss Franc. Those that detracted the most were the euro, Japanese yen, and British pound. The Fund maintained a daily correlation of over 99% to its benchmark of -200% of the daily price movement of the U.S. Dollar Index.
Cumulative performance* for the fund's most recently completed 10 years (as of 9.30.24), assuming a $10,000 initial investment.
| 09/30/2014 | 10000 | 10000 | 10000 |
| 12/31/2014 | 9006 | 10179 | 10504 |
| 03/31/2015 | 7565 | 10343 | 11445 |
| 06/30/2015 | 7992 | 10169 | 11111 |
| 09/30/2015 | 7831 | 10294 | 11211 |
| 12/31/2015 | 7404 | 10235 | 11477 |
| 03/31/2016 | 7999 | 10546 | 11007 |
| 06/30/2016 | 7712 | 10779 | 11187 |
| 09/30/2016 | 7733 | 10829 | 11108 |
| 12/31/2016 | 6653 | 10506 | 11893 |
| 03/31/2017 | 6847 | 10592 | 11677 |
| 06/30/2017 | 7476 | 10745 | 11128 |
| 09/30/2017 | 7800 | 10836 | 10831 |
| 12/31/2017 | 7849 | 10879 | 10719 |
| 03/31/2018 | 8125 | 10720 | 10490 |
| 06/30/2018 | 7279 | 10703 | 10993 |
| 09/30/2018 | 7112 | 10705 | 11069 |
| 12/31/2018 | 6870 | 10880 | 11190 |
| 03/31/2019 | 6618 | 11200 | 11320 |
| 06/30/2019 | 6688 | 11545 | 11186 |
| 09/30/2019 | 6173 | 11807 | 11564 |
| 12/31/2019 | 6469 | 11828 | 11216 |
| 03/31/2020 | 5979 | 12200 | 11525 |
| 06/30/2020 | 6140 | 12554 | 11332 |
| 09/30/2020 | 6567 | 12632 | 10925 |
| 12/31/2020 | 7099 | 12716 | 10465 |
| 03/31/2021 | 6547 | 12287 | 10848 |
| 06/30/2021 | 6619 | 12512 | 10756 |
| 09/30/2021 | 6310 | 12518 | 10965 |
| 12/31/2021 | 6060 | 12520 | 11132 |
| 03/31/2022 | 5658 | 11777 | 11439 |
| 06/30/2022 | 4923 | 11224 | 12182 |
| 09/30/2022 | 4225 | 10691 | 13046 |
| 12/31/2022 | 4903 | 10891 | 12046 |
| 03/31/2023 | 4957 | 11214 | 11928 |
| 06/30/2023 | 4900 | 11119 | 11975 |
| 09/30/2023 | 4588 | 10760 | 12354 |
| 12/31/2023 | 5003 | 11493 | 11791 |
| 03/31/2024 | 4684 | 11404 | 12165 |
| 06/30/2024 | 4556 | 11411 | 12319 |
| 09/30/2024 | 5002 | 12004 | 11727 |
| Class C (without CDSC) | 6.79% | 9.03% | -4.12% | -6.69% |
| Class C (with CDSC)§ | 5.79% | 8.03% | -4.12% | -6.69% |
| Bloomberg U.S. Aggregate Bond Index | 5.26% | 11.57% | 0.33% | 1.84% |
| U.S. Dollar Index | -3.61% | -5.08% | 0.28% | 1.61% |
The fund's past performance is not a good predictor of the fund's future performance. Visit GuggenheimInvestments.com/mutual-funds/performance for more recent performance information.
| Net Assets | $1,369,895 |
| Total Number of Portfolio Holdings | 5 |
| Portfolio Turnover Rate | 0% |
| Weakening Dollar 2x Strategy Fund | Class C | RYWJX | Semi-Annual Shareholder Report | September 30, 2024 |
| U.S. Dollar Index Swap Agreements Short Sales | -80.7% |
| U.S. Dollar Index Currency Futures Contracts Short Sales | -117.4% |
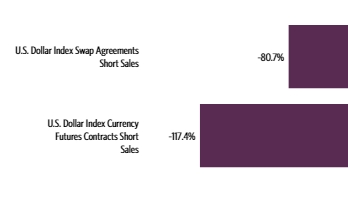
| |
1 | "Holdings Diversification (Market Exposure as a % of Net Assets)" excludes any temporary cash investments, investments in Guggenheim Strategy Funds Trust mutual funds, or investments in Guggenheim Ultra Short Duration Fund. The Fund's target exposure is achieved through a combination of total return swaps and futures contracts. |
There were no changes in or disagreements with fund accountants for the period.
| |  | Availability of Additional Information. For additional information, including the fund's prospectus, financial information, holdings and proxy voting information, go to GuggenheimInvestments.com/mutual-funds/literature or, call 800 820 0888. |
SAR-RYWJX-093024
Semi-Annual Shareholder Report | 9.30.24
This semi-annual shareholder report contains important information about the Weakening Dollar 2x Strategy Fund for the period of April 1, 2024 to September 30, 2024. You can find additional information about the fund at GuggenheimInvestments.com/mutual-funds/literature. You can also request this information by contacting 800 820 0888 or GuggenheimClientServices@mufg-is.com.
For the period of April 1, 2024 to September 30, 2024, the fund (Class H shares) returned 7.22%, outperforming the fund's benchmark, the Bloomberg U.S. Aggregate Bond Index, which returned 5.26% for the same period and outperforming the fund's secondary index, the U.S. Dollar Index, which returned -3.61% for the same period.
The fund's broad-based securities market index was changed from the U.S. Dollar Index to the Bloomberg U.S. Aggregate Bond Index to comply with the regulation that requires the fund's broad-based securities market index to represent the overall applicable market.
What factors materially affected the fund's performance over the last six months?
No currency contributed to the return of the U.S. Dollar Index (the "Index") for the period. The currencies detracting the least were the Canadian dollar, Swedish krona, and Swiss Franc. Those that detracted the most were the euro, Japanese yen, and British pound. The Fund maintained a daily correlation of over 99% to its benchmark of -200% of the daily price movement of the U.S. Dollar Index.
Cumulative performance* for the fund's most recently completed 10 years (as of 9.30.24), assuming a $10,000 initial investment.
| 09/30/2014 | 10000 | 10000 | 10000 |
| 12/31/2014 | 9025 | 10179 | 10504 |
| 03/31/2015 | 7598 | 10343 | 11445 |
| 06/30/2015 | 8037 | 10169 | 11111 |
| 09/30/2015 | 7889 | 10294 | 11211 |
| 12/31/2015 | 7476 | 10235 | 11477 |
| 03/31/2016 | 8096 | 10546 | 11007 |
| 06/30/2016 | 7818 | 10779 | 11187 |
| 09/30/2016 | 7857 | 10829 | 11108 |
| 12/31/2016 | 6773 | 10506 | 11893 |
| 03/31/2017 | 6984 | 10592 | 11677 |
| 06/30/2017 | 7639 | 10745 | 11128 |
| 09/30/2017 | 7986 | 10836 | 10831 |
| 12/31/2017 | 8051 | 10879 | 10719 |
| 03/31/2018 | 8349 | 10720 | 10490 |
| 06/30/2018 | 7495 | 10703 | 10993 |
| 09/30/2018 | 7337 | 10705 | 11069 |
| 12/31/2018 | 7099 | 10880 | 11190 |
| 03/31/2019 | 6851 | 11200 | 11320 |
| 06/30/2019 | 6937 | 11545 | 11186 |
| 09/30/2019 | 6415 | 11807 | 11564 |
| 12/31/2019 | 6734 | 11828 | 11216 |
| 03/31/2020 | 6236 | 12200 | 11525 |
| 06/30/2020 | 6417 | 12554 | 11332 |
| 09/30/2020 | 6872 | 12632 | 10925 |
| 12/31/2020 | 7445 | 12716 | 10465 |
| 03/31/2021 | 6877 | 12287 | 10848 |
| 06/30/2021 | 6968 | 12512 | 10756 |
| 09/30/2021 | 6653 | 12518 | 10965 |
| 12/31/2021 | 6402 | 12520 | 11132 |
| 03/31/2022 | 5988 | 11777 | 11439 |
| 06/30/2022 | 5219 | 11224 | 12182 |
| 09/30/2022 | 4488 | 10691 | 13046 |
| 12/31/2022 | 5218 | 10891 | 12046 |
| 03/31/2023 | 5285 | 11214 | 11928 |
| 06/30/2023 | 5234 | 11119 | 11975 |
| 09/30/2023 | 4911 | 10760 | 12354 |
| 12/31/2023 | 5369 | 11493 | 11791 |
| 03/31/2024 | 5040 | 11404 | 12165 |
| 06/30/2024 | 4911 | 11411 | 12319 |
| 09/30/2024 | 5404 | 12004 | 11727 |
| Class H | 7.22% | 10.03% | -3.37% | -5.97% |
| Bloomberg U.S. Aggregate Bond Index | 5.26% | 11.57% | 0.33% | 1.84% |
| U.S. Dollar Index | -3.61% | -5.08% | 0.28% | 1.61% |
The fund's past performance is not a good predictor of the fund's future performance. Visit GuggenheimInvestments.com/mutual-funds/performance for more recent performance information.
| Net Assets | $1,369,895 |
| Total Number of Portfolio Holdings | 5 |
| Portfolio Turnover Rate | 0% |
| Weakening Dollar 2x Strategy Fund | Class H | RYWBX | Semi-Annual Shareholder Report | September 30, 2024 |
| U.S. Dollar Index Swap Agreements Short Sales | -80.7% |
| U.S. Dollar Index Currency Futures Contracts Short Sales | -117.4% |

| |
1 | "Holdings Diversification (Market Exposure as a % of Net Assets)" excludes any temporary cash investments, investments in Guggenheim Strategy Funds Trust mutual funds, or investments in Guggenheim Ultra Short Duration Fund. The Fund's target exposure is achieved through a combination of total return swaps and futures contracts. |
There were no changes in or disagreements with fund accountants for the period.
| |  | Availability of Additional Information. For additional information, including the fund's prospectus, financial information, holdings and proxy voting information, go to GuggenheimInvestments.com/mutual-funds/literature or, call 800 820 0888. |
SAR-RYWBX-093024
Semi-Annual Shareholder Report | 9.30.24
This semi-annual shareholder report contains important information about the U.S. Government Money Market Fund for the period of April 1, 2024 to September 30, 2024. You can find additional information about the fund at GuggenheimInvestments.com/mutual-funds/literature. You can also request this information by contacting 800 820 0888 or GuggenheimClientServices@mufg-is.com.
| Money Market Class | $52 | 1.03%2 |
For the period of April 1, 2024 to September 30, 2024, the fund (Money Market Class shares) returned 2.19%.
What factors materially affected the fund's performance over the last six months?
Yields of U.S. Treasuries generally fell during the reporting period. Inflation moderated over the period, except for the housing sector, amid steady economic growth, which led the U.S. Federal Reserve (the "Fed") to cut its key lending rate of a half percentage point to a range of 4.75–5.00 percent in late September. The Fed released an updated Summary of Economic Projections ("SEP") report which lays out where committee members anticipate interest rates, economic growth, unemployment, and inflation are headed over the next couple years. According to the so-called "dot plot" within the report, the committee anticipates potentially cutting rates by up to another 150 basis points by the end of next year.
| U.S. Government Money Market Fund | 2.19% | 4.41% | 1.74% | 1.07% |
The fund's past performance is not a good predictor of the fund's future performance. Visit GuggenheimInvestments.com/mutual-funds/performance for more recent performance information.
| Net Assets | $276,711,294 |
| Total Number of Portfolio Holdings | 22 |
| U.S. Government Money Market Fund | Money Market Class | RYFXX | Semi-Annual Shareholder Report | September 30, 2024 |
| Federal Home Loan Bank - FADN | 11.4% |
| Federal Home Loan Bank - FAN | 22.6% |
| Federal Farm Credit Bank - FAN | 8.4% |
| Freddie Mac - FAN | 2.9% |
| Repurchase Agreements | 26.4% |
| U.S. Government Securities | 9.0% |
| U.S. Treasury Bills | 8.7% |
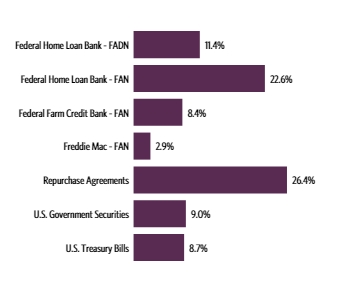
There were no changes in or disagreements with fund accountants for the period.
| |  | Availability of Additional Information. For additional information, including the fund's prospectus, financial information, holdings and proxy voting information, go to GuggenheimInvestments.com/mutual-funds/literature or, call 800 820 0888. |
SAR-RYFXX-093024
Not required at this time.
| Item 3. | Audit Committee Financial Expert. |
Not required at this time.
| Item 4. | Principal Accountant Fees and Services. |
Not required at this time.
| Item 5. | Audit Committee of Listed Registrants. |
Not required at this time.
(a) The Schedule of Investments is included under Item 7 of this Form.
(b) Not applicable.
| Item 7. | Financial Statements and Financial Highlights for Open-End Management Investment Companies |
9.30.2024
Rydex Funds Semi-Annual Financial Report
Sector Funds | | Domestic Equity Funds |
Banking Fund | | Dow Jones Industrial Average® Fund |
Basic Materials Fund | | Nova Fund |
Biotechnology Fund | | S&P 500® Fund |
Consumer Products Fund | | Inverse S&P 500® Strategy Fund |
Electronics Fund | | Monthly Rebalance NASDAQ-100® 2x Strategy Fund |
Energy Fund | | NASDAQ-100® Fund |
Energy Services Fund | | Inverse NASDAQ-100® Strategy Fund |
Financial Services Fund | | Mid-Cap 1.5x Strategy Fund |
Health Care Fund | | Inverse Mid-Cap Strategy Fund |
Internet Fund | | Russell 2000® 1.5x Strategy Fund |
Leisure Fund | | Russell 2000® Fund |
Precious Metals Fund | | Inverse Russell 2000® Strategy Fund |
Real Estate Fund | | S&P 500® Pure Growth Fund |
Retailing Fund | | S&P 500® Pure Value Fund |
Technology Fund | | S&P MidCap 400® Pure Growth Fund |
Telecommunications Fund | | S&P MidCap 400® Pure Value Fund |
Transportation Fund | | S&P SmallCap 600® Pure Growth Fund |
Utilities Fund | | S&P SmallCap 600® Pure Value Fund |
| | | |
Fixed Income Funds | | International Equity Funds |
Emerging Markets Bond Strategy Fund | | Emerging Markets 2x Strategy Fund |
Government Long Bond 1.2x Strategy Fund | | Inverse Emerging Markets 2x Strategy Fund |
Inverse Government Long Bond Strategy Fund | | Europe 1.25x Strategy Fund |
High Yield Strategy Fund | | Japan 2x Strategy Fund |
Inverse High Yield Strategy Fund | | |
| | | |
Specialty Funds | | Money Market Fund |
Strengthening Dollar 2x Strategy Fund | | U.S. Government Money Market Fund |
Weakening Dollar 2x Strategy Fund | | |
GuggenheimInvestments.com | |
This report and the financial statements contained herein are submitted for the general information of our shareholders. The report is not authorized for distribution to prospective investors unless preceded or accompanied by an effective prospectus.
Distributed by Guggenheim Funds Distributors, LLC.
| | |
Item 7: Financial Statements and Financial Highlights for Open-End Management Investment Companies (Semi-Annual Financial Report) | |
BANKING FUND | 3 |
BASIC MATERIALS FUND | 10 |
BIOTECHNOLOGY FUND | 17 |
CONSUMER PRODUCTS FUND | 24 |
ELECTRONICS FUND | 31 |
ENERGY FUND | 38 |
ENERGY SERVICES FUND | 45 |
FINANCIAL SERVICES FUND | 52 |
HEALTH CARE FUND | 60 |
INTERNET FUND | 68 |
LEISURE FUND | 75 |
PRECIOUS METALS FUND | 82 |
REAL ESTATE FUND | 89 |
RETAILING FUND | 96 |
TECHNOLOGY FUND | 103 |
TELECOMMUNICATIONS FUND | 111 |
TRANSPORTATION FUND | 118 |
UTILITIES FUND | 125 |
DOW JONES INDUSTRIAL AVERAGE® FUND | 132 |
NOVA FUND | 139 |
S&P 500® FUND | 152 |
INVERSE S&P 500® STRATEGY FUND | 163 |
MONTHLY REBALANCE NASDAQ-100® 2x STRATEGY FUND | 171 |
NASDAQ-100® FUND | 179 |
INVERSE NASDAQ-100® STRATEGY FUND | 188 |
MID-CAP 1.5x STRATEGY FUND | 196 |
INVERSE MID-CAP STRATEGY FUND | 206 |
RUSSELL 2000® 1.5x STRATEGY FUND | 212 |
RUSSELL 2000® FUND | 237 |
INVERSE RUSSELL 2000® STRATEGY FUND | 262 |
S&P 500® PURE GROWTH FUND | 268 |
S&P 500® PURE VALUE FUND | 274 |
S&P MIDCAP 400® PURE GROWTH FUND | 280 |
S&P MIDCAP 400® PURE VALUE FUND | 286 |
S&P SMALLCAP 600® PURE GROWTH FUND | 292 |
S&P SMALLCAP 600® PURE VALUE FUND | 299 |
EMERGING MARKETS BOND STRATEGY FUND | 306 |
| | THE RYDEX FUNDS SEMI-ANNUAL FINANCIAL REPORT | 1 |
TABLE OF CONTENTS (concluded) |
GOVERNMENT LONG BOND 1.2x STRATEGY FUND | 312 |
INVERSE GOVERNMENT LONG BOND STRATEGY FUND | 319 |
HIGH YIELD STRATEGY FUND | 327 |
INVERSE HIGH YIELD STRATEGY FUND | 334 |
EMERGING MARKETS 2x STRATEGY FUND | 340 |
INVERSE EMERGING MARKETS 2x STRATEGY FUND | 347 |
EUROPE 1.25x STRATEGY FUND | 353 |
JAPAN 2x STRATEGY FUND | 360 |
STRENGTHENING DOLLAR 2x STRATEGY FUND | 366 |
WEAKENING DOLLAR 2x STRATEGY FUND | 372 |
U.S. GOVERNMENT MONEY MARKET FUND | 378 |
NOTES TO FINANCIAL STATEMENTS | 383 |
OTHER INFORMATION | 409 |
ITEM 8: CHANGES IN AND DISAGREEMENTS WITH ACCOUNTANTS FOR OPEN-END MANAGEMENT INVESTMENT COMPANIES | 411 |
ITEM 9: PROXY DISCLOSURES FOR OPEN-END MANAGEMENT INVESTMENT COMPANIES | 412 |
ITEM 10: RENUMERATION PAID TO DIRECTORS, OFFICERS, AND OTHERS OF OPEN-END MANAGEMENT INVESTMENT COMPANIES | 413 |
ITEM 11: STATEMENT REGARDING BASIS FOR APPROVAL OF INVESTMENT ADVISORY CONTRACT | 414 |
2 | THE RYDEX FUNDS SEMI-ANNUAL FINANCIAL REPORT | |
SCHEDULE OF INVESTMENTS (Unaudited) | September 30, 2024 |
BANKING FUND | |
| | Shares | | | Value | |
COMMON STOCKS† - 98.5% |
| | | | | | | | | |
Banks - 91.7% |
Citigroup, Inc. | | | 3,351 | | | $ | 209,773 | |
Wells Fargo & Co. | | | 3,589 | | | | 202,743 | |
JPMorgan Chase & Co. | | | 936 | | | | 197,365 | |
Bank of America Corp. | | | 4,932 | | | | 195,702 | |
PNC Financial Services Group, Inc. | | | 902 | | | | 166,735 | |
U.S. Bancorp | | | 3,565 | | | | 163,027 | |
Truist Financial Corp. | | | 3,403 | | | | 145,546 | |
Bank of New York Mellon Corp. | | | 1,957 | | | | 140,630 | |
NU Holdings Limited/Cayman Islands — Class A* | | | 8,079 | | | | 110,278 | |
M&T Bank Corp. | | | 602 | | | | 107,228 | |
Fifth Third Bancorp | | | 2,442 | | | | 104,615 | |
State Street Corp. | | | 1,113 | | | | 98,467 | |
Regions Financial Corp. | | | 3,874 | | | | 90,380 | |
Huntington Bancshares, Inc. | | | 6,036 | | | | 88,729 | |
Citizens Financial Group, Inc. | | | 1,973 | | | | 81,031 | |
Northern Trust Corp. | | | 898 | | | | 80,847 | |
KeyCorp | | | 4,529 | | | | 75,861 | |
Toronto-Dominion Bank | | | 1,118 | | | | 70,725 | |
ICICI Bank Ltd. ADR | | | 2,348 | | | | 70,088 | |
HDFC Bank Ltd. ADR | | | 1,109 | | | | 69,379 | |
East West Bancorp, Inc. | | | 799 | | | | 66,109 | |
Bank of Nova Scotia1 | | | 1,122 | | | | 61,138 | |
Western Alliance Bancorporation | | | 689 | | | | 59,592 | |
Webster Financial Corp. | | | 1,191 | | | | 55,513 | |
Comerica, Inc. | | | 922 | | | | 55,237 | |
Royal Bank of Canada | | | 441 | | | | 55,006 | |
First Horizon Corp. | | | 3,498 | | | | 54,324 | |
First Citizens BancShares, Inc. — Class A | | | 29 | | | | 53,388 | |
SouthState Corp. | | | 542 | | | | 52,672 | |
Popular, Inc. | | | 517 | | | | 51,840 | |
Zions Bancorp North America | | | 1,079 | | | | 50,950 | |
Cullen/Frost Bankers, Inc. | | | 450 | | | | 50,337 | |
Commerce Bancshares, Inc. | | | 838 | | | | 49,777 | |
Prosperity Bancshares, Inc. | | | 681 | | | | 49,080 | |
Pinnacle Financial Partners, Inc. | | | 497 | | | | 48,691 | |
Bank of Montreal | | | 535 | | | | 48,257 | |
Synovus Financial Corp. | | | 1,059 | | | | 47,094 | |
Old National Bancorp | | | 2,499 | | | | 46,631 | |
Canadian Imperial Bank of Commerce | | | 759 | | | | 46,557 | |
Columbia Banking System, Inc. | | | 1,783 | | | | 46,554 | |
Cadence Bank | | | 1,450 | | | | 46,183 | |
Barclays plc ADR | | | 3,782 | | | | 45,951 | |
UBS Group AG | | | 1,485 | | | | 45,901 | |
HSBC Holdings plc ADR1 | | | 998 | | | | 45,100 | |
FNB Corp. | | | 3,059 | | | | 43,163 | |
Wintrust Financial Corp. | | | 397 | | | | 43,086 | |
Home BancShares, Inc. | | | 1,590 | | | | 43,073 | |
United Bankshares, Inc. | | | 1,146 | | | | 42,517 | |
Bank OZK | | | 984 | | | | 42,302 | |
First Financial Bankshares, Inc. | | | 1,103 | | | | 40,822 | |
Hancock Whitney Corp. | | | 796 | | | | 40,731 | |
UMB Financial Corp. | | | 381 | | | | 40,047 | |
Valley National Bancorp | | | 4,365 | | | | 39,547 | |
Ameris Bancorp | | | 631 | | | | 39,368 | |
United Community Banks, Inc. | | | 1,230 | | | | 35,768 | |
Texas Capital Bancshares, Inc.* | | | 492 | | | | 35,158 | |
Fulton Financial Corp. | | | 1,924 | | | | 34,882 | |
Associated Banc-Corp. | | | 1,611 | | | | 34,701 | |
Eastern Bankshares, Inc. | | | 2,109 | | | | 34,567 | |
Cathay General Bancorp | | | 778 | | | | 33,415 | |
First Hawaiian, Inc. | | | 1,425 | | | | 32,989 | |
First Interstate BancSystem, Inc. — Class A | | | 1,036 | | | | 31,784 | |
Simmons First National Corp. — Class A | | | 1,467 | | | | 31,599 | |
Bancorp, Inc.* | | | 586 | | | | 31,351 | |
CVB Financial Corp. | | | 1,675 | | | | 29,849 | |
Bank of Hawaii Corp. | | | 473 | | | | 29,690 | |
Banco Bradesco S.A. ADR | | | 10,890 | | | | 28,967 | |
Seacoast Banking Corporation of Florida | | | 1,069 | | | | 28,489 | |
International Bancshares Corp. | | | 446 | | | | 26,666 | |
BOK Financial Corp. | | | 213 | | | | 22,284 | |
Independent Bank Corp. | | | 372 | | | | 21,996 | |
Total Banks | | | | | | | 4,639,842 | |
| | | | | | | | | |
Savings & Loans - 3.9% |
New York Community Bancorp, Inc. | | | 3,305 | | | | 37,115 | |
Axos Financial, Inc.* | | | 563 | | | | 35,401 | |
WSFS Financial Corp. | | | 647 | | | | 32,991 | |
WaFd, Inc. | | | 914 | | | | 31,853 | |
Pacific Premier Bancorp, Inc. | | | 1,206 | | | | 30,343 | |
Banc of California, Inc. | | | 1,879 | | | | 27,678 | |
Total Savings & Loans | | | | | | | 195,381 | |
| | | | | | | | | |
Diversified Financial Services - 2.9% |
Capital One Financial Corp. | | | 981 | | | | 146,885 | |
| | | | | | | | | |
Total Common Stocks | | | | |
(Cost $3,165,433) | | | | | | | 4,982,108 | |
| | | | | | | | | |
PREFERRED STOCKS† - 1.0% |
Financial - 1.0% |
Itau Unibanco Holding S.A. |
ADR | | | 7,763 | | | | 51,624 | |
| | | | | | | | | |
Total Preferred Stocks | | | | |
(Cost $36,959) | | | | | | | 51,624 | |
| | | | | | | | | |
| | | Face
Amount | | | | | |
REPURCHASE AGREEMENTS††,2 - 0.0% |
J.P. Morgan Securities LLC
issued 09/30/24 at 4.86%
due 10/01/24 | | $ | 1,034 | | | | 1,034 | |
BofA Securities, Inc.
issued 09/30/24 at 4.85%
due 10/01/24 | | | 854 | | | | 854 | |
Total Repurchase Agreements | | | | |
(Cost $1,888) | | | | | | | 1,888 | |
| | | | | | | | | |
SEE NOTES TO FINANCIAL STATEMENTS. | THE RYDEX FUNDS SEMI-ANNUAL FINANCIAL REPORT | 3 |
SCHEDULE OF INVESTMENTS (Unaudited)(concluded) | September 30, 2024 |
BANKING FUND | |
| | Shares | | | Value | |
SECURITIES LENDING COLLATERAL†,3 - 1.4% |
Money Market Fund*** | | | | | | | | |
First American Government Obligations Fund - Class X, 4.82%4 | | | 69,753 | | | $ | 69,753 | |
Total Securities Lending Collateral | | | | |
(Cost $69,753) | | | | | | | 69,753 | |
| | | | | | | | | |
Total Investments - 100.9% | | | | |
(Cost $3,274,033) | | $ | 5,105,373 | |
Other Assets & Liabilities, net - (0.9)% | | | (43,510 | ) |
Total Net Assets - 100.0% | | $ | 5,061,863 | |
* | Non-income producing security. |
*** | A copy of each underlying unaffiliated fund’s financial statements is available at the SEC’s website at www.sec.gov. |
† | Value determined based on Level 1 inputs — See Note 4. |
†† | Value determined based on Level 2 inputs — See Note 4. |
1 | All or a portion of this security is on loan at September 30, 2024 — See Note 7. |
2 | Repurchase Agreements — See Note 6. |
3 | Securities lending collateral — See Note 7. |
4 | Rate indicated is the 7-day yield as of September 30, 2024. |
| | ADR — American Depositary Receipt |
| | plc — Public Limited Company |
| | |
| | See Sector Classification in Other Information section. |
The following table summarizes the inputs used to value the Fund’s investments at September 30, 2024 (See Note 4 in the Notes to Financial Statements):
Investments in Securities (Assets) | | Level 1
Quoted
Prices | | | Level 2
Significant
Observable
Inputs | | | Level 3
Significant
Unobservable
Inputs | | | Total | |
Common Stocks | | $ | 4,982,108 | | | $ | — | | | $ | — | | | $ | 4,982,108 | |
Preferred Stocks | | | 51,624 | | | | — | | | | — | | | | 51,624 | |
Repurchase Agreements | | | — | | | | 1,888 | | | | — | | | | 1,888 | |
Securities Lending Collateral | | | 69,753 | | | | — | | | | — | | | | 69,753 | |
Total Assets | | $ | 5,103,485 | | | $ | 1,888 | | | $ | — | | | $ | 5,105,373 | |
4 | THE RYDEX FUNDS SEMI-ANNUAL FINANCIAL REPORT | SEE NOTES TO FINANCIAL STATEMENTS. |
STATEMENT OF ASSETS AND LIABILITIES (Unaudited) |
September 30, 2024 |
Assets: |
Investments, at value - including $67,855 of securities loaned (cost $3,272,145) | | $ | 5,103,485 | |
Repurchase agreements, at value (cost $1,888) | | | 1,888 | |
Cash | | | 458 | |
Receivables: |
Fund shares sold | | | 410,557 | |
Dividends | | | 13,886 | |
Foreign tax reclaims | | | 1,188 | |
Securities lending income | | | 5 | |
Total assets | | | 5,531,467 | |
| | | | | |
Liabilities: |
Payable for: |
Securities purchased | | | 371,987 | |
Return of securities lending collateral | | | 69,753 | |
Fund shares redeemed | | | 14,817 | |
Transfer agent fees | | | 3,807 | |
Management fees | | | 3,240 | |
Distribution and service fees | | | 695 | |
Portfolio accounting and administration fees | | | 391 | |
Trustees’ fees* | | | 70 | |
Miscellaneous | | | 4,844 | |
Total liabilities | | | 469,604 | |
Net assets | | $ | 5,061,863 | |
| | | | | |
Net assets consist of: |
Paid in capital | | $ | 13,099,966 | |
Total distributable earnings (loss) | | | (8,038,103 | ) |
Net assets | | $ | 5,061,863 | |
| | | | | |
Investor Class: |
Net assets | | $ | 2,282,120 | |
Capital shares outstanding | | | 23,342 | |
Net asset value per share | | $ | 97.77 | |
| | | | | |
Class A: |
Net assets | | $ | 2,370,822 | |
Capital shares outstanding | | | 27,446 | |
Net asset value per share | | $ | 86.38 | |
Maximum offering price per share (Net asset value divided by 95.25%) | | $ | 90.69 | |
| | | | | |
Class C: |
Net assets | | $ | 212,352 | |
Capital shares outstanding | | | 2,914 | |
Net asset value per share | | $ | 72.87 | |
| | | | | |
Class H: |
Net assets | | $ | 196,569 | |
Capital shares outstanding | | | 2,344 | |
Net asset value per share | | $ | 83.86 | |
STATEMENT OF OPERATIONS (Unaudited) |
Six Months Ended September 30, 2024 |
Investment Income: |
Dividends (net of foreign withholding tax of $4,837) | | $ | 263,012 | |
Interest | | | 2,044 | |
Income from securities lending, net | | | 605 | |
Total investment income | | | 265,661 | |
| | | | | |
Expenses: |
Management fees | | | 67,065 | |
Distribution and service fees: |
Class A | | | 2,920 | |
Class C | | | 1,374 | |
Class H | | | 308 | |
Transfer agent fees | | | 15,618 | |
Portfolio accounting and administration fees | | | 12,039 | |
Professional fees | | | 5,691 | |
Trustees’ fees* | | | 1,198 | |
Custodian fees | | | 1,047 | |
Line of credit fees | | | 157 | |
Miscellaneous | | | 7,169 | |
Total expenses | | | 114,586 | |
Less: |
Expenses reimbursed by Adviser | | | (3,941 | ) |
Net expenses | | | 110,645 | |
Net investment income | | | 155,016 | |
| | | | | |
Net Realized and Unrealized Gain (Loss): |
Net realized gain (loss) on: |
Investments | | | 1,276,637 | |
Net realized gain | | | 1,276,637 | |
Net change in unrealized appreciation (depreciation) on: |
Investments | | | (1,299,798 | ) |
Net change in unrealized appreciation (depreciation) | | | (1,299,798 | ) |
Net realized and unrealized loss | | | (23,161 | ) |
Net increase in net assets resulting from operations | | $ | 131,855 | |
* | Relates to Trustees not deemed “interested persons” within the meaning of Section 2(a)(19) of the 1940 Act. |
SEE NOTES TO FINANCIAL STATEMENTS. | THE RYDEX FUNDS SEMI-ANNUAL FINANCIAL REPORT | 5 |
STATEMENTS OF CHANGES IN NET ASSETS |
| | Six Months Ended
September 30, 2024
(Unaudited) | | | Year Ended
March 31,
2024 | |
Increase (Decrease) in Net Assets from Operations: | | | | | | | | |
Net investment income | | $ | 155,016 | | | $ | 291,615 | |
Net realized gain on investments | | | 1,276,637 | | | | 271,737 | |
Net change in unrealized appreciation (depreciation) on investments | | | (1,299,798 | ) | | | 2,440,315 | |
Net increase in net assets resulting from operations | | | 131,855 | | | | 3,003,667 | |
| | | | | | | | | |
Distributions to shareholders: | | | | | | | | |
Investor Class | | | — | | | | (68,740 | ) |
Class A | | | — | | | | (46,546 | ) |
Class C | | | — | | | | (5,758 | ) |
Class H | | | — | | | | (3,113 | ) |
Total distributions to shareholders | | | — | | | | (124,157 | ) |
| | | | | | | | | |
Capital share transactions: | | | | | | | | |
Proceeds from sale of shares | | | | | | | | |
Investor Class | | | 16,620,808 | | | | 49,655,248 | |
Class A | | | 635,809 | | | | 3,251,051 | |
Class C | | | 42,994 | | | | 77,970 | |
Class H | | | 275,647 | | | | 417,622 | |
Distributions reinvested | | | | | | | | |
Investor Class | | | — | | | | 67,792 | |
Class A | | | — | | | | 46,127 | |
Class C | | | — | | | | 5,758 | |
Class H | | | — | | | | 3,067 | |
Cost of shares redeemed | | | | | | | | |
Investor Class | | | (37,705,860 | ) | | | (29,991,468 | ) |
Class A | | | (958,542 | ) | | | (4,243,656 | ) |
Class C | | | (162,184 | ) | | | (653,022 | ) |
Class H | | | (328,514 | ) | | | (324,799 | ) |
Net increase (decrease) from capital share transactions | | | (21,579,842 | ) | | | 18,311,690 | |
Net increase (decrease) in net assets | | | (21,447,987 | ) | | | 21,191,200 | |
| | | | | | | | | |
Net assets: | | | | | | | | |
Beginning of period | | | 26,509,850 | | | | 5,318,650 | |
End of period | | $ | 5,061,863 | | | $ | 26,509,850 | |
| | | | | | | | | |
Capital share activity: | | | | | | | | |
Shares sold | | | | | | | | |
Investor Class | | | 183,527 | | | | 632,229 | |
Class A | | | 8,004 | | | | 50,010 | |
Class C | | | 631 | | | | 1,375 | |
Class H | | | 3,462 | | | | 6,000 | |
Shares issued from reinvestment of distributions | | | | | | | | |
Investor Class | | | — | | | | 864 | |
Class A | | | — | | | | 664 | |
Class C | | | — | | | | 98 | |
Class H | | | — | | | | 45 | |
Shares redeemed | | | | | | | | |
Investor Class | | | (426,816 | ) | | | (388,185 | ) |
Class A | | | (12,173 | ) | | | (64,468 | ) |
Class C | | | (2,385 | ) | | | (12,251 | ) |
Class H | | | (4,250 | ) | | | (4,785 | ) |
Net increase (decrease) in shares | | | (250,000 | ) | | | 221,596 | |
6 | THE RYDEX FUNDS SEMI-ANNUAL FINANCIAL REPORT | SEE NOTES TO FINANCIAL STATEMENTS. |
This table is presented to show selected data for a share outstanding throughout each period and to assist shareholders in evaluating a Fund’s performance for the periods presented.
Investor Class | | Six Months Ended
September 30, 2024a | | | Year Ended
March 31,
2024 | | | Year Ended
March 31,
2023 | | | Year Ended
March 31,
2022 | | | Year Ended
March 31,
2021 | | | Year Ended
March 31,
2020 | |
Per Share Data |
Net asset value, beginning of period | | $ | 88.13 | | | $ | 70.50 | | | $ | 99.66 | | | $ | 95.71 | | | $ | 51.83 | | | $ | 74.58 | |
Income (loss) from investment operations: |
Net investment income (loss)b | | | .90 | | | | 1.96 | | | | 1.43 | | | | 1.03 | | | | 1.25 | | | | 1.14 | |
Net gain (loss) on investments (realized and unrealized) | | | 8.74 | e | | | 16.90 | | | | (28.00 | ) | | | 3.42 | | | | 44.89 | | | | (23.38 | ) |
Total from investment operations | | | 9.64 | | | | 18.86 | | | | (26.57 | ) | | | 4.45 | | | | 46.14 | | | | (22.24 | ) |
Less distributions from: |
Net investment income | | | — | | | | (1.23 | ) | | | (2.59 | ) | | | (.50 | ) | | | (2.26 | ) | | | (.51 | ) |
Total distributions | | | — | | | | (1.23 | ) | | | (2.59 | ) | | | (.50 | ) | | | (2.26 | ) | | | (.51 | ) |
Net asset value, end of period | | $ | 97.77 | | | $ | 88.13 | | | $ | 70.50 | | | $ | 99.66 | | | $ | 95.71 | | | $ | 51.83 | |
|
Total Return | | | 10.94 | % | | | 26.99 | % | | | (27.01 | %) | | | 4.62 | % | | | 90.06 | % | | | (30.08 | %) |
Ratios/Supplemental Data |
Net assets, end of period (in thousands) | | $ | 2,282 | | | $ | 23,499 | | | $ | 1,531 | | | $ | 4,239 | | | $ | 9,027 | | | $ | 17,507 | |
Ratios to average net assets: |
Net investment income (loss) | | | 2.08 | % | | | 2.46 | % | | | 1.62 | % | | | 1.02 | % | | | 1.79 | % | | | 1.47 | % |
Total expenses | | | 1.39 | % | | | 1.43 | % | | | 1.40 | % | | | 1.36 | % | | | 1.43 | % | | | 1.48 | % |
Net expensesc | | | 1.34 | % | | | 1.39 | % | | | 1.40 | % | | | 1.36 | % | | | 1.43 | % | | | 1.48 | % |
Portfolio turnover rate | | | 76 | % | | | 233 | % | | | 384 | % | | | 501 | % | | | 799 | % | | | 360 | % |
Class A | | Six Months Ended
September 30, 2024a | | | Year Ended
March 31,
2024 | | | Year Ended
March 31,
2023 | | | Year Ended
March 31,
2022 | | | Year Ended
March 31,
2021 | | | Year Ended
March 31,
2020 | |
Per Share Data |
Net asset value, beginning of period | | $ | 77.97 | | | $ | 62.66 | | | $ | 89.12 | | | $ | 85.85 | | | $ | 46.98 | | | $ | 67.81 | |
Income (loss) from investment operations: |
Net investment income (loss)b | | | .61 | | | | 1.49 | | | | 1.08 | | | | .71 | | | | 1.02 | | | | .87 | |
Net gain (loss) on investments (realized and unrealized) | | | 7.80 | e | | | 15.05 | | | | (24.95 | ) | | | 3.06 | | | | 40.11 | | | | (21.19 | ) |
Total from investment operations | | | 8.41 | | | | 16.54 | | | | (23.87 | ) | | | 3.77 | | | | 41.13 | | | | (20.32 | ) |
Less distributions from: |
Net investment income | | | — | | | | (1.23 | ) | | | (2.59 | ) | | | (.50 | ) | | | (2.26 | ) | | | (.51 | ) |
Total distributions | | | — | | | | (1.23 | ) | | | (2.59 | ) | | | (.50 | ) | | | (2.26 | ) | | | (.51 | ) |
Net asset value, end of period | | $ | 86.38 | | | $ | 77.97 | | | $ | 62.66 | | | $ | 89.12 | | | $ | 85.85 | | | $ | 46.98 | |
|
Total Returnd | | | 10.79 | % | | | 26.66 | % | | | (27.18 | %) | | | 4.36 | % | | | 88.72 | % | | | (30.25 | %) |
Ratios/Supplemental Data |
Net assets, end of period (in thousands) | | $ | 2,371 | | | $ | 2,465 | | | $ | 2,845 | | | $ | 4,591 | | | $ | 4,050 | | | $ | 2,789 | |
Ratios to average net assets: |
Net investment income (loss) | | | 1.53 | % | | | 2.25 | % | | | 1.38 | % | | | 0.77 | % | | | 1.67 | % | | | 1.23 | % |
Total expenses | | | 1.67 | % | | | 1.69 | % | | | 1.65 | % | | | 1.61 | % | | | 1.69 | % | | | 1.73 | % |
Net expensesc | | | 1.62 | % | | | 1.65 | % | | | 1.65 | % | | | 1.61 | % | | | 1.69 | % | | | 1.73 | % |
Portfolio turnover rate | | | 76 | % | | | 233 | % | | | 384 | % | | | 501 | % | | | 799 | % | | | 360 | % |
SEE NOTES TO FINANCIAL STATEMENTS. | THE RYDEX FUNDS SEMI-ANNUAL FINANCIAL REPORT | 7 |
FINANCIAL HIGHLIGHTS (continued) |
This table is presented to show selected data for a share outstanding throughout each period and to assist shareholders in evaluating a Fund’s performance for the periods presented.
Class C | | Six Months Ended
September 30, 2024a | | | Year Ended
March 31,
2024 | | | Year Ended
March 31,
2023 | | | Year Ended
March 31,
2022 | | | Year Ended
March 31,
2021 | | | Year Ended
March 31,
2020 | |
Per Share Data |
Net asset value, beginning of period | | $ | 66.03 | | | $ | 53.62 | | | $ | 77.28 | | | $ | 75.07 | | | $ | 41.57 | | | $ | 60.51 | |
Income (loss) from investment operations: |
Net investment income (loss)b | | | .26 | | | | .85 | | | | .41 | | | | .03 | | | | .49 | | | | .31 | |
Net gain (loss) on investments (realized and unrealized) | | | 6.58 | e | | | 12.79 | | | | (21.48 | ) | | | 2.68 | | | | 35.27 | | | | (18.74 | ) |
Total from investment operations | | | 6.84 | | | | 13.64 | | | | (21.07 | ) | | | 2.71 | | | | 35.76 | | | | (18.43 | ) |
Less distributions from: |
Net investment income | | | — | | | | (1.23 | ) | | | (2.59 | ) | | | (.50 | ) | | | (2.26 | ) | | | (.51 | ) |
Total distributions | | | — | | | | (1.23 | ) | | | (2.59 | ) | | | (.50 | ) | | | (2.26 | ) | | | (.51 | ) |
Net asset value, end of period | | $ | 72.87 | | | $ | 66.03 | | | $ | 53.62 | | | $ | 77.28 | | | $ | 75.07 | | | $ | 41.57 | |
|
Total Returnd | | | 10.36 | % | | | 25.72 | % | | | (27.73 | %) | | | 3.58 | % | | | 87.34 | % | | | (30.78 | %) |
Ratios/Supplemental Data |
Net assets, end of period (in thousands) | | $ | 212 | | | $ | 308 | | | $ | 828 | | | $ | 2,010 | | | $ | 892 | | | $ | 764 | |
Ratios to average net assets: |
Net investment income (loss) | | | 0.78 | % | | | 1.54 | % | | | 0.61 | % | | | 0.03 | % | | | 0.93 | % | | | 0.49 | % |
Total expenses | | | 2.42 | % | | | 2.43 | % | | | 2.40 | % | | | 2.36 | % | | | 2.45 | % | | | 2.48 | % |
Net expensesc | | | 2.37 | % | | | 2.41 | % | | | 2.40 | % | | | 2.36 | % | | | 2.45 | % | | | 2.48 | % |
Portfolio turnover rate | | | 76 | % | | | 233 | % | | | 384 | % | | | 501 | % | | | 799 | % | | | 360 | % |
8 | THE RYDEX FUNDS SEMI-ANNUAL FINANCIAL REPORT | SEE NOTES TO FINANCIAL STATEMENTS. |
FINANCIAL HIGHLIGHTS (concluded) |
This table is presented to show selected data for a share outstanding throughout each period and to assist shareholders in evaluating a Fund’s performance for the periods presented.
Class H | | Six Months Ended
September 30, 2024a | | | Year Ended
March 31,
2024 | | | Year Ended
March 31,
2023 | | | Year Ended
March 31,
2022 | | | Year Ended
March 31,
2021 | | | Year Ended
March 31,
2020 | |
Per Share Data |
Net asset value, beginning of period | | $ | 75.71 | | | $ | 60.85 | | | $ | 86.66 | | | $ | 83.48 | | | $ | 45.73 | | | $ | 66.00 | |
Income (loss) from investment operations: |
Net investment income (loss)b | | | .61 | | | | 1.47 | | | | .91 | | | | .63 | | | | .85 | | | | .74 | |
Net gain (loss) on investments (realized and unrealized) | | | 7.54 | e | | | 14.62 | | | | (24.13 | ) | | | 3.05 | | | | 39.16 | | | | (20.50 | ) |
Total from investment operations | | | 8.15 | | | | 16.09 | | | | (23.22 | ) | | | 3.68 | | | | 40.01 | | | | (19.76 | ) |
Less distributions from: |
Net investment income | | | — | | | | (1.23 | ) | | | (2.59 | ) | | | (.50 | ) | | | (2.26 | ) | | | (.51 | ) |
Total distributions | | | — | | | | (1.23 | ) | | | (2.59 | ) | | | (.50 | ) | | | (2.26 | ) | | | (.51 | ) |
Net asset value, end of period | | $ | 83.86 | | | $ | 75.71 | | | $ | 60.85 | | | $ | 86.66 | | | $ | 83.48 | | | $ | 45.73 | |
|
Total Return | | | 10.76 | % | | | 26.66 | % | | | (27.18 | %) | | | 4.38 | % | | | 88.66 | % | | | (30.24 | %) |
Ratios/Supplemental Data |
Net assets, end of period (in thousands) | | $ | 197 | | | $ | 237 | | | $ | 114 | | | $ | 2,316 | | | $ | 4,601 | | | $ | 162 | |
Ratios to average net assets: |
Net investment income (loss) | | | 1.57 | % | | | 2.23 | % | | | 1.16 | % | | | 0.71 | % | | | 1.15 | % | | | 1.02 | % |
Total expenses | | | 1.68 | % | | | 1.69 | % | | | 1.65 | % | | | 1.60 | % | | | 1.63 | % | | | 1.74 | % |
Net expensesc | | | 1.63 | % | | | 1.65 | % | | | 1.65 | % | | | 1.60 | % | | | 1.63 | % | | | 1.74 | % |
Portfolio turnover rate | | | 76 | % | | | 233 | % | | | 384 | % | | | 501 | % | | | 799 | % | | | 360 | % |
a | Unaudited figures for the period ended September 30, 2024. Percentage amounts for the period, except total return and portfolio turnover rate, have been annualized. |
b | Net investment income (loss) per share was computed using average shares outstanding throughout the period. |
c | Net expense information reflects the expense ratios after expense waivers and reimbursements, as applicable. |
d | Total return does not reflect the impact of any applicable sales charges. |
e | The amount shown for a share outstanding throughout the period does not agree with the aggregate net loss on investments for the period because of the sales and repurchases of fund shares in relation to fluctuating market value of the investments of the Fund. |
SEE NOTES TO FINANCIAL STATEMENTS. | THE RYDEX FUNDS SEMI-ANNUAL FINANCIAL REPORT | 9 |
SCHEDULE OF INVESTMENTS (Unaudited) | September 30, 2024 |
BASIC MATERIALS FUND | |
| | Shares | | | Value | |
COMMON STOCKS† - 99.4% |
| | | | | | | | | |
Chemicals - 36.1% |
Linde plc | | | 2,610 | | | $ | 1,244,605 | |
Sherwin-Williams Co. | | | 2,044 | | | | 780,133 | |
Air Products and Chemicals, Inc. | | | 2,329 | | | | 693,436 | |
Ecolab, Inc. | | | 2,589 | | | | 661,049 | |
Dow, Inc. | | | 9,696 | | | | 529,692 | |
DuPont de Nemours, Inc. | | | 5,513 | | | | 491,263 | |
PPG Industries, Inc. | | | 3,544 | | | | 469,438 | |
International Flavors & Fragrances, Inc. | | | 4,056 | | | | 425,596 | |
LyondellBasell Industries N.V. — Class A | | | 4,296 | | | | 411,986 | |
Celanese Corp. — Class A | | | 2,463 | | | | 334,870 | |
CF Industries Holdings, Inc. | | | 3,874 | | | | 332,389 | |
RPM International, Inc. | | | 2,659 | | | | 321,739 | |
Nutrien Ltd. | | | 6,610 | | | | 317,677 | |
Eastman Chemical Co. | | | 2,798 | | | | 313,236 | |
Albemarle Corp. | | | 2,988 | | | | 282,994 | |
Mosaic Co. | | | 9,060 | | | | 242,627 | |
FMC Corp. | | | 3,668 | | | | 241,868 | |
Axalta Coating Systems Ltd.* | | | 6,471 | | | | 234,186 | |
Element Solutions, Inc. | | | 7,645 | | | | 207,638 | |
Cabot Corp. | | | 1,856 | | | | 207,445 | |
Olin Corp. | | | 4,288 | | | | 205,738 | |
Westlake Corp. | | | 1,308 | | | | 196,579 | |
Huntsman Corp. | | | 7,053 | | | | 170,683 | |
Ashland, Inc. | | | 1,946 | | | | 169,244 | |
Chemours Co. | | | 7,534 | | | | 153,091 | |
Balchem Corp. | | | 849 | | | | 149,424 | |
Arcadium Lithium plc* | | | 41,507 | | | | 118,295 | |
Innospec, Inc. | | | 996 | | | | 112,638 | |
Total Chemicals | | | | | | | 10,019,559 | |
| | | | | | | | | |
Mining - 23.1% |
Freeport-McMoRan, Inc. | | | 14,854 | | | | 741,512 | |
Newmont Corp. | | | 11,817 | | | | 631,619 | |
Barrick Gold Corp. | | | 20,465 | | | | 407,049 | |
Rio Tinto plc ADR | | | 5,166 | | | | 367,664 | |
BHP Group Ltd. ADR1 | | | 5,755 | | | | 357,443 | |
Agnico Eagle Mines Ltd. | | | 4,026 | | | | 324,335 | |
Gold Fields Ltd. ADR | | | 19,114 | | | | 293,400 | |
Wheaton Precious Metals Corp. | | | 4,757 | | | | 290,558 | |
Pan American Silver Corp. | | | 13,902 | | | | 290,135 | |
Southern Copper Corp. | | | 2,391 | | | | 276,567 | |
Alcoa Corp. | | | 7,135 | | | | 275,268 | |
Kinross Gold Corp. | | | 29,348 | | | | 274,697 | |
Franco-Nevada Corp. | | | 2,178 | | | | 270,616 | |
Alamos Gold, Inc. — Class A | | | 12,903 | | | | 257,286 | |
Anglogold Ashanti plc1 | | | 9,403 | | | | 250,402 | |
Royal Gold, Inc. | | | 1,725 | | | | 242,018 | |
B2Gold Corp. | | | 73,825 | | | | 227,381 | |
Hecla Mining Co. | | | 24,344 | | | | 162,374 | |
MP Materials Corp.*,1 | | | 7,699 | | | | 135,887 | |
Coeur Mining, Inc.* | | | 17,755 | | | | 122,154 | |
SSR Mining, Inc.* | | | 14,808 | | | | 84,109 | |
Century Aluminum Co.* | | | 4,947 | | | | 80,290 | |
Kaiser Aluminum Corp. | | | 602 | | | | 43,657 | |
Total Mining | | | | | | | 6,406,421 | |
| | | | | | | | | |
Packaging & Containers - 11.4% |
Smurfit WestRock plc | | | 8,208 | | | | 405,639 | |
Ball Corp. | | | 5,534 | | | | 375,814 | |
Packaging Corporation of America | | | 1,691 | | | | 364,241 | |
Amcor plc | | | 27,245 | | | | 308,686 | |
Crown Holdings, Inc. | | | 2,968 | | | | 284,572 | |
AptarGroup, Inc. | | | 1,699 | | | | 272,163 | |
Graphic Packaging Holding Co. | | | 8,190 | | | | 242,342 | |
Berry Global Group, Inc. | | | 3,328 | | | | 226,237 | |
Sealed Air Corp. | | | 5,341 | | | | 193,878 | |
Sonoco Products Co. | | | 3,454 | | | | 188,692 | |
Silgan Holdings, Inc. | | | 3,287 | | | | 172,568 | |
O-I Glass, Inc.* | | | 9,063 | | | | 118,907 | |
Total Packaging & Containers | | | | | | | 3,153,739 | |
| | | | | | | | | |
Iron & Steel - 11.1% |
Nucor Corp. | | | 3,328 | | | | 500,331 | |
Vale S.A. ADR | | | 38,488 | | | | 449,540 | |
Steel Dynamics, Inc. | | | 2,939 | | | | 370,549 | |
Reliance, Inc. | | | 1,148 | | | | 332,013 | |
ArcelorMittal S.A. | | | 11,796 | | | | 309,763 | |
Carpenter Technology Corp. | | | 1,501 | | | | 239,529 | |
ATI, Inc.* | | | 3,537 | | | | 236,661 | |
United States Steel Corp. | | | 6,105 | | | | 215,690 | |
Commercial Metals Co. | | | 3,887 | | | | 213,629 | |
Cleveland-Cliffs, Inc.* | | | 16,262 | | | | 207,666 | |
Total Iron & Steel | | | | | | | 3,075,371 | |
| | | | | | | | | |
Building Materials - 9.7% |
CRH plc* | | | 7,194 | | | | 667,172 | |
Vulcan Materials Co. | | | 1,897 | | | | 475,066 | |
Martin Marietta Materials, Inc. | | | 880 | | | | 473,660 | |
Cemex SAB de CV ADR | | | 46,171 | | | | 281,643 | |
Eagle Materials, Inc. | | | 888 | | | | 255,433 | |
Louisiana-Pacific Corp. | | | 2,113 | | | | 227,063 | |
Summit Materials, Inc. — Class A* | | | 4,584 | | | | 178,914 | |
Aspen Aerogels, Inc.* | | | 4,448 | | | | 123,165 | |
Total Building Materials | | | | | | | 2,682,116 | |
| | | | | | | | | |
Coal - 2.7% |
Teck Resources Ltd. — Class B | | | 7,390 | | | | 386,054 | |
Warrior Met Coal, Inc. | | | 2,401 | | | | 153,424 | |
Arch Resources, Inc. | | | 934 | | | | 129,041 | |
Alpha Metallurgical Resources, Inc.* | | | 378 | | | | 89,276 | |
Total Coal | | | | | | | 757,795 | |
| | | | | | | | | |
Biotechnology - 1.9% |
Corteva, Inc. | | | 8,991 | | | | 528,581 | |
| | | | | | | | | |
Household Products & Housewares - 1.2% |
Avery Dennison Corp. | | | 1,557 | | | | 343,723 | |
| | | | | | | | | |
Forest Products & Paper - 1.2% |
International Paper Co. | | | 6,942 | | | | 339,117 | |
| | | | | | | | | |
10 | THE RYDEX FUNDS SEMI-ANNUAL FINANCIAL REPORT | SEE NOTES TO FINANCIAL STATEMENTS. |
SCHEDULE OF INVESTMENTS (Unaudited)(concluded) | September 30, 2024 |
BASIC MATERIALS FUND | |
| | Shares | | | Value | |
Housewares - 0.7% |
Scotts Miracle-Gro Co. — Class A | | | 2,062 | | | $ | 178,775 | |
| | | | | | | | | |
Environmental Control - 0.3% |
PureCycle Technologies, Inc.*,1 | | | 10,422 | | | | 99,009 | |
| | | | | | | | | |
Total Common Stocks | | | | |
(Cost $15,496,025) | | | | | | | 27,584,206 | |
| | | | | | | | | |
| | | Face
Amount | | | | | |
REPURCHASE AGREEMENTS††,2 - 0.6% |
J.P. Morgan Securities LLC
issued 09/30/24 at 4.86%
due 10/01/24 | | $ | 89,076 | | | | 89,076 | |
BofA Securities, Inc.
issued 09/30/24 at 4.85%
due 10/01/24 | | | 73,572 | | | | 73,572 | |
Total Repurchase Agreements | | | | |
(Cost $162,648) | | | | | | | 162,648 | |
| | | | | | | | | |
SECURITIES LENDING COLLATERAL†,3 - 2.4% |
Money Market Fund*** | | | | | | | | |
First American Government Obligations Fund - Class X, 4.82%4 | | | 654,014 | | | $ | 654,014 | |
Total Securities Lending Collateral | | | | |
(Cost $654,014) | | | | | | | 654,014 | |
| | | | | | | | | |
Total Investments - 102.4% | | | | |
(Cost $16,312,687) | | $ | 28,400,868 | |
Other Assets & Liabilities, net - (2.4)% | | | (658,254 | ) |
Total Net Assets - 100.0% | | $ | 27,742,614 | |
* | Non-income producing security. |
*** | A copy of each underlying unaffiliated fund’s financial statements is available at the SEC’s website at www.sec.gov. |
† | Value determined based on Level 1 inputs — See Note 4. |
†† | Value determined based on Level 2 inputs — See Note 4. |
1 | All or a portion of this security is on loan at September 30, 2024 — See Note 7. |
2 | Repurchase Agreements — See Note 6. |
3 | Securities lending collateral — See Note 7. |
4 | Rate indicated is the 7-day yield as of September 30, 2024. |
| | ADR — American Depositary Receipt |
| | plc — Public Limited Company |
| | |
| | See Sector Classification in Other Information section. |
The following table summarizes the inputs used to value the Fund’s investments at September 30, 2024 (See Note 4 in the Notes to Financial Statements):
Investments in Securities (Assets) | | Level 1
Quoted
Prices | | | Level 2
Significant
Observable
Inputs | | | Level 3
Significant
Unobservable
Inputs | | | Total | |
Common Stocks | | $ | 27,584,206 | | | $ | — | | | $ | — | | | $ | 27,584,206 | |
Repurchase Agreements | | | — | | | | 162,648 | | | | — | | | | 162,648 | |
Securities Lending Collateral | | | 654,014 | | | | — | | | | — | | | | 654,014 | |
Total Assets | | $ | 28,238,220 | | | $ | 162,648 | | | $ | — | | | $ | 28,400,868 | |
SEE NOTES TO FINANCIAL STATEMENTS. | THE RYDEX FUNDS SEMI-ANNUAL FINANCIAL REPORT | 11 |
STATEMENT OF ASSETS AND LIABILITIES (Unaudited) |
September 30, 2024 |
Assets: |
Investments, at value - including $625,216 of securities loaned (cost $16,150,039) | | $ | 28,238,220 | |
Repurchase agreements, at value (cost $162,648) | | | 162,648 | |
Cash | | | 2,707 | |
Receivables: |
Fund shares sold | | | 261,663 | |
Dividends | | | 26,122 | |
Securities lending income | | | 763 | |
Foreign tax reclaims | | | 600 | |
Interest | | | 22 | |
Total assets | | | 28,692,745 | |
| | | | | |
Liabilities: |
Payable for: |
Return of securities lending collateral | | | 654,014 | |
Securities purchased | | | 198,497 | |
Fund shares redeemed | | | 47,352 | |
Management fees | | | 17,322 | |
Transfer agent fees | | | 11,906 | |
Distribution and service fees | | | 2,478 | |
Portfolio accounting and administration fees | | | 2,091 | |
Trustees’ fees* | | | 238 | |
Miscellaneous | | | 16,233 | |
Total liabilities | | | 950,131 | |
Net assets | | $ | 27,742,614 | |
| | | | | |
Net assets consist of: |
Paid in capital | | $ | 16,761,895 | |
Total distributable earnings (loss) | | | 10,980,719 | |
Net assets | | $ | 27,742,614 | |
| | | | | |
Investor Class: |
Net assets | | $ | 18,212,039 | |
Capital shares outstanding | | | 200,632 | |
Net asset value per share | | $ | 90.77 | |
| | | | | |
Class A: |
Net assets | | $ | 7,068,455 | |
Capital shares outstanding | | | 85,285 | |
Net asset value per share | | $ | 82.88 | |
Maximum offering price per share (Net asset value divided by 95.25%) | | $ | 87.01 | |
| | | | | |
Class C: |
Net assets | | $ | 1,271,610 | |
Capital shares outstanding | | | 18,601 | |
Net asset value per share | | $ | 68.36 | |
| | | | | |
Class H: |
Net assets | | $ | 1,190,510 | |
Capital shares outstanding | | | 14,890 | |
Net asset value per share | | $ | 79.95 | |
STATEMENT OF OPERATIONS (Unaudited) |
Six Months Ended September 30, 2024 |
Investment Income: |
Dividends (net of foreign withholding tax of $7,004) | | $ | 261,239 | |
Interest | | | 3,473 | |
Income from securities lending, net | | | 8,015 | |
Total investment income | | | 272,727 | |
| | | | | |
Expenses: |
Management fees | | | 121,977 | |
Distribution and service fees: |
Class A | | | 8,739 | |
Class C | | | 7,080 | |
Class H | | | 1,372 | |
Transfer agent fees | | | 29,508 | |
Portfolio accounting and administration fees | | | 21,897 | |
Registration fees | | | 13,107 | |
Professional fees | | | 5,023 | |
Custodian fees | | | 1,845 | |
Trustees’ fees* | | | 1,607 | |
Line of credit fees | | | 35 | |
Miscellaneous | | | 8,243 | |
Total expenses | | | 220,433 | |
Less: |
Expenses reimbursed by Adviser | | | (7,169 | ) |
Net expenses | | | 213,264 | |
Net investment income | | | 59,463 | |
| | | | | |
Net Realized and Unrealized Gain (Loss): |
Net realized gain (loss) on: |
Investments | | | 1,308,568 | |
Net realized gain | | | 1,308,568 | |
Net change in unrealized appreciation (depreciation) on: |
Investments | | | 13,424 | |
Net change in unrealized appreciation (depreciation) | | | 13,424 | |
Net realized and unrealized gain | | | 1,321,992 | |
Net increase in net assets resulting from operations | | $ | 1,381,455 | |
* | Relates to Trustees not deemed “interested persons” within the meaning of Section 2(a)(19) of the 1940 Act. |
12 | THE RYDEX FUNDS SEMI-ANNUAL FINANCIAL REPORT | SEE NOTES TO FINANCIAL STATEMENTS. |
STATEMENTS OF CHANGES IN NET ASSETS |
| | Six Months Ended
September 30, 2024
(Unaudited) | | | Year Ended
March 31,
2024 | |
Increase (Decrease) in Net Assets from Operations: | | | | | | | | |
Net investment income | | $ | 59,463 | | | $ | 220,977 | |
Net realized gain on investments | | | 1,308,568 | | | | 3,098,421 | |
Net change in unrealized appreciation (depreciation) on investments | | | 13,424 | | | | (1,001,241 | ) |
Net increase in net assets resulting from operations | | | 1,381,455 | | | | 2,318,157 | |
| | | | | | | | | |
Distributions to shareholders: | | | | | | | | |
Investor Class | | | — | | | | (430,177 | ) |
Class A | | | — | | | | (163,593 | ) |
Class C | | | — | | | | (58,233 | ) |
Class H | | | — | | | | (29,080 | ) |
Total distributions to shareholders | | | — | | | | (681,083 | ) |
| | | | | | | | | |
Capital share transactions: | | | | | | | | |
Proceeds from sale of shares | | | | | | | | |
Investor Class | | | 7,751,187 | | | | 15,390,212 | |
Class A | | | 934,608 | | | | 1,725,949 | |
Class C | | | 55,285 | | | | 348,442 | |
Class H | | | 174,129 | | | | 68,201 | |
Distributions reinvested | | | | | | | | |
Investor Class | | | — | | | | 417,109 | |
Class A | | | — | | | | 159,729 | |
Class C | | | — | | | | 57,991 | |
Class H | | | — | | | | 28,998 | |
Cost of shares redeemed | | | | | | | | |
Investor Class | | | (9,872,837 | ) | | | (20,690,843 | ) |
Class A | | | (1,413,506 | ) | | | (2,660,085 | ) |
Class C | | | (522,416 | ) | | | (1,389,009 | ) |
Class H | | | (66,271 | ) | | | (690,092 | ) |
Net decrease from capital share transactions | | | (2,959,821 | ) | | | (7,233,398 | ) |
Net decrease in net assets | | | (1,578,366 | ) | | | (5,596,324 | ) |
| | | | | | | | | |
Net assets: | | | | | | | | |
Beginning of period | | | 29,320,980 | | | | 34,917,304 | |
End of period | | $ | 27,742,614 | | | $ | 29,320,980 | |
| | | | | | | | | |
Capital share activity: | | | | | | | | |
Shares sold | | | | | | | | |
Investor Class | | | 90,902 | | | | 192,395 | |
Class A | | | 11,909 | | | | 23,750 | |
Class C | | | 849 | | | | 5,700 | |
Class H | | | 2,271 | | | | 972 | |
Shares issued from reinvestment of distributions | | | | | | | | |
Investor Class | | | — | | | | 5,424 | |
Class A | | | — | | | | 2,270 | |
Class C | | | — | | | | 993 | |
Class H | | | — | | | | 427 | |
Shares redeemed | | | | | | | | |
Investor Class | | | (114,446 | ) | | | (260,804 | ) |
Class A | | | (18,128 | ) | | | (36,612 | ) |
Class C | | | (8,164 | ) | | | (23,075 | ) |
Class H | | | (892 | ) | | | (9,742 | ) |
Net decrease in shares | | | (35,699 | ) | | | (98,302 | ) |
SEE NOTES TO FINANCIAL STATEMENTS. | THE RYDEX FUNDS SEMI-ANNUAL FINANCIAL REPORT | 13 |
This table is presented to show selected data for a share outstanding throughout each period and to assist shareholders in evaluating a Fund’s performance for the periods presented.
Investor Class | | Six Months Ended
September 30, 2024a | | | Year Ended
March 31,
2024 | | | Year Ended
March 31,
2023 | | | Year Ended
March 31,
2022 | | | Year Ended
March 31,
2021 | | | Year Ended
March 31,
2020 | |
Per Share Data |
Net asset value, beginning of period | | $ | 86.40 | | | $ | 80.67 | | | $ | 89.73 | | | $ | 78.37 | | | $ | 42.39 | | | $ | 58.04 | |
Income (loss) from investment operations: |
Net investment income (loss)b | | | .22 | | | | .67 | | | | .89 | | | | .60 | | | | .43 | | | | .43 | |
Net gain (loss) on investments (realized and unrealized) | | | 4.15 | | | | 6.81 | | | | (8.66 | ) | | | 12.39 | | | | 37.12 | | | | (13.42 | ) |
Total from investment operations | | | 4.37 | | | | 7.48 | | | | (7.77 | ) | | | 12.99 | | | | 37.55 | | | | (12.99 | ) |
Less distributions from: |
Net investment income | | | — | | | | (1.75 | ) | | | (1.29 | ) | | | — | | | | (.54 | ) | | | (.90 | ) |
Net realized gains | | | — | | | | — | | | | — | | | | (1.63 | ) | | | (1.03 | ) | | | (1.76 | ) |
Total distributions | | | — | | | | (1.75 | ) | | | (1.29 | ) | | | (1.63 | ) | | | (1.57 | ) | | | (2.66 | ) |
Net asset value, end of period | | $ | 90.77 | | | $ | 86.40 | | | $ | 80.67 | | | $ | 89.73 | | | $ | 78.37 | | | $ | 42.39 | |
|
Total Return | | | 5.06 | % | | | 9.55 | % | | | (8.59 | %) | | | 16.72 | % | | | 89.00 | % | | | (23.61 | %) |
Ratios/Supplemental Data |
Net assets, end of period (in thousands) | | $ | 18,212 | | | $ | 19,369 | | | $ | 23,164 | | | $ | 51,058 | | | $ | 38,112 | | | $ | 13,313 | |
Ratios to average net assets: |
Net investment income (loss) | | | 0.52 | % | | | 0.85 | % | | | 1.11 | % | | | 0.71 | % | | | 0.67 | % | | | 0.74 | % |
Total expenses | | | 1.42 | % | | | 1.43 | % | | | 1.39 | % | | | 1.36 | % | | | 1.43 | % | | | 1.48 | % |
Net expensesc | | | 1.37 | % | | | 1.40 | % | | | 1.39 | % | | | 1.36 | % | | | 1.43 | % | | | 1.48 | % |
Portfolio turnover rate | | | 27 | % | | | 49 | % | | | 126 | % | | | 169 | % | | | 162 | % | | | 67 | % |
Class A | | Six Months Ended
September 30, 2024a | | | Year Ended
March 31,
2024 | | | Year Ended
March 31,
2023 | | | Year Ended
March 31,
2022 | | | Year Ended
March 31,
2021 | | | Year Ended
March 31,
2020 | |
Per Share Data |
Net asset value, beginning of period | | $ | 78.99 | | | $ | 74.08 | | | $ | 82.73 | | | $ | 72.55 | | | $ | 39.41 | | | $ | 54.27 | |
Income (loss) from investment operations: |
Net investment income (loss)b | | | .12 | | | | .46 | | | | .56 | | | | .35 | | | | .25 | | | | .26 | |
Net gain (loss) on investments (realized and unrealized) | | | 3.77 | | | | 6.20 | | | | (7.92 | ) | | | 11.46 | | | | 34.46 | | | | (12.46 | ) |
Total from investment operations | | | 3.89 | | | | 6.66 | | | | (7.36 | ) | | | 11.81 | | | | 34.71 | | | | (12.20 | ) |
Less distributions from: |
Net investment income | | | — | | | | (1.75 | ) | | | (1.29 | ) | | | — | | | | (.54 | ) | | | (.90 | ) |
Net realized gains | | | — | | | | — | | | | — | | | | (1.63 | ) | | | (1.03 | ) | | | (1.76 | ) |
Total distributions | | | — | | | | (1.75 | ) | | | (1.29 | ) | | | (1.63 | ) | | | (1.57 | ) | | | (2.66 | ) |
Net asset value, end of period | | $ | 82.88 | | | $ | 78.99 | | | $ | 74.08 | | | $ | 82.73 | | | $ | 72.55 | | | $ | 39.41 | |
|
Total Returnd | | | 4.92 | % | | | 9.29 | % | | | (8.83 | %) | | | 16.43 | % | | | 88.52 | % | | | (23.80 | %) |
Ratios/Supplemental Data |
Net assets, end of period (in thousands) | | $ | 7,068 | | | $ | 7,228 | | | $ | 7,563 | | | $ | 7,506 | | | $ | 5,599 | | | $ | 2,966 | |
Ratios to average net assets: |
Net investment income (loss) | | | 0.32 | % | | | 0.63 | % | | | 0.77 | % | | | 0.45 | % | | | 0.44 | % | | | 0.48 | % |
Total expenses | | | 1.67 | % | | | 1.68 | % | | | 1.64 | % | | | 1.61 | % | | | 1.69 | % | | | 1.73 | % |
Net expensesc | | | 1.62 | % | | | 1.65 | % | | | 1.64 | % | | | 1.61 | % | | | 1.69 | % | | | 1.73 | % |
Portfolio turnover rate | | | 27 | % | | | 49 | % | | | 126 | % | | | 169 | % | | | 162 | % | | | 67 | % |
14 | THE RYDEX FUNDS SEMI-ANNUAL FINANCIAL REPORT | SEE NOTES TO FINANCIAL STATEMENTS. |
FINANCIAL HIGHLIGHTS (continued) |
This table is presented to show selected data for a share outstanding throughout each period and to assist shareholders in evaluating a Fund’s performance for the periods presented.
Class C | | Six Months Ended
September 30, 2024a | | | Year Ended
March 31,
2024 | | | Year Ended
March 31,
2023 | | | Year Ended
March 31,
2022 | | | Year Ended
March 31,
2021 | | | Year Ended
March 31,
2020 | |
Per Share Data |
Net asset value, beginning of period | | $ | 65.40 | | | $ | 62.10 | | | $ | 70.12 | | | $ | 62.18 | | | $ | 34.17 | | | $ | 47.73 | |
Income (loss) from investment operations: |
Net investment income (loss)b | | | (.15 | ) | | | (.11 | ) | | | — | e | | | (.18 | ) | | | (.17 | ) | | | (.11 | ) |
Net gain (loss) on investments (realized and unrealized) | | | 3.11 | | | | 5.16 | | | | (6.73 | ) | | | 9.75 | | | | 29.75 | | | | (10.79 | ) |
Total from investment operations | | | 2.96 | | | | 5.05 | | | | (6.73 | ) | | | 9.57 | | | | 29.58 | | | | (10.90 | ) |
Less distributions from: |
Net investment income | | | — | | | | (1.75 | ) | | | (1.29 | ) | | | — | | | | (.54 | ) | | | (.90 | ) |
Net realized gains | | | — | | | | — | | | | — | | | | (1.63 | ) | | | (1.03 | ) | | | (1.76 | ) |
Total distributions | | | — | | | | (1.75 | ) | | | (1.29 | ) | | | (1.63 | ) | | | (1.57 | ) | | | (2.66 | ) |
Net asset value, end of period | | $ | 68.36 | | | $ | 65.40 | | | $ | 62.10 | | | $ | 70.12 | | | $ | 62.18 | | | $ | 34.17 | |
|
Total Returnd | | | 4.53 | % | | | 8.47 | % | | | (9.51 | %) | | | 15.57 | % | | | 87.07 | % | | | (24.35 | %) |
Ratios/Supplemental Data |
Net assets, end of period (in thousands) | | $ | 1,272 | | | $ | 1,695 | | | $ | 2,627 | | | $ | 3,839 | | | $ | 2,534 | | | $ | 1,526 | |
Ratios to average net assets: |
Net investment income (loss) | | | (0.47 | %) | | | (0.18 | %) | | | — | f | | | (0.27 | %) | | | (0.34 | %) | | | (0.23 | %) |
Total expenses | | | 2.41 | % | | | 2.43 | % | | | 2.39 | % | | | 2.36 | % | | | 2.44 | % | | | 2.47 | % |
Net expensesc | | | 2.36 | % | | | 2.40 | % | | | 2.39 | % | | | 2.36 | % | | | 2.44 | % | | | 2.47 | % |
Portfolio turnover rate | | | 27 | % | | | 49 | % | | | 126 | % | | | 169 | % | | | 162 | % | | | 67 | % |
SEE NOTES TO FINANCIAL STATEMENTS. | THE RYDEX FUNDS SEMI-ANNUAL FINANCIAL REPORT | 15 |
FINANCIAL HIGHLIGHTS (concluded) |
This table is presented to show selected data for a share outstanding throughout each period and to assist shareholders in evaluating a Fund’s performance for the periods presented.
Class H | | Six Months Ended
September 30, 2024a | | | Year Ended
March 31,
2024 | | | Year Ended
March 31,
2023 | | | Year Ended
March 31,
2022 | | | Year Ended
March 31,
2021 | | | Year Ended
March 31,
2020 | |
Per Share Data |
Net asset value, beginning of period | | $ | 76.20 | | | $ | 71.53 | | | $ | 79.95 | | | $ | 70.17 | | | $ | 38.15 | | | $ | 52.62 | |
Income (loss) from investment operations: |
Net investment income (loss)b | | | .13 | | | | .41 | | | | .28 | | | | .56 | | | | .19 | | | | .27 | |
Net gain (loss) on investments (realized and unrealized) | | | 3.62 | | | | 6.01 | | | | (7.41 | ) | | | 10.85 | | | | 33.40 | | | | (12.08 | ) |
Total from investment operations | | | 3.75 | | | | 6.42 | | | | (7.13 | ) | | | 11.41 | | | | 33.59 | | | | (11.81 | ) |
Less distributions from: |
Net investment income | | | — | | | | (1.75 | ) | | | (1.29 | ) | | | — | | | | (.54 | ) | | | (.90 | ) |
Net realized gains | | | — | | | | — | | | | — | | | | (1.63 | ) | | | (1.03 | ) | | | (1.76 | ) |
Total distributions | | | — | | | | (1.75 | ) | | | (1.29 | ) | | | (1.63 | ) | | | (1.57 | ) | | | (2.66 | ) |
Net asset value, end of period | | $ | 79.95 | | | $ | 76.20 | | | $ | 71.53 | | | $ | 79.95 | | | $ | 70.17 | | | $ | 38.15 | |
|
Total Return | | | 4.92 | % | | | 9.29 | % | | | (8.85 | %) | | | 16.42 | % | | | 88.51 | % | | | (23.81 | %) |
Ratios/Supplemental Data |
Net assets, end of period (in thousands) | | $ | 1,191 | | | $ | 1,030 | | | $ | 1,563 | | | $ | 10,420 | | | $ | 2,108 | | | $ | 825 | |
Ratios to average net assets: |
Net investment income (loss) | | | 0.35 | % | | | 0.59 | % | | | 0.38 | % | | | 0.73 | % | | | 0.33 | % | | | 0.51 | % |
Total expenses | | | 1.67 | % | | | 1.68 | % | | | 1.65 | % | | | 1.60 | % | | | 1.68 | % | | | 1.72 | % |
Net expensesc | | | 1.62 | % | | | 1.65 | % | | | 1.65 | % | | | 1.60 | % | | | 1.68 | % | | | 1.72 | % |
Portfolio turnover rate | | | 27 | % | | | 49 | % | | | 126 | % | | | 169 | % | | | 162 | % | | | 67 | % |
a | Unaudited figures for the period ended September 30, 2024. Percentage amounts for the period, except total return and portfolio turnover rate, have been annualized. |
b | Net investment income (loss) per share was computed using average shares outstanding throughout the period. |
c | Net expense information reflects the expense ratios after expense waivers and reimbursements, as applicable. |
d | Total return does not reflect the impact of any applicable sales charges. |
e | Less than $0.01 per share. |
f | Less than 0.01% or (0.01%). |
16 | THE RYDEX FUNDS SEMI-ANNUAL FINANCIAL REPORT | SEE NOTES TO FINANCIAL STATEMENTS. |
SCHEDULE OF INVESTMENTS (Unaudited) | September 30, 2024 |
BIOTECHNOLOGY FUND | |
| | Shares | | | Value | |
COMMON STOCKS† - 99.5% |
| | | | | | | | | |
Biotechnology - 74.7% |
Amgen, Inc. | | | 20,720 | | | $ | 6,676,191 | |
Gilead Sciences, Inc. | | | 61,905 | | | | 5,190,115 | |
Vertex Pharmaceuticals, Inc.* | | | 9,565 | | | | 4,448,490 | |
Regeneron Pharmaceuticals, Inc.* | | | 3,943 | | | | 4,145,039 | |
Corteva, Inc. | | | 56,438 | | | | 3,317,990 | |
Alnylam Pharmaceuticals, Inc.* | | | 11,100 | | | | 3,052,833 | |
Biogen, Inc.* | | | 14,005 | | | | 2,714,729 | |
Moderna, Inc.* | | | 40,346 | | | | 2,696,323 | |
Illumina, Inc.* | | | 18,489 | | | | 2,411,151 | |
United Therapeutics Corp.* | | | 5,787 | | | | 2,073,771 | |
Royalty Pharma plc — Class A | | | 69,084 | | | | 1,954,386 | |
Insmed, Inc.* | | | 24,177 | | | | 1,764,921 | |
Sarepta Therapeutics, Inc.* | | | 13,751 | | | | 1,717,362 | |
Incyte Corp.* | | | 25,900 | | | | 1,711,990 | |
BioMarin Pharmaceutical, Inc.* | | | 24,243 | | | | 1,704,041 | |
Legend Biotech Corp. ADR* | | | 30,903 | | | | 1,505,903 | |
BioNTech SE ADR* | | | 11,994 | | | | 1,424,527 | |
Argenx SE ADR* | | | 2,618 | | | | 1,419,165 | |
REVOLUTION Medicines, Inc.* | | | 30,792 | | | | 1,396,417 | |
Exelixis, Inc.* | | | 52,804 | | | | 1,370,264 | |
Intra-Cellular Therapies, Inc.* | | | 18,511 | | | | 1,354,450 | |
CRISPR Therapeutics AG*,1 | | | 28,827 | | | | 1,354,292 | |
Halozyme Therapeutics, Inc.* | | | 23,072 | | | | 1,320,641 | |
Viking Therapeutics, Inc.* | | | 20,101 | | | | 1,272,594 | |
Cytokinetics, Inc.* | | | 23,348 | | | | 1,232,774 | |
Blueprint Medicines Corp.* | | | 13,165 | | | | 1,217,763 | |
Avidity Biosciences, Inc.* | | | 26,463 | | | | 1,215,446 | |
Roivant Sciences Ltd.* | | | 102,527 | | | | 1,183,162 | |
Ionis Pharmaceuticals, Inc.* | | | 29,368 | | | | 1,176,482 | |
Ultragenyx Pharmaceutical, Inc.* | | | 19,704 | | | | 1,094,557 | |
Crinetics Pharmaceuticals, Inc.* | | | 20,024 | | | | 1,023,226 | |
Axsome Therapeutics, Inc.* | | | 10,647 | | | | 956,846 | |
Bridgebio Pharma, Inc.* | | | 36,536 | | | | 930,207 | |
Dyne Therapeutics, Inc.* | | | 25,778 | | | | 925,946 | |
TG Therapeutics, Inc.* | | | 39,286 | | | | 918,900 | |
Amicus Therapeutics, Inc.* | | | 82,481 | | | | 880,897 | |
Iovance Biotherapeutics, Inc.* | | | 88,004 | | | | 826,358 | |
PTC Therapeutics, Inc.* | | | 21,857 | | | | 810,895 | |
Guardant Health, Inc.* | | | 35,089 | | | | 804,942 | |
Nuvalent, Inc. — Class A* | | | 7,820 | | | | 799,986 | |
Apellis Pharmaceuticals, Inc.* | | | 27,159 | | | | 783,266 | |
Novavax, Inc.*,1 | | | 60,657 | | | | 766,098 | |
Arrowhead Pharmaceuticals, Inc.* | | | 38,866 | | | | 752,834 | |
Intellia Therapeutics, Inc.* | | | 35,674 | | | | 733,101 | |
ACADIA Pharmaceuticals, Inc.* | | | 44,830 | | | | 689,485 | |
SpringWorks Therapeutics, Inc.* | | | 21,493 | | | | 688,636 | |
Recursion Pharmaceuticals, Inc. — Class A*,1 | | | 103,389 | | | | 681,334 | |
Immunovant, Inc.* | | | 23,790 | | | | 678,253 | |
Ardelyx, Inc.* | | | 98,198 | | | | 676,584 | |
Dynavax Technologies Corp.* | | | 56,493 | | | | 629,332 | |
Beam Therapeutics, Inc.* | | | 23,602 | | | | 578,249 | |
Krystal Biotech, Inc.* | | | 3,081 | | | | 560,834 | |
Akero Therapeutics, Inc.* | | | 17,826 | | | | 511,428 | |
Sage Therapeutics, Inc.* | | | 43,626 | | | | 314,980 | |
Total Biotechnology | | | | | | | 83,040,386 | |
| | | | | | | | | |
Pharmaceuticals - 19.7% |
AbbVie, Inc. | | | 49,204 | | | | 9,716,806 | |
AstraZeneca plc ADR | | | 38,104 | | | | 2,968,683 | |
Vaxcyte, Inc.* | | | 16,335 | | | | 1,866,600 | |
Viatris, Inc. | | | 159,683 | | | | 1,853,920 | |
Neurocrine Biosciences, Inc.* | | | 14,645 | | | | 1,687,397 | |
Alkermes plc* | | | 53,379 | | | | 1,494,078 | |
Jazz Pharmaceuticals plc* | | | 12,083 | | | | 1,346,167 | |
Madrigal Pharmaceuticals, Inc.* | | | 2,607 | | | | 553,257 | |
Ironwood Pharmaceuticals, Inc. — Class A* | | | 89,285 | | | | 367,854 | |
Total Pharmaceuticals | | | | | | | 21,854,762 | |
| | | | | | | | | |
Healthcare-Products - 4.1% |
Natera, Inc.* | | | 15,628 | | | | 1,983,975 | |
Exact Sciences Corp.* | | | 26,518 | | | | 1,806,406 | |
Twist Bioscience Corp.* | | | 18,478 | | | | 834,836 | |
Total Healthcare-Products | | | | | | | 4,625,217 | |
| | | | | | | | | |
Healthcare-Services - 1.0% |
Medpace Holdings, Inc.* | | | 3,291 | | | | 1,098,536 | |
| | | | | | | | | |
Total Common Stocks | | | | |
(Cost $55,582,282) | | | | | | | 110,618,901 | |
| | | | | | | | | |
| | | Face
Amount | | | | | |
REPURCHASE AGREEMENTS††,2 - 0.7% |
J.P. Morgan Securities LLC
issued 09/30/24 at 4.86%
due 10/01/24 | | $ | 399,392 | | | | 399,392 | |
BofA Securities, Inc.
issued 09/30/24 at 4.85%
due 10/01/24 | | | 329,879 | | | | 329,879 | |
Total Repurchase Agreements | | | | |
(Cost $729,271) | | | | | | | 729,271 | |
| | | | | | | | | |
| | | Shares | | | | | |
SECURITIES LENDING COLLATERAL†,3 - 2.0% |
Money Market Fund*** | | | | | | | | |
First American Government Obligations Fund - Class X, 4.82%4 | | | 2,236,257 | | | | 2,236,257 | |
Total Securities Lending Collateral | | | | |
(Cost $2,236,257) | | | | | | | 2,236,257 | |
| | | | | | | | | |
Total Investments - 102.2% | | | | |
(Cost $58,547,810) | | $ | 113,584,429 | |
Other Assets & Liabilities, net - (2.2)% | | | (2,487,884 | ) |
Total Net Assets - 100.0% | | $ | 111,096,545 | |
SEE NOTES TO FINANCIAL STATEMENTS. | THE RYDEX FUNDS SEMI-ANNUAL FINANCIAL REPORT | 17 |
SCHEDULE OF INVESTMENTS (Unaudited)(concluded) | September 30, 2024 |
BIOTECHNOLOGY FUND | |
* | Non-income producing security. |
*** | A copy of each underlying unaffiliated fund’s financial statements is available at the SEC’s website at www.sec.gov. |
† | Value determined based on Level 1 inputs — See Note 4. |
†† | Value determined based on Level 2 inputs — See Note 4. |
1 | All or a portion of this security is on loan at September 30, 2024 — See Note 7. |
2 | Repurchase Agreements — See Note 6. |
3 | Securities lending collateral — See Note 7. |
4 | Rate indicated is the 7-day yield as of September 30, 2024. |
| | ADR — American Depositary Receipt |
| | plc — Public Limited Company |
| | |
| | See Sector Classification in Other Information section. |
The following table summarizes the inputs used to value the Fund’s investments at September 30, 2024 (See Note 4 in the Notes to Financial Statements):
Investments in Securities (Assets) | | Level 1
Quoted
Prices | | | Level 2
Significant
Observable
Inputs | | | Level 3
Significant
Unobservable
Inputs | | | Total | |
Common Stocks | | $ | 110,618,901 | | | $ | — | | | $ | — | | | $ | 110,618,901 | |
Repurchase Agreements | | | — | | | | 729,271 | | | | — | | | | 729,271 | |
Securities Lending Collateral | | | 2,236,257 | | | | — | | | | — | | | | 2,236,257 | |
Total Assets | | $ | 112,855,158 | | | $ | 729,271 | | | $ | — | | | $ | 113,584,429 | |
18 | THE RYDEX FUNDS SEMI-ANNUAL FINANCIAL REPORT | SEE NOTES TO FINANCIAL STATEMENTS. |
STATEMENT OF ASSETS AND LIABILITIES (Unaudited) |
September 30, 2024 |
Assets: |
Investments, at value - including $2,101,267 of securities loaned (cost $57,818,539) | | $ | 112,855,158 | |
Repurchase agreements, at value (cost $729,271) | | | 729,271 | |
Receivables: |
Fund shares sold | | | 18,104 | |
Foreign tax reclaims | | | 4,335 | |
Securities lending income | | | 328 | |
Interest | | | 99 | |
Total assets | | | 113,607,295 | |
| | | | | |
Liabilities: |
Payable for: |
Return of securities lending collateral | | | 2,236,257 | |
Management fees | | | 73,685 | |
Fund shares redeemed | | | 72,431 | |
Transfer agent fees | | | 47,973 | |
Portfolio accounting and administration fees | | | 8,896 | |
Distribution and service fees | | | 4,618 | |
Trustees’ fees* | | | 969 | |
Miscellaneous | | | 65,921 | |
Total liabilities | | | 2,510,750 | |
Net assets | | $ | 111,096,545 | |
| | | | | |
Net assets consist of: |
Paid in capital | | $ | 46,042,843 | |
Total distributable earnings (loss) | | | 65,053,702 | |
Net assets | | $ | 111,096,545 | |
| | | | | |
Investor Class: |
Net assets | | $ | 90,030,953 | |
Capital shares outstanding | | | 1,126,292 | |
Net asset value per share | | $ | 79.94 | |
| | | | | |
Class A: |
Net assets | | $ | 15,062,491 | |
Capital shares outstanding | | | 217,622 | |
Net asset value per share | | $ | 69.21 | |
Maximum offering price per share (Net asset value divided by 95.25%) | | $ | 72.66 | |
| | | | | |
Class C: |
Net assets | | $ | 897,141 | |
Capital shares outstanding | | | 16,583 | |
Net asset value per share | | $ | 54.10 | |
| | | | | |
Class H: |
Net assets | | $ | 5,105,960 | |
Capital shares outstanding | | | 77,316 | |
Net asset value per share | | $ | 66.04 | |
STATEMENT OF OPERATIONS (Unaudited) |
Six Months Ended September 30, 2024 |
Investment Income: |
Dividends (net of foreign withholding tax of $596) | | $ | 468,740 | |
Interest | | | 14,725 | |
Income from securities lending, net | | | 6,028 | |
Total investment income | | | 489,493 | |
| | | | | |
Expenses: |
Management fees | | | 463,681 | |
Distribution and service fees: |
Class A | | | 18,343 | |
Class C | | | 4,437 | |
Class H | | | 6,434 | |
Transfer agent fees | | | 112,507 | |
Portfolio accounting and administration fees | | | 83,237 | |
Registration fees | | | 45,471 | |
Professional fees | | | 19,122 | |
Custodian fees | | | 6,975 | |
Trustees’ fees* | | | 5,940 | |
Miscellaneous | | | 37,264 | |
Total expenses | | | 803,411 | |
Less: |
Expenses reimbursed by Adviser | | | (27,252 | ) |
Net expenses | | | 776,159 | |
Net investment loss | | | (286,666 | ) |
| | | | | |
Net Realized and Unrealized Gain (Loss): |
Net realized gain (loss) on: |
Investments | | | 5,095,479 | |
Net realized gain | | | 5,095,479 | |
Net change in unrealized appreciation (depreciation) on: |
Investments | | | 2,582,249 | |
Net change in unrealized appreciation (depreciation) | | | 2,582,249 | |
Net realized and unrealized gain | | | 7,677,728 | |
Net increase in net assets resulting from operations | | $ | 7,391,062 | |
* | Relates to Trustees not deemed “interested persons” within the meaning of Section 2(a)(19) of the 1940 Act. |
SEE NOTES TO FINANCIAL STATEMENTS. | THE RYDEX FUNDS SEMI-ANNUAL FINANCIAL REPORT | 19 |
STATEMENTS OF CHANGES IN NET ASSETS |
| | Six Months Ended
September 30, 2024
(Unaudited) | | | Year Ended
March 31,
2024 | |
Increase (Decrease) in Net Assets from Operations: | | | | | | | | |
Net investment loss | | $ | (286,666 | ) | | $ | (480,703 | ) |
Net realized gain on investments | | | 5,095,479 | | | | 14,859,997 | |
Net change in unrealized appreciation (depreciation) on investments | | | 2,582,249 | | | | (5,138,730 | ) |
Net increase in net assets resulting from operations | | | 7,391,062 | | | | 9,240,564 | |
| | | | | | | | | |
Capital share transactions: | | | | | | | | |
Proceeds from sale of shares | | | | | | | | |
Investor Class | | | 27,307,751 | | | | 27,388,563 | |
Class A | | | 1,090,898 | | | | 1,750,509 | |
Class C | | | 214,519 | | | | 185,861 | |
Class H | | | 123,756 | | | | 438,546 | |
Cost of shares redeemed | | | | | | | | |
Investor Class | | | (31,645,436 | ) | | | (40,330,995 | ) |
Class A | | | (1,765,521 | ) | | | (4,351,712 | ) |
Class C | | | (342,599 | ) | | | (1,010,807 | ) |
Class H | | | (653,975 | ) | | | (1,653,324 | ) |
Net decrease from capital share transactions | | | (5,670,607 | ) | | | (17,583,359 | ) |
Net increase (decrease) in net assets | | | 1,720,455 | | | | (8,342,795 | ) |
| | | | | | | | | |
Net assets: | | | | | | | | |
Beginning of period | | | 109,376,090 | | | | 117,718,885 | |
End of period | | $ | 111,096,545 | | | $ | 109,376,090 | |
| | | | | | | | | |
Capital share activity: | | | | | | | | |
Shares sold | | | | | | | | |
Investor Class | | | 361,347 | | | | 389,294 | |
Class A | | | 16,363 | | | | 29,027 | |
Class C | | | 4,016 | | | | 3,821 | |
Class H | | | 1,879 | | | | 7,277 | |
Shares redeemed | | | | | | | | |
Investor Class | | | (418,452 | ) | | | (579,083 | ) |
Class A | | | (26,988 | ) | | | (72,392 | ) |
Class C | | | (6,729 | ) | | | (21,302 | ) |
Class H | | | (10,389 | ) | | | (29,105 | ) |
Net decrease in shares | | | (78,953 | ) | | | (272,463 | ) |
20 | THE RYDEX FUNDS SEMI-ANNUAL FINANCIAL REPORT | SEE NOTES TO FINANCIAL STATEMENTS. |
This table is presented to show selected data for a share outstanding throughout each period and to assist shareholders in evaluating a Fund’s performance for the periods presented.
Investor Class | | Six Months Ended
September 30, 2024a | | | Year Ended
March 31,
2024 | | | Year Ended
March 31,
2023 | | | Year Ended
March 31,
2022 | | | Year Ended
March 31,
2021 | | | Year Ended
March 31,
2020 | |
Per Share Data |
Net asset value, beginning of period | | $ | 74.64 | | | $ | 68.29 | | | $ | 73.30 | | | $ | 94.01 | | | $ | 71.72 | | | $ | 83.02 | |
Income (loss) from investment operations: |
Net investment income (loss)b | | | (.18 | ) | | | (.26 | ) | | | (.24 | ) | | | (.52 | ) | | | (.58 | ) | | | (.44 | ) |
Net gain (loss) on investments (realized and unrealized) | | | 5.48 | | | | 6.61 | | | | (3.87 | ) | | | (4.42 | ) | | | 29.82 | | | | (7.26 | ) |
Total from investment operations | | | 5.30 | | | | 6.35 | | | | (4.11 | ) | | | (4.94 | ) | | | 29.24 | | | | (7.70 | ) |
Less distributions from: |
Net realized gains | | | — | | | | — | | | | (.90 | ) | | | (15.77 | ) | | | (6.95 | ) | | | (3.60 | ) |
Total distributions | | | — | | | | — | | | | (.90 | ) | | | (15.77 | ) | | | (6.95 | ) | | | (3.60 | ) |
Net asset value, end of period | | $ | 79.94 | | | $ | 74.64 | | | $ | 68.29 | | | $ | 73.30 | | | $ | 94.01 | | | $ | 71.72 | |
|
Total Return | | | 7.10 | % | | | 9.30 | % | | | (5.64 | %) | | | (6.81 | %) | | | 40.80 | % | | | (9.91 | %) |
Ratios/Supplemental Data |
Net assets, end of period (in thousands) | | $ | 90,031 | | | $ | 88,328 | | | $ | 93,776 | | | $ | 122,777 | | | $ | 151,506 | | | $ | 122,194 | |
Ratios to average net assets: |
Net investment income (loss) | | | (0.47 | %) | | | (0.37 | %) | | | (0.34 | %) | | | (0.56 | %) | | | (0.62 | %) | | | (0.56 | %) |
Total expenses | | | 1.42 | % | | | 1.43 | % | | | 1.39 | % | | | 1.36 | % | | | 1.45 | % | | | 1.48 | % |
Net expensesc | | | 1.37 | % | | | 1.40 | % | | | 1.39 | % | | | 1.36 | % | | | 1.45 | % | | | 1.48 | % |
Portfolio turnover rate | | | 32 | % | | | 51 | % | | | 61 | % | | | 65 | % | | | 115 | % | | | 64 | % |
Class A | | Six Months Ended
September 30, 2024a | | | Year Ended
March 31,
2024 | | | Year Ended
March 31,
2023 | | | Year Ended
March 31,
2022 | | | Year Ended
March 31,
2021 | | | Year Ended
March 31,
2020 | |
Per Share Data |
Net asset value, beginning of period | | $ | 64.71 | | | $ | 59.35 | | | $ | 63.98 | | | $ | 84.21 | | | $ | 64.92 | | | $ | 75.66 | |
Income (loss) from investment operations: |
Net investment income (loss)b | | | (.24 | ) | | | (.38 | ) | | | (.35 | ) | | | (.65 | ) | | | (.73 | ) | | | (.57 | ) |
Net gain (loss) on investments (realized and unrealized) | | | 4.74 | | | | 5.74 | | | | (3.38 | ) | | | (3.81 | ) | | | 26.97 | | | | (6.57 | ) |
Total from investment operations | | | 4.50 | | | | 5.36 | | | | (3.73 | ) | | | (4.46 | ) | | | 26.24 | | | | (7.14 | ) |
Less distributions from: |
Net realized gains | | | — | | | | — | | | | (.90 | ) | | | (15.77 | ) | | | (6.95 | ) | | | (3.60 | ) |
Total distributions | | | — | | | | — | | | | (.90 | ) | | | (15.77 | ) | | | (6.95 | ) | | | (3.60 | ) |
Net asset value, end of period | | $ | 69.21 | | | $ | 64.71 | | | $ | 59.35 | | | $ | 63.98 | | | $ | 84.21 | | | $ | 64.92 | |
|
Total Returnd | | | 6.95 | % | | | 9.03 | % | | | (5.87 | %) | | | (7.04 | %) | | | 40.44 | % | | | (10.14 | %) |
Ratios/Supplemental Data |
Net assets, end of period (in thousands) | | $ | 15,062 | | | $ | 14,770 | | | $ | 16,121 | | | $ | 19,263 | | | $ | 22,317 | | | $ | 14,565 | |
Ratios to average net assets: |
Net investment income (loss) | | | (0.72 | %) | | | (0.62 | %) | | | (0.59 | %) | | | (0.80 | %) | | | (0.87 | %) | | | (0.80 | %) |
Total expenses | | | 1.67 | % | | | 1.68 | % | | | 1.64 | % | | | 1.61 | % | | | 1.69 | % | | | 1.73 | % |
Net expensesc | | | 1.62 | % | | | 1.65 | % | | | 1.64 | % | | | 1.61 | % | | | 1.69 | % | | | 1.73 | % |
Portfolio turnover rate | | | 32 | % | | | 51 | % | | | 61 | % | | | 65 | % | | | 115 | % | | | 64 | % |
SEE NOTES TO FINANCIAL STATEMENTS. | THE RYDEX FUNDS SEMI-ANNUAL FINANCIAL REPORT | 21 |
FINANCIAL HIGHLIGHTS (continued) |
This table is presented to show selected data for a share outstanding throughout each period and to assist shareholders in evaluating a Fund’s performance for the periods presented.
Class C | | Six Months Ended
September 30, 2024a | | | Year Ended
March 31,
2024 | | | Year Ended
March 31,
2023 | | | Year Ended
March 31,
2022 | | | Year Ended
March 31,
2021 | | | Year Ended
March 31,
2020 | |
Per Share Data |
Net asset value, beginning of period | | $ | 50.77 | | | $ | 46.92 | | | $ | 51.15 | | | $ | 70.90 | | | $ | 55.85 | | | $ | 66.05 | |
Income (loss) from investment operations: |
Net investment income (loss)b | | | (.38 | ) | | | (.66 | ) | | | (.64 | ) | | | (1.09 | ) | | | (1.15 | ) | | | (.97 | ) |
Net gain (loss) on investments (realized and unrealized) | | | 3.71 | | | | 4.51 | | | | (2.69 | ) | | | (2.89 | ) | | | 23.15 | | | | (5.63 | ) |
Total from investment operations | | | 3.33 | | | | 3.85 | | | | (3.33 | ) | | | (3.98 | ) | | | 22.00 | | | | (6.60 | ) |
Less distributions from: |
Net realized gains | | | — | | | | — | | | | (.90 | ) | | | (15.77 | ) | | | (6.95 | ) | | | (3.60 | ) |
Total distributions | | | — | | | | — | | | | (.90 | ) | | | (15.77 | ) | | | (6.95 | ) | | | (3.60 | ) |
Net asset value, end of period | | $ | 54.10 | | | $ | 50.77 | | | $ | 46.92 | | | $ | 51.15 | | | $ | 70.90 | | | $ | 55.85 | |
|
Total Returnd | | | 6.56 | % | | | 8.21 | % | | | (6.58 | %) | | | (7.74 | %) | | | 39.39 | % | | | (10.80 | %) |
Ratios/Supplemental Data |
Net assets, end of period (in thousands) | | $ | 897 | | | $ | 980 | | | $ | 1,725 | | | $ | 3,174 | | | $ | 8,221 | | | $ | 8,692 | |
Ratios to average net assets: |
Net investment income (loss) | | | (1.48 | %) | | | (1.38 | %) | | | (1.34 | %) | | | (1.58 | %) | | | (1.61 | %) | | | (1.56 | %) |
Total expenses | | | 2.42 | % | | | 2.43 | % | | | 2.39 | % | | | 2.36 | % | | | 2.45 | % | | | 2.48 | % |
Net expensesc | | | 2.37 | % | | | 2.40 | % | | | 2.39 | % | | | 2.36 | % | | | 2.45 | % | | | 2.48 | % |
Portfolio turnover rate | | | 32 | % | | | 51 | % | | | 61 | % | | | 65 | % | | | 115 | % | | | 64 | % |
22 | THE RYDEX FUNDS SEMI-ANNUAL FINANCIAL REPORT | SEE NOTES TO FINANCIAL STATEMENTS. |
FINANCIAL HIGHLIGHTS (concluded) |
This table is presented to show selected data for a share outstanding throughout each period and to assist shareholders in evaluating a Fund’s performance for the periods presented.
Class H | | Six Months Ended
September 30, 2024a | | | Year Ended
March 31,
2024 | | | Year Ended
March 31,
2023 | | | Year Ended
March 31,
2022 | | | Year Ended
March 31,
2021 | | | Year Ended
March 31,
2020 | |
Per Share Data |
Net asset value, beginning of period | | $ | 61.74 | | | $ | 56.63 | | | $ | 61.09 | | | $ | 81.10 | | | $ | 62.70 | | | $ | 73.18 | |
Income (loss) from investment operations: |
Net investment income (loss)b | | | (.23 | ) | | | (.36 | ) | | | (.34 | ) | | | (.64 | ) | | | (.66 | ) | | | (.59 | ) |
Net gain (loss) on investments (realized and unrealized) | | | 4.53 | | | | 5.47 | | | | (3.22 | ) | | | (3.60 | ) | | | 26.01 | | | | (6.29 | ) |
Total from investment operations | | | 4.30 | | | | 5.11 | | | | (3.56 | ) | | | (4.24 | ) | | | 25.35 | | | | (6.88 | ) |
Less distributions from: |
Net realized gains | | | — | | | | — | | | | (.90 | ) | | | (15.77 | ) | | | (6.95 | ) | | | (3.60 | ) |
Total distributions | | | — | | | | — | | | | (.90 | ) | | | (15.77 | ) | | | (6.95 | ) | | | (3.60 | ) |
Net asset value, end of period | | $ | 66.04 | | | $ | 61.74 | | | $ | 56.63 | | | $ | 61.09 | | | $ | 81.10 | | | $ | 62.70 | |
|
Total Return | | | 6.96 | % | | | 9.02 | % | | | (5.87 | %) | | | (7.04 | %) | | | 40.45 | % | | | (10.12 | %) |
Ratios/Supplemental Data |
Net assets, end of period (in thousands) | | $ | 5,106 | | | $ | 5,299 | | | $ | 6,096 | | | $ | 9,352 | | | $ | 9,565 | | | $ | 8,365 | |
Ratios to average net assets: |
Net investment income (loss) | | | (0.72 | %) | | | (0.62 | %) | | | (0.59 | %) | | | (0.82 | %) | | | (0.83 | %) | | | (0.85 | %) |
Total expenses | | | 1.67 | % | | | 1.68 | % | | | 1.64 | % | | | 1.61 | % | | | 1.72 | % | | | 1.73 | % |
Net expensesc | | | 1.62 | % | | | 1.65 | % | | | 1.64 | % | | | 1.61 | % | | | 1.72 | % | | | 1.73 | % |
Portfolio turnover rate | | | 32 | % | | | 51 | % | | | 61 | % | | | 65 | % | | | 115 | % | | | 64 | % |
a | Unaudited figures for the period ended September 30, 2024. Percentage amounts for the period, except total return and portfolio turnover rate, have been annualized. |
b | Net investment income (loss) per share was computed using average shares outstanding throughout the period. |
c | Net expense information reflects the expense ratios after expense waivers and reimbursements, as applicable. |
d | Total return does not reflect the impact of any applicable sales charges. |
SEE NOTES TO FINANCIAL STATEMENTS. | THE RYDEX FUNDS SEMI-ANNUAL FINANCIAL REPORT | 23 |
SCHEDULE OF INVESTMENTS (Unaudited) | September 30, 2024 |
CONSUMER PRODUCTS FUND | |
| | Shares | | | Value | |
COMMON STOCKS† - 99.6% |
| | | | | | | | | |
Food - 34.0% |
Mondelez International, Inc. — Class A | | | 25,224 | | | $ | 1,858,252 | |
General Mills, Inc. | | | 16,423 | | | | 1,212,838 | |
Sysco Corp. | | | 14,969 | | | | 1,168,480 | |
Kroger Co. | | | 19,923 | | | | 1,141,588 | |
Hershey Co. | | | 5,952 | | | | 1,141,475 | |
Kraft Heinz Co. | | | 27,774 | | | | 975,145 | |
McCormick & Company, Inc. | | | 10,661 | | | | 877,400 | |
Kellanova | | | 10,830 | | | | 874,089 | |
Tyson Foods, Inc. — Class A | | | 14,031 | | | | 835,686 | |
Conagra Brands, Inc. | | | 22,858 | | | | 743,342 | |
US Foods Holding Corp.* | | | 11,871 | | | | 730,066 | |
J M Smucker Co. | | | 5,518 | | | | 668,230 | |
Performance Food Group Co.* | | | 8,448 | | | | 662,070 | |
Sprouts Farmers Market, Inc.* | | | 5,805 | | | | 640,930 | |
Campbell Soup Co. | | | 11,855 | | | | 579,947 | |
Lamb Weston Holdings, Inc. | | | 8,865 | | | | 573,920 | |
Hormel Foods Corp. | | | 17,937 | | | | 568,603 | |
Ingredion, Inc. | | | 4,091 | | | | 562,226 | |
Albertsons Companies, Inc. — Class A | | | 24,502 | | | | 452,797 | |
Post Holdings, Inc.* | | | 3,771 | | | | 436,493 | |
Flowers Foods, Inc. | | | 17,270 | | | | 398,419 | |
Cal-Maine Foods, Inc. | | | 4,639 | | | | 347,183 | |
Simply Good Foods Co.* | | | 9,793 | | | | 340,503 | |
Lancaster Colony Corp. | | | 1,769 | | | | 312,352 | |
Pilgrim’s Pride Corp.* | | | 5,898 | | | | 271,603 | |
Grocery Outlet Holding Corp.* | | | 13,743 | | | | 241,190 | |
Total Food | | | | | | | 18,614,827 | |
| | | | | | | | | |
Beverages - 25.4% |
Coca-Cola Co. | | | 41,604 | | | | 2,989,663 | |
PepsiCo, Inc. | | | 16,586 | | | | 2,820,449 | |
Constellation Brands, Inc. — Class A | | | 4,726 | | | | 1,217,843 | |
Keurig Dr Pepper, Inc. | | | 31,691 | | | | 1,187,779 | |
Monster Beverage Corp.* | | | 22,451 | | | | 1,171,269 | |
Coca-Cola Europacific Partners plc | | | 11,681 | | | | 919,879 | |
Brown-Forman Corp. — Class B | | | 18,453 | | | | 907,888 | |
Anheuser-Busch InBev S.A. ADR | | | 11,139 | | | | 738,404 | |
Fomento Economico Mexicano SAB de CV ADR | | | 6,739 | | | | 665,207 | |
Molson Coors Beverage Co. — Class B | | | 10,981 | | | | 631,627 | |
Celsius Holdings, Inc.* | | | 13,434 | | | | 421,290 | |
Coca-Cola Consolidated, Inc. | | | 195 | | | | 256,698 | |
Total Beverages | | | | | | | 13,927,996 | |
| | | | | | | | | |
Cosmetics & Personal Care - 16.7% |
Procter & Gamble Co. | | | 21,871 | | | | 3,788,057 | |
Colgate-Palmolive Co. | | | 16,461 | | | | 1,708,817 | |
Kenvue, Inc. | | | 54,359 | | | | 1,257,324 | |
Estee Lauder Companies, Inc. — Class A | | | 11,822 | | | | 1,178,535 | |
Unilever plc ADR | | | 11,795 | | | | 766,203 | |
elf Beauty, Inc.* | | | 4,102 | | | | 447,241 | |
Total Cosmetics & Personal Care | | | | | | | 9,146,177 | |
| | | | | | | | | |
Agriculture - 13.0% |
Philip Morris International, Inc. | | | 21,106 | | | | 2,562,268 | |
Altria Group, Inc. | | | 33,807 | | | | 1,725,509 | |
Archer-Daniels-Midland Co. | | | 16,668 | | | | 995,746 | |
British American Tobacco plc ADR | | | 18,963 | | | | 693,667 | |
Bunge Global S.A. | | | 7,151 | | | | 691,073 | |
Darling Ingredients, Inc.* | | | 12,712 | | | | 472,378 | |
Total Agriculture | | | | | | | 7,140,641 | |
| | | | | | | | | |
Household Products & Housewares - 6.5% |
Kimberly-Clark Corp. | | | 9,142 | | | | 1,300,724 | |
Church & Dwight Company, Inc. | | | 9,175 | | | | 960,806 | |
Clorox Co. | | | 5,171 | | | | 842,408 | |
Spectrum Brands Holdings, Inc. | | | 3,250 | | | | 309,205 | |
WD-40 Co. | | | 662 | | | | 170,716 | |
Total Household Products & Housewares | | | | | | | 3,583,859 | |
| | | | | | | | | |
Retail - 2.1% |
Casey’s General Stores, Inc. | | | 1,834 | | | | 689,052 | |
Freshpet, Inc.* | | | 3,424 | | | | 468,301 | |
Total Retail | | | | | | | 1,157,353 | |
| | | | | | | | | |
Pharmaceuticals - 1.0% |
BellRing Brands, Inc.* | | | 8,779 | | | | 533,061 | |
| | | | | | | | | |
Internet - 0.9% |
Maplebear, Inc.* | | | 12,002 | | | | 488,961 | |
| | | | | | | | | |
Total Common Stocks | | | | |
(Cost $27,148,914) | | | | | | | 54,592,875 | |
| | | | | | | | | |
| | | Face
Amount | | | | | |
REPURCHASE AGREEMENTS††,1 - 0.1% |
J.P. Morgan Securities LLC
issued 09/30/24 at 4.86%
due 10/01/24 | | $ | 29,376 | | | | 29,376 | |
BofA Securities, Inc.
issued 09/30/24 at 4.85%
due 10/01/24 | | | 24,263 | | | | 24,263 | |
Total Repurchase Agreements | | | | |
(Cost $53,639) | | | | | | | 53,639 | |
| | | | | | | | | |
Total Investments - 99.7% | | | | |
(Cost $27,202,553) | | $ | 54,646,514 | |
Other Assets & Liabilities, net - 0.3% | | | 184,727 | |
Total Net Assets - 100.0% | | $ | 54,831,241 | |
24 | THE RYDEX FUNDS SEMI-ANNUAL FINANCIAL REPORT | SEE NOTES TO FINANCIAL STATEMENTS. |
SCHEDULE OF INVESTMENTS (Unaudited)(concluded) | September 30, 2024 |
CONSUMER PRODUCTS FUND | |
* | Non-income producing security. |
† | Value determined based on Level 1 inputs — See Note 4. |
†† | Value determined based on Level 2 inputs — See Note 4. |
1 | Repurchase Agreements — See Note 6. |
| | ADR — American Depositary Receipt |
| | plc — Public Limited Company |
| | |
| | See Sector Classification in Other Information section. |
The following table summarizes the inputs used to value the Fund’s investments at September 30, 2024 (See Note 4 in the Notes to Financial Statements):
Investments in Securities (Assets) | | Level 1
Quoted
Prices | | | Level 2
Significant
Observable
Inputs | | | Level 3
Significant
Unobservable
Inputs | | | Total | |
Common Stocks | | $ | 54,592,875 | | | $ | — | | | $ | — | | | $ | 54,592,875 | |
Repurchase Agreements | | | — | | | | 53,639 | | | | — | | | | 53,639 | |
Total Assets | | $ | 54,592,875 | | | $ | 53,639 | | | $ | — | | | $ | 54,646,514 | |
SEE NOTES TO FINANCIAL STATEMENTS. | THE RYDEX FUNDS SEMI-ANNUAL FINANCIAL REPORT | 25 |
STATEMENT OF ASSETS AND LIABILITIES (Unaudited) |
September 30, 2024 |
Assets: |
Investments, at value (cost $27,148,914) | | $ | 54,592,875 | |
Repurchase agreements, at value (cost $53,639) | | | 53,639 | |
Receivables: |
Fund shares sold | | | 168,803 | |
Dividends | | | 133,410 | |
Foreign tax reclaims | | | 1,389 | |
Securities lending income | | | 17 | |
Interest | | | 7 | |
Total assets | | | 54,950,140 | |
| | | | | |
Liabilities: |
Payable for: |
Management fees | | | 35,927 | |
Transfer agent | | | 23,456 | |
Fund shares redeemed | | | 19,254 | |
Portfolio accounting and administration fees | | | 4,337 | |
Distribution and service fees | | | 3,305 | |
Trustees’ fees* | | | 471 | |
Miscellaneous | | | 32,149 | |
Total liabilities | | | 118,899 | |
Net assets | | $ | 54,831,241 | |
| | | | | |
Net assets consist of: |
Paid in capital | | $ | 25,585,474 | |
Total distributable earnings (loss) | | | 29,245,767 | |
Net assets | | $ | 54,831,241 | |
| | | | | |
Investor Class: |
Net assets | | $ | 43,185,286 | |
Capital shares outstanding | | | 783,729 | |
Net asset value per share | | $ | 55.10 | |
| | | | | |
Class A: |
Net assets | | $ | 8,208,289 | |
Capital shares outstanding | | | 176,023 | |
Net asset value per share | | $ | 46.63 | |
Maximum offering price per share (Net asset value divided by 95.25%) | | $ | 48.96 | |
| | | | | |
Class C: |
Net assets | | $ | 1,796,647 | |
Capital shares outstanding | | | 54,422 | |
Net asset value per share | | $ | 33.01 | |
| | | | | |
Class H: |
Net assets | | $ | 1,641,019 | |
Capital shares outstanding | | | 37,619 | |
Net asset value per share | | $ | 43.62 | |
STATEMENT OF OPERATIONS (Unaudited) |
Six Months Ended September 30, 2024 |
Investment Income: |
Dividends | | $ | 761,346 | |
Interest | | | 6,179 | |
Income from securities lending, net | | | 666 | |
Total investment income | | | 768,191 | |
| | | | | |
Expenses: |
Management fees | | | 235,794 | |
Distribution and service fees: |
Class A | | | 10,470 | |
Class C | | | 11,221 | |
Class H | | | 1,737 | |
Transfer agent fees | | | 56,975 | |
Portfolio accounting and administration fees | | | 42,328 | |
Registration fees | | | 24,527 | |
Professional fees | | | 9,741 | |
Custodian fees | | | 3,554 | |
Trustees’ fees* | | | 3,093 | |
Line of credit fees | | | 160 | |
Miscellaneous | | | 16,928 | |
Total expenses | | | 416,528 | |
Less: |
Expenses reimbursed by Adviser | | | (13,858 | ) |
Net expenses | | | 402,670 | |
Net investment income | | | 365,521 | |
| | | | | |
Net Realized and Unrealized Gain (Loss): |
Net realized gain (loss) on: |
Investments | | | 3,034,255 | |
Net realized gain | | | 3,034,255 | |
Net change in unrealized appreciation (depreciation) on: |
Investments | | | (1,318,261 | ) |
Net change in unrealized appreciation (depreciation) | | | (1,318,261 | ) |
Net realized and unrealized gain | | | 1,715,994 | |
Net increase in net assets resulting from operations | | $ | 2,081,515 | |
* | Relates to Trustees not deemed “interested persons” within the meaning of Section 2(a)(19) of the 1940 Act. |
26 | THE RYDEX FUNDS SEMI-ANNUAL FINANCIAL REPORT | SEE NOTES TO FINANCIAL STATEMENTS. |
STATEMENTS OF CHANGES IN NET ASSETS |
| | Six Months Ended
September 30, 2024
(Unaudited) | | | Year Ended
March 31,
2024 | |
Increase (Decrease) in Net Assets from Operations: | | | | | | | | |
Net investment income | | $ | 365,521 | | | $ | 845,472 | |
Net realized gain on investments | | | 3,034,255 | | | | 9,038,604 | |
Net change in unrealized appreciation (depreciation) on investments | | | (1,318,261 | ) | | | (9,386,084 | ) |
Net increase in net assets resulting from operations | | | 2,081,515 | | | | 497,992 | |
| | | | | | | | | |
Distributions to shareholders: | | | | | | | | |
Investor Class | | | — | | | | (4,528,074 | ) |
Class A | | | — | | | | (1,009,716 | ) |
Class C | | | — | | | | (579,599 | ) |
Class H | | | — | | | | (180,801 | ) |
Total distributions to shareholders | | | — | | | | (6,298,190 | ) |
| | | | | | | | | |
Capital share transactions: | | | | | | | | |
Proceeds from sale of shares | | | | | | | | |
Investor Class | | | 29,299,359 | | | | 30,668,858 | |
Class A | | | 1,137,238 | | | | 1,318,675 | |
Class C | | | 44,966 | | | | 190,577 | |
Class H | | | 388,880 | | | | 507,400 | |
Distributions reinvested | | | | | | | | |
Investor Class | | | — | | | | 4,402,722 | |
Class A | | | — | | | | 991,237 | |
Class C | | | — | | | | 568,974 | |
Class H | | | — | | | | 180,564 | |
Cost of shares redeemed | | | | | | | | |
Investor Class | | | (35,954,735 | ) | | | (45,479,254 | ) |
Class A | | | (1,673,741 | ) | | | (2,493,154 | ) |
Class C | | | (1,399,058 | ) | | | (1,917,191 | ) |
Class H | | | (186,475 | ) | | | (896,056 | ) |
Net decrease from capital share transactions | | | (8,343,566 | ) | | | (11,956,648 | ) |
Net decrease in net assets | | | (6,262,051 | ) | | | (17,756,846 | ) |
| | | | | | | | | |
Net assets: | | | | | | | | |
Beginning of period | | | 61,093,292 | | | | 78,850,138 | |
End of period | | $ | 54,831,241 | | | $ | 61,093,292 | |
| | | | | | | | | |
Capital share activity: | | | | | | | | |
Shares sold | | | | | | | | |
Investor Class | | | 560,975 | | | | 565,331 | |
Class A | | | 25,846 | | | | 28,215 | |
Class C | | | 1,380 | | | | 5,111 | |
Class H | | | 9,200 | | | | 11,051 | |
Shares issued from reinvestment of distributions | | | | | | | | |
Investor Class | | | — | | | | 90,183 | |
Class A | | | — | | | | 23,943 | |
Class C | | | — | | | | 19,294 | |
Class H | | | — | | | | 4,662 | |
Shares redeemed | | | | | | | | |
Investor Class | | | (692,164 | ) | | | (838,002 | ) |
Class A | | | (37,748 | ) | | | (55,030 | ) |
Class C | | | (44,744 | ) | | | (56,953 | ) |
Class H | | | (4,513 | ) | | | (20,051 | ) |
Net decrease in shares | | | (181,768 | ) | | | (222,246 | ) |
SEE NOTES TO FINANCIAL STATEMENTS. | THE RYDEX FUNDS SEMI-ANNUAL FINANCIAL REPORT | 27 |
This table is presented to show selected data for a share outstanding throughout each period and to assist shareholders in evaluating a Fund’s performance for the periods presented.
Investor Class | | Six Months Ended
September 30, 2024a | | | Year Ended
March 31,
2024 | | | Year Ended
March 31,
2023 | | | Year Ended
March 31,
2022 | | | Year Ended
March 31,
2021 | | | Year Ended
March 31,
2020 | |
Per Share Data |
Net asset value, beginning of period | | $ | 52.71 | | | $ | 57.24 | | | $ | 60.53 | | | $ | 66.72 | | | $ | 52.88 | | | $ | 59.56 | |
Income (loss) from investment operations: |
Net investment income (loss)b | | | .37 | | | | .75 | | | | .97 | | | | .66 | | | | .70 | | | | .72 | |
Net gain (loss) on investments (realized and unrealized) | | | 2.02 | | | | .35 | e | | | (.17 | )f | | | 2.18 | | | | 18.44 | | | | (5.71 | ) |
Total from investment operations | | | 2.39 | | | | 1.10 | | | | .80 | | | | 2.84 | | | | 19.14 | | | | (4.99 | ) |
Less distributions from: |
Net investment income | | | — | | | | (.88 | ) | | | (.62 | ) | | | (.62 | ) | | | (.73 | ) | | | (.77 | ) |
Net realized gains | | | — | | | | (4.75 | ) | | | (3.47 | ) | | | (8.41 | ) | | | (4.57 | ) | | | (.92 | ) |
Total distributions | | | — | | | | (5.63 | ) | | | (4.09 | ) | | | (9.03 | ) | | | (5.30 | ) | | | (1.69 | ) |
Net asset value, end of period | | $ | 55.10 | | | $ | 52.71 | | | $ | 57.24 | | | $ | 60.53 | | | $ | 66.72 | | | $ | 52.88 | |
|
Total Return | | | 4.53 | % | | | 2.71 | % | | | 1.40 | % | | | 4.89 | % | | | 36.78 | % | | | (8.81 | %) |
Ratios/Supplemental Data |
Net assets, end of period (in thousands) | | $ | 43,185 | | | $ | 48,221 | | | $ | 62,816 | | | $ | 67,612 | | | $ | 83,023 | | | $ | 79,890 | |
Ratios to average net assets: |
Net investment income (loss) | | | 1.40 | % | | | 1.39 | % | | | 1.65 | % | | | 1.01 | % | | | 1.12 | % | | | 1.17 | % |
Total expenses | | | 1.42 | % | | | 1.43 | % | | | 1.39 | % | | | 1.36 | % | | | 1.45 | % | | | 1.47 | % |
Net expensesc | | | 1.37 | % | | | 1.40 | % | | | 1.39 | % | | | 1.36 | % | | | 1.45 | % | | | 1.47 | % |
Portfolio turnover rate | | | 43 | % | | | 43 | % | | | 79 | % | | | 60 | % | | | 38 | % | | | 59 | % |
Class A | | Six Months Ended
September 30, 2024a | | | Year Ended
March 31,
2024 | | | Year Ended
March 31,
2023 | | | Year Ended
March 31,
2022 | | | Year Ended
March 31,
2021 | | | Year Ended
March 31,
2020 | |
Per Share Data |
Net asset value, beginning of period | | $ | 44.66 | | | $ | 49.52 | | | $ | 53.05 | | | $ | 59.72 | | | $ | 47.88 | | | $ | 54.21 | |
Income (loss) from investment operations: |
Net investment income (loss)b | | | .26 | | | | .54 | | | | .68 | | | | .44 | | | | .50 | | | | .51 | |
Net gain (loss) on investments (realized and unrealized) | | | 1.71 | | | | .23 | e | | | (.12 | )f | | | 1.92 | | | | 16.64 | | | | (5.15 | ) |
Total from investment operations | | | 1.97 | | | | .77 | | | | .56 | | | | 2.36 | | | | 17.14 | | | | (4.64 | ) |
Less distributions from: |
Net investment income | | | — | | | | (.88 | ) | | | (.62 | ) | | | (.62 | ) | | | (.73 | ) | | | (.77 | ) |
Net realized gains | | | — | | | | (4.75 | ) | | | (3.47 | ) | | | (8.41 | ) | | | (4.57 | ) | | | (.92 | ) |
Total distributions | | | — | | | | (5.63 | ) | | | (4.09 | ) | | | (9.03 | ) | | | (5.30 | ) | | | (1.69 | ) |
Net asset value, end of period | | $ | 46.63 | | | $ | 44.66 | | | $ | 49.52 | | | $ | 53.05 | | | $ | 59.72 | | | $ | 47.88 | |
|
Total Returnd | | | 4.41 | % | | | 2.46 | % | | | 1.13 | % | | | 4.65 | % | | | 36.43 | % | | | (9.04 | %) |
Ratios/Supplemental Data |
Net assets, end of period (in thousands) | | $ | 8,208 | | | $ | 8,393 | | | $ | 9,449 | | | $ | 9,820 | | | $ | 10,751 | | | $ | 8,561 | |
Ratios to average net assets: |
Net investment income (loss) | | | 1.15 | % | | | 1.15 | % | | | 1.34 | % | | | 0.76 | % | | | 0.89 | % | | | 0.92 | % |
Total expenses | | | 1.67 | % | | | 1.68 | % | | | 1.64 | % | | | 1.61 | % | | | 1.69 | % | | | 1.72 | % |
Net expensesc | | | 1.62 | % | | | 1.65 | % | | | 1.64 | % | | | 1.61 | % | | | 1.69 | % | | | 1.72 | % |
Portfolio turnover rate | | | 43 | % | | | 43 | % | | | 79 | % | | | 60 | % | | | 38 | % | | | 59 | % |
28 | THE RYDEX FUNDS SEMI-ANNUAL FINANCIAL REPORT | SEE NOTES TO FINANCIAL STATEMENTS. |
FINANCIAL HIGHLIGHTS (continued) |
This table is presented to show selected data for a share outstanding throughout each period and to assist shareholders in evaluating a Fund’s performance for the periods presented.
Class C | | Six Months Ended
September 30, 2024a | | | Year Ended
March 31,
2024 | | | Year Ended
March 31,
2023 | | | Year Ended
March 31,
2022 | | | Year Ended
March 31,
2021 | | | Year Ended
March 31,
2020 | |
Per Share Data |
Net asset value, beginning of period | | $ | 31.74 | | | $ | 37.17 | | | $ | 41.14 | | | $ | 48.68 | | | $ | 40.08 | | | $ | 45.98 | |
Income (loss) from investment operations: |
Net investment income (loss)b | | | .06 | | | | .13 | | | | .22 | | | | — | | | | .06 | | | | .08 | |
Net gain (loss) on investments (realized and unrealized) | | | 1.21 | | | | .07 | e | | | (.10 | )f | | | 1.49 | | | | 13.84 | | | | (4.29 | ) |
Total from investment operations | | | 1.27 | | | | .20 | | | | .12 | | | | 1.49 | | | | 13.90 | | | | (4.21 | ) |
Less distributions from: |
Net investment income | | | — | | | | (.88 | ) | | | (.62 | ) | | | (.62 | ) | | | (.73 | ) | | | (.77 | ) |
Net realized gains | | | — | | | | (4.75 | ) | | | (3.47 | ) | | | (8.41 | ) | | | (4.57 | ) | | | (.92 | ) |
Total distributions | | | — | | | | (5.63 | ) | | | (4.09 | ) | | | (9.03 | ) | | | (5.30 | ) | | | (1.69 | ) |
Net asset value, end of period | | $ | 33.01 | | | $ | 31.74 | | | $ | 37.17 | | | $ | 41.14 | | | $ | 48.68 | | | $ | 40.08 | |
|
Total Returnd | | | 4.00 | % | | | 1.70 | % | | | 0.37 | % | | | 3.87 | % | | | 35.40 | % | | | (9.73 | %) |
Ratios/Supplemental Data |
Net assets, end of period (in thousands) | | $ | 1,797 | | | $ | 3,103 | | | $ | 4,845 | | | $ | 6,578 | | | $ | 9,035 | | | $ | 9,816 | |
Ratios to average net assets: |
Net investment income (loss) | | | 0.36 | % | | | 0.38 | % | | | 0.56 | % | | | — | | | | 0.12 | % | | | 0.16 | % |
Total expenses | | | 2.41 | % | | | 2.43 | % | | | 2.39 | % | | | 2.36 | % | | | 2.45 | % | | | 2.47 | % |
Net expensesc | | | 2.36 | % | | | 2.40 | % | | | 2.39 | % | | | 2.36 | % | | | 2.45 | % | | | 2.47 | % |
Portfolio turnover rate | | | 43 | % | | | 43 | % | | | 79 | % | | | 60 | % | | | 38 | % | | | 59 | % |
SEE NOTES TO FINANCIAL STATEMENTS. | THE RYDEX FUNDS SEMI-ANNUAL FINANCIAL REPORT | 29 |
FINANCIAL HIGHLIGHTS (concluded) |
This table is presented to show selected data for a share outstanding throughout each period and to assist shareholders in evaluating a Fund’s performance for the periods presented.
Class H | | Six Months Ended
September 30, 2024a | | | Year Ended
March 31,
2024 | | | Year Ended
March 31,
2023 | | | Year Ended
March 31,
2022 | | | Year Ended
March 31,
2021 | | | Year Ended
March 31,
2020 | |
Per Share Data |
Net asset value, beginning of period | | $ | 41.78 | | | $ | 46.71 | | | $ | 50.27 | | | $ | 57.06 | | | $ | 45.93 | | | $ | 52.07 | |
Income (loss) from investment operations: |
Net investment income (loss)b | | | .24 | | | | .50 | | | | .62 | | | | .38 | | | | .49 | | | | .46 | |
Net gain (loss) on investments (realized and unrealized) | | | 1.60 | | | | .20 | e | | | (.09 | )f | | | 1.86 | | | | 15.94 | | | | (4.91 | ) |
Total from investment operations | | | 1.84 | | | | .70 | | | | .53 | | | | 2.24 | | | | 16.43 | | | | (4.45 | ) |
Less distributions from: |
Net investment income | | | — | | | | (.88 | ) | | | (.62 | ) | | | (.62 | ) | | | (.73 | ) | | | (.77 | ) |
Net realized gains | | | — | | | | (4.75 | ) | | | (3.47 | ) | | | (8.41 | ) | | | (4.57 | ) | | | (.92 | ) |
Total distributions | | | — | | | | (5.63 | ) | | | (4.09 | ) | | | (9.03 | ) | | | (5.30 | ) | | | (1.69 | ) |
Net asset value, end of period | | $ | 43.62 | | | $ | 41.78 | | | $ | 46.71 | | | $ | 50.27 | | | $ | 57.06 | | | $ | 45.93 | |
|
Total Return | | | 4.40 | % | | | 2.45 | % | | | 1.14 | % | | | 4.65 | % | | | 36.43 | % | | | (9.05 | %) |
Ratios/Supplemental Data |
Net assets, end of period (in thousands) | | $ | 1,641 | | | $ | 1,376 | | | $ | 1,741 | | | $ | 2,443 | | | $ | 5,601 | | | $ | 4,284 | |
Ratios to average net assets: |
Net investment income (loss) | | | 1.17 | % | | | 1.15 | % | | | 1.28 | % | | | 0.68 | % | | | 0.90 | % | | | 0.86 | % |
Total expenses | | | 1.67 | % | | | 1.68 | % | | | 1.64 | % | | | 1.61 | % | | | 1.69 | % | | | 1.72 | % |
Net expensesc | | | 1.62 | % | | | 1.65 | % | | | 1.64 | % | | | 1.61 | % | | | 1.69 | % | | | 1.72 | % |
Portfolio turnover rate | | | 43 | % | | | 43 | % | | | 79 | % | | | 60 | % | | | 38 | % | | | 59 | % |
a | Unaudited figures for the period ended September 30, 2024. Percentage amounts for the period, except total return and portfolio turnover rate, have been annualized. |
b | Net investment income (loss) per share was computed using average shares outstanding throughout the period. |
c | Net expense information reflects the expense ratios after expense waivers and reimbursements, as applicable. |
d | Total return does not reflect the impact of any applicable sales charges. |
e | The amount shown for a share outstanding throughout the period does not agree with the aggregate net loss on investments for the year because of the sales and repurchases of fund shares in relation to fluctuating market value of the investments of the Fund. |
f | The amount shown for a share outstanding throughout the period does not agree with the aggregate net gain on investments for the year because of the sales and repurchases of fund shares in relation to fluctuating market value of the investments of the Fund. |
30 | THE RYDEX FUNDS SEMI-ANNUAL FINANCIAL REPORT | SEE NOTES TO FINANCIAL STATEMENTS. |
SCHEDULE OF INVESTMENTS (Unaudited) | September 30, 2024 |
ELECTRONICS FUND | |
| | Shares | | | Value | |
COMMON STOCKS† - 99.7% |
| | | | | | | | | |
Semiconductors - 93.0% |
NVIDIA Corp. | | | 169,855 | | | $ | 20,627,191 | |
Broadcom, Inc. | | | 62,852 | | | | 10,841,970 | |
Advanced Micro Devices, Inc.* | | | 39,770 | | | | 6,525,462 | |
Texas Instruments, Inc. | | | 26,219 | | | | 5,416,059 | |
QUALCOMM, Inc. | | | 31,768 | | | | 5,402,148 | |
Applied Materials, Inc. | | | 26,032 | | | | 5,259,766 | |
Micron Technology, Inc. | | | 44,150 | | | | 4,578,797 | |
Intel Corp.* | | | 181,789 | | | | 4,264,770 | |
Analog Devices, Inc. | | | 18,255 | | | | 4,201,753 | |
Lam Research Corp. | | | 5,102 | | | | 4,163,640 | |
KLA Corp. | | | 5,239 | | | | 4,057,134 | |
Marvell Technology, Inc. | | | 41,138 | | | | 2,966,873 | |
Microchip Technology, Inc. | | | 32,129 | | | | 2,579,637 | |
Monolithic Power Systems, Inc. | | | 2,762 | | | | 2,553,469 | |
NXP Semiconductor N.V. | | | 10,589 | | | | 2,541,466 | |
ASML Holding N.V. — Class G | | | 2,800 | | | | 2,333,100 | |
Taiwan Semiconductor Manufacturing Company Ltd. ADR | | | 13,140 | | | | 2,282,024 | |
ON Semiconductor Corp.* | | | 30,536 | | | | 2,217,219 | |
ARM Holdings plc ADR* | | | 13,140 | | | | 1,879,151 | |
Teradyne, Inc. | | | 13,787 | | | | 1,846,493 | |
Entegris, Inc. | | | 14,422 | | | | 1,622,908 | |
Kulicke & Soffa Industries, Inc. | | | 35,141 | | | | 1,585,913 | |
STMicroelectronics N.V. — Class Y | | | 52,562 | | | | 1,562,668 | |
Skyworks Solutions, Inc. | | | 15,368 | | | | 1,517,897 | |
ASE Technology Holding Company Ltd. ADR | | | 147,245 | | | | 1,437,111 | |
United Microelectronics Corp. ADR1 | | | 164,292 | | | | 1,383,339 | |
Onto Innovation, Inc.* | | | 6,122 | | | | 1,270,682 | |
Qorvo, Inc.* | | | 11,548 | | | | 1,192,908 | |
Lattice Semiconductor Corp.* | | | 21,614 | | | | 1,147,055 | |
MKS Instruments, Inc. | | | 9,569 | | | | 1,040,246 | |
MACOM Technology Solutions Holdings, Inc.* | | | 9,146 | | | | 1,017,584 | |
Cirrus Logic, Inc.* | | | 7,578 | | | | 941,263 | |
Impinj, Inc.* | | | 4,268 | | | | 924,107 | |
Rambus, Inc.* | | | 19,984 | | | | 843,725 | |
Power Integrations, Inc. | | | 11,821 | | | | 757,963 | |
FormFactor, Inc.* | | | 16,425 | | | | 755,550 | |
Semtech Corp.* | | | 16,326 | | | | 745,445 | |
Amkor Technology, Inc. | | | 24,053 | | | | 736,022 | |
Silicon Laboratories, Inc.* | | | 6,321 | | | | 730,518 | |
Axcelis Technologies, Inc.* | | | 6,856 | | | | 718,852 | |
GLOBALFOUNDRIES, Inc.* | | | 17,757 | | | | 714,719 | |
Synaptics, Inc.* | | | 9,121 | | | | 707,607 | |
Allegro MicroSystems, Inc.* | | | 29,840 | | | | 695,272 | |
Diodes, Inc.* | | | 10,465 | | | | 670,702 | |
Ambarella, Inc.* | | | 10,515 | | | | 593,099 | |
Veeco Instruments, Inc.*,1 | | | 16,513 | | | | 547,076 | |
Wolfspeed, Inc.* | | | 47,111 | | | | 456,977 | |
Aehr Test Systems*,1 | | | 18,031 | | | | 231,698 | |
Total Semiconductors | | | | | | | 123,087,028 | |
| | | | | | | | | |
Energy-Alternate Sources - 5.2% |
First Solar, Inc.* | | | 7,914 | | | | 1,974,068 | |
SolarEdge Technologies, Inc.* | | | 77,262 | | | | 1,770,072 | |
Canadian Solar, Inc.*,1 | | | 98,864 | | | | 1,656,961 | |
Enphase Energy, Inc.* | | | 13,489 | | | | 1,524,527 | |
Total Energy-Alternate Sources | | | | | | | 6,925,628 | |
| | | | | | | | | |
Electrical Components & Equipment - 0.9% |
Universal Display Corp. | | | 5,699 | | | | 1,196,220 | |
| | | | | | | | | |
Telecommunications - 0.6% |
Credo Technology Group Holding Ltd.* | | | 26,243 | | | | 808,284 | |
| | | | | | | | | |
Total Common Stocks | | | | |
(Cost $77,351,766) | | | | | | | 132,017,160 | |
| | | | | | | | | |
| | | Face
Amount | | | | | |
REPURCHASE AGREEMENTS††,2 - 0.9% |
J.P. Morgan Securities LLC
issued 09/30/24 at 4.86%
due 10/01/24 | | $ | 667,015 | | | | 667,015 | |
BofA Securities, Inc.
issued 09/30/24 at 4.85%
due 10/01/24 | | | 550,923 | | | | 550,923 | |
Total Repurchase Agreements | | | | |
(Cost $1,217,938) | | | | | | | 1,217,938 | |
| | | | | | | | | |
| | | Shares | | | | | |
SECURITIES LENDING COLLATERAL†,3 - 2.0% |
Money Market Fund*** | | | | | | | | |
First American Government Obligations Fund - Class X, 4.82%4 | | | 2,641,043 | | | | 2,641,043 | |
Total Securities Lending Collateral | | | | |
(Cost $2,641,043) | | | | | | | 2,641,043 | |
| | | | | | | | | |
Total Investments - 102.6% | | | | |
(Cost $81,210,747) | | $ | 135,876,141 | |
Other Assets & Liabilities, net - (2.6)% | | | (3,423,760 | ) |
Total Net Assets - 100.0% | | $ | 132,452,381 | |
SEE NOTES TO FINANCIAL STATEMENTS. | THE RYDEX FUNDS SEMI-ANNUAL FINANCIAL REPORT | 31 |
SCHEDULE OF INVESTMENTS (Unaudited)(concluded) | September 30, 2024 |
ELECTRONICS FUND | |
* | Non-income producing security. |
*** | A copy of each underlying unaffiliated fund’s financial statements is available at the SEC’s website at www.sec.gov. |
† | Value determined based on Level 1 inputs — See Note 4. |
†† | Value determined based on Level 2 inputs — See Note 4. |
1 | All or a portion of this security is on loan at September 30, 2024 — See Note 7. |
2 | Repurchase Agreements — See Note 6. |
3 | Securities lending collateral — See Note 7. |
4 | Rate indicated is the 7-day yield as of September 30, 2024. |
| | ADR — American Depositary Receipt |
| | plc — Public Limited Company |
| | |
| | See Sector Classification in Other Information section. |
The following table summarizes the inputs used to value the Fund’s investments at September 30, 2024 (See Note 4 in the Notes to Financial Statements):
Investments in Securities (Assets) | | Level 1
Quoted
Prices | | | Level 2
Significant
Observable
Inputs | | | Level 3
Significant
Unobservable
Inputs | | | Total | |
Common Stocks | | $ | 132,017,160 | | | $ | — | | | $ | — | | | $ | 132,017,160 | |
Repurchase Agreements | | | — | | | | 1,217,938 | | | | — | | | | 1,217,938 | |
Securities Lending Collateral | | | 2,641,043 | | | | — | | | | — | | | | 2,641,043 | |
Total Assets | | $ | 134,658,203 | | | $ | 1,217,938 | | | $ | — | | | $ | 135,876,141 | |
32 | THE RYDEX FUNDS SEMI-ANNUAL FINANCIAL REPORT | SEE NOTES TO FINANCIAL STATEMENTS. |
STATEMENT OF ASSETS AND LIABILITIES (Unaudited) |
September 30, 2024 |
Assets: |
Investments, at value - including $2,576,405 of securities loaned (cost $79,992,809) | | $ | 134,658,203 | |
Repurchase agreements, at value (cost $1,217,938) | | | 1,217,938 | |
Receivables: |
Securities sold | | | 2,615,561 | |
Fund shares sold | | | 163,138 | |
Dividends | | | 44,905 | |
Securities lending income | | | 985 | |
Interest | | | 164 | |
Total assets | | | 138,700,894 | |
| | | | | |
Liabilities: |
Payable for: |
Fund shares redeemed | | | 3,379,576 | |
Return of securities lending collateral | | | 2,641,043 | |
Management fees | | | 82,782 | |
Transfer agent | | | 55,149 | |
Portfolio accounting and administration fees | | | 9,994 | |
Distribution and service fees | | | 3,663 | |
Trustees’ fees* | | | 1,120 | |
Miscellaneous | | | 75,186 | |
Total liabilities | | | 6,248,513 | |
Net assets | | $ | 132,452,381 | |
| | | | | |
Net assets consist of: |
Paid in capital | | $ | 85,270,197 | |
Total distributable earnings (loss) | | | 47,182,184 | |
Net assets | | $ | 132,452,381 | |
| | | | | |
Investor Class: |
Net assets | | $ | 117,979,717 | |
Capital shares outstanding | | | 267,096 | |
Net asset value per share | | $ | 441.71 | |
| | | | | |
Class A: |
Net assets | | $ | 8,816,525 | |
Capital shares outstanding | | | 21,972 | |
Net asset value per share | | $ | 401.26 | |
Maximum offering price per share (Net asset value divided by 95.25%) | | $ | 421.27 | |
| | | | | |
Class C: |
Net assets | | $ | 1,797,294 | |
Capital shares outstanding | | | 5,308 | |
Net asset value per share | | $ | 338.58 | |
| | | | | |
Class H: |
Net assets | | $ | 3,858,845 | |
Capital shares outstanding | | | 9,925 | |
Net asset value per share | | $ | 388.80 | |
STATEMENT OF OPERATIONS (Unaudited) |
Six Months Ended September 30, 2024 |
Investment Income: |
Dividends (net of foreign withholding tax of $5,626) | | $ | 567,908 | |
Interest | | | 22,245 | |
Income from securities lending, net | | | 14,293 | |
Total investment income | | | 604,446 | |
| | | | | |
Expenses: |
Management fees | | | 546,319 | |
Distribution and service fees: |
Class A | | | 10,652 | |
Class C | | | 9,206 | |
Class H | | | 4,299 | |
Transfer agent | | | 131,838 | |
Portfolio accounting and administration fees | | | 98,071 | |
Registration fees | | | 64,401 | |
Professional fees | | | 27,728 | |
Custodian fees | | | 8,256 | |
Trustees’ fees* | | | 5,704 | |
Miscellaneous | | | 29,916 | |
Total expenses | | | 936,390 | |
Less: |
Expenses reimbursed by Adviser | | | (32,110 | ) |
Net expenses | | | 904,280 | |
Net investment loss | | | (299,834 | ) |
| | | | | |
Net Realized and Unrealized Gain (Loss): |
Net realized gain (loss) on: |
Investments | | | (1,597,733 | ) |
Net realized loss | | | (1,597,733 | ) |
Net change in unrealized appreciation (depreciation) on: |
Investments | | | 6,367,194 | |
Net change in unrealized appreciation (depreciation) | | | 6,367,194 | |
Net realized and unrealized gain | | | 4,769,461 | |
Net increase in net assets resulting from operations | | $ | 4,469,627 | |
* | Relates to Trustees not deemed “interested persons” within the meaning of Section 2(a)(19) of the 1940 Act. |
SEE NOTES TO FINANCIAL STATEMENTS. | THE RYDEX FUNDS SEMI-ANNUAL FINANCIAL REPORT | 33 |
STATEMENTS OF CHANGES IN NET ASSETS |
| | Six Months Ended
September 30, 2024
(Unaudited) | | | Year Ended
March 31,
2024 | |
Increase (Decrease) in Net Assets from Operations: | | | | | | | | |
Net investment loss | | $ | (299,834 | ) | | $ | (258,356 | ) |
Net realized gain (loss) on investments | | | (1,597,733 | ) | | | 2,298,068 | |
Net change in unrealized appreciation (depreciation) on investments | | | 6,367,194 | | | | 25,104,892 | |
Net increase in net assets resulting from operations | | | 4,469,627 | | | | 27,144,604 | |
| | | | | | | | | |
Capital share transactions: | | | | | | | | |
Proceeds from sale of shares | | | | | | | | |
Investor Class | | | 93,821,321 | | | | 117,824,436 | |
Class A | | | 2,481,391 | | | | 3,569,727 | |
Class C | | | 401,400 | | | | 870,356 | |
Class H | | | 1,629,040 | | | | 1,607,175 | |
Cost of shares redeemed | | | | | | | | |
Investor Class | | | (61,947,562 | ) | | | (101,602,963 | ) |
Class A | | | (1,645,585 | ) | | | (4,009,456 | ) |
Class C | | | (404,012 | ) | | | (848,357 | ) |
Class H | | | (588,341 | ) | | | (5,124,430 | ) |
Net increase from capital share transactions | | | 33,747,652 | | | | 12,286,488 | |
Net increase in net assets | | | 38,217,279 | | | | 39,431,092 | |
| | | | | | | | | |
Net assets: | | | | | | | | |
Beginning of period | | | 94,235,102 | | | | 54,804,010 | |
End of period | | $ | 132,452,381 | | | $ | 94,235,102 | |
| | | | | | | | | |
Capital share activity: | | | | | | | | |
Shares sold | | | | | | | | |
Investor Class | | | 218,645 | | | | 369,137 | |
Class A | | | 6,207 | | | | 12,025 | |
Class C | | | 1,155 | | | | 3,332 | |
Class H | | | 3,980 | | | | 5,523 | |
Shares redeemed | | | | | | | | |
Investor Class | | | (145,759 | ) | | | (318,257 | ) |
Class A | | | (4,101 | ) | | | (13,692 | ) |
Class C | | | (1,217 | ) | | | (3,413 | ) |
Class H | | | (1,569 | ) | | | (19,867 | ) |
Net increase in shares | | | 77,341 | | | | 34,788 | |
34 | THE RYDEX FUNDS SEMI-ANNUAL FINANCIAL REPORT | SEE NOTES TO FINANCIAL STATEMENTS. |
This table is presented to show selected data for a share outstanding throughout each period and to assist shareholders in evaluating a Fund’s performance for the periods presented.
Investor Class | | Six Months Ended
September 30, 2024a | | | Year Ended
March 31,
2024 | | | Year Ended
March 31,
2023 | | | Year Ended
March 31,
2022 | | | Year Ended
March 31,
2021 | | | Year Ended
March 31,
2020 | |
Per Share Data |
Net asset value, beginning of period | | $ | 422.50 | | | $ | 293.83 | | | $ | 304.55 | | | $ | 281.78 | | | $ | 137.65 | | | $ | 126.31 | |
Income (loss) from investment operations: |
Net investment income (loss)b | | | (.94 | ) | | | (.90 | ) | | | (.35 | ) | | | (1.59 | ) | | | (.71 | ) | | | — | e |
Net gain (loss) on investments (realized and unrealized) | | | 20.15 | | | | 129.57 | | | | (10.37 | ) | | | 35.88 | | | | 150.08 | | | | 11.35 | |
Total from investment operations | | | 19.21 | | | | 128.67 | | | | (10.72 | ) | | | 34.29 | | | | 149.37 | | | | 11.35 | |
Less distributions from: |
Net investment income | | | — | | | | — | | | | — | | | | — | | | | — | | | | (.01 | ) |
Net realized gains | | | — | | | | — | | | | — | | | | (11.52 | ) | | | (5.24 | ) | | | — | |
Total distributions | | | — | | | | — | | | | — | | | | (11.52 | ) | | | (5.24 | ) | | | (.01 | ) |
Net asset value, end of period | | $ | 441.71 | | | $ | 422.50 | | | $ | 293.83 | | | $ | 304.55 | | | $ | 281.78 | | | $ | 137.65 | |
|
Total Return | | | 4.55 | % | | | 43.79 | % | | | (3.52 | %) | | | 11.63 | % | | | 109.05 | % | | | 8.99 | % |
Ratios/Supplemental Data |
Net assets, end of period (in thousands) | | $ | 117,980 | | | $ | 82,055 | | | $ | 42,114 | | | $ | 60,738 | | | $ | 55,324 | | | $ | 38,634 | |
Ratios to average net assets: |
Net investment income (loss) | | | (0.43 | %) | | | (0.27 | %) | | | (0.14 | %) | | | (0.51 | %) | | | (0.33 | %) | | | — | f |
Total expenses | | | 1.42 | % | | | 1.43 | % | | | 1.39 | % | | | 1.36 | % | | | 1.44 | % | | | 1.48 | % |
Net expensesc | | | 1.37 | % | | | 1.39 | % | | | 1.39 | % | | | 1.36 | % | | | 1.44 | % | | | 1.48 | % |
Portfolio turnover rate | | | 32 | % | | | 96 | % | | | 147 | % | | | 281 | % | | | 163 | % | | | 265 | % |
Class A | | Six Months Ended
September 30, 2024a | | | Year Ended
March 31,
2024 | | | Year Ended
March 31,
2023 | | | Year Ended
March 31,
2022 | | | Year Ended
March 31,
2021 | | | Year Ended
March 31,
2020 | |
Per Share Data |
Net asset value, beginning of period | | $ | 384.31 | | | $ | 267.90 | | | $ | 278.40 | | | $ | 259.00 | | | $ | 127.06 | | | $ | 116.88 | |
Income (loss) from investment operations: |
Net investment income (loss)b | | | (1.35 | ) | | | (1.69 | ) | | | (.95 | ) | | | (2.15 | ) | | | (1.15 | ) | | | (.31 | ) |
Net gain (loss) on investments (realized and unrealized) | | | 18.30 | | | | 118.10 | | | | (9.55 | ) | | | 33.07 | | | | 138.33 | | | | 10.50 | |
Total from investment operations | | | 16.95 | | | | 116.41 | | | | (10.50 | ) | | | 30.92 | | | | 137.18 | | | | 10.19 | |
Less distributions from: |
Net investment income | | | — | | | | — | | | | — | | | | — | | | | — | | | | (.01 | ) |
Net realized gains | | | — | | | | — | | | | — | | | | (11.52 | ) | | | (5.24 | ) | | | — | |
Total distributions | | | — | | | | — | | | | — | | | | (11.52 | ) | | | (5.24 | ) | | | (.01 | ) |
Net asset value, end of period | | $ | 401.26 | | | $ | 384.31 | | | $ | 267.90 | | | $ | 278.40 | | | $ | 259.00 | | | $ | 127.06 | |
|
Total Returnd | | | 4.41 | % | | | 43.45 | % | | | (3.77 | %) | | | 11.35 | % | | | 108.53 | % | | | 8.72 | % |
Ratios/Supplemental Data |
Net assets, end of period (in thousands) | | $ | 8,817 | | | $ | 7,635 | | | $ | 5,769 | | | $ | 8,827 | | | $ | 5,156 | | | $ | 2,120 | |
Ratios to average net assets: |
Net investment income (loss) | | | (0.68 | %) | | | (0.56 | %) | | | (0.41 | %) | | | (0.76 | %) | | | (0.58 | %) | | | (0.23 | %) |
Total expenses | | | 1.67 | % | | | 1.68 | % | | | 1.64 | % | | | 1.61 | % | | | 1.69 | % | | | 1.73 | % |
Net expensesc | | | 1.62 | % | | | 1.65 | % | | | 1.64 | % | | | 1.61 | % | | | 1.69 | % | | | 1.73 | % |
Portfolio turnover rate | | | 32 | % | | | 96 | % | | | 147 | % | | | 281 | % | | | 163 | % | | | 265 | % |
SEE NOTES TO FINANCIAL STATEMENTS. | THE RYDEX FUNDS SEMI-ANNUAL FINANCIAL REPORT | 35 |
FINANCIAL HIGHLIGHTS (continued) |
This table is presented to show selected data for a share outstanding throughout each period and to assist shareholders in evaluating a Fund’s performance for the periods presented.
Class C | | Six Months Ended
September 30, 2024a | | | Year Ended
March 31,
2024 | | | Year Ended
March 31,
2023 | | | Year Ended
March 31,
2022 | | | Year Ended
March 31,
2021 | | | Year Ended
March 31,
2020 | |
Per Share Data |
Net asset value, beginning of period | | $ | 325.49 | | | $ | 228.60 | | | $ | 239.35 | | | $ | 225.59 | | | $ | 111.87 | | | $ | 103.69 | |
Income (loss) from investment operations: |
Net investment income (loss)b | | | (2.40 | ) | | | (3.35 | ) | | | (2.30 | ) | | | (3.58 | ) | | | (2.32 | ) | | | (1.14 | ) |
Net gain (loss) on investments (realized and unrealized) | | | 15.51 | | | | 100.24 | | | | (8.45 | ) | | | 28.86 | | | | 121.28 | | | | 9.33 | |
Total from investment operations | | | 13.11 | | | | 96.89 | | | | (10.75 | ) | | | 25.28 | | | | 118.96 | | | | 8.19 | |
Less distributions from: |
Net investment income | | | — | | | | — | | | | — | | | | — | | | | — | | | | (.01 | ) |
Net realized gains | | | — | | | | — | | | | — | | | | (11.52 | ) | | | (5.24 | ) | | | — | |
Total distributions | | | — | | | | — | | | | — | | | | (11.52 | ) | | | (5.24 | ) | | | (.01 | ) |
Net asset value, end of period | | $ | 338.58 | | | $ | 325.49 | | | $ | 228.60 | | | $ | 239.35 | | | $ | 225.59 | | | $ | 111.87 | |
|
Total Returnd | | | 4.02 | % | | | 42.38 | % | | | (4.49 | %) | | | 10.51 | % | | | 106.98 | % | | | 7.91 | % |
Ratios/Supplemental Data |
Net assets, end of period (in thousands) | | $ | 1,797 | | | $ | 1,748 | | | $ | 1,246 | | | $ | 1,838 | | | $ | 2,987 | | | $ | 1,701 | |
Ratios to average net assets: |
Net investment income (loss) | | | (1.43 | %) | | | (1.31 | %) | | | (1.16 | %) | | | (1.48 | %) | | | (1.34 | %) | | | (0.96 | %) |
Total expenses | | | 2.42 | % | | | 2.43 | % | | | 2.39 | % | | | 2.36 | % | | | 2.44 | % | | | 2.48 | % |
Net expensesc | | | 2.37 | % | | | 2.40 | % | | | 2.39 | % | | | 2.36 | % | | | 2.44 | % | | | 2.48 | % |
Portfolio turnover rate | | | 32 | % | | | 96 | % | | | 147 | % | | | 281 | % | | | 163 | % | | | 265 | % |
36 | THE RYDEX FUNDS SEMI-ANNUAL FINANCIAL REPORT | SEE NOTES TO FINANCIAL STATEMENTS. |
FINANCIAL HIGHLIGHTS (concluded) |
This table is presented to show selected data for a share outstanding throughout each period and to assist shareholders in evaluating a Fund’s performance for the periods presented.
Class H | | Six Months Ended
September 30, 2024a | | | Year Ended
March 31,
2024 | | | Year Ended
March 31,
2023 | | | Year Ended
March 31,
2022 | | | Year Ended
March 31,
2021 | | | Year Ended
March 31,
2020 | |
Per Share Data |
Net asset value, beginning of period | | $ | 372.36 | | | $ | 259.59 | | | $ | 269.75 | | | $ | 251.22 | | | $ | 123.34 | | | $ | 113.47 | |
Income (loss) from investment operations: |
Net investment income (loss)b | | | (1.32 | ) | | | (1.56 | ) | | | (.97 | ) | | | (2.32 | ) | | | (1.23 | ) | | | (.30 | ) |
Net gain (loss) on investments (realized and unrealized) | | | 17.76 | | | | 114.33 | | | | (9.19 | ) | | | 32.37 | | | | 134.35 | | | | 10.18 | |
Total from investment operations | | | 16.44 | | | | 112.77 | | | | (10.16 | ) | | | 30.05 | | | | 133.12 | | | | 9.88 | |
Less distributions from: |
Net investment income | | | — | | | | — | | | | — | | | | — | | | | — | | | | (.01 | ) |
Net realized gains | | | — | | | | — | | | | — | | | | (11.52 | ) | | | (5.24 | ) | | | — | |
Total distributions | | | — | | | | — | | | | — | | | | (11.52 | ) | | | (5.24 | ) | | | (.01 | ) |
Net asset value, end of period | | $ | 388.80 | | | $ | 372.36 | | | $ | 259.59 | | | $ | 269.75 | | | $ | 251.22 | | | $ | 123.34 | |
|
Total Return | | | 4.42 | % | | | 43.44 | % | | | (3.77 | %) | | | 11.35 | % | | | 108.53 | % | | | 8.72 | % |
Ratios/Supplemental Data |
Net assets, end of period (in thousands) | | $ | 3,859 | | | $ | 2,798 | | | $ | 5,674 | | | $ | 2,051 | | | $ | 8,383 | | | $ | 2,142 | |
Ratios to average net assets: |
Net investment income (loss) | | | (0.68 | %) | | | (0.56 | %) | | | (0.43 | %) | | | (0.85 | %) | | | (0.60 | %) | | | (0.22 | %) |
Total expenses | | | 1.67 | % | | | 1.68 | % | | | 1.64 | % | | | 1.60 | % | | | 1.67 | % | | | 1.73 | % |
Net expensesc | | | 1.62 | % | | | 1.65 | % | | | 1.64 | % | | | 1.60 | % | | | 1.67 | % | | | 1.73 | % |
Portfolio turnover rate | | | 32 | % | | | 96 | % | | | 147 | % | | | 281 | % | | | 163 | % | | | 265 | % |
a | Unaudited figures for the period ended September 30, 2024. Percentage amounts for the period, except total return and portfolio turnover rate, have been annualized. |
b | Net investment income (loss) per share was computed using average shares outstanding throughout the period. |
c | Net expense information reflects the expense ratios after expense waivers and reimbursements, as applicable. |
d | Total return does not reflect the impact of any applicable sales charges. |
e | Less than $0.01 per share. |
f | Less than 0.01% or (0.01%). |
SEE NOTES TO FINANCIAL STATEMENTS. | THE RYDEX FUNDS SEMI-ANNUAL FINANCIAL REPORT | 37 |
SCHEDULE OF INVESTMENTS (Unaudited) | September 30, 2024 |
ENERGY FUND | |
| | Shares | | | Value | |
COMMON STOCKS† - 99.3% |
| | | | | | | | | |
Oil & Gas - 64.5% |
Exxon Mobil Corp. | | | 12,665 | | | $ | 1,484,591 | |
Chevron Corp. | | | 6,996 | | | | 1,030,301 | |
ConocoPhillips | | | 6,673 | | | | 702,533 | |
EOG Resources, Inc. | | | 4,373 | | | | 537,573 | |
Phillips 66 | | | 3,597 | | | | 472,826 | |
Marathon Petroleum Corp. | | | 2,850 | | | | 464,294 | |
Diamondback Energy, Inc. | | | 2,561 | | | | 441,516 | |
Equities Corp. | | | 11,350 | | | | 415,864 | |
Valero Energy Corp. | | | 3,038 | | | | 410,221 | |
Hess Corp. | | | 2,944 | | | | 399,795 | |
Occidental Petroleum Corp. | | | 7,115 | | | | 366,707 | |
Devon Energy Corp. | | | 7,833 | | | | 306,427 | |
BP plc ADR | | | 9,272 | | | | 291,048 | |
Petroleo Brasileiro S.A. ADR | | | 19,865 | | | | 286,255 | |
Shell plc ADR | | | 4,297 | | | | 283,387 | |
Coterra Energy, Inc. — Class A | | | 11,213 | | | | 268,551 | |
Canadian Natural Resources Ltd. | | | 7,702 | | | | 255,783 | |
Marathon Oil Corp. | | | 9,223 | | | | 245,608 | |
Suncor Energy, Inc. | | | 6,229 | | | | 229,975 | |
Cenovus Energy, Inc. | | | 13,218 | | | | 221,137 | |
Chesapeake Energy Corp.1 | | | 2,613 | | | | 214,919 | |
Permian Resources Corp. | | | 14,370 | | | | 195,576 | |
Ovintiv, Inc. | | | 5,083 | | | | 194,730 | |
APA Corp. | | | 7,799 | | | | 190,764 | |
Southwestern Energy Co.* | | | 26,496 | | | | 188,387 | |
Antero Resources Corp.* | | | 6,522 | | | | 186,855 | |
Viper Energy, Inc. | | | 4,000 | | | | 180,440 | |
Range Resources Corp. | | | 5,642 | | | | 173,548 | |
Chord Energy Corp. | | | 1,330 | | | | 173,206 | |
Equinor ASA ADR1 | | | 6,803 | | | | 172,320 | |
HF Sinclair Corp. | | | 3,771 | | | | 168,073 | |
Matador Resources Co. | | | 3,001 | | | | 148,309 | |
CNX Resources Corp.* | | | 4,537 | | | | 147,770 | |
Weatherford International plc | | | 1,728 | | | | 146,742 | |
Noble Corporation plc1 | | | 3,980 | | | | 143,837 | |
Magnolia Oil & Gas Corp. — Class A | | | 5,797 | | | | 141,563 | |
Civitas Resources, Inc. | | | 2,710 | | | | 137,316 | |
Murphy Oil Corp. | | | 4,044 | | | | 136,445 | |
SM Energy Co. | | | 3,343 | | | | 133,620 | |
California Resources Corp. | | | 2,513 | | | | 131,857 | |
Valaris Ltd.* | | | 2,112 | | | | 117,744 | |
Northern Oil & Gas, Inc. | | | 3,271 | | | | 115,826 | |
Transocean Ltd.* | | | 26,084 | | | | 110,857 | |
PBF Energy, Inc. — Class A | | | 3,365 | | | | 104,147 | |
Patterson-UTI Energy, Inc. | | | 13,492 | | | | 103,214 | |
Helmerich & Payne, Inc. | | | 3,319 | | | | 100,964 | |
Kosmos Energy Ltd.* | | | 20,028 | | | | 80,713 | |
Delek US Holdings, Inc. | | | 3,602 | | | | 67,537 | |
Comstock Resources, Inc.* | | | 5,558 | | | | 61,861 | |
Vital Energy, Inc.* | | | 2,098 | | | | 56,436 | |
Total Oil & Gas | | | | | | | 13,339,968 | |
| | | | | | | | | |
Pipelines - 15.0% |
Williams Companies, Inc. | | | 10,354 | | | | 472,660 | |
ONEOK, Inc. | | | 5,064 | | | | 461,482 | |
Kinder Morgan, Inc. | | | 19,205 | | | | 424,238 | |
Cheniere Energy, Inc. | | | 2,177 | | | | 391,512 | |
Targa Resources Corp. | | | 2,402 | | | | 355,520 | |
Enbridge, Inc. | | | 6,045 | | | | 245,487 | |
TC Energy Corp. | | | 4,683 | | | | 222,677 | |
DT Midstream, Inc. | | | 2,221 | | | | 174,704 | |
Golar LNG Ltd. | | | 4,428 | | | | 162,773 | |
Pembina Pipeline Corp. | | | 3,387 | | | | 139,680 | |
New Fortress Energy, Inc.1 | | | 5,855 | | | | 53,222 | |
Total Pipelines | | | | | | | 3,103,955 | |
| | | | | | | | | |
Oil & Gas Services - 9.3% |
Schlumberger N.V. | | | 11,968 | | | | 502,058 | |
Baker Hughes Co. | | | 10,782 | | | | 389,769 | |
Halliburton Co. | | | 10,670 | | | | 309,963 | |
TechnipFMC plc | | | 7,837 | | | | 205,564 | |
NOV, Inc. | | | 9,672 | | | | 154,462 | |
ChampionX Corp. | | | 5,075 | | | | 153,011 | |
Tidewater, Inc.* | | | 1,588 | | | | 114,003 | |
Liberty Energy, Inc. — Class A | | | 5,441 | | | | 103,869 | |
Total Oil & Gas Services | | | | | | | 1,932,699 | |
| | | | | | | | | |
Energy-Alternate Sources - 5.2% |
First Solar, Inc.* | | | 1,307 | | | | 326,018 | |
SolarEdge Technologies, Inc.* | | | 11,724 | | | | 268,597 | |
Enphase Energy, Inc.* | | | 2,229 | | | | 251,922 | |
Sunrun, Inc.* | | | 6,795 | | | | 122,718 | |
Green Plains, Inc.* | | | 4,406 | | | | 59,657 | |
Plug Power, Inc.*,1 | | | 17,450 | | | | 39,437 | |
Total Energy-Alternate Sources | | | | | | | 1,068,349 | |
| | | | | | | | | |
Mining - 1.7% |
Cameco Corp. | | | 5,212 | | | | 248,925 | |
Uranium Energy Corp.* | | | 17,090 | | | | 106,129 | |
Total Mining | | | | | | | 355,054 | |
| | | | | | | | | |
Transportation - 1.2% |
Scorpio Tankers, Inc. | | | 2,038 | | | | 145,309 | |
Frontline plc1 | | | 5,027 | | | | 114,867 | |
Total Transportation | | | | | | | 260,176 | |
| | | | | | | | | |
Coal - 0.9% |
Peabody Energy Corp. | | | 4,631 | | | | 122,907 | |
CONSOL Energy, Inc. | | | 693 | | | | 72,522 | |
Total Coal | | | | | | | 195,429 | |
| | | | | | | | | |
Metal Fabricate & Hardware - 0.8% |
Tenaris S.A. ADR | | | 5,093 | | | | 161,907 | |
| | | | | | | | | |
Retail - 0.7% |
Murphy USA, Inc. | | | 281 | | | | 138,496 | |
| | | | | | | | | |
Total Common Stocks | | | | |
(Cost $9,328,398) | | | | | | | 20,556,033 | |
| | | | | | | | | |
38 | THE RYDEX FUNDS SEMI-ANNUAL FINANCIAL REPORT | SEE NOTES TO FINANCIAL STATEMENTS. |
SCHEDULE OF INVESTMENTS (Unaudited)(concluded) | September 30, 2024 |
ENERGY FUND | |
| | Face
Amount | | | Value | |
REPURCHASE AGREEMENTS††,2 - 0.6% |
J.P. Morgan Securities LLC
issued 09/30/24 at 4.86%
due 10/01/24 | | $ | 67,431 | | | $ | 67,431 | |
BofA Securities, Inc.
issued 09/30/24 at 4.85%
due 10/01/24 | | | 55,695 | | | | 55,695 | |
Total Repurchase Agreements | | | | |
(Cost $123,126) | | | | | | | 123,126 | |
| | | | | | | | | |
| | Shares | | | Value | |
SECURITIES LENDING COLLATERAL†,3 - 2.8% |
Money Market Fund*** | | | | | | | | |
First American Government Obligations Fund - Class X, 4.82%4 | | | 570,260 | | | $ | 570,260 | |
Total Securities Lending Collateral | | | | |
(Cost $570,260) | | | | | | | 570,260 | |
| | | | | | | | | |
Total Investments - 102.7% | | | | |
(Cost $10,021,784) | | $ | 21,249,419 | |
Other Assets & Liabilities, net - (2.7)% | | | (565,181 | ) |
Total Net Assets - 100.0% | | $ | 20,684,238 | |
* | Non-income producing security. |
*** | A copy of each underlying unaffiliated fund’s financial statements is available at the SEC’s website at www.sec.gov. |
† | Value determined based on Level 1 inputs — See Note 4. |
†† | Value determined based on Level 2 inputs — See Note 4. |
1 | All or a portion of this security is on loan at September 30, 2024 — See Note 7. |
2 | Repurchase Agreements — See Note 6. |
3 | Securities lending collateral — See Note 7. |
4 | Rate indicated is the 7-day yield as of September 30, 2024. |
| | ADR — American Depositary Receipt |
| | plc — Public Limited Company |
| | |
| | See Sector Classification in Other Information section. |
The following table summarizes the inputs used to value the Fund’s investments at September 30, 2024 (See Note 4 in the Notes to Financial Statements):
Investments in Securities (Assets) | | Level 1
Quoted
Prices | | | Level 2
Significant
Observable
Inputs | | | Level 3
Significant
Unobservable
Inputs | | | Total | |
Common Stocks | | $ | 20,556,033 | | | $ | — | | | $ | — | | | $ | 20,556,033 | |
Repurchase Agreements | | | — | | | | 123,126 | | | | — | | | | 123,126 | |
Securities Lending Collateral | | | 570,260 | | | | — | | | | — | | | | 570,260 | |
Total Assets | | $ | 21,126,293 | | | $ | 123,126 | | | $ | — | | | $ | 21,249,419 | |
SEE NOTES TO FINANCIAL STATEMENTS. | THE RYDEX FUNDS SEMI-ANNUAL FINANCIAL REPORT | 39 |
STATEMENT OF ASSETS AND LIABILITIES (Unaudited) |
September 30, 2024 |
Assets: |
Investments, at value - including $552,248 of securities loaned (cost $9,898,658) | | $ | 21,126,293 | |
Repurchase agreements, at value (cost $123,126) | | | 123,126 | |
Cash | | | 10,056 | |
Receivables: |
Dividends | | | 22,419 | |
Fund shares sold | | | 20,736 | |
Securities lending income | | | 321 | |
Interest | | | 17 | |
Total assets | | | 21,302,968 | |
| | | | | |
Liabilities: |
Payable for: |
Return of securities lending collateral | | | 570,260 | |
Management fees | | | 13,733 | |
Transfer agent fees | | | 10,554 | |
Fund shares redeemed | | | 5,457 | |
Distribution and service fees | | | 2,286 | |
Portfolio accounting and administration fees | | | 1,658 | |
Trustees’ fees* | | | 210 | |
Miscellaneous | | | 14,572 | |
Total liabilities | | | 618,730 | |
Net assets | | $ | 20,684,238 | |
| | | | | |
Net assets consist of: |
Paid in capital | | $ | 23,897,143 | |
Total distributable earnings (loss) | | | (3,212,905 | ) |
Net assets | | $ | 20,684,238 | |
| | | | | |
Investor Class: |
Net assets | | $ | 13,953,667 | |
Capital shares outstanding | | | 53,147 | |
Net asset value per share | | $ | 262.55 | |
| | | | | |
Class A: |
Net assets | | $ | 3,968,024 | |
Capital shares outstanding | | | 16,550 | |
Net asset value per share | | $ | 239.76 | |
Maximum offering price per share (Net asset value divided by 95.25%) | | $ | 251.72 | |
| | | | | |
Class C: |
Net assets | | $ | 1,760,576 | |
Capital shares outstanding | | | 8,849 | |
Net asset value per share | | $ | 198.96 | |
| | | | | |
Class H: |
Net assets | | $ | 1,001,971 | |
Capital shares outstanding | | | 4,329 | |
Net asset value per share | | $ | 231.46 | |
STATEMENT OF OPERATIONS (Unaudited) |
Six Months Ended September 30, 2024 |
Investment Income: |
Dividends (net of foreign withholding tax of $7,458) | | $ | 477,192 | |
Interest | | | 3,424 | |
Income from securities lending, net | | | 1,958 | |
Total investment income | | | 482,574 | |
| | | | | |
Expenses: |
Management fees | | | 126,755 | |
Distribution and service fees: |
Class A | | | 5,260 | |
Class C | | | 9,294 | |
Class H | | | 2,506 | |
Transfer agent fees | | | 30,381 | |
Registration fees | | | 14,651 | |
Portfolio accounting and administration fees | | | 22,754 | |
Professional fees | | | 7,093 | |
Trustees’ fees* | | | 2,023 | |
Custodian fees | | | 1,938 | |
Line of credit fees | | | 57 | |
Miscellaneous | | | 4,270 | |
Total expenses | | | 226,982 | |
Less: |
Expenses reimbursed by Adviser | | | (7,449 | ) |
Net expenses | | | 219,533 | |
Net investment income | | | 263,041 | |
| | | | | |
Net Realized and Unrealized Gain (Loss): |
Net realized gain (loss) on: |
Investments | | | 2,638,121 | |
Net realized gain | | | 2,638,121 | |
Net change in unrealized appreciation (depreciation) on: |
Investments | | | (5,343,781 | ) |
Net change in unrealized appreciation (depreciation) | | | (5,343,781 | ) |
Net realized and unrealized loss | | | (2,705,660 | ) |
Net decrease in net assets resulting from operations | | $ | (2,442,619 | ) |
* | Relates to Trustees not deemed “interested persons” within the meaning of Section 2(a)(19) of the 1940 Act. |
40 | THE RYDEX FUNDS SEMI-ANNUAL FINANCIAL REPORT | SEE NOTES TO FINANCIAL STATEMENTS. |
STATEMENTS OF CHANGES IN NET ASSETS |
| | Six Months Ended
September 30, 2024
(Unaudited) | | | Year Ended
March 31,
2024 | |
Increase (Decrease) in Net Assets from Operations: | | | | | | | | |
Net investment income | | $ | 263,041 | | | $ | 761,104 | |
Net realized gain on investments | | | 2,638,121 | | | | 10,149,054 | |
Net change in unrealized appreciation (depreciation) on investments | | | (5,343,781 | ) | | | (8,687,737 | ) |
Net increase (decrease) in net assets resulting from operations | | | (2,442,619 | ) | | | 2,222,421 | |
| | | | | | | | | |
Distributions to shareholders: | | | | | | | | |
Investor Class | | | — | | | | (1,379,867 | ) |
Class A | | | — | | | | (122,041 | ) |
Class C | | | — | | | | (71,490 | ) |
Class H | | | — | | | | (36,889 | ) |
Total distributions to shareholders | | | — | | | | (1,610,287 | ) |
| | | | | | | | | |
Capital share transactions: | | | | | | | | |
Proceeds from sale of shares | | | | | | | | |
Investor Class | | | 80,746,974 | | | | 231,819,975 | |
Class A | | | 957,165 | | | | 2,695,528 | |
Class C | | | 244,801 | | | | 752,936 | |
Class H | | | 1,437,840 | | | | 5,454,292 | |
Distributions reinvested | | | | | | | | |
Investor Class | | | — | | | | 1,308,347 | |
Class A | | | — | | | | 117,682 | |
Class C | | | — | | | | 69,867 | |
Class H | | | — | | | | 36,342 | |
Cost of shares redeemed | | | | | | | | |
Investor Class | | | (89,573,747 | ) | | | (272,676,183 | ) |
Class A | | | (1,081,146 | ) | | | (3,672,418 | ) |
Class C | | | (216,406 | ) | | | (1,516,746 | ) |
Class H | | | (2,910,778 | ) | | | (4,148,511 | ) |
Net decrease from capital share transactions | | | (10,395,297 | ) | | | (39,758,889 | ) |
Net decrease in net assets | | | (12,837,916 | ) | | | (39,146,755 | ) |
| | | | | | | | | |
Net assets: | | | | | | | | |
Beginning of period | | | 33,522,154 | | | | 72,668,909 | |
End of period | | $ | 20,684,238 | | | $ | 33,522,154 | |
| | | | | | | | | |
Capital share activity: | | | | | | | | |
Shares sold | | | | | | | | |
Investor Class | | | 289,465 | | | | 869,045 | |
Class A | | | 3,836 | | | | 11,283 | |
Class C | | | 1,156 | | | | 3,642 | |
Class H | | | 5,749 | | | | 22,654 | |
Shares issued from reinvestment of distributions | | | | | | | | |
Investor Class | | | — | | | | 5,398 | |
Class A | | | — | | | | 531 | |
Class C | | | — | | | | 377 | |
Class H | | | — | | | | 170 | |
Shares redeemed | | | | | | | | |
Investor Class | | | (323,046 | ) | | | (1,048,889 | ) |
Class A | | | (4,318 | ) | | | (15,653 | ) |
Class C | | | (1,042 | ) | | | (7,663 | ) |
Class H | | | (11,986 | ) | | | (17,865 | ) |
Net decrease in shares | | | (40,186 | ) | | | (176,970 | ) |
SEE NOTES TO FINANCIAL STATEMENTS. | THE RYDEX FUNDS SEMI-ANNUAL FINANCIAL REPORT | 41 |
This table is presented to show selected data for a share outstanding throughout each period and to assist shareholders in evaluating a Fund’s performance for the periods presented.
Investor Class | | Six Months Ended
September 30, 2024a | | | Year Ended
March 31,
2024 | | | Year Ended
March 31,
2023 | | | Year Ended
March 31,
2022 | | | Year Ended
March 31,
2021 | | | Year Ended
March 31,
2020e | |
Per Share Data |
Net asset value, beginning of period | | $ | 283.41 | | | $ | 246.39 | | | $ | 239.96 | | | $ | 152.94 | | | $ | 81.74 | | | $ | 204.01 | |
Income (loss) from investment operations: |
Net investment income (loss)b | | | 2.62 | | | | 4.93 | | | | 7.06 | | | | 3.62 | | | | 1.44 | | | | 2.91 | |
Net gain (loss) on investments (realized and unrealized) | | | (23.48 | ) | | | 38.98 | | | | 6.01 | f | | | 84.29 | | | | 72.59 | | | | (123.74 | ) |
Total from investment operations | | | (20.86 | ) | | | 43.91 | | | | 13.07 | | | | 87.91 | | | | 74.03 | | | | (120.83 | ) |
Less distributions from: |
Net investment income | | | — | | | | (6.89 | ) | | | (6.64 | ) | | | (.89 | ) | | | (2.83 | ) | | | (1.44 | ) |
Total distributions | | | — | | | | (6.89 | ) | | | (6.64 | ) | | | (.89 | ) | | | (2.83 | ) | | | (1.44 | ) |
Net asset value, end of period | | $ | 262.55 | | | $ | 283.41 | | | $ | 246.39 | | | $ | 239.96 | | | $ | 152.94 | | | $ | 81.74 | |
|
Total Return | | | (7.36 | %) | | | 18.30 | % | | | 5.34 | % | | | 57.65 | % | | | 91.43 | % | | | (59.61 | %) |
Ratios/Supplemental Data |
Net assets, end of period (in thousands) | | $ | 13,954 | | | $ | 24,579 | | | $ | 64,350 | | | $ | 57,612 | | | $ | 18,220 | | | $ | 4,216 | |
Ratios to average net assets: |
Net investment income (loss) | | | 1.89 | % | | | 1.91 | % | | | 2.79 | % | | | 1.99 | % | | | 2.02 | % | | | 1.65 | % |
Total expenses | | | 1.41 | % | | | 1.45 | % | | | 1.39 | % | | | 1.36 | % | | | 1.42 | % | | | 1.48 | % |
Net expensesc | | | 1.36 | % | | | 1.41 | % | | | 1.39 | % | | | 1.36 | % | | | 1.42 | % | | | 1.48 | % |
Portfolio turnover rate | | | 219 | % | | | 500 | % | | | 363 | % | | | 382 | % | | | 939 | % | | | 428 | % |
Class A | | Six Months Ended
September 30, 2024a | | | Year Ended
March 31,
2024 | | | Year Ended
March 31,
2023 | | | Year Ended
March 31,
2022 | | | Year Ended
March 31,
2021 | | | Year Ended
March 31,
2020e | |
Per Share Data |
Net asset value, beginning of period | | $ | 259.15 | | | $ | 226.42 | | | $ | 221.55 | | | $ | 141.62 | | | $ | 76.01 | | | $ | 190.30 | |
Income (loss) from investment operations: |
Net investment income (loss)b | | | 1.96 | | | | 3.80 | | | | 5.79 | | | | 2.67 | | | | 1.00 | | | | 2.46 | |
Net gain (loss) on investments (realized and unrealized) | | | (21.35 | ) | | | 35.82 | | | | 5.72 | f | | | 78.15 | | | | 67.44 | | | | (115.31 | ) |
Total from investment operations | | | (19.39 | ) | | | 39.62 | | | | 11.51 | | | | 80.82 | | | | 68.44 | | | | (112.85 | ) |
Less distributions from: |
Net investment income | | | — | | | | (6.89 | ) | | | (6.64 | ) | | | (.89 | ) | | | (2.83 | ) | | | (1.44 | ) |
Total distributions | | | — | | | | (6.89 | ) | | | (6.64 | ) | | | (.89 | ) | | | (2.83 | ) | | | (1.44 | ) |
Net asset value, end of period | | $ | 239.76 | | | $ | 259.15 | | | $ | 226.42 | | | $ | 221.55 | | | $ | 141.62 | | | $ | 76.01 | |
|
Total Returnd | | | (7.48 | %) | | | 18.02 | % | | | 5.08 | % | | | 57.25 | % | | | 90.89 | % | | | (59.69 | %) |
Ratios/Supplemental Data |
Net assets, end of period (in thousands) | | $ | 3,968 | | | $ | 4,414 | | | $ | 4,726 | | | $ | 4,015 | | | $ | 2,214 | | | $ | 985 | |
Ratios to average net assets: |
Net investment income (loss) | | | 1.56 | % | | | 1.61 | % | | | 2.48 | % | | | 1.60 | % | | | 1.60 | % | | | 1.50 | % |
Total expenses | | | 1.67 | % | | | 1.68 | % | | | 1.64 | % | | | 1.61 | % | | | 1.68 | % | | | 1.73 | % |
Net expensesc | | | 1.62 | % | | | 1.65 | % | | | 1.64 | % | | | 1.61 | % | | | 1.68 | % | | | 1.73 | % |
Portfolio turnover rate | | | 219 | % | | | 500 | % | | | 363 | % | | | 382 | % | | | 939 | % | | | 428 | % |
42 | THE RYDEX FUNDS SEMI-ANNUAL FINANCIAL REPORT | SEE NOTES TO FINANCIAL STATEMENTS. |
FINANCIAL HIGHLIGHTS (continued) |
This table is presented to show selected data for a share outstanding throughout each period and to assist shareholders in evaluating a Fund’s performance for the periods presented.
Class C | | Six Months Ended
September 30, 2024a | | | Year Ended
March 31,
2024 | | | Year Ended
March 31,
2023 | | | Year Ended
March 31,
2022 | | | Year Ended
March 31,
2021 | | | Year Ended
March 31,
2020e | |
Per Share Data |
Net asset value, beginning of period | | $ | 215.84 | | | $ | 191.16 | | | $ | 189.40 | | | $ | 122.07 | | | $ | 66.27 | | | $ | 167.39 | |
Income (loss) from investment operations: |
Net investment income (loss)b | | | .85 | | | | 1.68 | | | | 3.61 | | | | 1.32 | | | | .56 | | | | 1.08 | |
Net gain (loss) on investments (realized and unrealized) | | | (17.73 | ) | | | 29.89 | | | | 4.79 | f | | | 66.90 | | | | 58.07 | | | | (100.76 | ) |
Total from investment operations | | | (16.88 | ) | | | 31.57 | | | | 8.40 | | | | 68.22 | | | | 58.63 | | | | (99.68 | ) |
Less distributions from: |
Net investment income | | | — | | | | (6.89 | ) | | | (6.64 | ) | | | (.89 | ) | | | (2.83 | ) | | | (1.44 | ) |
Total distributions | | | — | | | | (6.89 | ) | | | (6.64 | ) | | | (.89 | ) | | | (2.83 | ) | | | (1.44 | ) |
Net asset value, end of period | | $ | 198.96 | | | $ | 215.84 | | | $ | 191.16 | | | $ | 189.40 | | | $ | 122.07 | | | $ | 66.27 | |
|
Total Returnd | | | (7.82 | %) | | | 17.14 | % | | | 4.29 | % | | | 56.07 | % | | | 89.48 | % | | | (60.01 | %) |
Ratios/Supplemental Data |
Net assets, end of period (in thousands) | | $ | 1,761 | | | $ | 1,885 | | | $ | 2,366 | | | $ | 1,640 | | | $ | 746 | | | $ | 432 | |
Ratios to average net assets: |
Net investment income (loss) | | | 0.81 | % | | | 0.84 | % | | | 1.82 | % | | | 0.91 | % | | | 1.05 | % | | | 0.76 | % |
Total expenses | | | 2.42 | % | | | 2.43 | % | | | 2.39 | % | | | 2.36 | % | | | 2.44 | % | | | 2.48 | % |
Net expensesc | | | 2.37 | % | | | 2.40 | % | | | 2.39 | % | | | 2.36 | % | | | 2.44 | % | | | 2.48 | % |
Portfolio turnover rate | | | 219 | % | | | 500 | % | | | 363 | % | | | 382 | % | | | 939 | % | | | 428 | % |
SEE NOTES TO FINANCIAL STATEMENTS. | THE RYDEX FUNDS SEMI-ANNUAL FINANCIAL REPORT | 43 |
FINANCIAL HIGHLIGHTS (concluded) |
This table is presented to show selected data for a share outstanding throughout each period and to assist shareholders in evaluating a Fund’s performance for the periods presented.
Class H | | Six Months Ended
September 30, 2024a | | | Year Ended
March 31,
2024 | | | Year Ended
March 31,
2023 | | | Year Ended
March 31,
2022 | | | Year Ended
March 31,
2021 | | | Year Ended
March 31,
2020e | |
Per Share Data |
Net asset value, beginning of period | | $ | 250.19 | | | $ | 218.83 | | | $ | 214.30 | | | $ | 137.02 | | | $ | 73.61 | | | $ | 184.50 | |
Income (loss) from investment operations: |
Net investment income (loss)b | | | 2.09 | | | | 2.97 | | | | 5.41 | | | | 2.80 | | | | 1.06 | | | | 1.92 | |
Net gain (loss) on investments (realized and unrealized) | | | (20.82 | ) | | | 35.28 | | | | 5.76 | f | | | 75.37 | | | | 65.18 | | | | (111.37 | ) |
Total from investment operations | | | (18.73 | ) | | | 38.25 | | | | 11.17 | | | | 78.17 | | | | 66.24 | | | | (109.45 | ) |
Less distributions from: |
Net investment income | | | — | | | | (6.89 | ) | | | (6.64 | ) | | | (.89 | ) | | | (2.83 | ) | | | (1.44 | ) |
Total distributions | | | — | | | | (6.89 | ) | | | (6.64 | ) | | | (.89 | ) | | | (2.83 | ) | | | (1.44 | ) |
Net asset value, end of period | | $ | 231.46 | | | $ | 250.19 | | | $ | 218.83 | | | $ | 214.30 | | | $ | 137.02 | | | $ | 73.61 | |
|
Total Return | | | (7.49 | %) | | | 18.02 | % | | | 5.08 | % | | | 57.25 | % | | | 90.87 | % | | | (59.73 | %) |
Ratios/Supplemental Data |
Net assets, end of period (in thousands) | | $ | 1,002 | | | $ | 2,643 | | | $ | 1,227 | | | $ | 2,079 | | | $ | 1,578 | | | $ | 646 | |
Ratios to average net assets: |
Net investment income (loss) | | | 1.70 | % | | | 1.28 | % | | | 2.40 | % | | | 1.73 | % | | | 1.60 | % | | | 1.25 | % |
Total expenses | | | 1.65 | % | | | 1.68 | % | | | 1.65 | % | | | 1.61 | % | | | 1.68 | % | | | 1.72 | % |
Net expensesc | | | 1.60 | % | | | 1.65 | % | | | 1.65 | % | | | 1.61 | % | | | 1.68 | % | | | 1.72 | % |
Portfolio turnover rate | | | 219 | % | | | 500 | % | | | 363 | % | | | 382 | % | | | 939 | % | | | 428 | % |
a | Unaudited figures for the period ended September 30, 2024. Percentage amounts for the period, except total return and portfolio turnover rate, have been annualized. |
b | Net investment income (loss) per share was computed using average shares outstanding throughout the period. |
c | Net expense information reflects the expense ratios after expense waivers and reimbursements, as applicable. |
d | Total return does not reflect the impact of any applicable sales charges. |
e | Reverse share split – Per share amounts for the years presented through March 31, 2020 have been restated to reflect a 1:3 reverse share split effective August 10, 2020. |
f | The amount shown for a share outstanding throughout the period does not agree with the aggregate net loss on investments for the year because of the sales and repurchased of fund shares in relation to fluctuating market value of the investments of the Fund. |
44 | THE RYDEX FUNDS SEMI-ANNUAL FINANCIAL REPORT | SEE NOTES TO FINANCIAL STATEMENTS. |
SCHEDULE OF INVESTMENTS (Unaudited) | September 30, 2024 |
ENERGY SERVICES FUND | |
| | Shares | | | Value | |
COMMON STOCKS† - 99.3% |
| | | | | | | | | |
Oil & Gas Services - 68.4% |
Schlumberger N.V. | | | 20,892 | | | $ | 876,419 | |
Baker Hughes Co. | | | 18,850 | | | | 681,428 | |
Halliburton Co. | | | 18,679 | | | | 542,625 | |
TechnipFMC plc | | | 10,720 | | | | 281,186 | |
NOV, Inc. | | | 17,033 | | | | 272,017 | |
ChampionX Corp. | | | 8,941 | | | | 269,571 | |
Archrock, Inc. | | | 10,270 | | | | 207,865 | |
Tidewater, Inc.* | | | 2,795 | | | | 200,653 | |
Liberty Energy, Inc. — Class A | | | 9,585 | | | | 182,978 | |
Oceaneering International, Inc.* | | | 7,066 | | | | 175,731 | |
Helix Energy Solutions Group, Inc.* | | | 13,206 | | | | 146,587 | |
Expro Group Holdings N.V.* | | | 8,299 | | | | 142,494 | |
Atlas Energy Solutions, Inc. | | | 6,048 | | | | 131,846 | |
Select Water Solutions, Inc. — Class A | | | 10,754 | | | | 119,692 | |
ProPetro Holding Corp.* | | | 11,762 | | | | 90,097 | |
Core Laboratories, Inc. | | | 4,776 | | | | 88,499 | |
RPC, Inc. | | | 13,904 | | | | 88,429 | |
Kodiak Gas Services, Inc. | | | 2,842 | | | | 82,418 | |
ProFrac Holding Corp. — Class A*,1 | | | 4,689 | | | | 31,838 | |
Total Oil & Gas Services | | | | | | | 4,612,373 | |
| | | | | | | | | |
Oil & Gas - 24.0% |
Weatherford International plc | | | 3,045 | | | | 258,581 | |
Noble Corporation plc1 | | | 7,014 | | | | 253,493 | |
Valaris Ltd.* | | | 3,720 | | | | 207,390 | |
Transocean Ltd.* | | | 44,564 | | | | 189,397 | |
Patterson-UTI Energy, Inc. | | | 23,765 | | | | 181,802 | |
Helmerich & Payne, Inc. | | | 5,844 | | | | 177,775 | |
Seadrill Ltd.* | | | 4,391 | | | | 174,498 | |
Borr Drilling Ltd. | | | 26,238 | | | | 144,047 | |
Nabors Industries Ltd.* | | | 547 | | | | 35,265 | |
Total Oil & Gas | | | | | | | 1,622,248 | |
| | | | | | | | | |
Machinery-Diversified - 3.6% |
Cactus, Inc. — Class A | | | 4,080 | | | | 243,454 | |
| | | | | | | | | |
Metal Fabricate & Hardware - 3.3% |
Tenaris S.A. ADR | | | 7,080 | | | | 225,073 | |
| | | | | | | | | |
Total Common Stocks | | | | |
(Cost $3,402,190) | | | | | | | 6,703,148 | |
| | | | | | | | | |
| | Face
Amount | | | Value | |
REPURCHASE AGREEMENTS††,2 - 0.6% |
J.P. Morgan Securities LLC
issued 09/30/24 at 4.86%
due 10/01/24 | | $ | 23,163 | | | $ | 23,163 | |
BofA Securities, Inc.
issued 09/30/24 at 4.85%
due 10/01/24 | | | 19,131 | | | | 19,131 | |
Total Repurchase Agreements | | | | |
(Cost $42,294) | | | | | | | 42,294 | |
| | | | | | | | | |
| | | Shares | | | | | |
SECURITIES LENDING COLLATERAL†,3 - 3.1% |
Money Market Fund*** | | | | | | | | |
First American Government Obligations Fund - Class X, 4.82%4 | | | 207,758 | | | | 207,758 | |
Total Securities Lending Collateral | | | | |
(Cost $207,758) | | | | | | | 207,758 | |
| | | | | | | | | |
Total Investments - 103.0% | | | | |
(Cost $3,652,242) | | $ | 6,953,200 | |
Other Assets & Liabilities, net - (3.0)% | | | (204,823 | ) |
Total Net Assets - 100.0% | | $ | 6,748,377 | |
* | Non-income producing security. |
*** | A copy of each underlying unaffiliated fund’s financial statements is available at the SEC’s website at www.sec.gov. |
† | Value determined based on Level 1 inputs — See Note 4. |
†† | Value determined based on Level 2 inputs — See Note 4. |
1 | All or a portion of this security is on loan at September 30, 2024 — See Note 7. |
2 | Repurchase Agreements — See Note 6. |
3 | Securities lending collateral — See Note 7. |
4 | Rate indicated is the 7-day yield as of September 30, 2024. |
| | ADR — American Depositary Receipt |
| | plc — Public Limited Company |
| | |
| | See Sector Classification in Other Information section. |
SEE NOTES TO FINANCIAL STATEMENTS. | THE RYDEX FUNDS SEMI-ANNUAL FINANCIAL REPORT | 45 |
SCHEDULE OF INVESTMENTS (Unaudited)(concluded) | September 30, 2024 |
ENERGY SERVICES FUND | |
The following table summarizes the inputs used to value the Fund’s investments at September 30, 2024 (See Note 4 in the Notes to Financial Statements):
Investments in Securities (Assets) | | Level 1
Quoted
Prices | | | Level 2
Significant
Observable
Inputs | | | Level 3
Significant
Unobservable
Inputs | | | Total | |
Common Stocks | | $ | 6,703,148 | | | $ | — | | | $ | — | | | $ | 6,703,148 | |
Repurchase Agreements | | | — | | | | 42,294 | | | | — | | | | 42,294 | |
Securities Lending Collateral | | | 207,758 | | | | — | | | | — | | | | 207,758 | |
Total Assets | | $ | 6,910,906 | | | $ | 42,294 | | | $ | — | | | $ | 6,953,200 | |
46 | THE RYDEX FUNDS SEMI-ANNUAL FINANCIAL REPORT | SEE NOTES TO FINANCIAL STATEMENTS. |
STATEMENT OF ASSETS AND LIABILITIES (Unaudited) |
September 30, 2024 |
Assets: |
Investments, at value - including $201,562 of securities loaned (cost $3,609,948) | | $ | 6,910,906 | |
Repurchase agreements, at value (cost $42,294) | | | 42,294 | |
Receivables: |
Fund shares sold | | | 476,041 | |
Dividends | | | 5,434 | |
Foreign tax reclaims | | | 160 | |
Securities lending income | | | 48 | |
Total assets | | | 7,434,883 | |
| | | | | |
Liabilities: |
Payable for: |
Securities purchased | | | 389,007 | |
Return of securities lending collateral | | | 207,758 | |
Fund shares redeemed | | | 76,057 | |
Management fees | | | 4,206 | |
Transfer agent fees | | | 3,435 | |
Distribution and service fees | | | 615 | |
Portfolio accounting and administration fees | | | 507 | |
Trustees’ fees* | | | 67 | |
Miscellaneous | | | 4,854 | |
Total liabilities | | | 686,506 | |
Net assets | | $ | 6,748,377 | |
| | | | | |
Net assets consist of: |
Paid in capital | | $ | 43,184,522 | |
Total distributable earnings (loss) | | | (36,436,145 | ) |
Net assets | | $ | 6,748,377 | |
| | | | | |
Investor Class: |
Net assets | | $ | 4,939,612 | |
Capital shares outstanding | | | 21,379 | |
Net asset value per share | | $ | 231.05 | |
| | | | | |
Class A: |
Net assets | | $ | 871,528 | |
Capital shares outstanding | | | 4,089 | |
Net asset value per share | | $ | 213.14 | |
Maximum offering price per share (Net asset value divided by 95.25%) | | $ | 223.77 | |
| | | | | |
Class C: |
Net assets | | $ | 419,637 | |
Capital shares outstanding | | | 2,318 | |
Net asset value per share | | $ | 181.03 | |
| | | | | |
Class H: |
Net assets | | $ | 517,600 | |
Capital shares outstanding | | | 2,506 | |
Net asset value per share | | $ | 206.54 | |
STATEMENT OF OPERATIONS (Unaudited) |
Six Months Ended September 30, 2024 |
Investment Income: |
Dividends | | $ | 84,892 | |
Interest | | | 1,494 | |
Income from securities lending, net | | | 49 | |
Total investment income | | | 86,435 | |
| | | | | |
Expenses: |
Management fees | | | 39,342 | |
Distribution and service fees: |
Class A | | | 1,295 | |
Class C | | | 2,668 | |
Class H | | | 905 | |
Transfer agent fees | | | 9,619 | |
Registration fees | | | 3,205 | |
Portfolio accounting and administration fees | | | 7,062 | |
Professional fees | | | 4,217 | |
Trustees’ fees* | | | 853 | |
Custodian fees | | | 601 | |
Line of credit fees | | | 67 | |
Miscellaneous | | | 305 | |
Total expenses | | | 70,139 | |
Less: |
Expenses reimbursed by Adviser | | | (2,312 | ) |
Net expenses | | | 67,827 | |
Net investment income | | | 18,608 | |
| | | | | |
Net Realized and Unrealized Gain (Loss): |
Net realized gain (loss) on: |
Investments | | | 1,987,379 | |
Net realized gain | | | 1,987,379 | |
Net change in unrealized appreciation (depreciation) on: |
Investments | | | (3,255,817 | ) |
Net change in unrealized appreciation (depreciation) | | | (3,255,817 | ) |
Net realized and unrealized loss | | | (1,268,438 | ) |
Net decrease in net assets resulting from operations | | $ | (1,249,830 | ) |
* | Relates to Trustees not deemed “interested persons” within the meaning of Section 2(a)(19) of the 1940 Act. |
SEE NOTES TO FINANCIAL STATEMENTS. | THE RYDEX FUNDS SEMI-ANNUAL FINANCIAL REPORT | 47 |
STATEMENTS OF CHANGES IN NET ASSETS |
| | Six Months Ended
September 30, 2024
(Unaudited) | | | Year Ended
March 31,
2024 | |
Increase (Decrease) in Net Assets from Operations: | | | | | | | | |
Net investment income | | $ | 18,608 | | | $ | 1,489 | |
Net realized gain (loss) on investments | | | 1,987,379 | | | | (1,622,348 | ) |
Net change in unrealized appreciation (depreciation) on investments | | | (3,255,817 | ) | | | 2,917,554 | |
Net increase (decrease) in net assets resulting from operations | | | (1,249,830 | ) | | | 1,296,695 | |
| | | | | | | | | |
Capital share transactions: | | | | | | | | |
Proceeds from sale of shares | | | | | | | | |
Investor Class | | | 12,383,501 | | | | 80,881,054 | |
Class A | | | 651,675 | | | | 2,254,084 | |
Class C | | | 85,412 | | | | 121,373 | |
Class H | | | 47,143 | | | | 3,381,767 | |
Cost of shares redeemed | | | | | | | | |
Investor Class | | | (18,622,408 | ) | | | (102,094,522 | ) |
Class A | | | (934,194 | ) | | | (2,540,156 | ) |
Class C | | | (158,206 | ) | | | (662,919 | ) |
Class H | | | (288,162 | ) | | | (3,827,092 | ) |
Net decrease from capital share transactions | | | (6,835,239 | ) | | | (22,486,411 | ) |
Net decrease in net assets | | | (8,085,069 | ) | | | (21,189,716 | ) |
| | | | | | | | | |
Net assets: | | | | | | | | |
Beginning of period | | | 14,833,446 | | | | 36,023,162 | |
End of period | | $ | 6,748,377 | | | $ | 14,833,446 | |
| | | | | | | | | |
Capital share activity: | | | | | | | | |
Shares sold | | | | | | | | |
Investor Class | | | 48,992 | | | | 317,141 | |
Class A | | | 2,805 | | | | 10,056 | |
Class C | | | 430 | | | | 645 | |
Class H | | | 220 | | | | 14,895 | |
Shares redeemed | | | | | | | | |
Investor Class | | | (72,732 | ) | | | (424,550 | ) |
Class A | | | (3,964 | ) | | | (11,542 | ) |
Class C | | | (818 | ) | | | (3,706 | ) |
Class H | | | (1,307 | ) | | | (16,942 | ) |
Net decrease in shares | | | (26,374 | ) | | | (114,003 | ) |
48 | THE RYDEX FUNDS SEMI-ANNUAL FINANCIAL REPORT | SEE NOTES TO FINANCIAL STATEMENTS. |
This table is presented to show selected data for a share outstanding throughout each period and to assist shareholders in evaluating a Fund’s performance for the periods presented.
Investor Class | | Six Months Ended
September 30, 2024a | | | Year Ended
March 31,
2024 | | | Year Ended
March 31,
2023 | | | Year Ended
March 31,
2022 | | | Year Ended
March 31,
2021 | | | Year Ended
March 31,
2020e | |
Per Share Data |
Net asset value, beginning of period | | $ | 268.17 | | | $ | 213.90 | | | $ | 231.88 | | | $ | 169.20 | | | $ | 75.50 | | | $ | 281.99 | |
Income (loss) from investment operations: |
Net investment income (loss)b | | | .66 | | | | .15 | | | | (.56 | ) | | | (.63 | ) | | | .20 | | | | 2.40 | |
Net gain (loss) on investments (realized and unrealized) | | | (37.78 | ) | | | 54.12 | | | | (17.42 | ) | | | 63.81 | | | | 95.34 | | | | (208.59 | ) |
Total from investment operations | | | (37.12 | ) | | | 54.27 | | | | (17.98 | ) | | | 63.18 | | | | 95.54 | | | | (206.19 | ) |
Less distributions from: |
Net investment income | | | — | | | | — | | | | — | | | | (.50 | ) | | | (1.84 | ) | | | (.30 | ) |
Total distributions | | | — | | | | — | | | | — | | | | (.50 | ) | | | (1.84 | ) | | | (.30 | ) |
Net asset value, end of period | | $ | 231.05 | | | $ | 268.17 | | | $ | 213.90 | | | $ | 231.88 | | | $ | 169.20 | | | $ | 75.50 | |
|
Total Return | | | (13.84 | %) | | | 25.37 | % | | | (7.75 | %) | | | 37.44 | % | | | 127.06 | % | | | (73.21 | %) |
Ratios/Supplemental Data |
Net assets, end of period (in thousands) | | $ | 4,940 | | | $ | 12,100 | | | $ | 32,626 | | | $ | 9,376 | | | $ | 4,703 | | | $ | 1,502 | |
Ratios to average net assets: |
Net investment income (loss) | | | 0.52 | % | | | 0.06 | % | | | (0.26 | %) | | | (0.35 | %) | | | 0.82 | % | | | 1.11 | % |
Total expenses | | | 1.41 | % | | | 1.45 | % | | | 1.39 | % | | | 1.36 | % | | | 1.42 | % | | | 1.48 | % |
Net expensesc | | | 1.36 | % | | | 1.42 | % | | | 1.39 | % | | | 1.36 | % | | | 1.42 | % | | | 1.48 | % |
Portfolio turnover rate | | | 95 | % | | | 296 | % | | | 242 | % | | | 290 | % | | | 770 | % | | | 810 | % |
Class A | | Six Months Ended
September 30, 2024a | | | Year Ended
March 31,
2024 | | | Year Ended
March 31,
2023 | | | Year Ended
March 31,
2022 | | | Year Ended
March 31,
2021 | | | Year Ended
March 31,
2020e | |
Per Share Data |
Net asset value, beginning of period | | $ | 247.69 | | | $ | 198.04 | | | $ | 215.25 | | | $ | 157.49 | | | $ | 70.51 | | | $ | 264.03 | |
Income (loss) from investment operations: |
Net investment income (loss)b | | | .26 | | | | (.38 | ) | | | (1.16 | ) | | | (1.04 | ) | | | .19 | | | | 1.95 | |
Net gain (loss) on investments (realized and unrealized) | | | (34.81 | ) | | | 50.03 | | | | (16.05 | ) | | | 59.30 | | | | 88.63 | | | | (195.17 | ) |
Total from investment operations | | | (34.55 | ) | | | 49.65 | | | | (17.21 | ) | | | 58.26 | | | | 88.82 | | | | (193.22 | ) |
Less distributions from: |
Net investment income | | | — | | | | — | | | | — | | | | (.50 | ) | | | (1.84 | ) | | | (.30 | ) |
Total distributions | | | — | | | | — | | | | — | | | | (.50 | ) | | | (1.84 | ) | | | (.30 | ) |
Net asset value, end of period | | $ | 213.14 | | | $ | 247.69 | | | $ | 198.04 | | | $ | 215.25 | | | $ | 157.49 | | | $ | 70.51 | |
|
Total Returnd | | | (13.95 | %) | | | 25.07 | % | | | (8.00 | %) | | | 37.09 | % | | | 126.39 | % | | | (73.26 | %) |
Ratios/Supplemental Data |
Net assets, end of period (in thousands) | | $ | 872 | | | $ | 1,300 | | | $ | 1,334 | | | $ | 1,036 | | | $ | 676 | | | $ | 191 | |
Ratios to average net assets: |
Net investment income (loss) | | | 0.22 | % | | | (0.17 | %) | | | (0.58 | %) | | | (0.61 | %) | | | 0.87 | % | | | 0.94 | % |
Total expenses | | | 1.67 | % | | | 1.68 | % | | | 1.64 | % | | | 1.61 | % | | | 1.68 | % | | | 1.73 | % |
Net expensesc | | | 1.62 | % | | | 1.65 | % | | | 1.64 | % | | | 1.61 | % | | | 1.68 | % | | | 1.73 | % |
Portfolio turnover rate | | | 95 | % | | | 296 | % | | | 242 | % | | | 290 | % | | | 770 | % | | | 810 | % |
SEE NOTES TO FINANCIAL STATEMENTS. | THE RYDEX FUNDS SEMI-ANNUAL FINANCIAL REPORT | 49 |
FINANCIAL HIGHLIGHTS (continued) |
This table is presented to show selected data for a share outstanding throughout each period and to assist shareholders in evaluating a Fund’s performance for the periods presented.
Class C | | Six Months Ended
September 30, 2024a | | | Year Ended
March 31,
2024 | | | Year Ended
March 31,
2023 | | | Year Ended
March 31,
2022 | | | Year Ended
March 31,
2021 | | | Year Ended
March 31,
2020e | |
Per Share Data |
Net asset value, beginning of period | | $ | 211.16 | | | $ | 170.13 | | | $ | 186.29 | | | $ | 137.36 | | | $ | 62.08 | | | $ | 234.26 | |
Income (loss) from investment operations: |
Net investment income (loss)b | | | (.50 | ) | | | (1.79 | ) | | | (2.20 | ) | | | (2.02 | ) | | | (.01 | ) | | | .30 | |
Net gain (loss) on investments (realized and unrealized) | | | (29.63 | ) | | | 42.82 | | | | (13.96 | ) | | | 51.45 | | | | 77.13 | | | | (172.18 | ) |
Total from investment operations | | | (30.13 | ) | | | 41.03 | | | | (16.16 | ) | | | 49.43 | | | | 77.12 | | | | (171.88 | ) |
Less distributions from: |
Net investment income | | | — | | | | — | | | | — | | | | (.50 | ) | | | (1.84 | ) | | | (.30 | ) |
Total distributions | | | — | | | | — | | | | — | | | | (.50 | ) | | | (1.84 | ) | | | (.30 | ) |
Net asset value, end of period | | $ | 181.03 | | | $ | 211.16 | | | $ | 170.13 | | | $ | 186.29 | | | $ | 137.36 | | | $ | 62.08 | |
|
Total Returnd | | | (14.27 | %) | | | 24.12 | % | | | (8.67 | %) | | | 36.07 | % | | | 124.62 | % | | | (73.46 | %) |
Ratios/Supplemental Data |
Net assets, end of period (in thousands) | | $ | 420 | | | $ | 571 | | | $ | 981 | | | $ | 814 | | | $ | 479 | | | $ | 192 | |
Ratios to average net assets: |
Net investment income (loss) | | | (0.50 | %) | | | (0.95 | %) | | | (1.27 | %) | | | (1.37 | %) | | | (0.03 | %) | | | 0.20 | % |
Total expenses | | | 2.42 | % | | | 2.43 | % | | | 2.40 | % | | | 2.36 | % | | | 2.43 | % | | | 2.48 | % |
Net expensesc | | | 2.37 | % | | | 2.40 | % | | | 2.40 | % | | | 2.36 | % | | | 2.43 | % | | | 2.48 | % |
Portfolio turnover rate | | | 95 | % | | | 296 | % | | | 242 | % | | | 290 | % | | | 770 | % | | | 810 | % |
50 | THE RYDEX FUNDS SEMI-ANNUAL FINANCIAL REPORT | SEE NOTES TO FINANCIAL STATEMENTS. |
FINANCIAL HIGHLIGHTS (concluded) |
This table is presented to show selected data for a share outstanding throughout each period and to assist shareholders in evaluating a Fund’s performance for the periods presented.
Class H | | Six Months Ended
September 30, 2024a | | | Year Ended
March 31,
2024 | | | Year Ended
March 31,
2023 | | | Year Ended
March 31,
2022 | | | Year Ended
March 31,
2021 | | | Year Ended
March 31,
2020e | |
Per Share Data |
Net asset value, beginning of period | | $ | 240.05 | | | $ | 191.93 | | | $ | 208.59 | | | $ | 152.63 | | | $ | 68.37 | | | $ | 255.45 | |
Income (loss) from investment operations: |
Net investment income (loss)b | | | .26 | | | | (.49 | ) | | | (1.52 | ) | | | (.75 | ) | | | .02 | | | | 1.65 | |
Net gain (loss) on investments (realized and unrealized) | | | (33.77 | ) | | | 48.61 | | | | (15.14 | ) | | | 57.21 | | | | 86.08 | | | | (188.43 | ) |
Total from investment operations | | | (33.51 | ) | | | 48.12 | | | | (16.66 | ) | | | 56.46 | | | | 86.10 | | | | (186.78 | ) |
Less distributions from: |
Net investment income | | | — | | | | — | | | | — | | | | (.50 | ) | | | (1.84 | ) | | | (.30 | ) |
Total distributions | | | — | | | | — | | | | — | | | | (.50 | ) | | | (1.84 | ) | | | (.30 | ) |
Net asset value, end of period | | $ | 206.54 | | | $ | 240.05 | | | $ | 191.93 | | | $ | 208.59 | | | $ | 152.63 | | | $ | 68.37 | |
|
Total Return | | | (13.96 | %) | | | 25.07 | % | | | (7.99 | %) | | | 37.09 | % | | | 126.23 | % | | | (73.19 | %) |
Ratios/Supplemental Data |
Net assets, end of period (in thousands) | | $ | 518 | | | $ | 863 | | | $ | 1,082 | | | $ | 11,057 | | | $ | 689 | | | $ | 528 | |
Ratios to average net assets: |
Net investment income (loss) | | | 0.23 | % | | | (0.23 | %) | | | (0.76 | %) | | | (0.43 | %) | | | 0.11 | % | | | 0.77 | % |
Total expenses | | | 1.67 | % | | | 1.68 | % | | | 1.65 | % | | | 1.62 | % | | | 1.68 | % | | | 1.72 | % |
Net expensesc | | | 1.62 | % | | | 1.65 | % | | | 1.65 | % | | | 1.62 | % | | | 1.68 | % | | | 1.72 | % |
Portfolio turnover rate | | | 95 | % | | | 296 | % | | | 242 | % | | | 290 | % | | | 770 | % | | | 810 | % |
a | Unaudited figures for the period ended September 30, 2024. Percentage amounts for the period, except total return and portfolio turnover rate, have been annualized. |
b | Net investment income (loss) per share was computed using average shares outstanding throughout the period. |
c | Net expense information reflects the expense ratios after expense waivers and reimbursements, as applicable. |
d | Total return does not reflect the impact of any applicable sales charges. |
e | Reverse share split — Per share amounts for years presented through March 31, 2020 have been restated to reflect a 1:15 reverse share split effective August 10, 2020. |
SEE NOTES TO FINANCIAL STATEMENTS. | THE RYDEX FUNDS SEMI-ANNUAL FINANCIAL REPORT | 51 |
SCHEDULE OF INVESTMENTS (Unaudited) | September 30, 2024 |
FINANCIAL SERVICES FUND | |
| | Shares | | | Value | |
COMMON STOCKS† - 99.3% |
| | | | | | | | | |
Banks - 23.8% |
JPMorgan Chase & Co. | | | 1,989 | | | $ | 419,401 | |
Bank of America Corp. | | | 7,112 | | | | 282,204 | |
Wells Fargo & Co. | | | 4,269 | | | | 241,156 | |
Goldman Sachs Group, Inc. | | | 445 | | | | 220,324 | |
Morgan Stanley | | | 1,914 | | | | 199,515 | |
Citigroup, Inc. | | | 3,033 | | | | 189,866 | |
PNC Financial Services Group, Inc. | | | 803 | | | | 148,435 | |
U.S. Bancorp | | | 3,177 | | | | 145,284 | |
Truist Financial Corp. | | | 3,032 | | | | 129,679 | |
Bank of New York Mellon Corp. | | | 1,743 | | | | 125,252 | |
NU Holdings Limited/Cayman Islands — Class A* | | | 9,128 | | | | 124,597 | |
Toronto-Dominion Bank | | | 1,770 | | | | 111,970 | |
ICICI Bank Ltd. ADR | | | 3,691 | | | | 110,176 | |
HDFC Bank Ltd. ADR | | | 1,751 | | | | 109,543 | |
Bank of Nova Scotia1 | | | 2,007 | | | | 109,361 | |
Royal Bank of Canada | | | 827 | | | | 103,152 | |
M&T Bank Corp. | | | 536 | | | | 95,472 | |
Fifth Third Bancorp | | | 2,176 | | | | 93,220 | |
State Street Corp. | | | 991 | | | | 87,674 | |
Regions Financial Corp. | | | 3,451 | | | | 80,512 | |
Huntington Bancshares, Inc. | | | 5,378 | | | | 79,057 | |
Citizens Financial Group, Inc. | | | 1,759 | | | | 72,242 | |
Northern Trust Corp. | | | 801 | | | | 72,114 | |
KeyCorp | | | 4,036 | | | | 67,603 | |
East West Bancorp, Inc. | | | 712 | | | | 58,911 | |
Western Alliance Bancorporation | | | 615 | | | | 53,191 | |
Comerica, Inc. | | | 821 | | | | 49,186 | |
First Horizon Corp. | | | 3,116 | | | | 48,391 | |
Zions Bancorp North America | | | 961 | | | | 45,378 | |
Old National Bancorp | | | 2,225 | | | | 41,519 | |
Columbia Banking System, Inc. | | | 1,590 | | | | 41,515 | |
Bank OZK | | | 876 | | | | 37,659 | |
Valley National Bancorp | | | 3,889 | | | | 35,234 | |
First Citizens BancShares, Inc. — Class A | | | 19 | | | | 34,978 | |
Pinnacle Financial Partners, Inc. | | | 327 | | | | 32,036 | |
Wintrust Financial Corp. | | | 262 | | | | 28,435 | |
Total Banks | | | | | | | 3,924,242 | |
| | | | | | | | | |
Diversified Financial Services - 21.6% |
Visa, Inc. — Class A | | | 1,434 | | | | 394,278 | |
Mastercard, Inc. — Class A | | | 702 | | | | 346,648 | |
American Express Co. | | | 761 | | | | 206,383 | |
BlackRock, Inc. — Class A | | | 212 | | | | 201,296 | |
Charles Schwab Corp. | | | 2,715 | | | | 175,959 | |
Intercontinental Exchange, Inc. | | | 1,011 | | | | 162,407 | |
CME Group, Inc. — Class A | | | 696 | | | | 153,572 | |
Interactive Brokers Group, Inc. — Class A | | | 972 | | | | 135,458 | |
Capital One Financial Corp. | | | 875 | | | | 131,014 | |
Apollo Global Management, Inc. | | | 996 | | | | 124,410 | |
Ameriprise Financial, Inc. | | | 255 | | | | 119,802 | |
Ares Management Corp. — Class A | | | 750 | | | | 116,880 | |
Coinbase Global, Inc. — Class A* | | | 651 | | | | 115,989 | |
XP, Inc. — Class A | | | 6,464 | | | | 115,964 | |
Discover Financial Services | | | 747 | | | | 104,797 | |
Nasdaq, Inc. | | | 1,370 | | | | 100,024 | |
Blue Owl Capital, Inc. | | | 4,855 | | | | 93,993 | |
Tradeweb Markets, Inc. — Class A | | | 733 | | | | 90,650 | |
T. Rowe Price Group, Inc. | | | 776 | | | | 84,530 | |
Raymond James Financial, Inc. | | | 670 | | | | 82,048 | |
Synchrony Financial | | | 1,560 | | | | 77,813 | |
Cboe Global Markets, Inc. | | | 378 | | | | 77,441 | |
LPL Financial Holdings, Inc. | | | 319 | | | | 74,209 | |
Ally Financial, Inc. | | | 1,529 | | | | 54,417 | |
Invesco Ltd. | | | 2,829 | | | | 49,677 | |
SEI Investments Co. | | | 717 | | | | 49,609 | |
SoFi Technologies, Inc.* | | | 6,191 | | | | 48,661 | |
Franklin Resources, Inc. | | | 2,122 | | | | 42,758 | |
Upstart Holdings, Inc.*,1 | | | 776 | | | | 31,048 | |
Total Diversified Financial Services | | | | | | | 3,561,735 | |
| | | | | | | | | |
REITs - 20.6% |
Prologis, Inc. | | | 1,446 | | | | 182,601 | |
American Tower Corp. — Class A | | | 760 | | | | 176,746 | |
Equinix, Inc. | | | 174 | | | | 154,448 | |
Welltower, Inc. | | | 1,173 | | | | 150,179 | |
Public Storage | | | 359 | | | | 130,629 | |
Realty Income Corp. | | | 2,003 | | | | 127,030 | |
Digital Realty Trust, Inc. | | | 781 | | | | 126,389 | |
Simon Property Group, Inc. | | | 741 | | | | 125,244 | |
Crown Castle, Inc. | | | 1,033 | | | | 122,545 | |
Extra Space Storage, Inc. | | | 586 | | | | 105,591 | |
Iron Mountain, Inc. | | | 849 | | | | 100,887 | |
VICI Properties, Inc. | | | 2,988 | | | | 99,530 | |
AvalonBay Communities, Inc. | | | 421 | | | | 94,830 | |
Weyerhaeuser Co. | | | 2,589 | | | | 87,664 | |
Equity Residential | | | 1,177 | | | | 87,639 | |
SBA Communications Corp. | | | 361 | | | | 86,893 | |
Ventas, Inc. | | | 1,352 | | | | 86,704 | |
Alexandria Real Estate Equities, Inc. | | | 639 | | | | 75,881 | |
Invitation Homes, Inc. | | | 2,147 | | | | 75,703 | |
Mid-America Apartment Communities, Inc. | | | 453 | | | | 71,982 | |
Healthpeak Properties, Inc. | | | 2,987 | | | | 68,313 | |
Essex Property Trust, Inc. | | | 230 | | | | 67,947 | |
Sun Communities, Inc. | | | 500 | | | | 67,575 | |
Kimco Realty Corp. | | | 2,845 | | | | 66,061 | |
UDR, Inc. | | | 1,426 | | | | 64,655 | |
Lamar Advertising Co. — Class A | | | 479 | | | | 63,994 | |
Gaming and Leisure Properties, Inc. | | | 1,205 | | | | 61,997 | |
Regency Centers Corp. | | | 854 | | | | 61,684 | |
Camden Property Trust | | | 496 | | | | 61,271 | |
Host Hotels & Resorts, Inc. | | | 3,386 | | | | 59,594 | |
CubeSmart | | | 1,094 | | | | 58,890 | |
BXP, Inc. | | | 725 | | | | 58,333 | |
Equity LifeStyle Properties, Inc. | | | 808 | | | | 57,643 | |
American Homes 4 Rent — Class A | | | 1,497 | | | | 57,470 | |
Rexford Industrial Realty, Inc. | | | 1,132 | | | | 56,951 | |
Omega Healthcare Investors, Inc. | | | 1,352 | | | | 55,026 | |
Annaly Capital Management, Inc. | | | 2,661 | | | | 53,406 | |
AGNC Investment Corp.1 | | | 4,685 | | | | 49,005 | |
52 | THE RYDEX FUNDS SEMI-ANNUAL FINANCIAL REPORT | SEE NOTES TO FINANCIAL STATEMENTS. |
SCHEDULE OF INVESTMENTS (Unaudited)(continued) | September 30, 2024 |
FINANCIAL SERVICES FUND | |
| | Shares | | | Value | |
Sabra Health Care REIT, Inc. | | | 1,890 | | | $ | 35,173 | |
Total REITs | | | | | | | 3,394,103 | |
| | | | | | | | | |
Insurance - 18.5% |
Berkshire Hathaway, Inc. — Class B* | | | 1,159 | | | | 533,441 | |
Progressive Corp. | | | 822 | | | | 208,591 | |
Marsh & McLennan Companies, Inc. | | | 789 | | | | 176,018 | |
Arch Capital Group Ltd.* | | | 1,362 | | | | 152,381 | |
Aon plc — Class A | | | 417 | | | | 144,278 | |
Aflac, Inc. | | | 1,223 | | | | 136,731 | |
Willis Towers Watson plc | | | 441 | | | | 129,888 | |
Chubb Ltd. | | | 450 | | | | 129,775 | |
Arthur J Gallagher & Co. | | | 461 | | | | 129,712 | |
MetLife, Inc. | | | 1,502 | | | | 123,885 | |
Travelers Companies, Inc. | | | 527 | | | | 123,381 | |
Allstate Corp. | | | 627 | | | | 118,911 | |
American International Group, Inc. | | | 1,592 | | | | 116,582 | |
Prudential Financial, Inc. | | | 947 | | | | 114,682 | |
Everest Group Ltd. | | | 259 | | | | 101,484 | |
Hartford Financial Services Group, Inc. | | | 854 | | | | 100,439 | |
Brown & Brown, Inc. | | | 814 | | | | 84,330 | |
Principal Financial Group, Inc. | | | 915 | | | | 78,598 | |
Cincinnati Financial Corp. | | | 572 | | | | 77,861 | |
W R Berkley Corp. | | | 1,189 | | | | 67,452 | |
Equitable Holdings, Inc. | | | 1,518 | | | | 63,801 | |
Globe Life, Inc. | | | 504 | | | | 53,379 | |
Corebridge Financial, Inc. | | | 1,603 | | | | 46,743 | |
Erie Indemnity Co. — Class A | | | 62 | | | | 33,469 | |
Total Insurance | | | | | | | 3,045,812 | |
| | | | | | | | | |
Commercial Services - 7.4% |
S&P Global, Inc. | | | 423 | | | | 218,530 | |
PayPal Holdings, Inc.* | | | 2,043 | | | | 159,415 | |
Moody’s Corp. | | | 307 | | | | 145,699 | |
Block, Inc. — Class A* | | | 1,681 | | | | 112,846 | |
StoneCo Ltd. — Class A* | | | 9,087 | | | | 102,320 | |
Global Payments, Inc. | | | 827 | | | | 84,701 | |
Corpay, Inc.* | | | 252 | | | | 78,816 | |
Toast, Inc. — Class A* | | | 2,393 | | | | 67,746 | |
Affirm Holdings, Inc.* | | | 1,395 | | | | 56,944 | |
Shift4 Payments, Inc. — Class A*,1 | | | 562 | | | | 49,793 | |
MarketAxess Holdings, Inc. | | | 188 | | | | 48,166 | |
Euronet Worldwide, Inc.* | | | 353 | | | | 35,028 | |
Morningstar, Inc. | | | 101 | | | | 32,231 | |
Flywire Corp.* | | | 1,406 | | | | 23,044 | |
Total Commercial Services | | | | | | | 1,215,279 | |
| | | | | | | | | |
Private Equity - 3.5% |
Blackstone, Inc. — Class A | | | 1,542 | | | | 236,126 | |
KKR & Company, Inc. — Class A | | | 1,263 | | | | 164,923 | |
Brookfield Corp. | | | 2,152 | | | | 114,379 | |
Carlyle Group, Inc. | | | 1,333 | | | | 57,399 | |
Total Private Equity | | | | | | | 572,827 | |
| | | | | | | | | |
Software - 2.8% |
Fiserv, Inc.* | | | 974 | | | | 174,979 | |
MSCI, Inc. — Class A | | | 200 | | | | 116,586 | |
Fidelity National Information Services, Inc. | | | 1,365 | | | | 114,319 | |
Jack Henry & Associates, Inc. | | | 346 | | | | 61,083 | |
Total Software | | | | | | | 466,967 | |
| | | | | | | | | |
Internet - 0.5% |
Robinhood Markets, Inc. — Class A* | | | 3,282 | | | | 76,864 | |
| | | | | | | | | |
Media - 0.4% |
FactSet Research Systems, Inc. | | | 160 | | | | 73,576 | |
| | | | | | | | | |
Savings & Loans - 0.2% |
New York Community Bancorp, Inc. | | | 2,944 | | | | 33,061 | |
| | | | | | | | | |
Total Common Stocks | | | | |
(Cost $12,607,481) | | | | | | | 16,364,466 | |
| | | | | | | | | |
PREFERRED STOCKS† - 0.6% |
Financial - 0.6% |
Itau Unibanco Holding S.A. |
ADR | | | 15,315 | | | | 101,845 | |
Total Preferred Stocks | | | | |
(Cost $82,777) | | | | | | | 101,845 | |
| | | | | | | | | |
| | | Face
Amount | | | | | |
REPURCHASE AGREEMENTS††,2 - 0.5% |
J.P. Morgan Securities LLC
issued 09/30/24 at 4.86%
due 10/01/24 | | $ | 43,486 | | | | 43,486 | |
BofA Securities, Inc.
issued 09/30/24 at 4.85%
due 10/01/24 | | | 35,917 | | | | 35,917 | |
Total Repurchase Agreements | | | | |
(Cost $79,403) | | | | | | | 79,403 | |
| | | | | | | | | |
| | | Shares | | | | | |
SECURITIES LENDING COLLATERAL†,3 - 0.9% |
Money Market Fund*** | | | | | | | | |
First American Government Obligations Fund — Class X, 4.82%4 | | | 148,211 | | | | 148,211 | |
Total Securities Lending Collateral | | | | |
(Cost $148,211) | | | | | | | 148,211 | |
| | | | | | | | | |
Total Investments - 101.3% | | | | |
(Cost $12,917,872) | | $ | 16,693,925 | |
Other Assets & Liabilities, net - (1.3)% | | | (214,945 | ) |
Total Net Assets - 100.0% | | $ | 16,478,980 | |
SEE NOTES TO FINANCIAL STATEMENTS. | THE RYDEX FUNDS SEMI-ANNUAL FINANCIAL REPORT | 53 |
SCHEDULE OF INVESTMENTS (Unaudited)(concluded) | September 30, 2024 |
FINANCIAL SERVICES FUND | |
* | Non-income producing security. |
*** | A copy of each underlying unaffiliated fund’s financial statements is available at the SEC’s website at www.sec.gov. |
† | Value determined based on Level 1 inputs — See Note 4. |
†† | Value determined based on Level 2 inputs — See Note 4. |
1 | All or a portion of this security is on loan at September 30, 2024 — See Note 7. |
2 | Repurchase Agreements — See Note 6. |
3 | Securities lending collateral — See Note 7. |
4 | Rate indicated is the 7-day yield as of September 30, 2024. |
| | ADR — American Depositary Receipt |
| | plc — Public Limited Company |
| | REIT — Real Estate Investment Trust |
| | |
| | See Sector Classification in Other Information section. |
The following table summarizes the inputs used to value the Fund’s investments at September 30, 2024 (See Note 4 in the Notes to Financial Statements):
Investments in Securities (Assets) | | Level 1
Quoted
Prices | | | Level 2
Significant
Observable
Inputs | | | Level 3
Significant
Unobservable
Inputs | | | Total | |
Common Stocks | | $ | 16,364,466 | | | $ | — | | | $ | — | | | $ | 16,364,466 | |
Preferred Stocks | | | 101,845 | | | | — | | | | — | | | | 101,845 | |
Repurchase Agreements | | | — | | | | 79,403 | | | | — | | | | 79,403 | |
Securities Lending Collateral | | | 148,211 | | | | — | | | | — | | | | 148,211 | |
Total Assets | | $ | 16,614,522 | | | $ | 79,403 | | | $ | — | | | $ | 16,693,925 | |
54 | THE RYDEX FUNDS SEMI-ANNUAL FINANCIAL REPORT | SEE NOTES TO FINANCIAL STATEMENTS. |
STATEMENT OF ASSETS AND LIABILITIES (Unaudited) |
September 30, 2024 |
Assets: |
Investments, at value - including $144,254 of securities loaned (cost $12,838,469) | | $ | 16,614,522 | |
Repurchase agreements, at value (cost $79,403) | | | 79,403 | |
Cash | | | 508 | |
Receivables: |
Dividends | | | 21,171 | |
Foreign tax reclaims | | | 299 | |
Fund shares sold | | | 136 | |
Interest | | | 11 | |
Securities lending income | | | 4 | |
Total assets | | | 16,716,054 | |
| | | | | |
Liabilities: |
Payable for: |
Return of securities lending collateral | | | 148,211 | |
Fund shares redeemed | | | 61,064 | |
Management fees | | | 10,570 | |
Transfer agent fees | | | 6,333 | |
Portfolio accounting and administration fees | | | 1,276 | |
Distribution and service fees | | | 922 | |
Trustees’ fees* | | | 121 | |
Miscellaneous | | | 8,577 | |
Total liabilities | | | 237,074 | |
Net assets | | $ | 16,478,980 | |
| | | | | |
Net assets consist of: |
Paid in capital | | $ | 14,507,297 | |
Total distributable earnings (loss) | | | 1,971,683 | |
Net assets | | $ | 16,478,980 | |
| | | | | |
Investor Class: |
Net assets | | $ | 13,497,376 | |
Capital shares outstanding | | | 144,809 | |
Net asset value per share | | $ | 93.21 | |
| | | | | |
Class A: |
Net assets | | $ | 1,905,096 | |
Capital shares outstanding | | | 22,648 | |
Net asset value per share | | $ | 84.12 | |
Maximum offering price per share (Net asset value divided by 95.25%) | | $ | 88.31 | |
| | | | | |
Class C: |
Net assets | | $ | 630,002 | |
Capital shares outstanding | | | 9,351 | |
Net asset value per share | | $ | 67.37 | |
| | | | | |
Class H: |
Net assets | | $ | 446,506 | |
Capital shares outstanding | | | 5,527 | |
Net asset value per share | | $ | 80.79 | |
STATEMENT OF OPERATIONS (Unaudited) |
Six Months Ended September 30, 2024 |
Investment Income: |
Dividends (net of foreign withholding tax of $1,198) | | $ | 144,074 | |
Interest | | | 1,806 | |
Income from securities lending, net | | | 110 | |
Total investment income | | | 145,990 | |
| | | | | |
Expenses: |
Management fees | | | 55,549 | |
Distribution and service fees: |
Class A | | | 2,310 | |
Class C | | | 3,612 | |
Class H | | | 461 | |
Transfer agent fees | | | 13,663 | |
Portfolio accounting and administration fees | | | 9,972 | |
Registration fees | | | 4,478 | |
Professional fees | | | 4,216 | |
Trustees’ fees* | | | 1,011 | |
Custodian fees | | | 822 | |
Line of credit fees | | | 178 | |
Miscellaneous | | | 3,103 | |
Total expenses | | | 99,375 | |
Less: |
Expenses reimbursed by Adviser | | | (3,265 | ) |
Net expenses | | | 96,110 | |
Net investment income | | | 49,880 | |
| | | | | |
Net Realized and Unrealized Gain (Loss): |
Net realized gain (loss) on: |
Investments | | | 1,595,736 | |
Net realized gain | | | 1,595,736 | |
Net change in unrealized appreciation (depreciation) on: |
Investments | | | (1,041,912 | ) |
Net change in unrealized appreciation (depreciation) | | | (1,041,912 | ) |
Net realized and unrealized gain | | | 553,824 | |
Net increase in net assets resulting from operations | | $ | 603,704 | |
* | Relates to Trustees not deemed “interested persons” within the meaning of Section 2(a)(19) of the 1940 Act. |
SEE NOTES TO FINANCIAL STATEMENTS. | THE RYDEX FUNDS SEMI-ANNUAL FINANCIAL REPORT | 55 |
STATEMENTS OF CHANGES IN NET ASSETS |
| | Six Months Ended
September 30, 2024
(Unaudited) | | | Year Ended
March 31,
2024 | |
Increase (Decrease) in Net Assets from Operations: | | | | | | | | |
Net investment income | | $ | 49,880 | | | $ | 152,925 | |
Net realized gain (loss) on investments | | | 1,595,736 | | | | (195,131 | ) |
Net change in unrealized appreciation (depreciation) on investments | | | (1,041,912 | ) | | | 4,604,554 | |
Net increase in net assets resulting from operations | | | 603,704 | | | | 4,562,348 | |
| | | | | | | | | |
Capital share transactions: | | | | | | | | |
Proceeds from sale of shares | | | | | | | | |
Investor Class | | | 21,362,942 | | | | 44,844,326 | |
Class A | | | 647,129 | | | | 1,349,282 | |
Class C | | | 53,764 | | | | 87,965 | |
Class H | | | 233,588 | | | | 95,281 | |
Cost of shares redeemed | | | | | | | | |
Investor Class | | | (41,248,108 | ) | | | (19,986,831 | ) |
Class A | | | (882,489 | ) | | | (1,342,196 | ) |
Class C | | | (291,461 | ) | | | (280,194 | ) |
Class H | | | (180,934 | ) | | | (197,524 | ) |
Net increase (decrease) from capital share transactions | | | (20,305,569 | ) | | | 24,570,109 | |
Net increase (decrease) in net assets | | | (19,701,865 | ) | | | 29,132,457 | |
| | | | | | | | | |
Net assets: | | | | | | | | |
Beginning of period | | | 36,180,845 | | | | 7,048,388 | |
End of period | | $ | 16,478,980 | | | $ | 36,180,845 | |
| | | | | | | | | |
Capital share activity: | | | | | | | | |
Shares sold | | | | | | | | |
Investor Class | | | 248,223 | | | | 597,215 | |
Class A | | | 8,318 | | | | 20,506 | |
Class C | | | 851 | | | | 1,688 | |
Class H | | | 3,180 | | | | 1,600 | |
Shares redeemed | | | | | | | | |
Investor Class | | | (491,339 | ) | | | (273,868 | ) |
Class A | | | (11,467 | ) | | | (21,022 | ) |
Class C | | | (4,667 | ) | | | (5,621 | ) |
Class H | | | (2,496 | ) | | | (3,256 | ) |
Net increase (decrease) in shares | | | (249,397 | ) | | | 317,242 | |
56 | THE RYDEX FUNDS SEMI-ANNUAL FINANCIAL REPORT | SEE NOTES TO FINANCIAL STATEMENTS. |
This table is presented to show selected data for a share outstanding throughout each period and to assist shareholders in evaluating a Fund’s performance for the periods presented.
Investor Class | | Six Months Ended
September 30, 2024a | | | Year Ended
March 31,
2024 | | | Year Ended
March 31,
2023 | | | Year Ended
March 31,
2022 | | | Year Ended
March 31,
2021 | | | Year Ended
March 31,
2020 | |
Per Share Data |
Net asset value, beginning of period | | $ | 85.13 | | | $ | 66.11 | | | $ | 101.95 | | | $ | 88.84 | | | $ | 54.80 | | | $ | 68.68 | |
Income (loss) from investment operations: |
Net investment income (loss)b | | | .37 | | | | .86 | | | | .87 | | | | .64 | | | | .88 | | | | .83 | |
Net gain (loss) on investments (realized and unrealized) | | | 7.71 | | | | 18.16 | | | | (19.17 | ) | | | 13.35 | | | | 33.16 | | | | (14.39 | ) |
Total from investment operations | | | 8.08 | | | | 19.02 | | | | (18.30 | ) | | | 13.99 | | | | 34.04 | | | | (13.56 | ) |
Less distributions from: |
Net investment income | | | — | | | | — | | | | (2.30 | ) | | | (.34 | ) | | | — | | | | (.32 | ) |
Net realized gains | | | — | | | | — | | | | (15.24 | ) | | | (.54 | ) | | | — | | | | — | |
Total distributions | | | — | | | | — | | | | (17.54 | ) | | | (.88 | ) | | | — | | | | (.32 | ) |
Net asset value, end of period | | $ | 93.21 | | | $ | 85.13 | | | $ | 66.11 | | | $ | 101.95 | | | $ | 88.84 | | | $ | 54.80 | |
|
Total Return | | | 9.49 | % | | | 28.77 | % | | | (18.35 | %) | | | 15.72 | % | | | 62.12 | % | | | (19.88 | %) |
Ratios/Supplemental Data |
Net assets, end of period (in thousands) | | $ | 13,497 | | | $ | 33,024 | | | $ | 4,269 | | | $ | 32,004 | | | $ | 32,328 | | | $ | 2,968 | |
Ratios to average net assets: |
Net investment income (loss) | | | 0.87 | % | | | 1.12 | % | | | 1.00 | % | | | 0.63 | % | | | 1.19 | % | | | 1.12 | % |
Total expenses | | | 1.42 | % | | | 1.43 | % | | | 1.40 | % | | | 1.36 | % | | | 1.41 | % | | | 1.48 | % |
Net expensesc | | | 1.37 | % | | | 1.39 | % | | | 1.40 | % | | | 1.36 | % | | | 1.41 | % | | | 1.48 | % |
Portfolio turnover rate | | | 122 | % | | | 119 | % | | | 177 | % | | | 406 | % | | | 246 | % | | | 249 | % |
Class A | | Six Months Ended
September 30, 2024a | | | Year Ended
March 31,
2024 | | | Year Ended
March 31,
2023 | | | Year Ended
March 31,
2022 | | | Year Ended
March 31,
2021 | | | Year Ended
March 31,
2020 | |
Per Share Data |
Net asset value, beginning of period | | $ | 76.92 | | | $ | 59.89 | | | $ | 94.54 | | | $ | 82.65 | | | $ | 51.10 | | | $ | 64.22 | |
Income (loss) from investment operations: |
Net investment income (loss)b | | | .23 | | | | .63 | | | | .76 | | | | .36 | | | | .55 | | | | .54 | |
Net gain (loss) on investments (realized and unrealized) | | | 6.97 | | | | 16.40 | | | | (17.87 | ) | | | 12.41 | | | | 31.00 | | | | (13.34 | ) |
Total from investment operations | | | 7.20 | | | | 17.03 | | | | (17.11 | ) | | | 12.77 | | | | 31.55 | | | | (12.80 | ) |
Less distributions from: |
Net investment income | | | — | | | | — | | | | (2.30 | ) | | | (.34 | ) | | | — | | | | (.32 | ) |
Net realized gains | | | — | | | | — | | | | (15.24 | ) | | | (.54 | ) | | | — | | | | — | |
Total distributions | | | — | | | | — | | | | (17.54 | ) | | | (.88 | ) | | | — | | | | (.32 | ) |
Net asset value, end of period | | $ | 84.12 | | | $ | 76.92 | | | $ | 59.89 | | | $ | 94.54 | | | $ | 82.65 | | | $ | 51.10 | |
|
Total Returnd | | | 9.36 | % | | | 28.44 | % | | | (18.56 | %) | | | 15.42 | % | | | 61.74 | % | | | (20.07 | %) |
Ratios/Supplemental Data |
Net assets, end of period (in thousands) | | $ | 1,905 | | | $ | 1,984 | | | $ | 1,576 | | | $ | 3,276 | | | $ | 2,780 | | | $ | 5,745 | |
Ratios to average net assets: |
Net investment income (loss) | | | 0.59 | % | | | 0.96 | % | | | 0.97 | % | | | 0.39 | % | | | 0.86 | % | | | 0.78 | % |
Total expenses | | | 1.67 | % | | | 1.69 | % | | | 1.64 | % | | | 1.61 | % | | | 1.70 | % | | | 1.72 | % |
Net expensesc | | | 1.62 | % | | | 1.65 | % | | | 1.64 | % | | | 1.61 | % | | | 1.70 | % | | | 1.72 | % |
Portfolio turnover rate | | | 122 | % | | | 119 | % | | | 177 | % | | | 406 | % | | | 246 | % | | | 249 | % |
SEE NOTES TO FINANCIAL STATEMENTS. | THE RYDEX FUNDS SEMI-ANNUAL FINANCIAL REPORT | 57 |
FINANCIAL HIGHLIGHTS (continued) |
This table is presented to show selected data for a share outstanding throughout each period and to assist shareholders in evaluating a Fund’s performance for the periods presented.
Class C | | Six Months Ended
September 30, 2024a | | | Year Ended
March 31,
2024 | | | Year Ended
March 31,
2023 | | | Year Ended
March 31,
2022 | | | Year Ended
March 31,
2021 | | | Year Ended
March 31,
2020 | |
Per Share Data |
Net asset value, beginning of period | | $ | 61.84 | | | $ | 48.51 | | | $ | 81.13 | | | $ | 71.57 | | | $ | 44.59 | | | $ | 56.49 | |
Income (loss) from investment operations: |
Net investment income (loss)b | | | (.06 | ) | | | .11 | | | | .15 | | | | (.28 | ) | | | (.03 | ) | | | .01 | |
Net gain (loss) on investments (realized and unrealized) | | | 5.59 | | | | 13.22 | | | | (15.23 | ) | | | 10.72 | | | | 27.01 | | | | (11.59 | ) |
Total from investment operations | | | 5.53 | | | | 13.33 | | | | (15.08 | ) | | | 10.44 | | | | 26.98 | | | | (11.58 | ) |
Less distributions from: |
Net investment income | | | — | | | | — | | | | (2.30 | ) | | | (.34 | ) | | | — | | | | (.32 | ) |
Net realized gains | | | — | | | | — | | | | (15.24 | ) | | | (.54 | ) | | | — | | | | — | |
Total distributions | | | — | | | | — | | | | (17.54 | ) | | | (.88 | ) | | | — | | | | (.32 | ) |
Net asset value, end of period | | $ | 67.37 | | | $ | 61.84 | | | $ | 48.51 | | | $ | 81.13 | | | $ | 71.57 | | | $ | 44.59 | |
|
Total Returnd | | | 8.94 | % | | | 27.48 | % | | | (19.17 | %) | | | 14.55 | % | | | 60.51 | % | | | (20.66 | %) |
Ratios/Supplemental Data |
Net assets, end of period (in thousands) | | $ | 630 | | | $ | 814 | | | $ | 829 | | | $ | 1,216 | | | $ | 1,036 | | | $ | 638 | |
Ratios to average net assets: |
Net investment income (loss) | | | (0.19 | %) | | | 0.20 | % | | | 0.24 | % | | | (0.35 | %) | | | (0.06 | %) | | | 0.02 | % |
Total expenses | | | 2.42 | % | | | 2.44 | % | | | 2.40 | % | | | 2.36 | % | | | 2.43 | % | | | 2.47 | % |
Net expensesc | | | 2.37 | % | | | 2.40 | % | | | 2.40 | % | | | 2.36 | % | | | 2.43 | % | | | 2.47 | % |
Portfolio turnover rate | | | 122 | % | | | 119 | % | | | 177 | % | | | 406 | % | | | 246 | % | | | 249 | % |
58 | THE RYDEX FUNDS SEMI-ANNUAL FINANCIAL REPORT | SEE NOTES TO FINANCIAL STATEMENTS. |
FINANCIAL HIGHLIGHTS (concluded) |
This table is presented to show selected data for a share outstanding throughout each period and to assist shareholders in evaluating a Fund’s performance for the periods presented.
Class H | | Six Months Ended
September 30, 2024a | | | Year Ended
March 31,
2024 | | | Year Ended
March 31,
2023 | | | Year Ended
March 31,
2022 | | | Year Ended
March 31,
2021 | | | Year Ended
March 31,
2020 | |
Per Share Data |
Net asset value, beginning of period | | $ | 73.87 | | | $ | 57.51 | | | $ | 91.63 | | | $ | 80.10 | | | $ | 49.53 | | | $ | 62.26 | |
Income (loss) from investment operations: |
Net investment income (loss)b | | | .23 | | | | .59 | | | | (.06 | ) | | | .41 | | | | .68 | | | | .54 | |
Net gain (loss) on investments (realized and unrealized) | | | 6.69 | | | | 15.77 | | | | (16.52 | ) | | | 12.00 | | | | 29.89 | | | | (12.95 | ) |
Total from investment operations | | | 6.92 | | | | 16.36 | | | | (16.58 | ) | | | 12.41 | | | | 30.57 | | | | (12.41 | ) |
Less distributions from: |
Net investment income | | | — | | | | — | | | | (2.30 | ) | | | (.34 | ) | | | — | | | | (.32 | ) |
Net realized gains | | | — | | | | — | | | | (15.24 | ) | | | (.54 | ) | | | — | | | | — | |
Total distributions | | | — | | | | — | | | | (17.54 | ) | | | (.88 | ) | | | — | | | | (.32 | ) |
Net asset value, end of period | | $ | 80.79 | | | $ | 73.87 | | | $ | 57.51 | | | $ | 91.63 | | | $ | 80.10 | | | $ | 49.53 | |
|
Total Return | | | 9.37 | % | | | 28.45 | % | | | (18.56 | %) | | | 15.47 | % | | | 61.72 | % | | | (20.08 | %) |
Ratios/Supplemental Data |
Net assets, end of period (in thousands) | | $ | 447 | | | $ | 358 | | | $ | 374 | | | $ | 12,923 | | | $ | 3,250 | | | $ | 611 | |
Ratios to average net assets: |
Net investment income (loss) | | | 0.63 | % | | | 0.95 | % | | | (0.08 | %) | | | 0.45 | % | | | 1.07 | % | | | 0.81 | % |
Total expenses | | | 1.67 | % | | | 1.68 | % | | | 1.66 | % | | | 1.61 | % | | | 1.69 | % | | | 1.72 | % |
Net expensesc | | | 1.62 | % | | | 1.65 | % | | | 1.66 | % | | | 1.61 | % | | | 1.69 | % | | | 1.72 | % |
Portfolio turnover rate | | | 122 | % | | | 119 | % | | | 177 | % | | | 406 | % | | | 246 | % | | | 249 | % |
a | Unaudited figures for the period ended September 30, 2024. Percentage amounts for the period, except total return and portfolio turnover rate, have been annualized. |
b | Net investment income (loss) per share was computed using average shares outstanding throughout the period. |
c | Net expense information reflects the expense ratios after expense waivers and reimbursements, as applicable. |
d | Total return does not reflect the impact of any applicable sales charges. |
SEE NOTES TO FINANCIAL STATEMENTS. | THE RYDEX FUNDS SEMI-ANNUAL FINANCIAL REPORT | 59 |
SCHEDULE OF INVESTMENTS (Unaudited) | September 30, 2024 |
HEALTH CARE FUND | |
| | Shares | | | Value | |
COMMON STOCKS† - 100.3% |
| | | | | | | | | |
Pharmaceuticals - 31.9% |
Eli Lilly & Co. | | | 1,079 | | | $ | 955,929 | |
Johnson & Johnson | | | 4,353 | | | | 705,447 | |
AbbVie, Inc. | | | 3,440 | | | | 679,331 | |
Merck & Company, Inc. | | | 5,257 | | | | 596,985 | |
Pfizer, Inc. | | | 15,834 | | | | 458,236 | |
Bristol-Myers Squibb Co. | | | 7,339 | | | | 379,720 | |
Zoetis, Inc. | | | 1,686 | | | | 329,411 | |
CVS Health Corp. | | | 5,209 | | | | 327,542 | |
AstraZeneca plc ADR | | | 4,057 | | | | 316,081 | |
Becton Dickinson & Co. | | | 1,259 | | | | 303,545 | |
McKesson Corp. | | | 562 | | | | 277,864 | |
Cencora, Inc. — Class A | | | 960 | | | | 216,077 | |
Novo Nordisk A/S ADR | | | 1,764 | | | | 210,039 | |
Alkermes plc* | | | 7,028 | | | | 196,714 | |
Teva Pharmaceutical Industries Ltd. ADR* | | | 10,238 | | | | 184,489 | |
Novartis AG ADR | | | 1,600 | | | | 184,032 | |
Cardinal Health, Inc. | | | 1,655 | | | | 182,911 | |
Dexcom, Inc.* | | | 2,727 | | | | 182,818 | |
GSK plc ADR | | | 4,320 | | | | 176,602 | |
Vaxcyte, Inc.* | | | 1,143 | | | | 130,611 | |
Viatris, Inc. | | | 11,168 | | | | 129,660 | |
Neurocrine Biosciences, Inc.* | | | 1,024 | | | | 117,985 | |
Henry Schein, Inc.* | | | 1,536 | | | | 111,974 | |
Jazz Pharmaceuticals plc* | | | 846 | | | | 94,253 | |
Option Care Health, Inc.* | | | 2,618 | | | | 81,943 | |
Madrigal Pharmaceuticals, Inc.* | | | 204 | | | | 43,293 | |
Total Pharmaceuticals | | | | | | | 7,573,492 | |
| | | | | | | | | |
Healthcare-Products - 29.3% |
Thermo Fisher Scientific, Inc. | | | 901 | | | | 557,332 | |
Abbott Laboratories | | | 4,353 | | | | 496,286 | |
Danaher Corp. | | | 1,774 | | | | 493,207 | |
Intuitive Surgical, Inc.* | | | 965 | | | | 474,076 | |
Boston Scientific Corp.* | | | 4,756 | | | | 398,553 | |
Stryker Corp. | | | 1,095 | | | | 395,580 | |
Medtronic plc | | | 3,156 | | | | 284,135 | |
Agilent Technologies, Inc. | | | 1,669 | | | | 247,813 | |
GE HealthCare Technologies, Inc. | | | 2,513 | | | | 235,845 | |
IDEXX Laboratories, Inc.* | | | 465 | | | | 234,927 | |
Edwards Lifesciences Corp.* | | | 3,379 | | | | 222,980 | |
ResMed, Inc. | | | 868 | | | | 211,896 | |
Waters Corp.* | | | 496 | | | | 178,505 | |
Zimmer Biomet Holdings, Inc. | | | 1,584 | | | | 170,993 | |
Cooper Companies, Inc.* | | | 1,529 | | | | 168,710 | |
West Pharmaceutical Services, Inc. | | | 560 | | | | 168,090 | |
Align Technology, Inc.* | | | 626 | | | | 159,204 | |
Hologic, Inc.* | | | 1,925 | | | | 156,811 | |
Baxter International, Inc. | | | 4,062 | | | | 154,234 | |
Avantor, Inc.* | | | 5,695 | | | | 147,330 | |
Insulet Corp.* | | | 626 | | | | 145,702 | |
Natera, Inc.* | | | 1,093 | | | | 138,756 | |
Bio-Techne Corp. | | | 1,683 | | | | 134,522 | |
Exact Sciences Corp.* | | | 1,854 | | | | 126,294 | |
Repligen Corp.* | | | 681 | | | | 101,346 | |
Masimo Corp.* | | | 756 | | | | 100,797 | |
Bruker Corp. | | | 1,432 | | | | 98,894 | |
Lantheus Holdings, Inc.* | | | 899 | | �� | | 98,665 | |
Penumbra, Inc.* | | | 448 | | | | 87,051 | |
Dentsply Sirona, Inc. | | | 3,201 | | | | 86,619 | |
Inspire Medical Systems, Inc.* | | | 377 | | | | 79,566 | |
TransMedics Group, Inc.* | | | 496 | | | | 77,872 | |
Azenta, Inc.* | | | 1,129 | | | | 54,689 | |
Inari Medical, Inc.* | | | 1,206 | | | | 49,735 | |
Total Healthcare-Products | | | | | | | 6,937,015 | |
| | | | | | | | | |
Biotechnology - 20.4% |
Amgen, Inc. | | | 1,449 | | | | 466,882 | |
Vertex Pharmaceuticals, Inc.* | | | 837 | | | | 389,272 | |
Gilead Sciences, Inc. | | | 4,330 | | | | 363,027 | |
Regeneron Pharmaceuticals, Inc.* | | | 344 | | | | 361,627 | |
Alnylam Pharmaceuticals, Inc.* | | | 775 | | | | 213,148 | |
Biogen, Inc.* | | | 979 | | | | 189,769 | |
Moderna, Inc.* | | | 2,822 | | | | 188,594 | |
Argenx SE ADR* | | | 344 | | | | 186,476 | |
CRISPR Therapeutics AG*,1 | | | 3,900 | | | | 183,222 | |
Illumina, Inc.* | | | 1,292 | | | | 168,490 | |
United Therapeutics Corp.* | | | 405 | | | | 145,132 | |
Royalty Pharma plc — Class A | | | 4,832 | | | | 136,697 | |
Insmed, Inc.* | | | 1,691 | | | | 123,443 | |
Sarepta Therapeutics, Inc.* | | | 963 | | | | 120,269 | |
Incyte Corp.* | | | 1,812 | | | | 119,773 | |
BioMarin Pharmaceutical, Inc.* | | | 1,695 | | | | 119,142 | |
REVOLUTION Medicines, Inc.* | | | 2,153 | | | | 97,639 | |
Exelixis, Inc.* | | | 3,692 | | | | 95,807 | |
Intra-Cellular Therapies, Inc.* | | | 1,295 | | | | 94,755 | |
Halozyme Therapeutics, Inc.* | | | 1,615 | | | | 92,443 | |
Blueprint Medicines Corp.* | | | 967 | | | | 89,448 | |
Viking Therapeutics, Inc.* | | | 1,406 | | | | 89,014 | |
Cytokinetics, Inc.* | | | 1,634 | | | | 86,275 | |
Roivant Sciences Ltd.* | | | 7,170 | | | | 82,742 | |
Ionis Pharmaceuticals, Inc.* | | | 2,053 | | | | 82,243 | |
Ultragenyx Pharmaceutical, Inc.* | | | 1,378 | | | | 76,548 | |
Axsome Therapeutics, Inc.* | | | 745 | | | | 66,953 | |
Bridgebio Pharma, Inc.* | | | 2,556 | | | | 65,076 | |
TG Therapeutics, Inc.* | | | 2,748 | | | | 64,276 | |
Iovance Biotherapeutics, Inc.* | | | 6,155 | | | | 57,795 | |
Guardant Health, Inc.* | | | 2,454 | | | | 56,295 | |
Apellis Pharmaceuticals, Inc.* | | | 1,899 | | | | 54,767 | |
Arrowhead Pharmaceuticals, Inc.* | | | 2,720 | | | | 52,686 | |
ACADIA Pharmaceuticals, Inc.* | | | 3,135 | | | | 48,216 | |
Total Biotechnology | | | | | | | 4,827,941 | |
| | | | | | | | | |
Healthcare-Services - 17.0% |
UnitedHealth Group, Inc. | | | 1,420 | | | | 830,246 | |
Elevance Health, Inc. | | | 737 | | | | 383,240 | |
Cigna Group | | | 991 | | | | 343,322 | |
HCA Healthcare, Inc. | | | 778 | | | | 316,202 | |
IQVIA Holdings, Inc.* | | | 982 | | | | 232,704 | |
Centene Corp.* | | | 3,014 | | | | 226,894 | |
Humana, Inc. | | | 685 | | | | 216,967 | |
ICON plc* | | | 735 | | | | 211,173 | |
60 | THE RYDEX FUNDS SEMI-ANNUAL FINANCIAL REPORT | SEE NOTES TO FINANCIAL STATEMENTS. |
SCHEDULE OF INVESTMENTS (Unaudited)(continued) | September 30, 2024 |
HEALTH CARE FUND | |
| | Shares | | | Value | |
Molina Healthcare, Inc.* | | | 462 | | | $ | 159,187 | |
Labcorp Holdings, Inc. | | | 702 | | | | 156,883 | |
Quest Diagnostics, Inc. | | | 965 | | | | 149,816 | |
Tenet Healthcare Corp.* | | | 868 | | | | 144,261 | |
Universal Health Services, Inc. — Class B | | | 590 | | | | 135,116 | |
Catalent, Inc.* | | | 1,961 | | | | 118,778 | |
HealthEquity, Inc.* | | | 1,176 | | | | 96,256 | |
DaVita, Inc.* | | | 581 | | | | 95,243 | |
Medpace Holdings, Inc.* | | | 258 | | | | 86,120 | |
Acadia Healthcare Company, Inc.* | | | 1,214 | | | | 76,980 | |
Teladoc Health, Inc.* | | | 5,328 | | | | 48,911 | |
Total Healthcare-Services | | | | | | | 4,028,299 | |
| | | | | | | | | |
Software - 0.8% |
Veeva Systems, Inc. — Class A* | | | 932 | | | | 195,599 | |
| | | | | | | | | |
Electronics - 0.7% |
Mettler-Toledo International, Inc.* | | | 107 | | | | 160,468 | |
| | | | | | | | | |
Commercial Services - 0.2% |
R1 RCM, Inc.* | | | 3,763 | | | | 53,322 | |
| | | | | | | | | |
Total Common Stocks | | | | |
(Cost $14,041,173) | | | | | | | 23,776,136 | |
| | | | | | | | | |
RIGHTS††† - 0.0% |
Pharmaceuticals - 0.0% |
Johnson & Johnson | | | | | | | | |
Expires 12/31/29 | | | 752 | | | | — | |
Total Rights | | | | |
(Cost $—) | | | | | | | — | |
| | | | | | | | | |
| | Face
Amount | | | Value | |
REPURCHASE AGREEMENTS††,2 - 0.9% |
J.P. Morgan Securities LLC
issued 09/30/24 at 4.86%
due 10/01/24 | | $ | 111,253 | | | $ | 111,253 | |
BofA Securities, Inc.
issued 09/30/24 at 4.85%
due 10/01/24 | | | 91,889 | | | | 91,889 | |
Total Repurchase Agreements | | | | |
(Cost $203,142) | | | | | | | 203,142 | |
| | | | | | | | | |
| | | Shares | | | | | |
SECURITIES LENDING COLLATERAL†,3 - 0.6% |
Money Market Fund*** | | | | | | | | |
First American Government Obligations Fund - Class X, 4.82%4 | | | 136,964 | | | | 136,964 | |
Total Securities Lending Collateral | | | | |
(Cost $136,964) | | | | | | | 136,964 | |
| | | | | | | | | |
Total Investments - 101.8% | | | | |
(Cost $14,381,279) | | $ | 24,116,242 | |
Other Assets & Liabilities, net - (1.8)% | | | (427,311 | ) |
Total Net Assets - 100.0% | | $ | 23,688,931 | |
* | Non-income producing security. |
*** | A copy of each underlying unaffiliated fund’s financial statements is available at the SEC’s website at www.sec.gov. |
† | Value determined based on Level 1 inputs — See Note 4. |
†† | Value determined based on Level 2 inputs — See Note 4. |
††† | Value determined based on Level 3 inputs — See Note 4. |
1 | All or a portion of this security is on loan at September 30, 2024 — See Note 7. |
2 | Repurchase Agreements — See Note 6. |
3 | Securities lending collateral — See Note 7. |
4 | Rate indicated is the 7-day yield as of September 30, 2024. |
| | ADR — American Depositary Receipt |
| | plc — Public Limited Company |
| | |
| | See Sector Classification in Other Information section. |
SEE NOTES TO FINANCIAL STATEMENTS. | THE RYDEX FUNDS SEMI-ANNUAL FINANCIAL REPORT | 61 |
SCHEDULE OF INVESTMENTS (Unaudited)(concluded) | September 30, 2024 |
HEALTH CARE FUND | |
The following table summarizes the inputs used to value the Fund’s investments at September 30, 2024 (See Note 4 in the Notes to Financial Statements):
Investments in Securities (Assets) | | Level 1
Quoted
Prices | | | Level 2
Significant
Observable
Inputs | | | Level 3
Significant
Unobservable
Inputs | | | Total | |
Common Stocks | | $ | 23,776,136 | | | $ | — | | | $ | — | | | $ | 23,776,136 | |
Rights | | | — | | | | — | | | | — | * | | | — | |
Repurchase Agreements | | | — | | | | 203,142 | | | | — | | | | 203,142 | |
Securities Lending Collateral | | | 136,964 | | | | — | | | | — | | | | 136,964 | |
Total Assets | | $ | 23,913,100 | | | $ | 203,142 | | | $ | — | | | $ | 24,116,242 | |
* | Security has a market value of $0. |
62 | THE RYDEX FUNDS SEMI-ANNUAL FINANCIAL REPORT | SEE NOTES TO FINANCIAL STATEMENTS. |
STATEMENT OF ASSETS AND LIABILITIES (Unaudited) |
September 30, 2024 |
Assets: |
Investments, at value - including $132,672 of securities loaned (cost $14,178,137) | | $ | 23,913,100 | |
Repurchase agreements, at value (cost $203,142) | | | 203,142 | |
Receivables: |
Securities sold | | | 1,171,261 | |
Fund shares sold | | | 59,517 | |
Dividends | | | 14,736 | |
Foreign tax reclaims | | | 1,277 | |
Interest | | | 27 | |
Securities lending income | | | 17 | |
Total assets | | | 25,363,077 | |
| | | | | |
Liabilities: |
Payable for: |
Fund shares redeemed | | | 1,486,928 | |
Return of securities lending collateral | | | 136,964 | |
Management fees | | | 18,286 | |
Transfer agent fees | | | 11,571 | |
Portfolio accounting and administration fees | | | 2,207 | |
Distribution and service fees | | | 1,749 | |
Trustees’ fees* | | | 239 | |
Miscellaneous | | | 16,202 | |
Total liabilities | | | 1,674,146 | |
Net assets | | $ | 23,688,931 | |
| | | | | |
Net assets consist of: |
Paid in capital | | $ | 16,464,373 | |
Total distributable earnings (loss) | | | 7,224,558 | |
Net assets | | $ | 23,688,931 | |
| | | | | |
Investor Class: |
Net assets | | $ | 16,769,599 | |
Capital shares outstanding | | | 372,622 | |
Net asset value per share | | $ | 45.00 | |
| | | | | |
Class A: |
Net assets | | $ | 5,043,048 | |
Capital shares outstanding | | | 127,563 | |
Net asset value per share | | $ | 39.53 | |
Maximum offering price per share (Net asset value divided by 95.25%) | | $ | 41.50 | |
| | | | | |
Class C: |
Net assets | | $ | 687,314 | |
Capital shares outstanding | | | 21,833 | |
Net asset value per share | | $ | 31.48 | |
| | | | | |
Class H: |
Net assets | | $ | 1,188,970 | |
Capital shares outstanding | | | 31,418 | |
Net asset value per share | | $ | 37.84 | |
STATEMENT OF OPERATIONS (Unaudited) |
Six Months Ended September 30, 2024 |
Investment Income: |
Dividends (net of foreign withholding tax of $234) | | $ | 141,072 | |
Interest | | | 3,791 | |
Income from securities lending, net | | | 68 | |
Total investment income | | | 144,931 | |
| | | | | |
Expenses: |
Management fees | | | 108,209 | |
Distribution and service fees: | | | | |
Class A | | | 6,506 | |
Class C | | | 4,093 | |
Class H | | | 1,327 | |
Transfer agent fees | | | 26,232 | |
Portfolio accounting and administration fees | | | 19,425 | |
Professional fees | | | 4,310 | |
Custodian fees | | | 1,622 | |
Trustees’ fees* | | | 1,305 | |
Miscellaneous | | | 19,863 | |
Total expenses | | | 192,892 | |
Less: |
Expenses reimbursed by Adviser | | | (6,360 | ) |
Net expenses | | | 186,532 | |
Net investment loss | | | (41,601 | ) |
| | | | | |
Net Realized and Unrealized Gain (Loss): |
Net realized gain (loss) on: |
Investments | | | 399,221 | |
Net realized gain | | | 399,221 | |
Net change in unrealized appreciation (depreciation) on: |
Investments | | | 416,522 | |
Net change in unrealized appreciation (depreciation) | | | 416,522 | |
Net realized and unrealized gain | | | 815,743 | |
Net increase in net assets resulting from operations | | $ | 774,142 | |
* | Relates to Trustees not deemed “interested persons” within the meaning of Section 2(a)(19) of the 1940 Act. |
SEE NOTES TO FINANCIAL STATEMENTS. | THE RYDEX FUNDS SEMI-ANNUAL FINANCIAL REPORT | 63 |
STATEMENTS OF CHANGES IN NET ASSETS |
| | Six Months Ended
September 30, 2024
(Unaudited) | | | Year Ended
March 31,
2024 | |
Increase (Decrease) in Net Assets from Operations: | | | | | | | | |
Net investment loss | | $ | (41,601 | ) | | $ | (71,670 | ) |
Net realized gain on investments | | | 399,221 | | | | 1,685,621 | |
Net change in unrealized appreciation (depreciation) on investments | | | 416,522 | | | | 1,402,616 | |
Net increase in net assets resulting from operations | | | 774,142 | | | | 3,016,567 | |
| | | | | | | | | |
Capital share transactions: | | | | | | | | |
Proceeds from sale of shares | | | | | | | | |
Investor Class | | | 20,025,335 | | | | 29,374,905 | |
Class A | | | 648,799 | | | | 2,065,989 | |
Class C | | | 80,649 | | | | 425,218 | |
Class H | | | 274,498 | | | | 732,223 | |
Cost of shares redeemed | | | | | | | | |
Investor Class | | | (20,787,060 | ) | | | (32,465,824 | ) |
Class A | | | (1,285,803 | ) | | | (2,082,409 | ) |
Class C | | | (401,028 | ) | | | (1,051,086 | ) |
Class H | | | (353,519 | ) | | | (945,315 | ) |
Net decrease from capital share transactions | | | (1,798,129 | ) | | | (3,946,299 | ) |
Net decrease in net assets | | | (1,023,987 | ) | | | (929,732 | ) |
| | | | | | | | | |
Net assets: | | | | | | | | |
Beginning of period | | | 24,712,918 | | | | 25,642,650 | |
End of period | | $ | 23,688,931 | | | $ | 24,712,918 | |
| | | | | | | | | |
Capital share activity: | | | | | | | | |
Shares sold | | | | | | | | |
Investor Class | | | 460,013 | | | | 734,248 | |
Class A | | | 17,076 | | | | 58,855 | |
Class C | | | 2,595 | | | | 14,625 | |
Class H | | | 7,384 | | | | 21,681 | |
Shares redeemed | | | | | | | | |
Investor Class | | | (474,855 | ) | | | (812,620 | ) |
Class A | | | (33,768 | ) | | | (60,114 | ) |
Class C | | | (13,179 | ) | | | (38,320 | ) |
Class H | | | (9,796 | ) | | | (28,553 | ) |
Net decrease in shares | | | (44,530 | ) | | | (110,198 | ) |
64 | THE RYDEX FUNDS SEMI-ANNUAL FINANCIAL REPORT | SEE NOTES TO FINANCIAL STATEMENTS. |
This table is presented to show selected data for a share outstanding throughout each period and to assist shareholders in evaluating a Fund’s performance for the periods presented.
Investor Class | | Six Months Ended
September 30, 2024a | | | Year Ended
March 31,
2024 | | | Year Ended
March 31,
2023 | | | Year Ended
March 31,
2022 | | | Year Ended
March 31,
2021 | | | Year Ended
March 31,
2020 | |
Per Share Data |
Net asset value, beginning of period | | $ | 43.69 | | | $ | 38.37 | | | $ | 41.55 | | | $ | 39.24 | | | $ | 30.27 | | | $ | 32.03 | |
Income (loss) from investment operations: |
Net investment income (loss)b | | | (.05 | ) | | | (.07 | ) | | | (.10 | ) | | | (.12 | ) | | | (.15 | ) | | | (.06 | ) |
Net gain (loss) on investments (realized and unrealized) | | | 1.36 | | | | 5.39 | | | | (2.45 | ) | | | 3.84 | | | | 12.50 | | | | (1.70 | ) |
Total from investment operations | | | 1.31 | | | | 5.32 | | | | (2.55 | ) | | | 3.72 | | | | 12.35 | | | | (1.76 | ) |
Less distributions from: |
Net realized gains | | | — | | | | — | | | | (.63 | ) | | | (1.41 | ) | | | (3.38 | ) | | | — | |
Total distributions | | | — | | | | — | | | | (.63 | ) | | | (1.41 | ) | | | (3.38 | ) | | | — | |
Net asset value, end of period | | $ | 45.00 | | | $ | 43.69 | | | $ | 38.37 | | | $ | 41.55 | | | $ | 39.24 | | | $ | 30.27 | |
|
Total Return | | | 3.00 | % | | | 13.86 | % | | | (6.16 | %) | | | 9.40 | % | | | 41.24 | % | | | (5.49 | %) |
Ratios/Supplemental Data |
Net assets, end of period (in thousands) | | $ | 16,770 | | | $ | 16,929 | | | $ | 17,873 | | | $ | 25,478 | | | $ | 20,831 | | | $ | 12,408 | |
Ratios to average net assets: |
Net investment income (loss) | | | (0.24 | %) | | | (0.19 | %) | | | (0.26 | %) | | | (0.29 | %) | | | (0.41 | %) | | | (0.19 | %) |
Total expenses | | | 1.42 | % | | | 1.43 | % | | | 1.39 | % | | | 1.35 | % | | | 1.46 | % | | | 1.47 | % |
Net expensesc | | | 1.37 | % | | | 1.40 | % | | | 1.39 | % | | | 1.35 | % | | | 1.46 | % | | | 1.47 | % |
Portfolio turnover rate | | | 67 | % | | | 116 | % | | | 268 | % | | | 238 | % | | | 256 | % | | | 248 | % |
Class A | | Six Months Ended
September 30, 2024a | | | Year Ended
March 31,
2024 | | | Year Ended
March 31,
2023 | | | Year Ended
March 31,
2022 | | | Year Ended
March 31,
2021 | | | Year Ended
March 31,
2020 | |
Per Share Data |
Net asset value, beginning of period | | $ | 38.43 | | | $ | 33.83 | | | $ | 36.81 | | | $ | 34.99 | | | $ | 27.33 | | | $ | 29.00 | |
Income (loss) from investment operations: |
Net investment income (loss)b | | | (.09 | ) | | | (.15 | ) | | | (.16 | ) | | | (.19 | ) | | | (.21 | ) | | | (.12 | ) |
Net gain (loss) on investments (realized and unrealized) | | | 1.19 | | | | 4.75 | | | | (2.19 | ) | | | 3.42 | | | | 11.25 | | | | (1.55 | ) |
Total from investment operations | | | 1.10 | | | | 4.60 | | | | (2.35 | ) | | | 3.23 | | | | 11.04 | | | | (1.67 | ) |
Less distributions from: |
Net realized gains | | | — | | | | — | | | | (.63 | ) | | | (1.41 | ) | | | (3.38 | ) | | | — | |
Total distributions | | | — | | | | — | | | | (.63 | ) | | | (1.41 | ) | | | (3.38 | ) | | | — | |
Net asset value, end of period | | $ | 39.53 | | | $ | 38.43 | | | $ | 33.83 | | | $ | 36.81 | | | $ | 34.99 | | | $ | 27.33 | |
|
Total Returnd | | | 2.86 | % | | | 13.60 | % | | | (6.38 | %) | | | 9.14 | % | | | 40.87 | % | | | (5.76 | %) |
Ratios/Supplemental Data |
Net assets, end of period (in thousands) | | $ | 5,043 | | | $ | 5,544 | | | $ | 4,923 | | | $ | 5,650 | | | $ | 5,575 | | | $ | 3,606 | |
Ratios to average net assets: |
Net investment income (loss) | | | (0.47 | %) | | | (0.43 | %) | | | (0.49 | %) | | | (0.50 | %) | | | (0.63 | %) | | | (0.43 | %) |
Total expenses | | | 1.67 | % | | | 1.68 | % | | | 1.64 | % | | | 1.61 | % | | | 1.69 | % | | | 1.73 | % |
Net expensesc | | | 1.62 | % | | | 1.65 | % | | | 1.64 | % | | | 1.61 | % | | | 1.69 | % | | | 1.73 | % |
Portfolio turnover rate | | | 67 | % | | | 116 | % | | | 268 | % | | | 238 | % | | | 256 | % | | | 248 | % |
SEE NOTES TO FINANCIAL STATEMENTS. | THE RYDEX FUNDS SEMI-ANNUAL FINANCIAL REPORT | 65 |
FINANCIAL HIGHLIGHTS (continued) |
This table is presented to show selected data for a share outstanding throughout each period and to assist shareholders in evaluating a Fund’s performance for the periods presented.
Class C | | Six Months Ended
September 30, 2024a | | | Year Ended
March 31,
2024 | | | Year Ended
March 31,
2023 | | | Year Ended
March 31,
2022 | | | Year Ended
March 31,
2021 | | | Year Ended
March 31,
2020 | |
Per Share Data |
Net asset value, beginning of period | | $ | 30.72 | | | $ | 27.24 | | | $ | 29.99 | | | $ | 28.95 | | | $ | 23.21 | | | $ | 24.81 | |
Income (loss) from investment operations: |
Net investment income (loss)b | | | (.18 | ) | | | (.33 | ) | | | (.34 | ) | | | (.39 | ) | | | (.40 | ) | | | (.30 | ) |
Net gain (loss) on investments (realized and unrealized) | | | .94 | | | | 3.81 | | | | (1.78 | ) | | | 2.84 | | | | 9.52 | | | | (1.30 | ) |
Total from investment operations | | | .76 | | | | 3.48 | | | | (2.12 | ) | | | 2.45 | | | | 9.12 | | | | (1.60 | ) |
Less distributions from: |
Net realized gains | | | — | | | | — | | | | (.63 | ) | | | (1.41 | ) | | | (3.38 | ) | | | — | |
Total distributions | | | — | | | | — | | | | (.63 | ) | | | (1.41 | ) | | | (3.38 | ) | | | — | |
Net asset value, end of period | | $ | 31.48 | | | $ | 30.72 | | | $ | 27.24 | | | $ | 29.99 | | | $ | 28.95 | | | $ | 23.21 | |
|
Total Returnd | | | 2.47 | % | | | 12.78 | % | | | (7.07 | %) | | | 8.34 | % | | | 39.82 | % | | | (6.45 | %) |
Ratios/Supplemental Data |
Net assets, end of period (in thousands) | | $ | 687 | | | $ | 996 | | | $ | 1,529 | | | $ | 2,699 | | | $ | 3,147 | | | $ | 2,826 | |
Ratios to average net assets: |
Net investment income (loss) | | | (1.22 | %) | | | (1.20 | %) | | | (1.25 | %) | | | (1.26 | %) | | | (1.39 | %) | | | (1.20 | %) |
Total expenses | | | 2.41 | % | | | 2.43 | % | | | 2.39 | % | | | 2.36 | % | | | 2.45 | % | | | 2.48 | % |
Net expensesc | | | 2.36 | % | | | 2.40 | % | | | 2.39 | % | | | 2.36 | % | | | 2.45 | % | | | 2.48 | % |
Portfolio turnover rate | | | 67 | % | | | 116 | % | | | 268 | % | | | 238 | % | | | 256 | % | | | 248 | % |
66 | THE RYDEX FUNDS SEMI-ANNUAL FINANCIAL REPORT | SEE NOTES TO FINANCIAL STATEMENTS. |
FINANCIAL HIGHLIGHTS (concluded) |
This table is presented to show selected data for a share outstanding throughout each period and to assist shareholders in evaluating a Fund’s performance for the periods presented.
Class H | | Six Months Ended
September 30, 2024a | | | Year Ended
March 31,
2024 | | | Year Ended
March 31,
2023 | | | Year Ended
March 31,
2022 | | | Year Ended
March 31,
2021 | | | Year Ended
March 31,
2020 | |
Per Share Data |
Net asset value, beginning of period | | $ | 36.79 | | | $ | 32.39 | | | $ | 35.26 | | | $ | 33.57 | | | $ | 26.31 | | | $ | 27.91 | |
Income (loss) from investment operations: |
Net investment income (loss)b | | | (.09 | ) | | | (.14 | ) | | | (.21 | ) | | | (.17 | ) | | | (.21 | ) | | | (.13 | ) |
Net gain (loss) on investments (realized and unrealized) | | | 1.14 | | | | 4.54 | | | | (2.03 | ) | | | 3.27 | | | | 10.85 | | | | (1.47 | ) |
Total from investment operations | | | 1.05 | | | | 4.40 | | | | (2.24 | ) | | | 3.10 | | | | 10.64 | | | | (1.60 | ) |
Less distributions from: |
Net realized gains | | | — | | | | — | | | | (.63 | ) | | | (1.41 | ) | | | (3.38 | ) | | | — | |
Total distributions | | | — | | | | — | | | | (.63 | ) | | | (1.41 | ) | | | (3.38 | ) | | | — | |
Net asset value, end of period | | $ | 37.84 | | | $ | 36.79 | | | $ | 32.39 | | | $ | 35.26 | | | $ | 33.57 | | | $ | 26.31 | |
|
Total Return | | | 2.85 | % | | | 13.58 | % | | | (6.38 | %) | | | 9.14 | % | | | 40.93 | % | | | (5.73 | %) |
Ratios/Supplemental Data |
Net assets, end of period (in thousands) | | $ | 1,189 | | | $ | 1,245 | | | $ | 1,318 | | | $ | 10,297 | | | $ | 1,760 | | | $ | 1,021 | |
Ratios to average net assets: |
Net investment income (loss) | | | (0.47 | %) | | | (0.43 | %) | | | (0.64 | %) | | | (0.46 | %) | | | (0.68 | %) | | | (0.45 | %) |
Total expenses | | | 1.67 | % | | | 1.68 | % | | | 1.65 | % | | | 1.61 | % | | | 1.76 | % | | | 1.72 | % |
Net expensesc | | | 1.62 | % | | | 1.65 | % | | | 1.65 | % | | | 1.61 | % | | | 1.76 | % | | | 1.72 | % |
Portfolio turnover rate | | | 67 | % | | | 116 | % | | | 268 | % | | | 238 | % | | | 256 | % | | | 248 | % |
a | Unaudited figures for the period ended September 30, 2024. Percentage amounts for the period, except total return and portfolio turnover rate, have been annualized. |
b | Net investment income (loss) per share was computed using average shares outstanding throughout the period. |
c | Net expense information reflects the expense ratios after expense waivers and reimbursements, as applicable. |
d | Total return does not reflect the impact of any applicable sales charges. |
SEE NOTES TO FINANCIAL STATEMENTS. | THE RYDEX FUNDS SEMI-ANNUAL FINANCIAL REPORT | 67 |
SCHEDULE OF INVESTMENTS (Unaudited) | September 30, 2024 |
INTERNET FUND | |
| | Shares | | | Value | |
COMMON STOCKS† - 99.5% |
| | | | | | | | | |
Internet - 57.3% |
Alphabet, Inc. — Class A | | | 5,023 | | | $ | 833,065 | |
Amazon.com, Inc.* | | | 4,287 | | | | 798,797 | |
Meta Platforms, Inc. — Class A | | | 1,286 | | | | 736,158 | |
Netflix, Inc.* | | | 655 | | | | 464,572 | |
Uber Technologies, Inc.* | | | 4,522 | | | | 339,874 | |
Booking Holdings, Inc. | | | 56 | | | | 235,879 | |
Airbnb, Inc. — Class A* | | | 1,850 | | | | 234,599 | |
DoorDash, Inc. — Class A* | | | 1,364 | | | | 194,684 | |
JD.com, Inc. ADR | | | 4,738 | | | | 189,520 | |
Alibaba Group Holding Ltd. ADR | | | 1,784 | | | | 189,318 | |
Shopify, Inc. — Class A* | | | 1,932 | | | | 154,830 | |
Bilibili, Inc. ADR* | | | 6,479 | | | | 151,479 | |
eBay, Inc. | | | 2,295 | | | | 149,427 | |
Baidu, Inc. ADR* | | | 1,402 | | | | 147,617 | |
Spotify Technology S.A.* | | | 388 | | | | 142,990 | |
Trip.com Group Ltd. ADR* | | | 2,378 | | | | 141,325 | |
Sea Ltd. ADR* | | | 1,452 | | | | 136,895 | |
MercadoLibre, Inc.* | | | 63 | | | | 129,273 | |
Pinterest, Inc. — Class A* | | | 3,966 | | | | 128,379 | |
GoDaddy, Inc. — Class A* | | | 799 | | | | 125,267 | |
Expedia Group, Inc.* | | | 819 | | | | 121,228 | |
VeriSign, Inc.* | | | 577 | | | | 109,607 | |
Zillow Group, Inc. — Class C* | | | 1,598 | | | | 102,032 | |
Snap, Inc. — Class A* | | | 9,458 | | | | 101,201 | |
F5, Inc.* | | | 443 | | | | 97,549 | |
Okta, Inc.* | | | 1,251 | | | | 92,999 | |
Match Group, Inc.* | | | 2,267 | | | | 85,783 | |
Roku, Inc.* | | | 1,141 | | | | 85,187 | |
Chewy, Inc. — Class A* | | | 2,793 | | | | 81,807 | |
Wayfair, Inc. — Class A* | | | 1,380 | | | | 77,528 | |
Etsy, Inc.* | | | 1,236 | | | | 68,635 | |
Wix.com Ltd.* | | | 400 | | | | 66,868 | |
Lyft, Inc. — Class A* | | | 4,538 | | | | 57,859 | |
IAC, Inc.* | | | 1,015 | | | | 54,627 | |
Cargurus, Inc.* | | | 1,560 | | | | 46,847 | |
Ziff Davis, Inc.* | | | 801 | | | | 38,977 | |
TripAdvisor, Inc.* | | | 2,425 | | | | 35,138 | |
Trump Media & Technology Group Corp.*,1 | | | 1,971 | | | | 31,674 | |
Bumble, Inc. — Class A* | | | 3,975 | | | | 25,360 | |
Total Internet | | | | | | | 7,004,854 | |
| | | | | | | | | |
Software - 25.5% |
Salesforce, Inc. | | | 1,593 | | | | 436,020 | |
Adobe, Inc.* | | | 733 | | | | 379,533 | |
Workday, Inc. — Class A* | | | 855 | | | | 208,970 | |
Datadog, Inc. — Class A* | | | 1,418 | | | | 163,155 | |
Electronic Arts, Inc. | | | 1,125 | | | | 161,370 | |
Snowflake, Inc. — Class A* | | | 1,354 | | | | 155,520 | |
Veeva Systems, Inc. — Class A* | | | 688 | | | | 144,391 | |
Cloudflare, Inc. — Class A* | | | 1,674 | | | | 135,410 | |
Take-Two Interactive Software, Inc.* | | | 875 | | | | 134,496 | |
ROBLOX Corp. — Class A* | | | 2,953 | | | | 130,700 | |
NetEase, Inc. ADR | | | 1,370 | | | | 128,109 | |
Zoom Video Communications, Inc. — Class A* | | | 1,730 | | | | 120,650 | |
MongoDB, Inc.* | | | 413 | | | | 111,655 | |
Akamai Technologies, Inc.* | | | 1,034 | | | | 104,382 | |
Nutanix, Inc. — Class A* | | | 1,670 | | | | 98,947 | |
DocuSign, Inc.* | | | 1,575 | | | | 97,792 | |
Twilio, Inc. — Class A* | | | 1,306 | | | | 85,177 | |
Smartsheet, Inc. — Class A* | | | 1,365 | | | | 75,566 | |
Dropbox, Inc. — Class A* | | | 2,962 | | | | 75,324 | |
Box, Inc. — Class A* | | | 1,709 | | | | 55,936 | |
ZoomInfo Technologies, Inc. — Class A* | | | 4,715 | | | | 48,659 | |
DigitalOcean Holdings, Inc.* | | | 963 | | | | 38,896 | |
Fastly, Inc. — Class A* | | | 3,732 | | | | 28,251 | |
Total Software | | | | | | | 3,118,909 | |
| | | | | | | | | |
Telecommunications - 11.0% |
Cisco Systems, Inc. | | | 7,192 | | | | 382,758 | |
Arista Networks, Inc.* | | | 689 | | | | 264,452 | |
Motorola Solutions, Inc. | | | 511 | | | | 229,761 | |
Telefonaktiebolaget LM Ericsson ADR | | | 13,000 | | | | 98,540 | |
Juniper Networks, Inc. | | | 2,424 | | | | 94,488 | |
Nokia Oyj ADR1 | | | 21,160 | | | | 92,469 | |
Ciena Corp.* | | | 1,343 | | | | 82,715 | |
Viavi Solutions, Inc.* | | | 4,254 | | | | 38,371 | |
Extreme Networks, Inc.* | | | 2,406 | | | | 36,162 | |
Viasat, Inc.* | | | 2,265 | | | | 27,044 | |
Total Telecommunications | | | | | | | 1,346,760 | |
| | | | | | | | | |
Commercial Services - 2.5% |
PayPal Holdings, Inc.* | | | 3,182 | | | | 248,292 | |
Paylocity Holding Corp.* | | | 336 | | | | 55,430 | |
Total Commercial Services | | | | | | | 303,722 | |
| | | | | | | | | |
Real Estate - 1.2% |
CoStar Group, Inc.* | | | 1,919 | | | | 144,769 | |
| | | | | | | | | |
Entertainment - 0.9% |
DraftKings, Inc. — Class A* | | | 2,979 | | | | 116,777 | |
| | | | | | | | | |
Computers - 0.5% |
Lumentum Holdings, Inc.* | | | 919 | | | | 58,246 | |
| | | | | | | | | |
Investment Companies - 0.3% |
Core Scientific, Inc.* | | | 3,831 | | | | 45,436 | |
| | | | | | | | | |
Healthcare-Services - 0.3% |
Teladoc Health, Inc.* | | | 3,939 | | | | 36,160 | |
| | | | | | | | | |
Total Common Stocks | | | | |
(Cost $5,940,556) | | | | | | | 12,175,633 | |
| | | | | | | | | |
68 | THE RYDEX FUNDS SEMI-ANNUAL FINANCIAL REPORT | SEE NOTES TO FINANCIAL STATEMENTS. |
SCHEDULE OF INVESTMENTS (Unaudited)(concluded) | September 30, 2024 |
INTERNET FUND | |
| | Face
Amount | | | Value | |
REPURCHASE AGREEMENTS††,2 - 0.6% |
J.P. Morgan Securities LLC
issued 09/30/24 at 4.86%
due 10/01/24 | | $ | 42,490 | | | $ | 42,490 | |
BofA Securities, Inc.
issued 09/30/24 at 4.85%
due 10/01/24 | | | 35,095 | | | | 35,095 | |
Total Repurchase Agreements | | | | |
(Cost $77,585) | | | | | | | 77,585 | |
| | | | | | | | | |
| | Shares | | | Value | |
SECURITIES LENDING COLLATERAL†,3 - 0.7% |
Money Market Fund*** | | | | | | | | |
First American Government Obligations Fund - Class X, 4.82%4 | | | 81,434 | | | $ | 81,434 | |
Total Securities Lending Collateral | | | | |
(Cost $81,434) | | | | | | | 81,434 | |
| | | | | | | | | |
Total Investments - 100.8% | | | | |
(Cost $6,099,575) | | $ | 12,334,652 | |
Other Assets & Liabilities, net - (0.8)% | | | (99,859 | ) |
Total Net Assets - 100.0% | | $ | 12,234,793 | |
* | Non-income producing security. |
*** | A copy of each underlying unaffiliated fund’s financial statements is available at the SEC’s website at www.sec.gov. |
† | Value determined based on Level 1 inputs — See Note 4. |
†† | Value determined based on Level 2 inputs — See Note 4. |
1 | All or a portion of this security is on loan at September 30, 2024 — See Note 7. |
2 | Repurchase Agreements — See Note 6. |
3 | Securities lending collateral — See Note 7. |
4 | Rate indicated is the 7-day yield as of September 30, 2024. |
| | ADR — American Depositary Receipt |
| | |
| | See Sector Classification in Other Information section. |
The following table summarizes the inputs used to value the Fund’s investments at September 30, 2024 (See Note 4 in the Notes to Financial Statements):
Investments in Securities (Assets) | | Level 1
Quoted
Prices | | | Level 2
Significant
Observable
Inputs | | | Level 3
Significant
Unobservable
Inputs | | | Total | |
Common Stocks | | $ | 12,175,633 | | | $ | — | | | $ | — | | | $ | 12,175,633 | |
Repurchase Agreements | | | — | | | | 77,585 | | | | — | | | | 77,585 | |
Securities Lending Collateral | | | 81,434 | | | | — | | | | — | | | | 81,434 | |
Total Assets | | $ | 12,257,067 | | | $ | 77,585 | | | $ | — | | | $ | 12,334,652 | |
SEE NOTES TO FINANCIAL STATEMENTS. | THE RYDEX FUNDS SEMI-ANNUAL FINANCIAL REPORT | 69 |
STATEMENT OF ASSETS AND LIABILITIES (Unaudited) |
September 30, 2024 |
Assets: |
Investments, at value - including $79,910 of securities loaned (cost $6,021,990) | | $ | 12,257,067 | |
Repurchase agreements, at value (cost $77,585) | | | 77,585 | |
Receivables: |
Fund shares sold | | | 35,565 | |
Dividends | | | 1,165 | |
Securities lending income | | | 121 | |
Interest | | | 10 | |
Total assets | | | 12,371,513 | |
| | | | | |
Liabilities: |
Payable for: |
Return of securities lending collateral | | | 81,434 | |
Fund shares redeemed | | | 30,731 | |
Management fees | | | 7,619 | |
Transfer agent fees | | | 5,429 | |
Distribution and service fees | | | 3,272 | |
Portfolio accounting and administration fees | | | 920 | |
Trustees’ fees* | | | 102 | |
Miscellaneous | | | 7, 213 | |
Total liabilities | | | 136,720 | |
Net assets | | $ | 12,234,793 | |
| | | | | |
Net assets consist of: |
Paid in capital | | $ | 7,455,318 | |
Total distributable earnings (loss) | | | 4,779,475 | |
Net assets | | $ | 12,234,793 | |
| | | | | |
Investor Class: |
Net assets | | $ | 6,000,531 | |
Capital shares outstanding | | | 45,106 | |
Net asset value per share | | $ | 133.03 | |
| | | | | |
Class A: |
Net assets | | $ | 1,686,068 | |
Capital shares outstanding | | | 14,266 | |
Net asset value per share | | $ | 118.19 | |
Maximum offering price per share (Net asset value divided by 95.25%) | | $ | 124.08 | |
| | | | | |
Class C: |
Net assets | | $ | 3,870,439 | |
Capital shares outstanding | | | 42,250 | |
Net asset value per share | | $ | 91.61 | |
| | | | | |
Class H: |
Net assets | | $ | 677,755 | |
Capital shares outstanding | | | 6,013 | |
Net asset value per share | | $ | 112.71 | |
STATEMENT OF OPERATIONS (Unaudited) |
Six Months Ended September 30, 2024 |
Investment Income: |
Dividends (net of foreign withholding tax of $792) | | $ | 29,942 | |
Interest | | | 1,961 | |
Income from securities lending, net | | | 649 | |
Total investment income | | | 32,552 | |
| | | | | |
Expenses: |
Management fees | | | 52,017 | |
Distribution and service fees: |
Class A | | | 2,030 | |
Class C | | | 17,486 | |
Class H | | | 803 | |
Transfer agent fees | | | 12,851 | |
Portfolio accounting and administration fees | | | 9,338 | |
Professional fees | | | 6,032 | |
Trustees’ fees* | | | 1,196 | |
Custodian fees | | | 773 | |
Miscellaneous | | | 4,358 | |
Total expenses | | | 106,884 | |
Less: |
Expenses reimbursed by Adviser | | | (3,057 | ) |
Net expenses | | | 103,827 | |
Net investment loss | | | (71,275 | ) |
| | | | | |
Net Realized and Unrealized Gain (Loss): |
Net realized gain (loss) on: |
Investments | | | 3,678,719 | |
Net realized gain | | | 3,678,719 | |
Net change in unrealized appreciation (depreciation) on: |
Investments | | | (2,820,538 | ) |
Net change in unrealized appreciation (depreciation) | | | (2,820,538 | ) |
Net realized and unrealized gain | | | 858,181 | |
Net increase in net assets resulting from operations | | $ | 786,906 | |
* | Relates to Trustees not deemed “interested persons” within the meaning of Section 2(a)(19) of the 1940 Act. |
70 | THE RYDEX FUNDS SEMI-ANNUAL FINANCIAL REPORT | SEE NOTES TO FINANCIAL STATEMENTS. |
STATEMENTS OF CHANGES IN NET ASSETS |
| | Six Months Ended
September 30, 2024
(Unaudited) | | | Year Ended
March 31,
2024 | |
Increase (Decrease) in Net Assets from Operations: | | | | | | | | |
Net investment loss | | $ | (71,275 | ) | | $ | (321,230 | ) |
Net realized gain on investments | | | 3,678,719 | | | | 230,876 | |
Net change in unrealized appreciation (depreciation) on investments | | | (2,820,538 | ) | | | 5,041,324 | |
Net increase in net assets resulting from operations | | | 786,906 | | | | 4,950,970 | |
| | | | | | | | | |
Capital share transactions: | | | | | | | | |
Proceeds from sale of shares | | | | | | | | |
Investor Class | | | 6,597,600 | | | | 67,759,919 | |
Class A | | | 748,729 | | | | 2,033,502 | |
Class C | | | 354,648 | | | | 382,516 | |
Class H | | | 18,936 | | | | 141,027 | |
Cost of shares redeemed | | | | | | | | |
Investor Class | | | (33,517,582 | ) | | | (54,950,256 | ) |
Class A | | | (1,056,624 | ) | | | (1,922,686 | ) |
Class C | | | (87,741 | ) | | | (325,691 | ) |
Class H | | | (44,127 | ) | | | (226,709 | ) |
Net increase (decrease) from capital share transactions | | | (26,986,161 | ) | | | 12,891,622 | |
Net increase (decrease) in net assets | | | (26,199,255 | ) | | | 17,842,592 | |
| | | | | | | | | |
Net assets: | | | | | | | | |
Beginning of period | | | 38,434,048 | | | | 20,591,456 | |
End of period | | $ | 12,234,793 | | | $ | 38,434,048 | |
| | | | | | | | | |
Capital share activity: | | | | | | | | |
Shares sold | | | | | | | | |
Investor Class | | | 53,569 | | | | 632,253 | |
Class A | | | 6,852 | | | | 21,711 | |
Class C | | | 4,242 | | | | 5,346 | |
Class H | | | 183 | | | | 1,586 | |
Shares redeemed | | | | | | | | |
Investor Class | | | (271,792 | ) | | | (539,260 | ) |
Class A | | | (9,666 | ) | | | (20,504 | ) |
Class C | | | (1,045 | ) | | | (4,358 | ) |
Class H | | | (427 | ) | | | (2,516 | ) |
Net increase (decrease) in shares | | | (218,084 | ) | | | 94,258 | |
SEE NOTES TO FINANCIAL STATEMENTS. | THE RYDEX FUNDS SEMI-ANNUAL FINANCIAL REPORT | 71 |
This table is presented to show selected data for a share outstanding throughout each period and to assist shareholders in evaluating a Fund’s performance for the periods presented.
Investor Class | | Six Months Ended
September 30, 2024a | | | Year Ended
March 31,
2024 | | | Year Ended
March 31,
2023 | | | Year Ended
March 31,
2022 | | | Year Ended
March 31,
2021 | | | Year Ended
March 31,
2020 | |
Per Share Data |
Net asset value, beginning of period | | $ | 123.64 | | | $ | 94.80 | | | $ | 115.59 | | | $ | 195.59 | | | $ | 105.23 | | | $ | 118.80 | |
Income (loss) from investment operations: |
Net investment income (loss)b | | | (.50 | ) | | | (1.18 | ) | | | (.99 | ) | | | (2.11 | ) | | | (2.03 | ) | | | (1.30 | ) |
Net gain (loss) on investments (realized and unrealized) | | | 9.89 | | | | 30.02 | | | | (19.80 | ) | | | (34.69 | ) | | | 92.39 | | | | (8.17 | ) |
Total from investment operations | | | 9.39 | | | | 28.84 | | | | (20.79 | ) | | | (36.80 | ) | | | 90.36 | | | | (9.47 | ) |
Less distributions from: |
Net realized gains | | | — | | | | — | | | | — | | | | (43.20 | ) | | | — | | | | (4.10 | ) |
Total distributions | | | — | | | | — | | | | — | | | | (43.20 | ) | | | — | | | | (4.10 | ) |
Net asset value, end of period | | $ | 133.03 | | | $ | 123.64 | | | $ | 94.80 | | | $ | 115.59 | | | $ | 195.59 | | | $ | 105.23 | |
|
Total Return | | | 7.59 | % | | | 30.42 | % | | | (17.99 | %) | | | (23.48 | %) | | | 85.87 | % | | | (8.25 | %) |
Ratios/Supplemental Data |
Net assets, end of period (in thousands) | | $ | 6,001 | | | $ | 32,558 | | | $ | 16,148 | | | $ | 8,777 | | | $ | 25,113 | | | $ | 10,741 | |
Ratios to average net assets: |
Net investment income (loss) | | | (0.81 | %) | | | (1.09 | %) | | | (1.13 | %) | | | (1.18 | %) | | | (1.21 | %) | | | (1.08 | %) |
Total expenses | | | 1.41 | % | | | 1.42 | % | | | 1.39 | % | | | 1.36 | % | | | 1.44 | % | | | 1.47 | % |
Net expensesc | | | 1.36 | % | | | 1.38 | % | | | 1.39 | % | | | 1.36 | % | | | 1.44 | % | | | 1.47 | % |
Portfolio turnover rate | | | 43 | % | | | 205 | % | | | 133 | % | | | 150 | % | | | 284 | % | | | 359 | % |
Class A | | Six Months Ended
September 30, 2024a | | | Year Ended
March 31,
2024 | | | Year Ended
March 31,
2023 | | | Year Ended
March 31,
2022 | | | Year Ended
March 31,
2021 | | | Year Ended
March 31,
2020 | |
Per Share Data |
Net asset value, beginning of period | | $ | 109.97 | | | $ | 84.53 | | | $ | 103.33 | | | $ | 179.98 | | | $ | 97.07 | | | $ | 110.18 | |
Income (loss) from investment operations: |
Net investment income (loss)b | | | (.59 | ) | | | (1.26 | ) | | | (1.10 | ) | | | (2.28 | ) | | | (2.22 | ) | | | (1.32 | ) |
Net gain (loss) on investments (realized and unrealized) | | | 8.81 | | | | 26.70 | | | | (17.70 | ) | | | (31.17 | ) | | | 85.13 | | | | (7.69 | ) |
Total from investment operations | | | 8.22 | | | | 25.44 | | | | (18.80 | ) | | | (33.45 | ) | | | 82.91 | | | | (9.01 | ) |
Less distributions from: |
Net realized gains | | | — | | | | — | | | | — | | | | (43.20 | ) | | | — | | | | (4.10 | ) |
Total distributions | | | — | | | | — | | | | — | | | | (43.20 | ) | | | — | | | | (4.10 | ) |
Net asset value, end of period | | $ | 118.19 | | | $ | 109.97 | | | $ | 84.53 | | | $ | 103.33 | | | $ | 179.98 | | | $ | 97.07 | |
|
Total Returnd | | | 7.47 | % | | | 30.10 | % | | | (18.19 | %) | | | (23.67 | %) | | | 85.41 | % | | | (8.48 | %) |
Ratios/Supplemental Data |
Net assets, end of period (in thousands) | | $ | 1,686 | | | $ | 1,878 | | | $ | 1,342 | | | $ | 2,240 | | | $ | 2,952 | | | $ | 2,060 | |
Ratios to average net assets: |
Net investment income (loss) | | | (1.08 | %) | | | (1.33 | %) | | | (1.39 | %) | | | (1.44 | %) | | | (1.45 | %) | | | (1.20 | %) |
Total expenses | | | 1.67 | % | | | 1.69 | % | | | 1.65 | % | | | 1.61 | % | | | 1.69 | % | | | 1.73 | % |
Net expensesc | | | 1.62 | % | | | 1.65 | % | | | 1.65 | % | | | 1.61 | % | | | 1.69 | % | | | 1.73 | % |
Portfolio turnover rate | | | 43 | % | | | 205 | % | | | 133 | % | | | 150 | % | | | 284 | % | | | 359 | % |
72 | THE RYDEX FUNDS SEMI-ANNUAL FINANCIAL REPORT | SEE NOTES TO FINANCIAL STATEMENTS. |
FINANCIAL HIGHLIGHTS (continued) |
This table is presented to show selected data for a share outstanding throughout each period and to assist shareholders in evaluating a Fund’s performance for the periods presented.
Class C | | Six Months Ended
September 30, 2024a | | | Year Ended
March 31,
2024 | | | Year Ended
March 31,
2023 | | | Year Ended
March 31,
2022 | | | Year Ended
March 31,
2021 | | | Year Ended
March 31,
2020 | |
Per Share Data |
Net asset value, beginning of period | | $ | 85.56 | | | $ | 66.26 | | | $ | 81.61 | | | $ | 152.56 | | | $ | 82.90 | | | $ | 95.40 | |
Income (loss) from investment operations: |
Net investment income (loss)b | | | (.79 | ) | | | (1.54 | ) | | | (1.32 | ) | | | (2.89 | ) | | | (2.91 | ) | | | (1.96 | ) |
Net gain (loss) on investments (realized and unrealized) | | | 6.84 | | | | 20.84 | | | | (14.03 | ) | | | (24.86 | ) | | | 72.57 | | | | (6.44 | ) |
Total from investment operations | | | 6.05 | | | | 19.30 | | | | (15.35 | ) | | | (27.75 | ) | | | 69.66 | | | | (8.40 | ) |
Less distributions from: |
Net realized gains | | | — | | | | — | | | | — | | | | (43.20 | ) | | | — | | | | (4.10 | ) |
Total distributions | | | — | | | | — | | | | — | | | | (43.20 | ) | | | — | | | | (4.10 | ) |
Net asset value, end of period | | $ | 91.61 | | | $ | 85.56 | | | $ | 66.26 | | | $ | 81.61 | | | $ | 152.56 | | | $ | 82.90 | |
|
Total Returnd | | | 7.07 | % | | | 29.13 | % | | | (18.81 | %) | | | (24.24 | %) | | | 84.03 | % | | | (9.16 | %) |
Ratios/Supplemental Data |
Net assets, end of period (in thousands) | | $ | 3,870 | | | $ | 3,341 | | | $ | 2,522 | | | $ | 2,821 | | | $ | 4,124 | | | $ | 1,931 | |
Ratios to average net assets: |
Net investment income (loss) | | | (1.86 | %) | | | (2.08 | %) | | | (2.14 | %) | | | (2.19 | %) | | | (2.21 | %) | | | (2.06 | %) |
Total expenses | | | 2.42 | % | | | 2.44 | % | | | 2.40 | % | | | 2.36 | % | | | 2.43 | % | | | 2.47 | % |
Net expensesc | | | 2.37 | % | | | 2.40 | % | | | 2.40 | % | | | 2.36 | % | | | 2.43 | % | | | 2.47 | % |
Portfolio turnover rate | | | 43 | % | | | 205 | % | | | 133 | % | | | 150 | % | | | 284 | % | | | 359 | % |
SEE NOTES TO FINANCIAL STATEMENTS. | THE RYDEX FUNDS SEMI-ANNUAL FINANCIAL REPORT | 73 |
FINANCIAL HIGHLIGHTS (concluded) |
This table is presented to show selected data for a share outstanding throughout each period and to assist shareholders in evaluating a Fund’s performance for the periods presented.
Class H | | Six Months Ended
September 30, 2024a | | | Year Ended
March 31,
2024 | | | Year Ended
March 31,
2023 | | | Year Ended
March 31,
2022 | | | Year Ended
March 31,
2021 | | | Year Ended
March 31,
2020 | |
Per Share Data |
Net asset value, beginning of period | | $ | 104.88 | | | $ | 80.62 | | | $ | 98.55 | | | $ | 173.71 | | | $ | 93.70 | | | $ | 106.51 | |
Income (loss) from investment operations: |
Net investment income (loss)b | | | (.58 | ) | | | (1.19 | ) | | | (1.09 | ) | | | (2.23 | ) | | | (1.75 | ) | | | (1.41 | ) |
Net gain (loss) on investments (realized and unrealized) | | | 8.41 | | | | 25.45 | | | | (16.84 | ) | | | (29.73 | ) | | | 81.76 | | | | (7.30 | ) |
Total from investment operations | | | 7.83 | | | | 24.26 | | | | (17.93 | ) | | | (31.96 | ) | | | 80.01 | | | | (8.71 | ) |
Less distributions from: |
Net realized gains | | | — | | | | — | | | | — | | | | (43.20 | ) | | | — | | | | (4.10 | ) |
Total distributions | | | — | | | | — | | | | — | | | | (43.20 | ) | | | — | | | | (4.10 | ) |
Net asset value, end of period | | $ | 112.71 | | | $ | 104.88 | | | $ | 80.62 | | | $ | 98.55 | | | $ | 173.71 | | | $ | 93.70 | |
|
Total Return | | | 7.47 | % | | | 30.09 | % | | | (18.19 | %) | | | (23.67 | %) | | | 85.39 | % | | | (8.49 | %) |
Ratios/Supplemental Data |
Net assets, end of period (in thousands) | | $ | 678 | | | $ | 656 | | | $ | 579 | | | $ | 947 | | | $ | 1,067 | | | $ | 825 | |
Ratios to average net assets: |
Net investment income (loss) | | | (1.10 | %) | | | (1.33 | %) | | | (1.39 | %) | | | (1.45 | %) | | | (1.42 | %) | | | (1.30 | %) |
Total expenses | | | 1.67 | % | | | 1.68 | % | | | 1.65 | % | | | 1.61 | % | | | 1.76 | % | | | 1.71 | % |
Net expensesc | | | 1.62 | % | | | 1.65 | % | | | 1.65 | % | | | 1.61 | % | | | 1.76 | % | | | 1.71 | % |
Portfolio turnover rate | | | 43 | % | | | 205 | % | | | 133 | % | | | 150 | % | | | 284 | % | | | 359 | % |
a | Unaudited figures for the period ended September 30, 2024. Percentage amounts for the period, except total return and portfolio turnover rate, have been annualized. |
b | Net investment income (loss) per share was computed using average shares outstanding throughout the period. |
c | Net expense information reflects the expense ratios after expense waivers and reimbursements, as applicable. |
d | Total return does not reflect the impact of any applicable sales charges. |
74 | THE RYDEX FUNDS SEMI-ANNUAL FINANCIAL REPORT | SEE NOTES TO FINANCIAL STATEMENTS. |
SCHEDULE OF INVESTMENTS (Unaudited) | September 30, 2024 |
LEISURE FUND | |
| | Shares | | | Value | |
COMMON STOCKS† - 99.6% |
| | | | | | | | | |
Retail - 20.8% |
McDonald’s Corp. | | | 881 | | | $ | 268,273 | |
Starbucks Corp. | | | 1,889 | | | | 184,159 | |
Chipotle Mexican Grill, Inc. — Class A* | | | 2,769 | | | | 159,550 | |
Yum! Brands, Inc. | | | 815 | | | | 113,864 | |
Yum China Holdings, Inc. | | | 1,790 | | | | 80,586 | |
Darden Restaurants, Inc. | | | 487 | | | | 79,931 | |
Domino’s Pizza, Inc. | | | 165 | | | | 70,973 | |
Restaurant Brands International, Inc. | | | 957 | | | | 69,019 | |
Texas Roadhouse, Inc. — Class A | | | 360 | | | | 63,576 | |
Cava Group, Inc.* | | | 433 | | | | 53,627 | |
Wingstop, Inc. | | | 110 | | | | 45,769 | |
Dutch Bros, Inc. — Class A* | | | 1,155 | | | | 36,995 | |
Shake Shack, Inc. — Class A* | | | 356 | | | | 36,743 | |
Sweetgreen, Inc. — Class A* | | | 975 | | | | 34,564 | |
Brinker International, Inc.* | | | 440 | | | | 33,673 | |
Wendy’s Co. | | | 1,791 | | | | 31,378 | |
Cheesecake Factory, Inc. | | | 629 | | | | 25,506 | |
Papa John’s International, Inc. | | | 459 | | | | 24,726 | |
Bloomin’ Brands, Inc. | | | 1,272 | | | | 21,026 | |
Cracker Barrel Old Country Store, Inc. | | | 433 | | | | 19,636 | |
Dave & Buster’s Entertainment, Inc.* | | | 561 | | | | 19,102 | |
Jack in the Box, Inc. | | | 350 | | | | 16,289 | |
Total Retail | | | | | | | 1,488,965 | |
| | | | | | | | | |
Internet - 17.9% |
Netflix, Inc.* | | | 441 | | | | 312,788 | |
Booking Holdings, Inc. | | | 40 | | | | 168,485 | |
Airbnb, Inc. — Class A* | | | 1,246 | | | | 158,005 | |
DoorDash, Inc. — Class A* | | | 918 | | | | 131,026 | |
Spotify Technology S.A.* | | | 266 | | | | 98,029 | |
Bilibili, Inc. ADR* | | | 4,063 | | | | 94,993 | |
Trip.com Group Ltd. ADR* | | | 1,548 | | | | 91,998 | |
Sea Ltd. ADR* | | | 955 | | | | 90,037 | |
Expedia Group, Inc.* | | | 551 | | | | 81,559 | |
Roku, Inc.* | | | 768 | | | | 57,339 | |
Total Internet | | | | | | | 1,284,259 | |
| | | | | | | | | |
Media - 15.2% |
Walt Disney Co. | | | 2,527 | | | | 243,072 | |
Comcast Corp. — Class A | | | 5,600 | | | | 233,912 | |
Charter Communications, Inc. — Class A* | | | 303 | | | | 98,196 | |
Fox Corp. — Class A | | | 1,902 | | | | 80,512 | |
Warner Bros Discovery, Inc.* | | | 9,054 | | | | 74,695 | |
News Corp. — Class A | | | 2,647 | | | | 70,490 | |
Liberty Broadband Corp. — Class C* | | | 824 | | | | 63,687 | |
New York Times Co. — Class A | | | 959 | | | | 53,387 | |
Paramount Global — Class B1 | | | 4,288 | | | | 45,539 | |
Endeavor Group Holdings, Inc. — Class A1 | | | 1,578 | | | | 45,068 | |
Nexstar Media Group, Inc. — Class A | | | 244 | | | | 40,345 | |
Sirius XM Holdings, Inc. | | | 1,498 | | | | 35,435 | |
Total Media | | | | | | | 1,084,338 | |
| | | | | | | | | |
Entertainment - 10.8% |
DraftKings, Inc. — Class A* | | | 2,006 | | | | 78,635 | |
Live Nation Entertainment, Inc.* | | | 711 | | | | 77,848 | |
TKO Group Holdings, Inc.* | | | 628 | | | | 77,690 | |
Warner Music Group Corp. — Class A | | | 2,281 | | | | 71,395 | |
Flutter Entertainment plc* | | | 293 | | | | 69,523 | |
Caesars Entertainment, Inc.* | | | 1,364 | | | | 56,933 | |
Churchill Downs, Inc. | | | 386 | | | | 52,191 | |
Light & Wonder, Inc. — Class A* | | | 500 | | | | 45,365 | |
Vail Resorts, Inc. | | | 250 | | | | 43,573 | |
Red Rock Resorts, Inc. — Class A | | | 718 | | | | 39,088 | |
Cinemark Holdings, Inc.* | | | 1,087 | | | | 30,262 | |
Penn Entertainment, Inc.* | | | 1,600 | | | | 30,176 | |
International Game Technology plc | | | 1,293 | | | | 27,541 | |
Marriott Vacations Worldwide Corp. | | | 374 | | | | 27,482 | |
United Parks & Resorts, Inc.* | | | 432 | | | | 21,859 | |
AMC Entertainment Holdings, Inc. — Class A* | | | 4,791 | | | | 21,799 | |
Total Entertainment | | | | | | | 771,360 | |
| | | | | | | | | |
Lodging - 9.2% |
Marriott International, Inc. — Class A | | | 551 | | | | 136,979 | |
Hilton Worldwide Holdings, Inc. | | | 590 | | | | 135,995 | |
Las Vegas Sands Corp. | | | 1,692 | | | | 85,175 | |
Hyatt Hotels Corp. — Class A | | | 460 | | | | 70,012 | |
Wynn Resorts Ltd. | | | 625 | | | | 59,925 | |
MGM Resorts International* | | | 1,390 | | | | 54,335 | |
Wyndham Hotels & Resorts, Inc. | | | 556 | | | | 43,446 | |
Boyd Gaming Corp. | | | 583 | | | | 37,691 | |
Choice Hotels International, Inc.1 | | | 262 | | | | 34,138 | |
Total Lodging | | | | | | | 657,696 | |
| | | | | | | | | |
Leisure Time - 7.3% |
Royal Caribbean Cruises Ltd. | | | 641 | | | | 113,688 | |
Carnival Corp.* | | | 4,375 | | | | 80,850 | |
Planet Fitness, Inc. — Class A* | | | 677 | | | | 54,986 | |
Norwegian Cruise Line Holdings Ltd.* | | | 2,657 | | | | 54,495 | |
Brunswick Corp. | | | 524 | | | | 43,922 | |
Harley-Davidson, Inc. | | | 1,028 | | | | 39,609 | |
Polaris, Inc. | | | 460 | | | | 38,290 | |
YETI Holdings, Inc.* | | | 840 | | | | 34,465 | |
Peloton Interactive, Inc. — Class A* | | | 5,275 | | | | 24,687 | |
Topgolf Callaway Brands Corp.* | | | 2,204 | | | | 24,200 | |
Sabre Corp.* | | | 4,315 | | | | 15,836 | |
Total Leisure Time | | | | | | | 525,028 | |
| | | | | | | | | |
Agriculture - 6.5% |
Philip Morris International, Inc. | | | 2,007 | | | | 243,650 | |
Altria Group, Inc. | | | 3,215 | | | | 164,093 | |
British American Tobacco plc ADR | | | 1,588 | | | | 58,089 | |
Total Agriculture | | | | | | | 465,832 | |
| | | | | | | | | |
Software - 5.2% |
Electronic Arts, Inc. | | | 757 | | | | 108,584 | |
Take-Two Interactive Software, Inc.* | | | 588 | | | | 90,382 | |
ROBLOX Corp. — Class A* | | | 1,988 | | | | 87,989 | |
SEE NOTES TO FINANCIAL STATEMENTS. | THE RYDEX FUNDS SEMI-ANNUAL FINANCIAL REPORT | 75 |
SCHEDULE OF INVESTMENTS (Unaudited)(concluded) | September 30, 2024 |
LEISURE FUND | |
| | Shares | | | Value | |
NetEase, Inc. ADR | | | 879 | | | $ | 82,195 | |
Total Software | | | | | | | 369,150 | |
| | | | | | | | | |
Beverages - 4.5% |
Constellation Brands, Inc. — Class A | | | 450 | | | | 115,961 | |
Brown-Forman Corp. — Class B | | | 1,755 | | | | 86,346 | |
Anheuser-Busch InBev S.A. ADR | | | 936 | | | | 62,047 | |
Molson Coors Beverage Co. — Class B | | | 1,044 | | | | 60,051 | |
Total Beverages | | | | | | | 324,405 | |
| | | | | | | | | |
Toys, Games & Hobbies - 1.4% |
Hasbro, Inc. | | | 775 | | | | 56,048 | |
Mattel, Inc.* | | | 2,383 | | | | 45,396 | |
Total Toys, Games & Hobbies | | | | | | | 101,444 | |
| | | | | | | | | |
Food Service - 0.8% |
Aramark | | | 1,469 | | | | 56,894 | |
| | | | | | | | | |
Total Common Stocks | | | | |
(Cost $3,924,980) | | | | | | | 7,129,371 | |
| | Face
Amount | | | Value | |
REPURCHASE AGREEMENTS††,2 - 0.5% |
J.P. Morgan Securities LLC
issued 09/30/24 at 4.86%
due 10/01/24 | | $ | 20,315 | | | $ | 20,315 | |
BofA Securities, Inc.
issued 09/30/24 at 4.85%
due 10/01/24 | | | 16,780 | | | | 16,780 | |
Total Repurchase Agreements | | | | |
(Cost $37,095) | | | | | | | 37,095 | |
| | | | | | | | | |
| | | Shares | | | | | |
SECURITIES LENDING COLLATERAL†,3 - 1.4% |
Money Market Fund*** | | | | | | | | |
First American Government Obligations Fund - Class X, 4.82%4 | | | 96,913 | | | | 96,913 | |
Total Securities Lending Collateral | | | | |
(Cost $96,913) | | | | | | | 96,913 | |
| | | | | | | | | |
Total Investments - 101.5% | | | | |
(Cost $4,058,988) | | $ | 7,263,379 | |
Other Assets & Liabilities, net - (1.5)% | | | (108,449 | ) |
Total Net Assets - 100.0% | | $ | 7,154,930 | |
* | Non-income producing security. |
*** | A copy of each underlying unaffiliated fund’s financial statements is available at the SEC’s website at www.sec.gov. |
† | Value determined based on Level 1 inputs — See Note 4. |
†† | Value determined based on Level 2 inputs — See Note 4. |
1 | All or a portion of this security is on loan at September 30, 2024 — See Note 7. |
2 | Repurchase Agreements — See Note 6. |
3 | Securities lending collateral — See Note 7. |
4 | Rate indicated is the 7-day yield as of September 30, 2024. |
| | ADR — American Depositary Receipt |
| | plc — Public Limited Company |
| | |
| | See Sector Classification in Other Information section. |
The following table summarizes the inputs used to value the Fund’s investments at September 30, 2024 (See Note 4 in the Notes to Financial Statements):
Investments in Securities (Assets) | | Level 1
Quoted
Prices | | | Level 2
Significant
Observable
Inputs | | | Level 3
Significant
Unobservable
Inputs | | | Total | |
Common Stocks | | $ | 7,129,371 | | | $ | — | | | $ | — | | | $ | 7,129,371 | |
Repurchase Agreements | | | — | | | | 37,095 | | | | — | | | | 37,095 | |
Securities Lending Collateral | | | 96,913 | | | | — | | | | — | | | | 96,913 | |
Total Assets | | $ | 7,226,284 | | | $ | 37,095 | | | $ | — | | | $ | 7,263,379 | |
76 | THE RYDEX FUNDS SEMI-ANNUAL FINANCIAL REPORT | SEE NOTES TO FINANCIAL STATEMENTS. |
STATEMENT OF ASSETS AND LIABILITIES (Unaudited) |
September 30, 2024 |
Assets: |
Investments, at value - including $93,073 of securities loaned (cost $4,021,893) | | $ | 7,226,284 | |
Repurchase agreements, at value (cost $37,095) | | | 37,095 | |
Receivables: |
Dividends | | | 9,142 | |
Fund shares sold | | | 1,004 | |
Securities lending income | | | 557 | |
Interest | | | 5 | |
Total assets | | | 7,274,087 | |
| | | | | |
Liabilities: |
Payable for: |
Return of securities lending collateral | | | 96,913 | |
Fund shares redeemed | | | 9,370 | |
Management fees | | | 4,479 | |
Transfer agent fees | | | 2,987 | |
Distribution and service fees | | | 694 | |
Portfolio accounting and administration fees | | | 541 | |
Trustees’ fees* | | | 59 | |
Miscellaneous | | | 4,114 | |
Total liabilities | | | 119,157 | |
Net assets | | $ | 7,154,930 | |
| | | | | |
Net assets consist of: |
Paid in capital | | $ | 5,497,806 | |
Total distributable earnings (loss) | | | 1,657,124 | |
Net assets | | $ | 7,154,930 | |
| | | | | |
Investor Class: |
Net assets | | $ | 4,236,601 | |
Capital shares outstanding | | | 47,961 | |
Net asset value per share | | $ | 88.33 | |
| | | | | |
Class A: |
Net assets | | $ | 1,710,164 | |
Capital shares outstanding | | | 21,575 | |
Net asset value per share | | $ | 79.27 | |
Maximum offering price per share (Net asset value divided by 95.25%) | | $ | 83.22 | |
| | | | | |
Class C: |
Net assets | | $ | 272,915 | |
Capital shares outstanding | | | 4,107 | |
Net asset value per share | | $ | 66.45 | |
| | | | | |
Class H: |
Net assets | | $ | 935,250 | |
Capital shares outstanding | | | 12,175 | |
Net asset value per share | | $ | 76.82 | |
STATEMENT OF OPERATIONS (Unaudited) |
Six Months Ended September 30, 2024 |
Investment Income: |
Dividends (net of foreign withholding tax of $194) | | $ | 52,537 | |
Interest | | | 851 | |
Income from securities lending, net | | | 3,434 | |
Total investment income | | | 56,822 | |
| | | | | |
Expenses: |
Management fees | | | 29,686 | |
Distribution and service fees: |
Class A | | | 2,171 | |
Class C | | | 1,342 | |
Class H | | | 1,392 | |
Transfer agent fees | | | 7,223 | |
Portfolio accounting and administration fees | | | 5,329 | |
Registration fees | | | 4,276 | |
Professional fees | | | 1,455 | |
Trustees’ fees* | | | 463 | |
Custodian fees | | | 447 | |
Line of credit fees | | | 14 | |
Miscellaneous | | | 584 | |
Total expenses | | | 54,382 | |
Less: |
Expenses reimbursed by Adviser | | | (1,745 | ) |
Net expenses | | | 52,637 | |
Net investment income | | | 4,185 | |
| | | | | |
Net Realized and Unrealized Gain (Loss): |
Net realized gain (loss) on: |
Investments | | | 652,784 | |
Net realized gain | | | 652,784 | |
Net change in unrealized appreciation (depreciation) on: |
Investments | | | (331,094 | ) |
Net change in unrealized appreciation (depreciation) | | | (331,094 | ) |
Net realized and unrealized gain | | | 321,690 | |
Net increase in net assets resulting from operations | | $ | 325,875 | |
* | Relates to Trustees not deemed “interested persons” within the meaning of Section 2(a)(19) of the 1940 Act. |
SEE NOTES TO FINANCIAL STATEMENTS. | THE RYDEX FUNDS SEMI-ANNUAL FINANCIAL REPORT | 77 |
STATEMENTS OF CHANGES IN NET ASSETS |
| | Six Months Ended
September 30, 2024
(Unaudited) | | | Year Ended
March 31,
2024 | |
Increase (Decrease) in Net Assets from Operations: | | | | | | | | |
Net investment income | | $ | 4,185 | | | $ | 35,412 | |
Net realized gain on investments | | | 652,784 | | | | 445,439 | |
Net change in unrealized appreciation (depreciation) on investments | | | (331,094 | ) | | | (86,095 | ) |
Net increase in net assets resulting from operations | | | 325,875 | | | | 394,756 | |
| | | | | | | | | |
Distributions to shareholders: | | | | | | | | |
Investor Class | | | — | | | | (4,283 | ) |
Class A | | | — | | | | (1,567 | ) |
Class C | | | — | | | | (220 | ) |
Class H | | | — | | | | (1,111 | ) |
Total distributions to shareholders | | | — | | | | (7,181 | ) |
| | | | | | | | | |
Capital share transactions: | | | | | | | | |
Proceeds from sale of shares | | | | | | | | |
Investor Class | | | 2,822,419 | | | | 28,182,518 | |
Class A | | | 12,869 | | | | 320,756 | |
Class C | | | 26,125 | | | | 19,815 | |
Class H | | | 56,147 | | | | 1,246,731 | |
Distributions reinvested | | | | | | | | |
Investor Class | | | — | | | | 4,166 | |
Class A | | | — | | | | 1,122 | |
Class C | | | — | | | | 220 | |
Class H | | | — | | | | 1,103 | |
Cost of shares redeemed | | | | | | | | |
Investor Class | | | (3,563,749 | ) | | | (43,870,062 | ) |
Class A | | | (280,728 | ) | | | (1,314,667 | ) |
Class C | | | (44,566 | ) | | | (96,413 | ) |
Class H | | | (538,789 | ) | | | (1,868,660 | ) |
Net decrease from capital share transactions | | | (1,510,272 | ) | | | (17,373,371 | ) |
Net decrease in net assets | | | (1,184,397 | ) | | | (16,985,796 | ) |
| | | | | | | | | |
Net assets: | | | | | | | | |
Beginning of period | | | 8,339,327 | | | | 25,325,123 | |
End of period | | $ | 7,154,930 | | | $ | 8,339,327 | |
| | | | | | | | | |
Capital share activity: | | | | | | | | |
Shares sold | | | | | | | | |
Investor Class | | | 34,586 | | | | 368,511 | |
Class A | | | 177 | | | | 4,855 | |
Class C | | | 430 | | | | 347 | |
Class H | | | 795 | | | | 19,672 | |
Shares issued from reinvestment of distributions | | | | | | | | |
Investor Class | | | — | | | | 54 | |
Class A | | | — | | | | 16 | |
Class C | | | — | | | | 4 | |
Class H | | | — | | | | 16 | |
Shares redeemed | | | | | | | | |
Investor Class | | | (43,936 | ) | | | (594,121 | ) |
Class A | | | (3,853 | ) | | | (19,188 | ) |
Class C | | | (717 | ) | | | (1,664 | ) |
Class H | | | (7,629 | ) | | | (28,613 | ) |
Net decrease in shares | | | (20,147 | ) | | | (250,111 | ) |
78 | THE RYDEX FUNDS SEMI-ANNUAL FINANCIAL REPORT | SEE NOTES TO FINANCIAL STATEMENTS. |
This table is presented to show selected data for a share outstanding throughout each period and to assist shareholders in evaluating a Fund’s performance for the periods presented.
Investor Class | | Six Months Ended
September 30, 2024a | | | Year Ended
March 31,
2024 | | | Year Ended
March 31,
2023 | | | Year Ended
March 31,
2022 | | | Year Ended
March 31,
2021 | | | Year Ended
March 31,
2020 | |
Per Share Data |
Net asset value, beginning of period | | $ | 83.50 | | | $ | 72.93 | | | $ | 80.27 | | | $ | 100.94 | | | $ | 53.01 | | | $ | 68.98 | |
Income (loss) from investment operations: |
Net investment income (loss)b | | | .11 | | | | .27 | | | | .21 | | | | (.44 | ) | | | (.34 | ) | | | .08 | |
Net gain (loss) on investments (realized and unrealized) | | | 4.72 | | | | 10.35 | | | | (7.55 | ) | | | (14.80 | ) | | | 48.27 | | | | (15.86 | ) |
Total from investment operations | | | 4.83 | | | | 10.62 | | | | (7.34 | ) | | | (15.24 | ) | | | 47.93 | | | | (15.78 | ) |
Less distributions from: |
Net investment income | | | — | | | | (.05 | ) | | | — | | | | — | | | | — | | | | (.19 | ) |
Net realized gains | | | — | | | | — | | | | — | | | | (5.43 | ) | | | — | | | | — | |
Total distributions | | | — | | | | (.05 | ) | | | — | | | | (5.43 | ) | | | — | | | | (.19 | ) |
Net asset value, end of period | | $ | 88.33 | | | $ | 83.50 | | | $ | 72.93 | | | $ | 80.27 | | | $ | 100.94 | | | $ | 53.01 | |
|
Total Return | | | 5.78 | % | | | 14.58 | % | | | (9.14 | %) | | | (15.52 | %) | | | 90.42 | % | | | (22.96 | %) |
Ratios/Supplemental Data |
Net assets, end of period (in thousands) | | $ | 4,237 | | | $ | 4,786 | | | $ | 20,629 | | | $ | 5,574 | | | $ | 40,995 | | | $ | 2,839 | |
Ratios to average net assets: |
Net investment income (loss) | | | 0.26 | % | | | 0.36 | % | | | 0.30 | % | | | (0.45 | %) | | | (0.39 | %) | | | 0.11 | % |
Total expenses | | | 1.42 | % | | | 1.43 | % | | | 1.39 | % | | | 1.36 | % | | | 1.41 | % | | | 1.48 | % |
Net expensesc | | | 1.37 | % | | | 1.40 | % | | | 1.39 | % | | | 1.36 | % | | | 1.41 | % | | | 1.48 | % |
Portfolio turnover rate | | | 37 | % | | | 214 | % | | | 145 | % | | | 168 | % | | | 144 | % | | | 369 | % |
Class A | | Six Months Ended
September 30, 2024a | | | Year Ended
March 31,
2024 | | | Year Ended
March 31,
2023 | | | Year Ended
March 31,
2022 | | | Year Ended
March 31,
2021 | | | Year Ended
March 31,
2020 | |
Per Share Data |
Net asset value, beginning of period | | $ | 75.02 | | | $ | 65.70 | | | $ | 72.50 | | | $ | 91.96 | | | $ | 48.41 | | | $ | 63.17 | |
Income (loss) from investment operations: |
Net investment income (loss)b | | | .01 | | | | .10 | | | | (.12 | ) | | | (.51 | ) | | | (.41 | ) | | | .01 | |
Net gain (loss) on investments (realized and unrealized) | | | 4.24 | | | | 9.27 | | | | (6.68 | ) | | | (13.52 | ) | | | 43.96 | | | | (14.58 | ) |
Total from investment operations | | | 4.25 | | | | 9.37 | | | | (6.80 | ) | | | (14.03 | ) | | | 43.55 | | | | (14.57 | ) |
Less distributions from: |
Net investment income | | | — | | | | (.05 | ) | | | — | | | | — | | | | — | | | | (.19 | ) |
Net realized gains | | | — | | | | — | | | | — | | | | (5.43 | ) | | | — | | | | — | |
Total distributions | | | — | | | | (.05 | ) | | | — | | | | (5.43 | ) | | | — | | | | (.19 | ) |
Net asset value, end of period | | $ | 79.27 | | | $ | 75.02 | | | $ | 65.70 | | | $ | 72.50 | | | $ | 91.96 | | | $ | 48.41 | |
|
Total Returnd | | | 5.67 | % | | | 14.28 | % | | | (9.38 | %) | | | (15.72 | %) | | | 89.96 | % | | | (23.15 | %) |
Ratios/Supplemental Data |
Net assets, end of period (in thousands) | | $ | 1,710 | | | $ | 1,894 | | | $ | 2,600 | | | $ | 4,351 | | | $ | 4,291 | | | $ | 816 | |
Ratios to average net assets: |
Net investment income (loss) | | | 0.02 | % | | | 0.15 | % | | | (0.20 | %) | | | (0.59 | %) | | | (0.56 | %) | | | 0.02 | % |
Total expenses | | | 1.67 | % | | | 1.68 | % | | | 1.64 | % | | | 1.61 | % | | | 1.68 | % | | | 1.73 | % |
Net expensesc | | | 1.62 | % | | | 1.65 | % | | | 1.64 | % | | | 1.61 | % | | | 1.68 | % | | | 1.73 | % |
Portfolio turnover rate | | | 37 | % | | | 214 | % | | | 145 | % | | | 168 | % | | | 144 | % | | | 369 | % |
SEE NOTES TO FINANCIAL STATEMENTS. | THE RYDEX FUNDS SEMI-ANNUAL FINANCIAL REPORT | 79 |
FINANCIAL HIGHLIGHTS (continued) |
This table is presented to show selected data for a share outstanding throughout each period and to assist shareholders in evaluating a Fund’s performance for the periods presented.
Class C | | Six Months Ended
September 30, 2024a | | | Year Ended
March 31,
2024 | | | Year Ended
March 31,
2023 | | | Year Ended
March 31,
2022 | | | Year Ended
March 31,
2021 | | | Year Ended
March 31,
2020 | |
Per Share Data |
Net asset value, beginning of period | | $ | 63.14 | | | $ | 55.72 | | | $ | 61.94 | | | $ | 80.01 | | | $ | 42.44 | | | $ | 55.82 | |
Income (loss) from investment operations: |
Net investment income (loss)b | | | (.22 | ) | | | (.35 | ) | | | (.50 | ) | | | (1.04 | ) | | | (.87 | ) | | | (.42 | ) |
Net gain (loss) on investments (realized and unrealized) | | | 3.53 | | | | 7.82 | | | | (5.72 | ) | | | (11.60 | ) | | | 38.44 | | | | (12.77 | ) |
Total from investment operations | | | 3.31 | | | | 7.47 | | | | (6.22 | ) | | | (12.64 | ) | | | 37.57 | | | | (13.19 | ) |
Less distributions from: |
Net investment income | | | — | | | | (.05 | ) | | | — | | | | — | | | | — | | | | (.19 | ) |
Net realized gains | | | — | | | | — | | | | — | | | | (5.43 | ) | | | — | | | | — | |
Total distributions | | | — | | | | (.05 | ) | | | — | | | | (5.43 | ) | | | — | | | | (.19 | ) |
Net asset value, end of period | | $ | 66.45 | | | $ | 63.14 | | | $ | 55.72 | | | $ | 61.94 | | | $ | 80.01 | | | $ | 42.44 | |
|
Total Returnd | | | 5.24 | % | | | 13.43 | % | | | (10.04 | %) | | | (16.35 | %) | | | 88.52 | % | | | (23.73 | %) |
Ratios/Supplemental Data |
Net assets, end of period (in thousands) | | $ | 273 | | | $ | 277 | | | $ | 318 | | | $ | 591 | | | $ | 942 | | | $ | 398 | |
Ratios to average net assets: |
Net investment income (loss) | | | (0.73 | %) | | | (0.60 | %) | | | (0.96 | %) | | | (1.38 | %) | | | (1.36 | %) | | | (0.74 | %) |
Total expenses | | | 2.42 | % | | | 2.43 | % | | | 2.39 | % | | | 2.36 | % | | | 2.44 | % | | | 2.48 | % |
Net expensesc | | | 2.37 | % | | | 2.40 | % | | | 2.39 | % | | | 2.36 | % | | | 2.44 | % | | | 2.48 | % |
Portfolio turnover rate | | | 37 | % | | | 214 | % | | | 145 | % | | | 168 | % | | | 144 | % | | | 369 | % |
80 | THE RYDEX FUNDS SEMI-ANNUAL FINANCIAL REPORT | SEE NOTES TO FINANCIAL STATEMENTS. |
FINANCIAL HIGHLIGHTS (concluded) |
This table is presented to show selected data for a share outstanding throughout each period and to assist shareholders in evaluating a Fund’s performance for the periods presented.
Class H | | Six Months Ended
September 30, 2024a | | | Year Ended
March 31,
2024 | | | Year Ended
March 31,
2023 | | | Year Ended
March 31,
2022 | | | Year Ended
March 31,
2021 | | | Year Ended
March 31,
2020 | |
Per Share Data |
Net asset value, beginning of period | | $ | 72.70 | | | $ | 63.67 | | | $ | 70.26 | | | $ | 89.30 | | | $ | 47.01 | | | $ | 61.36 | |
Income (loss) from investment operations: |
Net investment income (loss)b | | | — | | | | .10 | | | | (.10 | ) | | | (.59 | ) | | | (.40 | ) | | | (.01 | ) |
Net gain (loss) on investments (realized and unrealized) | | | 4.12 | | | | 8.98 | | | | (6.49 | ) | | | (13.02 | ) | | | 42.69 | | | | (14.15 | ) |
Total from investment operations | | | 4.12 | | | | 9.08 | | | | (6.59 | ) | | | (13.61 | ) | | | 42.29 | | | | (14.16 | ) |
Less distributions from: |
Net investment income | | | — | | | | (.05 | ) | | | — | | | | — | | | | — | | | | (.19 | ) |
Net realized gains | | | — | | | | — | | | | — | | | | (5.43 | ) | | | — | | | | — | |
Total distributions | | | — | | | | (.05 | ) | | | — | | | | (5.43 | ) | | | — | | | | (.19 | ) |
Net asset value, end of period | | $ | 76.82 | | | $ | 72.70 | | | $ | 63.67 | | | $ | 70.26 | | | $ | 89.30 | | | $ | 47.01 | |
|
Total Return | | | 5.67 | % | | | 14.26 | % | | | (9.38 | %) | | | (15.72 | %) | | | 89.96 | % | | | (23.17 | %) |
Ratios/Supplemental Data |
Net assets, end of period (in thousands) | | $ | 935 | | | $ | 1,382 | | | $ | 1,779 | | | $ | 2,023 | | | $ | 6,594 | | | $ | 976 | |
Ratios to average net assets: |
Net investment income (loss) | | | (0.01 | %) | | | 0.15 | % | | | (0.16 | %) | | | (0.69 | %) | | | (0.55 | %) | | | (0.01 | %) |
Total expenses | | | 1.66 | % | | | 1.68 | % | | | 1.64 | % | | | 1.61 | % | | | 1.68 | % | | | 1.72 | % |
Net expensesc | | | 1.61 | % | | | 1.65 | % | | | 1.64 | % | | | 1.61 | % | | | 1.68 | % | | | 1.72 | % |
Portfolio turnover rate | | | 37 | % | | | 214 | % | | | 145 | % | | | 168 | % | | | 144 | % | | | 369 | % |
a | Unaudited figures for the period ended September 30, 2024. Percentage amounts for the period, except total return and portfolio turnover rate, have been annualized. |
b | Net investment income (loss) per share was computed using average shares outstanding throughout the period. |
c | Net expense information reflects the expense ratios after expense waivers and reimbursements, as applicable. |
d | Total return does not reflect the impact of any applicable sales charges. |
SEE NOTES TO FINANCIAL STATEMENTS. | THE RYDEX FUNDS SEMI-ANNUAL FINANCIAL REPORT | 81 |
SCHEDULE OF INVESTMENTS (Unaudited) | September 30, 2024 |
PRECIOUS METALS FUND | |
| | Shares | | | Value | |
COMMON STOCKS† - 99.5% |
| | | | | | | | | |
Mining - 99.5% |
Freeport-McMoRan, Inc. | | | 215,442 | | | $ | 10,754,865 | |
Newmont Corp. | | | 171,366 | | | | 9,159,513 | |
Agnico Eagle Mines Ltd. | | | 87,701 | | | | 7,065,193 | |
Barrick Gold Corp. | | | 336,207 | | | | 6,687,157 | |
Wheaton Precious Metals Corp. | | | 99,491 | | | | 6,076,910 | |
Gold Fields Ltd. ADR | | | 288,057 | | | | 4,421,675 | |
Franco-Nevada Corp. | | | 32,949 | | | | 4,093,913 | |
Kinross Gold Corp. | | | 410,052 | | | | 3,838,087 | |
Anglogold Ashanti plc1 | | | 133,631 | | | | 3,558,593 | |
Royal Gold, Inc. | | | 25,022 | | | | 3,510,587 | |
Alamos Gold, Inc. — Class A | | | 166,033 | | | | 3,310,698 | |
Pan American Silver Corp. | | | 151,946 | | | | 3,171,113 | |
Hecla Mining Co. | | | 353,061 | | | | 2,354,917 | |
Osisko Gold Royalties Ltd. | | | 117,950 | | | | 2,183,254 | |
Eldorado Gold Corp.* | | | 122,754 | | | | 2,132,237 | |
Harmony Gold Mining Company Ltd. ADR | | | 200,135 | | | | 2,035,373 | |
IAMGOLD Corp.* | | | 369,242 | | | | 1,931,136 | |
Coeur Mining, Inc.* | | | 257,491 | | | | 1,771,538 | |
Equinox Gold Corp.* | | | 288,941 | | | | 1,759,651 | |
B2Gold Corp. | | | 558,518 | | | | 1,720,235 | |
Sibanye Stillwater Ltd. ADR1 | | | 411,627 | | | | 1,691,787 | |
Sandstorm Gold Ltd. | | | 256,712 | | | | 1,540,272 | |
First Majestic Silver Corp.1 | | | 251,456 | | | | 1,508,736 | |
MAG Silver Corp.*,1 | | | 99,481 | | | | 1,396,713 | |
Fortuna Mining Corp.*,1 | | | 295,465 | | | | 1,368,003 | |
SilverCrest Metals, Inc.* | | | 147,593 | | | | 1,365,235 | |
Seabridge Gold, Inc.* | | | 76,775 | | | | 1,289,052 | |
SSR Mining, Inc.* | | | 214,740 | | | | 1,219,723 | |
New Gold, Inc.*,1 | | | 403,979 | | | | 1,163,459 | |
Silvercorp Metals, Inc.1 | | | 263,544 | | | | 1,151,687 | |
Novagold Resources, Inc.* | | | 272,298 | | | | 1,116,422 | |
Endeavour Silver Corp.*,1 | | | 251,197 | | | | 989,716 | |
Gatos Silver, Inc.* | | | 63,957 | | | | 964,472 | |
McEwen Mining, Inc.* | | | 78,534 | | | | 730,366 | |
Total Mining | | | | | | | 99,032,288 | |
| | | | | | | | | |
Total Common Stocks | | | | |
(Cost $64,670,668) | | | | | | | 99,032,288 | |
| | Face
Amount | | | Value | |
REPURCHASE AGREEMENTS††,2 - 0.7% |
J.P. Morgan Securities LLC
issued 09/30/24 at 4.86%
due 10/01/24 | | $ | 377,942 | | | $ | 377,942 | |
BofA Securities, Inc.
issued 09/30/24 at 4.85%
due 10/01/24 | | | 312,163 | | | | 312,163 | |
Total Repurchase Agreements | | | | |
(Cost $690,105) | | | | | | | 690,105 | |
| | | | | | | | | |
| | | Shares | | | | | |
SECURITIES LENDING COLLATERAL†,3 - 7.6% |
Money Market Fund*** | | | | | | | | |
First American Government Obligations Fund - Class X, 4.82%4 | | | 7,547,657 | | | | 7,547,657 | |
Total Securities Lending Collateral | | | | |
(Cost $7,547,657) | | | | | | | 7,547,657 | |
| | | | | | | | | |
Total Investments - 107.8% | | | | |
(Cost $72,908,430) | | $ | 107,270,050 | |
Other Assets & Liabilities, net - (7.8)% | | | (7,766,498 | ) |
Total Net Assets - 100.0% | | $ | 99,503,552 | |
* | Non-income producing security. |
*** | A copy of each underlying unaffiliated fund’s financial statements is available at the SEC’s website at www.sec.gov. |
† | Value determined based on Level 1 inputs — See Note 4. |
†† | Value determined based on Level 2 inputs — See Note 4. |
1 | All or a portion of this security is on loan at September 30, 2024 — See Note 7. |
2 | Repurchase Agreements — See Note 6. |
3 | Securities lending collateral — See Note 7. |
4 | Rate indicated is the 7-day yield as of September 30, 2024. |
| | ADR — American Depositary Receipt |
| | plc — Public Limited Company |
| | |
| | See Sector Classification in Other Information section. |
82 | THE RYDEX FUNDS SEMI-ANNUAL FINANCIAL REPORT | SEE NOTES TO FINANCIAL STATEMENTS. |
SCHEDULE OF INVESTMENTS (Unaudited)(concluded) | September 30, 2024 |
PRECIOUS METALS FUND | |
The following table summarizes the inputs used to value the Fund’s investments at September 30, 2024 (See Note 4 in the Notes to Financial Statements):
Investments in Securities (Assets) | | Level 1
Quoted
Prices | | | Level 2
Significant
Observable
Inputs | | | Level 3
Significant
Unobservable
Inputs | | | Total | |
Common Stocks | | $ | 99,032,288 | | | $ | — | | | $ | — | | | $ | 99,032,288 | |
Repurchase Agreements | | | — | | | | 690,105 | | | | — | | | | 690,105 | |
Securities Lending Collateral | | | 7,547,657 | | | | — | | | | — | | | | 7,547,657 | |
Total Assets | | $ | 106,579,945 | | | $ | 690,105 | | | $ | — | | | $ | 107,270,050 | |
SEE NOTES TO FINANCIAL STATEMENTS. | THE RYDEX FUNDS SEMI-ANNUAL FINANCIAL REPORT | 83 |
STATEMENT OF ASSETS AND LIABILITIES (Unaudited) |
September 30, 2024 |
Assets: |
Investments, at value - including $6,982,138 of securities loaned (cost $72,218,325) | | $ | 106,579,945 | |
Repurchase agreements, at value (cost $690,105) | | | 690,105 | |
Receivables: |
Securities sold | | | 6,875,051 | |
Fund shares sold | | | 935,281 | |
Dividends | | | 5,157 | |
Foreign tax reclaims | | | 1,956 | |
Securities lending income | | | 1,319 | |
Interest | | | 93 | |
Total assets | | | 115,088,907 | |
| | | | | |
Liabilities: |
Payable for: |
Fund shares redeemed | | | 7,877,492 | |
Return of securities lending collateral | | | 7,547,657 | |
Management fees | | | 56,156 | |
Transfer agent fees | | | 38,913 | |
Portfolio accounting and administration fees | | | 7,683 | |
Distribution and service fees | | | 2,721 | |
Trustees’ fees* | | | 802 | |
Miscellaneous | | | 53,931 | |
Total liabilities | | | 15,585,355 | |
Net assets | | $ | 99,503,552 | |
| | | | | |
Net assets consist of: |
Paid in capital | | $ | 136,370,817 | |
Total distributable earnings (loss) | | | (36,867,265 | ) |
Net assets | | $ | 99,503,552 | |
| | | | | |
Investor Class: |
Net assets | | $ | 87,731,152 | |
Capital shares outstanding | | | 2,012,711 | |
Net asset value per share | | $ | 43.59 | |
| | | | | |
Class A: |
Net assets | | $ | 8,532,808 | |
Capital shares outstanding | | | 211,184 | |
Net asset value per share | | $ | 40.40 | |
Maximum offering price per share (Net asset value divided by 95.25%) | | $ | 42.41 | |
| | | | | |
Class C: |
Net assets | | $ | 988,491 | |
Capital shares outstanding | | | 31,484 | |
Net asset value per share | | $ | 31.40 | |
| | | | | |
Class H: |
Net assets | | $ | 2,251,101 | |
Capital shares outstanding | | | 58,071 | |
Net asset value per share | | $ | 38.76 | |
STATEMENT OF OPERATIONS (Unaudited) |
Six Months Ended September 30, 2024 |
Investment Income: |
Dividends (net of foreign withholding tax of $53,461) | | $ | 486,060 | |
Interest | | | 11,384 | |
Income from securities lending, net | | | 6,242 | |
Total investment income | | | 503,686 | |
| | | | | |
Expenses: |
Management fees | | | 299,897 | |
Distribution and service fees: |
Class A | | | 9,866 | |
Class C | | | 4,993 | |
Class H | | | 3,883 | |
Transfer agent fees | | | 82,773 | |
Portfolio accounting and administration fees | | | 61,008 | |
Registration fees | | | 16,996 | |
Professional fees | | | 16,192 | |
Custodian fees | | | 5,055 | |
Trustees’ fees* | | | 3,090 | |
Miscellaneous | | | 45,297 | |
Total expenses | | | 549,050 | |
Less: |
Expenses reimbursed by Adviser | | | (19,975 | ) |
Net expenses | | | 529,075 | |
Net investment loss | | | (25,389 | ) |
| | | | | |
Net Realized and Unrealized Gain (Loss): |
Net realized gain (loss) on: |
Investments | | | (702,626 | ) |
Foreign currency transactions | | | 3 | |
Net realized loss | | | (702,623 | ) |
Net change in unrealized appreciation (depreciation) on: |
Investments | | | 17,584,067 | |
Net change in unrealized appreciation (depreciation) | | | 17,584,067 | |
Net realized and unrealized gain | | | 16,881,444 | |
Net increase in net assets resulting from operations | | $ | 16,856,055 | |
* | Relates to Trustees not deemed “interested persons” within the meaning of Section 2(a)(19) of the 1940 Act. |
84 | THE RYDEX FUNDS SEMI-ANNUAL FINANCIAL REPORT | SEE NOTES TO FINANCIAL STATEMENTS. |
STATEMENTS OF CHANGES IN NET ASSETS |
| | Six Months Ended
September 30, 2024
(Unaudited) | | | Year Ended
March 31,
2024 | |
Increase (Decrease) in Net Assets from Operations: | | | | | | | | |
Net investment income (loss) | | $ | (25,389 | ) | | $ | 77,389 | |
Net realized loss on investments | | | (702,623 | ) | | | (3,579,217 | ) |
Net change in unrealized appreciation (depreciation) on investments | | | 17,584,067 | | | | (2,840,129 | ) |
Net increase (decrease) in net assets resulting from operations | | | 16,856,055 | | | | (6,341,957 | ) |
| | | | | | | | | |
Distributions to shareholders: | | | | | | | | |
Investor Class | | | — | | | | (1,400,288 | ) |
Class A | | | — | | | | (280,268 | ) |
Class C | | | — | | | | (63,185 | ) |
Class H | | | — | | | | (78,773 | ) |
Total distributions to shareholders | | | — | | | | (1,822,514 | ) |
| | | | | | | | | |
Capital share transactions: | | | | | | | | |
Proceeds from sale of shares | | | | | | | | |
Investor Class | | | 298,705,388 | | | | 313,283,695 | |
Class A | | | 1,314,818 | | | | 2,870,709 | |
Class C | | | 277,844 | | | | 691,727 | |
Class H | | | 4,107,151 | | | | 2,898,452 | |
Distributions reinvested | | | | | | | | |
Investor Class | | | — | | | | 1,350,549 | |
Class A | | | — | | | | 272,009 | |
Class C | | | — | | | | 63,121 | |
Class H | | | — | | | | 78,773 | |
Cost of shares redeemed | | | | | | | | |
Investor Class | | | (276,543,641 | ) | | | (330,913,484 | ) |
Class A | | | (1,653,448 | ) | | | (3,922,482 | ) |
Class C | | | (529,982 | ) | | | (1,371,976 | ) |
Class H | | | (4,580,102 | ) | | | (3,056,070 | ) |
Net increase (decrease) from capital share transactions | | | 21,098,028 | | | | (17,754,977 | ) |
Net increase (decrease) in net assets | | | 37,954,083 | | | | (25,919,448 | ) |
| | | | | | | | | |
Net assets: | | | | | | | | |
Beginning of period | | | 61,549,469 | | | | 87,468,917 | |
End of period | | $ | 99,503,552 | | | $ | 61,549,469 | |
| | | | | | | | | |
Capital share activity: | | | | | | | | |
Shares sold | | | | | | | | |
Investor Class | | | 7,556,188 | | | | 9,492,990 | |
Class A | | | 35,603 | | | | 90,664 | |
Class C | | | 9,554 | | | | 26,656 | |
Class H | | | 117,673 | | | | 92,253 | |
Shares issued from reinvestment of distributions | | | | | | | | |
Investor Class | | | — | | | | 43,176 | |
Class A | | | — | | | | 9,363 | |
Class C | | | — | | | | 2,779 | |
Class H | | | — | | | | 2,826 | |
Shares redeemed | | | | | | | | |
Investor Class | | | (7,013,908 | ) | | | (10,049,980 | ) |
Class A | | | (45,487 | ) | | | (127,787 | ) |
Class C | | | (18,749 | ) | | | (54,849 | ) |
Class H | | | (129,469 | ) | | | (102,337 | ) |
Net increase (decrease) in shares | | | 511,405 | | | | (574,246 | ) |
SEE NOTES TO FINANCIAL STATEMENTS. | THE RYDEX FUNDS SEMI-ANNUAL FINANCIAL REPORT | 85 |
This table is presented to show selected data for a share outstanding throughout each period and to assist shareholders in evaluating a Fund’s performance for the periods presented.
Investor Class | | Six Months Ended
September 30, 2024a | | | Year Ended
March 31,
2024 | | | Year Ended
March 31,
2023 | | | Year Ended
March 31,
2022 | | | Year Ended
March 31,
2021 | | | Year Ended
March 31,
2020 | |
Per Share Data |
Net asset value, beginning of period | | $ | 34.83 | | | $ | 37.47 | | | $ | 47.98 | | | $ | 44.22 | | | $ | 26.50 | | | $ | 26.14 | |
Income (loss) from investment operations: |
Net investment income (loss)b | | | — | f | | | .06 | | | | .18 | | | | .16 | | | | (.06 | ) | | | (.12 | ) |
Net gain (loss) on investments (realized and unrealized) | | | 8.76 | | | | (1.50 | ) | | | (8.26 | ) | | | 6.21 | | | | 18.28 | | | | 1.23 | e |
Total from investment operations | | | 8.76 | | | | (1.44 | ) | | | (8.08 | ) | | | 6.37 | | | | 18.22 | | | | 1.11 | |
Less distributions from: |
Net investment income | | | — | | | | (1.20 | ) | | | (2.43 | ) | | | (2.61 | ) | | | (.50 | ) | | | (.75 | ) |
Total distributions | | | — | | | | (1.20 | ) | | | (2.43 | ) | | | (2.61 | ) | | | (.50 | ) | | | (.75 | ) |
Net asset value, end of period | | $ | 43.59 | | | $ | 34.83 | | | $ | 37.47 | | | $ | 47.98 | | | $ | 44.22 | | | $ | 26.50 | |
|
Total Return | | | 25.15 | % | | | (3.46 | %) | | | (16.34 | %) | | | 15.84 | % | | | 68.71 | % | | | 3.65 | % |
Ratios/Supplemental Data |
Net assets, end of period (in thousands) | | $ | 87,731 | | | $ | 51,211 | | | $ | 74,345 | | | $ | 63,069 | | | $ | 87,174 | | | $ | 46,153 | |
Ratios to average net assets: |
Net investment income (loss) | | | (0.01 | %) | | | 0.19 | % | | | 0.48 | % | | | 0.35 | % | | | (0.13 | %) | | | (0.40 | %) |
Total expenses | | | 1.33 | % | | | 1.33 | % | | | 1.30 | % | | | 1.26 | % | | | 1.34 | % | | | 1.38 | % |
Net expensesc | | | 1.28 | % | | | 1.30 | % | | | 1.30 | % | | | 1.26 | % | | | 1.34 | % | | | 1.38 | % |
Portfolio turnover rate | | | 250 | % | | | 387 | % | | | 424 | % | | | 114 | % | | | 281 | % | | | 277 | % |
Class A | | Six Months Ended
September 30, 2024a | | | Year Ended
March 31,
2024 | | | Year Ended
March 31,
2023 | | | Year Ended
March 31,
2022 | | | Year Ended
March 31,
2021 | | | Year Ended
March 31,
2020 | |
Per Share Data |
Net asset value, beginning of period | | $ | 32.33 | | | $ | 34.96 | | | $ | 45.09 | | | $ | 41.82 | | | $ | 25.14 | | | $ | 24.89 | |
Income (loss) from investment operations: |
Net investment income (loss)b | | | (.05 | ) | | | (.01 | ) | | | .08 | | | | .04 | | | | (.17 | ) | | | (.19 | ) |
Net gain (loss) on investments (realized and unrealized) | | | 8.12 | | | | (1.42 | ) | | | (7.78 | ) | | | 5.84 | | | | 17.35 | | | | 1.19 | e |
Total from investment operations | | | 8.07 | | | | (1.43 | ) | | | (7.70 | ) | | | 5.88 | | | | 17.18 | | | | 1.00 | |
Less distributions from: |
Net investment income | | | — | | | | (1.20 | ) | | | (2.43 | ) | | | (2.61 | ) | | | (.50 | ) | | | (.75 | ) |
Total distributions | | | — | | | | (1.20 | ) | | | (2.43 | ) | | | (2.61 | ) | | | (.50 | ) | | | (.75 | ) |
Net asset value, end of period | | $ | 40.40 | | | $ | 32.33 | | | $ | 34.96 | | | $ | 45.09 | | | $ | 41.82 | | | $ | 25.14 | |
|
Total Returnd | | | 24.96 | % | | | (3.68 | %) | | | (16.54 | %) | | | 15.57 | % | | | 68.28 | % | | | 3.39 | % |
Ratios/Supplemental Data |
Net assets, end of period (in thousands) | | $ | 8,533 | | | $ | 7,146 | | | $ | 8,698 | | | $ | 11,664 | | | $ | 18,801 | | | $ | 12,803 | |
Ratios to average net assets: |
Net investment income (loss) | | | (0.26 | %) | | | (0.02 | %) | | | 0.23 | % | | | 0.08 | % | | | (0.41 | %) | | | (0.67 | %) |
Total expenses | | | 1.57 | % | | | 1.58 | % | | | 1.54 | % | | | 1.51 | % | | | 1.59 | % | | | 1.63 | % |
Net expensesc | | | 1.52 | % | | | 1.55 | % | | | 1.54 | % | | | 1.51 | % | | | 1.59 | % | | | 1.63 | % |
Portfolio turnover rate | | | 250 | % | | | 387 | % | | | 424 | % | | | 114 | % | | | 281 | % | | | 277 | % |
86 | THE RYDEX FUNDS SEMI-ANNUAL FINANCIAL REPORT | SEE NOTES TO FINANCIAL STATEMENTS. |
FINANCIAL HIGHLIGHTS (continued) |
This table is presented to show selected data for a share outstanding throughout each period and to assist shareholders in evaluating a Fund’s performance for the periods presented.
Class C | | Six Months Ended
September 30, 2024a | | | Year Ended
March 31,
2024 | | | Year Ended
March 31,
2023 | | | Year Ended
March 31,
2022 | | | Year Ended
March 31,
2021 | | | Year Ended
March 31,
2020 | |
Per Share Data |
Net asset value, beginning of period | | $ | 25.21 | | | $ | 27.77 | | | $ | 36.75 | | | $ | 34.86 | | | $ | 21.16 | | | $ | 21.19 | |
Income (loss) from investment operations: |
Net investment income (loss)b | | | (.14 | ) | | | (.19 | ) | | | (.13 | ) | | | (.21 | ) | | | (.43 | ) | | | (.35 | ) |
Net gain (loss) on investments (realized and unrealized) | | | 6.33 | | | | (1.17 | ) | | | (6.42 | ) | | | 4.71 | | | | 14.63 | | | | 1.07 | e |
Total from investment operations | | | 6.19 | | | | (1.36 | ) | | | (6.55 | ) | | | 4.50 | | | | 14.20 | | | | .72 | |
Less distributions from: |
Net investment income | | | — | | | | (1.20 | ) | | | (2.43 | ) | | | (2.61 | ) | | | (.50 | ) | | | (.75 | ) |
Total distributions | | | — | | | | (1.20 | ) | | | (2.43 | ) | | | (2.61 | ) | | | (.50 | ) | | | (.75 | ) |
Net asset value, end of period | | $ | 31.40 | | | $ | 25.21 | | | $ | 27.77 | | | $ | 36.75 | | | $ | 34.86 | | | $ | 21.16 | |
|
Total Returnd | | | 24.55 | % | | | (4.43 | %) | | | (17.16 | %) | | | 14.70 | % | | | 67.04 | % | | | 2.65 | % |
Ratios/Supplemental Data |
Net assets, end of period (in thousands) | | $ | 988 | | | $ | 1,026 | | | $ | 1,836 | | | $ | 2,231 | | | $ | 2,086 | | | $ | 1,686 | |
Ratios to average net assets: |
Net investment income (loss) | | | (1.00 | %) | | | (0.76 | %) | | | (0.48 | %) | | | (0.59 | %) | | | (1.20 | %) | | | (1.41 | %) |
Total expenses | | | 2.31 | % | | | 2.33 | % | | | 2.29 | % | | | 2.26 | % | | | 2.35 | % | | | 2.38 | % |
Net expensesc | | | 2.26 | % | | | 2.30 | % | | | 2.29 | % | | | 2.26 | % | | | 2.35 | % | | | 2.38 | % |
Portfolio turnover rate | | | 250 | % | | | 387 | % | | | 424 | % | | | 114 | % | | | 281 | % | | | 277 | % |
SEE NOTES TO FINANCIAL STATEMENTS. | THE RYDEX FUNDS SEMI-ANNUAL FINANCIAL REPORT | 87 |
FINANCIAL HIGHLIGHTS (concluded) |
This table is presented to show selected data for a share outstanding throughout each period and to assist shareholders in evaluating a Fund’s performance for the periods presented.
Class H | | Six Months Ended
September 30, 2024a | | | Year Ended
March 31,
2024 | | | Year Ended
March 31,
2023 | | | Year Ended
March 31,
2022 | | | Year Ended
March 31,
2021 | | | Year Ended
March 31,
2020 | |
Per Share Data |
Net asset value, beginning of period | | $ | 31.01 | | | $ | 33.59 | | | $ | 43.46 | | | $ | 40.41 | | | $ | 24.30 | | | $ | 24.06 | |
Income (loss) from investment operations: |
Net investment income (loss)b | | | (.09 | ) | | | (.02 | ) | | | .06 | | | | .08 | | | | (.25 | ) | | | (.22 | ) |
Net gain (loss) on investments (realized and unrealized) | | | 7.84 | | | | (1.36 | ) | | | (7.50 | ) | | | 5.58 | | | | 16.86 | | | | 1.21 | e |
Total from investment operations | | | 7.75 | | | | (1.38 | ) | | | (7.44 | ) | | | 5.66 | | | | 16.61 | | | | .99 | |
Less distributions from: |
Net investment income | | | — | | | | (1.20 | ) | | | (2.43 | ) | | | (2.61 | ) | | | (.50 | ) | | | (.75 | ) |
Total distributions | | | — | | | | (1.20 | ) | | | (2.43 | ) | | | (2.61 | ) | | | (.50 | ) | | | (.75 | ) |
Net asset value, end of period | | $ | 38.76 | | | $ | 31.01 | | | $ | 33.59 | | | $ | 43.46 | | | $ | 40.41 | | | $ | 24.30 | |
|
Total Return | | | 24.99 | % | | | (3.71 | %) | | | (16.54 | %) | | | 15.57 | % | | | 68.30 | % | | | 3.46 | % |
Ratios/Supplemental Data |
Net assets, end of period (in thousands) | | $ | 2,251 | | | $ | 2,167 | | | $ | 2,591 | | | $ | 4,028 | | | $ | 2,628 | | | $ | 1,830 | |
Ratios to average net assets: |
Net investment income (loss) | | | (0.52 | %) | | | (0.05 | %) | | | 0.18 | % | | | 0.20 | % | | | (0.59 | %) | | | (0.78 | %) |
Total expenses | | | 1.57 | % | | | 1.58 | % | | | 1.54 | % | | | 1.51 | % | | | 1.60 | % | | | 1.63 | % |
Net expensesc | | | 1.52 | % | | | 1.55 | % | | | 1.54 | % | | | 1.51 | % | | | 1.60 | % | | | 1.63 | % |
Portfolio turnover rate | | | 250 | % | | | 387 | % | | | 424 | % | | | 114 | % | | | 281 | % | | | 277 | % |
a | Unaudited figures for the period ended September 30, 2024. Percentage amounts for the period, except total return and portfolio turnover rate, have been annualized. |
b | Net investment income (loss) per share was computed using average shares outstanding throughout the period. |
c | Net expense information reflects the expense ratios after expense waivers and reimbursements, as applicable. |
d | Total return does not reflect the impact of any applicable sales charges. |
e | The amount shown for a share outstanding throughout the period does not agree with the aggregate net loss on investments for the year because of the sales and repurchases of fund shares in relation to fluctuating market value of investments of the Fund. |
f | Less than $0.01 per share. |
88 | THE RYDEX FUNDS SEMI-ANNUAL FINANCIAL REPORT | SEE NOTES TO FINANCIAL STATEMENTS. |
SCHEDULE OF INVESTMENTS (Unaudited) | September 30, 2024 |
REAL ESTATE FUND | |
| | Shares | | | Value | |
COMMON STOCKS† - 99.3% |
| | | | | | | | | |
REITs - 91.3% |
| | | | | | | | | |
REITs-Diversified - 23.7% |
American Tower Corp. — Class A | | | 1,111 | | | $ | 258,374 | |
Equinix, Inc. | | | 256 | | | | 227,233 | |
Digital Realty Trust, Inc. | | | 1,140 | | | | 184,486 | |
Crown Castle, Inc. | | | 1,510 | | | | 179,131 | |
VICI Properties, Inc. | | | 4,367 | | | | 145,465 | |
Weyerhaeuser Co. | | | 3,783 | | | | 128,092 | |
SBA Communications Corp. | | | 527 | | | | 126,849 | |
Lamar Advertising Co. — Class A | | | 701 | | | | 93,654 | |
Gaming and Leisure Properties, Inc. | | | 1,761 | | | | 90,603 | |
WP Carey, Inc. | | | 1,453 | | | | 90,522 | |
Vornado Realty Trust | | | 1,708 | | | | 67,295 | |
National Storage Affiliates Trust | | | 1,182 | | | | 56,972 | |
EPR Properties | | | 978 | | | | 47,961 | |
PotlatchDeltic Corp. | | | 1,023 | | | | 46,086 | |
Outfront Media, Inc. | | | 2,276 | | | | 41,833 | |
Uniti Group, Inc.* | | | 5,352 | | | | 30,185 | |
Total REITs-Diversified | | | | | | | 1,814,741 | |
| | | | | | | | | |
REITs-Apartments - 11.8% |
AvalonBay Communities, Inc. | | | 617 | | | | 138,979 | |
Equity Residential | | | 1,720 | | | | 128,071 | |
Invitation Homes, Inc. | | | 3,137 | | | | 110,611 | |
Mid-America Apartment Communities, Inc. | | | 662 | | | | 105,192 | |
Essex Property Trust, Inc. | | | 339 | | | | 100,147 | |
UDR, Inc. | | | 2,084 | | | | 94,489 | |
Camden Property Trust | | | 727 | | | | 89,806 | |
American Homes 4 Rent — Class A | | | 2,189 | | | | 84,036 | |
Independence Realty Trust, Inc. | | | 2,583 | | | | 52,951 | |
Total REITs-Apartments | | | | | | | 904,282 | |
| | | | | | | | | |
REITs-Health Care - 9.7% |
Welltower, Inc. | | | 1,715 | | | | 219,571 | |
Ventas, Inc. | | | 1,975 | | | | 126,657 | |
Healthpeak Properties, Inc. | | | 4,365 | | | | 99,828 | |
Omega Healthcare Investors, Inc. | | | 1,976 | | | | 80,423 | |
Healthcare Realty Trust, Inc. | | | 3,424 | | | | 62,146 | |
CareTrust REIT, Inc. | | | 1,755 | | | | 54,159 | |
Sabra Health Care REIT, Inc. | | | 2,762 | | | | 51,401 | |
Medical Properties Trust, Inc.1 | | | 7,805 | | | | 45,659 | |
Total REITs-Health Care | | | | | | | 739,844 | |
| | | | | | | | | |
REITs-Warehouse/Industries - 9.1% |
Prologis, Inc. | | | 2,113 | | | | 266,830 | |
Rexford Industrial Realty, Inc. | | | 1,655 | | | | 83,263 | |
EastGroup Properties, Inc. | | | 403 | | | | 75,288 | |
Americold Realty Trust, Inc. | | | 2,450 | | | | 69,262 | |
First Industrial Realty Trust, Inc. | | | 1,207 | | | | 67,568 | |
STAG Industrial, Inc. | | | 1,717 | | | | 67,118 | |
Terreno Realty Corp. | | | 929 | | | | 62,085 | |
Total REITs-Warehouse/Industries | | | | | | | 691,414 | |
| | | | | | | | | |
REITs-Storage - 7.6% |
Public Storage | | | 525 | | | | 191,032 | |
Extra Space Storage, Inc. | | | 857 | | | | 154,423 | |
Iron Mountain, Inc. | | | 1,241 | | | | 147,468 | |
CubeSmart | | | 1,599 | | | | 86,074 | |
Total REITs-Storage | | | | | | | 578,997 | |
| | | | | | | | | |
REITs-Office Property - 7.1% |
Alexandria Real Estate Equities, Inc. | | | 932 | | | | 110,675 | |
BXP, Inc. | | | 1,059 | | | | 85,207 | |
Kilroy Realty Corp. | | | 1,416 | | | | 54,799 | |
Cousins Properties, Inc. | | | 1,784 | | | | 52,592 | |
SL Green Realty Corp. | | | 751 | | | | 52,277 | |
Highwoods Properties, Inc. | | | 1,399 | | | | 46,880 | |
Douglas Emmett, Inc. | | | 2,475 | | | | 43,486 | |
LXP Industrial Trust | | | 4,228 | | | | 42,491 | |
JBG SMITH Properties | | | 1,724 | | | | 30,136 | |
Hudson Pacific Properties, Inc.* | | | 4,249 | | | | 20,310 | |
Total REITs-Office Property | | | | | | | 538,853 | |
| | | | | | | | | |
REITs-Shopping Centers - 6.8% |
Kimco Realty Corp. | | | 4,157 | | | | 96,526 | |
Regency Centers Corp. | | | 1,247 | | | | 90,071 | |
Federal Realty Investment Trust | | | 659 | | | | 75,765 | |
Brixmor Property Group, Inc. | | | 2,585 | | | | 72,018 | |
Kite Realty Group Trust | | | 2,246 | | | | 59,654 | |
Phillips Edison & Company, Inc. | | | 1,479 | | | | 55,773 | |
SITE Centers Corp. | | | 605 | | | | 36,603 | |
Retail Opportunity Investments Corp. | | | 2,166 | | | | 34,071 | |
Total REITs-Shopping Centers | | | | | | | 520,481 | |
| | | | | | | | | |
REITs-Single Tenant - 5.1% |
Realty Income Corp. | | | 2,928 | | | | 185,694 | |
NNN REIT, Inc. | | | 1,524 | | | | 73,899 | |
Agree Realty Corp. | | | 895 | | | | 67,420 | |
Essential Properties Realty Trust, Inc. | | | 1,809 | | | | 61,777 | |
Total REITs-Single Tenant | | | | | | | 388,790 | |
| | | | | | | | | |
REITs-Hotels - 3.9% |
Host Hotels & Resorts, Inc. | | | 4,950 | | | | 87,120 | |
Ryman Hospitality Properties, Inc. | | | 528 | | | | 56,623 | |
Apple Hospitality REIT, Inc. | | | 3,037 | | | | 45,099 | |
Park Hotels & Resorts, Inc. | | | 2,931 | | | | 41,327 | |
Sunstone Hotel Investors, Inc. | | | 3,486 | | | | 35,976 | |
Pebblebrook Hotel Trust | | | 2,377 | | | | 31,448 | |
Total REITs-Hotels | | | | | | | 297,593 | |
| | | | | | | | | |
REITs-Regional Malls - 3.7% |
Simon Property Group, Inc. | | | 1,083 | | | | 183,049 | |
Macerich Co. | | | 2,823 | | | | 51,492 | |
Tanger, Inc. | | | 1,439 | | | | 47,746 | |
Total REITs-Regional Malls | | | | | | | 282,287 | |
| | | | | | | | | |
REITs-Manufactured Homes - 2.4% |
Sun Communities, Inc. | | | 730 | | | | 98,660 | |
Equity LifeStyle Properties, Inc. | | | 1,181 | | | | 84,253 | |
Total REITs-Manufactured Homes | | | | | | | 182,913 | |
| | | | | | | | | |
SEE NOTES TO FINANCIAL STATEMENTS. | THE RYDEX FUNDS SEMI-ANNUAL FINANCIAL REPORT | 89 |
SCHEDULE OF INVESTMENTS (Unaudited)(continued) | September 30, 2024 |
REAL ESTATE FUND | |
| | Shares | | | Value | |
Specialized Reit’s - 0.4% |
DiamondRock Hospitality Co. | | | 3,813 | | | $ | 33,287 | |
Total REITs | | | | | | | 6,973,482 | |
| | | | | | | | | |
Real Estate - 6.1% |
Real Estate Management/Services - 4.3% |
CBRE Group, Inc. — Class A* | | | 1,259 | | | | 156,720 | |
Jones Lang LaSalle, Inc.* | | | 255 | | | | 68,802 | |
Cushman & Wakefield plc* | | | 3,302 | | | | 45,006 | |
Redfin Corp.* | | | 2,540 | | | | 31,826 | |
eXp World Holdings, Inc. | | | 1,959 | | | | 27,602 | |
Total Real Estate Management/Services | | | | | | | 329,956 | |
| | | | | | | | | |
Research & Consulting Services - 1.8% |
CoStar Group, Inc.* | | | 1,801 | | | | 135,868 | |
Total Real Estate | | | | | | | 465,824 | |
| | | | | | | | | |
Internet - 1.4% |
E-Commerce/Services - 1.4% |
Zillow Group, Inc. — Class C* | | | 1,500 | | | | 95,775 | |
Opendoor Technologies, Inc.* | | | 5,819 | | | | 11,638 | |
Total E-Commerce/Services | | | | | | | 107,413 | |
| | | | | | | | | |
Total Internet | | | | | | | 107,413 | |
| | | | | | | | | |
Telecommunications - 0.5% |
Telecom Services - 0.5% |
DigitalBridge Group, Inc. | | | 2,733 | | | | 38,618 | |
| | | | | | | | | |
Total Common Stocks | | | | |
(Cost $6,003,093) | | | | | | | 7,585,337 | |
| | Face
Amount | | | Value | |
REPURCHASE AGREEMENTS††,2 - 0.4% |
J.P. Morgan Securities LLC
issued 09/30/24 at 4.86%
due 10/01/24 | | $ | 17,551 | | | $ | 17,551 | |
BofA Securities, Inc.
issued 09/30/24 at 4.85%
due 10/01/24 | | | 14,496 | | | | 14,496 | |
Total Repurchase Agreements | | | | |
(Cost $32,047) | | | | | | | 32,047 | |
| | | | | | | | | |
| | | Shares | | | | | |
SECURITIES LENDING COLLATERAL†,3 - 0.5% |
Money Market Fund*** | | | | | | | | |
First American Government Obligations Fund - Class X, 4.82%4 | | | 36,581 | | | | 36,581 | |
Total Securities Lending Collateral | | | | |
(Cost $36,581) | | | | | | | 36,581 | |
| | | | | | | | | |
Total Investments - 100.2% | | | | |
(Cost $6,071,721) | | $ | 7,653,965 | |
Other Assets & Liabilities, net - (0.2)% | | | (15,534 | ) |
Total Net Assets - 100.0% | | $ | 7,638,431 | |
* | Non-income producing security. |
*** | A copy of each underlying unaffiliated fund’s financial statements is available at the SEC’s website at www.sec.gov. |
† | Value determined based on Level 1 inputs — See Note 4. |
†† | Value determined based on Level 2 inputs — See Note 4. |
1 | All or a portion of this security is on loan at September 30, 2024 — See Note 7. |
2 | Repurchase Agreements — See Note 6. |
3 | Securities lending collateral — See Note 7. |
4 | Rate indicated is the 7-day yield as of September 30, 2024. |
| | plc — Public Limited Company |
| | REIT — Real Estate Investment Trust |
| | |
| | See Sector Classification in Other Information section. |
90 | THE RYDEX FUNDS SEMI-ANNUAL FINANCIAL REPORT | SEE NOTES TO FINANCIAL STATEMENTS. |
SCHEDULE OF INVESTMENTS (Unaudited)(concluded) | September 30, 2024 |
REAL ESTATE FUND | |
The following table summarizes the inputs used to value the Fund’s investments at September 30, 2024 (See Note 4 in the Notes to Financial Statements):
Investments in Securities (Assets) | | Level 1
Quoted
Prices | | | Level 2
Significant
Observable
Inputs | | | Level 3
Significant
Unobservable
Inputs | | | Total | |
Common Stocks | | $ | 7,585,337 | | | $ | — | | | $ | — | | | $ | 7,585,337 | |
Repurchase Agreements | | | — | | | | 32,047 | | | | — | | | | 32,047 | |
Securities Lending Collateral | | | 36,581 | | | | — | | | | — | | | | 36,581 | |
Total Assets | | $ | 7,621,918 | | | $ | 32,047 | | | $ | — | | | $ | 7,653,965 | |
SEE NOTES TO FINANCIAL STATEMENTS. | THE RYDEX FUNDS SEMI-ANNUAL FINANCIAL REPORT | 91 |
STATEMENT OF ASSETS AND LIABILITIES (Unaudited) |
September 30, 2024 |
Assets: |
Investments, at value - including $34,240 of securities loaned (cost $6,039,674) | | $ | 7,621,918 | |
Repurchase agreements, at value (cost $32,047) | | | 32,047 | |
Receivables: |
Dividends | | | 24,262 | |
Fund shares sold | | | 14,013 | |
Securities lending income | | | 36 | |
Interest | | | 4 | |
Total assets | | | 7,692,280 | |
| | | | | |
Liabilities: |
Payable for: |
Return of securities lending collateral | | | 36,581 | |
Management fees | | | 5,058 | |
Fund shares redeemed | | | 3,748 | |
Transfer agent fees | | | 2,612 | |
Distribution and service fees | | | 1,509 | |
Portfolio accounting and administration fees | | | 611 | |
Trustees’ fees* | | | 55 | |
Miscellaneous | | | 3,675 | |
Total liabilities | | | 53,849 | |
Net assets | | $ | 7,638,431 | |
| | | | | |
Net assets consist of: |
Paid in capital | | $ | 13,424,907 | |
Total distributable earnings (loss) | | | (5,786,476 | ) |
Net assets | | $ | 7,638,431 | |
| | | | | |
Class A: |
Net assets | | $ | 464,391 | |
Capital shares outstanding | | | 10,746 | |
Net asset value per share | | $ | 43.22 | |
Maximum offering price per share (Net asset value divided by 95.25%) | | $ | 45.38 | |
| | | | | |
Class C: |
Net assets | | $ | 37,567 | |
Capital shares outstanding | | | 1,064 | |
Net asset value per share | | $ | 35.31 | |
| | | | | |
Class H: |
Net assets | | $ | 7,136,473 | |
Capital shares outstanding | | | 165,480 | |
Net asset value per share | | $ | 43.13 | |
STATEMENT OF OPERATIONS (Unaudited) |
Six Months Ended September 30, 2024 |
Investment Income: |
Dividends | | $ | 83,284 | |
Interest | | | 726 | |
Income from securities lending, net | | | 203 | |
Total investment income | | | 84,213 | |
| | | | | |
Expenses: |
Management fees | | | 21,741 | |
Distribution and service fees: |
Class A | | | 503 | |
Class C | | | 256 | |
Class H | | | 5,828 | |
Transfer agent fees | | | 5,278 | |
Portfolio accounting and administration fees | | | 3,903 | |
Professional fees | | | 1,177 | |
Custodian fees | | | 328 | |
Trustees’ fees* | | | 197 | |
Line of credit fees | | | 36 | |
Miscellaneous | | | 3,952 | |
Total expenses | | | 43,199 | |
Less: |
Expenses reimbursed by Adviser | | | (1,278 | ) |
Net expenses | | | 41,921 | |
Net investment income | | | 42,292 | |
| | | | | |
Net Realized and Unrealized Gain (Loss): |
Net realized gain (loss) on: |
Investments | | | 42,194 | |
Net realized gain | | | 42,194 | |
Net change in unrealized appreciation (depreciation) on: |
Investments | | | 952,404 | |
Net change in unrealized appreciation (depreciation) | | | 952,404 | |
Net realized and unrealized gain | | | 994,598 | |
Net increase in net assets resulting from operations | | $ | 1,036,890 | |
* | Relates to Trustees not deemed “interested persons” within the meaning of Section 2(a)(19) of the 1940 Act. |
92 | THE RYDEX FUNDS SEMI-ANNUAL FINANCIAL REPORT | SEE NOTES TO FINANCIAL STATEMENTS. |
STATEMENTS OF CHANGES IN NET ASSETS |
| | Six Months Ended
September 30, 2024
(Unaudited) | | | Year Ended
March 31,
2024 | |
Increase (Decrease) in Net Assets from Operations: | | | | | | | | |
Net investment income | | $ | 42,292 | | | $ | 32,581 | |
Net realized gain (loss) on investments | | | 42,194 | | | | (36,172 | ) |
Net change in unrealized appreciation (depreciation) on investments | | | 952,404 | | | | 194,275 | |
Net increase in net assets resulting from operations | | | 1,036,890 | | | | 190,684 | |
| | | | | | | | | |
Distributions to shareholders: | | | | | | | | |
Class A | | | — | | | | (6,465 | ) |
Class C | | | — | | | | (2,581 | ) |
Class H | | | — | | | | (45,070 | ) |
Total distributions to shareholders | | | — | | | | (54,116 | ) |
| | | | | | | | | |
Capital share transactions: | | | | | | | | |
Proceeds from sale of shares | | | | | | | | |
Class A | | | 491,422 | | | | 591,538 | |
Class C | | | 26,792 | | | | 50,541 | |
Class H | | | 10,924,018 | | | | 5,981,741 | |
Distributions reinvested | | | | | | | | |
Class A | | | — | | | | 6,454 | |
Class C | | | — | | | | 2,581 | |
Class H | | | — | | | | 43,900 | |
Cost of shares redeemed | | | | | | | | |
Class A | | | (429,847 | ) | | | (774,547 | ) |
Class C | | | (100,104 | ) | | | (69,641 | ) |
Class H | | | (6,768,800 | ) | | | (6,169,856 | ) |
Net increase (decrease) from capital share transactions | | | 4,143,481 | | | | (337,289 | ) |
Net increase (decrease) in net assets | | | 5,180,371 | | | | (200,721 | ) |
| | | | | | | | | |
Net assets: | | | | | | | | |
Beginning of period | | | 2,458,060 | | | | 2,658,781 | |
End of period | | $ | 7,638,431 | | | $ | 2,458,060 | |
| | | | | | | | | |
Capital share activity: | | | | | | | | |
Shares sold | | | | | | | | |
Class A | | | 12,760 | | | | 16,705 | |
Class C | | | 842 | | | | 1,715 | |
Class H | | | 288,665 | | | | 169,328 | |
Shares issued from reinvestment of distributions | | | | | | | | |
Class A | | | — | | | | 182 | |
Class C | | | — | | | | 88 | |
Class H | | | — | | | | 1,238 | |
Shares redeemed | | | | | | | | |
Class A | | | (11,055 | ) | | | (21,815 | ) |
Class C | | | (3,304 | ) | | | (2,401 | ) |
Class H | | | (176,686 | ) | | | (175,501 | ) |
Net increase (decrease) in shares | | | 111,222 | | | | (10,461 | ) |
SEE NOTES TO FINANCIAL STATEMENTS. | THE RYDEX FUNDS SEMI-ANNUAL FINANCIAL REPORT | 93 |
This table is presented to show selected data for a share outstanding throughout each period and to assist shareholders in evaluating a Fund’s performance for the periods presented.
Class A | | Six Months Ended
September 30, 2024a | | | Year Ended
March 31,
2024 | | | Year Ended
March 31,
2023 | | | Year Ended
March 31,
2022 | | | Year Ended
March 31,
2021 | | | Year Ended
March 31,
2020 | |
Per Share Data |
Net asset value, beginning of period | | $ | 37.63 | | | $ | 35.12 | | | $ | 47.38 | | | $ | 40.87 | | | $ | 30.70 | | | $ | 41.24 | |
Income (loss) from investment operations: |
Net investment income (loss)b | | | .27 | | | | .50 | | | | .65 | | | | .21 | | | | .32 | | | | .56 | |
Net gain (loss) on investments (realized and unrealized) | | | 5.32 | | | | 2.74 | | | | (11.59 | ) | | | 6.48 | | | | 13.33 | | | | (10.37 | ) |
Total from investment operations | | | 5.59 | | | | 3.24 | | | | (10.94 | ) | | | 6.69 | | | | 13.65 | | | | (9.81 | ) |
Less distributions from: |
Net investment income | | | — | | | | (.73 | ) | | | (1.32 | ) | | | (.18 | ) | | | (3.48 | ) | | | (.73 | ) |
Total distributions | | | — | | | | (.73 | ) | | | (1.32 | ) | | | (.18 | ) | | | (3.48 | ) | | | (.73 | ) |
Net asset value, end of period | | $ | 43.22 | | | $ | 37.63 | | | $ | 35.12 | | | $ | 47.38 | | | $ | 40.87 | | | $ | 30.70 | |
|
Total Returnc | | | 14.86 | % | | | 9.34 | % | | | (23.05 | %) | | | 16.36 | % | | | 45.79 | % | | | (24.28 | %) |
Ratios/Supplemental Data |
Net assets, end of period (in thousands) | | $ | 464 | | | $ | 340 | | | $ | 491 | | | $ | 988 | | | $ | 1,049 | | | $ | 781 | |
Ratios to average net assets: |
Net investment income (loss) | | | 1.39 | % | | | 1.42 | % | | | 1.65 | % | | | 0.46 | % | | | 0.87 | % | | | 1.33 | % |
Total expenses | | | 1.67 | % | | | 1.69 | % | | | 1.65 | % | | | 1.61 | % | | | 1.70 | % | | | 1.72 | % |
Net expensesd | | | 1.62 | % | | | 1.66 | % | | | 1.65 | % | | | 1.61 | % | | | 1.70 | % | | | 1.72 | % |
Portfolio turnover rate | | | 114 | % | | | 249 | % | | | 308 | % | | | 380 | % | | | 499 | % | | | 539 | % |
Class C | | Six Months Ended
September 30, 2024a | | | Year Ended
March 31,
2024 | | | Year Ended
March 31,
2023 | | | Year Ended
March 31,
2022 | | | Year Ended
March 31,
2021 | | | Year Ended
March 31,
2020 | |
Per Share Data |
Net asset value, beginning of period | | $ | 30.85 | | | $ | 29.13 | | | $ | 39.90 | | | $ | 34.44 | | | $ | 26.48 | | | $ | 35.94 | |
Income (loss) from investment operations: |
Net investment income (loss)b | | | .01 | | | | .20 | | | | .31 | | | | (.09 | ) | | | (.03 | ) | | | .26 | |
Net gain (loss) on investments (realized and unrealized) | | | 4.45 | | | | 2.25 | | | | (9.76 | ) | | | 5.73 | | | | 11.47 | | | | (8.99 | ) |
Total from investment operations | | | 4.46 | | | | 2.45 | | | | (9.45 | ) | | | 5.64 | | | | 11.44 | | | | (8.73 | ) |
Less distributions from: |
Net investment income | | | — | | | | (.73 | ) | | | (1.32 | ) | | | (.18 | ) | | | (3.48 | ) | | | (.73 | ) |
Total distributions | | | — | | | | (.73 | ) | | | (1.32 | ) | | | (.18 | ) | | | (3.48 | ) | | | (.73 | ) |
Net asset value, end of period | | $ | 35.31 | | | $ | 30.85 | | | $ | 29.13 | | | $ | 39.90 | | | $ | 34.44 | | | $ | 26.48 | |
|
Total Returnc | | | 14.46 | % | | | 8.55 | % | | | (23.65 | %) | | | 16.37 | % | | | 44.71 | % | | | (24.86 | %) |
Ratios/Supplemental Data |
Net assets, end of period (in thousands) | | $ | 38 | | | $ | 109 | | | $ | 120 | | | $ | 322 | | | $ | 194 | | | $ | 430 | |
Ratios to average net assets: |
Net investment income (loss) | | | 0.09 | % | | | 0.68 | % | | | 0.94 | % | | | (0.22 | %) | | | (0.09 | %) | | | 0.71 | % |
Total expenses | | | 2.41 | % | | | 2.44 | % | | | 2.40 | % | | | 2.36 | % | | | 2.45 | % | | | 2.47 | % |
Net expensesd | | | 2.35 | % | | | 2.41 | % | | | 2.40 | % | | | 2.36 | % | | | 2.45 | % | | | 2.47 | % |
Portfolio turnover rate | | | 114 | % | | | 249 | % | | | 308 | % | | | 380 | % | | | 499 | % | | | 539 | % |
94 | THE RYDEX FUNDS SEMI-ANNUAL FINANCIAL REPORT | SEE NOTES TO FINANCIAL STATEMENTS. |
FINANCIAL HIGHLIGHTS (concluded) |
This table is presented to show selected data for a share outstanding throughout each period and to assist shareholders in evaluating a Fund’s performance for the periods presented.
Class H | | Six Months Ended
September 30, 2024a | | | Year Ended
March 31,
2024 | | | Year Ended
March 31,
2023 | | | Year Ended
March 31,
2022 | | | Year Ended
March 31,
2021 | | | Year Ended
March 31,
2020 | |
Per Share Data |
Net asset value, beginning of period | | $ | 37.55 | | | $ | 35.05 | | | $ | 47.28 | | | $ | 40.78 | | | $ | 30.63 | | | $ | 41.14 | |
Income (loss) from investment operations: |
Net investment income (loss)b | | | .33 | | | | .53 | | | | .54 | | | | .22 | | | | .23 | | | | .55 | |
Net gain (loss) on investments (realized and unrealized) | | | 5.25 | | | | 2.70 | | | | (11.45 | ) | | | 6.46 | | | | 13.40 | | | | (10.33 | ) |
Total from investment operations | | | 5.58 | | | | 3.23 | | | | (10.91 | ) | | | 6.68 | | | | 13.63 | | | | (9.78 | ) |
Less distributions from: |
Net investment income | | | — | | | | (.73 | ) | | | (1.32 | ) | | | (.18 | ) | | | (3.48 | ) | | | (.73 | ) |
Total distributions | | | — | | | | (.73 | ) | | | (1.32 | ) | | | (.18 | ) | | | (3.48 | ) | | | (.73 | ) |
Net asset value, end of period | | $ | 43.13 | | | $ | 37.55 | | | $ | 35.05 | | | $ | 47.28 | | | $ | 40.78 | | | $ | 30.63 | |
|
Total Return | | | 14.86 | % | | | 9.33 | % | | | (23.04 | %) | | | 16.37 | % | | | 45.83 | % | | | (24.27 | %) |
Ratios/Supplemental Data |
Net assets, end of period (in thousands) | | $ | 7,136 | | | $ | 2,009 | | | $ | 2,048 | | | $ | 36,643 | | | $ | 10,907 | | | $ | 2,284 | |
Ratios to average net assets: |
Net investment income (loss) | | | 1.69 | % | | | 1.50 | % | | | 1.33 | % | | | 0.49 | % | | | 0.60 | % | | | 1.30 | % |
Total expenses | | | 1.68 | % | | | 1.70 | % | | | 1.65 | % | | | 1.62 | % | | | 1.66 | % | | | 1.72 | % |
Net expensesd | | | 1.63 | % | | | 1.66 | % | | | 1.65 | % | | | 1.62 | % | | | 1.66 | % | | | 1.72 | % |
Portfolio turnover rate | | | 114 | % | | | 249 | % | | | 308 | % | | | 380 | % | | | 499 | % | | | 539 | % |
a | Unaudited figures for the period ended September 30, 2024. Percentage amounts for the period, except total return and portfolio turnover rate, have been annualized. |
b | Net investment income (loss) per share was computed using average shares outstanding throughout the period. |
c | Total return does not reflect the impact of any applicable sales charges. |
d | Net expense information reflects the expense ratios after expense waivers and reimbursements, as applicable. |
SEE NOTES TO FINANCIAL STATEMENTS. | THE RYDEX FUNDS SEMI-ANNUAL FINANCIAL REPORT | 95 |
SCHEDULE OF INVESTMENTS (Unaudited) | September 30, 2024 |
RETAILING FUND | |
| | Shares | | | Value | |
COMMON STOCKS† - 99.7% |
| | | | | | | | | |
Retail - 68.1% |
Walmart, Inc. | | | 4,681 | | | $ | 377,991 | |
Costco Wholesale Corp. | | | 396 | | | | 351,062 | |
Home Depot, Inc. | | | 859 | | | | 348,067 | |
Lowe’s Companies, Inc. | | | 1,278 | | | | 346,146 | |
TJX Companies, Inc. | | | 2,630 | | | | 309,130 | |
Target Corp. | | | 1,476 | | | | 230,049 | |
O’Reilly Automotive, Inc.* | | | 194 | | | | 223,410 | |
Ross Stores, Inc. | | | 1,241 | | | | 186,783 | |
Tractor Supply Co. | | | 530 | | | | 154,193 | |
Carvana Co.* | | | 770 | | | | 134,065 | |
Williams-Sonoma, Inc. | | | 818 | | | | 126,725 | |
Best Buy Company, Inc. | | | 1,220 | | | | 126,026 | |
AutoZone, Inc.* | | | 40 | | | | 126,002 | |
Genuine Parts Co. | | | 861 | | | | 120,264 | |
Ulta Beauty, Inc.* | | | 302 | | | | 117,514 | |
Dollar General Corp. | | | 1,363 | | | | 115,269 | |
Dick’s Sporting Goods, Inc. | | | 517 | | | | 107,898 | |
Burlington Stores, Inc.* | | | 406 | | | | 106,973 | |
Floor & Decor Holdings, Inc. — Class A* | | | 828 | | | | 102,813 | |
Dollar Tree, Inc.* | | | 1,430 | | | | 100,558 | |
CarMax, Inc.* | | | 1,217 | | | | 94,171 | |
BJ’s Wholesale Club Holdings, Inc.* | | | 1,083 | | | | 89,326 | |
GameStop Corp. — Class A* | | | 3,749 | | | | 85,965 | |
Bath & Body Works, Inc. | | | 2,415 | | | | 77,087 | |
Murphy USA, Inc. | | | 154 | | | | 75,902 | |
Lithia Motors, Inc. — Class A | | | 237 | | | | 75,281 | |
Abercrombie & Fitch Co. — Class A* | | | 504 | | | | 70,510 | |
Walgreens Boots Alliance, Inc. | | | 7,513 | | | | 67,316 | |
RH* | | | 196 | | | | 65,548 | |
Gap, Inc. | | | 2,949 | | | | 65,025 | |
Ollie’s Bargain Outlet Holdings, Inc.* | | | 663 | | | | 64,444 | |
Boot Barn Holdings, Inc.* | | | 380 | | | | 63,566 | |
AutoNation, Inc.* | | | 353 | | | | 63,159 | |
Five Below, Inc.* | | | 653 | | | | 57,693 | |
American Eagle Outfitters, Inc. | | | 2,568 | | | | 57,497 | |
Macy’s, Inc. | | | 3,621 | | | | 56,813 | |
Signet Jewelers Ltd. | | | 542 | | | | 55,902 | |
Academy Sports & Outdoors, Inc. | | | 945 | | | | 55,150 | |
Nordstrom, Inc. | | | 2,039 | | | | 45,857 | |
Urban Outfitters, Inc.* | | | 1,162 | | | | 44,516 | |
Kohl’s Corp. | | | 2,034 | | | | 42,917 | |
Foot Locker, Inc.* | | | 1,619 | | | | 41,835 | |
Advance Auto Parts, Inc. | | | 1,044 | | | | 40,706 | |
Victoria’s Secret & Co.* | | | 1,563 | | | | 40,169 | |
National Vision Holdings, Inc.* | | | 2,314 | | | | 25,246 | |
Leslie’s, Inc.* | | | 6,047 | | | | 19,108 | |
Total Retail | | | | | | | 5,351,647 | |
| | | | | | | | | |
Internet - 26.9% |
Amazon.com, Inc.* | | | 3,928 | | | | 731,904 | |
PDD Holdings, Inc. ADR* | | | 2,094 | | | | 282,292 | |
JD.com, Inc. ADR | | | 4,950 | | | | 198,000 | |
Alibaba Group Holding Ltd. ADR | | | 1,838 | | | | 195,049 | |
eBay, Inc. | | | 2,339 | | | | 152,292 | |
MercadoLibre, Inc.* | | | 74 | | | | 151,845 | |
Coupang, Inc.* | | | 6,185 | | | | 151,842 | |
Chewy, Inc. — Class A* | | | 2,847 | | | | 83,389 | |
Wayfair, Inc. — Class A* | | | 1,406 | | | | 78,989 | |
Etsy, Inc.* | | | 1,258 | | | | 69,857 | |
Beyond, Inc.* | | | 1,728 | | | | 17,418 | |
Total Internet | | | | | | | 2,112,877 | |
| | | | | | | | | |
Distribution & Wholesale - 2.5% |
Pool Corp. | | | 281 | | | | 105,881 | |
LKQ Corp. | | | 2,171 | | | | 86,666 | |
Total Distribution & Wholesale | | | | | | | 192,547 | |
| | | | | | | | | |
Software - 1.4% |
Global-e Online Ltd* | | | 2,760 | | | | 106,094 | |
| | | | | | | | | |
Commercial Services - 0.8% |
Valvoline, Inc.* | | | 1,515 | | | | 63,403 | |
| | | | | | | | | |
Total Common Stocks | | | | |
(Cost $4,222,697) | | | | | | | 7,826,568 | |
| | | | | | | | | |
| | | Face
Amount | | | | | |
REPURCHASE AGREEMENTS††,1 - 0.8% |
J.P. Morgan Securities LLC
issued 09/30/24 at 4.86%
due 10/01/24 | | $ | 36,325 | | | | 36,325 | |
BofA Securities, Inc.
issued 09/30/24 at 4.85%
due 10/01/24 | | | 30,003 | | | | 30,003 | |
Total Repurchase Agreements | | | | |
(Cost $66,328) | | | | | | | 66,328 | |
| | | | | | | | | |
Total Investments - 100.5% | | | | |
(Cost $4,289,025) | | $ | 7,892,896 | |
Other Assets & Liabilities, net - (0.5)% | | | (36,893 | ) |
Total Net Assets - 100.0% | | $ | 7,856,003 | |
96 | THE RYDEX FUNDS SEMI-ANNUAL FINANCIAL REPORT | SEE NOTES TO FINANCIAL STATEMENTS. |
SCHEDULE OF INVESTMENTS (Unaudited)(concluded) | September 30, 2024 |
RETAILING FUND | |
* | Non-income producing security. |
† | Value determined based on Level 1 inputs — See Note 4. |
†† | Value determined based on Level 2 inputs — See Note 4. |
1 | Repurchase Agreements — See Note 6. |
| | ADR — American Depositary Receipt |
| | |
| | See Sector Classification in Other Information section. |
The following table summarizes the inputs used to value the Fund’s investments at September 30, 2024 (See Note 4 in the Notes to Financial Statements):
Investments in Securities (Assets) | | Level 1
Quoted
Prices | | | Level 2
Significant
Observable
Inputs | | | Level 3
Significant
Unobservable
Inputs | | | Total | |
Common Stocks | | $ | 7,826,568 | | | $ | — | | | $ | — | | | $ | 7,826,568 | |
Repurchase Agreements | | | — | | | | 66,328 | | | | — | | | | 66,328 | |
Total Assets | | $ | 7,826,568 | | | $ | 66,328 | | | $ | — | | | $ | 7,892,896 | |
SEE NOTES TO FINANCIAL STATEMENTS. | THE RYDEX FUNDS SEMI-ANNUAL FINANCIAL REPORT | 97 |
STATEMENT OF ASSETS AND LIABILITIES (Unaudited) |
September 30, 2024 |
Assets: |
Investments, at value (cost $4,222,697) | | $ | 7,826,568 | |
Repurchase agreements, at value (cost $66,328) | | | 66,328 | |
Receivables: |
Securities sold | | | 2,308,670 | |
Fund shares sold | | | 9,290 | |
Dividends | | | 3,885 | |
Interest | | | 9 | |
Total assets | | | 10,214,750 | |
| | | | | |
Liabilities: |
Payable for: |
Fund shares redeemed | | | 2,342,075 | |
Management fees | | | 5,937 | |
Transfer agent fees | | | 4,123 | |
Portfolio accounting and administration fees | | | 717 | |
Distribution and service fees | | | 277 | |
Trustees’ fees* | | | 82 | |
Miscellaneous | | | 5,536 | |
Total liabilities | | | 2,358,747 | |
Net assets | | $ | 7,856,003 | |
| | | | | |
Net assets consist of: |
Paid in capital | | $ | 6,479,136 | |
Total distributable earnings (loss) | | | 1,376,867 | |
Net assets | | $ | 7,856,003 | |
| | | | | |
Investor Class: |
Net assets | | $ | 6,563,370 | |
Capital shares outstanding | | | 122,170 | |
Net asset value per share | | $ | 53.72 | |
| | | | | |
Class A: |
Net assets | | $ | 873,905 | |
Capital shares outstanding | | | 17,539 | |
Net asset value per share | | $ | 49.83 | |
Maximum offering price per share (Net asset value divided by 95.25%) | | $ | 52.31 | |
| | | | | |
Class C: |
Net assets | | $ | 73,134 | |
Capital shares outstanding | | | 1,759 | |
Net asset value per share | | $ | 41.58 | |
| | | | | |
Class H: |
Net assets | | $ | 345,594 | |
Capital shares outstanding | | | 7,129 | |
Net asset value per share | | $ | 48.48 | |
STATEMENT OF OPERATIONS (Unaudited) |
Six Months Ended September 30, 2024 |
Investment Income: |
Dividends (net of foreign withholding tax of $43) | | $ | 69,327 | |
Interest | | | 1,733 | |
Income from securities lending, net | | | 317 | |
Total investment income | | | 71,377 | |
| | | | | |
Expenses: |
Management fees | | | 47,691 | |
Distribution and service fees: |
Class A | | | 1,043 | |
Class C | | | 357 | |
Class H | | | 434 | |
Transfer agent fees | | | 11,329 | |
Portfolio accounting and administration fees | | | 8,561 | |
Registration fees | | | 4,024 | |
Professional fees | | | 2,261 | |
Custodian fees | | | 723 | |
Trustees’ fees* | | | 495 | |
Line of credit fees | | | 19 | |
Miscellaneous | | | 3,988 | |
Total expenses | | | 80,925 | |
Less: |
Expenses reimbursed by Adviser | | | (2,803 | ) |
Net expenses | | | 78,122 | |
Net investment loss | | | (6,745 | ) |
| | | | | |
Net Realized and Unrealized Gain (Loss): |
Net realized gain (loss) on: |
Investments | | | (125,917 | ) |
Net realized loss | | | (125,917 | ) |
Net change in unrealized appreciation (depreciation) on: |
Investments | | | 417,939 | |
Net change in unrealized appreciation (depreciation) | | | 417,939 | |
Net realized and unrealized gain | | | 292,022 | |
Net increase in net assets resulting from operations | | $ | 285,277 | |
* | Relates to Trustees not deemed “interested persons” within the meaning of Section 2(a)(19) of the 1940 Act. |
98 | THE RYDEX FUNDS SEMI-ANNUAL FINANCIAL REPORT | SEE NOTES TO FINANCIAL STATEMENTS. |
STATEMENTS OF CHANGES IN NET ASSETS |
| | Six Months Ended
September 30, 2024
(Unaudited) | | | Year Ended
March 31,
2024 | |
Increase (Decrease) in Net Assets from Operations: | | | | | | | | |
Net investment loss | | $ | (6,745 | ) | | $ | (9,976 | ) |
Net realized gain (loss) on investments | | | (125,917 | ) | | | 690,181 | |
Net change in unrealized appreciation (depreciation) on investments | | | 417,939 | | | | 648,186 | |
Net increase in net assets resulting from operations | | | 285,277 | | | | 1,328,391 | |
| | | | | | | | | |
Capital share transactions: | | | | | | | | |
Proceeds from sale of shares | | | | | | | | |
Investor Class | | | 14,589,759 | | | | 27,699,473 | |
Class A | | | 159,537 | | | | 244,458 | |
Class C | | | 12,729 | | | | 108,390 | |
Class H | | | 3,256 | | | | 16,566 | |
Cost of shares redeemed | | | | | | | | |
Investor Class | | | (16,790,279 | ) | | | (27,611,388 | ) |
Class A | | | (75,905 | ) | | | (620,195 | ) |
Class C | | | (12,989 | ) | | | (194,132 | ) |
Class H | | | (63,465 | ) | | | (292,400 | ) |
Net decrease from capital share transactions | | | (2,177,357 | ) | | | (649,228 | ) |
Net increase (decrease) in net assets | | | (1,892,080 | ) | | | 679,163 | |
| | | | | | | | | |
Net assets: | | | | | | | | |
Beginning of period | | | 9,748,083 | | | | 9,068,920 | |
End of period | | $ | 7,856,003 | | | $ | 9,748,083 | |
| | | | | | | | | |
Capital share activity: | | | | | | | | |
Shares sold | | | | | | | | |
Investor Class | | | 289,657 | | | | 622,418 | |
Class A | | | 3,475 | | | | 6,259 | |
Class C | | | 324 | | | | 3,140 | |
Class H | | | 72 | | | | 425 | |
Shares redeemed | | | | | | | | |
Investor Class | | | (333,418 | ) | | | (629,522 | ) |
Class A | | | (1,644 | ) | | | (15,500 | ) |
Class C | | | (335 | ) | | | (5,786 | ) |
Class H | | | (1,413 | ) | | | (7,656 | ) |
Net decrease in shares | | | (43,282 | ) | | | (26,222 | ) |
SEE NOTES TO FINANCIAL STATEMENTS. | THE RYDEX FUNDS SEMI-ANNUAL FINANCIAL REPORT | 99 |
This table is presented to show selected data for a share outstanding throughout each period and to assist shareholders in evaluating a Fund’s performance for the periods presented.
Investor Class | | Six Months Ended
September 30, 2024a | | | Year Ended
March 31,
2024 | | | Year Ended
March 31,
2023 | | | Year Ended
March 31,
2022 | | | Year Ended
March 31,
2021 | | | Year Ended
March 31,
2020 | |
Per Share Data |
Net asset value, beginning of period | | $ | 51.43 | | | $ | 42.39 | | | $ | 46.75 | | | $ | 57.11 | | | $ | 28.62 | | | $ | 33.46 | |
Income (loss) from investment operations: |
Net investment income (loss)b | | | (.02 | ) | | | (.03 | ) | | | (.08 | ) | | | (.30 | ) | | | (.25 | ) | | | (.06 | ) |
Net gain (loss) on investments (realized and unrealized) | | | 2.31 | | | | 9.07 | | | | (4.28 | ) | | | (5.31 | ) | | | 28.74 | | | | (4.78 | ) |
Total from investment operations | | | 2.29 | | | | 9.04 | | | | (4.36 | ) | | | (5.61 | ) | | | 28.49 | | | | (4.84 | ) |
Less distributions from: |
Net realized gains | | | — | | | | — | | | | — | | | | (4.75 | ) | | | — | | | | — | |
Total distributions | | | — | | | | — | | | | — | | | | (4.75 | ) | | | — | | | | — | |
Net asset value, end of period | | $ | 53.72 | | | $ | 51.43 | | | $ | 42.39 | | | $ | 46.75 | | | $ | 57.11 | | | $ | 28.62 | |
|
Total Return | | | 4.45 | % | | | 21.33 | % | | | (9.33 | %) | | | (10.94 | %) | | | 99.55 | % | | | (14.47 | %) |
Ratios/Supplemental Data |
Net assets, end of period (in thousands) | | $ | 6,563 | | | $ | 8,533 | | | $ | 7,334 | | | $ | 7,998 | | | $ | 24,987 | | | $ | 3,316 | |
Ratios to average net assets: |
Net investment income (loss) | | | (0.08 | %) | | | (0.08 | %) | | | (0.19 | %) | | | (0.53 | %) | | | (0.52 | %) | | | (0.17 | %) |
Total expenses | | | 1.41 | % | | | 1.43 | % | | | 1.40 | % | | | 1.36 | % | | | 1.43 | % | | | 1.47 | % |
Net expensesc | | | 1.36 | % | | | 1.40 | % | | | 1.40 | % | | | 1.36 | % | | | 1.43 | % | | | 1.47 | % |
Portfolio turnover rate | | | 135 | % | | | 299 | % | | | 371 | % | | | 214 | % | | | 270 | % | | | 228 | % |
Class A | | Six Months Ended
September 30, 2024a | | | Year Ended
March 31,
2024 | | | Year Ended
March 31,
2023 | | | Year Ended
March 31,
2022 | | | Year Ended
March 31,
2021 | | | Year Ended
March 31,
2020 | |
Per Share Data |
Net asset value, beginning of period | | $ | 47.76 | | | $ | 39.46 | | | $ | 43.64 | | | $ | 53.75 | | | $ | 27.00 | | | $ | 31.64 | |
Income (loss) from investment operations: |
Net investment income (loss)b | | | (.09 | ) | | | (.11 | ) | | | (.17 | ) | | | (.42 | ) | | | (.38 | ) | | | (.13 | ) |
Net gain (loss) on investments (realized and unrealized) | | | 2.16 | | | | 8.41 | | | | (4.01 | ) | | | (4.94 | ) | | | 27.13 | | | | (4.51 | ) |
Total from investment operations | | | 2.07 | | | | 8.30 | | | | (4.18 | ) | | | (5.36 | ) | | | 26.75 | | | | (4.64 | ) |
Less distributions from: |
Net realized gains | | | — | | | | — | | | | — | | | | (4.75 | ) | | | — | | | | — | |
Total distributions | | | — | | | | — | | | | — | | | | (4.75 | ) | | | — | | | | — | |
Net asset value, end of period | | $ | 49.83 | | | $ | 47.76 | | | $ | 39.46 | | | $ | 43.64 | | | $ | 53.75 | | | $ | 27.00 | |
|
Total Returnd | | | 4.33 | % | | | 21.03 | % | | | (9.58 | %) | | | (11.17 | %) | | | 99.07 | % | | | (14.66 | %) |
Ratios/Supplemental Data |
Net assets, end of period (in thousands) | | $ | 874 | | | $ | 750 | | | $ | 985 | | | $ | 1,917 | | | $ | 2,133 | | | $ | 456 | |
Ratios to average net assets: |
Net investment income (loss) | | | (0.37 | %) | | | (0.27 | %) | | | (0.45 | %) | | | (0.79 | %) | | | (0.83 | %) | | | (0.42 | %) |
Total expenses | | | 1.67 | % | | | 1.69 | % | | | 1.65 | % | | | 1.61 | % | | | 1.67 | % | | | 1.72 | % |
Net expensesc | | | 1.62 | % | | | 1.65 | % | | | 1.65 | % | | | 1.61 | % | | | 1.67 | % | | | 1.72 | % |
Portfolio turnover rate | | | 135 | % | | | 299 | % | | | 371 | % | | | 214 | % | | | 270 | % | | | 228 | % |
100 | THE RYDEX FUNDS SEMI-ANNUAL FINANCIAL REPORT | SEE NOTES TO FINANCIAL STATEMENTS. |
FINANCIAL HIGHLIGHTS (continued) |
This table is presented to show selected data for a share outstanding throughout each period and to assist shareholders in evaluating a Fund’s performance for the periods presented.
Class C | | Six Months Ended
September 30, 2024a | | | Year Ended
March 31,
2024 | | | Year Ended
March 31,
2023 | | | Year Ended
March 31,
2022 | | | Year Ended
March 31,
2021 | | | Year Ended
March 31,
2020 | |
Per Share Data |
Net asset value, beginning of period | | $ | 40.01 | | | $ | 33.31 | | | $ | 37.12 | | | $ | 46.74 | | | $ | 23.67 | | | $ | 27.95 | |
Income (loss) from investment operations: |
Net investment income (loss)b | | | (.21 | ) | | | (.34 | ) | | | (.39 | ) | | | (.70 | ) | | | (.62 | ) | | | (.33 | ) |
Net gain (loss) on investments (realized and unrealized) | | | 1.78 | | | | 7.04 | | | | (3.42 | ) | | | (4.17 | ) | | | 23.69 | | | | (3.95 | ) |
Total from investment operations | | | 1.57 | | | | 6.70 | | | | (3.81 | ) | | | (4.87 | ) | | | 23.07 | | | | (4.28 | ) |
Less distributions from: |
Net realized gains | | | — | | | | — | | | | — | | | | (4.75 | ) | | | — | | | | — | |
Total distributions | | | — | | | | — | | | | — | | | | (4.75 | ) | | | — | | | | — | |
Net asset value, end of period | | $ | 41.58 | | | $ | 40.01 | | | $ | 33.31 | | | $ | 37.12 | | | $ | 46.74 | | | $ | 23.67 | |
|
Total Returnd | | | 3.92 | % | | | 20.11 | % | | | (10.26 | %) | | | (11.84 | %) | | | 97.47 | % | | | (15.31 | %) |
Ratios/Supplemental Data |
Net assets, end of period (in thousands) | | $ | 73 | | | $ | 71 | | | $ | 147 | | | $ | 196 | | | $ | 294 | | | $ | 230 | |
Ratios to average net assets: |
Net investment income (loss) | | | (1.09 | %) | | | (1.01 | %) | | | (1.18 | %) | | | (1.54 | %) | | | (1.65 | %) | | | (1.16 | %) |
Total expenses | | | 2.42 | % | | | 2.43 | % | | | 2.40 | % | | | 2.36 | % | | | 2.44 | % | | | 2.48 | % |
Net expensesc | | | 2.37 | % | | | 2.40 | % | | | 2.40 | % | | | 2.36 | % | | | 2.44 | % | | | 2.48 | % |
Portfolio turnover rate | | | 135 | % | | | 299 | % | | | 371 | % | | | 214 | % | | | 270 | % | | | 228 | % |
SEE NOTES TO FINANCIAL STATEMENTS. | THE RYDEX FUNDS SEMI-ANNUAL FINANCIAL REPORT | 101 |
FINANCIAL HIGHLIGHTS (concluded) |
This table is presented to show selected data for a share outstanding throughout each period and to assist shareholders in evaluating a Fund’s performance for the periods presented.
Class H | | Six Months Ended
September 30, 2024a | | | Year Ended
March 31,
2024 | | | Year Ended
March 31,
2023 | | | Year Ended
March 31,
2022 | | | Year Ended
March 31,
2021 | | | Year Ended
March 31,
2020 | |
Per Share Data |
Net asset value, beginning of period | | $ | 46.47 | | | $ | 38.40 | | | $ | 42.47 | | | $ | 52.44 | | | $ | 26.35 | | | $ | 30.87 | |
Income (loss) from investment operations: |
Net investment income (loss)b | | | (.08 | ) | | | (.10 | ) | | | (.18 | ) | | | (.38 | ) | | | (.39 | ) | | | (.20 | ) |
Net gain (loss) on investments (realized and unrealized) | | | 2.09 | | | | 8.17 | | | | (3.89 | ) | | | (4.84 | ) | | | 26.48 | | | | (4.32 | ) |
Total from investment operations | | | 2.01 | | | | 8.07 | | | | (4.07 | ) | | | (5.22 | ) | | | 26.09 | | | | (4.52 | ) |
Less distributions from: |
Net realized gains | | | — | | | | — | | | | — | | | | (4.75 | ) | | | — | | | | — | |
Total distributions | | | — | | | | — | | | | — | | | | (4.75 | ) | | | — | | | | — | |
Net asset value, end of period | | $ | 48.48 | | | $ | 46.47 | | | $ | 38.40 | | | $ | 42.47 | | | $ | 52.44 | | | $ | 26.35 | |
|
Total Return | | | 4.33 | % | | | 21.02 | % | | | (9.58 | %) | | | (11.18 | %) | | | 99.01 | % | | | (14.64 | %) |
Ratios/Supplemental Data |
Net assets, end of period (in thousands) | | $ | 346 | | | $ | 394 | | | $ | 603 | | | $ | 673 | | | $ | 661 | | | $ | 345 | |
Ratios to average net assets: |
Net investment income (loss) | | | (0.35 | %) | | | (0.26 | %) | | | (0.47 | %) | | | (0.73 | %) | | | (0.91 | %) | | | (0.64 | %) |
Total expenses | | | 1.67 | % | | | 1.68 | % | | | 1.65 | % | | | 1.60 | % | | | 1.69 | % | | | 1.72 | % |
Net expensesc | | | 1.62 | % | | | 1.65 | % | | | 1.65 | % | | | 1.60 | % | | | 1.69 | % | | | 1.72 | % |
Portfolio turnover rate | | | 135 | % | | | 299 | % | | | 371 | % | | | 214 | % | | | 270 | % | | | 228 | % |
a | Unaudited figures for the period ended September 30, 2024. Percentage amounts for the period, except total return and portfolio turnover rate, have been annualized. |
b | Net investment income (loss) per share was computed using average shares outstanding throughout the period. |
c | Net expense information reflects the expense ratios after expense waivers and reimbursements, as applicable. |
d | Total return does not reflect the impact of any applicable sales charges. |
102 | THE RYDEX FUNDS SEMI-ANNUAL FINANCIAL REPORT | SEE NOTES TO FINANCIAL STATEMENTS. |
SCHEDULE OF INVESTMENTS (Unaudited) | September 30, 2024 |
TECHNOLOGY FUND | |
| | Shares | | | Value | |
COMMON STOCKS† - 99.5% |
| | | | | | | | | |
Software - 30.2% |
Microsoft Corp. | | | 8,313 | | | $ | 3,577,084 | |
Oracle Corp. | | | 6,215 | | | | 1,059,036 | |
Salesforce, Inc. | | | 3,761 | | | | 1,029,423 | |
Adobe, Inc.* | | | 1,735 | | | | 898,348 | |
ServiceNow, Inc.* | | | 949 | | | | 848,776 | |
Intuit, Inc. | | | 1,288 | | | | 799,848 | |
Palantir Technologies, Inc. — Class A* | | | 15,387 | | | | 572,397 | |
Synopsys, Inc.* | | | 1,088 | | | | 550,952 | |
Cadence Design Systems, Inc.* | | | 1,965 | | | | 532,574 | |
Autodesk, Inc.* | | | 1,802 | | | | 496,415 | |
Workday, Inc. — Class A* | | | 2,019 | | | | 493,464 | |
Roper Technologies, Inc. | | | 871 | | | | 484,659 | |
NetEase, Inc. ADR | | | 4,698 | | | | 439,310 | |
MicroStrategy, Inc. — Class A* | | | 2,400 | | | | 404,640 | |
Atlassian Corp. — Class A* | | | 2,515 | | | | 399,407 | |
AppLovin Corp. — Class A* | | | 3,053 | | | | 398,569 | |
Datadog, Inc. — Class A* | | | 3,349 | | | | 385,336 | |
Electronic Arts, Inc. | | | 2,660 | | | | 381,551 | |
Snowflake, Inc. — Class A* | | | 3,198 | | | | 367,322 | |
ANSYS, Inc.* | | | 1,040 | | | | 331,375 | |
Monday.com Ltd.* | | | 1,167 | | | | 324,158 | |
Cloudflare, Inc. — Class A* | | | 3,954 | | | | 319,839 | |
Take-Two Interactive Software, Inc.* | | | 2,068 | | | | 317,872 | |
ROBLOX Corp. — Class A* | | | 6,977 | | | | 308,802 | |
PTC, Inc.* | | | 1,602 | | | | 289,417 | |
Zoom Video Communications, Inc. — Class A* | | | 4,087 | | | | 285,027 | |
HubSpot, Inc.* | | | 526 | | | | 279,622 | |
MongoDB, Inc.* | | | 973 | | | | 263,051 | |
Manhattan Associates, Inc.* | | | 919 | | | | 258,588 | |
Dynatrace, Inc.* | | | 4,710 | | | | 251,844 | |
Akamai Technologies, Inc.* | | | 2,443 | | | | 246,621 | |
Nutanix, Inc. — Class A* | | | 3,942 | | | | 233,564 | |
DocuSign, Inc.* | | | 3,718 | | | | 230,851 | |
Twilio, Inc. — Class A* | | | 3,083 | | | | 201,073 | |
Unity Software, Inc.* | | | 8,023 | | | | 181,480 | |
Dropbox, Inc. — Class A* | | | 6,995 | | | | 177,883 | |
Gitlab, Inc. — Class A* | | | 3,198 | | | | 164,825 | |
Confluent, Inc. — Class A* | | | 7,443 | | | | 151,688 | |
BILL Holdings, Inc.* | | | 2,763 | | | | 145,776 | |
ZoomInfo Technologies, Inc. — Class A* | | | 11,137 | | | | 114,934 | |
C3.ai, Inc. — Class A*,1 | | | 4,426 | | | | 107,242 | |
Five9, Inc.* | | | 3,174 | | | | 91,189 | |
Total Software | | | | | | | 19,395,832 | |
| | | | | | | | | |
Semiconductors - 28.0% |
NVIDIA Corp. | | | 27,636 | | | | 3,356,116 | |
Broadcom, Inc. | | | 10,230 | | | | 1,764,675 | |
Advanced Micro Devices, Inc.* | | | 6,469 | | | | 1,061,434 | |
Texas Instruments, Inc. | | | 4,262 | | | | 880,401 | |
QUALCOMM, Inc. | | | 5,169 | | | | 878,988 | |
Applied Materials, Inc. | | | 4,238 | | | | 856,288 | |
Micron Technology, Inc. | | | 7,183 | | | | 744,949 | |
Intel Corp.* | | | 29,577 | | | | 693,876 | |
Analog Devices, Inc. | | | 2,969 | | | | 683,375 | |
Lam Research Corp. | | | 828 | | | | 675,714 | |
KLA Corp. | | | 828 | | | | 641,212 | |
NXP Semiconductor N.V. | | | 2,443 | | | | 586,344 | |
ASML Holding N.V. — Class G | | | 653 | | | | 544,112 | |
Taiwan Semiconductor Manufacturing Company Ltd. ADR | | | 3,053 | | | | 530,215 | |
Marvell Technology, Inc. | | | 6,693 | | | | 482,699 | |
ARM Holdings plc ADR* | | | 3,138 | | | | 448,765 | |
Microchip Technology, Inc. | | | 5,230 | | | | 419,917 | |
STMicroelectronics N.V. — Class Y | | | 12,999 | | | | 386,460 | |
ON Semiconductor Corp.* | | | 4,970 | | | | 360,872 | |
Teradyne, Inc. | | | 2,243 | | | | 300,405 | |
Monolithic Power Systems, Inc. | | | 302 | | | | 279,199 | |
Entegris, Inc. | | | 2,346 | | | | 263,995 | |
Skyworks Solutions, Inc. | | | 2,503 | | | | 247,221 | |
Qorvo, Inc.* | | | 1,880 | | | | 194,204 | |
Lattice Semiconductor Corp.* | | | 3,519 | | | | 186,753 | |
Rambus, Inc.* | | | 3,253 | | | | 137,342 | |
MKS Instruments, Inc. | | | 1,203 | | | | 130,778 | |
GLOBALFOUNDRIES, Inc.* | | | 2,890 | | | | 116,323 | |
Axcelis Technologies, Inc.* | | | 689 | | | | 72,242 | |
Total Semiconductors | | | | | | | 17,924,874 | |
| | | | | | | | | |
Computers - 17.7% |
Apple, Inc. | | | 16,088 | | | | 3,748,504 | |
International Business Machines Corp. | | | 4,111 | | | | 908,860 | |
Dell Technologies, Inc. — Class C | | | 4,686 | | | | 555,478 | |
Crowdstrike Holdings, Inc. — Class A* | | | 1,917 | | | | 537,661 | |
Fortinet, Inc.* | | | 5,683 | | | | 440,717 | |
Accenture plc — Class A | | | 1,233 | | | | 435,841 | |
TE Connectivity plc | | | 2,884 | | | | 435,455 | |
Cognizant Technology Solutions Corp. — Class A | | | 5,048 | | | | 389,605 | |
Gartner, Inc.* | | | 756 | | | | 383,111 | |
HP, Inc. | | | 10,605 | | | | 380,401 | |
Check Point Software Technologies Ltd.* | | | 1,929 | | | | 371,930 | |
Infosys Ltd. ADR1 | | | 16,004 | | | | 356,409 | |
Hewlett Packard Enterprise Co. | | | 17,400 | | | | 356,004 | |
NetApp, Inc. | | | 2,594 | | | | 320,385 | |
Seagate Technology Holdings plc | | | 2,872 | | | | 314,570 | |
Western Digital Corp.* | | | 4,595 | | | | 313,792 | |
Super Micro Computer, Inc.* | | | 659 | | | | 274,408 | |
Pure Storage, Inc. — Class A* | | | 4,976 | | | | 249,994 | |
Zscaler, Inc.* | | | 1,445 | | | | 247,008 | |
Amdocs Ltd. | | | 2,304 | | | | 201,554 | |
Lumentum Holdings, Inc.* | | | 2,170 | | | | 137,535 | |
Total Computers | | | | | | | 11,359,222 | |
| | | | | | | | | |
Internet - 14.8% |
Alphabet, Inc. — Class A | | | 17,509 | | | | 2,903,868 | |
Meta Platforms, Inc. — Class A | | | 4,317 | | | | 2,471,224 | |
Palo Alto Networks, Inc.* | | | 1,898 | | | | 648,736 | |
Baidu, Inc. ADR* | | | 4,504 | | | | 474,226 | |
Shopify, Inc. — Class A* | | | 5,719 | | | | 458,321 | |
Sea Ltd. ADR* | | | 4,722 | | | | 445,190 | |
CDW Corp. | | | 1,548 | | | | 350,313 | |
SEE NOTES TO FINANCIAL STATEMENTS. | THE RYDEX FUNDS SEMI-ANNUAL FINANCIAL REPORT | 103 |
SCHEDULE OF INVESTMENTS (Unaudited)(continued) | September 30, 2024 |
TECHNOLOGY FUND | |
| | Shares | | | Value | |
Pinterest, Inc. — Class A* | | | 9,371 | | | $ | 303,339 | |
VeriSign, Inc.* | | | 1,366 | | | | 259,485 | |
Gen Digital, Inc. | | | 8,978 | | | | 246,267 | |
Snap, Inc. — Class A* | | | 22,346 | | | | 239,102 | |
F5, Inc.* | | | 1,046 | | | | 230,329 | |
Okta, Inc.* | | | 2,956 | | | | 219,749 | |
Match Group, Inc.* | | | 5,357 | | | | 202,709 | |
Total Internet | | | | | | | 9,452,858 | |
| | | | | | | | | |
Telecommunications - 3.8% |
Cisco Systems, Inc. | | | 16,995 | | | | 904,474 | |
Arista Networks, Inc.* | | | 1,626 | | | | 624,091 | |
Motorola Solutions, Inc. | | | 1,209 | | | | 543,603 | |
Corning, Inc. | | | 8,549 | | | | 385,987 | |
Total Telecommunications | | | | | | | 2,458,155 | |
| | | | | | | | | |
Electronics - 2.5% |
Amphenol Corp. — Class A | | | 8,525 | | | | 555,489 | |
Keysight Technologies, Inc.* | | | 2,134 | | | | 339,157 | |
Trimble, Inc.* | | | 4,117 | | | | 255,624 | |
Jabil, Inc. | | | 2,013 | | | | 241,218 | |
Flex Ltd.* | | | 7,201 | | | | 240,729 | |
Total Electronics | | | | | | | 1,632,217 | |
| | | | | | | | | |
Energy-Alternate Sources - 1.6% |
SolarEdge Technologies, Inc.* | | | 19,129 | | | | 438,245 | |
First Solar, Inc.* | | | 1,288 | | | | 321,279 | |
Enphase Energy, Inc.* | | | 2,195 | | | | 248,079 | |
Total Energy-Alternate Sources | | | | | | | 1,007,603 | |
| | | | | | | | | |
Investment Companies - 0.5% |
MARA Holdings, Inc.*,1 | | | 8,392 | | | | 136,118 | |
Cleanspark, Inc.* | | | 10,145 | | | | 94,754 | |
Riot Platforms, Inc.*,1 | | | 12,449 | | | | 92,372 | |
Total Investment Companies | | | | | | | 323,244 | |
| | | | | | | | | |
Office & Business Equipment - 0.4% |
Zebra Technologies Corp. — Class A* | | | 732 | | | | 271,074 | |
| | | | | | | | | |
Total Common Stocks | | | | |
(Cost $32,381,483) | | | | | | | 63,825,079 | |
| | | | | | | | | |
| | | Face
Amount | | | | | |
REPURCHASE AGREEMENTS††,2 - 0.4% |
J.P. Morgan Securities LLC
issued 09/30/24 at 4.86%
due 10/01/24 | | $ | 153,306 | | | | 153,306 | |
BofA Securities, Inc.
issued 09/30/24 at 4.85%
due 10/01/24 | | | 126,623 | | | | 126,623 | |
Total Repurchase Agreements | | | | |
(Cost $279,929) | | | | | | | 279,929 | |
| | | | | | | | | |
| | | Shares | | | | | |
SECURITIES LENDING COLLATERAL†,3 - 0.9% |
Money Market Fund*** | | | | | | | | |
First American Government Obligations Fund - Class X, 4.82%4 | | | 569,606 | | | | 569,606 | |
Total Securities Lending Collateral | | | | |
(Cost $569,606) | | | | | | | 569,606 | |
| | | | | | | | | |
Total Investments - 100.8% | | | | |
(Cost $33,231,018) | | $ | 64,674,614 | |
Other Assets & Liabilities, net - (0.8)% | | | (521,492 | ) |
Total Net Assets - 100.0% | | $ | 64,153,122 | |
* | Non-income producing security. |
*** | A copy of each underlying unaffiliated fund’s financial statements is available at the SEC’s website at www.sec.gov. |
† | Value determined based on Level 1 inputs — See Note 4. |
†† | Value determined based on Level 2 inputs — See Note 4. |
1 | All or a portion of this security is on loan at September 30, 2024 — See Note 7. |
2 | Repurchase Agreements — See Note 6. |
3 | Securities lending collateral — See Note 7. |
4 | Rate indicated is the 7-day yield as of September 30, 2024. |
| | ADR — American Depositary Receipt |
| | plc — Public Limited Company |
| | |
| | See Sector Classification in Other Information section. |
104 | THE RYDEX FUNDS SEMI-ANNUAL FINANCIAL REPORT | SEE NOTES TO FINANCIAL STATEMENTS. |
SCHEDULE OF INVESTMENTS (Unaudited)(concluded) | September 30, 2024 |
TECHNOLOGY FUND | |
The following table summarizes the inputs used to value the Fund’s investments at September 30, 2024 (See Note 4 in the Notes to Financial Statements):
Investments in Securities (Assets) | | Level 1
Quoted
Prices | | | Level 2
Significant
Observable
Inputs | | | Level 3
Significant
Unobservable
Inputs | | | Total | |
Common Stocks | | $ | 63,825,079 | | | $ | — | | | $ | — | | | $ | 63,825,079 | |
Repurchase Agreements | | | — | | | | 279,929 | | | | — | | | | 279,929 | |
Securities Lending Collateral | | | 569,606 | | | | — | | | | — | | | | 569,606 | |
Total Assets | | $ | 64,394,685 | | | $ | 279,929 | | | $ | — | | | $ | 64,674,614 | |
SEE NOTES TO FINANCIAL STATEMENTS. | THE RYDEX FUNDS SEMI-ANNUAL FINANCIAL REPORT | 105 |
STATEMENT OF ASSETS AND LIABILITIES (Unaudited) |
September 30, 2024 |
Assets: |
Investments, at value - including $542,871 of securities loaned (cost $32,951,089) | | $ | 64,394,685 | |
Repurchase agreements, at value (cost $279,929) | | | 279,929 | |
Receivables: |
Securities sold | | | 3,166,527 | |
Fund shares sold | | | 463,118 | |
Dividends | | | 20,385 | |
Foreign tax reclaims | | | 1,108 | |
Securities lending income | | | 87 | |
Interest | | | 38 | |
Total assets | | | 68,325,877 | |
| | | | | |
Liabilities: |
Payable for: |
Fund shares redeemed | | | 3,482,271 | |
Return of securities lending collateral | | | 569,606 | |
Management fees | | | 42,590 | |
Transfer agent fees | | | 28,884 | |
Portfolio accounting and administration fees | | | 5,142 | |
Distribution and service fees | | | 3,953 | |
Trustees’ fees* | | | 587 | |
Miscellaneous | | | 39,722 | |
Total liabilities | | | 4,172,755 | |
Net assets | | $ | 64,153,122 | |
| | | | | |
Net assets consist of: |
Paid in capital | | $ | 34,385,780 | |
Total distributable earnings (loss) | | | 29,767,342 | |
Net assets | | $ | 64,153,122 | |
| | | | | |
Investor Class: |
Net assets | | $ | 51,179,111 | |
Capital shares outstanding | | | 251,045 | |
Net asset value per share | | $ | 203.86 | |
| | | | | |
Class A: |
Net assets | | $ | 9,107,457 | |
Capital shares outstanding | | | 49,539 | |
Net asset value per share | | $ | 183.84 | |
Maximum offering price per share (Net asset value divided by 95.25%) | | $ | 193.01 | |
| | | | | |
Class C: |
Net assets | | $ | 2,842,599 | |
Capital shares outstanding | | | 18,579 | |
Net asset value per share | | $ | 153.00 | |
| | | | | |
Class H: |
Net assets | | $ | 1,023,955 | |
Capital shares outstanding | | | 5,724 | |
Net asset value per share | | $ | 178.89 | |
STATEMENT OF OPERATIONS (Unaudited) |
Six Months Ended September 30, 2024 |
Investment Income: |
Dividends (net of foreign withholding tax of $812) | | $ | 229,795 | |
Interest | | | 10,218 | |
Income from securities lending, net | | | 391 | |
Total investment income | | | 240,404 | |
| | | | | |
Expenses: |
Management fees | | | 290,306 | |
Distribution and service fees: |
Class A | | | 11,230 | |
Class C | | | 14,450 | |
Class H | | | 2,465 | |
Transfer agent fees | | | 70,186 | |
Portfolio accounting and administration fees | | | 52,114 | |
Registration fees | | | 26,342 | |
Professional fees | | | 13,792 | |
Custodian fees | | | 4,386 | |
Trustees’ fees* | | | 3,479 | |
Miscellaneous | | | 23,702 | |
Total expenses | | | 512,452 | |
Less: |
Expenses reimbursed by Adviser | | | (17,062 | ) |
Net expenses | | | 495,390 | |
Net investment loss | | | (254,986 | ) |
| | | | | |
Net Realized and Unrealized Gain (Loss): |
Net realized gain (loss) on: |
Investments | | | 48,134 | |
Net realized gain | | | 48,134 | |
Net change in unrealized appreciation (depreciation) on: |
Investments | | | 4,164,428 | |
Net change in unrealized appreciation (depreciation) | | | 4,164,428 | |
Net realized and unrealized gain | | | 4,212,562 | |
Net increase in net assets resulting from operations | | $ | 3,957,576 | |
* | Relates to Trustees not deemed “interested persons” within the meaning of Section 2(a)(19) of the 1940 Act. |
106 | THE RYDEX FUNDS SEMI-ANNUAL FINANCIAL REPORT | SEE NOTES TO FINANCIAL STATEMENTS. |
STATEMENTS OF CHANGES IN NET ASSETS |
| | Six Months Ended
September 30, 2024
(Unaudited) | | | Year Ended
March 31,
2024 | |
Increase (Decrease) in Net Assets from Operations: | | | | | | | | |
Net investment loss | | $ | (254,986 | ) | | $ | (400,991 | ) |
Net realized gain on investments | | | 48,134 | | | | 4,495,145 | |
Net change in unrealized appreciation (depreciation) on investments | | | 4,164,428 | | | | 11,784,979 | |
Net increase in net assets resulting from operations | | | 3,957,576 | | | | 15,879,133 | |
| | | | | | | | | |
Distributions to shareholders: | | | | | | | | |
Investor Class | | | — | | | | (1,548,617 | ) |
Class A | | | — | | | | (227,970 | ) |
Class C | | | — | | | | (91,187 | ) |
Class H | | | — | | | | (87,573 | ) |
Total distributions to shareholders | | | — | | | | (1,955,347 | ) |
| | | | | | | | | |
Capital share transactions: | | | | | | | | |
Proceeds from sale of shares | | | | | | | | |
Investor Class | | | 47,792,239 | | | | 120,416,346 | |
Class A | | | 1,462,899 | | | | 2,572,213 | |
Class C | | | 331,717 | | | | 747,840 | |
Class H | | | 2,808,069 | | | | 4,472,665 | |
Distributions reinvested | | | | | | | | |
Investor Class | | | — | | | | 1,514,370 | |
Class A | | | — | | | | 226,883 | |
Class C | | | — | | | | 90,293 | |
Class H | | | — | | | | 87,101 | |
Cost of shares redeemed | | | | | | | | |
Investor Class | | | (35,865,430 | ) | | | (119,846,391 | ) |
Class A | | | (1,884,730 | ) | | | (2,736,773 | ) |
Class C | | | (691,166 | ) | | | (1,447,009 | ) |
Class H | | | (3,112,825 | ) | | | (4,714,179 | ) |
Net increase from capital share transactions | | | 10,840,773 | | | | 1,383,359 | |
Net increase in net assets | | | 14,798,349 | | | | 15,307,145 | |
| | | | | | | | | |
Net assets: | | | | | | | | |
Beginning of period | | | 49,354,773 | | | | 34,047,628 | |
End of period | | $ | 64,153,122 | | | $ | 49,354,773 | |
| | | | | | | | | |
Capital share activity: | | | | | | | | |
Shares sold | | | | | | | | |
Investor Class | | | 247,187 | | | | 767,301 | |
Class A | | | 8,282 | | | | 18,121 | |
Class C | | | 2,247 | | | | 6,073 | |
Class H | | | 16,536 | | | | 31,365 | |
Shares issued from reinvestment of distributions | | | | | | | | |
Investor Class | | | — | | | | 9,148 | |
Class A | | | — | | | | 1,517 | |
Class C | | | — | | | | 721 | |
Class H | | | — | | | | 598 | |
Shares redeemed | | | | | | | | |
Investor Class | | | (184,418 | ) | | | (755,479 | ) |
Class A | | | (10,664 | ) | | | (18,662 | ) |
Class C | | | (4,578 | ) | | | (12,187 | ) |
Class H | | | (18,249 | ) | | | (32,507 | ) |
Net increase in shares | | | 56,343 | | | | 16,009 | |
SEE NOTES TO FINANCIAL STATEMENTS. | THE RYDEX FUNDS SEMI-ANNUAL FINANCIAL REPORT | 107 |
This table is presented to show selected data for a share outstanding throughout each period and to assist shareholders in evaluating a Fund’s performance for the periods presented.
Investor Class | | Six Months Ended
September 30, 2024a | | | Year Ended
March 31,
2024 | | | Year Ended
March 31,
2023 | | | Year Ended
March 31,
2022 | | | Year Ended
March 31,
2021 | | | Year Ended
March 31,
2020 | |
Per Share Data |
Net asset value, beginning of period | | $ | 191.70 | | | $ | 141.40 | | | $ | 168.83 | | | $ | 177.69 | | | $ | 100.21 | | | $ | 101.77 | |
Income (loss) from investment operations: |
Net investment income (loss)b | | | (.65 | ) | | | (.97 | ) | | | (.68 | ) | | | (1.32 | ) | | | (.96 | ) | | | (.22 | ) |
Net gain (loss) on investments (realized and unrealized) | | | 12.81 | | | | 55.52 | | | | (20.64 | ) | | | 6.56 | | | | 81.24 | | | | (.80 | ) |
Total from investment operations | | | 12.16 | | | | 54.55 | | | | (21.32 | ) | | | 5.24 | | | | 80.28 | | | | (1.02 | ) |
Less distributions from: |
Net realized gains | | | — | | | | (4.25 | ) | | | (6.11 | ) | | | (14.10 | ) | | | (2.80 | ) | | | (.54 | ) |
Total distributions | | | — | | | | (4.25 | ) | | | (6.11 | ) | | | (14.10 | ) | | | (2.80 | ) | | | (.54 | ) |
Net asset value, end of period | | $ | 203.86 | | | $ | 191.70 | | | $ | 141.40 | | | $ | 168.83 | | | $ | 177.69 | | | $ | 100.21 | |
|
Total Return | | | 6.34 | % | | | 39.06 | % | | | (11.94 | %) | | | 1.94 | % | | | 80.31 | % | | | (1.06 | %) |
Ratios/Supplemental Data |
Net assets, end of period (in thousands) | | $ | 51,179 | | | $ | 36,092 | | | $ | 23,656 | | | $ | 32,397 | | | $ | 35,562 | | | $ | 23,190 | |
Ratios to average net assets: |
Net investment income (loss) | | | (0.66 | %) | | | (0.61 | %) | | | (0.50 | %) | | | (0.68 | %) | | | (0.65 | %) | | | (0.20 | %) |
Total expenses | | | 1.42 | % | | | 1.44 | % | | | 1.39 | % | | | 1.36 | % | | | 1.44 | % | | | 1.47 | % |
Net expensesc | | | 1.37 | % | | | 1.40 | % | | | 1.39 | % | | | 1.36 | % | | | 1.44 | % | | | 1.47 | % |
Portfolio turnover rate | | | 53 | % | | | 211 | % | | | 121 | % | | | 175 | % | | | 195 | % | | | 165 | % |
Class A | | Six Months Ended
September 30, 2024a | | | Year Ended
March 31,
2024 | | | Year Ended
March 31,
2023 | | | Year Ended
March 31,
2022 | | | Year Ended
March 31,
2021 | | | Year Ended
March 31,
2020 | |
Per Share Data |
Net asset value, beginning of period | | $ | 173.09 | | | $ | 128.33 | | | $ | 154.37 | | | $ | 163.90 | | | $ | 92.79 | | | $ | 94.51 | |
Income (loss) from investment operations: |
Net investment income (loss)b | | | (.80 | ) | | | (1.27 | ) | | | (.93 | ) | | | (1.68 | ) | | | (1.24 | ) | | | (.41 | ) |
Net gain (loss) on investments (realized and unrealized) | | | 11.55 | | | | 50.28 | | | | (19.00 | ) | | | 6.25 | | | | 75.15 | | | | (.77 | ) |
Total from investment operations | | | 10.75 | | | | 49.01 | | | | (19.93 | ) | | | 4.57 | | | | 73.91 | | | | (1.18 | ) |
Less distributions from: |
Net realized gains | | | — | | | | (4.25 | ) | | | (6.11 | ) | | | (14.10 | ) | | | (2.80 | ) | | | (.54 | ) |
Total distributions | | | — | | | | (4.25 | ) | | | (6.11 | ) | | | (14.10 | ) | | | (2.80 | ) | | | (.54 | ) |
Net asset value, end of period | | $ | 183.84 | | | $ | 173.09 | | | $ | 128.33 | | | $ | 154.37 | | | $ | 163.90 | | | $ | 92.79 | |
|
Total Returnd | | | 6.21 | % | | | 38.72 | % | | | (12.16 | %) | | | 1.69 | % | | | 79.86 | % | | | (1.31 | %) |
Ratios/Supplemental Data |
Net assets, end of period (in thousands) | | $ | 9,107 | | | $ | 8,987 | | | $ | 6,538 | | | $ | 8,305 | | | $ | 9,190 | | | $ | 5,321 | |
Ratios to average net assets: |
Net investment income (loss) | | | (0.92 | %) | | | (0.87 | %) | | | (0.75 | %) | | | (0.96 | %) | | | (0.90 | %) | | | (0.40 | %) |
Total expenses | | | 1.67 | % | | | 1.68 | % | | | 1.64 | % | | | 1.61 | % | | | 1.69 | % | | | 1.73 | % |
Net expensesc | | | 1.62 | % | | | 1.65 | % | | | 1.64 | % | | | 1.61 | % | | | 1.69 | % | | | 1.73 | % |
Portfolio turnover rate | | | 53 | % | | | 211 | % | | | 121 | % | | | 175 | % | | | 195 | % | | | 165 | % |
108 | THE RYDEX FUNDS SEMI-ANNUAL FINANCIAL REPORT | SEE NOTES TO FINANCIAL STATEMENTS. |
FINANCIAL HIGHLIGHTS (continued) |
This table is presented to show selected data for a share outstanding throughout each period and to assist shareholders in evaluating a Fund’s performance for the periods presented.
Class C | | Six Months Ended
September 30, 2024a | | | Year Ended
March 31,
2024 | | | Year Ended
March 31,
2023 | | | Year Ended
March 31,
2022 | | | Year Ended
March 31,
2021 | | | Year Ended
March 31,
2020 | |
Per Share Data |
Net asset value, beginning of period | | $ | 144.59 | | | $ | 108.59 | | | $ | 132.87 | | | $ | 143.81 | | | $ | 82.23 | | | $ | 84.44 | |
Income (loss) from investment operations: |
Net investment income (loss)b | | | (1.22 | ) | | | (1.97 | ) | | | (1.59 | ) | | | (2.60 | ) | | | (2.01 | ) | | | (1.06 | ) |
Net gain (loss) on investments (realized and unrealized) | | | 9.63 | | | | 42.22 | | | | (16.58 | ) | | | 5.76 | | | | 66.39 | | | | (.61 | ) |
Total from investment operations | | | 8.41 | | | | 40.25 | | | | (18.17 | ) | | | 3.16 | | | | 64.38 | | | | (1.67 | ) |
Less distributions from: |
Net realized gains | | | — | | | | (4.25 | ) | | | (6.11 | ) | | | (14.10 | ) | | | (2.80 | ) | | | (.54 | ) |
Total distributions | | | — | | | | (4.25 | ) | | | (6.11 | ) | | | (14.10 | ) | | | (2.80 | ) | | | (.54 | ) |
Net asset value, end of period | | $ | 153.00 | | | $ | 144.59 | | | $ | 108.59 | | | $ | 132.87 | | | $ | 143.81 | | | $ | 82.23 | |
|
Total Returnd | | | 5.82 | % | | | 37.69 | % | | | (12.82 | %) | | | 0.92 | % | | | 78.52 | % | | | (2.05 | %) |
Ratios/Supplemental Data |
Net assets, end of period (in thousands) | | $ | 2,843 | | | $ | 3,023 | | | $ | 2,856 | | | $ | 4,194 | | | $ | 6,214 | | | $ | 3,796 | |
Ratios to average net assets: |
Net investment income (loss) | | | (1.66 | %) | | | (1.62 | %) | | | (1.51 | %) | | | (1.70 | %) | | | (1.65 | %) | | | (1.17 | %) |
Total expenses | | | 2.42 | % | | | 2.43 | % | | | 2.39 | % | | | 2.36 | % | | | 2.44 | % | | | 2.48 | % |
Net expensesc | | | 2.37 | % | | | 2.40 | % | | | 2.39 | % | | | 2.36 | % | | | 2.44 | % | | | 2.48 | % |
Portfolio turnover rate | | | 53 | % | | | 211 | % | | | 121 | % | | | 175 | % | | | 195 | % | | | 165 | % |
SEE NOTES TO FINANCIAL STATEMENTS. | THE RYDEX FUNDS SEMI-ANNUAL FINANCIAL REPORT | 109 |
FINANCIAL HIGHLIGHTS (concluded) |
This table is presented to show selected data for a share outstanding throughout each period and to assist shareholders in evaluating a Fund’s performance for the periods presented.
Class H | | Six Months Ended
September 30, 2024a | | | Year Ended
March 31,
2024 | | | Year Ended
March 31,
2023 | | | Year Ended
March 31,
2022 | | | Year Ended
March 31,
2021 | | | Year Ended
March 31,
2020 | |
Per Share Data |
Net asset value, beginning of period | | $ | 168.44 | | | $ | 124.98 | | | $ | 150.57 | | | $ | 160.17 | | | $ | 90.72 | | | $ | 92.40 | |
Income (loss) from investment operations: |
Net investment income (loss)b | | | (.80 | ) | | | (1.26 | ) | | | (.92 | ) | | | (1.62 | ) | | | (1.01 | ) | | | (.47 | ) |
Net gain (loss) on investments (realized and unrealized) | | | 11.25 | | | | 48.97 | | | | (18.56 | ) | | | 6.12 | | | | 73.26 | | | | (.67 | ) |
Total from investment operations | | | 10.45 | | | | 47.71 | | | | (19.48 | ) | | | 4.50 | | | | 72.25 | | | | (1.14 | ) |
Less distributions from: |
Net realized gains | | | — | | | | (4.25 | ) | | | (6.11 | ) | | | (14.10 | ) | | | (2.80 | ) | | | (.54 | ) |
Total distributions | | | — | | | | (4.25 | ) | | | (6.11 | ) | | | (14.10 | ) | | | (2.80 | ) | | | (.54 | ) |
Net asset value, end of period | | $ | 178.89 | | | $ | 168.44 | | | $ | 124.98 | | | $ | 150.57 | | | $ | 160.17 | | | $ | 90.72 | |
|
Total Return | | | 6.20 | % | | | 38.72 | % | | | (12.17 | %) | | | 1.68 | % | | | 79.85 | % | | | (1.30 | %) |
Ratios/Supplemental Data |
Net assets, end of period (in thousands) | | $ | 1,024 | | | $ | 1,253 | | | $ | 997 | | | $ | 1,355 | | | $ | 1,734 | | | $ | 3,435 | |
Ratios to average net assets: |
Net investment income (loss) | | | (0.93 | %) | | | (0.88 | %) | | | (0.76 | %) | | | (0.93 | %) | | | (0.83 | %) | | | (0.47 | %) |
Total expenses | | | 1.67 | % | | | 1.69 | % | | | 1.64 | % | | | 1.60 | % | | | 1.74 | % | | | 1.72 | % |
Net expensesc | | | 1.62 | % | | | 1.65 | % | | | 1.64 | % | | | 1.60 | % | | | 1.74 | % | | | 1.72 | % |
Portfolio turnover rate | | | 53 | % | | | 211 | % | | | 121 | % | | | 175 | % | | | 195 | % | | | 165 | % |
a | Unaudited figures for the period ended September 30, 2024. Percentage amounts for the period, except total return and portfolio turnover rate, have been annualized. |
b | Net investment income (loss) per share was computed using average shares outstanding throughout the period. |
c | Net expense information reflects the expense ratios after expense waivers and reimbursements, as applicable. |
d | Total return does not reflect the impact of any applicable sales charges. |
110 | THE RYDEX FUNDS SEMI-ANNUAL FINANCIAL REPORT | SEE NOTES TO FINANCIAL STATEMENTS. |
SCHEDULE OF INVESTMENTS (Unaudited) | September 30, 2024 |
TELECOMMUNICATIONS FUND | |
| | Shares | | | Value | |
COMMON STOCKS† - 99.3% |
| | | | | | | | | |
Telecommunications - 71.9% |
Cisco Systems, Inc. | | | 11,043 | | | $ | 587,708 | |
Verizon Communications, Inc. | | | 12,043 | | | | 540,851 | |
AT&T, Inc. | | | 23,973 | | | | 527,406 | |
T-Mobile US, Inc. | | | 2,020 | | | | 416,847 | |
Arista Networks, Inc.* | | | 827 | | | | 317,419 | |
Motorola Solutions, Inc. | | | 663 | | | | 298,105 | |
Juniper Networks, Inc. | | | 4,695 | | | | 183,011 | |
Ciena Corp.* | | | 2,601 | | | | 160,196 | |
Frontier Communications Parent, Inc.* | | | 4,241 | | | | 150,683 | |
Lumen Technologies, Inc.* | | | 20,247 | | | | 143,754 | |
AST SpaceMobile, Inc.*,1 | | | 5,129 | | | | 134,123 | |
Telefonaktiebolaget LM Ericsson ADR | | | 17,326 | | | | 131,331 | |
BCE, Inc. | | | 3,704 | | | | 128,899 | |
EchoStar Corp. — Class A* | | | 5,190 | | | | 128,816 | |
Vodafone Group plc ADR | | | 12,291 | | | | 123,156 | |
TELUS Corp. | | | 7,262 | | | | 121,856 | |
Rogers Communications, Inc. — Class B | | | 2,900 | | | | 116,609 | |
America Movil SAB de CV ADR | | | 7,044 | | | | 115,240 | |
Nokia Oyj ADR1 | | | 24,645 | | | | 107,699 | |
Iridium Communications, Inc. | | | 3,249 | | | | 98,932 | |
InterDigital, Inc. | | | 626 | | | | 88,660 | |
Calix, Inc.* | | | 2,059 | | | | 79,869 | |
Telephone & Data Systems, Inc. | | | 3,230 | | | | 75,097 | |
Viavi Solutions, Inc.* | | | 8,240 | | | | 74,325 | |
Extreme Networks, Inc.* | | | 4,659 | | | | 70,025 | |
Harmonic, Inc.* | | | 4,648 | | | | 67,721 | |
Infinera Corp.*,1 | | | 9,055 | | | | 61,121 | |
CommScope Holding Company, Inc.* | | | 8,802 | | | | 53,780 | |
Viasat, Inc.* | | | 4,117 | | | | 49,157 | |
Gogo, Inc.* | | | 4,660 | | | | 33,459 | |
ADTRAN Holdings, Inc.* | | | 5,473 | | | | 32,455 | |
Total Telecommunications | | | | | | | 5,218,310 | |
| | | | | | | | | |
Media - 16.4% |
Comcast Corp. — Class A | | | 12,873 | | | | 537,705 | |
Charter Communications, Inc. — Class A* | | | 818 | | | | 265,098 | |
Liberty Broadband Corp. — Class C* | | | 2,373 | | | | 183,409 | |
Liberty Global Ltd. — Class C* | | | 6,373 | | | | 137,721 | |
Liberty Latin America Ltd. — Class C* | | | 6,570 | | | | 62,349 | |
Total Media | | | | | | | 1,186,282 | |
| | | | | | | | | |
Internet - 5.9% |
F5, Inc.* | | | 858 | | | | 188,932 | |
Roku, Inc.* | | | 2,210 | | | | 164,998 | |
Cogent Communications Holdings, Inc. | | | 995 | | | | 75,540 | |
Total Internet | | | | | | | 429,470 | |
| | | | | | | | | |
Computers - 2.5% |
Lumentum Holdings, Inc.* | | | 1,780 | | | | 112,817 | |
NetScout Systems, Inc.* | | | 3,024 | | | | 65,772 | |
Total Computers | | | | | | | 178,589 | |
| | | | | | | | | |
Software - 2.2% |
Nice Ltd. ADR* | | | 733 | | | | 127,300 | |
Digi International, Inc.* | | | 1,157 | | | | 31,852 | |
Total Software | | | | | | | 159,152 | |
| | | | | | | | | |
Electronics - 0.4% |
Applied Optoelectronics, Inc.* | | | 2,259 | | | | 32,326 | |
| | | | | | | | | |
Total Common Stocks | | | | |
(Cost $6,475,103) | | | | | | | 7,204,129 | |
| | | | | | | | | |
| | | Face
Amount | | | | | |
REPURCHASE AGREEMENTS††,2 - 0.3% |
J.P. Morgan Securities LLC
issued 09/30/24 at 4.86%
due 10/01/24 | | $ | 13,519 | | | | 13,519 | |
BofA Securities, Inc.
issued 09/30/24 at 4.85%
due 10/01/24 | | | 11,166 | | | | 11,166 | |
Total Repurchase Agreements | | | | |
(Cost $24,685) | | | | | | | 24,685 | |
| | | | | | | | | |
| | | Shares | | | | | |
SECURITIES LENDING COLLATERAL†,3 - 3.1% |
Money Market Fund*** | | | | | | | | |
First American Government Obligations Fund - Class X, 4.82%4 | | | 223,330 | | | | 223,330 | |
Total Securities Lending Collateral | | | | |
(Cost $223,330) | | | | | | | 223,330 | |
| | | | | | | | | |
Total Investments - 102.7% | | | | |
(Cost $6,723,118) | | $ | 7,452,144 | |
Other Assets & Liabilities, net - (2.7)% | | | (199,364 | ) |
Total Net Assets - 100.0% | | $ | 7,252,780 | |
SEE NOTES TO FINANCIAL STATEMENTS. | THE RYDEX FUNDS SEMI-ANNUAL FINANCIAL REPORT | 111 |
SCHEDULE OF INVESTMENTS (Unaudited)(concluded) | September 30, 2024 |
TELECOMMUNICATIONS FUND | |
* | Non-income producing security. |
*** | A copy of each underlying unaffiliated fund’s financial statements is available at the SEC’s website at www.sec.gov. |
† | Value determined based on Level 1 inputs — See Note 4. |
†† | Value determined based on Level 2 inputs — See Note 4. |
1 | All or a portion of this security is on loan at September 30, 2024 — See Note 7. |
2 | Repurchase Agreements — See Note 6. |
3 | Securities lending collateral — See Note 7. |
4 | Rate indicated is the 7-day yield as of September 30, 2024. |
| | ADR — American Depositary Receipt |
| | plc — Public Limited Company |
| | |
| | See Sector Classification in Other Information section. |
The following table summarizes the inputs used to value the Fund’s investments at September 30, 2024 (See Note 4 in the Notes to Financial Statements):
Investments in Securities (Assets) | | Level 1
Quoted
Prices | | | Level 2
Significant
Observable
Inputs | | | Level 3
Significant
Unobservable
Inputs | | | Total | |
Common Stocks | | $ | 7,204,129 | | | $ | — | | | $ | — | | | $ | 7,204,129 | |
Repurchase Agreements | | | — | | | | 24,685 | | | | — | | | | 24,685 | |
Securities Lending Collateral | | | 223,330 | | | | — | | | | — | | | | 223,330 | |
Total Assets | | $ | 7,427,459 | | | $ | 24,685 | | | $ | — | | | $ | 7,452,144 | |
112 | THE RYDEX FUNDS SEMI-ANNUAL FINANCIAL REPORT | SEE NOTES TO FINANCIAL STATEMENTS. |
STATEMENT OF ASSETS AND LIABILITIES (Unaudited) |
September 30, 2024 |
Assets: |
Investments, at value - including $219,919 of securities loaned (cost $6,698,433) | | $ | 7,427,459 | |
Repurchase agreements, at value (cost $24,685) | | | 24,685 | |
Receivables: |
Fund shares sold | | | 1,102,766 | |
Dividends | | | 5,046 | |
Securities lending income | | | 190 | |
Total assets | | | 8,560,146 | |
| | | | | |
Liabilities: |
Payable for: |
Fund shares redeemed | | | 845,891 | |
Securities purchased | | | 229,894 | |
Return of securities lending collateral | | | 223,330 | |
Management fees | | | 4,181 | |
Transfer agent fees | | | 1,524 | |
Portfolio accounting and administration fees | | | 505 | |
Distribution and service fees | | | 61 | |
Trustees’ fees* | | | 28 | |
Miscellaneous | | | 1,952 | |
Total liabilities | | | 1,307,366 | |
Net assets | | $ | 7,252,780 | |
| | | | | |
Net assets consist of: |
Paid in capital | | $ | 9,540,008 | |
Total distributable earnings (loss) | | | (2,287,228 | ) |
Net assets | | $ | 7,252,780 | |
| | | | | |
Investor Class: |
Net assets | | $ | 6,964,466 | |
Capital shares outstanding | | | 136,727 | |
Net asset value per share | | $ | 50.94 | |
| | | | | |
Class A: |
Net assets | | $ | 109,776 | |
Capital shares outstanding | | | 2,403 | |
Net asset value per share | | $ | 45.68 | |
Maximum offering price per share (Net asset value divided by 95.25%) | | $ | 47.96 | |
| | | | | |
Class C: |
Net assets | | $ | 12,062 | |
Capital shares outstanding | | | 315 | |
Net asset value per share | | $ | 38.29 | |
| | | | | |
Class H: |
Net assets | | $ | 166,476 | |
Capital shares outstanding | | | 3,749 | |
Net asset value per share | | $ | 44.41 | |
STATEMENT OF OPERATIONS (Unaudited) |
Six Months Ended September 30, 2024 |
Investment Income: |
Dividends (net of foreign withholding tax of $1,242) | | $ | 34,339 | |
Interest | | | 436 | |
Income from securities lending, net | | | 421 | |
Total investment income | | | 35,196 | |
| | | | | |
Expenses: |
Management fees | | | 12,730 | |
Distribution and service fees: |
Class A | | | 137 | |
Class C | | | 104 | |
Class H | | | 155 | |
Transfer agent fees | | | 3,028 | |
Portfolio accounting and administration fees | | | 2,285 | |
Professional fees | | | 706 | |
Custodian fees | | | 189 | |
Trustees’ fees* | | | 120 | |
Line of credit fees | | | 26 | |
Miscellaneous | | | 2,170 | |
Total expenses | | | 21,650 | |
Less: |
Expenses reimbursed by Adviser | | | (748 | ) |
Net expenses | | | 20,902 | |
Net investment income | | | 14,294 | |
| | | | | |
Net Realized and Unrealized Gain (Loss): |
Net realized gain (loss) on: |
Investments | | | (12,269 | ) |
Net realized loss | | | (12,269 | ) |
Net change in unrealized appreciation (depreciation) on: |
Investments | | | 482,438 | |
Net change in unrealized appreciation (depreciation) | | | 482,438 | |
Net realized and unrealized gain | | | 470,169 | |
Net increase in net assets resulting from operations | | $ | 484,463 | |
* | Relates to Trustees not deemed “interested persons” within the meaning of Section 2(a)(19) of the 1940 Act. |
SEE NOTES TO FINANCIAL STATEMENTS. | THE RYDEX FUNDS SEMI-ANNUAL FINANCIAL REPORT | 113 |
STATEMENTS OF CHANGES IN NET ASSETS |
| | Six Months Ended
September 30, 2024
(Unaudited) | | | Year Ended
March 31,
2024 | |
Increase (Decrease) in Net Assets from Operations: | | | | | | | | |
Net investment income | | $ | 14,294 | | | $ | 34,191 | |
Net realized loss on investments | | | (12,269 | ) | | | (342,667 | ) |
Net change in unrealized appreciation (depreciation) on investments | | | 482,438 | | | | (142,776 | ) |
Net increase (decrease) in net assets resulting from operations | | | 484,463 | | | | (451,252 | ) |
| | | | | | | | | |
Distributions to shareholders: | | | | | | | | |
Investor Class | | | — | | | | (26,701 | ) |
Class A | | | — | | | | (2,067 | ) |
Class C | | | — | | | | (525 | ) |
Class H | | | — | | | | (1,690 | ) |
Total distributions to shareholders | | | — | | | | (30,983 | ) |
| | | | | | | | | |
Capital share transactions: | | | | | | | | |
Proceeds from sale of shares | | | | | | | | |
Investor Class | | | 11,566,285 | | | | 16,845,642 | |
Class A | | | 487,520 | | | | 356,728 | |
Class C | | | 38,199 | | | | 30,651 | |
Class H | | | 71,217 | | | | 2,683 | |
Distributions reinvested | | | | | | | | |
Investor Class | | | — | | | | 26,583 | |
Class A | | | — | | | | 2,067 | |
Class C | | | — | | | | 525 | |
Class H | | | — | | | | 1,690 | |
Cost of shares redeemed | | | | | | | | |
Investor Class | | | (8,842,790 | ) | | | (20,759,144 | ) |
Class A | | | (499,767 | ) | | | (501,197 | ) |
Class C | | | (53,574 | ) | | | (37,327 | ) |
Class H | | | (23,472 | ) | | | (17,010 | ) |
Net increase (decrease) from capital share transactions | | | 2,743,618 | | | | (4,048,109 | ) |
Net increase (decrease) in net assets | | | 3,228,081 | | | | (4,530,344 | ) |
| | | | | | | | | |
Net assets: | | | | | | | | |
Beginning of period | | | 4,024,699 | | | | 8,555,043 | |
End of period | | $ | 7,252,780 | | | $ | 4,024,699 | |
| | | | | | | | | |
Capital share activity: | | | | | | | | |
Shares sold | | | | | | | | |
Investor Class | | | 241,874 | | | | 384,658 | |
Class A | | | 11,949 | | | | 9,249 | |
Class C | | | 1,126 | | | | 936 | |
Class H | | | 1,895 | | | | 71 | |
Shares issued from reinvestment of distributions | | | | | | | | |
Investor Class | | | — | | | | 619 | |
Class A | | | — | | | | 54 | |
Class C | | | — | | | | 16 | |
Class H | | | — | | | | 45 | |
Shares redeemed | | | | | | | | |
Investor Class | | | (192,164 | ) | | | (480,325 | ) |
Class A | | | (12,235 | ) | | | (13,018 | ) |
Class C | | | (1,576 | ) | | | (1,155 | ) |
Class H | | | (633 | ) | | | (460 | ) |
Net increase (decrease) in shares | | | 50,236 | | | | (99,310 | ) |
114 | THE RYDEX FUNDS SEMI-ANNUAL FINANCIAL REPORT | SEE NOTES TO FINANCIAL STATEMENTS. |
This table is presented to show selected data for a share outstanding throughout each period and to assist shareholders in evaluating a Fund’s performance for the periods presented.
Investor Class | | Six Months Ended
September 30, 2024a | | | Year Ended
March 31,
2024 | | | Year Ended
March 31,
2023 | | | Year Ended
March 31,
2022 | | | Year Ended
March 31,
2021 | | | Year Ended
March 31,
2020 | |
Per Share Data |
Net asset value, beginning of period | | $ | 43.66 | | | $ | 44.78 | | | $ | 53.37 | | | $ | 56.03 | | | $ | 43.19 | | | $ | 50.17 | |
Income (loss) from investment operations: |
Net investment income (loss)b | | | .22 | | | | .49 | | | | .11 | | | | .58 | | | | .66 | | | | .69 | |
Net gain (loss) on investments (realized and unrealized) | | | 7.06 | | | | (.92 | ) | | | (8.10 | ) | | | (3.00 | ) | | | 13.33 | | | | (5.91 | ) |
Total from investment operations | | | 7.28 | | | | (.43 | ) | | | (7.99 | ) | | | (2.42 | ) | | | 13.99 | | | | (5.22 | ) |
Less distributions from: |
Net investment income | | | — | | | | (.69 | ) | | | (.60 | ) | | | (.24 | ) | | | (1.15 | ) | | | (1.76 | ) |
Total distributions | | | — | | | | (.69 | ) | | | (.60 | ) | | | (.24 | ) | | | (1.15 | ) | | | (1.76 | ) |
Net asset value, end of period | | $ | 50.94 | | | $ | 43.66 | | | $ | 44.78 | | | $ | 53.37 | | | $ | 56.03 | | | $ | 43.19 | |
|
Total Return | | | 16.67 | % | | | (0.91 | %) | | | (14.87 | %) | | | (4.36 | %) | | | 32.55 | % | | | (10.74 | %) |
Ratios/Supplemental Data |
Net assets, end of period (in thousands) | | $ | 6,964 | | | $ | 3,799 | | | $ | 8,152 | | | $ | 997 | | | $ | 1,773 | | | $ | 2,984 | |
Ratios to average net assets: |
Net investment income (loss) | | | 0.97 | % | | | 1.13 | % | | | 0.26 | % | | | 1.02 | % | | | 1.33 | % | | | 1.38 | % |
Total expenses | | | 1.42 | % | | | 1.42 | % | | | 1.40 | % | | | 1.36 | % | | | 1.46 | % | | | 1.48 | % |
Net expensesc | | | 1.37 | % | | | 1.39 | % | | | 1.40 | % | | | 1.36 | % | | | 1.46 | % | | | 1.48 | % |
Portfolio turnover rate | | | 243 | % | | | 466 | % | | | 471 | % | | | 551 | % | | | 344 | % | | | 561 | % |
Class A | | Six Months Ended
September 30, 2024a | | | Year Ended
March 31,
2024 | | | Year Ended
March 31,
2023 | | | Year Ended
March 31,
2022 | | | Year Ended
March 31,
2021 | | | Year Ended
March 31,
2020 | |
Per Share Data |
Net asset value, beginning of period | | $ | 39.20 | | | $ | 40.35 | | | $ | 48.30 | | | $ | 50.87 | | | $ | 39.40 | | | $ | 46.03 | |
Income (loss) from investment operations: |
Net investment income (loss)b | | | .17 | | | | .32 | | | | .22 | | | | .37 | | | | .41 | | | | .31 | |
Net gain (loss) on investments (realized and unrealized) | | | 6.31 | | | | (.78 | ) | | | (7.57 | ) | | | (2.70 | ) | | | 12.21 | | | | (5.18 | ) |
Total from investment operations | | | 6.48 | | | | (.46 | ) | | | (7.35 | ) | | | (2.33 | ) | | | 12.62 | | | | (4.87 | ) |
Less distributions from: |
Net investment income | | | — | | | | (.69 | ) | | | (.60 | ) | | | (.24 | ) | | | (1.15 | ) | | | (1.76 | ) |
Total distributions | | | — | | | | (.69 | ) | | | (.60 | ) | | | (.24 | ) | | | (1.15 | ) | | | (1.76 | ) |
Net asset value, end of period | | $ | 45.68 | | | $ | 39.20 | | | $ | 40.35 | | | $ | 48.30 | | | $ | 50.87 | | | $ | 39.40 | |
|
Total Returnd | | | 16.53 | % | | | (1.08 | %) | | | (15.12 | %) | | | (4.59 | %) | | | 32.20 | % | | | (10.95 | %) |
Ratios/Supplemental Data |
Net assets, end of period (in thousands) | | $ | 110 | | | $ | 105 | | | $ | 258 | | | $ | 368 | | | $ | 467 | | | $ | 446 | |
Ratios to average net assets: |
Net investment income (loss) | | | 0.85 | % | | | 0.82 | % | | | 0.54 | % | | | 0.71 | % | | | 0.90 | % | | | 0.69 | % |
Total expenses | | | 1.67 | % | | | 1.69 | % | | | 1.65 | % | | | 1.61 | % | | | 1.70 | % | | | 1.73 | % |
Net expensesc | | | 1.62 | % | | | 1.66 | % | | | 1.65 | % | | | 1.61 | % | | | 1.70 | % | | | 1.73 | % |
Portfolio turnover rate | | | 243 | % | | | 466 | % | | | 471 | % | | | 551 | % | | | 344 | % | | | 561 | % |
SEE NOTES TO FINANCIAL STATEMENTS. | THE RYDEX FUNDS SEMI-ANNUAL FINANCIAL REPORT | 115 |
FINANCIAL HIGHLIGHTS (continued) |
This table is presented to show selected data for a share outstanding throughout each period and to assist shareholders in evaluating a Fund’s performance for the periods presented.
Class C | | Six Months Ended
September 30, 2024a | | | Year Ended
March 31,
2024 | | | Year Ended
March 31,
2023 | | | Year Ended
March 31,
2022 | | | Year Ended
March 31,
2021 | | | Year Ended
March 31,
2020 | |
Per Share Data |
Net asset value, beginning of period | | $ | 32.95 | | | $ | 34.29 | | | $ | 41.46 | | | $ | 44.03 | | | $ | 34.47 | | | $ | 40.81 | |
Income (loss) from investment operations: |
Net investment income (loss)b | | | .08 | | | | — | e | | | (.08 | ) | | | (.01 | ) | | | .01 | | | | .04 | |
Net gain (loss) on investments (realized and unrealized) | | | 5.26 | | | | (.65 | ) | | | (6.49 | ) | | | (2.32 | ) | | | 10.70 | | | | (4.62 | ) |
Total from investment operations | | | 5.34 | | | | (.65 | ) | | | (6.57 | ) | | | (2.33 | ) | | | 10.71 | | | | (4.58 | ) |
Less distributions from: |
Net investment income | | | — | | | | (.69 | ) | | | (.60 | ) | | | (.24 | ) | | | (1.15 | ) | | | (1.76 | ) |
Total distributions | | | — | | | | (.69 | ) | | | (.60 | ) | | | (.24 | ) | | | (1.15 | ) | | | (1.76 | ) |
Net asset value, end of period | | $ | 38.29 | | | $ | 32.95 | | | $ | 34.29 | | | $ | 41.46 | | | $ | 44.03 | | | $ | 34.47 | |
|
Total Returnd | | | 16.21 | % | | | (1.84 | %) | | | (15.76 | %) | | | (5.30 | %) | | | 31.22 | % | | | (11.62 | %) |
Ratios/Supplemental Data |
Net assets, end of period (in thousands) | | $ | 12 | | | $ | 25 | | | $ | 33 | | | $ | 122 | | | $ | 188 | | | $ | 116 | |
Ratios to average net assets: |
Net investment income (loss) | | | 0.49 | % | | | — | f | | | (0.22 | %) | | | (0.02 | %) | | | 0.03 | % | | | 0.10 | % |
Total expenses | | | 2.41 | % | | | 2.45 | % | | | 2.39 | % | | | 2.36 | % | | | 2.43 | % | | | 2.48 | % |
Net expensesc | | | 2.36 | % | | | 2.42 | % | | | 2.39 | % | | | 2.36 | % | | | 2.43 | % | | | 2.48 | % |
Portfolio turnover rate | | | 243 | % | | | 466 | % | | | 471 | % | | | 551 | % | | | 344 | % | | | 561 | % |
116 | THE RYDEX FUNDS SEMI-ANNUAL FINANCIAL REPORT | SEE NOTES TO FINANCIAL STATEMENTS. |
FINANCIAL HIGHLIGHTS (concluded) |
This table is presented to show selected data for a share outstanding throughout each period and to assist shareholders in evaluating a Fund’s performance for the periods presented.
Class H | | Six Months Ended
September 30, 2024a | | | Year Ended
March 31,
2024 | | | Year Ended
March 31,
2023 | | | Year Ended
March 31,
2022 | | | Year Ended
March 31,
2021 | | | Year Ended
March 31,
2020 | |
Per Share Data |
Net asset value, beginning of period | | $ | 38.11 | | | $ | 39.24 | | | $ | 47.00 | | | $ | 49.50 | | | $ | 38.36 | | | $ | 44.88 | |
Income (loss) from investment operations: |
Net investment income (loss)b | | | .16 | | | | .28 | | | | .22 | | | | .44 | | | | .28 | | | | .44 | |
Net gain (loss) on investments (realized and unrealized) | | | 6.14 | | | | (.72 | ) | | | (7.38 | ) | | | (2.70 | ) | | | 12.01 | | | | (5.20 | ) |
Total from investment operations | | | 6.30 | | | | (.44 | ) | | | (7.16 | ) | | | (2.26 | ) | | | 12.29 | | | | (4.76 | ) |
Less distributions from: |
Net investment income | | | — | | | | (.69 | ) | | | (.60 | ) | | | (.24 | ) | | | (1.15 | ) | | | (1.76 | ) |
Total distributions | | | — | | | | (.69 | ) | | | (.60 | ) | | | (.24 | ) | | | (1.15 | ) | | | (1.76 | ) |
Net asset value, end of period | | $ | 44.41 | | | $ | 38.11 | | | $ | 39.24 | | | $ | 47.00 | | | $ | 49.50 | | | $ | 38.36 | |
|
Total Return | | | 16.53 | % | | | (1.12 | %) | | | (15.14 | %) | | | (4.60 | %) | | | 32.24 | % | | | (10.98 | %) |
Ratios/Supplemental Data |
Net assets, end of period (in thousands) | | $ | 166 | | | $ | 95 | | | $ | 111 | | | $ | 124 | | | $ | 245 | | | $ | 104 | |
Ratios to average net assets: |
Net investment income (loss) | | | 0.79 | % | | | 0.73 | % | | | 0.55 | % | | | 0.86 | % | | | 0.61 | % | | | 0.99 | % |
Total expenses | | | 1.68 | % | | | 1.70 | % | | | 1.65 | % | | | 1.61 | % | | | 1.68 | % | | | 1.73 | % |
Net expensesc | | | 1.63 | % | | | 1.67 | % | | | 1.65 | % | | | 1.61 | % | | | 1.68 | % | | | 1.73 | % |
Portfolio turnover rate | | | 243 | % | | | 466 | % | | | 471 | % | | | 551 | % | | | 344 | % | | | 561 | % |
a | Unaudited figures for the period ended September 30, 2024. Percentage amounts for the period, except total return and portfolio turnover rate, have been annualized. |
b | Net investment income (loss) per share was computed using average shares outstanding throughout the period. |
c | Net expense information reflects the expense ratios after expense waivers and reimbursements, as applicable. |
d | Total return does not reflect the impact of any applicable sales charges. |
e | Less than $0.01 per share. |
f | Less than 0.01% or (0.01%). |
SEE NOTES TO FINANCIAL STATEMENTS. | THE RYDEX FUNDS SEMI-ANNUAL FINANCIAL REPORT | 117 |
SCHEDULE OF INVESTMENTS (Unaudited) | September 30, 2024 |
TRANSPORTATION FUND | |
| | Shares | | | Value | |
COMMON STOCKS† - 99.8% |
| | | | | | | | | |
Transportation - 37.2% |
Union Pacific Corp. | | | 1,585 | | | $ | 390,671 | |
United Parcel Service, Inc. — Class B | | | 2,630 | | | | 358,574 | |
CSX Corp. | | | 7,713 | | | | 266,330 | |
FedEx Corp. | | | 897 | | | | 245,491 | |
Norfolk Southern Corp. | | | 957 | | | | 237,815 | |
Old Dominion Freight Line, Inc. | | | 1,029 | | | | 204,401 | |
Expeditors International of Washington, Inc. | | | 1,100 | | | | 144,540 | |
ZTO Express Cayman, Inc. ADR | | | 5,299 | | | | 131,256 | |
J.B. Hunt Transport Services, Inc. | | | 713 | | | | 122,871 | |
CH Robinson Worldwide, Inc. | | | 1,092 | | | | 120,524 | |
Canadian Pacific Kansas City Ltd. | | | 1,402 | | | | 119,927 | |
Canadian National Railway Co. | | | 1,003 | | | | 117,501 | |
XPO, Inc.* | | | 1,034 | | | | 111,165 | |
TFI International, Inc. | | | 784 | | | | 107,322 | |
Knight-Swift Transportation Holdings, Inc. | | | 1,785 | | | | 96,301 | |
Saia, Inc.* | | | 210 | | | | 91,825 | |
Kirby Corp.* | | | 704 | | | | 86,191 | |
Landstar System, Inc. | | | 446 | | | | 84,236 | |
Hub Group, Inc. — Class A | | | 1,192 | | | | 54,176 | |
ArcBest Corp. | | | 481 | | | | 52,164 | |
Werner Enterprises, Inc. | | | 1,297 | | | | 50,051 | |
Forward Air Corp.* | | | 1,022 | | | | 36,179 | |
Total Transportation | | | | | | | 3,229,511 | |
| | | | | | | | | |
Auto Manufacturers - 26.1% |
Tesla, Inc.* | | | 3,537 | | | | 925,385 | |
General Motors Co. | | | 4,925 | | | | 220,837 | |
Ford Motor Co. | | | 19,641 | | | | 207,409 | |
Li Auto, Inc. ADR* | | | 6,497 | | | | 166,648 | |
NIO, Inc. ADR*,1 | | | 22,500 | | | | 150,300 | |
Ferrari N.V. | | | 240 | | | | 112,826 | |
Toyota Motor Corp. ADR | | | 630 | | | | 112,499 | |
Stellantis N.V. | | | 8,005 | | | | 112,470 | |
Honda Motor Company Ltd. ADR | | | 3,533 | | | | 112,102 | |
Rivian Automotive, Inc. — Class A*,1 | | | 7,902 | | | | 88,661 | |
Lucid Group, Inc.*,1 | | | 15,268 | | | | 53,896 | |
Total Auto Manufacturers | | | | | | | 2,263,033 | |
| | | | | | | | | |
Auto Parts & Equipment - 12.1% |
Mobileye Global, Inc. — Class A*,1 | | | 11,039 | | | | 151,234 | |
Aptiv plc* | | | 1,830 | | | | 131,778 | |
Magna International, Inc. | | | 2,897 | | | | 118,893 | |
Autoliv, Inc. | | | 1,216 | | | | 113,538 | |
BorgWarner, Inc. | | | 2,709 | | | | 98,310 | |
Gentex Corp. | | | 2,855 | | | | 84,765 | |
Lear Corp. | | | 749 | | | | 81,753 | |
Goodyear Tire & Rubber Co.* | | | 6,130 | | | | 54,251 | |
Visteon Corp.* | | | 550 | | | | 52,382 | |
Adient plc* | | | 2,134 | | | | 48,164 | |
QuantumScape Corp.*,1 | | | 8,269 | | | | 47,547 | |
Fox Factory Holding Corp.* | | | 1,082 | | | | 44,903 | |
Luminar Technologies, Inc.*,1 | | | 24,489 | | | | 22,033 | |
Total Auto Parts & Equipment | | | | | | | 1,049,551 | |
| | | | | | | | | |
Airlines - 11.8% |
Delta Air Lines, Inc. | | | 3,824 | | | | 194,221 | |
United Airlines Holdings, Inc.* | | | 2,597 | | | | 148,185 | |
Southwest Airlines Co. | | | 4,595 | | | | 136,150 | |
Ryanair Holdings plc ADR | | | 2,685 | | | | 121,308 | |
Copa Holdings S.A. — Class A | | | 1,238 | | | | 116,174 | |
American Airlines Group, Inc.* | | | 7,768 | | | | 87,312 | |
Alaska Air Group, Inc.* | | | 1,789 | | | | 80,881 | |
SkyWest, Inc.* | | | 717 | | | | 60,959 | |
JetBlue Airways Corp.* | | | 7,156 | | | | 46,943 | |
Allegiant Travel Co. — Class A* | | | 590 | | | | 32,486 | |
Total Airlines | | | | | | | 1,024,619 | |
| | | | | | | | | |
Internet - 7.1% |
Uber Technologies, Inc.* | | | 5,500 | | | | 413,380 | |
Grab Holdings Ltd. — Class A* | | | 33,961 | | | | 129,052 | |
Lyft, Inc. — Class A* | | | 5,520 | | | | 70,380 | |
Total Internet | | | | | | | 612,812 | |
| | | | | | | | | |
Commercial Services - 1.7% |
GXO Logistics, Inc.* | | | 1,566 | | | | 81,541 | |
Avis Budget Group, Inc. | | | 496 | | | | 43,445 | |
Hertz Global Holdings, Inc.* | | | 6,447 | | | | 21,275 | |
Total Commercial Services | | | | | | | 146,261 | |
| | | | | | | | | |
Home Builders - 1.4% |
Thor Industries, Inc. | | | 731 | | | | 80,330 | |
Winnebago Industries, Inc. | | | 723 | | | | 42,013 | |
Total Home Builders | | | | | | | 122,343 | |
| | | | | | | | | |
Building Materials - 1.0% |
Modine Manufacturing Co.* | | | 633 | | | | 84,056 | |
| | | | | | | | | |
Leisure Time - 0.8% |
Harley-Davidson, Inc. | | | 1,858 | | | | 71,589 | |
| | | | | | | | | |
Retail - 0.6% |
Patrick Industries, Inc. | | | 340 | | | | 48,406 | |
| | | | | | | | | |
Total Common Stocks | | | | |
(Cost $4,880,088) | | | | | | | 8,652,181 | |
| | | | | | | | | |
| | | Face
Amount | | | | | |
REPURCHASE AGREEMENTS††,2 - 0.6% |
J.P. Morgan Securities LLC
issued 09/30/24 at 4.86%
due 10/01/24 | | $ | 29,363 | | | | 29,363 | |
BofA Securities, Inc.
issued 09/30/24 at 4.85%
due 10/01/24 | | | 24,252 | | | | 24,252 | |
Total Repurchase Agreements | | | | |
(Cost $53,615) | | | | | | | 53,615 | |
118 | THE RYDEX FUNDS SEMI-ANNUAL FINANCIAL REPORT | SEE NOTES TO FINANCIAL STATEMENTS. |
SCHEDULE OF INVESTMENTS (Unaudited)(concluded) | September 30, 2024 |
TRANSPORTATION FUND | |
| | Shares | | | Value | |
SECURITIES LENDING COLLATERAL†,3 - 4.6% |
Money Market Fund*** | | | | | | | | |
First American Government Obligations Fund - Class X, 4.82%4 | | | 403,056 | | | $ | 403,056 | |
Total Securities Lending Collateral | | | | |
(Cost $403,056) | | | | | | | 403,056 | |
| | | | | | | | | |
Total Investments - 105.0% | | | | |
(Cost $5,336,759) | | $ | 9,108,852 | |
Other Assets & Liabilities, net - (5.0)% | | | (437,087 | ) |
Total Net Assets - 100.0% | | $ | 8,671,765 | |
* | Non-income producing security. |
*** | A copy of each underlying unaffiliated fund’s financial statements is available at the SEC’s website at www.sec.gov. |
† | Value determined based on Level 1 inputs — See Note 4. |
†† | Value determined based on Level 2 inputs — See Note 4. |
1 | All or a portion of this security is on loan at September 30, 2024 — See Note 7. |
2 | Repurchase Agreements — See Note 6. |
3 | Securities lending collateral — See Note 7. |
4 | Rate indicated is the 7-day yield as of September 30, 2024. |
| | ADR — American Depositary Receipt |
| | plc — Public Limited Company |
| | |
| | See Sector Classification in Other Information section. |
The following table summarizes the inputs used to value the Fund’s investments at September 30, 2024 (See Note 4 in the Notes to Financial Statements):
Investments in Securities (Assets) | | Level 1
Quoted
Prices | | | Level 2
Significant
Observable
Inputs | | | Level 3
Significant
Unobservable
Inputs | | | Total | |
Common Stocks | | $ | 8,652,181 | | | $ | — | | | $ | — | | | $ | 8,652,181 | |
Repurchase Agreements | | | — | | | | 53,615 | | | | — | | | | 53,615 | |
Securities Lending Collateral | | | 403,056 | | | | — | | | | — | | | | 403,056 | |
Total Assets | | $ | 9,055,237 | | | $ | 53,615 | | | $ | — | | | $ | 9,108,852 | |
SEE NOTES TO FINANCIAL STATEMENTS. | THE RYDEX FUNDS SEMI-ANNUAL FINANCIAL REPORT | 119 |
STATEMENT OF ASSETS AND LIABILITIES (Unaudited) |
September 30, 2024 |
Assets: |
Investments, at value - including $381,436 of securities loaned (cost $5,283,144) | | $ | 9,055,237 | |
Repurchase agreements, at value (cost $53,615) | | | 53,615 | |
Cash | | | 502 | |
Receivables: |
Dividends | | | 4,513 | |
Securities lending income | | | 318 | |
Foreign tax reclaims | | | 117 | |
Interest | | | 7 | |
Total assets | | | 9,114,309 | |
| | | | | |
Liabilities: |
Payable for: |
Return of securities lending collateral | | | 403,056 | |
Fund shares redeemed | | | 22,877 | |
Management fees | | | 5,612 | |
Transfer agent fees | | | 3,937 | |
Distribution and service fees | | | 922 | |
Portfolio accounting and administration fees | | | 678 | |
Trustees’ fees* | | | 78 | |
Miscellaneous | | | 5,384 | |
Total liabilities | | | 442,544 | |
Net assets | | $ | 8,671,765 | |
| | | | | |
Net assets consist of: |
Paid in capital | | $ | 6,401,952 | |
Total distributable earnings (loss) | | | 2,269,813 | |
Net assets | | $ | 8,671,765 | |
| | | | | |
Investor Class: |
Net assets | | $ | 4,633,998 | |
Capital shares outstanding | | | 77,808 | |
Net asset value per share | | $ | 59.56 | |
| | | | | |
Class A: |
Net assets | | $ | 3,422,429 | |
Capital shares outstanding | | | 65,933 | |
Net asset value per share | | $ | 51.91 | |
Maximum offering price per share (Net asset value divided by 95.25%) | | $ | 54.50 | |
| | | | | |
Class C: |
Net assets | | $ | 258,482 | |
Capital shares outstanding | | | 5,994 | |
Net asset value per share | | $ | 43.12 | |
| | | | | |
Class H: |
Net assets | | $ | 356,856 | |
Capital shares outstanding | | | 7,171 | |
Net asset value per share | | $ | 49.76 | |
STATEMENT OF OPERATIONS (Unaudited) |
Six Months Ended September 30, 2024 |
Investment Income: |
Dividends (net of foreign withholding tax of $3,236) | | $ | 79,007 | |
Interest | | | 1,328 | |
Income from securities lending, net | | | 6,264 | |
Total investment income | | | 86,599 | |
| | | | | |
Expenses: |
Management fees | | | 41,302 | |
Distribution and service fees: |
Class A | | | 4,781 | |
Class C | | | 1,559 | |
Class H | | | 432 | |
Transfer agent fees | | | 10,022 | |
Registration fees | | | 6,362 | |
Portfolio accounting and administration fees | | | 7,414 | |
Professional fees | | | 2,031 | |
Trustees’ fees* | | | 667 | |
Custodian fees | | | 625 | |
Line of credit fees | | | 16 | |
Miscellaneous | | | 261 | |
Total expenses | | | 75,472 | |
Less: |
Expenses reimbursed by Adviser | | | (2,427 | ) |
Net expenses | | | 73,045 | |
Net investment income | | | 13,554 | |
| | | | | |
Net Realized and Unrealized Gain (Loss): |
Net realized gain (loss) on: |
Investments | | | 849,165 | |
Net realized gain | | | 849,165 | |
Net change in unrealized appreciation (depreciation) on: |
Investments | | | (1,280,252 | ) |
Net change in unrealized appreciation (depreciation) | | | (1,280,252 | ) |
Net realized and unrealized loss | | | (431,087 | ) |
Net decrease in net assets resulting from operations | | $ | (417,533 | ) |
* | Relates to Trustees not deemed “interested persons” within the meaning of Section 2(a)(19) of the 1940 Act. |
120 | THE RYDEX FUNDS SEMI-ANNUAL FINANCIAL REPORT | SEE NOTES TO FINANCIAL STATEMENTS. |
STATEMENTS OF CHANGES IN NET ASSETS |
| | Six Months Ended
September 30, 2024
(Unaudited) | | | Year Ended
March 31,
2024 | |
Increase (Decrease) in Net Assets from Operations: | | | | | | | | |
Net investment income | | $ | 13,554 | | | $ | 41,418 | |
Net realized gain (loss) on investments | | | 849,165 | | | | (287,164 | ) |
Net change in unrealized appreciation (depreciation) on investments | | | (1,280,252 | ) | | | 586,127 | |
Net increase (decrease) in net assets resulting from operations | | | (417,533 | ) | | | 340,381 | |
| | | | | | | | | |
Distributions to shareholders: | | | | | | | | |
Investor Class | | | — | | | | (12,384 | ) |
Class A | | | — | | | | (8,129 | ) |
Class C | | | — | | | | (1,000 | ) |
Class H | | | — | | | | (725 | ) |
Total distributions to shareholders | | | — | | | | (22,238 | ) |
| | | | | | | | | |
Capital share transactions: | | | | | | | | |
Proceeds from sale of shares | | | | | | | | |
Investor Class | | | 3,439,259 | | | | 31,587,618 | |
Class A | | | 555,011 | | | | 1,457,449 | |
Class C | | | 34,622 | | | | 194,980 | |
Class H | | | 302 | | | | 1,200,445 | |
Distributions reinvested | | | | | | | | |
Investor Class | | | — | | | | 12,097 | |
Class A | | | — | | | | 8,065 | |
Class C | | | — | | | | 930 | |
Class H | | | — | | | | 703 | |
Cost of shares redeemed | | | | | | | | |
Investor Class | | | (4,965,045 | ) | | | (32,364,144 | ) |
Class A | | | (1,491,169 | ) | | | (2,285,805 | ) |
Class C | | | (236,818 | ) | | | (748,914 | ) |
Class H | | | (9,345 | ) | | | (1,373,938 | ) |
Net decrease from capital share transactions | | | (2,673,183 | ) | | | (2,310,514 | ) |
Net decrease in net assets | | | (3,090,716 | ) | | | (1,992,371 | ) |
| | | | | | | | | |
Net assets: | | | | | | | | |
Beginning of period | | | 11,762,481 | | | | 13,754,852 | |
End of period | | $ | 8,671,765 | | | $ | 11,762,481 | |
| | | | | | | | | |
Capital share activity: | | | | | | | | |
Shares sold | | | | | | | | |
Investor Class | | | 58,959 | | | | 547,710 | |
Class A | | | 11,229 | | | | 28,562 | |
Class C | | | 845 | | | | 4,639 | |
Class H | | | 6 | | | | 27,017 | |
Shares issued from reinvestment of distributions | | | | | | | | |
Investor Class | | | — | | | | 208 | |
Class A | | | — | | | | 159 | |
Class C | | | — | | | | 22 | |
Class H | | | — | | | | 14 | |
Shares redeemed | | | | | | | | |
Investor Class | | | (86,314 | ) | | | (575,081 | ) |
Class A | | | (30,153 | ) | | | (45,165 | ) |
Class C | | | (5,721 | ) | | | (16,906 | ) |
Class H | | | (197 | ) | | | (30,498 | ) |
Net decrease in shares | | | (51,346 | ) | | | (59,319 | ) |
SEE NOTES TO FINANCIAL STATEMENTS. | THE RYDEX FUNDS SEMI-ANNUAL FINANCIAL REPORT | 121 |
This table is presented to show selected data for a share outstanding throughout each period and to assist shareholders in evaluating a Fund’s performance for the periods presented.
Investor Class | | Six Months Ended
September 30, 2024a | | | Year Ended
March 31,
2024 | | | Year Ended
March 31,
2023 | | | Year Ended
March 31,
2022 | | | Year Ended
March 31,
2021 | | | Year Ended
March 31,
2020 | |
Per Share Data |
Net asset value, beginning of period | | $ | 60.86 | | | $ | 55.68 | | | $ | 74.70 | | | $ | 84.28 | | | $ | 37.39 | | | $ | 50.08 | |
Income (loss) from investment operations: |
Net investment income (loss)b | | | .12 | | | | .21 | | | | .19 | | | | .04 | | | | (.20 | ) | | | .30 | |
Net gain (loss) on investments (realized and unrealized) | | | (1.42 | ) | | | 5.06 | | | | (14.50 | ) | | | .07 | | | | 47.09 | | | | (11.07 | ) |
Total from investment operations | | | (1.30 | ) | | | 5.27 | | | | (14.31 | ) | | | .11 | | | | 46.89 | | | | (10.77 | ) |
Less distributions from: |
Net investment income | | | — | | | | (.09 | ) | | | — | | | | — | | | | — | | | | (.15 | ) |
Net realized gains | | | — | | | | — | | | | (4.71 | ) | | | (9.69 | ) | | | — | | | | (1.77 | ) |
Total distributions | | | — | | | | (.09 | ) | | | (4.71 | ) | | | (9.69 | ) | | | — | | | | (1.92 | ) |
Net asset value, end of period | | $ | 59.56 | | | $ | 60.86 | | | $ | 55.68 | | | $ | 74.70 | | | $ | 84.28 | | | $ | 37.39 | |
|
Total Return | | | (2.14 | %) | | | 9.49 | % | | | (18.40 | %) | | | (0.71 | %) | | | 125.41 | % | | | (22.59 | %) |
Ratios/Supplemental Data |
Net assets, end of period (in thousands) | | $ | 4,634 | | | $ | 6,400 | | | $ | 7,367 | | | $ | 10,814 | | | $ | 65,281 | | | $ | 3,283 | |
Ratios to average net assets: |
Net investment income (loss) | | | 0.42 | % | | | 0.36 | % | | | 0.32 | % | | | 0.05 | % | | | (0.29 | %) | | | 0.58 | % |
Total expenses | | | 1.41 | % | | | 1.43 | % | | | 1.39 | % | | | 1.35 | % | | | 1.41 | % | | | 1.48 | % |
Net expensesc | | | 1.36 | % | | | 1.40 | % | | | 1.39 | % | | | 1.35 | % | | | 1.41 | % | | | 1.48 | % |
Portfolio turnover rate | | | 34 | % | | | 207 | % | | | 185 | % | | | 162 | % | | | 205 | % | | | 483 | % |
Class A | | Six Months Ended
September 30, 2024a | | | Year Ended
March 31,
2024 | | | Year Ended
March 31,
2023 | | | Year Ended
March 31,
2022 | | | Year Ended
March 31,
2021 | | | Year Ended
March 31,
2020 | |
Per Share Data |
Net asset value, beginning of period | | $ | 53.11 | | | $ | 48.72 | | | $ | 66.33 | | | $ | 76.03 | | | $ | 33.82 | | | $ | 45.58 | |
Income (loss) from investment operations: |
Net investment income (loss)b | | | .04 | | | | .10 | | | | .03 | | | | (.04 | ) | | | (.34 | ) | | | .17 | |
Net gain (loss) on investments (realized and unrealized) | | | (1.24 | ) | | | 4.38 | | | | (12.93 | ) | | | .03 | | | | 42.55 | | | | (10.01 | ) |
Total from investment operations | | | (1.20 | ) | | | 4.48 | | | | (12.90 | ) | | | (.01 | ) | | | 42.21 | | | | (9.84 | ) |
Less distributions from: |
Net investment income | | | — | | | | (.09 | ) | | | — | | | | — | | | | — | | | | (.15 | ) |
Net realized gains | | | — | | | | — | | | | (4.71 | ) | | | (9.69 | ) | | | — | | | | (1.77 | ) |
Total distributions | | | — | | | | (.09 | ) | | | (4.71 | ) | | | (9.69 | ) | | | — | | | | (1.92 | ) |
Net asset value, end of period | | $ | 51.91 | | | $ | 53.11 | | | $ | 48.72 | | | $ | 66.33 | | | $ | 76.03 | | | $ | 33.82 | |
|
Total Returnd | | | (2.26 | %) | | | 9.23 | % | | | (18.60 | %) | | | (0.95 | %) | | | 124.81 | % | | | (22.78 | %) |
Ratios/Supplemental Data |
Net assets, end of period (in thousands) | | $ | 3,422 | | | $ | 4,506 | | | $ | 4,935 | | | $ | 7,123 | | | $ | 7,785 | | | $ | 1,757 | |
Ratios to average net assets: |
Net investment income (loss) | | | 0.16 | % | | | 0.20 | % | | | 0.07 | % | | | (0.05 | %) | | | (0.59 | %) | | | 0.37 | % |
Total expenses | | | 1.67 | % | | | 1.68 | % | | | 1.64 | % | | | 1.61 | % | | | 1.68 | % | | | 1.73 | % |
Net expensesc | | | 1.62 | % | | | 1.65 | % | | | 1.64 | % | | | 1.61 | % | | | 1.68 | % | | | 1.73 | % |
Portfolio turnover rate | | | 34 | % | | | 207 | % | | | 185 | % | | | 162 | % | | | 205 | % | | | 483 | % |
122 | THE RYDEX FUNDS SEMI-ANNUAL FINANCIAL REPORT | SEE NOTES TO FINANCIAL STATEMENTS. |
FINANCIAL HIGHLIGHTS (continued) |
This table is presented to show selected data for a share outstanding throughout each period and to assist shareholders in evaluating a Fund’s performance for the periods presented.
Class C | | Six Months Ended
September 30, 2024a | | | Year Ended
March 31,
2024 | | | Year Ended
March 31,
2023 | | | Year Ended
March 31,
2022 | | | Year Ended
March 31,
2021 | | | Year Ended
March 31,
2020 | |
Per Share Data |
Net asset value, beginning of period | | $ | 44.28 | | | $ | 40.94 | | | $ | 57.20 | | | $ | 67.28 | | | $ | 30.15 | | | $ | 41.14 | |
Income (loss) from investment operations: |
Net investment income (loss)b | | | (.12 | ) | | | (.17 | ) | | | (.32 | ) | | | (.52 | ) | | | (.67 | ) | | | (.18 | ) |
Net gain (loss) on investments (realized and unrealized) | | | (1.04 | ) | | | 3.60 | | | | (11.23 | ) | | | .13 | | | | 37.80 | | | | (8.89 | ) |
Total from investment operations | | | (1.16 | ) | | | 3.43 | | | | (11.55 | ) | | | (.39 | ) | | | 37.13 | | | | (9.07 | ) |
Less distributions from: |
Net investment income | | | — | | | | (.09 | ) | | | — | | | | — | | | | — | | | | (.15 | ) |
Net realized gains | | | — | | | | — | | | | (4.71 | ) | | | (9.69 | ) | | | — | | | | (1.77 | ) |
Total distributions | | | — | | | | (.09 | ) | | | (4.71 | ) | | | (9.69 | ) | | | — | | | | (1.92 | ) |
Net asset value, end of period | | $ | 43.12 | | | $ | 44.28 | | | $ | 40.94 | | | $ | 57.20 | | | $ | 67.28 | | | $ | 30.15 | |
|
Total Returnd | | | (2.62 | %) | | | 8.39 | % | | | (19.21 | %) | | | (1.68 | %) | | | 123.15 | % | | | (23.37 | %) |
Ratios/Supplemental Data |
Net assets, end of period (in thousands) | | $ | 258 | | | $ | 481 | | | $ | 946 | | | $ | 1,772 | | | $ | 1,954 | | | $ | 632 | |
Ratios to average net assets: |
Net investment income (loss) | | | (0.56 | %) | | | (0.40 | %) | | | (0.70 | %) | | | (0.80 | %) | | | (1.33 | %) | | | (0.43 | %) |
Total expenses | | | 2.41 | % | | | 2.43 | % | | | 2.39 | % | | | 2.36 | % | | | 2.43 | % | | | 2.48 | % |
Net expensesc | | | 2.36 | % | | | 2.40 | % | | | 2.39 | % | | | 2.36 | % | | | 2.43 | % | | | 2.48 | % |
Portfolio turnover rate | | | 34 | % | | | 207 | % | | | 185 | % | | | 162 | % | | | 205 | % | | | 483 | % |
SEE NOTES TO FINANCIAL STATEMENTS. | THE RYDEX FUNDS SEMI-ANNUAL FINANCIAL REPORT | 123 |
FINANCIAL HIGHLIGHTS (concluded) |
This table is presented to show selected data for a share outstanding throughout each period and to assist shareholders in evaluating a Fund’s performance for the periods presented.
Class H | | Six Months Ended
September 30, 2024a | | | Year Ended
March 31,
2024 | | | Year Ended
March 31,
2023 | | | Year Ended
March 31,
2022 | | | Year Ended
March 31,
2021 | | | Year Ended
March 31,
2020 | |
Per Share Data |
Net asset value, beginning of period | | $ | 50.92 | | | $ | 46.71 | | | $ | 63.86 | | | $ | 73.53 | | | $ | 32.70 | | | $ | 44.14 | |
Income (loss) from investment operations: |
Net investment income (loss)b | | | .03 | | | | .08 | | | | .03 | | | | (.25 | ) | | | (.32 | ) | | | (.02 | ) |
Net gain (loss) on investments (realized and unrealized) | | | (1.19 | ) | | | 4.22 | | | | (12.47 | ) | | | .27 | | | | 41.15 | | | | (9.50 | ) |
Total from investment operations | | | (1.16 | ) | | | 4.30 | | | | (12.44 | ) | | | .02 | | | | 40.83 | | | | (9.52 | ) |
Less distributions from: |
Net investment income | | | — | | | | (.09 | ) | | | — | | | | — | | | | — | | | | (.15 | ) |
Net realized gains | | | — | | | | — | | | | (4.71 | ) | | | (9.69 | ) | | | — | | | | (1.77 | ) |
Total distributions | | | — | | | | (.09 | ) | | | (4.71 | ) | | | (9.69 | ) | | | — | | | | (1.92 | ) |
Net asset value, end of period | | $ | 49.76 | | | $ | 50.92 | | | $ | 46.71 | | | $ | 63.86 | | | $ | 73.53 | | | $ | 32.70 | |
|
Total Return | | | (2.28 | %) | | | 9.24 | % | | | (18.60 | %) | | | (0.94 | %) | | | 124.86 | % | | | (22.78 | %) |
Ratios/Supplemental Data |
Net assets, end of period (in thousands) | | $ | 357 | | | $ | 375 | | | $ | 506 | | | $ | 600 | | | $ | 1,169 | | | $ | 325 | |
Ratios to average net assets: |
Net investment income (loss) | | | 0.14 | % | | | 0.17 | % | | | 0.07 | % | | | (0.35 | %) | | | (0.56 | %) | | | (0.03 | %) |
Total expenses | | | 1.67 | % | | | 1.68 | % | | | 1.64 | % | | | 1.61 | % | | | 1.68 | % | | | 1.72 | % |
Net expensesc | | | 1.62 | % | | | 1.65 | % | | | 1.64 | % | | | 1.61 | % | | | 1.68 | % | | | 1.72 | % |
Portfolio turnover rate | | | 34 | % | | | 207 | % | | | 185 | % | | | 162 | % | | | 205 | % | | | 483 | % |
a | Unaudited figures for the period ended September 30, 2024. Percentage amounts for the period, except total return and portfolio turnover rate, have been annualized. |
b | Net investment income (loss) per share was computed using average shares outstanding throughout the period. |
c | Net expense information reflects the expense ratios after expense waivers and reimbursements, as applicable. |
d | Total return does not reflect the impact of any applicable sales charges. |
124 | THE RYDEX FUNDS SEMI-ANNUAL FINANCIAL REPORT | SEE NOTES TO FINANCIAL STATEMENTS. |
SCHEDULE OF INVESTMENTS (Unaudited) | September 30, 2024 |
UTILITIES FUND | |
| | Shares | | | Value | |
COMMON STOCKS† - 99.5% |
| | | | | | | | | |
Electric - 85.6% |
NextEra Energy, Inc. | | | 20,160 | | | $ | 1,704,125 | |
Constellation Energy Corp. | | | 5,208 | | | | 1,354,184 | |
Southern Co. | | | 14,235 | | | | 1,283,712 | |
Duke Energy Corp. | | | 10,427 | | | | 1,202,233 | |
Vistra Corp. | | | 8,292 | | | | 982,934 | |
American Electric Power Company, Inc. | | | 9,247 | | | | 948,742 | |
Sempra | | | 11,326 | | | | 947,193 | |
Dominion Energy, Inc. | | | 15,582 | | | | 900,484 | |
Public Service Enterprise Group, Inc. | | | 9,936 | | | | 886,391 | |
PG&E Corp. | | | 42,097 | | | | 832,258 | |
Exelon Corp. | | | 20,355 | | | | 825,395 | |
Xcel Energy, Inc. | | | 11,975 | | | | 781,968 | |
Consolidated Edison, Inc. | | | 7,417 | | | | 772,332 | |
Edison International | | | 8,623 | | | | 750,977 | |
WEC Energy Group, Inc. | | | 7,431 | | | | 714,714 | |
Entergy Corp. | | | 5,346 | | | | 703,587 | |
PPL Corp. | | | 19,251 | | | | 636,823 | |
Eversource Energy | | | 9,337 | | | | 635,383 | |
Ameren Corp. | | | 7,256 | | | | 634,610 | |
FirstEnergy Corp. | | | 14,297 | | | | 634,072 | |
DTE Energy Co. | | | 4,909 | | | | 630,365 | |
CMS Energy Corp. | | | 8,357 | | | | 590,255 | |
NRG Energy, Inc. | | | 6,423 | | | | 585,135 | |
CenterPoint Energy, Inc. | | | 19,669 | | | | 578,662 | |
Alliant Energy Corp. | | | 8,484 | | | | 514,894 | |
AES Corp. | | | 25,060 | | | | 502,704 | |
Evergy, Inc. | | | 7,843 | | | | 486,344 | |
Fortis, Inc. | | | 10,021 | | | | 455,354 | |
Pinnacle West Capital Corp. | | | 4,590 | | | | 406,628 | |
OGE Energy Corp. | | | 9,077 | | | | 372,339 | |
Clearway Energy, Inc. — Class C | | | 10,543 | | | | 323,459 | |
Portland General Electric Co. | | | 5,985 | | | | 286,682 | |
Black Hills Corp. | | | 4,392 | | | | 268,439 | |
Ormat Technologies, Inc. | | | 3,225 | | | | 248,131 | |
Northwestern Energy Group, Inc. | | | 4,197 | | | | 240,152 | |
Avista Corp. | | | 5,818 | | | | 225,447 | |
Avangrid, Inc. | | | 5,716 | | | | 204,576 | |
Otter Tail Corp. | | | 2,559 | | | | 200,011 | |
Talen Energy Corp.* | | | 955 | | | | 170,219 | |
Hawaiian Electric Industries, Inc.* | | | 12,664 | | | | 122,588 | |
Total Electric | | | | | | | 25,544,501 | |
| | | | | | | | | |
Gas - 9.1% |
Atmos Energy Corp. | | | 4,361 | | | | 604,914 | |
NiSource, Inc. | | | 14,870 | | | | 515,246 | |
Brookfield Infrastructure Corp. — Class A | | | 10,605 | | | | 460,575 | |
UGI Corp. | | | 12,218 | | | | 305,694 | |
Southwest Gas Holdings, Inc. | | | 3,771 | | | | 278,149 | |
New Jersey Resources Corp. | | | 5,892 | | | | 278,102 | |
ONE Gas, Inc. | | | 3,601 | | | | 267,987 | |
Total Gas | | | | | | | 2,710,667 | |
| | | | | | | | | |
Water - 3.6% |
American Water Works Company, Inc. | | | 4,697 | | | | 686,889 | |
Essential Utilities, Inc. | | | 10,371 | | | | 400,010 | |
Total Water | | | | | | | 1,086,899 | |
| | | | | | | | | |
Energy-Alternate Sources - 1.2% |
NextEra Energy Partners, LP | | | 7,866 | | | | 217,259 | |
Sunnova Energy International, Inc.*,1 | | | 14,133 | | | | 137,655 | |
Total Energy-Alternate Sources | | | | | | | 354,914 | |
| | | | | | | | | |
Total Common Stocks | | | | |
(Cost $21,620,982) | | | | | | | 29,696,981 | |
| | | | | | | | | |
| | | Face
Amount | | | | | |
REPURCHASE AGREEMENTS††,2 - 0.6% |
J.P. Morgan Securities LLC
issued 09/30/24 at 4.86%
due 10/01/24 | | $ | 92,078 | | | | 92,078 | |
BofA Securities, Inc.
issued 09/30/24 at 4.85%
due 10/01/24 | | | 76,053 | | | | 76,053 | |
Total Repurchase Agreements | | | | |
(Cost $168,131) | | | | | | | 168,131 | |
| | | | | | | | | |
| | | Shares | | | | | |
SECURITIES LENDING COLLATERAL†,3 - 0.0% |
Money Market Fund*** | | | | | | | | |
First American Government Obligations Fund - Class X, 4.82%4 | | | 14,674 | | | | 14,674 | |
Total Securities Lending Collateral | | | | |
(Cost $14,674) | | | | | | | 14,674 | |
| | | | | | | | | |
Total Investments - 100.1% | | | | |
(Cost $21,803,787) | | $ | 29,879,786 | |
Other Assets & Liabilities, net - (0.1)% | | | (36,976 | ) |
Total Net Assets - 100.0% | | $ | 29,842,810 | |
SEE NOTES TO FINANCIAL STATEMENTS. | THE RYDEX FUNDS SEMI-ANNUAL FINANCIAL REPORT | 125 |
SCHEDULE OF INVESTMENTS (Unaudited)(concluded) | September 30, 2024 |
UTILITIES FUND | |
* | Non-income producing security. |
*** | A copy of each underlying unaffiliated fund’s financial statements is available at the SEC’s website at www.sec.gov. |
† | Value determined based on Level 1 inputs — See Note 4. |
†† | Value determined based on Level 2 inputs — See Note 4. |
1 | All or a portion of this security is on loan at September 30, 2024 — See Note 7. |
2 | Repurchase Agreements — See Note 6. |
3 | Securities lending collateral — See Note 7. |
4 | Rate indicated is the 7-day yield as of September 30, 2024. |
| | |
| | See Sector Classification in Other Information section. |
The following table summarizes the inputs used to value the Fund’s investments at September 30, 2024 (See Note 4 in the Notes to Financial Statements):
Investments in Securities (Assets) | | Level 1
Quoted
Prices | | | Level 2
Significant
Observable
Inputs | | | Level 3
Significant
Unobservable
Inputs | | | Total | |
Common Stocks | | $ | 29,696,981 | | | $ | — | | | $ | — | | | $ | 29,696,981 | |
Repurchase Agreements | | | — | | | | 168,131 | | | | — | | | | 168,131 | |
Securities Lending Collateral | | | 14,674 | | | | — | | | | — | | | | 14,674 | |
Total Assets | | $ | 29,711,655 | | | $ | 168,131 | | | $ | — | | | $ | 29,879,786 | |
126 | THE RYDEX FUNDS SEMI-ANNUAL FINANCIAL REPORT | SEE NOTES TO FINANCIAL STATEMENTS. |
STATEMENT OF ASSETS AND LIABILITIES (Unaudited) |
September 30, 2024 |
Assets: |
Investments, at value - including $13,295 of securities loaned (cost $21,635,656) | | $ | 29,711,655 | |
Repurchase agreements, at value (cost $168,131) | | | 168,131 | |
Receivables: |
Securities sold | | | 437,274 | |
Dividends | | | 37,969 | |
Fund shares sold | | | 19,713 | |
Securities lending income | | | 37 | |
Interest | | | 22 | |
Total assets | | | 30,374,801 | |
| | | | | |
Liabilities: |
Payable for: |
Fund shares redeemed | | | 466,271 | |
Management fees | | | 19,165 | |
Return of securities lending collateral | | | 14,674 | |
Transfer agent fees | | | 11,419 | |
Portfolio accounting and administration fees | | | 2,314 | |
Distribution and service fees | | | 1,834 | |
Trustees’ fees* | | | 238 | |
Miscellaneous | | | 16,076 | |
Total liabilities | | | 531,991 | |
Net assets | | $ | 29,842,810 | |
| | | | | |
Net assets consist of: |
Paid in capital | | $ | 25,268,484 | |
Total distributable earnings (loss) | | | 4,574,326 | |
Net assets | | $ | 29,842,810 | |
| | | | | |
Investor Class: |
Net assets | | $ | 21,802,151 | |
Capital shares outstanding | | | 364,745 | |
Net asset value per share | | $ | 59.77 | |
| | | | | |
Class A: |
Net assets | | $ | 6,383,249 | |
Capital shares outstanding | | | 118,926 | |
Net asset value per share | | $ | 53.67 | |
Maximum offering price per share (Net asset value divided by 95.25%) | | $ | 56.35 | |
| | | | | |
Class C: |
Net assets | | $ | 646,025 | |
Capital shares outstanding | | | 15,350 | |
Net asset value per share | | $ | 42.09 | |
| | | | | |
Class H: |
Net assets | | $ | 1,011,385 | |
Capital shares outstanding | | | 19,659 | |
Net asset value per share | | $ | 51.45 | |
STATEMENT OF OPERATIONS (Unaudited) |
Six Months Ended September 30, 2024 |
Investment Income: |
Dividends (net of foreign withholding tax of $2,305) | | $ | 417,642 | |
Interest | | | 2,858 | |
Income from securities lending, net | | | 403 | |
Total investment income | | | 420,903 | |
| | | | | |
Expenses: |
Management fees | | | 98,787 | |
Distribution and service fees: |
Class A | | | 6,916 | |
Class C | | | 3,127 | |
Class H | | | 1,019 | |
Transfer agent fees | | | 24,079 | |
Portfolio accounting and administration fees | | | 17,733 | |
Registration fees | | | 5,321 | |
Professional fees | | | 4,404 | |
Custodian fees | | | 1,482 | |
Trustees’ fees* | | | 1,008 | |
Line of credit fees | | | 70 | |
Miscellaneous | | | 13,088 | |
Total expenses | | | 177,034 | |
Less: |
Expenses reimbursed by Adviser | | | (5,807 | ) |
Net expenses | | | 171,227 | |
Net investment income | | | 249,676 | |
| | | | | |
Net Realized and Unrealized Gain (Loss): |
Net realized gain (loss) on: |
Investments | | | 208,463 | |
Net realized gain | | | 208,463 | |
Net change in unrealized appreciation (depreciation) on: |
Investments | | | 4,577,802 | |
Net change in unrealized appreciation (depreciation) | | | 4,577,802 | |
Net realized and unrealized gain | | | 4,786,265 | |
Net increase in net assets resulting from operations | | $ | 5,035,941 | |
* | Relates to Trustees not deemed “interested persons” within the meaning of Section 2(a)(19) of the 1940 Act. |
SEE NOTES TO FINANCIAL STATEMENTS. | THE RYDEX FUNDS SEMI-ANNUAL FINANCIAL REPORT | 127 |
STATEMENTS OF CHANGES IN NET ASSETS |
| | Six Months Ended
September 30, 2024
(Unaudited) | | | Year Ended
March 31,
2024 | |
Increase (Decrease) in Net Assets from Operations: | | | | | | | | |
Net investment income | | $ | 249,676 | | | $ | 303,851 | |
Net realized gain on investments | | | 208,463 | | | | 602,047 | |
Net change in unrealized appreciation (depreciation) on investments | | | 4,577,802 | | | | (1,034,402 | ) |
Net increase (decrease) in net assets resulting from operations | | | 5,035,941 | | | | (128,504 | ) |
| | | | | | | | | |
Distributions to shareholders: | | | | | | | | |
Investor Class | | | — | | | | (335,092 | ) |
Class A | | | — | | | | (172,630 | ) |
Class C | | | — | | | | (34,955 | ) |
Class H | | | — | | | | (28,809 | ) |
Total distributions to shareholders | | | — | | | | (571,486 | ) |
| | | | | | | | | |
Capital share transactions: | | | | | | | | |
Proceeds from sale of shares | | | | | | | | |
Investor Class | | | 46,508,881 | | | | 33,347,601 | |
Class A | | | 1,113,638 | | | | 993,331 | |
Class C | | | 137,000 | | | | 628,816 | |
Class H | | | 572,134 | | | | 1,058,498 | |
Distributions reinvested | | | | | | | | |
Investor Class | | | — | | | | 331,250 | |
Class A | | | — | | | | 171,729 | |
Class C | | | — | | | | 33,611 | |
Class H | | | — | | | | 27,589 | |
Cost of shares redeemed | | | | | | | | |
Investor Class | | | (36,487,309 | ) | | | (36,872,854 | ) |
Class A | | | (891,396 | ) | | | (1,754,754 | ) |
Class C | | | (278,700 | ) | | | (1,138,951 | ) |
Class H | | | (381,478 | ) | | | (2,083,156 | ) |
Net increase (decrease) from capital share transactions | | | 10,292,770 | | | | (5,257,290 | ) |
Net increase (decrease) in net assets | | | 15,328,711 | | | | (5,957,280 | ) |
| | | | | | | | | |
Net assets: | | | | | | | | |
Beginning of period | | | 14,514,099 | | | | 20,471,379 | |
End of period | | $ | 29,842,810 | | | $ | 14,514,099 | |
| | | | | | | | | |
Capital share activity: | | | | | | | | |
Shares sold | | | | | | | | |
Investor Class | | | 877,107 | | | | 703,176 | |
Class A | | | 23,434 | | | | 23,160 | |
Class C | | | 3,604 | | | | 18,640 | |
Class H | | | 12,480 | | | | 24,643 | |
Shares issued from reinvestment of distributions | | | | | | | | |
Investor Class | | | — | | | | 7,145 | |
Class A | | | — | | | | 4,116 | |
Class C | | | — | | | | 1,021 | |
Class H | | | — | | | | 690 | |
Shares redeemed | | | | | | | | |
Investor Class | | | (678,261 | ) | | | (774,299 | ) |
Class A | | | (18,570 | ) | | | (40,855 | ) |
Class C | | | (7,542 | ) | | | (33,733 | ) |
Class H | | | (8,363 | ) | | | (48,639 | ) |
Net increase (decrease) in shares | | | 203,889 | | | | (114,935 | ) |
128 | THE RYDEX FUNDS SEMI-ANNUAL FINANCIAL REPORT | SEE NOTES TO FINANCIAL STATEMENTS. |
This table is presented to show selected data for a share outstanding throughout each period and to assist shareholders in evaluating a Fund’s performance for the periods presented.
Investor Class | | Six Months Ended
September 30, 2024a | | | Year Ended
March 31,
2024 | | | Year Ended
March 31,
2023 | | | Year Ended
March 31,
2022 | | | Year Ended
March 31,
2021 | | | Year Ended
March 31,
2020 | |
Per Share Data |
Net asset value, beginning of period | | $ | 49.12 | | | $ | 50.77 | | | $ | 54.36 | | | $ | 47.92 | | | $ | 41.80 | | | $ | 46.23 | |
Income (loss) from investment operations: |
Net investment income (loss)b | | | .63 | | | | .91 | | | | .69 | | | | .77 | | | | .76 | | | | .74 | |
Net gain (loss) on investments (realized and unrealized) | | | 10.02 | | | | (1.07 | ) | | | (3.86 | ) | | | 7.02 | | | | 6.37 | | | | (4.72 | ) |
Total from investment operations | | | 10.65 | | | | (.16 | ) | | | (3.17 | ) | | | 7.79 | | | | 7.13 | | | | (3.98 | ) |
Less distributions from: |
Net investment income | | | — | | | | (1.49 | ) | | | (.42 | ) | | | (1.35 | ) | | | (1.01 | ) | | | (.45 | ) |
Total distributions | | | — | | | | (1.49 | ) | | | (.42 | ) | | | (1.35 | ) | | | (1.01 | ) | | | (.45 | ) |
Net asset value, end of period | | $ | 59.77 | | | $ | 49.12 | | | $ | 50.77 | | | $ | 54.36 | | | $ | 47.92 | | | $ | 41.80 | |
|
Total Return | | | 21.68 | % | | | (0.14 | %) | | | (5.84 | %) | | | 16.53 | % | | | 17.17 | % | | | (8.74 | %) |
Ratios/Supplemental Data |
Net assets, end of period (in thousands) | | $ | 21,802 | | | $ | 8,148 | | | $ | 11,671 | | | $ | 52,202 | | | $ | 21,099 | | | $ | 34,073 | |
Ratios to average net assets: |
Net investment income (loss) | | | 2.34 | % | | | 1.90 | % | | | 1.30 | % | | | 1.55 | % | | | 1.68 | % | | | 1.53 | % |
Total expenses | | | 1.43 | % | | | 1.43 | % | | | 1.39 | % | | | 1.36 | % | | | 1.45 | % | | | 1.48 | % |
Net expensesc | | | 1.38 | % | | | 1.40 | % | | | 1.39 | % | | | 1.36 | % | | | 1.45 | % | | | 1.48 | % |
Portfolio turnover rate | | | 116 | % | | | 163 | % | | | 293 | % | | | 175 | % | | | 156 | % | | | 169 | % |
Class A | | Six Months Ended
September 30, 2024a | | | Year Ended
March 31,
2024 | | | Year Ended
March 31,
2023 | | | Year Ended
March 31,
2022 | | | Year Ended
March 31,
2021 | | | Year Ended
March 31,
2020 | |
Per Share Data |
Net asset value, beginning of period | | $ | 44.16 | | | $ | 45.92 | | | $ | 49.34 | | | $ | 43.72 | | | $ | 38.30 | | | $ | 42.50 | |
Income (loss) from investment operations: |
Net investment income (loss)b | | | .42 | | | | .76 | | | | .56 | | | | .57 | | | | .57 | | | | .57 | |
Net gain (loss) on investments (realized and unrealized) | | | 9.09 | | | | (1.03 | ) | | | (3.56 | ) | | | 6.40 | | | | 5.86 | | | | (4.32 | ) |
Total from investment operations | | | 9.51 | | | | (.27 | ) | | | (3.00 | ) | | | 6.97 | | | | 6.43 | | | | (3.75 | ) |
Less distributions from: |
Net investment income | | | — | | | | (1.49 | ) | | | (.42 | ) | | | (1.35 | ) | | | (1.01 | ) | | | (.45 | ) |
Total distributions | | | — | | | | (1.49 | ) | | | (.42 | ) | | | (1.35 | ) | | | (1.01 | ) | | | (.45 | ) |
Net asset value, end of period | | $ | 53.67 | | | $ | 44.16 | | | $ | 45.92 | | | $ | 49.34 | | | $ | 43.72 | | | $ | 38.30 | |
|
Total Returnd | | | 21.54 | % | | | (0.40 | %) | | | (6.09 | %) | | | 16.24 | % | | | 16.91 | % | | | (8.96 | %) |
Ratios/Supplemental Data |
Net assets, end of period (in thousands) | | $ | 6,383 | | | $ | 5,037 | | | $ | 5,862 | | | $ | 6,522 | | | $ | 5,399 | | | $ | 4,225 | |
Ratios to average net assets: |
Net investment income (loss) | | | 1.77 | % | | | 1.76 | % | | | 1.18 | % | | | 1.26 | % | | | 1.39 | % | | | 1.29 | % |
Total expenses | | | 1.67 | % | | | 1.68 | % | | | 1.64 | % | | | 1.61 | % | | | 1.70 | % | | | 1.73 | % |
Net expensesc | | | 1.62 | % | | | 1.65 | % | | | 1.64 | % | | | 1.61 | % | | | 1.70 | % | | | 1.73 | % |
Portfolio turnover rate | | | 116 | % | | | 163 | % | | | 293 | % | | | 175 | % | | | 156 | % | | | 169 | % |
SEE NOTES TO FINANCIAL STATEMENTS. | THE RYDEX FUNDS SEMI-ANNUAL FINANCIAL REPORT | 129 |
FINANCIAL HIGHLIGHTS (continued) |
This table is presented to show selected data for a share outstanding throughout each period and to assist shareholders in evaluating a Fund’s performance for the periods presented.
Class C | | Six Months Ended
September 30, 2024a | | | Year Ended
March 31,
2024 | | | Year Ended
March 31,
2023 | | | Year Ended
March 31,
2022 | | | Year Ended
March 31,
2021 | | | Year Ended
March 31,
2020 | |
Per Share Data |
Net asset value, beginning of period | | $ | 34.76 | | | $ | 36.75 | | | $ | 39.87 | | | $ | 35.84 | | | $ | 31.80 | | | $ | 35.63 | |
Income (loss) from investment operations: |
Net investment income (loss)b | | | .19 | | | | .33 | | | | .16 | | | | .18 | | | | .21 | | | | .21 | |
Net gain (loss) on investments (realized and unrealized) | | | 7.14 | | | | (.83 | ) | | | (2.86 | ) | | | 5.20 | | | | 4.84 | | | | (3.59 | ) |
Total from investment operations | | | 7.33 | | | | (.50 | ) | | | (2.70 | ) | | | 5.38 | | | | 5.05 | | | | (3.38 | ) |
Less distributions from: |
Net investment income | | | — | | | | (1.49 | ) | | | (.42 | ) | | | (1.35 | ) | | | (1.01 | ) | | | (.45 | ) |
Total distributions | | | — | | | | (1.49 | ) | | | (.42 | ) | | | (1.35 | ) | | | (1.01 | ) | | | (.45 | ) |
Net asset value, end of period | | $ | 42.09 | | | $ | 34.76 | | | $ | 36.75 | | | $ | 39.87 | | | $ | 35.84 | | | $ | 31.80 | |
|
Total Returnd | | | 21.09 | % | | | (1.13 | %) | | | (6.79 | %) | | | 15.37 | % | | | 16.02 | % | | | (9.65 | %) |
Ratios/Supplemental Data |
Net assets, end of period (in thousands) | | $ | 646 | | | $ | 670 | | | $ | 1,226 | | | $ | 1,556 | | | $ | 2,646 | | | $ | 5,093 | |
Ratios to average net assets: |
Net investment income (loss) | | | 1.03 | % | | | 0.95 | % | | | 0.43 | % | | | 0.48 | % | | | 0.61 | % | | | 0.57 | % |
Total expenses | | | 2.42 | % | | | 2.43 | % | | | 2.39 | % | | | 2.36 | % | | | 2.45 | % | | | 2.47 | % |
Net expensesc | | | 2.37 | % | | | 2.40 | % | | | 2.39 | % | | | 2.36 | % | | | 2.45 | % | | | 2.47 | % |
Portfolio turnover rate | | | 116 | % | | | 163 | % | | | 293 | % | | | 175 | % | | | 156 | % | | | 169 | % |
130 | THE RYDEX FUNDS SEMI-ANNUAL FINANCIAL REPORT | SEE NOTES TO FINANCIAL STATEMENTS. |
FINANCIAL HIGHLIGHTS (concluded) |
This table is presented to show selected data for a share outstanding throughout each period and to assist shareholders in evaluating a Fund’s performance for the periods presented.
Class H | | Six Months Ended
September 30, 2024a | | | Year Ended
March 31,
2024 | | | Year Ended
March 31,
2023 | | | Year Ended
March 31,
2022 | | | Year Ended
March 31,
2021 | | | Year Ended
March 31,
2020 | |
Per Share Data |
Net asset value, beginning of period | | $ | 42.33 | | | $ | 44.08 | | | $ | 47.38 | | | $ | 42.04 | | | $ | 36.86 | | | $ | 40.92 | |
Income (loss) from investment operations: |
Net investment income (loss)b | | | .41 | | | | .67 | | | | .52 | | | | .63 | | | | .42 | | | | .50 | |
Net gain (loss) on investments (realized and unrealized) | | | 8.71 | | | | (.93 | ) | | | (3.40 | ) | | | 6.06 | | | | 5.77 | | | | (4.11 | ) |
Total from investment operations | | | 9.12 | | | | (.26 | ) | | | (2.88 | ) | | | 6.69 | | | | 6.19 | | | | (3.61 | ) |
Less distributions from: |
Net investment income | | | — | | | | (1.49 | ) | | | (.42 | ) | | | (1.35 | ) | | | (1.01 | ) | | | (.45 | ) |
Total distributions | | | — | | | | (1.49 | ) | | | (.42 | ) | | | (1.35 | ) | | | (1.01 | ) | | | (.45 | ) |
Net asset value, end of period | | $ | 51.45 | | | $ | 42.33 | | | $ | 44.08 | | | $ | 47.38 | | | $ | 42.04 | | | $ | 36.86 | |
|
Total Return | | | 21.55 | % | | | (0.39 | %) | | | (6.09 | %) | | | 16.23 | % | | | 16.92 | % | | | (8.97 | %) |
Ratios/Supplemental Data |
Net assets, end of period (in thousands) | | $ | 1,011 | | | $ | 658 | | | $ | 1,713 | | | $ | 2,148 | | | $ | 719 | | | $ | 2,427 | |
Ratios to average net assets: |
Net investment income (loss) | | | 1.81 | % | | | 1.61 | % | | | 1.14 | % | | | 1.45 | % | | | 1.08 | % | | | 1.18 | % |
Total expenses | | | 1.67 | % | | | 1.68 | % | | | 1.64 | % | | | 1.61 | % | | | 1.72 | % | | | 1.73 | % |
Net expensesc | | | 1.62 | % | | | 1.65 | % | | | 1.64 | % | | | 1.61 | % | | | 1.72 | % | | | 1.73 | % |
Portfolio turnover rate | | | 116 | % | | | 163 | % | | | 293 | % | | | 175 | % | | | 156 | % | | | 169 | % |
a | Unaudited figures for the period ended September 30, 2024. Percentage amounts for the period, except total return and portfolio turnover rate, have been annualized. |
b | Net investment income (loss) per share was computed using average shares outstanding throughout the period. |
c | Net expense information reflects the expense ratios after expense waivers and reimbursements, as applicable. |
d | Total return does not reflect the impact of any applicable sales charges. |
SEE NOTES TO FINANCIAL STATEMENTS. | THE RYDEX FUNDS SEMI-ANNUAL FINANCIAL REPORT | 131 |
SCHEDULE OF INVESTMENTS (Unaudited) | September 30, 2024 |
DOW JONES INDUSTRIAL AVERAGE® FUND | |
| | Shares | | | Value | |
COMMON STOCKS† - 86.6% |
| | | | | | | | | |
Financial - 20.0% |
Goldman Sachs Group, Inc. | | | 2,650 | | | $ | 1,312,041 | |
Visa, Inc. — Class A | | | 2,650 | | | | 728,618 | |
American Express Co. | | | 2,650 | | | | 718,680 | |
Travelers Companies, Inc. | | | 2,650 | | | | 620,418 | |
JPMorgan Chase & Co. | | | 2,650 | | | | 558,779 | |
Total Financial | | | | | | | 3,938,536 | |
| | | | | | | | | |
Consumer, Non-cyclical - 19.2% |
UnitedHealth Group, Inc. | | | 2,650 | | | | 1,549,402 | |
Amgen, Inc. | | | 2,650 | | | | 853,856 | |
Procter & Gamble Co. | | | 2,650 | | | | 458,980 | |
Johnson & Johnson | | | 2,650 | | | | 429,459 | |
Merck & Company, Inc. | | | 2,650 | | | | 300,934 | |
Coca-Cola Co. | | | 2,650 | | | | 190,429 | |
Total Consumer, Non-cyclical | | | | | | | 3,783,060 | |
| | | | | | | | | |
Technology - 15.9% |
Microsoft Corp. | | | 2,650 | | | | 1,140,295 | |
Salesforce, Inc. | | | 2,650 | | | | 725,331 | |
Apple, Inc. | | | 2,650 | | | | 617,450 | |
International Business Machines Corp. | | | 2,650 | | | | 585,862 | |
Intel Corp.* | | | 2,650 | | | | 62,169 | |
Total Technology | | | | | | | 3,131,107 | |
| | | | | | | | | |
Industrial - 11.9% |
Caterpillar, Inc. | | | 2,650 | | | | 1,036,468 | |
Honeywell International, Inc. | | | 2,650 | | | | 547,781 | |
Boeing Co.* | | | 2,650 | | | | 402,906 | |
3M Co. | | | 2,650 | | | | 362,255 | |
Total Industrial | | | | | | | 2,349,410 | |
| | | | | | | | | |
Consumer, Cyclical - 11.8% |
Home Depot, Inc. | | | 2,650 | | | | 1,073,780 | |
McDonald’s Corp. | | | 2,650 | | | | 806,951 | |
NIKE, Inc. — Class B | | | 2,650 | | | | 234,260 | |
Walmart, Inc. | | | 2,650 | | | | 213,988 | |
Total Consumer, Cyclical | | | | | | | 2,328,979 | |
| | | | | | | | | |
Communications - 5.1% |
Amazon.com, Inc.* | | | 2,650 | | | | 493,774 | |
Walt Disney Co. | | | 2,650 | | | | 254,904 | |
Cisco Systems, Inc. | | | 2,650 | | | | 141,033 | |
Verizon Communications, Inc. | | | 2,650 | | | | 119,012 | |
Total Communications | | | | | | | 1,008,723 | |
| | | | | | | | | |
Energy - 2.0% |
Chevron Corp. | | | 2,650 | | | | 390,266 | |
| | | | | | | | | |
Basic Materials - 0.7% |
Dow, Inc. | | | 2,650 | | | | 144,770 | |
| | | | | | | | | |
Total Common Stocks | | | | |
(Cost $11,320,020) | | | | | | | 17,074,851 | |
| | | | | | | | | |
MUTUAL FUNDS† - 6.6% |
Guggenheim Ultra Short Duration Fund — Institutional Class1 | | | 67,906 | | | | 680,422 | |
Guggenheim Strategy Fund II1 | | | 24,698 | | | | 612,519 | |
Total Mutual Funds | | | | |
(Cost $1,285,414) | | | | | | | 1,292,941 | |
| | | | | | | | | |
| | | Face
Amount | | | | | |
U.S. TREASURY BILLS†† - 0.6% |
U.S. Treasury Bills |
4.85% due 12/12/242,3 | | $ | 100,000 | | | | 99,106 | |
4.63% due 10/10/243,4 | | | 29,000 | | | | 28,966 | |
Total U.S. Treasury Bills | | | | |
(Cost $127,992) | | | | | | | 128,072 | |
| | | | | | | | | |
REPURCHASE AGREEMENTS††,5 - 6.7% |
J.P. Morgan Securities LLC
issued 09/30/24 at 4.86%
due 10/01/242 | | | 719,962 | | | | 719,962 | |
BofA Securities, Inc.
issued 09/30/24 at 4.85%
due 10/01/242 | | | 594,655 | | | | 594,655 | |
Total Repurchase Agreements | | | | |
(Cost $1,314,617) | | | | | | | 1,314,617 | |
| | | | | | | | | |
Total Investments - 100.5% | | | | |
(Cost $14,048,043) | | $ | 19,810,481 | |
Other Assets & Liabilities, net - (0.5)% | | | (90,222 | ) |
Total Net Assets - 100.0% | | $ | 19,720,259 | |
132 | THE RYDEX FUNDS SEMI-ANNUAL FINANCIAL REPORT | SEE NOTES TO FINANCIAL STATEMENTS. |
SCHEDULE OF INVESTMENTS (Unaudited)(continued) | September 30, 2024 |
DOW JONES INDUSTRIAL AVERAGE® FUND | |
Futures Contracts |
Description | | Number of
Contracts | | | Expiration
Date | | | Notional
Amount | | | Value and
Unrealized
Appreciation** | |
Equity Futures Contracts Purchased† |
Dow Jones Industrial Average Mini Futures Contracts | | | 1 | | | | Dec 2024 | | | $ | 213,260 | | | $ | 253 | |
Total Return Swap Agreements |
Counterparty | Index | Type | Financing
Rate | | Payment
Frequency | | | Maturity
Date | | | Units | | | Notional
Amount | | | Value and
Unrealized
Appreciation | |
OTC Equity Index Swap Agreements†† |
BNP Paribas | Dow Jones Industrial Average | Pay | 5.73% (Federal Funds Rate + 0.90%) | | | At Maturity | | | | 12/19/24 | | 41 | | $ | 1,714,790 | | | $ | 16,817 | |
Barclays Bank plc | Dow Jones Industrial Average | Pay | 5.44% (SOFR + 0.60%) | | | At Maturity | | | | 12/19/24 | | 18 | | | 770,058 | | | | 2,902 | |
| | | | | | | | | | | | | | | | | | $ | 2,484,848 | | | $ | 19,719 | |
* | Non-income producing security. |
** | Includes cumulative appreciation (depreciation). Variation margin is reported within the Statement of Assets and Liabilities. |
† | Value determined based on Level 1 inputs — See Note 4. |
†† | Value determined based on Level 2 inputs — See Note 4. |
1 | Affiliated issuer. |
2 | All or a portion of this security is pledged as equity index swap collateral at September 30, 2024. |
3 | Rate indicated is the effective yield at the time of purchase. |
4 | All or a portion of this security is pledged as futures collateral at September 30, 2024. |
5 | Repurchase Agreements — See Note 6. |
| | plc — Public Limited Company |
| | SOFR — Secured Overnight Financing Rate |
| | |
| | See Sector Classification in Other Information section. |
The following table summarizes the inputs used to value the Fund’s investments at September 30, 2024 (See Note 4 in the Notes to Financial Statements):
Investments in Securities (Assets) | | Level 1
Quoted
Prices | | | Level 2
Significant
Observable
Inputs | | | Level 3
Significant
Unobservable
Inputs | | | Total | |
Common Stocks | | $ | 17,074,851 | | | $ | — | | | $ | — | | | $ | 17,074,851 | |
Mutual Funds | | | 1,292,941 | | | | — | | | | — | | | | 1,292,941 | |
U.S. Treasury Bills | | | — | | | | 128,072 | | | | — | | | | 128,072 | |
Repurchase Agreements | | | — | | | | 1,314,617 | | | | — | | | | 1,314,617 | |
Equity Futures Contracts** | | | 253 | | | | — | | | | — | | | | 253 | |
Equity Index Swap Agreements** | | | — | | | | 19,719 | | | | — | | | | 19,719 | |
Total Assets | | $ | 18,368,045 | | | $ | 1,462,408 | | | $ | — | | | $ | 19,830,453 | |
** | This derivative is reported as unrealized appreciation/depreciation at period end. |
SEE NOTES TO FINANCIAL STATEMENTS. | THE RYDEX FUNDS SEMI-ANNUAL FINANCIAL REPORT | 133 |
SCHEDULE OF INVESTMENTS (Unaudited)(concluded) | September 30, 2024 |
DOW JONES INDUSTRIAL AVERAGE® FUND | |
Affiliated Transactions
Investments representing 5% or more of the outstanding voting shares of a company, or control of or by, or common control under Guggenheim Investments (“GI”), result in that company being considered an affiliated issuer, as defined in the 1940 Act.
The Fund may invest in certain of the underlying series of Guggenheim Strategy Funds Trust, including Guggenheim Strategy Fund II and Guggenheim Strategy Fund III (collectively, the “Guggenheim Strategy Funds”), each of which are open-end management investment companies managed by GI. The Guggenheim Strategy Funds, which launched on March 11, 2014, are offered as short term investment options only to mutual funds, trusts, and other accounts managed by GI and/or its affiliates, and are not available to the public. The Guggenheim Strategy Funds pay no investment management fees. The Guggenheim Strategy Funds’ annual report on Form N-CSR dated September 30, 2023 is available publicly or upon request. This information is available from the EDGAR database on the SEC’s website at https://www.sec.gov/Archives/edgar/data/1601445/000182126823000217/gug86449-ncsr.htm. The Fund may invest in certain of the underlying series of Guggenheim Funds Trust, which are open-end management investment companies managed by GI, are available to the public and whose most recent annual report on Form N-CSR is available publicly or upon request.
Transactions during the period ended September 30, 2024, in which the company is an affiliated issuer, were as follows:
Security Name | | Value
03/31/24 | | | Additions | | | Reductions | | | Realized
Gain (Loss) | | | Change in
Unrealized
Appreciation
(Depreciation) | | | Value
09/30/24 | | | Shares
09/30/24 | | | Investment
Income | |
Mutual Funds | | | | | | | | | | | | | | | | | | | | | | | | | | | | | | | | |
Guggenheim Strategy Fund II | | $ | 607,579 | | | $ | — | | | $ | — | | | $ | — | | | $ | 4,940 | | | $ | 612,519 | | | | 24,698 | | | $ | 17,396 | |
Guggenheim Ultra Short Duration Fund — Institutional Class | | | 672,952 | | | | — | | | | — | | | | — | | | | 7,470 | | | | 680,422 | | | | 67,906 | | | | 17,513 | |
| | | $ | 1,280,531 | | | $ | — | | | $ | — | | | $ | — | | | $ | 12,410 | | | $ | 1,292,941 | | | | | | | $ | 34,909 | |
134 | THE RYDEX FUNDS SEMI-ANNUAL FINANCIAL REPORT | SEE NOTES TO FINANCIAL STATEMENTS. |
DOW JONES INDUSTRIAL AVERAGE® FUND | |
STATEMENT OF ASSETS AND LIABILITIES (Unaudited) |
September 30, 2024 |
Assets: |
Investments in unaffiliated issuers, at value (cost $11,448,012) | | $ | 17,202,923 | |
Investments in affiliated issuers, at value (cost $1,285,414) | | | 1,292,941 | |
Repurchase agreements, at value (cost $1,314,617) | | | 1,314,617 | |
Unrealized appreciation on OTC swap agreements | | | 19,719 | |
Receivables: |
Dividends | | | 11,007 | |
Fund shares sold | | | 4,765 | |
Interest | | | 177 | |
Total assets | | | 19,846,149 | |
| | | | | |
Liabilities: |
Payable for: |
Fund shares redeemed | | | 72,977 | |
Management fees | | | 11,306 | |
Licensing fees | | | 11,113 | |
Transfer agent fees | | | 9,580 | |
Distribution and service fees | | | 5,214 | |
Portfolio accounting and administration fees | | | 1,566 | |
Swap settlement | | | 765 | |
Trustees’ fees* | | | 194 | |
Variation margin on futures contracts | | | 20 | |
Miscellaneous | | | 13,155 | |
Total liabilities | | | 125,890 | |
Net assets | | $ | 19,720,259 | |
| | | | | |
Net assets consist of: |
Paid in capital | | $ | 14,100,925 | |
Total distributable earnings (loss) | | | 5,619,334 | |
Net assets | | $ | 19,720,259 | |
Class A: |
Net assets | | $ | 3,656,469 | |
Capital shares outstanding | | | 35,890 | |
Net asset value per share | | $ | 101.88 | |
Maximum offering price per share (Net asset value divided by 95.25%) | | $ | 106.96 | |
Class C: |
Net assets | | $ | 2,486,413 | |
Capital shares outstanding | | | 26,264 | |
Net asset value per share | | $ | 94.67 | |
Class H: |
Net assets | | $ | 13,577,377 | |
Capital shares outstanding | | | 133,142 | |
Net asset value per share | | $ | 101.98 | |
STATEMENT OF OPERATIONS (Unaudited) |
Six Months Ended September 30, 2024 |
Investment Income: |
Dividends from securities of unaffiliated issuers | | $ | 184,017 | |
Dividends from securities of affiliated issuers | | | 34,909 | |
Interest | | | 54,213 | |
Total investment income | | | 273,139 | |
| | | | | |
Expenses: |
Management fees | | | 85,804 | |
Distribution and service fees: |
Class A | | | 3,954 | |
Class C | | | 12,491 | |
Class H | | | 21,524 | |
Transfer agent fees | | | 23,558 | |
Portfolio accounting and administration fees | | | 17,455 | |
Registration fees | | | 10,328 | |
Professional fees | | | 3,265 | |
Custodian fees | | | 1,462 | |
Trustees’ fees* | | | 1,261 | |
Miscellaneous | | | 13,960 | |
Total expenses | | | 195,062 | |
Less: |
Expenses reimbursed by Adviser | | | (5,704 | ) |
Expenses waived by Adviser | | | (845 | ) |
Total waived/reimbursed expenses | | | (6,549 | ) |
Net expenses | | | 188,513 | |
Net investment income | | | 84,626 | |
| | | | | |
Net Realized and Unrealized Gain (Loss): |
Net realized gain (loss) on: |
Investments in unaffiliated issuers | | | 777,623 | |
Swap agreements | | | 53,012 | |
Futures contracts | | | (3,700 | ) |
Net realized gain | | | 826,935 | |
Net change in unrealized appreciation (depreciation) on: |
Investments in unaffiliated issuers | | | 296,202 | |
Investments in affiliated issuers | | | 12,410 | |
Swap agreements | | | (29,860 | ) |
Futures contracts | | | (45,967 | ) |
Net change in unrealized appreciation (depreciation) | | | 232,785 | |
Net realized and unrealized gain | | | 1,059,720 | |
Net increase in net assets resulting from operations | | $ | 1,144,346 | |
* | Relates to Trustees not deemed “interested persons” within the meaning of Section 2(a)(19) of the 1940 Act. |
SEE NOTES TO FINANCIAL STATEMENTS. | THE RYDEX FUNDS SEMI-ANNUAL FINANCIAL REPORT | 135 |
DOW JONES INDUSTRIAL AVERAGE® FUND | |
STATEMENTS OF CHANGES IN NET ASSETS |
| | Six Months Ended
September 30, 2024
(Unaudited) | | | Year Ended
March 31,
2024 | |
Increase (Decrease) in Net Assets from Operations: | | | | | | | | |
Net investment income | | $ | 84,626 | | | $ | 200,734 | |
Net realized gain on investments | | | 826,935 | | | | 1,257,583 | |
Net change in unrealized appreciation (depreciation) on investments | | | 232,785 | | | | 2,422,418 | |
Net increase in net assets resulting from operations | | | 1,144,346 | | | | 3,880,735 | |
| | | | | | | | | |
Distributions to shareholders: | | | | | | | | |
Class A | | | — | | | | (21,691 | ) |
Class C | | | — | | | | (22,672 | ) |
Class H | | | — | | | | (125,457 | ) |
Total distributions to shareholders | | | — | | | | (169,820 | ) |
| | | | | | | | | |
Capital share transactions: | | | | | | | | |
Proceeds from sale of shares | | | | | | | | |
Class A | | | 784,989 | | | | 3,228,603 | |
Class C | | | 355,818 | | | | 1,275,512 | |
Class H | | | 21,680,206 | | | | 60,224,253 | |
Distributions reinvested | | | | | | | | |
Class A | | | — | | | | 21,667 | |
Class C | | | — | | | | 21,421 | |
Class H | | | — | | | | 125,178 | |
Cost of shares redeemed | | | | | | | | |
Class A | | | (1,430,030 | ) | | | (3,459,658 | ) |
Class C | | | (788,164 | ) | | | (1,846,636 | ) |
Class H | | | (28,699,414 | ) | | | (61,937,128 | ) |
Net decrease from capital share transactions | | | (8,096,595 | ) | | | (2,346,788 | ) |
Net increase (decrease) in net assets | | | (6,952,249 | ) | | | 1,364,127 | |
| | | | | | | | | |
Net assets: | | | | | | | | |
Beginning of period | | | 26,672,508 | | | | 25,308,381 | |
End of period | | $ | 19,720,259 | | | $ | 26,672,508 | |
| | | | | | | | | |
Capital share activity: | | | | | | | | |
Shares sold | | | | | | | | |
Class A | | | 8,200 | | | | 37,560 | |
Class C | | | 3,999 | | | | 16,180 | |
Class H | | | 226,261 | | | | 695,077 | |
Shares issued from reinvestment of distributions | | | | | | | | |
Class A | | | — | | | | 247 | |
Class C | | | — | | | | 261 | |
Class H | | | — | | | | 1,423 | |
Shares redeemed | | | | | | | | |
Class A | | | (15,294 | ) | | | (41,584 | ) |
Class C | | | (8,843 | ) | | | (23,085 | ) |
Class H | | | (299,801 | ) | | | (722,979 | ) |
Net decrease in shares | | | (85,478 | ) | | | (36,900 | ) |
136 | THE RYDEX FUNDS SEMI-ANNUAL FINANCIAL REPORT | SEE NOTES TO FINANCIAL STATEMENTS. |
DOW JONES INDUSTRIAL AVERAGE® FUND | |
This table is presented to show selected data for a share outstanding throughout each period and to assist shareholders in evaluating a Fund’s performance for the periods presented.
Class A | | Six Months Ended
September 30, 2024a | | | Year Ended
March 31,
2024 | | | Year Ended
March 31,
2023 | | | Year Ended
March 31,
2022 | | | Year Ended
March 31,
2021 | | | Year Ended
March 31,
2020 | |
Per Share Data |
Net asset value, beginning of period | | $ | 95.64 | | | $ | 80.18 | | | $ | 86.09 | | | $ | 82.82 | | | $ | 57.33 | | | $ | 70.54 | |
Income (loss) from investment operations: |
Net investment income (loss)b | | | .40 | | | | .79 | | | | .52 | | | | .05 | | | | .02 | | | | .47 | |
Net gain (loss) on investments (realized and unrealized) | | | 5.84 | | | | 15.35 | | | | (3.90 | )f | | | 4.32 | g | | | 29.21 | | | | (10.67 | ) |
Total from investment operations | | | 6.24 | | | | 16.14 | | | | (3.38 | ) | | | 4.37 | | | | 29.23 | | | | (10.20 | ) |
Less distributions from: |
Net investment income | | | — | | | | (.59 | ) | | | (.47 | ) | | | — | | | | (.06 | ) | | | (.31 | ) |
Net realized gains | | | — | | | | (.09 | ) | | | (2.06 | ) | | | (1.10 | ) | | | (3.68 | ) | | | (2.70 | ) |
Total distributions | | | — | | | | (.68 | ) | | | (2.53 | ) | | | (1.10 | ) | | | (3.74 | ) | | | (3.01 | ) |
Net asset value, end of period | | $ | 101.88 | | | $ | 95.64 | | | $ | 80.18 | | | $ | 86.09 | | | $ | 82.82 | | | $ | 57.33 | |
|
Total Returnc | | | 6.52 | % | | | 20.22 | % | | | (3.90 | %) | | | 5.23 | % | | | 51.61 | % | | | (15.38 | %) |
Ratios/Supplemental Data |
Net assets, end of period (in thousands) | | $ | 3,656 | | | $ | 4,111 | | | $ | 3,749 | | | $ | 4,632 | | | $ | 2,952 | | | $ | 2,652 | |
Ratios to average net assets: |
Net investment income (loss) | | | 0.83 | % | | | 0.93 | % | | | 0.65 | % | | | 0.05 | % | | | 0.02 | % | | | 0.65 | % |
Total expensesd | | | 1.63 | % | | | 1.67 | % | | | 1.57 | % | | | 1.56 | % | | | 1.69 | % | | | 1.66 | % |
Net expensese | | | 1.57 | % | | | 1.63 | % | | | 1.55 | % | | | 1.55 | % | | | 1.68 | % | | | 1.64 | % |
Portfolio turnover rate | | | 14 | % | | | 140 | % | | | 414 | % | | | 240 | % | | | 110 | % | | | 186 | % |
Class C | | Six Months Ended
September 30, 2024a | | | Year Ended
March 31,
2024 | | | Year Ended
March 31,
2023 | | | Year Ended
March 31,
2022 | | | Year Ended
March 31,
2021 | | | Year Ended
March 31,
2020 | |
Per Share Data |
Net asset value, beginning of period | | $ | 89.21 | | | $ | 75.39 | | | $ | 81.70 | | | $ | 79.25 | | | $ | 55.37 | | | $ | 68.74 | |
Income (loss) from investment operations: |
Net investment income (loss)b | | | .03 | | | | .14 | | | | (.03 | ) | | | (.56 | ) | | | (.49 | ) | | | (.02 | ) |
Net gain (loss) on investments (realized and unrealized) | | | 5.43 | | | | 14.36 | | | | (3.75 | )f | | | 4.11 | g | | | 28.11 | | | | (10.34 | ) |
Total from investment operations | | | 5.46 | | | | 14.50 | | | | (3.78 | ) | | | 3.55 | | | | 27.62 | | | | (10.36 | ) |
Less distributions from: |
Net investment income | | | — | | | | (.59 | ) | | | (.47 | ) | | | — | | | | (.06 | ) | | | (.31 | ) |
Net realized gains | | | — | | | | (.09 | ) | | | (2.06 | ) | | | (1.10 | ) | | | (3.68 | ) | | | (2.70 | ) |
Total distributions | | | — | | | | (.68 | ) | | | (2.53 | ) | | | (1.10 | ) | | | (3.74 | ) | | | (3.01 | ) |
Net asset value, end of period | | $ | 94.67 | | | $ | 89.21 | | | $ | 75.39 | | | $ | 81.70 | | | $ | 79.25 | | | $ | 55.37 | |
|
Total Returnc | | | 6.12 | % | | | 19.32 | % | | | (4.61 | %) | | | 4.43 | % | | | 50.52 | % | | | (16.03 | %) |
Ratios/Supplemental Data |
Net assets, end of period (in thousands) | | $ | 2,486 | | | $ | 2,775 | | | $ | 2,846 | | | $ | 3,001 | | | $ | 2,842 | | | $ | 1,637 | |
Ratios to average net assets: |
Net investment income (loss) | | | 0.06 | % | | | 0.17 | % | | | (0.04 | %) | | | (0.68 | %) | | | (0.70 | %) | | | (0.03 | %) |
Total expensesd | | | 2.37 | % | | | 2.42 | % | | | 2.32 | % | | | 2.32 | % | | | 2.44 | % | | | 2.42 | % |
Net expensese | | | 2.32 | % | | | 2.38 | % | | | 2.30 | % | | | 2.31 | % | | | 2.43 | % | | | 2.40 | % |
Portfolio turnover rate | | | 14 | % | | | 140 | % | | | 414 | % | | | 240 | % | | | 110 | % | | | 186 | % |
SEE NOTES TO FINANCIAL STATEMENTS. | THE RYDEX FUNDS SEMI-ANNUAL FINANCIAL REPORT | 137 |
DOW JONES INDUSTRIAL AVERAGE® FUND | |
FINANCIAL HIGHLIGHTS (concluded) |
This table is presented to show selected data for a share outstanding throughout each period and to assist shareholders in evaluating a Fund’s performance for the periods presented.
Class H | | Six Months Ended
September 30, 2024a | | | Year Ended
March 31,
2024 | | | Year Ended
March 31,
2023 | | | Year Ended
March 31,
2022 | | | Year Ended
March 31,
2021 | | | Year Ended
March 31,
2020 | |
Per Share Data |
Net asset value, beginning of period | | $ | 95.73 | | | $ | 80.26 | | | $ | 86.15 | | | $ | 82.88 | | | $ | 57.36 | | | $ | 70.59 | |
Income (loss) from investment operations: |
Net investment income (loss)b | | | .39 | | | | .79 | | | | .60 | | | | .17 | | | | .03 | | | | .51 | |
Net gain (loss) on investments (realized and unrealized) | | | 5.86 | | | | 15.36 | | | | (3.96 | )f | | | 4.20 | g | | | 29.23 | | | | (10.73 | ) |
Total from investment operations | | | 6.25 | | | | 16.15 | | | | (3.36 | ) | | | 4.37 | | | | 29.26 | | | | (10.22 | ) |
Less distributions from: |
Net investment income | | | — | | | | (.59 | ) | | | (.47 | ) | | | — | | | | (.06 | ) | | | (.31 | ) |
Net realized gains | | | — | | | | (.09 | ) | | | (2.06 | ) | | | (1.10 | ) | | | (3.68 | ) | | | (2.70 | ) |
Total distributions | | | — | | | | (.68 | ) | | | (2.53 | ) | | | (1.10 | ) | | | (3.74 | ) | | | (3.01 | ) |
Net asset value, end of period | | $ | 101.98 | | | $ | 95.73 | | | $ | 80.26 | | | $ | 86.15 | | | $ | 82.88 | | | $ | 57.36 | |
|
Total Return | | | 6.53 | % | | | 20.21 | % | | | (3.87 | %) | | | 5.23 | % | | | 51.64 | % | | | (15.40 | %) |
Ratios/Supplemental Data |
Net assets, end of period (in thousands) | | $ | 13,577 | | | $ | 19,786 | | | $ | 18,713 | | | $ | 23,009 | | | $ | 17,500 | | | $ | 24,331 | |
Ratios to average net assets: |
Net investment income (loss) | | | 0.82 | % | | | 0.93 | % | | | 0.74 | % | | | 0.19 | % | | | 0.05 | % | | | 0.70 | % |
Total expensesd | | | 1.62 | % | | | 1.67 | % | | | 1.57 | % | | | 1.57 | % | | | 1.70 | % | | | 1.66 | % |
Net expensese | | | 1.57 | % | | | 1.63 | % | | | 1.56 | % | | | 1.55 | % | | | 1.69 | % | | | 1.64 | % |
Portfolio turnover rate | | | 14 | % | | | 140 | % | | | 414 | % | | | 240 | % | | | 110 | % | | | 186 | % |
a | Unaudited figures for the period ended September 30, 2024. Percentage amounts for the period, except total return and portfolio turnover rate, have been annualized. |
b | Net investment income (loss) per share was computed using average shares outstanding throughout the period. |
c | Total return does not reflect the impact of any applicable sales charges. |
d | Does not include expenses of the underlying funds in which the Fund invests. |
e | Net expense information reflects the expense ratios after expense waivers and reimbursements, as applicable. |
f | The amount shown for a share outstanding throughout the period does not agree with the aggregate net gain on investments for the year because of the sales and purchases of fund shares in relation to fluctuating market value of the investments of the Fund. |
g | The amount shown for a share outstanding throughout the period does not agree with the aggregate net loss on investments for the year because of the sales and purchases of fund shares in relation to fluctuating market value of the investments of the Fund. |
138 | THE RYDEX FUNDS SEMI-ANNUAL FINANCIAL REPORT | SEE NOTES TO FINANCIAL STATEMENTS. |
SCHEDULE OF INVESTMENTS (Unaudited) | September 30, 2024 |
NOVA FUND | |
| | Shares | | | Value | |
COMMON STOCKS† - 79.6% |
| | | | | | | | | |
Technology - 24.5% |
Apple, Inc. | | | 59,643 | | | $ | 13,896,819 | |
Microsoft Corp. | | | 29,160 | | | | 12,547,548 | |
NVIDIA Corp. | | | 96,506 | | | | 11,719,689 | |
Broadcom, Inc. | | | 18,261 | | | | 3,150,023 | |
Oracle Corp. | | | 6,270 | | | | 1,068,408 | |
Advanced Micro Devices, Inc.* | | | 6,349 | | | | 1,041,744 | |
Salesforce, Inc. | | | 3,802 | | | | 1,040,645 | |
Adobe, Inc.* | | | 1,739 | | | | 900,420 | |
Accenture plc — Class A | | | 2,457 | | | | 868,500 | |
International Business Machines Corp. | | | 3,613 | | | | 798,762 | |
QUALCOMM, Inc. | | | 4,370 | | | | 743,118 | |
Texas Instruments, Inc. | | | 3,582 | | | | 739,934 | |
ServiceNow, Inc.* | | | 808 | | | | 722,667 | |
Intuit, Inc. | | | 1,096 | | | | 680,616 | |
Applied Materials, Inc. | | | 3,248 | | | | 656,258 | |
Micron Technology, Inc. | | | 4,350 | | | | 451,138 | |
Analog Devices, Inc. | | | 1,946 | | | | 447,911 | |
Lam Research Corp. | | | 511 | | | | 417,017 | |
KLA Corp. | | | 527 | | | | 408,114 | |
Fiserv, Inc.* | | | 2,258 | | | | 405,650 | |
Intel Corp.* | | | 16,741 | | | | 392,744 | |
Synopsys, Inc.* | | | 601 | | | | 304,340 | |
Palantir Technologies, Inc. — Class A* | | | 7,900 | | | | 293,880 | |
Cadence Design Systems, Inc.* | | | 1,074 | | | | 291,086 | |
Crowdstrike Holdings, Inc. — Class A* | | | 906 | | | | 254,106 | |
NXP Semiconductor N.V. | | | 999 | | | | 239,770 | |
Roper Technologies, Inc. | | | 420 | | | | 233,705 | |
Autodesk, Inc.* | | | 844 | | | | 232,505 | |
Fortinet, Inc.* | | | 2,490 | | | | 193,100 | |
Fair Isaac Corp.* | | | 96 | | | | 186,578 | |
MSCI, Inc. — Class A | | | 309 | | | | 180,125 | |
TE Connectivity plc | | | 1,192 | | | | 179,980 | |
Fidelity National Information Services, Inc. | | | 2,139 | | | | 179,141 | |
Monolithic Power Systems, Inc. | | | 191 | | | | 176,579 | |
Microchip Technology, Inc. | | | 2,105 | | | | 169,010 | |
Paychex, Inc. | | | 1,257 | | | | 168,677 | |
Gartner, Inc.* | | | 302 | | | | 153,042 | |
Cognizant Technology Solutions Corp. — Class A | | | 1,945 | | | | 150,115 | |
HP, Inc. | | | 3,838 | | | | 137,669 | |
Electronic Arts, Inc. | | | 943 | | | | 135,264 | |
Dell Technologies, Inc. — Class C | | | 1,129 | | | | 133,832 | |
ON Semiconductor Corp.* | | | 1,680 | | | | 121,985 | |
ANSYS, Inc.* | | | 343 | | | | 109,290 | |
Hewlett Packard Enterprise Co. | | | 5,098 | | | | 104,305 | |
NetApp, Inc. | | | 806 | | | | 99,549 | |
Broadridge Financial Solutions, Inc. | | | 458 | | | | 98,484 | |
Take-Two Interactive Software, Inc.* | | | 640 | | | | 98,374 | |
Tyler Technologies, Inc.* | | | 167 | | | | 97,481 | |
Seagate Technology Holdings plc | | | 823 | | | | 90,143 | |
Western Digital Corp.* | | | 1,281 | | | | 87,479 | |
Leidos Holdings, Inc. | | | 527 | | | | 85,901 | |
Teradyne, Inc. | | | 640 | | | | 85,715 | |
PTC, Inc.* | | | 471 | | | | 85,091 | |
Super Micro Computer, Inc.* | | | 198 | | | | 82,447 | |
Zebra Technologies Corp. — Class A* | | | 202 | | | | 74,805 | |
Skyworks Solutions, Inc. | | | 627 | | | | 61,929 | |
Akamai Technologies, Inc.* | | | 594 | | | | 59,964 | |
Jack Henry & Associates, Inc. | | | 286 | | | | 50,491 | |
EPAM Systems, Inc.* | | | 223 | | | | 44,384 | |
Qorvo, Inc.* | | | 372 | | | | 38,428 | |
Dayforce, Inc.* | | | 620 | | | | 37,975 | |
Paycom Software, Inc. | | | 191 | | | | 31,815 | |
Amentum Holdings, Inc.* | | | 491 | | | | 15,835 | |
Total Technology | | | | | | | 58,752,099 | |
| | | | | | | | | |
Consumer, Non-cyclical - 13.8% |
Eli Lilly & Co. | | | 3,094 | | | | 2,741,098 | |
UnitedHealth Group, Inc. | | | 3,623 | | | | 2,118,296 | |
Procter & Gamble Co. | | | 9,236 | | | | 1,599,675 | |
Johnson & Johnson | | | 9,443 | | | | 1,530,333 | |
AbbVie, Inc. | | | 6,929 | | | | 1,368,339 | |
Merck & Company, Inc. | | | 9,944 | | | | 1,129,241 | |
Coca-Cola Co. | | | 15,216 | | | | 1,093,422 | |
Thermo Fisher Scientific, Inc. | | | 1,499 | | | | 927,236 | |
PepsiCo, Inc. | | | 5,389 | | | | 916,399 | |
Abbott Laboratories | | | 6,825 | | | | 778,118 | |
Philip Morris International, Inc. | | | 6,100 | | | | 740,540 | |
Danaher Corp. | | | 2,522 | | | | 701,167 | |
Intuitive Surgical, Inc.* | | | 1,392 | | | | 683,848 | |
Amgen, Inc. | | | 2,108 | | | | 679,219 | |
S&P Global, Inc. | | | 1,256 | | | | 648,875 | |
Pfizer, Inc. | | | 22,231 | | | | 643,365 | |
Stryker Corp. | | | 1,345 | | | | 485,895 | |
Boston Scientific Corp.* | | | 5,778 | | | | 484,196 | |
Elevance Health, Inc. | | | 909 | | | | 472,680 | |
Vertex Pharmaceuticals, Inc.* | | | 1,012 | | | | 470,661 | |
Medtronic plc | | | 5,032 | | | | 453,031 | |
Automatic Data Processing, Inc. | | | 1,599 | | | | 442,491 | |
Regeneron Pharmaceuticals, Inc.* | | | 416 | | | | 437,316 | |
Bristol-Myers Squibb Co. | | | 7,953 | | | | 411,488 | |
Gilead Sciences, Inc. | | | 4,884 | | | | 409,474 | |
Mondelez International, Inc. — Class A | | | 5,240 | | | | 386,031 | |
Cigna Group | | | 1,096 | | | | 379,698 | |
Zoetis, Inc. | | | 1,777 | | | | 347,190 | |
Altria Group, Inc. | | | 6,693 | | | | 341,611 | |
Colgate-Palmolive Co. | | | 3,205 | | | | 332,711 | |
PayPal Holdings, Inc.* | | | 4,011 | | | | 312,978 | |
CVS Health Corp. | | | 4,935 | | | | 310,313 | |
HCA Healthcare, Inc. | | | 729 | | | | 296,287 | |
Moody’s Corp. | | | 614 | | | | 291,398 | |
Cintas Corp. | | | 1,343 | | | | 276,497 | |
Becton Dickinson & Co. | | | 1,134 | | | | 273,407 | |
McKesson Corp. | | | 509 | | | | 251,660 | |
United Rentals, Inc. | | | 261 | | | | 211,339 | |
Kimberly-Clark Corp. | | | 1,321 | | | | 187,952 | |
Kenvue, Inc. | | | 7,513 | | | | 173,776 | |
Quanta Services, Inc. | | | 578 | | | | 172,331 | |
Agilent Technologies, Inc. | | | 1,144 | | | | 169,861 | |
GE HealthCare Technologies, Inc. | | | 1,792 | | | | 168,179 | |
IDEXX Laboratories, Inc.* | | | 322 | | | | 162,681 | |
SEE NOTES TO FINANCIAL STATEMENTS. | THE RYDEX FUNDS SEMI-ANNUAL FINANCIAL REPORT | 139 |
SCHEDULE OF INVESTMENTS (Unaudited)(continued) | September 30, 2024 |
NOVA FUND | |
| | Shares | | | Value | |
General Mills, Inc. | | | 2,184 | | | $ | 161,288 | |
IQVIA Holdings, Inc.* | | | 679 | | | | 160,903 | |
Corteva, Inc. | | | 2,715 | | | | 159,615 | |
Constellation Brands, Inc. — Class A | | | 614 | | | | 158,222 | |
Edwards Lifesciences Corp.* | | | 2,363 | | | | 155,934 | |
Keurig Dr Pepper, Inc. | | | 4,149 | | | | 155,504 | |
Centene Corp.* | | | 2,064 | | | | 155,378 | |
Cencora, Inc. — Class A | | | 684 | | | | 153,955 | |
Sysco Corp. | | | 1,929 | | | | 150,578 | |
Verisk Analytics, Inc. — Class A | | | 558 | | | | 149,522 | |
Humana, Inc. | | | 472 | | | | 149,501 | |
Kroger Co. | | | 2,605 | | | | 149,266 | |
Monster Beverage Corp.* | | | 2,766 | | | | 144,302 | |
Equifax, Inc. | | | 485 | | | | 142,522 | |
ResMed, Inc. | | | 576 | | | | 140,613 | |
Kraft Heinz Co. | | | 3,463 | | | | 121,586 | |
Archer-Daniels-Midland Co. | | | 1,876 | | | | 112,072 | |
Hershey Co. | | | 579 | | | | 111,041 | |
Biogen, Inc.* | | | 571 | | | | 110,683 | |
Cardinal Health, Inc. | | | 956 | | | | 105,657 | |
Dexcom, Inc.* | | | 1,571 | | | | 105,320 | |
Global Payments, Inc. | | | 998 | | | | 102,215 | |
Church & Dwight Company, Inc. | | | 960 | | | | 100,531 | |
STERIS plc | | | 386 | | | | 93,620 | |
Estee Lauder Companies, Inc. — Class A | | | 914 | | | | 91,117 | |
Moderna, Inc.* | | | 1,327 | | | | 88,683 | |
Zimmer Biomet Holdings, Inc. | | | 799 | | | | 86,252 | |
Cooper Companies, Inc.* | | | 781 | | | | 86,176 | |
West Pharmaceutical Services, Inc. | | | 284 | | | | 85,246 | |
Corpay, Inc.* | | | 272 | | | | 85,071 | |
Kellanova | | | 1,052 | | | | 84,907 | |
Waters Corp.* | | | 233 | | | | 83,854 | |
McCormick & Company, Inc. | | | 988 | | | | 81,312 | |
Molina Healthcare, Inc.* | | | 230 | | | | 79,249 | |
Clorox Co. | | | 486 | | | | 79,174 | |
Baxter International, Inc. | | | 2,002 | | | | 76,016 | |
Hologic, Inc.* | | | 911 | | | | 74,210 | |
Labcorp Holdings, Inc. | | | 329 | | | | 73,525 | |
Avery Dennison Corp. | | | 316 | | | | 69,760 | |
Align Technology, Inc.* | | | 274 | | | | 69,684 | |
Quest Diagnostics, Inc. | | | 436 | | | | 67,689 | |
Tyson Foods, Inc. — Class A | | | 1,121 | | | | 66,767 | |
Insulet Corp.* | | | 275 | | | | 64,006 | |
Revvity, Inc. | | | 484 | | | | 61,831 | |
Conagra Brands, Inc. | | | 1,879 | | | | 61,105 | |
Rollins, Inc. | | | 1,102 | | | | 55,739 | |
Viatris, Inc. | | | 4,682 | | | | 54,358 | |
Bunge Global S.A. | | | 556 | | | | 53,732 | |
Universal Health Services, Inc. — Class B | | | 233 | | | | 53,359 | |
J M Smucker Co. | | | 418 | | | | 50,620 | |
Bio-Techne Corp. | | | 618 | | | | 49,397 | |
Teleflex, Inc. | | | 185 | | | | 45,754 | |
Catalent, Inc.* | | | 710 | | | | 43,005 | |
Incyte Corp.* | | | 627 | | | | 41,445 | |
Charles River Laboratories International, Inc.* | | | 203 | | | | 39,985 | |
Molson Coors Beverage Co. — Class B | | | 689 | | | | 39,631 | |
MarketAxess Holdings, Inc. | | | 148 | | | | 37,918 | |
Campbell Soup Co. | | | 773 | | | | 37,815 | |
Solventum Corp.* | | | 541 | | | | 37,719 | |
Lamb Weston Holdings, Inc. | | | 562 | | | | 36,384 | |
Henry Schein, Inc.* | | | 497 | | | | 36,231 | |
Hormel Foods Corp. | | | 1,140 | | | | 36,138 | |
Brown-Forman Corp. — Class B | | | 718 | | | | 35,326 | |
DaVita, Inc.* | | | 180 | | | | 29,507 | |
Total Consumer, Non-cyclical | | | | | | | 33,091,828 | |
| | | | | | | | | |
Communications - 11.5% |
Amazon.com, Inc.* | | | 36,644 | | | | 6,827,876 | |
Meta Platforms, Inc. — Class A | | | 8,570 | | | | 4,905,811 | |
Alphabet, Inc. — Class A | | | 22,986 | | | | 3,812,228 | |
Alphabet, Inc. — Class C | | | 18,842 | | | | 3,150,194 | |
Netflix, Inc.* | | | 1,684 | | | | 1,194,411 | |
Cisco Systems, Inc. | | | 15,804 | | | | 841,089 | |
Verizon Communications, Inc. | | | 16,514 | | | | 741,644 | |
Walt Disney Co. | | | 7,114 | | | | 684,296 | |
Comcast Corp. — Class A | | | 15,155 | | | | 633,024 | |
Uber Technologies, Inc.* | | | 8,242 | | | | 619,469 | |
AT&T, Inc. | | | 28,129 | | | | 618,838 | |
Booking Holdings, Inc. | | | 131 | | | | 551,788 | |
Palo Alto Networks, Inc.* | | | 1,270 | | | | 434,086 | |
T-Mobile US, Inc. | | | 1,922 | | | | 396,624 | |
Arista Networks, Inc.* | | | 1,011 | | | | 388,042 | |
Motorola Solutions, Inc. | | | 654 | | | | 294,058 | |
Airbnb, Inc. — Class A* | | | 1,726 | | | | 218,874 | |
Corning, Inc. | | | 3,021 | | | | 136,398 | |
eBay, Inc. | | | 1,918 | | | | 124,881 | |
Charter Communications, Inc. — Class A* | | | 381 | | | | 123,475 | |
CDW Corp. | | | 524 | | | | 118,581 | |
GoDaddy, Inc. — Class A* | | | 553 | | | | 86,699 | |
Omnicom Group, Inc. | | | 767 | | | | 79,300 | |
Expedia Group, Inc.* | | | 489 | | | | 72,382 | |
Warner Bros Discovery, Inc.* | | | 8,752 | | | | 72,204 | |
FactSet Research Systems, Inc. | | | 149 | | | | 68,518 | |
VeriSign, Inc.* | | | 329 | | | | 62,497 | |
Gen Digital, Inc. | | | 2,125 | | | | 58,289 | |
F5, Inc.* | | | 229 | | | | 50,426 | |
Juniper Networks, Inc. | | | 1,291 | | | | 50,323 | |
Interpublic Group of Companies, Inc. | | | 1,473 | | | | 46,591 | |
News Corp. — Class A | | | 1,484 | | | | 39,519 | |
Match Group, Inc.* | | | 1,012 | | | | 38,294 | |
Fox Corp. — Class A | | | 880 | | | | 37,250 | |
Paramount Global — Class B1 | | | 2,333 | | | | 24,776 | |
Fox Corp. — Class B | | | 518 | | | | 20,098 | |
News Corp. — Class B | | | 440 | | | | 12,298 | |
Total Communications | | | | | | | 27,635,151 | |
| | | | | | | | | |
Financial - 11.2% |
Berkshire Hathaway, Inc. — Class B* | | | 7,185 | | | | 3,306,968 | |
JPMorgan Chase & Co. | | | 11,160 | | | | 2,353,198 | |
Visa, Inc. — Class A | | | 6,553 | | | | 1,801,747 | |
Mastercard, Inc. — Class A | | | 3,237 | | | | 1,598,431 | |
Bank of America Corp. | | | 26,483 | | | | 1,050,845 | |
140 | THE RYDEX FUNDS SEMI-ANNUAL FINANCIAL REPORT | SEE NOTES TO FINANCIAL STATEMENTS. |
SCHEDULE OF INVESTMENTS (Unaudited)(continued) | September 30, 2024 |
NOVA FUND | |
| | Shares | | | Value | |
Wells Fargo & Co. | | | 13,351 | | | $ | 754,198 | |
Goldman Sachs Group, Inc. | | | 1,238 | | | | 612,946 | |
American Express Co. | | | 2,203 | | | | 597,454 | |
Progressive Corp. | | | 2,298 | | | | 583,141 | |
BlackRock, Inc. — Class A | | | 546 | | | | 518,432 | |
Morgan Stanley | | | 4,887 | | | | 509,421 | |
Citigroup, Inc. | | | 7,484 | | | | 468,498 | |
Prologis, Inc. REIT | | | 3,631 | | | | 458,523 | |
Blackstone, Inc. — Class A | | | 2,825 | | | | 432,592 | |
Marsh & McLennan Companies, Inc. | | | 1,929 | | | | 430,341 | |
American Tower Corp. — Class A REIT | | | 1,832 | | | | 426,050 | |
Chubb Ltd. | | | 1,473 | | | | 424,798 | |
Charles Schwab Corp. | | | 5,861 | | | | 379,851 | |
Intercontinental Exchange, Inc. | | | 2,252 | | | | 361,761 | |
KKR & Company, Inc. — Class A | | | 2,645 | | | | 345,384 | |
Equinix, Inc. REIT | | | 372 | | | | 330,198 | |
CME Group, Inc. — Class A | | | 1,412 | | | | 311,558 | |
Aon plc — Class A | | | 852 | | | | 294,783 | |
Welltower, Inc. REIT | | | 2,270 | | | | 290,628 | |
PNC Financial Services Group, Inc. | | | 1,559 | | | | 288,181 | |
U.S. Bancorp | | | 6,121 | | | | 279,913 | |
Arthur J Gallagher & Co. | | | 859 | | | | 241,697 | |
Public Storage REIT | | | 618 | | | | 224,872 | |
Truist Financial Corp. | | | 5,253 | | | | 224,671 | |
Capital One Financial Corp. | | | 1,498 | | | | 224,296 | |
Aflac, Inc. | | | 1,977 | | | | 221,029 | |
Realty Income Corp. REIT | | | 3,417 | | | | 216,706 | |
Travelers Companies, Inc. | | | 894 | | | | 209,303 | |
Bank of New York Mellon Corp. | | | 2,895 | | | | 208,035 | |
Simon Property Group, Inc. REIT | | | 1,202 | | | | 203,162 | |
Crown Castle, Inc. REIT | | | 1,705 | | | | 202,264 | |
Allstate Corp. | | | 1,035 | | | | 196,288 | |
Digital Realty Trust, Inc. REIT | | | 1,207 | | | | 195,329 | |
MetLife, Inc. | | | 2,308 | | | | 190,364 | |
American International Group, Inc. | | | 2,526 | | | | 184,979 | |
Ameriprise Financial, Inc. | | | 385 | | | | 180,877 | |
Prudential Financial, Inc. | | | 1,401 | | | | 169,661 | |
Arch Capital Group Ltd.* | | | 1,469 | | | | 164,352 | |
Extra Space Storage, Inc. REIT | | | 831 | | | | 149,738 | |
CBRE Group, Inc. — Class A* | | | 1,182 | | | | 147,135 | |
Discover Financial Services | | | 985 | | | | 138,186 | |
VICI Properties, Inc. REIT | | | 4,107 | | | | 136,804 | |
Iron Mountain, Inc. REIT | | | 1,151 | | | | 136,773 | |
Hartford Financial Services Group, Inc. | | | 1,149 | | | | 135,134 | |
AvalonBay Communities, Inc. REIT | | | 557 | | | | 125,464 | |
CoStar Group, Inc.* | | | 1,608 | | | | 121,308 | |
Nasdaq, Inc. | | | 1,624 | | | | 118,568 | |
Willis Towers Watson plc | | | 398 | | | | 117,223 | |
M&T Bank Corp. | | | 655 | | | | 116,669 | |
Fifth Third Bancorp | | | 2,655 | | | | 113,740 | |
Ventas, Inc. REIT | | | 1,620 | | | | 103,891 | |
State Street Corp. | | | 1,172 | | | | 103,687 | |
SBA Communications Corp. REIT | | | 422 | | | | 101,575 | |
Equity Residential REIT | | | 1,338 | | | | 99,627 | |
Weyerhaeuser Co. REIT | | | 2,853 | | | | 96,603 | |
Brown & Brown, Inc. | | | 929 | | | | 96,244 | |
T. Rowe Price Group, Inc. | | | 873 | | | | 95,096 | |
Raymond James Financial, Inc. | | | 727 | | | | 89,028 | |
Cboe Global Markets, Inc. | | | 410 | | | | 83,997 | |
Huntington Bancshares, Inc. | | | 5,698 | | | | 83,760 | |
Regions Financial Corp. | | | 3,590 | | | | 83,755 | |
Cincinnati Financial Corp. | | | 612 | | | | 83,305 | |
Invitation Homes, Inc. REIT | | | 2,235 | | | | 78,806 | |
Synchrony Financial | | | 1,550 | | | | 77,314 | |
Essex Property Trust, Inc. REIT | | | 252 | | | | 74,446 | |
Mid-America Apartment Communities, Inc. REIT | | | 458 | | | | 72,776 | |
Alexandria Real Estate Equities, Inc. REIT | | | 610 | | | | 72,438 | |
Citizens Financial Group, Inc. | | | 1,759 | | | | 72,242 | |
Principal Financial Group, Inc. | | | 836 | | | | 71,812 | |
Northern Trust Corp. | | | 790 | | | | 71,124 | |
W R Berkley Corp. | | | 1,179 | | | | 66,885 | |
Everest Group Ltd. | | | 169 | | | | 66,219 | |
Healthpeak Properties, Inc. REIT | | | 2,760 | | | | 63,121 | |
Kimco Realty Corp. REIT | | | 2,644 | | | | 61,394 | |
KeyCorp | | | 3,641 | | | | 60,987 | |
Loews Corp. | | | 715 | | | | 56,521 | |
UDR, Inc. REIT | | | 1,177 | | | | 53,365 | |
Erie Indemnity Co. — Class A | | | 98 | | | | 52,902 | |
Camden Property Trust REIT | | | 418 | | | | 51,636 | |
Host Hotels & Resorts, Inc. REIT | | | 2,756 | | | | 48,506 | |
Regency Centers Corp. REIT | | | 640 | | | | 46,227 | |
BXP, Inc. REIT | | | 570 | | | | 45,862 | |
Assurant, Inc. | | | 203 | | | | 40,369 | |
Globe Life, Inc. | | | 352 | | | | 37,280 | |
Federal Realty Investment Trust REIT | | | 295 | | | | 33,916 | |
Invesco Ltd. | | | 1,765 | | | | 30,993 | |
Franklin Resources, Inc. | | | 1,210 | | | | 24,382 | |
Total Financial | | | | | | | 26,776,558 | |
| | | | | | | | | |
Consumer, Cyclical - 6.6% |
Tesla, Inc.* | | | 10,884 | | | | 2,847,581 | |
Home Depot, Inc. | | | 3,890 | | | | 1,576,228 | |
Costco Wholesale Corp. | | | 1,739 | | | | 1,541,658 | |
Walmart, Inc. | | | 17,039 | | | | 1,375,899 | |
McDonald’s Corp. | | | 2,814 | | | | 856,891 | |
Lowe’s Companies, Inc. | | | 2,234 | | | | 605,079 | |
TJX Companies, Inc. | | | 4,433 | | | | 521,055 | |
Starbucks Corp. | | | 4,445 | | | | 433,343 | |
NIKE, Inc. — Class B | | | 4,714 | | | | 416,718 | |
Chipotle Mexican Grill, Inc. — Class A* | | | 5,372 | | | | 309,535 | |
Target Corp. | | | 1,815 | | | | 282,886 | |
O’Reilly Automotive, Inc.* | | | 227 | | | | 261,413 | |
Marriott International, Inc. — Class A | | | 916 | | | | 227,718 | |
Hilton Worldwide Holdings, Inc. | | | 966 | | | | 222,663 | |
DR Horton, Inc. | | | 1,151 | | | | 219,576 | |
AutoZone, Inc.* | | | 67 | | | | 211,053 | |
PACCAR, Inc. | | | 2,057 | | | | 202,985 | |
General Motors Co. | | | 4,409 | | | | 197,699 | |
Ross Stores, Inc. | | | 1,308 | | | | 196,867 | |
Copart, Inc.* | | | 3,435 | | | | 179,994 | |
WW Grainger, Inc. | | | 173 | | | | 179,714 | |
Lennar Corp. — Class A | | | 948 | | | | 177,731 | |
SEE NOTES TO FINANCIAL STATEMENTS. | THE RYDEX FUNDS SEMI-ANNUAL FINANCIAL REPORT | 141 |
SCHEDULE OF INVESTMENTS (Unaudited)(continued) | September 30, 2024 |
NOVA FUND | |
| | Shares | | | Value | |
Cummins, Inc. | | | 538 | | | $ | 174,199 | |
Royal Caribbean Cruises Ltd. | | | 929 | | | | 164,768 | |
Ford Motor Co. | | | 15,316 | | | | 161,737 | |
Fastenal Co. | | | 2,247 | | | | 160,481 | |
Yum! Brands, Inc. | | | 1,103 | | | | 154,100 | |
Delta Air Lines, Inc. | | | 2,514 | | | | 127,686 | |
Tractor Supply Co. | | | 423 | | | | 123,063 | |
Lululemon Athletica, Inc.* | | | 451 | | | | 122,379 | |
NVR, Inc.* | | | 12 | | | | 117,742 | |
PulteGroup, Inc. | | | 814 | | | | 116,833 | |
Deckers Outdoor Corp.* | | | 597 | | | | 95,192 | |
Best Buy Company, Inc. | | | 769 | | | | 79,438 | |
Genuine Parts Co. | | | 547 | | | | 76,405 | |
Darden Restaurants, Inc. | | | 465 | | | | 76,321 | |
Aptiv plc* | | | 1,042 | | | | 75,035 | |
United Airlines Holdings, Inc.* | | | 1,290 | | | | 73,608 | |
Carnival Corp.* | | | 3,963 | | | | 73,236 | |
Dollar General Corp. | | | 863 | | | | 72,984 | |
Ulta Beauty, Inc.* | | | 187 | | | | 72,765 | |
Las Vegas Sands Corp. | | | 1,386 | | | | 69,771 | |
Southwest Airlines Co. | | | 2,351 | | | | 69,660 | |
Live Nation Entertainment, Inc.* | | | 614 | | | | 67,227 | |
Domino’s Pizza, Inc. | | | 137 | | | | 58,929 | |
Pool Corp. | | | 150 | | | | 56,520 | |
Dollar Tree, Inc.* | | | 792 | | | | 55,693 | |
CarMax, Inc.* | | | 612 | | | | 47,357 | |
Tapestry, Inc. | | | 903 | | | | 42,423 | |
LKQ Corp. | | | 1,033 | | | | 41,237 | |
Hasbro, Inc. | | | 514 | | | | 37,172 | |
MGM Resorts International* | | | 906 | | | | 35,415 | |
Caesars Entertainment, Inc.* | | | 848 | | | | 35,395 | |
Norwegian Cruise Line Holdings Ltd.* | | | 1,724 | | | | 35,359 | |
Wynn Resorts Ltd. | | | 367 | | | | 35,188 | |
BorgWarner, Inc. | | | 894 | | | | 32,443 | |
Ralph Lauren Corp. — Class A | | | 157 | | | | 30,437 | |
Walgreens Boots Alliance, Inc. | | | 2,811 | | | | 25,187 | |
Total Consumer, Cyclical | | | | | | | 15,937,671 | |
| | | | | | | | | |
Industrial - 5.9% |
General Electric Co. | | | 4,254 | | | | 802,219 | |
Caterpillar, Inc. | | | 1,902 | | | | 743,910 | |
RTX Corp. | | | 5,218 | | | | 632,213 | |
Union Pacific Corp. | | | 2,390 | | | | 589,087 | |
Honeywell International, Inc. | | | 2,554 | | | | 527,937 | |
Eaton Corporation plc | | | 1,561 | | | | 517,378 | |
Lockheed Martin Corp. | | | 832 | | | | 486,354 | |
Deere & Co. | | | 1,005 | | | | 419,417 | |
United Parcel Service, Inc. — Class B | | | 2,874 | | | | 391,841 | |
Boeing Co.* | | | 2,297 | | | | 349,236 | |
Trane Technologies plc | | | 885 | | | | 344,026 | |
Parker-Hannifin Corp. | | | 504 | | | | 318,437 | |
TransDigm Group, Inc. | | | 220 | | | | 313,969 | |
Amphenol Corp. — Class A | | | 4,723 | | | | 307,751 | |
General Dynamics Corp. | | | 1,011 | | | | 305,524 | |
Waste Management, Inc. | | | 1,433 | | | | 297,491 | |
3M Co. | | | 2,155 | | | | 294,589 | |
Northrop Grumman Corp. | | | 539 | | | | 284,630 | |
Illinois Tool Works, Inc. | | | 1,059 | | | | 277,532 | |
GE Vernova, Inc.* | | | 1,078 | | | | 274,869 | |
Carrier Global Corp. | | | 3,294 | | | | 265,134 | |
CSX Corp. | | | 7,605 | | | | 262,601 | |
Emerson Electric Co. | | | 2,246 | | | | 245,645 | |
FedEx Corp. | | | 884 | | | | 241,933 | |
Norfolk Southern Corp. | | | 886 | | | | 220,171 | |
Johnson Controls International plc | | | 2,621 | | | | 203,416 | |
L3Harris Technologies, Inc. | | | 744 | | | | 176,975 | |
Otis Worldwide Corp. | | | 1,571 | | | | 163,290 | |
Republic Services, Inc. — Class A | | | 800 | | | | 160,672 | |
Howmet Aerospace, Inc. | | | 1,601 | | | | 160,500 | |
AMETEK, Inc. | | | 908 | | | | 155,913 | |
Ingersoll Rand, Inc. | | | 1,582 | | | | 155,289 | |
Old Dominion Freight Line, Inc. | | | 739 | | | | 146,795 | |
Vulcan Materials Co. | | | 518 | | | | 129,723 | |
Martin Marietta Materials, Inc. | | | 240 | | | | 129,180 | |
Xylem, Inc. | | | 953 | | | | 128,683 | |
Westinghouse Air Brake Technologies Corp. | | | 687 | | | | 124,876 | |
Mettler-Toledo International, Inc.* | | | 83 | | | | 124,475 | |
Rockwell Automation, Inc. | | | 445 | | | | 119,465 | |
Axon Enterprise, Inc.* | | | 282 | | | | 112,687 | |
Keysight Technologies, Inc.* | | | 685 | | | | 108,867 | |
Fortive Corp. | | | 1,374 | | | | 108,450 | |
Veralto Corp. | | | 969 | | | | 108,392 | |
Garmin Ltd. | | | 603 | | | | 106,146 | |
Dover Corp. | | | 539 | | | | 103,348 | |
Smurfit WestRock plc | | | 1,936 | | | | 95,677 | |
Hubbell, Inc. | | | 210 | | | | 89,953 | |
Builders FirstSource, Inc.* | | | 457 | | | | 88,594 | |
Ball Corp. | | | 1,191 | | | | 80,881 | |
Teledyne Technologies, Inc.* | | | 182 | | | | 79,654 | |
Packaging Corporation of America | | | 350 | | | | 75,390 | |
Expeditors International of Washington, Inc. | | | 554 | | | | 72,796 | |
Masco Corp. | | | 856 | | | | 71,853 | |
Stanley Black & Decker, Inc. | | | 604 | | | | 66,519 | |
Textron, Inc. | | | 734 | | | | 65,018 | |
Jacobs Solutions, Inc. | | | 491 | | | | 64,272 | |
Amcor plc | | | 5,670 | | | | 64,241 | |
IDEX Corp. | | | 297 | | | | 63,706 | |
Pentair plc | | | 649 | | | | 63,466 | |
Snap-on, Inc. | | | 206 | | | | 59,680 | |
Trimble, Inc.* | | | 958 | | | | 59,482 | |
Nordson Corp. | | | 213 | | | | 55,940 | |
J.B. Hunt Transport Services, Inc. | | | 316 | | | | 54,456 | |
Jabil, Inc. | | | 444 | | | | 53,205 | |
CH Robinson Worldwide, Inc. | | | 460 | | | | 50,770 | |
Allegion plc | | | 342 | | | | 49,843 | |
A O Smith Corp. | | | 471 | | | | 42,310 | |
Huntington Ingalls Industries, Inc. | | | 154 | | | | 40,715 | |
Generac Holdings, Inc.* | | | 236 | | | | 37,495 | |
Mohawk Industries, Inc.* | | | 205 | | | | 32,939 | |
Total Industrial | | | | | | | 14,019,891 | |
| | | | | | | | | |
142 | THE RYDEX FUNDS SEMI-ANNUAL FINANCIAL REPORT | SEE NOTES TO FINANCIAL STATEMENTS. |
SCHEDULE OF INVESTMENTS (Unaudited)(continued) | September 30, 2024 |
NOVA FUND | |
| | Shares | | | Value | |
Energy - 2.7% |
Exxon Mobil Corp. | | | 17,430 | | | $ | 2,043,144 | |
Chevron Corp. | | | 6,673 | | | | 982,733 | |
ConocoPhillips | | | 4,555 | | | | 479,550 | |
EOG Resources, Inc. | | | 2,231 | | | | 274,257 | |
Schlumberger N.V. | | | 5,571 | | | | 233,703 | |
Williams Companies, Inc. | | | 4,782 | | | | 218,298 | |
Phillips 66 | | | 1,642 | | | | 215,841 | |
Marathon Petroleum Corp. | | | 1,313 | | | | 213,901 | |
ONEOK, Inc. | | | 2,291 | | | | 208,779 | |
Valero Energy Corp. | | | 1,257 | | | | 169,733 | |
Kinder Morgan, Inc. | | | 7,574 | | | | 167,310 | |
Hess Corp. | | | 1,084 | | | | 147,207 | |
Baker Hughes Co. | | | 3,897 | | | | 140,877 | |
Occidental Petroleum Corp. | | | 2,642 | | | | 136,169 | |
Targa Resources Corp. | | | 859 | | | | 127,140 | |
Diamondback Energy, Inc. | | | 709 | | | | 122,231 | |
First Solar, Inc.* | | | 420 | | | | 104,765 | |
Halliburton Co. | | | 3,463 | | | | 100,600 | |
Devon Energy Corp. | | | 2,457 | | | | 96,118 | |
Equities Corp. | | | 2,331 | | | | 85,408 | |
Coterra Energy, Inc. — Class A | | | 2,900 | | | | 69,455 | |
Enphase Energy, Inc.* | | | 531 | | | | 60,014 | |
Marathon Oil Corp. | | | 2,194 | | | | 58,426 | |
APA Corp. | | | 1,450 | | | | 35,467 | |
Total Energy | | | | | | | 6,491,126 | |
| | | | | | | | | |
Utilities - 2.0% |
NextEra Energy, Inc. | | | 8,059 | | | | 681,227 | |
Southern Co. | | | 4,289 | | | | 386,782 | |
Duke Energy Corp. | | | 3,028 | | | | 349,128 | |
Constellation Energy Corp. | | | 1,227 | | | | 319,045 | |
American Electric Power Company, Inc. | | | 2,087 | | | | 214,126 | |
Sempra | | | 2,484 | | | | 207,737 | |
Dominion Energy, Inc. | | | 3,291 | | | | 190,187 | |
Public Service Enterprise Group, Inc. | | | 1,954 | | | | 174,316 | |
PG&E Corp. | | | 8,386 | | | | 165,791 | |
Vistra Corp. | | | 1,347 | | | | 159,673 | |
Exelon Corp. | | | 3,923 | | | | 159,078 | |
Xcel Energy, Inc. | | | 2,187 | | | | 142,811 | |
Consolidated Edison, Inc. | | | 1,357 | | | | 141,305 | |
Edison International | | | 1,515 | | | | 131,941 | |
WEC Energy Group, Inc. | | | 1,240 | | | | 119,263 | |
American Water Works Company, Inc. | | | 764 | | | | 111,727 | |
Entergy Corp. | | | 838 | | | | 110,289 | |
DTE Energy Co. | | | 812 | | | | 104,269 | |
PPL Corp. | | | 2,894 | | | | 95,734 | |
Eversource Energy | | | 1,402 | | | | 95,406 | |
Ameren Corp. | | | 1,047 | | | | 91,571 | |
FirstEnergy Corp. | | | 2,011 | | | | 89,188 | |
Atmos Energy Corp. | | | 609 | | | | 84,475 | |
CMS Energy Corp. | | | 1,171 | | | | 82,708 | |
CenterPoint Energy, Inc. | | | 2,557 | | | | 75,227 | |
NRG Energy, Inc. | | | 810 | | | | 73,791 | |
Alliant Energy Corp. | | | 1,006 | | | | 61,054 | |
NiSource, Inc. | | | 1,760 | | | | 60,984 | |
AES Corp. | | | 2,789 | | | | 55,947 | |
Evergy, Inc. | | | 901 | | | | 55,871 | |
Pinnacle West Capital Corp. | | | 446 | | | | 39,511 | |
Total Utilities | | | | | | | 4,830,162 | |
| | | | | | | | | |
Basic Materials - 1.4% |
Linde plc | | | 1,886 | | | | 899,358 | |
Sherwin-Williams Co. | | | 911 | | | | 347,701 | |
Freeport-McMoRan, Inc. | | | 5,636 | | | | 281,349 | |
Air Products and Chemicals, Inc. | | | 872 | | | | 259,629 | |
Ecolab, Inc. | | | 994 | | | | 253,798 | |
Newmont Corp. | | | 4,502 | | | | 240,632 | |
Dow, Inc. | | | 2,750 | | | | 150,233 | |
DuPont de Nemours, Inc. | | | 1,638 | | | | 145,962 | |
Nucor Corp. | | | 931 | | | | 139,967 | |
PPG Industries, Inc. | | | 915 | | | | 121,201 | |
International Flavors & Fragrances, Inc. | | | 1,003 | | | | 105,245 | |
LyondellBasell Industries N.V. — Class A | | | 1,020 | | | | 97,818 | |
Steel Dynamics, Inc. | | | 562 | | | | 70,857 | |
International Paper Co. | | | 1,362 | | | | 66,534 | |
CF Industries Holdings, Inc. | | | 708 | | | | 60,746 | |
Celanese Corp. — Class A | | | 429 | | | | 58,327 | |
Eastman Chemical Co. | | | 458 | | | | 51,273 | |
Albemarle Corp. | | | 461 | | | | 43,661 | |
Mosaic Co. | | | 1,250 | | | | 33,475 | |
FMC Corp. | | | 490 | | | | 32,311 | |
Total Basic Materials | | | | | | | 3,460,077 | |
| | | | | | | | | |
Total Common Stocks | | | | |
(Cost $159,287,676) | | | | | | | 190,994,563 | |
| | | | | | | | | |
MUTUAL FUNDS† - 7.3% |
Guggenheim Ultra Short Duration Fund — Institutional Class2 | | | 733,906 | | | | 7,353,741 | |
Guggenheim Strategy Fund II2 | | | 225,195 | | | | 5,584,832 | |
Guggenheim Strategy Fund III2 | | | 184,563 | | | | 4,593,764 | |
Total Mutual Funds | | | | |
(Cost $17,418,465) | | | | | | | 17,532,337 | |
| | | | | | | | | |
| | | Face
Amount | | | | | |
U.S. TREASURY BILLS†† - 3.1% |
U.S. Treasury Bills |
4.63% due 10/10/243,4 | | $ | 3,953,000 | | | | 3,948,410 | |
4.85% due 12/12/244,5 | | | 3,400,000 | | | | 3,369,604 | |
4.81% due 12/12/244 | | | 50,000 | | | | 49,553 | |
Total U.S. Treasury Bills | | | | |
(Cost $7,364,457) | | | | | | | 7,367,567 | |
| | | | | | | | | |
SEE NOTES TO FINANCIAL STATEMENTS. | THE RYDEX FUNDS SEMI-ANNUAL FINANCIAL REPORT | 143 |
SCHEDULE OF INVESTMENTS (Unaudited)(continued) | September 30, 2024 |
NOVA FUND | |
| | Face
Amount | | | Value | |
REPURCHASE AGREEMENTS††,6 - 8.7% |
J.P. Morgan Securities LLC
issued 09/30/24 at 4.86%
due 10/01/245 | | $ | 11,413,072 | | | $ | 11,413,072 | |
BofA Securities, Inc.
issued 09/30/24 at 4.85%
due 10/01/245 | | | 9,426,666 | | | | 9,426,666 | |
Total Repurchase Agreements | | | | |
(Cost $20,839,738) | | | | | | | 20,839,738 | |
| | Shares | | | Value | |
SECURITIES LENDING COLLATERAL†,7 - 0.0% |
Money Market Fund*** | | | | | | | | |
First American Government Obligations Fund - Class X, 4.82%8 | | | 8,820 | | | $ | 8,820 | |
Total Securities Lending Collateral | | | | |
(Cost $8,820) | | | | | | | 8,820 | |
| | | | | | | | | |
Total Investments - 98.7% | | | | |
(Cost $204,919,156) | | $ | 236,743,025 | |
Other Assets & Liabilities, net - 1.3% | | | 3,188,880 | |
Total Net Assets - 100.0% | | $ | 239,931,905 | |
Futures Contracts |
Description | | Number of
Contracts | | | Expiration
Date | | | Notional
Amount | | | Value and
Unrealized
Appreciation** | |
Equity Futures Contracts Purchased† |
S&P 500 Index Mini Futures Contracts | | | 182 | | | | Dec 2024 | | | $ | 52,925,600 | | | $ | 871,885 | |
Total Return Swap Agreements |
Counterparty | Index | Type | | Financing
Rate | | Payment
Frequency | | | Maturity
Date | | | Units | | | Notional
Amount | | | Value and
Unrealized
Appreciation | |
OTC Equity Index Swap Agreements†† |
Goldman Sachs International | S&P 500 Index | Pay | | 5.33% (Federal
Funds Rate +
0.50%) | | | At Maturity | | | | 12/18/24 | | 15,154 | | $ | 87,324,020 | | | $ | 364,478 | |
Barclays Bank plc | S&P 500 Index | Pay | | 5.44% (SOFR +
0.60%) | | | At Maturity | | | | 12/19/24 | | 3,705 | | | 21,351,805 | | | | 109,491 | |
BNP Paribas | S&P 500 Index | Pay | | 5.68% (Federal
Funds Rate +
0.85%) | | | At Maturity | | | | 12/19/24 | | 1,420 | | | 8,184,998 | | | | 44,860 | |
| | | | | | | | | | | | | | | | | | | $ | 116,860,823 | | | $ | 518,829 | |
* | Non-income producing security. |
** | Includes cumulative appreciation (depreciation). Variation margin is reported within the Statement of Assets and Liabilities. |
*** | A copy of each underlying unaffiliated fund’s financial statements is available at the SEC’s website at www.sec.gov. |
† | Value determined based on Level 1 inputs — See Note 4. |
†† | Value determined based on Level 2 inputs — See Note 4. |
1 | All or a portion of this security is on loan at September 30, 2024 — See Note 7. |
2 | Affiliated issuer. |
3 | All or a portion of this security is pledged as futures collateral at September 30, 2024. |
4 | Rate indicated is the effective yield at the time of purchase. |
5 | All or a portion of this security is pledged as equity index swap collateral at September 30, 2024. |
6 | Repurchase Agreements — See Note 6. |
7 | Securities lending collateral — See Note 7. |
8 | Rate indicated is the 7-day yield as of September 30, 2024. |
| | plc — Public Limited Company |
| | REIT — Real Estate Investment Trust |
| | SOFR — Secured Overnight Financing Rate |
| | |
| | See Sector Classification in Other Information section. |
144 | THE RYDEX FUNDS SEMI-ANNUAL FINANCIAL REPORT | SEE NOTES TO FINANCIAL STATEMENTS. |
SCHEDULE OF INVESTMENTS (Unaudited)(concluded) | September 30, 2024 |
NOVA FUND | |
The following table summarizes the inputs used to value the Fund’s investments at September 30, 2024 (See Note 4 in the Notes to Financial Statements):
Investments in Securities (Assets) | | Level 1
Quoted
Prices | | | Level 2
Significant
Observable
Inputs | | | Level 3
Significant
Unobservable
Inputs | | | Total | |
Common Stocks | | $ | 190,994,563 | | | $ | — | | | $ | — | | | $ | 190,994,563 | |
Mutual Funds | | | 17,532,337 | | | | — | | | | — | | | | 17,532,337 | |
U.S. Treasury Bills | | | — | | | | 7,367,567 | | | | — | | | | 7,367,567 | |
Repurchase Agreements | | | — | | | | 20,839,738 | | | | — | | | | 20,839,738 | |
Securities Lending Collateral | | | 8,820 | | | | — | | | | — | | | | 8,820 | |
Equity Futures Contracts** | | | 871,885 | | | | — | | | | — | | | | 871,885 | |
Equity Index Swap Agreements** | | | — | | | | 518,829 | | | | — | | | | 518,829 | |
Total Assets | | $ | 209,407,605 | | | $ | 28,726,134 | | | $ | — | | | $ | 238,133,739 | |
** | This derivative is reported as unrealized appreciation/depreciation at period end. |
Affiliated Transactions
Investments representing 5% or more of the outstanding voting shares of a company, or control of or by, or common control under Guggenheim Investments (“GI”), result in that company being considered an affiliated issuer, as defined in the 1940 Act.
The Fund may invest in certain of the underlying series of Guggenheim Strategy Funds Trust, including Guggenheim Strategy Fund II and Guggenheim Strategy Fund III (collectively, the “Guggenheim Strategy Funds”), each of which are open-end management investment companies managed by GI. The Guggenheim Strategy Funds, which launched on March 11, 2014, are offered as short term investment options only to mutual funds, trusts, and other accounts managed by GI and/or its affiliates, and are not available to the public. The Guggenheim Strategy Funds pay no investment management fees. The Guggenheim Strategy Funds’ annual report on Form N-CSR dated September 30, 2023 is available publicly or upon request. This information is available from the EDGAR database on the SEC’s website at https://www.sec.gov/Archives/edgar/data/1601445/000182126823000217/gug86449-ncsr.htm. The Fund may invest in certain of the underlying series of Guggenheim Funds Trust, which are open-end management investment companies managed by GI, are available to the public and whose most recent annual report on Form N-CSR is available publicly or upon request.
Transactions during the period ended September 30, 2024, in which the company is an affiliated issuer, were as follows:
Security Name | | Value
03/31/24 | | | Additions | | | Reductions | | | Realized
Gain (Loss) | | | Change in
Unrealized
Appreciation
(Depreciation) | | | Value
09/30/24 | | | Shares
09/30/24 | | | Investment
Income | |
Mutual Funds | | | | | | | | | | | | | | | | | | | | | | | | | | | | | | | | |
Guggenheim Strategy Fund II | | $ | 5,539,793 | | | $ | — | | | $ | — | | | $ | — | | | $ | 45,039 | | | $ | 5,584,832 | | | | 225,195 | | | $ | 158,612 | |
Guggenheim Strategy Fund III | | | 4,553,161 | | | | — | | | | — | | | | — | | | | 40,603 | | | | 4,593,764 | | | | 184,563 | | | | 124,609 | |
Guggenheim Ultra Short Duration Fund — Institutional Class | | | 7,273,011 | | | | — | | | | — | | | | — | | | | 80,730 | | | | 7,353,741 | | | | 733,906 | | | | 189,271 | |
| | | $ | 17,365,965 | | | $ | — | | | $ | — | | | $ | — | | | $ | 166,372 | | | $ | 17,532,337 | | | | | | | $ | 472,492 | |
SEE NOTES TO FINANCIAL STATEMENTS. | THE RYDEX FUNDS SEMI-ANNUAL FINANCIAL REPORT | 145 |
STATEMENT OF ASSETS AND LIABILITIES (Unaudited) |
September 30, 2024 |
Assets: |
Investments in unaffiliated issuers, at value - including $8,326 of securities loaned (cost $166,660,953) | | $ | 198,370,950 | |
Investments in affiliated issuers, at value (cost $17,418,465) | | | 17,532,337 | |
Repurchase agreements, at value (cost $20,839,738) | | | 20,839,738 | |
Cash | | | 1,795 | |
Unrealized appreciation on OTC swap agreements | | | 518,829 | |
Receivables: |
Fund shares sold | | | 28,118,465 | |
Variation margin on futures contracts | | | 225,225 | |
Dividends | | | 158,888 | |
Securities sold | | | 24,253 | |
Interest | | | 2,811 | |
Securities lending income | | | 3 | |
Total assets | | | 265,793,294 | |
| | | | | |
Liabilities: |
Segregated cash due to broker | | | 120,000 | |
Payable for: |
Securities purchased | | | 25,126,300 | |
Fund shares redeemed | | | 155,208 | |
Management fees | | | 111,779 | |
Transfer agent fees | | | 103,515 | |
Swap settlement | | | 48,167 | |
Portfolio accounting and administration fees | | | 15,449 | |
Return of securities lending collateral | | | 8,820 | |
Distribution and service fees | | | 3,937 | |
Trustees’ fees* | | | 2,136 | |
Miscellaneous | | | 166,078 | |
Total liabilities | | | 25,861,389 | |
Net assets | | $ | 239,931,905 | |
| | | | | |
Net assets consist of: |
Paid in capital | | $ | 292,106,708 | |
Total distributable earnings (loss) | | | (52,174,803 | ) |
Net assets | | $ | 239,931,905 | |
| | | | | |
Investor Class: |
Net assets | | $ | 221,277,717 | |
Capital shares outstanding | | | 1,527,643 | |
Net asset value per share | | $ | 144.85 | |
Class A: |
Net assets | | $ | 14,039,540 | |
Capital shares outstanding | | | 109,210 | |
Net asset value per share | | $ | 128.56 | |
Maximum offering price per share (Net asset value divided by 95.25%) | | $ | 134.97 | |
Class C: |
Net assets | | $ | 712,129 | |
Capital shares outstanding | | | 6,951 | |
Net asset value per share | | $ | 102.45 | |
Class H: |
Net assets | | $ | 3,902,519 | |
Capital shares outstanding | | | 30,313 | |
Net asset value per share | | $ | 128.74 | |
* | Relates to Trustees not deemed “interested persons” within the meaning of Section 2(a)(19) of the 1940 Act. |
146 | THE RYDEX FUNDS SEMI-ANNUAL FINANCIAL REPORT | SEE NOTES TO FINANCIAL STATEMENTS. |
STATEMENT OF OPERATIONS (Unaudited) |
Six Months Ended September 30, 2024 |
Investment Income: |
Dividends from securities of unaffiliated issuers (net of foreign withholding tax of $375) | | $ | 1,540,328 | |
Dividends from securities of affiliated issuers | | | 472,492 | |
Interest | | | 529,496 | |
Income from securities lending, net | | | 45 | |
Total investment income | | | 2,542,361 | |
| | | | | |
Expenses: |
Management fees | | | 972,063 | |
Distribution and service fees: |
Class A | | | 16,073 | |
Class C | | | 4,343 | |
Class H | | | 8,561 | |
Transfer agent fees | | | 265,216 | |
Portfolio accounting and administration fees | | | 195,751 | |
Registration fees | | | 91,738 | |
Professional fees | | | 35,525 | |
Interest expense | | | 26,017 | |
Custodian fees | | | 16,660 | |
Trustees’ fees* | | | 12,446 | |
Line of credit fees | | | 116 | |
Miscellaneous | | | 120,976 | |
Total expenses | | | 1,765,485 | |
Less: |
Expenses reimbursed by Adviser | | | (64,743 | ) |
Expenses waived by Adviser | | | (9,131 | ) |
Total waived/reimbursed expenses | | | (73,874 | ) |
Net expenses | | | 1,691,611 | |
Net investment income | | | 850,750 | |
| | | | | |
Net Realized and Unrealized Gain (Loss): |
Net realized gain (loss) on: |
Investments in unaffiliated issuers | | $ | 17,245,056 | |
Swap agreements | | | 6,713,434 | |
Futures contracts | | | 5,822,284 | |
Net realized gain | | | 29,780,774 | |
Net change in unrealized appreciation (depreciation) on: |
Investments in unaffiliated issuers | | | 1,499,169 | |
Investments in affiliated issuers | | | 166,372 | |
Swap agreements | | | (458,942 | ) |
Futures contracts | | | (514,432 | ) |
Net change in unrealized appreciation (depreciation) | | | 692,167 | |
Net realized and unrealized gain | | | 30,472,941 | |
Net increase in net assets resulting from operations | | $ | 31,323,691 | |
* | Relates to Trustees not deemed “interested persons” within the meaning of Section 2(a)(19) of the 1940 Act. |
SEE NOTES TO FINANCIAL STATEMENTS. | THE RYDEX FUNDS SEMI-ANNUAL FINANCIAL REPORT | 147 |
STATEMENTS OF CHANGES IN NET ASSETS |
| | Six Months Ended
September 30, 2024
(Unaudited) | | | Year Ended
March 31,
2024 | |
Increase (Decrease) in Net Assets from Operations: | | | | | | | | |
Net investment income | | $ | 850,750 | | | $ | 1,654,145 | |
Net realized gain on investments | | | 29,780,774 | | | | 37,976,910 | |
Net change in unrealized appreciation (depreciation) on investments | | | 692,167 | | | | 19,115,218 | |
Net increase in net assets resulting from operations | | | 31,323,691 | | | | 58,746,273 | |
| | | | | | | | | |
Distributions to shareholders: | | | | | | | | |
Investor Class | | | — | | | | (1,201,986 | ) |
Class A | | | — | | | | (73,774 | ) |
Class C | | | — | | | | (7,850 | ) |
Class H | | | — | | | | (28,368 | ) |
Total distributions to shareholders | | | — | | | | (1,311,978 | ) |
| | | | | | | | | |
Capital share transactions: | | | | | | | | |
Proceeds from sale of shares | | | | | | | | |
Investor Class | | | 372,842,366 | | | | 2,323,334,615 | |
Class A | | | 498,323 | | | | 27,827,480 | |
Class C | | | 58,839 | | | | 723,309 | |
Class H | | | 3,621,688 | | | | 51,548,688 | |
Distributions reinvested | | | | | | | | |
Investor Class | | | — | | | | 1,187,760 | |
Class A | | | — | | | | 64,707 | |
Class C | | | — | | | | 1,489 | |
Class H | | | — | | | | 28,368 | |
Cost of shares redeemed | | | | | | | | |
Investor Class | | | (433,239,063 | ) | | | (2,348,796,915 | ) |
Class A | | | (850,096 | ) | | | (37,738,187 | ) |
Class C | | | (475,549 | ) | | | (1,025,931 | ) |
Class H | | | (7,484,085 | ) | | | (57,853,426 | ) |
Net decrease from capital share transactions | | | (65,027,577 | ) | | | (40,698,043 | ) |
Net increase (decrease) in net assets | | | (33,703,886 | ) | | | 16,736,252 | |
| | | | | | | | | |
Net assets: | | | | | | | | |
Beginning of period | | | 273,635,791 | | | | 256,899,539 | |
End of period | | $ | 239,931,905 | | | $ | 273,635,791 | |
| | | | | | | | | |
Capital share activity: | | | | | | | | |
Shares sold | | | | | | | | |
Investor Class | | | 2,715,087 | | | | 22,584,221 | |
Class A | | | 4,146 | | | | 320,857 | |
Class C | | | 623 | | | | 9,605 | |
Class H | | | 29,634 | | | | 584,271 | |
Shares issued from reinvestment of distributions | | | | | | | | |
Investor Class | | | — | | | | 11,089 | |
Class A | | | — | | | | 679 | |
Class C | | | — | | | | 20 | |
Class H | | | — | | | | 297 | |
Shares redeemed | | | | | | | | |
Investor Class | | | (3,160,439 | ) | | | (23,090,070 | ) |
Class A | | | (7,306 | ) | | | (437,561 | ) |
Class C | | | (5,027 | ) | | | (13,813 | ) |
Class H | | | (63,506 | ) | | | (667,576 | ) |
Net decrease in shares | | | (486,788 | ) | | | (697,981 | ) |
148 | THE RYDEX FUNDS SEMI-ANNUAL FINANCIAL REPORT | SEE NOTES TO FINANCIAL STATEMENTS. |
This table is presented to show selected data for a share outstanding throughout each period and to assist shareholders in evaluating a Fund’s performance for the periods presented.
Investor Class | | Six Months Ended
September 30, 2024a | | | Year Ended
March 31,
2024 | | | Year Ended
March 31,
2023 | | | Year Ended
March 31,
2022 | | | Year Ended
March 31,
2021 | | | Year Ended
March 31,
2020 | |
Per Share Data |
Net asset value, beginning of period | | $ | 127.98 | | | $ | 91.30 | | | $ | 133.16 | | | $ | 120.51 | | | $ | 63.62 | | | $ | 76.83 | |
Income (loss) from investment operations: |
Net investment income (loss)b | | | .45 | | | | 1.04 | | | | .77 | | | | (.16 | ) | | | .05 | | | | .61 | |
Net gain (loss) on investments (realized and unrealized) | | | 16.42 | | | | 36.30 | | | | (24.31 | ) | | | 25.92 | | | | 57.43 | | | | (13.82 | ) |
Total from investment operations | | | 16.87 | | | | 37.34 | | | | (23.54 | ) | | | 25.76 | | | | 57.48 | | | | (13.21 | ) |
Less distributions from: |
Net investment income | | | — | | | | (.66 | ) | | | — | | | | — | | | | (.59 | ) | | | — | |
Net realized gains | | | — | | | | — | | | | (18.32 | ) | | | (13.11 | ) | | | — | | | | — | |
Total distributions | | | — | | | | (.66 | ) | | | (18.32 | ) | | | (13.11 | ) | | | (.59 | ) | | | — | |
Net asset value, end of period | | $ | 144.85 | | | $ | 127.98 | | | $ | 91.30 | | | $ | 133.16 | | | $ | 120.51 | | | $ | 63.62 | |
|
Total Return | | | 13.18 | % | | | 41.05 | % | | | (16.18 | %) | | | 20.83 | % | | | 90.46 | % | | | (17.19 | %) |
Ratios/Supplemental Data |
Net assets, end of period (in thousands) | | $ | 221,278 | | | $ | 252,513 | | | $ | 225,298 | | | $ | 380,170 | | | $ | 326,237 | | | $ | 37,874 | |
Ratios to average net assets: |
Net investment income (loss) | | | 0.68 | % | | | 0.99 | % | | | 0.74 | % | | | (0.12 | %) | | | 0.05 | % | | | 0.71 | % |
Total expensesc | | | 1.34 | % | | | 1.43 | % | | | 1.30 | % | | | 1.25 | % | | | 1.33 | % | | | 1.37 | % |
Net expensesd | | | 1.28 | % | | | 1.39 | % | | | 1.29 | % | | | 1.23 | % | | | 1.32 | % | | | 1.36 | % |
Portfolio turnover rate | | | 113 | % | | | 1,047 | % | | | 973 | % | | | 1,027 | % | | | 785 | % | | | 690 | % |
Class A | | Six Months Ended
September 30, 2024a | | | Year Ended
March 31,
2024 | | | Year Ended
March 31,
2023 | | | Year Ended
March 31,
2022 | | | Year Ended
March 31,
2021 | | | Year Ended
March 31,
2020 | |
Per Share Data |
Net asset value, beginning of period | | $ | 113.73 | | | $ | 81.37 | | | $ | 121.63 | | | $ | 111.23 | | | $ | 58.89 | | | $ | 71.28 | |
Income (loss) from investment operations: |
Net investment income (loss)b | | | .25 | | | | .73 | | | | .62 | | | | (.45 | ) | | | (.18 | ) | | | .40 | |
Net gain (loss) on investments (realized and unrealized) | | | 14.58 | | | | 32.29 | | | | (22.56 | ) | | | 23.96 | | | | 53.11 | | | | (12.79 | ) |
Total from investment operations | | | 14.83 | | | | 33.02 | | | | (21.94 | ) | | | 23.51 | | | | 52.93 | | | | (12.39 | ) |
Less distributions from: |
Net investment income | | | — | | | | (.66 | ) | | | — | | | | — | | | | (.59 | ) | | | — | |
Net realized gains | | | — | | | | — | | | | (18.32 | ) | | | (13.11 | ) | | | — | | | | — | |
Total distributions | | | — | | | | (.66 | ) | | | (18.32 | ) | | | (13.11 | ) | | | (.59 | ) | | | — | |
Net asset value, end of period | | $ | 128.56 | | | $ | 113.73 | | | $ | 81.37 | | | $ | 121.63 | | | $ | 111.23 | | | $ | 58.89 | |
|
Total Returne | | | 13.04 | % | | | 40.75 | % | | | (16.42 | %) | | | 20.54 | % | | | 90.00 | % | | | (17.38 | %) |
Ratios/Supplemental Data |
Net assets, end of period (in thousands) | | $ | 14,040 | | | $ | 12,780 | | | $ | 18,585 | | | $ | 21,403 | | | $ | 18,596 | | | $ | 7,435 | |
Ratios to average net assets: |
Net investment income (loss) | | | 0.42 | % | | | 0.79 | % | | | 0.67 | % | | | (0.35 | %) | | | (0.20 | %) | | | 0.52 | % |
Total expensesc | | | 1.60 | % | | | 1.70 | % | | | 1.55 | % | | | 1.50 | % | | | 1.59 | % | | | 1.62 | % |
Net expensesd | | | 1.54 | % | | | 1.66 | % | | | 1.53 | % | | | 1.48 | % | | | 1.58 | % | | | 1.61 | % |
Portfolio turnover rate | | | 113 | % | | | 1,047 | % | | | 973 | % | | | 1,027 | % | | | 785 | % | | | 690 | % |
SEE NOTES TO FINANCIAL STATEMENTS. | THE RYDEX FUNDS SEMI-ANNUAL FINANCIAL REPORT | 149 |
FINANCIAL HIGHLIGHTS (continued) |
This table is presented to show selected data for a share outstanding throughout each period and to assist shareholders in evaluating a Fund’s performance for the periods presented.
Class C | | Six Months Ended
September 30, 2024a | | | Year Ended
March 31,
2024 | | | Year Ended
March 31,
2023 | | | Year Ended
March 31,
2022 | | | Year Ended
March 31,
2021 | | | Year Ended
March 31,
2020 | |
Per Share Data |
Net asset value, beginning of period | | $ | 90.97 | | | $ | 65.69 | | | $ | 103.59 | | | $ | 96.96 | | | $ | 51.77 | | | $ | 63.15 | |
Income (loss) from investment operations: |
Net investment income (loss)b | | | (.15 | ) | | | .05 | | | | (.06 | ) | | | (1.19 | ) | | | (.74 | ) | | | (.22 | ) |
Net gain (loss) on investments (realized and unrealized) | | | 11.63 | | | | 25.89 | | | | (19.52 | ) | | | 20.93 | | | | 46.52 | | | | (11.16 | ) |
Total from investment operations | | | 11.48 | | | | 25.94 | | | | (19.58 | ) | | | 19.74 | | | | 45.78 | | | | (11.38 | ) |
Less distributions from: |
Net investment income | | | — | | | | (.66 | ) | | | — | | | | — | | | | (.59 | ) | | | — | |
Net realized gains | | | — | | | | — | | | | (18.32 | ) | | | (13.11 | ) | | | — | | | | — | |
Total distributions | | | — | | | | (.66 | ) | | | (18.32 | ) | | | (13.11 | ) | | | (.59 | ) | | | — | |
Net asset value, end of period | | $ | 102.45 | | | $ | 90.97 | | | $ | 65.69 | | | $ | 103.59 | | | $ | 96.96 | | | $ | 51.77 | |
|
Total Returne | | | 12.62 | % | | | 39.70 | % | | | (17.04 | %) | | | 19.64 | % | | | 88.56 | % | | | (18.02 | %) |
Ratios/Supplemental Data |
Net assets, end of period (in thousands) | | $ | 712 | | | $ | 1,033 | | | $ | 1,021 | | | $ | 1,929 | | | $ | 3,576 | | | $ | 3,333 | |
Ratios to average net assets: |
Net investment income (loss) | | | (0.33 | %) | | | 0.07 | % | | | (0.08 | %) | | | (1.09 | %) | | | (0.97 | %) | | | (0.32 | %) |
Total expensesc | | | 2.34 | % | | | 2.46 | % | | | 2.30 | % | | | 2.25 | % | | | 2.35 | % | | | 2.38 | % |
Net expensesd | | | 2.28 | % | | | 2.41 | % | | | 2.27 | % | | | 2.23 | % | | | 2.33 | % | | | 2.37 | % |
Portfolio turnover rate | | | 113 | % | | | 1,047 | % | | | 973 | % | | | 1,027 | % | | | 785 | % | | | 690 | % |
150 | THE RYDEX FUNDS SEMI-ANNUAL FINANCIAL REPORT | SEE NOTES TO FINANCIAL STATEMENTS. |
FINANCIAL HIGHLIGHTS (concluded) |
This table is presented to show selected data for a share outstanding throughout each period and to assist shareholders in evaluating a Fund’s performance for the periods presented.
Class H | | Six Months Ended
September 30, 2024a | | | Year Ended
March 31,
2024 | | | Year Ended
March 31,
2023 | | | Year Ended
March 31,
2022 | | | Year Ended
March 31,
2021 | | | Year Ended
March 31,
2020 | |
Per Share Data |
Net asset value, beginning of period | | $ | 113.89 | | | $ | 81.50 | | | $ | 121.73 | | | $ | 111.34 | | | $ | 58.94 | | | $ | 71.35 | |
Income (loss) from investment operations: |
Net investment income (loss)b | | | .22 | | | | .72 | | | | .37 | | | | (.48 | ) | | | (.18 | ) | | | .36 | |
Net gain (loss) on investments (realized and unrealized) | | | 14.63 | | | | 32.33 | | | | (22.28 | ) | | | 23.98 | | | | 53.17 | | | | (12.77 | ) |
Total from investment operations | | | 14.85 | | | | 33.05 | | | | (21.91 | ) | | | 23.50 | | | | 52.99 | | | | (12.41 | ) |
Less distributions from: |
Net investment income | | | — | | | | (.66 | ) | | | — | | | | — | | | | (.59 | ) | | | — | |
Net realized gains | | | — | | | | — | | | | (18.32 | ) | | | (13.11 | ) | | | — | | | | — | |
Total distributions | | | — | | | | (.66 | ) | | | (18.32 | ) | | | (13.11 | ) | | | (.59 | ) | | | — | |
Net asset value, end of period | | $ | 128.74 | | | $ | 113.89 | | | $ | 81.50 | | | $ | 121.73 | | | $ | 111.34 | | | $ | 58.94 | |
|
Total Return | | | 13.04 | % | | | 40.73 | % | | | (16.38 | %) | | | 20.51 | % | | | 90.03 | % | | | (17.39 | %) |
Ratios/Supplemental Data |
Net assets, end of period (in thousands) | | $ | 3,903 | | | $ | 7,310 | | | $ | 11,996 | | | $ | 40,702 | | | $ | 53,660 | | | $ | 4,057 | |
Ratios to average net assets: |
Net investment income (loss) | | | 0.38 | % | | | 0.77 | % | | | 0.39 | % | | | (0.37 | %) | | | (0.20 | %) | | | 0.46 | % |
Total expensesc | | | 1.59 | % | | | 1.69 | % | | | 1.55 | % | | | 1.50 | % | | | 1.59 | % | | | 1.62 | % |
Net expensesd | | | 1.53 | % | | | 1.65 | % | | | 1.54 | % | | | 1.48 | % | | | 1.58 | % | | | 1.61 | % |
Portfolio turnover rate | | | 113 | % | | | 1,047 | % | | | 973 | % | | | 1,027 | % | | | 785 | % | | | 690 | % |
a | Unaudited figures for the period ended September 30, 2024. Percentage amounts for the period, except total return and portfolio turnover rate, have been annualized. |
b | Net investment income (loss) per share was computed using average shares outstanding throughout the period. |
c | Does not include expenses of the underlying funds in which the Fund invests. |
d | Net expense information reflects the expense ratios after expense waivers and reimbursements, as applicable. |
e | Total return does not reflect the impact of any applicable sales charges. |
SEE NOTES TO FINANCIAL STATEMENTS. | THE RYDEX FUNDS SEMI-ANNUAL FINANCIAL REPORT | 151 |
SCHEDULE OF INVESTMENTS (Unaudited) | September 30, 2024 |
S&P 500® FUND | |
| | Shares | | | Value | |
COMMON STOCKS† - 95.5% |
| | | | | | | | | |
Technology - 29.4% |
Apple, Inc. | | | 71,393 | | | $ | 16,634,569 | |
Microsoft Corp. | | | 34,902 | | | | 15,018,331 | |
NVIDIA Corp. | | | 115,511 | | | | 14,027,656 | |
Broadcom, Inc. | | | 21,858 | | | | 3,770,505 | |
Oracle Corp. | | | 7,505 | | | | 1,278,852 | |
Advanced Micro Devices, Inc.* | | | 7,599 | | | | 1,246,844 | |
Salesforce, Inc. | | | 4,550 | | | | 1,245,381 | |
Adobe, Inc.* | | | 2,082 | | | | 1,078,018 | |
Accenture plc — Class A | | | 2,942 | | | | 1,039,938 | |
International Business Machines Corp. | | | 4,325 | | | | 956,171 | |
QUALCOMM, Inc. | | | 5,231 | | | | 889,532 | |
Texas Instruments, Inc. | | | 4,287 | | | | 885,566 | |
ServiceNow, Inc.* | | | 968 | | | | 865,770 | |
Intuit, Inc. | | | 1,313 | | | | 815,373 | |
Applied Materials, Inc. | | | 3,889 | | | | 785,772 | |
Micron Technology, Inc. | | | 5,206 | | | | 539,914 | |
Analog Devices, Inc. | | | 2,330 | | | | 536,296 | |
Lam Research Corp. | | | 612 | | | | 499,441 | |
KLA Corp. | | | 631 | | | | 488,653 | |
Fiserv, Inc.* | | | 2,703 | | | | 485,594 | |
Intel Corp.* | | | 20,036 | | | | 470,045 | |
Synopsys, Inc.* | | | 719 | | | | 364,094 | |
Palantir Technologies, Inc. — Class A* | | | 9,456 | | | | 351,763 | |
Cadence Design Systems, Inc.* | | | 1,286 | | | | 348,545 | |
Crowdstrike Holdings, Inc. — Class A* | | | 1,085 | | | | 304,310 | |
NXP Semiconductor N.V. | | | 1,196 | | | | 287,052 | |
Roper Technologies, Inc. | | | 503 | | | | 279,889 | |
Autodesk, Inc.* | | | 1,012 | | | | 278,786 | |
Fortinet, Inc.* | | | 2,981 | | | | 231,176 | |
Fair Isaac Corp.* | | | 115 | | | | 223,505 | |
TE Connectivity plc | | | 1,427 | | | | 215,463 | |
MSCI, Inc. — Class A | | | 369 | | | | 215,101 | |
Fidelity National Information Services, Inc. | | | 2,562 | | | | 214,567 | |
Monolithic Power Systems, Inc. | | | 229 | | | | 211,710 | |
Microchip Technology, Inc. | | | 2,519 | | | | 202,251 | |
Paychex, Inc. | | | 1,505 | | | | 201,956 | |
Gartner, Inc.* | | | 363 | | | | 183,954 | |
Cognizant Technology Solutions Corp. — Class A | | | 2,327 | | | | 179,598 | |
HP, Inc. | | | 4,595 | | | | 164,823 | |
Electronic Arts, Inc. | | | 1,130 | | | | 162,087 | |
Dell Technologies, Inc. — Class C | | | 1,351 | | | | 160,147 | |
ON Semiconductor Corp.* | | | 2,011 | | | | 146,019 | |
ANSYS, Inc.* | | | 410 | | | | 130,638 | |
Hewlett Packard Enterprise Co. | | | 6,102 | | | | 124,847 | |
NetApp, Inc. | | | 965 | | | | 119,187 | |
Broadridge Financial Solutions, Inc. | | | 549 | | | | 118,051 | |
Take-Two Interactive Software, Inc.* | | | 765 | | | | 117,588 | |
Tyler Technologies, Inc.* | | | 200 | | | | 116,744 | |
Seagate Technology Holdings plc | | | 986 | | | | 107,997 | |
Western Digital Corp.* | | | 1,533 | | | | 104,688 | |
Leidos Holdings, Inc. | | | 633 | | | | 103,179 | |
Teradyne, Inc. | | | 767 | | | | 102,724 | |
PTC, Inc.* | | | 564 | | | | 101,892 | |
Super Micro Computer, Inc.* | | | 237 | | | | 98,687 | |
Zebra Technologies Corp. — Class A* | | | 243 | | | | 89,988 | |
Skyworks Solutions, Inc. | | | 750 | | | | 74,077 | |
Akamai Technologies, Inc.* | | | 712 | | | | 71,876 | |
Jack Henry & Associates, Inc. | | | 342 | | | | 60,377 | |
EPAM Systems, Inc.* | | | 267 | | | | 53,141 | |
Qorvo, Inc.* | | | 445 | | | | 45,968 | |
Dayforce, Inc.* | | | 743 | | | | 45,509 | |
Paycom Software, Inc. | | | 229 | | | | 38,145 | |
Amentum Holdings, Inc.* | | | 589 | | | | 18,995 | |
Total Technology | | | | | | | 70,329,315 | |
| | | | | | | | | |
Consumer, Non-cyclical - 16.5% |
Eli Lilly & Co. | | | 3,704 | | | | 3,281,522 | |
UnitedHealth Group, Inc. | | | 4,336 | | | | 2,535,172 | |
Procter & Gamble Co. | | | 11,053 | | | | 1,914,380 | |
Johnson & Johnson | | | 11,303 | | | | 1,831,764 | |
AbbVie, Inc. | | | 8,294 | | | | 1,637,899 | |
Merck & Company, Inc. | | | 11,902 | | | | 1,351,591 | |
Coca-Cola Co. | | | 18,214 | | | | 1,308,858 | |
Thermo Fisher Scientific, Inc. | | | 1,794 | | | | 1,109,715 | |
PepsiCo, Inc. | | | 6,449 | | | | 1,096,653 | |
Abbott Laboratories | | | 8,170 | | | | 931,462 | |
Philip Morris International, Inc. | | | 7,300 | | | | 886,220 | |
Danaher Corp. | | | 3,018 | | | | 839,064 | |
Intuitive Surgical, Inc.* | | | 1,665 | | | | 817,964 | |
Amgen, Inc. | | | 2,523 | | | | 812,936 | |
S&P Global, Inc. | | | 1,504 | | | | 776,996 | |
Pfizer, Inc. | | | 26,608 | | | | 770,036 | |
Stryker Corp. | | | 1,610 | | | | 581,629 | |
Boston Scientific Corp.* | | | 6,915 | | | | 579,477 | |
Elevance Health, Inc. | | | 1,089 | | | | 566,280 | |
Vertex Pharmaceuticals, Inc.* | | | 1,212 | | | | 563,677 | |
Medtronic plc | | | 6,022 | | | | 542,161 | |
Automatic Data Processing, Inc. | | | 1,915 | | | | 529,938 | |
Regeneron Pharmaceuticals, Inc.* | | | 498 | | | | 523,517 | |
Bristol-Myers Squibb Co. | | | 9,519 | | | | 492,513 | |
Gilead Sciences, Inc. | | | 5,846 | | | | 490,129 | |
Mondelez International, Inc. — Class A | | | 6,272 | | | | 462,058 | |
Cigna Group | | | 1,313 | | | | 454,876 | |
Zoetis, Inc. | | | 2,127 | | | | 415,573 | |
Altria Group, Inc. | | | 8,011 | | | | 408,881 | |
Colgate-Palmolive Co. | | | 3,837 | | | | 398,319 | |
PayPal Holdings, Inc.* | | | 4,800 | | | | 374,544 | |
CVS Health Corp. | | | 5,907 | | | | 371,432 | |
HCA Healthcare, Inc. | | | 873 | | | | 354,813 | |
Moody’s Corp. | | | 736 | | | | 349,298 | |
Cintas Corp. | | | 1,609 | | | | 331,261 | |
Becton Dickinson & Co. | | | 1,358 | | | | 327,414 | |
McKesson Corp. | | | 609 | | | | 301,102 | |
United Rentals, Inc. | | | 313 | | | | 253,445 | |
Kimberly-Clark Corp. | | | 1,582 | | | | 225,087 | |
Kenvue, Inc. | | | 8,992 | | | | 207,985 | |
Quanta Services, Inc. | | | 692 | | | | 206,320 | |
Agilent Technologies, Inc. | | | 1,370 | | | | 203,418 | |
GE HealthCare Technologies, Inc. | | | 2,144 | | | | 201,214 | |
IDEXX Laboratories, Inc.* | | | 386 | | | | 195,015 | |
152 | THE RYDEX FUNDS SEMI-ANNUAL FINANCIAL REPORT | SEE NOTES TO FINANCIAL STATEMENTS. |
SCHEDULE OF INVESTMENTS (Unaudited)(continued) | September 30, 2024 |
S&P 500® FUND | |
| | Shares | | | Value | |
General Mills, Inc. | | | 2,614 | | | $ | 193,044 | |
IQVIA Holdings, Inc.* | | | 813 | | | | 192,657 | |
Corteva, Inc. | | | 3,250 | | | | 191,067 | |
Constellation Brands, Inc. — Class A | | | 736 | | | | 189,660 | |
Edwards Lifesciences Corp.* | | | 2,829 | | | | 186,686 | |
Keurig Dr Pepper, Inc. | | | 4,967 | | | | 186,163 | |
Centene Corp.* | | | 2,470 | | | | 185,941 | |
Cencora, Inc. — Class A | | | 819 | | | | 184,341 | |
Sysco Corp. | | | 2,309 | | | | 180,241 | |
Verisk Analytics, Inc. — Class A | | | 669 | | | | 179,265 | |
Humana, Inc. | | | 565 | | | | 178,958 | |
Kroger Co. | | | 3,118 | | | | 178,661 | |
Monster Beverage Corp.* | | | 3,312 | | | | 172,787 | |
Equifax, Inc. | | | 582 | | | | 171,027 | |
ResMed, Inc. | | | 690 | | | | 168,443 | |
Kraft Heinz Co. | | | 4,144 | | | | 145,496 | |
Archer-Daniels-Midland Co. | | | 2,245 | | | | 134,116 | |
Hershey Co. | | | 694 | | | | 133,095 | |
Biogen, Inc.* | | | 684 | | | | 132,587 | |
Cardinal Health, Inc. | | | 1,145 | | | | 126,545 | |
Dexcom, Inc.* | | | 1,882 | | | | 126,169 | |
Global Payments, Inc. | | | 1,195 | | | | 122,392 | |
Church & Dwight Company, Inc. | | | 1,150 | | | | 120,428 | |
STERIS plc | | | 463 | | | | 112,296 | |
Estee Lauder Companies, Inc. — Class A | | | 1,095 | | | | 109,160 | |
Moderna, Inc.* | | | 1,588 | | | | 106,126 | |
Zimmer Biomet Holdings, Inc. | | | 956 | | | | 103,200 | |
Cooper Companies, Inc.* | | | 935 | | | | 103,168 | |
West Pharmaceutical Services, Inc. | | | 341 | | | | 102,354 | |
Corpay, Inc.* | | | 327 | | | | 102,273 | |
Kellanova | | | 1,260 | | | | 101,695 | |
Waters Corp.* | | | 279 | | | | 100,409 | |
McCormick & Company, Inc. | | | 1,183 | | | | 97,361 | |
Clorox Co. | | | 582 | | | | 94,814 | |
Molina Healthcare, Inc.* | | | 275 | | | | 94,754 | |
Baxter International, Inc. | | | 2,395 | | | | 90,938 | |
Hologic, Inc.* | | | 1,091 | | | | 88,873 | |
Labcorp Holdings, Inc. | | | 395 | | | | 88,275 | |
Align Technology, Inc.* | | | 330 | | | | 83,926 | |
Avery Dennison Corp. | | | 378 | | | | 83,447 | |
Quest Diagnostics, Inc. | | | 523 | | | | 81,196 | |
Tyson Foods, Inc. — Class A | | | 1,343 | | | | 79,989 | |
Insulet Corp.* | | | 330 | | | | 76,807 | |
Revvity, Inc. | | | 580 | | | | 74,095 | |
Conagra Brands, Inc. | | | 2,249 | | | | 73,137 | |
Rollins, Inc. | | | 1,319 | | | | 66,715 | |
Viatris, Inc. | | | 5,604 | | | | 65,062 | |
Bunge Global S.A. | | | 665 | | | | 64,266 | |
Universal Health Services, Inc. — Class B | | | 279 | | | | 63,894 | |
J M Smucker Co. | | | 500 | | | | 60,550 | |
Bio-Techne Corp. | | | 740 | | | | 59,148 | |
Teleflex, Inc. | | | 221 | | | | 54,658 | |
Catalent, Inc.* | | | 850 | | | | 51,484 | |
Incyte Corp.* | | | 751 | | | | 49,641 | |
Charles River Laboratories International, Inc.* | | | 242 | | | | 47,667 | |
Molson Coors Beverage Co. — Class B | | | 825 | | | | 47,454 | |
MarketAxess Holdings, Inc. | | | 178 | | | | 45,604 | |
Campbell Soup Co. | | | 925 | | | | 45,251 | |
Solventum Corp.* | | | 649 | | | | 45,248 | |
Lamb Weston Holdings, Inc. | | | 675 | | | | 43,700 | |
Henry Schein, Inc.* | | | 595 | | | | 43,376 | |
Hormel Foods Corp. | | | 1,365 | | | | 43,270 | |
Brown-Forman Corp. — Class B | | | 861 | | | | 42,361 | |
DaVita, Inc.* | | | 217 | | | | 35,573 | |
Total Consumer, Non-cyclical | | | | | | | 39,616,592 | |
| | | | | | | | | |
Communications - 13.8% |
Amazon.com, Inc.* | | | 43,862 | | | | 8,172,806 | |
Meta Platforms, Inc. — Class A | | | 10,258 | | | | 5,872,090 | |
Alphabet, Inc. — Class A | | | 27,511 | | | | 4,562,699 | |
Alphabet, Inc. — Class C | | | 22,554 | | | | 3,770,803 | |
Netflix, Inc.* | | | 2,015 | | | | 1,429,179 | |
Cisco Systems, Inc. | | | 18,918 | | | | 1,006,816 | |
Verizon Communications, Inc. | | | 19,766 | | | | 887,691 | |
Walt Disney Co. | | | 8,516 | | | | 819,154 | |
Comcast Corp. — Class A | | | 18,140 | | | | 757,708 | |
Uber Technologies, Inc.* | | | 9,865 | | | | 741,453 | |
AT&T, Inc. | | | 33,668 | | | | 740,696 | |
Booking Holdings, Inc. | | | 157 | | | | 661,303 | |
Palo Alto Networks, Inc.* | | | 1,521 | | | | 519,878 | |
T-Mobile US, Inc. | | | 2,301 | | | | 474,834 | |
Arista Networks, Inc.* | | | 1,210 | | | | 464,422 | |
Motorola Solutions, Inc. | | | 783 | | | | 352,060 | |
Airbnb, Inc. — Class A* | | | 2,066 | | | | 261,990 | |
Corning, Inc. | | | 3,616 | | | | 163,263 | |
eBay, Inc. | | | 2,297 | | | | 149,558 | |
Charter Communications, Inc. — Class A* | | | 456 | | | | 147,780 | |
CDW Corp. | | | 627 | | | | 141,890 | |
GoDaddy, Inc. — Class A* | | | 662 | | | | 103,788 | |
Omnicom Group, Inc. | | | 919 | | | | 95,016 | |
Expedia Group, Inc.* | | | 586 | | | | 86,740 | |
Warner Bros Discovery, Inc.* | | | 10,477 | | | | 86,435 | |
FactSet Research Systems, Inc. | | | 179 | | | | 82,313 | |
VeriSign, Inc.* | | | 394 | | | | 74,844 | |
Gen Digital, Inc. | | | 2,543 | | | | 69,755 | |
F5, Inc.* | | | 275 | | | | 60,555 | |
Juniper Networks, Inc. | | | 1,546 | | | | 60,263 | |
Interpublic Group of Companies, Inc. | | | 1,764 | | | | 55,795 | |
News Corp. — Class A | | | 1,777 | | | | 47,322 | |
Match Group, Inc.* | | | 1,211 | | | | 45,824 | |
Fox Corp. — Class A | | | 1,055 | | | | 44,658 | |
Paramount Global — Class B1 | | | 2,792 | | | | 29,651 | |
Fox Corp. — Class B | | | 619 | | | | 24,017 | |
News Corp. — Class B | | | 527 | | | | 14,730 | |
Total Communications | | | | | | | 33,079,779 | |
| | | | | | | | | |
Financial - 13.4% |
Berkshire Hathaway, Inc. — Class B* | | | 8,601 | | | | 3,958,696 | |
JPMorgan Chase & Co. | | | 13,360 | | | | 2,817,090 | |
Visa, Inc. — Class A | | | 7,843 | | | | 2,156,433 | |
Mastercard, Inc. — Class A | | | 3,874 | | | | 1,912,981 | |
Bank of America Corp. | | | 31,699 | | | | 1,257,816 | |
SEE NOTES TO FINANCIAL STATEMENTS. | THE RYDEX FUNDS SEMI-ANNUAL FINANCIAL REPORT | 153 |
SCHEDULE OF INVESTMENTS (Unaudited)(continued) | September 30, 2024 |
S&P 500® FUND | |
| | Shares | | | Value | |
Wells Fargo & Co. | | | 15,983 | | | $ | 902,880 | |
Goldman Sachs Group, Inc. | | | 1,483 | | | | 734,248 | |
American Express Co. | | | 2,637 | | | | 715,154 | |
Progressive Corp. | | | 2,750 | | | | 697,840 | |
BlackRock, Inc. — Class A | | | 654 | | | | 620,980 | |
Morgan Stanley | | | 5,850 | | | | 609,804 | |
Citigroup, Inc. | | | 8,958 | | | | 560,771 | |
Prologis, Inc. REIT | | | 4,348 | | | | 549,066 | |
Blackstone, Inc. — Class A | | | 3,381 | | | | 517,733 | |
Marsh & McLennan Companies, Inc. | | | 2,309 | | | | 515,115 | |
American Tower Corp. — Class A REIT | | | 2,193 | | | | 510,004 | |
Chubb Ltd. | | | 1,764 | | | | 508,720 | |
Charles Schwab Corp. | | | 7,014 | | | | 454,577 | |
Intercontinental Exchange, Inc. | | | 2,696 | | | | 433,086 | |
KKR & Company, Inc. — Class A | | | 3,167 | | | | 413,547 | |
Equinix, Inc. REIT | | | 446 | | | | 395,883 | |
CME Group, Inc. — Class A | | | 1,691 | | | | 373,119 | |
Aon plc — Class A | | | 1,020 | | | | 352,910 | |
Welltower, Inc. REIT | | | 2,718 | | | | 347,986 | |
PNC Financial Services Group, Inc. | | | 1,867 | | | | 345,115 | |
U.S. Bancorp | | | 7,327 | | | | 335,064 | |
Arthur J Gallagher & Co. | | | 1,029 | | | | 289,530 | |
Public Storage REIT | | | 740 | | | | 269,264 | |
Truist Financial Corp. | | | 6,288 | | | | 268,938 | |
Capital One Financial Corp. | | | 1,793 | | | | 268,466 | |
Aflac, Inc. | | | 2,367 | | | | 264,631 | |
Realty Income Corp. REIT | | | 4,089 | | | | 259,324 | |
Travelers Companies, Inc. | | | 1,070 | | | | 250,508 | |
Bank of New York Mellon Corp. | �� | | 3,465 | | | | 248,995 | |
Simon Property Group, Inc. REIT | | | 1,439 | | | | 243,220 | |
Crown Castle, Inc. REIT | | | 2,040 | | | | 242,005 | |
Allstate Corp. | | | 1,240 | | | | 235,166 | |
Digital Realty Trust, Inc. REIT | | | 1,445 | | | | 233,844 | |
MetLife, Inc. | | | 2,763 | | | | 227,892 | |
American International Group, Inc. | | | 3,024 | | | | 221,447 | |
Ameriprise Financial, Inc. | | | 461 | | | | 216,582 | |
Prudential Financial, Inc. | | | 1,676 | | | | 202,964 | |
Arch Capital Group Ltd.* | | | 1,759 | | | | 196,797 | |
Extra Space Storage, Inc. REIT | | | 995 | | | | 179,289 | |
CBRE Group, Inc. — Class A* | | | 1,415 | | | | 176,139 | |
Discover Financial Services | | | 1,179 | | | | 165,402 | |
VICI Properties, Inc. REIT | | | 4,917 | | | | 163,785 | |
Iron Mountain, Inc. REIT | | | 1,377 | | | | 163,629 | |
Hartford Financial Services Group, Inc. | | | 1,376 | | | | 161,831 | |
AvalonBay Communities, Inc. REIT | | | 667 | | | | 150,242 | |
CoStar Group, Inc.* | | | 1,924 | | | | 145,147 | |
Nasdaq, Inc. | | | 1,943 | | | | 141,859 | |
Willis Towers Watson plc | | | 478 | | | | 140,785 | |
M&T Bank Corp. | | | 785 | | | | 139,824 | |
Fifth Third Bancorp | | | 3,179 | | | | 136,188 | |
Ventas, Inc. REIT | | | 1,940 | | | | 124,412 | |
State Street Corp. | | | 1,402 | | | | 124,035 | |
SBA Communications Corp. REIT | | | 505 | | | | 121,554 | |
Equity Residential REIT | | | 1,602 | | | | 119,285 | |
Weyerhaeuser Co. REIT | | | 3,415 | | | | 115,632 | |
Brown & Brown, Inc. | | | 1,113 | | | | 115,307 | |
T. Rowe Price Group, Inc. | | | 1,045 | | | | 113,832 | |
Raymond James Financial, Inc. | | | 870 | | | | 106,540 | |
Cboe Global Markets, Inc. | | | 491 | | | | 100,591 | |
Huntington Bancshares, Inc. | | | 6,820 | | | | 100,254 | |
Regions Financial Corp. | | | 4,297 | | | | 100,249 | |
Cincinnati Financial Corp. | | | 734 | | | | 99,912 | |
Invitation Homes, Inc. REIT | | | 2,676 | | | | 94,356 | |
Synchrony Financial | | | 1,856 | | | | 92,577 | |
Essex Property Trust, Inc. REIT | | | 302 | | | | 89,217 | |
Mid-America Apartment Communities, Inc. REIT | | | 549 | | | | 87,236 | |
Alexandria Real Estate Equities, Inc. REIT | | | 731 | | | | 86,806 | |
Citizens Financial Group, Inc. | | | 2,105 | | | | 86,452 | |
Principal Financial Group, Inc. | | | 1,000 | | | | 85,900 | |
Northern Trust Corp. | | | 947 | | | | 85,258 | |
W R Berkley Corp. | | | 1,412 | | | | 80,103 | |
Everest Group Ltd. | | | 203 | | | | 79,541 | |
Healthpeak Properties, Inc. REIT | | | 3,305 | | | | 75,585 | |
Kimco Realty Corp. REIT | | | 3,165 | | | | 73,491 | |
KeyCorp | | | 4,359 | | | | 73,013 | |
Loews Corp. | | | 855 | | | | 67,588 | |
UDR, Inc. REIT | | | 1,409 | | | | 63,884 | |
Erie Indemnity Co. — Class A | | | 117 | | | | 63,159 | |
Camden Property Trust REIT | | | 501 | | | | 61,889 | |
Host Hotels & Resorts, Inc. REIT | | | 3,298 | | | | 58,045 | |
Regency Centers Corp. REIT | | | 767 | | | | 55,400 | |
BXP, Inc. REIT | | | 682 | | | | 54,874 | |
Assurant, Inc. | | | 243 | | | | 48,323 | |
Globe Life, Inc. | | | 422 | | | | 44,694 | |
Federal Realty Investment Trust REIT | | | 353 | | | | 40,584 | |
Invesco Ltd. | | | 2,114 | | | | 37,122 | |
Franklin Resources, Inc. | | | 1,449 | | | | 29,197 | |
Total Financial | | | | | | | 32,056,208 | |
| | | | | | | | | |
Consumer, Cyclical - 8.0% |
Tesla, Inc.* | | | 13,029 | | | | 3,408,777 | |
Home Depot, Inc. | | | 4,656 | | | | 1,886,611 | |
Costco Wholesale Corp. | | | 2,082 | | | | 1,845,735 | |
Walmart, Inc. | | | 20,396 | | | | 1,646,977 | |
McDonald’s Corp. | | | 3,368 | | | | 1,025,590 | |
Lowe’s Companies, Inc. | | | 2,676 | | | | 724,795 | |
TJX Companies, Inc. | | | 5,307 | | | | 623,785 | |
Starbucks Corp. | | | 5,321 | | | | 518,744 | |
NIKE, Inc. — Class B | | | 5,641 | | | | 498,664 | |
Chipotle Mexican Grill, Inc. — Class A* | | | 6,430 | | | | 370,497 | |
Target Corp. | | | 2,173 | | | | 338,684 | |
O’Reilly Automotive, Inc.* | | | 272 | | | | 313,235 | |
Marriott International, Inc. — Class A | | | 1,097 | | | | 272,714 | |
Hilton Worldwide Holdings, Inc. | | | 1,157 | | | | 266,689 | |
DR Horton, Inc. | | | 1,378 | | | | 262,881 | |
AutoZone, Inc.* | | | 80 | | | | 252,003 | |
PACCAR, Inc. | | | 2,461 | | | | 242,851 | |
General Motors Co. | | | 5,277 | | | | 236,621 | |
Ross Stores, Inc. | | | 1,566 | | | | 235,699 | |
WW Grainger, Inc. | | | 209 | | | | 217,111 | |
Copart, Inc.* | | | 4,112 | | | | 215,469 | |
Lennar Corp. — Class A | | | 1,135 | | | | 212,790 | |
154 | THE RYDEX FUNDS SEMI-ANNUAL FINANCIAL REPORT | SEE NOTES TO FINANCIAL STATEMENTS. |
SCHEDULE OF INVESTMENTS (Unaudited)(continued) | September 30, 2024 |
S&P 500® FUND | |
| | Shares | | | Value | |
Cummins, Inc. | | | 643 | | | $ | 208,197 | |
Royal Caribbean Cruises Ltd. | | | 1,112 | | | | 197,224 | |
Ford Motor Co. | | | 18,334 | | | | 193,607 | |
Fastenal Co. | | | 2,689 | | | | 192,049 | |
Yum! Brands, Inc. | | | 1,320 | | | | 184,417 | |
Delta Air Lines, Inc. | | | 3,011 | | | | 152,929 | |
Tractor Supply Co. | | | 506 | | | | 147,210 | |
Lululemon Athletica, Inc.* | | | 540 | | | | 146,529 | |
PulteGroup, Inc. | | | 975 | | | | 139,942 | |
NVR, Inc.* | | | 14 | | | | 137,365 | |
Deckers Outdoor Corp.* | | | 716 | | | | 114,166 | |
Best Buy Company, Inc. | | | 922 | | | | 95,243 | |
Darden Restaurants, Inc. | | | 557 | | | | 91,420 | |
Genuine Parts Co. | | | 654 | | | | 91,351 | |
Aptiv plc* | | | 1,248 | | | | 89,869 | |
United Airlines Holdings, Inc.* | | | 1,544 | | | | 88,101 | |
Carnival Corp.* | | | 4,743 | | | | 87,651 | |
Ulta Beauty, Inc.* | | | 225 | | | | 87,552 | |
Dollar General Corp. | | | 1,032 | | | | 87,276 | |
Las Vegas Sands Corp. | | | 1,660 | | | | 83,564 | |
Southwest Airlines Co. | | | 2,813 | | | | 83,349 | |
Live Nation Entertainment, Inc.* | | | 736 | | | | 80,584 | |
Domino’s Pizza, Inc. | | | 164 | | | | 70,543 | |
Pool Corp. | | | 180 | | | | 67,824 | |
Dollar Tree, Inc.* | | | 949 | | | | 66,734 | |
CarMax, Inc.* | | | 733 | | | | 56,719 | |
Tapestry, Inc. | | | 1,081 | | | | 50,785 | |
LKQ Corp. | | | 1,236 | | | | 49,341 | |
Hasbro, Inc. | | | 615 | | | | 44,477 | |
Caesars Entertainment, Inc.* | | | 1,016 | | | | 42,408 | |
MGM Resorts International* | | | 1,084 | | | | 42,374 | |
Norwegian Cruise Line Holdings Ltd.* | | | 2,065 | | | | 42,353 | |
Wynn Resorts Ltd. | | | 439 | | | | 42,091 | |
BorgWarner, Inc. | | | 1,070 | | | | 38,830 | |
Ralph Lauren Corp. — Class A | | | 188 | | | | 36,448 | |
Walgreens Boots Alliance, Inc. | | | 3,364 | | | | 30,141 | |
Total Consumer, Cyclical | | | | | | | 19,077,585 | |
| | | | | | | | | |
Industrial - 7.0% |
General Electric Co. | | | 5,091 | | | | 960,061 | |
Caterpillar, Inc. | | | 2,277 | | | | 890,580 | |
RTX Corp. | | | 6,246 | | | | 756,766 | |
Union Pacific Corp. | | | 2,860 | | | | 704,933 | |
Honeywell International, Inc. | | | 3,058 | | | | 632,119 | |
Eaton Corporation plc | | | 1,869 | | | | 619,461 | |
Lockheed Martin Corp. | | | 997 | | | | 582,806 | |
Deere & Co. | | | 1,203 | | | | 502,048 | |
United Parcel Service, Inc. — Class B | | | 3,439 | | | | 468,873 | |
Boeing Co.* | | | 2,748 | | | | 417,806 | |
Trane Technologies plc | | | 1,060 | | | | 412,054 | |
Parker-Hannifin Corp. | | | 604 | | | | 381,619 | |
TransDigm Group, Inc. | | | 263 | | | | 375,335 | |
Amphenol Corp. — Class A | | | 5,655 | | | | 368,480 | |
General Dynamics Corp. | | | 1,211 | | | | 365,964 | |
Waste Management, Inc. | | | 1,715 | | | | 356,034 | |
3M Co. | | | 2,579 | | | | 352,550 | |
Northrop Grumman Corp. | | | 646 | | | | 341,133 | |
Illinois Tool Works, Inc. | | | 1,269 | | | | 332,567 | |
GE Vernova, Inc.* | | | 1,290 | | | | 328,924 | |
Carrier Global Corp. | | | 3,942 | | | | 317,292 | |
CSX Corp. | | | 9,103 | | | | 314,327 | |
Emerson Electric Co. | | | 2,689 | | | | 294,096 | |
FedEx Corp. | | | 1,059 | | | | 289,827 | |
Norfolk Southern Corp. | | | 1,062 | | | | 263,907 | |
Johnson Controls International plc | | | 3,137 | | | | 243,463 | |
L3Harris Technologies, Inc. | | | 891 | | | | 211,942 | |
Otis Worldwide Corp. | | | 1,881 | | | | 195,511 | |
Republic Services, Inc. — Class A | | | 959 | | | | 192,606 | |
Howmet Aerospace, Inc. | | | 1,916 | | | | 192,079 | |
AMETEK, Inc. | | | 1,088 | | | | 186,821 | |
Ingersoll Rand, Inc. | | | 1,895 | | | | 186,013 | |
Old Dominion Freight Line, Inc. | | | 885 | | | | 175,796 | |
Vulcan Materials Co. | | | 620 | | | | 155,267 | |
Martin Marietta Materials, Inc. | | | 287 | | | | 154,478 | |
Xylem, Inc. | | | 1,140 | | | | 153,934 | |
Mettler-Toledo International, Inc.* | | | 100 | | | | 149,970 | |
Westinghouse Air Brake Technologies Corp. | | | 823 | | | | 149,597 | |
Rockwell Automation, Inc. | | | 533 | | | | 143,089 | |
Axon Enterprise, Inc.* | | | 337 | | | | 134,665 | |
Keysight Technologies, Inc.* | | | 820 | | | | 130,323 | |
Veralto Corp. | | | 1,161 | | | | 129,869 | |
Fortive Corp. | | | 1,645 | | | | 129,840 | |
Garmin Ltd. | | | 722 | | | | 127,094 | |
Dover Corp. | | | 646 | | | | 123,864 | |
Smurfit WestRock plc | | | 2,317 | | | | 114,506 | |
Hubbell, Inc. | | | 252 | | | | 107,944 | |
Builders FirstSource, Inc.* | | | 547 | | | | 106,041 | |
Ball Corp. | | | 1,425 | | | | 96,772 | |
Teledyne Technologies, Inc.* | | | 220 | | | | 96,285 | |
Packaging Corporation of America | | | 419 | | | | 90,252 | |
Expeditors International of Washington, Inc. | | | 663 | | | | 87,118 | |
Masco Corp. | | | 1,025 | | | | 86,038 | |
Stanley Black & Decker, Inc. | | | 723 | | | | 79,624 | |
Textron, Inc. | | | 880 | | | | 77,951 | |
Jacobs Solutions, Inc. | | | 589 | | | | 77,100 | |
Amcor plc | | | 6,787 | | | | 76,897 | |
IDEX Corp. | | | 355 | | | | 76,148 | |
Pentair plc | | | 777 | | | | 75,983 | |
Snap-on, Inc. | | | 247 | | | | 71,558 | |
Trimble, Inc.* | | | 1,147 | | | | 71,217 | |
Nordson Corp. | | | 256 | | | | 67,233 | |
J.B. Hunt Transport Services, Inc. | | | 378 | | | | 65,141 | |
Jabil, Inc. | | | 533 | | | | 63,869 | |
CH Robinson Worldwide, Inc. | | | 552 | | | | 60,924 | |
Allegion plc | | | 409 | | | | 59,608 | |
A O Smith Corp. | | | 563 | | | | 50,574 | |
Huntington Ingalls Industries, Inc. | | | 184 | | | | 48,646 | |
Generac Holdings, Inc.* | | | 283 | | | | 44,963 | |
Mohawk Industries, Inc.* | | | 246 | | | | 39,527 | |
Total Industrial | | | | | | | 16,787,702 | |
| | | | | | | | | |
SEE NOTES TO FINANCIAL STATEMENTS. | THE RYDEX FUNDS SEMI-ANNUAL FINANCIAL REPORT | 155 |
SCHEDULE OF INVESTMENTS (Unaudited)(continued) | September 30, 2024 |
S&P 500® FUND | |
| | Shares | | | Value | |
Energy - 3.3% |
Exxon Mobil Corp. | | | 20,862 | | | $ | 2,445,444 | |
Chevron Corp. | | | 7,986 | | | | 1,176,098 | |
ConocoPhillips | | | 5,453 | | | | 574,092 | |
EOG Resources, Inc. | | | 2,670 | | | | 328,223 | |
Schlumberger N.V. | | | 6,667 | | | | 279,681 | |
Williams Companies, Inc. | | | 5,723 | | | | 261,255 | |
Phillips 66 | | | 1,966 | | | | 258,431 | |
Marathon Petroleum Corp. | | | 1,572 | | | | 256,095 | |
ONEOK, Inc. | | | 2,743 | | | | 249,970 | |
Valero Energy Corp. | | | 1,504 | | | | 203,085 | |
Kinder Morgan, Inc. | | | 9,067 | | | | 200,290 | |
Hess Corp. | | | 1,299 | | | | 176,404 | |
Baker Hughes Co. | | | 4,665 | | | | 168,640 | |
Occidental Petroleum Corp. | | | 3,162 | | | | 162,969 | |
Targa Resources Corp. | | | 1,029 | | | | 152,302 | |
Diamondback Energy, Inc. | | | 880 | | | | 151,712 | |
First Solar, Inc.* | | | 503 | | | | 125,468 | |
Halliburton Co. | | | 4,145 | | | | 120,412 | |
Devon Energy Corp. | | | 2,940 | | | | 115,013 | |
Equities Corp. | | | 2,789 | | | | 102,189 | |
Coterra Energy, Inc. — Class A | | | 3,471 | | | | 83,130 | |
Enphase Energy, Inc.* | | | 636 | | | | 71,881 | |
Marathon Oil Corp. | | | 2,627 | | | | 69,957 | |
APA Corp. | | | 1,737 | | | | 42,487 | |
Total Energy | | | | | | | 7,775,228 | |
| | | | | | | | | |
Utilities - 2.4% |
NextEra Energy, Inc. | | | 9,647 | | | | 815,461 | |
Southern Co. | | | 5,134 | | | | 462,984 | |
Duke Energy Corp. | | | 3,625 | | | | 417,963 | |
Constellation Energy Corp. | | | 1,468 | | | | 381,709 | |
American Electric Power Company, Inc. | | | 2,499 | | | | 256,397 | |
Sempra | | | 2,973 | | | | 248,632 | |
Dominion Energy, Inc. | | | 3,939 | | | | 227,635 | |
Public Service Enterprise Group, Inc. | | | 2,339 | | | | 208,662 | |
PG&E Corp. | | | 10,036 | | | | 198,412 | |
Vistra Corp. | | | 1,613 | | | | 191,205 | |
Exelon Corp. | | | 4,695 | | | | 190,382 | |
Xcel Energy, Inc. | | | 2,618 | | | | 170,955 | |
Consolidated Edison, Inc. | | | 1,624 | | | | 169,107 | |
Edison International | | | 1,814 | | | | 157,981 | |
WEC Energy Group, Inc. | | | 1,484 | | | | 142,731 | |
American Water Works Company, Inc. | | | 915 | | | | 133,810 | |
Entergy Corp. | | | 1,004 | | | | 132,136 | |
DTE Energy Co. | | | 972 | | | | 124,815 | |
PPL Corp. | | | 3,464 | | | | 114,589 | |
Eversource Energy | | | 1,678 | | | | 114,188 | |
Ameren Corp. | | | 1,253 | | | | 109,587 | |
FirstEnergy Corp. | | | 2,407 | | | | 106,751 | |
Atmos Energy Corp. | | | 729 | | | | 101,120 | |
CMS Energy Corp. | | | 1,403 | | | | 99,094 | |
CenterPoint Energy, Inc. | | | 3,060 | | | | 90,025 | |
NRG Energy, Inc. | | | 969 | | | | 88,276 | |
Alliant Energy Corp. | | | 1,204 | | | | 73,071 | |
NiSource, Inc. | | | 2,106 | | | | 72,973 | |
AES Corp. | | | 3,339 | | | | 66,980 | |
Evergy, Inc. | | | 1,080 | | | | 66,971 | |
Pinnacle West Capital Corp. | | | 533 | | | | 47,219 | |
Total Utilities | | | | | | | 5,781,821 | |
| | | | | | | | | |
Basic Materials - 1.7% |
Linde plc | | | 2,257 | | | | 1,076,273 | |
Sherwin-Williams Co. | | | 1,090 | | | | 416,020 | |
Freeport-McMoRan, Inc. | | | 6,747 | | | | 336,810 | |
Air Products and Chemicals, Inc. | | | 1,044 | | | | 310,841 | |
Ecolab, Inc. | | | 1,189 | | | | 303,587 | |
Newmont Corp. | | | 5,388 | | | | 287,989 | |
Dow, Inc. | | | 3,291 | | | | 179,787 | |
DuPont de Nemours, Inc. | | | 1,960 | | | | 174,656 | |
Nucor Corp. | | | 1,114 | | | | 167,479 | |
PPG Industries, Inc. | | | 1,096 | | | | 145,176 | |
International Flavors & Fragrances, Inc. | | | 1,200 | | | | 125,916 | |
LyondellBasell Industries N.V. — Class A | | | 1,222 | | | | 117,190 | |
Steel Dynamics, Inc. | | | 674 | | | | 84,978 | |
International Paper Co. | | | 1,631 | | | | 79,674 | |
CF Industries Holdings, Inc. | | | 847 | | | | 72,673 | |
Celanese Corp. — Class A | | | 513 | | | | 69,747 | |
Eastman Chemical Co. | | | 549 | | | | 61,460 | |
Albemarle Corp. | | | 552 | | | | 52,280 | |
Mosaic Co. | | | 1,496 | | | | 40,063 | |
FMC Corp. | | | 586 | | | | 38,641 | |
Total Basic Materials | | | | | | | 4,141,240 | |
| | | | | | | | | |
Total Common Stocks | | | | |
(Cost $138,715,426) | | | | | | | 228,645,470 | |
| | | | | | | | | |
| | | Face
Amount | | | | | |
U.S. TREASURY BILLS†† - 0.1% |
U.S. Treasury Bills |
4.85% due 12/12/242,3 | | $ | 200,000 | | | | 198,212 | |
4.81% due 12/12/243 | | | 50,000 | | | | 49,553 | |
4.63% due 10/10/243,4 | | | 13,000 | | | | 12,985 | |
Total U.S. Treasury Bills | | | | |
(Cost $260,562) | | | | | | | 260,750 | |
| | | | | | | | | |
REPURCHASE AGREEMENTS††,5 - 4.4% |
J.P. Morgan Securities LLC
issued 09/30/24 at 4.86%
due 10/01/242 | | | 5,823,700 | | | | 5,823,700 | |
BofA Securities, Inc.
issued 09/30/24 at 4.85%
due 10/01/242 | | | 4,810,106 | | | | 4,810,106 | |
Total Repurchase Agreements | | | | |
(Cost $10,633,806) | | | | | | | 10,633,806 | |
| | | | | | | | | |
156 | THE RYDEX FUNDS SEMI-ANNUAL FINANCIAL REPORT | SEE NOTES TO FINANCIAL STATEMENTS. |
SCHEDULE OF INVESTMENTS (Unaudited)(continued) | September 30, 2024 |
S&P 500® FUND | |
| | Shares | | | Value | |
SECURITIES LENDING COLLATERAL†,6 - 0.0% |
Money Market Fund*** | | | | | | | | |
First American Government Obligations Fund - Class X, 4.82%7 | | | 24,671 | | | $ | 24,671 | |
Total Securities Lending Collateral | | | | |
(Cost $24,671) | | | | | | | 24,671 | |
| | | | | | | | | |
Total Investments - 100.0% | | | | |
(Cost $149,634,465) | | $ | 239,564,697 | |
Other Assets & Liabilities, net - 0.0% | | | (22,768 | ) |
Total Net Assets - 100.0% | | $ | 239,541,929 | |
Futures Contracts |
Description | | Number of
Contracts | | | Expiration
Date | | | Notional
Amount | | | Value and
Unrealized
Appreciation** | |
Equity Futures Contracts Purchased† |
S&P 500 Index Mini Futures Contracts | | | 10 | | | | Dec 2024 | | | $ | 2,908,000 | | | $ | 62,746 | |
Total Return Swap Agreements |
Counterparty | Index | Type | Financing
Rate | | Payment
Frequency | | | Maturity
Date | | | Units | | | Notional
Amount | | | Value and
Unrealized
Appreciation | |
OTC Equity Index Swap Agreements†† |
Goldman Sachs International | S&P 500 Index | Pay | 5.33% (Federal Funds Rate + 0.50%) | | | At Maturity | | | | 12/18/24 | | 661 | | $ | 3,808,782 | | | $ | 23,631 | |
Barclays Bank plc | S&P 500 Index | Pay | 5.44% (SOFR + 0.60%) | | | At Maturity | | | | 12/19/24 | | 435 | | | 2,509,363 | | | | 12,866 | |
BNP Paribas | S&P 500 Index | Pay | 5.68% (Federal Funds Rate + 0.85%) | | | At Maturity | | | | 12/19/24 | | 277 | | | 1,597,271 | | | | 11,145 | |
| | | | | | | | | | | | | | | | | | $ | 7,915,416 | | | $ | 47,642 | |
* | Non-income producing security. |
** | Includes cumulative appreciation (depreciation). Variation margin is reported within the Statement of Assets and Liabilities. |
*** | A copy of each underlying unaffiliated fund’s financial statements is available at the SEC’s website at www.sec.gov. |
† | Value determined based on Level 1 inputs — See Note 4. |
†† | Value determined based on Level 2 inputs — See Note 4. |
1 | All or a portion of this security is on loan at September 30, 2024 — See Note 7. |
2 | All or a portion of this security is pledged as equity index swap collateral at September 30, 2024. |
3 | Rate indicated is the effective yield at the time of purchase. |
4 | All or a portion of this security is pledged as futures collateral at September 30, 2024. |
5 | Repurchase Agreements — See Note 6. |
6 | Securities lending collateral — See Note 7. |
7 | Rate indicated is the 7-day yield as of September 30, 2024. |
| | plc — Public Limited Company |
| | REIT — Real Estate Investment Trust |
| | SOFR — Secured Overnight Financing Rate |
| | |
| | See Sector Classification in Other Information section. |
SEE NOTES TO FINANCIAL STATEMENTS. | THE RYDEX FUNDS SEMI-ANNUAL FINANCIAL REPORT | 157 |
SCHEDULE OF INVESTMENTS (Unaudited)(concluded) | September 30, 2024 |
S&P 500® FUND | |
The following table summarizes the inputs used to value the Fund’s investments at September 30, 2024 (See Note 4 in the Notes to Financial Statements):
Investments in Securities (Assets) | | Level 1
Quoted
Prices | | | Level 2
Significant
Observable
Inputs | | | Level 3
Significant
Unobservable
Inputs | | | Total | |
Common Stocks | | $ | 228,645,470 | | | $ | — | | | $ | — | | | $ | 228,645,470 | |
U.S. Treasury Bills | | | — | | | | 260,750 | | | | — | | | | 260,750 | |
Repurchase Agreements | | | — | | | | 10,633,806 | | | | — | | | | 10,633,806 | |
Securities Lending Collateral | | | 24,671 | | | | — | | | | — | | | | 24,671 | |
Equity Futures Contracts** | | | 62,746 | | | | — | | | | — | | | | 62,746 | |
Equity Index Swap Agreements** | | | — | | | | 47,642 | | | | — | | | | 47,642 | |
Total Assets | | $ | 228,732,887 | | | $ | 10,942,198 | | | $ | — | | | $ | 239,675,085 | |
** | This derivative is reported as unrealized appreciation/depreciation at period end. |
158 | THE RYDEX FUNDS SEMI-ANNUAL FINANCIAL REPORT | SEE NOTES TO FINANCIAL STATEMENTS. |
STATEMENT OF ASSETS AND LIABILITIES (Unaudited) |
September 30, 2024 |
Assets: |
Investments, at value - including $23,290 of securities loaned (cost $139,000,659) | | $ | 228,930,891 | |
Repurchase agreements, at value (cost $10,633,806) | | | 10,633,806 | |
Cash | | | 2,040 | |
Segregated cash with broker | | | 139,082 | |
Unrealized appreciation on OTC swap agreements | | | 47,642 | |
Receivables: |
Securities sold | | | 15,077,877 | |
Fund shares sold | | | 497,832 | |
Dividends | | | 115,057 | |
Variation margin on futures contracts | | | 12,375 | |
Interest | | | 1,434 | |
Securities lending income | | | 5 | |
Total assets | | | 255,458,041 | |
| | | | | |
Liabilities: |
Segregated cash due to broker | | | 20,000 | |
Payable for: |
Fund shares redeemed | | | 15,393,702 | |
Management fees | | | 138,641 | |
Transfer agent fees | | | 102,797 | |
Distribution and service fees | | | 49,895 | |
Portfolio accounting and administration fees | | | 28,665 | |
Return of securities lending collateral | | | 24,671 | |
Swap settlement | | | 4,736 | |
Trustees’ fees* | | | 2,033 | |
Miscellaneous | | | 150,972 | |
Total liabilities | | | 15,916,112 | |
Net assets | | $ | 239,541,929 | |
| | | | | |
Net assets consist of: |
Paid in capital | | $ | 177,391,413 | |
Total distributable earnings (loss) | | | 62,150,516 | |
Net assets | | $ | 239,541,929 | |
Class A: |
Net assets | | $ | 17,892,317 | |
Capital shares outstanding | | | 202,564 | |
Net asset value per share | | $ | 88.33 | |
Maximum offering price per share (Net asset value divided by 95.25%) | | $ | 92.73 | |
Class C: |
Net assets | | $ | 6,513,698 | |
Capital shares outstanding | | | 88,027 | |
Net asset value per share | | $ | 74.00 | |
Class H: |
Net assets | | $ | 215,135,914 | |
Capital shares outstanding | | | 2,435,432 | |
Net asset value per share | | $ | 88.34 | |
STATEMENT OF OPERATIONS (Unaudited) |
Six Months Ended September 30, 2024 |
Investment Income: |
Dividends (net of foreign withholding tax of $372) | | $ | 1,463,404 | |
Interest | | | 297,771 | |
Income from securities lending, net | | | 49 | |
Total investment income | | | 1,761,224 | |
| | | | | |
Expenses: |
Management fees | | | 857,833 | |
Distribution and service fees: |
Class A | | | 22,612 | |
Class C | | | 39,766 | |
Class H | | | 253,391 | |
Transfer agent fees | | | 244,456 | |
Portfolio accounting and administration fees | | | 234,506 | |
Registration fees | | | 136,326 | |
Professional fees | | | 58,706 | |
Custodian fees | | | 14,630 | |
Trustees’ fees* | | | 11,184 | |
Interest expense | | | 1,628 | |
Miscellaneous | | | 24,823 | |
Total expenses | | | 1,899,861 | |
Less: |
Expenses reimbursed by Adviser | | | (57,134 | ) |
Net expenses | | | 1,842,727 | |
Net investment loss | | | (81,503 | ) |
| | | | | |
Net Realized and Unrealized Gain (Loss): |
Net realized gain (loss) on: |
Investments | | | (1,214,943 | ) |
Swap agreements | | | 650,762 | |
Futures contracts | | | (256,889 | ) |
Net realized loss | | | (821,070 | ) |
Net change in unrealized appreciation (depreciation) on: |
Investments | | | 20,400,894 | |
Swap agreements | | | (7,576 | ) |
Futures contracts | | | 28,720 | |
Net change in unrealized appreciation (depreciation) | | | 20,422,038 | |
Net realized and unrealized gain | | | 19,600,968 | |
Net increase in net assets resulting from operations | | $ | 19,519,465 | |
* | Relates to Trustees not deemed “interested persons” within the meaning of Section 2(a)(19) of the 1940 Act. |
SEE NOTES TO FINANCIAL STATEMENTS. | THE RYDEX FUNDS SEMI-ANNUAL FINANCIAL REPORT | 159 |
STATEMENTS OF CHANGES IN NET ASSETS |
| | Six Months Ended
September 30, 2024
(Unaudited) | | | Year Ended
March 31,
2024 | |
Increase (Decrease) in Net Assets from Operations: | | | | | | | | |
Net investment income (loss) | | $ | (81,503 | ) | | $ | 284,404 | |
Net realized gain (loss) on investments | | | (821,070 | ) | | | 55,511 | |
Net change in unrealized appreciation (depreciation) on investments | | | 20,422,038 | | | | 40,190,233 | |
Net increase in net assets resulting from operations | | | 19,519,465 | | | | 40,530,148 | |
| | | | | | | | | |
Distributions to shareholders: | | | | | | | | |
Class A | | | — | | | | (117,707 | ) |
Class C | | | — | | | | (83,641 | ) |
Class H | | | — | | | | (818,361 | ) |
Total distributions to shareholders | | | — | | | | (1,019,709 | ) |
| | | | | | | | | |
Capital share transactions: | | | | | | | | |
Proceeds from sale of shares | | | | | | | | |
Class A | | | 6,605,292 | | | | 22,882,679 | |
Class C | | | 3,449,902 | | | | 7,164,456 | |
Class H | | | 324,475,717 | | | | 890,992,827 | |
Distributions reinvested | | | | | | | | |
Class A | | | — | | | | 114,592 | |
Class C | | | — | | | | 78,106 | |
Class H | | | — | | | | 812,458 | |
Cost of shares redeemed | | | | | | | | |
Class A | | | (7,186,587 | ) | | | (26,229,266 | ) |
Class C | | | (4,850,171 | ) | | | (9,448,939 | ) |
Class H | | | (319,409,790 | ) | | | (809,555,290 | ) |
Net increase from capital share transactions | | | 3,084,363 | | | | 76,811,623 | |
Net increase in net assets | | | 22,603,828 | | | | 116,322,062 | |
| | | | | | | | | |
Net assets: | | | | | | | | |
Beginning of period | | | 216,938,101 | | | | 100,616,039 | |
End of period | | $ | 239,541,929 | | | $ | 216,938,101 | |
| | | | | | | | | |
Capital share activity: | | | | | | | | |
Shares sold | | | | | | | | |
Class A | | | 81,663 | | | | 347,472 | |
Class C | | | 50,560 | | | | 125,678 | |
Class H | | | 3,944,597 | | | | 12,992,625 | |
Shares issued from reinvestment of distributions | | | | | | | | |
Class A | | | — | | | | 1,607 | |
Class C | | | — | | | | 1,299 | |
Class H | | | — | | | | 11,390 | |
Shares redeemed | | | | | | | | |
Class A | | | (87,141 | ) | | | (388,197 | ) |
Class C | | | (69,914 | ) | | | (158,653 | ) |
Class H | | | (3,900,769 | ) | | | (11,830,812 | ) |
Net increase in shares | | | 18,996 | | | | 1,102,409 | |
160 | THE RYDEX FUNDS SEMI-ANNUAL FINANCIAL REPORT | SEE NOTES TO FINANCIAL STATEMENTS. |
This table is presented to show selected data for a share outstanding throughout each period and to assist shareholders in evaluating a Fund’s performance for the periods presented.
Class A | | Six Months Ended
September 30, 2024a | | | Year Ended
March 31,
2024 | | | Year Ended
March 31,
2023 | | | Year Ended
March 31,
2022 | | | Year Ended
March 31,
2021 | | | Year Ended
March 31,
2020 | |
Per Share Data |
Net asset value, beginning of period | | $ | 80.64 | | | $ | 63.54 | | | $ | 70.89 | | | $ | 63.06 | | | $ | 46.64 | | | $ | 51.55 | |
Income (loss) from investment operations: |
Net investment income (loss)b | | | (.01 | ) | | | .15 | | | | .18 | | | | (.18 | ) | | | (.08 | ) | | | .17 | |
Net gain (loss) on investments (realized and unrealized) | | | 7.70 | | | | 17.39 | | | | (6.83 | ) | | | 8.94 | | | | 24.50 | | | | (4.54 | ) |
Total from investment operations | | | 7.69 | | | | 17.54 | | | | (6.65 | ) | | | 8.76 | | | | 24.42 | | | | (4.37 | ) |
Less distributions from: |
Net investment income | | | — | | | | (.09 | ) | | | — | | | | — | | | | (.02 | ) | | | (.12 | ) |
Net realized gains | | | — | | | | (.35 | ) | | | (.70 | ) | | | (.93 | ) | | | (7.98 | ) | | | (.42 | ) |
Total distributions | | | — | | | | (.44 | ) | | | (.70 | ) | | | (.93 | ) | | | (8.00 | ) | | | (.54 | ) |
Net asset value, end of period | | $ | 88.33 | | | $ | 80.64 | | | $ | 63.54 | | | $ | 70.89 | | | $ | 63.06 | | | $ | 46.64 | |
|
Total Returnc | | | 9.54 | % | | | 27.72 | % | | | (9.32 | %) | | | 13.82 | % | | | 53.64 | % | | | (8.67 | %) |
Ratios/Supplemental Data |
Net assets, end of period (in thousands) | | $ | 17,892 | | | $ | 16,777 | | | $ | 15,703 | | | $ | 18,856 | | | $ | 18,653 | | | $ | 12,798 | |
Ratios to average net assets: |
Net investment income (loss) | | | (0.03 | %) | | | 0.21 | % | | | 0.30 | % | | | (0.25 | %) | | | (0.13 | %) | | | 0.31 | % |
Total expenses | | | 1.63 | % | | | 1.66 | % | | | 1.60 | % | | | 1.56 | % | | | 1.65 | % | | | 1.68 | % |
Net expensesd | | | 1.58 | % | | | 1.62 | % | | | 1.60 | % | | | 1.56 | % | | | 1.65 | % | | | 1.68 | % |
Portfolio turnover rate | | | 50 | % | | | 243 | % | | | 701 | % | | | 268 | % | | | 284 | % | | | 227 | % |
Class C | | Six Months Ended
September 30, 2024a | | | Year Ended
March 31,
2024 | | | Year Ended
March 31,
2023 | | | Year Ended
March 31,
2022 | | | Year Ended
March 31,
2021 | | | Year Ended
March 31,
2020 | |
Per Share Data |
Net asset value, beginning of period | | $ | 67.81 | | | $ | 53.89 | | | $ | 60.71 | | | $ | 54.52 | | | $ | 41.37 | | | $ | 46.12 | |
Income (loss) from investment operations: |
Net investment income (loss)b | | | (.28 | ) | | | (.31 | ) | | | (.30 | ) | | | (.60 | ) | | | (.46 | ) | | | (.24 | ) |
Net gain (loss) on investments (realized and unrealized) | | | 6.47 | | | | 14.67 | | | | (5.82 | ) | | | 7.72 | | | | 21.61 | | | | (3.97 | ) |
Total from investment operations | | | 6.19 | | | | 14.36 | | | | (6.12 | ) | | | 7.12 | | | | 21.15 | | | | (4.21 | ) |
Less distributions from: |
Net investment income | | | — | | | | (.09 | ) | | | — | | | | — | | | | (.02 | ) | | | (.12 | ) |
Net realized gains | | | — | | | | (.35 | ) | | | (.70 | ) | | | (.93 | ) | | | (7.98 | ) | | | (.42 | ) |
Total distributions | | | — | | | | (.44 | ) | | | (.70 | ) | | | (.93 | ) | | | (8.00 | ) | | | (.54 | ) |
Net asset value, end of period | | $ | 74.00 | | | $ | 67.81 | | | $ | 53.89 | | | $ | 60.71 | | | $ | 54.52 | | | $ | 41.37 | |
|
Total Returnc | | | 9.13 | % | | | 26.78 | % | | | (10.02 | %) | | | 12.99 | % | | | 52.49 | % | | | (9.35 | %) |
Ratios/Supplemental Data |
Net assets, end of period (in thousands) | | $ | 6,514 | | | $ | 7,282 | | | $ | 7,494 | | | $ | 10,273 | | | $ | 12,040 | | | $ | 8,981 | |
Ratios to average net assets: |
Net investment income (loss) | | | (0.80 | %) | | | (0.53 | %) | | | (0.57 | %) | | | (1.00 | %) | | | (0.88 | %) | | | (0.50 | %) |
Total expenses | | | 2.38 | % | | | 2.41 | % | | | 2.36 | % | | | 2.31 | % | | | 2.39 | % | | | 2.43 | % |
Net expensesd | | | 2.33 | % | | | 2.38 | % | | | 2.36 | % | | | 2.31 | % | | | 2.39 | % | | | 2.43 | % |
Portfolio turnover rate | | | 50 | % | | | 243 | % | | | 701 | % | | | 268 | % | | | 284 | % | | | 227 | % |
SEE NOTES TO FINANCIAL STATEMENTS. | THE RYDEX FUNDS SEMI-ANNUAL FINANCIAL REPORT | 161 |
FINANCIAL HIGHLIGHTS (concluded) |
This table is presented to show selected data for a share outstanding throughout each period and to assist shareholders in evaluating a Fund’s performance for the periods presented.
Class H | | Six Months Ended
September 30, 2024a | | | Year Ended
March 31,
2024 | | | Year Ended
March 31,
2023 | | | Year Ended
March 31,
2022 | | | Year Ended
March 31,
2021 | | | Year Ended
March 31,
2020 | |
Per Share Data |
Net asset value, beginning of period | | $ | 80.65 | | | $ | 63.54 | | | $ | 70.90 | | | $ | 63.07 | | | $ | 46.64 | | | $ | 51.54 | |
Income (loss) from investment operations: |
Net investment income (loss)b | | | (.02 | ) | | | .14 | | | | .15 | | | | (.18 | ) | | | (.08 | ) | | | .15 | |
Net gain (loss) on investments (realized and unrealized) | | | 7.71 | | | | 17.41 | | | | (6.81 | ) | | | 8.94 | | | | 24.51 | | | | (4.51 | ) |
Total from investment operations | | | 7.69 | | | | 17.55 | | | | (6.66 | ) | | | 8.76 | | | | 24.43 | | | | (4.36 | ) |
Less distributions from: |
Net investment income | | | — | | | | (.09 | ) | | | — | | | | — | | | | (.02 | ) | | | (.12 | ) |
Net realized gains | | | — | | | | (.35 | ) | | | (.70 | ) | | | (.93 | ) | | | (7.98 | ) | | | (.42 | ) |
Total distributions | | | — | | | | (.44 | ) | | | (.70 | ) | | | (.93 | ) | | | (8.00 | ) | | | (.54 | ) |
Net asset value, end of period | | $ | 88.34 | | | $ | 80.65 | | | $ | 63.54 | | | $ | 70.90 | | | $ | 63.07 | | | $ | 46.64 | |
|
Total Return | | | 9.54 | % | | | 27.71 | % | | | (9.32 | %) | | | 13.84 | % | | | 53.64 | % | | | (8.65 | %) |
Ratios/Supplemental Data |
Net assets, end of period (in thousands) | | $ | 215,136 | | | $ | 192,879 | | | $ | 77,419 | | | $ | 130,055 | | | $ | 123,613 | | | $ | 112,799 | |
Ratios to average net assets: |
Net investment income (loss) | | | (0.05 | %) | | | 0.21 | % | | | 0.23 | % | | | (0.25 | %) | | | (0.13 | %) | | | 0.28 | % |
Total expenses | | | 1.64 | % | | | 1.65 | % | | | 1.61 | % | | | 1.56 | % | | | 1.65 | % | | | 1.68 | % |
Net expensesd | | | 1.59 | % | | | 1.62 | % | | | 1.61 | % | | | 1.56 | % | | | 1.65 | % | | | 1.68 | % |
Portfolio turnover rate | | | 50 | % | | | 243 | % | | | 701 | % | | | 268 | % | | | 284 | % | | | 227 | % |
a | Unaudited figures for the period ended September 30, 2024. Percentage amounts for the period, except total return and portfolio turnover rate, have been annualized. |
b | Net investment income (loss) per share was computed using average shares outstanding throughout the period. |
c | Total return does not reflect the impact of any applicable sales charges. |
d | Net expense information reflects the expense ratios after expense waivers and reimbursements, as applicable. |
162 | THE RYDEX FUNDS SEMI-ANNUAL FINANCIAL REPORT | SEE NOTES TO FINANCIAL STATEMENTS. |
SCHEDULE OF INVESTMENTS (Unaudited) | September 30, 2024 |
INVERSE S&P 500® STRATEGY FUND | |
| | Shares | | | Value | |
MUTUAL FUNDS† - 24.0% |
Guggenheim Strategy Fund II1 | | | 262,625 | | | $ | 6,513,103 | |
Guggenheim Ultra Short Duration Fund — Institutional Class1 | | | 426,990 | | | | 4,278,442 | |
Total Mutual Funds | | | | |
(Cost $10,738,043) | | | | | | | 10,791,545 | |
| | | | | | | | | |
| | | Face
Amount | | | | | |
FEDERAL AGENCY DISCOUNT NOTES†† - 26.0% |
Federal Home Loan Bank |
4.69% due 11/13/242 | | $ | 4,000,000 | | | | 3,977,210 | |
4.68% due 10/23/242 | | | 3,000,000 | | | | 2,991,420 | |
5.18% due 10/04/242 | | | 2,700,000 | | | | 2,698,963 | |
Federal Farm Credit Bank |
4.73% due 10/18/242 | | | 2,000,000 | | | | 1,995,533 | |
Total Federal Agency Discount Notes | | | | |
(Cost $11,662,997) | | | | | | | 11,663,126 | |
| | | | | | | | | |
FEDERAL AGENCY NOTES†† - 21.1% |
Federal Home Loan Bank |
4.96% (SOFR + 0.12%, Rate Floor: 0.00%) due 11/18/24◊ | | | 3,000,000 | | | | 3,000,378 | |
4.88% (SOFR + 0.04%, Rate Floor: 0.00%) due 06/20/25◊ | | | 2,500,000 | | | | 2,499,890 | |
4.84% (SOFR — 0.00%, Rate Floor: 0.00%) due 11/15/24◊ | | | 2,000,000 | | | | 1,999,896 | |
Federal Farm Credit Bank |
5.50% due 11/25/24 | | | 2,000,000 | | | | 2,002,160 | |
Total Federal Agency Notes | | | | |
(Cost $9,500,778) | | | | | | | 9,502,324 | |
U.S. TREASURY BILLS†† - 11.9% |
U.S. Treasury Bills |
4.70% due 10/22/242 | | | 4,000,000 | | | | 3,989,008 | |
4.85% due 12/12/242,3 | | | 900,000 | | | | 891,954 | |
4.75% due 12/12/242 | | | 300,000 | | | | 297,318 | |
4.50% due 12/12/242 | | | 150,000 | | | | 148,659 | |
4.63% due 10/10/242,4 | | | 13,000 | | | | 12,985 | |
Total U.S. Treasury Bills | | | | |
(Cost $5,338,100) | | | | | | | 5,339,924 | |
| | | | | | | | | |
REPURCHASE AGREEMENTS††,5 - 67.2% |
J.P. Morgan Securities LLC
issued 09/30/24 at 4.86%
due 10/01/243 | | | 16,553,727 | | | | 16,553,727 | |
BofA Securities, Inc.
issued 09/30/24 at 4.85%
due 10/01/243 | | | 13,672,608 | | | | 13,672,608 | |
Total Repurchase Agreements | | | | |
(Cost $30,226,335) | | | | | | | 30,226,335 | |
| | | | | | | | | |
Total Investments - 150.2% | | | | |
(Cost $67,466,253) | | $ | 67,523,254 | |
Other Assets & Liabilities, net - (50.2)% | | | (22,559,940 | ) |
Total Net Assets - 100.0% | | $ | 44,963,314 | |
Futures Contracts |
Description | | Number of
Contracts | | | Expiration
Date | | | Notional
Amount | | | Value and
Unrealized
Depreciation** | |
Equity Futures Contracts Sold Short† |
S&P 500 Index Mini Futures Contracts | | | 28 | | | | Dec 2024 | | | $ | 8,142,400 | | | $ | (54,769 | ) |
Total Return Swap Agreements |
Counterparty | Index | Type | | Financing
Rate | | Payment
Frequency | | | Maturity
Date | | | Units | | | Notional
Amount | | | Value and
Unrealized
Depreciation | |
OTC Equity Index Swap Agreements Sold Short†† |
Goldman Sachs International | S&P 500 Index | Receive | | 5.13% (Federal
Funds Rate +
0.30%) | | | At Maturity | | | | 12/18/24 | | 1,153 | | $ | 6,646,395 | | | $ | (46,389 | ) |
Barclays Bank plc | S&P 500 Index | Receive | | 5.14% (SOFR +
0.30%) | | | At Maturity | | | | 12/19/24 | | 1,697 | | | 9,779,426 | | | | (50,149 | ) |
BNP Paribas | S&P 500 Index | Receive | | 5.28% (Federal
Funds Rate +
0.45%) | | | At Maturity | | | | 12/19/24 | | 3,537 | | | 20,381,552 | | | | (142,255 | ) |
| | | | | | | | | | | | | | | | | | | $ | 36,807,373 | | | $ | (238,793 | ) |
SEE NOTES TO FINANCIAL STATEMENTS. | THE RYDEX FUNDS SEMI-ANNUAL FINANCIAL REPORT | 163 |
SCHEDULE OF INVESTMENTS (Unaudited)(continued) | September 30, 2024 |
INVERSE S&P 500® STRATEGY FUND | |
** | Includes cumulative appreciation (depreciation). Variation margin is reported within the Statement of Assets and Liabilities. |
† | Value determined based on Level 1 inputs — See Note 4. |
†† | Value determined based on Level 2 inputs — See Note 4. |
◊ | Variable rate security. Rate indicated is the rate effective at September 30, 2024. In some instances, the effective rate is limited by a minimum rate floor or a maximum rate cap established by the issuer. The settlement status of a position may also impact the effective rate indicated. In some cases, a position may be unsettled at period end and may not have a stated effective rate. In instances where multiple underlying reference rates and spread amounts are shown, the effective rate is based on a weighted average. |
1 | Affiliated issuer. |
2 | Rate indicated is the effective yield at the time of purchase. |
3 | All or a portion of this security is pledged as equity index swap collateral at September 30, 2024. |
4 | All or a portion of this security is pledged as futures collateral at September 30, 2024. |
5 | Repurchase Agreements — See Note 6. |
| | plc — Public Limited Company |
| | SOFR — Secured Overnight Financing Rate |
| | |
| | See Sector Classification in Other Information section. |
The following table summarizes the inputs used to value the Fund’s investments at September 30, 2024 (See Note 4 in the Notes to Financial Statements):
Investments in Securities (Assets) | | Level 1
Quoted
Prices | | | Level 2
Significant
Observable
Inputs | | | Level 3
Significant
Unobservable
Inputs | | | Total | |
Mutual Funds | | $ | 10,791,545 | | | $ | — | | | $ | — | | | $ | 10,791,545 | |
Federal Agency Discount Notes | | | — | | | | 11,663,126 | | | | — | | | | 11,663,126 | |
Federal Agency Notes | | | — | | | | 9,502,324 | | | | — | | | | 9,502,324 | |
U.S. Treasury Bills | | | — | | | | 5,339,924 | | | | — | | | | 5,339,924 | |
Repurchase Agreements | | | — | | | | 30,226,335 | | | | — | | | | 30,226,335 | |
Total Assets | | $ | 10,791,545 | | | $ | 56,731,709 | | | $ | — | | | $ | 67,523,254 | |
Investments in Securities (Liabilities) | | Level 1
Quoted
Prices | | | Level 2
Significant
Observable
Inputs | | | Level 3
Significant
Unobservable
Inputs | | | Total | |
Equity Futures Contracts** | | $ | 54,769 | | | $ | — | | | $ | — | | | $ | 54,769 | |
Equity Index Swap Agreements** | | | — | | | | 238,793 | | | | — | | | | 238,793 | |
Total Liabilities | | $ | 54,769 | | | $ | 238,793 | | | $ | — | | | $ | 293,562 | |
** | This derivative is reported as unrealized appreciation/depreciation at period end. |
164 | THE RYDEX FUNDS SEMI-ANNUAL FINANCIAL REPORT | SEE NOTES TO FINANCIAL STATEMENTS. |
SCHEDULE OF INVESTMENTS (Unaudited)(concluded) | September 30, 2024 |
INVERSE S&P 500® STRATEGY FUND | |
Affiliated Transactions
Investments representing 5% or more of the outstanding voting shares of a company, or control of or by, or common control under Guggenheim Investments (“GI”), result in that company being considered an affiliated issuer, as defined in the 1940 Act.
The Fund may invest in certain of the underlying series of Guggenheim Strategy Funds Trust, including Guggenheim Strategy Fund II and Guggenheim Strategy Fund III (collectively, the “Guggenheim Strategy Funds”), each of which are open-end management investment companies managed by GI. The Guggenheim Strategy Funds, which launched on March 11, 2014, are offered as short term investment options only to mutual funds, trusts, and other accounts managed by GI and/or its affiliates, and are not available to the public. The Guggenheim Strategy Funds pay no investment management fees. The Guggenheim Strategy Funds’ annual report on Form N-CSR dated September 30, 2023 is available publicly or upon request. This information is available from the EDGAR database on the SEC’s website at https://www.sec.gov/Archives/edgar/data/1601445/000182126823000217/gug86449-ncsr.htm. The Fund may invest in certain of the underlying series of Guggenheim Funds Trust, which are open-end management investment companies managed by GI, are available to the public and whose most recent annual report on Form N-CSR is available publicly or upon request.
Transactions during the period ended September 30, 2024, in which the company is an affiliated issuer, were as follows:
Security Name | | Value
03/31/24 | | | Additions | | | Reductions | | | Realized
Gain (Loss) | | | Change in
Unrealized
Appreciation
(Depreciation) | | | Value
09/30/24 | | | Shares
09/30/24 | | | Investment
Income | |
Mutual Funds | | | | | | | | | | | | | | | | | | | | | | | | | | | | | | | | |
Guggenheim Strategy Fund II | | $ | 6,460,578 | | | $ | — | | | $ | — | | | $ | — | | | $ | 52,525 | | | $ | 6,513,103 | | | | 262,625 | | | $ | 184,975 | |
Guggenheim Ultra Short Duration Fund — Institutional Class | | $ | 4,231,473 | | | $ | — | | | $ | — | | | $ | — | | | $ | 46,969 | | | $ | 4,278,442 | | | | 426,990 | | | $ | 110,119 | |
| | | $ | 10,692,051 | | | $ | — | | | $ | — | | | $ | — | | | $ | 99,494 | | | $ | 10,791,545 | | | | | | | $ | 295,094 | |
SEE NOTES TO FINANCIAL STATEMENTS. | THE RYDEX FUNDS SEMI-ANNUAL FINANCIAL REPORT | 165 |
INVERSE S&P 500® STRATEGY FUND | |
STATEMENT OF ASSETS AND LIABILITIES (Unaudited) |
September 30, 2024 |
Assets: |
Investments in unaffiliated issuers, at value (cost $26,501,875) | | $ | 26,505,374 | |
Investments in affiliated issuers, at value (cost $10,738,043) | | | 10,791,545 | |
Repurchase agreements, at value (cost $30,226,335) | | | 30,226,335 | |
Segregated cash with broker | | | 395,882 | |
Receivables: |
Fund shares sold | | | 268,653 | |
Interest | | | 79,158 | |
Dividends | | | 46,192 | |
Total assets | | | 68,313,139 | |
| | | | | |
Liabilities: |
Unrealized depreciation on OTC swap agreements | | | 238,793 | |
Payable for: |
Fund shares redeemed | | | 22,638,848 | |
Swap settlement | | | 323,692 | |
Management fees | | | 52,917 | |
Variation margin on futures contracts | | | 34,650 | |
Transfer agent fees | | | 22,909 | |
Portfolio accounting and administration fees | | | 3,138 | |
Distribution and service fees | | | 652 | |
Trustees’ fees* | | | 438 | |
Miscellaneous | | | 33,788 | |
Total liabilities | | | 23,349,825 | |
Net assets | | $ | 44,963,314 | |
| | | | | |
Net assets consist of: |
Paid in capital | | $ | 325,242,449 | |
Total distributable earnings (loss) | | | (280,279,135 | ) |
Net assets | | $ | 44,963,314 | |
| | | | | |
Investor Class: |
Net assets | | $ | 42,570,603 | |
Capital shares outstanding | | | 1,782,187 | |
Net asset value per share | | $ | 23.89 | |
Class A: |
Net assets | | $ | 1,053,391 | |
Capital shares outstanding | | | 48,649 | |
Net asset value per share | | $ | 21.65 | |
Maximum offering price per share (Net asset value divided by 95.25%) | | $ | 22.73 | |
Class C: |
Net assets | | $ | 199,775 | |
Capital shares outstanding | | | 10,797 | |
Net asset value per share | | $ | 18.50 | |
Class H: |
Net assets | | $ | 1,139,545 | |
Capital shares outstanding | | | 52,578 | |
Net asset value per share | | $ | 21.67 | |
STATEMENT OF OPERATIONS (Unaudited) |
Six Months Ended September 30, 2024 |
Investment Income: |
Dividends from securities of affiliated issuers | | $ | 295,094 | |
Interest | | | 952,408 | |
Total investment income | | | 1,247,502 | |
| | | | | |
Expenses: |
Management fees | | | 209,142 | |
Distribution and service fees: |
Class A | | | 1,964 | |
Class C | | | 1,599 | |
Class H | | | 1,541 | |
Transfer agent fees | | | 47,759 | |
Portfolio accounting and administration fees | | | 35,455 | |
Registration fees | | | 12,856 | |
Professional fees | | | 12,395 | |
Interest expense | | | 5,528 | |
Custodian fees | | | 2,963 | |
Trustees’ fees* | | | 2,327 | |
Miscellaneous | | | 20,087 | |
Total expenses | | | 353,616 | |
Less: |
Expenses reimbursed by Adviser | | | (23,243 | ) |
Expenses waived by Adviser | | | (5,313 | ) |
Total waived/reimbursed expenses | | | (28,556 | ) |
Net expenses | | | 325,060 | |
Net investment income | | | 922,442 | |
| | | | | |
Net Realized and Unrealized Gain (Loss): |
Net realized gain (loss) on: |
Investments in unaffiliated issuers | | | 52 | |
Swap agreements | | | (4,360,718 | ) |
Futures contracts | | | (260,014 | ) |
Net realized loss | | | (4,620,680 | ) |
Net change in unrealized appreciation (depreciation) on: |
Investments in unaffiliated issuers | | | 3,164 | |
Investments in affiliated issuers | | | 99,494 | |
Swap agreements | | | 66,768 | |
Futures contracts | | | (823 | ) |
Net change in unrealized appreciation (depreciation) | | | 168,603 | |
Net realized and unrealized loss | | | (4,452,077 | ) |
Net decrease in net assets resulting from operations | | $ | (3,529,635 | ) |
* | Relates to Trustees not deemed “interested persons” within the meaning of Section 2(a)(19) of the 1940 Act. |
166 | THE RYDEX FUNDS SEMI-ANNUAL FINANCIAL REPORT | SEE NOTES TO FINANCIAL STATEMENTS. |
INVERSE S&P 500® STRATEGY FUND | |
STATEMENTS OF CHANGES IN NET ASSETS |
| | Six Months Ended
September 30, 2024
(Unaudited) | | | Year Ended
March 31,
2024 | |
Increase (Decrease) in Net Assets from Operations: | | | | | | | | |
Net investment income | | $ | 922,442 | | | $ | 1,976,484 | |
Net realized loss on investments | | | (4,620,680 | ) | | | (12,570,407 | ) |
Net change in unrealized appreciation (depreciation) on investments | | | 168,603 | | | | 2,115,246 | |
Net decrease in net assets resulting from operations | | | (3,529,635 | ) | | | (8,478,677 | ) |
| | | | | | | | | |
Distributions to shareholders: | | | | | | | | |
Investor Class | | | — | | | | (946,025 | ) |
Class A | | | — | | | | (110,261 | ) |
Class C | | | — | | | | (16,224 | ) |
Class H | | | — | | | | (21,482 | ) |
Total distributions to shareholders | | | — | | | | (1,093,992 | ) |
| | | | | | | | | |
Capital share transactions: | | | | | | | | |
Proceeds from sale of shares | | | | | | | | |
Investor Class | | | 164,565,647 | | | | 110,588,564 | |
Class A | | | 9,148,317 | | | | 5,459,230 | |
Class C | | | 35,011 | | | | 147,798 | |
Class H | | | 5,767,845 | | | | 15,057,008 | |
Distributions reinvested | | | | | | | | |
Investor Class | | | — | | | | 931,300 | |
Class A | | | — | | | | 109,255 | |
Class C | | | — | | | | 16,224 | |
Class H | | | — | | | | 21,466 | |
Cost of shares redeemed | | | | | | | | |
Investor Class | | | (154,458,736 | ) | | | (123,376,671 | ) |
Class A | | | (9,119,142 | ) | | | (7,927,015 | ) |
Class C | | | (236,795 | ) | | | (423,222 | ) |
Class H | | | (5,808,098 | ) | | | (15,201,206 | ) |
Net increase (decrease) from capital share transactions | | | 9,894,049 | | | | (14,597,269 | ) |
Net increase (decrease) in net assets | | | 6,364,414 | | | | (24,169,938 | ) |
| | | | | | | | | |
Net assets: | | | | | | | | |
Beginning of period | | | 38,598,900 | | | | 62,768,838 | |
End of period | | $ | 44,963,314 | | | $ | 38,598,900 | |
| | | | | | | | | |
Capital share activity: | | | | | | | | |
Shares sold | | | | | | | | |
Investor Class | | | 6,736,253 | | | | 3,824,309 | |
Class A | | | 396,485 | | | | 199,424 | |
Class C | | | 1,855 | | | | 6,382 | |
Class H | | | 244,777 | | | | 601,861 | |
Shares issued from reinvestment of distributions | | | | | | | | |
Investor Class | | | — | | | | 33,308 | |
Class A | | | — | | | | 4,305 | |
Class C | | | — | | | | 744 | |
Class H | | | — | | | | 845 | |
Shares redeemed | | | | | | | | |
Investor Class | | | (6,366,034 | ) | | | (4,258,649 | ) |
Class A | | | (400,619 | ) | | | (298,253 | ) |
Class C | | | (12,250 | ) | | | (18,572 | ) |
Class H | | | (246,410 | ) | | | (605,047 | ) |
Net increase (decrease) in shares | | | 354,057 | | | | (509,343 | ) |
SEE NOTES TO FINANCIAL STATEMENTS. | THE RYDEX FUNDS SEMI-ANNUAL FINANCIAL REPORT | 167 |
INVERSE S&P 500® STRATEGY FUND | |
This table is presented to show selected data for a share outstanding throughout each period and to assist shareholders in evaluating a Fund’s performance for the periods presented.
Investor Class | | Six Months Ended
September 30, 2024a | | | Year Ended
March 31,
2024 | | | Year Ended
March 31,
2023 | | | Year Ended
March 31,
2022 | | | Year Ended
March 31,
2021 | | | Year Ended
March 31,
2020 | |
Per Share Data |
Net asset value, beginning of period | | $ | 25.30 | | | $ | 31.00 | | | $ | 28.88 | | | $ | 34.46 | | | $ | 56.92 | | | $ | 56.77 | |
Income (loss) from investment operations: |
Net investment income (loss)b | | | .50 | | | | 1.17 | | | | .42 | | | | (.28 | ) | | | (.47 | ) | | | .31 | |
Net gain (loss) on investments (realized and unrealized) | | | (1.91 | ) | | | (6.11 | ) | | | 1.70 | | | | (5.30 | ) | | | (21.84 | ) | | | .26 | |
Total from investment operations | | | (1.41 | ) | | | (4.94 | ) | | | 2.12 | | | | (5.58 | ) | | | (22.31 | ) | | | .57 | |
Less distributions from: |
Net investment income | | | — | | | | (.76 | ) | | | — | | | | — | | | | (.15 | ) | | | (.42 | ) |
Total distributions | | | — | | | | (.76 | ) | | | — | | | | — | | | | (.15 | ) | | | (.42 | ) |
Net asset value, end of period | | $ | 23.89 | | | $ | 25.30 | | | $ | 31.00 | | | $ | 28.88 | | | $ | 34.46 | | | $ | 56.92 | |
|
Total Return | | | (5.57 | %) | | | (16.19 | %) | | | 7.34 | % | | | (16.19 | %) | | | (39.21 | %) | | | 1.10 | % |
Ratios/Supplemental Data |
Net assets, end of period (in thousands) | | $ | 42,571 | | | $ | 35,725 | | | $ | 56,203 | | | $ | 47,555 | | | $ | 53,937 | | | $ | 85,839 | |
Ratios to average net assets: |
Net investment income (loss) | | | 3.99 | % | | | 4.04 | % | | | 1.31 | % | | | (0.91 | %) | | | (1.12 | %) | | | 0.58 | % |
Total expensesc | | | 1.50 | % | | | 1.50 | % | | | 1.53 | % | | | 1.41 | % | | | 1.51 | % | | | 1.53 | % |
Net expensesd | | | 1.38 | % | | | 1.40 | % | | | 1.49 | % | | | 1.39 | % | | | 1.50 | % | | | 1.51 | % |
Portfolio turnover rate | | | — | | | | — | | | | — | | | | — | | | | — | | | | — | |
Class A | | Six Months Ended
September 30, 2024a | | | Year Ended
March 31,
2024 | | | Year Ended
March 31,
2023 | | | Year Ended
March 31,
2022 | | | Year Ended
March 31,
2021 | | | Year Ended
March 31,
2020 | |
Per Share Data |
Net asset value, beginning of period | | $ | 22.95 | | | $ | 28.27 | | | $ | 26.40 | | | $ | 31.58 | | | $ | 52.33 | | | $ | 52.36 | |
Income (loss) from investment operations: |
Net investment income (loss)b | | | .44 | | | | 1.02 | | | | .40 | | | | (.32 | ) | | | (.56 | ) | | | .21 | |
Net gain (loss) on investments (realized and unrealized) | | | (1.74 | ) | | | (5.58 | ) | | | 1.47 | | | | (4.86 | ) | | | (20.04 | ) | | | .18 | |
Total from investment operations | | | (1.30 | ) | | | (4.56 | ) | | | 1.87 | | | | (5.18 | ) | | | (20.60 | ) | | | .39 | |
Less distributions from: |
Net investment income | | | — | | | | (.76 | ) | | | — | | | | — | | | | (.15 | ) | | | (.42 | ) |
Total distributions | | | — | | | | (.76 | ) | | | — | | | | — | | | | (.15 | ) | | | (.42 | ) |
Net asset value, end of period | | $ | 21.65 | | | $ | 22.95 | | | $ | 28.27 | | | $ | 26.40 | | | $ | 31.58 | | | $ | 52.33 | |
|
Total Returne | | | (5.66 | %) | | | (16.38 | %) | | | 7.08 | % | | | (16.40 | %) | | | (39.38 | %) | | | 0.85 | % |
Ratios/Supplemental Data |
Net assets, end of period (in thousands) | | $ | 1,053 | | | $ | 1,211 | | | $ | 4,164 | | | $ | 1,829 | | | $ | 1,540 | | | $ | 7,575 | |
Ratios to average net assets: |
Net investment income (loss) | | | 3.82 | % | | | 3.77 | % | | | 1.34 | % | | | (1.15 | %) | | | (1.39 | %) | | | 0.43 | % |
Total expensesc | | | 1.75 | % | | | 1.76 | % | | | 1.79 | % | | | 1.66 | % | | | 1.78 | % | | | 1.78 | % |
Net expensesd | | | 1.63 | % | | | 1.66 | % | | | 1.74 | % | | | 1.64 | % | | | 1.77 | % | | | 1.76 | % |
Portfolio turnover rate | | | — | | | | — | | | | — | | | | — | | | | — | | | | — | |
168 | THE RYDEX FUNDS SEMI-ANNUAL FINANCIAL REPORT | SEE NOTES TO FINANCIAL STATEMENTS. |
INVERSE S&P 500® STRATEGY FUND | |
FINANCIAL HIGHLIGHTS (continued) |
This table is presented to show selected data for a share outstanding throughout each period and to assist shareholders in evaluating a Fund’s performance for the periods presented.
Class C | | Six Months Ended
September 30, 2024a | | | Year Ended
March 31,
2024 | | | Year Ended
March 31,
2023 | | | Year Ended
March 31,
2022 | | | Year Ended
March 31,
2021 | | | Year Ended
March 31,
2020 | |
Per Share Data |
Net asset value, beginning of period | | $ | 19.69 | | | $ | 24.55 | | | $ | 23.10 | | | $ | 27.84 | | | $ | 46.49 | | | $ | 46.92 | |
Income (loss) from investment operations: |
Net investment income (loss)b | | | .30 | | | | .70 | | | | .09 | | | | (.46 | ) | | | (.80 | ) | | | (.22 | ) |
Net gain (loss) on investments (realized and unrealized) | | | (1.49 | ) | | | (4.80 | ) | | | 1.36 | | | | (4.28 | ) | | | (17.70 | ) | | | .21 | |
Total from investment operations | | | (1.19 | ) | | | (4.10 | ) | | | 1.45 | | | | (4.74 | ) | | | (18.50 | ) | | | (.01 | ) |
Less distributions from: |
Net investment income | | | — | | | | (.76 | ) | | | — | | | | — | | | | (.15 | ) | | | (.42 | ) |
Total distributions | | | — | | | | (.76 | ) | | | — | | | | — | | | | (.15 | ) | | | (.42 | ) |
Net asset value, end of period | | $ | 18.50 | | | $ | 19.69 | | | $ | 24.55 | | | $ | 23.10 | | | $ | 27.84 | | | $ | 46.49 | |
|
Total Returne | | | (6.04 | %) | | | (16.99 | %) | | | 6.28 | % | | | (17.03 | %) | | | (39.82 | %) | | | 0.09 | % |
Ratios/Supplemental Data |
Net assets, end of period (in thousands) | | $ | 200 | | | $ | 417 | | | $ | 801 | | | $ | 762 | | | $ | 449 | | | $ | 6,376 | |
Ratios to average net assets: |
Net investment income (loss) | | | 3.08 | % | | | 3.03 | % | | | 0.35 | % | | | (1.92 | %) | | | (2.16 | %) | | | (0.51 | %) |
Total expensesc | | | 2.49 | % | | | 2.49 | % | | | 2.53 | % | | | 2.41 | % | | | 2.54 | % | | | 2.53 | % |
Net expensesd | | | 2.37 | % | | | 2.39 | % | | | 2.48 | % | | | 2.39 | % | | | 2.53 | % | | | 2.51 | % |
Portfolio turnover rate | | | — | | | | — | | | | — | | | | — | | | | — | | | | — | |
SEE NOTES TO FINANCIAL STATEMENTS. | THE RYDEX FUNDS SEMI-ANNUAL FINANCIAL REPORT | 169 |
INVERSE S&P 500® STRATEGY FUND | |
FINANCIAL HIGHLIGHTS (concluded) |
This table is presented to show selected data for a share outstanding throughout each period and to assist shareholders in evaluating a Fund’s performance for the periods presented.
Class H | | Six Months Ended
September 30, 2024a | | | Year Ended
March 31,
2024 | | | Year Ended
March 31,
2023 | | | Year Ended
March 31,
2022 | | | Year Ended
March 31,
2021 | | | Year Ended
March 31,
2020 | |
Per Share Data |
Net asset value, beginning of period | | $ | 22.98 | | | $ | 28.29 | | | $ | 26.41 | | | $ | 31.58 | | | $ | 52.32 | | | $ | 52.35 | |
Income (loss) from investment operations: |
Net investment income (loss)b | | | .44 | | | | 1.00 | | | | .25 | | | | (.32 | ) | | | (.56 | ) | | | .17 | |
Net gain (loss) on investments (realized and unrealized) | | | (1.75 | ) | | | (5.55 | ) | | | 1.63 | | | | (4.85 | ) | | | (20.03 | ) | | | .22 | |
Total from investment operations | | | (1.31 | ) | | | (4.55 | ) | | | 1.88 | | | | (5.17 | ) | | | (20.59 | ) | | | .39 | |
Less distributions from: |
Net investment income | | | — | | | | (.76 | ) | | | — | | | | — | | | | (.15 | ) | | | (.42 | ) |
Total distributions | | | — | | | | (.76 | ) | | | — | | | | — | | | | (.15 | ) | | | (.42 | ) |
Net asset value, end of period | | $ | 21.67 | | | $ | 22.98 | | | $ | 28.29 | | | $ | 26.41 | | | $ | 31.58 | | | $ | 52.32 | |
|
Total Return | | | (5.70 | %) | | | (16.36 | %) | | | 7.12 | % | | | (16.37 | %) | | | (39.37 | %) | | | 0.85 | % |
Ratios/Supplemental Data |
Net assets, end of period (in thousands) | | $ | 1,140 | | | $ | 1,246 | | | $ | 1,600 | | | $ | 2,618 | | | $ | 933 | | | $ | 8,890 | |
Ratios to average net assets: |
Net investment income (loss) | | | 3.82 | % | | | 3.81 | % | | | 0.86 | % | | | (1.15 | %) | | | (1.38 | %) | | | 0.34 | % |
Total expensesc | | | 1.75 | % | | | 1.75 | % | | | 1.78 | % | | | 1.66 | % | | | 1.78 | % | | | 1.78 | % |
Net expensesd | | | 1.62 | % | | | 1.64 | % | | | 1.74 | % | | | 1.64 | % | | | 1.76 | % | | | 1.76 | % |
Portfolio turnover rate | | | — | | | | — | | | | — | | | | — | | | | — | | | | — | |
a | Unaudited figures for the period ended September 30, 2024. Percentage amounts for the period, except total return and portfolio turnover rate, have been annualized. |
b | Net investment income (loss) per share was computed using average shares outstanding throughout the period. |
c | Does not include expenses of the underlying funds in which the Fund invests. |
d | Net expense information reflects the expense ratios after expense waivers and reimbursements, as applicable. |
e | Total return does not reflect the impact of any applicable sales charges. |
170 | THE RYDEX FUNDS SEMI-ANNUAL FINANCIAL REPORT | SEE NOTES TO FINANCIAL STATEMENTS. |
SCHEDULE OF INVESTMENTS (Unaudited) | September 30, 2024 |
MONTHLY REBALANCE NASDAQ-100® 2x STRATEGY FUND | |
| | Shares | | | Value | |
COMMON STOCKS† - 81.8% |
| | | | | | | | | |
Technology - 39.8% |
Apple, Inc. | | | 250,893 | | | $ | 58,458,069 | |
Microsoft Corp. | | | 122,658 | | | | 52,779,737 | |
NVIDIA Corp. | | | 404,786 | | | | 49,157,212 | |
Broadcom, Inc. | | | 197,518 | | | | 34,071,855 | |
Advanced Micro Devices, Inc.* | | | 68,982 | | | | 11,318,567 | |
Adobe, Inc.* | | | 18,898 | | | | 9,785,007 | |
QUALCOMM, Inc. | | | 47,480 | | | | 8,073,974 | |
Texas Instruments, Inc. | | | 38,915 | | | | 8,038,672 | |
Intuit, Inc. | | | 11,915 | | | | 7,399,215 | |
Applied Materials, Inc. | | | 35,137 | | | | 7,099,431 | |
Micron Technology, Inc. | | | 47,261 | | | | 4,901,438 | |
Analog Devices, Inc. | | | 21,161 | | | | 4,870,627 | |
Lam Research Corp. | | | 5,536 | | | | 4,517,819 | |
KLA Corp. | | | 5,729 | | | | 4,436,595 | |
Intel Corp.* | | | 182,250 | | | | 4,275,585 | |
ASML Holding N.V. — Class G | | | 4,017 | | | | 3,347,165 | |
Synopsys, Inc.* | | | 6,547 | | | | 3,315,335 | |
Cadence Design Systems, Inc.* | | | 11,671 | | | | 3,163,191 | |
Crowdstrike Holdings, Inc. — Class A* | | | 9,919 | | | | 2,781,982 | |
Marvell Technology, Inc. | | | 36,919 | | | | 2,662,598 | |
NXP Semiconductor N.V. | | | 10,857 | | | | 2,605,789 | |
Roper Technologies, Inc. | | | 4,569 | | | | 2,542,374 | |
Autodesk, Inc.* | | | 9,185 | | | | 2,530,284 | |
Fortinet, Inc.* | | | 32,602 | | | | 2,528,285 | |
Workday, Inc. — Class A* | | | 9,078 | | | | 2,218,754 | |
Paychex, Inc. | | | 15,333 | | | | 2,057,535 | |
Microchip Technology, Inc. | | | 22,867 | | | | 1,835,991 | |
Cognizant Technology Solutions Corp. — Class A | | | 21,126 | | | | 1,630,505 | |
Electronic Arts, Inc. | | | 11,261 | | | | 1,615,278 | |
Datadog, Inc. — Class A* | | | 13,260 | | | | 1,525,696 | |
ON Semiconductor Corp.* | | | 18,257 | | | | 1,325,641 | |
ANSYS, Inc.* | | | 3,725 | | | | 1,186,897 | |
Take-Two Interactive Software, Inc.* | | | 7,471 | | | | 1,148,367 | |
Zscaler, Inc.* | | | 6,442 | | | | 1,101,196 | |
Atlassian Corp. — Class A* | | | 6,821 | | | | 1,083,243 | |
Super Micro Computer, Inc.* | | | 2,496 | | | | 1,039,334 | |
GLOBALFOUNDRIES, Inc.* | | | 23,509 | | | | 946,237 | |
MongoDB, Inc.* | | | 3,148 | | | | 851,062 | |
ARM Holdings plc ADR* | | | 5,333 | | | | 762,672 | |
Total Technology | | | | | | | 314,989,214 | |
| | | | | | | | | |
Communications - 21.0% |
Meta Platforms, Inc. — Class A | | | 57,354 | | | | 32,831,724 | |
Amazon.com, Inc.* | | | 173,195 | | | | 32,271,424 | |
Alphabet, Inc. — Class A | | | 96,683 | | | | 16,034,875 | |
Alphabet, Inc. — Class C | | | 92,162 | | | | 15,408,565 | |
Netflix, Inc.* | | | 18,292 | | | | 12,973,967 | |
T-Mobile US, Inc. | | | 49,730 | | | | 10,262,283 | |
Cisco Systems, Inc. | | | 171,715 | | | | 9,138,672 | |
Comcast Corp. — Class A | | | 164,650 | | | | 6,877,430 | |
Booking Holdings, Inc. | | | 1,429 | | | | 6,019,119 | |
Palo Alto Networks, Inc.* | | | 13,801 | | | | 4,717,182 | |
MercadoLibre, Inc.* | | | 2,161 | | | | 4,434,286 | |
PDD Holdings, Inc. ADR* | | | 28,468 | | | | 3,837,771 | |
Airbnb, Inc. — Class A* | | | 18,754 | | | | 2,378,195 | |
DoorDash, Inc. — Class A* | | | 16,393 | | | | 2,339,773 | |
Trade Desk, Inc. — Class A* | | | 19,080 | | | | 2,092,122 | |
Charter Communications, Inc. — Class A* | | | 6,084 | | | | 1,971,703 | |
CDW Corp. | | | 5,693 | | | | 1,288,326 | |
Warner Bros Discovery, Inc.* | | | 104,504 | | | | 862,158 | |
Total Communications | | | | | | | 165,739,575 | |
| | | | | | | | | |
Consumer, Non-cyclical - 9.4% |
PepsiCo, Inc. | | | 58,544 | | | | 9,955,407 | |
Intuitive Surgical, Inc.* | | | 15,146 | | | | 7,440,776 | |
Amgen, Inc. | | | 22,902 | | | | 7,379,253 | |
Vertex Pharmaceuticals, Inc.* | | | 11,001 | | | | 5,116,345 | |
Regeneron Pharmaceuticals, Inc.* | | | 4,621 | | | | 4,857,780 | |
Automatic Data Processing, Inc. | | | 17,381 | | | | 4,809,844 | |
Gilead Sciences, Inc. | | | 53,064 | | | | 4,448,886 | |
Mondelez International, Inc. — Class A | | | 56,934 | | | | 4,194,328 | |
Cintas Corp. | | | 17,180 | | | | 3,537,019 | |
PayPal Holdings, Inc.* | | | 43,574 | | | | 3,400,079 | |
Monster Beverage Corp.* | | | 41,750 | | | | 2,178,097 | |
Keurig Dr Pepper, Inc. | | | 57,799 | | | | 2,166,307 | |
AstraZeneca plc ADR | | | 24,819 | | | | 1,933,648 | |
GE HealthCare Technologies, Inc. | | | 19,464 | | | | 1,826,696 | |
Kraft Heinz Co. | | | 51,533 | | | | 1,809,323 | |
IDEXX Laboratories, Inc.* | | | 3,508 | | | | 1,772,312 | |
Verisk Analytics, Inc. — Class A | | | 6,070 | | | | 1,626,517 | |
Coca-Cola Europacific Partners plc | | | 19,572 | | | | 1,541,295 | |
Biogen, Inc.* | | | 6,208 | | | | 1,203,359 | |
Dexcom, Inc.* | | | 17,080 | | | | 1,145,043 | |
Moderna, Inc.* | | | 16,384 | | | | 1,094,943 | |
Illumina, Inc.* | | | 6,790 | | | | 885,484 | |
Total Consumer, Non-cyclical | | | | | | | 74,322,741 | |
| | | | | | | | | |
Consumer, Cyclical - 7.4% |
Tesla, Inc.* | | | 79,796 | | | | 20,877,028 | |
Costco Wholesale Corp. | | | 18,896 | | | | 16,751,682 | |
Starbucks Corp. | | | 48,299 | | | | 4,708,670 | |
Marriott International, Inc. — Class A | | | 11,999 | | | | 2,982,951 | |
O’Reilly Automotive, Inc.* | | | 2,472 | | | | 2,846,755 | |
PACCAR, Inc. | | | 22,343 | | | | 2,204,807 | |
Copart, Inc.* | | | 41,015 | | | | 2,149,186 | |
Ross Stores, Inc. | | | 14,218 | | | | 2,139,951 | |
Fastenal Co. | | | 24,407 | | | | 1,743,148 | |
Lululemon Athletica, Inc.* | | | 5,015 | | | | 1,360,820 | |
Dollar Tree, Inc.* | | | 9,161 | | | | 644,202 | |
Total Consumer, Cyclical | | | | | | | 58,409,200 | |
| | | | | | | | | |
Industrial - 1.3% |
Honeywell International, Inc. | | | 27,690 | | | | 5,723,800 | |
CSX Corp. | | | 82,632 | | | | 2,853,283 | |
Old Dominion Freight Line, Inc. | | | 9,134 | | | | 1,814,378 | |
Total Industrial | | | | | | | 10,391,461 | |
| | | | | | | | | |
Basic Materials - 1.2% |
Linde plc | | | 20,352 | | | | 9,705,055 | |
| | | | | | | | | |
SEE NOTES TO FINANCIAL STATEMENTS. | THE RYDEX FUNDS SEMI-ANNUAL FINANCIAL REPORT | 171 |
SCHEDULE OF INVESTMENTS (Unaudited)(continued) | September 30, 2024 |
MONTHLY REBALANCE NASDAQ-100® 2x STRATEGY FUND | |
| | Shares | | | Value | |
Utilities - 1.1% |
Constellation Energy Corp. | | | 13,327 | | | $ | 3,465,286 | |
American Electric Power Company, Inc. | | | 22,680 | | | | 2,326,968 | |
Exelon Corp. | | | 42,643 | | | | 1,729,174 | |
Xcel Energy, Inc. | | | 23,762 | | | | 1,551,659 | |
Total Utilities | | | | | | | 9,073,087 | |
| | | | | | | | | |
Energy - 0.4% |
Baker Hughes Co. | | | 42,341 | | | | 1,530,627 | |
Diamondback Energy, Inc. | | | 7,603 | | | | 1,310,757 | |
Total Energy | | | | | | | 2,841,384 | |
| | | | | | | | | |
Financial - 0.2% |
CoStar Group, Inc.* | | | 17,467 | | | | 1,317,710 | |
| | | | | | | | | |
Total Common Stocks | | | | |
(Cost $543,737,138) | | | | | | | 646,789,427 | |
| | | | | | | | | |
MUTUAL FUNDS† - 0.7% |
Guggenheim Ultra Short Duration Fund — Institutional Class1 | | | 301,467 | | | | 3,020,703 | |
Guggenheim Strategy Fund II1 | | | 115,431 | | | | 2,862,700 | |
Total Mutual Funds | | | | |
(Cost $5,770,077) | | | | | | | 5,883,403 | |
| | | | | | | | | |
| | | Face
Amount | | | | | |
U.S. TREASURY BILLS†† - 12.7% |
U.S. Treasury Bills |
4.68% due 12/05/242,3 | | $ | 58,500,000 | | | | 58,022,377 | |
4.63% due 10/10/243,4 | | | 29,323,000 | | | | 29,288,949 | |
4.85% due 12/12/242,3 | | | 13,650,000 | | | | 13,527,969 | |
Total U.S. Treasury Bills | | | | |
(Cost $100,802,294) | | | | | | | 100,839,295 | |
REPURCHASE AGREEMENTS††,5 - 3.5% |
J.P. Morgan Securities LLC
issued 09/30/24 at 4.86%
due 10/01/242 | | | 15,028,581 | | | | 15,028,581 | |
BofA Securities, Inc.
issued 09/30/24 at 4.85%
due 10/01/242 | | | 12,412,909 | | | | 12,412,909 | |
Total Repurchase Agreements | | | | |
(Cost $27,441,490) | | | | | | | 27,441,490 | |
| | | | | | | | | |
Total Investments - 98.7% | | | | |
(Cost $677,750,999) | | $ | 780,953,615 | |
Other Assets & Liabilities, net - 1.3% | | | 10,248,831 | |
Total Net Assets - 100.0% | | $ | 791,202,446 | |
Futures Contracts |
Description | | Number of
Contracts | | | Expiration
Date | | | Notional
Amount | | | Value and
Unrealized
Appreciation** | |
Equity Futures Contracts Purchased† |
NASDAQ-100 Index Mini Futures Contracts | | | 627 | | | | Dec 2024 | | | $ | 254,195,205 | | | $ | 4,467,184 | |
Total Return Swap Agreements |
Counterparty | Index | Type | Financing
Rate | | Payment
Frequency | | | Maturity
Date | | | Units | | | Notional
Amount | | | Value and
Unrealized
Appreciation | |
OTC Equity Index Swap Agreements†† |
Goldman Sachs International | NASDAQ-100 Index | Pay | 5.33% (Federal Funds Rate + 0.50%) | | | At Maturity | | | | 12/18/24 | | 25,126 | | $ | 504,044,474 | | | $ | 1,613,108 | |
Barclays Bank plc | NASDAQ-100 Index | Pay | 5.54% (SOFR + 0.70%) | | | At Maturity | | | | 12/19/24 | | 6,600 | | | 132,391,982 | | | | 764,548 | |
BNP Paribas | NASDAQ-100 Index | Pay | 5.73% (Federal Funds Rate + 0.90%) | | | At Maturity | | | | 12/19/24 | | 2,254 | | | 45,207,920 | | | | 198,493 | |
| | | | | | | | | | | | | | | | | | $ | 681,644,376 | | | $ | 2,576,149 | |
* | Non-income producing security. |
172 | THE RYDEX FUNDS SEMI-ANNUAL FINANCIAL REPORT | SEE NOTES TO FINANCIAL STATEMENTS. |
SCHEDULE OF INVESTMENTS (Unaudited)(continued) | September 30, 2024 |
MONTHLY REBALANCE NASDAQ-100® 2x STRATEGY FUND | |
** | Includes cumulative appreciation (depreciation). Variation margin is reported within the Statement of Assets and Liabilities. |
† | Value determined based on Level 1 inputs — See Note 4. |
†† | Value determined based on Level 2 inputs — See Note 4. |
1 | Affiliated issuer. |
2 | All or a portion of this security is pledged as equity index swap collateral at September 30, 2024. |
3 | Rate indicated is the effective yield at the time of purchase. |
4 | All or a portion of this security is pledged as futures collateral at September 30, 2024. |
5 | Repurchase Agreements — See Note 6. |
| | ADR — American Depositary Receipt |
| | plc — Public Limited Company |
| | SOFR — Secured Overnight Financing Rate |
| | |
| | See Sector Classification in Other Information section. |
The following table summarizes the inputs used to value the Fund’s investments at September 30, 2024 (See Note 4 in the Notes to Financial Statements):
Investments in Securities (Assets) | | Level 1
Quoted
Prices | | | Level 2
Significant
Observable
Inputs | | | Level 3
Significant
Unobservable
Inputs | | | Total | |
Common Stocks | | $ | 646,789,427 | | | $ | — | | | $ | — | | | $ | 646,789,427 | |
Mutual Funds | | | 5,883,403 | | | | — | | | | — | | | | 5,883,403 | |
U.S. Treasury Bills | | | — | | | | 100,839,295 | | | | — | | | | 100,839,295 | |
Repurchase Agreements | | | — | | | | 27,441,490 | | | | — | | | | 27,441,490 | |
Equity Futures Contracts** | | | 4,467,184 | | | | — | | | | — | | | | 4,467,184 | |
Equity Index Swap Agreements** | | | — | | | | 2,576,149 | | | | — | | | | 2,576,149 | |
Total Assets | | $ | 657,140,014 | | | $ | 130,856,934 | | | $ | — | | | $ | 787,996,948 | |
** | This derivative is reported as unrealized appreciation/depreciation at period end. |
SEE NOTES TO FINANCIAL STATEMENTS. | THE RYDEX FUNDS SEMI-ANNUAL FINANCIAL REPORT | 173 |
SCHEDULE OF INVESTMENTS (Unaudited)(concluded) | September 30, 2024 |
MONTHLY REBALANCE NASDAQ-100® 2x STRATEGY FUND | |
Affiliated Transactions
Investments representing 5% or more of the outstanding voting shares of a company, or control of or by, or common control under Guggenheim Investments (“GI”), result in that company being considered an affiliated issuer, as defined in the 1940 Act.
The Fund may invest in certain of the underlying series of Guggenheim Strategy Funds Trust, including Guggenheim Strategy Fund II and Guggenheim Strategy Fund III (collectively, the “Guggenheim Strategy Funds”), each of which are open-end management investment companies managed by GI. The Guggenheim Strategy Funds, which launched on March 11, 2014, are offered as short term investment options only to mutual funds, trusts, and other accounts managed by GI and/or its affiliates, and are not available to the public. The Guggenheim Strategy Funds pay no investment management fees. The Guggenheim Strategy Funds’ annual report on Form N-CSR dated September 30, 2023 is available publicly or upon request. This information is available from the EDGAR database on the SEC’s website at https://www.sec.gov/Archives/edgar/data/1601445/000182126823000217/gug86449-ncsr.htm. The Fund may invest in certain of the underlying series of Guggenheim Funds Trust, which are open-end management investment companies managed by GI, are available to the public and whose most recent annual report on Form N-CSR is available publicly or upon request.
Transactions during the period ended September 30, 2024, in which the company is an affiliated issuer, were as follows:
Security Name | | Value
03/31/24 | | | Additions | | | Reductions | | | Realized
Gain (Loss) | | | Change in
Unrealized
Appreciation
(Depreciation) | | | Value
09/30/24 | | | Shares
09/30/24 | | | Investment
Income | |
Mutual Funds | | | | | | | | | | | | | | | | | | | | | | | | | | | | | | | | |
Guggenheim Strategy Fund II | | $ | 2,839,614 | | | $ | — | | | $ | — | | | $ | — | | | $ | 23,086 | | | $ | 2,862,700 | | | | 115,431 | | | $ | 81,302 | |
Guggenheim Ultra Short Duration Fund — Institutional Class | | | 2,987,542 | | | | — | | | | — | | | | — | | | | 33,161 | | | | 3,020,703 | | | | 301,467 | | | | 77,747 | |
| | | $ | 5,827,156 | | | $ | — | | | $ | — | | | $ | — | | | $ | 56,247 | | | $ | 5,883,403 | | | | | | | $ | 159,049 | |
174 | THE RYDEX FUNDS SEMI-ANNUAL FINANCIAL REPORT | SEE NOTES TO FINANCIAL STATEMENTS. |
MONTHLY REBALANCE NASDAQ-100® 2x STRATEGY FUND | |
STATEMENT OF ASSETS AND LIABILITIES (Unaudited) |
September 30, 2024 |
Assets: |
Investments in unaffiliated issuers, at value (cost $644,539,432) | | $ | 747,628,722 | |
Investments in affiliated issuers, at value (cost $5,770,077) | | | 5,883,403 | |
Repurchase agreements, at value (cost $27,441,490) | | | 27,441,490 | |
Unrealized appreciation on OTC swap agreements | | | 2,576,149 | |
Receivables: |
Fund shares sold | | | 166,303,477 | |
Variation margin on futures contracts | | | 431,706 | |
Investment Adviser | | | 266,463 | |
Dividends | | | 119,537 | |
Interest | | | 3,701 | |
Securities lending income | | | 23 | |
Total assets | | | 950,654,671 | |
| | | | | |
Liabilities: |
Segregated cash due to broker | | | 390,000 | |
Payable for: |
Securities purchased | | | 150,887,916 | |
Fund shares redeemed | | | 5,326,952 | |
Swap settlement | | | 1,218,184 | |
Management fees | | | 522,500 | |
Transfer agent fees | | | 332,646 | |
Distribution and service fees | | | 146,265 | |
Portfolio accounting and administration fees | | | 17,360 | |
Trustees’ fees* | | | 6,682 | |
Miscellaneous | | | 603,720 | |
Total liabilities | | | 159,452,225 | |
Net assets | | $ | 791,202,446 | |
| | | | | |
Net assets consist of: |
Paid in capital | | $ | 586,694,935 | |
Total distributable earnings (loss) | | | 204,507,511 | |
Net assets | | $ | 791,202,446 | |
Class A: |
Net assets | | $ | 8,591,975 | |
Capital shares outstanding | | | 14,557 | |
Net asset value per share | | $ | 590.23 | |
Maximum offering price per share (Net asset value divided by 95.25%) | | $ | 619.66 | |
Class C: |
Net assets | | $ | 1,796,276 | |
Capital shares outstanding | | | 3,308 | |
Net asset value per share | | $ | 543.01 | |
Class H: |
Net assets | | $ | 780,814,195 | |
Capital shares outstanding | | | 1,290,006 | |
Net asset value per share | | $ | 605.28 | |
STATEMENT OF OPERATIONS (Unaudited) |
Six Months Ended September 30, 2024 |
Investment Income: |
Dividends from securities of unaffiliated issuers (net of foreign withholding tax of $3,588) | | $ | 2,287,260 | |
Dividends from securities of affiliated issuers | | | 159,049 | |
Interest | | | 3,967,147 | |
Income from securities lending, net | | | 10,253 | |
Total investment income | | | 6,423,709 | |
| | | | | |
Expenses: |
Management fees | | | 3,397,745 | |
Distribution and service fees: |
Class A | | | 9,898 | |
Class C | | | 9,131 | |
Class H | | | 931,653 | |
Transfer agent fees | | | 777,013 | |
Portfolio accounting and administration fees | | | 487,124 | |
Registration fees | | | 246,723 | |
Interest expense | | | 115,775 | |
Professional fees | | | 104,019 | |
Custodian fees | | | 48,072 | |
Trustees’ fees* | | | 36,785 | |
Miscellaneous | | | 511,377 | |
Total expenses | | | 6,675,315 | |
Less: |
Expenses reimbursed by Adviser | | | (377,605 | ) |
Expenses waived by Adviser | | | (1,533,336 | ) |
Total waived/reimbursed expenses | | | (1,910,941 | ) |
Net expenses | | | 4,764,374 | |
Net investment income | | | 1,659,335 | |
| | | | | |
Net Realized and Unrealized Gain (Loss): |
Net realized gain (loss) on: |
Investments in unaffiliated issuers | | | 81,803,145 | |
Swap agreements | | | 6,657,756 | |
Futures contracts | | | 14,416,015 | |
Net realized gain | | | 102,876,916 | |
Net change in unrealized appreciation (depreciation) on: |
Investments in unaffiliated issuers | | | (55,473,276 | ) |
Investments in affiliated issuers | | | 56,247 | |
Swap agreements | | | (864,493 | ) |
Futures contracts | | | 2,833,321 | |
Net change in unrealized appreciation (depreciation) | | | (53,448,201 | ) |
Net realized and unrealized gain | | | 49,428,715 | |
Net increase in net assets resulting from operations | | $ | 51,088,050 | |
* | Relates to Trustees not deemed “interested persons” within the meaning of Section 2(a)(19) of the 1940 Act. |
SEE NOTES TO FINANCIAL STATEMENTS. | THE RYDEX FUNDS SEMI-ANNUAL FINANCIAL REPORT | 175 |
MONTHLY REBALANCE NASDAQ-100® 2x STRATEGY FUND | |
STATEMENTS OF CHANGES IN NET ASSETS |
| | Six Months Ended
September 30, 2024
(Unaudited) | | | Year Ended
March 31,
2024 | |
Increase (Decrease) in Net Assets from Operations: | | | | | | | | |
Net investment income | | $ | 1,659,335 | | | $ | 1,215,164 | |
Net realized gain on investments | | | 102,876,916 | | | | 204,655,816 | |
Net change in unrealized appreciation (depreciation) on investments | | | (53,448,201 | ) | | | 99,936,035 | |
Net increase in net assets resulting from operations | | | 51,088,050 | | | | 305,807,015 | |
| | | | | | | | | |
Distributions to shareholders: | | | | | | | | |
Class A | | | — | | | | (229,861 | ) |
Class C | | | — | | | | (52,499 | ) |
Class H | | | — | | | | (16,565,287 | ) |
Total distributions to shareholders | | | — | | | | (16,847,647 | ) |
| | | | | | | | | |
Capital share transactions: | | | | | | | | |
Proceeds from sale of shares | | | | | | | | |
Class A | | | 3,218,626 | | | | 5,788,991 | |
Class C | | | 278,979 | | | | 442,703 | |
Class H | | | 2,231,649,200 | | | | 2,095,676,099 | |
Distributions reinvested | | | | | | | | |
Class A | | | — | | | | 211,140 | |
Class C | | | — | | | | 36,396 | |
Class H | | | — | | | | 16,560,168 | |
Cost of shares redeemed | | | | | | | | |
Class A | | | (3,133,141 | ) | | | (6,391,583 | ) |
Class C | | | (481,998 | ) | | | (326,833 | ) |
Class H | | | (2,139,554,946 | ) | | | (2,138,872,563 | ) |
Net increase (decrease) from capital share transactions | | | 91,976,720 | | | | (26,875,482 | ) |
Net increase in net assets | | | 143,064,770 | | | | 262,083,886 | |
| | | | | | | | | |
Net assets: | | | | | | | | |
Beginning of period | | | 648,137,676 | | | | 386,053,790 | |
End of period | | $ | 791,202,446 | | | $ | 648,137,676 | |
| | | | | | | | | |
Capital share activity: | | | | | | | | |
Shares sold | | | | | | | | |
Class A | | | 6,027 | | | | 14,718 | |
Class C | | | 589 | | | | 1,149 | |
Class H | | | 4,018,333 | | | | 4,803,990 | |
Shares issued from reinvestment of distributions | | | | | | | | |
Class A | | | — | | | | 507 | |
Class C | | | — | | | | 94 | |
Class H | | | — | | | | 38,772 | |
Shares redeemed | | | | | | | | |
Class A | | | (5,907 | ) | | | (16,225 | ) |
Class C | | | (999 | ) | | | (933 | ) |
Class H | | | (3,954,682 | ) | | | (4,858,568 | ) |
Net increase (decrease) in shares | | | 63,361 | | | | (16,496 | ) |
176 | THE RYDEX FUNDS SEMI-ANNUAL FINANCIAL REPORT | SEE NOTES TO FINANCIAL STATEMENTS. |
MONTHLY REBALANCE NASDAQ-100® 2x STRATEGY FUND | |
This table is presented to show selected data for a share outstanding throughout each period and to assist shareholders in evaluating a Fund’s performance for the periods presented.
Class A | | Six Months Ended
September 30, 2024a | | | Year Ended
March 31,
2024 | | | Year Ended
March 31,
2023 | | | Year Ended
March 31,
2022 | | | Year Ended
March 31,
2021 | | | Year Ended
March 31,
2020 | |
Per Share Data |
Net asset value, beginning of period | | $ | 508.07 | | | $ | 298.90 | | | $ | 429.31 | | | $ | 355.42 | | | $ | 141.86 | | | $ | 134.54 | |
Income (loss) from investment operations: |
Net investment income (loss)b | | | 1.45 | | | | 1.04 | | | | .32 | | | | (3.11 | ) | | | (1.74 | ) | | | .23 | |
Net gain (loss) on investments (realized and unrealized) | | | 80.71 | | | | 224.62 | | | | (130.73 | ) | | | 88.53 | | | | 233.57 | | | | 7.28 | |
Total from investment operations | | | 82.16 | | | | 225.66 | | | | (130.41 | ) | | | 85.42 | | | | 231.83 | | | | 7.51 | |
Less distributions from: |
Net investment income | | | — | | | | (.60 | ) | | | — | | | | — | | | | — | | | | (.19 | ) |
Net realized gains | | | — | | | | (15.89 | ) | | | — | | | | (11.53 | ) | | | (18.27 | ) | | | — | |
Total distributions | | | — | | | | (16.49 | ) | | | — | | | | (11.53 | ) | | | (18.27 | ) | | | (.19 | ) |
Net asset value, end of period | | $ | 590.23 | | | $ | 508.07 | | | $ | 298.90 | | | $ | 429.31 | | | $ | 355.42 | | | $ | 141.86 | |
|
Total Returnc | | | 16.17 | % | | | 76.76 | % | | | (30.38 | %) | | | 23.48 | % | | | 164.83 | % | | | 5.56 | % |
Ratios/Supplemental Data |
Net assets, end of period (in thousands) | | $ | 8,592 | | | $ | 7,335 | | | $ | 4,614 | | | $ | 8,376 | | | $ | 5,504 | | | $ | 2,434 | |
Ratios to average net assets: |
Net investment income (loss) | | | 0.54 | % | | | 0.26 | % | | | 0.12 | % | | | (0.70 | %) | | | (0.60 | %) | | | 0.15 | % |
Total expensesd | | | 1.77 | % | | | 1.95 | % | | | 1.77 | % | | | 1.69 | % | | | 1.77 | % | | | 1.83 | % |
Net expensese,f | | | 1.24 | % | | | 1.42 | % | | | 1.31 | % | | | 1.32 | % | | | 1.33 | % | | | 1.34 | % |
Portfolio turnover rate | | | 248 | % | | | 334 | % | | | 1,054 | % | | | 922 | % | | | 509 | % | | | 990 | % |
Class C | | Six Months Ended
September 30, 2024a | | | Year Ended
March 31,
2024 | | | Year Ended
March 31,
2023 | | | Year Ended
March 31,
2022 | | | Year Ended
March 31,
2021 | | | Year Ended
March 31,
2020 | |
Per Share Data |
Net asset value, beginning of period | | $ | 469.27 | | | $ | 278.89 | | | $ | 403.95 | | | $ | 337.38 | | | $ | 136.06 | | | $ | 130.01 | |
Income (loss) from investment operations: |
Net investment income (loss)b | | | (.55 | ) | | | (1.79 | ) | | | (1.56 | ) | | | (6.08 | ) | | | (3.70 | ) | | | (.83 | ) |
Net gain (loss) on investments (realized and unrealized) | | | 74.29 | | | | 208.66 | | | | (123.50 | ) | | | 84.18 | | | | 223.29 | | | | 7.07 | |
Total from investment operations | | | 73.74 | | | | 206.87 | | | | (125.06 | ) | | | 78.10 | | | | 219.59 | | | | 6.24 | |
Less distributions from: |
Net investment income | | | — | | | | (.60 | ) | | | — | | | | — | | | | — | | | | (.19 | ) |
Net realized gains | | | — | | | | (15.89 | ) | | | — | | | | (11.53 | ) | | | (18.27 | ) | | | — | |
Total distributions | | | — | | | | (16.49 | ) | | | — | | | | (11.53 | ) | | | (18.27 | ) | | | (.19 | ) |
Net asset value, end of period | | $ | 543.01 | | | $ | 469.27 | | | $ | 278.89 | | | $ | 403.95 | | | $ | 337.38 | | | $ | 136.06 | |
|
Total Returnc | | | 15.71 | % | | | 75.44 | % | | | (30.96 | %) | | | 22.55 | % | | | 162.86 | % | | | 4.77 | % |
Ratios/Supplemental Data |
Net assets, end of period (in thousands) | | $ | 1,796 | | | $ | 1,745 | | | $ | 951 | | | $ | 1,433 | | | $ | 1,751 | | | $ | 552 | |
Ratios to average net assets: |
Net investment income (loss) | | | (0.22 | %) | | | (0.49 | %) | | | (0.61 | %) | | | (1.44 | %) | | | (1.34 | %) | | | (0.55 | %) |
Total expensesd | | | 2.52 | % | | | 2.71 | % | | | 2.52 | % | | | 2.44 | % | | | 2.52 | % | | | 2.58 | % |
Net expensese,f | | | 1.99 | % | | | 2.17 | % | | | 2.06 | % | | | 2.07 | % | | | 2.08 | % | | | 2.09 | % |
Portfolio turnover rate | | | 248 | % | | | 334 | % | | | 1,054 | % | | | 922 | % | | | 509 | % | | | 990 | % |
SEE NOTES TO FINANCIAL STATEMENTS. | THE RYDEX FUNDS SEMI-ANNUAL FINANCIAL REPORT | 177 |
MONTHLY REBALANCE NASDAQ-100® 2x STRATEGY FUND | |
FINANCIAL HIGHLIGHTS (concluded) |
This table is presented to show selected data for a share outstanding throughout each period and to assist shareholders in evaluating a Fund’s performance for the periods presented.
Class H | | Six Months Ended
September 30, 2024a | | | Year Ended
March 31,
2024 | | | Year Ended
March 31,
2023 | | | Year Ended
March 31,
2022 | | | Year Ended
March 31,
2021 | | | Year Ended
March 31,
2020 | |
Per Share Data |
Net asset value, beginning of period | | $ | 521.10 | | | $ | 306.31 | | | $ | 440.25 | | | $ | 364.34 | | | $ | 145.23 | | | $ | 137.80 | |
Income (loss) from investment operations: |
Net investment income (loss)b | | | 1.22 | | | | .96 | | | | .27 | | | | (3.35 | ) | | | (1.81 | ) | | | .12 | |
Net gain (loss) on investments (realized and unrealized) | | | 82.96 | | | | 230.32 | | | | (134.21 | ) | | | 90.79 | | | | 239.19 | | | | 7.50 | |
Total from investment operations | | | 84.18 | | | | 231.28 | | | | (133.94 | ) | | | 87.44 | | | | 237.38 | | | | 7.62 | |
Less distributions from: |
Net investment income | | | — | | | | (.60 | ) | | | — | | | | — | | | | — | | | | (.19 | ) |
Net realized gains | | | — | | | | (15.89 | ) | | | — | | | | (11.53 | ) | | | (18.27 | ) | | | — | |
Total distributions | | | — | | | | (16.49 | ) | | | — | | | | (11.53 | ) | | | (18.27 | ) | | | (.19 | ) |
Net asset value, end of period | | $ | 605.28 | | | $ | 521.10 | | | $ | 306.31 | | | $ | 440.25 | | | $ | 364.34 | | | $ | 145.23 | |
|
Total Return | | | 16.15 | % | | | 76.74 | % | | | (30.42 | %) | | | 23.46 | % | | | 164.81 | % | | | 5.51 | % |
Ratios/Supplemental Data |
Net assets, end of period (in thousands) | | $ | 780,814 | | | $ | 639,058 | | | $ | 380,489 | | | $ | 113,538 | | | $ | 90,776 | | | $ | 22,586 | |
Ratios to average net assets: |
Net investment income (loss) | | | 0.44 | % | | | 0.24 | % | | | 0.10 | % | | | (0.71 | %) | | | (0.60 | %) | | | 0.08 | % |
Total expensesd | | | 1.77 | % | | | 1.95 | % | | | 1.77 | % | | | 1.69 | % | | | 1.77 | % | | | 1.82 | % |
Net expensese,f | | | 1.26 | % | | | 1.43 | % | | | 1.32 | % | | | 1.33 | % | | | 1.33 | % | | | 1.34 | % |
Portfolio turnover rate | | | 248 | % | | | 334 | % | | | 1,054 | % | | | 922 | % | | | 509 | % | | | 990 | % |
a | Unaudited figures for the period ended September 30, 2024. Percentage amounts for the period, except total return and portfolio turnover rate, have been annualized. |
b | Net investment income (loss) per share was computed using average shares outstanding throughout the period. |
c | Total return does not reflect the impact of any applicable sales charges. |
d | Does not include expenses of the underlying funds in which the Fund invests. |
e | Net expense information reflects the expense ratios after expense waivers and reimbursements, as applicable. |
f | Net expenses may include expenses that are excluded from the expense limitation agreement. Excluding these expenses, the net expense ratios for the periods presented would be: |
| | | 09/30/24a | 03/31/24 | 03/31/23 | 03/31/22 | 03/31/21 | 03/31/20 |
| | Class A | 1.21% | 1.22% | 1.27% | 1.32% | 1.33% | 1.33% |
| | Class C | 1.96% | 1.97% | 2.02% | 2.06% | 2.08% | 2.08% |
| | Class H | 1.23% | 1.24% | 1.28% | 1.33% | 1.33% | 1.33% |
178 | THE RYDEX FUNDS SEMI-ANNUAL FINANCIAL REPORT | SEE NOTES TO FINANCIAL STATEMENTS. |
SCHEDULE OF INVESTMENTS (Unaudited) | September 30, 2024 |
NASDAQ-100® FUND | |
| | Shares | | | Value | |
COMMON STOCKS† - 95.7% |
| | | | | | | | | |
Technology - 46.6% |
Apple, Inc. | | | 691,783 | | | $ | 161,185,439 | |
Microsoft Corp. | | | 338,201 | | | | 145,527,890 | |
NVIDIA Corp. | | | 1,116,107 | | | | 135,540,034 | |
Broadcom, Inc. | | | 544,611 | | | | 93,945,398 | |
Advanced Micro Devices, Inc.* | | | 190,203 | | | | 31,208,508 | |
Adobe, Inc.* | | | 52,108 | | | | 26,980,480 | |
QUALCOMM, Inc. | | | 130,917 | | | | 22,262,436 | |
Texas Instruments, Inc. | | | 107,301 | | | | 22,165,168 | |
Intuit, Inc. | | | 32,852 | | | | 20,401,092 | |
Applied Materials, Inc. | | | 96,884 | | | | 19,575,412 | |
Micron Technology, Inc. | | | 130,310 | | | | 13,514,450 | |
Analog Devices, Inc. | | | 58,348 | | | | 13,429,959 | |
Lam Research Corp. | | | 15,264 | | | | 12,456,645 | |
KLA Corp. | | | 15,798 | | | | 12,234,129 | |
Intel Corp.* | | | 502,513 | | | | 11,788,955 | |
ASML Holding N.V. — Class G | | | 11,076 | | | | 9,229,077 | |
Synopsys, Inc.* | | | 18,054 | | | | 9,142,365 | |
Cadence Design Systems, Inc.* | | | 32,179 | | | | 8,721,474 | |
Crowdstrike Holdings, Inc. — Class A* | | | 27,349 | | | | 7,670,574 | |
Marvell Technology, Inc. | | | 101,795 | | | | 7,341,455 | |
NXP Semiconductor N.V. | | | 29,936 | | | | 7,184,939 | |
Roper Technologies, Inc. | | | 12,598 | | | | 7,010,031 | |
Autodesk, Inc.* | | | 25,326 | | | | 6,976,807 | |
Fortinet, Inc.* | | | 89,892 | | | | 6,971,124 | |
Workday, Inc. — Class A* | | | 25,032 | | | | 6,118,071 | |
Paychex, Inc. | | | 42,277 | | | | 5,673,151 | |
Microchip Technology, Inc. | | | 63,050 | | | | 5,062,285 | |
Cognizant Technology Solutions Corp. — Class A | | | 58,249 | | | | 4,495,658 | |
Electronic Arts, Inc. | | | 31,049 | | | | 4,453,669 | |
Datadog, Inc. — Class A* | | | 36,561 | | | | 4,206,709 | |
ON Semiconductor Corp.* | | | 50,340 | | | | 3,655,188 | |
ANSYS, Inc.* | | | 10,270 | | | | 3,272,330 | |
Take-Two Interactive Software, Inc.* | | | 20,599 | | | | 3,166,272 | |
Zscaler, Inc.* | | | 17,763 | | | | 3,036,407 | |
Atlassian Corp. — Class A* | | | 18,807 | | | | 2,986,740 | |
Super Micro Computer, Inc.* | | | 6,882 | | | | 2,865,665 | |
GLOBALFOUNDRIES, Inc.*,1 | | | 64,820 | | | | 2,609,005 | |
MongoDB, Inc.* | | | 8,681 | | | | 2,346,908 | |
ARM Holdings plc ADR*,1 | | | 14,706 | | | | 2,103,105 | |
Total Technology | | | | | | | 868,515,004 | |
| | | | | | | | | |
Communications - 24.5% |
Meta Platforms, Inc. — Class A | | | 158,142 | | | | 90,526,807 | |
Amazon.com, Inc.* | | | 477,545 | | | | 88,980,960 | |
Alphabet, Inc. — Class A | | | 266,583 | | | | 44,212,791 | |
Alphabet, Inc. — Class C | | | 254,117 | | | | 42,485,821 | |
Netflix, Inc.* | | | 50,435 | | | | 35,772,032 | |
T-Mobile US, Inc. | | | 137,120 | | | | 28,296,083 | |
Cisco Systems, Inc. | | | 473,464 | | | | 25,197,754 | |
Comcast Corp. — Class A | | | 453,985 | | | | 18,962,953 | |
Booking Holdings, Inc. | | | 3,940 | | | | 16,595,753 | |
Palo Alto Networks, Inc.* | | | 38,053 | | | | 13,006,515 | |
MercadoLibre, Inc.* | | | 5,958 | | | | 12,225,578 | |
PDD Holdings, Inc. ADR* | | | 78,494 | | | | 10,581,776 | |
Airbnb, Inc. — Class A* | | | 51,709 | | | | 6,557,218 | |
DoorDash, Inc. — Class A* | | | 45,201 | | | | 6,451,539 | |
Trade Desk, Inc. — Class A* | | | 52,609 | | | | 5,768,577 | |
Charter Communications, Inc. — Class A* | | | 16,775 | | | | 5,436,442 | |
CDW Corp. | | | 15,698 | | | | 3,552,457 | |
Warner Bros Discovery, Inc.* | | | 288,147 | | | | 2,377,213 | |
Total Communications | | | | | | | 456,988,269 | |
| | | | | | | | | |
Consumer, Non-cyclical - 11.0% |
PepsiCo, Inc. | | | 161,422 | | | | 27,449,811 | |
Intuitive Surgical, Inc.* | | | 41,761 | | | | 20,515,926 | |
Amgen, Inc. | | | 63,147 | | | | 20,346,595 | |
Vertex Pharmaceuticals, Inc.* | | | 30,332 | | | | 14,106,807 | |
Regeneron Pharmaceuticals, Inc.* | | | 12,741 | | | | 13,393,849 | |
Automatic Data Processing, Inc. | | | 47,924 | | | | 13,262,009 | |
Gilead Sciences, Inc. | | | 146,311 | | | | 12,266,714 | |
Mondelez International, Inc. — Class A | | | 156,982 | | | | 11,564,864 | |
Cintas Corp. | | | 47,369 | | | | 9,752,330 | |
PayPal Holdings, Inc.* | | | 120,144 | | | | 9,374,836 | |
Monster Beverage Corp.* | | | 115,116 | | | | 6,005,602 | |
Keurig Dr Pepper, Inc. | | | 159,367 | | | | 5,973,075 | |
AstraZeneca plc ADR | | | 68,432 | | | | 5,331,537 | |
GE HealthCare Technologies, Inc. | | | 53,667 | | | | 5,036,648 | |
Kraft Heinz Co. | | | 142,090 | | | | 4,988,780 | |
IDEXX Laboratories, Inc.* | | | 9,673 | | | | 4,886,993 | |
Verisk Analytics, Inc. — Class A | | | 16,739 | | | | 4,485,382 | |
Coca-Cola Europacific Partners plc | | | 53,965 | | | | 4,249,744 | |
Biogen, Inc.* | | | 17,118 | | | | 3,318,153 | |
Dexcom, Inc.* | | | 47,093 | | | | 3,157,115 | |
Moderna, Inc.* | | | 45,174 | | | | 3,018,978 | |
Illumina, Inc.* | | | 18,721 | | | | 2,441,406 | |
Total Consumer, Non-cyclical | | | | | | | 204,927,154 | |
| | | | | | | | | |
Consumer, Cyclical - 8.7% |
Tesla, Inc.*,1 | | | 220,018 | | | | 57,563,310 | |
Costco Wholesale Corp. | | | 52,100 | | | | 46,187,692 | |
Starbucks Corp. | | | 133,173 | | | | 12,983,036 | |
Marriott International, Inc. — Class A | | | 33,084 | | | | 8,224,682 | |
O’Reilly Automotive, Inc.* | | | 6,817 | | | | 7,850,457 | |
PACCAR, Inc. | | | 61,606 | | | | 6,079,280 | |
Copart, Inc.* | | | 113,089 | | | | 5,925,863 | |
Ross Stores, Inc. | | | 39,202 | | | | 5,900,293 | |
Fastenal Co. | | | 67,297 | | | | 4,806,352 | |
Lululemon Athletica, Inc.* | | | 13,827 | | | | 3,751,956 | |
Dollar Tree, Inc.* | | | 25,261 | | | | 1,776,354 | |
Total Consumer, Cyclical | | | | | | | 161,049,275 | |
| | | | | | | | | |
Industrial - 1.6% |
Honeywell International, Inc. | | | 76,349 | | | | 15,782,102 | |
CSX Corp. | | | 227,840 | | | | 7,867,315 | |
Old Dominion Freight Line, Inc. | | | 25,185 | | | | 5,002,748 | |
Total Industrial | | | | | | | 28,652,165 | |
| | | | | | | | | |
Basic Materials - 1.4% |
Linde plc | | | 56,117 | | | | 26,759,953 | |
| | | | | | | | | |
SEE NOTES TO FINANCIAL STATEMENTS. | THE RYDEX FUNDS SEMI-ANNUAL FINANCIAL REPORT | 179 |
SCHEDULE OF INVESTMENTS (Unaudited)(continued) | September 30, 2024 |
NASDAQ-100® FUND | |
| | Shares | | | Value | |
Utilities - 1.3% |
Constellation Energy Corp. | | | 36,747 | | | $ | 9,554,955 | |
American Electric Power Company, Inc. | | | 62,534 | | | | 6,415,988 | |
Exelon Corp. | | | 117,578 | | | | 4,767,788 | |
Xcel Energy, Inc. | | | 65,517 | | | | 4,278,260 | |
Total Utilities | | | | | | | 25,016,991 | |
| | | | | | | | | |
Energy - 0.4% |
Baker Hughes Co. | | | 116,747 | | | | 4,220,404 | |
Diamondback Energy, Inc. | | | 20,965 | | | | 3,614,366 | |
Total Energy | | | | | | | 7,834,770 | |
| | | | | | | | | |
Financial - 0.2% |
CoStar Group, Inc.* | | | 48,161 | | | | 3,633,266 | |
| | | | | | | | | |
Total Common Stocks | | | | |
(Cost $473,852,047) | | | | | | | 1,783,376,847 | |
| | | | | | | | | |
MUTUAL FUNDS† - 2.7% |
Guggenheim Ultra Short Duration Fund — Institutional Class2 | | | 2,756,359 | | | | 27,618,720 | |
Guggenheim Strategy Fund II2 | | | 575,584 | | | | 14,274,495 | |
Guggenheim Strategy Fund III2 | | | 370,504 | | | | 9,221,839 | |
Total Mutual Funds | | | | |
(Cost $51,083,879) | | | | | | | 51,115,054 | |
| | | | | | | | | |
| | | Face
Amount | | | | | |
FEDERAL AGENCY DISCOUNT NOTES†† - 0.2% |
Federal Farm Credit Bank |
4.73% due 10/18/243 | | $ | 4,000,000 | | | | 3,991,066 | |
Total Federal Agency Discount Notes | | | | |
(Cost $3,991,066) | | | | | | | 3,991,066 | |
U.S. TREASURY BILLS†† - 0.1% |
U.S. Treasury Bills |
4.85% due 12/12/243,4 | | | 950,000 | | | | 941,507 | |
4.63% due 10/10/243,5 | | | 591,000 | | | | 590,314 | |
4.49% due 12/12/243 | | | 50,000 | | | | 49,553 | |
Total U.S. Treasury Bills | | | | |
(Cost $1,580,574) | | | | | | | 1,581,374 | |
| | | | | | | | | |
REPURCHASE AGREEMENTS††,6 - 1.4% |
J.P. Morgan Securities LLC
issued 09/30/24 at 4.86%
due 10/01/244 | | | 14,243,034 | | | | 14,243,034 | |
BofA Securities, Inc.
issued 09/30/24 at 4.85%
due 10/01/244 | | | 11,764,083 | | | | 11,764,083 | |
Total Repurchase Agreements | | | | |
(Cost $26,007,117) | | | | | | | 26,007,117 | |
| | | | | | | | | |
| | | Shares | | | | | |
SECURITIES LENDING COLLATERAL†,7 - 0.1% |
Money Market Fund*** | | | | | | | | |
First American Government Obligations Fund - Class X, 4.82%8 | | | 1,746,916 | | | | 1,746,916 | |
Total Securities Lending Collateral | | | | |
(Cost $1,746,916) | | | | | | | 1,746,916 | |
| | | | | | | | | |
Total Investments - 100.2% | | | | |
(Cost $558,261,599) | | $ | 1,867,818,374 | |
Other Assets & Liabilities, net - (0.2)% | | | (5,178,185 | ) |
Total Net Assets - 100.0% | | $ | 1,862,640,189 | |
Futures Contracts |
Description | | Number of
Contracts | | | Expiration
Date | | | Notional
Amount | | | Value and
Unrealized
Appreciation** | |
Equity Futures Contracts Purchased† |
NASDAQ-100 Index Mini Futures Contracts | | | 14 | | | | Dec 2024 | | | $ | 5,675,810 | | | $ | 71,746 | |
Total Return Swap Agreements |
Counterparty | Index | Type | Financing
Rate | | Payment
Frequency | | | Maturity
Date | | | Units | | | Notional
Amount | | | Value and
Unrealized
Appreciation | |
OTC Equity Index Swap Agreements†† |
Goldman Sachs International | NASDAQ-100 Index | Pay | 5.33% (Federal Funds Rate + 0.50%) | | | At Maturity | | | | 12/18/24 | | 2,466 | | $ | 49,476,167 | | | $ | 213,560 | |
BNP Paribas | NASDAQ-100 Index | Pay | 5.73% (Federal Funds Rate + 0.90%) | | | At Maturity | | | | 12/19/24 | | 713 | | | 14,293,984 | | | | 62,757 | |
Barclays Bank plc | NASDAQ-100 Index | Pay | 5.54% (SOFR + 0.70%) | | | At Maturity | | | | 12/19/24 | | 501 | | | 10,041,709 | | | | 58,005 | |
| | | | | | | | | | | | | | | | | | $ | 73,811,860 | | | $ | 334,322 | |
180 | THE RYDEX FUNDS SEMI-ANNUAL FINANCIAL REPORT | SEE NOTES TO FINANCIAL STATEMENTS. |
SCHEDULE OF INVESTMENTS (Unaudited)(continued) | September 30, 2024 |
NASDAQ-100® FUND | |
* | Non-income producing security. |
** | Includes cumulative appreciation (depreciation). Variation margin is reported within the Statement of Assets and Liabilities. |
*** | A copy of each underlying unaffiliated fund’s financial statements is available at the SEC’s website at www.sec.gov. |
† | Value determined based on Level 1 inputs — See Note 4. |
†† | Value determined based on Level 2 inputs — See Note 4. |
1 | All or a portion of this security is on loan at September 30, 2024 — See Note 7. |
2 | Affiliated issuer. |
3 | Rate indicated is the effective yield at the time of purchase. |
4 | All or a portion of this security is pledged as equity index swap collateral at September 30, 2024. |
5 | All or a portion of this security is pledged as futures collateral at September 30, 2024. |
6 | Repurchase Agreements — See Note 6. |
7 | Securities lending collateral — See Note 7. |
8 | Rate indicated is the 7-day yield as of September 30, 2024. |
| | ADR — American Depositary Receipt |
| | plc — Public Limited Company |
| | SOFR — Secured Overnight Financing Rate |
| | |
| | See Sector Classification in Other Information section. |
The following table summarizes the inputs used to value the Fund’s investments at September 30, 2024 (See Note 4 in the Notes to Financial Statements):
Investments in Securities (Assets) | | Level 1
Quoted
Prices | | | Level 2
Significant
Observable
Inputs | | | Level 3
Significant
Unobservable
Inputs | | | Total | |
Common Stocks | | $ | 1,783,376,847 | | | $ | — | | | $ | — | | | $ | 1,783,376,847 | |
Mutual Funds | | | 51,115,054 | | | | — | | | | — | | | | 51,115,054 | |
Federal Agency Discount Notes | | | — | | | | 3,991,066 | | | | — | | | | 3,991,066 | |
U.S. Treasury Bills | | | — | | | | 1,581,374 | | | | — | | | | 1,581,374 | |
Repurchase Agreements | | | — | | | | 26,007,117 | | | | — | | | | 26,007,117 | |
Securities Lending Collateral | | | 1,746,916 | | | | — | | | | — | | | | 1,746,916 | |
Equity Futures Contracts** | | | 71,746 | | | | — | | | | — | | | | 71,746 | |
Equity Index Swap Agreements** | | | — | | | | 334,322 | | | | — | | | | 334,322 | |
Total Assets | | $ | 1,836,310,563 | | | $ | 31,913,879 | | | $ | — | | | $ | 1,868,224,442 | |
** | This derivative is reported as unrealized appreciation/depreciation at period end. |
SEE NOTES TO FINANCIAL STATEMENTS. | THE RYDEX FUNDS SEMI-ANNUAL FINANCIAL REPORT | 181 |
SCHEDULE OF INVESTMENTS (Unaudited)(concluded) | September 30, 2024 |
NASDAQ-100® FUND | |
Affiliated Transactions
Investments representing 5% or more of the outstanding voting shares of a company, or control of or by, or common control under Guggenheim Investments (“GI”), result in that company being considered an affiliated issuer, as defined in the 1940 Act.
The Fund may invest in certain of the underlying series of Guggenheim Strategy Funds Trust, including Guggenheim Strategy Fund II and Guggenheim Strategy Fund III (collectively, the “Guggenheim Strategy Funds”), each of which are open-end management investment companies managed by GI. The Guggenheim Strategy Funds, which launched on March 11, 2014, are offered as short term investment options only to mutual funds, trusts, and other accounts managed by GI and/or its affiliates, and are not available to the public. The Guggenheim Strategy Funds pay no investment management fees. The Guggenheim Strategy Funds’ annual report on Form N-CSR dated September 30, 2023 is available publicly or upon request. This information is available from the EDGAR database on the SEC’s website at https://www.sec.gov/Archives/edgar/data/1601445/000182126823000217/gug86449-ncsr.htm. The Fund may invest in certain of the underlying series of Guggenheim Funds Trust, which are open-end management investment companies managed by GI, are available to the public and whose most recent annual report on Form N-CSR is available publicly or upon request.
Transactions during the period ended September 30, 2024, in which the company is an affiliated issuer, were as follows:
Security Name | | Value
03/31/24 | | | Additions | | | Reductions | | | Realized
Gain (Loss) | | | Change in
Unrealized
Appreciation
(Depreciation) | | | Value
09/30/24 | | | Shares
09/30/24 | | | Investment
Income | |
Mutual Funds | | | | | | | | | | | | | | | | | | | | | | | | | | | | | | | | |
Guggenheim Strategy Fund II | | $ | 14,159,378 | | | $ | — | | | $ | — | | | $ | — | | | $ | 115,117 | | | $ | 14,274,495 | | | | 575,584 | | | $ | 405,403 | |
Guggenheim Strategy Fund III | | | 9,140,329 | | | | — | | | | — | | | | — | | | | 81,510 | | | | 9,221,839 | | | | 370,504 | | | | 250,148 | |
Guggenheim Ultra Short Duration Fund — Institutional Class | | | 27,315,520 | | | | — | | | | — | | | | — | | | | 303,200 | | | | 27,618,720 | | | | 2,756,359 | | | | 710,853 | |
| | | $ | 50,615,227 | | | $ | — | | | $ | — | | | $ | — | | | $ | 499,827 | | | $ | 51,115,054 | | | | | | | $ | 1,366,404 | |
182 | THE RYDEX FUNDS SEMI-ANNUAL FINANCIAL REPORT | SEE NOTES TO FINANCIAL STATEMENTS. |
STATEMENT OF ASSETS AND LIABILITIES (Unaudited) |
September 30, 2024 |
Assets: |
Investments in unaffiliated issuers, at value - including $1,682,430 of securities loaned (cost $481,170,603) | | $ | 1,790,696,203 | |
Investments in affiliated issuers, at value (cost $51,083,879) | | | 51,115,054 | |
Repurchase agreements, at value (cost $26,007,117) | | | 26,007,117 | |
Segregated cash with broker | | | 24,133 | |
Unrealized appreciation on OTC swap agreements | | | 334,322 | |
Receivables: |
Fund shares sold | | | 692,956 | |
Dividends | | | 500,368 | |
Investment Adviser | | | 50,479 | |
Variation margin on futures contracts | | | 13,790 | |
Interest | | | 3,508 | |
Securities lending income | | | 244 | |
Total assets | | | 1,869,438,174 | |
Liabilities: |
Segregated cash due to broker | | | 470,000 | |
Payable for: |
Return of securities lending collateral | | | 1,746,916 | |
Fund shares redeemed | | | 1,088,350 | |
Management fees | | | 1,040,173 | |
Transfer agent fees | | | 796,498 | |
Licensing fees | | | 370,244 | |
Distribution and service fees | | | 86,417 | |
Portfolio accounting and administration fees | | | 79,364 | |
Swap settlement | | | 16,606 | |
Trustees’ fees* | | | 16,019 | |
Miscellaneous | | | 1,087,398 | |
Total liabilities | | | 6,797,985 | |
Net assets | | $ | 1,862,640,189 | |
Net assets consist of: |
Paid in capital | | $ | 436,508,485 | |
Total distributable earnings (loss) | | | 1,426,131,704 | |
Net assets | | $ | 1,862,640,189 | |
Investor Class: |
Net assets | | $ | 1,637,404,481 | |
Capital shares outstanding | | | 19,439,473 | |
Net asset value per share | | $ | 84.23 | |
Class A: |
Net assets | | $ | 105,559,789 | |
Capital shares outstanding | | | 1,411,679 | |
Net asset value per share | | $ | 74.78 | |
Maximum offering price per share (Net asset value divided by 95.25%) | | $ | 78.51 | |
Class C: |
Net assets | | $ | 79,271,511 | |
Capital shares outstanding | | | 1,325,476 | |
Net asset value per share | | $ | 59.81 | |
Class H: |
Net assets | | $ | 40,404,408 | |
Capital shares outstanding | | | 540,486 | |
Net asset value per share | | $ | 74.76 | |
STATEMENT OF OPERATIONS (Unaudited) |
Six Months Ended September 30, 2024 |
Investment Income: |
Dividends from securities of unaffiliated issuers (net of foreign withholding tax of $9,992) | | $ | 7,181,820 | |
Dividends from securities of affiliated issuers | | | 1,366,404 | |
Interest | | | 1,193,170 | |
Income from securities lending, net | | | 33,593 | |
Total investment income | | | 9,774,987 | |
| | | | | |
Expenses: |
Management fees | | | 6,960,676 | |
Distribution and service fees: | | | | |
Class A | | | 126,011 | |
Class C | | | 396,169 | |
Class H | | | 49,611 | |
Transfer agent fees | | | 1,910,922 | |
Portfolio accounting and administration fees | | | 989,222 | |
Registration fees | | | 728,274 | |
Professional fees | | | 305,378 | |
Custodian fees | | | 119,094 | |
Trustees’ fees* | | | 98,646 | |
Interest expense | | | 27,878 | |
Miscellaneous | | | 1,066,309 | |
Total expenses | | | 12,778,190 | |
Less: |
Expenses reimbursed by Adviser | | | (463,612 | ) |
Expenses waived by Adviser | | | (372,732 | ) |
Total waived/reimbursed expenses | | | (836,344 | ) |
Net expenses | | | 11,941,846 | |
Net investment loss | | | (2,166,859 | ) |
| | | | | |
Net Realized and Unrealized Gain (Loss): |
Net realized gain (loss) on: |
Investments in affiliated issuers | | | 32,901,647 | |
Swap agreements | | | 6,664,468 | |
Futures contracts | | | (1,422,605 | ) |
Net realized gain | | | 38,143,510 | |
Net change in unrealized appreciation (depreciation) on: |
Investments in unaffiliated issuers | | | 134,701,307 | |
Investments in affiliated issuers | | | 499,827 | |
Swap agreements | | | (68,856 | ) |
Futures contracts | | | (121,897 | ) |
Net change in unrealized appreciation (depreciation) | | | 135,010,381 | |
Net realized and unrealized gain | | | 173,153,891 | |
Net increase in net assets resulting from operations | | $ | 170,987,032 | |
* | Relates to Trustees not deemed “interested persons” within the meaning of Section 2(a)(19) of the 1940 Act. |
SEE NOTES TO FINANCIAL STATEMENTS. | THE RYDEX FUNDS SEMI-ANNUAL FINANCIAL REPORT | 183 |
STATEMENTS OF CHANGES IN NET ASSETS |
| | Six Months Ended
September 30, 2024
(Unaudited) | | | Year Ended
March 31,
2024 | |
Increase (Decrease) in Net Assets from Operations: | | | | | | | | |
Net investment loss | | $ | (2,166,859 | ) | | $ | (2,716,420 | ) |
Net realized gain on investments | | | 38,143,510 | | | | 212,641,501 | |
Net change in unrealized appreciation (depreciation) on investments | | | 135,010,381 | | | | 293,377,084 | |
Net increase in net assets resulting from operations | | | 170,987,032 | | | | 503,302,165 | |
| | | | | | | | | |
Capital share transactions: | | | | | | | | |
Proceeds from sale of shares | | | | | | | | |
Investor Class | | | 692,777,409 | | | | 1,542,602,229 | |
Class A | | | 9,708,912 | | | | 19,822,679 | |
Class C | | | 3,607,877 | | | | 10,446,786 | |
Class H | | | 24,297,220 | | | | 37,156,428 | |
Cost of shares redeemed | | | | | | | | |
Investor Class | | | (766,868,086 | ) | | | (1,651,676,803 | ) |
Class A | | | (8,570,555 | ) | | | (14,123,233 | ) |
Class C | | | (12,444,250 | ) | | | (25,335,049 | ) |
Class H | | | (24,130,482 | ) | | | (32,030,171 | ) |
Net decrease from capital share transactions | | | (81,621,955 | ) | | | (113,137,134 | ) |
Net increase in net assets | | | 89,365,077 | | | | 390,165,031 | |
| | | | | | | | | |
Net assets: | | | | | | | | |
Beginning of period | | | 1,773,275,112 | | | | 1,383,110,081 | |
End of period | | $ | 1,862,640,189 | | | $ | 1,773,275,112 | |
| | | | | | | | | |
Capital share activity: | | | | | | | | |
Shares sold | | | | | | | | |
Investor Class | | | 8,615,191 | | | | 23,161,963 | |
Class A | | | 138,872 | | | | 343,412 | |
Class C | | | 63,966 | | | | 222,984 | |
Class H | | | 345,392 | | | | 633,174 | |
Shares redeemed | | | | | | | | |
Investor Class | | | (9,492,542 | ) | | | (24,846,491 | ) |
Class A | | | (120,353 | ) | | | (243,576 | ) |
Class C | | | (221,262 | ) | | | (543,161 | ) |
Class H | | | (345,005 | ) | | | (543,569 | ) |
Net decrease in shares | | | (1,015,741 | ) | | | (1,815,264 | ) |
184 | THE RYDEX FUNDS SEMI-ANNUAL FINANCIAL REPORT | SEE NOTES TO FINANCIAL STATEMENTS. |
This table is presented to show selected data for a share outstanding throughout each period and to assist shareholders in evaluating a Fund’s performance for the periods presented.
Investor Class | | Six Months Ended
September 30, 2024a | | | Year Ended
March 31,
2024 | | | Year Ended
March 31,
2023 | | | Year Ended
March 31,
2022 | | | Year Ended
March 31,
2021 | | | Year Ended
March 31,
2020 | |
Per Share Data |
Net asset value, beginning of period | | $ | 76.79 | | | $ | 55.65 | | | $ | 68.39 | | | $ | 63.43 | | | $ | 39.68 | | | $ | 38.39 | |
Income (loss) from investment operations: |
Net investment income (loss)b | | | (.07 | ) | | | (.07 | ) | | | (.10 | ) | | | (.37 | ) | | | (.28 | ) | | | (.08 | ) |
Net gain (loss) on investments (realized and unrealized) | | | 7.51 | | | | 21.21 | | | | (8.57 | ) | | | 8.70 | | | | 26.64 | | | | 2.21 | |
Total from investment operations | | | 7.44 | | | | 21.14 | | | | (8.67 | ) | | | 8.33 | | | | 26.36 | | | | 2.13 | |
Less distributions from: |
Net realized gains | | | — | | | | — | | | | (4.07 | ) | | | (3.37 | ) | | | (2.61 | ) | | | (.84 | ) |
Total distributions | | | — | | | | — | | | | (4.07 | ) | | | (3.37 | ) | | | (2.61 | ) | | | (.84 | ) |
Net asset value, end of period | | $ | 84.23 | | | $ | 76.79 | | | $ | 55.65 | | | $ | 68.39 | | | $ | 63.43 | | | $ | 39.68 | |
|
Total Return | | | 9.69 | % | | | 37.99 | % | | | (11.56 | %) | | | 12.69 | % | | | 66.78 | % | | | 5.40 | % |
Ratios/Supplemental Data |
Net assets, end of period (in thousands) | | $ | 1,637,404 | | | $ | 1,560,083 | | | $ | 1,224,330 | | | $ | 1,424,456 | | | $ | 1,386,721 | | | $ | 888,189 | |
Ratios to average net assets: |
Net investment income (loss) | | | (0.17 | %) | | | (0.11 | %) | | | (0.19 | %) | | | (0.53 | %) | | | (0.50 | %) | | | (0.19 | %) |
Total expensesc | | | 1.32 | % | | | 1.34 | % | | | 1.30 | % | | | 1.25 | % | | | 1.33 | % | | | 1.37 | % |
Net expensesd | | | 1.23 | % | | | 1.27 | % | | | 1.27 | % | | | 1.24 | % | | | 1.33 | % | | | 1.37 | % |
Portfolio turnover rate | | | 14 | % | | | 70 | % | | | 50 | % | | | 44 | % | | | 57 | % | | | 54 | % |
Class A | | Six Months Ended
September 30, 2024a | | | Year Ended
March 31,
2024 | | | Year Ended
March 31,
2023 | | | Year Ended
March 31,
2022 | | | Year Ended
March 31,
2021 | | | Year Ended
March 31,
2020 | |
Per Share Data |
Net asset value, beginning of period | | $ | 68.25 | | | $ | 49.59 | | | $ | 61.69 | | | $ | 57.63 | | | $ | 36.29 | | | $ | 35.26 | |
Income (loss) from investment operations: |
Net investment income (loss)b | | | (.15 | ) | | | (.21 | ) | | | (.21 | ) | | | (.50 | ) | | | (.39 | ) | | | (.17 | ) |
Net gain (loss) on investments (realized and unrealized) | | | 6.68 | | | | 18.87 | | | | (7.82 | ) | | | 7.93 | | | | 24.34 | | | | 2.04 | |
Total from investment operations | | | 6.53 | | | | 18.66 | | | | (8.03 | ) | | | 7.43 | | | | 23.95 | | | | 1.87 | |
Less distributions from: |
Net realized gains | | | — | | | | — | | | | (4.07 | ) | | | (3.37 | ) | | | (2.61 | ) | | | (.84 | ) |
Total distributions | | | — | | | | — | | | | (4.07 | ) | | | (3.37 | ) | | | (2.61 | ) | | | (.84 | ) |
Net asset value, end of period | | $ | 74.78 | | | $ | 68.25 | | | $ | 49.59 | | | $ | 61.69 | | | $ | 57.63 | | | $ | 36.29 | |
|
Total Returne | | | 9.57 | % | | | 37.63 | % | | | (11.78 | %) | | | 12.40 | % | | | 66.37 | % | | | 5.14 | % |
Ratios/Supplemental Data |
Net assets, end of period (in thousands) | | $ | 105,560 | | | $ | 95,089 | | | $ | 64,133 | | | $ | 74,179 | | | $ | 69,808 | | | $ | 41,054 | |
Ratios to average net assets: |
Net investment income (loss) | | | (0.42 | %) | | | (0.36 | %) | | | (0.43 | %) | | | (0.78 | %) | | | (0.75 | %) | | | (0.44 | %) |
Total expensesc | | | 1.57 | % | | | 1.59 | % | | | 1.54 | % | | | 1.50 | % | | | 1.58 | % | | | 1.62 | % |
Net expensesd | | | 1.48 | % | | | 1.51 | % | | | 1.52 | % | | | 1.49 | % | | | 1.58 | % | | | 1.62 | % |
Portfolio turnover rate | | | 14 | % | | | 70 | % | | | 50 | % | | | 44 | % | | | 57 | % | | | 54 | % |
SEE NOTES TO FINANCIAL STATEMENTS. | THE RYDEX FUNDS SEMI-ANNUAL FINANCIAL REPORT | 185 |
FINANCIAL HIGHLIGHTS (continued) |
This table is presented to show selected data for a share outstanding throughout each period and to assist shareholders in evaluating a Fund’s performance for the periods presented.
Class C | | Six Months Ended
September 30, 2024a | | | Year Ended
March 31,
2024 | | | Year Ended
March 31,
2023 | | | Year Ended
March 31,
2022 | | | Year Ended
March 31,
2021 | | | Year Ended
March 31,
2020 | |
Per Share Data |
Net asset value, beginning of period | | $ | 54.80 | | | $ | 40.11 | | | $ | 51.32 | | | $ | 48.76 | | | $ | 31.18 | | | $ | 30.64 | |
Income (loss) from investment operations: |
Net investment income (loss)b | | | (.33 | ) | | | (.52 | ) | | | (.48 | ) | | | (.82 | ) | | | (.66 | ) | | | (.39 | ) |
Net gain (loss) on investments (realized and unrealized) | | | 5.34 | | | | 15.21 | | | | (6.66 | ) | | | 6.75 | | | | 20.85 | | | | 1.77 | |
Total from investment operations | | | 5.01 | | | | 14.69 | | | | (7.14 | ) | | | 5.93 | | | | 20.19 | | | | 1.38 | |
Less distributions from: |
Net realized gains | | | — | | | | — | | | | (4.07 | ) | | | (3.37 | ) | | | (2.61 | ) | | | (.84 | ) |
Total distributions | | | — | | | | — | | | | (4.07 | ) | | | (3.37 | ) | | | (2.61 | ) | | | (.84 | ) |
Net asset value, end of period | | $ | 59.81 | | | $ | 54.80 | | | $ | 40.11 | | | $ | 51.32 | | | $ | 48.76 | | | $ | 31.18 | |
|
Total Returne | | | 9.14 | % | | | 36.62 | % | | | (12.45 | %) | | | 11.57 | % | | | 65.17 | % | | | 4.31 | % |
Ratios/Supplemental Data |
Net assets, end of period (in thousands) | | $ | 79,272 | | | $ | 81,249 | | | $ | 72,314 | | | $ | 106,419 | | | $ | 115,315 | | | $ | 80,633 | |
Ratios to average net assets: |
Net investment income (loss) | | | (1.17 | %) | | | (1.12 | %) | | | (1.19 | %) | | | (1.53 | %) | | | (1.50 | %) | | | (1.19 | %) |
Total expensesc | | | 2.31 | % | | | 2.34 | % | | | 2.29 | % | | | 2.25 | % | | | 2.33 | % | | | 2.37 | % |
Net expensesd | | | 2.22 | % | | | 2.27 | % | | | 2.27 | % | | | 2.24 | % | | | 2.33 | % | | | 2.37 | % |
Portfolio turnover rate | | | 14 | % | | | 70 | % | | | 50 | % | | | 44 | % | | | 57 | % | | | 54 | % |
186 | THE RYDEX FUNDS SEMI-ANNUAL FINANCIAL REPORT | SEE NOTES TO FINANCIAL STATEMENTS. |
FINANCIAL HIGHLIGHTS (concluded) |
This table is presented to show selected data for a share outstanding throughout each period and to assist shareholders in evaluating a Fund’s performance for the periods presented.
Class H | | Six Months Ended
September 30, 2024a | | | Year Ended
March 31,
2024 | | | Year Ended
March 31,
2023 | | | Year Ended
March 31,
2022 | | | Year Ended
March 31,
2021 | | | Year Ended
March 31,
2020 | |
Per Share Data |
Net asset value, beginning of period | | $ | 68.24 | | | $ | 49.57 | | | $ | 61.67 | | | $ | 57.61 | | | $ | 36.28 | | | $ | 35.26 | |
Income (loss) from investment operations: |
Net investment income (loss)b | | | (.15 | ) | | | (.20 | ) | | | (.21 | ) | | | (.51 | ) | | | (.38 | ) | | | (.16 | ) |
Net gain (loss) on investments (realized and unrealized) | | | 6.67 | | | | 18.87 | | | | (7.82 | ) | | | 7.94 | | | | 24.32 | | | | 2.02 | |
Total from investment operations | | | 6.52 | | | | 18.67 | | | | (8.03 | ) | | | 7.43 | | | | 23.94 | | | | 1.86 | |
Less distributions from: |
Net realized gains | | | — | | | | — | | | | (4.07 | ) | | | (3.37 | ) | | | (2.61 | ) | | | (.84 | ) |
Total distributions | | | — | | | | — | | | | (4.07 | ) | | | (3.37 | ) | | | (2.61 | ) | | | (.84 | ) |
Net asset value, end of period | | $ | 74.76 | | | $ | 68.24 | | | $ | 49.57 | | | $ | 61.67 | | | $ | 57.61 | | | $ | 36.28 | |
|
Total Return | | | 9.55 | % | | | 37.66 | % | | | (11.77 | %) | | | 12.41 | % | | | 66.36 | % | | | 5.11 | % |
Ratios/Supplemental Data |
Net assets, end of period (in thousands) | | $ | 40,404 | | | $ | 36,854 | | | $ | 22,333 | | | $ | 28,879 | | | $ | 24,532 | | | $ | 23,777 | |
Ratios to average net assets: |
Net investment income (loss) | | | (0.42 | %) | | | (0.35 | %) | | | (0.42 | %) | | | (0.79 | %) | | | (0.75 | %) | | | (0.43 | %) |
Total expensesc | | | 1.57 | % | | | 1.59 | % | | | 1.54 | % | | | 1.50 | % | | | 1.59 | % | | | 1.62 | % |
Net expensesd | | | 1.48 | % | | | 1.51 | % | | | 1.52 | % | | | 1.49 | % | | | 1.59 | % | | | 1.62 | % |
Portfolio turnover rate | | | 14 | % | | | 70 | % | | | 50 | % | | | 44 | % | | | 57 | % | | | 54 | % |
a | Unaudited figures for the period ended September 30, 2024. Percentage amounts for the period, except total return and portfolio turnover rate, have been annualized. |
b | Net investment income (loss) per share was computed using average shares outstanding throughout the period. |
c | Does not include expenses of the underlying funds in which the Fund invests. |
d | Net expense information reflects the expense ratios after expense waivers and reimbursements, as applicable. |
e | Total return does not reflect the impact of any applicable sales charges. |
SEE NOTES TO FINANCIAL STATEMENTS. | THE RYDEX FUNDS SEMI-ANNUAL FINANCIAL REPORT | 187 |
SCHEDULE OF INVESTMENTS (Unaudited) | September 30, 2024 |
INVERSE NASDAQ-100® STRATEGY FUND | |
| | Shares | | | Value | |
MUTUAL FUNDS† - 14.1% |
Guggenheim Strategy Fund II1 | | | 49,399 | | | $ | 1,225,103 | |
Guggenheim Ultra Short Duration Fund — Institutional Class1 | | | 87,169 | | | | 873,430 | |
Total Mutual Funds | | | | |
(Cost $2,033,556) | | | | | | | 2,098,533 | |
| | | | | | | | | |
| | | Face
Amount | | | | | |
U.S. TREASURY BILLS†† - 23.3% |
U.S. Treasury Bills |
4.70% due 10/22/242 | | $ | 3,000,000 | | | | 2,991,756 | |
4.85% due 12/12/242,3 | | | 350,000 | | | | 346,871 | |
4.63% due 10/10/242,4 | | | 126,000 | | | | 125,854 | |
Total U.S. Treasury Bills | | | | |
(Cost $3,463,479) | | | | | | | 3,464,481 | |
| | | | | | | | | |
FEDERAL AGENCY DISCOUNT NOTES†† - 22.1% |
Federal Home Loan Bank |
4.68% due 11/13/242 | | | 2,000,000 | | | | 1,988,605 | |
5.18% due 10/04/242 | | | 1,300,000 | | | | 1,299,501 | |
Total Federal Agency Discount Notes | | | | |
(Cost $3,288,044) | | | | | | | 3,288,106 | |
| | | | | | | | | |
REPURCHASE AGREEMENTS††,5 - 40.6% |
J.P. Morgan Securities LLC
issued 09/30/24 at 4.86%
due 10/01/243 | | | 3,311,559 | | | | 3,311,559 | |
BofA Securities, Inc.
issued 09/30/24 at 4.85%
due 10/01/243 | | | 2,735,193 | | | | 2,735,193 | |
Total Repurchase Agreements | | | | |
(Cost $6,046,752) | | | | | | | 6,046,752 | |
| | | | | | | | | |
Total Investments - 100.1% | | | | |
(Cost $14,831,831) | | $ | 14,897,872 | |
Other Assets & Liabilities, net - (0.1)% | | | (18,153 | ) |
Total Net Assets - 100.0% | | $ | 14,879,719 | |
Futures Contracts |
Description | | Number of
Contracts | | | Expiration
Date | | | Notional
Amount | | | Value and
Unrealized
Depreciation** | |
Equity Futures Contracts Sold Short† |
NASDAQ-100 Index Mini Futures Contracts | | | 6 | | | | Dec 2024 | | | $ | 2,432,490 | | | $ | (60,801 | ) |
Total Return Swap Agreements |
Counterparty | Index | Type | | Financing
Rate | | Payment
Frequency | | | Maturity
Date | | | Units | | | Notional
Amount | | | Value and
Unrealized
Depreciation | |
OTC Equity Index Swap Agreements Sold Short†† |
Goldman Sachs International | NASDAQ-100 Index | Receive | | 5.13% (Federal
Funds Rate +
0.30%) | | | At Maturity | | | | 12/18/24 | | 99 | | $ | 1,981,527 | | | $ | (8,529 | ) |
Barclays Bank plc | NASDAQ-100 Index | Receive | | 5.19% (SOFR +
0.35%) | | | At Maturity | | | | 12/19/24 | | 185 | | | 3,710,806 | | | | (21,424 | ) |
BNP Paribas | NASDAQ-100 Index | Receive | | 5.33% (Federal
Funds Rate +
0.50%) | | | At Maturity | | | | 12/19/24 | | 339 | | | 6,794,387 | | | | (29,848 | ) |
| | | | | | | | | | | | | | | | | | | $ | 12,486,720 | | | $ | (59,801 | ) |
188 | THE RYDEX FUNDS SEMI-ANNUAL FINANCIAL REPORT | SEE NOTES TO FINANCIAL STATEMENTS. |
SCHEDULE OF INVESTMENTS (Unaudited)(continued) | September 30, 2024 |
INVERSE NASDAQ-100® STRATEGY FUND | |
** | Includes cumulative appreciation (depreciation). Variation margin is reported within the Statement of Assets and Liabilities. |
† | Value determined based on Level 1 inputs — See Note 4. |
†† | Value determined based on Level 2 inputs — See Note 4. |
1 | Affiliated issuer. |
2 | Rate indicated is the effective yield at the time of purchase. |
3 | All or a portion of this security is pledged as equity index swap collateral at September 30, 2024. |
4 | All or a portion of this security is pledged as futures collateral at September 30, 2024. |
5 | Repurchase Agreements — See Note 6. |
| | plc — Public Limited Company |
| | SOFR — Secured Overnight Financing Rate |
| | |
| | See Sector Classification in Other Information section. |
The following table summarizes the inputs used to value the Fund’s investments at September 30, 2024 (See Note 4 in the Notes to Financial Statements):
Investments in Securities (Assets) | | Level 1
Quoted
Prices | | | Level 2
Significant
Observable
Inputs | | | Level 3
Significant
Unobservable
Inputs | | | Total | |
Mutual Funds | | $ | 2,098,533 | | | $ | — | | | $ | — | | | $ | 2,098,533 | |
U.S. Treasury Bills | | | — | | | | 3,464,481 | | | | — | | | | 3,464,481 | |
Federal Agency Discount Notes | | | — | | | | 3,288,106 | | | | — | | | | 3,288,106 | |
Repurchase Agreements | | | — | | | | 6,046,752 | | | | — | | | | 6,046,752 | |
Total Assets | | $ | 2,098,533 | | | $ | 12,799,339 | | | $ | — | | | $ | 14,897,872 | |
Investments in Securities (Liabilities) | | Level 1
Quoted
Prices | | | Level 2
Significant
Observable
Inputs | | | Level 3
Significant
Unobservable
Inputs | | | Total | |
Equity Futures Contracts** | | $ | 60,801 | | | $ | — | | | $ | — | | | $ | 60,801 | |
Equity Index Swap Agreements** | | | — | | | | 59,801 | | | | — | | | | 59,801 | |
Total Liabilities | | $ | 60,801 | | | $ | 59,801 | | | $ | — | | | $ | 120,602 | |
** | This derivative is reported as unrealized appreciation/depreciation at period end. |
SEE NOTES TO FINANCIAL STATEMENTS. | THE RYDEX FUNDS SEMI-ANNUAL FINANCIAL REPORT | 189 |
SCHEDULE OF INVESTMENTS (Unaudited)(concluded) | September 30, 2024 |
INVERSE NASDAQ-100® STRATEGY FUND | |
Affiliated Transactions
Investments representing 5% or more of the outstanding voting shares of a company, or control of or by, or common control under Guggenheim Investments (“GI”), result in that company being considered an affiliated issuer, as defined in the 1940 Act.
The Fund may invest in certain of the underlying series of Guggenheim Strategy Funds Trust, including Guggenheim Strategy Fund II and Guggenheim Strategy Fund III (collectively, the “Guggenheim Strategy Funds”), each of which are open-end management investment companies managed by GI. The Guggenheim Strategy Funds, which launched on March 11, 2014, are offered as short term investment options only to mutual funds, trusts, and other accounts managed by GI and/or its affiliates, and are not available to the public. The Guggenheim Strategy Funds pay no investment management fees. The Guggenheim Strategy Funds’ annual report on Form N-CSR dated September 30, 2023 is available publicly or upon request. This information is available from the EDGAR database on the SEC’s website at https://www.sec.gov/Archives/edgar/data/1601445/000182126823000217/gug86449-ncsr.htm. The Fund may invest in certain of the underlying series of Guggenheim Funds Trust, which are open-end management investment companies managed by GI, are available to the public and whose most recent annual report on Form N-CSR is available publicly or upon request.
Transactions during the period ended September 30, 2024, in which the company is an affiliated issuer, were as follows:
Security Name | | Value
03/31/24 | | | Additions | | | Reductions | | | Realized
Gain (Loss) | | | Change in
Unrealized
Appreciation
(Depreciation) | | | Value
09/30/24 | | | Shares
09/30/24 | | | Investment
Income | |
Mutual Funds | | | | | | | | | | | | | | | | | | | | | | | | | | | | | | | | |
Guggenheim Strategy Fund II | | $ | 1,215,224 | | | $ | — | | | $ | — | | | $ | — | | | $ | 9,879 | | | $ | 1,225,103 | | | | 49,399 | | | $ | 34,794 | |
Guggenheim Ultra Short Duration Fund — Institutional Class | | | 863,841 | | | | — | | | | — | | | | — | | | | 9,589 | | | | 873,430 | | | | 87,169 | | | | 22,480 | |
| | | $ | 2,079,065 | | | $ | — | | | $ | — | | | $ | — | | | $ | 19,468 | | | $ | 2,098,533 | | | | | | | $ | 57,274 | |
190 | THE RYDEX FUNDS SEMI-ANNUAL FINANCIAL REPORT | SEE NOTES TO FINANCIAL STATEMENTS. |
INVERSE NASDAQ-100® STRATEGY FUND | |
STATEMENT OF ASSETS AND LIABILITIES (Unaudited) |
September 30, 2024 |
Assets: |
Investments in unaffiliated issuers, at value (cost $6,751,523) | | $ | 6,752,587 | |
Investments in affiliated issuers, at value (cost $2,033,556) | | | 2,098,533 | |
Repurchase agreements, at value (cost $6,046,752) | | | 6,046,752 | |
Segregated cash with broker | | | 34,285 | |
Receivables: |
Fund shares sold | | | 54,153 | |
Dividends | | | 8,965 | |
Swap settlement | | | 7,389 | |
Interest | | | 816 | |
Total assets | | | 15,003,480 | |
| | | | | |
Liabilities: |
Unrealized depreciation on OTC swap agreements | | | 59,801 | |
Payable for: |
Fund shares redeemed | | | 23,918 | |
Management fees | | | 10,636 | |
Transfer agent fees | | | 7,537 | |
Variation margin on futures contracts | | | 5,910 | |
Portfolio accounting and administration fees | | | 631 | |
Distribution and service fees | | | 474 | |
Trustees’ fees* | | | 153 | |
Miscellaneous | | | 14,701 | |
Total liabilities | | | 123,761 | |
Net assets | | $ | 14,879,719 | |
| | | | | |
Net assets consist of: |
Paid in capital | | $ | 96,923,940 | |
Total distributable earnings (loss) | | | (82,044,221 | ) |
Net assets | | $ | 14,879,719 | |
| | | | | |
Investor Class: |
Net assets | | $ | 13,417,449 | |
Capital shares outstanding | | | 852,050 | |
Net asset value per share | | $ | 15.75 | |
Class A: |
Net assets | | $ | 660,361 | |
Capital shares outstanding | | | 43,988 | |
Net asset value per share | | $ | 15.01 | |
Maximum offering price per share (Net asset value divided by 95.25%) | | $ | 15.76 | |
Class C: |
Net assets | | $ | 310,779 | |
Capital shares outstanding | | | 25,717 | |
Net asset value per share | | $ | 12.08 | |
Class H: |
Net assets | | $ | 491,130 | |
Capital shares outstanding | | | 33,243 | |
Net asset value per share | | $ | 14.77 | |
STATEMENT OF OPERATIONS (Unaudited) |
Six Months Ended September 30, 2024 |
Investment Income: |
Dividends from securities of affiliated issuers | | $ | 57,274 | |
Interest | | | 444,200 | |
Total investment income | | | 501,474 | |
| | | | | |
Expenses: |
Management fees | | | 83,027 | |
Distribution and service fees: |
Class A | | | 863 | |
Class C | | | 1,137 | |
Class H | | | 617 | |
Transfer agent fees | | | 18,955 | |
Portfolio accounting and administration fees | | | 14,076 | |
Registration fees | | | 8,371 | |
Interest expense | | | 5,518 | |
Professional fees | | | 3,167 | |
Custodian fees | | | 1,186 | |
Trustees’ fees* | | | 1,006 | |
Miscellaneous | | | 9,136 | |
Total expenses | | | 147,059 | |
Less: |
Expenses reimbursed by Adviser | | | (9,227 | ) |
Expenses waived by Adviser | | | (1,085 | ) |
Total waived/reimbursed expenses | | | (10,312 | ) |
Net expenses | | | 136,747 | |
Net investment income | | | 364,727 | |
| | | | | |
Net Realized and Unrealized Gain (Loss): |
Net realized gain (loss) on: |
Investments in unaffiliated issuers | | | 33 | |
Swap agreements | | | (1,370,976 | ) |
Futures contracts | | | (256,109 | ) |
Net realized loss | | | (1,627,052 | ) |
Net change in unrealized appreciation (depreciation) on: |
Investments in unaffiliated issuers | | | 943 | |
Investments in affiliated issuers | | | 19,468 | |
Swap agreements | | | 10,468 | |
Futures contracts | | | (46,054 | ) |
Net change in unrealized appreciation (depreciation) | | | (15,175 | ) |
Net realized and unrealized loss | | | (1,642,227 | ) |
Net decrease in net assets resulting from operations | | $ | (1,277,500 | ) |
* | Relates to Trustees not deemed “interested persons” within the meaning of Section 2(a)(19) of the 1940 Act. |
SEE NOTES TO FINANCIAL STATEMENTS. | THE RYDEX FUNDS SEMI-ANNUAL FINANCIAL REPORT | 191 |
INVERSE NASDAQ-100® STRATEGY FUND | |
STATEMENTS OF CHANGES IN NET ASSETS |
| | Six Months Ended
September 30, 2024
(Unaudited) | | | Year Ended
March 31,
2024 | |
Increase (Decrease) in Net Assets from Operations: | | | | | | | | |
Net investment income | | $ | 364,727 | | | $ | 857,387 | |
Net realized loss on investments | | | (1,627,052 | ) | | | (7,363,158 | ) |
Net change in unrealized appreciation (depreciation) on investments | | | (15,175 | ) | | | 1,233,909 | |
Net decrease in net assets resulting from operations | | | (1,277,500 | ) | | | (5,271,862 | ) |
| | | | | | | | | |
Distributions to shareholders: | | | | | | | | |
Investor Class | | | — | | | | (633,663 | ) |
Class A | | | — | | | | (43,792 | ) |
Class C | | | — | | | | (10,242 | ) |
Class H | | | — | | | | (14,762 | ) |
Total distributions to shareholders | | | — | | | | (702,459 | ) |
| | | | | | | | | |
Capital share transactions: | | | | | | | | |
Proceeds from sale of shares | | | | | | | | |
Investor Class | | | 29,299,002 | | | | 64,417,535 | |
Class A | | | 434,248 | | | | 3,458,929 | |
Class C | | | 461,936 | | | | 737,897 | |
Class H | | | 1,578,935 | | | | 8,247,456 | |
Distributions reinvested | | | | | | | | |
Investor Class | | | — | | | | 625,369 | |
Class A | | | — | | | | 43,782 | |
Class C | | | — | | | | 10,242 | |
Class H | | | — | | | | 14,762 | |
Cost of shares redeemed | | | | | | | | |
Investor Class | | | (30,272,683 | ) | | | (73,872,760 | ) |
Class A | | | (563,292 | ) | | | (3,531,658 | ) |
Class C | | | (305,611 | ) | | | (563,509 | ) |
Class H | | | (1,370,726 | ) | | | (8,405,636 | ) |
Net decrease from capital share transactions | | | (738,191 | ) | | | (8,817,591 | ) |
Net decrease in net assets | | | (2,015,691 | ) | | | (14,791,912 | ) |
| | | | | | | | | |
Net assets: | | | | | | | | |
Beginning of period | | | 16,895,410 | | | | 31,687,322 | |
End of period | | $ | 14,879,719 | | | $ | 16,895,410 | |
| | | | | | | | | |
Capital share activity: | | | | | | | | |
Shares sold | | | | | | | | |
Investor Class | | | 1,731,477 | | | | 3,193,707 | |
Class A | | | 28,019 | | | | 167,977 | |
Class C | | | 37,770 | | | | 44,959 | |
Class H | | | 103,271 | | | | 427,115 | |
Shares issued from reinvestment of distributions | | | | | | | | |
Investor Class | | | — | | | | 33,822 | |
Class A | | | — | | | | 2,479 | |
Class C | | | — | | | | 716 | |
Class H | | | — | | | | 849 | |
Shares redeemed | | | | | | | | |
Investor Class | | | (1,800,812 | ) | | | (3,597,299 | ) |
Class A | | | (35,864 | ) | | | (177,952 | ) |
Class C | | | (24,325 | ) | | | (35,610 | ) |
Class H | | | (90,965 | ) | | | (433,402 | ) |
Net decrease in shares | | | (51,429 | ) | | | (372,639 | ) |
192 | THE RYDEX FUNDS SEMI-ANNUAL FINANCIAL REPORT | SEE NOTES TO FINANCIAL STATEMENTS. |
INVERSE NASDAQ-100® STRATEGY FUND | |
This table is presented to show selected data for a share outstanding throughout each period and to assist shareholders in evaluating a Fund’s performance for the periods presented.
Investor Class | | Six Months Ended
September 30, 2024a | | | Year Ended
March 31,
2024 | | | Year Ended
March 31,
2023 | | | Year Ended
March 31,
2022 | | | Year Ended
March 31,
2021 | | | Year Ended
March 31,
2020 | |
Per Share Data |
Net asset value, beginning of period | | $ | 16.90 | | | $ | 23.05 | | | $ | 21.73 | | | $ | 26.17 | | | $ | 47.65 | | | $ | 54.72 | |
Income (loss) from investment operations: |
Net investment income (loss)b | | | .33 | | | | .81 | | | | .40 | | | | (.28 | ) | | | (.40 | ) | | | .09 | |
Net gain (loss) on investments (realized and unrealized) | | | (1.48 | ) | | | (6.09 | ) | | | .92 | f | | | (4.16 | ) | | | (21.05 | ) | | | (6.83 | ) |
Total from investment operations | | | (1.15 | ) | | | (5.28 | ) | | | 1.32 | | | | (4.44 | ) | | | (21.45 | ) | | | (6.74 | ) |
Less distributions from: |
Net investment income | | | — | | | | (.87 | ) | | | — | | | | — | | | | (.03 | ) | | | (.33 | ) |
Total distributions | | | — | | | | (.87 | ) | | | — | | | | — | | | | (.03 | ) | | | (.33 | ) |
Net asset value, end of period | | $ | 15.75 | | | $ | 16.90 | | | $ | 23.05 | | | $ | 21.73 | | | $ | 26.17 | | | $ | 47.65 | |
|
Total Return | | | (6.80 | %) | | | (23.27 | %) | | | 6.07 | % | | | (16.97 | %) | | | (45.03 | %) | | | (12.32 | %) |
Ratios/Supplemental Data |
Net assets, end of period (in thousands) | | $ | 13,417 | | | $ | 15,568 | | | $ | 29,762 | | | $ | 14,902 | | | $ | 26,018 | | | $ | 59,321 | |
Ratios to average net assets: |
Net investment income (loss) | | | 3.98 | % | | | 4.04 | % | | | 1.55 | % | | | (1.22 | %) | | | (1.28 | %) | | | 0.17 | % |
Total expensesc | | | 1.57 | % | | | 1.54 | % | | | 1.59 | % | | | 1.46 | % | | | 1.54 | % | | | 1.57 | % |
Net expensesd | | | 1.45 | % | | | 1.45 | % | | | 1.55 | % | | | 1.44 | % | | | 1.52 | % | | | 1.54 | % |
Portfolio turnover rate | | | — | | | | — | | | | — | | | | 23 | % | | | 37 | % | | | 37 | % |
Class A | | Six Months Ended
September 30, 2024a | | | Year Ended
March 31,
2024 | | | Year Ended
March 31,
2023 | | | Year Ended
March 31,
2022 | | | Year Ended
March 31,
2021 | | | Year Ended
March 31,
2020 | |
Per Share Data |
Net asset value, beginning of period | | $ | 16.12 | | | $ | 22.10 | | | $ | 20.88 | | | $ | 25.22 | | | $ | 46.04 | | | $ | 53.01 | |
Income (loss) from investment operations: |
Net investment income (loss)b | | | .30 | | | | .74 | | | | .33 | | | | (.31 | ) | | | (.45 | ) | | | .19 | |
Net gain (loss) on investments (realized and unrealized) | | | (1.41 | ) | | | (5.85 | ) | | | .89 | f | | | (4.03 | ) | | | (20.34 | ) | | | (6.83 | ) |
Total from investment operations | | | (1.11 | ) | | | (5.11 | ) | | | 1.22 | | | | (4.34 | ) | | | (20.79 | ) | | | (6.64 | ) |
Less distributions from: |
Net investment income | | | — | | | | (.87 | ) | | | — | | | | — | | | | (.03 | ) | | | (.33 | ) |
Total distributions | | | — | | | | (.87 | ) | | | — | | | | — | | | | (.03 | ) | | | (.33 | ) |
Net asset value, end of period | | $ | 15.01 | | | $ | 16.12 | | | $ | 22.10 | | | $ | 20.88 | | | $ | 25.22 | | | $ | 46.04 | |
|
Total Returne | | | (6.89 | %) | | | (23.51 | %) | | | 5.84 | % | | | (17.21 | %) | | | (45.17 | %) | | | (12.53 | %) |
Ratios/Supplemental Data |
Net assets, end of period (in thousands) | | $ | 660 | | | $ | 836 | | | $ | 1,311 | | | $ | 1,885 | | | $ | 1,489 | | | $ | 523 | |
Ratios to average net assets: |
Net investment income (loss) | | | 3.73 | % | | | 3.80 | % | | | 1.35 | % | | | (1.41 | %) | | | (1.51 | %) | | | 0.39 | % |
Total expensesc | | | 1.81 | % | | | 1.78 | % | | | 1.82 | % | | | 1.70 | % | | | 1.78 | % | | | 1.81 | % |
Net expensesd | | | 1.70 | % | | | 1.69 | % | | | 1.78 | % | | | 1.68 | % | | | 1.76 | % | | | 1.76 | % |
Portfolio turnover rate | | | — | | | | — | | | | — | | | | 23 | % | | | 37 | % | | | 37 | % |
SEE NOTES TO FINANCIAL STATEMENTS. | THE RYDEX FUNDS SEMI-ANNUAL FINANCIAL REPORT | 193 |
INVERSE NASDAQ-100® STRATEGY FUND | |
FINANCIAL HIGHLIGHTS (continued) |
This table is presented to show selected data for a share outstanding throughout each period and to assist shareholders in evaluating a Fund’s performance for the periods presented.
Class C | | Six Months Ended
September 30, 2024a | | | Year Ended
March 31,
2024 | | | Year Ended
March 31,
2023 | | | Year Ended
March 31,
2022 | | | Year Ended
March 31,
2021 | | | Year Ended
March 31,
2020 | |
Per Share Data |
Net asset value, beginning of period | | $ | 13.03 | | | $ | 18.19 | | | $ | 17.31 | | | $ | 21.07 | | | $ | 38.76 | | | $ | 45.03 | |
Income (loss) from investment operations: |
Net investment income (loss)b | | | .19 | | | | .48 | | | | (.24 | ) | | | (.38 | ) | | | (.60 | ) | | | (.17 | ) |
Net gain (loss) on investments (realized and unrealized) | | | (1.14 | ) | | | (4.77 | ) | | | 1.12 | f | | | (3.38 | ) | | | (17.06 | ) | | | (5.77 | ) |
Total from investment operations | | | (.95 | ) | | | (4.29 | ) | | | .88 | | | | (3.76 | ) | | | (17.66 | ) | | | (5.94 | ) |
Less distributions from: |
Net investment income | | | — | | | | (.87 | ) | | | — | | | | — | | | | (.03 | ) | | | (.33 | ) |
Total distributions | | | — | | | | (.87 | ) | | | — | | | | — | | | | (.03 | ) | | | (.33 | ) |
Net asset value, end of period | | $ | 12.08 | | | $ | 13.03 | | | $ | 18.19 | | | $ | 17.31 | | | $ | 21.07 | | | $ | 38.76 | |
|
Total Returne | | | (7.29 | %) | | | (24.06 | %) | | | 5.08 | % | | | (17.85 | %) | | | (45.58 | %) | | | (13.19 | %) |
Ratios/Supplemental Data |
Net assets, end of period (in thousands) | | $ | 311 | | | $ | 160 | | | $ | 40 | | | $ | 707 | | | $ | 73 | | | $ | 234 | |
Ratios to average net assets: |
Net investment income (loss) | | | 2.95 | % | | | 3.10 | % | | | (1.22 | %) | | | (2.16 | %) | | | (2.26 | %) | | | (0.41 | %) |
Total expensesc | | | 2.58 | % | | | 2.55 | % | | | 2.56 | % | | | 2.45 | % | | | 2.55 | % | | | 2.57 | % |
Net expensesd | | | 2.47 | % | | | 2.46 | % | | | 2.55 | % | | | 2.43 | % | | | 2.54 | % | | | 2.53 | % |
Portfolio turnover rate | | | — | | | | — | | | | — | | | | 23 | % | | | 37 | % | | | 37 | % |
194 | THE RYDEX FUNDS SEMI-ANNUAL FINANCIAL REPORT | SEE NOTES TO FINANCIAL STATEMENTS. |
INVERSE NASDAQ-100® STRATEGY FUND | |
FINANCIAL HIGHLIGHTS (concluded) |
This table is presented to show selected data for a share outstanding throughout each period and to assist shareholders in evaluating a Fund’s performance for the periods presented.
Class H | | Six Months Ended
September 30, 2024a | | | Year Ended
March 31,
2024 | | | Year Ended
March 31,
2023 | | | Year Ended
March 31,
2022 | | | Year Ended
March 31,
2021 | | | Year Ended
March 31,
2020 | |
Per Share Data |
Net asset value, beginning of period | | $ | 15.87 | | | $ | 21.77 | | | $ | 20.57 | | | $ | 24.83 | | | $ | 45.36 | | | $ | 52.24 | |
Income (loss) from investment operations: |
Net investment income (loss)b | | | .29 | | | | .71 | | | | .09 | | | | (.32 | ) | | | (.46 | ) | | | (.02 | ) |
Net gain (loss) on investments (realized and unrealized) | | | (1.39 | ) | | | (5.74 | ) | | | 1.11 | f | | | (3.94 | ) | | | (20.04 | ) | | | (6.53 | ) |
Total from investment operations | | | (1.10 | ) | | | (5.03 | ) | | | 1.20 | | | | (4.26 | ) | | | (20.50 | ) | | | (6.55 | ) |
Less distributions from: |
Net investment income | | | — | | | | (.87 | ) | | | — | | | | — | | | | (.03 | ) | | | (.33 | ) |
Total distributions | | | — | | | | (.87 | ) | | | — | | | | — | | | | (.03 | ) | | | (.33 | ) |
Net asset value, end of period | | $ | 14.77 | | | $ | 15.87 | | | $ | 21.77 | | | $ | 20.57 | | | $ | 24.83 | | | $ | 45.36 | |
|
Total Return | | | (6.93 | %) | | | (23.41 | %) | | | 5.83 | % | | | (17.16 | %) | | | (45.21 | %) | | | (12.54 | %) |
Ratios/Supplemental Data |
Net assets, end of period (in thousands) | | $ | 491 | | | $ | 332 | | | $ | 574 | | | $ | 2,567 | | | $ | 337 | | | $ | 583 | |
Ratios to average net assets: |
Net investment income (loss) | | | 3.72 | % | | | 3.79 | % | | | 0.39 | % | | | (1.49 | %) | | | (1.51 | %) | | | (0.05 | %) |
Total expensesc | | | 1.83 | % | | | 1.80 | % | | | 1.83 | % | | | 1.72 | % | | | 1.79 | % | | | 1.82 | % |
Net expensesd | | | 1.72 | % | | | 1.71 | % | | | 1.80 | % | | | 1.71 | % | | | 1.78 | % | | | 1.79 | % |
Portfolio turnover rate | | | — | | | | — | | | | — | | | | 23 | % | | | 37 | % | | | 37 | % |
a | Unaudited figures for the period ended September 30, 2024. Percentage amounts for the period, except total return and portfolio turnover rate, have been annualized. |
b | Net investment income (loss) per share was computed using average shares outstanding throughout the period. |
c | Does not include expenses of the underlying funds in which the Fund invests. |
d | Net expense information reflects the expense ratios after expense waivers and reimbursements, as applicable. |
e | Total return does not reflect the impact of any applicable sales charges. |
f | The amount shown for a share outstanding throughout the period does not agree with the aggregate net loss on investments for the year because of the sales and purchases of fund shares in relation to fluctuating market value of the investments of the Fund. |
SEE NOTES TO FINANCIAL STATEMENTS. | THE RYDEX FUNDS SEMI-ANNUAL FINANCIAL REPORT | 195 |
SCHEDULE OF INVESTMENTS (Unaudited) | September 30, 2024 |
MID-CAP 1.5x STRATEGY FUND | |
| | Shares | | | Value | |
COMMON STOCKS† - 79.2% |
| | | | | | | | | |
Industrial - 18.5% |
Carlisle Companies, Inc. | | | 158 | | | $ | 71,060 | |
EMCOR Group, Inc. | | | 159 | | | | 68,454 | |
Lennox International, Inc. | | | 110 | | | | 66,472 | |
Owens Corning | | | 297 | | | | 52,426 | |
Graco, Inc. | | | 577 | | | | 50,493 | |
Comfort Systems USA, Inc. | | | 122 | | | | 47,623 | |
AECOM | | | 458 | | | | 47,298 | |
Coherent Corp.* | | | 524 | | | | 46,589 | |
Tetra Tech, Inc. | | | 914 | | | | 43,104 | |
Curtiss-Wright Corp. | | | 131 | | | | 43,058 | |
XPO, Inc.* | | | 398 | | | | 42,789 | |
Clean Harbors, Inc.* | | | 173 | | | | 41,816 | |
ITT, Inc. | | | 279 | | | | 41,713 | |
TopBuild Corp.* | | | 102 | | | | 41,495 | |
nVent Electric plc | | | 568 | | | | 39,908 | |
Saia, Inc.* | | | 91 | | | | 39,791 | |
Crown Holdings, Inc. | | | 407 | | | | 39,023 | |
Fortune Brands Innovations, Inc. | | | 424 | | | | 37,961 | |
Advanced Drainage Systems, Inc. | | | 241 | | | | 37,876 | |
Regal Rexnord Corp. | | | 227 | | | | 37,655 | |
Lincoln Electric Holdings, Inc. | | | 194 | | | | 37,252 | |
AptarGroup, Inc. | | | 227 | | | | 36,363 | |
Woodward, Inc. | | | 204 | | | | 34,988 | |
BWX Technologies, Inc. | | | 312 | | | | 33,914 | |
CNH Industrial N.V. | | | 2,999 | | | | 33,289 | |
Eagle Materials, Inc. | | | 115 | | | | 33,080 | |
Universal Display Corp. | | | 151 | | | | 31,695 | |
TD SYNNEX Corp. | | | 260 | | | | 31,221 | |
Toro Co. | | | 355 | | | | 30,789 | |
Graphic Packaging Holding Co. | | | 1,026 | | | | 30,359 | |
Donaldson Company, Inc. | | | 411 | | | | 30,291 | |
Knight-Swift Transportation Holdings, Inc. | | | 553 | | | | 29,834 | |
RBC Bearings, Inc.* | | | 99 | | | | 29,639 | |
Fabrinet* | | | 124 | | | | 29,319 | |
Applied Industrial Technologies, Inc. | | | 131 | | | | 29,230 | |
Acuity Brands, Inc. | | | 105 | | | | 28,916 | |
Fluor Corp.* | | | 585 | | | | 27,910 | |
Simpson Manufacturing Company, Inc. | | | 144 | | | | 27,543 | |
UFP Industries, Inc. | | | 208 | | | | 27,292 | |
Berry Global Group, Inc. | | | 392 | | | | 26,648 | |
Crane Co. | | | 166 | | | | 26,275 | |
MasTec, Inc.* | | | 210 | | | | 25,851 | |
Middleby Corp.* | | | 184 | | | | 25,600 | |
AAON, Inc. | | | 230 | | | | 24,803 | |
Trex Company, Inc.* | | | 371 | | | | 24,701 | |
Kirby Corp.* | | | 198 | | | | 24,241 | |
Arrow Electronics, Inc.* | | | 181 | | | | 24,042 | |
MSA Safety, Inc. | | | 134 | | | | 23,763 | |
Cognex Corp. | | | 586 | | | | 23,733 | |
Flowserve Corp. | | | 449 | | | | 23,209 | |
Louisiana-Pacific Corp. | | | 214 | | | | 22,996 | |
Landstar System, Inc. | | | 121 | | | | 22,853 | |
Littelfuse, Inc. | | | 85 | | | | 22,546 | |
Oshkosh Corp. | | | 222 | | | | 22,247 | |
Novanta, Inc.* | | | 123 | | | | 22,007 | |
Ryder System, Inc. | | | 148 | | | | 21,579 | |
AGCO Corp. | | | 212 | | | | 20,746 | |
Esab Corp. | | | 194 | | | | 20,624 | |
Valmont Industries, Inc. | | | 69 | | | | 20,006 | |
Exponent, Inc. | | | 173 | | | | 19,943 | |
Watts Water Technologies, Inc. — Class A | | | 94 | | | | 19,476 | |
Stericycle, Inc.* | | | 317 | | | | 19,337 | |
MDU Resources Group, Inc. | | | 697 | | | | 19,105 | |
Sensata Technologies Holding plc | | | 516 | | | | 18,504 | |
Timken Co. | | | 218 | | | | 18,375 | |
NEXTracker, Inc. — Class A* | | | 490 | | | | 18,365 | |
Sonoco Products Co. | | | 336 | | | | 18,356 | |
Chart Industries, Inc.* | | | 144 | | | | 17,876 | |
Vontier Corp. | | | 525 | | | | 17,714 | |
Knife River Corp.* | | | 193 | | | | 17,252 | |
Hexcel Corp. | | | 279 | | | | 17,251 | |
Avnet, Inc. | | | 301 | | | | 16,347 | |
Belden, Inc. | | | 139 | | | | 16,281 | |
GATX Corp. | | | 122 | | | | 16,159 | |
Silgan Holdings, Inc. | | | 277 | | | | 14,543 | |
EnerSys | | | 138 | | | | 14,083 | |
Terex Corp. | | | 229 | | | | 12,116 | |
Vishay Intertechnology, Inc. | | | 388 | | | | 7,337 | |
Greif, Inc. — Class A | | | 88 | | | | 5,514 | |
Total Industrial | | | | | | | 2,321,932 | |
| | | | | | | | | |
Financial - 18.4% |
Fidelity National Financial, Inc. | | | 888 | | | | 55,109 | |
Interactive Brokers Group, Inc. — Class A | | | 372 | | | | 51,842 | |
Reinsurance Group of America, Inc. — Class A | | | 225 | | | | 49,021 | |
RenaissanceRe Holdings Ltd. | | | 178 | | | | 48,487 | |
Gaming and Leisure Properties, Inc. REIT | | | 938 | | | | 48,260 | |
WP Carey, Inc. REIT | | | 748 | | | | 46,600 | |
Equitable Holdings, Inc. | | | 1,093 | | | | 45,939 | |
Equity LifeStyle Properties, Inc. REIT | | | 637 | | | | 45,444 | |
Jones Lang LaSalle, Inc.* | | | 162 | | | | 43,709 | |
CubeSmart REIT | | | 770 | | | | 41,449 | |
American Homes 4 Rent — Class A REIT | | | 1,075 | | | | 41,269 | |
Lamar Advertising Co. — Class A REIT | | | 300 | | | | 40,080 | |
East West Bancorp, Inc. | | | 474 | | | | 39,219 | |
Rexford Industrial Realty, Inc. REIT | | | 749 | | | | 37,682 | |
Omega Healthcare Investors, Inc. REIT | | | 881 | | | | 35,857 | |
Kinsale Capital Group, Inc. | | | 76 | | | | 35,383 | |
Unum Group | | | 584 | | | | 34,713 | |
Annaly Capital Management, Inc. REIT | | | 1,712 | | | | 34,360 | |
Jefferies Financial Group, Inc. | | | 555 | | | | 34,160 | |
Ally Financial, Inc. | | | 937 | | | | 33,348 | |
American Financial Group, Inc. | | | 247 | | | | 33,246 | |
Stifel Financial Corp. | | | 350 | | | | 32,865 | |
Western Alliance Bancorporation | | | 373 | | | | 32,261 | |
EastGroup Properties, Inc. REIT | | | 166 | | | | 31,012 | |
Carlyle Group, Inc. | | | 719 | | | | 30,960 | |
Evercore, Inc. — Class A | | | 122 | | | | 30,908 | |
Primerica, Inc. | | | 116 | | | | 30,757 | |
NNN REIT, Inc. | | | 628 | | | | 30,452 | |
196 | THE RYDEX FUNDS SEMI-ANNUAL FINANCIAL REPORT | SEE NOTES TO FINANCIAL STATEMENTS. |
SCHEDULE OF INVESTMENTS (Unaudited)(continued) | September 30, 2024 |
MID-CAP 1.5x STRATEGY FUND | |
| | Shares | | | Value | |
Old Republic International Corp. | | | 813 | | | $ | 28,797 | |
Houlihan Lokey, Inc. | | | 182 | | | | 28,760 | |
Brixmor Property Group, Inc. REIT | | | 1,030 | | | | 28,696 | |
First Horizon Corp. | | | 1,831 | | | | 28,435 | |
Webster Financial Corp. | | | 586 | | | | 27,314 | |
Voya Financial, Inc. | | | 336 | | | | 26,618 | |
Agree Realty Corp. REIT | | | 343 | | | | 25,838 | |
Pinnacle Financial Partners, Inc. | | | 261 | | | | 25,570 | |
First Industrial Realty Trust, Inc. REIT | | | 452 | | | | 25,303 | |
SouthState Corp. | | | 260 | | | | 25,267 | |
Wintrust Financial Corp. | | | 227 | | | | 24,636 | |
Cullen/Frost Bankers, Inc. | | | 219 | | | | 24,497 | |
STAG Industrial, Inc. REIT | | | 622 | | | | 24,314 | |
Zions Bancorp North America | | | 505 | | | | 23,846 | |
Commerce Bancshares, Inc. | | | 401 | | | | 23,819 | |
Prosperity Bancshares, Inc. | | | 326 | | | | 23,495 | |
Hamilton Lane, Inc. — Class A | | | 139 | | | | 23,406 | |
Essent Group Ltd. | | | 363 | | | | 23,337 | |
SEI Investments Co. | | | 337 | | | | 23,317 | |
Ryan Specialty Holdings, Inc. | | | 350 | | | | 23,237 | |
First American Financial Corp. | | | 352 | | | | 23,236 | |
MGIC Investment Corp. | | | 886 | | | | 22,682 | |
Healthcare Realty Trust, Inc. REIT | | | 1,241 | | | | 22,524 | |
Vornado Realty Trust REIT | | | 566 | | | | 22,300 | |
Starwood Property Trust, Inc. REIT | | | 1,085 | | | | 22,112 | |
RLI Corp. | | | 142 | | | | 22,007 | |
Synovus Financial Corp. | | | 492 | | | | 21,879 | |
Old National Bancorp | | | 1,090 | | | | 20,339 | |
Kite Realty Group Trust REIT | | | 751 | | | | 19,947 | |
Cadence Bank | | | 623 | | | | 19,843 | |
Selective Insurance Group, Inc. | | | 208 | | | | 19,406 | |
Columbia Banking System, Inc. | | | 716 | | | | 18,695 | |
Hanover Insurance Group, Inc. | | | 123 | | | | 18,218 | |
Affiliated Managers Group, Inc. | | | 102 | | | | 18,136 | |
Glacier Bancorp, Inc. | | | 387 | | | | 17,686 | |
FNB Corp. | | | 1,229 | | | | 17,341 | |
Home BancShares, Inc. | | | 635 | | | | 17,202 | |
United Bankshares, Inc. | | | 461 | | | | 17,103 | |
SLM Corp. | | | 743 | | | | 16,992 | |
Janus Henderson Group plc | | | 435 | | | | 16,560 | |
First Financial Bankshares, Inc. | | | 439 | | | | 16,247 | |
UMB Financial Corp. | | | 152 | | | | 15,977 | |
Independence Realty Trust, Inc. REIT | | | 768 | | | | 15,744 | |
Bank OZK | | | 361 | | | | 15,519 | |
Cousins Properties, Inc. REIT | | | 520 | | | | 15,330 | |
Hancock Whitney Corp. | | | 295 | | | | 15,095 | |
Sabra Health Care REIT, Inc. | | | 801 | | | | 14,907 | |
Rayonier, Inc. REIT | | | 458 | | | | 14,738 | |
Kilroy Realty Corp. REIT | | | 361 | | | | 13,971 | |
Western Union Co. | | | 1,154 | | | | 13,767 | |
Valley National Bancorp | | | 1,462 | | | | 13,246 | |
EPR Properties REIT | | | 259 | | | | 12,701 | |
Kemper Corp. | | | 207 | | | | 12,679 | |
CNO Financial Group, Inc. | | | 361 | | | | 12,671 | |
COPT Defense Properties REIT | | | 384 | | | | 11,647 | |
National Storage Affiliates Trust REIT | | | 239 | | | | 11,520 | |
New York Community Bancorp, Inc. | | | 1,018 | | | | 11,432 | |
Texas Capital Bancshares, Inc.* | | | 158 | | | | 11,291 | |
PotlatchDeltic Corp. REIT | | | 245 | | | | 11,037 | |
International Bancshares Corp. | | | 183 | | | | 10,942 | |
Associated Banc-Corp. | | | 507 | | | | 10,921 | |
Park Hotels & Resorts, Inc. REIT | | | 714 | | | | 10,067 | |
Federated Hermes, Inc. — Class B | | | 269 | | | | 9,891 | |
Brighthouse Financial, Inc.* | | | 208 | | | | 9,366 | |
Total Financial | | | | | | | 2,307,808 | |
| | | | | | | | | |
Consumer, Non-cyclical - 13.2% |
Illumina, Inc.* | | | 544 | | | | 70,943 | |
Avantor, Inc.* | | | 2,323 | | | | 60,096 | |
United Therapeutics Corp.* | | | 152 | | | | 54,469 | |
Tenet Healthcare Corp.* | | | 327 | | | | 54,347 | |
US Foods Holding Corp.* | | | 836 | | | | 51,414 | |
RB Global, Inc. | | | 630 | | | | 50,709 | |
BioMarin Pharmaceutical, Inc.* | | | 651 | | | | 45,759 | |
Performance Food Group Co.* | | | 533 | | | | 41,771 | |
Sarepta Therapeutics, Inc.* | | | 326 | | | | 40,714 | |
Neurocrine Biosciences, Inc.* | | | 345 | | | | 39,751 | |
Service Corporation International | | | 498 | | | | 39,307 | |
Sprouts Farmers Market, Inc.* | | | 342 | | | | 37,760 | |
Encompass Health Corp. | | | 344 | | | | 33,244 | |
Chemed Corp. | | | 51 | | | | 30,650 | |
Ingredion, Inc. | | | 222 | | | | 30,509 | |
H&R Block, Inc. | | | 477 | | | | 30,313 | |
WEX, Inc.* | | | 140 | | | | 29,362 | |
Morningstar, Inc. | | | 92 | | | | 29,359 | |
Medpace Holdings, Inc.* | | | 87 | | | | 29,041 | |
Ensign Group, Inc. | | | 193 | | | | 27,757 | |
Globus Medical, Inc. — Class A* | | | 386 | | | | 27,614 | |
FTI Consulting, Inc.* | | | 121 | | | | 27,535 | |
BellRing Brands, Inc.* | | | 442 | | | | 26,838 | |
Repligen Corp.* | | | 178 | | | | 26,490 | |
Coca-Cola Consolidated, Inc. | | | 20 | | | | 26,328 | |
Bruker Corp. | | | 378 | | | | 26,105 | |
Lantheus Holdings, Inc.* | | | 237 | | | | 26,011 | |
Penumbra, Inc.* | | | 133 | | | | 25,843 | |
Exelixis, Inc.* | | | 975 | | | | 25,301 | |
Halozyme Therapeutics, Inc.* | | | 433 | | | | 24,785 | |
Paylocity Holding Corp.* | | | 148 | | | | 24,416 | |
HealthEquity, Inc.* | | | 297 | | | | 24,310 | |
Jazz Pharmaceuticals plc* | | | 211 | | | | 23,508 | |
Bio-Rad Laboratories, Inc. — Class A* | | | 65 | | | | 21,748 | |
GXO Logistics, Inc.* | | | 408 | | | | 21,244 | |
Cytokinetics, Inc.* | | | 402 | | | | 21,226 | |
elf Beauty, Inc.* | | | 193 | | | | 21,043 | |
Darling Ingredients, Inc.* | | | 543 | | | | 20,178 | |
Masimo Corp.* | | | 151 | | | | 20,133 | |
Acadia Healthcare Company, Inc.* | | | 317 | | | | 20,101 | |
Dentsply Sirona, Inc. | | | 693 | | | | 18,753 | |
Post Holdings, Inc.* | | | 162 | | | | 18,752 | |
Valvoline, Inc.* | | | 440 | | | | 18,414 | |
Option Care Health, Inc.* | | | 584 | | | | 18,279 | |
Brink’s Co. | | | 151 | | | | 17,462 | |
Roivant Sciences Ltd.* | | | 1,491 | | | | 17,206 | |
SEE NOTES TO FINANCIAL STATEMENTS. | THE RYDEX FUNDS SEMI-ANNUAL FINANCIAL REPORT | 197 |
SCHEDULE OF INVESTMENTS (Unaudited)(continued) | September 30, 2024 |
MID-CAP 1.5x STRATEGY FUND | |
| | Shares | | | Value | |
Celsius Holdings, Inc.* | | | 534 | | | $ | 16,746 | |
Flowers Foods, Inc. | | | 669 | | | | 15,434 | |
Euronet Worldwide, Inc.* | | | 144 | | | | 14,289 | |
Haemonetics Corp.* | | | 175 | | | | 14,066 | |
Grand Canyon Education, Inc.* | | | 99 | | | | 14,043 | |
Perrigo Company plc | | | 466 | | | | 12,223 | |
ManpowerGroup, Inc. | | | 162 | | | | 11,910 | |
Coty, Inc. — Class A* | | | 1,246 | | | | 11,700 | |
Lancaster Colony Corp. | | | 66 | | | | 11,654 | |
Envista Holdings Corp.* | | | 588 | | | | 11,619 | |
Neogen Corp.* | | | 674 | | | | 11,330 | |
Amedisys, Inc.* | | | 112 | | | | 10,809 | |
Insperity, Inc. | | | 122 | | | | 10,736 | |
Graham Holdings Co. — Class B | | | 12 | | | | 9,861 | |
LivaNova plc* | | | 186 | | | | 9,772 | |
Sotera Health Co.* | | | 523 | | | | 8,734 | |
Boston Beer Company, Inc. — Class A* | | | 30 | | | | 8,674 | |
Arrowhead Pharmaceuticals, Inc.* | | | 425 | | | | 8,232 | |
Enovis Corp.* | | | 191 | | | | 8,223 | |
Azenta, Inc.* | | | 167 | | | | 8,089 | |
R1 RCM, Inc.* | | | 534 | | | | 7,567 | |
Pilgrim’s Pride Corp.* | | | 138 | | | | 6,355 | |
Avis Budget Group, Inc. | | | 58 | | | | 5,080 | |
Total Consumer, Non-cyclical | | | | | | | 1,664,044 | |
| | | | | | | | | |
Consumer, Cyclical - 12.5% |
Williams-Sonoma, Inc. | | | 440 | | | | 68,165 | |
Watsco, Inc. | | | 119 | | | | 58,534 | |
Burlington Stores, Inc.* | | | 216 | | | | 56,912 | |
Toll Brothers, Inc. | | | 351 | | | | 54,226 | |
Casey’s General Stores, Inc. | | | 127 | | | | 47,715 | |
Floor & Decor Holdings, Inc. — Class A* | | | 366 | | | | 45,446 | |
Wingstop, Inc. | | | 100 | | | | 41,608 | |
Dick’s Sporting Goods, Inc. | | | 198 | | | | 41,323 | |
Texas Roadhouse, Inc. — Class A | | | 228 | | | | 40,265 | |
BJ’s Wholesale Club Holdings, Inc.* | | | 453 | | | | 37,363 | |
Aramark | | | 900 | | | | 34,857 | |
Churchill Downs, Inc. | | | 251 | | | | 33,938 | |
Tempur Sealy International, Inc. | | | 593 | | | | 32,378 | |
Murphy USA, Inc. | | | 64 | | | | 31,544 | |
GameStop Corp. — Class A* | | | 1,325 | | | | 30,382 | |
Skechers USA, Inc. — Class A* | | | 453 | | | | 30,315 | |
Crocs, Inc.* | | | 203 | | | | 29,396 | |
Core & Main, Inc. — Class A* | | | 659 | | | | 29,259 | |
Lithia Motors, Inc. — Class A | | | 91 | | | | 28,905 | |
TKO Group Holdings, Inc.* | | | 227 | | | | 28,082 | |
Light & Wonder, Inc. — Class A* | | | 303 | | | | 27,491 | |
WESCO International, Inc. | | | 153 | | | | 25,701 | |
American Airlines Group, Inc.* | | | 2,244 | | | | 25,223 | |
Taylor Morrison Home Corp. — Class A* | | | 356 | | | | 25,012 | |
Abercrombie & Fitch Co. — Class A* | | | 175 | | | | 24,482 | |
Planet Fitness, Inc. — Class A* | | | 289 | | | | 23,472 | |
Hyatt Hotels Corp. — Class A | | | 154 | | | | 23,439 | |
Gentex Corp. | | | 787 | | | | 23,366 | |
Autoliv, Inc. | | | 250 | | | | 23,342 | |
Vail Resorts, Inc. | | | 129 | | | | 22,483 | |
Mattel, Inc.* | | | 1,162 | | | | 22,136 | |
Wyndham Hotels & Resorts, Inc. | | | 270 | | | | 21,098 | |
KB Home | | | 246 | | | | 21,080 | |
Lear Corp. | | | 192 | | | | 20,957 | |
Ollie’s Bargain Outlet Holdings, Inc.* | | | 209 | | | | 20,315 | |
Whirlpool Corp. | | | 188 | | | | 20,116 | |
Thor Industries, Inc. | | | 182 | | | | 20,000 | |
PVH Corp. | | | 191 | | | | 19,259 | |
Brunswick Corp. | | | 226 | | | | 18,943 | |
Capri Holdings Ltd.* | | | 403 | | | | 17,103 | |
RH* | | | 51 | | | | 17,056 | |
Gap, Inc. | | | 756 | | | | 16,670 | |
Five Below, Inc.* | | | 188 | | | | 16,610 | |
AutoNation, Inc.* | | | 89 | | | | 15,924 | |
Dolby Laboratories, Inc. — Class A | | | 204 | | | | 15,612 | |
Harley-Davidson, Inc. | | | 405 | | | | 15,605 | |
FirstCash Holdings, Inc. | | | 133 | | | | 15,268 | |
Boyd Gaming Corp. | | | 235 | | | | 15,193 | |
Warner Music Group Corp. — Class A | | | 484 | | | | 15,149 | |
Polaris, Inc. | | | 179 | | | | 14,900 | |
Macy’s, Inc. | | | 945 | | | | 14,827 | |
MSC Industrial Direct Company, Inc. — Class A | | | 153 | | | | 13,167 | |
Scotts Miracle-Gro Co. — Class A | | | 146 | | | | 12,658 | |
YETI Holdings, Inc.* | | | 289 | | | | 11,858 | |
Travel + Leisure Co. | | | 238 | | | | 10,967 | |
Penske Automotive Group, Inc. | | | 64 | | | | 10,395 | |
Wendy’s Co. | | | 583 | | | | 10,214 | |
Choice Hotels International, Inc.1 | | | 77 | | | | 10,033 | |
Columbia Sportswear Co. | | | 112 | | | | 9,317 | |
Visteon Corp.* | | | 94 | | | | 8,953 | |
Goodyear Tire & Rubber Co.* | | | 974 | | | | 8,620 | |
Marriott Vacations Worldwide Corp. | | | 110 | | | | 8,083 | |
Carter’s, Inc. | | | 123 | | | | 7,993 | |
Hilton Grand Vacations, Inc.* | | | 219 | | | | 7,954 | |
Nordstrom, Inc. | | | 330 | | | | 7,422 | |
Under Armour, Inc. — Class A* | | | 645 | | | | 5,747 | |
Under Armour, Inc. — Class C* | | | 442 | | | | 3,695 | |
Total Consumer, Cyclical | | | | | | | 1,565,521 | |
| | | | | | | | | |
Technology - 6.5% |
Manhattan Associates, Inc.* | | | 209 | | | | 58,808 | |
Dynatrace, Inc.* | | | 1,018 | | | | 54,432 | |
Pure Storage, Inc. — Class A* | | | 1,056 | | | | 53,053 | |
CACI International, Inc. — Class A* | | | 76 | | | | 38,347 | |
Duolingo, Inc.* | | | 128 | | | | 36,099 | |
Onto Innovation, Inc.* | | | 169 | | | | 35,078 | |
KBR, Inc. | | | 455 | | | | 29,634 | |
MKS Instruments, Inc. | | | 230 | | | | 25,003 | |
Lattice Semiconductor Corp.* | | | 471 | | | | 24,996 | |
Science Applications International Corp. | | | 175 | | | | 24,372 | |
CommVault Systems, Inc.* | | | 149 | | | | 22,924 | |
Cirrus Logic, Inc.* | | | 183 | | | | 22,731 | |
Genpact Ltd. | | | 560 | | | | 21,958 | |
MACOM Technology Solutions Holdings, Inc.* | | | 197 | | | | 21,918 | |
Aspen Technology, Inc.* | | | 91 | | | | 21,733 | |
ExlService Holdings, Inc.* | | | 552 | | | | 21,059 | |
198 | THE RYDEX FUNDS SEMI-ANNUAL FINANCIAL REPORT | SEE NOTES TO FINANCIAL STATEMENTS. |
SCHEDULE OF INVESTMENTS (Unaudited)(continued) | September 30, 2024 |
MID-CAP 1.5x STRATEGY FUND | |
| | Shares | | | Value | |
Dropbox, Inc. — Class A* | | | 811 | | | $ | 20,624 | |
Altair Engineering, Inc. — Class A* | | | 203 | | | | 19,389 | |
Maximus, Inc. | | | 206 | | | | 19,191 | |
Doximity, Inc. — Class A* | | | 428 | | | | 18,648 | |
Appfolio, Inc. — Class A* | | | 79 | | | | 18,597 | |
Kyndryl Holdings, Inc.* | | | 790 | | | | 18,154 | |
Parsons Corp.* | | | 160 | | | | 16,589 | |
Qualys, Inc.* | | | 126 | | | | 16,186 | |
Rambus, Inc.* | | | 368 | | | | 15,537 | |
Lumentum Holdings, Inc.* | | | 232 | | | | 14,704 | |
ASGN, Inc.* | | | 153 | | | | 14,264 | |
Silicon Laboratories, Inc.* | | | 110 | | | | 12,713 | |
Power Integrations, Inc. | | | 194 | | | | 12,439 | |
Allegro MicroSystems, Inc.* | | | 531 | | | | 12,372 | |
Amkor Technology, Inc. | | | 387 | | | | 11,842 | |
Blackbaud, Inc.* | | | 136 | | | | 11,516 | |
Synaptics, Inc.* | | | 135 | | | | 10,473 | |
ZoomInfo Technologies, Inc. — Class A* | | | 986 | | | | 10,175 | |
Teradata Corp.* | | | 328 | | | | 9,951 | |
Crane NXT Co. | | | 168 | | | | 9,425 | |
Concentrix Corp. | | | 161 | | | | 8,251 | |
IPG Photonics Corp.* | | | 94 | | | | 6,986 | |
Total Technology | | | | | | | 820,171 | |
| | | | | | | | | |
Energy - 4.0% |
Texas Pacific Land Corp. | | | 64 | | | | 56,623 | |
Ovintiv, Inc. | | | 902 | | | | 34,556 | |
Chesapeake Energy Corp.1 | | | 381 | | | | 31,337 | |
Permian Resources Corp. | | | 2,169 | | | | 29,520 | |
Antero Resources Corp.* | | | 999 | | | | 28,621 | |
Chord Energy Corp. | | | 211 | | | | 27,479 | |
Southwestern Energy Co.* | | | 3,769 | | | | 26,798 | |
DT Midstream, Inc. | | | 332 | | | | 26,115 | |
Range Resources Corp. | | | 827 | | | | 25,438 | |
HF Sinclair Corp. | | | 554 | | | | 24,692 | |
NOV, Inc. | | | 1,345 | | | | 21,480 | |
Weatherford International plc | | | 250 | | | | 21,230 | |
ChampionX Corp. | | | 651 | | | | 19,627 | |
Matador Resources Co. | | | 397 | | | | 19,620 | |
Antero Midstream Corp. | | | 1,151 | | | | 17,323 | |
CNX Resources Corp.* | | | 517 | | | | 16,839 | |
Murphy Oil Corp. | | | 485 | | | | 16,364 | |
Civitas Resources, Inc. | | | 309 | | | | 15,657 | |
Viper Energy, Inc. | | | 347 | | | | 15,653 | |
Valaris Ltd.* | | | 228 | | | | 12,711 | |
PBF Energy, Inc. — Class A | | | 340 | | | | 10,523 | |
Total Energy | | | | | | | 498,206 | |
| | | | | | | | | |
Basic Materials - 3.1% |
Reliance, Inc. | | | 188 | | | | 54,372 | |
RPM International, Inc. | | | 440 | | | | 53,240 | |
Alcoa Corp. | | | 883 | | | | 34,066 | |
Royal Gold, Inc. | | | 225 | | | | 31,568 | |
Axalta Coating Systems Ltd.* | | | 749 | | | | 27,106 | |
United States Steel Corp. | | | 765 | | | | 27,027 | |
Commercial Metals Co. | | | 393 | | | | 21,599 | |
Cabot Corp. | | | 187 | | | | 20,901 | |
Cleveland-Cliffs, Inc.* | | | 1,599 | | | | 20,419 | |
Olin Corp. | | | 402 | | | | 19,288 | |
Westlake Corp. | | | 114 | | | | 17,133 | |
Avient Corp. | | | 312 | | | | 15,700 | |
Ashland, Inc. | | | 167 | | | | 14,524 | |
NewMarket Corp. | | | 26 | | | | 14,349 | |
Arcadium Lithium plc* | | | 3,675 | | | | 10,474 | |
Chemours Co. | | | 510 | | | | 10,363 | |
Total Basic Materials | | | | | | | 392,129 | |
| | | | | | | | | |
Utilities - 2.1% |
Essential Utilities, Inc. | | | 860 | | | | 33,170 | |
OGE Energy Corp. | | | 686 | | | | 28,140 | |
National Fuel Gas Co. | | | 312 | | | | 18,910 | |
IDACORP, Inc. | | | 182 | | | | 18,762 | |
UGI Corp. | | | 734 | | | | 18,365 | |
Portland General Electric Co. | | | 352 | | | | 16,861 | |
New Jersey Resources Corp. | | | 339 | | | | 16,001 | |
Southwest Gas Holdings, Inc. | | | 206 | | | | 15,195 | |
Black Hills Corp. | | | 238 | | | | 14,547 | |
ONE Gas, Inc. | | | 194 | | | | 14,437 | |
Ormat Technologies, Inc. | | | 184 | | | | 14,157 | |
TXNM Energy, Inc. | | | 309 | | | | 13,525 | |
Spire, Inc. | | | 197 | | | | 13,256 | |
ALLETE, Inc. | | | 197 | | | | 12,645 | |
Northwestern Energy Group, Inc. | | | 209 | | | | 11,959 | |
Total Utilities | | | | | | | 259,930 | |
| | | | | | | | | |
Communications - 0.9% |
New York Times Co. — Class A | | | 559 | | | | 31,120 | |
Ciena Corp.* | | | 491 | | | | 30,241 | |
Frontier Communications Parent, Inc.* | | | 756 | | | | 26,861 | |
Nexstar Media Group, Inc. — Class A | | | 104 | | | | 17,196 | |
Iridium Communications, Inc. | | | 405 | | | | 12,332 | |
Total Communications | | | | | | | 117,750 | |
| | | | | | | | | |
Total Common Stocks | | | | |
(Cost $7,017,069) | | | | | | | 9,947,491 | |
| | | | | | | | | |
MUTUAL FUNDS† - 9.0% |
Guggenheim Ultra Short Duration Fund — Institutional Class2 | | | 88,750 | | | | 889,279 | |
Guggenheim Strategy Fund II2 | | | 9,844 | | | | 244,122 | |
Total Mutual Funds | | | | |
(Cost $1,123,599) | | | | | | | 1,133,401 | |
| | | | | | | | | |
| | | Face
Amount | | | | | |
U.S. TREASURY BILLS†† - 1.9% |
U.S. Treasury Bills |
4.85% due 12/12/243,4 | | $ | 130,000 | | | | 128,838 | |
4.63% due 10/10/244,5 | | | 105,000 | | | | 104,878 | |
Total U.S. Treasury Bills | | | | |
(Cost $233,604) | | | | | | | 233,716 | |
| | | | | | | | | |
SEE NOTES TO FINANCIAL STATEMENTS. | THE RYDEX FUNDS SEMI-ANNUAL FINANCIAL REPORT | 199 |
SCHEDULE OF INVESTMENTS (Unaudited)(continued) | September 30, 2024 |
MID-CAP 1.5x STRATEGY FUND | |
| | Face
Amount | | | Value | |
REPURCHASE AGREEMENTS††,6 - 9.3% |
J.P. Morgan Securities LLC
issued 09/30/24 at 4.86%
due 10/01/243 | | $ | 639,715 | | | $ | 639,715 | |
BofA Securities, Inc.
issued 09/30/24 at 4.85%
due 10/01/243 | | | 528,375 | | | | 528,375 | |
Total Repurchase Agreements | | | | |
(Cost $1,168,090) | | | | | | | 1,168,090 | |
| | Shares | | | Value | |
SECURITIES LENDING COLLATERAL†,7 - 0.3% |
Money Market Fund*** | | | | | | | | |
First American Government Obligations Fund - Class X, 4.82%8 | | | 31,806 | | | $ | 31,806 | |
Total Securities Lending Collateral | | | | |
(Cost $31,806) | | | | | | | 31,806 | |
| | | | | | | | | |
Total Investments - 99.7% | | | | |
(Cost $9,574,168) | | $ | 12,514,504 | |
Other Assets & Liabilities, net - 0.3% | | | 39,513 | |
Total Net Assets - 100.0% | | $ | 12,554,017 | |
Futures Contracts |
Description | | Number of
Contracts | | | Expiration
Date | | | Notional
Amount | | | Value and
Unrealized
Appreciation** | |
Equity Futures Contracts Purchased† |
S&P MidCap 400 Index Mini Futures Contracts | | | 6 | | | | Dec 2024 | | | $ | 1,889,640 | | | $ | 49,734 | |
Total Return Swap Agreements |
Counterparty | Index | Type | | Financing
Rate | | Payment
Frequency | | | Maturity
Date | | | Units | | | Notional
Amount | | | Value and
Unrealized
Appreciation | |
OTC Equity Index Swap Agreements†† |
Goldman Sachs International | S&P MidCap 400 Index | Pay | | 5.08% (Federal
Funds Rate +
0.25%) | | | At Maturity | | | | 12/18/24 | | 1,631 | | $ | 5,091,807 | | | $ | 49,115 | |
BNP Paribas | S&P MidCap 400 Index | Pay | | 5.38% (Federal
Funds Rate +
0.55%) | | | At Maturity | | | | 12/19/24 | | 248 | | | 773,316 | | | | 8,153 | |
Barclays Bank plc | S&P MidCap 400 Index | Pay | | 5.39% (SOFR +
0.55%) | | | At Maturity | | | | 12/19/24 | | 354 | | | 1,105,624 | | | | 1,064 | |
| | | | | | | | | | | | | | | | | | | $ | 6,970,747 | | | $ | 58,332 | |
* | Non-income producing security. |
** | Includes cumulative appreciation (depreciation). Variation margin is reported within the Statement of Assets and Liabilities. |
*** | A copy of each underlying unaffiliated fund’s financial statements is available at the SEC’s website at www.sec.gov. |
† | Value determined based on Level 1 inputs — See Note 4. |
†† | Value determined based on Level 2 inputs — See Note 4. |
1 | All or a portion of this security is on loan at September 30, 2024 — See Note 7. |
2 | Affiliated issuer. |
3 | All or a portion of this security is pledged as equity index swap collateral at September 30, 2024. |
4 | Rate indicated is the effective yield at the time of purchase. |
5 | All or a portion of this security is pledged as futures collateral at September 30, 2024. |
6 | Repurchase Agreements — See Note 6. |
7 | Securities lending collateral — See Note 7. |
8 | Rate indicated is the 7-day yield as of September 30, 2024. |
| | plc — Public Limited Company |
| | REIT — Real Estate Investment Trust |
| | SOFR — Secured Overnight Financing Rate |
| | |
| | See Sector Classification in Other Information section. |
200 | THE RYDEX FUNDS SEMI-ANNUAL FINANCIAL REPORT | SEE NOTES TO FINANCIAL STATEMENTS. |
SCHEDULE OF INVESTMENTS (Unaudited)(concluded) | September 30, 2024 |
MID-CAP 1.5x STRATEGY FUND | |
The following table summarizes the inputs used to value the Fund’s investments at September 30, 2024 (See Note 4 in the Notes to Financial Statements):
Investments in Securities (Assets) | | Level 1
Quoted
Prices | | | Level 2
Significant
Observable
Inputs | | | Level 3
Significant
Unobservable
Inputs | | | Total | |
Common Stocks | | $ | 9,947,491 | | | $ | — | | | $ | — | | | $ | 9,947,491 | |
Mutual Funds | | | 1,133,401 | | | | — | | | | — | | | | 1,133,401 | |
U.S. Treasury Bills | | | — | | | | 233,716 | | | | — | | | | 233,716 | |
Repurchase Agreements | | | — | | | | 1,168,090 | | | | — | | | | 1,168,090 | |
Securities Lending Collateral | | | 31,806 | | | | — | | | | — | | | | 31,806 | |
Equity Futures Contracts** | | | 49,734 | | | | — | | | | — | | | | 49,734 | |
Equity Index Swap Agreements** | | | — | | | | 58,332 | | | | — | | | | 58,332 | |
Total Assets | | $ | 11,162,432 | | | $ | 1,460,138 | | | $ | — | | | $ | 12,622,570 | |
** | This derivative is reported as unrealized appreciation/depreciation at period end. |
Affiliated Transactions
Investments representing 5% or more of the outstanding voting shares of a company, or control of or by, or common control under Guggenheim Investments (“GI”), result in that company being considered an affiliated issuer, as defined in the 1940 Act.
The Fund may invest in certain of the underlying series of Guggenheim Strategy Funds Trust, including Guggenheim Strategy Fund II and Guggenheim Strategy Fund III (collectively, the “Guggenheim Strategy Funds”), each of which are open-end management investment companies managed by GI. The Guggenheim Strategy Funds, which launched on March 11, 2014, are offered as short term investment options only to mutual funds, trusts, and other accounts managed by GI and/or its affiliates, and are not available to the public. The Guggenheim Strategy Funds pay no investment management fees. The Guggenheim Strategy Funds’ annual report on Form N-CSR dated September 30, 2023 is available publicly or upon request. This information is available from the EDGAR database on the SEC’s website at https://www.sec.gov/Archives/edgar/data/1601445/000182126823000217/gug86449-ncsr.htm. The Fund may invest in certain of the underlying series of Guggenheim Funds Trust, which are open-end management investment companies managed by GI, are available to the public and whose most recent annual report on Form N-CSR is available publicly or upon request.
Transactions during the period ended September 30, 2024, in which the company is an affiliated issuer, were as follows:
Security Name | | Value
03/31/24 | | | Additions | | | Reductions | | | Realized
Gain (Loss) | | | Change in
Unrealized
Appreciation
(Depreciation) | | | Value
09/30/24 | | | Shares
09/30/24 | | | Investment
Income | |
Mutual Funds | | | | | | | | | | | | | | | | | | | | | | | | | | | | | | | | |
Guggenheim Strategy Fund II | | $ | 242,153 | | | $ | — | | | $ | — | | | $ | — | | | $ | 1,969 | | | $ | 244,122 | | | | 9,844 | | | $ | 6,933 | |
Guggenheim Ultra Short Duration Fund — Institutional Class | | | 879,517 | | | | — | | | | — | | | | — | | | | 9,762 | | | | 889,279 | | | | 88,750 | | | | 22,888 | |
| | | $ | 1,121,670 | | | $ | — | | | $ | — | | | $ | — | | | $ | 11,731 | | | $ | 1,133,401 | | | | | | | $ | 29,821 | |
SEE NOTES TO FINANCIAL STATEMENTS. | THE RYDEX FUNDS SEMI-ANNUAL FINANCIAL REPORT | 201 |
MID-CAP 1.5x STRATEGY FUND | |
STATEMENT OF ASSETS AND LIABILITIES (Unaudited) |
September 30, 2024 |
Assets: |
Investments in unaffiliated issuers, at value - including $30,868 of securities loaned (cost $7,282,479) | | $ | 10,213,013 | |
Investments in affiliated issuers, at value (cost $1,123,599) | | | 1,133,401 | |
Repurchase agreements, at value (cost $1,168,090) | | | 1,168,090 | |
Cash | | | 76 | |
Segregated cash with broker | | | 6,060 | |
Unrealized appreciation on OTC swap agreements | | | 58,332 | |
Receivables: |
Fund shares sold | | | 159,522 | |
Dividends | | | 13,500 | |
Swap settlement | | | 6,083 | |
Variation margin on futures contracts | | | 1,920 | |
Interest | | | 158 | |
Securities lending income | | | 31 | |
Total assets | | | 12,760,186 | |
| | | | | |
Liabilities: |
Segregated cash due to broker | | | 120,000 | |
Payable for: |
Return of securities lending collateral | | | 31,806 | |
Securities purchased | | | 27,758 | |
Management fees | | | 8,670 | |
Transfer agent fees | | | 5,699 | |
Distribution and service fees | | | 2,598 | |
Portfolio accounting and administration fees | | | 516 | |
Trustees’ fees* | | | 115 | |
Fund shares redeemed | | | 13 | |
Miscellaneous | | | 8,994 | |
Total liabilities | | | 206,169 | |
Net assets | | $ | 12,554,017 | |
| | | | | |
Net assets consist of: |
Paid in capital | | $ | 10,150,637 | |
Total distributable earnings (loss) | | | 2,403,380 | |
Net assets | | $ | 12,554,017 | |
Class A: |
Net assets | | $ | 3,108,591 | |
Capital shares outstanding | | | 23,282 | |
Net asset value per share | | $ | 133.52 | |
Maximum offering price per share (Net asset value divided by 95.25%) | | $ | 140.18 | |
Class C: |
Net assets | | $ | 333,972 | |
Capital shares outstanding | | | 3,113 | |
Net asset value per share | | $ | 107.28 | |
Class H: |
Net assets | | $ | 9,111,454 | |
Capital shares outstanding | | | 67,928 | |
Net asset value per share | | $ | 134.13 | |
STATEMENT OF OPERATIONS (Unaudited) |
Six Months Ended September 30, 2024 |
Investment Income: |
Dividends from securities of unaffiliated issuers (net of foreign withholding tax of $32) | | $ | 76,811 | |
Dividends from securities of affiliated issuers | | | 29,821 | |
Interest | | | 51,042 | |
Income from securities lending, net | | | 166 | |
Total investment income | | | 157,840 | |
| | | | | |
Expenses: |
Management fees | | | 60,550 | |
Distribution and service fees: |
Class A | | | 4,469 | |
Class C | | | 1,251 | |
Class H | | | 12,038 | |
Transfer agent fees | | | 13,824 | |
Portfolio accounting and administration fees | | | 10,265 | |
Professional fees | | | 2,170 | |
Interest expense | | | 1,203 | |
Custodian fees | | | 862 | |
Trustees’ fees* | | | 703 | |
Miscellaneous | | | 10,701 | |
Total expenses | | | 118,036 | |
Less: |
Expenses reimbursed by Adviser | | | (6,730 | ) |
Expenses waived by Adviser | | | (1,104 | ) |
Total waived/reimbursed expenses | | | (7,834 | ) |
Net expenses | | | 110,202 | |
Net investment income | | | 47,638 | |
| | | | | |
Net Realized and Unrealized Gain (Loss): |
Net realized gain (loss) on: |
Investments in unaffiliated issuers | | | 67,466 | |
Swap agreements | | | 129,875 | |
Futures contracts | | | 12,254 | |
Net realized gain | | | 209,595 | |
Net change in unrealized appreciation (depreciation) on: |
Investments in unaffiliated issuers | | | 221,373 | |
Investments in affiliated issuers | | | 11,731 | |
Swap agreements | | | (153,331 | ) |
Futures contracts | | | (27,413 | ) |
Net change in unrealized appreciation (depreciation) | | | 52,360 | |
Net realized and unrealized gain | | | 261,955 | |
Net increase in net assets resulting from operations | | $ | 309,593 | |
* | Relates to Trustees not deemed “interested persons” within the meaning of Section 2(a)(19) of the 1940 Act. |
202 | THE RYDEX FUNDS SEMI-ANNUAL FINANCIAL REPORT | SEE NOTES TO FINANCIAL STATEMENTS. |
MID-CAP 1.5x STRATEGY FUND | |
STATEMENTS OF CHANGES IN NET ASSETS |
| | Six Months Ended
September 30, 2024
(Unaudited) | | | Year Ended
March 31,
2024 | |
Increase (Decrease) in Net Assets from Operations: | | | | | | | | |
Net investment income | | $ | 47,638 | | | $ | 104,474 | |
Net realized gain on investments | | | 209,595 | | | | 1,646,978 | |
Net change in unrealized appreciation (depreciation) on investments | | | 52,360 | | | | 1,910,935 | |
Net increase in net assets resulting from operations | | | 309,593 | | | | 3,662,387 | |
| | | | | | | | | |
Distributions to shareholders: | | | | | | | | |
Class A | | | — | | | | (12,601 | ) |
Class C | | | — | | | | (1,279 | ) |
Class H | | | — | | | | (30,819 | ) |
Total distributions to shareholders | | | — | | | | (44,699 | ) |
| | | | | | | | | |
Capital share transactions: | | | | | | | | |
Proceeds from sale of shares | | | | | | | | |
Class A | | | 98,480 | | | | 1,023,710 | |
Class C | | | 211,320 | | | | 199,913 | |
Class H | | | 11,257,083 | | | | 23,963,867 | |
Distributions reinvested | | | | | | | | |
Class A | | | — | | | | 12,590 | |
Class C | | | — | | | | 1,278 | |
Class H | | | — | | | | 30,338 | |
Cost of shares redeemed | | | | | | | | |
Class A | | | (1,046,289 | ) | | | (1,680,856 | ) |
Class C | | | (86,486 | ) | | | (160,513 | ) |
Class H | | | (11,878,520 | ) | | | (24,085,146 | ) |
Net decrease from capital share transactions | | | (1,444,412 | ) | | | (694,819 | ) |
Net increase (decrease) in net assets | | | (1,134,819 | ) | | | 2,922,869 | |
| | | | | | | | | |
Net assets: | | | | | | | | |
Beginning of period | | | 13,688,836 | | | | 10,765,967 | |
End of period | | $ | 12,554,017 | | | $ | 13,688,836 | |
| | | | | | | | | |
Capital share activity: | | | | | | | | |
Shares sold | | | | | | | | |
Class A | | | 777 | | | | 10,264 | |
Class C | | | 2,046 | | | | 2,417 | |
Class H | | | 89,168 | | | | 230,583 | |
Shares issued from reinvestment of distributions | | | | | | | | |
Class A | | | — | | | | 119 | |
Class C | | | — | | | | 15 | |
Class H | | | — | | | | 285 | |
Shares redeemed | | | | | | | | |
Class A | | | (8,187 | ) | | | (16,724 | ) |
Class C | | | (883 | ) | | | (1,864 | ) |
Class H | | | (93,311 | ) | | | (227,051 | ) |
Net decrease in shares | | | (10,390 | ) | | | (1,956 | ) |
SEE NOTES TO FINANCIAL STATEMENTS. | THE RYDEX FUNDS SEMI-ANNUAL FINANCIAL REPORT | 203 |
MID-CAP 1.5x STRATEGY FUND | |
This table is presented to show selected data for a share outstanding throughout each period and to assist shareholders in evaluating a Fund’s performance for the periods presented.
Class A | | Six Months Ended
September 30, 2024a | | | Year Ended
March 31,
2024 | | | Year Ended
March 31,
2023 | | | Year Ended
March 31,
2022 | | | Year Ended
March 31,
2021 | | | Year Ended
March 31,
2020 | |
Per Share Data |
Net asset value, beginning of period | | $ | 130.78 | | | $ | 100.88 | | | $ | 115.54 | | | $ | 131.92 | | | $ | 56.02 | | | $ | 89.82 | |
Income (loss) from investment operations: |
Net investment income (loss)b | | | .46 | | | | .96 | | | | .41 | | | | (.72 | ) | | | (.68 | ) | | | .37 | |
Net gain (loss) on investments (realized and unrealized) | | | 2.28 | | | | 29.35 | | | | (15.07 | ) | | | 6.46 | | | | 77.00 | | | | (33.98 | ) |
Total from investment operations | | | 2.74 | | | | 30.31 | | | | (14.66 | ) | | | 5.74 | | | | 76.32 | | | | (33.61 | ) |
Less distributions from: |
Net investment income | | | — | | | | (.41 | ) | | | — | | | | — | | | | (.42 | ) | | | (.19 | ) |
Net realized gains | | | — | | | | — | | | | — | | | | (22.12 | ) | | | — | | | | — | |
Total distributions | | | — | | | | (.41 | ) | | | — | | | | (22.12 | ) | | | (.42 | ) | | | (.19 | ) |
Net asset value, end of period | | $ | 133.52 | | | $ | 130.78 | | | $ | 100.88 | | | $ | 115.54 | | | $ | 131.92 | | | $ | 56.02 | |
|
Total Returnc | | | 2.10 | % | | | 30.15 | % | | | (12.69 | %) | | | 3.49 | % | | | 136.41 | % | | | (37.52 | %) |
Ratios/Supplemental Data |
Net assets, end of period (in thousands) | | $ | 3,109 | | | $ | 4,014 | | | $ | 3,736 | | | $ | 4,017 | | | $ | 4,337 | | | $ | 1,950 | |
Ratios to average net assets: |
Net investment income (loss) | | | 0.73 | % | | | 0.90 | % | | | 0.41 | % | | | (0.54 | %) | | | (0.75 | %) | | | 0.40 | % |
Total expensesd | | | 1.74 | % | | | 1.78 | % | | | 1.70 | % | | | 1.66 | % | | | 1.75 | % | | | 1.77 | % |
Net expensese | | | 1.62 | % | | | 1.68 | % | | | 1.65 | % | | | 1.65 | % | | | 1.72 | % | | | 1.72 | % |
Portfolio turnover rate | | | 29 | % | | | 57 | % | | | 44 | % | | | 159 | % | | | 501 | % | | | 617 | % |
Class C | | Six Months Ended
September 30, 2024a | | | Year Ended
March 31,
2024 | | | Year Ended
March 31,
2023 | | | Year Ended
March 31,
2022 | | | Year Ended
March 31,
2021 | | | Year Ended
March 31,
2020 | |
Per Share Data |
Net asset value, beginning of period | | $ | 105.47 | | | $ | 82.02 | | | $ | 94.68 | | | $ | 112.55 | | | $ | 48.18 | | | $ | 77.86 | |
Income (loss) from investment operations: |
Net investment income (loss)b | | | — | | | | .15 | | | | (.34 | ) | | | (1.48 | ) | | | (1.12 | ) | | | (.27 | ) |
Net gain (loss) on investments (realized and unrealized) | | | 1.81 | | | | 23.71 | | | | (12.32 | ) | | | 5.73 | | | | 65.91 | | | | (29.22 | ) |
Total from investment operations | | | 1.81 | | | | 23.86 | | | | (12.66 | ) | | | 4.25 | | | | 64.79 | | | | (29.49 | ) |
Less distributions from: |
Net investment income | | | — | | | | (.41 | ) | | | — | | | | — | | | | (.42 | ) | | | (.19 | ) |
Net realized gains | | | — | | | | — | | | | — | | | | (22.12 | ) | | | — | | | | — | |
Total distributions | | | — | | | | (.41 | ) | | | — | | | | (22.12 | ) | | | (.42 | ) | | | (.19 | ) |
Net asset value, end of period | | $ | 107.28 | | | $ | 105.47 | | | $ | 82.02 | | | $ | 94.68 | | | $ | 112.55 | | | $ | 48.18 | |
|
Total Returnc | | | 1.72 | % | | | 29.20 | % | | | (13.37 | %) | | | 2.71 | % | | | 134.67 | % | | | (37.98 | %) |
Ratios/Supplemental Data |
Net assets, end of period (in thousands) | | $ | 334 | | | $ | 206 | | | $ | 113 | | | $ | 231 | | | $ | 653 | | | $ | 1,933 | |
Ratios to average net assets: |
Net investment income (loss) | | | 0.01 | % | | | 0.17 | % | | | (0.42 | %) | | | (1.31 | %) | | | (1.59 | %) | | | (0.34 | %) |
Total expensesd | | | 2.49 | % | | | 2.54 | % | | | 2.45 | % | | | 2.41 | % | | | 2.52 | % | | | 2.52 | % |
Net expensese | | | 2.37 | % | | | 2.44 | % | | | 2.40 | % | | | 2.39 | % | | | 2.50 | % | | | 2.47 | % |
Portfolio turnover rate | | | 29 | % | | | 57 | % | | | 44 | % | | | 159 | % | | | 501 | % | | | 617 | % |
204 | THE RYDEX FUNDS SEMI-ANNUAL FINANCIAL REPORT | SEE NOTES TO FINANCIAL STATEMENTS. |
MID-CAP 1.5x STRATEGY FUND | |
FINANCIAL HIGHLIGHTS (concluded) |
This table is presented to show selected data for a share outstanding throughout each period and to assist shareholders in evaluating a Fund’s performance for the periods presented.
Class H | | Six Months Ended
September 30, 2024a | | | Year Ended
March 31,
2024 | | | Year Ended
March 31,
2023 | | | Year Ended
March 31,
2022 | | | Year Ended
March 31,
2021 | | | Year Ended
March 31,
2020 | |
Per Share Data |
Net asset value, beginning of period | | $ | 131.39 | | | $ | 101.34 | | | $ | 116.07 | | | $ | 132.43 | | | $ | 56.24 | | | $ | 90.18 | |
Income (loss) from investment operations: |
Net investment income (loss)b | | | .45 | | | | .98 | | | | .36 | | | | (.76 | ) | | | (.60 | ) | | | .27 | |
Net gain (loss) on investments (realized and unrealized) | | | 2.29 | | | | 29.48 | | | | (15.09 | ) | | | 6.52 | | | | 77.21 | | | | (34.02 | ) |
Total from investment operations | | | 2.74 | | | | 30.46 | | | | (14.73 | ) | | | 5.76 | | | | 76.61 | | | | (33.75 | ) |
Less distributions from: |
Net investment income | | | — | | | | (.41 | ) | | | — | | | | — | | | | (.42 | ) | | | (.19 | ) |
Net realized gains | | | — | | | | — | | | | — | | | | (22.12 | ) | | | — | | | | — | |
Total distributions | | | — | | | | (.41 | ) | | | — | | | | (22.12 | ) | | | (.42 | ) | | | (.19 | ) |
Net asset value, end of period | | $ | 134.13 | | | $ | 131.39 | | | $ | 101.34 | | | $ | 116.07 | | | $ | 132.43 | | | $ | 56.24 | |
|
Total Return | | | 2.09 | % | | | 30.16 | % | | | (12.69 | %) | | | 3.49 | % | | | 136.39 | % | | | (37.52 | %) |
Ratios/Supplemental Data |
Net assets, end of period (in thousands) | | $ | 9,111 | | | $ | 9,469 | | | $ | 6,917 | | | $ | 10,327 | | | $ | 12,089 | | | $ | 4,054 | |
Ratios to average net assets: |
Net investment income (loss) | | | 0.72 | % | | | 0.92 | % | | | 0.36 | % | | | (0.57 | %) | | | (0.64 | %) | | | 0.28 | % |
Total expensesd | | | 1.74 | % | | | 1.79 | % | | | 1.70 | % | | | 1.66 | % | | | 1.74 | % | | | 1.79 | % |
Net expensese | | | 1.63 | % | | | 1.68 | % | | | 1.65 | % | | | 1.65 | % | | | 1.72 | % | | | 1.77 | % |
Portfolio turnover rate | | | 29 | % | | | 57 | % | | | 44 | % | | | 159 | % | | | 501 | % | | | 617 | % |
a | Unaudited figures for the period ended September 30, 2024. Percentage amounts for the period, except total return and portfolio turnover rate, have been annualized. |
b | Net investment income (loss) per share was computed using average shares outstanding throughout the period. |
c | Total return does not reflect the impact of any applicable sales charges. |
d | Does not include expenses of the underlying funds in which the Fund invests. |
e | Net expense information reflects the expense ratios after expense waivers and reimbursements, as applicable. |
SEE NOTES TO FINANCIAL STATEMENTS. | THE RYDEX FUNDS SEMI-ANNUAL FINANCIAL REPORT | 205 |
SCHEDULE OF INVESTMENTS (Unaudited) | September 30, 2024 |
INVERSE MID-CAP STRATEGY FUND | |
| | Shares | | | Value | |
MUTUAL FUNDS† - 36.5% |
Guggenheim Strategy Fund II1 | | | 2,020 | | | $ | 50,096 | |
Guggenheim Ultra Short Duration Fund — Institutional Class1 | | | 4,630 | | | | 46,393 | |
Total Mutual Funds | | | | |
(Cost $95,671) | | | | | | | 96,489 | |
| | Face
Amount | | | | |
REPURCHASE AGREEMENTS††,2 - 64.0% |
J.P. Morgan Securities LLC
issued 09/30/24 at 4.86%
due 10/01/243 | | $ | 92,636 | | | | 92,636 | |
BofA Securities, Inc.
issued 09/30/24 at 4.85%
due 10/01/243 | | | 76,513 | | | | 76,513 | |
Total Repurchase Agreements | | | | |
(Cost $169,149) | | | | | | | 169,149 | |
| | | | | | | | | |
Total Investments - 100.5% | | | | |
(Cost $264,820) | | $ | 265,638 | |
Other Assets & Liabilities, net - (0.5)% | | | (1,208 | ) |
Total Net Assets - 100.0% | | $ | 264,430 | |
Total Return Swap Agreements |
Counterparty | Index | Type | | Financing
Rate | | Payment
Frequency | | | Maturity
Date | | | Units | | | Notional
Amount | | | Value and
Unrealized
Depreciation | |
OTC Equity Index Swap Agreements Sold Short†† |
Barclays Bank plc | S&P MidCap 400 Index | Receive | | 5.09% (SOFR +
0.25%) | | | At Maturity | | | | 12/19/24 | | 34 | | $ | 106,193 | | | $ | (102 | ) |
Goldman Sachs International | S&P MidCap 400 Index | Receive | | 4.78% (Federal
Funds Rate -
0.05%) | | | At Maturity | | | | 12/18/24 | | 23 | | | 71,646 | | | | (756 | ) |
BNP Paribas | S&P MidCap 400 Index | Receive | | 4.98% (Federal
Funds Rate +
0.15%) | | | At Maturity | | | | 12/19/24 | | 28 | | | 87,722 | | | | (923 | ) |
| | | | | | | | | | | | | | | | | | | $ | 265,561 | | | $ | (1,781 | ) |
† | Value determined based on Level 1 inputs — See Note 4. |
†† | Value determined based on Level 2 inputs — See Note 4. |
1 | Affiliated issuer. |
2 | Repurchase Agreements — See Note 6. |
3 | All or a portion of this security is pledged as equity index swap collateral at September 30, 2024. |
| | plc — Public Limited Company |
| | SOFR — Secured Overnight Financing Rate |
| | |
| | See Sector Classification in Other Information section. |
206 | THE RYDEX FUNDS SEMI-ANNUAL FINANCIAL REPORT | SEE NOTES TO FINANCIAL STATEMENTS. |
SCHEDULE OF INVESTMENTS (Unaudited)(concluded) | September 30, 2024 |
INVERSE MID-CAP STRATEGY FUND | |
The following table summarizes the inputs used to value the Fund’s investments at September 30, 2024 (See Note 4 in the Notes to Financial Statements):
Investments in Securities (Assets) | | Level 1
Quoted
Prices | | | Level 2
Significant
Observable
Inputs | | | Level 3
Significant
Unobservable
Inputs | | | Total | |
Mutual Funds | | $ | 96,489 | | | $ | — | | | $ | — | | | $ | 96,489 | |
Repurchase Agreements | | | — | | | | 169,149 | | | | — | | | | 169,149 | |
Total Assets | | $ | 96,489 | | | $ | 169,149 | | | $ | — | | | $ | 265,638 | |
Investments in Securities (Liabilities) | | Level 1
Quoted
Prices | | | Level 2
Significant
Observable
Inputs | | | Level 3
Significant
Unobservable
Inputs | | | Total | |
Equity Index Swap Agreements** | | $ | — | | | $ | 1,781 | | | $ | — | | | $ | 1,781 | |
** | This derivative is reported as unrealized appreciation/depreciation at period end. |
Affiliated Transactions
Investments representing 5% or more of the outstanding voting shares of a company, or control of or by, or common control under Guggenheim Investments (“GI”), result in that company being considered an affiliated issuer, as defined in the 1940 Act.
The Fund may invest in certain of the underlying series of Guggenheim Strategy Funds Trust, including Guggenheim Strategy Fund II and Guggenheim Strategy Fund III (collectively, the “Guggenheim Strategy Funds”), each of which are open-end management investment companies managed by GI. The Guggenheim Strategy Funds, which launched on March 11, 2014, are offered as short term investment options only to mutual funds, trusts, and other accounts managed by GI and/or its affiliates, and are not available to the public. The Guggenheim Strategy Funds pay no investment management fees. The Guggenheim Strategy Funds’ annual report on Form N-CSR dated September 30, 2023 is available publicly or upon request. This information is available from the EDGAR database on the SEC’s website at https://www.sec.gov/Archives/edgar/data/1601445/000182126823000217/gug86449-ncsr.htm. The Fund may invest in certain of the underlying series of Guggenheim Funds Trust, which are open-end management investment companies managed by GI, are available to the public and whose most recent annual report on Form N-CSR is available publicly or upon request.
Transactions during the period ended September 30, 2024, in which the company is an affiliated issuer, were as follows:
Security Name | | Value
03/31/24 | | | Additions | | | Reductions | | | Realized
Gain (Loss) | | | Change in
Unrealized
Appreciation
(Depreciation) | | | Value
09/30/24 | | | Shares
09/30/24 | | | Investment
Income | |
Mutual Funds | | | | | | | | | | | | | | | | | | | | | | | | | | | | | | | | |
Guggenheim Strategy Fund II | | $ | 49,692 | | | $ | — | | | $ | — | | | $ | — | | | $ | 404 | | | $ | 50,096 | | | | 2,020 | | | $ | 1,423 | |
Guggenheim Ultra Short Duration Fund — Institutional Class | | | 45,884 | | | | — | | | | — | | | | — | | | | 509 | | | | 46,393 | | | | 4,630 | | | | 1,194 | |
| | | $ | 95,576 | | | $ | — | | | $ | — | | | $ | — | | | $ | 913 | | | $ | 96,489 | | | | | | | $ | 2,617 | |
SEE NOTES TO FINANCIAL STATEMENTS. | THE RYDEX FUNDS SEMI-ANNUAL FINANCIAL REPORT | 207 |
INVERSE MID-CAP STRATEGY FUND | |
STATEMENT OF ASSETS AND LIABILITIES (Unaudited) |
September 30, 2024 |
Assets: |
Investments in affiliated issuers, at value (cost $95,671) | | | 96,489 | |
Repurchase agreements, at value (cost $169,149) | | | 169,149 | |
Segregated cash with broker | | | 1,000 | |
Receivables: |
Dividends | | | 410 | |
Interest | | | 23 | |
Swap settlement | | | 18 | |
Fund shares sold | | | 6 | |
Total assets | | | 267,095 | |
| | | | | |
Liabilities: |
Unrealized depreciation on OTC swap agreements | | | 1,781 | |
Payable for: |
Management fees | | | 260 | |
Transfer agent fees | | | 184 | |
Distribution and service fees | | | 77 | |
Portfolio accounting and administration fees | | | 16 | |
Fund shares redeemed | | | 11 | |
Trustees’ fees* | | | 4 | |
Miscellaneous | | | 332 | |
Total liabilities | | | 2,665 | |
Net assets | | $ | 264,430 | |
| | | | | |
Net assets consist of: |
Paid in capital | | $ | 6,543,081 | |
Total distributable earnings (loss) | | | (6,278,651 | ) |
Net assets | | $ | 264,430 | |
Class A: |
Net assets | | $ | 20,297 | |
Capital shares outstanding | | | 423 | |
Net asset value per share | | $ | 47.93 | |
Maximum offering price per share (Net asset value divided by 95.25%) | | $ | 50.32 | |
Class C: |
Net assets | | $ | 3,155 | |
Capital shares outstanding | | | 76 | |
Net asset value per share | | $ | 41.61 | |
Class H: |
Net assets | | $ | 240,978 | |
Capital shares outstanding | | | 5,024 | |
Net asset value per share | | $ | 47.97 | |
STATEMENT OF OPERATIONS (Unaudited) |
Six Months Ended September 30, 2024 |
Investment Income: |
Dividends from securities of affiliated issuers | | $ | 2,617 | |
Interest | | | 9,541 | |
Total investment income | | | 12,158 | |
| | | | | |
Expenses: |
Management fees | | | 2,089 | |
Distribution and service fees: |
Class A | | | 48 | |
Class C | | | 4 | |
Class H | | | 531 | |
Transfer agent fees | | | 482 | |
Portfolio accounting and administration fees | | | 355 | |
Registration fees | | | 223 | |
Professional fees | | | 133 | |
Trustees’ fees* | | | 37 | |
Custodian fees | | | 30 | |
Miscellaneous | | | 62 | |
Total expenses | | | 3,994 | |
Less: |
Expenses reimbursed by Adviser | | | (232 | ) |
Expenses waived by Adviser | | | (58 | ) |
Total waived/reimbursed expenses | | | (290 | ) |
Net expenses | | | 3,704 | |
Net investment income | | | 8,454 | |
| | | | | |
Net Realized and Unrealized Gain (Loss): |
Net realized gain (loss) on: |
Swap agreements | | | (11,924 | ) |
Net realized loss | | | (11,924 | ) |
Net change in unrealized appreciation (depreciation) on: |
Investments in affiliated issuers | | | 913 | |
Swap agreements | | | 11,449 | |
Net change in unrealized appreciation (depreciation) | | | 12,362 | |
Net realized and unrealized gain | | | 438 | |
Net increase in net assets resulting from operations | | $ | 8,892 | |
* | Relates to Trustees not deemed “interested persons” within the meaning of Section 2(a)(19) of the 1940 Act. |
208 | THE RYDEX FUNDS SEMI-ANNUAL FINANCIAL REPORT | SEE NOTES TO FINANCIAL STATEMENTS. |
INVERSE MID-CAP STRATEGY FUND | |
STATEMENTS OF CHANGES IN NET ASSETS |
| | Six Months Ended
September 30, 2024
(Unaudited) | | | Year Ended
March 31,
2024 | |
Increase (Decrease) in Net Assets from Operations: | | | | | | | | |
Net investment income | | $ | 8,454 | | | $ | 75,618 | |
Net realized loss on investments | | | (11,924 | ) | | | (219,383 | ) |
Net change in unrealized appreciation (depreciation) on investments | | | 12,362 | | | | 72,499 | |
Net increase (decrease) in net assets resulting from operations | | | 8,892 | | | | (71,266 | ) |
| | | | | | | | | |
Distributions to shareholders: | | | | | | | | |
Class A | | | — | | | | (3,819 | ) |
Class C | | | — | | | | (10 | ) |
Class H | | | — | | | | (52,183 | ) |
Total distributions to shareholders | | | — | | | | (56,012 | ) |
| | | | | | | | | |
Capital share transactions: | | | | | | | | |
Proceeds from sale of shares | | | | | | | | |
Class A | | | 38,897 | | | | 87,472 | |
Class C | | | 3,200 | | | | — | |
Class H | | | 3,298,263 | | | | 5,523,737 | |
Distributions reinvested | | | | | | | | |
Class A | | | — | | | | 3,804 | |
Class C | | | — | | | | 10 | |
Class H | | | — | | | | 52,182 | |
Cost of shares redeemed | | | | | | | | |
Class A | | | (67,837 | ) | | | (89,458 | ) |
Class C | | | — | | | | — | |
Class H | | | (3,581,756 | ) | | | (7,533,294 | ) |
Net decrease from capital share transactions | | | (309,233 | ) | | | (1,955,547 | ) |
Net decrease in net assets | | | (300,341 | ) | | | (2,082,825 | ) |
| | | | | | | | | |
Net assets: | | | | | | | | |
Beginning of period | | | 564,771 | | | | 2,647,596 | |
End of period | | $ | 264,430 | | | $ | 564,771 | |
| | | | | | | | | |
Capital share activity: | | | | | | | | |
Shares sold | | | | | | | | |
Class A | | | 778 | | | | 1,433 | |
Class C | | | 74 | | | | — | |
Class H | | | 66,217 | | | | 98,363 | |
Shares issued from reinvestment of distributions | | | | | | | | |
Class A | | | — | | | | 70 | |
Class C | | | — | | | | �� | |
Class H | | | — | | | | 960 | |
Shares redeemed | | | | | | | | |
Class A | | | (1,365 | ) | | | (1,477 | ) |
Class C | | | — | | | | — | |
Class H | | | (71,959 | ) | | | (132,116 | ) |
Net decrease in shares | | | (6,255 | ) | | | (32,767 | ) |
SEE NOTES TO FINANCIAL STATEMENTS. | THE RYDEX FUNDS SEMI-ANNUAL FINANCIAL REPORT | 209 |
INVERSE MID-CAP STRATEGY FUND | |
This table is presented to show selected data for a share outstanding throughout each period and to assist shareholders in evaluating a Fund’s performance for the periods presented.
Class A | | Six Months Ended
September 30, 2024a | | | Year Ended
March 31,
2024 | | | Year Ended
March 31,
2023 | | | Year Ended
March 31,
2022 | | | Year Ended
March 31,
2021 | | | Year Ended
March 31,
2020j | |
Per Share Data |
Net asset value, beginning of period | | $ | 47.91 | | | $ | 59.40 | | | $ | 57.57 | | | $ | 63.60 | | | $ | 127.90 | | | $ | 109.10 | |
Income (loss) from investment operations: |
Net investment income (loss)b | | | .85 | | | | 2.02 | | | | .90 | | | | (.75 | ) | | | (.45 | ) | | | .75 | |
Net gain (loss) on investments (realized and unrealized) | | | (.83 | )f | | | (9.45 | ) | | | .93 | f | | | (5.28 | ) | | | (63.36 | ) | | | 18.85 | f |
Total from investment operations | | | .02 | | | | (7.43 | ) | | | 1.83 | | | | (6.03 | ) | | | (63.81 | ) | | | 19.60 | |
Less distributions from: |
Net investment income | | | — | | | | (4.06 | ) | | | — | | | | — | | | | (.49 | ) | | | (.80 | ) |
Total distributions | | | — | | | | (4.06 | ) | | | — | | | | — | | | | (.49 | ) | | | (.80 | ) |
Net asset value, end of period | | $ | 47.93 | | | $ | 47.91 | | | $ | 59.40 | | | $ | 57.57 | | | $ | 63.60 | | | $ | 127.90 | |
|
Total Returnc | | | 0.04 | % | | | (13.31 | %) | | | 3.18 | % | | | (9.48 | %) | | | (49.94 | %) | | | 18.13 | % |
Ratios/Supplemental Data |
Net assets, end of period (in thousands) | | $ | 20 | | | $ | 48 | | | $ | 58 | | | $ | 61 | | | $ | 100 | | | $ | 60 | |
Ratios to average net assets: |
Net investment income (loss) | | | 3.60 | % | | | 3.52 | % | | | 1.48 | % | | | (1.25 | %) | | | (1.29 | %) | | | 0.68 | % |
Total expensesd | | | 1.71 | % | | | 1.73 | % | | | 1.66 | % | | | 1.66 | % | | | 1.76 | % | | | 1.77 | % |
Net expensese | | | 1.58 | % | | | 1.64 | % | | | 1.61 | % | | | 1.63 | % | | | 1.73 | % | | | 1.70 | % |
Portfolio turnover rate | | | — | | | | — | | | | — | | | | 24 | % | | | 42 | % | | | — | |
Class C | | Six Months Ended
September 30, 2024a | | | Year Ended
March 31,
2024 | | | Year Ended
March 31,
2023 | | | Year Ended
March 31,
2022 | | | Year Ended
March 31,
2021 | | | Year Ended
March 31,
2020j | |
Per Share Data |
Net asset value, beginning of period | | $ | 41.44 | | | $ | 51.61 | | | $ | 50.06 | | | $ | 55.65 | | | $ | 112.07 | | | $ | 97.04 | |
Income (loss) from investment operations: |
Net investment income (loss)b | | | .72 | | | | 1.67 | | | | (.54 | ) | | | (1.10 | ) | | | (.83 | ) | | | — | g |
Net gain (loss) on investments (realized and unrealized) | | | (.55 | )f | | | (7.78 | ) | | | 2.09 | f | | | (4.49 | ) | | | (55.10 | ) | | | 15.83 | f |
Total from investment operations | | | .17 | | | | (6.11 | ) | | | 1.55 | | | | (5.59 | ) | | | (55.93 | ) | | | 15.83 | |
Less distributions from: |
Net investment income | | | — | | | | (4.06 | ) | | | — | | | | — | | | | (.49 | ) | | | (.80 | ) |
Total distributions | | | — | | | | (4.06 | ) | | | — | | | | — | | | | (.49 | ) | | | (.80 | ) |
Net asset value, end of period | | $ | 41.61 | | | $ | 41.44 | | | $ | 51.61 | | | $ | 50.06 | | | $ | 55.65 | | | $ | 112.07 | |
|
Total Returnc | | | 0.41 | % | | | (12.73 | %) | | | 3.10 | % | | | (10.04 | %) | | | (50.08 | %) | | | 16.78 | % |
Ratios/Supplemental Data |
Net assets, end of period (in thousands) | | $ | 3 | | | $ | — | h | | $ | — | h | | $ | — | h | | $ | 3 | | | $ | — | h |
Ratios to average net assets: |
Net investment income (loss) | | | 2.83 | % | | | 3.97 | % | | | (0.94 | %) | | | (2.11 | %) | | | (1.95 | %) | | | 0.00 | %i |
Total expensesd | | | 2.40 | % | | | 1.59 | % | | | 2.39 | % | | | 2.39 | % | | | 2.49 | % | | | 2.63 | % |
Net expensese | | | 2.40 | % | | | 1.59 | % | | | 2.39 | % | | | 2.39 | % | | | 2.46 | % | | | 2.63 | % |
Portfolio turnover rate | | | — | | | | — | | | | — | | | | 24 | % | | | 42 | % | | | — | |
210 | THE RYDEX FUNDS SEMI-ANNUAL FINANCIAL REPORT | SEE NOTES TO FINANCIAL STATEMENTS. |
INVERSE MID-CAP STRATEGY FUND | |
FINANCIAL HIGHLIGHTS (concluded) |
This table is presented to show selected data for a share outstanding throughout each period and to assist shareholders in evaluating a Fund’s performance for the periods presented.
Class H | | Six Months Ended
September 30, 2024a | | | Year Ended
March 31,
2024 | | | Year Ended
March 31,
2023 | | | Year Ended
March 31,
2022 | | | Year Ended
March 31,
2021 | | | Year Ended
March 31,
2020j | |
Per Share Data |
Net asset value, beginning of period | | $ | 47.96 | | | $ | 59.44 | | | $ | 57.62 | | | $ | 63.65 | | | $ | 128.00 | | | $ | 109.20 | |
Income (loss) from investment operations: |
Net investment income (loss)b | | | .91 | | | | 2.08 | | | | .81 | | | | (.84 | ) | | | (.42 | ) | | | .70 | |
Net gain (loss) on investments (realized and unrealized) | | | (.90 | )f | | | (9.50 | ) | | | 1.01 | f | | | (5.19 | ) | | | (63.44 | ) | | | 18.90 | f |
Total from investment operations | | | .01 | | | | (7.42 | ) | | | 1.82 | | | | (6.03 | ) | | | (63.86 | ) | | | 19.60 | |
Less distributions from: |
Net investment income | | | — | | | | (4.06 | ) | | | — | | | | — | | | | (.49 | ) | | | (.80 | ) |
Total distributions | | | — | | | | (4.06 | ) | | | — | | | | — | | | | (.49 | ) | | | (.80 | ) |
Net asset value, end of period | | $ | 47.97 | | | $ | 47.96 | | | $ | 59.44 | | | $ | 57.62 | | | $ | 63.65 | | | $ | 128.00 | |
|
Total Return | | | 0.02 | % | | | (13.30 | %) | | | 3.16 | % | | | (9.47 | %) | | | (49.94 | %) | | | 18.11 | % |
Ratios/Supplemental Data |
Net assets, end of period (in thousands) | | $ | 241 | | | $ | 516 | | | $ | 2,589 | | | $ | 291 | | | $ | 779 | | | $ | 1,488 | |
Ratios to average net assets: |
Net investment income (loss) | | | 3.65 | % | | | 3.54 | % | | | 1.32 | % | | | (1.40 | %) | | | (1.38 | %) | | | 0.65 | % |
Total expensesd | | | 1.72 | % | | | 1.71 | % | | | 1.71 | % | | | 1.66 | % | | | 1.77 | % | | | 1.78 | % |
Net expensese | | | 1.59 | % | | | 1.64 | % | | | 1.67 | % | | | 1.64 | % | | | 1.75 | % | | | 1.70 | % |
Portfolio turnover rate | | | — | | | | — | | | | — | | | | 24 | % | | | 42 | % | | | — | |
a | Unaudited figures for the period ended September 30, 2024. Percentage amounts for the period, except total return and portfolio turnover rate, have been annualized. |
b | Net investment income (loss) per share was computed using average shares outstanding throughout the period. |
c | Total return does not reflect the impact of any applicable sales charges. |
d | Does not include expenses of the underlying funds in which the Fund invests. |
e | Net expense information reflects the expense ratios after expense waivers and reimbursements, as applicable. |
f | The amount shown for a share outstanding throughout the period does not agree with the aggregate net loss on investments for the year because of the sales and purchases of fund shares in relation to fluctuating market value of the investments of the Fund. |
g | Less than $0.01 per share. |
h | Less than $1,000 in Net Assets. |
i | Less than 0.01%. |
j | Reverse share split — Per share amounts for the year presented through March 31, 2020 have been restated to reflect a 1:5 reverse share split effective August 17, 2020. |
SEE NOTES TO FINANCIAL STATEMENTS. | THE RYDEX FUNDS SEMI-ANNUAL FINANCIAL REPORT | 211 |
SCHEDULE OF INVESTMENTS (Unaudited) | September 30, 2024 |
RUSSELL 2000® 1.5x STRATEGY FUND | |
| | Shares | | | Value | |
COMMON STOCKS† - 64.6% |
| | | | | | | | | |
Financial - 15.6% |
FTAI Aviation Ltd. | | | 159 | | | $ | 21,131 | |
SouthState Corp. | | | 119 | | | | 11,564 | |
Jackson Financial, Inc. — Class A | | | 120 | | | | 10,948 | |
Essent Group Ltd. | | | 163 | | | | 10,479 | |
Hamilton Lane, Inc. — Class A | | | 60 | | | | 10,103 | |
Terreno Realty Corp. REIT | | | 150 | | | | 10,025 | |
Ryman Hospitality Properties, Inc. REIT | | | 92 | | | | 9,866 | |
Essential Properties Realty Trust, Inc. REIT | | | 275 | | | | 9,391 | |
Mr Cooper Group, Inc.* | | | 100 | | | | 9,218 | |
Old National Bancorp | | | 493 | | | | 9,199 | |
Cadence Bank | | | 287 | | | | 9,141 | |
Kite Realty Group Trust REIT | | | 342 | | | | 9,084 | |
Selective Insurance Group, Inc. | | | 96 | | | | 8,957 | |
Radian Group, Inc. | | | 239 | | | | 8,291 | |
Glacier Bancorp, Inc. | | | 178 | | | | 8,135 | |
Home BancShares, Inc. | | | 297 | | | | 8,046 | |
United Bankshares, Inc. | | | 208 | | | | 7,717 | |
Piper Sandler Cos. | | | 27 | | | | 7,663 | |
Moelis & Co. — Class A | | | 111 | | | | 7,605 | |
First Financial Bankshares, Inc. | | | 205 | | | | 7,587 | |
UMB Financial Corp. | | | 70 | | | | 7,358 | |
Phillips Edison & Company, Inc. REIT | | | 194 | | | | 7,316 | |
Independence Realty Trust, Inc. REIT | | | 356 | | | | 7,298 | |
SL Green Realty Corp. REIT | | | 102 | | | | 7,100 | |
Hancock Whitney Corp. | | | 137 | | | | 7,010 | |
MARA Holdings, Inc.* | | | 428 | | | | 6,942 | |
CareTrust REIT, Inc. | | | 223 | | | | 6,882 | |
Sabra Health Care REIT, Inc. | | | 362 | | | | 6,737 | |
Ameris Bancorp | | | 104 | | | | 6,489 | |
ServisFirst Bancshares, Inc. | | | 80 | | | | 6,436 | |
Enstar Group Ltd.* | | | 20 | | | | 6,432 | |
Macerich Co. REIT | | | 339 | | | | 6,183 | |
Valley National Bancorp | | | 676 | | | | 6,125 | |
HA Sustainable Infrastructure Capital, Inc. | | | 177 | | | | 6,101 | |
Innovative Industrial Properties, Inc. REIT | | | 44 | | | | 5,922 | |
CNO Financial Group, Inc. | | | 165 | | | | 5,791 | |
Walker & Dunlop, Inc. | | | 50 | | | | 5,679 | |
PotlatchDeltic Corp. REIT | | | 125 | | | | 5,631 | |
Broadstone Net Lease, Inc. REIT | | | 297 | | | | 5,628 | |
Tanger, Inc. REIT | | | 168 | | | | 5,574 | |
National Health Investors, Inc. REIT | | | 66 | | | | 5,548 | |
StepStone Group, Inc. — Class A | | | 97 | | | | 5,512 | |
United Community Banks, Inc. | | | 189 | | | | 5,496 | |
Axos Financial, Inc.* | | | 86 | | | | 5,408 | |
COPT Defense Properties REIT | | | 177 | | | | 5,368 | |
First BanCorp | | | 253 | | | | 5,356 | |
Apple Hospitality REIT, Inc. | | | 359 | | | | 5,331 | |
Atlantic Union Bankshares Corp. | | | 141 | | | | 5,311 | |
BGC Group, Inc. — Class A | | | 570 | | | | 5,233 | |
Texas Capital Bancshares, Inc.* | | | 73 | | | | 5,217 | |
Blackstone Mortgage Trust, Inc. — Class A REIT1 | | | 274 | | | | 5,209 | |
Baldwin Insurance Group, Inc. — Class A* | | | 104 | | | | 5,179 | |
Fulton Financial Corp. | | | 282 | | | | 5,113 | |
Associated Banc-Corp. | | | 236 | | | | 5,083 | |
International Bancshares Corp. | | | 85 | | | | 5,082 | |
NMI Holdings, Inc. — Class A* | | | 123 | | | | 5,066 | |
Eastern Bankshares, Inc. | | | 304 | | | | 4,983 | |
PJT Partners, Inc. — Class A | | | 37 | | | | 4,934 | |
Cushman & Wakefield plc* | | | 361 | | | | 4,920 | |
Upstart Holdings, Inc.*,1 | | | 121 | | | | 4,841 | |
PennyMac Financial Services, Inc. | | | 42 | | | | 4,787 | |
Community Financial System, Inc. | | | 82 | | | | 4,762 | |
WSFS Financial Corp. | | | 93 | | | | 4,742 | |
Cathay General Bancorp | | | 110 | | | | 4,724 | |
Genworth Financial, Inc. — Class A* | | | 674 | | | | 4,617 | |
LXP Industrial Trust REIT | | | 455 | | | | 4,573 | |
Arbor Realty Trust, Inc. REIT1 | | | 290 | | | | 4,512 | |
New York Community Bancorp, Inc. | | | 399 | | | | 4,481 | |
Douglas Emmett, Inc. REIT | | | 255 | | | | 4,480 | |
SITE Centers Corp. REIT | | | 74 | | | | 4,477 | |
BankUnited, Inc. | | | 118 | | | | 4,300 | |
Artisan Partners Asset Management, Inc. — Class A | | | 99 | | | | 4,289 | |
Outfront Media, Inc. REIT | | | 233 | | | | 4,283 | |
Four Corners Property Trust, Inc. REIT | | | 145 | | | | 4,250 | |
Bancorp, Inc.* | | | 79 | | | | 4,227 | |
Simmons First National Corp. — Class A | | | 196 | | | | 4,222 | |
Burford Capital Ltd. | | | 316 | | | | 4,190 | |
Cohen & Steers, Inc. | | | 43 | | | | 4,126 | |
Urban Edge Properties REIT | | | 189 | | | | 4,043 | |
McGrath RentCorp | | | 38 | | | | 4,001 | |
Independent Bank Corp. | | | 67 | | | | 3,962 | |
Bank of Hawaii Corp. | | | 62 | | | | 3,892 | |
Park National Corp. | | | 23 | | | | 3,864 | |
First Interstate BancSystem, Inc. — Class A | | | 124 | | | | 3,804 | |
Pacific Premier Bancorp, Inc. | | | 151 | | | | 3,799 | |
Heartland Financial USA, Inc. | | | 67 | | | | 3,799 | |
First Financial Bancorp | | | 149 | | | | 3,759 | |
Acadia Realty Trust REIT | | | 159 | | | | 3,733 | |
CVB Financial Corp. | | | 209 | | | | 3,724 | |
Bread Financial Holdings, Inc. | | | 78 | | | | 3,711 | |
Palomar Holdings, Inc.* | | | 39 | | | | 3,692 | |
Provident Financial Services, Inc. | | | 198 | | | | 3,675 | |
TowneBank | | | 111 | | | | 3,670 | |
WaFd, Inc. | | | 105 | | | | 3,659 | |
Victory Capital Holdings, Inc. — Class A | | | 65 | | | | 3,601 | |
Seacoast Banking Corporation of Florida | | | 133 | | | | 3,544 | |
StoneX Group, Inc.* | | | 43 | | | | 3,521 | |
Compass, Inc. — Class A* | | | 575 | | | | 3,513 | |
First Merchants Corp. | | | 92 | | | | 3,422 | |
American Healthcare REIT, Inc. | | | 129 | | | | 3,367 | |
Enova International, Inc.* | | | 40 | | | | 3,352 | |
Core Scientific, Inc.* | | | 281 | | | | 3,333 | |
St. Joe Co. | | | 57 | | | | 3,324 | |
Equity Commonwealth REIT* | | | 167 | | | | 3,323 | |
Independent Bank Group, Inc. | | | 57 | | | | 3,287 | |
Sunstone Hotel Investors, Inc. REIT | | | 318 | | | | 3,282 | |
OFG Bancorp | | | 73 | | | | 3,279 | |
BancFirst Corp. | | | 31 | | | | 3,263 | |
212 | THE RYDEX FUNDS SEMI-ANNUAL FINANCIAL REPORT | SEE NOTES TO FINANCIAL STATEMENTS. |
SCHEDULE OF INVESTMENTS (Unaudited)(continued) | September 30, 2024 |
RUSSELL 2000® 1.5x STRATEGY FUND | |
| | Shares | | | Value | |
Newmark Group, Inc. — Class A | | | 210 | | | $ | 3,261 | |
Cleanspark, Inc.* | | | 349 | | | | 3,260 | |
NBT Bancorp, Inc. | | | 73 | | | | 3,229 | |
Banc of California, Inc. | | | 219 | | | | 3,226 | |
Banner Corp. | | | 54 | | | | 3,216 | |
Stewart Information Services Corp. | | | 43 | | | | 3,214 | |
Riot Platforms, Inc.*,1 | | | 428 | | | | 3,176 | |
Goosehead Insurance, Inc. — Class A* | | | 35 | | | | 3,125 | |
Renasant Corp. | | | 96 | | | | 3,120 | |
Retail Opportunity Investments Corp. REIT | | | 195 | | | | 3,067 | |
Trustmark Corp. | | | 96 | | | | 3,055 | |
InvenTrust Properties Corp. REIT | | | 107 | | | | 3,036 | |
Enterprise Financial Services Corp. | | | 58 | | | | 2,973 | |
DiamondRock Hospitality Co. REIT | | | 329 | | | | 2,872 | |
Triumph Financial, Inc.* | | | 35 | | | | 2,784 | |
First Commonwealth Financial Corp. | | | 159 | | | | 2,727 | |
WesBanco, Inc. | | | 91 | | | | 2,710 | |
City Holding Co. | | | 23 | | | | 2,700 | |
Bank of NT Butterfield & Son Ltd. | | | 73 | | | | 2,692 | |
Northwest Bancshares, Inc. | | | 201 | | | | 2,689 | |
Mercury General Corp. | | | 42 | | | | 2,645 | |
Global Net Lease, Inc. REIT | | | 314 | | | | 2,644 | |
Pathward Financial, Inc. | | | 40 | | | | 2,640 | |
FB Financial Corp. | | | 56 | | | | 2,628 | |
Farmer Mac — Class C | | | 14 | | | | 2,624 | |
First Bancorp | | | 63 | | | | 2,620 | |
Live Oak Bancshares, Inc. | | | 55 | | | | 2,605 | |
Pagseguro Digital Ltd. — Class A* | | | 297 | | | | 2,557 | |
Lakeland Financial Corp. | | | 39 | | | | 2,540 | |
S&T Bancorp, Inc. | | | 60 | | | | 2,518 | |
LTC Properties, Inc. REIT | | | 68 | | | | 2,495 | |
Nelnet, Inc. — Class A | | | 22 | | | | 2,492 | |
Pebblebrook Hotel Trust REIT | | | 188 | | | | 2,487 | |
Getty Realty Corp. REIT | | | 78 | | | | 2,481 | |
Stock Yards Bancorp, Inc. | | | 40 | | | | 2,480 | |
Elme Communities REIT | | | 139 | | | | 2,445 | |
National Bank Holdings Corp. — Class A | | | 58 | | | | 2,442 | |
Skyward Specialty Insurance Group, Inc.* | | | 59 | | | | 2,403 | |
Xenia Hotels & Resorts, Inc. REIT | | | 161 | | | | 2,378 | |
Hilltop Holdings, Inc. | | | 73 | | | | 2,348 | |
Empire State Realty Trust, Inc. — Class A REIT | | | 211 | | | | 2,338 | |
Compass Diversified Holdings | | | 105 | | | | 2,324 | |
Redfin Corp.* | | | 185 | | | | 2,318 | |
Virtus Investment Partners, Inc. | | | 11 | | | | 2,304 | |
Hope Bancorp, Inc. | | | 183 | | | | 2,298 | |
JBG SMITH Properties REIT | | | 131 | | | | 2,290 | |
Two Harbors Investment Corp. REIT | | | 164 | | | | 2,276 | |
Horace Mann Educators Corp. | | | 65 | | | | 2,272 | |
SiriusPoint Ltd.* | | | 155 | | | | 2,223 | |
Veris Residential, Inc. REIT | | | 124 | | | | 2,215 | |
Alexander & Baldwin, Inc. REIT | | | 115 | | | | 2,208 | |
RLJ Lodging Trust REIT | | | 240 | | | | 2,203 | |
WisdomTree, Inc. | | | 220 | | | | 2,198 | |
First Busey Corp. | | | 84 | | | | 2,186 | |
Veritex Holdings, Inc. | | | 83 | | | | 2,185 | |
Customers Bancorp, Inc.* | | | 47 | | | | 2,183 | |
Trupanion, Inc.* | | | 52 | | | | 2,183 | |
Sandy Spring Bancorp, Inc. | | | 69 | | | | 2,165 | |
Safehold, Inc. REIT | | | 82 | | | | 2,151 | |
TriCo Bancshares | | | 50 | | | | 2,132 | |
Uniti Group, Inc. REIT | | | 374 | | | | 2,109 | |
Easterly Government Properties, Inc. REIT | | | 153 | | | | 2,078 | |
Ladder Capital Corp. — Class A REIT | | | 179 | | | | 2,076 | |
Apollo Commercial Real Estate Finance, Inc. REIT | | | 225 | | | | 2,068 | |
MFA Financial, Inc. REIT | | | 161 | | | | 2,048 | |
American Assets Trust, Inc. REIT | | | 76 | | | | 2,031 | |
Apartment Investment and Management Co. — Class A REIT* | | | 224 | | | | 2,025 | |
Chimera Investment Corp. REIT | | | 127 | | | | 2,010 | |
Nicolet Bankshares, Inc. | | | 21 | | | | 2,008 | |
Stellar Bancorp, Inc. | | | 77 | | | | 1,994 | |
UMH Properties, Inc. REIT | | | 101 | | | | 1,987 | |
Kennedy-Wilson Holdings, Inc. | | | 179 | | | | 1,978 | |
Westamerica BanCorp | | | 40 | | | | 1,977 | |
Piedmont Office Realty Trust, Inc. — Class A REIT | | | 195 | | | | 1,970 | |
LendingClub Corp.* | | | 172 | | | | 1,966 | |
PennyMac Mortgage Investment Trust REIT | | | 137 | | | | 1,954 | |
Ready Capital Corp. REIT | | | 255 | | | | 1,946 | |
Navient Corp. | | | 124 | | | | 1,933 | |
QCR Holdings, Inc. | | | 26 | | | | 1,925 | |
Employers Holdings, Inc. | | | 40 | | | | 1,919 | |
NETSTREIT Corp. REIT | | | 116 | | | | 1,917 | |
Safety Insurance Group, Inc. | | | 23 | | | | 1,881 | |
Berkshire Hills Bancorp, Inc. | | | 68 | | | | 1,831 | |
eXp World Holdings, Inc. | | | 128 | | | | 1,804 | |
Encore Capital Group, Inc.* | | | 37 | | | | 1,749 | |
German American Bancorp, Inc. | | | 45 | | | | 1,744 | |
1st Source Corp. | | | 29 | | | | 1,737 | |
Terawulf, Inc.* | | | 363 | | | | 1,699 | |
Cannae Holdings, Inc. | | | 89 | | | | 1,696 | |
OceanFirst Financial Corp. | | | 91 | | | | 1,692 | |
Franklin BSP Realty Trust, Inc. REIT | | | 129 | | | | 1,685 | |
Ellington Financial, Inc. REIT | | | 130 | | | | 1,676 | |
Enact Holdings, Inc. | | | 46 | | | | 1,671 | |
Peoples Bancorp, Inc. | | | 55 | | | | 1,655 | |
Centerspace REIT | | | 23 | | | | 1,621 | |
Dime Community Bancshares, Inc. | | | 56 | | | | 1,613 | |
Redwood Trust, Inc. REIT | | | 208 | | | | 1,608 | |
Preferred Bank/Los Angeles CA | | | 20 | | | | 1,605 | |
Perella Weinberg Partners | | | 83 | | | | 1,603 | |
NexPoint Residential Trust, Inc. REIT | | | 36 | | | | 1,584 | |
ARMOUR Residential REIT, Inc. REIT | | | 77 | | | | 1,571 | |
Hut 8 Corp.*,1 | | | 126 | | | | 1,545 | |
First Bancshares, Inc. | | | 48 | | | | 1,542 | |
Southside Bancshares, Inc. | | | 45 | | | | 1,504 | |
FTAI Infrastructure, Inc. | | | 159 | | | | 1,488 | |
Origin Bancorp, Inc. | | | 46 | | | | 1,479 | |
Marcus & Millichap, Inc. | | | 37 | | | | 1,466 | |
Brandywine Realty Trust REIT | | | 267 | | | | 1,452 | |
SEE NOTES TO FINANCIAL STATEMENTS. | THE RYDEX FUNDS SEMI-ANNUAL FINANCIAL REPORT | 213 |
SCHEDULE OF INVESTMENTS (Unaudited)(continued) | September 30, 2024 |
RUSSELL 2000® 1.5x STRATEGY FUND | |
| | Shares | | | Value | |
AMERISAFE, Inc. | | | 30 | | | $ | 1,450 | |
Diversified Healthcare Trust REIT | | | 344 | | | | 1,441 | |
Paramount Group, Inc. REIT | | | 291 | | | | 1,432 | |
ConnectOne Bancorp, Inc. | | | 57 | | | | 1,428 | |
Plymouth Industrial REIT, Inc. REIT | | | 63 | | | | 1,424 | |
Brookline Bancorp, Inc. | | | 139 | | | | 1,403 | |
First Mid Bancshares, Inc. | | | 36 | | | | 1,401 | |
HCI Group, Inc. | | | 13 | | | | 1,392 | |
Fidelis Insurance Holdings Ltd. | | | 76 | | | | 1,372 | |
PRA Group, Inc.* | | | 61 | | | | 1,364 | |
Bank First Corp. | | | 15 | | | | 1,360 | |
Lemonade, Inc.* | | | 81 | | | | 1,336 | |
Premier Financial Corp. | | | 56 | | | | 1,315 | |
Byline Bancorp, Inc. | | | 49 | | | | 1,312 | |
F&G Annuities & Life, Inc. | | | 29 | | | | 1,297 | |
Univest Financial Corp. | | | 46 | | | | 1,294 | |
Dynex Capital, Inc. REIT | | | 101 | | | | 1,289 | |
Central Pacific Financial Corp. | | | 42 | | | | 1,239 | |
Burke & Herbert Financial Services Corp. | | | 20 | | | | 1,220 | |
Merchants Bancorp | | | 27 | | | | 1,214 | |
ProAssurance Corp.* | | | 80 | | | | 1,203 | |
CrossFirst Bankshares, Inc.* | | | 72 | | | | 1,202 | |
Hamilton Insurance Group Ltd. — Class B* | | | 62 | | | | 1,199 | |
Community Trust Bancorp, Inc. | | | 24 | | | | 1,192 | |
Service Properties Trust REIT | | | 260 | | | | 1,186 | |
Heritage Financial Corp. | | | 54 | | | | 1,176 | |
First Community Bankshares, Inc. | | | 27 | | | | 1,165 | |
Tompkins Financial Corp. | | | 20 | | | | 1,156 | |
KKR Real Estate Finance Trust, Inc. REIT | | | 93 | | | | 1,149 | |
Capitol Federal Financial, Inc. | | | 196 | | | | 1,145 | |
BrightSpire Capital, Inc. REIT | | | 204 | | | | 1,142 | |
Armada Hoffler Properties, Inc. REIT | | | 105 | | | | 1,137 | |
NB Bancorp, Inc.* | | | 61 | | | | 1,132 | |
Summit Hotel Properties, Inc. REIT | | | 165 | | | | 1,132 | |
Brightsphere Investment Group, Inc. | | | 44 | | | | 1,118 | |
Mercantile Bank Corp. | | | 25 | | | | 1,093 | |
Old Second Bancorp, Inc. | | | 69 | | | | 1,076 | |
Eagle Bancorp, Inc. | | | 47 | | | | 1,061 | |
Horizon Bancorp, Inc. | | | 68 | | | | 1,057 | |
Cipher Mining, Inc.* | | | 272 | | | | 1,052 | |
Orrstown Financial Services, Inc. | | | 29 | | | | 1,043 | |
Whitestone REIT — Class B REIT | | | 77 | | | | 1,042 | |
Brookfield Business Corp. — Class A | | | 41 | | | | 1,039 | |
Independent Bank Corp. | | | 31 | | | | 1,034 | |
Hudson Pacific Properties, Inc. REIT | | | 216 | | | | 1,032 | |
Gladstone Commercial Corp. REIT | | | 63 | | | | 1,023 | |
Claros Mortgage Trust, Inc. | | | 136 | | | | 1,019 | |
Amerant Bancorp, Inc. | | | 47 | | | | 1,004 | |
Business First Bancshares, Inc. | | | 38 | | | | 975 | |
Coastal Financial Corp.* | | | 18 | | | | 972 | |
Patria Investments Ltd. — Class A | | | 87 | | | | 972 | |
TrustCo Bank Corporation NY | | | 29 | | | | 959 | |
Global Medical REIT, Inc. REIT | | | 96 | | | | 951 | |
Camden National Corp. | | | 23 | | | | 950 | |
Equity Bancshares, Inc. — Class A | | | 23 | | | | 940 | |
Heritage Commerce Corp. | | | 94 | | | | 929 | |
LendingTree, Inc.* | | | 16 | | | | 928 | |
International Money Express, Inc.* | | | 50 | | | | 924 | |
Universal Health Realty Income Trust REIT | | | 20 | | | | 915 | |
CBL & Associates Properties, Inc. REIT | | | 36 | | | | 907 | |
New York Mortgage Trust, Inc. REIT | | | 143 | | | | 905 | |
Metropolitan Bank Holding Corp.* | | | 17 | | | | 894 | |
Metrocity Bankshares, Inc. | | | 29 | | | | 888 | |
Amalgamated Financial Corp. | | | 28 | | | | 878 | |
Hanmi Financial Corp. | | | 47 | | | | 874 | |
Washington Trust Bancorp, Inc. | | | 27 | | | | 870 | |
Farmers National Banc Corp. | | | 57 | | | | 862 | |
Republic Bancorp, Inc. — Class A | | | 13 | | | | 849 | |
Northeast Bank | | | 11 | | | | 848 | |
Southern Missouri Bancorp, Inc. | | | 15 | | | | 847 | |
Universal Insurance Holdings, Inc. | | | 38 | | | | 842 | |
Real Brokerage, Inc.* | | | 150 | | | | 833 | |
Great Southern Bancorp, Inc. | | | 14 | | | | 802 | |
Peakstone Realty Trust REIT | | | 58 | | | | 791 | |
First Financial Corp. | | | 18 | | | | 789 | |
Anywhere Real Estate, Inc.* | | | 155 | | | | 787 | |
HomeTrust Bancshares, Inc. | | | 23 | | | | 784 | |
Tiptree, Inc. — Class A | | | 40 | | | | 783 | |
HarborOne Bancorp, Inc. | | | 60 | | | | 779 | |
Capital City Bank Group, Inc. | | | 22 | | | | 776 | |
NerdWallet, Inc. — Class A* | | | 61 | | | | 775 | |
Five Star Bancorp | | | 26 | | | | 773 | |
CNB Financial Corp. | | | 32 | | | | 770 | |
TPG RE Finance Trust, Inc. REIT | | | 90 | | | | 768 | |
Community Healthcare Trust, Inc. REIT | | | 42 | | | | 762 | |
Ambac Financial Group, Inc.* | | | 68 | | | | 762 | |
Arrow Financial Corp. | | | 26 | | | | 745 | |
Bar Harbor Bankshares | | | 24 | | | | 740 | |
Midland States Bancorp, Inc. | | | 33 | | | | 739 | |
Gladstone Land Corp. REIT | | | 53 | | | | 737 | |
GCM Grosvenor, Inc. — Class A | | | 65 | | | | 736 | |
Columbia Financial, Inc.* | | | 43 | | | | 734 | |
SmartFinancial, Inc. | | | 25 | | | | 728 | |
Alexander’s, Inc. REIT | | | 3 | | | | 727 | |
Invesco Mortgage Capital, Inc. REIT | | | 77 | | | | 723 | |
Farmland Partners, Inc. REIT | | | 69 | | | | 721 | |
Northfield Bancorp, Inc. | | | 62 | | | | 719 | |
Esquire Financial Holdings, Inc. | | | 11 | | | | 717 | |
Mid Penn Bancorp, Inc. | | | 24 | | | | 716 | |
Saul Centers, Inc. REIT | | | 17 | | | | 713 | |
Peapack-Gladstone Financial Corp. | | | 26 | | | | 713 | |
P10, Inc. — Class A | | | 66 | | | | 707 | |
NET Lease Office Properties REIT | | | 23 | | | | 704 | |
Peoples Financial Services Corp. | | | 15 | | | | 703 | |
United Fire Group, Inc. | | | 33 | | | | 691 | |
Orchid Island Capital, Inc. REIT | | | 84 | | | | 690 | |
One Liberty Properties, Inc. REIT | | | 25 | | | | 689 | |
Shore Bancshares, Inc. | | | 48 | | | | 672 | |
CTO Realty Growth, Inc. REIT | | | 35 | | | | 666 | |
MidWestOne Financial Group, Inc. | | | 23 | | | | 656 | |
Chatham Lodging Trust REIT | | | 76 | | | | 648 | |
214 | THE RYDEX FUNDS SEMI-ANNUAL FINANCIAL REPORT | SEE NOTES TO FINANCIAL STATEMENTS. |
SCHEDULE OF INVESTMENTS (Unaudited)(continued) | September 30, 2024 |
RUSSELL 2000® 1.5x STRATEGY FUND | |
| | Shares | | | Value | |
Diamond Hill Investment Group, Inc. | | | 4 | | | $ | 646 | |
Bit Digital, Inc.*,1 | | | 184 | | | | 646 | |
South Plains Financial, Inc. | | | 19 | | | | 644 | |
Alerus Financial Corp. | | | 28 | | | | 641 | |
FRP Holdings, Inc.* | | | 21 | | | | 627 | |
Flushing Financial Corp. | | | 43 | | | | 627 | |
Carter Bankshares, Inc.* | | | 36 | | | | 626 | |
RBB Bancorp | | | 27 | | | | 622 | |
Financial Institutions, Inc. | | | 24 | | | | 611 | |
RMR Group, Inc. — Class A | | | 24 | | | | 609 | |
Sierra Bancorp | | | 21 | | | | 606 | |
Greenlight Capital Re Ltd. — Class A* | | | 44 | | | | 601 | |
Kearny Financial Corp. | | | 86 | | | | 591 | |
World Acceptance Corp.* | | | 5 | | | | 590 | |
Ares Commercial Real Estate Corp. REIT | | | 84 | | | | 588 | |
Northrim BanCorp, Inc. | | | 8 | | | | 570 | |
ACNB Corp. | | | 13 | | | | 568 | |
California BanCorp* | | | 38 | | | | 562 | |
Farmers & Merchants Bancorp Incorporated/Archbold OH | | | 20 | | | | 553 | |
First Business Financial Services, Inc. | | | 12 | | | | 547 | |
Root, Inc. — Class A* | | | 14 | | | | 529 | |
Hippo Holdings, Inc.* | | | 31 | | | | 523 | |
Community West Bancshares | | | 27 | | | | 520 | |
First Foundation, Inc. | | | 82 | | | | 512 | |
Northeast Community Bancorp, Inc. | | | 19 | | | | 503 | |
Bank of Marin Bancorp | | | 25 | | | | 502 | |
First Bank/Hamilton NJ | | | 33 | | | | 502 | |
Postal Realty Trust, Inc. — Class A REIT | | | 34 | | | | 498 | |
Legacy Housing Corp.* | | | 18 | | | | 492 | |
Home Bancorp, Inc. | | | 11 | | | | 490 | |
Industrial Logistics Properties Trust REIT | | | 103 | | | | 490 | |
FS Bancorp, Inc. | | | 11 | | | | 489 | |
Hingham Institution For Savings | | | 2 | | | | 487 | |
Orange County Bancorp, Inc. | | | 8 | | | | 483 | |
Third Coast Bancshares, Inc.* | | | 18 | | | | 482 | |
Dave, Inc.* | | | 12 | | | | 479 | |
Enterprise Bancorp, Inc. | | | 15 | | | | 479 | |
West BanCorp, Inc. | | | 25 | | | | 475 | |
NewtekOne, Inc. | | | 37 | | | | 461 | |
Investors Title Co. | | | 2 | | | | 460 | |
Selectquote, Inc.* | | | 211 | | | | 458 | |
HomeStreet, Inc. | | | 29 | | | | 457 | |
Bridgewater Bancshares, Inc.* | | | 32 | | | | 453 | |
Citizens & Northern Corp. | | | 23 | | | | 453 | |
First Bancorp, Inc. | | | 17 | | | | 447 | |
Guaranty Bancshares, Inc. | | | 13 | | | | 447 | |
First Internet Bancorp | | | 13 | | | | 445 | |
Heritage Insurance Holdings, Inc.* | | | 36 | | | | 441 | |
HBT Financial, Inc. | | | 20 | | | | 438 | |
First of Long Island Corp. | | | 34 | | | | 438 | |
American Coastal Insurance Corp.* | | | 38 | | | | 428 | |
Civista Bancshares, Inc. | | | 24 | | | | 428 | |
Regional Management Corp. | | | 13 | | | | 425 | |
Chicago Atlantic Real Estate Finance, Inc. REIT | | | 27 | | | | 418 | |
Citizens Financial Services, Inc. | | | 7 | | | | 411 | |
Southern First Bancshares, Inc.* | | | 12 | | | | 409 | |
Colony Bankcorp, Inc. | | | 26 | | | | 404 | |
BayCom Corp. | | | 17 | | | | 403 | |
Southern States Bancshares, Inc. | | | 13 | | | | 399 | |
John Marshall Bancorp, Inc. | | | 20 | | | | 396 | |
Primis Financial Corp. | | | 32 | | | | 390 | |
Capital Bancorp, Inc. | | | 15 | | | | 386 | |
Waterstone Financial, Inc. | | | 26 | | | | 382 | |
Unity Bancorp, Inc. | | | 11 | | | | 375 | |
Plumas Bancorp | | | 9 | | | | 367 | |
Red River Bancshares, Inc. | | | 7 | | | | 364 | |
Alpine Income Property Trust, Inc. REIT | | | 20 | | | | 364 | |
Timberland Bancorp, Inc. | | | 12 | | | | 363 | |
City Office REIT, Inc. | | | 61 | | | | 356 | |
Orion Office REIT, Inc. | | | 89 | | | | 356 | |
Parke Bancorp, Inc. | | | 17 | | | | 355 | |
Donegal Group, Inc. — Class A | | | 24 | | | | 354 | |
Ponce Financial Group, Inc.* | | | 30 | | | | 351 | |
RE/MAX Holdings, Inc. — Class A* | | | 28 | | | | 349 | |
MVB Financial Corp. | | | 18 | | | | 348 | |
Fidelity D&D Bancorp, Inc. | | | 7 | | | | 345 | |
ChoiceOne Financial Services, Inc. | | | 11 | | | | 340 | |
Greene County Bancorp, Inc. | | | 11 | | | | 340 | |
FVCBankcorp, Inc.* | | | 26 | | | | 339 | |
Blue Foundry Bancorp* | | | 33 | | | | 338 | |
AG Mortgage Investment Trust, Inc. REIT | | | 45 | | | | 338 | |
Norwood Financial Corp. | | | 12 | | | | 331 | |
Braemar Hotels & Resorts, Inc. REIT | | | 104 | | | | 321 | |
PCB Bancorp | | | 17 | | | | 319 | |
Onity Group, Inc.* | | | 10 | | | | 319 | |
NexPoint Diversified Real Estate Trust REIT | | | 51 | | | | 319 | |
Middlefield Banc Corp. | | | 11 | | | | 317 | |
BRT Apartments Corp. REIT | | | 18 | | | | 316 | |
Atlanticus Holdings Corp.* | | | 9 | | | | 316 | |
Bowhead Specialty Holdings, Inc.* | | | 11 | | | | 308 | |
James River Group Holdings Ltd. | | | 49 | | | | 307 | |
LCNB Corp. | | | 20 | | | | 301 | |
Bankwell Financial Group, Inc. | | | 10 | | | | 299 | |
BCB Bancorp, Inc. | | | 24 | | | | 296 | |
Princeton Bancorp, Inc. | | | 8 | | | | 296 | |
Oak Valley Bancorp | | | 11 | | | | 292 | |
Virginia National Bankshares Corp. | | | 7 | | | | 292 | |
Investar Holding Corp. | | | 15 | | | | 291 | |
Star Holdings* | | | 20 | | | | 277 | |
AFC Gamma, Inc. REIT | | | 27 | | | | 276 | |
Seven Hills Realty Trust REIT | | | 20 | | | | 275 | |
Velocity Financial, Inc.* | | | 14 | | | | 275 | |
Franklin Street Properties Corp. REIT | | | 154 | | | | 273 | |
Provident Bancorp, Inc.* | | | 25 | | | | 270 | |
Maui Land & Pineapple Company, Inc.* | | | 12 | | | | 269 | |
National Bankshares, Inc. | | | 9 | | | | 269 | |
Crawford & Co. — Class A | | | 24 | | | | 263 | |
First Western Financial, Inc.* | | | 13 | | | | 260 | |
USCB Financial Holdings, Inc. | | | 17 | | | | 259 | |
SEE NOTES TO FINANCIAL STATEMENTS. | THE RYDEX FUNDS SEMI-ANNUAL FINANCIAL REPORT | 215 |
SCHEDULE OF INVESTMENTS (Unaudited)(continued) | September 30, 2024 |
RUSSELL 2000® 1.5x STRATEGY FUND | |
| | Shares | | | Value | |
Silvercrest Asset Management Group, Inc. — Class A | | | 15 | | | $ | 259 | |
Ames National Corp. | | | 14 | | | | 255 | |
Granite Point Mortgage Trust, Inc. REIT | | | 79 | | | | 250 | |
MBIA, Inc.* | | | 70 | | | | 250 | |
ESSA Bancorp, Inc. | | | 13 | | | | 250 | |
First Financial Northwest, Inc. | | | 11 | | | | 248 | |
Maiden Holdings Ltd.* | | | 139 | | | | 246 | |
Medallion Financial Corp. | | | 30 | | | | 244 | |
Chemung Financial Corp. | | | 5 | | | | 240 | |
Forge Global Holdings, Inc.* | | | 181 | | | | 237 | |
Stratus Properties, Inc.* | | | 9 | | | | 234 | |
Bank7 Corp. | | | 6 | | | | 225 | |
LINKBANCORP, Inc. | | | 35 | | | | 224 | |
Nexpoint Real Estate Finance, Inc. REIT | | | 13 | | | | 203 | |
Sky Harbour Group Corp.* | | | 18 | | | | 199 | |
AlTi Global, Inc.* | | | 53 | | | | 198 | |
Angel Oak Mortgage REIT, Inc. | | | 19 | | | | 198 | |
Pioneer Bancorp, Inc.* | | | 18 | | | | 197 | |
Paysign, Inc.* | | | 52 | | | | 191 | |
NI Holdings, Inc.* | | | 12 | | | | 188 | |
Peoples Bancorp of North Carolina, Inc. | | | 7 | | | | 178 | |
B Riley Financial, Inc. | | | 32 | | | | 168 | |
Kingsway Financial Services, Inc.* | | | 20 | | | | 166 | |
Sterling Bancorp, Inc.* | | | 34 | | | | 155 | |
OppFi, Inc. | | | 29 | | | | 137 | |
Sunrise Realty Trust, Inc. REIT | | | 9 | | | | 130 | |
Consumer Portfolio Services, Inc.* | | | 13 | | | | 122 | |
Strawberry Fields REIT, Inc. | | | 9 | | | | 114 | |
Clipper Realty, Inc. REIT | | | 19 | | | | 108 | |
SWK Holdings Corp.* | | | 5 | | | | 86 | |
GoHealth, Inc. — Class A* | | | 7 | | | | 66 | |
Offerpad Solutions, Inc.* | | | 16 | | | | 65 | |
Transcontinental Realty Investors, Inc.* | | | 2 | | | | 58 | |
American Realty Investors, Inc.* | | | 2 | | | | 35 | |
Roadzen, Inc.* | | | 24 | | | | 28 | |
Total Financial | | | | | | | 1,017,316 | |
| | | | | | | | | |
Consumer, Non-cyclical - 15.5% |
Vaxcyte, Inc.* | | | 187 | | | | 21,368 | |
Insmed, Inc.* | | | 245 | | | | 17,885 | |
Sprouts Farmers Market, Inc.* | | | 158 | | | | 17,445 | |
Ensign Group, Inc. | | | 87 | | | | 12,512 | |
Lantheus Holdings, Inc.* | | | 107 | | | | 11,743 | |
Halozyme Therapeutics, Inc.* | | | 195 | | | | 11,162 | |
HealthEquity, Inc.* | | | 133 | | | | 10,886 | |
REVOLUTION Medicines, Inc.* | | | 240 | | | | 10,884 | |
Glaukos Corp.* | | | 77 | | | | 10,032 | |
Cytokinetics, Inc.* | | | 176 | | | | 9,293 | |
Blueprint Medicines Corp.* | | | 99 | | | | 9,158 | |
Merit Medical Systems, Inc.* | | | 90 | | | | 8,895 | |
Option Care Health, Inc.* | | | 269 | | | | 8,420 | |
Brink’s Co. | | | 71 | | | | 8,210 | |
TransMedics Group, Inc.* | | | 50 | | | | 7,850 | |
Avidity Biosciences, Inc.* | | | 170 | | | | 7,808 | |
Verra Mobility Corp.* | | | 262 | | | | 7,286 | |
RadNet, Inc.* | | | 104 | | | | 7,217 | |
Alkermes plc* | | | 257 | | | | 7,193 | |
Krystal Biotech, Inc.* | | | 39 | | | | 7,099 | |
ADMA Biologics, Inc.* | | | 355 | | | | 7,097 | |
Herc Holdings, Inc. | | | 44 | | | | 7,015 | |
Integer Holdings Corp.* | | | 52 | | | | 6,760 | |
Oscar Health, Inc. — Class A* | | | 304 | | | | 6,448 | |
Haemonetics Corp.* | | | 79 | | | | 6,350 | |
Primo Water Corp. | | | 249 | | | | 6,287 | |
Crinetics Pharmaceuticals, Inc.* | | | 123 | | | | 6,285 | |
ICU Medical, Inc.* | | | 34 | | | | 6,196 | |
Korn Ferry | | | 82 | | | | 6,170 | |
Biohaven Ltd.* | | | 118 | | | | 5,896 | |
Corcept Therapeutics, Inc.* | | | 127 | | | | 5,878 | |
Select Medical Holdings Corp. | | | 168 | | | | 5,858 | |
Neogen Corp.* | | | 344 | | | | 5,783 | |
Madrigal Pharmaceuticals, Inc.* | | | 27 | | | | 5,730 | |
Stride, Inc.* | | | 67 | | | | 5,716 | |
Denali Therapeutics, Inc.* | | | 196 | | | | 5,709 | |
Arcellx, Inc.* | | | 68 | | | | 5,679 | |
Bridgebio Pharma, Inc.* | | | 222 | | | | 5,652 | |
Prestige Consumer Healthcare, Inc.* | | | 78 | | | | 5,624 | |
Axonics, Inc.* | | | 80 | | | | 5,568 | |
Nuvalent, Inc. — Class A* | | | 54 | | | | 5,524 | |
Lancaster Colony Corp. | | | 31 | | | | 5,474 | |
WD-40 Co. | | | 21 | | | | 5,415 | |
PROCEPT BioRobotics Corp.* | | | 67 | | | | 5,368 | |
ABM Industries, Inc. | | | 100 | | | | 5,276 | |
TG Therapeutics, Inc.* | | | 220 | | | | 5,146 | |
Axsome Therapeutics, Inc.* | | | 57 | | | | 5,123 | |
CBIZ, Inc.* | | | 76 | | | | 5,114 | |
StoneCo Ltd. — Class A* | | | 448 | | | | 5,044 | |
Insperity, Inc. | | | 57 | | | | 5,016 | |
Simply Good Foods Co.* | | | 144 | | | | 5,007 | |
Alight, Inc. — Class A* | | | 664 | | | | 4,914 | |
Amicus Therapeutics, Inc.* | | | 459 | | | | 4,902 | |
Cal-Maine Foods, Inc. | | | 65 | | | | 4,865 | |
TriNet Group, Inc. | | | 50 | | | | 4,848 | |
ICF International, Inc. | | | 29 | | | | 4,837 | |
CorVel Corp.* | | | 14 | | | | 4,576 | |
Dyne Therapeutics, Inc.* | | | 127 | | | | 4,562 | |
LivaNova plc* | | | 86 | | | | 4,518 | |
Rhythm Pharmaceuticals, Inc.* | | | 86 | | | | 4,505 | |
Adtalem Global Education, Inc.* | | | 59 | | | | 4,453 | |
PTC Therapeutics, Inc.* | | | 120 | | | | 4,452 | |
Tandem Diabetes Care, Inc.* | | | 102 | | | | 4,326 | |
Guardant Health, Inc.* | | | 186 | | | | 4,267 | |
Alarm.com Holdings, Inc.* | | | 76 | | | | 4,155 | |
Protagonist Therapeutics, Inc.* | | | 92 | | | | 4,140 | |
J & J Snack Foods Corp. | | | 24 | | | | 4,131 | |
Geron Corp.* | | | 908 | | | | 4,122 | |
Veracyte, Inc.* | | | 121 | | | | 4,119 | |
Twist Bioscience Corp.* | | | 91 | | | | 4,111 | |
Graham Holdings Co. — Class B | | | 5 | | | | 4,109 | |
Ideaya Biosciences, Inc.* | | | 129 | | | | 4,087 | |
Agios Pharmaceuticals, Inc.* | | | 89 | | | | 3,954 | |
Astrana Health, Inc.* | | | 68 | | | | 3,940 | |
216 | THE RYDEX FUNDS SEMI-ANNUAL FINANCIAL REPORT | SEE NOTES TO FINANCIAL STATEMENTS. |
SCHEDULE OF INVESTMENTS (Unaudited)(continued) | September 30, 2024 |
RUSSELL 2000® 1.5x STRATEGY FUND | |
| | Shares | | | Value | |
Surgery Partners, Inc.* | | | 121 | | | $ | 3,901 | |
Myriad Genetics, Inc.* | | | 141 | | | | 3,862 | |
Inter Parfums, Inc. | | | 29 | | | | 3,755 | |
Iovance Biotherapeutics, Inc.* | | | 396 | | | | 3,718 | |
Arrowhead Pharmaceuticals, Inc.* | | | 188 | | | | 3,642 | |
iRhythm Technologies, Inc.* | | | 49 | | | | 3,638 | |
Addus HomeCare Corp.* | | | 27 | | | | 3,592 | |
Marqeta, Inc. — Class A* | | | 730 | | | | 3,592 | |
CONMED Corp. | | | 49 | | | | 3,524 | |
Laureate Education, Inc. — Class A | | | 211 | | | | 3,505 | |
UFP Technologies, Inc.* | | | 11 | | | | 3,484 | |
Catalyst Pharmaceuticals, Inc.* | | | 175 | | | | 3,479 | |
Celldex Therapeutics, Inc.* | | | 102 | | | | 3,467 | |
Vector Group Ltd. | | | 232 | | | | 3,461 | |
SpringWorks Therapeutics, Inc.* | | | 108 | | | | 3,460 | |
EVERTEC, Inc. | | | 102 | | | | 3,457 | |
Inari Medical, Inc.* | | | 83 | | | | 3,423 | |
Apogee Therapeutics, Inc.* | | | 57 | | | | 3,348 | |
Payoneer Global, Inc.* | | | 443 | | | | 3,336 | |
Kymera Therapeutics, Inc.* | | | 70 | | | | 3,313 | |
Strategic Education, Inc. | | | 35 | | | | 3,239 | |
Vericel Corp.* | | | 76 | | | | 3,211 | |
PROG Holdings, Inc. | | | 65 | | | | 3,152 | |
TreeHouse Foods, Inc.* | | | 75 | | | | 3,148 | |
Omnicell, Inc.* | | | 72 | | | | 3,139 | |
Intellia Therapeutics, Inc.* | | | 152 | | | | 3,124 | |
Flywire Corp.* | | | 190 | | | | 3,114 | |
Akero Therapeutics, Inc.* | | | 107 | | | | 3,070 | |
Remitly Global, Inc.* | | | 229 | | | | 3,066 | |
Huron Consulting Group, Inc.* | | | 28 | | | | 3,044 | |
Edgewise Therapeutics, Inc.* | | | 114 | | | | 3,043 | |
Summit Therapeutics, Inc.* | | | 138 | | | | 3,022 | |
LeMaitre Vascular, Inc. | | | 32 | | | | 2,972 | |
NeoGenomics, Inc.* | | | 201 | | | | 2,965 | |
Beam Therapeutics, Inc.* | | | 121 | | | | 2,965 | |
Amphastar Pharmaceuticals, Inc.* | | | 61 | | | | 2,960 | |
ACADIA Pharmaceuticals, Inc.* | | | 189 | | | | 2,907 | |
STAAR Surgical Co.* | | | 78 | | | | 2,898 | |
Edgewell Personal Care Co. | | | 78 | | | | 2,834 | |
Novavax, Inc.*,1 | | | 223 | | | | 2,817 | |
CG oncology, Inc.* | | | 74 | | | | 2,792 | |
John Wiley & Sons, Inc. — Class A | | | 57 | | | | 2,750 | |
Upbound Group, Inc. | | | 85 | | | | 2,719 | |
Ligand Pharmaceuticals, Inc. — Class B* | | | 27 | | | | 2,702 | |
Vera Therapeutics, Inc.* | | | 61 | | | | 2,696 | |
Patterson Companies, Inc. | | | 123 | | | | 2,686 | |
Keros Therapeutics, Inc.* | | | 46 | | | | 2,671 | |
RxSight, Inc.* | | | 54 | | | | 2,669 | |
Novocure Ltd.* | | | 168 | | | | 2,626 | |
Immunovant, Inc.* | | | 92 | | | | 2,623 | |
MannKind Corp.* | | | 415 | | | | 2,610 | |
Central Garden & Pet Co. — Class A* | | | 82 | | | | 2,575 | |
Andersons, Inc. | | | 51 | | | | 2,557 | |
LiveRamp Holdings, Inc.* | | | 103 | | | | 2,552 | |
AMN Healthcare Services, Inc.* | | | 60 | | | | 2,543 | |
Ardelyx, Inc.* | | | 366 | | | | 2,522 | |
GEO Group, Inc.* | | | 196 | | | | 2,519 | |
National Healthcare Corp. | | | 20 | | | | 2,515 | |
Syndax Pharmaceuticals, Inc.* | | | 130 | | | | 2,503 | |
Arvinas, Inc.* | | | 101 | | | | 2,488 | |
PACS Group, Inc.* | | | 62 | | | | 2,478 | |
BioCryst Pharmaceuticals, Inc.* | | | 326 | | | | 2,478 | |
CareDx, Inc.* | | | 79 | | | | 2,467 | |
Supernus Pharmaceuticals, Inc.* | | | 79 | | | | 2,463 | |
Teladoc Health, Inc.* | | | 268 | | | | 2,460 | |
Recursion Pharmaceuticals, Inc. — Class A*,1 | | | 373 | | | | 2,458 | |
Mirum Pharmaceuticals, Inc.* | | | 62 | | | | 2,418 | |
Dynavax Technologies Corp.* | | | 208 | | | | 2,317 | |
Chefs’ Warehouse, Inc.* | | | 55 | | | | 2,310 | |
Perdoceo Education Corp. | | | 103 | | | | 2,291 | |
Viridian Therapeutics, Inc.* | | | 99 | | | | 2,252 | |
Progyny, Inc.* | | | 133 | | | | 2,229 | |
Kura Oncology, Inc.* | | | 114 | | | | 2,228 | |
Helen of Troy Ltd.* | | | 36 | | | | 2,227 | |
Cimpress plc* | | | 27 | | | | 2,212 | |
CoreCivic, Inc.* | | | 174 | | | | 2,201 | |
Harrow, Inc.* | | | 48 | | | | 2,158 | |
Nurix Therapeutics, Inc.* | | | 95 | | | | 2,135 | |
Ocular Therapeutix, Inc.* | | | 245 | | | | 2,131 | |
Inmode Ltd.* | | | 125 | | | | 2,119 | |
AtriCure, Inc.* | | | 75 | | | | 2,103 | |
Amneal Pharmaceuticals, Inc.* | | | 251 | | | | 2,088 | |
Brookdale Senior Living, Inc. — Class A* | | | 302 | | | | 2,051 | |
US Physical Therapy, Inc. | | | 24 | | | | 2,031 | |
Universal Corp. | | | 38 | | | | 2,018 | |
Janux Therapeutics, Inc.* | | | 44 | | | | 1,999 | |
Collegium Pharmaceutical, Inc.* | | | 51 | | | | 1,971 | |
Integra LifeSciences Holdings Corp.* | | | 108 | | | | 1,962 | |
Dole plc | | | 118 | | | | 1,922 | |
Rocket Pharmaceuticals, Inc.* | | | 104 | | | | 1,921 | |
Harmony Biosciences Holdings, Inc.* | | | 48 | | | | 1,920 | |
Avadel Pharmaceuticals plc* | | | 146 | | | | 1,915 | |
Quanex Building Products Corp. | | | 69 | | | | 1,915 | |
Tarsus Pharmaceuticals, Inc.* | | | 58 | | | | 1,908 | |
agilon health, Inc.* | | | 483 | | | | 1,898 | |
Xencor, Inc.* | | | 94 | | | | 1,890 | |
Cassava Sciences, Inc.* | | | 64 | | | | 1,884 | |
Owens & Minor, Inc.* | | | 119 | | | | 1,867 | |
MGP Ingredients, Inc. | | | 22 | | | | 1,832 | |
Utz Brands, Inc. | | | 103 | | | | 1,823 | |
Arlo Technologies, Inc.* | | | 150 | | | | 1,816 | |
AdaptHealth Corp.* | | | 160 | | | | 1,797 | |
Weis Markets, Inc. | | | 26 | | | | 1,792 | |
Vital Farms, Inc.* | | | 51 | | | | 1,789 | |
Kforce, Inc. | | | 29 | | | | 1,782 | |
Soleno Therapeutics, Inc.* | | | 35 | | | | 1,767 | |
WK Kellogg Co. | | | 103 | | | | 1,762 | |
Neumora Therapeutics, Inc.* | | | 133 | | | | 1,757 | |
Vita Coco Company, Inc.* | | | 62 | | | | 1,755 | |
CRA International, Inc. | | | 10 | | | | 1,753 | |
National Beverage Corp. | | | 37 | | | | 1,737 | |
SEE NOTES TO FINANCIAL STATEMENTS. | THE RYDEX FUNDS SEMI-ANNUAL FINANCIAL REPORT | 217 |
SCHEDULE OF INVESTMENTS (Unaudited)(continued) | September 30, 2024 |
RUSSELL 2000® 1.5x STRATEGY FUND | |
| | Shares | | | Value | |
Avanos Medical, Inc.* | | | 72 | | | $ | 1,730 | |
ANI Pharmaceuticals, Inc.* | | | 29 | | | | 1,730 | |
Coursera, Inc.* | | | 217 | | | | 1,723 | |
Ingles Markets, Inc. — Class A | | | 23 | | | | 1,716 | |
Longboard Pharmaceuticals, Inc.* | | | 51 | | | | 1,700 | |
Transcat, Inc.* | | | 14 | | | | 1,691 | |
Innoviva, Inc.* | | | 87 | | | | 1,680 | |
Artivion, Inc.* | | | 63 | | | | 1,677 | |
Pennant Group, Inc.* | | | 46 | | | | 1,642 | |
Travere Therapeutics, Inc.* | | | 116 | | | | 1,623 | |
Spyre Therapeutics, Inc.* | | | 55 | | | | 1,618 | |
First Advantage Corp.* | | | 80 | | | | 1,588 | |
Cogent Biosciences, Inc.* | | | 145 | | | | 1,566 | |
Fresh Del Monte Produce, Inc. | | | 53 | | | | 1,566 | |
United Natural Foods, Inc.* | | | 93 | | | | 1,564 | |
Praxis Precision Medicines, Inc.* | | | 27 | | | | 1,554 | |
Arcutis Biotherapeutics, Inc.* | | | 167 | | | | 1,553 | |
Pediatrix Medical Group, Inc.* | | | 133 | | | | 1,542 | |
Aurinia Pharmaceuticals, Inc.* | | | 210 | | | | 1,539 | |
Barrett Business Services, Inc. | | | 40 | | | | 1,500 | |
Kiniksa Pharmaceuticals International plc* | | | 59 | | | | 1,474 | |
Krispy Kreme, Inc. | | | 135 | | | | 1,450 | |
Maravai LifeSciences Holdings, Inc. — Class A* | | | 174 | | | | 1,446 | |
BrightView Holdings, Inc.* | | | 91 | | | | 1,432 | |
Evolus, Inc.* | | | 87 | | | | 1,409 | |
Enliven Therapeutics, Inc.* | | | 55 | | | | 1,405 | |
BioLife Solutions, Inc.* | | | 56 | | | | 1,402 | |
Legalzoom.com, Inc.* | | | 217 | | | | 1,378 | |
Deluxe Corp. | | | 70 | | | | 1,364 | |
Monro, Inc. | | | 47 | | | | 1,356 | |
Cullinan Therapeutics, Inc.* | | | 81 | | | | 1,356 | |
Driven Brands Holdings, Inc.* | | | 94 | | | | 1,341 | |
PetIQ, Inc.* | | | 43 | | | | 1,323 | |
John B Sanfilippo & Son, Inc. | | | 14 | | | | 1,320 | |
LifeStance Health Group, Inc.* | | | 188 | | | | 1,316 | |
Arcus Biosciences, Inc.* | | | 86 | | | | 1,315 | |
Healthcare Services Group, Inc.* | | | 116 | | | | 1,296 | |
Applied Therapeutics, Inc.* | | | 152 | | | | 1,292 | |
Embecta Corp. | | | 91 | | | | 1,283 | |
Disc Medicine, Inc.* | | | 26 | | | | 1,278 | |
BrightSpring Health Services, Inc.* | | | 85 | | | | 1,248 | |
Heidrick & Struggles International, Inc. | | | 32 | | | | 1,244 | |
Hain Celestial Group, Inc.* | | | 141 | | | | 1,217 | |
SpartanNash Co. | | | 54 | | | | 1,210 | |
Community Health Systems, Inc.* | | | 198 | | | | 1,202 | |
Immunome, Inc.* | | | 81 | | | | 1,184 | |
Castle Biosciences, Inc.* | | | 41 | | | | 1,169 | |
Repay Holdings Corp.* | | | 143 | | | | 1,167 | |
Turning Point Brands, Inc. | | | 27 | | | | 1,165 | |
Viad Corp.* | | | 32 | | | | 1,147 | |
Paysafe Ltd.* | | | 51 | | | | 1,144 | |
Day One Biopharmaceuticals, Inc.* | | | 82 | | | | 1,142 | |
Herbalife Ltd.* | | | 158 | | | | 1,136 | |
ARS Pharmaceuticals, Inc.* | | | 78 | | | | 1,131 | |
Udemy, Inc.* | | | 151 | | | | 1,123 | |
Prothena Corporation plc* | | | 67 | | | | 1,121 | |
Avid Bioservices, Inc.* | | | 98 | | | | 1,115 | |
Relay Therapeutics, Inc.* | | | 157 | | | | 1,112 | |
MiMedx Group, Inc.* | | | 187 | | | | 1,105 | |
Zymeworks, Inc.* | | | 88 | | | | 1,104 | |
B&G Foods, Inc. | | | 123 | | | | 1,092 | |
Matthews International Corp. — Class A | | | 47 | | | | 1,090 | |
Pacira BioSciences, Inc.* | | | 72 | | | | 1,084 | |
ZipRecruiter, Inc. — Class A* | | | 113 | | | | 1,073 | |
Cytek Biosciences, Inc.* | | | 191 | | | | 1,058 | |
Vir Biotechnology, Inc.* | | | 141 | | | | 1,056 | |
Hackett Group, Inc. | | | 40 | | | | 1,051 | |
Kelly Services, Inc. — Class A | | | 49 | | | | 1,049 | |
Dianthus Therapeutics, Inc.* | | | 38 | | | | 1,040 | |
AnaptysBio, Inc.* | | | 31 | | | | 1,039 | |
ArriVent Biopharma, Inc.* | | | 44 | | | | 1,034 | |
Pliant Therapeutics, Inc.* | | | 90 | | | | 1,009 | |
Universal Technical Institute, Inc.* | | | 62 | | | | 1,008 | |
WaVe Life Sciences Ltd.* | | | 122 | | | | 1,000 | |
Cargo Therapeutics, Inc.* | | | 54 | | | | 996 | |
ORIC Pharmaceuticals, Inc.* | | | 97 | | | | 994 | |
Perspective Therapeutics, Inc.* | | | 74 | | | | 988 | |
Green Dot Corp. — Class A* | | | 84 | | | | 984 | |
Phathom Pharmaceuticals, Inc.* | | | 54 | | | | 976 | |
Ennis, Inc. | | | 40 | | | | 973 | |
Mister Car Wash, Inc.* | | | 148 | | | | 963 | |
89bio, Inc.* | | | 128 | | | | 947 | |
Axogen, Inc.* | | | 67 | | | | 939 | |
Adaptive Biotechnologies Corp.* | | | 183 | | | | 937 | |
Tourmaline Bio, Inc. | | | 36 | | | | 926 | |
SunOpta, Inc.* | | | 145 | | | | 925 | |
Ironwood Pharmaceuticals, Inc. — Class A* | | | 223 | | | | 919 | |
Liquidia Corp.* | | | 91 | | | | 910 | |
Alphatec Holdings, Inc.* | | | 162 | | | | 901 | |
SI-BONE, Inc.* | | | 64 | | | | 895 | |
Mission Produce, Inc.* | | | 69 | | | | 885 | |
Cass Information Systems, Inc. | | | 21 | | | | 871 | |
Sterling Check Corp.* | | | 52 | | | | 869 | |
Replimune Group, Inc.* | | | 79 | | | | 866 | |
Sana Biotechnology, Inc.* | | | 208 | | | | 865 | |
Scholar Rock Holding Corp.* | | | 108 | | | | 865 | |
4D Molecular Therapeutics, Inc.* | | | 79 | | | | 854 | |
Surmodics, Inc.* | | | 22 | | | | 853 | |
Revance Therapeutics, Inc.* | | | 164 | | | | 851 | |
Arbutus Biopharma Corp.* | | | 220 | | | | 847 | |
Arcturus Therapeutics Holdings, Inc.* | | | 36 | | | | 836 | |
ImmunityBio, Inc.*,1 | | | 223 | | | | 830 | |
Orthofix Medical, Inc.* | | | 53 | | | | 828 | |
Willdan Group, Inc.* | | | 20 | | | | 819 | |
GeneDx Holdings Corp.* | | | 19 | | | | 806 | |
Concentra Group Holdings Parent, Inc.* | | | 36 | | | | 805 | |
ACCO Brands Corp. | | | 147 | | | | 804 | |
Annexon, Inc.* | | | 133 | | | | 787 | |
Astria Therapeutics, Inc.* | | | 71 | | | | 782 | |
REGENXBIO, Inc.* | | | 73 | | | | 766 | |
218 | THE RYDEX FUNDS SEMI-ANNUAL FINANCIAL REPORT | SEE NOTES TO FINANCIAL STATEMENTS. |
SCHEDULE OF INVESTMENTS (Unaudited)(continued) | September 30, 2024 |
RUSSELL 2000® 1.5x STRATEGY FUND | |
| | Shares | | | Value | |
Y-mAbs Therapeutics, Inc.* | | | 58 | | | $ | 763 | |
OPKO Health, Inc.*,1 | | | 510 | | | | 760 | |
Terns Pharmaceuticals, Inc.* | | | 91 | | | | 759 | |
Erasca, Inc.* | | | 278 | | | | 759 | |
Humacyte, Inc.* | | | 139 | | | | 756 | |
Tyra Biosciences, Inc.* | | | 32 | | | | 752 | |
Olema Pharmaceuticals, Inc.* | | | 63 | | | | 752 | |
Calavo Growers, Inc. | | | 26 | | | | 742 | |
Franklin Covey Co.* | | | 18 | | | | 740 | |
Quanterix Corp.* | | | 57 | | | | 739 | |
Pacific Biosciences of California, Inc.* | | | 428 | | | | 728 | |
Varex Imaging Corp.* | | | 61 | | | | 727 | |
Carriage Services, Inc. — Class A | | | 22 | | | | 722 | |
Phibro Animal Health Corp. — Class A | | | 32 | | | | 721 | |
Bioventus, Inc. — Class A* | | | 59 | | | | 705 | |
OrthoPediatrics Corp.* | | | 26 | | | | 705 | |
CorMedix, Inc.* | | | 87 | | | | 703 | |
Cross Country Healthcare, Inc.* | | | 52 | | | | 699 | |
Fulgent Genetics, Inc.* | | | 32 | | | | 695 | |
KalVista Pharmaceuticals, Inc.* | | | 60 | | | | 695 | |
Limoneira Co. | | | 26 | | | | 689 | |
Stoke Therapeutics, Inc.* | | | 56 | | | | 688 | |
Altimmune, Inc.* | | | 112 | | | | 688 | |
UroGen Pharma Ltd.* | | | 54 | | | | 686 | |
USANA Health Sciences, Inc.* | | | 18 | | | | 683 | |
Zimvie, Inc.* | | | 43 | | | | 682 | |
Sezzle, Inc.* | | | 4 | | | | 682 | |
Neurogene, Inc.* | | | 16 | | | | 671 | |
Distribution Solutions Group, Inc.* | | | 17 | | | | 655 | |
iRadimed Corp. | | | 13 | | | | 654 | |
Anavex Life Sciences Corp.* | | | 115 | | | | 653 | |
Aura Biosciences, Inc.* | | | 73 | | | | 650 | |
Savara, Inc.* | | | 153 | | | | 649 | |
Nuvation Bio, Inc.* | | | 283 | | | | 648 | |
Mind Medicine MindMed, Inc.* | | | 113 | | | | 643 | |
MaxCyte, Inc.* | | | 165 | | | | 642 | |
Beyond Meat, Inc.* | | | 94 | | | | 637 | |
Hertz Global Holdings, Inc.* | | | 193 | | | | 637 | |
EyePoint Pharmaceuticals, Inc.* | | | 79 | | | | 631 | |
Xeris Biopharma Holdings, Inc.* | | | 221 | | | | 630 | |
Entrada Therapeutics, Inc.* | | | 39 | | | | 623 | |
Enhabit, Inc.* | | | 78 | | | | 616 | |
Sage Therapeutics, Inc.* | | | 85 | | | | 614 | |
OmniAb, Inc.* | | | 145 | | | | 613 | |
Capricor Therapeutics, Inc.* | | | 40 | | | | 608 | |
Alector, Inc.* | | | 127 | | | | 592 | |
Aquestive Therapeutics, Inc.* | | | 117 | | | | 583 | |
Tejon Ranch Co.* | | | 33 | | | | 579 | |
Tango Therapeutics, Inc.* | | | 75 | | | | 578 | |
Anika Therapeutics, Inc.* | | | 23 | | | | 568 | |
ACELYRIN, Inc.* | | | 115 | | | | 567 | |
Fate Therapeutics, Inc.* | | | 158 | | | | 553 | |
Celcuity, Inc.* | | | 37 | | | | 552 | |
National Research Corp. — Class A | | | 24 | | | | 549 | |
Central Garden & Pet Co.* | | | 15 | | | | 547 | |
Mineralys Therapeutics, Inc.* | | | 45 | | | | 545 | |
Verve Therapeutics, Inc.* | | | 112 | | | | 542 | |
Tactile Systems Technology, Inc.* | | | 37 | | | | 541 | |
Moneylion, Inc.* | | | 13 | | | | 540 | |
DocGo, Inc.* | | | 160 | | | | 531 | |
C4 Therapeutics, Inc.* | | | 92 | | | | 524 | |
Nano-X Imaging Ltd.*,1 | | | 85 | | | | 517 | |
Olaplex Holdings, Inc.* | | | 219 | | | | 515 | |
Pulse Biosciences, Inc.* | | | 29 | | | | 509 | |
Taysha Gene Therapies, Inc.* | | | 252 | | | | 507 | |
Seneca Foods Corp. — Class A* | | | 8 | | | | 499 | |
Pulmonx Corp.* | | | 60 | | | | 497 | |
Resources Connection, Inc. | | | 51 | | | | 495 | |
Paragon 28, Inc.* | | | 74 | | | | 494 | |
Cerus Corp.* | | | 284 | | | | 494 | |
SIGA Technologies, Inc. | | | 73 | | | | 493 | |
Esperion Therapeutics, Inc.*,1 | | | 298 | | | | 492 | |
Lincoln Educational Services Corp.* | | | 41 | | | | 490 | |
Duckhorn Portfolio, Inc.* | | | 84 | | | | 488 | |
Aaron’s Company, Inc. | | | 49 | | | | 488 | |
OraSure Technologies, Inc.* | | | 113 | | | | 483 | |
Absci Corp.* | | | 126 | | | | 481 | |
LENZ Therapeutics, Inc. | | | 20 | | | | 475 | |
Theravance Biopharma, Inc.* | | | 58 | | | | 467 | |
AngioDynamics, Inc.* | | | 60 | | | | 467 | |
Allogene Therapeutics, Inc.* | | | 166 | | | | 465 | |
Zevra Therapeutics, Inc.* | | | 66 | | | | 458 | |
Honest Company, Inc.* | | | 126 | | | | 450 | |
Editas Medicine, Inc.* | | | 131 | | | | 447 | |
Treace Medical Concepts, Inc.* | | | 77 | | | | 447 | |
Sutro Biopharma, Inc.* | | | 129 | | | | 446 | |
Q32 Bio, Inc.* | | | 10 | | | | 446 | |
Natural Grocers by Vitamin Cottage, Inc. | | | 15 | | | | 445 | |
Village Super Market, Inc. — Class A | | | 14 | | | | 445 | |
Biomea Fusion, Inc.* | | | 44 | | | | 444 | |
Accolade, Inc.* | | | 114 | | | | 439 | |
Rigel Pharmaceuticals, Inc.* | | | 27 | | | | 437 | |
Akebia Therapeutics, Inc.* | | | 328 | | | | 433 | |
Larimar Therapeutics, Inc.* | | | 66 | | | | 432 | |
Avita Medical, Inc.* | | | 40 | | | | 429 | |
Voyager Therapeutics, Inc.* | | | 73 | | | | 427 | |
Aveanna Healthcare Holdings, Inc.* | | | 82 | | | | 426 | |
Aldeyra Therapeutics, Inc.* | | | 79 | | | | 426 | |
Inozyme Pharma, Inc.* | | | 81 | | | | 424 | |
Vanda Pharmaceuticals, Inc.* | | | 90 | | | | 422 | |
Third Harmonic Bio, Inc.* | | | 31 | | | | 420 | |
iTeos Therapeutics, Inc.* | | | 41 | | | | 419 | |
Performant Financial Corp.* | | | 111 | | | | 415 | |
Atea Pharmaceuticals, Inc.* | | | 122 | | | | 409 | |
Target Hospitality Corp.* | | | 52 | | | | 405 | |
Ocugen, Inc.* | | | 403 | | | | 400 | |
IGM Biosciences, Inc.* | | | 24 | | | | 397 | |
Viemed Healthcare, Inc.* | | | 54 | | | | 396 | |
CompoSecure, Inc. — Class A1 | | | 28 | | | | 393 | |
Mama’s Creations, Inc.* | | | 52 | | | | 380 | |
TrueBlue, Inc.* | | | 48 | | | | 379 | |
Nkarta, Inc.* | | | 83 | | | | 375 | |
SEE NOTES TO FINANCIAL STATEMENTS. | THE RYDEX FUNDS SEMI-ANNUAL FINANCIAL REPORT | 219 |
SCHEDULE OF INVESTMENTS (Unaudited)(continued) | September 30, 2024 |
RUSSELL 2000® 1.5x STRATEGY FUND | |
| | Shares | | | Value | |
Foghorn Therapeutics, Inc.* | | | 40 | | | $ | 372 | |
American Public Education, Inc.* | | | 25 | | | | 369 | |
Heron Therapeutics, Inc.*,1 | | | 185 | | | | 368 | |
Nektar Therapeutics* | | | 281 | | | | 365 | |
2seventy bio, Inc.* | | | 77 | | | | 363 | |
European Wax Center, Inc. — Class A* | | | 53 | | | | 360 | |
Inogen, Inc.* | | | 37 | | | | 359 | |
Fulcrum Therapeutics, Inc.* | | | 98 | | | | 350 | |
Spire Global, Inc.*,1 | | | 35 | | | | 350 | |
Omeros Corp.* | | | 88 | | | | 349 | |
Ardent Health Partners, Inc.* | | | 19 | | | | 349 | |
Lyell Immunopharma, Inc.* | | | 253 | | | | 349 | |
ADC Therapeutics S.A.* | | | 110 | | | | 347 | |
Westrock Coffee Co.* | | | 53 | | | | 345 | |
Prime Medicine, Inc.* | | | 89 | | | | 344 | |
XOMA Royalty Corp.* | | | 13 | | | | 344 | |
Sera Prognostics, Inc. — Class A* | | | 44 | | | | 343 | |
Forrester Research, Inc.* | | | 19 | | | | 342 | |
Artiva Biotherapeutics, Inc.* | | | 22 | | | | 340 | |
Jasper Therapeutics, Inc.* | | | 18 | | | | 339 | |
Mersana Therapeutics, Inc.* | | | 179 | | | | 338 | |
Utah Medical Products, Inc. | | | 5 | | | | 335 | |
Korro Bio, Inc.* | | | 10 | | | | 334 | |
Enanta Pharmaceuticals, Inc.* | | | 32 | | | | 331 | |
Zentalis Pharmaceuticals, Inc.* | | | 90 | | | | 331 | |
Corbus Pharmaceuticals Holdings, Inc.* | | | 16 | | | | 330 | |
Organogenesis Holdings, Inc.* | | | 114 | | | | 326 | |
Medifast, Inc.* | | | 17 | | | | 325 | |
Nathan’s Famous, Inc. | | | 4 | | | | 324 | |
Cabaletta Bio, Inc.* | | | 68 | | | | 321 | |
MacroGenics, Inc.* | | | 97 | | | | 319 | |
Nevro Corp.* | | | 57 | | | | 319 | |
Trevi Therapeutics, Inc.* | | | 93 | | | | 311 | |
Poseida Therapeutics, Inc.* | | | 108 | | | | 309 | |
Alico, Inc. | | | 11 | | | | 308 | |
Rapport Therapeutics, Inc.* | | | 15 | | | | 307 | |
TScan Therapeutics, Inc.* | | | 61 | | | | 304 | |
Atossa Therapeutics, Inc.* | | | 199 | | | | 302 | |
Compass Therapeutics, Inc.* | | | 161 | | | | 296 | |
Lexicon Pharmaceuticals, Inc.* | | | 181 | | | | 284 | |
Alta Equipment Group, Inc. | | | 42 | | | | 283 | |
Pyxis Oncology, Inc.* | | | 77 | | | | 283 | |
ChromaDex Corp.* | | | 77 | | | | 281 | |
BRC, Inc. — Class A* | | | 82 | | | | 280 | |
Acacia Research Corp.* | | | 60 | | | | 280 | |
Chegg, Inc.* | | | 157 | | | | 278 | |
Custom Truck One Source, Inc.* | | | 80 | | | | 276 | |
Nature’s Sunshine Products, Inc.* | | | 20 | | | | 272 | |
Accuray, Inc.* | | | 151 | | | | 272 | |
Inhibrx Biosciences, Inc.* | | | 17 | | | | 266 | |
Design Therapeutics, Inc.* | | | 49 | | | | 264 | |
Blade Air Mobility, Inc.* | | | 89 | | | | 262 | |
ModivCare, Inc.* | | | 18 | | | | 257 | |
Black Diamond Therapeutics, Inc.* | | | 59 | | | | 257 | |
Achieve Life Sciences, Inc.* | | | 54 | | | | 256 | |
Caribou Biosciences, Inc.* | | | 130 | | | | 255 | |
Monte Rosa Therapeutics, Inc.* | | | 48 | | | | 254 | |
MeiraGTx Holdings plc* | | | 61 | | | | 254 | |
Solid Biosciences, Inc.* | | | 35 | | | | 244 | |
Biote Corp. — Class A* | | | 43 | | | | 240 | |
MediWound Ltd.* | | | 13 | | | | 235 | |
Eliem Therapeutics, Inc.* | | | 46 | | | | 234 | |
Adverum Biotechnologies, Inc.* | | | 33 | | | | 232 | |
Inovio Pharmaceuticals, Inc.* | | | 40 | | | | 231 | |
HF Foods Group, Inc.* | | | 63 | | | | 225 | |
Alumis, Inc.* | | | 21 | | | | 224 | |
XBiotech, Inc.* | | | 29 | | | | 224 | |
CPI Card Group, Inc.* | | | 8 | | | | 223 | |
Nautilus Biotechnology, Inc.* | | | 77 | | | | 219 | |
Shattuck Labs, Inc.* | | | 62 | | | | 216 | |
Candel Therapeutics, Inc.* | | | 31 | | | | 215 | |
Quad/Graphics, Inc. | | | 47 | | | | 213 | |
Lineage Cell Therapeutics, Inc.* | | | 233 | | | | 211 | |
Contineum Therapeutics, Inc. — Class A* | | | 11 | | | | 211 | |
Ventyx Biosciences, Inc.* | | | 96 | | | | 209 | |
InfuSystem Holdings, Inc.* | | | 31 | | | | 208 | |
scPharmaceuticals, Inc.* | | | 45 | | | | 205 | |
PepGen, Inc.* | | | 24 | | | | 205 | |
Cadiz, Inc.* | | | 66 | | | | 200 | |
Priority Technology Holdings, Inc.* | | | 29 | | | | 198 | |
Zynex, Inc.*,1 | | | 24 | | | | 196 | |
Joint Corp.* | | | 17 | | | | 195 | |
Generation Bio Co.* | | | 78 | | | | 193 | |
Orchestra BioMed Holdings, Inc.* | | | 37 | | | | 190 | |
ProKidney Corp.* | | | 99 | | | | 190 | |
Precigen, Inc.* | | | 200 | | | | 189 | |
Quipt Home Medical Corp.* | | | 64 | | | | 187 | |
Ispire Technology, Inc.* | | | 30 | | | | 186 | |
SoundThinking, Inc.* | | | 16 | | | | 185 | |
CVRx, Inc.* | | | 21 | | | | 185 | |
Fennec Pharmaceuticals, Inc.* | | | 37 | | | | 185 | |
Information Services Group, Inc. | | | 56 | | | | 185 | |
Lifeway Foods, Inc.* | | | 7 | | | | 181 | |
Sanara Medtech, Inc.* | | | 6 | | | | 181 | |
Coherus Biosciences, Inc.* | | | 174 | | | | 181 | |
Innovage Holding Corp.* | | | 30 | | | | 180 | |
X4 Pharmaceuticals, Inc.* | | | 265 | | | | 177 | |
Cartesian Therapeutics, Inc.*,1 | | | 11 | | | | 177 | |
Stereotaxis, Inc.* | | | 86 | | | | 175 | |
Agenus, Inc.* | | | 32 | | | | 175 | |
Harvard Bioscience, Inc.* | | | 64 | | | | 172 | |
Beauty Health Co.* | | | 117 | | | | 168 | |
Tenaya Therapeutics, Inc.* | | | 87 | | | | 168 | |
Lifecore Biomedical, Inc.* | | | 34 | | | | 168 | |
Puma Biotechnology, Inc.* | | | 65 | | | | 166 | |
Cardiff Oncology, Inc.* | | | 62 | | | | 166 | |
Semler Scientific, Inc.* | | | 7 | | | | 165 | |
Acumen Pharmaceuticals, Inc.* | | | 66 | | | | 164 | |
Alto Neuroscience, Inc.* | | | 14 | | | | 160 | |
Veru, Inc.* | | | 208 | | | | 160 | |
Regulus Therapeutics, Inc.* | | | 100 | | | | 157 | |
Bluebird Bio, Inc.* | | | 302 | | | | 157 | |
220 | THE RYDEX FUNDS SEMI-ANNUAL FINANCIAL REPORT | SEE NOTES TO FINANCIAL STATEMENTS. |
SCHEDULE OF INVESTMENTS (Unaudited)(continued) | September 30, 2024 |
RUSSELL 2000® 1.5x STRATEGY FUND | |
| | Shares | | | Value | |
NeuroPace, Inc.* | | | 22 | | | $ | 153 | |
Lexeo Therapeutics, Inc.* | | | 16 | | | | 145 | |
Waldencast plc — Class A*,1 | | | 39 | | | | 142 | |
Quantum-Si, Inc.* | | | 158 | | | | 139 | |
Gyre Therapeutics, Inc.* | | | 11 | | | | 138 | |
Sonida Senior Living, Inc.* | | | 5 | | | | 134 | |
Kodiak Sciences, Inc.* | | | 51 | | | | 133 | |
Acrivon Therapeutics, Inc.* | | | 19 | | | | 133 | |
Kyverna Therapeutics, Inc.* | | | 27 | | | | 132 | |
CervoMed, Inc.* | | | 9 | | | | 131 | |
Zura Bio Ltd.* | | | 32 | | | | 130 | |
Greenwich Lifesciences, Inc.* | | | 9 | | | | 129 | |
Invivyd, Inc.* | | | 125 | | | | 128 | |
HireQuest, Inc. | | | 9 | | | | 127 | |
Fibrobiologics, Inc.* | | | 40 | | | | 124 | |
Century Therapeutics, Inc.* | | | 72 | | | | 123 | |
DLH Holdings Corp.* | | | 13 | | | | 122 | |
FiscalNote Holdings, Inc.* | | | 95 | | | | 122 | |
Emerald Holding, Inc. | | | 24 | | | | 120 | |
Verastem, Inc.* | | | 40 | | | | 120 | |
Akoya Biosciences, Inc.* | | | 42 | | | | 114 | |
Ovid therapeutics, Inc.* | | | 93 | | | | 110 | |
AirSculpt Technologies, Inc.* | | | 21 | | | | 106 | |
Skye Bioscience, Inc.* | | | 27 | | | | 106 | |
Scilex Holding Co.* | | | 113 | | | | 105 | |
Inmune Bio, Inc.* | | | 19 | | | | 102 | |
Forafric Global plc* | | | 9 | | | | 102 | |
Werewolf Therapeutics, Inc.* | | | 48 | | | | 102 | |
ALX Oncology Holdings, Inc.* | | | 52 | | | | 95 | |
RAPT Therapeutics, Inc.* | | | 47 | | | | 94 | |
Actinium Pharmaceuticals, Inc.* | | | 47 | | | | 88 | |
HilleVax, Inc.* | | | 50 | | | | 88 | |
Galectin Therapeutics, Inc.*,1 | | | 32 | | | | 88 | |
Cibus, Inc.* | | | 24 | | | | 78 | |
Outlook Therapeutics, Inc.* | | | 12 | | | | 64 | |
Telomir Pharmaceuticals, Inc.* | | | 8 | | | | 51 | |
Elevation Oncology, Inc.* | | | 82 | | | | 49 | |
Aerovate Therapeutics, Inc.* | | | 21 | | | | 44 | |
Verrica Pharmaceuticals, Inc.* | | | 30 | | | | 43 | |
Prelude Therapeutics, Inc.* | | | 21 | | | | 43 | |
MarketWise, Inc. | | | 61 | | | | 41 | |
Renovaro, Inc.* | | | 77 | | | | 37 | |
Boundless Bio, Inc.* | | | 10 | | | | 35 | |
Fractyl Health, Inc.* | | | 12 | | | | 30 | |
Metagenomi, Inc.* | | | 10 | | | | 22 | |
Lyra Therapeutics, Inc.* | | | 76 | | | | 20 | |
Tevogen Bio Holdings, Inc.* | | | 34 | | | | 13 | |
Conduit Pharmaceuticals, Inc.* | | | 36 | | | | 4 | |
Ligand Pharmaceuticals, Inc.*,††† | | | 24 | | | | — | |
Total Consumer, Non-cyclical | | | | | | | 1,006,266 | |
| | | | | | | | | |
Industrial - 10.2% |
Fabrinet* | | | 57 | | | | 13,477 | |
Applied Industrial Technologies, Inc. | | | 60 | | | | 13,388 | |
Mueller Industries, Inc. | | | 175 | | | | 12,967 | |
Fluor Corp.* | | | 267 | | | | 12,739 | |
UFP Industries, Inc. | | | 95 | | | | 12,465 | |
SPX Technologies, Inc.* | | | 70 | | | | 11,162 | |
Modine Manufacturing Co.* | | | 81 | | | | 10,756 | |
Badger Meter, Inc. | | | 46 | | | | 10,047 | |
Novanta, Inc.* | | | 56 | | | | 10,020 | |
Casella Waste Systems, Inc. — Class A* | | | 97 | | | | 9,651 | |
CSW Industrials, Inc. | | | 26 | | | | 9,526 | |
Exponent, Inc. | | | 79 | | | | 9,107 | |
Watts Water Technologies, Inc. — Class A | | | 43 | | | | 8,909 | |
Moog, Inc. — Class A | | | 44 | | | | 8,889 | |
Federal Signal Corp. | | | 94 | | | | 8,785 | |
Boise Cascade Co. | | | 62 | | | | 8,741 | |
Dycom Industries, Inc.* | | | 44 | | | | 8,673 | |
NEXTracker, Inc. — Class A* | | | 226 | | | | 8,470 | |
Chart Industries, Inc.* | | | 67 | | | | 8,317 | |
AeroVironment, Inc.* | | | 41 | | | | 8,220 | |
Zurn Elkay Water Solutions Corp. | | | 226 | | | | 8,122 | |
Knife River Corp.* | | | 89 | | | | 7,956 | |
Itron, Inc.* | | | 72 | | | | 7,690 | |
Matson, Inc. | | | 53 | | | | 7,559 | |
Belden, Inc. | | | 64 | | | | 7,496 | |
Summit Materials, Inc. — Class A* | | | 191 | | | | 7,455 | |
Franklin Electric Company, Inc. | | | 71 | | | | 7,442 | |
GATX Corp. | | | 56 | | | | 7,417 | |
Arcosa, Inc. | | | 76 | | | | 7,202 | |
Sterling Infrastructure, Inc.* | | | 47 | | | | 6,816 | |
EnerSys | | | 63 | | | | 6,429 | |
Advanced Energy Industries, Inc. | | | 59 | | | | 6,209 | |
Cactus, Inc. — Class A | | | 103 | | | | 6,146 | |
Kadant, Inc. | | | 18 | | | | 6,084 | |
RXO, Inc.* | | | 214 | | | | 5,992 | |
Frontdoor, Inc.* | | | 124 | | | | 5,951 | |
Plexus Corp.* | | | 43 | | | | 5,879 | |
Sanmina Corp.* | | | 84 | | | | 5,750 | |
Golar LNG Ltd. | | | 156 | | | | 5,734 | |
Terex Corp. | | | 105 | | | | 5,555 | |
Granite Construction, Inc. | | | 69 | | | | 5,470 | |
Kratos Defense & Security Solutions, Inc.* | | | 233 | | | | 5,429 | |
Enpro, Inc. | | | 33 | | | | 5,352 | |
Mueller Water Products, Inc. — Class A | | | 245 | | | | 5,317 | |
Rocket Lab USA, Inc.* | | | 545 | | | | 5,303 | |
ESCO Technologies, Inc. | | | 41 | | | | 5,288 | |
Scorpio Tankers, Inc. | | | 74 | | | | 5,276 | |
Atmus Filtration Technologies, Inc. | | | 132 | | | | 4,954 | |
John Bean Technologies Corp. | | | 50 | | | | 4,925 | |
Atkore, Inc. | | | 58 | | | | 4,915 | |
Primoris Services Corp. | | | 84 | | | | 4,879 | |
Construction Partners, Inc. — Class A* | | | 68 | | | | 4,747 | |
Trinity Industries, Inc. | | | 129 | | | | 4,494 | |
Hub Group, Inc. — Class A | | | 96 | | | | 4,363 | |
Albany International Corp. — Class A | | | 49 | | | | 4,354 | |
Griffon Corp. | | | 59 | | | | 4,130 | |
ArcBest Corp. | | | 37 | | | | 4,013 | |
AZZ, Inc. | | | 46 | | | | 3,800 | |
OSI Systems, Inc.* | | | 25 | | | | 3,796 | |
Vishay Intertechnology, Inc. | | | 199 | | | | 3,763 | |
Werner Enterprises, Inc. | | | 97 | | | | 3,743 | |
SEE NOTES TO FINANCIAL STATEMENTS. | THE RYDEX FUNDS SEMI-ANNUAL FINANCIAL REPORT | 221 |
SCHEDULE OF INVESTMENTS (Unaudited)(continued) | September 30, 2024 |
RUSSELL 2000® 1.5x STRATEGY FUND | |
| | Shares | | | Value | |
Masterbrand, Inc.* | | | 200 | | | $ | 3,708 | |
Enerpac Tool Group Corp. | | | 86 | | | | 3,603 | |
Energizer Holdings, Inc. | | | 113 | | | | 3,589 | |
Materion Corp. | | | 32 | | | | 3,580 | |
AAR Corp.* | | | 54 | | | | 3,529 | |
Mirion Technologies, Inc.* | | | 315 | | | | 3,487 | |
Gibraltar Industries, Inc.* | | | 48 | | | | 3,357 | |
Powell Industries, Inc. | | | 15 | | | | 3,330 | |
International Seaways, Inc. | | | 64 | | | | 3,300 | |
Standex International Corp. | | | 18 | | | | 3,290 | |
Bloom Energy Corp. — Class A*,1 | | | 311 | | | | 3,284 | |
Hillman Solutions Corp.* | | | 310 | | | | 3,274 | |
Leonardo DRS, Inc.* | | | 116 | | | | 3,274 | |
Kennametal, Inc. | | | 125 | | | | 3,241 | |
O-I Glass, Inc.* | | | 244 | | | | 3,201 | |
Mercury Systems, Inc.* | | | 86 | | | | 3,182 | |
Joby Aviation, Inc.*,1 | | | 629 | | | | 3,164 | |
Hillenbrand, Inc. | | | 111 | | | | 3,086 | |
Barnes Group, Inc. | | | 73 | | | | 2,950 | |
TTM Technologies, Inc.* | | | 159 | | | | 2,902 | |
Alamo Group, Inc. | | | 16 | | | | 2,882 | |
Tennant Co. | | | 30 | | | | 2,881 | |
World Kinect Corp. | | | 93 | | | | 2,875 | |
MYR Group, Inc.* | | | 26 | | | | 2,658 | |
IES Holdings, Inc.* | | | 13 | | | | 2,595 | |
Golden Ocean Group Ltd. | | | 192 | | | | 2,569 | |
Aspen Aerogels, Inc.* | | | 92 | | | | 2,547 | |
Benchmark Electronics, Inc. | | | 56 | | | | 2,482 | |
Helios Technologies, Inc. | | | 52 | | | | 2,480 | |
Knowles Corp.* | | | 136 | | | | 2,452 | |
Greif, Inc. — Class A | | | 39 | | | | 2,444 | |
Greenbrier Companies, Inc. | | | 48 | | | | 2,443 | |
Tecnoglass, Inc. | | | 35 | | | | 2,403 | |
Apogee Enterprises, Inc. | | | 34 | | | | 2,381 | |
DHT Holdings, Inc. | | | 213 | | | | 2,349 | |
American Woodmark Corp.* | | | 25 | | | | 2,336 | |
CTS Corp. | | | 48 | | | | 2,322 | |
Napco Security Technologies, Inc. | | | 56 | | | | 2,266 | |
Janus International Group, Inc.* | | | 224 | | | | 2,265 | |
Teekay Tankers Ltd. — Class A | | | 38 | | | | 2,214 | |
Enovix Corp.*,1 | | | 234 | | | | 2,186 | |
NV5 Global, Inc.* | | | 23 | | | | 2,150 | |
JELD-WEN Holding, Inc.* | | | 135 | | | | 2,134 | |
Lindsay Corp. | | | 17 | | | | 2,119 | |
Worthington Enterprises, Inc. | | | 50 | | | | 2,072 | |
SFL Corporation Ltd. | | | 178 | | | | 2,059 | |
Argan, Inc. | | | 20 | | | | 2,029 | |
Dorian LPG Ltd. | | | 55 | | | | 1,893 | |
Tutor Perini Corp.* | | | 68 | | | | 1,847 | |
PureCycle Technologies, Inc.*,1 | | | 194 | | | | 1,843 | |
Worthington Steel, Inc. | | | 51 | | | | 1,734 | |
TriMas Corp. | | | 64 | | | | 1,634 | |
Marten Transport Ltd. | | | 92 | | | | 1,628 | |
Ichor Holdings Ltd.* | | | 51 | | | | 1,622 | |
Columbus McKinnon Corp. | | | 45 | | | | 1,620 | |
Thermon Group Holdings, Inc.* | | | 53 | | | | 1,582 | |
Energy Recovery, Inc.* | | | 90 | | | | 1,565 | |
Cadre Holdings, Inc. | | | 41 | | | | 1,556 | |
Vicor Corp.* | | | 35 | | | | 1,473 | |
NuScale Power Corp.* | | | 122 | | | | 1,413 | |
Ducommun, Inc.* | | | 21 | | | | 1,382 | |
Forward Air Corp. | | | 39 | | | | 1,381 | |
Montrose Environmental Group, Inc.* | | | 50 | | | | 1,315 | |
Triumph Group, Inc.* | | | 102 | | | | 1,315 | |
Air Transport Services Group, Inc.* | | | 81 | | | | 1,311 | |
CECO Environmental Corp.* | | | 46 | | | | 1,297 | |
Enviri Corp.* | | | 125 | | | | 1,293 | |
Genco Shipping & Trading Ltd. | | | 66 | | | | 1,287 | |
Gorman-Rupp Co. | | | 33 | | | | 1,285 | |
American Superconductor Corp.* | | | 54 | | | | 1,274 | |
Bel Fuse, Inc. — Class B | | | 16 | | | | 1,256 | |
FLEX LNG Ltd. | | | 48 | | | | 1,221 | |
Xometry, Inc. — Class A* | | | 66 | | | | 1,212 | |
Limbach Holdings, Inc.* | | | 16 | | | | 1,212 | |
Nordic American Tankers Ltd. | | | 321 | | | | 1,178 | |
Ardmore Shipping Corp. | | | 65 | | | | 1,177 | |
Proto Labs, Inc.* | | | 40 | | | | 1,175 | |
Astec Industries, Inc. | | | 36 | | | | 1,150 | |
Hyster-Yale, Inc. | | | 18 | | | | 1,148 | |
Sturm Ruger & Company, Inc. | | | 27 | | | | 1,125 | |
Archer Aviation, Inc. — Class A* | | | 368 | | | | 1,115 | |
Great Lakes Dredge & Dock Corp.* | | | 104 | | | | 1,095 | |
Costamare, Inc. | | | 68 | | | | 1,069 | |
DXP Enterprises, Inc.* | | | 20 | | | | 1,067 | |
Mesa Laboratories, Inc. | | | 8 | | | | 1,039 | |
Metallus, Inc.* | | | 67 | | | | 994 | |
Smith & Wesson Brands, Inc. | | | 72 | | | | 935 | |
Insteel Industries, Inc. | | | 30 | | | | 933 | |
Ryerson Holding Corp. | | | 46 | | | | 916 | |
Heartland Express, Inc. | | | 74 | | | | 909 | |
Standard BioTools, Inc.* | | | 462 | | | | 892 | |
Astronics Corp.* | | | 45 | | | | 877 | |
Ardagh Metal Packaging S.A.1 | | | 228 | | | | 859 | |
Evolv Technologies Holdings, Inc.* | | | 206 | | | | 834 | |
ChargePoint Holdings, Inc.*,1 | | | 608 | | | | 833 | |
Applied Optoelectronics, Inc.* | | | 58 | | | | 830 | |
Teekay Corp.* | | | 90 | | | | 828 | |
Myers Industries, Inc. | | | 58 | | | | 802 | |
nLight, Inc.* | | | 73 | | | | 780 | |
Willis Lease Finance Corp. | | | 5 | | | | 744 | |
Clearwater Paper Corp.* | | | 26 | | | | 742 | |
Pactiv Evergreen, Inc. | | | 64 | | | | 737 | |
Kimball Electronics, Inc.* | | | 39 | | | | 722 | |
LSI Industries, Inc. | | | 44 | | | | 711 | |
Covenant Logistics Group, Inc. — Class A | | | 13 | | | | 687 | |
Northwest Pipe Co.* | | | 15 | | | | 677 | |
LSB Industries, Inc.* | | | 84 | | | | 675 | |
Olympic Steel, Inc. | | | 17 | | | | 663 | |
NVE Corp. | | | 8 | | | | 639 | |
National Presto Industries, Inc. | | | 8 | | | | 601 | |
CryoPort, Inc.* | | | 69 | | | | 560 | |
Greif, Inc. — Class B | | | 8 | | | | 559 | |
222 | THE RYDEX FUNDS SEMI-ANNUAL FINANCIAL REPORT | SEE NOTES TO FINANCIAL STATEMENTS. |
SCHEDULE OF INVESTMENTS (Unaudited)(continued) | September 30, 2024 |
RUSSELL 2000® 1.5x STRATEGY FUND | |
| | Shares | | | Value | |
Luxfer Holdings plc | | | 42 | | | $ | 544 | |
FARO Technologies, Inc.* | | | 28 | | | | 536 | |
GrafTech International Ltd.* | | | 405 | | | | 535 | |
Manitowoc Company, Inc.* | | | 55 | | | | 529 | |
SmartRent, Inc.* | | | 299 | | | | 517 | |
Bowman Consulting Group Ltd.* | | | 21 | | | | 506 | |
Safe Bulkers, Inc. | | | 95 | | | | 492 | |
Stoneridge, Inc.* | | | 43 | | | | 481 | |
Iteris, Inc.* | | | 67 | | | | 478 | |
Universal Logistics Holdings, Inc. | | | 11 | | | | 474 | |
Graham Corp.* | | | 16 | | | | 473 | |
Byrna Technologies, Inc.* | | | 27 | | | | 458 | |
Eastman Kodak Co.* | | | 95 | | | | 448 | |
Ranpak Holdings Corp.* | | | 68 | | | | 444 | |
Allient, Inc. | | | 23 | | | | 437 | |
Latham Group, Inc.* | | | 64 | | | | 435 | |
Park-Ohio Holdings Corp. | | | 14 | | | | 430 | |
Mayville Engineering Company, Inc.* | | | 20 | | | | 422 | |
Turtle Beach Corp.* | | | 27 | | | | 414 | |
Himalaya Shipping Ltd.* | | | 47 | | | | 407 | |
Park Aerospace Corp. | | | 29 | | | | 378 | |
Mistras Group, Inc.* | | | 33 | | | | 375 | |
MicroVision, Inc.* | | | 325 | | | | 370 | |
Intuitive Machines, Inc.*,1 | | | 45 | | | | 362 | |
Radiant Logistics, Inc.* | | | 56 | | | | 360 | |
Pure Cycle Corp.* | | | 33 | | | | 355 | |
Centuri Holdings, Inc.* | | | 22 | | | | 355 | |
Pangaea Logistics Solutions Ltd. | | | 49 | | | | 354 | |
Sight Sciences, Inc.* | | | 55 | | | | 346 | |
Proficient Auto Logistics, Inc.* | | | 24 | | | | 340 | |
LanzaTech Global, Inc.* | | | 176 | | | | 336 | |
Gencor Industries, Inc.* | | | 16 | | | | 334 | |
Tredegar Corp.* | | | 42 | | | | 306 | |
Omega Flex, Inc. | | | 6 | | | | 299 | |
Bel Fuse, Inc. — Class A | | | 3 | | | | 298 | |
L B Foster Co. — Class A* | | | 14 | | | | 286 | |
Karat Packaging, Inc. | | | 11 | | | | 285 | |
NN, Inc.* | | | 73 | | | | 285 | |
Orion Group Holdings, Inc.* | | | 48 | | | | 277 | |
GoPro, Inc. — Class A* | | | 197 | | | | 268 | |
AerSale Corp.* | | | 53 | | | | 268 | |
Eastern Co. | | | 8 | | | | 260 | |
Perma-Fix Environmental Services, Inc.* | | | 20 | | | | 245 | |
Redwire Corp.*,1 | | | 35 | | | | 240 | |
Smith-Midland Corp.* | | | 7 | | | | 234 | |
Net Power, Inc.* | | | 33 | | | | 231 | |
Arq, Inc.* | | | 39 | | | | 229 | |
Twin Disc, Inc. | | | 18 | | | | 225 | |
Concrete Pumping Holdings, Inc.* | | | 38 | | | | 220 | |
Quest Resource Holding Corp.* | | | 27 | | | | 216 | |
Core Molding Technologies, Inc.* | | | 12 | | | | 207 | |
AMMO, Inc.* | | | 141 | | | | 202 | |
Taylor Devices, Inc.* | | | 4 | | | | 200 | |
PAM Transportation Services, Inc.* | | | 10 | | | | 185 | |
Virgin Galactic Holdings, Inc.*,1 | | | 30 | | | | 183 | |
Caesarstone Ltd.* | | | 33 | | | | 150 | |
Ultralife Corp.* | | | 16 | | | | 145 | |
374Water, Inc.* | | | 103 | | | | 140 | |
908 Devices, Inc.* | | | 37 | | | | 128 | |
VirTra, Inc.* | | | 17 | | | | 106 | |
NL Industries, Inc. | | | 13 | | | | 97 | |
Eve Holding, Inc.* | | | 28 | | | | 91 | |
Southland Holdings, Inc.* | | | 16 | | | | 59 | |
Bridger Aerospace Group Holdings, Inc.* | | | 14 | | | | 31 | |
Amprius Technologies, Inc.* | | | 22 | | | | 24 | |
Solidion Technology, Inc.* | | | 14 | | | | 5 | |
Total Industrial | | | | | | | 661,506 | |
| | | | | | | | | |
Consumer, Cyclical - 7.2% |
Meritage Homes Corp. | | | 56 | | | | 11,484 | |
Taylor Morrison Home Corp. — Class A* | | | 160 | | | | 11,242 | |
Abercrombie & Fitch Co. — Class A* | | | 79 | | | | 11,052 | |
Installed Building Products, Inc. | | | 38 | | | | 9,358 | |
KB Home | | | 106 | | | | 9,083 | |
Beacon Roofing Supply, Inc.* | | | 100 | | | | 8,643 | |
Aurora Innovation, Inc.* | | | 1,455 | | | | 8,614 | |
Group 1 Automotive, Inc. | | | 21 | | | | 8,044 | |
Champion Homes, Inc.* | | | 84 | | | | 7,967 | |
Boot Barn Holdings, Inc.* | | | 46 | | | | 7,695 | |
Asbury Automotive Group, Inc.* | | | 32 | | | | 7,635 | |
M/I Homes, Inc.* | | | 42 | | | | 7,197 | |
Kontoor Brands, Inc. | | | 88 | | | | 7,197 | |
Signet Jewelers Ltd. | | | 67 | | | | 6,910 | |
FirstCash Holdings, Inc. | | | 60 | | | | 6,888 | |
Tri Pointe Homes, Inc.* | | | 144 | | | | 6,525 | |
Academy Sports & Outdoors, Inc. | | | 111 | | | | 6,478 | |
American Eagle Outfitters, Inc. | | | 287 | | | | 6,426 | |
Shake Shack, Inc. — Class A* | | | 60 | | | | 6,193 | |
Six Flags Entertainment Corp. | | | 145 | | | | 5,845 | |
GMS, Inc.* | | | 63 | | | | 5,706 | |
Steven Madden Ltd. | | | 114 | | | | 5,585 | |
Cavco Industries, Inc.* | | | 13 | | | | 5,567 | |
Sweetgreen, Inc. — Class A* | | | 156 | | | | 5,530 | |
Brinker International, Inc.* | | | 69 | | | | 5,281 | |
SkyWest, Inc.* | | | 62 | | | | 5,271 | |
Rush Enterprises, Inc. — Class A | | | 96 | | | | 5,072 | |
Cinemark Holdings, Inc.* | | | 174 | | | | 4,844 | |
Patrick Industries, Inc. | | | 34 | | | | 4,841 | |
UniFirst Corp. | | | 24 | | | | 4,768 | |
LCI Industries | | | 39 | | | | 4,701 | |
Dorman Products, Inc.* | | | 41 | | | | 4,638 | |
Resideo Technologies, Inc.* | | | 230 | | | | 4,632 | |
Century Communities, Inc. | | | 44 | | | | 4,531 | |
Red Rock Resorts, Inc. — Class A | | | 78 | | | | 4,246 | |
Hilton Grand Vacations, Inc.* | | | 116 | | | | 4,213 | |
Visteon Corp.* | | | 43 | | | | 4,095 | |
Green Brick Partners, Inc.* | | | 49 | | | | 4,093 | |
Hanesbrands, Inc.* | | | 553 | | | | 4,065 | |
HNI Corp. | | | 74 | | | | 3,984 | |
Goodyear Tire & Rubber Co.* | | | 446 | | | | 3,947 | |
LGI Homes, Inc.* | | | 33 | | | | 3,911 | |
Urban Outfitters, Inc.* | | | 101 | | | | 3,869 | |
International Game Technology plc | | | 179 | | | | 3,813 | |
SEE NOTES TO FINANCIAL STATEMENTS. | THE RYDEX FUNDS SEMI-ANNUAL FINANCIAL REPORT | 223 |
SCHEDULE OF INVESTMENTS (Unaudited)(continued) | September 30, 2024 |
RUSSELL 2000® 1.5x STRATEGY FUND | |
| | Shares | | | Value | |
PriceSmart, Inc. | | | 40 | | | $ | 3,671 | |
Vista Outdoor, Inc.* | | | 92 | | | | 3,605 | |
Foot Locker, Inc. | | | 132 | | | | 3,411 | |
Victoria’s Secret & Co.* | | | 124 | | | | 3,187 | |
JetBlue Airways Corp.* | | | 483 | | | | 3,169 | |
Adient plc* | | | 140 | | | | 3,160 | |
Atlanta Braves Holdings, Inc. — Class C* | | | 79 | | | | 3,144 | |
Phinia, Inc. | | | 68 | | | | 3,130 | |
Cheesecake Factory, Inc. | | | 76 | | | | 3,082 | |
Acushnet Holdings Corp. | | | 46 | | | | 2,932 | |
OPENLANE, Inc.* | | | 169 | | | | 2,853 | |
United Parks & Resorts, Inc.* | | | 56 | | | | 2,834 | |
La-Z-Boy, Inc. | | | 66 | | | | 2,833 | |
Papa John’s International, Inc. | | | 52 | | | | 2,801 | |
Fox Factory Holding Corp.* | | | 67 | | | | 2,781 | |
MillerKnoll, Inc. | | | 109 | | | | 2,699 | |
Madison Square Garden Entertainment Corp.* | | | 62 | | | | 2,637 | |
Winnebago Industries, Inc. | | | 45 | | | | 2,615 | |
OneSpaWorld Holdings Ltd. | | | 158 | | | | 2,609 | |
Peloton Interactive, Inc. — Class A* | | | 533 | | | | 2,494 | |
H&E Equipment Services, Inc. | | | 51 | | | | 2,483 | |
Topgolf Callaway Brands Corp.* | | | 224 | | | | 2,459 | |
Blue Bird Corp.* | | | 51 | | | | 2,446 | |
AMC Entertainment Holdings, Inc. — Class A* | | | 530 | | | | 2,411 | |
Sonos, Inc.* | | | 194 | | | | 2,384 | |
Gentherm, Inc.* | | | 50 | | | | 2,328 | |
REV Group, Inc. | | | 81 | | | | 2,273 | |
Life Time Group Holdings, Inc.* | | | 93 | | | | 2,271 | |
Warby Parker, Inc. — Class A* | | | 137 | | | | 2,237 | |
Sally Beauty Holdings, Inc.* | | | 161 | | | | 2,185 | |
Wolverine World Wide, Inc. | | | 125 | | | | 2,178 | |
Dana, Inc. | | | 206 | | | | 2,175 | |
Sabre Corp.* | | | 589 | | | | 2,162 | |
Buckle, Inc. | | | 49 | | | | 2,154 | |
Bloomin’ Brands, Inc. | | | 124 | | | | 2,050 | |
Oxford Industries, Inc. | | | 23 | | | | 1,995 | |
Steelcase, Inc. — Class A | | | 146 | | | | 1,970 | |
G-III Apparel Group Ltd.* | | | 64 | | | | 1,953 | |
Winmark Corp. | | | 5 | | | | 1,915 | |
ScanSource, Inc.* | | | 39 | | | | 1,873 | |
VSE Corp. | | | 22 | | | | 1,820 | |
Caleres, Inc. | | | 54 | | | | 1,785 | |
Dave & Buster’s Entertainment, Inc.* | | | 52 | | | | 1,771 | |
XPEL, Inc.* | | | 40 | | | | 1,735 | |
Interface, Inc. — Class A | | | 90 | | | | 1,707 | |
MRC Global, Inc.* | | | 133 | | | | 1,694 | |
ODP Corp.* | | | 56 | | | | 1,666 | |
Monarch Casino & Resort, Inc. | | | 21 | | | | 1,665 | |
Everi Holdings, Inc.* | | | 125 | | | | 1,643 | |
Hovnanian Enterprises, Inc. — Class A* | | | 8 | | | | 1,635 | |
Camping World Holdings, Inc. — Class A | | | 67 | | | | 1,623 | |
Beazer Homes USA, Inc.* | | | 47 | | | | 1,606 | |
Dream Finders Homes, Inc. — Class A* | | | 44 | | | | 1,593 | |
Cracker Barrel Old Country Store, Inc. | | | 35 | | | | 1,587 | |
Vizio Holding Corp. — Class A* | | | 140 | | | | 1,564 | |
Global Business Travel Group I* | | | 198 | | | | 1,523 | |
Jack in the Box, Inc. | | | 31 | | | | 1,443 | |
IMAX Corp.* | | | 68 | | | | 1,395 | |
BlueLinx Holdings, Inc.* | | | 13 | | | | 1,370 | |
PC Connection, Inc. | | | 18 | | | | 1,358 | |
Sonic Automotive, Inc. — Class A | | | 23 | | | | 1,345 | |
Wabash National Corp. | | | 70 | | | | 1,343 | |
National Vision Holdings, Inc.* | | | 123 | | | | 1,342 | |
Lions Gate Entertainment Corp. — Class B* | | | 192 | | | | 1,329 | |
Allegiant Travel Co. — Class A | | | 24 | | | | 1,322 | |
Rush Street Interactive, Inc.* | | | 120 | | | | 1,302 | |
Malibu Boats, Inc. — Class A* | | | 32 | | | | 1,242 | |
A-Mark Precious Metals, Inc. | | | 28 | | | | 1,237 | |
Shoe Carnival, Inc. | | | 28 | | | | 1,228 | |
MarineMax, Inc.* | | | 34 | | | | 1,199 | |
Ethan Allen Interiors, Inc. | | | 36 | | | | 1,148 | |
Portillo’s, Inc. — Class A*,1 | | | 85 | | | | 1,145 | |
Standard Motor Products, Inc. | | | 34 | | | | 1,129 | |
American Axle & Manufacturing Holdings, Inc.* | | | 181 | | | | 1,119 | |
Miller Industries, Inc. | | | 17 | | | | 1,037 | |
indie Semiconductor, Inc. — Class A* | | | 259 | | | | 1,033 | |
Golden Entertainment, Inc. | | | 32 | | | | 1,017 | |
Chuy’s Holdings, Inc.* | | | 27 | | | | 1,010 | |
Arhaus, Inc. | | | 81 | | | | 997 | |
Douglas Dynamics, Inc. | | | 36 | | | | 993 | |
BJ’s Restaurants, Inc.* | | | 30 | | | | 977 | |
Forestar Group, Inc.* | | | 30 | | | | 971 | |
Accel Entertainment, Inc.* | | | 83 | | | | 964 | |
Leslie’s, Inc.* | | | 283 | | | | 894 | |
Arko Corp. | | | 127 | | | | 891 | |
Super Group SGHC Ltd. | | | 236 | | | | 857 | |
Clean Energy Fuels Corp.* | | | 269 | | | | 837 | |
Dine Brands Global, Inc. | | | 24 | | | | 749 | |
First Watch Restaurant Group, Inc.* | | | 48 | | | | 749 | |
Daktronics, Inc.* | | | 58 | | | | 749 | |
Lions Gate Entertainment Corp. — Class A* | | | 94 | | | | 736 | |
Kura Sushi USA, Inc. — Class A* | | | 9 | | | | 725 | |
Global Industrial Co. | | | 21 | | | | 713 | |
Sun Country Airlines Holdings, Inc.* | | | 62 | | | | 695 | |
Build-A-Bear Workshop, Inc. — Class A | | | 20 | | | | 687 | |
Atlanta Braves Holdings, Inc. — Class A* | | | 16 | | | | 674 | |
Rush Enterprises, Inc. — Class B | | | 14 | | | | 671 | |
Shyft Group, Inc. | | | 53 | | | | 665 | |
EVgo, Inc.*,1 | | | 159 | | | | 658 | |
Xperi, Inc.* | | | 71 | | | | 656 | |
Bally’s Corp.* | | | 38 | | | | 655 | |
Titan International, Inc.* | | | 79 | | | | 642 | |
Methode Electronics, Inc. | | | 53 | | | | 634 | |
Haverty Furniture Companies, Inc. | | | 23 | | | | 632 | |
Lovesac Co.* | | | 22 | | | | 630 | |
RCI Hospitality Holdings, Inc. | | | 14 | | | | 624 | |
Sleep Number Corp.* | | | 34 | | | | 623 | |
224 | THE RYDEX FUNDS SEMI-ANNUAL FINANCIAL REPORT | SEE NOTES TO FINANCIAL STATEMENTS. |
SCHEDULE OF INVESTMENTS (Unaudited)(continued) | September 30, 2024 |
RUSSELL 2000® 1.5x STRATEGY FUND | |
| | Shares | | | Value | |
Petco Health & Wellness Company, Inc.* | | | 131 | | | $ | 596 | |
Funko, Inc. — Class A* | | | 48 | | | | 586 | |
Hudson Technologies, Inc.* | | | 70 | | | | 584 | |
El Pollo Loco Holdings, Inc.* | | | 42 | | | | 575 | |
Nu Skin Enterprises, Inc. — Class A | | | 78 | | | | 575 | |
Marcus Corp. | | | 38 | | | | 573 | |
Zumiez, Inc.* | | | 26 | | | | 554 | |
Hyliion Holdings Corp.* | | | 222 | | | | 551 | |
Lindblad Expeditions Holdings, Inc.* | | | 56 | | | | 518 | |
Denny’s Corp.* | | | 80 | | | | 516 | |
Designer Brands, Inc. — Class A | | | 66 | | | | 487 | |
MasterCraft Boat Holdings, Inc.* | | | 26 | | | | 473 | |
Luminar Technologies, Inc.*,1 | | | 525 | | | | 472 | |
Xponential Fitness, Inc. — Class A* | | | 38 | | | | 471 | |
Genesco, Inc.* | | | 17 | | | | 462 | |
Titan Machinery, Inc.* | | | 33 | | | | 460 | |
OneWater Marine, Inc. — Class A* | | | 19 | | | | 454 | |
Movado Group, Inc. | | | 24 | | | | 446 | |
America’s Car-Mart, Inc.* | | | 10 | | | | 419 | |
Spirit Airlines, Inc.1 | | | 173 | | | | 415 | |
Hamilton Beach Brands Holding Co. — Class A | | | 13 | | | | 396 | |
iRobot Corp.* | | | 45 | | | | 391 | |
Savers Value Village, Inc.* | | | 37 | | | | 389 | |
Cooper-Standard Holdings, Inc.* | | | 27 | | | | 375 | |
Potbelly Corp.* | | | 43 | | | | 359 | |
Frontier Group Holdings, Inc.*,1 | | | 66 | | | | 353 | |
Rocky Brands, Inc. | | | 11 | | | | 350 | |
Landsea Homes Corp.* | | | 28 | | | | 346 | |
Wheels Up Experience, Inc.* | | | 141 | | | | 341 | |
Weyco Group, Inc. | | | 10 | | | | 340 | |
JAKKS Pacific, Inc.* | | | 13 | | | | 332 | |
Superior Group of Companies, Inc. | | | 21 | | | | 325 | |
Solid Power, Inc.* | | | 240 | | | | 324 | |
Flexsteel Industries, Inc. | | | 7 | | | | 310 | |
Hooker Furnishings Corp. | | | 17 | | | | 307 | |
Tile Shop Holdings, Inc.* | | | 45 | | | | 297 | |
Webtoon Entertainment, Inc.* | | | 24 | | | | 275 | |
Blink Charging Co.*,1 | | | 152 | | | | 261 | |
Full House Resorts, Inc.* | | | 52 | | | | 261 | |
Johnson Outdoors, Inc. — Class A | | | 7 | | | | 253 | |
Reservoir Media, Inc.* | | | 31 | | | | 251 | |
Destination XL Group, Inc.* | | | 84 | | | | 247 | |
Vera Bradley, Inc.* | | | 42 | | | | 229 | |
Escalade, Inc. | | | 16 | | | | 225 | |
Virco Mfg. Corp. | | | 16 | | | | 221 | |
Clarus Corp. | | | 48 | | | | 216 | |
Holley, Inc.* | | | 73 | | | | 215 | |
Traeger, Inc.* | | | 54 | | | | 199 | |
GrowGeneration Corp.* | | | 92 | | | | 196 | |
Citi Trends, Inc.* | | | 10 | | | | 184 | |
Livewire Group, Inc.* | | | 29 | | | | 177 | |
J Jill, Inc. | | | 7 | | | | 173 | |
Biglari Holdings, Inc. — Class B* | | | 1 | | | | 172 | |
Commercial Vehicle Group, Inc.* | | | 52 | | | | 169 | |
EVI Industries, Inc. | | | 8 | | | | 155 | |
Marine Products Corp. | | | 14 | | | | 136 | |
SES AI Corp.* | | | 205 | | | | 131 | |
Lifetime Brands, Inc. | | | 20 | | | | 131 | |
ONE Group Hospitality, Inc.* | | | 33 | | | | 121 | |
Aeva Technologies, Inc.* | | | 36 | | | | 118 | |
Tilly’s, Inc. — Class A* | | | 23 | | | | 117 | |
ThredUp, Inc. — Class A* | | | 124 | | | | 104 | |
Canoo, Inc.* | | | 94 | | | | 92 | |
Purple Innovation, Inc.* | | | 90 | | | | 89 | |
Torrid Holdings, Inc.* | | | 19 | | | | 75 | |
CompX International, Inc. | | | 2 | | | | 58 | |
United Homes Group, Inc.*,1 | | | 8 | | | | 49 | |
Qurate Retail, Inc. — Class B* | | | 2 | | | | 9 | |
Total Consumer, Cyclical | | | | | | | 471,917 | |
| | | | | | | | | |
Technology - 6.1% |
SPS Commerce, Inc.* | | | 58 | | | | 11,262 | |
CommVault Systems, Inc.* | | | 68 | | | | 10,462 | |
Varonis Systems, Inc.* | | | 173 | | | | 9,775 | |
Insight Enterprises, Inc.* | | | 44 | | | | 9,477 | |
ExlService Holdings, Inc.* | | | 248 | | | | 9,461 | |
Maximus, Inc. | | | 96 | | | | 8,943 | |
Altair Engineering, Inc. — Class A* | | | 90 | | | | 8,596 | |
ACI Worldwide, Inc.* | | | 166 | | | | 8,449 | |
Zeta Global Holdings Corp. — Class A* | | | 278 | | | | 8,293 | |
Impinj, Inc.* | | | 36 | | | | 7,795 | |
Tenable Holdings, Inc.* | | | 186 | | | | 7,537 | |
Qualys, Inc.* | | | 58 | | | | 7,451 | |
Box, Inc. — Class A* | | | 222 | | | | 7,266 | |
Rambus, Inc.* | | | 172 | | | | 7,262 | |
ASGN, Inc.* | | | 71 | | | | 6,619 | |
Workiva, Inc.* | | | 80 | | | | 6,330 | |
Clearwater Analytics Holdings, Inc. — Class A* | | | 238 | | | | 6,010 | |
Silicon Laboratories, Inc.* | | | 50 | | | | 5,779 | |
Power Integrations, Inc. | | | 89 | | | | 5,707 | |
FormFactor, Inc.* | | | 122 | | | | 5,612 | |
Blackbaud, Inc.* | | | 65 | | | | 5,504 | |
Axcelis Technologies, Inc.* | | | 51 | | | | 5,347 | |
Evolent Health, Inc. — Class A* | | | 182 | | | | 5,147 | |
BlackLine, Inc.* | | | 91 | | | | 5,018 | |
Envestnet, Inc.* | | | 80 | | | | 5,010 | |
SiTime Corp.* | | | 29 | | | | 4,974 | |
ACV Auctions, Inc. — Class A* | | | 233 | | | | 4,737 | |
Synaptics, Inc.* | | | 61 | | | | 4,732 | |
Semtech Corp.* | | | 102 | | | | 4,657 | |
Diodes, Inc.* | | | 72 | | | | 4,615 | |
Clear Secure, Inc. — Class A | | | 138 | | | | 4,573 | |
Progress Software Corp. | | | 67 | | | | 4,514 | |
DigitalOcean Holdings, Inc.* | | | 103 | | | | 4,160 | |
Rapid7, Inc.* | | | 98 | | | | 3,909 | |
Kulicke & Soffa Industries, Inc. | | | 86 | | | | 3,881 | |
Agilysys, Inc.* | | | 35 | | | | 3,814 | |
WNS Holdings Ltd.* | | | 71 | | | | 3,742 | |
Freshworks, Inc. — Class A* | | | 321 | | | | 3,685 | |
Ambarella, Inc.* | | | 60 | | | | 3,384 | |
Braze, Inc. — Class A* | | | 103 | | | | 3,331 | |
SEE NOTES TO FINANCIAL STATEMENTS. | THE RYDEX FUNDS SEMI-ANNUAL FINANCIAL REPORT | 225 |
SCHEDULE OF INVESTMENTS (Unaudited)(continued) | September 30, 2024 |
RUSSELL 2000® 1.5x STRATEGY FUND | |
| | Shares | | | Value | |
Vertex, Inc. — Class A* | | | 86 | | | $ | 3,312 | |
NCR Atleos Corp.* | | | 114 | | | | 3,252 | |
C3.ai, Inc. — Class A* | | | 130 | | | | 3,150 | |
NCR Voyix Corp.* | | | 229 | | | | 3,108 | |
Intapp, Inc.* | | | 62 | | | | 2,965 | |
Privia Health Group, Inc.* | | | 161 | | | | 2,932 | |
Veeco Instruments, Inc.* | | | 88 | | | | 2,915 | |
Ultra Clean Holdings, Inc.* | | | 70 | | | | 2,795 | |
PAR Technology Corp.* | | | 53 | | | | 2,760 | |
IonQ, Inc.*,1 | | | 313 | | | | 2,736 | |
Donnelley Financial Solutions, Inc.* | | | 41 | | | | 2,699 | |
PagerDuty, Inc.* | | | 141 | | | | 2,616 | |
Verint Systems, Inc.* | | | 97 | | | | 2,457 | |
Photronics, Inc.* | | | 97 | | | | 2,402 | |
NetScout Systems, Inc.* | | | 109 | | | | 2,371 | |
AvePoint, Inc.* | | | 200 | | | | 2,354 | |
CSG Systems International, Inc. | | | 47 | | | | 2,287 | |
Sprout Social, Inc. — Class A* | | | 78 | | | | 2,267 | |
AvidXchange Holdings, Inc.* | | | 274 | | | | 2,222 | |
Alkami Technology, Inc.* | | | 69 | | | | 2,176 | |
Appian Corp. — Class A* | | | 63 | | | | 2,151 | |
PowerSchool Holdings, Inc. — Class A* | | | 94 | | | | 2,144 | |
SoundHound AI, Inc. — Class A*,1 | | | 447 | | | | 2,083 | |
Adeia, Inc. | | | 172 | | | | 2,049 | |
Jamf Holding Corp.* | | | 117 | | | | 2,030 | |
Xerox Holdings Corp. | | | 183 | | | | 1,899 | |
Waystar Holding Corp.* | | | 68 | | | | 1,897 | |
Cohu, Inc.* | | | 73 | | | | 1,876 | |
Alignment Healthcare, Inc.* | | | 158 | | | | 1,868 | |
Matterport, Inc.* | | | 413 | | | | 1,859 | |
Sapiens International Corporation N.V. | | | 49 | | | | 1,826 | |
Phreesia, Inc.* | | | 80 | | | | 1,823 | |
MaxLinear, Inc. — Class A* | | | 125 | | | | 1,810 | |
Pitney Bowes, Inc. | | | 253 | | | | 1,804 | |
Diebold Nixdorf, Inc.*,1 | | | 40 | | | | 1,786 | |
Zuora, Inc. — Class A* | | | 204 | | | | 1,758 | |
SMART Global Holdings, Inc.* | | | 81 | | | | 1,697 | |
Schrodinger Incorporated/United States* | | | 88 | | | | 1,632 | |
ACM Research, Inc. — Class A* | | | 80 | | | | 1,624 | |
PDF Solutions, Inc.* | | | 49 | | | | 1,552 | |
Digi International, Inc.* | | | 56 | | | | 1,542 | |
Fastly, Inc. — Class A* | | | 203 | | | | 1,537 | |
N-able, Inc.* | | | 113 | | | | 1,476 | |
Asana, Inc. — Class A* | | | 125 | | | | 1,449 | |
Alpha & Omega Semiconductor Ltd.* | | | 37 | | | | 1,373 | |
Blend Labs, Inc. — Class A* | | | 364 | | | | 1,365 | |
PROS Holdings, Inc.* | | | 72 | | | | 1,333 | |
Grid Dynamics Holdings, Inc.* | | | 90 | | | | 1,260 | |
Integral Ad Science Holding Corp.* | | | 114 | | | | 1,232 | |
E2open Parent Holdings, Inc.* | | | 269 | | | | 1,186 | |
Vimeo, Inc.* | | | 233 | | | | 1,177 | |
Yext, Inc.* | | | 165 | | | | 1,142 | |
SolarWinds Corp. | | | 86 | | | | 1,122 | |
Amplitude, Inc. — Class A* | | | 120 | | | | 1,076 | |
V2X, Inc.* | | | 19 | | | | 1,061 | |
OneSpan, Inc.* | | | 60 | | | | 1,000 | |
Conduent, Inc.* | | | 248 | | | | 1,000 | |
PubMatic, Inc. — Class A* | | | 66 | | | | 981 | |
Daily Journal Corp.* | | | 2 | | | | 980 | |
SEMrush Holdings, Inc. — Class A* | | | 57 | | | | 895 | |
CEVA, Inc.* | | | 37 | | | | 894 | |
MeridianLink, Inc.* | | | 43 | | | | 885 | |
NextNav, Inc.* | | | 118 | | | | 884 | |
GigaCloud Technology, Inc. — Class A*,1 | | | 37 | | | | 850 | |
Instructure Holdings, Inc.* | | | 35 | | | | 824 | |
Olo, Inc. — Class A* | | | 165 | | | | 818 | |
Simulations Plus, Inc. | | | 25 | | | | 801 | |
Weave Communications, Inc.* | | | 62 | | | | 794 | |
I3 Verticals, Inc. — Class A* | | | 36 | | | | 767 | |
Health Catalyst, Inc.* | | | 92 | | | | 749 | |
Ibotta, Inc. — Class A*,1 | | | 12 | | | | 739 | |
Enfusion, Inc. — Class A* | | | 76 | | | | 721 | |
Innodata, Inc.* | | | 43 | | | | 721 | |
PlayAGS, Inc.* | | | 62 | | | | 706 | |
Thoughtworks Holding, Inc.* | | | 158 | | | | 698 | |
Climb Global Solutions, Inc. | | | 7 | | | | 697 | |
Bandwidth, Inc. — Class A* | | | 39 | | | | 683 | |
Cantaloupe, Inc.* | | | 92 | | | | 681 | |
Pagaya Technologies Ltd. — Class A*,1 | | | 64 | | | | 676 | |
Consensus Cloud Solutions, Inc.* | | | 28 | | | | 659 | |
BigCommerce Holdings, Inc.* | | | 111 | | | | 649 | |
Digimarc Corp.* | | | 24 | | | | 645 | |
Mitek Systems, Inc.* | | | 73 | | | | 633 | |
Planet Labs PBC* | | | 266 | | | | 593 | |
Unisys Corp.* | | | 104 | | | | 591 | |
3D Systems Corp.* | | | 201 | | | | 571 | |
Aehr Test Systems* | | | 44 | | | | 565 | |
American Software, Inc. — Class A | | | 50 | | | | 560 | |
Cricut, Inc. — Class A | | | 73 | | | | 506 | |
Vishay Precision Group, Inc.* | | | 19 | | | | 492 | |
Navitas Semiconductor Corp.* | | | 199 | | | | 488 | |
Corsair Gaming, Inc.* | | | 70 | | | | 487 | |
Red Violet, Inc.* | | | 17 | | | | 484 | |
Digital Turbine, Inc.* | | | 151 | | | | 464 | |
Ouster, Inc.* | | | 68 | | | | 428 | |
Immersion Corp. | | | 48 | | | | 428 | |
Talkspace, Inc.* | | | 194 | | | | 405 | |
Domo, Inc. — Class B* | | | 53 | | | | 398 | |
SkyWater Technology, Inc.* | | | 43 | | | | 390 | |
Definitive Healthcare Corp.* | | | 84 | | | | 375 | |
8x8, Inc.* | | | 184 | | | | 375 | |
Life360, Inc.*,1 | | | 9 | | | | 354 | |
EverCommerce, Inc.* | | | 34 | | | | 352 | |
Asure Software, Inc.* | | | 37 | | | | 335 | |
ReposiTrak, Inc.1 | | | 18 | | | | 332 | |
Arteris, Inc.* | | | 43 | | | | 332 | |
Inspired Entertainment, Inc.* | | | 35 | | | | 324 | |
Telos Corp.* | | | 86 | | | | 309 | |
Outbrain, Inc.* | | | 61 | | | | 296 | |
IBEX Holdings Ltd.* | | | 14 | | | | 280 | |
Viant Technology, Inc. — Class A* | | | 25 | | | | 277 | |
CS Disco, Inc.* | | | 46 | | | | 271 | |
226 | THE RYDEX FUNDS SEMI-ANNUAL FINANCIAL REPORT | SEE NOTES TO FINANCIAL STATEMENTS. |
SCHEDULE OF INVESTMENTS (Unaudited)(continued) | September 30, 2024 |
RUSSELL 2000® 1.5x STRATEGY FUND | |
| | Shares | | | Value | |
ON24, Inc.* | | | 43 | | | $ | 263 | |
Rackspace Technology, Inc.* | | | 105 | | | | 257 | |
Richardson Electronics Ltd. | | | 19 | | | | 235 | |
BigBear.ai Holdings, Inc.* | | | 160 | | | | 234 | |
Playstudios, Inc.* | | | 139 | | | | 210 | |
Kaltura, Inc.* | | | 152 | | | | 207 | |
Cerence, Inc.* | | | 65 | | | | 205 | |
Porch Group, Inc.* | | | 122 | | | | 187 | |
Everspin Technologies, Inc.* | | | 31 | | | | 183 | |
TTEC Holdings, Inc. | | | 31 | | | | 182 | |
Rigetti Computing, Inc.*,1 | | | 223 | | | | 175 | |
QuickLogic Corp.* | | | 22 | | | | 169 | |
eGain Corp.* | | | 32 | | | | 163 | |
Rimini Street, Inc.* | | | 84 | | | | 155 | |
D-Wave Quantum, Inc.*,1 | | | 138 | | | | 136 | |
Rekor Systems, Inc.* | | | 112 | | | | 132 | |
Silvaco Group, Inc.*,1 | | | 9 | | | | 129 | |
WM Technology, Inc.* | | | 132 | | | | 115 | |
iLearningEngines Holdings, Inc.* | | | 46 | | | | 77 | |
Golden Matrix Group, Inc.* | | | 31 | | | | 72 | |
System1, Inc.* | | | 37 | | | | 42 | |
GCT Semiconductor Holding, Inc.* | | | 12 | | | | 40 | |
Airship AI Holdings, Inc.* | | | 5 | | | | 12 | |
Total Technology | | | | | | | 394,767 | |
| | | | | | | | | |
Energy - 3.3% |
ChampionX Corp. | | | 301 | | | | 9,075 | |
Noble Corporation plc1 | | | 217 | | | | 7,853 | |
Murphy Oil Corp. | | | 229 | | | | 7,726 | |
CNX Resources Corp.* | | | 231 | | | | 7,524 | |
SM Energy Co. | | | 180 | | | | 7,195 | |
Magnolia Oil & Gas Corp. — Class A | | | 273 | | | | 6,667 | |
Sunrun, Inc.* | | | 342 | | | | 6,176 | |
California Resources Corp. | | | 109 | | | | 5,719 | |
Tidewater, Inc.* | | | 77 | | | | 5,528 | |
Northern Oil & Gas, Inc. | | | 156 | | | | 5,524 | |
Valaris Ltd.* | | | 99 | | | | 5,519 | |
Archrock, Inc. | | | 261 | | | | 5,283 | |
Peabody Energy Corp. | | | 198 | | | | 5,255 | |
Warrior Met Coal, Inc. | | | 82 | | | | 5,240 | |
PBF Energy, Inc. — Class A | | | 164 | | | | 5,076 | |
Liberty Energy, Inc. — Class A | | | 255 | | | | 4,868 | |
Transocean Ltd.* | | | 1,142 | | | | 4,853 | |
CONSOL Energy, Inc. | | | 46 | | | | 4,814 | |
Patterson-UTI Energy, Inc. | | | 609 | | | | 4,659 | |
Helmerich & Payne, Inc. | | | 152 | | | | 4,624 | |
Seadrill Ltd.* | | | 107 | | | | 4,252 | |
Alpha Metallurgical Resources, Inc. | | | 17 | | | | 4,015 | |
Oceaneering International, Inc.* | | | 159 | | | | 3,954 | |
Arch Resources, Inc. | | | 28 | | | | 3,869 | |
Gulfport Energy Corp.* | | | 20 | | | | 3,027 | |
Kosmos Energy Ltd.* | | | 733 | | | | 2,954 | |
Kinetik Holdings, Inc. — Class A | | | 60 | | | | 2,716 | |
Plug Power, Inc.*,1 | | | 1,166 | | | | 2,635 | |
Sitio Royalties Corp. — Class A | | | 126 | | | | 2,626 | |
Expro Group Holdings N.V.* | | | 149 | | | | 2,558 | |
Helix Energy Solutions Group, Inc.* | | | 227 | | | | 2,520 | |
Talos Energy, Inc.* | | | 233 | | | | 2,412 | |
Crescent Energy Co. — Class A | | | 218 | | | | 2,387 | |
Atlas Energy Solutions, Inc. | | | 107 | | | | 2,333 | |
Fluence Energy, Inc.* | | | 96 | | | | 2,180 | |
DNOW, Inc.* | | | 165 | | | | 2,133 | |
Borr Drilling Ltd.* | | | 371 | | | | 2,037 | |
Sable Offshore Corp.* | | | 80 | | | | 1,890 | |
Delek US Holdings, Inc. | | | 100 | | | | 1,875 | |
Sunnova Energy International, Inc.* | | | 171 | | | | 1,666 | |
Comstock Resources, Inc. | | | 146 | | | | 1,625 | |
Select Water Solutions, Inc. — Class A | | | 144 | | | | 1,603 | |
Array Technologies, Inc.* | | | 241 | | | | 1,591 | |
Par Pacific Holdings, Inc.* | | | 90 | | | | 1,584 | |
Shoals Technologies Group, Inc. — Class A* | | | 270 | | | | 1,515 | |
Core Laboratories, Inc. | | | 74 | | | | 1,371 | |
Green Plains, Inc.* | | | 100 | | | | 1,354 | |
Bristow Group, Inc.* | | | 39 | | | | 1,353 | |
CVR Energy, Inc. | | | 54 | | | | 1,244 | |
Vital Energy, Inc.* | | | 45 | | | | 1,210 | |
SunCoke Energy, Inc. | | | 132 | | | | 1,146 | |
REX American Resources Corp.* | | | 24 | | | | 1,111 | |
ProPetro Holding Corp.* | | | 138 | | | | 1,057 | |
VAALCO Energy, Inc. | | | 164 | | | | 941 | |
Vitesse Energy, Inc. | | | 39 | | | | 937 | |
Kodiak Gas Services, Inc. | | | 32 | | | | 928 | |
Newpark Resources, Inc.* | | | 131 | | | | 908 | |
Nabors Industries Ltd.* | | | 14 | | | | 903 | |
NextDecade Corp.* | | | 182 | | | | 857 | |
RPC, Inc. | | | 134 | | | | 852 | |
Diversified Energy Company plc | | | 74 | | | | 842 | |
Innovex International, Inc.* | | | 54 | | | | 793 | |
Aris Water Solutions, Inc. — Class A | | | 42 | | | | 708 | |
SandRidge Energy, Inc. | | | 51 | | | | 624 | |
Berry Corp. | | | 121 | | | | 622 | |
TETRA Technologies, Inc.* | | | 198 | | | | 614 | |
Excelerate Energy, Inc. — Class A | | | 27 | | | | 594 | |
Montauk Renewables, Inc.* | | | 104 | | | | 542 | |
Solaris Oilfield Infrastructure, Inc. — Class A | | | 40 | | | | 510 | |
Granite Ridge Resources, Inc. | | | 83 | | | | 493 | |
Ramaco Resources, Inc. — Class A | | | 42 | | | | 491 | |
Matrix Service Co.* | | | 42 | | | | 484 | |
Riley Exploration Permian, Inc. | | | 18 | | | | 477 | |
Oil States International, Inc.* | | | 97 | | | | 446 | |
Amplify Energy Corp.* | | | 62 | | | | 405 | |
DMC Global, Inc.* | | | 31 | | | | 402 | |
Ring Energy, Inc.* | | | 234 | | | | 374 | |
Hallador Energy Co.* | | | 39 | | | | 368 | |
SEACOR Marine Holdings, Inc.* | | | 38 | | | | 367 | |
W&T Offshore, Inc. | | | 155 | | | | 333 | |
TPI Composites, Inc.*,1 | | | 73 | | | | 332 | |
Natural Gas Services Group, Inc.* | | | 17 | | | | 325 | |
HighPeak Energy, Inc.1 | | | 23 | | | | 319 | |
Ranger Energy Services, Inc. | | | 26 | | | | 310 | |
Forum Energy Technologies, Inc.* | | | 18 | | | | 278 | |
SEE NOTES TO FINANCIAL STATEMENTS. | THE RYDEX FUNDS SEMI-ANNUAL FINANCIAL REPORT | 227 |
SCHEDULE OF INVESTMENTS (Unaudited)(continued) | September 30, 2024 |
RUSSELL 2000® 1.5x STRATEGY FUND | |
| | Shares | | | Value | |
FuelCell Energy, Inc.*,1 | | | 715 | | | $ | 272 | |
Evolution Petroleum Corp. | | | 48 | | | | 255 | |
ProFrac Holding Corp. — Class A*,1 | | | 35 | | | | 238 | |
FutureFuel Corp. | | | 41 | | | | 236 | |
Geospace Technologies Corp.* | | | 20 | | | | 207 | |
NACCO Industries, Inc. — Class A | | | 7 | | | | 198 | |
ASP Isotopes, Inc.* | | | 62 | | | | 172 | |
Freyr Battery, Inc.* | | | 177 | | | | 172 | |
Energy Vault Holdings, Inc.* | | | 162 | | | | 155 | |
Mammoth Energy Services, Inc.* | | | 38 | | | | 155 | |
PrimeEnergy Resources Corp.* | | | 1 | | | | 138 | |
Aemetis, Inc.* | | | 57 | | | | 131 | |
Empire Petroleum Corp.* | | | 22 | | | | 115 | |
Ramaco Resources, Inc. — Class B | | | 8 | | | | 86 | |
Stem, Inc.* | | | 239 | | | | 83 | |
Prairie Operating Co.* | | | 7 | | | | 61 | |
Drilling Tools International Corp.* | | | 15 | | | | 56 | |
Verde Clean Fuels, Inc.* | | | 5 | | | | 20 | |
SolarMax Technology, Inc.* | | | 8 | | | | 5 | |
Total Energy | | | | | | | 212,115 | |
| | | | | | | | | |
Communications - 2.6% |
Lumen Technologies, Inc.* | | | 1,585 | | | | 11,254 | |
Q2 Holdings, Inc.* | | | 93 | | | | 7,419 | |
Credo Technology Group Holding Ltd.* | | | 201 | | | | 6,191 | |
InterDigital, Inc. | | | 40 | | | | 5,665 | |
Hims & Hers Health, Inc.* | | | 299 | | | | 5,508 | |
AST SpaceMobile, Inc.*,1 | | | 210 | | | | 5,492 | |
Cogent Communications Holdings, Inc. | | | 69 | | | | 5,238 | |
EchoStar Corp. — Class A* | | | 192 | | | | 4,765 | |
Squarespace, Inc. — Class A* | | | 96 | | | | 4,457 | |
TEGNA, Inc. | | | 266 | | | | 4,197 | |
Cargurus, Inc.* | | | 139 | | | | 4,174 | |
Perficient, Inc.* | | | 55 | | | | 4,151 | |
ePlus, Inc.* | | | 41 | | | | 4,032 | |
Yelp, Inc. — Class A* | | | 103 | | | | 3,613 | |
Calix, Inc.* | | | 93 | | | | 3,607 | |
Telephone & Data Systems, Inc. | | | 155 | | | | 3,604 | |
DigitalBridge Group, Inc. | | | 251 | | | | 3,547 | |
Ziff Davis, Inc.* | | | 72 | | | | 3,504 | |
Cable One, Inc. | | | 9 | | | | 3,148 | |
Viavi Solutions, Inc.* | | | 347 | | | | 3,130 | |
Extreme Networks, Inc.* | | | 198 | | | | 2,976 | |
Magnite, Inc.* | | | 198 | | | | 2,742 | |
Harmonic, Inc.* | | | 174 | | | | 2,535 | |
Viasat, Inc.* | | | 191 | | | | 2,281 | |
Infinera Corp.*,1 | | | 314 | | | | 2,120 | |
Upwork, Inc.* | | | 196 | | | | 2,048 | |
CommScope Holding Company, Inc.* | | | 330 | | | | 2,016 | |
Opendoor Technologies, Inc.* | | | 970 | | | | 1,940 | |
Liberty Latin America Ltd. — Class C* | | | 203 | | | | 1,926 | |
Sphere Entertainment Co.* | | | 42 | | | | 1,856 | |
Cars.com, Inc.* | | | 104 | | | | 1,743 | |
A10 Networks, Inc. | | | 112 | | | | 1,617 | |
QuinStreet, Inc.* | | | 83 | | | | 1,588 | |
Sprinklr, Inc. — Class A* | | | 198 | | | | 1,531 | |
Revolve Group, Inc.* | | | 60 | | | | 1,487 | |
Globalstar, Inc.* | | | 1,142 | | | | 1,416 | |
Figs, Inc. — Class A* | | | 205 | | | | 1,402 | |
Shutterstock, Inc. | | | 39 | | | | 1,379 | |
Applied Digital Corp.*,1 | | | 155 | | | | 1,279 | |
Gannett Company, Inc.* | | | 224 | | | | 1,259 | |
Despegar.com Corp.* | | | 97 | | | | 1,203 | |
Scholastic Corp. | | | 37 | | | | 1,184 | |
HealthStream, Inc. | | | 38 | | | | 1,096 | |
Shenandoah Telecommunications Co. | | | 77 | | | | 1,086 | |
TechTarget, Inc.* | | | 41 | | | | 1,002 | |
Open Lending Corp. — Class A* | | | 161 | | | | 985 | |
Couchbase, Inc.* | | | 61 | | | | 983 | |
Bumble, Inc. — Class A* | | | 151 | | | | 963 | |
Stagwell, Inc.* | | | 135 | | | | 948 | |
IDT Corp. — Class B | | | 24 | | | | 916 | |
NETGEAR, Inc.* | | | 45 | | | | 903 | |
Clear Channel Outdoor Holdings, Inc.* | | | 550 | | | | 880 | |
Thryv Holdings, Inc.* | | | 50 | | | | 862 | |
EverQuote, Inc. — Class A* | | | 40 | | | | 844 | |
National CineMedia, Inc.* | | | 112 | | | | 789 | |
Clearfield, Inc.* | | | 20 | | | | 779 | |
Liquidity Services, Inc.* | | | 34 | | | | 775 | |
Sinclair, Inc. | | | 50 | | | | 765 | |
ADTRAN Holdings, Inc.* | | | 124 | | | | 735 | |
Gogo, Inc.* | | | 102 | | | | 732 | |
Beyond, Inc.* | | | 72 | | | | 726 | |
Gray Television, Inc. | | | 135 | | | | 724 | |
Powerfleet Incorporated NJ* | | | 143 | | | | 715 | |
MediaAlpha, Inc. — Class A* | | | 39 | | | | 706 | |
Nextdoor Holdings, Inc.* | | | 275 | | | | 682 | |
fuboTV, Inc.* | | | 460 | | | | 653 | |
Anterix, Inc.* | | | 16 | | | | 603 | |
Getty Images Holdings, Inc.* | | | 158 | | | | 602 | |
Boston Omaha Corp. — Class A* | | | 39 | | | | 580 | |
Advantage Solutions, Inc.* | | | 169 | | | | 580 | |
Consolidated Communications Holdings, Inc.* | | | 121 | | | | 561 | |
ATN International, Inc. | | | 17 | | | | 550 | |
Preformed Line Products Co. | | | 4 | | | | 512 | |
Liberty Latin America Ltd. — Class A* | | | 52 | | | | 498 | |
RealReal, Inc.* | | | 154 | | | | 484 | |
Grindr, Inc.* | | | 39 | | | | 465 | |
Ribbon Communications, Inc.* | | | 143 | | | | 465 | |
Vivid Seats, Inc. — Class A* | | | 123 | | | | 455 | |
Ooma, Inc.* | | | 39 | | | | 444 | |
Spok Holdings, Inc. | | | 29 | | | | 437 | |
AMC Networks, Inc. — Class A* | | | 50 | | | | 434 | |
WideOpenWest, Inc.* | | | 78 | | | | 410 | |
Backblaze, Inc. — Class A* | | | 63 | | | | 403 | |
Stitch Fix, Inc. — Class A* | | | 142 | | | | 400 | |
Aviat Networks, Inc.* | | | 18 | | | | 389 | |
Lands’ End, Inc.* | | | 22 | | | | 380 | |
Groupon, Inc.*,1 | | | 36 | | | | 352 | |
Eventbrite, Inc. — Class A* | | | 126 | | | | 344 | |
BARK, Inc.* | | | 209 | | | | 341 | |
1-800-Flowers.com, Inc. — Class A* | | | 41 | | | | 325 | |
Innovid Corp.* | | | 168 | | | | 302 | |
228 | THE RYDEX FUNDS SEMI-ANNUAL FINANCIAL REPORT | SEE NOTES TO FINANCIAL STATEMENTS. |
SCHEDULE OF INVESTMENTS (Unaudited)(continued) | September 30, 2024 |
RUSSELL 2000® 1.5x STRATEGY FUND | |
| | Shares | | | Value | |
iHeartMedia, Inc. — Class A* | | | 163 | | | $ | 302 | |
LifeMD, Inc.* | | | 55 | | | | 288 | |
Tucows, Inc. — Class A* | | | 13 | | | | 272 | |
Gambling.com Group Ltd.* | | | 27 | | | | 271 | |
AudioEye, Inc.* | | | 11 | | | | 251 | |
OptimizeRx Corp.* | | | 28 | | | | 216 | |
EW Scripps Co. — Class A* | | | 96 | | | | 216 | |
Townsquare Media, Inc. — Class A | | | 21 | | | | 213 | |
Cardlytics, Inc.* | | | 63 | | | | 202 | |
Entravision Communications Corp. — Class A | | | 97 | | | | 201 | |
1stdibs.com, Inc.* | | | 40 | | | | 176 | |
RumbleON, Inc. — Class B* | | | 25 | | | | 120 | |
Nerdy, Inc.* | | | 115 | | | | 113 | |
LiveOne, Inc.* | | | 107 | | | | 102 | |
BlackSky Technology, Inc.* | | | 21 | | | | 100 | |
Mondee Holdings, Inc.* | | | 60 | | | | 83 | |
Terran Orbital Corp.*,1 | | | 243 | | | | 61 | |
Value Line, Inc. | | | 1 | | | | 46 | |
Vacasa, Inc. — Class A* | | | 15 | | | | 42 | |
Solo Brands, Inc. — Class A* | | | 26 | | | | 37 | |
aka Brands Holding Corp.* | | | 1 | | | | 24 | |
Total Communications | | | | | | | 171,125 | |
| | | | | | | | | |
Basic Materials - 2.3% |
Carpenter Technology Corp. | | | 75 | | | | 11,968 | |
Commercial Metals Co. | | | 182 | | | | 10,003 | |
Cabot Corp. | | | 85 | | | | 9,500 | |
Balchem Corp. | | | 51 | | | | 8,976 | |
Avient Corp. | | | 142 | | | | 7,145 | |
HB Fuller Co. | | | 86 | | | | 6,827 | |
Hecla Mining Co. | | | 912 | | | | 6,083 | |
Sensient Technologies Corp. | | | 66 | | | | 5,295 | |
Arcadium Lithium plc* | | | 1,697 | | | | 4,836 | |
Sylvamo Corp. | | | 55 | | | | 4,722 | |
Innospec, Inc. | | | 39 | | | | 4,411 | |
Coeur Mining, Inc.* | | | 619 | | | | 4,259 | |
Minerals Technologies, Inc. | | | 51 | | | | 3,939 | |
Uranium Energy Corp.* | | | 620 | | | | 3,850 | |
Hawkins, Inc. | | | 30 | | | | 3,824 | |
Quaker Chemical Corp. | | | 22 | | | | 3,707 | |
Rogers Corp.* | | | 30 | | | | 3,390 | |
Constellium SE* | | | 204 | | | | 3,317 | |
Perimeter Solutions S.A.* | | | 211 | | | | 2,838 | |
Tronox Holdings plc — Class A | | | 187 | | | | 2,736 | |
Stepan Co. | | | 34 | | | | 2,626 | |
Ingevity Corp.* | | | 57 | | | | 2,223 | |
SSR Mining, Inc. | | | 320 | | | | 1,818 | |
Kaiser Aluminum Corp. | | | 25 | | | | 1,813 | |
Orion S.A. | | | 91 | | | | 1,621 | |
Novagold Resources, Inc.* | | | 384 | | | | 1,574 | |
United States Lime & Minerals, Inc. | | | 15 | | | | 1,465 | |
Mativ Holdings, Inc. | | | 85 | | | | 1,444 | |
Energy Fuels, Inc.* | | | 255 | | �� | | 1,400 | |
Century Aluminum Co.* | | | 83 | | | | 1,347 | |
Ecovyst, Inc.* | | | 183 | | | | 1,254 | |
AdvanSix, Inc. | | | 40 | | | | 1,215 | |
Centrus Energy Corp. — Class A* | | | 22 | | | | 1,207 | |
Haynes International, Inc. | | | 20 | | | | 1,191 | |
Metals Acquisition Ltd. — Class A* | | | 85 | | | | 1,177 | |
Koppers Holdings, Inc. | | | 32 | | | | 1,169 | |
Encore Energy Corp.* | | | 281 | | | | 1,135 | |
Ivanhoe Electric Incorporated / US* | | | 132 | | | | 1,117 | |
Rayonier Advanced Materials, Inc.* | | | 101 | | | | 865 | |
Radius Recycling, Inc. — Class A | | | 42 | | | | 779 | |
Compass Minerals International, Inc. | | | 54 | | | | 649 | |
Perpetua Resources Corp.* | | | 61 | | | | 570 | |
Oil-Dri Corporation of America | | | 8 | | | | 552 | |
Universal Stainless & Alloy Products, Inc.* | | | 14 | | | | 541 | |
Lightwave Logic, Inc.* | | | 189 | | | | 522 | |
Ur-Energy, Inc.* | | | 433 | | | | 515 | |
i-80 Gold Corp.* | | | 409 | | | | 475 | |
Kronos Worldwide, Inc. | | | 34 | | | | 423 | |
Intrepid Potash, Inc.* | | | 17 | | | | 408 | |
Lifezone Metals Ltd.* | | | 58 | | | | 406 | |
Caledonia Mining Corporation plc | | | 26 | | | | 389 | |
Codexis, Inc.* | | | 110 | | | | 339 | |
Piedmont Lithium, Inc.* | | | 29 | | | | 259 | |
Dakota Gold Corp.* | | | 103 | | | | 243 | |
Contango ORE, Inc.* | | | 12 | | | | 231 | |
American Vanguard Corp. | | | 40 | | | | 212 | |
Northern Technologies International Corp. | | | 12 | | | | 147 | |
Valhi, Inc. | | | 4 | | | | 133 | |
Critical Metals Corp.* | | | 12 | | | | 89 | |
Total Basic Materials | | | | | | | 147,169 | |
| | | | | | | | | |
Utilities - 1.8% |
Brookfield Infrastructure Corp. — Class A | | | 189 | | | | 8,208 | |
Portland General Electric Co. | | | 160 | | | | 7,664 | |
New Jersey Resources Corp. | | | 155 | | | | 7,316 | |
Southwest Gas Holdings, Inc. | | | 96 | | | | 7,081 | |
ONE Gas, Inc. | | | 89 | | | | 6,623 | |
Black Hills Corp. | | | 108 | | | | 6,601 | |
Ormat Technologies, Inc. | | | 85 | | | | 6,540 | |
TXNM Energy, Inc. | | | 142 | | | | 6,215 | |
ALLETE, Inc. | | | 92 | | | | 5,905 | |
Spire, Inc. | | | 85 | | | | 5,720 | |
Northwestern Energy Group, Inc. | | | 97 | | | | 5,550 | |
MGE Energy, Inc. | | | 57 | | | | 5,213 | |
Otter Tail Corp. | | | 65 | | | | 5,080 | |
California Water Service Group | | | 91 | | | | 4,934 | |
American States Water Co. | | | 59 | | | | 4,914 | |
Avista Corp. | | | 123 | | | | 4,766 | |
Chesapeake Utilities Corp. | | | 35 | | | | 4,346 | |
SJW Group | | | 51 | | | | 2,964 | |
Hawaiian Electric Industries, Inc.* | | | 260 | | | | 2,517 | |
Northwest Natural Holding Co. | | | 60 | | | | 2,449 | |
Ameresco, Inc. — Class A* | | | 51 | | | | 1,935 | |
Middlesex Water Co. | | | 28 | | | | 1,827 | |
Unitil Corp. | | | 25 | | | | 1,515 | |
York Water Co. | | | 23 | | | | 861 | |
Consolidated Water Company Ltd. | | | 24 | | | | 605 | |
Altus Power, Inc.* | | | 120 | | | | 382 | |
Genie Energy Ltd. — Class B | | | 20 | | | | 325 | |
SEE NOTES TO FINANCIAL STATEMENTS. | THE RYDEX FUNDS SEMI-ANNUAL FINANCIAL REPORT | 229 |
SCHEDULE OF INVESTMENTS (Unaudited)(continued) | September 30, 2024 |
RUSSELL 2000® 1.5x STRATEGY FUND | |
| | Shares | | | Value | |
RGC Resources, Inc. | | | 13 | | | $ | 294 | |
Global Water Resources, Inc. | | | 18 | | | | 227 | |
Total Utilities | | | | | | | 118,577 | |
| | | | | | | | | |
Government - 0.0% |
Banco Latinoamericano de Comercio Exterior S.A. — Class E | | | 43 | | | | 1,397 | |
| | | | | | | | | |
Total Common Stocks | | | | |
(Cost $3,904,912) | | | | | | | 4,202,155 | |
| | | | | | | | | |
WARRANT† - 0.0% |
Danimer Scientific, Inc. | | | | | | | | |
Expiring 07/15/25 | | | 2 | | | | — | |
Total Warrant | | | | |
(Cost $—) | | | | | | | — | |
| | | | | | | | | |
RIGHTS† - 0.0% |
Consumer, Non-cyclical - 0.0% |
Sanofi SA* | | | 52 | | | | — | |
Tobira Therapeutics, Inc. *,††† | | | 14 | | | | — | |
Novartis AG*,††† | | | 100 | | | | — | |
Cartesian Therapeutics Inc.* | | | 179 | | | | — | |
Total Consumer, Non-cyclical | | | | | | | — | |
| | | | | | | | | |
Energy - 0.0% |
Empire Petroleum Corp.* | | | | | | | | |
Expires 10/16/24 | | | 22 | | | | — | |
Total Rights | | | | |
(Cost $39) | | | | | | | — | |
| | | | | | | | | |
MUTUAL FUNDS† - 18.4% |
Guggenheim Strategy Fund II2 | | | 25,618 | | �� | | 635,320 | |
Guggenheim Ultra Short Duration Fund — Institutional Class2 | | | 56,061 | | | | 561,735 | |
Total Mutual Funds | | | | |
(Cost $1,183,372) | | | | | | | 1,197,055 | |
| | Face
Amount~ | | | | |
U.S. TREASURY BILL†† - 3.0% |
U.S. Treasury Bills |
4.85% due 12/12/243,4 | | $ | 200,000 | | | | 198,212 | |
Total U.S. Treasury Bill | | | | |
(Cost $198,059) | | | | | | | 198,212 | |
| | | | | | | | | |
REPURCHASE AGREEMENTS††,5 - 13.0% |
J.P. Morgan Securities LLC
issued 09/30/24 at 4.86%
due 10/01/243 | | | 463,138 | | | | 463,138 | |
BofA Securities, Inc.
issued 09/30/24 at 4.85%
due 10/01/243 | | | 382,530 | | | | 382,530 | |
Total Repurchase Agreements | | | | |
(Cost $845,668) | | | | | | | 845,668 | |
| | | | | | | | | |
| | | Shares | | | | | |
SECURITIES LENDING COLLATERAL†,6 - 0.9% |
Money Market Fund*** | | | | | | | | |
First American Government Obligations Fund - Class X, 4.82%7 | | | 58,826 | | | | 58,826 | |
Total Securities Lending Collateral | | | | |
(Cost $58,826) | | | | | | | 58,826 | |
| | | | | | | | | |
Total Investments - 99.9% | | | | |
(Cost $6,190,876) | | $ | 6,501,916 | |
Other Assets & Liabilities, net - 0.1% | | | 5,965 | |
Total Net Assets - 100.0% | | $ | 6,507,881 | |
Total Return Swap Agreements |
Counterparty | Index | Type | | Financing
Rate | | Payment
Frequency | | | Maturity
Date | | | Units | | | Notional
Amount | | | Value and
Unrealized
Appreciation | |
OTC Equity Index Swap Agreements†† |
Goldman Sachs International | Russell 2000 Index | Pay | | 4.93% (Federal
Funds Rate +
0.10%) | | | At Maturity | | | | 12/18/24 | | | | 875 | | | $ | 1,950,837 | | | $ | 27,830 | |
BNP Paribas | Russell 2000 Index | Pay | | 5.38% (Federal
Funds Rate +
0.55%) | | | At Maturity | | | | 12/19/24 | | | | 676 | | | | 1,506,985 | | | | 21,694 | |
Barclays Bank plc | Russell 2000 Index | Pay | | 5.29% (SOFR +
0.45%) | | | At Maturity | | | | 12/19/24 | | | | 944 | | | | 2,104,933 | | | | 5,643 | |
| | | | | | | | | | | | | | | | | | | $ | 5,562,755 | | | $ | 55,167 | |
230 | THE RYDEX FUNDS SEMI-ANNUAL FINANCIAL REPORT | SEE NOTES TO FINANCIAL STATEMENTS. |
SCHEDULE OF INVESTMENTS (Unaudited)(continued) | September 30, 2024 |
RUSSELL 2000® 1.5x STRATEGY FUND | |
~ | The face amount is denominated in U.S. dollars unless otherwise indicated. |
* | Non-income producing security. |
*** | A copy of each underlying unaffiliated fund’s financial statements is available at the SEC’s website at www.sec.gov. |
† | Value determined based on Level 1 inputs, unless otherwise noted — See Note 4. |
†† | Value determined based on Level 2 inputs — See Note 4. |
††† | Value determined based on Level 3 inputs — See Note 4. |
1 | All or a portion of this security is on loan at September 30, 2024 — See Note 7. |
2 | Affiliated issuer. |
3 | All or a portion of this security is pledged as equity index swap collateral at September 30, 2024. |
4 | Rate indicated is the effective yield at the time of purchase. |
5 | Repurchase Agreements — See Note 6. |
6 | Securities lending collateral — See Note 7. |
7 | Rate indicated is the 7-day yield as of September 30, 2024. |
| | plc — Public Limited Company |
| | REIT — Real Estate Investment Trust |
| | SOFR — Secured Overnight Financing Rate |
| | |
| | See Sector Classification in Other Information section. |
The following table summarizes the inputs used to value the Fund’s investments at September 30, 2024 (See Note 4 in the Notes to Financial Statements):
Investments in Securities (Assets) | | Level 1
Quoted
Prices | | | Level 2
Significant
Observable
Inputs | | | Level 3
Significant
Unobservable
Inputs | | | Total | |
Common Stocks | | $ | 4,202,155 | | | $ | — | | | $ | — | * | | $ | 4,202,155 | |
Warrant | | | — | * | | | — | | | | — | | | | — | |
Rights | | | — | * | | | — | | | | — | * | | | — | |
Mutual Funds | | | 1,197,055 | | | | — | | | | — | | | | 1,197,055 | |
U.S. Treasury Bill | | | — | | | | 198,212 | | | | — | | | | 198,212 | |
Repurchase Agreements | | | — | | | | 845,668 | | | | — | | | | 845,668 | |
Securities Lending Collateral | | | 58,826 | | | | — | | | | — | | | | 58,826 | |
Equity Index Swap Agreements** | | | — | | | | 55,167 | | | | — | | | | 55,167 | |
Total Assets | | $ | 5,458,036 | | | $ | 1,099,047 | | | $ | — | | | $ | 6,557,083 | |
* | Security has a market value of $0. |
** | This derivative is reported as unrealized appreciation/depreciation at period end. |
SEE NOTES TO FINANCIAL STATEMENTS. | THE RYDEX FUNDS SEMI-ANNUAL FINANCIAL REPORT | 231 |
SCHEDULE OF INVESTMENTS (Unaudited)(concluded) | September 30, 2024 |
RUSSELL 2000® 1.5x STRATEGY FUND | |
Affiliated Transactions
Investments representing 5% or more of the outstanding voting shares of a company, or control of or by, or common control under Guggenheim Investments (“GI”), result in that company being considered an affiliated issuer, as defined in the 1940 Act.
The Fund may invest in certain of the underlying series of Guggenheim Strategy Funds Trust, including Guggenheim Strategy Fund II and Guggenheim Strategy Fund III (collectively, the “Guggenheim Strategy Funds”), each of which are open-end management investment companies managed by GI. The Guggenheim Strategy Funds, which launched on March 11, 2014, are offered as short term investment options only to mutual funds, trusts, and other accounts managed by GI and/or its affiliates, and are not available to the public. The Guggenheim Strategy Funds pay no investment management fees. The Guggenheim Strategy Funds’ annual report on Form N-CSR dated September 30, 2023 is available publicly or upon request. This information is available from the EDGAR database on the SEC’s website at https://www.sec.gov/Archives/edgar/data/1601445/000182126823000217/gug86449-ncsr.htm. The Fund may invest in certain of the underlying series of Guggenheim Funds Trust, which are open-end management investment companies managed by GI, are available to the public and whose most recent annual report on Form N-CSR is available publicly or upon request.
Transactions during the period ended September 30, 2024, in which the company is an affiliated issuer, were as follows:
Security Name | | Value
03/31/24 | | | Additions | | | Reductions | | | Realized
Gain (Loss) | | | Change in
Unrealized
Appreciation
(Depreciation) | | | Value
09/30/24 | | | Shares
09/30/24 | | | Investment
Income | |
Mutual Funds | | | | | | | | | | | | | | | | | | | | | | | | | | | | | | | | |
Guggenheim Strategy Fund II | | $ | 630,196 | | | $ | — | | | $ | — | | | $ | — | | | $ | 5,124 | | | $ | 635,320 | | | | 25,618 | | | $ | 18,043 | |
Guggenheim Ultra Short Duration Fund — Institutional Class | | | 555,568 | | | | — | | | | — | | | | — | | | | 6,167 | | | | 561,735 | | | | 56,061 | | | | 14,458 | |
| | | $ | 1,185,764 | | | $ | — | | | $ | — | | | $ | — | | | $ | 11,291 | | | $ | 1,197,055 | | | | | | | $ | 32,501 | |
232 | THE RYDEX FUNDS SEMI-ANNUAL FINANCIAL REPORT | SEE NOTES TO FINANCIAL STATEMENTS. |
RUSSELL 2000® 1.5x STRATEGY FUND | |
STATEMENT OF ASSETS AND LIABILITIES (Unaudited) |
| |
Assets: |
Investments in unaffiliated issuers, at value - including $55,311 of securities loaned (cost $4,161,836) | | $ | 4,459,193 | |
Investments in affiliated issuers, at value (cost $1,183,372) | | | 1,197,055 | |
Repurchase agreements, at value (cost $845,668) | | | 845,668 | |
Cash | | | 609 | |
Segregated cash with broker | | | 13,000 | |
Unrealized appreciation on OTC swap agreements | | | 55,167 | |
Receivables: |
Dividends | | | 8,714 | |
Fund shares sold | | | 700 | |
Interest | | | 114 | |
Securities lending income | | | 100 | |
Total assets | | | 6,580,320 | |
| | | | | |
Liabilities: |
Payable for: |
Return of securities lending collateral | | | 58,826 | |
Management fees | | | 4,253 | |
Transfer agent fees | | | 2,713 | |
Swap settlement | | | 1,231 | |
Distribution and service fees | | | 1,217 | |
Portfolio accounting and administration fees | | | 255 | |
Trustees’ fees* | | | 54 | |
Fund shares redeemed | | | 20 | |
Miscellaneous | | | 3,870 | |
Total liabilities | | | 72,439 | |
Net assets | | $ | 6,507,881 | |
| | | | | |
Net assets consist of: |
Paid in capital | | $ | 8,565,090 | |
Total distributable earnings (loss) | | | (2,057,209 | ) |
Net assets | | $ | 6,507,881 | |
Class A: |
Net assets | | $ | 1,019,732 | |
Capital shares outstanding | | | 17,610 | |
Net asset value per share | | $ | 57.91 | |
Maximum offering price per share (Net asset value divided by 95.25%) | | $ | 60.80 | |
Class C: |
Net assets | | $ | 10,651 | |
Capital shares outstanding | | | 256 | |
Net asset value per share | | $ | 41.56 | |
Class H: |
Net assets | | $ | 5,477,498 | |
Capital shares outstanding | | | 95,212 | |
Net asset value per share | | $ | 57.53 | |
STATEMENT OF OPERATIONS (Unaudited) |
| |
Investment Income: |
Dividends from securities of unaffiliated issuers (net of foreign withholding tax of $59) | | $ | 26,161 | |
Dividends from securities of affiliated issuers | | | 32,501 | |
Interest | | | 32,430 | |
Income from securities lending, net | | | 766 | |
Total investment income | | | 91,858 | |
| | | | | |
Expenses: |
Management fees | | | 28,750 | |
Distribution and service fees: |
Class A | | | 1,188 | |
Class C | | | 193 | |
Class H | | | 6,750 | |
Transfer agent fees | | | 6,568 | |
Portfolio accounting and administration fees | | | 4,874 | |
Registration fees | | | 4,532 | |
Professional fees | | | 1,997 | |
Interest expense | | | 829 | |
Custodian fees | | | 409 | |
Trustees’ fees* | | | 355 | |
Line of credit fees | | | 59 | |
Miscellaneous | | | 151 | |
Total expenses | | | 56,655 | |
Less: |
Expenses reimbursed by Adviser | | | (3,195 | ) |
Expenses waived by Adviser | | | (697 | ) |
Total waived/reimbursed expenses | | | (3,892 | ) |
Net expenses | | | 52,763 | |
Net investment income | | | 39,095 | |
| | | | | |
Net Realized and Unrealized Gain (Loss): |
Net realized gain (loss) on: |
Investments | | | 153,809 | |
Swap agreements | | | 104,976 | |
Futures contracts | | | (5,241 | ) |
Net realized gain | | | 253,544 | |
Net change in unrealized appreciation (depreciation) on: |
Investments in unaffiliated issuers | | | 46,018 | |
Investments in affiliated issuers | | | 11,291 | |
Swap agreements | | | (144,803 | ) |
Futures contracts | | | (13,073 | ) |
Net change in unrealized appreciation (depreciation) | | | (100,567 | ) |
Net realized and unrealized gain | | | 152,977 | |
Net increase in net assets resulting from operations | | $ | 192,072 | |
* | Relates to Trustees not deemed “interested persons” within the meaning of Section 2(a)(19) of the 1940 Act. |
SEE NOTES TO FINANCIAL STATEMENTS. | THE RYDEX FUNDS SEMI-ANNUAL FINANCIAL REPORT | 233 |
RUSSELL 2000® 1.5x STRATEGY FUND | |
STATEMENTS OF CHANGES IN NET ASSETS |
| | Six Months Ended
September 30, 2024
(Unaudited) | | | Year Ended
March 31,
2024 | |
Increase (Decrease) in Net Assets from Operations: | | | | | | | | |
Net investment income | | $ | 39,095 | | | $ | 86,505 | |
Net realized gain on investments | | | 253,544 | | | | 638,902 | |
Net change in unrealized appreciation (depreciation) on investments | | | (100,567 | ) | | | 781,468 | |
Net increase in net assets resulting from operations | | | 192,072 | | | | 1,506,875 | |
| | | | | | | | | |
Distributions to shareholders: | | | | | | | | |
Class A | | | — | | | | (1,949 | ) |
Class C | | | — | | | | (43 | ) |
Class H | | | — | | | | (12,432 | ) |
Total distributions to shareholders | | | — | | | | (14,424 | ) |
| | | | | | | | | |
Capital share transactions: | | | | | | | | |
Proceeds from sale of shares | | | | | | | | |
Class A | | | 28,996 | | | | 207,195 | |
Class C | | | 12,982 | | | | 524,610 | |
Class H | | | 2,238,822 | | | | 3,917,573 | |
Distributions reinvested | | | | | | | | |
Class A | | | — | | | | 1,880 | |
Class C | | | — | | | | 43 | |
Class H | | | — | | | | 12,382 | |
Cost of shares redeemed | | | | | | | | |
Class A | | | (45,708 | ) | | | (303,541 | ) |
Class C | | | (134,219 | ) | | | (437,323 | ) |
Class H | | | (2,907,031 | ) | | | (4,495,631 | ) |
Net decrease from capital share transactions | | | (806,158 | ) | | | (572,812 | ) |
Net increase (decrease) in net assets | | | (614,086 | ) | | | 919,639 | |
| | | | | | | | | |
Net assets: | | | | | | | | |
Beginning of period | | | 7,121,967 | | | | 6,202,328 | |
End of period | | $ | 6,507,881 | | | $ | 7,121,967 | |
| | | | | | | | | |
Capital share activity: | | | | | | | | |
Shares sold | | | | | | | | |
Class A | | | 548 | | | | 4,576 | |
Class C | | | 347 | | | | 14,942 | |
Class H | | | 40,801 | | | | 88,623 | |
Shares issued from reinvestment of distributions | | | | | | | | |
Class A | | | — | | | | 41 | |
Class C | | | — | | | | 1 | |
Class H | | | — | | | | 270 | |
Shares redeemed | | | | | | | | |
Class A | | | (852 | ) | | | (6,512 | ) |
Class C | | | (3,499 | ) | | | (12,255 | ) |
Class H | | | (55,646 | ) | | | (99,091 | ) |
Net decrease in shares | | | (18,301 | ) | | | (9,405 | ) |
234 | THE RYDEX FUNDS SEMI-ANNUAL FINANCIAL REPORT | SEE NOTES TO FINANCIAL STATEMENTS. |
RUSSELL 2000® 1.5x STRATEGY FUND | |
This table is presented to show selected data for a share outstanding throughout each period and to assist shareholders in evaluating a Fund’s performance for the periods presented.
Class A | | Six Months Ended
September 30, 2024a | | | Year Ended
March 31,
2024 | | | Year Ended
March 31,
2023 | | | Year Ended
March 31,
2022 | | | Year Ended
March 31,
2021 | | | Year Ended
March 31,
2020 | |
Per Share Data |
Net asset value, beginning of period | | $ | 54.91 | | | $ | 44.36 | | | $ | 56.57 | | | $ | 101.22 | | | $ | 39.16 | | | $ | 63.62 | |
Income (loss) from investment operations: |
Net investment income (loss)b | | | .33 | | | | .61 | | | | .22 | | | | (1.02 | ) | | | (.94 | ) | | | .32 | |
Net gain (loss) on investments (realized and unrealized) | | | 2.67 | | | | 10.05 | | | | (12.43 | ) | | | (7.02 | ) | | | 63.25 | | | | (24.78 | ) |
Total from investment operations | | | 3.00 | | | | 10.66 | | | | (12.21 | ) | | | (8.04 | ) | | | 62.31 | | | | (24.46 | ) |
Less distributions from: |
Net investment income | | | — | | | | (.11 | ) | | | — | | | | — | | | | (.25 | ) | | | — | |
Net realized gains | | | — | | | | — | | | | — | | | | (36.61 | ) | | | — | | | | — | |
Total distributions | | | — | | | | (.11 | ) | | | — | | | | (36.61 | ) | | | (.25 | ) | | | — | |
Net asset value, end of period | | $ | 57.91 | | | $ | 54.91 | | | $ | 44.36 | | | $ | 56.57 | | | $ | 101.22 | | | $ | 39.16 | |
|
Total Returnc | | | 5.46 | % | | | 24.07 | % | | | (21.58 | %) | | | (11.85 | %) | | | 159.26 | % | | | (38.45 | %) |
Ratios/Supplemental Data |
Net assets, end of period (in thousands) | | $ | 1,020 | | | $ | 984 | | | $ | 879 | | | $ | 1,268 | | | $ | 1,749 | | | $ | 948 | |
Ratios to average net assets: |
Net investment income (loss) | | | 1.22 | % | | | 1.32 | % | | | 0.48 | % | | | (1.18 | %) | | | (1.40 | %) | | | 0.50 | % |
Total expensesd | | | 1.77 | % | | | 1.77 | % | | | 1.75 | % | | | 1.71 | % | | | 1.79 | % | | | 1.82 | % |
Net expensese | | | 1.65 | % | | | 1.67 | % | | | 1.69 | % | | | 1.68 | % | | | 1.77 | % | | | 1.76 | % |
Portfolio turnover rate | | | 9 | % | | | 8 | % | | | 9 | % | | | 62 | % | | | — | | | | 93 | % |
Class C | | Six Months Ended
September 30, 2024a | | | Year Ended
March 31,
2024 | | | Year Ended
March 31,
2023 | | | Year Ended
March 31,
2022 | | | Year Ended
March 31,
2021 | | | Year Ended
March 31,
2020 | |
Per Share Data |
Net asset value, beginning of period | | $ | 39.56 | | | $ | 32.26 | | | $ | 41.41 | | | $ | 84.58 | | | $ | 32.98 | | | $ | 54.00 | |
Income (loss) from investment operations: |
Net investment income (loss)b | | | .11 | | | | .29 | | | | (.09 | ) | | | (1.28 | ) | | | (1.27 | ) | | | (.12 | ) |
Net gain (loss) on investments (realized and unrealized) | | | 1.89 | | | | 7.12 | | | | (9.06 | ) | | | (5.28 | ) | | | 53.12 | | | | (20.90 | ) |
Total from investment operations | | | 2.00 | | | | 7.41 | | | | (9.15 | ) | | | (6.56 | ) | | | 51.85 | | | | (21.02 | ) |
Less distributions from: |
Net investment income | | | — | | | | (.11 | ) | | | — | | | | — | | | | (.25 | ) | | | — | |
Net realized gains | | | — | | | | — | | | | — | | | | (36.61 | ) | | | — | | | | — | |
Total distributions | | | — | | | | (.11 | ) | | | — | | | | (36.61 | ) | | | (.25 | ) | | | — | |
Net asset value, end of period | | $ | 41.56 | | | $ | 39.56 | | | $ | 32.26 | | | $ | 41.41 | | | $ | 84.58 | | | $ | 32.98 | |
|
Total Returnc | | | 5.06 | % | | | 23.13 | % | | | (22.10 | %) | | | (12.52 | %) | | | 157.38 | % | | | (38.93 | %) |
Ratios/Supplemental Data |
Net assets, end of period (in thousands) | | $ | 11 | | | $ | 135 | | | $ | 23 | | | $ | 35 | | | $ | 75 | | | $ | 22 | |
Ratios to average net assets: |
Net investment income (loss) | | | 0.57 | % | | | 0.82 | % | | | (0.27 | %) | | | (1.93 | %) | | | (2.16 | %) | | | (0.22 | %) |
Total expensesd | | | 2.45 | % | | | 2.49 | % | | | 2.50 | % | | | 2.46 | % | | | 2.52 | % | | | 2.57 | % |
Net expensese | | | 2.32 | % | | | 2.38 | % | | | 2.44 | % | | | 2.43 | % | | | 2.50 | % | | | 2.51 | % |
Portfolio turnover rate | | | 9 | % | | | 8 | % | | | 9 | % | | | 62 | % | | | — | | | | 93 | % |
SEE NOTES TO FINANCIAL STATEMENTS. | THE RYDEX FUNDS SEMI-ANNUAL FINANCIAL REPORT | 235 |
RUSSELL 2000® 1.5x STRATEGY FUND | |
FINANCIAL HIGHLIGHTS (concluded) |
This table is presented to show selected data for a share outstanding throughout each period and to assist shareholders in evaluating a Fund’s performance for the periods presented.
Class H | | Six Months Ended
September 30, 2024a | | | Year Ended
March 31,
2024 | | | Year Ended
March 31,
2023 | | | Year Ended
March 31,
2022 | | | Year Ended
March 31,
2021 | | | Year Ended
March 31,
2020 | |
Per Share Data |
Net asset value, beginning of period | | $ | 54.55 | | | $ | 44.08 | | | $ | 56.20 | | | $ | 100.81 | | | $ | 39.00 | | | $ | 63.37 | |
Income (loss) from investment operations: |
Net investment income (loss)b | | | .33 | | | | .61 | | | | .21 | | | | (.98 | ) | | | (.98 | ) | | | .09 | |
Net gain (loss) on investments (realized and unrealized) | | | 2.65 | | | | 9.97 | | | | (12.33 | ) | | | (7.02 | ) | | | 63.04 | | | | (24.46 | ) |
Total from investment operations | | | 2.98 | | | | 10.58 | | | | (12.12 | ) | | | (8.00 | ) | | | 62.06 | | | | (24.37 | ) |
Less distributions from: |
Net investment income | | | — | | | | (.11 | ) | | | — | | | | — | | | | (.25 | ) | | | — | |
Net realized gains | | | — | | | | — | | | | — | | | | (36.61 | ) | | | — | | | | — | |
Total distributions | | | — | | | | (.11 | ) | | | — | | | | (36.61 | ) | | | (.25 | ) | | | — | |
Net asset value, end of period | | $ | 57.53 | | | $ | 54.55 | | | $ | 44.08 | | | $ | 56.20 | | | $ | 100.81 | | | $ | 39.00 | |
|
Total Return | | | 5.46 | % | | | 24.07 | % | | | (21.57 | %) | | | (11.86 | %) | | | 159.27 | % | | | (38.46 | %) |
Ratios/Supplemental Data |
Net assets, end of period (in thousands) | | $ | 5,477 | | | $ | 6,004 | | | $ | 5,300 | | | $ | 8,683 | | | $ | 9,482 | | | $ | 3,347 | |
Ratios to average net assets: |
Net investment income (loss) | | | 1.23 | % | | | 1.34 | % | | | 0.46 | % | | | (1.17 | %) | | | (1.42 | %) | | | 0.14 | % |
Total expensesd | | | 1.77 | % | | | 1.77 | % | | | 1.75 | % | | | 1.71 | % | | | 1.78 | % | | | 1.84 | % |
Net expensese | | | 1.65 | % | | | 1.67 | % | | | 1.69 | % | | | 1.68 | % | | | 1.76 | % | | | 1.80 | % |
Portfolio turnover rate | | | 9 | % | | | 8 | % | | | 9 | % | | | 62 | % | | | — | | | | 93 | % |
a | Unaudited figures for the period ended September 30, 2024. Percentage amounts for the period, except total return and portfolio turnover rate, have been annualized. |
b | Net investment income (loss) per share was computed using average shares outstanding throughout the period. |
c | Total return does not reflect the impact of any applicable sales charges. |
d | Does not include expenses of the underlying funds in which the Fund invests. |
e | Net expense information reflects the expense ratios after expense waivers and reimbursements, as applicable. |
236 | THE RYDEX FUNDS SEMI-ANNUAL FINANCIAL REPORT | SEE NOTES TO FINANCIAL STATEMENTS. |
SCHEDULE OF INVESTMENTS (Unaudited) | September 30, 2024 |
RUSSELL 2000® FUND | |
| | Shares | | | Value | |
COMMON STOCKS† - 55.1% |
| | | | | | | | | |
Financial - 13.3% |
FTAI Aviation Ltd. | | | 349 | | | $ | 46,382 | |
SouthState Corp. | | | 262 | | | | 25,461 | |
Jackson Financial, Inc. — Class A | | | 262 | | | | 23,902 | |
Essent Group Ltd. | | | 358 | | | | 23,016 | |
Hamilton Lane, Inc. — Class A | | | 132 | | | | 22,227 | |
Terreno Realty Corp. REIT | | | 328 | | | | 21,920 | |
Ryman Hospitality Properties, Inc. REIT | | | 201 | | | | 21,555 | |
Essential Properties Realty Trust, Inc. REIT1 | | | 602 | | | | 20,558 | |
Mr Cooper Group, Inc.* | | | 219 | | | | 20,187 | |
Old National Bancorp | | | 1,080 | | | | 20,153 | |
Cadence Bank | | | 625 | | | | 19,906 | |
Kite Realty Group Trust REIT | | | 746 | | | | 19,814 | |
Selective Insurance Group, Inc. | | | 209 | | | | 19,500 | |
Radian Group, Inc. | | | 520 | | | | 18,039 | |
Glacier Bancorp, Inc. | | | 393 | | | | 17,960 | |
Home BancShares, Inc. | | | 647 | | | | 17,527 | |
Piper Sandler Cos. | | | 60 | | | | 17,029 | |
United Bankshares, Inc. | | | 456 | | | | 16,918 | |
Moelis & Co. — Class A | | | 243 | | | | 16,648 | |
First Financial Bankshares, Inc. | | | 447 | | | | 16,543 | |
UMB Financial Corp. | | | 154 | | | | 16,187 | |
Phillips Edison & Company, Inc. REIT | | | 422 | | | | 15,914 | |
Independence Realty Trust, Inc. REIT | | | 776 | | | | 15,908 | |
SL Green Realty Corp. REIT | | | 224 | | | | 15,593 | |
Hancock Whitney Corp. | | | 298 | | | | 15,249 | |
MARA Holdings, Inc.* | | | 939 | | | | 15,231 | |
CareTrust REIT, Inc | | | 490 | | | | 15,121 | |
Sabra Health Care REIT, Inc. | | | 795 | | | | 14,795 | |
Ameris Bancorp | | | 227 | | | | 14,163 | |
ServisFirst Bancshares, Inc. | | | 175 | | | | 14,079 | |
Enstar Group Ltd.* | | | 43 | | | | 13,828 | |
Macerich Co. REIT | | | 744 | | | | 13,571 | |
Valley National Bancorp | | | 1,482 | | | | 13,427 | |
HA Sustainable Infrastructure Capital, Inc. | | | 388 | | | | 13,374 | |
Innovative Industrial Properties, Inc. REIT | | | 97 | | | | 13,056 | |
CNO Financial Group, Inc. | | | 362 | | | | 12,706 | |
Walker & Dunlop, Inc. | | | 111 | | | | 12,608 | |
PotlatchDeltic Corp. REIT | | | 274 | | | | 12,344 | |
Broadstone Net Lease, Inc. REIT | | | 648 | | | | 12,280 | |
Tanger, Inc. REIT | | | 368 | | | | 12,210 | |
StepStone Group, Inc. — Class A | | | 213 | | | | 12,105 | |
National Health Investors, Inc. REIT | | | 144 | | | | 12,105 | |
United Community Banks, Inc. | | | 413 | | | | 12,010 | |
Axos Financial, Inc.* | | | 188 | | | | 11,821 | |
COPT Defense Properties REIT | | | 389 | | | | 11,798 | |
First BanCorp | | | 556 | | | | 11,771 | |
Atlantic Union Bankshares Corp. | | | 309 | | | | 11,640 | |
Apple Hospitality REIT, Inc. | | | 783 | | | | 11,628 | |
BGC Group, Inc. — Class A | | | 1,251 | | | | 11,484 | |
Texas Capital Bancshares, Inc.* | | | 160 | | | | 11,434 | |
Blackstone Mortgage Trust, Inc. — Class A REIT1 | | | 596 | | | | 11,330 | |
Baldwin Insurance Group, Inc. — Class A* | | | 227 | | | | 11,305 | |
Fulton Financial Corp. | | | 618 | | | | 11,204 | |
International Bancshares Corp. | | | 187 | | | | 11,181 | |
NMI Holdings, Inc. — Class A* | | | 269 | | | | 11,080 | |
Associated Banc-Corp. | | | 514 | | | | 11,072 | |
Eastern Bankshares, Inc. | | | 663 | | | | 10,867 | |
PJT Partners, Inc. — Class A | | | 81 | | | | 10,800 | |
Cushman & Wakefield plc* | | | 786 | | | | 10,713 | |
Upstart Holdings, Inc.*,1 | | | 266 | | | | 10,643 | |
Community Financial System, Inc. | | | 181 | | | | 10,511 | |
PennyMac Financial Services, Inc. | | | 92 | | | | 10,485 | |
WSFS Financial Corp. | | | 203 | | | | 10,351 | |
Cathay General Bancorp | | | 240 | | | | 10,308 | |
Genworth Financial, Inc. — Class A* | | | 1,478 | | | | 10,124 | |
LXP Industrial Trust REIT | | | 998 | | | | 10,030 | |
SITE Centers Corp. REIT | | | 164 | | | | 9,922 | |
Arbor Realty Trust, Inc. REIT1 | | | 632 | | | | 9,834 | |
New York Community Bancorp, Inc. | | | 871 | | | | 9,781 | |
Douglas Emmett, Inc. REIT | | | 554 | | | | 9,734 | |
Artisan Partners Asset Management, Inc. — Class A | | | 217 | | | | 9,400 | |
BankUnited, Inc. | | | 257 | | | | 9,365 | |
Outfront Media, Inc. REIT | | | 508 | | | | 9,337 | |
Four Corners Property Trust, Inc. REIT | | | 317 | | | | 9,291 | |
Bancorp, Inc.* | | | 173 | | | | 9,255 | |
Simmons First National Corp. — Class A | | | 426 | | | | 9,176 | |
Burford Capital Ltd. | | | 688 | | | | 9,123 | |
Cohen & Steers, Inc. | | | 95 | | | | 9,115 | |
Urban Edge Properties REIT | | | 414 | | | | 8,855 | |
McGrath RentCorp | | | 84 | | | | 8,843 | |
Independent Bank Corp. | | | 147 | | | | 8,692 | |
Bank of Hawaii Corp. | | | 135 | | | | 8,474 | |
Pacific Premier Bancorp, Inc. | | | 331 | | | | 8,328 | |
First Interstate BancSystem, Inc. — Class A | | | 271 | | | | 8,314 | |
Heartland Financial USA, Inc. | | | 146 | | | | 8,278 | |
Park National Corp. | | | 49 | | | | 8,231 | |
First Financial Bancorp | | | 326 | | | | 8,225 | |
Acadia Realty Trust REIT | | | 349 | | | | 8,195 | |
Bread Financial Holdings, Inc. | | | 172 | | | | 8,184 | |
CVB Financial Corp. | | | 455 | | | | 8,108 | |
WaFd, Inc. | | | 231 | | | | 8,050 | |
TowneBank | | | 243 | | | | 8,034 | |
Provident Financial Services, Inc. | | | 432 | | | | 8,018 | |
Palomar Holdings, Inc.* | | | 84 | | | | 7,952 | |
Victory Capital Holdings, Inc. — Class A | | | 142 | | | | 7,867 | |
Seacoast Banking Corporation of Florida | | | 292 | | | | 7,782 | |
StoneX Group, Inc.* | | | 95 | | | | 7,779 | |
Compass, Inc. — Class A* | | | 1,259 | | | | 7,692 | |
First Merchants Corp. | | | 201 | | | | 7,477 | |
American Healthcare REIT, Inc. | | | 283 | | | | 7,386 | |
Enova International, Inc.* | | | 88 | | | | 7,373 | |
St. Joe Co. | | | 125 | | | | 7,289 | |
Equity Commonwealth REIT* | | | 365 | | | | 7,264 | |
BancFirst Corp. | | | 69 | | | | 7,262 | |
Core Scientific, Inc.* | | | 612 | | | | 7,258 | |
Independent Bank Group, Inc. | | | 125 | | | | 7,207 | |
Sunstone Hotel Investors, Inc. REIT | | | 698 | | | | 7,203 | |
Cleanspark, Inc.* | | | 765 | | | | 7,145 | |
SEE NOTES TO FINANCIAL STATEMENTS. | THE RYDEX FUNDS SEMI-ANNUAL FINANCIAL REPORT | 237 |
SCHEDULE OF INVESTMENTS (Unaudited)(continued) | September 30, 2024 |
RUSSELL 2000® FUND | |
| | Shares | | | Value | |
Newmark Group, Inc. — Class A | | | 460 | | | $ | 7,144 | |
OFG Bancorp | | | 158 | | | | 7,097 | |
Banner Corp. | | | 119 | | | | 7,088 | |
NBT Bancorp, Inc. | | | 159 | | | | 7,033 | |
Banc of California, Inc. | | | 477 | | | | 7,026 | |
Riot Platforms, Inc.*,1 | | | 937 | | | | 6,953 | |
Stewart Information Services Corp. | | | 93 | | | | 6,951 | |
Goosehead Insurance, Inc. — Class A* | | | 77 | | | | 6,876 | |
Renasant Corp. | | | 211 | | | | 6,857 | |
Retail Opportunity Investments Corp. REIT | | | 428 | | | | 6,732 | |
InvenTrust Properties Corp. REIT | | | 236 | | | | 6,695 | |
Trustmark Corp. | | | 210 | | | | 6,682 | |
Enterprise Financial Services Corp. | | | 128 | | | | 6,561 | |
DiamondRock Hospitality Co. REIT | | | 722 | | | | 6,303 | |
Triumph Financial, Inc.* | | | 76 | | | | 6,045 | |
City Holding Co. | | | 51 | | | | 5,987 | |
First Commonwealth Financial Corp. | | | 347 | | | | 5,951 | |
Bank of NT Butterfield & Son Ltd. | | | 161 | | | | 5,938 | |
WesBanco, Inc. | | | 199 | | | | 5,926 | |
Northwest Bancshares, Inc. | | | 437 | | | | 5,847 | |
Farmer Mac — Class C | | | 31 | | | | 5,810 | |
Global Net Lease, Inc. REIT | | | 689 | | | | 5,801 | |
Mercury General Corp. | | | 92 | | | | 5,794 | |
FB Financial Corp. | | | 123 | | | | 5,772 | |
First Bancorp | | | 138 | | | | 5,739 | |
Live Oak Bancshares, Inc. | | | 120 | | | | 5,684 | |
Pathward Financial, Inc. | | | 86 | | | | 5,677 | |
Lakeland Financial Corp. | | | 86 | | | | 5,600 | |
Pagseguro Digital Ltd. — Class A* | | | 647 | | | | 5,571 | |
Nelnet, Inc. — Class A | | | 49 | | | | 5,551 | |
S&T Bancorp, Inc. | | | 132 | | | | 5,540 | |
Stock Yards Bancorp, Inc. | | | 89 | | | | 5,517 | |
Pebblebrook Hotel Trust REIT | | | 412 | | | | 5,451 | |
Getty Realty Corp. REIT | | | 171 | | | | 5,440 | |
LTC Properties, Inc. REIT | | | 148 | | | | 5,430 | |
National Bank Holdings Corp. — Class A | | | 127 | | | | 5,347 | |
Elme Communities REIT | | | 302 | | | | 5,312 | |
Skyward Specialty Insurance Group, Inc.* | | | 128 | | | | 5,213 | |
Xenia Hotels & Resorts, Inc. REIT | | | 352 | | | | 5,199 | |
Hilltop Holdings, Inc. | | | 161 | | | | 5,178 | |
Compass Diversified Holdings | | | 231 | | | | 5,112 | |
Empire State Realty Trust, Inc. — Class A REIT | | | 460 | | | | 5,097 | |
Redfin Corp.* | | | 405 | | | | 5,075 | |
Hope Bancorp, Inc. | | | 400 | | | | 5,024 | |
JBG SMITH Properties REIT | | | 287 | | | | 5,017 | |
Two Harbors Investment Corp. REIT | | | 358 | | | | 4,969 | |
Horace Mann Educators Corp. | | | 142 | | | | 4,963 | |
SiriusPoint Ltd.* | | | 341 | | | | 4,890 | |
Veris Residential, Inc. REIT | | | 272 | | | | 4,858 | |
Alexander & Baldwin, Inc. REIT | | | 251 | | | | 4,819 | |
Virtus Investment Partners, Inc. | | | 23 | | | | 4,817 | |
RLJ Lodging Trust REIT | | | 523 | | | | 4,801 | |
Veritex Holdings, Inc. | | | 182 | | | | 4,790 | |
First Busey Corp. | | | 184 | | | | 4,788 | |
Trupanion, Inc.* | | | 114 | | | | 4,786 | |
WisdomTree, Inc. | | | 479 | | | | 4,785 | |
Sandy Spring Bancorp, Inc. | | | 152 | | | | 4,768 | |
Customers Bancorp, Inc.* | | | 102 | | | | 4,738 | |
Safehold, Inc. REIT | | | 179 | | | | 4,695 | |
TriCo Bancshares | | | 110 | | | | 4,691 | |
Uniti Group, Inc. REIT* | | | 821 | | | | 4,630 | |
Easterly Government Properties, Inc. REIT | | | 335 | | | | 4,549 | |
Ladder Capital Corp. — Class A REIT | | | 392 | | | | 4,547 | |
Apollo Commercial Real Estate Finance, Inc. REIT | | | 489 | | | | 4,494 | |
MFA Financial, Inc. REIT | | | 351 | | | | 4,465 | |
American Assets Trust, Inc. REIT | | | 166 | | | | 4,436 | |
Apartment Investment and Management Co. — Class A REIT* | | | 488 | | | | 4,412 | |
Stellar Bancorp, Inc. | | | 170 | | | | 4,401 | |
Chimera Investment Corp. REIT | | | 278 | | | | 4,401 | |
Nicolet Bankshares, Inc. | | | 46 | | | | 4,399 | |
Westamerica BanCorp | | | 89 | | | | 4,398 | |
Kennedy-Wilson Holdings, Inc. | | | 392 | | | | 4,331 | |
UMH Properties, Inc. REIT | | | 220 | | | | 4,327 | |
LendingClub Corp.* | | | 377 | | | | 4,309 | |
Piedmont Office Realty Trust, Inc. — Class A REIT | | | 424 | | | | 4,282 | |
PennyMac Mortgage Investment Trust REIT | | | 298 | | | | 4,249 | |
Ready Capital Corp. REIT | | | 555 | | | | 4,235 | |
Navient Corp. | | | 271 | | | | 4,225 | |
QCR Holdings, Inc. | | | 57 | | | | 4,220 | |
NETSTREIT Corp. REIT | | | 255 | | | | 4,215 | |
Safety Insurance Group, Inc. | | | 51 | | | | 4,171 | |
Employers Holdings, Inc. | | | 85 | | | | 4,077 | |
Berkshire Hills Bancorp, Inc. | | | 147 | | | | 3,959 | |
eXp World Holdings, Inc.1 | | | 280 | | | | 3,945 | |
Encore Capital Group, Inc.* | | | 82 | | | | 3,876 | |
German American Bancorp, Inc. | | | 98 | | | | 3,798 | |
1st Source Corp. | | | 63 | | | | 3,772 | |
Terawulf, Inc.* | | | 795 | | | | 3,721 | |
Cannae Holdings, Inc. | | | 195 | | | | 3,717 | |
OceanFirst Financial Corp. | | | 199 | | | | 3,699 | |
Franklin BSP Realty Trust, Inc. REIT | | | 283 | | | | 3,696 | |
Ellington Financial, Inc. REIT | | | 285 | | | | 3,674 | |
Enact Holdings, Inc. | | | 101 | | | | 3,669 | |
Centerspace REIT | | | 51 | | | | 3,594 | |
Peoples Bancorp, Inc. | | | 119 | | | | 3,581 | |
Dime Community Bancshares, Inc. | | | 122 | | | | 3,514 | |
Redwood Trust, Inc. REIT | | | 454 | | | | 3,509 | |
Perella Weinberg Partners | | | 181 | | | | 3,495 | |
Preferred Bank/Los Angeles CA | | | 43 | | | | 3,451 | |
ARMOUR Residential REIT, Inc. | | | 169 | | | | 3,448 | |
NexPoint Residential Trust, Inc. REIT | | | 78 | | | | 3,433 | |
First Bancshares, Inc. | | | 106 | | | | 3,406 | |
Hut 8 Corp.*,1 | | | 277 | | | | 3,396 | |
Southside Bancshares, Inc. | | | 99 | | | | 3,310 | |
FTAI Infrastructure, Inc. | | | 348 | | | | 3,257 | |
Origin Bancorp, Inc. | | | 101 | | | | 3,248 | |
Marcus & Millichap, Inc. | | | 81 | | | | 3,210 | |
AMERISAFE, Inc. | | | 66 | | | | 3,190 | |
238 | THE RYDEX FUNDS SEMI-ANNUAL FINANCIAL REPORT | SEE NOTES TO FINANCIAL STATEMENTS. |
SCHEDULE OF INVESTMENTS (Unaudited)(continued) | September 30, 2024 |
RUSSELL 2000® FUND | |
| | Shares | | | Value | |
Brandywine Realty Trust REIT | | | 582 | | | $ | 3,166 | |
Diversified Healthcare Trust REIT | | | 750 | | | | 3,142 | |
Plymouth Industrial REIT, Inc | | | 139 | | | | 3,141 | |
ConnectOne Bancorp, Inc. | | | 125 | | | | 3,131 | |
Paramount Group, Inc. REIT* | | | 633 | | | | 3,114 | |
Bank First Corp. | | | 34 | | | | 3,084 | |
Brookline Bancorp, Inc. | | | 305 | | | | 3,077 | |
First Mid Bancshares, Inc. | | | 79 | | | | 3,074 | |
Fidelis Insurance Holdings Ltd. | | | 166 | | | | 2,998 | |
HCI Group, Inc. | | | 28 | | | | 2,998 | |
PRA Group, Inc.* | | | 134 | | | | 2,996 | |
Lemonade, Inc.* | | | 178 | | | | 2,935 | |
Premier Financial Corp. | | | 122 | | | | 2,865 | |
Byline Bancorp, Inc. | | | 107 | | | | 2,864 | |
F&G Annuities & Life, Inc. | | | 64 | | | | 2,862 | |
Dynex Capital, Inc. REIT | | | 221 | | | | 2,820 | |
Univest Financial Corp. | | | 100 | | | | 2,814 | |
Burke & Herbert Financial Services Corp. | | | 45 | | | | 2,745 | |
Central Pacific Financial Corp. | | | 93 | | | | 2,744 | |
Merchants Bancorp | | | 59 | | | | 2,653 | |
ProAssurance Corp.* | | | 175 | | | | 2,632 | |
Community Trust Bancorp, Inc. | | | 53 | | | | 2,632 | |
Hamilton Insurance Group Ltd. — Class B* | | | 136 | | | | 2,630 | |
CrossFirst Bankshares, Inc.* | | | 157 | | | | 2,620 | |
Service Properties Trust REIT | | | 566 | | | | 2,581 | |
Heritage Financial Corp. | | | 118 | | | | 2,569 | |
First Community Bankshares, Inc. | | | 59 | | | | 2,546 | |
Tompkins Financial Corp. | | | 44 | | | | 2,543 | |
KKR Real Estate Finance Trust, Inc. REIT | | | 203 | | | | 2,507 | |
Capitol Federal Financial, Inc. | | | 428 | | | | 2,500 | |
NB Bancorp, Inc.* | | | 134 | | | | 2,487 | |
Summit Hotel Properties, Inc. REIT | | | 362 | | | | 2,483 | |
BrightSpire Capital, Inc. REIT | | | 443 | | | | 2,481 | |
Armada Hoffler Properties, Inc. REIT | | | 229 | | | | 2,480 | |
Brightsphere Investment Group, Inc. | | | 95 | | | | 2,413 | |
Mercantile Bank Corp. | | | 54 | | | | 2,361 | |
Old Second Bancorp, Inc. | | | 151 | | | | 2,354 | |
Horizon Bancorp, Inc. | | | 150 | | | | 2,333 | |
Cipher Mining, Inc.* | | | 596 | | | | 2,306 | |
Eagle Bancorp, Inc. | | | 102 | | | | 2,303 | |
Orrstown Financial Services, Inc. | | | 64 | | | | 2,301 | |
Independent Bank Corp. | | | 69 | | | | 2,301 | |
Whitestone REIT — Class B | | | 169 | | | | 2,287 | |
Brookfield Business Corp. — Class A | | | 90 | | | | 2,280 | |
Gladstone Commercial Corp. REIT | | | 139 | | | | 2,257 | |
Hudson Pacific Properties, Inc. REIT* | | | 470 | | | | 2,247 | |
Claros Mortgage Trust, Inc. | | | 298 | | | | 2,232 | |
Amerant Bancorp, Inc. | | | 102 | | | | 2,180 | |
Business First Bancshares, Inc. | | | 84 | | | | 2,156 | |
Patria Investments Ltd. — Class A | | | 190 | | | | 2,122 | |
TrustCo Bank Corporation NY | | | 64 | | | | 2,116 | |
Coastal Financial Corp.* | | | 39 | | | | 2,106 | |
Global Medical REIT, Inc. | | | 210 | | | | 2,081 | |
Camden National Corp. | | | 50 | | | | 2,066 | |
Universal Health Realty Income Trust REIT | | | 45 | | | | 2,059 | |
Equity Bancshares, Inc. — Class A | | | 50 | | | | 2,044 | |
Heritage Commerce Corp. | | | 206 | | | | 2,035 | |
International Money Express, Inc.* | | | 110 | | | | 2,034 | |
Orchid Island Capital, Inc. REIT | | | 246 | | | | 2,022 | |
New York Mortgage Trust, Inc. REIT | | | 313 | | | | 1,981 | |
LendingTree, Inc.* | | | 34 | | | | 1,973 | |
CBL & Associates Properties, Inc. REIT | | | 78 | | | | 1,966 | |
Metrocity Bankshares, Inc. | | | 64 | | | | 1,960 | |
Metropolitan Bank Holding Corp.* | | | 37 | | | | 1,945 | |
Amalgamated Financial Corp. | | | 62 | | | | 1,945 | |
Hanmi Financial Corp. | | | 104 | | | | 1,934 | |
Farmers National Banc Corp. | | | 127 | | | | 1,920 | |
Republic Bancorp, Inc. — Class A | | | 29 | | | | 1,894 | |
Washington Trust Bancorp, Inc. | | | 58 | | | | 1,868 | |
Southern Missouri Bancorp, Inc. | | | 33 | | | | 1,864 | |
Universal Insurance Holdings, Inc. | | | 83 | | | | 1,839 | |
Real Brokerage, Inc.* | | | 329 | | | | 1,826 | |
Northeast Bank | | | 23 | | | | 1,774 | |
First Financial Corp. | | | 40 | | | | 1,754 | |
HomeTrust Bancshares, Inc. | | | 51 | | | | 1,738 | |
Tiptree, Inc. — Class A | | | 88 | | | | 1,722 | |
Anywhere Real Estate, Inc.* | | | 339 | | | | 1,722 | |
Great Southern Bancorp, Inc. | | | 30 | | | | 1,719 | |
Peakstone Realty Trust REIT | | | 126 | | | | 1,717 | |
HarborOne Bancorp, Inc. | | | 132 | | | | 1,713 | |
CNB Financial Corp. | | | 71 | | | | 1,708 | |
NerdWallet, Inc. — Class A* | | | 134 | | | | 1,703 | |
TPG RE Finance Trust, Inc. REIT | | | 199 | | | | 1,697 | |
Alexander’s, Inc. REIT | | | 7 | | | | 1,697 | |
Capital City Bank Group, Inc. | | | 48 | | | | 1,694 | |
Community Healthcare Trust, Inc. REIT | | | 93 | | | | 1,688 | |
Ambac Financial Group, Inc.* | | | 150 | | | | 1,682 | |
Five Star Bancorp | | | 56 | | | | 1,665 | |
Midland States Bancorp, Inc. | | | 73 | | | | 1,634 | |
Arrow Financial Corp. | | | 57 | | | | 1,634 | |
Esquire Financial Holdings, Inc. | | | 25 | | | | 1,630 | |
Columbia Financial, Inc.* | | | 95 | | | | 1,622 | |
GCM Grosvenor, Inc. — Class A | | | 143 | | | | 1,619 | |
Gladstone Land Corp. REIT | | | 116 | | | | 1,612 | |
Bar Harbor Bankshares | | | 52 | | | | 1,604 | |
SmartFinancial, Inc. | | | 55 | | | | 1,603 | |
Invesco Mortgage Capital, Inc. REIT | | | 170 | | | | 1,596 | |
NET Lease Office Properties REIT | | | 52 | | | | 1,592 | |
Peapack-Gladstone Financial Corp. | | | 58 | | | | 1,590 | |
Farmland Partners, Inc. REIT | | | 152 | | | | 1,588 | |
Northfield Bancorp, Inc. | | | 135 | | | | 1,566 | |
Mid Penn Bancorp, Inc. | | | 52 | | | | 1,551 | |
One Liberty Properties, Inc. REIT | | | 55 | | | | 1,515 | |
Saul Centers, Inc. REIT | | | 36 | | | | 1,511 | |
United Fire Group, Inc. | | | 72 | | | | 1,507 | |
Peoples Financial Services Corp. | | | 32 | | | | 1,500 | |
P10, Inc. — Class A | | | 140 | | | | 1,499 | |
Shore Bancshares, Inc. | | | 106 | | | | 1,483 | |
Diamond Hill Investment Group, Inc. | | | 9 | | | | 1,454 | |
CTO Realty Growth, Inc. REIT | | | 76 | | | | 1,446 | |
MidWestOne Financial Group, Inc. | | | 50 | | | | 1,426 | |
SEE NOTES TO FINANCIAL STATEMENTS. | THE RYDEX FUNDS SEMI-ANNUAL FINANCIAL REPORT | 239 |
SCHEDULE OF INVESTMENTS (Unaudited)(continued) | September 30, 2024 |
RUSSELL 2000® FUND | |
| | Shares | | | Value | |
Chatham Lodging Trust REIT | | | 167 | | | $ | 1,423 | |
Alerus Financial Corp. | | | 62 | | | | 1,419 | |
Bit Digital, Inc.*,1 | | | 404 | | | | 1,418 | |
World Acceptance Corp.* | | | 12 | | | | 1,416 | |
FRP Holdings, Inc.* | | | 47 | | | | 1,403 | |
Flushing Financial Corp. | | | 96 | | | | 1,400 | |
South Plains Financial, Inc. | | | 41 | | | | 1,391 | |
Carter Bankshares, Inc.* | | | 79 | | | | 1,374 | |
RMR Group, Inc. — Class A | | | 54 | | | | 1,370 | |
RBB Bancorp | | | 59 | | | | 1,358 | |
Northrim BanCorp, Inc. | | | 19 | | | | 1,353 | |
Financial Institutions, Inc. | | | 53 | | | | 1,350 | |
Sierra Bancorp | | | 46 | | | | 1,328 | |
Kearny Financial Corp. | | | 190 | | | | 1,305 | |
Greenlight Capital Re Ltd. — Class A* | | | 95 | | | | 1,297 | |
Ares Commercial Real Estate Corp. REIT | | | 184 | | | | 1,288 | |
ACNB Corp. | | | 29 | | | | 1,266 | |
California BanCorp* | | | 84 | | | | 1,242 | |
First Business Financial Services, Inc. | | | 27 | | | | 1,231 | |
Farmers & Merchants Bancorp Incorporated/Archbold OH | | | 44 | | | | 1,217 | |
Hingham Institution For Savings | | | 5 | | | | 1,217 | |
Investors Title Co. | | | 5 | | | | 1,149 | |
Hippo Holdings, Inc.* | | | 68 | | | | 1,148 | |
Northeast Community Bancorp, Inc. | | | 43 | | | | 1,137 | |
Community West Bancshares | | | 59 | | | | 1,136 | |
Root, Inc. — Class A* | | | 30 | | | | 1,133 | |
First Foundation, Inc. | | | 181 | | | | 1,129 | |
Home Bancorp, Inc. | | | 25 | | | | 1,115 | |
First Bank/Hamilton NJ | | | 73 | | | | 1,110 | |
Bank of Marin Bancorp | | | 55 | | | | 1,105 | |
Enterprise Bancorp, Inc. | | | 34 | | | | 1,087 | |
Orange County Bancorp, Inc. | | | 18 | | | | 1,086 | |
Postal Realty Trust, Inc. — Class A REIT | | | 74 | | | | 1,083 | |
Dave, Inc.* | | | 27 | | | | 1,079 | |
Industrial Logistics Properties Trust REIT | | | 225 | | | | 1,071 | |
Third Coast Bancshares, Inc.* | | | 40 | | | | 1,071 | |
Legacy Housing Corp.* | | | 39 | | | | 1,067 | |
West BanCorp, Inc. | | | 56 | | | | 1,065 | |
FS Bancorp, Inc. | | | 23 | | | | 1,023 | |
HomeStreet, Inc.* | | | 64 | | | | 1,009 | |
Citizens & Northern Corp. | | | 51 | | | | 1,004 | |
Selectquote, Inc.* | | | 462 | | | | 1,003 | |
First Bancorp, Inc. | | | 38 | | | | 1,000 | |
NewtekOne, Inc. | | | 80 | | | | 997 | |
Bridgewater Bancshares, Inc.* | | | 70 | | | | 992 | |
Heritage Insurance Holdings, Inc.* | | | 79 | | | | 967 | |
HBT Financial, Inc. | | | 44 | | | | 963 | |
Guaranty Bancshares, Inc. | | | 28 | | | | 963 | |
First Internet Bancorp | | | 28 | | | | 959 | |
First of Long Island Corp. | | | 74 | | | | 952 | |
Regional Management Corp. | | | 29 | | | | 949 | |
American Coastal Insurance Corp.* | | | 84 | | | | 947 | |
Civista Bancshares, Inc. | | | 53 | | | | 944 | |
Citizens Financial Services, Inc. | | | 16 | | | | 940 | |
Southern First Bancshares, Inc.* | | | 27 | | | | 920 | |
Colony Bankcorp, Inc. | | | 58 | | | | 900 | |
Chicago Atlantic Real Estate Finance, Inc. REIT | | | 58 | | | | 900 | |
Southern States Bancshares, Inc. | | | 29 | | | | 891 | |
Red River Bancshares, Inc. | | | 17 | | | | 884 | |
BayCom Corp. | | | 37 | | | | 878 | |
Primis Financial Corp. | | | 70 | | | | 853 | |
Unity Bancorp, Inc. | | | 25 | | | | 851 | |
John Marshall Bancorp, Inc. | | | 43 | | | | 851 | |
Waterstone Financial, Inc. | | | 57 | | | | 838 | |
Capital Bancorp, Inc. | | | 32 | | | | 823 | |
Donegal Group, Inc. — Class A | | | 54 | | | | 796 | |
Fidelity D&D Bancorp, Inc. | | | 16 | | | | 789 | |
City Office REIT, Inc. | | | 135 | | | | 788 | |
Timberland Bancorp, Inc. | | | 26 | | | | 787 | |
Ponce Financial Group, Inc.* | | | 67 | | | | 783 | |
Alpine Income Property Trust, Inc. REIT | | | 43 | | | | 783 | |
Orion Office REIT, Inc. | | | 194 | | | | 776 | |
Plumas Bancorp | | | 19 | | | | 775 | |
MVB Financial Corp. | | | 40 | | | | 774 | |
Parke Bancorp, Inc. | | | 37 | | | | 773 | |
RE/MAX Holdings, Inc. — Class A* | | | 62 | | | | 772 | |
FVCBankcorp, Inc.* | | | 57 | | | | 744 | |
AG Mortgage Investment Trust, Inc. REIT | | | 99 | | | | 743 | |
ChoiceOne Financial Services, Inc. | | | 24 | | | | 742 | |
Greene County Bancorp, Inc. | | | 24 | | | | 742 | |
Blue Foundry Bancorp* | | | 72 | | | | 738 | |
Onity Group, Inc.* | | | 23 | | | | 735 | |
Middlefield Banc Corp. | | | 25 | | | | 720 | |
Norwood Financial Corp. | | | 26 | | | | 717 | |
PCB Bancorp | | | 38 | | | | 714 | |
NexPoint Diversified Real Estate Trust REIT | | | 113 | | | | 706 | |
Braemar Hotels & Resorts, Inc. REIT | | | 228 | | | | 705 | |
Bowhead Specialty Holdings, Inc.* | | | 25 | | | | 700 | |
Bankwell Financial Group, Inc. | | | 23 | | | | 689 | |
BRT Apartments Corp. REIT | | | 39 | | | | 686 | |
James River Group Holdings Ltd. | | | 108 | | | | 677 | |
Atlanticus Holdings Corp.* | | | 19 | | | | 666 | |
Virginia National Bankshares Corp. | | | 16 | | | | 666 | |
Princeton Bancorp, Inc. | | | 18 | | | | 666 | |
LCNB Corp. | | | 43 | | | | 648 | |
BCB Bancorp, Inc. | | | 52 | | | | 642 | |
Oak Valley Bancorp | | | 24 | | | | 638 | |
Star Holdings* | | | 45 | | | | 623 | |
Investar Holding Corp. | | | 32 | | | | 621 | |
Velocity Financial, Inc.* | | | 31 | | | | 608 | |
Seven Hills Realty Trust REIT | | | 44 | | | | 606 | |
National Bankshares, Inc. | | | 20 | | | | 598 | |
Franklin Street Properties Corp. REIT | | | 337 | | | | 596 | |
AFC Gamma, Inc. REIT | | | 58 | | | | 592 | |
Maui Land & Pineapple Company, Inc.* | | | 26 | | | | 584 | |
Provident Bancorp, Inc.* | | | 54 | | | | 583 | |
Crawford & Co. — Class A | | | 53 | | | | 581 | |
Silvercrest Asset Management Group, Inc. — Class A | | | 33 | | | | 569 | |
First Western Financial, Inc.* | | | 28 | | | | 560 | |
240 | THE RYDEX FUNDS SEMI-ANNUAL FINANCIAL REPORT | SEE NOTES TO FINANCIAL STATEMENTS. |
SCHEDULE OF INVESTMENTS (Unaudited)(continued) | September 30, 2024 |
RUSSELL 2000® FUND | |
| | Shares | | | Value | |
ESSA Bancorp, Inc. | | | 29 | | | $ | 557 | |
Granite Point Mortgage Trust, Inc. REIT | | | 174 | | | | 552 | |
MBIA, Inc. | | | 154 | | | | 550 | |
USCB Financial Holdings, Inc. | | | 36 | | | | 549 | |
Ames National Corp. | | | 30 | | | | 547 | |
First Financial Northwest, Inc. | | | 24 | | | | 541 | |
Maiden Holdings Ltd.* | | | 304 | | | | 538 | |
Medallion Financial Corp. | | | 65 | | | | 529 | |
Chemung Financial Corp. | | | 11 | | | | 528 | |
Bank7 Corp. | | | 14 | | | | 525 | |
Stratus Properties, Inc.* | | | 20 | | | | 520 | |
Forge Global Holdings, Inc.* | | | 396 | | | | 519 | |
LINKBANCORP, Inc. | | | 77 | | | | 494 | |
Sky Harbour Group Corp.* | | | 40 | | | | 442 | |
Pioneer Bancorp, Inc.* | | | 40 | | | | 439 | |
Nexpoint Real Estate Finance, Inc. REIT | | | 28 | | | | 438 | |
AlTi Global, Inc.* | | | 116 | | | | 434 | |
Angel Oak Mortgage REIT, Inc. | | | 41 | | | | 428 | |
NI Holdings, Inc.* | | | 27 | | | | 423 | |
Paysign, Inc.* | | | 115 | | | | 422 | |
Peoples Bancorp of North Carolina, Inc. | | | 16 | | | | 406 | |
B Riley Financial, Inc.* | | | 71 | | | | 373 | |
Kingsway Financial Services, Inc.* | | | 45 | | | | 373 | |
Sterling Bancorp, Inc.* | | | 74 | | | | 337 | |
OppFi, Inc. | | | 63 | | | | 298 | |
Sunrise Realty Trust, Inc. REIT | | | 19 | | | | 274 | |
Consumer Portfolio Services, Inc.* | | | 29 | | | | 272 | |
Strawberry Fields REIT, Inc. | | | 20 | | | | 254 | |
Clipper Realty, Inc. REIT | | | 41 | | | | 234 | |
SWK Holdings Corp.* | | | 11 | | | | 190 | |
GoHealth, Inc. — Class A* | | | 16 | | | | 150 | |
Offerpad Solutions, Inc.* | | | 36 | | | | 146 | |
Transcontinental Realty Investors, Inc.* | | | 5 | | | | 144 | |
American Realty Investors, Inc.* | | | 5 | | | | 88 | |
Roadzen, Inc.* | | | 52 | | | | 62 | |
Total Financial | | | | | | | 2,228,944 | |
| | | | | | | | | |
Consumer, Non-cyclical - 13.2% |
Vaxcyte, Inc.* | | | 410 | | | | 46,851 | |
Insmed, Inc.* | | | 536 | | | | 39,128 | |
Sprouts Farmers Market, Inc.* | | | 346 | | | | 38,202 | |
Ensign Group, Inc. | | | 191 | | | | 27,470 | |
Lantheus Holdings, Inc.* | | | 235 | | | | 25,791 | |
Halozyme Therapeutics, Inc.* | | | 428 | | | | 24,499 | |
HealthEquity, Inc.* | | | 291 | | | | 23,818 | |
REVOLUTION Medicines, Inc.* | | | 523 | | | | 23,718 | |
Glaukos Corp.* | | | 168 | | | | 21,887 | |
Cytokinetics, Inc.* | | | 386 | | | | 20,381 | |
Blueprint Medicines Corp.* | | | 216 | | | | 19,980 | |
Merit Medical Systems, Inc.* | | | 196 | | | | 19,371 | |
Option Care Health, Inc.* | | | 589 | | | | 18,436 | |
Brink’s Co. | | | 155 | | | | 17,924 | |
TransMedics Group, Inc.* | | | 110 | | | | 17,270 | |
Avidity Biosciences, Inc.* | | | 371 | | | | 17,040 | |
Verra Mobility Corp.* | | | 572 | | | | 15,907 | |
RadNet, Inc.* | | | 228 | | | | 15,821 | |
Alkermes plc* | | | 563 | | | | 15,758 | |
Krystal Biotech, Inc.* | | | 85 | | | | 15,473 | |
Herc Holdings, Inc. | | | 97 | | | | 15,465 | |
ADMA Biologics, Inc.* | | | 773 | | | | 15,452 | |
Integer Holdings Corp.* | | | 115 | | | | 14,950 | |
Oscar Health, Inc. — Class A* | | | 668 | | | | 14,168 | |
Haemonetics Corp.* | | | 173 | | | | 13,906 | |
Primo Water Corp. | | | 542 | | | | 13,685 | |
Crinetics Pharmaceuticals, Inc.* | | | 267 | | | | 13,644 | |
ICU Medical, Inc.* | | | 74 | | | | 13,484 | |
Korn Ferry | | | 178 | | | | 13,393 | |
Biohaven Ltd.* | | | 259 | | | | 12,942 | |
Corcept Therapeutics, Inc.* | | | 279 | | | | 12,912 | |
Select Medical Holdings Corp. | | | 369 | | | | 12,867 | |
Madrigal Pharmaceuticals, Inc.* | | | 60 | | | | 12,733 | |
Neogen Corp.* | | | 749 | | | | 12,591 | |
Stride, Inc.* | | | 147 | | | | 12,541 | |
Denali Therapeutics, Inc.* | | | 429 | | | | 12,497 | |
Arcellx, Inc.* | | | 148 | | | | 12,359 | |
Bridgebio Pharma, Inc.* | | | 485 | | | | 12,348 | |
Prestige Consumer Healthcare, Inc.* | | | 171 | | | | 12,329 | |
Axonics, Inc.* | | | 176 | | | | 12,250 | |
Nuvalent, Inc. — Class A* | | | 119 | | | | 12,174 | |
WD-40 Co. | | | 47 | | | | 12,120 | |
Lancaster Colony Corp. | | | 67 | | | | 11,830 | |
PROCEPT BioRobotics Corp.* | | | 146 | | | | 11,698 | |
ABM Industries, Inc. | | | 218 | | | | 11,502 | |
Axsome Therapeutics, Inc.* | | | 126 | | | | 11,324 | |
TG Therapeutics, Inc.* | | | 479 | | | | 11,204 | |
CBIZ, Inc.* | | | 165 | | | | 11,103 | |
StoneCo Ltd. — Class A* | | | 983 | | | | 11,069 | |
Simply Good Foods Co.* | | | 315 | | | | 10,953 | |
Insperity, Inc. | | | 124 | | | | 10,912 | |
Alight, Inc. — Class A* | | | 1,456 | | | | 10,774 | |
Amicus Therapeutics, Inc.* | | | 1,007 | | | | 10,755 | |
ICF International, Inc. | | | 64 | | | | 10,675 | |
TriNet Group, Inc. | | | 110 | | | | 10,667 | |
Cal-Maine Foods, Inc. | | | 141 | | | | 10,552 | |
Dyne Therapeutics, Inc.* | | | 279 | | | | 10,022 | |
LivaNova plc* | | | 189 | | | | 9,930 | |
Rhythm Pharmaceuticals, Inc.* | | | 189 | | | | 9,902 | |
CorVel Corp.* | | | 30 | | | | 9,807 | |
PTC Therapeutics, Inc.* | | | 263 | | | | 9,757 | |
Adtalem Global Education, Inc.* | | | 129 | | | | 9,737 | |
Tandem Diabetes Care, Inc.* | | | 224 | | | | 9,500 | |
Guardant Health, Inc.* | | | 405 | | | | 9,291 | |
Alarm.com Holdings, Inc.* | | | 167 | | | | 9,130 | |
Protagonist Therapeutics, Inc.* | | | 202 | | | | 9,090 | |
Graham Holdings Co. — Class B | | | 11 | | | | 9,039 | |
Geron Corp.* | | | 1,988 | | | | 9,026 | |
Veracyte, Inc.* | | | 265 | | | | 9,021 | |
Twist Bioscience Corp.* | | | 199 | | | | 8,991 | |
Ideaya Biosciences, Inc.* | | | 283 | | | | 8,965 | |
J & J Snack Foods Corp. | | | 52 | | | | 8,950 | |
Astrana Health, Inc.* | | | 149 | | | | 8,633 | |
Agios Pharmaceuticals, Inc.* | | | 194 | | | | 8,619 | |
Surgery Partners, Inc.* | | | 265 | | | | 8,544 | |
SEE NOTES TO FINANCIAL STATEMENTS. | THE RYDEX FUNDS SEMI-ANNUAL FINANCIAL REPORT | 241 |
SCHEDULE OF INVESTMENTS (Unaudited)(continued) | September 30, 2024 |
RUSSELL 2000® FUND | |
| | Shares | | | Value | |
Myriad Genetics, Inc.* | | | 309 | | | $ | 8,463 | |
Iovance Biotherapeutics, Inc.* | | | 869 | | | | 8,160 | |
Inter Parfums, Inc. | | | 63 | | | | 8,157 | |
iRhythm Technologies, Inc.* | | | 108 | | | | 8,018 | |
Addus HomeCare Corp.* | | | 60 | | | | 7,982 | |
Arrowhead Pharmaceuticals, Inc.* | | | 412 | | | | 7,980 | |
UFP Technologies, Inc.* | | | 25 | | | | 7,918 | |
Marqeta, Inc. — Class A* | | | 1,601 | | | | 7,877 | |
CONMED Corp. | | | 107 | | | | 7,695 | |
Laureate Education, Inc. — Class A | | | 463 | | | | 7,690 | |
Catalyst Pharmaceuticals, Inc.* | | | 384 | | | | 7,634 | |
SpringWorks Therapeutics, Inc.* | | | 237 | | | | 7,593 | |
Celldex Therapeutics, Inc.* | | | 223 | | | | 7,580 | |
EVERTEC, Inc. | | | 223 | | | | 7,557 | |
Inari Medical, Inc.* | | | 183 | | | | 7,547 | |
Vector Group Ltd. | | | 504 | | | | 7,520 | |
Apogee Therapeutics, Inc.* | | | 126 | | | | 7,401 | |
Payoneer Global, Inc.* | | | 972 | | | | 7,319 | |
Kymera Therapeutics, Inc.* | | | 154 | | | | 7,289 | |
Strategic Education, Inc. | | | 77 | | | | 7,126 | |
Vericel Corp.* | | | 167 | | | | 7,056 | |
PROG Holdings, Inc. | | | 143 | | | | 6,934 | |
TreeHouse Foods, Inc.* | | | 164 | | | | 6,885 | |
Omnicell, Inc.* | | | 157 | | | | 6,845 | |
Flywire Corp.* | | | 417 | | | | 6,835 | |
Intellia Therapeutics, Inc.* | | | 332 | | | | 6,823 | |
Akero Therapeutics, Inc.* | | | 234 | | | | 6,713 | |
Remitly Global, Inc.* | | | 501 | | | | 6,708 | |
Edgewise Therapeutics, Inc.* | | | 251 | | | | 6,699 | |
Huron Consulting Group, Inc.* | | | 61 | | | | 6,631 | |
Summit Therapeutics, Inc.* | | | 302 | | | | 6,614 | |
LeMaitre Vascular, Inc. | | | 70 | | | | 6,502 | |
Beam Therapeutics, Inc.* | | | 264 | | | | 6,468 | |
NeoGenomics, Inc.* | | | 438 | | | | 6,460 | |
Amphastar Pharmaceuticals, Inc.* | | | 133 | | | | 6,454 | |
STAAR Surgical Co.* | | | 171 | | | | 6,353 | |
ACADIA Pharmaceuticals, Inc.* | | | 413 | | | | 6,352 | |
Edgewell Personal Care Co. | | | 170 | | | | 6,178 | |
CG oncology, Inc.* | | | 163 | | | | 6,150 | |
Novavax, Inc.*,1 | | | 485 | | | | 6,126 | |
John Wiley & Sons, Inc. — Class A | | | 125 | | | | 6,031 | |
Vera Therapeutics, Inc.* | | | 135 | | | | 5,967 | |
Upbound Group, Inc. | | | 186 | | | | 5,950 | |
Keros Therapeutics, Inc.* | | | 102 | | | | 5,923 | |
Ligand Pharmaceuticals, Inc. — Class B* | | | 59 | | | | 5,905 | |
Patterson Companies, Inc. | | | 270 | | | | 5,897 | |
RxSight, Inc.* | | | 117 | | | | 5,783 | |
Novocure Ltd.* | | | 368 | | | | 5,752 | |
Immunovant, Inc.* | | | 201 | | | | 5,730 | |
MannKind Corp.* | | | 910 | | | | 5,724 | |
Central Garden & Pet Co. — Class A* | | | 181 | | | | 5,684 | |
Andersons, Inc. | | | 113 | | | | 5,666 | |
LiveRamp Holdings, Inc.* | | | 225 | | | | 5,576 | |
AMN Healthcare Services, Inc.* | | | 131 | | | | 5,553 | |
Ardelyx, Inc.* | | | 798 | | | | 5,498 | |
GEO Group, Inc.* | | | 427 | | | | 5,487 | |
Arvinas, Inc.* | | | 222 | | | | 5,468 | |
Syndax Pharmaceuticals, Inc.* | | | 284 | | | | 5,467 | |
PACS Group, Inc.* | | | 136 | | | | 5,436 | |
Supernus Pharmaceuticals, Inc.* | | | 174 | | | | 5,425 | |
National Healthcare Corp. | | | 43 | | | | 5,408 | |
Recursion Pharmaceuticals, Inc. — Class A*,1 | | | 819 | | | | 5,397 | |
BioCryst Pharmaceuticals, Inc.* | | | 709 | | | | 5,388 | |
CareDx, Inc.* | | | 172 | | | | 5,371 | |
Teladoc Health, Inc.* | | | 584 | | | | 5,361 | |
Mirum Pharmaceuticals, Inc.* | | | 136 | | | | 5,304 | |
Chefs’ Warehouse, Inc.* | | | 121 | | | | 5,083 | |
Dynavax Technologies Corp.* | | | 452 | | | | 5,035 | |
Perdoceo Education Corp. | | | 226 | | | | 5,026 | |
Viridian Therapeutics, Inc.* | | | 216 | | | | 4,914 | |
Kura Oncology, Inc.* | | | 251 | | | | 4,904 | |
Progyny, Inc.* | | | 291 | | | | 4,877 | |
Cimpress plc* | | | 59 | | | | 4,833 | |
Helen of Troy Ltd.* | | | 78 | | | | 4,824 | |
CoreCivic, Inc.* | | | 379 | | | | 4,794 | |
Harrow, Inc.* | | | 105 | | | | 4,721 | |
Nurix Therapeutics, Inc.* | | | 209 | | | | 4,696 | |
Inmode Ltd.* | | | 275 | | | | 4,661 | |
Ocular Therapeutix, Inc.* | | | 534 | | | | 4,646 | |
AtriCure, Inc.* | | | 163 | | | | 4,571 | |
Amneal Pharmaceuticals, Inc.* | | | 546 | | | | 4,543 | |
Brookdale Senior Living, Inc. — Class A* | | | 657 | | | | 4,461 | |
Universal Corp. | | | 83 | | | | 4,408 | |
Janux Therapeutics, Inc.* | | | 97 | | | | 4,407 | |
US Physical Therapy, Inc. | | | 52 | | | | 4,401 | |
Collegium Pharmaceutical, Inc.* | | | 113 | | | | 4,366 | |
Dole plc | | | 260 | | | | 4,235 | |
Quanex Building Products Corp. | | | 152 | | | | 4,218 | |
Integra LifeSciences Holdings Corp.* | | | 232 | | | | 4,215 | |
Rocket Pharmaceuticals, Inc.* | | | 228 | | | | 4,211 | |
Harmony Biosciences Holdings, Inc.* | | | 105 | | | | 4,200 | |
Avadel Pharmaceuticals plc* | | | 319 | | | | 4,184 | |
Tarsus Pharmaceuticals, Inc.* | | | 127 | | | | 4,177 | |
agilon health, Inc.* | | | 1,059 | | | | 4,162 | |
Xencor, Inc.* | | | 205 | | | | 4,123 | |
Cassava Sciences, Inc.* | | | 140 | | | | 4,120 | |
Owens & Minor, Inc.* | | | 260 | | | | 4,079 | |
MGP Ingredients, Inc.1 | | | 49 | | | | 4,079 | |
CRA International, Inc. | | | 23 | | | | 4,032 | |
Arlo Technologies, Inc.* | | | 329 | | | | 3,984 | |
Utz Brands, Inc. | | | 225 | | | | 3,982 | |
Vital Farms, Inc.* | | | 113 | | | | 3,963 | |
Kforce, Inc. | | | 64 | | | | 3,933 | |
Weis Markets, Inc. | | | 57 | | | | 3,929 | |
AdaptHealth Corp.* | | | 349 | | | | 3,919 | |
WK Kellogg Co. | | | 226 | | | | 3,867 | |
Soleno Therapeutics, Inc.* | | | 76 | | | | 3,837 | |
Neumora Therapeutics, Inc.* | | | 290 | | | | 3,831 | |
Vita Coco Company, Inc.* | | | 135 | | | | 3,822 | |
ANI Pharmaceuticals, Inc.* | | | 64 | | | | 3,818 | |
National Beverage Corp. | | | 81 | | | | 3,802 | |
242 | THE RYDEX FUNDS SEMI-ANNUAL FINANCIAL REPORT | SEE NOTES TO FINANCIAL STATEMENTS. |
SCHEDULE OF INVESTMENTS (Unaudited)(continued) | September 30, 2024 |
RUSSELL 2000® FUND | |
| | Shares | | | Value | |
Avanos Medical, Inc.* | | | 157 | | | $ | 3,773 | |
Coursera, Inc.* | | | 472 | | | | 3,748 | |
Longboard Pharmaceuticals, Inc.* | | | 112 | | | | 3,733 | |
Ingles Markets, Inc. — Class A | | | 50 | | | | 3,730 | |
Innoviva, Inc.* | | | 191 | | | | 3,688 | |
Artivion, Inc.* | | | 137 | | | | 3,647 | |
Transcat, Inc.* | | | 30 | | | | 3,623 | |
Pennant Group, Inc.* | | | 100 | | | | 3,570 | |
Travere Therapeutics, Inc.* | | | 254 | | | | 3,553 | |
Spyre Therapeutics, Inc.* | | | 119 | | | | 3,500 | |
First Advantage Corp.* | | | 175 | | | | 3,474 | |
Fresh Del Monte Produce, Inc. | | | 117 | | | | 3,456 | |
Praxis Precision Medicines, Inc.* | | | 60 | | | | 3,452 | |
Cogent Biosciences, Inc.* | | | 317 | | | | 3,424 | |
United Natural Foods, Inc.* | | | 203 | | | | 3,414 | |
Arcutis Biotherapeutics, Inc.* | | | 367 | | | | 3,413 | |
Aurinia Pharmaceuticals, Inc.* | | | 461 | | | | 3,379 | |
Pediatrix Medical Group, Inc.* | | | 291 | | | | 3,373 | |
Disc Medicine, Inc.* | | | 68 | | | | 3,342 | |
Barrett Business Services, Inc. | | | 89 | | | | 3,338 | |
Kiniksa Pharmaceuticals International plc* | | | 129 | | | | 3,224 | |
Krispy Kreme, Inc. | | | 295 | | | | 3,168 | |
Maravai LifeSciences Holdings, Inc. — Class A* | | | 381 | | | | 3,166 | |
BrightView Holdings, Inc.* | | | 200 | | | | 3,148 | |
Enliven Therapeutics, Inc.* | | | 122 | | | | 3,116 | |
Evolus, Inc.* | | | 191 | | | | 3,094 | |
BioLife Solutions, Inc.* | | | 122 | | | | 3,055 | |
Legalzoom.com, Inc.* | | | 473 | | | | 3,004 | |
Deluxe Corp. | | | 153 | | | | 2,982 | |
Cullinan Therapeutics, Inc.* | | | 178 | | | | 2,980 | |
Monro, Inc. | | | 103 | | | | 2,973 | |
Driven Brands Holdings, Inc.* | | | 208 | | | | 2,968 | |
John B Sanfilippo & Son, Inc. | | | 31 | | | | 2,924 | |
LifeStance Health Group, Inc.* | | | 412 | | | | 2,884 | |
Arcus Biosciences, Inc.* | | | 188 | | | | 2,875 | |
PetIQ, Inc.* | | | 93 | | | | 2,862 | |
Healthcare Services Group, Inc.* | | | 254 | | | | 2,837 | |
Applied Therapeutics, Inc.* | | | 332 | | | | 2,822 | |
Embecta Corp. | | | 200 | | | | 2,820 | |
BrightSpring Health Services, Inc.* | | | 186 | | | | 2,730 | |
Heidrick & Struggles International, Inc. | | | 69 | | | | 2,681 | |
Hain Celestial Group, Inc.* | | | 310 | | | | 2,675 | |
Community Health Systems, Inc.* | | | 433 | | | | 2,628 | |
Immunome, Inc.* | | | 178 | | | | 2,602 | |
SpartanNash Co. | | | 116 | | | | 2,600 | |
Repay Holdings Corp.* | | | 313 | | | | 2,554 | |
Turning Point Brands, Inc. | | | 59 | | | | 2,546 | |
Viad Corp.* | | | 71 | | | | 2,544 | |
Castle Biosciences, Inc.* | | | 89 | | | | 2,538 | |
Day One Biopharmaceuticals, Inc.* | | | 179 | | | | 2,493 | |
Paysafe Ltd.* | | | 111 | | | | 2,490 | |
Herbalife Ltd.* | | | 345 | | | | 2,480 | |
ARS Pharmaceuticals, Inc.* | | | 170 | | | | 2,465 | |
Prothena Corporation plc* | | | 147 | | | | 2,459 | |
Avid Bioservices, Inc.* | | | 215 | | | | 2,447 | |
Udemy, Inc.* | | | 328 | | | | 2,440 | |
Relay Therapeutics, Inc.* | | | 343 | | | | 2,428 | |
Zymeworks, Inc.* | | | 193 | | | | 2,422 | |
MiMedx Group, Inc.* | | | 409 | | | | 2,417 | |
Matthews International Corp. — Class A | | | 103 | | | | 2,390 | |
B&G Foods, Inc. | | | 268 | | | | 2,380 | |
Pacira BioSciences, Inc.* | | | 158 | | | | 2,378 | |
ZipRecruiter, Inc. — Class A* | | | 246 | | | | 2,337 | |
Cytek Biosciences, Inc.* | | | 419 | | | | 2,321 | |
Vir Biotechnology, Inc.* | | | 309 | | | | 2,314 | |
Kelly Services, Inc. — Class A | | | 107 | | | | 2,291 | |
Hackett Group, Inc. | | | 87 | | | | 2,285 | |
ArriVent Biopharma, Inc.* | | | 97 | | | | 2,279 | |
AnaptysBio, Inc.* | | | 68 | | | | 2,278 | |
Dianthus Therapeutics, Inc.* | | | 82 | | | | 2,245 | |
Universal Technical Institute, Inc.* | | | 136 | | | | 2,211 | |
Pliant Therapeutics, Inc.* | | | 197 | | | | 2,208 | |
WaVe Life Sciences Ltd.* | | | 268 | | | | 2,198 | |
Cargo Therapeutics, Inc.* | | | 118 | | | | 2,177 | |
Perspective Therapeutics, Inc.* | | | 163 | | | | 2,176 | |
ORIC Pharmaceuticals, Inc.* | | | 212 | | | | 2,173 | |
Green Dot Corp. — Class A* | | | 184 | | | | 2,155 | |
Ennis, Inc. | | | 88 | | | | 2,140 | |
Phathom Pharmaceuticals, Inc.* | | | 118 | | | | 2,133 | |
Mister Car Wash, Inc.* | | | 321 | | | | 2,090 | |
89bio, Inc.* | | | 280 | | | | 2,072 | |
Tourmaline Bio, Inc. | | | 80 | | | | 2,057 | |
Adaptive Biotechnologies Corp.* | | | 400 | | | | 2,048 | |
Axogen, Inc.* | | | 146 | | | | 2,047 | |
SunOpta, Inc.* | | | 317 | | | | 2,022 | |
Ironwood Pharmaceuticals, Inc. — Class A* | | | 488 | | | | 2,011 | |
Liquidia Corp.* | | | 199 | | | | 1,990 | |
SI-BONE, Inc.* | | | 141 | | | | 1,971 | |
Alphatec Holdings, Inc.* | | | 352 | | | | 1,957 | |
Cass Information Systems, Inc. | | | 47 | | | | 1,950 | |
Mission Produce, Inc.* | | | 150 | | | | 1,923 | |
Replimune Group, Inc.* | | | 174 | | | | 1,907 | |
Sterling Check Corp.* | | | 114 | | | | 1,906 | |
Scholar Rock Holding Corp.* | | | 236 | | | | 1,890 | |
Sana Biotechnology, Inc.* | | | 454 | | | | 1,889 | |
Surmodics, Inc.* | | | 48 | | | | 1,861 | |
4D Molecular Therapeutics, Inc.* | | | 172 | | | | 1,859 | |
Arbutus Biopharma Corp.* | | | 482 | | | | 1,856 | |
Revance Therapeutics, Inc.* | | | 357 | | | | 1,853 | |
Arcturus Therapeutics Holdings, Inc.* | | | 79 | | | | 1,834 | |
ImmunityBio, Inc.*,1 | | | 489 | | | | 1,819 | |
Orthofix Medical, Inc.* | | | 116 | | | | 1,812 | |
GeneDx Holdings Corp.* | | | 42 | | | | 1,783 | |
ACCO Brands Corp. | | | 323 | | | | 1,767 | |
Willdan Group, Inc.* | | | 43 | | | | 1,761 | |
Concentra Group Holdings Parent, Inc. | | | 78 | | | | 1,744 | |
Annexon, Inc.* | | | 291 | | | | 1,723 | |
Astria Therapeutics, Inc.* | | | 156 | | | | 1,718 | |
Y-mAbs Therapeutics, Inc.* | | | 127 | | | | 1,670 | |
REGENXBIO, Inc.* | | | 159 | | | | 1,668 | |
SEE NOTES TO FINANCIAL STATEMENTS. | THE RYDEX FUNDS SEMI-ANNUAL FINANCIAL REPORT | 243 |
SCHEDULE OF INVESTMENTS (Unaudited)(continued) | September 30, 2024 |
RUSSELL 2000® FUND | |
| | Shares | | | Value | |
OPKO Health, Inc.*,1 | | | 1,118 | | | $ | 1,666 | |
Erasca, Inc.* | | | 609 | | | | 1,663 | |
Terns Pharmaceuticals, Inc.* | | | 199 | | | | 1,660 | |
Calavo Growers, Inc. | | | 58 | | | | 1,655 | |
Humacyte, Inc.* | | | 304 | | | | 1,654 | |
Olema Pharmaceuticals, Inc.* | | | 138 | | | | 1,648 | |
Tyra Biosciences, Inc.* | | | 70 | | | | 1,646 | |
Quanterix Corp.* | | | 124 | | | | 1,607 | |
Franklin Covey Co.* | | | 39 | | | | 1,604 | |
Phibro Animal Health Corp. — Class A | | | 71 | | | | 1,599 | |
Varex Imaging Corp.* | | | 134 | | | | 1,597 | |
Pacific Biosciences of California, Inc.* | | | 939 | | | | 1,596 | |
Bioventus, Inc. — Class A* | | | 130 | | | | 1,554 | |
OrthoPediatrics Corp.* | | | 57 | | | | 1,545 | |
Carriage Services, Inc. — Class A | | | 47 | | | | 1,543 | |
Limoneira Co. | | | 58 | | | | 1,537 | |
CorMedix, Inc.* | | | 190 | | | | 1,535 | |
Fulgent Genetics, Inc.* | | | 70 | | | | 1,521 | |
KalVista Pharmaceuticals, Inc.* | | | 131 | | | | 1,517 | |
Stoke Therapeutics, Inc.* | | | 123 | | | | 1,512 | |
UroGen Pharma Ltd.* | | | 119 | | | | 1,511 | |
Neurogene, Inc.* | | | 36 | | | | 1,511 | |
Altimmune, Inc.* | | | 246 | | | | 1,510 | |
USANA Health Sciences, Inc.* | | | 39 | | | | 1,479 | |
Cross Country Healthcare, Inc.* | | | 110 | | | | 1,478 | |
Zimvie, Inc.* | | | 93 | | | | 1,476 | |
Distribution Solutions Group, Inc.* | | | 38 | | | | 1,463 | |
Anavex Life Sciences Corp.* | | | 251 | | | | 1,426 | |
Aura Biosciences, Inc.* | | | 160 | | | | 1,426 | |
Savara, Inc.* | | | 335 | | | | 1,420 | |
Nuvation Bio, Inc.* | | | 619 | | | | 1,417 | |
Mind Medicine MindMed, Inc.* | | | 248 | | | | 1,411 | |
MaxCyte, Inc.* | | | 362 | | | | 1,408 | |
iRadimed Corp. | | | 28 | | | | 1,408 | |
Beyond Meat, Inc.* | | | 206 | | | | 1,397 | |
Hertz Global Holdings, Inc.* | | | 421 | | | | 1,389 | |
EyePoint Pharmaceuticals, Inc.* | | | 173 | | | | 1,382 | |
Xeris Biopharma Holdings, Inc.* | | | 481 | | | | 1,371 | |
Enhabit, Inc.* | | | 173 | | | | 1,367 | |
Sezzle, Inc.* | | | 8 | | | | 1,365 | |
Entrada Therapeutics, Inc.* | | | 85 | | | | 1,358 | |
OmniAb, Inc.* | | | 319 | | | | 1,349 | |
Sage Therapeutics, Inc.* | | | 186 | | | | 1,343 | |
Capricor Therapeutics, Inc.* | | | 88 | | | | 1,338 | |
Alector, Inc.* | | | 279 | | | | 1,300 | |
Tejon Ranch Co.* | | | 73 | | | | 1,281 | |
Aquestive Therapeutics, Inc.* | | | 257 | | | | 1,280 | |
Tango Therapeutics, Inc.* | | | 165 | | | | 1,270 | |
ACELYRIN, Inc.* | | | 252 | | | | 1,242 | |
Central Garden & Pet Co.* | | | 34 | | | | 1,240 | |
National Research Corp. — Class A | | | 53 | | | | 1,212 | |
Fate Therapeutics, Inc.* | | | 346 | | | | 1,211 | |
Celcuity, Inc.* | | | 81 | | | | 1,208 | |
Moneylion, Inc.* | | | 29 | | | | 1,205 | |
Mineralys Therapeutics, Inc.* | | | 99 | | | | 1,199 | |
Tactile Systems Technology, Inc.* | | | 82 | | | | 1,198 | |
Verve Therapeutics, Inc.* | | | 245 | | | | 1,186 | |
DocGo, Inc.* | | | 351 | | | | 1,165 | |
C4 Therapeutics, Inc.* | | | 202 | | | | 1,151 | |
Nano-X Imaging Ltd.*,1 | | | 187 | | | | 1,137 | |
Pulse Biosciences, Inc.* | | | 64 | | | | 1,123 | |
Olaplex Holdings, Inc.* | | | 476 | | | | 1,119 | |
Taysha Gene Therapies, Inc.* | | | 553 | | | | 1,112 | |
Anika Therapeutics, Inc.* | | | 45 | | | | 1,111 | |
Paragon 28, Inc.* | | | 163 | | | | 1,089 | |
SIGA Technologies, Inc. | | | 161 | | | | 1,087 | |
Resources Connection, Inc. | | | 112 | | | | 1,086 | |
Pulmonx Corp.* | | | 131 | | | | 1,086 | |
Cerus Corp.* | | | 619 | | | | 1,077 | |
Lincoln Educational Services Corp.* | | | 90 | | | | 1,075 | |
Esperion Therapeutics, Inc.*,1 | | | 649 | | | | 1,071 | |
Aaron’s Company, Inc. | | | 107 | | | | 1,065 | |
Duckhorn Portfolio, Inc.* | | | 183 | | | | 1,063 | |
Seneca Foods Corp. — Class A* | | | 17 | | | | 1,060 | |
OraSure Technologies, Inc.* | | | 248 | | | | 1,059 | |
Absci Corp.* | | | 276 | | | | 1,054 | |
LENZ Therapeutics, Inc. | | | 44 | | | | 1,045 | |
AngioDynamics, Inc.* | | | 132 | | | | 1,027 | |
Theravance Biopharma, Inc.* | | | 127 | | | | 1,024 | |
Allogene Therapeutics, Inc.* | | | 363 | | | | 1,016 | |
Zevra Therapeutics, Inc.* | | | 146 | | | | 1,013 | |
Honest Company, Inc.* | | | 276 | | | | 985 | |
Treace Medical Concepts, Inc.* | | | 169 | | | | 980 | |
Sutro Biopharma, Inc.* | | | 283 | | | | 979 | |
Editas Medicine, Inc.* | | | 287 | | | | 979 | |
Rigel Pharmaceuticals, Inc.* | | | 60 | | | | 971 | |
Accolade, Inc.* | | | 251 | | | | 966 | |
Biomea Fusion, Inc.* | | | 95 | | | | 959 | |
Larimar Therapeutics, Inc.* | | | 146 | | | | 956 | |
Village Super Market, Inc. — Class A | | | 30 | | | | 954 | |
Natural Grocers by Vitamin Cottage, Inc. | | | 32 | | | | 950 | |
Avita Medical, Inc.* | | | 88 | | | | 943 | |
Akebia Therapeutics, Inc.* | | | 714 | | | | 942 | |
Q32 Bio, Inc.* | | | 21 | | | | 937 | |
Aveanna Healthcare Holdings, Inc.* | | | 180 | | | | 936 | |
Third Harmonic Bio, Inc.* | | | 69 | | | | 935 | |
Inozyme Pharma, Inc.* | | | 178 | | | | 931 | |
Voyager Therapeutics, Inc.* | | | 159 | | | | 930 | |
Aldeyra Therapeutics, Inc.* | | | 172 | | | | 927 | |
Vanda Pharmaceuticals, Inc.* | | | 197 | | | | 924 | |
iTeos Therapeutics, Inc.* | | | 90 | | | | 919 | |
Performant Financial Corp.* | | | 244 | | | | 913 | |
Atea Pharmaceuticals, Inc.* | | | 266 | | | | 891 | |
Target Hospitality Corp.* | | | 114 | | | | 887 | |
Viemed Healthcare, Inc.* | | | 119 | | | | 872 | |
Ocugen, Inc.* | | | 878 | | | | 871 | |
IGM Biosciences, Inc.* | | | 52 | | | | 860 | |
CompoSecure, Inc. — Class A1 | | | 61 | | | | 855 | |
Alto Neuroscience, Inc.* | | | 73 | | | | 835 | |
Mama’s Creations, Inc.* | | | 114 | | | | 832 | |
Nkarta, Inc.* | | | 183 | | | | 827 | |
TrueBlue, Inc.* | | | 103 | | | | 813 | |
244 | THE RYDEX FUNDS SEMI-ANNUAL FINANCIAL REPORT | SEE NOTES TO FINANCIAL STATEMENTS. |
SCHEDULE OF INVESTMENTS (Unaudited)(continued) | September 30, 2024 |
RUSSELL 2000® FUND | |
| | Shares | | | Value | |
American Public Education, Inc.* | | | 55 | | | $ | 811 | |
Foghorn Therapeutics, Inc.* | | | 87 | | | | 810 | |
Nathan’s Famous, Inc. | | | 10 | | | | 809 | |
Utah Medical Products, Inc. | | | 12 | | | | 803 | |
Heron Therapeutics, Inc.*,1 | | | 403 | | | | 802 | |
2seventy bio, Inc.* | | | 169 | | | | 798 | |
Nektar Therapeutics* | | | 613 | | | | 797 | |
European Wax Center, Inc. — Class A* | | | 117 | | | | 796 | |
Inogen, Inc.* | | | 82 | | | | 795 | |
Ardent Health Partners, Inc. | | | 42 | | | | 772 | |
Spire Global, Inc.*,1 | | | 77 | | | | 769 | |
Omeros Corp.* | | | 193 | | | | 766 | |
Fulcrum Therapeutics, Inc.* | | | 214 | | | | 764 | |
ADC Therapeutics S.A.* | | | 242 | | | | 762 | |
Lyell Immunopharma, Inc.* | | | 552 | | | | 762 | |
Westrock Coffee Co.* | | | 117 | | | | 761 | |
Prime Medicine, Inc.* | | | 196 | | | | 759 | |
Artiva Biotherapeutics, Inc.* | | | 48 | | | | 742 | |
XOMA Royalty Corp.* | | | 28 | | | | 741 | |
Sera Prognostics, Inc. — Class A* | | | 95 | | | | 741 | |
Forrester Research, Inc.* | | | 41 | | | | 738 | |
Mersana Therapeutics, Inc.* | | | 389 | | | | 735 | |
Jasper Therapeutics, Inc.* | | | 39 | | | | 734 | |
Lexeo Therapeutics, Inc.* | | | 81 | | | | 732 | |
Zentalis Pharmaceuticals, Inc.* | | | 198 | | | | 729 | |
Corbus Pharmaceuticals Holdings, Inc.* | | | 35 | | | | 722 | |
Enanta Pharmaceuticals, Inc.* | | | 69 | | | | 715 | |
Organogenesis Holdings, Inc.* | | | 249 | | | | 712 | |
Medifast, Inc.* | | | 37 | | | | 708 | |
Nevro Corp.* | | | 126 | | | | 704 | |
Korro Bio, Inc.* | | | 21 | | | | 702 | |
Alico, Inc. | | | 25 | | | | 699 | |
Cabaletta Bio, Inc.* | | | 148 | | | | 699 | |
MacroGenics, Inc.* | | | 212 | | | | 697 | |
Trevi Therapeutics, Inc.* | | | 203 | | | | 678 | |
Poseida Therapeutics, Inc.* | | | 237 | | | | 678 | |
TScan Therapeutics, Inc.* | | | 133 | | | | 662 | |
Atossa Therapeutics, Inc.* | | | 434 | | | | 660 | |
Rapport Therapeutics, Inc.* | | | 32 | | | | 655 | |
Compass Therapeutics, Inc.* | | | 352 | | | | 648 | |
Alta Equipment Group, Inc. | | | 93 | | | | 627 | |
Lexicon Pharmaceuticals, Inc.* | | | 396 | | | | 622 | |
Pyxis Oncology, Inc.* | | | 169 | | | | 620 | |
ChromaDex Corp.* | | | 169 | | | | 617 | |
BRC, Inc. — Class A* | | | 180 | | | | 616 | |
Nature’s Sunshine Products, Inc.* | | | 45 | | | | 613 | |
Custom Truck One Source, Inc.* | | | 176 | | | | 607 | |
Chegg, Inc.* | | | 343 | | | | 607 | |
Acacia Research Corp.* | | | 130 | | | | 606 | |
Accuray, Inc.* | | | 331 | | | | 596 | |
Design Therapeutics, Inc.* | | | 108 | | | | 581 | |
Blade Air Mobility, Inc.* | | | 195 | | | | 573 | |
Achieve Life Sciences, Inc.* | | | 120 | | | | 569 | |
Inhibrx Biosciences, Inc.* | | | 36 | | | | 564 | |
MeiraGTx Holdings plc* | | | 135 | | | | 563 | |
ModivCare, Inc.* | | | 39 | | | | 557 | |
Black Diamond Therapeutics, Inc.* | | | 128 | | | | 557 | |
Caribou Biosciences, Inc.* | | | 284 | | | | 557 | |
Monte Rosa Therapeutics, Inc.* | | | 105 | | | | 556 | |
Solid Biosciences, Inc.* | | | 78 | | | | 544 | |
Biote Corp. — Class A* | | | 93 | | | | 519 | |
Eliem Therapeutics, Inc.* | | | 101 | | | | 514 | |
Inovio Pharmaceuticals, Inc.* | | | 88 | | | | 509 | |
MediWound Ltd.* | | | 28 | | | | 506 | |
Adverum Biotechnologies, Inc.* | | | 72 | | | | 505 | |
XBiotech, Inc.* | | | 64 | | | | 495 | |
HF Foods Group, Inc.* | | | 137 | | | | 489 | |
Alumis, Inc. | | | 45 | | | | 481 | |
Nautilus Biotechnology, Inc.* | | | 168 | | | | 479 | |
Candel Therapeutics, Inc.* | | | 69 | | | | 478 | |
CPI Card Group, Inc.* | | | 17 | | | | 473 | |
Quad/Graphics, Inc. | | | 104 | | | | 472 | |
Shattuck Labs, Inc.* | | | 135 | | | | 471 | |
InfuSystem Holdings, Inc.* | | | 69 | | | | 462 | |
PepGen, Inc.* | | | 54 | | | | 462 | |
Ventyx Biosciences, Inc.* | | | 211 | | | | 460 | |
Lineage Cell Therapeutics, Inc.* | | | 507 | | | | 459 | |
scPharmaceuticals, Inc.* | | | 98 | | | | 447 | |
Cadiz, Inc.* | | | 145 | | | | 439 | |
Joint Corp.* | | | 38 | | | | 435 | |
Zynex, Inc.*,1 | | | 53 | | | | 433 | |
Priority Technology Holdings, Inc.* | | | 63 | | | | 430 | |
Sanara Medtech, Inc.* | | | 14 | | | | 423 | |
Generation Bio Co.* | | | 171 | | | | 422 | |
ProKidney Corp.* | | | 218 | | | | 419 | |
Orchestra BioMed Holdings, Inc.* | | | 81 | | | | 416 | |
Ispire Technology, Inc.* | | | 67 | | | | 416 | |
Lifeway Foods, Inc.* | | | 16 | | | | 415 | |
Precigen, Inc.* | | | 437 | | | | 414 | |
Quipt Home Medical Corp.* | | | 141 | | | | 412 | |
Fennec Pharmaceuticals, Inc.* | | | 82 | | | | 410 | |
SoundThinking, Inc.* | | | 35 | | | | 406 | |
CVRx, Inc.* | | | 46 | | | | 405 | |
Cartesian Therapeutics, Inc.*,1 | | | 25 | | | | 403 | |
Information Services Group, Inc. | | | 122 | | | | 403 | |
Innovage Holding Corp.* | | | 66 | | | | 396 | |
Coherus Biosciences, Inc.* | | | 380 | | | | 395 | |
X4 Pharmaceuticals, Inc.* | | | 577 | | | | 386 | |
Stereotaxis, Inc.* | | | 189 | | | | 386 | |
Agenus, Inc.* | | | 70 | | | | 384 | |
Harvard Bioscience, Inc.* | | | 141 | | | | 379 | |
Semler Scientific, Inc.* | | | 16 | | | | 377 | |
Scilex Holding Co.* | | | 402 | | | | 371 | |
Beauty Health Co.* | | | 257 | | | | 370 | |
Tenaya Therapeutics, Inc.* | | | 190 | | | | 367 | |
Lifecore Biomedical, Inc.* | | | 74 | | | | 365 | |
Puma Biotechnology, Inc.* | | | 143 | | | | 365 | |
Contineum Therapeutics, Inc. — Class A* | | | 19 | | | | 364 | |
Cardiff Oncology, Inc.* | | | 135 | | | | 360 | |
Acumen Pharmaceuticals, Inc.* | | | 145 | | | | 360 | |
Veru, Inc.* | | | 453 | | | | 348 | |
Regulus Therapeutics, Inc.* | | | 219 | | | | 344 | |
SEE NOTES TO FINANCIAL STATEMENTS. | THE RYDEX FUNDS SEMI-ANNUAL FINANCIAL REPORT | 245 |
SCHEDULE OF INVESTMENTS (Unaudited)(continued) | September 30, 2024 |
RUSSELL 2000® FUND | |
| | Shares | | | Value | |
Bluebird Bio, Inc.* | | | 658 | | | $ | 342 | |
NeuroPace, Inc.* | | | 47 | | | | 328 | |
Sonida Senior Living, Inc.* | | | 12 | | | | 321 | |
Waldencast plc — Class A*,1 | | | 85 | | | | 310 | |
Quantum-Si, Inc.* | | | 346 | | | | 305 | |
Greenwich Lifesciences, Inc.* | | | 21 | | | | 302 | |
Gyre Therapeutics, Inc.* | | | 24 | | | | 301 | |
Kodiak Sciences, Inc.* | | | 113 | | | | 295 | |
Acrivon Therapeutics, Inc.* | | | 41 | | | | 287 | |
Kyverna Therapeutics, Inc.* | | | 58 | | | | 284 | |
Zura Bio Ltd.* | | | 69 | | | | 280 | |
Invivyd, Inc.* | | | 274 | | | | 279 | |
CervoMed, Inc.* | | | 19 | | | | 277 | |
Fibrobiologics, Inc.* | | | 88 | | | | 272 | |
Century Therapeutics, Inc.* | | | 159 | | | | 272 | |
DLH Holdings Corp.* | | | 29 | | | | 271 | |
HireQuest, Inc. | | | 19 | | | | 269 | |
FiscalNote Holdings, Inc.* | | | 208 | | | | 266 | |
Verastem, Inc.* | | | 88 | | | | 263 | |
Emerald Holding, Inc. | | | 52 | | | | 259 | |
Akoya Biosciences, Inc.* | | | 92 | | | | 250 | |
Ovid therapeutics, Inc.* | | | 204 | | | | 241 | |
Skye Bioscience, Inc.* | | | 60 | | | | 235 | |
AirSculpt Technologies, Inc.* | | | 46 | | | | 233 | |
Inmune Bio, Inc.* | | | 43 | | | | 232 | |
Werewolf Therapeutics, Inc.* | | | 105 | | | | 223 | |
Forafric Global plc* | | | 19 | | | | 215 | |
RAPT Therapeutics, Inc.* | | | 104 | | | | 209 | |
ALX Oncology Holdings, Inc.* | | | 114 | | | | 207 | |
Actinium Pharmaceuticals, Inc.* | | | 104 | | | | 196 | |
Galectin Therapeutics, Inc.*,1 | | | 70 | | | | 192 | |
HilleVax, Inc.* | | | 109 | | | | 192 | |
Cibus, Inc.* | | | 52 | | | | 170 | |
Outlook Therapeutics, Inc.* | | | 27 | | | | 144 | |
Telomir Pharmaceuticals, Inc.* | | | 17 | | | | 109 | |
Elevation Oncology, Inc.* | | | 181 | | | | 109 | |
Aerovate Therapeutics, Inc.* | | | 47 | | | | 98 | |
Verrica Pharmaceuticals, Inc.* | | | 66 | | | | 96 | |
Prelude Therapeutics, Inc.* | | | 46 | | | | 95 | |
MarketWise, Inc. | | | 134 | | | | 90 | |
Renovaro, Inc.* | | | 168 | | | | 81 | |
Boundless Bio, Inc.* | | | 22 | | | | 76 | |
Fractyl Health, Inc.* | | | 26 | | | | 66 | |
Metagenomi, Inc.* | | | 22 | | | | 48 | |
Lyra Therapeutics, Inc.* | | | 167 | | | | 43 | |
Tevogen Bio Holdings, Inc.* | | | 76 | | | | 28 | |
Conduit Pharmaceuticals, Inc.* | | | 80 | | | | 9 | |
Ligand Pharmaceuticals, Inc.*,††† | | | 42 | | | | — | |
Ligand Pharmaceuticals, Inc.*,††† | | | 42 | | | | — | |
Total Consumer, Non-cyclical | | | | | | | 2,204,897 | |
| | | | | | | | | |
Industrial - 8.7% |
Fabrinet* | | | 125 | | | | 29,555 | |
Applied Industrial Technologies, Inc. | | | 132 | | | | 29,453 | |
Mueller Industries, Inc. | | | 384 | | | | 28,454 | |
Fluor Corp.* | | | 586 | | | | 27,958 | |
UFP Industries, Inc. | | | 208 | | | | 27,292 | |
SPX Technologies, Inc.* | | | 155 | | | | 24,716 | |
Modine Manufacturing Co.* | | | 178 | | | | 23,637 | |
Badger Meter, Inc. | | | 101 | | | | 22,059 | |
Novanta, Inc.* | | | 123 | | | | 22,007 | |
Casella Waste Systems, Inc. — Class A* | | | 212 | | | | 21,092 | |
CSW Industrials, Inc. | | | 57 | | | | 20,884 | |
Exponent, Inc. | | | 174 | | | | 20,059 | |
Moog, Inc. — Class A | | | 98 | | | | 19,798 | |
Watts Water Technologies, Inc. — Class A | | | 94 | | | | 19,476 | |
Dycom Industries, Inc.* | | | 98 | | | | 19,316 | |
Federal Signal Corp. | | | 206 | | | | 19,253 | |
Boise Cascade Co. | | | 136 | | | | 19,173 | |
NEXTracker, Inc. — Class A* | | | 495 | | | | 18,553 | |
Chart Industries, Inc.* | | | 146 | | | | 18,124 | |
AeroVironment, Inc.* | | | 90 | | | | 18,045 | |
Zurn Elkay Water Solutions Corp. | | | 495 | | | | 17,790 | |
Knife River Corp.* | | | 196 | | | | 17,520 | |
Itron, Inc.* | | | 158 | | | | 16,876 | |
Matson, Inc. | | | 117 | | | | 16,687 | |
Franklin Electric Company, Inc. | | | 156 | | | | 16,352 | |
GATX Corp. | | | 123 | | | | 16,292 | |
Belden, Inc. | | | 139 | | | | 16,281 | |
Summit Materials, Inc. — Class A* | | | 416 | | | | 16,236 | |
Arcosa, Inc. | | | 167 | | | | 15,825 | |
Sterling Infrastructure, Inc.* | | | 104 | | | | 15,082 | |
EnerSys | | | 138 | | | | 14,083 | |
Advanced Energy Industries, Inc. | | | 129 | | | | 13,576 | |
Kadant, Inc. | | | 40 | | | | 13,520 | |
Cactus, Inc. — Class A | | | 226 | | | | 13,485 | |
RXO, Inc.* | | | 466 | | | | 13,048 | |
Frontdoor, Inc.* | | | 270 | | | | 12,957 | |
Plexus Corp.* | | | 94 | | | | 12,851 | |
Sanmina Corp.* | | | 184 | | | | 12,595 | |
Golar LNG Ltd. | | | 342 | | | | 12,572 | |
Terex Corp. | | | 229 | | | | 12,116 | |
Granite Construction, Inc. | | | 152 | | | | 12,050 | |
Kratos Defense & Security Solutions, Inc.* | | | 508 | | | | 11,836 | |
Enpro, Inc. | | | 72 | | | | 11,677 | |
Rocket Lab USA, Inc.* | | | 1,194 | | | | 11,618 | |
Mueller Water Products, Inc. — Class A | | | 533 | | | | 11,566 | |
Scorpio Tankers, Inc. | | | 162 | | | | 11,551 | |
ESCO Technologies, Inc. | | | 89 | | | | 11,479 | |
Atmus Filtration Technologies, Inc. | | | 289 | | | | 10,846 | |
John Bean Technologies Corp. | | | 110 | | | | 10,836 | |
Atkore, Inc. | | | 127 | | | | 10,762 | |
Primoris Services Corp. | | | 184 | | | | 10,687 | |
Construction Partners, Inc. — Class A* | | | 147 | | | | 10,261 | |
Trinity Industries, Inc. | | | 282 | | | | 9,825 | |
Albany International Corp. — Class A | | | 108 | | | | 9,596 | |
Hub Group, Inc. — Class A | | | 211 | | | | 9,590 | |
Griffon Corp. | | | 129 | | | | 9,030 | |
ArcBest Corp. | | | 81 | | | | 8,784 | |
OSI Systems, Inc.* | | | 56 | | | | 8,502 | |
AZZ, Inc. | | | 101 | | | | 8,344 | |
Vishay Intertechnology, Inc. | | | 436 | | | | 8,245 | |
Werner Enterprises, Inc. | | | 212 | | | | 8,181 | |
246 | THE RYDEX FUNDS SEMI-ANNUAL FINANCIAL REPORT | SEE NOTES TO FINANCIAL STATEMENTS. |
SCHEDULE OF INVESTMENTS (Unaudited)(continued) | September 30, 2024 |
RUSSELL 2000® FUND | |
| | Shares | | | Value | |
Masterbrand, Inc.* | | | 437 | | | $ | 8,102 | |
Materion Corp. | | | 71 | | | | 7,942 | |
Energizer Holdings, Inc. | | | 248 | | | | 7,876 | |
Enerpac Tool Group Corp. | | | 188 | | | | 7,875 | |
AAR Corp.* | | | 119 | | | | 7,778 | |
Mirion Technologies, Inc.* | | | 686 | | | | 7,594 | |
Gibraltar Industries, Inc.* | | | 106 | | | | 7,413 | |
Standex International Corp. | | | 40 | | | | 7,311 | |
Bloom Energy Corp. — Class A*,1 | | | 683 | | | | 7,213 | |
Leonardo DRS, Inc.* | | | 254 | | | | 7,168 | |
International Seaways, Inc. | | | 139 | | | | 7,167 | |
Hillman Solutions Corp.* | | | 675 | | | | 7,128 | |
Powell Industries, Inc. | | | 32 | | | | 7,104 | |
Kennametal, Inc. | | | 273 | | | | 7,079 | |
Mercury Systems, Inc.* | | | 189 | | | | 6,993 | |
O-I Glass, Inc.* | | | 532 | | | | 6,980 | |
Joby Aviation, Inc.*,1 | | | 1,380 | | | | 6,941 | |
Hillenbrand, Inc. | | | 242 | | | | 6,728 | |
Barnes Group, Inc. | | | 160 | | | | 6,466 | |
TTM Technologies, Inc.* | | | 349 | | | | 6,369 | |
Tennant Co. | | | 66 | | | | 6,339 | |
Alamo Group, Inc. | | | 35 | | | | 6,305 | |
World Kinect Corp. | | | 199 | | | | 6,151 | |
MYR Group, Inc.* | | | 57 | | | | 5,827 | |
Golden Ocean Group Ltd. | | | 420 | | | | 5,620 | |
IES Holdings, Inc.* | | | 28 | | | | 5,589 | |
Aspen Aerogels, Inc.* | | | 201 | | | | 5,566 | |
Helios Technologies, Inc. | | | 115 | | | | 5,485 | |
Benchmark Electronics, Inc. | | | 123 | | | | 5,451 | |
Greenbrier Companies, Inc. | | | 106 | | | | 5,394 | |
Knowles Corp.* | | | 299 | | | | 5,391 | |
Greif, Inc. — Class A | | | 86 | | | | 5,389 | |
Tecnoglass, Inc. | | | 78 | | | | 5,355 | |
Apogee Enterprises, Inc. | | | 75 | | | | 5,251 | |
DHT Holdings, Inc. | | | 463 | | | | 5,107 | |
CTS Corp. | | | 105 | | | | 5,080 | |
American Woodmark Corp.* | | | 54 | | | | 5,046 | |
Napco Security Technologies, Inc. | | | 122 | | | | 4,936 | |
Janus International Group, Inc.* | | | 487 | | | | 4,924 | |
Teekay Tankers Ltd. — Class A | | | 83 | | | | 4,835 | |
Enovix Corp.*,1 | | | 513 | | | | 4,791 | |
JELD-WEN Holding, Inc.* | | | 297 | | | | 4,696 | |
Lindsay Corp. | | | 37 | | | | 4,612 | |
NV5 Global, Inc.* | | | 49 | | | | 4,580 | |
Worthington Enterprises, Inc. | | | 109 | | | | 4,518 | |
SFL Corporation Ltd. | | | 390 | | | | 4,512 | |
Argan, Inc. | | | 43 | | | | 4,362 | |
Dorian LPG Ltd. | | | 120 | | | | 4,130 | |
Tutor Perini Corp.* | | | 149 | | | | 4,047 | |
PureCycle Technologies, Inc.*,1 | | | 423 | | | | 4,019 | |
Worthington Steel, Inc. | | | 113 | | | | 3,843 | |
Ichor Holdings Ltd.* | | | 113 | | | | 3,595 | |
TriMas Corp. | | | 140 | | | | 3,574 | |
Columbus McKinnon Corp. | | | 99 | | | | 3,564 | |
Marten Transport Ltd. | | | 200 | | | | 3,540 | |
Thermon Group Holdings, Inc.* | | | 115 | | | | 3,432 | |
Cadre Holdings, Inc. | | | 90 | | | | 3,416 | |
Energy Recovery, Inc.* | | | 196 | | | | 3,408 | |
Vicor Corp.* | | | 78 | | | | 3,284 | |
NuScale Power Corp.* | | | 268 | | | | 3,103 | |
Ducommun, Inc.* | | | 47 | | | | 3,094 | |
Forward Air Corp.* | | | 86 | | | | 3,044 | |
Montrose Environmental Group, Inc.* | | | 110 | | | | 2,893 | |
Triumph Group, Inc.* | | | 223 | | | | 2,874 | |
Air Transport Services Group, Inc.* | | | 177 | | | | 2,866 | |
CECO Environmental Corp.* | | | 101 | | | | 2,848 | |
Genco Shipping & Trading Ltd. | | | 146 | | | | 2,847 | |
Enviri Corp.* | | | 274 | | | | 2,833 | |
Bel Fuse, Inc. — Class B | | | 36 | | | | 2,826 | |
Gorman-Rupp Co. | | | 72 | | | | 2,804 | |
American Superconductor Corp.* | | | 118 | | | | 2,785 | |
Xometry, Inc. — Class A* | | | 146 | | | | 2,682 | |
FLEX LNG Ltd. | | | 105 | | | | 2,671 | |
Limbach Holdings, Inc.* | | | 35 | | | | 2,652 | |
Proto Labs, Inc.* | | | 89 | | | | 2,614 | |
Ardmore Shipping Corp. | | | 143 | | | | 2,588 | |
Nordic American Tankers Ltd. | | | 700 | | | | 2,569 | |
Astec Industries, Inc. | | | 80 | | | | 2,555 | |
Hyster-Yale, Inc. | | | 40 | | | | 2,551 | |
Archer Aviation, Inc. — Class A* | | | 802 | | | | 2,430 | |
Great Lakes Dredge & Dock Corp.* | | | 228 | | | | 2,401 | |
Costamare, Inc. | | | 149 | | | | 2,342 | |
Mesa Laboratories, Inc. | | | 18 | | | | 2,337 | |
Sturm Ruger & Company, Inc. | | | 56 | | | | 2,334 | |
DXP Enterprises, Inc.* | | | 43 | | | | 2,295 | |
Metallus, Inc.* | | | 148 | | | | 2,195 | |
Smith & Wesson Brands, Inc. | | | 158 | | | | 2,051 | |
Insteel Industries, Inc. | | | 65 | | | | 2,021 | |
Heartland Express, Inc. | | | 161 | | | | 1,977 | |
Standard BioTools, Inc.* | | | 1,014 | | | | 1,957 | |
Astronics Corp.* | | | 99 | | | | 1,929 | |
Ryerson Holding Corp. | | | 96 | | | | 1,911 | |
Ardagh Metal Packaging S.A.1 | | | 496 | | | | 1,870 | |
Applied Optoelectronics, Inc.* | | | 128 | | | | 1,832 | |
Evolv Technologies Holdings, Inc.* | | | 451 | | | | 1,827 | |
ChargePoint Holdings, Inc.*,1 | | | 1,333 | | | | 1,826 | |
Teekay Corp.* | | | 197 | | | | 1,812 | |
Myers Industries, Inc. | | | 127 | | | | 1,755 | |
nLight, Inc.* | | | 159 | | | | 1,700 | |
Pactiv Evergreen, Inc. | | | 140 | | | | 1,611 | |
Clearwater Paper Corp.* | | | 56 | | | | 1,598 | |
Kimball Electronics, Inc.* | | | 85 | | | | 1,573 | |
LSI Industries, Inc. | | | 97 | | | | 1,567 | |
Northwest Pipe Co.* | | | 34 | | | | 1,534 | |
Willis Lease Finance Corp. | | | 10 | | | | 1,488 | |
Covenant Logistics Group, Inc. — Class A | | | 28 | | | | 1,480 | |
LSB Industries, Inc.* | | | 184 | | | | 1,479 | |
NVE Corp. | | | 17 | | | | 1,358 | |
National Presto Industries, Inc. | | | 18 | | | | 1,353 | |
Olympic Steel, Inc. | | | 34 | | | | 1,326 | |
CryoPort, Inc.* | | | 150 | | | | 1,216 | |
Luxfer Holdings plc | | | 92 | | | | 1,191 | |
SEE NOTES TO FINANCIAL STATEMENTS. | THE RYDEX FUNDS SEMI-ANNUAL FINANCIAL REPORT | 247 |
SCHEDULE OF INVESTMENTS (Unaudited)(continued) | September 30, 2024 |
RUSSELL 2000® FUND | |
| | Shares | | | Value | |
Greif, Inc. — Class B | | | 17 | | | $ | 1,187 | |
FARO Technologies, Inc.* | | | 62 | | | | 1,187 | |
GrafTech International Ltd.* | | | 889 | | | | 1,173 | |
Manitowoc Company, Inc.* | | | 120 | | | | 1,154 | |
SmartRent, Inc.* | | | 657 | | | | 1,137 | |
Bowman Consulting Group Ltd.* | | | 46 | | | | 1,108 | |
Safe Bulkers, Inc. | | | 208 | | | | 1,077 | |
Stoneridge, Inc.* | | | 94 | | | | 1,052 | |
Iteris, Inc.* | | | 147 | | | | 1,049 | |
Graham Corp.* | | | 35 | | | | 1,036 | |
Universal Logistics Holdings, Inc. | | | 24 | | | | 1,035 | |
Byrna Technologies, Inc.* | | | 60 | | | | 1,018 | |
Eastman Kodak Co.* | | | 209 | | | | 987 | |
Ranpak Holdings Corp.* | | | 148 | | | | 967 | |
Latham Group, Inc.* | | | 140 | | | | 952 | |
Allient, Inc. | | | 50 | | | | 949 | |
Mayville Engineering Company, Inc.* | | | 44 | | | | 928 | |
Park-Ohio Holdings Corp. | | | 30 | | | | 921 | |
Turtle Beach Corp.* | | | 59 | | | | 905 | |
Himalaya Shipping Ltd. | | | 103 | | | | 892 | |
Park Aerospace Corp. | | | 64 | | | | 834 | |
Mistras Group, Inc.* | | | 72 | | | | 819 | |
MicroVision, Inc.* | | | 708 | | | | 807 | |
Radiant Logistics, Inc.* | | | 123 | | | | 791 | |
Intuitive Machines, Inc.*,1 | | | 98 | | | | 789 | |
Pangaea Logistics Solutions Ltd. | | | 108 | | | | 781 | |
Pure Cycle Corp.* | | | 72 | | | | 776 | |
Sight Sciences, Inc.* | | | 121 | | | | 762 | |
Centuri Holdings, Inc.* | | | 47 | | | | 759 | |
Gencor Industries, Inc.* | | | 36 | | | | 751 | |
Profecient Auto Logistics, Inc. | | | 52 | | | | 738 | |
LanzaTech Global, Inc.* | | | 386 | | | | 737 | |
Tredegar Corp.* | | | 92 | | | | 671 | |
L B Foster Co. — Class A* | | | 32 | | | | 654 | |
Karat Packaging, Inc. | | | 24 | | | | 621 | |
NN, Inc.* | | | 159 | | | | 620 | |
Orion Group Holdings, Inc.* | | | 106 | | | | 612 | |
Omega Flex, Inc. | | | 12 | | | | 599 | |
Bel Fuse, Inc. — Class A | | | 6 | | | | 597 | |
GoPro, Inc. — Class A* | | | 432 | | | | 588 | |
AerSale Corp.* | | | 116 | | | | 586 | |
Eastern Co. | | | 18 | | | | 584 | |
Redwire Corp.* | | | 78 | | | | 536 | |
Smith-Midland Corp.* | | | 16 | | | | 534 | |
Perma-Fix Environmental Services, Inc.* | | | 43 | | | | 528 | |
Net Power, Inc.* | | | 73 | | | | 512 | |
Arq, Inc.* | | | 85 | | | | 499 | |
Twin Disc, Inc. | | | 39 | | | | 487 | |
Quest Resource Holding Corp.* | | | 60 | | | | 479 | |
Concrete Pumping Holdings, Inc.* | | | 82 | | | | 475 | |
Core Molding Technologies, Inc.* | | | 27 | | | | 465 | |
AMMO, Inc.* | | | 310 | | | | 443 | |
Taylor Devices, Inc.* | | | 8 | | | | 399 | |
Virgin Galactic Holdings, Inc.*,1 | | | 65 | | | | 396 | |
PAM Transportation Services, Inc.* | | | 21 | | | | 389 | |
Caesarstone Ltd.* | | | 72 | | | | 328 | |
Ultralife Corp.* | | | 36 | | | | 325 | |
374Water, Inc.* | | | 226 | | | | 307 | |
908 Devices, Inc.* | | | 82 | | | | 284 | |
VirTra, Inc.* | | | 37 | | | | 230 | |
NL Industries, Inc. | | | 29 | | | | 216 | |
Eve Holding, Inc.* | | | 61 | | | | 198 | |
Southland Holdings, Inc.* | | | 35 | | | | 129 | |
Bridger Aerospace Group Holdings, Inc.* | | | 32 | | | | 71 | |
Amprius Technologies, Inc.* | | | 48 | | | | 53 | |
Solidion Technology, Inc.* | | | 31 | | | | 11 | |
Total Industrial | | | | | | | 1,449,864 | |
| | | | | | | | | |
Consumer, Cyclical - 6.2% |
Meritage Homes Corp. | | | 123 | | | | 25,224 | |
Taylor Morrison Home Corp. — Class A* | | | 351 | | | | 24,661 | |
Abercrombie & Fitch Co. — Class A* | | | 173 | | | | 24,203 | |
Installed Building Products, Inc. | | | 82 | | | | 20,194 | |
KB Home | | | 231 | | | | 19,794 | |
Beacon Roofing Supply, Inc.* | | | 219 | | | | 18,928 | |
Aurora Innovation, Inc.* | | | 3,191 | | | | 18,891 | |
Champion Homes, Inc.* | | | 184 | | | | 17,452 | |
Group 1 Automotive, Inc. | | | 45 | | | | 17,237 | |
Boot Barn Holdings, Inc.* | | | 102 | | | | 17,063 | |
Asbury Automotive Group, Inc.* | | | 70 | | | | 16,701 | |
Kontoor Brands, Inc. | | | 191 | | | | 15,620 | |
M/I Homes, Inc.* | | | 91 | | | | 15,594 | |
Signet Jewelers Ltd. | | | 147 | | | | 15,162 | |
FirstCash Holdings, Inc. | | | 132 | | | | 15,154 | |
Tri Pointe Homes, Inc.* | | | 317 | | | | 14,363 | |
Academy Sports & Outdoors, Inc. | | | 243 | | | | 14,181 | |
American Eagle Outfitters, Inc. | | | 626 | | | | 14,016 | |
Shake Shack, Inc. — Class A* | | | 131 | | | | 13,520 | |
Six Flags Entertainment Corp. | | | 319 | | | | 12,859 | |
GMS, Inc.* | | | 138 | | | | 12,499 | |
Cavco Industries, Inc.* | | | 29 | | | | 12,419 | |
Steven Madden Ltd. | | | 250 | | | | 12,248 | |
Sweetgreen, Inc. — Class A* | | | 339 | | | | 12,018 | |
SkyWest, Inc.* | | | 137 | | | | 11,648 | |
Brinker International, Inc.* | | | 152 | | | | 11,633 | |
Rush Enterprises, Inc. — Class A | | | 210 | | | | 11,094 | |
Cinemark Holdings, Inc.* | | | 381 | | | | 10,607 | |
Patrick Industries, Inc. | | | 74 | | | | 10,535 | |
UniFirst Corp. | | | 52 | | | | 10,330 | |
LCI Industries | | | 85 | | | | 10,246 | |
Dorman Products, Inc.* | | | 90 | | | | 10,181 | |
Resideo Technologies, Inc.* | | | 501 | | | | 10,090 | |
Century Communities, Inc. | | | 96 | | | | 9,886 | |
Hilton Grand Vacations, Inc.* | | | 255 | | | | 9,262 | |
Red Rock Resorts, Inc. — Class A | | | 170 | | | | 9,255 | |
Visteon Corp.* | | | 94 | | | | 8,953 | |
Green Brick Partners, Inc.* | | | 107 | | | | 8,937 | |
Hanesbrands, Inc.* | | | 1,213 | | | | 8,916 | |
HNI Corp. | | | 162 | | | | 8,722 | |
Goodyear Tire & Rubber Co.* | | | 978 | | | | 8,655 | |
LGI Homes, Inc.* | | | 72 | | | | 8,534 | |
Urban Outfitters, Inc.* | | | 221 | | | | 8,466 | |
International Game Technology plc | | | 393 | | | | 8,371 | |
248 | THE RYDEX FUNDS SEMI-ANNUAL FINANCIAL REPORT | SEE NOTES TO FINANCIAL STATEMENTS. |
SCHEDULE OF INVESTMENTS (Unaudited)(continued) | September 30, 2024 |
RUSSELL 2000® FUND | |
| | Shares | | | Value | |
PriceSmart, Inc. | | | 87 | | | $ | 7,985 | |
Vista Outdoor, Inc.* | | | 201 | | | | 7,875 | |
Foot Locker, Inc.* | | | 288 | | | | 7,442 | |
Victoria’s Secret & Co.* | | | 271 | | | | 6,965 | |
JetBlue Airways Corp.* | | | 1,058 | | | | 6,940 | |
Adient plc* | | | 307 | | | | 6,929 | |
Atlanta Braves Holdings, Inc. — Class C* | | | 173 | | | | 6,885 | |
Phinia, Inc. | | | 149 | | | | 6,858 | |
Cheesecake Factory, Inc. | | | 167 | | | | 6,772 | |
Acushnet Holdings Corp. | | | 100 | | | | 6,375 | |
OPENLANE, Inc.* | | | 371 | | | | 6,262 | |
La-Z-Boy, Inc. | | | 145 | | | | 6,225 | |
Papa John’s International, Inc. | | | 115 | | | | 6,195 | |
United Parks & Resorts, Inc.* | | | 121 | | | | 6,123 | |
Fox Factory Holding Corp.* | | | 147 | | | | 6,101 | |
MillerKnoll, Inc. | | | 239 | | | | 5,918 | |
Madison Square Garden Entertainment Corp.* | | | 135 | | | | 5,742 | |
OneSpaWorld Holdings Ltd. | | | 347 | | | | 5,729 | |
Winnebago Industries, Inc. | | | 97 | | | | 5,637 | |
Peloton Interactive, Inc. — Class A* | | | 1,168 | | | | 5,466 | |
H&E Equipment Services, Inc. | | | 111 | | | | 5,404 | |
Topgolf Callaway Brands Corp.* | | | 487 | | | | 5,347 | |
Blue Bird Corp.* | | | 111 | | | | 5,324 | |
AMC Entertainment Holdings, Inc. — Class A* | | | 1,162 | | | | 5,287 | |
Sonos, Inc.* | | | 423 | | | | 5,199 | |
Gentherm, Inc.* | | | 109 | | | | 5,074 | |
REV Group, Inc. | | | 177 | | | | 4,967 | |
Life Time Group Holdings, Inc.* | | | 203 | | | | 4,957 | |
Warby Parker, Inc. — Class A* | | | 301 | | | | 4,915 | |
Sally Beauty Holdings, Inc.* | | | 354 | | | | 4,804 | |
Wolverine World Wide, Inc. | | | 275 | | | | 4,790 | |
Sabre Corp.* | | | 1,291 | | | | 4,738 | |
Dana, Inc. | | | 448 | | | | 4,731 | |
Buckle, Inc. | | | 107 | | | | 4,705 | |
VSE Corp. | | | 55 | | | | 4,550 | |
Bloomin’ Brands, Inc. | | | 273 | | | | 4,513 | |
Oxford Industries, Inc. | | | 51 | | | | 4,425 | |
Steelcase, Inc. — Class A | | | 320 | | | | 4,317 | |
G-III Apparel Group Ltd.* | | | 140 | | | | 4,273 | |
ScanSource, Inc.* | | | 86 | | | | 4,131 | |
Caleres, Inc. | | | 118 | | | | 3,900 | |
Winmark Corp. | | | 10 | | | | 3,829 | |
Dave & Buster’s Entertainment, Inc.* | | | 111 | | | | 3,780 | |
XPEL, Inc.* | | | 87 | | | | 3,773 | |
Interface, Inc. — Class A | | | 198 | | | | 3,756 | |
MRC Global, Inc.* | | | 291 | | | | 3,707 | |
Everi Holdings, Inc.* | | | 273 | | | | 3,587 | |
ODP Corp.* | | | 120 | | | | 3,570 | |
Monarch Casino & Resort, Inc. | | | 45 | | | | 3,567 | |
Camping World Holdings, Inc. — Class A | | | 146 | | | | 3,536 | |
Dream Finders Homes, Inc. — Class A* | | | 97 | | | | 3,512 | |
Beazer Homes USA, Inc.* | | | 102 | | | | 3,485 | |
Hovnanian Enterprises, Inc. — Class A* | | | 17 | | | | 3,474 | |
Cracker Barrel Old Country Store, Inc. | | | 76 | | | | 3,447 | |
Vizio Holding Corp. — Class A* | | | 305 | | | | 3,407 | |
Global Business Travel Group I* | | | 433 | | | | 3,330 | |
Jack in the Box, Inc. | | | 68 | | | | 3,165 | |
BlueLinx Holdings, Inc.* | | | 29 | | | | 3,057 | |
IMAX Corp.* | | | 148 | | | | 3,035 | |
PC Connection, Inc. | | | 40 | | | | 3,017 | |
Allegiant Travel Co. — Class A* | | | 54 | | | | 2,973 | |
National Vision Holdings, Inc.* | | | 269 | | | | 2,935 | |
Sonic Automotive, Inc. — Class A | | | 50 | | | | 2,924 | |
Lions Gate Entertainment Corp. — Class B* | | | 420 | | | | 2,906 | |
Wabash National Corp. | | | 150 | | | | 2,878 | |
Rush Street Interactive, Inc.* | | | 263 | | | | 2,854 | |
Shoe Carnival, Inc. | | | 62 | | | | 2,719 | |
Malibu Boats, Inc. — Class A* | | | 70 | | | | 2,717 | |
A-Mark Precious Metals, Inc. | | | 60 | | | | 2,650 | |
MarineMax, Inc.* | | | 75 | | | | 2,645 | |
Ethan Allen Interiors, Inc. | | | 79 | | | | 2,519 | |
Portillo’s, Inc. — Class A*,1 | | | 186 | | | | 2,505 | |
American Axle & Manufacturing Holdings, Inc.* | | | 395 | | | | 2,441 | |
Standard Motor Products, Inc. | | | 72 | | | | 2,390 | |
Miller Industries, Inc. | | | 38 | | | | 2,318 | |
Golden Entertainment, Inc. | | | 71 | | | | 2,257 | |
indie Semiconductor, Inc. — Class A* | | | 563 | | | | 2,246 | |
Chuy’s Holdings, Inc.* | | | 60 | | | | 2,244 | |
Arhaus, Inc. | | | 177 | | | | 2,179 | |
Douglas Dynamics, Inc. | | | 78 | | | | 2,151 | |
BJ’s Restaurants, Inc.* | | | 66 | | | | 2,149 | |
Forestar Group, Inc.* | | | 66 | | | | 2,136 | |
Accel Entertainment, Inc.* | | | 177 | | | | 2,057 | |
Leslie’s, Inc.* | | | 617 | | | | 1,950 | |
Arko Corp. | | | 276 | | | | 1,938 | |
Super Group SGHC Ltd. | | | 514 | | | | 1,866 | |
Clean Energy Fuels Corp.* | | | 586 | | | | 1,822 | |
Dine Brands Global, Inc. | | | 53 | | | | 1,655 | |
Daktronics, Inc.* | | | 128 | | | | 1,652 | |
First Watch Restaurant Group, Inc.* | | | 105 | | | | 1,638 | |
Lions Gate Entertainment Corp. — Class A* | | | 206 | | | | 1,613 | |
Kura Sushi USA, Inc. — Class A*,1 | | | 20 | | | | 1,611 | |
Global Industrial Co. | | | 47 | | | | 1,597 | |
Build-A-Bear Workshop, Inc. — Class A | | | 45 | | | | 1,547 | |
Sun Country Airlines Holdings, Inc.* | | | 136 | | | | 1,525 | |
Rush Enterprises, Inc. — Class B | | | 31 | | | | 1,486 | |
Atlanta Braves Holdings, Inc. — Class A* | | | 35 | | | | 1,475 | |
Shyft Group, Inc. | | | 117 | | | | 1,468 | |
EVgo, Inc.*,1 | | | 348 | | | | 1,441 | |
Lovesac Co.* | | | 50 | | | | 1,432 | |
Xperi, Inc.* | | | 155 | | | | 1,432 | |
Bally’s Corp.* | | | 83 | | | | 1,432 | |
Titan International, Inc.* | | | 173 | | | | 1,407 | |
Methode Electronics, Inc. | | | 117 | | | | 1,399 | |
Sleep Number Corp.* | | | 75 | | | | 1,374 | |
Haverty Furniture Companies, Inc. | | | 50 | | | | 1,373 | |
RCI Hospitality Holdings, Inc. | | | 30 | | | | 1,337 | |
SEE NOTES TO FINANCIAL STATEMENTS. | THE RYDEX FUNDS SEMI-ANNUAL FINANCIAL REPORT | 249 |
SCHEDULE OF INVESTMENTS (Unaudited)(continued) | September 30, 2024 |
RUSSELL 2000® FUND | |
| | Shares | | | Value | |
Petco Health & Wellness Company, Inc.* | | | 287 | | | $ | 1,306 | |
Funko, Inc. — Class A* | | | 106 | | | | 1,295 | |
Hudson Technologies, Inc.* | | | 154 | | | | 1,284 | |
Nu Skin Enterprises, Inc. — Class A | | | 171 | | | | 1,260 | |
Marcus Corp. | | | 83 | | | | 1,251 | |
Zumiez, Inc.* | | | 57 | | | | 1,214 | |
El Pollo Loco Holdings, Inc.* | | | 88 | | | | 1,206 | |
Hyliion Holdings Corp.* | | | 486 | | | | 1,205 | |
Lindblad Expeditions Holdings, Inc.* | | | 122 | | | | 1,129 | |
Denny’s Corp.* | | | 173 | | | | 1,116 | |
Designer Brands, Inc. — Class A | | | 145 | | | | 1,070 | |
MasterCraft Boat Holdings, Inc.* | | | 58 | | | | 1,056 | |
Luminar Technologies, Inc.*,1 | | | 1,151 | | | | 1,036 | |
Xponential Fitness, Inc. — Class A* | | | 83 | | | | 1,029 | |
Genesco, Inc.* | | | 37 | | | | 1,005 | |
Titan Machinery, Inc.* | | | 71 | | | | 989 | |
OneWater Marine, Inc. — Class A* | | | 41 | | | | 980 | |
Movado Group, Inc. | | | 52 | | | | 967 | |
Hamilton Beach Brands Holding Co. — Class A | | | 30 | | | | 913 | |
Spirit Airlines, Inc.1 | | | 379 | | | | 910 | |
America’s Car-Mart, Inc.* | | | 21 | | | | 880 | |
iRobot Corp.* | | | 99 | | | | 860 | |
Savers Value Village, Inc.* | | | 81 | | | | 852 | |
Rocky Brands, Inc. | | | 26 | | | | 828 | |
Cooper-Standard Holdings, Inc.* | | | 58 | | | | 804 | |
Potbelly Corp.* | | | 95 | | | | 792 | |
Frontier Group Holdings, Inc.*,1 | | | 146 | | | | 781 | |
Landsea Homes Corp.* | | | 62 | | | | 766 | |
Wheels Up Experience, Inc.* | | | 310 | | | | 750 | |
Weyco Group, Inc. | | | 21 | | | | 715 | |
JAKKS Pacific, Inc.* | | | 28 | | | | 715 | |
Solid Power, Inc.* | | | 527 | | | | 711 | |
Flexsteel Industries, Inc. | | | 16 | | | | 709 | |
Superior Group of Companies, Inc. | | | 45 | | | | 697 | |
Hooker Furnishings Corp. | | | 37 | | | | 669 | |
Tile Shop Holdings, Inc.* | | | 99 | | | | 652 | |
Webtoon Entertainment, Inc.* | | | 52 | | | | 595 | |
Johnson Outdoors, Inc. — Class A | | | 16 | | | | 579 | |
Full House Resorts, Inc.* | | | 114 | | | | 572 | |
Blink Charging Co.*,1 | | | 332 | | | | 571 | |
Destination XL Group, Inc.* | | | 185 | | | | 544 | |
Reservoir Media, Inc.* | | | 67 | | | | 543 | |
Biglari Holdings, Inc. — Class B* | | | 3 | | | | 516 | |
Virco Mfg. Corp. | | | 36 | | | | 497 | |
Escalade, Inc. | | | 35 | | | | 492 | |
Vera Bradley, Inc.* | | | 88 | | | | 480 | |
Holley, Inc.* | | | 161 | | | | 475 | |
Clarus Corp. | | | 105 | | | | 473 | |
Traeger, Inc.* | | | 118 | | | | 434 | |
GrowGeneration Corp.* | | | 197 | | | | 420 | |
Citi Trends, Inc.* | | | 22 | | | | 404 | |
J Jill, Inc. | | | 16 | | | | 395 | |
Livewire Group, Inc.* | | | 63 | | | | 384 | |
Commercial Vehicle Group, Inc.* | | | 114 | | | | 371 | |
EVI Industries, Inc. | | | 18 | | | | 348 | |
Marine Products Corp. | | | 30 | | | | 291 | |
Lifetime Brands, Inc. | | | 44 | | | | 288 | |
SES AI Corp.* | | | 447 | | | | 286 | |
Tilly’s, Inc. — Class A* | | | 52 | | | | 265 | |
ONE Group Hospitality, Inc.* | | | 72 | | | | 265 | |
Aeva Technologies, Inc.* | | | 79 | | | | 260 | |
ThredUp, Inc. — Class A* | | | 271 | | | | 228 | |
Canoo, Inc.* | | | 205 | | | | 202 | |
Purple Innovation, Inc.* | | | 196 | | | | 194 | |
Torrid Holdings, Inc.* | | | 43 | | | | 169 | |
CompX International, Inc. | | | 5 | | | | 146 | |
United Homes Group, Inc.*,1 | | | 18 | | | | 111 | |
Qurate Retail, Inc. — Class B* | | | 4 | | | | 17 | |
Total Consumer, Cyclical | | | | | | | 1,032,611 | |
| | | | | | | | | |
Technology - 5.2% |
SPS Commerce, Inc.* | | | 128 | | | | 24,854 | |
CommVault Systems, Inc.* | | | 150 | | | | 23,077 | |
Varonis Systems, Inc.* | | | 379 | | | | 21,414 | |
Insight Enterprises, Inc.* | | | 96 | | | | 20,677 | |
ExlService Holdings, Inc.* | | | 540 | | | | 20,601 | |
Maximus, Inc. | | | 209 | | | | 19,470 | |
Altair Engineering, Inc. — Class A* | | | 196 | | | | 18,720 | |
ACI Worldwide, Inc.* | | | 362 | | | | 18,426 | |
Zeta Global Holdings Corp. — Class A* | | | 610 | | | | 18,196 | |
Impinj, Inc.* | | | 78 | | | | 16,889 | |
Tenable Holdings, Inc.* | | | 407 | | | | 16,492 | |
Qualys, Inc.* | | | 128 | | | | 16,443 | |
Box, Inc. — Class A* | | | 486 | | | | 15,907 | |
Rambus, Inc.* | | | 376 | | | | 15,875 | |
ASGN, Inc.* | | | 155 | | | | 14,451 | |
Workiva, Inc.* | | | 174 | | | | 13,767 | |
Clearwater Analytics Holdings, Inc. — Class A* | | | 521 | | | | 13,155 | |
Silicon Laboratories, Inc.* | | | 110 | | | | 12,713 | |
Power Integrations, Inc. | | | 195 | | | | 12,503 | |
FormFactor, Inc.* | | | 266 | | | | 12,236 | |
Blackbaud, Inc.* | | | 142 | | | | 12,025 | |
Axcelis Technologies, Inc.* | | | 112 | | | | 11,743 | |
Evolent Health, Inc. — Class A* | | | 396 | | | | 11,199 | |
BlackLine, Inc.* | | | 199 | | | | 10,973 | |
Envestnet, Inc.* | | | 175 | | | | 10,959 | |
SiTime Corp.* | | | 63 | | | | 10,805 | |
Synaptics, Inc.* | | | 135 | | | | 10,473 | |
ACV Auctions, Inc. — Class A* | | | 508 | | | | 10,328 | |
Semtech Corp.* | | | 224 | | | | 10,228 | |
Diodes, Inc.* | | | 157 | | | | 10,062 | |
Clear Secure, Inc. — Class A | | | 301 | | | | 9,975 | |
Progress Software Corp. | | | 146 | | | | 9,836 | |
DigitalOcean Holdings, Inc.* | | | 227 | | | | 9,169 | |
Rapid7, Inc.* | | | 214 | | | | 8,537 | |
Kulicke & Soffa Industries, Inc. | | | 185 | | | | 8,349 | |
Agilysys, Inc.* | | | 76 | | | | 8,282 | |
WNS Holdings Ltd.* | | | 155 | | | | 8,170 | |
Freshworks, Inc. — Class A* | | | 704 | | | | 8,082 | |
Ambarella, Inc.* | | | 131 | | | | 7,389 | |
Braze, Inc. — Class A* | | | 226 | | | | 7,309 | |
250 | THE RYDEX FUNDS SEMI-ANNUAL FINANCIAL REPORT | SEE NOTES TO FINANCIAL STATEMENTS. |
SCHEDULE OF INVESTMENTS (Unaudited)(continued) | September 30, 2024 |
RUSSELL 2000® FUND | |
| | Shares | | | Value | |
Vertex, Inc. — Class A* | | | 187 | | | $ | 7,201 | |
NCR Atleos Corp.* | | | 249 | | | | 7,104 | |
C3.ai, Inc. — Class A*,1 | | | 286 | | | | 6,930 | |
NCR Voyix Corp.* | | | 502 | | | | 6,812 | |
PAR Technology Corp.* | | | 125 | | | | 6,510 | |
Intapp, Inc.* | | | 135 | | | | 6,457 | |
Privia Health Group, Inc.* | | | 350 | | | | 6,373 | |
Veeco Instruments, Inc.*,1 | | | 192 | | | | 6,361 | |
Ultra Clean Holdings, Inc.* | | | 153 | | | | 6,109 | |
IonQ, Inc.*,1 | | | 681 | | | | 5,952 | |
Donnelley Financial Solutions, Inc.* | | | 89 | | | | 5,859 | |
PagerDuty, Inc.* | | | 308 | | | | 5,713 | |
Verint Systems, Inc.* | | | 210 | | | | 5,319 | |
Photronics, Inc.* | | | 213 | | | | 5,274 | |
NetScout Systems, Inc.* | | | 239 | | | | 5,198 | |
AvePoint, Inc.* | | | 438 | | | | 5,155 | |
Sprout Social, Inc. — Class A* | | | 171 | | | | 4,971 | |
CSG Systems International, Inc. | | | 102 | | | | 4,962 | |
AvidXchange Holdings, Inc.* | | | 597 | | | | 4,842 | |
Alkami Technology, Inc.* | | | 152 | | | | 4,794 | |
Appian Corp. — Class A* | | | 139 | | | | 4,745 | |
PowerSchool Holdings, Inc. — Class A* | | | 206 | | | | 4,699 | |
SoundHound AI, Inc. — Class A*,1 | | | 980 | | | | 4,567 | |
Adeia, Inc. | | | 376 | | | | 4,478 | |
Jamf Holding Corp.* | | | 257 | | | | 4,459 | |
Xerox Holdings Corp. | | | 401 | | | | 4,162 | |
Waystar Holding Corp. | | | 148 | | | | 4,128 | |
Cohu, Inc.* | | | 160 | | | | 4,112 | |
Alignment Healthcare, Inc.* | | | 346 | | | | 4,090 | |
Matterport, Inc.* | | | 904 | | | | 4,068 | |
Phreesia, Inc.* | | | 176 | | | | 4,011 | |
MaxLinear, Inc. — Class A* | | | 273 | | | | 3,953 | |
Sapiens International Corporation N.V. | | | 106 | | | | 3,951 | |
Pitney Bowes, Inc. | | | 551 | | | | 3,929 | |
Diebold Nixdorf, Inc.*,1 | | | 87 | | | | 3,885 | |
Zuora, Inc. — Class A* | | | 447 | | | | 3,853 | |
SMART Global Holdings, Inc.* | | | 178 | | | | 3,729 | |
ACM Research, Inc. — Class A* | | | 176 | | | | 3,573 | |
Schrodinger Incorporated/United States* | | | 192 | | | | 3,562 | |
PDF Solutions, Inc.* | | | 107 | | | | 3,390 | |
Digi International, Inc.* | | | 123 | | | | 3,386 | |
Fastly, Inc. — Class A* | | | 442 | | | | 3,346 | |
N-able, Inc.* | | | 247 | | | | 3,226 | |
Asana, Inc. — Class A* | | | 275 | | | | 3,187 | |
E2open Parent Holdings, Inc.* | | | 703 | | | | 3,100 | |
Blend Labs, Inc. — Class A* | | | 793 | | | | 2,974 | |
Alpha & Omega Semiconductor Ltd.* | | | 80 | | | | 2,970 | |
PROS Holdings, Inc.* | | | 158 | | | | 2,926 | |
Grid Dynamics Holdings, Inc.* | | | 197 | | | | 2,758 | |
Integral Ad Science Holding Corp.* | | | 250 | | | | 2,703 | |
Vimeo, Inc.* | | | 508 | | | | 2,565 | |
Yext, Inc.* | | | 362 | | | | 2,505 | |
SolarWinds Corp. | | | 188 | | | | 2,453 | |
Daily Journal Corp.* | | | 5 | | | | 2,450 | |
Amplitude, Inc. — Class A* | | | 264 | | | | 2,368 | |
V2X, Inc.* | | | 42 | | | | 2,346 | |
Conduent, Inc.* | | | 544 | | | | 2,192 | |
OneSpan, Inc.* | | | 131 | | | | 2,184 | |
PubMatic, Inc. — Class A* | | | 145 | | | | 2,156 | |
SEMrush Holdings, Inc. — Class A* | | | 125 | | | | 1,964 | |
CEVA, Inc.* | | | 81 | | | | 1,956 | |
NextNav, Inc.* | | | 260 | | | | 1,947 | |
MeridianLink, Inc.* | | | 93 | | | | 1,913 | |
GigaCloud Technology, Inc. — Class A* | | | 81 | | | | 1,861 | |
Olo, Inc. — Class A* | | | 362 | | | | 1,796 | |
Instructure Holdings, Inc.* | | | 76 | | | | 1,790 | |
Simulations Plus, Inc. | | | 55 | | | | 1,761 | |
Weave Communications, Inc.* | | | 135 | | | | 1,728 | |
I3 Verticals, Inc. — Class A* | | | 78 | | | | 1,662 | |
Health Catalyst, Inc.* | | | 202 | | | | 1,644 | |
Ibotta, Inc. — Class A*,1 | | | 26 | | | | 1,602 | |
Enfusion, Inc. — Class A* | | | 167 | | | | 1,585 | |
Innodata, Inc.* | | | 94 | | | | 1,576 | |
Thoughtworks Holding, Inc.* | | | 345 | | | | 1,525 | |
PlayAGS, Inc.* | | | 132 | | | | 1,504 | |
Cantaloupe, Inc.* | | | 202 | | | | 1,495 | |
Climb Global Solutions, Inc. | | | 15 | | | | 1,493 | |
Bandwidth, Inc. — Class A* | | | 85 | | | | 1,488 | |
Pagaya Technologies Ltd. — Class A*,1 | | | 139 | | | | 1,469 | |
Consensus Cloud Solutions, Inc.* | | | 62 | | | | 1,460 | |
BigCommerce Holdings, Inc.* | | | 244 | | | | 1,427 | |
Digimarc Corp.* | | | 52 | | | | 1,398 | |
Mitek Systems, Inc.* | | | 160 | | | | 1,387 | |
Planet Labs PBC* | | | 582 | | | | 1,298 | |
Unisys Corp.* | | | 227 | | | | 1,289 | |
3D Systems Corp.* | | | 437 | | | | 1,241 | |
Aehr Test Systems*,1 | | | 96 | | | | 1,234 | |
American Software, Inc. — Class A | | | 109 | | | | 1,220 | |
Cricut, Inc. — Class A | | | 160 | | | | 1,109 | |
Vishay Precision Group, Inc.* | | | 42 | | | | 1,088 | |
Red Violet, Inc.* | | | 38 | | | | 1,081 | |
Corsair Gaming, Inc.* | | | 154 | | | | 1,072 | |
Navitas Semiconductor Corp.* | | | 435 | | | | 1,066 | |
Digital Turbine, Inc.* | | | 331 | | | | 1,016 | |
Ouster, Inc.* | | | 149 | | | | 939 | |
Immersion Corp. | | | 104 | | | | 928 | |
Talkspace, Inc.* | | | 424 | | | | 886 | |
Domo, Inc. — Class B* | | | 117 | | | | 879 | |
SkyWater Technology, Inc.* | | | 94 | | | | 853 | |
8x8, Inc.* | | | 404 | | | | 824 | |
Definitive Healthcare Corp.* | | | 184 | | | | 822 | |
Life360, Inc. | | | 20 | | | | 786 | |
EverCommerce, Inc.* | | | 74 | | | | 767 | |
Asure Software, Inc.* | | | 82 | | | | 742 | |
Arteris, Inc.* | | | 96 | | | | 741 | |
ReposiTrak, Inc.1 | | | 40 | | | | 739 | |
Inspired Entertainment, Inc.* | | | 76 | | | | 705 | |
Telos Corp.* | | | 189 | | | | 679 | |
Outbrain, Inc.* | | | 134 | | | | 651 | |
IBEX Holdings Ltd.* | | | 32 | | | | 639 | |
Viant Technology, Inc. — Class A* | | | 54 | | | | 598 | |
CS Disco, Inc.* | | | 101 | | | | 594 | |
SEE NOTES TO FINANCIAL STATEMENTS. | THE RYDEX FUNDS SEMI-ANNUAL FINANCIAL REPORT | 251 |
SCHEDULE OF INVESTMENTS (Unaudited)(continued) | September 30, 2024 |
RUSSELL 2000® FUND | |
| | Shares | | | Value | |
ON24, Inc.* | | | 96 | | | $ | 588 | |
Rackspace Technology, Inc.* | | | 231 | | | | 566 | |
Richardson Electronics Ltd. | | | 42 | | | | 518 | |
BigBear.ai Holdings, Inc.* | | | 351 | | | | 512 | |
Playstudios, Inc.* | | | 304 | | | | 459 | |
Kaltura, Inc.* | | | 332 | | | | 452 | |
Cerence, Inc.* | | | 142 | | | | 447 | |
Porch Group, Inc.*,1 | | | 267 | | | | 410 | |
TTEC Holdings, Inc. | | | 68 | | | | 399 | |
Everspin Technologies, Inc.* | | | 67 | | | | 395 | |
Rigetti Computing, Inc.*,1 | | | 488 | | | | 382 | |
QuickLogic Corp.* | | | 48 | | | | 368 | |
eGain Corp.* | | | 67 | | | | 342 | |
Rimini Street, Inc.* | | | 184 | | | | 340 | |
D-Wave Quantum, Inc.*,1 | | | 302 | | | | 297 | |
Rekor Systems, Inc.* | | | 245 | | | | 289 | |
WM Technology, Inc.* | | | 288 | | | | 251 | |
iLearningEngines Holdings, Inc.* | | | 102 | | | | 170 | |
Golden Matrix Group, Inc.* | | | 69 | | | | 161 | |
System1, Inc.* | | | 81 | | | | 91 | |
GCT Semiconductor Holding, Inc.* | | | 26 | | | | 87 | |
Airship AI Holdings, Inc.* | | | 11 | | | | 25 | |
Total Technology | | | | | | | 864,260 | |
| | | | | | | | | |
Energy - 2.8% |
ChampionX Corp. | | | 655 | | | | 19,748 | |
Noble Corporation plc1 | | | 477 | | | | 17,230 | |
Murphy Oil Corp. | | | 498 | | | | 16,802 | |
CNX Resources Corp.* | | | 508 | | | | 16,546 | |
SM Energy Co. | | | 393 | | | | 15,708 | |
Magnolia Oil & Gas Corp. — Class A | | | 595 | | | | 14,530 | |
Sunrun, Inc.* | | | 750 | | | | 13,545 | |
California Resources Corp. | | | 238 | | | | 12,488 | |
Northern Oil & Gas, Inc. | | | 342 | | | | 12,110 | |
Valaris Ltd.* | | | 217 | | | | 12,098 | |
Tidewater, Inc.* | | | 167 | | | | 11,989 | |
Archrock, Inc. | | | 573 | | | | 11,597 | |
Peabody Energy Corp. | | | 434 | | | | 11,518 | |
Warrior Met Coal, Inc. | | | 179 | | | | 11,438 | |
PBF Energy, Inc. — Class A | | | 359 | | | | 11,111 | |
Transocean Ltd.* | | | 2,505 | | | | 10,646 | |
Liberty Energy, Inc. — Class A | | | 554 | | | | 10,576 | |
CONSOL Energy, Inc. | | | 101 | | | | 10,570 | |
Patterson-UTI Energy, Inc. | | | 1,336 | | | | 10,220 | |
Helmerich & Payne, Inc. | | | 334 | | | | 10,160 | |
Seadrill Ltd.* | | | 235 | | | | 9,339 | |
Alpha Metallurgical Resources, Inc.* | | | 38 | | | | 8,975 | |
Oceaneering International, Inc.* | | | 349 | | | | 8,680 | |
Arch Resources, Inc. | | | 61 | | | | 8,428 | |
Gulfport Energy Corp.* | | | 45 | | | | 6,811 | |
Kosmos Energy Ltd.* | | | 1,606 | | | | 6,472 | |
Kinetik Holdings, Inc. — Class A | | | 132 | | | | 5,974 | |
Plug Power, Inc.*,1 | | | 2,556 | | | | 5,777 | |
Sitio Royalties Corp. — Class A | | | 277 | | | | 5,773 | |
Expro Group Holdings N.V.* | | | 327 | | | | 5,614 | |
Helix Energy Solutions Group, Inc.* | | | 497 | | | | 5,517 | |
Talos Energy, Inc.* | | | 508 | | | | 5,258 | |
Crescent Energy Co. — Class A | | | 477 | | | | 5,223 | |
Atlas Energy Solutions, Inc. | | | 235 | | | | 5,123 | |
Fluence Energy, Inc.* | | | 210 | | | | 4,769 | |
DNOW, Inc.* | | | 362 | | | | 4,681 | |
Borr Drilling Ltd. | | | 814 | | | | 4,469 | |
Delek US Holdings, Inc. | | | 220 | | | | 4,125 | |
Sable Offshore Corp.* | | | 174 | | | | 4,112 | |
Sunnova Energy International, Inc.*,1 | | | 375 | | | | 3,653 | |
Comstock Resources, Inc.* | | | 319 | | | | 3,550 | |
Select Water Solutions, Inc. — Class A | | | 313 | | | | 3,484 | |
Array Technologies, Inc.* | | | 524 | | | | 3,458 | |
Par Pacific Holdings, Inc.* | | | 192 | | | | 3,379 | |
Shoals Technologies Group, Inc. — Class A* | | | 589 | | | | 3,304 | |
Core Laboratories, Inc. | | | 162 | | | | 3,002 | |
Green Plains, Inc.* | | | 220 | | | | 2,979 | |
Bristow Group, Inc.* | | | 85 | | | | 2,949 | |
CVR Energy, Inc. | | | 118 | | | | 2,718 | |
Vital Energy, Inc.* | | | 99 | | | | 2,663 | |
SunCoke Energy, Inc. | | | 289 | | | | 2,509 | |
REX American Resources Corp.* | | | 53 | | | | 2,453 | |
ProPetro Holding Corp.* | | | 303 | | | | 2,321 | |
VAALCO Energy, Inc. | | | 360 | | | | 2,066 | |
Vitesse Energy, Inc. | | | 86 | | | | 2,066 | |
Nabors Industries Ltd.* | | | 32 | | | | 2,063 | |
Kodiak Gas Services, Inc. | | | 70 | | | | 2,030 | |
Newpark Resources, Inc.* | | | 286 | | | | 1,982 | |
NextDecade Corp.* | | | 397 | | | | 1,870 | |
RPC, Inc. | | | 293 | | | | 1,863 | |
Diversified Energy Company plc | | | 162 | | | | 1,844 | |
Innovex International, Inc. | | | 118 | | | | 1,732 | |
Aris Water Solutions, Inc. — Class A | | | 93 | | | | 1,569 | |
SandRidge Energy, Inc. | | | 112 | | | | 1,370 | |
Berry Corp. | | | 264 | | | | 1,357 | |
Excelerate Energy, Inc. — Class A | | | 61 | | | | 1,343 | |
TETRA Technologies, Inc.* | | | 431 | | | | 1,336 | |
Montauk Renewables, Inc.* | | | 228 | | | | 1,188 | |
Solaris Oilfield Infrastructure, Inc. — Class A | | | 87 | | | | 1,110 | |
Granite Ridge Resources, Inc. | | | 182 | | | | 1,081 | |
Ramaco Resources, Inc. — Class A | | | 92 | | | | 1,076 | |
Riley Exploration Permian, Inc. | | | 40 | | | | 1,060 | |
Matrix Service Co.* | | | 91 | | | | 1,049 | |
Oil States International, Inc.* | | | 212 | | | | 975 | |
Amplify Energy Corp.* | | | 136 | | | | 888 | |
DMC Global, Inc.* | | | 68 | | | | 883 | |
Hallador Energy Co.* | | | 87 | | | | 820 | |
Ring Energy, Inc.* | | | 509 | | | | 814 | |
SEACOR Marine Holdings, Inc.* | | | 84 | | | | 811 | |
W&T Offshore, Inc. | | | 341 | | | | 733 | |
TPI Composites, Inc.*,1 | | | 159 | | | | 723 | |
Natural Gas Services Group, Inc.* | | | 37 | | | | 707 | |
HighPeak Energy, Inc.1 | | | 50 | | | | 694 | |
Ranger Energy Services, Inc. | | | 54 | | | | 643 | |
Forum Energy Technologies, Inc.* | | | 40 | | | | 618 | |
FuelCell Energy, Inc.*,1 | | | 1,566 | | | | 595 | |
252 | THE RYDEX FUNDS SEMI-ANNUAL FINANCIAL REPORT | SEE NOTES TO FINANCIAL STATEMENTS. |
SCHEDULE OF INVESTMENTS (Unaudited)(continued) | September 30, 2024 |
RUSSELL 2000® FUND | |
| | Shares | | | Value | |
Evolution Petroleum Corp. | | | 106 | | | $ | 563 | |
ProFrac Holding Corp. — Class A*,1 | | | 77 | | | | 523 | |
FutureFuel Corp. | | | 90 | | | | 518 | |
Geospace Technologies Corp.* | | | 44 | | | | 455 | |
PrimeEnergy Resources Corp.* | | | 3 | | | | 413 | |
NACCO Industries, Inc. — Class A | | | 14 | | | | 397 | |
ASP Isotopes, Inc.* | | | 137 | | | | 381 | |
Freyr Battery, Inc.* | | | 387 | | | | 375 | |
Mammoth Energy Services, Inc.* | | | 85 | | | | 348 | |
Energy Vault Holdings, Inc.* | | | 356 | | | | 342 | |
Aemetis, Inc.* | | | 125 | | | | 288 | |
Empire Petroleum Corp.* | | | 48 | | | | 252 | |
Ramaco Resources, Inc. — Class B | | | 17 | | | | 183 | |
Stem, Inc.* | | | 521 | | | | 181 | |
Prairie Operating Co.* | | | 15 | | | | 131 | |
Drilling Tools International Corp.* | | | 33 | | | | 123 | |
Verde Clean Fuels, Inc.* | | | 11 | | | | 44 | |
SolarMax Technology, Inc.* | | | 18 | | | | 11 | |
Total Energy | | | | | | | 464,659 | |
| | | | | | | | | |
Communications - 2.2% |
Lumen Technologies, Inc.* | | | 3,475 | | | | 24,672 | |
Q2 Holdings, Inc.* | | | 203 | | | | 16,193 | |
Credo Technology Group Holding Ltd.* | | | 440 | | | | 13,552 | |
InterDigital, Inc. | | | 87 | | | | 12,322 | |
AST SpaceMobile, Inc.*,1 | | | 460 | | | | 12,029 | |
Hims & Hers Health, Inc.* | | | 652 | | | | 12,010 | |
Cogent Communications Holdings, Inc. | | | 152 | | | | 11,540 | |
EchoStar Corp. — Class A* | | | 418 | | | | 10,375 | |
Squarespace, Inc. — Class A* | | | 210 | | | | 9,750 | |
TEGNA, Inc. | | | 583 | | | | 9,200 | |
Cargurus, Inc.* | | | 305 | | | | 9,159 | |
Perficient, Inc.* | | | 120 | | | | 9,058 | |
ePlus, Inc.* | | | 91 | | | | 8,949 | |
Yelp, Inc. — Class A* | | | 227 | | | | 7,963 | |
Telephone & Data Systems, Inc. | | | 341 | | | | 7,928 | |
Calix, Inc.* | | | 203 | | | | 7,874 | |
DigitalBridge Group, Inc. | | | 546 | | | | 7,715 | |
Ziff Davis, Inc.* | | | 157 | | | | 7,640 | |
Viavi Solutions, Inc.* | | | 756 | | | | 6,819 | |
Cable One, Inc. | | | 19 | | | | 6,646 | |
Extreme Networks, Inc.* | | | 431 | | | | 6,478 | |
Magnite, Inc.* | | | 434 | | | | 6,011 | |
Harmonic, Inc.* | | | 381 | | | | 5,551 | |
Viasat, Inc.* | | | 419 | | | | 5,003 | |
Infinera Corp.*,1 | | | 688 | | | | 4,644 | |
Upwork, Inc.* | | | 430 | | | | 4,494 | |
CommScope Holding Company, Inc.* | | | 725 | | | | 4,430 | |
Opendoor Technologies, Inc.* | | | 2,128 | | | | 4,256 | |
Liberty Latin America Ltd. — Class C* | | | 445 | | | | 4,223 | |
Sphere Entertainment Co.* | | | 92 | | | | 4,065 | |
Cars.com, Inc.* | | | 227 | | | | 3,805 | |
A10 Networks, Inc. | | | 245 | | | | 3,538 | |
QuinStreet, Inc.* | | | 182 | | | | 3,482 | |
Sprinklr, Inc. — Class A* | | | 435 | | | | 3,363 | |
Revolve Group, Inc.* | | | 133 | | | | 3,296 | |
Globalstar, Inc.* | | | 2,506 | | | | 3,107 | |
Shutterstock, Inc. | | | 87 | | | | 3,077 | |
Figs, Inc. — Class A* | | | 448 | | | | 3,064 | |
Applied Digital Corp.*,1 | | | 340 | | | | 2,805 | |
Gannett Company, Inc.* | | | 487 | | | | 2,737 | |
Despegar.com Corp.* | | | 212 | | | | 2,629 | |
Scholastic Corp. | | | 81 | | | | 2,593 | |
HealthStream, Inc. | | | 84 | | | | 2,423 | |
Shenandoah Telecommunications Co. | | | 169 | | | | 2,385 | |
TechTarget, Inc.* | | | 90 | | | | 2,200 | |
Open Lending Corp. — Class A* | | | 353 | | | | 2,160 | |
Couchbase, Inc.* | | | 134 | | | | 2,160 | |
Bumble, Inc. — Class A* | | | 332 | | | | 2,118 | |
Stagwell, Inc.* | | | 295 | | | | 2,071 | |
IDT Corp. — Class B | | | 53 | | | | 2,023 | |
NETGEAR, Inc.* | | | 98 | | | | 1,966 | |
Clear Channel Outdoor Holdings, Inc.* | | | 1,205 | | | | 1,928 | |
Thryv Holdings, Inc.* | | | 110 | | | | 1,895 | |
EverQuote, Inc. — Class A* | | | 87 | | | | 1,835 | |
National CineMedia, Inc.* | | | 245 | | | | 1,727 | |
Liquidity Services, Inc.* | | | 74 | | | | 1,687 | |
Sinclair, Inc. | | | 110 | | | | 1,683 | |
Clearfield, Inc.* | | | 43 | | | | 1,675 | |
Gogo, Inc.* | | | 224 | | | | 1,608 | |
ADTRAN Holdings, Inc.* | | | 270 | | | | 1,601 | |
Beyond, Inc.* | | | 157 | | | | 1,583 | |
Gray Television, Inc. | | | 295 | | | | 1,581 | |
Powerfleet Incorporated NJ* | | | 313 | | | | 1,565 | |
MediaAlpha, Inc. — Class A* | | | 86 | | | | 1,557 | |
Nextdoor Holdings, Inc.* | | | 599 | | | | 1,486 | |
fuboTV, Inc.* | | | 1,008 | | | | 1,431 | |
Getty Images Holdings, Inc.* | | | 346 | | | | 1,318 | |
Anterix, Inc.* | | | 35 | | | | 1,318 | |
Boston Omaha Corp. — Class A* | | | 85 | | | | 1,264 | |
Advantage Solutions, Inc.* | | | 367 | | | | 1,259 | |
Consolidated Communications Holdings, Inc.* | | | 265 | | | | 1,230 | |
ATN International, Inc. | | | 37 | | | | 1,197 | |
RealReal, Inc.* | | | 338 | | | | 1,061 | |
Liberty Latin America Ltd. — Class A* | | | 110 | | | | 1,054 | |
Preformed Line Products Co. | | | 8 | | | | 1,025 | |
Ribbon Communications, Inc.* | | | 313 | | | | 1,017 | |
Grindr, Inc.* | | | 85 | | | | 1,014 | |
Vivid Seats, Inc. — Class A* | | | 265 | | | | 981 | |
Ooma, Inc.* | | | 85 | | | | 968 | |
AMC Networks, Inc. — Class A* | | | 110 | | | | 956 | |
Spok Holdings, Inc. | | | 63 | | | | 949 | |
WideOpenWest, Inc.* | | | 170 | | | | 893 | |
Backblaze, Inc. — Class A* | | | 138 | | | | 882 | |
Stitch Fix, Inc. — Class A* | | | 310 | | | | 874 | |
Lands’ End, Inc.* | | | 50 | | | | 863 | |
Aviat Networks, Inc.* | | | 39 | | | | 843 | |
Groupon, Inc.*,1 | | | 79 | | | | 773 | |
Eventbrite, Inc. — Class A* | | | 276 | | | | 753 | |
BARK, Inc.* | | | 455 | | | | 742 | |
1-800-Flowers.com, Inc. — Class A* | | | 90 | | | | 714 | |
Innovid Corp.* | | | 368 | | | | 662 | |
iHeartMedia, Inc. — Class A* | | | 357 | | | | 660 | |
SEE NOTES TO FINANCIAL STATEMENTS. | THE RYDEX FUNDS SEMI-ANNUAL FINANCIAL REPORT | 253 |
SCHEDULE OF INVESTMENTS (Unaudited)(continued) | September 30, 2024 |
RUSSELL 2000® FUND | |
| | Shares | | | Value | |
LifeMD, Inc.* | | | 120 | | | $ | 629 | |
Gambling.com Group Ltd.* | | | 60 | | | | 601 | |
Tucows, Inc. — Class A* | | | 28 | | | | 585 | |
AudioEye, Inc.* | | | 24 | | | | 548 | |
OptimizeRx Corp.* | | | 61 | | | | 471 | |
EW Scripps Co. — Class A* | | | 209 | | | | 469 | |
Townsquare Media, Inc. — Class A | | | 46 | | | | 467 | |
Cardlytics, Inc.* | | | 139 | | | | 445 | |
Entravision Communications Corp. — Class A | | | 212 | | | | 439 | |
1stdibs.com, Inc.* | | | 88 | | | | 388 | |
RumbleON, Inc. — Class B* | | | 56 | | | | 268 | |
Nerdy, Inc.* | | | 251 | | | | 247 | |
LiveOne, Inc.* | | | 235 | | | | 223 | |
BlackSky Tehnology, Inc. | | | 45 | | | | 213 | |
Mondee Holdings, Inc.* | | | 131 | | | | 182 | |
Value Line, Inc. | | | 3 | | | | 139 | |
Terran Orbital Corp.*,1 | | | 532 | | | | 134 | |
Vacasa, Inc. — Class A* | | | 32 | | | | 90 | |
Solo Brands, Inc. — Class A* | | | 57 | | | | 80 | |
aka Brands Holding Corp.* | | | 2 | | | | 47 | |
Total Communications | | | | | | | 374,328 | |
| | | | | | | | | |
Basic Materials - 1.9% |
Carpenter Technology Corp. | | | 163 | | | | 26,011 | |
Commercial Metals Co. | | | 397 | | | | 21,819 | |
Cabot Corp. | | | 186 | | | | 20,789 | |
Balchem Corp. | | | 111 | | | | 19,536 | |
Avient Corp. | | | 310 | | | | 15,599 | |
HB Fuller Co. | | | 189 | | | | 15,003 | |
Hecla Mining Co. | | | 1,997 | | | | 13,320 | |
Sensient Technologies Corp. | | | 145 | | | | 11,632 | |
Arcadium Lithium plc* | | | 3,721 | | | | 10,605 | |
Sylvamo Corp. | | | 121 | | | | 10,388 | |
Innospec, Inc. | | | 86 | | | | 9,726 | |
Coeur Mining, Inc.* | | | 1,356 | | | | 9,329 | |
Minerals Technologies, Inc. | | | 111 | | | | 8,573 | |
Hawkins, Inc. | | | 67 | | | | 8,540 | |
Uranium Energy Corp.* | | | 1,358 | | | | 8,433 | |
Quaker Chemical Corp. | | | 48 | | | | 8,087 | |
Rogers Corp.* | | | 65 | | | | 7,346 | |
Constellium SE* | | | 447 | | | | 7,268 | |
Perimeter Solutions S.A.* | | | 459 | | | | 6,174 | |
Tronox Holdings plc — Class A | | | 410 | | | | 5,998 | |
Stepan Co. | | | 74 | | | | 5,716 | |
Ingevity Corp.* | | | 126 | | | | 4,914 | |
Kaiser Aluminum Corp. | | | 55 | | | | 3,989 | |
SSR Mining, Inc.* | | | 697 | | | | 3,959 | |
Orion S.A. | | | 199 | | | | 3,544 | |
United States Lime & Minerals, Inc. | | | 36 | | | | 3,516 | |
Novagold Resources, Inc.* | | | 837 | | | | 3,432 | |
Mativ Holdings, Inc. | | | 186 | | | | 3,160 | |
Energy Fuels, Inc.* | | | 560 | | | | 3,074 | |
Century Aluminum Co.* | | | 183 | | | | 2,970 | |
Ecovyst, Inc.* | | | 402 | | | | 2,754 | |
Centrus Energy Corp. — Class A* | | | 49 | | | | 2,688 | |
AdvanSix, Inc. | | | 88 | | | | 2,673 | |
Haynes International, Inc. | | | 44 | | | | 2,620 | |
Koppers Holdings, Inc. | | | 71 | | | | 2,594 | |
Metals Acquisition Ltd. — Class A* | | | 186 | | | | 2,576 | |
Encore Energy Corp.* | | | 616 | | | | 2,489 | |
Ivanhoe Electric Incorporated / US* | | | 288 | | | | 2,436 | |
Rayonier Advanced Materials, Inc.* | | | 222 | | | | 1,900 | |
Radius Recycling, Inc. — Class A | | | 91 | | | | 1,687 | |
Compass Minerals International, Inc. | | | 120 | | | | 1,442 | |
Perpetua Resources Corp.* | | | 133 | | | | 1,244 | |
Oil-Dri Corporation of America | | | 17 | | | | 1,173 | |
Universal Stainless & Alloy Products, Inc.* | | | 30 | | | | 1,159 | |
Lightwave Logic, Inc.* | | | 414 | | | | 1,143 | |
Ur-Energy, Inc.* | | | 950 | | | | 1,131 | |
i-80 Gold Corp.* | | | 895 | | | | 1,038 | |
Intrepid Potash, Inc.* | | | 39 | | | | 936 | |
Kronos Worldwide, Inc. | | | 75 | | | | 934 | |
Lifezone Metals Ltd.* | | | 126 | | | | 882 | |
Caledonia Mining Corporation plc | | | 57 | | | | 853 | |
Codexis, Inc.* | | | 241 | | | | 742 | |
Piedmont Lithium, Inc.* | | | 63 | | | | 563 | |
Dakota Gold Corp.* | | | 226 | | | | 533 | |
Contango ORE, Inc.* | | | 27 | | | | 520 | |
American Vanguard Corp. | | | 87 | | | | 461 | |
Northern Technologies International Corp. | | | 27 | | | | 332 | |
Valhi, Inc. | | | 8 | | | | 267 | |
Critical Metals Corp.* | | | 26 | | | | 193 | |
Total Basic Materials | | | | | | | 322,413 | |
| | | | | | | | | |
Utilities - 1.6% |
Brookfield Infrastructure Corp. — Class A | | | 412 | | | | 17,893 | |
Portland General Electric Co. | | | 349 | | | | 16,717 | |
New Jersey Resources Corp. | | | 339 | | | | 16,001 | |
Southwest Gas Holdings, Inc. | | | 210 | | | | 15,490 | |
Black Hills Corp. | | | 236 | | | | 14,424 | |
ONE Gas, Inc. | | | 193 | | | | 14,363 | |
Ormat Technologies, Inc. | | | 186 | | | | 14,311 | |
TXNM Energy, Inc. | | | 311 | | | | 13,613 | |
Spire, Inc. | | | 195 | | | | 13,121 | |
ALLETE, Inc. | | | 200 | | | | 12,838 | |
Northwestern Energy Group, Inc. | | | 212 | | | | 12,131 | |
MGE Energy, Inc. | | | 126 | | | | 11,523 | |
Otter Tail Corp. | | | 143 | | | | 11,177 | |
California Water Service Group | | | 200 | | | | 10,844 | |
American States Water Co. | | | 129 | | | | 10,744 | |
Avista Corp. | | | 271 | | | | 10,501 | |
Chesapeake Utilities Corp. | | | 76 | | | | 9,437 | |
SJW Group | | | 112 | | | | 6,508 | |
Hawaiian Electric Industries, Inc.* | | | 569 | | | | 5,508 | |
Northwest Natural Holding Co. | | | 132 | | | | 5,388 | |
Ameresco, Inc. — Class A* | | | 111 | | | | 4,211 | |
Middlesex Water Co. | | | 61 | | | | 3,980 | |
Unitil Corp. | | | 55 | | | | 3,332 | |
York Water Co. | | | 49 | | | | 1,836 | |
Consolidated Water Company Ltd. | | | 52 | | | | 1,311 | |
Altus Power, Inc.* | | | 263 | | | | 836 | |
Genie Energy Ltd. — Class B | | | 45 | | | | 731 | |
RGC Resources, Inc. | | | 28 | | | | 632 | |
254 | THE RYDEX FUNDS SEMI-ANNUAL FINANCIAL REPORT | SEE NOTES TO FINANCIAL STATEMENTS. |
SCHEDULE OF INVESTMENTS (Unaudited)(continued) | September 30, 2024 |
RUSSELL 2000® FUND | |
| | Shares | | | Value | |
Global Water Resources, Inc. | | | 41 | | | $ | 516 | |
Total Utilities | | | | | | | 259,917 | |
| | | | | | | | | |
Government - 0.0% |
Banco Latinoamericano de Comercio Exterior S.A. — Class E | | | 95 | | | | 3,087 | |
| | | | | | | | | |
Total Common Stocks | | | | |
(Cost $7,639,562) | | | | | | | 9,204,980 | |
| | | | | | | | | |
WARRANT† - 0.0% |
Danimer Scientific, Inc. | | | | | | | | |
Expiring 07/15/25* | | | 1 | | | | — | |
Total Warrant | | | | |
(Cost $—) | | | | | | | — | |
| | | | | | | | | |
RIGHTS† - 0.0% |
Consumer, Non-cyclical - 0.0% |
Sanofi SA | | | 261 | | | | — | |
Tobira Therapeutics, Inc.*,††† | | | 141 | | | | — | |
Novartis AG*,††† | | | 429 | | | | — | |
Cartesian Therapeutics Inc.* | | | 881 | | | | — | |
Oncternal Therapeutics, Inc.*,††† | | | 7 | | | | — | |
Total Consumer, Non-cyclical | | | | | | | — | |
| | | | | | | | | |
Total Rights | | | | |
(Cost $271) | | | | | | | — | |
| | | | | | | | | |
EXCHANGE-TRADED FUNDS***,† - 16.8% |
Vanguard Russell 2000 ETF1 | | | 15,743 | | | | 1,406,794 | |
iShares Russell 2000 Index ETF | | | 6,356 | | | | 1,403,977 | |
Total Exchange-Traded Funds | | | | |
(Cost $2,799,130) | | | | | | | 2,810,771 | |
| | | | | | | | | |
U.S. TREASURY BILLS†† - 1.0% |
U.S. Treasury Bills |
4.85% due 12/12/242,3 | | | 150,000 | | | | 148,659 | |
4.63% due 10/10/243,4 | | | 21,000 | | | | 20,976 | |
Total U.S. Treasury Bills | | | | |
(Cost $169,517) | | | | | | | 169,635 | |
| | | | | | | | | |
REPURCHASE AGREEMENTS††,5 - 26.7% |
J.P. Morgan Securities LLC
issued 09/30/24 at 4.86%
due 10/01/242 | | | 2,438,500 | | | | 2,438,500 | |
BofA Securities, Inc.
issued 09/30/24 at 4.85%
due 10/01/242 | | | 2,014,088 | | | | 2,014,088 | |
Total Repurchase Agreements | | | | |
(Cost $4,452,588) | | | | | | | 4,452,588 | |
| | | | | | | | | |
| | | Shares | | | | | |
SECURITIES LENDING COLLATERAL†,6 - 1.5% |
Money Market Fund*** | | | | | | | | |
First American Government Obligations Fund - Class X, 4.82%7 | | | 251,648 | | | | 251,648 | |
Total Securities Lending Collateral | | | | |
(Cost $251,648) | | | | | | | 251,648 | |
| | | | | | | | | |
Total Investments - 101.1% | | | | |
(Cost $15,312,716) | | $ | 16,889,622 | |
Other Assets & Liabilities, net - (1.1)% | | | (182,227 | ) |
Total Net Assets - 100.0% | | $ | 16,707,395 | |
Futures Contracts |
Description | | Number of
Contracts | | | Expiration
Date | | | Notional
Amount | | | Value and
Unrealized
Appreciation** | |
Equity Futures Contracts Purchased† |
Russell 2000 Index Mini Futures Contracts | | | 3 | | | | Dec 2024 | | | $ | 337,470 | | | $ | 6,550 | |
Total Return Swap Agreements |
Counterparty | Index | Type | | | Financing
Rate | | Payment
Frequency | | | Maturity
Date | | | Units | | | Notional
Amount | | | Value and
Unrealized
Appreciation | |
OTC Equity Index Swap Agreements†† |
Goldman Sachs International | Russell 2000 Index | Pay | | | 4.93% (Federal
Funds Rate +
0.10%) | | | At Maturity | | | | 12/18/24 | | 908 | | $ | 2,024,090 | | | $ | 29,207 | |
BNP Paribas | Russell 2000 Index | Pay | | | 5.38% (Federal
Funds Rate +
0.55%) | | | At Maturity | | | | 12/19/24 | | 305 | | | 679,276 | | | | 9,904 | |
Barclays Bank plc | Russell 2000 Index | Pay | | | 5.29% (SOFR +
0.45%) | | | At Maturity | | | | 12/19/24 | | 723 | | | 1,612,981 | | | | 4,322 | |
| | | | | | | | | | | | | | | | | | | | $ | 4,316,347 | | | $ | 43,433 | |
SEE NOTES TO FINANCIAL STATEMENTS. | THE RYDEX FUNDS SEMI-ANNUAL FINANCIAL REPORT | 255 |
SCHEDULE OF INVESTMENTS (Unaudited)(continued) | September 30, 2024 |
RUSSELL 2000® FUND | |
* | Non-income producing security. |
** | Includes cumulative appreciation (depreciation). Variation margin is reported within the Statement of Assets and Liabilities. |
*** | A copy of each underlying unaffiliated fund’s financial statements is available at the SEC’s website at www.sec.gov. |
† | Value determined based on Level 1 inputs, unless otherwise noted — See Note 4. |
†† | Value determined based on Level 2 inputs — See Note 4. |
††† | Value determined based on Level 3 inputs — See Note 4. |
1 | All or a portion of this security is on loan at September 30, 2024 — See Note 7. |
2 | All or a portion of this security is pledged as equity index swap collateral at September 30, 2024. |
3 | Rate indicated is the effective yield at the time of purchase. |
4 | All or a portion of this security is pledged as futures collateral at September 30, 2024. |
5 | Repurchase Agreements — See Note 6. |
6 | Securities lending collateral — See Note 7. |
7 | Rate indicated is the 7-day yield as of September 30, 2024. |
| | plc — Public Limited Company |
| | REIT — Real Estate Investment Trust |
| | SOFR — Secured Overnight Financing Rate |
| | |
| | See Sector Classification in Other Information section. |
256 | THE RYDEX FUNDS SEMI-ANNUAL FINANCIAL REPORT | SEE NOTES TO FINANCIAL STATEMENTS. |
SCHEDULE OF INVESTMENTS (Unaudited)(concluded) | September 30, 2024 |
RUSSELL 2000® FUND | |
The following table summarizes the inputs used to value the Fund’s investments at September 30, 2024 (See Note 4 in the Notes to Financial Statements):
Investments in Securities (Assets) | | Level 1
Quoted
Prices | | | Level 2
Significant
Observable
Inputs | | | Level 3
Significant
Unobservable
Inputs | | | Total | |
Common Stocks | | $ | 9,204,980 | | | | — | | | | — | * | | $ | 9,204,980 | |
Warrant | | | — | * | | | — | | | | — | | | | — | |
Rights | | | — | * | | | — | | | | — | * | | | — | |
Exchange-Traded Funds | | | 2,810,771 | | | | — | | | | — | | | | 2,810,771 | |
U.S. Treasury Bills | | | — | | | | 169,635 | | | | — | | | | 169,635 | |
Repurchase Agreements | | | — | | | | 4,452,588 | | | | — | | | | 4,452,588 | |
Securities Lending Collateral | | | 251,648 | | | | — | | | | — | | | | 251,648 | |
Equity Futures Contracts** | | | 6,550 | | | | — | | | | — | | | | 6,550 | |
Equity Index Swap Agreements** | | | — | | | | 43,433 | | | | — | | | | 43,433 | |
Total Assets | | $ | 12,273,949 | | | $ | 4,665,656 | | | | — | | | $ | 16,939,605 | |
* | Security has a market value of $0. |
** | This derivative is reported as unrealized appreciation/depreciation at period end. |
SEE NOTES TO FINANCIAL STATEMENTS. | THE RYDEX FUNDS SEMI-ANNUAL FINANCIAL REPORT | 257 |
STATEMENT OF ASSETS AND LIABILITIES (Unaudited) |
September 30, 2024 |
Assets: |
Investments, at value - including $240,978 of securities loaned (cost $10,860,128) | | $ | 12,437,034 | |
Repurchase agreements, at value (cost $4,452,588) | | | 4,452,588 | |
Cash | | | 1,794 | |
Segregated cash with broker | | | 7,932 | |
Unrealized appreciation on OTC swap agreements | | | 43,433 | |
Receivables: |
Fund shares sold | | | 41,383 | |
Dividends | | | 12,305 | |
Variation margin on futures contracts | | | 825 | |
Interest | | | 601 | |
Securities lending income | | | 523 | |
Total assets | | | 16,998,418 | |
| | | | | |
Liabilities: |
Payable for: |
Return of securities lending collateral | | | 251,648 | |
Management fees | | | 9,559 | |
Transfer agent fees | | | 8,628 | |
Distribution and service fees | | | 3,951 | |
Fund shares redeemed | | | 3,004 | |
Portfolio accounting and administration fees | | | 1,977 | |
Swap settlement | | | 654 | |
Trustees’ fees* | | | 170 | |
Miscellaneous | | | 11,432 | |
Total liabilities | | | 291,023 | |
Net assets | | $ | 16,707,395 | |
| | | | | |
Net assets consist of: |
Paid in capital | | $ | 18,689,184 | |
Total distributable earnings (loss) | | | (1,981,789 | ) |
Net assets | | $ | 16,707,395 | |
Class A: |
Net assets | | $ | 4,853,781 | |
Capital shares outstanding | | | 89,289 | |
Net asset value per share | | $ | 54.36 | |
Maximum offering price per share (Net asset value divided by 95.25%) | | $ | 57.07 | |
Class C: |
Net assets | | $ | 1,320,926 | |
Capital shares outstanding | | | 29,012 | |
Net asset value per share | | $ | 45.53 | |
Class H: |
Net assets | | $ | 10,532,688 | |
Capital shares outstanding | | | 194,226 | |
Net asset value per share | | $ | 54.23 | |
STATEMENT OF OPERATIONS (Unaudited) |
Six Months Ended September 30, 2024 |
Investment Income: |
Dividends (net of foreign withholding tax of $202) | | $ | 106,545 | |
Interest | | | 235,865 | |
Income from securities lending, net | | | 4,532 | |
Total investment income | | | 346,942 | |
| | | | | |
Expenses: |
Management fees | | | 93,971 | |
Distribution and service fees: |
Class A | | | 7,069 | |
Class C | | | 13,585 | |
Class H | | | 20,860 | |
Transfer agent fees | | | 26,261 | |
Portfolio accounting and administration fees | | | 25,690 | |
Registration fees | | | 15,818 | |
Professional fees | | | 7,312 | |
Custodian fees | | | 1,634 | |
Trustees’ fees* | | | 1,631 | |
Interest expense | | | 746 | |
Miscellaneous | | | 247 | |
Total expenses | | | 214,824 | |
Less: |
Expenses reimbursed by Adviser | | | (6,257 | ) |
Net expenses | | | 208,567 | |
Net investment income | | | 138,375 | |
| | | | | |
Net Realized and Unrealized Gain (Loss): |
Net realized gain (loss) on: |
Investments | | | (882,412 | ) |
Swap agreements | | | 86,504 | |
Futures contracts | | | (61,360 | ) |
Net realized loss | | | (857,268 | ) |
Net change in unrealized appreciation (depreciation) on: |
Investments | | | 1,122,946 | |
Swap agreements | | | (230,111 | ) |
Futures contracts | | | (65,103 | ) |
Net change in unrealized appreciation (depreciation) | | | 827,732 | |
Net realized and unrealized loss | | | (29,536 | ) |
Net increase in net assets resulting from operations | | $ | 108,839 | |
* | Relates to Trustees not deemed “interested persons” within the meaning of Section 2(a)(19) of the 1940 Act. |
258 | THE RYDEX FUNDS SEMI-ANNUAL FINANCIAL REPORT | SEE NOTES TO FINANCIAL STATEMENTS. |
STATEMENTS OF CHANGES IN NET ASSETS |
| | Six Months Ended
September 30, 2024
(Unaudited) | | | Year Ended
March 31,
2024 | |
Increase (Decrease) in Net Assets from Operations: | | | | | | | | |
Net investment income | | $ | 138,375 | | | $ | 235,333 | |
Net realized gain (loss) on investments | | | (857,268 | ) | | | 197,472 | |
Net change in unrealized appreciation (depreciation) on investments | | | 827,732 | | | | 3,796,083 | |
Net increase in net assets resulting from operations | | | 108,839 | | | | 4,228,888 | |
| | | | | | | | | |
Distributions to shareholders: | | | | | | | | |
Class A | | | — | | | | (9,693 | ) |
Class C | | | — | | | | (3,174 | ) |
Class H | | | — | | | | (46,037 | ) |
Total distributions to shareholders | | | — | | | | (58,904 | ) |
| | | | | | | | | |
Capital share transactions: | | | | | | | | |
Proceeds from sale of shares | | | | | | | | |
Class A | | | 1,405,151 | | | | 12,021,235 | |
Class C | | | 625,262 | | | | 2,714,592 | |
Class H | | | 55,740,615 | | | | 67,073,724 | |
Distributions reinvested | | | | | | | | |
Class A | | | — | | | | 9,570 | |
Class C | | | — | | | | 2,469 | |
Class H | | | — | | | | 46,005 | |
Cost of shares redeemed | | | | | | | | |
Class A | | | (3,918,901 | ) | | | (9,294,688 | ) |
Class C | | | (3,300,119 | ) | | | (553,562 | ) |
Class H | | | (70,100,392 | ) | | | (61,143,883 | ) |
Net increase (decrease) from capital share transactions | | | (19,548,384 | ) | | | 10,875,462 | |
Net increase (decrease) in net assets | | | (19,439,545 | ) | | | 15,045,446 | |
| | | | | | | | | |
Net assets: | | | | | | | | |
Beginning of period | | | 36,146,940 | | | | 21,101,494 | |
End of period | | $ | 16,707,395 | | | $ | 36,146,940 | |
| | | | | | | | | |
Capital share activity: | | | | | | | | |
Shares sold | | | | | | | | |
Class A | | | 27,430 | | | | 258,409 | |
Class C | | | 14,582 | | | | 63,825 | |
Class H | | | 1,111,600 | | | | 1,423,771 | |
Shares issued from reinvestment of distributions | | | | | | | | |
Class A | | | — | | | | 209 | |
Class C | | | — | | | | 64 | |
Class H | | | — | | | | 1,005 | |
Shares redeemed | | | | | | | | |
Class A | | | (76,802 | ) | | | (206,292 | ) |
Class C | | | (75,805 | ) | | | (14,751 | ) |
Class H | | | (1,401,725 | ) | | | (1,298,866 | ) |
Net increase (decrease) in shares | | | (400,720 | ) | | | 227,374 | |
SEE NOTES TO FINANCIAL STATEMENTS. | THE RYDEX FUNDS SEMI-ANNUAL FINANCIAL REPORT | 259 |
This table is presented to show selected data for a share outstanding throughout each period and to assist shareholders in evaluating a Fund’s performance for the periods presented.
Class A | | Six Months Ended
September 30, 2024a | | | Year Ended
March 31,
2024 | | | Year Ended
March 31,
2023 | | | Year Ended
March 31,
2022 | | | Year Ended
March 31,
2021 | | | Year Ended
March 31,
2020 | |
Per Share Data |
Net asset value, beginning of period | | $ | 51.81 | | | $ | 44.08 | | | $ | 50.66 | | | $ | 61.82 | | | $ | 32.24 | | | $ | 43.81 | |
Income (loss) from investment operations: |
Net investment income (loss)b | | | .29 | | | | .40 | | | | .13 | | | | (.69 | ) | | | (.77 | ) | | | — | f |
Net gain (loss) on investments (realized and unrealized) | | | 2.26 | | | | 7.42 | | | | (6.71 | ) | | | (3.41 | ) | | | 30.35 | | | | (10.89 | ) |
Total from investment operations | | | 2.55 | | | | 7.82 | | | | (6.58 | ) | | | (4.10 | ) | | | 29.58 | | | | (10.89 | ) |
Less distributions from: |
Net investment income | | | — | | | | (.09 | ) | | | — | | | | — | | | | — | | | | (.01 | ) |
Net realized gains | | | — | | | | — | | | | — | | | | (7.06 | ) | | | — | | | | (.67 | ) |
Total distributions | | | — | | | | (.09 | ) | | | — | | | | (7.06 | ) | | | — | | | | (.68 | ) |
Net asset value, end of period | | $ | 54.36 | | | $ | 51.81 | | | $ | 44.08 | | | $ | 50.66 | | | $ | 61.82 | | | $ | 32.24 | |
|
Total Returnc | | | 4.92 | % | | | 17.77 | % | | | (12.99 | %) | | | (7.29 | %) | | | 91.75 | % | | | (25.32 | %) |
Ratios/Supplemental Data |
Net assets, end of period (in thousands) | | $ | 4,854 | | | $ | 7,184 | | | $ | 3,806 | | | $ | 5,781 | | | $ | 12,421 | | | $ | 10,712 | |
Ratios to average net assets: |
Net investment income (loss) | | | 1.15 | % | | | 0.87 | % | | | 0.28 | % | | | (1.14 | %) | | | (1.53 | %) | | | — | g |
Total expensesd | | | 1.64 | % | | | 1.66 | % | | | 1.65 | % | | | 1.60 | % | | | 1.67 | % | | | 1.73 | % |
Net expensese | | | 1.59 | % | | | 1.63 | % | | | 1.65 | % | | | 1.60 | % | | | 1.67 | % | | | 1.73 | % |
Portfolio turnover rate | | | 8 | % | | | 12 | % | | | 25 | % | | | 76 | % | | | — | | | | 35 | % |
Class C | | Six Months Ended
September 30, 2024a | | | Year Ended
March 31,
2024 | | | Year Ended
March 31,
2023 | | | Year Ended
March 31,
2022 | | | Year Ended
March 31,
2021 | | | Year Ended
March 31,
2020 | |
Per Share Data |
Net asset value, beginning of period | | $ | 43.55 | | | $ | 37.35 | | | $ | 43.24 | | | $ | 54.24 | | | $ | 28.50 | | | $ | 39.09 | |
Income (loss) from investment operations: |
Net investment income (loss)b | | | .09 | | | | .05 | | | | (.21 | ) | | | (.98 | ) | | | (.95 | ) | | | (.29 | ) |
Net gain (loss) on investments (realized and unrealized) | | | 1.89 | | | | 6.24 | | | | (5.68 | ) | | | (2.96 | ) | | | 26.69 | | | | (9.62 | ) |
Total from investment operations | | | 1.98 | | | | 6.29 | | | | (5.89 | ) | | | (3.94 | ) | | | 25.74 | | | | (9.91 | ) |
Less distributions from: |
Net investment income | | | — | | | | (.09 | ) | | | — | | | | — | | | | — | | | | (.01 | ) |
Net realized gains | | | — | | | | — | | | | — | | | | (7.06 | ) | | | — | | | | (.67 | ) |
Total distributions | | | — | | | | (.09 | ) | | | — | | | | (7.06 | ) | | | — | | | | (.68 | ) |
Net asset value, end of period | | $ | 45.53 | | | $ | 43.55 | | | $ | 37.35 | | | $ | 43.24 | | | $ | 54.24 | | | $ | 28.50 | |
|
Total Returnc | | | 4.55 | % | | | 16.91 | % | | | (13.62 | %) | | | (8.05 | %) | | | 90.32 | % | | | (25.88 | %) |
Ratios/Supplemental Data |
Net assets, end of period (in thousands) | | $ | 1,321 | | | $ | 3,930 | | | $ | 1,535 | | | $ | 1,904 | | | $ | 3,717 | | | $ | 1,590 | |
Ratios to average net assets: |
Net investment income (loss) | | | 0.41 | % | | | 0.12 | % | | | (0.56 | %) | | | (1.89 | %) | | | (2.28 | %) | | | (0.74 | %) |
Total expensesd | | | 2.38 | % | | | 2.42 | % | | | 2.40 | % | | | 2.36 | % | | | 2.43 | % | | | 2.48 | % |
Net expensese | | | 2.33 | % | | | 2.38 | % | | | 2.40 | % | | | 2.36 | % | | | 2.43 | % | | | 2.48 | % |
Portfolio turnover rate | | | 8 | % | | | 12 | % | | | 25 | % | | | 76 | % | | | — | | | | 35 | % |
260 | THE RYDEX FUNDS SEMI-ANNUAL FINANCIAL REPORT | SEE NOTES TO FINANCIAL STATEMENTS. |
FINANCIAL HIGHLIGHTS (concluded) |
This table is presented to show selected data for a share outstanding throughout each period and to assist shareholders in evaluating a Fund’s performance for the periods presented.
Class H | | Six Months Ended
September 30, 2024a | | | Year Ended
March 31,
2024 | | | Year Ended
March 31,
2023 | | | Year Ended
March 31,
2022 | | | Year Ended
March 31,
2021 | | | Year Ended
March 31,
2020 | |
Per Share Data |
Net asset value, beginning of period | | $ | 51.68 | | | $ | 43.97 | | | $ | 50.53 | | | $ | 61.68 | | | $ | 32.17 | | | $ | 43.70 | |
Income (loss) from investment operations: |
Net investment income (loss)b | | | .30 | | | | .42 | | | | .09 | | | | (.66 | ) | | | (.75 | ) | | | .01 | |
Net gain (loss) on investments (realized and unrealized) | | | 2.25 | | | | 7.38 | | | | (6.65 | ) | | | (3.43 | ) | | | 30.26 | | | | (10.86 | ) |
Total from investment operations | | | 2.55 | | | | 7.80 | | | | (6.56 | ) | | | (4.09 | ) | | | 29.51 | | | | (10.85 | ) |
Less distributions from: |
Net investment income | | | — | | | | (.09 | ) | | | — | | | | — | | | | — | | | | (.01 | ) |
Net realized gains | | | — | | | | — | | | | — | | | | (7.06 | ) | | | — | | | | (.67 | ) |
Total distributions | | | — | | | | (.09 | ) | | | — | | | | (7.06 | ) | | | — | | | | (.68 | ) |
Net asset value, end of period | | $ | 54.23 | | | $ | 51.68 | | | $ | 43.97 | | | $ | 50.53 | | | $ | 61.68 | | | $ | 32.17 | |
|
Total Return | | | 4.93 | % | | | 17.77 | % | | | (12.98 | %) | | | (7.29 | %) | | | 91.73 | % | | | (25.30 | %) |
Ratios/Supplemental Data |
Net assets, end of period (in thousands) | | $ | 10,533 | | | $ | 25,033 | | | $ | 15,761 | | | $ | 18,432 | | | $ | 29,743 | | | $ | 6,731 | |
Ratios to average net assets: |
Net investment income (loss) | | | 1.20 | % | | | 0.92 | % | | | 0.21 | % | | | (1.12 | %) | | | (1.52 | %) | | | 0.01 | % |
Total expensesd | | | 1.63 | % | | | 1.67 | % | | | 1.65 | % | | | 1.61 | % | | | 1.67 | % | | | 1.73 | % |
Net expensese | | | 1.58 | % | | | 1.63 | % | | | 1.65 | % | | | 1.61 | % | | | 1.67 | % | | | 1.73 | % |
Portfolio turnover rate | | | 8 | % | | | 12 | % | | | 25 | % | | | 76 | % | | | — | | | | 35 | % |
a | Unaudited figures for the period ended September 30, 2024. Percentage amounts for the period, except total return and portfolio turnover rate, have been annualized. |
b | Net investment income (loss) per share was computed using average shares outstanding throughout the period. |
c | Total return does not reflect the impact of any applicable sales charges. |
d | Does not include expenses of the underlying funds in which the Fund invests. |
e | Net expense information reflects the expense ratios after expense waivers and reimbursements, as applicable. |
f | Less than $0.01 per share. |
g | Less than 0.01%. |
SEE NOTES TO FINANCIAL STATEMENTS. | THE RYDEX FUNDS SEMI-ANNUAL FINANCIAL REPORT | 261 |
SCHEDULE OF INVESTMENTS (Unaudited) | September 30, 2024 |
INVERSE RUSSELL 2000® STRATEGY FUND | |
| | Shares | | | Value | |
MUTUAL FUNDS† - 46.0% |
Guggenheim Ultra Short Duration Fund — Institutional Class1 | | | 44,544 | | | $ | 446,326 | |
Guggenheim Strategy Fund II1 | | | 17,889 | | | | 443,656 | |
Total Mutual Funds | | | | |
(Cost $868,958) | | | | | | | 889,982 | |
| | | | | | | | | |
| | | Face
Amount | | | | | |
U.S. TREASURY BILLS†† - 3.3% |
U.S. Treasury Bills |
4.81% due 12/12/242,3 | | $ | 50,000 | | | | 49,553 | |
4.63% due 10/10/243,4 | | | 14,000 | | | | 13,984 | |
Total U.S. Treasury Bills | | | | |
(Cost $63,501) | | | | | | | 63,537 | |
REPURCHASE AGREEMENTS††,5 - 51.1% |
J.P. Morgan Securities LLC
issued 09/30/24 at 4.86%
due 10/01/242 | | | 542,724 | | | | 542,724 | |
BofA Securities, Inc.
issued 09/30/24 at 4.85%
due 10/01/242 | | | 448,264 | | | | 448,264 | |
Total Repurchase Agreements | | | | |
(Cost $990,988) | | | | | | | 990,988 | |
| | | | | | | | | |
Total Investments - 100.4% | | | | |
(Cost $1,923,447) | | $ | 1,944,507 | |
Other Assets & Liabilities, net - (0.4)% | | | (6,850 | ) |
Total Net Assets - 100.0% | | $ | 1,937,657 | |
Futures Contracts |
Description | | Number of
Contracts | | | Expiration
Date | | | Notional
Amount | | | Value and
Unrealized
Depreciation** | |
Equity Futures Contracts Sold Short† |
Russell 2000 Index Mini Futures Contracts | | | 2 | | | | Dec 2024 | | | $ | 224,980 | | | $ | (4,368 | ) |
Total Return Swap Agreements |
Counterparty | Index | Type | | Financing
Rate | | Payment
Frequency | | | Maturity
Date | | | Units | | | Notional
Amount | | | Value and
Unrealized
Depreciation | |
OTC Equity Index Swap Agreements Sold Short†† |
Barclays Bank plc | Russell 2000 Index | Receive | | 4.89% (SOFR +
0.05%) | | | At Maturity | | | | 12/19/24 | | 279 | | $ | 621,637 | | | $ | (1,666 | ) |
Goldman Sachs International | Russell 2000 Index | Receive | | 4.68% (Federal
Funds Rate -
0.15%) | | | At Maturity | | | | 12/18/24 | | 243 | | | 541,773 | | | | (7,902 | ) |
BNP Paribas | Russell 2000 Index | Receive | | 4.98% (Federal
Funds Rate +
0.15%) | | | At Maturity | | | | 12/19/24 | | 251 | | | 558,739 | | | | (8,148 | ) |
| | | | | | | | | | | | | | | | | | | $ | 1,722,149 | | | $ | (17,716 | ) |
** | Includes cumulative appreciation (depreciation). Variation margin is reported within the Statement of Assets and Liabilities. |
† | Value determined based on Level 1 inputs — See Note 4. |
†† | Value determined based on Level 2 inputs — See Note 4. |
1 | Affiliated issuer. |
2 | All or a portion of this security is pledged as equity index swap collateral at September 30, 2024. |
3 | Rate indicated is the effective yield at the time of purchase. |
4 | All or a portion of this security is pledged as futures collateral at September 30, 2024. |
5 | Repurchase Agreements — See Note 6. |
| | plc — Public Limited Company |
| | SOFR — Secured Overnight Financing Rate |
| | |
| | See Sector Classification in Other Information section. |
262 | THE RYDEX FUNDS SEMI-ANNUAL FINANCIAL REPORT | SEE NOTES TO FINANCIAL STATEMENTS. |
SCHEDULE OF INVESTMENTS (Unaudited)(concluded) | September 30, 2024 |
INVERSE RUSSELL 2000® STRATEGY FUND | |
The following table summarizes the inputs used to value the Fund’s investments at September 30, 2024 (See Note 4 in the Notes to Financial Statements):
Investments in Securities (Assets) | | Level 1
Quoted
Prices | | | Level 2
Significant
Observable
Inputs | | | Level 3
Significant
Unobservable
Inputs | | | Total | |
Mutual Funds | | $ | 889,982 | | | $ | — | | | $ | — | | | $ | 889,982 | |
U.S. Treasury Bills | | | — | | | | 63,537 | | | | — | | | | 63,537 | |
Repurchase Agreements | | | — | | | | 990,988 | | | | — | | | | 990,988 | |
Total Assets | | $ | 889,982 | | | $ | 1,054,525 | | | $ | — | | | $ | 1,944,507 | |
Investments in Securities (Liabilities) | | Level 1
Quoted
Prices | | | Level 2
Significant
Observable
Inputs | | | Level 3
Significant
Unobservable
Inputs | | | Total | |
Equity Futures Contracts** | | $ | 4,368 | | | $ | — | | | $ | — | | | $ | 4,368 | |
Equity Index Swap Agreements** | | | — | | | | 17,716 | | | | — | | | | 17,716 | |
Total Liabilities | | $ | 4,368 | | | $ | 17,716 | | | $ | — | | | $ | 22,084 | |
** | This derivative is reported as unrealized appreciation/depreciation at period end. |
Affiliated Transactions
Investments representing 5% or more of the outstanding voting shares of a company, or control of or by, or common control under Guggenheim Investments (“GI”), result in that company being considered an affiliated issuer, as defined in the 1940 Act.
The Fund may invest in certain of the underlying series of Guggenheim Strategy Funds Trust, including Guggenheim Strategy Fund II and Guggenheim Strategy Fund III (collectively, the “Guggenheim Strategy Funds”), each of which are open-end management investment companies managed by GI. The Guggenheim Strategy Funds, which launched on March 11, 2014, are offered as short term investment options only to mutual funds, trusts, and other accounts managed by GI and/or its affiliates, and are not available to the public. The Guggenheim Strategy Funds pay no investment management fees. The Guggenheim Strategy Funds’ annual report on Form N-CSR dated September 30, 2023 is available publicly or upon request. This information is available from the EDGAR database on the SEC’s website at https://www.sec.gov/Archives/edgar/data/1601445/000182126823000217/gug86449-ncsr.htm. The Fund may invest in certain of the underlying series of Guggenheim Funds Trust, which are open-end management investment companies managed by GI, are available to the public and whose most recent annual report on Form N-CSR is available publicly or upon request.
Transactions during the period ended September 30, 2024, in which the company is an affiliated issuer, were as follows:
Security Name | | Value
03/31/24 | | | Additions | | | Reductions | | | Realized
Gain (Loss) | | | Change in
Unrealized
Appreciation
(Depreciation) | | | Value
09/30/24 | | | Shares
09/30/24 | | | Investment
Income | |
Mutual Funds | | | | | | | | | | | | | | | | | | | | | | | | | | | | | | | | |
Guggenheim Strategy Fund II | | $ | 440,079 | | | $ | — | | | $ | — | | | $ | — | | | $ | 3,577 | | | $ | 443,656 | | | | 17,889 | | | $ | 12,600 | |
Guggenheim Ultra Short Duration Fund — Institutional Class | | | 441,426 | | | | — | | | | — | | | | — | | | | 4,900 | | | | 446,326 | | | | 44,544 | | | | 11,488 | |
| | | $ | 881,505 | | | $ | — | | | $ | — | | | $ | — | | | $ | 8,477 | | | $ | 889,982 | | | | | | | $ | 24,088 | |
SEE NOTES TO FINANCIAL STATEMENTS. | THE RYDEX FUNDS SEMI-ANNUAL FINANCIAL REPORT | 263 |
INVERSE RUSSELL 2000® STRATEGY FUND | |
STATEMENT OF ASSETS AND LIABILITIES (Unaudited) |
September 30, 2024 |
Assets: |
Investments in unaffiliated issuers, at value (cost $63,501) | | $ | 63,537 | |
Investments in affiliated issuers, at value (cost $868,958) | | | 889,982 | |
Repurchase agreements, at value (cost $990,988) | | | 990,988 | |
Segregated cash with broker | | | 11,288 | |
Receivables: |
Dividends | | | 3,770 | |
Fund shares sold | | | 536 | |
Interest | | | 134 | |
Total assets | | | 1,960,235 | |
| | | | | |
Liabilities: |
Unrealized depreciation on OTC swap agreements | | | 17,716 | |
Payable for: |
Management fees | | | 1,300 | |
Transfer agent fees | | | 907 | |
Variation margin on futures contracts | | | 550 | |
Distribution and service fees | | | 385 | |
Swap settlement | | | 313 | |
Portfolio accounting and administration fees | | | 81 | |
Trustees’ fees* | | | 18 | |
Miscellaneous | | | 1,308 | |
Total liabilities | | | 22,578 | |
Net assets | | $ | 1,937,657 | |
| | | | | |
Net assets consist of: |
Paid in capital | | $ | 44,628,940 | |
Total distributable earnings (loss) | | | (42,691,283 | ) |
Net assets | | $ | 1,937,657 | |
Class A: |
Net assets | | $ | 421,830 | |
Capital shares outstanding | | | 8,794 | |
Net asset value per share | | $ | 47.97 | |
Maximum offering price per share (Net asset value divided by 95.25%) | | $ | 50.36 | |
Class C: |
Net assets | | $ | 133 | |
Capital shares outstanding | | | 3 | |
Net asset value per share | | $ | 40.50 | |
Class H: |
Net assets | | $ | 1,515,694 | |
Capital shares outstanding | | | 31,463 | |
Net asset value per share | | $ | 48.17 | |
STATEMENT OF OPERATIONS (Unaudited) |
Six Months Ended September 30, 2024 |
Investment Income: |
Dividends from securities of affiliated issuers | | $ | 24,088 | |
Interest | | | 42,529 | |
Total investment income | | | 66,617 | |
| | | | | |
Expenses: |
Management fees | | | 10,946 | |
Distribution and service fees: |
Class A | | | 560 | |
Class C | | | 1 | |
Class H | | | 2,480 | |
Transfer agent fees | | | 2,475 | |
Portfolio accounting and administration fees | | | 1,856 | |
Registration fees | | | 1,198 | |
Professional fees | | | 388 | |
Interest expense | | | 312 | |
Custodian fees | | | 158 | |
Trustees’ fees* | | | 146 | |
Miscellaneous | | | 868 | |
Total expenses | | | 21,388 | |
Less: |
Expenses reimbursed by Adviser | | | (1,217 | ) |
Expenses waived by Adviser | | | (554 | ) |
Total waived/reimbursed expenses | | | (1,771 | ) |
Net expenses | | | 19,617 | |
Net investment income | | | 47,000 | |
| | | | | |
Net Realized and Unrealized Gain (Loss): |
Net realized gain (loss) on: |
Swap agreements | | | (144,346 | ) |
Futures contracts | | | (17,509 | ) |
Net realized loss | | | (161,855 | ) |
Net change in unrealized appreciation (depreciation) on: |
Investments in unaffiliated issuers | | | 36 | |
Investments in affiliated issuers | | | 8,477 | |
Swap agreements | | | 40,201 | |
Futures contracts | | | (4,368 | ) |
Net change in unrealized appreciation (depreciation) | | | 44,346 | |
Net realized and unrealized loss | | | (117,509 | ) |
Net decrease in net assets resulting from operations | | $ | (70,509 | ) |
* | Relates to Trustees not deemed “interested persons” within the meaning of Section 2(a)(19) of the 1940 Act. |
264 | THE RYDEX FUNDS SEMI-ANNUAL FINANCIAL REPORT | SEE NOTES TO FINANCIAL STATEMENTS. |
INVERSE RUSSELL 2000® STRATEGY FUND | |
STATEMENTS OF CHANGES IN NET ASSETS |
| | Six Months Ended
September 30, 2024
(Unaudited) | | | Year Ended
March 31,
2024 | |
Increase (Decrease) in Net Assets from Operations: | | | | | | | | |
Net investment income | | $ | 47,000 | | | $ | 145,904 | |
Net realized loss on investments | | | (161,855 | ) | | | (584,924 | ) |
Net change in unrealized appreciation (depreciation) on investments | | | 44,346 | | | | 142,974 | |
Net decrease in net assets resulting from operations | | | (70,509 | ) | | | (296,046 | ) |
| | | | | | | | | |
Distributions to shareholders: | | | | | | | | |
Class A | | | — | | | | (22,717 | ) |
Class C | | | — | | | | (871 | ) |
Class H | | | — | | | | (106,847 | ) |
Total distributions to shareholders | | | — | | | | (130,435 | ) |
| | | | | | | | | |
Capital share transactions: | | | | | | | | |
Proceeds from sale of shares | | | | | | | | |
Class A | | | 539,603 | | | | 611,136 | |
Class C | | | 5,408 | | | | 3,800 | |
Class H | | | 3,272,266 | | | | 18,993,823 | |
Distributions reinvested | | | | | | | | |
Class A | | | — | | | | 22,700 | |
Class C | | | — | | | | 871 | |
Class H | | | — | | | | 106,719 | |
Cost of shares redeemed | | | | | | | | |
Class A | | | (474,147 | ) | | | (707,833 | ) |
Class C | | | (5,617 | ) | | | (56,811 | ) |
Class H | | | (3,544,317 | ) | | | (22,343,474 | ) |
Net decrease from capital share transactions | | | (206,804 | ) | | | (3,369,069 | ) |
Net decrease in net assets | | | (277,313 | ) | | | (3,795,550 | ) |
| | | | | | | | | |
Net assets: | | | | | | | | |
Beginning of period | | | 2,214,970 | | | | 6,010,520 | |
End of period | | $ | 1,937,657 | | | $ | 2,214,970 | |
| | | | | | | | | |
Capital share activity: | | | | | | | | |
Shares sold | | | | | | | | |
Class A | | | 10,694 | | | | 11,015 | |
Class C | | | 124 | | | | 78 | |
Class H | | | 64,026 | | | | 318,605 | |
Shares issued from reinvestment of distributions | | | | | | | | |
Class A | | | — | | | | 413 | |
Class C | | | — | | | | 19 | |
Class H | | | — | | | | 1,933 | |
Shares redeemed | | | | | | | | |
Class A | | | (9,329 | ) | | | (12,333 | ) |
Class C | | | (124 | ) | | | (1,155 | ) |
Class H | | | (69,923 | ) | | | (373,513 | ) |
Net decrease in shares | | | (4,532 | ) | | | (54,938 | ) |
SEE NOTES TO FINANCIAL STATEMENTS. | THE RYDEX FUNDS SEMI-ANNUAL FINANCIAL REPORT | 265 |
INVERSE RUSSELL 2000® STRATEGY FUND | |
This table is presented to show selected data for a share outstanding throughout each period and to assist shareholders in evaluating a Fund’s performance for the periods presented.
Class A | | Six Months Ended
September 30, 2024a | | | Year Ended
March 31,
2024 | | | Year Ended
March 31,
2023 | | | Year Ended
March 31,
2022 | | | Year Ended
March 31,
2021 | | | Year Ended
March 31,
2020f | |
Per Share Data |
Net asset value, beginning of period | | $ | 49.28 | | | $ | 60.13 | | | $ | 55.13 | | | $ | 55.28 | | | $ | 120.61 | | | $ | 102.08 | |
Income (loss) from investment operations: |
Net investment income (loss)b | | | .99 | | | | 2.16 | | | | .67 | | | | (.64 | ) | | | (.45 | ) | | | .50 | |
Net gain (loss) on investments (realized and unrealized) | | | (2.30 | ) | | | (8.72 | ) | | | 4.33 | g | | | .49 | | | | (64.83 | ) | | | 18.73 | g |
Total from investment operations | | | (1.31 | ) | | | (6.56 | ) | | | 5.00 | | | | (.15 | ) | | | (65.28 | ) | | | 19.23 | |
Less distributions from: |
Net investment income | | | — | | | | (4.29 | ) | | | — | | | | — | | | | (.05 | ) | | | (.70 | ) |
Total distributions | | | — | | | | (4.29 | ) | | | — | | | | — | | | | (.05 | ) | | | (.70 | ) |
Net asset value, end of period | | $ | 47.97 | | | $ | 49.28 | | | $ | 60.13 | | | $ | 55.13 | | | $ | 55.28 | | | $ | 120.61 | |
|
Total Returnc | | | (2.66 | %) | | | (11.70 | %) | | | 9.07 | % | | | (0.27 | %) | | | (54.13 | %) | | | 19.00 | % |
Ratios/Supplemental Data |
Net assets, end of period (in thousands) | | $ | 422 | | | $ | 366 | | | $ | 501 | | | $ | 443 | | | $ | 320 | | | $ | 207 | |
Ratios to average net assets: |
Net investment income (loss) | | | 3.89 | % | | | 3.73 | % | | | 1.13 | % | | | (1.17 | %) | | | (1.38 | %) | | | 0.51 | % |
Total expensesd | | | 1.76 | % | | | 1.75 | % | | | 1.80 | % | | | 1.71 | % | | | 1.80 | % | | | 1.82 | % |
Net expensese | | | 1.61 | % | | | 1.62 | % | | | 1.75 | % | | | 1.66 | % | | | 1.78 | % | | | 1.78 | % |
Portfolio turnover rate | | | — | | | | — | | | | — | | | | — | | | | 14 | % | | | 7 | % |
Class C | | Six Months Ended
September 30, 2024a | | | Year Ended
March 31,
2024 | | | Year Ended
March 31,
2023 | | | Year Ended
March 31,
2022 | | | Year Ended
March 31,
2021 | | | Year Ended
March 31,
2020f | |
Per Share Data |
Net asset value, beginning of period | | $ | 41.76 | | | $ | 52.00 | | | $ | 48.07 | | | $ | 48.51 | | | $ | 106.73 | | | $ | 91.07 | |
Income (loss) from investment operations: |
Net investment income (loss)b | | | .57 | | | | 1.50 | | | | .30 | | | | (.89 | ) | | | (.61 | ) | | | (.30 | ) |
Net gain (loss) on investments (realized and unrealized) | | | (1.83 | ) | | | (7.45 | ) | | | 3.63 | g | | | .45 | | | | (57.56 | ) | | | 16.66 | g |
Total from investment operations | | | (1.26 | ) | | | (5.95 | ) | | | 3.93 | | | | (.44 | ) | | | (58.17 | ) | | | 16.36 | |
Less distributions from: |
Net investment income | | | — | | | | (4.29 | ) | | | — | | | | — | | | | (.05 | ) | | | (.70 | ) |
Total distributions | | | — | | | | (4.29 | ) | | | — | | | | — | | | | (.05 | ) | | | (.70 | ) |
Net asset value, end of period | | $ | 40.50 | | | $ | 41.76 | | | $ | 52.00 | | | $ | 48.07 | | | $ | 48.51 | | | $ | 106.73 | |
|
Total Returnc | | | (3.02 | %) | | | (12.35 | %) | | | 8.18 | % | | | (0.91 | %) | | | (54.49 | %) | | | 18.22 | % |
Ratios/Supplemental Data |
Net assets, end of period (in thousands) | | $ | 0 | | | $ | 0 | | | $ | 55 | | | $ | 28 | | | $ | 26 | | | $ | 94 | |
Ratios to average net assets: |
Net investment income (loss) | | | 2.75 | % | | | 2.92 | % | | | 0.58 | % | | | (1.88 | %) | | | (2.15 | %) | | | (0.34 | %) |
Total expensesd | | | 2.75 | % | | | 2.49 | % | | | 2.55 | % | | | 2.46 | % | | | 2.57 | % | | | 2.57 | % |
Net expensese | | | 2.75 | % | | | 2.38 | % | | | 2.49 | % | | | 2.40 | % | | | 2.54 | % | | | 2.53 | % |
Portfolio turnover rate | | | — | | | | — | | | | — | | | | — | | | | 14 | % | | | 7 | % |
266 | THE RYDEX FUNDS SEMI-ANNUAL FINANCIAL REPORT | SEE NOTES TO FINANCIAL STATEMENTS. |
INVERSE RUSSELL 2000® STRATEGY FUND | |
FINANCIAL HIGHLIGHTS (concluded) |
This table is presented to show selected data for a share outstanding throughout each period and to assist shareholders in evaluating a Fund’s performance for the periods presented.
Class H | | Six Months Ended
September 30, 2024a | | | Year Ended
March 31,
2024 | | | Year Ended
March 31,
2023 | | | Year Ended
March 31,
2022 | | | Year Ended
March 31,
2021 | | | Year Ended
March 31,
2020f | |
Per Share Data |
Net asset value, beginning of period | | $ | 49.49 | | | $ | 60.38 | | | $ | 55.35 | | | $ | 55.51 | | | $ | 121.09 | | | $ | 102.43 | |
Income (loss) from investment operations: |
Net investment income (loss)b | | | .99 | | | | 2.16 | | | | .64 | | | | (.64 | ) | | | (.44 | ) | | | .10 | |
Net gain (loss) on investments (realized and unrealized) | | | (2.31 | ) | | | (8.76 | ) | | | 4.39 | g | | | .48 | | | | (65.09 | ) | | | 19.26 | g |
Total from investment operations | | | (1.32 | ) | | | (6.60 | ) | | | 5.03 | | | | (.16 | ) | | | (65.53 | ) | | | 19.36 | |
Less distributions from: |
Net investment income | | | — | | | | (4.29 | ) | | | — | | | | — | | | | (.05 | ) | | | (.70 | ) |
Total distributions | | | — | | | | (4.29 | ) | | | — | | | | — | | | | (.05 | ) | | | (.70 | ) |
Net asset value, end of period | | $ | 48.17 | | | $ | 49.49 | | | $ | 60.38 | | | $ | 55.35 | | | $ | 55.51 | | | $ | 121.09 | |
|
Total Return | | | (2.67 | %) | | | (11.70 | %) | | | 9.09 | % | | | (0.29 | %) | | | (54.13 | %) | | | 19.08 | % |
Ratios/Supplemental Data |
Net assets, end of period (in thousands) | | $ | 1,516 | | | $ | 1,849 | | | $ | 5,454 | | | $ | 5,396 | | | $ | 5,087 | | | $ | 22,414 | |
Ratios to average net assets: |
Net investment income (loss) | | | 3.86 | % | | | 3.69 | % | | | 1.06 | % | | | (1.17 | %) | | | (1.42 | %) | | | 0.07 | % |
Total expensesd | | | 1.76 | % | | | 1.74 | % | | | 1.78 | % | | | 1.71 | % | | | 1.81 | % | | | 1.82 | % |
Net expensese | | | 1.61 | % | | | 1.62 | % | | | 1.72 | % | | | 1.66 | % | | | 1.79 | % | | | 1.79 | % |
Portfolio turnover rate | | | — | | | | — | | | | — | | | | — | | | | 14 | % | | | 7 | % |
a | Unaudited figures for the period ended September 30, 2024. Percentage amounts for the period, except total return and portfolio turnover rate, have been annualized. |
b | Net investment income (loss) per share was computed using average shares outstanding throughout the period. |
c | Total return does not reflect the impact of any applicable sales charges. |
d | Does not include expenses of the underlying funds in which the Fund invests. |
e | Net expense information reflects the expense ratios after expense waivers and reimbursements, as applicable. |
f | Reverse share split — Per share amounts for the period presented through March 31, 2020 have been restated to reflect a 1:5 reverse share split effective August 17, 2020. |
g | The amount shown for a share outstanding throughout the period does not agree with the aggregate net loss on investments for the period because of the sales and purchases of fund shares in relation to fluctuating market value of the investments of the Fund. |
SEE NOTES TO FINANCIAL STATEMENTS. | THE RYDEX FUNDS SEMI-ANNUAL FINANCIAL REPORT | 267 |
SCHEDULE OF INVESTMENTS (Unaudited) | September 30, 2024 |
S&P 500® PURE GROWTH FUND | |
| | Shares | | | Value | |
COMMON STOCKS† - 99.4% |
| | | | | | | | | |
Technology - 34.2% |
NVIDIA Corp. | | | 54,233 | | | $ | 6,586,056 | |
Monolithic Power Systems, Inc. | | | 4,378 | | | | 4,047,461 | |
KLA Corp. | | | 4,032 | | | | 3,122,421 | |
Palantir Technologies, Inc. — Class A* | | | 79,746 | | | | 2,966,551 | |
Advanced Micro Devices, Inc.* | | | 16,540 | | | | 2,713,883 | |
ServiceNow, Inc.* | | | 2,964 | | | | 2,650,972 | |
Crowdstrike Holdings, Inc. — Class A* | | | 9,254 | | | | 2,595,469 | |
Broadcom, Inc. | | | 13,691 | | | | 2,361,698 | |
Applied Materials, Inc. | | | 11,097 | | | | 2,242,149 | |
Oracle Corp. | | | 11,796 | | | | 2,010,038 | |
Fair Isaac Corp.* | | | 955 | | | | 1,856,062 | |
Intuit, Inc. | | | 2,972 | | | | 1,845,612 | |
Fortinet, Inc.* | | | 23,547 | | | | 1,826,070 | |
Lam Research Corp. | | | 2,031 | | | | 1,657,458 | |
Tyler Technologies, Inc.* | | | 2,734 | | | | 1,595,890 | |
Microsoft Corp. | | | 3,654 | | | | 1,572,316 | |
Cadence Design Systems, Inc.* | | | 5,600 | | | | 1,517,768 | |
Salesforce, Inc. | | | 5,117 | | | | 1,400,574 | |
Super Micro Computer, Inc.* | | | 3,280 | | | | 1,365,792 | |
Adobe, Inc.* | | | 2,487 | | | | 1,287,719 | |
Synopsys, Inc.* | | | 2,443 | | | | 1,237,111 | |
Gartner, Inc.* | | | 2,205 | | | | 1,117,406 | |
Apple, Inc. | | | 4,769 | | | | 1,111,177 | |
Total Technology | | | | | | | 50,687,653 | |
| | | | | | | | | |
Consumer, Cyclical - 23.7% |
Royal Caribbean Cruises Ltd. | | | 23,647 | | | | 4,194,032 | |
PulteGroup, Inc. | | | 23,406 | | | | 3,359,463 | |
DR Horton, Inc. | | | 15,537 | | | | 2,963,993 | |
Live Nation Entertainment, Inc.* | | | 25,289 | | | | 2,768,893 | |
Hilton Worldwide Holdings, Inc. | | | 11,188 | | | | 2,578,834 | |
Marriott International, Inc. — Class A | | | 10,277 | | | | 2,554,862 | |
Deckers Outdoor Corp.* | | | 15,881 | | | | 2,532,226 | |
Tesla, Inc.* | | | 8,524 | | | | 2,230,134 | |
NVR, Inc.* | | | 227 | | | | 2,227,279 | |
Chipotle Mexican Grill, Inc. — Class A* | | | 36,158 | | | | 2,083,424 | |
Copart, Inc.* | | | 37,261 | | | | 1,952,476 | |
Norwegian Cruise Line Holdings Ltd.* | | | 84,951 | | | | 1,742,345 | |
Wynn Resorts Ltd. | | | 15,275 | | | | 1,464,567 | |
Ross Stores, Inc. | | | 9,229 | | | | 1,389,057 | |
Lululemon Athletica, Inc.* | | | 3,944 | | | | 1,070,204 | |
Total Consumer, Cyclical | | | | | | | 35,111,789 | |
| | | | | | | | | |
Communications - 17.2% |
Arista Networks, Inc.* | | | 11,604 | | | | 4,453,847 | |
Booking Holdings, Inc. | | | 795 | | | | 3,348,635 | |
Meta Platforms, Inc. — Class A | | | 5,684 | | | | 3,253,749 | |
Uber Technologies, Inc.* | | | 43,140 | | | | 3,242,402 | |
Palo Alto Networks, Inc.* | | | 7,197 | | | | 2,459,935 | |
Expedia Group, Inc.* | | | 12,878 | | | | 1,906,202 | |
Amazon.com, Inc.* | | | 9,643 | | | | 1,796,780 | |
Netflix, Inc.* | | | 2,383 | | | | 1,690,190 | |
Alphabet, Inc. — Class A | | | 7,633 | | | | 1,265,933 | |
Alphabet, Inc. — Class C | | | 6,432 | | | | 1,075,366 | |
GoDaddy, Inc. — Class A* | | | 6,716 | | | | 1,052,935 | |
Total Communications | | | | | | | 25,545,974 | |
| | | | | | | | | |
Industrial - 6.6% |
Builders FirstSource, Inc.* | | | 15,273 | | | | 2,960,824 | |
Axon Enterprise, Inc.* | | | 6,067 | | | | 2,424,373 | |
Fortive Corp. | | | 21,145 | | | | 1,668,975 | |
TransDigm Group, Inc. | | | 983 | | | | 1,402,869 | |
Old Dominion Freight Line, Inc. | | | 6,585 | | | | 1,308,044 | |
Total Industrial | | | | | | | 9,765,085 | |
| | | | | | | | | |
Energy - 5.4% |
Targa Resources Corp. | | | 22,996 | | | | 3,403,638 | |
Diamondback Energy, Inc. | | | 11,491 | | | | 1,981,048 | |
Hess Corp. | | | 10,058 | | | | 1,365,876 | |
APA Corp. | | | 55,271 | | | | 1,351,929 | |
Total Energy | | | | | | | 8,102,491 | |
| | | | | | | | | |
Consumer, Non-cyclical - 4.6% |
United Rentals, Inc. | | | 3,298 | | | | 2,670,489 | |
Eli Lilly & Co. | | | 1,878 | | | | 1,663,795 | |
Corpay, Inc.* | | | 4,876 | | | | 1,525,018 | |
West Pharmaceutical Services, Inc. | | | 3,465 | | | | 1,040,055 | |
Total Consumer, Non-cyclical | | | | | | | 6,899,357 | |
| | | | | | | | | |
Financial - 4.2% |
KKR & Company, Inc. — Class A | | | 27,789 | | | | 3,628,688 | |
Arch Capital Group Ltd.* | | | 23,701 | | | | 2,651,668 | |
Total Financial | | | | | | | 6,280,356 | |
| | | | | | | | | |
Utilities - 2.0% |
Vistra Corp. | | | 24,970 | | | | 2,959,944 | |
| | | | | | | | | |
Basic Materials - 1.5% |
Celanese Corp. — Class A | | | 16,014 | | | | 2,177,264 | |
| | | | | | | | | |
Total Common Stocks | | | | |
(Cost $131,719,412) | | | | | | | 147,529,913 | |
| | | | | | | | | |
| | | Face
Amount | | | | | |
REPURCHASE AGREEMENTS††,1 - 0.6% |
J.P. Morgan Securities LLC
issued 09/30/24 at 4.86%
due 10/01/24 | | $ | 494,584 | | | | 494,584 | |
BofA Securities, Inc.
issued 09/30/24 at 4.85%
due 10/01/24 | | | 408,504 | | | | 408,504 | |
Total Repurchase Agreements | | | | |
(Cost $903,088) | | | | | | | 903,088 | |
| | | | | | | | | |
Total Investments - 100.0% | | | | |
(Cost $132,622,500) | | $ | 148,433,001 | |
Other Assets & Liabilities, net - 0.0% | | | (68,094 | ) |
Total Net Assets - 100.0% | | $ | 148,364,907 | |
268 | THE RYDEX FUNDS SEMI-ANNUAL FINANCIAL REPORT | SEE NOTES TO FINANCIAL STATEMENTS. |
SCHEDULE OF INVESTMENTS (Unaudited)(concluded) | September 30, 2024 |
S&P 500® PURE GROWTH FUND | |
* | Non-income producing security. |
† | Value determined based on Level 1 inputs — See Note 4. |
†† | Value determined based on Level 2 inputs — See Note 4. |
1 | Repurchase Agreements — See Note 6. |
| | |
| | See Sector Classification in Other Information section. |
The following table summarizes the inputs used to value the Fund’s investments at September 30, 2024 (See Note 4 in the Notes to Financial Statements):
Investments in Securities (Assets) | | Level 1
Quoted
Prices | | | Level 2
Significant
Observable
Inputs | | | Level 3
Significant
Unobservable
Inputs | | | Total | |
Common Stocks | | $ | 147,529,913 | | | $ | — | | | $ | — | | | $ | 147,529,913 | |
Repurchase Agreements | | | — | | | | 903,088 | | | | — | | | | 903,088 | |
Total Assets | | $ | 147,529,913 | | | $ | 903,088 | | | $ | — | | | $ | 148,433,001 | |
SEE NOTES TO FINANCIAL STATEMENTS. | THE RYDEX FUNDS SEMI-ANNUAL FINANCIAL REPORT | 269 |
S&P 500® PURE GROWTH FUND | |
STATEMENT OF ASSETS AND LIABILITIES (Unaudited) |
September 30, 2024 |
Assets: |
Investments, at value (cost $131,719,412) | | $ | 147,529,913 | |
Repurchase agreements, at value (cost $903,088) | | | 903,088 | |
Receivables: |
Fund shares sold | | | 105,255 | |
Dividends | | | 27,029 | |
Interest | | | 122 | |
Total assets | | | 148,565,407 | |
| | | | | |
Liabilities: |
Payable for: |
Management fees | | | 60,569 | |
Fund shares redeemed | | | 46,258 | |
Transfer agent fees | | | 26,373 | |
Distribution and service fees | | | 21,200 | |
Portfolio accounting and administration fees | | | 8,287 | |
Trustees’ fees* | | | 502 | |
Miscellaneous | | | 37,311 | |
Total liabilities | | | 200,500 | |
Net assets | | $ | 148,364,907 | |
| | | | | |
Net assets consist of: |
Paid in capital | | $ | 137,280,002 | |
Total distributable earnings (loss) | | | 11,084,905 | |
Net assets | | $ | 148,364,907 | |
Class A: |
Net assets | | $ | 8,527,028 | |
Capital shares outstanding | | | 88,455 | |
Net asset value per share | | $ | 96.40 | |
Maximum offering price per share (Net asset value divided by 95.25%) | | $ | 101.21 | |
Class C: |
Net assets | | $ | 1,789,965 | |
Capital shares outstanding | | | 22,524 | |
Net asset value per share | | $ | 79.47 | |
Class H: |
Net assets | | $ | 138,047,914 | |
Capital shares outstanding | | | 1,432,289 | |
Net asset value per share | | $ | 96.38 | |
STATEMENT OF OPERATIONS (Unaudited) |
Six Months Ended September 30, 2024 |
Investment Income: |
Dividends | | $ | 123,606 | |
Interest | | | 7,065 | |
Total investment income | | | 130,671 | |
| | | | | |
Expenses: |
Management fees | | | 166,797 | |
Distribution and service fees: |
Class A | | | 10,899 | |
Class C | | | 9,985 | |
Class H | | | 42,203 | |
Transfer agent fees | | | 46,108 | |
Portfolio accounting and administration fees | | | 33,931 | |
Registration fees | | | 23,369 | |
Professional fees | | | 10,117 | |
Custodian fees | | | 2,804 | |
Trustees’ fees* | | | 1,840 | |
Line of credit fees | | | 31 | |
Miscellaneous | | | 12,247 | |
Total expenses | | | 360,331 | |
Less: |
Expenses reimbursed by Adviser | | | (11,110 | ) |
Net expenses | | | 349,221 | |
Net investment loss | | | (218,550 | ) |
| | | | | |
Net Realized and Unrealized Gain (Loss): |
Net realized gain (loss) on: |
Investments | | | (1,064,686 | ) |
Net realized loss | | | (1,064,686 | ) |
Net change in unrealized appreciation (depreciation) on: |
Investments | | | 9,368,888 | |
Net change in unrealized appreciation (depreciation) | | | 9,368,888 | |
Net realized and unrealized gain | | | 8,304,202 | |
Net increase in net assets resulting from operations | | $ | 8,085,652 | |
* | Relates to Trustees not deemed “interested persons” within the meaning of Section 2(a)(19) of the 1940 Act. |
270 | THE RYDEX FUNDS SEMI-ANNUAL FINANCIAL REPORT | SEE NOTES TO FINANCIAL STATEMENTS. |
S&P 500® PURE GROWTH FUND | |
STATEMENTS OF CHANGES IN NET ASSETS |
| | Six Months Ended
September 30, 2024
(Unaudited) | | | Year Ended
March 31,
2024 | |
Increase (Decrease) in Net Assets from Operations: | | | | | | | | |
Net investment loss | | $ | (218,550 | ) | | $ | (39,909 | ) |
Net realized gain (loss) on investments | | | (1,064,686 | ) | | | 473,930 | |
Net change in unrealized appreciation (depreciation) on investments | | | 9,368,888 | | | | 3,751,669 | |
Net increase in net assets resulting from operations | | | 8,085,652 | | | | 4,185,690 | |
| | | | | | | | | |
Capital share transactions: | | | | | | | | |
Proceeds from sale of shares | | | | | | | | |
Class A | | | 451,699 | | | | 2,556,282 | |
Class C | | | 195,534 | | | | 1,772,328 | |
Class H | | | 186,644,637 | | | | 253,179,686 | |
Cost of shares redeemed | | | | | | | | |
Class A | | | (1,666,890 | ) | | | (2,695,246 | ) |
Class C | | | (691,846 | ) | | | (3,076,091 | ) |
Class H | | | (76,176,238 | ) | | | (258,609,418 | ) |
Net increase (decrease) from capital share transactions | | | 108,756,896 | | | | (6,872,459 | ) |
Net increase (decrease) in net assets | | | 116,842,548 | | | | (2,686,769 | ) |
| | | | | | | | | |
Net assets: | | | | | | | | |
Beginning of period | | | 31,522,359 | | | | 34,209,128 | |
End of period | | $ | 148,364,907 | | | $ | 31,522,359 | |
| | | | | | | | | |
Capital share activity: | | | | | | | | |
Shares sold | | | | | | | | |
Class A | | | 4,957 | | | | 32,924 | |
Class C | | | 2,545 | | | | 27,685 | |
Class H | | | 2,065,320 | | | | 3,256,450 | |
Shares redeemed | | | | | | | | |
Class A | | | (18,805 | ) | | | (34,867 | ) |
Class C | | | (9,369 | ) | | | (47,995 | ) |
Class H | | | (854,151 | ) | | | (3,347,039 | ) |
Net increase (decrease) in shares | | | 1,190,497 | | | | (112,842 | ) |
SEE NOTES TO FINANCIAL STATEMENTS. | THE RYDEX FUNDS SEMI-ANNUAL FINANCIAL REPORT | 271 |
S&P 500® PURE GROWTH FUND | |
This table is presented to show selected data for a share outstanding throughout each period and to assist shareholders in evaluating a Fund’s performance for the periods presented.
Class A | | Six Months Ended
September 30, 2024a | | | Year Ended
March 31,
2024 | | | Year Ended
March 31,
2023 | | | Year Ended
March 31,
2022 | | | Year Ended
March 31,
2021 | | | Year Ended
March 31,
2020 | |
Per Share Data |
Net asset value, beginning of period | | $ | 90.66 | | | $ | 74.81 | | | $ | 90.73 | | | $ | 84.03 | | | $ | 53.91 | | | $ | 65.86 | |
Income (loss) from investment operations: |
Net investment income (loss)b | | | (.43 | ) | | | (.15 | ) | | | (.05 | ) | | | (1.11 | ) | | | (.80 | ) | | | (.29 | ) |
Net gain (loss) on investments (realized and unrealized) | | | 6.17 | | | | 16.00 | | | | (15.87 | ) | | | 10.27 | | | | 34.07 | | | | (8.09 | ) |
Total from investment operations | | | 5.74 | | | | 15.85 | | | | (15.92 | ) | | | 9.16 | | | | 33.27 | | | | (8.38 | ) |
Less distributions from: |
Net realized gains | | | — | | | | — | | | | — | | | | (2.46 | ) | | | (3.15 | ) | | | (3.57 | ) |
Total distributions | | | — | | | | — | | | | — | | | | (2.46 | ) | | | (3.15 | ) | | | (3.57 | ) |
Net asset value, end of period | | $ | 96.40 | | | $ | 90.66 | | | $ | 74.81 | | | $ | 90.73 | | | $ | 84.03 | | | $ | 53.91 | |
|
Total Returnc | | | 6.33 | % | | | 21.19 | % | | | (17.55 | %) | | | 10.53 | % | | | 61.92 | % | | | (13.76 | %) |
Ratios/Supplemental Data |
Net assets, end of period (in thousands) | | $ | 8,527 | | | $ | 9,275 | | | $ | 7,799 | | | $ | 10,104 | | | $ | 9,724 | | | $ | 7,656 | |
Ratios to average net assets: |
Net investment income (loss) | | | (0.96 | %) | | | (0.20 | %) | | | (0.06 | %) | | | (1.15 | %) | | | (1.06 | %) | | | (0.43 | %) |
Total expenses | | | 1.57 | % | | | 1.59 | % | | | 1.55 | % | | | 1.51 | % | | | 1.60 | % | | | 1.63 | % |
Net expensesd | | | 1.52 | % | | | 1.55 | % | | | 1.55 | % | | | 1.51 | % | | | 1.60 | % | | | 1.63 | % |
Portfolio turnover rate | | | 147 | % | | | 649 | % | | | 434 | % | | | 727 | % | | | 240 | % | | | 282 | % |
Class C | | Six Months Ended
September 30, 2024a | | | Year Ended
March 31,
2024 | | | Year Ended
March 31,
2023 | | | Year Ended
March 31,
2022 | | | Year Ended
March 31,
2021 | | | Year Ended
March 31,
2020 | |
Per Share Data |
Net asset value, beginning of period | | $ | 75.02 | | | $ | 62.37 | | | $ | 76.21 | | | $ | 71.42 | | | $ | 46.47 | | | $ | 57.65 | |
Income (loss) from investment operations: |
Net investment income (loss)b | | | (.64 | ) | | | (.58 | ) | | | (.55 | ) | | | (1.55 | ) | | | (1.16 | ) | | | (.69 | ) |
Net gain (loss) on investments (realized and unrealized) | | | 5.09 | | | | 13.23 | | | | (13.29 | ) | | | 8.80 | | | | 29.26 | | | | (6.92 | ) |
Total from investment operations | | | 4.45 | | | | 12.65 | | | | (13.84 | ) | | | 7.25 | | | | 28.10 | | | | (7.61 | ) |
Less distributions from: |
Net realized gains | | | — | | | | — | | | | — | | | | (2.46 | ) | | | (3.15 | ) | | | (3.57 | ) |
Total distributions | | | — | | | | — | | | | — | | | | (2.46 | ) | | | (3.15 | ) | | | (3.57 | ) |
Net asset value, end of period | | $ | 79.47 | | | $ | 75.02 | | | $ | 62.37 | | | $ | 76.21 | | | $ | 71.42 | | | $ | 46.47 | |
|
Total Returnc | | | 5.93 | % | | | 20.28 | % | | | (18.16 | %) | | | 9.71 | % | | | 60.69 | % | | | (14.40 | %) |
Ratios/Supplemental Data |
Net assets, end of period (in thousands) | | $ | 1,790 | | | $ | 2,202 | | | $ | 3,097 | | | $ | 5,339 | | | $ | 7,314 | | | $ | 6,050 | |
Ratios to average net assets: |
Net investment income (loss) | | | (1.71 | %) | | | (0.91 | %) | | | (0.85 | %) | | | (1.91 | %) | | | (1.80 | %) | | | (1.18 | %) |
Total expenses | | | 2.32 | % | | | 2.34 | % | | | 2.30 | % | | | 2.26 | % | | | 2.35 | % | | | 2.38 | % |
Net expensesd | | | 2.27 | % | | | 2.30 | % | | | 2.30 | % | | | 2.26 | % | | | 2.35 | % | | | 2.38 | % |
Portfolio turnover rate | | | 147 | % | | | 649 | % | | | 434 | % | | | 727 | % | | | 240 | % | | | 282 | % |
272 | THE RYDEX FUNDS SEMI-ANNUAL FINANCIAL REPORT | SEE NOTES TO FINANCIAL STATEMENTS. |
S&P 500® PURE GROWTH FUND | |
FINANCIAL HIGHLIGHTS (concluded) |
This table is presented to show selected data for a share outstanding throughout each period and to assist shareholders in evaluating a Fund’s performance for the periods presented.
Class H | | Six Months Ended
September 30, 2024a | | | Year Ended
March 31,
2024 | | | Year Ended
March 31,
2023 | | | Year Ended
March 31,
2022 | | | Year Ended
March 31,
2021 | | | Year Ended
March 31,
2020 | |
Per Share Data |
Net asset value, beginning of period | | $ | 90.65 | | | $ | 74.79 | | | $ | 90.70 | | | $ | 84.00 | | | $ | 53.89 | | | $ | 65.84 | |
Income (loss) from investment operations: |
Net investment income (loss)b | | | (.43 | ) | | | — | | | | (.02 | ) | | | (1.19 | ) | | | (.77 | ) | | | (.29 | ) |
Net gain (loss) on investments (realized and unrealized) | | | 6.16 | | | | 15.86 | | | | (15.89 | ) | | | 10.35 | | | | 34.03 | | | | (8.09 | ) |
Total from investment operations | | | 5.73 | | | | 15.86 | | | | (15.91 | ) | | | 9.16 | | | | 33.26 | | | | (8.38 | ) |
Less distributions from: |
Net realized gains | | | — | | | | — | | | | — | | | | (2.46 | ) | | | (3.15 | ) | | | (3.57 | ) |
Total distributions | | | — | | | | — | | | | — | | | | (2.46 | ) | | | (3.15 | ) | | | (3.57 | ) |
Net asset value, end of period | | $ | 96.38 | | | $ | 90.65 | | | $ | 74.79 | | | $ | 90.70 | | | $ | 84.00 | | | $ | 53.89 | |
|
Total Return | | | 6.32 | % | | | 21.21 | % | | | (17.54 | %) | | | 10.53 | % | | | 61.92 | % | | | (13.77 | %) |
Ratios/Supplemental Data |
Net assets, end of period (in thousands) | | $ | 138,048 | | | $ | 20,046 | | | $ | 23,313 | | | $ | 27,751 | | | $ | 22,141 | | | $ | 25,981 | |
Ratios to average net assets: |
Net investment income (loss) | | | (0.94 | %) | | | (0.00 | %)e | | | (0.03 | %) | | | (1.21 | %) | | | (1.03 | %) | | | (0.44 | %) |
Total expenses | | | 1.59 | % | | | 1.59 | % | | | 1.55 | % | | | 1.51 | % | | | 1.61 | % | | | 1.63 | % |
Net expensesd | | | 1.54 | % | | | 1.55 | % | | | 1.55 | % | | | 1.51 | % | | | 1.61 | % | | | 1.63 | % |
Portfolio turnover rate | | | 147 | % | | | 649 | % | | | 434 | % | | | 727 | % | | | 240 | % | | | 282 | % |
a | Unaudited figures for the period ended September 30, 2024. Percentage amounts for the period, except total return and portfolio turnover rate, have been annualized. |
b | Net investment income (loss) per share was computed using average shares outstanding throughout the period. |
c | Total return does not reflect the impact of any applicable sales charges. |
d | Net expense information reflects the expense ratios after expense waivers and reimbursements, as applicable. |
e | Less than (0.01%). |
SEE NOTES TO FINANCIAL STATEMENTS. | THE RYDEX FUNDS SEMI-ANNUAL FINANCIAL REPORT | 273 |
SCHEDULE OF INVESTMENTS (Unaudited) | September 30, 2024 |
S&P 500® PURE VALUE FUND | |
| | Shares | | | Value | |
COMMON STOCKS† - 100.0% |
| | | | | | | | | |
Financial - 32.9% |
Berkshire Hathaway, Inc. — Class B* | | | 862 | | | $ | 396,744 | |
Citigroup, Inc. | | | 3,460 | | | | 216,596 | |
Citizens Financial Group, Inc. | | | 4,947 | | | | 203,173 | |
Invesco Ltd. | | | 11,171 | | | | 196,163 | |
Truist Financial Corp. | | | 3,212 | | | | 137,377 | |
Capital One Financial Corp. | | | 891 | | | | 133,409 | |
Synchrony Financial | | | 2,488 | | | | 124,102 | |
M&T Bank Corp. | | | 669 | | | | 119,162 | |
Prudential Financial, Inc. | | | 901 | | | | 109,111 | |
Loews Corp. | | | 1,344 | | | | 106,243 | |
Bank of New York Mellon Corp. | | | 1,466 | | | | 105,347 | |
Bank of America Corp. | | | 2,597 | | | | 103,049 | |
Wells Fargo & Co. | | | 1,718 | | | | 97,050 | |
American International Group, Inc. | | | 1,315 | | | | 96,298 | |
Regions Financial Corp. | | | 3,922 | | | | 91,500 | |
State Street Corp. | | | 1,031 | | | | 91,213 | |
Huntington Bancshares, Inc. | | | 6,171 | | | | 90,714 | |
KeyCorp | | | 5,313 | | | | 88,993 | |
Hartford Financial Services Group, Inc. | | | 688 | | | | 80,916 | |
Goldman Sachs Group, Inc. | | | 159 | | | | 78,722 | |
MetLife, Inc. | | | 903 | | | | 74,479 | |
Fifth Third Bancorp | | | 1,578 | | | | 67,601 | |
Assurant, Inc. | | | 336 | | | | 66,817 | |
PNC Financial Services Group, Inc. | | | 359 | | | | 66,361 | |
Franklin Resources, Inc. | | | 3,035 | | | | 61,155 | |
Cincinnati Financial Corp. | | | 446 | | | | 60,710 | |
Allstate Corp. | | | 319 | | | | 60,498 | |
Everest Group Ltd. | | | 147 | | | | 57,599 | |
U.S. Bancorp | | | 1,201 | | | | 54,922 | |
Travelers Companies, Inc. | | | 234 | | | | 54,784 | |
Principal Financial Group, Inc. | | | 623 | | | | 53,516 | |
Alexandria Real Estate Equities, Inc. REIT | | | 427 | | | | 50,706 | |
Total Financial | | | | | | | 3,395,030 | |
| | | | | | | | | |
Consumer, Non-cyclical - 23.9% |
Viatris, Inc. | | | 19,766 | | | | 229,483 | |
Tyson Foods, Inc. — Class A | | | 3,777 | | | | 224,958 | |
Kroger Co. | | | 3,487 | | | | 199,805 | |
Centene Corp.* | | | 2,403 | | | | 180,898 | |
CVS Health Corp. | | | 2,861 | | | | 179,900 | |
Bunge Global S.A. | | | 1,854 | | | | 179,171 | |
Cigna Group | | | 424 | | | | 146,890 | |
Universal Health Services, Inc. — Class B | | | 604 | | | | 138,322 | |
Cencora, Inc. — Class A | | | 605 | | | | 136,173 | |
McKesson Corp. | | | 268 | | | | 132,505 | |
Cardinal Health, Inc. | | | 1,112 | | | | 122,898 | |
Archer-Daniels-Midland Co. | | | 1,742 | | | | 104,067 | |
Kraft Heinz Co. | | | 2,717 | | | | 95,394 | |
Molson Coors Beverage Co. — Class B | | | 1,430 | | | | 82,254 | |
Conagra Brands, Inc. | | | 1,905 | | | | 61,951 | |
Elevance Health, Inc. | | | 109 | | | | 56,680 | |
Corteva, Inc. | | | 960 | | | | 56,438 | |
Sysco Corp. | | | 691 | | | | 53,939 | |
Henry Schein, Inc.* | | | 703 | | | | 51,249 | |
Humana, Inc. | | | 101 | | | | 31,991 | |
Total Consumer, Non-cyclical | | | | | | | 2,464,966 | |
| | | | | | | | | |
Consumer, Cyclical - 16.1% |
General Motors Co. | | | 9,233 | | | | 414,008 | |
United Airlines Holdings, Inc.* | | | 4,779 | | | | 272,690 | |
Ford Motor Co. | | | 22,165 | | | | 234,062 | |
CarMax, Inc.* | | | 2,100 | | | | 162,498 | |
Best Buy Company, Inc. | | | 1,397 | | | | 144,310 | |
BorgWarner, Inc. | | | 3,811 | | | | 138,301 | |
Southwest Airlines Co. | | | 3,583 | | | | 106,164 | |
Walgreens Boots Alliance, Inc. | | | 9,896 | | | | 88,668 | |
Target Corp. | | | 373 | | | | 58,136 | |
LKQ Corp. | | | 1,039 | | | | 41,477 | |
Total Consumer, Cyclical | | | | | | | 1,660,314 | |
| | | | | | | | | |
Industrial - 6.1% |
Mohawk Industries, Inc.* | | | 1,797 | | | | 288,742 | |
Smurfit WestRock plc | | | 3,166 | | | | 156,464 | |
Stanley Black & Decker, Inc. | | | 654 | | | | 72,025 | |
CH Robinson Worldwide, Inc. | | | 538 | | | | 59,379 | |
FedEx Corp. | | | 192 | | | | 52,546 | |
Total Industrial | | | | | | | 629,156 | |
| | | | | | | | | |
Communications - 6.0% |
Paramount Global — Class B1 | | | 17,628 | | | | 187,210 | |
Warner Bros Discovery, Inc.* | | | 15,985 | | | | 131,876 | |
AT&T, Inc. | | | 4,327 | | | | 95,194 | |
Verizon Communications, Inc. | | | 1,457 | | | | 65,434 | |
Fox Corp. — Class A | | | 1,409 | | | | 59,643 | |
News Corp. — Class A | | | 1,559 | | | | 41,516 | |
Fox Corp. — Class B | | | 754 | | | | 29,255 | |
News Corp. — Class B | | | 468 | | | | 13,081 | |
Total Communications | | | | | | | 623,209 | |
| | | | | | | | | |
Basic Materials - 5.0% |
International Paper Co. | | | 2,814 | | | | 137,464 | |
Mosaic Co. | | | 3,187 | | | | 85,348 | |
International Flavors & Fragrances, Inc. | | | 781 | | | | 81,950 | |
Eastman Chemical Co. | | | 549 | | | | 61,461 | |
Dow, Inc. | | | 1,100 | | | | 60,093 | |
LyondellBasell Industries N.V. — Class A | | | 535 | | | | 51,306 | |
Albemarle Corp. | | | 403 | | | | 38,168 | |
Total Basic Materials | | | | | | | 515,790 | |
| | | | | | | | | |
Energy - 4.8% |
Valero Energy Corp. | | | 1,360 | | | | 183,641 | |
Phillips 66 | | | 1,162 | | | | 152,745 | |
Kinder Morgan, Inc. | | | 2,581 | | | | 57,014 | |
Equities Corp. | | | 1,512 | | | | 55,400 | |
Chevron Corp. | | | 306 | | | | 45,064 | |
Total Energy | | | | | | | 493,864 | |
| | | | | | | | | |
Utilities - 3.2% |
NRG Energy, Inc. | | | 1,648 | | | | 150,133 | |
Evergy, Inc. | | | 1,004 | | | | 62,258 | |
Pinnacle West Capital Corp. | | | 662 | | | | 58,647 | |
274 | THE RYDEX FUNDS SEMI-ANNUAL FINANCIAL REPORT | SEE NOTES TO FINANCIAL STATEMENTS. |
SCHEDULE OF INVESTMENTS (Unaudited)(concluded) | September 30, 2024 |
S&P 500® PURE VALUE FUND | |
| | Shares | | | Value | |
Eversource Energy | | | 823 | | | $ | 56,005 | |
Total Utilities | | | | | | | 327,043 | |
| | | | | | | | | |
Technology - 2.0% |
Hewlett Packard Enterprise Co. | | | 7,247 | | | | 148,274 | |
HP, Inc. | | | 1,500 | | | | 53,805 | |
Total Technology | | | | | | | 202,079 | |
| | | | | | | | | |
Total Common Stocks | | | | |
(Cost $8,095,857) | | | | | | | 10,311,451 | |
| | | | | | | | | |
| | | Face
Amount | | | | | |
REPURCHASE AGREEMENTS††,2 - 1.0% |
J.P. Morgan Securities LLC
issued 09/30/24 at 4.86%
due 10/01/24 | | $ | 58,862 | | | | 58,862 | |
BofA Securities, Inc.
issued 09/30/24 at 4.85%
due 10/01/24 | | | 48,618 | | | | 48,618 | |
Total Repurchase Agreements | | | | |
(Cost $107,480) | | | | | | | 107,480 | |
SECURITIES LENDING COLLATERAL†,3 - 1.4% |
Money Market Fund*** | | | | | | | | |
First American Government Obligations Fund - Class X, 4.82%4 | | | 148,736 | | | $ | 148,736 | |
Total Securities Lending Collateral | | | | |
(Cost $148,736) | | | | | | | 148,736 | |
| | | | | | | | | |
Total Investments - 102.4% | | | | |
(Cost $8,352,073) | | $ | 10,567,667 | |
Other Assets & Liabilities, net - (2.4)% | | | (244,432 | ) |
Total Net Assets - 100.0% | | $ | 10,323,235 | |
* | Non-income producing security. |
*** | A copy of each underlying unaffiliated fund’s financial statements is available at the SEC’s website at www.sec.gov. |
† | Value determined based on Level 1 inputs — See Note 4. |
†† | Value determined based on Level 2 inputs — See Note 4. |
1 | All or a portion of this security is on loan at September 30, 2024 — See Note 7. |
2 | Repurchase Agreements — See Note 6. |
3 | Securities lending collateral — See Note 7. |
4 | Rate indicated is the 7-day yield as of September 30, 2024. |
| | plc — Public Limited Company |
| | REIT — Real Estate Investment Trust |
| | |
| | See Sector Classification in Other Information section. |
The following table summarizes the inputs used to value the Fund’s investments at September 30, 2024 (See Note 4 in the Notes to Financial Statements):
Investments in Securities (Assets) | | Level 1
Quoted
Prices | | | Level 2
Significant
Observable
Inputs | | | Level 3
Significant
Unobservable
Inputs | | | Total | |
Common Stocks | | $ | 10,311,451 | | | $ | — | | | $ | — | | | $ | 10,311,451 | |
Repurchase Agreements | | | — | | | | 107,480 | | | | — | | | | 107,480 | |
Securities Lending Collateral | | | 148,736 | | | | — | | | | — | | | | 148,736 | |
Total Assets | | $ | 10,460,187 | | | $ | 107,480 | | | $ | — | | | $ | 10,567,667 | |
SEE NOTES TO FINANCIAL STATEMENTS. | THE RYDEX FUNDS SEMI-ANNUAL FINANCIAL REPORT | 275 |
STATEMENT OF ASSETS AND LIABILITIES (Unaudited) |
September 30, 2024 |
Assets: |
Investments, at value - including $140,407 of securities loaned (cost $8,244,593) | | $ | 10,460,187 | |
Repurchase agreements, at value (cost $107,480) | | | 107,480 | |
Cash | | | 338 | |
Receivables: |
Dividends | | | 25,253 | |
Fund shares sold | | | 100 | |
Securities lending income | | | 29 | |
Interest | | | 15 | |
Total assets | | | 10,593,402 | |
| | | | | |
Liabilities: |
Payable for: |
Return of securities lending collateral | | | 148,736 | |
Fund shares redeemed | | | 62,881 | |
Management fees | | | 20,822 | |
Transfer agent/maintenance fees | | | 11,024 | |
Distribution and service fees | | | 7,386 | |
Portfolio accounting and administration fees | | | 2,849 | |
Trustees’ fees* | | | 211 | |
Miscellaneous | | | 16,258 | |
Total liabilities | | | 270,167 | |
Net assets | | $ | 10,323,235 | |
| | | | | |
Net assets consist of: |
Paid in capital | | $ | 29,078,906 | |
Total distributable earnings (loss) | | | (18,755,671 | ) |
Net assets | | $ | 10,323,235 | |
Class A: |
Net assets | | $ | 3,110,265 | |
Capital shares outstanding | | | 30,016 | |
Net asset value per share | | $ | 103.62 | |
Maximum offering price per share (Net asset value divided by 95.25%) | | $ | 108.79 | |
Class C: |
Net assets | | $ | 811,310 | |
Capital shares outstanding | | | 9,742 | |
Net asset value per share | | $ | 83.28 | |
Class H: |
Net assets | | $ | 6,401,660 | |
Capital shares outstanding | | | 61,469 | |
Net asset value per share | | $ | 104.14 | |
STATEMENT OF OPERATIONS (Unaudited) |
Six Months Ended September 30, 2024 |
Investment Income: |
Dividends (net of foreign withholding tax of $6) | | $ | 232,695 | |
Interest | | | 2,989 | |
Income from securities lending, net | | | 62 | |
Total investment income | | | 235,746 | |
| | | | | |
Expenses: |
Management fees | | | 70,474 | |
Distribution and service fees: |
Class A | | | 3,389 | |
Class C | | | 3,984 | |
Class H | | | 19,106 | |
Transfer agent fees | | | 19,833 | |
Portfolio accounting and administration fees | | | 14,336 | |
Professional fees | | | 7,621 | |
Custodian fees | | | 1,162 | |
Trustees’ fees* | | | 861 | |
Line of credit fees | | | 57 | |
Miscellaneous | | | 11,372 | |
Total expenses | | | 152,195 | |
Less: |
Expenses reimbursed by Adviser | | | (4,694 | ) |
Net expenses | | | 147,501 | |
Net investment income | | | 88,245 | |
| | | | | |
Net Realized and Unrealized Gain (Loss): |
Net realized gain (loss) on: |
Investments | | | (2,754,605 | ) |
Net realized loss | | | (2,754,605 | ) |
Net change in unrealized appreciation (depreciation) on: |
Investments | | | 219,717 | |
Net change in unrealized appreciation (depreciation) | | | 219,717 | |
Net realized and unrealized loss | | | (2,534,888 | ) |
Net decrease in net assets resulting from operations | | $ | (2,446,643 | ) |
* | Relates to Trustees not deemed “interested persons” within the meaning of Section 2(a)(19) of the 1940 Act. |
276 | THE RYDEX FUNDS SEMI-ANNUAL FINANCIAL REPORT | SEE NOTES TO FINANCIAL STATEMENTS. |
STATEMENTS OF CHANGES IN NET ASSETS |
| | Six Months Ended
September 30, 2024
(Unaudited) | | | Year Ended
March 31,
2024 | |
Increase (Decrease) in Net Assets from Operations: | | | | | | | | |
Net investment income | | $ | 88,245 | | | $ | 112,080 | |
Net realized loss on investments | | | (2,754,605 | ) | | | (1,915,091 | ) |
Net change in unrealized appreciation (depreciation) on investments | | | 219,717 | | | | 747,914 | |
Net decrease in net assets resulting from operations | | | (2,446,643 | ) | | | (1,055,097 | ) |
| | | | | | | | | |
Distributions to shareholders: | | | | | | | | |
Class A | | | — | | | | (44,842 | ) |
Class C | | | — | | | | (24,738 | ) |
Class H | | | — | | | | (114,337 | ) |
Total distributions to shareholders | | | — | | | | (183,917 | ) |
| | | | | | | | | |
Capital share transactions: | | | | | | | | |
Proceeds from sale of shares | | | | | | | | |
Class A | | | 712,436 | | | | 1,311,773 | |
Class C | | | 284,659 | | | | 1,122,162 | |
Class H | | | 174,637,822 | | | | 185,750,419 | |
Distributions reinvested | | | | | | | | |
Class A | | | — | | | | 44,771 | |
Class C | | | — | | | | 24,642 | |
Class H | | | — | | | | 102,176 | |
Cost of shares redeemed | | | | | | | | |
Class A | | | (600,896 | ) | | | (2,172,031 | ) |
Class C | | | (445,327 | ) | | | (1,541,562 | ) |
Class H | | | (172,214,868 | ) | | | (190,450,170 | ) |
Net increase (decrease) from capital share transactions | | | 2,373,826 | | | | (5,807,820 | ) |
Net decrease in net assets | | | (72,817 | ) | | | (7,046,834 | ) |
| | | | | | | | | |
Net assets: | | | | | | | | |
Beginning of period | | | 10,396,052 | | | | 17,442,886 | |
End of period | | $ | 10,323,235 | | | $ | 10,396,052 | |
| | | | | | | | | |
Capital share activity: | | | | | | | | |
Shares sold | | | | | | | | |
Class A | | | 7,140 | | | | 14,140 | |
Class C | | | 3,586 | | | | 15,296 | |
Class H | | | 1,705,425 | | | | 1,970,582 | |
Shares issued from reinvestment of distributions | | | | | | | | |
Class A | | | — | | | | 491 | |
Class C | | | — | | | | 334 | |
Class H | | | — | | | | 1,114 | |
Shares redeemed | | | | | | | | |
Class A | | | (6,104 | ) | | | (24,552 | ) |
Class C | | | (5,566 | ) | | | (21,338 | ) |
Class H | | | (1,706,320 | ) | | | (2,051,875 | ) |
Net decrease in shares | | | (1,839 | ) | | | (95,808 | ) |
SEE NOTES TO FINANCIAL STATEMENTS. | THE RYDEX FUNDS SEMI-ANNUAL FINANCIAL REPORT | 277 |
This table is presented to show selected data for a share outstanding throughout each period and to assist shareholders in evaluating a Fund’s performance for the periods presented.
Class A | | Six Months Ended
September 30, 2024a | | | Year Ended
March 31,
2024 | | | Year Ended
March 31,
2023 | | | Year Ended
March 31,
2022 | | | Year Ended
March 31,
2021 | | | Year Ended
March 31,
2020 | |
Per Share Data |
Net asset value, beginning of period | | $ | 102.82 | | | $ | 88.84 | | | $ | 101.27 | | | $ | 89.23 | | | $ | 48.65 | | | $ | 76.07 | |
Income (loss) from investment operations: |
Net investment income (loss)b | | | .54 | | | | 1.03 | | | | 1.05 | | | | .89 | | | | .70 | | | | 1.02 | |
Net gain (loss) on investments (realized and unrealized) | | | .26 | e | | | 14.67 | | | | (11.35 | ) | | | 13.43 | | | | 40.58 | | | | (27.62 | ) |
Total from investment operations | | | .80 | | | | 15.70 | | | | (10.30 | ) | | | 14.32 | | | | 41.28 | | | | (26.60 | ) |
Less distributions from: |
Net investment income | | | — | | | | (1.72 | ) | | | (2.13 | ) | | | (2.28 | ) | | | (.70 | ) | | | (.82 | ) |
Total distributions | | | — | | | | (1.72 | ) | | | (2.13 | ) | | | (2.28 | ) | | | (.70 | ) | | | (.82 | ) |
Net asset value, end of period | | $ | 103.62 | | | $ | 102.82 | | | $ | 88.84 | | | $ | 101.27 | | | $ | 89.23 | | | $ | 48.65 | |
|
Total Returnc | | | 0.78 | % | | | 17.93 | % | | | (10.20 | %) | | | 16.26 | % | | | 85.10 | % | | | (35.38 | %) |
Ratios/Supplemental Data |
Net assets, end of period (in thousands) | | $ | 3,110 | | | $ | 2,980 | | | $ | 3,456 | | | $ | 3,600 | | | $ | 2,925 | | | $ | 1,716 | |
Ratios to average net assets: |
Net investment income (loss) | | | 1.08 | % | | | 1.14 | % | | | 1.11 | % | | | 0.94 | % | | | 1.06 | % | | | 1.32 | % |
Total expenses | | | 1.57 | % | | | 1.59 | % | | | 1.55 | % | | | 1.51 | % | | | 1.60 | % | | | 1.63 | % |
Net expensesd | | | 1.52 | % | | | 1.55 | % | | | 1.55 | % | | | 1.51 | % | | | 1.60 | % | | | 1.63 | % |
Portfolio turnover rate | | | 1,071 | % | | | 1,099 | % | | | 594 | % | | | 823 | % | | | 1,207 | % | | | 254 | % |
Class C | | Six Months Ended
September 30, 2024a | | | Year Ended
March 31,
2024 | | | Year Ended
March 31,
2023 | | | Year Ended
March 31,
2022 | | | Year Ended
March 31,
2021 | | | Year Ended
March 31,
2020 | |
Per Share Data |
Net asset value, beginning of period | | $ | 82.95 | | | $ | 72.52 | | | $ | 83.72 | | | $ | 74.69 | | | $ | 41.11 | | | $ | 64.87 | |
Income (loss) from investment operations: |
Net investment income (loss)b | | | .12 | | | | .27 | | | | .30 | | | | .14 | | | | .18 | | | | .17 | |
Net gain (loss) on investments (realized and unrealized) | | | .21 | e | | | 11.88 | | | | (9.37 | ) | | | 11.17 | | | | 34.10 | | | | (23.11 | ) |
Total from investment operations | | | .33 | | | | 12.15 | | | | (9.07 | ) | | | 11.31 | | | | 34.28 | | | | (22.94 | ) |
Less distributions from: |
Net investment income | | | — | | | | (1.72 | ) | | | (2.13 | ) | | | (2.28 | ) | | | (.70 | ) | | | (.82 | ) |
Total distributions | | | — | | | | (1.72 | ) | | | (2.13 | ) | | | (2.28 | ) | | | (.70 | ) | | | (.82 | ) |
Net asset value, end of period | | $ | 83.28 | | | $ | 82.95 | | | $ | 72.52 | | | $ | 83.72 | | | $ | 74.69 | | | $ | 41.11 | |
|
Total Returnc | | | 0.40 | % | | | 17.07 | % | | | (10.89 | %) | | | 15.40 | % | | | 83.72 | % | | | (35.87 | %) |
Ratios/Supplemental Data |
Net assets, end of period (in thousands) | | $ | 811 | | | $ | 972 | | | $ | 1,264 | | | $ | 1,484 | | | $ | 1,805 | | | $ | 1,321 | |
Ratios to average net assets: |
Net investment income (loss) | | | 0.31 | % | | | 0.37 | % | | | 0.39 | % | | | 0.17 | % | | | 0.32 | % | | | 0.26 | % |
Total expenses | | | 2.32 | % | | | 2.34 | % | | | 2.30 | % | | | 2.26 | % | | | 2.35 | % | | | 2.38 | % |
Net expensesd | | | 2.27 | % | | | 2.31 | % | | | 2.30 | % | | | 2.26 | % | | | 2.35 | % | | | 2.38 | % |
Portfolio turnover rate | | | 1,071 | % | | | 1,099 | % | | | 594 | % | | | 823 | % | | | 1,207 | % | | | 254 | % |
278 | THE RYDEX FUNDS SEMI-ANNUAL FINANCIAL REPORT | SEE NOTES TO FINANCIAL STATEMENTS. |
FINANCIAL HIGHLIGHTS (concluded) |
This table is presented to show selected data for a share outstanding throughout each period and to assist shareholders in evaluating a Fund’s performance for the periods presented.
Class H | | Six Months Ended
September 30, 2024a | | | Year Ended
March 31,
2024 | | | Year Ended
March 31,
2023 | | | Year Ended
March 31,
2022 | | | Year Ended
March 31,
2021 | | | Year Ended
March 31,
2020 | |
Per Share Data |
Net asset value, beginning of period | | $ | 103.33 | | | $ | 89.26 | | | $ | 101.75 | | | $ | 89.64 | | | $ | 48.87 | | | $ | 76.39 | |
Income (loss) from investment operations: |
Net investment income (loss)b | | | .48 | | | | .47 | | | | .98 | | | | .98 | | | | .84 | | | | .96 | |
Net gain (loss) on investments (realized and unrealized) | | | .33 | e | | | 15.32 | | | | (11.34 | ) | | | 13.41 | | | | 40.63 | | | | (27.66 | ) |
Total from investment operations | | | .81 | | | | 15.79 | | | | (10.36 | ) | | | 14.39 | | | | 41.47 | | | | (26.70 | ) |
Less distributions from: |
Net investment income | | | — | | | | (1.72 | ) | | | (2.13 | ) | | | (2.28 | ) | | | (.70 | ) | | | (.82 | ) |
Total distributions | | | — | | | | (1.72 | ) | | | (2.13 | ) | | | (2.28 | ) | | | (.70 | ) | | | (.82 | ) |
Net asset value, end of period | | $ | 104.14 | | | $ | 103.33 | | | $ | 89.26 | | | $ | 101.75 | | | $ | 89.64 | | | $ | 48.87 | |
|
Total Return | | | 0.78 | % | | | 17.95 | % | | | (10.22 | %) | | | 16.26 | % | | | 85.15 | % | | | (35.38 | %) |
Ratios/Supplemental Data |
Net assets, end of period (in thousands) | | $ | 6,402 | | | $ | 6,444 | | | $ | 12,723 | | | $ | 164,615 | | | $ | 52,797 | | | $ | 5,422 | |
Ratios to average net assets: |
Net investment income (loss) | | | 0.95 | % | | | 0.51 | % | | | 1.01 | % | | | 1.01 | % | | | 1.17 | % | | | 1.22 | % |
Total expenses | | | 1.59 | % | | | 1.60 | % | | | 1.55 | % | | | 1.52 | % | | | 1.58 | % | | | 1.63 | % |
Net expensesd | | | 1.54 | % | | | 1.56 | % | | | 1.55 | % | | | 1.52 | % | | | 1.58 | % | | | 1.63 | % |
Portfolio turnover rate | | | 1,071 | % | | | 1,099 | % | | | 594 | % | | | 823 | % | | | 1,207 | % | | | 254 | % |
a | Unaudited figures for the period ended September 30, 2024. Percentage amounts for the period, except total return and portfolio turnover rate, have been annualized. |
b | Net investment income (loss) per share was computed using average shares outstanding throughout the period. |
c | Total return does not reflect the impact of any applicable sales charges. |
d | Net expense information reflects the expense ratios after expense waivers and reimbursements, as applicable. |
e | The amount shown for a share outstanding throughout the period does not agree with the aggregate net loss on investments for the period because of the sales and purchases of fund shares in relation to fluctuating market value of the investments of the Fund. |
SEE NOTES TO FINANCIAL STATEMENTS. | THE RYDEX FUNDS SEMI-ANNUAL FINANCIAL REPORT | 279 |
SCHEDULE OF INVESTMENTS (Unaudited) | September 30, 2024 |
S&P MIDCAP 400® PURE GROWTH FUND | |
| | Shares | | | Value | |
COMMON STOCKS† - 99.5% |
| | | | | | | | | |
Industrial - 28.2% |
Comfort Systems USA, Inc. | | | 2,047 | | | $ | 799,046 | |
AAON, Inc. | | | 6,376 | | | | 687,588 | |
TopBuild Corp.* | | | 1,568 | | | | 637,878 | |
EMCOR Group, Inc. | | | 1,379 | | | | 593,701 | |
Clean Harbors, Inc.* | | | 2,091 | | | | 505,416 | |
Owens Corning | | | 2,816 | | | | 497,080 | |
Eagle Materials, Inc. | | | 1,703 | | | | 489,868 | |
Simpson Manufacturing Company, Inc. | | | 2,287 | | | | 437,434 | |
Fabrinet* | | | 1,729 | | | | 408,805 | |
Lennox International, Inc. | | | 635 | | | | 383,724 | |
UFP Industries, Inc. | | | 2,766 | | | | 362,927 | |
nVent Electric plc | | | 5,146 | | | | 361,558 | |
Universal Display Corp. | | | 1,582 | | | | 332,062 | |
Saia, Inc.* | | | 736 | | | | 321,823 | |
Esab Corp. | | | 2,904 | | | | 308,724 | |
Applied Industrial Technologies, Inc. | | | 1,370 | | | | 305,688 | |
Crane Co. | | | 1,677 | | | | 265,436 | |
RBC Bearings, Inc.* | | | 865 | | | | 258,964 | |
Chart Industries, Inc.* | | | 2,047 | | | | 254,115 | |
Advanced Drainage Systems, Inc. | | | 1,570 | | | | 246,741 | |
Lincoln Electric Holdings, Inc. | | | 1,213 | | | | 232,920 | |
Trex Company, Inc.* | | | 3,332 | | | | 221,845 | |
Vontier Corp. | | | 5,774 | | | | 194,815 | |
NEXTracker, Inc. — Class A* | | | 4,249 | | | | 159,252 | |
Total Industrial | | | | | | | 9,267,410 | |
| | | | | | | | | |
Consumer, Cyclical - 21.5% |
Toll Brothers, Inc. | | | 4,678 | | | | 722,704 | |
Wingstop, Inc. | | | 1,572 | | | | 654,078 | |
Murphy USA, Inc. | | | 1,151 | | | | 567,293 | |
Hyatt Hotels Corp. — Class A | | | 3,495 | | | | 531,939 | |
Abercrombie & Fitch Co. — Class A* | | | 2,908 | | | | 406,829 | |
Churchill Downs, Inc. | | | 2,881 | | | | 389,540 | |
Texas Roadhouse, Inc. — Class A | | | 2,196 | | | | 387,814 | |
Williams-Sonoma, Inc. | | | 2,441 | | | | 378,160 | |
Crocs, Inc.* | | | 2,585 | | | | 374,334 | |
Floor & Decor Holdings, Inc. — Class A* | | | 2,985 | | | | 370,647 | |
Casey’s General Stores, Inc. | | | 920 | | | | 345,653 | |
Skechers USA, Inc. — Class A* | | | 4,979 | | | | 333,195 | |
Tempur Sealy International, Inc. | | | 6,019 | | | | 328,637 | |
Watsco, Inc. | | | 567 | | | | 278,896 | |
Planet Fitness, Inc. — Class A* | | | 3,244 | | | | 263,478 | |
Light & Wonder, Inc. — Class A* | | | 2,392 | | | | 217,026 | |
FirstCash Holdings, Inc. | | | 1,843 | | | | 211,576 | |
Boyd Gaming Corp. | | | 2,673 | | | | 172,810 | |
Five Below, Inc.* | | | 1,296 | | | | 114,502 | |
Total Consumer, Cyclical | | | | | | | 7,049,111 | |
| | | | | | | | | |
Consumer, Non-cyclical - 15.8% |
Lantheus Holdings, Inc.* | | | 5,653 | | | | 620,417 | |
Medpace Holdings, Inc.* | | | 1,509 | | | | 503,704 | |
elf Beauty, Inc.* | | | 3,783 | | | | 412,461 | |
Valvoline, Inc.* | | | 9,110 | | | | 381,254 | |
Coca-Cola Consolidated, Inc. | | | 288 | | | | 379,123 | |
Celsius Holdings, Inc.* | | | 10,160 | | | | 318,618 | |
Exelixis, Inc.* | | | 11,958 | | | | 310,310 | |
RB Global, Inc. | | | 3,652 | | | | 293,949 | |
Grand Canyon Education, Inc.* | | | 2,025 | | | | 287,246 | |
Brink’s Co. | | | 2,186 | | | | 252,789 | |
Halozyme Therapeutics, Inc.* | | | 3,970 | | | | 227,243 | |
Ensign Group, Inc. | | | 1,428 | | | | 205,375 | |
Acadia Healthcare Company, Inc.* | | | 3,063 | | | | 194,225 | |
Arrowhead Pharmaceuticals, Inc.* | | | 9,250 | | | | 179,172 | |
Penumbra, Inc.* | | | 920 | | | | 178,765 | |
FTI Consulting, Inc.* | | | 748 | | | | 170,215 | |
Coty, Inc. — Class A* | | | 15,819 | | | | 148,540 | |
Avis Budget Group, Inc. | | | 1,473 | | | | 129,020 | |
Total Consumer, Non-cyclical | | | | | | | 5,192,426 | |
| | | | | | | | | |
Technology - 12.4% |
Duolingo, Inc.* | | | 3,437 | | | | 969,303 | |
Appfolio, Inc. — Class A* | | | 2,405 | | | | 566,137 | |
Onto Innovation, Inc.* | | | 2,292 | | | | 475,728 | |
Dynatrace, Inc.* | | | 8,190 | | | | 437,919 | |
Manhattan Associates, Inc.* | | | 1,279 | | | | 359,885 | |
Rambus, Inc.* | | | 7,182 | | | | 303,224 | |
Pure Storage, Inc. — Class A* | | | 5,439 | | | | 273,255 | |
Altair Engineering, Inc. — Class A* | | | 2,843 | | | | 271,535 | |
Qualys, Inc.* | | | 1,715 | | | | 220,309 | |
Dropbox, Inc. — Class A* | | | 7,257 | | | | 184,545 | |
Total Technology | | | | | | | 4,061,840 | |
| | | | | | | | | |
Energy - 11.9% |
CNX Resources Corp.* | | | 31,720 | | | | 1,033,120 | |
Permian Resources Corp. | | | 37,485 | | | | 510,171 | |
Weatherford International plc | | | 5,664 | | | | 480,987 | |
Range Resources Corp. | | | 12,417 | | | | 381,947 | |
Valaris Ltd.* | | | 6,295 | | | | 350,946 | |
Ovintiv, Inc. | | | 8,590 | | | | 329,083 | |
Chord Energy Corp. | | | 2,438 | | | | 317,501 | |
Civitas Resources, Inc. | | | 5,015 | | | | 254,110 | |
Matador Resources Co. | | | 4,797 | | | | 237,068 | |
Total Energy | | | | | | | 3,894,933 | |
| | | | | | | | | |
Financial - 6.6% |
Ryan Specialty Holdings, Inc. | | | 10,644 | | | | 706,655 | |
Kinsale Capital Group, Inc. | | | 1,141 | | | | 531,216 | |
Park Hotels & Resorts, Inc. REIT | | | 27,979 | | | | 394,504 | |
Primerica, Inc. | | | 1,180 | | | | 312,877 | |
Hamilton Lane, Inc. — Class A | | | 1,364 | | | | 229,684 | |
Total Financial | | | | | | | 2,174,936 | |
| | | | | | | | | |
Basic Materials - 3.1% |
Reliance, Inc. | | | 1,336 | | | | 386,384 | |
Westlake Corp. | | | 2,168 | | | | 325,829 | |
NewMarket Corp. | | | 565 | | | | 311,818 | |
Total Basic Materials | | | | | | | 1,024,031 | |
| | | | | | | | | |
Total Common Stocks | | | | |
(Cost $25,579,771) | | | | | | | 32,664,687 | |
| | | | | | | | | |
280 | THE RYDEX FUNDS SEMI-ANNUAL FINANCIAL REPORT | SEE NOTES TO FINANCIAL STATEMENTS. |
SCHEDULE OF INVESTMENTS (Unaudited)(concluded) | September 30, 2024 |
S&P MIDCAP 400® PURE GROWTH FUND | |
| | Face
Amount | | | Value | |
REPURCHASE AGREEMENTS††,1 - 0.5% |
J.P. Morgan Securities LLC
issued 09/30/24 at 4.86%
due 10/01/24 | | $ | 87,505 | | | $ | 87,505 | |
BofA Securities, Inc.
issued 09/30/24 at 4.85%
due 10/01/24 | | | 72,275 | | | | 72,275 | |
Total Repurchase Agreements | | | | |
(Cost $159,780) | | | | | | $ | 159,780 | |
| | | | | | | | | |
Total Investments - 100.0% | | | | |
(Cost $25,739,551) | | $ | 32,824,467 | |
Other Assets & Liabilities, net - 0.0% | | | 1,659 | |
Total Net Assets - 100.0% | | $ | 32,826,126 | |
* | Non-income producing security. |
† | Value determined based on Level 1 inputs — See Note 4. |
†† | Value determined based on Level 2 inputs — See Note 4. |
1 | Repurchase Agreements — See Note 6. |
| | plc — Public Limited Company |
| | REIT — Real Estate Investment Trust |
| | |
| | See Sector Classification in Other Information section. |
The following table summarizes the inputs used to value the Fund’s investments at September 30, 2024 (See Note 4 in the Notes to Financial Statements):
Investments in Securities (Assets) | | Level 1
Quoted
Prices | | | Level 2
Significant
Observable
Inputs | | | Level 3
Significant
Unobservable
Inputs | | | Total | |
Common Stocks | | $ | 32,664,687 | | | $ | — | | | $ | — | | | $ | 32,664,687 | |
Repurchase Agreements | | | — | | | | 159,780 | | | | — | | | | 159,780 | |
Total Assets | | $ | 32,664,687 | | | $ | 159,780 | | | $ | — | | | $ | 32,824,467 | |
SEE NOTES TO FINANCIAL STATEMENTS. | THE RYDEX FUNDS SEMI-ANNUAL FINANCIAL REPORT | 281 |
S&P MIDCAP 400® PURE GROWTH FUND | |
STATEMENT OF ASSETS AND LIABILITIES (Unaudited) |
September 30, 2024 |
Assets: |
Investments, at value (cost $25,579,771) | | $ | 32,664,687 | |
Repurchase agreements, at value (cost $159,780) | | | 159,780 | |
Cash | | | 106 | |
Receivables: |
Securities sold | | | 714,300 | |
Dividends | | | 10,999 | |
Fund shares sold | | | 625 | |
Foreign tax reclaims | | | 462 | |
Interest | | | 21 | |
Securities lending income | | | 1 | |
Total assets | | | 33,550,981 | |
| | | | | |
Liabilities: |
Payable for: |
Securities purchased | | | 646,238 | |
Management fees | | | 18,312 | |
Transfer agent fees | | | 17,202 | |
Fund shares redeemed | | | 8,346 | |
Distribution and service fees | | | 6,282 | |
Portfolio accounting and administration fees | | | 2,505 | |
Trustees’ fees* | | | 318 | |
Miscellaneous | | | 25,652 | |
Total liabilities | | | 724,855 | |
Net assets | | $ | 32,826,126 | |
| | | | | |
Net assets consist of: |
Paid in capital | | $ | 24,375,098 | |
Total distributable earnings (loss) | | | 8,451,028 | |
Net assets | | $ | 32,826,126 | |
Class A: |
Net assets | | $ | 7,966,894 | |
Capital shares outstanding | | | 138,977 | |
Net asset value per share | | $ | 57.33 | |
Maximum offering price per share (Net asset value divided by 95.25%) | | $ | 60.19 | |
Class C: |
Net assets | | $ | 316,464 | |
Capital shares outstanding | | | 7,235 | |
Net asset value per share | | $ | 43.74 | |
Class H: |
Net assets | | $ | 24,542,768 | |
Capital shares outstanding | | | 427,603 | |
Net asset value per share | | $ | 57.40 | |
STATEMENT OF OPERATIONS (Unaudited) |
Six Months Ended September 30, 2024 |
Investment Income: |
Dividends (net of foreign withholding tax of $53) | | $ | 167,795 | |
Interest | | | 8,853 | |
Income from securities lending, net | | | 6 | |
Total investment income | | | 176,654 | |
| | | | | |
Expenses: |
Management fees | | | 213,903 | |
Distribution and service fees: |
Class A | | | 10,666 | |
Class C | | | 2,680 | |
Class H | | | 59,965 | |
Transfer agent and administrative fees | | | 56,953 | |
Portfolio accounting and administration fees | | | 43,514 | |
Professional fees | | | 17,864 | |
Registration fees | | | 6,855 | |
Custodian fees | | | 3,718 | |
Trustees’ fees* | | | 3,459 | |
Line of credit fees | | | 8 | |
Miscellaneous | | | 25,712 | |
Total expenses | | | 445,297 | |
Less: |
Expenses reimbursed by Adviser | | | (14,245 | ) |
Net expenses | | | 431,052 | |
Net investment loss | | | (254,398 | ) |
| | | | | |
Net Realized and Unrealized Gain (Loss): |
Net realized gain (loss) on: |
Investments | | | 199,691 | |
Net realized gain | | | 199,691 | |
Net change in unrealized appreciation (depreciation) on: |
Investments | | | (6,397,167 | ) |
Net change in unrealized appreciation (depreciation) | | | (6,397,167 | ) |
Net realized and unrealized loss | | | (6,197,476 | ) |
Net decrease in net assets resulting from operations | | $ | (6,451,874 | ) |
* | Relates to Trustees not deemed “interested persons” within the meaning of Section 2(a)(19) of the 1940 Act. |
282 | THE RYDEX FUNDS SEMI-ANNUAL FINANCIAL REPORT | SEE NOTES TO FINANCIAL STATEMENTS. |
S&P MIDCAP 400® PURE GROWTH FUND | |
STATEMENTS OF CHANGES IN NET ASSETS |
| | Six Months Ended
September 30, 2024
(Unaudited) | | | Year Ended
March 31,
2024 | |
Increase (Decrease) in Net Assets from Operations: | | | | | | | | |
Net investment loss | | $ | (254,398 | ) | | $ | (133,163 | ) |
Net realized gain on investments | | | 199,691 | | | | 7,559,420 | |
Net change in unrealized appreciation (depreciation) on investments | | | (6,397,167 | ) | | | 10,648,798 | |
Net increase (decrease) in net assets resulting from operations | | | (6,451,874 | ) | | | 18,075,055 | |
| | | | | | | | | |
Capital share transactions: | | | | | | | | |
Proceeds from sale of shares | | | | | | | | |
Class A | | | 535,419 | | | | 2,098,799 | |
Class C | | | 190,207 | | | | 902,792 | |
Class H | | | 354,455,364 | | | | 512,967,320 | |
Cost of shares redeemed | | | | | | | | |
Class A | | | (1,680,144 | ) | | | (1,479,340 | ) |
Class C | | | (610,187 | ) | | | (1,543,282 | ) |
Class H | | | (537,689,189 | ) | | | (334,724,356 | ) |
Net increase (decrease) from capital share transactions | | | (184,798,530 | ) | | | 178,221,933 | |
Net increase (decrease) in net assets | | | (191,250,404 | ) | | | 196,296,988 | |
| | | | | | | | | |
Net assets: | | | | | | | | |
Beginning of period | | | 224,076,530 | | | | 27,779,542 | |
End of period | | $ | 32,826,126 | | | $ | 224,076,530 | |
| | | | | | | | | |
Capital share activity: | | | | | | | | |
Shares sold | | | | | | | | |
Class A | | | 9,287 | | | | 43,587 | |
Class C | | | 4,294 | | | | 23,765 | |
Class H | | | 6,179,789 | | | | 9,671,323 | |
Shares redeemed | | | | | | | | |
Class A | | | (29,412 | ) | | | (30,814 | ) |
Class C | | | (13,868 | ) | | | (43,388 | ) |
Class H | | | (9,350,688 | ) | | | (6,541,026 | ) |
Net increase (decrease) in shares | | | (3,200,598 | ) | | | 3,123,447 | |
SEE NOTES TO FINANCIAL STATEMENTS. | THE RYDEX FUNDS SEMI-ANNUAL FINANCIAL REPORT | 283 |
S&P MIDCAP 400® PURE GROWTH FUND | |
This table is presented to show selected data for a share outstanding throughout each period and to assist shareholders in evaluating a Fund’s performance for the periods presented.
Class A | | Six Months Ended
September 30, 2024a | | | Year Ended
March 31,
2024 | | | Year Ended
March 31,
2023 | | | Year Ended
March 31,
2022 | | | Year Ended
March 31,
2021 | | | Year Ended
March 31,
2020 | |
Per Share Data |
Net asset value, beginning of period | | $ | 59.38 | | | $ | 43.18 | | | $ | 53.47 | | | $ | 64.65 | | | $ | 33.77 | | | $ | 45.88 | |
Income (loss) from investment operations: |
Net investment income (loss)b | | | (.23 | ) | | | (.16 | ) | | | (.18 | ) | | | (.69 | ) | | | (.57 | ) | | | (.32 | ) |
Net gain (loss) on investments (realized and unrealized) | | | (1.82 | ) | | | 16.36 | | | | (5.43 | ) | | | (3.86 | ) | | | 32.09 | | | | (11.79 | ) |
Total from investment operations | | | (2.05 | ) | | | 16.20 | | | | (5.61 | ) | | | (4.55 | ) | | | 31.52 | | | | (12.11 | ) |
Less distributions from: |
Net realized gains | | | — | | | | — | | | | (4.68 | ) | | | (6.63 | ) | | | (.64 | ) | | | — | |
Total distributions | | | — | | | | — | | | | (4.68 | ) | | | (6.63 | ) | | | (.64 | ) | | | — | |
Net asset value, end of period | | $ | 57.33 | | | $ | 59.38 | | | $ | 43.18 | | | $ | 53.47 | | | $ | 64.65 | | | $ | 33.77 | |
|
Total Returnc | | | (3.45 | %) | | | 37.52 | % | | | (10.32 | %) | | | (8.07 | %) | | | 93.55 | % | | | (26.39 | %) |
Ratios/Supplemental Data |
Net assets, end of period (in thousands) | | $ | 7,967 | | | $ | 9,447 | | | $ | 6,319 | | | $ | 7,895 | | | $ | 11,272 | | | $ | 4,556 | |
Ratios to average net assets: |
Net investment income (loss) | | | (0.80 | %) | | | (0.34 | %) | | | (0.39 | %) | | | (1.09 | %) | | | (1.08 | %) | | | (0.72 | %) |
Total expenses | | | 1.57 | % | | | 1.59 | % | | | 1.55 | % | | | 1.51 | % | | | 1.59 | % | | | 1.63 | % |
Net expensesd | | | 1.52 | % | | | 1.55 | % | | | 1.55 | % | | | 1.51 | % | | | 1.59 | % | | | 1.63 | % |
Portfolio turnover rate | | | 498 | % | | | 570 | % | | | 372 | % | | | 125 | % | | | 407 | % | | | 190 | % |
Class C | | Six Months Ended
September 30, 2024a | | | Year Ended
March 31,
2024 | | | Year Ended
March 31,
2023 | | | Year Ended
March 31,
2022 | | | Year Ended
March 31,
2021 | | | Year Ended
March 31,
2020 | |
Per Share Data |
Net asset value, beginning of period | | $ | 45.47 | | | $ | 33.32 | | | $ | 42.78 | | | $ | 53.41 | | | $ | 28.17 | | | $ | 38.56 | |
Income (loss) from investment operations: |
Net investment income (loss)b | | | (.35 | ) | | | (.41 | ) | | | (.43 | ) | | | (.96 | ) | | | (.78 | ) | | | (.54 | ) |
Net gain (loss) on investments (realized and unrealized) | | | (1.38 | ) | | | 12.56 | | | | (4.35 | ) | | | (3.04 | ) | | | 26.66 | | | | (9.85 | ) |
Total from investment operations | | | (1.73 | ) | | | 12.15 | | | | (4.78 | ) | | | (4.00 | ) | | | 25.88 | | | | (10.39 | ) |
Less distributions from: |
Net realized gains | | | — | | | | — | | | | (4.68 | ) | | | (6.63 | ) | | | (.64 | ) | | | — | |
Total distributions | | | — | | | | — | | | | (4.68 | ) | | | (6.63 | ) | | | (.64 | ) | | | — | |
Net asset value, end of period | | $ | 43.74 | | | $ | 45.47 | | | $ | 33.32 | | | $ | 42.78 | | | $ | 53.41 | | | $ | 28.17 | |
|
Total Returnc | | | (3.80 | %) | | | 36.46 | % | | | (11.00 | %) | | | (8.76 | %) | | | 92.12 | % | | | (26.95 | %) |
Ratios/Supplemental Data |
Net assets, end of period (in thousands) | | $ | 316 | | | $ | 764 | | | $ | 1,214 | | | $ | 2,023 | | | $ | 4,005 | | | $ | 3,956 | |
Ratios to average net assets: |
Net investment income (loss) | | | (1.59 | %) | | | (1.15 | %) | | | (1.16 | %) | | | (1.85 | %) | | | (1.82 | %) | | | (1.47 | %) |
Total expenses | | | 2.31 | % | | | 2.33 | % | | | 2.30 | % | | | 2.26 | % | | | 2.35 | % | | | 2.38 | % |
Net expensesd | | | 2.26 | % | | | 2.30 | % | | | 2.30 | % | | | 2.26 | % | | | 2.35 | % | | | 2.38 | % |
Portfolio turnover rate | | | 498 | % | | | 570 | % | | | 372 | % | | | 125 | % | | | 407 | % | | | 190 | % |
284 | THE RYDEX FUNDS SEMI-ANNUAL FINANCIAL REPORT | SEE NOTES TO FINANCIAL STATEMENTS. |
S&P MIDCAP 400® PURE GROWTH FUND | |
FINANCIAL HIGHLIGHTS (concluded) |
This table is presented to show selected data for a share outstanding throughout each period and to assist shareholders in evaluating a Fund’s performance for the periods presented.
Class H | | Six Months Ended
September 30, 2024a | | | Year Ended
March 31,
2024 | | | Year Ended
March 31,
2023 | | | Year Ended
March 31,
2022 | | | Year Ended
March 31,
2021 | | | Year Ended
March 31,
2020 | |
Per Share Data |
Net asset value, beginning of period | | $ | 59.43 | | | $ | 43.24 | | | $ | 53.54 | | | $ | 64.74 | | | $ | 33.82 | | | $ | 45.94 | |
Income (loss) from investment operations: |
Net investment income (loss)b | | | (.26 | ) | | | (.13 | ) | | | (.17 | ) | | | (.70 | ) | | | (.56 | ) | | | (.31 | ) |
Net gain (loss) on investments (realized and unrealized) | | | (1.77 | ) | | | 16.32 | | | | (5.45 | ) | | | (3.87 | ) | | | 32.12 | | | | (11.81 | ) |
Total from investment operations | | | (2.03 | ) | | | 16.19 | | | | (5.62 | ) | | | (4.57 | ) | | | 31.56 | | | | (12.12 | ) |
Less distributions from: |
Net realized gains | | | — | | | | — | | | | (4.68 | ) | | | (6.63 | ) | | | (.64 | ) | | | — | |
Total distributions | | | — | | | | — | | | | (4.68 | ) | | | (6.63 | ) | | | (.64 | ) | | | — | |
Net asset value, end of period | | $ | 57.40 | | | $ | 59.43 | | | $ | 43.24 | | | $ | 53.54 | | | $ | 64.74 | | | $ | 33.82 | |
|
Total Return | | | (3.42 | %) | | | 37.44 | % | | | (10.32 | %) | | | (8.09 | %) | | | 93.53 | % | | | (26.38 | %) |
Ratios/Supplemental Data |
Net assets, end of period (in thousands) | | $ | 24,543 | | | $ | 213,865 | | | $ | 20,247 | | | $ | 29,225 | | | $ | 50,599 | | | $ | 27,848 | |
Ratios to average net assets: |
Net investment income (loss) | | | (0.90 | %) | | | (0.26 | %) | | | (0.36 | %) | | | (1.10 | %) | | | (1.06 | %) | | | (0.71 | %) |
Total expenses | | | 1.55 | % | | | 1.57 | % | | | 1.55 | % | | | 1.51 | % | | | 1.59 | % | | | 1.63 | % |
Net expensesd | | | 1.50 | % | | | 1.53 | % | | | 1.55 | % | | | 1.51 | % | | | 1.59 | % | | | 1.63 | % |
Portfolio turnover rate | | | 498 | % | | | 570 | % | | | 372 | % | | | 125 | % | | | 407 | % | | | 190 | % |
a | Unaudited figures for the period ended September 30, 2024. Percentage amounts for the period, except total return and portfolio turnover rate, have been annualized. |
b | Net investment income (loss) per share was computed using average shares outstanding throughout the period. |
c | Total return does not reflect the impact of any applicable sales charges. |
d | Net expense information reflects the expense ratios after expense waivers and reimbursements, as applicable. |
SEE NOTES TO FINANCIAL STATEMENTS. | THE RYDEX FUNDS SEMI-ANNUAL FINANCIAL REPORT | 285 |
SCHEDULE OF INVESTMENTS (Unaudited) | September 30, 2024 |
S&P MIDCAP 400® PURE VALUE FUND | |
| | Shares | | | Value | |
COMMON STOCKS† - 99.9% |
| | | | | | | | | |
Consumer, Cyclical - 25.5% |
Lithia Motors, Inc. — Class A | | | 401 | | | $ | 127,374 | |
Macy’s, Inc. | | | 7,467 | | | | 117,157 | |
Nordstrom, Inc. | | | 4,822 | | | | 108,447 | |
AutoNation, Inc.* | | | 601 | | | | 107,531 | |
Taylor Morrison Home Corp. — Class A* | | | 1,385 | | | | 97,310 | |
American Airlines Group, Inc.* | | | 7,515 | | | | 84,469 | |
Aramark | | | 2,143 | | | | 82,998 | |
WESCO International, Inc. | | | 472 | | | | 79,287 | |
Goodyear Tire & Rubber Co.* | | | 8,562 | | | | 75,774 | |
Penske Automotive Group, Inc. | | | 398 | | | | 64,643 | |
Whirlpool Corp. | | | 565 | | | | 60,455 | |
Thor Industries, Inc. | | | 519 | | | | 57,033 | |
Lear Corp. | | | 521 | | | | 56,867 | |
PVH Corp. | | | 555 | | | | 55,961 | |
Harley-Davidson, Inc. | | | 1,339 | | | | 51,592 | |
Gap, Inc. | | | 1,693 | | | | 37,331 | |
Marriott Vacations Worldwide Corp. | | | 480 | | | | 35,270 | |
BJ’s Wholesale Club Holdings, Inc.* | | | 407 | | | | 33,569 | |
Under Armour, Inc. — Class A* | | | 2,499 | | | | 22,266 | |
Under Armour, Inc. — Class C* | | | 2,585 | | | | 21,610 | |
Total Consumer, Cyclical | | | | | | | 1,376,944 | |
| | | | | | | | | |
Financial - 23.8% |
Jones Lang LaSalle, Inc.* | | | 484 | | | | 130,588 | |
Unum Group | | | 1,567 | | | | 93,143 | |
Jefferies Financial Group, Inc. | | | 1,296 | | | | 79,769 | |
Ally Financial, Inc. | | | 1,919 | | | | 68,297 | |
Reinsurance Group of America, Inc. — Class A | | | 309 | | | | 67,322 | |
Cousins Properties, Inc. REIT | | | 2,227 | | | | 65,652 | |
Kemper Corp. | | | 1,056 | | | | 64,680 | |
Associated Banc-Corp. | | | 2,956 | | | | 63,672 | |
Kilroy Realty Corp. REIT | | | 1,411 | | | | 54,605 | |
FNB Corp. | | | 3,757 | | | | 53,011 | |
Zions Bancorp North America | | | 1,111 | | | | 52,462 | |
Valley National Bancorp | | | 5,397 | | | | 48,897 | |
First Horizon Corp. | | | 2,846 | | | | 44,198 | |
Janus Henderson Group plc | | | 1,123 | | | | 42,753 | |
Old National Bancorp | | | 2,273 | | | | 42,414 | |
Independence Realty Trust, Inc. REIT | | | 2,032 | | | | 41,656 | |
Texas Capital Bancshares, Inc.* | | | 573 | | | | 40,947 | |
Prosperity Bancshares, Inc. | | | 560 | | | | 40,359 | |
CNO Financial Group, Inc. | | | 1,054 | | | | 36,995 | |
Healthcare Realty Trust, Inc. REIT | | | 1,998 | | | | 36,264 | |
Old Republic International Corp. | | | 933 | | | | 33,047 | |
First American Financial Corp. | | | 446 | | | | 29,440 | |
Webster Financial Corp. | | | 631 | | | | 29,411 | |
New York Community Bancorp, Inc. | | | 2,168 | | | | 24,347 | |
Total Financial | | | | | | | 1,283,929 | |
| | | | | | | | | |
Industrial - 19.1% |
Avnet, Inc. | | | 2,737 | | | | 148,646 | |
TD SYNNEX Corp. | | | 1,157 | | | | 138,932 | |
MasTec, Inc.* | | | 1,057 | | | | 130,117 | |
Arrow Electronics, Inc.* | | | 926 | | | | 123,001 | |
Ryder System, Inc. | | | 586 | | | | 85,439 | |
MDU Resources Group, Inc. | | | 2,815 | | | | 77,159 | |
Fluor Corp.* | | | 1,255 | | | | 59,876 | |
Coherent Corp.* | | | 634 | | | | 56,369 | |
CNH Industrial N.V. | | | 4,106 | | | | 45,576 | |
Greif, Inc. — Class A | | | 562 | | | | 35,215 | |
Oshkosh Corp. | | | 290 | | | | 29,061 | |
Berry Global Group, Inc. | | | 408 | | | | 27,736 | |
AGCO Corp. | | | 274 | | | | 26,814 | |
Knight-Swift Transportation Holdings, Inc. | | | 476 | | | | 25,680 | |
Vishay Intertechnology, Inc. | | | 1,233 | | | | 23,316 | |
Total Industrial | | | | | | | 1,032,937 | |
| | | | | | | | | |
Consumer, Non-cyclical - 14.9% |
Tenet Healthcare Corp.* | | | 773 | | | | 128,473 | |
US Foods Holding Corp.* | | | 1,757 | | | | 108,055 | |
Pilgrim’s Pride Corp.* | | | 2,178 | | | | 100,297 | |
Performance Food Group Co.* | | | 1,216 | | | | 95,298 | |
Graham Holdings Co. — Class B | | | 113 | | | | 92,854 | |
ManpowerGroup, Inc. | | | 1,258 | | | | 92,488 | |
Post Holdings, Inc.* | | | 424 | | | | 49,078 | |
Perrigo Company plc | | | 1,739 | | | | 45,614 | |
Enovis Corp.* | | | 764 | | | | 32,890 | |
Bio-Rad Laboratories, Inc. — Class A* | | | 94 | | | | 31,450 | |
Envista Holdings Corp.* | | | 1,486 | | | | 29,364 | |
Total Consumer, Non-cyclical | | | | | | | 805,861 | |
| | | | | | | | | |
Basic Materials - 5.9% |
United States Steel Corp. | | | 3,039 | | | | 107,368 | |
Alcoa Corp. | | | 2,420 | | | | 93,363 | |
Commercial Metals Co. | | | 1,083 | | | | 59,522 | |
Cleveland-Cliffs, Inc.* | | | 4,495 | | | | 57,401 | |
Total Basic Materials | | | | | | | 317,654 | |
| | | | | | | | | |
Energy - 5.4% |
PBF Energy, Inc. — Class A | | | 3,225 | | | | 99,814 | |
HF Sinclair Corp. | | | 2,030 | | | | 90,477 | |
Chesapeake Energy Corp.1 | | | 457 | | | | 37,588 | |
Antero Resources Corp.* | | | 1,303 | | | | 37,331 | |
NOV, Inc. | | | 1,458 | | | | 23,284 | |
Total Energy | | | | | | | 288,494 | |
| | | | | | | | | |
Utilities - 2.5% |
UGI Corp. | | | 1,706 | | | | 42,684 | |
Southwest Gas Holdings, Inc. | | | 469 | | | | 34,594 | |
Black Hills Corp. | | | 527 | | | | 32,210 | |
Spire, Inc. | | | 399 | | | | 26,849 | |
Total Utilities | | | | | | | 136,337 | |
| | | | | | | | | |
Technology - 1.5% |
Kyndryl Holdings, Inc.* | | | 2,814 | | | | 64,666 | |
Concentrix Corp. | | | 321 | | | | 16,451 | |
Total Technology | | | | | | | 81,117 | |
| | | | | | | | | |
286 | THE RYDEX FUNDS SEMI-ANNUAL FINANCIAL REPORT | SEE NOTES TO FINANCIAL STATEMENTS. |
SCHEDULE OF INVESTMENTS (Unaudited)(concluded) | September 30, 2024 |
S&P MIDCAP 400® PURE VALUE FUND | |
| | Shares | | | Value | |
Communications - 1.3% |
Frontier Communications Parent, Inc.* | | | 1,979 | | | $ | 70,314 | |
| | | | | | | | | |
Total Common Stocks | | | | |
(Cost $4,129,572) | | | | | | | 5,393,587 | |
| | | | | | | | | |
| | | Face
Amount | | | | | |
REPURCHASE AGREEMENTS††,2 - 0.7% |
J.P. Morgan Securities LLC
issued 09/30/24 at 4.86%
due 10/01/24 | | $ | 20,409 | | | | 20,409 | |
BofA Securities, Inc.
issued 09/30/24 at 4.85%
due 10/01/24 | | | 16,856 | | | | 16,856 | |
Total Repurchase Agreements | | | | |
(Cost $37,265) | | | | | | | 37,265 | |
| | | | | | | | | |
SECURITIES LENDING COLLATERAL†,3 - 0.5% |
Money Market Fund** | | | | | | | | |
First American Government Obligations Fund - Class X, 4.82%4 | | | 28,899 | | | $ | 28,899 | |
Total Securities Lending Collateral | | | | |
(Cost $28,899) | | | | | | | 28,899 | |
| | | | | | | | | |
Total Investments - 101.1% | | | | |
(Cost $4,195,736) | | $ | 5,459,751 | |
Other Assets & Liabilities, net - (1.1)% | | | (61,791 | ) |
Total Net Assets - 100.0% | | $ | 5,397,960 | |
* | Non-income producing security. |
** | A copy of each underlying unaffiliated fund’s financial statements is available at the SEC’s website at www.sec.gov. |
† | Value determined based on Level 1 inputs — See Note 4. |
†† | Value determined based on Level 2 inputs — See Note 4. |
1 | All or a portion of this security is on loan at September 30, 2024 — See Note 7. |
2 | Repurchase Agreements — See Note 6. |
3 | Securities lending collateral — See Note 7. |
4 | Rate indicated is the 7-day yield as of September 30, 2024. |
| | plc — Public Limited Company |
| | REIT — Real Estate Investment Trust |
| | |
| | See Sector Classification in Other Information section. |
The following table summarizes the inputs used to value the Fund’s investments at September 30, 2024 (See Note 4 in the Notes to Financial Statements):
Investments in Securities (Assets) | | Level 1
Quoted
Prices | | | Level 2
Significant
Observable
Inputs | | | Level 3
Significant
Unobservable
Inputs | | | Total | |
Common Stocks | | $ | 5,393,587 | | | $ | — | | | $ | — | | | $ | 5,393,587 | |
Repurchase Agreements | | | — | | | | 37,265 | | | | — | | | | 37,265 | |
Securities Lending Collateral | | | 28,899 | | | | — | | | | — | | | | 28,899 | |
Total Assets | | $ | 5,422,486 | | | $ | 37,265 | | | $ | — | | | $ | 5,459,751 | |
SEE NOTES TO FINANCIAL STATEMENTS. | THE RYDEX FUNDS SEMI-ANNUAL FINANCIAL REPORT | 287 |
S&P MIDCAP 400® PURE VALUE FUND | |
STATEMENT OF ASSETS AND LIABILITIES (Unaudited) |
September 30, 2024 |
Assets: |
Investments, at value - including $28,130 of securities loaned (cost $4,158,471) | | $ | 5,422,486 | |
Repurchase agreements, at value (cost $37,265) | | | 37,265 | |
Receivables: |
Dividends | | | 6,117 | |
Fund shares sold | | | 432 | |
Interest | | | 5 | |
Securities lending income | | | 4 | |
Total assets | | | 5,466,309 | |
| | | | | |
Liabilities: |
Payable for: |
Return of securities lending collateral | | | 28,899 | |
Fund shares redeemed | | | 27,242 | |
Management fees | | | 3,131 | |
Transfer agent fees | | | 2,558 | |
Distribution and service fees | | | 1,195 | |
Portfolio accounting and administration fees | | | 428 | |
Trustees’ fees* | | | 51 | |
Miscellaneous | | | 4,845 | |
Total liabilities | | | 68,349 | |
Net assets | | $ | 5,397,960 | |
| | | | | |
Net assets consist of: |
Paid in capital | | $ | 3,951,457 | |
Total distributable earnings (loss) | | | 1,446,503 | |
Net assets | | $ | 5,397,960 | |
Class A: |
Net assets | | $ | 1,711,509 | |
Capital shares outstanding | | | 22,533 | |
Net asset value per share | | $ | 75.96 | |
Maximum offering price per share (Net asset value divided by 95.25%) | | $ | 79.75 | |
Class C: |
Net assets | | $ | 252,114 | |
Capital shares outstanding | | | 4,096 | |
Net asset value per share | | $ | 61.55 | |
Class H: |
Net assets | | $ | 3,434,337 | |
Capital shares outstanding | | | 45,272 | |
Net asset value per share | | $ | 75.86 | |
STATEMENT OF OPERATIONS (Unaudited) |
Six Months Ended September 30, 2024 |
Investment Income: |
Dividends | | $ | 52,940 | |
Interest | | | 878 | |
Income from securities lending, net | | | 39 | |
Total investment income | | | 53,857 | |
| | | | | |
Expenses: |
Management fees | | | 22,058 | |
Distribution and service fees: |
Class A | | | 2,154 | |
Class C | | | 1,471 | |
Class H | | | 4,831 | |
Transfer agent fees | | | 6,206 | |
Portfolio accounting and administration fees | | | 4,487 | |
Professional fees | | | 2,380 | |
Registration fees | | | 2,182 | |
Trustees’ fees* | | | 557 | |
Custodian fees | | | 379 | |
Miscellaneous | | | 631 | |
Total expenses | | | 47,336 | |
Less: |
Expenses reimbursed by Adviser | | | (1,469 | ) |
Net expenses | | | 45,867 | |
Net investment income | | | 7,990 | |
| | | | | |
Net Realized and Unrealized Gain (Loss): |
Net realized gain (loss) on: |
Investments | | | (205,919 | ) |
Net realized loss | | | (205,919 | ) |
Net change in unrealized appreciation (depreciation) on: |
Investments | | | 45,246 | |
Net change in unrealized appreciation (depreciation) | | | 45,246 | |
Net realized and unrealized loss | | | (160,673 | ) |
Net decrease in net assets resulting from operations | | $ | (152,683 | ) |
* | Relates to Trustees not deemed “interested persons” within the meaning of Section 2(a)(19) of the 1940 Act. |
288 | THE RYDEX FUNDS SEMI-ANNUAL FINANCIAL REPORT | SEE NOTES TO FINANCIAL STATEMENTS. |
S&P MIDCAP 400® PURE VALUE FUND | |
STATEMENTS OF CHANGES IN NET ASSETS |
| | Six Months Ended
September 30, 2024
(Unaudited) | | | Year Ended
March 31,
2024 | |
Increase (Decrease) in Net Assets from Operations: | | | | | | | | |
Net investment income (loss) | | $ | 7,990 | | | $ | (2,398 | ) |
Net realized gain (loss) on investments | | | (205,919 | ) | | | 5,688,107 | |
Net change in unrealized appreciation (depreciation) on investments | | | 45,246 | | | | (41,440 | ) |
Net increase (decrease) in net assets resulting from operations | | | (152,683 | ) | | | 5,644,269 | |
| | | | | | | | | |
Distributions to shareholders: | | | | | | | | |
Class A | | | — | | | | (6,522 | ) |
Class C | | | — | | | | (1,618 | ) |
Class H | | | — | | | | (183,212 | ) |
Total distributions to shareholders | | | — | | | | (191,352 | ) |
| | | | | | | | | |
Capital share transactions: | | | | | | | | |
Proceeds from sale of shares | | | | | | | | |
Class A | | | 385,714 | | | | 1,437,937 | |
Class C | | | 124,419 | | | | 500,148 | |
Class H | | | 2,531,390 | | | | 89,083,027 | |
Distributions reinvested | | | | | | | | |
Class A | | | — | | | | 6,510 | |
Class C | | | — | | | | 1,605 | |
Class H | | | — | | | | 182,867 | |
Cost of shares redeemed | | | | | | | | |
Class A | | | (368,209 | ) | | | (2,231,565 | ) |
Class C | | | (185,145 | ) | | | (1,962,755 | ) |
Class H | | | (3,284,364 | ) | | | (97,881,236 | ) |
Net decrease from capital share transactions | | | (796,195 | ) | | | (10,863,462 | ) |
Net decrease in net assets | | | (948,878 | ) | | | (5,410,545 | ) |
| | | | | | | | | |
Net assets: | | | | | | | | |
Beginning of period | | | 6,346,838 | | | | 11,757,383 | |
End of period | | $ | 5,397,960 | | | $ | 6,346,838 | |
| | | | | | | | | |
Capital share activity: | | | | | | | | |
Shares sold | | | | | | | | |
Class A | | | 5,162 | | | | 20,945 | |
Class C | | | 2,035 | | | | 8,752 | |
Class H | | | 34,826 | | | | 1,337,752 | |
Shares issued from reinvestment of distributions | | | | | | | | |
Class A | | | — | | | | 95 | |
Class C | | | — | | | | 29 | |
Class H | | | — | | | | 2,666 | |
Shares redeemed | | | | | | | | |
Class A | | | (5,151 | ) | | | (35,465 | ) |
Class C | | | (3,199 | ) | | | (39,052 | ) |
Class H | | | (45,896 | ) | | | (1,412,035 | ) |
Net decrease in shares | | | (12,223 | ) | | | (116,313 | ) |
SEE NOTES TO FINANCIAL STATEMENTS. | THE RYDEX FUNDS SEMI-ANNUAL FINANCIAL REPORT | 289 |
S&P MIDCAP 400® PURE VALUE FUND | |
This table is presented to show selected data for a share outstanding throughout each period and to assist shareholders in evaluating a Fund’s performance for the periods presented.
Class A | | Six Months Ended
September 30, 2024a | | | Year Ended
March 31,
2024 | | | Year Ended
March 31,
2023 | | | Year Ended
March 31,
2022 | | | Year Ended
March 31,
2021 | | | Year Ended
March 31,
2020 | |
Per Share Data |
Net asset value, beginning of period | | $ | 76.40 | | | $ | 60.65 | | | $ | 70.65 | | | $ | 70.16 | | | $ | 30.53 | | | $ | 51.62 | |
Income (loss) from investment operations: |
Net investment income (loss)b | | | .12 | | | | .04 | | | | .49 | | | | .40 | | | | .20 | | | | .34 | |
Net gain (loss) on investments (realized and unrealized) | | | (.56 | ) | | | 16.00 | | | | (1.88 | ) | | | 4.22 | | | | 39.45 | | | | (21.43 | ) |
Total from investment operations | | | (.44 | ) | | | 16.04 | | | | (1.39 | ) | | | 4.62 | | | | 39.65 | | | | (21.09 | ) |
Less distributions from: |
Net investment income | | | — | | | | (.29 | ) | | | (.08 | ) | | | (.86 | ) | | | (.02 | ) | | | — | |
Net realized gains | | | — | | | | — | | | | (8.53 | ) | | | (3.27 | ) | | | — | | | | — | |
Total distributions | | | — | | | | (.29 | ) | | | (8.61 | ) | | | (4.13 | ) | | | (.02 | ) | | | — | |
Net asset value, end of period | | $ | 75.96 | | | $ | 76.40 | | | $ | 60.65 | | | $ | 70.65 | | | $ | 70.16 | | | $ | 30.53 | |
|
Total Returnc | | | (0.58 | %) | | | 26.51 | % | | | (1.32 | %) | | | 6.67 | % | | | 129.91 | % | | | (40.86 | %) |
Ratios/Supplemental Data |
Net assets, end of period (in thousands) | | $ | 1,712 | | | $ | 1,721 | | | $ | 2,241 | | | $ | 1,400 | | | $ | 1,868 | | | $ | 749 | |
Ratios to average net assets: |
Net investment income (loss) | | | 0.34 | % | | | 0.07 | % | | | 0.75 | % | | | 0.55 | % | | | 0.41 | % | | | 0.68 | % |
Total expenses | | | 1.57 | % | | | 1.59 | % | | | 1.55 | % | | | 1.51 | % | | | 1.59 | % | | | 1.63 | % |
Net expensesd | | | 1.53 | % | | | 1.55 | % | | | 1.55 | % | | | 1.51 | % | | | 1.59 | % | | | 1.63 | % |
Portfolio turnover rate | | | 46 | % | | | 868 | % | | | 1,064 | % | | | 252 | % | | | 454 | % | | | 993 | % |
Class C | | Six Months Ended
September 30, 2024a | | | Year Ended
March 31,
2024 | | | Year Ended
March 31,
2023 | | | Year Ended
March 31,
2022 | | | Year Ended
March 31,
2021 | | | Year Ended
March 31,
2020 | |
Per Share Data |
Net asset value, beginning of period | | $ | 62.15 | | | $ | 49.75 | | | $ | 60.04 | | | $ | 60.66 | | | $ | 26.59 | | | $ | 45.31 | |
Income (loss) from investment operations: |
Net investment income (loss)b | | | (.14 | ) | | | (.40 | ) | | | (.02 | ) | | | (.13 | ) | | | (.13 | ) | | | (.05 | ) |
Net gain (loss) on investments (realized and unrealized) | | | (.46 | ) | | | 13.09 | | | | (1.66 | ) | | | 3.64 | | | | 34.22 | | | | (18.67 | ) |
Total from investment operations | | | (.60 | ) | | | 12.69 | | | | (1.68 | ) | | | 3.51 | | | | 34.09 | | | | (18.72 | ) |
Less distributions from: |
Net investment income | | | — | | | | (.29 | ) | | | (.08 | ) | | | (.86 | ) | | | (.02 | ) | | | — | |
Net realized gains | | | — | | | | — | | | | (8.53 | ) | | | (3.27 | ) | | | — | | | | — | |
Total distributions | | | — | | | | (.29 | ) | | | (8.61 | ) | | | (4.13 | ) | | | (.02 | ) | | | — | |
Net asset value, end of period | | $ | 61.55 | | | $ | 62.15 | | | $ | 49.75 | | | $ | 60.04 | | | $ | 60.66 | | | $ | 26.59 | |
|
Total Returnc | | | (0.97 | %) | | | 25.58 | % | | | (2.06 | %) | | | 5.86 | % | | | 128.24 | % | | | (41.32 | %) |
Ratios/Supplemental Data |
Net assets, end of period (in thousands) | | $ | 252 | | | $ | 327 | | | $ | 1,768 | | | $ | 493 | | | $ | 1,690 | | | $ | 708 | |
Ratios to average net assets: |
Net investment income (loss) | | | (0.45 | %) | | | (0.77 | %) | | | (0.03 | %) | | | (0.21 | %) | | | (0.30 | %) | | | (0.12 | %) |
Total expenses | | | 2.32 | % | | | 2.33 | % | | | 2.30 | % | | | 2.26 | % | | | 2.34 | % | | | 2.37 | % |
Net expensesd | | | 2.27 | % | | | 2.31 | % | | | 2.30 | % | | | 2.26 | % | | | 2.34 | % | | | 2.37 | % |
Portfolio turnover rate | | | 46 | % | | | 868 | % | | | 1,064 | % | | | 252 | % | | | 454 | % | | | 993 | % |
290 | THE RYDEX FUNDS SEMI-ANNUAL FINANCIAL REPORT | SEE NOTES TO FINANCIAL STATEMENTS. |
S&P MIDCAP 400® PURE VALUE FUND | |
FINANCIAL HIGHLIGHTS (concluded) |
This table is presented to show selected data for a share outstanding throughout each period and to assist shareholders in evaluating a Fund’s performance for the periods presented.
Class H | | Six Months Ended
September 30, 2024a | | | Year Ended
March 31,
2024 | | | Year Ended
March 31,
2023 | | | Year Ended
March 31,
2022 | | | Year Ended
March 31,
2021 | | | Year Ended
March 31,
2020 | |
Per Share Data |
Net asset value, beginning of period | | $ | 76.31 | | | $ | 60.56 | | | $ | 70.54 | | | $ | 70.05 | | | $ | 30.48 | | | $ | 51.54 | |
Income (loss) from investment operations: |
Net investment income (loss)b | | | .11 | | | | — | | | | .49 | | | | .35 | | | | .31 | | | | .20 | |
Net gain (loss) on investments (realized and unrealized) | | | (.56 | ) | | | 16.04 | | | | (1.86 | ) | | | 4.27 | | | | 39.28 | | | | (21.26 | ) |
Total from investment operations | | | (.45 | ) | | | 16.04 | | | | (1.37 | ) | | | 4.62 | | | | 39.59 | | | | (21.06 | ) |
Less distributions from: |
Net investment income | | | — | | | | (.29 | ) | | | (.08 | ) | | | (.86 | ) | | | (.02 | ) | | | — | |
Net realized gains | | | — | | | | — | | | | (8.53 | ) | | | (3.27 | ) | | | — | | | | — | |
Total distributions | | | — | | | | (.29 | ) | | | (8.61 | ) | | | (4.13 | ) | | | (.02 | ) | | | — | |
Net asset value, end of period | | $ | 75.86 | | | $ | 76.31 | | | $ | 60.56 | | | $ | 70.54 | | | $ | 70.05 | | | $ | 30.48 | |
|
Total Return | | | (0.59 | %) | | | 26.57 | % | | | (1.30 | %) | | | 6.68 | % | | | 129.92 | % | | | (40.86 | %) |
Ratios/Supplemental Data |
Net assets, end of period (in thousands) | | $ | 3,434 | | | $ | 4,299 | | | $ | 7,749 | | | $ | 28,139 | | | $ | 154,269 | | | $ | 1,618 | |
Ratios to average net assets: |
Net investment income (loss) | | | 0.30 | % | | | 0.01 | % | | | 0.74 | % | | | 0.48 | % | | | 0.51 | % | | | 0.39 | % |
Total expenses | | | 1.57 | % | | | 1.59 | % | | | 1.55 | % | | | 1.51 | % | | | 1.54 | % | | | 1.63 | % |
Net expensesd | | | 1.52 | % | | | 1.55 | % | | | 1.55 | % | | | 1.51 | % | | | 1.54 | % | | | 1.63 | % |
Portfolio turnover rate | | | 46 | % | | | 868 | % | | | 1,064 | % | | | 252 | % | | | 454 | % | | | 993 | % |
a | Unaudited figures for the period ended September 30, 2024. Percentage amounts for the period, except total return and portfolio turnover rate, have been annualized. |
b | Net investment income (loss) per share was computed using average shares outstanding throughout the period. |
c | Total return does not reflect the impact of any applicable sales charges. |
d | Net expense information reflects the expense ratios after expense waivers and reimbursements, as applicable. |
SEE NOTES TO FINANCIAL STATEMENTS. | THE RYDEX FUNDS SEMI-ANNUAL FINANCIAL REPORT | 291 |
SCHEDULE OF INVESTMENTS (Unaudited) | September 30, 2024 |
S&P SMALLCAP 600® PURE GROWTH FUND | |
| | Shares | | | Value | |
COMMON STOCKS† - 99.4% |
| | | | | | | | | |
Consumer, Non-cyclical - 21.6% |
PROG Holdings, Inc. | | | 1,538 | | | $ | 74,578 | |
UFP Technologies, Inc.* | | | 219 | | | | 69,357 | |
TG Therapeutics, Inc.* | | | 2,332 | | | | 54,545 | |
ADMA Biologics, Inc.* | | | 2,515 | | | | 50,275 | |
Verra Mobility Corp.* | | | 1,583 | | | | 44,023 | |
TransMedics Group, Inc.* | | | 277 | | | | 43,489 | |
Inter Parfums, Inc. | | | 313 | | | | 40,527 | |
Cal-Maine Foods, Inc. | | | 510 | | | | 38,168 | |
Stride, Inc.* | | | 421 | | | | 35,915 | |
Adtalem Global Education, Inc.* | | | 439 | | | | 33,136 | |
Viad Corp.* | | | 894 | | | | 32,032 | |
Collegium Pharmaceutical, Inc.* | | | 783 | | | | 30,255 | |
CorVel Corp.* | | | 92 | | | | 30,074 | |
RadNet, Inc.* | | | 427 | | | | 29,630 | |
Vericel Corp.* | | | 686 | | | | 28,984 | |
Catalyst Pharmaceuticals, Inc.* | | | 1,434 | | | | 28,508 | |
Amphastar Pharmaceuticals, Inc.* | | | 534 | | | | 25,915 | |
ANI Pharmaceuticals, Inc.* | | | 418 | | | | 24,938 | |
Glaukos Corp.* | | | 189 | | | | 24,623 | |
Dynavax Technologies Corp.* | | | 2,030 | | | | 22,614 | |
Astrana Health, Inc.* | | | 379 | | | | 21,959 | |
Integer Holdings Corp.* | | | 140 | | | | 18,200 | |
Arlo Technologies, Inc.* | | | 1,488 | | | | 18,020 | |
LiveRamp Holdings, Inc.* | | | 719 | | | | 17,817 | |
Progyny, Inc.* | | | 909 | | | | 15,235 | |
WD-40 Co. | | | 53 | | | | 13,668 | |
NeoGenomics, Inc.* | | | 720 | | | | 10,620 | |
CONMED Corp. | | | 99 | | | | 7,120 | |
Ligand Pharmaceuticals, Inc.*,††† | | | 107 | | | | — | |
Ligand Pharmaceuticals, Inc.*,††† | | | 107 | | | | — | |
Total Consumer, Non-cyclical | | | | | | | 884,225 | |
| | | | | | | | | |
Consumer, Cyclical - 19.3% |
Cinemark Holdings, Inc.* | | | 2,487 | | | | 69,238 | |
Green Brick Partners, Inc.* | | | 819 | | | | 68,403 | |
Boot Barn Holdings, Inc.* | | | 386 | | | | 64,570 | |
Group 1 Automotive, Inc. | | | 148 | | | | 56,690 | |
Patrick Industries, Inc. | | | 353 | | | | 50,257 | |
Installed Building Products, Inc. | | | 203 | | | | 49,993 | |
Cavco Industries, Inc.* | | | 109 | | | | 46,678 | |
M/I Homes, Inc.* | | | 242 | | | | 41,469 | |
Shake Shack, Inc. — Class A* | | | 379 | | | | 39,116 | |
Meritage Homes Corp. | | | 185 | | | | 37,938 | |
GMS, Inc.* | | | 403 | | | | 36,500 | |
Signet Jewelers Ltd. | | | 276 | | | | 28,467 | |
Urban Outfitters, Inc.* | | | 729 | | | | 27,928 | |
Guess?, Inc. | | | 1,082 | | | | 21,781 | |
Monarch Casino & Resort, Inc. | | | 270 | | | | 21,403 | |
Dave & Buster’s Entertainment, Inc.* | | | 611 | | | | 20,804 | |
Steven Madden Ltd. | | | 396 | | | | 19,400 | |
American Eagle Outfitters, Inc. | | | 843 | | | | 18,875 | |
Oxford Industries, Inc. | | | 204 | | | | 17,699 | |
Kontoor Brands, Inc. | | | 207 | | | | 16,929 | |
Madison Square Garden Sports Corp. — Class A* | | | 74 | | | | 15,411 | |
XPEL, Inc.* | | | 298 | | | | 12,924 | |
Jack in the Box, Inc. | | | 136 | | | | 6,329 | |
Total Consumer, Cyclical | | | | | | | 788,802 | |
| | | | | | | | | |
Financial - 18.6% |
Two Harbors Investment Corp. REIT | | | 4,378 | | | | 60,767 | |
SiriusPoint Ltd.* | | | 3,970 | | | | 56,930 | |
St. Joe Co. | | | 759 | | | | 44,257 | |
Goosehead Insurance, Inc. — Class A* | | | 460 | | | | 41,078 | |
Bancorp, Inc.* | | | 755 | | | | 40,393 | |
Redwood Trust, Inc. REIT | | | 5,165 | | | | 39,925 | |
First BanCorp | | | 1,709 | | | | 36,180 | |
HCI Group, Inc. | | | 334 | | | | 35,758 | |
Pathward Financial, Inc. | | | 499 | | | | 32,939 | |
Palomar Holdings, Inc.* | | | 345 | | | | 32,661 | |
Ambac Financial Group, Inc.* | | | 2,818 | | | | 31,590 | |
OFG Bancorp | | | 666 | | | | 29,917 | |
MARA Holdings, Inc.* | | | 1,843 | | | | 29,893 | |
Customers Bancorp, Inc.* | | | 634 | | | | 29,449 | |
Sunstone Hotel Investors, Inc. REIT | | | 2,723 | | | | 28,101 | |
eXp World Holdings, Inc.1 | | | 1,945 | | | | 27,405 | |
Ellington Financial, Inc. REIT | | | 1,984 | | | | 25,574 | |
DiamondRock Hospitality Co. REIT | | | 2,890 | | | | 25,230 | |
WisdomTree, Inc. | | | 2,469 | | | | 24,665 | |
Preferred Bank/Los Angeles CA | | | 282 | | | | 22,630 | |
World Acceptance Corp.* | | | 152 | | | | 17,933 | |
Triumph Financial, Inc.* | | | 219 | | | | 17,419 | |
New York Mortgage Trust, Inc. REIT | | | 2,453 | | | | 15,528 | |
Apple Hospitality REIT, Inc. | | | 931 | | | | 13,825 | |
Total Financial | | | | | | | 760,047 | |
| | | | | | | | | |
Industrial - 15.1% |
CSW Industrials, Inc. | | | 147 | | | | 53,859 | |
Powell Industries, Inc. | | | 202 | | | | 44,842 | |
Matson, Inc. | | | 310 | | | | 44,212 | |
Dorian LPG Ltd. | | | 1,006 | | | | 34,627 | |
Mueller Industries, Inc. | | | 463 | | | | 34,308 | |
AZZ, Inc. | | | 409 | | | | 33,788 | |
ArcBest Corp. | | | 296 | | | | 32,101 | |
AeroVironment, Inc.* | | | 146 | | | | 29,273 | |
Badger Meter, Inc. | | | 130 | | | | 28,393 | |
Federal Signal Corp. | | | 292 | | | | 27,290 | |
Boise Cascade Co. | | | 184 | | | | 25,940 | |
Gibraltar Industries, Inc.* | | | 350 | | | | 24,476 | |
Frontdoor, Inc.* | | | 501 | | | | 24,043 | |
Materion Corp. | | | 214 | | | | 23,938 | |
Moog, Inc. — Class A | | | 115 | | | | 23,232 | |
SPX Technologies, Inc.* | | | 135 | | | | 21,527 | |
Franklin Electric Company, Inc. | | | 166 | | | | 17,400 | |
Standex International Corp. | | | 95 | | | | 17,364 | |
MYR Group, Inc.* | | | 156 | | | | 15,948 | |
Armstrong World Industries, Inc. | | | 121 | | | | 15,903 | |
OSI Systems, Inc.* | | | 102 | | | | 15,487 | |
Tennant Co. | | | 152 | | | | 14,598 | |
Alamo Group, Inc. | | | 72 | | | | 12,970 | |
Total Industrial | | | | | | | 615,519 | |
| | | | | | | | | |
292 | THE RYDEX FUNDS SEMI-ANNUAL FINANCIAL REPORT | SEE NOTES TO FINANCIAL STATEMENTS. |
SCHEDULE OF INVESTMENTS (Unaudited)(continued) | September 30, 2024 |
S&P SMALLCAP 600® PURE GROWTH FUND | |
| | Shares | | | Value | |
Energy - 11.2% |
Warrior Met Coal, Inc. | | | 759 | | | $ | 48,500 | |
CONSOL Energy, Inc. | | | 424 | | | | 44,372 | |
Northern Oil & Gas, Inc. | | | 1,234 | | | | 43,696 | |
Alpha Metallurgical Resources, Inc.* | | | 161 | | | | 38,025 | |
Liberty Energy, Inc. — Class A | | | 1,937 | | | | 36,977 | |
REX American Resources Corp.* | | | 708 | | | | 32,773 | |
Helix Energy Solutions Group, Inc.* | | | 2,782 | | | | 30,880 | |
California Resources Corp. | | | 538 | | | | 28,229 | |
Tidewater, Inc.* | | | 374 | | | | 26,850 | |
Oceaneering International, Inc.* | | | 1,055 | | | | 26,238 | |
Magnolia Oil & Gas Corp. — Class A | | | 940 | | | | 22,955 | |
Par Pacific Holdings, Inc.* | | | 1,184 | | | | 20,838 | |
SM Energy Co. | | | 501 | | | | 20,025 | |
RPC, Inc. | | | 3,051 | | | | 19,404 | |
Archrock, Inc. | | | 782 | | | | 15,828 | |
Total Energy | | | | | | | 455,590 | |
| | | | | | | | | |
Communications - 4.7% |
Cargurus, Inc.* | | | 1,457 | | | | 43,754 | |
InterDigital, Inc. | | | 288 | | | | 40,790 | |
Cars.com, Inc.* | | | 1,612 | | | | 27,017 | |
Liquidity Services, Inc.* | | | 1,000 | | | | 22,800 | |
Cogent Communications Holdings, Inc. | | | 256 | | | | 19,435 | |
Yelp, Inc. — Class A* | | | 550 | | | | 19,294 | |
TripAdvisor, Inc.* | | | 1,232 | | | | 17,852 | |
Total Communications | | | | | | | 190,942 | |
| | | | | | | | | |
Technology - 4.1% |
Axcelis Technologies, Inc.* | | | 344 | | | | 36,068 | |
Veeco Instruments, Inc.*,1 | | | 800 | | | | 26,504 | |
SPS Commerce, Inc.* | | | 127 | | | | 24,660 | |
Agilysys, Inc.* | | | 187 | | | | 20,377 | |
DoubleVerify Holdings, Inc.* | | | 842 | | | | 14,179 | |
Progress Software Corp. | | | 199 | | | | 13,407 | |
Donnelley Financial Solutions, Inc.* | | | 201 | | | | 13,232 | |
PDF Solutions, Inc.* | | | 362 | | | | 11,468 | |
Privia Health Group, Inc.* | | | 495 | | | | 9,014 | |
Total Technology | | | | | | | 168,909 | |
| | | | | | | | | |
Basic Materials - 3.5% |
Hawkins, Inc. | | | 503 | | | | 64,117 | |
Carpenter Technology Corp. | | | 303 | | | | 48,353 | |
ATI, Inc.* | | | 465 | | | | 31,113 | |
Total Basic Materials | | | | | | | 143,583 | |
| | | | | | | | | |
Common Stocks - 0.7% |
Six Flags Entertainment Corp. | | | 745 | | | | 30,031 | |
| | | | | | | | | |
Utilities - 0.6% |
Otter Tail Corp. | | | 306 | | | | 23,917 | |
| | | | | | | | | |
Total Common Stocks | | | | |
(Cost $2,978,625) | | | | | | | 4,061,565 | |
| | | | | | | | | |
| | | Face
Amount | | | | | |
REPURCHASE AGREEMENTS††,2 - 0.8% |
J.P. Morgan Securities LLC
issued 09/30/24 at 4.86%
due 10/01/24 | | $ | 17,744 | | | | 17,744 | |
BofA Securities, Inc.
issued 09/30/24 at 4.85%
due 10/01/24 | | | 14,656 | | | | 14,656 | |
Total Repurchase Agreements | | | | |
(Cost $32,400) | | | | | | | 32,400 | |
| | | | | | | | | |
| | | Shares | | | | | |
SECURITIES LENDING COLLATERAL†,3 - 0.9% |
Money Market Fund*** | | | | | | | | |
First American Government Obligations Fund - Class X, 4.82%4 | | | 36,591 | | | | 36,591 | |
Total Securities Lending Collateral | | | | |
(Cost $36,591) | | | | | | | 36,591 | |
| | | | | | | | | |
Total Investments - 101.1% | | | | |
(Cost $3,047,616) | | $ | 4,130,556 | |
Other Assets & Liabilities, net - (1.1)% | | | (46,658 | ) |
Total Net Assets - 100.0% | | $ | 4,083,898 | |
* | Non-income producing security. |
*** | A copy of each underlying unaffiliated fund’s financial statements is available at the SEC’s website at www.sec.gov. |
† | Value determined based on Level 1 inputs, unless otherwise noted — See Note 4. |
†† | Value determined based on Level 2 inputs — See Note 4. |
1 | All or a portion of this security is on loan at September 30, 2024 — See Note 7. |
2 | Repurchase Agreements — See Note 6. |
3 | Securities lending collateral — See Note 7. |
4 | Rate indicated is the 7-day yield as of September 30, 2024. |
| | REIT — Real Estate Investment Trust |
| | |
| | See Sector Classification in Other Information section. |
SEE NOTES TO FINANCIAL STATEMENTS. | THE RYDEX FUNDS SEMI-ANNUAL FINANCIAL REPORT | 293 |
SCHEDULE OF INVESTMENTS (Unaudited)(concluded) | September 30, 2024 |
S&P SMALLCAP 600® PURE GROWTH FUND | |
The following table summarizes the inputs used to value the Fund’s investments at September 30, 2024 (See Note 4 in the Notes to Financial Statements):
Investments in Securities (Assets) | | Level 1
Quoted
Prices | | | Level 2
Significant
Observable
Inputs | | | Level 3
Significant
Unobservable
Inputs | | | Total | |
Common Stocks | | $ | 4,061,565 | | | $ | — | | | $ | — | * | | $ | 4,061,565 | |
Repurchase Agreements | | | — | | | | 32,400 | | | | — | | | | 32,400 | |
Securities Lending Collateral | | | 36,591 | | | | — | | | | — | | | | 36,591 | |
Total Assets | | $ | 4,098,156 | | | $ | 32,400 | | | $ | — | | | $ | 4,130,556 | |
* | Security has a market value of $0. |
294 | THE RYDEX FUNDS SEMI-ANNUAL FINANCIAL REPORT | SEE NOTES TO FINANCIAL STATEMENTS. |
S&P SMALLCAP 600® PURE GROWTH FUND | |
STATEMENT OF ASSETS AND LIABILITIES (Unaudited) |
September 30, 2024 |
Assets: |
Investments, at value - including $35,133 of securities loaned (cost $3,015,216) | | $ | 4,098,156 | |
Repurchase agreements, at value (cost $32,400) | | | 32,400 | |
Receivables: |
Securities sold | | | 58,103 | |
Dividends | | | 1,888 | |
Fund shares sold | | | 368 | |
Securities lending income | | | 7 | |
Interest | | | 5 | |
Total assets | | | 4,190,927 | |
| | | | | |
Liabilities: |
Payable for: |
Securities purchased | | | 43,491 | |
Return of securities lending collateral | | | 36,591 | |
Transfer agent fees | | | 7,081 | |
Fund shares redeemed | | | 4,244 | |
Management fees | | | 2,527 | |
Distribution and service fees | | | 987 | |
Portfolio accounting/administration fees | | | 346 | |
Trustees’ fees* | | | 167 | |
Miscellaneous | | | 11,595 | |
Total liabilities | | | 107,029 | |
Net assets | | $ | 4,083,898 | |
| | | | | |
Net assets consist of: |
Paid in capital | | $ | 3,313,335 | |
Total distributable earnings (loss) | | | 770,563 | |
Net assets | | $ | 4,083,898 | |
Class A: |
Net assets | | $ | 964,740 | |
Capital shares outstanding | | | 16,546 | |
Net asset value per share | | $ | 58.31 | |
Maximum offering price per share (Net asset value divided by 95.25%) | | $ | 61.22 | |
Class C: |
Net assets | | $ | 221,889 | |
Capital shares outstanding | | | 4,867 | |
Net asset value per share | | $ | 45.59 | |
Class H: |
Net assets | | $ | 2,897,269 | |
Capital shares outstanding | | | 49,783 | |
Net asset value per share | | $ | 58.20 | |
STATEMENT OF OPERATIONS (Unaudited) |
Six Months Ended September 30, 2024 |
Investment Income: |
Dividends (net of foreign withholding tax of $170) | | $ | 98,167 | |
Interest | | | 2,540 | |
Income from securities lending, net | | | 113 | |
Total investment income | | | 100,820 | |
| | | | | |
Expenses: |
Management fees | | | 58,106 | |
Distribution and service fees: |
Class A | | | 1,441 | |
Class C | | | 1,497 | |
Class H | | | 17,553 | |
Transfer agent fees | | | 16,301 | |
Portfolio accounting fees | | | 11,820 | |
Registration fees | | | 4,956 | |
Professional fees | | | 1,865 | |
Custodian fees | | | 966 | |
Trustees’ fees* | | | 334 | |
Line of credit fees | | | 26 | |
Miscellaneous | | | 9,397 | |
Total expenses | | | 124,262 | |
Less: |
Expenses reimbursed by Adviser | | | (3,871 | ) |
Net expenses | | | 120,391 | |
Net investment loss | | | (19,571 | ) |
| | | | | |
Net Realized and Unrealized Gain (Loss): |
Net realized gain (loss) on: |
Investments | | | (533,099 | ) |
Net realized loss | | | (533,099 | ) |
Net change in unrealized appreciation (depreciation) on: |
Investments | | | 331,385 | |
Net change in unrealized appreciation (depreciation) | | | 331,385 | |
Net realized and unrealized loss | | | (201,714 | ) |
Net decrease in net assets resulting from operations | | $ | (221,285 | ) |
* | Relates to Trustees not deemed “interested persons” within the meaning of Section 2(a)(19) of the 1940 Act. |
SEE NOTES TO FINANCIAL STATEMENTS. | THE RYDEX FUNDS SEMI-ANNUAL FINANCIAL REPORT | 295 |
S&P SMALLCAP 600® PURE GROWTH FUND | |
STATEMENTS OF CHANGES IN NET ASSETS |
| | Six Months Ended
September 30, 2024
(Unaudited) | | | Year Ended
March 31,
2024 | |
Increase (Decrease) in Net Assets from Operations: | | | | | | | | |
Net investment income (loss) | | $ | (19,571 | ) | | $ | 966 | |
Net realized gain (loss) on investments | | | (533,099 | ) | | | 948,891 | |
Net change in unrealized appreciation (depreciation) on investments | | | 331,385 | | | | 409,946 | |
Net increase (decrease) in net assets resulting from operations | | | (221,285 | ) | | | 1,359,803 | |
| | | | | | | | | |
Capital share transactions: | | | | | | | | |
Proceeds from sale of shares | | | | | | | | |
Class A | | | 917,641 | | | | 977,493 | |
Class C | | | 356,005 | | | | 488,130 | |
Class H | | | 176,756,808 | | | | 40,031,434 | |
Cost of shares redeemed | | | | | | | | |
Class A | | | (1,001,498 | ) | | | (1,067,226 | ) |
Class C | | | (446,954 | ) | | | (489,574 | ) |
Class H | | | (176,322,941 | ) | | | (41,880,234 | ) |
Net increase (decrease) from capital share transactions | | | 259,061 | | | | (1,939,977 | ) |
Net increase (decrease) in net assets | | | 37,776 | | | | (580,174 | ) |
| | | | | | | | | |
Net assets: | | | | | | | | |
Beginning of period | | | 4,046,122 | | | | 4,626,296 | |
End of period | | $ | 4,083,898 | | | $ | 4,046,122 | |
| | | | | | | | | |
Capital share activity: | | | | | | | | |
Shares sold | | | | | | | | |
Class A | | | 16,011 | | | | 19,522 | |
Class C | | | 7,890 | | | | 12,418 | |
Class H | | | 3,164,869 | | | | 859,211 | |
Shares redeemed | | | | | | | | |
Class A | | | (18,533 | ) | | | (21,633 | ) |
Class C | | | (10,541 | ) | | | (12,751 | ) |
Class H | | | (3,163,265 | ) | | | (887,163 | ) |
Net decrease in shares | | | (3,569 | ) | | | (30,396 | ) |
296 | THE RYDEX FUNDS SEMI-ANNUAL FINANCIAL REPORT | SEE NOTES TO FINANCIAL STATEMENTS. |
S&P SMALLCAP 600® PURE GROWTH FUND | |
This table is presented to show selected data for a share outstanding throughout each period and to assist shareholders in evaluating a Fund’s performance for the periods presented.
Class A | | Six Months Ended
September 30, 2024a | | | Year Ended
March 31,
2024 | | | Year Ended
March 31,
2023 | | | Year Ended
March 31,
2022 | | | Year Ended
March 31,
2021 | | | Year Ended
March 31,
2020 | |
Per Share Data |
Net asset value, beginning of period | | $ | 55.36 | | | $ | 44.74 | | | $ | 53.16 | | | $ | 89.23 | | | $ | 43.85 | | | $ | 65.22 | |
Income (loss) from investment operations: |
Net investment income (loss)b | | | (.01 | ) | | | (.02 | ) | | | .13 | | | | (.70 | ) | | | (.62 | ) | | | (.44 | ) |
Net gain (loss) on investments (realized and unrealized) | | | 2.96 | e | | | 10.64 | | | | (8.55 | )e | | | (5.41 | ) | | | 46.00 | | | | (20.93 | ) |
Total from investment operations | | | 2.95 | | | | 10.62 | | | | (8.42 | ) | | | (6.11 | ) | | | 45.38 | | | | (21.37 | ) |
Less distributions from: |
Net realized gains | | | — | | | | — | | | | — | | | | (29.96 | ) | | | — | | | | — | |
Total distributions | | | — | | | | — | | | | — | | | | (29.96 | ) | | | — | | | | — | |
Net asset value, end of period | | $ | 58.31 | | | $ | 55.36 | | | $ | 44.74 | | | $ | 53.16 | | | $ | 89.23 | | | $ | 43.85 | |
|
Total Returnc | | | 5.33 | % | | | 23.74 | % | | | (15.84 | %) | | | (11.08 | %) | | | 103.49 | % | | | (32.77 | %) |
Ratios/Supplemental Data |
Net assets, end of period (in thousands) | | $ | 965 | | | $ | 1,056 | | | $ | 948 | | | $ | 1,406 | | | $ | 3,448 | | | $ | 1,169 | |
Ratios to average net assets: |
Net investment income (loss) | | | (0.03 | %) | | | (0.05 | %) | | | 0.29 | % | | | (0.88 | %) | | | (0.86 | %) | | | (0.69 | %) |
Total expenses | | | 1.58 | % | | | 1.59 | % | | | 1.55 | % | | | 1.51 | % | | | 1.58 | % | | | 1.63 | % |
Net expensesd | | | 1.53 | % | | | 1.55 | % | | | 1.55 | % | | | 1.51 | % | | | 1.58 | % | | | 1.63 | % |
Portfolio turnover rate | | | 1,548 | % | | | 942 | % | | | 812 | % | | | 707 | % | | | 752 | % | | | 628 | % |
Class C | | Six Months Ended
September 30, 2024a | | | Year Ended
March 31,
2024 | | | Year Ended
March 31,
2023 | | | Year Ended
March 31,
2022 | | | Year Ended
March 31,
2021 | | | Year Ended
March 31,
2020 | |
Per Share Data |
Net asset value, beginning of period | | $ | 43.46 | | | $ | 35.39 | | | $ | 42.35 | | | $ | 77.59 | | | $ | 38.41 | | | $ | 57.57 | |
Income (loss) from investment operations: |
Net investment income (loss)b | | | (.17 | ) | | | (.31 | ) | | | (.20 | ) | | | (1.17 | ) | | | (.96 | ) | | | (.79 | ) |
Net gain (loss) on investments (realized and unrealized) | | | 2.30 | e | | | 8.38 | | | | (6.76 | )e | | | (4.11 | ) | | | 40.14 | | | | (18.37 | ) |
Total from investment operations | | | 2.13 | | | | 8.07 | | | | (6.96 | ) | | | (5.28 | ) | | | 39.18 | | | | (19.16 | ) |
Less distributions from: |
Net realized gains | | | — | | | | — | | | | — | | | | (29.96 | ) | | | — | | | | — | |
Total distributions | | | — | | | | — | | | | — | | | | (29.96 | ) | | | — | | | | — | |
Net asset value, end of period | | $ | 45.59 | | | $ | 43.46 | | | $ | 35.39 | | | $ | 42.35 | | | $ | 77.59 | | | $ | 38.41 | |
|
Total Returnc | | | 4.90 | % | | | 22.80 | % | | | (16.43 | %) | | | (11.75 | %) | | | 102.00 | % | | | (33.28 | %) |
Ratios/Supplemental Data |
Net assets, end of period (in thousands) | | $ | 222 | | | $ | 327 | | | $ | 278 | | | $ | 483 | | | $ | 2,329 | | | $ | 678 | |
Ratios to average net assets: |
Net investment income (loss) | | | (0.79 | %) | | | (0.83 | %) | | | (0.54 | %) | | | (1.69 | %) | | | (1.59 | %) | | | (1.43 | %) |
Total expenses | | | 2.33 | % | | | 2.34 | % | | | 2.30 | % | | | 2.26 | % | | | 2.33 | % | | | 2.38 | % |
Net expensesd | | | 2.28 | % | | | 2.30 | % | | | 2.30 | % | | | 2.26 | % | | | 2.33 | % | | | 2.38 | % |
Portfolio turnover rate | | | 1,548 | % | | | 942 | % | | | 812 | % | | | 707 | % | | | 752 | % | | | 628 | % |
SEE NOTES TO FINANCIAL STATEMENTS. | THE RYDEX FUNDS SEMI-ANNUAL FINANCIAL REPORT | 297 |
S&P SMALLCAP 600® PURE GROWTH FUND | |
FINANCIAL HIGHLIGHTS (concluded) |
This table is presented to show selected data for a share outstanding throughout each period and to assist shareholders in evaluating a Fund’s performance for the periods presented.
Class H | | Six Months Ended
September 30, 2024a | | | Year Ended
March 31,
2024 | | | Year Ended
March 31,
2023 | | | Year Ended
March 31,
2022 | | | Year Ended
March 31,
2021 | | | Year Ended
March 31,
2020 | |
Per Share Data |
Net asset value, beginning of period | | $ | 55.29 | | | $ | 44.67 | | | $ | 53.15 | | | $ | 89.21 | | | $ | 43.84 | | | $ | 65.21 | |
Income (loss) from investment operations: |
Net investment income (loss)b | | | (.07 | ) | | | .04 | | | | .02 | | | | (.81 | ) | | | (.86 | ) | | | (.40 | ) |
Net gain (loss) on investments (realized and unrealized) | | | 2.98 | e | | | 10.58 | | | | (8.50 | )e | | | (5.29 | ) | | | 46.23 | | | | (20.97 | ) |
Total from investment operations | | | 2.91 | | | | 10.62 | | | | (8.48 | ) | | | (6.10 | ) | | | 45.37 | | | | (21.37 | ) |
Less distributions from: |
Net realized gains | | | — | | | | — | | | | — | | | | (29.96 | ) | | | — | | | | — | |
Total distributions | | | — | | | | — | | | | — | | | | (29.96 | ) | | | — | | | | — | |
Net asset value, end of period | | $ | 58.20 | | | $ | 55.29 | | | $ | 44.67 | | | $ | 53.15 | | | $ | 89.21 | | | $ | 43.84 | |
|
Total Return | | | 5.26 | % | | | 23.77 | % | | | (15.95 | %) | | | (11.06 | %) | | | 103.49 | % | | | (32.77 | %) |
Ratios/Supplemental Data |
Net assets, end of period (in thousands) | | $ | 2,897 | | | $ | 2,664 | | | $ | 3,401 | | | $ | 3,312 | | | $ | 25,071 | | | $ | 2,430 | |
Ratios to average net assets: |
Net investment income (loss) | | | (0.26 | %) | | | 0.09 | % | | | 0.05 | % | | | (0.97 | %) | | | (1.05 | %) | | | (0.63 | %) |
Total expenses | | | 1.59 | % | | | 1.57 | % | | | 1.55 | % | | | 1.51 | % | | | 1.54 | % | | | 1.63 | % |
Net expensesd | | | 1.54 | % | | | 1.55 | % | | | 1.55 | % | | | 1.51 | % | | | 1.54 | % | | | 1.63 | % |
Portfolio turnover rate | | | 1,548 | % | | | 942 | % | | | 812 | % | | | 707 | % | | | 752 | % | | | 628 | % |
a | Unaudited figures for the period ended September 30, 2024. Percentage amounts for the period, except total return and portfolio turnover rate, have been annualized. |
b | Net investment income (loss) per share was computed using average shares outstanding throughout the period. |
c | Total return does not reflect the impact of any applicable sales charges. |
d | Net expense information reflects the expense ratios after expense waivers and reimbursements, as applicable. |
e | The amount shown for a share outstanding throughout the period does not agree with the aggregate net gain (loss) on investments for the period because of the sales and purchases of fund shares in relation to fluctuating market value of the investments of the Fund. |
298 | THE RYDEX FUNDS SEMI-ANNUAL FINANCIAL REPORT | SEE NOTES TO FINANCIAL STATEMENTS. |
SCHEDULE OF INVESTMENTS (Unaudited) | September 30, 2024 |
S&P SMALLCAP 600® PURE VALUE FUND | |
| | Shares | | | Value | |
COMMON STOCKS† - 99.7% |
| | | | | | | | | |
Consumer, Cyclical - 25.7% |
Phinia, Inc. | | | 2,460 | | | $ | 113,234 | |
JetBlue Airways Corp.* | | | 15,911 | | | | 104,376 | |
ScanSource, Inc.* | | | 1,719 | | | | 82,564 | |
MarineMax, Inc.* | | | 2,171 | | | | 76,571 | |
Adient plc* | | | 3,111 | | | | 70,215 | |
Foot Locker, Inc.* | | | 2,689 | | | | 69,484 | |
Kohl’s Corp. | | | 2,848 | | | | 60,093 | |
Sally Beauty Holdings, Inc.* | | | 4,027 | | | | 54,646 | |
Resideo Technologies, Inc.* | | | 2,409 | | | | 48,517 | |
Topgolf Callaway Brands Corp.* | | | 4,244 | | | | 46,599 | |
Sonic Automotive, Inc. — Class A | | | 702 | | | | 41,053 | |
Shoe Carnival, Inc. | | | 914 | | | | 40,079 | |
Wolverine World Wide, Inc. | | | 2,229 | | | | 38,829 | |
Caleres, Inc. | | | 1,133 | | | | 37,446 | |
Advance Auto Parts, Inc. | | | 958 | | | | 37,353 | |
Penn Entertainment, Inc.* | | | 1,968 | | | | 37,117 | |
American Axle & Manufacturing Holdings, Inc.* | | | 5,977 | | | | 36,938 | |
Dana, Inc. | | | 3,454 | | | | 36,474 | |
Alaska Air Group, Inc.* | | | 794 | | | | 35,897 | |
G-III Apparel Group Ltd.* | | | 1,145 | | | | 34,945 | |
Interface, Inc. — Class A | | | 1,716 | | | | 32,553 | |
Newell Brands, Inc. | | | 3,977 | | | | 30,543 | |
Hanesbrands, Inc.* | | | 4,102 | | | | 30,150 | |
ODP Corp.* | | | 992 | | | | 29,512 | |
Victoria’s Secret & Co.* | | | 1,089 | | | | 27,987 | |
Allegiant Travel Co. — Class A* | | | 508 | | | | 27,970 | |
Vista Outdoor, Inc.* | | | 632 | | | | 24,762 | |
VF Corp. | | | 1,237 | | | | 24,678 | |
PriceSmart, Inc. | | | 222 | | | | 20,375 | |
MillerKnoll, Inc. | | | 776 | | | | 19,214 | |
Wabash National Corp. | | | 975 | | | | 18,710 | |
Standard Motor Products, Inc. | | | 553 | | | | 18,360 | |
Leggett & Platt, Inc. | | | 1,343 | | | | 18,291 | |
Titan International, Inc.* | | | 1,442 | | | | 11,723 | |
Total Consumer, Cyclical | | | | | | | 1,437,258 | |
| | | | | | | | | |
Financial - 24.3% |
Bread Financial Holdings, Inc. | | | 1,962 | | | | 93,352 | |
Jackson Financial, Inc. — Class A | | | 939 | | | | 85,665 | |
Genworth Financial, Inc. — Class A* | | | 11,152 | | | | 76,391 | |
EZCORP, Inc. — Class A* | | | 6,767 | | | | 75,858 | |
Cushman & Wakefield plc* | | | 5,404 | | | | 73,656 | |
StoneX Group, Inc.* | | | 764 | | | | 62,556 | |
Medical Properties Trust, Inc. REIT1 | | | 9,538 | | | | 55,797 | |
ProAssurance Corp.* | | | 2,933 | | | | 44,112 | |
Stewart Information Services Corp. | | | 557 | | | | 41,630 | |
United Fire Group, Inc. | | | 1,827 | | | | 38,239 | |
PRA Group, Inc.* | | | 1,621 | | | | 36,246 | |
Hope Bancorp, Inc. | | | 2,809 | | | | 35,281 | |
Brandywine Realty Trust REIT | | | 6,476 | | | | 35,230 | |
Pebblebrook Hotel Trust REIT | | | 2,477 | | | | 32,771 | |
Simmons First National Corp. — Class A | | | 1,488 | | | | 32,052 | |
SL Green Realty Corp. REIT | | | 458 | | | | 31,881 | |
JBG SMITH Properties REIT | | | 1,690 | | | | 29,541 | |
Mercury General Corp. | | | 469 | | | | 29,538 | |
Safehold, Inc. REIT | | | 1,037 | | | | 27,201 | |
Lincoln National Corp. | | | 838 | | | | 26,406 | |
Comerica, Inc. | | | 432 | | | | 25,881 | |
Eagle Bancorp, Inc. | | | 1,127 | | | | 25,448 | |
Independent Bank Group, Inc. | | | 424 | | | | 24,448 | |
Veritex Holdings, Inc. | | | 920 | | | | 24,214 | |
Dime Community Bancshares, Inc. | | | 837 | | | | 24,106 | |
Hudson Pacific Properties, Inc. REIT* | | | 5,041 | | | | 24,096 | |
Banc of California, Inc. | | | 1,615 | | | | 23,789 | |
Virtu Financial, Inc. — Class A | | | 763 | | | | 23,241 | |
Navient Corp. | | | 1,436 | | | | 22,387 | |
Provident Financial Services, Inc. | | | 1,153 | | | | 21,400 | |
Encore Capital Group, Inc.* | | | 452 | | | | 21,366 | |
Renasant Corp. | | | 619 | | | | 20,117 | |
BankUnited, Inc. | | | 521 | | | | 18,985 | |
Hanmi Financial Corp. | | | 977 | | | | 18,172 | |
Heritage Financial Corp. | | | 831 | | | | 18,091 | |
Brookline Bancorp, Inc. | | | 1,681 | | | | 16,961 | |
Pacific Premier Bancorp, Inc. | | | 606 | | | | 15,247 | |
Ready Capital Corp. REIT | | | 1,919 | | | | 14,642 | |
Service Properties Trust REIT | | | 2,988 | | | | 13,625 | |
Total Financial | | | | | | | 1,359,619 | |
| | | | | | | | | |
Consumer, Non-cyclical - 20.4% |
Fresh Del Monte Produce, Inc. | | | 3,494 | | | | 103,213 | |
Green Dot Corp. — Class A* | | | 8,727 | | | | 102,193 | |
United Natural Foods, Inc.* | | | 5,282 | | | | 88,843 | |
Kelly Services, Inc. — Class A | | | 3,790 | | | | 81,144 | |
Hertz Global Holdings, Inc.* | | | 20,899 | | | | 68,967 | |
Pediatrix Medical Group, Inc.* | | | 5,675 | | | | 65,773 | |
AdaptHealth Corp.* | | | 5,299 | | | | 59,508 | |
SpartanNash Co. | | | 2,484 | | | | 55,666 | |
Chefs’ Warehouse, Inc.* | | | 1,177 | | | | 49,446 | |
GEO Group, Inc.* | | | 3,466 | | | | 44,538 | |
ABM Industries, Inc. | | | 811 | | | | 42,788 | |
B&G Foods, Inc. | | | 4,788 | | | | 42,518 | |
Phibro Animal Health Corp. — Class A | | | 1,637 | | | | 36,865 | |
Deluxe Corp. | | | 1,697 | | | | 33,075 | |
Heidrick & Struggles International, Inc. | | | 785 | | | | 30,505 | |
QuidelOrtho Corp.* | | | 654 | | | | 29,822 | |
Universal Corp. | | | 538 | | | | 28,573 | |
Owens & Minor, Inc.* | | | 1,746 | | | | 27,395 | |
Cross Country Healthcare, Inc.* | | | 1,801 | | | | 24,205 | |
Select Medical Holdings Corp. | | | 637 | | | | 22,212 | |
Healthcare Services Group, Inc.* | | | 1,889 | | | | 21,100 | |
Avanos Medical, Inc.* | | | 783 | | | | 18,816 | |
Patterson Companies, Inc. | | | 762 | | | | 16,642 | |
Hain Celestial Group, Inc.* | | | 1,772 | | | | 15,292 | |
TreeHouse Foods, Inc.* | | | 358 | | | | 15,029 | |
Fulgent Genetics, Inc.* | | | 646 | | | | 14,038 | |
Total Consumer, Non-cyclical | | | | | | | 1,138,166 | |
| | | | | | | | | |
Industrial - 12.6% |
World Kinect Corp. | | | 3,717 | | | | 114,892 | |
Benchmark Electronics, Inc. | | | 2,204 | | | | 97,681 | |
SEE NOTES TO FINANCIAL STATEMENTS. | THE RYDEX FUNDS SEMI-ANNUAL FINANCIAL REPORT | 299 |
SCHEDULE OF INVESTMENTS (Unaudited)(continued) | September 30, 2024 |
S&P SMALLCAP 600® PURE VALUE FUND | |
| | Shares | | | Value | |
Enviri Corp.* | | | 8,487 | | | $ | 87,755 | |
Greenbrier Companies, Inc. | | | 1,358 | | | | 69,109 | |
DXP Enterprises, Inc.* | | | 1,252 | | | | 66,807 | |
Sanmina Corp.* | | | 829 | | | | 56,745 | |
Clearwater Paper Corp.* | | | 1,635 | | | | 46,663 | |
O-I Glass, Inc.* | | | 2,849 | | | | 37,379 | |
Schneider National, Inc. — Class B | | | 938 | | | | 26,770 | |
TTM Technologies, Inc.* | | | 1,370 | | | | 25,003 | |
Astec Industries, Inc. | | | 648 | | | | 20,697 | |
Hub Group, Inc. — Class A | | | 435 | | | | 19,771 | |
Masterbrand, Inc.* | | | 1,029 | | | | 19,078 | |
Werner Enterprises, Inc. | | | 486 | | | | 18,755 | |
Total Industrial | | | | | | | 707,105 | |
| | | | | | | | | |
Communications - 5.2% |
EchoStar Corp. — Class A* | | | 5,067 | | | | 125,763 | |
Lumen Technologies, Inc.* | | | 14,076 | | | | 99,940 | |
TEGNA, Inc. | | | 1,873 | | | | 29,556 | |
Viasat, Inc.* | | | 1,462 | | | | 17,456 | |
Consolidated Communications Holdings, Inc.* | | | 3,283 | | | | 15,233 | |
Total Communications | | | | | | | 287,948 | |
| | | | | | | | | |
Technology - 4.8% |
NCR Atleos Corp.* | | | 2,844 | | | | 81,139 | |
Xerox Holdings Corp. | | | 5,170 | | | | 53,664 | |
NCR Voyix Corp.* | | | 3,342 | | | | 45,351 | |
Alpha & Omega Semiconductor Ltd.* | | | 1,215 | | | | 45,101 | |
DXC Technology Co.* | | | 1,149 | | | | 23,842 | |
NetScout Systems, Inc.* | | | 976 | | | | 21,228 | |
Total Technology | | | | | | | 270,325 | |
| | | | | | | | | |
Energy - 3.7% |
Sunrun, Inc.* | | | 2,944 | | | | 53,169 | |
Bristow Group, Inc.* | | | 933 | | | | 32,366 | |
SunCoke Energy, Inc. | | | 3,726 | | | | 32,342 | |
DNOW, Inc.* | | | 2,480 | | | | 32,066 | |
Nabors Industries Ltd.* | | | 357 | | | | 23,016 | |
ProPetro Holding Corp.* | | | 2,825 | | | | 21,640 | |
Talos Energy, Inc.* | | | 1,325 | | | | 13,713 | |
Total Energy | | | | | | | 208,312 | |
| | | | | | | | | |
Basic Materials - 3.0% |
Kaiser Aluminum Corp. | | | 613 | | | | 44,455 | |
Mativ Holdings, Inc. | | | 2,504 | | | | 42,543 | |
Century Aluminum Co.* | | | 2,501 | | | | 40,591 | |
AdvanSix, Inc. | | | 1,283 | | | | 38,978 | |
Total Basic Materials | | | | | | | 166,567 | |
| | | | | | | | | |
Total Common Stocks | | | | |
(Cost $4,415,101) | | | | | | | 5,575,300 | |
| | | | | | | | | |
| | | Face
Amount | | | | | |
REPURCHASE AGREEMENTS††,2 - 1.1% |
J.P. Morgan Securities LLC
issued 09/30/24 at 4.86%
due 10/01/24 | | $ | 32,220 | | | | 32,220 | |
BofA Securities, Inc.
issued 09/30/24 at 4.85%
due 10/01/24 | | | 26,612 | | | | 26,612 | |
Total Repurchase Agreements | | | | |
(Cost $58,832) | | | | | | | 58,832 | |
| | | | | | | | | |
| | | Shares | | | | | |
SECURITIES LENDING COLLATERAL†,3 - 0.8% |
Money Market Fund*** | | | | | | | | |
First American Government Obligations Fund - Class X, 4.82%4 | | | 44,706 | | | | 44,706 | |
Total Securities Lending Collateral | | | | |
(Cost $44,706) | | | | | | | 44,706 | |
| | | | | | | | | |
Total Investments - 101.6% | | | | |
(Cost $4,518,639) | | $ | 5,678,838 | |
Other Assets & Liabilities, net - (1.6)% | | | (88,223 | ) |
Total Net Assets - 100.0% | | $ | 5,590,615 | |
* | Non-income producing security. |
*** | A copy of each underlying unaffiliated fund’s financial statements is available at the SEC’s website at www.sec.gov. |
† | Value determined based on Level 1 inputs — See Note 4. |
†† | Value determined based on Level 2 inputs — See Note 4. |
1 | All or a portion of this security is on loan at September 30, 2024 — See Note 7. |
2 | Repurchase Agreements — See Note 6. |
3 | Securities lending collateral — See Note 7. |
4 | Rate indicated is the 7-day yield as of September 30, 2024. |
| | plc — Public Limited Company |
| | REIT — Real Estate Investment Trust |
| | |
| | See Sector Classification in Other Information section. |
300 | THE RYDEX FUNDS SEMI-ANNUAL FINANCIAL REPORT | SEE NOTES TO FINANCIAL STATEMENTS. |
SCHEDULE OF INVESTMENTS (Unaudited)(concluded) | September 30, 2024 |
S&P SMALLCAP 600® PURE VALUE FUND | |
The following table summarizes the inputs used to value the Fund’s investments at September 30, 2024 (See Note 4 in the Notes to Financial Statements):
Investments in Securities (Assets) | | Level 1
Quoted
Prices | | | Level 2
Significant
Observable
Inputs | | | Level 3
Significant
Unobservable
Inputs | | | Total | |
Common Stocks | | $ | 5,575,300 | | | $ | — | | | $ | — | | | $ | 5,575,300 | |
Repurchase Agreements | | | — | | | | 58,832 | | | | — | | | | 58,832 | |
Securities Lending Collateral | | | 44,706 | | | | — | | | | — | | | | 44,706 | |
Total Assets | | $ | 5,620,006 | | | $ | 58,832 | | | $ | — | | | $ | 5,678,838 | |
SEE NOTES TO FINANCIAL STATEMENTS. | THE RYDEX FUNDS SEMI-ANNUAL FINANCIAL REPORT | 301 |
S&P SMALLCAP 600® PURE VALUE FUND | |
STATEMENT OF ASSETS AND LIABILITIES (Unaudited) |
September 30, 2024 |
Assets: |
Investments, at value - including $41,845 of securities loaned (cost $4,459,807) | | $ | 5,620,006 | |
Repurchase agreements, at value (cost $58,832) | | | 58,832 | |
Receivables: |
Dividends | | | 12,923 | |
Fund shares sold | | | 426 | |
Securities lending income | | | 273 | |
Interest | | | 8 | |
Total assets | | | 5,692,468 | |
| | | | | |
Liabilities: |
Payable for: |
Return of securities lending collateral | | | 44,706 | |
Transfer agent fees | | | 14,326 | |
Management fees | | | 10,909 | |
Printing fees | | | 3,728 | |
Distribution and service fees | | | 3,712 | |
Professional fees | | | 2,791 | |
Portfolio accounting and administration fees | | | 1,492 | |
Fund shares redeemed | | | 1,492 | |
Trustees’ fees* | | | 363 | |
Miscellaneous | | | 18,334 | |
Total liabilities | | | 101,853 | |
Net assets | | $ | 5,590,615 | |
| | | | | |
Net assets consist of: |
Paid in capital | | $ | 28,939,103 | |
Total distributable earnings (loss) | | | (23,348,488 | ) |
Net assets | | $ | 5,590,615 | |
Class A: |
Net assets | | $ | 1,860,855 | |
Capital shares outstanding | | | 9,153 | |
Net asset value per share | | $ | 203.32 | |
Maximum offering price per share (Net asset value divided by 95.25%) | | $ | 213.46 | |
Class C: |
Net assets | | $ | 133,264 | |
Capital shares outstanding | | | 799 | |
Net asset value per share | | $ | 166.77 | |
Class H: |
Net assets | | $ | 3,596,496 | |
Capital shares outstanding | | | 17,740 | |
Net asset value per share | | $ | 202.73 | |
STATEMENT OF OPERATIONS (Unaudited) |
Six Months Ended September 30, 2024 |
Investment Income: |
Dividends | | $ | 224,526 | |
Interest | | | 3,474 | |
Income from securities lending, net | | | 2,076 | |
Total investment income | | | 230,076 | |
| | | | | |
Expenses: |
Management fees | | | 105,814 | |
Distribution and service fees: |
Class A | | | 1,776 | |
Class C | | | 466 | |
Class H | | | 33,379 | |
Transfer agent fees | | | 29,396 | |
Portfolio accounting and administration fees | | | 21,526 | |
Printing fees | | | 4,007 | |
Professional fees | | | 3,808 | |
Registration fees | | | 2,561 | |
Custodian fees | | | 1,782 | |
Trustees’ fees* | | | 648 | |
Line of credit fees | | | 29 | |
Miscellaneous | | | 20,491 | |
Total expenses | | | 225,683 | |
Less: |
Expenses reimbursed by Adviser | | | (7,049 | ) |
Net expenses | | | 218,634 | |
Net investment income | | | 11,442 | |
| | | | | |
Net Realized and Unrealized Gain (Loss): |
Net realized gain (loss) on: |
Investments | | | (3,248,763 | ) |
Net realized loss | | | (3,248,763 | ) |
Net change in unrealized appreciation (depreciation) on: |
Investments | | | 481,081 | |
Net change in unrealized appreciation (depreciation) | | | 481,081 | |
Net realized and unrealized loss | | | (2,767,682 | ) |
Net decrease in net assets resulting from operations | | $ | (2,756,240 | ) |
* | Relates to Trustees not deemed “interested persons” within the meaning of Section 2(a)(19) of the 1940 Act. |
302 | THE RYDEX FUNDS SEMI-ANNUAL FINANCIAL REPORT | SEE NOTES TO FINANCIAL STATEMENTS. |
S&P SMALLCAP 600® PURE VALUE FUND | |
STATEMENTS OF CHANGES IN NET ASSETS |
| | Six Months Ended
September 30, 2024
(Unaudited) | | | Year Ended
March 31,
2024 | |
Increase (Decrease) in Net Assets from Operations: | | | | | | | | |
Net investment income (loss) | | $ | 11,442 | | | $ | (7,601 | ) |
Net realized loss on investments | | | (3,248,763 | ) | | | (855,622 | ) |
Net change in unrealized appreciation (depreciation) on investments | | | 481,081 | | | | (224,538 | ) |
Net decrease in net assets resulting from operations | | | (2,756,240 | ) | | | (1,087,761 | ) |
| | | | | | | | | |
Distributions to shareholders: | | | | | | | | |
Class A | | | — | | | | (12,537 | ) |
Class C | | | — | | | | (1,492 | ) |
Class H | | | — | | | | (31,240 | ) |
Total distributions to shareholders | | | — | | | | (45,269 | ) |
| | | | | | | | | |
Capital share transactions: | | | | | | | | |
Proceeds from sale of shares | | | | | | | | |
Class A | | | 745,602 | | | | 672,041 | |
Class C | | | 310,947 | | | | 338,768 | |
Class H | | | 218,448,873 | | | | 58,856,482 | |
Distributions reinvested | | | | | | | | |
Class A | | | — | | | | 12,106 | |
Class C | | | — | | | | 1,154 | |
Class H | | | — | | | | 30,246 | |
Cost of shares redeemed | | | | | | | | |
Class A | | | (187,789 | ) | | | (797,746 | ) |
Class C | | | (194,616 | ) | | | (398,324 | ) |
Class H | | | (215,123,343 | ) | | | (61,975,679 | ) |
Net increase (decrease) from capital share transactions | | | 3,999,674 | | | | (3,260,952 | ) |
Net increase (decrease) in net assets | | | 1,243,434 | | | | (4,393,982 | ) |
| | | | | | | | | |
Net assets: | | | | | | | | |
Beginning of period | | | 4,347,181 | | | | 8,741,163 | |
End of period | | $ | 5,590,615 | | | $ | 4,347,181 | |
| | | | | | | | | |
Capital share activity: | | | | | | | | |
Shares sold | | | | | | | | |
Class A | | | 3,703 | | | | 3,434 | |
Class C | | | 1,887 | | | | 2,086 | |
Class H | | | 1,105,204 | | | | 332,288 | |
Shares issued from reinvestment of distributions | | | | | | | | |
Class A | | | — | | | | 66 | |
Class C | | | — | | | | 8 | |
Class H | | | — | | | | 165 | |
Shares redeemed | | | | | | | | |
Class A | | | (958 | ) | | | (4,191 | ) |
Class C | | | (1,248 | ) | | | (2,494 | ) |
Class H | | | (1,102,644 | ) | | | (361,004 | ) |
Net increase (decrease) in shares | | | 5,944 | | | | (29,642 | ) |
SEE NOTES TO FINANCIAL STATEMENTS. | THE RYDEX FUNDS SEMI-ANNUAL FINANCIAL REPORT | 303 |
S&P SMALLCAP 600® PURE VALUE FUND | |
This table is presented to show selected data for a share outstanding throughout each period and to assist shareholders in evaluating a Fund’s performance for the periods presented.
Class A | | Six Months Ended
September 30, 2024a | | | Year Ended
March 31,
2024 | | | Year Ended
March 31,
2023 | | | Year Ended
March 31,
2022 | | | Year Ended
March 31,
2021 | | | Year Ended
March 31,
2020f | |
Per Share Data |
Net asset value, beginning of period | | $ | 200.53 | | | $ | 170.77 | | | $ | 182.48 | | | $ | 167.98 | | | $ | 67.45 | | | $ | 129.32 | |
Income (loss) from investment operations: |
Net investment income (loss)b | | | .26 | | | | (.23 | ) | | | .25 | | | | (.34 | ) | | | (.14 | ) | | | (.50 | ) |
Net gain (loss) on investments (realized and unrealized) | | | 2.53 | e | | | 31.89 | e | | | (11.96 | ) | | | 14.84 | e | | | 100.67 | e | | | (61.37 | ) |
Total from investment operations | | | 2.79 | | | | 31.66 | | | | (11.71 | ) | | | 14.50 | | | | 100.53 | | | | (61.87 | ) |
Less distributions from: |
Net investment income | | | — | | | | (1.90 | ) | | | — | | | | — | | | | — | | | | — | |
Total distributions | | | — | | | | (1.90 | ) | | | — | | | | — | | | | — | | | | — | |
Net asset value, end of period | | $ | 203.32 | | | $ | 200.53 | | | $ | 170.77 | | | $ | 182.48 | | | $ | 167.98 | | | $ | 67.45 | |
|
Total Returnc | | | 1.39 | % | | | 18.65 | % | | | (6.42 | %) | | | 8.63 | % | | | 149.04 | % | | | (47.83 | %) |
Ratios/Supplemental Data |
Net assets, end of period (in thousands) | | $ | 1,861 | | | $ | 1,285 | | | $ | 1,212 | | | $ | 4,732 | | | $ | 3,242 | | | $ | 936 | |
Ratios to average net assets: |
Net investment income (loss) | | | 0.27 | % | | | (0.13 | %) | | | 0.15 | % | | | (0.19 | %) | | | (0.31 | %) | | | (0.42 | %) |
Total expenses | | | 1.58 | % | | | 1.59 | % | | | 1.55 | % | | | 1.51 | % | | | 1.59 | % | | | 1.63 | % |
Net expensesd | | | 1.53 | % | | | 1.56 | % | | | 1.55 | % | | | 1.51 | % | | | 1.59 | % | | | 1.63 | % |
Portfolio turnover rate | | | 901 | % | | | 1,058 | % | | | 1,520 | % | | | 892 | % | | | 1,503 | % | | | 1,104 | % |
Class C | | Six Months Ended
September 30, 2024a | | | Year Ended
March 31,
2024 | | | Year Ended
March 31,
2023 | | | Year Ended
March 31,
2022 | | | Year Ended
March 31,
2021 | | | Year Ended
March 31,
2020f | |
Per Share Data |
Net asset value, beginning of period | | $ | 165.10 | | | $ | 141.95 | | | $ | 152.84 | | | $ | 141.75 | | | $ | 57.31 | | | $ | 110.69 | |
Income (loss) from investment operations: |
Net investment income (loss)b | | | (.34 | ) | | | (1.46 | ) | | | (.85 | ) | | | (1.65 | ) | | | (.40 | ) | | | (1.25 | ) |
Net gain (loss) on investments (realized and unrealized) | | | 2.01 | e | | | 26.51 | e | | | (10.04 | ) | | | 12.74 | e | | | 84.84 | e | | | (52.13 | ) |
Total from investment operations | | | 1.67 | | | | 25.05 | | | | (10.89 | ) | | | 11.09 | | | | 84.44 | | | | (53.38 | ) |
Less distributions from: |
Net investment income | | | — | | | | (1.90 | ) | | | — | | | | — | | | | — | | | | — | |
Total distributions | | | — | | | | (1.90 | ) | | | — | | | | — | | | | — | | | | — | |
Net asset value, end of period | | $ | 166.77 | | | $ | 165.10 | | | $ | 141.95 | | | $ | 152.84 | | | $ | 141.75 | | | $ | 57.31 | |
|
Total Returnc | | | 1.01 | % | | | 17.76 | % | | | (7.13 | %) | | | 7.82 | % | | | 147.34 | % | | | (48.24 | %) |
Ratios/Supplemental Data |
Net assets, end of period (in thousands) | | $ | 133 | | | $ | 26 | | | $ | 80 | | | $ | 140 | | | $ | 1,472 | | | $ | 571 | |
Ratios to average net assets: |
Net investment income (loss) | | | (0.43 | %) | | | (0.98 | %) | | | (0.60 | %) | | | (1.11 | %) | | | (1.07 | %) | | | (1.20 | %) |
Total expenses | | | 2.34 | % | | | 2.35 | % | | | 2.29 | % | | | 2.26 | % | | | 2.34 | % | | | 2.38 | % |
Net expensesd | | | 2.29 | % | | | 2.32 | % | | | 2.29 | % | | | 2.26 | % | | | 2.34 | % | | | 2.38 | % |
Portfolio turnover rate | | | 901 | % | | | 1,058 | % | | | 1,520 | % | | | 892 | % | | | 1,503 | % | | | 1,104 | % |
304 | THE RYDEX FUNDS SEMI-ANNUAL FINANCIAL REPORT | SEE NOTES TO FINANCIAL STATEMENTS. |
S&P SMALLCAP 600® PURE VALUE FUND | |
FINANCIAL HIGHLIGHTS (concluded) |
This table is presented to show selected data for a share outstanding throughout each period and to assist shareholders in evaluating a Fund’s performance for the periods presented.
Class H | | Six Months Ended
September 30, 2024a | | | Year Ended
March 31,
2024 | | | Year Ended
March 31,
2023 | | | Year Ended
March 31,
2022 | | | Year Ended
March 31,
2021 | | | Year Ended
March 31,
2020f | |
Per Share Data |
Net asset value, beginning of period | | $ | 199.98 | | | $ | 170.34 | | | $ | 182.04 | | | $ | 167.56 | | | $ | 67.25 | | | $ | 129.01 | |
Income (loss) from investment operations: |
Net investment income (loss)b | | | .07 | | | | (.16 | ) | | | .49 | | | | (.53 | ) | | | (.13 | ) | | | (.55 | ) |
Net gain (loss) on investments (realized and unrealized) | | | 2.68 | e | | | 31.71 | e | | | (12.19 | ) | | | 15.01 | e | | | 100.44 | e | | | (61.21 | ) |
Total from investment operations | | | 2.75 | | | | 31.55 | | | | (11.70 | ) | | | 14.48 | | | | 100.31 | | | | (61.76 | ) |
Less distributions from: |
Net investment income | | | — | | | | (1.91 | ) | | | — | | | | — | | | | — | | | | — | |
Total distributions | | | — | | | | (1.91 | ) | | | — | | | | — | | | | — | | | | — | |
Net asset value, end of period | | $ | 202.73 | | | $ | 199.98 | | | $ | 170.34 | | | $ | 182.04 | | | $ | 167.56 | | | $ | 67.25 | |
|
Total Return | | | 1.38 | % | | | 18.63 | % | | | (6.43 | %) | | | 8.64 | % | | | 149.16 | % | | | (47.87 | %) |
Ratios/Supplemental Data |
Net assets, end of period (in thousands) | | $ | 3,596 | | | $ | 3,036 | | | $ | 7,449 | | | $ | 18,001 | | | $ | 35,499 | | | $ | 1,507 | |
Ratios to average net assets: |
Net investment income (loss) | | | 0.07 | % | | | (0.09 | %) | | | 0.29 | % | | | (0.29 | %) | | | (0.18 | %) | | | (0.44 | %) |
Total expenses | | | 1.60 | % | | | 1.59 | % | | | 1.55 | % | | | 1.51 | % | | | 1.55 | % | | | 1.64 | % |
Net expensesd | | | 1.55 | % | | | 1.56 | % | | | 1.55 | % | | | 1.51 | % | | | 1.55 | % | | | 1.64 | % |
Portfolio turnover rate | | | 901 | % | | | 1,058 | % | | | 1,520 | % | | | 892 | % | | | 1,503 | % | | | 1,104 | % |
a | Unaudited figures for the period ended September 30, 2024. Percentage amounts for the period, except total return and portfolio turnover rate, have been annualized. |
b | Net investment income (loss) per share was computed using average shares outstanding throughout the period. |
c | Total return does not reflect the impact of any applicable sales charges. |
d | Net expense information reflects the expense ratios after expense waivers and reimbursements, as applicable. |
e | The amount shown for a share outstanding throughout the year does not agree with the aggregate net loss on investments for the year because of the sales and purchases of fund shares in relation to fluctuating market value of the investments of the Fund. |
f | Reverse share split — Per share amounts for the year presented through March 31, 2020 have been restated to reflect a 1:5 reverse share split effective August 17, 2020. |
SEE NOTES TO FINANCIAL STATEMENTS. | THE RYDEX FUNDS SEMI-ANNUAL FINANCIAL REPORT | 305 |
SCHEDULE OF INVESTMENTS (Unaudited) | September 30, 2024 |
EMERGING MARKETS BOND STRATEGY FUND | |
| | Face
Amount | | | Value | |
U.S. TREASURY BILLS†† - 0.7% |
U.S. Treasury Bills |
4.63% due 10/10/241,2 | | $ | 5,000 | | | $ | 4,994 | |
Total U.S. Treasury Bills | | | | |
(Cost $4,994) | | | | | | | 4,994 | |
| | | | | | | | | |
REPURCHASE AGREEMENTS††,3 - 93.4% |
J.P. Morgan Securities LLC
issued 09/30/24 at 4.86%
due 10/01/244 | | | 356,130 | | | | 356,130 | |
BofA Securities, Inc.
issued 09/30/24 at 4.85%
due 10/01/244 | | | 294,147 | | | | 294,147 | |
Total Repurchase Agreements | | | | |
(Cost $650,277) | | | | | | | 650,277 | |
| | | | | | | | | |
Total Investments - 94.1% | | | | |
(Cost $655,271) | | $ | 655,271 | |
Other Assets & Liabilities, net - 5.9% | | | 40,859 | |
Total Net Assets - 100.0% | | $ | 696,130 | |
Futures Contracts |
Description | | Number of
Contracts | | | Expiration
Date | | | Notional
Amount | | | Value and
Unrealized
Appreciation** | |
Interest Rate Futures Contracts Purchased† |
U.S. Treasury 5 Year Note Futures Contracts | | | 4 | | | | Dec 2024 | | | $ | 439,813 | | | $ | 931 | |
Centrally Cleared Credit Default Swap Agreements Protection Sold†† |
Counterparty | Exchange | Index | | Protection
Premium
Rate | | | Payment
Frequency | | | Maturity
Date | | | Notional
Amount | | | Value | | | Upfront
Premiums
Received | | | Unrealized
Appreciation** | |
Barclays Bank plc | ICE | CDX.EM.42.V1 | | | 1.00% | | | | Quarterly | | 12/20/29 | | $ | 470,000 | | | $ | (13,513 | ) | | $ | (13,924 | ) | | $ | 411 | |
Total Return Swap Agreements |
Counterparty | Index | Type | Financing
Rate | | Payment
Frequency | | | Maturity
Date | | | Units | | | Notional
Amount | | | Value and
Unrealized
Appreciation | |
OTC Credit Index Swap Agreements†† |
Goldman Sachs International | Invesco Emerging Markets Sovereign Debt ETF | Pay | 5.43% (Federal Funds Rate + 0.60%) | | | At Maturity | | | | 10/29/24 | | | | 12,179 | | | $ | 261,849 | | | $ | 974 | |
** | Includes cumulative appreciation (depreciation). Variation margin is reported within the Statement of Assets and Liabilities. |
† | Value determined based on Level 1 inputs — See Note 4. |
†† | Value determined based on Level 2 inputs — See Note 4. |
1 | All or a portion of this security is pledged as futures collateral at September 30, 2024. |
2 | Rate indicated is the effective yield at the time of purchase. |
3 | Repurchase Agreements — See Note 6. |
4 | All or a portion of this security is pledged as equity index swap collateral at September 30, 2024. |
| | CDX.EM.42.V1 — Credit Default Swap Emerging Markets Series 42 Index Version 1 |
| | ICE — Intercontinental Exchange |
| | plc — Public Limited Company |
| | |
| | See Sector Classification in Other Information section. |
306 | THE RYDEX FUNDS SEMI-ANNUAL FINANCIAL REPORT | SEE NOTES TO FINANCIAL STATEMENTS. |
SCHEDULE OF INVESTMENTS (Unaudited)(concluded) | September 30, 2024 |
EMERGING MARKETS BOND STRATEGY FUND | |
The following table summarizes the inputs used to value the Fund’s investments at September 30, 2024 (See Note 4 in the Notes to Financial Statements):
Investments in Securities (Assets) | | Level 1
Quoted
Prices | | | Level 2
Significant
Observable
Inputs | | | Level 3
Significant
Unobservable
Inputs | | | Total | |
U.S. Treasury Bills | | $ | — | | | $ | 4,994 | | | $ | — | | | $ | 4,994 | |
Repurchase Agreements | | | — | | | | 650,277 | | | | — | | | | 650,277 | |
Interest Rate Futures Contracts** | | | 931 | | | | — | | | | — | | | | 931 | |
Credit Default Swap Agreements** | | | — | | | | 411 | | | | — | | | | 411 | |
Credit Index Swap Agreements** | | | — | | | | 974 | | | | — | | | | 974 | |
Total Assets | | $ | 931 | | | $ | 656,656 | | | $ | — | | | $ | 657,587 | |
** | This derivative is reported as unrealized appreciation/depreciation at period end. |
SEE NOTES TO FINANCIAL STATEMENTS. | THE RYDEX FUNDS SEMI-ANNUAL FINANCIAL REPORT | 307 |
EMERGING MARKETS BOND STRATEGY FUND | |
STATEMENT OF ASSETS AND LIABILITIES (Unaudited) |
September 30, 2024 |
Assets: |
Investments, at value (cost $4,994) | | $ | 4,994 | |
Repurchase agreements, at value (cost $650,277) | | | 650,277 | |
Segregated cash with broker | | | 70,684 | |
Unrealized appreciation on OTC swap agreements | | | 974 | |
Receivables: |
Investment Adviser | | | 186 | |
Variation margin on credit default swap agreements | | | 173 | |
Protection fees on credit default swap agreements | | | 144 | |
Interest | | | 88 | |
Total assets | | | 727,520 | |
| | | | | |
Liabilities: |
Unamortized upfront premiums received on credit default swap agreements | | | 13,924 | |
Payable for: |
Fund shares redeemed | | | 14,610 | |
Variation margin on futures contracts | | | 1,187 | |
Management fees | | | 428 | |
Swap settlement | | | 300 | |
Transfer agent fees | | | 286 | |
Distribution and service fees | | | 157 | |
Portfolio accounting and administration fees | | | 89 | |
Trustees’ fees* | | | 5 | |
Miscellaneous | | | 404 | |
Total liabilities | | | 31,390 | |
Net assets | | $ | 696,130 | |
| | | | | |
Net assets consist of: |
Paid in capital | | $ | 1,232,672 | |
Total distributable earnings (loss) | | | (536,542 | ) |
Net assets | | $ | 696,130 | |
Class A: |
Net assets | | $ | 42,389 | |
Capital shares outstanding | | | 693 | |
Net asset value per share | | $ | 61.17 | |
Maximum offering price per share (Net asset value divided by 95.25%) | | $ | 64.22 | |
Class C: |
Net assets | | $ | 24,776 | |
Capital shares outstanding | | | 453 | |
Net asset value per share | | $ | 54.69 | |
Class H: |
Net assets | | $ | 628,965 | |
Capital shares outstanding | | | 10,343 | |
Net asset value per share | | $ | 60.81 | |
STATEMENT OF OPERATIONS (Unaudited) |
Six Months Ended September 30, 2024 |
Investment Income: |
Interest | | $ | 14,869 | |
Total investment income | | | 14,869 | |
| | | | | |
Expenses: |
Management fees | | | 2,297 | |
Distribution and service fees: |
Class A | | | 49 | |
Class C | | | 60 | |
Class H | | | 704 | |
Transfer agent fees | | | 658 | |
Portfolio accounting and administration fees | | | 630 | |
Registration fees | | | 275 | |
Professional fees | | | 140 | |
Custodian fees | | | 39 | |
Trustees’ fees* | | | 35 | |
Miscellaneous | | | 159 | |
Total expenses | | | 5,046 | |
Less: |
Expenses reimbursed by Adviser | | | (152 | ) |
Net expenses | | | 4,894 | |
Net investment income | | | 9,975 | |
| | | | | |
Net Realized and Unrealized Gain (Loss): |
Net realized gain (loss) on: |
Swap agreements | | | 20,294 | |
Futures contracts | | | 6,736 | |
Net realized gain | | | 27,030 | |
Net change in unrealized appreciation (depreciation) on: |
Swap agreements | | | 136 | |
Futures contracts | | | 1,274 | |
Net change in unrealized appreciation (depreciation) | | | 1,410 | |
Net realized and unrealized gain | | | 28,440 | |
Net increase in net assets resulting from operations | | $ | 38,415 | |
* | Relates to Trustees not deemed “interested persons” within the meaning of Section 2(a)(19) of the 1940 Act. |
308 | THE RYDEX FUNDS SEMI-ANNUAL FINANCIAL REPORT | SEE NOTES TO FINANCIAL STATEMENTS. |
EMERGING MARKETS BOND STRATEGY FUND | |
STATEMENTS OF CHANGES IN NET ASSETS |
| | Six Months Ended
September 30, 2024
(Unaudited) | | | Year Ended
March 31,
2024 | |
Increase (Decrease) in Net Assets from Operations: | | | | | | | | |
Net investment income | | $ | 9,975 | | | $ | 40,177 | |
Net realized gain (loss) on investments | | | 27,030 | | | | (104,857 | ) |
Net change in unrealized appreciation (depreciation) on investments | | | 1,410 | | | | (20,813 | ) |
Net increase (decrease) in net assets resulting from operations | | | 38,415 | | | | (85,493 | ) |
| | | | | | | | | |
Distributions to shareholders: | | | | | | | | |
Class A | | | — | | | | (12,775 | ) |
Class C | | | — | | | | (2,324 | ) |
Class H | | | — | | | | (71,481 | ) |
Total distributions to shareholders | | | — | | | | (86,580 | ) |
| | | | | | | | | |
Capital share transactions: | | | | | | | | |
Proceeds from sale of shares | | | | | | | | |
Class A | | | 11,567 | | | | 91,950 | |
Class C | | | 25,890 | | | | — | |
Class H | | | 1,704,385 | | | | 16,585,002 | |
Distributions reinvested | | | | | | | | |
Class A | | | — | | | | 12,775 | |
Class C | | | — | | | | 1,442 | |
Class H | | | — | | | | 68,368 | |
Cost of shares redeemed | | | | | | | | |
Class A | | | (41,233 | ) | | | (291,950 | ) |
Class C | | | (11,237 | ) | | | (13,350 | ) |
Class H | | | (1,629,808 | ) | | | (16,360,599 | ) |
Net increase from capital share transactions | | | 59,564 | | | | 93,638 | |
Net increase (decrease) in net assets | | | 97,979 | | | | (78,435 | ) |
| | | | | | | | | |
Net assets: | | | | | | | | |
Beginning of period | | | 598,151 | | | | 676,586 | |
End of period | | $ | 696,130 | | | $ | 598,151 | |
| | | | | | | | | |
Capital share activity: | | | | | | | | |
Shares sold | | | | | | | | |
Class A | | | 191 | | | | 1,555 | |
Class C | | | 476 | | | | — | |
Class H | | | 29,323 | | | | 285,343 | |
Shares issued from reinvestment of distributions | | | | | | | | |
Class A | | | — | | | | 229 | |
Class C | | | — | | | | 29 | |
Class H | | | — | | | | 1,232 | |
Shares redeemed | | | | | | | | |
Class A | | | (731 | ) | | | (5,085 | ) |
Class C | | | (206 | ) | | | (261 | ) |
Class H | | | (28,003 | ) | | | (284,219 | ) |
Net increase (decrease) in shares | | | 1,050 | | | | (1,177 | ) |
SEE NOTES TO FINANCIAL STATEMENTS. | THE RYDEX FUNDS SEMI-ANNUAL FINANCIAL REPORT | 309 |
EMERGING MARKETS BOND STRATEGY FUND | |
This table is presented to show selected data for a share outstanding throughout each period and to assist shareholders in evaluating a Fund’s performance for the periods presented.
Class A | | Six Months Ended
September 30, 2024a | | | Year Ended
March 31,
2024 | | | Year Ended
March 31,
2023 | | | Year Ended
March 31,
2022 | | | Year Ended
March 31,
2021 | | | Year Ended
March 31,
2020 | |
Per Share Data |
Net asset value, beginning of period | | $ | 57.69 | | | $ | 58.60 | | | $ | 62.44 | | | $ | 70.11 | | | $ | 63.93 | | | $ | 74.95 | |
Income (loss) from investment operations: |
Net investment income (loss)b | | | .95 | | | | 1.79 | | | | .60 | | | | (1.07 | ) | | | (1.14 | ) | | | .03 | |
Net gain (loss) on investments (realized and unrealized) | | | 2.53 | | | | 3.08 | | | | (4.44 | ) | | | (6.60 | ) | | | 8.16 | | | | (4.86 | ) |
Total from investment operations | | | 3.48 | | | | 4.87 | | | | (3.84 | ) | | | (7.67 | ) | | | 7.02 | | | | (4.83 | ) |
Less distributions from: |
Net investment income | | | — | | | | (5.78 | ) | | | — | | | | — | | | | (.84 | ) | | | (2.36 | ) |
Net realized gains | | | — | | | | — | | | | — | | | | — | | | | — | | | | (3.83 | ) |
Total distributions | | | — | | | | (5.78 | ) | | | — | | | | — | | | | (.84 | ) | | | (6.19 | ) |
Net asset value, end of period | | $ | 61.17 | | | $ | 57.69 | | | $ | 58.60 | | | $ | 62.44 | | | $ | 70.11 | | | $ | 63.93 | |
|
Total Returnc | | | 6.03 | % | | | 8.63 | % | | | (6.15 | %) | | | (10.98 | %) | | | 10.92 | % | | | (7.41 | %) |
Ratios/Supplemental Data |
Net assets, end of period (in thousands) | | $ | 42 | | | $ | 71 | | | $ | 266 | | | $ | 46 | | | $ | 48 | | | $ | 1,105 | |
Ratios to average net assets: |
Net investment income (loss) | | | 3.24 | % | | | 3.07 | % | | | 1.06 | % | | | (1.54 | %) | | | (1.72 | %) | | | 0.03 | % |
Total expenses | | | 1.63 | % | | | 1.64 | % | | | 1.61 | % | | | 1.57 | % | | | 1.74 | % | | | 1.68 | % |
Net expensesd | | | 1.57 | % | | | 1.62 | % | | | 1.61 | % | | | 1.57 | % | | | 1.74 | % | | | 1.68 | % |
Portfolio turnover rate | | | — | | | | — | | | | — | | | | — | | | | — | | | | — | |
Class C | | Six Months Ended
September 30, 2024a | | | Year Ended
March 31,
2024 | | | Year Ended
March 31,
2023 | | | Year Ended
March 31,
2022 | | | Year Ended
March 31,
2021 | | | Year Ended
March 31,
2020 | |
Per Share Data |
Net asset value, beginning of period | | $ | 51.80 | | | $ | 53.59 | | | $ | 57.52 | | | $ | 65.07 | | | $ | 59.82 | | | $ | 71.05 | |
Income (loss) from investment operations: |
Net investment income (loss)b | | | .64 | | | | 1.35 | | | | (.04 | ) | | | (1.47 | ) | | | (1.56 | ) | | | (.46 | ) |
Net gain (loss) on investments (realized and unrealized) | | | 2.25 | | | | 2.64 | | | | (3.89 | ) | | | (6.08 | ) | | | 7.65 | | | | (4.58 | ) |
Total from investment operations | | | 2.89 | | | | 3.99 | | | | (3.93 | ) | | | (7.55 | ) | | | 6.09 | | | | (5.04 | ) |
Less distributions from: |
Net investment income | | | — | | | | (5.78 | ) | | | — | | | | — | | | | (.84 | ) | | | (2.36 | ) |
Net realized gains | | | — | | | | — | | | | — | | | | — | | | | — | | | | (3.83 | ) |
Total distributions | | | — | | | | (5.78 | ) | | | — | | | | — | | | | (.84 | ) | | | (6.19 | ) |
Net asset value, end of period | | $ | 54.69 | | | $ | 51.80 | | | $ | 53.59 | | | $ | 57.52 | | | $ | 65.07 | | | $ | 59.82 | |
|
Total Returnc | | | 5.58 | % | | | 7.81 | % | | | (6.83 | %) | | | (11.62 | %) | | | 10.10 | % | | | (8.13 | %) |
Ratios/Supplemental Data |
Net assets, end of period (in thousands) | | $ | 25 | | | $ | 9 | | | $ | 22 | | | $ | 63 | | | $ | 52 | | | $ | 62 | |
Ratios to average net assets: |
Net investment income (loss) | | | 2.42 | % | | | 2.53 | % | | | (0.07 | %) | | | (2.28 | %) | | | (2.36 | %) | | | (0.61 | %) |
Total expenses | | | 2.39 | % | | | 2.37 | % | | | 2.35 | % | | | 2.31 | % | | | 2.40 | % | | | 2.42 | % |
Net expensesd | | | 2.36 | % | | | 2.34 | % | | | 2.35 | % | | | 2.31 | % | | | 2.40 | % | | | 2.42 | % |
Portfolio turnover rate | | | — | | | | — | | | | — | | | | — | | | | — | | | | — | |
310 | THE RYDEX FUNDS SEMI-ANNUAL FINANCIAL REPORT | SEE NOTES TO FINANCIAL STATEMENTS. |
EMERGING MARKETS BOND STRATEGY FUND | |
FINANCIAL HIGHLIGHTS (concluded) |
This table is presented to show selected data for a share outstanding throughout each period and to assist shareholders in evaluating a Fund’s performance for the periods presented.
Class H | | Six Months Ended
September 30, 2024a | | | Year Ended
March 31,
2024 | | | Year Ended
March 31,
2023 | | | Year Ended
March 31,
2022 | | | Year Ended
March 31,
2021 | | | Year Ended
March 31,
2020 | |
Per Share Data |
Net asset value, beginning of period | | $ | 57.36 | | | $ | 58.30 | | | $ | 62.03 | | | $ | 69.64 | | | $ | 63.50 | | | $ | 74.52 | |
Income (loss) from investment operations: |
Net investment income (loss)b | | | .94 | | | | 1.65 | | | | .40 | | | | (1.07 | ) | | | (1.14 | ) | | | .15 | |
Net gain (loss) on investments (realized and unrealized) | | | 2.51 | | | | 3.19 | | | | (4.13 | ) | | | (6.54 | ) | | | 8.12 | | | | (4.98 | ) |
Total from investment operations | | | 3.45 | | | | 4.84 | | | | (3.73 | ) | | | (7.61 | ) | | | 6.98 | | | | (4.83 | ) |
Less distributions from: |
Net investment income | | | — | | | | (5.78 | ) | | | — | | | | — | | | | (.84 | ) | | | (2.36 | ) |
Net realized gains | | | — | | | | — | | | | — | | | | — | | | | — | | | | (3.83 | ) |
Total distributions | | | — | | | | (5.78 | ) | | | — | | | | — | | | | (.84 | ) | | | (6.19 | ) |
Net asset value, end of period | | $ | 60.81 | | | $ | 57.36 | | | $ | 58.30 | | | $ | 62.03 | | | $ | 69.64 | | | $ | 63.50 | |
|
Total Return | | | 6.01 | % | | | 8.62 | % | | | (6.01 | %) | | | (10.93 | %) | | | 10.93 | % | | | (7.45 | %) |
Ratios/Supplemental Data |
Net assets, end of period (in thousands) | | $ | 629 | | | $ | 518 | | | $ | 389 | | | $ | 494 | | | $ | 343 | | | $ | 307 | |
Ratios to average net assets: |
Net investment income (loss) | | | 3.28 | % | | | 2.85 | % | | | 0.70 | % | | | (1.52 | %) | | | (1.61 | %) | | | 0.20 | % |
Total expenses | | | 1.63 | % | | | 1.64 | % | | | 1.61 | % | | | 1.56 | % | | | 1.65 | % | | | 1.67 | % |
Net expensesd | | | 1.58 | % | | | 1.62 | % | | | 1.61 | % | | | 1.56 | % | | | 1.65 | % | | | 1.67 | % |
Portfolio turnover rate | | | — | | | | — | | | | — | | | | — | | | | — | | | | — | |
a | Unaudited figures for the period ended September 30, 2024. Percentage amounts for the period, except total return and portfolio turnover rate, have been annualized. |
b | Net investment income (loss) per share was computed using average shares outstanding throughout the period. |
c | Total return does not reflect the impact of any applicable sales charges. |
d | Net expense information reflects the expense ratios after expense waivers and reimbursements, as applicable. |
SEE NOTES TO FINANCIAL STATEMENTS. | THE RYDEX FUNDS SEMI-ANNUAL FINANCIAL REPORT | 311 |
SCHEDULE OF INVESTMENTS (Unaudited) | September 30, 2024 |
GOVERNMENT LONG BOND 1.2x STRATEGY FUND | |
| | Shares | | | Value | |
MUTUAL FUNDS† - 5.9% |
Guggenheim Ultra Short Duration Fund — Institutional Class1 | | | 81,225 | | | $ | 813,870 | |
Guggenheim Strategy Fund II1 | | | 32,350 | | | | 802,284 | |
Total Mutual Funds | | | | |
(Cost $1,607,879) | | | | | | | 1,616,154 | |
| | | | | | | | | |
| | | Face
Amount | | | | | |
U.S. GOVERNMENT SECURITIES†† - 86.0% |
U.S. Treasury Bond |
4.25% due 08/15/54 | | $ | 23,200,000 | | | | 23,693,000 | |
Total U.S. Government Securities | | | | |
(Cost $23,728,074) | | | | | | | 23,693,000 | |
| | | | | | | | | |
U.S. TREASURY BILLS†† |
U.S. Treasury Bills |
4.63% due 10/10/242,3 | | | 392,000 | | | | 391,545 | |
Total U.S. Treasury Bills | | | | |
(Cost $391,498) | | | | | | | 391,545 | |
REPURCHASE AGREEMENTS††,4 - 14.6% |
J.P. Morgan Securities LLC
issued 09/30/24 at 4.86%
due 10/01/24 | | | 2,198,696 | | | | 2,198,696 | |
BofA Securities, Inc.
issued 09/30/24 at 4.85%
due 10/01/24 | | | 1,816,020 | | | | 1,816,020 | |
Total Repurchase Agreements | | | | |
(Cost $4,014,716) | | | | | | | 4,014,716 | |
| | | | | | | | | |
Total Investments - 107.9% | | | | |
(Cost $29,742,167) | | $ | 29,715,415 | |
Other Assets & Liabilities, net - (7.9)% | | | (2,168,077 | ) |
Total Net Assets - 100.0% | | $ | 27,547,338 | |
Futures Contracts |
Description | | Number of
Contracts | | | Expiration
Date | | | Notional
Amount | | | Value and
Unrealized
Depreciation** | |
Interest Rate Futures Contracts Purchased† |
U.S. Treasury Ultra Long Bond Futures Contracts | | | 72 | | | | Dec 2024 | | | $ | 9,596,250 | | | $ | (39,527 | ) |
** | Includes cumulative appreciation (depreciation). Variation margin is reported within the Statement of Assets and Liabilities. |
† | Value determined based on Level 1 inputs — See Note 4. |
†† | Value determined based on Level 2 inputs — See Note 4. |
1 | Affiliated issuer. |
2 | All or a portion of this security is pledged as futures collateral at September 30, 2024. |
3 | Rate indicated is the effective yield at the time of purchase. |
4 | Repurchase Agreements — See Note 6. |
| | |
| | See Sector Classification in Other Information section. |
312 | THE RYDEX FUNDS SEMI-ANNUAL FINANCIAL REPORT | SEE NOTES TO FINANCIAL STATEMENTS. |
SCHEDULE OF INVESTMENTS (Unaudited)(concluded) | September 30, 2024 |
GOVERNMENT LONG BOND 1.2x STRATEGY FUND | |
The following table summarizes the inputs used to value the Fund’s investments at September 30, 2024 (See Note 4 in the Notes to Financial Statements):
Investments in Securities (Assets) | | Level 1
Quoted
Prices | | | Level 2
Significant
Observable
Inputs | | | Level 3
Significant
Unobservable
Inputs | | | Total | |
Mutual Funds | | $ | 1,616,154 | | | $ | — | | | $ | — | | | $ | 1,616,154 | |
U.S. Government Securities | | | — | | | | 23,693,000 | | | | — | | | | 23,693,000 | |
U.S. Treasury Bills | | | — | | | | 391,545 | | | | — | | | | 391,545 | |
Repurchase Agreements | | | — | | | | 4,014,716 | | | | — | | | | 4,014,716 | |
Total Assets | | $ | 1,616,154 | | | $ | 28,099,261 | | | $ | — | | | $ | 29,715,415 | |
Investments in Securities (Liabilities) | | Level 1
Quoted
Prices | | | Level 2
Significant
Observable
Inputs | | | Level 3
Significant
Unobservable
Inputs | | | Total | |
Interest Rate Futures Contracts** | | $ | 39,527 | | | $ | — | | | $ | — | | | $ | 39,527 | |
** | This derivative is reported as unrealized appreciation/depreciation at period end. |
Affiliated Transactions
Investments representing 5% or more of the outstanding voting shares of a company, or control of or by, or common control under Guggenheim Investments (“GI”), result in that company being considered an affiliated issuer, as defined in the 1940 Act.
The Fund may invest in certain of the underlying series of Guggenheim Strategy Funds Trust, including Guggenheim Strategy Fund II and Guggenheim Strategy Fund III (collectively, the “Guggenheim Strategy Funds”), each of which are open-end management investment companies managed by GI. The Guggenheim Strategy Funds, which launched on March 11, 2014, are offered as short term investment options only to mutual funds, trusts, and other accounts managed by GI and/or its affiliates, and are not available to the public. The Guggenheim Strategy Funds pay no investment management fees. The Guggenheim Strategy Funds’ annual report on Form N-CSR dated September 30, 2023 is available publicly or upon request. This information is available from the EDGAR database on the SEC’s website at https://www.sec.gov/Archives/edgar/data/1601445/000182126823000217/gug86449-ncsr.htm. The Fund may invest in certain of the underlying series of Guggenheim Funds Trust, which are open-end management investment companies managed by GI, are available to the public and whose most recent annual report on Form N-CSR is available publicly or upon request.
Transactions during the period ended September 30, 2024, in which the company is an affiliated issuer, were as follows:
Security Name | | Value
03/31/24 | | | Additions | | | Reductions | | | Realized
Gain (Loss) | | | Change in
Unrealized
Appreciation
(Depreciation) | | | Value
09/30/24 | | | Shares
09/30/24 | | | Investment
Income | |
Mutual Funds | | | | | | | | | | | | | | | | | | | | | | | | | | | | | | | | |
Guggenheim Strategy Fund II | | $ | 1,597,404 | | | $ | — | | | $ | (800,000 | ) | | $ | (6,340 | ) | | $ | 11,220 | | | $ | 802,284 | | | | 32,350 | | | $ | 24,679 | |
Guggenheim Ultra Short Duration Fund — Institutional Class | | | 1,806,249 | | | | — | | | | (1,000,000 | ) | | | (6,366 | ) | | | 13,987 | | | | 813,870 | | | | 81,225 | | | | 23,017 | |
| | | $ | 3,403,653 | | | $ | — | | | $ | (1,800,000 | ) | | $ | (12,706 | ) | | $ | 25,207 | | | $ | 1,616,154 | | | | | | | $ | 47,696 | |
SEE NOTES TO FINANCIAL STATEMENTS. | THE RYDEX FUNDS SEMI-ANNUAL FINANCIAL REPORT | 313 |
GOVERNMENT LONG BOND 1.2x STRATEGY FUND | |
STATEMENT OF ASSETS AND LIABILITIES (Unaudited) |
September 30, 2024 |
Assets: |
Investments in unaffiliated issuers, at value (cost $24,119,572) | | $ | 24,084,545 | |
Investments in affiliated issuers, at value (cost $1,607,879) | | | 1,616,154 | |
Repurchase agreements, at value (cost $4,014,716) | | | 4,014,716 | |
Segregated cash with broker | | | 149,463 | |
Receivables: |
Securities sold | | | 2,042,500 | |
Fund shares sold | | | 921,930 | |
Interest | | | 137,327 | |
Dividends | | | 6,846 | |
Total assets | | | 32,973,481 | |
| | | | | |
Liabilities: |
Payable for: |
Fund shares redeemed | | | 5,324,046 | |
Variation margin on futures contracts | | | 58,695 | |
Management fees | | | 11,374 | |
Transfer agent fees | | | 11,025 | |
Portfolio accounting and administration fees | | | 2,366 | |
Distribution and service fees | | | 1,038 | |
Distributions to shareholders | | | 897 | |
Trustees’ fees* | | | 239 | |
Miscellaneous | | | 16,463 | |
Total liabilities | | | 5,426,143 | |
Net assets | | $ | 27,547,338 | |
| | | | | |
Net assets consist of: |
Paid in capital | | $ | 94,679,723 | |
Total distributable earnings (loss) | | | (67,132,385 | ) |
Net assets | | $ | 27,547,338 | |
| | | | | |
Investor Class: |
Net assets | | $ | 22,427,632 | |
Capital shares outstanding | | | 948,954 | |
Net asset value per share | | $ | 23.63 | |
Class A: |
Net assets | | $ | 1,573,930 | |
Capital shares outstanding | | | 65,963 | |
Net asset value per share | | $ | 23.86 | |
Maximum offering price per share (Net asset value divided by 95.25%) | | $ | 25.05 | |
Class C: |
Net assets | | $ | 472,306 | |
Capital shares outstanding | | | 19,574 | |
Net asset value per share | | $ | 24.13 | |
Class H: |
Net assets | | $ | 3,073,470 | |
Capital shares outstanding | | | 128,544 | |
Net asset value per share | | $ | 23.91 | |
STATEMENT OF OPERATIONS (Unaudited) |
Six Months Ended September 30, 2024 |
Investment Income: |
Dividends from securities of affiliated issuers | | $ | 47,696 | |
Interest | | | 500,815 | |
Total investment income | | | 548,511 | |
| | | | | |
Expenses: |
Management fees | | | 60,901 | |
Distribution and service fees: |
Class A | | | 1,030 | |
Class C | | | 1,167 | |
Class H | | | 2,222 | |
Transfer agent fees | | | 21,167 | |
Portfolio accounting and administration fees | | | 18,584 | |
Registration fees | | | 12,790 | |
Professional fees | | | 5,212 | |
Custodian fees | | | 1,535 | |
Trustees’ fees* | | | 1,512 | |
Miscellaneous | | | 4,823 | |
Total expenses | | | 130,943 | |
Less: |
Expenses reimbursed by Adviser | | | (6,085 | ) |
Expenses waived by Adviser | | | (1,112 | ) |
Total waived/reimbursed expenses | | | (7,197 | ) |
Net expenses | | | 123,746 | |
Net investment income | | | 424,765 | |
| | | | | |
Net Realized and Unrealized Gain (Loss): |
Net realized gain (loss) on: |
Investments in unaffiliated issuers | | | 803,234 | |
Investments in affiliated issuers | | | (12,706 | ) |
Futures contracts | | | 193,268 | |
Net realized gain | | | 983,796 | |
Net change in unrealized appreciation (depreciation) on: |
Investments in unaffiliated issuers | | | (242,158 | ) |
Investments in affiliated issuers | | | 25,207 | |
Futures contracts | | | (148,423 | ) |
Net change in unrealized appreciation (depreciation) | | | (365,374 | ) |
Net realized and unrealized gain | | | 618,422 | |
Net increase in net assets resulting from operations | | $ | 1,043,187 | |
* | Relates to Trustees not deemed “interested persons” within the meaning of Section 2(a)(19) of the 1940 Act. |
314 | THE RYDEX FUNDS SEMI-ANNUAL FINANCIAL REPORT | SEE NOTES TO FINANCIAL STATEMENTS. |
GOVERNMENT LONG BOND 1.2x STRATEGY FUND | |
STATEMENTS OF CHANGES IN NET ASSETS |
| | Six Months Ended
September 30, 2024
(Unaudited) | | | Year Ended
March 31,
2024 | |
Increase (Decrease) in Net Assets from Operations: | | | | | | | | |
Net investment income | | $ | 424,765 | | | $ | 1,312,507 | |
Net realized gain (loss) on investments | | | 983,796 | | | | (4,687,041 | ) |
Net change in unrealized appreciation (depreciation) on investments | | | (365,374 | ) | | | (1,764,743 | ) |
Net increase (decrease) in net assets resulting from operations | | | 1,043,187 | | | | (5,139,277 | ) |
| | | | | | | | | |
Distributions to shareholders: | | | | | | | | |
Investor Class | | | (379,427 | ) | | | (1,100,587 | ) |
Class A | | | (13,216 | ) | | | (22,850 | ) |
Class C | | | (2,861 | ) | | | (1,389 | ) |
Class H | | | (29,261 | ) | | | (185,370 | ) |
Total distributions to shareholders | | | (424,765 | ) | | | (1,310,196 | ) |
| | | | | | | | | |
Capital share transactions: | | | | | | | | |
Proceeds from sale of shares | | | | | | | | |
Investor Class | | | 173,664,848 | | | | 572,977,937 | |
Class A | | | 1,977,691 | | | | 464,696 | |
Class C | | | 514,758 | | | | 256,440 | |
Class H | | | 21,521,217 | | | | 93,228,054 | |
Distributions reinvested | | | | | | | | |
Investor Class | | | 377,213 | | | | 1,095,330 | |
Class A | | | 12,912 | | | | 21,720 | |
Class C | | | 2,528 | | | | 1,265 | |
Class H | | | 28,982 | | | | 179,852 | |
Cost of shares redeemed | | | | | | | | |
Investor Class | | | (166,774,741 | ) | | | (572,664,631 | ) |
Class A | | | (768,493 | ) | | | (2,656,842 | ) |
Class C | | | (172,284 | ) | | | (494,082 | ) |
Class H | | | (19,279,179 | ) | | | (114,651,594 | ) |
Net increase (decrease) from capital share transactions | | | 11,105,452 | | | | (22,241,855 | ) |
Net increase (decrease) in net assets | | | 11,723,874 | | | | (28,691,328 | ) |
| | | | | | | | | |
Net assets: | | | | | | | | |
Beginning of period | | | 15,823,464 | | | | 44,514,792 | |
End of period | | $ | 27,547,338 | | | $ | 15,823,464 | |
| | | | | | | | | |
Capital share activity: | | | | | | | | |
Shares sold | | | | | | | | |
Investor Class | | | 7,677,142 | | | | 24,603,342 | |
Class A | | | 84,775 | | | | 19,515 | |
Class C | | | 21,765 | | | | 10,565 | |
Class H | | | 948,268 | | | | 3,777,836 | |
Shares issued from reinvestment of distributions | | | | | | | | |
Investor Class | | | 16,884 | | | | 47,018 | |
Class A | | | 564 | | | | 873 | |
Class C | | | 110 | | | | 53 | |
Class H | | | 1,291 | | | | 7,194 | |
Shares redeemed | | | | | | | | |
Investor Class | | | (7,375,112 | ) | | | (24,664,484 | ) |
Class A | | | (33,414 | ) | | | (104,176 | ) |
Class C | | | (7,455 | ) | | | (19,733 | ) |
Class H | | | (863,228 | ) | | | (4,636,683 | ) |
Net increase (decrease) in shares | | | 471,590 | | | | (958,680 | ) |
SEE NOTES TO FINANCIAL STATEMENTS. | THE RYDEX FUNDS SEMI-ANNUAL FINANCIAL REPORT | 315 |
GOVERNMENT LONG BOND 1.2x STRATEGY FUND | |
This table is presented to show selected data for a share outstanding throughout each period and to assist shareholders in evaluating a Fund’s performance for the periods presented.
Investor Class | | Six Months Ended
September 30, 2024a | | | Year Ended
March 31,
2024 | | | Year Ended
March 31,
2023 | | | Year Ended
March 31,
2022 | | | Year Ended
March 31,
2021 | | | Year Ended
March 31,
2020 | |
Per Share Data |
Net asset value, beginning of period | | $ | 22.86 | | | $ | 26.79 | | | $ | 36.94 | | | $ | 37.93 | | | $ | 74.11 | | | $ | 53.22 | |
Income (loss) from investment operations: |
Net investment income (loss)b | | | .40 | | | | .80 | | | | .64 | | | | .39 | | | | .25 | | | | .77 | |
Net gain (loss) on investments (realized and unrealized) | | | .77 | | | | (3.93 | ) | | | (10.11 | ) | | | (1.00 | ) | | | (14.59 | ) | | | 22.86 | |
Total from investment operations | | | 1.17 | | | | (3.13 | ) | | | (9.47 | ) | | | (.61 | ) | | | (14.34 | ) | | | 23.63 | |
Less distributions from: |
Net investment income | | | (.40 | ) | | | (.80 | ) | | | (.68 | ) | | | (.38 | ) | | | (.25 | ) | | | (.77 | ) |
Net realized gains | | | — | | | | — | | | | — | | | | — | | | | (21.59 | ) | | | (1.97 | ) |
Total distributions | | | (.40 | ) | | | (.80 | ) | | | (.68 | ) | | | (.38 | ) | | | (21.84 | ) | | | (2.74 | ) |
Net asset value, end of period | | $ | 23.63 | | | $ | 22.86 | | | $ | 26.79 | | | $ | 36.94 | | | $ | 37.93 | | | $ | 74.11 | |
|
Total Return | | | 5.29 | % | | | (11.71 | %) | | | (25.66 | %) | | | (1.71 | %) | | | (24.72 | %) | | | 45.84 | % |
Ratios/Supplemental Data |
Net assets, end of period (in thousands) | | $ | 22,428 | | | $ | 14,403 | | | $ | 17,260 | | | $ | 11,904 | | | $ | 69,360 | | | $ | 37,919 | |
Ratios to average net assets: |
Net investment income (loss) | | | 3.53 | % | | | 3.42 | % | | | 2.15 | % | | | 0.95 | % | | | 0.40 | % | | | 1.28 | % |
Total expensesc | | | 1.04 | % | | | 1.05 | % | | | 1.01 | % | | | 0.96 | % | | | 1.07 | % | | | 1.07 | % |
Net expensesd | | | 0.98 | % | | | 1.00 | % | | | 0.99 | % | | | 0.95 | % | | | 1.05 | % | | | 1.05 | % |
Portfolio turnover rate | | | 760 | % | | | 1,573 | % | | | 2,562 | % | | | 2,153 | % | | | 1,938 | % | | | 1,130 | % |
Class A | | Six Months Ended
September 30, 2024a | | | Year Ended
March 31,
2024 | | | Year Ended
March 31,
2023 | | | Year Ended
March 31,
2022 | | | Year Ended
March 31,
2021 | | | Year Ended
March 31,
2020 | |
Per Share Data |
Net asset value, beginning of period | | $ | 23.08 | | | $ | 27.07 | | | $ | 37.34 | | | $ | 38.34 | | | $ | 74.70 | | | $ | 53.63 | |
Income (loss) from investment operations: |
Net investment income (loss)b | | | .37 | | | | .73 | | | | .62 | | | | .28 | | | | .11 | | | | .72 | |
Net gain (loss) on investments (realized and unrealized) | | | .79 | | | | (3.97 | ) | | | (10.28 | ) | | | (1.00 | ) | | | (14.78 | ) | | | 22.95 | |
Total from investment operations | | | 1.16 | | | | (3.24 | ) | | | (9.66 | ) | | | (.72 | ) | | | (14.67 | ) | | | 23.67 | |
Less distributions from: |
Net investment income | | | (.38 | ) | | | (.75 | ) | | | (.61 | ) | | | (.28 | ) | | | (.10 | ) | | | (.63 | ) |
Net realized gains | | | — | | | | — | | | | — | | | | — | | | | (21.59 | ) | | | (1.97 | ) |
Total distributions | | | (.38 | ) | | | (.75 | ) | | | (.61 | ) | | | (.28 | ) | | | (21.69 | ) | | | (2.60 | ) |
Net asset value, end of period | | $ | 23.86 | | | $ | 23.08 | | | $ | 27.07 | | | $ | 37.34 | | | $ | 38.34 | | | $ | 74.70 | |
|
Total Returne | | | 5.17 | % | | | (12.04 | %) | | | (25.88 | %) | | | (1.96 | %) | | | (24.98 | %) | | | 45.48 | % |
Ratios/Supplemental Data |
Net assets, end of period (in thousands) | | $ | 1,574 | | | $ | 324 | | | $ | 2,648 | | | $ | 2,231 | | | $ | 1,610 | | | $ | 2,775 | |
Ratios to average net assets: |
Net investment income (loss) | | | 3.21 | % | | | 2.93 | % | | | 2.18 | % | | | 0.66 | % | | | 0.18 | % | | | 1.24 | % |
Total expensesc | | | 1.30 | % | | | 1.29 | % | | | 1.25 | % | | | 1.21 | % | | | 1.30 | % | | | 1.32 | % |
Net expensesd | | | 1.24 | % | | | 1.26 | % | | | 1.24 | % | | | 1.19 | % | | | 1.29 | % | | | 1.30 | % |
Portfolio turnover rate | | | 760 | % | | | 1,573 | % | | | 2,562 | % | | | 2,153 | % | | | 1,938 | % | | | 1,130 | % |
316 | THE RYDEX FUNDS SEMI-ANNUAL FINANCIAL REPORT | SEE NOTES TO FINANCIAL STATEMENTS. |
GOVERNMENT LONG BOND 1.2x STRATEGY FUND | |
FINANCIAL HIGHLIGHTS (continued) |
This table is presented to show selected data for a share outstanding throughout each period and to assist shareholders in evaluating a Fund’s performance for the periods presented.
Class C | | Six Months Ended
September 30, 2024a | | | Year Ended
March 31,
2024 | | | Year Ended
March 31,
2023 | | | Year Ended
March 31,
2022 | | | Year Ended
March 31,
2021 | | | Year Ended
March 31,
2020 | |
Per Share Data |
Net asset value, beginning of period | | $ | 23.33 | | | $ | 26.92 | | | $ | 36.61 | | | $ | 37.63 | | | $ | 74.15 | | | $ | 53.27 | |
Income (loss) from investment operations: |
Net investment income (loss)b | | | .29 | | | | .57 | | | | .40 | | | | (.05 | ) | | | (.33 | ) | | | .13 | |
Net gain (loss) on investments (realized and unrealized) | | | .80 | | | | (3.97 | ) | | | (10.09 | ) | | | (.97 | ) | | | (14.60 | ) | | | 22.92 | |
Total from investment operations | | | 1.09 | | | | (3.40 | ) | | | (9.69 | ) | | | (1.02 | ) | | | (14.93 | ) | | | 23.05 | |
Less distributions from: |
Net investment income | | | (.29 | ) | | | (.19 | ) | | | — | | | | — | | | | — | | | | (.20 | ) |
Net realized gains | | | — | | | | — | | | | — | | | | — | | | | (21.59 | ) | | | (1.97 | ) |
Total distributions | | | (.29 | ) | | | (.19 | ) | | | — | | | | — | | | | (21.59 | ) | | | (2.17 | ) |
Net asset value, end of period | | $ | 24.13 | | | $ | 23.33 | | | $ | 26.92 | | | $ | 36.61 | | | $ | 37.63 | | | $ | 74.15 | |
|
Total Returne | | | 4.78 | % | | | (12.67 | %) | | | (26.47 | %) | | | (2.71 | %) | | | (25.55 | %) | | | 44.41 | % |
Ratios/Supplemental Data |
Net assets, end of period (in thousands) | | $ | 472 | | | $ | 120 | | | $ | 384 | | | $ | 149 | | | $ | 169 | | | $ | 1,249 | |
Ratios to average net assets: |
Net investment income (loss) | | | 2.45 | % | | | 2.36 | % | | | 1.41 | % | | | (0.12 | %) | | | (0.55 | %) | | | 0.21 | % |
Total expensesc | | | 2.05 | % | | | 2.05 | % | | | 2.01 | % | | | 1.96 | % | | | 2.05 | % | | | 2.08 | % |
Net expensesd | | | 1.99 | % | | | 2.00 | % | | | 1.99 | % | | | 1.94 | % | | | 2.03 | % | | | 2.06 | % |
Portfolio turnover rate | | | 760 | % | | | 1,573 | % | | | 2,562 | % | | | 2,153 | % | | | 1,938 | % | | | 1,130 | % |
SEE NOTES TO FINANCIAL STATEMENTS. | THE RYDEX FUNDS SEMI-ANNUAL FINANCIAL REPORT | 317 |
GOVERNMENT LONG BOND 1.2x STRATEGY FUND | |
FINANCIAL HIGHLIGHTS (concluded) |
This table is presented to show selected data for a share outstanding throughout each period and to assist shareholders in evaluating a Fund’s performance for the periods presented.
Class H | | Six Months Ended
September 30, 2024a | | | Year Ended
March 31,
2024 | | | Year Ended
March 31,
2023 | | | Year Ended
March 31,
2022 | | | Year Ended
March 31,
2021 | | | Year Ended
March 31,
2020 | |
Per Share Data |
Net asset value, beginning of period | | $ | 23.14 | | | $ | 27.10 | | | $ | 37.37 | | | $ | 38.38 | | | $ | 74.75 | | | $ | 53.65 | |
Income (loss) from investment operations: |
Net investment income (loss)b | | | .38 | | | | .73 | | | | .60 | | | | .28 | | | | .13 | | | | .61 | |
Net gain (loss) on investments (realized and unrealized) | | | .77 | | | | (3.94 | ) | | | (10.26 | ) | | | (1.01 | ) | | | (14.82 | ) | | | 23.09 | |
Total from investment operations | | | 1.15 | | | | (3.21 | ) | | | (9.66 | ) | | | (.73 | ) | | | (14.69 | ) | | | 23.70 | |
Less distributions from: |
Net investment income | | | (.38 | ) | | | (.75 | ) | | | (.61 | ) | | | (.28 | ) | | | (.09 | ) | | | (.63 | ) |
Net realized gains | | | — | | | | — | | | | — | | | | — | | | | (21.59 | ) | | | (1.97 | ) |
Total distributions | | | (.38 | ) | | | (.75 | ) | | | (.61 | ) | | | (.28 | ) | | | (21.68 | ) | | | (2.60 | ) |
Net asset value, end of period | | $ | 23.91 | | | $ | 23.14 | | | $ | 27.10 | | | $ | 37.37 | | | $ | 38.38 | | | $ | 74.75 | |
|
Total Return | | | 5.07 | % | | | (11.87 | %) | | | (25.87 | %) | | | (1.95 | %) | | | (24.98 | %) | | | 45.55 | % |
Ratios/Supplemental Data |
Net assets, end of period (in thousands) | | $ | 3,073 | | | $ | 977 | | | $ | 24,223 | | | $ | 49,287 | | | $ | 85,087 | | | $ | 78,070 | |
Ratios to average net assets: |
Net investment income (loss) | | | 3.29 | % | | | 2.87 | % | | | 2.05 | % | | | 0.69 | % | | | 0.23 | % | | | 1.02 | % |
Total expensesc | | | 1.28 | % | | | 1.28 | % | | | 1.25 | % | | | 1.21 | % | | | 1.29 | % | | | 1.32 | % |
Net expensesd | | | 1.22 | % | | | 1.26 | % | | | 1.24 | % | | | 1.19 | % | | | 1.28 | % | | | 1.30 | % |
Portfolio turnover rate | | | 760 | % | | | 1,573 | % | | | 2,562 | % | | | 2,153 | % | | | 1,938 | % | | | 1,130 | % |
a | Unaudited figures for the period ended September 30, 2024. Percentage amounts for the period, except total return and portfolio turnover rate, have been annualized. |
b | Net investment income (loss) per share was computed using average shares outstanding throughout the period. |
c | Does not include expenses of the underlying funds in which the Fund invests. |
d | Net expense information reflects the expense ratios after expense waivers and reimbursements, as applicable. |
e | Total return does not reflect the impact of any applicable sales charges. |
318 | THE RYDEX FUNDS SEMI-ANNUAL FINANCIAL REPORT | SEE NOTES TO FINANCIAL STATEMENTS. |
SCHEDULE OF INVESTMENTS (Unaudited) | September 30, 2024 |
INVERSE GOVERNMENT LONG BOND STRATEGY FUND | |
| | Shares | | | Value | |
MUTUAL FUNDS† - 43.5% |
Guggenheim Strategy Fund II1 | | | 137,556 | | | $ | 3,411,381 | |
Guggenheim Ultra Short Duration Fund — Institutional Class1 | | | 326,794 | | | | 3,274,479 | |
Total Mutual Funds | | | | |
(Cost $6,642,019) | | | | | | | 6,685,860 | |
| | | | | | | | | |
| | | Face
Amount | | | | | |
U.S. TREASURY BILLS†† - 20.2% |
U.S. Treasury Bills |
4.70% due 10/22/242 | | $ | 3,000,000 | | | | 2,991,756 | |
4.63% due 10/10/242,3 | | | 116,000 | | | | 115,865 | |
Total U.S. Treasury Bills | | | | |
(Cost $3,106,889) | | | | | | | 3,107,621 | |
| | | | | | | | | |
FEDERAL AGENCY DISCOUNT NOTES†† - 7.8% |
Federal Home Loan Bank |
5.18% due 10/04/242 | | | 1,200,000 | | | | 1,199,539 | |
Total Federal Agency Discount Notes | | | | |
(Cost $1,199,482) | | | | | | | 1,199,539 | |
REPURCHASE AGREEMENTS††,4 - 102.4% |
Individual Repurchase Agreements5 |
Barclays Capital, Inc.
issued 09/30/24 at 4.50%
due 10/01/24 (secured by a U.S.
Treasury Bond, at a rate of 4.25%
and maturing 08/15/54 as collateral,
with a value of $7,220,325) to
be repurchased at $7,079,635 | | | 7,078,750 | | | | 7,078,750 | |
Mizuho Securities USA LLC
issued 09/30/24 at 4.70%
due 10/01/24 (secured by a U.S.
Treasury Bond, at a rate of 4.25%
and maturing 08/15/54 as collateral,
with a value of $5,255,391) to
be repurchased at $5,153,017 | | | 5,152,344 | | | | 5,152,344 | |
Joint Repurchase Agreements5 | | | | | | | | |
J.P. Morgan Securities LLC
issued 09/30/24 at 4.86%
due 10/01/24 | | | 1,921,052 | | | | 1,921,052 | |
BofA Securities, Inc.
issued 09/30/24 at 4.85%
due 10/01/24 | | | 1,586,699 | | | | 1,586,699 | |
Total Repurchase Agreements | | | | |
(Cost $15,738,845) | | | | | | | 15,738,845 | |
| | | | | | | | | |
Total Investments - 173.9% | | | | |
(Cost $26,687,235) | | $ | 26,731,865 | |
| | | | | | | | | |
U.S. Government Securities Sold Short† - (85.7)% |
U.S. Treasury Bonds |
4.25% due 08/15/54†† | | | 12,900,000 | | | | (13,174,125 | ) |
Total U.S. Government Securities Sold Short - (85.7)% | | | | |
(Proceeds $13,299,658) | | $ | (13,174,125 | ) |
Other Assets & Liabilities, net - 11.8% | | | 1,814,982 | |
Total Net Assets - 100.0% | | $ | 15,372,722 | |
Futures Contracts |
Description | | Number of
Contracts | | | Expiration
Date | | | Notional
Amount | | | Value and
Unrealized
Appreciation** | |
Interest Rate Futures Contracts Sold Short† |
U.S. Treasury Ultra Long Bond Futures Contracts | | | 17 | | | | Dec 2024 | | | $ | 2,265,781 | | | $ | 48,167 | |
SEE NOTES TO FINANCIAL STATEMENTS. | THE RYDEX FUNDS SEMI-ANNUAL FINANCIAL REPORT | 319 |
SCHEDULE OF INVESTMENTS (Unaudited)(continued) | September 30, 2024 |
INVERSE GOVERNMENT LONG BOND STRATEGY FUND | |
** | Includes cumulative appreciation (depreciation). Variation margin is reported within the Statement of Assets and Liabilities. |
† | Value determined based on Level 1 inputs — See Note 4. |
†† | Value determined based on Level 2 inputs — See Note 4. |
1 | Affiliated issuer. |
2 | Rate indicated is the effective yield at the time of purchase. |
3 | All or a portion of this security is pledged as futures collateral at September 30, 2024. |
4 | Repurchase Agreements — See Note 6. |
5 | All or a portion of this security is pledged as short security collateral at September 30, 2024. |
| | |
| | See Sector Classification in Other Information section. |
The following table summarizes the inputs used to value the Fund’s investments at September 30, 2024 (See Note 4 in the Notes to Financial Statements):
Investments in Securities (Assets) | | Level 1
Quoted
Prices | | | Level 2
Significant
Observable
Inputs | | | Level 3
Significant
Unobservable
Inputs | | | Total | |
Mutual Funds | | $ | 6,685,860 | | | $ | — | | | $ | — | | | $ | 6,685,860 | |
U.S. Treasury Bills | | | — | | | | 3,107,621 | | | | — | | | | 3,107,621 | |
Federal Agency Discount Notes | | | — | | | | 1,199,539 | | | | — | | | | 1,199,539 | |
Repurchase Agreements | | | — | | | | 15,738,845 | | | | — | | | | 15,738,845 | |
Interest Rate Futures Contracts** | | | 48,167 | | | | — | | | | — | | | | 48,167 | |
Total Assets | | $ | 6,734,027 | | | $ | 20,046,005 | | | $ | — | | | $ | 26,780,032 | |
Investments in Securities (Liabilities) | | Level 1
Quoted
Prices | | | Level 2
Significant
Observable
Inputs | | | Level 3
Significant
Unobservable
Inputs | | | Total | |
U.S. Government Securities | | $ | — | | | $ | 13,174,125 | | | $ | — | | | $ | 13,174,125 | |
** | This derivative is reported as unrealized appreciation/depreciation at period end. |
320 | THE RYDEX FUNDS SEMI-ANNUAL FINANCIAL REPORT | SEE NOTES TO FINANCIAL STATEMENTS. |
SCHEDULE OF INVESTMENTS (Unaudited)(concluded) | September 30, 2024 |
INVERSE GOVERNMENT LONG BOND STRATEGY FUND | |
Affiliated Transactions
Investments representing 5% or more of the outstanding voting shares of a company, or control of or by, or common control under Guggenheim Investments (“GI”), result in that company being considered an affiliated issuer, as defined in the 1940 Act.
The Fund may invest in certain of the underlying series of Guggenheim Strategy Funds Trust, including Guggenheim Strategy Fund II and Guggenheim Strategy Fund III (collectively, the “Guggenheim Strategy Funds”), each of which are open-end management investment companies managed by GI. The Guggenheim Strategy Funds, which launched on March 11, 2014, are offered as short term investment options only to mutual funds, trusts, and other accounts managed by GI and/or its affiliates, and are not available to the public. The Guggenheim Strategy Funds pay no investment management fees. The Guggenheim Strategy Funds’ annual report on Form N-CSR dated September 30, 2023 is available publicly or upon request. This information is available from the EDGAR database on the SEC’s website at https://www.sec.gov/Archives/edgar/data/1601445/000182126823000217/gug86449-ncsr.htm. The Fund may invest in certain of the underlying series of Guggenheim Funds Trust, which are open-end management investment companies managed by GI, are available to the public and whose most recent annual report on Form N-CSR is available publicly or upon request.
Transactions during the period ended September 30, 2024, in which the company is an affiliated issuer, were as follows:
Security Name | | Value
03/31/24 | | | Additions | | | Reductions | | | Realized
Gain (Loss) | | | Change in
Unrealized
Appreciation
(Depreciation) | | | Value
09/30/24 | | | Shares
09/30/24 | | | Investment
Income | |
Mutual Funds | | | | | | | | | | | | | | | | | | | | | | | | | | | | | | | | |
Guggenheim Strategy Fund II | | $ | 5,180,462 | | | $ | — | | | $ | (1,800,000 | ) | | $ | (19,647 | ) | | $ | 50,566 | | | $ | 3,411,381 | | | | 137,556 | | | $ | 119,237 | |
Guggenheim Ultra Short Duration Fund — Institutional Class | | | 4,734,506 | | | | — | | | | (1,500,000 | ) | | | (3,171 | ) | | | 43,144 | | | | 3,274,479 | | | | 326,794 | | | | 101,889 | |
| | | $ | 9,914,968 | | | $ | — | | | $ | (3,300,000 | ) | | $ | (22,818 | ) | | $ | 93,710 | | | $ | 6,685,860 | | | | | | | $ | 221,126 | |
SEE NOTES TO FINANCIAL STATEMENTS. | THE RYDEX FUNDS SEMI-ANNUAL FINANCIAL REPORT | 321 |
INVERSE GOVERNMENT LONG BOND STRATEGY FUND | |
STATEMENT OF ASSETS AND LIABILITIES (Unaudited) |
September 30, 2024 |
Assets: |
Investments in unaffiliated issuers, at value (cost $4,306,371) | | $ | 4,307,160 | |
Investments in affiliated issuers, at value (cost $6,642,019) | | | 6,685,860 | |
Repurchase agreements, at value (cost $15,738,845) | | | 15,738,845 | |
Receivables: |
Fund shares sold | | | 1,053,542 | |
Securities sold | | | 817,000 | |
Dividends | | | 28,357 | |
Variation margin on futures contracts | | | 8,867 | |
Interest | | | 6,373 | |
Total assets | | | 28,646,004 | |
| | | | | |
Liabilities: |
Securities sold short, at value (proceeds $13,299,658) | | | 13,174,125 | |
Payable for: |
Management fees | | | 9,935 | |
Transfer agent fees | | | 7,101 | |
Distribution and service fees | | | 1,407 | |
Portfolio accounting and administration fees | | | 617 | |
Trustees’ fees* | | | 142 | |
Fund shares redeemed | | | 12 | |
Miscellaneous | | | 79,943 | |
Total liabilities | | | 13,273,282 | |
Net assets | | $ | 15,372,722 | |
| | | | | |
Net assets consist of: |
Paid in capital | | $ | 251,104,087 | |
Total distributable earnings (loss) | | | (235,731,365 | ) |
Net assets | | $ | 15,372,722 | |
| | | | | |
Investor Class: |
Net assets | | $ | 9,540,022 | |
Capital shares outstanding | | | 50,198 | |
Net asset value per share | | $ | 190.05 | |
Class A: |
Net assets | | $ | 2,622,139 | |
Capital shares outstanding | | | 14,596 | |
Net asset value per share | | $ | 179.65 | |
Maximum offering price per share (Net asset value divided by 95.25%) | | $ | 188.60 | |
Class C: |
Net assets | | $ | 544,971 | |
Capital shares outstanding | | | 3,645 | |
Net asset value per share | | $ | 149.51 | |
Class H: |
Net assets | | $ | 2,665,590 | |
Capital shares outstanding | | | 14,772 | |
Net asset value per share | | $ | 180.45 | |
STATEMENT OF OPERATIONS (Unaudited) |
Six Months Ended September 30, 2024 |
Investment Income: |
Dividends from securities of affiliated issuers | | $ | 221,126 | |
Interest | | | 625,398 | |
Total investment income | | | 846,524 | |
| | | | | |
Expenses: |
Management fees | | | 80,680 | |
Distribution and service fees: |
Class A | | | 3,573 | |
Class C | | | 2,828 | |
Class H | | | 3,722 | |
Transfer agent fees | | | 18,485 | |
Interest expense | | | 313,665 | |
Portfolio accounting and administration fees | | | 13,677 | |
Professional fees | | | 4,738 | |
Trustees’ fees* | | | 1,255 | |
Custodian fees | | | 1,156 | |
Miscellaneous | | | 11,139 | |
Total expenses | | | 454,918 | |
Less: |
Expenses reimbursed by Adviser | | | (8,966 | ) |
Expenses waived by Adviser | | | (4,922 | ) |
Total waived/reimbursed expenses | | | (13,888 | ) |
Net expenses | | | 441,030 | |
Net investment income | | | 405,494 | |
| | | | | |
Net Realized and Unrealized Gain (Loss): |
Net realized gain (loss) on: |
Investments in unaffiliated issuers | | | 59 | |
Investments in affiliated issuers | | | (22,818 | ) |
Investments sold short | | | (834,726 | ) |
Futures contracts | | | (197,483 | ) |
Net realized loss | | | (1,054,968 | ) |
Net change in unrealized appreciation (depreciation) on: |
Investments in unaffiliated issuers | | | 555 | |
Investments in affiliated issuers | | | 93,710 | |
Investments sold short | | | 332,320 | |
Futures contracts | | | 98,422 | |
Net change in unrealized appreciation (depreciation) | | | 525,007 | |
Net realized and unrealized loss | | | (529,961 | ) |
Net decrease in net assets resulting from operations | | $ | (124,467 | ) |
* | Relates to Trustees not deemed “interested persons” within the meaning of Section 2(a)(19) of the 1940 Act. |
322 | THE RYDEX FUNDS SEMI-ANNUAL FINANCIAL REPORT | SEE NOTES TO FINANCIAL STATEMENTS. |
INVERSE GOVERNMENT LONG BOND STRATEGY FUND | |
STATEMENTS OF CHANGES IN NET ASSETS |
| | Six Months Ended
September 30, 2024
(Unaudited) | | | Year Ended
March 31,
2024 | |
Increase (Decrease) in Net Assets from Operations: | | | | | | | | |
Net investment income | | $ | 405,494 | | | $ | 1,563,051 | |
Net realized gain (loss) on investments | | | (1,054,968 | ) | | | 3,037,041 | |
Net change in unrealized appreciation (depreciation) on investments | | | 525,007 | | | | 1,158,430 | |
Net increase (decrease) in net assets resulting from operations | | | (124,467 | ) | | | 5,758,522 | |
| | | | | | | | | |
Distributions to shareholders: | | | | | | | | |
Investor Class | | | — | | | | (201,149 | ) |
Class A | | | — | | | | (41,496 | ) |
Class C | | | — | | | | (11,320 | ) |
Class H | | | — | | | | (41,518 | ) |
Total distributions to shareholders | | | — | | | | (295,483 | ) |
| | | | | | | | | |
Capital share transactions: | | | | | | | | |
Proceeds from sale of shares | | | | | | | | |
Investor Class | | | 30,987,099 | | | | 146,365,405 | |
Class A | | | 913,641 | | | | 873,386 | |
Class C | | | 63,032 | | | | 219,029 | |
Class H | | | 2,311,127 | | | | 12,820,341 | |
Distributions reinvested | | | | | | | | |
Investor Class | | | — | | | | 195,362 | |
Class A | | | — | | | | 38,381 | |
Class C | | | — | | | | 10,648 | |
Class H | | | — | | | | 41,355 | |
Cost of shares redeemed | | | | | | | | |
Investor Class | | | (34,506,462 | ) | | | (167,273,388 | ) |
Class A | | | (1,117,481 | ) | | | (2,276,323 | ) |
Class C | | | (93,496 | ) | | | (642,663 | ) |
Class H | | | (2,378,455 | ) | | | (24,814,951 | ) |
Net decrease from capital share transactions | | | (3,820,995 | ) | | | (34,443,418 | ) |
Net decrease in net assets | | | (3,945,462 | ) | | | (28,980,379 | ) |
| | | | | | | | | |
Net assets: | | | | | | | | |
Beginning of period | | | 19,318,184 | | | | 48,298,563 | |
End of period | | $ | 15,372,722 | | | $ | 19,318,184 | |
| | | | | | | | | |
Capital share activity: | | | | | | | | |
Shares sold | | | | | | | | |
Investor Class | | | 157,510 | | | | 793,646 | |
Class A | | | 4,903 | | | | 4,973 | |
Class C | | | 417 | | | | 1,456 | |
Class H | | | 12,021 | | | | 75,821 | |
Shares issued from reinvestment of distributions | | | | | | | | |
Investor Class | | | — | | | | 1,032 | |
Class A | | | — | | | | 214 | |
Class C | | | — | | | | 71 | |
Class H | | | — | | | | 230 | |
Shares redeemed | | | | | | | | |
Investor Class | | | (175,423 | ) | | | (904,401 | ) |
Class A | | | (6,021 | ) | | | (12,690 | ) |
Class C | | | (600 | ) | | | (4,333 | ) |
Class H | | | (12,387 | ) | | | (149,365 | ) |
Net decrease in shares | | | (19,580 | ) | | | (193,346 | ) |
SEE NOTES TO FINANCIAL STATEMENTS. | THE RYDEX FUNDS SEMI-ANNUAL FINANCIAL REPORT | 323 |
INVERSE GOVERNMENT LONG BOND STRATEGY FUND | |
This table is presented to show selected data for a share outstanding throughout each period and to assist shareholders in evaluating a Fund’s performance for the periods presented.
Investor Class | | Six Months Ended
September 30, 2024a | | | Year Ended
March 31,
2024 | | | Year Ended
March 31,
2023 | | | Year Ended
March 31,
2022 | | | Year Ended
March 31,
2021 | | | Year Ended
March 31,
2020g | |
Per Share Data |
Net asset value, beginning of period | | $ | 192.41 | | | $ | 166.83 | | | $ | 133.30 | | | $ | 139.52 | | | $ | 114.58 | | | $ | 165.45 | |
Income (loss) from investment operations: |
Net investment income (loss)b | | | 4.58 | | | | 8.64 | | | | (.15 | ) | | | (3.89 | ) | | | (1.30 | ) | | | .60 | |
Net gain (loss) on investments (realized and unrealized) | | | (6.94 | ) | | | 19.22 | | | | 33.68 | | | | (2.33 | ) | | | 26.68 | | | | (51.47 | ) |
Total from investment operations | | | (2.36 | ) | | | 27.86 | | | | 33.53 | | | | (6.22 | ) | | | 25.38 | | | | (50.87 | ) |
Less distributions from: |
Net investment income | | | — | | | | (2.28 | ) | | | — | | | | — | | | | (.44 | ) | | | — | |
Total distributions | | | — | | | | (2.28 | ) | | | — | | | | — | | | | (.44 | ) | | | — | |
Net asset value, end of period | | $ | 190.05 | | | $ | 192.41 | | | $ | 166.83 | | | $ | 133.30 | | | $ | 139.52 | | | $ | 114.58 | |
|
Total Return | | | (1.23 | %) | | | 16.72 | % | | | 25.15 | % | | | (4.46 | %) | | | 22.19 | % | | | (30.73 | %) |
Ratios/Supplemental Data |
Net assets, end of period (in thousands) | | $ | 9,540 | | | $ | 13,105 | | | $ | 29,663 | | | $ | 78,436 | | | $ | 36,863 | | | $ | 20,983 | |
Ratios to average net assets: |
Net investment income (loss) | | | 4.64 | % | | | 4.62 | % | | | (0.09 | %) | | | (3.02 | %) | | | (2.46 | %) | | | 0.40 | % |
Total expensesc | | | 4.96 | % | | | 4.75 | % | | | 4.32 | % | | | 3.31 | % | | | 2.75 | % | | | 2.91 | % |
Net expensesd,e | | | 4.80 | % | | | 4.63 | % | | | 4.28 | % | | | 3.29 | % | | | 2.73 | % | | | 2.89 | % |
Portfolio turnover rate | | | 264 | % | | | 662 | % | | | 1,076 | % | | | 2,058 | % | | | 2,159 | % | | | 864 | % |
Class A | | Six Months Ended
September 30, 2024a | | | Year Ended
March 31,
2024 | | | Year Ended
March 31,
2023 | | | Year Ended
March 31,
2022 | | | Year Ended
March 31,
2021 | | | Year Ended
March 31,
2020g | |
Per Share Data |
Net asset value, beginning of period | | $ | 182.11 | | | $ | 158.40 | | | $ | 126.88 | | | $ | 133.13 | | | $ | 109.61 | | | $ | 158.62 | |
Income (loss) from investment operations: |
Net investment income (loss)b | | | 4.09 | | | | 7.77 | | | | .56 | | | | (3.77 | ) | | | (1.09 | ) | | | .20 | |
Net gain (loss) on investments (realized and unrealized) | | | (6.55 | ) | | | 18.22 | | | | 30.96 | | | | (2.48 | ) | | | 25.05 | | | | (49.21 | ) |
Total from investment operations | | | (2.46 | ) | | | 25.99 | | | | 31.52 | | | | (6.25 | ) | | | 23.96 | | | | (49.01 | ) |
Less distributions from: |
Net investment income | | | — | | | | (2.28 | ) | | | — | | | | — | | | | (.44 | ) | | | — | |
Total distributions | | | — | | | | (2.28 | ) | | | — | | | | — | | | | (.44 | ) | | | — | |
Net asset value, end of period | | $ | 179.65 | | | $ | 182.11 | | | $ | 158.40 | | | $ | 126.88 | | | $ | 133.13 | | | $ | 109.61 | |
|
Total Returnf | | | (1.35 | %) | | | 16.42 | % | | | 24.84 | % | | | (4.69 | %) | | | 21.95 | % | | | (30.90 | %) |
Ratios/Supplemental Data |
Net assets, end of period (in thousands) | | $ | 2,622 | | | $ | 2,862 | | | $ | 3,677 | | | $ | 4,385 | | | $ | 4,798 | | | $ | 4,832 | |
Ratios to average net assets: |
Net investment income (loss) | | | 4.39 | % | | | 4.40 | % | | | 0.37 | % | | | (3.11 | %) | | | (2.59 | %) | | | 0.15 | % |
Total expensesc | | | 5.21 | % | | | 5.01 | % | | | 4.61 | % | | | 3.47 | % | | | 2.97 | % | | | 3.17 | % |
Net expensesd,e | | | 5.05 | % | | | 4.88 | % | | | 4.56 | % | | | 3.45 | % | | | 2.94 | % | | | 3.15 | % |
Portfolio turnover rate | | | 264 | % | | | 662 | % | | | 1,076 | % | | | 2,058 | % | | | 2,159 | % | | | 864 | % |
324 | THE RYDEX FUNDS SEMI-ANNUAL FINANCIAL REPORT | SEE NOTES TO FINANCIAL STATEMENTS. |
INVERSE GOVERNMENT LONG BOND STRATEGY FUND | |
FINANCIAL HIGHLIGHTS (continued) |
This table is presented to show selected data for a share outstanding throughout each period and to assist shareholders in evaluating a Fund’s performance for the periods presented.
Class C | | Six Months Ended
September 30, 2024a | | | Year Ended
March 31,
2024 | | | Year Ended
March 31,
2023 | | | Year Ended
March 31,
2022 | | | Year Ended
March 31,
2021 | | | Year Ended
March 31,
2020g | |
Per Share Data |
Net asset value, beginning of period | | $ | 152.14 | | | $ | 133.62 | | | $ | 107.86 | | | $ | 114.03 | | | $ | 94.64 | | | $ | 138.00 | |
Income (loss) from investment operations: |
Net investment income (loss)b | | | 2.83 | | | | 5.42 | | | | (1.03 | ) | | | (4.01 | ) | | | (1.11 | ) | | | (.75 | ) |
Net gain (loss) on investments (realized and unrealized) | | | (5.46 | ) | | | 15.38 | | | | 26.79 | | | | (2.16 | ) | | | 20.94 | | | | (42.61 | ) |
Total from investment operations | | | (2.63 | ) | | | 20.80 | | | | 25.76 | | | | (6.17 | ) | | | 19.83 | | | | (43.36 | ) |
Less distributions from: |
Net investment income | | | — | | | | (2.28 | ) | | | — | | | | — | | | | (.44 | ) | | | — | |
Total distributions | | | — | | | | (2.28 | ) | | | — | | | | — | | | | (.44 | ) | | | — | |
Net asset value, end of period | | $ | 149.51 | | | $ | 152.14 | | | $ | 133.62 | | | $ | 107.86 | | | $ | 114.03 | | | $ | 94.64 | |
|
Total Returnf | | | (1.73 | %) | | | 15.56 | % | | | 23.88 | % | | | (5.41 | %) | | | 21.00 | % | | | (31.41 | %) |
Ratios/Supplemental Data |
Net assets, end of period (in thousands) | | $ | 545 | | | $ | 582 | | | $ | 886 | | | $ | 1,048 | | | $ | 1,500 | | | $ | 2,472 | |
Ratios to average net assets: |
Net investment income (loss) | | | 3.64 | % | | | 3.64 | % | | | (0.79 | %) | | | (3.85 | %) | | | (3.32 | %) | | | (0.59 | %) |
Total expensesc | | | 5.96 | % | | | 5.76 | % | | | 5.35 | % | | | 4.22 | % | | | 3.70 | % | | | 3.93 | % |
Net expensesd,e | | | 5.80 | % | | | 5.64 | % | | | 5.31 | % | | | 4.19 | % | | | 3.68 | % | | | 3.91 | % |
Portfolio turnover rate | | | 264 | % | | | 662 | % | | | 1,076 | % | | | 2,058 | % | | | 2,159 | % | | | 864 | % |
SEE NOTES TO FINANCIAL STATEMENTS. | THE RYDEX FUNDS SEMI-ANNUAL FINANCIAL REPORT | 325 |
INVERSE GOVERNMENT LONG BOND STRATEGY FUND | |
FINANCIAL HIGHLIGHTS (concluded) |
This table is presented to show selected data for a share outstanding throughout each period and to assist shareholders in evaluating a Fund’s performance for the periods presented.
Class H | | Six Months Ended
September 30, 2024a | | | Year Ended
March 31,
2024 | | | Year Ended
March 31,
2023 | | | Year Ended
March 31,
2022 | | | Year Ended
March 31,
2021 | | | Year Ended
March 31,
2020g | |
Per Share Data |
Net asset value, beginning of period | | $ | 182.92 | | | $ | 159.09 | | | $ | 127.42 | | | $ | 133.70 | | | $ | 109.85 | | | $ | 159.05 | |
Income (loss) from investment operations: |
Net investment income (loss)b | | | 4.11 | | | | 7.67 | | | | (.55 | ) | | | (3.95 | ) | | | (.98 | ) | | | .25 | |
Net gain (loss) on investments (realized and unrealized) | | | (6.58 | ) | | | 18.44 | | | | 32.22 | | | | (2.33 | ) | | | 25.27 | | | | (49.45 | ) |
Total from investment operations | | | (2.47 | ) | | | 26.11 | | | | 31.67 | | | | (6.28 | ) | | | 24.29 | | | | (49.20 | ) |
Less distributions from: |
Net investment income | | | — | | | | (2.28 | ) | | | — | | | | — | | | | (.44 | ) | | | — | |
Total distributions | | | — | | | | (2.28 | ) | | | — | | | | — | | | | (.44 | ) | | | — | |
Net asset value, end of period | | $ | 180.45 | | | $ | 182.92 | | | $ | 159.09 | | | $ | 127.42 | | | $ | 133.70 | | | $ | 109.85 | |
|
Total Return | | | (1.35 | %) | | | 16.43 | % | | | 24.85 | % | | | (4.70 | %) | | | 22.18 | % | | | (30.93 | %) |
Ratios/Supplemental Data |
Net assets, end of period (in thousands) | | $ | 2,666 | | | $ | 2,769 | | | $ | 14,072 | | | $ | 11,922 | | | $ | 7,472 | | | $ | 5,881 | |
Ratios to average net assets: |
Net investment income (loss) | | | 4.38 | % | | | 4.37 | % | | | (0.36 | %) | | | (3.20 | %) | | | (2.62 | %) | | | 0.16 | % |
Total expensesc | | | 5.21 | % | | | 4.99 | % | | | 4.55 | % | | | 3.49 | % | | | 2.94 | % | | | 3.30 | % |
Net expensesd,e | | | 5.05 | % | | | 4.88 | % | | | 4.51 | % | | | 3.47 | % | | | 2.92 | % | | | 3.28 | % |
Portfolio turnover rate | | | 264 | % | | | 662 | % | | | 1,076 | % | | | 2,058 | % | | | 2,159 | % | | | 872 | % |
a | Unaudited figures for the period ended September 30, 2024. Percentage amounts for the period, except total return and portfolio turnover rate, have been annualized. |
b | Net investment income (loss) per share was computed using average shares outstanding throughout the period. |
c | Does not include expenses of the underlying funds in which the Fund invests. |
d | Net expense information reflects the expense ratios after expense waivers and reimbursements, as applicable. |
e | Net expense may include expenses related to short sales. Excluding these expenses, the net expense ratios for the periods presented would be: |
| | | 09/30/24a | 03/31/24 | 03/31/23 | 03/31/22 | 03/31/21 | 03/31/20 |
| | Investor Class | 1.30% | 1.37% | 1.40% | 1.39% | 1.47% | 1.50% |
| | Class A | 1.56% | 1.61% | 1.64% | 1.63% | 1.73% | 1.75% |
| | Class C | 2.31% | 2.36% | 2.40% | 2.38% | 2.48% | 2.50% |
| | Class H | 1.56% | 1.62% | 1.65% | 1.64% | 1.73% | 1.75% |
f | Total return does not reflect the impact of any applicable sales charges. |
g | Reverse share split — Per share amounts for the periods presented through March 31, 2020 have been restated to reflect a 1:5 reverse share split effective August 17, 2020. |
326 | THE RYDEX FUNDS SEMI-ANNUAL FINANCIAL REPORT | SEE NOTES TO FINANCIAL STATEMENTS. |
SCHEDULE OF INVESTMENTS (Unaudited) | September 30, 2024 |
HIGH YIELD STRATEGY FUND | |
| | Shares | | | Value | |
MUTUAL FUNDS† - 7.5% |
Guggenheim Strategy Fund III1 | | | 79,841 | | | $ | 1,987,244 | |
Guggenheim Ultra Short Duration Fund — Institutional Class1 | | | 133,249 | | | | 1,335,155 | |
Guggenheim Strategy Fund II1 | | | 53,173 | | | | 1,318,684 | |
Total Mutual Funds | | | | |
(Cost $4,578,426) | | | | | | | 4,641,083 | |
| | | | | | | | | |
| | | Face
Amount | | | | | |
FEDERAL AGENCY NOTES†† - 22.1% |
Federal Home Loan Bank |
4.84% (SOFR, Rate Floor: 0.00%) due 11/15/24◊ | | $ | 4,000,000 | | | | 3,999,792 | |
4.96% (SOFR + 0.12%, Rate Floor: 0.00%) due 11/18/24◊ | | | 3,000,000 | | | | 3,000,378 | |
4.88% (SOFR + 0.04%, Rate Floor: 0.00%) due 06/20/25◊ | | | 3,000,000 | | | | 2,999,868 | |
Federal Farm Credit Bank |
5.50% due 11/25/24 | | | 2,000,000 | | | | 2,002,160 | |
Freddie Mac |
5.15% due 01/17/25 | | | 1,600,000 | | | | 1,600,320 | |
Total Federal Agency Notes | | | | |
(Cost $13,601,066) | | | | | | | 13,602,518 | |
| | | | | | | | | |
FEDERAL AGENCY DISCOUNT NOTES†† - 16.8% |
Federal Home Loan Bank |
4.68% due 10/23/242 | | | 6,400,000 | | | | 6,381,696 | |
4.68% due 11/13/242 | | | 3,000,000 | | | | 2,982,908 | |
4.68% due 10/16/242 | | | 1,000,000 | | | | 997,977 | |
Total Federal Agency Discount Notes | | | | |
(Cost $10,362,581) | | | | | | | 10,362,581 | |
U.S. GOVERNMENT SECURITIES†† - 6.5% |
United States Treasury Floating Rate Note |
4.73% (3 Month U.S. Treasury Bill Rate + 0.14%, Rate Floor: 0.00%) due 10/31/24◊ | | | 4,000,000 | | | | 3,999,023 | |
Total U.S. Government Securities | | | | |
(Cost $3,999,884) | | | | | | | 3,999,023 | |
| | | | | | | | | |
U.S. TREASURY BILLS†† - 4.6% |
U.S. Treasury Bills |
4.70% due 10/22/242 | | | 2,000,000 | | | | 1,994,504 | |
4.63% due 10/10/242,3 | | | 867,000 | | | | 865,993 | |
Total U.S. Treasury Bills | | | | |
(Cost $2,859,914) | | | | | | | 2,860,497 | |
| | | | | | | | | |
REPURCHASE AGREEMENTS††,4 - 36.0% |
J.P. Morgan Securities LLC
issued 09/30/24 at 4.86%
due 10/01/245 | | | 12,168,302 | | | | 12,168,302 | |
BofA Securities, Inc.
issued 09/30/24 at 4.85%
due 10/01/245 | | | 10,050,451 | | | | 10,050,451 | |
Total Repurchase Agreements | | | | |
(Cost $22,218,753) | | | | | | | 22,218,753 | |
| | | | | | | | | |
Total Investments - 93.5% | | | | |
(Cost $57,620,624) | | $ | 57,684,455 | |
Other Assets & Liabilities, net - 6.5% | | | 4,028,424 | |
Total Net Assets - 100.0% | | $ | 61,712,879 | |
SEE NOTES TO FINANCIAL STATEMENTS. | THE RYDEX FUNDS SEMI-ANNUAL FINANCIAL REPORT | 327 |
SCHEDULE OF INVESTMENTS (Unaudited)(continued) | September 30, 2024 |
HIGH YIELD STRATEGY FUND | |
Futures Contracts |
Description | | Number of
Contracts | | | Expiration
Date | | | Notional
Amount | | | Value and
Unrealized
Appreciation
(Depreciation)** | |
Interest Rate Futures Contracts Purchased† |
U.S. Treasury 5 Year Note Futures Contracts | | | 568 | | | | Dec 2024 | | | $ | 62,453,375 | | | $ | (71,346 | ) |
Centrally Cleared Credit Default Swap Agreements Protection Sold†† |
Counterparty | Exchange | Index | | Protection
Premium
Rate | | | Payment
Frequency | | | Maturity
Date | | | Notional
Amount | | | Value | | | Upfront
Premiums
Paid | | | Unrealized
Appreciation** | |
Barclays Bank plc | ICE | CDX.NA.HY.43.V1 | | | 5.00% | | Quarterly | 12/20/29 | | $ | 49,600,000 | | | $ | 3,636,325 | | | $ | 3,633,001 | | | $ | 3,324 | |
Goldman Sachs International | ICE | CDX.NA.HY.43.V1 | | | 5.00% | | Quarterly | 12/20/29 | | | 6,700,000 | | | | 491,197 | | | | 490,179 | | | | 1,018 | |
| | | | | | | | | | | | | | | | | | | | | $ | 4,127,522 | | | $ | 4,123,180 | | | $ | 4,342 | |
Total Return Swap Agreements |
Counterparty | Reference Obligation | Type | | Financing Rate | | Payment
Frequency | | | Maturity
Date | | | Units | | | Notional
Amount | | | Value and
Unrealized
Appreciation | |
OTC Credit Index Swap Agreements†† |
Goldman Sachs International | iShares iBoxx $ High Yield Corporate Bond ETF | Pay | | 5.08% (Federal
Funds Rate +
0.25%) | At Maturity | 10/29/24 | 16,337 | | $ | 1,311,861 | | | $ | 2,941 | |
BNP Paribas | SPDR Bloomberg High Yield Bond ETF | Pay | | 5.38% (Federal
Funds Rate +
0.55%) | At Maturity | 12/19/24 | 1,788 | | | 174,858 | | | | 518 | |
BNP Paribas | iShares iBoxx $ High Yield Corporate Bond ETF | Pay | | 5.38% (Federal
Funds Rate +
0.55%) | At Maturity | 12/19/24 | 1,222 | | | 98,142 | | | | 330 | |
| | | | | | | | | | | | | | | | | | | $ | 1,584,861 | | | $ | 3,789 | |
** | Includes cumulative appreciation (depreciation). Variation margin is reported within the Statement of Assets and Liabilities. |
† | Value determined based on Level 1 inputs — See Note 4. |
†† | Value determined based on Level 2 inputs — See Note 4. |
◊ | Variable rate security. Rate indicated is the rate effective at September 30, 2024. In some instances, the effective rate is limited by a minimum rate floor or a maximum rate cap established by the issuer. The settlement status of a position may also impact the effective rate indicated. In some cases, a position may be unsettled at period end and may not have a stated effective rate. In instances where multiple underlying reference rates and spread amounts are shown, the effective rate is based on a weighted average. |
1 | Affiliated issuer. |
2 | Rate indicated is the effective yield at the time of purchase. |
3 | All or a portion of this security is pledged as futures and credit default swap collateral at September 30, 2024. |
4 | Repurchase Agreements — See Note 6. |
5 | All or a portion of this security is pledged as equity index swap collateral at September 30, 2024. |
| | CDX.NA.HY.43.V1 — Credit Default Swap North American High Yield Series 43 Index Version 1 |
| | ICE — Intercontinental Exchange |
| | plc — Public Limited Company |
| | SOFR — Secured Overnight Financing Rate |
| | |
| | See Sector Classification in Other Information section. |
328 | THE RYDEX FUNDS SEMI-ANNUAL FINANCIAL REPORT | SEE NOTES TO FINANCIAL STATEMENTS. |
SCHEDULE OF INVESTMENTS (Unaudited)(concluded) | September 30, 2024 |
HIGH YIELD STRATEGY FUND | |
The following table summarizes the inputs used to value the Fund’s investments at September 30, 2024 (See Note 4 in the Notes to Financial Statements):
Investments in Securities (Assets) | | Level 1
Quoted
Prices | | | Level 2
Significant
Observable
Inputs | | | Level 3
Significant
Unobservable
Inputs | | | Total | |
Mutual Funds | | $ | 4,641,083 | | | $ | — | | | $ | — | | | $ | 4,641,083 | |
Federal Agency Notes | | | — | | | | 13,602,518 | | | | — | | | | 13,602,518 | |
Federal Agency Discount Notes | | | — | | | | 10,362,581 | | | | — | | | | 10,362,581 | |
U.S. Government Securities | | | — | | | | 3,999,023 | | | | — | | | | 3,999,023 | |
U.S. Treasury Bills | | | — | | | | 2,860,497 | | | | — | | | | 2,860,497 | |
Repurchase Agreements | | | — | | | | 22,218,753 | | | | — | | | | 22,218,753 | |
Credit Default Swap Agreements** | | | — | | | | 4,342 | | | | — | | | | 4,342 | |
Credit Index Swap Agreements** | | | — | | | | 3,789 | | | | — | | | | 3,789 | |
Total Assets | | $ | 4,641,083 | | | $ | 53,051,503 | | | $ | — | | | $ | 57,692,586 | |
Investments in Securities (Liabilities) | | Level 1
Quoted
Prices | | | Level 2
Significant
Observable
Inputs | | | Level 3
Significant
Unobservable
Inputs | | | Total | |
Interest Rate Futures Contracts** | | $ | 71,346 | | | $ | — | | | $ | — | | | $ | 71,346 | |
** | This derivative is reported as unrealized appreciation/depreciation at period end. |
Affiliated Transactions
Investments representing 5% or more of the outstanding voting shares of a company, or control of or by, or common control under Guggenheim Investments (“GI”), result in that company being considered an affiliated issuer, as defined in the 1940 Act.
The Fund may invest in certain of the underlying series of Guggenheim Strategy Funds Trust, including Guggenheim Strategy Fund II and Guggenheim Strategy Fund III (collectively, the “Guggenheim Strategy Funds”), each of which are open-end management investment companies managed by GI. The Guggenheim Strategy Funds, which launched on March 11, 2014, are offered as short term investment options only to mutual funds, trusts, and other accounts managed by GI and/or its affiliates, and are not available to the public. The Guggenheim Strategy Funds pay no investment management fees. The Guggenheim Strategy Funds’ annual report on Form N-CSR dated September 30, 2023 is available publicly or upon request. This information is available from the EDGAR database on the SEC’s website at https://www.sec.gov/Archives/edgar/data/1601445/000182126823000217/gug86449-ncsr.htm. The Fund may invest in certain of the underlying series of Guggenheim Funds Trust, which are open-end management investment companies managed by GI, are available to the public and whose most recent annual report on Form N-CSR is available publicly or upon request.
Transactions during the period ended September 30, 2024, in which the company is an affiliated issuer, were as follows:
Security Name | | Value
03/31/24 | | | Additions | | | Reductions | | | Realized
Gain (Loss) | | | Change in
Unrealized
Appreciation
(Depreciation) | | | Value
09/30/24 | | | Shares
09/30/24 | | | Investment
Income | |
Mutual Funds | | | | | | | | | | | | | | | | | | | | | | | | | | | | | | | | |
Guggenheim Strategy Fund II | | $ | 1,308,049 | | | $ | — | | | $ | — | | | $ | — | | | $ | 10,635 | | | $ | 1,318,684 | | | | 53,173 | | | $ | 37,455 | |
Guggenheim Strategy Fund III | | | 1,969,680 | | | | — | | | | — | | | | — | | | | 17,564 | | | | 1,987,244 | | | | 79,841 | | | | 53,912 | |
Guggenheim Ultra Short Duration Fund — Institutional Class | | | 1,320,497 | | | | — | | | | — | | | | — | | | | 14,658 | | | | 1,335,155 | | | | 133,249 | | | | 34,412 | |
| | | $ | 4,598,226 | | | $ | — | | | $ | — | | | $ | — | | | $ | 42,857 | | | $ | 4,641,083 | | | | | | | $ | 125,779 | |
SEE NOTES TO FINANCIAL STATEMENTS. | THE RYDEX FUNDS SEMI-ANNUAL FINANCIAL REPORT | 329 |
STATEMENT OF ASSETS AND LIABILITIES (Unaudited) |
September 30, 2024 |
Assets: |
Investments in unaffiliated issuers, at value (cost $30,823,445) | | $ | 30,824,619 | |
Investments in affiliated issuers, at value (cost $4,578,426) | | | 4,641,083 | |
Repurchase agreements, at value (cost $22,218,753) | | | 22,218,753 | |
Segregated cash with broker | | | 883,211 | |
Unamortized upfront premiums paid on credit default swap agreements | | | 4,123,180 | |
Unrealized appreciation on OTC swap agreements | | | 3,789 | |
Receivables: |
Swap settlement | | | 228,628 | |
Interest | | | 144,514 | |
Protection fees on credit default swap agreements | | | 86,014 | |
Fund shares sold | | | 23,312 | |
Dividends | | | 19,574 | |
Total assets | | | 63,196,677 | |
| | | | | |
Liabilities: |
Segregated cash due to broker | | | 433,544 | |
Payable for: |
Variation margin on credit default swap agreements | | | 770,440 | |
Variation margin on futures contracts | | | 162,673 | |
Fund shares redeemed | | | 31,905 | |
Management fees | | | 27,887 | |
Transfer agent fees | | | 18,310 | |
Distribution and service fees | | | 9,660 | |
Portfolio accounting and administration fees | | | 3,850 | |
Trustees’ fees* | | | 369 | |
Miscellaneous | | | 25,160 | |
Total liabilities | | | 1,483,798 | |
Net assets | | $ | 61,712,879 | |
| | | | | |
Net assets consist of: |
Paid in capital | | $ | 70,812,911 | |
Total distributable earnings (loss) | | | (9,100,032 | ) |
Net assets | | $ | 61,712,879 | |
Class A: |
Net assets | | $ | 3,278,781 | |
Capital shares outstanding | | | 25,345 | |
Net asset value per share | | $ | 129.37 | |
Maximum offering price per share (Net asset value divided by 95.25%) | | $ | 135.82 | |
Class C: |
Net assets | | $ | 499,807 | |
Capital shares outstanding | | | 4,661 | |
Net asset value per share | | $ | 107.23 | |
Class H: |
Net assets | | $ | 57,934,291 | |
Capital shares outstanding | | | 448,100 | |
Net asset value per share | | $ | 129.29 | |
STATEMENT OF OPERATIONS (Unaudited) |
Six Months Ended September 30, 2024 |
Investment Income: |
Dividends from securities of affiliated issuers | | $ | 125,779 | |
Interest | | | 829,240 | |
Total investment income | | | 955,019 | |
| | | | | |
Expenses: |
Management fees | | | 142,589 | |
Distribution and service fees: |
Class A | | | 3,849 | |
Class C | | | 2,222 | |
Class H | | | 43,124 | |
Transfer agent fees | | | 39,440 | |
Portfolio accounting and administration fees | | | 29,007 | |
Registration fees | | | 15,073 | |
Professional fees | | | 8,338 | |
Custodian fees | | | 2,417 | |
Trustees’ fees* | | | 2,039 | |
Miscellaneous | | | 12,725 | |
Total expenses | | | 300,823 | |
Less: |
Expenses reimbursed by Adviser | | | (9,497 | ) |
Expenses waived by Adviser | | | (1,658 | ) |
Total waived/reimbursed expenses | | | (11,155 | ) |
Net expenses | | | 289,668 | |
Net investment income | | | 665,351 | |
| | | | | |
Net Realized and Unrealized Gain (Loss): |
Net realized gain (loss) on: |
Investments in unaffiliated issuers | | | 168 | |
Swap agreements | | | 1,389,539 | |
Futures contracts | | | 644,836 | |
Net realized gain | | | 2,034,543 | |
Net change in unrealized appreciation (depreciation) on: |
Investments in unaffiliated issuers | | | (1,387 | ) |
Investments in affiliated issuers | | | 42,857 | |
Swap agreements | | | (53,536 | ) |
Futures contracts | | | (165,074 | ) |
Net change in unrealized appreciation (depreciation) | | | (177,140 | ) |
Net realized and unrealized gain | | | 1,857,403 | |
Net increase in net assets resulting from operations | | $ | 2,522,754 | |
* | Relates to Trustees not deemed “interested persons” within the meaning of Section 2(a)(19) of the 1940 Act. |
330 | THE RYDEX FUNDS SEMI-ANNUAL FINANCIAL REPORT | SEE NOTES TO FINANCIAL STATEMENTS. |
STATEMENTS OF CHANGES IN NET ASSETS |
| | Six Months Ended
September 30, 2024
(Unaudited) | | | Year Ended
March 31,
2024 | |
Increase (Decrease) in Net Assets from Operations: | | | | | | | | |
Net investment income | | $ | 665,351 | | | $ | 1,337,382 | |
Net realized gain on investments | | | 2,034,543 | | | | 2,497,595 | |
Net change in unrealized appreciation (depreciation) on investments | | | (177,140 | ) | | | (237,216 | ) |
Net increase in net assets resulting from operations | | | 2,522,754 | | | | 3,597,761 | |
| | | | | | | | | |
Distributions to shareholders: | | | | | | | | |
Class A | | | — | | | | (137,018 | ) |
Class C | | | — | | | | (33,052 | ) |
Class H | | | — | | | | (1,598,601 | ) |
Total distributions to shareholders | | | — | | | | (1,768,671 | ) |
| | | | | | | | | |
Capital share transactions: | | | | | | | | |
Proceeds from sale of shares | | | | | | | | |
Class A | | | 706,314 | | | | 1,827,822 | |
Class C | | | 221,569 | | | | 785,584 | |
Class H | | | 100,580,345 | | | | 136,262,338 | |
Distributions reinvested | | | | | | | | |
Class A | | | — | | | | 136,021 | |
Class C | | | — | | | | 27,809 | |
Class H | | | — | | | | 1,594,479 | |
Cost of shares redeemed | | | | | | | | |
Class A | | | (620,542 | ) | | | (1,695,572 | ) |
Class C | | | (166,963 | ) | | | (1,677,806 | ) |
Class H | | | (77,774,336 | ) | | | (121,545,224 | ) |
Net increase from capital share transactions | | | 22,946,387 | | | | 15,715,451 | |
Net increase in net assets | | | 25,469,141 | | | | 17,544,541 | |
| | | | | | | | | |
Net assets: | | | | | | | | |
Beginning of period | | | 36,243,738 | | | | 18,699,197 | |
End of period | | $ | 61,712,879 | | | $ | 36,243,738 | |
| | | | | | | | | |
Capital share activity: | | | | | | | | |
Shares sold | | | | | | | | |
Class A | | | 5,721 | | | | 15,897 | |
Class C | | | 2,158 | | | | 8,108 | |
Class H | | | 803,456 | | | | 1,177,645 | |
Shares issued from reinvestment of distributions | | | | | | | | |
Class A | | | — | | | | 1,178 | |
Class C | | | — | | | | 289 | |
Class H | | | — | | | | 13,812 | |
Shares redeemed | | | | | | | | |
Class A | | | (5,024 | ) | | | (14,472 | ) |
Class C | | | (1,632 | ) | | | (17,200 | ) |
Class H | | | (626,237 | ) | | | (1,051,014 | ) |
Net increase in shares | | | 178,442 | | | | 134,243 | |
SEE NOTES TO FINANCIAL STATEMENTS. | THE RYDEX FUNDS SEMI-ANNUAL FINANCIAL REPORT | 331 |
This table is presented to show selected data for a share outstanding throughout each period and to assist shareholders in evaluating a Fund’s performance for the periods presented.
Class A | | Six Months Ended
September 30, 2024a | | | Year Ended
March 31,
2024 | | | Year Ended
March 31,
2023 | | | Year Ended
March 31,
2022 | | | Year Ended
March 31,
2021 | | | Year Ended
March 31,
2020g | |
Per Share Data |
Net asset value, beginning of period | | $ | 121.29 | | | $ | 114.48 | | | $ | 117.11 | | | $ | 122.60 | | | $ | 108.68 | | | $ | 120.48 | |
Income (loss) from investment operations: |
Net investment income (loss)b | | | 2.18 | | | | 3.96 | | | | 1.41 | | | | (1.36 | ) | | | (.55 | ) | | | .70 | |
Net gain (loss) on investments (realized and unrealized) | | | 5.90 | | | | 7.66 | | | | (3.68 | ) | | | (4.13 | ) | | | 14.47 | f | | | (7.05 | ) |
Total from investment operations | | | 8.08 | | | | 11.62 | | | | (2.27 | ) | | | (5.49 | ) | | | 13.92 | | | | (6.35 | ) |
Less distributions from: |
Net investment income | | | — | | | | (4.81 | ) | | | (.36 | ) | | | — | | | | — | | | | (5.45 | ) |
Total distributions | | | — | | | | (4.81 | ) | | | (.36 | ) | | | — | | | | — | | | | (5.45 | ) |
Net asset value, end of period | | $ | 129.37 | | | $ | 121.29 | | | $ | 114.48 | | | $ | 117.11 | | | $ | 122.60 | | | $ | 108.68 | |
|
Total Returnc | | | 6.66 | % | | | 10.33 | % | | | (1.89 | %) | | | (4.48 | %) | | | 12.81 | % | | | (5.76 | %) |
Ratios/Supplemental Data |
Net assets, end of period (in thousands) | | $ | 3,279 | | | $ | 2,990 | | | $ | 2,524 | | | $ | 2,962 | | | $ | 4,021 | | | $ | 3,933 | |
Ratios to average net assets: |
Net investment income (loss) | | | 3.53 | % | | | 3.40 | % | | | 1.28 | % | | | (1.10 | %) | | | (1.21 | %) | | | 0.58 | % |
Total expensesd | | | 1.57 | % | | | 1.59 | % | | | 1.54 | % | | | 1.51 | % | | | 1.60 | % | | | 1.63 | % |
Net expensese | | | 1.51 | % | | | 1.54 | % | | | 1.52 | % | | | 1.49 | % | | | 1.57 | % | | | 1.61 | % |
Portfolio turnover rate | | | — | | | | — | | | | — | | | | 40 | % | | | 134 | % | | | — | |
Class C | | Six Months Ended
September 30, 2024a | | | Year Ended
March 31,
2024 | | | Year Ended
March 31,
2023 | | | Year Ended
March 31,
2022 | | | Year Ended
March 31,
2021 | | | Year Ended
March 31,
2020g | |
Per Share Data |
Net asset value, beginning of period | | $ | 100.93 | | | $ | 96.73 | | | $ | 99.75 | | | $ | 105.21 | | | $ | 93.96 | | | $ | 105.62 | |
Income (loss) from investment operations: |
Net investment income (loss)b | | | 1.43 | | | | 2.49 | | | | .50 | | | | (1.97 | ) | | | (.81 | ) | | | (.20 | ) |
Net gain (loss) on investments (realized and unrealized) | | | 4.87 | | | | 6.52 | | | | (3.16 | ) | | | (3.49 | ) | | | 12.06 | f | | | (6.01 | ) |
Total from investment operations | | | 6.30 | | | | 9.01 | | | | (2.66 | ) | | | (5.46 | ) | | | 11.25 | | | | (6.21 | ) |
Less distributions from: |
Net investment income | | | — | | | | (4.81 | ) | | | (.36 | ) | | | — | | | | — | | | | (5.45 | ) |
Total distributions | | | — | | | | (4.81 | ) | | | (.36 | ) | | | — | | | | — | | | | (5.45 | ) |
Net asset value, end of period | | $ | 107.23 | | | $ | 100.93 | | | $ | 96.73 | | | $ | 99.75 | | | $ | 105.21 | | | $ | 93.96 | |
|
Total Returnc | | | 6.24 | % | | | 9.51 | % | | | (2.62 | %) | | | (5.19 | %) | | | 11.97 | % | | | (6.45 | %) |
Ratios/Supplemental Data |
Net assets, end of period (in thousands) | | $ | 500 | | | $ | 417 | | | $ | 1,251 | | | $ | 1,313 | | | $ | 2,136 | | | $ | 866 | |
Ratios to average net assets: |
Net investment income (loss) | | | 2.78 | % | | | 2.55 | % | | | 0.53 | % | | | (1.86 | %) | | | (1.96 | %) | | | (0.20 | %) |
Total expensesd | | | 2.32 | % | | | 2.33 | % | | | 2.29 | % | | | 2.26 | % | | | 2.34 | % | | | 2.38 | % |
Net expensese | | | 2.26 | % | | | 2.30 | % | | | 2.27 | % | | | 2.24 | % | | | 2.32 | % | | | 2.36 | % |
Portfolio turnover rate | | | — | | | | — | | | | — | | | | 40 | % | | | 134 | % | | | — | |
332 | THE RYDEX FUNDS SEMI-ANNUAL FINANCIAL REPORT | SEE NOTES TO FINANCIAL STATEMENTS. |
FINANCIAL HIGHLIGHTS (concluded) |
This table is presented to show selected data for a share outstanding throughout each period and to assist shareholders in evaluating a Fund’s performance for the periods presented.
Class H | | Six Months Ended
September 30, 2024a | | | Year Ended
March 31,
2024 | | | Year Ended
March 31,
2023 | | | Year Ended
March 31,
2022 | | | Year Ended
March 31,
2021 | | | Year Ended
March 31,
2020g | |
Per Share Data |
Net asset value, beginning of period | | $ | 121.22 | | | $ | 114.41 | | | $ | 117.03 | | | $ | 122.51 | | | $ | 108.54 | | | $ | 120.32 | |
Income (loss) from investment operations: |
Net investment income (loss)b | | | 2.17 | | | | 3.98 | | | | 1.61 | | | | (1.41 | ) | | | (.47 | ) | | | .75 | |
Net gain (loss) on investments (realized and unrealized) | | | 5.90 | | | | 7.64 | | | | (3.87 | ) | | | (4.07 | ) | | | 14.44 | f | | | (7.08 | ) |
Total from investment operations | | | 8.07 | | | | 11.62 | | | | (2.26 | ) | | | (5.48 | ) | | | 13.97 | | | | (6.33 | ) |
Less distributions from: |
Net investment income | | | — | | | | (4.81 | ) | | | (.36 | ) | | | — | | | | — | | | | (5.45 | ) |
Total distributions | | | — | | | | (4.81 | ) | | | (.36 | ) | | | — | | | | — | | | | (5.45 | ) |
Net asset value, end of period | | $ | 129.29 | | | $ | 121.22 | | | $ | 114.41 | | | $ | 117.03 | | | $ | 122.51 | | | $ | 108.54 | |
|
Total Return | | | 6.66 | % | | | 10.32 | % | | | (1.88 | %) | | | (4.47 | %) | | | 12.87 | % | | | (5.73 | %) |
Ratios/Supplemental Data |
Net assets, end of period (in thousands) | | $ | 57,934 | | | $ | 32,837 | | | $ | 14,924 | | | $ | 16,947 | | | $ | 19,835 | | | $ | 23,125 | |
Ratios to average net assets: |
Net investment income (loss) | | | 3.51 | % | | | 3.41 | % | | | 1.45 | % | | | (1.14 | %) | | | (1.23 | %) | | | 0.59 | % |
Total expensesd | | | 1.57 | % | | | 1.58 | % | | | 1.55 | % | | | 1.51 | % | | | 1.61 | % | | | 1.63 | % |
Net expensese | | | 1.52 | % | | | 1.54 | % | | | 1.53 | % | | | 1.49 | % | | | 1.59 | % | | | 1.61 | % |
Portfolio turnover rate | | | — | | | | — | | | | — | | | | 40 | % | | | 134 | % | | | — | |
a | Unaudited figures for the period ended September 30, 2024. Percentage amounts for the period, except total return and portfolio turnover rate, have been annualized. |
b | Net investment income (loss) per share was computed using average shares outstanding throughout the period. |
c | Total return does not reflect the impact of any applicable sales charges. |
d | Does not include expenses of the underlying funds in which the Fund invests. |
e | Net expense information reflects the expense ratios after expense waivers and reimbursements, as applicable. |
f | The amount shown for a share outstanding throughout the period does not agree with the aggregate net loss on investments for the year because of sales and purchases of fund shares in relation to fluctuating market value of the investments of the Fund. |
g | Reverse share split — Per share amounts for the period presented through March 31, 2020 have been restated to reflect a 1:5 reverse share split effective August 17, 2020. |
SEE NOTES TO FINANCIAL STATEMENTS. | THE RYDEX FUNDS SEMI-ANNUAL FINANCIAL REPORT | 333 |
SCHEDULE OF INVESTMENTS (Unaudited) | September 30, 2024 |
INVERSE HIGH YIELD STRATEGY FUND | |
| | Shares | | | Value | |
MUTUAL FUNDS† - 19.9% |
Guggenheim Strategy Fund II1 | | | 29,310 | | | $ | 726,877 | |
Guggenheim Ultra Short Duration Fund — Institutional Class1 | | | 37,683 | | | | 377,584 | |
Total Mutual Funds | | | | |
(Cost $1,096,686) | | | | | | | 1,104,461 | |
| | | | | | | | | |
| | | Face
Amount | | | | | |
FEDERAL AGENCY DISCOUNT NOTES†† - 9.0% |
Federal Home Loan Bank |
4.60% due 10/02/242 | | $ | 500,000 | | | | 499,936 | |
Total Federal Agency Discount Notes | | | | |
(Cost $499,936) | | | | | | | 499,936 | |
| | | | | | | | | |
U.S. TREASURY BILLS†† - 1.2% |
U.S. Treasury Bills |
4.63% due 10/10/242,3 | | | 65,000 | | | | 64,924 | |
Total U.S. Treasury Bills | | | | |
(Cost $64,917) | | | | | | | 64,924 | |
| | | | | | | | | |
| | Face
Amount | | | Value | |
REPURCHASE AGREEMENTS††,4 - 65.1% |
J.P. Morgan Securities LLC
issued 09/30/24 at 4.86%
due 10/01/24 | | $ | 1,980,978 | | | $ | 1,980,978 | |
BofA Securities, Inc.
issued 09/30/24 at 4.85%
due 10/01/24 | | | 1,636,195 | | | | 1,636,195 | |
Total Repurchase Agreements | | | | |
(Cost $3,617,173) | | | | | | | 3,617,173 | |
| | | | | | | | | |
Total Investments - 95.2% | | | | |
(Cost $5,278,712) | | $ | 5,286,494 | |
Other Assets & Liabilities, net - 4.8% | | | 266,726 | |
Total Net Assets - 100.0% | | $ | 5,553,220 | |
Futures Contracts |
Description | | Number of
Contracts | | | Expiration
Date | | | Notional
Amount | | | Value and
Unrealized
Depreciation** | |
Interest Rate Futures Contracts Sold Short† |
U.S. Treasury 5 Year Note Futures Contracts | | | 52 | | | | Dec 2024 | | | $ | 5,717,563 | | | $ | (11,119 | ) |
Centrally Cleared Credit Default Swap Agreements Protection Purchased†† |
Counterparty | | Exchange | | | Index | | | Protection
Premium
Rate | | | Payment
Frequency | | | Maturity
Date | | | Notional
Amount | | | Value | | | Upfront
Premiums
Paid | | | Unrealized
Depreciation** | |
Barclays Bank plc | ICE | CDX.NA.HY.43.V1 | | | 5.00% | | | | Quarterly | | | | 12/20/29 | | | $ | 5,250,000 | | | $ | (384,893 | ) | | $ | (382,090 | ) | | $ | (2,803 | ) |
** | Includes cumulative appreciation (depreciation). Variation margin is reported within the Statement of Assets and Liabilities. |
† | Value determined based on Level 1 inputs — See Note 4. |
†† | Value determined based on Level 2 inputs — See Note 4. |
1 | Affiliated issuer. |
2 | Rate indicated is the effective yield at the time of purchase. |
3 | All or a portion of this security is pledged as futures and credit default swap collateral at September 30, 2024. |
4 | Repurchase Agreements — See Note 6. |
| | CDX.NA.HY.43.V1 — Credit Default Swap North American High Yield Series 43 Index Version 1 |
| | ICE — Intercontinental Exchange |
| | plc — Public Limited Company |
| | |
| | See Sector Classification in Other Information section. |
334 | THE RYDEX FUNDS SEMI-ANNUAL FINANCIAL REPORT | SEE NOTES TO FINANCIAL STATEMENTS. |
SCHEDULE OF INVESTMENTS (Unaudited)(concluded) | September 30, 2024 |
INVERSE HIGH YIELD STRATEGY FUND | |
The following table summarizes the inputs used to value the Fund’s investments at September 30, 2024 (See Note 4 in the Notes to Financial Statements):
Investments in Securities (Assets) | | Level 1
Quoted
Prices | | | Level 2
Significant
Observable
Inputs | | | Level 3
Significant
Unobservable
Inputs | | | Total | |
Mutual Funds | | $ | 1,104,461 | | | $ | — | | | $ | — | | | $ | 1,104,461 | |
Federal Agency Discount Notes | | | — | | | | 499,936 | | | | — | | | | 499,936 | |
U.S. Treasury Bills | | | — | | | | 64,924 | | | | — | | | | 64,924 | |
Repurchase Agreements | | | — | | | | 3,617,173 | | | | — | | | | 3,617,173 | |
Total Assets | | $ | 1,104,461 | | | $ | 4,182,033 | | | $ | — | | | $ | 5,286,494 | |
Investments in Securities (Liabilities) | | Level 1
Quoted
Prices | | | Level 2
Significant
Observable
Inputs | | | Level 3
Significant
Unobservable
Inputs | | | Total | |
Interest Rate Futures Contracts** | | $ | 11,119 | | | $ | — | | | $ | — | | | $ | 11,119 | |
Credit Default Swap Agreements** | | | — | | | | 2,803 | | | | — | | | | 2,803 | |
Total Liabilities | | $ | 11,119 | | | $ | 2,803 | | | $ | — | | | $ | 13,922 | |
** | This derivative is reported as unrealized appreciation/depreciation at period end. |
Affiliated Transactions
Investments representing 5% or more of the outstanding voting shares of a company, or control of or by, or common control under Guggenheim Investments (“GI”), result in that company being considered an affiliated issuer, as defined in the 1940 Act.
The Fund may invest in certain of the underlying series of Guggenheim Strategy Funds Trust, including Guggenheim Strategy Fund II and Guggenheim Strategy Fund III (collectively, the “Guggenheim Strategy Funds”), each of which are open-end management investment companies managed by GI. The Guggenheim Strategy Funds, which launched on March 11, 2014, are offered as short term investment options only to mutual funds, trusts, and other accounts managed by GI and/or its affiliates, and are not available to the public. The Guggenheim Strategy Funds pay no investment management fees. The Guggenheim Strategy Funds’ annual report on Form N-CSR dated September 30, 2023 is available publicly or upon request. This information is available from the EDGAR database on the SEC’s website at https://www.sec.gov/Archives/edgar/data/1601445/000182126823000217/gug86449-ncsr.htm. The Fund may invest in certain of the underlying series of Guggenheim Funds Trust, which are open-end management investment companies managed by GI, are available to the public and whose most recent annual report on Form N-CSR is available publicly or upon request.
Transactions during the period ended September 30, 2024, in which the company is an affiliated issuer, were as follows:
Security Name | | Value
03/31/24 | | | Additions | | | Reductions | | | Realized
Gain (Loss) | | | Change in
Unrealized
Appreciation
(Depreciation) | | | Value
09/30/24 | | | Shares
09/30/24 | | | Investment
Income | |
Mutual Funds | | | | | | | | | | | | | | | | | | | | | | | | | | | | | | | | |
Guggenheim Strategy Fund II | | $ | 721,015 | | | $ | — | | | $ | — | | | $ | — | | | $ | 5,862 | | | $ | 726,877 | | | | 29,310 | | | $ | 20,645 | |
Guggenheim Ultra Short Duration Fund — Institutional Class | | | 373,439 | | | | — | | | | — | | | | — | | | | 4,145 | | | | 377,584 | | | | 37,683 | | | | 9,732 | |
| | | $ | 1,094,454 | | | $ | — | | | $ | — | | | $ | — | | | $ | 10,007 | | | $ | 1,104,461 | | | | | | | $ | 30,377 | |
SEE NOTES TO FINANCIAL STATEMENTS. | THE RYDEX FUNDS SEMI-ANNUAL FINANCIAL REPORT | 335 |
INVERSE HIGH YIELD STRATEGY FUND | |
STATEMENT OF ASSETS AND LIABILITIES (Unaudited) |
September 30, 2024 |
Assets: |
Investments in unaffiliated issuers, at value (cost $564,853) | | $ | 564,860 | |
Investments in affiliated issuers, at value (cost $1,096,686) | | | 1,104,461 | |
Repurchase agreements, at value (cost $3,617,173) | | | 3,617,173 | |
Segregated cash with broker | | | 594,612 | |
Receivables: |
Variation margin on credit default swap agreements | | | 75,362 | |
Variation margin on futures contracts | | | 14,839 | |
Dividends | | | 4,752 | |
Interest | | | 488 | |
Fund shares sold | | | 22 | |
Total assets | | | 5,976,569 | |
| | | | | |
Liabilities: |
Unamortized upfront premiums received on credit default swap agreements | | | 382,090 | |
Payable for: |
Swap settlement | | | 22,270 | |
Protection fees on credit default swap agreements | | | 8,021 | |
Management fees | | | 3,156 | |
Transfer agent fees | | | 2,627 | |
Distribution and service fees | | | 1,087 | |
Portfolio accounting and administration fees | | | 442 | |
Trustees’ fees* | | | 52 | |
Miscellaneous | | | 3,604 | |
Total liabilities | | | 423,349 | |
Net assets | | $ | 5,553,220 | |
| | | | | |
Net assets consist of: |
Paid in capital | | $ | 16,890,163 | |
Total distributable earnings (loss) | | | (11,336,943 | ) |
Net assets | | $ | 5,553,220 | |
Class A: |
Net assets | | $ | 239,828 | |
Capital shares outstanding | | | 5,079 | |
Net asset value per share | | $ | 47.22 | |
Maximum offering price per share (Net asset value divided by 95.25%) | | $ | 49.57 | |
Class C: |
Net assets | | $ | 18,254 | |
Capital shares outstanding | | | 443 | |
Net asset value per share | | $ | 41.24 | |
Class H: |
Net assets | | $ | 5,295,138 | |
Capital shares outstanding | | | 109,279 | |
Net asset value per share | | $ | 48.46 | |
STATEMENT OF OPERATIONS (Unaudited) |
Six Months Ended September 30, 2024 |
Investment Income: |
Dividends from securities of affiliated issuers | | $ | 30,377 | |
Interest | | | 139,643 | |
Total investment income | | | 170,020 | |
| | | | | |
Expenses: |
Management fees | | | 24,915 | |
Distribution and service fees: |
Class A | | | 310 | |
Class C | | | 139 | |
Class H | | | 7,960 | |
Transfer agent fees | | | 6,825 | |
Portfolio accounting and administration fees | | | 5,068 | |
Registration fees | | | 3,577 | |
Professional fees | | | 1,607 | |
Trustees’ fees* | | | 436 | |
Custodian fees | | | 426 | |
Miscellaneous | | | 725 | |
Total expenses | | | 51,988 | |
Less: |
Expenses reimbursed by Adviser | | | (1,659 | ) |
Expenses waived by Adviser | | | (469 | ) |
Total waived expenses | | | (2,128 | ) |
Net expenses | | | 49,860 | |
Net investment income | | | 120,160 | |
| | | | | |
Net Realized and Unrealized Gain (Loss): |
Net realized gain (loss) on: |
Investments in unaffiliated issuers | | | 4 | |
Swap agreements | | | (223,181 | ) |
Futures contracts | | | (126,282 | ) |
Net realized loss | | | (349,459 | ) |
Net change in unrealized appreciation (depreciation) on: |
Investments in unaffiliated issuers | | | 8 | |
Investments in affiliated issuers | | | 10,007 | |
Swap agreements | | | 10,419 | |
Futures contracts | | | 7,057 | |
Net change in unrealized appreciation (depreciation) | | | 27,491 | |
Net realized and unrealized loss | | | (321,968 | ) |
Net decrease in net assets resulting from operations | | $ | (201,808 | ) |
* | Relates to Trustees not deemed “interested persons” within the meaning of Section 2(a)(19) of the 1940 Act. |
336 | THE RYDEX FUNDS SEMI-ANNUAL FINANCIAL REPORT | SEE NOTES TO FINANCIAL STATEMENTS. |
INVERSE HIGH YIELD STRATEGY FUND | |
STATEMENTS OF CHANGES IN NET ASSETS |
| | Six Months Ended
September 30, 2024
(Unaudited) | | | Year Ended
March 31,
2024 | |
Increase (Decrease) in Net Assets from Operations: | | | | | | | | |
Net investment income | | $ | 120,160 | | | $ | 397,509 | |
Net realized loss on investments | | | (349,459 | ) | | | (1,040,432 | ) |
Net change in unrealized appreciation (depreciation) on investments | | | 27,491 | | | | 490,522 | |
Net decrease in net assets resulting from operations | | | (201,808 | ) | | | (152,401 | ) |
| | | | | | | | | |
Capital share transactions: | | | | | | | | |
Proceeds from sale of shares | | | | | | | | |
Class A | | | 59,307 | | | | 149,996 | |
Class C | | | 10,000 | | | | 14,129 | |
Class H | | | 12,203,736 | | | | 37,702,557 | |
Cost of shares redeemed | | | | | | | | |
Class A | | | (44,936 | ) | | | (259,305 | ) |
Class C | | | (15,005 | ) | | | (73,793 | ) |
Class H | | | (12,823,360 | ) | | | (49,378,394 | ) |
Net decrease from capital share transactions | | | (610,258 | ) | | | (11,844,810 | ) |
Net decrease in net assets | | | (812,066 | ) | | | (11,997,211 | ) |
| | | | | | | | | |
Net assets: | | | | | | | | |
Beginning of period | | | 6,365,286 | | | | 18,362,497 | |
End of period | | $ | 5,553,220 | | | $ | 6,365,286 | |
| | | | | | | | | |
Capital share activity: | | | | | | | | |
Shares sold | | | | | | | | |
Class A | | | 1,215 | | | | 2,986 | |
Class C | | | 231 | | | | 320 | |
Class H | | | 240,737 | | | | 732,244 | |
Shares redeemed | | | | | | | | |
Class A | | | (930 | ) | | | (5,233 | ) |
Class C | | | (359 | ) | | | (1,679 | ) |
Class H | | | (254,234 | ) | | | (960,166 | ) |
Net decrease in shares | | | (13,340 | ) | | | (231,528 | ) |
SEE NOTES TO FINANCIAL STATEMENTS. | THE RYDEX FUNDS SEMI-ANNUAL FINANCIAL REPORT | 337 |
INVERSE HIGH YIELD STRATEGY FUND | |
This table is presented to show selected data for a share outstanding throughout each period and to assist shareholders in evaluating a Fund’s performance for the periods presented.
Class A | | Six Months Ended
September 30, 2024a | | | Year Ended
March 31,
2024 | | | Year Ended
March 31,
2023 | | | Year Ended
March 31,
2022 | | | Year Ended
March 31,
2021 | | | Year Ended
March 31,
2020 | |
Per Share Data |
Net asset value, beginning of period | | $ | 48.49 | | | $ | 49.81 | | | $ | 49.19 | | | $ | 50.15 | | | $ | 62.01 | | | $ | 60.47 | |
Income (loss) from investment operations: |
Net investment income (loss)b | | | .88 | | | | 1.72 | | | | (.01 | ) | | | (.64 | ) | | | (.68 | ) | | | .24 | |
Net gain (loss) on investments (realized and unrealized) | | | (2.15 | ) | | | (3.04 | ) | | | .63 | f | | | .82 | | | | (7.31 | ) | | | 1.30 | |
Total from investment operations | | | (1.27 | ) | | | (1.32 | ) | | | .62 | | | | .18 | | | | (7.99 | ) | | | 1.54 | |
Less distributions from: |
Net investment income | | | — | | | | — | | | | — | | | | (1.14 | ) | | | (3.87 | ) | | | — | |
Total distributions | | | — | | | | — | | | | — | | | | (1.14 | ) | | | (3.87 | ) | | | — | |
Net asset value, end of period | | $ | 47.22 | | | $ | 48.49 | | | $ | 49.81 | | | $ | 49.19 | | | $ | 50.15 | | | $ | 62.01 | |
|
Total Returnc | | | (2.62 | %) | | | (2.65 | %) | | | 1.26 | % | | | 0.47 | % | | | (12.88 | %) | | | 2.56 | % |
Ratios/Supplemental Data |
Net assets, end of period (in thousands) | | $ | 240 | | | $ | 232 | | | $ | 351 | | | $ | 238 | | | $ | 5,612 | | | $ | 256 | |
Ratios to average net assets: |
Net investment income (loss) | | | 3.62 | % | | | 3.43 | % | | | (0.02 | %) | | | (1.31 | %) | | | (1.28 | %) | | | 0.40 | % |
Total expensesd | | | 1.57 | % | | | 1.58 | % | | | 1.55 | % | | | 1.50 | % | | | 1.56 | % | | | 1.62 | % |
Net expensese | | | 1.50 | % | | | 1.54 | % | | | 1.55 | % | | | 1.49 | % | | | 1.54 | % | | | 1.61 | % |
Portfolio turnover rate | | | — | | | | — | | | | — | | | | 344 | % | | | 438 | % | | | 254 | % |
Class C | | Six Months Ended
September 30, 2024a | | | Year Ended
March 31,
2024 | | | Year Ended
March 31,
2023 | | | Year Ended
March 31,
2022 | | | Year Ended
March 31,
2021 | | | Year Ended
March 31,
2020 | |
Per Share Data |
Net asset value, beginning of period | | $ | 42.50 | | | $ | 44.00 | | | $ | 43.75 | | | $ | 44.74 | | | $ | 56.62 | | | $ | 55.76 | |
Income (loss) from investment operations: |
Net investment income (loss)b | | | .61 | | | | 1.17 | | | | .01 | | | | (.81 | ) | | | (.90 | ) | | | (.05 | ) |
Net gain (loss) on investments (realized and unrealized) | | | (1.87 | ) | | | (2.67 | ) | | | .24 | f | | | .96 | | | | (7.11 | ) | | | .91 | |
Total from investment operations | | | (1.26 | ) | | | (1.50 | ) | | | .25 | | | | .15 | | | | (8.01 | ) | | | .86 | |
Less distributions from: |
Net investment income | | | — | | | | — | | | | — | | | | (1.14 | ) | | | (3.87 | ) | | | — | |
Total distributions | | | — | | | | — | | | | — | | | | (1.14 | ) | | | (3.87 | ) | | | — | |
Net asset value, end of period | | $ | 41.24 | | | $ | 42.50 | | | $ | 44.00 | | | $ | 43.75 | | | $ | 44.74 | | | $ | 56.62 | |
|
Total Returnc | | | (2.96 | %) | | | (3.41 | %) | | | 0.57 | % | | | 0.45 | % | | | (14.23 | %) | | | 1.54 | % |
Ratios/Supplemental Data |
Net assets, end of period (in thousands) | | $ | 18 | | | $ | 24 | | | $ | 85 | | | $ | 119 | | | $ | 162 | | | $ | 362 | |
Ratios to average net assets: |
Net investment income (loss) | | | 2.87 | % | | | 2.64 | % | | | 0.01 | % | | | (1.88 | %) | | | (1.78 | %) | | | (0.09 | %) |
Total expensesd | | | 2.32 | % | | | 2.33 | % | | | 2.29 | % | | | 2.26 | % | | | 2.36 | % | | | 2.37 | % |
Net expensese | | | 2.25 | % | | | 2.29 | % | | | 2.29 | % | | | 2.22 | % | | | 2.31 | % | | | 2.34 | % |
Portfolio turnover rate | | | — | | | | — | | | | — | | | | 344 | % | | | 438 | % | | | 254 | % |
338 | THE RYDEX FUNDS SEMI-ANNUAL FINANCIAL REPORT | SEE NOTES TO FINANCIAL STATEMENTS. |
INVERSE HIGH YIELD STRATEGY FUND | |
FINANCIAL HIGHLIGHTS (concluded) |
This table is presented to show selected data for a share outstanding throughout each period and to assist shareholders in evaluating a Fund’s performance for the periods presented.
Class H | | Six Months Ended
September 30, 2024a | | | Year Ended
March 31,
2024 | | | Year Ended
March 31,
2023 | | | Year Ended
March 31,
2022 | | | Year Ended
March 31,
2021 | | | Year Ended
March 31,
2020 | |
Per Share Data |
Net asset value, beginning of period | | $ | 49.75 | | | $ | 51.12 | | | $ | 50.44 | | | $ | 50.99 | | | $ | 63.45 | | | $ | 61.97 | |
Income (loss) from investment operations: |
Net investment income (loss)b | | | .91 | | | | 1.75 | | | | .47 | | | | (.68 | ) | | | (.74 | ) | | | .06 | |
Net gain (loss) on investments (realized and unrealized) | | | (2.20 | ) | | | (3.12 | ) | | | .21 | f | | | 1.27 | | | | (7.85 | ) | | | 1.42 | |
Total from investment operations | | | (1.29 | ) | | | (1.37 | ) | | | .68 | | | | .59 | | | | (8.59 | ) | | | 1.48 | |
Less distributions from: |
Net investment income | | | — | | | | — | | | | — | | | | (1.14 | ) | | | (3.87 | ) | | | — | |
Total distributions | | | — | | | | — | | | | — | | | | (1.14 | ) | | | (3.87 | ) | | | — | |
Net asset value, end of period | | $ | 48.46 | | | $ | 49.75 | | | $ | 51.12 | | | $ | 50.44 | | | $ | 50.99 | | | $ | 63.45 | |
|
Total Return | | | (2.59 | %) | | | (2.68 | %) | | | 1.35 | % | | | 1.27 | % | | | (13.58 | %) | | | 2.39 | % |
Ratios/Supplemental Data |
Net assets, end of period (in thousands) | | $ | 5,295 | | | $ | 6,109 | | | $ | 17,927 | | | $ | 6,706 | | | $ | 3,719 | | | $ | 13,479 | |
Ratios to average net assets: |
Net investment income (loss) | | | 3.62 | % | | | 3.39 | % | | | 0.88 | % | | | (1.35 | %) | | | (1.26 | %) | | | 0.09 | % |
Total expensesd | | | 1.56 | % | | | 1.58 | % | | | 1.54 | % | | | 1.52 | % | | | 1.62 | % | | | 1.64 | % |
Net expensese | | | 1.50 | % | | | 1.55 | % | | | 1.53 | % | | | 1.51 | % | | | 1.60 | % | | | 1.62 | % |
Portfolio turnover rate | | | — | | | | — | | | | — | | | | 344 | % | | | 438 | % | | | 254 | % |
a | Unaudited figures for the period ended September 30, 2024. Percentage amounts for the period, except total return and portfolio turnover rate, have been annualized. |
b | Net investment income (loss) per share was computed using average shares outstanding throughout the period. |
c | Total return does not reflect the impact of any applicable sales charges. |
d | Does not include expenses of the underlying funds in which the Fund invests. |
e | Net expense information reflects the expense ratios after expense waivers and reimbursements, as applicable. |
f | The amount shown for a share outstanding throughout the period does not agree with the aggregate net loss on investments for the year because of the sales and repurchases of fund shares in relation to fluctuating market value of the investments of the Fund. |
SEE NOTES TO FINANCIAL STATEMENTS. | THE RYDEX FUNDS SEMI-ANNUAL FINANCIAL REPORT | 339 |
SCHEDULE OF INVESTMENTS (Unaudited) | September 30, 2024 |
EMERGING MARKETS 2x STRATEGY FUND | |
| | Shares | | | Value | |
COMMON STOCKS† - 42.4% |
| | | | | | | | | |
Communications - 13.9% |
Alibaba Group Holding Ltd. ADR | | | 1,688 | | | $ | 179,130 | |
PDD Holdings, Inc. ADR* | | | 581 | | | | 78,325 | |
JD.com, Inc. ADR | | | 1,327 | | | | 53,080 | |
Trip.com Group Ltd. ADR* | | | 513 | | | | 30,487 | |
Baidu, Inc. ADR* | | | 265 | | | | 27,902 | |
America Movil SAB de CV ADR | | | 885 | | | | 14,479 | |
Chunghwa Telecom Company Ltd. ADR | | | 353 | | | | 14,003 | |
Telkom Indonesia Persero Tbk PT ADR | | | 441 | | | | 8,723 | |
Tencent Music Entertainment Group ADR | | | 615 | | | | 7,411 | |
Full Truck Alliance Company Ltd. ADR | | | 688 | | | | 6,199 | |
Kanzhun Ltd. ADR | | | 308 | | | | 5,347 | |
Total Communications | | | | | | | 425,086 | |
| | | | | | | | | |
Technology - 12.7% |
Taiwan Semiconductor Manufacturing Company Ltd. ADR | | | 1,446 | | | | 251,127 | |
Infosys Ltd. ADR1 | | | 3,003 | | | | 66,877 | |
NetEase, Inc. ADR | | | 323 | | | | 30,204 | |
United Microelectronics Corp. ADR1 | | | 2,163 | | | | 18,212 | |
ASE Technology Holding Company Ltd. ADR | | | 1,589 | | | | 15,509 | |
Wipro Ltd. ADR1 | | | 1,311 | | | | 8,495 | |
Total Technology | | | | | | | 390,424 | |
| | | | | | | | | |
Financial - 7.7% |
HDFC Bank Ltd. ADR | | | 1,562 | | | | 97,719 | |
ICICI Bank Ltd. ADR | | | 1,897 | | | | 56,625 | |
KB Financial Group, Inc. ADR | | | 352 | | | | 21,736 | |
Shinhan Financial Group Company Ltd. ADR | | | 473 | | | | 20,041 | |
KE Holdings, Inc. ADR | | | 664 | | | | 13,220 | |
Banco Bradesco S.A. ADR | | | 4,929 | | | | 13,111 | |
Woori Financial Group, Inc. ADR1 | | | 204 | | | | 7,289 | |
Banco de Chile ADR | | | 206 | | | | 5,214 | |
Total Financial | | | | | | | 234,955 | |
| | | | | | | | | |
Basic Materials - 3.0% |
Vale S.A. ADR | | | 3,328 | | | | 38,871 | |
POSCO Holdings, Inc. ADR | | | 283 | | | | 19,807 | |
Gold Fields Ltd. ADR | | | 829 | | | | 12,725 | |
Suzano S.A. ADR1 | | | 645 | | | | 6,450 | |
Sociedad Quimica y Minera de Chile S.A. ADR1 | | | 133 | | | | 5,544 | |
Harmony Gold Mining Company Ltd. ADR | | | 512 | | | | 5,207 | |
Gerdau S.A. ADR | | | 1,288 | | | | 4,508 | |
Total Basic Materials | | | | | | | 93,112 | |
| | | | | | | | | |
Consumer, Non-cyclical - 2.0% |
Fomento Economico Mexicano SAB de CV ADR | | | 164 | | | | 16,188 | |
BeiGene Ltd. ADR* | | | 58 | | | | 13,022 | |
Ambev S.A. ADR | | | 4,095 | | | | 9,992 | |
Dr Reddy’s Laboratories Ltd. ADR | | | 113 | | | | 8,978 | |
New Oriental Education & Technology Group, Inc. ADR | | | 118 | | | | 8,949 | |
Coca-Cola Femsa SAB de CV ADR | | | 49 | | | | 4,347 | |
Total Consumer, Non-cyclical | | | | | | | 61,476 | |
| | | | | | | | | |
Industrial - 1.1% |
ZTO Express Cayman, Inc. ADR | | | 349 | | | | 8,645 | |
Cemex SAB de CV ADR | | | 1,405 | | | | 8,570 | |
Grupo Aeroportuario del Pacifico SAB de CV ADR | | | 38 | | | | 6,613 | |
Embraer S.A. ADR* | | | 160 | | | | 5,659 | |
Grupo Aeroportuario del Sureste SAB de CV ADR | | | 16 | | | | 4,524 | |
Total Industrial | | | | | | | 34,011 | |
| | | | | | | | | |
Consumer, Cyclical - 0.8% |
Li Auto, Inc. ADR*,1 | | | 589 | | | | 15,108 | |
NIO, Inc. ADR*,1 | | | 1,626 | | | | 10,862 | |
Total Consumer, Cyclical | | | | | | | 25,970 | |
| | | | | | | | | |
Energy - 0.8% |
Petroleo Brasileiro S.A. ADR | | | 1,727 | | | | 24,886 | |
| | | | | | | | | |
Utilities - 0.4% |
Cia de Saneamento Basico do Estado de Sao Paulo SABESP ADR | | | 425 | | | | 7,029 | |
Centrais Eletricas Brasileiras S.A. ADR1 | | | 847 | | | | 6,124 | |
Total Utilities | | | | | | | 13,153 | |
| | | | | | | | | |
Total Common Stocks | | | | |
(Cost $764,508) | | | | | | | 1,303,073 | |
| | | | | | | | | |
PREFERRED STOCKS† - 1.9% |
Financial - 1.0% |
Itau Unibanco Holding S.A. ADR | | | 4,498 | | | | 29,912 | |
| | | | | | | | | |
Energy - 0.9% |
Petroleo Brasileiro S.A. ADR | | | 2,054 | | | | 27,092 | |
Total Preferred Stocks | | | | |
(Cost $37,568) | | | | | | | 57,004 | |
| | | | | | | | | |
| | | Face
Amount | | | | | |
REPURCHASE AGREEMENTS††,2 - 52.5% |
J.P. Morgan Securities LLC
issued 09/30/24 at 4.86%
due 10/01/243 | | $ | 883,412 | | | | 883,412 | |
BofA Securities, Inc.
issued 09/30/24 at 4.85%
due 10/01/243 | | | 729,657 | | | | 729,657 | |
Total Repurchase Agreements | | | | |
(Cost $1,613,069) | | | | | | | 1,613,069 | |
| | | | | | | | | |
340 | THE RYDEX FUNDS SEMI-ANNUAL FINANCIAL REPORT | SEE NOTES TO FINANCIAL STATEMENTS. |
SCHEDULE OF INVESTMENTS (Unaudited)(continued) | September 30, 2024 |
EMERGING MARKETS 2x STRATEGY FUND | |
| | Shares | | | Value | |
SECURITIES LENDING COLLATERAL†,4 - 3.7% |
Money Market Fund*** | | | | | | | | |
First American Government Obligations Fund - Class X, 4.82%5 | | | 112,491 | | | $ | 112,491 | |
Total Securities Lending Collateral | | | | |
(Cost $112,491) | | | | | | | 112,491 | |
| | | | | | | | | |
Total Investments - 100.5% | | | | |
(Cost $2,527,636) | | $ | 3,085,637 | |
Other Assets & Liabilities, net - (0.5)% | | | (15,733 | ) |
Total Net Assets - 100.0% | | $ | 3,069,904 | |
Total Return Swap Agreements |
Counterparty | Index | Type | | Financing
Rate | | Payment
Frequency | | | Maturity
Date | | | Units | | | Notional
Amount | | | Value and
Unrealized
Appreciation | |
OTC Equity Index Swap Agreements†† |
Goldman Sachs International | S&P Emerging 50 ADR Index | Pay | | 5.08% (Federal
Funds Rate +
0.25%) | | | At Maturity | | | | 12/18/24 | | | | 1,158 | | | $ | 3,687,916 | | | $ | 98,017 | |
BNP Paribas | S&P Emerging 50 ADR Index | Pay | | 5.43% (Federal
Funds Rate +
0.60%) | | | At Maturity | | | | 12/19/24 | | | | 348 | | | | 1,108,400 | | | | 31,523 | |
| | | | | | | | | | | | | | | | | | | $ | 4,796,316 | | | $ | 129,540 | |
* | Non-income producing security. |
*** | A copy of each underlying unaffiliated fund’s financial statements is available at the SEC’s website at www.sec.gov. |
† | Value determined based on Level 1 inputs — See Note 4. |
†† | Value determined based on Level 2 inputs — See Note 4. |
1 | All or a portion of this security is on loan at September 30, 2024 — See Note 7. |
2 | Repurchase Agreements — See Note 6. |
3 | All or a portion of this security is pledged as equity index swap collateral at September 30, 2024. |
4 | Securities lending collateral — See Note 7. |
5 | Rate indicated is the 7-day yield as of September 30, 2024. |
| | ADR — American Depositary Receipt |
| | |
| | See Sector Classification in Other Information section. |
SEE NOTES TO FINANCIAL STATEMENTS. | THE RYDEX FUNDS SEMI-ANNUAL FINANCIAL REPORT | 341 |
SCHEDULE OF INVESTMENTS (Unaudited)(concluded) | September 30, 2024 |
EMERGING MARKETS 2x STRATEGY FUND | |
The following table summarizes the inputs used to value the Fund’s investments at September 30, 2024 (See Note 4 in the Notes to Financial Statements):
Investments in Securities (Assets) | | Level 1
Quoted
Prices | | | Level 2
Significant
Observable
Inputs | | | Level 3
Significant
Unobservable
Inputs | | | Total | |
Common Stocks | | $ | 1,303,073 | | | $ | — | | | $ | — | | | $ | 1,303,073 | |
Preferred Stocks | | | 57,004 | | | | — | | | | — | | | | 57,004 | |
Repurchase Agreements | | | — | | | | 1,613,069 | | | | — | | | | 1,613,069 | |
Securities Lending Collateral | | | 112,491 | | | | — | | | | — | | | | 112,491 | |
Equity Index Swap Agreements** | | | — | | | | 129,540 | | | | — | | | | 129,540 | |
Total Assets | | $ | 1,472,568 | | | $ | 1,742,609 | | | $ | — | | | $ | 3,215,177 | |
** | This derivative is reported as unrealized appreciation/depreciation at period end. |
342 | THE RYDEX FUNDS SEMI-ANNUAL FINANCIAL REPORT | SEE NOTES TO FINANCIAL STATEMENTS. |
EMERGING MARKETS 2x STRATEGY FUND | |
STATEMENT OF ASSETS AND LIABILITIES (Unaudited) |
September 30, 2024 |
Assets: |
Investments, at value - including $108,517 of securities loaned (cost $914,567) | | $ | 1,472,568 | |
Repurchase agreements, at value (cost $1,613,069) | | | 1,613,069 | |
Cash | | | 655 | |
Unrealized appreciation on OTC swap agreements | | | 129,540 | |
Receivables: |
Fund shares sold | | | 129,435 | |
Swap settlement | | | 9,485 | |
Dividends | | | 2,647 | |
Interest | | | 218 | |
Securities lending income | | | 41 | |
Total assets | | | 3,357,658 | |
| | | | | |
Liabilities: |
Segregated cash due to broker | | | 120,000 | |
Payable for: |
Return of securities lending collateral | | | 112,491 | |
Fund shares redeemed | | | 48,977 | |
Management fees | | | 1,900 | |
Transfer agent fees | | | 1,252 | |
Distribution and service fees | | | 671 | |
Portfolio accounting and administration fees | | | 222 | |
Trustees’ fees* | | | 25 | |
Miscellaneous | | | 2,216 | |
Total liabilities | | | 287,754 | |
Net assets | �� | $ | 3,069,904 | |
| | | | | |
Net assets consist of: |
Paid in capital | | $ | 17,934,946 | |
Total distributable earnings (loss) | | | (14,865,042 | ) |
Net assets | | $ | 3,069,904 | |
Class A: |
Net assets | | $ | 249,474 | |
Capital shares outstanding | | | 3,505 | |
Net asset value per share | | $ | 71.18 | |
Maximum offering price per share (Net asset value divided by 95.25%) | | $ | 74.73 | |
Class C: |
Net assets | | $ | 252,355 | |
Capital shares outstanding | | | 3,899 | |
Net asset value per share | | $ | 64.72 | |
Class H: |
Net assets | | $ | 2,568,075 | |
Capital shares outstanding | | | 36,200 | |
Net asset value per share | | $ | 70.94 | |
STATEMENT OF OPERATIONS (Unaudited) |
Six Months Ended September 30, 2024 |
Investment Income: |
Dividends (net of foreign withholding tax of $816) | | $ | 21,643 | |
Interest | | | 46,059 | |
Income from securities lending, net | | | 508 | |
Total investment income | | | 68,210 | |
| | | | | |
Expenses: |
Management fees | | | 13,236 | |
Distribution and service fees: |
Class A | | | 264 | |
Class C | | | 910 | |
Class H | | | 3,187 | |
Transfer agent fees | | | 3,148 | |
Portfolio accounting and administration fees | | | 3,017 | |
Registration fees | | | 1,637 | |
Interest expense | | | 1,060 | |
Professional fees | | | 682 | |
Custodian fees | | | 189 | |
Trustees’ fees* | | | 186 | |
Miscellaneous | | | 945 | |
Total expenses | | | 28,461 | |
Less: |
Expenses reimbursed by Adviser | | | (1,470 | ) |
Net expenses | | | 26,991 | |
Net investment income | | | 41,219 | |
| | | | | |
Net Realized and Unrealized Gain (Loss): |
Net realized gain (loss) on: |
Investments | | | 47,500 | |
Swap agreements | | | 346,685 | |
Net realized gain | | | 394,185 | |
Net change in unrealized appreciation (depreciation) on: |
Investments | | | 117,634 | |
Swap agreements | | | 195,414 | |
Net change in unrealized appreciation (depreciation) | | | 313,048 | |
Net realized and unrealized gain | | | 707,233 | |
Net increase in net assets resulting from operations | | $ | 748,452 | |
* | Relates to Trustees not deemed “interested persons” within the meaning of Section 2(a)(19) of the 1940 Act. |
SEE NOTES TO FINANCIAL STATEMENTS. | THE RYDEX FUNDS SEMI-ANNUAL FINANCIAL REPORT | 343 |
EMERGING MARKETS 2x STRATEGY FUND | |
STATEMENTS OF CHANGES IN NET ASSETS |
| | Six Months Ended
September 30, 2024
(Unaudited) | | | Year Ended
March 31,
2024 | |
Increase (Decrease) in Net Assets from Operations: | | | | | | | | |
Net investment income | | $ | 41,219 | | | $ | 85,880 | |
Net realized gain on investments | | | 394,185 | | | | 382,168 | |
Net change in unrealized appreciation (depreciation) on investments | | | 313,048 | | | | (9,018 | ) |
Net increase in net assets resulting from operations | | | 748,452 | | | | 459,030 | |
| | | | | | | | | |
Distributions to shareholders: | | | | | | | | |
Class A | | | — | | | | (5,559 | ) |
Class C | | | — | | | | (1,980 | ) |
Class H | | | — | | | | (118,887 | ) |
Total distributions to shareholders | | | — | | | | (126,426 | ) |
| | | | | | | | | |
Capital share transactions: | | | | | | | | |
Proceeds from sale of shares | | | | | | | | |
Class A | | | 324,843 | | | | 1,709,814 | |
Class C | | | 150,024 | | | | 71,088 | |
Class H | | | 47,227,889 | | | | 95,653,191 | |
Distributions reinvested | | | | | | | | |
Class A | | | — | | | | 5,559 | |
Class C | | | — | | | | 1,880 | |
Class H | | | — | | | | 118,161 | |
Cost of shares redeemed | | | | | | | | |
Class A | | | (318,587 | ) | | | (1,844,361 | ) |
Class C | | | (60,957 | ) | | | (98,102 | ) |
Class H | | | (47,996,733 | ) | | | (96,053,650 | ) |
Net decrease from capital share transactions | | | (673,521 | ) | | | (436,420 | ) |
Net increase (decrease) in net assets | | | 74,931 | | | | (103,816 | ) |
| | | | | | | | | |
Net assets: | | | | | | | | |
Beginning of period | | | 2,994,973 | | | | 3,098,789 | |
End of period | | $ | 3,069,904 | | | $ | 2,994,973 | |
| | | | | | | | | |
Capital share activity: | | | | | | | | |
Shares sold | | | | | | | | |
Class A | | | 5,375 | | | | 31,716 | |
Class C | | | 2,737 | | | | 1,483 | |
Class H | | | 792,945 | | | | 1,824,086 | |
Shares issued from reinvestment of distributions | | | | | | | | |
Class A | | | — | | | | 108 | |
Class C | | | — | | | | 40 | |
Class H | | | — | | | | 2,291 | |
Shares redeemed | | | | | | | | |
Class A | | | (5,410 | ) | | | (35,082 | ) |
Class C | | | (972 | ) | | | (2,027 | ) |
Class H | | | (804,571 | ) | | | (1,826,338 | ) |
Net decrease in shares | | | (9,896 | ) | | | (3,723 | ) |
344 | THE RYDEX FUNDS SEMI-ANNUAL FINANCIAL REPORT | SEE NOTES TO FINANCIAL STATEMENTS. |
EMERGING MARKETS 2x STRATEGY FUND | |
This table is presented to show selected data for a share outstanding throughout each period and to assist shareholders in evaluating a Fund’s performance for the periods presented.
Class A | | Six Months Ended
September 30, 2024a | | | Year Ended
March 31,
2024 | | | Year Ended
March 31,
2023 | | | Year Ended
March 31,
2022 | | | Year Ended
March 31,
2021 | | | Year Ended
March 31,
2020 | |
Per Share Data |
Net asset value, beginning of period | | $ | 56.30 | | | $ | 54.39 | | | $ | 68.28 | | | $ | 116.33 | | | $ | 44.29 | | | $ | 71.02 | |
Income (loss) from investment operations: |
Net investment income (loss)b | | | .96 | | | | 1.36 | | | | .89 | | | | (.03 | ) | | | (.94 | ) | | | .17 | |
Net gain (loss) on investments (realized and unrealized) | | | 13.92 | | | | 1.76 | | | | (14.78 | ) | | | (48.02 | ) | | | 72.98 | | | | (26.42 | ) |
Total from investment operations | | | 14.88 | | | | 3.12 | | | | (13.89 | ) | | | (48.05 | ) | | | 72.04 | | | | (26.25 | ) |
Less distributions from: |
Net investment income | | | — | | | | (1.21 | ) | | | — | | | | — | | | | — | | | | (.48 | ) |
Total distributions | | | — | | | | (1.21 | ) | | | — | | | | — | | | | — | | | | (.48 | ) |
Net asset value, end of period | | $ | 71.18 | | | $ | 56.30 | | | $ | 54.39 | | | $ | 68.28 | | | $ | 116.33 | | | $ | 44.29 | |
|
Total Returnc | | | 26.43 | % | | | 5.93 | % | | | (20.35 | %) | | | (41.30 | %) | | | 162.66 | % | | | (37.27 | %) |
Ratios/Supplemental Data |
Net assets, end of period (in thousands) | | $ | 249 | | | $ | 199 | | | $ | 370 | | | $ | 193 | | | $ | 647 | | | $ | 628 | |
Ratios to average net assets: |
Net investment income (loss) | | | 3.18 | % | | | 2.58 | % | | | 1.67 | % | | | (0.03 | %) | | | (1.10 | %) | | | 0.25 | % |
Total expenses | | | 1.87 | % | | | 1.91 | % | | | 1.85 | % | | | 1.75 | % | | | 1.83 | % | | | 1.86 | % |
Net expensesd | | | 1.77 | % | | | 1.84 | % | | | 1.82 | % | | | 1.75 | % | | | 1.83 | % | | | 1.86 | % |
Portfolio turnover rate | | | 469 | % | | | 905 | % | | | 416 | % | | | 266 | % | | | 632 | % | | | 974 | % |
Class C | | Six Months Ended
September 30, 2024a | | | Year Ended
March 31,
2024 | | | Year Ended
March 31,
2023 | | | Year Ended
March 31,
2022 | | | Year Ended
March 31,
2021 | | | Year Ended
March 31,
2020 | |
Per Share Data |
Net asset value, beginning of period | | $ | 51.39 | | | $ | 50.17 | | | $ | 63.47 | | | $ | 108.94 | | | $ | 41.79 | | | $ | 67.53 | |
Income (loss) from investment operations: |
Net investment income (loss)b | | | .62 | | | | .79 | | | | .69 | | | | (.48 | ) | | | (1.69 | ) | | | (.28 | ) |
Net gain (loss) on investments (realized and unrealized) | | | 12.71 | | | | 1.64 | | | | (13.99 | ) | | | (44.99 | ) | | | 68.84 | | | | (24.98 | ) |
Total from investment operations | | | 13.33 | | | | 2.43 | | | | (13.30 | ) | | | (45.47 | ) | | | 67.15 | | | | (25.26 | ) |
Less distributions from: |
Net investment income | | | — | | | | (1.21 | ) | | | — | | | | — | | | | — | | | | (.48 | ) |
Total distributions | | | — | | | | (1.21 | ) | | | — | | | | — | | | | — | | | | (.48 | ) |
Net asset value, end of period | | $ | 64.72 | | | $ | 51.39 | | | $ | 50.17 | | | $ | 63.47 | | | $ | 108.94 | | | $ | 41.79 | |
|
Total Returnc | | | 25.94 | % | | | 5.07 | % | | | (20.97 | %) | | | (41.74 | %) | | | 160.68 | % | | | (37.73 | %) |
Ratios/Supplemental Data |
Net assets, end of period (in thousands) | | $ | 252 | | | $ | 110 | | | $ | 132 | | | $ | 311 | | | $ | 449 | | | $ | 161 | |
Ratios to average net assets: |
Net investment income (loss) | | | 2.24 | % | | | 1.64 | % | | | 1.43 | % | | | (0.55 | %) | | | (1.95 | %) | | | (0.44 | %) |
Total expenses | | | 2.62 | % | | | 2.68 | % | | | 2.57 | % | | | 2.50 | % | | | 2.57 | % | | | 2.60 | % |
Net expensesd | | | 2.52 | % | | | 2.60 | % | | | 2.54 | % | | | 2.50 | % | | | 2.57 | % | | | 2.60 | % |
Portfolio turnover rate | | | 469 | % | | | 905 | % | | | 416 | % | | | 266 | % | | | 632 | % | | | 974 | % |
SEE NOTES TO FINANCIAL STATEMENTS. | THE RYDEX FUNDS SEMI-ANNUAL FINANCIAL REPORT | 345 |
EMERGING MARKETS 2x STRATEGY FUND | |
FINANCIAL HIGHLIGHTS (concluded) |
This table is presented to show selected data for a share outstanding throughout each period and to assist shareholders in evaluating a Fund’s performance for the periods presented.
Class H | | Six Months Ended
September 30, 2024a | | | Year Ended
March 31,
2024 | | | Year Ended
March 31,
2023 | | | Year Ended
March 31,
2022 | | | Year Ended
March 31,
2021 | | | Year Ended
March 31,
2020 | |
Per Share Data |
Net asset value, beginning of period | | $ | 56.16 | | | $ | 54.34 | | | $ | 68.26 | | | $ | 116.30 | | | $ | 44.29 | | | $ | 71.02 | |
Income (loss) from investment operations: |
Net investment income (loss)b | | | .81 | | | | 1.32 | | | | 1.20 | | | | .01 | | | | (1.28 | ) | | | (.05 | ) |
Net gain (loss) on investments (realized and unrealized) | | | 13.97 | | | | 1.71 | | | | (15.12 | ) | | | (48.05 | ) | | | 73.29 | | | | (26.20 | ) |
Total from investment operations | | | 14.78 | | | | 3.03 | | | | (13.92 | ) | | | (48.04 | ) | | | 72.01 | | | | (26.25 | ) |
Less distributions from: |
Net investment income | | | — | | | | (1.21 | ) | | | — | | | | — | | | | — | | | | (.48 | ) |
Total distributions | | | — | | | | (1.21 | ) | | | — | | | | — | | | | — | | | | (.48 | ) |
Net asset value, end of period | | $ | 70.94 | | | $ | 56.16 | | | $ | 54.34 | | | $ | 68.26 | | | $ | 116.30 | | | $ | 44.29 | |
|
Total Return | | | 26.32 | % | | | 5.78 | % | | | (20.41 | %) | | | (41.31 | %) | | | 162.59 | % | | | (37.27 | %) |
Ratios/Supplemental Data |
Net assets, end of period (in thousands) | | $ | 2,568 | | | $ | 2,686 | | | $ | 2,597 | | | $ | 2,810 | | | $ | 6,808 | | | $ | 1,464 | |
Ratios to average net assets: |
Net investment income (loss) | | | 2.81 | % | | | 2.53 | % | | | 2.35 | % | | | 0.01 | % | | | (1.29 | %) | | | (0.07 | %) |
Total expenses | | | 1.89 | % | | | 1.93 | % | | | 1.82 | % | | | 1.75 | % | | | 1.81 | % | | | 1.87 | % |
Net expensesd | | | 1.79 | % | | | 1.85 | % | | | 1.76 | % | | | 1.75 | % | | | 1.81 | % | | | 1.87 | % |
Portfolio turnover rate | | | 469 | % | | | 905 | % | | | 416 | % | | | 266 | % | | | 632 | % | | | 974 | % |
a | Unaudited figures for the period ended September 30, 2024. Percentage amounts for the period, except total return and portfolio turnover rate, have been annualized. |
b | Net investment income (loss) per share was computed using average shares outstanding throughout the period. |
c | Total return does not reflect the impact of any applicable sales charges. |
d | Net expense information reflects the expense ratios after expense waivers and reimbursements, as applicable. |
346 | THE RYDEX FUNDS SEMI-ANNUAL FINANCIAL REPORT | SEE NOTES TO FINANCIAL STATEMENTS. |
SCHEDULE OF INVESTMENTS (Unaudited) | September 30, 2024 |
INVERSE EMERGING MARKETS 2x STRATEGY FUND | |
| | Face
Amount | | | Value | |
REPURCHASE AGREEMENTS††,1 - 83.4% |
J.P. Morgan Securities LLC
issued 09/30/24 at 4.86%
due 10/01/242 | | $ | 174,811 | | | $ | 174,811 | |
BofA Securities, Inc.
issued 09/30/24 at 4.85%
due 10/01/242 | | | 144,386 | | | | 144,386 | |
Total Repurchase Agreements | | | | |
(Cost $319,197) | | | | | | | 319,197 | |
| | | | | | | | | |
Total Investments - 83.4% | | | | |
(Cost $319,197) | | $ | 319,197 | |
Other Assets & Liabilities, net - 16.6% | | | 63,556 | |
Total Net Assets - 100.0% | | $ | 382,753 | |
Total Return Swap Agreements |
Counterparty | Index | Type | | Financing
Rate | | Payment
Frequency | | | Maturity
Date | | | Units | | | Notional
Amount | | | Value and
Unrealized
Appreciation
(Depreciation) | |
OTC Equity Index Swap Agreements Sold Short†† |
Goldman Sachs International | S&P Emerging 50 ADR Index | Receive | | 4.08% (Federal
Funds Rate -
0.75%) | | | At Maturity | | | | 12/18/24 | | | | 152 | | | $ | 483,814 | | | $ | 47 | |
BNP Paribas | S&P Emerging 50 ADR Index | Receive | | 4.63% (Federal
Funds Rate -
0.20%) | | | At Maturity | | | | 12/19/24 | | | | 88 | | | | 279,114 | | | | (7,938 | ) |
| | | | | | | | | | | | | | | | | | | $ | 762,928 | | | $ | (7,891 | ) |
†† | Value determined based on Level 2 inputs — See Note 4. |
1 | Repurchase Agreements — See Note 6. |
2 | All or a portion of this security is pledged as equity index swap collateral at September 30, 2024. ADR — American Depositary Receipt |
| | ADR — American Depositary Receipt |
| | |
| | See Sector Classification in Other Information section. |
SEE NOTES TO FINANCIAL STATEMENTS. | THE RYDEX FUNDS SEMI-ANNUAL FINANCIAL REPORT | 347 |
SCHEDULE OF INVESTMENTS (Unaudited)(concluded) | September 30, 2024 |
INVERSE EMERGING MARKETS 2x STRATEGY FUND | |
The following table summarizes the inputs used to value the Fund’s investments at September 30, 2024 (See Note 4 in the Notes to Financial Statements):
Investments in Securities (Assets) | | Level 1
Quoted
Prices | | | Level 2
Significant
Observable
Inputs | | | Level 3
Significant
Unobservable
Inputs | | | Total | |
Repurchase Agreements | | $ | — | | | $ | 319,197 | | | $ | — | | | $ | 319,197 | |
Equity Index Swap Agreements** | | | — | | | | 47 | | | | — | | | | 47 | |
Total Assets | | $ | — | | | $ | 319,244 | | | $ | — | | | $ | 319,244 | |
Investments in Securities (Liabilities) | | Level 1
Quoted
Prices | | | Level 2
Significant
Observable
Inputs | | | Level 3
Significant
Unobservable
Inputs | | | Total | |
Equity Index Swap Agreements** | | $ | — | | | $ | 7,938 | | | $ | — | | | $ | 7,938 | |
** | This derivative is reported as unrealized appreciation/depreciation at period end. |
348 | THE RYDEX FUNDS SEMI-ANNUAL FINANCIAL REPORT | SEE NOTES TO FINANCIAL STATEMENTS. |
INVERSE EMERGING MARKETS 2x STRATEGY FUND | |
STATEMENT OF ASSETS AND LIABILITIES (Unaudited) |
September 30, 2024 |
Assets: |
Repurchase agreements, at value (cost $319,197) | | | 319,197 | |
Unrealized appreciation on OTC swap agreements | | | 47 | |
Receivables: |
Fund shares sold | | | 73,732 | |
Interest | | | 43 | |
Total assets | | | 393,019 | |
| | | | | |
Liabilities: |
Unrealized depreciation on OTC swap agreements | | | 7,938 | |
Payable for: |
Swap settlement | | | 1,596 | |
Management fees | | | 215 | |
Transfer agent fees | | | 144 | |
Distribution and service fees | | | 64 | |
Portfolio accounting and administration fees | | | 26 | |
Trustees’ fees* | | | 3 | |
Miscellaneous | | | 280 | |
Total liabilities | | | 10,266 | |
Net assets | | $ | 382,753 | |
| | | | | |
Net assets consist of: |
Paid in capital | | $ | 20,441,564 | |
Total distributable earnings (loss) | | | (20,058,811 | ) |
Net assets | | $ | 382,753 | |
Class A: |
Net assets | | $ | 48,904 | |
Capital shares outstanding | | | 6,095 | |
Net asset value per share | | $ | 8.02 | |
Maximum offering price per share (Net asset value divided by 95.25%) | | $ | 8.42 | |
Class C: |
Net assets | | $ | 69,882 | |
Capital shares outstanding | | | 8,903 | |
Net asset value per share | | $ | 7.85 | |
Class H: |
Net assets | | $ | 263,967 | |
Capital shares outstanding | | | 32,642 | |
Net asset value per share | | $ | 8.09 | |
STATEMENT OF OPERATIONS (Unaudited) |
Six Months Ended September 30, 2024 |
Investment Income: |
Interest | | $ | 9,243 | |
Total investment income | | | 9,243 | |
| | | | | |
Expenses: |
Management fees | | | 1,553 | |
Distribution and service fees: |
Class A | | | 30 | |
Class C | | | 26 | |
Class H | | | 398 | |
Transfer agent fees | | | 368 | |
Portfolio accounting and administration fees | | | 356 | |
Registration fees | | | 182 | |
Professional fees | | | 82 | |
Custodian fees | | | 22 | |
Trustees’ fees* | | | 19 | |
Miscellaneous | | | 123 | |
Total expenses | | | 3,159 | |
Less: |
Expenses reimbursed by Adviser | | | (172 | ) |
Net expenses | | | 2,987 | |
Net investment income | | | 6,256 | |
| | | | | |
Net Realized and Unrealized Gain (Loss): |
Net realized gain (loss) on: |
Swap agreements | | | (37,709 | ) |
Net realized loss | | | (37,709 | ) |
Net change in unrealized appreciation (depreciation) on: |
Swap agreements | | | (24,158 | ) |
Net change in unrealized appreciation (depreciation) | | | (24,158 | ) |
Net realized and unrealized loss | | | (61,867 | ) |
Net decrease in net assets resulting from operations | | $ | (55,611 | ) |
* | Relates to Trustees not deemed “interested persons” within the meaning of Section 2(a)(19) of the 1940 Act. |
SEE NOTES TO FINANCIAL STATEMENTS. | THE RYDEX FUNDS SEMI-ANNUAL FINANCIAL REPORT | 349 |
INVERSE EMERGING MARKETS 2x STRATEGY FUND | |
STATEMENTS OF CHANGES IN NET ASSETS |
| | Six Months Ended
September 30, 2024
(Unaudited) | | | Year Ended
March 31,
2024 | |
Increase (Decrease) in Net Assets from Operations: | | | | | | | | |
Net investment income | | $ | 6,256 | | | $ | 16,213 | |
Net realized loss on investments | | | (37,709 | ) | | | (134,331 | ) |
Net change in unrealized appreciation (depreciation) on investments | | | (24,158 | ) | | | 26,165 | |
Net decrease in net assets resulting from operations | | | (55,611 | ) | | | (91,953 | ) |
| | | | | | | | | |
Distributions to shareholders: | | | | | | | | |
Class A | | | — | | | | (185 | ) |
Class C | | | — | | | | (169 | ) |
Class H | | | — | | | | (14,212 | ) |
Total distributions to shareholders | | | — | | | | (14,566 | ) |
| | | | | | | | | |
Capital share transactions: | | | | | | | | |
Proceeds from sale of shares | | | | | | | | |
Class A | | | 301,858 | | | | 460,042 | |
Class C | | | 73,369 | | | | 17,007 | |
Class H | | | 10,761,488 | | | | 25,735,086 | |
Distributions reinvested | | | | | | | | |
Class A | | | — | | | | 185 | |
Class C | | | — | | | | 169 | |
Class H | | | — | | | | 14,168 | |
Cost of shares redeemed | | | | | | | | |
Class A | | | (322,483 | ) | | | (406,762 | ) |
Class C | | | (9,060 | ) | | | (17,060 | ) |
Class H | | | (10,731,094 | ) | | | (25,809,602 | ) |
Net increase (decrease) from capital share transactions | | | 74,078 | | | | (6,767 | ) |
Net increase (decrease) in net assets | | | 18,467 | | | | (113,286 | ) |
| | | | | | | | | |
Net assets: | | | | | | | | |
Beginning of period | | | 364,286 | | | | 477,572 | |
End of period | | $ | 382,753 | | | $ | 364,286 | |
| | | | | | | | | |
Capital share activity: | | | | | | | | |
Shares sold | | | | | | | | |
Class A | | | 32,180 | | | | 36,934 | |
Class C | | | 9,375 | | | | 1,411 | |
Class H | | | 1,060,743 | | | | 1,992,537 | |
Shares issued from reinvestment of distributions | | | | | | | | |
Class A | | | — | | | | 15 | |
Class C | | | — | | | | 14 | |
Class H | | | — | | | | 1,139 | |
Shares redeemed | | | | | | | | |
Class A | | | (31,590 | ) | | | (31,950 | ) |
Class C | | | (945 | ) | | | (1,411 | ) |
Class H | | | (1,055,080 | ) | | | (2,001,240 | ) |
Net increase (decrease) in shares | | | 14,683 | | | | (2,551 | ) |
350 | THE RYDEX FUNDS SEMI-ANNUAL FINANCIAL REPORT | SEE NOTES TO FINANCIAL STATEMENTS. |
INVERSE EMERGING MARKETS 2x STRATEGY FUND | |
This table is presented to show selected data for a share outstanding throughout each period and to assist shareholders in evaluating a Fund’s performance for the periods presented.
Class A | | Six Months Ended
September 30, 2024a | | | Year Ended
March 31,
2024 | | | Year Ended
March 31,
2023 | | | Year Ended
March 31,
2022 | | | Year Ended
March 31,
2021 | | | Year Ended
March 31,
2020 | |
Per Share Data |
Net asset value, beginning of period | | $ | 10.96 | | | $ | 13.28 | | | $ | 15.03 | | | $ | 12.44 | | | $ | 46.71 | | | $ | 40.57 | |
Income (loss) from investment operations: |
Net investment income (loss)b | | | .20 | | | | .47 | | | | .11 | | | | (.23 | ) | | | (.54 | ) | | | (.16 | ) |
Net gain (loss) on investments (realized and unrealized) | | | (3.14 | ) | | | (2.42 | ) | | | (1.86 | ) | | | 2.82 | | | | (33.73 | ) | | | 6.64 | |
Total from investment operations | | | (2.94 | ) | | | (1.95 | ) | | | (1.75 | ) | | | 2.59 | | | | (34.27 | ) | | | 6.48 | |
Less distributions from: |
Net investment income | | | — | | | | (.37 | ) | | | — | | | | — | | | | — | | | | (.34 | ) |
Total distributions | | | — | | | | (.37 | ) | | | — | | | | — | | | | — | | | | (.34 | ) |
Net asset value, end of period | | $ | 8.02 | | | $ | 10.96 | | | $ | 13.28 | | | $ | 15.03 | | | $ | 12.44 | | | $ | 46.71 | |
|
Total Returnc | | | (26.82 | %) | | | (15.06 | %) | | | (11.64 | %) | | | 20.82 | % | | | (73.37 | %) | | | 16.30 | % |
Ratios/Supplemental Data |
Net assets, end of period (in thousands) | | $ | 49 | | | $ | 60 | | | $ | 7 | | | $ | 14 | | | $ | 2 | | | $ | 147 | |
Ratios to average net assets: |
Net investment income (loss) | | | 4.15 | % | | | 3.72 | % | | | 0.65 | % | | | (1.86 | %) | | | (1.81 | %) | | | (0.37 | %) |
Total expenses | | | 1.83 | % | | | 1.82 | % | | | 2.00 | % | | | 1.87 | % | | | 1.86 | % | | | 1.89 | % |
Net expensesd | | | 1.73 | % | | | 1.75 | % | | | 1.97 | % | | | 1.87 | % | | | 1.86 | % | | | 1.89 | % |
Portfolio turnover rate | | | — | | | | — | | | | — | | | | — | | | | — | | | | — | |
Class C | | Six Months Ended
September 30, 2024a | | | Year Ended
March 31,
2024 | | | Year Ended
March 31,
2023 | | | Year Ended
March 31,
2022 | | | Year Ended
March 31,
2021 | | | Year Ended
March 31,
2020 | |
Per Share Data |
Net asset value, beginning of period | | $ | 10.77 | | | $ | 13.14 | | | $ | 15.02 | | | $ | 12.40 | | | $ | 46.82 | | | $ | 40.45 | |
Income (loss) from investment operations: |
Net investment income (loss)b | | | .14 | | | | .39 | | | | .01 | | | | (.36 | ) | | | (.69 | ) | | | (.31 | ) |
Net gain (loss) on investments (realized and unrealized) | | | (3.06 | ) | | | (2.39 | ) | | | (1.89 | ) | | | 2.98 | | | | (33.73 | ) | | | 7.02 | |
Total from investment operations | | | (2.92 | ) | | | (2.00 | ) | | | (1.88 | ) | | | 2.62 | | | | (34.42 | ) | | | 6.71 | |
Less distributions from: |
Net investment income | | | — | | | | (.37 | ) | | | — | | | | — | | | | — | | | | (.34 | ) |
Total distributions | | | — | | | | (.37 | ) | | | — | | | | — | | | | — | | | | (.34 | ) |
Net asset value, end of period | | $ | 7.85 | | | $ | 10.77 | | | $ | 13.14 | | | $ | 15.02 | | | $ | 12.40 | | | $ | 46.82 | |
|
Total Returnc | | | (27.11 | %) | | | (15.60 | %) | | | (12.52 | %) | | | 21.13 | % | | | (73.52 | %) | | | 16.96 | % |
Ratios/Supplemental Data |
Net assets, end of period (in thousands) | | $ | 70 | | | $ | 5 | | | $ | 6 | | | $ | 7 | | | $ | 6 | | | $ | 103 | |
Ratios to average net assets: |
Net investment income (loss) | | | 3.01 | % | | | 3.08 | % | | | 0.08 | % | | | (2.44 | %) | | | (2.62 | %) | | | (1.09 | %) |
Total expenses | | | 2.62 | % | | | 2.59 | % | | | 2.76 | % | | | 2.48 | % | | | 2.66 | % | | | 2.79 | % |
Net expensesd | | | 2.54 | % | | | 2.51 | % | | | 2.73 | % | | | 2.48 | % | | | 2.66 | % | | | 2.79 | % |
Portfolio turnover rate | | | — | | | | — | | | | — | | | | — | | | | — | | | | — | |
SEE NOTES TO FINANCIAL STATEMENTS. | THE RYDEX FUNDS SEMI-ANNUAL FINANCIAL REPORT | 351 |
INVERSE EMERGING MARKETS 2x STRATEGY FUND | |
FINANCIAL HIGHLIGHTS (concluded) |
This table is presented to show selected data for a share outstanding throughout each period and to assist shareholders in evaluating a Fund’s performance for the periods presented.
Class H | | Six Months Ended
September 30, 2024a | | | Year Ended
March 31,
2024 | | | Year Ended
March 31,
2023 | | | Year Ended
March 31,
2022 | | | Year Ended
March 31,
2021 | | | Year Ended
March 31,
2020 | |
Per Share Data |
Net asset value, beginning of period | | $ | 11.08 | | | $ | 13.46 | | | $ | 15.17 | | | $ | 12.54 | | | $ | 46.39 | | | $ | 40.27 | |
Income (loss) from investment operations: |
Net investment income (loss)b | | | .18 | | | | .43 | | | | .11 | | | | (.23 | ) | | | (.42 | ) | | | .07 | |
Net gain (loss) on investments (realized and unrealized) | | | (3.17 | ) | | | (2.44 | ) | | | (1.82 | ) | | | 2.86 | | | | (33.43 | ) | | | 6.39 | |
Total from investment operations | | | (2.99 | ) | | | (2.01 | ) | | | (1.71 | ) | | | 2.63 | | | | (33.85 | ) | | | 6.46 | |
Less distributions from: |
Net investment income | | | — | | | | (.37 | ) | | | — | | | | — | | | | — | | | | (.34 | ) |
Total distributions | | | — | | | | (.37 | ) | | | — | | | | — | | | | — | | | | (.34 | ) |
Net asset value, end of period | | $ | 8.09 | | | $ | 11.08 | | | $ | 13.46 | | | $ | 15.17 | | | $ | 12.54 | | | $ | 46.39 | |
|
Total Return | | | (26.99 | %) | | | (15.24 | %) | | | (11.27 | %) | | | 20.97 | % | | | (72.97 | %) | | | 16.40 | % |
Ratios/Supplemental Data |
Net assets, end of period (in thousands) | | $ | 264 | | | $ | 299 | | | $ | 465 | | | $ | 1,265 | | | $ | 400 | | | $ | 649 | |
Ratios to average net assets: |
Net investment income (loss) | | | 3.60 | % | | | 3.61 | % | | | 0.66 | % | | | (1.70 | %) | | | (1.85 | %) | | | 0.19 | % |
Total expenses | | | 1.82 | % | | | 1.83 | % | | | 2.01 | % | | | 1.75 | % | | | 1.89 | % | | | 1.87 | % |
Net expensesd | | | 1.72 | % | | | 1.75 | % | | | 1.97 | % | | | 1.75 | % | | | 1.89 | % | | | 1.87 | % |
Portfolio turnover rate | | | — | | | | — | | | | — | | | | — | | | | — | | | | — | |
a | Unaudited figures for the period ended September 30, 2024. Percentage amounts for the period, except total return and portfolio turnover rate, have been annualized. |
b | Net investment income (loss) per share was computed using average shares outstanding throughout the period. |
c | Total return does not reflect the impact of any applicable sales charges. |
d | Net expense information reflects the expense ratios after expense waivers and reimbursements, as applicable. |
352 | THE RYDEX FUNDS SEMI-ANNUAL FINANCIAL REPORT | SEE NOTES TO FINANCIAL STATEMENTS. |
SCHEDULE OF INVESTMENTS (Unaudited) | September 30, 2024 |
EUROPE 1.25x STRATEGY FUND | |
| | Shares | | | Value | |
COMMON STOCKS† - 45.7% |
| | | | | | | | | |
Consumer, Non-cyclical - 16.8% |
Novo Nordisk A/S ADR | | | 407 | | | $ | 48,462 | |
Nestle S.A. ADR | | | 332 | | | | 33,423 | |
AstraZeneca plc ADR | | | 392 | | | | 30,541 | |
Novartis AG ADR | | | 255 | | | | 29,330 | |
Roche Holding AG ADR | | | 712 | | | | 28,444 | |
Unilever plc ADR | | | 320 | | | | 20,787 | |
Sanofi S.A. ADR | | | 292 | | | | 16,828 | |
L’Oreal S.A. ADR1 | | | 153 | | | | 13,734 | |
RELX plc ADR | | | 242 | | | | 11,485 | |
GSK plc ADR | | | 271 | | | | 11,078 | |
Diageo plc ADR | | | 70 | | | | 9,824 | |
EssilorLuxottica S.A. ADR | | | 78 | | | | 9,249 | |
British American Tobacco plc ADR | | | 252 | | | | 9,218 | |
Anheuser-Busch InBev S.A. ADR | | | 122 | | | | 8,087 | |
Total Consumer, Non-cyclical | | | | | | | 280,490 | |
| | | | | | | | | |
Financial - 8.0% |
HSBC Holdings plc ADR1 | | | 464 | | | | 20,968 | |
Allianz SE ADR | | | 499 | | | | 16,377 | |
UBS Group AG* | | | 404 | | | | 12,488 | |
Zurich Insurance Group AG ADR1 | | | 370 | | | | 11,163 | |
Banco Santander S.A. ADR | | | 1,969 | | | | 10,042 | |
Muenchener Rueckversicherungs-Gesellschaft AG in Muenchen ADR | | | 170 | | | | 9,367 | |
BNP Paribas S.A. ADR1 | | | 271 | | | | 9,303 | |
UniCredit SpA ADR | | | 418 | | | | 9,167 | |
AXA S.A. ADR | | | 234 | | | | 9,035 | |
London Stock Exchange Group plc ADR | | | 256 | | | | 8,896 | |
Intesa Sanpaolo SpA ADR | | | 341 | | | | 8,760 | |
ING Groep N.V. ADR | | | 421 | | | | 7,645 | |
Total Financial | | | | | | | 133,211 | |
| | | | | | | | | |
Industrial - 4.9% |
Siemens AG ADR | | | 191 | | | | 19,301 | |
Schneider Electric SE ADR1 | | | 366 | | | | 19,299 | |
ABB Ltd. ADR | | | 202 | | | | 11,700 | |
Safran S.A. ADR | | | 193 | | | | 11,364 | |
Airbus SE ADR | | | 300 | | | | 10,959 | |
Vinci S.A. ADR | | | 301 | | | | 8,810 | |
Total Industrial | | | | | | | 81,433 | |
| | | | | | | | | |
Technology - 4.3% |
ASML Holding N.V. — Class G | | | 51 | | | | 42,496 | |
SAP SE ADR | | | 130 | | | | 29,783 | |
Total Technology | | | | | | | 72,279 | |
| | | | | | | | | |
Energy - 3.4% |
Shell plc ADR | | | 398 | | | | 26,248 | |
TotalEnergies SE ADR | | | 305 | | | | 19,709 | |
BP plc ADR | | | 362 | | | | 11,363 | |
Total Energy | | | | | | | 57,320 | |
| | | | | | | | | |
Consumer, Cyclical - 3.1% |
LVMH Moet Hennessy Louis Vuitton SE ADR | | | 162 | | | | 24,885 | |
Hermes International SCA ADR | | | 45 | | | | 11,112 | |
Cie Financiere Richemont S.A. ADR | | | 683 | | | | 10,798 | |
Mercedes-Benz Group AG ADR | | | 359 | | | | 5,784 | |
Total Consumer, Cyclical | | | | | | | 52,579 | |
| | | | | | | | | |
Basic Materials - 2.2% |
Air Liquide S.A. ADR | | | 368 | | | | 14,223 | |
Rio Tinto plc ADR | | | 136 | | | | 9,679 | |
Glencore plc ADR* | | | 633 | | | | 7,248 | |
BASF SE ADR | | | 454 | | | | 5,989 | |
Total Basic Materials | | | | | | | 37,139 | |
| | | | | | | | | |
Utilities - 1.7% |
Iberdrola S.A. ADR | | | 184 | | | | 11,406 | |
National Grid plc ADR | | | 128 | | | | 8,918 | |
Enel SpA ADR1 | | | 996 | | | | 7,928 | |
Total Utilities | | | | | | | 28,252 | |
| | | | | | | | | |
Communications - 1.3% |
Deutsche Telekom AG ADR | | | 456 | | | | 13,420 | |
Prosus N.V. ADR | | | 921 | | | | 8,013 | |
Total Communications | | | | | | | 21,433 | |
| | | | | | | | | |
Total Common Stocks | | | | |
(Cost $509,922) | | | | | | | 764,136 | |
| | | | | | | | | |
MUTUAL FUNDS† - 8.3% |
Guggenheim Ultra Short Duration Fund — Institutional Class2 | | | 7,027 | | | | 70,411 | |
Guggenheim Strategy Fund II2 | | | 2,760 | | | | 68,460 | |
Total Mutual Funds | | | | |
(Cost $138,225) | | | | | | | 138,871 | |
| | | | | | | | | |
| | | Face
Amount | | | | | |
U.S. TREASURY BILLS†† - 7.8% |
U.S. Treasury Bills |
4.63% due 10/10/243,4 | | $ | 131,000 | | | | 130,848 | |
Total U.S. Treasury Bills | | | | |
(Cost $130,832) | | | | | | | 130,848 | |
| | | | | | | | | |
REPURCHASE AGREEMENTS††,5 - 38.8% |
J.P. Morgan Securities LLC
issued 09/30/24 at 4.86%
due 10/01/24 | | | 356,140 | | | | 356,140 | |
BofA Securities, Inc.
issued 09/30/24 at 4.85%
due 10/01/24 | | | 294,155 | | | | 294,155 | |
Total Repurchase Agreements | | | | |
(Cost $650,295) | | | | | | | 650,295 | |
| | | | | | | | | |
SEE NOTES TO FINANCIAL STATEMENTS. | THE RYDEX FUNDS SEMI-ANNUAL FINANCIAL REPORT | 353 |
SCHEDULE OF INVESTMENTS (Unaudited)(continued) | September 30, 2024 |
EUROPE 1.25x STRATEGY FUND | |
| | Shares | | | Value | |
SECURITIES LENDING COLLATERAL†,6 - 3.8% |
Money Market Fund*** | | | | | | | | |
First American Government Obligations Fund - Class X, 4.82%7 | | | 63,108 | | | $ | 63,108 | |
Total Securities Lending Collateral | | | | |
(Cost $63,108) | | | | | | | 63,108 | |
| | | | | | | | | |
Total Investments - 104.4% | | | | |
(Cost $1,492,382) | | $ | 1,747,258 | |
Other Assets & Liabilities, net - (4.4)% | | | (73,307 | ) |
Total Net Assets - 100.0% | | $ | 1,673,951 | |
Futures Contracts |
Description | | Number of
Contracts | | | Expiration
Date | | | Notional
Amount | | | Value and
Unrealized
Appreciation** | |
Equity Futures Contracts Purchased† |
STOXX 50 Index Futures Contracts | | | 27 | | | | Dec 2024 | | | $ | 1,349,850 | | | $ | 11,198 | |
Currency Futures Contracts Purchased† |
Euro FX Futures Contracts | | | 10 | | | | Dec 2024 | | | | 1,395,875 | | | | 9,549 | |
* | Non-income producing security. |
** | Includes cumulative appreciation (depreciation). Variation margin is reported within the Statement of Assets and Liabilities. |
*** | A copy of each underlying unaffiliated fund’s financial statements is available at the SEC’s website at www.sec.gov. |
† | Value determined based on Level 1 inputs — See Note 4. |
†† | Value determined based on Level 2 inputs — See Note 4. |
1 | All or a portion of this security is on loan at September 30, 2024 — See Note 7. |
2 | Affiliated issuer. |
3 | All or a portion of this security is pledged as futures collateral at September 30, 2024. |
4 | Rate indicated is the effective yield at the time of purchase. |
5 | Repurchase Agreements — See Note 6. |
6 | Securities lending collateral — See Note 7. |
7 | Rate indicated is the 7-day yield as of September 30, 2024. |
| | ADR — American Depositary Receipt |
| | plc — Public Limited Company |
| | |
| | See Sector Classification in Other Information section. |
354 | THE RYDEX FUNDS SEMI-ANNUAL FINANCIAL REPORT | SEE NOTES TO FINANCIAL STATEMENTS. |
SCHEDULE OF INVESTMENTS (Unaudited)(concluded) | September 30, 2024 |
EUROPE 1.25x STRATEGY FUND | |
The following table summarizes the inputs used to value the Fund’s investments at September 30, 2024 (See Note 4 in the Notes to Financial Statements):
Investments in Securities (Assets) | | Level 1
Quoted
Prices | | | Level 2
Significant
Observable
Inputs | | | Level 3
Significant
Unobservable
Inputs | | | Total | |
Common Stocks | | $ | 764,136 | | | $ | — | | | $ | — | | | $ | 764,136 | |
Mutual Funds | | | 138,871 | | | | — | | | | — | | | | 138,871 | |
U.S. Treasury Bills | | | — | | | | 130,848 | | | | — | | | | 130,848 | |
Repurchase Agreements | | | — | | | | 650,295 | | | | — | | | | 650,295 | |
Securities Lending Collateral | | | 63,108 | | | | — | | | | — | | | | 63,108 | |
Equity Futures Contracts** | | | 11,198 | | | | — | | | | — | | | | 11,198 | |
Currency Futures Contracts** | | | 9,549 | | | | — | | | | — | | | | 9,549 | |
Total Assets | | $ | 986,862 | | | $ | 781,143 | | | $ | — | | | $ | 1,768,005 | |
** | This derivative is reported as unrealized appreciation/depreciation at period end. |
Affiliated Transactions
Investments representing 5% or more of the outstanding voting shares of a company, or control of or by, or common control under Guggenheim Investments (“GI”), result in that company being considered an affiliated issuer, as defined in the 1940 Act.
The Fund may invest in certain of the underlying series of Guggenheim Strategy Funds Trust, including Guggenheim Strategy Fund II and Guggenheim Strategy Fund III (collectively, the “Guggenheim Strategy Funds”), each of which are open-end management investment companies managed by GI. The Guggenheim Strategy Funds, which launched on March 11, 2014, are offered as short term investment options only to mutual funds, trusts, and other accounts managed by GI and/or its affiliates, and are not available to the public. The Guggenheim Strategy Funds pay no investment management fees. The Guggenheim Strategy Funds’ annual report on Form N-CSR dated September 30, 2023 is available publicly or upon request. This information is available from the EDGAR database on the SEC’s website at https://www.sec.gov/Archives/edgar/data/1601445/000182126823000217/gug86449-ncsr.htm. The Fund may invest in certain of the underlying series of Guggenheim Funds Trust, which are open-end management investment companies managed by GI, are available to the public and whose most recent annual report on Form N-CSR is available publicly or upon request.
Transactions during the period ended September 30, 2024, in which the company is an affiliated issuer, were as follows:
Security Name | | Value
03/31/24 | | | Additions | | | Reductions | | | Realized
Gain (Loss) | | | Change in
Unrealized
Appreciation
(Depreciation) | | | Value
09/30/24 | | | Shares
09/30/24 | | | Investment
Income | |
Mutual Funds | | | | | | | | | | | | | | | | | | | | | | | | | | | | | | | | |
Guggenheim Strategy Fund II | | $ | 67,907 | | | $ | — | | | $ | — | | | $ | — | | | $ | 552 | | | $ | 68,460 | | | | 2,760 | | | $ | 1,945 | |
Guggenheim Ultra Short Duration Fund — Institutional Class | | | 69,638 | | | | — | | | | — | | | | — | | | | 774 | | | | 70,411 | | | | 7,027 | | | | 1,811 | |
| | | $ | 137,545 | | | $ | — | | | $ | — | | | $ | — | | | $ | 1,326 | | | $ | 138,871 | | | | | | | $ | 3,756 | |
SEE NOTES TO FINANCIAL STATEMENTS. | THE RYDEX FUNDS SEMI-ANNUAL FINANCIAL REPORT | 355 |
EUROPE 1.25x STRATEGY FUND | |
STATEMENT OF ASSETS AND LIABILITIES (Unaudited) |
September 30, 2024 |
Assets: |
Investments in unaffiliated issuers, at value - including $60,891 of securities loaned (cost $703,862) | | $ | 958,092 | |
Investments in affiliated issuers, at value (cost $138,225) | | | 138,871 | |
Repurchase agreements, at value (cost $650,295) | | | 650,295 | |
Cash | | | 344 | |
Receivables: |
Foreign tax reclaims | | | 17,979 | |
Fund shares sold | | | 4,880 | |
Dividends | | | 1,388 | |
Securities lending income | | | 609 | |
Investment Adviser | | | 148 | |
Interest | | | 87 | |
Total assets | | | 1,772,693 | |
| | | | | |
Liabilities: |
Payable for: |
Return of securities lending collateral | | | 63,108 | |
Variation margin on futures contracts | | | 16,075 | |
Fund shares redeemed | | | 11,368 | |
Management fees | | | 2,784 | |
Transfer agent fees | | | 1,404 | |
Distribution and service fees | | | 796 | |
Trustees’ fees* | | | 26 | |
Miscellaneous | | | 3,181 | |
Total liabilities | | | 98,742 | |
Net assets | | $ | 1,673,951 | |
| | | | | |
Net assets consist of: |
Paid in capital | | $ | 1,426,596 | |
Total distributable earnings (loss) | | | 247,355 | |
Net assets | | $ | 1,673,951 | |
Class A: |
Net assets | | $ | 84,811 | |
Capital shares outstanding | | | 663 | |
Net asset value per share | | $ | 127.92 | |
Maximum offering price per share (Net asset value divided by 95.25%) | | $ | 134.30 | |
Class C: |
Net assets | | $ | 43,254 | |
Capital shares outstanding | | | 424 | |
Net asset value per share | | $ | 102.01 | |
Class H: |
Net assets | | $ | 1,545,886 | |
Capital shares outstanding | | | 12,275 | |
Net asset value per share | | $ | 125.94 | |
STATEMENT OF OPERATIONS (Unaudited) |
Six Months Ended September 30, 2024 |
Investment Income: |
Dividends from securities of unaffiliated issuers (net of foreign withholding tax of $2,505) | | $ | 22,439 | |
Dividends from securities of affiliated issuers | | | 3,756 | |
Interest | | | 45,876 | |
Income from securities lending, net | | | 2,239 | |
Total investment income | | | 74,310 | |
| | | | | |
Expenses: |
Management fees | | | 15,348 | |
Distribution and service fees: |
Class A | | | 519 | |
Class C | | | 769 | |
Class H | | | 3,552 | |
Transfer agent fees | | | 3,488 | |
Portfolio accounting and administration fees | | | 2,602 | |
Professional fees | | | 836 | |
Custodian fees | | | 221 | |
Trustees’ fees* | | | 203 | |
Miscellaneous | | | 2,771 | |
Total expenses | | | 30,309 | |
Less: |
Expenses reimbursed by Adviser | | | (2,156 | ) |
Expenses waived by Adviser | | | (88 | ) |
Total waived/reimbursed expenses | | | (2,244 | ) |
Net expenses | | | 28,065 | |
Net investment income | | | 46,245 | |
| | | | | |
Net Realized and Unrealized Gain (Loss): |
Net realized gain (loss) on: |
Investments in unaffiliated issuers | | | 287,478 | |
Futures contracts | | | 378,798 | |
Foreign currency transactions | | | 390 | |
Net realized gain | | | 666,666 | |
Net change in unrealized appreciation (depreciation) on: |
Investments in unaffiliated issuers | | | 4,018 | |
Investments in affiliated issuers | | | 1,326 | |
Futures contracts | | | 15,305 | |
Foreign currency translations | | | 15 | |
Net change in unrealized appreciation (depreciation) | | | 20,664 | |
Net realized and unrealized gain | | | 687,330 | |
Net increase in net assets resulting from operations | | $ | 733,575 | |
* | Relates to Trustees not deemed “interested persons” within the meaning of Section 2(a)(19) of the 1940 Act. |
356 | THE RYDEX FUNDS SEMI-ANNUAL FINANCIAL REPORT | SEE NOTES TO FINANCIAL STATEMENTS. |
EUROPE 1.25x STRATEGY FUND | |
STATEMENTS OF CHANGES IN NET ASSETS |
| | Six Months Ended
September 30, 2024
(Unaudited) | | | Year Ended
March 31,
2024 | |
Increase (Decrease) in Net Assets from Operations: | | | | | | | | |
Net investment income | | $ | 46,245 | | | $ | 160,899 | |
Net realized gain on investments | | | 666,666 | | | | 373,278 | |
Net change in unrealized appreciation (depreciation) on investments | | | 20,664 | | | | 11,551 | |
Net increase in net assets resulting from operations | | | 733,575 | | | | 545,728 | |
| | | | | | | | | |
Distributions to shareholders: | | | | | | | | |
Class A | | | — | | | | (5,330 | ) |
Class C | | | — | | | | (2,990 | ) |
Class H | | | — | | | | (19,342 | ) |
Total distributions to shareholders | | | — | | | | (27,662 | ) |
| | | | | | | | | |
Capital share transactions: | | | | | | | | |
Proceeds from sale of shares | | | | | | | | |
Class A | | | 399,873 | | | | 55,633,399 | |
Class C | | | 102,116 | | | | 905,676 | |
Class H | | | 90,687,891 | | | | 36,893,142 | |
Distributions reinvested | | | | | | | | |
Class A | | | — | | | | 5,211 | |
Class C | | | — | | | | 2,052 | |
Class H | | | — | | | | 19,247 | |
Cost of shares redeemed | | | | | | | | |
Class A | | | (843,186 | ) | | | (55,672,258 | ) |
Class C | | | (243,189 | ) | | | (918,503 | ) |
Class H | | | (91,598,794 | ) | | | (48,981,942 | ) |
Net decrease from capital share transactions | | | (1,495,289 | ) | | | (12,113,976 | ) |
Net decrease in net assets | | | (761,714 | ) | | | (11,595,910 | ) |
| | | | | | | | | |
Net assets: | | | | | | | | |
Beginning of period | | | 2,435,665 | | | | 14,031,575 | |
End of period | | $ | 1,673,951 | | | $ | 2,435,665 | |
| | | | | | | | | |
Capital share activity: | | | | | | | | |
Shares sold | | | | | | | | |
Class A | | | 3,215 | | | | 511,589 | |
Class C | | | 1,036 | | | | 10,433 | |
Class H | | | 751,361 | | | | 340,783 | |
Shares issued from reinvestment of distributions | | | | | | | | |
Class A | | | — | | | | 48 | |
Class C | | | — | | | | 25 | |
Class H | | | — | | | | 179 | |
Shares redeemed | | | | | | | | |
Class A | | | (6,840 | ) | | | (510,986 | ) |
Class C | | | (2,479 | ) | | | (10,500 | ) |
Class H | | | (753,619 | ) | | | (454,633 | ) |
Net decrease in shares | | | (7,326 | ) | | | (113,061 | ) |
SEE NOTES TO FINANCIAL STATEMENTS. | THE RYDEX FUNDS SEMI-ANNUAL FINANCIAL REPORT | 357 |
EUROPE 1.25x STRATEGY FUND | |
This table is presented to show selected data for a share outstanding throughout each period and to assist shareholders in evaluating a Fund’s performance for the periods presented.
Class A | | Six Months Ended
September 30, 2024a | | | Year Ended
March 31,
2024 | | | Year Ended
March 31,
2023 | | | Year Ended
March 31,
2022 | | | Year Ended
March 31,
2021 | | | Year Ended
March 31,
2020 | |
Per Share Data |
Net asset value, beginning of period | | $ | 121.23 | | | $ | 106.74 | | | $ | 101.20 | | | $ | 94.56 | | | $ | 69.30 | | | $ | 85.18 | |
Income (loss) from investment operations: |
Net investment income (loss)b | | | 2.10 | | | | 2.61 | | | | 1.76 | | | | (.96 | ) | | | (.93 | ) | | | .63 | |
Net gain (loss) on investments (realized and unrealized) | | | 4.59 | | | | 12.63 | | | | 3.78 | f | | | 7.60 | f | | | 30.74 | | | | (16.07 | )f |
Total from investment operations | | | 6.69 | | | | 15.24 | | | | 5.54 | | | | 6.64 | | | | 29.81 | | | | (15.44 | ) |
Less distributions from: |
Net investment income | | | — | | | | (.75 | ) | | | — | | | | — | | | | (4.55 | ) | | | (.44 | ) |
Total distributions | | | — | | | | (.75 | ) | | | — | | | | — | | | | (4.55 | ) | | | (.44 | ) |
Net asset value, end of period | | $ | 127.92 | | | $ | 121.23 | | | $ | 106.74 | | | $ | 101.20 | | | $ | 94.56 | | | $ | 69.30 | |
|
Total Returnc | | | 5.52 | % | | | 14.35 | % | | | 5.48 | % | | | 7.02 | % | | | 43.39 | % | | | (18.25 | %) |
Ratios/Supplemental Data |
Net assets, end of period (in thousands) | | $ | 85 | | | $ | 520 | | | $ | 388 | | | $ | 482 | | | $ | 130 | | | $ | 217 | |
Ratios to average net assets: |
Net investment income (loss) | | | 3.40 | % | | | 2.41 | % | | | 1.84 | % | | | (0.93 | %) | | | (1.10 | %) | | | 0.72 | % |
Total expensesd | | | 1.73 | % | | | 1.74 | % | | | 1.79 | % | | | 1.72 | % | | | 1.75 | % | | | 1.77 | % |
Net expensese | | | 1.62 | % | | | 1.66 | % | | | 1.74 | % | | | 1.70 | % | | | 1.73 | % | | | 1.73 | % |
Portfolio turnover rate | | | 1,496 | % | | | 1,595 | % | | | 231 | % | | | 517 | % | | | 534 | % | | | 1,787 | % |
Class C | | Six Months Ended
September 30, 2024a | | | Year Ended
March 31,
2024 | | | Year Ended
March 31,
2023 | | | Year Ended
March 31,
2022 | | | Year Ended
March 31,
2021 | | | Year Ended
March 31,
2020 | |
Per Share Data |
Net asset value, beginning of period | | $ | 96.99 | | | $ | 86.21 | | | $ | 82.72 | | | $ | 77.88 | | | $ | 58.24 | | | $ | 72.13 | |
Income (loss) from investment operations: |
Net investment income (loss)b | | | 1.32 | | | | 1.28 | | | | .94 | | | | (1.18 | ) | | | (.96 | ) | | | (.18 | ) |
Net gain (loss) on investments (realized and unrealized) | | | 3.70 | | | | 10.25 | | | | 2.55 | f | | | 6.02 | f | | | 25.15 | | | | (13.27 | )f |
Total from investment operations | | | 5.02 | | | | 11.53 | | | | 3.49 | | | | 4.84 | | | | 24.19 | | | | (13.45 | ) |
Less distributions from: |
Net investment income | | | — | | | | (.75 | ) | | | — | | | | — | | | | (4.55 | ) | | | (.44 | ) |
Total distributions | | | — | | | | (.75 | ) | | | — | | | | — | | | | (4.55 | ) | | | (.44 | ) |
Net asset value, end of period | | $ | 102.01 | | | $ | 96.99 | | | $ | 86.21 | | | $ | 82.72 | | | $ | 77.88 | | | $ | 58.24 | |
|
Total Returnc | | | 5.18 | % | | | 13.48 | % | | | 4.22 | % | | | 6.21 | % | | | 41.93 | % | | | (18.79 | %) |
Ratios/Supplemental Data |
Net assets, end of period (in thousands) | | $ | 43 | | | $ | 181 | | | $ | 165 | | | $ | 483 | | | $ | 142 | | | $ | 296 | |
Ratios to average net assets: |
Net investment income (loss) | | | 2.67 | % | | | 1.47 | % | | | 1.17 | % | | | (1.41 | %) | | | (1.50 | %) | | | (0.25 | %) |
Total expensesd | | | 2.48 | % | | | 2.51 | % | | | 2.53 | % | | | 2.48 | % | | | 2.58 | % | | | 2.49 | % |
Net expensese | | | 2.37 | % | | | 2.42 | % | | | 2.48 | % | | | 2.46 | % | | | 2.55 | % | | | 2.45 | % |
Portfolio turnover rate | | | 1,496 | % | | | 1,595 | % | | | 231 | % | | | 517 | % | | | 534 | % | | | 1,787 | % |
358 | THE RYDEX FUNDS SEMI-ANNUAL FINANCIAL REPORT | SEE NOTES TO FINANCIAL STATEMENTS. |
EUROPE 1.25x STRATEGY FUND | |
FINANCIAL HIGHLIGHTS (concluded) |
This table is presented to show selected data for a share outstanding throughout each period and to assist shareholders in evaluating a Fund’s performance for the periods presented.
Class H | | Six Months Ended
September 30, 2024a | | | Year Ended
March 31,
2024 | | | Year Ended
March 31,
2023 | | | Year Ended
March 31,
2022 | | | Year Ended
March 31,
2021 | | | Year Ended
March 31,
2020 | |
Per Share Data |
Net asset value, beginning of period | | $ | 119.37 | | | $ | 105.14 | | | $ | 100.11 | | | $ | 93.56 | | | $ | 68.79 | | | $ | 84.58 | |
Income (loss) from investment operations: |
Net investment income (loss)b | | | 1.60 | | | | 3.64 | | | | 1.01 | | | | (.93 | ) | | | (.74 | ) | | | .58 | |
Net gain (loss) on investments (realized and unrealized) | | | 4.97 | | | | 11.34 | | | | 4.02 | f | | | 7.48 | f | | | 30.06 | | | | (15.93 | )f |
Total from investment operations | | | 6.57 | | | | 14.98 | | | | 5.03 | | | | 6.55 | | | | 29.32 | | | | (15.35 | ) |
Less distributions from: |
Net investment income | | | — | | | | (.75 | ) | | | — | | | | — | | | | (4.55 | ) | | | (.44 | ) |
Total distributions | | | — | | | | (.75 | ) | | | — | | | | — | | | | (4.55 | ) | | | (.44 | ) |
Net asset value, end of period | | $ | 125.94 | | | $ | 119.37 | | | $ | 105.14 | | | $ | 100.11 | | | $ | 93.56 | | | $ | 68.79 | |
|
Total Return | | | 5.50 | % | | | 14.32 | % | | | 5.01 | % | | | 7.00 | % | | | 42.96 | % | | | (18.28 | %) |
Ratios/Supplemental Data |
Net assets, end of period (in thousands) | | $ | 1,546 | | | $ | 1,735 | | | $ | 13,479 | | | $ | 4,182 | | | $ | 1,410 | | | $ | 1,344 | |
Ratios to average net assets: |
Net investment income (loss) | | | 2.61 | % | | | 3.37 | % | | | 1.08 | % | | | (0.90 | %) | | | (0.88 | %) | | | 0.66 | % |
Total expensesd | | | 1.75 | % | | | 1.76 | % | | | 1.77 | % | | | 1.71 | % | | | 1.77 | % | | | 1.80 | % |
Net expensese | | | 1.61 | % | | | 1.69 | % | | | 1.73 | % | | | 1.69 | % | | | 1.74 | % | | | 1.76 | % |
Portfolio turnover rate | | | 1,496 | % | | | 1,595 | % | | | 231 | % | | | 517 | % | | | 534 | % | | | 1,787 | % |
a | Unaudited figures for the period ended September 30, 2024. Percentage amounts for the period, except total return and portfolio turnover rate, have been annualized. |
b | Net investment income (loss) per share was computed using average shares outstanding throughout the period. |
c | Total return does not reflect the impact of any applicable sales charges. |
d | Does not include expenses of the underlying funds in which the Fund invests. |
e | Net expense information reflects the expense ratios after expense waivers and reimbursements, as applicable. |
f | The amount shown for a share outstanding throughout the year does not agree with the aggregate net gain on investments for the year because of the sales and purchases of fund shares in relation to fluctuating market value of the investments of the Fund. |
SEE NOTES TO FINANCIAL STATEMENTS. | THE RYDEX FUNDS SEMI-ANNUAL FINANCIAL REPORT | 359 |
SCHEDULE OF INVESTMENTS (Unaudited) | September 30, 2024 |
JAPAN 2x STRATEGY FUND | |
| | Face
Amount | | | Value | |
U.S. TREASURY BILLS†† - 28.2% |
U.S. Treasury Bills |
4.63% due 10/10/241,2 | | $ | 492,000 | | | $ | 491,428 | |
Total U.S. Treasury Bills | | | | |
(Cost $491,369) | | | | | | | 491,428 | |
| | | | | | | | | |
REPURCHASE AGREEMENTS††,3 - 70.8% |
J.P. Morgan Securities LLC
issued 09/30/24 at 4.86%
due 10/01/24 | | | 673,887 | | | | 673,887 | |
BofA Securities, Inc.
issued 09/30/24 at 4.85%
due 10/01/24 | | | 556,599 | | | | 556,599 | |
Total Repurchase Agreements | | | | |
(Cost $1,230,486) | | | | | | | 1,230,486 | |
| | | | | | | | | |
Total Investments - 99.0% | | | | |
(Cost $1,721,855) | | $ | 1,721,914 | |
Other Assets & Liabilities, net - 1.0% | | | 16,674 | |
Total Net Assets - 100.0% | | $ | 1,738,588 | |
Futures Contracts |
Description | | Number of
Contracts | | | Expiration
Date | | | Notional
Amount | | | Value and
Unrealized
Appreciation
(Depreciation)** | |
Equity Futures Contracts Purchased† |
Nikkei 225 (CME) Index Futures Contracts | | | 18 | | | | Dec 2024 | | | $ | 3,444,750 | | | $ | 257,015 | |
Currency Futures Contracts Purchased† |
Japanese Yen Futures Contracts | | | 39 | | | | Dec 2024 | | | | 3,426,150 | | | | (26,035 | ) |
** | Includes cumulative appreciation (depreciation). Variation margin is reported within the Statement of Assets and Liabilities. |
† | Value determined based on Level 1 inputs — See Note 4. |
†† | Value determined based on Level 2 inputs — See Note 4. |
1 | All or a portion of this security is pledged as futures collateral at September 30, 2024. |
2 | Rate indicated is the effective yield at the time of purchase. |
3 | Repurchase Agreements — See Note 6. |
| | CME — Chicago Mercantile Exchange |
| | |
| | See Sector Classification in Other Information section. |
360 | THE RYDEX FUNDS SEMI-ANNUAL FINANCIAL REPORT | SEE NOTES TO FINANCIAL STATEMENTS. |
SCHEDULE OF INVESTMENTS (Unaudited)(concluded) | September 30, 2024 |
JAPAN 2x STRATEGY FUND | |
The following table summarizes the inputs used to value the Fund’s investments at September 30, 2024 (See Note 4 in the Notes to Financial Statements):
Investments in Securities (Assets) | | Level 1
Quoted
Prices | | | Level 2
Significant
Observable
Inputs | | | Level 3
Significant
Unobservable
Inputs | | | Total | |
U.S. Treasury Bills | | $ | — | | | $ | 491,428 | | | $ | — | | | $ | 491,428 | |
Repurchase Agreements | | | — | | | | 1,230,486 | | | | — | | | | 1,230,486 | |
Equity Futures Contracts** | | | 257,015 | | | | — | | | | — | | | | 257,015 | |
Total Assets | | $ | 257,015 | | | $ | 1,721,914 | | | $ | — | | | $ | 1,978,929 | |
Investments in Securities (Liabilities) | | Level 1
Quoted
Prices | | | Level 2
Significant
Observable
Inputs | | | Level 3
Significant
Unobservable
Inputs | | | Total | |
Currency Futures Contracts** | | $ | 26,035 | | | $ | — | | | $ | — | | | $ | 26,035 | |
** | This derivative is reported as unrealized appreciation/depreciation at period end. |
SEE NOTES TO FINANCIAL STATEMENTS. | THE RYDEX FUNDS SEMI-ANNUAL FINANCIAL REPORT | 361 |
STATEMENT OF ASSETS AND LIABILITIES (Unaudited) |
September 30, 2024 |
Assets: |
Investments, at value (cost $491,369) | | $ | 491,428 | |
Repurchase agreements, at value (cost $1,230,486) | | | 1,230,486 | |
Receivables: |
Variation margin on futures contracts | | | 22,829 | |
Fund shares sold | | | 1,575 | |
Interest | | | 166 | |
Total assets | | | 1,746,484 | |
| | | | | |
Liabilities: |
Payable for: |
Fund shares redeemed | | | 4,786 | |
Management fees | | | 955 | |
Transfer agent fees | | | 723 | |
Distribution and service fees | | | 319 | |
Portfolio accounting and administration fees | | | 131 | |
Trustees’ fees* | | | 14 | |
Miscellaneous | | | 15 | |
Total liabilities | | | 7,896 | |
Net assets | | $ | 1,738,588 | |
| | | | | |
Net assets consist of: |
Paid in capital | | $ | 3,592,078 | |
Total distributable earnings (loss) | | | (1,853,490 | ) |
Net assets | | $ | 1,738,588 | |
Class A: |
Net assets | | $ | 351,482 | |
Capital shares outstanding | | | 2,344 | |
Net asset value per share | | $ | 149.95 | |
Maximum offering price per share (Net asset value divided by 95.25%) | | $ | 157.43 | |
Class C: |
Net assets | | $ | 651 | |
Capital shares outstanding | | | 5 | |
Net asset value per share | | $ | 131.63 | |
Class H: |
Net assets | | $ | 1,386,455 | |
Capital shares outstanding | | | 9,173 | |
Net asset value per share | | $ | 151.15 | |
STATEMENT OF OPERATIONS (Unaudited) |
Six Months Ended September 30, 2024 |
Investment Income: |
Interest | | $ | 49,062 | |
Total investment income | | | 49,062 | |
| | | | | |
Expenses: |
Management fees | | | 6,772 | |
Distribution and service fees: |
Class A | | | 484 | |
Class C | | | 25 | |
Class H | | | 1,767 | |
Transfer agent fees | | | 1,839 | |
Portfolio accounting and administration fees | | | 1,378 | |
Registration fees | | | 870 | |
Professional fees | | | 446 | |
Custodian fees | | | 115 | |
Trustees’ fees* | | | 97 | |
Miscellaneous | | | 326 | |
Total expenses | | | 14,119 | |
Less: |
Expenses reimbursed by Adviser | | | (451 | ) |
Net expenses | | | 13,668 | |
Net investment income | | | 35,394 | |
| | | | | |
Net Realized and Unrealized Gain (Loss): |
Net realized gain (loss) on: |
Futures contracts | | | (634,899 | ) |
Net realized loss | | | (634,899 | ) |
Net change in unrealized appreciation (depreciation) on: |
Investments | | | 61 | |
Futures contracts | | | 283,861 | |
Net change in unrealized appreciation (depreciation) | | | 283,922 | |
Net realized and unrealized loss | | | (350,977 | ) |
Net decrease in net assets resulting from operations | | $ | (315,583 | ) |
* | Relates to Trustees not deemed “interested persons” within the meaning of Section 2(a)(19) of the 1940 Act. |
362 | THE RYDEX FUNDS SEMI-ANNUAL FINANCIAL REPORT | SEE NOTES TO FINANCIAL STATEMENTS. |
STATEMENTS OF CHANGES IN NET ASSETS |
| | Six Months Ended
September 30, 2024
(Unaudited) | | | Year Ended
March 31,
2024 | |
Increase (Decrease) in Net Assets from Operations: | | | | | | | | |
Net investment income | | $ | 35,394 | | | $ | 96,866 | |
Net realized gain (loss) on investments | | | (634,899 | ) | | | 1,175,918 | |
Net change in unrealized appreciation (depreciation) on investments | | | 283,922 | | | | (456,037 | ) |
Net increase (decrease) in net assets resulting from operations | | | (315,583 | ) | | | 816,747 | |
| | | | | | | | | |
Distributions to shareholders: | | | | | | | | |
Class A | | | — | | | | (6,903 | ) |
Class C | | | — | | | | (36 | ) |
Class H | | | — | | | | (65,831 | ) |
Total distributions to shareholders | | | — | | | | (72,770 | ) |
| | | | | | | | | |
Capital share transactions: | | | | | | | | |
Proceeds from sale of shares | | | | | | | | |
Class A | | | 71,596 | | | | 367,084 | |
Class C | | | 2,713 | | | | 54,791 | |
Class H | | | 1,669,657 | | | | 12,144,683 | |
Distributions reinvested | | | | | | | | |
Class A | | | — | | | | 6,903 | |
Class C | | | — | | | | 36 | |
Class H | | | — | | | | 64,437 | |
Cost of shares redeemed | | | | | | | | |
Class A | | | (136,110 | ) | | | (183,316 | ) |
Class C | | | (20,477 | ) | | | (34,007 | ) |
Class H | | | (2,343,390 | ) | | | (17,911,961 | ) |
Net decrease from capital share transactions | | | (756,011 | ) | | | (5,491,350 | ) |
Net decrease in net assets | | | (1,071,594 | ) | | | (4,747,373 | ) |
| | | | | | | | | |
Net assets: | | | | | | | | |
Beginning of period | | | 2,810,182 | | | | 7,557,555 | |
End of period | | $ | 1,738,588 | | | $ | 2,810,183 | |
| | | | | | | | | |
Capital share activity: | | | | | | | | |
Shares sold | | | | | | | | |
Class A | | | 544 | | | | 2,482 | |
Class C | | | 23 | | | | 455 | |
Class H | | | 11,699 | | | | 92,132 | |
Shares issued from reinvestment of distributions | | | | | | | | |
Class A | | | — | | | | 59 | |
Class C | | | — | | | | - | |
Class H | | | — | | | | 545 | |
Shares redeemed | | | | | | | | |
Class A | | | (1,030 | ) | | | (1,475 | ) |
Class C | | | (173 | ) | | | (338 | ) |
Class H | | | (17,100 | ) | | | (140,294 | ) |
Net decrease in shares | | | (6,037 | ) | | | (46,433 | ) |
SEE NOTES TO FINANCIAL STATEMENTS. | THE RYDEX FUNDS SEMI-ANNUAL FINANCIAL REPORT | 363 |
This table is presented to show selected data for a share outstanding throughout each period and to assist shareholders in evaluating a Fund’s performance for the periods presented.
Class A | | Six Months Ended
September 30, 2024a | | | Year Ended
March 31,
2024 | | | Year Ended
March 31,
2023 | | | Year Ended
March 31,
2022 | | | Year Ended
March 31,
2021 | | | Year Ended
March 31,
2020 | |
Per Share Data |
Net asset value, beginning of period | | $ | 159.13 | | | $ | 117.27 | | | $ | 142.84 | | | $ | 201.08 | | | $ | 94.96 | | | $ | 119.96 | |
Income (loss) from investment operations: |
Net investment income (loss)b | | | 2.69 | | | | 4.91 | | | | 1.39 | | | | (2.21 | ) | | | (1.95 | ) | | | .91 | |
Net gain (loss) on investments (realized and unrealized) | | | (11.87 | ) | | | 44.41 | | | | (26.96 | ) | | | (56.03 | ) | | | 109.13 | | | | (24.67 | ) |
Total from investment operations | | | (9.18 | ) | | | 49.32 | | | | (25.57 | ) | | | (58.24 | ) | | | 107.18 | | | | (23.76 | ) |
Less distributions from: |
Net investment income | | | — | | | | (7.46 | ) | | | — | | | | — | | | | (1.06 | ) | | | (1.24 | ) |
Total distributions | | | — | | | | (7.46 | ) | | | — | | | | — | | | | (1.06 | ) | | | (1.24 | ) |
Net asset value, end of period | | $ | 149.95 | | | $ | 159.13 | | | $ | 117.27 | | | $ | 142.84 | | | $ | 201.08 | | | $ | 94.96 | |
|
Total Returnc | | | (5.79 | %) | | | 44.34 | % | | | (17.90 | %) | | | (28.96 | %) | | | 112.92 | % | | | (20.15 | %) |
Ratios/Supplemental Data |
Net assets, end of period (in thousands) | | $ | 351 | | | $ | 450 | | | $ | 207 | | | $ | 207 | | | $ | 255 | | | $ | 141 | |
Ratios to average net assets: |
Net investment income (loss) | | | 3.90 | % | | | 3.77 | % | | | 1.27 | % | | | (1.22 | %) | | | (1.26 | %) | | | 0.70 | % |
Total expenses | | | 1.56 | % | | | 1.57 | % | | | 1.50 | % | | | 1.51 | % | | | 1.58 | % | | | 1.63 | % |
Net expensesd | | | 1.51 | % | | | 1.54 | % | | | 1.49 | % | | | 1.49 | % | | | 1.56 | % | | | 1.57 | % |
Portfolio turnover rate | | | — | | | | — | | | | — | | | | — | | | | 15 | % | | | — | |
Class C | | Six Months Ended
September 30, 2024a | | | Year Ended
March 31,
2024 | | | Year Ended
March 31,
2023 | | | Year Ended
March 31,
2022 | | | Year Ended
March 31,
2021 | | | Year Ended
March 31,
2020 | |
Per Share Data |
Net asset value, beginning of period | | $ | 140.30 | | | $ | 104.92 | | | $ | 128.84 | | | $ | 182.53 | | | $ | 87.00 | | | $ | 110.80 | |
Income (loss) from investment operations: |
Net investment income (loss)b | | | 2.08 | | | | 3.51 | | | | .39 | | | | (3.48 | ) | | | (2.98 | ) | | | (.06 | ) |
Net gain (loss) on investments (realized and unrealized) | | | (10.75 | ) | | | 39.33 | | | | (24.31 | ) | | | (50.21 | ) | | | 99.57 | | | | (22.50 | ) |
Total from investment operations | | | (8.67 | ) | | | 42.84 | | | | (23.92 | ) | | | (53.69 | ) | | | 96.59 | | | | (22.56 | ) |
Less distributions from: |
Net investment income | | | — | | | | (7.46 | ) | | | — | | | | — | | | | (1.06 | ) | | | (1.24 | ) |
Total distributions | | | — | | | | (7.46 | ) | | | — | | | | — | | | | (1.06 | ) | | | (1.24 | ) |
Net asset value, end of period | | $ | 131.63 | | | $ | 140.30 | | | $ | 104.92 | | | $ | 128.84 | | | $ | 182.53 | | | $ | 87.00 | |
|
Total Returnc | | | (6.18 | %) | | | 43.33 | % | | | (18.57 | %) | | | (29.41 | %) | | | 111.34 | % | | | (20.75 | %) |
Ratios/Supplemental Data |
Net assets, end of period (in thousands) | | $ | 1 | | | $ | 22 | | | $ | 4 | | | $ | 5 | | | $ | 53 | | | $ | 21 | |
Ratios to average net assets: |
Net investment income (loss) | | | 3.38 | % | | | 3.05 | % | | | 0.40 | % | | | (2.00 | %) | | | (2.02 | %) | | | (0.05 | %) |
Total expenses | | | 2.29 | % | | | 2.30 | % | | | 2.30 | % | | | 2.25 | % | | | 2.32 | % | | | 2.38 | % |
Net expensesd | | | 2.25 | % | | | 2.27 | % | | | 2.30 | % | | | 2.24 | % | | | 2.30 | % | | | 2.32 | % |
Portfolio turnover rate | | | — | | | | — | | | | — | | | | — | | | | 15 | % | | | — | |
364 | THE RYDEX FUNDS SEMI-ANNUAL FINANCIAL REPORT | SEE NOTES TO FINANCIAL STATEMENTS. |
FINANCIAL HIGHLIGHTS (concluded) |
This table is presented to show selected data for a share outstanding throughout each period and to assist shareholders in evaluating a Fund’s performance for the periods presented.
Class H | | Six Months Ended
September 30, 2024a | | | Year Ended
March 31,
2024 | | | Year Ended
March 31,
2023 | | | Year Ended
March 31,
2022 | | | Year Ended
March 31,
2021 | | | Year Ended
March 31,
2020 | |
Per Share Data |
Net asset value, beginning of period | | $ | 160.43 | | | $ | 118.13 | | | $ | 143.98 | | | $ | 202.65 | | | $ | 95.70 | | | $ | 120.89 | |
Income (loss) from investment operations: |
Net investment income (loss)b | | | 2.75 | | | | 4.48 | | | | 1.64 | | | | (2.25 | ) | | | (2.07 | ) | | | .90 | |
Net gain (loss) on investments (realized and unrealized) | | | (12.03 | ) | | | 45.28 | | | | (27.49 | ) | | | (56.42 | ) | | | 110.08 | | | | (24.85 | ) |
Total from investment operations | | | (9.28 | ) | | | 49.76 | | | | (25.85 | ) | | | (58.67 | ) | | | 108.01 | | | | (23.95 | ) |
Less distributions from: |
Net investment income | | | — | | | | (7.46 | ) | | | — | | | | — | | | | (1.06 | ) | | | (1.24 | ) |
Total distributions | | | — | | | | (7.46 | ) | | | — | | | | — | | | | (1.06 | ) | | | (1.24 | ) |
Net asset value, end of period | | $ | 151.15 | | | $ | 160.43 | | | $ | 118.13 | | | $ | 143.98 | | | $ | 202.65 | | | $ | 95.70 | |
|
Total Return | | | (5.79 | %) | | | 44.34 | % | | | (17.95 | %) | | | (28.95 | %) | | | 112.94 | % | | | (20.17 | %) |
Ratios/Supplemental Data |
Net assets, end of period (in thousands) | | $ | 1,386 | | | $ | 2,338 | | | $ | 7,347 | | | $ | 1,049 | | | $ | 1,560 | | | $ | 817 | |
Ratios to average net assets: |
Net investment income (loss) | | | 3.93 | % | | | 3.54 | % | | | 1.48 | % | | | (1.22 | %) | | | (1.27 | %) | | | 0.69 | % |
Total expenses | | | 1.56 | % | | | 1.58 | % | | | 1.54 | % | | | 1.51 | % | | | 1.58 | % | | | 1.63 | % |
Net expensesd | | | 1.51 | % | | | 1.56 | % | | | 1.53 | % | | | 1.49 | % | | | 1.56 | % | | | 1.58 | % |
Portfolio turnover rate | | | — | | | | — | | | | — | | | | — | | | | 15 | % | | | — | |
a | Unaudited figures for the period ended September 30, 2024. Percentage amounts for the period, except total return and portfolio turnover rate, have been annualized. |
b | Net investment income (loss) per share was computed using average shares outstanding throughout the period. |
c | Total return does not reflect the impact of any applicable sales charges. |
d | Net expense information reflects the expense ratios after expense waivers and reimbursements, as applicable. |
SEE NOTES TO FINANCIAL STATEMENTS. | THE RYDEX FUNDS SEMI-ANNUAL FINANCIAL REPORT | 365 |
SCHEDULE OF INVESTMENTS (Unaudited) | September 30, 2024 |
STRENGTHENING DOLLAR 2x STRATEGY FUND | |
| | Face
Amount | | | Value | |
U.S. TREASURY BILLS†† - 2.0% |
U.S. Treasury Bills |
4.63% due 10/10/241,2 | | $ | 46,000 | | | $ | 45,946 | |
Total U.S. Treasury Bills | | | | |
(Cost $45,941) | | | | | | | 45,946 | |
| | | | | | | | | |
REPURCHASE AGREEMENTS††,3 - 75.6% |
J.P. Morgan Securities LLC
issued 09/30/24 at 4.86%
due 10/01/244 | | | 954,479 | | | | 954,479 | |
BofA Securities, Inc.
issued 09/30/24 at 4.85%
due 10/01/244 | | | 788,356 | | | | 788,356 | |
Total Repurchase Agreements | | | | |
(Cost $1,742,835) | | | | | | | 1,742,835 | |
| | | | | | | | | |
Total Investments - 77.6% | | | | |
(Cost $1,788,776) | | $ | 1,788,781 | |
Other Assets & Liabilities, net - 22.4% | | | 517,789 | |
Total Net Assets - 100.0% | | $ | 2,306,570 | |
Futures Contracts |
Description | | Number of
Contracts | | | Expiration
Date | | | Notional
Amount | | | Value and
Unrealized
Appreciation** | |
Currency Futures Contracts Purchased† |
U.S. Dollar Index Futures Contracts | | | 39 | | | | Dec 2024 | | | $ | 3,920,085 | | | $ | 5,647 | |
Total Return Swap Agreements |
Counterparty | Index | Type | Financing
Rate | | Payment
Frequency | | | Maturity
Date | | | Units | | | Notional
Amount | | | Value and
Unrealized
Depreciation | |
OTC Currency Index Swap Agreements†† |
Goldman Sachs International | U.S. Dollar Index | Receive | N/A | | | At Maturity | | | | 12/20/24 | | | | 6,346 | | | $ | 637,853 | | | $ | (436 | ) |
** | Includes cumulative appreciation (depreciation). Variation margin is reported within the Statement of Assets and Liabilities. |
† | Value determined based on Level 1 inputs — See Note 4. |
†† | Value determined based on Level 2 inputs — See Note 4. |
1 | All or a portion of this security is pledged as futures collateral at September 30, 2024. |
2 | Rate indicated is the effective yield at the time of purchase. |
3 | Repurchase Agreements — See Note 6. |
4 | All or a portion of this security is pledged as currency index swap collateral at September 30, 2024. |
| | |
| | See Sector Classification in Other Information section. |
366 | THE RYDEX FUNDS SEMI-ANNUAL FINANCIAL REPORT | SEE NOTES TO FINANCIAL STATEMENTS. |
SCHEDULE OF INVESTMENTS (Unaudited)(concluded) | September 30, 2024 |
STRENGTHENING DOLLAR 2x STRATEGY FUND | |
The following table summarizes the inputs used to value the Fund’s investments at September 30, 2024 (See Note 4 in the Notes to Financial Statements):
Investments in Securities (Assets) | | Level 1
Quoted
Prices | | | Level 2
Significant
Observable
Inputs | | | Level 3
Significant
Unobservable
Inputs | | | Total | |
U.S. Treasury Bills | | $ | — | | | $ | 45,946 | | | $ | — | | | $ | 45,946 | |
Repurchase Agreements | | | — | | | | 1,742,835 | | | | — | | | | 1,742,835 | |
Currency Futures Contracts** | | | 5,647 | | | | — | | | | — | | | | 5,647 | |
Total Assets | | $ | 5,647 | | | $ | 1,788,781 | | | $ | — | | | $ | 1,794,428 | |
Investments in Securities (Liabilities) | | Level 1
Quoted
Prices | | | Level 2
Significant
Observable
Inputs | | | Level 3
Significant
Unobservable
Inputs | | | Total | |
Currency Index Swap Agreements** | | $ | — | | | $ | 436 | | | $ | — | | | $ | 436 | |
** | This derivative is reported as unrealized appreciation/depreciation at period end. |
SEE NOTES TO FINANCIAL STATEMENTS. | THE RYDEX FUNDS SEMI-ANNUAL FINANCIAL REPORT | 367 |
STRENGTHENING DOLLAR 2x STRATEGY FUND | |
STATEMENT OF ASSETS AND LIABILITIES (Unaudited) |
September 30, 2024 |
Assets: |
Investments, at value (cost $45,941) | | $ | 45,946 | |
Repurchase agreements, at value (cost $1,742,835) | | | 1,742,835 | |
Segregated cash with broker | | | 109 | |
Receivables: |
Fund shares sold | | | 530,414 | |
Variation margin on futures contracts | | | 11,685 | |
Interest | | | 235 | |
Total assets | | | 2,331,224 | |
| | | | | |
Liabilities: |
Unrealized depreciation on OTC swap agreements | | | 436 | |
Payable for: |
Licensing fees | | | 10,011 | |
Fund shares redeemed | | | 6,912 | |
Management fees | | | 2,337 | |
Transfer agent fees | | | 1,244 | |
Swap settlement | | | 1,186 | |
Distribution and service fees | | | 651 | |
Portfolio accounting and administration fees | | | 136 | |
Trustees’ fees* | | | 25 | |
Miscellaneous | | | 1,716 | |
Total liabilities | | | 24,654 | |
Net assets | | $ | 2,306,570 | |
| | | | | |
Net assets consist of: |
Paid in capital | | $ | 22,754,426 | |
Total distributable earnings (loss) | | | (20,447,856 | ) |
Net assets | | $ | 2,306,570 | |
Class A: |
Net assets | | $ | 353,802 | |
Capital shares outstanding | | | 5,886 | |
Net asset value per share | | $ | 60.11 | |
Maximum offering price per share (Net asset value divided by 95.25%) | | $ | 63.11 | |
Class C: |
Net assets | | $ | 2,086 | |
Capital shares outstanding | | | 41 | |
Net asset value per share | | $ | 51.34 | |
Class H: |
Net assets | | $ | 1,950,682 | |
Capital shares outstanding | | | 32,571 | |
Net asset value per share | | $ | 59.89 | |
STATEMENT OF OPERATIONS (Unaudited) |
Six Months Ended September 30, 2024 |
Investment Income: |
Interest | | $ | 70,623 | |
Total investment income | | | 70,623 | |
| | | | | |
Expenses: |
Management fees | | | 11,881 | |
Distribution and service fees: |
Class A | | | 495 | |
Class C | | | 14 | |
Class H | | | 2,801 | |
Transfer agent fees | | | 2,745 | |
Licensing fees | | | 4,349 | |
Portfolio accounting and fees | | | 2,014 | |
Registration fees | | | 1,391 | |
Professional fees | | | 695 | |
Custodian fees | | | 169 | |
Trustees’ fees* | | | 168 | |
Miscellaneous | | | 365 | |
Total expenses | | | 27,087 | |
Less: |
Expenses reimbursed by Adviser | | | (1,320 | ) |
Net expenses | | | 25,767 | |
Net investment income | | | 44,856 | |
| | | | | |
Net Realized and Unrealized Gain (Loss): |
Net realized gain (loss) on: |
Swap agreements | | | (19,623 | ) |
Futures contracts | | | (85,470 | ) |
Net realized loss | | | (105,093 | ) |
Net change in unrealized appreciation (depreciation) on: |
Investments | | | 5 | |
Swap agreements | | | (11,517 | ) |
Futures contracts | | | (56,263 | ) |
Net change in unrealized appreciation (depreciation) | | | (67,775 | ) |
Net realized and unrealized loss | | | (172,868 | ) |
Net decrease in net assets resulting from operations | | $ | (128,012 | ) |
* | Relates to Trustees not deemed “interested persons” within the meaning of Section 2(a)(19) of the 1940 Act. |
368 | THE RYDEX FUNDS SEMI-ANNUAL FINANCIAL REPORT | SEE NOTES TO FINANCIAL STATEMENTS. |
STRENGTHENING DOLLAR 2x STRATEGY FUND | |
STATEMENTS OF CHANGES IN NET ASSETS |
| | Six Months Ended
September 30, 2024
(Unaudited) | | | Year Ended
March 31,
2024 | |
Increase (Decrease) in Net Assets from Operations: | | | | | | | | |
Net investment income | | $ | 44,856 | | | $ | 164,524 | |
Net realized loss on investments | | | (105,093 | ) | | | (654,241 | ) |
Net change in unrealized appreciation (depreciation) on investments | | | (67,775 | ) | | | 453,802 | |
Net decrease in net assets resulting from operations | | | (128,012 | ) | | | (35,915 | ) |
| | | | | | | | | |
Distributions to shareholders: | | | | | | | | |
Class A | | | — | | | | (8,436 | ) |
Class C | | | — | | | | (601 | ) |
Class H | | | — | | | | (71,717 | ) |
Total distributions to shareholders | | | — | | | | (80,754 | ) |
| | | | | | | | | |
Capital share transactions: | | | | | | | | |
Proceeds from sale of shares | | | | | | | | |
Class A | | | 320,619 | | | | 683,629 | |
Class C | | | 16,511 | | | | 94,305 | |
Class H | | | 43,264,997 | | | | 37,742,379 | |
Distributions reinvested | | | | | | | | |
Class A | | | — | | | | 7,532 | |
Class C | | | — | | | | 206 | |
Class H | | | — | | | | 71,112 | |
Cost of shares redeemed | | | | | | | | |
Class A | | | (374,839 | ) | | | (931,162 | ) |
Class C | | | (23,634 | ) | | | (120,696 | ) |
Class H | | | (43,207,343 | ) | | | (42,250,193 | ) |
Net decrease from capital share transactions | | | (3,689 | ) | | | (4,702,888 | ) |
Net decrease in net assets | | | (131,701 | ) | | | (4,819,557 | ) |
| | | | | | | | | |
Net assets: | | | | | | | | |
Beginning of period | | | 2,438,271 | | | | 7,257,828 | |
End of period | | $ | 2,306,570 | | | $ | 2,438,271 | |
| | | | | | | | | |
Capital share activity: | | | | | | | | |
Shares sold | | | | | | | | |
Class A | | | 5,063 | | | | 11,321 | |
Class C | | | 306 | | | | 1,775 | |
Class H | | | 706,011 | | | | 621,543 | |
Shares issued from reinvestment of distributions | | | | | | | | |
Class A | | | — | | | | 124 | |
Class C | | | — | | | | 4 | |
Class H | | | — | | | | 1,175 | |
Shares redeemed | | | | | | | | |
Class A | | | (5,949 | ) | | | (15,415 | ) |
Class C | | | (435 | ) | | | (2,371 | ) |
Class H | | | (705,479 | ) | | | (704,670 | ) |
Net decrease in shares | | | (483 | ) | | | (86,514 | ) |
SEE NOTES TO FINANCIAL STATEMENTS. | THE RYDEX FUNDS SEMI-ANNUAL FINANCIAL REPORT | 369 |
STRENGTHENING DOLLAR 2x STRATEGY FUND | |
This table is presented to show selected data for a share outstanding throughout each period and to assist shareholders in evaluating a Fund’s performance for the periods presented.
Class A | | Six Months Ended
September 30, 2024a | | | Year Ended
March 31,
2024 | | | Year Ended
March 31,
2023 | | | Year Ended
March 31,
2022 | | | Year Ended
March 31,
2021 | | | Year Ended
March 31,
2020 | |
Per Share Data |
Net asset value, beginning of period | | $ | 62.78 | | | $ | 58.06 | | | $ | 52.63 | | | $ | 48.47 | | | $ | 55.34 | | | $ | 52.46 | |
Income (loss) from investment operations: |
Net investment income (loss)b | | | 1.08 | | | | 2.11 | | | | .38 | | | | (.64 | ) | | | (.64 | ) | | | .16 | |
Net gain (loss) on investments (realized and unrealized) | | | (3.75 | ) | | | 3.88 | f | | | 5.05 | f | | | 4.80 | | | | (5.95 | ) | | | 3.17 | |
Total from investment operations | | | (2.67 | ) | | | 5.99 | | | | 5.43 | | | | 4.16 | | | | (6.59 | ) | | | 3.33 | |
Less distributions from: |
Net investment income | | | — | | | | (1.27 | ) | | | — | | | | — | | | | (.28 | ) | | | (.45 | ) |
Total distributions | | | — | | | | (1.27 | ) | | | — | | | | — | | | | (.28 | ) | | | (.45 | ) |
Net asset value, end of period | | $ | 60.11 | | | $ | 62.78 | | | $ | 58.06 | | | $ | 52.63 | | | $ | 48.47 | | | $ | 55.34 | |
|
Total Returnc | | | (4.25 | %) | | | 10.36 | % | | | 10.32 | % | | | 8.58 | % | | | (11.88 | %) | | | 6.38 | % |
Ratios/Supplemental Data |
Net assets, end of period (in thousands) | | $ | 354 | | | $ | 425 | | | $ | 624 | | | $ | 1,023 | | | $ | 1,464 | | | $ | 2,535 | |
Ratios to average net assets: |
Net investment income (loss) | | | 3.42 | % | | | 3.50 | % | | | 0.64 | % | | | (1.32 | %) | | | (1.26 | %) | | | 0.29 | % |
Total expensesd | | | 2.06 | % | | | 1.91 | % | | | 1.82 | % | | | 1.89 | % | | | 1.91 | % | | | 2.00 | % |
Net expensese | | | 1.96 | % | | | 1.83 | % | | | 1.79 | % | | | 1.86 | % | | | 1.87 | % | | | 1.96 | % |
Portfolio turnover rate | | | — | | | | — | | | | — | | | | — | | | | — | | | | — | |
Class C | | Six Months Ended
September 30, 2024a | | | Year Ended
March 31,
2024 | | | Year Ended
March 31,
2023 | | | Year Ended
March 31,
2022 | | | Year Ended
March 31,
2021 | | | Year Ended
March 31,
2020 | |
Per Share Data |
Net asset value, beginning of period | | $ | 53.82 | | | $ | 50.31 | | | $ | 45.94 | | | $ | 42.62 | | | $ | 49.08 | | | $ | 46.91 | |
Income (loss) from investment operations: |
Net investment income (loss)b | | | 1.20 | | | | 1.38 | | | | .23 | | | | (.87 | ) | | | (.90 | ) | | | (.16 | ) |
Net gain (loss) on investments (realized and unrealized) | | | (3.68 | ) | | | 3.40 | f | | | 4.14 | f | | | 4.19 | | | | (5.28 | ) | | | 2.78 | |
Total from investment operations | | | (2.48 | ) | | | 4.78 | | | | 4.37 | | | | 3.32 | | | | (6.18 | ) | | | 2.62 | |
Less distributions from: |
Net investment income | | | — | | | | (1.27 | ) | | | — | | | | — | | | | (.28 | ) | | | (.45 | ) |
Total distributions | | | — | | | | (1.27 | ) | | | — | | | | — | | | | (.28 | ) | | | (.45 | ) |
Net asset value, end of period | | $ | 51.34 | | | $ | 53.82 | | | $ | 50.31 | | | $ | 45.94 | | | $ | 42.62 | | | $ | 49.08 | |
|
Total Returnc | | | (4.61 | %) | | | 9.57 | % | | | 9.51 | % | | | 7.79 | % | | | (12.56 | %) | | | 5.62 | % |
Ratios/Supplemental Data |
Net assets, end of period (in thousands) | | $ | 2 | | | $ | 9 | | | $ | 38 | | | $ | 34 | | | $ | 35 | | | $ | 96 | |
Ratios to average net assets: |
Net investment income (loss) | | | 2.70 | % | | | 2.66 | % | | | 0.43 | % | | | (2.07 | %) | | | (2.00 | %) | | | (0.33 | %) |
Total expensesd | | | 2.84 | % | | | 2.64 | % | | | 2.56 | % | | | 2.66 | % | | | 2.67 | % | | | 2.77 | % |
Net expensese | | | 2.70 | % | | | 2.57 | % | | | 2.52 | % | | | 2.62 | % | | | 2.63 | % | | | 2.72 | % |
Portfolio turnover rate | | | — | | | | — | | | | — | | | | — | | | | — | | | | — | |
370 | THE RYDEX FUNDS SEMI-ANNUAL FINANCIAL REPORT | SEE NOTES TO FINANCIAL STATEMENTS. |
STRENGTHENING DOLLAR 2x STRATEGY FUND | |
FINANCIAL HIGHLIGHTS (concluded) |
This table is presented to show selected data for a share outstanding throughout each period and to assist shareholders in evaluating a Fund’s performance for the periods presented.
Class H | | Six Months Ended
September 30, 2024a | | | Year Ended
March 31,
2024 | | | Year Ended
March 31,
2023 | | | Year Ended
March 31,
2022 | | | Year Ended
March 31,
2021 | | | Year Ended
March 31,
2020 | |
Per Share Data |
Net asset value, beginning of period | | $ | 62.55 | | | $ | 57.86 | | | $ | 52.44 | | | $ | 48.29 | | | $ | 55.12 | | | $ | 52.25 | |
Income (loss) from investment operations: |
Net investment income (loss)b | | | 1.06 | | | | 2.07 | | | | .67 | | | | (.66 | ) | | | (.70 | ) | | | .12 | |
Net gain (loss) on investments (realized and unrealized) | | | (3.72 | ) | | | 3.89 | f | | | 4.75 | f | | | 4.81 | | | | (5.85 | ) | | | 3.20 | |
Total from investment operations | | | (2.66 | ) | | | 5.96 | | | | 5.42 | | | | 4.15 | | | | (6.55 | ) | | | 3.32 | |
Less distributions from: |
Net investment income | | | — | | | | (1.27 | ) | | | — | | | | — | | | | (.28 | ) | | | (.45 | ) |
Total distributions | | | — | | | | (1.27 | ) | | | — | | | | — | | | | (.28 | ) | | | (.45 | ) |
Net asset value, end of period | | $ | 59.89 | | | $ | 62.55 | | | $ | 57.86 | | | $ | 52.44 | | | $ | 48.29 | | | $ | 55.12 | |
|
Total Return | | | (4.25 | %) | | | 10.35 | % | | | 10.34 | % | | | 8.59 | % | | | (11.86 | %) | | | 6.39 | % |
Ratios/Supplemental Data |
Net assets, end of period (in thousands) | | $ | 1,951 | | | $ | 2,004 | | | $ | 6,596 | | | $ | 4,190 | | | $ | 2,437 | | | $ | 10,549 | |
Ratios to average net assets: |
Net investment income (loss) | | | 3.39 | % | | | 3.46 | % | | | 1.08 | % | | | (1.36 | %) | | | (1.36 | %) | | | 0.22 | % |
Total expensesd | | | 2.05 | % | | | 1.90 | % | | | 1.81 | % | | | 1.89 | % | | | 1.94 | % | | | 2.00 | % |
Net expensese | | | 1.95 | % | | | 1.83 | % | | | 1.77 | % | | | 1.85 | % | | | 1.90 | % | | | 1.96 | % |
Portfolio turnover rate | | | — | | | | — | | | | — | | | | — | | | | — | | | | — | |
a | Unaudited figures for the period ended September 30, 2024. Percentage amounts for the period, except total return and portfolio turnover rate, have been annualized. |
b | Net investment income (loss) per share was computed using average shares outstanding throughout the period. |
c | Total return does not reflect the impact of any applicable sales charges. |
d | Does not include expenses of the underlying funds in which the Fund invests. |
e | Net expense information reflects the expense ratios after expense waivers and reimbursements, as applicable. |
f | The amount shown for a share outstanding throughout the period does not agree with the aggregate net gain on investments for the period because of the sales and purchases of fund shares in relation to fluctuating market value of the investments of the Fund. |
SEE NOTES TO FINANCIAL STATEMENTS. | THE RYDEX FUNDS SEMI-ANNUAL FINANCIAL REPORT | 371 |
SCHEDULE OF INVESTMENTS (Unaudited) | September 30, 2024 |
WEAKENING DOLLAR 2x STRATEGY FUND | |
| | Face
Amount | | | Value | |
U.S. TREASURY BILLS†† - 2.6% |
U.S. Treasury Bills |
4.63% due 10/10/241,2 | | $ | 36,000 | | | $ | 35,958 | |
Total U.S. Treasury Bills | | | | |
(Cost $35,954) | | | | | | | 35,958 | |
| | | | | | | | | |
REPURCHASE AGREEMENTS††,3 - 87.3% |
J.P. Morgan Securities LLC
issued 09/30/24 at 4.86%
due 10/01/244 | | | 654,776 | | | | 654,776 | |
BofA Securities, Inc.
issued 09/30/24 at 4.85%
due 10/01/244 | | | 540,814 | | | | 540,814 | |
Total Repurchase Agreements | | | | |
(Cost $1,195,590) | | | | | | | 1,195,590 | |
| | | | | | | | | |
Total Investments - 89.9% | | | | |
(Cost $1,231,544) | | $ | 1,231,548 | |
Other Assets & Liabilities, net - 10.1% | | | 138,347 | |
Total Net Assets - 100.0% | | $ | 1,369,895 | |
Futures Contracts |
Description | | Number of
Contracts | | | Expiration
Date | | | Notional
Amount | | | Value and
Unrealized
Appreciation** | |
Currency Futures Contracts Sold Short† |
U.S. Dollar Index Futures Contracts | | | 16 | | | | Dec 2024 | | | $ | 1,608,240 | | | $ | 11,559 | |
Total Return Swap Agreements |
Counterparty | Index | Type | Financing
Rate | | Payment
Frequency | | | Maturity
Date | | | Units | | | Notional
Amount | | | Value and
Unrealized
Appreciation | |
OTC Currency Index Swap Agreements Sold Short†† |
Goldman Sachs International | U.S. Dollar Index | Pay | N/A | | | At Maturity | | | | 12/20/24 | | | | 10,994 | | | $ | 1,105,011 | | | $ | 1,075 | |
** | Includes cumulative appreciation (depreciation). Variation margin is reported within the Statement of Assets and Liabilities. |
† | Value determined based on Level 1 inputs — See Note 4. |
†† | Value determined based on Level 2 inputs — See Note 4. |
1 | All or a portion of this security is pledged as futures collateral at September 30, 2024. |
2 | Rate indicated is the effective yield at the time of purchase. |
3 | Repurchase Agreements — See Note 6. |
4 | All or a portion of this security is pledged as currency index swap collateral at September 30, 2024. |
| | |
| | See Sector Classification in Other Information section. |
372 | THE RYDEX FUNDS SEMI-ANNUAL FINANCIAL REPORT | SEE NOTES TO FINANCIAL STATEMENTS. |
SCHEDULE OF INVESTMENTS (Unaudited)(concluded) | September 30, 2024 |
WEAKENING DOLLAR 2x STRATEGY FUND | |
The following table summarizes the inputs used to value the Fund’s investments at September 30, 2024 (See Note 4 in the Notes to Financial Statements):
Investments in Securities (Assets) | | Level 1
Quoted
Prices | | | Level 2
Significant
Observable
Inputs | | | Level 3
Significant
Unobservable
Inputs | | | Total | |
U.S. Treasury Bills | | $ | — | | | $ | 35,958 | | | $ | — | | | $ | 35,958 | |
Repurchase Agreements | | | — | | | | 1,195,590 | | | | — | | | | 1,195,590 | |
Currency Futures Contracts** | | | 11,559 | | | | — | | | | — | | | | 11,559 | |
Currency Index Swap Agreements** | | | — | | | | 1,075 | | | | — | | | | 1,075 | |
Total Assets | | $ | 11,559 | | | $ | 1,232,623 | | | $ | — | | | $ | 1,244,182 | |
** | This derivative is reported as unrealized appreciation/depreciation at period end. |
SEE NOTES TO FINANCIAL STATEMENTS. | THE RYDEX FUNDS SEMI-ANNUAL FINANCIAL REPORT | 373 |
WEAKENING DOLLAR 2x STRATEGY FUND | |
STATEMENT OF ASSETS AND LIABILITIES (Unaudited) |
September 30, 2024 |
Assets: |
Investments, at value (cost $35,954) | | $ | 35,958 | |
Repurchase agreements, at value (cost $1,195,590) | | | 1,195,590 | |
Unrealized appreciation on OTC swap agreements | | | 1,075 | |
Receivables: |
Fund shares sold | | | 225,735 | |
Swap settlement | | | 258 | |
Interest | | | 161 | |
Total assets | | | 1,458,777 | |
| | | | | |
Liabilities: |
Payable for: |
Fund shares redeemed | | | 75,030 | |
Variation margin on futures contracts | | | 6,496 | |
Management fees | | | 1,365 | |
Transfer agent fees | | | 650 | |
Distribution and service fees | | | 379 | |
Portfolio accounting and administration fees | | | 80 | |
Trustees’ fees* | | | 13 | |
Miscellaneous | | | 4,869 | |
Total liabilities | | | 88,882 | |
Net assets | | $ | 1,369,895 | |
| | | | | |
Net assets consist of: |
Paid in capital | | $ | 11,740,249 | |
Total distributable earnings (loss) | | | (10,370,354 | ) |
Net assets | | $ | 1,369,895 | |
Class A: |
Net assets | | $ | 205,494 | |
Capital shares outstanding | | | 4,149 | |
Net asset value per share | | $ | 49.53 | |
Maximum offering price per share (Net asset value divided by 95.25%) | | $ | 52.00 | |
Class C: |
Net assets | | $ | 429 | |
Capital shares outstanding | | | 10 | |
Net asset value per share | | $ | 42.13 | |
Class H: |
Net assets | | $ | 1,163,972 | |
Capital shares outstanding | | | 23,538 | |
Net asset value per share | | $ | 49.45 | |
STATEMENT OF OPERATIONS (Unaudited) |
Six Months Ended September 30, 2024 |
Investment Income: |
Interest | | $ | 33,277 | |
Total investment income | | | 33,277 | |
| | | | | |
Expenses: |
Management fees | | | 5,619 | |
Distribution and service fees: |
Class A | | | 254 | |
Class C | | | 2 | |
Class H | | | 1,306 | |
Transfer agent fees | | | 1,295 | |
Licensing fees | | | 1,971 | |
Portfolio accounting and administration fees | | | 953 | |
Registration fees | | | 322 | |
Professional fees | | | 317 | |
Custodian fees | | | 79 | |
Trustees’ fees* | | | 60 | |
Miscellaneous | | | 583 | |
Total expenses | | | 12,761 | |
Less: |
Expenses reimbursed by Adviser | | | (624 | ) |
Net expenses | | | 12,137 | |
Net investment income | | | 21,140 | |
| | | | | |
Net Realized and Unrealized Gain (Loss): |
Net realized gain (loss) on: |
Swap agreements | | | 1,717 | |
Futures contracts | | | (15,303 | ) |
Net realized loss | | | (13,586 | ) |
Net change in unrealized appreciation (depreciation) on: |
Investments | | | 4 | |
Swap agreements | | | 3,255 | |
Futures contracts | | | 36,488 | |
Net change in unrealized appreciation (depreciation) | | | 39,747 | |
Net realized and unrealized gain | | | 26,161 | |
Net increase in net assets resulting from operations | | $ | 47,301 | |
* | Relates to Trustees not deemed “interested persons” within the meaning of Section 2(a)(19) of the 1940 Act. |
374 | THE RYDEX FUNDS SEMI-ANNUAL FINANCIAL REPORT | SEE NOTES TO FINANCIAL STATEMENTS. |
WEAKENING DOLLAR 2x STRATEGY FUND | |
STATEMENTS OF CHANGES IN NET ASSETS |
| | Six Months Ended
September 30, 2024
(Unaudited) | | | Year Ended
March 31,
2024 | |
Increase (Decrease) in Net Assets from Operations: | | | | | | | | |
Net investment income | | $ | 21,140 | | | $ | 47,547 | |
Net realized loss on investments | | | (13,586 | ) | | | (225,508 | ) |
Net change in unrealized appreciation (depreciation) on investments | | | 39,747 | | | | (92,593 | ) |
Net increase (decrease) in net assets resulting from operations | | | 47,301 | | | | (270,554 | ) |
| | | | | | | | | |
Distributions to shareholders: | | | | | | | | |
Class A | | | — | | | | (2,465 | ) |
Class C | | | — | | | | (4 | ) |
Class H | | | — | | | | (8,970 | ) |
Total distributions to shareholders | | | — | | | | (11,439 | ) |
| | | | | | | | | |
Capital share transactions: | | | | | | | | |
Proceeds from sale of shares | | | | | | | | |
Class A | | | 31,639 | | | | 87,160 | |
Class C | | | 500 | | | | 34,672 | |
Class H | | | 24,560,077 | | | | 14,094,456 | |
Distributions reinvested | | | | | | | | |
Class A | | | — | | | | 2,464 | |
Class C | | | — | | | | 4 | |
Class H | | | — | | | | 8,717 | |
Cost of shares redeemed | | | | | | | | |
Class A | | | (48,318 | ) | | | (91,457 | ) |
Class C | | | (364 | ) | | | (36,772 | ) |
Class H | | | (24,165,834 | ) | | | (14,466,225 | ) |
Net increase (decrease) from capital share transactions | | | 377,700 | | | | (366,981 | ) |
Net increase (decrease) in net assets | | | 425,001 | | | | (648,974 | ) |
| | | | | | | | | |
Net assets: | | | | | | | | |
Beginning of period | | | 944,894 | | | | 1,593,868 | |
End of period | | $ | 1,369,895 | | | $ | 944,894 | |
| | | | | | | | | |
Capital share activity: | | | | | | | | |
Shares sold | | | | | | | | |
Class A | | | 666 | | | | 1,793 | |
Class C | | | 13 | | | | 782 | |
Class H | | | 507,479 | | | | 287,573 | |
Shares issued from reinvestment of distributions | | | | | | | | |
Class A | | | — | | | | 52 | |
Class C | | | — | | | | — | |
Class H | | | — | | | | 186 | |
Shares redeemed | | | | | | | | |
Class A | | | (1,004 | ) | | | (1,950 | ) |
Class C | | | (10 | ) | | | (910 | ) |
Class H | | | (499,930 | ) | | | (299,670 | ) |
Net increase (decrease) in shares | | | 7,214 | | | | (12,144 | ) |
SEE NOTES TO FINANCIAL STATEMENTS. | THE RYDEX FUNDS SEMI-ANNUAL FINANCIAL REPORT | 375 |
WEAKENING DOLLAR 2x STRATEGY FUND | |
This table is presented to show selected data for a share outstanding throughout each period and to assist shareholders in evaluating a Fund’s performance for the periods presented.
Class A | | Six Months Ended
September 30, 2024a | | | Year Ended
March 31,
2024 | | | Year Ended
March 31,
2023 | | | Year Ended
March 31,
2022 | | | Year Ended
March 31,
2021 | | | Year Ended
March 31,
2020 | |
Per Share Data |
Net asset value, beginning of period | | $ | 46.20 | | | $ | 48.96 | | | $ | 55.46 | | | $ | 63.71 | | | $ | 57.85 | | | $ | 63.74 | |
Income (loss) from investment operations: |
Net investment income (loss)b | | | .80 | | | | 1.66 | | | | .52 | | | | (.74 | ) | | | (.84 | ) | | | .16 | |
Net gain (loss) on investments (realized and unrealized) | | | 2.53 | | | | (3.93 | ) | | | (7.02 | ) | | | (7.51 | ) | | | 6.82 | | | | (5.84 | ) |
Total from investment operations | | | 3.33 | | | | (2.27 | ) | | | (6.50 | ) | | | (8.25 | ) | | | 5.98 | | | | (5.68 | ) |
Less distributions from: |
Net investment income | | | — | | | | (.49 | ) | | | — | | | | — | | | | (.12 | ) | | | (.21 | ) |
Total distributions | | | — | | | | (.49 | ) | | | — | | | | — | | | | (.12 | ) | | | (.21 | ) |
Net asset value, end of period | | $ | 49.53 | | | $ | 46.20 | | | $ | 48.96 | | | $ | 55.46 | | | $ | 63.71 | | | $ | 57.85 | |
|
Total Returnc | | | 7.21 | % | | | (4.65 | %) | | | (11.72 | %) | | | (12.95 | %) | | | 10.32 | % | | | (8.94 | %) |
Ratios/Supplemental Data |
Net assets, end of period (in thousands) | | $ | 205 | | | $ | 207 | | | $ | 225 | | | $ | 192 | | | $ | 387 | | | $ | 237 | |
Ratios to average net assets: |
Net investment income (loss) | | | 3.39 | % | | | 3.48 | % | | | 1.10 | % | | | (1.18 | %) | | | (1.30 | %) | | | 0.26 | % |
Total expensesd | | | 2.06 | % | | | 1.91 | % | | | 1.74 | % | | | 1.90 | % | | | 1.90 | % | | | 2.01 | % |
Net expensese | | | 1.96 | % | | | 1.83 | % | | | 1.69 | % | | | 1.84 | % | | | 1.86 | % | | | 2.00 | % |
Portfolio turnover rate | | | — | | | | — | | | | — | | | | — | | | | 48 | % | | | — | |
Class C | | Six Months Ended
September 30, 2024a | | | Year Ended
March 31,
2024 | | | Year Ended
March 31,
2023 | | | Year Ended
March 31,
2022 | | | Year Ended
March 31,
2021 | | | Year Ended
March 31,
2020 | |
Per Share Data |
Net asset value, beginning of period | | $ | 39.45 | | | $ | 42.26 | | | $ | 48.23 | | | $ | 55.80 | | | $ | 51.07 | | | $ | 56.74 | |
Income (loss) from investment operations: |
Net investment income (loss)b | | | .45 | | | | 1.20 | | | | .32 | | | | (1.06 | ) | | | (1.17 | ) | | | (.29 | ) |
Net gain (loss) on investments (realized and unrealized) | | | 2.23 | | | | (3.52 | ) | | | (6.29 | ) | | | (6.51 | ) | | | 6.02 | | | | (5.17 | ) |
Total from investment operations | | | 2.68 | | | | (2.32 | ) | | | (5.97 | ) | | | (7.57 | ) | | | 4.85 | | | | (5.46 | ) |
Less distributions from: |
Net investment income | | | — | | | | (.49 | ) | | | — | | | | — | | | | (.12 | ) | | | (.21 | ) |
Total distributions | | | — | | | | (.49 | ) | | | — | | | | — | | | | (.12 | ) | | | (.21 | ) |
Net asset value, end of period | | $ | 42.13 | | | $ | 39.45 | | | $ | 42.26 | | | $ | 48.23 | | | $ | 55.80 | | | $ | 51.07 | |
|
Total Returnc | | | 6.79 | % | | | (5.51 | %) | | | (12.38 | %) | | | (13.57 | %) | | | 9.50 | % | | | (9.65 | %) |
Ratios/Supplemental Data |
Net assets, end of period (in thousands) | | $ | 0 | | | $ | 0 | | | $ | 6 | | | $ | 15 | | | $ | 37 | | | $ | 21 | |
Ratios to average net assets: |
Net investment income (loss) | | | 2.37 | % | | | 2.87 | % | | | 0.81 | % | | | (1.93 | %) | | | (2.04 | %) | | | (0.53 | %) |
Total expensesd | | | 2.84 | % | | | 2.53 | % | | | 2.37 | % | | | 2.66 | % | | | 2.66 | % | | | 2.75 | % |
Net expensese | | | 2.84 | % | | | 2.46 | % | | | 2.32 | % | | | 2.59 | % | | | 2.62 | % | | | 2.73 | % |
Portfolio turnover rate | | | — | | | | — | | | | — | | | | — | | | | 48 | % | | | — | |
376 | THE RYDEX FUNDS SEMI-ANNUAL FINANCIAL REPORT | SEE NOTES TO FINANCIAL STATEMENTS. |
WEAKENING DOLLAR 2x STRATEGY FUND | |
FINANCIAL HIGHLIGHTS (concluded) |
This table is presented to show selected data for a share outstanding throughout each period and to assist shareholders in evaluating a Fund’s performance for the periods presented.
Class H | | Six Months Ended
September 30, 2024a | | | Year Ended
March 31,
2024 | | | Year Ended
March 31,
2023 | | | Year Ended
March 31,
2022 | | | Year Ended
March 31,
2021 | | | Year Ended
March 31,
2020 | |
Per Share Data |
Net asset value, beginning of period | | $ | 46.12 | | | $ | 48.87 | | | $ | 55.37 | | | $ | 63.59 | | | $ | 57.76 | | | $ | 63.67 | |
Income (loss) from investment operations: |
Net investment income (loss)b | | | .80 | | | | 1.68 | | | | .55 | | | | (.73 | ) | | | (.93 | ) | | | .07 | |
Net gain (loss) on investments (realized and unrealized) | | | 2.53 | | | | (3.94 | ) | | | (7.05 | ) | | | (7.49 | ) | | | 6.88 | | | | (5.77 | ) |
Total from investment operations | | | 3.33 | | | | (2.26 | ) | | | (6.50 | ) | | | (8.22 | ) | | | 5.95 | | | | (5.70 | ) |
Less distributions from: |
Net investment income | | | — | | | | (.49 | ) | | | — | | | | — | | | | (.12 | ) | | | (.21 | ) |
Total distributions | | | — | | | | (.49 | ) | | | — | | | | — | | | | (.12 | ) | | | (.21 | ) |
Net asset value, end of period | | $ | 49.45 | | | $ | 46.12 | | | $ | 48.87 | | | $ | 55.37 | | | $ | 63.59 | | | $ | 57.76 | |
|
Total Return | | | 7.22 | % | | | (4.64 | %) | | | (11.74 | %) | | | (12.93 | %) | | | 10.29 | % | | | (8.98 | %) |
Ratios/Supplemental Data |
Net assets, end of period (in thousands) | | $ | 1,164 | | | $ | 737 | | | $ | 1,363 | | | $ | 1,005 | | | $ | 1,063 | | | $ | 1,308 | |
Ratios to average net assets: |
Net investment income (loss) | | | 3.39 | % | | | 3.50 | % | | | 1.18 | % | | | (1.17 | %) | | | (1.47 | %) | | | 0.12 | % |
Total expensesd | | | 2.04 | % | | | 1.89 | % | | | 1.74 | % | | | 1.90 | % | | | 1.88 | % | | | 1.99 | % |
Net expensese | | | 1.94 | % | | | 1.81 | % | | | 1.69 | % | | | 1.84 | % | | | 1.86 | % | | | 1.97 | % |
Portfolio turnover rate | | | — | | | | — | | | | — | | | | — | | | | 48 | % | | | — | |
a | Unaudited figures for the period ended September 30, 2024. Percentage amounts for the period, except total return and portfolio turnover rate, have been annualized. |
b | Net investment income (loss) per share was computed using average shares outstanding throughout the period. |
c | Total return does not reflect the impact of any applicable sales charges. |
d | Does not include expenses of the underlying funds in which the Fund invests. |
e | Net expense information reflects the expense ratios after expense waivers and reimbursements, as applicable. |
SEE NOTES TO FINANCIAL STATEMENTS. | THE RYDEX FUNDS SEMI-ANNUAL FINANCIAL REPORT | 377 |
SCHEDULE OF INVESTMENTS (Unaudited) | September 30, 2024 |
U.S. GOVERNMENT MONEY MARKET FUND | |
| | Face
Amount | | | Value | |
FEDERAL AGENCY NOTES†† - 33.9% |
Federal Home Loan Bank |
4.88% (SOFR + 0.04%, Rate Floor: 0.00%) due 06/20/25◊ | | $ | 15,000,000 | | | $ | 15,000,000 | |
4.84% (SOFR + 0.00%, Rate Floor: 0.00%) due 11/15/24◊ | | | 15,000,000 | | | | 15,000,000 | |
4.96% (SOFR + 0.12%, Rate Floor: 0.00%) due 11/18/24◊ | | | 12,000,000 | | | | 12,001,584 | |
4.85% (SOFR + 0.01%, Rate Floor: 0.00%) due 02/06/25◊ | | | 10,500,000 | | | | 10,499,039 | |
4.85% (SOFR + 0.01%, Rate Floor: 0.00%) due 11/25/24◊ | | | 10,000,000 | | | | 9,999,861 | |
Federal Farm Credit Bank |
4.92% (SOFR + 0.08%, Rate Floor: 0.00%) due 12/30/24◊ | | | 10,000,000 | | | | 10,001,300 | |
5.13% due 05/22/25 | | | 8,700,000 | | | | 8,696,725 | |
4.63% due 12/05/24 | | | 4,670,000 | | | | 4,665,417 | |
Freddie Mac |
0.45% due 11/25/24 | | | 8,102,000 | | | | 8,045,912 | |
Total Federal Agency Notes | | | | |
(Cost $93,909,838) | | | | | | | 93,909,838 | |
| | | | | | | | | |
FEDERAL AGENCY DISCOUNT NOTES†† - 11.4% |
Federal Home Loan Bank |
5.17% due 10/09/241 | | | 10,000,000 | | | | 9,988,504 | |
4.69% due 11/13/241 | | | 10,000,000 | | | | 9,943,025 | |
5.15% due 10/09/241 | | | 5,590,000 | | | | 5,583,603 | |
4.68% due 10/16/241 | | | 2,000,000 | | | | 1,995,954 | |
5.17% due 10/04/241 | | | 1,700,000 | | | | 1,699,268 | |
5.16% due 10/09/241 | | | 1,500,000 | | | | 1,498,280 | |
5.14% due 10/23/241 | | | 900,000 | | | | 897,173 | |
Total Federal Agency Discount Notes | | | | |
(Cost $31,605,807) | | | | | | | 31,605,807 | |
| | | | | | | | | |
U.S. GOVERNMENT SECURITIES†† - 9.0% |
United States Treasury Floating Rate Note |
4.73% (3 Month U.S. Treasury Bill Rate + 0.14%, Rate Floor: 0.00%) due 10/31/24◊ | | | 15,000,000 | | | | 14,999,565 | |
4.79% (3 Month U.S. Treasury Bill Rate + 0.20%, Rate Floor: 0.00%) due 01/31/25◊ | | | 10,000,000 | | | | 10,003,605 | |
Total U.S. Government Securities | | | | |
(Cost $25,003,170) | | | | | | | 25,003,170 | |
| | | | | | | | | |
U.S. TREASURY BILLS†† - 8.7% |
U.S. Treasury Bills |
4.01% due 10/22/241 | | | 15,000,000 | | | | 14,957,328 | |
4.70% due 10/22/241 | | | 9,000,000 | | | | 8,974,397 | |
Total U.S. Treasury Bills | | | | |
(Cost $23,931,725) | | | | | | | 23,931,725 | |
| | | | | | | | | |
REPURCHASE AGREEMENTS††,2 - 26.4% |
J.P. Morgan Securities LLC
issued 09/30/24 at 4.86%
due 10/01/24 | | | 39,947,302 | | | | 39,947,302 | |
BofA Securities, Inc.
issued 09/30/24 at 4.85%
due 10/01/24 | | | 32,994,614 | | | | 32,994,614 | |
Total Repurchase Agreements | | | | |
(Cost $72,941,916) | | | | | | | 72,941,916 | |
| | | | | | | | | |
Total Investments - 89.4% | | | | |
(Cost $247,392,456) | | $ | 247,392,456 | |
Other Assets & Liabilities, net - 10.6% | | | 29,318,838 | |
Total Net Assets - 100.0% | | $ | 276,711,294 | |
†† | Value determined based on Level 2 inputs — See Note 4. |
◊ | Variable rate security. Rate indicated is the rate effective at September 30, 2024. In some instances, the effective rate is limited by a minimum rate floor or a maximum rate cap established by the issuer. The settlement status of a position may also impact the effective rate indicated. In some cases, a position may be unsettled at period end and may not have a stated effective rate. In instances where multiple underlying reference rates and spread amounts are shown, the effective rate is based on a weighted average. |
1 | Rate indicated is the effective yield at the time of purchase. |
2 | Repurchase Agreements — See Note 6. |
| | SOFR — Secured Overnight Financing Rate |
| | |
| | See Sector Classification in Other Information section. |
378 | THE RYDEX FUNDS SEMI-ANNUAL FINANCIAL REPORT | SEE NOTES TO FINANCIAL STATEMENTS. |
SCHEDULE OF INVESTMENTS (Unaudited)(concluded) | September 30, 2024 |
U.S. GOVERNMENT MONEY MARKET FUND | |
The following table summarizes the inputs used to value the Fund’s investments at September 30, 2024 (See Note 4 in the Notes to Financial Statements):
Investments in Securities (Assets) | | Level 1
Quoted
Prices | | | Level 2
Significant
Observable
Inputs | | | Level 3
Significant
Unobservable
Inputs | | | Total | |
Federal Agency Notes | | $ | — | | | $ | 93,909,838 | | | $ | — | | | $ | 93,909,838 | |
Federal Agency Discount Notes | | | — | | | | 31,605,807 | | | | — | | | | 31,605,807 | |
U.S. Government Securities | | | — | | | | 25,003,170 | | | | — | | | | 25,003,170 | |
U.S. Treasury Bills | | | — | | | | 23,931,725 | | | | — | | | | 23,931,725 | |
Repurchase Agreements | | | — | | | | 72,941,916 | | | | — | | | | 72,941,916 | |
Total Assets | | $ | — | | | $ | 247,392,456 | | | $ | — | | | $ | 247,392,456 | |
SEE NOTES TO FINANCIAL STATEMENTS. | THE RYDEX FUNDS SEMI-ANNUAL FINANCIAL REPORT | 379 |
U.S. GOVERNMENT MONEY MARKET FUND | |
STATEMENT OF ASSETS AND LIABILITIES (Unaudited) |
September 30, 2024 |
Assets: |
Investments, at value (cost $174,450,540) | | $ | 174,450,540 | |
Repurchase agreements, at value (cost $72,941,916) | | | 72,941,916 | |
Receivables: |
Fund shares sold | | | 54,882,536 | |
Interest | | | 816,975 | |
Total assets | | | 303,091,967 | |
| | | | | |
Liabilities: |
Payable for: |
Fund shares redeemed | | | 25,981,026 | |
Transfer agent fees | | | 103,846 | |
Management fees | | | 97,075 | |
Portfolio accounting and administration fees | | | 29,467 | |
Distributions to shareholders | | | 14,507 | |
Trustees’ fees* | | | 2,241 | |
Miscellaneous | | | 152,511 | |
Total liabilities | | | 26,380,673 | |
Net assets | | $ | 276,711,294 | |
| | | | | |
Net assets consist of: |
Paid in capital | | $ | 276,574,412 | |
Total distributable earnings (loss) | | | 136,882 | |
Net assets | | $ | 276,711,294 | |
Capital shares outstanding | | | 276,552,068 | |
Net asset value per share | | $ | 1.00 | |
STATEMENT OF OPERATIONS (Unaudited) |
Six Months Ended September 30, 2024 |
Investment Income: |
Interest | | $ | 7,036,250 | |
Total investment income | | | 7,036,250 | |
| | | | | |
Expenses: |
Management fees | | | 657,289 | |
Transfer agent fees | | | 224,017 | |
Portfolio accounting and administration fees | | | 198,691 | |
Registration fees | | | 113,047 | |
Professional fees | | | 44,842 | |
Custodian fees | | | 16,865 | |
Trustees’ fees* | | | 14,408 | |
Miscellaneous | | | 85,536 | |
Total expenses | | | 1,354,695 | |
Net investment income | | | 5,681,555 | |
| | | | | |
Net Realized and Unrealized Gain (Loss): |
Net realized gain (loss) on: |
Investments | | | 1,659 | |
Net realized gain | | | 1,659 | |
Net increase in net assets resulting from operations | | $ | 5,683,214 | |
* | Relates to Trustees not deemed “interested persons” within the meaning of Section 2(a)(19) of the 1940 Act. |
380 | THE RYDEX FUNDS SEMI-ANNUAL FINANCIAL REPORT | SEE NOTES TO FINANCIAL STATEMENTS. |
U.S. GOVERNMENT MONEY MARKET FUND | |
STATEMENTS OF CHANGES IN NET ASSETS |
| | Six Months Ended
September 30, 2024
(Unaudited) | | | Year Ended
March 31,
2024 | |
Increase (Decrease) in Net Assets from Operations: | | | | | | | | |
Net investment income | | $ | 5,681,555 | | | $ | 11,193,014 | |
Net realized gain on investments | | | 1,659 | | | | 996 | |
Net change in unrealized appreciation (depreciation) on investments | | | — | | | | — | |
Net increase in net assets resulting from operations | | | 5,683,214 | | | | 11,194,010 | |
| | | | | | | | | |
Distributions to shareholders | | | (5,681,555 | ) | | | (11,193,012 | ) |
| | | | | | | | | |
Capital share transactions: | | | | | | | | |
Proceeds from sale of shares | | | 2,624,274,502 | | | | 4,820,555,785 | |
Distributions reinvested | | | 5,620,946 | | | | 11,032,690 | |
Cost of shares redeemed | | | (2,628,835,570 | ) | | | (4,867,638,651 | ) |
Net increase (decrease) from capital share transactions | | | 1,059,878 | | | | (36,050,176 | ) |
Net increase (decrease) in net assets | | | 1,061,537 | | | | (36,049,178 | ) |
| | | | | | | | | |
Net assets: | | | | | | | | |
Beginning of period | | | 275,649,757 | | | | 311,698,935 | |
End of period | | $ | 276,711,294 | | | $ | 275,649,757 | |
| | | | | | | | | |
Capital share activity: | | | | | | | | |
Shares sold | | | 2,624,274,502 | | | | 4,820,555,785 | |
Shares issued from reinvestment of distributions | | | 5,620,811 | | | | 11,032,702 | |
Shares redeemed | | | (2,628,835,570 | ) | | | (4,867,638,651 | ) |
Net increase (decrease) in shares | | | 1,059,743 | | | | (36,050,164 | ) |
SEE NOTES TO FINANCIAL STATEMENTS. | THE RYDEX FUNDS SEMI-ANNUAL FINANCIAL REPORT | 381 |
U.S. GOVERNMENT MONEY MARKET FUND | |
This table is presented to show selected data for a share outstanding throughout each period and to assist shareholders in evaluating a Fund’s performance for the periods presented.
| | Six Months Ended
September 30, 2024a | | | Year Ended
March 31,
2024 | | | Year Ended
March 31,
2023 | | | Year Ended
March 31,
2022 | | | Year Ended
March 31,
2021 | | | Year Ended
March 31,
2020 | |
Per Share Data |
Net asset value, beginning of period | | $ | 1.00 | | | $ | 1.00 | | | $ | 1.00 | | | $ | 1.00 | | | $ | 1.00 | | | $ | 1.00 | |
Income (loss) from investment operations: |
Net investment income (loss)b | | | .02 | | | | .04 | | | | .02 | | | | — | c | | | — | c | | | .01 | |
Net gain (loss) on investments (realized and unrealized) | | | — | c | | | — | c | | | — | c | | | — | c | | | — | c | | | — | c |
Total from investment operations | | | .02 | | | | .04 | | | | .02 | | | | — | c | | | — | c | | | .01 | |
Less distributions from: |
Net investment income | | | (.02 | ) | | | (.04 | ) | | | (.02 | ) | | | — | | | | — | | | | (.01 | ) |
Net realized gains | | | — | | | | — | c | | | — | | | | — | | | | — | | | | — | |
Total distributions | | | (.02 | ) | | | (.04 | ) | | | (.02 | ) | | | — | | | | — | | | | (.01 | ) |
Net asset value, end of period | | $ | 1.00 | | | $ | 1.00 | | | $ | 1.00 | | | $ | 1.00 | | | $ | 1.00 | | | $ | 1.00 | |
|
Total Return | | | 2.19 | % | | | 4.33 | % | | | 1.86 | % | | | 0.00 | %d | | | 0.05 | % | | | 0.99 | % |
Ratios/Supplemental Data |
Net assets, end of period (in thousands) | | $ | 276,711 | | | $ | 275,650 | | | $ | 311,699 | | | $ | 356,201 | | | $ | 348,971 | | | $ | 390,791 | |
Ratios to average net assets: |
Net investment income (loss) | | | 4.32 | % | | | 4.26 | % | | | 1.81 | % | | | (0.04 | %) | | | 0.00 | %d | | | 1.01 | % |
Total expenses | | | 1.03 | % | | | 1.05 | % | | | 0.99 | % | | | 0.95 | % | | | 1.04 | % | | | 1.06 | % |
Net expensese | | | 1.03 | % | | | 1.05 | % | | | 0.86 | % | | | 0.12 | % | | | 0.16 | % | | | 1.03 | % |
a | Unaudited figures for the period ended September 30, 2024. Percentage amounts for the period, except total return, have been annualized. |
b | Net investment income (loss) per share was computed using average shares outstanding throughout the period. |
c | Less than $0.01 per share. |
d | Less than 0.01%. |
e | Net expense information reflects the expense ratios after expense waivers and reimbursements, as applicable. |
382 | THE RYDEX FUNDS SEMI-ANNUAL FINANCIAL REPORT | SEE NOTES TO FINANCIAL STATEMENTS. |
NOTES TO FINANCIAL STATEMENTS (Unaudited) |
Note 1 – Organization and Significant Accounting Policies
Organization
The Rydex Series Funds (the “Trust”), a Delaware statutory trust, is registered with the U.S. Securities and Exchange Commission (the “SEC”) under the Investment Company Act of 1940 (the ”1940 Act”), as an open-ended investment company of the series type. Each series, in effect, is representing a separate fund (each, a “Fund”). The Trust may issue an unlimited number of authorized shares. The Trust accounts for the assets of each Fund separately.
The Trust offers a combination of seven separate classes of shares: Investor Class shares, Class A shares, Class C shares, Class H shares, Class P shares, Institutional Class shares and Money Market Class shares. Sales of shares of each Class are made without a front-end sales charge at the net asset value per share (“NAV”), with the exception of Class A shares. Class A shares are sold at the NAV, plus the applicable front-end sales charge. The sales charge varies depending on the amount purchased, but will not exceed 4.75%. Class A share purchases of $1 million or more are exempt from the front-end sales charge but have a 1% contingent deferred sales charge (“CDSC”) if shares are redeemed within 12 months of purchase. Class C shares have a 1% CDSC if shares are redeemed within 12 months of purchase. Class C shares of each Fund automatically convert to Class A shares of the same Fund on or about the 10th day of the month following the 8-year anniversary of the purchase of the Class C shares. This conversion will be executed without any sales charge, fee or other charge. After the conversion is completed, the shares will be subject to all features and expenses of Class A shares. Institutional Class shares are offered primarily for direct investment by institutions such as pension and profit sharing plans, endowments, foundations and corporations. Institutional Class shares require a minimum initial investment of $2 million and a minimum account balance of $1 million. At September 30, 2024, the Trust consisted of fifty-one funds.
This report covers the following funds (collectively, the “Funds”):
Fund Name | Investment
Company Type |
Banking Fund | Diversified |
Basic Materials Fund | Diversified |
Biotechnology Fund | Diversified |
Consumer Products Fund | Diversified |
Electronics Fund | Non-diversified |
Energy Fund | Diversified |
Energy Services Fund | Non-diversified |
Financial Services Fund | Diversified |
Health Care Fund | Diversified |
Internet Fund | Diversified |
Leisure Fund | Diversified |
Precious Metals Fund | Non-diversified |
Real Estate Fund | Diversified |
Retailing Fund | Diversified |
Technology Fund | Diversified |
Telecommunications Fund | Non-diversified |
Transportation Fund | Diversified |
Utilities Fund | Diversified |
Dow Jones Industrial Average® Fund | Non-diversified |
Nova Fund | Non-diversified |
S&P 500® Fund | Non-diversified |
Inverse S&P 500® Strategy Fund | Non-diversified |
Monthly Rebalance NASDAQ-100® 2x Strategy Fund | Non-diversified |
NASDAQ-100® Fund | Non-diversified |
Inverse NASDAQ-100® Strategy Fund | Non-diversified |
Mid-Cap 1.5x Strategy Fund | Non-diversified |
Inverse Mid-Cap Strategy Fund | Non-diversified |
Russell 2000® 1.5x Strategy Fund | Non-diversified |
Russell 2000® Fund | Non-diversified |
Inverse Russell 2000® Strategy Fund | Non-diversified |
S&P 500® Pure Growth Fund | Non-diversified |
S&P 500® Pure Value Fund | Non-diversified |
S&P MidCap 400® Pure Growth Fund | Non-diversified |
S&P MidCap 400® Pure Value Fund | Non-diversified |
S&P SmallCap 600® Pure Growth Fund | Non-diversified |
S&P SmallCap 600® Pure Value Fund | Non-diversified |
Emerging Markets Bond Strategy Fund | Diversified |
Government Long Bond 1.2x Strategy Fund | Diversified |
Inverse Government Long Bond Strategy Fund | Diversified |
High Yield Strategy Fund | Non-diversified |
Inverse High Yield Strategy Fund | Non-diversified |
Emerging Markets 2x Strategy Fund | Non-diversified |
Inverse Emerging Markets 2x Strategy Fund | Non-diversified |
Europe 1.25x Strategy Fund | Non-diversified |
Japan 2x Strategy Fund | Non-diversified |
Strengthening Dollar 2x Strategy Fund | Non-diversified |
Weakening Dollar 2x Strategy Fund | Non-diversified |
U.S. Government Money Market Fund | Diversified |
At September 30, 2024, Investor Class, Class A, Class C, Class H, and Money Market Class shares have been issued by the Funds.
The Funds are designed and operated to accommodate frequent trading by shareholders and, unlike most mutual funds, offer unlimited exchange privileges with no minimum holding periods or transactions fees, which may cause the Funds to experience high portfolio turnover.
Certain Funds (“Sector Funds”) invest in a specific industry sector. To the extent that investments are concentrated in a single sector, the Sector Funds are subject to legislative or regulatory changes, adverse market conditions and/or increased competition affecting such sector.
The Sector Funds seek capital appreciation and invest substantially all of their assets in equity securities of companies involved in their sector.
Security Investors, LLC (the “Adviser”), which operates under the name Guggenheim Investments (“GI”), provides advisory services. Guggenheim Funds Distributors, LLC (“GFD”) serves as distributor of the Funds’ shares. GI and GFD are affiliated entities.
| | THE RYDEX FUNDS SEMI-ANNUAL FINANCIAL REPORT | 383 |
NOTES TO FINANCIAL STATEMENTS (Unaudited)(continued) |
Significant Accounting Policies
The Funds operate as investment companies and, accordingly, follow the investment company accounting and reporting guidance of the Financial Accounting Standards Board (“FASB”) Accounting Standards Codification Topic 946 Financial Services – Investment Companies.
The following significant accounting policies are in conformity with U.S. generally accepted accounting principles (“U.S. GAAP”) and are consistently followed by the Trust. This requires management to make estimates and assumptions that affect the reported amount of assets and liabilities, contingent assets and liabilities at the date of the financial statements, and the reported amounts of revenues and expenses during the reporting period. Actual results could differ from these estimates. All time references are based on Eastern Time.
The NAV of each share class of each Fund is calculated by dividing the market value of a fund’s securities and other assets, less all liabilities attributable to the share class by the number of outstanding shares of the share class on the specified date.
The Trust calculates a NAV twice each business day; at 10:45 a.m. and at the close of the New York Stock Exchange (“NYSE”), usually 4:00 p.m. for the Russell 2000® Fund, S&P 500® Fund, Emerging Markets 2x Strategy Fund, Inverse Emerging Markets 2x Strategy Fund and Emerging Markets Bond Strategy Fund. All other Funds in this report will price at the afternoon NAV. The NAV is calculated using the current market value of each Fund’s total assets as of the respective time of calculation. These financial statements are based on the September 30, 2024, afternoon NAV.
(a) Valuation of Investments
The Board of Trustees of the Trust (the “Board”) adopted policies and procedures for the valuation of the Funds’ investments (the “Fund Valuation Procedures”).
Pursuant to Rule 2a-5, the Board designated the Adviser as the valuation designee to perform fair valuation determinations for the Funds with respect to all Fund investments and/or other assets. As the Funds’ valuation designee pursuant to Rule 2a-5, the Adviser has adopted separate procedures (the “Valuation Designee Procedures” and collectively with the Fund Valuation Procedures, the “Valuation Procedures”) reasonably designed to prevent violations of the requirements of Rule 2a-5 and Rule 31a-4 under the 1940 Act. The Adviser, in its role as valuation designee, utilizes the assistance of a valuation committee, consisting of representatives from Guggenheim’s investment management, fund administration, legal and compliance departments (the “Valuation Committee”), in determining the fair value of the Funds’ securities and/or other assets. The Valuation Procedures may be amended and potentially adversely affected as the Funds seek to comply with regulations that apply to the valuation practices of registered investment companies.
Valuations of the Funds’ securities and other assets are supplied primarily by independent third-party pricing services appointed pursuant to the processes set forth in the Valuation Procedures. The Adviser, with the assistance of the Valuation Committee, convenes monthly, or more frequently as needed, to review the valuation of all assets which have been fair valued. The Adviser, consistent with the monitoring and review responsibilities set forth in the Valuation Procedures, regularly reviews the appropriateness of the inputs, methods, models and assumptions employed by the independent third-party pricing services.
If the independent third-party pricing service cannot or does not provide a valuation for a particular investment or such valuation is deemed unreliable, such investment is fair valued by the Adviser.
Equity securities listed or traded on a recognized U.S. securities exchange or the Nasdaq Stock Market (“NASDAQ”) will generally be valued on the basis of the last sale price on the primary U.S. exchange or market on which the security is listed or traded; provided, however, that securities listed on NASDAQ will be valued at the NASDAQ official closing price, which may not necessarily represent the last sale price.
Open-end investment companies are valued at their NAV as of the close of business, on the valuation date. Exchange-traded funds and closed-end investment companies are generally valued at the last quoted sale price.
The U.S. Government Money Market Fund values debt securities at amortized cost pursuant to Rule 2a-7 of the 1940 Act, which approximates market value.
With the exception of the U.S. Government Money Market Fund, U.S. Government securities are valued by independent third-party pricing services, using the last traded fill price, or at the reported bid price at the close of business on the valuation date.
Commercial paper and discount notes with a maturity of greater than 60 days at acquisition are valued at prices that reflect broker-dealer supplied valuations or are obtained from independent third-party pricing services, which may consider the trade activity, treasury spreads, yields or price of bonds of comparable quality, coupon, maturity, and type, as well as prices quoted by dealers who make markets in such securities. Commercial paper and discount notes with a maturity of 60 days or less at acquisition are valued at amortized cost, unless the Adviser concludes that amortized cost does not represent the fair value of the applicable asset in which case it will be valued using an independent third-party pricing service.
384 | THE RYDEX FUNDS SEMI-ANNUAL FINANCIAL REPORT | |
NOTES TO FINANCIAL STATEMENTS (Unaudited)(continued) |
Repurchase agreements are generally valued at amortized cost, provided such amounts approximate market value.
Futures contracts are valued on the basis of the last sale price as of 4:00 p.m. on the valuation date. In the event that the exchange for a specific futures contract closes earlier than 4:00 p.m., the futures contract is valued at the official settlement price of the exchange. However, the underlying securities from which the futures contract value is derived are monitored until 4:00 p.m. to determine if fair valuation of the underlying securities would provide a more accurate valuation of the futures contract.
The value of currency index swap agreements entered into by a Fund is accounted for using the unrealized appreciation or depreciation on the agreements that is determined by marking the agreements to the broker quote.
Swap agreements entered into by a Fund are generally valued using an evaluated price provided by an independent third-party pricing service.
Investments for which market quotations are not readily available are fair valued as determined in good faith by the Adviser. Valuations in accordance with these methods are intended to reflect each security’s (or asset’s or liability’s) “fair value”. Each such determination is based on a consideration of all relevant factors, which are likely to vary from one pricing context to another. Examples of such factors may include, but are not limited to market prices; sale prices; broker quotes; and models which derive prices based on inputs such as prices of securities with comparable maturities and characteristics, or on inputs such as anticipated cash flows or collateral, spread over U.S. Treasury securities, and other information analysis. In connection with futures contracts and other derivative investments, such factors may include obtaining information as to how (a) these contracts and other derivative investments trade in the futures or other derivative markets, respectively, and (b) the securities underlying these contracts and other derivative investments trade in the cash market.
(b) U.S. Government and Agency Obligations
Certain U.S. Government and Agency Obligations are traded on a discount basis; the interest rates shown on the Funds’ Schedules of Investments reflect the effective rates paid at the time of purchase by the Funds. Other securities bear interest at the rates shown, payable at fixed dates through maturity.
(c) Short Sales
When a Fund engages in a short sale of a security, an amount equal to the proceeds is reflected as an asset and an equivalent liability. The amount of the liability is subsequently marked-to-market to reflect the market value of the short sale. The Fund maintains a segregated account of cash and/or securities as collateral for short sales.
Fees, if any, paid to brokers to borrow securities in connection with short sales are recorded as interest expense. In addition, the Fund must pay out the dividend rate of the equity or coupon rate of the obligation to the lender and record this as an expense. Short dividend or interest expense is a cost associated with the investment objective of short sales transactions, rather than an operational cost associated with the day-to-day management of any mutual fund. The Fund may also receive rebate income from the broker resulting from the investment of the proceeds from securities sold short.
(d) Futures Contracts
Upon entering into a futures contract, a Fund deposits and maintains as collateral such initial margin as required by the exchange on which the transaction is affected. Pursuant to the contract, the Fund agrees to receive from or pay to the broker an amount of cash equal to the daily fluctuation in value of the contract. Such receipts or payments are known as variation margin and are recorded by the Fund as unrealized appreciation or depreciation. When the contract is closed, the Fund records a realized gain or loss equal to the difference between the value of the contract at the time it was opened and the value at the time it was closed.
(e) Swap Agreements
Swap agreements are marked-to-market daily and the change, if any, is recorded as unrealized appreciation or depreciation. Payments received or made as a result of an agreement or termination of an agreement are recognized as realized gains or losses.
Upon entering into certain centrally-cleared swap transactions, a Fund is required to deposit with its clearing broker an amount of cash or securities as an initial margin. Subsequent variation margin receipts or payments are received or made by the Fund depending on fluctuations in the fair value of the reference entity and are recorded by the Fund as unrealized appreciation or depreciation. When the contract is closed, the Fund records a realized gain or loss equal to the difference between the value of the contract at the time it was opened and the value at the time it was closed.
Upfront payments received or made by a Fund on credit default swap agreements and interest rate swap agreements are amortized over the expected life of the agreement. Periodic payments received or paid by a Fund are recorded as realized gains or losses. Payments received or made as a result of a credit event or termination of the contract are recognized, net of a proportional amount of the upfront payment, as realized gains or losses.
| | THE RYDEX FUNDS SEMI-ANNUAL FINANCIAL REPORT | 385 |
NOTES TO FINANCIAL STATEMENTS (Unaudited)(continued) |
(f) Currency Translations
The accounting records of the Funds are maintained in U.S. dollars. All assets and liabilities initially expressed in foreign currencies are converted into U.S. dollars at prevailing exchange rates. Purchases and sales of investment securities, dividend and interest income, and certain expenses are translated at the rates of exchange prevailing on the respective dates of such transactions. Changes in the relationship of these foreign currencies to the U.S. dollar can significantly affect the value of the investments and earnings of the Funds. Foreign investments may also subject the Funds to foreign government exchange restrictions, expropriation, taxation, or other political, social, geopolitical or economic developments, all of which could affect the market and/or credit risk of the investments.
The Funds do not isolate that portion of the results of operations resulting from changes in the foreign exchange rates on investments from the fluctuations arising from changes in the market prices of securities held. Such fluctuations are included with the net realized gain or loss and unrealized appreciation or depreciation on investments.
Reported net realized foreign exchange gains and losses arise from sales of foreign currencies and currency gains or losses realized between the trade and settlement dates on investment transactions. Net unrealized appreciation and depreciation arise from changes in the fair values of assets and liabilities other than investments in securities at the fiscal period end, resulting from changes in exchange rates.
(g) Foreign Taxes
The Funds may be subject to foreign taxes (a portion of which may be reclaimable) on income, stock dividends, capital gains on investments or certain foreign currency transactions. All foreign taxes are recorded in accordance with the applicable foreign tax regulations and rates that exist in the foreign jurisdictions in which the Funds invest. These foreign taxes, if any, are paid by the Funds and reflected in their Statements of Operations as follows: foreign taxes withheld at source are presented as a reduction of income and foreign taxes on capital gains from sales of investments are included with the net realized gain (loss) on investments. Foreign taxes payable or deferred as of September 30, 2024, if any, are disclosed in the Funds’ Statements of Assets and Liabilities.
(h) Security Transactions
Security transactions are recorded on the trade date for financial reporting purposes. Realized gains and losses from securities transactions are recorded using the identified cost basis. Proceeds from lawsuits related to investment holdings are recorded as a reduction to cost if the securities are still held and as realized gains if no longer held in the respective Fund. Dividend income is recorded on the ex-dividend date, net of applicable taxes withheld by foreign countries, if any. Taxable non-cash dividends are recorded as dividend income. Interest income, including amortization of premiums and accretion of discounts, is accrued on a daily basis. Dividend income from Real Estate Investment Trusts (“REITs”) is recorded based on the income included in the distributions received from the REIT investments using published REIT classifications, including some management estimates when actual amounts are not available. Distributions received in excess of this estimated amount are recorded as a reduction of the cost of investments or reclassified to realized gains. The actual amounts of income, return of capital, and realized gains are only determined by each REIT after its fiscal year-end, and may differ from the estimated amounts.
(i) Distributions
Dividends from net investment income are declared daily in the Government Long Bond 1.2x Strategy Fund and the U.S. Government Money Market Fund. Distributions of net investment income in the remaining Funds and distributions of net realized gains, if any, in all Funds are declared at least annually. Dividends are reinvested in additional shares unless shareholders request payment in cash. Distributions are recorded on the ex-dividend date and are determined in accordance with U.S. federal income tax regulations which may differ from U.S. GAAP.
(j) Class Allocations
Interest and dividend income, most expenses, all realized gains and losses, and all unrealized appreciation and depreciation are allocated to the share classes based upon the value of the outstanding shares in each share class. Certain costs, such as distribution and service fees are charged directly to specific share classes. In addition, certain expenses have been allocated to the individual Funds in the Trust based on the respective net assets of each Fund included in the Trust.
(k) Cash
The Funds may leave cash overnight in their cash account with the custodian. Periodically, a Fund may have cash due to the custodian bank as an overdraft balance. A fee is incurred on this overdraft, calculated by multiplying the overdraft by a rate based on the federal funds rate, which was 4.83% at September 30, 2024.
(l) Indemnifications
Under the Funds’ organizational documents, the Trustees and Officers of the Trust are indemnified against certain liabilities arising out of the performance of their duties to the Trust. In addition, throughout the normal course of business, the Trust on behalf of the Funds enters into contracts that contain a variety of
386 | THE RYDEX FUNDS SEMI-ANNUAL FINANCIAL REPORT | |
NOTES TO FINANCIAL STATEMENTS (Unaudited)(continued) |
representations and warranties which provide general indemnifications. The Funds’ maximum exposure under these arrangements is unknown, as this would involve future claims that may be made against the Funds and/or their affiliates that have not yet occurred. However, based on experience, the Funds expect the risk of loss to be remote.
Note 2 – Financial Instruments and Derivatives
As part of their investment strategies, the Funds may utilize short sales and a variety of derivative instruments. These investments involve, to varying degrees, elements of market risk and risks in excess of amounts recognized on the Funds’ Statements of Assets and Liabilities. Valuation and accounting treatment of these instruments can be found under Significant Accounting Policies in Note 1 of these Notes to Financial Statements.
Short Sales
A short sale is a transaction in which a Fund sells a security it does not own. If the security sold short decreases in price between the time the Fund sells the security and closes its short position, the Fund will realize a gain on the transaction. Conversely, if the security increases in price during the period, the Fund will realize a loss on the transaction. The risk of such price increases is the principal risk of engaging in short sales.
Derivatives
Derivatives are instruments whose values depend on, or are derived from, in whole or in part, the value of one or more other assets, such as securities, currencies, commodities or indices. Derivative instruments may be used for investment purposes (including to maintain cash reserves while maintaining exposure to certain other assets), for risk management (hedging) purposes, to facilitate trading, to reduce transaction costs and to pursue higher investment returns. Derivative instruments may also be used to seek to mitigate certain investment risks, such as foreign currency exchange rate risk, interest rate risk and credit risk. U.S. GAAP requires disclosures to enable investors to better understand how and why a Fund uses derivative instruments, how these derivative instruments are accounted for and their effects on the Fund’s financial position and results of operations.
The Funds may utilize derivatives for the following purposes:
Duration: the use of an instrument to manage the interest rate risk of a portfolio.
Index Exposure: the use of an instrument to obtain exposure to a listed or other type of index.
Leverage: gaining total exposure to equities or other assets on the long and short sides at greater than 100% of invested capital.
Liquidity: the ability to buy or sell exposure with little price/market impact.
If a Fund’s investment strategy consistently involves applying leverage, the value of the Fund’s shares will tend to increase or decrease more than the value of any increase or decrease in the underlying index or other asset. In addition, because an investment in derivative instruments generally requires a small investment relative to the amount of investment exposure assumed, an opportunity for increased net income is created; but, at the same time, leverage risk will increase. The Fund’s use of leverage, through borrowings or instruments such as derivatives, may cause the Fund to be more volatile and riskier than if the Fund had not been leveraged.
Futures Contracts
A futures contract is an agreement to purchase (long) or sell (short) an agreed amount of securities or other instruments at a set price for delivery at a future date. There are significant risks associated with a Fund’s use of futures contracts, including (i) there may be an imperfect or no correlation between the changes in market value of the underlying asset and the prices of futures contracts; (ii) there may not be a liquid secondary market for a futures contract; (iii) trading restrictions or limitations may be imposed by an exchange; and (iv) government regulations may restrict trading in futures contracts. When investing in futures, there is minimal counterparty credit risk to a Fund because futures are exchange-traded and the exchange’s clearinghouse, as counterparty to all exchange-traded futures, guarantees against default. Cash deposits are shown as segregated cash with broker on the Funds’ Statements of Assets and Liabilities; securities held as collateral are noted on the Funds’ Schedules of Investments.
| | THE RYDEX FUNDS SEMI-ANNUAL FINANCIAL REPORT | 387 |
NOTES TO FINANCIAL STATEMENTS (Unaudited)(continued) |
The following table represents the Funds’ use and volume of futures on a monthly basis:
| | | | Average Notional Amount | |
Fund | Use | | Long | | | Short | |
Dow Jones Industrial Average® Fund | Index exposure, Liquidity | | $ | 660,273 | | | $ | — | |
Nova Fund | Index exposure, Leverage, Liquidity | | | 83,998,142 | | | | — | |
S&P 500® Fund | Index exposure, Liquidity | | | 1,331,802 | | | | — | |
Inverse S&P 500® Strategy Fund | Index exposure, Liquidity | | | — | | | | 2,110,569 | |
Monthly Rebalance NASDAQ-100® 2x Strategy Fund | Index exposure, Leverage, Liquidity | | | 282,969,045 | | | | — | |
NASDAQ-100® Fund | Index exposure, Liquidity | | | 19,737,640 | | | | — | |
Inverse NASDAQ-100® Strategy Fund | Index exposure, Liquidity | | | — | | | | 4,453,649 | |
Mid-Cap 1.5x Strategy Fund | Index exposure, Leverage, Liquidity | | | 1,966,800 | | | | — | |
Russell 2000® 1.5x Strategy Fund | Index exposure, Leverage, Liquidity | | | 186,319 | | | | — | |
Russell 2000® Fund | Index exposure, Liquidity | | | 2,045,053 | | | | — | |
Inverse Russell 2000® Strategy Fund | Index exposure, Liquidity | | | — | | | | 250,503 | |
| | | | Average Notional Amount | |
Fund | Use | | Long | | | Short | |
Emerging Markets Bond Strategy Fund | Duration, Index exposure, Leverage, Liquidity | | $ | 413,178 | | | $ | — | |
Government Long Bond 1.2x Strategy Fund | Duration, Index exposure, Leverage, Liquidity, Speculation | | | 7,787,370 | | | | — | |
Inverse Government Long Bond Strategy Fund | Duration, Index exposure, Liquidity | | | — | | | | 3,795,802 | |
High Yield Strategy Fund | Duration, Index exposure, Liquidity | | | 37,390,623 | | | | — | |
Inverse High Yield Strategy Fund | Duration, Index exposure, Liquidity | | | — | | | | 6,454,600 | |
Europe 1.25x Strategy Fund | Index exposure, Leverage, Liquidity | | | 9,169,216 | | | | — | |
Japan 2x Strategy Fund | Index exposure, Leverage, Liquidity | | | 6,965,462 | | | | — | |
Strengthening Dollar 2x Strategy Fund | Index exposure, Leverage, Liquidity | | | 3,962,774 | | | | — | |
Weakening Dollar 2x Strategy Fund | Index exposure, Leverage, Liquidity | | | — | | | | 1,793,696 | |
Swap Agreements
A swap is an agreement that obligates two parties to exchange a series of cash flows at specified intervals based upon or calculated by reference to changes in specified prices or rates for a specified amount of an underlying asset. When utilizing over-the-counter (“OTC”) swaps, a Fund bears the risk of loss of the amount expected to be received under a swap agreement in the event of the default or bankruptcy of a swap agreement counterparty or if the underlying asset declines in value. Certain standardized swaps are subject to mandatory central clearing and are executed on a multi-lateral or other trade facility platform, such as a registered exchange. There is limited counterparty credit risk with respect to centrally-cleared swaps as the transaction is facilitated through a central clearinghouse, much like exchange-traded futures contracts. For a Fund utilizing centrally-cleared swaps, the exchange bears the risk of loss resulting from a counterparty not being able to pay. There is no guarantee that a Fund or an underlying fund could eliminate its exposure under an outstanding swap agreement by entering into an offsetting swap agreement with the same or another party.
Total return swaps involve commitments where single or multiple cash flows are exchanged based on the price of an underlying reference asset (such as an index) for a fixed or variable interest rate. Total return swaps will usually be computed based on the current value of the reference asset as of the close of regular trading on the NYSE or other exchange, with the swap value being adjusted to include dividends accrued, financing charges and/or interest associated with the swap agreement. When utilizing total return swaps, a Fund bears the risk of loss of the amount expected to be received under a swap agreement in the event of the default or bankruptcy of a swap agreement counterparty or if the underlying reference asset declines in value.
388 | THE RYDEX FUNDS SEMI-ANNUAL FINANCIAL REPORT | |
NOTES TO FINANCIAL STATEMENTS (Unaudited)(continued) |
The following table represents the Funds’ use and volume of total return swaps on a monthly basis:
| | | | Average Notional Amount | |
Fund | Use | | Long | | | Short | |
Dow Jones Industrial Average® Fund | Index exposure, Liquidity | | $ | 2,625,201 | | | $ | — | |
Nova Fund | Index exposure, Leverage, Liquidity | | | 86,086,615 | | | | — | |
S&P 500® Fund | Index exposure, Liquidity | | | 8,571,780 | | | | — | |
Inverse S&P 500® Strategy Fund | Index exposure, Liquidity | | | — | | | | 38,637,046 | |
Monthly Rebalance NASDAQ-100® 2x Strategy Fund | Index exposure, Leverage, Liquidity | | | 660,023,526 | | | | — | |
NASDAQ-100® Fund | Index exposure, Liquidity | | | 61,989,765 | | | | — | |
Inverse NASDAQ-100® Strategy Fund | Index exposure, Liquidity | | | — | | | | 13,912,785 | |
Mid-Cap 1.5x Strategy Fund | Index exposure, Leverage, Liquidity | | | 7,647,710 | | | | — | |
Inverse Mid-Cap Strategy Fund | Index exposure, Liquidity | | | — | | | | 370,921 | |
Russell 2000® 1.5x Strategy Fund | Index exposure, Leverage, Liquidity | | | 5,509,300 | | | | — | |
Russell 2000® Fund | Index exposure, Liquidity | | | 5,351,647 | | | | — | |
Inverse Russell 2000® Strategy Fund | Index exposure, Liquidity | | | — | | | | 2,089,958 | |
| | | | Average Notional Amount | |
Fund | Use | | Long | | | Short | |
Emerging Markets Bond Strategy Fund | Duration, Index exposure, Leverage, Liquidity | | $ | 217,110 | | | $ | — | |
High Yield Strategy Fund | Duration, Index exposure, Liquidity | | | 1,542,397 | | | | — | |
Emerging Markets 2x Strategy Fund | Index exposure, Leverage, Liquidity | | | 4,825,988 | | | | — | |
Inverse Emerging Markets 2x Strategy Fund | Index exposure, Leverage, Liquidity | | | — | | | | 627,497 | |
Currency swaps enable the Funds to gain exposure to currencies in a market without actually possessing a given currency, or to hedge a position. Currency swaps involve the exchange of the principal and interest in one currency for the principal and interest in another currency. As in other types of OTC swaps, the Funds may be at risk due to the counterparty’s inability to perform.
The following table represents the Funds’ use and volume of currency swaps on a monthly basis:
| | | | Average Notional Amount | |
Fund | Use | | Long | | | Short | |
Strengthening Dollar 2x Strategy Fund | Index exposure, Leverage, Liquidity | | $ | 756,954 | | | $ | — | |
Weakening Dollar 2x Strategy Fund | Index exposure, Leverage, Liquidity | | | — | | | | 561,783 | |
Credit default swaps are instruments which allow for the full or partial transfer of third party credit risk, with respect to a particular entity or entities, from one counterparty to the other. A fund enters into credit default swaps as a “seller” or “buyer” of protection primarily to gain or reduce exposure to the investment grade and/or high yield bond market. A seller of credit default swaps is selling credit protection or assuming credit risk with respect to the underlying entity or entities. The buyer in a credit default swap is obligated to pay the seller a periodic stream of payments over the term of the contract provided that no event of default on an underlying reference obligation has occurred. If a credit event occurs, as defined under the terms of the swap agreement, the seller will either (i) pay to the buyer of protection an amount equal to the notional amount of the swap and take delivery of the referenced obligation or underlying securities comprising the referenced index or (ii) pay a net settlement amount in the form of cash or securities equal to the notional amount of the swap less the recovery value of the referenced obligation or underlying securities comprising the referenced index. The notional amount reflects the maximum potential amount the seller of credit protection could be required to pay to the buyer if a credit event occurs. The seller of protection receives periodic premium payments from the buyer and may also receive or pay an upfront premium adjustment to the stated periodic payments. In the event a credit default occurs on a credit default swap referencing an index, a factor adjustment will take place and the buyer of protection will receive a payment reflecting the par less the default recovery rate of the defaulted index component based on its weighting in the index. If no default occurs, the counterparty will pay the stream of payments and have no further obligations to the fund selling the credit protection. For a fund utilizing centrally cleared credit default swaps, the exchange bears the risk of loss resulting from a counterparty not being able to pay. For OTC credit default swaps, a fund bears the risk of loss of the amount expected to be received under a swap agreement in the event of the default or bankruptcy of a swap agreement counterparty, or in the case of a credit default swap in which a fund is selling credit protection, the default of a third party issuer.
| | THE RYDEX FUNDS SEMI-ANNUAL FINANCIAL REPORT | 389 |
NOTES TO FINANCIAL STATEMENTS (Unaudited)(continued) |
The quoted market prices and resulting market values for credit default swap agreements on securities and credit indices serve as an indicator of the current status of the payment/performance risk and represent the likelihood of an expected liability (or profit) for the credit derivative had the notional amount of the swap agreement been closed/sold as of the period end. Increasing market values, in absolute terms when compared to the notional amount of the swap, represent a deterioration of the referenced entity’s credit soundness and a greater likelihood or risk of default or other credit event occurring as defined under the terms of the agreement.
The following table represents the Funds’ use and volume of credit default swaps on a monthly basis:
| | | | Average Notional Amount | |
Fund | Use | | Protection Sold | | | Protection Purchased | |
Emerging Markets Bond Strategy Fund | Duration, Index exposure, Leverage, Liquidity | | $ | 453,333 | | | $ | — | |
High Yield Strategy Fund | Duration, Index exposure, Liquidity | | | 34,650,000 | | | | — | |
Inverse High Yield Strategy Fund | Duration, Index exposure, Liquidity | | | — | | | | 6,033,333 | |
Derivative Investment Holdings Categorized by Risk Exposure
The following is a summary of the location of derivative investments on the Funds’ Statements of Assets and Liabilities as of September 30, 2024:
Derivative Investment Type | Asset Derivatives | Liability Derivatives |
Equity/Interest rate futures contracts | Variation margin on futures contracts | Variation margin on futures contracts |
Credit default swap agreements | Unamortized upfront premiums paid on credit default swap agreements Unrealized appreciation on OTC swap agreements Variation margin on credit default swap agreements | Unamortized upfront premiums received on credit default swap agreements Unrealized depreciation on OTC swap agreements Variation margin on credit default swap agreements |
The following tables set forth the fair value of the Funds’ derivative investments categorized by primary risk exposure at September 30, 2024:
Asset Derivative Investments Value |
Fund | | Futures
Equity
Risk* | | | Swaps
Equity
Risk | | | Total Value at
September 30,
2024 | |
Dow Jones Industrial Average® Fund | | $ | 253 | | | $ | 19,719 | | | $ | 19,972 | |
Nova Fund | | | 871,885 | | | | 518,829 | | | | 1,390,714 | |
S&P 500® Fund | | | 62,746 | | | | 47,642 | | | | 110,388 | |
Monthly Rebalance NASDAQ-100® 2x Strategy Fund | | | 4,467,184 | | | | 2,576,149 | | | | 7,043,333 | |
NASDAQ-100® Fund | | | 71,746 | | | | 334,322 | | | | 406,068 | |
Mid-Cap 1.5x Strategy Fund | | | 49,734 | | | | 58,332 | | | | 108,066 | |
Russell 2000® 1.5x Strategy Fund | | | — | | | | 55,167 | | | | 55,167 | |
Russell 2000® Fund | | | 6,550 | | | | 43,433 | | | | 49,983 | |
Liability Derivative Investments Value |
Fund | | Futures
Equity
Risk* | | | Swaps
Equity
Risk | | | Total Value at
September 30,
2024 | |
Inverse S&P 500® Strategy Fund | | $ | 54,769 | | | $ | 238,793 | | | $ | 293,562 | |
Inverse NASDAQ-100® Strategy Fund | | | 60,801 | | | | 59,801 | | | | 120,602 | |
Inverse Mid-Cap Strategy Fund | | | — | | | | 1,781 | | | | 1,781 | |
Inverse Russell 2000® Strategy Fund | | | 4,368 | | | | 17,716 | | | | 22,084 | |
* | Includes cumulative appreciation (depreciation) of exchange-traded, OTC and centrally-cleared derivatives contracts as reported on the Schedules of Investments. For exchange-traded and centrally-cleared derivatives, variation margin is reported within the Funds’ Statements of Assets and Liabilities. |
390 | THE RYDEX FUNDS SEMI-ANNUAL FINANCIAL REPORT | |
NOTES TO FINANCIAL STATEMENTS (Unaudited)(continued) |
Asset Derivative Investments Value |
Fund | | Futures
Equity
Risk* | | | Swaps
Equity
Risk | | | Futures
Foreign
Currency
Exchange
Risk* | | | Swaps
Currency
Risk | | | Futures
Interest
Rate Risk* | | | Swaps
Credit
Risk* | | | Total Value at
September 30,
2024 | |
Emerging Markets Bond Strategy Fund | | $ | — | | | $ | — | | | $ | — | | | $ | — | | | $ | 931 | | | $ | 1,385 | | | $ | 2,316 | |
Inverse Government Long Bond Strategy Fund | | | — | | | | — | | | | — | | | | — | | | | 48,167 | | | | — | | | | 48,167 | |
High Yield Strategy Fund | | | — | | | | — | | | | — | | | | — | | | | — | | | | 8,131 | | | | 8,131 | |
Emerging Markets 2x Strategy Fund | | | — | | | | 129,540 | | | | — | | | | — | | | | — | | | | — | | | | 129,540 | |
Inverse Emerging Markets 2x Strategy Fund | | | — | | | | 47 | | | | — | | | | — | | | | — | | | | — | | | | 47 | |
Europe 1.25x Strategy Fund | | | 11,198 | | | | — | | | | 9,549 | | | | — | | | | — | | | | — | | | | 20,747 | |
Japan 2x Strategy Fund | | | 257,015 | | | | — | | | | — | | | | — | | | | — | | | | — | | | | 257,015 | |
Strengthening Dollar 2x Strategy Fund | | | — | | | | — | | | | 5,647 | | | | — | | | | — | | | | — | | | | 5,647 | |
Weakening Dollar 2x Strategy Fund | | | — | | | | — | | | | 11,559 | | | | 1,075 | | | | — | | | | — | | | | 12,634 | |
Liability Derivative Investments Value |
Fund | | Futures
Equity
Risk* | | | Swaps
Equity
Risk | | | Futures
Foreign
Currency
Exchange
Risk* | | | Swaps
Currency
Risk | | | Futures
Interest
Rate Risk* | | | Swaps
Credit
Risk* | | | Total Value at
September 30,
2024 | |
Government Long Bond 1.2x Strategy Fund | | $ | — | | | $ | — | | | $ | — | | | $ | — | | | $ | 39,527 | | | $ | — | | | $ | 39,527 | |
High Yield Strategy Fund | | | — | | | | — | | | | — | | | | — | | | | 71,346 | | | | — | | | | 71,346 | |
Inverse High Yield Strategy Fund | | | — | | | | — | | | | — | | | | — | | | | 11,119 | | | | 2,803 | | | | 13,922 | |
Inverse Emerging Markets 2x Strategy Fund | | | — | | | | 7,938 | | | | — | | | | — | | | | — | | | | — | | | | 7,938 | |
Japan 2x Strategy Fund | | | — | | | | — | | | | 26,035 | | | | — | | | | — | | | | — | | | | 26,035 | |
Strengthening Dollar 2x Strategy Fund | | | — | | | | — | | | | — | | | | 436 | | | | — | | | | — | | | | 436 | |
* | Includes cumulative appreciation (depreciation) of futures contracts as reported on the Schedules of Investments. Variation margin is reported within the Statements of Assets and Liabilities. |
The following is a summary of the location of derivative investments on the Funds’ Statements of Operations for the period ended September 30, 2024:
Derivative Investment Type | Location of Gain (Loss) on Derivatives |
Equity/Interest rate futures contracts | Net realized gain (loss) on futures contracts |
| Net change in unrealized appreciation (depreciation) on futures contracts |
Credit/Equity swap agreements | Net realized gain (loss) on swap agreements Net change in unrealized appreciation (depreciation) on swap agreements |
| | THE RYDEX FUNDS SEMI-ANNUAL FINANCIAL REPORT | 391 |
NOTES TO FINANCIAL STATEMENTS (Unaudited)(continued) |
The following is a summary of the Funds’ realized gain (loss) and change in unrealized appreciation (depreciation) on derivative investments recognized on the Funds’ Statements of Operations categorized by primary risk exposure for the period ended September 30, 2024:
Realized Gain (Loss) on Derivative Investments Recognized on the Statements of Operations |
Fund | | Futures
Equity
Risk | | | Swaps
Equity
Risk | | | Futures
Commodity
Risk | | | Swaps
Credit
Risk | | | Total | |
Dow Jones Industrial Average® Fund | | $ | (3,700 | ) | | $ | 53,012 | | | $ | — | | | $ | — | | | $ | 49,312 | |
Nova Fund | | | 5,822,284 | | | | 6,713,434 | | | | — | | | | — | | | | 12,535,718 | |
S&P 500® Fund | | | (256,889 | ) | | | 650,762 | | | | — | | | | — | | | | 393,873 | |
Inverse S&P 500® Strategy Fund | | | (260,014 | ) | | | (4,360,718 | ) | | | — | | | | — | | | | (4,620,732 | ) |
Monthly Rebalance NASDAQ-100® 2x Strategy Fund | | | 14,416,015 | | | | 6,657,756 | | | | — | | | | — | | | | 21,073,771 | |
NASDAQ-100® Fund | | | (1,422,605 | ) | | | 6,664,468 | | | | — | | | | — | | | | 5,241,863 | |
Inverse NASDAQ-100® Strategy Fund | | | (256,109 | ) | | | (1,370,976 | ) | | | — | | | | — | | | | (1,627,085 | ) |
Mid-Cap 1.5x Strategy Fund | | | 12,254 | | | | 129,875 | | | | — | | | | — | | | | 142,129 | |
Inverse Mid-Cap Strategy Fund | | | — | | | | (11,924 | ) | | | — | | | | — | | | | (11,924 | ) |
Russell 2000® 1.5x Strategy Fund | | | (5,241 | ) | | | 104,976 | | | | — | | | | — | | | | 99,735 | |
Russell 2000® Fund | | | (61,360 | ) | | | 86,504 | | | | — | | | | — | | | | 25,144 | |
Inverse Russell 2000® Strategy Fund | | | (17,509 | ) | | | (144,346 | ) | | | — | | | | — | | | | (161,855 | ) |
Change in Unrealized Appreciation (Depreciation) on Derivative Investments Recognized on the Statements of Operations |
Fund | | Futures
Equity
Risk | | | Swaps
Equity
Risk | | | Futures
Commodity
Risk | | | Swaps
Credit
Risk | | | Total | |
Dow Jones Industrial Average® Fund | | $ | (45,967 | ) | | $ | (29,860 | ) | | $ | — | | | $ | — | | | $ | (75,827 | ) |
Nova Fund | | | (514,432 | ) | | | (458,942 | ) | | | — | | | | — | | | | (973,374 | ) |
S&P 500® Fund | | | 28,720 | | | | (7,576 | ) | | | — | | | | — | | | | 21,144 | |
Inverse S&P 500® Strategy Fund | | | (823 | ) | | | 66,768 | | | | — | | | | — | | | | 65,945 | |
Monthly Rebalance NASDAQ-100® 2x Strategy Fund | | | 2,833,321 | | | | (864,493 | ) | | | — | | | | — | | | | 1,968,828 | |
NASDAQ-100® Fund | | | (121,897 | ) | | | (68,856 | ) | | | — | | | | — | | | | (190,753 | ) |
Inverse NASDAQ-100® Strategy Fund | | | (46,054 | ) | | | 10,468 | | | | — | | | | — | | | | (35,586 | ) |
Mid-Cap 1.5x Strategy Fund | | | (27,413 | ) | | | (153,331 | ) | | | — | | | | — | | | | (180,744 | ) |
Inverse Mid-Cap Strategy Fund | | | — | | | | 11,449 | | | | — | | | | — | | | | 11,449 | |
Russell 2000® 1.5x Strategy Fund | | | (13,073 | ) | | | (144,803 | ) | | | — | | | | — | | | | (157,876 | ) |
Russell 2000® Fund | | | (65,103 | ) | | | (230,111 | ) | | | — | | | | — | | | | (295,214 | ) |
Inverse Russell 2000® Strategy Fund | | | (4,368 | ) | | | 40,201 | | | | — | | | | — | | | | 35,833 | |
392 | THE RYDEX FUNDS SEMI-ANNUAL FINANCIAL REPORT | |
NOTES TO FINANCIAL STATEMENTS (Unaudited)(continued) |
Realized Gain (Loss) on Derivative Investments Recognized on the Statements of Operations |
Fund | | Futures
Equity
Risk | | | Swaps
Equity
Risk | | | Futures
Foreign
Currency
Exchange
Risk | | | Swaps
Currency
Risk | | | Futures
Interest Rate
Risk | | | Futures
Commodity
Risk | | | Swaps
Credit
Risk | | | Total | |
Emerging Markets Bond Strategy Fund | | $ | — | | | $ | — | | | $ | — | | | $ | — | | | $ | 6,736 | | | $ | — | | | $ | 20,294 | | | $ | 27,030 | |
Government Long Bond 1.2x Strategy Fund | | | — | | | | — | | | | — | | | | — | | | | 193,268 | | | | — | | | | — | | | | 193,268 | |
Inverse Government Long Bond Strategy Fund | | | — | | | | — | | | | — | | | | — | | | | (197,483 | ) | | | — | | | | — | | | | (197,483 | ) |
High Yield Strategy Fund | | | — | | | | — | | | | — | | | | — | | | | 644,836 | | | | — | | | | 1,389,539 | | | | 2,034,375 | |
Inverse High Yield Strategy Fund | | | — | | | | — | | | | — | | | | — | | | | (126,282 | ) | | | — | | | | (223,181 | ) | | | (349,463 | ) |
Emerging Markets 2x Strategy Fund | | | — | | | | 346,685 | | | | — | | | | — | | | | — | | | | — | | | | — | | | | 346,685 | |
Inverse Emerging Markets 2x Strategy Fund | | | — | | | | (37,709 | ) | | | — | | | | — | | | | — | | | | — | | | | — | | | | (37,709 | ) |
Europe 1.25x Strategy Fund | | | 190,270 | | | | — | | | | 188,528 | | | | — | | | | — | | | | — | | | | — | | | | 378,798 | |
Japan 2x Strategy Fund | | | (597,586 | ) | | | — | | | | (37,313 | ) | | | — | | | | — | | | | — | | | | — | | | | (634,899 | ) |
Strengthening Dollar 2x Strategy Fund | | | — | | | | — | | | | (85,470 | ) | | | (19,623 | ) | | | — | | | | — | | | | — | | | | (105,093 | ) |
Weakening Dollar 2x Strategy Fund | | | — | | | | — | | | | (15,303 | ) | | | 1,717 | | | | — | | | | — | | | | — | | | | (13,586 | ) |
Change in Unrealized Appreciation (Depreciation) on Derivative Investments Recognized on the Statements of Operations |
Fund | | Futures
Equity
Risk | | | Swaps
Equity
Risk | | | Futures
Foreign
Currency
Exchange
Risk | | | Swaps
Currency
Risk | | | Futures
Interest Rate
Risk | | | Futures
Commodity
Risk | | | Swaps
Credit
Risk | | | Total | |
Emerging Markets Bond Strategy Fund | | $ | — | | | $ | — | | | $ | — | | | $ | — | | | $ | 1,274 | | | $ | — | | | $ | 136 | | | $ | 1,410 | |
Government Long Bond 1.2x Strategy Fund | | | — | | | | — | | | | — | | | | — | | | | (148,423 | ) | | | — | | | | — | | | | (148,423 | ) |
Inverse Government Long Bond Strategy Fund | | | — | | | | — | | | | — | | | | — | | | | 98,422 | | | | — | | | | — | | | | 98,422 | |
High Yield Strategy Fund | | | — | | | | — | | | | — | | | | — | | | | (165,074 | ) | | | — | | | | (53,536 | ) | | | (218,610 | ) |
Inverse High Yield Strategy Fund | | | — | | | | — | | | | — | | | | — | | | | 7,057 | | | | — | | | | 10,419 | | | | 17,476 | |
Emerging Markets 2x Strategy Fund | | | — | | | | 195,414 | | | | — | | | | — | | | | — | | | | — | | | | — | | | | 195,414 | |
Inverse Emerging Markets 2x Strategy Fund | | | — | | | | (24,158 | ) | | | — | | | | — | | | | — | | | | — | | | | — | | | | (24,158 | ) |
Europe 1.25x Strategy Fund | | | (14,077 | ) | | | — | | | | 29,381 | | | | — | | | | — | | | | 1 | | | | — | | | | 15,305 | |
Japan 2x Strategy Fund | | | 181,898 | | | | — | | | | 101,963 | | | | — | | | | — | | | | — | | | | — | | | | 283,861 | |
Strengthening Dollar 2x Strategy Fund | | | — | | | | — | | | | (56,263 | ) | | | (11,517 | ) | | | — | | | | — | | | | — | | | | (67,780 | ) |
Weakening Dollar 2x Strategy Fund | | | — | | | | — | | | | 36,488 | | | | 3,255 | | | | — | | | | — | | | | — | | | | 39,743 | |
| | THE RYDEX FUNDS SEMI-ANNUAL FINANCIAL REPORT | 393 |
NOTES TO FINANCIAL STATEMENTS (Unaudited)(continued) |
In conjunction with short sales and the use of derivative instruments, the Funds are required to maintain collateral in various forms. Depending on the financial instrument utilized and the broker involved, the Funds use margin deposits at the broker, cash and/or securities segregated at the custodian bank, discount notes or repurchase agreements allocated to the Funds as collateral.
The Trust has established counterparty credit guidelines and enters into transactions only with financial institutions rated/identified as investment grade or better. The Trust monitors the counterparty credit risk associated with each such financial institution.
Foreign Investments
There are several risks associated with exposure to foreign currencies, foreign issuers and emerging markets. A fund’s indirect and direct exposure to foreign currencies subjects the Fund to the risk that those currencies will decline in value relative to the U.S. dollar, or in the case of short positions, that the U.S. dollar will decline in value relative to the currency being hedged. Currency rates in foreign countries may fluctuate significantly over short periods of time for a number of reasons, including changes in interest rates and the imposition of currency controls or other political developments in the U.S. or abroad. In addition, the Funds may incur transaction costs in connection with conversions between various currencies. The Funds may, but is not obligated to, engage in currency hedging transactions, which generally involve buying currency forward, options or futures contracts. However, not all currency risks may be effectively hedged, and in some cases the costs of hedging techniques may outweigh expected benefits. In such instances, the value of securities denominated in foreign currencies can change significantly when foreign currencies strengthen or weaken relative to the U.S. dollar.
The Funds may invest in securities of foreign companies directly, or in financial instruments, such as ADRs and exchange-traded funds, which are indirectly linked to the performance of foreign issuers. Foreign markets can be more volatile than the U.S. market due to increased risks of adverse issuer, political, regulatory, market, or economic developments and can perform differently from the U.S. market. Investing in securities of foreign companies directly, or in financial instruments that are indirectly linked to the performance of foreign issuers, may involve risks not typically associated with investing in U.S. issuers. The value of securities denominated in foreign currencies, and of dividends from such securities, can change significantly when foreign currencies strengthen or weaken relative to the U.S. dollar. Foreign securities markets generally have less trading volume and less liquidity than U.S. markets, and prices in some foreign markets may fluctuate more than those of securities traded on U.S. markets. Many foreign countries lack accounting and disclosure standards comparable to those that apply to U.S. companies, and it may be more difficult to obtain reliable information regarding a foreign issuer’s financial condition and operations. Transaction costs and costs associated with custody services are generally higher for foreign securities than they are for U.S. securities. Some foreign governments levy withholding taxes against dividend and interest income. Although in some countries portions of these taxes are recoverable, the non-recovered portion will reduce the income received by the Funds.
Emerging markets, which consist of countries that have an emerging stock market as defined by Standard & Poor’s®, countries or markets with low- to middle-income economies as classified by the World Bank, and other countries or markets with similar characteristics as determined by GI, can be more volatile than the U.S. market due to increased risks of adverse issuer, political, regulatory, market, or economic developments and can perform differently from the U.S. market. Emerging markets can be subject to greater social, economic, regulatory, and political uncertainties and can be extremely volatile. As a result, the securities of emerging market issuers may present market, credit, currency, liquidity, legal, political and other risks different from, or greater than, the risks of investing in securities of developed foreign countries. In addition, the risks associated with investing in a narrowly defined geographic area are generally more pronounced with respect to investments in emerging market countries. The Fund may also be subject to this risk with respect to its investments in derivatives or other securities or financial instruments whose returns are related to the returns of emerging market securities.
Note 3 – Offsetting
In the normal course of business, the Funds enter into transactions subject to enforceable master netting arrangements or other similar arrangements. Generally, the right to offset in those agreements allows the Funds to counteract the exposure to a specific counterparty with collateral received from or delivered to that counterparty based on the terms of the arrangements. These arrangements provide for the right to liquidate upon the occurrence of an event of default, credit event upon merger or additional termination event.
In order to better define their contractual rights and to secure rights that will help the Funds mitigate their counterparty risk, the Funds may enter into an International Swaps and Derivatives Association, Inc. Master Agreement (“ISDA Master Agreement”) or similar agreement with their derivative contract counterparties. An ISDA Master Agreement is a bilateral agreement between a fund and a counterparty that governs
394 | THE RYDEX FUNDS SEMI-ANNUAL FINANCIAL REPORT | |
NOTES TO FINANCIAL STATEMENTS (Unaudited)(continued) |
OTC derivatives, including foreign exchange contracts, and typically contains, among other things, collateral posting terms and netting provisions in the event of a default and/or termination event. The provisions of the ISDA Master Agreement typically permit a single net payment in the event of a default (close-out netting) or similar event, including the bankruptcy or insolvency of the counterparty.
For derivatives traded under an ISDA Master Agreement, the collateral requirements are typically calculated by netting the mark-to-market amount for each transaction under such agreement and comparing that amount to the value of any collateral currently pledged by the Funds and the counterparty. For financial reporting purposes, cash collateral that has been pledged to cover obligations of the Funds and cash collateral received from the counterparty, if any, are reported separately on the Funds’ Statements of Assets and Liabilities as segregated cash with broker/receivable for variation margin, or payable for swap settlement/variation margin. Cash and/or securities pledged or received as collateral by the Funds in connection with an OTC derivative subject to an ISDA Master Agreement generally may not be invested, sold or rehypothecated by the counterparty or the Funds, as applicable, absent an event of default under such agreement, in which case such collateral generally may be applied towards obligations due to and payable by such counterparty or the Funds, as applicable. Generally, the amount of collateral due from or to a counterparty must exceed a minimum transfer amount threshold (e.g., $300,000) before a transfer is required to be made. To the extent amounts due to the Funds from their counterparties are not fully collateralized, contractually or otherwise, the Funds bear the risk of loss from counterparty nonperformance. The Funds attempt to mitigate counterparty risk by only entering into agreements with counterparties that they believe to be of good standing and by monitoring the financial stability of those counterparties.
For financial reporting purposes, the Funds do not offset derivative assets and derivative liabilities that are subject to netting arrangements in the Funds’ Statements of Assets and Liabilities.
The following tables present derivative financial instruments and secured financing transactions that are subject to enforceable netting arrangements:
| | | | | | | | | | | | | | | | Gross Amounts Not Offset
in the Statement of
Assets and Liabilities | | | | | |
Fund | Instrument | | Gross
Amounts of
Recognized
Assets1 | | | Gross
Amounts
Offset in the
Statements
of Assets and
Liabilities | | | Net Amount
of Assets
Presented on
the Statements
of Assets and
Liabilities | | | Financial
Instruments | | | Cash
Collateral
Received | | | Net
Amount | |
Dow Jones Industrial Average® Fund | Equity index swap agreements | | $ | 19,719 | | | $ | — | | | $ | 19,719 | | | $ | — | | | $ | — | | | $ | 19,719 | |
Nova Fund | Equity index swap agreements | | | 518,829 | | | | — | | | | 518,829 | | | | — | | | | (120,000 | ) | | | 398,829 | |
S&P 500® Fund | Equity index swap agreements | | | 47,642 | | | | — | | | | 47,642 | | | | — | | | | (20,000 | ) | | | 27,642 | |
Monthly Rebalance NASDAQ-100® 2x Strategy Fund | Equity index swap agreements | | | 2,576,149 | | | | — | | | | 2,576,149 | | | | — | | | | (390,000 | ) | | | 2,186,149 | |
NASDAQ-100® Fund | Equity index swap agreements | | | 334,322 | | | | — | | | | 334,322 | | | | — | | | | (230,762 | ) | | | 103,560 | |
Mid-Cap 1.5x Strategy Fund | Equity index swap agreements | | | 58,332 | | | | — | | | | 58,332 | | | | — | | | | (49,115 | ) | | | 9,217 | |
Russell 2000® 1.5x Strategy Fund | Equity index swap agreements | | | 55,167 | | | | — | | | | 55,167 | | | | — | | | | — | | | | 55,167 | |
Russell 2000® Fund | Equity index swap agreements | | | 43,433 | | | | — | | | | 43,433 | | | | — | | | | — | | | | 43,433 | |
Inverse Emerging Markets 2x Strategy Fund | Equity index swap agreements | | | 47 | | | | — | | | | 47 | | | | — | | | | — | | | | 47 | |
Emerging Markets 2x Strategy Fund | Equity index swap agreements | | | 129,540 | | | | — | | | | 129,540 | | | | — | | | | (98,017 | ) | | | 31,523 | |
High Yield Strategy Fund | Credit index swap agreements | | | 3,789 | | | | — | | | | 3,789 | | | | — | | | | — | | | | 3,789 | |
Weakening Dollar 2x Strategy Fund | Currency Swap Agreements | | | 1,075 | | | | — | | | | 1,075 | | | | — | | | | — | | | | 1,075 | |
Emerging Markets Bond Strategy Fund | Equity index swap agreements | | | 974 | | | | — | | | | 974 | | | | — | | | | — | | | | 974 | |
| | THE RYDEX FUNDS SEMI-ANNUAL FINANCIAL REPORT | 395 |
NOTES TO FINANCIAL STATEMENTS (Unaudited)(continued) |
| | | | | | | | | | | | | | | | Gross Amounts Not Offset
in the Statement of
Assets and Liabilities | | | | | |
Fund | Instrument | | Gross
Amounts of
Recognized
Liabilities1 | | | Gross
Amounts
Offset in the
Statements
of Assets and
Liabilities | | | Net Amount
of Liabilities
Presented on
the Statements
of Assets and
Liabilities | | | Financial
Instruments | | | Cash
Collateral
Pledged | | | Net
Amount | |
Inverse S&P 500® Strategy Fund | Equity index swap agreements | | $ | 238,793 | | | $ | — | | | $ | 238,793 | | | $ | (238,793 | ) | | $ | — | | | $ | — | |
Inverse NASDAQ-100® Strategy Fund | Equity index swap agreements | | | 59,801 | | | | — | | | | 59,801 | | | | (38,377 | ) | | | (21,424 | ) | | | — | |
Inverse Mid-Cap Strategy Fund | Equity index swap agreements | | | 1,781 | | | | — | | | | 1,781 | | | | (1,679 | ) | | | (102 | ) | | | — | |
Inverse Russell 2000® Strategy Fund | Equity index swap agreements | | | 17,716 | | | | — | | | | 17,716 | | | | (16,050 | ) | | | (1,666 | ) | | | — | |
Inverse Emerging Markets 2x Strategy Fund | Equity index swap agreements | | | 7,938 | | | | — | | | | 7,938 | | | | (7,938 | ) | | | — | | | | — | |
Strengthening Dollar 2x Strategy Fund | Currency Swap Agreements | | | 436 | | | | — | | | | 436 | | | | (436 | ) | | | — | | | | — | |
1 | Exchange-traded or centrally-cleared derivatives are excluded from these reported amounts. |
The Funds have the right to offset deposits against any related derivative liabilities outstanding with each counterparty with the exception of exchange-traded or centrally-cleared derivatives. The following table presents deposits held by others in connection with derivative investments as of September 30, 2024.
Fund | Counterparty | Asset Type | | Cash Pledged | | | Cash Received | |
Nova Fund | Goldman Sachs International | Total return swap agreements | | $ | — | | | $ | 120,000 | |
S&P 500® Fund | Barclays Bank plc | Total return swap agreements | | | 6,000 | | | | — | |
| | Goldman Sachs International | Futures contracts | | | 133,082 | | | | — | |
| Goldman Sachs International | Total return swap agreements | | | — | | | | 20,000 | |
| | | | | 139,082 | | | | 20,000 | |
Inverse S&P 500® Strategy Fund | Goldman Sachs International | Futures contracts | | | 395,882 | | | | — | |
Monthly Rebalance NASDAQ-100® 2x Strategy Fund | Barclays Bank plc | Total return swap agreements | | | — | | | | 330,000 | |
| BNP Paribas | Total return swap agreements | | | — | | | | 60,000 | |
| | | | | — | | | | 390,000 | |
NASDAQ-100® Fund | Barclays Bank plc | Total return swap agreements | | | 24,133 | | | | 260,000 | |
| | BNP Paribas | Total return swap agreements | | | — | | | | 100,000 | |
| Goldman Sachs International | Total return swap agreements | | | — | | | | 110,000 | |
| | | | | 24,133 | | | | 470,000 | |
Inverse NASDAQ-100® Strategy Fund | Barclays Bank plc | Total return swap agreements | | | 26,293 | | | | — | |
| Goldman Sachs International | Futures contracts | | | 7,992 | | | | — | |
| | | | | 34,285 | | | | — | |
Mid-Cap 1.5x Strategy Fund | Goldman Sachs International | Futures contracts | | | 6,060 | | | | — | |
| Goldman Sachs International | Total return swap agreements | | | — | | | | 120,000 | |
| | | | | 6,060 | | | | 120,000 | |
Inverse Mid-Cap Strategy Fund | Barclays Bank plc | Total return swap agreements | | | 1,000 | | | | — | |
Russell 2000® 1.5x Strategy Fund | Barclays Bank plc | Total return swap agreements | | | 13,000 | | | | — | |
Russell 2000® Fund | Barclays Bank plc | Total return swap agreements | | | 6,000 | | | | — | |
| Goldman Sachs International | Futures contracts | | | 1,932 | | | | — | |
| | | | | 7,932 | | | | — | |
396 | THE RYDEX FUNDS SEMI-ANNUAL FINANCIAL REPORT | |
NOTES TO FINANCIAL STATEMENTS (Unaudited)(continued) |
Fund | Counterparty | Asset Type | | Cash Pledged | | | Cash Received | |
Inverse Russell 2000® Strategy Fund | Barclays Bank plc | Total return swap agreements | | $ | 10,000 | | | $ | — | |
| Goldman Sachs International | Futures contracts | | | 1,288 | | | | — | |
| | | | | 11,288 | | | | — | |
Emerging Markets Bond Strategy Fund | Barclays Bank plc | Credit default swap agreements | | | 70,452 | | | | — | |
| Goldman Sachs International | Futures contracts | | | 232 | | | | — | |
Emerging Markets Bond Strategy Fund Total | | | | | 70,684 | | | | — | |
Government Long Bond 1.2x Strategy Fund | Goldman Sachs International | Futures contracts | | | 149,463 | | | | — | |
High Yield Strategy Fund | Barclays Bank plc | Credit default swap agreements | | | 586,273 | | | | — | |
| | Goldman Sachs International | Credit default swap agreements | | | — | | | | 433,544 | |
| Goldman Sachs International | Futures contracts | | | 296,938 | | | | — | |
High Yield Strategy Fund Total | | | | | 883,211 | | | | 433,544 | |
Inverse High Yield Strategy Fund | Barclays Bank plc | Credit default swap agreements | | | 594,612 | | | | — | |
Emerging Markets 2x Strategy Fund | Goldman Sachs International | Total return swap agreements | | | — | | | | 120,000 | |
Strengthening Dollar 2x Strategy Fund | Goldman Sachs International | Futures contracts | | | 109 | | | | — | |
Note 4 – Fair Value Measurement
In accordance with U.S. GAAP, fair value is defined as the price that the Funds would receive to sell an investment or pay to transfer a liability in an orderly transaction between market participants at the measurement date. U.S. GAAP establishes a three-tier fair value hierarchy based on the types of inputs used to value assets and liabilities and requires corresponding disclosure. The hierarchy and the corresponding inputs are summarized below:
Level 1 — | unadjusted quoted prices in active markets for identical assets or liabilities. |
Level 2 — | significant other observable inputs (for example quoted prices for securities that are similar based on characteristics such as interest rates, prepayment speeds, credit risk, etc.). |
Level 3 — | significant unobservable inputs based on the best information available under the circumstances, to the extent observable inputs are not available, which may include assumptions. |
Rule 2a-5 sets forth a definition of “readily available market quotations,” which is consistent with the definition of a Level 1 input under U.S. GAAP. Rule 2a-5 provides that “a market quotation is readily available only when that quotation is a quoted price (unadjusted) in active markets for identical investments that the fund can access at the measurement date, provided that a quotation will not be readily available if it is not reliable.”
Securities for which market quotations are not readily available must be valued at fair value as determined in good faith. Accordingly, any security priced using inputs other than Level 1 inputs will be subject to fair value requirements. The types of inputs available depend on a variety of factors, such as the type of security and the characteristics of the markets in which it trades, if any. Fair valuation determinations that rely on fewer or no observable inputs require greater judgment. Accordingly, fair value determinations for Level 3 securities require the greatest amount of judgment.
The inputs or methodologies selected and applied for valuing securities or other assets are not necessarily an indication of the risk associated with investing in those securities. The suitability, appropriateness and accuracy of the techniques, methodologies and sources employed to determine fair valuation are periodically reviewed and subject to change.
| | THE RYDEX FUNDS SEMI-ANNUAL FINANCIAL REPORT | 397 |
NOTES TO FINANCIAL STATEMENTS (Unaudited)(continued) |
Note 5 – Investment Advisory Agreement and Other Agreements
Under the terms of an investment advisory contract, the Funds pay GI investment advisory fees on a monthly basis calculated daily at the annualized rates below, based on the average daily net assets of the Funds:
Fund | | Management Fees
(as a % of Net Assets) | |
Banking Fund | | | 0.85 | % |
Basic Materials Fund | | | 0.85 | % |
Biotechnology Fund | | | 0.85 | % |
Consumer Products Fund | | | 0.85 | % |
Electronics Fund | | | 0.85 | % |
Energy Fund | | | 0.85 | % |
Energy Services Fund | | | 0.85 | % |
Financial Services Fund | | | 0.85 | % |
Health Care Fund | | | 0.85 | % |
Internet Fund | | | 0.85 | % |
Leisure Fund | | | 0.85 | % |
Precious Metals Fund | | | 0.75 | % |
Real Estate Fund | | | 0.85 | % |
Retailing Fund | | | 0.85 | % |
Technology Fund | | | 0.85 | % |
Telecommunications Fund | | | 0.85 | % |
Transportation Fund | | | 0.85 | % |
Utilities Fund | | | 0.85 | % |
Dow Jones Industrial Average® Fund | | | 0.75 | % |
Nova Fund | | | 0.75 | % |
S&P 500® Fund | | | 0.75 | % |
Inverse S&P 500® Strategy Fund | | | 0.90 | % |
Monthly Rebalance NASDAQ-100® 2x Strategy Fund | | | 0.90 | % |
NASDAQ-100® Fund | | | 0.75 | % |
Inverse NASDAQ-100® Strategy Fund | | | 0.90 | % |
Mid-Cap 1.5x Strategy Fund | | | 0.90 | % |
Inverse Mid-Cap Strategy Fund | | | 0.90 | % |
Russell 2000® 1.5x Strategy Fund | | | 0.90 | % |
Russell 2000® Fund | | | 0.75 | % |
Inverse Russell 2000® Strategy Fund | | | 0.90 | % |
S&P 500® Pure Growth Fund | | | 0.75 | % |
S&P 500® Pure Value Fund | | | 0.75 | % |
S&P MidCap 400® Pure Growth Fund | | | 0.75 | % |
S&P MidCap 400® Pure Value Fund | | | 0.75 | % |
S&P SmallCap 600® Pure Growth Fund | | | 0.75 | % |
S&P SmallCap 600® Pure Value Fund | | | 0.75 | % |
Emerging Markets Bond Strategy Fund | | | 0.75 | % |
Government Long Bond 1.2x Strategy Fund | | | 0.50 | % |
Inverse Government Long Bond Strategy Fund | | | 0.90 | % |
High Yield Strategy Fund | | | 0.75 | % |
Inverse High Yield Strategy Fund | | | 0.75 | % |
Emerging Markets 2x Strategy Fund | | | 0.90 | % |
Inverse Emerging Markets 2x Strategy Fund | | | 0.90 | % |
Europe 1.25x Strategy Fund | | | 0.90 | % |
Japan 2x Strategy Fund | | | 0.75 | % |
Strengthening Dollar 2x Strategy Fund | | | 0.90 | % |
Weakening Dollar 2x Strategy Fund | | | 0.90 | % |
U.S. Government Money Market Fund | | | 0.50 | % |
398 | THE RYDEX FUNDS SEMI-ANNUAL FINANCIAL REPORT | |
NOTES TO FINANCIAL STATEMENTS (Unaudited)(continued) |
When the aggregate assets of each series of the Trust (excluding the Managed Futures Strategy Fund and Multi-Hedge Strategies Fund) and each series of Rydex Dynamic Funds equal or exceed $10 billion, the advisory fee rate paid by each individual Fund (excluding the Managed Futures Strategy Fund and Multi-Hedge Strategies Fund) will be reduced in accordance with the asset level and breakpoint schedule set forth below.
Fund Assets Under Management | | Fund Asset-Based
Breakpoint Reductions | |
$500 million - $1 billion | | | 0.025 | % |
$1 billion - $2 billion | | | 0.050 | % |
>$2 billion | | | 0.075 | % |
GI pays operating expenses on behalf of the Trust, such as audit and accounting related services, legal services, custody, printing and mailing, among others, on a pass-through basis. Such expenses are allocated to various Funds within the complex based on relative net assets.
The Board has adopted a separate Distribution Plan applicable to Class A shares and Class H shares for which GFD and other firms that provide distribution and/or shareholder services (“Service Providers”) may receive compensation. If a Service Provider provides distribution services, the Funds will pay distribution fees to GFD at an annual rate not to exceed 0.25% of average daily net assets, pursuant to Rule 12b-1 of the 1940 Act. GFD, in turn, will pay the Service Provider out of its fees. GFD may, at its discretion, retain a portion of such payments to compensate itself for distribution services it performs.
The Board has adopted a separate Distribution and Shareholder Services Plan applicable to Class C shares that allows the Funds to pay annual distribution and service fees of 1.00% of the Funds’ Class C shares average daily net assets. The annual 0.25% service fee compensates a shareholder’s financial adviser for providing ongoing services to the shareholder. The annual distribution fee of 0.75% reimburses GFD for paying the shareholder’s financial adviser an ongoing sales commission. GFD advances the first year’s service and distribution fees to the financial adviser. GFD retains the service and distribution fees on accounts with no authorized dealer of record.
For the period ended September 30, 2024, GFD retained sales charges of $222,401 relating to sales of Class A shares of the Trust.
If a Fund invests in a fund that is advised by the same adviser or an affiliated adviser, the investing Fund’s adviser has agreed to waive fees at the investing fund level to the extent necessary to offset the proportionate share of any management fee paid by each Fund with respect to its investment in such affiliated fund. Fee waivers will be calculated at the investing fund level without regard to any expense cap in effect for the investing fund. Fees waived under this arrangement are not subject to reimbursement to GI. For the period ended September 30, 2024, the following Funds waived fees related to investments in affiliated funds:
Fund | | Amount Waived | |
Dow Jones Industrial Average® Fund | | $ | 845 | |
Nova Fund | | | 9,131 | |
Inverse S&P 500® Strategy Fund | | | 5,313 | |
Monthly Rebalance NASDAQ-100® 2x Strategy Fund | | | 3,751 | |
NASDAQ-100® Fund | | | 34,295 | |
Inverse NASDAQ-100® Strategy Fund | | | 1,085 | |
Mid-Cap 1.5x Strategy Fund | | | 1,104 | |
Inverse Mid-Cap Strategy Fund | | | 58 | |
Russell 2000® 1.5x Strategy Fund | | | 697 | |
Inverse Russell 2000® Strategy Fund | | | 554 | |
Government Long Bond 1.2x Strategy Fund | | | 1,112 | |
Inverse Government Long Bond Strategy Fund | | | 4,922 | |
High Yield Strategy Fund | | | 1,658 | |
Inverse High Yield Strategy Fund | | | 469 | |
Europe 1.25x Strategy Fund | | | 88 | |
GI and its affiliates have voluntarily agreed to waive their fees, including but not limited to accounting, shareholder investor services and investment advisory fees, in an attempt to maintain a positive net yield for the U.S. Government Money Market Fund. GI or its affiliates may terminate this voluntary waiver at any time upon notice to the Fund. When shareholder investor services fees are waived, dealer compensation will be reduced to the extent of such waiver.
| | THE RYDEX FUNDS SEMI-ANNUAL FINANCIAL REPORT | 399 |
NOTES TO FINANCIAL STATEMENTS (Unaudited)(continued) |
GI has contractually agreed to reduce fees and/or reimburse expenses for the Monthly Rebalance NASDAQ-100 2x Strategy Fund to the extent necessary to keep net operating expenses for Class A, Class C and Class H shares ( including Rule 12b-1 fees if any) (excluding brokerage, dividends on securities sold short, acquired fund fees and expenses, interest, taxes, litigation, indemnifi cation, and extraordinary expenses) from exceeding 1.35%, 2.10% and 1.35% of the Fund’s Class A, Class C and Class H shares average daily net assets, respectively. The Total Annual Fund Operating Expenses After Fee Waiver and /or Expense Reimbursement includes Excluded Expenses and, thus, from time to time may be higher than 1.35%, 2.10% and 1.35%, respectively. This agreement may be terminated only with the approval of the Fund’s Board of Trustees.
Effective August 1, 2022, GI has contractually agreed to waive and/or reimburse expenses for the Inverse S&P 500® Strategy Fund, Monthly Rebalance NASDAQ-100® 2x Strategy Fund, Inverse NASDAQ-100® Strategy Fund, Mid-Cap 1.5x Strategy Fund, Inverse Mid-Cap Strategy Fund, Russell 2000® 1.5x Strategy Fund, Inverse Russell 2000® Strategy Fund, Inverse Government Long Bond Strategy Fund, Emerging Markets 2x Strategy Fund, Inverse Emerging Markets 2x Strategy Fund, Europe 1.25x Strategy Fund, Strengthening Dollar 2x Strategy Fund and Weakening Dollar 2x Strategy Fund in an amount equal to an annual percentage rate of 0.05% of each Fund’s average daily net assets. This agreement shall automatically renew for one-year terms, unless GI provides written notice to the Fund of the termination at least thirty days prior to the end of the then-current term. This agreement may be terminated at any time by the Fund’s Board upon sixty days’ written notice to the Adviser. In addition, the agreement will terminate automatically if the Advisory Agreement, with respect to a Fund, is terminated, with such termination effective upon the effective date of the termination of the Advisory Agreement.
Effective August 1, 2022, GI has contractually agreed to waive and/or reimburse expenses for the NASDAQ-100® Fund in an amount equal to an annual percentage rate of 0.05% of the Fund’s average daily net assets in excess of $500,000,000. This agreement shall automatically renew for one-year terms, unless GI provides written notice to the Fund of the termination at least thirty days prior to the end of the then-current term. This agreement may be terminated at any time by the Fund’s Board upon sixty days’ written notice to the Adviser. In addition, the agreement will terminate automatically if the Advisory Agreement, with respect to the Fund, is terminated, with such termination effective upon the effective date of the termination of the Advisory Agreement.
Effective August 1, 2023, GI has contractually agreed to waive and/or reimburse expenses for the Banking Fund, Basic Materials Fund, Biotechnology Fund, Consumer Products Fund, Electronics Fund, Energy Fund, Energy Services Fund, Financial Services Fund, Health Care Fund, Internet Fund, Leisure Fund, Precious Metals Fund, Real Estate Fund, Retailing Fund, Technology Fund, Telecommunications Fund, Transportation Fund, Utilities Fund, Dow Jones Industrial Average Fund, Nova Fund, S&P 500 Fund, Inverse S&P 500 Strategy Fund, Monthly Rebalance NASDAQ-100 2x Strategy Fund, NASDAQ-100® Fund, Inverse NASDAQ-100 Strategy Fund, Mid-Cap 1.5x Strategy Fund, Inverse Mid-Cap Strategy Fund, Russell 2000 1.5x Strategy Fund, Russell 2000 Fund, Inverse Russell 2000 Strategy Fund, S&P 500® Pure Growth Fund, S&P 500® Pure Value Fund, S&P MidCap 400® Pure Growth Fund, S&P MidCap 400® Pure Value Fund, S&P SmallCap 600® Pure Growth Fund, S&P 600® Pure Value Fund, Emerging Markets Bond Fund, Government Long Bond 1.2x Strategy Fund, Inverse Government Long Bond Strategy Fund, High Yield Strategy Fund, Inverse High Yield Strategy Fund Emerging Markets 2x Strategy Fund, Inverse Emerging Markets 2x Strategy Fund, Europe 1.25x Strategy Fund, Japan 2x Strategy Fund, Strengthening Dollar 2x Strategy Fund and Weakening Dollar 2x Strategy Fund in an amount equal to an annual percentage rate of 0.05% of each Fund’s average daily net assets. This agreement shall automatically renew for one-year terms, unless GI provides written notice to the Fund of the termination at least thirty days prior to the end of the then-current term. This agreement may be terminated at any time by the Fund’s Board upon sixty days’ written notice to the Adviser. In addition, the agreement will terminate automatically if the Advisory Agreement, with respect to a Fund, is terminated, with such termination effective upon the effective date of the termination of the Advisory Agreement.
On May 21, 2024, the Board approved a waiver and/or expense reimbursement arrangement whereby GI has agreed to waive and/or reimburse, in addition to other contractual wavier and/or reimbursement arrangements, expenses for Europe 1 25x Strategy Fund in an amount equal to an annual percentage rate of 0.10% of the Fund’s average daily net assets. This arrangement went into effect on August 1, 2024 and the end of the initial term is August 1, 2025. This agreement shall automatically renew for one-year terms, unless GI provides written notice to the Fund of the termination at least thirty days prior to the end of the then-current term This agreement may be terminated at any time by the Fund’s Board of Trustees upon sixty days’ written notice to GI In addition, the agreement will terminate automatically if the Advisory Agreement, with respect to the Fund, is terminated, with such termination effective upon the effective date of the termination of the Advisory Agreement.
Certain trustees and officers of the Trust are also officers of GI and/or GFD. The Trust does not compensate its officers or trustees who are officers, directors and/or employees of GI or GFD.
400 | THE RYDEX FUNDS SEMI-ANNUAL FINANCIAL REPORT | |
NOTES TO FINANCIAL STATEMENTS (Unaudited)(continued) |
MUFG Investor Services (US), LLC (“MUIS”) acts as the Funds’ administrator, transfer agent and accounting agent. As administrator, transfer agent and accounting agent, MUIS maintains the books and records of the Funds’ securities and cash. U.S. Bank, N.A. (“U.S. Bank”) acts as the Funds’ custodian. As custodian, U.S. Bank is responsible for the custody of the Funds’ assets. For providing the aforementioned services, MUIS and U.S. Bank are entitled to receive a monthly fee equal to an annual percentage of each Fund’s average daily net assets and out of pocket expenses.
Note 6 – Repurchase Agreements
The Funds transfer uninvested cash balances into a single joint account, the daily aggregate balance of which is invested in one or more repurchase agreements collateralized by obligations of the U.S. Treasury and U.S. government agencies. The joint account includes other Funds in the Guggenheim complex not covered in this report. The collateral is in the possession of the Funds’ custodian and is evaluated to ensure that its market value exceeds, at a minimum, 102% of the original face amount of the repurchase agreements. Each Fund holds a pro rata share of the collateral based on the dollar amount of the repurchase agreement entered into by each Fund.
At September 30, 2024, the repurchase agreements in the joint account were as follows:
Counterparty and
Terms of Agreement | | Face Value | | | Repurchase Price | | | Collateral | | Par Value | | | Fair Value | |
J.P. Morgan Securities LLC | | | | | | | | | | U.S. Treasury Strip | | | | | | | | |
4.86% | | | | | | | | | | 0.00% | | | | | | | | |
Due 10/01/24 | | $ | 147,358,750 | | | $ | 147,378,643 | | | Due 08/15/25 | | $ | 155,537,427 | | | $ | 150,305,926 | |
| | | | | | | | | | | | | | | | | | | |
BofA Securities, Inc. | | | | | | | | | | U.S. Treasury Strip | | | | | | | | |
4.85% | | | | | | | | | | 0.00% | | | | | | | | |
Due 10/01/24 | | | 121,711,476 | | | | 121,727,874 | | | Due 05/15/32 | | | 165,639,580 | | | | 124,145,706 | |
In the event of counterparty default, the Funds have the right to collect the collateral to offset losses incurred. There is potential loss to the Funds in the event the Funds are delayed or prevented from exercising their rights to dispose of the collateral securities, including the risk of a possible decline in the value of the underlying securities during the period while the Funds seek to assert their rights. GI, acting under the supervision of the Board, reviews the value of the collateral and the creditworthiness of those banks and dealers with which the Funds enter into repurchase agreements to evaluate potential risks.
Note 7 – Portfolio Securities Loaned
The Funds may lend their securities to approved brokers to earn additional income. Securities lending income shown on the Funds’ Statements of Operations is shown net of rebates paid to the borrowers and earnings on cash collateral investments shared with the lending agent. Within this arrangement, the Funds act as the lender, U.S. Bank acts as the lending agent, and other approved registered broker dealers act as the borrowers. The Funds receive cash collateral, valued at 102% of the value of the securities on loan. Under the terms of the Funds’ securities lending agreement with U.S. Bank, cash collateral and proceeds are invested in the First American Government Obligations Fund — Class X. The Funds bear the risk of loss on cash collateral investments. Collateral is maintained over the life of the loan in an amount not less than the value of loaned securities, as determined at the close of fund business each day; any additional collateral required due to changes in security values is delivered to the Funds the next business day. Although the collateral mitigates the risk, the Funds could experience a delay in recovering their securities and a possible loss of income or value if the borrower fails to return the securities. The Funds have the right under the securities lending agreement to recover the securities from the borrower on demand. Securities lending transactions are accounted for as secured borrowings. The remaining contractual maturity of the securities lending agreement is overnight and continuous.
| | THE RYDEX FUNDS SEMI-ANNUAL FINANCIAL REPORT | 401 |
NOTES TO FINANCIAL STATEMENTS (Unaudited)(continued) |
At September 30, 2024, the following Funds participated in securities lending transactions, which are subject to enforceable netting arrangements, as follows:
| | | Gross Amounts Not Offset in the
Statements of Assets and Liabilities | | | | Securities Lending Collateral | |
Fund | | Value of
Securities
Loaned | | | Collateral
Received(a) | | | Net
Amount | | | | Cash
Collateral
Invested | | | Cash
Collateral
Uninvested | | | Total
Collateral | |
Banking Fund | | $ | 67,855 | | | $ | (67,855 | ) | | $ | — | | | | $ | 69,753 | | | $ | — | | | $ | 69,753 | |
Basic Materials Fund | | | 625,216 | | | | (625,216 | ) | | | — | | | | | 654,014 | | | | — | | | | 654,014 | |
Biotechnology Fund | | | 2,101,267 | | | | (2,101,267 | ) | | | — | | | | | 2,236,257 | | | | — | | | | 2,236,257 | |
Electronics Fund | | | 2,576,405 | | | | (2,576,405 | ) | | | — | | | | | 2,641,043 | | | | — | | | | 2,641,043 | |
Energy Fund | | | 552,248 | | | | (552,248 | ) | | | — | | | | | 570,260 | | | | — | | | | 570,260 | |
Energy Services Fund | | | 201,562 | | | | (201,562 | ) | | | — | | | | | 207,758 | | | | — | | | | 207,758 | |
Financial Services Fund | | | 144,254 | | | | (144,254 | ) | | | — | | | | | 148,211 | | | | — | | | | 148,211 | |
Health Care Fund | | | 132,672 | | | | (132,672 | ) | | | — | | | | | 136,964 | | | | — | | | | 136,964 | |
Internet Fund | | | 79,910 | | | | (79,910 | ) | | | — | | | | | 81,434 | | | | — | | | | 81,434 | |
Leisure Fund | | | 93,073 | | | | (93,073 | ) | | | — | | | | | 96,913 | | | | — | | | | 96,913 | |
Precious Metals Fund | | | 6,982,138 | | | | (6,982,138 | ) | | | — | | | | | 7,547,657 | | | | — | | | | 7,547,657 | |
Real Estate Fund | | | 34,240 | | | | (34,240 | ) | | | — | | | | | 36,581 | | | | — | | | | 36,581 | |
Technology Fund | | | 542,871 | | | | (542,871 | ) | | | — | | | | | 569,606 | | | | — | | | | 569,606 | |
Telecommunications Fund | | | 219,919 | | | | (219,919 | ) | | | — | | | | | 223,330 | | | | — | | | | 223,330 | |
Transportation Fund | | | 381,436 | | | | (381,436 | ) | | | — | | | | | 403,056 | | | | — | | | | 403,056 | |
Utilities Fund | | | 13,295 | | | | (13,295 | ) | | | — | | | | | 14,674 | | | | — | | | | 14,674 | |
| | | Gross Amounts Not Offset in the
Statements of Assets and Liabilities | | | | S ecurities Lending Collateral | |
Fund | | Value of
Securities
Loaned | | | Collateral
Received(a) | | | Net
Amount | | | | Cash
Collateral
Invested | | | Cash
Collateral
Uninvested | | | Total
Collateral | |
Nova Fund | | $ | 8,326 | | | $ | (8,326 | ) | | $ | — | | | | $ | 8,820 | | | $ | — | | | $ | 8,820 | |
S&P 500® Fund | | | 23,290 | | | | (23,290 | ) | | | — | | | | | 24,671 | | | | — | | | | 24,671 | |
NASDAQ-100® Fund | | | 1,682,430 | | | | (1,682,430 | ) | | | — | | | | | 1,746,916 | | | | — | | | | 1,746,916 | |
Mid-Cap 1.5x Strategy Fund | | | 30,868 | | | | (30,868 | ) | | | — | | | | | 31,806 | | | | — | | | | 31,806 | |
Russell 2000® 1.5x Strategy Fund | | | 55,311 | | | | (55,311 | ) | | | — | | | | | 58,826 | | | | — | | | | 58,826 | |
Russell 2000® Fund | | | 240,978 | | | | (240,978 | ) | | | — | | | | | 251,648 | | | | — | | | | 251,648 | |
S&P 500® Pure Value Fund | | | 140,407 | | | | (140,407 | ) | | | — | | | | | 148,736 | | | | — | | | | 148,736 | |
S&P MidCap 400® Pure Value Fund | | | 28,130 | | | | (28,130 | ) | | | — | | | | | 28,899 | | | | — | | | | 28,899 | |
S&P SmallCap 600® Pure Growth Fund | | | 35,133 | | | | (35,133 | ) | | | — | | | | | 36,591 | | | | — | | | | 36,591 | |
S&P SmallCap 600® Pure Value Fund | | | 41,845 | | | | (41,845 | ) | | | — | | | | | 44,706 | | | | — | | | | 44,706 | |
Emerging Markets 2x Strategy Fund | | | 108,517 | | | | (108,517 | ) | | | — | | | | | 112,491 | | | | — | | | | 112,491 | |
Europe 1.25x Strategy Fund | | | 60,891 | | | | (60,891 | ) | | | — | | | | | 63,108 | | | | — | | | | 63,108 | |
(a) | Actual collateral received by the Fund is generally greater than the amount shown due to overcollateralization. |
In the event of counterparty default, the Funds have the right to collect the collateral to offset losses incurred. There is potential loss to the Funds in the event the Funds are delayed or prevented from exercising their rights to dispose of the collateral securities, including the risk of a possible decline in the value of the underlying securities during the period while the Funds seek to assert their rights. GI, acting under the supervision of the Board, reviews the value of the collateral and the creditworthiness of those banks and dealers to evaluate potential risks.
402 | THE RYDEX FUNDS SEMI-ANNUAL FINANCIAL REPORT | |
NOTES TO FINANCIAL STATEMENTS (Unaudited)(continued) |
Note 8 – Federal Income Tax Information
The Funds intend to comply with the provisions of Subchapter M of the Internal Revenue Code of 1986, as amended (the “Internal Revenue Code”), applicable to regulated investment companies and will distribute substantially all taxable net investment income and capital gains sufficient to relieve the Funds from all, or substantially all, federal income, excise and state income taxes. Therefore, no provision for federal or state income tax or federal excise tax is required.
Tax positions taken or expected to be taken in the course of preparing the Funds’ tax returns are evaluated to determine whether the tax positions are “more-likely-than-not” of being sustained by the applicable tax authority. Tax positions not deemed to meet the “more-likely-than-not” threshold would be recorded as a tax benefit or expense in the current year. Management has analyzed the Funds’ tax positions taken, or to be taken, on U.S. federal income tax returns for all open tax years, and has concluded that no provision for income tax is required in the Funds’ financial statements. The Funds’ U.S. federal income tax returns are subject to examination by the Internal Revenue Service (“IRS”) for a period of three years after they are filed.
If a Fund makes a distribution to its shareholders in excess of its current and accumulated “earnings and profits” in any taxable year, the excess distribution will be treated as a return of capital to the extent of each shareholder’s basis (for tax purposes) in its shares, and any distribution in excess of basis will be treated as capital gain. A return of capital is not taxable, but it reduces the shareholder’s basis in its shares, which reduces the loss (or increases the gain) on a subsequent taxable disposition by such shareholder of the shares.
At September 30, 2024, the cost of investments for U.S. federal income tax purposes, the aggregate gross unrealized appreciation for all investments for which there was an excess of value over tax cost, and the aggregate gross unrealized depreciation for all investments for which there was an excess of tax cost over value, were as follows:
Fund | | Tax
Cost | | | Tax
Unrealized
Appreciation | | | Tax
Unrealized
Depreciation | | | Net Tax Unrealized
Appreciation
(Depreciation) | |
Banking Fund | | $ | 4,548,973 | | | $ | 556,626 | | | $ | (226 | ) | | $ | 556,400 | |
Basic Materials Fund | | | 18,251,183 | | | | 10,359,854 | | | | (210,169 | ) | | | 10,149,685 | |
Biotechnology Fund | | | 65,008,566 | | | | 52,165,856 | | | | (3,589,993 | ) | | | 48,575,863 | |
Consumer Products Fund | | | 30,339,818 | | | | 24,651,504 | | | | (344,808 | ) | | | 24,306,696 | |
Electronics Fund | | | 92,273,777 | | | | 47,280,427 | | | | (3,678,063 | ) | | | 43,602,364 | |
Energy Fund | | | 17,438,474 | | | | 3,978,520 | | | | (167,575 | ) | | | 3,810,945 | |
Energy Services Fund | | | 7,299,966 | | | | — | | | | (346,766 | ) | | | (346,766 | ) |
Financial Services Fund | | | 15,345,308 | | | | 1,355,978 | | | | (7,361 | ) | | | 1,348,617 | |
Health Care Fund | | | 17,467,307 | | | | 6,810,521 | | | | (161,586 | ) | | | 6,648,935 | |
Internet Fund | | | 7,847,762 | | | | 4,594,243 | | | | (107,353 | ) | | | 4,486,890 | |
Leisure Fund | | | 4,975,888 | | | | 2,336,447 | | | | (48,956 | ) | | | 2,287,491 | |
Precious Metals Fund | | | 102,588,137 | | | | 4,681,913 | | | | — | | | | 4,681,913 | |
Real Estate Fund | | | 6,676,554 | | | | 978,755 | | | | (1,344 | ) | | | 977,411 | |
Retailing Fund | | | 5,610,265 | | | | 2,406,902 | | | | (124,271 | ) | | | 2,282,631 | |
Technology Fund | | | 38,297,097 | | | | 27,226,555 | | | | (849,038 | ) | | | 26,377,517 | |
Telecommunications Fund | | | 6,971,461 | | | | 524,184 | | | | (43,501 | ) | | | 480,683 | |
Transportation Fund | | | 6,815,243 | | | | 2,370,182 | | | | (76,573 | ) | | | 2,293,609 | |
Utilities Fund | | | 24,965,522 | | | | 4,930,779 | | | | (16,515 | ) | | | 4,914,264 | |
| | THE RYDEX FUNDS SEMI-ANNUAL FINANCIAL REPORT | 403 |
NOTES TO FINANCIAL STATEMENTS (Unaudited)(continued) |
Fund | | Tax
Cost | | | Tax
Unrealized
Appreciation | | | Tax
Unrealized
Depreciation | | | Net Tax Unrealized
Appreciation
(Depreciation) | |
Dow Jones Industrial Average® Fund | | $ | 15,248,858 | | | $ | 4,587,663 | | | $ | (6,068 | ) | | $ | 4,581,595 | |
Nova Fund | | | 223,125,288 | | | | 15,034,005 | | | | (25,554 | ) | | | 15,008,451 | |
S&P 500® Fund | | | 179,994,330 | | | | 60,302,673 | | | | (621,918 | ) | | | 59,680,755 | |
Inverse S&P 500® Strategy Fund | | | 67,466,253 | | | | 57,233 | | | | (293,794 | ) | | | (236,561 | ) |
Monthly Rebalance Nasdaq-100 2x Strategy Fund | | | 760,705,682 | | | | 27,957,279 | | | | (666,013 | ) | | | 27,291,266 | |
NASDAQ-100® Fund | | | 558,261,599 | | | | 1,318,539,883 | | | | (8,577,040 | ) | | | 1,309,962,843 | |
Inverse NASDAQ-100® Strategy Fund | | | 14,853,685 | | | | 44,187 | | | | (120,602 | ) | | | (76,415 | ) |
Mid-Cap 1.5x Strategy Fund | | | 10,285,176 | | | | 2,515,053 | | | | (177,659 | ) | | | 2,337,394 | |
Inverse Mid-Cap Strategy Fund | | | 264,820 | | | | 818 | | | | (1,781 | ) | | | (963 | ) |
Russell 2000® 1.5x Strategy Fund | | | 6,344,490 | | | | 983,047 | | | | (770,454 | ) | | | 212,593 | |
Russell 2000® Fund | | | 15,822,401 | | | | 2,252,063 | | | | (1,134,859 | ) | | | 1,117,204 | |
Inverse Russell 2000® Strategy Fund | | | 1,923,447 | | | | 21,060 | | | | (22,084 | ) | | | (1,024 | ) |
S&P 500® Pure Growth Fund | | | 132,622,501 | | | | 16,076,464 | | | | (265,964 | ) | | | 15,810,500 | |
S&P 500® Pure Value Fund | | | 9,614,467 | | | | 969,912 | | | | (16,712 | ) | | | 953,200 | |
S&P MidCap 400® Pure Growth Fund | | | 27,072,622 | | | | 6,864,106 | | | | (1,112,261 | ) | | | 5,751,845 | |
S&P MidCap 400® Pure Value Fund | | | 4,535,084 | | | | 1,074,545 | | | | (149,878 | ) | | | 924,667 | |
S&P SmallCap 600® Pure Growth Fund | | | 3,283,010 | | | | 875,431 | | | | (27,885 | ) | | | 847,546 | |
S&P SmallCap 600® Pure Value Fund | | | 5,059,529 | | | | 692,057 | | | | (72,748 | ) | | | 619,309 | |
Fund | | Tax
Cost | | | Tax
Unrealized
Appreciation | | | Tax
Unrealized
Depreciation | | | Net Tax Unrealized
Appreciation
(Depreciation) | |
Emerging Markets Bond Strategy Fund | | $ | 655,271 | | | $ | 2,316 | | | $ | — | | | $ | 2,316 | |
Government Long Bond 1.2x Strategy Fund | | | 29,933,920 | | | | — | | | | (258,032 | ) | | | (258,032 | ) |
Inverse Government Long Bond Strategy Fund | | | 13,530,744 | | | | 75,163 | | | | — | | | | 75,163 | |
High Yield Strategy Fund | | | 57,642,550 | | | | 51,660 | | | | (72,970 | ) | | | (21,310 | ) |
Inverse High Yield Strategy Fund | | | 5,279,985 | | | | 6,510 | | | | (13,923 | ) | | | (7,413 | ) |
Emerging Markets 2x Strategy Fund | | | 2,664,562 | | | | 551,862 | | | | (1,247 | ) | | | 550,615 | |
Inverse Emerging Markets 2x Strategy Fund | | | 319,197 | | | | 47 | | | | (7,938 | ) | | | (7,891 | ) |
Europe 1.25x Strategy Fund | | | 1,492,382 | | | | 275,627 | | | | (4 | ) | | | 275,623 | |
Japan 2x Strategy Fund | | | 1,721,855 | | | | 257,074 | | | | (26,035 | ) | | | 231,039 | |
Strengthening Dollar 2x Strategy Fund | | | 1,788,776 | | | | 5,652 | | | | (436 | ) | | | 5,216 | |
Weakening Dollar 2x Strategy Fund | | | 1,231,544 | | | | 12,638 | | | | — | | | | 12,638 | |
U.S. Government Money Market Fund | | | 247,392,456 | | | | — | | | | — | | | | — | |
404 | THE RYDEX FUNDS SEMI-ANNUAL FINANCIAL REPORT | |
NOTES TO FINANCIAL STATEMENTS (Unaudited)(continued) |
Note 9 – Securities Transactions
For the period ended September 30, 2024, the cost of purchases and proceeds from sales of investment securities, excluding government securities, short-term investments and derivatives, were as follows:
Fund | | Purchases | | | Sales | |
Banking Fund | | $ | 12,943,708 | | | $ | 34,168,998 | |
Basic Materials Fund | | | 7,639,496 | | | | 10,517,080 | |
Biotechnology Fund | | | 35,190,020 | | | | 41,035,858 | |
Consumer Products Fund | | | 23,805,551 | | | | 32,523,845 | |
Electronics Fund | | | 73,615,891 | | | | 40,368,369 | |
Energy Fund | | | 63,916,528 | | | | 73,916,693 | |
Energy Services Fund | | | 9,196,248 | | | | 15,975,024 | |
Financial Services Fund | | | 19,463,162 | | | | 39,597,800 | |
Health Care Fund | | | 16,888,549 | | | | 18,582,102 | |
Internet Fund | | | 6,633,558 | | | | 33,649,363 | |
Leisure Fund | | | 2,565,164 | | | | 4,082,122 | |
Precious Metals Fund | | | 219,815,100 | | | | 198,929,021 | |
Real Estate Fund | | | 9,841,095 | | | | 5,673,863 | |
Retailing Fund | | | 13,530,964 | | | | 15,686,081 | |
Technology Fund | | | 44,638,614 | | | | 34,143,846 | |
Telecommunications Fund | | | 9,902,428 | | | | 7,172,151 | |
Transportation Fund | | | 3,286,352 | | | | 5,896,876 | |
Utilities Fund | | | 37,020,898 | | | | 26,551,872 | |
Fund | | Purchases | | | Sales | |
Dow Jones Industrial Average® Fund | | $ | 2,851,236 | | | $ | 7,365,074 | |
Nova Fund | | | 279,460,780 | | | | 347,278,068 | |
S&P 500® Fund | | | 121,416,245 | | | | 109,146,424 | |
Inverse S&P 500® Strategy Fund | | | — | | | | — | |
Monthly Rebalance NASDAQ-100® 2x Strategy Fund | | | 1,681,090,286 | | | | 1,600,247,376 | |
NASDAQ-100® Fund | | | 245,002,603 | | | | 315,373,509 | |
Inverse NASDAQ-100® Strategy Fund | | | — | | | | — | |
Mid-Cap 1.5x Strategy Fund | | | 3,338,061 | | | | 3,436,440 | |
Inverse Mid-Cap Strategy Fund | | | — | | | | — | |
Russell 2000® 1.5x Strategy Fund | | | 452,577 | | | | 473,780 | |
Russell 2000® Fund | | | 1,332,643 | | | | 12,155,867 | |
Inverse Russell 2000® Strategy Fund | | | — | | | | — | |
S&P 500® Pure Growth Fund | | | 184,581,452 | | | | 76,717,009 | |
S&P 500® Pure Value Fund | | | 169,632,249 | | | | 167,138,871 | |
S&P MidCap 400® Pure Growth Fund | | | 354,030,555 | | | | 538,311,327 | |
S&P MidCap 400® Pure Value Fund | | | 2,790,667 | | | | 3,546,743 | |
S&P SmallCap 600® Pure Growth Fund | | | 175,865,021 | | | | 175,622,514 | |
S&P SmallCap 600® Pure Value Fund | | | 213,802,515 | | | | 209,768,859 | |
Fund | | Purchases | | | Sales | |
Emerging Markets Bond Strategy Fund | | $ | — | | | $ | — | |
Government Long Bond 1.2x Strategy Fund | | | — | | | | 1,800,000 | |
Inverse Government Long Bond Strategy Fund | | | — | | | | 3,300,000 | |
High Yield Strategy Fund | | | — | | | | — | |
Inverse High Yield Strategy Fund | | | — | | | | — | |
Emerging Markets 2x Strategy Fund | | | 6,102,281 | | | | 6,574,769 | |
Inverse Emerging Markets 2x Strategy Fund | | | — | | | | — | |
Europe 1.25x Strategy Fund | | | 39,179,301 | | | | 39,950,503 | |
Japan 2x Strategy Fund | | | — | | | | — | |
Strengthening Dollar 2x Strategy Fund | | | — | | | | — | |
Weakening Dollar 2x Strategy Fund | | | — | | | | — | |
U.S. Government Money Market Fund | | | — | | | | — | |
| | THE RYDEX FUNDS SEMI-ANNUAL FINANCIAL REPORT | 405 |
NOTES TO FINANCIAL STATEMENTS (Unaudited)(continued) |
For the period ended September 30, 2024, the cost of purchases and proceeds from sales of government securities were as follows:
Fund | | Purchases | | | Sales | |
Government Long Bond 1.2x Strategy Fund | | $ | 167,251,281 | | | $ | 157,028,359 | |
Inverse Government Long Bond Strategy Fund | | | 59,807,625 | | | | 56,909,188 | |
The Funds are permitted to purchase or sell securities from or to certain affiliated funds under specified conditions outlined in procedures adopted by the Board. The procedures have been designed to ensure that any purchase or sale of securities by a Fund from or to another fund or portfolio that is or could be considered an affiliate by virtue of having a common investment adviser (or affiliated investment advisers), common trustees and/or common officers complies with Rule 17a-7 of the 1940 Act. Further, as defined under these procedures, each transaction is effected at the current market price. For the period ended September 30, 2024, the Funds engaged in purchases and sales of securities pursuant to Rule 17a-7 of the 1940 Act, as follows:
Fund | | Purchases | | | Sales | | | Realized
Gain (Loss) | |
Banking Fund | | $ | 1,768,008 | | | $ | 2,457,460 | | | $ | 2,936 | |
Basic Materials Fund | | | 753,945 | | | | 1,495,903 | | | | 140,841 | |
Biotechnology Fund | | | 1,216,651 | | | | 1,339,476 | | | | 124,851 | |
Consumer Products Fund | | | 1,482,947 | | | | 3,438,873 | | | | 510,696 | |
Electronics Fund | | | 5,023,594 | | | | 3,104,570 | | | | (218,639 | ) |
Energy Fund | | | 8,448,456 | | | | 10,658,989 | | | | 599,034 | |
Energy Services Fund | | | 2,102,542 | | | | 3,781,296 | | | | 327,712 | |
Financial Services Fund | | | 4,001,164 | | | | 2,757,123 | | | | 15,440 | |
Health Care Fund | | | 2,772,704 | | | | 1,472,758 | | | | (5,287 | ) |
Internet Fund | �� | | 992,240 | | | | 7,977,242 | | | | 716,155 | |
Leisure Fund | | | 373,724 | | | | 397,000 | | | | 3,842 | |
Precious Metals Fund | | | 13,526,998 | | | | 2,232,373 | | | | 363 | |
Real Estate Fund | | | 1,825,361 | | | | 1,788,364 | | | | (17,743 | ) |
Retailing Fund | | | 2,391,152 | | | | 1,349,246 | | | | 42,061 | |
Technology Fund | | | 8,971,937 | | | | 7,406,867 | | | | (65,231 | ) |
Telecommunications Fund | | | 1,230,181 | | | | 701,859 | | | | 1,124 | |
Transportation Fund | | | 303,171 | | | | 392,860 | | | | 58,345 | |
Utilities Fund | | | 4,606,523 | | | | 1,413,530 | | | | (1,454 | ) |
Fund | | Purchases | | | Sales | | | Realized
Gain (Loss) | |
Dow Jones Industrial Average® Fund | | $ | 1,833,603 | | | $ | 582,517 | | | $ | 47,204 | |
Nova Fund | | | 110,827,176 | | | | 183,529,084 | | | | 12,733,963 | |
S&P 500® Fund | | | 51,457,103 | | | | 57,324,030 | | | | 244,766 | |
Monthly Rebalance Nasdaq-100® 2x Strategy Fund | | | 179,646,793 | | | | 254,587,034 | | | | 26,406,614 | |
NASDAQ-100® Fund | | | 55,834,191 | | | | 63,363,800 | | | | 14,345,134 | |
Mid-Cap 1.5x Strategy Fund | | | 1,183,583 | | | | 482,646 | | | | 53,957 | |
Russell 2000® Fund | | | — | | | | 10,721,224 | | | | (1,465,625 | ) |
S&P 500® Pure Growth Fund | | | 22,897,017 | | | | 5,108,181 | | | | 101,829 | |
S&P 500® Pure Value Fund | | | 2,365,133 | | | | 5,097,589 | | | | 10,698 | |
S&P MidCap 400 Pure Growth Fund | | | 1,910,326 | | | | 3,548,880 | | | | 663,658 | |
S&P MidCap 400 Pure Value Fund | | | 268,238 | | | | 458,212 | | | | (124,526 | ) |
S&P SmallCap 600 Pure Growth Fund | | | 932,472 | | | | 1,518,382 | | | | (48,236 | ) |
S&P SmallCap 600 Pure Value Fund | | | 1,024,953 | | | | 624,256 | | | | 41,498 | |
Fund | | Purchases | | | Sales | | | Realized
Gain (Loss) | |
Emerging Markets 2x Strategy Fund | | $ | — | | | $ | 42,318 | | | $ | 374 | |
Europe 1.25x Strategy Fund | | | 1,021,358 | | | | 347,869 | | | | 2,793 | |
406 | THE RYDEX FUNDS SEMI-ANNUAL FINANCIAL REPORT | |
NOTES TO FINANCIAL STATEMENTS (Unaudited)(continued) |
Note 10 – Line of Credit
The Trust, along with other affiliated trusts, secured an uncommitted $200,000,000 line of credit from U.S. Bank, N.A. On June 3, 2024, the line of credit agreement was renewed and on November 18, 2024, a new line of credit agreement was entered into which expires on November 17, 2025. This line of credit is reserved for emergency or temporary purposes. Borrowings, if any, under this arrangement bear interest equal to the Prime Rate, minus 2%, which shall be paid monthly, averaging 6.48% for the period ended September 30, 2024. The Funds did not have any borrowings outstanding under this agreement at September 30, 2024.
The average daily balances borrowed for the period ended September 30, 2024, were as follows:
Fund | | Average Daily Balance | |
Banking Fund | | $ | 2,384 | |
Basic Materials Fund | | | 542 | |
Biotechnology Fund | | | 115 | |
Consumer Products Fund | | | 2,441 | |
Energy Fund | | | 866 | |
Energy Services Fund | | | 1,071 | |
Financial Services Fund | | | 2,699 | |
Health Care Fund | | | 8 | |
Leisure Fund | | | 216 | |
Precious Metals Fund | | | 71 | |
Real Estate Fund | | | 553 | |
Retailing Fund | | | 279 | |
Telecommunications Fund | | | 392 | |
Transportation Fund | | | 241 | |
Utilities Fund | | | 1,068 | |
Fund | | Average Daily Balance | |
Nova Fund | | $ | 1,764 | |
Mid-Cap 1.5x Strategy Fund | | | 101 | |
Russell 2000® 1.5x Strategy Fund | | | 893 | |
S&P 500® Pure Growth Fund | | | 468 | |
S&P 500® Pure Value Fund | | | 879 | |
S&P MidCap 400® Pure Growth Fund | | | 129 | |
S&P SmallCap 600® Pure Growth Fund | | | 400 | |
S&P SmallCap 600® Pure Value Fund | | | 447 | |
Note 11– Market Risks
The value of, or income generated by, the investments held by the Funds are subject to the possibility of rapid and unpredictable fluctuation, and loss that may result from various factors. These factors include, among others, developments affecting individual companies, or issuers or particular industries, or from broader influences, including real or perceived changes in prevailing interest rates (which may change at any time based on changes in monetary policies and various market and other economic conditions), changes in inflation rates or expectations about inflation rates, adverse investor confidence or sentiment, changing economic, political (including geopolitical), social or financial market conditions, increased instability or general uncertainty, extreme weather, natural/environmental or man made disasters, governmental actions, public health emergencies (such as the spread of infectious diseases, pandemics and epidemics), debt crises, actual or threatened wars or other armed conflicts (such as the escalated conflict in the Middle East and the ongoing Russia-Ukraine conflict and its collateral economic and other effects, including, but not limited to, sanctions and other international trade barriers) or ratings downgrades, and other similar events, each of which may be temporary or last for extended periods. Different sectors, industries and security types may react differently to such developments. Moreover, changing economic, political, geopolitical, social, financial market or other conditions in one country, geographic region or industry could adversely affect the value, yield and return of the investments held by the Funds in a different country, geographic region, economy, industry or market because of the increasingly interconnected global economies and financial markets. The duration and extent of the foregoing types of factors or conditions are highly uncertain and difficult to predict and have in the past, and may in the future, cause volatility and distress in economies and financial markets or other adverse circumstances, which may negatively affect the value of the Funds’ investments and performance of the Funds.
| | THE RYDEX FUNDS SEMI-ANNUAL FINANCIAL REPORT | 407 |
NOTES TO FINANCIAL STATEMENTS (Unaudited)(concluded) |
Note 12 – Subsequent Events
The Funds evaluated subsequent events through the date the financial statements are issued and determined there were no material events that would require adjustment to or disclosure in the Funds’ financial statements.
408 | THE RYDEX FUNDS SEMI-ANNUAL FINANCIAL REPORT | |
OTHER INFORMATION (Unaudited) |
A Brief Note on The Compounding of Returns
Many of the Funds described in this report are benchmarked daily to leveraged and/or inverse leveraged versions of published indices. To properly evaluate the performance of these funds, it is essential to understand the effect of mathematical compounding on their respective returns.
Because of the nonlinear effects of leverage applied over time, it is possible for a fund to perform in-line with its benchmark for several individual periods in a row, yet seem to trail the benchmark over the entire period on a cumulative basis. It is also possible that a fund that performs in-line with its benchmark on a daily basis may seem to outperform its benchmark over longer periods.
An Example of Compounding
For example, consider a hypothetical fund that is designed to produce returns that correspond to 150% of an index. On the first day of a period, the index rises from a level of 100 to a level of 106, producing a 6.0% gain and an expectation that the fund will rise by 9.0%. On the same day, the fund’s net asset value per share (“NAV”) increases from $10.00 to $10.90 for a gain of 9.0% — in line with its benchmark.
On day two, assume the index falls from 106 to 99 for a loss of about 6.6%. The fund, as expected, falls 9.9% to a price of $9.82. On each day, the fund performed exactly in line with its benchmark, but for the two-day period, the fund was down 1.8%, while the index was down only 1.0%. Without taking into account the daily compounding of returns, one would expect the fund to lose 1.5% and would see the fund as trailing by 0.3% when in fact it had performed perfectly. This example is summarized in the table below.
| Index
Level | Index
Performance | Fund
Expectation | Fund
NAV | Fund
Performance | Assessment |
Start | 100 | | | $ 10.00 | | |
Day 1 | 106 | 6.0% | 9.0% | $ 10.90 | 9.0% | In line |
Day 2 | 99 | -6.6% | -9.9% | $ 9.82 | -9.9% | In line |
Cumulative | | -1.0% | -1.5% | | -1.8% | -0.3% |
As illustrated by this simple example, the effect of leverage can make it difficult to form expectations or judgments about fund performance given only the returns of the unleveraged index.
Because certain funds seek to track the performance of their benchmark on a daily basis, mathematical compounding, especially with respect to those funds that use leverage as part of their investment strategy, may prevent a fund from correlating with the monthly, quarterly, annual or other period performance of its benchmark. Due to the compounding of daily returns, leveraged and inverse funds’ returns over periods other than one day will likely differ in amount and possibly direction from the benchmark return for the same period. Investors should monitor their leveraged and inverse funds’ holdings to ensure that they are consistent with their strategies, as frequently as daily. For those funds that consistently apply leverage, the value of the fund’s shares will tend to increase or decrease more than the value of any increase or decrease in its benchmark index. For more information on correlation, leverage and other risks, please read the prospectus.
In general, any change in direction in an index will produce compounding that seems to work against an investor. Were the index to move in the same direction (either up or down) for two or more periods in a row, the compounding of those returns would work in an investor’s favor, causing the fund to seemingly beat its benchmark.
As a general rule of thumb, more leverage in a fund will magnify the compounding effect, while less leverage will generally produce results that are more in line with expectations. In addition, periods of high volatility in an underlying index will also cause the effects of compounding to be more pronounced, while lower volatility will produce a more muted effect.
Sector Classification
Information in the Schedule of Investments is categorized by sectors using sector-level Classifications defined by the Bloomberg Industry Classification System, a widely recognized industry classification system provider. Each Fund’s registration statement has investment policies relating to concentration in specific sectors/industries. For purposes of these investment policies, the Funds usually classify sectors/industries based on industry-level Classifications used by widely recognized industry classification system providers such as Bloomberg Industry Classification System, Global Industry Classification Standards and Barclays Global Classification Scheme.
| | THE RYDEX FUNDS SEMI-ANNUAL FINANCIAL REPORT | 409 |
OTHER INFORMATION (Unaudited)(concluded) |
Quarterly Portfolio Schedules Information
The Trust files its complete schedule of portfolio holdings with the SEC for the first and third quarters of each fiscal year as an exhibit to its reports on Form N-PORT. The Funds’ Form N-PORT is available on the SEC’s website at https://www.sec.gov. The Funds’ complete schedules of securities holdings as of the end of each fiscal quarter will be made available to the public on the SEC’s website at www.sec.gov and on our website at www.guggenheiminvestments.com, and will be made available, upon request and without charge, by calling 800.820.0888.
410 | THE RYDEX FUNDS SEMI-ANNUAL FINANCIAL REPORT | |
ITEM 8: CHANGES IN AND DISAGREEMENTS WITH ACCOUNTANTS FOR OPEN-END MANAGEMENT INVESTMENT COMPANIES
Note: This is not applicable for any fund included in this document.
| | THE RYDEX FUNDS SEMI-ANNUAL FINANCIAL REPORT | 411 |
ITEM 9: PROXY DISCLOSURES FOR OPEN-END MANAGEMENT INVESTMENT COMPANIES
Note: This is not applicable for any fund included in this document.
412 | THE RYDEX FUNDS SEMI-ANNUAL FINANCIAL REPORT | |
ITEM 10: RENUMERATION PAID TO DIRECTORS, OFFICERS, AND OTHERS OF OPEN-END MANAGEMENT INVESTMENT COMPANIES
The remuneration paid to directors, officers, and others, if applicable, are included as part of the financial statements included under Item 7 of this Form.
| | THE RYDEX FUNDS SEMI-ANNUAL FINANCIAL REPORT | 413 |
ITEM 11: STATEMENT REGARDING BASIS FOR APPROVAL OF INVESTMENT ADVISORY CONTRACT
Report of the Rydex Series Funds Board of Trustees
The Board of Trustees of Rydex Series Funds (the “Trust”), including the Independent Trustees, approved the renewal of the investment management agreement (the “Advisory Agreement”) with Security Investors, LLC (“Security Investors” or the “Adviser”) on behalf of the series of the Trust listed below (each a “Fund” and collectively, the “Funds”):
Tradable Funds (Including Sector Funds*) |
● | Banking Fund* | ● | Basic Materials Fund* |
● | Biotechnology Fund* | ● | Commodities Strategy Fund |
● | Consumer Products Fund* | ● | Dow Jones Industrial Average Fund |
● | Electronics Fund* | ● | Emerging Markets 2x Strategy Fund |
● | Emerging Markets Bond Strategy Fund | ● | Energy Fund* |
● | Energy Services Fund* | ● | Europe 1.25x Strategy Fund |
● | Financial Services Fund* | ● | Government Long Bond 1.2x Strategy Fund |
● | Health Care Fund* | ● | High Yield Strategy Fund |
● | Internet Fund* | ● | Inverse Emerging Markets 2x Strategy Fund |
● | Inverse Government Long Bond Strategy Fund | ● | Inverse High Yield Strategy Fund |
● | Inverse Mid-Cap Strategy Fund | ● | Inverse NASDAQ-100 Strategy Fund |
● | Inverse Russell 2000 Strategy Fund | ● | Inverse S&P 500 Strategy Fund |
● | Japan 2x Strategy Fund | ● | Leisure Fund* |
● | Mid-Cap 1.5x Strategy Fund | ● | Monthly Rebalance NASDAQ-100 2x Strategy Fund |
● | NASDAQ-100 Fund | ● | Nova Fund |
● | Precious Metals Fund* | ● | Real Estate Fund* |
● | Retailing Fund* | ● | Russell 2000 1.5x Strategy Fund |
● | Russell 2000 Fund | ● | S&P 500 Fund |
● | S&P 500 Pure Growth Fund | ● | S&P 500 Pure Value Fund |
● | S&P MidCap 400 Pure Growth Fund | ● | S&P MidCap 400 Pure Value Fund |
● | S&P SmallCap 600 Pure Growth Fund | ● | S&P SmallCap 600 Pure Value Fund |
● | Strengthening Dollar 2x Strategy Fund | ● | Technology Fund* |
● | Telecommunications Fund* | ● | Transportation Fund* |
● | Utilities Fund* | ● | U.S. Government Money Market Fund |
● | Weakening Dollar 2x Strategy Fund | | |
Alternative Funds** (i.e., Non-Tradable Funds) |
● | Long Short Equity Fund** | ● | Managed Futures Strategy Fund** |
● | Multi-Hedge Strategies Fund** | | |
* | Each a “Sector Fund” and collectively, the “Sector Funds.” |
** | Each an “Alternative Fund” and collectively, the “Alternative Funds.” Each Fund other than the Alternative Funds is referred to herein as a “Tradable Fund” and collectively, the “Tradable Funds.” |
414 | THE RYDEX FUNDS SEMI-ANNUAL FINANCIAL REPORT | |
ITEM 11: STATEMENT REGARDING BASIS FOR APPROVAL OF INVESTMENT ADVISORY CONTRACT (continued) |
Security Investors1 is an indirect subsidiary of Guggenheim Partners, LLC, a privately-held, global investment and advisory firm (“Guggenheim Partners”). Guggenheim Partners, Security Investors and their affiliates may be referred to herein collectively as “Guggenheim.” “Guggenheim Investments” refers to the global asset management and investment advisory division of Guggenheim Partners and includes Security Investors, Guggenheim Partners Investment Management, LLC, Guggenheim Funds Investment Advisors, LLC and other affiliated investment management businesses of Guggenheim Partners.
At meetings held in person on April 16, 2024 (the “April Meeting”) and on May 20-21, 2024 (the “May Meeting”), the Contracts Review Committee of the Board (the “Committee”), consisting solely of the Independent Trustees, met separately from Guggenheim to consider the proposed renewal of the Advisory Agreement. As part of its review process, the Committee was represented by independent legal counsel to the Independent Trustees (“Independent Legal Counsel”), from whom the Independent Trustees received separate legal advice and with whom they met separately. Independent Legal Counsel reviewed and discussed with the Committee various key aspects of the Trustees’ legal responsibilities relating to the proposed renewal of the Advisory Agreement and other principal contracts. The Committee took into account various materials received from Guggenheim and Independent Legal Counsel. The Committee also considered the variety of written materials, reports and oral presentations the Board received throughout the year regarding performance and operating results of the Funds, and other information relevant to its evaluation of the Advisory Agreement.
In connection with the contract review process, FUSE Research Network LLC (“FUSE”), an independent, third-party research provider, was engaged to prepare advisory contract renewal reports designed specifically to help the Board fulfill its advisory contract renewal responsibilities. The objective of the FUSE reports is to present the subject fund’s relative position regarding fees, expenses and total return performance, with peer group and universe comparisons. The Committee assessed the data provided in the FUSE reports as well as commentary presented by Guggenheim, including, among other things, a list of Funds for which no peer funds were identified, a summary of notable distinctions between certain Funds and the applicable peer group identified in the FUSE reports and explanations for custom peer groups created for certain Funds that do not fit well into any particular category.
As part of its evaluation of the Adviser and the proposed renewal of the Advisory Agreement, the Committee took into account that the beneficial owners of the Funds are clients of tactical advisors who are engaged to provide tactical asset allocation investment advisory services. Each Tradable Fund is designed to provide such tactical advisors with specific exposures (with the exception of the U.S. Government Money Market Fund which is designed to support tactical advisors seeking to avoid market exposure or preserve capital) while also providing for unlimited trading privileges, and that the Tradable Funds offer a unique set of product features. The Committee noted that each Tradable Fund (other than the U.S. Government Money Market Fund) seeks to track, or correlate to, the performance (before fees and expenses) of a specific benchmark index over certain time periods or a specific market, noting that, because appropriate published indices are not available for many of the Sector Funds, the Adviser has developed its own methodology to construct internal performance benchmarks for the Sector Funds. In this regard, the Committee received information regarding the Adviser’s proprietary methodology for constructing internal performance benchmarks for such Funds, including the personnel with primary responsibility for the maintenance and execution of the methodology. The Committee also noted that, in addition to the performance information included in the FUSE reports, the Adviser provided tracking error data for each Tradable Fund (other than the U.S. Government Money Market Fund) relative to the applicable benchmark index or Guggenheim-constructed internal performance benchmark. The Committee took into account the limitations of the peer group and universe comparisons provided by FUSE with respect to the Tradable Funds in light of their unique features and the limited size of the marketplace for tradable funds designed to support tactical advisors, noting that there are only two direct competitor product suites.
In addition, Guggenheim provided materials and data in response to formal requests for information sent by Independent Legal Counsel on behalf of the Committee. Guggenheim also made a presentation at the April Meeting. Throughout the process, the Committee asked questions of management and requested certain additional information, which Guggenheim provided (collectively with the foregoing reports
1 | Security Investors also serves as investment adviser to each of Rydex Series Funds Commodities Strategy CFC, Rydex Managed Futures Strategy CFC and Rydex Series Funds Multi-Hedge Strategies CFC (each a “Subsidiary” and collectively, the “Subsidiaries”), wholly-owned subsidiaries of the Trust that are organized as limited companies under the laws of the Cayman Islands and used by Commodities Strategy Fund, Managed Futures Strategy Fund and Multi-Hedge Strategies Fund, respectively, to obtain commodities exposure. Pursuant to a separate investment management agreement for each Subsidiary (each a “Subsidiary Advisory Agreement” and collectively, the “Subsidiary Advisory Agreements”), the Subsidiary pays Security Investors an advisory fee at the same rate that the respective Fund pays Security Investors under the Advisory Agreement. The Subsidiary Advisory Agreements do not require annual renewal by the Board and will continue until they are terminated as provided in the Agreements. In addition, Security Investors has entered into a separate waiver agreement with respect to each applicable Fund pursuant to which Security Investors has contractually agreed to waive the advisory fee it receives from the Fund in an amount equal to the advisory fee paid to Security Investors by the respective Subsidiary. This undertaking will continue with respect to each applicable Fund for so long as the Fund invests in the respective Subsidiary, and may be terminated only with the approval of the Board. |
| | THE RYDEX FUNDS SEMI-ANNUAL FINANCIAL REPORT | 415 |
ITEM 11: STATEMENT REGARDING BASIS FOR APPROVAL OF INVESTMENT ADVISORY CONTRACT (continued) |
and materials, the “Contract Review Materials”). The Committee considered the Contract Review Materials in the context of its accumulated experience governing the Trust and other funds in the Guggenheim fund complex and weighed the factors and standards discussed with Independent Legal Counsel.
As a part of its analysis, the Committee considered that Guggenheim had engaged in a strategic review of the Guggenheim fund line-up beginning in 2023, which resulted in a recommendation to the Board in 2024 for Long Short Equity Fund to be liquidated and terminated (the “Proposed Liquidation”). The Committee noted that the Board was engaged in an extensive due diligence process to evaluate the Proposed Liquidation, which was ongoing at the time of the May Board Meeting (defined below), at which meeting the Advisory Agreement was being considered for renewal. The Committee considered the potential timing of the Proposed Liquidation and that the continuation of the Advisory Agreement for the Fund would allow the Fund to operate until the completion of the Proposed Liquidation, if approved by the Board, and would provide for the operation of the Fund to continue in the event the Board does not approve the Proposed Liquidation.
Following an analysis and discussion of relevant factors, including those identified below, and in the exercise of its business judgment, the Committee concluded that the Advisory Agreement represented a reasonable business arrangement negotiated at arm’s length and that it was in the best interest of each Fund to recommend that the Board approve the renewal of the Advisory Agreement for an additional annual term. Following its review of the Committee’s recommendation, the Board approved the renewal of the Advisory Agreement for each Fund for a one-year period ending August 1, 2025 at a meeting held on May 20-21, 2024 (the “May Board Meeting” and together with the May Meeting, the “May Meetings”) and determined to adopt the Committee’s considerations and conclusions, which follow.
Nature, Extent and Quality of Services Provided by the Adviser: With respect to the nature, extent and quality of services currently provided by the Adviser, the Committee considered the qualifications, experience and skills of key personnel performing services for the Funds, including those personnel providing compliance and risk oversight, as well as the supervisors and reporting lines for such personnel. The Committee also considered other information, including Guggenheim’s resources and related efforts to retain, attract and motivate capable personnel to serve the Funds. In evaluating Guggenheim’s resources and capabilities, the Committee considered Guggenheim’s commitment to focusing on, and investing resources in support of, funds in the Guggenheim fund complex, including the Funds. The Committee also considered Guggenheim’s discussions with the Committee and the Board regarding the Proposed Liquidation, including at the April Meeting and the May Meetings. In this regard, the Committee considered Guggenheim’s representation that it continues to manage Long Short Equity Fund in the best interest of the Fund and its shareholders and will continue to do so for so long as it serves as investment adviser to the Fund, including until the Proposed Liquidation, if approved by the Board, is completed. In addition, the Committee considered the acceptability of the terms of the Advisory Agreement, including the scope of services required to be performed by the Adviser.
The Committee’s review of the services provided by Guggenheim to the Funds included consideration of Guggenheim’s investment processes and index methodologies and resulting performance, portfolio oversight and risk management, and the related regular quarterly reports and presentations received by the Board. The Committee took into account the risks borne by Guggenheim in sponsoring and providing services to the Funds, including regulatory, operational, legal and entrepreneurial risks. The Committee considered the resources dedicated by Guggenheim to compliance functions and the reporting made to the Board by Guggenheim compliance personnel regarding Guggenheim’s adherence to regulatory requirements. The Committee also considered the regular reports the Board receives from the Trust’s Chief Compliance Officer regarding compliance policies and procedures established pursuant to Rule 38a-1 under the Investment Company Act of 1940, as amended.
With respect to the Tradable Funds, the Committee considered their unique product features, including their tradability, the real time cash process employed for such Funds, twice-daily pricing for certain Tradable Funds on select trading platforms, and the leveraged and inverse strategies offered, the Adviser’s assessment of the value to shareholders provided by the Funds’ structure and the services required by the Adviser to provide the Funds’ unique features, as well as the personnel responsible for such services. The Committee noted that the Tradable Funds allow frequent trading and unlimited exchange privileges among like share classes and noted the magnitude of changes in each Fund’s assets during 2023, 2022 and 2021. The Committee also considered additional information regarding trading activity in the Tradable Funds during 2023 and 2022, including purchases and redemptions in dollar value and in number of transactions as well as transaction volume relative to the assets in the Tradable Funds. In this regard, the Committee noted that the real time cash process is utilized by the Adviser to aggregate shareholder flow data to estimate daily net subscriptions or redemptions in order to mitigate the costs associated with the tradability feature, improve tracking and keep the Funds fully invested. The Committee took into account the infrastructure developed by the Adviser to manage the significant volume and size of trading that typically occurs near the end of each business day, as well as the unique considerations required in the portfolio construction process to determine the optimal way to obtain the applicable exposures, including leveraged and inverse exposures, while allowing for high turnover. In addition, the Committee considered information provided by the Adviser analyzing the potential costs to shareholders of investing in tradable mutual funds, such as the Tradable Funds, compared to those of investing in exchange-traded funds,
416 | THE RYDEX FUNDS SEMI-ANNUAL FINANCIAL REPORT | |
ITEM 11: STATEMENT REGARDING BASIS FOR APPROVAL OF INVESTMENT ADVISORY CONTRACT (continued) |
including expense ratios, brokerage commissions and spread costs, as well as the relative advantages and disadvantages of each investment product. The Committee also considered management’s representations at the April Meeting that there continued to be a high level of trading activity in the Tradable Funds and that the Tradable Funds continued to be utilized by tactical advisors as intended. With respect to the Sector Funds, the Committee also considered the Adviser’s proprietary methodology for constructing internal performance benchmarks for such Funds, noting the Adviser’s statement that it uses a quantitative portfolio investment process that also requires investment discretion in implementing adjustments for factors that affect tradability and liquidity, changing dynamics within a sector, and corporate actions such as spin-offs, among other adjustments.
In connection with the Committee’s evaluation of the overall package of services provided by Guggenheim, the Committee considered Guggenheim’s administrative services, including its role in supervising, monitoring, coordinating and evaluating the various services provided by the fund administrator, transfer agent, distributor, custodian and other service providers to the Funds. The Committee evaluated the Office of Chief Financial Officer (the “OCFO”), which oversees the fund administration, accounting and transfer agency services provided to the Funds and other funds in the Guggenheim fund complex, including the OCFO’s resources, personnel and services provided.
With respect to Guggenheim’s resources and the ability of the Adviser to carry out its responsibilities under the Advisory Agreement, the Chief Financial Officer of Guggenheim Investments reviewed with the Committee financial information concerning the holding company for Guggenheim Investments, Guggenheim Partners Investment Management Holdings, LLC (“GPIMH”), and the various entities comprising Guggenheim Investments, and provided the audited consolidated financial statements of GPIMH.
Based on the foregoing, and based on other information received (both oral and written) at the April Meeting and the May Meetings, as well as other considerations, including the Committee’s knowledge of how the Adviser performs its duties obtained through Board meetings, discussions and reports throughout the year, the Committee concluded that the Adviser and its personnel were qualified to serve the Funds in such capacity and may reasonably be expected to continue to provide a high quality of services under the Advisory Agreement with respect to the Funds.
Investment Performance: Except as otherwise noted, the Committee received, for each Fund, investment returns for the since-inception, ten-year, five-year, three-year, one-year and three-month periods ended December 31, 2023, as applicable. For certain Tradable Funds with only one or two identified peer funds, if any, from the two direct competitor product suites, only investment returns for the five-year, three-year and one-year periods ended December 31, 2023, as applicable, were received. In addition, the Committee received a comparison of each Fund’s performance to the performance of a benchmark and a peer group of similar funds based on asset levels as identified by FUSE, and for certain Funds, a broader universe of funds, in each case for the same periods, as applicable. The Committee also received from FUSE a description of the methodology for identifying each Fund’s peer group and universe, if any, for performance and expense comparisons. For the Tradable Funds (other than the U.S. Government Money Market Fund), the Committee received tracking error data for such Funds relative to the applicable benchmark index or Guggenheim-constructed internal performance benchmark for the five-year, three-year and one-year periods ended December 31, 2023, as applicable. For certain Tradable Funds with only one or two identified peer funds from the two direct competitor product suites, the Committee received a comparison of the tracking error of each Fund’s Class H shares to the tracking error of a peer fund, in each case for the same periods, as applicable. The Committee also received certain performance information for the Alternative Funds (i.e., the non-Tradable Funds) as of March 31, 2024. In assessing each Fund’s performance, the Committee considered that the Board receives regular reporting from Guggenheim regarding performance and evaluates performance throughout the year.
With respect to the Tradable Funds (other than the U.S. Government Money Market Fund), the Committee considered the Adviser’s statement that such Funds are designed as a suite of products seeking to provide a number of broad and specific exposures for tactical advisors and also considered that the Funds have a unique set of product features designed to meet the needs of those tactical advisors, which has an impact on performance. The Committee considered the Adviser’s statement that, in circumstances where there are significant deviations from expected returns, management seeks to understand the cause of such deviations and determine if any remedial actions should be considered, noting that no such remedial actions were currently deemed necessary by the Adviser to address performance. The Committee also considered the Adviser’s discussion of factors that contribute to such deviations, including shareholder activity, financing costs associated with leverage and investment instruments used to achieve certain exposures. In this connection, the Committee considered the tracking error of each Fund’s Class H shares relative to its applicable benchmark index or Guggenheim-constructed internal performance benchmark and, for certain Tradable Funds, compared to the tracking error of a peer fund. The Committee considered the Adviser’s commentary explaining the higher levels of tracking error for certain Funds.
| | THE RYDEX FUNDS SEMI-ANNUAL FINANCIAL REPORT | 417 |
ITEM 11: STATEMENT REGARDING BASIS FOR APPROVAL OF INVESTMENT ADVISORY CONTRACT (continued) |
With respect to certain Tradable Funds with only one or two identified peer funds, if any, from the two direct competitor product suites, the Committee considered the Adviser’s summary of notable distinctions between the Tradable Funds and the peer funds in the two direct competitor product suites and noted the Adviser’s statement that certain Tradable Funds do not have any peer funds that provide the same index, leverage or inverse exposure. The Committee also considered management’s commentary explaining circumstances in which the performance of the Tradable Funds may deviate from the performance of their respective peer funds due to, among other factors, differences in portfolio construction methodologies and exposures. The Committee noted that the two direct competitor product suites do not offer a fund comparable to either the Commodities Strategy Fund or the Emerging Markets Bond Strategy Fund. The Committee considered, for each of the Commodities Strategy Fund and the Emerging Markets Bond Strategy Fund, a comparison to a peer group identified in the FUSE report that includes actively-managed funds, in each case noting the limitations in the comparability of such peer group.
With respect to the U.S. Government Money Market Fund, the Committee noted the Adviser’s statement that the Fund is designed to support tactical advisors seeking to avoid market exposure or preserve capital and considered that only one other fund in its peer group identified in the FUSE report has product features that make it comparable in this regard. The Committee considered that although the Fund’s performance ranked in the fourth quartile of the broader peer group over the five-year, three-year and one-year periods ended December 31, 2023, the Fund outperformed the comparable peer fund over the one-year time period and no performance information was available for the comparable peer fund over the five-year and three-year time periods.
With respect to the Sector Funds, the Committee considered the Adviser’s summary of notable distinctions between each Fund and the applicable peer group identified in the FUSE reports. The Committee considered that the peer groups are comprised of actively-managed funds seeking similar exposures but that do not offer the same product features, including unlimited trading privileges, noting the Adviser’s statement that certain peer funds also cover a narrower or wider market segment than the applicable Fund. The Committee considered management’s commentary explaining circumstances in which the Sector Funds may underperform their respective peer groups due to, among other factors, high turnover associated with daily shareholder flows, differences in exposures and the Funds’ modified cap weighting approach to portfolio construction.
With respect to the Alternative Funds (i.e., the non-Tradable Funds), in seeking to evaluate Fund performance over a full market cycle, the Committee focused its attention on five-year and three-year performance rankings as compared to the relevant universe of funds. The Committee observed that the returns of each Alternative Fund’s Institutional Class shares ranked in the third quartile or better of its performance universe for each of the five-year and three-year periods considered.
Based on the foregoing, and based on other information received (both oral and written) at the April Meeting and the May Meetings, as well as other considerations, the Committee concluded that: (i) each Fund’s performance was acceptable; or (ii) it was satisfied with Guggenheim’s responses and/or efforts to improve investment performance.
Comparative Fees, Costs of Services Provided and the Benefits Realized by the Adviser from Its Relationship with the Funds: The Committee compared each Fund’s contractual advisory fee, net effective management fee2 and total net expense ratio to the applicable peer group, if any. The Committee also reviewed the median advisory fees and expense ratios, including expense ratio components (e.g., transfer agency fees, administration fees, other operating expenses, distribution fees and fee waivers/reimbursements), of the peer group. In addition, the Committee considered information regarding Guggenheim’s process for evaluating the competitiveness of each Fund’s fees and expenses, noting Guggenheim’s statement that evaluations seek to incorporate a variety of factors with a general focus on ensuring fees and expenses: (i) are competitive; (ii) give consideration to resource support requirements; and (iii) ensure Funds are able to deliver on shareholder return expectations.
As part of its evaluation of each Fund’s advisory fee, the Committee considered how such fees compared to the advisory fee charged by Guggenheim to one or more other clients that it manages pursuant to similar investment strategies, to the extent applicable. The Committee noted Guggenheim’s statement that it does not provide advisory services to other clients that have investment strategies similar to those of the Funds, other than variable insurance fund counterparts to certain Funds and certain other clients with respect to Long Short Equity Fund, each of which is charged the same advisory fee as the corresponding Fund.
2 | The “net effective management fee” for each Fund represents the combined effective advisory fee and administration fee as a percentage of average net assets for the latest fiscal year, after any waivers and/or reimbursements. |
418 | THE RYDEX FUNDS SEMI-ANNUAL FINANCIAL REPORT | |
ITEM 11: STATEMENT REGARDING BASIS FOR APPROVAL OF INVESTMENT ADVISORY CONTRACT (continued) |
With respect to the Tradable Funds that are designed to track a widely available index, which have only one or two identified peer funds, if any, from the two direct competitor product suites, the Committee considered the Adviser’s summary of notable distinctions between the Tradable Funds and the peer funds, noting the Adviser’s statement that only one of the two direct competitor product suites (which also employs a daily rebalance feature) is directly comparable for purposes of assessing such Funds’ advisory fees, with the exception of the Monthly Rebalance NASDAQ-100 2x Strategy Fund for which the other competitor product suite (which employs a monthly rebalance feature) is directly comparable. The Committee noted that the contractual advisory fee for each Fund’s Class H shares, other than the Monthly Rebalance NASDAQ-100 2x Strategy Fund, was equal to or lower than the contractual advisory fee charged to the comparable peer fund. The Committee also considered the net effective management fee and total net expense ratio for each such Fund’s Class H shares as compared to the peer fund. For the Monthly Rebalance NASDAQ-100 2x Strategy Fund, the Committee considered that, although the contractual advisory fee for the Fund’s Class H shares is higher than the contractual advisory fee charged to the peer fund, the Adviser has contractually agreed to cap Fund expenses to ensure that total net expenses are competitive. The Committee noted that the net effective management fee and the total net expense ratio for the Fund’s Class H shares were lower than those of the peer fund.
With respect to the U.S. Government Money Market Fund, the Committee noted the Adviser’s statement that the Fund is designed to support tactical advisors seeking to avoid market exposure or preserve capital and considered that only one other fund in its peer group identified in the FUSE report is directly comparable in terms of product features offered. The Committee considered that, as of the Fund’s and the peer fund’s respective fiscal year ends, the Fund’s contractual advisory fee and total net expense ratio were higher than those of the comparable peer fund, but noted management’s statement that it believes that the peer fund’s unique structural arrangement of investing in a master portfolio managed by an unaffiliated investment adviser may result in the peer fund’s stated advisory fees being understated.
With respect to the Sector Funds, the Committee considered the Adviser’s summary of notable distinctions between each Fund and the applicable peer group identified in the FUSE reports. The Committee considered that the peer groups are comprised of actively-managed funds seeking similar exposures but that do not offer the same product features, such as unlimited trading privileges. As a result, the fee and expense comparisons are more difficult given the uniqueness of both the Funds’ structure and the portfolio management needed to meet client requirements.
The Committee considered management’s agreement, as part of the 2024 annual contract renewal process, to reduce the total net expense ratio of Europe 1.25x Strategy Fund by 0.10% of its average daily net assets through an expense reimbursement and/or waiver agreement effective August 1, 2024 for an initial term ending August 1, 2025, with such reduction to apply in addition to any other contractual waiver and/or reimbursement arrangements already in place. The Committee also considered the continuation through August 1, 2025 of management’s agreement, implemented as part of the 2023 annual contract review process, to reduce the total net expense ratio of each Tradable Fund (other than the U.S. Government Money Market Fund) by 0.05% of its average daily net assets through an expense reimbursement and/or waiver agreement, with such reduction applicable in addition to any other contractual waiver and/or reimbursement arrangements in place. The Committee also noted the continuation through August 1, 2025 of management’s separate agreement, implemented as part of the 2022 annual contract review process, to reduce the total net expense ratio of each Tradable Fund with a contractual advisory fee of 0.90% of its average daily net assets3 by 0.05% of its average daily net assets and, with respect to NASDAQ-100 Fund, to reduce the total net expense ratio of the Fund by 0.05% of its average daily net assets in excess of $500 million, through expense reimbursement and/or waiver agreements.
With respect to the Alternative Funds (i.e., the non-Tradable Funds), the Committee observed that the contractual advisory fee, net effective management fee and total net expense ratio for each Fund’s Institutional Class shares each rank in the third quartile or better of such Fund’s peer group.
With respect to the costs of services provided and benefits realized by Guggenheim Investments from its relationship with the Funds, the Committee reviewed a profitability analysis and data from management for each Fund setting forth the average assets under management for the twelve months ended December 31, 2023, gross revenues received, and expenses incurred directly or through allocations, by Guggenheim Investments, expense waivers (as applicable), earnings and the operating margin/profitability rate, including variance information relative to the foregoing amounts as of December 31, 2022 and December 31, 2021. In addition, the Chief Financial Officer of Guggenheim Investments reviewed with, and addressed questions from, the Committee concerning the expense allocation methodology employed in producing the profitability analysis. In the course of its review of Guggenheim Investments’ profitability, the Committee took into account the methods used by
3 | Emerging Markets 2x Strategy Fund, Europe 1.25x Strategy Fund, Inverse Emerging Markets 2x Strategy Fund, Inverse Government Long Bond Strategy Fund, Inverse Mid-Cap Strategy Fund, Inverse NASDAQ-100 Strategy Fund, Inverse Russell 2000 Strategy Fund, Inverse S&P 500 Strategy Fund, Mid-Cap 1.5x Strategy Fund, Monthly Rebalance NASDAQ-100 2x Strategy Fund, Russell 2000 1.5x Strategy Fund, Strengthening Dollar 2x Strategy Fund and Weakening Dollar 2x Strategy Fund. |
| | THE RYDEX FUNDS SEMI-ANNUAL FINANCIAL REPORT | 419 |
ITEM 11: STATEMENT REGARDING BASIS FOR APPROVAL OF INVESTMENT ADVISORY CONTRACT (continued) |
Guggenheim Investments to determine expenses and profit and the representation by the Chief Financial Officer of Guggenheim Investments that such methods provided a reasonable basis for determining the profitability of the Adviser with respect to each Fund. The Committee considered all of the foregoing, among other things, in evaluating the costs of services provided, the profitability to Guggenheim Investments and the profitability rates presented.
The Committee also considered other benefits available to the Adviser because of its relationship with the Funds and noted Guggenheim’s statement that it does not believe the Adviser derives any such “fall-out” benefits. In this regard, the Committee noted Guggenheim’s statement that, although it does not consider such benefits to be fall-out benefits, the Adviser may benefit from certain economies of scale and synergies, such as enhanced visibility of the Adviser, enhanced leverage in fee negotiations and other synergies arising from offering a broad spectrum of products, including the Funds.
Based on the foregoing, and based on other information received (both oral and written) at the April Meeting and the May Meetings, as well as other considerations, the Committee concluded that the comparative fees and the benefits realized by the Adviser from its relationship with the Funds reflected reasonable business arrangements negotiated at arm’s length and that the Adviser’s profitability from its relationship with the Funds was not unreasonable.
Economies of Scale: The Committee received and considered information regarding whether there have been economies of scale with respect to the management of the Funds as Fund assets grow, whether the Funds have appropriately benefited from any economies of scale, and whether there is potential for realization of any further economies of scale. The Committee considered whether economies of scale in the provision of services to the Funds were being passed along to and shared with the shareholders. The Committee considered that Guggenheim believes it is appropriately sharing potential economies of scale and that Guggenheim’s decrease in overall expenses in 2023 was attributable to decreased product and distribution related costs driven by lower average assets under management (which also resulted in decreased revenue from the funds in the Guggenheim fund complex), decreased expense waivers and reimbursements, and decreased expenses associated with non-recurring items.
With respect to the Tradable Funds, the Committee noted that, in addition to the expense reimbursement and/or waiver arrangement implemented in August 2022 for the NASDAQ-100 Fund on average daily net assets in excess of $500 million, the Adviser has agreed to a contractual advisory fee breakpoint schedule for the Funds that is applied at the product-suite level, rather than on a Fund level, as the Funds are designed for tactical advisors and provide unlimited trading privileges, with individual Fund assets fluctuating significantly throughout the year. Under the breakpoint schedule adopted in June 2018 to reflect product-suite level economies of scale, each Fund’s advisory fee would be subject to a uniform fee breakpoint reduction schedule that would take effect if the aggregate assets of the Tradable Funds and the tradable series of Rydex Dynamic Funds, a separate trust, equal or exceed $10 billion.
The Committee also noted the process employed by the Adviser to evaluate whether it would be appropriate to institute a new breakpoint for an Alternative Fund (i.e., a non-Tradable Fund), with consideration given to, among other things: (i) the Fund’s size and trends in asset levels over recent years; (ii) the competitiveness of the expense levels; (iii) whether expense waivers are in place; (iv) changes and trends in revenue and expenses; (v) whether there are any anticipated expenditures that may benefit the Fund in the future; (vi) Fund profit level margins; (vii) relative Fund performance; (viii) the nature, extent and quality of services management provides to the Fund; and (ix) the complexity of the Fund’s investment strategy and the resources required to support the Fund.
As part of its assessment of economies of scale, the Committee took into account Guggenheim’s representation that it seeks to share economies of scale through a number of means, including breakpoints, advisory fees set at competitive rates pre-assuming future asset growth, expense waivers and limitations, and investments in personnel, operations and infrastructure to support the fund business. The Committee also received information regarding amounts that had been shared with shareholders through such expense waivers and limitations and considered that the newly agreed expense reimbursement and/or waiver arrangement would produce additional savings to shareholders. Thus, the Committee considered the size of the Funds and the competitiveness of and/or other determinations made regarding the current advisory fee for each Fund, as well as whether a Fund is subject to an expense limitation.
Based on the foregoing, and based on other information received (both oral and written) at the April Meeting and May Meetings, as well as other considerations, the Committee concluded that the advisory fee for each Fund reflected a reasonable business arrangement negotiated at arm’s length.
420 | THE RYDEX FUNDS SEMI-ANNUAL FINANCIAL REPORT | |
ITEM 11: STATEMENT REGARDING BASIS FOR APPROVAL OF INVESTMENT ADVISORY CONTRACT (concluded) |
Overall Conclusions
The Committee concluded that the investment advisory fees reflect reasonable business arrangements negotiated at arm’s length in light of the extent and quality of the services provided and other benefits received and that the renewal of the Advisory Agreement is in the best interest of each Fund. In reaching this conclusion, no single factor was determinative or conclusive and each Committee member, in the exercise of their informed business judgment, may afford different weights to different factors.
Following its review of the Committee’s analysis and determinations, the Board adopted the considerations and conclusions of the Committee and determined to approve the renewal of the Advisory Agreement. As a part of its considerations, the Board noted its ongoing evaluation of the Proposed Liquidation for Long Short Equity Fund and determined that the renewal of the Advisory Agreement for the Fund would allow the Fund to operate until the completion of the Proposed Liquidation, if approved by the Board, and would provide for the operation of the Fund to continue in the event the Board does not approve the Proposed Liquidation. (Following the May Board Meeting, the Board approved the Proposed Liquidation at a reconvening of the May Board Meeting held by videoconference on May 24, 2024.)
| | THE RYDEX FUNDS SEMI-ANNUAL FINANCIAL REPORT | 421 |
| Item 8. | Changes in and Disagreements with Accountants for Open-End Management Investment Companies. |
Not applicable.
| Item 9. | Proxy Disclosures for Open-End Management Investment Companies. |
Not applicable.
| Item 10. | Remuneration Paid to Directors, Officers, and Others of Open-End Management Investment Companies. |
The information is included as part of the material filed under Item 7 of this Form.
| Item 11. | Statement Regarding Basis for Approval of Investment Advisory Contract. |
The information is included as part of the material filed under Item 7 of this Form.
| Item 12. | Disclosure of Proxy Voting Policies and Procedures for Closed-End Management Investment Companies. |
Not applicable to this registrant.
| Item 13. | Portfolio Managers of Closed-End Management Investment Companies. |
Not applicable to this registrant.
| Item 14. | Purchases of Equity Securities by Closed-End Management Investment Company and Affiliated Purchases. |
Not applicable to this registrant.
| Item 15. | Submission of Matters to a Vote of Security Holders. |
There have been no changes to the procedures by which shareholders may recommend nominees to the registrant’s board of trustees.
| Item 16. | Controls and Procedures. |
(a) The registrant’s President (principal executive officer) and Treasurer (principal financial officer) have evaluated the registrant’s disclosure controls and procedures (as defined in Rule 30a-3(c) under the Investment Company Act) as of a date within 90 days of this filing and have concluded that based on such evaluation as required by Rule 30a-3(b) under the Investment Company Act, that the registrant’s disclosure controls and procedures were effective as of that date in ensuring that information required to be disclosed by the registrant in this Form N-CSR was recorded, processed, summarized, and reported within the time periods specified in the Securities and Exchange Commission’s rules and forms.
(b) There were no changes in the registrant’s internal control over financial reporting (as defined in Rule 30a-3(d) under the Investment Company Act) that occurred during the period covered by this report that the officers listed above believe to have materially affected, or to be reasonably likely to materially affect, the registrant’s internal control over financial reporting.
| Item 17. | Disclosure of Securities Lending Activities for Closed-End Management Investment Companies. |
Not applicable to this registrant.
| Item 18. | Recovery of Erroneously Awarded Compensation. |
(a) Not applicable
(b) Not applicable
(a)(1) Not applicable.
(a)(2) Separate certifications by the President (principal executive officer) and Treasurer (principal financial officer) of the registrant as required by Rule 30a-2(a) under the Investment Company Act (17 CFR 270.30a-2(a)) are attached.
(a)(3) Not applicable.
(a)(4) Not applicable.
(a)(5) Not applicable.
(b) A certification by the registrant’s President (principal executive officer) and Treasurer (principal financial officer) as required by Rule 30a-2(b) under the Investment Company Act (17 CFR 270.30a-2(b)) is attached.
SIGNATURES
Pursuant to the requirements of the Securities Exchange Act of 1934 and the Investment Company Act of 1940, the registrant has duly caused this report to be signed on its behalf by the undersigned, thereunto duly authorized.
(Registrant) | Rydex Series Funds | |
| | | |
| By (Signature and Title)* | /s/ Brian E. Binder | |
| | Brian E. Binder, President and Chief Executive Officer |
| | | |
| Date | December 6, 2024 | |
Pursuant to the requirements of the Securities Exchange Act of 1934 and the Investment Company Act of 1940, this report has been signed below by the following persons on behalf of the registrant and in the capacities and on the dates indicated.
| By (Signature and Title)* | /s/ Brian E. Binder | |
| | Brian E. Binder, President and Chief Executive Officer |
| | | |
| Date | December 6, 2024 | |
| | | |
| By (Signature and Title)* | /s/ James Howley | |
| | James Howley, Chief Financial Officer, Chief Accounting Officer, and Treasurer | |
| | |
| Date | December 6, 2024 | |
| * | Print the name and title of each signing officer under his or her signature. |