UNITED STATES
SECURITIES AND EXCHANGE COMMISSION
Washington, D.C. 20549
FORM N-CSR
CERTIFIED SHAREHOLDER REPORT OF REGISTERED MANAGEMENT INVESTMENT COMPANIES
Investment Company Act file number 811- 07584
Rydex Series Funds
(Exact name of registrant as specified in charter)
702 King Farm Boulevard, Suite 200
Rockville, Maryland 20850
(Address of principal executive offices) (Zip code)
Amy J. Lee
Rydex Series Funds
702 King Farm Boulevard, Suite 200
Rockville, Maryland 20850
(Name and address of agent for service)
Registrant's telephone number, including area code: (301) 296-5100
Date of fiscal year end: March 31
Date of reporting period: April 1, 2023 - March 31, 2024
Item 1. Reports to Stockholders.
The registrant’s annual report transmitted to shareholders pursuant to Rule 30e-1 under the Investment Company Act of 1940, as amended (the “Investment Company Act”), is as follows:
3.31.2024
Rydex Funds Annual Report
Guggenheim Alternatives Funds |
Guggenheim Long Short Equity Fund | | |
Rydex International Equity Funds |
Rydex Emerging Markets 2x Strategy Fund | | |
Rydex Inverse Emerging Markets 2x Strategy Fund | | |
Rydex Fixed Income Fund |
Rydex Emerging Markets Bond Strategy Fund | | |
GuggenheimInvestments.com | RSTF-ANN-0324x0325 |
| | |
DEAR SHAREHOLDER | 2 |
ECONOMIC AND MARKET OVERVIEW | 4 |
A BRIEF NOTE ON THE COMPOUNDING OF RETURNS | 6 |
ABOUT SHAREHOLDERS’ FUND EXPENSES | 7 |
LONG SHORT EQUITY FUND | 10 |
EMERGING MARKETS 2x STRATEGY FUND | 31 |
INVERSE EMERGING MARKETS 2x STRATEGY FUND | 40 |
EMERGING MARKETS BOND STRATEGY FUND | 48 |
NOTES TO FINANCIAL STATEMENTS | 56 |
REPORT OF INDEPENDENT REGISTERED PUBLIC ACCOUNTING FIRM | 71 |
OTHER INFORMATION | 72 |
INFORMATION ON BOARD OF TRUSTEES AND OFFICERS | 74 |
GUGGENHEIM INVESTMENTS PRIVACY NOTICE | 80 |
| | THE RYDEX FUNDS ANNUAL REPORT | 1 |
Dear Shareholder:
Security Investors, LLC (the “Investment Adviser”) is pleased to present the annual shareholder report for the Long Short Equity Fund, Emerging Markets 2x Strategy Fund, Inverse Emerging Markets 2x Strategy Fund, and Emerging Markets Bond Strategy Fund (the “Fund” or “Funds”) for the 12-month period ended March 31, 2024 (the “Reporting Period”).
The Investment Adviser is a part of Guggenheim Investments, which represents the investment management businesses of Guggenheim Partners, LLC (“Guggenheim”), a global, diversified financial services firm.
Guggenheim Funds Distributors, LLC is the distributor of the Funds. Guggenheim Funds Distributors, LLC is affiliated with Guggenheim and the Investment Adviser.
We encourage you to read the Economic and Market Overview section of the report, which follows this letter, and then the Performance Report and Fund Profile for each Fund.
We are committed to providing innovative investment solutions and appreciate the trust you place in us.
Sincerely,
Security Investors, LLC
April 30, 2024
Read a prospectus and summary prospectus (if available) carefully before investing. It contains the investment objectives, risks, charges, expenses and other information, which should be considered carefully before investing. Obtain a prospectus and summary prospectus (if available) at guggenheiminvestments.com or call 800.820.0888.
This material is not intended as a recommendation or as investment advice of any kind, including in connection with rollovers, transfers, and distributions. Such material is not provided in a fiduciary capacity, may not be relied upon for or in connection with the making of investment decisions, and does not constitute a solicitation of an offer to buy or sell securities. All content has been provided for informational or educational purposes only and is not intended to be and should not be construed as legal or tax advice and/or a legal opinion. Always consult a financial, tax and/or legal professional regarding your specific situation.
The Long Short Equity Fund may not be suitable for all investors. ●The Fund is subject to the risk that the Investment Adviser’s use of a momentum-driven investment strategy may cause the Fund to underperform other types of mutual funds that use different investment strategies during periods when momentum investing is out of favor. ● It is possible that the stocks the Fund holds long will decline in value at the same time that the stocks or indices being shorted increase in value, thereby increasing potential losses to the Fund. ● The Fund’s loss on a short sale is potentially unlimited because there is no upper limit on the price a borrowed security could attain. ● The more the Fund invests in leveraged instruments, the more the leverage will magnify any gains or losses on those investments. ● The use of derivatives, such as futures, options and swap agreements, may expose the Fund to additional risks that it would not be subject to if it invested directly in the securities underlying those derivatives. ● The Fund may invest in American Depositary Receipts (“ADRs”), therefore subjecting the value of the Fund’s portfolio to fluctuations in foreign exchange rates. ● The Fund is considered non-diversified and can invest a greater portion of its assets in securities of individual issuers than a diversified fund. As a result, changes in the market value of a single security could cause greater fluctuations in the value of Fund shares than would occur in a more diversified fund. Please read the prospectus for more detailed information regarding these and other risks.
The Emerging Markets 2x Strategy Fund and Inverse Emerging Markets 2x Strategy Fund are very different from most mutual funds in that they seek to provide leveraged and leveraged inverse investment results, respectively, on a daily basis, and are intended to be used as short-term trading vehicles. The Funds are not intended to be used by, and are not appropriate for, investors who do not intend to actively manage and monitor their portfolios. The Inverse Emerging Markets 2x Strategy Fund pursues an investment goal which is inverse to 200% of the performance of its underlying index, a result opposite of most other mutual funds. Investors should note that the Funds’ pursuit of such leveraged and leveraged inverse investment goals has the following implications: ● The Funds are riskier than alternatives that do not use leverage because the performance of an investment in a Fund is magnified. ●The effect of leverage on a Fund will generally cause the Fund’s performance to not match the performance of the Fund’s benchmark (e.g., 200% of the performance of its underlying index) over a period of time greater than one day. This means that the return of a Fund for a period of longer than a single trading day will be the result of each day’s compounded returns over the period, which will very likely differ from the return of the Fund’s benchmark for that period. As a consequence, especially during periods of market volatility, the path or trend of the benchmark during the longer period may be at least as important to the Fund’s cumulative return for the longer period as the cumulative return of the benchmark for the relevant longer period. Further, the return for investors who invest for a period longer than a single trading day will not be the product of the return of a Fund’s stated investment goal (e.g., 2x) and the cumulative performance of the Fund’s benchmark.
2 | THE RYDEX FUNDS ANNUAL REPORT | |
The Funds are not suitable for all investors. The Funds are designed to be utilized only by sophisticated investors, such as traders and active investors employing dynamic strategies. Investors in the Funds should: (a) understand the risks associated with the use of leverage, (b) understand the consequences of seeking daily leveraged investment results, (c) for the Inverse Emerging Markets 2x Strategy Fund, understand the risks of shorting, and (d) intend to actively manage and monitor their investments. Investors who do not understand the Funds or do not actively manage and monitor their investments should not buy shares of the Funds.
The Emerging Markets 2x Strategy Fund seeks daily exposure to its underlying index equal to or in excess of 200% of its net assets while the Inverse Emerging Markets 2x Strategy Fund seeks daily exposure to its underlying index equal to -200% of its net assets. As a consequence, for each Fund the risk of total loss of your investment exists in the event of a movement of the Fund’s underlying index in excess of 50% in a direction adverse to the Fund (meaning a decline in the value of the underlying index of a Leveraged Fund and a gain in the value of the underlying index of a Leveraged Inverse Fund). In short, the risk of total loss of your investment exists.
There is no assurance that any Fund will achieve its investment objective and an investment in a Fund could lose money. No single Fund is a complete investment program.
The Emerging Markets Bond Strategy Fund may not be suitable for all investors. Investments in securities, in general, are subject to market risks that may cause their prices to fluctuate over time. An investment in the Fund may lose money. ● The Fund’s investments in bonds and financial instruments that in combination have economic characteristics similar to emerging markets bonds carries additional risks when compared to investing in U.S. securities, due to the impact of diplomatic, political or economic developments in the country in question. ● The Fund’s investments in derivatives, including credit default swaps, may pose risks in addition to those associated with investing directly in securities or other investments, including illiquidity of the derivatives, imperfect correlations with underlying investments or the Fund’s other portfolio holdings, lack of availability and counterparty risk. To the extent the Fund invests in derivatives to seek to hedge risk or limit leveraged exposure created by other investments, there is no guarantee that such hedging strategies will be effective at managing risk or limiting exposure to leveraged investments. ● The Fund’s exposure to high yield securities may subject the Fund to greater volatility. ● The Fund’s market value will change in response to interest rate changes and market conditions among other factors. In general, bond prices rise when interest rates fall and vice versa. ● The Fund’s investments in bank obligations may expose it to adverse developments in or related to the banking industry. ● The Funds use of leverage will exaggerate the effect on net asset value of any increase or decrease in the market value of the Fund’s portfolio. ● The Fund’s indirect and direct exposure to foreign currencies subjects the Fund to the risk that those currencies will decline in value relative to the U.S. dollar, or, in the case of short positions, that the U.S. dollar will decline in value relative to the currency being hedged. ● The Fund’s investments in other investment vehicles subject the Fund to those risks and expenses affecting the investment vehicle. ● This Fund is considered non-diversified and can invest a greater portion of its assets in securities of individual issuers than a diversified fund. As a result, changes in the market value of a single security could cause greater fluctuations in the value of fund shares than would occur in a more diversified fund. ● See the prospectus for more information on these and other risks.
| | THE RYDEX FUNDS ANNUAL REPORT | 3 |
ECONOMIC AND MARKET OVERVIEW (Unaudited) | March 31, 2024 |
While job growth remains robust, recent labor data brought increased confidence in a labor market in better balance, allowing for inflation to soften further. Labor force growth remains strong, aided by high immigration flows, helping bring labor supply in line with gradually cooling demand. The Small Business Survey indicates that plans to increase compensation have returned to pre-COVID levels. Additionally, Bureau of Labor Statistics data reveal a continued decline in the “quits rate,” reducing the pressure on businesses to raise wages to attract or retain employees. These developments suggest wage pressures may ease further by year end. And despite some speculation against any Federal Reserve (“Fed”) rate cuts materializing in 2024, we continue to anticipate cuts later this year.
Following the stronger-than-expected March Consumer Price Index, we believe that there is a high probability that the easing cycle will start in the second half of the year, since the Fed will likely need more time to gather confirming data. In the latest Summary of Economic Projections, the Federal Open Market Committee (“FOMC”) significantly increased the median forecast for 2024 U.S. gross domestic product, slightly increased it for core personal consumption expenditures year over year, and continues to expect no material increase in the unemployment rate. These adjustments left the median view for three rate cuts for 2024, which suggests the bar is very high for the Fed to keep rates where they are all year, and even higher for more rate hikes to materialize.
Amid this macroeconomic backdrop, in the first quarter of 2024 the two-year Treasury yield increased to 4.59% from 4.23%, and the 10-year Treasury yield increased to 4.20% from 3.88%, keeping the inverted 2s/10s yield curve consistent at 39 basis points as of the end of the Reporting Period, up four basis points since the start of the year. One basis point equals 0.01%. In general, spreads to Treasurys have remained tight across sectors. In investment-grade corporate bonds, BBB-rated bonds continued to remain attractive relative to A and BB-rated bonds, and supply slowed toward the end of the first quarter of 2024, which we believe should support spreads in the near term. High yield bond spreads tightened during the first quarter of 2024 to 301 basis points from 323 basis points at the start of the year, while leveraged loans’ discount margins to maturity tightened to 509 basis points from 528 basis points. Structured credit spreads tightened marginally amid strong demand. Investor demand and an improved arbitrage led to robust new collateralized loan obligation issuance, and tightening liabilities led to an increase in refinances/resets.
Looking forward, Fed officials continue to advocate for a patient approach. A conventional easing cycle is therefore far from guaranteed. Market expectations have already adjusted significantly from market-implied expectations of six rate cuts in 2024 just two months ago to only three as of the end of the Reporting Period, aligning more closely with the FOMC’s views. So far, the market has taken this delay in stride, but its patience and assessment of credit risk could be tested.
For the Reporting Period, the S&P 500® Index* returned 29.88%. The MSCI Europe-Australasia-Far East (“EAFE”) Index* returned 15.32%. The return of the MSCI Emerging Markets Index* was 8.15%.
In the bond market, the Bloomberg U.S. Aggregate Bond Index* posted a 1.70% return for the Reporting Period, while the Bloomberg U.S. Corporate High Yield Index* returned 11.15%. The return of the ICE Bank of America (“BofA”) 3-Month U.S. Treasury Bill Index* was 5.27% for the Reporting Period.
The opinions and forecasts expressed may not actually come to pass. This information is subject to change at any time, based on market and other conditions, and should not be construed as a recommendation of any specific security or strategy.
*Index Definitions:
The following indices are referenced throughout this report. Indices are unmanaged and not available for direct investment. Index performance does not reflect transaction costs, fees, or expenses.
4 | THE RYDEX FUNDS ANNUAL REPORT | |
ECONOMIC AND MARKET OVERVIEW (Unaudited)(concluded) | March 31, 2024 |
Bloomberg U.S. Aggregate Bond Index is a broad-based flagship benchmark that measures the investment grade, U.S. dollar-denominated, fixed-rate taxable bond market, including U.S. Treasuries, government-related and corporate securities, mortgage-backed securities or “MBS”(agency fixed-rate and hybrid adjustable-rate mortgage, or “ARM”, pass-throughs), asset-backed securities (“ABS”), and commercial mortgage-backed securities (“CMBS”) (agency and non-agency).
Bloomberg U.S. Corporate High Yield Index measures the U.S. dollar-denominated, high yield, fixed-rate corporate bond market. Securities are classified as high yield if the middle rating of Moody’s, Fitch, and S&P is Ba1/BB +/BB + or below.
ICE BofA 3-Month U.S. Treasury Bill Index is an unmanaged market Index of U.S. Treasury securities maturing in 90 days that assumes reinvestment of all income.
ICE BofA BBB & Lower Sovereign USD External Debt Index tracks the performance of U.S. dollar-denominated emerging market and crossover sovereign debt publicly issued in the eurobond or U.S. domestic market. Qualifying countries must have a BBB1 or lower foreign currency long-term sovereign debt rating (based on an average of Moody’s, S&P and Fitch). Countries that are not rated, or that are rated “D” or “SD” by one or several rating agencies qualify for inclusion in the index but individual non-performing securities are removed. Qualifying securities must have at least one year remaining term to final maturity, at least 18 months to maturity at point of issuance, a fixed or floating coupon and a minimum amount outstanding of $250 million. Local currency debt is excluded from the Index. Index constituents are capitalization-weighted based on their current amount outstanding times the market price plus accrued interest.
Morningstar Long/Short Equity Category Average represents long-short portfolios which hold sizable stakes in both long and short positions in equities and related derivatives. Some funds that fall into this category will shift their exposure to long and short positions depending on their macro outlook or the opportunities they uncover through bottom-up research. Some funds may simply hedge long stock positions through exchange traded funds or derivatives. At least 75% of the assets are in equity securities or derivatives.
MSCI EAFE Index is a free float-adjusted market capitalization index that is designed to measure the equity market performance of developed markets, excluding the U.S. & Canada.
MSCI Emerging Markets Index is a free float-adjusted market capitalization weighted index that is designed to measure equity market performance in the global emerging markets.
S&P Emerging 50 ADR Index is capitalization-weighted and designed to track the performance of approximately 50 emerging market-based depositary receipts.
S&P 500® Index is a broad-based index, the performance of which is based on the performance of 500 widely held common stocks chosen for market size, liquidity, and industry group representation.
| | THE RYDEX FUNDS ANNUAL REPORT | 5 |
A BRIEF NOTE ON THE COMPOUNDING OF RETURNS (Unaudited) | |
The Rydex Emerging Markets 2x Strategy Fund and the Rydex Inverse Emerging Markets 2x Strategy Fund are benchmarked daily to leveraged and/or inverse leveraged versions of published indices. To properly evaluate the performance of these Funds, it is essential to understand the effect of mathematical compounding on their respective returns.
Because of the nonlinear effects of leverage applied over time, it is possible for a fund to perform in-line with its benchmark for several individual periods in a row, yet seem to trail the benchmark over the entire period on a cumulative basis. It is also possible that a fund that performs in-line with its benchmark on a daily basis may seem to outperform its benchmark over longer periods.
An Example of Compounding
For example, consider a hypothetical fund that is designed to produce returns that correspond to 150% of an index. On the first day of a period, the index rises from a level of 100 to a level of 106, producing a 6.0% gain and an expectation that the fund will rise by 9.0%. On the same day, the fund’s net asset value per share (“NAV”) increases from $10.00 to $10.90 for a gain of 9.0% — in line with its benchmark.
On day two, assume the index falls from 106 to 99 for a loss of about 6.6%. The fund, as expected, falls 9.9% to a price of $9.82. On each day, the fund performed exactly in line with its benchmark, but for the two-day period, the fund was down 1.8%, while the index was down only 1.0%. Without taking into account the daily compounding of returns, one would expect the fund to lose 1.5% and would see the fund as trailing by 0.3% when in fact it had performed perfectly. This example is summarized in the table below.
| Index
Level | Index
Performance | Fund
Expectation | Fund
NAV | Fund
Performance | Assessment |
Start | 100 | | | $10.00 | | |
Day 1 | 106 | 6.0% | 9.0% | $10.90 | 9.0% | In line |
Day 2 | 99 | -6.6% | -9.9% | $ 9.82 | -9.9% | In line |
Cumulative | | -1.0% | -1.5% | | -1.8% | -0.3% |
As illustrated by this simple example, the effect of leverage can make it difficult to form expectations or judgments about fund performance given only the returns of the unleveraged index.
Because certain funds seek to track the performance of their benchmark on a daily basis, mathematical compounding, especially with respect to those funds that use leverage as part of their investment strategy, may prevent a fund from correlating with the monthly, quarterly, annual or other period performance of its benchmark. Due to the compounding of daily returns, leveraged and inverse funds’ returns over periods other than one day will likely differ in amount and possibly direction from the benchmark return for the same period. Investors should monitor their leveraged and inverse funds’ holdings to ensure that they are consistent with their strategies, as frequently as daily. For those funds that consistently apply leverage, the value of the fund’s shares will tend to increase or decrease more than the value of any increase or decrease in its benchmark index. For more information on correlation, leverage and other risks, please read the prospectus.
In general, any change in direction in an index will produce compounding that seems to work against an investor. Were the index to move in the same direction (either up or down) for two or more periods in a row, the compounding of those returns would work in an investor’s favor, causing the fund to seemingly beat its benchmark.
As a general rule of thumb, more leverage in a fund will magnify the compounding effect, while less leverage will generally produce results that are more in line with expectations. In addition, periods of high volatility in an underlying index will also cause the effects of compounding to be more pronounced, while lower volatility will produce a more muted effect.
6 | THE RYDEX FUNDS ANNUAL REPORT | |
ABOUT SHAREHOLDERS’ FUND EXPENSES (Unaudited) | |
All mutual funds have operating expenses, and it is important for our shareholders to understand the impact of costs on their investments. Shareholders of a fund incur two types of costs: (i) transaction costs, including sales charges (loads) on purchase payments, reinvested dividends, other distributions, and exchange fees, and (ii) ongoing costs, including management fees, administrative services, and shareholder reports, among others. These ongoing costs, or operating expenses, are deducted from a fund’s gross income and reduce the investment return of the fund.
A fund’s expenses are expressed as a percentage of its average net assets, which is known as the expense ratio. The following examples are intended to help investors understand the ongoing costs (in dollars) of investing in a fund and to compare these costs with the ongoing costs of investing in other mutual funds.
The examples are based on an investment of $1,000 made at the beginning of the period and held for the entire six-month period beginning September 30, 2023 and ending March 31, 2024.
The following tables illustrate the Funds’ costs in two ways:
Table 1. Based on actual Fund return: This section helps investors estimate the actual expenses paid over the period. The “Ending Account Value” shown is derived from the Fund’s actual return, and the fifth column shows the dollar amount that would have been paid by an investor who started with $1,000 in the Fund. Investors may use the information here, together with the amount invested, to estimate the expenses paid over the period. Simply divide the Fund’s account value by $1,000 (for example, an $8,600 account value divided by $1,000 = 8.6), then multiply the result by the number provided under the heading “Expenses Paid During Period.”
Table 2. Based on hypothetical 5% return: This section is intended to help investors compare a fund’s cost with those of other mutual funds. The table provides information about hypothetical account values and hypothetical expenses based on the Fund’s actual expense ratio and an assumed rate of return of 5% per year before expenses, which is not the Fund’s actual return. The hypothetical account values and expenses may not be used to estimate the actual ending account balance or expenses paid during the period. The example is useful in making comparisons because the U.S. Securities and Exchange Commission (the “SEC”) requires all mutual funds to calculate expenses based on the 5% return. Investors can assess a fund’s costs by comparing this hypothetical example with the hypothetical examples that appear in shareholder reports of other funds.
The calculations illustrated above assume no shares were bought or sold during the period. Actual costs may have been higher or lower, depending on the amount of investment and the timing of any purchases or redemptions.
Please note that the expenses shown in the table are meant to highlight your ongoing costs only and do not reflect any transactional costs, such as sales charges (loads) on purchase payments, and contingent deferred sales charges (“CDSC”) on redemptions, if any. Therefore, the second table is useful in comparing ongoing costs only, and will not help you determine the relative total costs of owning different funds. In addition, if these transactional costs were included, your costs would have been higher.
More information about the Funds’ expenses, including annual expense ratios for periods up to five years (subject to the Fund’s inception date), can be found in the Financial Highlights section of this report. For additional information on operating expenses and other shareholder costs, please refer to the appropriate Fund prospectus.
| | THE RYDEX FUNDS ANNUAL REPORT | 7 |
ABOUT SHAREHOLDERS’ FUND EXPENSES (Unaudited)(continued) | |
| | Expense
Ratio1 | | | Fund
Return | | | Beginning
Account Value
September 30, 2023 | | | Ending
Account Value
March 31,
2024 | | | Expenses
Paid During
Period2 | |
Table 1. Based on actual Fund return3 | | | | | | | | | | | | | | | | | | | | |
Long Short Equity Fund | | | | | | | | | | | | | | | | | | | | |
Class A | | | 1.85 | % | | | 18.25 | % | | $ | 1,000.00 | | | $ | 1,182.50 | | | $ | 10.09 | |
Class C | | | 2.81 | % | | | 17.69 | % | | | 1,000.00 | | | | 1,176.90 | | | | 15.29 | |
Class P | | | 1.85 | % | | | 18.29 | % | | | 1,000.00 | | | | 1,182.90 | | | | 10.10 | |
Institutional Class | | | 1.56 | % | | | 18.46 | % | | | 1,000.00 | | | | 1,184.60 | | | | 8.52 | |
Emerging Markets 2x Strategy Fund | | | | | | | | | | | | | | | | | | | | |
Class A | | | 1.92 | % | | | 19.68 | % | | | 1,000.00 | | | | 1,196.80 | | | | 10.54 | |
Class C | | | 2.68 | % | | | 19.21 | % | | | 1,000.00 | | | | 1,192.10 | | | | 14.69 | |
Class H | | | 1.92 | % | | | 19.61 | % | | | 1,000.00 | | | | 1,196.10 | | | | 10.54 | |
Inverse Emerging Markets 2x Strategy Fund | | | | | | | | | | | | | | | | | | | | |
Class A | | | 1.78 | % | | | (20.05 | %) | | | 1,000.00 | | | | 799.50 | | | | 8.01 | |
Class C | | | 2.54 | % | | | (20.33 | %) | | | 1,000.00 | | | | 796.70 | | | | 11.41 | |
Class H | | | 1.77 | % | | | (20.05 | %) | | | 1,000.00 | | | | 799.50 | | | | 7.96 | |
Emerging Markets Bond Strategy Fund | | | | | | | | | | | | | | | | | | | | |
Class A | | | 1.63 | % | | | 9.98 | % | | | 1,000.00 | | | | 1,099.80 | | | | 8.56 | |
Class C | | | 2.40 | % | | | 9.57 | % | | | 1,000.00 | | | | 1,095.70 | | | | 12.57 | |
Class H | | | 1.64 | % | | | 10.00 | % | | | 1,000.00 | | | | 1,100.00 | | | | 8.61 | |
8 | THE RYDEX FUNDS ANNUAL REPORT | |
ABOUT SHAREHOLDERS’ FUND EXPENSES (Unaudited)(concluded) | |
| | Expense
Ratio1 | | | Fund
Return | | | Beginning
Account Value
September 30, 2023 | | | Ending
Account Value
March 31,
2024 | | | Expenses
Paid During
Period2 | |
Table 2. Based on hypothetical 5% return (before expenses) | | | | | | | | | | | | | | | | |
Long Short Equity Fund | | | | | | | | | | | | | | | | | | | | |
Class A | | | 1.85 | % | | | 5.00 | % | | $ | 1,000.00 | | | $ | 1,015.75 | | | $ | 9.32 | |
Class C | | | 2.81 | % | | | 5.00 | % | | | 1,000.00 | | | | 1,010.95 | | | | 14.13 | |
Class P | | | 1.85 | % | | | 5.00 | % | | | 1,000.00 | | | | 1,015.75 | | | | 9.32 | |
Institutional Class | | | 1.56 | % | | | 5.00 | % | | | 1,000.00 | | | | 1,017.20 | | | | 7.87 | |
Emerging Markets 2x Strategy Fund | | | | | | | | | | | | | | | | | | | | |
Class A | | | 1.92 | % | | | 5.00 | % | | | 1,000.00 | | | | 1,015.40 | | | | 9.67 | |
Class C | | | 2.68 | % | | | 5.00 | % | | | 1,000.00 | | | | 1,011.60 | | | | 13.48 | |
Class H | | | 1.92 | % | | | 5.00 | % | | | 1,000.00 | | | | 1,015.40 | | | | 9.67 | |
Inverse Emerging Markets 2x Strategy Fund | | | | | | | | | | | | | | | | | | | | |
Class A | | | 1.78 | % | | | 5.00 | % | | | 1,000.00 | | | | 1,016.10 | | | | 8.97 | |
Class C | | | 2.54 | % | | | 5.00 | % | | | 1,000.00 | | | | 1,012.30 | | | | 12.78 | |
Class H | | | 1.77 | % | | | 5.00 | % | | | 1,000.00 | | | | 1,016.15 | | | | 8.92 | |
Emerging Markets Bond Strategy Fund | | | | | | | | | | | | | | | | | | | | |
Class A | | | 1.63 | % | | | 5.00 | % | | | 1,000.00 | | | | 1,016.85 | | | | 8.22 | |
Class C | | | 2.40 | % | | | 5.00 | % | | | 1,000.00 | | | | 1,013.00 | | | | 12.08 | |
Class H | | | 1.64 | % | | | 5.00 | % | | | 1,000.00 | | | | 1,016.80 | | | | 8.27 | |
1 | Annualized and excludes expense of the underlying funds in which the Funds invest, if any. |
2 | Expenses are equal to the Fund’s annualized expense ratio, net of any applicable fee waivers, multiplied by the average account value over the period, multiplied by 183/366 (to reflect the one-half year period). |
3 | Actual cumulative return at net asset value for the period September 30, 2023 to March 31, 2024. |
| | THE RYDEX FUNDS ANNUAL REPORT | 9 |
PERFORMANCE REPORT AND FUND PROFILE (Unaudited) | March 31, 2024 |
LONG SHORT EQUITY FUND
OBJECTIVE: Seeks long-term capital appreciation.
For the Reporting Period, Long Short Equity Fund Class P returned 23.31%. The Fund outperformed one of the two benchmarks used by the Fund, the Morningstar Long/Short Equity Category Average, which returned 14.54%. The Fund underperformed the other benchmark, the S&P 500 Index, which returned 29.88% for the same one-year period.
What factors contributed or detracted from the Fund’s performance during the Reporting Period?
For the full Reporting Period, the broad market strongly recovered in a goldilocks environment of slowing inflation with sustained economic strength. However, the path has been bumpy, with the market ultra-sensitive to inflation data that is still struggling from the supply and demand imbalances post-Covid. The fiscal year started with rates on a steady upward trend, which lead to pockets of struggle (for example, several regional banks collapsed due to imbalances between their short-term and long-term liabilities). By late summer 2023, the tone had changed. Supply constraints eased, as did many commodity prices (particularly oil & gas). Meanwhile, the drumbeat of calls for a coming recession proved to be wrong (or early perhaps) – with the job market holding fairly steady despite the continued Federal Reserve Board (“Fed”) rate increases. ‘Soft Landing’ replaced the term ‘Recession’ in economic news. The last Fed hike was in July and for the rest of the calendar year the new consensus was for gradual and steady Fed rate cuts to come in 2024. That shift in sentiment drove a strong rally across asset classes through 2023’s final calendar quarter. However, the high Consumer Price Index and strong economic data points in early 2024 called into question the pace of rate cuts – with the Fed looking more likely to hold higher for longer.
As is often the case, the equity markets responded unpredictably. For most of the year, the cap-weighted benchmarks had impressive gains driven by the so-called ‘Magnificent Seven’ megacaps, with AI-related growth being a huge driver for the likes of Microsoft, Nvidia, Alphabet, and Meta. Outside of those largest growth companies, returns were much weaker. The large-cap-value benchmarks and small-cap benchmarks, were all underwater for the year-to-date in late October. From that point forward, all asset classes held a sustained risk-on rally (including the laggards from earlier in the year). Companies with difficult profitability or leverage metrics seemed to rebound the most, as the easing of rate increases and spreads eased their situations the most. Stocks have not blinked in early 2024 months despite rates ticking up near their earlier highs – as this new cycle of rate move has been accompanied by strong job and manufacturing data points which bode well for corporate profits.
The Fund had a 23.31% return. After subtracting the 12.33% gain in our preferred risk benchmark blend of 30% S&P 500 and 70% cash, the excess return was a strong 10.98% outperformance. The overall market gains attributed about 1.7% based on our net-long exposure averaging a bit higher than the benchmark. The realized beta (sensitivity of daily returns to broad stock benchmark moves) was about 0.42 for the Reporting Period.
Fundamental style positioning worked in the Fund’s favor by about 4.1% attribution. Value names had a good year vis-à-vis expensive names, particularly among the small- and mid-caps. Biases towards lower volatility names and higher momentum also paid off.
Industry tilts ended with a moderate 1.0% contribution in excess of the risk benchmark. Two key exposures working in our favor were net longs in the Capital Goods industry and net shorts in REITs.
Security selection (the impact of returns within style and industry groups) provided a gain of 6.0%.
How did the Fund use derivatives during the Reporting Period?
The Fund used total return swaps to gain exposure to short positions and to attain some leverage on the long side when surpassing 100% long weights. The derivatives totaled a net-negative market exposure, creating a partial market hedge against assets that are invested in long stocks. Despite the net negative exposure, the derivative long exposures outperformed the derivative short exposures by enough to end with total positive performance for the year.
How was the Fund positioned at the end of the Reporting Period?
At Reporting Period end, the Fund held about 182% of assets in long securities, and 110% short, for a net-dollar exposure of 72%. Because the long side exposure holds higher-profitability and lower-volatility biased names, while the short side focuses on higher-risk names, the actual expected net ‘beta’ of the Fund was in the 0.40 to 0.50 range.
10 | THE RYDEX FUNDS ANNUAL REPORT | |
PERFORMANCE REPORT AND FUND PROFILE (Unaudited)(continued) | March 31, 2024 |
The Fund continued to maintain its style bias towards cheaper valuation, higher profitability, and lower stock volatility. The Fund was close to neutral on growth factor exposure, after several years of being short.
From an industry perspective, the Fund’s largest net long sectors were IT, Health Care, and Consumer Discretionary, with our names mostly focused on cheaper and higher-cash-flow-generating groups within those otherwise growth-oriented sectors. The largest net short exposures were Real Estate, Materials, Consumer Staples, and Utilities. Notably, the Fund flipped to a net short exposure in the Staples and Materials after being positioned net long last year.
Performance displayed represents past performance, which is no guarantee of future results.
Holdings Diversification (Market Exposure as % of Net Assets)
“Holdings Diversification (Market Exposure as % of Net Assets)” excludes any temporary cash investments.
Inception Dates: |
Institutional Class | November 30, 2011 |
Class A | March 31, 2004 |
Class C | March 22, 2002 |
Class P | March 22, 2002 |
Ten Largest Holdings | % of Total Net Assets |
Alphabet, Inc. — Class C | 1.3% |
Microsoft Corp. | 0.9% |
Apple, Inc. | 0.9% |
Merck & Company, Inc. | 0.9% |
Marathon Petroleum Corp. | 0.8% |
Caterpillar, Inc. | 0.8% |
MGIC Investment Corp. | 0.8% |
Devon Energy Corp. | 0.8% |
Lowe’s Companies, Inc. | 0.8% |
Cisco Systems, Inc. | 0.8% |
Top Ten Total | 8.8% |
| | |
“Ten Largest Holdings” excludes any temporary cash or derivative investments. |
| | THE RYDEX FUNDS ANNUAL REPORT | 11 |
PERFORMANCE REPORT AND FUND PROFILE (Unaudited)(concluded) | March 31, 2024 |
Cumulative Fund Performance*
Average Annual Returns*
Periods Ended March 31, 2024
| 1 Year | 5 Year | 10 Year |
Class A Shares | 23.29% | 8.10% | 4.91% |
Class A Shares with sales charge† | 17.43% | 7.05% | 4.40% |
Class C Shares | 22.18% | 7.23% | 4.09% |
Class C Shares with CDSC‡ | 21.18% | 7.23% | 4.09% |
Class P Shares | 23.31% | 8.11% | 4.91% |
Institutional Class Shares | 23.66% | 8.38% | 5.18% |
S&P 500 Index** | 29.88% | 15.05% | 12.96% |
Morningstar Long/Short Equity Category Average** | 14.54% | 5.47% | 3.81% |
* | The performance data above represents past performance that is not predictive of future results. The investment return and principal value of an investment in the Fund will fluctuate so that an investor’s shares, when redeemed, may be worth more or less than their original cost. Returns are historical and include changes in principal and reinvested dividends and capital gains and do not reflect the effect of taxes. The Morningstar Long/Short Equity Category Average and S&P 500 Index are unmanaged indices and, unlike the Fund, have no management fees or operating expenses to reduce their reported returns. The Morningstar Long/Short Equity Category Average is the equal-weighted, simple average daily return for all funds in the Morningstar Long/Short Equity Category. The graphs are based on Class A shares and Class P shares only; performance for Class C shares and Institutional Class shares will vary due to differences in fee structure. |
** | Effective May 31, 2017, the Fund changed its principal investment strategy. As a result of the investment strategy change, the Fund’s new benchmarks are the Morningstar Long/Short Equity Category Average and S&P 500 Index. Prior to May 31, 2017, the Fund’s benchmark was the HFRX Equity Hedge Index and Russell 3000 Index. |
† | Fund returns are calculated using the maximum sales charge of 4.75%. |
‡ | Fund returns include a CDSC of 1% if redeemed within 12 months of purchase. |
12 | THE RYDEX FUNDS ANNUAL REPORT | |
SCHEDULE OF INVESTMENTS | March 31, 2024 |
LONG SHORT EQUITY FUND | |
| | Shares | | | Value | |
COMMON STOCKS† - 90.7% |
| | | | | | | | | |
Financial - 15.3% |
MGIC Investment Corp. | | | 6,641 | | | $ | 148,493 | |
Essent Group Ltd. | | | 2,440 | | | | 145,204 | |
Hartford Financial Services Group, Inc. | | | 1,394 | | | | 143,652 | |
NMI Holdings, Inc. — Class A* | | | 4,417 | | | | 142,846 | |
Travelers Companies, Inc. | | | 614 | | | | 141,306 | |
Apartment Income REIT Corp. REIT1 | | | 4,206 | | | | 136,569 | |
Loews Corp.1 | | | 1,533 | | | | 120,018 | |
Synchrony Financial1 | | | 2,758 | | | | 118,925 | |
VICI Properties, Inc. REIT | | | 3,937 | | | | 117,283 | |
Enact Holdings, Inc.1 | | | 3,739 | | | | 116,582 | |
Ambac Financial Group, Inc.* | | | 7,116 | | | | 111,223 | |
Innovative Industrial Properties, Inc. REIT | | | 988 | | | | 102,298 | |
Walker & Dunlop, Inc. | | | 978 | | | | 98,837 | |
Janus Henderson Group plc | | | 2,727 | | | | 89,691 | |
Regions Financial Corp.1 | | | 4,190 | | | | 88,158 | |
International Bancshares Corp.1 | | | 1,475 | | | | 82,806 | |
Bread Financial Holdings, Inc. | | | 2,182 | | | | 81,258 | |
Preferred Bank/Los Angeles CA | | | 1,002 | | | | 76,923 | |
OneMain Holdings, Inc. | | | 1,447 | | | | 73,927 | |
T. Rowe Price Group, Inc. | | | 592 | | | | 72,177 | |
First BanCorp | | | 3,670 | | | | 64,372 | |
Mr Cooper Group, Inc.* | | | 816 | | | | 63,607 | |
Everest Group Ltd. | | | 158 | | | | 62,805 | |
Employers Holdings, Inc. | | | 1,332 | | | | 60,459 | |
W R Berkley Corp. | | | 636 | | | | 56,248 | |
Citizens Financial Group, Inc. | | | 1,494 | | | | 54,217 | |
Affiliated Managers Group, Inc. | | | 319 | | | | 53,423 | |
Federated Hermes, Inc. — Class B | | | 1,159 | | | | 41,863 | |
Westamerica BanCorp | | | 818 | | | | 39,984 | |
EZCORP, Inc. — Class A*,1 | | | 2,766 | | | | 31,339 | |
PJT Partners, Inc. — Class A | | | 332 | | | | 31,294 | |
Hanmi Financial Corp.2 | | | 1,736 | | | | 27,637 | |
Total Financial | | | | | | | 2,795,424 | |
| | | | | | | | | |
Consumer, Non-cyclical - 15.2% |
Merck & Company, Inc.1 | | | 1,227 | | | | 161,903 | |
Bristol-Myers Squibb Co.1 | | | 2,654 | | | | 143,926 | |
HCA Healthcare, Inc. | | | 427 | | | | 142,417 | |
Abbott Laboratories | | | 1,206 | | | | 137,074 | |
United Therapeutics Corp.* | | | 560 | | | | 128,643 | |
Johnson & Johnson1 | | | 808 | | | | 127,818 | |
Exelixis, Inc.*,1 | | | 5,262 | | | | 124,867 | |
Constellation Brands, Inc. — Class A | | | 436 | | | | 118,487 | |
Incyte Corp.*,1 | | | 1,947 | | | | 110,921 | |
PayPal Holdings, Inc.*,1 | | | 1,478 | | | | 99,011 | |
Thermo Fisher Scientific, Inc. | | | 167 | | | | 97,062 | |
AbbVie, Inc.1 | | | 474 | | | | 86,315 | |
Royalty Pharma plc — Class A | | | 2,742 | | | | 83,274 | |
Hologic, Inc.*,1 | | | 931 | | | | 72,581 | |
Amgen, Inc. | | | 237 | | | | 67,384 | |
Biogen, Inc.* | | | 300 | | | | 64,689 | |
Perdoceo Education Corp.1 | | | 3,598 | | | | 63,181 | |
Medtronic plc | | | 696 | | | | 60,656 | |
Molina Healthcare, Inc.* | | | 131 | | | | 53,819 | |
Innoviva, Inc.*,1 | | | 3,524 | | | | 53,706 | |
Vertex Pharmaceuticals, Inc.* | | | 125 | | | | 52,251 | |
Jazz Pharmaceuticals plc* | | | 432 | | | | 52,021 | |
Laboratory Corporation of America Holdings | | | 232 | | | | 50,683 | |
Dynavax Technologies Corp.*,1 | | | 4,029 | | | | 50,000 | |
Supernus Pharmaceuticals, Inc.* | | | 1,426 | | | | 48,641 | |
Agilent Technologies, Inc.1 | | | 323 | | | | 47,000 | |
Alarm.com Holdings, Inc.* | | | 626 | | | | 45,366 | |
Heidrick & Struggles International, Inc.1 | | | 1,184 | | | | 39,854 | |
Organon & Co. | | | 2,116 | | | | 39,781 | |
Neurocrine Biosciences, Inc.* | | | 282 | | | | 38,893 | |
Collegium Pharmaceutical, Inc.* | | | 972 | | | | 37,733 | |
Simply Good Foods Co.* | | | 1,098 | | | | 37,365 | |
Centene Corp.* | | | 438 | | | | 34,374 | |
Elevance Health, Inc. | | | 66 | | | | 34,224 | |
Euronet Worldwide, Inc.* | | | 284 | | | | 31,220 | |
Intuitive Surgical, Inc.* | | | 67 | | | | 26,739 | |
Eli Lilly & Co. | | | 34 | | | | 26,451 | |
IDEXX Laboratories, Inc.* | | | 48 | | | | 25,917 | |
Lantheus Holdings, Inc.* | | | 410 | | | | 25,518 | |
Viatris, Inc.1 | | | 2,120 | | | | 25,313 | |
Total Consumer, Non-cyclical | | | | | | | 2,767,078 | |
| | | | | | | | | |
Consumer, Cyclical - 14.9% |
Lowe’s Companies, Inc. | | | 577 | | | | 146,979 | |
Lennar Corp. — Class A | | | 827 | | | | 142,228 | |
Taylor Morrison Home Corp. — Class A* | | | 2,265 | | | | 140,815 | |
McDonald’s Corp. | | | 494 | | | | 139,283 | |
GMS, Inc.* | | | 1,425 | | | | 138,710 | |
MSC Industrial Direct Company, Inc. — Class A | | | 1,294 | | | | 125,570 | |
Monarch Casino & Resort, Inc. | | | 1,648 | | | | 123,584 | |
Home Depot, Inc. | | | 286 | | | | 109,710 | |
Gentex Corp.1 | | | 2,870 | | | | 103,664 | |
Allison Transmission Holdings, Inc. | | | 1,210 | | | | 98,203 | |
PACCAR, Inc.1 | | | 757 | | | | 93,785 | |
Autoliv, Inc. | | | 674 | | | | 81,170 | |
Wabash National Corp. | | | 2,562 | | | | 76,706 | |
Ethan Allen Interiors, Inc. | | | 2,143 | | | | 74,083 | |
Darden Restaurants, Inc. | | | 433 | | | | 72,376 | |
Golden Entertainment, Inc. | | | 1,940 | | | | 71,450 | |
Brunswick Corp.1 | | | 724 | | | | 69,881 | |
Columbia Sportswear Co. | | | 825 | | | | 66,973 | |
M/I Homes, Inc.* | | | 488 | | | | 66,510 | |
Harley-Davidson, Inc. | | | 1,489 | | | | 65,129 | |
Tri Pointe Homes, Inc.* | | | 1,431 | | | | 55,322 | |
Wendy’s Co. | | | 2,814 | | | | 53,016 | |
PulteGroup, Inc. | | | 426 | | | | 51,384 | |
Polaris, Inc. | | | 510 | | | | 51,061 | |
Aptiv plc* | | | 641 | | | | 51,056 | |
KB Home | | | 684 | | | | 48,482 | |
Buckle, Inc. | | | 1,152 | | | | 46,391 | |
Oxford Industries, Inc. | | | 410 | | | | 46,084 | |
Build-A-Bear Workshop, Inc. — Class A | | | 1,532 | | | | 45,761 | |
Vail Resorts, Inc. | | | 199 | | | | 44,343 | |
MasterCraft Boat Holdings, Inc.* | | | 1,792 | | | | 42,506 | |
SEE NOTES TO FINANCIAL STATEMENTS. | THE RYDEX FUNDS ANNUAL REPORT | 13 |
SCHEDULE OF INVESTMENTS (continued) | March 31, 2024 |
LONG SHORT EQUITY FUND | |
| | Shares | | | Value | |
Ralph Lauren Corp. — Class A | | | 185 | | | $ | 34,736 | |
Chipotle Mexican Grill, Inc. — Class A* | | | 11 | | | | 31,974 | |
Visteon Corp.* | | | 262 | | | | 30,814 | |
Cavco Industries, Inc.* | | | 73 | | | | 29,131 | |
Dine Brands Global, Inc. | | | 609 | | | | 28,306 | |
Deckers Outdoor Corp.* | | | 29 | | | | 27,297 | |
Total Consumer, Cyclical | | | | | | | 2,724,473 | |
| | | | | | | | | |
Industrial - 12.8% |
Caterpillar, Inc. | | | 421 | | | | 154,267 | |
Owens Corning | | | 863 | | | | 143,948 | |
UFP Industries, Inc. | | | 1,140 | | | | 140,231 | |
Masco Corp.1 | | | 1,703 | | | | 134,333 | |
Apogee Enterprises, Inc. | | | 2,221 | | | | 131,483 | |
Mueller Industries, Inc. | | | 2,069 | | | | 111,581 | |
International Seaways, Inc. | | | 2,083 | | | | 110,816 | |
Boise Cascade Co.1 | | | 681 | | | | 104,445 | |
Otis Worldwide Corp. | | | 1,048 | | | | 104,035 | |
AGCO Corp. | | | 739 | | | | 90,912 | |
Encore Wire Corp. | | | 341 | | | | 89,608 | |
Scorpio Tankers, Inc. | | | 1,246 | | | | 89,151 | |
Teekay Corp.* | | | 11,616 | | | | 84,565 | |
Ardmore Shipping Corp. | | | 4,479 | | | | 73,545 | |
Atkore, Inc. | | | 347 | | | | 66,055 | |
Teekay Tankers Ltd. — Class A | | | 1,127 | | | | 65,828 | |
Fortune Brands Innovations, Inc. | | | 750 | | | | 63,503 | |
TD SYNNEX Corp. | | | 555 | | | | 62,771 | |
Keysight Technologies, Inc.* | | | 371 | | | | 58,017 | |
Argan, Inc.1 | | | 1,109 | | | | 56,049 | |
Snap-on, Inc. | | | 189 | | | | 55,986 | |
Lockheed Martin Corp. | | | 122 | | | | 55,494 | |
Mettler-Toledo International, Inc.* | | | 29 | | | | 38,607 | |
Lincoln Electric Holdings, Inc. | | | 133 | | | | 33,973 | |
Vishay Intertechnology, Inc. | | | 1,418 | | | | 32,160 | |
Frontdoor, Inc.* | | | 903 | | | | 29,420 | |
Belden, Inc. | | | 301 | | | | 27,875 | |
Graco, Inc. | | | 295 | | | | 27,571 | |
Advanced Drainage Systems, Inc. | | | 160 | | | | 27,558 | |
Teledyne Technologies, Inc.*,1 | | | 63 | | | | 27,047 | |
Advanced Energy Industries, Inc. | | | 261 | | | | 26,617 | |
Albany International Corp. — Class A | | | 283 | | | | 26,463 | |
Total Industrial | | | | | | | 2,343,914 | |
| | | | | | | | | |
Communications - 10.6% |
Alphabet, Inc. — Class C*,1 | | | 1,531 | | | | 233,110 | |
Cisco Systems, Inc.1 | | | 2,940 | | | | 146,735 | |
Verizon Communications, Inc.1 | | | 3,495 | | | | 146,650 | |
Motorola Solutions, Inc. | | | 404 | | | | 143,412 | |
InterDigital, Inc. | | | 1,243 | | | | 132,330 | |
AT&T, Inc.1 | | | 7,037 | | | | 123,851 | |
Comcast Corp. — Class A1 | | | 2,652 | | | | 114,964 | |
IDT Corp. — Class B1 | | | 2,917 | | | | 110,292 | |
T-Mobile US, Inc.1 | | | 665 | | | | 108,541 | |
eBay, Inc. | | | 2,019 | | | | 106,563 | |
Gogo, Inc.*,1 | | | 10,288 | | | | 90,329 | |
Amazon.com, Inc.*,1 | | | 475 | | | | 85,680 | |
Ooma, Inc.* | | | 8,877 | | | | 75,721 | |
Meta Platforms, Inc. — Class A | | | 103 | | | | 50,015 | |
Match Group, Inc.* | | | 1,259 | | | | 45,676 | |
VeriSign, Inc.* | | | 233 | | | | 44,156 | |
Booking Holdings, Inc. | | | 12 | | | | 43,535 | |
Yelp, Inc. — Class A* | | | 1,045 | | | | 41,173 | |
Spok Holdings, Inc. | | | 2,044 | | | | 32,602 | |
A10 Networks, Inc.1 | | | 2,064 | | | | 28,256 | |
Anterix, Inc.* | | | 691 | | | | 23,225 | |
Total Communications | | | | | | | 1,926,816 | |
| | | | | | | | | |
Technology - 9.4% |
Microsoft Corp.1 | | | 390 | | | | 164,081 | |
Apple, Inc. | | | 950 | | | | 162,906 | |
Accenture plc — Class A | | | 387 | | | | 134,138 | |
Amdocs Ltd. | | | 1,415 | | | | 127,874 | |
International Business Machines Corp. | | | 566 | | | | 108,083 | |
Applied Materials, Inc.1 | | | 478 | | | | 98,578 | |
NVIDIA Corp.1 | | | 109 | | | | 98,488 | |
Dropbox, Inc. — Class A* | | | 3,697 | | | | 89,837 | |
Adobe, Inc.*,1 | | | 171 | | | | 86,287 | |
Immersion Corp.1 | | | 8,009 | | | | 59,907 | |
Insight Enterprises, Inc.* | | | 309 | | | | 57,326 | |
Skyworks Solutions, Inc. | | | 524 | | | | 56,760 | |
NetScout Systems, Inc.* | | | 2,179 | | | | 47,589 | |
Photronics, Inc.* | | | 1,424 | | | | 40,328 | |
Zoom Video Communications, Inc. — Class A* | | | 611 | | | | 39,941 | |
Progress Software Corp. | | | 703 | | | | 37,477 | |
Box, Inc. — Class A* | | | 1,258 | | | | 35,627 | |
Adeia, Inc. | | | 3,243 | | | | 35,413 | |
Broadcom, Inc.1 | | | 26 | | | | 34,460 | |
Playtika Holding Corp. | | | 4,550 | | | | 32,077 | |
Digi International, Inc.* | | | 906 | | | | 28,929 | |
Crane NXT Co. | | | 467 | | | | 28,907 | |
Teradyne, Inc. | | | 254 | | | | 28,659 | |
Teradata Corp.* | | | 719 | | | | 27,804 | |
CEVA, Inc.* | | | 1,165 | | | | 26,457 | |
Xerox Holdings Corp. | | | 1,415 | | | | 25,329 | |
Total Technology | | | | | | | 1,713,262 | |
| | | | | | | | | |
Energy - 6.8% |
Marathon Petroleum Corp.1 | | | 771 | | | | 155,356 | |
Devon Energy Corp. | | | 2,952 | | | | 148,131 | |
Cheniere Energy, Inc. | | | 856 | | | | 138,056 | |
CNX Resources Corp.*,1 | | | 5,057 | | | | 119,952 | |
Chevron Corp. | | | 709 | | | | 111,838 | |
Valero Energy Corp.1 | | | 614 | | | | 104,804 | |
Exxon Mobil Corp.1 | | | 878 | | | | 102,059 | |
CVR Energy, Inc.1 | | | 2,605 | | | | 92,894 | |
PBF Energy, Inc. — Class A | | | 1,331 | | | | 76,626 | |
SandRidge Energy, Inc.1 | | | 4,520 | | | | 65,856 | |
Par Pacific Holdings, Inc.* | | | 1,413 | | | | 52,366 | |
RPC, Inc.1 | | | 6,344 | | | | 49,102 | |
SolarEdge Technologies, Inc.* | | | 395 | | | | 28,037 | |
Total Energy | | | | | | | 1,245,077 | |
14 | THE RYDEX FUNDS ANNUAL REPORT | SEE NOTES TO FINANCIAL STATEMENTS. |
SCHEDULE OF INVESTMENTS (continued) | March 31, 2024 |
LONG SHORT EQUITY FUND | |
| | Shares | | | Value | |
Utilities - 4.8% |
National Fuel Gas Co.1 | | | 2,595 | | | $ | 139,403 | |
Public Service Enterprise Group, Inc.1 | | | 2,053 | | | | 137,099 | |
Atmos Energy Corp.1 | | | 1,150 | | | | 136,701 | |
Black Hills Corp. | | | 2,463 | | | | 134,480 | |
OGE Energy Corp. | | | 3,874 | | | | 132,878 | |
CMS Energy Corp. | | | 1,917 | | | | 115,672 | |
ONE Gas, Inc. | | | 1,207 | | | | 77,888 | |
Total Utilities | | | | | | | 874,121 | |
| | | | | | | | | |
Government - 0.5% |
Banco Latinoamericano de Comercio Exterior S.A. — Class E | | | 3,067 | | | | 90,845 | |
| | | | | | | | | |
Basic Materials - 0.4% |
Olin Corp. | | | 1,325 | | | | 77,910 | |
| | | | | | | | | |
Total Common Stocks | | | | |
(Cost $14,551,676) | | | | | | | 16,558,920 | |
| | | | | | | | | |
MONEY MARKET FUND† - 1.4% |
Invesco Short-Term Treasury Obligations Portfolio — Institutional Class 0.00%3 | | | 250,980 | | | | 250,980 | |
Total Money Market Fund | | | | |
(Cost $250,980) | | | | | | | 250,980 | |
| | | | | | | | | |
SECURITIES LENDING COLLATERAL†,4 - 0.1% |
Money Market Fund | | | | | | | | |
First American Government Obligations Fund - Class X, 5.23%3 | | | 21,771 | | | | 21,771 | |
Total Securities Lending Collateral | | | | |
(Cost $21,771) | | | | | | | 21,771 | |
| | | | | | | | | |
Total Investments - 92.2% | | | | |
(Cost $14,824,427) | | $ | 16,831,671 | |
Other Assets & Liabilities, net - 7.8% | | | 1,424,832 | |
Total Net Assets - 100.0% | | $ | 18,256,503 | |
Custom Basket Swap Agreements |
Counterparty | Reference Obligation | Type | | Financing
Rate | | Payment
Frequency | | | Maturity
Date | | | Notional
Amount | | | Value and
Unrealized
Appreciation
(Depreciation) | |
OTC Custom Basket Swap Agreements†† |
Morgan Stanley Capital Services LLC | MS Equity Custom Basket | Pay | | 5.73% (Federal Funds Rate + 0.40%) | | | At Maturity | | | | 11/27/24 | | | $ | 8,549,988 | | | $ | 1,029,328 | |
Goldman Sachs International | GS Equity Custom Basket | Pay | | 5.78% (Federal Funds Rate + 0.45%) | | | At Maturity | | | | 05/06/24 | | | | 8,549,984 | | | | 1,025,848 | |
| | | | | | | | | | | | | | | $ | 17,099,972 | | | $ | 2,055,176 | |
OTC Custom Basket Swap Agreements Sold Short†† |
Morgan Stanley Capital Services LLC | MS Equity Custom Basket | Receive | | 5.02% (Federal Funds Rate -0.31% | | | At Maturity | | | | 11/27/24 | | | $ | 10,260,206 | | | $ | (398,016 | ) |
Goldman Sachs International | GS Equity Custom Basket | Receive | | 5.13% (Federal Funds Rate - 0.20%) | | | At Maturity | | | | 05/06/24 | | | | 10,167,031 | | | | (404,286 | ) |
| | | | | | | | | | | | | | | $ | 20,427,237 | | | $ | (802,302 | ) |
SEE NOTES TO FINANCIAL STATEMENTS. | THE RYDEX FUNDS ANNUAL REPORT | 15 |
SCHEDULE OF INVESTMENTS (continued) | March 31, 2024 |
LONG SHORT EQUITY FUND | |
| | Shares | | | Percentage
Notional
Amount | | | Value and
Unrealized
Appreciation
(Depreciation) | |
MS EQUITY LONG CUSTOM BASKET | | | | | | | | |
Industrial | | | | | | | | | | | | |
Boise Cascade Co. | | | 352 | | | | 0.62 | % | | $ | 27,805 | |
Mueller Industries, Inc. | | | 1,068 | | | | 0.67 | % | | | 23,581 | |
Encore Wire Corp. | | | 176 | | | | 0.54 | % | | | 14,591 | |
Owens Corning | | | 445 | | | | 0.87 | % | | | 13,528 | |
Apogee Enterprises, Inc. | | | 1,147 | | | | 0.79 | % | | | 12,717 | |
International Seaways, Inc. | | | 1,075 | | | | 0.67 | % | | | 11,355 | |
Scorpio Tankers, Inc. | | | 643 | | | | 0.54 | % | | | 11,344 | |
Atkore, Inc. | | | 179 | | | | 0.40 | % | | | 10,159 | |
Snap-on, Inc. | | | 98 | | | | 0.34 | % | | | 9,059 | |
UFP Industries, Inc. | | | 588 | | | | 0.85 | % | | | 8,897 | |
Masco Corp. | | | 879 | | | | 0.81 | % | | | 7,163 | |
Ardmore Shipping Corp. | | | 2,312 | | | | 0.44 | % | | | 7,097 | |
Caterpillar, Inc. | | | 217 | | | | 0.93 | % | | | 6,797 | |
Teekay Tankers Ltd. — Class A | | | 582 | | | | 0.40 | % | | | 6,687 | |
Argan, Inc. | | | 573 | | | | 0.34 | % | | | 5,936 | |
TD SYNNEX Corp. | | | 286 | | | | 0.38 | % | | | 5,346 | |
Otis Worldwide Corp. | | | 541 | | | | 0.63 | % | | | 3,460 | |
Fortune Brands Innovations, Inc. | | | 387 | | | | 0.38 | % | | | 3,169 | |
Teekay Corp. | | | 5,997 | | | | 0.51 | % | | | 2,802 | |
Lockheed Martin Corp. | | | 63 | | | | 0.34 | % | | | 1,908 | |
AGCO Corp. | | | 381 | | | | 0.55 | % | | | 1,900 | |
Graco, Inc. | | | 152 | | | | 0.17 | % | | | 1,103 | |
Frontdoor, Inc. | | | 466 | | | | 0.18 | % | | | 1,048 | |
Belden, Inc. | | | 155 | | | | 0.17 | % | | | 803 | |
Advanced Drainage Systems, Inc. | | | 83 | | | | 0.17 | % | | | 633 | |
Mettler-Toledo International, Inc. | | | 15 | | | | 0.23 | % | | | 622 | |
Lincoln Electric Holdings, Inc. | | | 69 | | | | 0.21 | % | | | 141 | |
Albany International Corp. — Class A | | | 146 | | | | 0.16 | % | | | 138 | |
Advanced Energy Industries, Inc. | | | 135 | | | | 0.16 | % | | | 88 | |
Keysight Technologies, Inc. | | | 192 | | | | 0.35 | % | | | 54 | |
Teledyne Technologies, Inc. | | | 32 | | | | 0.16 | % | | | 4 | |
Vishay Intertechnology, Inc. | | | 732 | | | | 0.19 | % | | | (117 | ) |
Total Industrial | | | | | | | | | | | 199,818 | |
| | | | | | | | | | | | | |
Communications | | | | | | | | | | | | |
Alphabet, Inc. — Class C | | | 790 | | | | 1.41 | % | | | 35,600 | |
IDT Corp. — Class B | | | 1,506 | | | | 0.67 | % | | | 17,963 | |
Meta Platforms, Inc. — Class A | | | 53 | | | | 0.30 | % | | | 15,547 | |
Verizon Communications, Inc. | | | 1,804 | | | | 0.89 | % | | | 14,458 | |
InterDigital, Inc. | | | 642 | | | | 0.80 | % | | | 14,376 | |
Amazon.com, Inc. | | | 245 | | | | 0.52 | % | | | 12,665 | |
AT&T, Inc. | | | 3,633 | | | | 0.75 | % | | | 9,755 | |
T-Mobile US, Inc. | | | 343 | | | | 0.65 | % | | | 5,776 | |
Cisco Systems, Inc. | | | 1,518 | | | | 0.89 | % | | | 5,025 | |
Motorola Solutions, Inc. | | | 209 | | | | 0.87 | % | | | 4,953 | |
eBay, Inc. | | | 1,042 | | | | 0.64 | % | | | 2,620 | |
A10 Networks, Inc. | | | 1,066 | | | | 0.17 | % | | | 2,469 | |
Booking Holdings, Inc. | | | 6 | | | | 0.25 | % | | | 1,062 | |
Match Group, Inc. | | | 650 | | | | 0.28 | % | | | 837 | |
Spok Holdings, Inc. | | | 1,055 | | | | 0.20 | % | | | (407 | ) |
VeriSign, Inc. | | | 120 | | | | 0.27 | % | | | (1,220 | ) |
Anterix, Inc. | | | 357 | | | | 0.14 | % | | | (1,500 | ) |
Yelp, Inc. — Class A | | | 540 | | | | 0.25 | % | | | (1,859 | ) |
Comcast Corp. — Class A | | | 1,369 | | | | 0.69 | % | | | (2,236 | ) |
Gogo, Inc. | | | 5,311 | | | | 0.55 | % | | | (4,375 | ) |
Ooma, Inc. | | | 4,583 | | | | 0.46 | % | | | (13,484 | ) |
Total Communications | | | | | | | | | | | 118,025 | |
| | | | | | | | | | | | | |
Consumer, Non-cyclical | | | | | | | | | | | | |
Merck & Company, Inc. | | | 634 | | | | 0.97 | % | | | 17,475 | |
Exelixis, Inc. | | | 2,717 | | | | 0.75 | % | | | 10,485 | |
Perdoceo Education Corp. | | | 1,858 | | | | 0.38 | % | | | 9,437 | |
PayPal Holdings, Inc. | | | 763 | | | | 0.60 | % | | | 6,347 | |
AbbVie, Inc. | | | 245 | | | | 0.52 | % | | | 5,647 | |
Innoviva, Inc. | | | 1,819 | | | | 0.32 | % | | | 5,421 | |
Constellation Brands, Inc. — Class A | | | 225 | | | | 0.72 | % | | | 5,106 | |
HCA Healthcare, Inc. | | | 220 | | | | 0.86 | % | | | 4,807 | |
Molina Healthcare, Inc. | | | 68 | | | | 0.33 | % | | | 4,785 | |
Royalty Pharma plc — Class A | | | 1,416 | | | | 0.50 | % | | | 4,196 | |
Supernus Pharmaceuticals, Inc. | | | 736 | | | | 0.29 | % | | | 4,023 | |
Alarm.com Holdings, Inc. | | | 323 | | | | 0.27 | % | | | 4,023 | |
Hologic, Inc. | | | 480 | | | | 0.44 | % | | | 3,830 | |
Heidrick & Struggles International, Inc. | | | 611 | | | | 0.24 | % | | | 3,821 | |
Collegium Pharmaceutical, Inc. | | | 502 | | | | 0.23 | % | | | 3,482 | |
Eli Lilly & Co. | | | 18 | | | | 0.16 | % | | | 3,481 | |
Agilent Technologies, Inc. | | | 167 | | | | 0.28 | % | | | 2,622 | |
Viatris, Inc. | | | 1,094 | | | | 0.15 | % | | | 2,486 | |
Johnson & Johnson | | | 417 | | | | 0.77 | % | | | 1,941 | |
United Therapeutics Corp. | | | 289 | | | | 0.78 | % | | | 1,694 | |
Organon & Co. | | | 1,092 | | | | 0.24 | % | | | 1,130 | |
Dynavax Technologies Corp. | | | 2,080 | | | | 0.30 | % | | | 1,102 | |
Abbott Laboratories | | | 622 | | | | 0.83 | % | | | 1,089 | |
Amgen, Inc. | | | 122 | | | | 0.41 | % | | | 878 | |
Medtronic plc | | | 359 | | | | 0.37 | % | | | 795 | |
Elevance Health, Inc. | | | 34 | | | | 0.21 | % | | | 673 | |
Neurocrine Biosciences, Inc. | | | 146 | | | | 0.24 | % | | | 634 | |
Intuitive Surgical, Inc. | | | 35 | | | | 0.16 | % | | | 304 | |
Centene Corp. | | | 226 | | | | 0.21 | % | | | 265 | |
Euronet Worldwide, Inc. | | | 147 | | | | 0.19 | % | | | 180 | |
16 | THE RYDEX FUNDS ANNUAL REPORT | SEE NOTES TO FINANCIAL STATEMENTS. |
SCHEDULE OF INVESTMENTS (continued) | March 31, 2024 |
LONG SHORT EQUITY FUND | |
| | Shares | | | Percentage
Notional
Amount | | | Value and
Unrealized
Appreciation
(Depreciation) | |
Laboratory Corporation of America Holdings | | | 120 | | | | 0.31 | % | | $ | 150 | |
Vertex Pharmaceuticals, Inc. | | | 65 | | | | 0.32 | % | | | 125 | |
Simply Good Foods Co. | | | 567 | | | | 0.23 | % | | | (175 | ) |
Incyte Corp. | | | 1,005 | | | | 0.67 | % | | | (220 | ) |
Biogen, Inc. | | | 155 | | | | 0.39 | % | | | (243 | ) |
Thermo Fisher Scientific, Inc. | | | 86 | | | | 0.58 | % | | | (256 | ) |
IDEXX Laboratories, Inc. | | | 25 | | | | 0.16 | % | | | (432 | ) |
Lantheus Holdings, Inc. | | | 212 | | | | 0.15 | % | | | (475 | ) |
Jazz Pharmaceuticals plc | | | 223 | | | | 0.31 | % | | | (665 | ) |
Bristol-Myers Squibb Co. | | | 1,370 | | | | 0.87 | % | | | (1,538 | ) |
Total Consumer, Non-cyclical | | | | | | | | | | | 108,430 | |
| | | | | | | | | | | | | |
Technology | | | | | | | | | | | | |
Microsoft Corp. | | | 201 | | | | 0.99 | % | | | 50,968 | |
Apple, Inc. | | | 491 | | | | 0.98 | % | | | 32,704 | |
NVIDIA Corp. | | | 56 | | | | 0.59 | % | | | 26,573 | |
Applied Materials, Inc. | | | 247 | | | | 0.60 | % | | | 15,109 | |
International Business Machines Corp. | | | 292 | | | | 0.65 | % | | | 13,645 | |
Broadcom, Inc. | | | 13 | | | | 0.20 | % | | | 5,186 | |
Skyworks Solutions, Inc. | | | 271 | | | | 0.34 | % | | | 3,457 | |
Amdocs Ltd. | | | 730 | | | | 0.77 | % | | | 2,989 | |
Immersion Corp. | | | 4,135 | | | | 0.36 | % | | | 2,615 | |
Teradyne, Inc. | | | 131 | | | | 0.17 | % | | | 2,107 | |
Insight Enterprises, Inc. | | | 159 | | | | 0.35 | % | | | 1,859 | |
Accenture plc — Class A | | | 200 | | | | 0.81 | % | | | 1,787 | |
Digi International, Inc. | | | 468 | | | | 0.17 | % | | | 1,235 | |
CEVA, Inc. | | | 601 | | | | 0.16 | % | | | 1,157 | |
NetScout Systems, Inc. | | | 1,125 | | | | 0.29 | % | | | 953 | |
Dropbox, Inc. — Class A | | | 1,909 | | | | 0.54 | % | | | 724 | |
Box, Inc. — Class A | | | 649 | | | | 0.21 | % | | | 641 | |
Crane NXT Co. | | | 241 | | | | 0.17 | % | | | 624 | |
Zoom Video Communications, Inc. — Class A | | | 315 | | | | 0.24 | % | | | 537 | |
Playtika Holding Corp. | | | 2,349 | | | | 0.19 | % | | | 485 | |
Progress Software Corp. | | | 363 | | | | 0.23 | % | | | 348 | |
Xerox Holdings Corp. | | | 731 | | | | 0.15 | % | | | 21 | |
Photronics, Inc. | | | 735 | | | | 0.24 | % | | | (110 | ) |
Adeia, Inc. | | | 1,674 | | | | 0.21 | % | | | (637 | ) |
Teradata Corp. | | | 371 | | | | 0.17 | % | | | (1,760 | ) |
Adobe, Inc. | | | 88 | | | | 0.52 | % | | | (8,673 | ) |
Total Technology | | | | | | | | | | | 154,544 | |
| | | | | | | | | | | | | |
Financial | | | | | | | | | | | | |
MGIC Investment Corp. | | | 3,428 | | | | 0.89 | % | | | 26,360 | |
Essent Group Ltd. | | | 1,264 | | | | 0.88 | % | | | 19,768 | |
Mr Cooper Group, Inc. | | | 421 | | | | 0.38 | % | | | 12,310 | |
Hartford Financial Services Group, Inc. | | | 720 | | | | 0.87 | % | | | 9,172 | |
International Bancshares Corp. | | | 762 | | | | 0.50 | % | | | 8,751 | |
Preferred Bank/Los Angeles CA | | | 518 | | | | 0.47 | % | | | 6,915 | |
Synchrony Financial | | | 1,424 | | | | 0.72 | % | | | 6,795 | |
Regions Financial Corp. | | | 2,163 | | | | 0.53 | % | | | 6,592 | |
Enact Holdings, Inc. | | | 1,930 | | | | 0.70 | % | | | 6,102 | |
NMI Holdings, Inc. — Class A | | | 2,280 | | | | 0.86 | % | | | 6,045 | |
Loews Corp. | | | 791 | | | | 0.72 | % | | | 5,863 | |
Innovative Industrial Properties, Inc. | | | 510 | | | | 0.62 | % | | | 4,955 | |
Ambac Financial Group, Inc. | | | 3,763 | | | | 0.69 | % | | | 4,333 | |
Travelers Companies, Inc. | | | 317 | | | | 0.85 | % | | | 4,150 | |
Affiliated Managers Group, Inc. | | | 165 | | | | 0.32 | % | | | 3,988 | |
Citizens Financial Group, Inc. | | | 771 | | | | 0.33 | % | | | 3,546 | |
Walker & Dunlop, Inc. | | | 505 | | | | 0.60 | % | | | 3,358 | |
W R Berkley Corp. | | | 328 | | | | 0.34 | % | | | 2,286 | |
OneMain Holdings, Inc. | | | 747 | | | | 0.45 | % | | | 2,191 | |
EZCORP, Inc. — Class A | | | 1,428 | | | | 0.19 | % | | | 1,624 | |
T. Rowe Price Group, Inc. | | | 306 | | | | 0.44 | % | | | 1,484 | |
Everest Group Ltd. | | | 81 | | | | 0.38 | % | | | 1,471 | |
VICI Properties, Inc. | | | 2,032 | | | | 0.71 | % | | | 1,413 | |
First BanCorp | | | 1,895 | | | | 0.39 | % | | | 1,300 | |
Janus Henderson Group plc | | | 1,408 | | | | 0.54 | % | | | 1,083 | |
Bread Financial Holdings, Inc. | | | 1,127 | | | | 0.49 | % | | | 947 | |
Westamerica BanCorp | | | 422 | | | | 0.24 | % | | | 406 | |
Federated Hermes, Inc. — Class B | | | 598 | | | | 0.25 | % | | | (102 | ) |
Employers Holdings, Inc. | | | 688 | | | | 0.37 | % | | | (136 | ) |
PJT Partners, Inc. — Class A | | | 171 | | | | 0.19 | % | | | (931 | ) |
Hanmi Financial Corp. | | | 896 | | | | 0.17 | % | | | (2,787 | ) |
Apartment Income REIT Corp. | | | 2,172 | | | | 0.82 | % | | | (3,367 | ) |
Total Financial | | | | | | | | | | | 145,885 | |
| | | | | | | | | | | | | |
Consumer, Cyclical | | | | | | | | | | | | |
Allison Transmission Holdings, Inc. | | | 624 | | | | 0.59 | % | | | 26,375 | |
Lennar Corp. — Class A | | | 427 | | | | 0.86 | % | | | 15,390 | |
Taylor Morrison Home Corp. — Class A | | | 1,169 | | | | 0.85 | % | | | 15,085 | |
M/I Homes, Inc. | | | 252 | | | | 0.40 | % | | | 13,629 | |
PulteGroup, Inc. | | | 220 | | | | 0.31 | % | | | 10,387 | |
Brunswick Corp. | | | 374 | | | | 0.42 | % | | | 9,685 | |
Monarch Casino & Resort, Inc. | | | 851 | | | | 0.75 | % | | | 9,255 | |
KB Home | | | 353 | | | | 0.29 | % | | | 8,325 | |
PACCAR, Inc. | | | 391 | | | | 0.57 | % | | | 7,750 | |
Gentex Corp. | | | 1,482 | | | | 0.63 | % | | | 7,635 | |
SEE NOTES TO FINANCIAL STATEMENTS. | THE RYDEX FUNDS ANNUAL REPORT | 17 |
SCHEDULE OF INVESTMENTS (continued) | March 31, 2024 |
LONG SHORT EQUITY FUND | |
| | Shares | | | Percentage
Notional
Amount | | | Value and
Unrealized
Appreciation
(Depreciation) | |
GMS, Inc. | | | 736 | | | | 0.84 | % | | $ | 6,771 | |
Build-A-Bear Workshop, Inc. — Class A | | | 791 | | | | 0.28 | % | | | 5,827 | |
Ethan Allen Interiors, Inc. | | | 1,107 | | | | 0.45 | % | | | 4,983 | |
MSC Industrial Direct Company, Inc. — Class A | | | 668 | | | | 0.76 | % | | | 4,440 | |
Autoliv, Inc. | | | 348 | | | | 0.49 | % | | | 3,890 | |
Lowe’s Companies, Inc. | | | 298 | | | | 0.89 | % | | | 3,739 | |
Wabash National Corp. | | | 1,322 | | | | 0.46 | % | | | 3,731 | |
Oxford Industries, Inc. | | | 212 | | | | 0.28 | % | | | 3,309 | |
Tri Pointe Homes, Inc. | | | 739 | | | | 0.33 | % | | | 3,101 | |
Harley-Davidson, Inc. | | | 769 | | | | 0.39 | % | | | 2,939 | |
Polaris, Inc. | | | 263 | | | | 0.31 | % | | | 2,701 | |
MasterCraft Boat Holdings, Inc. | | | 925 | | | | 0.26 | % | | | 1,510 | |
Buckle, Inc. | | | 595 | | | | 0.28 | % | | | 1,377 | |
Darden Restaurants, Inc. | | | 224 | | | | 0.44 | % | | | 1,291 | |
Cavco Industries, Inc. | | | 37 | | | | 0.17 | % | | | 1,198 | |
Chipotle Mexican Grill, Inc. — Class A | | | 6 | | | | 0.20 | % | | | 1,173 | |
Vail Resorts, Inc. | | | 103 | | | | 0.27 | % | | | 1,128 | |
Ralph Lauren Corp. — Class A | | | 96 | | | | 0.21 | % | | | 640 | |
Home Depot, Inc. | | | 148 | | | | 0.66 | % | | | 591 | |
Wendy’s Co. | | | 1,453 | | | | 0.32 | % | | | 492 | |
Deckers Outdoor Corp. | | | 15 | | | | 0.17 | % | | | 395 | |
Columbia Sportswear Co. | | | 426 | | | | 0.40 | % | | | 267 | |
Visteon Corp. | | | 135 | | | | 0.19 | % | | | 118 | |
Aptiv plc | | | 331 | | | | 0.31 | % | | | (227 | ) |
Golden Entertainment, Inc. | | | 1,001 | | | | 0.43 | % | | | (287 | ) |
Dine Brands Global, Inc. | | | 315 | | | | 0.17 | % | | | (1,133 | ) |
McDonald’s Corp. | | | 255 | | | | 0.84 | % | | | (2,724 | ) |
Total Consumer, Cyclical | | | | | | | | | | | 174,756 | |
| | | | | | | | | | | | | |
Utilities | | | | | | | | | | | | |
Public Service Enterprise Group, Inc. | | | 1,060 | | | | 0.83 | % | | | 7,622 | |
Atmos Energy Corp. | | | 594 | | | | 0.83 | % | | | 3,900 | |
National Fuel Gas Co. | | | 1,340 | | | | 0.84 | % | | | 3,334 | |
Black Hills Corp. | | | 1,271 | | | | 0.81 | % | | | 2,792 | |
ONE Gas, Inc. | | | 623 | | | | 0.47 | % | | | 1,973 | |
OGE Energy Corp. | | | 2,000 | | | | 0.80 | % | | | 1,308 | |
CMS Energy Corp. | | | 990 | | | | 0.70 | % | | | 1,040 | |
Total Utilities | | | | | | | | | | | 21,969 | |
| | | | | | | | | | | | | |
Energy | | | | | | | | | | | | |
Marathon Petroleum Corp. | | | 398 | | | | 0.94 | % | | | 28,134 | |
Valero Energy Corp. | | | 317 | | | | 0.63 | % | | | 18,309 | |
PBF Energy, Inc. — Class A | | | 687 | | | | 0.46 | % | | | 10,182 | |
CNX Resources Corp. | | | 2,610 | | | | 0.72 | % | | | 9,244 | |
Devon Energy Corp. | | | 1,524 | | | | 0.89 | % | | | 7,506 | |
Exxon Mobil Corp. | | | 453 | | | | 0.62 | % | | | 6,485 | |
CVR Energy, Inc. | | | 1,345 | | | | 0.56 | % | | | 5,036 | |
Chevron Corp. | | | 366 | | | | 0.68 | % | | | 2,767 | |
RPC, Inc. | | | 3,275 | | | | 0.30 | % | | | 2,574 | |
Cheniere Energy, Inc. | | | 442 | | | | 0.83 | % | | | 1,461 | |
SandRidge Energy, Inc. | | | 2,333 | | | | 0.40 | % | | | 737 | |
Par Pacific Holdings, Inc. | | | 730 | | | | 0.32 | % | | | 253 | |
SolarEdge Technologies, Inc. | | | 204 | | | | 0.17 | % | | | (656 | ) |
Total Energy | | | | | | | | | | | 92,032 | |
| | | | | | | | | | | | | |
Basic Materials | | | | | | | | | | | | |
Olin Corp. | | | 684 | | | | 0.47 | % | | | 4,616 | |
Total Basic Materials | | | | | | | | | | | 4,616 | |
| | | | | | | | | | | | | |
Government | | | | | | | | | | | | |
Banco Latinoamericano de Comercio Exterior S.A. — Class E | | | 1,584 | | | | 0.55 | % | | | 9,253 | |
Total MS Equity Long Custom Basket | | | | | | | 1,029,328 | |
| | | | | | | | | |
MS EQUITY SHORT CUSTOM BASKET | | | | | | | | |
Utilities | | | | | | | | | | | | |
AES Corp. | | | 6,881 | | | | (1.21 | )% | | | 16,817 | |
California Water Service Group | | | 2,506 | | | | (1.14 | )% | | | 14,842 | |
Portland General Electric Co. | | | 2,822 | | | | (1.16 | )% | | | 10,365 | |
Middlesex Water Co. | | | 1,424 | | | | (0.73 | )% | | | 8,814 | |
Alliant Energy Corp. | | | 1,857 | | | | (0.91 | )% | | | 2,445 | |
Ormat Technologies, Inc. | | | 1,162 | | | | (0.75 | )% | | | (1,859 | ) |
Edison International | | | 632 | | | | (0.44 | )% | | | (2,052 | ) |
American Electric Power Company, Inc. | | | 1,470 | | | | (1.23 | )% | | | (2,230 | ) |
PNM Resources, Inc. | | | 1,714 | | | | (0.63 | )% | | | (3,829 | ) |
FirstEnergy Corp. | | | 2,715 | | | | (1.02 | )% | | | (5,123 | ) |
Eversource Energy | | | 2,080 | | | | (1.21 | )% | | | (6,453 | ) |
Pinnacle West Capital Corp. | | | 1,198 | | | | (0.87 | )% | | | (7,864 | ) |
NRG Energy, Inc. | | | 1,902 | | | | (1.25 | )% | | | (14,502 | ) |
Avangrid, Inc. | | | 3,883 | | | | (1.38 | )% | | | (23,151 | ) |
Total Utilities | | | | | | | | | | | (13,780 | ) |
| | | | | | | | | | | | | |
Consumer, Non-cyclical | | | | | | | | | | | | |
ICF International, Inc. | | | 302 | | | | (0.45 | )% | | | 1,259 | |
Insmed, Inc. | | | 1,869 | | | | (0.49 | )% | | | 1,200 | |
Bright Horizons Family Solutions, Inc. | | | 525 | | | | (0.58 | )% | | | 573 | |
Acadia Healthcare Company, Inc. | | | 1,125 | | | | (0.87 | )% | | | (860 | ) |
Tyson Foods, Inc. — Class A | | | 824 | | | | (0.47 | )% | | | (993 | ) |
Flowers Foods, Inc. | | | 3,316 | | | | (0.77 | )% | | | (1,775 | ) |
CBIZ, Inc. | | | 698 | | | | (0.53 | )% | | | (1,894 | ) |
Paylocity Holding Corp. | | | 262 | | | | (0.44 | )% | | | (1,989 | ) |
18 | THE RYDEX FUNDS ANNUAL REPORT | SEE NOTES TO FINANCIAL STATEMENTS. |
SCHEDULE OF INVESTMENTS (continued) | March 31, 2024 |
LONG SHORT EQUITY FUND | |
| | Shares | | | Percentage
Notional
Amount | | | Value and
Unrealized
Appreciation
(Depreciation) | |
McCormick & Company, Inc. | | | 527 | | | | (0.39 | )% | | $ | (4,152 | ) |
Utz Brands, Inc. | | | 2,878 | | | | (0.52 | )% | | | (4,513 | ) |
Clorox Co. | | | 547 | | | | (0.82 | )% | | | (4,832 | ) |
U-Haul Holding Co. | | | 640 | | | | (0.42 | )% | | | (4,902 | ) |
RB Global, Inc. | | | 933 | | | | (0.69 | )% | | | (7,990 | ) |
RxSight, Inc. | | | 749 | | | | (0.38 | )% | | | (11,726 | ) |
GXO Logistics, Inc. | | | 2,709 | | | | (1.42 | )% | | | (13,808 | ) |
Spectrum Brands Holdings, Inc. | | | 1,265 | | | | (1.10 | )% | | | (16,436 | ) |
TransUnion | | | 1,006 | | | | (0.78 | )% | | | (18,498 | ) |
Pilgrim’s Pride Corp. | | | 3,675 | | | | (1.23 | )% | | | (36,695 | ) |
Total Consumer, Non-cyclical | | | | | | | | | | | (128,031 | ) |
| | | | | | | | | | | | | |
Basic Materials | | | | | | | | | | | | |
Piedmont Lithium, Inc. | | | 4,025 | | | | (0.52 | )% | | | 57,084 | |
Compass Minerals International, Inc. | | | 3,028 | | | | (0.46 | )% | | | 24,012 | |
Novagold Resources, Inc. | | | 16,634 | | | | (0.49 | )% | | | 16,282 | |
Hecla Mining Co. | | | 12,117 | | | | (0.57 | )% | | | 8,174 | |
Air Products and Chemicals, Inc. | | | 185 | | | | (0.44 | )% | | | (513 | ) |
Huntsman Corp. | | | 2,736 | | | | (0.69 | )% | | | (696 | ) |
Ecolab, Inc. | | | 141 | | | | (0.32 | )% | | | (4,872 | ) |
Element Solutions, Inc. | | | 3,464 | | | | (0.84 | )% | | | (11,475 | ) |
ATI, Inc. | | | 1,190 | | | | (0.59 | )% | | | (11,684 | ) |
Kronos Worldwide, Inc. | | | 7,486 | | | | (0.86 | )% | | | (19,703 | ) |
Century Aluminum Co. | | | 5,478 | | | | (0.82 | )% | | | (44,316 | ) |
Total Basic Materials | | | | | | | | | | | 12,293 | |
| | | | | | | | | | | | | |
Financial | | | | | | | | | | | | |
Kennedy-Wilson Holdings, Inc. | | | 11,764 | | | | (0.98 | )% | | | 76,357 | |
Americold Realty Trust, Inc. | | | 4,359 | | | | (1.06 | )% | | | 33,911 | |
Sun Communities, Inc. | | | 947 | | | | (1.19 | )% | | | 29,081 | |
New York Mortgage Trust, Inc. | | | 10,137 | | | | (0.71 | )% | | | 15,797 | |
Marcus & Millichap, Inc. | | | 3,830 | | | | (1.28 | )% | | | 7,439 | |
Ellington Financial, Inc. | | | 7,624 | | | | (0.88 | )% | | | 7,185 | |
Alexander & Baldwin, Inc. | | | 1,950 | | | | (0.31 | )% | | | 4,938 | |
TFS Financial Corp. | | | 8,446 | | | | (1.03 | )% | | | 4,658 | |
COPT Defense Properties | | | 1,510 | | | | (0.36 | )% | | | 1,746 | |
Equity LifeStyle Properties, Inc. | | | 425 | | | | (0.27 | )% | | | 1,122 | |
Equinix, Inc. | | | 117 | | | | (0.94 | )% | | | 999 | |
EastGroup Properties, Inc. | | | 159 | | | | (0.28 | )% | | | 59 | |
Ventas, Inc. | | | 1,548 | | | | (0.66 | )% | | | (33 | ) |
Invitation Homes, Inc. | | | 883 | | | | (0.31 | )% | | | (567 | ) |
Capitol Federal Financial, Inc. | | | 12,779 | | | | (0.74 | )% | | | (1,195 | ) |
Brighthouse Financial, Inc. | | | 2,792 | | | | (1.40 | )% | | | (1,529 | ) |
Iron Mountain, Inc. | | | 1,427 | | | | (1.12 | )% | | | (2,097 | ) |
Elme Communities | | | 8,622 | | | | (1.17 | )% | | | (2,124 | ) |
Terreno Realty Corp. | | | 994 | | | | (0.64 | )% | | | (2,314 | ) |
PotlatchDeltic Corp. | | | 2,496 | | | | (1.14 | )% | | | (2,414 | ) |
Howard Hughes Holdings, Inc. | | | 1,527 | | | | (1.08 | )% | | | (2,587 | ) |
UMH Properties, Inc. | | | 4,666 | | | | (0.74 | )% | | | (2,828 | ) |
Allstate Corp. | | | 178 | | | | (0.30 | )% | | | (2,829 | ) |
American Tower Corp. — Class A | | | 374 | | | | (0.72 | )% | | | (2,927 | ) |
Digital Realty Trust, Inc. | | | 549 | | | | (0.77 | )% | | | (4,641 | ) |
Moelis & Co. — Class A | | | 1,139 | | | | (0.63 | )% | | | (5,219 | ) |
State Street Corp. | | | 1,344 | | | | (1.01 | )% | | | (5,985 | ) |
Cannae Holdings, Inc. | | | 3,704 | | | | (0.80 | )% | | | (7,630 | ) |
Global Net Lease, Inc. | | | 13,447 | | | | (1.02 | )% | | | (7,677 | ) |
CBRE Group, Inc. — Class A | | | 523 | | | | (0.50 | )% | | | (8,698 | ) |
Welltower, Inc. | | | 1,400 | | | | (1.27 | )% | | | (11,398 | ) |
Apartment Investment and Management Co. — Class A | | | 13,485 | | | | (1.08 | )% | | | (11,679 | ) |
Macerich Co. | | | 4,751 | | | | (0.80 | )% | | | (14,094 | ) |
FTAI Infrastructure, Inc. | | | 6,234 | | | | (0.38 | )% | | | (16,603 | ) |
PennyMac Financial Services, Inc. | | | 974 | | | | (0.86 | )% | | | (19,333 | ) |
Carlyle Group, Inc. | | | 1,963 | | | | (0.90 | )% | | | (20,232 | ) |
Merchants Bancorp | | | 2,188 | | | | (0.92 | )% | | | (23,709 | ) |
KKR & Company, Inc. — Class A | | | 1,180 | | | | (1.16 | )% | | | (42,105 | ) |
Total Financial | | | | | | | | | | | (39,155 | ) |
| | | | | | | | | | | | | |
Energy | | | | | | | | | | | | |
Baker Hughes Co. | | | 1,427 | | | | (0.47 | )% | | | (244 | ) |
Dril-Quip, Inc. | | | 4,645 | | | | (1.02 | )% | | | (752 | ) |
Oceaneering International, Inc. | | | 3,042 | | | | (0.69 | )% | | | (3,242 | ) |
Schlumberger N.V. | | | 927 | | | | (0.50 | )% | | | (5,698 | ) |
Antero Resources Corp. | | | 2,969 | | | | (0.84 | )% | | | (6,028 | ) |
Helix Energy Solutions Group, Inc. | | | 4,587 | | | | (0.48 | )% | | | (6,433 | ) |
Sitio Royalties Corp. — Class A | | | 2,922 | | | | (0.70 | )% | | | (8,698 | ) |
Valaris Ltd. | | | 1,753 | | | | (1.29 | )% | | | (11,541 | ) |
NOV, Inc. | | | 6,940 | | | | (1.32 | )% | | | (15,973 | ) |
TechnipFMC plc | | | 4,474 | | | | (1.09 | )% | | | (22,721 | ) |
Archrock, Inc. | | | 4,175 | | | | (0.80 | )% | | | (27,253 | ) |
Total Energy | | | | | | | | | | | (108,583 | ) |
| | | | | | | | | | | | | |
Industrial | | | | | | | | | | | | |
NV5 Global, Inc. | | | 439 | | | | (0.42 | )% | | | 3,081 | |
Knight-Swift Transportation Holdings, Inc. | | | 842 | | | | (0.45 | )% | | | 1,623 | |
Boeing Co. | | | 322 | | | | (0.61 | )% | | | 1,560 | |
XPO, Inc. | | | 435 | | | | (0.52 | )% | | | 610 | |
RXO, Inc. | | | 4,292 | | | | (0.91 | )% | | | 494 | |
J.B. Hunt Transport Services, Inc. | | | 210 | | | | (0.41 | )% | | | 294 | |
Materion Corp. | | | 260 | | | | (0.33 | )% | | | 171 | |
SEE NOTES TO FINANCIAL STATEMENTS. | THE RYDEX FUNDS ANNUAL REPORT | 19 |
SCHEDULE OF INVESTMENTS (continued) | March 31, 2024 |
LONG SHORT EQUITY FUND | |
| | Shares | | | Percentage
Notional
Amount | | | Value and
Unrealized
Appreciation
(Depreciation) | |
Exponent, Inc. | | | 1,005 | | | | (0.81 | )% | | $ | 41 | |
Tetra Tech, Inc. | | | 250 | | | | (0.45 | )% | | | (578 | ) |
Norfolk Southern Corp. | | | 223 | | | | (0.55 | )% | | | (1,226 | ) |
Ryder System, Inc. | | | 275 | | | | (0.32 | )% | | | (1,929 | ) |
Kirby Corp. | | | 377 | | | | (0.35 | )% | | | (2,368 | ) |
CH Robinson Worldwide, Inc. | | | 511 | | | | (0.38 | )% | | | (3,202 | ) |
Republic Services, Inc. — Class A | | | 568 | | | | (1.06 | )% | | | (4,625 | ) |
SPX Technologies, Inc. | | | 532 | | | | (0.64 | )% | | | (5,223 | ) |
Stericycle, Inc. | | | 1,909 | | | | (0.98 | )% | | | (5,999 | ) |
Casella Waste Systems, Inc. — Class A | | | 1,211 | | | | (1.17 | )% | | | (24,683 | ) |
Total Industrial | | | | | | | | | | | (41,959 | ) |
| | | | | | | | | | | | | |
Communications | | | | | | | | | | | | |
Boston Omaha Corp. — Class A | | | 3,475 | | | | (0.52 | )% | | | (1,844 | ) |
DoorDash, Inc. — Class A | | | 416 | | | | (0.56 | )% | | | (18,730 | ) |
Total Communications | | | | | | | | | | | (20,574 | ) |
| | | | | | | | | | | | | |
Technology | | | | | | | | | | | | |
Paycor HCM, Inc. | | | 4,966 | | | | (0.94 | )% | | | 15,688 | |
Privia Health Group, Inc. | | | 4,756 | | | | (0.91 | )% | | | 9,879 | |
Braze, Inc. — Class A | | | 1,727 | | | | (0.75 | )% | | | 7,592 | |
ROBLOX Corp. — Class A | | | 688 | | | | (0.26 | )% | | | 2,004 | |
Take-Two Interactive Software, Inc. | | | 877 | | | | (1.27 | )% | | | 1,990 | |
Broadridge Financial Solutions, Inc. | | | 141 | | | | (0.28 | )% | | | (598 | ) |
KBR, Inc. | | | 1,388 | | | | (0.86 | )% | | | (5,982 | ) |
Evolent Health, Inc. — Class A | | | 2,146 | | | | (0.69 | )% | | | (9,297 | ) |
Micron Technology, Inc. | | | 700 | | | | (0.80 | )% | | | (16,776 | ) |
Parsons Corp. | | | 887 | | | | (0.72 | )% | | | (22,624 | ) |
Total Technology | | | | | | | | | | | (18,124 | ) |
| | | | | | | | | | | | | |
Consumer, Cyclical | | | | | | | | | | | | |
Walgreens Boots Alliance, Inc. | | | 3,616 | | | | (0.76 | )% | | | 16,454 | |
Dollar Tree, Inc. | | | 407 | | | | (0.53 | )% | | | 2,812 | |
LGI Homes, Inc. | | | 488 | | | | (0.55 | )% | | | 321 | |
Tesla, Inc. | | | 63 | | | | (0.11 | )% | | | (225 | ) |
Hyatt Hotels Corp. — Class A | | | 470 | | | | (0.73 | )% | | | (857 | ) |
UniFirst Corp. | | | 238 | | | | (0.40 | )% | | | (1,649 | ) |
MarineMax, Inc. | | | 2,404 | | | | (0.78 | )% | | | (4,952 | ) |
Dollar General Corp. | | | 268 | | | | (0.41 | )% | | | (5,459 | ) |
Sonic Automotive, Inc. — Class A | | | 1,066 | | | | (0.59 | )% | | | (5,887 | ) |
DraftKings, Inc. — Class A | | | 1,089 | | | | (0.48 | )% | | | (7,041 | ) |
Copart, Inc. | | | 1,955 | | | | (1.10 | )% | | | (8,119 | ) |
CarMax, Inc. | | | 1,352 | | | | (1.15 | )% | | | (25,501 | ) |
Total Consumer, Cyclical | | | | | | | | | | | (40,103 | ) |
Total MS Equity Short Custom Basket | | | | | | | (398,016 | ) |
| | | | | | | | | |
GS EQUITY LONG CUSTOM BASKET | | | | | | | | |
Industrial | | | | | | | | | | | | |
Boise Cascade Co. | | | 352 | | | | 0.62 | % | | | 27,827 | |
Mueller Industries, Inc. | | | 1,068 | | | | 0.67 | % | | | 23,615 | |
Encore Wire Corp. | | | 176 | | | | 0.54 | % | | | 14,591 | |
Owens Corning | | | 445 | | | | 0.87 | % | | | 13,559 | |
Apogee Enterprises, Inc. | | | 1,147 | | | | 0.79 | % | | | 12,710 | |
Scorpio Tankers, Inc. | | | 643 | | | | 0.54 | % | | | 11,342 | |
International Seaways, Inc. | | | 1,075 | | | | 0.67 | % | | | 11,254 | |
Atkore, Inc. | | | 179 | | | | 0.40 | % | | | 10,144 | |
Snap-on, Inc. | | | 98 | | | | 0.34 | % | | | 9,052 | |
UFP Industries, Inc. | | | 588 | | | | 0.85 | % | | | 8,658 | |
Masco Corp. | | | 879 | | | | 0.81 | % | | | 7,155 | |
Ardmore Shipping Corp. | | | 2,312 | | | | 0.44 | % | | | 7,000 | |
Caterpillar, Inc. | | | 217 | | | | 0.93 | % | | | 6,735 | |
Teekay Tankers Ltd. — Class A | | | 582 | | | | 0.40 | % | | | 6,656 | |
Argan, Inc. | | | 573 | | | | 0.34 | % | | | 5,919 | |
TD SYNNEX Corp. | | | 286 | | | | 0.38 | % | | | 5,417 | |
Otis Worldwide Corp. | | | 541 | | | | 0.63 | % | | | 3,502 | |
Fortune Brands Innovations, Inc. | | | 387 | | | | 0.38 | % | | | 3,159 | |
Teekay Corp. | | | 5,997 | | | | 0.51 | % | | | 2,762 | |
Lockheed Martin Corp. | | | 63 | | | | 0.34 | % | | | 1,930 | |
AGCO Corp. | | | 381 | | | | 0.55 | % | | | 1,879 | |
Graco, Inc. | | | 152 | | | | 0.17 | % | | | 1,092 | |
Frontdoor, Inc. | | | 466 | | | | 0.18 | % | | | 977 | |
Belden, Inc. | | | 155 | | | | 0.17 | % | | | 871 | |
Advanced Drainage Systems, Inc. | | | 83 | | | | 0.17 | % | | | 678 | |
Mettler-Toledo International, Inc. | | | 15 | | | | 0.23 | % | | | 599 | |
Lincoln Electric Holdings, Inc. | | | 69 | | | | 0.21 | % | | | 188 | |
Albany International Corp. — Class A | | | 146 | | | | 0.16 | % | | | 157 | |
Advanced Energy Industries, Inc. | | | 135 | | | | 0.16 | % | | | 143 | |
Keysight Technologies, Inc. | | | 192 | | | | 0.35 | % | | | 32 | |
Teledyne Technologies, Inc. | | | 32 | | | | 0.16 | % | | | (11 | ) |
Vishay Intertechnology, Inc. | | | 732 | | | | 0.19 | % | | | (132 | ) |
Total Industrial | | | | | | | | | | | 199,460 | |
| | | | | | | | | | | | | |
Communications | | | | | | | | | | | | |
Alphabet, Inc. — Class C | | | 790 | | | | 1.41 | % | | | 36,621 | |
IDT Corp. — Class B | | | 1,506 | | | | 0.67 | % | | | 17,920 | |
Meta Platforms, Inc. — Class A | | | 53 | | | | 0.30 | % | | | 15,532 | |
Verizon Communications, Inc. | | | 1,804 | | | | 0.89 | % | | | 14,394 | |
InterDigital, Inc. | | | 642 | | | | 0.80 | % | | | 14,380 | |
Amazon.com, Inc. | | | 245 | | | | 0.52 | % | | | 12,686 | |
AT&T, Inc. | | | 3,633 | | | | 0.75 | % | | | 9,753 | |
20 | THE RYDEX FUNDS ANNUAL REPORT | SEE NOTES TO FINANCIAL STATEMENTS. |
SCHEDULE OF INVESTMENTS (continued) | March 31, 2024 |
LONG SHORT EQUITY FUND | |
| | Shares | | | Percentage
Notional
Amount | | | Value and
Unrealized
Appreciation
(Depreciation) | |
T-Mobile US, Inc. | | | 343 | | | | 0.65 | % | | $ | 5,754 | |
Cisco Systems, Inc. | | | 1,518 | | | | 0.89 | % | | | 5,107 | |
Motorola Solutions, Inc. | | | 209 | | | | 0.87 | % | | | 4,886 | |
eBay, Inc. | | | 1,042 | | | | 0.64 | % | | | 2,654 | |
A10 Networks, Inc. | | | 1,066 | | | | 0.17 | % | | | 2,475 | |
Booking Holdings, Inc. | | | 6 | | | | 0.25 | % | | | 1,086 | |
Match Group, Inc. | | | 650 | | | | 0.28 | % | | | 776 | |
Spok Holdings, Inc. | | | 1,055 | | | | 0.20 | % | | | (624 | ) |
VeriSign, Inc. | | | 120 | | | | 0.27 | % | | | (1,249 | ) |
Anterix, Inc. | | | 357 | | | | 0.14 | % | | | (1,561 | ) |
Yelp, Inc. — Class A | | | 540 | | | | 0.25 | % | | | (1,842 | ) |
Comcast Corp. — Class A | | | 1,369 | | | | 0.69 | % | | | (2,220 | ) |
Gogo, Inc. | | | 5,311 | | | | 0.55 | % | | | (4,617 | ) |
Ooma, Inc. | | | 4,583 | | | | 0.46 | % | | | (13,467 | ) |
Total Communications | | | | | | | | | | | 118,444 | |
| | | | | | | | | | | | | |
Consumer, Non-cyclical | | | | | | | | | | | | |
Merck & Company, Inc. | | | 634 | | | | 0.97 | % | | | 17,500 | |
Exelixis, Inc. | | | 2,717 | | | | 0.75 | % | | | 10,477 | |
Perdoceo Education Corp. | | | 1,858 | | | | 0.38 | % | | | 9,364 | |
PayPal Holdings, Inc. | | | 763 | | | | 0.60 | % | | | 6,338 | |
AbbVie, Inc. | | | 245 | | | | 0.52 | % | | | 5,672 | |
Innoviva, Inc. | | | 1,819 | | | | 0.32 | % | | | 5,426 | |
Constellation Brands, Inc. — Class A | | | 225 | | | | 0.72 | % | | | 5,096 | |
HCA Healthcare, Inc. | | | 220 | | | | 0.86 | % | | | 4,871 | |
Molina Healthcare, Inc. | | | 68 | | | | 0.33 | % | | | 4,864 | |
Royalty Pharma plc — Class A | | | 1,416 | | | | 0.50 | % | | | 4,204 | |
Supernus Pharmaceuticals, Inc. | | | 736 | | | | 0.29 | % | | | 4,073 | |
Alarm.com Holdings, Inc. | | | 323 | | | | 0.27 | % | | | 4,053 | |
Heidrick & Struggles International, Inc. | | | 611 | | | | 0.24 | % | | | 3,848 | |
Hologic, Inc. | | | 480 | | | | 0.44 | % | | | 3,840 | |
Collegium Pharmaceutical, Inc. | | | 502 | | | | 0.23 | % | | | 3,589 | |
Eli Lilly & Co. | | | 18 | | | | 0.16 | % | | | 3,470 | |
Agilent Technologies, Inc. | | | 167 | | | | 0.28 | % | | | 2,630 | |
Viatris, Inc. | | | 1,094 | | | | 0.15 | % | | | 2,528 | |
Johnson & Johnson | | | 417 | | | | 0.77 | % | | | 1,907 | |
United Therapeutics Corp. | | | 289 | | | | 0.78 | % | | | 1,754 | |
Abbott Laboratories | | | 622 | | | | 0.83 | % | | | 1,133 | |
Dynavax Technologies Corp. | | | 2,080 | | | | 0.30 | % | | | 1,118 | |
Organon & Co. | | | 1,092 | | | | 0.24 | % | | | 1,050 | |
Amgen, Inc. | | | 122 | | | | 0.41 | % | | | 862 | |
Medtronic plc | | | 359 | | | | 0.37 | % | | | 798 | |
Elevance Health, Inc. | | | 34 | | | | 0.21 | % | | | 720 | |
Neurocrine Biosciences, Inc. | | | 146 | | | | 0.24 | % | | | 617 | |
Intuitive Surgical, Inc. | | | 35 | | | | 0.16 | % | | | 297 | |
Centene Corp. | | | 226 | | | | 0.21 | % | | | 266 | |
Euronet Worldwide, Inc. | | | 147 | | | | 0.19 | % | | | 181 | |
Laboratory Corporation of America Holdings | | | 120 | | | | 0.31 | % | | | 147 | |
Vertex Pharmaceuticals, Inc. | | | 65 | | | | 0.32 | % | | | 135 | |
Biogen, Inc. | | | 155 | | | | 0.39 | % | | | (220 | ) |
Incyte Corp. | | | 1,005 | | | | 0.67 | % | | | (237 | ) |
Simply Good Foods Co. | | | 567 | | | | 0.23 | % | | | (238 | ) |
Thermo Fisher Scientific, Inc. | | | 86 | | | | 0.58 | % | | | (252 | ) |
IDEXX Laboratories, Inc. | | | 25 | | | | 0.16 | % | | | (457 | ) |
Lantheus Holdings, Inc. | | | 212 | | | | 0.15 | % | | | (501 | ) |
Jazz Pharmaceuticals plc | | | 223 | | | | 0.31 | % | | | (627 | ) |
Bristol-Myers Squibb Co. | | | 1,370 | | | | 0.87 | % | | | (1,508 | ) |
Total Consumer, Non-cyclical | | | | | | | | | | | 108,788 | |
| | | | | | | | | | | | | |
Technology | | | | | | | | | | | | |
Microsoft Corp. | | | 201 | | | | 0.98 | % | | | 49,408 | |
Apple, Inc. | | | 491 | | | | 0.98 | % | | | 32,269 | |
NVIDIA Corp. | | | 56 | | | | 0.59 | % | | | 26,588 | |
Applied Materials, Inc. | | | 247 | | | | 0.60 | % | | | 15,147 | |
International Business Machines Corp. | | | 292 | | | | 0.65 | % | | | 13,643 | |
Broadcom, Inc. | | | 13 | | | | 0.20 | % | | | 5,170 | |
Skyworks Solutions, Inc. | | | 271 | | | | 0.34 | % | | | 3,510 | |
Amdocs Ltd. | | | 730 | | | | 0.77 | % | | | 3,005 | |
Immersion Corp. | | | 4,135 | | | | 0.36 | % | | | 2,573 | |
Teradyne, Inc. | | | 131 | | | | 0.17 | % | | | 2,109 | |
Insight Enterprises, Inc. | | | 159 | | | | 0.35 | % | | | 1,865 | |
Accenture plc — Class A | | | 200 | | | | 0.81 | % | | | 1,813 | |
Digi International, Inc. | | | 468 | | | | 0.17 | % | | | 1,175 | |
CEVA, Inc. | | | 601 | | | | 0.16 | % | | | 1,144 | |
NetScout Systems, Inc. | | | 1,125 | | | | 0.29 | % | | | 969 | |
Dropbox, Inc. — Class A | | | 1,909 | | | | 0.54 | % | | | 669 | |
Box, Inc. — Class A | | | 649 | | | | 0.21 | % | | | 632 | |
Crane NXT Co. | | | 241 | | | | 0.17 | % | | | 543 | |
Playtika Holding Corp. | | | 2,349 | | | | 0.19 | % | | | 537 | |
Zoom Video Communications, Inc. — Class A | | | 315 | | | | 0.24 | % | | | 503 | |
Progress Software Corp. | | | 363 | | | | 0.23 | % | | | 380 | |
Xerox Holdings Corp. | | | 731 | | | | 0.15 | % | | | 22 | |
Photronics, Inc. | | | 735 | | | | 0.24 | % | | | (199 | ) |
Adeia, Inc. | | | 1,674 | | | | 0.21 | % | | | (627 | ) |
Teradata Corp. | | | 371 | | | | 0.17 | % | | | (1,782 | ) |
Adobe, Inc. | | | 88 | | | | 0.52 | % | | | (8,675 | ) |
Total Technology | | | | | | | | | | | 152,391 | |
| | | | | | | | | | | | | |
Financial | | | | | | | | | | | | |
MGIC Investment Corp. | | | 3,428 | | | | 0.90 | % | | | 26,348 | |
Essent Group Ltd. | | | 1,264 | | | | 0.88 | % | | | 19,789 | |
Mr Cooper Group, Inc. | | | 421 | | | | 0.38 | % | | | 12,361 | |
Hartford Financial Services Group, Inc. | | | 720 | | | | 0.87 | % | | | 9,250 | |
International Bancshares Corp. | | | 762 | | | | 0.50 | % | | | 8,750 | |
SEE NOTES TO FINANCIAL STATEMENTS. | THE RYDEX FUNDS ANNUAL REPORT | 21 |
SCHEDULE OF INVESTMENTS (continued) | March 31, 2024 |
LONG SHORT EQUITY FUND | |
| | Shares | | | Percentage
Notional
Amount | | | Value and
Unrealized
Appreciation
(Depreciation) | |
Synchrony Financial | | | 1,424 | | | | 0.72 | % | | $ | 6,895 | |
Preferred Bank/Los Angeles CA | | | 518 | | | | 0.47 | % | | | 6,877 | |
Regions Financial Corp. | | | 2,163 | | | | 0.53 | % | | | 6,636 | |
Enact Holdings, Inc. | | | 1,930 | | | | 0.70 | % | | | 6,128 | |
NMI Holdings, Inc. — Class A | | | 2,280 | | | | 0.86 | % | | | 5,856 | |
Loews Corp. | | | 791 | | | | 0.72 | % | | | 5,722 | |
Innovative Industrial Properties, Inc. | | | 510 | | | | 0.62 | % | | | 4,893 | |
Ambac Financial Group, Inc. | | | 3,763 | | | | 0.69 | % | | | 4,325 | |
Travelers Companies, Inc. | | | 317 | | | | 0.85 | % | | | 4,149 | |
Affiliated Managers Group, Inc. | | | 165 | | | | 0.32 | % | | | 3,996 | |
Citizens Financial Group, Inc. | | | 771 | | | | 0.33 | % | | | 3,573 | |
Walker & Dunlop, Inc. | | | 505 | | | | 0.60 | % | | | 3,234 | |
W R Berkley Corp. | | | 328 | | | | 0.34 | % | | | 2,315 | |
OneMain Holdings, Inc. | | | 747 | | | | 0.45 | % | | | 2,160 | |
EZCORP, Inc. — Class A | | | 1,428 | | | | 0.19 | % | | | 1,694 | |
Everest Group Ltd. | | | 81 | | | | 0.38 | % | | | 1,479 | |
T. Rowe Price Group, Inc. | | | 306 | | | | 0.44 | % | | | 1,464 | |
First BanCorp | | | 1,895 | | | | 0.39 | % | | | 1,367 | |
VICI Properties, Inc. | | | 2,032 | | | | 0.71 | % | | | 1,164 | |
Janus Henderson Group plc | | | 1,408 | | | | 0.54 | % | | | 958 | |
Bread Financial Holdings, Inc. | | | 1,127 | | | | 0.49 | % | | | 599 | |
Westamerica BanCorp | | | 422 | | | | 0.24 | % | | | 394 | |
Federated Hermes, Inc. — Class B | | | 598 | | | | 0.25 | % | | | (118 | ) |
Employers Holdings, Inc. | | | 688 | | | | 0.37 | % | | | (145 | ) |
PJT Partners, Inc. — Class A | | | 171 | | | | 0.19 | % | | | (939 | ) |
Hanmi Financial Corp. | | | 896 | | | | 0.17 | % | | | (2,790 | ) |
Apartment Income REIT Corp. | | | 2,172 | | | | 0.82 | % | | | (3,080 | ) |
Total Financial | | | | | | | | | | | 145,304 | |
| | | | | | | | | | | | | |
Consumer, Cyclical | | | | | | | | | | | | |
Allison Transmission Holdings, Inc. | | | 624 | | | | 0.59 | % | | | 26,356 | |
Lennar Corp. — Class A | | | 427 | | | | 0.86 | % | | | 15,340 | |
Taylor Morrison Home Corp. — Class A | | | 1,169 | | | | 0.85 | % | | | 15,065 | |
M/I Homes, Inc. | | | 252 | | | | 0.40 | % | | | 13,631 | |
PulteGroup, Inc. | | | 220 | | | | 0.31 | % | | | 10,384 | |
Brunswick Corp. | | | 374 | | | | 0.42 | % | | | 9,741 | |
Monarch Casino & Resort, Inc. | | | 851 | | | | 0.75 | % | | | 9,230 | |
KB Home | | | 353 | | | | 0.29 | % | | | 8,319 | |
PACCAR, Inc. | | | 391 | | | | 0.57 | % | | | 7,759 | |
Gentex Corp. | | | 1,482 | | | | 0.63 | % | | | 7,592 | |
GMS, Inc. | | | 736 | | | | 0.84 | % | | | 6,705 | |
Build-A-Bear Workshop, Inc. — Class A | | | 791 | | | | 0.28 | % | | | 5,855 | |
Ethan Allen Interiors, Inc. | | | 1,107 | | | | 0.45 | % | | | 4,919 | |
MSC Industrial Direct Company, Inc. — Class A | | | 668 | | | | 0.76 | % | | | 4,473 | |
Autoliv, Inc. | | | 348 | | | | 0.49 | % | | | 3,852 | |
Wabash National Corp. | | | 1,322 | | | | 0.46 | % | | | 3,747 | |
Lowe’s Companies, Inc. | | | 298 | | | | 0.89 | % | | | 3,695 | |
Oxford Industries, Inc. | | | 212 | | | | 0.28 | % | | | 3,411 | |
Harley-Davidson, Inc. | | | 769 | | | | 0.39 | % | | | 3,108 | |
Tri Pointe Homes, Inc. | | | 739 | | | | 0.33 | % | | | 3,090 | |
Polaris, Inc. | | | 263 | | | | 0.31 | % | | | 2,627 | |
MasterCraft Boat Holdings, Inc. | | | 925 | | | | 0.26 | % | | | 1,494 | |
Buckle, Inc. | | | 595 | | | | 0.28 | % | | | 1,413 | |
Darden Restaurants, Inc. | | | 224 | | | | 0.44 | % | | | 1,295 | |
Vail Resorts, Inc. | | | 103 | | | | 0.27 | % | | | 1,170 | |
Chipotle Mexican Grill, Inc. — Class A | | | 6 | | | | 0.20 | % | | | 1,138 | |
Cavco Industries, Inc. | | | 37 | | | | 0.17 | % | | | 1,123 | |
Home Depot, Inc. | | | 148 | | | | 0.66 | % | | | 727 | |
Ralph Lauren Corp. — Class A | | | 96 | | | | 0.21 | % | | | 704 | |
Wendy’s Co. | | | 1,453 | | | | 0.32 | % | | | 486 | |
Deckers Outdoor Corp. | | | 15 | | | | 0.17 | % | | | 408 | |
Columbia Sportswear Co. | | | 426 | | | | 0.40 | % | | | 369 | |
Visteon Corp. | | | 135 | | | | 0.19 | % | | | 120 | |
Aptiv plc | | | 331 | | | | 0.31 | % | | | (219 | ) |
Golden Entertainment, Inc. | | | 1,001 | | | | 0.43 | % | | | (269 | ) |
Dine Brands Global, Inc. | | | 315 | | | | 0.17 | % | | | (1,113 | ) |
McDonald’s Corp. | | | 255 | | | | 0.84 | % | | | (2,759 | ) |
Total Consumer, Cyclical | | | | | | | | | | | 174,986 | |
| | | | | | | | | | | | | |
Utilities | | | | | | | | | | | | |
Public Service Enterprise Group, Inc. | | | 1,060 | | | | 0.83 | % | | | 7,699 | |
Atmos Energy Corp. | | | 594 | | | | 0.83 | % | | | 3,937 | |
National Fuel Gas Co. | | | 1,340 | | | | 0.84 | % | | | 3,308 | |
Black Hills Corp. | | | 1,271 | | | | 0.81 | % | | | 2,561 | |
ONE Gas, Inc. | | | 623 | | | | 0.47 | % | | | 1,935 | |
OGE Energy Corp. | | | 2,000 | | | | 0.80 | % | | | 1,138 | |
CMS Energy Corp. | | | 990 | | | | 0.70 | % | | | 747 | |
Total Utilities | | | | | | | | | | | 21,325 | |
| | | | | | | | | | | | | |
Energy | | | | | | | | | | | | |
Marathon Petroleum Corp. | | | 398 | | | | 0.94 | % | | | 28,144 | |
Valero Energy Corp. | | | 317 | | | | 0.63 | % | | | 18,293 | |
PBF Energy, Inc. — Class A | | | 687 | | | | 0.46 | % | | | 10,164 | |
CNX Resources Corp. | | | 2,610 | | | | 0.72 | % | | | 9,115 | |
Devon Energy Corp. | | | 1,524 | | | | 0.89 | % | | | 7,402 | |
Exxon Mobil Corp. | | | 453 | | | | 0.62 | % | | | 6,331 | |
CVR Energy, Inc. | | | 1,345 | | | | 0.56 | % | | | 5,053 | |
Chevron Corp. | | | 366 | | | | 0.68 | % | | | 2,708 | |
22 | THE RYDEX FUNDS ANNUAL REPORT | SEE NOTES TO FINANCIAL STATEMENTS. |
SCHEDULE OF INVESTMENTS (continued) | March 31, 2024 |
LONG SHORT EQUITY FUND | |
| | Shares | | | Percentage
Notional
Amount | | | Value and
Unrealized
Appreciation
(Depreciation) | |
RPC, Inc. | | | 3,275 | | | | 0.30 | % | | $ | 2,499 | |
Cheniere Energy, Inc. | | | 442 | | | | 0.83 | % | | | 1,384 | |
SandRidge Energy, Inc. | | | 2,333 | | | | 0.40 | % | | | 707 | |
Par Pacific Holdings, Inc. | | | 730 | | | | 0.32 | % | | | 376 | |
SolarEdge Technologies, Inc. | | | 204 | | | | 0.17 | % | | | (646 | ) |
Total Energy | | | | | | | | | | | 91,530 | |
| | | | | | | | | | | | | |
Basic Materials | | | | | | | | | | | | |
Olin Corp. | | | 684 | | | | 0.47 | % | | | 4,602 | |
| | | | | | | | | | | | | |
Government | | | | | | | | | | | | |
Banco Latinoamericano de Comercio Exterior S.A. — Class E | | | 1,584 | | | | 0.55 | % | | | 9,018 | |
Total GS Equity Long Custom Basket | | | | | | | 1,025,848 | |
| | | | | | | | | |
GS EQUITY SHORT CUSTOM BASKET | | | | | | | | |
Utilities | | | | | | | | | | | | |
AES Corp. | | | 6,881 | | | | (1.21 | )% | | | 17,563 | |
California Water Service Group | | | 2,506 | | | | (1.15 | )% | | | 14,736 | |
Portland General Electric Co. | | | 2,822 | | | | (1.17 | )% | | | 10,383 | |
Middlesex Water Co. | | | 1,424 | | | | (0.74 | )% | | | 8,915 | |
Alliant Energy Corp. | | | 1,857 | | | | (0.92 | )% | | | 2,459 | |
Ormat Technologies, Inc. | | | 1,162 | | | | (0.76 | )% | | | (1,647 | ) |
American Electric Power Company, Inc. | | | 1,470 | | | | (1.24 | )% | | | (1,990 | ) |
Edison International | | | 632 | | | | (0.44 | )% | | | (2,125 | ) |
PNM Resources, Inc. | | | 1,714 | | | | (0.63 | )% | | | (3,790 | ) |
FirstEnergy Corp. | | | 2,715 | | | | (1.03 | )% | | | (5,314 | ) |
Eversource Energy | | | 2,080 | | | | (1.22 | )% | | | (6,693 | ) |
Pinnacle West Capital Corp. | | | 1,198 | | | | (0.88 | )% | | | (7,993 | ) |
NRG Energy, Inc. | | | 1,902 | | | | (1.27 | )% | | | (14,826 | ) |
Avangrid, Inc. | | | 3,883 | | | | (1.39 | )% | | | (22,930 | ) |
Total Utilities | | | | | | | | | | | (13,252 | ) |
| | | | | | | | | | | | | |
Consumer, Non-cyclical | | | | | | | | | | | | |
ICF International, Inc. | | | 302 | | | | (0.45 | )% | | | 1,234 | |
Insmed, Inc. | | | 1,869 | | | | (0.50 | )% | | | 1,229 | |
Bright Horizons Family Solutions, Inc. | | | 525 | | | | (0.59 | )% | | | 667 | |
Tyson Foods, Inc. — Class A | | | 824 | | | | (0.48 | )% | | | (893 | ) |
Acadia Healthcare Company, Inc. | | | 1,125 | | | | (0.88 | )% | | | (950 | ) |
CBIZ, Inc. | | | 698 | | | | (0.54 | )% | | | (1,625 | ) |
Flowers Foods, Inc. | | | 3,316 | | | | (0.77 | )% | | | (1,686 | ) |
Paylocity Holding Corp. | | | 262 | | | | (0.44 | )% | | | (1,821 | ) |
McCormick & Company, Inc. | | | 527 | | | | (0.40 | )% | | | (4,240 | ) |
Utz Brands, Inc. | | | 2,878 | | | | (0.52 | )% | | | (4,450 | ) |
U-Haul Holding Co. | | | 640 | | | | (0.43 | )% | | | (4,823 | ) |
Clorox Co. | | | 547 | | | | (0.82 | )% | | | (4,869 | ) |
RB Global, Inc. | | | 933 | | | | (0.70 | )% | | | (7,995 | ) |
RxSight, Inc. | | | 749 | | | | (0.38 | )% | | | (11,487 | ) |
GXO Logistics, Inc. | | | 2,709 | | | | (1.43 | )% | | | (12,790 | ) |
Spectrum Brands Holdings, Inc. | | | 1,265 | | | | (1.11 | )% | | | (16,678 | ) |
TransUnion | | | 1,006 | | | | (0.79 | )% | | | (18,509 | ) |
Pilgrim’s Pride Corp. | | | 3,675 | | | | (1.24 | )% | | | (36,749 | ) |
Total Consumer, Non-cyclical | | | | | | | | | | | (126,435 | ) |
| | | | | | | | | | | | | |
Basic Materials | | | | | | | | | | | | |
Piedmont Lithium, Inc. | | | 4,025 | | | | (0.53 | )% | | | 57,201 | |
Compass Minerals International, Inc. | | | 3,028 | | | | (0.47 | )% | | | 23,775 | |
Novagold Resources, Inc. | | | 16,634 | | | | (0.49 | )% | | | 16,281 | |
Hecla Mining Co. | | | 12,117 | | | | (0.57 | )% | | | 8,209 | |
Air Products and Chemicals, Inc. | | | 185 | | | | (0.44 | )% | | | (471 | ) |
Huntsman Corp. | | | 2,736 | | | | (0.70 | )% | | | (725 | ) |
Ecolab, Inc. | | | 141 | | | | (0.32 | )% | | | (4,876 | ) |
Element Solutions, Inc. | | | 3,464 | | | | (0.85 | )% | | | (11,535 | ) |
ATI, Inc. | | | 1,190 | | | | (0.60 | )% | | | (11,564 | ) |
Kronos Worldwide, Inc. | | | 7,486 | | | | (0.87 | )% | | | (19,863 | ) |
Century Aluminum Co. | | | 5,478 | | | | (0.83 | )% | | | (44,491 | ) |
Total Basic Materials | | | | | | | | | | | 11,941 | |
| | | | | | | | | | | | | |
Financial | | | | | | | | | | | | |
Kennedy-Wilson Holdings, Inc. | | | 11,764 | | | | (0.99 | )% | | | 76,196 | |
Americold Realty Trust, Inc. | | | 4,359 | | | | (1.07 | )% | | | 33,740 | |
Sun Communities, Inc. | | | 947 | | | | (1.20 | )% | | | 29,110 | |
New York Mortgage Trust, Inc. | | | 10,137 | | | | (0.72 | )% | | | 15,725 | |
Marcus & Millichap, Inc. | | | 3,830 | | | | (1.29 | )% | | | 7,390 | |
Ellington Financial, Inc. | | | 7,624 | | | | (0.89 | )% | | | 7,167 | |
Alexander & Baldwin, Inc. | | | 1,950 | | | | (0.32 | )% | | | 4,926 | |
TFS Financial Corp. | | | 8,446 | | | | (1.04 | )% | | | 4,582 | |
COPT Defense Properties | | | 1,510 | | | | (0.36 | )% | | | 1,758 | |
Equity LifeStyle Properties, Inc. | | | 425 | | | | (0.27 | )% | | | 1,103 | |
Equinix, Inc. | | | 117 | | | | (0.95 | )% | | | 831 | |
EastGroup Properties, Inc. | | | 159 | | | | (0.28 | )% | | | 62 | |
Ventas, Inc. | | | 1,548 | | | | (0.66 | )% | | | (51 | ) |
Invitation Homes, Inc. | | | 883 | | | | (0.31 | )% | | | (535 | ) |
Capitol Federal Financial, Inc. | | | 12,779 | | | | (0.75 | )% | | | (1,275 | ) |
Brighthouse Financial, Inc. | | | 2,792 | | | | (1.42 | )% | | | (1,568 | ) |
Terreno Realty Corp. | | | 994 | | | | (0.65 | )% | | | (1,790 | ) |
Iron Mountain, Inc. | | | 1,427 | | | | (1.13 | )% | | | (1,949 | ) |
Elme Communities | | | 8,622 | | | | (1.18 | )% | | | (1,957 | ) |
PotlatchDeltic Corp. | | | 2,496 | | | | (1.15 | )% | | | (2,297 | ) |
Howard Hughes Holdings, Inc. | | | 1,527 | | | | (1.09 | )% | | | (2,619 | ) |
UMH Properties, Inc. | | | 4,666 | | | | (0.75 | )% | | | (2,763 | ) |
SEE NOTES TO FINANCIAL STATEMENTS. | THE RYDEX FUNDS ANNUAL REPORT | 23 |
SCHEDULE OF INVESTMENTS (continued) | March 31, 2024 |
LONG SHORT EQUITY FUND | |
| | Shares | | | Percentage
Notional
Amount | | | Value and
Unrealized
Appreciation
(Depreciation) | |
Allstate Corp. | | | 178 | | | | (0.30 | )% | | $ | (2,851 | ) |
American Tower Corp. — Class A | | | 374 | | | | (0.73 | )% | | | (2,907 | ) |
Digital Realty Trust, Inc. | | | 549 | | | | (0.78 | )% | | | (4,602 | ) |
Moelis & Co. — Class A | | | 1,139 | | | | (0.64 | )% | | | (5,502 | ) |
State Street Corp. | | | 1,344 | | | | (1.02 | )% | | | (6,017 | ) |
Global Net Lease, Inc. | | | 13,447 | | | | (1.03 | )% | | | (7,718 | ) |
Cannae Holdings, Inc. | | | 3,704 | | | | (0.81 | )% | | | (7,723 | ) |
CBRE Group, Inc. — Class A | | | 523 | | | | (0.50 | )% | | | (8,696 | ) |
Welltower, Inc. | | | 1,400 | | | | (1.29 | )% | | | (11,357 | ) |
Apartment Investment and Management Co. — Class A | | | 13,485 | | | | (1.09 | )% | | | (11,818 | ) |
Macerich Co. | | | 4,751 | | | | (0.81 | )% | | | (14,403 | ) |
FTAI Infrastructure, Inc. | | | 6,234 | | | | (0.39 | )% | | | (16,597 | ) |
PennyMac Financial Services, Inc. | | | 974 | | | | (0.87 | )% | | | (19,218 | ) |
Carlyle Group, Inc. | | | 1,963 | | | | (0.91 | )% | | | (20,436 | ) |
Merchants Bancorp | | | 2,188 | | | | (0.93 | )% | | | (23,583 | ) |
KKR & Company, Inc. — Class A | | | 1,180 | | | | (1.17 | )% | | | (42,076 | ) |
Total Financial | | | | | | | | | | | (39,718 | ) |
| | | | | | | | | | | | | |
Energy | | | | | | | | | | | | |
Baker Hughes Co. | | | 1,427 | | | | (0.47 | )% | | | (92 | ) |
Dril-Quip, Inc. | | | 4,645 | | | | (1.03 | )% | | | (887 | ) |
Oceaneering International, Inc. | | | 3,042 | | | | (0.70 | )% | | | (3,111 | ) |
Schlumberger N.V. | | | 927 | | | | (0.50 | )% | | | (5,634 | ) |
Antero Resources Corp. | | | 2,969 | | | | (0.85 | )% | | | (6,152 | ) |
Helix Energy Solutions Group, Inc. | | | 4,587 | | | | (0.49 | )% | | | (6,300 | ) |
Sitio Royalties Corp. — Class A | | | 2,922 | | | | (0.71 | )% | | | (8,721 | ) |
Valaris Ltd. | | | 1,753 | | | | (1.30 | )% | | | (11,433 | ) |
NOV, Inc. | | | 6,940 | | | | (1.33 | )% | | | (16,123 | ) |
TechnipFMC plc | | | 4,474 | | | | (1.10 | )% | | | (22,713 | ) |
Archrock, Inc. | | | 4,175 | | | | (0.81 | )% | | | (27,190 | ) |
Total Energy | | | | | | | | | | | (108,356 | ) |
| | | | | | | | | | | | | |
Industrial | | | | | | | | | | | | |
NV5 Global, Inc. | | | 439 | | | | (0.42 | )% | | | 2,999 | |
Knight-Swift Transportation Holdings, Inc. | | | 842 | | | | (0.46 | )% | | | 1,603 | |
Boeing Co. | | | 322 | | | | (0.61 | )% | | | 1,583 | |
XPO, Inc. | | | 435 | | | | (0.52 | )% | | | 979 | |
J.B. Hunt Transport Services, Inc. | | | 210 | | | | (0.41 | )% | | | 508 | |
Exponent, Inc. | | | 1,005 | | | | (0.82 | )% | | | 401 | |
Materion Corp. | | | 260 | | | | (0.34 | )% | | | 356 | |
RXO, Inc. | | | 4,292 | | | | (0.92 | )% | | | 247 | |
Tetra Tech, Inc. | | | 250 | | | | (0.45 | )% | | | (403 | ) |
Norfolk Southern Corp. | | | 223 | | | | (0.56 | )% | | | (1,222 | ) |
Ryder System, Inc. | | | 275 | | | | (0.33 | )% | | | (1,742 | ) |
Kirby Corp. | | | 377 | | | | (0.35 | )% | | | (2,259 | ) |
CH Robinson Worldwide, Inc. | | | 511 | | | | (0.38 | )% | | | (3,177 | ) |
Republic Services, Inc. — Class A | | | 568 | | | | (1.07 | )% | | | (4,520 | ) |
SPX Technologies, Inc. | | | 532 | | | | (0.64 | )% | | | (5,064 | ) |
Stericycle, Inc. | | | 1,909 | | | | (0.99 | )% | | | (6,032 | ) |
Casella Waste Systems, Inc. — Class A | | | 1,211 | | | | (1.18 | )% | | | (24,682 | ) |
Total Industrial | | | | | | | | | | | (40,425 | ) |
| | | | | | | | | | | | | |
Communications | | | | | | | | | | | | |
Boston Omaha Corp. — Class A | | | 3,475 | | | | (0.53 | )% | | | (2,088 | ) |
DoorDash, Inc. — Class A | | | 416 | | | | (0.56 | )% | | | (18,694 | ) |
Total Communications | | | | | | | | | | | (20,782 | ) |
| | | | | | | | | | | | | |
Technology | | | | | | | | | | | | |
Paycor HCM, Inc. | | | 4,966 | | | | (0.95 | )% | | | 15,658 | |
Braze, Inc. — Class A | | | 1,727 | | | | (0.75 | )% | | | 7,700 | |
ROBLOX Corp. — Class A | | | 688 | | | | (0.26 | )% | | | 2,061 | |
Take-Two Interactive Software, Inc. | | | 877 | | | | (1.28 | )% | | | 1,941 | |
Broadridge Financial Solutions, Inc. | | | 141 | | | | (0.28 | )% | | | (600 | ) |
KBR, Inc. | | | 1,388 | | | | (0.87 | )% | | | (5,927 | ) |
Evolent Health, Inc. — Class A | | | 2,146 | | | | (0.69 | )% | | | (9,291 | ) |
Micron Technology, Inc. | | | 700 | | | | (0.81 | )% | | | (16,759 | ) |
Parsons Corp. | | | 887 | | | | (0.72 | )% | | | (22,623 | ) |
Total Technology | | | | | | | | | | | (27,840 | ) |
| | | | | | | | | | | | | |
Consumer, Cyclical | | | | | | | | | | | | |
Walgreens Boots Alliance, Inc. | | | 3,616 | | | | (0.77 | )% | | | 16,539 | |
Dollar Tree, Inc. | | | 407 | | | | (0.53 | )% | | | 2,881 | |
LGI Homes, Inc. | | | 488 | | | | (0.56 | )% | | | 331 | |
Tesla, Inc. | | | 63 | | | | (0.11 | )% | | | (225 | ) |
Hyatt Hotels Corp. — Class A | | | 470 | | | | (0.74 | )% | | | (687 | ) |
UniFirst Corp. | | | 238 | | | | (0.41 | )% | | | (1,592 | ) |
MarineMax, Inc. | | | 2,404 | | | | (0.79 | )% | | | (4,856 | ) |
Dollar General Corp. | | | 268 | | | | (0.41 | )% | | | (5,515 | ) |
Sonic Automotive, Inc. — Class A | | | 1,066 | | | | (0.60 | )% | | | (5,799 | ) |
DraftKings, Inc. — Class A | | | 1,089 | | | | (0.49 | )% | | | (7,012 | ) |
Copart, Inc. | | | 1,955 | | | | (1.11 | )% | | | (7,987 | ) |
CarMax, Inc. | | | 1,352 | | | | (1.16 | )% | | | (25,497 | ) |
Total Consumer, Cyclical | | | | | | | | | | | (39,419 | ) |
Total GS Equity Short Custom Basket | | | | | | | (404,286 | ) |
24 | THE RYDEX FUNDS ANNUAL REPORT | SEE NOTES TO FINANCIAL STATEMENTS. |
SCHEDULE OF INVESTMENTS (concluded) | March 31, 2024 |
LONG SHORT EQUITY FUND | |
* | Non-income producing security. |
† | Value determined based on Level 1 inputs — See Note 4. |
†† | Value determined based on Level 2 inputs — See Note 4. |
1 | All or a portion of this security is pledged as equity custom basket swap collateral at March 31, 2024. |
2 | All or a portion of this security is on loan at March 31, 2024 — See Note 7. |
3 | Rate indicated is the 7-day yield as of March 31, 2024. |
4 | Securities lending collateral — See Note 7. |
| | GS — Goldman Sachs International |
| | MS — Morgan Stanley Capital Services LLC |
| | plc — Public Limited Company |
| | REIT — Real Estate Investment Trust |
| | |
| | See Sector Classification in Other Information section. |
The following table summarizes the inputs used to value the Fund’s investments at March 31, 2024 (See Note 4 in the Notes to Financial Statements):
Investments in Securities (Assets) | | Level 1
Quoted
Prices | | | Level 2
Significant
Observable
Inputs | | | Level 3
Significant
Unobservable
Inputs | | | Total | |
Common Stocks | | $ | 16,558,920 | | | $ | — | | | $ | — | | | $ | 16,558,920 | |
Money Market Fund | | | 250,980 | | | | — | | | | — | | | | 250,980 | |
Securities Lending Collateral | | | 21,771 | | | | — | | | | — | | | | 21,771 | |
Equity Custom Basket Swap Agreements** | | | — | | | | 2,055,176 | | | | — | | | | 2,055,176 | |
Total Assets | | $ | 16,831,671 | | | $ | 2,055,176 | | | $ | — | | | $ | 18,886,847 | |
Investments in Securities (Liabilities) | | Level 1
Quoted
Prices | | | Level 2
Significant
Observable
Inputs | | | Level 3
Significant
Unobservable
Inputs | | | Total | |
Equity Custom Basket Swap Agreements** | | $ | — | | | $ | 802,302 | | | $ | — | | | $ | 802,302 | |
** | This derivative is reported as unrealized appreciation/depreciation at period end. |
SEE NOTES TO FINANCIAL STATEMENTS. | THE RYDEX FUNDS ANNUAL REPORT | 25 |
STATEMENT OF ASSETS AND LIABILITIES |
March 31, 2024 |
Assets: |
Investments, at value - including $20,728 of securities loaned (cost $14,824,427) | | $ | 16,831,671 | |
Cash | | | 96,507 | |
Unrealized appreciation on OTC swap agreements | | | 2,055,176 | |
Receivables: |
Swap settlement | | | 81,028 | |
Fund shares sold | | | 42,692 | |
Dividends | | | 13,692 | |
Securities lending income | | | 2 | |
Total assets | | | 19,120,768 | |
| | | | | |
Liabilities: |
Unrealized depreciation on OTC swap agreements | | | 802,302 | |
Payable for: |
Return of securities lending collateral | | | 21,771 | |
Management fees | | | 13,660 | |
Transfer agent fees | | | 7,694 | |
Distribution and service fees | | | 3,113 | |
Portfolio accounting and administration fees | | | 2,314 | |
Trustees’ fees* | | | 161 | |
Miscellaneous | | | 13,250 | |
Total liabilities | | | 864,265 | |
Net assets | | $ | 18,256,503 | |
| | | | | |
Net assets consist of: |
Paid in capital | | $ | 16,234,704 | |
Total distributable earnings (loss) | | | 2,021,799 | |
Net assets | | $ | 18,256,503 | |
CLASS A: |
Net assets | | $ | 7,667,364 | |
Capital shares outstanding | | | 330,156 | |
Net asset value per share | | $ | 23.22 | |
Maximum offering price per share (Net asset value divided by 95.25%) | | $ | 24.38 | |
CLASS C: |
Net assets | | $ | 103,612 | |
Capital shares outstanding | | | 5,183 | |
Net asset value per share | | $ | 19.99 | |
CLASS P: |
Net assets | | $ | 6,878,147 | |
Capital shares outstanding | | | 295,184 | |
Net asset value per share | | $ | 23.30 | |
| | | | | |
Institutional Class: |
Net assets | | $ | 3,607,380 | |
Capital shares outstanding | | | 150,624 | |
Net asset value per share | | $ | 23.95 | |
STATEMENT OF OPERATIONS |
Year Ended March 31, 2024 |
Investment Income: |
Dividends (net of foreign withholding tax of $110) | | $ | 318,592 | |
Income from securities lending, net | | | 111 | |
Total investment income | | | 318,703 | |
| | | | | |
Expenses: |
Management fees | | | 146,430 | |
Distribution and service fees: |
Class A | | | 17,318 | |
Class C | | | 1,444 | |
Class P | | | 16,293 | |
Transfer agent fees | | | 45,869 | |
Portfolio accounting and administration fees | | | 24,802 | |
Registration fees | | | 14,848 | |
Professional fees | | | 7,865 | |
Trustees’ fees* | | | 2,636 | |
Custodian fees | | | 2,403 | |
Line of credit fees | | | 1,556 | |
Miscellaneous | | | 7,786 | |
Total expenses | | | 289,250 | |
Net investment income | | | 29,453 | |
| | | | | |
Net Realized and Unrealized Gain (Loss): |
Net realized gain (loss) on: |
Investments | | | 1,255,091 | |
Swap agreements | | | 466,209 | |
Net realized gain | | | 1,721,300 | |
Net change in unrealized appreciation (depreciation) on: |
Investments | | | 1,571,596 | |
Swap agreements | | | 48,555 | |
Net change in unrealized appreciation (depreciation) | | | 1,620,151 | |
Net realized and unrealized gain | | | 3,341,451 | |
Net increase in net assets resulting from operations | | $ | 3,370,904 | |
* | Relates to Trustees not deemed “interested persons” within the meaning of Section 2(a)(19) of the 1940 Act. |
26 | THE RYDEX FUNDS ANNUAL REPORT | SEE NOTES TO FINANCIAL STATEMENTS. |
STATEMENTS OF CHANGES IN NET ASSETS |
| | Year Ended
March 31,
2024 | | | Year Ended
March 31,
2023 | |
Increase (Decrease) in Net Assets from Operations: | | | | | | | | |
Net investment income | | $ | 29,453 | | | $ | 49,790 | |
Net realized gain (loss) on investments | | | 1,721,300 | | | | (516,401 | ) |
Net change in unrealized appreciation (depreciation) on investments | | | 1,620,151 | | | | 397,693 | |
Net increase (decrease) in net assets resulting from operations | | | 3,370,904 | | | | (68,918 | ) |
| | | | | | | | | |
Distributions to shareholders: | | | | | | | | |
Class A | | | (63,210 | ) | | | (28,087 | ) |
Class C | | | (786 | ) | | | — | |
Class P | | | (57,392 | ) | | | (24,299 | ) |
Institutional Class | | | (23,773 | ) | | | (11,987 | ) |
Total distributions to shareholders | | | (145,161 | ) | | | (64,373 | ) |
| | | | | | | | | |
Capital share transactions: | | | | | | | | |
Proceeds from sale of shares | | | | | | | | |
Class A | | | 189,553 | | | | 268,590 | |
Class C | | | 3,600 | | | | 3,600 | |
Class P | | | 7,834,551 | | | | 137,512 | |
Institutional Class | | | 1,821,949 | | | | 235,070 | |
Distributions reinvested | | | | | | | | |
Class A | | | 61,137 | | | | 27,162 | |
Class C | | | 786 | | | | — | |
Class P | | | 51,198 | | | | 21,690 | |
Institutional Class | | | 23,773 | | | | 11,987 | |
Cost of shares redeemed | | | | | | | | |
Class A | | | (921,710 | ) | | | (670,625 | ) |
Class C | | | (98,104 | ) | | | (94,021 | ) |
Class P | | | (8,256,255 | ) | | | (370,219 | ) |
Institutional Class | | | (1,197,917 | ) | | | (375,971 | ) |
Net decrease from capital share transactions | | | (487,439 | ) | | | (805,225 | ) |
Net increase (decrease) in net assets | | | 2,738,304 | | | | (938,516 | ) |
| | | | | | | | | |
Net assets: | | | | | | | | |
Beginning of year | | | 15,518,199 | | | | 16,456,715 | |
End of year | | $ | 18,256,503 | | | $ | 15,518,199 | |
| | | | | | | | | |
Capital share activity: | | | | | | | | |
Shares sold | | | | | | | | |
Class A | | | 9,508 | | | | 14,643 | |
Class C | | | 206 | | | | 227 | |
Class P | | | 389,380 | | | | 7,790 | |
Institutional Class | | | 84,891 | | | | 12,159 | |
Shares issued from reinvestment of distributions | | | | | | | | |
Class A | | | 3,039 | | | | 1,478 | |
Class C | | | 45 | | | | — | |
Class P | | | 2,536 | | | | 1,176 | |
Institutional Class | | | 1,146 | | | | 634 | |
Shares redeemed | | | | | | | | |
Class A | | | (46,049 | ) | | | (36,723 | ) |
Class C | | | (5,656 | ) | | | (5,825 | ) |
Class P | | | (412,620 | ) | | | (20,694 | ) |
Institutional Class | | | (58,302 | ) | | | (20,267 | ) |
Net decrease in shares | | | (31,876 | ) | | | (45,402 | ) |
SEE NOTES TO FINANCIAL STATEMENTS. | THE RYDEX FUNDS ANNUAL REPORT | 27 |
This table is presented to show selected data for a share outstanding throughout each period and to assist shareholders in evaluating a Fund’s performance for the periods presented.
Class A | | Year Ended
March 31,
2024 | | | Year Ended
March 31,
2023 | | | Year Ended
March 31,
2022 | | | Year Ended
March 31,
2021 | | | Year Ended
March 31,
2020 | |
Per Share Data |
Net asset value, beginning of period | | $ | 19.01 | | | $ | 19.11 | | | $ | 18.98 | | | $ | 14.12 | | | $ | 16.20 | |
Income (loss) from investment operations: |
Net investment income (loss)a | | | .03 | | | | .05 | | | | .06 | | | | .10 | | | | .09 | |
Net gain (loss) on investments (realized and unrealized) | | | 4.37 | | | | (.07 | ) | | | .14 | | | | 4.84 | | | | (2.04 | ) |
Total from investment operations | | | 4.40 | | | | (.02 | ) | | | .20 | | | | 4.94 | | | | (1.95 | ) |
Less distributions from: |
Net investment income | | | (.05 | ) | | | (.08 | ) | | | (.07 | ) | | | (.08 | ) | | | (.13 | ) |
Net realized gains | | | (.14 | ) | | | — | | | | — | | | | — | | | | — | |
Total distributions | | | (.19 | ) | | | (.08 | ) | | | (.07 | ) | | | (.08 | ) | | | (.13 | ) |
Net asset value, end of period | | $ | 23.22 | | | $ | 19.01 | | | $ | 19.11 | | | $ | 18.98 | | | $ | 14.12 | |
|
Total Returnb | | | 23.29 | % | | | (0.11 | %) | | | 1.03 | % | | | 35.04 | % | | | (12.15 | %) |
Ratios/Supplemental Data |
Net assets, end of period (in thousands) | | $ | 7,667 | | | $ | 6,914 | | | $ | 7,344 | | | $ | 8,044 | | | $ | 7,021 | |
Ratios to average net assets: |
Net investment income (loss) | | | 0.17 | % | | | 0.30 | % | | | 0.30 | % | | | 0.61 | % | | | 0.58 | % |
Total expensesc,d | | | 1.81 | % | | | 1.76 | % | | | 1.66 | % | | | 1.75 | % | | | 1.78 | % |
Portfolio turnover rate | | | 394 | % | | | 329 | % | | | 233 | % | | | 162 | % | | | 119 | % |
Class C | | Year Ended
March 31,
2024 | | | Year Ended
March 31,
2023 | | | Year Ended
March 31,
2022 | | | Year Ended
March 31,
2021 | | | Year Ended
March 31,
2020 | |
Per Share Data |
Net asset value, beginning of period | | $ | 16.50 | | | $ | 16.66 | | | $ | 16.61 | | | $ | 12.39 | | | $ | 14.21 | |
Income (loss) from investment operations: |
Net investment income (loss)a | | | (.13 | ) | | | (.09 | ) | | | (.08 | ) | | | (.02 | ) | | | (.02 | ) |
Net gain (loss) on investments (realized and unrealized) | | | 3.76 | | | | (.07 | ) | | | .13 | | | | 4.24 | | | | (1.80 | ) |
Total from investment operations | | | 3.63 | | | | (.16 | ) | | | .05 | | | | 4.22 | | | | (1.82 | ) |
Less distributions from: |
Net realized gains | | | (.14 | ) | | | — | | | | — | | | | — | | | | — | |
Total distributions | | | (.14 | ) | | | — | | | | — | | | | — | | | | — | |
Net asset value, end of period | | $ | 19.99 | | | $ | 16.50 | | | $ | 16.66 | | | $ | 16.61 | | | $ | 12.39 | |
|
Total Returnb | | | 22.18 | % | | | (0.96 | %) | | | 0.30 | % | | | 34.06 | % | | | (12.81 | %) |
Ratios/Supplemental Data |
Net assets, end of period (in thousands) | | $ | 104 | | | $ | 175 | | | $ | 270 | | | $ | 378 | | | $ | 567 | |
Ratios to average net assets: |
Net investment income (loss) | | | (0.74 | %) | | | (0.57 | %) | | | (0.46 | %) | | | (0.16 | %) | | | (0.18 | %) |
Total expensesc,d | | | 2.74 | % | | | 2.61 | % | | | 2.41 | % | | | 2.51 | % | | | 2.53 | % |
Portfolio turnover rate | | | 394 | % | | | 329 | % | | | 233 | % | | | 162 | % | | | 119 | % |
28 | THE RYDEX FUNDS ANNUAL REPORT | SEE NOTES TO FINANCIAL STATEMENTS. |
FINANCIAL HIGHLIGHTS (continued) |
This table is presented to show selected data for a share outstanding throughout each period and to assist shareholders in evaluating a Fund’s performance for the periods presented.
Class P | | Year Ended
March 31,
2024 | | | Year Ended
March 31,
2023 | | | Year Ended
March 31,
2022 | | | Year Ended
March 31,
2021 | | | Year Ended
March 31,
2020 | |
Per Share Data |
Net asset value, beginning of period | | $ | 19.07 | | | $ | 19.17 | | | $ | 19.04 | | | $ | 14.17 | | | $ | 16.25 | |
Income (loss) from investment operations: |
Net investment income (loss)a | | | .02 | | | | .06 | | | | .06 | | | | .10 | | | | .09 | |
Net gain (loss) on investments (realized and unrealized) | | | 4.40 | | | | (.08 | ) | | | .14 | | | | 4.85 | | | | (2.04 | ) |
Total from investment operations | | | 4.42 | | | | (.02 | ) | | | .20 | | | | 4.95 | | | | (1.95 | ) |
Less distributions from: |
Net investment income | | | (.05 | ) | | | (.08 | ) | | | (.07 | ) | | | (.08 | ) | | | (.13 | ) |
Net realized gains | | | (.14 | ) | | | — | | | | — | | | | — | | | | — | |
Total distributions | | | (.19 | ) | | | (.08 | ) | | | (.07 | ) | | | (.08 | ) | | | (.13 | ) |
Net asset value, end of period | | $ | 23.30 | | | $ | 19.07 | | | $ | 19.17 | | | $ | 19.04 | | | $ | 14.17 | |
|
Total Return | | | 23.31 | % | | | (0.11 | %) | | | 1.03 | % | | | 35.09 | % | | | (12.17 | %) |
Ratios/Supplemental Data |
Net assets, end of period (in thousands) | | $ | 6,878 | | | $ | 6,024 | | | $ | 6,281 | | | $ | 6,415 | | | $ | 5,370 | |
Ratios to average net assets: |
Net investment income (loss) | | | 0.11 | % | | | 0.30 | % | | | 0.30 | % | | | 0.61 | % | | | 0.57 | % |
Total expensesc,d | | | 1.81 | % | | | 1.76 | % | | | 1.66 | % | | | 1.75 | % | | | 1.78 | % |
Portfolio turnover rate | | | 394 | % | | | 329 | % | | | 233 | % | | | 162 | % | | | 119 | % |
SEE NOTES TO FINANCIAL STATEMENTS. | THE RYDEX FUNDS ANNUAL REPORT | 29 |
FINANCIAL HIGHLIGHTS (concluded) |
This table is presented to show selected data for a share outstanding throughout each period and to assist shareholders in evaluating a Fund’s performance for the periods presented.
Institutional Class | | Year Ended
March 31,
2024 | | | Year Ended
March 31,
2023 | | | Year Ended
March 31,
2022 | | | Year Ended
March 31,
2021 | | | Year Ended
March 31,
2020 | |
Per Share Data |
Net asset value, beginning of period | | $ | 19.57 | | | $ | 19.65 | | | $ | 19.50 | | | $ | 14.49 | | | $ | 16.60 | |
Income (loss) from investment operations: |
Net investment income (loss)a | | | .09 | | | | .11 | | | | .11 | | | | .15 | | | | .14 | |
Net gain (loss) on investments (realized and unrealized) | | | 4.51 | | | | (0.09 | ) | | | .14 | | | | 4.97 | | | | (2.10 | ) |
Total from investment operations | | | 4.60 | | | | .02 | | | | .25 | | | | 5.12 | | | | (1.96 | ) |
Less distributions from: |
Net investment income | | | (.08 | ) | | | (.10 | ) | | | (.10 | ) | | | (.11 | ) | | | (.15 | ) |
Net realized gains | | | (.14 | ) | | | — | | | | — | | | | — | | | | — | |
Total distributions | | | (.22 | ) | | | (.10 | ) | | | (.10 | ) | | | (.11 | ) | | | (.15 | ) |
Net asset value, end of period | | $ | 23.95 | | | $ | 19.57 | | | $ | 19.65 | | | $ | 19.50 | | | $ | 14.49 | |
|
Total Return | | | 23.66 | % | | | 0.14 | % | | | 1.24 | % | | | 35.47 | % | | | (11.96 | %) |
Ratios/Supplemental Data |
Net assets, end of period (in thousands) | | $ | 3,607 | | | $ | 2,405 | | | $ | 2,562 | | | $ | 2,247 | | | $ | 1,794 | |
Ratios to average net assets: |
Net investment income (loss) | | | 0.45 | % | | | 0.57 | % | | | 0.55 | % | | | 0.86 | % | | | 0.85 | % |
Total expensesc,d | | | 1.54 | % | | | 1.49 | % | | | 1.41 | % | | | 1.50 | % | | | 1.53 | % |
Portfolio turnover rate | | | 394 | % | | | 329 | % | | | 233 | % | | | 162 | % | | | 119 | % |
a | Net investment income (loss) per share was computed using average shares outstanding throughout the period. |
b | Total return does not reflect the impact of any applicable sales charges. |
c | Does not include expenses of the underlying funds in which the Fund invests. |
d | Excluding interest and dividend expense related to short sales, the operating expense ratios for the years or periods presented was as follows: |
| 03/31/24 | 03/31/23 | 03/31/22 | 03/31/21 | 03/31/20 |
Class A | 1.81% | 1.76% | 1.66% | 1.78% | 1.78% |
Class C | 2.74% | 2.61% | 2.41% | 2.51% | 2.53% |
Class P | 1.81% | 1.76% | 1.66% | 1.75% | 1.78% |
Institutional Class | 1.54% | 1.49% | 1.41% | 1.50% | 1.53% |
30 | THE RYDEX FUNDS ANNUAL REPORT | SEE NOTES TO FINANCIAL STATEMENTS. |
PERFORMANCE REPORT AND FUND PROFILE (Unaudited) | March 31, 2024 |
EMERGING MARKETS 2x STRATEGY FUND
OBJECTIVE: Seeks to provide investment results that correlate, before fees and expenses, to the performance of a specific benchmark on a daily basis. The Fund’s current benchmark is 200% of the performance of the S&P Emerging 50 ADR Index (the “underlying index”). The Fund does not seek to achieve its investment objective over a period of time greater than one day.
For the Reporting Period, the Emerging Markets 2x Strategy Fund maintained a daily correlation of over 99% to its benchmark of 200% of the daily price movement of the S&P Emerging 50 ADR Index. Emerging Markets 2x Strategy Fund Class H returned 5.78%, while the S&P Emerging 50 ADR Index returned 9.01% over the same period.
The industries that contributed the most to the performance of the underlying index were semiconductors and semiconductor equipment, and oil and gas consumable fuels. The sectors that detracted the most were broadline retail and interactive media and services.
The stocks that contributed the most to the return of the underlying index were Taiwan Semiconductor Manufacturing Co. Ltd. ADR, PDD Holdings, Inc. ADR, and Petoleo Brasileiro Preferred SA ADR. The stocks that detracted the most were HDFC Bank Ltd. ADR, JD.com, Inc. ADR, and Alibaba Group Holding Ltd. ADR.
Derivatives in the Fund were used to help provide exposure to the composition of the benchmark in the most efficient manner and to provide leverage and not for hedging purposes. Derivatives performed as expected.
Due to the compounding of daily returns, the Fund’s returns over periods other than one day will likely differ in amount and possibly direction from the benchmark return for the same period. Investors should monitor their Fund holdings to ensure that they are consistent with their strategies, as frequently as daily.
The effects of compounding may cause the longer-term correlation of the Fund to its benchmark to diminish. A significant contributor to the discrepancy between the leveraged and unleveraged indices is the effect of compounding on the leveraged index, which is discussed under “A Brief Note on the Compounding of Returns.”
Performance displayed represents past performance, which is no guarantee of future results.
Holdings Diversification (Market Exposure as % of Net Assets)
“Holdings Diversification (Market Exposure as % of Net Assets)” excludes any temporary cash investments.
Country Diversification
Country | % of Long-Term Investments |
Taiwan, Province of China | 23.4% |
Cayman Islands | 19.0% |
India | 17.8% |
Brazil | 14.3% |
China | 12.4% |
Mexico | 5.4% |
Republic of Korea | 4.9% |
Other | 2.8% |
Total Long-Term Investments | 100.0% |
Inception Dates: |
Class A | October 29, 2010 |
Class C | October 29, 2010 |
Class H | October 29, 2010 |
| | THE RYDEX FUNDS ANNUAL REPORT | 31 |
PERFORMANCE REPORT AND FUND PROFILE (Unaudited)(concluded) | March 31, 2024 |
Cumulative Fund Performance*
Ten Largest Holdings | % of Total Net Assets |
Taiwan Semiconductor Manufacturing Company Ltd. ADR | 10.9% |
Alibaba Group Holding Ltd. ADR | 5.5% |
HDFC Bank Ltd. ADR | 4.3% |
PDD Holdings, Inc. ADR | 3.3% |
ICICI Bank Ltd. ADR | 2.6% |
Infosys Ltd. ADR | 2.4% |
Vale S.A. ADR | 1.8% |
NetEase, Inc. ADR | 1.5% |
Petroleo Brasileiro S.A. ADR | 1.4% |
JD.com, Inc. ADR | 1.4% |
Top Ten Total | 35.1% |
| | |
“Ten Largest Holdings” excludes any temporary cash or derivative investments. |
Average Annual Returns*
Periods Ended March 31, 2024
| 1 Year | 5 Year | 10 Year |
Class A Shares | 5.93% | (3.99%) | (1.19%) |
Class A Shares with sales charge† | 0.90% | (4.92%) | (1.66%) |
Class C Shares | 5.07% | (4.72%) | (1.93%) |
Class C Shares with CDSC‡ | 4.07% | (4.72%) | (1.93%) |
Class H Shares | 5.78% | (4.03%) | (1.22%) |
S&P 500 Index | 29.88% | 15.05% | 12.96% |
S&P Emerging 50 ADR Index | 9.01% | 3.64% | 4.15% |
* | The performance data above represents past performance that is not predictive of future results. The investment return and principal value of an investment in the Fund will fluctuate so that an investor’s shares, when redeemed, may be worth more or less than their original cost. Returns are historical and include changes in principal and reinvested dividends and capital gains and do not reflect the effect of taxes. The S&P Emerging 50 ADR Index and S&P 500 Index are unmanaged indices and, unlike the Fund, have no management fees or operating expenses to reduce their reported returns. The graphs are based on Class A shares and Class H shares only; performance for Class C shares will vary due to differences in fee structure. |
† | Fund returns are calculated using the maximum sales charge of 4.75%. |
‡ | Fund returns include a CDSC of 1% if redeemed within 12 months of purchase. |
32 | THE RYDEX FUNDS ANNUAL REPORT | |
SCHEDULE OF INVESTMENTS | March 31, 2024 |
EMERGING MARKETS 2x STRATEGY FUND | |
| | Shares | | | Value | |
COMMON STOCKS† - 52.9% |
| | | | | | | | | |
Technology - 16.6% |
Taiwan Semiconductor Manufacturing Company Ltd. ADR | | | 2,401 | | | $ | 326,656 | |
Infosys Ltd. ADR | | | 3,956 | | | | 70,931 | |
NetEase, Inc. ADR | | | 425 | | | | 43,975 | |
United Microelectronics Corp. ADR1 | | | 2,844 | | | | 23,008 | |
ASE Technology Holding Company Ltd. ADR | | | 2,086 | | | | 22,925 | |
Wipro Ltd. ADR1 | | | 1,721 | | | | 9,896 | |
Total Technology | | | | | | | 497,391 | |
| | | | | | | | | |
Communications - 14.8% |
Alibaba Group Holding Ltd. ADR | | | 2,265 | | | | 163,896 | |
PDD Holdings, Inc. ADR* | | | 843 | | | | 97,999 | |
JD.com, Inc. ADR | | | 1,500 | | | | 41,085 | |
Baidu, Inc. ADR* | | | 346 | | | | 36,427 | |
Trip.com Group Ltd. ADR* | | | 678 | | | | 29,758 | |
America Movil SAB de CV ADR | | | 1,254 | | | | 23,399 | |
Chunghwa Telecom Company Ltd. ADR | | | 464 | | | | 18,161 | |
Telkom Indonesia Persero Tbk PT ADR | | | 580 | | | | 12,911 | |
Tencent Music Entertainment Group ADR* | | | 765 | | | | 8,560 | |
Kanzhun Ltd. ADR | | | 408 | | | | 7,152 | |
Vipshop Holdings Ltd. ADR | | | 328 | | | | 5,428 | |
Total Communications | | | | | | | 444,776 | |
| | | | | | | | | |
Financial - 9.8% |
HDFC Bank Ltd. ADR | | | 2,286 | | | | 127,947 | |
ICICI Bank Ltd. ADR | | | 2,900 | | | | 76,589 | |
KB Financial Group, Inc. ADR | | | 458 | | | | 23,848 | |
Shinhan Financial Group Company Ltd. ADR | | | 594 | | | | 21,081 | |
Banco Bradesco S.A. ADR | | | 6,481 | | | | 18,536 | |
KE Holdings, Inc. ADR | | | 808 | | | | 11,094 | |
Woori Financial Group, Inc. ADR1 | | | 272 | | | | 8,821 | |
Banco de Chile ADR | | | 265 | | | | 5,902 | |
Total Financial | | | | | | | 293,818 | |
| | | | | | | | | |
Basic Materials - 4.2% |
Vale S.A. ADR | | | 4,431 | | | | 54,014 | |
POSCO Holdings, Inc. ADR1 | | | 363 | | | | 28,466 | |
Gold Fields Ltd. ADR | | | 1,090 | | | | 17,320 | |
Suzano S.A. ADR | | | 891 | | | | 11,387 | |
Sociedad Quimica y Minera de Chile S.A. ADR | | | 174 | | | | 8,554 | |
Gerdau S.A. ADR | | | 1,411 | | | | 6,237 | |
Total Basic Materials | | | | | | | 125,978 | |
| | | | | | | | | |
Consumer, Non-cyclical - 3.1% |
Fomento Economico Mexicano SAB de CV ADR | | | 224 | | | | 29,181 | |
New Oriental Education & Technology Group, Inc. ADR* | | | 183 | | | | 15,888 | |
Ambev S.A. ADR | | | 5,382 | | | | 13,347 | |
BeiGene Ltd. ADR* | | | 73 | | | | 11,416 | |
Dr Reddy’s Laboratories Ltd. ADR | | | 149 | | | | 10,929 | |
TAL Education Group ADR* | | | 563 | | | | 6,390 | |
Coca-Cola Femsa SAB de CV ADR | | | 64 | | | | 6,221 | |
Total Consumer, Non-cyclical | | | | | | | 93,372 | |
| | | | | | | | | |
Industrial - 1.4% |
Cemex SAB de CV ADR* | | | 1,847 | | | | 16,641 | |
ZTO Express Cayman, Inc. ADR | | | 518 | | | | 10,847 | |
Grupo Aeroportuario del Pacifico SAB de CV ADR | | | 48 | | | | 7,832 | |
Grupo Aeroportuario del Sureste SAB de CV ADR | | | 22 | | | | 7,011 | |
Total Industrial | | | | | | | 42,331 | |
| | | | | | | | | |
Consumer, Cyclical - 1.2% |
Li Auto, Inc. ADR* | | | 711 | | | | 21,529 | |
NIO, Inc. ADR*,1 | | | 1,706 | | | | 7,677 | |
XPeng, Inc. ADR* | | | 750 | | | | 5,760 | |
Total Consumer, Cyclical | | | | | | | 34,966 | |
| | | | | | | | | |
Energy - 1.2% |
Petroleo Brasileiro S.A. ADR | | | 2,270 | | | | 34,527 | |
| | | | | | | | | |
Utilities - 0.6% |
Centrais Eletricas Brasileiras S.A. ADR | | | 1,261 | | | | 10,529 | |
Cia de Saneamento Basico do Estado de Sao Paulo ADR | | | 417 | | | | 7,018 | |
Total Utilities | | | | | | | 17,547 | |
| | | | | | | | | |
Total Common Stocks | | | | |
(Cost $1,169,867) | | | | | | | 1,584,706 | |
| | | | | | | | | |
PREFERRED STOCKS† - 2.8% |
Energy - 1.4% |
Petroleo Brasileiro S.A. ADR | | | 2,802 | | | | 41,750 | |
| | | | | | | | | |
Financial - 1.4% |
Itau Unibanco Holding S.A. ADR | | | 5,913 | | | | 40,977 | |
Total Preferred Stocks | | | | |
(Cost $57,199) | | | | | | | 82,727 | |
| | | | | | | | | |
| | | Face
Amount | | | | | |
REPURCHASE AGREEMENTS††,2 - 36.9% |
J.P. Morgan Securities LLC
issued 03/28/24 at 5.31%
due 04/01/243 | | $ | 638,146 | | | | 638,146 | |
BofA Securities, Inc.
issued 03/28/24 at 5.31%
due 04/01/243 | | | 245,441 | | | | 245,441 | |
Barclays Capital, Inc.
issued 03/28/24 at 5.30%
due 04/01/243 | | | 222,471 | | | | 222,471 | |
Total Repurchase Agreements | | | | |
(Cost $1,106,058) | | | | | | | 1,106,058 | |
| | | | | | | | | |
SEE NOTES TO FINANCIAL STATEMENTS. | THE RYDEX FUNDS ANNUAL REPORT | 33 |
SCHEDULE OF INVESTMENTS (continued) | March 31, 2024 |
EMERGING MARKETS 2x STRATEGY FUND | |
| | Shares | | | Value | |
SECURITIES LENDING COLLATERAL†,4 - 2.0% |
Money Market Fund | | | | | | | | |
First American Government Obligations Fund - Class X, 5.23%5 | | | 60,031 | | | $ | 60,031 | |
Total Securities Lending Collateral | | | | |
(Cost $60,031) | | | | | | | 60,031 | |
| | | | | | | | | |
Total Investments - 94.6% | | | | |
(Cost $2,393,155) | | $ | 2,833,522 | |
Other Assets & Liabilities, net - 5.4% | | | 161,451 | |
Total Net Assets - 100.0% | | $ | 2,994,973 | |
Total Return Swap Agreements |
Counterparty | Index | Type | | Financing
Rate | | Payment
Frequency | | | Maturity
Date | | | Units | | | Notional
Amount | | | Value and
Unrealized
Depreciation | |
OTC Equity Index Swap Agreements†† |
BNP Paribas | S&P Emerging 50 ADR Index | Pay | | 5.93% (Federal Funds Rate + 0.60%) | | | At Maturity | | | | 06/26/24 | | | | 390 | | | $ | 1,082,890 | | | $ | (26,178 | ) |
Goldman Sachs International | S&P Emerging 50 ADR Index | Pay | | 5.58% (Federal Funds Rate + 0.25%) | | | At Maturity | | | | 06/26/24 | | | | 1,183 | | | | 3,285,103 | | | | (39,696 | ) |
| | | | | | | | | | | | | | | | | | | $ | 4,367,993 | | | $ | (65,874 | ) |
* | Non-income producing security. |
† | Value determined based on Level 1 inputs — See Note 4. |
†† | Value determined based on Level 2 inputs — See Note 4. |
1 | All or a portion of this security is on loan at March 31, 2024 — See Note 7. |
2 | Repurchase Agreements — See Note 6. |
3 | All or a portion of this security is pledged as equity index swap collateral at March 31, 2024. |
4 | Securities lending collateral — See Note 7. |
5 | Rate indicated is the 7-day yield as of March 31, 2024. |
| | ADR — American Depositary Receipt |
| | |
| | See Sector Classification in Other Information section. |
34 | THE RYDEX FUNDS ANNUAL REPORT | SEE NOTES TO FINANCIAL STATEMENTS. |
SCHEDULE OF INVESTMENTS (concluded) | March 31, 2024 |
EMERGING MARKETS 2x STRATEGY FUND | |
The following table summarizes the inputs used to value the Fund’s investments at March 31, 2024 (See Note 4 in the Notes to Financial Statements):
Investments in Securities (Assets) | | Level 1
Quoted
Prices | | | Level 2
Significant
Observable
Inputs | | | Level 3
Significant
Unobservable
Inputs | | | Total | |
Common Stocks | | $ | 1,584,706 | | | $ | — | | | $ | — | | | $ | 1,584,706 | |
Preferred Stocks | | | 82,727 | | | | — | | | | — | | | | 82,727 | |
Repurchase Agreements | | | — | | | | 1,106,058 | | | | — | | | | 1,106,058 | |
Securities Lending Collateral | | | 60,031 | | | | — | | | | — | | | | 60,031 | |
Total Assets | | $ | 1,727,464 | | | $ | 1,106,058 | | | $ | — | | | $ | 2,833,522 | |
Investments in Securities (Liabilities) | | Level 1
Quoted
Prices | | | Level 2
Significant
Observable
Inputs | | | Level 3
Significant
Unobservable
Inputs | | | Total | |
Equity Index Swap Agreements** | | $ | — | | | $ | 65,874 | | | $ | — | | | $ | 65,874 | |
** | This derivative is reported as unrealized appreciation/depreciation at period end. |
SEE NOTES TO FINANCIAL STATEMENTS. | THE RYDEX FUNDS ANNUAL REPORT | 35 |
EMERGING MARKETS 2x STRATEGY FUND | |
STATEMENT OF ASSETS AND LIABILITIES |
March 31, 2024 |
Assets: |
Investments, at value - including $55,827 of securities loaned (cost $1,287,097) | | $ | 1,727,464 | |
Repurchase agreements, at value (cost $1,106,058) | | | 1,106,058 | |
Cash | | | 64 | |
Receivables: |
Fund shares sold | | | 352,471 | |
Dividends | | | 3,210 | |
Interest | | | 652 | |
Securities lending income | | | 103 | |
Foreign tax reclaims | | | 54 | |
Total assets | | | 3,190,076 | |
| | | | | |
Liabilities: |
Unrealized depreciation on OTC swap agreements | | | 65,874 | |
Payable for: |
Return of securities lending collateral | | | 60,031 | |
Swap settlement | | | 39,543 | |
Fund shares redeemed | | | 19,553 | |
Management fees | | | 2,787 | |
Transfer agent fees | | | 1,600 | |
Distribution and service fees | | | 849 | |
Portfolio accounting and administration fees | | | 326 | |
Trustees’ fees* | | | 35 | |
Miscellaneous | | | 4,505 | |
Total liabilities | | | 195,103 | |
Net assets | | $ | 2,994,973 | |
| | | | | |
Net assets consist of: |
Paid in capital | | $ | 18,608,467 | |
Total distributable earnings (loss) | | | (15,613,494 | ) |
Net assets | | $ | 2,994,973 | |
CLASS A: |
Net assets | | $ | 199,289 | |
Capital shares outstanding | | | 3,540 | |
Net asset value per share | | $ | 56.30 | |
Maximum offering price per share (Net asset value divided by 95.25%) | | $ | 59.10 | |
CLASS C: |
Net assets | | $ | 109,666 | |
Capital shares outstanding | | | 2,134 | |
Net asset value per share | | $ | 51.39 | |
CLASS H: |
Net assets | | $ | 2,686,018 | |
Capital shares outstanding | | | 47,826 | |
Net asset value per share | | $ | 56.16 | |
STATEMENT OF OPERATIONS |
Year Ended March 31, 2024 |
Investment Income: |
Dividends (net of foreign withholding tax of $1,698) | | $ | 60,791 | |
Interest | | | 87,274 | |
Income from securities lending, net | | | 1,608 | |
Total investment income | | | 149,673 | |
| | | | | |
Expenses: |
Management fees | | | 30,764 | |
Distribution and service fees: |
Class A | | | 687 | |
Class C | | | 965 | |
Class H | | | 7,622 | |
Transfer agent fees | | | 7,719 | |
Portfolio accounting and administration fees | | | 7,008 | |
Interest expense | | | 3,161 | |
Professional fees | | | 1,633 | |
Custodian fees | | | 650 | |
Trustees’ fees* | | | 565 | |
Miscellaneous | | | 5,858 | |
Total expenses | | | 66,632 | |
Less: |
Expenses reimbursed by Adviser | | | (2,839 | ) |
Net expenses | | | 63,793 | |
Net investment income | | | 85,880 | |
| | | | | |
Net Realized and Unrealized Gain (Loss): |
Net realized gain (loss) on: |
Investments | | | (7,671 | ) |
Swap agreements | | | 391,118 | |
Futures contracts | | | (1,279 | ) |
Net realized gain | | | 382,168 | |
Net change in unrealized appreciation (depreciation) on: |
Investments | | | 166,650 | |
Swap agreements | | | (175,668 | ) |
Net change in unrealized appreciation (depreciation) | | | (9,018 | ) |
Net realized and unrealized gain | | | 373,150 | |
Net increase in net assets resulting from operations | | $ | 459,030 | |
* | Relates to Trustees not deemed “interested persons” within the meaning of Section 2(a)(19) of the 1940 Act. |
36 | THE RYDEX FUNDS ANNUAL REPORT | SEE NOTES TO FINANCIAL STATEMENTS. |
EMERGING MARKETS 2x STRATEGY FUND | |
STATEMENTS OF CHANGES IN NET ASSETS |
| | Year Ended
March 31,
2024 | | | Year Ended
March 31,
2023 | |
Increase (Decrease) in Net Assets from Operations: | | | | | | | | |
Net investment income | | $ | 85,880 | | | $ | 123,778 | |
Net realized gain (loss) on investments | | | 382,168 | | | | (2,360,959 | ) |
Net change in unrealized appreciation (depreciation) on investments | | | (9,018 | ) | | | 43,786 | |
Net increase (decrease) in net assets resulting from operations | | | 459,030 | | | | (2,193,395 | ) |
| | | | | | | | | |
Distributions to shareholders: | | | | | | | | |
Class A | | | (5,559 | ) | | | — | |
Class C | | | (1,980 | ) | | | — | |
Class H | | | (118,887 | ) | | | — | |
Total distributions to shareholders | | | (126,426 | ) | | | — | |
| | | | | | | | | |
Capital share transactions: | | | | | | | | |
Proceeds from sale of shares | | | | | | | | |
Class A | | | 1,709,814 | | | | 3,280,035 | |
Class C | | | 71,088 | | | | 137,269 | |
Class H | | | 95,653,191 | | | | 100,246,481 | |
Distributions reinvested | | | | | | | | |
Class A | | | 5,559 | | | | — | |
Class C | | | 1,880 | | | | — | |
Class H | | | 118,161 | | | | — | |
Cost of shares redeemed | | | | | | | | |
Class A | | | (1,844,361 | ) | | | (2,969,703 | ) |
Class C | | | (98,102 | ) | | | (246,621 | ) |
Class H | | | (96,053,650 | ) | | | (98,469,708 | ) |
Net increase (decrease) from capital share transactions | | | (436,420 | ) | | | 1,977,753 | |
Net decrease in net assets | | | (103,816 | ) | | | (215,642 | ) |
| | | | | | | | | |
Net assets: | | | | | | | | |
Beginning of year | | | 3,098,789 | | | | 3,314,431 | |
End of year | | $ | 2,994,973 | | | $ | 3,098,789 | |
| | | | | | | | | |
Capital share activity: | | | | | | | | |
Shares sold | | | | | | | | |
Class A | | | 31,716 | | | | 59,221 | |
Class C | | | 1,483 | | | | 2,793 | |
Class H | | | 1,824,086 | | | | 1,898,688 | |
Shares issued from reinvestment of distributions | | | | | | | | |
Class A | | | 108 | | | | — | |
Class C | | | 40 | | | | — | |
Class H | | | 2,291 | | | | — | |
Shares redeemed | | | | | | | | |
Class A | | | (35,082 | ) | | | (55,255 | ) |
Class C | | | (2,027 | ) | | | (5,051 | ) |
Class H | | | (1,826,338 | ) | | | (1,892,071 | ) |
Net increase (decrease) in shares | | | (3,723 | ) | | | 8,325 | |
SEE NOTES TO FINANCIAL STATEMENTS. | THE RYDEX FUNDS ANNUAL REPORT | 37 |
EMERGING MARKETS 2x STRATEGY FUND | |
This table is presented to show selected data for a share outstanding throughout each period and to assist shareholders in evaluating a Fund’s performance for the periods presented.
Class A | | Year Ended
March 31,
2024 | | | Year Ended
March 31,
2023 | | | Year Ended
March 31,
2022 | | | Year Ended
March 31,
2021 | | | Year Ended
March 31,
2020 | |
Per Share Data |
Net asset value, beginning of period | | $ | 54.39 | | | $ | 68.28 | | | $ | 116.33 | | | $ | 44.29 | | | $ | 71.02 | |
Income (loss) from investment operations: |
Net investment income (loss)a | | | 1.36 | | | | .89 | | | | (.03 | ) | | | (.94 | ) | | | .17 | |
Net gain (loss) on investments (realized and unrealized) | | | 1.76 | | | | (14.78 | ) | | | (48.02 | ) | | | 72.98 | | | | (26.42 | ) |
Total from investment operations | | | 3.12 | | | | (13.89 | ) | | | (48.05 | ) | | | 72.04 | | | | (26.25 | ) |
Less distributions from: |
Net investment income | | | (1.21 | ) | | | — | | | | — | | | | — | | | | (.48 | ) |
Total distributions | | | (1.21 | ) | | | — | | | | — | | | | — | | | | (.48 | ) |
Net asset value, end of period | | $ | 56.30 | | | $ | 54.39 | | | $ | 68.28 | | | $ | 116.33 | | | $ | 44.29 | |
|
Total Returnb | | | 5.93 | % | | | (20.35 | %) | | | (41.30 | %) | | | 162.66 | % | | | (37.27 | %) |
Ratios/Supplemental Data |
Net assets, end of period (in thousands) | | $ | 199 | | | $ | 370 | | | $ | 193 | | | $ | 647 | | | $ | 628 | |
Ratios to average net assets: |
Net investment income (loss) | | | 2.58 | % | | | 1.67 | % | | | (0.03 | %) | | | (1.10 | %) | | | 0.25 | % |
Total expenses | | | 1.91 | % | | | 1.85 | % | | | 1.75 | % | | | 1.83 | % | | | 1.86 | % |
Net expensesc | | | 1.84 | % | | | 1.82 | % | | | 1.75 | % | | | 1.83 | % | | | 1.86 | % |
Portfolio turnover rate | | | 905 | % | | | 416 | % | | | 266 | % | | | 632 | % | | | 974 | % |
Class C | | Year Ended
March 31,
2024 | | | Year Ended
March 31,
2023 | | | Year Ended
March 31,
2022 | | | Year Ended
March 31,
2021 | | | Year Ended
March 31,
2020 | |
Per Share Data |
Net asset value, beginning of period | | $ | 50.17 | | | $ | 63.47 | | | $ | 108.94 | | | $ | 41.79 | | | $ | 67.53 | |
Income (loss) from investment operations: |
Net investment income (loss)a | | | .79 | | | | .69 | | | | (.48 | ) | | | (1.69 | ) | | | (.28 | ) |
Net gain (loss) on investments (realized and unrealized) | | | 1.64 | | | | (13.99 | ) | | | (44.99 | ) | | | 68.84 | | | | (24.98 | ) |
Total from investment operations | | | 2.43 | | | | (13.30 | ) | | | (45.47 | ) | | | 67.15 | | | | (25.26 | ) |
Less distributions from: |
Net investment income | | | (1.21 | ) | | | — | | | | — | | | | — | | | | (.48 | ) |
Total distributions | | | (1.21 | ) | | | — | | | | — | | | | — | | | | (.48 | ) |
Net asset value, end of period | | $ | 51.39 | | | $ | 50.17 | | | $ | 63.47 | | | $ | 108.94 | | | $ | 41.79 | |
|
Total Returnb | | | 5.07 | % | | | (20.97 | %) | | | (41.74 | %) | | | 160.68 | % | | | (37.73 | %) |
Ratios/Supplemental Data |
Net assets, end of period (in thousands) | | $ | 110 | | | $ | 132 | | | $ | 311 | | | $ | 449 | | | $ | 161 | |
Ratios to average net assets: |
Net investment income (loss) | | | 1.64 | % | | | 1.43 | % | | | (0.55 | %) | | | (1.95 | %) | | | (0.44 | %) |
Total expenses | | | 2.68 | % | | | 2.57 | % | | | 2.50 | % | | | 2.57 | % | | | 2.60 | % |
Net expensesc | | | 2.60 | % | | | 2.54 | % | | | 2.50 | % | | | 2.57 | % | | | 2.60 | % |
Portfolio turnover rate | | | 905 | % | | | 416 | % | | | 266 | % | | | 632 | % | | | 974 | % |
38 | THE RYDEX FUNDS ANNUAL REPORT | SEE NOTES TO FINANCIAL STATEMENTS. |
EMERGING MARKETS 2x STRATEGY FUND | |
FINANCIAL HIGHLIGHTS (concluded) |
This table is presented to show selected data for a share outstanding throughout each period and to assist shareholders in evaluating a Fund’s performance for the periods presented.
Class H | | Year Ended
March 31,
2024 | | | Year Ended
March 31,
2023 | | | Year Ended
March 31,
2022 | | | Year Ended
March 31,
2021 | | | Year Ended
March 31,
2020 | |
Per Share Data |
Net asset value, beginning of period | | $ | 54.34 | | | $ | 68.26 | | | $ | 116.30 | | | $ | 44.29 | | | $ | 71.02 | |
Income (loss) from investment operations: |
Net investment income (loss)a | | | 1.32 | | | | 1.20 | | | | .01 | | | | (1.28 | ) | | | (.05 | ) |
Net gain (loss) on investments (realized and unrealized) | | | 1.71 | | | | (15.12 | ) | | | (48.05 | ) | | | 73.29 | | | | (26.20 | ) |
Total from investment operations | | | 3.03 | | | | (13.92 | ) | | | (48.04 | ) | | | 72.01 | | | | (26.25 | ) |
Less distributions from: |
Net investment income | | | (1.21 | ) | | | — | | | | — | | | | — | | | | (.48 | ) |
Total distributions | | | (1.21 | ) | | | — | | | | — | | | | — | | | | (.48 | ) |
Net asset value, end of period | | $ | 56.16 | | | $ | 54.34 | | | $ | 68.26 | | | $ | 116.30 | | | $ | 44.29 | |
|
Total Return | | | 5.78 | % | | | (20.41 | %) | | | (41.31 | %) | | | 162.59 | % | | | (37.27 | %) |
Ratios/Supplemental Data |
Net assets, end of period (in thousands) | | $ | 2,686 | | | $ | 2,597 | | | $ | 2,810 | | | $ | 6,808 | | | $ | 1,464 | |
Ratios to average net assets: |
Net investment income (loss) | | | 2.53 | % | | | 2.35 | % | | | 0.01 | % | | | (1.29 | %) | | | (0.07 | %) |
Total expenses | | | 1.93 | % | | | 1.82 | % | | | 1.75 | % | | | 1.81 | % | | | 1.87 | % |
Net expensesc | | | 1.85 | % | | | 1.76 | % | | | 1.75 | % | | | 1.81 | % | | | 1.87 | % |
Portfolio turnover rate | | | 905 | % | | | 416 | % | | | 266 | % | | | 632 | % | | | 974 | % |
a | Net investment income (loss) per share was computed using average shares outstanding throughout the period. |
b | Total return does not reflect the impact of any applicable sales charges. |
c | Net expense information reflects the expense ratios after expense waivers and reimbursements, as applicable. |
SEE NOTES TO FINANCIAL STATEMENTS. | THE RYDEX FUNDS ANNUAL REPORT | 39 |
PERFORMANCE REPORT AND FUND PROFILE (Unaudited) | March 31, 2024 |
INVERSE EMERGING MARKETS 2x STRATEGY FUND
OBJECTIVE: Seeks to provide investment results that correlate, before fees and expenses, to the performance of a specific benchmark on a daily basis. The Fund’s current benchmark is 200% of the inverse (opposite) of the performance of the S&P Emerging 50 ADR Index (the “underlying index”). The Fund does not seek to achieve its investment objective over a period of time greater than a single day.
For the Reporting Period, the Inverse Emerging Markets 2x Strategy Fund maintained a daily correlation of over 99% to its benchmark of -200% of the daily price movement of the S&P Emerging 50 ADR Index. Inverse Emerging Markets 2x Strategy Fund Class H returned -15.24%, while the S&P Emerging 50 ADR Index returned 9.01% over the same period.
The industries that contributed the most to the performance of the underlying index were semiconductors and semiconductor equipment, and oil and gas consumable fuels. The sectors that detracted the most were broadline retail and interactive media and services.
The stocks that contributed the most to the return of the underlying index were Taiwan Semiconductor Manufacturing Co. Ltd. ADR, PDD Holdings, Inc. ADR, and Petoleo Brasileiro Preferred SA ADR. The stocks that detracted the most were HDFC Bank Ltd. ADR, JD.com, Inc. ADR, and Alibaba Group Holding Ltd. ADR.
Derivatives in the Fund were used to help provide exposure to the composition of the benchmark in the most efficient manner and to provide leverage and not for hedging purposes. Derivatives performed as expected.
Due to the compounding of daily returns, the Fund’s returns over periods other than one day will likely differ in amount and possibly direction from the benchmark return for the same period. Investors should monitor their Fund holdings to ensure that they are consistent with their strategies, as frequently as daily.
The effects of compounding may cause the longer-term correlation of the Fund to its benchmark to diminish. A significant contributor to the discrepancy between the leveraged and unleveraged indices is the effect of compounding on the leveraged index, which is discussed under “A Brief Note on the Compounding of Returns.”
Performance displayed represents past performance, which is no guarantee of future results.
Holdings Diversification (Market Exposure as % of Net Assets)
“Holdings Diversification (Market Exposure as % of Net Assets)” excludes any temporary cash investments.
The Fund invests principally in derivative investments such as swap agreements.
Inception Dates: |
Class A | October 29, 2010 |
Class C | October 29, 2010 |
Class H | October 29, 2010 |
40 | THE RYDEX FUNDS ANNUAL REPORT | |
PERFORMANCE REPORT AND FUND PROFILE (Unaudited)(concluded) | March 31, 2024 |
Cumulative Fund Performance*
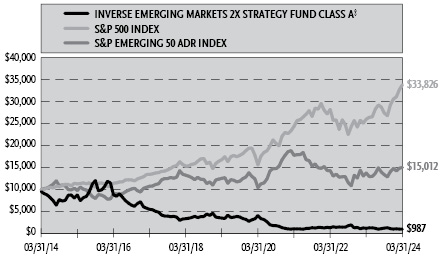
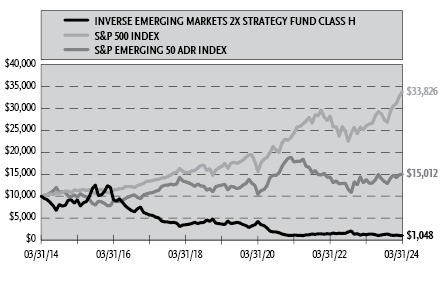
Average Annual Returns*
Periods Ended March 31, 2024
| 1 Year | 5 Year | 10 Year |
Class A Shares | (15.06%) | (22.41%) | (20.28%) |
Class A Shares with sales charge† | (19.09%) | (23.16%) | (20.67%) |
Class C Shares | (15.60%) | (22.63%) | (20.71%) |
Class C Shares with CDSC‡ | (16.42%) | (22.63%) | (20.71%) |
Class H Shares | (15.24%) | (22.13%) | (20.19%) |
S&P 500 Index | 29.88% | 15.05% | 12.96% |
S&P Emerging 50 ADR Index | 9.01% | 3.64% | 4.15% |
* | The performance data above represents past performance that is not predictive of future results. The investment return and principal value of an investment in the Fund will fluctuate so that an investor’s shares, when redeemed, may be worth more or less than their original cost. Returns are historical and include changes in principal and reinvested dividends and capital gains and do not reflect the effect of taxes. The S&P Emerging 50 ADR Index and the S&P 500 Index are unmanaged indices and, unlike the Fund, have no management fees or operating expenses to reduce their reported returns. The graphs are based on Class A shares and Class H shares only; performance for Class C shares will vary due to differences in fee structure. |
† | Fund returns are calculated using the maximum sales charge of 4.75%. |
‡ | Fund returns include a CDSC of 1% if redeemed within 12 months of purchase. |
| | THE RYDEX FUNDS ANNUAL REPORT | 41 |
SCHEDULE OF INVESTMENTS | March 31, 2024 |
INVERSE EMERGING MARKETS 2x STRATEGY FUND | |
| | Face
Amount | | | Value | |
REPURCHASE AGREEMENTS††,1 - 140.3% |
J.P. Morgan Securities LLC
issued 03/28/24 at 5.31%
due 04/01/242 | | $ | 294,919 | | | $ | 294,919 | |
BofA Securities, Inc.
issued 03/28/24 at 5.31%
due 04/01/242 | | | 113,431 | | | | 113,431 | |
Barclays Capital, Inc.
issued 03/28/24 at 5.30%
due 04/01/242 | | | 102,815 | | | | 102,815 | |
Total Repurchase Agreements | | | | |
(Cost $511,165) | | | | | | | 511,165 | |
| | | | | | | | | |
Total Investments - 140.3% | | | | |
(Cost $511,165) | | | 511,165 | |
Other Assets & Liabilities, net - (40.3)% | | | (146,879 | ) |
Total Net Assets - 100.0% | | $ | 364,286 | |
Total Return Swap Agreements |
Counterparty | Index | Type | | Financing
Rate | | Payment
Frequency | | | Maturity
Date | | | Units | | | Notional
Amount | | | Value and
Unrealized
Appreciation | |
OTC Equity Index Swap Agreements Sold Short†† |
BNP Paribas | S&P Emerging 50 ADR Index | Receive | | 5.13% (Federal Funds Rate - 0.20%) | | | At Maturity | | | | 06/26/24 | | | | 130 | | | $ | 359,771 | | | $ | 8,697 | |
Goldman Sachs International | S&P Emerging 50 ADR Index | Receive | | 4.58% (Federal Funds Rate - 0.75%) | | | At Maturity | | | | 06/26/24 | | | | 130 | | | | 359,615 | | | | 7,570 | |
| | | | | | | | | | | | | | | | | | | $ | 719,386 | | | $ | 16,267 | |
†† | Value determined based on Level 2 inputs — See Note 4. |
1 | Repurchase Agreements — See Note 6. |
2 | All or a portion of this security is pledged as equity index swap collateral at March 31, 2024. |
| | ADR — American Depositary Receipt |
| | |
| | See Sector Classification in Other Information section. |
42 | THE RYDEX FUNDS ANNUAL REPORT | SEE NOTES TO FINANCIAL STATEMENTS. |
SCHEDULE OF INVESTMENTS (concluded) | March 31, 2024 |
INVERSE EMERGING MARKETS 2x STRATEGY FUND | |
The following table summarizes the inputs used to value the Fund’s investments at March 31, 2024 (See Note 4 in the Notes to Financial Statements):
Investments in Securities (Assets) | | Level 1
Quoted
Prices | | | Level 2
Significant
Observable
Inputs | | | Level 3
Significant
Unobservable
Inputs | | | Total | |
Repurchase Agreements | | $ | — | | | $ | 511,165 | | | $ | — | | | $ | 511,165 | |
Equity Index Swap Agreements** | | | — | | | | 16,267 | | | | — | | | | 16,267 | |
Total Assets | | $ | — | | | $ | 527,432 | | | $ | — | | | $ | 527,432 | |
** | This derivative is reported as unrealized appreciation/depreciation at period end. |
SEE NOTES TO FINANCIAL STATEMENTS. | THE RYDEX FUNDS ANNUAL REPORT | 43 |
INVERSE EMERGING MARKETS 2x STRATEGY FUND | |
STATEMENT OF ASSETS AND LIABILITIES |
March 31, 2024 |
Assets: |
Repurchase agreements, at value (cost $511,165) | | $ | 511,165 | |
Unrealized appreciation on OTC swap agreements | | | 16,267 | |
Receivables: |
Fund shares sold | | | 27,797 | |
Interest | | | 301 | |
Total assets | | | 555,530 | |
| | | | | |
Liabilities: |
Payable for: |
Fund shares redeemed | | | 190,261 | |
Management fees | | | 303 | |
Transfer agent fees | | | 158 | |
Distribution and service fees | | | 88 | |
Portfolio accounting and administration fees | | | 36 | |
Swap settlement | | | 12 | |
Trustees’ fees* | | | 4 | |
Miscellaneous | | | 382 | |
Total liabilities | | | 191,244 | |
Net assets | | $ | 364,286 | |
| | | | | |
Net assets consist of: |
Paid in capital | | $ | 20,367,486 | |
Total distributable earnings (loss) | | | (20,003,200 | ) |
Net assets | | $ | 364,286 | |
CLASS A: |
Net assets | | $ | 60,357 | |
Capital shares outstanding | | | 5,505 | |
Net asset value per share | | $ | 10.96 | |
Maximum offering price per share (Net asset value divided by 95.25%) | | $ | 11.51 | |
CLASS C: |
Net assets | | $ | 5,094 | |
Capital shares outstanding | | | 473 | |
Net asset value per share | | $ | 10.77 | |
CLASS H: |
Net assets | | $ | 298,835 | |
Capital shares outstanding | | | 26,979 | |
Net asset value per share | | $ | 11.08 | |
STATEMENT OF OPERATIONS |
Year Ended March 31, 2024 |
Investment Income: |
Interest | | $ | 24,145 | |
Total investment income | | | 24,145 | |
| | | | | |
Expenses: |
Management fees | | | 4,048 | |
Distribution and service fees: |
Class A | | | 46 | |
Class C | | | 62 | |
Class H | | | 1,066 | |
Transfer agent fees | | | 1,018 | |
Portfolio accounting and administration fees | | | 924 | |
Registration fees | | | 524 | |
Professional fees | | | 196 | |
Trustees’ fees* | | | 94 | |
Custodian fees | | | 62 | |
Miscellaneous | | | 250 | |
Total expenses | | | 8,290 | |
Less: |
Expenses reimbursed by Adviser | | | (358 | ) |
Net expenses | | | 7,932 | |
Net investment income | | | 16,213 | |
| | | | | |
Net Realized and Unrealized Gain (Loss): |
Net realized gain (loss) on: |
Swap agreements | | | (134,331 | ) |
Net realized loss | | | (134,331 | ) |
Net change in unrealized appreciation (depreciation) on: |
Swap agreements | | | 26,165 | |
Net change in unrealized appreciation (depreciation) | | | 26,165 | |
Net realized and unrealized loss | | | (108,166 | ) |
Net decrease in net assets resulting from operations | | $ | (91,953 | ) |
* | Relates to Trustees not deemed “interested persons” within the meaning of Section 2(a)(19) of the 1940 Act. |
44 | THE RYDEX FUNDS ANNUAL REPORT | SEE NOTES TO FINANCIAL STATEMENTS. |
INVERSE EMERGING MARKETS 2x STRATEGY FUND | |
STATEMENTS OF CHANGES IN NET ASSETS |
| | Year Ended
March 31,
2024 | | | Year Ended
March 31,
2023 | |
Increase (Decrease) in Net Assets from Operations: | | | | | | | | |
Net investment income | | $ | 16,213 | | | $ | 6,878 | |
Net realized loss on investments | | | (134,331 | ) | | | (44,584 | ) |
Net change in unrealized appreciation (depreciation) on investments | | | 26,165 | | | | (76,311 | ) |
Net decrease in net assets resulting from operations | | | (91,953 | ) | | | (114,017 | ) |
| | | | | | | | | |
Distributions to shareholders: | | | | | | | | |
Class A | | | (185 | ) | | | — | |
Class C | | | (169 | ) | | | — | |
Class H | | | (14,212 | ) | | | — | |
Total distributions to shareholders | | | (14,566 | ) | | | — | |
| | | | | | | | | |
Capital share transactions: | | | | | | | | |
Proceeds from sale of shares | | | | | | | | |
Class A | | | 460,042 | | | | 544,771 | |
Class C | | | 17,007 | | | | 79,314 | |
Class H | | | 25,735,086 | | | | 47,202,687 | |
Distributions reinvested | | | | | | | | |
Class A | | | 185 | | | | — | |
Class C | | | 169 | | | | — | |
Class H | | | 14,168 | | | | — | |
Cost of shares redeemed | | | | | | | | |
Class A | | | (406,762 | ) | | | (544,324 | ) |
Class C | | | (17,060 | ) | | | (76,129 | ) |
Class H | | | (25,809,602 | ) | | | (47,901,477 | ) |
Net decrease from capital share transactions | | | (6,767 | ) | | | (695,158 | ) |
Net decrease in net assets | | | (113,286 | ) | | | (809,175 | ) |
| | | | | | | | | |
Net assets: | | | | | | | | |
Beginning of year | | | 477,572 | | | | 1,286,747 | |
End of year | | $ | 364,286 | | | $ | 477,572 | |
| | | | | | | | | |
Capital share activity: | | | | | | | | |
Shares sold | | | | | | | | |
Class A | | | 36,934 | | | | 32,880 | |
Class C | | | 1,411 | | | | 4,768 | |
Class H | | | 1,992,537 | | | | 2,904,991 | |
Shares issued from reinvestment of distributions | | | | | | | | |
Class A | | | 15 | | | | — | |
Class C | | | 14 | | | | — | |
Class H | | | 1,139 | | | | — | |
Shares redeemed | | | | | | | | |
Class A | | | (31,950 | ) | | | (33,335 | ) |
Class C | | | (1,411 | ) | | | (4,767 | ) |
Class H | | | (2,001,240 | ) | | | (2,953,864 | ) |
Net decrease in shares | | | (2,551 | ) | | | (49,327 | ) |
SEE NOTES TO FINANCIAL STATEMENTS. | THE RYDEX FUNDS ANNUAL REPORT | 45 |
INVERSE EMERGING MARKETS 2x STRATEGY FUND | |
This table is presented to show selected data for a share outstanding throughout each period and to assist shareholders in evaluating a Fund’s performance for the periods presented.
Class A | | Year Ended
March 31,
2024 | | | Year Ended
March 31,
2023 | | | Year Ended
March 31,
2022 | | | Year Ended
March 31,
2021 | | | Year Ended
March 31,
2020 | |
Per Share Data |
Net asset value, beginning of period | | $ | 13.28 | | | $ | 15.03 | | | $ | 12.44 | | | $ | 46.71 | | | $ | 40.57 | |
Income (loss) from investment operations: |
Net investment income (loss)a | | | .47 | | | | .11 | | | | (.23 | ) | | | (.54 | ) | | | (.16 | ) |
Net gain (loss) on investments (realized and unrealized) | | | (2.42 | ) | | | (1.86 | ) | | | 2.82 | | | | (33.73 | ) | | | 6.64 | |
Total from investment operations | | | (1.95 | ) | | | (1.75 | ) | | | 2.59 | | | | (34.27 | ) | | | 6.48 | |
Less distributions from: |
Net investment income | | | (.37 | ) | | | — | | | | — | | | | — | | | | (.34 | ) |
Total distributions | | | (.37 | ) | | | — | | | | — | | | | — | | | | (.34 | ) |
Net asset value, end of period | | $ | 10.96 | | | $ | 13.28 | | | $ | 15.03 | | | $ | 12.44 | | | $ | 46.71 | |
|
Total Returnb | | | (15.06 | %) | | | (11.64 | %) | | | 20.82 | % | | | (73.37 | %) | | | 16.30 | % |
Ratios/Supplemental Data |
Net assets, end of period (in thousands) | | $ | 60 | | | $ | 7 | | | $ | 14 | | | $ | 2 | | | $ | 147 | |
Ratios to average net assets: |
Net investment income (loss) | | | 3.72 | % | | | 0.65 | % | | | (1.86 | %) | | | (1.81 | %) | | | (0.37 | %) |
Total expenses | | | 1.82 | % | | | 2.00 | % | | | 1.87 | % | | | 1.86 | % | | | 1.89 | % |
Net expensesc | | | 1.75 | % | | | 1.97 | % | | | 1.87 | % | | | 1.86 | % | | | 1.89 | % |
Portfolio turnover rate | | | — | | | | — | | | | — | | | | — | | | | — | |
Class C | | Year Ended
March 31,
2024 | | | Year Ended
March 31,
2023 | | | Year Ended
March 31,
2022 | | | Year Ended
March 31,
2021 | | | Year Ended
March 31,
2020 | |
Per Share Data |
Net asset value, beginning of period | | $ | 13.14 | | | $ | 15.02 | | | $ | 12.40 | | | $ | 46.82 | | | $ | 40.45 | |
Income (loss) from investment operations: |
Net investment income (loss)a | | | .39 | | | | .01 | | | | (.36 | ) | | | (.69 | ) | | | (.31 | ) |
Net gain (loss) on investments (realized and unrealized) | | | (2.39 | ) | | | (1.89 | ) | | | 2.98 | | | | (33.73 | ) | | | 7.02 | |
Total from investment operations | | | (2.00 | ) | | | (1.88 | ) | | | 2.62 | | | | (34.42 | ) | | | 6.71 | |
Less distributions from: |
Net investment income | | | (.37 | ) | | | — | | | | — | | | | — | | | | (.34 | ) |
Total distributions | | | (.37 | ) | | | — | | | | — | | | | — | | | | (.34 | ) |
Net asset value, end of period | | $ | 10.77 | | | $ | 13.14 | | | $ | 15.02 | | | $ | 12.40 | | | $ | 46.82 | |
|
Total Returnb | | | (15.60 | %) | | | (12.52 | %) | | | 21.13 | % | | | (73.52 | %) | | | 16.96 | % |
Ratios/Supplemental Data |
Net assets, end of period (in thousands) | | $ | 5 | | | $ | 6 | | | $ | 7 | | | $ | 6 | | | $ | 103 | |
Ratios to average net assets: |
Net investment income (loss) | | | 3.08 | % | | | 0.08 | % | | | (2.44 | %) | | | (2.62 | %) | | | (1.09 | %) |
Total expenses | | | 2.59 | % | | | 2.76 | % | | | 2.48 | % | | | 2.66 | % | | | 2.79 | % |
Net expensesc | | | 2.51 | % | | | 2.73 | % | | | 2.48 | % | | | 2.66 | % | | | 2.79 | % |
Portfolio turnover rate | | | — | | | | — | | | | — | | | | — | | | | — | |
46 | THE RYDEX FUNDS ANNUAL REPORT | SEE NOTES TO FINANCIAL STATEMENTS. |
INVERSE EMERGING MARKETS 2x STRATEGY FUND | |
FINANCIAL HIGHLIGHTS (concluded) |
This table is presented to show selected data for a share outstanding throughout each period and to assist shareholders in evaluating a Fund’s performance for the periods presented.
Class H | | Year Ended
March 31,
2024 | | | Year Ended
March 31,
2023 | | | Year Ended
March 31,
2022 | | | Year Ended
March 31,
2021 | | | Year Ended
March 31,
2020 | |
Per Share Data |
Net asset value, beginning of period | | $ | 13.46 | | | $ | 15.17 | | | $ | 12.54 | | | $ | 46.39 | | | $ | 40.27 | |
Income (loss) from investment operations: |
Net investment income (loss)a | | | .43 | | | | .11 | | | | (.23 | ) | | | (.42 | ) | | | .07 | |
Net gain (loss) on investments (realized and unrealized) | | | (2.44 | ) | | | (1.82 | ) | | | 2.86 | | | | (33.43 | ) | | | 6.39 | |
Total from investment operations | | | (2.01 | ) | | | (1.71 | ) | | | 2.63 | | | | (33.85 | ) | | | 6.46 | |
Less distributions from: |
Net investment income | | | (.37 | ) | | | — | | | | — | | | | — | | | | (.34 | ) |
Total distributions | | | (.37 | ) | | | — | | | | — | | | | — | | | | (.34 | ) |
Net asset value, end of period | | $ | 11.08 | | | $ | 13.46 | | | $ | 15.17 | | | $ | 12.54 | | | $ | 46.39 | |
|
Total Return | | | (15.24 | %) | | | (11.27 | %) | | | 20.97 | % | | | (72.97 | %) | | | 16.40 | % |
Ratios/Supplemental Data |
Net assets, end of period (in thousands) | | $ | 299 | | | $ | 465 | | | $ | 1,265 | | | $ | 400 | | | $ | 649 | |
Ratios to average net assets: |
Net investment income (loss) | | | 3.61 | % | | | 0.66 | % | | | (1.70 | %) | | | (1.85 | %) | | | 0.19 | % |
Total expenses | | | 1.83 | % | | | 2.01 | % | | | 1.75 | % | | | 1.89 | % | | | 1.87 | % |
Net expensesc | | | 1.75 | % | | | 1.97 | % | | | 1.75 | % | | | 1.89 | % | | | 1.87 | % |
Portfolio turnover rate | | | — | | | | — | | | | — | | | | — | | | | — | |
a | Net investment income (loss) per share was computed using average shares outstanding throughout the period. |
b | Total return does not reflect the impact of any applicable sales charges. |
c | Net expense information reflects the expense ratios after expense waivers and reimbursements, as applicable. |
SEE NOTES TO FINANCIAL STATEMENTS. | THE RYDEX FUNDS ANNUAL REPORT | 47 |
PERFORMANCE REPORT AND FUND PROFILE (Unaudited) | March 31, 2024 |
EMERGING MARKETS BOND STRATEGY FUND
OBJECTIVE: Seeks to provide investment results that correlate, before fees and expenses, to the performance of the emerging markets bond market as defined by the Adviser.
For the Reporting Period, Emerging Markets Bond Strategy Fund Class H returned 8.62%. By comparison, the ICE Bank of America BBB & Lower Sovereign USD External Debt Index returned 12.51% over the same period.
During 2023 and the first quarter of 2024 credit default swap spreads decreased for most emerging market countries while global and local events contributed to positive performance for the Fund. Inflationary pressures continued to impact credit default swap spreads for some emerging market countries throughout 2023. Some countries experienced wider credit default swap spreads due to local political and economic instability as well as weather related issues that impacted the economy. The emerging markets countries that experienced increases in credit default swap spreads were Argentina and Panama. During this period, the Federal Republic of Nigeria and the Kingdom of Morocco were added to the credit default swap.
Egypt, Turkey, and the Dominican Republic experienced some of the larger decreases in credit default swap spreads. These countries benefited from increased growth expectations and improving local economies throughout 2023.
Derivatives in the Fund were used to help provide exposure to the composition of the benchmark in the most efficient manner and not for hedging purposes. Derivatives performed as expected.
Performance displayed represents past performance, which is no guarantee of future results.
Holdings Diversification (Market Exposure as % of Net Assets)
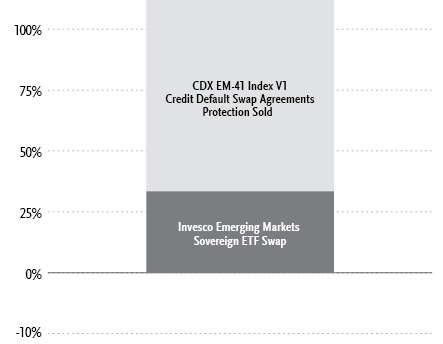
“Holdings Diversification (Market Exposure as % of Net Assets)” excludes any temporary cash investments.
The Fund invests principally in derivative investments such as swap agreements and futures contracts.
Inception Dates: |
Class A | October 8, 2013 |
Class C | October 8, 2013 |
Class H | October 8, 2013 |
48 | THE RYDEX FUNDS ANNUAL REPORT | |
PERFORMANCE REPORT AND FUND PROFILE (Unaudited)(concluded) | March 31, 2024 |
Cumulative Fund Performance*
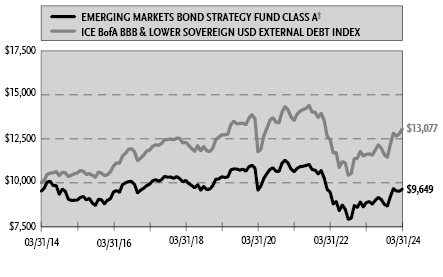
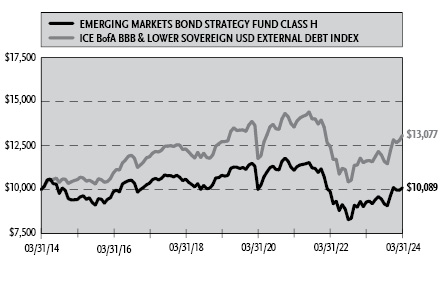
Average Annual Returns*
Periods Ended March 31, 2024
| 1 Year | 5 Year | 10 Year |
Class A Shares | 8.63% | (1.38%) | 0.13% |
Class A Shares with sales charge† | 3.47% | (2.34%) | (0.36%) |
Class C Shares | 7.81% | (2.13%) | (0.67%) |
Class C Shares with CDSC‡ | 6.84% | (2.13%) | (0.67%) |
Class H Shares | 8.62% | (1.36%) | 0.09% |
ICE BofA BBB & Lower Sovereign USD External Debt Index | 12.51% | 0.54% | 2.72% |
* | The performance data above represents past performance that is not predictive of future results. The investment return and principal value of an investment in the Fund will fluctuate so that an investor’s shares, when redeemed, may be worth more or less than their original cost. Returns are historical and include changes in principal and reinvested dividends and capital gains and do not reflect the effect of taxes. The ICE Bank of America BBB & Lower Sovereign USD External Debt Index is an unmanaged index and, unlike the Fund, has no management fees or operating expenses to reduce its reported return. The graphs are based on Class A shares and Class H shares only; performance for Class C shares will vary due to differences in fee structure. |
† | Fund returns are calculated using the maximum sales charge of 4.75%. |
‡ | Fund returns include a CDSC of 1% if redeemed within 12 months of purchase. |
| | THE RYDEX FUNDS ANNUAL REPORT | 49 |
SCHEDULE OF INVESTMENTS | March 31, 2024 |
EMERGING MARKETS BOND STRATEGY FUND | |
| | Face
Amount | | | Value | |
U.S. TREASURY BILLS†† - 0.6% |
U.S. Treasury Bills | | | | | | | | |
5.17% due 04/16/241,2 | | $ | 4,000 | | | $ | 3,992 | |
| | | | | | | | | |
Total U.S. Treasury Bills | | | | | | | | |
(Cost $3,992) | | | | | | | 3,992 | |
| | | | | | | | | |
REPURCHASE AGREEMENTS††,3 - 89.2% | | | | | | | | |
J.P. Morgan Securities LLC issued 03/28/24 at 5.31% due 04/01/244 | | | 307,615 | | | | 307,615 | |
BofA Securities, Inc. issued 03/28/24 at 5.31% due 04/01/244 | | | 118,313 | | | | 118,313 | |
Barclays Capital, Inc. issued 03/28/24 at 5.30% due 04/01/244 | | | 107,241 | | | | 107,241 | |
| | | | | | | | | |
Total Repurchase Agreements | | | | |
(Cost $533,169) | | | | | | | 533,169 | |
| | | | | | | | | |
Total Investments - 89.8% | | | | |
(Cost $537,161) | | $ | 537,161 | |
Other Assets & Liabilities, net - 10.2% | | | 60,990 | |
Total Net Assets - 100.0% | | $ | 598,151 | |
Futures Contracts |
Description | | Number of
Contracts | | | Expiration Date | | | Notional
Amount | | | Value and
Unrealized
Appreciation
(Depreciation)** | |
Interest Rate Futures Contracts Purchased† |
U.S. Treasury 5 Year Note Futures Contracts | | | 3 | | | | Jun 2024 | | | $ | 321,070 | | | $ | 643 | |
U.S. Treasury 10 Year Note Futures Contracts | | | 1 | | | | Jun 2024 | | | | 110,797 | | | | (986 | ) |
| | | | | | | | | | | $ | 431,867 | | | $ | (343 | ) |
Centrally Cleared Credit Default Swap Agreements Protection Sold†† |
Counterparty | Exchange | Index | | Protection
Premium
Rate | | | Payment
Frequency | | | Maturity
Date | | | Notional
Amount | | | Value | | | Upfront
Premiums
Received | | | Unrealized
Appreciation** | |
Barclays Bank plc | ICE | CDX.EM.41.V1 | 1.00% | | | Quarterly | | 06/20/29 | | $ | 470,000 | | | $ | (14,340 | ) | | $ | (15,297 | ) | | $ | 957 | |
Total Return Swap Agreements |
Counterparty | Index | Type | Financing
Rate | | Payment
Frequency | | | Maturity Date | | | Units | | | Notional
Amount | | | Value and
Unrealized
Appreciation | |
OTC Credit Index Swap Agreements†† |
Goldman Sachs International | Invesco Emerging Markets Sovereign Debt ETF | Pay | 5.93% (Federal Funds Rate + 0.60%) | | | At Maturity | | | | 04/25/24 | | | | 9,743 | | | $ | 199,634 | | | $ | 292 | |
** | Includes cumulative appreciation (depreciation). Variation margin is reported within the Statement of Assets and Liabilities. |
† | Value determined based on Level 1 inputs — See Note 4. |
†† | Value determined based on Level 2 inputs — See Note 4. |
1 | All or a portion of this security is pledged as futures collateral at March 31, 2024. |
2 | Rate indicated is the effective yield at the time of purchase. |
3 | Repurchase Agreements — See Note 6. |
4 | All or a portion of this security is pledged as credit index swap collateral at March 31, 2024. |
| | CDX.EM.41.V1 — Credit Default Swap Emerging Markets Series 41 Index Version 1 |
| | ICE — Intercontinental Exchange |
| | plc — Public Limited Company |
| | |
| | See Sector Classification in Other Information section. |
50 | THE RYDEX FUNDS ANNUAL REPORT | SEE NOTES TO FINANCIAL STATEMENTS. |
SCHEDULE OF INVESTMENTS (concluded) | March 31, 2024 |
EMERGING MARKETS BOND STRATEGY FUND | |
The following table summarizes the inputs used to value the Fund’s investments at March 31, 2024 (See Note 4 in the Notes to Financial Statements):
Investments in Securities (Assets) | | Level 1
Quoted
Prices | | | Level 2
Significant
Observable
Inputs | | | Level 3
Significant
Unobservable
Inputs | | | Total | |
U.S. Treasury Bills | | $ | — | | | $ | 3,992 | | | $ | — | | | $ | 3,992 | |
Repurchase Agreements | | | — | | | | 533,169 | | | | — | | | | 533,169 | |
Interest Rate Futures Contracts** | | | 643 | | | | — | | | | — | | | | 643 | |
Credit Default Swap Agreements** | | | — | | | | 957 | | | | — | | | | 957 | |
Credit Index Swap Agreements** | | | — | | | | 292 | | | | — | | | | 292 | |
Total Assets | | $ | 643 | | | $ | 538,410 | | | $ | — | | | $ | 539,053 | |
Investments in Securities (Liabilities) | | Level 1
Quoted
Prices | | | Level 2
Significant
Observable
Inputs | | | Level 3
Significant
Unobservable
Inputs | | | Total | |
Interest Rate Futures Contracts** | | $ | 986 | | | $ | — | | | $ | — | | | $ | 986 | |
** | This derivative is reported as unrealized appreciation/depreciation at period end. |
SEE NOTES TO FINANCIAL STATEMENTS. | THE RYDEX FUNDS ANNUAL REPORT | 51 |
EMERGING MARKETS BOND STRATEGY FUND | |
STATEMENT OF ASSETS AND LIABILITIES |
March 31, 2024 |
Assets: |
Investments, at value (cost $3,992) | | $ | 3,992 | |
Repurchase agreements, at value (cost $533,169) | | | 533,169 | |
Cash | | | 14 | |
Segregated cash with broker | | | 73,332 | |
Unrealized appreciation on OTC swap agreements | | | 292 | |
Receivables: |
Fund shares sold | | | 4,000 | |
Interest | | | 314 | |
Protection fees on credit default swap agreements | | | 144 | |
Total assets | | | 615,257 | |
| | | | | |
Liabilities: |
Unamortized upfront premiums received on credit default swap agreements | | | 15,297 | |
Payable for: |
Management fees | | | 382 | |
Variation margin on futures contracts | | | 291 | |
Transfer agent fees | | | 278 | |
Distribution and service fees | | | 134 | |
Portfolio accounting and administration fees | | | 79 | |
Fund shares redeemed | | | 73 | |
Swap settlement | | | 16 | |
Variation margin on credit default swap agreements | | | 8 | |
Trustees’ fees* | | | 7 | |
Miscellaneous | | | 541 | |
Total liabilities | | | 17,106 | |
Net assets | | $ | 598,151 | |
| | | | | |
Net assets consist of: |
Paid in capital | | $ | 1,173,108 | |
Total distributable earnings (loss) | | | (574,957 | ) |
Net assets | | $ | 598,151 | |
CLASS A: |
Net assets | | $ | 71,113 | |
Capital shares outstanding | | | 1,233 | |
Net asset value per share | | $ | 57.69 | |
Maximum offering price per share (Net asset value divided by 95.25%) | | $ | 60.57 | |
CLASS C: |
Net assets | | $ | 9,468 | |
Capital shares outstanding | | | 183 | |
Net asset value per share | | $ | 51.80 | |
CLASS H: |
Net assets | | $ | 517,570 | |
Capital shares outstanding | | | 9,023 | |
Net asset value per share | | $ | 57.36 | |
STATEMENT OF OPERATIONS |
Year Ended March 31, 2024 |
Investment Income: |
Interest | | $ | 63,107 | |
Total investment income | | | 63,107 | |
| | | | | |
Expenses: |
Management fees | | | 10,543 | |
Distribution and service fees: |
Class A | | | 260 | |
Class C | | | 193 | |
Class H | | | 3,209 | |
Transfer agent fees | | | 3,260 | |
Portfolio accounting and administration fees | | | 2,885 | |
Professional fees | | | 759 | |
Trustees’ fees* | | | 197 | |
Custodian fees | | | 192 | |
Miscellaneous | | | 1,635 | |
Total expenses | | | 23,133 | |
Less: |
Expenses reimbursed by Adviser | | | (203 | ) |
Net expenses | | | 22,930 | |
Net investment income | | | 40,177 | |
| | | | | |
Net Realized and Unrealized Gain (Loss): |
Net realized gain (loss) on: |
Swap agreements | | | (44,137 | ) |
Futures contracts | | | (60,720 | ) |
Net realized loss | | | (104,857 | ) |
Net change in unrealized appreciation (depreciation) on: |
Swap agreements | | | (12,733 | ) |
Futures contracts | | | (8,080 | ) |
Net change in unrealized appreciation (depreciation) | | | (20,813 | ) |
Net realized and unrealized loss | | | (125,670 | ) |
Net decrease in net assets resulting from operations | | $ | (85,493 | ) |
* | Relates to Trustees not deemed “interested persons” within the meaning of Section 2(a)(19) of the 1940 Act. |
52 | THE RYDEX FUNDS ANNUAL REPORT | SEE NOTES TO FINANCIAL STATEMENTS. |
EMERGING MARKETS BOND STRATEGY FUND | |
STATEMENTS OF CHANGES IN NET ASSETS |
| | Year Ended
March 31,
2024 | | | Year Ended
March 31,
2023 | |
Increase (Decrease) in Net Assets from Operations: | | | | | | | | |
Net investment income | | $ | 40,177 | | | $ | 2,866 | |
Net realized loss on investments | | | (104,857 | ) | | | (204,745 | ) |
Net change in unrealized appreciation (depreciation) on investments | | | (20,813 | ) | | | 17,028 | |
Net decrease in net assets resulting from operations | | | (85,493 | ) | | | (184,851 | ) |
| | | | | | | | | |
Distributions to shareholders: | | | | | | | | |
Class A | | | (12,775 | ) | | | — | |
Class C | | | (2,324 | ) | | | — | |
Class H | | | (71,481 | ) | | | — | |
Total distributions to shareholders | | | (86,580 | ) | | | — | |
| | | | | | | | | |
Capital share transactions: | | | | | | | | |
Proceeds from sale of shares | | | | | | | | |
Class A | | | 91,950 | | | | 248,714 | |
Class C | | | — | | | | 37,131 | |
Class H | | | 16,585,002 | | | | 4,538,351 | |
Distributions reinvested | | | | | | | | |
Class A | | | 12,775 | | | | — | |
Class C | | | 1,442 | | | | — | |
Class H | | | 68,368 | | | | — | |
Cost of shares redeemed | | | | | | | | |
Class A | | | (291,950 | ) | | | (30,106 | ) |
Class C | | | (13,350 | ) | | | (73,773 | ) |
Class H | | | (16,360,599 | ) | | | (4,461,930 | ) |
Net increase from capital share transactions | | | 93,638 | | | | 258,387 | |
Net increase (decrease) in net assets | | | (78,435 | ) | | | 73,536 | |
| | | | | | | | | |
Net assets: | | | | | | | | |
Beginning of year | | | 676,586 | | | | 603,050 | |
End of year | | $ | 598,151 | | | $ | 676,586 | |
| | | | | | | | | |
Capital share activity: | | | | | | | | |
Shares sold | | | | | | | | |
Class A | | | 1,555 | | | | 4,342 | |
Class C | | | — | | | | 686 | |
Class H | | | 285,343 | | | | 78,489 | |
Shares issued from reinvestment of distributions | | | | | | | | |
Class A | | | 229 | | | | — | |
Class C | | | 29 | | | | — | |
Class H | | | 1,232 | | | | — | |
Shares redeemed | | | | | | | | |
Class A | | | (5,085 | ) | | | (540 | ) |
Class C | | | (261 | ) | | | (1,367 | ) |
Class H | | | (284,219 | ) | | | (79,791 | ) |
Net increase (decrease) in shares | | | (1,177 | ) | | | 1,819 | |
SEE NOTES TO FINANCIAL STATEMENTS. | THE RYDEX FUNDS ANNUAL REPORT | 53 |
EMERGING MARKETS BOND STRATEGY FUND | |
This table is presented to show selected data for a share outstanding throughout each period and to assist shareholders in evaluating a Fund’s performance for the periods presented.
Class A | | Year Ended
March 31,
2024 | | | Year Ended
March 31,
2023 | | | Year Ended
March 31,
2022 | | | Year Ended
March 31,
2021 | | | Year Ended
March 31,
2020 | |
Per Share Data |
Net asset value, beginning of period | | $ | 58.60 | | | $ | 62.44 | | | $ | 70.11 | | | $ | 63.93 | | | $ | 74.95 | |
Income (loss) from investment operations: |
Net investment income (loss)a | | | 1.79 | | | | .60 | | | | (1.07 | ) | | | (1.14 | ) | | | .03 | |
Net gain (loss) on investments (realized and unrealized) | | | 3.08 | | | | (4.44 | ) | | | (6.60 | ) | | | 8.16 | | | | (4.86 | ) |
Total from investment operations | | | 4.87 | | | | (3.84 | ) | | | (7.67 | ) | | | 7.02 | | | | (4.83 | ) |
Less distributions from: |
Net investment income | | | (5.78 | ) | | | — | | | | — | | | | (.84 | ) | | | (2.36 | ) |
Net realized gains | | | — | | | | — | | | | — | | | | — | | | | (3.83 | ) |
Total distributions | | | (5.78 | ) | | | — | | | | — | | | | (.84 | ) | | | (6.19 | ) |
Net asset value, end of period | | $ | 57.69 | | | $ | 58.60 | | | $ | 62.44 | | | $ | 70.11 | | | $ | 63.93 | |
|
Total Returnb | | | 8.63 | % | | | (6.15 | %) | | | (10.98 | %) | | | 10.92 | % | | | (7.41 | %) |
Ratios/Supplemental Data |
Net assets, end of period (in thousands) | | $ | 71 | | | $ | 266 | | | $ | 46 | | | $ | 48 | | | $ | 1,105 | |
Ratios to average net assets: |
Net investment income (loss) | | | 3.07 | % | | | 1.06 | % | | | (1.54 | %) | | | (1.72 | %) | | | 0.03 | % |
Total expenses | | | 1.64 | % | | | 1.61 | % | | | 1.57 | % | | | 1.74 | % | | | 1.68 | % |
Net expensesc | | | 1.62 | % | | | 1.61 | % | | | 1.57 | % | | | 1.74 | % | | | 1.68 | % |
Portfolio turnover rate | | | — | | | | — | | | | — | | | | — | | | | — | |
Class C | | Year Ended
March 31,
2024 | | | Year Ended
March 31,
2023 | | | Year Ended
March 31,
2022 | | | Year Ended
March 31,
2021 | | | Year Ended
March 31,
2020 | |
Per Share Data |
Net asset value, beginning of period | | $ | 53.59 | | | $ | 57.52 | | | $ | 65.07 | | | $ | 59.82 | | | $ | 71.05 | |
Income (loss) from investment operations: |
Net investment income (loss)a | | | 1.35 | | | | (.04 | ) | | | (1.47 | ) | | | (1.56 | ) | | | (.46 | ) |
Net gain (loss) on investments (realized and unrealized) | | | 2.64 | | | | (3.89 | ) | | | (6.08 | ) | | | 7.65 | | | | (4.58 | ) |
Total from investment operations | | | 3.99 | | | | (3.93 | ) | | | (7.55 | ) | | | 6.09 | | | | (5.04 | ) |
Less distributions from: |
Net investment income | | | (5.78 | ) | | | — | | | | — | | | | (.84 | ) | | | (2.36 | ) |
Net realized gains | | | — | | | | — | | | | — | | | | — | | | | (3.83 | ) |
Total distributions | | | (5.78 | ) | | | — | | | | — | | | | (.84 | ) | | | (6.19 | ) |
Net asset value, end of period | | $ | 51.80 | | | $ | 53.59 | | | $ | 57.52 | | | $ | 65.07 | | | $ | 59.82 | |
|
Total Returnb | | | 7.81 | % | | | (6.83 | %) | | | (11.62 | %) | | | 10.10 | % | | | (8.13 | %) |
Ratios/Supplemental Data |
Net assets, end of period (in thousands) | | $ | 9 | | | $ | 22 | | | $ | 63 | | | $ | 52 | | | $ | 62 | |
Ratios to average net assets: |
Net investment income (loss) | | | 2.53 | % | | | (0.07 | %) | | | (2.28 | %) | | | (2.36 | %) | | | (0.61 | %) |
Total expenses | | | 2.37 | % | | | 2.35 | % | | | 2.31 | % | | | 2.40 | % | | | 2.42 | % |
Net expensesc | | | 2.34 | % | | | 2.35 | % | | | 2.31 | % | | | 2.40 | % | | | 2.42 | % |
Portfolio turnover rate | | | — | | | | — | | | | — | | | | — | | | | — | |
54 | THE RYDEX FUNDS ANNUAL REPORT | SEE NOTES TO FINANCIAL STATEMENTS. |
EMERGING MARKETS BOND STRATEGY FUND | |
FINANCIAL HIGHLIGHTS (concluded) |
This table is presented to show selected data for a share outstanding throughout each period and to assist shareholders in evaluating a Fund’s performance for the periods presented.
Class H | | Year Ended
March 31,
2024 | | | Year Ended
March 31,
2023 | | | Year Ended
March 31,
2022 | | | Year Ended
March 31,
2021 | | | Year Ended
March 31,
2020 | |
Per Share Data |
Net asset value, beginning of period | | $ | 58.30 | | | $ | 62.03 | | | $ | 69.64 | | | $ | 63.50 | | | $ | 74.52 | |
Income (loss) from investment operations: |
Net investment income (loss)a | | | 1.65 | | | | .40 | | | | (1.07 | ) | | | (1.14 | ) | | | .15 | |
Net gain (loss) on investments (realized and unrealized) | | | 3.19 | | | | (4.13 | ) | | | (6.54 | ) | | | 8.12 | | | | (4.98 | ) |
Total from investment operations | | | 4.84 | | | | (3.73 | ) | | | (7.61 | ) | | | 6.98 | | | | (4.83 | ) |
Less distributions from: |
Net investment income | | | (5.78 | ) | | | — | | | | — | | | | (.84 | ) | | | (2.36 | ) |
Net realized gains | | | — | | | | — | | | | — | | | | — | | | | (3.83 | ) |
Total distributions | | | (5.78 | ) | | | — | | | | — | | | | (.84 | ) | | | (6.19 | ) |
Net asset value, end of period | | $ | 57.36 | | | $ | 58.30 | | | $ | 62.03 | | | $ | 69.64 | | | $ | 63.50 | |
|
Total Return | | | 8.62 | % | | | (6.01 | %) | | | (10.93 | %) | | | 10.93 | % | | | (7.45 | %) |
Ratios/Supplemental Data |
Net assets, end of period (in thousands) | | $ | 518 | | | $ | 389 | | | $ | 494 | | | $ | 343 | | | $ | 307 | |
Ratios to average net assets: |
Net investment income (loss) | | | 2.85 | % | | | 0.70 | % | | | (1.52 | %) | | | (1.61 | %) | | | 0.20 | % |
Total expenses | | | 1.64 | % | | | 1.61 | % | | | 1.56 | % | | | 1.65 | % | | | 1.67 | % |
Net expensesc | | | 1.62 | % | | | 1.61 | % | | | 1.56 | % | | | 1.65 | % | | | 1.67 | % |
Portfolio turnover rate | | | — | | | | — | | | | — | | | | — | | | | — | |
a | Net investment income (loss) per share was computed using average shares outstanding throughout the period. |
b | Total return does not reflect the impact of any applicable sales charges. |
c | Net expense information reflects the expense ratios after expense waivers and reimbursements, as applicable. |
SEE NOTES TO FINANCIAL STATEMENTS. | THE RYDEX FUNDS ANNUAL REPORT | 55 |
NOTES TO FINANCIAL STATEMENTS |
Note 1 – Organization and Significant Accounting Policies
Organization
The Rydex Series Funds (the “Trust”), a Delaware statutory trust, is registered with the U.S. Securities and Exchange Commission (the “SEC”) under the Investment Company Act of 1940 (the ”1940 Act”), as an open-ended investment company of the series type. Each series, in effect, is representing a separate fund (each, a “Fund”). The Trust may issue an unlimited number of authorized shares. The Trust accounts for the assets of each Fund separately.
The Trust offers a combination of seven separate classes of shares: Investor Class shares, Class A shares, Class C shares, Class H shares, Class P shares, Institutional Class shares and Money Market Class shares. Sales of shares of each Class are made without a front-end sales charge at the net asset value per share (“NAV”), with the exception of Class A shares. Class A shares are sold at the NAV, plus the applicable front-end sales charge. The sales charge varies depending on the amount purchased, but will not exceed 4.75%. Class A share purchases of $1 million or more are exempt from the front-end sales charge but have a 1% contingent deferred sales charge (“CDSC”) if shares are redeemed within 12 months of purchase. Class C shares have a 1% CDSC if shares are redeemed within 12 months of purchase. Class C shares of each Fund automatically convert to Class A shares of the same Fund on or about the 10th day of the month following the 8-year anniversary of the purchase of the Class C shares. This conversion will be executed without any sales charge, fee or other charge. After the conversion is completed, the shares will be subject to all features and expenses of Class A shares. Institutional Class shares are offered primarily for direct investment by institutions such as pension and profit sharing plans, endowments, foundations and corporations. Institutional Class shares require a minimum initial investment of $2 million and a minimum account balance of $1 million. At March 31, 2024, the Trust consisted of fifty-two funds.
This report covers the following funds (collectively, the “Funds”):
Fund Name | Investment
Company Type |
Long Short Equity Fund | Non-diversified |
Emerging Markets 2x Strategy Fund | Non-diversified |
Inverse Emerging Markets 2x Strategy Fund | Non-diversified |
Emerging Markets Bond Strategy Fund | Diversified |
At March 31, 2024, Class A, Class C, Class H, Class P, and Institutional Class shares have been issued by the Funds.
The Emerging Markets 2x Strategy Fund, Inverse Emerging Markets 2x Strategy Fund and Emerging Markets Bond Strategy
Fund are designed and operated to accommodate frequent trading by shareholders and, unlike most mutual funds, offer unlimited exchange privileges with no minimum holding periods or transactions fees, which may cause the Funds to experience high portfolio turnover.
Security Investors, LLC (the “Adviser”), which operates under the name Guggenheim Investments (“GI”), provides advisory services. Guggenheim Funds Distributors, LLC (“GFD”) serves as distributor of the Funds’ shares. GI and GFD are affiliated entities.
Significant Accounting Policies
The Funds operate as investment companies and, accordingly, follow the investment company accounting and reporting guidance of the Financial Accounting Standards Board (“FASB”) Accounting Standards Codification Topic 946 Financial Services – Investment Companies.
The following significant accounting policies are in conformity with U.S. generally accepted accounting principles (“U.S. GAAP”) and are consistently followed by the Trust. This requires management to make estimates and assumptions that affect the reported amount of assets and liabilities, contingent assets and liabilities at the date of the financial statements, and the reported amounts of revenues and expenses during the reporting period. Actual results could differ from these estimates. All time references are based on Eastern Time.
The NAV of each share class of each Fund is calculated by dividing the market value of the Fund’s securities and other assets, less all liabilities attributable to the share class by the number of outstanding shares of the share class on the specified date.
The Trust calculates a NAV twice each business day; at 10:45 a.m. and at the close of the New York Stock Exchange (“NYSE”), usually 4:00 p.m. for the Emerging Markets 2x Strategy Fund, Inverse Emerging Markets 2x Strategy Fund and Emerging Markets Bond Strategy Fund. The Long Short Equity Fund prices its shares at the afternoon NAV. The NAV is calculated using the current market value of each Fund’s total assets as of the respective time of calculation. These financial statements are based on the afternoon NAV.
(a) Valuation of Investments
The Board of Trustees of the Trust (the “Board”) adopted policies and procedures for the valuation of the Funds’ investments (the “Fund Valuation Procedures”). The SEC adopted Rule 2a-5 under the 1940 Act (“Rule 2a-5”) which establishes requirements for determining fair value in good faith. Rule 2a-5 also defines “readily available market quotations” for purposes of the 1940 Act and establishes requirements for determining whether a fund must fair value a security in good faith.
56 | THE RYDEX FUNDS ANNUAL REPORT | |
NOTES TO FINANCIAL STATEMENTS (continued) |
Pursuant to Rule 2a-5, the Board has designated the Adviser as the valuation designee to perform fair valuation determinations for the Funds with respect to all Fund investments and other assets. As the Funds’ valuation designee pursuant to Rule 2a-5, the Adviser has adopted separate procedures (the “Valuation Designee Procedures” and collectively with the Fund Valuation Procedures, the “Valuation Procedures”) reasonably designed to prevent violations of the requirements of Rule 2a-5 and Rule 31a-4. The Adviser, in its role as valuation designee, utilizes the assistance of a valuation committee, consisting of representatives from Guggenheim’s investment management, fund administration, legal and compliance departments (the “Valuation Committee”), in determining the fair value of the Funds’ securities and other assets.
Valuations of the Funds’ securities and other assets are supplied primarily by pricing service providers appointed pursuant to the processes set forth in the Valuation Procedures. The Adviser, with the assistance of the Valuation Committee, convenes monthly, or more frequently as needed, to review the valuation of all assets which have been fair valued. The Adviser, consistent with the monitoring and review responsibilities set forth in the Valuation Procedures, regularly reviews the appropriateness of the inputs, methods, models and assumptions employed by the pricing service providers.
If a pricing service provider cannot or does not provide a valuation for a particular investment or such valuation is deemed unreliable, such investment is fair valued by the Adviser.
Equity securities listed or traded on a recognized U.S. securities exchange or the Nasdaq Stock Market (“NASDAQ”) will generally be valued on the basis of the last sale price on the primary U.S. exchange or market on which the security is listed or traded; provided, however, that securities listed on NASDAQ will be valued at the NASDAQ official closing price, which may not necessarily represent the last sale price.
Open-end investment companies are valued at their NAV as of the close of business, on the valuation date. Exchange-traded funds and closed-end investment companies are generally valued at the last quoted sale price.
U.S. Government securities are valued by pricing service providers, using the last traded fill price, or at the reported bid price at the close of business on the valuation date.
Commercial paper and discount notes with a maturity of greater than 60 days at acquisition are valued at prices that reflect brokerdealer supplied valuations or are obtained from pricing service providers, which may consider the trade activity, treasury spreads, yields or price of bonds of comparable quality, coupon, maturity, and type, as well as prices quoted by dealers who make markets in such securities. Commercial paper and discount notes with a maturity of 60 days or less at acquisition are valued at amortized cost, unless the Adviser concludes that amortized cost does not represent the fair value of the applicable asset in which case it will be valued using a pricing service provider.
Repurchase agreements are generally valued at amortized cost, provided such amounts approximate market value.
Futures contracts are valued on the basis of the last sale price as of 4:00 p.m. on the valuation date. In the event that the exchange for a specific futures contract closes earlier than 4:00 p.m., the futures contract is valued at the official settlement price of the exchange. However, the underlying securities from which the futures contract value is derived are monitored until 4:00 p.m. to determine if fair valuation of the underlying securities would provide a more accurate valuation of the futures contract.
Swap agreements entered into by a Fund are generally valued using an evaluated price provided by a pricing service provider.
Investments for which market quotations are not readily available are fair valued as determined in good faith by the Adviser. Valuations in accordance with these methods are intended to reflect each security’s (or asset’s or liability’s) “fair value”. Each such determination is based on a consideration of all relevant factors, which are likely to vary from one pricing context to another. Examples of such factors may include, but are not limited to market prices; sale prices; broker quotes; and models which derive prices based on inputs such as anticipated cash flows or collateral, spread over U.S. Treasury securities, and other information analysis. In connection with futures contracts and other derivative investments, such factors may include obtaining information as to how (a) these contracts and other derivative investments trade in the futures or other derivative markets, respectively, and (b) the securities underlying these contracts and other derivative investments trade in the cash market.
(b) Futures Contracts
Upon entering into a futures contract, a Fund deposits and maintains as collateral such initial margin as required by the exchange on which the transaction is affected. Pursuant to the contract, the Fund agrees to receive from or pay to the broker an amount of cash equal to the daily fluctuation in value of the contract. Such receipts or payments are known as variation margin and are recorded by the Fund as unrealized appreciation or depreciation. When the contract is closed, the Fund records a realized gain or loss equal to the difference between the value of the contract at the time it was opened and the value at the time it was closed.
| | THE RYDEX FUNDS ANNUAL REPORT | 57 |
NOTES TO FINANCIAL STATEMENTS (continued) |
(c) Swap Agreements
Swap agreements are marked-to-market daily and the change, if any, is recorded as unrealized appreciation or depreciation. Payments received or made as a result of an agreement or termination of an agreement are recognized as realized gains or losses.
Upon entering into certain centrally-cleared swap transactions, a Fund is required to deposit with its clearing broker an amount of cash or securities as an initial margin. Subsequent variation margin receipts or payments are received or made by the Fund depending on fluctuations in the fair value of the reference entity and are recorded by the Fund as unrealized appreciation or depreciation. When the contract is closed, the Fund records a realized gain or loss equal to the difference between the value of the contract at the time it was opened and the value at the time it was closed.
Upfront payments received or made by a Fund on credit default swap agreements and interest rate swap agreements are amortized over the expected life of the agreement. Periodic payments received or paid by a Fund are recorded as realized gains or losses. Payments received or made as a result of a credit event or termination of the contract are recognized, net of a proportional amount of the upfront payment, as realized gains or losses.
(d) Currency Translations
The accounting records of the Funds are maintained in U.S. dollars. All assets and liabilities initially expressed in foreign currencies are converted into U.S. dollars at prevailing exchange rates. Purchases and sales of investment securities, dividend and interest income, and certain expenses are translated at the rates of exchange prevailing on the respective dates of such transactions. Changes in the relationship of these foreign currencies to the U.S. dollar can significantly affect the value of the investments and earnings of the Funds. Foreign investments may also subject the Funds to foreign government exchange restrictions, expropriation, taxation, or other political, social, geopoliticall or economic developments, all of which could affect the market and/or credit risk of the investments.
The Funds do not isolate that portion of the results of operations resulting from changes in the foreign exchange rates on investments from the fluctuations arising from changes in the market prices of securities held. Such fluctuations are included with the net realized gain or loss and unrealized appreciation or depreciation on investments.
Reported net realized foreign exchange gains and losses arise from sales of foreign currencies and currency gains or losses realized between the trade and settlement dates on investment transactions. Net unrealized appreciation and depreciation arise from changes in the fair values of assets and liabilities other than investments in securities at the fiscal period end, resulting from changes in exchange rates.
(e) Foreign Taxes
The Funds may be subject to foreign taxes (a portion of which may be reclaimable) on income, stock dividends, capital gains on investments or certain foreign currency transactions. All foreign taxes are recorded in accordance with the applicable foreign tax regulations and rates that exist in the foreign jurisdictions in which the Funds invest. These foreign taxes, if any, are paid by the Funds and reflected in their Statements of Operations as follows: foreign taxes withheld at source are presented as a reduction of income and foreign taxes on capital gains from sales of investments are included with the net realized gain (loss) on investments. Foreign taxes payable or deferred as of March 31, 2024, if any, are disclosed in the Funds’ Statements of Assets and Liabilities.
(f) Security Transactions
Security transactions are recorded on the trade date for financial reporting purposes. Realized gains and losses from securities transactions are recorded using the identified cost basis. Proceeds from lawsuits related to investment holdings are recorded as a reduction to cost if the securities are still held and as realized gains if no longer held in the respective Fund. Dividend income is recorded on the ex-dividend date, net of applicable taxes withheld by foreign countries, if any. Taxable non-cash dividends are recorded as dividend income. Interest income, including amortization of premiums and accretion of discounts, is accrued on a daily basis. Dividend income from Real Estate Investment Trusts (“REITs”) is recorded based on the income included in the distributions received from the REIT investments using published REIT classifications, including some management estimates when actual amounts are not available. Distributions received in excess of this estimated amount are recorded as a reduction of the cost of investments or reclassified to realized gains. The actual amounts of income, return of capital, and realized gains are only determined by each REIT after its fiscal year-end, and may differ from the estimated amounts.
(g) Distributions
Distributions of net investment income and net realized gains, if any, are declared and paid at least annually. Dividends are reinvested in additional shares, unless shareholders request payment in cash. Distributions are recorded on the ex-dividend date and are determined in accordance with U.S. federal income tax regulations which may differ from U.S. GAAP.
58 | THE RYDEX FUNDS ANNUAL REPORT | |
NOTES TO FINANCIAL STATEMENTS (continued) |
(h) Class Allocations
Interest and dividend income, most expenses, all realized gains and losses, and all unrealized appreciation and depreciation are allocated to the share classes based upon the value of the outstanding shares in each share class. Certain costs, such as distribution and service fees are charged directly to specific share classes. In addition, certain expenses have been allocated to the individual Funds in the Trust based on the respective net assets of each Fund included in the Trust.
(i) Cash
The Funds may leave cash overnight in their cash account with the custodian. Periodically, a Fund may have cash due to the custodian bank as an overdraft balance. A fee is incurred on this overdraft, calculated by multiplying the overdraft by a rate based on the federal funds rate, which was 5.33% at March 31, 2024.
(j) Indemnifications
Under the Trust’s organizational documents, the Trustees and Officers of the Trust are indemnified against certain liabilities arising out of the performance of their duties to the Trust. In addition, throughout the normal course of business, the Trust, on behalf of the Funds, enters into contracts that contain a variety of representations and warranties which provide general indemnifications. The Funds’ maximum exposure under these arrangements is unknown, as this would involve future claims that may be made against the Funds and/or their affiliates that have not yet occurred. However, based on experience, the Funds expect the risk of loss to be remote.
Note 2 – Derivatives
As part of their investment strategies, the Funds may utilize a variety of derivative instruments. These investments involve, to varying degrees, elements of market risk and risks in excess of amounts recognized on the Funds’ Statements of Assets and Liabilities. Valuation and accounting treatment of these instruments can be found under Significant Accounting Policies in Note 1 of these Notes to Financial Statements.
Derivatives are instruments whose values depend on, or are derived from, in whole or in part, the value of one or more other assets, such as securities, currencies, commodities or indices. Derivative instruments may be used for investment purposes (including to maintain cash reserves while maintaining exposure to certain other assets), for risk management (hedging) purposes, to facilitate trading, to reduce transaction costs and to pursue higher investment returns. Derivative instruments may also be used to seek to mitigate certain investment risks, such as foreign currency exchange rate risk, interest rate risk and credit risk. U.S. GAAP requires disclosures to enable investors to better understand how and why a Fund uses derivative instruments, how these derivative instruments are accounted for and their effects on the Fund’s financial position and results of operations.
The Funds may utilize derivatives for the following purposes:
Duration: the use of an instrument to manage the interest rate risk of a portfolio.
Index Exposure: the use of an instrument to obtain exposure to a listed or other type of index.
Leverage: gaining total exposure to equities or other assets on the long and short sides at greater than 100% of invested capital.
Liquidity: the ability to buy or sell exposure with little price/market impact.
If a Fund’s investment strategy consistently involves applying leverage, the value of the Fund’s shares will tend to increase or decrease more than the value of any increase or decrease in the underlying index or other asset. In addition, because an investment in derivative instruments generally requires a small investment relative to the amount of investment exposure assumed, an opportunity for increased net income is created; but, at the same time, leverage risk will increase. A Fund’s use of leverage, through borrowings or instruments such as derivatives, may cause an investment in the Fund to be more volatile and riskier than if the Fund had not been leveraged.
Futures Contracts
A futures contract is an agreement to purchase (long) or sell (short) an agreed amount of securities or other instruments at a set price for delivery at a future date. There are significant risks associated with a Fund’s use of futures contracts, including (i) there may be an imperfect or no correlation between the changes in market value of the underlying asset and the prices of futures contracts; (ii) there may not be a liquid secondary market for a futures contract; (iii) trading restrictions or limitations may be imposed by an exchange; and (iv) government regulations may restrict trading in futures contracts. When investing in futures, there is minimal counterparty credit risk to a Fund because futures are exchange-traded and the exchange’s clearinghouse, as counterparty to all exchange-traded futures, guarantees against default. Cash deposits are shown as segregated cash with broker on the Funds’ Statements of Assets and Liabilities; securities held as collateral are noted on the Funds’ Schedules of Investments.
| | THE RYDEX FUNDS ANNUAL REPORT | 59 |
NOTES TO FINANCIAL STATEMENTS (continued) |
The following table represents the Funds’ use and volume of futures on a monthly basis:
| | | | Average Notional Amount | |
Fund | Use | | Long | | | Short | |
Emerging Markets Bond Strategy Fund | Duration, Index exposure, Leverage, Liquidity | | $ | 716,253 | | | $ | — | |
Swap Agreements
A swap is an agreement that obligates two parties to exchange a series of cash flows at specified intervals based upon or calculated by reference to changes in specified prices or rates for a specified amount of an underlying asset. When utilizing over-the-counter (“OTC”) swaps, a Fund bears the risk of loss of the amount expected to be received under a swap agreement in the event of the default or bankruptcy of a swap agreement counterparty or if the underlying asset declines in value. Certain standardized swaps are subject to mandatory central clearing and are executed on a multi-lateral or other trade facility platform, such as a registered exchange. There is limited counterparty credit risk with respect to centrally-cleared swaps as the transaction is facilitated through a central clearinghouse, much like exchange-traded futures contracts. For a Fund utilizing centrally-cleared swaps, the exchange bears the risk of loss resulting from a counterparty not being able to pay. There is no guarantee that a Fund or an underlying fund could eliminate its exposure under an outstanding swap agreement by entering into an offsetting swap agreement with the same or another party.
Total return and custom basket swaps involve commitments where single or multiple cash flows are exchanged based on the price of an underlying reference asset (such as an index or custom basket of securities) for a fixed or variable interest rate. Total return and custom basket swaps will usually be computed based on the current value of the reference asset as of the close of regular trading on the NYSE or other exchange, with the swap value being adjusted to include dividends accrued, financing charges and/or interest associated with the swap agreement. When utilizing total return or custom basket swaps, a Fund bears the risk of loss of the amount expected to be received under a swap agreement in the event of the default or bankruptcy of a swap agreement counterparty or if the underlying reference asset declines in value.
The following table represents the Funds’ use and volume of total return swaps on a monthly basis:
| | | | Average Notional Amount | |
Fund | Use | | Long | | | Short | |
Emerging Markets 2x Strategy Fund | Index exposure, Leverage, Liquidity | | $ | 5,177,425 | | | $ | — | |
Inverse Emerging Markets 2x Strategy Fund | Index exposure, Leverage, Liquidity | | | — | | | | 939,619 | |
Emerging Markets Bond Strategy Fund | Duration, Index exposure, Leverage, Liquidity | | | 390,011 | | | | — | |
The following table represents the Funds’ use and volume of custom basket swaps on a monthly basis:
| | | | Average Notional Amount | |
Fund | Use | | Long | | | Short | |
Long Short Equity Fund | Index exposure, Leverage | | $ | 15,120,741 | | | $ | 18,111,549 | |
Credit default swaps are instruments which allow for the full or partial transfer of third party credit risk, with respect to a particular entity or entities, from one counterparty to the other. A fund enters into credit default swaps as a “seller” or “buyer” of protection primarily to gain or reduce exposure to the investment grade and/or high yield bond market. A seller of credit default swaps is selling credit protection or assuming credit risk with respect to the underlying entity or entities. The buyer in a credit default swap is obligated to pay the seller a periodic stream of payments over the term of the contract provided that no event of default on an underlying reference obligation has occurred. If a credit event occurs, as defined under the terms of the swap agreement, the seller will either (i) pay to the buyer of protection an amount equal to the notional amount of the swap and take delivery of the referenced obligation or underlying securities comprising the referenced index or (ii) pay a net settlement amount in the form of cash or securities equal to the notional amount of the swap less the recovery value of the referenced obligation or underlying securities comprising the referenced index. The notional amount reflects the maximum potential amount the seller of credit protection could be required to pay to the buyer if a credit event occurs. The seller of protection receives periodic premium payments from the buyer and may also receive or pay an upfront premium adjustment to the stated periodic payments. In the event a credit default occurs on a credit default swap referencing an index, a factor adjustment will take place and the buyer of protection will receive a payment reflecting the par less the default recovery rate of the defaulted index component based on its weighting in the index. If no default occurs, the counterparty will
60 | THE RYDEX FUNDS ANNUAL REPORT | |
NOTES TO FINANCIAL STATEMENTS (continued) |
pay the stream of payments and have no further obligations to the fund selling the credit protection. For a fund utilizing centrally cleared credit default swaps, the exchange bears the risk of loss resulting from a counterparty not being able to pay. For OTC credit default swaps, a fund bears the risk of loss of the amount expected to be received under a swap agreement in the event of the default or bankruptcy of a swap agreement counterparty, or in the case of a credit default swap in which a fund is selling credit protection, the default of a third party issuer.
The quoted market prices and resulting market values for credit default swap agreements on securities and credit indices serve as an indicator of the current status of the payment/performance risk and represent the likelihood of an expected liability (or profit) for the credit derivative had the notional amount of the swap agreement been closed/sold as of the period end. Increasing market values, in absolute terms when compared to the notional amount of the swap, represent a deterioration of the referenced entity’s credit soundness and a greater likelihood or risk of default or other credit event occurring as defined under the terms of the agreement.
The following table represents the Funds’ use and volume of credit default swaps on a monthly basis:
| | | | Average Notional Amount | |
Fund | Use | | Protection Sold | | | Protection Purchased | |
Emerging Markets Bond Strategy Fund | Duration, Index exposure, Leverage, Liquidity | | $ | 933,333 | | | $ | — | |
Derivative Investment Holdings Categorized by Risk Exposure
The following is a summary of the location of derivative investments on the Funds’ Statements of Assets and Liabilities as of March 31, 2024:
Derivative Investment Type | Asset Derivatives | Liability Derivatives |
Interest rate futures contracts | — | Variation margin on futures contracts |
Credit/Equity swap agreements | Unrealized appreciation on OTC swap agreements | Unamortized upfront premiums received on credit default swap agreements |
| | Unrealized depreciation on OTC swap agreements |
| | | Variation margin on credit default swap agreements |
The following tables set forth the fair value of the Funds’ derivative investments categorized by primary risk exposure at March 31, 2024:
Asset Derivative Investments Value |
Fund | | Swaps
Equity
Risk | | | Futures
Interest Rate
Risk* | | | Swaps
Credit
Risk* | | | Total Value at
March 31,
2024 | |
Long Short Equity Fund | | $ | 2,055,176 | | | $ | — | | | $ | — | | | $ | 2,055,176 | |
Inverse Emerging Markets 2x Strategy Fund | | | 16,267 | | | | — | | | | — | | | | 16,267 | |
Emerging Markets Bond Strategy Fund | | | — | | | | 643 | | | | 1,249 | | | | 1,892 | |
Liability Derivative Investments Value |
Fund | | Swaps
Equity
Risk | | | Futures
Interest Rate
Risk* | | | Swaps
Credit
Risk* | | | Total Value at
March 31,
2024 | |
Long Short Equity Fund | | $ | 802,302 | | | $ | — | | | $ | — | | | $ | 802,302 | |
Emerging Markets 2x Strategy Fund | | | 65,874 | | | | — | | | | — | | | | 65,874 | |
Emerging Markets Bond Strategy Fund | | | — | | | | 986 | | | | — | | | | 986 | |
* | Includes cumulative appreciation (depreciation) of exchange-traded, OTC and centrally-cleared derivatives contracts as reported on the Schedules of Investments. For exchange-traded and centrally-cleared derivatives, variation margin is reported within the Funds’ Statements of Assets and Liabilities. |
| | THE RYDEX FUNDS ANNUAL REPORT | 61 |
NOTES TO FINANCIAL STATEMENTS (continued) |
The following is a summary of the location of derivative investments on the Funds’ Statements of Operations for the year ended March 31, 2024:
Derivative Investment Type | Location of Gain (Loss) on Derivatives |
Interest rate futures contracts | Net realized gain (loss) on futures contracts |
| Net change in unrealized appreciation (depreciation) on futures contracts |
Credit/Equity agreements | Net realized gain (loss) on swap agreements |
| Net change in unrealized appreciation (depreciation) on swap agreements |
The following is a summary of the Funds’ realized gain (loss) and change in unrealized appreciation (depreciation) on derivative investments recognized on the Funds’ Statements of Operations categorized by primary risk exposure for the year ended March 31, 2024:
Realized Gain (Loss) on Derivative Investments Recognized on the Statements of Operations |
Fund | | Futures
Equity
Risk | | | Swaps
Equity
Risk | | | Futures
Interest Rate
Risk | | | Swaps
Credit
Risk | | | Total | |
Long Short Equity Fund | | $ | — | | | $ | 466,209 | | | $ | — | | | $ | — | | | $ | 466,209 | |
Emerging Markets 2x Strategy Fund | | | (1,279 | ) | | | 391,118 | | | | — | | | | — | | | | 389,839 | |
Inverse Emerging Markets 2x Strategy Fund | | | — | | | | (134,331 | ) | | | — | | | | — | | | | (134,331 | ) |
Emerging Markets Bond Strategy Fund | | | — | | | | — | | | | (60,720 | ) | | | (44,137 | ) | | | (104,857 | ) |
| | | | | | | | | | | | | | | | | | | | | |
Change in Unrealized Appreciation (Depreciation) on Derivative Investments Recognized on the Statements of Operations |
Fund | | Futures
Equity
Risk | | | Swaps
Equity
Risk | | | Futures
Interest Rate
Risk | | | Swaps
Credit
Risk | | | Total | |
Long Short Equity Fund | | $ | — | | | $ | 48,555 | | | $ | — | | | $ | — | | | $ | 48,555 | |
Emerging Markets 2x Strategy Fund | | | — | | | | (175,668 | ) | | | — | | | | — | | | | (175,668 | ) |
Inverse Emerging Markets 2x Strategy Fund | | | — | | | | 26,165 | | | | — | | | | — | | | | 26,165 | |
Emerging Markets Bond Strategy Fund | | | — | | | | — | | | | (8,080 | ) | | | (12,733 | ) | | | (20,813 | ) |
In conjunction with the use of derivative instruments, the Funds are required to maintain collateral in various forms. Depending on the financial instrument utilized and the broker involved, the Funds use margin deposits at the broker, cash and/or securities segregated at the custodian bank, discount notes or repurchase agreements allocated to the Funds as collateral.
The Trust has established counterparty credit guidelines and enters into transactions only with financial institutions rated/identified as investment grade or better. The Trust monitors the counterparty credit risk associated with each such financial institution.
Foreign Investments
There are several risks associated with exposure to foreign currencies, foreign issuers and emerging markets. A fund’s indirect and direct exposure to foreign currencies subjects the Fund to the risk that those currencies will decline in value relative to the U.S. dollar, or in the case of short positions, that the U.S. dollar will decline in value relative to the currency being hedged. Currency rates in foreign countries may fluctuate significantly over short periods of time for a number of reasons, including changes in interest rates and the imposition of currency controls or other political developments in the U.S. or abroad. In addition, the Funds may incur transaction costs in connection with conversions between various currencies. The Funds may, but are not obligated to, engage in currency hedging transactions, which generally involve buying currency forward, options or futures contracts. However, not all currency risks may be effectively hedged, and in some cases the costs of hedging techniques may outweigh expected benefits. In such instances, the value of securities denominated in foreign currencies can change significantly when foreign currencies strengthen or weaken relative to the U.S. dollar.
The Funds may invest in securities of foreign companies directly, or in financial instruments, such as ADRs and exchange-traded funds, which are indirectly linked to the performance of foreign issuers. Foreign markets can be more volatile than the U.S. market due to increased risks of adverse issuer, political, regulatory, market, or economic developments and can perform differently from the U.S. market. Investing in securities
62 | THE RYDEX FUNDS ANNUAL REPORT | |
NOTES TO FINANCIAL STATEMENTS (continued) |
of foreign companies directly, or in financial instruments that are indirectly linked to the performance of foreign issuers, may involve risks not typically associated with investing in U.S. issuers. The value of securities denominated in foreign currencies, and of dividends from such securities, can change significantly when foreign currencies strengthen or weaken relative to the U.S. dollar. Foreign securities markets generally have less trading volume and less liquidity than U.S. markets, and prices in some foreign markets may fluctuate more than those of securities traded on U.S. markets. Many foreign countries lack accounting and disclosure standards comparable to those that apply to U.S. companies, and it may be more difficult to obtain reliable information regarding a foreign issuer’s financial condition and operations. Transaction costs and costs associated with custody services are generally higher for foreign securities than they are for U.S. securities. Some foreign governments levy withholding taxes against dividend and interest income. Although in some countries portions of these taxes are recoverable, the non-recovered portion will reduce the income received by the Funds.
Emerging markets, which consist of countries that have an emerging stock market as defined by Standard & Poor’s®, countries or markets with low- to middle-income economies as classified by the World Bank, and other countries or markets with similar characteristics as determined by GI, can be more volatile than the U.S. market due to increased risks of adverse issuer, political, regulatory, market, or economic developments and can perform differently from the U.S. market. Emerging markets can be subject to greater social, economic, regulatory, and political uncertainties and can be extremely volatile. As a result, the securities of emerging market issuers may present market, credit, currency, liquidity, legal, political and other risks different from, or greater than, the risks of investing in securities of developed foreign countries. In addition, the risks associated with investing in a narrowly defined geographic area are generally more pronounced with respect to investments in emerging market countries. The Fund may also be subject to this risk with respect to its investments in derivatives or other securities or financial instruments whose returns are related to the returns of emerging market securities.
Note 3 – Offsetting
In the normal course of business, the Funds enter into transactions subject to enforceable master netting arrangements or other similar arrangements. Generally, the right to offset in those agreements allows the Funds to counteract the exposure to a specific counterparty with collateral received from or delivered to that counterparty based on the terms of the arrangements. These arrangements provide for the right to liquidate upon the occurrence of an event of default, credit event upon merger or additional termination event.
In order to better define their contractual rights and to secure rights that will help the Funds mitigate their counterparty risk, the Funds may enter into an International Swaps and Derivatives Association, Inc. Master Agreement (“ISDA Master Agreement”) or similar agreement with their derivative contract counterparties. An ISDA Master Agreement is a bilateral agreement between a fund and a counterparty that governs OTC derivatives, including foreign exchange contracts, and typically contains, among other things, collateral posting terms and netting provisions in the event of a default and/or termination event. The provisions of the ISDA Master Agreement typically permit a single net payment in the event of a default (close-out netting) or similar event, including the bankruptcy or insolvency of the counterparty.
For derivatives traded under an ISDA Master Agreement, the collateral requirements are typically calculated by netting the mark-to-market amount for each transaction under such agreement and comparing that amount to the value of any collateral currently pledged by the Funds and the counterparty. For financial reporting purposes, cash collateral that has been pledged to cover obligations of the Funds and cash collateral received from the counterparty, if any, are reported separately on the Funds’ Statements of Assets and Liabilities as segregated cash with broker/receivable for variation margin, or payable for swap settlement/variation margin. Cash and/or securities pledged or received as collateral by the Funds in connection with an OTC derivative subject to an ISDA Master Agreement generally may not be invested, sold or rehypothecated by the counterparty or the Funds, as applicable, absent an event of default under such agreement, in which case such collateral generally may be applied towards obligations due to and payable by such counterparty or the Funds, as applicable. Generally, the amount of collateral due from or to a counterparty must exceed a minimum transfer amount threshold (e.g., $300,000) before a transfer is required to be made. To the extent amounts due to the Funds from their counterparties are not fully collateralized, contractually or otherwise, the Funds bear the risk of loss from counterparty nonperformance. The Funds attempt to mitigate counterparty risk by only entering into agreements with counterparties that they believe to be of good standing and by monitoring the financial stability of those counterparties.
For financial reporting purposes, the Funds do not offset derivative assets and derivative liabilities that are subject to netting arrangements in the Funds’ Statements of Assets and Liabilities.
| | THE RYDEX FUNDS ANNUAL REPORT | 63 |
NOTES TO FINANCIAL STATEMENTS (continued) |
The following tables present derivative financial instruments and secured financing transactions that are subject to enforceable netting arrangements:
| | | | | | | | | | | | | | | | Gross Amounts Not Offset
in the Statements of
Assets and Liabilities | | | | | |
Fund | Instrument | | Gross
Amounts of
Recognized
Assets1 | | | Gross
Amounts
Offset in the
Statements
of Assets and
Liabilities | | | Net Amount
of Assets
Presented on
the Statements
of Assets and
Liabilities | | | Financial
Instruments | | | Cash
Collateral
Received | | | Net
Amount | |
Long Short Equity Fund | Custom basket swap agreements | | $ | 2,055,176 | | | $ | — | | | $ | 2,055,176 | | | $ | (802,302 | ) | | $ | — | | | $ | 1,252,874 | |
Inverse Emerging Markets 2x Strategy Fund | Swap equity contracts | | | 16,267 | | | | — | | | | 16,267 | | | | — | | | | — | | | | 16,267 | |
Emerging Markets Bond Strategy Fund | Credit index swap agreements | | | 292 | | | | — | | | | 292 | | | | — | | | | — | | | | 292 | |
| | | | | | | | | | | | | | | | Gross Amounts Not Offset
in the Statements of
Assets and Liabilities | | | | | |
Fund | Instrument | | Gross
Amounts of
Recognized
Liabilities1 | | | Gross
Amounts
Offset in the
Statements
of Assets and
Liabilities | | | Net Amounts
of Liabilities
Presented on
the Statements
of Assets and
Liabilities | | | Financial
Instruments | | | Cash
Collateral
Pledged | | | Net
Amount | |
Long Short Equity Fund | Custom basket swap agreements | | $ | 802,302 | | | $ | — | | | $ | 802,302 | | | $ | (802,302 | ) | | $ | — | | | $ | — | |
Emerging Markets 2x Strategy Fund | Swap equity contracts | | | 65,874 | | | | — | | | | 65,874 | | | | (65,874 | ) | | | — | | | | — | |
1 | Exchange-traded or centrally-cleared derivatives are excluded from these reported amounts |
The Funds have the right to offset deposits against any related derivative liabilities outstanding with each counterparty with the exception of exchange-traded or centrally-cleared derivatives. The following table presents deposits held by others in connection with derivative investments as of March 31, 2024.
Fund | Counterparty | Asset Type | | Cash Pledged | | | Cash Received | |
Emerging Markets Bond Strategy Fund | Barclays Bank plc | Credit default swap agreements | | $ | 72,375 | | | $ | — | |
| | Goldman Sachs International | Futures contracts | | | 957 | | | | — | |
| | | | | $ | 73,332 | | | $ | — | |
Note 4 – Fair Value Measurement
In accordance with U.S. GAAP, fair value is defined as the price that the Funds would receive to sell an investment or pay to transfer a liability in an orderly transaction between market participants at the measurement date. U.S. GAAP establishes a three-tier fair value hierarchy based on the types of inputs used to value assets and liabilities and requires corresponding disclosure. The hierarchy and the corresponding inputs are summarized below:
Level 1 — | unadjusted quoted prices in active markets for identical assets or liabilities. |
Level 2 — | significant other observable inputs (for example quoted prices for securities that are similar based on characteristics such as interest rates, prepayment speeds, credit risk, etc.). |
64 | THE RYDEX FUNDS ANNUAL REPORT | |
NOTES TO FINANCIAL STATEMENTS (continued) |
Level 3 — | significant unobservable inputs based on the best information available under the circumstances, to the extent observable inputs are not available, which may include assumptions. |
Rule 2a-5 sets forth a definition of “readily available market quotations,” which is consistent with the definition of a Level 1 input under U.S. GAAP. Rule 2a-5 provides that “a market quotation is readily available only when that quotation is a quoted price (unadjusted) in active markets for identical investments that the fund can access at the measurement date, provided that a quotation will not be readily available if it is not reliable.”
Securities for which market quotations are not readily available must be valued at fair value as determined in good faith. Accordingly, any security priced using inputs other than Level 1 inputs will be subject to fair value requirements. The types of inputs available depend on a variety of factors, such as the type of security and the characteristics of the markets in which it trades, if any. Fair valuation determinations that rely on fewer or no observable inputs require greater judgment. Accordingly, fair value determinations for Level 3 securities require the greatest amount of judgment.
The inputs or methodologies selected and applied for valuing securities or other assets are not necessarily an indication of the risk associated with investing in those securities. The suitability, appropriateness and accuracy of the techniques, methodologies and sources employed to determine fair valuation are periodically reviewed and subject to change.
Note 5 – Investment Advisory Agreement and Other Agreements
Under the terms of an investment advisory contract, the Funds pay GI investment advisory fees on a monthly basis calculated daily at the annualized rates below, based on the average daily net assets of the Funds:
Fund | | Management Fees
(as a % of Net Assets) | |
Long Short Equity Fund | | | 0.90 | % |
Emerging Markets 2x Strategy Fund | | | 0.90 | % |
Inverse Emerging Markets 2x Strategy Fund | | | 0.90 | % |
Emerging Markets Bond Strategy Fund | | | 0.75 | % |
When the aggregate assets of each series of the Trust (excluding the Long Short Equity Fund, Managed Futures Strategy Fund and Multi-Hedge Strategies Fund) and each series of Rydex Dynamic Funds equal or exceed $10 billion, the advisory fee rate paid by each individual Fund (excluding the Long Short Equity Fund, Managed Futures Strategy Fund and Multi-Hedge Strategies Fund) will be reduced in accordance with the asset level and breakpoint schedule set forth below.
Fund Assets Under Management | | Fund Asset-Based
Breakpoint Reductions | |
$500 million - $1 billion | | | 0.025 | % |
> $1 billion - $2 billion | | | 0.050 | % |
> $2 billion | | | 0.075 | % |
GI pays operating expenses on behalf of the Trust, such as audit and accounting related services, legal services, custody, printing and mailing, among others, on a pass-through basis. Such expenses are allocated to various Funds within the complex based on relative net assets.
The Board has adopted a separate Distribution Plan applicable to Class A shares, Class H shares and Class P shares for which GFD and other firms that provide distribution and/or shareholder services (“Service Providers”) may receive compensation. If a Service Provider provides distribution services, the Funds will pay distribution fees to GFD at an annual rate not to exceed 0.25% of average daily net assets, pursuant to Rule 12b-1 of the 1940 Act. GFD, in turn, will pay the Service Provider out of its fees. GFD may, at its discretion, retain a portion of such payments to compensate itself for distribution services it performs.
| | THE RYDEX FUNDS ANNUAL REPORT | 65 |
NOTES TO FINANCIAL STATEMENTS (continued) |
The Board has adopted a separate Distribution and Shareholder Services Plan applicable to Class C shares that allows the Funds to pay annual distribution and service fees of 1.00% of the Funds’ Class C shares average daily net assets. The annual 0.25% service fee compensates a shareholder’s financial adviser for providing ongoing services to the shareholder. The annual distribution fee of 0.75% reimburses GFD for paying the shareholder’s financial adviser an ongoing sales commission. GFD advances the first year’s service and distribution fees to the financial adviser. GFD retains the service and distribution fees on accounts with no authorized dealer of record.
For the year ended March 31, 2024, GFD retained sales charges of $75,543 relating to sales of Class A shares of the Trust.
Effective August 1, 2022, GI has contractually agreed to waive and/or reimburse expenses for the Emerging Markets 2x Strategy Fund and the Inverse Emerging Markets 2x Strategy Fund in an amount equal to an annual percentage rate of 0.05% of each Fund’s average daily net assets. This agreement shall automatically renew for one-year terms, unless GI provides written notice to the Fund of the termination at least thirty days prior to the end of the then-current term. This agreement may be terminated at any time by the Fund’s Board upon sixty days’ written notice to the Adviser. In addition, the agreement will terminate automatically if the Advisory Agreement, with respect to a Fund, is terminated, with such termination effective upon the effective date of the termination of the Advisory Agreement.
On May 24, 2023, the Board approved a waiver and/or expense reimbursement arranagment whereby GI has agreed to waive and/or reimburse expenses for Emerging Markets 2x Strategy Fund, Inverse Emerging Markets 2x Strategy Fund and Emerging Markets Bond Fund in an amount equal to an annual percentage rate of 0.05% of each Fund’s average daily net assets. This arrangement went into effect on August 1, 2023 and the end of the initial term is August 1, 2024. This agreement shall automatically renew for one-year terms, unless GI provides written notice to the Fund of the termination at least thirty days prior to the end of the then-current term. This agreement may be terminated at any time by the Fund’s Board upon sixty days’ written notice to the Adviser. In addition, the agreement will terminate automatically if the Advisory Agreement, with respect to a Fund, is terminated, with such termination effective upon the effective date of the termination of the Advisory Agreement.
Certain trustees and officers of the Trust are also officers of GI and/or GFD. The Trust does not compensate its officers or trustees who are officers, directors and/or employees of GI or GFD.
MUFG Investor Services (US), LLC (“MUIS”) acts as the Funds’ administrator, transfer agent and accounting agent. As administrator, transfer agent and accounting agent, MUIS maintains the books and records of the Funds’ securities and cash. U.S. Bank, N.A. (“U.S. Bank”) acts as the Funds’ custodian. As custodian, U.S. Bank is responsible for the custody of the Funds’ assets. For providing the aforementioned services, MUIS and U.S. Bank are entitled to receive a monthly fee equal to an annual percentage of each Fund’s average daily net assets and out of pocket expenses.
Note 6 – Repurchase Agreements
The Funds transfer uninvested cash balances into a single joint account, the daily aggregate balance of which is invested in one or more repurchase agreements collateralized by obligations of the U.S. Treasury and U.S. government agencies. The joint account includes other funds in the Guggenheim complex not covered in this report. The collateral is in the possession of the Funds’ custodian and is evaluated to ensure that its market value exceeds, at a minimum, 102% of the original face amount of the repurchase agreements. Each Fund holds a pro rata share of the collateral based on the dollar amount of the repurchase agreement entered into by each Fund.
At March 31, 2024, the repurchase agreements in the joint account were as follows:
Counterparty and
Terms of Agreement | | Face Value | | | Repurchase Price | | | Collateral | | Par Value | | | Fair Value | |
J.P. Morgan Securities LLC | | | | | | | | | | U.S. Treasury Notes | | | | | | | | |
5.31% | | | | | | | | | | 0.25% - 5.00% | | | | | | | | |
Due 04/01/24 | | $ | 166,514,975 | | | $ | 166,588,658 | | | Due 03/31/24 - 02/15/33 | | $ | 172,847,100 | | | $ | 169,834,991 | |
| | | | | | | | | | | | | | | | | | | |
| | | | | | | | | | | U.S. Treasury Strips | | | | | | | | |
| | | | | | | | | | | 0.00% | | | | | | | | |
| | | | | | | | | | | Due 11/15/27 - 05/15/48 | | | 4,894 | | | | 4,141 | |
| | | | | | | | | | | | | | | | | | | |
| | | | | | | | | | | U.S. Treasury Bills | | | | | | | | |
| | | | | | | | | | | 0.00% | | | | | | | | |
| | | | | | | | | | | Due 04/11/24 - 05/02/24 | | | 4,500 | | | | 4,480 | |
| | | | | | | | | | | | | | | | | | | |
66 | THE RYDEX FUNDS ANNUAL REPORT | |
NOTES TO FINANCIAL STATEMENTS (continued) |
Counterparty and
Terms of Agreement | | Face Value | | | Repurchase Price | | | Collateral | | Par Value | | | Fair Value | |
| | | | | | | | | | | U.S. Treasury Bond | | | | | | | | |
| | | | | | | | | | | 4.50% | | | | | | | | |
| | | | | | | | | | | Due 05/15/38 | | $ | 800 | | | $ | 840 | |
| | | | | | | | | | | U.S. Treasury Inflation Indexed Bond | | | | | | | | |
| | | | | | | | | | | 0.13% | | | | | | | | |
| | | | | | | | | | | Due 04/15/27 | | | 874 | | | | 823 | |
| | | | | | | | | | | | | | 172,858,168 | | | | 169,845,275 | |
| | | | | | | | | | | | | | | | | | | |
BofA Securities, Inc. | | | | | | | | | | U.S. Treasury Note | | | | | | | | |
5.31% | | | | | | | | | | 0.75% | | | | | | | | |
Due 04/01/24 | | $ | 64,044,221 | | | $ | 64,072,561 | | | Due 03/31/26 | | | 70,171,700 | | | | 65,325,118 | |
| | | | | | | | | | | | | | | | | | | |
Barclays Capital, Inc. | | | | | | | | | | U.S. Treasury Notes | | | | | | | | |
5.30% | | | | | | | | | | 0.63% - 3.50% | | | | | | | | |
Due 04/01/24 | | | 58,050,546 | | | | 58,076,185 | | | Due 11/30/27 - 02/15/33 | | | 64,598,100 | | | | 59,211,567 | |
In the event of counterparty default, the Funds have the right to collect the collateral to offset losses incurred. There is potential loss to the Funds in the event the Funds are delayed or prevented from exercising their rights to dispose of the collateral securities, including the risk of a possible decline in the value of the underlying securities during the period while the Funds seek to assert their rights. GI, acting under the supervision of the Board, reviews the value of the collateral and the creditworthiness of those banks and dealers with which the Funds enter into repurchase agreements to evaluate potential risks.
Note 7 – Portfolio Securities Loaned
The Funds may lend their securities to approved brokers to earn additional income. Securities lending income shown on the Funds’ Statements of Operations is shown net of rebates paid to the borrowers and earnings on cash collateral investments shared with the lending agent. Within this arrangement, the Funds act as the lender, U.S. Bank acts as the lending agent, and other approved registered broker dealers act as the borrowers. The Funds receive cash collateral, valued at 102% of the value of the securities on loan. Under the terms of the Funds’ securities lending agreement with U.S. Bank, cash collateral and proceeds are invested in the First American Government Obligations Fund — Class X. The Funds bear the risk of loss on cash collateral investments. Collateral is maintained over the life of the loan in an amount not less than the value of loaned securities, as determined at the close of fund business each day; any additional collateral required due to changes in security values is delivered to the Funds the next business day. Although the collateral mitigates the risk, the Funds could experience a delay in recovering their securities and a possible loss of income or value if the borrower fails to return the securities. The Funds have the right under the securities lending agreement to recover the securities from the borrower on demand. Securities lending transactions are accounted for as secured borrowings. The remaining contractual maturity of the securities lending agreement is overnight and continuous.
At March 31, 2024, the following Funds participated in securities lending transactions, which are subject to enforceable netting arrangements, as follows:
| | | Gross Amounts Not Offset in the
Statements of Assets and Liabilities | | | | Securities Lending Collateral | |
Fund | | Value of
Securities
Loaned | | | Collateral
Received(a) | | | Net
Amount | | | | Cash
Collateral
Invested | | | Cash
Collateral
Uninvested | | | Total
Collateral | |
Long Short Equity Fund | | $ | 20,728 | | | $ | (20,728 | ) | | $ | — | | | | $ | 21,771 | | | $ | — | | | $ | 21,771 | |
Emerging Markets 2x Strategy Fund | | | 55,827 | | | | (55,827 | ) | | | — | | | | | 60,031 | | | | — | | | | 60,031 | |
(a) | Actual collateral received by the Fund is generally greater than the amount shown due to overcollateralization. |
In the event of counterparty default, the Funds have the right to collect the collateral to offset losses incurred. There is potential loss to the Funds in the event the Funds are delayed or prevented from exercising their rights to dispose of the collateral securities, including the risk of a possible decline in the value of the underlying securities during the period while the Funds seek to assert their rights. GI, acting under the supervision of the Board, reviews the value of the collateral and the creditworthiness of those banks and dealers to evaluate potential risks.
| | THE RYDEX FUNDS ANNUAL REPORT | 67 |
NOTES TO FINANCIAL STATEMENTS (continued) |
Note 8 – Federal Income Tax Information
The Funds intend to comply with the provisions of Subchapter M of the Internal Revenue Code of 1986, as amended (the “Internal Revenue Code”), applicable to regulated investment companies and will distribute substantially all taxable net investment income and capital gains sufficient to relieve the Funds from all, or substantially all, federal income, excise and state income taxes. Therefore, no provision for federal or state income tax or federal excise tax is required.
Tax positions taken or expected to be taken in the course of preparing the Funds’ tax returns are evaluated to determine whether the tax positions are “more-likely-than-not” of being sustained by the applicable tax authority. Tax positions not deemed to meet the “more-likely-than-not” threshold would be recorded as a tax benefit or expense in the current year. Management has analyzed the Funds’ tax positions taken, or to be taken, on U.S. federal income tax returns for all open tax years, and has concluded that no provision for income tax is required in the Funds’ financial statements. The Funds’ U.S. federal income tax returns are subject to examination by the Internal Revenue Service (“IRS”) for a period of three years after they are filed.
The tax character of distributions paid during the year ended March 31, 2024 was as follows:
Fund | | Ordinary
Income | | | Long-Term
Capital Gain | | | Total
Distributions | |
Long Short Equity Fund | | $ | 42,750 | | | $ | 102,411 | | | $ | 145,161 | |
Emerging Markets 2x Strategy Fund | | | 126,426 | | | | — | | | | 126,426 | |
Inverse Emerging Markets 2x Strategy Fund | | | 14,566 | | | | — | | | | 14,566 | |
Emerging Markets Bond Strategy Fund | | | 86,580 | | | | — | | | | 86,580 | |
The tax character of distributions paid during the year ended March 31, 2023 was as follows:
Fund | | Ordinary
Income | | | Long-Term
Capital Gain | | | Total
Distributions | |
Long Short Equity Fund | | $ | 64,373 | | | $ | — | | | $ | 64,373 | |
Note: For U.S. federal income tax purposes, short-term capital gain distributions are treated as ordinary income distributions.
The tax components of distributable earnings/(loss) as of March 31, 2024 were as follows:
Fund | | Undistributed
Ordinary
Income | | | Undistributed
Long-Term
Capital Gain | | | Net Unrealized
Appreciation
(Depreciation) | | | Accumulated
Capital and
Other Losses | | | Total | |
Long Short Equity Fund | | $ | — | | | $ | — | | | $ | 3,149,999 | | | $ | (1,128,200 | ) | | $ | 2,021,799 | |
Emerging Markets 2x Strategy Fund | | | 97,868 | | | | — | | | | 154,343 | | | | (15,865,705 | ) | | | (15,613,494 | ) |
Inverse Emerging Markets 2x Strategy Fund | | | 3,648 | | | | — | | | | 16,267 | | | | (20,023,115 | ) | | | (20,003,200 | ) |
Emerging Markets Bond Strategy Fund | | | 17,113 | | | | — | | | | 1,249 | | | | (593,319 | ) | | | (574,957 | ) |
For U.S. federal income tax purposes, capital loss carryforwards represent realized losses of the Funds that may be carried forward and applied against future capital gains. The Funds are permitted to carry forward capital losses for an unlimited period and such capital loss carryforwards retain their character as either short-term or long-term capital losses. As of March 31, 2024, capital loss carryforwards for the Funds were as follows:
| | | Unlimited | | | Total
Capital Loss
Carryforwards | |
Fund | | Short-Term | | | Long-Term | |
Long Short Equity Fund | | $ | (1,128,200 | ) | | $ | — | | | $ | (1,128,200 | ) |
Emerging Markets 2x Strategy Fund | | | (14,248,509 | ) | | | (1,617,196 | ) | | | (15,865,705 | ) |
Inverse Emerging Markets 2x Strategy Fund | | | (19,144,404 | ) | | | (878,711 | ) | | | (20,023,115 | ) |
Emerging Markets Bond Strategy Fund | | | (521,344 | ) | | | (71,975 | ) | | | (593,319 | ) |
68 | THE RYDEX FUNDS ANNUAL REPORT | |
NOTES TO FINANCIAL STATEMENTS (continued) |
For the year ended March 31, 2024, the following capital loss carryforward amounts were utilized:
Fund | | Utilized | |
Long Short Equity Fund | | $ | 1,797,036 | |
Emerging Markets 2x Strategy Fund | | | 258,988 | |
Net investment income and net realized gains (losses) may differ for financial statement and tax purposes because of temporary or permanent book/tax differences. These differences are primarily due to investments in swap agreements, losses deferred due to wash sales, distributions in connection with redemption of fund shares, reclassification of distributions, and the “mark-to-market,” recharacterization, or disposition of certain Passive Foreign Investment Companies (PFICs). Additional differences may result from the “mark-to-market” of certain derivatives and distributions in excess of income. To the extent these differences are permanent and would require a reclassification between Paid in Capital and Total Distributable Earnings (Loss), such reclassifications are made in the period that the differences arise. These reclassifications have no effect on net assets or NAV per share.
The following adjustments were made on the Statements of Assets and Liabilities as of March 31, 2024 for permanent book/tax differences:
Fund | | Paid In
Capital | | | Total
Distributable
Earnings/(Loss) | |
Long Short Equity Fund | | $ | (102,411 | ) | | $ | 102,411 | |
Inverse Emerging Markets 2x Strategy Fund | | | 1,413 | | | | (1,413 | ) |
Emerging Markets Bond Strategy Fund | | | 4,011 | | | | (4,011 | ) |
At March 31, 2024, the cost of investments for U.S. federal income tax purposes, the aggregate gross unrealized appreciation for all investments for which there was an excess of value over tax cost and the aggregate gross unrealized depreciation for all investments for which there was an excess of tax cost over value, were as follows:
Fund | | Tax
Cost | | | Tax
Unrealized
Appreciation | | | Tax
Unrealized
Depreciation | | | Net Tax
Unrealized
Appreciation/
(Depreciation) | |
Long Short Equity Fund | | $ | 15,012,612 | | | $ | 4,040,689 | | | $ | (890,690 | ) | | $ | 3,149,999 | |
Emerging Markets 2x Strategy Fund | | | 2,613,305 | | | | 235,333 | | | | (80,990 | ) | | | 154,343 | |
Inverse Emerging Markets 2x Strategy Fund | | | 511,165 | | | | 16,267 | | | | — | | | | 16,267 | |
Emerging Markets Bond Strategy Fund | | | 537,161 | | | | 1,249 | | | | — | | | | 1,249 | |
Note 9 – Securities Transactions
For the year ended March 31, 2024, the cost of purchases and proceeds from sales of investment securities, excluding government securities, short-term investments and derivatives, were as follows:
Fund | | Purchases | | | Sales | |
Long Short Equity Fund | | $ | 58,560,218 | | | $ | 57,858,028 | |
Emerging Markets 2x Strategy Fund | | | 16,823,979 | | | | 16,369,627 | |
The Funds are permitted to purchase or sell securities from or to certain affiliated funds under specified conditions outlined in procedures adopted by the Board. The procedures have been designed to ensure that any purchase or sale of securities by a Fund from or to another fund or portfolio that is or could be considered an affiliate by virtue of having a common investment adviser (or affiliated investment advisers), common
| | THE RYDEX FUNDS ANNUAL REPORT | 69 |
NOTES TO FINANCIAL STATEMENTS (concluded) |
trustees and/or common officers complies with Rule 17a-7 of the 1940 Act. Further, as defined under these procedures, each transaction is effected at the current market price. For the year ended March 31, 2024, the Funds engaged in purchases and sales of securities pursuant to Rule 17a-7 of the 1940 Act, as follows:
Fund | | Purchases | | | Sales | | | Realized
Loss | |
Emerging Markets 2x Strategy Fund | | $ | 197,249 | | | $ | 82,179 | | | $ | (762 | ) |
Note 10 – Line of Credit
The Trust, along with other affiliated trusts, secured an uncommitted $200,000,000 line of credit from U.S. Bank, N.A. On June 5, 2023, the line of credit agreement was renewed and expires on June 3, 2024. This line of credit is reserved for emergency or temporary purposes. Borrowings, if any, under this arrangement bear interest equal to the Prime Rate, minus 2%, which shall be paid monthly, averaging 6.39% for the year ended March 31, 2024. The Funds did not have any borrowings outstanding under this agreement at March 31, 2024.
The average daily balances borrowed for the year ended March 31, 2024, were as follows:
Fund | | Average Daily Balance | |
Long Short Equity Fund | | $ | 23,541 | |
Note 11 – Market Risks
The value of, or income generated by, the investments held by the Funds are subject to the possibility of rapid and unpredictable fluctuation, and loss that may result from various factors. These factors include, among others, developments affecting individual companies, or from broader influences, including real or perceived changes in prevailing interest rates (which may change at any time based on changes in monetary policies and various market and other economic conditions), changes in inflation rates or expectations about inflation rates, adverse investor confidence or sentiment, changing economic, political (including geopolitical), social or financial market conditions, increased instability or general uncertainty, environmental disasters, governmental actions, public health emergencies (such as the spread of infectious diseases, pandemics and epidemics), debt crises, actual or threatened wars or other armed conflicts (such as the ongoing Russia-Ukraine conflict and its collateral economic and other effects, including, but not limited to, sanctions and other international trade barriers) or ratings downgrades, and other similar events, each of which may be temporary or last for extended periods. Moreover, changing economic, political, geopolitical, social, financial market or other conditions in one country, geographic region or industry could adversely affect the value, yield and return of the investments held by the Funds in a different country, geographic region, economy, industry or market because of the increasingly interconnected global economies and financial markets. The duration and extent of the foregoing types of factors or conditions are highly uncertain and difficult to predict and have in the past, and may in the future, cause volatility and distress in economies and financial markets or other adverse circumstances, which may negatively affect the value of the Funds’ investments and performance of the Funds.
Note 12 – Subsequent Events
The Funds evaluated subsequent events through the date the financial statements are issued and determined there were no material events that would require adjustment to or disclosure in the Funds’ financial statements.
70 | THE RYDEX FUNDS ANNUAL REPORT | |
REPORT OF INDEPENDENT REGISTERED PUBLIC ACCOUNTING FIRM |
To the Shareholders of Guggenheim Long Short Equity Fund, Rydex Emerging Markets 2x Strategy Fund, Rydex Inverse Emerging Markets 2x Strategy Fund and Rydex Emerging Markets Bond Strategy Fund and the Board of Trustees of Rydex Series Funds
Opinion on the Financial Statements
We have audited the accompanying statements of assets and liabilities of Guggenheim Long Short Equity Fund, Rydex Emerging Markets 2x Strategy Fund, Rydex Inverse Emerging Markets 2x Strategy Fund and Rydex Emerging Markets Bond Strategy Fund (collectively referred to as the “Funds”), (four of the funds constituting Rydex Series Funds (the “Trust”)), including the schedules of investments, as of March 31, 2024, and the related statements of operations for the year then ended, the statements of changes in net assets for each of the two years in the period then ended, the financial highlights for each of the five years in the period then ended and the related notes (collectively referred to as the “financial statements”). In our opinion, the financial statements present fairly, in all material respects, the financial position of each of the Funds (four of the funds constituting Rydex Series Funds) at March 31, 2024, the results of their operations for the year then ended, the changes in their net assets for each of the two years in the period then ended and their financial highlights for each of the five years in the period then ended, in conformity with U.S. generally accepted accounting principles.
Basis for Opinion
These financial statements are the responsibility of the Trust’s management. Our responsibility is to express an opinion on each of the Funds’ financial statements based on our audits. We are a public accounting firm registered with the Public Company Accounting Oversight Board (United States) (“PCAOB”) and are required to be independent with respect to the Trust in accordance with the U.S. federal securities laws and the applicable rules and regulations of the Securities and Exchange Commission and the PCAOB.
We conducted our audits in accordance with the standards of the PCAOB. Those standards require that we plan and perform the audit to obtain reasonable assurance about whether the financial statements are free of material misstatement, whether due to error or fraud. The Trust is not required to have, nor were we engaged to perform, an audit of the Trust’s internal control over financial reporting. As part of our audits, we are required to obtain an understanding of internal control over financial reporting but not for the purpose of expressing an opinion on the effectiveness of the Trust’s internal control over financial reporting. Accordingly, we express no such opinion.
Our audits included performing procedures to assess the risks of material misstatement of the financial statements, whether due to error or fraud, and performing procedures that respond to those risks. Such procedures included examining, on a test basis, evidence regarding the amounts and disclosures in the financial statements. Our procedures included confirmation of securities owned as of March 31, 2024, by correspondence with the custodian and brokers. Our audits also included evaluating the accounting principles used and significant estimates made by management, as well as evaluating the overall presentation of the financial statements. We believe that our audits provide a reasonable basis for our opinion.

We have served as the auditor of one or more Guggenheim investment companies since 1979.
Tysons, Virginia
May 22, 2024
| | THE RYDEX FUNDS ANNUAL REPORT | 71 |
OTHER INFORMATION (Unaudited) |
Federal Income Tax Information
This information is being provided as required by the Internal Revenue Code. Amounts shown may differ from those elsewhere in the report because of differences in tax and financial reporting practice.
In January 2025, shareholders will be advised on IRS Form 1099 DIV or substitute 1099 DIV as to the federal tax status of the distributions received by shareholders in the calendar year 2024.
The Funds’ investment income (dividend income plus short-term capital gains, if any) qualifies as follows:
Of the taxable ordinary income distributions paid during the fiscal year ended March 31, 2024, the following funds had the corresponding percentages qualify for the reduced tax rate pursuant to the Jobs and Growth Tax Relief and Reconciliation Act of 2003 or for the dividends received deduction for corporations. See the qualified dividend income and dividend received deduction columns, respectively, in the table below.
Additionally, of the taxable ordinary income distributions paid during the fiscal year ended March 31, 2024, the following funds had the corresponding percentages qualify as interest related dividends as permitted by IRC Section 871(k)(1). See the qualified interest income column in the table below.
Fund | | Qualified
Dividend
Income | | | Dividend
Received
Deduction | | | Qualified
Interest
Income | |
Long Short Equity Fund | | | 100.00 | % | | | 100.00 | % | | | 0.00 | % |
Emerging Markets 2x Strategy Fund | | | 62.82 | % | | | 1.69 | % | | | 26.99 | % |
Inverse Emerging Markets 2x Strategy Fund | | | 0.00 | % | | | 0.00 | % | | | 81.01 | % |
Emerging Markets Bond Strategy Fund | | | 0.00 | % | | | 0.00 | % | | | 46.26 | % |
With respect to the taxable year ended March 31, 2024, the Funds hereby designate as capital gain dividends the amounts listed below, or, if subsequently determined to be different, the net capital gain of such year:
Fund | | From long-term
capital gain: | | | From long-term capital
gain, using proceeds
from shareholder
redemptions: | |
Long Short Equity Fund | | $ | 102,411 | | | $ | — | |
Delivery of Shareholder Reports
Paper copies of the Funds’ annual and semi-annual shareholder reports are not sent by mail, unless you specifically request paper copies of the reports from a Fund or from your financial intermediary. Instead, the reports are made available on a website, and you are notified by mail each time a report is posted and provided with a website link to access the report.
You may elect to receive all future shareholder reports in paper free of charge. If you hold shares of a Fund directly, you can inform the Fund that you wish to receive paper copies of reports by calling 800.820.0888. If you hold shares of a Fund through a financial intermediary, please contact the financial intermediary to make this election. Your election to receive reports in paper may apply to all Guggenheim funds in which you are invested and may apply to all Guggenheim funds held with your financial intermediary.
Tailored Shareholder Reports for Open-End Mutual Funds and Exchange-Traded Funds
Effective January 24, 2023, the SEC adopted rule and form amendments to require open-end mutual funds and exchange-traded funds registered on Form N-1A to transmit concise and visually engaging streamlined annual and semi-annual reports to shareholders that highlight key information. Other information, including financial statements, will no longer appear in a streamlined shareholder report but must be
72 | THE RYDEX FUNDS ANNUAL REPORT | |
OTHER INFORMATION (Unaudited)(concluded) |
available online, delivered free of charge upon request, and filed on a semi-annual basis on Form N-CSR. The rule and form amendments have a compliance date of July 24, 2024. At this time, management is evaluating the impact of these amendments on the shareholder reports for the Funds.
Proxy Voting Information
A description of the policies and procedures that the Trust uses to determine how to vote proxies relating to securities held in the Funds’ portfolios is available, without charge and upon request, by calling 800.820.0888. This information is also available from the EDGAR database on the SEC’s website at https://www.sec.gov.
Information regarding how the Funds’ voted proxies relating to portfolio securities during the most recent 12-month period ended June 30 is available without charge, upon request, by calling 800.820.0888. This information is also available from the EDGAR database on the SEC’s website at https://www.sec.gov.
Sector Classification
Information in the Schedule of Investments is categorized by sectors using sector-level Classifications defined by the Bloomberg Industry Classification System, a widely recognized industry classification system provider. Each Fund’s registration statement has investment policies relating to concentration in specific sectors/industries. For purposes of these investment policies, the Funds usually classify sectors/industries based on industry-level Classifications used by widely recognized industry classification system providers such as Bloomberg Industry Classification System, Global Industry Classification Standards and Barclays Global Classification Scheme.
Quarterly Portfolio Schedules Information
The Trust files its complete schedule of portfolio holdings with the SEC for the first and third quarters of each fiscal year as an exhibit to its reports on Form N-PORT. The Funds’ Form N-PORT is available on the SEC’s website at https://www.sec.gov. The Funds’ complete schedules of securities holdings as of the end of each fiscal quarter will be made available to the public on the SEC’s website at www.sec.gov and on our website at www.guggenheiminvestments.com, and will be made available, upon request and without charge, by calling 800.820.0888.
| | THE RYDEX FUNDS ANNUAL REPORT | 73 |
INFORMATION ON BOARD OF TRUSTEES AND OFFICERS (Unaudited) |
A Board of Trustees oversees the Trust, as well as other trusts of GI, in which its members have no stated term of service, and continue to serve after election until resignation. The Funds’ Statement of Additional Information includes further information about Fund Trustees and Officers, and can be obtained without charge by visiting guggenheiminvestments.com or by calling 800.820.0888.
Name, Address*
and Year of Birth | Position(s)
Held with
Trust | Term of Office
and Length of
Time Served** | Principal Occupation(s)
During Past Five Years | Number of
Portfolios
in Fund
Complex
Overseen | Other
Directorships Held
by Trustees*** |
INDEPENDENT TRUSTEES | | | |
Randall C. Barnes (1951) | Trustee and Chair of the Valuation Oversight Committee | Since 2019 (Trustee)
Since 2020 (Chair of the Valuation Oversight Committee) | Current: Private Investor (2001-present).
Former: Senior Vice President and Treasurer, PepsiCo, Inc. (1993-1997); President, Pizza Hut International (1991-1993); Senior Vice President, Strategic Planning and New Business Development, PepsiCo, Inc. (1987-1990). | 153 | Current: Advent Convertible and Income Fund (2005-present); Purpose Investments Funds (2013-present).
Former: Guggenheim Energy & Income Fund (2015-2023); Fiduciary/Claymore Energy Infrastructure Fund (2004-2022); Guggenheim Enhanced Equity Income Fund (2005-2021); Guggenheim Credit Allocation Fund (2013-2021). |
Angela Brock-Kyle (1959) | Trustee | Since 2016 | Current: Founder and Chief Executive Officer, B.O.A.R.D.S. (consulting firm) (2013-present); Director, Mutual Fund Directors Forum (2022-present).
Former: Senior Leader, TIAA (financial services firm) (1987-2012). | 152 | Current: Bowhead Insurance GP, LLC (2020-present); Hunt Companies, Inc. (2019-present).
Former: Guggenheim Energy & Income Fund (2019-2023); Fiduciary/Claymore Energy Infrastructure Fund (2019-2022); Guggenheim Enhanced Equity Income Fund (2019-2021); Guggenheim Credit Allocation Fund (2019-2021); Infinity Property & Casualty Corp. (2014-2018). |
74 | THE RYDEX FUNDS ANNUAL REPORT | |
INFORMATION ON BOARD OF TRUSTEES AND OFFICERS (Unaudited)(continued) |
Name, Address*
and Year of Birth | Position(s)
Held with
Trust | Term of Office
and Length of
Time Served** | Principal Occupation(s)
During Past Five Years | Number of
Portfolios
in Fund
Complex
Overseen | Other
Directorships Held
by Trustees*** |
INDEPENDENT TRUSTEES - continued | | | |
Thomas F. Lydon, Jr. (1960) | Trustee and Chair of the Contracts Review Committee | Since 2005 (Trustee)
Since 2020 (Chair of the Contracts Review Committee) | Current: President, Global Trends Investments (registered investment adviser) (1996-present); Chief Executive Officer, Lydon Media (2016-present); Vice Chairman, VettaFi, a wholly owned subsidiary of The TMX Group (financial advisor content, research and digital distribution provider) (2022-present).
Former: Chief Executive Officer, ETF Flows, LLC (financial advisor education and research provider) (2019-2023); Director, GDX Index Partners, LLC (index provider) (2021-2023). | 152 | Current: US Global Investors, Inc. (GROW) (1995-present); The 2023 ETF Series Trust (4) (2023-present); The 2023 ETF Series II (1) (2023-present).
Former: Guggenheim Energy & Income Fund (2019-2023); Fiduciary/Claymore Energy Infrastructure Fund (2019-2022); Guggenheim Enhanced Equity Income Fund (2019-2021); Guggenheim Credit Allocation Fund (2019-2021); Harvest Volatility Edge Trust (3) (2017-2019). |
Ronald A. Nyberg (1953) | Trustee and Chair of the Nominating and Governance Committee | Since 2019 | Current: Of Counsel (formerly Partner), Momkus LLP (law firm) (2016-present).
Former: Partner, Nyberg & Cassioppi, LLC (law firm) (2000-2016); Executive Vice President, General Counsel, and Corporate Secretary, Van Kampen Investments (1982-1999). | 153 | Current: Advent Convertible and Income Fund (2003-present); PPM Funds (2) (2018-present); Endeavor Health (2012-present). Former: Guggenheim Energy & Income Fund (2015-2023); Fiduciary/Claymore Energy Infrastructure Fund (2004-2022); Guggenheim Enhanced Equity Income Fund (2005-2021); Guggenheim Credit Allocation Fund (2013-2021); Western Asset Inflation-Linked Opportunities & Income Fund (2004-2020); Western Asset Inflation-Linked Income Fund (2003-2020). |
| | THE RYDEX FUNDS ANNUAL REPORT | 75 |
INFORMATION ON BOARD OF TRUSTEES AND OFFICERS (Unaudited)(continued) |
Name, Address*
and Year of Birth | Position(s)
Held with
Trust | Term of Office
and Length of
Time Served** | Principal Occupation(s)
During Past Five Years | Number of
Portfolios
in Fund
Complex
Overseen | Other
Directorships Held
by Trustees*** |
INDEPENDENT TRUSTEES - concluded | | |
Sandra G. Sponem (1958) | Trustee and Chair of the Audit Committee | Since 2016 (Trustee)
Since 2019 (Chair of the Audit Committee) | Current: Retired.
Former: Senior Vice President and Chief Financial Officer, M.A. Mortenson-Companies, Inc. (construction and real estate development company) (2007-2017). | 152 | Current: SPDR Series Trust (81) (2018-present); SPDR Index Shares Funds (30) (2018-present); SSGA Active Trust (14) (2018-present).
Former: Guggenheim Energy & Income Fund (2019-2023); Fiduciary/Claymore Energy Infrastructure Fund (2019-2022); Guggenheim Enhanced Equity Income Fund (2019-2021); Guggenheim Credit Allocation Fund (2019-2021); SSGA Master Trust (1) (2018-2020). |
Ronald E. Toupin, Jr. (1958) | Trustee, Chair of the Board and Chair of the Executive Committee | Since 2019 | Current: Portfolio Consultant (2010-present); Member, Governing Council, Independent Directors Council (2013-present); Governor, Board of Governors, Investment Company Institute (2018-present).
Former: Member, Executive Committee, Independent Directors Council (2016-2018); Vice President, Manager and Portfolio Manager, Nuveen Asset Management (1998-1999); Vice President, Nuveen Investment Advisory Corp. (1992-1999); Vice President and Manager, Nuveen Unit Investment Trusts (1991-1999); and Assistant Vice President and Portfolio Manager, Nuveen Unit Investment Trusts (1988-1999), each of John Nuveen & Co., Inc. (registered broker dealer) (1982-1999). | 152 | Former: Guggenheim Energy & Income Fund (2015-2023); Fiduciary/Claymore Energy Infrastructure Fund (2004-2022); Guggenheim Enhanced Equity Income Fund (2005-2021); Guggenheim Credit Allocation Fund (2013-2021); Western Asset Inflation-Linked Opportunities & Income Fund (2004-2020); Western Asset Inflation-Linked Income Fund (2003-2020). |
76 | THE RYDEX FUNDS ANNUAL REPORT | |
INFORMATION ON BOARD OF TRUSTEES AND OFFICERS (Unaudited)(continued) |
Name, Address*
and Year of Birth | Position(s)
Held with
Trust | Term of Office
and Length of
Time Served** | Principal Occupation(s)
During Past Five Years | Number of
Portfolios
in Fund
Complex
Overseen | Other
Directorships Held
by Trustees*** |
INTERESTED TRUSTEE | | | | |
Amy J. Lee**** (1961) | Trustee, Vice President and Chief Legal Officer | Since 2019 | Current: Interested Trustee, certain other funds in the Fund Complex (2018-present); Chief Legal Officer, certain other funds in the Fund Complex (2014-present); Vice President, certain other funds in the Fund Complex (2007-present); Senior Managing Director, Guggenheim Investments (2012-present).
Former: President and/or Chief Executive Officer, certain other funds in the Fund Complex (2017-2019); Vice President, Associate General Counsel and Assistant Secretary, Security Benefit Life Insurance Company and Security Benefit Corporation (2004-2012). | 152 | Former: Guggenheim Energy & Income Fund (2018-2023); Fiduciary/Claymore Energy Infrastructure Fund (2018-2022); Guggenheim Enhanced Equity Income Fund (2018-2021); Guggenheim Credit Allocation Fund (2018-2021). |
* | The business address of each Trustee is c/o Guggenheim Investments, 227 West Monroe Street, Chicago, Illinois 60606. |
** | Each Trustee serves an indefinite term, until his or her successor is elected and qualified. |
*** | Each Trustee also serves on the Boards of Trustees of Guggenheim Funds Trust, Guggenheim Variable Funds Trust, Guggenheim Strategy Funds Trust, Guggenheim Taxable Municipal Bond & Investment Grade Debt Trust, Guggenheim Strategic Opportunities Fund, Guggenheim Active Allocation Fund, Rydex Series Funds, Rydex Dynamic Funds, Rydex Variable Trust and Transparent Value Trust. Messrs. Barnes and Nyberg also serve on the Board of Trustees of Advent Convertible & Income Fund. |
**** | This Trustee is deemed to be an “interested person” of the Funds under the 1940 Act by reason of her position with the Funds’ Adviser and/or the parent of the Adviser. |
| | THE RYDEX FUNDS ANNUAL REPORT | 77 |
INFORMATION ON BOARD OF TRUSTEES AND OFFICERS (Unaudited)(continued) |
Name, Address*
and Year of Birth | Position(s)
Held with
Trust | Term of Office
and Length of
Time Served** | Principal Occupation(s)
During Past Five Years |
OFFICERS | | | |
Brian E. Binder (1972) | President and Chief Executive Officer | Since 2019 | Current: President, Mutual Fund Boards, Guggenheim Investments (2022-present); President and Chief Executive Officer, certain other funds in the Fund Complex (2018-present); President, Mutual Funds Boards and Senior Managing Director, Guggenheim Funds Investment Advisors, LLC and Security Investors, LLC (2018-present); Board Member, Guggenheim Partners Investment Funds plc (2022-present); Board Member, Guggenheim Global Investments plc (2022-present); Board Member, Guggenheim Partners Fund Management (Europe) Limited (2018-present).
Former: Senior Managing Director and Chief Administrative Officer, Guggenheim Investments (2018-2022); Managing Director and President, Deutsche Funds, and Head of US Product, Trading and Fund Administration, Deutsche Asset Management (2013-2018); Managing Director, Chairman of North American Executive Committee and Head of Business Management and Consulting, Invesco Ltd. (2010-2012). |
James Howley (1972) | Chief Financial Officer, Chief Accounting Officer and Treasurer | Since 2022 | Current: Managing Director, Guggenheim Investments (2004-present); Chief Financial Officer, Chief Accounting Officer, and Treasurer, certain other funds in the Fund Complex (2022-present).
Former: Assistant Treasurer, certain other funds in the Fund Complex (2006-2022); Manager, Mutual Fund Administration of Van Kampen Investments, Inc. (1996-2004). |
Mark E. Mathiasen (1978) | Secretary | Since 2017 | Current: Secretary, certain other funds in the Fund Complex (2007-present); Managing Director, Guggenheim Investments (2007-present). |
Glenn McWhinnie (1969) | Assistant Treasurer | Since 2016 | Current: Vice President, Guggenheim Investments (2009-present); Assistant Treasurer, certain other funds in the Fund Complex (2016-present). |
Michael P. Megaris (1984) | Assistant Secretary | Since 2018 | Current: Assistant Secretary, certain other funds in the Fund Complex (2014-present); Managing Director, Guggenheim Investments (2012-present). |
Elisabeth Miller (1968) | Chief Compliance Officer | Since 2012 | Current: Chief Compliance Officer, certain other funds in the Fund Complex (2012-present); Senior Managing Director, Guggenheim Investments (2012-present); Senior Managing Director, Guggenheim Funds Distributors, LLC (2014-present).
Former: Chief Compliance Officer, Security Investors, LLC and Guggenheim Funds Investment Advisors, LLC (2012-2018); Chief Compliance Officer, Guggenheim Distributors, LLC (2009-2014); Senior Manager, Security Investors, LLC (2004-2014); Senior Manager, Guggenheim Distributors, LLC (2004-2014). |
Margaux Misantone (1978) | AML Officer | Since 2017 | Current: Chief Compliance Officer, Security Investors, LLC and Guggenheim Funds Investment Advisors, LLC (2018-present); AML Officer, Security Investors, LLC and certain other funds in the Fund Complex (2017-present); Managing Director, Guggenheim Investments (2015-present).
Former: Assistant Chief Compliance Officer, Security Investors, LLC and Guggenheim Funds Investments Advisors, LLC (2015-2018). |
78 | THE RYDEX FUNDS ANNUAL REPORT | |
INFORMATION ON BOARD OF TRUSTEES AND OFFICERS (Unaudited)(concluded) |
Name, Address*
and Year of Birth | Position(s)
Held with
Trust | Term of Office
and Length of
Time Served** | Principal Occupation(s)
During Past Five Years |
OFFICERS - concluded | |
Kimberly J. Scott (1974) | Assistant Treasurer | Since 2016 | Current: Director, Guggenheim Investments (2012-present); Assistant Treasurer, certain other funds in the Fund Complex (2012-present).
Former: Financial Reporting Manager, Invesco, Ltd. (2010-2011); Vice President/Assistant Treasurer, Mutual Fund Administration for Van Kampen Investments, Inc./Morgan Stanley Investment Management (2009-2010); Manager of Mutual Fund Administration, Van Kampen Investments, Inc./Morgan Stanley Investment Management (2005-2009). |
Jon Szafran (1989) | Assistant Treasurer | Since 2017 | Current: Director, Guggenheim Investments (2017-present); Assistant Treasurer, certain other funds in the Fund Complex (2017-present).
Former: Assistant Treasurer of Henderson Global Funds and Manager of US Fund Administration, Henderson Global Investors (North America) Inc. (“HGINA”), (2017); Senior Analyst of US Fund Administration, HGINA (2014–2017); Senior Associate of Fund Administration, Cortland Capital Market Services, LLC (2013-2014); Experienced Associate, PricewaterhouseCoopers LLP (2012-2013). |
* | The business address of each officer is c/o Guggenheim Investments, 227 West Monroe Street, Chicago, Illinois 60606. |
** | Each officer serves an indefinite term, until his or her successor is duly elected and qualified. |
| | THE RYDEX FUNDS ANNUAL REPORT | 79 |
GUGGENHEIM INVESTMENTS PRIVACY NOTICE (Unaudited) |
Who We Are
This Privacy Notice describes the data protection practices of Guggenheim Investments. Guggenheim Investments as used herein refers to the affiliated investment management businesses of Guggenheim Partners, LLC: Guggenheim Funds Investment Advisors, LLC, Guggenheim Partners Investment Management, LLC, Guggenheim Funds Distributors, LLC, Security Investors, LLC, Guggenheim Investment Advisors (Europe) Limited, Guggenheim Real Estate, LLC, GS Gamma Advisors, LLC, Guggenheim Partners India Management, LLC, Guggenheim Partners Europe Limited, as well as the funds in the Guggenheim Funds complex (the “Funds”) (“Guggenheim Investments,” “we,” “us,” or “our”).
Guggenheim Partners Investment Management Holdings, LLC, located at 330 Madison Avenue, New York, New York, 10017 is the data controller for your information. The affiliates who are also controllers of certain of your information are: Guggenheim Investment Advisors (Europe) Limited, Guggenheim Partners Europe Limited, Guggenheim Partners, LLC, Guggenheim Funds Investment Advisors, LLC, Guggenheim Partners Investment Management, LLC, Guggenheim Funds Distributors, LLC and Security Investors, LLC, as well as the Funds.
Our Commitment to You
Guggenheim Investments considers your privacy our utmost concern. When you become our client or investor, you entrust us with not only your hard-earned money but also with your personal and financial information. Because we have access to your private information, we hold ourselves to the highest standards in its safekeeping and use. We strictly limit how we share your information with others, whether you are a current or former Guggenheim Investments client or investor.
The Information We Collect About You
We collect certain nonpublic personal information about you from information you provide on applications, other forms, our website, and/or from third parties including investment advisors. This information includes Social Security or other tax identification number, assets, income, tax information, retirement and estate plan information, transaction history, account balance, payment history, bank account information, marital status, family relationships, information that we collect on our website through the use of “cookies,” and other personal information that you or others provide to us. We may also collect such information through your inquiries by mail, e-mail or telephone. We may also collect customer due diligence information, as required by applicable law and regulation, through third party service providers.
How We Handle Your Personal Information
The legal basis for using your information as set out in this Privacy Notice is as follows: (a) use of your personal data is necessary to perform our obligations under any contract with you (such as a contract for us to provide financial services to you); or (b) where use of your personal data is not necessary for performance of a contract, use of your personal data is necessary for our legitimate interests or the legitimate interests of others (for example, to enforce the legal terms governing our services, operate and market our website and other services we offer, ensure safe environments for our personnel and others, make and receive payments, prevent fraud and to know the customer to whom we are providing the services). Some processing is done to comply with applicable law.
In addition to the specific uses described above, we also use your information in the following manner:
| | ● | We use your information in connection with servicing your accounts. |
| | ● | We use information to respond to your requests or questions. For example, we might use your information to respond to your customer feedback. |
| | ● | We use information to improve our products and services. We may use your information to make our website and products better. We may use your information to customize your experience with us. |
| | ● | We use information for security purposes. We may use your information to protect our company and our customers. |
| | ● | We use information to communicate with you. For example, we will communicate with you about your account or our relationship. We may contact you about your feedback. We might also contact you about this Privacy Notice. We may also enroll you in our email newsletter. |
80 | THE RYDEX FUNDS ANNUAL REPORT | |
GUGGENHEIM INVESTMENTS PRIVACY NOTICE (Unaudited)(continued) |
| | ● | We use information as otherwise permitted by law, as we may notify you. |
| | ● | Aggregate/Anonymous Data. We may aggregate and/or anonymize any information collected through the website so that such information can no longer be linked to you or your device (“Aggregate/Anonymous Information”). We may use Aggregate/Anonymous Information for any purpose, including without limitation for research and marketing purposes, and may also share such data with any third parties, including advertisers, promotional partners, and sponsors. |
We do not sell information about current or former clients or their accounts to third parties. Nor do we share this information, except when necessary to complete transactions at your request, to make you aware of investment products and services that we or our affiliates offer, or as permitted or required by law.
We provide information about you to companies and individuals not affiliated with Guggenheim Investments to complete certain transactions or account changes, or to perform services for us related to your account. For example, if you ask to transfer assets from another financial institution to Guggenheim Investments, we must provide certain information about you to that company to complete the transaction. We provide the third party with only the information necessary to carry out its responsibilities and only for that purpose. And we require these third parties to treat your private information with the same high degree of confidentiality that we do. To alert you to other Guggenheim Investments products and services, we share your information within our family of affiliated companies. You may limit our sharing with affiliated companies as set out below. We may also share information with any successor to all or part of our business, or in connection with steps leading up to a merger or acquisition. For example, if part of our business was sold we may give customer information as part of that transaction. We may also share information about you with your consent.
We will release information about you if you direct us to do so, if we are compelled by law to do so, or in other circumstances as permitted by law (for example, to protect your account from fraud).
If you close your account(s) or become an inactive client or investor, we will continue to adhere to the privacy policies and practices described in this notice.
Opt-Out Provisions and Your Data Choices
The law allows you to “opt out” of certain kinds of information sharing with third parties. We do not share personal information about you with any third parties that triggers this opt-out right. This means YOU ARE ALREADY OPTED OUT.
When you are no longer our client or investor, we continue to share your information as described in this notice, and you may contact us at any time to limit our sharing by sending an email to CorporateDataPrivacy@GuggenheimPartners.com.
European Union Data Subjects and certain others: In addition to the choices set forth above, residents of the European Union and certain other jurisdictions have certain rights to (1) request access to or rectification or deletion of information we collect about them, (2) request a restriction on the processing of their information, (3) object to the processing of their information, or (4) request the portability of certain information. To exercise these or other rights, please contact us using the contact information below. We will consider all requests and provide our response within the time period stated by applicable law. Please note, however, that certain information may be exempt from such requests in some circumstances, which may include if we need to keep processing your information for our legitimate interests or to comply with a legal obligation. We may request you provide us with information necessary to confirm your identity before responding to your request.
Residents of France and certain other jurisdictions may also provide us with instructions regarding the manner in which we may continue to store, erase and share your information after your death, and where applicable, the person you have designated to exercise these rights after your death.
How We Protect Privacy Online
We take steps to protect your privacy when you use our web site – www.guggenheiminvestments.com – by using secure forms of online communication, including encryption technology, Secure Socket Layer (SSL) protocol, firewalls and user names and passwords. These safeguards vary based on the sensitivity of the information that we collect and store. However, we cannot and do not guarantee that these measures will prevent every unauthorized attempt to access, use, or disclose your information since despite our efforts, no Internet and/or other
| | THE RYDEX FUNDS ANNUAL REPORT | 81 |
GUGGENHEIM INVESTMENTS PRIVACY NOTICE (Unaudited)(concluded) |
electronic transmissions can be completely secure. Our web site uses “http cookies”—tiny pieces of information that we ask your browser to store. We use cookies for session management and security features on the Guggenheim Investments web site. We do not use them to pull data from your hard drive, to learn your e-mail address, or to view data in cookies created by other web sites. We will not share the information in our cookies or give others access to it. See the legal information area on our web site for more details about web site security and privacy features.
How We Safeguard Your Personal Information and Data Retention
We restrict access to nonpublic personal information about you to our employees and in some cases to third parties (for example, the service providers described above) as permitted by law. We maintain strict physical, electronic and procedural safeguards that comply with federal standards to guard your nonpublic personal information.
We keep your information for no longer than necessary for the purposes for which it is processed. The length of time for which we retain information depends on the purposes for which we collected and use it and/or as required to comply with applicable laws. Information may persist in copies made for backup and business continuity purposes for additional time.
International Visitors
If you are not a resident of the United States, please be aware that your information may be transferred to, stored and processed in the United States where our servers are located and our databases are operated. The data protection and other laws of the United States and other countries might not be as comprehensive as those in your country.
In such cases, we ensure that a legal basis for such a transfer exists and that adequate protection is provided as required by applicable law, for example, by using standard contractual clauses or by transferring your data to a jurisdiction that has obtained an adequacy finding. Individuals whose data may be transferred on the basis of standard contractual clauses may contact us as described below.
We’ll Keep You Informed
If you have any questions or concerns about how we treat your personal data, we encourage you to consult with us first. You may also contact the relevant supervisory authority.
We reserve the right to modify this policy at any time and will inform you promptly of material changes. You may access our privacy policy from our web site at www.guggenheiminvestments.com. Should you have any questions regarding our privacy policy, contact us by email at CorporateDataPrivacy@GuggenheimPartners.com.
82 | THE RYDEX FUNDS ANNUAL REPORT | |
This page intentionally left blank.
This page intentionally left blank.
This page intentionally left blank.
3.31.2024
Rydex Funds Annual Report
Domestic Equity Fund |
NASDAQ-100® Fund | | |
GuggenheimInvestments.com | ROTC-ANN-0324x0325 |

| | |
DEAR SHAREHOLDER | 2 |
ECONOMIC AND MARKET OVERVIEW | 3 |
ABOUT SHAREHOLDERS’ FUND EXPENSES | 5 |
NASDAQ-100® FUND | 8 |
NOTES TO FINANCIAL STATEMENTS | 26 |
REPORT OF INDEPENDENT REGISTERED PUBLIC ACCOUNTING FIRM | 44 |
OTHER INFORMATION | 46 |
INFORMATION ON BOARD OF TRUSTEES AND OFFICERS | 48 |
GUGGENHEIM INVESTMENTS PRIVACY NOTICE | 58 |
| | THE RYDEX FUNDS ANNUAL REPORT | 1 |
Dear Shareholder:
Security Investors, LLC (the “Investment Adviser”) is pleased to present the annual shareholder report for NASDAQ-100® Fund (the “Fund”). This report covers performance for the annual period ended March 31, 2024 (the “Reporting Period”).
The Investment Adviser is part of Guggenheim Investments, which represents the investment management businesses of Guggenheim Partners, LLC (“Guggenheim”), a global, diversified financial services firm.
Guggenheim Funds Distributors, LLC is the distributor of the Fund. Guggenheim Funds Distributors, LLC is affiliated with Guggenheim and the Investment Adviser.
We encourage you to read the Economic and Market Overview section of the report, which follows this letter, and then the Performance Report and Fund Profile for the Fund.
We are committed to providing innovative investment solutions and appreciate the trust you place in us.
Sincerely,
Security Investors, LLC
April 30, 2024
Read a prospectus and summary prospectus (if available) carefully before investing. It contains the investment objectives, risks, charges, expenses and other information, which should be considered carefully before investing. Obtain a prospectus and summary prospectus (if available) at guggenheiminvestments.com or call 800.820.0888.
This material is not intended as a recommendation or as investment advice of any kind, including in connection with rollovers, transfers, and distributions. Such material is not provided in a fiduciary capacity, may not be relied upon for or in connection with the making of investment decisions, and does not constitute a solicitation of an offer to buy or sell securities. All content has been provided for informational or educational purposes only and is not intended to be and should not be construed as legal or tax advice and/or a legal opinion. Always consult a financial, tax and/or legal professional regarding your specific situation.
The NASDAQ-100® Fund may not be suitable for all investors. ● Investing in the Fund involves certain risks, which may include increased volatility due to the use of futures and the possibility that companies in which the Fund invests may not be commercially successful or may become obsolete more quickly. ● There are no assurances that the Fund will achieve its investment objective and/or investment strategies. The Fund is subject to active trading and tracking error risks, which may increase volatility, impact the Fund’s ability to achieve its investment objective and may decrease the Fund’s performance. ● The Fund is considered non-diversified and can invest a greater portion of its assets in securities of individual issuers than a diversified fund. As a result, changes in the market value of a single security could cause greater fluctuations in the value of Fund shares than would occur in a more diversified fund. ●See the prospectus for more information on these and additional risks.
2 | THE RYDEX FUNDS ANNUAL REPORT | |
ECONOMIC AND MARKET OVERVIEW (Unaudited) | March 31, 2024 |
While job growth remains robust, recent labor data brought increased confidence in a labor market in better balance, allowing for inflation to soften further. Labor force growth remains strong, aided by high immigration flows, helping bring labor supply in line with gradually cooling demand. The Small Business Survey indicates that plans to increase compensation have returned to pre-COVID levels. Additionally, Bureau of Labor Statistics data reveal a continued decline in the “quits rate,” reducing the pressure on businesses to raise wages to attract or retain employees. These developments suggest wage pressures may ease further by year end. And despite some speculation against any Federal Reserve (“Fed”) rate cuts materializing in 2024, we continue to anticipate cuts later this year.
Following the stronger-than-expected March Consumer Price Index, we believe that there is a high probability that the easing cycle will start in the second half of the year, since the Fed will likely need more time to gather confirming data. In the latest Summary of Economic Projections, the Federal Open Market Committee (“FOMC”) significantly increased the median forecast for 2024 U.S. gross domestic product, slightly increased it for core personal consumption expenditures year over year, and continues to expect no material increase in the unemployment rate. These adjustments left the median view for three rate cuts for 2024, which we believe suggests the bar is very high for the Fed to keep rates where they are all year, and even higher for more rate hikes to materialize.
Amid this macroeconomic backdrop, in the first quarter of 2024 the two-year Treasury yield increased to 4.59% from 4.23%, and the 10-year Treasury yield increased to 4.20% from 3.88%, keeping the inverted 2s/10s yield curve consistent at 39 basis points as of the end of the Reporting Period, up four basis points since the start of the year. One basis point equals 0.01%. In general, spreads to Treasurys have remained tight across sectors. In investment-grade corporate bonds, BBB-rated bonds continued to remain attractive relative to A and BB-rated bonds, and supply slowed toward the end of the first quarter of 2024, which should support spreads in the near term. High yield bond spreads tightened during the first quarter of 2024 to 301 basis points from 323 basis points at the start of the year, while leveraged loans’ discount margins to maturity tightened to 509 basis points from 528 basis points. Structured credit spreads tightened marginally amid strong demand. Investor demand and an improved arbitrage led to robust new collateralized loan obligation issuance, and tightening liabilities led to an increase in refinances/resets.
Looking forward, Fed officials continue to advocate for a patient approach. A conventional easing cycle is therefore far from guaranteed. Market expectations have already adjusted significantly from market-implied expectations of six rate cuts in 2024 just two months ago to only three as of the end of the Reporting Period, aligning more closely with the FOMC’s views. So far, the market has taken this delay in stride, but its patience and assessment of credit risk could be tested.
For the Reporting Period, the S&P 500® Index* returned 29.88%. The MSCI Europe-Australasia-Far East (“EAFE”) Index* returned 15.32%. The return of the MSCI Emerging Markets Index* was 8.15%.
| | THE RYDEX FUNDS ANNUAL REPORT | 3 |
ECONOMIC AND MARKET OVERVIEW (Unaudited)(continued) | March 31, 2024 |
In the bond market, the Bloomberg U.S. Aggregate Bond Index* posted a 1.70% return for the Reporting Period, while the Bloomberg U.S. Corporate High Yield Index* returned 11.15%. The return of the ICE Bank of America (“BofA”) 3-Month U.S. Treasury Bill Index* was 5.27% for the Reporting Period.
The opinions and forecasts expressed may not actually come to pass. This information is subject to change at any time, based on market and other conditions, and should not be construed as a recommendation of any specific security or strategy.
*Index Definitions:
The following indices are referenced throughout this report. Indices are unmanaged and not available for direct investment. Index performance does not reflect transaction costs, fees, or expenses.
Bloomberg U.S. Aggregate Bond Index is a broad-based flagship benchmark that measures the investment grade, U.S. dollar-denominated, fixed-rate taxable bond market, including U.S. Treasuries, government-related and corporate securities, mortgage-backed securities or “MBS”(agency fixed-rate and hybrid adjustable-rate mortgage, or “ARM”, pass-throughs), asset-backed securities (“ABS”), and commercial mortgage-backed securities (“CMBS”) (agency and non-agency).
Bloomberg U.S. Corporate High Yield Index measures the U.S. dollar-denominated, high yield, fixed-rate corporate bond market. Securities are classified as high yield if the middle rating of Moody’s, Fitch, and S&P is Ba1/BB +/BB + or below.
ICE BofA 3-Month U.S. Treasury Bill Index is an unmanaged market Index of U.S. Treasury securities maturing in 90 days that assumes reinvestment of all income.
MSCI EAFE Index is a free float-adjusted market capitalization index that is designed to measure the equity market performance of developed markets, excluding the U.S. & Canada.
MSCI Emerging Markets Index is a free float-adjusted market capitalization weighted index that is designed to measure equity market performance in the global emerging markets.
NASDAQ-100® Index includes 100 of the largest domestic and international non-financial securities listed on The Nasdaq Stock Market based on market capitalization. The Index reflects companies across major industry groups including computer hardware and software, telecommunications, retail/wholesale trade and biotechnology. It does not contain securities of financial companies including investment companies.
S&P 500® Index is a broad-based index, the performance of which is based on the performance of 500 widely held common stocks chosen for market size, liquidity, and industry group representation.
4 | THE RYDEX FUNDS ANNUAL REPORT | |
ABOUT SHAREHOLDERS’ FUND EXPENSES (Unaudited) |
All mutual funds have operating expenses, and it is important for our shareholders to understand the impact of costs on their investments. Shareholders of a fund incur two types of costs: (i) transaction costs, including sales charges (loads) on purchase payments, reinvested dividends, other distributions, and exchange fees, and (ii) ongoing costs, including management fees, administrative services, and shareholder reports, among others. These ongoing costs, or operating expenses, are deducted from a fund’s gross income and reduce the investment return of the fund.
A fund’s expenses are expressed as a percentage of its average net assets, which is known as the expense ratio. The following examples are intended to help investors understand the ongoing costs (in dollars) of investing in a fund and to compare these costs with the ongoing costs of investing in other mutual funds.
The examples are based on an investment of $1,000 made at the beginning of the period and held for the entire six-month period beginning September 30, 2023 and ending March 31, 2024.
The following tables illustrate the Fund’s costs in two ways:
Table 1. Based on actual Fund return: This section helps investors estimate the actual expenses paid over the period. The “Ending Account Value” shown is derived from the Fund’s actual return, and the fifth column shows the dollar amount that would have been paid by an investor who started with $1,000 in the Fund. Investors may use the information here, together with the amount invested, to estimate the expenses paid over the period. Simply divide the Fund’s account value by $1,000 (for example, an $8,600 account value divided by $1,000 = 8.6), then multiply the result by the number provided under the heading “Expenses Paid During Period.”
Table 2. Based on hypothetical 5% return: This section is intended to help investors compare a fund’s cost with those of other mutual funds. The table provides information about hypothetical account values and hypothetical expenses based on the Fund’s actual expense ratio and an assumed rate of return of 5% per year before expenses, which is not the Fund’s actual return. The hypothetical account values and expenses may not be used to estimate the actual ending account balance or expenses paid during the period. The example is useful in making comparisons because the U.S. Securities and Exchange Commission (the “SEC”) requires all mutual funds to calculate expenses based on the 5% return. Investors can assess a Fund’s costs by comparing this hypothetical example with the hypothetical examples that appear in shareholder reports of other funds.
The calculations illustrated above assume no shares were bought or sold during the period. Actual costs may have been higher or lower, depending on the amount of investment and the timing of any purchases or redemptions.
| | THE RYDEX FUNDS ANNUAL REPORT | 5 |
ABOUT SHAREHOLDERS’ FUND EXPENSES (Unaudited)(continued) |
Please note that the expenses shown in the table are meant to highlight your ongoing costs only and do not reflect any transactional costs, such as sales charges (loads) on purchase payments, and contingent deferred sales charges (“CDSC”) on redemptions, if any. Therefore, the second table is useful in comparing ongoing costs only, and will not help you determine the relative total costs of owning different funds. In addition, if these transactional costs were included, your costs would have been higher.
More information about the Fund’s expenses, including annual expense ratios for periods up to five years (subject to the Fund’s inception date), can be found in the Financial Highlights section of this report. For additional information on operating expenses and other shareholder costs, please refer to the Fund’s prospectus.
6 | THE RYDEX FUNDS ANNUAL REPORT | |
ABOUT SHAREHOLDERS’ FUND EXPENSES (Unaudited)(concluded) |
| Expense
Ratio1 | Fund
Return | Beginning
Account Value
September 30,
2023 | Ending
Account Value
March 31,
2024 | Expenses
Paid During
Period2 |
Table 1. Based on actual Fund return3 |
Investor Class | 1.28% | 23.87% | $ 1,000.00 | $ 1,238.70 | $ 7.16 |
Class A | 1.52% | 23.71% | 1,000.00 | 1,237.10 | 8.50 |
Class C | 2.28% | 23.26% | 1,000.00 | 1,232.60 | 12.73 |
Class H | 1.52% | 23.74% | 1,000.00 | 1,237.40 | 8.50 |
| | | | | |
Table 2. Based on hypothetical 5% return (before expenses) |
Investor Class | 1.28% | 5.00% | $ 1,000.00 | $ 1,018.60 | $ 6.46 |
Class A | 1.52% | 5.00% | 1,000.00 | 1,017.40 | 7.67 |
Class C | 2.28% | 5.00% | 1,000.00 | 1,013.60 | 11.48 |
Class H | 1.52% | 5.00% | 1,000.00 | 1,017.40 | 7.67 |
1 | Annualized and excludes expenses of the underlying funds in which the Fund invests, if any. |
2 | Expenses are equal to the Fund’s annualized expense ratio, net of any applicable fee waivers, multiplied by the average account value over the period, multiplied by 183/366 (to reflect the one-half year period). |
3 | Actual cumulative return at net asset value for the period September 30, 2023 to March 31, 2024. |
| | THE RYDEX FUNDS ANNUAL REPORT | 7 |
PERFORMANCE REPORT AND FUND PROFILE (Unaudited) | March 31, 2024 |
NASDAQ-100® FUND
OBJECTIVE: Seeks to provide investment results that correspond, before fees and expenses, to a benchmark for over-the-counter (“OTC”) securities on a daily basis. The Fund’s current benchmark is the NASDAQ-100® Index (the “underlying index”).
For the Reporting Period, the NASDAQ-100 Fund maintained a daily correlation of over 99% to its benchmark of 100% of the daily price movement of the underlying index. Investor Class shares of the Fund returned 37.99%, while the underlying index returned 39.65% over the same time period.
The sectors that contributed the most to the return of the underlying index for the Reporting Period were Information Technology, Communication Services, and Consumer Discretionary. The only sector that detracted was Financials.
The holdings that contributed the most to the return of the underlying index were NVIDIA Corp., Microsoft Corp., and Meta Platforms, Inc. – Class A. Those that detracted the most were Tesla, Inc., Moderna, Inc., and PayPal Holdings, Inc.
Derivatives in the Fund were used to help provide exposure to the composition of the benchmark in the highest efficient manner and not for hedging purposes. Derivatives performed as expected.
The Fund may invest in certain of the underlying series of Guggenheim Funds Trust and Guggenheim Strategy Funds Trust, including Guggenheim Ultra Short Duration, Guggenheim Strategy Fund II, and Guggenheim Strategy Fund III (collectively, the “Short Term Investment Vehicles”), each of which are open-end management investment companies managed by Guggenheim Investments. The Short Term Investment Vehicles, which launched on March 11, 2014, are offered as short term investment options only to mutual funds, trusts, and other accounts managed by Guggenheim Investments and/or its affiliates, and are not available to the public, with the exception of Guggenheim Ultra Short Duration Fund, which is available to the public. Guggenheim Strategy Fund II and Guggenheim Strategy Fund III do not charge an investment management fee. Guggenheim Ultra Short Duration Fund charges an investment management fee, but the Fund’s adviser has agreed to waive fees to the extent necessary to offset the proportionate share of any management fee paid by the Fund with respect to its investment in such affiliated fund. For the Reporting Period, investment in the Short Term Investment Vehicles contributed to Fund performance.
Performance displayed represents past performance, which is no guarantee of future results.
8 | THE RYDEX FUNDS ANNUAL REPORT | |
PERFORMANCE REPORT AND FUND PROFILE (Unaudited)(continued) | March 31, 2024 |
Holdings Diversification (Market Exposure as % of Net Assets)

“Holdings Diversification (Market Exposure as % of Net Assets)” excludes any temporary cash investments, investments in Guggenheim Strategy Funds Trust mutual funds, or investments in Guggenheim Ultra Short Duration Fund. Investments in those Funds do not provide “market exposure” to meet the Fund’s investment objective, but will significantly increase the portfolio’s exposure to certain other asset categories (and their associated risks), which may cause the Fund to deviate from its principal investment strategy, including: (i) high yield, high risk debt securities rated below the top four long-term rating categories by a nationally recognized statistical rating organization (also known as “junk bonds”); (ii) securities issued by the U.S. government or its agencies and instrumentalities; (iii) CLOs and similar investments; and (iv) other short-term fixed income securities.
Inception Dates: |
Investor Class | February 14, 1994 |
Class A | March 31, 2004 |
Class C | March 26, 2001 |
Class H | September 18, 2014 |
Ten Largest Holdings | % of Total Net Assets |
Microsoft Corp. | 8.3% |
Apple, Inc. | 7.1% |
NVIDIA Corp. | 6.0% |
Amazon.com, Inc. | 5.0% |
Meta Platforms, Inc. — Class A | 4.5% |
Broadcom, Inc. | 4.2% |
Alphabet, Inc. — Class A | 2.4% |
Alphabet, Inc. — Class C | 2.3% |
Tesla, Inc. | 2.3% |
Costco Wholesale Corp. | 2.2% |
Top Ten Total | 44.3% |
| | |
“Ten Largest Holdings” excludes any temporary cash or derivative investments. |
| | THE RYDEX FUNDS ANNUAL REPORT | 9 |
PERFORMANCE REPORT AND FUND PROFILE (Unaudited)(continued) | March 31, 2024 |
Cumulative Fund Performance*
10 | THE RYDEX FUNDS ANNUAL REPORT | |
PERFORMANCE REPORT AND FUND PROFILE (Unaudited)(concluded) | March 31, 2024 |
Average Annual Returns*
Periods Ended March 31, 2024
| 1 Year | 5 Year | 10 Year |
Investor Class Shares | 37.99% | 19.31% | 17.31% |
Class A Shares | 37.63% | 19.01% | 17.00% |
Class A Shares with sales charge† | 31.09% | 17.86% | 16.44% |
Class C Shares | 36.62% | 18.12% | 16.15% |
Class C Shares with CDSC‡ | 35.62% | 18.12% | 16.15% |
NASDAQ-100 Index | 39.65% | 20.90% | 18.85% |
| 1 Year | 5 Year | Since
Inception
(09/18/14) |
Class H Shares | 37.66% | 19.01% | 16.30% |
NASDAQ-100 Index | 39.65% | 20.90% | 18.14% |
* | The performance data above represents past performance that is not predictive of future results. The investment return and principal value of an investment in the Fund will fluctuate so that an investor’s shares, when redeemed, may be worth more or less than their original cost. Returns are historical and include changes in principal and reinvested dividends and capital gains and do not reflect the effect of taxes. The NASDAQ-100 Index is an unmanaged index and, unlike the Fund, has no management fees or operating expenses to reduce its reported return. The graphs are based on the Investor Class shares and Class A shares only; performance for Class C shares and Class H shares will vary due to differences in fee structures. |
† | Fund returns are calculated using the maximum sales charge of 4.75%. |
‡ | Fund returns include a CDSC of 1% if redeemed within 12 months of purchase. |
| | THE RYDEX FUNDS ANNUAL REPORT | 11 |
SCHEDULE OF INVESTMENTS | March 31, 2024 |
NASDAQ-100® FUND | |
| | Shares | | | Value | |
COMMON STOCKS† - 95.1% |
| | | | | | | | | |
Technology - 45.8% |
Microsoft Corp. | | | 350,814 | | | $ | 147,594,466 | |
Apple, Inc. | | | 729,058 | | | | 125,018,866 | |
NVIDIA Corp. | | | 118,033 | | | | 106,649,897 | |
Broadcom, Inc. | | | 56,512 | | | | 74,901,570 | |
Advanced Micro Devices, Inc.* | | | 197,037 | | | | 35,563,208 | |
Adobe, Inc.* | | | 55,119 | | | | 27,813,047 | |
QUALCOMM, Inc. | | | 136,090 | | | | 23,040,037 | |
Intel Corp. | | | 515,583 | | | | 22,773,301 | |
Intuit, Inc. | | | 34,142 | | | | 22,192,300 | |
Applied Materials, Inc. | | | 101,324 | | | | 20,896,049 | |
Texas Instruments, Inc. | | | 110,883 | | | | 19,316,927 | |
Micron Technology, Inc. | | | 134,616 | | | | 15,869,880 | |
Lam Research Corp. | | | 15,987 | | | | 15,532,490 | |
Analog Devices, Inc. | | | 60,473 | | | | 11,960,955 | |
KLA Corp. | | | 16,491 | | | | 11,520,118 | |
Synopsys, Inc.* | | | 18,602 | | | | 10,631,043 | |
Cadence Design Systems, Inc.* | | | 33,198 | | | | 10,333,874 | |
ASML Holding N.V. — Class G | | | 10,532 | | | | 10,220,990 | |
Crowdstrike Holdings, Inc. — Class A* | | | 27,758 | | | | 8,898,937 | |
NXP Semiconductor N.V. | | | 31,274 | | | | 7,748,759 | |
Marvell Technology, Inc. | | | 105,421 | | | | 7,472,240 | |
Roper Technologies, Inc. | | | 13,051 | | | | 7,319,523 | |
Workday, Inc. — Class A* | | | 25,486 | | | | 6,951,307 | |
Autodesk, Inc.* | | | 26,086 | | | | 6,793,316 | |
Fortinet, Inc.* | | | 93,048 | | | | 6,356,109 | |
Microchip Technology, Inc. | | | 65,898 | | | | 5,911,710 | |
Paychex, Inc. | | | 44,050 | | | | 5,409,340 | |
Datadog, Inc. — Class A* | | | 37,307 | | | | 4,611,145 | |
Cognizant Technology Solutions Corp. — Class A | | | 60,709 | | | | 4,449,363 | |
Electronic Arts, Inc. | | | 32,602 | | | | 4,325,307 | |
ON Semiconductor Corp.* | | | 52,110 | | | | 3,832,690 | |
Atlassian Corp. — Class A* | | | 19,190 | | | | 3,744,161 | |
ANSYS, Inc.* | | | 10,611 | | | | 3,683,715 | |
Zscaler, Inc.* | | | 18,089 | | | | 3,484,484 | |
GLOBALFOUNDRIES, Inc.*,1 | | | 66,796 | | | | 3,480,740 | |
MongoDB, Inc.* | | | 8,802 | | | | 3,156,749 | |
Take-Two Interactive Software, Inc.* | | | 20,802 | | | | 3,088,889 | |
Total Technology | | | | | | | 812,547,502 | |
| | | | | | | | | |
Communications - 24.3% |
Amazon.com, Inc.* | | | 490,420 | | | | 88,461,960 | |
Meta Platforms, Inc. — Class A | | | 165,248 | | | | 80,241,124 | |
Alphabet, Inc. — Class A* | | | 278,227 | | | | 41,992,801 | |
Alphabet, Inc. — Class C* | | | 267,745 | | | | 40,766,854 | |
Netflix, Inc.* | | | 52,773 | | | | 32,050,626 | |
Cisco Systems, Inc. | | | 493,778 | | | | 24,644,460 | |
T-Mobile US, Inc. | | | 144,732 | | | | 23,623,157 | |
Comcast Corp. — Class A | | | 483,196 | | | | 20,946,546 | |
Booking Holdings, Inc. | | | 4,167 | | | | 15,117,376 | |
Palo Alto Networks, Inc.* | | | 39,400 | | | | 11,194,722 | |
PDD Holdings, Inc. ADR* | | | 81,450 | | | | 9,468,562 | |
MercadoLibre, Inc.* | | | 6,182 | | | | 9,346,937 | |
Airbnb, Inc. — Class A* | | | 53,422 | | | | 8,812,493 | |
DoorDash, Inc. — Class A* | | | 45,944 | | | | 6,327,408 | |
Charter Communications, Inc. — Class A* | | | 17,709 | | | | 5,146,767 | |
12 | THE RYDEX FUNDS ANNUAL REPORT | SEE NOTES TO FINANCIAL STATEMENTS. |
SCHEDULE OF INVESTMENTS (continued) | March 31, 2024 |
NASDAQ-100® FUND | |
| | Shares | | | Value | |
Trade Desk, Inc. — Class A* | | | 54,268 | | | $ | 4,744,108 | |
CDW Corp. | | | 16,367 | | | | 4,186,351 | |
Warner Bros Discovery, Inc.* | | | 297,507 | | | | 2,597,236 | |
Sirius XM Holdings, Inc.1 | | | 468,569 | | | | 1,818,048 | |
Total Communications | | | | | | | 431,487,536 | |
| | | | | | | | | |
Consumer, Non-cyclical - 11.7% |
PepsiCo, Inc. | | | 167,605 | | | | 29,332,551 | |
Amgen, Inc. | | | 65,353 | | | | 18,581,165 | |
Intuitive Surgical, Inc.* | | | 42,964 | | | | 17,146,503 | |
Vertex Pharmaceuticals, Inc.* | | | 31,499 | | | | 13,166,897 | |
Regeneron Pharmaceuticals, Inc.* | | | 13,163 | | | | 12,669,256 | |
Automatic Data Processing, Inc. | | | 50,094 | | | | 12,510,475 | |
Mondelez International, Inc. — Class A | | | 164,196 | | | | 11,493,720 | |
Gilead Sciences, Inc. | | | 151,916 | | | | 11,127,847 | |
PayPal Holdings, Inc.* | | | 130,693 | | | | 8,755,124 | |
Cintas Corp. | | | 12,362 | | | | 8,493,065 | |
Monster Beverage Corp.* | | | 126,900 | | | | 7,522,632 | |
Dexcom, Inc.* | | | 47,012 | | | | 6,520,564 | |
IDEXX Laboratories, Inc.* | | | 10,132 | | | | 5,470,571 | |
Kraft Heinz Co. | | | 147,931 | | | | 5,458,654 | |
Keurig Dr Pepper, Inc. | | | 169,210 | | | | 5,189,671 | |
GE HealthCare Technologies, Inc. | | | 55,528 | | | | 5,048,050 | |
Moderna, Inc.* | | | 46,592 | | | | 4,964,843 | |
CoStar Group, Inc.* | | | 49,803 | | | | 4,810,970 | |
AstraZeneca plc ADR | | | 71,009 | | | | 4,810,860 | |
Verisk Analytics, Inc. — Class A | | | 17,486 | | | | 4,121,975 | |
Coca-Cola Europacific Partners plc | | | 55,703 | | | | 3,896,425 | |
Biogen, Inc.* | | | 17,726 | | | | 3,822,257 | |
Illumina, Inc.* | | | 19,377 | | | | 2,660,850 | |
Total Consumer, Non-cyclical | | | | | | | 207,574,925 | |
| | | | | | | | | |
Consumer, Cyclical - 8.3% |
Tesla, Inc.* | | | 227,600 | | | | 40,009,804 | |
Costco Wholesale Corp. | | | 54,110 | | | | 39,642,609 | |
Starbucks Corp. | | | 138,066 | | | | 12,617,852 | |
Marriott International, Inc. — Class A | | | 35,301 | | | | 8,906,795 | |
O’Reilly Automotive, Inc.* | | | 7,199 | | | | 8,126,807 | |
PACCAR, Inc. | | | 63,885 | | | | 7,914,713 | |
Copart, Inc.* | | | 117,245 | | | | 6,790,831 | |
Ross Stores, Inc. | | | 41,055 | | | | 6,025,232 | |
Lululemon Athletica, Inc.* | | | 14,764 | | | | 5,767,556 | |
Fastenal Co. | | | 69,781 | | | | 5,382,906 | |
Dollar Tree, Inc.* | | | 26,568 | | | | 3,537,529 | |
Walgreens Boots Alliance, Inc. | | | 105,162 | | | | 2,280,964 | |
Total Consumer, Cyclical | | | | | | | 147,003,598 | |
| | | | | | | | | |
Industrial - 1.8% |
Honeywell International, Inc. | | | 79,530 | | | | 16,323,533 | |
CSX Corp. | | | 238,906 | | | | 8,856,245 | |
Old Dominion Freight Line, Inc. | | | 26,544 | | | | 5,821,365 | |
Total Industrial | | | | | | | 31,001,143 | |
| | | | | | | | | |
Basic Materials - 1.5% |
Linde plc | | | 58,726 | | | | 27,267,656 | |
| | | | | | | | | |
SEE NOTES TO FINANCIAL STATEMENTS. | THE RYDEX FUNDS ANNUAL REPORT | 13 |
SCHEDULE OF INVESTMENTS (continued) | March 31, 2024 |
NASDAQ-100® FUND | |
| | Shares | | | Value | |
Utilities - 1.2% |
Constellation Energy Corp. | | | 38,616 | | | $ | 7,138,168 | |
American Electric Power Company, Inc. | | | 64,166 | | | | 5,524,693 | |
Exelon Corp. | | | 121,889 | | | | 4,579,370 | |
Xcel Energy, Inc. | | | 67,698 | | | | 3,638,767 | |
Total Utilities | | | | | | | 20,880,998 | |
| | | | | | | | | |
Energy - 0.5% |
Diamondback Energy, Inc. | | | 21,761 | | | | 4,312,377 | |
Baker Hughes Co. | | | 122,052 | | | | 4,088,742 | |
Total Energy | | | | | | | 8,401,119 | |
| | | | | | | | | |
Total Common Stocks | | | | |
(Cost $511,340,149) | | | | | | | 1,686,164,477 | |
| | | | | | | | | |
MUTUAL FUNDS† - 2.9% |
Guggenheim Ultra Short Duration Fund — Institutional Class2 | | | 2,756,359 | | | | 27,315,520 | |
Guggenheim Strategy Fund II2 | | | 575,584 | | | | 14,159,378 | |
Guggenheim Strategy Fund III2 | | | 370,504 | | | | 9,140,329 | |
Total Mutual Funds | | | | |
(Cost $51,083,879) | | | | | | | 50,615,227 | |
| | | | | | | | | |
| | | Face
Amount | | | | | |
FEDERAL AGENCY DISCOUNT NOTES†† - 1.1% |
Federal Home Loan Bank |
5.15% due 04/01/243 | | $ | 20,000,000 | | | | 20,000,000 | |
Total Federal Agency Discount Notes | | | | |
(Cost $20,000,000) | | | | | | | 20,000,000 | |
| | | | | | | | | |
U.S. TREASURY BILLS†† - 0.4% |
U.S. Treasury Bills |
5.27% due 04/23/243 | | | 3,950,000 | | | | 3,937,279 | |
5.25% due 04/23/243,4 | | | 1,700,000 | | | | 1,694,525 | |
5.17% due 04/16/243,5 | | | 1,512,000 | | | | 1,508,680 | |
Total U.S. Treasury Bills | | | | |
(Cost $7,140,519) | | | | | | | 7,140,484 | |
| | | | | | | | | |
REPURCHASE AGREEMENTS††,6 - 0.7% |
J.P. Morgan Securities LLC
issued 03/28/24 at 5.31%
due 04/01/244 | | | 6,827,975 | | | | 6,827,975 | |
BofA Securities, Inc.
issued 03/28/24 at 5.31%
due 04/01/244 | | | 2,626,144 | | | | 2,626,144 | |
Barclays Capital, Inc.
issued 03/28/24 at 5.30%
due 04/01/244 | | | 2,380,373 | | | | 2,380,373 | |
Total Repurchase Agreements | | | | |
(Cost $11,834,492) | | | | | | | 11,834,492 | |
| | | Shares | | | | | |
SECURITIES LENDING COLLATERAL†,7 - 0.2% |
Money Market Fund | | | | | | | | |
First American Government Obligations Fund — Class X, 5.23%8 | | | 4,178,608 | | | | 4,178,608 | |
Total Securities Lending Collateral | | | | |
(Cost $4,178,608) | | | | | | | 4,178,608 | |
| | | | | | | | | |
Total Investments - 100.4% | | | | |
(Cost $605,577,647) | | $ | 1,779,933,288 | |
Other Assets & Liabilities, net - (0.4)% | | | (6,658,176 | ) |
Total Net Assets - 100.0% | | $ | 1,773,275,112 | |
14 | THE RYDEX FUNDS ANNUAL REPORT | SEE NOTES TO FINANCIAL STATEMENTS. |
SCHEDULE OF INVESTMENTS (continued) | March 31, 2024 |
NASDAQ-100® FUND | |
Futures Contracts |
Description | | Number of
Contracts | | | Expiration
Date | | | Notional
Amount | | | Value and
Unrealized
Appreciation** | |
Equity Futures Contracts Purchased† |
NASDAQ-100 Index Mini Futures Contracts | | | 52 | | | | Jun 2024 | | | $ | 19,201,000 | | | $ | 193,643 | |
Total Return Swap Agreements |
Counterparty | Index | Type | | Financing
Rate | | Payment
Frequency | | | Maturity
Date | | | Units | | | Notional
Amount | | | Value and
Unrealized
Appreciation | |
OTC Equity Index Swap Agreements†† |
Barclays Bank plc | NASDAQ-100 Index | Pay | | 6.03% (SOFR +
0.70%) | | | At Maturity | | | | 06/25/24 | | | | 2,019 | | | $ | 36,862,935 | | | $ | 380,967 | |
Goldman Sachs International | NASDAQ-100 Index | Pay | | 5.83% (Federal
Funds Rate +
0.50%) | | | At Maturity | | | | 06/26/24 | | | | 1,259 | | | | 22,986,530 | | | | 15,126 | |
BNP Paribas | NASDAQ-100 Index | Pay | | 5.98% (Federal
Funds Rate +
0.65%) | | | At Maturity | | | | 06/26/24 | | | | 486 | | | | 8,872,813 | | | | 7,085 | |
| | | | | | | | | | | | | | | | | | | $ | 68,722,278 | | | $ | 403,178 | |
SEE NOTES TO FINANCIAL STATEMENTS. | THE RYDEX FUNDS ANNUAL REPORT | 15 |
SCHEDULE OF INVESTMENTS (continued) | March 31, 2024 |
NASDAQ-100® FUND | |
* | Non-income producing security. |
** | Includes cumulative appreciation (depreciation). Variation margin is reported within the Statement of Assets and Liabilities. |
† | Value determined based on Level 1 inputs — See Note 4. |
†† | Value determined based on Level 2 inputs — See Note 4. |
1 | All or a portion of this security is on loan at March 31, 2024 — See Note 7. |
2 | Affiliated issuer. |
3 | Rate indicated is the effective yield at the time of purchase. |
4 | All or a portion of this security is pledged as equity index swap collateral at March 31, 2024. |
5 | All or a portion of this security is pledged as futures collateral at March 31, 2024. |
6 | Repurchase Agreements — See Note 6. |
7 | Securities lending collateral — See Note 7. |
8 | Rate indicated is the 7-day yield as of March 31, 2024. |
| | ADR — American Depositary Receipt |
| | plc — Public Limited Company |
| | SOFR — Secured Overnight Financing Rate |
| | |
| | See Sector Classification in Other Information section. |
The following table summarizes the inputs used to value the Fund’s investments at March 31, 2024 (See Note 4 in the Notes to Financial Statements):
Investments in Securities (Assets) | | Level 1
Quoted
Prices | | | Level 2
Significant
Observable
Inputs | | | Level 3
Significant
Unobservable
Inputs | | | Total | |
Common Stocks | | $ | 1,686,164,477 | | | $ | — | | | $ | — | | | $ | 1,686,164,477 | |
Mutual Funds | | | 50,615,227 | | | | — | | | | — | | | | 50,615,227 | |
Federal Agency Discount Notes | | | — | | | | 20,000,000 | | | | — | | | | 20,000,000 | |
U.S. Treasury Bills | | | — | | | | 7,140,484 | | | | — | | | | 7,140,484 | |
Repurchase Agreements | | | — | | | | 11,834,492 | | | | — | | | | 11,834,492 | |
Securities Lending Collateral | | | 4,178,608 | | | | — | | | | — | | | | 4,178,608 | |
Equity Futures Contracts** | | | 193,643 | | | | — | | | | — | | | | 193,643 | |
Equity Index Swap Agreements** | | | — | | | | 403,178 | | | | — | | | | 403,178 | |
Total Assets | | $ | 1,741,151,955 | | | $ | 39,378,154 | | | $ | — | | | $ | 1,780,530,109 | |
** | This derivative is reported as unrealized appreciation/depreciation at period end. |
16 | THE RYDEX FUNDS ANNUAL REPORT | SEE NOTES TO FINANCIAL STATEMENTS. |
SCHEDULE OF INVESTMENTS (concluded) | March 31, 2024 |
NASDAQ-100® FUND | |
Affiliated Transactions
Investments representing 5% or more of the outstanding voting shares of a company, or control of or by, or common control under Guggenheim Investments (“GI”), result in that company being considered an affiliated issuer, as defined in the 1940 Act.
The Fund may invest in certain of the underlying series of Guggenheim Strategy Funds Trust, including Guggenheim Strategy Fund II and Guggenheim Strategy Fund III (collectively, the “Guggenheim Strategy Funds”), each of which are open-end management investment companies managed by GI. The Guggenheim Strategy Funds, which launched on March 11, 2014, are offered as short term investment options only to mutual funds, trusts, and other accounts managed by GI and/or its affiliates, and are not available to the public. The Guggenheim Strategy Funds pay no investment management fees. The Guggenheim Strategy Funds’ annual report on Form N-CSR dated September 30, 2023 is available publicly or upon request. This information is available from the EDGAR database on the SEC’s website at https://www.sec.gov/Archives/edgar/data/1601445/000182126823000217/gug86449-ncsr.htm. The Fund may invest in certain of the underlying series of Guggenheim Funds Trust, which are open-end management investment companies managed by GI, are available to the public and whose most recent annual report on Form N-CSR is available publicly or upon request.
Transactions during the year ended March 31, 2024, in which the company is an affiliated issuer, were as follows:
Security Name | | Value
03/31/23 | | | Additions | | | Reductions | | | Realized
Gain (Loss) | | | Change in
Unrealized
Appreciation
(Depreciation) | |
Mutual Funds | | | | | | | | | | | | | | | | | | | | |
Guggenheim Strategy Fund II | | $ | 13,934,899 | | | $ | — | | | $ | — | | | $ | — | | | $ | 224,479 | |
Guggenheim Strategy Fund III | | | 8,984,717 | | | | — | | | | — | | | | — | | | | 155,612 | |
Guggenheim Ultra Short Duration Fund — Institutional Class | | | 29,758,082 | | | | — | | | | (3,000,000 | ) | | | (94,831 | ) | | | 652,269 | |
| | | $ | 52,677,698 | | | $ | — | | | $ | (3,000,000 | ) | | $ | (94,831 | ) | | $ | 1,032,360 | |
Security Name | | | | | Value
03/31/24 | | | Shares
03/31/24 | | | Investment
Income | |
Mutual Funds | | | | | | | | | | | | | | | | |
Guggenheim Strategy Fund II | | | | | | $ | 14,159,378 | | | | 575,584 | | | $ | 780,890 | |
Guggenheim Strategy Fund III | | | | | | | 9,140,329 | | | | 370,504 | | | | 492,448 | |
Guggenheim Ultra Short Duration Fund — Institutional Class | | | | | | | 27,315,520 | | | | 2,756,359 | | | | 1,487,105 | |
| | | | | | | $ | 50,615,227 | | | | | | | $ | 2,760,443 | |
SEE NOTES TO FINANCIAL STATEMENTS. | THE RYDEX FUNDS ANNUAL REPORT | 17 |
STATEMENT OF ASSETS AND LIABILITIES |
NASDAQ-100® FUND |
March 31, 2024
Assets: |
Investments in unaffiliated issuers, at value - including $3,974,088 of securities loaned (cost $542,659,276) | | $ | 1,717,483,569 | |
Investments in affiliated issuers, at value (cost $51,083,879) | | | 50,615,227 | |
Repurchase agreements, at value (cost $11,834,492) | | | 11,834,492 | |
Cash | | | 399,661 | |
Unrealized appreciation on OTC swap agreements | | | 403,178 | |
Receivables: |
Dividends | | | 731,183 | |
Fund shares sold | | | 412,057 | |
Investment Adviser | | | 53,651 | |
Securities lending income | | | 30,996 | |
Interest | | | 6,980 | |
Total assets | | | 1,781,970,994 | |
| | | | | |
Liabilities: |
Segregated cash due to broker | | | 340,000 | |
Payable for: |
Return of securities lending collateral | | | 4,178,608 | |
Management fees | | | 1,116,619 | |
Transfer agent fees | | | 712,355 | |
Fund shares redeemed | | | 401,045 | |
Swap settlement | | | 101,443 | |
Distribution and service fees | | | 96,883 | |
Portfolio accounting and administration fees | | | 85,800 | |
Variation margin on futures contracts | | | 42,900 | |
Trustees’ fees* | | | 16,207 | |
Miscellaneous | | | 1,604,022 | |
Total liabilities | | | 8,695,882 | |
Net assets | | $ | 1,773,275,112 | |
| | | | | |
Net assets consist of: |
Paid in capital | | $ | 518,130,440 | |
Total distributable earnings (loss) | | | 1,255,144,672 | |
Net assets | | $ | 1,773,275,112 | |
| | | | | |
Investor Class: |
Net assets | | $ | 1,560,082,583 | |
Capital shares outstanding | | | 20,316,824 | |
Net asset value per share | | $ | 76.79 | |
| |
Class A: |
Net assets | | $ | 95,089,213 | |
Capital shares outstanding | | | 1,393,160 | |
Net asset value per share | | $ | 68.25 | |
Maximum offering price per share (Net asset value divided by 95.25%) | | $ | 71.65 | |
| |
Class C: |
Net assets | | $ | 81,249,132 | |
Capital shares outstanding | | | 1,482,772 | |
Net asset value per share | | $ | 54.80 | |
| |
Class H: |
Net assets | | $ | 36,854,184 | |
Capital shares outstanding | | | 540,099 | |
Net asset value per share | | $ | 68.24 | |
* | Relates to Trustees not deemed “interested persons” within the meaning of Section 2(a)(19) of the 1940 Act. |
18 | THE RYDEX FUNDS ANNUAL REPORT | SEE NOTES TO FINANCIAL STATEMENTS. |
STATEMENT OF OPERATIONS |
NASDAQ-100® FUND |
Year Ended March 31, 2024
Investment Income: |
Dividends from securities of unaffiliated issuers (net of foreign withholding tax of $20,101) | | $ | 13,610,214 | |
Dividends from securities of affiliated issuers | | | 2,760,443 | |
Interest | | | 1,418,190 | |
Income from securities lending, net | | | 406,527 | |
Total investment income | | | 18,195,374 | |
| | | | | |
Expenses: |
Management fees | | | 11,779,624 | |
Distribution and service fees: |
Class A | | | 196,983 | |
Class C | | | 765,053 | |
Class H | | | 72,757 | |
Transfer agent fees | | | 3,427,036 | |
Portfolio accounting and administration fees | | | 1,719,203 | |
Registration fees | | | 1,348,220 | |
Professional fees | | | 759,119 | |
Trustees’ fees* | | | 240,324 | |
Custodian fees | | | 213,330 | |
Interest expense | | | 118,650 | |
Line of credit fees | | | 331 | |
Miscellaneous | | | 1,420,191 | |
Total expenses | | | 22,060,821 | |
Less: |
Expenses reimbursed by Adviser | | | (545,048 | ) |
Expenses waived by Adviser | | | (603,979 | ) |
Total waived/reimbursed expenses | | | (1,149,027 | ) |
Net expenses | | | 20,911,794 | |
Net investment loss | | | (2,716,420 | ) |
| | | | | |
Net Realized and Unrealized Gain (Loss): |
Net realized gain (loss) on: |
Investments in unaffiliated issuers | | $ | 188,874,076 | |
Investments in affiliated issuers | | | (94,831 | ) |
Swap agreements | | | 18,244,549 | |
Futures contracts | | | 5,617,707 | |
Net realized gain | | | 212,641,501 | |
Net change in unrealized appreciation (depreciation) on: |
Investments in unaffiliated issuers | | | 295,516,732 | |
Investments in affiliated issuers | | | 1,032,360 | |
Swap agreements | | | (2,456,596 | ) |
Futures contracts | | | (715,412 | ) |
Net change in unrealized appreciation (depreciation) | | | 293,377,084 | |
Net realized and unrealized gain | | | 506,018,585 | |
Net increase in net assets resulting from operations | | $ | 503,302,165 | |
* | Relates to Trustees not deemed “interested persons” within the meaning of Section 2(a)(19) of the 1940 Act. |
SEE NOTES TO FINANCIAL STATEMENTS. | THE RYDEX FUNDS ANNUAL REPORT | 19 |
STATEMENTS OF CHANGES IN NET ASSETS |
NASDAQ-100® FUND | |
| | Year Ended
March 31,
2024 | | | Year Ended
March 31,
2023 | |
Increase (Decrease) in Net Assets from Operations: | | | | | | | | |
Net investment loss | | $ | (2,716,420 | ) | | $ | (3,337,104 | ) |
Net realized gain on investments | | | 212,641,501 | | | | 10,241,757 | |
Net change in unrealized appreciation (depreciation) on investments | | | 293,377,084 | | | | (211,252,225 | ) |
Net increase (decrease) in net assets resulting from operations | | | 503,302,165 | | | | (204,347,572 | ) |
| | | | | | | | | |
Distributions to shareholders: | | | | | | | | |
Investor Class | | | — | | | | (77,687,668 | ) |
Class A | | | — | | | | (4,843,280 | ) |
Class C | | | — | | | | (7,083,939 | ) |
Class H | | | — | | | | (1,710,370 | ) |
Total distributions to shareholders | | | — | | | | (91,325,257 | ) |
| | | | | | | | | |
Capital share transactions: | | | | | | | | |
Proceeds from sale of shares | | | | | | | | |
Investor Class | | | 1,542,602,229 | | | | 1,049,808,809 | |
Class A | | | 19,822,679 | | | | 13,187,157 | |
Class C | | | 10,446,786 | | | | 5,718,757 | |
Class H | | | 37,156,428 | | | | 26,799,257 | |
Distributions reinvested | | | | | | | | |
Investor Class | | | — | | | | 74,594,196 | |
Class A | | | — | | | | 4,570,561 | |
Class C | | | — | | | | 6,551,420 | |
Class H | | | — | | | | 1,709,611 | |
Cost of shares redeemed | | | | | | | | |
Investor Class | | | (1,651,676,803 | ) | | | (1,071,528,281 | ) |
Class A | | | (14,123,233 | ) | | | (13,908,368 | ) |
Class C | | | (25,335,049 | ) | | | (24,159,992 | ) |
Class H | | | (32,030,171 | ) | | | (28,494,171 | ) |
Net increase (decrease) from capital share transactions | | | (113,137,134 | ) | | | 44,848,956 | |
Net increase (decrease) in net assets | | | 390,165,031 | | | | (250,823,873 | ) |
| | | | | | | | | |
Net assets: | | | | | | | | |
Beginning of year | | | 1,383,110,081 | | | | 1,633,933,954 | |
End of year | | $ | 1,773,275,112 | | | $ | 1,383,110,081 | |
| | | | | | | | | |
20 | THE RYDEX FUNDS ANNUAL REPORT | SEE NOTES TO FINANCIAL STATEMENTS. |
STATEMENTS OF CHANGES IN NET ASSETS (concluded) |
NASDAQ-100® FUND | |
| | Year Ended
March 31,
2024 | | | Year Ended
March 31,
2023 | |
Capital share activity: | | | | | | | | |
Shares sold | | | | | | | | |
Investor Class | | | 23,161,963 | | | | 19,159,694 | |
Class A | | | 343,412 | | | | 270,590 | |
Class C | | | 222,984 | | | | 139,492 | |
Class H | | | 633,174 | | | | 511,150 | |
Shares issued from reinvestment of distributions | | | | | | | | |
Investor Class | | | — | | | | 1,594,575 | |
Class A | | | — | | | | 109,580 | |
Class C | | | — | | | | 193,772 | |
Class H | | | — | | | | 40,998 | |
Shares redeemed | | | | | | | | |
Investor Class | | | (24,846,491 | ) | | | (19,581,281 | ) |
Class A | | | (243,576 | ) | | | (289,295 | ) |
Class C | | | (543,161 | ) | | | (604,030 | ) |
Class H | | | (543,569 | ) | | | (569,921 | ) |
Net increase (decrease) in shares | | | (1,815,264 | ) | | | 975,324 | |
SEE NOTES TO FINANCIAL STATEMENTS. | THE RYDEX FUNDS ANNUAL REPORT | 21 |
FINANCIAL HIGHLIGHTS |
NASDAQ-100® FUND | |
This table is presented to show selected data for a share outstanding throughout each period and to assist shareholders in evaluating a Fund’s performance for the periods presented.
Investor Class | | Year
Ended
March 31,
2024 | | | Year
Ended
March 31,
2023 | | | Year
Ended
March 31,
2022 | | | Year
Ended
March 31,
2021 | | | Year
Ended
March 31,
2020 | |
Per Share Data |
Net asset value, beginning of period | | $ | 55.65 | | | $ | 68.39 | | | $ | 63.43 | | | $ | 39.68 | | | $ | 38.39 | |
Income (loss) from investment operations: |
Net investment income (loss)a | | | (.07 | ) | | | (.10 | ) | | | (.37 | ) | | | (.28 | ) | | | (.08 | ) |
Net gain (loss) on investments (realized and unrealized) | | | 21.21 | | | | (8.57 | ) | | | 8.70 | | | | 26.64 | | | | 2.21 | |
Total from investment operations | | | 21.14 | | | | (8.67 | ) | | | 8.33 | | | | 26.36 | | | | 2.13 | |
Less distributions from: |
Net realized gains | | | — | | | | (4.07 | ) | | | (3.37 | ) | | | (2.61 | ) | | | (.84 | ) |
Total distributions | | | — | | | | (4.07 | ) | | | (3.37 | ) | | | (2.61 | ) | | | (.84 | ) |
Net asset value, end of period | | $ | 76.79 | | | $ | 55.65 | | | $ | 68.39 | | | $ | 63.43 | | | $ | 39.68 | |
|
Total Return | | | 37.99 | % | | | (11.56 | %) | | | 12.69 | % | | | 66.78 | % | | | 5.40 | % |
Ratios/Supplemental Data |
Net assets, end of period (in thousands) | | $ | 1,560,083 | | | $ | 1,224,330 | | | $ | 1,424,456 | | | $ | 1,386,721 | | | $ | 888,189 | |
Ratios to average net assets: |
Net investment income (loss) | | | (0.11 | %) | | | (0.19 | %) | | | (0.53 | %) | | | (0.50 | %) | | | (0.19 | %) |
Total expensesb | | | 1.34 | % | | | 1.30 | % | | | 1.25 | % | | | 1.33 | % | | | 1.37 | % |
Net expensesc | | | 1.27 | % | | | 1.27 | % | | | 1.24 | % | | | 1.33 | % | | | 1.37 | % |
Portfolio turnover rate | | | 70 | % | | | 50 | % | | | 44 | % | | | 57 | % | | | 54 | % |
22 | THE RYDEX FUNDS ANNUAL REPORT | SEE NOTES TO FINANCIAL STATEMENTS. |
FINANCIAL HIGHLIGHTS (continued) |
NASDAQ-100® FUND |
This table is presented to show selected data for a share outstanding throughout each period and to assist shareholders in evaluating a Fund’s performance for the periods presented.
Class A | | Year
Ended
March 31,
2024 | | | Year
Ended
March 31,
2023 | | | Year
Ended
March 31,
2022 | | | Year
Ended
March 31,
2021 | | | Year
Ended
March 31,
2020 | |
Per Share Data |
Net asset value, beginning of period | | $ | 49.59 | | | $ | 61.69 | | | $ | 57.63 | | | $ | 36.29 | | | $ | 35.26 | |
Income (loss) from investment operations: |
Net investment income (loss)a | | | (.21 | ) | | | (.21 | ) | | | (.50 | ) | | | (.39 | ) | | | (.17 | ) |
Net gain (loss) on investments (realized and unrealized) | | | 18.87 | | | | (7.82 | ) | | | 7.93 | | | | 24.34 | | | | 2.04 | |
Total from investment operations | | | 18.66 | | | | (8.03 | ) | | | 7.43 | | | | 23.95 | | | | 1.87 | |
Less distributions from: |
Net realized gains | | | — | | | | (4.07 | ) | | | (3.37 | ) | | | (2.61 | ) | | | (.84 | ) |
Total distributions | | | — | | | | (4.07 | ) | | | (3.37 | ) | | | (2.61 | ) | | | (.84 | ) |
Net asset value, end of period | | $ | 68.25 | | | $ | 49.59 | | | $ | 61.69 | | | $ | 57.63 | | | $ | 36.29 | |
|
Total Returnd | | | 37.63 | % | | | (11.78 | %) | | | 12.40 | % | | | 66.37 | % | | | 5.14 | % |
Ratios/Supplemental Data |
Net assets, end of period (in thousands) | | $ | 95,089 | | | $ | 64,133 | | | $ | 74,179 | | | $ | 69,808 | | | $ | 41,054 | |
Ratios to average net assets: |
Net investment income (loss) | | | (0.36 | %) | | | (0.43 | %) | | | (0.78 | %) | | | (0.75 | %) | | | (0.44 | %) |
Total expensesb | | | 1.59 | % | | | 1.54 | % | | | 1.50 | % | | | 1.58 | % | | | 1.62 | % |
Net expensesc | | | 1.51 | % | | | 1.52 | % | | | 1.49 | % | | | 1.58 | % | | | 1.62 | % |
Portfolio turnover rate | | | 70 | % | | | 50 | % | | | 44 | % | | | 57 | % | | | 54 | % |
SEE NOTES TO FINANCIAL STATEMENTS. | THE RYDEX FUNDS ANNUAL REPORT | 23 |
FINANCIAL HIGHLIGHTS (continued) |
NASDAQ-100® FUND |
This table is presented to show selected data for a share outstanding throughout each period and to assist shareholders in evaluating a Fund’s performance for the periods presented.
Class C | | Year
Ended
March 31,
2024 | | | Year
Ended
March 31,
2023 | | | Year
Ended
March 31,
2022 | | | Year
Ended
March 31,
2021 | | | Year
Ended
March 31,
2020 | |
Per Share Data |
Net asset value, beginning of period | | $ | 40.11 | | | $ | 51.32 | | | $ | 48.76 | | | $ | 31.18 | | | $ | 30.64 | |
Income (loss) from investment operations: |
Net investment income (loss)a | | | (.52 | ) | | | (.48 | ) | | | (.82 | ) | | | (.66 | ) | | | (.39 | ) |
Net gain (loss) on investments (realized and unrealized) | | | 15.21 | | | | (6.66 | ) | | | 6.75 | | | | 20.85 | | | | 1.77 | |
Total from investment operations | | | 14.69 | | | | (7.14 | ) | | | 5.93 | | | | 20.19 | | | | 1.38 | |
Less distributions from: |
Net realized gains | | | — | | | | (4.07 | ) | | | (3.37 | ) | | | (2.61 | ) | | | (.84 | ) |
Total distributions | | | — | | | | (4.07 | ) | | | (3.37 | ) | | | (2.61 | ) | | | (.84 | ) |
Net asset value, end of period | | $ | 54.80 | | | $ | 40.11 | | | $ | 51.32 | | | $ | 48.76 | | | $ | 31.18 | |
|
Total Returnd | | | 36.62 | % | | | (12.45 | %) | | | 11.57 | % | | | 65.17 | % | | | 4.31 | % |
Ratios/Supplemental Data |
Net assets, end of period (in thousands) | | $ | 81,249 | | | $ | 72,314 | | | $ | 106,419 | | | $ | 115,315 | | | $ | 80,633 | |
Ratios to average net assets: |
Net investment income (loss) | | | (1.12 | %) | | | (1.19 | %) | | | (1.53 | %) | | | (1.50 | %) | | | (1.19 | %) |
Total expensesb | | | 2.34 | % | | | 2.29 | % | | | 2.25 | % | | | 2.33 | % | | | 2.37 | % |
Net expensesc | | | 2.27 | % | | | 2.27 | % | | | 2.24 | % | | | 2.33 | % | | | 2.37 | % |
Portfolio turnover rate | | | 70 | % | | | 50 | % | | | 44 | % | | | 57 | % | | | 54 | % |
24 | THE RYDEX FUNDS ANNUAL REPORT | SEE NOTES TO FINANCIAL STATEMENTS. |
FINANCIAL HIGHLIGHTS (concluded) |
NASDAQ-100® FUND |
This table is presented to show selected data for a share outstanding throughout each period and to assist shareholders in evaluating a Fund’s performance for the periods presented.
Class H | | Year
Ended
March 31,
2024 | | | Year
Ended
March 31,
2023 | | | Year
Ended
March 31,
2022 | | | Year
Ended
March 31,
2021 | | | Year
Ended
March 31,
2020 | |
Per Share Data |
Net asset value, beginning of period | | $ | 49.57 | | | $ | 61.67 | | | $ | 57.61 | | | $ | 36.28 | | | $ | 35.26 | |
Income (loss) from investment operations: |
Net investment income (loss)a | | | (.20 | ) | | | (.21 | ) | | | (.51 | ) | | | (.38 | ) | | | (.16 | ) |
Net gain (loss) on investments (realized and unrealized) | | | 18.87 | | | | (7.82 | ) | | | 7.94 | | | | 24.32 | | | | 2.02 | |
Total from investment operations | | | 18.67 | | | | (8.03 | ) | | | 7.43 | | | | 23.94 | | | | 1.86 | |
Less distributions from: |
Net realized gains | | | — | | | | (4.07 | ) | | | (3.37 | ) | | | (2.61 | ) | | | (.84 | ) |
Total distributions | | | — | | | | (4.07 | ) | | | (3.37 | ) | | | (2.61 | ) | | | (.84 | ) |
Net asset value, end of period | | $ | 68.24 | | | $ | 49.57 | | | $ | 61.67 | | | $ | 57.61 | | | $ | 36.28 | |
|
Total Return | | | 37.66 | % | | | (11.77 | %) | | | 12.41 | % | | | 66.36 | % | | | 5.11 | % |
Ratios/Supplemental Data |
Net assets, end of period (in thousands) | | $ | 36,854 | | | $ | 22,333 | | | $ | 28,879 | | | $ | 24,532 | | | $ | 23,777 | |
Ratios to average net assets: |
Net investment income (loss) | | | (0.35 | %) | | | (0.42 | %) | | | (0.79 | %) | | | (0.75 | %) | | | (0.43 | %) |
Total expensesb | | | 1.59 | % | | | 1.54 | % | | | 1.50 | % | | | 1.59 | % | | | 1.62 | % |
Net expensesc | | | 1.51 | % | | | 1.52 | % | | | 1.49 | % | | | 1.59 | % | | | 1.62 | % |
Portfolio turnover rate | | | 70 | % | | | 50 | % | | | 44 | % | | | 57 | % | | | 54 | % |
a | Net investment income (loss) per share was computed using average shares outstanding throughout the period. |
b | Does not include expenses of the underlying funds in which the Fund invests. |
c | Net expense information reflects the expense ratios after expense waivers and reimbursements, as applicable. |
d | Total return does not reflect the impact of any applicable sales charges. |
SEE NOTES TO FINANCIAL STATEMENTS. | THE RYDEX FUNDS ANNUAL REPORT | 25 |
NOTES TO FINANCIAL STATEMENTS |
Note 1 – Organization and Significant Accounting Policies
Organization
The Rydex Series Funds (the “Trust”), a Delaware statutory trust, is registered with the U.S. Securities and Exchange Commission (the “SEC”) under the Investment Company Act of 1940 (the “1940 Act”), as an open-ended investment company of the series type. Each series, in effect, is representing a separate fund. The Trust may issue an unlimited number of authorized shares. The Trust accounts for the assets of each fund separately.
The Trust offers a combination of seven separate classes of shares: Investor Class shares, Class A shares, Class C shares, Class H shares, Class P shares, Institutional Class shares and Money Market Class shares. Sales of shares of each Class are made without a front-end sales charge at the net asset value per share (“NAV”), with the exception of Class A shares. Class A shares are sold at the NAV, plus the applicable front-end sales charge. The sales charge varies depending on the amount purchased, but will not exceed 4.75%. Class A share purchases of $1 million or more are exempt from the front-end sales charge but have a 1% contingent deferred sales charge (“CDSC”) if shares are redeemed within 12 months of purchase. Class C shares have a 1% CDSC if shares are redeemed within 12 months of purchase. Class C shares automatically convert to Class A shares on or about the 10th day of the month following the 8-year anniversary of the purchase of the Class C shares. This conversion will be executed without any sales charge, fee or other charge. After the conversion is completed, the shares will be subject to all features and expenses of Class A shares. Institutional Class shares are offered primarily for direct investment by institutions such as pension and profit sharing plans, endowments, foundations and corporations. Institutional Class shares require a minimum initial investment of $2 million and a minimum account balance of $1 million. At March 31, 2024, the Trust consisted of fifty-two funds (the “Funds”).
This report covers the NASDAQ-100® Fund (the “Fund”), a non-diversified investment company.
At March 31, 2024, Class A, Class C, Investor Class and Class H shares have been issued by the Fund.
The Fund is designed and operated to accommodate frequent trading by shareholders and, unlike most mutual funds, offers unlimited exchange privileges with no minimum holding periods or transactions fees, which may cause the Fund to experience high portfolio turnover.
Security Investors, LLC (the “Adviser”), which operates under the name Guggenheim Investments (“GI”), provides advisory services. Guggenheim Funds Distributors, LLC (“GFD”) serves as distributor of the Fund’s shares. GI and GFD are affiliated entities.
Significant Accounting Policies
The Fund operates as an investment company and, accordingly, follows the investment company accounting and reporting guidance of the Financial Accounting Standards Board (“FASB”) Accounting Standards Codification Topic 946 Financial Services – Investment Companies.
26 | THE RYDEX FUNDS ANNUAL REPORT | |
NOTES TO FINANCIAL STATEMENTS (continued) |
The following significant accounting policies are in conformity with U.S. generally accepted accounting principles (“U.S. GAAP”) and are consistently followed by the Trust. This requires management to make estimates and assumptions that affect the reported amount of assets and liabilities, contingent assets and liabilities at the date of the financial statements, and the reported amounts of revenues and expenses during the reporting period. Actual results could differ from these estimates. All time references are based on Eastern Time.
The NAV of each share class of the Fund is calculated by dividing the market value of the Fund’s securities and other assets, less all liabilities attributable to the share class by the number of outstanding shares of the share class on the specified date.
(a) Valuation of Investments
The Board of Trustees of the Fund (the “Board”) adopted policies and procedures for the valuation of the Fund’s investments (the “Fund Valuation Procedures”). The SEC adopted Rule 2a-5 under the 1940 Act (“Rule 2a-5”) which establishes requirements for determining fair value in good faith. Rule 2a-5 also defines “readily available market quotations” for purposes of the 1940 Act and establishes requirements for determining whether a fund must fair value a security in good faith.
Pursuant to Rule 2a-5, the Board has designated the Adviser as the valuation designee to perform fair valuation determinations for the Fund with respect to all Fund investments and other assets. As the Fund’s valuation designee pursuant to Rule 2a-5, the Adviser has adopted separate procedures (the “Valuation Designee Procedures” and collectively with the Fund Valuation Procedures, the “Valuation Procedures”) reasonably designed to prevent violations of the requirements of Rule 2a-5 and Rule 31a-4. The Adviser, in its role as valuation designee, utilizes the assistance of a valuation committee, consisting of representatives from Guggenheim’s investment management, fund administration, legal and compliance departments (the “Valuation Committee”), in determining the fair value of the Fund’s securities and other assets.
Valuations of the Fund’s securities and other assets are supplied primarily by pricing service providers appointed pursuant to the processes set forth in the Valuation Procedures. The Adviser, with the assistance of the Valuation Committee, convenes monthly, or more frequently as needed, to review the valuation of all assets which have been fair valued. The Adviser, consistent with the monitoring and review responsibilities set forth in the Valuation Procedures, regularly reviews the appropriateness of the inputs, methods, models and assumptions employed by the pricing service providers.
If the pricing service provider cannot or does not provide a valuation for a particular investment or such valuation is deemed unreliable, such investment is fair valued by the Adviser.
Equity securities listed or traded on a recognized U.S. securities exchange or the Nasdaq Stock Market (“NASDAQ”) will generally be valued on the basis of the last sale price on the primary U.S. exchange or market on which the security is listed or traded; provided, however, that securities listed on NASDAQ will be valued at the NASDAQ official closing price, which may not necessarily represent the last sale price.
| | THE RYDEX FUNDS ANNUAL REPORT | 27 |
NOTES TO FINANCIAL STATEMENTS (continued) |
Open-end investment companies are valued at their NAV as of the close of business, on the valuation date.
U.S. Government securities are valued by pricing service providers, using the last traded fill price, or at the reported bid price at the close of business on the valuation date.
Repurchase agreements are generally valued at amortized cost, provided such amounts approximate market value.
Commercial paper and discount notes with a maturity of greater than 60 days at acquisition are valued at prices that reflect broker-dealer supplied valuations or are obtained from pricing service providers, which may consider the trade activity, treasury spreads, yields or price of bonds of comparable quality, coupon, maturity, and type, as well as prices quoted by dealers who make markets in such securities. Commercial paper and discount notes with a maturity of 60 days or less at acquisition are valued at amortized cost, unless the Adviser concludes that amortized cost does not represent the fair value of the applicable asset in which case it will be valued using an independent pricing service provider.
Futures contracts are valued on the basis of the last sale price as of 4:00 p.m. on the valuation date. In the event that the exchange for a specific futures contract closes earlier than 4:00 p.m., the futures contract is valued at the official settlement price of the exchange. However, the underlying securities from which the futures contract value is derived are monitored until 4:00 p.m. to determine if fair valuation of the underlying securities would provide a more accurate valuation of the futures contract.
Swap agreements entered into by the Fund are generally valued using an evaluated price provided by a pricing service provider.
Investments for which market quotations are not readily available are fair valued as determined in good faith by the Adviser. Valuations in accordance with these methods are intended to reflect each security’s (or asset’s or liability’s) “fair value”. Each such determination is based on a consideration of all relevant factors, which are likely to vary from one pricing context to another. Examples of such factors may include, but are not limited to market prices; sale prices; broker quotes; and models which derive prices based on inputs such as prices of securities with comparable maturities and characteristics, or on inputs such as anticipated cash flows or collateral, spread over U.S. Treasury securities, and other information analysis. In connection with futures contracts and other derivative investments, such factors may include obtaining information as to how (a) these contracts and other derivative investments trade in the futures or other derivative markets, respectively, and (b) the securities underlying these contracts and other derivative investments trade in the cash market.
28 | THE RYDEX FUNDS ANNUAL REPORT | |
NOTES TO FINANCIAL STATEMENTS (continued) |
(b) U.S. Government and Agency Obligations
Certain U.S. Government and Agency Obligations are traded on a discount basis; the interest rates shown on the Fund’s Schedule of Investments reflect the effective rates paid at the time of purchase by the Fund. Other securities bear interest at the rates shown, payable at fixed dates through maturity.
(c) Futures Contracts
Upon entering into a futures contract, the Fund deposits and maintains as collateral such initial margin as required by the exchange on which the transaction is affected. Pursuant to the contract, the Fund agrees to receive from or pay to the broker an amount of cash equal to the daily fluctuation in value of the contract. Such receipts or payments are known as variation margin and are recorded by the Fund as unrealized appreciation or depreciation. When the contract is closed, the Fund records a realized gain or loss equal to the difference between the value of the contract at the time it was opened and the value at the time it was closed.
(d) Swap Agreements
Swap agreements are marked-to-market daily and the change, if any, is recorded as unrealized appreciation or depreciation. Payments received or made as a result of an agreement or termination of an agreement are recognized as realized gains or losses.
(e) Foreign Taxes
The Fund may be subject to foreign taxes (a portion of which may be reclaimable) on income, stock dividends, capital gains on investments or certain foreign currency transactions. All foreign taxes are recorded in accordance with the applicable foreign tax regulations and rates that exist in the foreign jurisdictions in which the Fund invests. These foreign taxes, if any, are paid by the Fund and reflected in its Statement of Operations as follows: foreign taxes withheld at source are presented as a reduction of income and foreign taxes on capital gains from sales of investments are included with the net realized gain (loss) on investments. Foreign taxes payable or deferred as of March 31, 2024, if any, are disclosed in the Fund’s Statement of Assets and Liabilities.
(f) Security Transactions
Security transactions are recorded on the trade date for financial reporting purposes. Realized gains and losses from securities transactions are recorded using the identified cost basis. Proceeds from lawsuits related to investment holdings are recorded as a reduction to cost if the securities are still held and as realized gains if no longer held in the Fund. Dividend income is recorded on the ex-dividend date, net of applicable taxes withheld by foreign countries, if any. Taxable non-cash dividends are recorded as dividend income. Interest income, including amortization of premiums and accretion of discounts, is accrued on a daily basis. Dividend income from Real Estate Investment Trusts (“REITs”) is recorded based on the income included in the distributions received from the REIT investments using published REIT classifications, including some management estimates when actual amounts are not available. Distributions
| | THE RYDEX FUNDS ANNUAL REPORT | 29 |
NOTES TO FINANCIAL STATEMENTS (continued) |
received in excess of this estimated amount are recorded as a reduction of the cost of investments or reclassified to realized gains. The actual amounts of income, return of capital, and realized gains are only determined by each REIT after its fiscal year-end, and may differ from the estimated amounts.
(g) Distributions
Distributions of net investment income and net realized gains, if any, are declared and paid at least annually. Dividends are reinvested in additional shares, unless shareholders request payment in cash. Distributions are recorded on the ex-dividend date and are determined in accordance with U.S. federal income tax regulations which may differ from U.S. GAAP.
(h) Class Allocations
Interest and dividend income, most expenses, all realized gains and losses, and all unrealized appreciation and depreciation are allocated to the share classes based upon the value of the outstanding shares in each share class. Certain costs, such as distribution and service fees are charged directly to specific share classes. In addition, certain expenses have been allocated to the individual Funds in the Trust based on the respective net assets of each Fund included in the Trust.
(i) Cash
The Fund may leave cash overnight in its cash account with the custodian. Periodically, the Fund may have cash due to the custodian bank as an overdraft balance. A fee is incurred on this overdraft, calculated by multiplying the overdraft by a rate based on the federal funds rate, which was 5.33% at March 31, 2024.
(j) Indemnifications
Under the Fund’s organizational documents, its Trustees and Officers are indemnified against certain liabilities arising out of the performance of their duties to the Trust. In addition, throughout the normal course of business, the Fund enters into contracts that contain a variety of representations and warranties which provide general indemnifications. The Fund’s maximum exposure under these arrangements is unknown, as this would involve future claims that may be made against the Fund and/or its affiliates that have not yet occurred. However, based on experience, the Fund expects the risk of loss to be remote.
Note 2 – Derivatives
As part of its investment strategy, the Fund utilizes a variety of derivative instruments. These investments involve, to varying degrees, elements of market risk and risks in excess of amounts recognized on the Fund’s Statement of Assets and Liabilities. Valuation and accounting treatment of these instruments can be found under Significant Accounting Policies in Note 1 of these Notes to Financial Statements.
30 | THE RYDEX FUNDS ANNUAL REPORT | |
NOTES TO FINANCIAL STATEMENTS (continued) |
Derivatives are instruments whose values depend on, or are derived from, in whole or in part, the value of one or more other assets, such as securities, currencies, commodities or indices. Derivative instruments may be used for investment purposes (including to maintain cash reserves while maintaining exposure to certain other assets), for risk management (hedging) purposes, to facilitate trading, to reduce transaction costs and to pursue higher investment returns. Derivative instruments may also be used to seek to mitigate certain investment risks, such as foreign currency exchange rate risk, interest rate risk and credit risk. U.S. GAAP requires disclosures to enable investors to better understand how and why a Fund uses derivative instruments, how these derivative instruments are accounted for and their effects on the Fund’s financial position and results of operations.
The Fund utilized derivatives for the following purposes:
Index Exposure: the use of an instrument to obtain exposure to a listed or other type of index.
Liquidity: the ability to buy or sell exposure with little price/market impact.
Futures Contracts
A futures contract is an agreement to purchase (long) or sell (short) an agreed amount of securities or other instruments at a set price for delivery at a future date. There are significant risks associated with the Fund’s use of futures contracts, including (i) there may be an imperfect or no correlation between the changes in market value of the underlying asset and the prices of futures contracts; (ii) there may not be a liquid secondary market for a futures contract; (iii) trading restrictions or limitations may be imposed by an exchange; and (iv) government regulations may restrict trading in futures contracts. When investing in futures, there is minimal counterparty credit risk to the Fund because futures are exchange-traded and the exchange’s clearinghouse, as counterparty to all exchange-traded futures, guarantees against default. Cash deposits are shown as segregated cash with broker on the Fund’s Statement of Assets and Liabilities; securities held as collateral are noted on the Fund’s Schedule of Investments.
The following table represents the Fund’s use and volume of futures on a monthly basis:
| | | | | | | Average Notional Amount | |
Use | | Long | | | Short | |
Index exposure, Liquidity | | $ | 21,917,711 | | | $ | — | |
Swap Agreements
A swap is an agreement that obligates two parties to exchange a series of cash flows at specified intervals based upon or calculated by reference to changes in specified prices or rates for a specified amount of an underlying asset. When utilizing over-the-counter (“OTC”) swaps, the Fund bears the risk of loss of the amount expected to be received under a swap agreement in the event of the default or bankruptcy of a swap agreement counterparty or if the underlying asset declines in value. Certain standardized swaps are subject to mandatory central clearing and are
| | THE RYDEX FUNDS ANNUAL REPORT | 31 |
NOTES TO FINANCIAL STATEMENTS (continued) |
executed on a multi-lateral or other trade facility platform, such as a registered exchange. There is limited counterparty credit risk with respect to centrally-cleared swaps as the transaction is facilitated through a central clearinghouse, much like exchange-traded futures contracts. For a Fund utilizing centrally-cleared swaps, the exchange bears the risk of loss resulting from a counterparty not being able to pay. There is no guarantee that a Fund or an underlying fund could eliminate its exposure under an outstanding swap agreement by entering into an offsetting swap agreement with the same or another party.
Total return swaps involve commitments where single or multiple cash flows are exchanged based on the price of an underlying reference asset (such as an index) for a fixed or variable interest rate. Total return swaps will usually be computed based on the current value of the reference asset as of the close of regular trading on the New York Stock Exchange (“NYSE”) or other exchange, with the swap value being adjusted to include dividends accrued, financing charges and/or interest associated with the swap agreement. When utilizing total return swaps, the Fund bears the risk of loss of the amount expected to be received under a swap agreement in the event of the default or bankruptcy of a swap agreement counterparty or if the underlying reference asset declines in value.
The following table represents the Fund’s use and volume of total return swaps on a monthly basis:
| | | | | | | Average Notional Amount | |
Use | | Long | | | Short | |
Index exposure, Liquidity | | $ | 57,862,091 | | | $ | — | |
Derivative Investment Holdings Categorized by Risk Exposure
The following is a summary of the location of derivative investments on the Fund’s Statement of Assets and Liabilities as of March 31, 2024:
Derivative Investment Type | Asset Derivatives | Liability Derivatives |
Equity contracts | — | Variation margin on futures contracts |
| Unrealized appreciation on OTC swap agreements | — |
32 | THE RYDEX FUNDS ANNUAL REPORT | |
NOTES TO FINANCIAL STATEMENTS (continued) |
The following tables set forth the fair value of the Fund’s derivative investments categorized by primary risk exposure at March 31, 2024:
Asset Derivative Investments Value |
| | Futures
Equity
Risk* | | | Swaps
Equity
Risk | | | Total Value at
March 31,
2024 | |
| | | $ | 193,643 | | | $ | 403,178 | | | $ | 596,821 | |
* | Includes cumulative appreciation (depreciation) of futures contracts as reported on the Fund’s Schedule of Investments. For exchange-traded derivatives, variation margin is reported within the Fund’s Statement of Assets and Liabilities. |
The following is a summary of the location of derivative investments on the Fund’s Statement of Operations for the year ended March 31, 2024:
Derivative Investment Type | Location of Gain (Loss) on Derivatives |
Equity contracts | Net realized gain (loss) on futures contracts |
| Net change in unrealized appreciation (depreciation) on futures contracts |
| Net realized gain (loss) on swap agreements |
| Net change in unrealized appreciation (depreciation) on swap agreements |
The following is a summary of the Fund’s realized gain (loss) and change in unrealized appreciation (depreciation) on derivative investments recognized on the Fund’s Statement of Operations categorized by primary risk exposure for the year ended March 31, 2024:
Realized Gain (Loss) on Derivative Investments Recognized on the Statement of Operations |
| | Futures
Equity
Risk | | | Swaps
Equity
Risk | | | Total | |
| | | $ | 5,617,707 | | | $ | 18,244,549 | | | $ | 23,862,256 | |
Change in Unrealized Appreciation (Depreciation) on Derivative Investments Recognized on the Statement of Operations |
| | Futures
Equity
Risk | | | Swaps
Equity
Risk | | | Total | |
| | | $ | (715,412 | ) | | $ | (2,456,596 | ) | | $ | (3,172,008 | ) |
| | THE RYDEX FUNDS ANNUAL REPORT | 33 |
NOTES TO FINANCIAL STATEMENTS (continued) |
In conjunction with the use of derivative instruments, the Fund is required to maintain collateral in various forms. Depending on the financial instrument utilized and the broker involved, the Fund uses margin deposits at the broker, cash and/or securities segregated at the custodian bank, discount notes or repurchase agreements allocated to the Fund as collateral.
The Trust has established counterparty credit guidelines and enters into transactions only with financial institutions rated/identified as investment grade or better. The Trust monitors the counterparty credit risk associated with each such financial institution.
Note 3 – Offsetting
In the normal course of business, the Fund enters into transactions subject to enforceable master netting arrangements or other similar arrangements. Generally, the right to offset in those agreements allows the Fund to counteract the exposure to a specific counterparty with collateral received from or delivered to that counterparty based on the terms of the arrangements. These arrangements provide for the right to liquidate upon the occurrence of an event of default, credit event upon merger or additional termination event.
In order to better define its contractual rights and to secure rights that will help the Fund mitigate its counterparty risk, the Fund may enter into an International Swaps and Derivatives Association, Inc. Master Agreement (“ISDA Master Agreement”) or similar agreement with its derivative contract counterparties. An ISDA Master Agreement is a bilateral agreement between a fund and a counterparty that governs OTC derivatives, including foreign exchange contracts, and typically contains, among other things, collateral posting terms and netting provisions in the event of a default and/or termination event. The provisions of the ISDA Master Agreement typically permit a single net payment in the event of a default (close-out netting) or similar event, including the bankruptcy or insolvency of the counterparty.
For derivatives traded under an ISDA Master Agreement, the collateral requirements are typically calculated by netting the mark-to-market amount for each transaction under such agreement and comparing that amount to the value of any collateral currently pledged by the Fund and the counterparty. For financial reporting purposes, cash collateral that has been pledged to cover obligations of the Fund and cash collateral received from the counterparty, if any, are reported separately on the Fund’s Statement of Assets and Liabilities as segregated cash with broker/receivable for variation margin, or payable for swap settlement/variation margin. Cash and/or securities pledged or received as collateral by the Fund in connection with an OTC derivative subject to an ISDA Master Agreement generally may not be invested, sold or rehypothecated by the counterparty or the Fund, as applicable, absent an event of default under such agreement, in which case such collateral generally may be applied towards obligations due to and payable by such counterparty or the Fund, as applicable. Generally, the amount of collateral due from or to a counterparty must exceed a minimum transfer amount threshold (e.g., $300,000) before a transfer is required to be made. To the extent amounts due to the Fund from its counterparties are not fully collateralized, contractually or otherwise, the Fund bears the risk of loss from
34 | THE RYDEX FUNDS ANNUAL REPORT | |
NOTES TO FINANCIAL STATEMENTS (continued) |
counterparty nonperformance. The Fund attempts to mitigate counterparty risk by only entering into agreements with counterparties that it believes to be of good standing and by monitoring the financial stability of those counterparties.
For financial reporting purposes, the Fund does not offset derivative assets and derivative liabilities that are subject to netting arrangements in the Fund’s Statement of Assets and Liabilities.
The following tables present derivative financial instruments and secured financing transactions that are subject to enforceable netting arrangements:
| | | | | | | | | | | | | | | Gross Amounts Not Offset
in the Statement of
Assets and Liabilities | | | | | |
Instrument | | Gross
Amounts of
Recognized
Assets1 | | | Gross
Amounts
Offset in the
Statement
of Assets and
Liabilities | | | Net Amount
of Assets
Presented
on the
Statement
of Assets and
Liabilities | | | Financial
Instruments | | | Cash
Collateral
Received | | | Net
Amount | |
Swap equity contracts | | $ | 403,178 | | | $ | — | | | | 403,178 | | | $ | — | | | $ | (340,000 | ) | | $ | 63,178 | |
1 | Exchange-traded or centrally-cleared derivatives are excluded from these reported amounts. |
The Fund has the right to offset deposits against any related derivative liabilities outstanding with each counterparty with the exception of exchange-traded or centrally-cleared derivatives. The following table presents deposits held by others in connection with derivative investments as of March 31, 2024.
Counterparty | Asset Type | | Cash Pledged | | | Cash Received | |
Barclays Bank plc | Total return swap agreements | | $ | — | | | $ | 340,000 | |
Note 4 – Fair Value Measurement
In accordance with U.S. GAAP, fair value is defined as the price that the Fund would receive to sell an investment or pay to transfer a liability in an orderly transaction between market participants at the measurement date. U.S. GAAP establishes a three-tier fair value hierarchy based on the types of inputs used to value assets and liabilities and requires corresponding disclosure. The hierarchy and the corresponding inputs are summarized below:
Level 1 — | unadjusted quoted prices in active markets for identical assets or liabilities. |
| | THE RYDEX FUNDS ANNUAL REPORT | 35 |
NOTES TO FINANCIAL STATEMENTS (continued) |
Level 2 — | significant other observable inputs (for example quoted prices for securities that are similar based on characteristics such as interest rates, prepayment speeds, credit risk, etc.). |
Level 3 — | significant unobservable inputs based on the best information available under the circumstances, to the extent observable inputs are not available, which may include assumptions. |
Rule 2a-5 sets forth a definition of “readily available market quotations,” which is consistent with the definition of a Level 1 input under U.S. GAAP. Rule 2a-5 provides that “a market quotation is readily available only when that quotation is a quoted price (unadjusted) in active markets for identical investments that the fund can access at the measurement date, provided that a quotation will not be readily available if it is not reliable.”
Securities for which market quotations are not readily available must be valued at fair value as determined in good faith. Accordingly, any security priced using inputs other than Level 1 inputs will be subject to fair value requirements. The types of inputs available depend on a variety of factors, such as the type of security and the characteristics of the markets in which it trades, if any. Fair valuation determinations that rely on fewer or no observable inputs require greater judgment. Accordingly, fair value determinations for Level 3 securities require the greatest amount of judgment.
The inputs or methodologies selected and applied for valuing securities or other assets are not necessarily an indication of the risk associated with investing in those securities. The suitability, appropriateness and accuracy of the techniques, methodologies and sources employed to determine fair valuation are periodically reviewed and subject to change.
Note 5 – Investment Advisory Agreement and Other Agreements
Under the terms of an investment advisory contract, the Fund pays GI investment advisory fees on a monthly basis calculated daily at an annualized rate of 0.75% of the average daily net assets of the Fund.
When the aggregate assets of each series of the Trust (excluding the Long Short Equity Fund, Managed Futures Strategy Fund and Multi-Hedge Strategies Fund) and each series of Rydex Dynamic Funds equal or exceed $10 billion, the advisory fee rate paid by the Fund (excluding the Long Short Equity Fund, Managed Futures Strategy Fund and Multi-Hedge Strategies Fund) will be reduced in accordance with the asset level and breakpoint schedule set forth below.
Fund Assets Under Management | | Fund Asset-Based
Breakpoint Reductions | |
$500 million - $1 billion | | | 0.025 | % |
$1 billion - $2 billion | | | 0.050 | % |
> $2 billion | | | 0.075 | % |
36 | THE RYDEX FUNDS ANNUAL REPORT | |
NOTES TO FINANCIAL STATEMENTS (continued) |
GI pays operating expenses on behalf of the Trust, such as audit and accounting related services, legal services, custody, printing and mailing, among others, on a pass-through basis. Such expenses are allocated to various Funds within the complex based on relative net assets.
The Board has adopted separate Distribution Plans applicable to Class A, Class P and Class H shares, for which GFD and other firms that provide distribution and/or shareholder services (“Service Providers”) may receive compensation. If a Service Provider provides distribution services, the Fund will pay distribution fees to GFD at an annual rate not to exceed 0.25% of average daily net assets, pursuant to Rule 12b-1 of the 1940 Act. GFD, in turn, will pay the Service Provider out of its fees. GFD may, at its discretion, retain a portion of such payments to compensate itself for distribution services it performs.
The Board has adopted a separate Distribution and Shareholder Services Plan applicable to Class C shares, that allows the Fund to pay annual distribution and service fees of 1.00% of the Fund’s C-Class shares average daily net assets. The annual 0.25% service fee compensates a shareholder’s financial adviser for providing ongoing services to the shareholder. The annual distribution fee of 0.75% reimburses GFD for paying the shareholder’s financial adviser an ongoing sales commission. GFD advances the first year’s service and distribution fees to the financial adviser. GFD retains the service and distribution fees on accounts with no authorized dealer of record.
For the year ended March 31, 2024, GFD retained sales charges of $75,543 relating to sales of Class A shares of the Trust.
If the Fund invests in a fund that is advised by the same adviser or an affiliated adviser, the investing Fund’s adviser has agreed to waive fees at the investing fund level to the extent necessary to offset the proportionate share of any management fee paid by the Fund with respect to its investment in such affiliated fund. Fee waivers will be calculated at the investing fund level without regard to any expense cap, if any, in effect for the investing fund. Fees waived under this arrangement are not subject to reimbursement to GI. For the year ended March 31, 2024, the Fund waived $68,441 related to investments in affiliated funds.
Effective August 1, 2022, GI has contractually agreed to waive and/or reimburse expenses in an amount equal to an annual percentage rate of 0.05% of the Fund’s average daily net assets in excess of $500,000,000. This agreement shall automatically renew for one-year terms, unless GI provides written notice to the Fund of the termination at least thirty days prior to the end of the then-current term. This agreement may be terminated at any time by the Fund’s Board upon sixty days’ written notice to the Adviser. In addition, the agreement will terminate automatically if the Advisory Agreement, with respect to the Fund, is terminated, with such termination effective upon the effective date of the termination of the Advisory Agreement.
On May 24, 2023, the Board approved a waiver and/or expense reimbursement arrangement whereby GI has agreed to waive and/or reimburse expenses for the Fund in an amount equal to an annual percentage rate of 0.05% of the Fund’s average daily net assets. This arrangement went
| | THE RYDEX FUNDS ANNUAL REPORT | 37 |
NOTES TO FINANCIAL STATEMENTS (continued) |
into effect on August 1, 2023 and the end of the initial term is August 1, 2024. This agreement shall automatically renew for one-year terms, unless GI provides written notice to the Fund of the termination at least thirty days prior to the end of the then-current term. This agreement may be terminated at any time by the Fund’s Board upon sixty days’ written notice to the Adviser. In addition, the agreement will terminate automatically if the Advisory Agreement, with respect to the Fund, is terminated, with such termination effective upon the effective date of the termination of the Advisory Agreement.
Certain trustees and officers of the Trust are also officers of GI and/or GFD. The Trust does not compensate its officers or trustees who are officers, directors and/or employees of GI or GFD.
MUFG Investor Services (US), LLC (“MUIS”) acts as the Fund’s administrator, transfer agent and accounting agent. As administrator, transfer agent and accounting agent, MUIS maintains the books and records of the Fund’s securities and cash. U.S. Bank, N.A. (“U.S. Bank”) acts as the Fund’s custodian. As custodian, U.S. Bank is responsible for the custody of the Fund’s assets. For providing the aforementioned services, MUIS and U.S. Bank are entitled to receive a monthly fee equal to an annual percentage of the Fund’s average daily net assets and out of pocket expenses.
Note 6 – Repurchase Agreements
The Fund transfers uninvested cash balances into a single joint account, the daily aggregate balance of which is invested in one or more repurchase agreements collateralized by obligations of the U.S. Treasury and U.S. government agencies. The joint account includes other funds in the Guggenheim complex not covered in this report. The collateral is in the possession of the Funds’ custodian and is evaluated to ensure that its market value exceeds, at a minimum, 102% of the original face amount of the repurchase agreements. Each Fund holds a pro rata share of the collateral based on the dollar amount of the repurchase agreement entered into by each Fund.
38 | THE RYDEX FUNDS ANNUAL REPORT | |
NOTES TO FINANCIAL STATEMENTS (continued) |
At March 31, 2024, the repurchase agreements in the joint account were as follows:
Counterparty and
Terms of Agreement | | Face
Value | | | Repurchase
Price | | | | | | Collateral | | Par
Value | | | Fair
Value | |
J.P. Morgan Securities LLC | | | | | | | | | | | | | U.S. Treasury Notes | | | | | | | | |
5.31% | | | | | | | | | | | | | 0.25% - 5.00% | | | | | | | | |
Due 04/01/24 | | $ | 166,514,975 | | | $ | 166,588,658 | | | | | | Due 03/31/24 - 02/15/33 | | $ | 172,847,100 | | | $ | 169,834,991 | |
| | | | | | | | | | | | | | | | | | | | | | |
| | | | | | | | | | | | | | U.S. Treasury Strips | | | | | | | | |
| | | | | | | | | | | | | | 0.00% | | | | | | | | |
| | | | | | | | | | | | | | Due 11/15/27 - 05/15/48 | | | 4,894 | | | | 4,141 | |
| | | | | | | | | | | | | | | | | | | | | | |
| | | | | | | | | | | | | | U.S. Treasury Bills | | | | | | | | |
| | | | | | | | | | | | | | 0.00% | | | | | | | | |
| | | | | | | | | | | | | | Due 04/11/24 - 05/02/24 | | | 4,500 | | | | 4,480 | |
| | | | | | | | | | | | | | | | | | | | | | |
| | | | | | | | | | | | | | U.S. Treasury Bond | | | | | | | | |
| | | | | | | | | | | | | | 4.50% | | | | | | | | |
| | | | | | | | | | | | | | Due 05/15/38 | | | 800 | | | | 840 | |
| | | | | | | | | | | | | | | | | | | | | | |
| | | | | | | | | | | | | | U.S. Treasury Inflation Indexed Bond | | | | | | | | |
| | | | | | | | | | | | | | 0.13% | | | | | | | | |
| | | | | | | | | | | | | | Due 04/15/27 | | | 874 | | | | 823 | |
| | | | | | | | | | | | | | | | | 172,858,168 | | | | 169,845,275 | |
BofA Securities, Inc. | | | | | | | | | | | | | U.S. Treasury Note | | | | | | | | |
5.31% | | | | | | | | | | | | | 0.75% | | | | | | | | |
Due 04/01/24 | | | 64,044,221 | | | | 64,072,561 | | | | | | Due 03/31/26 | | | 70,171,700 | | | | 65,325,118 | |
| | | | | | | | | | | | | | | | | | | | | | |
Barclays Capital, Inc. | | | | | | | | | | | | | U.S. Treasury Notes | | | | | | | | |
5.30% | | | | | | | | | | | | | 0.63% - 3.50% | | | | | | | | |
Due 04/01/24 | | | 58,050,546 | | | | 58,076,185 | | | | | | Due 11/30/27 - 02/15/33 | | | 64,598,100 | | | | 59,211,567 | |
In the event of counterparty default, the Funds have the right to collect the collateral to offset losses incurred. There is potential loss to the Funds in the event the Funds are delayed or prevented from exercising their rights to dispose of the collateral securities, including the risk of a possible decline in the value of the underlying securities during the period while the Funds seek to assert their rights. GI, acting under the supervision of the Board, reviews the value of the collateral and the creditworthiness of those banks and dealers with which the Funds enter into repurchase agreements to evaluate potential risks.
Note 7 – Portfolio Securities Loaned
The Fund may lend its securities to approved brokers to earn additional income. Securities lending income shown on the Fund’s Statement of Operations is shown net of rebates paid to the borrowers and earnings on cash collateral investments shared with the lending agent. Within this arrangement, the Fund acts as the lender, U.S. Bank acts as the lending agent, and other approved registered broker dealers act as the borrowers. The Fund receives cash collateral, valued at 102%
| | THE RYDEX FUNDS ANNUAL REPORT | 39 |
NOTES TO FINANCIAL STATEMENTS (continued) |
of the value of the securities on loan. Under the terms of the Fund’s securities lending agreement with U.S. Bank, cash collateral and proceeds are invested in the First American Government Obligations Fund — Class X. The Fund bears the risk of loss on cash collateral investments. Collateral is maintained over the life of the loan in an amount not less than the value of loaned securities, as determined at the close of fund business each day; any additional collateral required due to changes in security values is delivered to the Fund the next business day. Although the collateral mitigates the risk, the Fund could experience a delay in recovering its securities and a possible loss of income or value if the borrower fails to return the securities. The Fund has the right under the securities lending agreement to recover the securities from the borrower on demand. Securities lending transactions are accounted for as secured borrowings. The remaining contractual maturity of the securities lending agreement is overnight and continuous.
At March 31, 2024, the Fund participated in securities lending transactions, which are subject to enforceable netting arrangements, as follows:
| | | Gross Amounts Not Offset in the
Statement of Assets and Liabilities | | | | | | | Securities Lending Collateral | |
| | Value of
Securities
Loaned | | | Collateral
Received(a) | | | Net
Amount | | | | | | | Cash
Collateral
Invested | | | Cash
Collateral
Uninvested | | | Total
Collateral | |
| | | $ | 3,974,088 | | | $ | (3,974,088 | ) | | $ | — | | | | | | | $ | 4,178,608 | | | $ | — | | | $ | 4,178,608 | |
(a) | Actual collateral received by the Fund is generally greater than the amount shown due to over-collateralization. |
In the event of counterparty default, the Fund has the right to collect the collateral to offset losses incurred. There is potential loss to the Fund in the event the Fund is delayed or prevented from exercising its right to dispose of the collateral securities, including the risk of a possible decline in the value of the underlying securities during the period while the Fund seeks to assert its rights. GI, acting under the supervision of the Board, reviews the value of the collateral and the creditworthiness of those banks and dealers to evaluate potential risks.
Note 8 – Federal Income Tax Information
The Fund intends to comply with the provisions of Subchapter M of the Internal Revenue Code of 1986, as amended (the “Internal Revenue Code”), applicable to regulated investment companies and will distribute substantially all taxable net investment income and capital gains sufficient to relieve the Fund from all, or substantially all, federal income, excise and state income taxes. Therefore, no provision for federal or state income tax or federal excise tax is required.
Tax positions taken or expected to be taken in the course of preparing the Fund’s tax returns are evaluated to determine whether the tax positions are “more-likely-than-not” of being sustained by the applicable tax authority. Tax positions not deemed to meet the “more-likely-than-not” threshold would be recorded as a tax benefit or expense in the current year. Management has analyzed the Fund’s tax positions taken, or to be taken, on U.S. federal income tax returns for
40 | THE RYDEX FUNDS ANNUAL REPORT | |
NOTES TO FINANCIAL STATEMENTS (continued) |
all open tax years, and has concluded that no provision for income tax is required in the Fund’s financial statements. The Fund’s U.S. federal income tax returns are subject to examination by the Internal Revenue Service (“IRS”) for a period of three years after they are filed.
There were no distributions paid during the year ended March 31, 2024.
The tax character of distributions paid during the year ended March 31, 2023 was as follows:
| | Ordinary
Income | | | Long-Term
Capital Gain | | | Total
Distributions | |
| | | $ | — | | | $ | 91,325,257 | | | $ | 91,325,257 | |
Note: For U.S. federal income tax purposes, short-term capital gain distributions are treated as ordinary income distributions.
The tax components of distributable earnings/(loss) as of March 31, 2024 were as follows:
| | Undistributed
Ordinary
Income | | | Undistributed
Long-Term
Capital Gain | | | Net Unrealized
Appreciation
(Depreciation) | | | Accumulated
Capital and
Other Losses | | | Total | |
| | | $ | 44,520,109 | | | $ | 88,030,402 | | | $ | 1,122,594,161 | | | $ | — | | | $ | 1,255,144,672 | |
For U.S. federal income tax purposes, capital loss carryforwards represent realized losses of the Fund that may be carried forward and applied against future capital gains. The Fund is permitted to carry forward capital losses for an unlimited period and such capital loss carryforwards retain their character as either short-term or long-term capital losses. As of March 31, 2024, the Fund had no capital loss carryforwards.
Net investment income and net realized gains (losses) may differ for financial statement and tax purposes because of temporary or permanent book/tax differences. These differences are primarily due to losses deferred due to wash sales, distributions in connection with redemption of fund shares, and the “mark-to-market” of certain derivatives. Additional differences may result from the tax treatment of net operating losses. To the extent these differences are permanent and would require a reclassification between Paid in Capital and Total Distributable Earnings (Loss), such reclassifications are made in the period that the differences arise. These reclassifications have no effect on net assets or NAV per share.
The following adjustments were made on the Statement of Assets and Liabilities as of March 31, 2024 for permanent book/tax differences:
| | Paid In
Capital | | | Total
Distributable
Earnings/(Loss) | |
| | | $ | 76,864,420 | | | $ | (76,864,420 | ) |
| | THE RYDEX FUNDS ANNUAL REPORT | 41 |
NOTES TO FINANCIAL STATEMENTS (continued) |
At March 31, 2024, the cost of investments for U.S. federal income tax purposes, the aggregate gross unrealized appreciation for all investments for which there was an excess of value over tax cost and the aggregate gross unrealized depreciation for all investments for which there was an excess of tax cost over value, were as follows:
| | Tax
Cost | | | Tax
Unrealized
Appreciation | | | Tax
Unrealized
Depreciation | | | Net Tax
Unrealized
Appreciation/
(Depreciation) | |
| | | $ | 657,742,305 | | | $ | 1,126,401,039 | | | $ | (3,806,878 | ) | | $ | 1,122,594,161 | |
Note 9 – Securities Transactions
For the year ended March 31, 2024, the cost of purchases and proceeds from sales of investment securities, excluding government securities, short-term investments and derivatives, were as follows:
| | Purchases | | | Sales | |
| | | $ | 1,080,647,883 | | | $ | 1,184,694,733 | |
The Fund is permitted to purchase or sell securities from or to certain affiliated funds under specified conditions outlined in procedures adopted by the Board. The procedures have been designed to ensure that any purchase or sale of securities by the Fund from or to another fund or portfolio that is or could be considered an affiliate by virtue of having a common investment adviser (or affiliated investment advisers), common trustees and/or common officers complies with Rule 17a-7 of the 1940 Act. Further, as defined under these procedures, each transaction is effected at the current market price to save costs, where permissible. For the year ended March 31, 2024, the Fund engaged in purchases and sales of securities pursuant to Rule 17a-7 of the 1940 Act, as follows:
| | Purchases | | | Sales | | | Realized Gain | |
| | | $ | 344,773,879 | | | $ | 486,851,477 | | | $ | 26,041,843 | |
Note 10 – Line of Credit
The Trust, along with other affiliated trusts, secured an uncommitted $200,000,000 line of credit from U.S. Bank, N.A. On June 5, 2023, the line of credit agreement was renewed and expires on June 3, 2024. This line of credit is reserved for emergency or temporary purposes. Borrowings, if any, under this arrangement bear interest equal to the Prime Rate, minus 2%, which shall be paid monthly, averaging 6.39% for the year ended March 31, 2024. The Fund did not have any borrowings outstanding under this agreement at March 31, 2024.
The average daily balance borrowed for the year ended March 31, 2024 was $5,216.
42 | THE RYDEX FUNDS ANNUAL REPORT | |
NOTES TO FINANCIAL STATEMENTS (concluded) |
Note 11 – Market Risks
The value of, or income generated by, the investments held by the Fund are subject to the possibility of rapid and unpredictable fluctuation, and loss that may result from various factors. These factors include, among others, developments affecting individual companies, or from broader influences, including real or perceived changes in prevailing interest rates (which may change at any time based on changes in monetary policies and various market and other economic conditions), changes in inflation rates or expectations about inflation rates, adverse investor confidence or sentiment, changing economic, political (including geopolitical), social or financial market conditions, increased instability or general uncertainty, environmental disasters, governmental actions, public health emergencies (such as the spread of infectious diseases, pandemics and epidemics), debt crises, actual or threatened wars or other armed conflicts (such as the ongoing Russia-Ukraine conflict and its collateral economic and other effects, including, but not limited to, sanctions and other international trade barriers) or ratings downgrades, and other similar events, each of which may be temporary or last for extended periods. Moreover, changing economic, political, geopolitical, social, financial market or other conditions in one country or geographic region could adversely affect the value, yield and return of the investments held by the Fund in a different country, geographic region, economy, and market because of the increasingly interconnected global economies and financial markets. The duration and extent of the foregoing types of factors or conditions are highly uncertain and difficult to predict and have in the past, and may in the future, cause volatility and distress in economies and financial markets or other adverse circumstances, which may negatively affect the value of the Fund’s investments and performance of the Fund.
Note 12 – Subsequent Events
The Fund evaluated subsequent events through the date the financial statements are issued and determined there were no material events that would require adjustment to or disclosure in the Fund’s financial statements.
| | THE RYDEX FUNDS ANNUAL REPORT | 43 |
REPORT OF INDEPENDENT REGISTERED PUBLIC ACCOUNTING FIRM |
To the Shareholders of NASDAQ-100® Fund and the Board of Trustees of Rydex Series Funds
Opinion on the Financial Statements
We have audited the accompanying statement of assets and liabilities of NASDAQ-100® Fund (the “Fund”) (one of the funds constituting Rydex Series Funds (the “Trust”)), including the schedule of investments, as of March 31, 2024, and the related statement of operations for the year then ended, the statements of changes in net assets for each of the two years in the period then ended, the financial highlights for each of the five years in the period then ended and the related notes (collectively referred to as the “financial statements”). In our opinion, the financial statements present fairly, in all material respects, the financial position of the Fund (one of the funds constituting Rydex Series Funds) at March 31, 2024, the results of its operations for the year then ended, the changes in its net assets for each of the two years in the period then ended and its financial highlights for each of the five years in the period then ended, in conformity with U.S. generally accepted accounting principles.
Basis for Opinion
These financial statements are the responsibility of the Trust’s management. Our responsibility is to express an opinion on the Fund’s financial statements based on our audits. We are a public accounting firm registered with the Public Company Accounting Oversight Board (United States) (“PCAOB”) and are required to be independent with respect to the Trust in accordance with the U.S. federal securities laws and the applicable rules and regulations of the Securities and Exchange Commission and the PCAOB.
We conducted our audits in accordance with the standards of the PCAOB. Those standards require that we plan and perform the audit to obtain reasonable assurance about whether the financial statements are free of material misstatement, whether due to error or fraud. The Trust is not required to have, nor were we engaged to perform, an audit of the Trust’s internal control over financial reporting. As part of our audits, we are required to obtain an understanding of internal control over financial reporting but not for the purpose of expressing an opinion on the effectiveness of the Trust’s internal control over financial reporting. Accordingly, we express no such opinion.
Our audits included performing procedures to assess the risks of material misstatement of the financial statements, whether due to error or fraud, and performing procedures that respond to those risks. Such procedures included examining, on a test basis, evidence regarding the amounts and disclosures in the financial statements. Our procedures included confirmation of securities
44 | THE RYDEX FUNDS ANNUAL REPORT | |
REPORT OF INDEPENDENT REGISTERED PUBLIC ACCOUNTING FIRM (concluded) |
owned as of March 31, 2024, by correspondence with the custodian, transfer agent and brokers. Our audits also included evaluating the accounting principles used and significant estimates made by management, as well as evaluating the overall presentation of the financial statements. We believe that our audits provide a reasonable basis for our opinion.

We have served as the auditor of one or more Guggenheim investment companies since 1979.
Tysons, Virginia
May 22, 2024
| | THE RYDEX FUNDS ANNUAL REPORT | 45 |
OTHER INFORMATION (Unaudited) |
Federal Income Tax Information
This information is being provided as required by the Internal Revenue Code. Amounts shown may differ from those elsewhere in the report because of differences in tax and financial reporting practice.
In January 2025, shareholders will be advised on IRS Form 1099 DIV or substitute 1099 DIV as to the federal tax status of the distributions received by shareholders in the calendar year 2024.
With respect to the taxable year ended March 31, 2024, the Fund hereby designates as capital gain dividends the amount listed below, or, if subsequently determined to be different, the net capital gain of such year:
| | From long-term
capital gain: | | | From long-term capital
gain, using proceeds
from shareholder
redemptions: | |
| | | $ | — | | | $ | 76,864,420 | |
Delivery of Shareholder Reports
Paper copies of the Fund’s annual and semi-annual shareholder reports are not sent by mail, unless you specifically request paper copies of the reports from the Fund or from your financial intermediary. Instead, the reports are made available on a website, and you are notified by mail each time a report is posted and provided with a website link to access the report.
You may elect to receive all future shareholder reports in paper free of charge. If you hold shares of the Fund directly, you can inform the Fund that you wish to receive paper copies of reports by calling 800.820.0888. If you hold shares of the Fund through a financial intermediary, please contact the financial intermediary to make this election. Your election to receive reports in paper may apply to all Guggenheim funds in which you are invested and may apply to all Guggenheim funds held with your financial intermediary.
Tailored Shareholder Reports for Open-End Mutual Funds and Exchange-Traded Funds
Effective January 24, 2023, the SEC adopted rule and form amendments to require open-end mutual funds and exchange-traded funds registered on Form N-1A to transmit concise and visually engaging streamlined annual and semi-annual reports to shareholders that highlight key information. Other information, including financial statements, will no longer appear in a streamlined shareholder report but must be available online, delivered free of charge upon request, and filed on a semi-annual basis on Form N-CSR. The rule and form amendments have a compliance date of July 24, 2024. At this time, management is evaluating the impact of these amendments on the shareholder reports for the Fund.
46 | THE RYDEX FUNDS ANNUAL REPORT | |
OTHER INFORMATION (Unaudited)(concluded) |
Proxy Voting Information
A description of the policies and procedures that the Trust uses to determine how to vote proxies relating to securities held in the Fund’s portfolio is available, without charge and upon request, by calling 800.820.0888. This information is also available from the EDGAR database on the SEC’s website at https://www.sec.gov.
Information regarding how the Fund voted proxies relating to portfolio securities during the most recent 12-month period ended June 30 is available without charge, upon request, by calling 800.820.0888. This information is also available from the EDGAR database on the SEC’s website at https://www.sec.gov.
Sector Classification
Information in the Schedule of Investments is categorized by sectors using sector-level Classifications defined by the Bloomberg Industry Classification System, a widely recognized industry classification system provider. The Fund’s registration statement has investment policies relating to concentration in specific sectors/industries. For purposes of these investment policies, the Fund usually classifies sectors/industries based on industry-level Classifications used by widely recognized industry classification system providers such as Bloomberg Industry Classification System, Global Industry Classification Standards and Barclays Global Classification Scheme.
Quarterly Portfolio Schedules Information
The Trust files its complete schedule of portfolio holdings with the SEC for the first and third quarters of each fiscal year as an exhibit to its reports on Form N-PORT. The Fund’s Form N-PORT is available on the SEC’s website at https://www.sec.gov. The Funds’ complete schedules of securities holdings as of the end of each fiscal quarter will be made available to the public on the SEC’s website at www.sec.gov and will be made available, upon request and without charge, by calling 800.820.0888.
| | THE RYDEX FUNDS ANNUAL REPORT | 47 |
INFORMATION ON BOARD OF TRUSTEES AND OFFICERS (Unaudited) |
A Board of Trustees oversees the Trust, as well as other trusts of GI, in which its members have no stated term of service, and continue to serve after election until resignation. The Statement of Additional Information includes further information about Fund Trustees and Officers, and can be obtained without charge by visiting guggenheiminvestments.com or by calling 800.820.0888.
Name, Address*
and Year of Birth | Position(s)
Held with
Trust | Term of Office
and Length of
Time Served** | Principal Occupation(s)
During Past Five Years | Number of
Portfolios
in Fund
Complex
Overseen | Other
Directorships Held
by Trustees*** |
INDEPENDENT TRUSTEES | | | |
Randall C. Barnes (1951) | Trustee and Chair of the Valuation Oversight Committee | Since 2019 (Trustee) Since 2020 (Chair of the Valuation Oversight Committee) | Current: Private Investor (2001-present). Former: Senior Vice President and Treasurer, PepsiCo, Inc. (1993-1997); President, Pizza Hut International (1991-1993); Senior Vice President, Strategic Planning and New Business Development, PepsiCo, Inc. (1987-1990). | 153 | Current: Advent Convertible and Income Fund (2005-present); Purpose Investments Funds (2013-present). Former: Guggenheim Energy & Income Fund (2015-2023); Fiduciary/Claymore Energy Infrastructure Fund (2004-2022); Guggenheim Enhanced Equity Income Fund (2005-2021); Guggenheim Credit Allocation Fund (2013-2021). |
48 | THE RYDEX FUNDS ANNUAL REPORT | |
INFORMATION ON BOARD OF TRUSTEES AND OFFICERS (Unaudited)(continued) |
Name, Address*
and Year of Birth | Position(s)
Held with
Trust | Term of Office
and Length of
Time Served** | Principal Occupation(s)
During Past Five Years | Number of
Portfolios
in Fund
Complex
Overseen | Other
Directorships Held
by Trustees*** |
INDEPENDENT TRUSTEES - continued | | | |
Angela Brock-Kyle (1959) | Trustee | Since 2016 | Current: Founder and Chief Executive Officer, B.O.A.R.D.S. (consulting firm) (2013-present); Director, Mutual Fund Directors Forum (2022-present). Former: Senior Leader, TIAA (financial services firm) (1987-2012). | 152 | Current: Bowhead Insurance GP, LLC (2020-present); Hunt Companies, Inc. (2019-present). Former: Guggenheim Energy & Income Fund (2019-2023); Fiduciary/Claymore Energy Infrastructure Fund (2019-2022); Guggenheim Enhanced Equity Income Fund (2019-2021); Guggenheim Credit Allocation Fund (2019-2021); Infinity Property & Casualty Corp. (2014-2018). |
| | THE RYDEX FUNDS ANNUAL REPORT | 49 |
INFORMATION ON BOARD OF TRUSTEES AND OFFICERS (Unaudited)(continued) |
Name, Address*
and Year of Birth | Position(s)
Held with
Trust | Term of Office
and Length of
Time Served** | Principal Occupation(s)
During Past Five Years | Number of
Portfolios
in Fund
Complex
Overseen | Other
Directorships Held
by Trustees*** |
INDEPENDENT TRUSTEES - continued | | | |
Thomas F. Lydon, Jr. (1960) | Trustee and Chair of the Contracts Review Committee | Since 2005 (Trustee) Since 2020 (Chair of the Contracts Review Committee) | Current: President, Global Trends Investments (registered investment adviser) (1996-present); Chief Executive Officer, Lydon Media (2016-present); Vice Chairman, VettaFi, a wholly owned subsidiary of The TMX Group (financial advisor content, research and digital distribution provider) (2022-present). Former: Chief Executive Officer, ETF Flows, LLC (financial advisor education and research provider) (2019-2023); Director, GDX Index Partners, LLC (index provider) (2021-2023). | 152 | Current: US Global Investors, Inc. (GROW) (1995-present); The 2023 ETF Series Trust (4) (2023-present); The 2023 ETF Series II (1) (2023-present). Former: Guggenheim Energy & Income Fund (2019-2023); Fiduciary/Claymore Energy Infrastructure Fund (2019-2022); Guggenheim Enhanced Equity Income Fund (2019-2021); Guggenheim Credit Allocation Fund (2019-2021); Harvest Volatility Edge Trust (3) (2017-2019). |
50 | THE RYDEX FUNDS ANNUAL REPORT | |
INFORMATION ON BOARD OF TRUSTEES AND OFFICERS (Unaudited)(continued) |
Name, Address*
and Year of Birth | Position(s)
Held with
Trust | Term of Office
and Length of
Time Served** | Principal Occupation(s)
During Past Five Years | Number of
Portfolios
in Fund
Complex
Overseen | Other
Directorships Held
by Trustees*** |
INDEPENDENT TRUSTEES - continued | | | |
Ronald A. Nyberg (1953) | Trustee and Chair of the Nominating and Governance Committee | Since 2019 | Current: Of Counsel (formerly Partner), Momkus LLP (law firm) (2016-present). Former: Partner, Nyberg & Cassioppi, LLC (law firm) (2000-2016); Executive Vice President, General Counsel, and Corporate Secretary, Van Kampen Investments (1982-1999). | 153 | Current: Advent Convertible and Income Fund (2003-present); PPM Funds (2) (2018-present); Endeavor Health (2012-present). Former: Guggenheim Energy & Income Fund (2015-2023); Fiduciary/Claymore Energy Infrastructure Fund (2004-2022); Guggenheim Enhanced Equity Income Fund (2005-2021); Guggenheim Credit Allocation Fund (2013-2021); Western Asset Inflation-Linked Opportunities & Income Fund (2004-2020); Western Asset Inflation-Linked Income Fund (2003-2020). |
| | THE RYDEX FUNDS ANNUAL REPORT | 51 |
INFORMATION ON BOARD OF TRUSTEES AND OFFICERS (Unaudited)(continued) |
Name, Address*
and Year of Birth | Position(s)
Held with
Trust | Term of Office
and Length of
Time Served** | Principal Occupation(s)
During Past Five Years | Number of
Portfolios
in Fund
Complex
Overseen | Other
Directorships Held
by Trustees*** |
INDEPENDENT TRUSTEES - continued | | | |
Sandra G. Sponem (1958) | Trustee and Chair of the Audit Committee | Since 2016 (Trustee) Since 2019 (Chair of the Audit Committee) | Current: Retired. Former: Senior Vice President and Chief Financial Officer, M.A. Mortenson-Companies, Inc. (construction and real estate development company) (2007-2017). | 152 | Current: SPDR Series Trust (81) (2018-present); SPDR Index Shares Funds (30) (2018-present); SSGA Active Trust (14) (2018-present). Former: Guggenheim Energy & Income Fund (2019-2023); Fiduciary/Claymore Energy Infrastructure Fund (2019-2022); Guggenheim Enhanced Equity Income Fund (2019-2021); Guggenheim Credit Allocation Fund (2019-2021); SSGA Master Trust (1) (2018-2020). |
52 | THE RYDEX FUNDS ANNUAL REPORT | |
INFORMATION ON BOARD OF TRUSTEES AND OFFICERS (Unaudited)(continued) |
Name, Address*
and Year of Birth | Position(s)
Held with
Trust | Term of Office
and Length of
Time Served** | Principal Occupation(s)
During Past Five Years | Number of
Portfolios
in Fund
Complex
Overseen | Other
Directorships Held
by Trustees*** |
INDEPENDENT TRUSTEES - concluded | | | |
Ronald E. Toupin, Jr. (1958) | Trustee, Chair of the Board and Chair of the Executive Committee | Since 2019 | Current: Portfolio Consultant (2010-present); Member, Governing Council, Independent Directors Council (2013-present); Governor, Board of Governors, Investment Company Institute (2018-present). Former: Member, Executive Committee, Independent Directors Council (2016-2018); Vice President, Manager and Portfolio Manager, Nuveen Asset Management (1998-1999); Vice President, Nuveen Investment Advisory Corp. (1992-1999); Vice President and Manager, Nuveen Unit Investment Trusts (1991-1999); and Assistant Vice President and Portfolio Manager, Nuveen Unit Investment Trusts (1988-1999), each of John Nuveen & Co., Inc. (registered broker dealer) (1982-1999). | 152 | Former: Guggenheim Energy & Income Fund (2015-2023); Fiduciary/Claymore Energy Infrastructure Fund (2004-2022); Guggenheim Enhanced Equity Income Fund (2005-2021); Guggenheim Credit Allocation Fund (2013-2021); Western Asset Inflation-Linked Opportunities & Income Fund (2004-2020); Western Asset Inflation-Linked Income Fund (2003-2020). |
| | THE RYDEX FUNDS ANNUAL REPORT | 53 |
INFORMATION ON BOARD OF TRUSTEES AND OFFICERS (Unaudited)(continued) |
Name, Address*
and Year of Birth | Position(s)
Held with
Trust | Term of Office
and Length of
Time Served** | Principal Occupation(s)
During Past Five Years | Number of
Portfolios
in Fund
Complex
Overseen | Other
Directorships Held
by Trustees*** |
INTERESTED TRUSTEE | | | |
Amy J. Lee**** (1961) | Trustee, Vice President and Chief Legal Officer | Since 2019 | Current: Interested Trustee, certain other funds in the Fund Complex (2018-present); Chief Legal Officer, certain other funds in the Fund Complex (2014-present); Vice President, certain other funds in the Fund Complex (2007-present); Senior Managing Director, Guggenheim Investments (2012-present). Former: President and/or Chief Executive Officer, certain other funds in the Fund Complex (2017-2019); Vice President, Associate General Counsel and Assistant Secretary, Security Benefit Life Insurance Company and Security Benefit Corporation (2004-2012). | 152 | Former: Guggenheim Energy & Income Fund (2018-2023); Fiduciary/Claymore Energy Infrastructure Fund (2018-2022); Guggenheim Enhanced Equity Income Fund (2018-2021); Guggenheim Credit Allocation Fund (2018-2021). |
* | The business address of each Trustee is c/o Guggenheim Investments, 227 West Monroe Street, Chicago, Illinois 60606. |
** | Each Trustee serves an indefinite term, until his or her successor is elected and qualified. |
*** | Each Trustee also serves on the Boards of Trustees of Guggenheim Funds Trust, Guggenheim Variable Funds Trust, Guggenheim Strategy Funds Trust, Guggenheim Taxable Municipal Bond & Investment Grade Debt Trust, Guggenheim Strategic Opportunities Fund, Guggenheim Active Allocation Fund, Rydex Series Funds, Rydex Dynamic Funds, Rydex Variable Trust and Transparent Value Trust. Messrs. Barnes and Nyberg also serve on the Board of Trustees of Advent Convertible & Income Fund. |
**** | This Trustee is deemed to be an “interested person” of the Funds under the 1940 Act by reason of her position with the Funds’ Adviser and/or the parent of the Adviser. |
54 | THE RYDEX FUNDS ANNUAL REPORT | |
INFORMATION ON BOARD OF TRUSTEES AND OFFICERS (Unaudited)(continued) |
Name, Address*
and Year of Birth | Position(s)
Held with
Trust | Term of Office
and Length of
Time Served** | Principal Occupation(s)
During Past Five Years |
OFFICERS | | | |
Brian E. Binder (1972) | President and Chief Executive Officer | Since 2019 | Current: President, Mutual Funds Boards, Guggenheim Investments (2022-present); President and Chief Executive Officer, certain other funds in the Fund Complex (2018-present); President, Mutual Funds Boards and Senior Managing Director, Guggenheim Funds Investment Advisors, LLC and Security Investors, LLC (2018-present); Board Member, Guggenheim Partners Investment Funds plc (2022-present); Board Member, Guggenheim Global Investments plc (2022-present); Board Member, Guggenheim Partners Fund Management (Europe) Limited (2018-present). Former: Senior Managing Director and Chief Administrative Officer, Guggenheim Investments (2018-2022); Managing Director and President, Deutsche Funds, and Head of US Product, Trading and Fund Administration, Deutsche Asset Management (2013-2018); Managing Director, Chairman of North American Executive Committee and Head of Business Management and Consulting, Invesco Ltd. (2010-2012). |
James Howley (1972) | Chief Financial Officer, Chief Accounting Officer and Treasurer | Since 2022 | Current: Managing Director, Guggenheim Investments (2004-present); Chief Financial Officer, Chief Accounting Officer, and Treasurer, certain other funds in the Fund Complex (2022-present). Former: Assistant Treasurer, certain other funds in the Fund Complex (2006-2022); Manager, Mutual Fund Administration of Van Kampen Investments, Inc. (1996-2004). |
Mark E. Mathiasen (1978) | Secretary | Since 2017 | Current: Secretary, certain other funds in the Fund Complex (2007-present); Managing Director, Guggenheim Investments (2007-present). |
Glenn McWhinnie (1969) | Assistant Treasurer | Since 2016 | Current: Vice President, Guggenheim Investments (2009-present); Assistant Treasurer, certain other funds in the Fund Complex (2016-present). |
Michael P. Megaris (1984) | Assistant Secretary | Since 2018 | Current: Assistant Secretary, certain other funds in the Fund Complex (2014-present); Managing Director, Guggenheim Investments (2012-present). |
| | THE RYDEX FUNDS ANNUAL REPORT | 55 |
INFORMATION ON BOARD OF TRUSTEES AND OFFICERS (Unaudited)(continued) |
Name, Address*
and Year of Birth | Position(s)
Held with
Trust | Term of Office
and Length of
Time Served** | Principal Occupation(s)
During Past Five Years |
OFFICERS - continued | | |
Elisabeth Miller (1968) | Chief Compliance Officer | Since 2012 | Current: Chief Compliance Officer, certain other funds in the Fund Complex (2012-present); Senior Managing Director, Guggenheim Investments (2012-present); Senior Managing Director, Guggenheim Funds Distributors, LLC (2014-present). Former: Chief Compliance Officer, Security Investors, LLC and Guggenheim Funds Investment Advisors, LLC (2012-2018); Chief Compliance Officer, Guggenheim Distributors, LLC (2009-2014); Senior Manager, Security Investors, LLC (2004-2014); Senior Manager, Guggenheim Distributors, LLC (2004-2014). |
Margaux Misantone (1978) | AML Officer | Since 2017 | Current: Chief Compliance Officer, Security Investors, LLC and Guggenheim Funds Investment Advisors, LLC (2018-present); AML Officer, Security Investors, LLC and certain other funds in the Fund Complex (2017-present); Managing Director, Guggenheim Investments (2015-present). Former: Assistant Chief Compliance Officer, Security Investors, LLC and Guggenheim Funds Investments Advisors, LLC (2015-2018). |
Kimberly J. Scott (1974) | Assistant Treasurer | Since 2016 | Current: Director, Guggenheim Investments (2012-present); Assistant Treasurer, certain other funds in the Fund Complex (2012-present). Former: Financial Reporting Manager, Invesco, Ltd. (2010-2011); Vice President/Assistant Treasurer, Mutual Fund Administration for Van Kampen Investments, Inc./Morgan Stanley Investment Management (2009-2010); Manager of Mutual Fund Administration, Van Kampen Investments, Inc./Morgan Stanley Investment Management (2005-2009). |
56 | THE RYDEX FUNDS ANNUAL REPORT | |
INFORMATION ON BOARD OF TRUSTEES AND OFFICERS (Unaudited)(concluded) |
Name, Address*
and Year of Birth | Position(s)
Held with
Trust | Term of Office
and Length of
Time Served** | Principal Occupation(s)
During Past Five Years |
OFFICERS - concluded | | |
Jon Szafran (1989) | Assistant Treasurer | Since 2017 | Current: Director, Guggenheim Investments (2017-present); Assistant Treasurer, certain other funds in the Fund Complex (2017-present). Former: Assistant Treasurer of Henderson Global Funds and Manager of US Fund Administration, Henderson Global Investors (North America) Inc. (“HGINA”), (2017); Senior Analyst of US Fund Administration, HGINA (2014–2017); Senior Associate of Fund Administration, Cortland Capital Market Services, LLC (2013-2014); Experienced Associate, PricewaterhouseCoopers LLP (2012-2013). |
* | The business address of each officer is c/o Guggenheim Investments, 227 West Monroe Street, Chicago, Illinois 60606. |
** | Each officer serves an indefinite term, until his or her successor is duly elected and qualified. |
| | THE RYDEX FUNDS ANNUAL REPORT | 57 |
GUGGENHEIM INVESTMENTS PRIVACY NOTICE (Unaudited) |
Who We Are
This Privacy Notice describes the data protection practices of Guggenheim Investments. Guggenheim Investments as used herein refers to the affiliated investment management businesses of Guggenheim Partners, LLC: Guggenheim Funds Investment Advisors, LLC, Guggenheim Partners Investment Management, LLC, Guggenheim Funds Distributors, LLC, Security Investors, LLC, Guggenheim Investment Advisors (Europe) Limited, Guggenheim Real Estate, LLC, GS Gamma Advisors, LLC, Guggenheim Partners India Management, LLC, Guggenheim Partners Europe Limited, as well as the funds in the Guggenheim Funds complex (the “Funds”) (“Guggenheim Investments,” “we,” “us,” or “our”).
Guggenheim Partners Investment Management Holdings, LLC, located at 330 Madison Avenue, New York, New York, 10017 is the data controller for your information. The affiliates who are also controllers of certain of your information are: Guggenheim Investment Advisors (Europe) Limited, Guggenheim Partners Europe Limited, Guggenheim Partners, LLC, Guggenheim Funds Investment Advisors, LLC, Guggenheim Partners Investment Management, LLC, Guggenheim Funds Distributors, LLC and Security Investors, LLC, as well as the Funds.
Our Commitment to You
Guggenheim Investments considers your privacy our utmost concern. When you become our client or investor, you entrust us with not only your hard-earned money but also with your personal and financial information. Because we have access to your private information, we hold ourselves to the highest standards in its safekeeping and use. We strictly limit how we share your information with others, whether you are a current or former Guggenheim Investments client or investor.
The Information We Collect About You
We collect certain nonpublic personal information about you from information you provide on applications, other forms, our website, and/or from third parties including investment advisors. This information includes Social Security or other tax identification number, assets, income, tax information, retirement and estate plan information, transaction history, account balance, payment history, bank account information, marital status, family relationships, information that we collect on our website through the use of “cookies,” and other personal information that you or others provide to us. We may also collect such information through your inquiries by mail, e-mail or telephone. We may also collect customer due diligence information, as required by applicable law and regulation, through third party service providers.
How We Handle Your Personal Information
The legal basis for using your information as set out in this Privacy Notice is as follows: (a) use of your personal data is necessary to perform our obligations under any contract with you (such as a contract for us to provide financial services to you); or (b) where use of your personal data is not necessary for performance of a contract, use of your personal data is necessary for our legitimate interests or the legitimate interests of others (for example, to enforce the legal terms
58 | THE RYDEX FUNDS ANNUAL REPORT | |
GUGGENHEIM INVESTMENTS PRIVACY NOTICE (Unaudited)(continued) |
governing our services, operate and market our website and other services we offer, ensure safe environments for our personnel and others, make and receive payments, prevent fraud and to know the customer to whom we are providing the services). Some processing is done to comply with applicable law.
In addition to the specific uses described above, we also use your information in the following manner:
| | ● | We use your information in connection with servicing your accounts. |
| | ● | We use information to respond to your requests or questions. For example, we might use your information to respond to your customer feedback. |
| | ● | We use information to improve our products and services. We may use your information to make our website and products better. We may use your information to customize your experience with us. |
| | ● | We use information for security purposes. We may use your information to protect our company and our customers. |
| | ● | We use information to communicate with you. For example, we will communicate with you about your account or our relationship. We may contact you about your feedback. We might also contact you about this Privacy Notice. We may also enroll you in our email newsletter. |
| | ● | We use information as otherwise permitted by law, as we may notify you. |
| | ● | Aggregate/Anonymous Data. We may aggregate and/or anonymize any information collected through the website so that such information can no longer be linked to you or your device (“Aggregate/Anonymous Information”). We may use Aggregate/Anonymous Information for any purpose, including without limitation for research and marketing purposes, and may also share such data with any third parties, including advertisers, promotional partners, and sponsors. |
We do not sell information about current or former clients or their accounts to third parties. Nor do we share this information, except when necessary to complete transactions at your request, to make you aware of investment products and services that we or our affiliates offer, or as permitted or required by law.
We provide information about you to companies and individuals not affiliated with Guggenheim Investments to complete certain transactions or account changes, or to perform services for us related to your account. For example, if you ask to transfer assets from another financial institution to Guggenheim Investments, we must provide certain information about you to that company to complete the transaction. We provide the third party with only the information necessary to carry out its responsibilities and only for that purpose. And we require these third parties to treat your private information with the same high degree of confidentiality that we do.
| | THE RYDEX FUNDS ANNUAL REPORT | 59 |
GUGGENHEIM INVESTMENTS PRIVACY NOTICE (Unaudited)(continued) |
To alert you to other Guggenheim Investments products and services, we share your information within our family of affiliated companies. You may limit our sharing with affiliated companies as set out below. We may also share information with any successor to all or part of our business, or in connection with steps leading up to a merger or acquisition. For example, if part of our business was sold we may give customer information as part of that transaction. We may also share information about you with your consent.
We will release information about you if you direct us to do so, if we are compelled by law to do so, or in other circumstances as permitted by law (for example, to protect your account from fraud).
If you close your account(s) or become an inactive client or investor, we will continue to adhere to the privacy policies and practices described in this notice.
Opt-Out Provisions and Your Data Choices
The law allows you to “opt out” of certain kinds of information sharing with third parties. We do not share personal information about you with any third parties that triggers this opt-out right. This means YOU ARE ALREADY OPTED OUT.
When you are no longer our client or investor, we continue to share your information as described in this notice, and you may contact us at any time to limit our sharing by sending an email to CorporateDataPrivacy@GuggenheimPartners.com.
European Union Data Subjects and certain others: In addition to the choices set forth above, residents of the European Union and certain other jurisdictions have certain rights to (1) request access to or rectification or deletion of information we collect about them, (2) request a restriction on the processing of their information, (3) object to the processing of their information, or (4) request the portability of certain information. To exercise these or other rights, please contact us using the contact information below. We will consider all requests and provide our response within the time period stated by applicable law. Please note, however, that certain information may be exempt from such requests in some circumstances, which may include if we need to keep processing your information for our legitimate interests or to comply with a legal obligation. We may request you provide us with information necessary to confirm your identity before responding to your request.
Residents of France and certain other jurisdictions may also provide us with instructions regarding the manner in which we may continue to store, erase and share your information after your death, and where applicable, the person you have designated to exercise these rights after your death.
How We Protect Privacy Online
We take steps to protect your privacy when you use our web site – www.guggenheiminvestments.com – by using secure forms of online communication, including encryption technology, Secure Socket Layer (SSL) protocol, firewalls and user names and
60 | THE RYDEX FUNDS ANNUAL REPORT | |
GUGGENHEIM INVESTMENTS PRIVACY NOTICE (Unaudited)(concluded) |
passwords. These safeguards vary based on the sensitivity of the information that we collect and store. However, we cannot and do not guarantee that these measures will prevent every unauthorized attempt to access, use, or disclose your information since despite our efforts, no Internet and/or other electronic transmissions can be completely secure. Our web site uses “http cookies”—tiny pieces of information that we ask your browser to store. We use cookies for session management and security features on the Guggenheim Investments web site. We do not use them to pull data from your hard drive, to learn your e-mail address, or to view data in cookies created by other web sites. We will not share the information in our cookies or give others access to it. See the legal information area on our web site for more details about web site security and privacy features.
How We Safeguard Your Personal Information and Data Retention
We restrict access to nonpublic personal information about you to our employees and in some cases to third parties (for example, the service providers described above) as permitted by law. We maintain strict physical, electronic and procedural safeguards that comply with federal standards to guard your nonpublic personal information. We keep your information for no longer than necessary for the purposes for which it is processed. The length of time for which we retain information depends on the purposes for which we collected and use it and/or as required to comply with applicable laws. Information may persist in copies made for backup and business continuity purposes for additional time.
International Visitors
If you are not a resident of the United States, please be aware that your information may be transferred to, stored and processed in the United States where our servers are located and our databases are operated. The data protection and other laws of the United States and other countries might not be as comprehensive as those in your country.
In such cases, we ensure that a legal basis for such a transfer exists and that adequate protection is provided as required by applicable law, for example, by using standard contractual clauses or by transferring your data to a jurisdiction that has obtained an adequacy finding. Individuals whose data may be transferred on the basis of standard contractual clauses may contact us as described below.
We’ll Keep You Informed
If you have any questions or concerns about how we treat your personal data, we encourage you to consult with us first. You may also contact the relevant supervisory authority.
We reserve the right to modify this policy at any time and will inform you promptly of material changes. You may access our privacy policy from our web site at www.guggenheiminvestments.com. Should you have any questions regarding our privacy policy, contact us by email at CorporateDataPrivacy@GuggenheimPartners.com.
| | THE RYDEX FUNDS ANNUAL REPORT | 61 |
This page intentionally left blank.
This page intentionally left blank.
This page intentionally left blank.
This page intentionally left blank.
3.31.2024
Rydex Funds Annual Report
Domestic Equity Funds |
S&P 500® Pure Growth Fund |
S&P 500® Pure Value Fund |
S&P MidCap 400® Pure Growth Fund |
S&P MidCap 400® Pure Value Fund |
S&P SmallCap 600® Pure Growth Fund |
S&P SmallCap 600® Pure Value Fund |
International Equity Funds |
Europe 1.25x Strategy Fund |
Japan 2x Strategy Fund |
Specialty Funds |
Strengthening Dollar 2x Strategy Fund |
Weakening Dollar 2x Strategy Fund |
GuggenheimInvestments.com | RBENF2-ANN-0324x0325 |
| | |
DEAR SHAREHOLDER | 2 |
ECONOMIC AND MARKET OVERVIEW | 4 |
A BRIEF NOTE ON THE COMPOUNDING OF RETURNS | 6 |
ABOUT SHAREHOLDERS’ FUND EXPENSES | 7 |
S&P 500® PURE GROWTH FUND | 10 |
S&P 500® PURE VALUE FUND | 18 |
S&P MIDCAP 400® PURE GROWTH FUND | 26 |
S&P MIDCAP 400® PURE VALUE FUND | 34 |
S&P SMALLCAP 600® PURE GROWTH FUND | 42 |
S&P SMALLCAP 600® PURE VALUE FUND | 51 |
EUROPE 1.25x STRATEGY FUND | 60 |
JAPAN 2x STRATEGY FUND | 70 |
STRENGTHENING DOLLAR 2x STRATEGY FUND | 78 |
WEAKENING DOLLAR 2x STRATEGY FUND | 86 |
NOTES TO FINANCIAL STATEMENTS | 94 |
REPORT OF INDEPENDENT REGISTERED PUBLIC ACCOUNTING FIRM | 109 |
OTHER INFORMATION | 110 |
INFORMATION ON BOARD OF TRUSTEES AND OFFICERS | 112 |
GUGGENHEIM INVESTMENTS PRIVACY NOTICE | 118 |
| | THE RYDEX FUNDS ANNUAL REPORT | 1 |
Dear Shareholder:
Security Investors, LLC (the “Investment Adviser”) is pleased to present the annual shareholder report for a selection of our Rydex funds (the “Fund” or “Funds”). This report covers performance for the annual period ended March 31, 2024 (the “Reporting Period”).
The Investment Adviser is part of Guggenheim Investments, which represents the investment management businesses of Guggenheim Partners, LLC (“Guggenheim”), a global, diversified financial services firm.
Guggenheim Funds Distributors, LLC is the distributor of the Funds. Guggenheim Funds Distributors, LLC is affiliated with Guggenheim and the Investment Adviser.
We encourage you to read the Economic and Market Overview section of the report, which follows this letter, and then the Performance Report and Fund Profile for each Fund.
We are committed to providing innovative investment solutions and appreciate the trust you place in us.
Sincerely,
Security Investors, LLC
April 30, 2024
Read a prospectus and summary prospectus (if available) carefully before investing. It contains the investment objectives, risks, charges, expenses and other information, which should be considered carefully before investing. Obtain a prospectus and summary prospectus (if available) at guggenheiminvestments.com or call 800.820.0888.
This material is not intended as a recommendation or as investment advice of any kind, including in connection with rollovers, transfers, and distributions. Such material is not provided in a fiduciary capacity, may not be relied upon for or in connection with the making of investment decisions, and does not constitute a solicitation of an offer to buy or sell securities. All content has been provided for informational or educational purposes only and is not intended to be and should not be construed as legal or tax advice and/or a legal opinion. Always consult a financial, tax and/or legal professional regarding your specific situation.
Inverse and leveraged Funds are not suitable for all investors. ● These Funds should be utilized only by investors who (a) understand the risks associated with the use of leverage, (b) understand the consequences of seeking daily leveraged investment results, (c) understand the risk of shorting, and (d) intend to actively monitor and manage their investments. ● The more a Fund invests in leveraged instruments, the more the leverage will magnify any gains or losses on those investments. ● Inverse Funds involve certain risks, which include increased volatility due to the Funds’ possible use of short sales of securities and derivatives, such as options and futures. ●The Funds’ use of derivatives, such as futures, options and swap agreements, may expose the Funds’ shareholders to additional risks that they would not be subject to if they invested directly in the securities underlying those derivatives. ● Short-selling involves increased risks and costs. You risk paying more for a security than you received from its sale. ● Leveraged and inverse Funds seek to provide investment results that match the performance of a specific benchmark, before fees and expenses, on a daily basis. Because the Funds seek to track the performance of their benchmark on a daily basis, mathematical compounding, especially with respect to those Funds that use leverage as part of their investment strategy, may prevent a Fund from correlating with the monthly, quarterly, annual or other period performance of its benchmark. Due to the compounding of daily returns, leveraged and inverse Funds’ returns over periods other than one day will likely differ in amount and possibly direction from the benchmark return for the same period. For those Funds that consistently apply leverage, the value of the Fund’s shares will tend to increase or decrease more than the value of any increase or decrease in its benchmark index. The Funds rebalance their portfolios on a daily basis, increasing exposure in response to that day’s gains or
2 | THE RYDEX FUNDS ANNUAL REPORT | |
reducing exposure in response to that day’s losses. Daily rebalancing will impair a Fund’s performance if the benchmark experiences volatility. Investors should monitor their leveraged and inverse Funds’ holdings consistent with their strategies, as frequently as daily. ● For more information on these and other risks, please read the prospectus.
The S&P 500® Pure Growth Fund, S&P 500® Pure Value Fund, S&P MidCap 400® Pure Growth Fund, S&P MidCap 400® Pure Value Fund, S&P SmallCap 600® Pure Growth Fund, and S&P SmallCap 600® Pure Value Fund may not be suitable for all investors. ● The Funds are subject to the risk that large, medium and small-capitalization stocks may under-perform other segments of the equity market or the equity market as a whole. ● Value stocks are subject to the risk that the intrinsic value of the stock may never be realized by the market or that the price goes down. Growth stocks typically invest a high portion of their earnings back into their business and may lack the dividend yield that could cushion their decline in a market downturn. Growth stocks may be more volatile than other stocks because they are more sensitive to investor perceptions regarding the growth potential of the issuing company. ●The Funds are subject to the risk that unanticipated early closings of securities exchanges and other financial markets may result in the Funds’ inability to buy or sell securities or other financial instruments on that day. In certain circumstances, it may be difficult for the funds to purchase and sell particular investments within a reasonable time at a fair price. ● Unlike many investment companies, the Funds are not actively “managed” This means that based on market and economic conditions, the Funds’ performance could be lower than other types of Funds that may actively shift their portfolio assets to take advantage of market opportunities or to lessen the impact of a market decline. ● The Funds are subject to active trading and tracking error risks, which may increase volatility, impact the Funds’ ability to achieve its investment objective and may decrease the Fund’s performance. ●These Funds are considered non-diversified and can invest a greater portion of its assets in securities of individual issuers than a diversified fund. As a result, changes in the market value of a single security could cause greater fluctuations in the value of fund shares than would occur in a more diversified fund. ● Securities are not deposits or obligations of any bank, are not guaranteed by any bank, are not insured by the FDIC or any other agency, and involve investment risks, including the possible loss of the principal amount invested. ● Please read the prospectus for more detailed information regarding these and other risks.
The Strengthening Dollar 2x Strategy Fund is subject to a number of risks and may not be suitable for all investors. ● The Fund’s use of derivatives such as futures and swap agreements may expose the Fund to additional risks that it would not be subject to if it invested directly in the securities underlying those derivatives. ● The Fund’s exposure to foreign currencies subjects the Fund to the risk that those currencies will decline in value relative to the U.S. dollar, or, in the case of short positions, that the U.S. dollar will decline in value relative to the currency being hedged. ● The more the Fund invests in leveraged instruments, the more the leverage will magnify any gains or losses on those investments. These risks may cause the Fund to experience higher losses and/or volatility than a Fund that does not invest in derivatives, use leverage or have exposure to foreign currencies. ● Also, the Fund is subject to active trading and tracking error risks that may increase volatility, decrease performance and impact the Fund’s ability to achieve its investment objective. This Fund is considered non-diversified and can invest a greater portion of its assets in securities of individual issuers than a diversified fund. As a result, changes in the market value of a single security could cause greater fluctuations in the value of Fund shares than would occur in a more diversified fund. ● For more information on these and other risks, please read the prospectus.
The Weakening Dollar 2x Strategy Fund is subject to a number of risks and may not be suitable for all investors. ● The Fund’s use of derivatives such as futures and swap agreements may expose the Fund to additional risks that it would not be subject to if it invested directly in the securities underlying those derivatives. ● The Fund’s exposure to foreign currencies subjects the Fund to the risk that those currencies will decline in value relative to the U.S. dollar, or, in the case of short positions, that the U.S. dollar will decline in value relative to the currency being hedged. ● The more the Fund invests in leveraged instruments, the more the leverage will magnify any gains or losses on those investments. These risks may cause the Fund to experience higher losses and/or volatility than a fund that does not invest in derivatives, use leverage or have exposure to foreign currencies. ● Also, the Fund is subject to active trading and tracking error risks that may increase volatility, decrease performance and impact the Fund’s ability to achieve its investment objective. This Fund is considered non-diversified and can invest a greater portion of its assets in securities of individual issuers than a diversified fund. As a result, changes in the market value of a single security could cause greater fluctuations n the value of Fund shares than would occur in a more diversified fund. ● For more information on these and other risks, please read the prospectus.
| | THE RYDEX FUNDS ANNUAL REPORT | 3 |
ECONOMIC AND MARKET OVERVIEW (Unaudited) | March 31, 2024 |
While job growth remains robust, recent labor data brought increased confidence in a labor market in better balance, allowing for inflation to soften further. Labor force growth remains strong, aided by high immigration flows, helping bring labor supply in line with gradually cooling demand. The Small Business Survey indicates that plans to increase compensation have returned to pre-COVID levels. Additionally, Bureau of Labor Statistics data reveal a continued decline in the “quits rate,” reducing the pressure on businesses to raise wages to attract or retain employees. These developments suggest wage pressures may ease further by year end. And despite some speculation against any Federal Reserve (“Fed”) rate cuts materializing in 2024, we continue to anticipate cuts later this year.
Following the stronger-than-expected March Consumer Price Index, we believe that there is a high probability that the easing cycle will start in the second half of the year, since the Fed will likely need more time to gather confirming data. In the latest Summary of Economic Projections, the Federal Open Market Committee (“FOMC”) significantly increased the median forecast for 2024 U.S. gross domestic product, slightly increased it for core personal consumption expenditures year over year, and continues to expect no material increase in the unemployment rate. These adjustments left the median view for three rate cuts for 2024, which suggests the bar is very high for the Fed to keep rates where they are all year, and even higher for more rate hikes to materialize.
Amid this macroeconomic backdrop, in the first quarter of 2024 the two-year Treasury yield increased to 4.59% from 4.23%, and the 10-year Treasury yield increased to 4.20% from 3.88%, keeping the inverted 2s/10s yield curve consistent at 39 basis points as of the end of the Reporting Period, up four basis points since the start of the year. One basis point equals 0.01%. In general, spreads to Treasurys have remained tight across sectors. In investment-grade corporate bonds, BBB-rated bonds continued to remain attractive relative to A and BB-rated bonds, and supply slowed toward the end of the first quarter of 2024, which we believe should support spreads in the near term. High yield bond spreads tightened during the first quarter of 2024 to 301 basis points from 323 basis points at the start of the year, while leveraged loans’ discount margins to maturity tightened to 509 basis points from 528 basis points. Structured credit spreads tightened marginally amid strong demand. Investor demand and an improved arbitrage led to robust new collateralized loan obligation issuance, and tightening liabilities led to an increase in refinances/resets.
Looking forward, Fed officials continue to advocate for a patient approach. A conventional easing cycle is therefore far from guaranteed. Market expectations have already adjusted significantly from market-implied expectations of six rate cuts in 2024 just two months ago to only three as of the end of the Reporting Period, aligning more closely with the FOMC’s views. So far, the market has taken this delay in stride, but its patience and assessment of credit risk could be tested.
For the Reporting Period, the S&P 500® Index* returned 29.88%. The MSCI Europe-Australasia-Far East (“EAFE”) Index* returned 15.32%. The return of the MSCI Emerging Markets Index* was 8.15%.
In the bond market, the Bloomberg U.S. Aggregate Bond Index* posted a 1.70% return for the Reporting Period, while the Bloomberg U.S. Corporate High Yield Index* returned 11.15%. The return of the ICE Bank of America (“BofA”) 3-Month U.S. Treasury Bill Index* was 5.27% for the Reporting Period.
The opinions and forecasts expressed may not actually come to pass. This information is subject to change at any time, based on market and other conditions, and should not be construed as a recommendation of any specific security or strategy.
4 | THE RYDEX FUNDS ANNUAL REPORT | |
ECONOMIC AND MARKET OVERVIEW (Unaudited)(concluded) | March 31, 2024 |
*Index Definitions:
The following indices are referenced throughout this report. Indices are unmanaged and not available for direct investment. Index performance does not reflect transaction costs, fees, or expenses.
Bloomberg U.S. Aggregate Bond Index is a broad-based flagship benchmark that measures the investment grade, U.S. dollar-denominated, fixed-rate taxable bond market, including U.S. Treasuries, government-related and corporate securities, mortgage-backed securities or “MBS” (agency fixed-rate and hybrid adjustable-rate mortgage, or “ARM”, pass-throughs), asset-backed securities (“ABS”), and commercial mortgage-backed securities (“CMBS”) (agency and non-agency).
Bloomberg U.S. Corporate High Yield Index measures the U.S. dollar-denominated, high yield, fixed-rate corporate bond market. Securities are classified as high yield if the middle rating of Moody’s, Fitch, and S&P is Ba1/BB +/BB + or below.
ICE BofA 3-Month U.S. Treasury Bill Index is an unmanaged market Index of U.S. Treasury securities maturing in 90 days that assumes reinvestment of all income.
MSCI EAFE Index is a free float-adjusted market capitalization index that is designed to measure the equity market performance of developed markets, excluding the U.S. & Canada.
MSCI Emerging Markets Index is a free float-adjusted market capitalization weighted index that is designed to measure equity market performance in the global emerging markets.
Nikkei-225 Stock Average Index is a price-weighted index comprised of Japan’s top 225 blue-chip companies on the Tokyo Stock Exchange.
S&P 500® Index is a broad-based index, the performance of which is based on the performance of 500 widely held common stocks chosen for market size, liquidity, and industry group representation.
S&P 500® Pure Growth Index is narrow in focus, containing only those S&P 500 Index companies with strong growth characteristics as selected by S&P. The S&P 500 Index is a capitalization-weighted index covering 500 industrial, utility, transportation and financial companies of the U.S. markets (mostly NYSE Euronext issues).
S&P 500® Pure Value Index is narrow in focus, containing only those S&P 500 Index companies with strong value characteristics as selected by S&P. The S&P 500 Index is a capitalization-weighted index covering 500 industrial, utility, transportation and financial companies of the U.S. markets (mostly NYSE Euronext issues).
S&P MidCap 400® Pure Growth Index is narrow in focus, containing only those S&P MidCap 400 Index companies with strong growth characteristics as selected by S&P. The S&P MidCap 400 Index measures the performance of the mid-capitalization sector of the U.S. equity market.
S&P MidCap 400® Pure Value Index is narrow in focus, containing only those S&P MidCap 400 Index companies with strong value characteristics as selected by S&P. The S&P MidCap 400 Index measures the performance of the mid-capitalization sector of the U.S. equity market.
S&P SmallCap 600® Pure Growth Index is narrow in focus, containing only those S&P SmallCap 600 Index companies with strong growth characteristics as selected by S&P. The S&P SmallCap 600 Index measures the performance of the small-capitalization sector of the U.S. equity market.
S&P SmallCap 600® Pure Value Index is narrow in focus, containing only those S&P SmallCap 600 Index companies with strong value characteristics as selected by S&P. The S&P SmallCap 600 Index measures the performance of the small-capitalization sector of the U.S. equity market.
STOXX Europe 50® Index provides a blue-chip representation of supersector leaders in Europe. The index covers 50 stocks from 17 European countries: Austria, Belgium, Denmark, Finland, France, Germany, Ireland, Italy, Luxembourg, the Netherlands, Norway, Poland, Portugal, Spain, Sweden, Switzerland and the United Kingdom.
ICE U.S. Dollar Index® (USDX) is an index that determines the relative value of the United States dollar to a basket of foreign currencies. This formulated “basket” of currencies comprises the weighting of six other currencies as follows: Euro (EUR), 57.6% + Japanese Yen (JPY), 13.6% + Pound Sterling (GBP), 11.9% + Canadian Dollar (CAD), 9.1% + Swedish Krona (SEK), 4.2% + Swiss Franc (CHF) 3.6%.
| | THE RYDEX FUNDS ANNUAL REPORT | 5 |
A BRIEF NOTE ON THE COMPOUNDING OF RETURNS (Unaudited) | |
Many of the Funds described in this report are benchmarked daily to leveraged and/or inverse leveraged versions of published indices. To properly evaluate the performance of these funds, it is essential to understand the effect of mathematical compounding on their respective returns.
Because of the nonlinear effects of leverage applied over time, it is possible for a fund to perform in-line with its benchmark for several individual periods in a row, yet seem to trail the benchmark over the entire period on a cumulative basis. It is also possible that a fund that performs in-line with its benchmark on a daily basis may seem to outperform its benchmark over longer periods.
An Example of Compounding
For example, consider a hypothetical fund that is designed to produce returns that correspond to 150% of an index. On the first day of a period, the index rises from a level of 100 to a level of 106, producing a 6.0% gain and an expectation that the fund will rise by 9.0%. On the same day, the fund’s net asset value per share (“NAV”) increases from $10.00 to $10.90 for a gain of 9.0% — in line with its benchmark.
On day two, assume the index falls from 106 to 99 for a loss of about 6.6%. The fund, as expected, falls 9.9% to a price of $9.82. On each day, the fund performed exactly in line with its benchmark, but for the two-day period, the fund was down 1.8%, while the index was down only 1.0%. Without taking into account the daily compounding of returns, one would expect the fund to lose 1.5% and would see the fund as trailing by 0.3% when in fact it had performed perfectly. This example is summarized in the table below.
| | Index
Level | | | Index
Performance | | | Fund
Expectation | | | Fund
NAV | | | Fund
Performance | | | Assessment | |
Start | | | 100 | | | | | | | | | | | $ | 10.00 | | | | | | | | | |
Day 1 | | | 106 | | | | 6.0 | % | | | 9.0 | % | | $ | 10.90 | | | | 9.0 | % | | | In line | |
Day 2 | | | 99 | | | | -6.6 | % | | | -9.9 | % | | $ | 9.82 | | | | -9.9 | % | | | In line | |
Cumulative | | | | | | | -1.0 | % | | | -1.5 | % | | | | | | | -1.8 | % | | | -0.3 | % |
As illustrated by this simple example, the effect of leverage can make it difficult to form expectations or judgments about fund performance given only the returns of the unleveraged index.
Because certain funds seek to track the performance of their benchmark on a daily basis, mathematical compounding, especially with respect to those funds that use leverage as part of their investment strategy, may prevent a fund from correlating with the monthly, quarterly, annual or other period performance of its benchmark. Due to the compounding of daily returns, leveraged and inverse funds’ returns over periods other than one day will likely differ in amount and possibly direction from the benchmark return for the same period. Investors should monitor their leveraged and inverse funds’ holdings to ensure that they are consistent with their strategies, as frequently as daily. For those funds that consistently apply leverage, the value of the fund’s shares will tend to increase or decrease more than the value of any increase or decrease in its benchmark index. For more information on correlation, leverage and other risks, please read the prospectus.
In general, any change in direction in an index will produce compounding that seems to work against an investor. Were the index to move in the same direction (either up or down) for two or more periods in a row, the compounding of those returns would work in an investor’s favor, causing the fund to seemingly beat its benchmark.
As a general rule of thumb, more leverage in a fund will magnify the compounding effect, while less leverage will generally produce results that are more in line with expectations. In addition, periods of high volatility in an underlying index will also cause the effects of compounding to be more pronounced, while lower volatility will produce a more muted effect.
6 | THE RYDEX FUNDS ANNUAL REPORT | |
ABOUT SHAREHOLDERS’ FUND EXPENSES (Unaudited) | |
All mutual funds have operating expenses, and it is important for our shareholders to understand the impact of costs on their investments. Shareholders of a fund incur two types of costs: (i) transaction costs, including sales charges (loads) on purchase payments, reinvested dividends, other distributions, and exchange fees, and (ii) ongoing costs, including management fees, administrative services, and shareholder reports, among others. These ongoing costs, or operating expenses, are deducted from a fund’s gross income and reduce the investment return of the fund.
A fund’s expenses are expressed as a percentage of its average net assets, which is known as the expense ratio. The following examples are intended to help investors understand the ongoing costs (in dollars) of investing in a fund and to compare these costs with the ongoing costs of investing in other mutual funds.
The examples are based on an investment of $1,000 made at the beginning of the period and held for the entire six-month period beginning September 30, 2023 and ending March 31, 2024.
The following tables illustrate the Funds’ costs in two ways:
Table 1. Based on actual Fund return: This section helps investors estimate the actual expenses paid over the period. The “Ending Account Value” shown is derived from the Fund’s actual return, and the fifth column shows the dollar amount that would have been paid by an investor who started with $1,000 in the Fund. Investors may use the information here, together with the amount invested, to estimate the expenses paid over the period. Simply divide the Fund’s account value by $1,000 (for example, an $8,600 account value divided by $1,000 = 8.6), then multiply the result by the number provided under the heading “Expenses Paid During Period.”
Table 2. Based on hypothetical 5% return: This section is intended to help investors compare a fund’s cost with those of other mutual funds. The table provides information about hypothetical account values and hypothetical expenses based on the Fund’s actual expense ratio and an assumed rate of return of 5% per year before expenses, which is not the Fund’s actual return. The hypothetical account values and expenses may not be used to estimate the actual ending account balance or expenses paid during the period. The example is useful in making comparisons because the U.S. Securities and Exchange Commission (the “SEC”) requires all mutual funds to calculate expenses based on the 5% return. Investors can assess a fund’s costs by comparing this hypothetical example with the hypothetical examples that appear in shareholder reports of other funds.
The calculations illustrated above assume no shares were bought or sold during the period. Actual costs may have been higher or lower, depending on the amount of investment and the timing of any purchases or redemptions.
Please note that the expenses shown in the table are meant to highlight your ongoing costs only and do not reflect any transactional costs, such as sales charges (loads) on purchase payments, and contingent deferred sales charges (“CDSC”) on redemptions, if any. Therefore, the second table is useful in comparing ongoing costs only, and will not help you determine the relative total costs of owning different funds. In addition, if these transactional costs were included, your costs would have been higher.
More information about the Funds’ expenses, including annual expense ratios for periods up to five years (subject to the Fund’s inception date), can be found in the Financial Highlights section of this report. For additional information on operating expenses and other shareholder costs, please refer to the appropriate Fund prospectus.
| | THE RYDEX FUNDS ANNUAL REPORT | 7 |
ABOUT SHAREHOLDERS’ FUND EXPENSES (Unaudited)(continued) | |
| | Expense
Ratio1 | | | Fund
Return | | | Beginning
Account Value
September 30, 2023 | | | Ending
Account Value
March 31, 2024 | | | Expenses
Paid During
Period2 | |
Table 1. Based on actual Fund return3 | | | | | | | | | | | | | | | | | | | | |
S&P 500® Pure Growth Fund | | | | | | | | | | | | | | | | | | | | |
Class A | | | 1.57 | % | | | 21.46 | % | | $ | 1,000.00 | | | $ | 1,214.60 | | | $ | 8.69 | |
Class C | | | 2.32 | % | | | 21.02 | % | | | 1,000.00 | | | | 1,210.20 | | | | 12.82 | |
Class H | | | 1.57 | % | | | 21.48 | % | | | 1,000.00 | | | | 1,214.80 | | | | 8.69 | |
S&P 500® Pure Value Fund | | | | | | | | | | | | | | | | | | | | |
Class A | | | 1.57 | % | | | 20.89 | % | | | 1,000.00 | | | | 1,208.90 | | | | 8.67 | |
Class C | | | 2.33 | % | | | 20.44 | % | | | 1,000.00 | | | | 1,204.40 | | | | 12.84 | |
Class H | | | 1.58 | % | | | 20.89 | % | | | 1,000.00 | | | | 1,208.90 | | | | 8.73 | |
S&P MidCap 400® Pure Growth Fund | | | | | | | | | | | | | | | | | | | | |
Class A | | | 1.57 | % | | | 28.84 | % | | | 1,000.00 | | | | 1,288.40 | | | | 8.98 | |
Class C | | | 2.32 | % | | | 28.34 | % | | | 1,000.00 | | | | 1,283.40 | | | | 13.24 | |
Class H | | | 1.53 | % | | | 28.80 | % | | | 1,000.00 | | | | 1,288.00 | | | | 8.75 | |
S&P MidCap 400® Pure Value Fund | | | | | | | | | | | | | | | | | | | | |
Class A | | | 1.57 | % | | | 20.92 | % | | | 1,000.00 | | | | 1,209.20 | | | | 8.67 | |
Class C | | | 2.32 | % | | | 20.49 | % | | | 1,000.00 | | | | 1,204.90 | | | | 12.79 | |
Class H | | | 1.60 | % | | | 20.97 | % | | | 1,000.00 | | | | 1,209.70 | | | | 8.84 | |
S&P SmallCap 600® Pure Growth Fund | | | | | | | | | | | | | | | | | | | | |
Class A | | | 1.57 | % | | | 20.69 | % | | | 1,000.00 | | | | 1,206.90 | | | | 8.66 | |
Class C | | | 2.32 | % | | | 20.23 | % | | | 1,000.00 | | | | 1,202.30 | | | | 12.77 | |
Class H | | | 1.57 | % | | | 20.69 | % | | | 1,000.00 | | | | 1,206.90 | | | | 8.66 | |
S&P SmallCap 600® Pure Value Fund | | | | | | | | | | | | | | | | | | | | |
Class A | | | 1.58 | % | | | 18.19 | % | | | 1,000.00 | | | | 1,181.90 | | | | 8.62 | |
Class C | | | 2.33 | % | | | 17.74 | % | | | 1,000.00 | | | | 1,177.40 | | | | 12.68 | |
Class H | | | 1.59 | % | | | 18.17 | % | | | 1,000.00 | | | | 1,181.70 | | | | 8.67 | |
Europe 1.25x Strategy Fund | | | | | | | | | | | | | | | | | | | | |
Class A | | | 1.70 | % | | | 19.65 | % | | | 1,000.00 | | | | 1,196.50 | | | | 9.34 | |
Class C | | | 2.46 | % | | | 19.19 | % | | | 1,000.00 | | | | 1,191.90 | | | | 13.48 | |
Class H | | | 1.69 | % | | | 19.62 | % | | | 1,000.00 | | | | 1,196.20 | | | | 9.28 | |
Japan 2x Strategy Fund | | | | | | | | | | | | | | | | | | | | |
Class A | | | 1.54 | % | | | 49.98 | % | | | 1,000.00 | | | | 1,499.80 | | | | 9.62 | |
Class C | | | 2.23 | % | | | 49.49 | % | | | 1,000.00 | | | | 1,494.90 | | | | 13.91 | |
Class H | | | 1.55 | % | | | 49.98 | % | | | 1,000.00 | | | | 1,499.80 | | | | 9.69 | |
Strengthening Dollar 2x Strategy Fund | | | | | | | | | | | | | | | | | | | | |
Class A | | | 1.93 | % | | | (0.11 | %) | | | 1,000.00 | | | | 998.90 | | | | 9.64 | |
Class C | | | 2.68 | % | | | (0.52 | %) | | | 1,000.00 | | | | 994.80 | | | | 13.37 | |
Class H | | | 1.93 | % | | | (0.13 | %) | | | 1,000.00 | | | | 998.70 | | | | 9.64 | |
Weakening Dollar 2x Strategy Fund | | | | | | | | | | | | | | | | | | | | |
Class A | | | 1.94 | % | | | 2.62 | % | | | 1,000.00 | | | | 1,026.20 | | | | 9.83 | |
Class C | | | 2.92 | % | | | 2.10 | % | | | 1,000.00 | | | | 1,021.00 | | | | 14.75 | |
Class H | | | 1.94 | % | | | 2.62 | % | | | 1,000.00 | | | | 1,026.20 | | | | 9.83 | |
| | | | | | | | | | | | | | | | | | | | | |
8 | THE RYDEX FUNDS ANNUAL REPORT | |
ABOUT SHAREHOLDERS’ FUND EXPENSES (Unaudited)(concluded) | |
| | Expense
Ratio1 | | | Fund
Return | | | Beginning
Account Value
September 30, 2023 | | | Ending
Account Value
March 31, 2024 | | | Expenses
Paid During
Period2 | |
Table 2. Based on hypothetical 5% return (before expenses) |
S&P 500® Pure Growth Fund | | | | | | | | | | | | | | | | | | | | |
Class A | | | 1.57 | % | | | 5.00 | % | | $ | 1,000.00 | | | $ | 1,017.15 | | | $ | 7.92 | |
Class C | | | 2.32 | % | | | 5.00 | % | | | 1,000.00 | | | | 1,013.40 | | | | 11.68 | |
Class H | | | 1.57 | % | | | 5.00 | % | | | 1,000.00 | | | | 1,017.15 | | | | 7.92 | |
S&P 500® Pure Value Fund | | | | | | | | | | | | | | | | | | | | |
Class A | | | 1.57 | % | | | 5.00 | % | | | 1,000.00 | | | | 1,017.15 | | | | 7.92 | |
Class C | | | 2.33 | % | | | 5.00 | % | | | 1,000.00 | | | | 1,013.35 | | | | 11.73 | |
Class H | | | 1.58 | % | | | 5.00 | % | | | 1,000.00 | | | | 1,017.10 | | | | 7.97 | |
S&P MidCap 400® Pure Growth Fund | | | | | | | | | | | | | | | | | | | | |
Class A | | | 1.57 | % | | | 5.00 | % | | | 1,000.00 | | | | 1,017.15 | | | | 7.92 | |
Class C | | | 2.32 | % | | | 5.00 | % | | | 1,000.00 | | | | 1,013.40 | | | | 11.68 | |
Class H | | | 1.53 | % | | | 5.00 | % | | | 1,000.00 | | | | 1,017.35 | | | | 7.72 | |
S&P MidCap 400® Pure Value Fund | | | | | | | | | | | | | | | | | | | | |
Class A | | | 1.57 | % | | | 5.00 | % | | | 1,000.00 | | | | 1,017.15 | | | | 7.92 | |
Class C | | | 2.32 | % | | | 5.00 | % | | | 1,000.00 | | | | 1,013.40 | | | | 11.68 | |
Class H | | | 1.60 | % | | | 5.00 | % | | | 1,000.00 | | | | 1,017.00 | | | | 8.07 | |
S&P SmallCap 600® Pure Growth Fund | | | | | | | | | | | | | | | | | | | | |
Class A | | | 1.57 | % | | | 5.00 | % | | | 1,000.00 | | | | 1,017.15 | | | | 7.92 | |
Class C | | | 2.32 | % | | | 5.00 | % | | | 1,000.00 | | | | 1,013.40 | | | | 11.68 | |
Class H | | | 1.57 | % | | | 5.00 | % | | | 1,000.00 | | | | 1,017.15 | | | | 7.92 | |
S&P SmallCap 600® Pure Value Fund | | | | | | | | | | | | | | | | | | | | |
Class A | | | 1.58 | % | | | 5.00 | % | | | 1,000.00 | | | | 1,017.10 | | | | 7.97 | |
Class C | | | 2.33 | % | | | 5.00 | % | | | 1,000.00 | | | | 1,013.35 | | | | 11.73 | |
Class H | | | 1.59 | % | | | 5.00 | % | | | 1,000.00 | | | | 1,017.05 | | | | 8.02 | |
Europe 1.25x Strategy Fund | | | | | | | | | | | | | | | | | | | | |
Class A | | | 1.70 | % | | | 5.00 | % | | | 1,000.00 | | | | 1,016.50 | | | | 8.57 | |
Class C | | | 2.46 | % | | | 5.00 | % | | | 1,000.00 | | | | 1,012.70 | | | | 12.38 | |
Class H | | | 1.69 | % | | | 5.00 | % | | | 1,000.00 | | | | 1,016.55 | | | | 8.52 | |
Japan 2x Strategy Fund | | | | | | | | | | | | | | | | | | | | |
Class A | | | 1.54 | % | | | 5.00 | % | | | 1,000.00 | | | | 1,017.30 | | | | 7.77 | |
Class C | | | 2.23 | % | | | 5.00 | % | | | 1,000.00 | | | | 1,013.85 | | | | 11.23 | |
Class H | | | 1.55 | % | | | 5.00 | % | | | 1,000.00 | | | | 1,017.25 | | | | 7.82 | |
Strengthening Dollar 2x Strategy Fund | | | | | | | | | | | | | | | | | | | | |
Class A | | | 1.93 | % | | | 5.00 | % | | | 1,000.00 | | | | 1,015.35 | | | | 9.72 | |
Class C | | | 2.68 | % | | | 5.00 | % | | | 1,000.00 | | | | 1,011.60 | | | | 13.48 | |
Class H | | | 1.93 | % | | | 5.00 | % | | | 1,000.00 | | | | 1,015.35 | | | | 9.72 | |
Weakening Dollar 2x Strategy Fund | | | | | | | | | | | | | | | | | | | | |
Class A | | | 1.94 | % | | | 5.00 | % | | | 1,000.00 | | | | 1,015.30 | | | | 9.77 | |
Class C | | | 2.92 | % | | | 5.00 | % | | | 1,000.00 | | | | 1,010.40 | | | | 14.68 | |
Class H | | | 1.94 | % | | | 5.00 | % | | | 1,000.00 | | | | 1,015.30 | | | | 9.77 | |
1 | Annualized and excludes expenses of the underlying funds in which the Funds invest, if any. |
2 | Expenses are equal to the Fund’s annualized expense ratio, net of any applicable fee waivers, multiplied by the average account value over the period, multiplied by 183/366 (to reflect the one-half year period). |
3 | Actual cumulative return at net asset value for the period September 30, 2023 to March 31, 2024. |
| | THE RYDEX FUNDS ANNUAL REPORT | 9 |
PERFORMANCE REPORT AND FUND PROFILE (Unaudited) | March 31, 2024 |
S&P 500® PURE GROWTH FUND
OBJECTIVE: Seeks to provide investment results that match, before fees and expenses, the performance of a benchmark for large-cap growth securities on a daily basis. The Fund’s current benchmark is the S&P 500® Pure Growth Index (the “underlying index”).
For the Reporting Period, S&P 500® Pure Growth Fund Class H returned 21.21%, compared with a return of 23.22% for the underlying index. The Fund maintained a daily correlation of over 99% to its benchmark for the period.
The sectors that contributed the most to the return of the underlying index for the Reporting Period were Information Technology, Industrials, and Energy. The only sectors that detracted were Consumer Staples and Materials.
The holdings that contributed the most to the return of the underlying index for the Reporting Period were NVIDIA Corp., KLA Corp., and Arista Networks, Inc. Those that detracted the most were SolarEdge Technologies, Inc., Enphase Energy, Inc., and Tesla, Inc.
Performance displayed represents past performance, which is no guarantee of future results.
Holdings Diversification (Market Exposure as % of Net Assets)
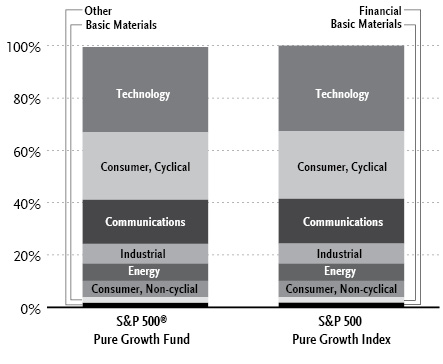
“Holdings Diversification (Market Exposure as % of Net Assets)” excludes any temporary cash investments.
Inception Dates: |
Class A | September 1, 2004 |
Class C | February 20, 2004 |
Class H | February 20, 2004 |
Ten Largest Holdings | % of Total Net Assets |
NVIDIA Corp. | 3.9% |
Arista Networks, Inc. | 2.7% |
Super Micro Computer, Inc. | 2.7% |
Uber Technologies, Inc. | 2.6% |
Royal Caribbean Cruises Ltd. | 2.6% |
Builders FirstSource, Inc. | 2.5% |
Advanced Micro Devices, Inc. | 2.4% |
Monolithic Power Systems, Inc. | 2.3% |
PulteGroup, Inc. | 2.2% |
KLA Corp. | 2.2% |
Top Ten Total | 26.1% |
| | |
“Ten Largest Holdings” excludes any temporary cash investments. |
10 | THE RYDEX FUNDS ANNUAL REPORT | |
PERFORMANCE REPORT AND FUND PROFILE (Unaudited)(concluded) | March 31, 2024 |
Cumulative Fund Performance*
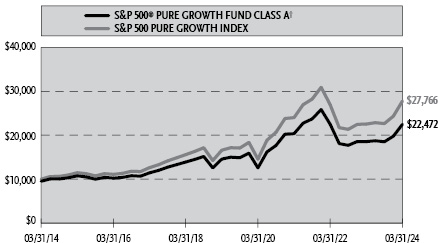
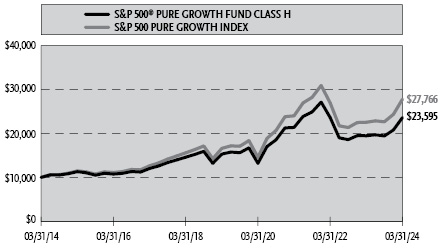
Average Annual Returns*
Periods Ended March 31, 2024
| 1 Year | 5 Year | 10 Year |
Class A Shares | 21.19% | 9.05% | 8.96% |
Class A Shares with sales charge† | 15.43% | 8.00% | 8.43% |
Class C Shares | 20.28% | 8.24% | 8.15% |
Class C Shares with CDSC‡ | 19.28% | 8.24% | 8.15% |
Class H Shares | 21.21% | 9.06% | 8.96% |
S&P 500 Pure Growth Index | 23.22% | 10.84% | 10.75% |
* | The performance data above represents past performance that is not predictive of future results. The investment return and principal value of an investment in the Fund will fluctuate so that an investor’s shares, when redeemed, may be worth more or less than their original cost. Returns are historical and include changes in principal and reinvested dividends and capital gains and do not reflect the effect of taxes. The S&P 500 Pure Growth Index is an unmanaged index and, unlike the Fund, has no management fees or operating expenses to reduce its reported return. The graphs are based on Class A and Class H shares only; performance for Class C shares will vary due to differences in fee structure. |
† | Fund returns are calculated using the maximum sales charge of 4.75%. |
‡ | Fund returns include a CDSC of 1% if redeemed within 12 months of purchase. |
| | THE RYDEX FUNDS ANNUAL REPORT | 11 |
SCHEDULE OF INVESTMENTS | March 31, 2024 |
S&P 500® PURE GROWTH FUND | |
| | Shares | | | Value | |
COMMON STOCKS† - 99.5% |
| | | | | | | | | |
Technology - 32.6% |
NVIDIA Corp. | | | 1,353 | | | $ | 1,222,517 | |
Super Micro Computer, Inc.* | | | 828 | | | | 836,305 | |
Advanced Micro Devices, Inc.* | | | 4,127 | | | | 744,882 | |
Monolithic Power Systems, Inc. | | | 1,093 | | | | 740,420 | |
KLA Corp. | | | 1,006 | | | | 702,761 | |
Applied Materials, Inc. | | | 2,769 | | | | 571,051 | |
ServiceNow, Inc.* | | | 748 | | | | 570,275 | |
Lam Research Corp. | | | 512 | | | | 497,444 | |
Intuit, Inc. | | | 750 | | | | 487,500 | |
Broadcom, Inc. | | | 346 | | | | 458,592 | |
Cadence Design Systems, Inc.* | | | 1,397 | | | | 434,858 | |
Fortinet, Inc.* | | | 5,876 | | | | 401,390 | |
Salesforce, Inc. | | | 1,276 | | | | 384,306 | |
Microsoft Corp. | | | 912 | | | | 383,697 | |
Oracle Corp. | | | 2,944 | | | | 369,796 | |
Synopsys, Inc.* | | | 617 | | | | 352,615 | |
Adobe, Inc.* | | | 628 | | | | 316,889 | |
Tyler Technologies, Inc.* | | | 690 | | | | 293,257 | |
Fair Isaac Corp.* | | | 232 | | | | 289,909 | |
Apple, Inc. | | | 1,190 | | | | 204,061 | |
Total Technology | | | | | | | 10,262,525 | |
| | | | | | | | | |
Consumer, Cyclical - 25.8% |
Royal Caribbean Cruises Ltd.* | | | 5,901 | | | | 820,298 | |
PulteGroup, Inc. | | | 5,841 | | | | 704,542 | |
Live Nation Entertainment, Inc.* | | | 6,311 | | | | 667,515 | |
Marriott International, Inc. — Class A | | | 2,565 | | | | 647,175 | |
DR Horton, Inc. | | | 3,877 | | | | 637,960 | |
Deckers Outdoor Corp.* | | | 668 | | | | 628,762 | |
Hilton Worldwide Holdings, Inc. | | | 2,792 | | | | 595,561 | |
Copart, Inc.* | | | 9,297 | | | | 538,482 | |
Chipotle Mexican Grill, Inc. — Class A* | | | 175 | | | | 508,685 | |
NVR, Inc.* | | | 55 | | | | 445,498 | |
Norwegian Cruise Line Holdings Ltd.* | | | 21,198 | | | | 443,674 | |
Wynn Resorts Ltd. | | | 3,812 | | | | 389,701 | |
Lululemon Athletica, Inc.* | | | 984 | | | | 384,400 | |
Tesla, Inc.* | | | 2,127 | | | | 373,905 | |
Ross Stores, Inc. | | | 2,303 | | | | 337,988 | |
Total Consumer, Cyclical | | | | | | | 8,124,146 | |
| | | | | | | | | |
Communications - 16.9% |
Arista Networks, Inc.* | | | 2,896 | | | | 839,782 | |
Uber Technologies, Inc.* | | | 10,765 | | | | 828,797 | |
Booking Holdings, Inc. | | | 193 | | | | 700,181 | |
Meta Platforms, Inc. — Class A | | | 1,418 | | | | 688,552 | |
Palo Alto Networks, Inc.* | | | 1,796 | | | | 510,297 | |
Expedia Group, Inc.* | | | 3,214 | | | | 442,729 | |
Amazon.com, Inc.* | | | 2,406 | | | | 433,994 | |
Netflix, Inc.* | | | 602 | | | | 365,613 | |
Alphabet, Inc. — Class A* | | | 1,904 | | | | 287,371 | |
Alphabet, Inc. — Class C* | | | 1,604 | | | | 244,225 | |
Total Communications | | | | | | | 5,341,541 | |
| | | | | | | | | |
Industrial - 7.5% |
Builders FirstSource, Inc.* | | | 3,812 | | | | 794,993 | |
Axon Enterprise, Inc.* | | | 1,514 | | | | 473,700 | |
Fortive Corp. | | | 5,276 | | | | 453,842 | |
Old Dominion Freight Line, Inc. | | | 1,662 | | | | 364,493 | |
TransDigm Group, Inc. | | | 238 | | | | 293,121 | |
Total Industrial | | | | | | | 2,380,149 | |
| | | | | | | | | |
Energy - 6.6% |
Targa Resources Corp. | | | 5,738 | | | | 642,598 | |
Diamondback Energy, Inc. | | | 2,867 | | | | 568,153 | |
APA Corp. | | | 13,792 | | | | 474,169 | |
Hess Corp. | | | 2,510 | | | | 383,127 | |
Total Energy | | | | | | | 2,068,047 | |
| | | | | | | | | |
Consumer, Non-cyclical - 6.2% |
United Rentals, Inc. | | | 832 | | | | 599,964 | |
Corpay, Inc.* | | | 1,217 | | | | 375,493 | |
Eli Lilly & Co. | | | 474 | | | | 368,753 | |
West Pharmaceutical Services, Inc. | | | 874 | | | | 345,851 | |
Gartner, Inc.* | | | 557 | | | | 265,505 | |
Total Consumer, Non-cyclical | | | | | | | 1,955,566 | |
| | | | | | | | | |
Basic Materials - 2.2% |
Celanese Corp. — Class A | | | 3,997 | | | | 686,924 | |
| | | | | | | | | |
Financial - 1.7% |
Arch Capital Group Ltd.* | | | 5,914 | | | | 546,690 | |
| | | | | | | | | |
Total Common Stocks | | | | |
(Cost $24,923,975) | | | | | | | 31,365,588 | |
| | | | | | | | | |
| | | Face
Amount | | | | | |
REPURCHASE AGREEMENTS††,1 - 0.8% |
J.P. Morgan Securities LLC
issued 03/28/24 at 5.31%
due 04/01/24 | | $ | 137,401 | | | | 137,401 | |
BofA Securities, Inc.
issued 03/28/24 at 5.31%
due 04/01/24 | | | 52,846 | | | | 52,846 | |
Barclays Capital, Inc.
issued 03/28/24 at 5.30%
due 04/01/24 | | | 47,901 | | | | 47,901 | |
Total Repurchase Agreements | | | | |
(Cost $238,148) | | | | | | | 238,148 | |
| | | | | | | | | |
Total Investments - 100.3% | | | | |
(Cost $25,162,123) | | $ | 31,603,736 | |
Other Assets & Liabilities, net - (0.3)% | | | (81,377 | ) |
Total Net Assets - 100.0% | | $ | 31,522,359 | |
12 | THE RYDEX FUNDS ANNUAL REPORT | SEE NOTES TO FINANCIAL STATEMENTS. |
SCHEDULE OF INVESTMENTS (concluded) | March 31, 2024 |
S&P 500® PURE GROWTH FUND | |
* | Non-income producing security. |
† | Value determined based on Level 1 inputs — See Note 4. |
†† | Value determined based on Level 2 inputs — See Note 4. |
1 | Repurchase Agreements — See Note 6. |
| | |
| | See Sector Classification in Other Information section. |
The following table summarizes the inputs used to value the Fund’s investments at March 31, 2024 (See Note 4 in the Notes to Financial Statements):
Investments in Securities (Assets) | | Level 1
Quoted
Prices | | | Level 2
Significant
Observable
Inputs | | | Level 3
Significant
Unobservable
Inputs | | | Total | |
Common Stocks | | $ | 31,365,588 | | | $ | — | | | $ | — | | | $ | 31,365,588 | |
Repurchase Agreements | | | — | | | | 238,148 | | | | — | | | | 238,148 | |
Total Assets | | $ | 31,365,588 | | | $ | 238,148 | | | $ | — | | | $ | 31,603,736 | |
SEE NOTES TO FINANCIAL STATEMENTS. | THE RYDEX FUNDS ANNUAL REPORT | 13 |
S&P 500® PURE GROWTH FUND | |
STATEMENT OF ASSETS AND LIABILITIES |
March 31, 2024 |
Assets: |
Investments, at value (cost $24,923,975) | | $ | 31,365,588 | |
Repurchase agreements, at value (cost $238,148) | | | 238,148 | |
Cash | | | 6,674 | |
Receivables: |
Dividends | | | 4,916 | |
Fund shares sold | | | 3,209 | |
Interest | | | 140 | |
Total assets | | | 31,618,675 | |
| | | | | |
Liabilities: |
Payable for: |
Management fees | | | 22,567 | |
Fund shares redeemed | | | 19,477 | |
Transfer agent fees | | | 14,180 | |
Professional Fees | | | 10,033 | |
Distribution and service fees | | | 8,947 | |
Printing Fees | | | 6,407 | |
Portfolio accounting and administration fees | | | 3,084 | |
Trustees’ fees* | | | 334 | |
Miscellaneous | | | 11,287 | |
Total liabilities | | | 96,316 | |
Net assets | | $ | 31,522,359 | |
| | | | | |
Net assets consist of: |
Paid in capital | | $ | 28,523,106 | |
Total distributable earnings (loss) | | | 2,999,253 | |
Net assets | | $ | 31,522,359 | |
Class A: |
Net assets | | $ | 9,275,020 | |
Capital shares outstanding | | | 102,303 | |
Net asset value per share | | $ | 90.66 | |
Maximum offering price per share (Net asset value divided by 95.25%) | | $ | 95.18 | |
Class C: |
Net assets | | $ | 2,201,756 | |
Capital shares outstanding | | | 29,348 | |
Net asset value per share | | $ | 75.02 | |
Class H: |
Net assets | | $ | 20,045,583 | |
Capital shares outstanding | | | 221,120 | |
Net asset value per share | | $ | 90.65 | |
STATEMENT OF OPERATIONS |
Year Ended March 31, 2024 |
Investment Income: |
Dividends | | $ | 495,716 | |
Interest | | | 10,837 | |
Total investment income | | | 506,553 | |
| | | | | |
Expenses: |
Management fees | | | 255,040 | |
Distribution and service fees: |
Class A | | | 20,601 | |
Class C | | | 25,591 | |
Class H | | | 58,006 | |
Transfer agent fees | | | 73,807 | |
Portfolio accounting and administration fees | | | 51,834 | |
Registration fees | | | 32,271 | |
Professional fees | | | 15,628 | |
Trustees’ fees* | | | 5,649 | |
Custodian fees | | | 4,826 | |
Miscellaneous | | | 15,245 | |
Total expenses | | | 558,498 | |
Less: |
Expenses reimbursed by Adviser | | | (12,036 | ) |
Net expenses | | | 546,462 | |
Net investment loss | | | (39,909 | ) |
| | | | | |
Net Realized and Unrealized Gain (Loss): |
Net realized gain (loss) on: |
Investments | | | 473,930 | |
Net realized gain | | | 473,930 | |
Net change in unrealized appreciation (depreciation) on: |
Investments | | | 3,751,669 | |
Net change in unrealized appreciation (depreciation) | | | 3,751,669 | |
Net realized and unrealized gain | | | 4,225,599 | |
Net increase in net assets resulting from operations | | $ | 4,185,690 | |
* | Relates to Trustees not deemed “interested persons” within the meaning of Section 2(a)(19) of the 1940 Act. |
14 | THE RYDEX FUNDS ANNUAL REPORT | SEE NOTES TO FINANCIAL STATEMENTS. |
S&P 500® PURE GROWTH FUND | |
STATEMENTS OF CHANGES IN NET ASSETS |
| | Year Ended
March 31,
2024 | | | Year Ended
March 31,
2023 | |
Increase (Decrease) in Net Assets from Operations: | | | | | | | | |
Net investment loss | | $ | (39,909 | ) | | $ | (46,324 | ) |
Net realized gain (loss) on investments | | | 473,930 | | | | (859,188 | ) |
Net change in unrealized appreciation (depreciation) on investments | | | 3,751,669 | | | | (6,601,380 | ) |
Net increase (decrease) in net assets resulting from operations | | | 4,185,690 | | | | (7,506,892 | ) |
| | | | | | | | | |
Capital share transactions: | | | | | | | | |
Proceeds from sale of shares | | | | | | | | |
Class A | | | 2,556,282 | | | | 1,613,405 | |
Class C | | | 1,772,328 | | | | 949,811 | |
Class H | | | 253,179,686 | | | | 141,950,955 | |
Cost of shares redeemed | | | | | | | | |
Class A | | | (2,695,246 | ) | | | (2,131,424 | ) |
Class C | | | (3,076,091 | ) | | | (2,274,255 | ) |
Class H | | | (258,609,418 | ) | | | (141,586,134 | ) |
Net decrease from capital share transactions | | | (6,872,459 | ) | | | (1,477,642 | ) |
Net decrease in net assets | | | (2,686,769 | ) | | | (8,984,534 | ) |
| | | | | | | | | |
Net assets: | | | | | | | | |
Beginning of year | | | 34,209,128 | | | | 43,193,662 | |
End of year | | $ | 31,522,359 | | | $ | 34,209,128 | |
| | | | | | | | | |
Capital share activity: | | | | | | | | |
Shares sold | | | | | | | | |
Class A | | | 32,924 | | | | 20,935 | |
Class C | | | 27,685 | | | | 14,621 | |
Class H | | | 3,256,450 | | | | 1,856,336 | |
Shares redeemed | | | | | | | | |
Class A | | | (34,867 | ) | | | (28,047 | ) |
Class C | | | (47,995 | ) | | | (35,021 | ) |
Class H | | | (3,347,039 | ) | | | (1,850,589 | ) |
Net decrease in shares | | | (112,842 | ) | | | (21,765 | ) |
SEE NOTES TO FINANCIAL STATEMENTS. | THE RYDEX FUNDS ANNUAL REPORT | 15 |
S&P 500® PURE GROWTH FUND | |
This table is presented to show selected data for a share outstanding throughout each period and to assist shareholders in evaluating a Fund’s performance for the periods presented.
Class A | | Year Ended
March 31,
2024 | | | Year Ended
March 31,
2023 | | | Year Ended
March 31,
2022 | | | Year Ended
March 31,
2021 | | | Year Ended
March 31,
2020 | |
Per Share Data |
Net asset value, beginning of period | | $ | 74.81 | | | $ | 90.73 | | | $ | 84.03 | | | $ | 53.91 | | | $ | 65.86 | |
Income (loss) from investment operations: |
Net investment income (loss)a | | | (.15 | ) | | | (.05 | ) | | | (1.11 | ) | | | (.80 | ) | | | (.29 | ) |
Net gain (loss) on investments (realized and unrealized) | | | 16.00 | | | | (15.87 | ) | | | 10.27 | | | | 34.07 | | | | (8.09 | ) |
Total from investment operations | | | 15.85 | | | | (15.92 | ) | | | 9.16 | | | | 33.27 | | | | (8.38 | ) |
Less distributions from: |
Net realized gains | | | — | | | | — | | | | (2.46 | ) | | | (3.15 | ) | | | (3.57 | ) |
Total distributions | | | — | | | | — | | | | (2.46 | ) | | | (3.15 | ) | | | (3.57 | ) |
Net asset value, end of period | | $ | 90.66 | | | $ | 74.81 | | | $ | 90.73 | | | $ | 84.03 | | | $ | 53.91 | |
|
Total Returnb | | | 21.19 | % | | | (17.55 | %) | | | 10.53 | % | | | 61.92 | % | | | (13.76 | %) |
Ratios/Supplemental Data |
Net assets, end of period (in thousands) | | $ | 9,275 | | | $ | 7,799 | | | $ | 10,104 | | | $ | 9,724 | | | $ | 7,656 | |
Ratios to average net assets: |
Net investment income (loss) | | | (0.20 | %) | | | (0.06 | %) | | | (1.15 | %) | | | (1.06 | %) | | | (0.43 | %) |
Total expenses | | | 1.59 | % | | | 1.55 | % | | | 1.51 | % | | | 1.60 | % | | | 1.63 | % |
Net expensesc | | | 1.55 | % | | | 1.55 | % | | | 1.51 | % | | | 1.60 | % | | | 1.63 | % |
Portfolio turnover rate | | | 649 | % | | | 434 | % | | | 727 | % | | | 240 | % | | | 282 | % |
Class C | | Year Ended
March 31,
2024 | | | Year Ended
March 31,
2023 | | | Year Ended
March 31,
2022 | | | Year Ended
March 31,
2021 | | | Year Ended
March 31,
2020 | |
Per Share Data |
Net asset value, beginning of period | | $ | 62.37 | | | $ | 76.21 | | | $ | 71.42 | | | $ | 46.47 | | | $ | 57.65 | |
Income (loss) from investment operations: |
Net investment income (loss)a | | | (.58 | ) | | | (.55 | ) | | | (1.55 | ) | | | (1.16 | ) | | | (.69 | ) |
Net gain (loss) on investments (realized and unrealized) | | | 13.23 | | | | (13.29 | ) | | | 8.80 | | | | 29.26 | | | | (6.92 | ) |
Total from investment operations | | | 12.65 | | | | (13.84 | ) | | | 7.25 | | | | 28.10 | | | | (7.61 | ) |
Less distributions from: |
Net realized gains | | | — | | | | — | | | | (2.46 | ) | | | (3.15 | ) | | | (3.57 | ) |
Total distributions | | | — | | | | — | | | | (2.46 | ) | | | (3.15 | ) | | | (3.57 | ) |
Net asset value, end of period | | $ | 75.02 | | | $ | 62.37 | | | $ | 76.21 | | | $ | 71.42 | | | $ | 46.47 | |
|
Total Returnb | | | 20.28 | % | | | (18.16 | %) | | | 9.71 | % | | | 60.69 | % | | | (14.40 | %) |
Ratios/Supplemental Data |
Net assets, end of period (in thousands) | | $ | 2,202 | | | $ | 3,097 | | | $ | 5,339 | | | $ | 7,314 | | | $ | 6,050 | |
Ratios to average net assets: |
Net investment income (loss) | | | (0.91 | %) | | | (0.85 | %) | | | (1.91 | %) | | | (1.80 | %) | | | (1.18 | %) |
Total expenses | | | 2.34 | % | | | 2.30 | % | | | 2.26 | % | | | 2.35 | % | | | 2.38 | % |
Net expensesc | | | 2.30 | % | | | 2.30 | % | | | 2.26 | % | | | 2.35 | % | | | 2.38 | % |
Portfolio turnover rate | | | 649 | % | | | 434 | % | | | 727 | % | | | 240 | % | | | 282 | % |
16 | THE RYDEX FUNDS ANNUAL REPORT | SEE NOTES TO FINANCIAL STATEMENTS. |
S&P 500® PURE GROWTH FUND | |
FINANCIAL HIGHLIGHTS (concluded) |
This table is presented to show selected data for a share outstanding throughout each period and to assist shareholders in evaluating a Fund’s performance for the periods presented.
Class H | | Year Ended
March 31,
2024 | | | Year Ended
March 31,
2023 | | | Year Ended
March 31,
2022 | | | Year Ended
March 31,
2021 | | | Year Ended
March 31,
2020 | |
Per Share Data |
Net asset value, beginning of period | | $ | 74.79 | | | $ | 90.70 | | | $ | 84.00 | | | $ | 53.89 | | | $ | 65.84 | |
Income (loss) from investment operations: |
Net investment income (loss)a | | | — | | | | (.02 | ) | | | (1.19 | ) | | | (.77 | ) | | | (.29 | ) |
Net gain (loss) on investments (realized and unrealized) | | | 15.86 | | | | (15.89 | ) | | | 10.35 | | | | 34.03 | | | | (8.09 | ) |
Total from investment operations | | | 15.86 | | | | (15.91 | ) | | | 9.16 | | | | 33.26 | | | | (8.38 | ) |
Less distributions from: |
Net realized gains | | | — | | | | — | | | | (2.46 | ) | | | (3.15 | ) | | | (3.57 | ) |
Total distributions | | | — | | | | — | | | | (2.46 | ) | | | (3.15 | ) | | | (3.57 | ) |
Net asset value, end of period | | $ | 90.65 | | | $ | 74.79 | | | $ | 90.70 | | | $ | 84.00 | | | $ | 53.89 | |
|
Total Return | | | 21.21 | % | | | (17.54 | %) | | | 10.53 | % | | | 61.92 | % | | | (13.77 | %) |
Ratios/Supplemental Data |
Net assets, end of period (in thousands) | | $ | 20,046 | | | $ | 23,313 | | | $ | 27,751 | | | $ | 22,141 | | | $ | 25,981 | |
Ratios to average net assets: |
Net investment income (loss) | | | (0.00 | %)d | | | (0.03 | %) | | | (1.21 | %) | | | (1.03 | %) | | | (0.44 | %) |
Total expenses | | | 1.59 | % | | | 1.55 | % | | | 1.51 | % | | | 1.61 | % | | | 1.63 | % |
Net expensesc | | | 1.55 | % | | | 1.55 | % | | | 1.51 | % | | | 1.61 | % | | | 1.63 | % |
Portfolio turnover rate | | | 649 | % | | | 434 | % | | | 727 | % | | | 240 | % | | | 282 | % |
a | Net investment income (loss) per share was computed using average shares outstanding throughout the period. |
b | Total return does not reflect the impact of any applicable sales charges. |
c | Net expense information reflects the expense ratios after expense waivers and reimbursements, as applicable. |
d | Less than (0.01%). |
SEE NOTES TO FINANCIAL STATEMENTS. | THE RYDEX FUNDS ANNUAL REPORT | 17 |
PERFORMANCE REPORT AND FUND PROFILE (Unaudited) | March 31, 2024 |
S&P 500® PURE VALUE FUND
OBJECTIVE: Seeks to provide investment results that match, before fees and expenses, the performance of a benchmark for large-cap value securities on a daily basis. The Fund’s current benchmark is the S&P 500® Pure Value Index (the “underlying index”).
For the Reporting Period, S&P 500® Pure Value Fund Class H returned 17.95%, compared with a return of 19.88% for the underlying index. The Fund maintained a daily correlation of over 99% to its benchmark for the period.
The sectors that contributed the most to the return of the underlying index for the Reporting Period were Financials, Consumer Discretionary, and Health Care. The only sectors that detracted were Communication Services and Consumer Staples.
The holdings that contributed the most to the return of the underlying index for the Reporting Period were PulteGroup, Inc., Westrock Co., and Phillips 66. Those that detracted the most were Paramount Global – Class B, Warner Bros. Discovery, Inc., and Walgreens Boots Alliance, Inc.
Performance displayed represents past performance, which is no guarantee of future results.
Holdings Diversification (Market Exposure as % of Net Assets)
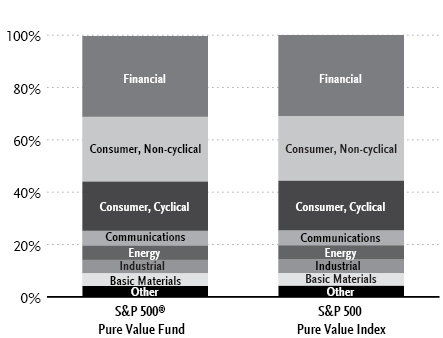
“Holdings Diversification (Market Exposure as % of Net Assets)” excludes any temporary cash investments.
Inception Dates: |
Class A | September 1, 2004 |
Class C | February 20, 2004 |
Class H | February 20, 2004 |
Ten Largest Holdings | % of Total Net Assets |
General Motors Co. | 3.9% |
Berkshire Hathaway, Inc. — Class B | 3.5% |
Ford Motor Co. | 2.8% |
Viatris, Inc. | 2.2% |
Mohawk Industries, Inc. | 2.2% |
Valero Energy Corp. | 2.2% |
United Airlines Holdings, Inc. | 2.2% |
CVS Health Corp. | 2.2% |
Tyson Foods, Inc. — Class A | 2.1% |
Citigroup, Inc. | 2.1% |
Top Ten Total | 25.4% |
| | |
“Ten Largest Holdings” excludes any temporary cash investments. |
18 | THE RYDEX FUNDS ANNUAL REPORT | |
PERFORMANCE REPORT AND FUND PROFILE (Unaudited)(concluded) | March 31, 2024 |
Cumulative Fund Performance*
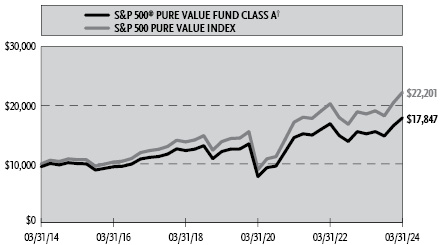
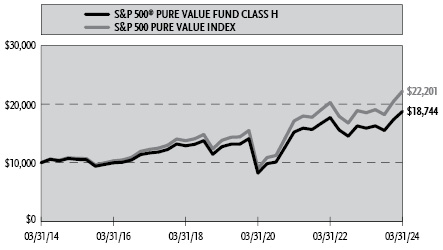
Average Annual Returns*
Periods Ended March 31, 2024
| 1 Year | 5 Year | 10 Year |
Class A Shares | 17.93% | 8.05% | 6.48% |
Class A Shares with sales charge† | 12.33% | 7.00% | 5.96% |
Class C Shares | 17.07% | 7.24% | 5.69% |
Class C Shares with CDSC‡ | 16.07% | 7.24% | 5.69% |
Class H Shares | 17.95% | 8.05% | 6.48% |
S&P 500 Pure Value Index | 19.88% | 9.97% | 8.31% |
* | The performance data above represents past performance that is not predictive of future results. The investment return and principal value of an investment in the Fund will fluctuate so that an investor’s shares, when redeemed, may be worth more or less than their original cost. Returns are historical and include changes in principal and reinvested dividends and capital gains and do not reflect the effect of taxes. The S&P 500 Pure Value Index is an unmanaged index and, unlike the Fund, has no management fees or operating expenses to reduce its reported return. The graphs are based on Class A and Class H shares only; performance for Class C shares will vary due to differences in fee structure. |
† | Fund returns are calculated using the maximum sales charge of 4.75%. |
‡ | Fund returns include a CDSC of 1% if redeemed within 12 months of purchase. |
| | THE RYDEX FUNDS ANNUAL REPORT | 19 |
SCHEDULE OF INVESTMENTS | March 31, 2024 |
S&P 500® PURE VALUE FUND | |
| | Shares | | | Value | |
COMMON STOCKS† - 99.6% |
| | | | | | | | | |
Financial - 30.8% |
Berkshire Hathaway, Inc. — Class B* | | | 854 | | | $ | 359,124 | |
Citigroup, Inc. | | | 3,386 | | | | 214,131 | |
Invesco Ltd. | | | 10,932 | | | | 181,362 | |
Citizens Financial Group, Inc. | | | 4,841 | | | | 175,680 | |
Capital One Financial Corp. | | | 883 | | | | 131,470 | |
Truist Financial Corp. | | | 3,143 | | | | 122,514 | |
Synchrony Financial | | | 2,435 | | | | 104,997 | |
Prudential Financial, Inc. | | | 893 | | | | 104,838 | |
Loews Corp. | | | 1,314 | | | | 102,873 | |
American International Group, Inc. | | | 1,286 | | | | 100,527 | |
Wells Fargo & Co. | | | 1,681 | | | | 97,431 | |
Bank of America Corp. | | | 2,542 | | | | 96,393 | |
M&T Bank Corp. | | | 662 | | | | 96,281 | |
Huntington Bancshares, Inc. | | | 6,039 | | | | 84,244 | |
Franklin Resources, Inc. | | | 2,970 | | | | 83,487 | |
Bank of New York Mellon Corp. | | | 1,435 | | | | 82,685 | |
KeyCorp | | | 5,199 | | | | 82,196 | |
Regions Financial Corp. | | | 3,837 | | | | 80,730 | |
State Street Corp. | | | 1,021 | | | | 78,944 | |
Hartford Financial Services Group, Inc. | | | 681 | | | | 70,177 | |
Goldman Sachs Group, Inc. | | | 162 | | | | 67,666 | |
MetLife, Inc. | | | 895 | | | | 66,328 | |
Comerica, Inc. | | | 1,166 | | | | 64,118 | |
Assurant, Inc. | | | 326 | | | | 61,366 | |
Everest Group Ltd. | | | 150 | | | | 59,625 | |
Fifth Third Bancorp | | | 1,544 | | | | 57,452 | |
PNC Financial Services Group, Inc. | | | 349 | | | | 56,398 | |
Allstate Corp. | | | 315 | | | | 54,498 | |
Travelers Companies, Inc. | | | 236 | | | | 54,313 | |
Cincinnati Financial Corp. | | | 434 | | | | 53,890 | |
Alexandria Real Estate Equities, Inc. REIT | | | 415 | | | | 53,498 | |
U.S. Bancorp | | | 1,174 | | | | 52,478 | |
Principal Financial Group, Inc. | | | 606 | | | | 52,304 | |
Total Financial | | | | | | | 3,204,018 | |
| | | | | | | | | |
Consumer, Non-cyclical - 24.8% |
Viatris, Inc. | | | 19,343 | | | | 230,955 | |
CVS Health Corp. | | | 2,799 | | | | 223,248 | |
Tyson Foods, Inc. — Class A | | | 3,696 | | | | 217,066 | |
Kroger Co. | | | 3,413 | | | | 194,985 | |
Bunge Global S.A. | | | 1,815 | | | | 186,074 | |
Centene Corp.* | | | 2,351 | | | | 184,507 | |
Cigna Group | | | 412 | | | | 149,635 | |
McKesson Corp. | | | 270 | | | | 144,950 | |
Cencora, Inc. — Class A | | | 588 | | | | 142,878 | |
Cardinal Health, Inc. | | | 1,088 | | | | 121,747 | |
Universal Health Services, Inc. — Class B | | | 588 | | | | 107,286 | |
Archer-Daniels-Midland Co. | | | 1,705 | | | | 107,091 | |
Kraft Heinz Co. | | | 2,660 | | | | 98,154 | |
Molson Coors Beverage Co. — Class B | | | 1,399 | | | | 94,083 | |
Elevance Health, Inc. | | | 117 | | | | 60,669 | |
Bio-Rad Laboratories, Inc. — Class A* | | | 161 | | | | 55,685 | |
Sysco Corp. | | | 684 | | | | 55,527 | |
Conagra Brands, Inc. | | | 1,864 | | | | 55,249 | |
Corteva, Inc. | | | 951 | | | | 54,844 | |
Henry Schein, Inc.* | | | 683 | | | | 51,580 | |
Humana, Inc. | | | 108 | | | | 37,446 | |
Total Consumer, Non-cyclical | | | | | | | 2,573,659 | |
| | | | | | | | | |
Consumer, Cyclical - 18.8% |
General Motors Co. | | | 9,035 | | | | 409,737 | |
Ford Motor Co. | | | 21,690 | | | | 288,043 | |
United Airlines Holdings, Inc.* | | | 4,676 | | | | 223,887 | |
Walgreens Boots Alliance, Inc. | | | 9,684 | | | | 210,046 | |
CarMax, Inc.* | | | 2,055 | | | | 179,011 | |
American Airlines Group, Inc.* | | | 9,309 | | | | 142,893 | |
BorgWarner, Inc. | | | 3,729 | | | | 129,545 | |
Best Buy Company, Inc. | | | 1,366 | | | | 112,053 | |
Southwest Airlines Co. | | | 3,506 | | | | 102,340 | |
Target Corp. | | | 363 | | | | 64,327 | |
LKQ Corp. | | | 1,028 | | | | 54,906 | |
VF Corp. | | | 2,675 | | | | 41,035 | |
Total Consumer, Cyclical | | | | | | | 1,957,823 | |
| | | | | | | | | |
Communications - 5.7% |
Paramount Global — Class B | | | 17,251 | | | | 203,044 | |
Warner Bros Discovery, Inc.* | | | 15,643 | | | | 136,564 | |
AT&T, Inc. | | | 4,234 | | | | 74,519 | |
Verizon Communications, Inc. | | | 1,426 | | | | 59,835 | |
Fox Corp. — Class A | | | 1,379 | | | | 43,121 | |
News Corp. — Class A | | | 1,524 | | | | 39,898 | |
Fox Corp. — Class B | | | 746 | | | | 21,351 | |
News Corp. — Class B | | | 455 | | | | 12,312 | |
Total Communications | | | | | | | 590,644 | |
| | | | | | | | | |
Energy - 5.4% |
Valero Energy Corp. | | | 1,330 | | | | 227,018 | |
Phillips 66 | | | 1,136 | | | | 185,554 | |
Equities Corp. | | | 1,479 | | | | 54,826 | |
Chevron Corp. | | | 308 | | | | 48,584 | |
Kinder Morgan, Inc. | | | 2,526 | | | | 46,327 | |
Total Energy | | | | | | | 562,309 | |
| | | | | | | | | |
Industrial - 5.2% |
Mohawk Industries, Inc.* | | | 1,759 | | | | 230,235 | |
Westrock Co. | | | 3,099 | | | | 153,246 | |
Stanley Black & Decker, Inc. | | | 637 | | | | 62,381 | |
FedEx Corp. | | | 194 | | | | 56,210 | |
CH Robinson Worldwide, Inc. | | | 524 | | | | 39,897 | |
Total Industrial | | | | | | | 541,969 | |
| | | | | | | | | |
Basic Materials - 4.8% |
International Paper Co. | | | 2,754 | | | | 107,461 | |
Mosaic Co. | | | 3,118 | | | | 101,210 | |
International Flavors & Fragrances, Inc. | | | 773 | | | | 66,470 | |
Dow, Inc. | | | 1,077 | | | | 62,391 | |
Eastman Chemical Co. | | | 534 | | | | 53,518 | |
LyondellBasell Industries N.V. — Class A | | | 520 | | | | 53,186 | |
Albemarle Corp. | | | 391 | | | | 51,510 | |
Total Basic Materials | | | | | | | 495,746 | |
| | | | | | | | | |
20 | THE RYDEX FUNDS ANNUAL REPORT | SEE NOTES TO FINANCIAL STATEMENTS. |
SCHEDULE OF INVESTMENTS (concluded) | March 31, 2024 |
S&P 500® PURE VALUE FUND | |
| | Shares | | | Value | |
Utilities - 2.5% |
NRG Energy, Inc. | | | 1,628 | | | $ | 110,199 | |
Evergy, Inc. | | | 994 | | | | 53,060 | |
Pinnacle West Capital Corp. | | | 665 | | | | 49,695 | |
Eversource Energy | | | 815 | | | | 48,713 | |
Total Utilities | | | | | | | 261,667 | |
| | | | | | | | | |
Technology - 1.6% |
Hewlett Packard Enterprise Co. | | | 7,091 | | | | 125,723 | |
HP, Inc. | | | 1,467 | | | | 44,333 | |
Total Technology | | | | | | | 170,056 | |
| | | | | | | | | |
Total Common Stocks | | | | |
(Cost $8,362,014) | | | | | | | 10,357,891 | |
| | | | | | | | | |
Total Investments - 99.6% | | | | |
(Cost $8,362,014) | | $ | 10,357,891 | |
Other Assets & Liabilities, net - 0.4% | | | 38,161 | |
Total Net Assets - 100.0% | | $ | 10,396,052 | |
* | Non-income producing security. |
† | Value determined based on Level 1 inputs — See Note 4. |
| | REIT — Real Estate Investment Trust |
| | |
| | See Sector Classification in Other Information section. |
The following table summarizes the inputs used to value the Fund’s investments at March 31, 2024 (See Note 4 in the Notes to Financial Statements):
Investments in Securities (Assets) | | Level 1
Quoted
Prices | | | Level 2
Significant
Observable
Inputs | | | Level 3
Significant
Unobservable
Inputs | | | Total | |
Common Stocks | | $ | 10,357,891 | | | $ | — | | | $ | — | | | $ | 10,357,891 | |
SEE NOTES TO FINANCIAL STATEMENTS. | THE RYDEX FUNDS ANNUAL REPORT | 21 |
STATEMENT OF ASSETS AND LIABILITIES |
March 31, 2024 |
Assets: |
Investments, at value (cost $8,362,014) | | $ | 10,357,891 | |
Cash | | | 3,734 | |
Receivables: |
Securities sold | | | 115,599 | |
Dividends | | | 12,638 | |
Fund shares sold | | | 6,782 | |
Securities lending income | | | 2 | |
Total assets | | | 10,496,646 | |
| | | | | |
Liabilities: |
Line of credit | | | 27,000 | |
Payable for: |
Fund shares redeemed | | | 37,859 | |
Transfer agent fees | | | 8,419 | |
Management fees | | | 6,255 | |
Distribution and service fees | | | 2,644 | |
Portfolio accounting and administration fees | | | 855 | |
Trustees’ fees* | | | 208 | |
Miscellaneous | | | 17,354 | |
Total liabilities | | | 100,594 | |
Net assets | | $ | 10,396,052 | |
| | | | | |
Net assets consist of: |
Paid in capital | | $ | 26,705,080 | |
Total distributable earnings (loss) | | | (16,309,028 | ) |
Net assets | | $ | 10,396,052 | |
Class A: |
Net assets | | $ | 2,979,862 | |
Capital shares outstanding | | | 28,980 | |
Net asset value per share | | $ | 102.82 | |
Maximum offering price per share (Net asset value divided by 95.25%) | | $ | 107.95 | |
Class C: |
Net assets | | $ | 972,350 | |
Capital shares outstanding | | | 11,722 | |
Net asset value per share | | $ | 82.95 | |
Class H: |
Net assets | | $ | 6,443,840 | |
Capital shares outstanding | | | 62,364 | |
Net asset value per share | | $ | 103.33 | |
STATEMENT OF OPERATIONS |
Year Ended March 31, 2024 |
Investment Income: |
Dividends | | $ | 407,817 | |
Interest | | | 5,406 | |
Income from securities lending, net | | | 69 | |
Total investment income | | | 413,292 | |
| | | | | |
Expenses: |
Management fees | | | 140,972 | |
Distribution and service fees: |
Class A | | | 6,762 | |
Class C | | | 10,306 | |
Class H | | | 37,648 | |
Transfer agent fees | | | 42,186 | |
Portfolio accounting and administration fees | | | 28,652 | |
Registration fees | | | 19,544 | |
Professional fees | | | 6,402 | |
Trustees’ fees* | | | 3,292 | |
Custodian fees | | | 2,765 | |
Line of credit fees | | | 60 | |
Miscellaneous | | | 9,066 | |
Total expenses | | | 307,655 | |
Less: |
Expenses reimbursed by Adviser | | | (6,443 | ) |
Total waived expenses | | | (6,443 | ) |
Net expenses | | | 301,212 | |
Net investment income | | | 112,080 | |
| | | | | |
Net Realized and Unrealized Gain (Loss): |
Net realized gain (loss) on: |
Investments | | | (1,915,091 | ) |
Net realized loss | | | (1,915,091 | ) |
Net change in unrealized appreciation (depreciation) on: |
Investments | | | 747,914 | |
Net change in unrealized appreciation (depreciation) | | | 747,914 | |
Net realized and unrealized loss | | | (1,167,177 | ) |
Net decrease in net assets resulting from operations | | $ | (1,055,097 | ) |
* | Relates to Trustees not deemed “interested persons” within the meaning of Section 2(a)(19) of the 1940 Act. |
22 | THE RYDEX FUNDS ANNUAL REPORT | SEE NOTES TO FINANCIAL STATEMENTS. |
STATEMENTS OF CHANGES IN NET ASSETS |
| | Year Ended
March 31,
2024 | | | Year Ended
March 31,
2023 | |
Increase (Decrease) in Net Assets from Operations: | | | | | | | | |
Net investment income | | $ | 112,080 | | | $ | 544,100 | |
Net realized loss on investments | | | (1,915,091 | ) | | | (3,790,184 | ) |
Net change in unrealized appreciation (depreciation) on investments | | | 747,914 | | | | (12,156,011 | ) |
Net decrease in net assets resulting from operations | | | (1,055,097 | ) | | | (15,402,095 | ) |
| | | | | | | | | |
Distributions to shareholders: | | | | | | | | |
Class A | | | (44,842 | ) | | | (87,355 | ) |
Class C | | | (24,738 | ) | | | (42,550 | ) |
Class H | | | (114,337 | ) | | | (618,541 | ) |
Total distributions to shareholders | | | (183,917 | ) | | | (748,446 | ) |
| | | | | | | | | |
Capital share transactions: | | | | | | | | |
Proceeds from sale of shares | | | | | | | | |
Class A | | | 1,311,773 | | | | 2,654,044 | |
Class C | | | 1,122,162 | | | | 2,075,357 | |
Class H | | | 185,750,419 | | | | 394,450,132 | |
Distributions reinvested | | | | | | | | |
Class A | | | 44,771 | | | | 74,124 | |
Class C | | | 24,642 | | | | 24,525 | |
Class H | | | 102,176 | | | | 601,352 | |
Cost of shares redeemed | | | | | | | | |
Class A | | | (2,172,031 | ) | | | (2,394,815 | ) |
Class C | | | (1,541,562 | ) | | | (2,080,018 | ) |
Class H | | | (190,450,170 | ) | | | (531,510,532 | ) |
Net decrease from capital share transactions | | | (5,807,820 | ) | | | (136,105,831 | ) |
Net decrease in net assets | | | (7,046,834 | ) | | | (152,256,372 | ) |
| | | | | | | | | |
Net assets: | | | | | | | | |
Beginning of year | | | 17,442,886 | | | | 169,699,258 | |
End of year | | $ | 10,396,052 | | | $ | 17,442,886 | |
| | | | | | | | | |
Capital share activity: | | | | | | | | |
Shares sold | | | | | | | | |
Class A | | | 14,140 | | | | 27,753 | |
Class C | | | 15,296 | | | | 26,306 | |
Class H | | | 1,970,582 | | | | 4,039,490 | |
Shares issued from reinvestment of distributions | | | | | | | | |
Class A | | | 491 | | | | 826 | |
Class C | | | 334 | | | | 334 | |
Class H | | | 1,114 | | | | 6,668 | |
Shares redeemed | | | | | | | | |
Class A | | | (24,552 | ) | | | (25,229 | ) |
Class C | | | (21,338 | ) | | | (26,938 | ) |
Class H | | | (2,051,875 | ) | | | (5,521,518 | ) |
Net decrease in shares | | | (95,808 | ) | | | (1,472,308 | ) |
SEE NOTES TO FINANCIAL STATEMENTS. | THE RYDEX FUNDS ANNUAL REPORT | 23 |
This table is presented to show selected data for a share outstanding throughout each period and to assist shareholders in evaluating a Fund’s performance for the periods presented.
Class A | | Year Ended
March 31,
2024 | | | Year Ended
March 31,
2023 | | | Year Ended
March 31,
2022 | | | Year Ended
March 31,
2021 | | | Year Ended
March 31,
2020 | |
Per Share Data |
Net asset value, beginning of period | | $ | 88.84 | | | $ | 101.27 | | | $ | 89.23 | | | $ | 48.65 | | | $ | 76.07 | |
Income (loss) from investment operations: |
Net investment income (loss)a | | | 1.03 | | | | 1.05 | | | | .89 | | | | .70 | | | | 1.02 | |
Net gain (loss) on investments (realized and unrealized) | | | 14.67 | | | | (11.35 | ) | | | 13.43 | | | | 40.58 | | | | (27.62 | ) |
Total from investment operations | | | 15.70 | | | | (10.30 | ) | | | 14.32 | | | | 41.28 | | | | (26.60 | ) |
Less distributions from: |
Net investment income | | | (1.72 | ) | | | (2.13 | ) | | | (2.28 | ) | | | (.70 | ) | | | (.82 | ) |
Total distributions | | | (1.72 | ) | | | (2.13 | ) | | | (2.28 | ) | | | (.70 | ) | | | (.82 | ) |
Net asset value, end of period | | $ | 102.82 | | | $ | 88.84 | | | $ | 101.27 | | | $ | 89.23 | | | $ | 48.65 | |
|
Total Returnb | | | 17.93 | % | | | (10.20 | %) | | | 16.26 | % | | | 85.10 | % | | | (35.38 | %) |
Ratios/Supplemental Data |
Net assets, end of period (in thousands) | | $ | 2,980 | | | $ | 3,456 | | | $ | 3,600 | | | $ | 2,925 | | | $ | 1,716 | |
Ratios to average net assets: |
Net investment income (loss) | | | 1.14 | % | | | 1.11 | % | | | 0.94 | % | | | 1.06 | % | | | 1.32 | % |
Total expenses | | | 1.59 | % | | | 1.55 | % | | | 1.51 | % | | | 1.60 | % | | | 1.63 | % |
Net expensesc | | | 1.55 | % | | | 1.55 | % | | | 1.51 | % | | | 1.60 | % | | | 1.63 | % |
Portfolio turnover rate | | | 1,099 | % | | | 594 | % | | | 823 | % | | | 1,207 | % | | | 254 | % |
Class C | | Year Ended
March 31,
2024 | | | Year Ended
March 31,
2023 | | | Year Ended
March 31,
2022 | | | Year Ended
March 31,
2021 | | | Year Ended
March 31,
2020 | |
Per Share Data |
Net asset value, beginning of period | | $ | 72.52 | | | $ | 83.72 | | | $ | 74.69 | | | $ | 41.11 | | | $ | 64.87 | |
Income (loss) from investment operations: |
Net investment income (loss)a | | | .27 | | | | .30 | | | | .14 | | | | .18 | | | | .17 | |
Net gain (loss) on investments (realized and unrealized) | | | 11.88 | | | | (9.37 | ) | | | 11.17 | | | | 34.10 | | | | (23.11 | ) |
Total from investment operations | | | 12.15 | | | | (9.07 | ) | | | 11.31 | | | | 34.28 | | | | (22.94 | ) |
Less distributions from: |
Net investment income | | | (1.72 | ) | | | (2.13 | ) | | | (2.28 | ) | | | (.70 | ) | | | (.82 | ) |
Total distributions | | | (1.72 | ) | | | (2.13 | ) | | | (2.28 | ) | | | (.70 | ) | | | (.82 | ) |
Net asset value, end of period | | $ | 82.95 | | | $ | 72.52 | | | $ | 83.72 | | | $ | 74.69 | | | $ | 41.11 | |
|
Total Returnb | | | 17.07 | % | | | (10.89 | %) | | | 15.40 | % | | | 83.72 | % | | | (35.87 | %) |
Ratios/Supplemental Data |
Net assets, end of period (in thousands) | | $ | 972 | | | $ | 1,264 | | | $ | 1,484 | | | $ | 1,805 | | | $ | 1,321 | |
Ratios to average net assets: |
Net investment income (loss) | | | 0.37 | % | | | 0.39 | % | | | 0.17 | % | | | 0.32 | % | | | 0.26 | % |
Total expenses | | | 2.34 | % | | | 2.30 | % | | | 2.26 | % | | | 2.35 | % | | | 2.38 | % |
Net expensesc | | | 2.31 | % | | | 2.30 | % | | | 2.26 | % | | | 2.35 | % | | | 2.38 | % |
Portfolio turnover rate | | | 1,099 | % | | | 594 | % | | | 823 | % | | | 1,207 | % | | | 254 | % |
24 | THE RYDEX FUNDS ANNUAL REPORT | SEE NOTES TO FINANCIAL STATEMENTS. |
FINANCIAL HIGHLIGHTS (concluded) |
This table is presented to show selected data for a share outstanding throughout each period and to assist shareholders in evaluating a Fund’s performance for the periods presented.
Class H | | Year Ended
March 31,
2024 | | | Year Ended
March 31,
2023 | | | Year Ended
March 31,
2022 | | | Year Ended
March 31,
2021 | | | Year Ended
March 31,
2020 | |
Per Share Data |
Net asset value, beginning of period | | $ | 89.26 | | | $ | 101.75 | | | $ | 89.64 | | | $ | 48.87 | | | $ | 76.39 | |
Income (loss) from investment operations: |
Net investment income (loss)a | | | .47 | | | | .98 | | | | .98 | | | | .84 | | | | .96 | |
Net gain (loss) on investments (realized and unrealized) | | | 15.32 | | | | (11.34 | ) | | | 13.41 | | | | 40.63 | | | | (27.66 | ) |
Total from investment operations | | | 15.79 | | | | (10.36 | ) | | | 14.39 | | | | 41.47 | | | | (26.70 | ) |
Less distributions from: |
Net investment income | | | (1.72 | ) | | | (2.13 | ) | | | (2.28 | ) | | | (.70 | ) | | | (.82 | ) |
Total distributions | | | (1.72 | ) | | | (2.13 | ) | | | (2.28 | ) | | | (.70 | ) | | | (.82 | ) |
Net asset value, end of period | | $ | 103.33 | | | $ | 89.26 | | | $ | 101.75 | | | $ | 89.64 | | | $ | 48.87 | |
|
Total Return | | | 17.95 | % | | | (10.22 | %) | | | 16.26 | % | | | 85.15 | % | | | (35.38 | %) |
Ratios/Supplemental Data |
Net assets, end of period (in thousands) | | $ | 6,444 | | | $ | 12,723 | | | $ | 164,615 | | | $ | 52,797 | | | $ | 5,422 | |
Ratios to average net assets: |
Net investment income (loss) | | | 0.51 | % | | | 1.01 | % | | | 1.01 | % | | | 1.17 | % | | | 1.22 | % |
Total expenses | | | 1.60 | % | | | 1.55 | % | | | 1.52 | % | | | 1.58 | % | | | 1.63 | % |
Net expensesc | | | 1.56 | % | | | 1.55 | % | | | 1.52 | % | | | 1.58 | % | | | 1.63 | % |
Portfolio turnover rate | | | 1,099 | % | | | 594 | % | | | 823 | % | | | 1,207 | % | | | 254 | % |
a | Net investment income (loss) per share was computed using average shares outstanding throughout the period. |
b | Total return does not reflect the impact of any applicable sales charges. |
c | Net expense information reflects the expense ratios after expense waivers and reimbursements, as applicable. |
SEE NOTES TO FINANCIAL STATEMENTS. | THE RYDEX FUNDS ANNUAL REPORT | 25 |
PERFORMANCE REPORT AND FUND PROFILE (Unaudited) | March 31, 2024 |
S&P MIDCAP 400® PURE GROWTH FUND
OBJECTIVE: Seeks to provide investment results that match, before fees and expenses, the performance of a benchmark for mid-cap growth securities on a daily basis. The Fund’s current benchmark is the S&P MidCap 400® Pure Growth Index (the “underlying index”).
For the Reporting Period, S&P MidCap 400® Pure Growth Fund Class H returned 37.44%, compared with a return of 40.02% for the underlying index. The Fund maintained a daily correlation of over 99% to its benchmark for the period.
The sectors that contributed the most to the return of the underlying index for the Reporting Period were Industrials, Consumer Discretionary, and Information Technology. The only sector that detracted was Communication Services.
The holdings that contributed the most to return of the underlying index for the Reporting Period were Super Micro Computer, Inc., Celsius Holdings, Inc., and Builders FirstSource, Inc. Those that detracted the most were Cirrus Logic, Inc., Lantheus Holdings, Inc., and MP Materials Corp. – Class A.
Performance displayed represents past performance, which is no guarantee of future results.
Holdings Diversification (Market Exposure as % of Net Assets)
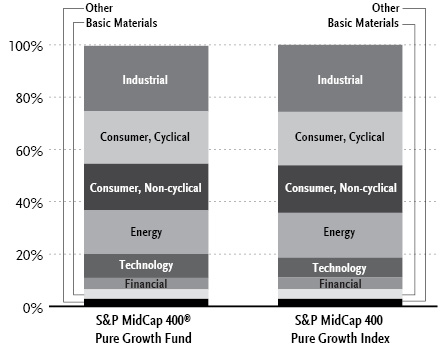
“Holdings Diversification (Market Exposure as % of Net Assets)” excludes any temporary cash investments.
Inception Dates: |
Class A | September 1, 2004 |
Class C | February 20, 2004 |
Class H | February 20, 2004 |
Ten Largest Holdings | % of Total Net Assets |
Celsius Holdings, Inc. | 2.7% |
Southwestern Energy Co. | 2.4% |
CNX Resources Corp. | 2.4% |
elf Beauty, Inc. | 2.3% |
Vistra Corp. | 2.3% |
TopBuild Corp. | 2.2% |
Permian Resources Corp. | 2.1% |
Weatherford International plc | 2.1% |
Comfort Systems USA, Inc. | 2.0% |
Medpace Holdings, Inc. | 1.9% |
Top Ten Total | 22.4% |
| | |
“Ten Largest Holdings” excludes any temporary cash investments. |
26 | THE RYDEX FUNDS ANNUAL REPORT | |
PERFORMANCE REPORT AND FUND PROFILE (Unaudited)(concluded) | March 31, 2024 |
Cumulative Fund Performance*
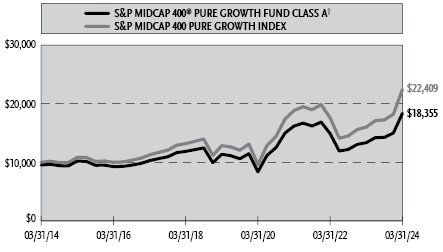
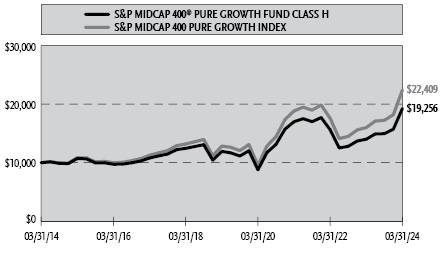
Average Annual Returns*
Periods Ended March 31, 2024
| 1 Year | 5 Year | 10 Year |
Class A Shares | 37.52% | 10.06% | 6.78% |
Class A Shares with sales charge† | 30.99% | 9.00% | 6.26% |
Class C Shares | 36.46% | 9.24% | 5.98% |
Class C Shares with CDSC‡ | 35.46% | 9.24% | 5.98% |
Class H Shares | 37.44% | 10.05% | 6.77% |
S&P MidCap 400 Pure Growth Index | 40.02% | 11.77% | 8.40% |
* | The performance data above represents past performance that is not predictive of future results. The investment return and principal value of an investment in the Fund will fluctuate so that an investor’s shares, when redeemed, may be worth more or less than their original cost. Returns are historical and include changes in principal and reinvested dividends and capital gains and do not reflect the effect of taxes. The S&P MidCap 400 Pure Growth Index is an unmanaged index and, unlike the Fund, has no management fees or operating expenses to reduce its reported return. The graphs are based on Class A and Class H shares only; performance for Class C shares will vary due to differences in fee structure. |
† | Fund returns are calculated using the maximum sales charge of 4.75%. |
‡ | Fund returns include a CDSC of 1% if redeemed within 12 months of purchase. |
| | THE RYDEX FUNDS ANNUAL REPORT | 27 |
SCHEDULE OF INVESTMENTS | March 31, 2024 |
S&P MIDCAP 400® PURE GROWTH FUND | |
| | Shares | | | Value | |
COMMON STOCKS† - 99.6% |
| | | | | | | | | |
Industrial - 25.1% |
TopBuild Corp.* | | | 11,082 | | | $ | 4,884,170 | |
Comfort Systems USA, Inc. | | | 14,467 | | | | 4,596,311 | |
EMCOR Group, Inc. | | | 9,747 | | | | 3,413,399 | |
Owens Corning | | | 19,900 | | | | 3,319,320 | |
Simpson Manufacturing Company, Inc. | | | 16,158 | | | | 3,315,298 | |
Eagle Materials, Inc. | | | 12,035 | | | | 3,270,511 | |
Saia, Inc.* | | | 5,200 | | | | 3,042,000 | |
Clean Harbors, Inc.* | | | 14,772 | | | | 2,973,751 | |
nVent Electric plc | | | 36,361 | | | | 2,741,620 | |
UFP Industries, Inc. | | | 19,545 | | | | 2,404,230 | |
Chart Industries, Inc.* | | | 14,461 | | | | 2,382,016 | |
Trex Company, Inc.* | | | 23,546 | | | | 2,348,714 | |
Esab Corp. | | | 20,518 | | | | 2,268,675 | |
Lennox International, Inc. | | | 4,489 | | | | 2,194,044 | |
Lincoln Electric Holdings, Inc. | | | 8,575 | | | | 2,190,398 | |
Applied Industrial Technologies, Inc. | | | 9,683 | | | | 1,912,877 | |
Advanced Drainage Systems, Inc. | | | 11,095 | | | | 1,911,003 | |
Universal Display Corp. | | | 11,176 | | | | 1,882,597 | |
Vontier Corp. | | | 40,803 | | | | 1,850,824 | |
RBC Bearings, Inc.* | | | 6,111 | | | | 1,652,109 | |
Crane Co. | | | 11,848 | | | | 1,601,020 | |
Total Industrial | | | | | | | 56,154,887 | |
| | | | | | | | | |
Consumer, Cyclical - 20.0% |
Toll Brothers, Inc. | | | 33,054 | | | | 4,276,196 | |
Wingstop, Inc. | | | 11,106 | | | | 4,069,238 | |
Hyatt Hotels Corp. — Class A | | | 24,695 | | | | 3,941,816 | |
Murphy USA, Inc. | | | 8,133 | | | | 3,409,354 | |
Williams-Sonoma, Inc. | | | 8,626 | | | | 2,739,014 | |
Floor & Decor Holdings, Inc. — Class A* | | | 21,095 | | | | 2,734,334 | |
Crocs, Inc.* | | | 18,269 | | | | 2,627,082 | |
Churchill Downs, Inc. | | | 20,360 | | | | 2,519,550 | |
Tempur Sealy International, Inc. | | | 42,530 | | | | 2,416,555 | |
Texas Roadhouse, Inc. — Class A | | | 15,518 | | | | 2,397,065 | |
Skechers USA, Inc. — Class A* | | | 35,181 | | | | 2,155,188 | |
Casey’s General Stores, Inc. | | | 6,499 | | | | 2,069,607 | |
Watsco, Inc. | | | 4,004 | | | | 1,729,608 | |
Light & Wonder, Inc. — Class A* | | | 16,903 | | | | 1,725,627 | |
FirstCash Holdings, Inc. | | | 13,026 | | | | 1,661,336 | |
Five Below, Inc.* | | | 9,158 | | | | 1,661,078 | |
Planet Fitness, Inc. — Class A* | | | 22,924 | | | | 1,435,730 | |
Boyd Gaming Corp. | | | 18,884 | | | | 1,271,271 | |
Total Consumer, Cyclical | | | | | | | 44,839,649 | |
| | | | | | | | | |
Consumer, Non-cyclical - 17.7% |
Celsius Holdings, Inc.* | | | 71,795 | | | | 5,953,242 | |
elf Beauty, Inc.* | | | 26,732 | | | | 5,240,274 | |
Medpace Holdings, Inc.* | | | 10,666 | | | | 4,310,664 | |
Valvoline, Inc.* | | | 64,374 | | | | 2,869,149 | |
Lantheus Holdings, Inc.* | | | 39,944 | | | | 2,486,115 | |
Exelixis, Inc.* | | | 84,501 | | | | 2,005,209 | |
Grand Canyon Education, Inc.* | | | 14,307 | | | | 1,948,756 | |
Progyny, Inc.* | | | 50,465 | | | | 1,925,240 | |
Arrowhead Pharmaceuticals, Inc.* | | | 65,360 | | | | 1,869,296 | |
Coca-Cola Consolidated, Inc. | | | 2,037 | | | | 1,724,137 | |
Acadia Healthcare Company, Inc.* | | | 21,646 | | | | 1,714,796 | |
Penumbra, Inc.* | | | 6,503 | | | | 1,451,339 | |
Brink’s Co. | | | 15,446 | | | | 1,426,902 | |
Coty, Inc. — Class A* | | | 111,774 | | | | 1,336,817 | |
Avis Budget Group, Inc. | | | 10,409 | | | | 1,274,686 | |
Halozyme Therapeutics, Inc.* | | | 28,052 | | | | 1,141,155 | |
FTI Consulting, Inc.* | | | 5,287 | | | | 1,111,803 | |
Total Consumer, Non-cyclical | | | | | | | 39,789,580 | |
| | | | | | | | | |
Energy - 16.8% |
Southwestern Energy Co.* | | | 720,329 | | | | 5,460,094 | |
CNX Resources Corp.* | | | 224,137 | | | | 5,316,529 | |
Permian Resources Corp. | | | 264,872 | | | | 4,677,639 | |
Weatherford International plc* | | | 40,026 | | | | 4,619,801 | |
Valaris Ltd.* | | | 44,485 | | | | 3,347,941 | |
Ovintiv, Inc. | | | 60,702 | | | | 3,150,434 | |
Chord Energy Corp. | | | 17,228 | | | | 3,070,719 | |
Range Resources Corp. | | | 87,740 | | | | 3,020,888 | |
Civitas Resources, Inc. | | | 35,437 | | | | 2,690,023 | |
Matador Resources Co. | | | 33,899 | | | | 2,263,436 | |
Total Energy | | | | | | | 37,617,504 | |
| | | | | | | | | |
Technology - 9.1% |
Appfolio, Inc. — Class A* | | | 16,983 | | | | 4,190,386 | |
Rambus, Inc.* | | | 50,749 | | | | 3,136,796 | |
Onto Innovation, Inc.* | | | 16,196 | | | | 2,932,771 | |
Dynatrace, Inc.* | | | 57,870 | | | | 2,687,483 | |
Manhattan Associates, Inc.* | | | 9,040 | | | | 2,262,079 | |
Qualys, Inc.* | | | 12,117 | | | | 2,021,964 | |
Pure Storage, Inc. — Class A* | | | 38,433 | | | | 1,998,131 | |
Dropbox, Inc. — Class A* | | | 51,284 | | | | 1,246,201 | |
Total Technology | | | | | | | 20,475,811 | |
| | | | | | | | | |
Financial - 4.4% |
Kinsale Capital Group, Inc. | | | 8,061 | | | | 4,229,929 | |
Park Hotels & Resorts, Inc. REIT | | | 197,699 | | | | 3,457,756 | |
Primerica, Inc. | | | 8,341 | | | | 2,109,939 | |
Total Financial | | | | | | | 9,797,624 | |
| | | | | | | | | |
Basic Materials - 3.6% |
Reliance, Inc. | | | 9,442 | | | | 3,155,328 | |
NewMarket Corp. | | | 3,996 | | | | 2,535,941 | |
Westlake Corp. | | | 15,317 | | | | 2,340,438 | |
Total Basic Materials | | | | | | | 8,031,707 | |
| | | | | | | | | |
Utilities - 2.3% |
Vistra Corp. | | | 72,926 | | | | 5,079,296 | |
| | | | | | | | | |
Communications - 0.6% |
GoDaddy, Inc. — Class A* | | | 11,556 | | | | 1,371,466 | |
| | | | | | | | | |
Total Common Stocks | | | | |
(Cost $209,675,441) | | | | | | | 223,157,524 | |
| | | | | | | | | |
28 | THE RYDEX FUNDS ANNUAL REPORT | SEE NOTES TO FINANCIAL STATEMENTS. |
SCHEDULE OF INVESTMENTS (concluded) | March 31, 2024 |
S&P MIDCAP 400® PURE GROWTH FUND | |
| | Face
Amount | | | Value | |
REPURCHASE AGREEMENTS††,1 - 0.6% |
J.P. Morgan Securities LLC
issued 03/28/24 at 5.31%
due 04/01/24 | | $ | 733,767 | | | $ | 733,767 | |
BofA Securities, Inc.
issued 03/28/24 at 5.31%
due 04/01/24 | | | 282,218 | | | | 282,218 | |
Barclays Capital, Inc.
issued 03/28/24 at 5.30%
due 04/01/24 | | | 255,807 | | | | 255,807 | |
Total Repurchase Agreements | | | | |
(Cost $1,271,792) | | | | | | | 1,271,792 | |
| | | | | | | | | |
Total Investments - 100.2% | | | | |
(Cost $210,947,233) | | $ | 224,429,316 | |
Other Assets & Liabilities, net - (0.2)% | | | (352,786 | ) |
Total Net Assets - 100.0% | | $ | 224,076,530 | |
* | Non-income producing security. |
† | Value determined based on Level 1 inputs — See Note 4. |
†† | Value determined based on Level 2 inputs — See Note 4. |
1 | Repurchase Agreements — See Note 6. |
| | plc — Public Limited Company |
| | REIT — Real Estate Investment Trust |
| | |
| | See Sector Classification in Other Information section. |
The following table summarizes the inputs used to value the Fund’s investments at March 31, 2024 (See Note 4 in the Notes to Financial Statements):
Investments in Securities (Assets) | | Level 1
Quoted
Prices | | | Level 2
Significant
Observable
Inputs | | | Level 3
Significant
Unobservable
Inputs | | | Total | |
Common Stocks | | $ | 223,157,524 | | | $ | — | | | $ | — | | | $ | 223,157,524 | |
Repurchase Agreements | | | — | | | | 1,271,792 | | | | — | | | | 1,271,792 | |
Total Assets | | $ | 223,157,524 | | | $ | 1,271,792 | | | $ | — | | | $ | 224,429,316 | |
SEE NOTES TO FINANCIAL STATEMENTS. | THE RYDEX FUNDS ANNUAL REPORT | 29 |
S&P MIDCAP 400® PURE GROWTH FUND | |
STATEMENT OF ASSETS AND LIABILITIES |
March 31, 2024 |
Assets: |
Investments, at value (cost $209,675,441) | | $ | 223,157,524 | |
Repurchase agreements, at value (cost $1,271,792) | | | 1,271,792 | |
Cash | | | 15,013 | |
Receivables: |
Securities sold | | | 4,071,334 | |
Fund shares sold | | | 254,802 | |
Dividends | | | 82,856 | |
Interest | | | 750 | |
Securities lending income | | | 28 | |
Total assets | | | 228,854,099 | |
| | | | | |
Liabilities: |
Payable for: |
Securities purchased | | | 4,190,598 | |
Fund shares redeemed | | | 342,448 | |
Management fees | | | 107,510 | |
Transfer agent fees | | | 36,604 | |
Distribution and service fees | | | 36,273 | |
Portfolio accounting and administration fees | | | 14,693 | |
Trustees’ fees* | | | 587 | |
Miscellaneous | | | 48,856 | |
Total liabilities | | | 4,777,569 | |
Net assets | | $ | 224,076,530 | |
| | | | | |
Net assets consist of: |
Paid in capital | | $ | 209,173,628 | |
Total distributable earnings (loss) | | | 14,902,902 | |
Net assets | | $ | 224,076,530 | |
Class A: |
Net assets | | $ | 9,447,446 | |
Capital shares outstanding | | | 159,102 | |
Net asset value per share | | $ | 59.38 | |
Maximum offering price per share (Net asset value divided by 95.25%) | | $ | 62.34 | |
Class C: |
Net assets | | $ | 764,373 | |
Capital shares outstanding | | | 16,809 | |
Net asset value per share | | $ | 45.47 | |
Class H: |
Net assets | | $ | 213,864,711 | |
Capital shares outstanding | | | 3,598,502 | |
Net asset value per share | | $ | 59.43 | |
STATEMENT OF OPERATIONS |
Year Ended March 31, 2024 |
Investment Income: |
Dividends | | $ | 559,700 | |
Interest | | | 13,551 | |
Income from securities lending, net | | | 249 | |
Total investment income | | | 573,500 | |
| | | | | |
Expenses: |
Management fees | | | 341,946 | |
Distribution and service fees: |
Class A | | | 18,025 | |
Class C | | | 8,817 | |
Class H | | | 93,744 | |
Transfer agent fees | | | 96,735 | |
Portfolio accounting and administration fees | | | 69,504 | |
Professional fees | | | 49,393 | |
Custodian fees | | | 6,245 | |
Trustees’ fees* | | | 5,920 | |
Line of credit fees | | | 178 | |
Miscellaneous | | | 33,781 | |
Total expenses | | | 724,288 | |
Less: |
Expenses reimbursed by Adviser | | | (17,625 | ) |
Net expenses | | | 706,663 | |
Net investment loss | | | (133,163 | ) |
| | | | | |
Net Realized and Unrealized Gain (Loss): |
Net realized gain (loss) on: |
Investments | | | 7,559,420 | |
Net realized gain | | | 7,559,420 | |
Net change in unrealized appreciation (depreciation) on: |
Investments | | | 10,648,798 | |
Net change in unrealized appreciation (depreciation) | | | 10,648,798 | |
Net realized and unrealized gain | | | 18,208,218 | |
Net increase in net assets resulting from operations | | $ | 18,075,055 | |
* | Relates to Trustees not deemed “interested persons” within the meaning of Section 2(a)(19) of the 1940 Act. |
30 | THE RYDEX FUNDS ANNUAL REPORT | SEE NOTES TO FINANCIAL STATEMENTS. |
S&P MIDCAP 400® PURE GROWTH FUND | |
STATEMENTS OF CHANGES IN NET ASSETS |
| | Year Ended
March 31,
2024 | | | Year Ended
March 31,
2023 | |
Increase (Decrease) in Net Assets from Operations: | | | | | | | | |
Net investment loss | | $ | (133,163 | ) | | $ | (155,534 | ) |
Net realized gain (loss) on investments | | | 7,559,420 | | | | (3,393,226 | ) |
Net change in unrealized appreciation (depreciation) on investments | | | 10,648,798 | | | | (1,434,482 | ) |
Net increase (decrease) in net assets resulting from operations | | | 18,075,055 | | | | (4,983,242 | ) |
| | | | | | | | | |
Distributions to shareholders: | | | | | | | | |
Class A | | | — | | | | (627,690 | ) |
Class C | | | — | | | | (178,592 | ) |
Class H | | | — | | | | (3,304,813 | ) |
Total distributions to shareholders | | | — | | | | (4,111,095 | ) |
| | | | | | | | | |
Capital share transactions: | | | | | | | | |
Proceeds from sale of shares | | | | | | | | |
Class A | | | 2,098,799 | | | | 964,531 | |
Class C | | | 902,792 | | | | 595,621 | |
Class H | | | 512,967,320 | | | | 103,836,867 | |
Distributions reinvested | | | | | | | | |
Class A | | | — | | | | 611,507 | |
Class C | | | — | | | | 178,362 | |
Class H | | | — | | | | 3,274,675 | |
Cost of shares redeemed | | | | | | | | |
Class A | | | (1,479,340 | ) | | | (1,696,089 | ) |
Class C | | | (1,543,282 | ) | | | (1,186,861 | ) |
Class H | | | (334,724,356 | ) | | | (108,848,399 | ) |
Net increase (decrease) from capital share transactions | | | 178,221,933 | | | | (2,269,786 | ) |
Net increase (decrease) in net assets | | | 196,296,988 | | | | (11,364,123 | ) |
| | | | | | | | | |
Net assets: | | | | | | | | |
Beginning of year | | | 27,779,542 | | | | 39,143,665 | |
End of year | | $ | 224,076,530 | | | $ | 27,779,542 | |
| | | | | | | | | |
Capital share activity: | | | | | | | | |
Shares sold | | | | | | | | |
Class A | | | 43,587 | | | | 20,931 | |
Class C | | | 23,765 | | | | 16,019 | |
Class H | | | 9,671,323 | | | | 2,163,142 | |
Shares issued from reinvestment of distributions | | | | | | | | |
Class A | | | — | | | | 14,436 | |
Class C | | | — | | | | 5,446 | |
Class H | | | — | | | | 77,196 | |
Shares redeemed | | | | | | | | |
Class A | | | (30,814 | ) | | | (36,712 | ) |
Class C | | | (43,388 | ) | | | (32,330 | ) |
Class H | | | (6,541,026 | ) | | | (2,317,952 | ) |
Net increase (decrease) in shares | | | 3,123,447 | | | | (89,824 | ) |
SEE NOTES TO FINANCIAL STATEMENTS. | THE RYDEX FUNDS ANNUAL REPORT | 31 |
S&P MIDCAP 400® PURE GROWTH FUND | |
This table is presented to show selected data for a share outstanding throughout each period and to assist shareholders in evaluating a Fund’s performance for the periods presented.
Class A | | Year Ended
March 31,
2024 | | | Year Ended
March 31,
2023 | | | Year Ended
March 31,
2022 | | | Year Ended
March 31,
2021 | | | Year Ended
March 31,
2020 | |
Per Share Data |
Net asset value, beginning of period | | $ | 43.18 | | | $ | 53.47 | | | $ | 64.65 | | | $ | 33.77 | | | $ | 45.88 | |
Income (loss) from investment operations: |
Net investment income (loss)a | | | (.16 | ) | | | (.18 | ) | | | (.69 | ) | | | (.57 | ) | | | (.32 | ) |
Net gain (loss) on investments (realized and unrealized) | | | 16.36 | | | | (5.43 | ) | | | (3.86 | ) | | | 32.09 | | | | (11.79 | ) |
Total from investment operations | | | 16.20 | | | | (5.61 | ) | | | (4.55 | ) | | | 31.52 | | | | (12.11 | ) |
Less distributions from: |
Net realized gains | | | — | | | | (4.68 | ) | | | (6.63 | ) | | | (.64 | ) | | | — | |
Total distributions | | | — | | | | (4.68 | ) | | | (6.63 | ) | | | (.64 | ) | | | — | |
Net asset value, end of period | | $ | 59.38 | | | $ | 43.18 | | | $ | 53.47 | | | $ | 64.65 | | | $ | 33.77 | |
|
Total Returnb | | | 37.52 | % | | | (10.32 | %) | | | (8.07 | %) | | | 93.55 | % | | | (26.39 | %) |
Ratios/Supplemental Data |
Net assets, end of period (in thousands) | | $ | 9,447 | | | $ | 6,319 | | | $ | 7,895 | | | $ | 11,272 | | | $ | 4,556 | |
Ratios to average net assets: |
Net investment income (loss) | | | (0.34 | %) | | | (0.39 | %) | | | (1.09 | %) | | | (1.08 | %) | | | (0.72 | %) |
Total expenses | | | 1.59 | % | | | 1.55 | % | | | 1.51 | % | | | 1.59 | % | | | 1.63 | % |
Net expensesc | | | 1.55 | % | | | 1.55 | % | | | 1.51 | % | | | 1.59 | % | | | 1.63 | % |
Portfolio turnover rate | | | 570 | % | | | 372 | % | | | 125 | % | | | 407 | % | | | 190 | % |
Class C | | Year Ended
March 31,
2024 | | | Year Ended
March 31,
2023 | | | Year Ended
March 31,
2022 | | | Year Ended
March 31,
2021 | | | Year Ended
March 31,
2020 | |
Per Share Data |
Net asset value, beginning of period | | $ | 33.32 | | | $ | 42.78 | | | $ | 53.41 | | | $ | 28.17 | | | $ | 38.56 | |
Income (loss) from investment operations: |
Net investment income (loss)a | | | (.41 | ) | | | (.43 | ) | | | (.96 | ) | | | (.78 | ) | | | (.54 | ) |
Net gain (loss) on investments (realized and unrealized) | | | 12.56 | | | | (4.35 | ) | | | (3.04 | ) | | | 26.66 | | | | (9.85 | ) |
Total from investment operations | | | 12.15 | | | | (4.78 | ) | | | (4.00 | ) | | | 25.88 | | | | (10.39 | ) |
Less distributions from: |
Net realized gains | | | — | | | | (4.68 | ) | | | (6.63 | ) | | | (.64 | ) | | | — | |
Total distributions | | | — | | | | (4.68 | ) | | | (6.63 | ) | | | (.64 | ) | | | — | |
Net asset value, end of period | | $ | 45.47 | | | $ | 33.32 | | | $ | 42.78 | | | $ | 53.41 | | | $ | 28.17 | |
|
Total Returnb | | | 36.46 | % | | | (11.00 | %) | | | (8.76 | %) | | | 92.12 | % | | | (26.95 | %) |
Ratios/Supplemental Data |
Net assets, end of period (in thousands) | | $ | 764 | | | $ | 1,214 | | | $ | 2,023 | | | $ | 4,005 | | | $ | 3,956 | |
Ratios to average net assets: |
Net investment income (loss) | | | (1.15 | %) | | | (1.16 | %) | | | (1.85 | %) | | | (1.82 | %) | | | (1.47 | %) |
Total expenses | | | 2.33 | % | | | 2.30 | % | | | 2.26 | % | | | 2.35 | % | | | 2.38 | % |
Net expensesc | | | 2.30 | % | | | 2.30 | % | | | 2.26 | % | | | 2.35 | % | | | 2.38 | % |
Portfolio turnover rate | | | 570 | % | | | 372 | % | | | 125 | % | | | 407 | % | | | 190 | % |
32 | THE RYDEX FUNDS ANNUAL REPORT | SEE NOTES TO FINANCIAL STATEMENTS. |
S&P MIDCAP 400® PURE GROWTH FUND | |
FINANCIAL HIGHLIGHTS (concluded) |
This table is presented to show selected data for a share outstanding throughout each period and to assist shareholders in evaluating a Fund’s performance for the periods presented.
Class H | | Year Ended
March 31,
2024 | | | Year Ended
March 31,
2023 | | | Year Ended
March 31,
2022 | | | Year Ended
March 31,
2021 | | | Year Ended
March 31,
2020 | |
Per Share Data |
Net asset value, beginning of period | | $ | 43.24 | | | $ | 53.54 | | | $ | 64.74 | | | $ | 33.82 | | | $ | 45.94 | |
Income (loss) from investment operations: |
Net investment income (loss)a | | | (.13 | ) | | | (.17 | ) | | | (.70 | ) | | | (.56 | ) | | | (.31 | ) |
Net gain (loss) on investments (realized and unrealized) | | | 16.32 | | | | (5.45 | ) | | | (3.87 | ) | | | 32.12 | | | | (11.81 | ) |
Total from investment operations | | | 16.19 | | | | (5.62 | ) | | | (4.57 | ) | | | 31.56 | | | | (12.12 | ) |
Less distributions from: |
Net realized gains | | | — | | | | (4.68 | ) | | | (6.63 | ) | | | (.64 | ) | | | — | |
Total distributions | | | — | | | | (4.68 | ) | | | (6.63 | ) | | | (.64 | ) | | | — | |
Net asset value, end of period | | $ | 59.43 | | | $ | 43.24 | | | $ | 53.54 | | | $ | 64.74 | | | $ | 33.82 | |
|
Total Return | | | 37.44 | % | | | (10.32 | %) | | | (8.09 | %) | | | 93.53 | % | | | (26.38 | %) |
Ratios/Supplemental Data |
Net assets, end of period (in thousands) | | $ | 213,865 | | | $ | 20,247 | | | $ | 29,225 | | | $ | 50,599 | | | $ | 27,848 | |
Ratios to average net assets: |
Net investment income (loss) | | | (0.26 | %) | | | (0.36 | %) | | | (1.10 | %) | | | (1.06 | %) | | | (0.71 | %) |
Total expenses | | | 1.57 | % | | | 1.55 | % | | | 1.51 | % | | | 1.59 | % | | | 1.63 | % |
Net expensesc | | | 1.53 | % | | | 1.55 | % | | | 1.51 | % | | | 1.59 | % | | | 1.63 | % |
Portfolio turnover rate | | | 570 | % | | | 372 | % | | | 125 | % | | | 407 | % | | | 190 | % |
a | Net investment income (loss) per share was computed using average shares outstanding throughout the period. |
b | Total return does not reflect the impact of any applicable sales charges. |
c | Net expense information reflects the expense ratios after expense waivers and reimbursements, as applicable. |
SEE NOTES TO FINANCIAL STATEMENTS. | THE RYDEX FUNDS ANNUAL REPORT | 33 |
PERFORMANCE REPORT AND FUND PROFILE (Unaudited) | March 31, 2024 |
S&P MIDCAP 400® PURE VALUE FUND
OBJECTIVE: Seeks to provide investment results that match, before fees and expenses, the performance of a benchmark for mid-cap value securities on a daily basis. The Fund’s current benchmark is the S&P MidCap 400® Pure Value Index (the “underlying index”).
For the Reporting Period, S&P MidCap 400® Pure Value Fund Class H returned 26.57%, compared with a return of 28.84% for the underlying index. The Fund maintained a daily correlation of over 99% to its benchmark for the period.
The sectors that contributed the most to the return of the underlying index for the Reporting Period were Consumer Discretionary, Financials, and Information Technology. The only sector that detracted was Utilities.
The holdings that contributed the most to the return of the underlying index for the Reporting Period were XPO, Inc., KB Home, and United States Steel Corp. Those that detracted the most were Foot Locker, Inc., Hertz Global Holdings, Inc., and JetBlue Airways Corp.
Performance displayed represents past performance, which is no guarantee of future results.
Holdings Diversification (Market Exposure as % of Net Assets)
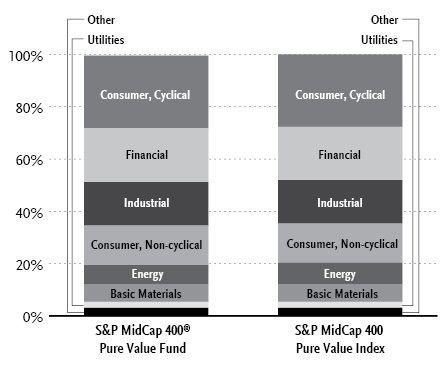
“Holdings Diversification (Market Exposure as % of Net Assets)” excludes any temporary cash investments.
Inception Dates: |
Class A | September 1, 2004 |
Class C | February 20, 2004 |
Class H | February 20, 2004 |
Ten Largest Holdings | % of Total Net Assets |
PBF Energy, Inc. — Class A | 3.3% |
Macy’s, Inc. | 2.7% |
Avnet, Inc. | 2.4% |
TD SYNNEX Corp. | 2.3% |
United States Steel Corp. | 2.2% |
HF Sinclair Corp. | 2.2% |
Lithia Motors, Inc. — Class A | 2.2% |
Arrow Electronics, Inc. | 2.1% |
Goodyear Tire & Rubber Co. | 2.1% |
Hertz Global Holdings, Inc. | 1.9% |
Top Ten Total | 23.4% |
| | |
“Ten Largest Holdings” excludes any temporary cash investments. |
34 | THE RYDEX FUNDS ANNUAL REPORT | |
PERFORMANCE REPORT AND FUND PROFILE (Unaudited)(concluded) | March 31, 2024 |
Cumulative Fund Performance*
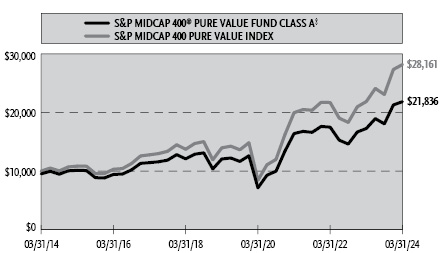
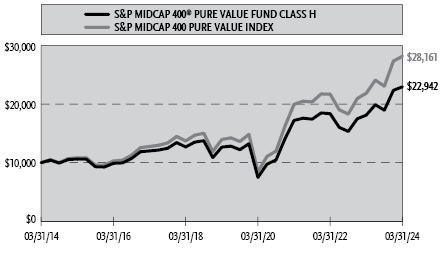
Average Annual Returns*
Periods Ended March 31, 2024
| 1 Year | 5 Year | 10 Year |
Class A Shares | 26.51% | 12.61% | 8.65% |
Class A Shares with sales charge‡ | 20.51% | 11.52% | 8.12% |
Class C Shares | 25.58% | 11.77% | 7.84% |
Class C Shares with CDSC§ | 24.58% | 11.77% | 7.84% |
Class H Shares | 26.57% | 12.62% | 8.66% |
S&P MidCap 400 Pure Value Index | 28.84% | 15.07% | 10.91% |
* | The performance data above represents past performance that is not predictive of future results. The investment return and principal value of an investment in the Fund will fluctuate so that an investor’s shares, when redeemed, may be worth more or less than their original cost. Returns are historical and include changes in principal and reinvested dividends and capital gains and do not reflect the effect of taxes. The S&P MidCap 400 Pure Value Index is an unmanaged index and, unlike the Fund, has no management fees or operating expenses to reduce its reported return. The graphs are based on Class A and Class H shares only; performance for Class C shares will vary due to differences in fee structure. |
‡ | Fund returns are calculated using the maximum sales charge of 4.75%. |
§ | Fund returns include a CDSC of 1% if redeemed within 12 months of purchase. |
| | THE RYDEX FUNDS ANNUAL REPORT | 35 |
SCHEDULE OF INVESTMENTS | March 31, 2024 |
S&P MIDCAP 400® PURE VALUE FUND | |
| | Shares | | | Value | |
COMMON STOCKS† - 99.5% |
| | | | | | | | | |
Consumer, Cyclical - 27.8% |
Macy’s, Inc. | | | 8,485 | | | $ | 169,615 | |
Lithia Motors, Inc. — Class A | | | 455 | | | | 136,891 | |
Goodyear Tire & Rubber Co.* | | | 9,728 | | | | 133,565 | |
Adient plc* | | | 3,452 | | | | 113,640 | |
AutoNation, Inc.* | | | 682 | | | | 112,926 | |
Nordstrom, Inc. | | | 5,479 | | | | 111,059 | |
Taylor Morrison Home Corp. — Class A* | | | 1,574 | | | | 97,856 | |
WESCO International, Inc. | | | 536 | | | | 91,806 | |
PVH Corp. | | | 631 | | | | 88,725 | |
Lear Corp. | | | 592 | | | | 85,769 | |
Aramark | | | 2,435 | | | | 79,186 | |
Whirlpool Corp. | | | 642 | | | | 76,802 | |
Penske Automotive Group, Inc. | | | 452 | | | | 73,220 | |
Thor Industries, Inc. | | | 591 | | | | 69,348 | |
Harley-Davidson, Inc. | | | 1,521 | | | | 66,529 | |
Marriott Vacations Worldwide Corp. | | | 546 | | | | 58,820 | |
Gap, Inc. | | | 1,924 | | | | 53,006 | |
Penn Entertainment, Inc.* | | | 2,579 | | | | 46,964 | |
BJ’s Wholesale Club Holdings, Inc.* | | | 463 | | | | 35,026 | |
Leggett & Platt, Inc. | | | 1,151 | | | | 22,042 | |
Under Armour, Inc. — Class C* | | | 2,937 | | | | 20,970 | |
Under Armour, Inc. — Class A* | | | 2,839 | | | | 20,952 | |
Total Consumer, Cyclical | | | | | | | 1,764,717 | |
| | | | | | | | | |
Financial - 20.5% |
Jones Lang LaSalle, Inc.* | | | 550 | | | | 107,300 | |
Unum Group | | | 1,780 | | | | 95,515 | |
Ally Financial, Inc. | | | 2,180 | | | | 88,486 | |
Kemper Corp. | | | 1,200 | | | | 74,304 | |
Associated Banc-Corp. | | | 3,360 | | | | 72,273 | |
Reinsurance Group of America, Inc. — Class A | | | 351 | | | | 67,701 | |
Jefferies Financial Group, Inc. | | | 1,472 | | | | 64,915 | |
Cousins Properties, Inc. REIT | | | 2,530 | | | | 60,821 | |
FNB Corp. | | | 4,269 | | | | 60,193 | |
Kilroy Realty Corp. REIT | | | 1,603 | | | | 58,397 | |
Zions Bancorp North America | | | 1,263 | | | | 54,814 | |
First Horizon Corp. | | | 3,234 | | | | 49,804 | |
Valley National Bancorp | | | 6,132 | | | | 48,811 | |
Old National Bancorp | | | 2,582 | | | | 44,953 | |
Janus Henderson Group plc | | | 1,275 | | | | 41,935 | |
Prosperity Bancshares, Inc. | | | 637 | | | | 41,902 | |
Texas Capital Bancshares, Inc.* | | | 651 | | | | 40,069 | |
Independence Realty Trust, Inc. REIT | | | 2,309 | | | | 37,244 | |
Webster Financial Corp. | | | 716 | | | | 36,351 | |
CNO Financial Group, Inc. | | | 1,198 | | | | 32,921 | |
Old Republic International Corp. | | | 1,061 | | | | 32,594 | |
Healthcare Realty Trust, Inc. REIT | | | 2,270 | | | | 32,121 | |
First American Financial Corp. | | | 508 | | | | 31,013 | |
New York Community Bancorp, Inc.1 | | | 7,390 | | | | 23,796 | |
Total Financial | | | | | | | 1,298,233 | |
| | | | | | | | | |
Industrial - 16.7% |
Avnet, Inc. | | | 3,110 | | | | 154,194 | |
TD SYNNEX Corp. | | | 1,314 | | | | 148,613 | |
Arrow Electronics, Inc.* | | | 1,053 | | | | 136,321 | |
MasTec, Inc.* | | | 1,201 | | | | 111,993 | |
MDU Resources Group, Inc. | | | 3,198 | | | | 80,590 | |
Ryder System, Inc. | | | 666 | | | | 80,047 | |
Fluor Corp.* | | | 1,425 | | | | 60,249 | |
Greif, Inc. — Class A | | | 639 | | | | 44,123 | |
Coherent Corp.* | | | 720 | | | | 43,647 | |
Oshkosh Corp. | | | 329 | | | | 41,029 | |
AGCO Corp. | | | 311 | | | | 38,259 | |
Vishay Intertechnology, Inc. | | | 1,400 | | | | 31,752 | |
Werner Enterprises, Inc. | | | 795 | | | | 31,100 | |
Knight-Swift Transportation Holdings, Inc. | | | 541 | | | | 29,766 | |
Berry Global Group, Inc. | | | 464 | | | | 28,063 | |
Total Industrial | | | | | | | 1,059,746 | |
| | | | | | | | | |
Consumer, Non-cyclical - 15.1% |
Hertz Global Holdings, Inc.*,1 | | | 15,764 | | | | 123,432 | |
ManpowerGroup, Inc. | | | 1,429 | | | | 110,948 | |
US Foods Holding Corp.* | | | 1,996 | | | | 107,724 | |
Performance Food Group Co.* | | | 1,381 | | | | 103,078 | |
Graham Holdings Co. — Class B | | | 133 | | | | 102,101 | |
Tenet Healthcare Corp.* | | | 877 | | | | 92,182 | |
Pilgrim’s Pride Corp.* | | | 2,475 | | | | 84,942 | |
Perrigo Company plc | | | 1,976 | | | | 63,607 | |
Enovis Corp.* | | | 867 | | | | 54,144 | |
Post Holdings, Inc.* | | | 482 | | | | 51,227 | |
Envista Holdings Corp.* | | | 1,688 | | | | 36,089 | |
QuidelOrtho Corp.* | | | 626 | | | | 30,011 | |
Total Consumer, Non-cyclical | | | | | | | 959,485 | |
| | | | | | | | | |
Energy - 7.4% |
PBF Energy, Inc. — Class A | | | 3,665 | | | | 210,994 | |
HF Sinclair Corp. | | | 2,307 | | | | 139,274 | |
Chesapeake Energy Corp.1 | | | 520 | | | | 46,191 | |
Antero Resources Corp.* | | | 1,481 | | | | 42,949 | |
NOV, Inc. | | | 1,656 | | | | 32,325 | |
Total Energy | | | | | | | 471,733 | |
| | | | | | | | | |
Basic Materials - 6.6% |
United States Steel Corp. | | | 3,453 | | | | 140,813 | |
Cleveland-Cliffs, Inc.* | | | 5,108 | | | | 116,156 | |
Alcoa Corp. | | | 2,750 | | | | 92,923 | |
Commercial Metals Co. | | | 1,230 | | | | 72,287 | |
Total Basic Materials | | | | | | | 422,179 | |
| | | | | | | | | |
Utilities - 2.3% |
UGI Corp. | | | 1,939 | | | | 47,583 | |
Southwest Gas Holdings, Inc. | | | 534 | | | | 40,654 | |
Black Hills Corp. | | | 599 | | | | 32,705 | |
Spire, Inc. | | | 452 | | | | 27,739 | |
Total Utilities | | | | | | | 148,681 | |
| | | | | | | | | |
36 | THE RYDEX FUNDS ANNUAL REPORT | SEE NOTES TO FINANCIAL STATEMENTS. |
SCHEDULE OF INVESTMENTS (concluded) | March 31, 2024 |
S&P MIDCAP 400® PURE VALUE FUND | |
| | Shares | | | Value | |
Communications - 1.6% |
Frontier Communications Parent, Inc.* | | | 2,248 | | | $ | 55,076 | |
TEGNA, Inc. | | | 2,918 | | | | 43,595 | |
Total Communications | | | | | | | 98,671 | |
| | | | | | | | | |
Technology - 1.5% |
Kyndryl Holdings, Inc.* | | | 3,198 | | | | 69,589 | |
Concentrix Corp. | | | 364 | | | | 24,104 | |
Total Technology | | | | | | | 93,693 | |
| | | | | | | | | |
Total Common Stocks | | | | |
(Cost $5,098,369) | | | | | | | 6,317,138 | |
| | | | | | | | | |
| | | Face
Amount | | | | | |
REPURCHASE AGREEMENTS††,2 - 0.7% |
J.P. Morgan Securities LLC
issued 03/28/24 at 5.31%
due 04/01/24 | | $ | 25,832 | | | | 25,832 | |
BofA Securities, Inc.
issued 03/28/24 at 5.31%
due 04/01/24 | | | 9,936 | | | | 9,936 | |
Barclays Capital, Inc.
issued 03/28/24 at 5.30%
due 04/01/24 | | | 9,006 | | | | 9,006 | |
Total Repurchase Agreements | | | | |
(Cost $44,774) | | | | | | | 44,774 | |
| | | | | | | | | |
SECURITIES LENDING COLLATERAL†,3 - 2.5% |
Money Market Fund | | | | | | | | |
First American Government Obligations Fund - Class X, 5.23%4 | | | 155,520 | | | | 155,520 | |
Total Securities Lending Collateral | | | | |
(Cost $155,520) | | | | | | | 155,520 | |
| | | | | | | | | |
Total Investments - 102.7% | | | | |
(Cost $5,298,663) | | $ | 6,517,432 | |
Other Assets & Liabilities, net - (2.7)% | | | (170,594 | ) |
Total Net Assets - 100.0% | | $ | 6,346,838 | |
* | Non-income producing security. |
† | Value determined based on Level 1 inputs — See Note 4. |
†† | Value determined based on Level 2 inputs — See Note 4. |
1 | All or a portion of this security is on loan at March 31, 2024 — See Note 7. |
2 | Repurchase Agreements — See Note 6. |
3 | Securities lending collateral — See Note 7. |
4 | Rate indicated is the 7-day yield as of March 31, 2024. |
| | plc — Public Limited Company |
| | REIT — Real Estate Investment Trust |
| | |
| | See Sector Classification in Other Information section. |
The following table summarizes the inputs used to value the Fund’s investments at March 31, 2024 (See Note 4 in the Notes to Financial Statements):
Investments in Securities (Assets) | | Level 1
Quoted
Prices | | | Level 2
Significant
Observable
Inputs | | | Level 3
Significant
Unobservable
Inputs | | | Total | |
Common Stocks | | $ | 6,317,138 | | | $ | — | | | $ | — | | | $ | 6,317,138 | |
Repurchase Agreements | | | — | | | | 44,774 | | | | — | | | | 44,774 | |
Securities Lending Collateral | | | 155,520 | | | | — | | | | — | | | | 155,520 | |
Total Assets | | $ | 6,472,658 | | | $ | 44,774 | | | $ | — | | | $ | 6,517,432 | |
SEE NOTES TO FINANCIAL STATEMENTS. | THE RYDEX FUNDS ANNUAL REPORT | 37 |
S&P MIDCAP 400® PURE VALUE FUND | |
STATEMENT OF ASSETS AND LIABILITIES |
March 31, 2024 |
Assets: |
Investments, at value - including $141,628 of securities loaned (cost $5,253,889) | | $ | 6,472,658 | |
Repurchase agreements, at value (cost $44,774) | | | 44,774 | |
Cash | | | 222 | |
Receivables: |
Fund shares sold | | | 66,265 | |
Securities sold | | | 56,625 | |
Dividends | | | 7,169 | |
Interest | | | 26 | |
Securities lending income | | | 20 | |
Total assets | | | 6,647,759 | |
| | | | | |
Liabilities: |
Payable for: |
Return of securities lending collateral | | | 155,520 | |
Securities purchased | | | 90,572 | |
Fund shares redeemed | | | 32,728 | |
Transfer agent fees | | | 4,581 | |
Management fees | | | 3,924 | |
Distribution and service fees | | | 1,524 | |
Portfolio accounting and administration fees | | | 536 | |
Trustees’ fees* | | | 133 | |
Miscellaneous | | | 11,403 | |
Total liabilities | | | 300,921 | |
Net assets | | $ | 6,346,838 | |
| | | | | |
Net assets consist of: |
Paid in capital | | $ | 4,747,652 | |
Total distributable earnings (loss) | | | 1,599,186 | |
Net assets | | $ | 6,346,838 | |
Class A: |
Net assets | | $ | 1,720,716 | |
Capital shares outstanding | | | 22,522 | |
Net asset value per share | | $ | 76.40 | |
Maximum offering price per share (Net asset value divided by 95.25%) | | $ | 80.21 | |
Class C: |
Net assets | | $ | 326,884 | |
Capital shares outstanding | | | 5,260 | |
Net asset value per share | | $ | 62.15 | |
Class H: |
Net assets | | $ | 4,299,238 | |
Capital shares outstanding | | | 56,342 | |
Net asset value per share | | $ | 76.31 | |
STATEMENT OF OPERATIONS |
Year Ended March 31, 2024 |
Investment Income: |
Dividends | | $ | 256,222 | |
Interest | | | 5,778 | |
Income from securities lending, net | | | 808 | |
Total investment income | | | 262,808 | |
| | | | | |
Expenses: |
Management fees | | | 126,013 | |
Distribution and service fees: |
Class A | | | 4,228 | |
Class C | | | 5,536 | |
Class H | | | 36,388 | |
Transfer agent fees | | | 36,340 | |
Portfolio accounting and administration fees | | | 25,609 | |
Registration fees | | | 19,491 | |
Professional fees | | | 5,875 | |
Trustees’ fees* | | | 3,481 | |
Custodian fees | | | 2,499 | |
Line of credit fees | | | 269 | |
Miscellaneous | | | 5,180 | |
Total expenses | | | 270,909 | |
Less: |
Expenses reimbursed by Adviser | | | (5,703 | ) |
Net expenses | | | 265,206 | |
Net investment loss | | | (2,398 | ) |
| | | | | |
Net Realized and Unrealized Gain (Loss): |
Net realized gain (loss) on: |
Investments | | | 5,688,107 | |
Net realized gain | | | 5,688,107 | |
Net change in unrealized appreciation (depreciation) on: |
Investments | | | (41,440 | ) |
Net change in unrealized appreciation (depreciation) | | | (41,440 | ) |
Net realized and unrealized gain | | | 5,646,667 | |
Net increase in net assets resulting from operations | | $ | 5,644,269 | |
* | Relates to Trustees not deemed “interested persons” within the meaning of Section 2(a)(19) of the 1940 Act. |
38 | THE RYDEX FUNDS ANNUAL REPORT | SEE NOTES TO FINANCIAL STATEMENTS. |
S&P MIDCAP 400® PURE VALUE FUND | |
STATEMENTS OF CHANGES IN NET ASSETS |
| | Year Ended
March 31,
2024 | | | Year Ended
March 31,
2023 | |
Increase (Decrease) in Net Assets from Operations: | | | | | | | | |
Net investment income (loss) | | $ | (2,398 | ) | | $ | 191,352 | |
Net realized gain (loss) on investments | | | 5,688,107 | | | | (679,914 | ) |
Net change in unrealized appreciation (depreciation) on investments | | | (41,440 | ) | | | (422,791 | ) |
Net increase (decrease) in net assets resulting from operations | | | 5,644,269 | | | | (911,353 | ) |
| | | | | | | | | |
Distributions to shareholders: | | | | | | | | |
Class A | | | (6,522 | ) | | | (216,123 | ) |
Class C | | | (1,618 | ) | | | (279,123 | ) |
Class H | | | (183,212 | ) | | | (2,173,163 | ) |
Total distributions to shareholders | | | (191,352 | ) | | | (2,668,409 | ) |
| | | | | | | | | |
Capital share transactions: | | | | | | | | |
Proceeds from sale of shares | | | | | | | | |
Class A | | | 1,437,937 | | | | 1,636,761 | |
Class C | | | 500,148 | | | | 1,978,270 | |
Class H | | | 89,083,027 | | | | 333,340,335 | |
Distributions reinvested | | | | | | | | |
Class A | | | 6,510 | | | | 216,123 | |
Class C | | | 1,605 | | | | 276,619 | |
Class H | | | 182,867 | | | | 2,155,836 | |
Cost of shares redeemed | | | | | | | | |
Class A | | | (2,231,565 | ) | | | (706,450 | ) |
Class C | | | (1,962,755 | ) | | | (629,158 | ) |
Class H | | | (97,881,236 | ) | | | (352,963,951 | ) |
Net decrease from capital share transactions | | | (10,863,462 | ) | | | (14,695,615 | ) |
Net decrease in net assets | | | (5,410,545 | ) | | | (18,275,377 | ) |
| | | | | | | | | |
Net assets: | | | | | | | | |
Beginning of year | | | 11,757,383 | | | | 30,032,760 | |
End of year | | $ | 6,346,838 | | | $ | 11,757,383 | |
| | | | | | | | | |
Capital share activity: | | | | | | | | |
Shares sold | | | | | | | | |
Class A | | | 20,945 | | | | 24,062 | |
Class C | | | 8,752 | | | | 33,722 | |
Class H | | | 1,337,752 | | | | 5,080,728 | |
Shares issued from reinvestment of distributions | | | | | | | | |
Class A | | | 95 | | | | 3,753 | |
Class C | | | 29 | | | | 5,844 | |
Class H | | | 2,666 | | | | 37,506 | |
Shares redeemed | | | | | | | | |
Class A | | | (35,465 | ) | | | (10,689 | ) |
Class C | | | (39,052 | ) | | | (12,248 | ) |
Class H | | | (1,412,035 | ) | | | (5,389,191 | ) |
Net decrease in shares | | | (116,313 | ) | | | (226,513 | ) |
SEE NOTES TO FINANCIAL STATEMENTS. | THE RYDEX FUNDS ANNUAL REPORT | 39 |
S&P MIDCAP 400® PURE VALUE FUND | |
This table is presented to show selected data for a share outstanding throughout each period and to assist shareholders in evaluating a Fund’s performance for the periods presented.
Class A | | Year Ended
March 31,
2024 | | | Year Ended
March 31,
2023 | | | Year Ended
March 31,
2022 | | | Year Ended
March 31,
2021 | | | Year Ended
March 31,
2020 | |
Per Share Data |
Net asset value, beginning of period | | $ | 60.65 | | | $ | 70.65 | | | $ | 70.16 | | | $ | 30.53 | | | $ | 51.62 | |
Income (loss) from investment operations: |
Net investment income (loss)a | | | .04 | | | | .49 | | | | .40 | | | | .20 | | | | .34 | |
Net gain (loss) on investments (realized and unrealized) | | | 16.00 | | | | (1.88 | ) | | | 4.22 | | | | 39.45 | | | | (21.43 | ) |
Total from investment operations | | | 16.04 | | | | (1.39 | ) | | | 4.62 | | | | 39.65 | | | | (21.09 | ) |
Less distributions from: |
Net investment income | | | (.29 | ) | | | (.08 | ) | | | (.86 | ) | | | (.02 | ) | | | — | |
Net realized gains | | | — | | | | (8.53 | ) | | | (3.27 | ) | | | — | | | | — | |
Total distributions | | | (.29 | ) | | | (8.61 | ) | | | (4.13 | ) | | | (.02 | ) | | | — | |
Net asset value, end of period | | $ | 76.40 | | | $ | 60.65 | | | $ | 70.65 | | | $ | 70.16 | | | $ | 30.53 | |
|
Total Returnb | | | 26.51 | % | | | (1.32 | %) | | | 6.67 | % | | | 129.91 | % | | | (40.86 | %) |
Ratios/Supplemental Data |
Net assets, end of period (in thousands) | | $ | 1,721 | | | $ | 2,241 | | | $ | 1,400 | | | $ | 1,868 | | | $ | 749 | |
Ratios to average net assets: |
Net investment income (loss) | | | 0.07 | % | | | 0.75 | % | | | 0.55 | % | | | 0.41 | % | | | 0.68 | % |
Total expenses | | | 1.59 | % | | | 1.55 | % | | | 1.51 | % | | | 1.59 | % | | | 1.63 | % |
Net expensesc | | | 1.55 | % | | | 1.55 | % | | | 1.51 | % | | | 1.59 | % | | | 1.63 | % |
Portfolio turnover rate | | | 868 | % | | | 1,064 | % | | | 252 | % | | | 454 | % | | | 993 | % |
Class C | | Year Ended
March 31,
2024 | | | Year Ended
March 31,
2023 | | | Year Ended
March 31,
2022 | | | Year Ended
March 31,
2021 | | | Year Ended
March 31,
2020 | |
Per Share Data |
Net asset value, beginning of period | | $ | 49.75 | | | $ | 60.04 | | | $ | 60.66 | | | $ | 26.59 | | | $ | 45.31 | |
Income (loss) from investment operations: |
Net investment income (loss)a | | | (.40 | ) | | | (.02 | ) | | | (.13 | ) | | | (.13 | ) | | | (.05 | ) |
Net gain (loss) on investments (realized and unrealized) | | | 13.09 | | | | (1.66 | ) | | | 3.64 | | | | 34.22 | | | | (18.67 | ) |
Total from investment operations | | | 12.69 | | | | (1.68 | ) | | | 3.51 | | | | 34.09 | | | | (18.72 | ) |
Less distributions from: |
Net investment income | | | (.29 | ) | | | (.08 | ) | | | (.86 | ) | | | (.02 | ) | | | — | |
Net realized gains | | | — | | | | (8.53 | ) | | | (3.27 | ) | | | — | | | | — | |
Total distributions | | | (.29 | ) | | | (8.61 | ) | | | (4.13 | ) | | | (.02 | ) | | | — | |
Net asset value, end of period | | $ | 62.15 | | | $ | 49.75 | | | $ | 60.04 | | | $ | 60.66 | | | $ | 26.59 | |
|
Total Returnb | | | 25.58 | % | | | (2.06 | %) | | | 5.86 | % | | | 128.24 | % | | | (41.32 | %) |
Ratios/Supplemental Data |
Net assets, end of period (in thousands) | | $ | 327 | | | $ | 1,768 | | | $ | 493 | | | $ | 1,690 | | | $ | 708 | |
Ratios to average net assets: |
Net investment income (loss) | | | (0.77 | %) | | | (0.03 | %) | | | (0.21 | %) | | | (0.30 | %) | | | (0.12 | %) |
Total expenses | | | 2.33 | % | | | 2.30 | % | | | 2.26 | % | | | 2.34 | % | | | 2.37 | % |
Net expensesc | | | 2.31 | % | | | 2.30 | % | | | 2.26 | % | | | 2.34 | % | | | 2.37 | % |
Portfolio turnover rate | | | 868 | % | | | 1,064 | % | | | 252 | % | | | 454 | % | | | 993 | % |
40 | THE RYDEX FUNDS ANNUAL REPORT | SEE NOTES TO FINANCIAL STATEMENTS. |
S&P MIDCAP 400® PURE VALUE FUND | |
FINANCIAL HIGHLIGHTS (concluded) |
This table is presented to show selected data for a share outstanding throughout each period and to assist shareholders in evaluating a Fund’s performance for the periods presented.
Class H | | Year Ended
March 31,
2024 | | | Year Ended
March 31,
2023 | | | Year Ended
March 31,
2022 | | | Year Ended
March 31,
2021 | | | Year Ended
March 31,
2020 | |
Per Share Data |
Net asset value, beginning of period | | $ | 60.56 | | | $ | 70.54 | | | $ | 70.05 | | | $ | 30.48 | | | $ | 51.54 | |
Income (loss) from investment operations: |
Net investment income (loss)a | | | — | | | | .49 | | | | .35 | | | | .31 | | | | .20 | |
Net gain (loss) on investments (realized and unrealized) | | | 16.04 | | | | (1.86 | ) | | | 4.27 | | | | 39.28 | | | | (21.26 | ) |
Total from investment operations | | | 16.04 | | | | (1.37 | ) | | | 4.62 | | | | 39.59 | | | | (21.06 | ) |
Less distributions from: |
Net investment income | | | (.29 | ) | | | (.08 | ) | | | (.86 | ) | | | (.02 | ) | | | — | |
Net realized gains | | | — | | | | (8.53 | ) | | | (3.27 | ) | | | — | | | | — | |
Total distributions | | | (.29 | ) | | | (8.61 | ) | | | (4.13 | ) | | | (.02 | ) | | | — | |
Net asset value, end of period | | $ | 76.31 | | | $ | 60.56 | | | $ | 70.54 | | | $ | 70.05 | | | $ | 30.48 | |
|
Total Return | | | 26.57 | % | | | (1.30 | %) | | | 6.68 | % | | | 129.92 | % | | | (40.86 | %) |
Ratios/Supplemental Data |
Net assets, end of period (in thousands) | | $ | 4,299 | | | $ | 7,749 | | | $ | 28,139 | | | $ | 154,269 | | | $ | 1,618 | |
Ratios to average net assets: |
Net investment income (loss) | | | 0.01 | % | | | 0.74 | % | | | 0.48 | % | | | 0.51 | % | | | 0.39 | % |
Total expenses | | | 1.59 | % | | | 1.55 | % | | | 1.51 | % | | | 1.54 | % | | | 1.63 | % |
Net expensesc | | | 1.55 | % | | | 1.55 | % | | | 1.51 | % | | | 1.54 | % | | | 1.63 | % |
Portfolio turnover rate | | | 868 | % | | | 1,064 | % | | | 252 | % | | | 454 | % | | | 993 | % |
a | Net investment income (loss) per share was computed using average shares outstanding throughout the period. |
b | Total return does not reflect the impact of any applicable sales charges. |
c | Net expense information reflects the expense ratios after expense waivers and reimbursements, as applicable. |
SEE NOTES TO FINANCIAL STATEMENTS. | THE RYDEX FUNDS ANNUAL REPORT | 41 |
PERFORMANCE REPORT AND FUND PROFILE (Unaudited) | March 31, 2024 |
S&P SMALLCAP 600® PURE GROWTH FUND
OBJECTIVE: Seeks to provide investment results that match, before fees and expenses, the performance of a benchmark for small-cap growth securities on a daily basis. The Fund’s current benchmark is the S&P SmallCap 600® Pure Growth Index (the “underlying index”).
For the Reporting Period, S&P SmallCap 600® Pure Growth Fund Class H return was 23.77%, compared with a return of 25.55% for the underlying index. The Fund maintained a daily correlation of over 99% to its benchmark for the period.
The sectors that contributed the most to the return of the underlying index for the Reporting Period were Industrials, Consumer Discretionary, and Energy. The only sectors that detracted were Health Care and Utilities.
The holdings that contributed the most to the return of the underlying index for the Reporting Period were Dorian LPG Ltd., Boise Cascade Co., and Green Brick Partners, Inc. Those that detracted the most were Vir Biotechnology, Inc., uniQure N.V., and iTeos Therapeutics, Inc.
Performance displayed represents past performance, which is no guarantee of future results.
Holdings Diversification (Market Exposure as % of Net Assets)
“Holdings Diversification (Market Exposure as % of Net Assets)” excludes any temporary cash investments.
Inception Dates: |
Class A | September 1, 2004 |
Class C | February 20, 2004 |
Class H | February 20, 2004 |
Ten Largest Holdings | % of Total Net Assets |
Two Harbors Investment Corp. | 1.6% |
UFP Technologies, Inc. | 1.4% |
PROG Holdings, Inc. | 1.4% |
Alpha Metallurgical Resources, Inc. | 1.4% |
Encore Wire Corp. | 1.4% |
Installed Building Products, Inc. | 1.4% |
SiriusPoint Ltd. | 1.4% |
Green Brick Partners, Inc. | 1.3% |
Northern Oil and Gas, Inc. | 1.3% |
Warrior Met Coal, Inc. | 1.2% |
Top Ten Total | 13.8% |
| | |
“Ten Largest Holdings” excludes any temporary cash investments. |
42 | THE RYDEX FUNDS ANNUAL REPORT | |
PERFORMANCE REPORT AND FUND PROFILE (Unaudited)(concluded) | March 31, 2024 |
Cumulative Fund Performance*
Average Annual Returns*
Periods Ended March 31, 2024
| 1 Year | 5 Year | 10 Year |
Class A Shares | 23.74% | 4.85% | 5.67% |
Class A Shares with sales charge† | 17.86% | 3.83% | 5.16% |
Class C Shares | 22.80% | 4.06% | 4.88% |
Class C Shares with CDSC‡ | 21.80% | 4.06% | 4.88% |
Class H Shares | 23.77% | 4.82% | 5.66% |
S&P SmallCap 600 Pure Growth Index | 25.55% | 6.62% | 7.52% |
* | The performance data above represents past performance that is not predictive of future results. The investment return and principal value of an investment in the Fund will fluctuate so that an investor’s shares, when redeemed, may be worth more or less than their original cost. Returns are historical and include changes in principal and reinvested dividends and capital gains and do not reflect the effect of taxes. The S&P SmallCap 600 Pure Growth Index is an unmanaged index and, unlike the Fund, has no management fees or operating expenses to reduce its reported return. The graphs are based on Class A and Class H shares only; performance for Class C shares will vary due to differences in fee structure. |
† | Fund returns are calculated using the maximum sales charge of 4.75%. |
‡ | Fund returns include a CDSC of 1% if redeemed within 12 months of purchase. |
| | THE RYDEX FUNDS ANNUAL REPORT | 43 |
SCHEDULE OF INVESTMENTS | March 31, 2024 |
S&P SMALLCAP 600® PURE GROWTH FUND | |
| | Shares | | | Value | |
COMMON STOCKS† - 99.6% |
| | | | | | | | | |
Consumer, Cyclical - 20.9% |
Installed Building Products, Inc. | | | 211 | | | $ | 54,592 | |
Green Brick Partners, Inc.* | | | 888 | | | | 53,484 | |
Cinemark Holdings, Inc.* | | | 2,691 | | | | 48,358 | |
Abercrombie & Fitch Co. — Class A* | | | 377 | | | | 47,249 | |
Cavco Industries, Inc.* | | | 114 | | | | 45,493 | |
Group 1 Automotive, Inc. | | | 154 | | | | 45,004 | |
Patrick Industries, Inc. | | | 367 | | | | 43,846 | |
Dave & Buster’s Entertainment, Inc.* | | | 661 | | | | 41,379 | |
Shake Shack, Inc. — Class A* | | | 395 | | | | 41,092 | |
GMS, Inc.* | | | 420 | | | | 40,883 | |
Boot Barn Holdings, Inc.* | | | 402 | | | | 38,250 | |
Guess?, Inc. | | | 1,171 | | | | 36,851 | |
Six Flags Entertainment Corp.* | | | 1,391 | | | | 36,611 | |
M/I Homes, Inc.* | | | 252 | | | | 34,345 | |
Urban Outfitters, Inc.* | | | 790 | | | | 34,302 | |
Meritage Homes Corp. | | | 193 | | | | 33,864 | |
Signet Jewelers Ltd. | | | 288 | | | | 28,820 | |
Oxford Industries, Inc. | | | 213 | | | | 23,941 | |
American Eagle Outfitters, Inc. | | | 913 | | | | 23,546 | |
Monarch Casino & Resort, Inc. | | | 282 | | | | 21,147 | |
Steven Madden Ltd. | | | 412 | | | | 17,419 | |
XPEL, Inc.* | | | 310 | | | | 16,746 | |
Madison Square Garden Sports Corp. — Class A* | | | 77 | | | | 14,208 | |
Kontoor Brands, Inc. | | | 216 | | | | 13,014 | |
Jack in the Box, Inc. | | | 142 | | | | 9,724 | |
Total Consumer, Cyclical | | | | | | | 844,168 | |
| | | | | | | | | |
Financial - 18.2% |
Two Harbors Investment Corp. REIT | | | 4,737 | | | | 62,718 | |
SiriusPoint Ltd.* | | | 4,295 | | | | 54,589 | |
St. Joe Co. | | | 823 | | | | 47,709 | |
Ambac Financial Group, Inc.* | | | 3,049 | | | | 47,656 | |
HCI Group, Inc. | | | 347 | | | | 40,280 | |
Customers Bancorp, Inc.* | | | 687 | | | | 36,452 | |
Redwood Trust, Inc. REIT | | | 5,588 | | | | 35,595 | |
Goosehead Insurance, Inc. — Class A* | | | 498 | | | | 33,177 | |
Sunstone Hotel Investors, Inc. REIT | | | 2,948 | | | | 32,841 | |
First BanCorp | | | 1,849 | | | | 32,432 | |
Palomar Holdings, Inc.* | | | 359 | | | | 30,095 | |
DiamondRock Hospitality Co. REIT | | | 3,126 | | | | 30,041 | |
Bancorp, Inc.* | | | 817 | | | | 27,337 | |
Pathward Financial, Inc. | | | 539 | | | | 27,209 | |
OFG Bancorp | | | 721 | | | | 26,540 | |
Ellington Financial, Inc. REIT | | | 2,147 | | | | 25,356 | |
WisdomTree, Inc. | | | 2,673 | | | | 24,565 | |
World Acceptance Corp.* | | | 159 | | | | 23,052 | |
Preferred Bank/Los Angeles CA | | | 294 | | | | 22,570 | |
eXp World Holdings, Inc.1 | | | 2,106 | | | | 21,755 | |
New York Mortgage Trust, Inc. REIT | | | 2,654 | | | | 19,109 | |
Triumph Financial, Inc.* | | | 228 | | | | 18,085 | |
Apple Hospitality REIT, Inc. REIT | | | 1,007 | | | | 16,494 | |
Total Financial | | | | | | | 735,657 | |
| | | | | | | | | |
Consumer, Non-cyclical - 17.2% |
UFP Technologies, Inc.* | | | 228 | | | | 57,502 | |
PROG Holdings, Inc. | | | 1,663 | | | | 57,274 | |
Inter Parfums, Inc. | | | 326 | | | | 45,806 | |
OraSure Technologies, Inc.* | | | 6,429 | | | | 39,539 | |
Vericel Corp.* | | | 743 | | | | 38,651 | |
Viad Corp.* | | | 967 | | | | 38,187 | |
Collegium Pharmaceutical, Inc.* | | | 847 | | | | 32,881 | |
Cal-Maine Foods, Inc. | | | 552 | | | | 32,485 | |
ANI Pharmaceuticals, Inc.* | | | 435 | | | | 30,071 | |
Stride, Inc.* | | | 438 | | | | 27,616 | |
Dynavax Technologies Corp.* | | | 2,197 | | | | 27,265 | |
LiveRamp Holdings, Inc.* | | | 778 | | | | 26,841 | |
Amphastar Pharmaceuticals, Inc.* | | | 577 | | | | 25,336 | |
CorVel Corp.* | | | 95 | | | | 24,981 | |
Catalyst Pharmaceuticals, Inc.* | | | 1,551 | | | | 24,723 | |
Adtalem Global Education, Inc.* | | | 457 | | | | 23,490 | |
RadNet, Inc.* | | | 445 | | | | 21,654 | |
Arlo Technologies, Inc.* | | | 1,610 | | | | 20,366 | |
Glaukos Corp.* | | | 197 | | | | 18,575 | |
Integer Holdings Corp.* | | | 146 | | | | 17,035 | |
Astrana Health, Inc.* | | | 395 | | | | 16,586 | |
Ensign Group, Inc. | | | 121 | | | | 15,055 | |
WD-40 Co. | | | 55 | | | | 13,932 | |
NeoGenomics, Inc.* | | | 781 | | | | 12,277 | |
CONMED Corp. | | | 103 | | | | 8,248 | |
Ligand Pharmaceuticals, Inc.* | | | 107 | | | | — | |
Ligand Pharmaceuticals, Inc.* | | | 107 | | | | — | |
Total Consumer, Non-cyclical | | | | | | | 696,376 | |
| | | | | | | | | |
Industrial - 16.9% |
Encore Wire Corp. | | | 211 | | | | 55,446 | |
AAON, Inc. | | | 507 | | | | 44,667 | |
ArcBest Corp. | | | 309 | | | | 44,033 | |
Dorian LPG Ltd. | | | 1,088 | | | | 41,844 | |
Matson, Inc. | | | 322 | | | | 36,193 | |
AZZ, Inc. | | | 426 | | | | 32,934 | |
Powell Industries, Inc. | | | 210 | | | | 29,883 | |
Boise Cascade Co. | | | 192 | | | | 29,447 | |
Materion Corp. | | | 223 | | | | 29,380 | |
Gibraltar Industries, Inc.* | | | 364 | | | | 29,313 | |
MYR Group, Inc.* | | | 163 | | | | 28,810 | |
Fabrinet* | | | 146 | | | | 27,597 | |
Mueller Industries, Inc. | | | 501 | | | | 27,019 | |
Federal Signal Corp. | | | 304 | | | | 25,801 | |
AeroVironment, Inc.* | | | 152 | | | | 23,298 | |
Badger Meter, Inc. | | | 135 | | | | 21,844 | |
Tennant Co. | | | 158 | | | | 19,214 | |
Moog, Inc. — Class A | | | 120 | | | | 19,158 | |
Franklin Electric Company, Inc. | | | 173 | | | | 18,478 | |
Standex International Corp. | | | 99 | | | | 18,040 | |
Frontdoor, Inc.* | | | 542 | | | | 17,659 | |
SPX Technologies, Inc.* | | | 141 | | | | 17,361 | |
Alamo Group, Inc. | | | 75 | | | | 17,125 | |
Armstrong World Industries, Inc. | | | 126 | | | | 15,652 | |
OSI Systems, Inc.* | | | 106 | | | | 15,139 | |
Total Industrial | | | | | | | 685,335 | |
44 | THE RYDEX FUNDS ANNUAL REPORT | SEE NOTES TO FINANCIAL STATEMENTS. |
SCHEDULE OF INVESTMENTS (continued) | March 31, 2024 |
S&P SMALLCAP 600® PURE GROWTH FUND | |
| | Shares | | | Value | |
Energy - 12.8% |
Alpha Metallurgical Resources, Inc. | | | 168 | | | $ | 55,636 | |
Northern Oil and Gas, Inc. | | | 1,335 | | | | 52,973 | |
Warrior Met Coal, Inc. | | | 821 | | | | 49,835 | |
Par Pacific Holdings, Inc.* | | | 1,281 | | | | 47,474 | |
REX American Resources Corp.* | | | 766 | | | | 44,972 | |
Liberty Energy, Inc. — Class A | | | 2,097 | | | | 43,450 | |
CONSOL Energy, Inc. | | | 441 | | | | 36,938 | |
Helix Energy Solutions Group, Inc.* | | | 3,010 | | | | 32,628 | |
California Resources Corp. | | | 583 | | | | 32,123 | |
SM Energy Co. | | | 543 | | | | 27,069 | |
Oceaneering International, Inc.* | | | 1,142 | | | | 26,723 | |
Magnolia Oil & Gas Corp. — Class A | | | 1,017 | | | | 26,391 | |
RPC, Inc. | | | 3,302 | | | | 25,557 | |
Archrock, Inc. | | | 847 | | | | 16,661 | |
Total Energy | | | | | | | 518,430 | |
| | | | | | | | | |
Technology - 5.8% |
Verra Mobility Corp.* | | | 1,713 | | | | 42,774 | |
Axcelis Technologies, Inc.* | | | 359 | | | | 40,036 | |
DoubleVerify Holdings, Inc.* | | | 911 | | | | 32,031 | |
Veeco Instruments, Inc.* | | | 866 | | | | 30,457 | |
SPS Commerce, Inc.* | | | 132 | | | | 24,407 | |
Agilysys, Inc.* | | | 194 | | | | 16,346 | |
Donnelley Financial Solutions, Inc.* | | | 209 | | | | 12,960 | |
PDF Solutions, Inc.* | | | 377 | | | | 12,693 | |
Progress Software Corp. | | | 208 | | | | 11,088 | |
Privia Health Group, Inc.* | | | 535 | | | | 10,481 | |
Total Technology | | | | | | | 233,273 | |
| | | | | | | | | |
Communications - 4.9% |
TripAdvisor, Inc.* | | | 1,333 | | | | 37,044 | |
Cargurus, Inc.* | | | 1,577 | | | | 36,397 | |
InterDigital, Inc. | | | 300 | | | | 31,938 | |
Cars.com, Inc.* | | | 1,745 | | | | 29,979 | |
Yelp, Inc. — Class A* | | | 594 | | | | 23,404 | |
Liquidity Services, Inc.* | | | 1,081 | | | | 20,106 | |
Cogent Communications Holdings, Inc. | | | 266 | | | | 17,378 | |
Total Communications | | | | | | | 196,246 | |
| | | | | | | | | |
Basic Materials - 2.2% |
Hawkins, Inc. | | | 545 | | | | 41,856 | |
ATI, Inc.* | | | 503 | | | | 25,739 | |
Carpenter Technology Corp. | | | 315 | | | | 22,497 | |
Total Basic Materials | | | | | | | 90,092 | |
| | | | | | | | | |
Utilities - 0.7% |
Otter Tail Corp. | | | 319 | | | | 27,562 | |
| | | | | | | | | |
Total Common Stocks | | | | |
(Cost $3,275,584) | | | | | | | 4,027,139 | |
| | | | | | | | | |
| | | Face
Amount | | | | | |
REPURCHASE AGREEMENTS††,2 - 0.3% |
J.P. Morgan Securities LLC
issued 03/28/24 at 5.31%
due 04/01/24 | | $ | 8,087 | | | | 8,087 | |
BofA Securities, Inc.
issued 03/28/24 at 5.31%
due 04/01/24 | | | 3,111 | | | | 3,111 | |
Barclays Capital, Inc.
issued 03/28/24 at 5.30%
due 04/01/24 | | | 2,819 | | | | 2,819 | |
Total Repurchase Agreements | | | | |
(Cost $14,017) | | | | | | | 14,017 | |
| | | | | | | | | |
| | | Shares | | | | | |
SECURITIES LENDING COLLATERAL†,3 - 0.3% |
Money Market Fund | | | | | | | | |
First American Government Obligations Fund - Class X, 5.23%4 | | | 13,416 | | | | 13,416 | |
Total Securities Lending Collateral | | | | |
(Cost $13,416) | | | | | | | 13,416 | |
| | | | | | | | | |
Total Investments - 100.2% | | | | |
(Cost $3,303,017) | | $ | 4,054,572 | |
Other Assets & Liabilities, net - (0.2)% | | | (8,450 | ) |
Total Net Assets - 100.0% | | $ | 4,046,122 | |
* | Non-income producing security. |
† | Value determined based on Level 1 inputs — See Note 4. |
†† | Value determined based on Level 2 inputs — See Note 4. |
1 | All or a portion of this security is on loan at March 31, 2024 — See Note 7. |
2 | Repurchase Agreements — See Note 6. |
3 | Securities lending collateral — See Note 7. |
4 | Rate indicated is the 7-day yield as of March 31, 2024. |
| | REIT — Real Estate Investment Trust |
| | |
| | See Sector Classification in Other Information section. |
SEE NOTES TO FINANCIAL STATEMENTS. | THE RYDEX FUNDS ANNUAL REPORT | 45 |
SCHEDULE OF INVESTMENTS (concluded) | March 31, 2024 |
S&P SMALLCAP 600® PURE GROWTH FUND | |
The following table summarizes the inputs used to value the Fund’s investments at March 31, 2024 (See Note 4 in the Notes to Financial Statements):
Investments in Securities (Assets) | | Level 1
Quoted
Prices | | | Level 2
Significant
Observable
Inputs | | | Level 3
Significant
Unobservable
Inputs | | | Total | |
Common Stocks | | $ | 4,027,139 | | | $ | — | | | $ | — | | | $ | 4,027,139 | |
Repurchase Agreements | | | — | | | | 14,017 | | | | — | | | | 14,017 | |
Securities Lending Collateral | | | 13,416 | | | | — | | | | — | | | | 13,416 | |
Total Assets | | $ | 4,040,555 | | | $ | 14,017 | | | $ | — | | | $ | 4,054,572 | |
46 | THE RYDEX FUNDS ANNUAL REPORT | SEE NOTES TO FINANCIAL STATEMENTS. |
S&P SMALLCAP 600® PURE GROWTH FUND | |
STATEMENT OF ASSETS AND LIABILITIES |
March 31, 2024 |
Assets: |
Investments, at value - including $13,140 of securities loaned (cost $3,289,000) | | $ | 4,040,555 | |
Repurchase agreements, at value (cost $14,017) | | | 14,017 | |
Cash | | | 1,320 | |
Receivables: |
Securities sold | | | 48,544 | |
Interest | | | 43,814 | |
Dividends | | | 2,312 | |
Fund shares sold | | | 491 | |
Securities lending income | | | 2 | |
Total assets | | | 4,151,055 | |
| | | | | |
Liabilities: |
Payable for: |
Securities purchased | | | 81,170 | |
Return of securities lending collateral | | | 13,416 | |
Management fees | | | 2,996 | |
Transfer agent fees | | | 1,867 | |
Distribution and service fees | | | 1,267 | |
Portfolio accounting and administration fees | | | 409 | |
Trustees’ fees* | | | 43 | |
Fund shares redeemed | | | 13 | |
Miscellaneous | | | 3,752 | |
Total liabilities | | | 104,933 | |
Net assets | | $ | 4,046,122 | |
| | | | | |
Net assets consist of: |
Paid in capital | | $ | 3,054,274 | |
Total distributable earnings (loss) | | | 991,848 | |
Net assets | | $ | 4,046,122 | |
Class A: |
Net assets | | $ | 1,055,654 | |
Capital shares outstanding | | | 19,068 | |
Net asset value per share | | $ | 55.36 | |
Maximum offering price per share (Net asset value divided by 95.25%) | | $ | 58.12 | |
Class C: |
Net assets | | $ | 326,711 | |
Capital shares outstanding | | | 7,518 | |
Net asset value per share | | $ | 43.46 | |
Class H: |
Net assets | | $ | 2,663,757 | |
Capital shares outstanding | | | 48,179 | |
Net asset value per share | | $ | 55.29 | |
STATEMENT OF OPERATIONS |
Year Ended March 31, 2024 |
Investment Income: |
Dividends (net of foreign withholding tax of $257) | | $ | 99,070 | |
Interest | | | 1,988 | |
Income from securities lending, net | | | 176 | |
Total investment income | | | 101,234 | |
| | | | | |
Expenses: |
Management fees | | | 47,230 | |
Distribution and service fees: | | | | |
Class A | | | 2,710 | |
Class C | | | 3,458 | |
Class H | | | 12,167 | |
Transfer agent fees | | | 13,324 | |
Portfolio accounting and administration fees | | | 9,599 | |
Registration fees | | | 5,457 | |
Professional fees | | | 2,519 | |
Trustees’ fees* | | | 1,244 | |
Custodian fees | | | 1,054 | |
Line of credit fees | | | 42 | |
Miscellaneous | | | 2,947 | |
Total expenses | | | 101,751 | |
Less: |
Expenses reimbursed by Adviser | | | (1,483 | ) |
Net expenses | | | 100,268 | |
Net investment income | | | 966 | |
| | | | | |
Net Realized and Unrealized Gain (Loss): |
Net realized gain (loss) on: |
Investments | | | 948,891 | |
Net realized gain | | | 948,891 | |
Net change in unrealized appreciation (depreciation) on: |
Investments | | | 409,946 | |
Net change in unrealized appreciation (depreciation) | | | 409,946 | |
Net realized and unrealized gain | | | 1,358,837 | |
Net increase in net assets resulting from operations | | $ | 1,359,803 | |
* | Relates to Trustees not deemed “interested persons” within the meaning of Section 2(a)(19) of the 1940 Act. |
SEE NOTES TO FINANCIAL STATEMENTS. | THE RYDEX FUNDS ANNUAL REPORT | 47 |
S&P SMALLCAP 600® PURE GROWTH FUND | |
STATEMENTS OF CHANGES IN NET ASSETS |
| | Year Ended
March 31,
2024 | | | Year Ended
March 31,
2023 | |
Increase (Decrease) in Net Assets from Operations: | | | | | | | | |
Net investment income | | $ | 966 | | | $ | 6,599 | |
Net realized gain on investments | | | 948,891 | | | | 288,771 | |
Net change in unrealized appreciation (depreciation) on investments | | | 409,946 | | | | (29,892 | ) |
Net increase in net assets resulting from operations | | | 1,359,803 | | | | 265,478 | |
| | | | | | | | | |
Capital share transactions: | | | | | | | | |
Proceeds from sale of shares | | | | | | | | |
Class A | | | 977,493 | | | | 557,244 | |
Class C | | | 488,130 | | | | 384,770 | |
Class H | | | 40,031,434 | | | | 117,176,874 | |
Cost of shares redeemed | | | | | | | | |
Class A | | | (1,067,226 | ) | | | (763,817 | ) |
Class C | | | (489,574 | ) | | | (478,499 | ) |
Class H | | | (41,880,234 | ) | | | (117,717,482 | ) |
Net decrease from capital share transactions | | | (1,939,977 | ) | | | (840,910 | ) |
Net decrease in net assets | | | (580,174 | ) | | | (575,432 | ) |
| | | | | | | | | |
Net assets: | | | | | | | | |
Beginning of year | | | 4,626,296 | | | | 5,201,728 | |
End of year | | $ | 4,046,122 | | | $ | 4,626,296 | |
| | | | | | | | | |
Capital share activity: | | | | | | | | |
Shares sold | | | | | | | | |
Class A | | | 19,522 | | | | 12,180 | |
Class C | | | 12,418 | | | | 10,501 | |
Class H | | | 859,211 | | | | 2,556,914 | |
Shares redeemed | | | | | | | | |
Class A | | | (21,633 | ) | | | (17,455 | ) |
Class C | | | (12,751 | ) | | | (14,065 | ) |
Class H | | | (887,163 | ) | | | (2,543,098 | ) |
Net increase (decrease) in shares | | | (30,396 | ) | | | 4,977 | |
48 | THE RYDEX FUNDS ANNUAL REPORT | SEE NOTES TO FINANCIAL STATEMENTS. |
S&P SMALLCAP 600® PURE GROWTH FUND | |
This table is presented to show selected data for a share outstanding throughout each period and to assist shareholders in evaluating a Fund’s performance for the periods presented.
Class A | | Year Ended
March 31,
2024 | | | Year Ended
March 31,
2023 | | | Year Ended
March 31,
2022 | | | Year Ended
March 31,
2021 | | | Year Ended
March 31,
2020 | |
Per Share Data |
Net asset value, beginning of period | | $ | 44.74 | | | $ | 53.16 | | | $ | 89.23 | | | $ | 43.85 | | | $ | 65.22 | |
Income (loss) from investment operations: |
Net investment income (loss)a | | | (.02 | ) | | | .13 | | | | (.70 | ) | | | (.62 | ) | | | (.44 | ) |
Net gain (loss) on investments (realized and unrealized) | | | 10.64 | | | | (8.55 | )d | | | (5.41 | ) | | | 46.00 | | | | (20.93 | ) |
Total from investment operations | | | 10.62 | | | | (8.42 | ) | | | (6.11 | ) | | | 45.38 | | | | (21.37 | ) |
Less distributions from: |
Net realized gains | | | — | | | | — | | | | (29.96 | ) | | | — | | | | — | |
Total distributions | | | — | | | | — | | | | (29.96 | ) | | | — | | | | — | |
Net asset value, end of period | | $ | 55.36 | | | $ | 44.74 | | | $ | 53.16 | | | $ | 89.23 | | | $ | 43.85 | |
|
Total Returnb | | | 23.74 | % | | | (15.84 | %) | | | (11.08 | %) | | | 103.49 | % | | | (32.77 | %) |
Ratios/Supplemental Data |
Net assets, end of period (in thousands) | | $ | 1,056 | | | $ | 948 | | | $ | 1,406 | | | $ | 3,448 | | | $ | 1,169 | |
Ratios to average net assets: |
Net investment income (loss) | | | (0.05 | %) | | | 0.29 | % | | | (0.88 | %) | | | (0.86 | %) | | | (0.69 | %) |
Total expenses | | | 1.59 | % | | | 1.55 | % | | | 1.51 | % | | | 1.58 | % | | | 1.63 | % |
Net expensesc | | | 1.55 | % | | | 1.55 | % | | | 1.51 | % | | | 1.58 | % | | | 1.63 | % |
Portfolio turnover rate | | | 942 | % | | | 812 | % | | | 707 | % | | | 752 | % | | | 628 | % |
Class C | | Year Ended
March 31,
2024 | | | Year Ended
March 31,
2023 | | | Year Ended
March 31,
2022 | | | Year Ended
March 31,
2021 | | | Year Ended
March 31,
2020 | |
Per Share Data |
Net asset value, beginning of period | | $ | 35.39 | | | $ | 42.35 | | | $ | 77.59 | | | $ | 38.41 | | | $ | 57.57 | |
Income (loss) from investment operations: |
Net investment income (loss)a | | | (.31 | ) | | | (.20 | ) | | | (1.17 | ) | | | (.96 | ) | | | (.79 | ) |
Net gain (loss) on investments (realized and unrealized) | | | 8.38 | | | | (6.76 | )d | | | (4.11 | ) | | | 40.14 | | | | (18.37 | ) |
Total from investment operations | | | 8.07 | | | | (6.96 | ) | | | (5.28 | ) | | | 39.18 | | | | (19.16 | ) |
Less distributions from: |
Net realized gains | | | — | | | | — | | | | (29.96 | ) | | | — | | | | — | |
Total distributions | | | — | | | | — | | | | (29.96 | ) | | | — | | | | — | |
Net asset value, end of period | | $ | 43.46 | | | $ | 35.39 | | | $ | 42.35 | | | $ | 77.59 | | | $ | 38.41 | |
|
Total Returnb | | | 22.80 | % | | | (16.43 | %) | | | (11.75 | %) | | | 102.00 | % | | | (33.28 | %) |
Ratios/Supplemental Data |
Net assets, end of period (in thousands) | | $ | 327 | | | $ | 278 | | | $ | 483 | | | $ | 2,329 | | | $ | 678 | |
Ratios to average net assets: |
Net investment income (loss) | | | (0.83 | %) | | | (0.54 | %) | | | (1.69 | %) | | | (1.59 | %) | | | (1.43 | %) |
Total expenses | | | 2.34 | % | | | 2.30 | % | | | 2.26 | % | | | 2.33 | % | | | 2.38 | % |
Net expensesc | | | 2.30 | % | | | 2.30 | % | | | 2.26 | % | | | 2.33 | % | | | 2.38 | % |
Portfolio turnover rate | | | 942 | % | | | 812 | % | | | 707 | % | | | 752 | % | | | 628 | % |
SEE NOTES TO FINANCIAL STATEMENTS. | THE RYDEX FUNDS ANNUAL REPORT | 49 |
S&P SMALLCAP 600® PURE GROWTH FUND | |
FINANCIAL HIGHLIGHTS (concluded) |
This table is presented to show selected data for a share outstanding throughout each period and to assist shareholders in evaluating a Fund’s performance for the periods presented.
Class H | | Year Ended
March 31,
2024 | | | Year Ended
March 31,
2023 | | | Year Ended
March 31,
2022 | | | Year Ended
March 31,
2021 | | | Year Ended
March 31,
2020 | |
Per Share Data |
Net asset value, beginning of period | | $ | 44.67 | | | $ | 53.15 | | | $ | 89.21 | | | $ | 43.84 | | | $ | 65.21 | |
Income (loss) from investment operations: |
Net investment income (loss)a | | | .04 | | | | .02 | | | | (.81 | ) | | | (.86 | ) | | | (.40 | ) |
Net gain (loss) on investments (realized and unrealized) | | | 10.58 | | | | (8.50 | )d | | | (5.29 | ) | | | 46.23 | | | | (20.97 | ) |
Total from investment operations | | | 10.62 | | | | (8.48 | ) | | | (6.10 | ) | | | 45.37 | | | | (21.37 | ) |
Less distributions from: |
Net realized gains | | | — | | | | — | | | | (29.96 | ) | | | — | | | | — | |
Total distributions | | | — | | | | — | | | | (29.96 | ) | | | — | | | | — | |
Net asset value, end of period | | $ | 55.29 | | | $ | 44.67 | | | $ | 53.15 | | | $ | 89.21 | | | $ | 43.84 | |
|
Total Return | | | 23.77 | % | | | (15.95 | %) | | | (11.06 | %) | | | 103.49 | % | | | (32.77 | %) |
Ratios/Supplemental Data |
Net assets, end of period (in thousands) | | $ | 2,664 | | | $ | 3,401 | | | $ | 3,312 | | | $ | 25,071 | | | $ | 2,430 | |
Ratios to average net assets: |
Net investment income (loss) | | | 0.09 | % | | | 0.05 | % | | | (0.97 | %) | | | (1.05 | %) | | | (0.63 | %) |
Total expenses | | | 1.57 | % | | | 1.55 | % | | | 1.51 | % | | | 1.54 | % | | | 1.63 | % |
Net expensesc | | | 1.55 | % | | | 1.55 | % | | | 1.51 | % | | | 1.54 | % | | | 1.63 | % |
Portfolio turnover rate | | | 942 | % | | | 812 | % | | | 707 | % | | | 752 | % | | | 628 | % |
a | Net investment income (loss) per share was computed using average shares outstanding throughout the period. |
b | Total return does not reflect the impact of any applicable sales charges. |
c | Net expense information reflects the expense ratios after expense waivers and reimbursements, as applicable. |
d | The amount shown for a share outstanding throughout the period does not agree with the aggregate net gain on investments for the period because of the sales and purchases of fund shares in relation to fluctuating market value of the investments of the Fund. |
50 | THE RYDEX FUNDS ANNUAL REPORT | SEE NOTES TO FINANCIAL STATEMENTS. |
PERFORMANCE REPORT AND FUND PROFILE (Unaudited) | March 31, 2024 |
S&P SMALLCAP 600® PURE VALUE FUND
OBJECTIVE: Seeks to provide investment results that match, before fees and expenses, the performance of a benchmark for small-cap value securities on a daily basis. The Fund’s current benchmark is the S&P SmallCap 600® Pure Value Index (the “underlying index”).
For the Reporting Period, S&P SmallCap 600® Pure Value Fund Class H returned 18.63%, compared with a return of 20.46% for the underlying index. The Fund maintained a daily correlation of over 99% to its benchmark for the period.
The sectors that contributed the most to the return of the underlying index for the Reporting Period were Consumer Discretionary, Industrials, and Financials. Those that detracted the most were Consumer Staples, Communication Services, and Health Care.
The holdings that contributed the most to the return of the underlying index for the Reporting Period were SkyWest, Inc., M/I Homes, Inc., and G-III Apparel Group Ltd. Those that detracted the most were Lumen Technologies, Inc. United Natural Foods, Inc., and Emergent BioSolutions, Inc.
Performance displayed represents past performance, which is no guarantee of future results.
Holdings Diversification (Market Exposure as % of Net Assets)
“Holdings Diversification (Market Exposure as % of Net Assets)” excludes any temporary cash investments.
Inception Dates: |
Class A | September 1, 2004 |
Class C | February 20, 2004 |
Class H | February 20, 2004 |
Ten Largest Holdings | % of Total Net Assets |
JetBlue Airways Corp. | 2.1% |
World Kinect Corp. | 1.7% |
Kelly Services, Inc. — Class A | 1.7% |
Phinia, Inc. | 1.7% |
Xerox Holdings Corp. | 1.6% |
Fresh Del Monte Produce, Inc. | 1.6% |
Kohl’s Corp. | 1.5% |
Advance Auto Parts, Inc. | 1.5% |
Green Dot Corp. — Class A | 1.4% |
Enviri Corp. | 1.4% |
Top Ten Total | 16.2% |
| | |
“Ten Largest Holdings” excludes any temporary cash investments. |
| | THE RYDEX FUNDS ANNUAL REPORT | 51 |
PERFORMANCE REPORT AND FUND PROFILE (Unaudited)(concluded) | March 31, 2024 |
Cumulative Fund Performance*

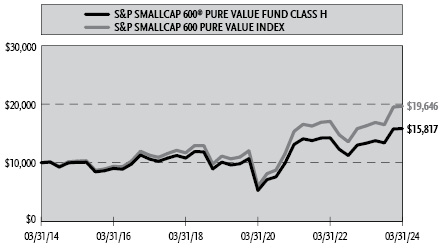
Average Annual Returns*
Periods Ended March 31, 2024
| 1 Year | 5 Year | 10 Year |
Class A Shares | 18.65% | 9.40% | 4.68% |
Class A Shares with sales charge† | 13.01% | 8.34% | 4.17% |
Class C Shares | 17.76% | 8.59% | 3.90% |
Class C Shares with CDSC‡ | 16.76% | 8.59% | 3.90% |
Class H Shares | 18.63% | 9.39% | 4.69% |
S&P SmallCap 600 Pure Value Index | 20.46% | 12.06% | 6.99% |
* | The performance data above represents past performance that is not predictive of future results. The investment return and principal value of an investment in the Fund will fluctuate so that an investor’s shares, when redeemed, may be worth more or less than their original cost. Returns are historical and include changes in principal and reinvested dividends and capital gains and do not reflect the effect of taxes. The S&P SmallCap 600 Pure Value Index is an unmanaged index and, unlike the Fund, has no management fees or operating expenses to reduce its reported return. The graphs are based on Class A and Class H shares only; performance for Class C shares will vary due to differences in fee structure. |
† | Fund returns are calculated using the maximum sales charge of 4.75%. |
‡ | Fund returns include a CDSC of 1% if redeemed within 12 months of purchase. |
52 | THE RYDEX FUNDS ANNUAL REPORT | |
SCHEDULE OF INVESTMENTS | March 31, 2024 |
S&P SMALLCAP 600® PURE VALUE FUND | |
| | Shares | | | Value | |
COMMON STOCKS† - 99.5% |
| | | | | | | | | |
Consumer, Cyclical - 27.7% |
JetBlue Airways Corp.* | | | 12,161 | | | $ | 90,235 | |
Phinia, Inc. | | | 1,881 | | | | 72,287 | |
Kohl’s Corp. | | | 2,176 | | | | 63,430 | |
Advance Auto Parts, Inc. | | | 743 | | | | 63,222 | |
Foot Locker, Inc. | | | 2,055 | | | | 58,568 | |
ScanSource, Inc.* | | | 1,314 | | | | 57,868 | |
MarineMax, Inc.* | | | 1,659 | | | | 55,178 | |
Topgolf Callaway Brands Corp.* | | | 3,244 | | | | 52,455 | |
Designer Brands, Inc. — Class A | | | 4,288 | | | | 46,868 | |
Resideo Technologies, Inc.* | | | 1,842 | | | | 41,298 | |
ODP Corp.* | | | 769 | | | | 40,795 | |
Sally Beauty Holdings, Inc.* | | | 3,077 | | | | 38,216 | |
Caleres, Inc. | | | 879 | | | | 36,065 | |
American Axle & Manufacturing Holdings, Inc.* | | | 4,569 | | | | 33,628 | |
Dana, Inc. | | | 2,639 | | | | 33,515 | |
Sonic Automotive, Inc. — Class A | | | 551 | | | | 31,374 | |
Allegiant Travel Co. — Class A | | | 393 | | | | 29,557 | |
Alaska Air Group, Inc.* | | | 616 | | | | 26,482 | |
Shoe Carnival, Inc. | | | 709 | | | | 25,978 | |
G-III Apparel Group Ltd.* | | | 888 | | | | 25,761 | |
Newell Brands, Inc. | | | 3,040 | | | | 24,411 | |
Hibbett, Inc. | | | 315 | | | | 24,195 | |
MDC Holdings, Inc. | | | 363 | | | | 22,836 | |
Wabash National Corp. | | | 756 | | | | 22,635 | |
Interface, Inc. — Class A | | | 1,312 | | | | 22,068 | |
Wolverine World Wide, Inc. | | | 1,704 | | | | 19,102 | |
Nu Skin Enterprises, Inc. — Class A | | | 1,343 | | | | 18,574 | |
Hanesbrands, Inc.* | | | 3,135 | | | | 18,183 | |
Victoria’s Secret & Co.* | | | 844 | | | | 16,357 | |
Vista Outdoor, Inc.* | | | 496 | | | | 16,259 | |
MillerKnoll, Inc. | | | 602 | | | | 14,906 | |
Standard Motor Products, Inc. | | | 435 | | | | 14,594 | |
PriceSmart, Inc. | | | 171 | | | | 14,364 | |
Titan International, Inc.* | | | 1,101 | | | | 13,719 | |
Haverty Furniture Companies, Inc. | | | 356 | | | | 12,147 | |
Methode Electronics, Inc. | | | 716 | | | | 8,721 | |
Total Consumer, Cyclical | | | | | | | 1,205,851 | |
| | | | | | | | | |
Financial - 22.7% |
EZCORP, Inc. — Class A* | | | 5,172 | | | | 58,599 | |
Bread Financial Holdings, Inc. | | | 1,500 | | | | 55,860 | |
Genworth Financial, Inc. — Class A* | | | 8,524 | | | | 54,809 | |
Jackson Financial, Inc. — Class A | | | 728 | | | | 48,150 | |
Cushman & Wakefield plc* | | | 4,131 | | | | 43,210 | |
Anywhere Real Estate, Inc.* | | | 6,929 | | | | 42,821 | |
StoneX Group, Inc.* | | | 593 | | | | 41,664 | |
Medical Properties Trust, Inc. REIT1 | | | 7,289 | | | | 34,258 | |
PRA Group, Inc.* | | | 1,239 | | | | 32,313 | |
United Fire Group, Inc. | | | 1,396 | | | | 30,391 | |
Pebblebrook Hotel Trust REIT | | | 1,893 | | | | 29,171 | |
ProAssurance Corp.* | | | 2,242 | | | | 28,832 | |
Stewart Information Services Corp. | | | 431 | | | | 28,041 | |
Hudson Pacific Properties, Inc. REIT | | | 3,852 | | | | 24,846 | |
Hope Bancorp, Inc. | | | 2,147 | | | | 24,712 | |
Brandywine Realty Trust REIT | | | 4,949 | | | | 23,755 | |
Simmons First National Corp. — Class A | | | 1,137 | | | | 22,126 | |
Lincoln National Corp. | | | 650 | | | | 20,755 | |
JBG SMITH Properties REIT | | | 1,292 | | | | 20,737 | |
Eagle Bancorp, Inc. | | | 874 | | | | 20,530 | |
Chatham Lodging Trust REIT | | | 1,972 | | | | 19,937 | |
SL Green Realty Corp. REIT | | | 355 | | | | 19,571 | |
Navient Corp. | | | 1,097 | | | | 19,088 | |
Mercury General Corp. | | | 364 | | | | 18,782 | |
Banc of California, Inc. | | | 1,234 | | | | 18,769 | |
Safehold, Inc. REIT | | | 804 | | | | 16,562 | |
Encore Capital Group, Inc.* | | | 349 | | | | 15,918 | |
Service Properties Trust REIT | | | 2,283 | | | | 15,479 | |
Northfield Bancorp, Inc. | | | 1,584 | | | | 15,396 | |
Renasant Corp. | | | 486 | | | | 15,222 | |
Independent Bank Group, Inc. | | | 327 | | | | 14,928 | |
Veritex Holdings, Inc. | | | 713 | | | | 14,609 | |
Ready Capital Corp. REIT | | | 1,467 | | | | 13,394 | |
Provident Financial Services, Inc. | | | 894 | | | | 13,026 | |
Brookline Bancorp, Inc. | | | 1,285 | | | | 12,799 | |
Dime Community Bancshares, Inc. | | | 649 | | | | 12,500 | |
Heritage Financial Corp. | | | 644 | | | | 12,487 | |
Hanmi Financial Corp.1 | | | 758 | | | | 12,067 | |
Pacific Premier Bancorp, Inc. | | | 476 | | | | 11,424 | |
BankUnited, Inc. | | | 403 | | | | 11,284 | |
Total Financial | | | | | | | 988,822 | |
| | | | | | | | | |
Consumer, Non-cyclical - 18.7% |
Kelly Services, Inc. — Class A | | | 2,898 | | | | 72,566 | |
Fresh Del Monte Produce, Inc. | | | 2,670 | | | | 69,180 | |
Green Dot Corp. — Class A* | | | 6,670 | | | | 62,231 | |
AdaptHealth Corp.* | | | 4,050 | | | | 46,616 | |
United Natural Foods, Inc.* | | | 4,037 | | | | 46,385 | |
Pediatrix Medical Group, Inc.* | | | 4,337 | | | | 43,500 | |
B&G Foods, Inc. | | | 3,659 | | | | 41,859 | |
SpartanNash Co. | | | 1,900 | | | | 38,399 | |
GEO Group, Inc.* | | | 2,648 | | | | 37,390 | |
Owens & Minor, Inc.* | | | 1,335 | | | | 36,993 | |
Chefs’ Warehouse, Inc.* | | | 913 | | | | 34,384 | |
ABM Industries, Inc. | | | 629 | | | | 28,066 | |
Deluxe Corp. | | | 1,297 | | | | 26,705 | |
Enhabit, Inc.* | | | 2,263 | | | | 26,364 | |
Cross Country Healthcare, Inc.* | | | 1,377 | | | | 25,777 | |
Universal Corp. | | | 416 | | | | 21,515 | |
Heidrick & Struggles International, Inc. | | | 609 | | | | 20,499 | |
Healthcare Services Group, Inc.* | | | 1,444 | | | | 18,021 | |
Patterson Companies, Inc. | | | 591 | | | | 16,341 | |
Phibro Animal Health Corp. — Class A | | | 1,251 | | | | 16,175 | |
Select Medical Holdings Corp. | | | 500 | | | | 15,075 | |
Resources Connection, Inc. | | | 1,017 | | | | 13,384 | |
Avanos Medical, Inc.* | | | 607 | | | | 12,086 | |
Fulgent Genetics, Inc.* | | | 508 | | | | 11,023 | |
TreeHouse Foods, Inc.* | | | 277 | | | | 10,789 | |
Hain Celestial Group, Inc.* | | | 1,355 | | | | 10,650 | |
ModivCare, Inc.* | | | 368 | | | | 8,630 | |
Total Consumer, Non-cyclical | | | | | | | 810,603 | |
| | | | | | | | | |
SEE NOTES TO FINANCIAL STATEMENTS. | THE RYDEX FUNDS ANNUAL REPORT | 53 |
SCHEDULE OF INVESTMENTS (continued) | March 31, 2024 |
S&P SMALLCAP 600® PURE VALUE FUND | |
| | Shares | | | Value | |
Industrial - 12.0% |
World Kinect Corp. | | | 2,842 | | | $ | 75,171 | |
Enviri Corp.* | | | 6,487 | | | | 59,356 | |
Clearwater Paper Corp.* | | | 1,249 | | | | 54,619 | |
Greenbrier Companies, Inc. | | | 1,038 | | | | 54,080 | |
DXP Enterprises, Inc.* | | | 957 | | | | 51,420 | |
Benchmark Electronics, Inc. | | | 1,684 | | | | 50,537 | |
Sanmina Corp.* | | | 643 | | | | 39,982 | |
O-I Glass, Inc.* | | | 2,177 | | | | 36,116 | |
Kaman Corp. | | | 729 | | | | 33,439 | |
Astec Industries, Inc. | | | 509 | | | | 22,248 | |
TTM Technologies, Inc.* | | | 1,047 | | | | 16,385 | |
Masterbrand, Inc.* | | | 797 | | | | 14,936 | |
Hub Group, Inc. — Class A | | | 336 | | | | 14,522 | |
Total Industrial | | | | | | | 522,811 | |
| | | | | | | | | |
Communications - 5.0% |
EchoStar Corp. — Class A* | | | 3,872 | | | | 55,176 | |
AMC Networks, Inc. — Class A* | | | 3,285 | | | | 39,847 | |
ADTRAN Holdings, Inc. | | | 6,958 | | | | 37,851 | |
Viasat, Inc.* | | | 1,117 | | | | 20,207 | |
ATN International, Inc. | | | 614 | | | | 19,344 | |
EW Scripps Co. — Class A* | | | 4,313 | | | | 16,950 | |
Lumen Technologies, Inc.* | | | 10,759 | | | | 16,784 | |
Consolidated Communications Holdings, Inc.* | | | 2,509 | | | | 10,839 | |
Total Communications | | | | | | | 216,998 | |
| | | | | | | | | |
Technology - 4.9% |
Xerox Holdings Corp. | | | 3,952 | | | | 70,741 | |
NCR Atleos Corp.* | | | 2,173 | | | | 42,917 | |
NCR Voyix Corp.* | | | 2,553 | | | | 32,244 | |
Alpha & Omega Semiconductor Ltd.* | | | 942 | | | | 20,762 | |
DXC Technology Co.* | | | 891 | | | | 18,898 | |
NetScout Systems, Inc.* | | | 757 | | | | 16,533 | |
TTEC Holdings, Inc. | | | 1,236 | | | | 12,817 | |
Total Technology | | | | | | | 214,912 | |
| | | | | | | | | |
Energy - 4.4% |
SunCoke Energy, Inc. | | | 2,848 | | | | 32,097 | |
Sunrun, Inc.* | | | 2,261 | | | | 29,800 | |
DNOW, Inc.* | | | 1,895 | | | | 28,804 | |
US Silica Holdings, Inc.* | | | 1,971 | | | | 24,460 | |
Nabors Industries Ltd.* | | | 275 | | | | 23,686 | |
Bristow Group, Inc.* | | | 723 | | | | 19,665 | |
ProPetro Holding Corp.* | | | 2,158 | | | | 17,437 | |
Talos Energy, Inc.* | | | 1,013 | | | | 14,111 | |
Total Energy | | | | | | | 190,060 | |
| | | | | | | | | |
Basic Materials - 4.1% |
Kaiser Aluminum Corp. | | | 481 | | | | 42,982 | |
Mercer International, Inc. | | | 4,028 | | | | 40,079 | |
Mativ Holdings, Inc. | | | 1,914 | | | | 35,887 | |
Century Aluminum Co.* | | | 1,911 | | | | 29,410 | |
AdvanSix, Inc. | | | 981 | | | | 28,057 | |
Total Basic Materials | | | | | | | 176,415 | |
| | | | | | | | | |
Total Common Stocks | | | | |
(Cost $3,647,354) | | | | | | | 4,326,472 | |
| | | | | | | | | |
| | | Face
Amount | | | | | |
REPURCHASE AGREEMENTS††,2 - 0.3% |
J.P. Morgan Securities LLC
issued 03/28/24 at 5.31%
due 04/01/24 | | $ | 8,170 | | | | 8,170 | |
BofA Securities, Inc.
issued 03/28/24 at 5.31%
due 04/01/24 | | | 3,142 | | | | 3,142 | |
Barclays Capital, Inc.
issued 03/28/24 at 5.30%
due 04/01/24 | | | 2,848 | | | | 2,848 | |
Total Repurchase Agreements | | | | |
(Cost $14,160) | | | | | | | 14,160 | |
| | | | | | | | | |
| | | Shares | | | | | |
SECURITIES LENDING COLLATERAL†,3 - 0.9% |
Money Market Fund | | | | | | | | |
First American Government Obligations Fund - Class X, 5.23%4 | | | 38,016 | | | | 38,016 | |
Total Securities Lending Collateral | | | | |
(Cost $38,016) | | | | | | | 38,016 | |
| | | | | | | | | |
Total Investments - 100.7% | | | | |
(Cost $3,699,530) | | $ | 4,378,648 | |
Other Assets & Liabilities, net - (0.7)% | | | (31,467 | ) |
Total Net Assets - 100.0% | | $ | 4,347,181 | |
* | Non-income producing security. |
† | Value determined based on Level 1 inputs — See Note 4. |
†† | Value determined based on Level 2 inputs — See Note 4. |
1 | All or a portion of this security is on loan at March 31, 2024 — See Note 7. |
2 | Repurchase Agreements — See Note 6. |
3 | Securities lending collateral — See Note 7. |
4 | Rate indicated is the 7-day yield as of March 31, 2024. |
| | plc — Public Limited Company |
| | REIT — Real Estate Investment Trust |
| | |
| | See Sector Classification in Other Information section. |
54 | THE RYDEX FUNDS ANNUAL REPORT | SEE NOTES TO FINANCIAL STATEMENTS. |
SCHEDULE OF INVESTMENTS (concluded) | March 31, 2024 |
S&P SMALLCAP 600® PURE VALUE FUND | |
The following table summarizes the inputs used to value the Fund’s investments at March 31, 2024 (See Note 4 in the Notes to Financial Statements):
Investments in Securities (Assets) | | Level 1
Quoted
Prices | | | Level 2
Significant
Observable
Inputs | | | Level 3
Significant
Unobservable
Inputs | | | Total | |
Common Stocks | | $ | 4,326,472 | | | $ | — | | | $ | — | | | $ | 4,326,472 | |
Repurchase Agreements | | | — | | | | 14,160 | | | | — | | | | 14,160 | |
Securities Lending Collateral | | | 38,016 | | | | — | | | | — | | | | 38,016 | |
Total Assets | | $ | 4,364,488 | | | $ | 14,160 | | | $ | — | | | $ | 4,378,648 | |
SEE NOTES TO FINANCIAL STATEMENTS. | THE RYDEX FUNDS ANNUAL REPORT | 55 |
S&P SMALLCAP 600® PURE VALUE FUND | |
STATEMENT OF ASSETS AND LIABILITIES |
March 31, 2024 |
Assets: |
Investments, at value - including $35,095 of securities loaned (cost $3,685,370) | | $ | 4,364,488 | |
Repurchase agreements, at value (cost $14,160) | | | 14,160 | |
Cash | | | 995 | |
Receivables: |
Securities sold | | | 42,191 | |
Dividends | | | 6,561 | |
Fund shares sold | | | 4,640 | |
Securities lending income | | | 22 | |
Interest | | | 8 | |
Total assets | | | 4,433,065 | |
| | | | | |
Liabilities: |
Payable for: |
Return of securities lending collateral | | | 38,016 | |
Securities purchased | | | 29,800 | |
Fund shares redeemed | | | 6,232 | |
Management fees | | | 2,983 | |
Transfer agent fees | | | 2,245 | |
Distribution and service fees | | | 1,011 | |
Portfolio accounting and administration fees | | | 408 | |
Trustees’ fees* | | | 59 | |
Miscellaneous | | | 5,130 | |
Total liabilities | | | 85,884 | |
Net assets | | $ | 4,347,181 | |
| | | | | |
Net assets consist of: |
Paid in capital | | $ | 24,939,429 | |
Total distributable earnings (loss) | | | (20,592,248 | ) |
Net assets | | $ | 4,347,181 | |
Class A: |
Net assets | | $ | 1,285,018 | |
Capital shares outstanding | | | 6,408 | |
Net asset value per share | | $ | 200.53 | |
Maximum offering price per share (Net asset value divided by 95.25%) | | $ | 210.53 | |
Class C: |
Net assets | | $ | 26,465 | |
Capital shares outstanding | | | 160 | |
Net asset value per share | | $ | 165.10 | |
Class H: |
Net assets | | $ | 3,035,698 | |
Capital shares outstanding | | | 15,180 | |
Net asset value per share | | $ | 199.98 | |
STATEMENT OF OPERATIONS |
Year Ended March 31, 2024 |
Investment Income: |
Dividends (net of foreign withholding tax of $9) | | $ | 96,415 | |
Interest | | | 2,161 | |
Income from securities lending, net | | | 634 | |
Total investment income | | | 99,210 | |
| | | | | |
Expenses: |
Management fees | | | 51,072 | |
Distribution and service fees: |
Class A | | | 3,157 | |
Class C | | | 1,060 | |
Class H | | | 13,600 | |
Transfer agent fees | | | 15,078 | |
Portfolio accounting and administration fees | | | 10,380 | |
Professional fees | | | 5,739 | |
Registration fees | | | 5,600 | |
Trustees’ fees* | | | 1,648 | |
Custodian fees | | | 1,144 | |
Line of credit fees | | | 60 | |
Miscellaneous | | | 523 | |
Total expenses | | | 109,061 | |
Less: |
Expenses reimbursed by Adviser | | | (2,250 | ) |
Net expenses | | | 106,811 | |
Net investment loss | | | (7,601 | ) |
| | | | | |
Net Realized and Unrealized Gain (Loss): |
Net realized gain (loss) on: |
Investments | | | (855,622 | ) |
Net realized loss | | | (855,622 | ) |
Net change in unrealized appreciation (depreciation) on: |
Investments | | | (224,538 | ) |
Net change in unrealized appreciation (depreciation) | | | (224,538 | ) |
Net realized and unrealized loss | | | (1,080,160 | ) |
Net decrease in net assets resulting from operations | | $ | (1,087,761 | ) |
* | Relates to Trustees not deemed “interested persons” within the meaning of Section 2(a)(19) of the 1940 Act. |
56 | THE RYDEX FUNDS ANNUAL REPORT | SEE NOTES TO FINANCIAL STATEMENTS. |
S&P SMALLCAP 600® PURE VALUE FUND | |
STATEMENTS OF CHANGES IN NET ASSETS |
| | Year Ended
March 31,
2024 | | | Year Ended
March 31,
2023 | |
Increase (Decrease) in Net Assets from Operations: | | | | | | | | |
Net investment income (loss) | | $ | (7,601 | ) | | $ | 45,269 | |
Net realized loss on investments | | | (855,622 | ) | | | (1,808,762 | ) |
Net change in unrealized appreciation (depreciation) on investments | | | (224,538 | ) | | | (2,008,207 | ) |
Net decrease in net assets resulting from operations | | | (1,087,761 | ) | | | (3,771,700 | ) |
| | | | | | | | | |
Distributions to shareholders: | | | | | | | | |
Class A | | | (12,537 | ) | | | — | |
Class C | | | (1,492 | ) | | | — | |
Class H | | | (31,240 | ) | | | — | |
Total distributions to shareholders | | | (45,269 | ) | | | — | |
| | | | | | | | | |
Capital share transactions: | | | | | | | | |
Proceeds from sale of shares | | | | | | | | |
Class A | | | 672,041 | | | | 3,575,515 | |
Class C | | | 338,768 | | | | 457,743 | |
Class H | | | 58,856,482 | | | | 246,177,716 | |
Distributions reinvested | | | | | | | | |
Class A | | | 12,106 | | | | — | |
Class C | | | 1,154 | | | | — | |
Class H | | | 30,246 | | | | — | |
Cost of shares redeemed | | | | | | | | |
Class A | | | (797,746 | ) | | | (6,496,797 | ) |
Class C | | | (398,324 | ) | | | (448,126 | ) |
Class H | | | (61,975,679 | ) | | | (253,626,506 | ) |
Net decrease from capital share transactions | | | (3,260,952 | ) | | | (10,360,455 | ) |
Net decrease in net assets | | | (4,393,982 | ) | | | (14,132,155 | ) |
| | | | | | | | | |
Net assets: | | | | | | | | |
Beginning of year | | | 8,741,163 | | | | 22,873,318 | |
End of year | | $ | 4,347,181 | | | $ | 8,741,163 | |
| | | | | | | | | |
Capital share activity: | | | | | | | | |
Shares sold | | | | | | | | |
Class A | | | 3,434 | | | | 20,336 | |
Class C | | | 2,086 | | | | 3,116 | |
Class H | | | 332,288 | | | | 1,417,252 | |
Shares issued from reinvestment of distributions | | | | | | | | |
Class A | | | 66 | | | | — | |
Class C | | | 8 | | | | — | |
Class H | | | 165 | | | | — | |
Shares redeemed | | | | | | | | |
Class A | | | (4,191 | ) | | | (39,168 | ) |
Class C | | | (2,494 | ) | | | (3,473 | ) |
Class H | | | (361,004 | ) | | | (1,472,406 | ) |
Net decrease in shares | | | (29,642 | ) | | | (74,343 | ) |
SEE NOTES TO FINANCIAL STATEMENTS. | THE RYDEX FUNDS ANNUAL REPORT | 57 |
S&P SMALLCAP 600® PURE VALUE FUND | |
This table is presented to show selected data for a share outstanding throughout each period and to assist shareholders in evaluating a Fund’s performance for the periods presented.
Class A | | Year Ended
March 31,
2024 | | | Year Ended
March 31,
2023 | | | Year Ended
March 31,
2022 | | | Year Ended
March 31,
2021 | | | Year Ended
March 31,
2020c | |
Per Share Data |
Net asset value, beginning of period | | $ | 170.77 | | | $ | 182.48 | | | $ | 167.98 | | | $ | 67.45 | | | $ | 129.32 | |
Income (loss) from investment operations: |
Net investment income (loss)a | | | (.23 | ) | | | .25 | | | | (.34 | ) | | | (.14 | ) | | | (.50 | ) |
Net gain (loss) on investments (realized and unrealized) | | | 31.89 | d | | | (11.96 | ) | | | 14.84 | d | | | 100.67 | d | | | (61.37 | ) |
Total from investment operations | | | 31.66 | | | | (11.71 | ) | | | 14.50 | | | | 100.53 | | | | (61.87 | ) |
Less distributions from: |
Net investment income | | | (1.90 | ) | | | — | | | | — | | | | — | | | | — | |
Total distributions | | | (1.90 | ) | | | — | | | | — | | | | — | | | | — | |
Net asset value, end of period | | $ | 200.53 | | | $ | 170.77 | | | $ | 182.48 | | | $ | 167.98 | | | $ | 67.45 | |
|
Total Returnb | | | 18.65 | % | | | (6.42 | %) | | | 8.63 | % | | | 149.04 | % | | | (47.83 | %) |
Ratios/Supplemental Data |
Net assets, end of period (in thousands) | | $ | 1,285 | | | $ | 1,212 | | | $ | 4,732 | | | $ | 3,242 | | | $ | 936 | |
Ratios to average net assets: |
Net investment income (loss) | | | (0.13 | %) | | | 0.15 | % | | | (0.19 | %) | | | (0.31 | %) | | | (0.42 | %) |
Total expenses | | | 1.59 | % | | | 1.55 | % | | | 1.51 | % | | | 1.59 | % | | | 1.63 | % |
Net expensese | | | 1.56 | % | | | 1.55 | % | | | 1.51 | % | | | 1.59 | % | | | 1.63 | % |
Portfolio turnover rate | | | 1,058 | % | | | 1,520 | % | | | 892 | % | | | 1,503 | % | | | 1,104 | % |
Class C | | Year Ended
March 31,
2024 | | | Year Ended
March 31,
2023 | | | Year Ended
March 31,
2022 | | | Year Ended
March 31,
2021 | | | Year Ended
March 31,
2020c | |
Per Share Data |
Net asset value, beginning of period | | $ | 141.95 | | | $ | 152.84 | | | $ | 141.75 | | | $ | 57.31 | | | $ | 110.69 | |
Income (loss) from investment operations: |
Net investment income (loss)a | | | (1.46 | ) | | | (0.85 | ) | | | (1.65 | ) | | | (.40 | ) | | | (1.25 | ) |
Net gain (loss) on investments (realized and unrealized) | | | 26.51 | d | | | (10.04 | ) | | | 12.74 | d | | | 84.84 | d | | | (52.13 | ) |
Total from investment operations | | | 25.05 | | | | (10.89 | ) | | | 11.09 | | | | 84.44 | | | | (53.38 | ) |
Less distributions from: |
Net investment income | | | (1.90 | ) | | | — | | | | — | | | | — | | | | — | |
Total distributions | | | (1.90 | ) | | | — | | | | — | | | | — | | | | — | |
Net asset value, end of period | | $ | 165.10 | | | $ | 141.95 | | | $ | 152.84 | | | $ | 141.75 | | | $ | 57.31 | |
|
Total Returnb | | | 17.76 | % | | | (7.13 | %) | | | 7.82 | % | | | 147.34 | % | | | (48.24 | %) |
Ratios/Supplemental Data |
Net assets, end of period (in thousands) | | $ | 26 | | | $ | 80 | | | $ | 140 | | | $ | 1,472 | | | $ | 571 | |
Ratios to average net assets: |
Net investment income (loss) | | | (0.98 | %) | | | (0.60 | %) | | | (1.11 | %) | | | (1.07 | %) | | | (1.20 | %) |
Total expenses | | | 2.35 | % | | | 2.29 | % | | | 2.26 | % | | | 2.34 | % | | | 2.38 | % |
Net expensese | | | 2.32 | % | | | 2.29 | % | | | 2.26 | % | | | 2.34 | % | | | 2.38 | % |
Portfolio turnover rate | | | 1,058 | % | | | 1,520 | % | | | 892 | % | | | 1,503 | % | | | 1,104 | % |
58 | THE RYDEX FUNDS ANNUAL REPORT | SEE NOTES TO FINANCIAL STATEMENTS. |
S&P SMALLCAP 600® PURE VALUE FUND | |
FINANCIAL HIGHLIGHTS (concluded) |
This table is presented to show selected data for a share outstanding throughout each period and to assist shareholders in evaluating a Fund’s performance for the periods presented.
Class H | | Year Ended
March 31,
2024 | | | Year Ended
March 31,
2023 | | | Year Ended
March 31,
2022 | | | Year Ended
March 31,
2021 | | | Year Ended
March 31,
2020c | |
Per Share Data |
Net asset value, beginning of period | | $ | 170.34 | | | $ | 182.04 | | | $ | 167.56 | | | $ | 67.25 | | | $ | 129.01 | |
Income (loss) from investment operations: |
Net investment income (loss)a | | | (.16 | ) | | | .49 | | | | (.53 | ) | | | (.13 | ) | | | (.55 | ) |
Net gain (loss) on investments (realized and unrealized) | | | 31.71 | d | | | (12.19 | ) | | | 15.01 | d | | | 100.44 | d | | | (61.21 | ) |
Total from investment operations | | | 31.55 | | | | (11.70 | ) | | | 14.48 | | | | 100.31 | | | | (61.76 | ) |
Less distributions from: |
Net investment income | | | (1.91 | ) | | | — | | | | — | | | | — | | | | — | |
Total distributions | | | (1.91 | ) | | | — | | | | — | | | | — | | | | — | |
Net asset value, end of period | | $ | 199.98 | | | $ | 170.34 | | | $ | 182.04 | | | $ | 167.56 | | | $ | 67.25 | |
|
Total Return | | | 18.63 | % | | | (6.43 | %) | | | 8.64 | % | | | 149.16 | % | | | (47.87 | %) |
Ratios/Supplemental Data |
Net assets, end of period (in thousands) | | $ | 3,036 | | | $ | 7,449 | | | $ | 18,001 | | | $ | 35,499 | | | $ | 1,507 | |
Ratios to average net assets: |
Net investment income (loss) | | | (0.09 | %) | | | 0.29 | % | | | (0.29 | %) | | | (0.18 | %) | | | (0.44 | %) |
Total expenses | | | 1.59 | % | | | 1.55 | % | | | 1.51 | % | | | 1.55 | % | | | 1.64 | % |
Net expensese | | | 1.56 | % | | | 1.55 | % | | | 1.51 | % | | | 1.55 | % | | | 1.64 | % |
Portfolio turnover rate | | | 1,058 | % | | | 1,520 | % | | | 892 | % | | | 1,503 | % | | | 1,104 | % |
a | Net investment income (loss) per share was computed using average shares outstanding throughout the period. |
b | Total return does not reflect the impact of any applicable sales charges. |
c | Reverse share split — Per share amounts for the years presented through March 31, 2020 have been restated to reflect a 1:5 reverse share split effective August 17, 2020. |
d | The amount shown for a share outstanding throughout the year does not agree with the aggregate net loss on investments for the year because of the sales and purchases of fund shares in relation to fluctuating market value of the investments of the Fund. |
e | Net expense information reflects the expense ratios after expense waivers and reimbursements, as applicable. |
SEE NOTES TO FINANCIAL STATEMENTS. | THE RYDEX FUNDS ANNUAL REPORT | 59 |
PERFORMANCE REPORT AND FUND PROFILE (Unaudited) | March 31, 2024 |
EUROPE 1.25x STRATEGY FUND
OBJECTIVE: Seeks to provide investment results that correlate, before fees and expenses, to the performance of a specific benchmark. The Fund’s current benchmark is 125% of the fair value of the STOXX® Europe 50 Index (the “underlying index”).
For the Reporting Period, Europe 1.25x Strategy Fund maintained a daily correlation of over 99% to its benchmark of 125% of the daily price movement of the underlying index. Europe 1.25x Strategy Fund Class H returned 14.32% while the underlying index returned 14.68% over the same period.
The sectors that contributed the most to the return of the underlying index for the Reporting Period were Financials, Information Technology, and Industrials. The only sectors that detracted were Health Care and Consumer Staples.
The holdings that contributed the most to the return of the underlying index for the Reporting Period were ASML Holding N.V. - Class G, SAP SE ADR, and UniCredit SpA ADR. Those that detracted the most were Bayer AG, Kering S.A., and Sanofi S.A. ADR.
Derivatives in the Fund were used to help provide exposure to the composition of the benchmark in the highest efficient manner and to provide leverage and not for hedging purposes. The results of derivatives use during the period were within our expectations.
Due to the compounding of daily returns, leveraged and inverse returns over periods other than one day will likely differ in amount and possibly direction from the benchmark return for the same period. Investors should monitor their Fund holdings to ensure that they are consistent with their strategies, as frequently as daily.
The effects of compounding may cause the longer-term correlation of the Fund to its benchmark to diminish. The apparent discrepancy between the leveraged and unleveraged indices is the result of compounding, which is described briefly on page 6 of this report.
The Fund may invest in certain of the underlying series of Guggenheim Funds Trust and Guggenheim Strategy Funds Trust, including Guggenheim Ultra Short Duration, Guggenheim Strategy Fund II, and Guggenheim Strategy Fund III (collectively, the “Short Term Investment Vehicles”), each of which are open-end management investment companies managed by Guggenheim Investments. The Short Term Investment Vehicles, which launched on March 11, 2014, are offered as short term investment options only to mutual funds, trusts, and other accounts managed by Guggenheim Investments and/or its affiliates, and are not available to the public, with the exception of Guggenheim Ultra Short Duration Fund, which is available to the public. Guggenheim Strategy Fund II and Guggenheim Strategy Fund III do not charge an investment management fee. Guggenheim Ultra Short Duration Fund charges an investment management fee, but the Fund’s adviser has agreed to waive fees to the extent necessary to offset the proportionate share of any management fee paid by the Fund with respect to its investment in such affiliated fund. For the Reporting Period, investment in the Short Term Investment Vehicles contributed to Fund performance.
Performance displayed represents past performance, which is no guarantee of future results.
60 | THE RYDEX FUNDS ANNUAL REPORT | |
PERFORMANCE REPORT AND FUND PROFILE (Unaudited)(continued) | March 31, 2024 |
Holdings Diversification (Market Exposure as % of Net Assets)
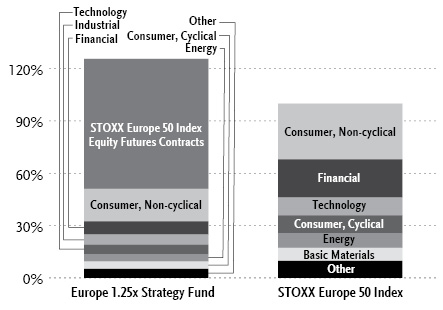
“Holdings Diversification (Market Exposure as % of Net Assets)” excludes any temporary cash investments, investments in Guggenheim Strategy Funds Trust mutual funds, or investments in Guggenheim Ultra Short Duration Fund. Investments in those Funds do not provide “market exposure” to meet the Fund’s investment objective, but will significantly increase the portfolio’s exposure to certain other asset categories (and their associated risks), which may cause the Fund to deviate from its principal investment strategy, including: (i) high yield, high risk debt securities rated below the top four long-term rating categories by a nationally recognized statistical rating organization (also known as “junk bonds”); (ii) securities issued by the U.S. government or its agencies and instrumentalities; (iii) CLOs and similar investments; and (iv) other short-term fixed income securities.
Inception Dates: |
Class A | March 31, 2004 |
Class C | May 10, 2001 |
Class H | May 8, 2000 |
Ten Largest Holdings | % of Total Net Assets |
Novo Nordisk A/S ADR | 3.7% |
ASML Holding N.V. — Class G | 3.4% |
Guggenheim Ultra Short Duration Fund — Institutional Class | 2.8% |
Guggenheim Strategy Fund II | 2.8% |
Nestle S.A. ADR | 2.5% |
LVMH Moet Hennessy Louis Vuitton SE ADR | 2.1% |
Shell plc ADR | 1.9% |
SAP SE ADR | 1.9% |
AstraZeneca plc ADR | 1.8% |
Novartis AG ADR | 1.8% |
Top Ten Total | 24.7% |
| | |
“Ten Largest Holdings” excludes any temporary cash or derivative investments. |
Country Diversification |
Country | % of
Long-Term
Investments |
France | 24.9% |
Switzerland | 17.2% |
United Kingdom | 16.9% |
Germany | 13.5% |
Netherlands | 12.2% |
Denmark | 7.2% |
Spain | 2.6% |
Other | 5.5% |
Total Long-Term Investments | 100.0% |
| | THE RYDEX FUNDS ANNUAL REPORT | 61 |
PERFORMANCE REPORT AND FUND PROFILE (Unaudited)(concluded) | March 31, 2024 |
Cumulative Fund Performance*
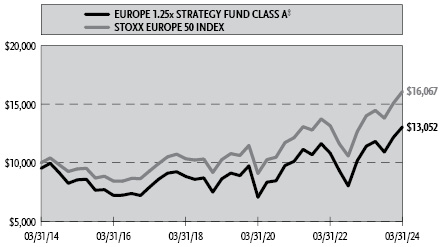
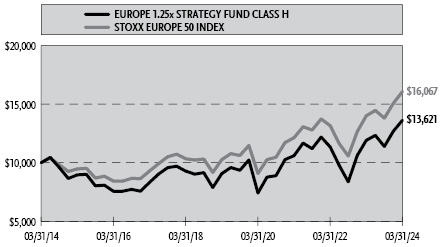
Average Annual Returns*
Periods Ended March 31, 2024
| 1 Year | 5 Year | 10 Year |
Class A Shares | 14.35% | 8.64% | 3.20% |
Class A Shares with sales charge‡ | 8.92% | 7.58% | 2.70% |
Class C Shares | 13.48% | 7.69% | 2.39% |
Class C Shares with CDSC§ | 12.48% | 7.69% | 2.39% |
Class H Shares | 14.32% | 8.47% | 3.14% |
STOXX Europe 50 Index | 14.68% | 9.38% | 4.85% |
* | The performance data above represents past performance that is not predictive of future results. The investment return and principal value of an investment in the Fund will fluctuate so that an investor’s shares, when redeemed, may be worth more or less than their original cost. Returns are historical and include changes in principal and reinvested dividends and capital gains and do not reflect the effect of taxes. The STOXX Europe 50 Index is an unmanaged index and, unlike the Fund, has no management fees or operating expenses to reduce its reported return. The graphs are based on Class A and Class H shares only; performance for Class C shares will vary due to differences in fee structure. |
‡ | Fund returns are calculated using the maximum sales charge of 4.75%. |
§ | Fund returns include a CDSC of 1% if redeemed within 12 months of purchase. |
62 | THE RYDEX FUNDS ANNUAL REPORT | |
SCHEDULE OF INVESTMENTS | March 31, 2024 |
EUROPE 1.25x STRATEGY FUND | |
| | Shares | | | Value | |
COMMON STOCKS† - 51.1% |
| | | | | | | | | |
Consumer, Non-cyclical - 18.7% |
Novo Nordisk A/S ADR | | | 698 | | | $ | 89,623 | |
Nestle S.A. ADR | | | 574 | | | | 60,959 | |
AstraZeneca plc ADR | | | 660 | | | | 44,715 | |
Novartis AG ADR | | | 441 | | | | 42,658 | |
Roche Holding AG ADR | | | 1,212 | | | | 38,687 | |
Unilever plc ADR | | | 542 | | | | 27,203 | |
L’Oreal S.A. ADR | | | 260 | | | | 24,648 | |
Sanofi S.A. ADR | | | 494 | | | | 24,008 | |
GSK plc ADR | | | 464 | | | | 19,892 | |
RELX plc ADR | | | 410 | | | | 17,749 | |
Diageo plc ADR | | | 119 | | | | 17,700 | |
EssilorLuxottica S.A. ADR1 | | | 132 | | | | 14,965 | |
British American Tobacco plc ADR | | | 428 | | | | 13,054 | |
Anheuser-Busch InBev S.A. ADR1 | | | 193 | | | | 11,731 | |
Reckitt Benckiser Group plc ADR | | | 796 | | | | 9,050 | |
Total Consumer, Non-cyclical | | | | | | | 456,642 | |
| | | | | | | | | |
Financial - 7.6% |
HSBC Holdings plc ADR1 | | | 816 | | | | 32,118 | |
Allianz SE ADR1 | | | 846 | | | | 25,321 | |
UBS Group AG* | | | 689 | | | | 21,166 | |
Zurich Insurance Group AG ADR1 | | | 315 | | | | 17,082 | |
Banco Santander S.A. ADR | | | 3,446 | | | | 16,679 | |
BNP Paribas S.A. ADR1 | | | 466 | | | | 16,655 | |
AXA S.A. ADR | | | 411 | | | | 15,453 | |
Muenchener Rueckversicherungs-Gesellschaft AG in Muenchen ADR1 | | | 294 | | | | 14,368 | |
UniCredit SpA ADR1 | | | 742 | | | | 14,035 | |
ING Groep N.V. ADR | | | 711 | | | | 11,724 | |
Total Financial | | | | | | | 184,601 | |
| | | | | | | | | |
Industrial - 5.8% |
Siemens AG ADR | | | 322 | | | | 30,728 | |
Schneider Electric SE ADR | | | 615 | | | | 27,860 | |
Airbus SE ADR | | | 505 | | | | 23,311 | |
Safran S.A. ADR | | | 326 | | | | 18,468 | |
Vinci S.A. ADR | | | 508 | | | | 16,368 | |
ABB Ltd. ADR | | | 348 | | | | 16,133 | |
Deutsche Post AG ADR | | | 208 | | | | 8,960 | |
Total Industrial | | | | | | | 141,828 | |
| | | | | | | | | |
Technology - 5.3% |
ASML Holding N.V. — Class G | | | 86 | | | | 83,461 | |
SAP SE ADR1 | | | 233 | | | | 45,442 | |
Total Technology | | | | | | | 128,903 | |
| | | | | | | | | |
Energy - 4.4% |
Shell plc ADR | | | 696 | | | | 46,660 | |
TotalEnergies SE ADR | | | 513 | | | | 35,310 | |
BP plc ADR | | | 636 | | | | 23,964 | |
Total Energy | | | | | | | 105,934 | |
| | | | | | | | | |
Consumer, Cyclical - 4.1% |
LVMH Moet Hennessy Louis Vuitton SE ADR | | | 276 | | | | 49,964 | |
Hermes International SCA ADR1 | | | 76 | | | | 19,488 | |
Cie Financiere Richemont S.A. ADR1 | | | 1,160 | | | | 17,679 | |
Mercedes-Benz Group AG ADR | | | 689 | | | $ | 13,704 | |
Total Consumer, Cyclical | | | | | | | 100,835 | |
| | | | | | | | | |
Basic Materials - 2.5% |
Air Liquide S.A. ADR | | | 563 | | | | 23,472 | |
Rio Tinto plc ADR | | | 230 | | | | 14,660 | |
Glencore plc ADR* | | | 1,072 | | | | 11,738 | |
BASF SE ADR | | | 766 | | | | 10,946 | |
Total Basic Materials | | | | | | | 60,816 | |
| | | | | | | | | |
Utilities - 1.5% |
Iberdrola S.A. ADR1 | | | 315 | | | | 15,703 | |
Enel SpA ADR1 | | | 1,687 | | | | 11,067 | |
National Grid plc ADR1 | | | 157 | | | | 10,710 | |
Total Utilities | | | | | | | 37,480 | |
| | | | | | | | | |
Communications - 1.2% |
Deutsche Telekom AG ADR | | | 746 | | | | 18,061 | |
Prosus N.V. ADR | | | 1,621 | | | | 10,147 | |
Total Communications | | | | | | | 28,208 | |
| | | | | | | | | |
Total Common Stocks | | | | |
(Cost $995,035) | | | | | | | 1,245,247 | |
| | | | | | | | | |
MUTUAL FUNDS† - 5.7% |
Guggenheim Ultra Short Duration Fund — Institutional Class2 | | | 7,027 | | | | 69,638 | |
Guggenheim Strategy Fund II2 | | | 2,760 | | | | 67,907 | |
Total Mutual Funds | | | | |
(Cost $138,225) | | | | | | | 137,545 | |
| | | | | | | | | |
| | | Face
Amount | | | | | |
U.S. TREASURY BILLS†† - 5.7% |
U.S. Treasury Bills |
5.17% due 04/16/243,4 | | $ | 138,000 | | | | 137,697 | |
Total U.S. Treasury Bills | | | | |
(Cost $137,697) | | | | | | | 137,697 | |
| | | | | | | | | |
REPURCHASE AGREEMENTS††,5 - 37.5% |
J.P. Morgan Securities LLC
issued 03/28/24 at 5.31%
due 04/01/24 | | | 527,451 | | | | 527,451 | |
BofA Securities, Inc.
issued 03/28/24 at 5.31%
due 04/01/24 | | | 202,866 | | | | 202,866 | |
Barclays Capital, Inc.
issued 03/28/24 at 5.30%
due 04/01/24 | | | 183,881 | | | | 183,881 | |
Total Repurchase Agreements | | | | |
(Cost $914,198) | | | | | | | 914,198 | |
SEE NOTES TO FINANCIAL STATEMENTS. | THE RYDEX FUNDS ANNUAL REPORT | 63 |
SCHEDULE OF INVESTMENTS (continued) | March 31, 2024 |
EUROPE 1.25x STRATEGY FUND | |
| | Shares | | | Value | |
| | | | | | | | | |
SECURITIES LENDING COLLATERAL†,6 - 7.3% |
Money Market Fund | | | | | | | | |
First American Government Obligations Fund - Class X, 5.23%7 | | | 178,326 | | | $ | 178,326 | |
Total Securities Lending Collateral | | | | |
(Cost $178,326) | | | | | | | 178,326 | |
| | | | | | | | | |
Total Investments - 107.3% | | | | |
(Cost $2,363,481 ) | | $ | 2,613,013 | |
Other Assets & Liabilities, net - (7.3)% | | | (177,348 | ) |
Total Net Assets - 100.0% | | $ | 2,435,665 | |
Futures Contracts |
Description | | Number of
Contracts | | | Expiration
Date | | | Notional
Amount | | | Value and
Unrealized
Appreciation
(Depreciation)** | |
Equity Futures Contracts Purchased† |
STOXX 50 Index Futures Contracts | | | 38 | | | | Jun 2024 | | | $ | 1,813,487 | | | $ | 25,275 | |
Currency Futures Contracts Purchased† |
Euro FX Futures Contracts | | | 13 | | | | Jun 2024 | | | | 1,758,575 | | | | (19,833 | ) |
* | Non-income producing security. |
** | Includes cumulative appreciation (depreciation). Variation margin is reported within the Statement of Assets and Liabilities. |
† | Value determined based on Level 1 inputs — See Note 4. |
†† | Value determined based on Level 2 inputs — See Note 4. |
1 | All or a portion of this security is on loan at March 31, 2024 — See Note 7. |
2 | Affiliated issuer. |
3 | All or a portion of this security is pledged as futures collateral at March 31, 2024. |
4 | Rate indicated is the effective yield at the time of purchase. |
5 | Repurchase Agreements — See Note 6. |
6 | Securities lending collateral — See Note 7. |
7 | Rate indicated is the 7-day yield as of March 31, 2024. |
| | ADR — American Depositary Receipt |
| | plc — Public Limited Company |
| | |
| | See Sector Classification in Other Information section. |
64 | THE RYDEX FUNDS ANNUAL REPORT | SEE NOTES TO FINANCIAL STATEMENTS. |
SCHEDULE OF INVESTMENTS (concluded) | March 31, 2024 |
EUROPE 1.25x STRATEGY FUND | |
The following table summarizes the inputs used to value the Fund’s investments at March 31, 2024 (See Note 4 in the Notes to Financial Statements):
Investments in Securities (Assets) | | Level 1
Quoted
Prices | | | Level 2
Significant
Observable
Inputs | | | Level 3
Significant
Unobservable
Inputs | | | Total | |
Common Stocks | | $ | 1,245,247 | | | $ | — | | | $ | — | | | $ | 1,245,247 | |
Mutual Funds | | | 137,545 | | | | — | | | | — | | | | 137,545 | |
U.S. Treasury Bills | | | — | | | | 137,697 | | | | — | | | | 137,697 | |
Repurchase Agreements | | | — | | | | 914,198 | | | | — | | | | 914,198 | |
Securities Lending Collateral | | | 178,326 | | | | — | | | | — | | | | 178,326 | |
Equity Futures Contracts** | | | 25,275 | | | | — | | | | — | | | | 25,275 | |
Total Assets | | $ | 1,586,393 | | | $ | 1,051,895 | | | $ | — | | | $ | 2,638,288 | |
Investments in Securities (Liabilities) | | Level 1
Quoted
Prices | | | Level 2
Significant
Observable
Inputs | | | Level 3
Significant
Unobservable
Inputs | | | Total | |
Currency Futures Contracts** | | $ | 19,833 | | | $ | — | | | $ | — | | | $ | 19,833 | |
** | This derivative is reported as unrealized appreciation/depreciation at period end. |
Affiliated Transactions
Investments representing 5% or more of the outstanding voting shares of a company, or control of or by, or common control under Guggenheim Investments (“GI”), result in that company being considered an affiliated issuer, as defined in the 1940 Act.
The Fund may invest in certain of the underlying series of Guggenheim Strategy Funds Trust, including Guggenheim Strategy Fund II and Guggenheim Strategy Fund III (collectively, the “Guggenheim Strategy Funds”), each of which are open-end management investment companies managed by GI. The Guggenheim Strategy Funds, which launched on March 11, 2014, are offered as short term investment options only to mutual funds, trusts, and other accounts managed by GI and/or its affiliates, and are not available to the public. The Guggenheim Strategy Funds pay no investment management fees. The Guggenheim Strategy Funds’ annual report on Form N-CSR dated September 30, 2023 is available publicly or upon request. This information is available from the EDGAR database on the SEC’s website at https://www.sec.gov/Archives/edgar/data/1601445/000182126823000217/gug86449-ncsr.htm. The Fund may invest in certain of the underlying series of Guggenheim Funds Trust, which are open-end management investment companies managed by GI, are available to the public and whose most recent annual report on Form N-CSR is available publicly or upon request.
Transactions during the year ended March 31, 2024, in which the company is an affiliated issuer, were as follows:
Security Name | | Value
03/31/23 | | | Additions | | | Reductions | | | Realized
Gain (Loss) | | | Change in
Unrealized
Appreciation
(Depreciation) | | | Value
03/31/24 | | | Shares
03/31/24 | | | Investment
Income | |
Mutual Funds | | | | | | | | | | | | | | | | | | | | | | | | | | | | | | | | |
Guggenheim Strategy Fund II | | $ | 66,830 | | | $ | — | | | $ | — | | | $ | — | | | $ | 1,077 | | | $ | 67,907 | | | | 2,760 | | | $ | 3,745 | |
Guggenheim Ultra Short Duration Fund — Institutional Class | | | 68,233 | | | | — | | | | — | | | | — | | | | 1,405 | | | | 69,638 | | | | 7,027 | | | | 3,742 | |
| | | $ | 135,063 | | | $ | — | | | $ | — | | | $ | — | | | $ | 2,482 | | | $ | 137,545 | | | | | | | $ | 7,487 | |
SEE NOTES TO FINANCIAL STATEMENTS. | THE RYDEX FUNDS ANNUAL REPORT | 65 |
EUROPE 1.25x STRATEGY FUND | |
STATEMENT OF ASSETS AND LIABILITIES |
March 31, 2024 |
Assets: |
Investments in unaffiliated issuers, at value - including $169,356 of securities loaned (cost $1,311,058) | | $ | 1,561,270 | |
Investments in affiliated issuers, at value (cost $138,225) | | | 137,545 | |
Repurchase agreements, at value (cost $914,198) | | | 914,198 | |
Cash | | | 323 | |
Segregated cash with broker | | | 13,241 | |
Receivables: |
Foreign tax reclaims | | | 18,370 | |
Dividends | | | 5,918 | |
Variation margin on futures contracts | | | 3,453 | |
Interest | | | 540 | |
Fund shares sold | | | 300 | |
Securities lending income | | | 264 | |
Total assets | | | 2,655,422 | |
| | | | | |
Liabilities: |
Payable for: |
Return of securities lending collateral | | | 178,326 | |
Fund shares redeemed | | | 31,435 | |
Securities purchased | | | 3,406 | |
Management fees | | | 1,737 | |
Transfer agent fees | | | 1,077 | |
Distribution and service fees | | | 582 | |
Portfolio accounting and administration fees | | | 102 | |
Trustees’ fees* | | | 28 | |
Miscellaneous | | | 3,064 | |
Total liabilities | | | 219,757 | |
Net assets | | $ | 2,435,665 | |
| | | | | |
Net assets consist of: |
Paid in capital | | $ | 2,921,885 | |
Total distributable earnings (loss) | | | (486,220 | ) |
Net assets | | $ | 2,435,665 | |
Class A: |
Net assets | | $ | 519,854 | |
Capital shares outstanding | | | 4,288 | |
Net asset value per share | | $ | 121.23 | |
Maximum offering price per share (Net asset value divided by 95.25%) | | $ | 127.28 | |
Class C: |
Net assets | | $ | 181,073 | |
Capital shares outstanding | | | 1,867 | |
Net asset value per share | | $ | 96.99 | |
Class H: |
Net assets | | $ | 1,734,738 | |
Capital shares outstanding | | | 14,533 | |
Net asset value per share | | $ | 119.37 | |
STATEMENT OF OPERATIONS |
Year Ended March 31, 2024 |
Investment Income: |
Dividends from securities of unaffiliated issuers (net of foreign withholding tax of $9,804) | | $ | 100,807 | |
Dividends from securities of affiliated issuers | | | 7,487 | |
Interest | | | 136,758 | |
Income from securities lending, net | | | 4,633 | |
Total investment income | | | 249,685 | |
| | | | | |
Expenses: |
Management fees | | | 46,593 | |
Distribution and service fees: |
Class A | | | 2,566 | |
Class C | | | 1,921 | |
Class H | | | 9,896 | |
Transfer agent fees | | | 11,439 | |
Portfolio accounting and administration fees | | | 7,891 | |
Professional fees | | | 2,395 | |
Custodian fees | | | 897 | |
Trustees’ fees* | | | 802 | |
Miscellaneous | | | 8,108 | |
Total expenses | | | 92,508 | |
Less: |
Expenses reimbursed by Adviser | | | (3,551 | ) |
Expenses waived by Adviser | | | (171 | ) |
Total waived expenses | | | (3,722 | ) |
Net expenses | | | 88,786 | |
Net investment income | | | 160,899 | |
| | | | | |
Net Realized and Unrealized Gain (Loss): |
Net realized gain (loss) on: |
Investments | | | (13,742 | ) |
Futures contracts | | | 386,919 | |
Foreign currency transactions | | | 101 | |
Net realized gain | | | 373,278 | |
Net change in unrealized appreciation (depreciation) on: |
Investments in unaffiliated issuers | | | 114,064 | |
Investments in affiliated issuers | | | 2,482 | |
Futures contracts | | | (105,033 | ) |
Foreign currency translations | | | 38 | |
Net change in unrealized appreciation (depreciation) | | | 11,551 | |
Net realized and unrealized gain | | | 384,829 | |
Net increase in net assets resulting from operations | | $ | 545,728 | |
* | Relates to Trustees not deemed “interested persons” within the meaning of Section 2(a)(19) of the 1940 Act. |
66 | THE RYDEX FUNDS ANNUAL REPORT | SEE NOTES TO FINANCIAL STATEMENTS. |
EUROPE 1.25x STRATEGY FUND | |
STATEMENTS OF CHANGES IN NET ASSETS |
| | Year Ended
March 31,
2024 | | | Year Ended
March 31,
2023 | |
Increase (Decrease) in Net Assets from Operations: | | | | | | | | |
Net investment income | | $ | 160,899 | | | $ | 30,827 | |
Net realized gain (loss) on investments | | | 373,278 | | | | (10,782 | ) |
Net change in unrealized appreciation (depreciation) on investments | | | 11,551 | | | | (82,833 | ) |
Net increase (decrease) in net assets resulting from operations | | | 545,728 | | | | (62,788 | ) |
| | | | | | | | | |
Distributions to shareholders: | | | | | | | | |
Class A | | | (5,330 | ) | | | — | |
Class C | | | (2,990 | ) | | | — | |
Class H | | | (19,342 | ) | | | — | |
Total distributions to shareholders | | | (27,662 | ) | | | — | |
| | | | | | | | | |
Capital share transactions: | | | | | | | | |
Proceeds from sale of shares | | | | | | | | |
Class A | | | 55,633,399 | | | | 18,528,974 | |
Class C | | | 905,676 | | | | 208,645 | |
Class H | | | 36,893,142 | | | | 41,975,592 | |
Distributions reinvested | | | | | | | | |
Class A | | | 5,211 | | | | — | |
Class C | | | 2,052 | | | | — | |
Class H | | | 19,247 | | | | — | |
Cost of shares redeemed | | | | | | | | |
Class A | | | (55,672,258 | ) | | | (18,854,295 | ) |
Class C | | | (918,503 | ) | | | (543,957 | ) |
Class H | | | (48,981,942 | ) | | | (32,367,804 | ) |
Net increase (decrease) from capital share transactions | | | (12,113,976 | ) | | | 8,947,155 | |
Net increase (decrease) in net assets | | | (11,595,910 | ) | | | 8,884,367 | |
| | | | | | | | | |
Net assets: | | | | | | | | |
Beginning of year | | | 14,031,575 | | | | 5,147,208 | |
End of year | | $ | 2,435,665 | | | $ | 14,031,575 | |
| | | | | | | | | |
Capital share activity: | | | | | | | | |
Shares sold | | | | | | | | |
Class A | | | 511,589 | | | | 195,330 | |
Class C | | | 10,433 | | | | 2,694 | |
Class H | | | 340,783 | | | | 439,379 | |
Shares issued from reinvestment of distributions | | | | | | | | |
Class A | | | 48 | | | | — | |
Class C | | | 25 | | | | — | |
Class H | | | 179 | | | | — | |
Shares redeemed | | | | | | | | |
Class A | | | (510,986 | ) | | | (196,454 | ) |
Class C | | | (10,500 | ) | | | (6,623 | ) |
Class H | | | (454,633 | ) | | | (352,952 | ) |
Net increase (decrease) in shares | | | (113,061 | ) | | | 81,374 | |
SEE NOTES TO FINANCIAL STATEMENTS. | THE RYDEX FUNDS ANNUAL REPORT | 67 |
EUROPE 1.25x STRATEGY FUND | |
This table is presented to show selected data for a share outstanding throughout each period and to assist shareholders in evaluating a Fund’s performance for the periods presented.
Class A | | Year Ended
March 31,
2024 | | | Year Ended
March 31,
2023 | | | Year Ended
March 31,
2022 | | | Year Ended
March 31,
2021 | | | Year Ended
March 31,
2020 | |
Per Share Data |
Net asset value, beginning of period | | $ | 106.74 | | | $ | 101.20 | | | $ | 94.56 | | | $ | 69.30 | | | $ | 85.18 | |
Income (loss) from investment operations: |
Net investment income (loss)a | | | 2.61 | | | | 1.76 | | | | (.96 | ) | | | (.93 | ) | | | .63 | |
Net gain (loss) on investments (realized and unrealized) | | | 12.63 | | | | 3.78 | e | | | 7.60 | e | | | 30.74 | | | | (16.07 | )e |
Total from investment operations | | | 15.24 | | | | 5.54 | | | | 6.64 | | | | 29.81 | | | | (15.44 | ) |
Less distributions from: |
Net investment income | | | (.75 | ) | | | — | | | | — | | | | (4.55 | ) | | | (.44 | ) |
Total distributions | | | (.75 | ) | | | — | | | | — | | | | (4.55 | ) | | | (.44 | ) |
Net asset value, end of period | | $ | 121.23 | | | $ | 106.74 | | | $ | 101.20 | | | $ | 94.56 | | | $ | 69.30 | |
|
Total Returnb | | | 14.35 | % | | | 5.48 | % | | | 7.02 | % | | | 43.39 | % | | | (18.25 | %) |
Ratios/Supplemental Data |
Net assets, end of period (in thousands) | | $ | 520 | | | $ | 388 | | | $ | 482 | | | $ | 130 | | | $ | 217 | |
Ratios to average net assets: |
Net investment income (loss) | | | 2.41 | % | | | 1.84 | % | | | (0.93 | %) | | | (1.10 | %) | | | 0.72 | % |
Total expensesc | | | 1.74 | % | | | 1.79 | % | | | 1.72 | % | | | 1.75 | % | | | 1.77 | % |
Net expensesd | | | 1.66 | % | | | 1.74 | % | | | 1.70 | % | | | 1.73 | % | | | 1.73 | % |
Portfolio turnover rate | | | 1,595 | % | | | 231 | % | | | 517 | % | | | 534 | % | | | 1,787 | % |
Class C | | Year Ended
March 31,
2024 | | | Year Ended
March 31,
2023 | | | Year Ended
March 31,
2022 | | | Year Ended
March 31,
2021 | | | Year Ended
March 31,
2020 | |
Per Share Data |
Net asset value, beginning of period | | $ | 86.21 | | | $ | 82.72 | | | $ | 77.88 | | | $ | 58.24 | | | $ | 72.13 | |
Income (loss) from investment operations: |
Net investment income (loss)a | | | 1.28 | | | | .94 | | | | (1.18 | ) | | | (.96 | ) | | | (.18 | ) |
Net gain (loss) on investments (realized and unrealized) | | | 10.25 | | | | 2.55 | e | | | 6.02 | e | | | 25.15 | | | | (13.27 | )e |
Total from investment operations | | | 11.53 | | | | 3.49 | | | | 4.84 | | | | 24.19 | | | | (13.45 | ) |
Less distributions from: |
Net investment income | | | (.75 | ) | | | — | | | | — | | | | (4.55 | ) | | | (.44 | ) |
Total distributions | | | (.75 | ) | | | — | | | | — | | | | (4.55 | ) | | | (.44 | ) |
Net asset value, end of period | | $ | 96.99 | | | $ | 86.21 | | | $ | 82.72 | | | $ | 77.88 | | | $ | 58.24 | |
|
Total Returnb | | | 13.48 | % | | | 4.22 | % | | | 6.21 | % | | | 41.93 | % | | | (18.79 | %) |
Ratios/Supplemental Data |
Net assets, end of period (in thousands) | | $ | 181 | | | $ | 165 | | | $ | 483 | | | $ | 142 | | | $ | 296 | |
Ratios to average net assets: |
Net investment income (loss) | | | 1.47 | % | | | 1.17 | % | | | (1.41 | %) | | | (1.50 | %) | | | (0.25 | %) |
Total expensesc | | | 2.51 | % | | | 2.53 | % | | | 2.48 | % | | | 2.58 | % | | | 2.49 | % |
Net expensesd | | | 2.42 | % | | | 2.48 | % | | | 2.46 | % | | | 2.55 | % | | | 2.45 | % |
Portfolio turnover rate | | | 1,595 | % | | | 231 | % | | | 517 | % | | | 534 | % | | | 1,787 | % |
68 | THE RYDEX FUNDS ANNUAL REPORT | SEE NOTES TO FINANCIAL STATEMENTS. |
EUROPE 1.25x STRATEGY FUND | |
FINANCIAL HIGHLIGHTS (concluded) |
This table is presented to show selected data for a share outstanding throughout each period and to assist shareholders in evaluating a Fund’s performance for the periods presented.
Class H | | Year Ended
March 31,
2024 | | | Year Ended
March 31,
2023 | | | Year Ended
March 31,
2022 | | | Year Ended
March 31,
2021 | | | Year Ended
March 31,
2020 | |
Per Share Data |
Net asset value, beginning of period | | $ | 105.14 | | | $ | 100.11 | | | $ | 93.56 | | | $ | 68.79 | | | $ | 84.58 | |
Income (loss) from investment operations: |
Net investment income (loss)a | | | 3.64 | | | | 1.01 | | | | (.93 | ) | | | (.74 | ) | | | .58 | |
Net gain (loss) on investments (realized and unrealized) | | | 11.34 | | | | 4.02 | e | | | 7.48 | e | | | 30.06 | | | | (15.93 | )e |
Total from investment operations | | | 14.98 | | | | 5.03 | | | | 6.55 | | | | 29.32 | | | | (15.35 | ) |
Less distributions from: |
Net investment income | | | (.75 | ) | | | — | | | | — | | | | (4.55 | ) | | | (.44 | ) |
Total distributions | | | (.75 | ) | | | — | | | | — | | | | (4.55 | ) | | | (.44 | ) |
Net asset value, end of period | | $ | 119.37 | | | $ | 105.14 | | | $ | 100.11 | | | $ | 93.56 | | | $ | 68.79 | |
|
Total Return | | | 14.32 | % | | | 5.01 | % | | | 7.00 | % | | | 42.96 | % | | | (18.28 | %) |
Ratios/Supplemental Data |
Net assets, end of period (in thousands) | | $ | 1,735 | | | $ | 13,479 | | | $ | 4,182 | | | $ | 1,410 | | | $ | 1,344 | |
Ratios to average net assets: |
Net investment income (loss) | | | 3.37 | % | | | 1.08 | % | | | (0.90 | %) | | | (0.88 | %) | | | 0.66 | % |
Total expensesc | | | 1.76 | % | | | 1.77 | % | | | 1.71 | % | | | 1.77 | % | | | 1.80 | % |
Net expensesd | | | 1.69 | % | | | 1.73 | % | | | 1.69 | % | | | 1.74 | % | | | 1.76 | % |
Portfolio turnover rate | | | 1,595 | % | | | 231 | % | | | 517 | % | | | 534 | % | | | 1,787 | % |
a | Net investment income (loss) per share was computed using average shares outstanding throughout the period. |
b | Total return does not reflect the impact of any applicable sales charges. |
c | Does not include expenses of the underlying funds in which the Fund invests. |
d | Net expense information reflects the expense ratios after expense waivers and reimbursements, as applicable. |
e | The amount shown for a share outstanding throughout the year does not agree with the aggregate net gain on investments for the year because of the sales and purchases of fund shares in relation to fluctuating market value of the investments of the Fund. |
SEE NOTES TO FINANCIAL STATEMENTS. | THE RYDEX FUNDS ANNUAL REPORT | 69 |
PERFORMANCE REPORT AND FUND PROFILE (Unaudited) | March 31, 2024 |
JAPAN 2x STRATEGY FUND
OBJECTIVE: Seeks to provide investment results that correlate, before fees and expenses, to the performance of a specific benchmark. The Fund’s current benchmark is 200% of the fair value of the Nikkei-225 Stock Average Index (the “underlying index”).
For the Reporting Period, Japan 2x Strategy Fund Class H maintained a daily correlation of over 99% to its benchmark of 200% of the daily price movement of the fair value of the underlying index. Japan 2x Strategy Fund Class H returned 44.34%, while the underlying index returned 25.63% over the same time period.
The sectors that contributed the most to the return of the underlying index for the Reporting Period were Information Technology, Consumer Discretionary, and Industrials. No sector detracted.
The holdings contributing the most to the return of the underlying index were Tokyo Electron Ltd., Fast Retailing Co. Ltd., and Advantest Corp. Those that detracted the most were Fanuc Corp., Daikin Industries Ltd., and M3, Inc.
Derivatives in the Fund were used to help provide exposure to the composition of the benchmark in the highest efficient manner and to provide leverage and not for hedging purposes. The results of derivatives use during the period were within our expectations.
Due to the compounding of daily returns, leveraged and inverse returns over periods other than one day will likely differ in amount and possibly direction from the benchmark return for the same period. Investors should monitor their Fund holdings to ensure that they are consistent with their strategies, as frequently as daily.
The effects of compounding may cause the longer-term correlation of the Fund to its benchmark to diminish. The apparent discrepancy between the leveraged and unleveraged indices is the result of compounding, which is described briefly on page 6 of this report.
Performance displayed represents past performance, which is no guarantee of future results.
Holdings Diversification (Market Exposure as % of Net Assets)
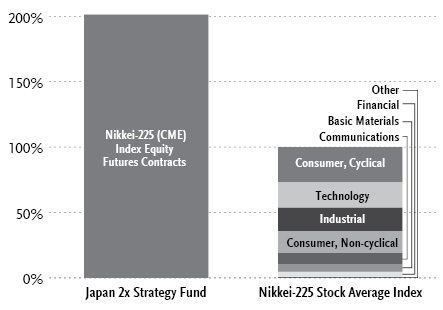
“Holdings Diversification (Market Exposure as % of Net Assets)” excludes any temporary cash investments.
Inception Dates: |
Class A | February 22, 2008 |
Class C | February 22, 2008 |
Class H | February 22, 2008 |
The Fund invests principally in derivative investments such as futures contracts.
70 | THE RYDEX FUNDS ANNUAL REPORT | |
PERFORMANCE REPORT AND FUND PROFILE (Unaudited)(concluded) | March 31, 2024 |
Cumulative Fund Performance*
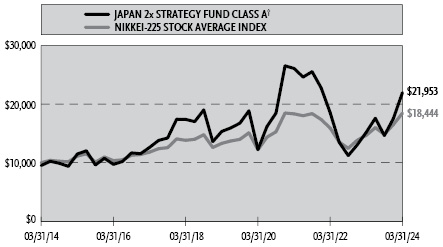
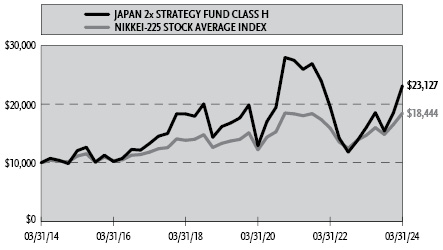
Average Annual Returns*
Periods Ended March 31, 2024
| 1 Year | 5 Year | 10 Year |
Class A Shares | 44.34% | 7.43% | 8.71% |
Class A Shares with sales charge† | 37.48% | 6.39% | 8.18% |
Class C Shares | 43.33% | 6.63% | 7.94% |
Class C Shares with CDSC‡ | 42.33% | 6.63% | 7.94% |
Class H Shares | 44.34% | 7.42% | 8.75% |
Nikkei-225 Stock Average Index | 25.63% | 6.75% | 6.31% |
* | The performance data above represents past performance that is not predictive of future results. The investment return and principal value of an investment in the Fund will fluctuate so that an investor’s shares, when redeemed, may be worth more or less than their original cost. Returns are historical and include changes in principal and reinvested dividends and capital gains and do not reflect the effect of taxes. The Nikkei-225 Stock Average Index is an unmanaged index and, unlike the Fund, has no management fees or operating expenses to reduce its reported return. The graphs are based on A-Class and H-Class shares only; performance for C-Class shares will vary due to differences in fee structure. |
† | Fund returns are calculated using the maximum sales charge of 4.75%. |
‡ | Fund returns include a CDSC of 1% if redeemed within 12 months of purchase. |
| | THE RYDEX FUNDS ANNUAL REPORT | 71 |
SCHEDULE OF INVESTMENTS | March 31, 2024 |
JAPAN 2x STRATEGY FUND | |
| | Face
Amount | | | Value | |
U.S. TREASURY BILLS†† - 22.0% |
U.S. Treasury Bills |
5.17% due 04/16/241,2 | | $ | 620,000 | | | $ | 618,638 | |
Total U.S. Treasury Bills | | | | |
(Cost $618,640) | | | | | | | 618,638 | |
| | | | | | | | | |
REPURCHASE AGREEMENTS††,3 - 81.8% |
J.P. Morgan Securities LLC
issued 03/28/24 at 5.31%
due 04/01/24 | | | 1,325,935 | | | | 1,325,935 | |
BofA Securities, Inc.
issued 03/28/24 at 5.31%
due 04/01/24 | | | 509,975 | | | | 509,975 | |
Barclays Capital, Inc.
issued 03/28/24 at 5.30%
due 04/01/24 | | | 462,248 | | | | 462,248 | |
Total Repurchase Agreements | | | | |
(Cost $2,298,158) | | | | | | | 2,298,158 | |
| | | | | | | | | |
Total Investments - 103.8% | | | | |
(Cost $2,916,798) | | $ | 2,916,796 | |
Other Assets & Liabilities, net - (3.8)% | | | (106,614 | ) |
Total Net Assets - 100.0% | | $ | 2,810,182 | |
Futures Contracts |
Description | | Number of
Contracts | | | Expiration
Date | | | Notional
Amount | | | Value and
Unrealized
Appreciation
(Depreciation)** | |
Equity Futures Contracts Purchased† |
Nikkei 225 (CME) Index Futures Contracts | | | 28 | | | | Jun 2024 | | | $ | 5,656,000 | | | $ | 75,118 | |
Currency Futures Contracts Purchased† |
Japanese Yen Futures Contracts | | | 67 | | | | Jun 2024 | | | | 5,599,106 | | | | (127,999 | ) |
** | Includes cumulative appreciation (depreciation). Variation margin is reported within the Statement of Assets and Liabilities. |
† | Value determined based on Level 1 inputs — See Note 4. |
†† | Value determined based on Level 2 inputs — See Note 4. |
1 | All or a portion of this security is pledged as futures collateral at March 31, 2024. |
2 | Rate indicated is the effective yield at the time of purchase. |
3 | Repurchase Agreements — See Note 6. |
| | CME — Chicago Mercantile Exchange |
| | |
| | See Sector Classification in Other Information section. |
72 | THE RYDEX FUNDS ANNUAL REPORT | SEE NOTES TO FINANCIAL STATEMENTS. |
SCHEDULE OF INVESTMENTS (concluded) | March 31, 2024 |
JAPAN 2x STRATEGY FUND | |
The following table summarizes the inputs used to value the Fund’s investments at March 31, 2024 (See Note 4 in the Notes to Financial Statements):
Investments in Securities (Assets) | | Level 1
Quoted
Prices | | | Level 2
Significant
Observable
Inputs | | | Level 3
Significant
Unobservable
Inputs | | | Total | |
U.S. Treasury Bills | | $ | — | | | $ | 618,638 | | | $ | — | | | $ | 618,638 | |
Repurchase Agreements | | | — | | | | 2,298,158 | | | | — | | | | 2,298,158 | |
Equity Futures Contracts** | | | 75,118 | | | | — | | | | — | | | | 75,118 | |
Total Assets | | $ | 75,118 | | | $ | 2,916,796 | | | $ | — | | | $ | 2,991,914 | |
Investments in Securities (Liabilities) | | Level 1
Quoted
Prices | | | Level 2
Significant
Observable
Inputs | | | Level 3
Significant
Unobservable
Inputs | | | Total | |
Currency Futures Contracts** | | $ | 127,999 | | | $ | — | | | $ | — | | | $ | 127,999 | |
** | This derivative is reported as unrealized appreciation/depreciation at period end. |
SEE NOTES TO FINANCIAL STATEMENTS. | THE RYDEX FUNDS ANNUAL REPORT | 73 |
STATEMENT OF ASSETS AND LIABILITIES |
March 31, 2024 |
Assets: |
Investments, at value (cost $618,640) | | $ | 618,638 | |
Repurchase agreements, at value (cost $2,298,158) | | | 2,298,158 | |
Segregated cash with broker | | | 16,479 | |
Receivables: |
Interest | | | 1,356 | |
Total assets | | | 2,934,631 | |
| | | | | |
Liabilities: |
Payable for: |
Fund shares redeemed | | | 99,352 | |
Variation margin on futures contracts | | | 19,974 | |
Management fees | | | 1,877 | |
Transfer agent fees | | | 905 | |
Distribution and service fees | | | 632 | |
Portfolio accounting and administration fees | | | 257 | |
Trustees’ fees* | | | 18 | |
Miscellaneous | | | 1,434 | |
Total liabilities | | | 124,449 | |
Net assets | | $ | 2,810,182 | |
| | | | | |
Net assets consist of: |
Paid in capital | | $ | 4,348,089 | |
Total distributable earnings (loss) | | | (1,537,907 | ) |
Net assets | | $ | 2,810,182 | |
Class A: |
Net assets | | $ | 450,339 | |
Capital shares outstanding | | | 2,830 | |
Net asset value per share | | $ | 159.13 | |
Maximum offering price per share (Net asset value divided by 95.25%) | | $ | 167.07 | |
Class C: |
Net assets | | $ | 21,712 | |
Capital shares outstanding | | | 155 | |
Net asset value per share | | $ | 140.30 | |
Class H: |
Net assets | | $ | 2,338,131 | |
Capital shares outstanding | | | 14,574 | |
Net asset value per share | | $ | 160.43 | |
STATEMENT OF OPERATIONS |
Year Ended March 31, 2024 |
Investment Income: |
Interest | | $ | 139,284 | |
Total investment income | | | 139,284 | |
| | | | | |
Expenses: |
Management fees | | | 20,433 | |
Distribution and service fees: |
Class A | | | 486 | |
Class C | | | 68 | |
Class H | | | 6,307 | |
Transfer agent fees | | | 5,974 | |
Portfolio accounting and administration fees | | | 4,153 | |
Registration fees | | | 2,303 | |
Professional fees | | | 1,388 | |
Trustees’ fees* | | | 425 | |
Custodian fees | | | 373 | |
Miscellaneous | | | 1,072 | |
Total expenses | | | 42,982 | |
Less: |
Expenses reimbursed by Adviser | | | (564 | ) |
Net expenses | | | 42,418 | |
Net investment income | | | 96,866 | |
| | | | | |
Net Realized and Unrealized Gain (Loss): |
Net realized gain (loss) on: |
Investments | | | 52 | |
Futures contracts | | | 1,175,866 | |
Net realized gain | | | 1,175,918 | |
Net change in unrealized appreciation (depreciation) on: |
Investments | | | 20 | |
Futures contracts | | | (456,057 | ) |
Net change in unrealized appreciation (depreciation) | | | (456,037 | ) |
Net realized and unrealized gain | | | 719,881 | |
Net increase in net assets resulting from operations | | $ | 816,747 | |
* | Relates to Trustees not deemed “interested persons” within the meaning of Section 2(a)(19) of the 1940 Act. |
74 | THE RYDEX FUNDS ANNUAL REPORT | SEE NOTES TO FINANCIAL STATEMENTS. |
STATEMENTS OF CHANGES IN NET ASSETS |
| | Year Ended
March 31,
2024 | | | Year Ended
March 31,
2023 | |
Increase (Decrease) in Net Assets from Operations: | | | | | | | | |
Net investment income | | $ | 96,866 | | | $ | 18,134 | |
Net realized gain (loss) on investments | | | 1,175,918 | | | | (260,068 | ) |
Net change in unrealized appreciation (depreciation) on investments | | | (456,037 | ) | | | 249,823 | |
Net increase in net assets resulting from operations | | | 816,747 | | | | 7,889 | |
| | | | | | | | | |
Distributions to shareholders: | | | | | | | | |
Class A | | | (6,903 | ) | | | — | |
Class C | | | (36 | ) | | | — | |
Class H | | | (65,831 | ) | | | — | |
Total distributions to shareholders | | | (72,770 | ) | | | — | |
| | | | | | | | | |
Capital share transactions: | | | | | | | | |
Proceeds from sale of shares | | | | | | | | |
Class A | | | 367,084 | | | | 130,762 | |
Class C | | | 54,791 | | | | 2,736 | |
Class H | | | 12,144,683 | | | | 15,623,889 | |
Distributions reinvested | | | | | | | | |
Class A | | | 6,903 | | | | — | |
Class C | | | 36 | | | | — | |
Class H | | | 64,437 | | | | — | |
Cost of shares redeemed | | | | | | | | |
Class A | | | (183,316 | ) | | | (101,183 | ) |
Class C | | | (34,007 | ) | | | (2,386 | ) |
Class H | | | (17,911,961 | ) | | | (9,364,977 | ) |
Net increase (decrease) from capital share transactions | | | (5,491,350 | ) | | | 6,288,841 | |
Net increase (decrease) in net assets | | | (4,747,373 | ) | | | 6,296,730 | |
| | | | | | | | | |
Net assets: | | | | | | | | |
Beginning of year | | | 7,557,555 | | | | 1,260,825 | |
End of year | | $ | 2,810,182 | | | $ | 7,557,555 | |
| | | | | | | | | |
Capital share activity: | | | | | | | | |
Shares sold | | | | | | | | |
Class A | | | 2,483 | | | | 1,220 | |
Class C | | | 455 | | | | 26 | |
Class H | | | 92,132 | | | | 139,552 | |
Shares issued from reinvestment of distributions | | | | | | | | |
Class A | | | 59 | | | | — | |
Class C | | | — | | | | — | |
Class H | | | 545 | | | | — | |
Shares redeemed | | | | | | | | |
Class A | | | (1,475 | ) | | | (907 | ) |
Class C | | | (338 | ) | | | (23 | ) |
Class H | | | (140,294 | ) | | | (84,648 | ) |
Net increase (decrease) in shares | | | (46,433 | ) | | | 55,220 | |
SEE NOTES TO FINANCIAL STATEMENTS. | THE RYDEX FUNDS ANNUAL REPORT | 75 |
This table is presented to show selected data for a share outstanding throughout each period and to assist shareholders in evaluating a Fund’s performance for the periods presented.
Class A | | Year Ended
March 31,
2024 | | | Year Ended
March 31,
2023 | | | Year Ended
March 31,
2022 | | | Year Ended
March 31,
2021 | | | Year Ended
March 31,
2020 | |
Per Share Data |
Net asset value, beginning of period | | $ | 117.27 | | | $ | 142.84 | | | $ | 201.08 | | | $ | 94.96 | | | $ | 119.96 | |
Income (loss) from investment operations: |
Net investment income (loss)a | | | 4.91 | | | | 1.39 | | | | (2.21 | ) | | | (1.95 | ) | | | .91 | |
Net gain (loss) on investments (realized and unrealized) | | | 44.41 | | | | (26.96 | ) | | | (56.03 | ) | | | 109.13 | | | | (24.67 | ) |
Total from investment operations | | | 49.32 | | | | (25.57 | ) | | | (58.24 | ) | | | 107.18 | | | | (23.76 | ) |
Less distributions from: |
Net investment income | | | (7.46 | ) | | | — | | | | — | | | | (1.06 | ) | | | (1.24 | ) |
Total distributions | | | (7.46 | ) | | | — | | | | — | | | | (1.06 | ) | | | (1.24 | ) |
Net asset value, end of period | | $ | 159.13 | | | $ | 117.27 | | | $ | 142.84 | | | $ | 201.08 | | | $ | 94.96 | |
|
Total Returnb | | | 44.34 | % | | | (17.90 | %) | | | (28.96 | %) | | | 112.92 | % | | | (20.15 | %) |
Ratios/Supplemental Data |
Net assets, end of period (in thousands) | | $ | 450 | | | $ | 207 | | | $ | 207 | | | $ | 255 | | | $ | 141 | |
Ratios to average net assets: |
Net investment income (loss) | | | 3.77 | % | | | 1.27 | % | | | (1.22 | %) | | | (1.26 | %) | | | 0.70 | % |
Total expensesd | | | 1.57 | % | | | 1.50 | % | | | 1.51 | % | | | 1.58 | % | | | 1.63 | % |
Net expensesc | | | 1.54 | % | | | 1.49 | % | | | 1.49 | % | | | 1.56 | % | | | 1.57 | % |
Portfolio turnover rate | | | — | | | | — | | | | — | | | | 15 | % | | | — | |
Class C | | Year Ended
March 31,
2024 | | | Year Ended
March 31,
2023 | | | Year Ended
March 31,
2022 | | | Year Ended
March 31,
2021 | | | Year Ended
March 31,
2020 | |
Per Share Data |
Net asset value, beginning of period | | $ | 104.92 | | | $ | 128.84 | | | $ | 182.53 | | | $ | 87.00 | | | $ | 110.80 | |
Income (loss) from investment operations: |
Net investment income (loss)a | | | 3.51 | | | | .39 | | | | (3.48 | ) | | | (2.98 | ) | | | (.06 | ) |
Net gain (loss) on investments (realized and unrealized) | | | 39.33 | | | | (24.31 | ) | | | (50.21 | ) | | | 99.57 | | | | (22.50 | ) |
Total from investment operations | | | 42.84 | | | | (23.92 | ) | | | (53.69 | ) | | | 96.59 | | | | (22.56 | ) |
Less distributions from: |
Net investment income | | | (7.46 | ) | | | — | | | | — | | | | (1.06 | ) | | | (1.24 | ) |
Total distributions | | | (7.46 | ) | | | — | | | | — | | | | (1.06 | ) | | | (1.24 | ) |
Net asset value, end of period | | $ | 140.30 | | | $ | 104.92 | | | $ | 128.84 | | | $ | 182.53 | | | $ | 87.00 | |
|
Total Returnb | | | 43.33 | % | | | (18.57 | %) | | | (29.41 | %) | | | 111.34 | % | | | (20.75 | %) |
Ratios/Supplemental Data |
Net assets, end of period (in thousands) | | $ | 22 | | | $ | 4 | | | $ | 5 | | | $ | 53 | | | $ | 21 | |
Ratios to average net assets: |
Net investment income (loss) | | | 3.05 | % | | | 0.40 | % | | | (2.00 | %) | | | (2.02 | %) | | | (0.05 | %) |
Total expensesd | | | 2.30 | % | | | 2.30 | % | | | 2.25 | % | | | 2.32 | % | | | 2.38 | % |
Net expensesc | | | 2.27 | % | | | 2.30 | % | | | 2.24 | % | | | 2.30 | % | | | 2.32 | % |
Portfolio turnover rate | | | — | | | | — | | | | — | | | | 15 | % | | | — | |
76 | THE RYDEX FUNDS ANNUAL REPORT | SEE NOTES TO FINANCIAL STATEMENTS. |
FINANCIAL HIGHLIGHTS (concluded) |
This table is presented to show selected data for a share outstanding throughout each period and to assist shareholders in evaluating a Fund’s performance for the periods presented.
Class H | | Year Ended
March 31,
2024 | | | Year Ended
March 31,
2023 | | | Year Ended
March 31,
2022 | | | Year Ended
March 31,
2021 | | | Year Ended
March 31,
2020 | |
Per Share Data |
Net asset value, beginning of period | | $ | 118.13 | | | $ | 143.98 | | | $ | 202.65 | | | $ | 95.70 | | | $ | 120.89 | |
Income (loss) from investment operations: |
Net investment income (loss)a | | | 4.48 | | | | 1.64 | | | | (2.25 | ) | | | (2.07 | ) | | | .90 | |
Net gain (loss) on investments (realized and unrealized) | | | 45.28 | | | | (27.49 | ) | | | (56.42 | ) | | | 110.08 | | | | (24.85 | ) |
Total from investment operations | | | 49.76 | | | | (25.85 | ) | | | (58.67 | ) | | | 108.01 | | | | (23.95 | ) |
Less distributions from: |
Net investment income | | | (7.46 | ) | | | — | | | | — | | | | (1.06 | ) | | | (1.24 | ) |
Total distributions | | | (7.46 | ) | | | — | | | | — | | | | (1.06 | ) | | | (1.24 | ) |
Net asset value, end of period | | $ | 160.43 | | | $ | 118.13 | | | $ | 143.98 | | | $ | 202.65 | | | $ | 95.70 | |
|
Total Return | | | 44.34 | % | | | (17.95 | %) | | | (28.95 | %) | | | 112.94 | % | | | (20.17 | %) |
Ratios/Supplemental Data |
Net assets, end of period (in thousands) | | $ | 2,338 | | | $ | 7,347 | | | $ | 1,049 | | | $ | 1,560 | | | $ | 817 | |
Ratios to average net assets: |
Net investment income (loss) | | | 3.54 | % | | | 1.48 | % | | | (1.22 | %) | | | (1.27 | %) | | | 0.69 | % |
Total expensesd | | | 1.58 | % | | | 1.54 | % | | | 1.51 | % | | | 1.58 | % | | | 1.63 | % |
Net expensesc | | | 1.56 | % | | | 1.53 | % | | | 1.49 | % | | | 1.56 | % | | | 1.58 | % |
Portfolio turnover rate | | | — | | | | — | | | | — | | | | 15 | % | | | — | |
a | Net investment income (loss) per share was computed using average shares outstanding throughout the period. |
b | Total return does not reflect the impact of any applicable sales charges. |
c | Net expense information reflects the expense ratios after expense waivers and reimbursements, as applicable. |
d | Does not include expenses of the underlying funds in which the Fund invests. |
SEE NOTES TO FINANCIAL STATEMENTS. | THE RYDEX FUNDS ANNUAL REPORT | 77 |
PERFORMANCE REPORT AND FUND PROFILE (Unaudited) | March 31, 2024 |
STRENGTHENING DOLLAR 2x STRATEGY FUND
OBJECTIVE: Seeks to provide investment results that match the performance of a specific benchmark, before fees and expenses, on a daily basis. The Fund’s current benchmark is 200% of the performance of the U.S. Dollar Index® (the “underlying index”). The Fund does not seek to achieve its investment objective over a period of time greater than one day.
For the Reporting Period, Strengthening Dollar 2x Strategy Fund maintained a daily correlation of over 99% to its benchmark of 200% of the daily price movement of the underlying index. Strengthening Dollar 2x Strategy Fund Class H returned 10.35%, compared with a return of 1.99% for the underlying index.
The Japanese Yen was the leading contributor to the underlying index during the Reporting Period, followed by the Euro and the Swedish Krona. The British Pound and Swiss Franc detracted the most from the underlying index during the Reporting Period.
Derivatives in the Fund were used to help provide exposure to the composition of the benchmark in the highest efficient manner and to provide leverage and not for hedging purposes. The results of derivatives use during the period were within our expectations.
Due to the compounding of daily returns, the leveraged and inverse returns over periods other than one day will likely differ in amount and possibly direction from the benchmark return for the same period. Investors should monitor their Fund holdings to ensure that they are consistent with their strategies, as frequently as daily.
The effects of compounding may cause the longer-term correlation of the Fund to its benchmark to diminish. The apparent discrepancy between the leveraged and unleveraged indices is the result of compounding, which is described briefly on page 6 of this report.
Performance displayed represents past performance, which is no guarantee of future results.
Holdings Diversification (Market Exposure as % of Net Assets)
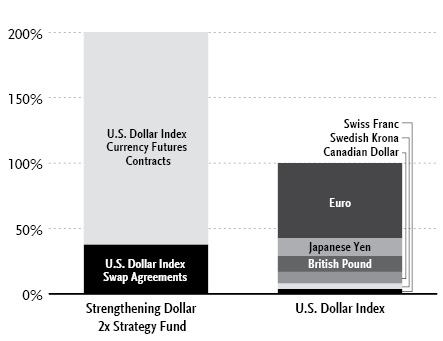
“Holdings Diversification (Market Exposure as % of Net Assets)” excludes any temporary cash investments.
Inception Dates: |
Class A | May 25, 2005 |
Class C | May 25, 2005 |
Class H | May 25, 2005 |
The Fund invests principally in derivative investments such as swap agreements and futures contracts.
78 | THE RYDEX FUNDS ANNUAL REPORT | |
PERFORMANCE REPORT AND FUND PROFILE (Unaudited)(concluded) | March 31, 2024 |
Cumulative Fund Performance*
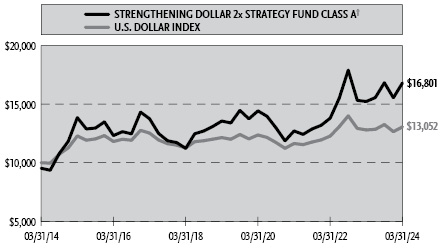
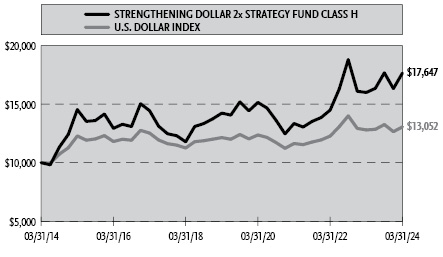
Average Annual Returns*
Periods Ended March 31, 2024
| 1 Year | 5 Year | 10 Year |
Class A Shares | 10.36% | 4.39% | 5.84% |
Class A Shares with sales charge† | 5.11% | 3.37% | 5.33% |
Class C Shares | 9.57% | 3.62% | 5.05% |
Class C Shares with CDSC‡ | 8.57% | 3.62% | 5.05% |
Class H Shares | 10.35% | 4.40% | 5.84% |
U.S. Dollar Index | 1.99% | 1.45% | 2.70% |
* | The performance data above represents past performance that is not predictive of future results. The investment return and principal value of an investment in the Fund will fluctuate so that an investor’s shares, when redeemed, may be worth more or less than their original cost. Returns are historical and include changes in principal and reinvested dividends and capital gains and do not reflect the effect of taxes. The U.S. Dollar Index is an unmanaged index and, unlike the Fund, has no management fees or operating expenses to reduce its reported return. The graphs are based on Class A and Class H shares only; performance for Class C shares will vary due to differences in fee structure. |
† | Fund returns are calculated using the maximum sales charge of 4.75%. |
‡ | Fund returns include a CDSC of 1% if redeemed within 12 months of purchase. |
| | THE RYDEX FUNDS ANNUAL REPORT | 79 |
SCHEDULE OF INVESTMENTS | March 31, 2024 |
STRENGTHENING DOLLAR 2x STRATEGY FUND | |
| | Face
Amount | | | Value | |
U.S. TREASURY BILLS†† - 3.5% |
U.S. Treasury Bills |
5.17% due 04/16/241,2 | | $ | 85,000 | | | $ | 84,814 | |
Total U.S. Treasury Bills | | | | |
(Cost $84,814) | | | | | | | 84,814 | |
| | | | | | | | | |
REPURCHASE AGREEMENTS††,3 - 94.8% |
J.P. Morgan Securities LLC
issued 03/28/24 at 5.31%
due 04/01/244 | | | 1,333,669 | | | | 1,333,669 | |
BofA Securities, Inc.
issued 03/28/24 at 5.31%
due 04/01/244 | | | 512,950 | | | | 512,950 | |
Barclays Capital, Inc.
issued 03/28/24 at 5.30%
due 04/01/244 | | | 464,944 | | | | 464,944 | |
Total Repurchase Agreements | | | | |
(Cost $2,311,563) | | | | | | | 2,311,563 | |
| | | | | | | | | |
Total Investments - 98.3% | | | | |
(Cost $2,396,377) | | $ | 2,396,377 | |
Other Assets & Liabilities, net - 1.7% | | | 41,894 | |
Total Net Assets - 100.0% | | $ | 2,438,271 | |
Futures Contracts |
Description | | Number of
Contracts | | | Expiration
Date | | | Notional
Amount | | | Value and
Unrealized
Appreciation** | |
Currency Futures Contracts Purchased† |
U.S. Dollar Index Futures Contracts | | | 38 | | | | Jun 2024 | | | $ | 3,962,640 | | | $ | 61,910 | |
Total Return Swap Agreements |
Counterparty | Index | Type | Financing
Rate | | Payment
Frequency | | | Maturity
Date | | | Units | | | Notional
Amount | | | Value and
Unrealized
Appreciation | |
OTC Currency Index Swap Agreements†† |
Goldman Sachs International | U.S. Dollar Index | Receive | N/A | | | At Maturity | | | | 06/24/24 | | | | 8,807 | | | $ | 917,533 | | | $ | 11,081 | |
** | Includes cumulative appreciation (depreciation). Variation margin is reported within the Statement of Assets and Liabilities. |
† | Value determined based on Level 1 inputs — See Note 4. |
†† | Value determined based on Level 2 inputs — See Note 4. |
1 | All or a portion of this security is pledged as futures collateral at March 31, 2024. |
2 | Rate indicated is the effective yield at the time of purchase. |
3 | Repurchase Agreements — See Note 6. |
4 | All or a portion of this security is pledged as currency index swap collateral at March 31, 2024. |
| | |
| | See Sector Classification in Other Information section. |
80 | THE RYDEX FUNDS ANNUAL REPORT | SEE NOTES TO FINANCIAL STATEMENTS. |
SCHEDULE OF INVESTMENTS (concluded) | March 31, 2024 |
STRENGTHENING DOLLAR 2x STRATEGY FUND | |
The following table summarizes the inputs used to value the Fund’s investments at March 31, 2024 (See Note 4 in the Notes to Financial Statements):
Investments in Securities (Assets) | | Level 1
Quoted
Prices | | | Level 2
Significant
Observable
Inputs | | | Level 3
Significant
Unobservable
Inputs | | | Total | |
U.S. Treasury Bills | | $ | — | | | $ | 84,814 | | | $ | — | | | $ | 84,814 | |
Repurchase Agreements | | | — | | | | 2,311,563 | | | | — | | | | 2,311,563 | |
Currency Futures Contracts** | | | 61,910 | | | | — | | | | — | | | | 61,910 | |
Currency Index Swap Agreements** | | | — | | | | 11,081 | | | | — | | | | 11,081 | |
Total Assets | | $ | 61,910 | | | $ | 2,407,458 | | | $ | — | | | $ | 2,469,368 | |
** | This derivative is reported as unrealized appreciation/depreciation at period end. |
SEE NOTES TO FINANCIAL STATEMENTS. | THE RYDEX FUNDS ANNUAL REPORT | 81 |
STRENGTHENING DOLLAR 2x STRATEGY FUND | |
STATEMENT OF ASSETS AND LIABILITIES |
March 31, 2024 |
Assets: |
Investments, at value (cost $84,814) | | $ | 84,814 | |
Repurchase agreements, at value (cost $2,311,563) | | | 2,311,563 | |
Unrealized appreciation on OTC swap agreements | | | 11,081 | |
Receivables: |
Fund shares sold | | | 34,211 | |
Variation margin on futures contracts | | | 7,990 | |
Interest | | | 1,363 | |
Total assets | | | 2,451,022 | |
| | | | | |
Liabilities: |
Payable for: |
Licensing fees | | | 5,662 | |
Management fees | | | 1,950 | |
Transfer agent and administrative fees | | | 1,193 | |
Professional fees | | | 723 | |
Swap settlement | | | 628 | |
Distribution and service fees | | | 545 | |
Printing fees | | | 461 | |
Portfolio accounting and administration fees | | | 114 | |
Trustees’ fees* | | | 34 | |
Miscellaneous | | | 1,441 | |
Total liabilities | | | 12,751 | |
Net assets | | $ | 2,438,271 | |
| | | | | |
Net assets consist of: |
Paid in capital | | $ | 22,758,115 | |
Total distributable earnings (loss) | | | (20,319,844 | ) |
Net assets | | $ | 2,438,271 | |
Class A: |
Net assets | | $ | 425,142 | |
Capital shares outstanding | | | 6,772 | |
Net asset value per share | | $ | 62.78 | |
Maximum offering price per share (Net asset value divided by 95.25%) | | $ | 65.91 | |
Class C: |
Net assets | | $ | 9,124 | |
Capital shares outstanding | | | 170 | |
Net asset value per share | | $ | 53.82 | |
Class H: |
Net assets | | $ | 2,004,005 | |
Capital shares outstanding | | | 32,039 | |
Net asset value per share | | $ | 62.55 | |
STATEMENT OF OPERATIONS |
Year Ended March 31, 2024 |
Investment Income: |
Interest | | $ | 251,629 | |
Total investment income | | | 251,629 | |
| | | | | |
Expenses: |
Management fees | | | 42,834 | |
Distribution and service fees: | | | | |
Class A | | | 1,227 | |
Class C | | | 193 | |
Class H | | | 10,623 | |
Transfer agent fees | | | 10,460 | |
Licensing fees | | | 8,104 | |
Portfolio accounting and administration fees | | | 7,255 | |
Registration fees | | | 5,817 | |
Professional fees | | | 1,771 | |
Trustees’ fees* | | | 1,046 | |
Custodian fees | | | 666 | |
Miscellaneous | | | 721 | |
Total expenses | | | 90,717 | |
Less: |
Expenses reimbursed by Adviser | | | (3,612 | ) |
Total waived expenses | | | (3,612 | ) |
Net expenses | | | 87,105 | |
Net investment income | | | 164,524 | |
| | | | | |
Net Realized and Unrealized Gain (Loss): |
Net realized gain (loss) on: |
Swap agreements | | | (219,970 | ) |
Futures contracts | | | (434,271 | ) |
Net realized loss | | | (654,241 | ) |
Net change in unrealized appreciation (depreciation) on: |
Investments | | | 5 | |
Swap agreements | | | 119,467 | |
Futures contracts | | | 334,330 | |
Net change in unrealized appreciation (depreciation) | | | 453,802 | |
Net realized and unrealized loss | | | (200,439 | ) |
Net decrease in net assets resulting from operations | | $ | (35,915 | ) |
* | Relates to Trustees not deemed “interested persons” within the meaning of Section 2(a)(19) of the 1940 Act. |
82 | THE RYDEX FUNDS ANNUAL REPORT | SEE NOTES TO FINANCIAL STATEMENTS. |
STRENGTHENING DOLLAR 2x STRATEGY FUND | |
STATEMENTS OF CHANGES IN NET ASSETS |
| | Year Ended
March 31,
2024 | | | Year Ended
March 31,
2023 | |
Increase (Decrease) in Net Assets from Operations: | | | | | | | | |
Net investment income | | $ | 164,524 | | | $ | 98,138 | |
Net realized loss on investments | | | (654,241 | ) | | | (1,142,027 | ) |
Net change in unrealized appreciation (depreciation) on investments | | | 453,802 | | | | (268,516 | ) |
Net decrease in net assets resulting from operations | | | (35,915 | ) | | | (1,312,405 | ) |
| | | | | | | | | |
Distributions to shareholders: | | | | | | | | |
Class A | | | (8,436 | ) | | | — | |
Class C | | | (601 | ) | | | — | |
Class H | | | (71,717 | ) | | | — | |
Total distributions to shareholders | | | (80,754 | ) | | | — | |
| | | | | | | | | |
Capital share transactions: | | | | | | | | |
Proceeds from sale of shares | | | | | | | | |
Class A | | | 683,629 | | | | 2,713,416 | |
Class C | | | 94,305 | | | | 147,526 | |
Class H | | | 37,742,379 | | | | 88,021,425 | |
Distributions reinvested | | | | | | | | |
Class A | | | 7,532 | | | | — | |
Class C | | | 206 | | | | — | |
Class H | | | 71,112 | | | | — | |
Cost of shares redeemed | | | | | | | | |
Class A | | | (931,162 | ) | | | (3,204,200 | ) |
Class C | | | (120,696 | ) | | | (146,172 | ) |
Class H | | | (42,250,193 | ) | | | (84,208,343 | ) |
Net increase (decrease) from capital share transactions | | | (4,702,888 | ) | | | 3,323,652 | |
Net increase (decrease) in net assets | | | (4,819,557 | ) | | | 2,011,247 | |
| | | | | | | | | |
Net assets: | | | | | | | | |
Beginning of year | | | 7,257,828 | | | | 5,246,581 | |
End of year | | $ | 2,438,271 | | | $ | 7,257,828 | |
| | | | | | | | | |
Capital share activity: | | | | | | | | |
Shares sold | | | | | | | | |
Class A | | | 11,321 | | | | 45,340 | |
Class C | | | 1,775 | | | | 2,822 | |
Class H | | | 621,543 | | | | 1,387,213 | |
Shares issued from reinvestment of distributions | | | | | | | | |
Class A | | | 124 | | | | — | |
Class C | | | 4 | | | | — | |
Class H | | | 1,175 | | | | — | |
Shares redeemed | | | | | | | | |
Class A | | | (15,415 | ) | | | (54,039 | ) |
Class C | | | (2,371 | ) | | | (2,790 | ) |
Class H | | | (704,670 | ) | | | (1,353,118 | ) |
Net increase (decrease) in shares | | | (86,514 | ) | | | 25,428 | |
SEE NOTES TO FINANCIAL STATEMENTS. | THE RYDEX FUNDS ANNUAL REPORT | 83 |
STRENGTHENING DOLLAR 2x STRATEGY FUND | |
This table is presented to show selected data for a share outstanding throughout each period and to assist shareholders in evaluating a Fund’s performance for the periods presented.
Class A | | Year Ended
March 31,
2024 | | | Year Ended
March 31,
2023 | | | Year Ended
March 31,
2022 | | | Year Ended
March 31,
2021 | | | Year Ended
March 31,
2020 | |
Per Share Data |
Net asset value, beginning of period | | $ | 58.06 | | | $ | 52.63 | | | $ | 48.47 | | | $ | 55.34 | | | $ | 52.46 | |
Income (loss) from investment operations: |
Net investment income (loss)a | | | 2.11 | | | | .38 | | | | (.64 | ) | | | (.64 | ) | | | .16 | |
Net gain (loss) on investments (realized and unrealized) | | | 3.88 | e | | | 5.05 | e | | | 4.80 | | | | (5.95 | ) | | | 3.17 | |
Total from investment operations | | | 5.99 | | | | 5.43 | | | | 4.16 | | | | (6.59 | ) | | | 3.33 | |
Less distributions from: |
Net investment income | | | (1.27 | ) | | | — | | | | — | | | | (.28 | ) | | | (.45 | ) |
Total distributions | | | (1.27 | ) | | | — | | | | — | | | | (.28 | ) | | | (.45 | ) |
Net asset value, end of period | | $ | 62.78 | | | $ | 58.06 | | | $ | 52.63 | | | $ | 48.47 | | | $ | 55.34 | |
|
Total Returnb | | | 10.36 | % | | | 10.32 | % | | | 8.58 | % | | | (11.88 | %) | | | 6.38 | % |
Ratios/Supplemental Data |
Net assets, end of period (in thousands) | | $ | 425 | | | $ | 624 | | | $ | 1,023 | | | $ | 1,464 | | | $ | 2,535 | |
Ratios to average net assets: |
Net investment income (loss) | | | 3.50 | % | | | 0.64 | % | | | (1.32 | %) | | | (1.26 | %) | | | 0.29 | % |
Total expensesc | | | 1.91 | % | | | 1.82 | % | | | 1.89 | % | | | 1.91 | % | | | 2.00 | % |
Net expensesd | | | 1.83 | % | | | 1.79 | % | | | 1.86 | % | | | 1.87 | % | | | 1.96 | % |
Portfolio turnover rate | | | — | | | | — | | | | — | | | | — | | | | — | |
Class C | | Year Ended
March 31,
2024 | | | Year Ended
March 31,
2023 | | | Year Ended
March 31,
2022 | | | Year Ended
March 31,
2021 | | | Year Ended
March 31,
2020 | |
Per Share Data |
Net asset value, beginning of period | | $ | 50.31 | | | $ | 45.94 | | | $ | 42.62 | | | $ | 49.08 | | | $ | 46.91 | |
Income (loss) from investment operations: |
Net investment income (loss)a | | | 1.38 | | | | .23 | | | | (.87 | ) | | | (.90 | ) | | | (.16 | ) |
Net gain (loss) on investments (realized and unrealized) | | | 3.40 | e | | | 4.14 | e | | | 4.19 | | | | (5.28 | ) | | | 2.78 | |
Total from investment operations | | | 4.78 | | | | 4.37 | | | | 3.32 | | | | (6.18 | ) | | | 2.62 | |
Less distributions from: |
Net investment income | | | (1.27 | ) | | | — | | | | — | | | | (.28 | ) | | | (.45 | ) |
Total distributions | | | (1.27 | ) | | | — | | | | — | | | | (.28 | ) | | | (.45 | ) |
Net asset value, end of period | | $ | 53.82 | | | $ | 50.31 | | | $ | 45.94 | | | $ | 42.62 | | | $ | 49.08 | |
|
Total Returnb | | | 9.57 | % | | | 9.51 | % | | | 7.79 | % | | | (12.56 | %) | | | 5.62 | % |
Ratios/Supplemental Data |
Net assets, end of period (in thousands) | | $ | 9 | | | $ | 38 | | | $ | 34 | | | $ | 35 | | | $ | 96 | |
Ratios to average net assets: |
Net investment income (loss) | | | 2.66 | % | | | 0.43 | % | | | (2.07 | %) | | | (2.00 | %) | | | (0.33 | %) |
Total expensesc | | | 2.64 | % | | | 2.56 | % | | | 2.66 | % | | | 2.67 | % | | | 2.77 | % |
Net expensesd | | | 2.57 | % | | | 2.52 | % | | | 2.62 | % | | | 2.63 | % | | | 2.72 | % |
Portfolio turnover rate | | | — | | | | — | | | | — | | | | — | | | | — | |
84 | THE RYDEX FUNDS ANNUAL REPORT | SEE NOTES TO FINANCIAL STATEMENTS. |
STRENGTHENING DOLLAR 2x STRATEGY FUND | |
FINANCIAL HIGHLIGHTS (concluded) |
This table is presented to show selected data for a share outstanding throughout each period and to assist shareholders in evaluating a Fund’s performance for the periods presented.
Class H | | Year Ended
March 31,
2024 | | | Year Ended
March 31,
2023 | | | Year Ended
March 31,
2022 | | | Year Ended
March 31,
2021 | | | Year Ended
March 31,
2020 | |
Per Share Data |
Net asset value, beginning of period | | $ | 57.86 | | | $ | 52.44 | | | $ | 48.29 | | | $ | 55.12 | | | $ | 52.25 | |
Income (loss) from investment operations: |
Net investment income (loss)a | | | 2.07 | | | | .67 | | | | (.66 | ) | | | (.70 | ) | | | .12 | |
Net gain (loss) on investments (realized and unrealized) | | | 3.89 | d | | | 4.75 | e | | | 4.81 | | | | (5.85 | ) | | | 3.20 | |
Total from investment operations | | | 5.96 | | | | 5.42 | | | | 4.15 | | | | (6.55 | ) | | | 3.32 | |
Less distributions from: |
Net investment income | | | (1.27 | ) | | | — | | | | — | | | | (.28 | ) | | | (.45 | ) |
Total distributions | | | (1.27 | ) | | | — | | | | — | | | | (.28 | ) | | | (.45 | ) |
Net asset value, end of period | | $ | 62.55 | | | $ | 57.86 | | | $ | 52.44 | | | $ | 48.29 | | | $ | 55.12 | |
|
Total Return | | | 10.35 | % | | | 10.34 | % | | | 8.59 | % | | | (11.86 | %) | | | 6.39 | % |
Ratios/Supplemental Data |
Net assets, end of period (in thousands) | | $ | 2,004 | | | $ | 6,596 | | | $ | 4,190 | | | $ | 2,437 | | | $ | 10,549 | |
Ratios to average net assets: |
Net investment income (loss) | | | 3.46 | % | | | 1.08 | % | | | (1.36 | %) | | | (1.36 | %) | | | 0.22 | % |
Total expensesc | | | 1.90 | % | | | 1.81 | % | | | 1.89 | % | | | 1.94 | % | | | 2.00 | % |
Net expensesd | | | 1.83 | % | | | 1.77 | % | | | 1.85 | % | | | 1.90 | % | | | 1.96 | % |
Portfolio turnover rate | | | — | | | | — | | | | — | | | | — | | | | — | |
a | Net investment income (loss) per share was computed using average shares outstanding throughout the period. |
b | Total return does not reflect the impact of any applicable sales charges. |
c | Does not include expenses of the underlying funds in which the Fund invests. |
d | Net expense information reflects the expense ratios after expense waivers and reimbursements, as applicable. |
e | The amount shown for a share outstanding throughout the period does not agree with the aggregate net gain on investments for the period because of the sales and purchases of fund shares in relation to fluctuating market value of the investments of the Fund. |
SEE NOTES TO FINANCIAL STATEMENTS. | THE RYDEX FUNDS ANNUAL REPORT | 85 |
PERFORMANCE REPORT AND FUND PROFILE (Unaudited) | March 31, 2024 |
WEAKENING DOLLAR 2x STRATEGY FUND
OBJECTIVE: Seeks to provide investment results that match, before fees and expenses, the performance of a specific benchmark on a daily basis. The Fund’s current benchmark is 200% of the inverse (opposite) of the performance of the U.S. Dollar Index (the “underlying index”). The Fund does not seek to achieve its investment objective over a period of time greater than one day.
For the Reporting Period, Weakening Dollar 2x Strategy Fund maintained a daily correlation of over 99% to its benchmark of -200% of the daily price movement of the underlying index. Weakening Dollar 2x Strategy Fund Class H returned -4.64%, compared with a return of 1.99% for the underlying index.
The Japanese Yen was the leading contributor to the underlying index during the Reporting Period, followed by the Euro and the Swedish Krona. The British Pound and Swiss Franc detracted the most from the underlying index during the Reporting Period.
Derivatives in the Fund were used to help provide exposure to the composition of the benchmark in the highest efficient manner and to provide leverage and not for hedging purposes. The results of derivatives use during the period were within our expectations.
Due to the compounding of daily returns, leveraged and inverse returns over periods other than one day will likely differ in amount and possibly direction from the benchmark return for the same period. Investors should monitor their Fund holdings to ensure that they are consistent with their strategies, as frequently as daily.
The effects of compounding may cause the longer-term correlation of the Fund to its benchmark to diminish. The apparent discrepancy between the leveraged and unleveraged indices is the result of compounding, which is described briefly on page 6 of this report.
Performance displayed represents past performance, which is no guarantee of future results.
Holdings Diversification (Market Exposure as % of Net Assets)
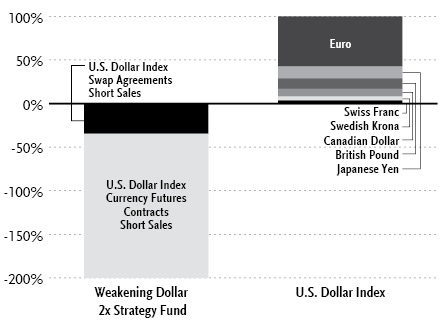
“Holdings Diversification (Market Exposure as % of Net Assets)” excludes any temporary cash investments.
Inception Dates: |
Class A | May 25, 2005 |
Class C | May 25, 2005 |
Class H | May 25, 2005 |
The Fund invests principally in derivative investments such as swap agreements and futures contracts.
86 | THE RYDEX FUNDS ANNUAL REPORT | |
PERFORMANCE REPORT AND FUND PROFILE (Unaudited)(concluded) | March 31, 2024 |
Cumulative Fund Performance*
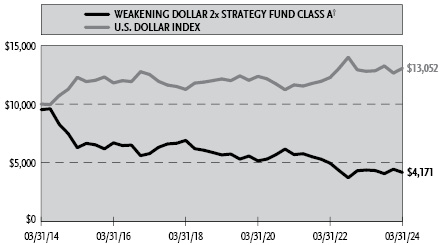
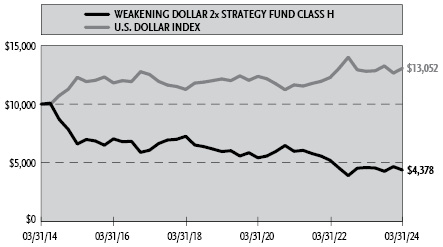
Average Annual Returns*
Periods Ended March 31, 2024
| 1 Year | 5 Year | 10 Year |
Class A Shares | (4.65%) | (5.94%) | (7.93%) |
Class A Shares with sales charge† | (9.18%) | (6.86%) | (8.37%) |
Class C Shares | (5.51%) | (6.68%) | (8.63%) |
Class C Shares with CDSC‡ | (6.45%) | (6.68%) | (8.63%) |
Class H Shares | (4.64%) | (5.96%) | (7.93%) |
U.S. Dollar Index | 1.99% | 1.45% | 2.70% |
* | The performance data above represents past performance that is not predictive of future results. The investment return and principal value of an investment in the Fund will fluctuate so that an investor’s shares, when redeemed, may be worth more or less than their original cost. Returns are historical and include changes in principal and reinvested dividends and capital gains and do not reflect the effect of taxes. The U.S. Dollar Index is an unmanaged index and, unlike the Fund, has no management fees or operating expenses to reduce its reported return. The graphs are based on A-Class and H-Class shares only; performance for C-Class shares will vary due to differences in fee structure. |
† | Fund returns are calculated using the maximum sales charge of 4.75%. |
‡ | Fund returns include a CDSC of 1% if redeemed within 12 months of purchase. |
| | THE RYDEX FUNDS ANNUAL REPORT | 87 |
SCHEDULE OF INVESTMENTS | March 31, 2024 |
WEAKENING DOLLAR 2x STRATEGY FUND | |
| | Face
Amount | | | Value | |
U.S. TREASURY BILLS†† - 2.7% |
U.S. Treasury Bills |
5.17% due 04/16/241,2 | | $ | 25,000 | | | $ | 24,945 | |
Total U.S. Treasury Bills | | | | |
(Cost $24,945) | | | | | | | 24,945 | |
| | | | | | | | | |
REPURCHASE AGREEMENTS††,3 - 98.4% |
J.P. Morgan Securities LLC
issued 03/28/24 at 5.31%
due 04/01/244 | | | 536,582 | | | | 536,582 | |
BofA Securities, Inc.
issued 03/28/24 at 5.31%
due 04/01/244 | | | 206,378 | | | | 206,378 | |
Barclays Capital, Inc.
issued 03/28/24 at 5.30%
due 04/01/244 | | | 187,063 | | | | 187,063 | |
Total Repurchase Agreements | | | | |
(Cost $930,023) | | | | | | | 930,023 | |
| | | | | | | | | |
Total Investments - 101.1% | | | | |
(Cost $954,968) | | $ | 954,968 | |
Other Assets & Liabilities, net - (1.1)% | | | (10,074 | ) |
Total Net Assets - 100.0% | | $ | 944,894 | |
Futures Contracts |
Description | | Number of
Contracts | | | Expiration
Date | | | Notional
Amount | | | Value and
Unrealized
Depreciation** | |
Currency Futures Contracts Sold Short† |
U.S. Dollar Index Futures Contracts | | | 15 | | | | Jun 2024 | | | $ | 1,564,200 | | | $ | (24,929 | ) |
Total Return Swap Agreements |
Counterparty | Index | Type | Financing
Rate | | Payment
Frequency | | | Maturity
Date | | | Units | | | Notional
Amount | | | Value and
Unrealized
Depreciation | |
OTC Currency Index Swap Agreements Sold Short†† |
Goldman Sachs International | U.S. Dollar Index | Pay | N/A | | | At Maturity | | | | 06/24/24 | | | | 3,127 | | | $ | 325,745 | | | $ | (2,180 | ) |
** | Includes cumulative appreciation (depreciation). Variation margin is reported within the Statement of Assets and Liabilities. |
† | Value determined based on Level 1 inputs — See Note 4. |
†† | Value determined based on Level 2 inputs — See Note 4. |
1 | All or a portion of this security is pledged as futures collateral at March 31, 2024. |
2 | Rate indicated is the effective yield at the time of purchase. |
3 | Repurchase Agreements — See Note 6. |
4 | All or a portion of this security is pledged as currency index swap collateral at March 31, 2024. |
| | |
| | See Sector Classification in Other Information section. |
88 | THE RYDEX FUNDS ANNUAL REPORT | SEE NOTES TO FINANCIAL STATEMENTS. |
SCHEDULE OF INVESTMENTS (concluded) | March 31, 2024 |
WEAKENING DOLLAR 2x STRATEGY FUND | |
The following table summarizes the inputs used to value the Fund’s investments at March 31, 2024 (See Note 4 in the Notes to Financial Statements):
Investments in Securities (Assets) | | Level 1
Quoted
Prices | | | Level 2
Significant
Observable
Inputs | | | Level 3
Significant
Unobservable
Inputs | | | Total | |
U.S. Treasury Bills | | $ | — | | | $ | 24,945 | | | $ | — | | | $ | 24,945 | |
Repurchase Agreements | | | — | | | | 930,023 | | | | — | | | | 930,023 | |
Total Assets | | $ | — | | | $ | 954,968 | | | $ | — | | | $ | 954,968 | |
Investments in Securities (Liabilities) | | Level 1
Quoted
Prices | | | Level 2
Significant
Observable
Inputs | | | Level 3
Significant
Unobservable
Inputs | | | Total | |
Currency Futures Contracts** | | $ | 24,929 | | | $ | — | | | $ | — | | | $ | 24,929 | |
Currency Index Swap Agreements** | | | — | | | | 2,180 | | | | — | | | | 2,180 | |
Total Liabilities | | $ | 24,929 | | | $ | 2,180 | | | $ | — | | | $ | 27,109 | |
** | This derivative is reported as unrealized appreciation/depreciation at period end. |
SEE NOTES TO FINANCIAL STATEMENTS. | THE RYDEX FUNDS ANNUAL REPORT | 89 |
WEAKENING DOLLAR 2x STRATEGY FUND | |
STATEMENT OF ASSETS AND LIABILITIES |
March 31, 2024 |
Assets: |
Investments, at value (cost $24,945) | | $ | 24,945 | |
Repurchase agreements, at value (cost $930,023) | | | 930,023 | |
Segregated cash with broker | | | 2,194 | |
Receivables: |
Interest | | | 549 | |
Fund shares sold | | | 20 | |
Total assets | | | 957,731 | |
| | | | | |
Liabilities: |
Unrealized depreciation on OTC swap agreements | | | 2,180 | |
Payable for: |
Variation margin on futures contracts | | | 3,240 | |
Fund shares redeemed | | | 2,083 | |
Licensing fees | | | 1,997 | |
Swap settlement | | | 1,029 | |
Management fees | | | 759 | |
Transfer agent fees | | | 432 | |
Distribution and service fees | | | 211 | |
Portfolio accounting and administration fees | | | 44 | |
Trustees’ fees* | | | 11 | |
Miscellaneous | | | 851 | |
Total liabilities | | | 12,837 | |
Net assets | | $ | 944,894 | |
| | | | | |
Net assets consist of: |
Paid in capital | | $ | 11,362,549 | |
Total distributable earnings (loss) | | | (10,417,655 | ) |
Net assets | | $ | 944,894 | |
Class A: |
Net assets | | $ | 207,284 | |
Capital shares outstanding | | | 4,487 | |
Net asset value per share | | $ | 46.20 | |
Maximum offering price per share (Net asset value divided by 95.25%) | | $ | 48.50 | |
Class C: |
Net assets | | $ | 269 | |
Capital shares outstanding | | | 7 | |
Net asset value per share | | $ | 39.45 | |
Class H: |
Net assets | | $ | 737,341 | |
Capital shares outstanding | | | 15,989 | |
Net asset value per share | | $ | 46.12 | |
STATEMENT OF OPERATIONS |
Year Ended March 31, 2024 |
Investment Income: |
Interest | | $ | 72,217 | |
Total investment income | | | 72,217 | |
| | | | | |
Expenses: |
Management fees | | | 12,244 | |
Distribution and service fees: |
Class A | | | 587 | |
Class C | | | 71 | |
Class H | | | 2,796 | |
Transfer agent fees | | | 2,929 | |
Licensing fees | | | 2,407 | |
Portfolio accounting and administration fees | | | 2,074 | |
Registration fees | | | 1,316 | |
Professional fees | | | 541 | |
Trustees’ fees* | | | 226 | |
Custodian fees | | | 186 | |
Miscellaneous | | | 397 | |
Total expenses | | | 25,774 | |
Less: |
Expenses reimbursed by Adviser | | | (1,104 | ) |
Net expenses | | | 24,670 | |
Net investment income | | | 47,547 | |
| | | | | |
Net Realized and Unrealized Gain (Loss): |
Net realized gain (loss) on: |
Swap agreements | | | (87,099 | ) |
Futures contracts | | | (138,409 | ) |
Net realized loss | | | (225,508 | ) |
Net change in unrealized appreciation (depreciation) on: |
Investments | | | 1 | |
Swap agreements | | | (7,931 | ) |
Futures contracts | | | (84,663 | ) |
Net change in unrealized appreciation (depreciation) | | | (92,593 | ) |
Net realized and unrealized loss | | | (318,101 | ) |
Net decrease in net assets resulting from operations | | $ | (270,554 | ) |
* | Relates to Trustees not deemed “interested persons” within the meaning of Section 2(a)(19) of the 1940 Act. |
90 | THE RYDEX FUNDS ANNUAL REPORT | SEE NOTES TO FINANCIAL STATEMENTS. |
WEAKENING DOLLAR 2x STRATEGY FUND | |
STATEMENTS OF CHANGES IN NET ASSETS |
| | Year Ended
March 31,
2024 | | | Year Ended
March 31,
2023 | |
Increase (Decrease) in Net Assets from Operations: | | | | | | | | |
Net investment income | | $ | 47,547 | | | $ | 14,929 | |
Net realized loss on investments | | | (225,508 | ) | | | (150,896 | ) |
Net change in unrealized appreciation (depreciation) on investments | | | (92,593 | ) | | | 50,682 | |
Net decrease in net assets resulting from operations | | | (270,554 | ) | | | (85,285 | ) |
| | | | | | | | | |
Distributions to shareholders: | | | | | | | | |
Class A | | | (2,465 | ) | | | — | |
Class C | | | (4 | ) | | | — | |
Class H | | | (8,970 | ) | | | — | |
Total distributions to shareholders | | | (11,439 | ) | | | — | |
| | | | | | | | | |
Capital share transactions: | | | | | | | | |
Proceeds from sale of shares | | | | | | | | |
Class A | | | 87,160 | | | | 3,879,273 | |
Class C | | | 34,672 | | | | 67,534 | |
Class H | | | 14,094,456 | | | | 11,565,500 | |
Distributions reinvested | | | | | | | | |
Class A | | | 2,464 | | | | — | |
Class C | | | 4 | | | | — | |
Class H | | | 8,717 | | | | — | |
Cost of shares redeemed | | | | | | | | |
Class A | | | (91,457 | ) | | | (3,833,949 | ) |
Class C | | | (36,772 | ) | | | (79,468 | ) |
Class H | | | (14,466,225 | ) | | | (11,130,689 | ) |
Net increase (decrease) from capital share transactions | | | (366,981 | ) | | | 468,201 | |
Net increase (decrease) in net assets | | | (648,974 | ) | | | 382,916 | |
| | | | | | | | | |
Net assets: | | | | | | | | |
Beginning of year | | | 1,593,868 | | | | 1,210,952 | |
End of year | | $ | 944,894 | | | $ | 1,593,868 | |
| | | | | | | | | |
Capital share activity: | | | | | | | | |
Shares sold | | | | | | | | |
Class A | | | 1,793 | | | | 77,177 | |
Class C | | | 782 | | | | 1,745 | |
Class H | | | 287,573 | | | | 246,282 | |
Shares issued from reinvestment of distributions | | | | | | | | |
Class A | | | 52 | | | | — | |
Class C | | | — | | | | — | |
Class H | | | 186 | | | | — | |
Shares redeemed | | | | | | | | |
Class A | | | (1,950 | ) | | | (76,041 | ) |
Class C | | | (910 | ) | | | (1,915 | ) |
Class H | | | (299,670 | ) | | | (236,525 | ) |
Net increase (decrease) in shares | | | (12,144 | ) | | | 10,723 | |
SEE NOTES TO FINANCIAL STATEMENTS. | THE RYDEX FUNDS ANNUAL REPORT | 91 |
WEAKENING DOLLAR 2x STRATEGY FUND | |
This table is presented to show selected data for a share outstanding throughout each period and to assist shareholders in evaluating a Fund’s performance for the periods presented.
Class A | | Year Ended
March 31,
2024 | | | Year Ended
March 31,
2023 | | | Year Ended
March 31,
2022 | | | Year Ended
March 31,
2021 | | | Year Ended
March 31,
2020 | |
Per Share Data |
Net asset value, beginning of period | | $ | 48.96 | | | $ | 55.46 | | | $ | 63.71 | | | $ | 57.85 | | | $ | 63.74 | |
Income (loss) from investment operations: |
Net investment income (loss)a | | | 1.66 | | | | .52 | | | | (.74 | ) | | | (.84 | ) | | | .16 | |
Net gain (loss) on investments (realized and unrealized) | | | (3.93 | ) | | | (7.02 | ) | | | (7.51 | ) | | | 6.82 | | | | (5.84 | ) |
Total from investment operations | | | (2.27 | ) | | | (6.50 | ) | | | (8.25 | ) | | | 5.98 | | | | (5.68 | ) |
Less distributions from: |
Net investment income | | | (.49 | ) | | | — | | | | — | | | | (.12 | ) | | | (.21 | ) |
Total distributions | | | (.49 | ) | | | — | | | | — | | | | (.12 | ) | | | (.21 | ) |
Net asset value, end of period | | $ | 46.20 | | | $ | 48.96 | | | $ | 55.46 | | | $ | 63.71 | | | $ | 57.85 | |
|
Total Returnb | | | (4.65 | %) | | | (11.72 | %) | | | (12.95 | %) | | | 10.32 | % | | | (8.94 | %) |
Ratios/Supplemental Data |
Net assets, end of period (in thousands) | | $ | 207 | | | $ | 225 | | | $ | 192 | | | $ | 387 | | | $ | 237 | |
Ratios to average net assets: |
Net investment income (loss) | | | 3.48 | % | | | 1.10 | % | | | (1.18 | %) | | | (1.30 | %) | | | 0.26 | % |
Total expensesc | | | 1.91 | % | | | 1.74 | % | | | 1.90 | % | | | 1.90 | % | | | 2.01 | % |
Net expensesd | | | 1.83 | % | | | 1.69 | % | | | 1.84 | % | | | 1.86 | % | | | 2.00 | % |
Portfolio turnover rate | | | — | | | | — | | | | — | | | | 48 | % | | | — | |
Class C | | Year Ended
March 31,
2024 | | | Year Ended
March 31,
2023 | | | Year Ended
March 31,
2022 | | | Year Ended
March 31,
2021 | | | Year Ended
March 31,
2020 | |
Per Share Data |
Net asset value, beginning of period | | $ | 42.26 | | | $ | 48.23 | | | $ | 55.80 | | | $ | 51.07 | | | $ | 56.74 | |
Income (loss) from investment operations: |
Net investment income (loss)a | | | 1.20 | | | | .32 | | | | (1.06 | ) | | | (1.17 | ) | | | (.29 | ) |
Net gain (loss) on investments (realized and unrealized) | | | (3.52 | ) | | | (6.29 | ) | | | (6.51 | ) | | | 6.02 | | | | (5.17 | ) |
Total from investment operations | | | (2.32 | ) | | | (5.97 | ) | | | (7.57 | ) | | | 4.85 | | | | (5.46 | ) |
Less distributions from: |
Net investment income | | | (.49 | ) | | | — | | | | — | | | | (.12 | ) | | | (.21 | ) |
Total distributions | | | (.49 | ) | | | — | | | | — | | | | (.12 | ) | | | (.21 | ) |
Net asset value, end of period | | $ | 39.45 | | | $ | 42.26 | | | $ | 48.23 | | | $ | 55.80 | | | $ | 51.07 | |
|
Total Returnb | | | (5.51 | %) | | | (12.38 | %) | | | (13.57 | %) | | | 9.50 | % | | | (9.65 | %) |
Ratios/Supplemental Data |
Net assets, end of period (in thousands) | | $ | 0 | | | $ | 6 | | | $ | 15 | | | $ | 37 | | | $ | 21 | |
Ratios to average net assets: |
Net investment income (loss) | | | 2.87 | % | | | 0.81 | % | | | (1.93 | %) | | | (2.04 | %) | | | (0.53 | %) |
Total expensesc | | | 2.53 | % | | | 2.37 | % | | | 2.66 | % | | | 2.66 | % | | | 2.75 | % |
Net expensesd | | | 2.46 | % | | | 2.32 | % | | | 2.59 | % | | | 2.62 | % | | | 2.73 | % |
Portfolio turnover rate | | | — | | | | — | | | | — | | | | 48 | % | | | — | |
92 | THE RYDEX FUNDS ANNUAL REPORT | SEE NOTES TO FINANCIAL STATEMENTS. |
WEAKENING DOLLAR 2x STRATEGY FUND | |
FINANCIAL HIGHLIGHTS (concluded) |
This table is presented to show selected data for a share outstanding throughout each period and to assist shareholders in evaluating a Fund’s performance for the periods presented.
Class H | | Year Ended
March 31,
2024 | | | Year Ended
March 31,
2023 | | | Year Ended
March 31,
2022 | | | Year Ended
March 31,
2021 | | | Year Ended
March 31,
2020 | |
Per Share Data |
Net asset value, beginning of period | | $ | 48.87 | | | $ | 55.37 | | | $ | 63.59 | | | $ | 57.76 | | | $ | 63.67 | |
Income (loss) from investment operations: |
Net investment income (loss)a | | | 1.68 | | | | .55 | | | | (.73 | ) | | | (.93 | ) | | | .07 | |
Net gain (loss) on investments (realized and unrealized) | | | (3.94 | ) | | | (7.05 | ) | | | (7.49 | ) | | | 6.88 | | | | (5.77 | ) |
Total from investment operations | | | (2.26 | ) | | | (6.50 | ) | | | (8.22 | ) | | | 5.95 | | | | (5.70 | ) |
Less distributions from: |
Net investment income | | | (.49 | ) | | | — | | | | — | | | | (.12 | ) | | | (.21 | ) |
Total distributions | | | (.49 | ) | | | — | | | | — | | | | (.12 | ) | | | (.21 | ) |
Net asset value, end of period | | $ | 46.12 | | | $ | 48.87 | | | $ | 55.37 | | | $ | 63.59 | | | $ | 57.76 | |
|
Total Return | | | (4.64 | %) | | | (11.74 | %) | | | (12.93 | %) | | | 10.29 | % | | | (8.98 | %) |
Ratios/Supplemental Data |
Net assets, end of period (in thousands) | | $ | 737 | | | $ | 1,363 | | | $ | 1,005 | | | $ | 1,063 | | | $ | 1,308 | |
Ratios to average net assets: |
Net investment income (loss) | | | 3.50 | % | | | 1.18 | % | | | (1.17 | %) | | | (1.47 | %) | | | 0.12 | % |
Total expensesc | | | 1.89 | % | | | 1.74 | % | | | 1.90 | % | | | 1.88 | % | | | 1.99 | % |
Net expensesd | | | 1.81 | % | | | 1.69 | % | | | 1.84 | % | | | 1.86 | % | | | 1.97 | % |
Portfolio turnover rate | | | — | | | | — | | | | — | | | | 48 | % | | | — | |
a | Net investment income (loss) per share was computed using average shares outstanding throughout the period. |
b | Total return does not reflect the impact of any applicable sales charges. |
c | Does not include expenses of the underlying funds in which the Fund invests. |
d | Net expense information reflects the expense ratios after expense waivers and reimbursements, as applicable. |
SEE NOTES TO FINANCIAL STATEMENTS. | THE RYDEX FUNDS ANNUAL REPORT | 93 |
NOTES TO FINANCIAL STATEMENTS |
Note 1 – Organization and Significant Accounting Policies
Organization
The Rydex Series Funds (the “Trust”), a Delaware statutory trust, is registered with the U.S. Securities and Exchange Commission (the “SEC”) under the Investment Company Act of 1940 (the ”1940 Act”), as an open-ended investment company of the series type. Each series, in effect, is representing a separate fund (each, a “Fund”). The Trust may issue an unlimited number of authorized shares. The Trust accounts for the assets of each Fund separately.
The Trust offers a combination of seven separate classes of shares: Investor Class shares, Class A shares, Class C shares, Class H shares, Class P shares, Institutional Class shares and Money Market Class shares. Sales of shares of each Class are made without a front-end sales charge at the net asset value per share (“NAV”), with the exception of Class A shares.Class A shares are sold at the NAV, plus the applicable front-end sales charge. The sales charge varies depending on the amount purchased, but will not exceed 4.75%. Class A share purchases of $1 million or more are exempt from the front-end sales charge but have a 1% contingent deferred sales charge (“CDSC”) if shares are redeemed within 12 months of purchase. Class C shares have a 1% CDSC if shares are redeemed within 12 months of purchase. Class C shares of each Fund automatically convert to Class A shares of the same Fund on or about the 10th day of the month following the 8-year anniversary of the purchase of the Class C shares. This conversion will be executed without any sales charge, fee or other charge. After the conversion is completed, the shares will be subject to all features and expenses of Class A shares. Institutional Class shares are offered primarily for direct investment by institutions such as pension and profit sharing plans, endowments, foundations and corporations. Institutional Class shares require a minimum initial investment of $2 million and a minimum account balance of $1 million. At March 31, 2024, the Trust consisted of fifty-two funds.
This report covers the following funds (collectively, the “Funds”):
Fund Name | Investment
Company Type |
S&P 500® Pure Growth Fund | Non-diversified |
S&P 500® Pure Value Fund | Non-diversified |
S&P MidCap 400® Pure Growth Fund | Non-diversified |
S&P MidCap 400® Pure Value Fund | Non-diversified |
S&P SmallCap 600® Pure Growth Fund | Non-diversified |
S&P SmallCap 600® Pure Value Fund | Non-diversified |
Europe 1.25x Strategy Fund | Non-diversified |
Japan 2x Strategy Fund | Non-diversified |
Strengthening Dollar 2x Strategy Fund | Non-diversified |
Weakening Dollar 2x Strategy Fund | Non-diversified |
At March 31, 2024, Class A, Class C and Class H have been issued by the Funds.
The Funds are designed and operated to accommodate frequent trading by shareholders and, unlike most mutual funds, offer unlimited exchange privileges with no minimum holding periods or transactions fees, which may cause the Funds to experience high portfolio turnover.
Security Investors, LLC (the “Adviser”), which operates under the name Guggenheim Investments (“GI”), provides advisory services. Guggenheim Funds Distributors, LLC (“GFD”) serves as distributor of the Funds’ shares. GI and GFD are affiliated entities.
Significant Accounting Policies
The Funds operate as investment companies and, accordingly, follow the investment company accounting and reporting guidance of the Financial Accounting Standards Board (“FASB”) Accounting Standards Codification Topic 946 Financial Services – Investment Companies.
The following significant accounting policies are in conformity with U.S. generally accepted accounting principles (“U.S. GAAP”) and are consistently followed by the Trust. This requires management to make estimates and assumptions that affect the reported amount of assets and liabilities, contingent assets and liabilities at the date of the financial statements, and the reported amounts of revenues and expenses during the reporting period. Actual results could differ from these estimates. All time references are based on Eastern Time.
The NAV of each share class of a fund is calculated by dividing the market value of a fund’s securities and other assets, less all liabilities attributable to the share class by the number of outstanding shares of the share class on the specified date.
(a) Valuation of Investments
The Board of Trustees of the Trust (the “Board”) adopted policies and procedures for the valuation of the Funds’ investments (the “Fund Valuation Procedures”). The SEC adopted Rule 2a-5 under the 1940 Act (“Rule 2a-5”) which establishes requirements for determining fair value in good faith. Rule 2a-5 also defines “readily available market quotations” for purposes of the 1940 Act and establishes requirements for determining whether a fund must fair value a security in good faith.
Pursuant to Rule 2a-5, the Board has designated the Adviser as the valuation designee to perform fair valuation determinations for the Funds with respect to all Fund investments and other assets. As the Funds’ valuation designee pursuant to Rule 2a-5, the Adviser has adopted separate procedures (the “Valuation Designee Procedures” and collectively with the Fund Valuation Procedures, the “Valuation Procedures”) reasonably designed to prevent violations of the requirements of Rule 2a-5 and Rule 31a-4. The Adviser, in its role as valuation designee, utilizes the assistance
94 | THE RYDEX FUNDS ANNUAL REPORT | |
NOTES TO FINANCIAL STATEMENTS (continued) |
of a valuation committee, consisting of representatives from Guggenheim’s investment management, fund administration, legal and compliance departments (the “Valuation Committee”), in determining the fair value of the Funds’ securities and other assets.
Valuations of the Funds’ securities and other assets are supplied primarily by pricing service providers appointed pursuant to the processes set forth in the Valuation Procedures. The Adviser, with the assistance of the Valuation Committee, convenes monthly, or more frequently as needed, to review the valuation of all assets which have been fair valued. The Adviser, consistent with the monitoring and review responsibilities set forth in the Valuation Procedures, regularly reviews the appropriateness of the inputs, methods, models and assumptions employed by the pricing service providers.
If the pricing service provider cannot or does not provide a valuation for a particular investment or such valuation is deemed unreliable, such investment is fair valued by the Adviser.
Equity securities listed or traded on a recognized U.S. securities exchange or the Nasdaq Stock Market (“NASDAQ”) will generally be valued on the basis of the last sale price on the primary U.S. exchange or market on which the security is listed or traded; provided, however, that securities listed on NASDAQ will be valued at the NASDAQ official closing price, which may not necessarily represent the last sale price.
Open-end investment companies are valued at their NAV as of the close of business, on the valuation date. Exchange-traded funds and closed-end investment companies are generally valued at the last quoted sale price.
U.S. government securities are valued by pricing service providers, using the last traded fill price, or at the reported bid price at the close of business on the valuation date.
Commercial paper and discount notes with a maturity of greater than 60 days at acquisition are valued at prices that reflect broker-dealer supplied valuations or are obtained from independent pricing service providers, which may consider the trade activity, treasury spreads, yields or price of bonds of comparable quality, coupon, maturity, and type, as well as prices quoted by dealers who make markets in such securities. Commercial paper and discount notes with a maturity of 60 days or less at acquisition are valued at amortized cost, unless the Adviser concludes that amortized cost does not represent the fair value of the applicable asset in which case it will be evaluated using an independent pricing service provider.
Repurchase agreements are generally valued at amortized cost, provided such amounts approximate market value.
Futures contracts are valued on the basis of the last sale price as of 4:00 p.m. on the valuation date. In the event that the exchange for a specific futures contract closes earlier than 4:00 p.m., the futures contract is valued at the official settlement price of the exchange. However, the underlying securities from which the futures contract value is derived are monitored until 4:00 p.m. to determine if fair valuation of the underlying securities would provide a more accurate valuation of the futures contract.
The value of currency index swap agreements entered into by a Fund is accounted for using the unrealized appreciation or depreciation on the agreements that is determined by marking the agreements to the broker quote.
Investments for which market quotations are not readily available are fair valued as determined in good faith by the Adviser. Valuations in accordance with these methods are intended to reflect each security’s (or asset’s or liability’s) “fair value”. Each such determination is based on a consideration of all relevant factors, which are likely to vary from one pricing context to another. Examples of such factors may include, but are not limited to market prices; sale prices; broker quotes; and models which derive prices based on inputs such as prices of securities with comparable maturities and characteristics, or on inputs such as anticipated cash flows or collateral, spread over U.S. Treasury securities, and other information analysis. In connection with futures contracts and other derivative investments, such factors may include obtaining information as to how (a) these contracts and other derivative investments trade in the futures or other derivative markets, respectively, and (b) the securities underlying these contracts and other derivative investments trade in the cash market.
(b) U.S. Government and Agency Obligations
Certain U.S. Government and Agency Obligations are traded on a discount basis; the interest rates shown on the Schedules of Investments reflect the effective rates paid at the time of purchase by the Funds. Other securities bear interest at the rates shown, payable at fixed dates through maturity.
(c) Futures Contracts
Upon entering into a futures contract, a Fund deposits and maintains as collateral such initial margin as required by the exchange on which the transaction is affected. Pursuant to the contract, the Fund agrees to receive from or pay to the broker an amount of cash equal to the daily fluctuation in value of the contract. Such receipts or payments are known as variation margin and are recorded by the Fund as unrealized appreciation or depreciation. When the contract is closed, the Fund records a realized gain or loss equal to the difference between the value of the contract at the time it was opened and the value at the time it was closed.
| | THE RYDEX FUNDS ANNUAL REPORT | 95 |
NOTES TO FINANCIAL STATEMENTS (continued) |
(d) Swap Agreements
Swap agreements are marked-to-market daily and the change, if any, is recorded as unrealized appreciation or depreciation. Payments received or made as a result of an agreement or termination of an agreement are recognized as realized gains or losses.
(e) Currency Translations
The accounting records of the Funds are maintained in U.S. dollars. All assets and liabilities initially expressed in foreign currencies are converted into U.S. dollars at prevailing exchange rates. Purchases and sales of investment securities, dividend and interest income, and certain expenses are translated at the rates of exchange prevailing on the respective dates of such transactions. Changes in the relationship of these foreign currencies to the U.S. dollar can significantly affect the value of the investments and earnings of the Funds. Foreign investments may also subject the Funds to foreign government exchange restrictions, expropriation, taxation, or other political, social, geopolitical or economic developments, all of which could affect the market and/or credit risk of the investments.
The Funds do not isolate that portion of the results of operations resulting from changes in the foreign exchange rates on investments from the fluctuations arising from changes in the market prices of securities held. Such fluctuations are included with the net realized gain or loss and unrealized appreciation or depreciation on investments.
Reported net realized foreign exchange gains and losses arise from sales of foreign currencies and currency gains or losses realized between the trade and settlement dates on investment transactions. Net unrealized appreciation and depreciation arise from changes in the fair values of assets and liabilities other than investments in securities at the fiscal period end, resulting from changes in exchange rates.
(f) Foreign Taxes
The Funds may be subject to foreign taxes (a portion of which may be reclaimable) on income, stock dividends, capital gains on investments or certain foreign currency transactions. All foreign taxes are recorded in accordance with the applicable foreign tax regulations and rates that exist in the foreign jurisdictions in which the Funds invest. These foreign taxes, if any, are paid by the Funds and reflected in their Statements of Operations as follows: foreign taxes withheld at source are presented as a reduction of income and foreign taxes on capital gains from sales of investments are included with the net realized gain (loss) on investments. Foreign taxes payable or deferred as of March 31, 2024, if any, are disclosed in the Funds’ Statements of Assets and Liabilities.
(g) Security Transactions
Security transactions are recorded on the trade date for financial reporting purposes. Realized gains and losses from securities transactions are recorded using the identified cost basis. Proceeds from lawsuits related to investment holdings are recorded as a reduction to cost if the securities are still held and as realized gains if no longer held in the respective Fund. Dividend income is recorded on the ex-dividend date, net of applicable taxes withheld by foreign countries, if any. Taxable non-cash dividends are recorded as dividend income. Interest income, including amortization of premiums and accretion of discounts, is accrued on a daily basis. Dividend income from Real Estate Investment Trusts (“REITs”) is recorded based on the income included in the distributions received from the REIT investments using published REIT classifications, including some management estimates when actual amounts are not available. Distributions received in excess of this estimated amount are recorded as a reduction of the cost of investments or reclassified to realized gains. The actual amounts of income, return of capital, and realized gains are only determined by each REIT after its fiscal year-end, and may differ from the estimated amounts.
(h) Distributions
Distributions of net investment income and net realized gains, if any, are declared and paid at least annually. Dividends are reinvested in additional shares, unless shareholders request payment in cash. Distributions are recorded on the ex-dividend date and are determined in accordance with U.S. federal income tax regulations which may differ from U.S. GAAP.
(i) Class Allocations
Interest and dividend income, most expenses, all realized gains and losses, and all unrealized appreciation and depreciation are allocated to the share classes based upon the value of the outstanding shares in each share class. Certain costs, such as distribution and service fees are charged directly to specific share classes. In addition, certain expenses have been allocated to the individual Funds in the Trust based on the respective net assets of each Fund included in the Trust.
(j) Cash
The Funds may leave cash overnight in their cash account with the custodian. Periodically, a Fund may have cash due to the custodian bank as an overdraft balance. A fee is incurred on this overdraft, calculated by multiplying the overdraft by a rate based on the federal funds rate, which was 5.33% at March 31, 2024.
96 | THE RYDEX FUNDS ANNUAL REPORT | |
NOTES TO FINANCIAL STATEMENTS (continued) |
(k) Indemnifications
Under the Funds’ organizational documents, the Trustees and Officers are indemnified against certain liabilities arising out of the performance of their duties to the Trust. In addition, throughout the normal course of business, the Funds enter into contracts that contain a variety of representations and warranties which provide general indemnifications. The Funds’ maximum exposure under these arrangements is unknown, as this would involve future claims that may be made against the Funds and/or their affiliates that have not yet occurred. However, based on experience, the Funds expect the risk of loss to be remote.
Note 2 – Derivatives
As part of their investment strategies, the Funds may utilize a variety of derivative instruments. These investments involve, to varying degrees, elements of market risk and risks in excess of amounts recognized on the Funds’ Statements of Assets and Liabilities. Valuation and accounting treatment of these instruments can be found under Significant Accounting Policies in Note 1 of these Notes to Financial Statements.
Derivatives are instruments whose values depend on, or are derived from, in whole or in part, the value of one or more other assets, such as securities, currencies, commodities or indices. Derivative instruments may be used for investment purposes (including to maintain cash reserves while maintaining exposure to certain other assets), for risk management (hedging) purposes, to facilitate trading, to reduce transaction costs and to pursue higher investment returns. Derivative instruments may also be used to seek to mitigate certain investment risks, such as foreign currency exchange rate risk, interest rate risk and credit risk. U.S. GAAP requires disclosures to enable investors to better understand how and why a Fund uses derivative instruments, how these derivative instruments are accounted for and their effects on the Fund’s financial position and results of operations.
The Funds may utilize derivatives for the following purposes:
Index Exposure: the use of an instrument to obtain exposure to a listed or other type of index.
Leverage: gaining total exposure to equities or other assets on the long and short sides at greater than 100% of invested capital.
Liquidity: the ability to buy or sell exposure with little price/market impact.
If a Fund’s investment strategy consistently involves applying leverage, the value of the Fund’s shares will tend to increase or decrease more than the value of any increase or decrease in the underlying index or other asset. In addition, because an investment in derivative instruments generally requires a small investment relative to the amount of investment exposure assumed, an opportunity for increased net income is created; but, at the same time, leverage risk will increase. The Fund’s use of leverage, through borrowings or instruments such as derivatives, may cause the Fund to be more volatile and riskier than if the Fund had not been leveraged.
Futures Contracts
A futures contract is an agreement to purchase (long) or sell (short) an agreed amount of securities or other instruments at a set price for delivery at a future date. There are significant risks associated with a Fund’s use of futures contracts, including (i) there may be an imperfect or no correlation between the changes in market value of the underlying asset and the prices of futures contracts; (ii) there may not be a liquid secondary market for a futures contract; (iii) trading restrictions or limitations may be imposed by an exchange; and (iv) government regulations may restrict trading in futures contracts. When investing in futures, there is minimal counterparty credit risk to a Fund because futures are exchange-traded and the exchange’s clearinghouse, as counterparty to all exchange-traded futures, guarantees against default. Cash deposits are shown as segregated cash with broker on the Funds’ Statements of Assets and Liabilities; securities held as collateral are noted on the Funds’ Schedules of Investments.
The following table represents the Funds’ use and volume of futures on a monthly basis:
| | | | Average Notional Amount | |
Fund | Use | | Long | | | Short | |
Europe 1.25x Strategy Fund | Index exposure, Leverage, Liquidity | | $ | 6,371,956 | | | $ | — | |
Japan 2x Strategy Fund | Index exposure, Leverage, Liquidity | | | 8,926,303 | | | | — | |
Strengthening Dollar 2x Strategy Fund | Index exposure, Leverage, Liquidity | | | 7,285,274 | | | | — | |
Weakening Dollar 2x Strategy Fund | Index exposure, Leverage, Liquidity | | | — | | | | 1,994,955 | |
| | THE RYDEX FUNDS ANNUAL REPORT | 97 |
NOTES TO FINANCIAL STATEMENTS (continued) |
Swap Agreements
A swap is an agreement that obligates two parties to exchange a series of cash flows at specified intervals based upon or calculated by reference to changes in specified prices or rates for a specified amount of an underlying asset. When utilizing over-the-counter (“OTC”) swaps, a Fund bears the risk of loss of the amount expected to be received under a swap agreement in the event of the default or bankruptcy of a swap agreement counterparty or if the underlying asset declines in value. Certain standardized swaps are subject to mandatory central clearing and are executed on a multi-lateral or other trade facility platform, such as a registered exchange. There is limited counterparty credit risk with respect to centrally-cleared swaps as the transaction is facilitated through a central clearinghouse, much like exchange-traded futures contracts. For a Fund utilizing centrally-cleared swaps, the exchange bears the risk of loss resulting from a counterparty not being able to pay. There is no guarantee that a Fund or an underlying fund could eliminate its exposure under an outstanding swap agreement by entering into an offsetting swap agreement with the same or another party.
Currency swaps enable the Funds to gain exposure to currencies in a market without actually possessing a given currency, or to hedge a position. Currency swaps involve the exchange of the principal and interest in one currency for the principal and interest in another currency. As in other types of OTC swaps, the Funds may be at risk due to the counterparty’s inability to perform.
The following table represents the Funds’ use and volume of currency swaps on a monthly basis:
| | | | Average Notional Amount | |
Fund | Use | | Long | | | Short | |
Strengthening Dollar 2x Strategy Fund | Index exposure, Leverage, Liquidity | | $ | 2,173,246 | | | $ | — | |
Weakening Dollar 2x Strategy Fund | Index exposure, Leverage, Liquidity | | | — | | | | 598,271 | |
Derivative Investment Holdings Categorized by Risk Exposure
The following is a summary of the location of derivative investments on the Funds’ Statements of Assets and Liabilities as of March 31, 2024:
Derivative Investment Type | Asset Derivatives | Liability Derivatives |
Currency/Equity futures contracts | Variation margin on futures contracts | Variation margin on futures contracts |
Currency swap agreements | Unrealized appreciation on OTC swap agreements | Unrealized depreciation on OTC swap agreements |
The following tables set forth the fair value of the Funds’ derivative investments categorized by primary risk exposure at March 31, 2024:
Asset Derivative Investments Value |
Fund | | Futures
Equity
Risk* | | | Futures
Foreign
Currency
Exchange
Risk* | | | Swaps
Currency
Risk | | | Total Value at
March 31,
2024 | |
Europe 1.25x Strategy Fund | | $ | 25,275 | | | $ | — | | | $ | — | | | $ | 25,275 | |
Japan 2x Strategy Fund | | | 75,118 | | | | — | | | | — | | | | 75,118 | |
Strengthening Dollar 2x Strategy Fund | | | — | | | | 61,910 | | | | 11,081 | | | | 72,991 | |
Liability Derivative Investments Value |
Fund | | Futures
Equity
Risk* | | | Futures
Foreign
Currency
Exchange
Risk* | | | Swaps
Currency
Risk | | | Total Value at
March 31,
2024 | |
Europe 1.25x Strategy Fund | | $ | — | | | $ | 19,833 | | | $ | — | | | $ | 19,833 | |
Japan 2x Strategy Fund | | | — | | | | 127,999 | | | | — | | | | 127,999 | |
Weakening Dollar 2x Strategy Fund | | | — | | | | 24,929 | | | | 2,180 | | | | 27,109 | |
* | Includes cumulative appreciation (depreciation) of exchange-traded, OTC and centrally-cleared derivatives contracts as reported on the Schedules of Investments. For exchange-traded and centrally-cleared derivatives, variation margin is reported within the Funds’ Statements of Assets and Liabilities. |
98 | THE RYDEX FUNDS ANNUAL REPORT | |
NOTES TO FINANCIAL STATEMENTS (continued) |
The following is a summary of the location of derivative investments on the Funds’ Statements of Operations for the year ended March 31, 2024:
Derivative Investment Type | Location of Gain (Loss) on Derivatives |
Currency/Equity futures contracts | Net realized gain (loss) on futures contracts |
| | Net change in unrealized appreciation (depreciation) on futures contracts |
Currency swap agreements | Net realized gain (loss) on swap agreements |
| | Net change in unrealized appreciation (depreciation) on swap agreements |
The following is a summary of the Funds’ realized gain (loss) and change in unrealized appreciation (depreciation) on derivative investments recognized on the Funds’ Statements of Operations categorized by primary risk exposure for the year ended March 31, 2024:
Realized Gain (Loss) on Derivative Investments Recognized on the Statements of Operations |
Fund | | Futures
Equity
Risk | | | Futures
Foreign
Currency
Exchange
Risk | | | Swaps
Currency
Risk | | | Total | |
Europe 1.25x Strategy Fund | | $ | 529,258 | | | $ | (142,339 | ) | | $ | — | | | $ | 386,919 | |
Japan 2x Strategy Fund | | | 2,552,534 | | | | (1,376,668 | ) | | | — | | | | 1,175,866 | |
Strengthening Dollar 2x Strategy Fund | | | — | | | | (434,271 | ) | | | (219,970 | ) | | | (654,241 | ) |
Weakening Dollar 2x Strategy Fund | | | — | | | | (138,409 | ) | | | (87,099 | ) | | | (225,508 | ) |
Change in Unrealized Appreciation (Depreciation) on Derivative Investments Recognized on the Statements of Operations |
Fund | | Futures
Equity
Risk | | | Futures
Foreign
Currency
Exchange
Risk | | | Swaps
Currency
Risk | | | Total | |
Europe 1.25x Strategy Fund | | $ | (119,800 | ) | | $ | 14,767 | | | $ | — | | | $ | (105,033 | ) |
Japan 2x Strategy Fund | | | (470,522 | ) | | | 14,465 | | | | — | | | | (456,057 | ) |
Strengthening Dollar 2x Strategy Fund | | | — | | | | 334,330 | | | | 119,467 | | | | 453,797 | |
Weakening Dollar 2x Strategy Fund | | | — | | | | (84,663 | ) | | | (7,931 | ) | | | (92,594 | ) |
In conjunction with the use of derivative instruments, the Funds are required to maintain collateral in various forms. Depending on the financial instrument utilized and the broker involved, the Funds use margin deposits at the broker, cash and/or securities segregated at the custodian bank, discount notes or repurchase agreements allocated to the Funds as collateral.
The Trust has established counterparty credit guidelines and enters into transactions only with financial institutions rated/identified as investment grade or better. The Trust monitors the counterparty credit risk associated with each such financial institution.
Note 3 – Offsetting
In the normal course of business, the Funds enter into transactions subject to enforceable master netting arrangements or other similar arrangements. Generally, the right to offset in those agreements allows the Funds to counteract the exposure to a specific counterparty with collateral received from or delivered to that counterparty based on the terms of the arrangements. These arrangements provide for the right to liquidate upon the occurrence of an event of default, credit event upon merger or additional termination event.
In order to better define their contractual rights and to secure rights that will help the Funds mitigate their counterparty risk, the Funds may enter into an International Swaps and Derivatives Association, Inc. Master Agreement (“ISDA Master Agreement”) or similar agreement with their derivative contract counterparties. An ISDA Master Agreement is a bilateral agreement between a fund and a counterparty that governs OTC derivatives, including foreign exchange contracts, and typically contains, among other things, collateral posting terms and netting provisions in the event of a default and/or termination event. The provisions of the ISDA Master Agreement typically permit a single net payment in the event of a default (close-out netting) or similar event, including the bankruptcy or insolvency of the counterparty.
| | THE RYDEX FUNDS ANNUAL REPORT | 99 |
NOTES TO FINANCIAL STATEMENTS (continued) |
For derivatives traded under an ISDA Master Agreement, the collateral requirements are typically calculated by netting the mark-to-market amount for each transaction under such agreement and comparing that amount to the value of any collateral currently pledged by the Funds and the counterparty. For financial reporting purposes, cash collateral that has been pledged to cover obligations of the Funds and cash collateral received from the counterparty, if any, are reported separately on the Funds’ Statements of Assets and Liabilities as segregated cash with broker/receivable for variation margin, or payable for swap settlement/variation margin. Cash and/or securities pledged or received as collateral by the Funds in connection with an OTC derivative subject to an ISDA Master Agreement generally may not be invested, sold or rehypothecated by the counterparty or the Funds, as applicable, absent an event of default under such agreement, in which case such collateral generally may be applied towards obligations due to and payable by such counterparty or the Funds, as applicable. Generally, the amount of collateral due from or to a counterparty must exceed a minimum transfer amount threshold (e.g., $300,000) before a transfer is required to be made. To the extent amounts due to the Funds from their counterparties are not fully collateralized, contractually or otherwise, the Funds bear the risk of loss from counterparty nonperformance. The Funds attempt to mitigate counterparty risk by only entering into agreements with counterparties that they believe to be of good standing and by monitoring the financial stability of those counterparties.
For financial reporting purposes, the Funds do not offset derivative assets and derivative liabilities that are subject to netting arrangements in the Funds’ Statements of Assets and Liabilities.
The following tables present derivative financial instruments and secured financing transactions that are subject to enforceable netting arrangements:
| | | | | | | | | | | | | | | | Gross Amounts Not Offset
in the Statements of
Assets and Liabilities | | | | | |
Fund | Instrument | | Gross
Amounts of
Recognized
Assets1 | | | Gross
Amounts
Offset in the
Statements
of Assets and
Liabilities | | | Net Amount
of Assets
Presented on
the Statements
of Assets and
Liabilities | | | Financial
Instruments | | | Cash
Collateral
Received | | | Net
Amount | |
Strengthening Dollar 2x Strategy Fund | Currency Swap Agreements | | $ | 11,081 | | | $ | — | | | | 11,081 | | | $ | — | | | $ | — | | | $ | 11,081 | |
| | | | | | | | | | | | | | | | | | | Gross Amounts Not Offset
in the Statements of
Assets and Liabilities | | | | | |
Fund | | Instrument | | | Gross
Amounts of
Recognized
Liabilities1 | | | Gross
Amounts
Offset in the
Statements
of Assets and
Liabilities | | | Net Amounts
of Assets
Presented on
the Statements
of Assets and
Liabilities | | | Financial
Instruments | | | Cash
Collateral
Pledged | | | Net
Amount | |
Weakening Dollar 2x Strategy Fund | Currency Swap Agreements | | $ | 2,180 | | | $ | — | | | $ | 2,180 | | | $ | (2,180 | ) | | $ | — | | | $ | — | |
1 | Exchange-traded or centrally-cleared derivatives are excluded from these reported amounts. |
The Funds have the right to offset deposits against any related derivative liabilities outstanding with each counterparty with the exception of exchange-traded or centrally-cleared derivatives. The following table presents deposits held by others in connection with derivative investments as of March 31, 2024.
Fund | Counterparty | Asset Type | | Cash Pledged | | | Cash Received | |
Europe 1.25x Strategy Fund | Goldman Sachs International | Futures contracts | | $ | 13,241 | | | $ | — | |
Japan 2x Strategy Fund | Goldman Sachs International | Futures contracts | | | 16,479 | | | | — | |
Weakening Dollar 2x Strategy Fund | Goldman Sachs International | Futures contracts | | | 2,194 | | | | — | |
100 | THE RYDEX FUNDS ANNUAL REPORT | |
NOTES TO FINANCIAL STATEMENTS (continued) |
Note 4 – Fair Value Measurement
In accordance with U.S. GAAP, fair value is defined as the price that the Funds would receive to sell an investment or pay to transfer a liability in an orderly transaction between market participants at the measurement date. U.S. GAAP establishes a three-tier fair value hierarchy based on the types of inputs used to value assets and liabilities and requires corresponding disclosure. The hierarchy and the corresponding inputs are summarized below:
Level 1 — | unadjusted quoted prices in active markets for identical assets or liabilities. |
Level 2 — | significant other observable inputs (for example quoted prices for securities that are similar based on characteristics such as interest rates, prepayment speeds, credit risk, etc.). |
Level 3 — | significant unobservable inputs based on the best information available under the circumstances, to the extent observable inputs are not available, which may include assumptions. |
Rule 2a-5 sets forth a definition of “readily available market quotations,” which is consistent with the definition of a Level 1 input under U.S. GAAP. Rule 2a-5 provides that “a market quotation is readily available only when that quotation is a quoted price (unadjusted) in active markets for identical investments that the fund can access at the measurement date, provided that a quotation will not be readily available if it is not reliable.”
Securities for which market quotations are not readily available must be valued at fair value as determined in good faith. Accordingly, any security priced using inputs other than Level 1 inputs will be subject to fair value requirements. The types of inputs available depend on a variety of factors, such as the type of security and the characteristics of the markets in which it trades, if any. Fair valuation determinations that rely on fewer or no observable inputs require greater judgment. Accordingly, fair value determinations for Level 3 securities require the greatest amount of judgment.
The inputs or methodologies selected and applied for valuing securities or other assets are not necessarily an indication of the risk associated with investing in those securities. The suitability, appropriateness and accuracy of the techniques, methodologies and sources employed to determine fair valuation are periodically reviewed and subject to change.
Note 5 – Investment Advisory Agreement and Other Agreements
Under the terms of an investment advisory contract, the Funds pay GI investment advisory fees on a monthly basis calculated daily at the annualized rates below, based on the average daily net assets of the Funds:
Fund | | Management Fees
(as a % of Net Assets) | |
S&P 500® Pure Growth Fund | | | 0.75 | % |
S&P 500® Pure Value Fund | | | 0.75 | % |
S&P MidCap 400® Pure Growth Fund | | | 0.75 | % |
S&P MidCap 400® Pure Value Fund | | | 0.75 | % |
S&P SmallCap 600® Pure Growth Fund | | | 0.75 | % |
S&P SmallCap 600® Pure Value Fund | | | 0.75 | % |
Europe 1.25x Strategy Fund | | | 0.90 | % |
Japan 2x Strategy Fund | | | 0.75 | % |
Strengthening Dollar 2x Strategy Fund | | | 0.90 | % |
Weakening Dollar 2x Strategy Fund | | | 0.90 | % |
| | THE RYDEX FUNDS ANNUAL REPORT | 101 |
NOTES TO FINANCIAL STATEMENTS (continued) |
When the aggregate assets of each series of the Trust (excluding the Long Short Equity Fund, Managed Futures Strategy Fund and Multi-Hedge Strategies Fund) and each series of Rydex Dynamic Funds equal or exceed $10 billion, the advisory fee rate paid by each individual Fund (excluding the Long Short Equity Fund, Managed Futures Strategy Fund and Multi-Hedge Strategies Fund) will be reduced in accordance with the asset level and breakpoint schedule set forth below.
Fund Assets Under Management | Fund Asset-Based
Breakpoint Reductions |
$500 million – $1 billion | 0.025% |
> $1 billion – $2 billion | 0.050% |
> $2 billion | 0.075% |
GI pays operating expenses on behalf of the Trust, such as audit and accounting related services, legal services, custody, printing and mailing, among others, on a pass-through basis. Such expenses are allocated to various Funds within the complex based on relative net assets.
The Board has adopted seperate Distribution plans applicable to Class A shares and Class H shares for which GFD and other firms that provide distribution and/or shareholder services (“Service Providers”) may receive compensation. If a Service Provider provides distribution services, the Funds will pay distribution fees to GFD at an annual rate not to exceed 0.25% of average daily net assets, pursuant to Rule 12b-1 of the 1940 Act. GFD, in turn, will pay the Service Provider out of its fees. GFD may, at its discretion, retain a portion of such payments to compensate itself for distribution services it performs.
The Board has adopted a separate Distribution and Shareholder Services Plan applicable to Class C shares that allows the Funds to pay annual distribution and service fees of 1.00% of the Funds’ Class C shares average daily net assets. The annual 0.25% service fee compensates a shareholder’s financial adviser for providing ongoing services to the shareholder. The annual distribution fee of 0.75% reimburses GFD for paying the shareholder’s financial adviser an ongoing sales commission. GFD advances the first year’s service and distribution fees to the financial adviser. GFD retains the service and distribution fees on accounts with no authorized dealer of record.
For the period ended March 31, 2024, GFD retained sales charges of $75,543 relating to sales of Class A shares of the Trust.
If a Fund invests in a fund that is advised by the same adviser or an affiliated adviser, the investing Fund’s adviser has agreed to waive fees at the investing fund level to the extent necessary to offset the proportionate share of any management fee paid by each Fund with respect to its investment in such affiliated fund. Fee waivers will be calculated at the investing fund level without regard to any expense cap in effect for the investing fund. Fees waived under this arrangement are not subject to reimbursement to GI. For the year ended March 31, 2024, the following Funds waived fees related to investments in affiliated funds:
Fund | | Amount Waived | |
Europe 1.25x Strategy Fund | | $ | 171 | |
Effective August 1, 2022, GI has contractually agreed to waive and/or reimburse expenses for Europe 1.25x Strategy Fund, Strengthening Dollar 2x Strategy Fund and Weakening Dollar 2x Strategy Fund in an amount equal to an annual percentage rate of 0.05% of each Fund’s average daily net assets. This agreement shall automatically renew for one-year terms, unless GI provides written notice to the Fund of the termination at least thirty days prior to the end of the then-current term. This agreement may be terminated at any time by the Fund’s Board upon sixty days’ written notice to the Adviser. In addition, the agreement will terminate automatically if the Advisory Agreement, with respect to a Fund, is terminated, with such termination effective upon the effective date of the termination of the Advisory Agreement.
On May 24, 2023, the Board approved a waiver and/or expense reimbursement arrangement whereby GI has agreed to waive and/or reimburse expenses for S&P 500® Pure Growth Fund, S&P 500® Pure Value Fund, S&P MidCap 400® Pure Growth Fund, S&P MidCap 400® Pure Value Fund, S&P SmallCap 600® Pure Growth Fund, S&P 600® Pure Value Fund, Europe 1.25x Strategy Fund, Japan 2x Strategy Fund, Strengthening Dollar 2x Strategy Fund and Weakening Dollar 2x Strategy Fund in an amount equal to an annual percentage rate of 0.05% of each Fund’s average daily net assets. This agreement went into effect August 1, 2023 and the end of the initial term is August 1, 2024. This agreement shall automatically renew for one-year terms, unless GI provides written notice to the Fund of the termination at least thirty days prior to the end
102 | THE RYDEX FUNDS ANNUAL REPORT | |
NOTES TO FINANCIAL STATEMENTS (continued) |
of the then-current term. This agreement may be terminated at any time by the Fund’s Board upon sixty days’ written notice to the Adviser. In addition, the agreement will terminate automatically if the Advisory Agreement, with respect to a Fund, is terminated, with such termination effective upon the effective date of the termination of the Advisory Agreement.
Certain trustees and officers of the Trust are also officers of GI and/or GFD. The Trust does not compensate its officers or trustees who are officers, directors and/or employees of GI or GFD.
MUFG Investor Services (US), LLC (“MUIS”) acts as the Funds’ administrator, transfer agent and accounting agent. As administrator, transfer agent and accounting agent, MUIS maintains the books and records of the Funds’ securities and cash. U.S. Bank, N.A. (“U.S. Bank”) acts as the Funds’ custodian. As custodian, U.S. Bank is responsible for the custody of the Funds’ assets. For providing the aforementioned services, MUIS and U.S. Bank are entitled to receive a monthly fee equal to an annual percentage of each Fund’s average daily net assets and out of pocket expenses.
Note 6 – Repurchase Agreements
The Funds transfer uninvested cash balances into a single joint account, the daily aggregate balance of which is invested in one or more repurchase agreements collateralized by obligations of the U.S. Treasury and U.S. government agencies. The joint account includes other Funds in the Guggenheim complex not covered in this report. The collateral is in the possession of the Funds’ custodian and is evaluated to ensure that its market value exceeds, at a minimum, 102% of the original face amount of the repurchase agreements. Each Fund holds a pro rata share of the collateral based on the dollar amount of the repurchase agreement entered into by each Fund.
At March 31, 2024, the repurchase agreements in the joint account were as follows:
Counterparty and
Terms of Agreement | | Face Value | | | Repurchase Price | | | Collateral | | Par Value | | | Fair Value | |
J.P. Morgan Securities LLC | | | | | | | | | | U.S. Treasury Notes | | | | | | | | |
5.31% | | | | | | | | | | 0.25% - 5.00% | | | | | | | | |
Due 04/01/24 | | $ | 166,514,975 | | | $ | 166,588,658 | | | Due 03/31/24 - 02/15/33 | | $ | 172,847,100 | | | $ | 169,834,991 | |
| | | | | | | | | | | U.S. Treasury Strips | | | | | | | | |
| | | | | | | | | | | 0.00% | | | | | | | | |
| | | | | | | | | | | Due 11/15/27 - 05/15/48 | | | 4,894 | | | | 4,141 | |
| | | | | | | | | | | U.S. Treasury Bills | | | | | | | | |
| | | | | | | | | | | 0.00% | | | | | | | | |
| | | | | | | | | | | Due 04/11/24 - 05/02/24 | | | 4,500 | | | | 4,480 | |
| | | | | | | | | | | U.S. Treasury Bond | | | | | | | | |
| | | | | | | | | | | 4.50% | | | | | | | | |
| | | | | | | | | | | Due 05/15/38 | | | 800 | | | | 840 | |
| | | | | | | | | | | U.S. Treasury Inflation Indexed Bond | | | | | | | | |
| | | | | | | | | | | 0.13% | | | | | | | | |
| | | | | | | | | | | Due 04/15/27 | | | 874 | | | | 823 | |
| | | | | | | | | | | | | | 172,858,168 | | | | 169,845,275 | |
| | | | | | | | | | | | | | | | | | | |
BofA Securities, Inc. | | | | | | | | | | U.S. Treasury Note | | | | | | | | |
5.31% | | | | | | | | | | 0.75% | | | | | | | | |
Due 04/01/24 | | | 64,044,221 | | | | 64,072,561 | | | Due 03/31/26 | | | 70,171,700 | | | | 65,325,118 | |
| | | | | | | | | | | | | | | | | | | |
Barclays Capital, Inc. | | | | | | | | | | U.S. Treasury Notes | | | | | | | | |
5.30% | | | | | | | | | | 0.63% - 3.50% | | | | | | | | |
Due 04/01/24 | | | 58,050,546 | | | | 58,076,185 | | | Due 11/30/27 - 02/15/33 | | | 64,598,100 | | | | 59,211,567 | |
In the event of counterparty default, the Funds have the right to collect the collateral to offset losses incurred. There is potential loss to the Funds in the event the Funds are delayed or prevented from exercising their rights to dispose of the collateral securities, including the risk of a possible decline in the value of the underlying securities during the period while the Funds seek to assert their rights. GI, acting under the supervision of the Board, reviews the value of the collateral and the creditworthiness of those banks and dealers with which the Funds enter into repurchase agreements to evaluate potential risks.
| | THE RYDEX FUNDS ANNUAL REPORT | 103 |
NOTES TO FINANCIAL STATEMENTS (continued) |
Note 7 – Portfolio Securities Loaned
The Funds may lend their securities to approved brokers to earn additional income. Securities lending income shown on the Funds’ Statements of Operations is shown net of rebates paid to the borrowers and earnings on cash collateral investments shared with the lending agent. Within this arrangement, the Funds act as the lender, U.S. Bank acts as the lending agent, and other approved registered broker dealers act as the borrowers. The Funds receive cash collateral, valued at 102% of the value of the securities on loan. Under the terms of the Funds’ securities lending agreement with U.S. Bank, cash collateral and proceeds are invested in the First American Government Obligations Fund — Class X. The Funds bear the risk of loss on cash collateral investments. Collateral is maintained over the life of the loan in an amount not less than the value of loaned securities, as determined at the close of fund business each day; any additional collateral required due to changes in security values is delivered to the Funds the next business day. Although the collateral mitigates the risk, the Funds could experience a delay in recovering their securities and a possible loss of income or value if the borrower fails to return the securities. The Funds have the right under the securities lending agreement to recover the securities from the borrower on demand. Securities lending transactions are accounted for as secured borrowings. The remaining contractual maturity of the securities lending agreement is overnight and continuous.
At March 31, 2024, the following Funds participated in securities lending transactions, which are subject to enforceable netting arrangements, as follows:
| | | Gross Amounts Not Offset in the
Statements of Assets and Liabilities | | | | Securities Lending Collateral | |
Fund | | Value of
Securities
Loaned | | | Collateral
Received(a) | | | Net
Amount | | | | Cash
Collateral
Invested | | | Cash
Collateral
Uninvested | | | Total
Collateral | |
S&P MidCap 400® Pure Value Fund | | $ | 141,628 | | | $ | (141,628 | ) | | $ | — | | | | $ | 155,520 | | | $ | — | | | $ | 155,520 | |
S&P SmallCap 600® Pure Growth Fund | | | 13,140 | | | | (13,140 | ) | | | — | | | | | 13,416 | | | | — | | | | 13,416 | |
S&P SmallCap 600® Pure Value Fund | | | 35,095 | | | | (35,095 | ) | | | — | | | | | 38,016 | | | | — | | | | 38,016 | |
Europe 1.25x Strategy Fund | | | 169,356 | | | | (169,356 | ) | | | — | | | | | 178,326 | | | | — | | | | 178,326 | |
(a) | Actual collateral received by the Fund is generally greater than the amount shown due to overcollateralization. |
In the event of counterparty default, the Funds have the right to collect the collateral to offset losses incurred. There is potential loss to the Funds in the event the Funds are delayed or prevented from exercising their rights to dispose of the collateral securities, including the risk of a possible decline in the value of the underlying securities during the period while the Funds seek to assert their rights. GI, acting under the supervision of the Board, reviews the value of the collateral and the creditworthiness of those banks and dealers to evaluate potential risks.
Note 8 – Federal Income Tax Information
The Funds intend to comply with the provisions of Subchapter M of the Internal Revenue Code of 1986, as amended (the “Internal Revenue Code”), applicable to regulated investment companies and will distribute substantially all taxable net investment income and capital gains sufficient to relieve the Funds from all, or substantially all, federal income, excise and state income taxes. Therefore, no provision for federal or state income tax or federal excise tax is required.
Tax positions taken or expected to be taken in the course of preparing the Funds’ tax returns are evaluated to determine whether the tax positions are “more-likely-than-not” of being sustained by the applicable tax authority. Tax positions not deemed to meet the “more-likely-than-not” threshold would be recorded as a tax benefit or expense in the current year. Management has analyzed the Funds’ tax positions taken, or to be taken, on U.S. federal income tax returns for all open tax years, and has concluded that no provision for income tax is required in the Funds’ financial statements. The Funds’ U.S. federal income tax returns are subject to examination by the Internal Revenue Service (“IRS”) for a period of three years after they are filed.
104 | THE RYDEX FUNDS ANNUAL REPORT | |
NOTES TO FINANCIAL STATEMENTS (continued) |
The tax character of distributions paid during the year ended March 31, 2024 was as follows:
Fund | | Ordinary
Income | | | Long-Term
Capital Gain | | | Total
Distributions | |
S&P 500® Pure Value Fund | | $ | 183,917 | | | $ | — | | | $ | 183,917 | |
S&P MidCap 400® Pure Value Fund | | | 191,352 | | | | — | | | | 191,352 | |
S&P SmallCap 600® Pure Value Fund | | | 45,269 | | | | — | | | | 45,269 | |
Europe 1.25x Strategy Fund | | | 27,662 | | | | — | | | | 27,662 | |
Japan 2x Strategy Fund | | | 72,770 | | | | — | | | | 72,770 | |
Strengthening Dollar 2x Strategy Fund | | | 80,754 | | | | — | | | | 80,754 | |
Weakening Dollar 2x Strategy Fund | | | 11,439 | | | | — | | | | 11,439 | |
The tax character of distributions paid during the year ended March 31, 2023 was as follows:
Fund | | Ordinary
Income | | | Long-Term
Capital Gain | | | Total
Distributions | |
S&P 500®Pure Value Fund | | $ | 748,446 | | | $ | — | | | $ | 748,446 | |
S&P MidCap 400®Pure Growth Fund | | | — | | | | 4,111,095 | | | | 4,111,095 | |
S&P MidCap 400®Pure Value Fund | | | 2,668,409 | | | | — | | | | 2,668,409 | |
Note: For U.S. federal income tax purposes, short-term capital gain distributions are treated as ordinary income distributions.
The tax components of distributable earnings/(loss) as of March 31, 2024 were as follows:
Fund | | Undistributed
Ordinary
Income | | | Undistributed
Long-Term
Capital Gain | | | Net Unrealized
Appreciation
(Depreciation) | | | Accumulated
Capital and
Other Losses | | | Total | |
S&P 500® Pure Growth Fund | | $ | — | | | $ | — | | | $ | 5,753,863 | | | $ | (2,754,610 | ) | | $ | 2,999,253 | |
S&P 500® Pure Value Fund | | | 4,358 | | | | — | | | | 640,892 | | | | (16,954,278 | ) | | | (16,309,028 | ) |
S&P MidCap 400® Pure Growth Fund | | | 4,225,931 | | | | — | | | | 10,676,971 | | | | — | | | | 14,902,902 | |
S&P MidCap 400® Pure Value Fund | | | 683,785 | | | | — | | | | 915,401 | | | | — | | | | 1,599,186 | |
S&P SmallCap 600® Pure Growth Fund | | | 374,657 | | | | — | | | | 617,191 | | | | — | | | | 991,848 | |
S&P SmallCap 600® Pure Value Fund | | | — | | | | — | | | | 341,849 | | | | (20,934,097 | ) | | | (20,592,248 | ) |
Europe 1.25x Strategy Fund | | | 161,001 | | | | — | | | | 200,286 | | | | (847,507 | ) | | | (486,220 | ) |
Japan 2x Strategy Fund | | | 20,223 | | | | — | | | | (3 | ) | | | (1,558,127 | ) | | | (1,537,907 | ) |
Strengthening Dollar 2x Strategy Fund | | | 164,523 | | | | — | | | | — | | | | (20,484,367 | ) | | | (20,319,844 | ) |
Weakening Dollar 2x Strategy Fund | | | 47,534 | | | | — | | | | — | | | | (10,465,189 | ) | | | (10,417,655 | ) |
For U.S. federal income tax purposes, capital loss carryforwards represent realized losses of the Funds that may be carried forward and applied against future capital gains. The Funds are permitted to carry forward capital losses for an unlimited period and such capital loss carryforwards retain their character as either short-term or long-term capital losses. As of March 31, 2024, capital loss carryforwards for the Funds were as follows:
| | | Unlimited | | | | | |
Fund | | Short-Term | | | Long-Term | | | Total
Capital Loss
Carryforward | |
S&P 500® Pure Growth Fund | | $ | (2,085,873 | ) | | $ | (628,828 | ) | | $ | (2,714,701 | ) |
S&P 500® Pure Value Fund | | | (13,204,542 | ) | | | (3,749,736 | ) | | | (16,954,278 | ) |
S&P SmallCap 600® Pure Value Fund | | | (20,928,316 | ) | | | — | | | | (20,928,316 | ) |
Europe 1.25x Strategy Fund | | | (588,583 | ) | | | (258,924 | ) | | | (847,507 | ) |
Japan 2x Strategy Fund | | | (296,914 | ) | | | (1,261,213 | ) | | | (1,558,127 | ) |
Strengthening Dollar 2x Strategy Fund | | | (8,232,412 | ) | | | (12,251,955 | ) | | | (20,484,367 | ) |
Weakening Dollar 2x Strategy Fund | | | (4,192,919 | ) | | | (6,272,270 | ) | | | (10,465,189 | ) |
| | THE RYDEX FUNDS ANNUAL REPORT | 105 |
NOTES TO FINANCIAL STATEMENTS (continued) |
For the year ended March 31, 2024, the following capital loss carryforward amounts were utilized:
Fund | | Utilized | |
S&P MidCap 400® Pure Growth Fund | | $ | 3,370,371 | |
S&P MidCap 400® Pure Value Fund | | | 1,475,579 | |
Europe 1.25x Strategy Fund | | | 264,734 | |
Japan 2x Strategy Fund | | | 719,860 | |
Net investment income and net realized gains (losses) may differ for financial statement and tax purposes because of temporary or permanent book/tax differences. These differences are primarily due to foreign currency gains and losses, losses deferred due to wash sales, distributions in connection with redemption of fund shares, and the “mark-to-market” of certain derivatives. Additional differences may result from the tax treatment of net operating losses and the deferral of qualified late-year losses. To the extent these differences are permanent and would require a reclassification between Paid in Capital and Total Distributable Earnings (Loss), such reclassifications are made in the period that the differences arise. These reclassifications have no effect on net assets or NAV per share.
The following adjustments were made on the Statements of Assets and Liabilities as of March 31, 2024 for permanent book/tax differences:
Fund | | Paid In
Capital | | | Total
Distributable
Earnings/(Loss) | |
S&P MidCap 400® Pure Growth Fund | | $ | 25,943 | | | $ | (25,943 | ) |
S&P MidCap 400® Pure Value Fund | | | 2,628,124 | | | | (2,628,124 | ) |
S&P SmallCap 600® Pure Growth Fund | | | 462,241 | | | | (462,241 | ) |
S&P SmallCap 600® Pure Value Fund | | | (1,820 | ) | | | 1,820 | |
Japan 2x Strategy Fund | | | 17,939 | | | | (17,939 | ) |
At March 31, 2024, the cost of investments for U.S. federal income tax purposes, the aggregate gross unrealized appreciation for all investments for which there was an excess of value over tax cost and the aggregate gross unrealized depreciation for all investments for which there was an excess of tax cost over value, were as follows:
Fund | | Tax
Cost | | | Tax
Unrealized
Appreciation | | | Tax
Unrealized
Depreciation | | | Net Tax
Unrealized
Appreciation/
(Depreciation) | |
S&P 500® Pure Growth Fund | | $ | 25,849,873 | | | $ | 5,926,093 | | | $ | (172,230 | ) | | $ | 5,753,863 | |
S&P 500® Pure Value Fund | | | 9,716,999 | | | | 693,360 | | | | (52,468 | ) | | | 640,892 | |
S&P MidCap 400® Pure Growth Fund | | | 213,752,345 | | | | 11,069,759 | | | | (392,788 | ) | | | 10,676,971 | |
S&P MidCap 400® Pure Value Fund | | | 5,602,031 | | | | 1,088,527 | | | | (173,126 | ) | | | 915,401 | |
S&P SmallCap 600® Pure Growth Fund | | | 3,437,381 | | | | 670,633 | | | | (53,442 | ) | | | 617,191 | |
S&P SmallCap 600® Pure Value Fund | | | 4,036,799 | | | | 558,119 | | | | (216,270 | ) | | | 341,849 | |
Europe 1.25x Strategy Fund | | | 2,412,689 | | | | 225,494 | | | | (25,170 | ) | | | 200,324 | |
Japan 2x Strategy Fund | | | 2,916,799 | | | | 94,674 | | | | (94,677 | ) | | | (3 | ) |
Strengthening Dollar 2x Strategy Fund | | | 2,396,377 | | | | — | | | | — | | | | — | |
Weakening Dollar 2x Strategy Fund | | | 954,968 | | | | — | | | | — | | | | — | |
Pursuant to U.S. federal income tax regulations applicable to regulated investment companies, the Funds have elected to treat net capital losses and certain ordinary losses realized between November 1 and March 31 of each year as occurring on the first day of the following tax year. The Funds have also elected to treat certain ordinary losses realized between January 1 and March 31 of each year as occurring on the first day of the following tax year. For the year ended March 31, 2024, the following losses reflected in the accompanying financial statements were deferred for U.S. federal income tax purposes until April 1, 2024:
Fund | | Ordinary | | | Capital | |
S&P 500® Pure Growth Fund | | $ | (39,909 | ) | | $ | — | |
S&P SmallCap 600® Pure Value Fund | | | (5,781 | ) | | | — | |
106 | THE RYDEX FUNDS ANNUAL REPORT | |
NOTES TO FINANCIAL STATEMENTS (continued) |
Note 9 – Securities Transactions
For the year ended March 31, 2024, the cost of purchases and proceeds from sales of investment securities, excluding government securities, short-term investments and derivatives, were as follows:
Fund | | Purchases | | | Sales | |
S&P 500® Pure Growth Fund | | $ | 231,352,427 | | | $ | 238,080,540 | |
S&P 500® Pure Value Fund | | | 185,420,044 | | | | 191,128,023 | |
S&P MidCap 400® Pure Growth Fund | | | 523,285,358 | | | | 345,912,652 | |
S&P MidCap 400® Pure Value Fund | | | 109,225,820 | | | | 120,226,511 | |
S&P SmallCap 600® Pure Growth Fund | | | 42,984,308 | | | | 44,891,975 | |
S&P SmallCap 600® Pure Value Fund | | | 60,919,171 | | | | 64,148,003 | |
Europe 1.25x Strategy Fund | | | 36,636,706 | | | | 41,380,330 | |
Japan 2x Strategy Fund | | | — | | | | — | |
Strengthening Dollar 2x Strategy Fund | | | — | | | | — | |
Weakening Dollar 2x Strategy Fund | | | — | | | | — | |
The Funds are permitted to purchase or sell securities from or to certain affiliated funds under specified conditions outlined in procedures adopted by the Board. The procedures have been designed to ensure that any purchase or sale of securities by a Fund from or to another fund or portfolio that is or could be considered an affiliate by virtue of having a common investment adviser (or affiliated investment advisers), common trustees and/or common officers complies with Rule 17a-7 of the 1940 Act. Further, as defined under these procedures, each transaction is effected at the current market price. For the year ended March 31, 2024, the Funds engaged in purchases and sales of securities pursuant to Rule 17a-7 of the 1940 Act, as follows:
Fund | | Purchases | | | Sales | | | Realized Gain (Loss) | |
S&P 500® Pure Growth Fund | | $ | 26,219,612 | | | $ | 20,781,868 | | | $ | 157,701 | |
S&P 500® Pure Value Fund | | | 5,949,057 | | | | 17,118,473 | | | | 426,677 | |
S&P MidCap 400® Pure Growth Fund | | | 8,874,315 | | | | 7,998,073 | | | | 2,667,756 | |
S&P MidCap 400® Pure Value Fund | | | 3,525,809 | | | | 3,593,494 | | | | 82,891 | |
S&P SmallCap 600® Pure Growth Fund | | | 953,352 | | | | 937,239 | | | | 249,197 | |
S&P SmallCap 600® Pure Value Fund | | | 1,760,747 | | | | 881,666 | | | | 225,071 | |
Europe 1.25x Strategy Fund | | | 1,518,866 | | | | 1,276,009 | | | | 16,706 | |
Note 10 – Line of Credit
The Trust, along with other affiliated trusts, secured an uncommitted $200,000,000 line of credit from U.S. Bank, N.A. On June 5, 2023, the line of credit agreement was renewed and expires on June 3, 2024. This line of credit is reserved for emergency or temporary purposes. Borrowings, if any, under this arrangement bear interest equal to the Prime Rate, minus 2%, which shall be paid monthly, averaging 6.39% for the year ended March 31, 2024. On March 31, 2024, the S&P 500 Pure Value Fund borrowed $27,000 under this agreement. The remaining Funds did not have any borrowings outstanding under this agreement at March 31, 2024.
The average daily balances borrowed for the year ended March 31, 2024, were as follows:
Fund | | Average Daily Balance | |
S&P 500® Pure Growth Fund | | $ | 126 | |
S&P 500® Pure Value Fund | | | 915 | |
S&P MidCap 400 Pure Growth Fund | | | 2,708 | |
S&P MidCap 400 Pure Value Fund | | | 4,175 | |
S&P SmallCap 600 Pure Growth Fund | | | 656 | |
S&P SmallCap 600 Pure Value Fund | | | 940 | |
Europe 1.25x Strategy Fund | | | 3 | |
| | THE RYDEX FUNDS ANNUAL REPORT | 107 |
NOTES TO FINANCIAL STATEMENTS (concluded) |
Note 11 – Market Risks
The value of, or income generated by, the investments held by the Funds are subject to the possibility of rapid and unpredictable fluctuation, and loss that may result from various factors. These factors include, among others, developments affecting individual companies, or from broader influences, including real or perceived changes in prevailing interest rates (which may change at any time based on changes in monetary policies and various market and other economic condition), changes in inflation rates or expectations about inflation rates, adverse investor confidence or sentiment, changing economic, political (including geopolitical), social or financial market conditions, increased instability or general uncertainty, environmental disasters, governmental actions, public health emergencies (such as the spread of infectious diseases, pandemics and epidemics), debt crises, actual or threatened wars or other armed conflicts (such as the ongoing Russia-Ukraine conflict and its collateral economic and other effects, including, but not limited to, sanctions and other international trade barriers) or ratings downgrades, and other similar events, each of which may be temporary or last for extended periods. Moreover, changing economic, political, geopolitical, social, financial market or other conditions in one country, geographic region or industry could adversely affect the value, yield and return of the investments held by the Funds in a different country, geographic region, economy, industry or market because of the increasingly interconnected global economies and financial markets. The duration and extent of the foregoing types of factors or conditions are highly uncertain and difficult to predict and have in the past, and may in the future, cause volatility and distress in economies and financial markets or other adverse circumstances, which may negatively affect the value of the Funds’ investments and performance of the Funds.
Note 12 – Subsequent Events
On May 21, 2024, the Board approved a waiver and/or expense reimbursement arrangement whereby GI has agreed to waive and/or reimburse expenses for Europe 1.25x Strategy Fund, in an amount equal to an annual percentage rate of 0.10% of the Fund’s average daily net assets. This arrangement will take effect on August 1, 2024 and the end of the initial term is August 1, 2025. This agreement shall automatically renew for one-year terms, unless GI provides written notice to the Fund of the termination at least thirty days prior to the end of the then-current term. This agreement may be terminated at any time by the Fund’s Board upon sixty days’ written notice to the Adviser. In addition, the agreement will terminate automatically if the Advisory Agreement, with respect to the Fund, is terminated, with such termination effective upon the effective date of the termination of the Advisory Agreement. The Funds evaluated subsequent events through the date the financial statements are issued and determined there were no additional material events that would require adjustment to or disclosure in the Funds’ financial statements.
108 | THE RYDEX FUNDS ANNUAL REPORT | |
REPORT OF INDEPENDENT REGISTERED PUBLIC ACCOUNTING FIRM |
To the Shareholders of S&P 500® Pure Growth Fund, S&P 500® Pure Value Fund, S&P MidCap 400® Pure Growth Fund, S&P MidCap 400® Pure Value Fund, S&P SmallCap 600® Pure Growth Fund, S&P SmallCap 600® Pure Value Fund, Europe 1.25x Strategy Fund, Japan 2x Strategy Fund, Strengthening Dollar 2x Strategy Fund and Weakening Dollar 2x Strategy Fund and the Board of Trustees of Rydex Series Funds
Opinion on the Financial Statements
We have audited the accompanying statements of assets and liabilities of S&P 500® Pure Growth Fund, S&P 500® Pure Value Fund, S&P MidCap 400® Pure Growth Fund, S&P MidCap 400® Pure Value Fund, S&P SmallCap 600® Pure Growth Fund, S&P SmallCap 600® Pure Value Fund, Europe 1.25x Strategy Fund, Japan 2x Strategy Fund, Strengthening Dollar 2x Strategy Fund, and Weakening Dollar 2x Strategy Fund (collectively referred to as the “Funds”), (ten of the funds constituting Rydex Series Funds (the “Trust”)), including the schedules of investments, as of March 31, 2024, and the related statements of operations for the year then ended, the statements of changes in net assets for each of the two years in the period then ended, the financial highlights for each of the five years in the period then ended and the related notes (collectively referred to as the “financial statements”). In our opinion, the financial statements present fairly, in all material respects, the financial position of each of the Funds (ten of the funds constituting Rydex Series Funds) at March 31, 2024, the results of their operations for the year then ended, the changes in their net assets for each of the two years in the period then ended and their financial highlights for each of the five years in the period then ended, in conformity with U.S. generally accepted accounting principles.
Basis for Opinion
These financial statements are the responsibility of the Trust’s management. Our responsibility is to express an opinion on each of the Funds’ financial statements based on our audits. We are a public accounting firm registered with the Public Company Accounting Oversight Board (United States) (“PCAOB”) and are required to be independent with respect to the Trust in accordance with the U.S. federal securities laws and the applicable rules and regulations of the Securities and Exchange Commission and the PCAOB.
We conducted our audits in accordance with the standards of the PCAOB. Those standards require that we plan and perform the audit to obtain reasonable assurance about whether the financial statements are free of material misstatement, whether due to error or fraud. The Trust is not required to have, nor were we engaged to perform, an audit of the Trust’s internal control over financial reporting. As part of our audits, we are required to obtain an understanding of internal control over financial reporting but not for the purpose of expressing an opinion on the effectiveness of the Trust’s internal control over financial reporting. Accordingly, we express no such opinion.
Our audits included performing procedures to assess the risks of material misstatement of the financial statements, whether due to error or fraud, and performing procedures that respond to those risks. Such procedures included examining, on a test basis, evidence regarding the amounts and disclosures in the financial statements. Our procedures included confirmation of securities owned as of March 31, 2024, by correspondence with the custodian, transfer agent, and brokers; when replies were not received from brokers, we performed other auditing procedures. Our audits also included evaluating the accounting principles used and significant estimates made by management, as well as evaluating the overall presentation of the financial statements. We believe that our audits provide a reasonable basis for our opinion.

We have served as the auditor of one or more Guggenheim investment companies since 1979.
Tysons, Virginia
May 22, 2024
| | THE RYDEX FUNDS ANNUAL REPORT | 109 |
OTHER INFORMATION (Unaudited) |
Federal Income Tax Information
This information is being provided as required by the Internal Revenue Code. Amounts shown may differ from those elsewhere in the report because of differences in tax and financial reporting practice.
In January 2025, shareholders will be advised on IRS Form 1099 DIV or substitute 1099 DIV as to the federal tax status of the distributions received by shareholders in the calendar year 2024.
The Funds’ investment income (dividend income plus short-term capital gains, if any) qualifies as follows:
Of the taxable ordinary income distributions paid during the fiscal year ended March 31, 2024, the following funds had the corresponding percentages qualify for the reduced tax rate pursuant to the Jobs and Growth Tax Relief and Reconciliation Act of 2003 or for the dividends received deduction for corporations. See the qualified dividend income and dividend received deduction columns, respectively, in the table below.
Additionally, of the taxable ordinary income distributions paid during the fiscal year ended March 31, 2024, the following funds had the corresponding percentages qualify as interest related dividends as permitted by IRC Section 871(k)(1). See the qualified interest income column in the table below.
Fund | | Qualified
Dividend
Income | | | Dividend
Received
Deduction | | | Qualified
Interest
Income | |
S&P 500® Pure Value Fund | | | 100.00 | % | | | 100.00 | % | | | 1.02 | % |
S&P MidCap 400® Pure Value Fund | | | 100.00 | % | | | 100.00 | % | | | 0.29 | % |
S&P SmallCap 600® Pure Value Fund | | | 100.00 | % | | | 100.00 | % | | | 0.00 | % |
Europe 1.25x Strategy Fund | | | 81.22 | % | | | 4.42 | % | | | 26.97 | % |
Japan 2x Strategy Fund | | | 0.00 | % | | | 0.00 | % | | | 83.80 | % |
Strengthening Dollar 2x Strategy Fund | | | 0.00 | % | | | 0.00 | % | | | 50.00 | % |
Weakening Dollar 2x Strategy Fund | | | 0.00 | % | | | 0.00 | % | | | 50.03 | % |
With respect to the taxable year ended March 31, 2024, the Funds hereby designate as capital gain dividends the amounts listed below, or, if subsequently determined to be different, the net capital gain of such year:
Fund | | From long-term
capital gain: | | | From long-term
capital gain, using
proceeds from
shareholder
redemptions: | |
S&P MidCap 400® Pure Value Fund | | $ | — | | | $ | 508,499 | |
S&P SmallCap 600® Pure Growth Fund | | | — | | | | 255,830 | |
Delivery of Shareholder Reports
Paper copies of the Funds’ annual and semi-annual shareholder reports are not sent by mail, unless you specifically request paper copies of the reports from a Fund or from your financial intermediary. Instead, the reports are made available on a website, and you are notified by mail each time a report is posted and provided with a website link to access the report.
You may elect to receive all future shareholder reports in paper free of charge. If you hold shares of a Fund directly, you can inform the Fund that you wish to receive paper copies of reports by calling 800.820.0888. If you hold shares of a Fund through a financial intermediary, please contact the financial intermediary to make this election. Your election to receive reports in paper may apply to all Guggenheim Funds in which you are invested and may apply to all Guggenheim Funds held with your financial intermediary.
110 | THE RYDEX FUNDS ANNUAL REPORT | |
OTHER INFORMATION (Unaudited)(concluded) |
Tailored Shareholder Reports for Open-End Mutual Funds and Exchange-Traded Funds
Effective January 24, 2023, the SEC adopted rule and form amendments to require open-end mutual funds and exchange-traded funds registered on Form N-1A to transmit concise and visually engaging streamlined annual and semi-annual reports to shareholders that highlight key information. Other information, including financial statements, will no longer appear in a streamlined shareholder report but must be available online, delivered free of charge upon request, and filed on a semi-annual basis on Form N-CSR. The rule and form amendments have a compliance date of July 24, 2024. At this time, management is evaluating the impact of these amendments on the shareholder reports for the Funds.
Proxy Voting Information
A description of the policies and procedures that the Trust uses to determine how to vote proxies relating to securities held in the Funds’ portfolios is available, without charge and upon request, by calling 800.820.0888. This information is also available from the EDGAR database on the SEC’s website at https://www.sec.gov.
Information regarding how the Funds’ voted proxies relating to portfolio securities during the most recent 12-month period ended June 30 is available without charge, upon request, by calling 800.820.0888. This information is also available from the EDGAR database on the SEC’s website at https://www.sec.gov.
Sector Classification
Information in the Schedule of Investments is categorized by sectors using sector-level Classifications defined by the Bloomberg Industry Classification System, a widely recognized industry classification system provider. Each Fund’s registration statement has investment policies relating to concentration in specific sectors/industries. For purposes of these investment policies, the Funds usually classify sectors/industries based on industry-level Classifications used by widely recognized industry classification system providers such as Bloomberg Industry Classification System, Global Industry Classification Standards and Barclays Global Classification Scheme.
Quarterly Portfolio Schedules Information
The Trust files its complete schedule of portfolio holdings with the SEC for the first and third quarters of each fiscal year as an exhibit to its reports on Form N-PORT. The Funds’ Form N-PORT is available on the SEC’s website at https://www.sec.gov. The Funds’ complete schedules of securities holdings as of the end of each fiscal quarter will be made available to the public on the SEC’s website at www.sec.gov and will be made available, upon request and without charge, by calling 800.820.0888.
| | THE RYDEX FUNDS ANNUAL REPORT | 111 |
INFORMATION ON BOARD OF TRUSTEES AND OFFICERS (Unaudited) |
A Board of Trustees oversees the Trust, as well as other trusts of GI, in which its members have no stated term of service, and continue to serve after election until resignation. The Statement of Additional Information includes further information about Fund Trustees and Officers, and can be obtained without charge by visiting guggenheiminvestments.com or by calling 800.820.0888.
Name, Address*
and Year of Birth | Position(s)
Held with
Trust | Term of Office
and Length of
Time Served** | Principal Occupation(s)
During Past Five Years | Number of
Portfolios
in Fund
Complex
Overseen | Other
Directorships Held
by Trustees*** |
INDEPENDENT TRUSTEES | | | |
Randall C. Barnes (1951) | Trustee and Chair of the Valuation Oversight Committee | Since 2019 (Trustee) Since 2020 (Chair of the Valuation Oversight Committee) | Current: Private Investor (2001-present). Former: Senior Vice President and Treasurer, PepsiCo, Inc. (1993-1997); President, Pizza Hut International (1991-1993); Senior Vice President, Strategic Planning and New Business Development, PepsiCo, Inc. (1987-1990). | 153 | Current: Advent Convertible and Income Fund (2005-present); Purpose Investments Funds (2013-present). Former: Guggenheim Energy & Income Fund (2015-2023); Fiduciary/Claymore Energy Infrastructure Fund (2004-2022); Guggenheim Enhanced Equity Income Fund (2005-2021); Guggenheim Credit Allocation Fund (2013-2021). |
Angela Brock-Kyle (1959) | Trustee | Since 2016 | Current: Founder and Chief Executive Officer, B.O.A.R.D.S. (consulting firm) (2013-present); Director, Mutual Fund Directors Forum (2022-present). Former: Senior Leader, TIAA (financial services firm) (1987-2012). | 152 | Current: Bowhead Insurance GP, LLC (2020-present); Hunt Companies, Inc. (2019-present). Former: Guggenheim Energy & Income Fund (2019-2023); Fiduciary/Claymore Energy Infrastructure Fund (2019-2022); Guggenheim Enhanced Equity Income Fund (2019-2021); Guggenheim Credit Allocation Fund (2019-2021); Infinity Property & Casualty Corp. (2014-2018). |
112 | THE RYDEX FUNDS ANNUAL REPORT | |
INFORMATION ON BOARD OF TRUSTEES AND OFFICERS (Unaudited)(continued) |
Name, Address*
and Year of Birth | Position(s)
Held with
Trust | Term of Office
and Length of
Time Served** | Principal Occupation(s)
During Past Five Years | Number of
Portfolios
in Fund
Complex
Overseen | Other
Directorships Held
by Trustees*** |
INDEPENDENT TRUSTEES - continued | | |
Thomas F. Lydon, Jr. (1960) | Trustee and Chair of the Contracts Review Committee | Since 2005 (Trustee) Since 2020 (Chair of the Contracts Review Committee) | Current: President, Global Trends Investments (registered investment adviser) (1996-present); Chief Executive Officer, Lydon Media (2016-present); Vice Chairman, VettaFi, a wholly owned subsidiary of The TMX Group (financial advisor content, research and digital distribution provider) (2022-present). Former: Chief Executive Officer, ETF Flows, LLC (financial advisor education and research provider) (2019-2023); Director, GDX Index Partners, LLC (index provider) (2021-2023). | 152 | Current: US Global Investors, Inc. (GROW) (1995-present); The 2023 ETF Series Trust (4) (2023-present); The 2023 ETF Series II (1) (2023-present). Former: Guggenheim Energy & Income Fund (2019-2023); Fiduciary/Claymore Energy Infrastructure Fund (2019-2022); Guggenheim Enhanced Equity Income Fund (2019-2021); Guggenheim Credit Allocation Fund (2019-2021); Harvest Volatility Edge Trust (3) (2017-2019). |
Ronald A. Nyberg (1953) | Trustee and Chair of the Nominating and Governance Committee | Since 2019 | Current: Of Counsel (formerly Partner), Momkus LLP (law firm) (2016-present). Former: Partner, Nyberg & Cassioppi, LLC (law firm) (2000-2016); Executive Vice President, General Counsel, and Corporate Secretary, Van Kampen Investments (1982-1999). | 153 | Current: Advent Convertible and Income Fund (2003-present); PPM Funds (2) (2018-present); Endeavor Health (2012-present). Former: Guggenheim Energy & Income Fund (2015-2023); Fiduciary/Claymore Energy Infrastructure Fund (2004-2022); Guggenheim Enhanced Equity Income Fund (2005-2021); Guggenheim Credit Allocation Fund (2013-2021); Western Asset Inflation-Linked Opportunities & Income Fund (2004-2020); Western Asset Inflation-Linked Income Fund (2003-2020). |
| | THE RYDEX FUNDS ANNUAL REPORT | 113 |
INFORMATION ON BOARD OF TRUSTEES AND OFFICERS (Unaudited)(continued) |
Name, Address*
and Year of Birth | Position(s)
Held with
Trust | Term of Office
and Length of
Time Served** | Principal Occupation(s)
During Past Five Years | Number of
Portfolios
in Fund
Complex
Overseen | Other
Directorships Held
by Trustees*** |
INDEPENDENT TRUSTEES - concluded | | |
Sandra G. Sponem (1958) | Trustee and Chair of the Audit Committee | Since 2016 (Trustee) Since 2019 (Chair of the Audit Committee) | Current: Retired. Former: Senior Vice President and Chief Financial Officer, M.A. Mortenson-Companies, Inc. (construction and real estate development company) (2007-2017). | 152 | Current: SPDR Series Trust (81) (2018-present); SPDR Index Shares Funds (30) (2018-present); SSGA Active Trust (14) (2018-present). Former: Guggenheim Energy & Income Fund (2019-2023); Fiduciary/Claymore Energy Infrastructure Fund (2019-2022); Guggenheim Enhanced Equity Income Fund (2019-2021); Guggenheim Credit Allocation Fund (2019-2021); SSGA Master Trust (1) (2018-2020). |
Ronald E. Toupin, Jr. (1958) | Trustee, Chair of the Board and Chair of the Executive Committee | Since 2019 | Current: Portfolio Consultant (2010-present); Member, Governing Council, Independent Directors Council (2013-present); Governor, Board of Governors, Investment Company Institute (2018-present). Former: Member, Executive Committee, Independent Directors Council (2016-2018); Vice President, Manager and Portfolio Manager, Nuveen Asset Management (1998-1999); Vice President, Nuveen Investment Advisory Corp. (1992-1999); Vice President and Manager, Nuveen Unit Investment Trusts (1991-1999); and Assistant Vice President and Portfolio Manager, Nuveen Unit Investment Trusts (1988-1999), each of John Nuveen & Co., Inc. (registered broker dealer) (1982-1999). | 152 | Former: Guggenheim Energy & Income Fund (2015-2023); Fiduciary/Claymore Energy Infrastructure Fund (2004-2022); Guggenheim Enhanced Equity Income Fund (2005-2021); Guggenheim Credit Allocation Fund (2013-2021); Western Asset Inflation-Linked Opportunities & Income Fund (2004-2020); Western Asset Inflation-Linked Income Fund (2003-2020). |
114 | THE RYDEX FUNDS ANNUAL REPORT | |
INFORMATION ON BOARD OF TRUSTEES AND OFFICERS (Unaudited)(continued) |
Name, Address*
and Year of Birth | Position(s)
Held with
Trust | Term of Office
and Length of
Time Served** | Principal Occupation(s)
During Past Five Years | Number of
Portfolios
in Fund
Complex
Overseen | Other
Directorships Held
by Trustees*** |
INTERESTED TRUSTEE | | | | |
Amy J. Lee**** (1961) | Trustee, Vice President and Chief Legal Officer | Since 2019 | Current: Interested Trustee, certain other funds in the Fund Complex (2018-present); Chief Legal Officer, certain other funds in the Fund Complex (2014-present); Vice President, certain other funds in the Fund Complex (2007-present); Senior Managing Director, Guggenheim Investments (2012-present). Former: President and/or Chief Executive Officer, certain other funds in the Fund Complex (2017-2019); Vice President, Associate General Counsel and Assistant Secretary, Security Benefit Life Insurance Company and Security Benefit Corporation (2004-2012). | 152 | Former: Guggenheim Energy & Income Fund (2018-2023); Fiduciary/Claymore Energy Infrastructure Fund (2018-2022); Guggenheim Enhanced Equity Income Fund (2018-2021); Guggenheim Credit Allocation Fund (2018-2021). |
* | The business address of each Trustee is c/o Guggenheim Investments, 227 West Monroe Street, Chicago, Illinois 60606. |
** | Each Trustee serves an indefinite term, until his or her successor is elected and qualified. |
*** | Each Trustee also serves on the Boards of Trustees of Guggenheim Funds Trust, Guggenheim Variable Funds Trust, Guggenheim Strategy Funds Trust, Guggenheim Taxable Municipal Bond & Investment Grade Debt Trust, Guggenheim Strategic Opportunities Fund, Guggenheim Active Allocation Fund, Rydex Series Funds, Rydex Dynamic Funds, Rydex Variable Trust and Transparent Value Trust. Messrs. Barnes and Nyberg also serve on the Board of Trustees of Advent Convertible & Income Fund. |
**** | This Trustee is deemed to be an “interested person” of the Funds under the 1940 Act by reason of her position with the Funds’ Adviser and/or the parent of the Adviser. |
| | THE RYDEX FUNDS ANNUAL REPORT | 115 |
INFORMATION ON BOARD OF TRUSTEES AND OFFICERS (Unaudited)(continued) |
Name, Address*
and Year of Birth | Position(s)
Held with
Trust | Term of Office
and Length of
Time Served** | Principal Occupation(s)
During Past Five Years |
OFFICERS | | | |
Brian E. Binder (1972) | President and Chief Executive Officer | Since 2019 | Current: President, Mutual Funds Boards, Guggenheim Investments (2022-present); President and Chief Executive Officer, certain other funds in the Fund Complex (2018-present); President, Mutual Funds Boards and Senior Managing Director, Guggenheim Funds Investment Advisors, LLC and Security Investors, LLC (2018-present); Board Member, Guggenheim Partners Investment Funds plc (2022-present); Board Member, Guggenheim Global Investments plc (2022-present); Board Member, Guggenheim Partners Fund Management (Europe) Limited (2018-present). Former: Senior Managing Director and Chief Administrative Officer, Guggenheim Investments (2018-2022); Managing Director and President, Deutsche Funds, and Head of US Product, Trading and Fund Administration, Deutsche Asset Management (2013-2018); Managing Director, Chairman of North American Executive Committee and Head of Business Management and Consulting, Invesco Ltd. (2010-2012). |
James Howley (1972) | Chief Financial Officer, Chief Accounting Officer and Treasurer | Since 2022 | Current: Managing Director, Guggenheim Investments (2004-present); Chief Financial Officer, Chief Accounting Officer, and Treasurer, certain other funds in the Fund Complex (2022-present). Former: Assistant Treasurer, certain other funds in the Fund Complex (2006-2022); Manager, Mutual Fund Administration of Van Kampen Investments, Inc. (1996-2004). |
Mark E. Mathiasen (1978) | Secretary | Since 2017 | Current: Secretary, certain other funds in the Fund Complex (2007-present); Managing Director, Guggenheim Investments (2007-present). |
Glenn McWhinnie (1969) | Assistant Treasurer | Since 2016 | Current: Vice President, Guggenheim Investments (2009-present); Assistant Treasurer, certain other funds in the Fund Complex (2016-present). |
Michael P. Megaris (1984) | Assistant Secretary | Since 2018 | Current: Assistant Secretary, certain other funds in the Fund Complex (2014-present); Managing Director, Guggenheim Investments (2012-present). |
Elisabeth Miller (1968) | Chief Compliance Officer | Since 2012 | Current: Chief Compliance Officer, certain other funds in the Fund Complex (2012-present); Senior Managing Director, Guggenheim Investments (2012-present); Senior Managing Director, Guggenheim Funds Distributors, LLC (2014-present). Former: Chief Compliance Officer, Security Investors, LLC and Guggenheim Funds Investment Advisors, LLC (2012-2018); Chief Compliance Officer, Guggenheim Distributors, LLC (2009-2014); Senior Manager, Security Investors, LLC (2004-2014); Senior Manager, Guggenheim Distributors, LLC (2004-2014). |
Margaux Misantone (1978) | AML Officer | Since 2017 | Current: Chief Compliance Officer, Security Investors, LLC and Guggenheim Funds Investment Advisors, LLC (2018-present); AML Officer, Security Investors, LLC and certain other funds in the Fund Complex (2017-present); Managing Director, Guggenheim Investments (2015-present). Former: Assistant Chief Compliance Officer, Security Investors, LLC and Guggenheim Funds Investments Advisors, LLC (2015-2018). |
116 | THE RYDEX FUNDS ANNUAL REPORT | |
INFORMATION ON BOARD OF TRUSTEES AND OFFICERS (Unaudited)(concluded) |
Name, Address*
and Year of Birth | Position(s)
Held with
Trust | Term of Office
and Length of
Time Served** | Principal Occupation(s)
During Past Five Years |
OFFICERS - concluded | |
Kimberly J. Scott (1974) | Assistant Treasurer | Since 2016 | Current: Director, Guggenheim Investments (2012-present); Assistant Treasurer, certain other funds in the Fund Complex (2012-present). Former: Financial Reporting Manager, Invesco, Ltd. (2010-2011); Vice President/Assistant Treasurer, Mutual Fund Administration for Van Kampen Investments, Inc./Morgan Stanley Investment Management (2009-2010); Manager of Mutual Fund Administration, Van Kampen Investments, Inc./Morgan Stanley Investment Management (2005-2009). |
Jon Szafran (1989) | Assistant Treasurer | Since 2017 | Current: Director, Guggenheim Investments (2017-present); Assistant Treasurer, certain other funds in the Fund Complex (2017-present). Former: Assistant Treasurer of Henderson Global Funds and Manager of US Fund Administration, Henderson Global Investors (North America) Inc. (“HGINA”), (2017); Senior Analyst of US Fund Administration, HGINA (2014–2017); Senior Associate of Fund Administration, Cortland Capital Market Services, LLC (2013-2014); Experienced Associate, PricewaterhouseCoopers LLP (2012-2013). |
* | The business address of each officer is c/o Guggenheim Investments, 227 West Monroe Street, Chicago, Illinois 60606. |
** | Each officer serves an indefinite term, until his or her successor is duly elected and qualified. |
| | THE RYDEX FUNDS ANNUAL REPORT | 117 |
GUGGENHEIM INVESTMENTS PRIVACY NOTICE (Unaudited) |
Who We Are
This Privacy Notice describes the data protection practices of Guggenheim Investments. Guggenheim Investments as used herein refers to the affiliated investment management businesses of Guggenheim Partners, LLC: Guggenheim Funds Investment Advisors, LLC, Guggenheim Partners Investment Management, LLC, Guggenheim Funds Distributors, LLC, Security Investors, LLC, Guggenheim Investment Advisors (Europe) Limited, Guggenheim Real Estate, LLC, GS Gamma Advisors, LLC, Guggenheim Partners India Management, LLC, Guggenheim Partners Europe Limited, as well as the funds in the Guggenheim Funds complex (the “Funds”) (“Guggenheim Investments,” “we,” “us,” or “our”).
Guggenheim Partners Investment Management Holdings, LLC, located at 330 Madison Avenue, New York, New York, 10017 is the data controller for your information. The affiliates who are also controllers of certain of your information are: Guggenheim Investment Advisors (Europe) Limited, Guggenheim Partners Europe Limited, Guggenheim Partners, LLC, Guggenheim Funds Investment Advisors, LLC, Guggenheim Partners Investment Management, LLC, Guggenheim Funds Distributors, LLC and Security Investors, LLC, as well as the Funds.
Our Commitment to You
Guggenheim Investments considers your privacy our utmost concern. When you become our client or investor, you entrust us with not only your hard-earned money but also with your personal and financial information. Because we have access to your private information, we hold ourselves to the highest standards in its safekeeping and use. We strictly limit how we share your information with others, whether you are a current or former Guggenheim Investments client or investor.
The Information We Collect About You
We collect certain nonpublic personal information about you from information you provide on applications, other forms, our website, and/or from third parties including investment advisors. This information includes Social Security or other tax identification number, assets, income, tax information, retirement and estate plan information, transaction history, account balance, payment history, bank account information, marital status, family relationships, information that we collect on our website through the use of “cookies,” and other personal information that you or others provide to us. We may also collect such information through your inquiries by mail, e-mail or telephone. We may also collect customer due diligence information, as required by applicable law and regulation, through third party service providers.
How We Handle Your Personal Information
The legal basis for using your information as set out in this Privacy Notice is as follows: (a) use of your personal data is necessary to perform our obligations under any contract with you (such as a contract for us to provide financial services to you); or (b) where use of your personal data is not necessary for performance of a contract, use of your personal data is necessary for our legitimate interests or the legitimate interests of others (for example, to enforce the legal terms governing our services, operate and market our website and other services we offer, ensure safe environments for our personnel and others, make and receive payments, prevent fraud and to know the customer to whom we are providing the services). Some processing is done to comply with applicable law.
In addition to the specific uses described above, we also use your information in the following manner:
| | ● | We use your information in connection with servicing your accounts. |
| | ● | We use information to respond to your requests or questions. For example, we might use your information to respond to your customer feedback. |
| | ● | We use information to improve our products and services. We may use your information to make our website and products better. We may use your information to customize your experience with us. |
| | ● | We use information for security purposes. We may use your information to protect our company and our customers. |
| | ● | We use information to communicate with you. For example, we will communicate with you about your account or our relationship. We may contact you about your feedback. We might also contact you about this Privacy Notice. We may also enroll you in our email newsletter. |
118 | THE RYDEX FUNDS ANNUAL REPORT | |
GUGGENHEIM INVESTMENTS PRIVACY NOTICE (Unaudited)(continued) |
| | ● | We use information as otherwise permitted by law, as we may notify you. |
| | ● | Aggregate/Anonymous Data. We may aggregate and/or anonymize any information collected through the website so that such information can no longer be linked to you or your device (“Aggregate/Anonymous Information”). We may use Aggregate/Anonymous Information for any purpose, including without limitation for research and marketing purposes, and may also share such data with any third parties, including advertisers, promotional partners, and sponsors. |
We do not sell information about current or former clients or their accounts to third parties. Nor do we share this information, except when necessary to complete transactions at your request, to make you aware of investment products and services that we or our affiliates offer, or as permitted or required by law.
We provide information about you to companies and individuals not affiliated with Guggenheim Investments to complete certain transactions or account changes, or to perform services for us related to your account. For example, if you ask to transfer assets from another financial institution to Guggenheim Investments, we must provide certain information about you to that company to complete the transaction. We provide the third party with only the information necessary to carry out its responsibilities and only for that purpose. And we require these third parties to treat your private information with the same high degree of confidentiality that we do. To alert you to other Guggenheim Investments products and services, we share your information within our family of affiliated companies. You may limit our sharing with affiliated companies as set out below. We may also share information with any successor to all or part of our business, or in connection with steps leading up to a merger or acquisition. For example, if part of our business was sold we may give customer information as part of that transaction. We may also share information about you with your consent.
We will release information about you if you direct us to do so, if we are compelled by law to do so, or in other circumstances as permitted by law (for example, to protect your account from fraud).
If you close your account(s) or become an inactive client or investor, we will continue to adhere to the privacy policies and practices described in this notice.
Opt-Out Provisions and Your Data Choices
The law allows you to “opt out” of certain kinds of information sharing with third parties. We do not share personal information about you with any third parties that triggers this opt-out right. This means YOU ARE ALREADY OPTED OUT.
When you are no longer our client or investor, we continue to share your information as described in this notice, and you may contact us at any time to limit our sharing by sending an email to CorporateDataPrivacy@GuggenheimPartners.com.
European Union Data Subjects and certain others: In addition to the choices set forth above, residents of the European Union and certain other jurisdictions have certain rights to (1) request access to or rectification or deletion of information we collect about them, (2) request a restriction on the processing of their information, (3) object to the processing of their information, or (4) request the portability of certain information. To exercise these or other rights, please contact us using the contact information below. We will consider all requests and provide our response within the time period stated by applicable law. Please note, however, that certain information may be exempt from such requests in some circumstances, which may include if we need to keep processing your information for our legitimate interests or to comply with a legal obligation. We may request you provide us with information necessary to confirm your identity before responding to your request.
Residents of France and certain other jurisdictions may also provide us with instructions regarding the manner in which we may continue to store, erase and share your information after your death, and where applicable, the person you have designated to exercise these rights after your death.
How We Protect Privacy Online
We take steps to protect your privacy when you use our web site – www.guggenheiminvestments.com – by using secure forms of online communication, including encryption technology, Secure Socket Layer (SSL) protocol, firewalls and user names and passwords. These safeguards vary based on the sensitivity of the information that we collect and store. However, we cannot and do not guarantee that these measures will prevent every unauthorized attempt to access, use, or disclose your information since despite our efforts, no Internet and/or other
| | THE RYDEX FUNDS ANNUAL REPORT | 119 |
GUGGENHEIM INVESTMENTS PRIVACY NOTICE (Unaudited)(concluded) |
electronic transmissions can be completely secure. Our web site uses “http cookies”—tiny pieces of information that we ask your browser to store. We use cookies for session management and security features on the Guggenheim Investments web site. We do not use them to pull data from your hard drive, to learn your e-mail address, or to view data in cookies created by other web sites. We will not share the information in our cookies or give others access to it. See the legal information area on our web site for more details about web site security and privacy features.
How We Safeguard Your Personal Information and Data Retention
We restrict access to nonpublic personal information about you to our employees and in some cases to third parties (for example, the service providers described above) as permitted by law. We maintain strict physical, electronic and procedural safeguards that comply with federal standards to guard your nonpublic personal information.
We keep your information for no longer than necessary for the purposes for which it is processed. The length of time for which we retain information depends on the purposes for which we collected and use it and/or as required to comply with applicable laws. Information may persist in copies made for backup and business continuity purposes for additional time.
International Visitors
If you are not a resident of the United States, please be aware that your information may be transferred to, stored and processed in the United States where our servers are located and our databases are operated. The data protection and other laws of the United States and other countries might not be as comprehensive as those in your country.
In such cases, we ensure that a legal basis for such a transfer exists and that adequate protection is provided as required by applicable law, for example, by using standard contractual clauses or by transferring your data to a jurisdiction that has obtained an adequacy finding. Individuals whose data may be transferred on the basis of standard contractual clauses may contact us as described below.
We’ll Keep You Informed
If you have any questions or concerns about how we treat your personal data, we encourage you to consult with us first. You may also contact the relevant supervisory authority.
We reserve the right to modify this policy at any time and will inform you promptly of material changes. You may access our privacy policy from our web site at www.guggenheiminvestments.com. Should you have any questions regarding our privacy policy, contact us by email at CorporateDataPrivacy@GuggenheimPartners.com.
120 | THE RYDEX FUNDS ANNUAL REPORT | |
This page intentionally left blank.
This page intentionally left blank.
This page intentionally left blank.
This page intentionally left blank.
This page intentionally left blank.
3.31.2024
Rydex Funds Annual Report
Domestic Equity Funds |
Nova Fund |
S&P 500® Fund |
Inverse S&P 500® Strategy Fund |
Monthly Rebalance NASDAQ-100® 2x Strategy Fund |
Inverse NASDAQ-100® Strategy Fund |
Mid-Cap 1.5x Strategy Fund |
Inverse Mid-Cap Strategy Fund |
Russell 2000® 1.5x Strategy Fund |
Russell 2000® Fund |
Inverse Russell 2000® Strategy Fund |
Dow Jones Industrial Average® Fund |
Fixed Income Funds |
Government Long Bond 1.2x Strategy Fund |
Inverse Government Long Bond Strategy Fund |
High Yield Strategy Fund |
Inverse High Yield Strategy Fund |
Money Market Fund |
U.S. Government Money Market Fund |
GuggenheimInvestments.com | RBENF-ANN-0324x0325 |

| | |
DEAR SHAREHOLDER | 2 |
ECONOMIC AND MARKET OVERVIEW | 4 |
A BRIEF NOTE ON THE COMPOUNDING OF RETURNS | 6 |
ABOUT SHAREHOLDERS’ FUND EXPENSES | 7 |
NOVA FUND | 12 |
S&P 500® FUND | 27 |
INVERSE S&P 500® STRATEGY FUND | 40 |
MONTHLY REBALANCE NASDAQ-100® 2x STRATEGY FUND | 49 |
INVERSE NASDAQ-100® STRATEGY FUND | 59 |
MID-CAP 1.5x STRATEGY FUND | 69 |
INVERSE MID-CAP STRATEGY FUND | 81 |
RUSSELL 2000® 1.5x STRATEGY FUND | 89 |
RUSSELL 2000® FUND | 116 |
INVERSE RUSSELL 2000® STRATEGY FUND | 143 |
DOW JONES INDUSTRIAL AVERAGE® FUND | 151 |
GOVERNMENT LONG BOND 1.2x STRATEGY FUND | 160 |
INVERSE GOVERNMENT LONG BOND STRATEGY FUND | 170 |
HIGH YIELD STRATEGY FUND | 181 |
INVERSE HIGH YIELD STRATEGY FUND | 191 |
U.S. GOVERNMENT MONEY MARKET FUND | 200 |
NOTES TO FINANCIAL STATEMENTS | 206 |
REPORT OF INDEPENDENT REGISTERED PUBLIC ACCOUNTING FIRM | 226 |
OTHER INFORMATION | 227 |
INFORMATION ON BOARD OF TRUSTEES AND OFFICERS | 229 |
GUGGENHEIM INVESTMENTS PRIVACY NOTICE | 235 |
| | THE RYDEX FUNDS ANNUAL REPORT | 1 |
Dear Shareholder:
Security Investors, LLC (the “Investment Adviser”) is pleased to present the annual shareholder report for a selection of our funds (the “Fund” or “Funds”). This report covers performance for the annual period ended March 31, 2024 (“Reporting Period”).
The Investment Adviser is part of Guggenheim Investments, which represents the investment management businesses of Guggenheim Partners, LLC (“Guggenheim”), a global, diversified financial services firm.
Guggenheim Funds Distributors, LLC is the distributor of the Funds. Guggenheim Funds Distributors, LLC is affiliated with Guggenheim and the Investment Adviser.
We encourage you to read the Economic and Market Overview section of the report, which follows this letter, and then the Performance Report and Fund Profile for each Fund.
We are committed to providing innovative investment solutions and appreciate the trust you place in us.
Sincerely,
Security Investors, LLC
April 30, 2024
Read a prospectus and summary prospectus (if available) carefully before investing. It contains the investment objectives, risks, charges, expenses and other information, which should be considered carefully before investing. Obtain a prospectus and summary prospectus (if available) at guggenheiminvestments.com or call 800.820.0888.
This material is not intended as a recommendation or as investment advice of any kind, including in connection with rollovers, transfers, and distributions. Such material is not provided in a fiduciary capacity, may not be relied upon for or in connection with the making of investment decisions, and does not constitute a solicitation of an offer to buy or sell securities. All content has been provided for informational or educational purposes only and is not intended to be and should not be construed as legal or tax advice and/or a legal opinion. Always consult a financial, tax and/or legal professional regarding your specific situation.
The Domestic Equity Funds (with the exception of the S&P 500® Fund, Russell 2000® Fund, and Dow Jones Industrial Average® Fund) and Fixed Income Funds (with the exception of the High Yield Strategy Fund) are very different from most mutual funds in that they seek to provide leveraged or inverse investment results and are intended to be used as short-term trading vehicles. The Funds are not intended to be used by, and are not appropriate for, investors who do not intend to actively manage and monitor their portfolios. Certain of the Funds seek to provide such investment results on a daily basis and the Monthly Rebalance NASDAQ-100® 2x Strategy Fund seeks to provide such investment results on a calendar month basis. Each Inverse Fund pursues an investment goal which is inverse to the performance of its underlying index. Investors should note that the pursuit of such leveraged and inverse investment goals has the following implications: ● The Leveraged Funds are riskier than alternatives that do not use leverage because the performance of an investment in a Leveraged Fund is magnified. ● The effect of leverage on a Fund will generally cause the Fund’s performance to not match the performance of the Fund’s benchmark (e.g., 200% of the performance of its underlying index) over a period of time greater than one day or full calendar month, as applicable. This means that the return of a Fund for a period of longer than a single trading day or full calendar month, as applicable, will be the result of each day’s or month’s compounded returns over the period, which will very likely differ from the return of the Fund’s benchmark for that period. As a consequence, especially during periods of market volatility, the path or trend of the benchmark during the longer period may be at least as important to the Fund’s cumulative return for the longer period as the cumulative return of the benchmark for the relevant longer period. Further, the return for investors who invest for a period longer than a single trading day or different than a full calendar month (whether for a period shorter or longer than a full calendar month), as applicable, will not be the product of the return of a Fund’s stated investment goal (e.g., 2x) and the cumulative performance of the Fund’s benchmark. For the Monthly Rebalance NASDAQ-100® 2x Strategy Fund, which seeks to provide investment results on a calendar month basis, an investor who purchases shares on a day other than the last business day of a calendar month will generally receive more, or less, than the exposure to the underlying index from that point until the end of the calendar month. In addition, for
2 | THE RYDEX FUNDS ANNUAL REPORT | |
Funds that seek to provide investment results on a daily basis, as a result of compounding, a Fund’s performance for periods greater than one day is likely to be either greater than or less than the performance of the Fund’s underlying index times the stated multiple in the Fund’s investment objective, before accounting for fees and fund expenses.
The Funds are not suitable for all investors. The Funds are designed to be utilized only by sophisticated investors, such as traders and active investors employing dynamic strategies. Investors in the Funds should: (a) understand the risks associated with the use of leverage, (b) understand the consequences of seeking daily leveraged investment results, (c) for each Inverse Fund, understand the risks of shorting, and (d) intend to actively manage and monitor their investments. Investors who do not understand the Funds or do not actively manage and monitor their investments should not buy shares of the Funds.
Each Leveraged Fund (except for the Monthly Rebalance NASDAQ-100® 2x Strategy Fund) seeks daily exposure to its underlying index equal to or in excess of 120% (please see each Leveraged Fund’s prospectus and/or summary prospectus for the specific daily exposure sought, which may be in excess of 120%) of its net assets. As a consequence, for each Fund the risk of total loss of your investment exists in the event of a movement of the Fund’s underlying index in excess of 50% in a direction adverse to the Fund (meaning a decline in the value of the underlying index of a Leveraged Fund). In short, the risk of total loss of your investment exists.
The Monthly Rebalance NASDAQ-100® 2x Strategy Fund does not seek to provide investment results on a daily basis or for periods different than a full calendar month that match the performance of its benchmark, but rather seeks to provide investment results that match the performance of its benchmark on a full calendar month basis. The Fund seeks exposure to its underlying index equal to 200% of its net assets. As a consequence, the risk of total loss of your investment exists in the event of a decline in the value of the Fund’s underlying index in excess of 50%. In short, the risk of total loss of your investment exists.
There is no assurance that any Fund will achieve its investment objective and an investment in a Fund could lose money. No single Fund is a complete investment program.
The High Yield Strategy Fund and Inverse High Yield Strategy Fund may not be suitable for all investors. ● The Funds’ use of derivatives, such as futures, options, and swap agreements, will expose the Funds to additional risks that they would not be subject to if they invested directly in the securities underlying those derivatives. ●A highly liquid secondary market may not exist for the credit default swaps the Funds invest in, and there can be no assurance that a highly liquid secondary market will develop. ●The Funds’ market value will change in response to interest rate changes and market conditions among other factors. ● You may have a gain or loss when you sell your shares. ● In general, bond prices rise when interest rates fall, and vice versa. ●The Funds’ exposure to the high yield bond market may subject the Funds to greater volatility because (i) the Funds will be affected by the ability of high yield security issuers’ ability to make principal and interest payments and (ii) the prices of derivatives linked to high yield bonds may fluctuate unpredictably and not necessarily in relation to interest rates. ● It is important to note that the Funds are not guaranteed by the U.S. government. ● The Funds are subject to active trading risk that may increase volatility and impact the Funds’ ability to achieve their investment objectives. ● See the Fund’s prospectus for more information on these and additional risks.
The U.S. Government Money Market Fund may not be suitable for all investors. ● The Fund’s assets are valued using the amortized cost method, which generally enables the Fund to maintain a stable price of $1.00 per share. Although the Fund is managed to maintain a stable price per share of $1.00, there is no guarantee that the price will be constantly maintained, and it is possible to lose money by investing in the Fund. An investment in the Fund is not insured or guaranteed by the Federal Deposit Insurance Corporation or any other government agency. The Advisor and its affiliates have no legal obligation to provide financial support to the Fund, and you should not expect that the Advisor or its affiliates will provide financial support to the Fund at any time, including during periods of market stress. In the event any money market fund fails to maintain a stable NAV, other money market funds, including the Fund, could face a universal risk of increased redemption pressures, potentially jeopardizing the stability of their NAVs. In exchange for the Fund’s emphasis on a stable price per share and liquidity, the Fund may experience lower long-term performance than stock or bond investments. ● See the Fund’s prospectus for more information on these and additional risks.
| | THE RYDEX FUNDS ANNUAL REPORT | 3 |
ECONOMIC AND MARKET OVERVIEW (Unaudited) | March 31, 2024 |
While job growth remains robust, recent labor data brought increased confidence in a labor market in better balance, allowing for inflation to soften further. Labor force growth remains strong, aided by high immigration flows, helping bring labor supply in line with gradually cooling demand. The Small Business Survey indicates that plans to increase compensation have returned to pre-COVID levels. Additionally, Bureau of Labor Statistics data reveal a continued decline in the “quits rate,” reducing the pressure on businesses to raise wages to attract or retain employees. These developments suggest wage pressures may ease further by year end. And despite some speculation against any Federal Reserve (the “Fed”) rate cuts materializing in 2024, we continue to anticipate cuts later this year.
Following the stronger-than-expected March Consumer Price Index, we believe that there is a high probability that the easing cycle will start in the second half of the year, since the Fed will likely need more time to gather confirming data. In the latest Summary of Economic Projections, the Federal Open Market Committee (“FOMC”) significantly increased the median forecast for 2024 U.S. gross domestic product, slightly increased it for core personal consumption expenditures year over year, and continues to expect no material increase in the unemployment rate. These adjustments left the median view for three rate cuts for 2024, which suggests the bar is very high for the Fed to keep rates where they are all year, and even higher for more rate hikes to materialize.
Amid this macroeconomic backdrop, in the first quarter of 2024 the two-year Treasury yield increased to 4.59% from 4.23%, and the 10-year Treasury yield increased to 4.20% from 3.88%, keeping the inverted 2s/10s yield curve consistent at 39 basis points as of the end of the Reporting Period, up four basis points since the start of the year. One basis point equals 0.01%. In general, spreads to Treasurys have remained tight across sectors. In investment-grade corporate bonds, BBB-rated bonds continued to remain attractive relative to A and BB-rated bonds, and supply slowed toward the end of the first quarter of 2024, we believe which should support spreads in the near term. High yield bond spreads tightened during the first quarter of 2024 to 301 basis points from 323 basis points at the start of the year, while leveraged loans’ discount margins to maturity tightened to 509 basis points from 528 basis points. Structured credit spreads tightened marginally amid strong demand. Investor demand and an improved arbitrage led to robust new collateralized loan obligation issuance, and tightening liabilities led to an increase in refinances/resets.
Looking forward, Fed officials continue to advocate for a patient approach. A conventional easing cycle is therefore far from guaranteed. Market expectations have already adjusted significantly from market-implied expectations of six rate cuts in 2024 just two months ago to only three as of the end of the Reporting Period, aligning more closely with the FOMC’s views. So far, the market has taken this delay in stride, but its patience and assessment of credit risk could be tested.
For the Reporting Period, the S&P 500® Index* returned 29.88%. The MSCI Europe-Australasia-Far East (“EAFE”) Index* returned 15.32%. The return of the MSCI Emerging Markets Index* was 8.15%.
In the bond market, the Bloomberg U.S. Aggregate Bond Index* posted a 1.70% return for the Reporting Period, while the Bloomberg U.S. Corporate High Yield Index* returned 11.15%. The return of the ICE Bank of America (“BofA”) 3-Month U.S. Treasury Bill Index* was 5.27% for the Reporting Period.
The opinions and forecasts expressed may not actually come to pass. This information is subject to change at any time, based on market and other conditions, and should not be construed as a recommendation of any specific security or strategy.
*Index Definitions:
The following indices are referenced throughout this report. Indices are unmanaged and not available for direct investment. Index performance does not reflect transaction costs, fees, or expenses.
Bloomberg U.S. Aggregate Bond Index is a broad-based flagship benchmark that measures the investment grade, U.S. dollar-denominated, fixed-rate taxable bond market, including U.S. Treasuries, government-related and corporate securities, mortgage-backed securities or “MBS”(agency fixed-rate and hybrid adjustable-rate mortgage, or “ARM”, pass-throughs), asset-backed securities (“ABS”), and commercial mortgage-backed securities (“CMBS”) (agency and non-agency).
Bloomberg U.S. Corporate High Yield Index measures the U.S. dollar-denominated, high yield, fixed-rate corporate bond market. Securities are classified as high yield if the middle rating of Moody’s, Fitch, and S&P is Ba1/BB +/BB + or below.
Bloomberg U.S. Long Treasury Index includes all publicly issued, U.S. Treasury securities that have a remaining maturity of 10 or more years, are rated investment grade, and have $250 million or more of outstanding face value. In addition, the securities must be denominated in U.S. dollars and must be fixed rate and nonconvertible. The U.S. Long Treasury Index is market capitalization weighted and the securities in the index are updated on the last business day of each month.
Bloomberg U.S. Treasury Bellwethers 30 Yr. Index is an unmanaged index representing the on-the-run (most recently auctioned) U.S. Treasury bond with 30 years’ maturity.
4 | THE RYDEX FUNDS ANNUAL REPORT | |
ECONOMIC AND MARKET OVERVIEW (Unaudited)(concluded) | March 31, 2024 |
Dow Jones Industrial Average® is a price-weighted average of 30 significant stocks traded on the New York Stock Exchange and the Nasdaq.
ICE BofA 3-Month U.S. Treasury Bill Index is an unmanaged market index of U.S. Treasury securities maturing in 90 days that assumes reinvestment of all income.
MSCI EAFE Index is a free float-adjusted market capitalization index that is designed to measure the equity market performance of developed markets, excluding the U.S. & Canada.
MSCI Emerging Markets Index is a free float-adjusted market capitalization weighted index that is designed to measure equity market performance in the global emerging markets.
NASDAQ-100® Index includes 100 of the largest domestic and international non-financial securities listed on The Nasdaq Stock Market based on market capitalization. The Index reflects companies across major industry groups including computer hardware and software, telecommunications, retail/wholesale trade and biotechnology. It does not contain securities of financial companies including investment companies.
Russell 2000® Index measures the performance of the small-cap segment of the U.S. equity universe.
S&P 500® Index is a broad-based index, the performance of which is based on the performance of 500 widely held common stocks chosen for market size, liquidity, and industry group representation.
S&P MidCap 400® Index provides investors with a benchmark for mid-sized companies. The index covers approximately 7% of the U.S. equity market, and seeks to remain an accurate measure of mid-sized companies, reflecting the risk and return characteristics of the broader mid-cap universe on an on-going basis.
| | THE RYDEX FUNDS ANNUAL REPORT | 5 |
A BRIEF NOTE ON THE COMPOUNDING OF RETURNS (Unaudited) | |
Many of the Funds described in this report are benchmarked daily to leveraged and/or inverse leveraged versions of published indices. To properly evaluate the performance of these funds, it is essential to understand the effect of mathematical compounding on their respective returns.
Because of the nonlinear effects of leverage applied over time, it is possible for a fund to perform in-line with its benchmark for several individual periods in a row, yet seem to trail the benchmark over the entire period on a cumulative basis. It is also possible that a fund that performs in-line with its benchmark on a daily basis may seem to outperform its benchmark over longer periods.
An Example of Compounding
For example, consider a hypothetical fund that is designed to produce returns that correspond to 150% of an index. On the first day of a period, the index rises from a level of 100 to a level of 106, producing a 6.0% gain and an expectation that the fund will rise by 9.0%. On the same day, the fund’s net asset value per share (“NAV”) increases from $10.00 to $10.90 for a gain of 9.0% — in line with its benchmark.
On day two, assume the index falls from 106 to 99 for a loss of about 6.6%. The fund, as expected, falls 9.9% to a price of $9.82. On each day, the fund performed exactly in line with its benchmark, but for the two-day period, the fund was down 1.8%, while the index was down only 1.0%. Without taking into account the daily compounding of returns, one would expect the fund to lose 1.5% and would see the fund as trailing by 0.3% when in fact it had performed perfectly. This example is summarized in the table below.
| Index
Level | Index
Performance | Fund
Expectation | Fund
NAV | Fund
Performance | Assessment |
Start | 100 | | | $ 10.00 | | |
Day 1 | 106 | 6.0% | 9.0% | $ 10.90 | 9.0% | In line |
Day 2 | 99 | -6.6% | -9.9% | $ 9.82 | -9.9% | In line |
Cumulative | | -1.0% | -1.5% | | -1.8% | -0.3% |
As illustrated by this simple example, the effect of leverage can make it difficult to form expectations or judgments about fund performance given only the returns of the unleveraged index.
Because certain funds seek to track the performance of their benchmark on a daily basis, mathematical compounding, especially with respect to those funds that use leverage as part of their investment strategy, may prevent a fund from correlating with the monthly, quarterly, annual or other period performance of its benchmark. Due to the compounding of daily returns, leveraged and inverse funds’ returns over periods other than one day will likely differ in amount and possibly direction from the benchmark return for the same period. Investors should monitor their leveraged and inverse funds’ holdings to ensure that they are consistent with their strategies, as frequently as daily. For those funds that consistently apply leverage, the value of the fund’s shares will tend to increase or decrease more than the value of any increase or decrease in its benchmark index. For more information on correlation, leverage and other risks, please read the prospectus.
In general, any change in direction in an index will produce compounding that seems to work against an investor. Were the index to move in the same direction (either up or down) for two or more periods in a row, the compounding of those returns would work in an investor’s favor, causing the fund to seemingly beat its benchmark.
As a general rule of thumb, more leverage in a fund will magnify the compounding effect, while less leverage will generally produce results that are more in line with expectations. In addition, periods of high volatility in an underlying index will also cause the effects of compounding to be more pronounced, while lower volatility will produce a more muted effect.
6 | THE RYDEX FUNDS ANNUAL REPORT | |
ABOUT SHAREHOLDERS’ FUND EXPENSES (Unaudited) | |
All mutual funds have operating expenses, and it is important for our shareholders to understand the impact of costs on their investments. Shareholders of a fund incur two types of costs: (i) transaction costs, including sales charges (loads) on purchase payments, reinvested dividends, other distributions, and exchange fees, and (ii) ongoing costs, including management fees, administrative services, and shareholder reports, among others. These ongoing costs, or operating expenses, are deducted from a fund’s gross income and reduce the investment return of the fund.
A fund’s expenses are expressed as a percentage of its average net assets, which is known as the expense ratio. The following examples are intended to help investors understand the ongoing costs (in dollars) of investing in a fund and to compare these costs with the ongoing costs of investing in other mutual funds.
The examples are based on an investment of $1,000 made at the beginning of the period and held for the entire six-month period beginning September 30, 2023 and ending March 31, 2024.
The following tables illustrate the Funds’ costs in two ways:
Table 1. Based on actual Fund return: This section helps investors estimate the actual expenses paid over the period. The “Ending Account Value” shown is derived from the Fund’s actual return, and the fifth column shows the dollar amount that would have been paid by an investor who started with $1,000 in the Fund. Investors may use the information here, together with the amount invested, to estimate the expenses paid over the period. Simply divide the Fund’s account value by $1,000 (for example, an $8,600 account value divided by $1,000 = 8.6), then multiply the result by the number provided under the heading “Expenses Paid During Period.”
Table 2. Based on hypothetical 5% return: This section is intended to help investors compare a fund’s cost with those of other mutual funds. The table provides information about hypothetical account values and hypothetical expenses based on the Fund’s actual expense ratio and an assumed rate of return of 5% per year before expenses, which is not the Fund’s actual return. The hypothetical account values and expenses may not be used to estimate the actual ending account balance or expenses paid during the period. The example is useful in making comparisons because the U.S. Securities and Exchange Commission (the “SEC”) requires all mutual funds to calculate expenses based on the 5% return. Investors can assess a fund’s costs by comparing this hypothetical example with the hypothetical examples that appear in shareholder reports of other funds.
The calculations illustrated above assume no shares were bought or sold during the period. Actual costs may have been higher or lower, depending on the amount of investment and the timing of any purchases or redemptions.
Please note that the expenses shown in the table are meant to highlight your ongoing costs only and do not reflect any transactional costs, such as sales charges (loads) on purchase payments, and contingent deferred sales charges (“CDSC”) on redemptions, if any. Therefore, the second table is useful in comparing ongoing costs only, and will not help you determine the relative total costs of owning different funds. In addition, if these transactional costs were included, your costs would have been higher.
More information about the Funds’ expenses, including annual expense ratios for periods up to five years (subject to the Fund’s inception date), can be found in the Financial Highlights section of this report. For additional information on operating expenses and other shareholder costs, please refer to the appropriate Fund prospectus.
| | THE RYDEX FUNDS ANNUAL REPORT | 7 |
ABOUT SHAREHOLDERS’ FUND EXPENSES (Unaudited)(continued) | |
| | Expense
Ratio1 | | | Fund
Return | | | Beginning
Account Value
September 30, 2023 | | | Ending
Account Value
March 31, 2024 | | | Expenses
Paid During
Period2 | |
Table 1. Based on actual Fund return3 | | | | | | | | | | | | | | | | | | | | |
Nova Fund | | | | | | | | | | | | | | | | | | | | |
Investor Class | | | 1.39 | % | | | 33.94 | % | | $ | 1,000.00 | | | $ | 1,339.40 | | | $ | 8.13 | |
Class A | | | 1.66 | % | | | 33.78 | % | | | 1,000.00 | | | | 1,337.80 | | | | 9.70 | |
Class C | | | 2.41 | % | | | 33.29 | % | | | 1,000.00 | | | | 1,332.90 | | | | 14.06 | |
Class H | | | 1.65 | % | | | 33.78 | % | | | 1,000.00 | | | | 1,337.80 | | | | 9.64 | |
S&P 500® Fund | | | | | | | | | | | | | | | | | | | | |
Class A | | | 1.64 | % | | | 22.44 | % | | | 1,000.00 | | | | 1,224.40 | | | | 9.12 | |
Class C | | | 2.39 | % | | | 21.98 | % | | | 1,000.00 | | | | 1,219.80 | | | | 13.26 | |
Class H | | | 1.63 | % | | | 22.43 | % | | | 1,000.00 | | | | 1,224.30 | | | | 9.06 | |
Inverse S&P 500® Strategy Fund | | | | | | | | | | | | | | | | | | | | |
Investor Class | | | 1.42 | % | | | (15.29 | %) | | | 1,000.00 | | | | 847.10 | | | | 6.56 | |
Class A | | | 1.70 | % | | | (15.36 | %) | | | 1,000.00 | | | | 846.40 | | | | 7.85 | |
Class C | | | 2.42 | % | | | (15.69 | %) | | | 1,000.00 | | | | 843.10 | | | | 11.15 | |
Class H | | | 1.66 | % | | | (15.37 | %) | | | 1,000.00 | | | | 846.30 | | | | 7.66 | |
Monthly Rebalance NASDAQ-100® 2x Strategy Fund | | | | | | | | | | | | | | | | |
Class A | | | 1.36 | % | | | 47.64 | % | | | 1,000.00 | | | | 1,476.40 | | | | 8.42 | |
Class C | | | 2.11 | % | | | 47.10 | % | | | 1,000.00 | | | | 1,471.00 | | | | 13.03 | |
Class H | | | 1.37 | % | | | 47.63 | % | | | 1,000.00 | | | | 1,476.30 | | | | 8.48 | |
Inverse NASDAQ-100® Strategy Fund | | | | | | | | | | | | | | | | | | | | |
Investor Class | | | 1.49 | % | | | (16.78 | %) | | | 1,000.00 | | | | 832.20 | | | | 6.82 | |
Class A | | | 1.73 | % | | | (16.94 | %) | | | 1,000.00 | | | | 830.60 | | | | 7.92 | |
Class C | | | 2.51 | % | | | (17.19 | %) | | | 1,000.00 | | | | 828.10 | | | | 11.47 | |
Class H | | | 1.73 | % | | | (16.85 | %) | | | 1,000.00 | | | | 831.50 | | | | 7.92 | |
Mid-Cap 1.5x Strategy Fund | | | | | | | | | | | | | | | | | | | | |
Class A | | | 1.70 | % | | | 32.71 | % | | | 1,000.00 | | | | 1,327.10 | | | | 9.89 | |
Class C | | | 2.45 | % | | | 32.22 | % | | | 1,000.00 | | | | 1,322.20 | | | | 14.22 | |
Class H | | | 1.70 | % | | | 32.72 | % | | | 1,000.00 | | | | 1,327.20 | | | | 9.89 | |
Inverse Mid-Cap Strategy Fund | | | | | | | | | | | | | | | | | | | | |
Class A | | | 1.65 | % | | | (15.74 | %) | | | 1,000.00 | | | | 842.60 | | | | 7.60 | |
Class C | | | 1.59 | % | | | (15.43 | %) | | | 1,000.00 | | | | 845.70 | | | | 7.34 | |
Class H | | | 1.66 | % | | | (15.74 | %) | | | 1,000.00 | | | | 842.60 | | | | 7.65 | |
Russell 2000® 1.5x Strategy Fund | | | | | | | | | | | | | | | | | | | | |
Class A | | | 1.68 | % | | | 27.64 | % | | | 1,000.00 | | | | 1,276.40 | | | | 9.56 | |
Class C | | | 2.37 | % | | | 27.16 | % | | | 1,000.00 | | | | 1,271.60 | | | | 13.46 | |
Class H | | | 1.68 | % | | | 27.63 | % | | | 1,000.00 | | | | 1,276.30 | | | | 9.56 | |
Russell 2000® Fund | | | | | | | | | | | | | | | | | | | | |
Class A | | | 1.65 | % | | | 18.96 | % | | | 1,000.00 | | | | 1,189.60 | | | | 9.03 | |
Class C | | | 2.39 | % | | | 18.53 | % | | | 1,000.00 | | | | 1,185.30 | | | | 13.06 | |
Class H | | | 1.65 | % | | | 18.96 | % | | | 1,000.00 | | | | 1,189.60 | | | | 9.03 | |
Inverse Russell 2000® Strategy Fund | | | | | | | | | | | | | | | | | | | | |
Class A | | | 1.63 | % | | | (14.44 | %) | | | 1,000.00 | | | | 855.60 | | | | 7.56 | |
Class C | | | 2.36 | % | | | (14.74 | %) | | | 1,000.00 | | | | 852.60 | | | | 10.93 | |
Class H | | | 1.62 | % | | | (14.43 | %) | | | 1,000.00 | | | | 855.70 | | | | 7.52 | |
8 | THE RYDEX FUNDS ANNUAL REPORT | |
ABOUT SHAREHOLDERS’ FUND EXPENSES (Unaudited)(continued) | |
| | Expense
Ratio1 | | | Fund
Return | | | Beginning
Account Value
September 30, 2023 | | | Ending
Account Value
March 31, 2024 | | | Expenses
Paid During
Period2 | |
Dow Jones Industrial Average® Fund | | | | | | | | | | | | | | | | | | | | |
Class A | | | 1.66 | % | | | 19.06 | % | | $ | 1,000.00 | | | $ | 1,190.60 | | | $ | 9.09 | |
Class C | | | 2.43 | % | | | 18.62 | % | | | 1,000.00 | | | | 1,186.20 | | | | 13.28 | |
Class H | | | 1.67 | % | | | 19.05 | % | | | 1,000.00 | | | | 1,190.50 | | | | 9.15 | |
Government Long Bond 1.2x Strategy Fund | | | | | | | | | | | | | | | | | | | | |
Investor Class | | | 1.02 | % | | | 8.91 | % | | | 1,000.00 | | | | 1,089.10 | | | | 5.33 | |
Class A | | | 1.26 | % | | | 8.76 | % | | | 1,000.00 | | | | 1,087.60 | | | | 6.58 | |
Class C | | | 2.01 | % | | | 8.38 | % | | | 1,000.00 | | | | 1,083.80 | | | | 10.47 | |
Class H | | | 1.27 | % | | | 8.94 | % | | | 1,000.00 | | | | 1,089.40 | | | | 6.63 | |
Inverse Government Long Bond Strategy Fund | | | | | | | | | | | | | | | | |
Investor Class | | | 4.88 | % | | | (4.20 | %) | | | 1,000.00 | | | | 958.00 | | | | 23.89 | |
Class A | | | 5.09 | % | | | (4.32 | %) | | | 1,000.00 | | | | 956.80 | | | | 24.90 | |
Class C | | | 5.85 | % | | | (4.67 | %) | | | 1,000.00 | | | | 953.30 | | | | 28.57 | |
Class H | | | 5.09 | % | | | (4.32 | %) | | | 1,000.00 | | | | 956.80 | | | | 24.90 | |
High Yield Strategy Fund | | | | | | | | | | | | | | | | | | | | |
Class A | | | 1.56 | % | | | 10.75 | % | | | 1,000.00 | | | | 1,107.50 | | | | 8.22 | |
Class C | | | 2.32 | % | | | 10.33 | % | | | 1,000.00 | | | | 1,103.30 | | | | 12.20 | |
Class H | | | 1.56 | % | | | 10.74 | % | | | 1,000.00 | | | | 1,107.40 | | | | 8.22 | |
Inverse High Yield Strategy Fund | | | | | | | | | | | | | | | | | | | | |
Class A | | | 1.56 | % | | | (6.25 | %) | | | 1,000.00 | | | | 937.50 | | | | 7.56 | |
Class C | | | 2.32 | % | | | (6.59 | %) | | | 1,000.00 | | | | 934.10 | | | | 11.22 | |
Class H | | | 1.56 | % | | | (6.26 | %) | | | 1,000.00 | | | | 937.40 | | | | 7.56 | |
U.S. Government Money Market Fund | | | 1.08 | % | | | 2.18 | % | | | 1,000.00 | | | | 1,021.80 | | | | 5.46 | |
| | THE RYDEX FUNDS ANNUAL REPORT | 9 |
ABOUT SHAREHOLDERS’ FUND EXPENSES (Unaudited)(continued) | |
| | Expense
Ratio1 | | | Fund
Return | | | Beginning
Account Value
September 30, 2023 | | | Ending
Account Value
March 31, 2024 | | | Expenses
Paid During
Period2 | |
Table 2. Based on hypothetical 5% return (before expenses)3 | | | | | | | | | | | | | | | | |
Nova Fund | | | | | | | | | | | | | | | | | | | | |
Investor Class | | | 1.39 | % | | | 5.00 | % | | $ | 1,000.00 | | | $ | 1,018.05 | | | $ | 7.01 | |
Class A | | | 1.66 | % | | | 5.00 | % | | | 1,000.00 | | | | 1,016.70 | | | | 8.37 | |
Class C | | | 2.41 | % | | | 5.00 | % | | | 1,000.00 | | | | 1,012.95 | | | | 12.13 | |
Class H | | | 1.65 | % | | | 5.00 | % | | | 1,000.00 | | | | 1,016.75 | | | | 8.32 | |
S&P 500® Fund | | | | | | | | | | | | | | | | | | | | |
Class A | | | 1.64 | % | | | 5.00 | % | | | 1,000.00 | | | | 1,016.80 | | | | 8.27 | |
Class C | | | 2.39 | % | | | 5.00 | % | | | 1,000.00 | | | | 1,013.05 | | | | 12.03 | |
Class H | | | 1.63 | % | | | 5.00 | % | | | 1,000.00 | | | | 1,016.85 | | | | 8.22 | |
Inverse S&P 500® Strategy Fund | | | | | | | | | | | | | | | | | | | | |
Investor Class | | | 1.42 | % | | | 5.00 | % | | | 1,000.00 | | | | 1,017.90 | | | | 7.16 | |
Class A | | | 1.70 | % | | | 5.00 | % | | | 1,000.00 | | | | 1,016.50 | | | | 8.57 | |
Class C | | | 2.42 | % | | | 5.00 | % | | | 1,000.00 | | | | 1,012.90 | | | | 12.18 | |
Class H | | | 1.66 | % | | | 5.00 | % | | | 1,000.00 | | | | 1,016.70 | | | | 8.37 | |
Monthly Rebalance NASDAQ-100® 2x Strategy Fund | | | | | | | | | | | | | | | | |
Class A | | | 1.36 | % | | | 5.00 | % | | | 1,000.00 | | | | 1,018.20 | | | | 6.86 | |
Class C | | | 2.11 | % | | | 5.00 | % | | | 1,000.00 | | | | 1,014.45 | | | | 10.63 | |
Class H | | | 1.37 | % | | | 5.00 | % | | | 1,000.00 | | | | 1,018.15 | | | | 6.91 | |
Inverse NASDAQ-100® Strategy Fund | | | | | | | | | | | | | | | | | | | | |
Investor Class | | | 1.49 | % | | | 5.00 | % | | | 1,000.00 | | | | 1,017.55 | | | | 7.52 | |
Class A | | | 1.73 | % | | | 5.00 | % | | | 1,000.00 | | | | 1,016.35 | | | | 8.72 | |
Class C | | | 2.51 | % | | | 5.00 | % | | | 1,000.00 | | | | 1,012.45 | | | | 12.63 | |
Class H | | | 1.73 | % | | | 5.00 | % | | | 1,000.00 | | | | 1,016.35 | | | | 8.72 | |
Mid-Cap 1.5x Strategy Fund | | | | | | | | | | | | | | | | | | | | |
Class A | | | 1.70 | % | | | 5.00 | % | | | 1,000.00 | | | | 1,016.50 | | | | 8.57 | |
Class C | | | 2.45 | % | | | 5.00 | % | | | 1,000.00 | | | | 1,012.75 | | | | 12.33 | |
Class H | | | 1.70 | % | | | 5.00 | % | | | 1,000.00 | | | | 1,016.50 | | | | 8.57 | |
Inverse Mid-Cap Strategy Fund | | | | | | | | | | | | | | | | | | | | |
Class A | | | 1.65 | % | | | 5.00 | % | | | 1,000.00 | | | | 1,016.75 | | | | 8.32 | |
Class C | | | 1.59 | % | | | 5.00 | % | | | 1,000.00 | | | | 1,017.05 | | | | 8.02 | |
Class H | | | 1.66 | % | | | 5.00 | % | | | 1,000.00 | | | | 1,016.70 | | | | 8.37 | |
Russell 2000® 1.5x Strategy Fund | | | | | | | | | | | | | | | | | | | | |
Class A | | | 1.68 | % | | | 5.00 | % | | | 1,000.00 | | | | 1,016.60 | | | | 8.47 | |
Class C | | | 2.37 | % | | | 5.00 | % | | | 1,000.00 | | | | 1,013.15 | | | | 11.93 | |
Class H | | | 1.68 | % | | | 5.00 | % | | | 1,000.00 | | | | 1,016.60 | | | | 8.47 | |
Russell 2000® Fund | | | | | | | | | | | | | | | | | | | | |
Class A | | | 1.65 | % | | | 5.00 | % | | | 1,000.00 | | | | 1,016.75 | | | | 8.32 | |
Class C | | | 2.39 | % | | | 5.00 | % | | | 1,000.00 | | | | 1,013.05 | | | | 12.03 | |
Class H | | | 1.65 | % | | | 5.00 | % | | | 1,000.00 | | | | 1,016.75 | | | | 8.32 | |
Inverse Russell 2000® Strategy Fund | | | | | | | | | | | | | | | | | | | | |
Class A | | | 1.63 | % | | | 5.00 | % | | | 1,000.00 | | | | 1,016.85 | | | | 8.22 | |
Class C | | | 2.36 | % | | | 5.00 | % | | | 1,000.00 | | | | 1,013.20 | | | | 11.88 | |
Class H | | | 1.62 | % | | | 5.00 | % | | | 1,000.00 | | | | 1,016.90 | | | | 8.17 | |
10 | THE RYDEX FUNDS ANNUAL REPORT | |
ABOUT SHAREHOLDERS’ FUND EXPENSES (Unaudited)(concluded) | |
| | Expense
Ratio1 | | | Fund
Return | | | Beginning
Account Value
September 30, 2023 | | | Ending
Account Value
March 31, 2024 | | | Expenses
Paid During
Period2 | |
Dow Jones Industrial Average® Fund | | | | | | | | | | | | | | | | | | | | |
Class A | | | 1.66 | % | | | 5.00 | % | | $ | 1,000.00 | | | $ | 1,016.70 | | | $ | 8.37 | |
Class C | | | 2.43 | % | | | 5.00 | % | | | 1,000.00 | | | | 1,012.85 | | | | 12.23 | |
Class H | | | 1.67 | % | | | 5.00 | % | | | 1,000.00 | | | | 1,016.65 | | | | 8.42 | |
Government Long Bond 1.2x Strategy Fund | | | | | | | | | | | | | | | | | | | | |
Investor Class | | | 1.02 | % | | | 5.00 | % | | | 1,000.00 | | | | 1,019.90 | | | | 5.15 | |
Class A | | | 1.26 | % | | | 5.00 | % | | | 1,000.00 | | | | 1,018.70 | | | | 6.36 | |
Class C | | | 2.01 | % | | | 5.00 | % | | | 1,000.00 | | | | 1,014.95 | | | | 10.13 | |
Class H | | | 1.27 | % | | | 5.00 | % | | | 1,000.00 | | | | 1,018.65 | | | | 6.41 | |
Inverse Government Long Bond Strategy Fund | | | | | | | | | | | | | | | | |
Investor Class | | | 4.88 | % | | | 5.00 | % | | | 1,000.00 | | | | 1,000.60 | | | | 24.41 | |
Class A | | | 5.09 | % | | | 5.00 | % | | | 1,000.00 | | | | 999.55 | | | | 25.44 | |
Class C | | | 5.85 | % | | | 5.00 | % | | | 1,000.00 | | | | 995.75 | | | | 29.19 | |
Class H | | | 5.09 | % | | | 5.00 | % | | | 1,000.00 | | | | 999.55 | | | | 25.44 | |
High Yield Strategy Fund | | | | | | | | | | | | | | | | | | | | |
Class A | | | 1.56 | % | | | 5.00 | % | | | 1,000.00 | | | | 1,017.20 | | | | 7.87 | |
Class C | | | 2.32 | % | | | 5.00 | % | | | 1,000.00 | | | | 1,013.40 | | | | 11.68 | |
Class H | | | 1.56 | % | | | 5.00 | % | | | 1,000.00 | | | | 1,017.20 | | | | 7.87 | |
Inverse High Yield Strategy Fund | | | | | | | | | | | | | | | | | | | | |
Class A | | | 1.56 | % | | | 5.00 | % | | | 1,000.00 | | | | 1,017.20 | | | | 7.87 | |
Class C | | | 2.32 | % | | | 5.00 | % | | | 1,000.00 | | | | 1,013.40 | | | | 11.68 | |
Class H | | | 1.56 | % | | | 5.00 | % | | | 1,000.00 | | | | 1,017.20 | | | | 7.87 | |
U.S. Government Money Market Fund | | | 1.08 | % | | | 5.00 | % | | | 1,000.00 | | | | 1,019.60 | | | | 5.45 | |
1 | This ratio represents annualized Net Expense, which includes interest expense related to securities sold short. Excluding short interest expense, the operating ratio of the Inverse Government Long Bond Strategy Fund would be 1.37%, 1.61%, 2.36% and 1.62% for Investor Class, Class A, Class C, and Class H, respectively. Excludes expenses of the underlying funds in which the Funds invests, if any. |
2 | Expenses are equal to the Fund’s annualized expense ratio, net of any applicable fee waivers, multiplied by the average account value over the period, multiplied by 183/366 (to reflect the one-half year period). |
3 | Actual cumulative return at net asset value for the period September 30, 2023 to March 31, 2024. |
| | THE RYDEX FUNDS ANNUAL REPORT | 11 |
PERFORMANCE REPORT AND FUND PROFILE (Unaudited) | March 31, 2024 |
NOVA FUND
OBJECTIVE: Seeks to provide investment results that match, before fees and expenses, the performance of a specific benchmark on a daily basis. The Fund’s current benchmark is 150% of the performance of the S&P 500® Index (the “underlying index”). The Fund does not seek to achieve its investment objective over a period of time greater than one day.
For the Reporting Period, the Nova Fund maintained a daily correlation of over 99% to its benchmark of 150% of the daily price movement of the S&P 500 Index. The Fund Investor Class returned 41.05%, while the S&P 500 Index returned 29.88% over the same time period.
The sectors that contributed the most to the return of the underlying index were Information Technology, Financials, and Communication Services. The only sector that detracted was Utilities.
The holdings that contributed the most to the return of the underlying index were NVIDIA Corp., Microsoft Corp., and Amazon.com, Inc. Those that detracted the most were Pfizer, Inc., Tesla, Inc., and Bristol-Myers Squibb Co.
Derivatives in the Fund were used to help provide exposure to the composition of the benchmark in the highest efficient manner and to provide leverage and not for hedging purposes. Derivatives performed as expected.
Due to the compounding of daily returns, the Fund’s returns over periods other than one day will likely differ in amount and possibly direction from the benchmark return for the same period. Investors should monitor their Fund holdings to ensure that they are consistent with their strategies, as frequently as daily.
The effects of compounding may cause the longer-term correlation of the Fund to its benchmark to diminish. A significant contributor to the discrepancy between the leveraged and unleveraged indices is the effect of compounding on the leveraged index, which is discussed under “A Brief Note on the Compounding of Returns” on page 6.
The Fund may invest in certain of the underlying series of Guggenheim Funds Trust and Guggenheim Strategy Funds Trust, including Guggenheim Ultra Short Duration, Guggenheim Strategy Fund II, and Guggenheim Strategy Fund III (collectively, the “Short Term Investment Vehicles”), each of which are open-end management investment companies managed by Guggenheim Investments. The Short Term Investment Vehicles, which launched on March 11, 2014, are offered as short term investment options only to mutual funds, trusts, and other accounts managed by Guggenheim Investments and/or its affiliates, and are not available to the public, with the exception of Guggenheim Ultra Short Duration Fund, which is available to the public. Guggenheim Strategy Fund II and Guggenheim Strategy Fund III do not charge an investment management fee. Guggenheim Ultra Short Duration Fund charges an investment management fee, but the Fund’s adviser has agreed to waive fees to the extent necessary to offset the proportionate share of any management fee paid by the Fund with respect to its investment in such affiliated fund. For the Reporting Period, investment in the Short Term Investment Vehicles contributed to Fund performance.
Performance displayed represents past performance, which is no guarantee of future results.
Holdings Diversification (Market Exposure as % of Net Assets)
“Holdings Diversification (Market Exposure as % of Net Assets)” excludes any temporary cash investments, investments in Guggenheim Strategy Funds Trust mutual funds, or investments in Guggenheim Ultra Short Duration Fund. Investments in those Funds do not provide “market exposure” to meet the Fund’s investment objective, but will significantly increase the portfolio’s exposure to certain other asset categories (and their associated risks), which may cause the Fund to deviate from its principal investment strategy, including: (i) high yield, high risk debt securities rated below the top four long-term rating categories by a nationally recognized statistical rating organization (also known as “junk bonds”); (ii) securities issued by the U.S. government or its agencies and instrumentalities; (iii) CLOs and similar investments; and (iv) other short-term fixed income securities.
12 | THE RYDEX FUNDS ANNUAL REPORT | |
PERFORMANCE REPORT AND FUND PROFILE (Unaudited)(concluded) | March 31, 2024 |
Inception Dates: |
Investor Class | July 12, 1993 |
Class A | March 31, 2004 |
Class C | March 14, 2001 |
Class H | September 18, 2014 |
Cumulative Fund Performance*
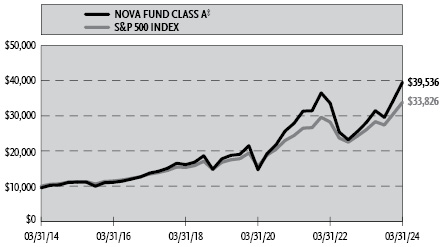
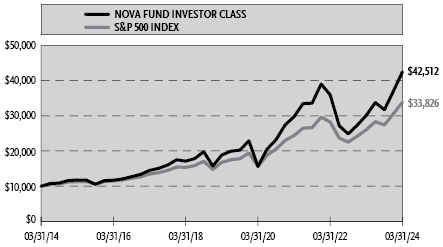
Ten Largest Holdings | % of Total Net Assets |
Microsoft Corp. | 6.2% |
Apple, Inc. | 5.0% |
NVIDIA Corp. | 4.4% |
Amazon.com, Inc. | 3.3% |
Guggenheim Ultra Short Duration Fund — Institutional Class | 2.7% |
Meta Platforms, Inc. — Class A | 2.1% |
Guggenheim Strategy Fund II | 2.0% |
Alphabet, Inc. — Class A | 1.8% |
Guggenheim Strategy Fund III | 1.7% |
Berkshire Hathaway, Inc. — Class B | 1.5% |
Top Ten Total | 30.7% |
| | |
“Ten Largest Holdings” excludes any temporary cash or derivative investments. |
Average Annual Returns*
Periods Ended March 31, 2024
| 1 Year | 5 Year | 10 Year |
Investor Class Shares | 41.05% | 17.64% | 15.57% |
Class A Shares | 40.75% | 17.36% | 15.30% |
Class A Shares with sales charge† | 34.06% | 16.22% | 14.74% |
Class C Shares | 39.70% | 16.47% | 14.44% |
Class C Shares with CDSC‡ | 38.70% | 16.47% | 14.44% |
S&P 500 Index | 29.88% | 15.05% | 12.96% |
| 1 Year | 5 Year | Since
Inception
(09/18/14) |
Class H Shares | 40.73% | 17.36% | 14.75% |
S&P 500 Index | 29.88% | 15.05% | 12.67% |
* | The performance data above represents past performance that is not predictive of future results. The investment return and principal value of an investment in the Fund will fluctuate so that an investor’s shares, when redeemed, may be worth more or less than their original cost. Returns are historical and include changes in principal and reinvested dividends and capital gains and do not reflect the effect of taxes. The S&P 500 Index is an unmanaged index and, unlike the Fund, has no management fees or operating expenses to reduce its reported return. The graphs are based on Investor Class shares and Class A shares only; performance for Class C shares and Class H shares will vary due to differences in fee structures. |
† | Fund returns are calculated using the maximum sales charge of 4.75%. |
‡ | Fund returns include a CDSC of 1% if redeemed within 12 months of purchase. |
| | THE RYDEX FUNDS ANNUAL REPORT | 13 |
SCHEDULE OF INVESTMENTS | March 31, 2024 |
NOVA FUND | |
| | Shares | | | Value | |
COMMON STOCKS† - 87.8% |
| | | | | | | | | |
Technology - 25.1% |
Microsoft Corp. | | | 40,472 | | | $ | 17,027,380 | |
Apple, Inc. | | | 79,060 | | | | 13,557,209 | |
NVIDIA Corp. | | | 13,453 | | | | 12,155,593 | |
Broadcom, Inc. | | | 2,398 | | | | 3,178,333 | |
Advanced Micro Devices, Inc.* | | | 8,801 | | | | 1,588,492 | |
Salesforce, Inc. | | | 5,273 | | | | 1,588,122 | |
Adobe, Inc.* | | | 2,462 | | | | 1,242,325 | |
Accenture plc — Class A | | | 3,415 | | | | 1,183,673 | |
Oracle Corp. | | | 8,684 | | | | 1,090,797 | |
QUALCOMM, Inc. | | | 6,080 | | | | 1,029,344 | |
Intel Corp. | | | 23,029 | | | | 1,017,191 | |
Intuit, Inc. | | | 1,525 | | | | 991,250 | |
International Business Machines Corp. | | | 4,983 | | | | 951,554 | |
Applied Materials, Inc. | | | 4,532 | | | | 934,634 | |
Texas Instruments, Inc. | | | 4,953 | | | | 862,862 | |
ServiceNow, Inc.* | | | 1,116 | | | | 850,838 | |
Micron Technology, Inc. | | | 6,013 | | | | 708,873 | |
Lam Research Corp. | | | 714 | | | | 693,701 | |
Analog Devices, Inc. | | | 2,700 | | | | 534,033 | |
Fiserv, Inc.* | | | 3,269 | | | | 522,452 | |
KLA Corp. | | | 736 | | | | 514,148 | |
Synopsys, Inc.* | | | 831 | | | | 474,917 | |
Cadence Design Systems, Inc.* | | | 1,482 | | | | 461,317 | |
NXP Semiconductor N.V. | | | 1,404 | | | | 347,869 | |
Roper Technologies, Inc. | | | 582 | | | | 326,409 | |
Autodesk, Inc.* | | | 1,165 | | | | 303,389 | |
Super Micro Computer, Inc.* | | | 274 | | | | 276,748 | |
Microchip Technology, Inc. | | | 2,943 | | | | 264,017 | |
MSCI, Inc. — Class A | | | 431 | | | | 241,554 | |
Fidelity National Information Services, Inc. | | | 3,227 | | | | 239,379 | |
Fortinet, Inc.* | | | 3,471 | | | | 237,104 | |
Paychex, Inc. | | | 1,744 | | | | 214,163 | |
Cognizant Technology Solutions Corp. — Class A | | | 2,712 | | | | 198,763 | |
Monolithic Power Systems, Inc. | | | 262 | | | | 177,484 | |
Electronic Arts, Inc. | | | 1,325 | | | | 175,788 | |
ON Semiconductor Corp.* | | | 2,327 | | | | 171,151 | |
Fair Isaac Corp.* | | | 135 | | | | 168,697 | |
ANSYS, Inc.* | | | 473 | | | | 164,207 | |
HP, Inc. | | | 4,749 | | | | 143,515 | |
Broadridge Financial Solutions, Inc. | | | 641 | | | | 131,315 | |
Take-Two Interactive Software, Inc.* | | | 864 | | | | 128,295 | |
Hewlett Packard Enterprise Co. | | | 7,081 | | | | 125,546 | |
PTC, Inc.* | | | 651 | | | | 123,000 | |
Western Digital Corp.* | | | 1,766 | | | | 120,512 | |
NetApp, Inc. | | | 1,122 | | | | 117,776 | |
Seagate Technology Holdings plc | | | 1,061 | | | | 98,726 | |
Leidos Holdings, Inc. | | | 749 | | | | 98,186 | |
Tyler Technologies, Inc.* | | | 229 | | | | 97,327 | |
Skyworks Solutions, Inc. | | | 873 | | | | 94,563 | |
Teradyne, Inc. | | | 833 | | | | 93,987 | |
Akamai Technologies, Inc.* | | | 822 | | | | 89,401 | |
EPAM Systems, Inc.* | | | 314 | | | | 86,714 | |
Zebra Technologies Corp. — Class A* | | | 280 | | | | 84,403 | |
Jack Henry & Associates, Inc. | | | 397 | | | | 68,971 | |
Qorvo, Inc.* | | | 526 | | | | 60,401 | |
Dayforce, Inc.* | | | 850 | | | | 56,278 | |
Paycom Software, Inc. | | | 262 | | | | 52,141 | |
Total Technology | | | | | | | 68,536,817 | |
| | | | | | | | | |
Consumer, Non-cyclical - 16.2% |
Eli Lilly & Co. | | | 4,344 | | | | 3,379,458 | |
UnitedHealth Group, Inc. | | | 5,038 | | | | 2,492,299 | |
Procter & Gamble Co. | | | 12,817 | | | | 2,079,558 | |
Johnson & Johnson | | | 13,112 | | | | 2,074,187 | |
Merck & Company, Inc. | | | 13,802 | | | | 1,821,174 | |
AbbVie, Inc. | | | 9,617 | | | | 1,751,256 | |
PepsiCo, Inc. | | | 7,487 | | | | 1,310,300 | |
Coca-Cola Co. | | | 21,194 | | | | 1,296,649 | |
Thermo Fisher Scientific, Inc. | | | 2,104 | | | | 1,222,866 | |
Abbott Laboratories | | | 9,456 | | | | 1,074,769 | |
Danaher Corp. | | | 3,581 | | | | 894,247 | |
Pfizer, Inc. | | | 30,754 | | | | 853,424 | |
Amgen, Inc. | | | 2,914 | | | | 828,508 | |
Philip Morris International, Inc. | | | 8,456 | | | | 774,739 | |
Intuitive Surgical, Inc.* | | | 1,919 | | | | 765,854 | |
S&P Global, Inc. | | | 1,750 | | | | 744,537 | |
Elevance Health, Inc. | | | 1,280 | | | | 663,731 | |
Stryker Corp. | | | 1,841 | | | | 658,839 | |
Medtronic plc | | | 7,243 | | | | 631,227 | |
Bristol-Myers Squibb Co. | | | 11,083 | | | | 601,031 | |
Vertex Pharmaceuticals, Inc.* | | | 1,404 | | | | 586,886 | |
Cigna Group | | | 1,593 | | | | 578,562 | |
Automatic Data Processing, Inc. | | | 2,237 | | | | 558,668 | |
Regeneron Pharmaceuticals, Inc.* | | | 575 | | | | 553,432 | |
CVS Health Corp. | | | 6,854 | | | | 546,675 | |
Boston Scientific Corp.* | | | 7,980 | | | | 546,550 | |
Mondelez International, Inc. — Class A | | | 7,334 | | | | 513,380 | |
Gilead Sciences, Inc. | | | 6,786 | | | | 497,074 | |
Zoetis, Inc. | | | 2,501 | | | | 423,194 | |
Altria Group, Inc. | | | 9,604 | | | | 418,927 | |
Colgate-Palmolive Co. | | | 4,485 | | | | 403,874 | |
PayPal Holdings, Inc.* | | | 5,837 | | | | 391,021 | |
Becton Dickinson & Co. | | | 1,574 | | | | 389,486 | |
McKesson Corp. | | | 716 | | | | 384,385 | |
HCA Healthcare, Inc. | | | 1,079 | | | | 359,879 | |
Moody’s Corp. | | | 857 | | | | 336,827 | |
Cintas Corp. | | | 469 | | | | 322,217 | |
Edwards Lifesciences Corp.* | | | 3,304 | | | | 315,730 | |
Dexcom, Inc.* | | | 2,100 | | | | 291,270 | |
United Rentals, Inc. | | | 366 | | | | 263,926 | |
IQVIA Holdings, Inc.* | | | 994 | | | | 251,373 | |
IDEXX Laboratories, Inc.* | | | 452 | | | | 244,048 | |
Monster Beverage Corp.* | | | 4,023 | | | | 238,483 | |
Constellation Brands, Inc. — Class A | | | 876 | | | | 238,062 | |
Kimberly-Clark Corp. | | | 1,835 | | | | 237,357 | |
Agilent Technologies, Inc. | | | 1,596 | | | | 232,234 | |
Humana, Inc. | | | 666 | | | | 230,915 | |
Centene Corp.* | | | 2,911 | | | | 228,455 | |
Corteva, Inc. | | | 3,822 | | | | 220,415 | |
Sysco Corp. | | | 2,711 | | | | 220,079 | |
14 | THE RYDEX FUNDS ANNUAL REPORT | SEE NOTES TO FINANCIAL STATEMENTS. |
SCHEDULE OF INVESTMENTS (continued) | March 31, 2024 |
NOVA FUND | |
| | Shares | | | Value | |
Cencora, Inc. — Class A | | | 902 | | | $ | 219,177 | |
General Mills, Inc. | | | 3,093 | | | | 216,417 | |
CoStar Group, Inc.* | | | 2,224 | | | | 214,838 | |
GE HealthCare Technologies, Inc. | | | 2,306 | | | | 209,639 | |
Kroger Co. | | | 3,605 | | | | 205,954 | |
Quanta Services, Inc. | | | 791 | | | | 205,502 | |
Gartner, Inc.* | | | 425 | | | | 202,585 | |
Kenvue, Inc. | | | 9,388 | | | | 201,467 | |
Estee Lauder Companies, Inc. — Class A | | | 1,269 | | | | 195,616 | |
Moderna, Inc.* | | | 1,807 | | | | 192,554 | |
Global Payments, Inc. | | | 1,419 | | | | 189,664 | |
Verisk Analytics, Inc. — Class A | | | 790 | | | | 186,227 | |
Archer-Daniels-Midland Co. | | | 2,905 | | | | 182,463 | |
Equifax, Inc. | | | 672 | | | | 179,773 | |
Keurig Dr Pepper, Inc. | | | 5,673 | | | | 173,991 | |
Biogen, Inc.* | | | 789 | | | | 170,132 | |
Kraft Heinz Co. | | | 4,342 | | | | 160,220 | |
West Pharmaceutical Services, Inc. | | | 403 | | | | 159,471 | |
Hershey Co. | | | 816 | | | | 158,712 | |
ResMed, Inc. | | | 801 | | | | 158,622 | |
Zimmer Biomet Holdings, Inc. | | | 1,138 | | | | 150,193 | |
Cardinal Health, Inc. | | | 1,325 | | | | 148,267 | |
Church & Dwight Company, Inc. | | | 1,342 | | | | 139,984 | |
Molina Healthcare, Inc.* | | | 316 | | | | 129,822 | |
Align Technology, Inc.* | | | 388 | | | | 127,233 | |
Corpay, Inc.* | | | 393 | | | | 121,256 | |
STERIS plc | | | 539 | | | | 121,178 | |
Illumina, Inc.* | | | 865 | | | | 118,782 | |
Baxter International, Inc. | | | 2,766 | | | | 118,219 | |
Waters Corp.* | | | 322 | | | | 110,842 | |
Cooper Companies, Inc.* | | | 1,082 | | | | 109,780 | |
McCormick & Company, Inc. | | | 1,370 | | | | 105,230 | |
Clorox Co. | | | 676 | | | | 103,502 | |
Laboratory Corporation of America Holdings | | | 462 | | | | 100,928 | |
Hologic, Inc.* | | | 1,278 | | | | 99,633 | |
Avery Dennison Corp. | | | 439 | | | | 98,007 | |
Tyson Foods, Inc. — Class A | | | 1,559 | | | | 91,560 | |
Lamb Weston Holdings, Inc. | | | 786 | | | | 83,732 | |
Kellanova | | | 1,436 | | | | 82,268 | |
Bunge Global S.A. | | | 791 | | | | 81,093 | |
Quest Diagnostics, Inc. | | | 604 | | | | 80,398 | |
Viatris, Inc. | | | 6,534 | | | | 78,016 | |
Conagra Brands, Inc. | | | 2,603 | | | | 77,153 | |
Charles River Laboratories International, Inc.* | | | 280 | | | | 75,866 | |
J M Smucker Co. | | | 578 | | | | 72,753 | |
Rollins, Inc. | | | 1,529 | | | | 70,747 | |
Revvity, Inc. | | | 672 | | | | 70,560 | |
Molson Coors Beverage Co. — Class B | | | 1,008 | | | | 67,788 | |
Insulet Corp.* | | | 380 | | | | 65,132 | |
Universal Health Services, Inc. — Class B | | | 332 | | | | 60,577 | |
Bio-Techne Corp. | | | 856 | | | | 60,254 | |
Teleflex, Inc. | | | 256 | | | | 57,900 | |
Incyte Corp.* | | | 1,013 | | | | 57,711 | |
Catalent, Inc.* | | | 984 | | | | 55,547 | |
Hormel Foods Corp. | | | 1,579 | | | | 55,091 | |
Henry Schein, Inc.* | | | 708 | | | | 53,468 | |
Brown-Forman Corp. — Class B | | | 985 | | | | 50,846 | |
Campbell Soup Co. | | | 1,071 | | | | 47,606 | |
MarketAxess Holdings, Inc. | | | 207 | | | | 45,385 | |
Robert Half, Inc. | | | 567 | | | | 44,952 | |
DaVita, Inc.* | | | 293 | | | | 40,449 | |
Bio-Rad Laboratories, Inc. — Class A* | | | 114 | | | | 39,429 | |
Dentsply Sirona, Inc. | | | 1,154 | | | | 38,301 | |
Total Consumer, Non-cyclical | | | | | | | 44,332,499 | |
| | | | | | | | | |
Communications - 12.9% |
Amazon.com, Inc.* | | | 49,788 | | | | 8,980,760 | |
Meta Platforms, Inc. — Class A | | | 11,983 | | | | 5,818,705 | |
Alphabet, Inc. — Class A* | | | 32,097 | | | | 4,844,400 | |
Alphabet, Inc. — Class C* | | | 26,873 | | | | 4,091,683 | |
Netflix, Inc.* | | | 2,357 | | | | 1,431,477 | |
Walt Disney Co. | | | 9,992 | | | | 1,222,621 | |
Cisco Systems, Inc. | | | 22,132 | | | | 1,104,608 | |
Verizon Communications, Inc. | | | 22,900 | | | | 960,884 | |
Comcast Corp. — Class A | | | 21,583 | | | | 935,623 | |
Uber Technologies, Inc.* | | | 11,208 | | | | 862,904 | |
Booking Holdings, Inc. | | | 190 | | | | 689,297 | |
AT&T, Inc. | | | 38,943 | | | | 685,397 | |
Palo Alto Networks, Inc.* | | | 1,717 | | | | 487,851 | |
T-Mobile US, Inc. | | | 2,844 | | | | 464,198 | |
Arista Networks, Inc.* | | | 1,373 | | | | 398,142 | |
Airbnb, Inc. — Class A* | | | 2,373 | | | | 391,450 | |
Motorola Solutions, Inc. | | | 904 | | | | 320,902 | |
CDW Corp. | | | 730 | | | | 186,719 | |
Charter Communications, Inc. — Class A* | | | 538 | | | | 156,359 | |
eBay, Inc. | | | 2,826 | | | | 149,156 | |
Corning, Inc. | | | 4,183 | | | | 137,872 | |
Warner Bros Discovery, Inc.* | | | 12,087 | | | | 105,519 | |
Omnicom Group, Inc. | | | 1,079 | | | | 104,404 | |
Expedia Group, Inc.* | | | 712 | | | | 98,078 | |
FactSet Research Systems, Inc. | | | 207 | | | | 94,059 | |
VeriSign, Inc.* | | | 480 | | | | 90,965 | |
Gen Digital, Inc. | | | 3,052 | | | | 68,365 | |
Interpublic Group of Companies, Inc. | | | 2,086 | | | | 68,066 | |
Juniper Networks, Inc. | | | 1,753 | | | | 64,966 | |
F5, Inc.* | | | 320 | | | | 60,669 | |
News Corp. — Class A | | | 2,070 | | | | 54,193 | |
Match Group, Inc.* | | | 1,480 | | | | 53,694 | |
Etsy, Inc.* | | | 652 | | | | 44,806 | |
Fox Corp. — Class A | | | 1,303 | | | | 40,745 | |
Paramount Global — Class B | | | 2,628 | | | | 30,932 | |
Fox Corp. — Class B | | | 719 | | | | 20,578 | |
News Corp. — Class B | | | 624 | | | | 16,885 | |
Total Communications | | | | | | | 35,337,932 | |
| | | | | | | | | |
Financial - 12.4% |
Berkshire Hathaway, Inc. — Class B* | | | 9,910 | | | | 4,167,353 | |
JPMorgan Chase & Co. | | | 15,746 | | | | 3,153,924 | |
Visa, Inc. — Class A | | | 8,614 | | | | 2,403,995 | |
Mastercard, Inc. — Class A | | | 4,493 | | | | 2,163,694 | |
Bank of America Corp. | | | 37,500 | | | | 1,422,000 | |
SEE NOTES TO FINANCIAL STATEMENTS. | THE RYDEX FUNDS ANNUAL REPORT | 15 |
SCHEDULE OF INVESTMENTS (continued) | March 31, 2024 |
NOVA FUND | |
| | Shares | | | Value | |
Wells Fargo & Co. | | | 19,602 | | | $ | 1,136,132 | |
Goldman Sachs Group, Inc. | | | 1,776 | | | | 741,817 | |
American Express Co. | | | 3,115 | | | | 709,254 | |
Progressive Corp. | | | 3,188 | | | | 659,342 | |
Citigroup, Inc. | | | 10,365 | | | | 655,482 | |
Prologis, Inc. REIT | | | 5,033 | | | | 655,397 | |
Morgan Stanley | | | 6,824 | | | | 642,548 | |
BlackRock, Inc. — Class A | | | 762 | | | | 635,279 | |
Charles Schwab Corp. | | | 8,105 | | | | 586,316 | |
Chubb Ltd. | | | 2,208 | | | | 572,159 | |
Marsh & McLennan Companies, Inc. | | | 2,679 | | | | 551,820 | |
Blackstone, Inc. — Class A | | | 3,918 | | | | 514,708 | |
American Tower Corp. — Class A REIT | | | 2,539 | | | | 501,681 | |
Intercontinental Exchange, Inc. | | | 3,118 | | | | 428,507 | |
CME Group, Inc. — Class A | | | 1,960 | | | | 421,968 | |
Equinix, Inc. REIT | | | 511 | | | | 421,744 | |
U.S. Bancorp | | | 8,481 | | | | 379,101 | |
Aon plc — Class A | | | 1,090 | | | | 363,755 | |
PNC Financial Services Group, Inc. | | | 2,168 | | | | 350,349 | |
Capital One Financial Corp. | | | 2,072 | | | | 308,500 | |
American International Group, Inc. | | | 3,824 | | | | 298,922 | |
Arthur J Gallagher & Co. | | | 1,181 | | | | 295,297 | |
Travelers Companies, Inc. | | | 1,243 | | | | 286,064 | |
Truist Financial Corp. | | | 7,265 | | | | 283,190 | |
Welltower, Inc. REIT | | | 3,015 | | | | 281,722 | |
Simon Property Group, Inc. REIT | | | 1,775 | | | | 277,770 | |
Public Storage REIT | | | 862 | | | | 250,032 | |
Crown Castle, Inc. REIT | | | 2,362 | | | | 249,970 | |
MetLife, Inc. | | | 3,344 | | | | 247,824 | |
Allstate Corp. | | | 1,430 | | | | 247,404 | |
Aflac, Inc. | | | 2,867 | | | | 246,161 | |
Realty Income Corp. REIT | | | 4,529 | | | | 245,019 | |
Ameriprise Financial, Inc. | | | 546 | | | | 239,388 | |
Bank of New York Mellon Corp. | | | 4,136 | | | | 238,316 | |
Digital Realty Trust, Inc. REIT | | | 1,649 | | | | 237,522 | |
Prudential Financial, Inc. | | | 1,966 | | | | 230,808 | |
Arch Capital Group Ltd.* | | | 2,020 | | | | 186,729 | |
Discover Financial Services | | | 1,362 | | | | 178,545 | |
Extra Space Storage, Inc. REIT | | | 1,151 | | | | 169,197 | |
VICI Properties, Inc. REIT | | | 5,634 | | | | 167,837 | |
Hartford Financial Services Group, Inc. | | | 1,626 | | | | 167,559 | |
CBRE Group, Inc. — Class A* | | | 1,619 | | | | 157,432 | |
Willis Towers Watson plc | | | 558 | | | | 153,450 | |
T. Rowe Price Group, Inc. | | | 1,219 | | | | 148,620 | |
AvalonBay Communities, Inc. REIT | | | 773 | | | | 143,438 | |
Weyerhaeuser Co. REIT | | | 3,975 | | | | 142,742 | |
Fifth Third Bancorp | | | 3,710 | | | | 138,049 | |
Raymond James Financial, Inc. | | | 1,025 | | | | 131,631 | |
M&T Bank Corp. | | | 905 | | | | 131,623 | |
Nasdaq, Inc. | | | 2,069 | | | | 130,554 | |
Iron Mountain, Inc. REIT | | | 1,590 | | | | 127,534 | |
SBA Communications Corp. REIT | | | 588 | | | | 127,419 | |
State Street Corp. | | | 1,644 | | | | 127,114 | |
Equity Residential REIT | | | 1,880 | | | | 118,647 | |
Brown & Brown, Inc. | | | 1,287 | | | | 112,664 | |
Invitation Homes, Inc. REIT | | | 3,133 | | | | 111,566 | |
Alexandria Real Estate Equities, Inc. REIT | | | 858 | | | | 110,605 | |
Huntington Bancshares, Inc. | | | 7,888 | | | | 110,038 | |
Cincinnati Financial Corp. | | | 856 | | | | 106,290 | |
Regions Financial Corp. | | | 5,033 | | | | 105,894 | |
Cboe Global Markets, Inc. | | | 575 | | | | 105,645 | |
Principal Financial Group, Inc. | | | 1,194 | | | | 103,054 | |
Northern Trust Corp. | | | 1,117 | | | | 99,324 | |
W R Berkley Corp. | | | 1,105 | | | | 97,726 | |
Synchrony Financial | | | 2,216 | | | | 95,554 | |
Ventas, Inc. REIT | | | 2,192 | | | | 95,440 | |
Everest Group Ltd. | | | 236 | | | | 93,810 | |
Citizens Financial Group, Inc. | | | 2,539 | | | | 92,140 | |
Essex Property Trust, Inc. REIT | | | 350 | | | | 85,683 | |
Mid-America Apartment Communities, Inc. REIT | | | 636 | | | | 83,685 | |
KeyCorp | | | 5,101 | | | | 80,647 | |
Host Hotels & Resorts, Inc. REIT | | | 3,842 | | | | 79,452 | |
Loews Corp. | | | 992 | | | | 77,664 | |
Healthpeak Properties, Inc. REIT | | | 3,856 | | | | 72,300 | |
Kimco Realty Corp. REIT | | | 3,628 | | | | 71,145 | |
UDR, Inc. REIT | | | 1,648 | | | | 61,652 | |
Camden Property Trust REIT | | | 581 | | | | 57,170 | |
Globe Life, Inc. | | | 466 | | | | 54,229 | |
Regency Centers Corp. REIT | | | 895 | | | | 54,201 | |
Assurant, Inc. | | | 283 | | | | 53,272 | |
Boston Properties, Inc. REIT | | | 786 | | | | 51,334 | |
Franklin Resources, Inc. | | | 1,635 | | | | 45,960 | |
Federal Realty Investment Trust REIT | | | 400 | | | | 40,848 | |
Invesco Ltd. | | | 2,448 | | | | 40,612 | |
Comerica, Inc. | | | 718 | | | | 39,483 | |
Total Financial | | | | | | | 33,839,441 | |
| | | | | | | | | |
Consumer, Cyclical - 7.4% |
Tesla, Inc.* | | | 15,092 | | | | 2,653,023 | |
Home Depot, Inc. | | | 5,421 | | | | 2,079,496 | |
Costco Wholesale Corp. | | | 2,417 | | | | 1,770,767 | |
Walmart, Inc. | | | 23,316 | | | | 1,402,924 | |
McDonald’s Corp. | | | 3,950 | | | | 1,113,702 | |
Lowe’s Companies, Inc. | | | 3,132 | | | | 797,814 | |
TJX Companies, Inc. | | | 6,207 | | | | 629,514 | |
NIKE, Inc. — Class B | | | 6,630 | | | | 623,087 | |
Starbucks Corp. | | | 6,167 | | | | 563,602 | |
Target Corp. | | | 2,515 | | | | 445,683 | |
Chipotle Mexican Grill, Inc. — Class A* | | | 149 | | | | 433,109 | |
O’Reilly Automotive, Inc.* | | | 322 | | | | 363,499 | |
PACCAR, Inc. | | | 2,849 | | | | 352,962 | |
Marriott International, Inc. — Class A | | | 1,343 | | | | 338,852 | |
AutoZone, Inc.* | | | 94 | | | | 296,255 | |
Hilton Worldwide Holdings, Inc. | | | 1,374 | | | | 293,088 | |
General Motors Co. | | | 6,288 | | | | 285,161 | |
Ford Motor Co. | | | 21,257 | | | | 282,293 | |
Copart, Inc.* | | | 4,759 | | | | 275,641 | |
Ross Stores, Inc. | | | 1,833 | | | | 269,011 | |
DR Horton, Inc. | | | 1,626 | | | | 267,559 | |
WW Grainger, Inc. | | | 241 | | | | 245,169 | |
Lululemon Athletica, Inc.* | | | 625 | | | | 244,156 | |
Fastenal Co. | | | 3,116 | | | | 240,368 | |
16 | THE RYDEX FUNDS ANNUAL REPORT | SEE NOTES TO FINANCIAL STATEMENTS. |
SCHEDULE OF INVESTMENTS (continued) | March 31, 2024 |
NOVA FUND | |
| | Shares | | | Value | |
Lennar Corp. — Class A | | | 1,346 | | | $ | 231,485 | |
Cummins, Inc. | | | 743 | | | | 218,925 | |
Yum! Brands, Inc. | | | 1,531 | | | | 212,273 | |
Dollar General Corp. | | | 1,195 | | | | 186,492 | |
Royal Caribbean Cruises Ltd.* | | | 1,285 | | | | 178,628 | |
Delta Air Lines, Inc. | | | 3,488 | | | | 166,971 | |
Tractor Supply Co. | | | 589 | | | | 154,153 | |
Dollar Tree, Inc.* | | | 1,127 | | | | 150,060 | |
NVR, Inc.* | | | 18 | | | | 145,799 | |
PulteGroup, Inc. | | | 1,155 | | | | 139,316 | |
Ulta Beauty, Inc.* | | | 264 | | | | 138,040 | |
Deckers Outdoor Corp.* | | | 139 | | | | 130,835 | |
Aptiv plc* | | | 1,520 | | | | 121,068 | |
Genuine Parts Co. | | | 764 | | | | 118,367 | |
Darden Restaurants, Inc. | | | 650 | | | | 108,647 | |
Las Vegas Sands Corp. | | | 2,011 | | | | 103,969 | |
Southwest Airlines Co. | | | 3,250 | | | | 94,867 | |
Domino’s Pizza, Inc. | | | 190 | | | | 94,407 | |
Carnival Corp.* | | | 5,487 | | | | 89,657 | |
Best Buy Company, Inc. | | | 1,044 | | | | 85,639 | |
United Airlines Holdings, Inc.* | | | 1,786 | | | | 85,514 | |
Pool Corp. | | | 211 | | | | 85,139 | |
Walgreens Boots Alliance, Inc. | | | 3,898 | | | | 84,548 | |
Live Nation Entertainment, Inc.* | | | 773 | | | | 81,760 | |
LKQ Corp. | | | 1,457 | | | | 77,819 | |
CarMax, Inc.* | | | 860 | | | | 74,915 | |
MGM Resorts International* | | | 1,488 | | | | 70,249 | |
Bath & Body Works, Inc. | | | 1,230 | | | | 61,525 | |
Tapestry, Inc. | | | 1,250 | | | | 59,350 | |
American Airlines Group, Inc.* | | | 3,563 | | | | 54,692 | |
Wynn Resorts Ltd. | | | 519 | | | | 53,057 | |
Caesars Entertainment, Inc.* | | | 1,175 | | | | 51,395 | |
Norwegian Cruise Line Holdings Ltd.* | | | 2,317 | | | | 48,495 | |
BorgWarner, Inc. | | | 1,251 | | | | 43,460 | |
Hasbro, Inc. | | | 710 | | | | 40,129 | |
Ralph Lauren Corp. — Class A | | | 213 | | | | 39,993 | |
VF Corp. | | | 1,800 | | | | 27,612 | |
Total Consumer, Cyclical | | | | | | | 20,175,985 | |
| | | | | | | | | |
Industrial - 6.7% |
General Electric Co. | | | 5,928 | | | | 1,040,542 | |
Caterpillar, Inc. | | | 2,772 | | | | 1,015,744 | |
Union Pacific Corp. | | | 3,322 | | | | 816,979 | |
Honeywell International, Inc. | | | 3,591 | | | | 737,053 | |
RTX Corp. | | | 7,227 | | | | 704,849 | |
Eaton Corporation plc | | | 2,175 | | | | 680,079 | |
Boeing Co.* | | | 3,124 | | | | 602,901 | |
United Parcel Service, Inc. — Class B | | | 3,939 | | | | 585,454 | |
Deere & Co. | | | 1,419 | | | | 582,840 | |
Lockheed Martin Corp. | | | 1,171 | | | | 532,653 | |
Waste Management, Inc. | | | 1,996 | | | | 425,448 | |
CSX Corp. | | | 10,763 | | | | 398,984 | |
Illinois Tool Works, Inc. | | | 1,481 | | | | 397,397 | |
Parker-Hannifin Corp. | | | 699 | | | | 388,497 | |
Amphenol Corp. — Class A | | | 3,267 | | | | 376,848 | |
TransDigm Group, Inc. | | | 303 | | | | 373,175 | |
Trane Technologies plc | | | 1,239 | | | | 371,948 | |
Northrop Grumman Corp. | | | 768 | | | | 367,611 | |
FedEx Corp. | | | 1,252 | | | | 362,755 | |
Emerson Electric Co. | | | 3,114 | | | | 353,190 | |
General Dynamics Corp. | | | 1,236 | | | | 349,158 | |
3M Co. | | | 3,010 | | | | 319,271 | |
Norfolk Southern Corp. | | | 1,230 | | | | 313,490 | |
Carrier Global Corp. | | | 4,550 | | | | 264,491 | |
TE Connectivity Ltd. | | | 1,682 | | | | 244,294 | |
Johnson Controls International plc | | | 3,712 | | | | 242,468 | |
AMETEK, Inc. | | | 1,257 | | | | 229,905 | |
L3Harris Technologies, Inc. | | | 1,033 | | | | 220,132 | |
Otis Worldwide Corp. | | | 2,208 | | | | 219,188 | |
Old Dominion Freight Line, Inc. | | | 974 | | | | 213,608 | |
Republic Services, Inc. — Class A | | | 1,114 | | | | 213,264 | |
Ingersoll Rand, Inc. | | | 2,205 | | | | 209,365 | |
Martin Marietta Materials, Inc. | | | 337 | | | | 206,898 | |
Vulcan Materials Co. | | | 724 | | | | 197,594 | |
Rockwell Automation, Inc. | | | 624 | | | | 181,790 | |
Xylem, Inc. | | | 1,313 | | | | 169,692 | |
Fortive Corp. | | | 1,910 | | | | 164,298 | |
Mettler-Toledo International, Inc.* | | | 117 | | | | 155,761 | |
Keysight Technologies, Inc.* | | | 951 | | | | 148,717 | |
Howmet Aerospace, Inc. | | | 2,131 | | | | 145,824 | |
Westinghouse Air Brake Technologies Corp. | | | 976 | | | | 142,184 | |
Builders FirstSource, Inc.* | | | 672 | | | | 140,146 | |
Dover Corp. | | | 762 | | | | 135,019 | |
Garmin Ltd. | | | 834 | | | | 124,158 | |
Hubbell, Inc. | | | 292 | | | | 121,195 | |
Axon Enterprise, Inc.* | | | 384 | | | | 120,146 | |
Ball Corp. | | | 1,717 | | | | 115,657 | |
Teledyne Technologies, Inc.* | | | 257 | | | | 110,335 | |
Veralto Corp. | | | 1,195 | | | | 105,941 | |
Jacobs Solutions, Inc. | | | 684 | | | | 105,151 | |
Textron, Inc. | | | 1,067 | | | | 102,357 | |
IDEX Corp. | | | 412 | | | | 100,536 | |
Expeditors International of Washington, Inc. | | | 792 | | | | 96,283 | |
Masco Corp. | | | 1,197 | | | | 94,419 | |
Jabil, Inc. | | | 695 | | | | 93,095 | |
Packaging Corporation of America | | | 484 | | | | 91,853 | |
J.B. Hunt Transport Services, Inc. | | | 444 | | | | 88,467 | |
Trimble, Inc.* | | | 1,355 | | | | 87,208 | |
Snap-on, Inc. | | | 287 | | | | 85,015 | |
Stanley Black & Decker, Inc. | | | 835 | | | | 81,772 | |
Nordson Corp. | | | 296 | | | | 81,264 | |
Pentair plc | | | 900 | | | | 76,896 | |
Amcor plc | | | 7,873 | | | | 74,872 | |
Westrock Co. | | | 1,399 | | | | 69,181 | |
Allegion plc | | | 478 | | | | 64,391 | |
Huntington Ingalls Industries, Inc. | | | 216 | | | | 62,957 | |
A O Smith Corp. | | | 669 | | | | 59,849 | |
CH Robinson Worldwide, Inc. | | | 635 | | | | 48,349 | |
SEE NOTES TO FINANCIAL STATEMENTS. | THE RYDEX FUNDS ANNUAL REPORT | 17 |
SCHEDULE OF INVESTMENTS (continued) | March 31, 2024 |
NOVA FUND | |
| | Shares | | | Value | |
Generac Holdings, Inc.* | | | 335 | | | $ | 42,257 | |
Mohawk Industries, Inc.* | | | 288 | | | | 37,696 | |
Total Industrial | | | | | | | 18,282,804 | |
| | | | | | | | | |
Energy - 3.5% |
Exxon Mobil Corp. | | | 21,629 | | | | 2,514,155 | |
Chevron Corp. | | | 9,447 | | | | 1,490,170 | |
ConocoPhillips | | | 6,417 | | | | 816,756 | |
Schlumberger N.V. | | | 7,775 | | | | 426,148 | |
EOG Resources, Inc. | | | 3,176 | | | | 406,020 | |
Marathon Petroleum Corp. | | | 2,004 | | | | 403,806 | |
Phillips 66 | | | 2,342 | | | | 382,542 | |
Pioneer Natural Resources Co. | | | 1,272 | | | | 333,900 | |
Valero Energy Corp. | | | 1,854 | | | | 316,459 | |
Williams Companies, Inc. | | | 6,626 | | | | 258,215 | |
ONEOK, Inc. | | | 3,173 | | | | 254,380 | |
Occidental Petroleum Corp. | | | 3,584 | | | | 232,924 | |
Hess Corp. | | | 1,499 | | | | 228,807 | |
Diamondback Energy, Inc. | | | 975 | | | | 193,216 | |
Kinder Morgan, Inc. | | | 10,533 | | | | 193,175 | |
Halliburton Co. | | | 4,847 | | | | 191,068 | |
Baker Hughes Co. | | | 5,452 | | | | 182,642 | |
Devon Energy Corp. | | | 3,489 | | | | 175,078 | |
Targa Resources Corp. | | | 1,214 | | | | 135,956 | |
Coterra Energy, Inc. — Class A | | | 4,097 | | | | 114,224 | |
First Solar, Inc.* | | | 582 | | | | 98,242 | |
Marathon Oil Corp. | | | 3,188 | | | | 90,348 | |
Enphase Energy, Inc.* | | | 739 | | | | 89,404 | |
Equities Corp. | | | 2,240 | | | | 83,037 | |
APA Corp. | | | 1,967 | | | | 67,626 | |
Total Energy | | | | | | | 9,678,298 | |
| | | | | | | | | |
Utilities - 1.9% |
NextEra Energy, Inc. | | | 11,175 | | | | 714,194 | |
Southern Co. | | | 5,940 | | | | 426,136 | |
Duke Energy Corp. | | | 4,200 | | | | 406,182 | |
Constellation Energy Corp. | | | 1,739 | | | | 321,454 | |
American Electric Power Company, Inc. | | | 2,864 | | | | 246,590 | |
Sempra | | | 3,427 | | | | 246,161 | |
Dominion Energy, Inc. | | | 4,558 | | | | 224,208 | |
Exelon Corp. | | | 5,423 | | | | 203,742 | |
PG&E Corp. | | | 11,621 | | | | 194,768 | |
Public Service Enterprise Group, Inc. | | | 2,714 | | | | 181,241 | |
Consolidated Edison, Inc. | | | 1,881 | | | | 170,814 | |
Xcel Energy, Inc. | | | 3,005 | | | | 161,519 | |
Edison International | | | 2,089 | | | | 147,755 | |
WEC Energy Group, Inc. | | | 1,718 | | | | 141,082 | |
American Water Works Company, Inc. | | | 1,060 | | | | 129,543 | |
DTE Energy Co. | | | 1,125 | | | | 126,158 | |
Entergy Corp. | | | 1,152 | | | | 121,743 | |
Eversource Energy | | | 1,903 | | | | 113,742 | |
PPL Corp. | | | 4,015 | | | | 110,533 | |
FirstEnergy Corp. | | | 2,813 | | | | 108,638 | |
Ameren Corp. | | | 1,432 | | | | 105,911 | |
CenterPoint Energy, Inc. | | | 3,438 | | | | 97,949 | |
Atmos Energy Corp. | | | 822 | | | | 97,711 | |
CMS Energy Corp. | | | 1,604 | | | | 96,785 | |
NRG Energy, Inc. | | | 1,229 | | | | 83,191 | |
Alliant Energy Corp. | | | 1,390 | | | | 70,056 | |
Evergy, Inc. | | | 1,251 | | | | 66,778 | |
AES Corp. | | | 3,647 | | | | 65,391 | |
NiSource, Inc. | | | 2,252 | | | | 62,290 | |
Pinnacle West Capital Corp. | | | 618 | | | | 46,183 | |
Total Utilities | | | | | | | 5,288,448 | |
| | | | | | | | | |
Basic Materials - 1.7% |
Linde plc | | | 2,641 | | | | 1,226,269 | |
Sherwin-Williams Co. | | | 1,282 | | | | 445,277 | |
Freeport-McMoRan, Inc. | | | 7,811 | | | | 367,273 | |
Ecolab, Inc. | | | 1,382 | | | | 319,104 | |
Air Products and Chemicals, Inc. | | | 1,211 | | | | 293,389 | |
Nucor Corp. | | | 1,339 | | | | 264,988 | |
Newmont Corp. | | | 6,277 | | | | 224,968 | |
Dow, Inc. | | | 3,825 | | | | 221,582 | |
PPG Industries, Inc. | | | 1,284 | | | | 186,052 | |
DuPont de Nemours, Inc. | | | 2,343 | | | | 179,638 | |
LyondellBasell Industries N.V. — Class A | | | 1,395 | | | | 142,681 | |
Steel Dynamics, Inc. | | | 828 | | | | 122,734 | |
International Flavors & Fragrances, Inc. | | | 1,390 | | | | 119,526 | |
Celanese Corp. — Class A | | | 546 | | | | 93,835 | |
CF Industries Holdings, Inc. | | | 1,040 | | | | 86,538 | |
Albemarle Corp. | | | 639 | | | | 84,182 | |
International Paper Co. | | | 1,884 | | | | 73,514 | |
Eastman Chemical Co. | | | 639 | | | | 64,041 | |
Mosaic Co. | | | 1,780 | | | | 57,779 | |
FMC Corp. | | | 679 | | | | 43,252 | |
Total Basic Materials | | | | | | | 4,616,622 | |
| | | | | | | | | |
Total Common Stocks | | | | |
(Cost $209,877,958) | | | | | | | 240,088,846 | |
| | | | | | | | | |
MUTUAL FUNDS† - 6.4% |
Guggenheim Ultra Short Duration Fund — Institutional Class1 | | | 733,906 | | | | 7,273,011 | |
Guggenheim Strategy Fund II1 | | | 225,195 | | | | 5,539,793 | |
Guggenheim Strategy Fund III1 | | | 184,563 | | | | 4,553,161 | |
Total Mutual Funds | | | | |
(Cost $17,418,465) | | | | | | | 17,365,965 | |
| | | | | | | | | |
| | | Face
Amount | | | | | |
U.S. TREASURY BILLS†† - 2.5% |
U.S. Treasury Bills |
5.25% due 04/23/242,3 | | $ | 4,300,000 | | | | 4,286,151 | |
5.17% due 04/16/243,4 | | | 1,541,000 | | | | 1,537,616 | |
5.26% due 04/23/243 | | | 900,000 | | | | 897,102 | |
5.28% due 04/23/243 | | | 200,000 | | | | 199,356 | |
Total U.S. Treasury Bills | | | | |
(Cost $6,920,285) | | | | | | | 6,920,225 | |
| | | | | | | | | |
18 | THE RYDEX FUNDS ANNUAL REPORT | SEE NOTES TO FINANCIAL STATEMENTS. |
SCHEDULE OF INVESTMENTS (continued) | March 31, 2024 |
NOVA FUND | |
| | Face
Amount | | | Value | |
REPURCHASE AGREEMENTS††,5 - 2.8% |
J.P. Morgan Securities LLC
issued 03/28/24 at 5.31%
due 04/01/242 | | $ | 4,479,453 | | | $ | 4,479,453 | |
BofA Securities, Inc.
issued 03/28/24 at 5.31%
due 04/01/242 | | | 1,722,867 | | | | 1,722,867 | |
Barclays Capital, Inc.
issued 03/28/24 at 5.30%
due 04/01/242 | | | 1,561,630 | | | | 1,561,630 | |
Total Repurchase Agreements | | | | |
(Cost $7,763,950) | | | | | | | 7,763,950 | |
| | | | | | | | | |
Total Investments - 99.5% | | | | |
(Cost $241,980,658) | | $ | 272,138,986 | |
Other Assets & Liabilities, net - 0.5% | | | 1,496,805 | |
Total Net Assets - 100.0% | | $ | 273,635,791 | |
Futures Contracts |
Description | | Number of
Contracts | | | Expiration
Date | | | Notional
Amount | | | Value and
Unrealized
Appreciation** | |
Equity Futures Contracts Purchased† |
S&P 500 Index Mini Futures Contracts | | | 283 | | | | Jun 2024 | | | $ | 75,072,825 | | | $ | 1,386,317 | |
Total Return Swap Agreements |
Counterparty | Index | Type | | Financing
Rate | | Payment
Frequency | | | Maturity
Date | | | Units | | | Notional
Amount | | | Value and
Unrealized
Appreciation | |
OTC Equity Index Swap Agreements†† |
Barclays Bank plc | S&P 500 Index | Pay | | 5.93% (SOFR +
0.60%) | | | At Maturity | | | | 06/25/24 | | | | 9,880 | | | $ | 51,912,268 | | | $ | 730,216 | |
Goldman Sachs International | S&P 500 Index | Pay | | 5.83% (Federal
Funds Rate +
0.50%) | | | At Maturity | | | | 06/26/24 | | | | 7,877 | | | | 41,389,230 | | | | 232,895 | |
BNP Paribas | S&P 500 Index | Pay | | 5.93% (Federal
Funds Rate +
0.60%) | | | At Maturity | | | | 06/26/24 | | | | 493 | | | | 2,590,192 | | | | 14,660 | |
| | | | | | | | | | | | | | | | | | | $ | 95,891,690 | | | $ | 977,771 | |
* | Non-income producing security. |
** | Includes cumulative appreciation (depreciation). Variation margin is reported within the Statement of Assets and Liabilities. |
† | Value determined based on Level 1 inputs — See Note 4. |
†† | Value determined based on Level 2 inputs — See Note 4. |
1 | Affiliated issuer. |
2 | All or a portion of this security is pledged as equity index swap collateral at March 31, 2024. |
3 | Rate indicated is the effective yield at the time of purchase. |
4 | All or a portion of this security is pledged as futures collateral at March 31, 2024. |
5 | Repurchase Agreements — See Note 6. |
| | plc — Public Limited Company |
| | REIT — Real Estate Investment Trust |
| | SOFR — Secured Overnight Financing Rate |
| | |
| | See Sector Classification in Other Information section. |
SEE NOTES TO FINANCIAL STATEMENTS. | THE RYDEX FUNDS ANNUAL REPORT | 19 |
SCHEDULE OF INVESTMENTS (concluded) | March 31, 2024 |
NOVA FUND | |
The following table summarizes the inputs used to value the Fund’s investments at March 31, 2024 (See Note 4 in the Notes to Financial Statements):
Investments in Securities (Assets) | | Level 1
Quoted
Prices | | | Level 2
Significant
Observable
Inputs | | | Level 3
Significant
Unobservable
Inputs | | | Total | |
Common Stocks | | $ | 240,088,846 | | | $ | — | | | $ | — | | | $ | 240,088,846 | |
Mutual Funds | | | 17,365,965 | | | | — | | | | — | | | | 17,365,965 | |
U.S. Treasury Bills | | | — | | | | 6,920,225 | | | | — | | | | 6,920,225 | |
Repurchase Agreements | | | — | | | | 7,763,950 | | | | — | | | | 7,763,950 | |
Equity Futures Contracts** | | | 1,386,317 | | | | — | | | | — | | | | 1,386,317 | |
Equity Index Swap Agreements** | | | — | | | | 977,771 | | | | — | | | | 977,771 | |
Total Assets | | $ | 258,841,128 | | | $ | 15,661,946 | | | $ | — | | | $ | 274,503,074 | |
** | This derivative is reported as unrealized appreciation/depreciation at period end. |
Affiliated Transactions
Investments representing 5% or more of the outstanding voting shares of a company, or control of or by, or common control under Guggenheim Investments (“GI”), result in that company being considered an affiliated issuer, as defined in the 1940 Act.
The Fund may invest in certain of the underlying series of Guggenheim Strategy Funds Trust, including Guggenheim Strategy Fund II and Guggenheim Strategy Fund III (collectively, the “Guggenheim Strategy Funds”), each of which are open-end management investment companies managed by GI. The Guggenheim Strategy Funds, which launched on March 11, 2014, are offered as short term investment options only to mutual funds, trusts, and other accounts managed by GI and/or its affiliates, and are not available to the public. The Guggenheim Strategy Funds pay no investment management fees. The Guggenheim Strategy Funds’ annual report on Form N-CSR dated September 30, 2023 is available publicly or upon request. This information is available from the EDGAR database on the SEC’s website at https://www.sec.gov/Archives/edgar/data/1601445/000182126823000217/gug86449-ncsr.htm. The Fund may invest in certain of the underlying series of Guggenheim Funds Trust, which are open-end management investment companies managed by GI, are available to the public and whose most recent annual report on Form N-CSR is available publicly or upon request.
Transactions during the year ended March 31, 2024, in which the company is an affiliated issuer, were as follows:
Security Name | | Value
03/31/23 | | | Additions | | | Reductions | | | Realized
Gain (Loss) | | | Change in
Unrealized
Appreciation
(Depreciation) | | | Value
03/31/24 | | | Shares
03/31/24 | | | Investment
Income | |
Mutual Funds | | | | | | | | | | | | | | | | | | | | | | | | | | | | | | | | |
Guggenheim Strategy Fund II | | $ | 5,950,321 | | | $ | — | | | $ | (500,000 | ) | | $ | (10,498 | ) | | $ | 99,970 | | | $ | 5,539,793 | | | | 225,195 | | | $ | 318,266 | |
Guggenheim Strategy Fund III | | | 4,475,644 | | | | — | | | | — | | | | — | | | | 77,517 | | | | 4,553,161 | | | | 184,563 | | | | 245,308 | |
Guggenheim Ultra Short Duration Fund — Institutional Class | | | 7,623,159 | | | | — | | | | (500,000 | ) | | | (9,212 | ) | | | 159,064 | | | | 7,273,011 | | | | 733,906 | | | | 402,919 | |
| | | $ | 18,049,124 | | | $ | — | | | $ | (1,000,000 | ) | | $ | (19,710 | ) | | $ | 336,551 | | | $ | 17,365,965 | | | | | | | $ | 966,493 | |
20 | THE RYDEX FUNDS ANNUAL REPORT | SEE NOTES TO FINANCIAL STATEMENTS. |
STATEMENT OF ASSETS AND LIABILITIES |
March 31, 2024 |
Assets: |
Investments in unaffiliated issuers, at value (cost $216,798,243) | | $ | 247,009,071 | |
Investments in affiliated issuers, at value (cost $17,418,465) | | | 17,365,965 | |
Repurchase agreements, at value (cost $7,763,950) | | | 7,763,950 | |
Cash | | | 41,551 | |
Segregated cash with broker | | | 1,715,952 | |
Unrealized appreciation on OTC swap agreements | | | 977,771 | |
Receivables: |
Dividends | | | 206,191 | |
Fund shares sold | | | 94,962 | |
Interest | | | 4,579 | |
Securities lending income | | | 406 | |
Total assets | | | 275,180,398 | |
| | | | | |
Liabilities: |
Segregated cash due to broker | | | 810,000 | |
Payable for: |
Fund shares redeemed | | | 170,561 | |
Management fees | | | 136,906 | |
Swap settlement | | | 99,463 | |
Transfer agent fees | | | 81,006 | |
Variation margin on futures contracts | | | 38,402 | |
Portfolio accounting and administration fees | | | 18,678 | |
Securities purchased | | | 10,902 | |
Distribution and service fees | | | 5,002 | |
Trustees’ fees* | | | 1,781 | |
Miscellaneous | | | 171,906 | |
Total liabilities | | | 1,544,607 | |
Net assets | | $ | 273,635,791 | |
| | | | | |
Net assets consist of: |
Paid in capital | | $ | 357,134,285 | |
Total distributable earnings (loss) | | | (83,498,494 | ) |
Net assets | | $ | 273,635,791 | |
| | | | | |
Investor Class : |
Net assets | | $ | 252,513,132 | |
Capital shares outstanding | | | 1,972,995 | |
Net asset value per share | | $ | 127.98 | |
Class A: |
Net assets | | $ | 12,779,642 | |
Capital shares outstanding | | | 112,370 | |
Net asset value per share | | $ | 113.73 | |
Maximum offering price per share (Net asset value divided by 95.25%) | | $ | 119.40 | |
Class C: |
Net assets | | $ | 1,032,958 | |
Capital shares outstanding | | | 11,355 | |
Net asset value per share | | $ | 90.97 | |
Class H: |
Net assets | | $ | 7,310,059 | |
Capital shares outstanding | | | 64,185 | |
Net asset value per share | | $ | 113.89 | |
* | Relates to Trustees not deemed “interested persons” within the meaning of Section 2(a)(19) of the 1940 Act. |
SEE NOTES TO FINANCIAL STATEMENTS. | THE RYDEX FUNDS ANNUAL REPORT | 21 |
STATEMENT OF OPERATIONS |
Year Ended March 31, 2024 |
Investment Income: |
Dividends from securities of unaffiliated issuers (net of foreign withholding tax of $757) | | $ | 2,084,831 | |
Dividends from securities of affiliated issuers | | | 966,493 | |
Interest | | | 1,053,178 | |
Income from securities lending, net | | | 909 | |
Total investment income | | | 4,105,411 | |
| | | | | |
Expenses: |
Management fees | | | 1,289,992 | |
Distribution and service fees: |
Class A | | | 33,289 | |
Class C | | | 9,018 | |
Class H | | | 16,002 | |
Transfer agent fees | | | 374,254 | |
Portfolio accounting and administration fees | | | 261,791 | |
Interest expense | | | 170,912 | |
Registration fees | | | 159,440 | |
Professional fees | | | 87,732 | |
Trustees’ fees* | | | 28,363 | |
Custodian fees | | | 23,610 | |
Line of credit fees | | | 1,934 | |
Miscellaneous | | | 72,563 | |
Total expenses | | | 2,528,900 | |
Less: |
Expenses reimbursed by Adviser | | | (59,077 | ) |
Expenses waived by Adviser | | | (18,557 | ) |
Total waived/reimbursed expenses | | | (77,634 | ) |
Net expenses | | | 2,451,266 | |
Net investment income | | | 1,654,145 | |
| | | | | |
Net Realized and Unrealized Gain (Loss): |
Net realized gain (loss) on: |
Investments in unaffiliated issuers | | $ | 10,110,250 | |
Investments in affiliated issuers | | | (19,710 | ) |
Swap agreements | | | 24,650,008 | |
Futures contracts | | | 3,236,362 | |
Net realized gain | | | 37,976,910 | |
Net change in unrealized appreciation (depreciation) on: |
Investments in unaffiliated issuers | | | 21,707,715 | |
Investments in affiliated issuers | | | 336,551 | |
Swap agreements | | | (3,144,951 | ) |
Futures contracts | | | 215,903 | |
Net change in unrealized appreciation (depreciation) | | | 19,115,218 | |
Net realized and unrealized gain | | | 57,092,128 | |
Net increase in net assets resulting from operations | | $ | 58,746,273 | |
* | Relates to Trustees not deemed “interested persons” within the meaning of Section 2(a)(19) of the 1940 Act. |
22 | THE RYDEX FUNDS ANNUAL REPORT | SEE NOTES TO FINANCIAL STATEMENTS. |
STATEMENTS OF CHANGES IN NET ASSETS |
| | Year Ended
March 31,
2024 | | | Year Ended
March 31,
2023 | |
Increase (Decrease) in Net Assets from Operations: | | | | | | | | |
Net investment income | | $ | 1,654,145 | | | $ | 1,311,978 | |
Net realized gain (loss) on investments | | | 37,976,910 | | | | (112,260,599 | ) |
Net change in unrealized appreciation (depreciation) on investments | | | 19,115,218 | | | | 16,095,307 | |
Net increase (decrease) in net assets resulting from operations | | | 58,746,273 | | | | (94,853,314 | ) |
| | | | | | | | | |
Distributions to shareholders: | | | | | | | | |
Investor Class | | | (1,201,986 | ) | | | (11,389,603 | ) |
Class A | | | (73,774 | ) | | | (1,766,899 | ) |
Class C | | | (7,850 | ) | | | (204,783 | ) |
Class H | | | (28,368 | ) | | | (1,087,250 | ) |
Total distributions to shareholders | | | (1,311,978 | ) | | | (14,448,535 | ) |
| | | | | | | | | |
Capital share transactions: | | | | | | | | |
Proceeds from sale of shares | | | | | | | | |
Investor Class | | | 2,323,334,615 | | | | 1,888,247,405 | |
Class A | | | 27,827,480 | | | | 87,207,798 | |
Class C | | | 723,309 | | | | 356,281 | |
Class H | | | 51,548,688 | | | | 196,137,541 | |
Distributions reinvested | | | | | | | | |
Investor Class | | | 1,187,760 | | | | 10,905,585 | |
Class A | | | 64,707 | | | | 1,649,156 | |
Class C | | | 1,489 | | | | 115,249 | |
Class H | | | 28,368 | | | | 1,087,250 | |
Cost of shares redeemed | | | | | | | | |
Investor Class | | | (2,348,796,915 | ) | | | (1,963,356,492 | ) |
Class A | | | (37,738,187 | ) | | | (84,237,819 | ) |
Class C | | | (1,025,931 | ) | | | (826,901 | ) |
Class H | | | (57,853,426 | ) | | | (215,287,997 | ) |
Net decrease from capital share transactions | | | (40,698,043 | ) | | | (78,002,944 | ) |
Net increase (decrease) in net assets | | | 16,736,252 | | | | (187,304,793 | ) |
| | | | | | | | | |
Net assets: | | | | | | | | |
Beginning of year | | | 256,899,539 | | | | 444,204,332 | |
End of year | | $ | 273,635,791 | | | $ | 256,899,539 | |
| | | | | | | | | |
Capital share activity: | | | | | | | | |
Shares sold | | | | | | | | |
Investor Class | | | 22,584,221 | | | | 18,516,555 | |
Class A | | | 320,857 | | | | 950,512 | |
Class C | | | 9,605 | | | | 4,851 | |
Class H | | | 584,271 | | | | 2,097,674 | |
Shares issued from reinvestment of distributions | | | | | | | | |
Investor Class | | | 11,089 | | | | 132,510 | |
Class A | | | 679 | | | | 22,465 | |
Class C | | | 20 | | | | 1,941 | |
Class H | | | 297 | | | | 14,788 | |
Shares redeemed | | | | | | | | |
Investor Class | | | (23,090,070 | ) | | | (19,036,194 | ) |
Class A | | | (437,561 | ) | | | (920,554 | ) |
Class C | | | (13,813 | ) | | | (9,871 | ) |
Class H | | | (667,576 | ) | | | (2,299,636 | ) |
Net decrease in shares | | | (697,981 | ) | | | (524,959 | ) |
SEE NOTES TO FINANCIAL STATEMENTS. | THE RYDEX FUNDS ANNUAL REPORT | 23 |
This table is presented to show selected data for a share outstanding throughout each period and to assist shareholders in evaluating a Fund’s performance for the periods presented.
Investor Class | | Year Ended
March 31,
2024 | | | Year Ended
March 31,
2023 | | | Year Ended
March 31,
2022 | | | Year Ended
March 31,
2021 | | | Year Ended
March 31,
2020 | |
Per Share Data |
Net asset value, beginning of period | | $ | 91.30 | | | $ | 133.16 | | | $ | 120.51 | | | $ | 63.62 | | | $ | 76.83 | |
Income (loss) from investment operations: |
Net investment income (loss)a | | | 1.04 | | | | .77 | | | | (.16 | ) | | | .05 | | | | .61 | |
Net gain (loss) on investments (realized and unrealized) | | | 36.30 | | | | (24.31 | ) | | | 25.92 | | | | 57.43 | | | | (13.82 | ) |
Total from investment operations | | | 37.34 | | | | (23.54 | ) | | | 25.76 | | | | 57.48 | | | | (13.21 | ) |
Less distributions from: |
Net investment income | | | (.66 | ) | | | — | | | | — | | | | (.59 | ) | | | — | |
Net realized gains | | | — | | | | (18.32 | ) | | | (13.11 | ) | | | — | | | | — | |
Total distributions | | | (.66 | ) | | | (18.32 | ) | | | (13.11 | ) | | | (.59 | ) | | | — | |
Net asset value, end of period | | $ | 127.98 | | | $ | 91.30 | | | $ | 133.16 | | | $ | 120.51 | | | $ | 63.62 | |
|
Total Return | | | 41.05 | % | | | (16.18 | %) | | | 20.83 | % | | | 90.46 | % | | | (17.19 | %) |
Ratios/Supplemental Data |
Net assets, end of period (in thousands) | | $ | 252,513 | | | $ | 225,298 | | | $ | 380,170 | | | $ | 326,237 | | | $ | 37,874 | |
Ratios to average net assets: |
Net investment income (loss) | | | 0.99 | % | | | 0.74 | % | | | (0.12 | %) | | | 0.05 | % | | | 0.71 | % |
Total expensesb | | | 1.43 | % | | | 1.30 | % | | | 1.25 | % | | | 1.33 | % | | | 1.37 | % |
Net expensesc | | | 1.39 | % | | | 1.29 | % | | | 1.23 | % | | | 1.32 | % | | | 1.36 | % |
Portfolio turnover rate | | | 1,047 | % | | | 973 | % | | | 1,027 | % | | | 785 | % | | | 690 | % |
Class A | | Year Ended
March 31,
2024 | | | Year Ended
March 31,
2023 | | | Year Ended
March 31,
2022 | | | Year Ended
March 31,
2021 | | | Year Ended
March 31,
2020 | |
Per Share Data |
Net asset value, beginning of period | | $ | 81.37 | | | $ | 121.63 | | | $ | 111.23 | | | $ | 58.89 | | | $ | 71.28 | |
Income (loss) from investment operations: |
Net investment income (loss)a | | | .73 | | | | .62 | | | | (.45 | ) | | | (.18 | ) | | | .40 | |
Net gain (loss) on investments (realized and unrealized) | | | 32.29 | | | | (22.56 | ) | | | 23.96 | | | | 53.11 | | | | (12.79 | ) |
Total from investment operations | | | 33.02 | | | | (21.94 | ) | | | 23.51 | | | | 52.93 | | | | (12.39 | ) |
Less distributions from: |
Net investment income | | | (.66 | ) | | | — | | | | — | | | | (.59 | ) | | | — | |
Net realized gains | | | — | | | | (18.32 | ) | | | (13.11 | ) | | | — | | | | — | |
Total distributions | | | (.66 | ) | | | (18.32 | ) | | | (13.11 | ) | | | (.59 | ) | | | — | |
Net asset value, end of period | | $ | 113.73 | | | $ | 81.37 | | | $ | 121.63 | | | $ | 111.23 | | | $ | 58.89 | |
|
Total Returnd | | | 40.75 | % | | | (16.42 | %) | | | 20.54 | % | | | 90.00 | % | | | (17.38 | %) |
Ratios/Supplemental Data |
Net assets, end of period (in thousands) | | $ | 12,780 | | | $ | 18,585 | | | $ | 21,403 | | | $ | 18,596 | | | $ | 7,435 | |
Ratios to average net assets: |
Net investment income (loss) | | | 0.79 | % | | | 0.67 | % | | | (0.35 | %) | | | (0.20 | %) | | | 0.52 | % |
Total expensesb | | | 1.70 | % | | | 1.55 | % | | | 1.50 | % | | | 1.59 | % | | | 1.62 | % |
Net expensesc | | | 1.66 | % | | | 1.53 | % | | | 1.48 | % | | | 1.58 | % | | | 1.61 | % |
Portfolio turnover rate | | | 1,047 | % | | | 973 | % | | | 1,027 | % | | | 785 | % | | | 690 | % |
24 | THE RYDEX FUNDS ANNUAL REPORT | SEE NOTES TO FINANCIAL STATEMENTS. |
FINANCIAL HIGHLIGHTS (continued) |
This table is presented to show selected data for a share outstanding throughout each period and to assist shareholders in evaluating a Fund’s performance for the periods presented.
Class C | | Year Ended
March 31,
2024 | | | Year Ended
March 31,
2023 | | | Year Ended
March 31,
2022 | | | Year Ended
March 31,
2021 | | | Year Ended
March 31,
2020 | |
Per Share Data |
Net asset value, beginning of period | | $ | 65.69 | | | $ | 103.59 | | | $ | 96.96 | | | $ | 51.77 | | | $ | 63.15 | |
Income (loss) from investment operations: |
Net investment income (loss)a | | | .05 | | | | (.06 | ) | | | (1.19 | ) | | | (.74 | ) | | | (.22 | ) |
Net gain (loss) on investments (realized and unrealized) | | | 25.89 | | | | (19.52 | ) | | | 20.93 | | | | 46.52 | | | | (11.16 | ) |
Total from investment operations | | | 25.94 | | | | (19.58 | ) | | | 19.74 | | | | 45.78 | | | | (11.38 | ) |
Less distributions from: |
Net investment income | | | (.66 | ) | | | — | | | | — | | | | (.59 | ) | | | — | |
Net realized gains | | | — | | | | (18.32 | ) | | | (13.11 | ) | | | — | | | | — | |
Total distributions | | | (.66 | ) | | | (18.32 | ) | | | (13.11 | ) | | | (.59 | ) | | | — | |
Net asset value, end of period | | $ | 90.97 | | | $ | 65.69 | | | $ | 103.59 | | | $ | 96.96 | | | $ | 51.77 | |
|
Total Returnd | | | 39.70 | % | | | (17.04 | %) | | | 19.64 | % | | | 88.56 | % | | | (18.02 | %) |
Ratios/Supplemental Data |
Net assets, end of period (in thousands) | | $ | 1,033 | | | $ | 1,021 | | | $ | 1,929 | | | $ | 3,576 | | | $ | 3,333 | |
Ratios to average net assets: |
Net investment income (loss) | | | 0.07 | % | | | (0.08 | %) | | | (1.09 | %) | | | (0.97 | %) | | | (0.32 | %) |
Total expensesb | | | 2.46 | % | | | 2.30 | % | | | 2.25 | % | | | 2.35 | % | | | 2.38 | % |
Net expensesc | | | 2.41 | % | | | 2.27 | % | | | 2.23 | % | | | 2.33 | % | | | 2.37 | % |
Portfolio turnover rate | | | 1,047 | % | | | 973 | % | | | 1,027 | % | | | 785 | % | | | 690 | % |
SEE NOTES TO FINANCIAL STATEMENTS. | THE RYDEX FUNDS ANNUAL REPORT | 25 |
FINANCIAL HIGHLIGHTS (concluded) |
This table is presented to show selected data for a share outstanding throughout each period and to assist shareholders in evaluating a Fund’s performance for the periods presented.
Class H | | Year Ended
March 31,
2024 | | | Year Ended
March 31,
2023 | | | Year Ended
March 31,
2022 | | | Year Ended
March 31,
2021 | | | Year Ended
March 31,
2020 | |
Per Share Data |
Net asset value, beginning of period | | $ | 81.50 | | | $ | 121.73 | | | $ | 111.34 | | | $ | 58.94 | | | $ | 71.35 | |
Income (loss) from investment operations: |
Net investment income (loss)a | | | .72 | | | | .37 | | | | (.48 | ) | | | (.18 | ) | | | .36 | |
Net gain (loss) on investments (realized and unrealized) | | | 32.33 | | | | (22.28 | ) | | | 23.98 | | | | 53.17 | | | | (12.77 | ) |
Total from investment operations | | | 33.05 | | | | (21.91 | ) | | | 23.50 | | | | 52.99 | | | | (12.41 | ) |
Less distributions from: |
Net investment income | | | (.66 | ) | | | — | | | | — | | | | (.59 | ) | | | — | |
Net realized gains | | | — | | | | (18.32 | ) | | | (13.11 | ) | | | — | | | | — | |
Total distributions | | | (.66 | ) | | | (18.32 | ) | | | (13.11 | ) | | | (.59 | ) | | | — | |
Net asset value, end of period | | $ | 113.89 | | | $ | 81.50 | | | $ | 121.73 | | | $ | 111.34 | | | $ | 58.94 | |
|
Total Return | | | 40.73 | % | | | (16.38 | %) | | | 20.51 | % | | | 90.03 | % | | | (17.39 | %) |
Ratios/Supplemental Data |
Net assets, end of period (in thousands) | | $ | 7,310 | | | $ | 11,996 | | | $ | 40,702 | | | $ | 53,660 | | | $ | 4,057 | |
Ratios to average net assets: |
Net investment income (loss) | | | 0.77 | % | | | 0.39 | % | | | (0.37 | %) | | | (0.20 | %) | | | 0.46 | % |
Total expensesb | | | 1.69 | % | | | 1.55 | % | | | 1.50 | % | | | 1.59 | % | | | 1.62 | % |
Net expensesc | | | 1.65 | % | | | 1.54 | % | | | 1.48 | % | | | 1.58 | % | | | 1.61 | % |
Portfolio turnover rate | | | 1,047 | % | | | 973 | % | | | 1,027 | % | | | 785 | % | | | 690 | % |
a | Net investment income (loss) per share was computed using average shares outstanding throughout the period. |
b | Does not include expenses of the underlying funds in which the Fund invests. |
c | Net expense information reflects the expense ratios after expense waivers and reimbursements, as applicable. |
d | Total return does not reflect the impact of any applicable sales charges. |
26 | THE RYDEX FUNDS ANNUAL REPORT | SEE NOTES TO FINANCIAL STATEMENTS. |
PERFORMANCE REPORT AND FUND PROFILE (Unaudited) | March 31, 2024 |
S&P 500® FUND
OBJECTIVE: Seeks to provide investment results that match, before fees and expenses, the performance of a specific benchmark on a daily basis. The Fund’s current benchmark is the S&P 500® Index (the “underlying index”).
For the Reporting Period, S&P 500 Fund maintained a daily correlation of over 99% to its benchmark of the daily price movement of the S&P 500 Index. S&P 500 Fund Class H returned 27.71%, while the S&P 500 Index returned 29.88% over the same time period.
The sectors that contributed the most to the return of the underlying index were Information Technology, Financials, and Communication Services. The only sector that detracted was Utilities.
The holdings that contributed the most to the return of the underlying index were NVIDIA Corp., Microsoft Corp., and Amazon.com, Inc. Those that detracted the most were Pfizer, Inc., Tesla, Inc., and Bristol-Myers Squibb Co.
Derivatives in the Fund were used to help provide exposure to the composition of the benchmark in the most efficient manner possible and not for hedging purposes. Derivatives performed as expected.
Performance displayed represents past performance, which is no guarantee of future results.
Holdings Diversification (Market Exposure as % of Net Assets)
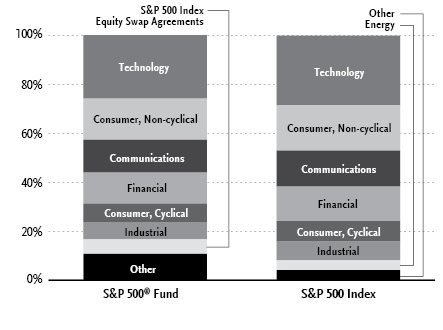
“Holdings Diversification (Market Exposure as % of Net Assets)” excludes any temporary cash investments.
Inception Dates: |
Class A | May 31, 2006 |
Class C | May 31, 2006 |
Class H | May 31, 2006 |
Ten Largest Holdings | % of Total Net Assets |
Microsoft Corp. | 6.5% |
Apple, Inc. | 5.1% |
NVIDIA Corp. | 4.6% |
Amazon.com, Inc. | 3.4% |
Meta Platforms, Inc. — Class A | 2.2% |
Alphabet, Inc. — Class A | 1.8% |
Berkshire Hathaway, Inc. — Class B | 1.6% |
Alphabet, Inc. — Class C | 1.6% |
Eli Lilly & Co. | 1.3% |
Broadcom, Inc. | 1.2% |
Top Ten Total | 29.3% |
| | |
“Ten Largest Holdings” excludes any temporary cash or derivative investments. |
| | THE RYDEX FUNDS ANNUAL REPORT | 27 |
PERFORMANCE REPORT AND FUND PROFILE (Unaudited)(concluded) | March 31, 2024 |
Cumulative Fund Performance*
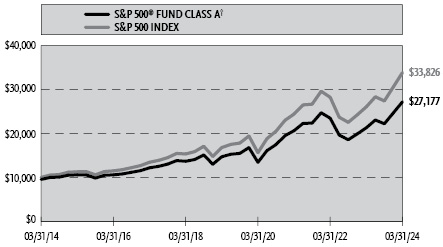
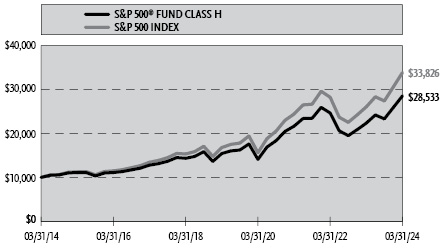
Average Annual Returns*
Periods Ended March 31, 2024
| 1 Year | 5 Year | 10 Year |
Class A Shares | 27.72% | 13.09% | 11.05% |
Class A Shares with sales charge† | 21.65% | 11.99% | 10.51% |
Class C Shares | 26.78% | 12.25% | 10.22% |
Class C Shares with CDSC‡ | 25.78% | 12.25% | 10.22% |
Class H Shares | 27.71% | 13.09% | 11.05% |
S&P 500 Index | 29.88% | 15.05% | 12.96% |
* | The performance data above represents past performance that is not predictive of future results. The investment return and principal value of an investment in the Fund will fluctuate so that an investor’s shares, when redeemed, may be worth more or less than their original cost. Returns are historical and include changes in principal and reinvested dividends and capital gains and do not reflect the effect of taxes. The S&P 500 Index is an unmanaged index and, unlike the Fund, has no management fees or operating expenses to reduce its reported return. The graphs are based on Class A shares and Class H shares only; performance for Class C shares will vary due to difference in fee structures. |
† | Fund returns are calculated using the maximum sales charge of 4.75%. |
‡ | Fund returns include a CDSC of 1% if redeemed within 12 months of purchase. |
28 | THE RYDEX FUNDS ANNUAL REPORT | |
SCHEDULE OF INVESTMENTS | March 31, 2024 |
S&P 500® FUND | |
| | Shares | | | Value | |
COMMON STOCKS† - 90.9% |
| | | | | | | | | |
Technology - 26.0% |
Microsoft Corp. | | | 33,245 | | | $ | 13,986,836 | |
Apple, Inc. | | | 64,945 | | | | 11,136,769 | |
NVIDIA Corp. | | | 11,051 | | | | 9,985,241 | |
Broadcom, Inc. | | | 1,969 | | | | 2,609,732 | |
Advanced Micro Devices, Inc.* | | | 7,230 | | | | 1,304,943 | |
Salesforce, Inc. | | | 4,331 | | | | 1,304,411 | |
Adobe, Inc.* | | | 2,022 | | | | 1,020,301 | |
Accenture plc — Class A | | | 2,806 | | | | 972,588 | |
Oracle Corp. | | | 7,133 | | | | 895,976 | |
QUALCOMM, Inc. | | | 4,993 | | | | 845,315 | |
Intel Corp. | | | 18,917 | | | | 835,564 | |
Intuit, Inc. | | | 1,253 | | | | 814,450 | |
International Business Machines Corp. | | | 4,094 | | | | 781,790 | |
Applied Materials, Inc. | | | 3,723 | | | | 767,794 | |
Texas Instruments, Inc. | | | 4,069 | | | | 708,860 | |
ServiceNow, Inc.* | | | 917 | | | | 699,121 | |
Micron Technology, Inc. | | | 4,940 | | | | 582,377 | |
Lam Research Corp. | | | 587 | | | | 570,312 | |
Analog Devices, Inc. | | | 2,219 | | | | 438,896 | |
Fiserv, Inc.* | | | 2,686 | | | | 429,276 | |
KLA Corp. | | | 605 | | | | 422,635 | |
Synopsys, Inc.* | | | 682 | | | | 389,763 | |
Cadence Design Systems, Inc.* | | | 1,217 | | | | 378,828 | |
NXP Semiconductor N.V. | | | 1,153 | | | | 285,679 | |
Roper Technologies, Inc. | | | 478 | | | | 268,082 | |
Autodesk, Inc.* | | | 957 | | | | 249,222 | |
Super Micro Computer, Inc.* | | | 225 | | | | 227,257 | |
Microchip Technology, Inc. | | | 2,418 | | | | 216,919 | |
MSCI, Inc. — Class A | | | 354 | | | | 198,399 | |
Fidelity National Information Services, Inc. | | | 2,651 | | | | 196,651 | |
Fortinet, Inc.* | | | 2,851 | | | | 194,752 | |
Paychex, Inc. | | | 1,433 | | | | 175,972 | |
Cognizant Technology Solutions Corp. — Class A | | | 2,228 | | | | 163,290 | |
Monolithic Power Systems, Inc. | | | 215 | | | | 145,645 | |
Electronic Arts, Inc. | | | 1,088 | | | | 144,345 | |
ON Semiconductor Corp.* | | | 1,912 | | | | 140,628 | |
Fair Isaac Corp.* | | | 111 | | | | 138,707 | |
ANSYS, Inc.* | | | 389 | | | | 135,045 | |
HP, Inc. | | | 3,902 | | | | 117,919 | |
Broadridge Financial Solutions, Inc. | | | 527 | | | | 107,961 | |
Take-Two Interactive Software, Inc.* | | | 710 | | | | 105,428 | |
Hewlett Packard Enterprise Co. | | | 5,817 | | | | 103,135 | |
PTC, Inc.* | | | 534 | | | | 100,894 | |
Western Digital Corp.* | | | 1,451 | | | | 99,016 | |
NetApp, Inc. | | | 921 | | | | 96,677 | |
Seagate Technology Holdings plc | | | 872 | | | | 81,140 | |
Leidos Holdings, Inc. | | | 615 | | | | 80,620 | |
Tyler Technologies, Inc.* | | | 188 | | | | 79,902 | |
Skyworks Solutions, Inc. | | | 717 | | | | 77,665 | |
Teradyne, Inc. | | | 684 | | | | 77,176 | |
Akamai Technologies, Inc.* | | | 675 | | | | 73,413 | |
EPAM Systems, Inc.* | | | 258 | | | | 71,249 | |
Zebra Technologies Corp. — Class A* | | | 230 | | | | 69,331 | |
Jack Henry & Associates, Inc. | | | 326 | | | | 56,636 | |
Qorvo, Inc.* | | | 432 | | | | 49,607 | |
Dayforce, Inc.* | | | 698 | | | | 46,215 | |
Paycom Software, Inc. | | | 215 | | | | 42,787 | |
Total Technology | | | | | | | 56,299,142 | |
| | | | | | | | | |
Consumer, Non-cyclical - 16.8% |
Eli Lilly & Co. | | | 3,567 | | | | 2,774,983 | |
UnitedHealth Group, Inc. | | | 4,138 | | | | 2,047,069 | |
Procter & Gamble Co. | | | 10,528 | | | | 1,708,168 | |
Johnson & Johnson | | | 10,770 | | | | 1,703,706 | |
Merck & Company, Inc. | | | 11,338 | | | | 1,496,049 | |
AbbVie, Inc. | | | 7,899 | | | | 1,438,408 | |
PepsiCo, Inc. | | | 6,148 | | | | 1,075,962 | |
Coca-Cola Co. | | | 17,410 | | | | 1,065,144 | |
Thermo Fisher Scientific, Inc. | | | 1,728 | | | | 1,004,331 | |
Abbott Laboratories | | | 7,767 | | | | 882,797 | |
Danaher Corp. | | | 2,942 | | | | 734,676 | |
Pfizer, Inc. | | | 25,264 | | | | 701,076 | |
Amgen, Inc. | | | 2,393 | | | | 680,378 | |
Philip Morris International, Inc. | | | 6,945 | | | | 636,301 | |
Intuitive Surgical, Inc.* | | | 1,576 | | | | 628,966 | |
S&P Global, Inc. | | | 1,438 | | | | 611,797 | |
Elevance Health, Inc. | | | 1,050 | | | | 544,467 | |
Stryker Corp. | | | 1,513 | | | | 541,457 | |
Medtronic plc | | | 5,950 | | | | 518,543 | |
Bristol-Myers Squibb Co. | | | 9,104 | | | | 493,710 | |
Vertex Pharmaceuticals, Inc.* | | | 1,153 | | | | 481,965 | |
Cigna Group | | | 1,309 | | | | 475,416 | |
Automatic Data Processing, Inc. | | | 1,838 | | | | 459,022 | |
Regeneron Pharmaceuticals, Inc.* | | | 473 | | | | 455,258 | |
CVS Health Corp. | | | 5,631 | | | | 449,129 | |
Boston Scientific Corp.* | | | 6,555 | | | | 448,952 | |
Mondelez International, Inc. — Class A | | | 6,024 | | | | 421,680 | |
Gilead Sciences, Inc. | | | 5,575 | | | | 408,369 | |
Zoetis, Inc. | | | 2,054 | | | | 347,557 | |
Altria Group, Inc. | | | 7,890 | | | | 344,162 | |
Colgate-Palmolive Co. | | | 3,684 | | | | 331,744 | |
PayPal Holdings, Inc.* | | | 4,795 | | | | 321,217 | |
Becton Dickinson & Co. | | | 1,293 | | | | 319,953 | |
McKesson Corp. | | | 588 | | | | 315,668 | |
HCA Healthcare, Inc. | | | 886 | | | | 295,507 | |
Moody’s Corp. | | | 704 | | | | 276,693 | |
Cintas Corp. | | | 386 | | | | 265,194 | |
Edwards Lifesciences Corp.* | | | 2,714 | | | | 259,350 | |
Dexcom, Inc.* | | | 1,725 | | | | 239,257 | |
United Rentals, Inc. | | | 301 | | | | 217,054 | |
IQVIA Holdings, Inc.* | | | 816 | | | | 206,358 | |
IDEXX Laboratories, Inc.* | | | 372 | | | | 200,854 | |
Monster Beverage Corp.* | | | 3,305 | | | | 195,920 | |
Constellation Brands, Inc. — Class A | | | 719 | | | | 195,395 | |
Kimberly-Clark Corp. | | | 1,507 | | | | 194,930 | |
Agilent Technologies, Inc. | | | 1,311 | | | | 190,764 | |
Humana, Inc. | | | 546 | | | | 189,309 | |
Centene Corp.* | | | 2,391 | | | | 187,646 | |
Corteva, Inc. | | | 3,140 | | | | 181,084 | |
Sysco Corp. | | | 2,228 | | | | 180,869 | |
SEE NOTES TO FINANCIAL STATEMENTS. | THE RYDEX FUNDS ANNUAL REPORT | 29 |
SCHEDULE OF INVESTMENTS (continued) | March 31, 2024 |
S&P 500® FUND | |
| | Shares | | | Value | |
Cencora, Inc. — Class A | | | 741 | | | $ | 180,056 | |
General Mills, Inc. | | | 2,541 | | | | 177,794 | |
CoStar Group, Inc.* | | | 1,827 | | | | 176,488 | |
GE HealthCare Technologies, Inc. | | | 1,895 | | | | 172,274 | |
Kroger Co. | | | 2,961 | | | | 169,162 | |
Quanta Services, Inc. | | | 650 | | | | 168,870 | |
Gartner, Inc.* | | | 349 | | | | 166,358 | |
Kenvue, Inc. | | | 7,711 | | | | 165,478 | |
Estee Lauder Companies, Inc. — Class A | | | 1,042 | | | | 160,625 | |
Moderna, Inc.* | | | 1,484 | | | | 158,135 | |
Global Payments, Inc. | | | 1,165 | | | | 155,714 | |
Verisk Analytics, Inc. — Class A | | | 649 | | | | 152,989 | |
Archer-Daniels-Midland Co. | | | 2,386 | | | | 149,864 | |
Equifax, Inc. | | | 552 | | | | 147,671 | |
Keurig Dr Pepper, Inc. | | | 4,660 | | | | 142,922 | |
Biogen, Inc.* | | | 648 | | | | 139,728 | |
Kraft Heinz Co. | | | 3,567 | | | | 131,622 | |
West Pharmaceutical Services, Inc. | | | 331 | | | | 130,980 | |
Hershey Co. | | | 671 | | | | 130,510 | |
ResMed, Inc. | | | 657 | | | | 130,106 | |
Zimmer Biomet Holdings, Inc. | | | 935 | | | | 123,401 | |
Cardinal Health, Inc. | | | 1,088 | | | | 121,747 | |
Church & Dwight Company, Inc. | | | 1,102 | | | | 114,950 | |
Molina Healthcare, Inc.* | | | 260 | | | | 106,816 | |
Align Technology, Inc.* | | | 319 | | | | 104,607 | |
Corpay, Inc.* | | | 323 | | | | 99,659 | |
STERIS plc | | | 442 | | | | 99,370 | |
Illumina, Inc.* | | | 710 | | | | 97,497 | |
Baxter International, Inc. | | | 2,272 | | | | 97,105 | |
Waters Corp.* | | | 265 | | | | 91,221 | |
Cooper Companies, Inc.* | | | 889 | | | | 90,198 | |
McCormick & Company, Inc. | | | 1,125 | | | | 86,411 | |
Clorox Co. | | | 555 | | | | 84,976 | |
Laboratory Corporation of America Holdings | | | 380 | | | | 83,015 | |
Hologic, Inc.* | | | 1,050 | | | | 81,858 | |
Avery Dennison Corp. | | | 360 | | | | 80,370 | |
Tyson Foods, Inc. — Class A | | | 1,281 | | | | 75,233 | |
Lamb Weston Holdings, Inc. | | | 646 | | | | 68,818 | |
Kellanova | | | 1,180 | | | | 67,602 | |
Bunge Global S.A. | | | 650 | | | | 66,638 | |
Quest Diagnostics, Inc. | | | 497 | | | | 66,156 | |
Viatris, Inc. | | | 5,368 | | | | 64,094 | |
Conagra Brands, Inc. | | | 2,138 | | | | 63,370 | |
Charles River Laboratories International, Inc.* | | | 229 | | | | 62,047 | |
J M Smucker Co. | | | 475 | | | | 59,788 | |
Rollins, Inc. | | | 1,256 | | | | 58,115 | |
Revvity, Inc. | | | 551 | | | | 57,855 | |
Molson Coors Beverage Co. — Class B | | | 828 | | | | 55,683 | |
Insulet Corp.* | | | 312 | | | | 53,477 | |
Universal Health Services, Inc. — Class B | | | 273 | | | | 49,812 | |
Bio-Techne Corp. | | | 703 | | | | 49,484 | |
Teleflex, Inc. | | | 210 | | | | 47,496 | |
Incyte Corp.* | | | 832 | | | | 47,399 | |
Catalent, Inc.* | | | 809 | | | | 45,668 | |
Hormel Foods Corp. | | | 1,296 | | | | 45,218 | |
Henry Schein, Inc.* | | | 581 | | | | 43,877 | |
Brown-Forman Corp. — Class B | | | 809 | | | | 41,761 | |
Campbell Soup Co. | | | 880 | | | | 39,116 | |
MarketAxess Holdings, Inc. | | | 169 | | | | 37,053 | |
Robert Half, Inc. | | | 465 | | | | 36,865 | |
DaVita, Inc.* | | | 241 | | | | 33,270 | |
Bio-Rad Laboratories, Inc. — Class A* | | | 94 | | | | 32,512 | |
Dentsply Sirona, Inc. | | | 948 | | | | 31,464 | |
Total Consumer, Non-cyclical | | | | | | | 36,414,682 | |
| | | | | | | | | |
Communications - 13.4% |
Amazon.com, Inc.* | | | 40,897 | | | | 7,377,001 | |
Meta Platforms, Inc. — Class A | | | 9,843 | | | | 4,779,564 | |
Alphabet, Inc. — Class A* | | | 26,367 | | | | 3,979,571 | |
Alphabet, Inc. — Class C* | | | 22,075 | | | | 3,361,140 | |
Netflix, Inc.* | | | 1,936 | | | | 1,175,791 | |
Walt Disney Co. | | | 8,208 | | | | 1,004,331 | |
Cisco Systems, Inc. | | | 18,182 | | | | 907,464 | |
Verizon Communications, Inc. | | | 18,811 | | | | 789,310 | |
Comcast Corp. — Class A | | | 17,728 | | | | 768,509 | |
Uber Technologies, Inc.* | | | 9,208 | | | | 708,924 | |
Booking Holdings, Inc. | | | 156 | | | | 565,949 | |
AT&T, Inc. | | | 31,991 | | | | 563,042 | |
Palo Alto Networks, Inc.* | | | 1,411 | | | | 400,907 | |
T-Mobile US, Inc. | | | 2,337 | | | | 381,445 | |
Arista Networks, Inc.* | | | 1,127 | | | | 326,807 | |
Airbnb, Inc. — Class A* | | | 1,949 | | | | 321,507 | |
Motorola Solutions, Inc. | | | 743 | | | | 263,750 | |
CDW Corp. | | | 599 | | | | 153,212 | |
Charter Communications, Inc. — Class A* | | | 441 | | | | 128,168 | |
eBay, Inc. | | | 2,322 | | | | 122,555 | |
Corning, Inc. | | | 3,436 | | | | 113,251 | |
Warner Bros Discovery, Inc.* | | | 9,929 | | | | 86,680 | |
Omnicom Group, Inc. | | | 886 | | | | 85,729 | |
Expedia Group, Inc.* | | | 585 | | | | 80,584 | |
FactSet Research Systems, Inc. | | | 170 | | | | 77,246 | |
VeriSign, Inc.* | | | 394 | | | | 74,667 | |
Gen Digital, Inc. | | | 2,508 | | | | 56,179 | |
Interpublic Group of Companies, Inc. | | | 1,714 | | | | 55,928 | |
Juniper Networks, Inc. | | | 1,440 | | | | 53,366 | |
F5, Inc.* | | | 262 | | | | 49,673 | |
News Corp. — Class A | | | 1,700 | | | | 44,506 | |
Match Group, Inc.* | | | 1,216 | | | | 44,116 | |
Etsy, Inc.* | | | 536 | | | | 36,834 | |
Fox Corp. — Class A | | | 1,071 | | | | 33,490 | |
Paramount Global — Class B | | | 2,159 | | | | 25,411 | |
Fox Corp. — Class B | | | 590 | | | | 16,886 | |
News Corp. — Class B | | | 513 | | | | 13,882 | |
Total Communications | | | | | | | 29,027,375 | |
| | | | | | | | | |
Financial - 12.8% |
Berkshire Hathaway, Inc. — Class B* | | | 8,141 | | | | 3,423,453 | |
JPMorgan Chase & Co. | | | 12,935 | | | | 2,590,880 | |
Visa, Inc. — Class A | | | 7,077 | | | | 1,975,049 | |
Mastercard, Inc. — Class A | | | 3,692 | | | | 1,777,956 | |
Bank of America Corp. | | | 30,805 | | | | 1,168,125 | |
30 | THE RYDEX FUNDS ANNUAL REPORT | SEE NOTES TO FINANCIAL STATEMENTS. |
SCHEDULE OF INVESTMENTS (continued) | March 31, 2024 |
S&P 500® FUND | |
| | Shares | | | Value | |
Wells Fargo & Co. | | | 16,102 | | | $ | 933,272 | |
Goldman Sachs Group, Inc. | | | 1,459 | | | | 609,410 | |
American Express Co. | | | 2,559 | | | | 582,659 | |
Progressive Corp. | | | 2,618 | | | | 541,455 | |
Citigroup, Inc. | | | 8,516 | | | | 538,552 | |
Prologis, Inc. REIT | | | 4,134 | | | | 538,330 | |
Morgan Stanley | | | 5,605 | | | | 527,767 | |
BlackRock, Inc. — Class A | | | 625 | | | | 521,062 | |
Charles Schwab Corp. | | | 6,659 | | | | 481,712 | |
Chubb Ltd. | | | 1,813 | | | | 469,803 | |
Marsh & McLennan Companies, Inc. | | | 2,201 | | | | 453,362 | |
Blackstone, Inc. — Class A | | | 3,219 | | | | 422,880 | |
American Tower Corp. — Class A REIT | | | 2,085 | | | | 411,975 | |
Intercontinental Exchange, Inc. | | | 2,562 | | | | 352,096 | |
CME Group, Inc. — Class A | | | 1,611 | | | | 346,832 | |
Equinix, Inc. REIT | | | 420 | | | | 346,639 | |
U.S. Bancorp | | | 6,967 | | | | 311,425 | |
Aon plc — Class A | | | 896 | | | | 299,013 | |
PNC Financial Services Group, Inc. | | | 1,781 | | | | 287,809 | |
Capital One Financial Corp. | | | 1,702 | | | | 253,411 | |
American International Group, Inc. | | | 3,141 | | | | 245,532 | |
Arthur J Gallagher & Co. | | | 970 | | | | 242,539 | |
Travelers Companies, Inc. | | | 1,021 | | | | 234,973 | |
Truist Financial Corp. | | | 5,968 | | | | 232,633 | |
Welltower, Inc. REIT | | | 2,477 | | | | 231,451 | |
Simon Property Group, Inc. REIT | | | 1,458 | | | | 228,162 | |
Crown Castle, Inc. REIT | | | 1,941 | | | | 205,416 | |
Public Storage REIT | | | 708 | | | | 205,363 | |
MetLife, Inc. | | | 2,747 | | | | 203,580 | |
Allstate Corp. | | | 1,174 | | | | 203,114 | |
Aflac, Inc. | | | 2,355 | | | | 202,200 | |
Realty Income Corp. REIT | | | 3,721 | | | | 201,306 | |
Ameriprise Financial, Inc. | | | 448 | | | | 196,421 | |
Bank of New York Mellon Corp. | | | 3,397 | | | | 195,735 | |
Digital Realty Trust, Inc. REIT | | | 1,355 | | | | 195,174 | |
Prudential Financial, Inc. | | | 1,615 | | | | 189,601 | |
Arch Capital Group Ltd.* | | | 1,660 | | | | 153,450 | |
Discover Financial Services | | | 1,119 | | | | 146,690 | |
Extra Space Storage, Inc. REIT | | | 945 | | | | 138,915 | |
VICI Properties, Inc. REIT | | | 4,629 | | | | 137,898 | |
Hartford Financial Services Group, Inc. | | | 1,336 | | | | 137,675 | |
CBRE Group, Inc. — Class A* | | | 1,330 | | | | 129,329 | |
Willis Towers Watson plc | | | 459 | | | | 126,225 | |
T. Rowe Price Group, Inc. | | | 1,002 | | | | 122,164 | |
AvalonBay Communities, Inc. REIT | | | 634 | | | | 117,645 | |
Weyerhaeuser Co. REIT | | | 3,265 | | | | 117,246 | |
Fifth Third Bancorp | | | 3,047 | | | | 113,379 | |
Raymond James Financial, Inc. | | | 842 | | | | 108,130 | |
M&T Bank Corp. | | | 743 | | | | 108,062 | |
Nasdaq, Inc. | | | 1,700 | | | | 107,270 | |
Iron Mountain, Inc. REIT | | | 1,306 | | | | 104,754 | |
SBA Communications Corp. REIT | | | 483 | | | | 104,666 | |
State Street Corp. | | | 1,351 | | | | 104,459 | |
Equity Residential REIT | | | 1,544 | | | | 97,442 | |
Brown & Brown, Inc. | | | 1,057 | | | | 92,530 | |
Invitation Homes, Inc. REIT | | | 2,574 | | | | 91,660 | |
Alexandria Real Estate Equities, Inc. REIT | | | 705 | | | | 90,882 | |
Huntington Bancshares, Inc. | | | 6,481 | | | | 90,410 | |
Cincinnati Financial Corp. | | | 703 | | | | 87,291 | |
Regions Financial Corp. | | | 4,134 | | | | 86,979 | |
Cboe Global Markets, Inc. | | | 471 | | | | 86,537 | |
Principal Financial Group, Inc. | | | 981 | | | | 84,670 | |
Northern Trust Corp. | | | 917 | | | | 81,540 | |
W R Berkley Corp. | | | 906 | | | | 80,127 | |
Synchrony Financial | | | 1,820 | | | | 78,478 | |
Ventas, Inc. REIT | | | 1,800 | | | | 78,372 | |
Everest Group Ltd. | | | 194 | | | | 77,115 | |
Citizens Financial Group, Inc. | | | 2,086 | | | | 75,701 | |
Essex Property Trust, Inc. REIT | | | 287 | | | | 70,260 | |
Mid-America Apartment Communities, Inc. REIT | | | 522 | | | | 68,685 | |
KeyCorp | | | 4,191 | | | | 66,260 | |
Host Hotels & Resorts, Inc. REIT | | | 3,157 | | | | 65,287 | |
Loews Corp. | | | 815 | | | | 63,806 | |
Healthpeak Properties, Inc. REIT | | | 3,167 | | | | 59,381 | |
Kimco Realty Corp. REIT | | | 2,981 | | | | 58,457 | |
UDR, Inc. REIT | | | 1,354 | | | | 50,653 | |
Camden Property Trust REIT | | | 478 | | | | 47,035 | |
Globe Life, Inc. | | | 383 | | | | 44,570 | |
Regency Centers Corp. REIT | | | 735 | | | | 44,512 | |
Assurant, Inc. | | | 232 | | | | 43,672 | |
Boston Properties, Inc. REIT | | | 646 | | | | 42,190 | |
Franklin Resources, Inc. | | | 1,343 | | | | 37,752 | |
Federal Realty Investment Trust REIT | | | 329 | | | | 33,598 | |
Invesco Ltd. | | | 2,011 | | | | 33,362 | |
Comerica, Inc. | | | 590 | | | | 32,444 | |
Total Financial | | | | | | | 27,797,742 | |
| | | | | | | | | |
Consumer, Cyclical - 7.6% |
Tesla, Inc.* | | | 12,397 | | | | 2,179,269 | |
Home Depot, Inc. | | | 4,452 | | | | 1,707,787 | |
Costco Wholesale Corp. | | | 1,985 | | | | 1,454,270 | |
Walmart, Inc. | | | 19,152 | | | | 1,152,376 | |
McDonald’s Corp. | | | 3,246 | | | | 915,210 | |
Lowe’s Companies, Inc. | | | 2,573 | | | | 655,420 | |
TJX Companies, Inc. | | | 5,099 | | | | 517,141 | |
NIKE, Inc. — Class B | | | 5,445 | | | | 511,721 | |
Starbucks Corp. | | | 5,066 | | | | 462,982 | |
Target Corp. | | | 2,065 | | | | 365,939 | |
Chipotle Mexican Grill, Inc. — Class A* | | | 122 | | | | 354,626 | |
O’Reilly Automotive, Inc.* | | | 264 | | | | 298,024 | |
PACCAR, Inc. | | | 2,340 | | | | 289,903 | |
Marriott International, Inc. — Class A | | | 1,103 | | | | 278,298 | |
AutoZone, Inc.* | | | 78 | | | | 245,829 | |
Hilton Worldwide Holdings, Inc. | | | 1,128 | | | | 240,613 | |
General Motors Co. | | | 5,165 | | | | 234,233 | |
Ford Motor Co. | | | 17,462 | | | | 231,895 | |
Copart, Inc.* | | | 3,910 | | | | 226,467 | |
Ross Stores, Inc. | | | 1,506 | | | | 221,021 | |
DR Horton, Inc. | | | 1,336 | | | | 219,839 | |
WW Grainger, Inc. | | | 198 | | | | 201,425 | |
Lululemon Athletica, Inc.* | | | 514 | | | | 200,794 | |
Fastenal Co. | | | 2,560 | | | | 197,478 | |
SEE NOTES TO FINANCIAL STATEMENTS. | THE RYDEX FUNDS ANNUAL REPORT | 31 |
SCHEDULE OF INVESTMENTS (continued) | March 31, 2024 |
S&P 500® FUND | |
| | Shares | | | Value | |
Lennar Corp. — Class A | | | 1,106 | | | $ | 190,210 | |
Cummins, Inc. | | | 610 | | | | 179,736 | |
Yum! Brands, Inc. | | | 1,257 | | | | 174,283 | |
Dollar General Corp. | | | 982 | | | | 153,251 | |
Royal Caribbean Cruises Ltd.* | | | 1,056 | | | | 146,794 | |
Delta Air Lines, Inc. | | | 2,865 | | | | 137,147 | |
Tractor Supply Co. | | | 484 | | | | 126,672 | |
Dollar Tree, Inc.* | | | 926 | | | | 123,297 | |
PulteGroup, Inc. | | | 949 | | | | 114,468 | |
Ulta Beauty, Inc.* | | | 217 | | | | 113,465 | |
NVR, Inc.* | | | 14 | | | | 113,400 | |
Deckers Outdoor Corp.* | | | 115 | | | | 108,245 | |
Aptiv plc* | | | 1,249 | | | | 99,483 | |
Genuine Parts Co. | | | 627 | | | | 97,141 | |
Darden Restaurants, Inc. | | | 534 | | | | 89,258 | |
Las Vegas Sands Corp. | | | 1,651 | | | | 85,357 | |
Southwest Airlines Co. | | | 2,670 | | | | 77,937 | |
Domino’s Pizza, Inc. | | | 156 | | | | 77,513 | |
Carnival Corp.* | | | 4,508 | | | | 73,661 | |
Best Buy Company, Inc. | | | 858 | | | | 70,382 | |
United Airlines Holdings, Inc.* | | | 1,468 | | | | 70,288 | |
Pool Corp. | | | 173 | | | | 69,806 | |
Walgreens Boots Alliance, Inc. | | | 3,203 | | | | 69,473 | |
Live Nation Entertainment, Inc.* | | | 635 | | | | 67,164 | |
LKQ Corp. | | | 1,197 | | | | 63,932 | |
CarMax, Inc.* | | | 707 | | | | 61,587 | |
MGM Resorts International* | | | 1,223 | | | | 57,738 | |
Bath & Body Works, Inc. | | | 1,011 | | | | 50,570 | |
Tapestry, Inc. | | | 1,026 | | | | 48,714 | |
American Airlines Group, Inc.* | | | 2,928 | | | | 44,945 | |
Wynn Resorts Ltd. | | | 426 | | | | 43,550 | |
Caesars Entertainment, Inc.* | | | 965 | | | | 42,209 | |
Norwegian Cruise Line Holdings Ltd.* | | | 1,904 | | | | 39,851 | |
BorgWarner, Inc. | | | 1,028 | | | | 35,713 | |
Hasbro, Inc. | | | 584 | | | | 33,008 | |
Ralph Lauren Corp. — Class A | | | 175 | | | | 32,858 | |
VF Corp. | | | 1,479 | | | | 22,688 | |
Total Consumer, Cyclical | | | | | | | 16,568,354 | |
| | | | | | | | | |
Industrial - 6.9% |
General Electric Co. | | | 4,870 | | | | 854,831 | |
Caterpillar, Inc. | | | 2,277 | | | | 834,361 | |
Union Pacific Corp. | | | 2,727 | | | | 670,651 | |
Honeywell International, Inc. | | | 2,949 | | | | 605,282 | |
RTX Corp. | | | 5,937 | | | | 579,036 | |
Eaton Corporation plc | | | 1,787 | | | | 558,759 | |
Boeing Co.* | | | 2,566 | | | | 495,212 | |
United Parcel Service, Inc. — Class B | | | 3,236 | | | | 480,967 | |
Deere & Co. | | | 1,165 | | | | 478,512 | |
Lockheed Martin Corp. | | | 962 | | | | 437,585 | |
Waste Management, Inc. | | | 1,640 | | | | 349,566 | |
CSX Corp. | | | 8,842 | | | | 327,773 | |
Illinois Tool Works, Inc. | | | 1,217 | | | | 326,558 | |
Parker-Hannifin Corp. | | | 575 | | | | 319,579 | |
Amphenol Corp. — Class A | | | 2,684 | | | | 309,599 | |
TransDigm Group, Inc. | | | 249 | | | | 306,668 | |
Trane Technologies plc | | | 1,018 | | | | 305,604 | |
Northrop Grumman Corp. | | | 631 | | | | 302,034 | |
FedEx Corp. | | | 1,029 | | | | 298,142 | |
Emerson Electric Co. | | | 2,558 | | | | 290,128 | |
General Dynamics Corp. | | | 1,016 | | | | 287,010 | |
3M Co. | | | 2,473 | | | | 262,311 | |
Norfolk Southern Corp. | | | 1,010 | | | | 257,419 | |
Carrier Global Corp. | | | 3,738 | | | | 217,290 | |
TE Connectivity Ltd. | | | 1,381 | | | | 200,577 | |
Johnson Controls International plc | | | 3,049 | | | | 199,161 | |
AMETEK, Inc. | | | 1,033 | | | | 188,936 | |
L3Harris Technologies, Inc. | | | 848 | | | | 180,709 | |
Otis Worldwide Corp. | | | 1,814 | | | | 180,076 | |
Old Dominion Freight Line, Inc. | | | 800 | | | | 175,448 | |
Republic Services, Inc. — Class A | | | 915 | | | | 175,168 | |
Ingersoll Rand, Inc. | | | 1,811 | | | | 171,955 | |
Martin Marietta Materials, Inc. | | | 277 | | | | 170,061 | |
Vulcan Materials Co. | | | 594 | | | | 162,114 | |
Rockwell Automation, Inc. | | | 513 | | | | 149,452 | |
Xylem, Inc. | | | 1,079 | | | | 139,450 | |
Fortive Corp. | | | 1,569 | | | | 134,965 | |
Mettler-Toledo International, Inc.* | | | 96 | | | | 127,804 | |
Keysight Technologies, Inc.* | | | 782 | | | | 122,289 | |
Howmet Aerospace, Inc. | | | 1,750 | | | | 119,753 | |
Westinghouse Air Brake Technologies Corp. | | | 802 | | | | 116,835 | |
Builders FirstSource, Inc.* | | | 551 | | | | 114,911 | |
Dover Corp. | | | 626 | | | | 110,921 | |
Garmin Ltd. | | | 685 | | | | 101,976 | |
Hubbell, Inc. | | | 239 | | | | 99,197 | |
Axon Enterprise, Inc.* | | | 315 | | | | 98,557 | |
Ball Corp. | | | 1,411 | | | | 95,045 | |
Teledyne Technologies, Inc.* | | | 211 | | | | 90,586 | |
Veralto Corp. | | | 981 | | | | 86,975 | |
Jacobs Solutions, Inc. | | | 562 | | | | 86,396 | |
Textron, Inc. | | | 877 | | | | 84,131 | |
IDEX Corp. | | | 338 | | | | 82,479 | |
Expeditors International of Washington, Inc. | | | 651 | | | | 79,142 | |
Masco Corp. | | | 983 | | | | 77,539 | |
Jabil, Inc. | | | 571 | | | | 76,486 | |
Packaging Corporation of America | | | 398 | | | | 75,532 | |
J.B. Hunt Transport Services, Inc. | | | 365 | | | | 72,726 | |
Trimble, Inc.* | | | 1,113 | | | | 71,633 | |
Snap-on, Inc. | | | 236 | | | | 69,908 | |
Stanley Black & Decker, Inc. | | | 686 | | | | 67,180 | |
Nordson Corp. | | | 243 | | | | 66,713 | |
Pentair plc | | | 740 | | | | 63,226 | |
Amcor plc | | | 6,467 | | | | 61,501 | |
Westrock Co. | | | 1,150 | | | | 56,868 | |
Allegion plc | | | 393 | | | | 52,941 | |
Huntington Ingalls Industries, Inc. | | | 177 | | | | 51,590 | |
A O Smith Corp. | | | 550 | | | | 49,203 | |
CH Robinson Worldwide, Inc. | | | 522 | | | | 39,745 | |
Generac Holdings, Inc.* | | | 275 | | | | 34,689 | |
Mohawk Industries, Inc.* | | | 237 | | | | 31,021 | |
Total Industrial | | | | | | | 15,018,447 | |
| | | | | | | | | |
32 | THE RYDEX FUNDS ANNUAL REPORT | SEE NOTES TO FINANCIAL STATEMENTS. |
SCHEDULE OF INVESTMENTS (continued) | March 31, 2024 |
S&P 500® FUND | |
| | Shares | | | Value | |
Energy - 3.7% |
Exxon Mobil Corp. | | | 17,768 | | | $ | 2,065,352 | |
Chevron Corp. | | | 7,761 | | | | 1,224,220 | |
ConocoPhillips | | | 5,270 | | | | 670,766 | |
Schlumberger N.V. | | | 6,387 | | | | 350,072 | |
EOG Resources, Inc. | | | 2,608 | | | | 333,407 | |
Marathon Petroleum Corp. | | | 1,647 | | | | 331,870 | |
Phillips 66 | | | 1,924 | | | | 314,266 | |
Pioneer Natural Resources Co. | | | 1,045 | | | | 274,313 | |
Valero Energy Corp. | | | 1,523 | | | | 259,961 | |
Williams Companies, Inc. | | | 5,443 | | | | 212,114 | |
ONEOK, Inc. | | | 2,607 | | | | 209,003 | |
Occidental Petroleum Corp. | | | 2,945 | | | | 191,396 | |
Hess Corp. | | | 1,231 | | | | 187,900 | |
Diamondback Energy, Inc. | | | 801 | | | | 158,734 | |
Kinder Morgan, Inc. | | | 8,652 | | | | 158,678 | |
Halliburton Co. | | | 3,982 | | | | 156,970 | |
Baker Hughes Co. | | | 4,478 | | | | 150,013 | |
Devon Energy Corp. | | | 2,867 | | | | 143,866 | |
Targa Resources Corp. | | | 997 | | | | 111,654 | |
Coterra Energy, Inc. — Class A | | | 3,365 | | | | 93,816 | |
First Solar, Inc.* | | | 478 | | | | 80,686 | |
Marathon Oil Corp. | | | 2,619 | | | | 74,222 | |
Enphase Energy, Inc.* | | | 607 | | | | 73,435 | |
Equities Corp. | | | 1,840 | | | | 68,209 | |
APA Corp. | | | 1,616 | | | | 55,558 | |
Total Energy | | | | | | | 7,950,481 | |
| | | | | | | | | |
Utilities - 2.0% |
NextEra Energy, Inc. | | | 9,180 | | | | 586,694 | |
Southern Co. | | | 4,880 | | | | 350,091 | |
Duke Energy Corp. | | | 3,449 | | | | 333,553 | |
Constellation Energy Corp. | | | 1,429 | | | | 264,151 | |
American Electric Power Company, Inc. | | | 2,353 | | | | 202,593 | |
Sempra | | | 2,816 | | | | 202,273 | |
Dominion Energy, Inc. | | | 3,744 | | | | 184,167 | |
Exelon Corp. | | | 4,454 | | | | 167,337 | |
PG&E Corp. | | | 9,547 | | | | 160,008 | |
Public Service Enterprise Group, Inc. | | | 2,230 | | | | 148,919 | |
Consolidated Edison, Inc. | | | 1,545 | | | | 140,302 | |
Xcel Energy, Inc. | | | 2,469 | | | | 132,709 | |
Edison International | | | 1,716 | | | | 121,373 | |
WEC Energy Group, Inc. | | | 1,411 | | | | 115,871 | |
American Water Works Company, Inc. | | | 871 | | | | 106,445 | |
DTE Energy Co. | | | 923 | | | | 103,505 | |
Entergy Corp. | | | 946 | | | | 99,973 | |
Eversource Energy | | | 1,562 | | | | 93,361 | |
PPL Corp. | | | 3,298 | | | | 90,794 | |
FirstEnergy Corp. | | | 2,311 | | | | 89,251 | |
Ameren Corp. | | | 1,177 | | | | 87,051 | |
CenterPoint Energy, Inc. | | | 2,824 | | | | 80,456 | |
Atmos Energy Corp. | | | 675 | | | | 80,237 | |
CMS Energy Corp. | | | 1,318 | | | | 79,528 | |
NRG Energy, Inc. | | | 1,010 | | | | 68,367 | |
Alliant Energy Corp. | | | 1,142 | | | | 57,557 | |
Evergy, Inc. | | | 1,027 | | | | 54,821 | |
AES Corp. | | | 2,995 | | | | 53,700 | |
NiSource, Inc. | | | 1,849 | | | | 51,143 | |
Pinnacle West Capital Corp. | | | 507 | | | | 37,888 | |
Total Utilities | | | | | | | 4,344,118 | |
| | | | | | | | | |
Basic Materials - 1.7% |
Linde plc | | | 2,170 | | | | 1,007,574 | |
Sherwin-Williams Co. | | | 1,054 | | | | 366,086 | |
Freeport-McMoRan, Inc. | | | 6,416 | | | | 301,680 | |
Ecolab, Inc. | | | 1,136 | | | | 262,302 | |
Air Products and Chemicals, Inc. | | | 995 | | | | 241,059 | |
Nucor Corp. | | | 1,100 | | | | 217,690 | |
Newmont Corp. | | | 5,156 | | | | 184,791 | |
Dow, Inc. | | | 3,142 | | | | 182,016 | |
PPG Industries, Inc. | | | 1,055 | | | | 152,869 | |
DuPont de Nemours, Inc. | | | 1,924 | | | | 147,513 | |
LyondellBasell Industries N.V. — Class A | | | 1,145 | | | | 117,111 | |
Steel Dynamics, Inc. | | | 681 | | | | 100,945 | |
International Flavors & Fragrances, Inc. | | | 1,142 | | | | 98,201 | |
Celanese Corp. — Class A | | | 448 | | | | 76,993 | |
CF Industries Holdings, Inc. | | | 855 | | | | 71,145 | |
Albemarle Corp. | | | 525 | | | | 69,163 | |
International Paper Co. | | | 1,547 | | | | 60,364 | |
Eastman Chemical Co. | | | 524 | | | | 52,515 | |
Mosaic Co. | | | 1,462 | | | | 47,457 | |
FMC Corp. | | | 557 | | | | 35,481 | |
Total Basic Materials | | | | | | | 3,792,955 | |
| | | | | | | | | |
Total Common Stocks | | | | |
(Cost $127,683,961) | | | | | | | 197,213,296 | |
| | | | | | | | | |
| | | Face
Amount | | | | | |
FEDERAL AGENCY DISCOUNT NOTES†† - 4.6% |
Federal Home Loan Bank |
5.15% due 04/01/241 | | $ | 10,000,000 | | | | 10,000,000 | |
Total Federal Agency Discount Notes | | | | |
(Cost $10,000,000) | | | | | | | 10,000,000 | |
| | | | | | | | | |
U.S. TREASURY BILLS†† - 0.4% |
U.S. Treasury Bills |
5.29% due 04/23/241 | | | 700,000 | | | | 697,745 | |
5.25% due 04/23/241,2 | | | 300,000 | | | | 299,034 | |
Total U.S. Treasury Bills | | | | |
(Cost $996,776) | | | | | | | 996,779 | |
| | | | | | | | | |
SEE NOTES TO FINANCIAL STATEMENTS. | THE RYDEX FUNDS ANNUAL REPORT | 33 |
SCHEDULE OF INVESTMENTS (continued) | March 31, 2024 |
S&P 500® FUND | |
| | Shares | | | Value | |
REPURCHASE AGREEMENTS††,3 - 2.8% |
J.P. Morgan Securities LLC
issued 03/28/24 at 5.31%
due 04/01/242 | | | 3,465,037 | | | $ | 3,465,037 | |
BofA Securities, Inc.
issued 03/28/24 at 5.31%
due 04/01/242 | | | 1,332,706 | | | | 1,332,706 | |
Barclays Capital, Inc.
issued 03/28/24 at 5.30%
due 04/01/242 | | | 1,207,983 | | | | 1,207,983 | |
Total Repurchase Agreements | | | | |
(Cost $6,005,726) | | | | | | | 6,005,726 | |
| | | | | | | | | |
Total Investments - 98.7% | | | | |
(Cost $144,686,463) | | $ | 214,215,801 | |
Other Assets & Liabilities, net - 1.3% | | | 2,722,300 | |
Total Net Assets - 100.0% | | $ | 216,938,101 | |
Futures Contracts |
Description | | Number of
Contracts | | | Expiration
Date | | | Notional
Amount | | | Value and
Unrealized
Appreciation** | |
Equity Futures Contracts Purchased† |
S&P 500 Index Mini Futures Contracts | | | 28 | | | | Jun 2024 | | | $ | 7,427,700 | | | $ | 34,026 | |
Total Return Swap Agreements |
Counterparty | Index | Type | | Financing
Rate | | Payment
Frequency | | | Maturity
Date | | | Units | | | Notional
Amount | | | Value and
Unrealized
Appreciation | |
OTC Equity Index Swap Agreements†† |
Barclays Bank plc | S&P 500 Index | Pay | | 5.93% (SOFR +
0.60%) | | | At Maturity | | | | 06/25/24 | | | | 1,133 | | | $ | 5,953,928 | | | $ | 32,603 | |
Goldman Sachs International | S&P 500 Index | Pay | | 5.83% (Federal
Funds Rate +
0.50%) | | | At Maturity | | | | 06/26/24 | | | | 1,155 | | | | 6,071,295 | | | | 18,865 | |
BNP Paribas | S&P 500 Index | Pay | | 5.93% (Federal
Funds Rate +
0.60%) | | | At Maturity | | | | 06/26/24 | | | | 126 | | | | 663,351 | | | | 3,750 | |
| | | | | | | | | | | | | | | | | | | $ | 12,688,574 | | | $ | 55,218 | |
* | Non-income producing security. |
** | Includes cumulative appreciation (depreciation). Variation margin is reported within the Statement of Assets and Liabilities. |
† | Value determined based on Level 1 inputs — See Note 4. |
†† | Value determined based on Level 2 inputs — See Note 4. |
1 | Rate indicated is the effective yield at the time of purchase. |
2 | All or a portion of this security is pledged as equity index swap collateral at March 31, 2024. |
3 | Repurchase Agreements — See Note 6. |
| | plc — Public Limited Company |
| | REIT — Real Estate Investment Trust |
| | SOFR — Secured Overnight Financing Rate |
| | |
| | See Sector Classification in Other Information section. |
34 | THE RYDEX FUNDS ANNUAL REPORT | SEE NOTES TO FINANCIAL STATEMENTS. |
SCHEDULE OF INVESTMENTS (concluded) | March 31, 2024 |
S&P 500® FUND | |
The following table summarizes the inputs used to value the Fund’s investments at March 31, 2024 (See Note 4 in the Notes to Financial Statements):
Investments in Securities (Assets) | | Level 1
Quoted
Prices | | | Level 2
Significant
Observable
Inputs | | | Level 3
Significant
Unobservable
Inputs | | | Total | |
Common Stocks | | $ | 197,213,296 | | | $ | — | | | $ | — | | | $ | 197,213,296 | |
Federal Agency Discount Notes | | | — | | | | 10,000,000 | | | | — | | | | 10,000,000 | |
U.S. Treasury Bills | | | — | | | | 996,779 | | | | — | | | | 996,779 | |
Repurchase Agreements | | | — | | | | 6,005,726 | | | | — | | | | 6,005,726 | |
Equity Futures Contracts** | | | 34,026 | | | | — | | | | — | | | | 34,026 | |
Equity Index Swap Agreements** | | | — | | | | 55,218 | | | | — | | | | 55,218 | |
Total Assets | | $ | 197,247,322 | | | $ | 17,057,723 | | | $ | — | | | $ | 214,305,045 | |
** | This derivative is reported as unrealized appreciation/depreciation at period end. |
SEE NOTES TO FINANCIAL STATEMENTS. | THE RYDEX FUNDS ANNUAL REPORT | 35 |
STATEMENT OF ASSETS AND LIABILITIES |
March 31, 2024 |
Assets: |
Investments, at value (cost $138,680,737) | | $ | 208,210,075 | |
Repurchase agreements, at value (cost $6,005,726) | | | 6,005,726 | |
Cash | | | 51,612 | |
Segregated cash with broker | | | 271,400 | |
Unrealized appreciation on OTC swap agreements | | | 55,218 | |
Receivables: |
Fund shares sold | | | 3,048,457 | |
Dividends | | | 122,887 | |
Interest | | | 3,542 | |
Securities lending income | | | 661 | |
Total assets | | | 217,769,578 | |
| | | | | |
Liabilities: |
Payable for: |
Fund shares redeemed | | | 347,016 | |
Management fees | | | 131,770 | |
Transfer agent fees | | | 82,316 | |
Distribution and service fees | | | 48,493 | |
Swap settlement | | | 32,611 | |
Portfolio accounting and administration fees | | | 27,232 | |
Securities purchased | | | 8,976 | |
Variation margin on futures contracts | | | 3,531 | |
Trustees’ fees* | | | 1,776 | |
Miscellaneous | | | 147,756 | |
Total liabilities | | | 831,477 | |
Net assets | | $ | 216,938,101 | |
| | | | | |
Net assets consist of: |
Paid in capital | | $ | 174,307,050 | |
Total distributable earnings (loss) | | | 42,631,051 | |
Net assets | | $ | 216,938,101 | |
Class A: |
Net assets | | $ | 16,777,048 | |
Capital shares outstanding | | | 208,042 | |
Net asset value per share | | $ | 80.64 | |
Maximum offering price per share (Net asset value divided by 95.25%) | | $ | 84.66 | |
Class C: |
Net assets | | $ | 7,281,704 | |
Capital shares outstanding | | | 107,381 | |
Net asset value per share | | $ | 67.81 | |
Class H: |
Net assets | | $ | 192,879,349 | |
Capital shares outstanding | | | 2,391,604 | |
Net asset value per share | | $ | 80.65 | |
STATEMENT OF OPERATIONS |
Year Ended March 31, 2024 |
Investment Income: |
Dividends (net of foreign withholding tax of $636) | | $ | 2,392,677 | |
Interest | | | 635,724 | |
Income from securities lending, net | | | 1,842 | |
Total investment income | | | 3,030,243 | |
| | | | | |
Expenses: |
Management fees | | | 1,244,428 | |
Distribution and service fees: |
Class A | | | 40,638 | |
Class C | | | 79,598 | |
Class H | | | 354,236 | |
Transfer agent fees | | | 374,339 | |
Portfolio accounting and administration fees | | | 340,083 | |
Professional fees | | | 86,009 | |
Trustees’ fees* | | | 24,747 | |
Custodian fees | | | 22,742 | |
Interest expense | | | 11,147 | |
Miscellaneous | | | 226,191 | |
Total expenses | | | 2,804,158 | |
Less: |
Expenses reimbursed by Adviser | | | (58,319 | ) |
Net expenses | | | 2,745,839 | |
Net investment income | | | 284,404 | |
| | | | | |
Net Realized and Unrealized Gain (Loss): |
Net realized gain (loss) on: |
Investments | | | (2,296,677 | ) |
Swap agreements | | | 1,971,729 | |
Futures contracts | | | 380,459 | |
Net realized gain | | | 55,511 | |
Net change in unrealized appreciation (depreciation) on: |
Investments | | | 40,603,889 | |
Swap agreements | | | (219,027 | ) |
Futures contracts | | | (194,629 | ) |
Net change in unrealized appreciation (depreciation) | | | 40,190,233 | |
Net realized and unrealized gain | | | 40,245,744 | |
Net increase in net assets resulting from operations | | $ | 40,530,148 | |
* | Relates to Trustees not deemed “interested persons” within the meaning of Section 2(a)(19) of the 1940 Act. |
36 | THE RYDEX FUNDS ANNUAL REPORT | SEE NOTES TO FINANCIAL STATEMENTS. |
STATEMENTS OF CHANGES IN NET ASSETS |
| | Year Ended
March 31,
2024 | | | Year Ended
March 31,
2023 | |
Increase (Decrease) in Net Assets from Operations: | | | | | | | | |
Net investment income | | $ | 284,404 | | | $ | 212,016 | |
Net realized gain on investments | | | 55,511 | | | | 12,006,189 | |
Net change in unrealized appreciation (depreciation) on investments | | | 40,190,233 | | | | (24,977,298 | ) |
Net increase (decrease) in net assets resulting from operations | | | 40,530,148 | | | | (12,759,093 | ) |
| | | | | | | | | |
Distributions to shareholders: | | | | | | | | |
Class A | | | (117,707 | ) | | | (166,524 | ) |
Class C | | | (83,641 | ) | | | (95,260 | ) |
Class H | | | (818,361 | ) | | | (1,119,511 | ) |
Total distributions to shareholders | | | (1,019,709 | ) | | | (1,381,295 | ) |
| | | | | | | | | |
Capital share transactions: | | | | | | | | |
Proceeds from sale of shares | | | | | | | | |
Class A | | | 22,882,679 | | | | 163,996,670 | |
Class C | | | 7,164,456 | | | | 8,401,805 | |
Class H | | | 890,992,827 | | | | 1,165,341,867 | |
Distributions reinvested | | | | | | | | |
Class A | | | 114,592 | | | | 156,579 | |
Class C | | | 78,106 | | | | 86,278 | |
Class H | | | 812,458 | | | | 1,113,139 | |
Cost of shares redeemed | | | | | | | | |
Class A | | | (26,229,266 | ) | | | (166,137,432 | ) |
Class C | | | (9,448,939 | ) | | | (10,253,653 | ) |
Class H | | | (809,555,290 | ) | | | (1,207,132,991 | ) |
Net increase (decrease) from capital share transactions | | | 76,811,623 | | | | (44,427,738 | ) |
Net increase (decrease) in net assets | | | 116,322,062 | | | | (58,568,126 | ) |
| | | | | | | | | |
Net assets: | | | | | | | | |
Beginning of year | | | 100,616,039 | | | | 159,184,165 | |
End of year | | $ | 216,938,101 | | | $ | 100,616,039 | |
| | | | | | | | | |
Capital share activity: | | | | | | | | |
Shares sold | | | | | | | | |
Class A | | | 347,472 | | | | 2,698,775 | |
Class C | | | 125,678 | | | | 161,320 | |
Class H | | | 12,992,625 | | | | 18,869,344 | |
Shares issued from reinvestment of distributions | | | | | | | | |
Class A | | | 1,607 | | | | 2,650 | |
Class C | | | 1,299 | | | | 1,718 | |
Class H | | | 11,390 | | | | 18,841 | |
Shares redeemed | | | | | | | | |
Class A | | | (388,197 | ) | | | (2,720,235 | ) |
Class C | | | (158,653 | ) | | | (193,195 | ) |
Class H | | | (11,830,812 | ) | | | (19,504,067 | ) |
Net increase (decrease) in shares | | | 1,102,409 | | | | (664,849 | ) |
SEE NOTES TO FINANCIAL STATEMENTS. | THE RYDEX FUNDS ANNUAL REPORT | 37 |
This table is presented to show selected data for a share outstanding throughout each period and to assist shareholders in evaluating a Fund’s performance for the periods presented.
Class A | | Year Ended
March 31,
2024 | | | Year Ended
March 31,
2023 | | | Year Ended
March 31,
2022 | | | Year Ended
March 31,
2021 | | | Year Ended
March 31,
2020 | |
Per Share Data |
Net asset value, beginning of period | | $ | 63.54 | | | $ | 70.89 | | | $ | 63.06 | | | $ | 46.64 | | | $ | 51.55 | |
Income (loss) from investment operations: |
Net investment income (loss)a | | | .15 | | | | .18 | | | | (.18 | ) | | | (.08 | ) | | | .17 | |
Net gain (loss) on investments (realized and unrealized) | | | 17.39 | | | | (6.83 | ) | | | 8.94 | | | | 24.50 | | | | (4.54 | ) |
Total from investment operations | | | 17.54 | | | | (6.65 | ) | | | 8.76 | | | | 24.42 | | | | (4.37 | ) |
Less distributions from: |
Net investment income | | | (.09 | ) | | | — | | | | — | | | | (.02 | ) | | | (.12 | ) |
Net realized gains | | | (.35 | ) | | | (.70 | ) | | | (.93 | ) | | | (7.98 | ) | | | (.42 | ) |
Total distributions | | | (.44 | ) | | | (.70 | ) | | | (.93 | ) | | | (8.00 | ) | | | (.54 | ) |
Net asset value, end of period | | $ | 80.64 | | | $ | 63.54 | | | $ | 70.89 | | | $ | 63.06 | | | $ | 46.64 | |
|
Total Returnb | | | 27.72 | % | | | (9.32 | %) | | | 13.82 | % | | | 53.64 | % | | | (8.67 | %) |
Ratios/Supplemental Data |
Net assets, end of period (in thousands) | | $ | 16,777 | | | $ | 15,703 | | | $ | 18,856 | | | $ | 18,653 | | | $ | 12,798 | |
Ratios to average net assets: |
Net investment income (loss) | | | 0.21 | % | | | 0.30 | % | | | (0.25 | %) | | | (0.13 | %) | | | 0.31 | % |
Total expenses | | | 1.66 | % | | | 1.60 | % | | | 1.56 | % | | | 1.65 | % | | | 1.68 | % |
Net expensesc | | | 1.62 | % | | | 1.60 | % | | | 1.56 | % | | | 1.65 | % | | | 1.68 | % |
Portfolio turnover rate | | | 243 | % | | | 701 | % | | | 268 | % | | | 284 | % | | | 227 | % |
Class C | | Year Ended
March 31,
2024 | | | Year Ended
March 31,
2023 | | | Year Ended
March 31,
2022 | | | Year Ended
March 31,
2021 | | | Year Ended
March 31,
2020 | |
Per Share Data |
Net asset value, beginning of period | | $ | 53.89 | | | $ | 60.71 | | | $ | 54.52 | | | $ | 41.37 | | | $ | 46.12 | |
Income (loss) from investment operations: |
Net investment income (loss)a | | | (.31 | ) | | | (.30 | ) | | | (.60 | ) | | | (.46 | ) | | | (.24 | ) |
Net gain (loss) on investments (realized and unrealized) | | | 14.67 | | | | (5.82 | ) | | | 7.72 | | | | 21.61 | | | | (3.97 | ) |
Total from investment operations | | | 14.36 | | | | (6.12 | ) | | | 7.12 | | | | 21.15 | | | | (4.21 | ) |
Less distributions from: |
Net investment income | | | (.09 | ) | | | — | | | | — | | | | (.02 | ) | | | (.12 | ) |
Net realized gains | | | (.35 | ) | | | (.70 | ) | | | (.93 | ) | | | (7.98 | ) | | | (.42 | ) |
Total distributions | | | (.44 | ) | | | (.70 | ) | | | (.93 | ) | | | (8.00 | ) | | | (.54 | ) |
Net asset value, end of period | | $ | 67.81 | | | $ | 53.89 | | | $ | 60.71 | | | $ | 54.52 | | | $ | 41.37 | |
|
Total Returnb | | | 26.78 | % | | | (10.02 | %) | | | 12.99 | % | | | 52.49 | % | | | (9.35 | %) |
Ratios/Supplemental Data |
Net assets, end of period (in thousands) | | $ | 7,282 | | | $ | 7,494 | | | $ | 10,273 | | | $ | 12,040 | | | $ | 8,981 | |
Ratios to average net assets: |
Net investment income (loss) | | | (0.53 | %) | | | (0.57 | %) | | | (1.00 | %) | | | (0.88 | %) | | | (0.50 | %) |
Total expenses | | | 2.41 | % | | | 2.36 | % | | | 2.31 | % | | | 2.39 | % | | | 2.43 | % |
Net expensesc | | | 2.38 | % | | | 2.36 | % | | | 2.31 | % | | | 2.39 | % | | | 2.43 | % |
Portfolio turnover rate | | | 243 | % | | | 701 | % | | | 268 | % | | | 284 | % | | | 227 | % |
38 | THE RYDEX FUNDS ANNUAL REPORT | SEE NOTES TO FINANCIAL STATEMENTS. |
FINANCIAL HIGHLIGHTS (concluded) |
This table is presented to show selected data for a share outstanding throughout each period and to assist shareholders in evaluating a Fund’s performance for the periods presented.
Class H | | Year Ended
March 31,
2024 | | | Year Ended
March 31,
2023 | | | Year Ended
March 31,
2022 | | | Year Ended
March 31,
2021 | | | Year Ended
March 31,
2020 | |
Per Share Data |
Net asset value, beginning of period | | $ | 63.54 | | | $ | 70.90 | | | $ | 63.07 | | | $ | 46.64 | | | $ | 51.54 | |
Income (loss) from investment operations: |
Net investment income (loss)a | | | .14 | | | | .15 | | | | (.18 | ) | | | (.08 | ) | | | .15 | |
Net gain (loss) on investments (realized and unrealized) | | | 17.41 | | | | (6.81 | ) | | | 8.94 | | | | 24.51 | | | | (4.51 | ) |
Total from investment operations | | | 17.55 | | | | (6.66 | ) | | | 8.76 | | | | 24.43 | | | | (4.36 | ) |
Less distributions from: |
Net investment income | | | (.09 | ) | | | — | | | | — | | | | (.02 | ) | | | (.12 | ) |
Net realized gains | | | (.35 | ) | | | (.70 | ) | | | (.93 | ) | | | (7.98 | ) | | | (.42 | ) |
Total distributions | | | (.44 | ) | | | (.70 | ) | | | (.93 | ) | | | (8.00 | ) | | | (.54 | ) |
Net asset value, end of period | | $ | 80.65 | | | $ | 63.54 | | | $ | 70.90 | | | $ | 63.07 | | | $ | 46.64 | |
|
Total Return | | | 27.71 | % | | | (9.32 | %) | | | 13.84 | % | | | 53.64 | % | | | (8.65 | %) |
Ratios/Supplemental Data |
Net assets, end of period (in thousands) | | $ | 192,879 | | | $ | 77,419 | | | $ | 130,055 | | | $ | 123,613 | | | $ | 112,799 | |
Ratios to average net assets: |
Net investment income (loss) | | | 0.21 | % | | | 0.23 | % | | | (0.25 | %) | | | (0.13 | %) | | | 0.28 | % |
Total expenses | | | 1.65 | % | | | 1.61 | % | | | 1.56 | % | | | 1.65 | % | | | 1.68 | % |
Net expensesc | | | 1.62 | % | | | 1.61 | % | | | 1.56 | % | | | 1.65 | % | | | 1.68 | % |
Portfolio turnover rate | | | 243 | % | | | 701 | % | | | 268 | % | | | 284 | % | | | 227 | % |
a | Net investment income (loss) per share was computed using average shares outstanding throughout the period. |
b | Total return does not reflect the impact of any applicable sales charges. |
c | Net expense information reflects the expense ratios after expense waivers and reimbursements, as applicable. |
SEE NOTES TO FINANCIAL STATEMENTS. | THE RYDEX FUNDS ANNUAL REPORT | 39 |
PERFORMANCE REPORT AND FUND PROFILE (Unaudited) | March 31, 2024 |
INVERSE S&P 500® STRATEGY FUND
OBJECTIVE: Seeks to provide investment results that match, before fees and expenses, the performance of a specific benchmark on a daily basis. The Fund’s current benchmark is the inverse (opposite) of the performance of the S&P 500® Index (the “underlying index”). The Fund does not seek to achieve its investment objective over a period of time greater than one day.
For the Reporting Period, the Inverse S&P 500® Strategy Fund maintained a daily correlation of over 99% to its benchmark of -100% of the daily price movement of the S&P 500 Index. The Fund Investor Class returned -16.19%, while the S&P 500 Index returned 29.88% over the same time period.
The sectors that contributed the most to the return of the underlying index were Information Technology, Financials, and Communication Services. The only sector that detracted was Utilities.
The holdings that contributed the most to the return of the underlying index were NVIDIA Corp., Microsoft Corp., and Amazon.com, Inc. Those that detracted the most were Pfizer, Inc., Tesla, Inc., and Bristol-Myers Squibb Co.
Derivatives in the Fund were used to help provide exposure to the composition of the benchmark in the highest efficient manner and to provide leverage and not for hedging purposes. Derivatives performed as expected.
Due to the compounding of daily returns, the Fund’s returns over periods other than one day will likely differ in amount and possibly direction from the benchmark return for the same period. Investors should monitor their Fund holdings to ensure that they are consistent with their strategies, as frequently as daily.
The effects of compounding may cause the longer-term correlation of the Fund to its benchmark to diminish. A significant contributor to the discrepancy between the leveraged and unleveraged indices is the effect of compounding on the leveraged index, which is discussed under “A Brief Note on the Compounding of Returns” on page 6.
The Fund may invest in certain of the underlying series of Guggenheim Funds Trust and Guggenheim Strategy Funds Trust, including Guggenheim Ultra Short Duration, Guggenheim Strategy Fund II, and Guggenheim Strategy Fund III (collectively, the “Short Term Investment Vehicles”), each of which are open-end management investment companies managed by Guggenheim Investments. The Short Term Investment Vehicles, which launched on March 11, 2014, are offered as short term investment options only to mutual funds, trusts, and other accounts managed by Guggenheim Investments and/or its affiliates, and are not available to the public, with the exception of Guggenheim Ultra Short Duration Fund, which is available to the public. Guggenheim Strategy Fund II and Guggenheim Strategy Fund III do not charge an investment management fee. Guggenheim Ultra Short Duration Fund charges an investment management fee, but the Fund’s adviser has agreed to waive fees to the extent necessary to offset the proportionate share of any management fee paid by the Fund with respect to its investment in such affiliated fund. For the Reporting Period, investment in the Short Term Investment Vehicles contributed to Fund performance.
Performance displayed represents past performance, which is no guarantee of future results.
Holdings Diversification (Market Exposure as % of Net Assets)
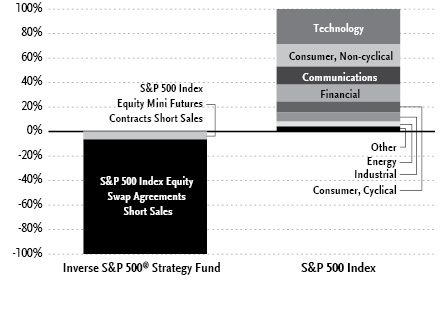
“Holdings Diversification (Market Exposure as % of Net Assets)” excludes any temporary cash investments, investments in Guggenheim Strategy Funds Trust mutual funds, or investments in Guggenheim Ultra Short Duration Fund. Investments in those Funds do not provide “market exposure” to meet the Fund’s investment objective, but will significantly increase the portfolio’s exposure to certain other asset categories (and their associated risks), which may cause the Fund to deviate from its principal investment strategy, including: (i) high yield, high risk debt securities rated below the top four long-term rating categories by a nationally recognized statistical rating organization (also known as “junk bonds”); (ii) securities issued by the U.S. government or its agencies and instrumentalities; (iii) CLOs and similar investments; and (iv) other short-term fixed income securities.
40 | THE RYDEX FUNDS ANNUAL REPORT | |
PERFORMANCE REPORT AND FUND PROFILE (Unaudited)(concluded) | March 31, 2024 |
Inception Dates: |
Investor Class | January 7, 1994 |
Class A | March 31, 2004 |
Class C | March 15, 2001 |
Class H | September 18, 2014 |
Cumulative Fund Performance*
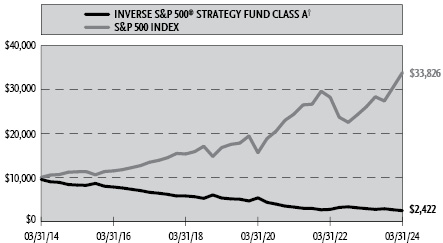
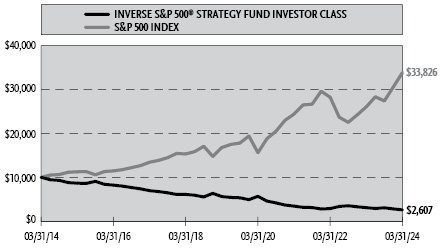
The Fund invests principally in derivative investments such as swap agreements and futures contracts.
Largest Holdings | % of Total Net Assets |
Guggenheim Strategy Fund II | 16.7% |
Guggenheim Ultra Short Duration Fund — Institutional Class | 11.0% |
Total | 27.7% |
| | |
“Largest Holdings” excludes any temporary cash or derivative investments. |
Average Annual Returns*
Periods Ended March 31, 2024
| 1 Year | 5 Year | 10 Year |
Investor Class Shares | (16.19%) | (14.25%) | (12.58%) |
Class A Shares | (16.38%) | (14.47%) | (12.80%) |
Class A Shares with sales charge† | (20.35%) | (15.30%) | (13.22%) |
Class C Shares | (16.99%) | (15.11%) | (13.45%) |
Class C Shares with CDSC‡ | (17.79%) | (15.11%) | (13.45%) |
S&P 500 Index | 29.88% | 15.05% | 12.96% |
| 1 Year | 5 Year | Since
Inception
(09/18/14) |
Class H Shares | (16.36%) | (14.45%) | (12.55%) |
S&P 500 Index | 29.88% | 15.05% | 12.67% |
* | The performance data above represents past performance that is not predictive of future results. The investment return and principal value of an investment in the Fund will fluctuate so that an investor’s shares, when redeemed, may be worth more or less than their original cost. Returns are historical and include changes in principal and reinvested dividends and capital gains and do not reflect the effect of taxes. The S&P 500 Index is an unmanaged index and, unlike the Fund, has no management fees or operating expenses to reduce its reported return. The graphs are based on Investor Class shares and Class A shares only; performance for Class C shares and Class H shares will vary due to differences in fee structures. |
† | Fund returns are calculated using the maximum sales charge of 4.75%. |
‡ | Fund returns include a CDSC of 1% if redeemed within 12 months of purchase. |
| | THE RYDEX FUNDS ANNUAL REPORT | 41 |
SCHEDULE OF INVESTMENTS | March 31, 2024 |
INVERSE S&P 500® STRATEGY FUND | |
| | Shares | | | Value | |
MUTUAL FUNDS† - 27.7% |
Guggenheim Strategy Fund II1 | | | 262,625 | | | $ | 6,460,578 | |
Guggenheim Ultra Short Duration Fund — Institutional Class1 | | | 426,990 | | | | 4,231,473 | |
Total Mutual Funds | | | | |
(Cost $10,738,043) | | | | | | | 10,692,051 | |
| | | | | | | | | |
| | | Face
Amount | | | | | |
U.S. TREASURY BILLS†† - 27.7% |
U.S. Treasury Bills |
5.28% due 04/18/242 | | $ | 4,300,000 | | | | 4,289,312 | |
5.28% due 04/30/242 | | | 4,200,000 | | | | 4,182,210 | |
5.25% due 04/23/242,3 | | | 1,450,000 | | | | 1,445,330 | |
5.27% due 04/23/242 | | | 350,000 | | | | 348,873 | |
5.17% due 04/16/242,4 | | | 249,000 | | | | 248,453 | |
5.26% due 04/23/242 | | | 100,000 | | | | 99,678 | |
5.29% due 04/23/242 | | | 100,000 | | | | 99,678 | |
Total U.S. Treasury Bills | | | | |
(Cost $10,713,472) | | | | | | | 10,713,534 | |
| | | | | | | | | |
FEDERAL AGENCY NOTES†† - 5.7% |
Federal Home Loan Bank |
5.40% (SOFR + 0.07%, Rate Floor: 0.00%) due 06/17/24◊ | | | 2,200,000 | | | | 2,200,273 | |
Total Federal Agency Notes | | | | |
(Cost $2,200,000) | | | | | | | 2,200,273 | |
| | | | | | | | | |
REPURCHASE AGREEMENTS††,5 - 38.9% |
J.P. Morgan Securities LLC
issued 03/28/24 at 5.31%
due 04/01/243 | | | 8,652,664 | | | | 8,652,664 | |
BofA Securities, Inc.
issued 03/28/24 at 5.31%
due 04/01/243 | | | 3,327,948 | | | | 3,327,948 | |
Barclays Capital, Inc.
issued 03/28/24 at 5.30%
due 04/01/243 | | | 3,016,496 | | | | 3,016,496 | |
Total Repurchase Agreements | | | | |
(Cost $14,997,108) | | | | | | | 14,997,108 | |
| | | | | | | | | |
Total Investments - 100.0% | | | | |
(Cost $38,648,623) | | $ | 38,602,966 | |
Other Assets & Liabilities, net - 0.0% | | | (4,066 | ) |
Total Net Assets - 100.0% | | $ | 38,598,900 | |
Futures Contracts |
Description | | Number of
Contracts | | | Expiration
Date | | | Notional
Amount | | | Value and
Unrealized
Depreciation** | |
Equity Futures Contracts Sold Short† |
S&P 500 Index Mini Futures Contracts | | | 9 | | | | Jun 2024 | | | $ | 2,387,475 | | | $ | (53,946 | ) |
Total Return Swap Agreements |
Counterparty | Index | Type | | Financing
Rate | | Payment
Frequency | | | Maturity
Date | | | Units | | | Notional
Amount | | | Value and
Unrealized
Depreciation | |
OTC Equity Index Swap Agreements Sold Short†† |
BNP Paribas | S&P 500 Index | Receive | | 5.53% (Federal
Funds Rate +
0.20%) | | | At Maturity | | | | 06/26/24 | | | | 730 | | | $ | 3,837,015 | | | $ | (21,709 | ) |
Goldman Sachs International | S&P 500 Index | Receive | | 5.63% (Federal
Funds Rate +
0.30%) | | | At Maturity | | | | 06/26/24 | | | | 3,651 | | | | 19,184,708 | | | | (106,949 | ) |
Barclays Bank plc | S&P 500 Index | Receive | | 5.63% (SOFR +
0.30%) | | | At Maturity | | | | 06/25/24 | | | | 2,499 | | | | 13,131,891 | | | | (176,903 | ) |
| | | | | | | | | | | | | | | | | | | $ | 36,153,614 | | | $ | (305,561 | ) |
42 | THE RYDEX FUNDS ANNUAL REPORT | SEE NOTES TO FINANCIAL STATEMENTS. |
SCHEDULE OF INVESTMENTS (continued) | March 31, 2024 |
INVERSE S&P 500® STRATEGY FUND | |
** | Includes cumulative appreciation (depreciation). Variation margin is reported within the Statement of Assets and Liabilities. |
† | Value determined based on Level 1 inputs — See Note 4. |
†† | Value determined based on Level 2 inputs — See Note 4. |
◊ | Variable rate security. Rate indicated is the rate effective at March 31, 2024. In some instances, the effective rate is limited by a minimum rate floor or a maximum rate cap established by the issuer. The settlement status of a position may also impact the effective rate indicated. In some cases, a position may be unsettled at period end and may not have a stated effective rate. In instances where multiple underlying reference rates and spread amounts are shown, the effective rate is based on a weighted average. |
1 | Affiliated issuer. |
2 | Rate indicated is the effective yield at the time of purchase. |
3 | All or a portion of this security is pledged as equity index swap collateral at March 31, 2024. |
4 | All or a portion of this security is pledged as futures collateral at March 31, 2024. |
5 | Repurchase Agreements — See Note 6. |
| | plc — Public Limited Company |
| | SOFR — Secured Overnight Financing Rate |
| | |
| | See Sector Classification in Other Information section. |
The following table summarizes the inputs used to value the Fund’s investments at March 31, 2024 (See Note 4 in the Notes to Financial Statements):
Investments in Securities (Assets) | | Level 1
Quoted
Prices | | | Level 2
Significant
Observable
Inputs | | | Level 3
Significant
Unobservable
Inputs | | | Total | |
Mutual Funds | | $ | 10,692,051 | | | $ | — | | | $ | — | | | $ | 10,692,051 | |
U.S. Treasury Bills | | | — | | | | 10,713,534 | | | | — | | | | 10,713,534 | |
Federal Agency Notes | | | — | | | | 2,200,273 | | | | — | | | | 2,200,273 | |
Repurchase Agreements | | | — | | | | 14,997,108 | | | | — | | | | 14,997,108 | |
Total Assets | | $ | 10,692,051 | | | $ | 27,910,915 | | | $ | — | | | $ | 38,602,966 | |
Investments in Securities (Liabilities) | | Level 1
Quoted
Prices | | | Level 2
Significant
Observable
Inputs | | | Level 3
Significant
Unobservable
Inputs | | | Total | |
Equity Futures Contracts** | | $ | 53,946 | | | $ | — | | | $ | — | | | $ | 53,946 | |
Equity Index Swap Agreements** | | | — | | | | 305,561 | | | | — | | | | 305,561 | |
Total Liabilities | | $ | 53,946 | | | $ | 305,561 | | | $ | — | | | $ | 359,507 | |
** | This derivative is reported as unrealized appreciation/depreciation at period end. |
SEE NOTES TO FINANCIAL STATEMENTS. | THE RYDEX FUNDS ANNUAL REPORT | 43 |
SCHEDULE OF INVESTMENTS (concluded) | March 31, 2024 |
INVERSE S&P 500® STRATEGY FUND | |
Affiliated Transactions
Investments representing 5% or more of the outstanding voting shares of a company, or control of or by, or common control under Guggenheim Investments (“GI”), result in that company being considered an affiliated issuer, as defined in the 1940 Act.
The Fund may invest in certain of the underlying series of Guggenheim Strategy Funds Trust, including Guggenheim Strategy Fund II and Guggenheim Strategy Fund III (collectively, the “Guggenheim Strategy Funds”), each of which are open-end management investment companies managed by GI. The Guggenheim Strategy Funds, which launched on March 11, 2014, are offered as short term investment options only to mutual funds, trusts, and other accounts managed by GI and/or its affiliates, and are not available to the public. The Guggenheim Strategy Funds pay no investment management fees. The Guggenheim Strategy Funds’ annual report on Form N-CSR dated September 30, 2023 is available publicly or upon request. This information is available from the EDGAR database on the SEC’s website at https://www.sec.gov/Archives/edgar/data/1601445/000182126823000217/gug86449-ncsr.htm. The Fund may invest in certain of the underlying series of Guggenheim Funds Trust, which are open-end management investment companies managed by GI, are available to the public and whose most recent annual report on Form N-CSR is available publicly or upon request.
Transactions during the year ended March 31, 2024, in which the company is an affiliated issuer, were as follows:
Security Name | | Value
03/31/23 | | | Additions | | | Reductions | | | Realized
Gain (Loss) | | | Change in
Unrealized
Appreciation
(Depreciation) | | | Value
03/31/24 | | | Shares
03/31/24 | | | Investment
Income | |
Mutual Funds | | | | | | | | | | | | | | | | | | | | | | | | | | | | | | | | |
Guggenheim Strategy Fund II | | $ | 6,358,154 | | | $ | — | | | $ | — | | | $ | — | | | $ | 102,424 | | | $ | 6,460,578 | | | | 262,625 | | | $ | 356,301 | |
Guggenheim Ultra Short Duration Fund — Institutional Class | | | 4,146,075 | | | | — | | | | — | | | | — | | | | 85,398 | | | | 4,231,473 | | | | 426,990 | | | | 227,385 | |
| | | $ | 10,504,229 | | | $ | — | | | $ | — | | | $ | — | | | $ | 187,822 | | | $ | 10,692,051 | | | | | | | $ | 583,686 | |
44 | THE RYDEX FUNDS ANNUAL REPORT | SEE NOTES TO FINANCIAL STATEMENTS. |
INVERSE S&P 500® STRATEGY FUND | |
STATEMENT OF ASSETS AND LIABILITIES |
March 31, 2024 |
Assets: |
Investments in unaffiliated issuers, at value (cost $12,913,472) | | $ | 12,913,807 | |
Investments in affiliated issuers, at value (cost $10,738,043) | | | 10,692,051 | |
Repurchase agreements, at value (cost $14,997,108) | | | 14,997,108 | |
Receivables: |
Fund shares sold | | | 334,407 | |
Dividends | | | 49,023 | |
Swap settlement | | | 17,848 | |
Interest | | | 13,782 | |
Variation margin on futures contracts | | | 1,238 | |
Total assets | | | 39,019,264 | |
| | | | | |
Liabilities: |
Unrealized depreciation on OTC swap agreements | | | 305,561 | |
Payable for: |
Fund shares redeemed | | | 30,160 | |
Management fees | | | 29,776 | |
Transfer agent fees | | | 16,938 | |
Portfolio accounting and administration fees | | | 1,789 | |
Distribution and service fees | | | 917 | |
Trustees’ fees* | | | 414 | |
Miscellaneous | | | 34,809 | |
Total liabilities | | | 420,364 | |
Net assets | | $ | 38,598,900 | |
| | | | | |
Net assets consist of: |
Paid in capital | | $ | 315,348,400 | |
Total distributable earnings (loss) | | | (276,749,500 | ) |
Net assets | | $ | 38,598,900 | |
| | | | | |
Investor Class : |
Net assets | | $ | 35,724,544 | |
Capital shares outstanding | | | 1,411,968 | |
Net asset value per share | | $ | 25.30 | |
Class A: |
Net assets | | $ | 1,211,462 | |
Capital shares outstanding | | | 52,783 | |
Net asset value per share | | $ | 22.95 | |
Maximum offering price per share (Net asset value divided by 95.25%) | | $ | 24.09 | |
Class C: |
Net assets | | $ | 417,305 | |
Capital shares outstanding | | | 21,192 | |
Net asset value per share | | $ | 19.69 | |
Class H: |
Net assets | | $ | 1,245,589 | |
Capital shares outstanding | | | 54,211 | |
Net asset value per share | | $ | 22.98 | |
STATEMENT OF OPERATIONS |
Year Ended March 31, 2024 |
Investment Income: |
Dividends from securities of affiliated issuers | | $ | 583,686 | |
Interest | | | 2,098,062 | |
Total investment income | | | 2,681,748 | |
| | | | | |
Expenses: |
Management fees | | | 443,690 | |
Distribution and service fees: |
Class A | | | 7,853 | |
Class C | | | 6,014 | |
Class H | | | 3,158 | |
Transfer agent fees | | | 107,838 | |
Portfolio accounting and administration fees | | | 75,151 | |
Registration fees | | | 55,282 | |
Professional fees | | | 20,428 | |
Trustees’ fees* | | | 10,043 | |
Custodian fees | | | 6,822 | |
Interest expense | | | 6,295 | |
Miscellaneous | | | 12,628 | |
Total expenses | | | 755,202 | |
Less: |
Expenses reimbursed by Adviser | | | (39,481 | ) |
Expenses waived by Adviser | | | (10,457 | ) |
Total waived/reimbursed expenses | | | (49,938 | ) |
Net expenses | | | 705,264 | |
Net investment income | | | 1,976,484 | |
| | | | | |
Net Realized and Unrealized Gain (Loss): |
Net realized gain (loss) on: |
Investments in unaffiliated issuers | | | (328 | ) |
Swap agreements | | | (10,617,835 | ) |
Futures contracts | | | (1,952,244 | ) |
Net realized loss | | | (12,570,407 | ) |
Net change in unrealized appreciation (depreciation) on: |
Investments in unaffiliated issuers | | | (7,800 | ) |
Investments in affiliated issuers | | | 187,822 | |
Swap agreements | | | 1,426,258 | |
Futures contracts | | | 508,966 | |
Net change in unrealized appreciation (depreciation) | | | 2,115,246 | |
Net realized and unrealized loss | | | (10,455,161 | ) |
Net decrease in net assets resulting from operations | | $ | (8,478,677 | ) |
* | Relates to Trustees not deemed “interested persons” within the meaning of Section 2(a)(19) of the 1940 Act. |
SEE NOTES TO FINANCIAL STATEMENTS. | THE RYDEX FUNDS ANNUAL REPORT | 45 |
INVERSE S&P 500® STRATEGY FUND | |
STATEMENTS OF CHANGES IN NET ASSETS |
| | Year Ended
March 31,
2024 | | | Year Ended
March 31,
2023 | |
Increase (Decrease) in Net Assets from Operations: | | | | | | | | |
Net investment income | | $ | 1,976,484 | | | $ | 1,093,992 | |
Net realized loss on investments | | | (12,570,407 | ) | | | (272,408 | ) |
Net change in unrealized appreciation (depreciation) on investments | | | 2,115,246 | | | | (858,214 | ) |
Net decrease in net assets resulting from operations | | | (8,478,677 | ) | | | (36,630 | ) |
| | | | | | | | | |
Distributions to shareholders: | | | | | | | | |
Investor Class | | | (946,025 | ) | | | — | |
Class A | | | (110,261 | ) | | | — | |
Class C | | | (16,224 | ) | | | — | |
Class H | | | (21,482 | ) | | | — | |
Total distributions to shareholders | | | (1,093,992 | ) | | | — | |
| | | | | | | | | |
Capital share transactions: | | | | | | | | |
Proceeds from sale of shares | | | | | | | | |
Investor Class | | | 110,588,564 | | | | 275,554,341 | |
Class A | | | 5,459,230 | | | | 10,216,741 | |
Class C | | | 147,798 | | | | 973,671 | |
Class H | | | 15,057,008 | | | | 47,033,095 | |
Distributions reinvested | | | | | | | | |
Investor Class | | | 931,300 | | | | — | |
Class A | | | 109,255 | | | | — | |
Class C | | | 16,224 | | | | — | |
Class H | | | 21,466 | | | | — | |
Cost of shares redeemed | | | | | | | | |
Investor Class | | | (123,376,671 | ) | | | (266,747,915 | ) |
Class A | | | (7,927,015 | ) | | | (7,975,728 | ) |
Class C | | | (423,222 | ) | | | (946,029 | ) |
Class H | | | (15,201,206 | ) | | | (48,066,981 | ) |
Net increase (decrease) from capital share transactions | | | (14,597,269 | ) | | | 10,041,195 | |
Net increase (decrease) in net assets | | | (24,169,938 | ) | | | 10,004,565 | |
| | | | | | | | | |
Net assets: | | | | | | | | |
Beginning of year | | | 62,768,838 | | | | 52,764,273 | |
End of year | | $ | 38,598,900 | | | $ | 62,768,838 | |
| | | | | | | | | |
Capital share activity: | | | | | | | | |
Shares sold | | | | | | | | |
Investor Class | | | 3,824,309 | | | | 8,506,158 | |
Class A | | | 199,424 | | | | 347,893 | |
Class C | | | 6,382 | | | | 36,018 | |
Class H | | | 601,861 | | | | 1,603,396 | |
Shares issued from reinvestment of distributions | | | | | | | | |
Investor Class | | | 33,308 | | | | — | |
Class A | | | 4,305 | | | | — | |
Class C | | | 744 | | | | — | |
Class H | | | 845 | | | | — | |
Shares redeemed | | | | | | | | |
Investor Class | | | (4,258,649 | ) | | | (8,339,953 | ) |
Class A | | | (298,253 | ) | | | (269,870 | ) |
Class C | | | (18,572 | ) | | | (36,364 | ) |
Class H | | | (605,047 | ) | | | (1,645,973 | ) |
Net increase (decrease) in shares | | | (509,343 | ) | | | 201,305 | |
46 | THE RYDEX FUNDS ANNUAL REPORT | SEE NOTES TO FINANCIAL STATEMENTS. |
INVERSE S&P 500® STRATEGY FUND | |
This table is presented to show selected data for a share outstanding throughout each period and to assist shareholders in evaluating a Fund’s performance for the periods presented.
Investor Class | | Year Ended
March 31,
2024 | | | Year Ended
March 31,
2023 | | | Year Ended
March 31,
2022 | | | Year Ended
March 31,
2021 | | | Year Ended
March 31,
2020 | |
Per Share Data |
Net asset value, beginning of period | | $ | 31.00 | | | $ | 28.88 | | | $ | 34.46 | | | $ | 56.92 | | | $ | 56.77 | |
Income (loss) from investment operations: |
Net investment income (loss)a | | | 1.17 | | | | .42 | | | | (.28 | ) | | | (.47 | ) | | | .31 | |
Net gain (loss) on investments (realized and unrealized) | | | (6.11 | ) | | | 1.70 | | | | (5.30 | ) | | | (21.84 | ) | | | .26 | |
Total from investment operations | | | (4.94 | ) | | | 2.12 | | | | (5.58 | ) | | | (22.31 | ) | | | .57 | |
Less distributions from: |
Net investment income | | | (.76 | ) | | | — | | | | — | | | | (.15 | ) | | | (.42 | ) |
Total distributions | | | (.76 | ) | | | — | | | | — | | | | (.15 | ) | | | (.42 | ) |
Net asset value, end of period | | $ | 25.30 | | | $ | 31.00 | | | $ | 28.88 | | | $ | 34.46 | | | $ | 56.92 | |
|
Total Return | | | (16.19 | %) | | | 7.34 | % | | | (16.19 | %) | | | (39.21 | %) | | | 1.10 | % |
Ratios/Supplemental Data |
Net assets, end of period (in thousands) | | $ | 35,725 | | | $ | 56,203 | | | $ | 47,555 | | | $ | 53,937 | | | $ | 85,839 | |
Ratios to average net assets: |
Net investment income (loss) | | | 4.04 | % | | | 1.31 | % | | | (0.91 | %) | | | (1.12 | %) | | | 0.58 | % |
Total expensesb | | | 1.50 | % | | | 1.53 | % | | | 1.41 | % | | | 1.51 | % | | | 1.53 | % |
Net expensesc | | | 1.40 | % | | | 1.49 | % | | | 1.39 | % | | | 1.50 | % | | | 1.51 | % |
Portfolio turnover rate | | | — | | | | — | | | | — | | | | — | | | | — | |
Class A | | Year Ended
March 31,
2024 | | | Year Ended
March 31,
2023 | | | Year Ended
March 31,
2022 | | | Year Ended
March 31,
2021 | | | Year Ended
March 31,
2020 | |
Per Share Data |
Net asset value, beginning of period | | $ | 28.27 | | | $ | 26.40 | | | $ | 31.58 | | | $ | 52.33 | | | $ | 52.36 | |
Income (loss) from investment operations: |
Net investment income (loss)a | | | 1.02 | | | | .40 | | | | (.32 | ) | | | (.56 | ) | | | .21 | |
Net gain (loss) on investments (realized and unrealized) | | | (5.58 | ) | | | 1.47 | | | | (4.86 | ) | | | (20.04 | ) | | | .18 | |
Total from investment operations | | | (4.56 | ) | | | 1.87 | | | | (5.18 | ) | | | (20.60 | ) | | | .39 | |
Less distributions from: |
Net investment income | | | (.76 | ) | | | — | | | | — | | | | (.15 | ) | | | (.42 | ) |
Total distributions | | | (.76 | ) | | | — | | | | — | | | | (.15 | ) | | | (.42 | ) |
Net asset value, end of period | | $ | 22.95 | | | $ | 28.27 | | | $ | 26.40 | | | $ | 31.58 | | | $ | 52.33 | |
|
Total Returnd | | | (16.38 | %) | | | 7.08 | % | | | (16.40 | %) | | | (39.38 | %) | | | 0.85 | % |
Ratios/Supplemental Data |
Net assets, end of period (in thousands) | | $ | 1,211 | | | $ | 4,164 | | | $ | 1,829 | | | $ | 1,540 | | | $ | 7,575 | |
Ratios to average net assets: |
Net investment income (loss) | | | 3.77 | % | | | 1.34 | % | | | (1.15 | %) | | | (1.39 | %) | | | 0.43 | % |
Total expensesb | | | 1.76 | % | | | 1.79 | % | | | 1.66 | % | | | 1.78 | % | | | 1.78 | % |
Net expensesc | | | 1.66 | % | | | 1.74 | % | | | 1.64 | % | | | 1.77 | % | | | 1.76 | % |
Portfolio turnover rate | | | — | | | | — | | | | — | | | | — | | | | — | |
SEE NOTES TO FINANCIAL STATEMENTS. | THE RYDEX FUNDS ANNUAL REPORT | 47 |
INVERSE S&P 500® STRATEGY FUND | |
FINANCIAL HIGHLIGHTS (concluded) |
This table is presented to show selected data for a share outstanding throughout each period and to assist shareholders in evaluating a Fund’s performance for the periods presented.
Class C | | Year Ended
March 31,
2024 | | | Year Ended
March 31,
2023 | | | Year Ended
March 31,
2022 | | | Year Ended
March 31,
2021 | | | Year Ended
March 31,
2020 | |
Per Share Data |
Net asset value, beginning of period | | $ | 24.55 | | | $ | 23.10 | | | $ | 27.84 | | | $ | 46.49 | | | $ | 46.92 | |
Income (loss) from investment operations: |
Net investment income (loss)a | | | .70 | | | | .09 | | | | (.46 | ) | | | (.80 | ) | | | (.22 | ) |
Net gain (loss) on investments (realized and unrealized) | | | (4.80 | ) | | | 1.36 | | | | (4.28 | ) | | | (17.70 | ) | | | .21 | |
Total from investment operations | | | (4.10 | ) | | | 1.45 | | | | (4.74 | ) | | | (18.50 | ) | | | (.01 | ) |
Less distributions from: |
Net investment income | | | (.76 | ) | | | — | | | | — | | | | (.15 | ) | | | (.42 | ) |
Total distributions | | | (.76 | ) | | | — | | | | — | | | | (.15 | ) | | | (.42 | ) |
Net asset value, end of period | | $ | 19.69 | | | $ | 24.55 | | | $ | 23.10 | | | $ | 27.84 | | | $ | 46.49 | |
|
Total Returnd | | | (16.99 | %) | | | 6.28 | % | | | (17.03 | %) | | | (39.82 | %) | | | 0.09 | % |
Ratios/Supplemental Data |
Net assets, end of period (in thousands) | | $ | 417 | | | $ | 801 | | | $ | 762 | | | $ | 449 | | | $ | 6,376 | |
Ratios to average net assets: |
Net investment income (loss) | | | 3.03 | % | | | 0.35 | % | | | (1.92 | %) | | | (2.16 | %) | | | (0.51 | %) |
Total expensesb | | | 2.49 | % | | | 2.53 | % | | | 2.41 | % | | | 2.54 | % | | | 2.53 | % |
Net expensesc | | | 2.39 | % | | | 2.48 | % | | | 2.39 | % | | | 2.53 | % | | | 2.51 | % |
Portfolio turnover rate | | | — | | | | — | | | | — | | | | — | | | | — | |
Class H | | Year Ended
March 31,
2024 | | | Year Ended
March 31,
2023 | | | Year Ended
March 31,
2022 | | | Year Ended
March 31,
2021 | | | Year Ended
March 31,
2020 | |
Per Share Data |
Net asset value, beginning of period | | $ | 28.29 | | | $ | 26.41 | | | $ | 31.58 | | | $ | 52.32 | | | $ | 52.35 | |
Income (loss) from investment operations: |
Net investment income (loss)a | | | 1.00 | | | | .25 | | | | (.32 | ) | | | (.56 | ) | | | .17 | |
Net gain (loss) on investments (realized and unrealized) | | | (5.55 | ) | | | 1.63 | | | | (4.85 | ) | | | (20.03 | ) | | | .22 | |
Total from investment operations | | | (4.55 | ) | | | 1.88 | | | | (5.17 | ) | | | (20.59 | ) | | | .39 | |
Less distributions from: |
Net investment income | | | (.76 | ) | | | — | | | | — | | | | (.15 | ) | | | (.42 | ) |
Total distributions | | | (.76 | ) | | | — | | | | — | | | | (.15 | ) | | | (.42 | ) |
Net asset value, end of period | | $ | 22.98 | | | $ | 28.29 | | | $ | 26.41 | | | $ | 31.58 | | | $ | 52.32 | |
|
Total Return | | | (16.36 | %) | | | 7.12 | % | | | (16.37 | %) | | | (39.37 | %) | | | 0.85 | % |
Ratios/Supplemental Data |
Net assets, end of period (in thousands) | | $ | 1,246 | | | $ | 1,600 | | | $ | 2,618 | | | $ | 933 | | | $ | 8,890 | |
Ratios to average net assets: |
Net investment income (loss) | | | 3.81 | % | | | 0.86 | % | | | (1.15 | %) | | | (1.38 | %) | | | 0.34 | % |
Total expensesb | | | 1.75 | % | | | 1.78 | % | | | 1.66 | % | | | 1.78 | % | | | 1.78 | % |
Net expensesc | | | 1.64 | % | | | 1.74 | % | | | 1.64 | % | | | 1.76 | % | | | 1.76 | % |
Portfolio turnover rate | | | — | | | | — | | | | — | | | | — | | | | — | |
a | Net investment income (loss) per share was computed using average shares outstanding throughout the period. |
b | Does not include expenses of the underlying funds in which the Fund invests. |
c | Net expense information reflects the expense ratios after expense waivers and reimbursements, as applicable. |
d | Total return does not reflect the impact of any applicable sales charges. |
48 | THE RYDEX FUNDS ANNUAL REPORT | SEE NOTES TO FINANCIAL STATEMENTS. |
PERFORMANCE REPORT AND FUND PROFILE (Unaudited) | March 31, 2024 |
MONTHLY REBALANCE NASDAQ-100® 2x STRATEGY FUND
OBJECTIVE: Seeks to provide investment results that match, before fees and expenses, the performance of a specific benchmark on a calendar month basis. The Fund’s current benchmark is 200% of the performance of the NASDAQ-100 Index® (the “underlying index”). The Fund does not seek to achieve its investment objective over a period of time different than a full calendar month.
For the Reporting Period, the Monthly Rebalance NASDAQ-100 2x Strategy Fund Class H returned 76.74%, while the NASDAQ-100 Index returned 39.65% over the same time period.
The sectors that contributed the most to the return of the underlying index for the Reporting Period were Information Technology, Communication Services, and Consumer Discretionary. The only sector that detracted was Financials.
The holdings that contributed the most to the return of the underlying index were NVIDIA Corp., Microsoft Corp., and Meta Platforms, Inc. – Class A. Those that detracted the most were Tesla, Inc., Moderna, Inc., and PayPal Holdings, Inc.
Derivatives in the Fund were used to help provide exposure to the composition of the benchmark in the most efficient manner possible and to provide leverage and not for hedging purposes. Derivatives performed as expected.
Due to compounding, the Fund’s performance generally will not correlate to the performance of the benchmark over periods greater than a full calendar month. For example, the Fund’s compounded returns for periods greater than a full calendar month will be different than the performance of the benchmark over the same period.
The effects of compounding may cause the longer-term correlation of the Fund to its benchmark to diminish. A significant contributor to the discrepancy between the leveraged and unleveraged indices is the effect of compounding on the leveraged index, which is discussed under “A Brief Note on the Compounding of Returns” on page 6.
The Fund may invest in certain of the underlying series of Guggenheim Funds Trust and Guggenheim Strategy Funds Trust, including Guggenheim Ultra Short Duration, Guggenheim Strategy Fund II, and Guggenheim Strategy Fund III (collectively, the “Short Term Investment Vehicles”), each of which are open-end management investment companies managed by Guggenheim Investments. The Short Term Investment Vehicles, which launched on March 11, 2014, are offered as short term investment options only to mutual funds, trusts, and other accounts managed by Guggenheim Investments and/or its affiliates, and are not available to the public, with the exception of Guggenheim Ultra Short Duration Fund, which is available to the public. Guggenheim Strategy Fund II and Guggenheim Strategy Fund III do not charge an investment management fee. Guggenheim Ultra Short Duration Fund charges an investment management fee, but the Fund’s adviser has agreed to waive fees to the extent necessary to offset the proportionate share of any management fee paid by the Fund with respect to its investment in such affiliated fund. For the Reporting Period, investment in the Short Term Investment Vehicles contributed to Fund performance.
Performance displayed represents past performance which is no guarantee of future results.
Holdings Diversification (Market Exposure as % of Net Assets)

“Holdings Diversification (Market Exposure as % of Net Assets)” excludes any temporary cash investments, investments in Guggenheim Strategy Funds Trust mutual funds, or investments in Guggenheim Ultra Short Duration Fund. Investments in those Funds do not provide “market exposure” to meet the Fund’s investment objective, but will significantly increase the portfolio’s exposure to certain other asset categories (and their associated risks), which may cause the Fund to deviate from its principal investment strategy, including: (i) high yield, high risk debt securities rated below the top four long-term rating categories by a nationally recognized statistical rating organization (also known as “junk bonds”); (ii) securities issued by the U.S. government or its agencies and instrumentalities; (iii) CLOs and similar investments; and (iv) other short-term fixed income securities.
| | THE RYDEX FUNDS ANNUAL REPORT | 49 |
PERFORMANCE REPORT AND FUND PROFILE (Unaudited)(concluded) | March 31, 2024 |
Inception Dates: |
Class A | November 28, 2014 |
Class C | November 28, 2014 |
Class H | November 28, 2014 |
Cumulative Fund Performance*
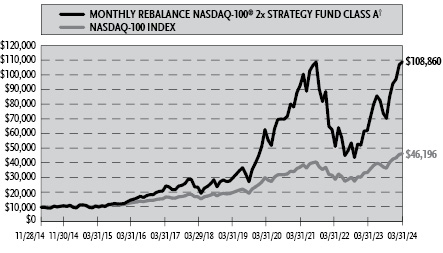

Ten Largest Holdings | % of Total Net Assets |
Microsoft Corp. | 7.3% |
Apple, Inc. | 6.2% |
NVIDIA Corp. | 5.3% |
Amazon.com, Inc. | 4.4% |
Meta Platforms, Inc. — Class A | 4.0% |
Broadcom, Inc. | 3.7% |
Alphabet, Inc. — Class A | 2.1% |
Alphabet, Inc. — Class C | 2.0% |
Tesla, Inc. | 2.0% |
Costco Wholesale Corp. | 2.0% |
Top Ten Total | 39.0% |
| | |
“Ten Largest Holdings” excludes any temporary cash or derivative investments. |
Average Annual Returns*
Periods Ended March 31, 2024
| 1 Year | 5 Year | Since
Inception
(11/28/14) |
Class A Shares | 76.76% | 33.54% | 29.81% |
Class A Shares with sales charge† | 68.37% | 32.25% | 29.14% |
Class C Shares | 75.44% | 32.53% | 28.81% |
Class C Shares with CDSC‡ | 74.44% | 32.53% | 28.81% |
Class H Shares | 76.74% | 33.50% | 30.12% |
NASDAQ-100 Index | 39.65% | 20.90% | 17.81% |
* | The performance data above represents past performance that is not predictive of future results. The investment return and principal value of an investment in the Fund will fluctuate so that an investor’s shares, when redeemed, may be worth more or less than their original cost. Returns are historical and include changes in principal and reinvested dividends and capital gains and do not reflect the effect of taxes. The NASDAQ-100 Index is an unmanaged index and, unlike the Fund, has no management fees or operating expenses to reduce its reported return. The graphs are based on Class A shares and Class H shares only; performance for Class C shares will vary due to difference in fee structures. |
† | Fund returns are calculated using the maximum sales charge of 4.75%. |
‡ | Fund returns include a CDSC of 1% if redeemed within 12 months of purchase. |
50 | THE RYDEX FUNDS ANNUAL REPORT | |
SCHEDULE OF INVESTMENTS | March 31, 2024 |
MONTHLY REBALANCE NASDAQ-100® 2x STRATEGY FUND | |
| | Shares | | | Value | |
COMMON STOCKS† - 83.3% |
| | | | | | | | | |
Technology - 40.1% |
Microsoft Corp. | | | 112,280 | | | $ | 47,238,442 | |
Apple, Inc. | | | 233,340 | | | | 40,013,143 | |
NVIDIA Corp. | | | 37,777 | | | | 34,133,786 | |
Broadcom, Inc. | | | 18,087 | | | | 23,972,691 | |
Advanced Micro Devices, Inc.* | | | 63,063 | | | | 11,382,241 | |
Adobe, Inc.* | | | 17,641 | | | | 8,901,648 | |
QUALCOMM, Inc. | | | 43,557 | | | | 7,374,200 | |
Intel Corp. | | | 165,016 | | | | 7,288,757 | |
Intuit, Inc. | | | 10,927 | | | | 7,102,550 | |
Applied Materials, Inc. | | | 32,429 | | | | 6,687,833 | |
Texas Instruments, Inc. | | | 35,489 | | | | 6,182,539 | |
Micron Technology, Inc. | | | 43,085 | | | | 5,079,291 | |
Lam Research Corp. | | | 5,117 | | | | 4,971,524 | |
Analog Devices, Inc. | | | 19,355 | | | | 3,828,225 | |
KLA Corp. | | | 5,278 | | | | 3,687,052 | |
Synopsys, Inc.* | | | 5,954 | | | | 3,402,711 | |
Cadence Design Systems, Inc.* | | | 10,625 | | | | 3,307,350 | |
ASML Holding N.V. — Class G | | | 3,371 | | | | 3,271,454 | |
Crowdstrike Holdings, Inc. — Class A* | | | 8,884 | | | | 2,848,122 | |
NXP Semiconductor N.V. | | | 10,009 | | | | 2,479,930 | |
Marvell Technology, Inc. | | | 33,741 | | | | 2,391,562 | |
Roper Technologies, Inc. | | | 4,177 | | | | 2,342,629 | |
Workday, Inc. — Class A* | | | 8,157 | | | | 2,224,822 | |
Autodesk, Inc.* | | | 8,349 | | | | 2,174,246 | |
Fortinet, Inc.* | | | 29,781 | | | | 2,034,340 | |
Microchip Technology, Inc. | | | 21,091 | | | | 1,892,074 | |
Paychex, Inc. | | | 14,099 | | | | 1,731,357 | |
Datadog, Inc. — Class A* | | | 11,940 | | | | 1,475,784 | |
Cognizant Technology Solutions Corp. — Class A | | | 19,430 | | | | 1,424,025 | |
Electronic Arts, Inc. | | | 10,434 | | | | 1,384,279 | |
ON Semiconductor Corp.* | | | 16,678 | | | | 1,226,667 | |
Atlassian Corp. — Class A* | | | 6,142 | | | | 1,198,366 | |
ANSYS, Inc.* | | | 3,396 | | | | 1,178,955 | |
Zscaler, Inc.* | | | 5,789 | | | | 1,115,135 | |
GLOBALFOUNDRIES, Inc.*,1 | | | 21,378 | | | | 1,114,007 | |
MongoDB, Inc.* | | | 2,817 | | | | 1,010,289 | |
Take-Two Interactive Software, Inc.* | | | 6,658 | | | | 988,646 | |
Total Technology | | | | | | | 260,060,672 | |
| | | | | | | | | |
Communications - 21.3% |
Amazon.com, Inc.* | | | 156,962 | | | | 28,312,805 | |
Meta Platforms, Inc. — Class A | | | 52,889 | | | | 25,681,841 | |
Alphabet, Inc. — Class A* | | | 89,048 | | | | 13,440,015 | |
Alphabet, Inc. — Class C* | | | 85,694 | | | | 13,047,768 | |
Netflix, Inc.* | | | 16,890 | | | | 10,257,804 | |
Cisco Systems, Inc. | | | 158,037 | | | | 7,887,627 | |
T-Mobile US, Inc. | | | 46,323 | | | | 7,560,840 | |
Comcast Corp. — Class A | | | 154,650 | | | | 6,704,077 | |
Booking Holdings, Inc. | | | 1,334 | | | | 4,839,592 | |
Palo Alto Networks, Inc.* | | | 12,610 | | | | 3,582,879 | |
PDD Holdings, Inc. ADR* | | | 26,069 | | | | 3,030,521 | |
MercadoLibre, Inc.* | | | 1,979 | | | | 2,992,169 | |
Airbnb, Inc. — Class A* | | | 17,098 | | | | 2,820,486 | |
DoorDash, Inc. — Class A* | | | 14,705 | | | | 2,025,172 | |
Charter Communications, Inc. — Class A* | | | 5,668 | | | | 1,647,291 | |
Trade Desk, Inc. — Class A* | | | 17,369 | | | | 1,518,398 | |
CDW Corp. | | | 5,238 | | | | 1,339,776 | |
Warner Bros Discovery, Inc.* | | | 95,219 | | | | 831,262 | |
Sirius XM Holdings, Inc.1 | | | 149,969 | | | | 581,880 | |
Total Communications | | | | | | | 138,102,203 | |
| | | | | | | | | |
Consumer, Non-cyclical - 10.3% |
PepsiCo, Inc. | | | 53,643 | | | | 9,388,061 | |
Amgen, Inc. | | | 20,917 | | | | 5,947,121 | |
Intuitive Surgical, Inc.* | | | 13,751 | | | | 5,487,887 | |
Vertex Pharmaceuticals, Inc.* | | | 10,082 | | | | 4,214,377 | |
Regeneron Pharmaceuticals, Inc.* | | | 4,213 | | | | 4,054,970 | |
Automatic Data Processing, Inc. | | | 16,033 | | | | 4,004,081 | |
Mondelez International, Inc. — Class A | | | 52,552 | | | | 3,678,640 | |
Gilead Sciences, Inc. | | | 48,622 | | | | 3,561,562 | |
PayPal Holdings, Inc.* | | | 41,829 | | | | 2,802,125 | |
Cintas Corp. | | | 3,956 | | | | 2,717,891 | |
Monster Beverage Corp.* | | | 40,615 | | | | 2,407,657 | |
Dexcom, Inc.* | | | 15,046 | | | | 2,086,880 | |
IDEXX Laboratories, Inc.* | | | 3,243 | | | | 1,750,993 | |
Kraft Heinz Co. | | | 47,346 | | | | 1,747,067 | |
Keurig Dr Pepper, Inc. | | | 54,157 | | | | 1,660,995 | |
GE HealthCare Technologies, Inc. | | | 17,772 | | | | 1,615,652 | |
Moderna, Inc.* | | | 14,912 | | | | 1,589,023 | |
CoStar Group, Inc.* | | | 15,940 | | | | 1,539,804 | |
AstraZeneca plc ADR | | | 22,727 | | | | 1,539,755 | |
Verisk Analytics, Inc. — Class A | | | 5,596 | | | | 1,319,145 | |
Coca-Cola Europacific Partners plc | | | 17,828 | | | | 1,247,069 | |
Biogen, Inc.* | | | 5,673 | | | | 1,223,269 | |
Illumina, Inc.* | | | 6,202 | | | | 851,659 | |
Total Consumer, Non-cyclical | | | | | | | 66,435,683 | |
| | | | | | | | | |
Consumer, Cyclical - 7.3% |
Tesla, Inc.* | | | 72,845 | | | | 12,805,422 | |
Costco Wholesale Corp. | | | 17,318 | | | | 12,687,686 | |
Starbucks Corp. | | | 44,189 | | | | 4,038,433 | |
Marriott International, Inc. — Class A | | | 11,298 | | | | 2,850,598 | |
O’Reilly Automotive, Inc.* | | | 2,304 | | | | 2,600,940 | |
PACCAR, Inc. | | | 20,447 | | | | 2,533,179 | |
Copart, Inc.* | | | 37,525 | | | | 2,173,448 | |
Ross Stores, Inc. | | | 13,140 | | | | 1,928,426 | |
Lululemon Athletica, Inc.* | | | 4,725 | | | | 1,845,821 | |
Fastenal Co. | | | 22,334 | | | | 1,722,845 | |
Dollar Tree, Inc.* | | | 8,503 | | | | 1,132,175 | |
Walgreens Boots Alliance, Inc. | | | 33,658 | | | | 730,042 | |
Total Consumer, Cyclical | | | | | | | 47,049,015 | |
| | | | | | | | | |
Industrial - 1.5% |
Honeywell International, Inc. | | | 25,454 | | | | 5,224,434 | |
CSX Corp. | | | 76,464 | | | | 2,834,520 | |
Old Dominion Freight Line, Inc. | | | 8,496 | | | | 1,863,258 | |
Total Industrial | | | | | | | 9,922,212 | |
| | | | | | | | | |
SEE NOTES TO FINANCIAL STATEMENTS. | THE RYDEX FUNDS ANNUAL REPORT | 51 |
SCHEDULE OF INVESTMENTS (continued) | March 31, 2024 |
MONTHLY REBALANCE NASDAQ-100® 2x STRATEGY FUND | |
| | Shares | | | Value | |
Basic Materials - 1.4% |
Linde plc | | | 18,796 | | | $ | 8,727,359 | |
| | | | | | | | | |
Utilities - 1.0% |
Constellation Energy Corp. | | | 12,359 | | | | 2,284,561 | |
American Electric Power Company, Inc. | | | 20,537 | | | | 1,768,236 | |
Exelon Corp. | | | 39,011 | | | | 1,465,643 | |
Xcel Energy, Inc. | | | 21,667 | | | | 1,164,601 | |
Total Utilities | | | | | | | 6,683,041 | |
| | | | | | | | | |
Energy - 0.4% |
Diamondback Energy, Inc. | | | 6,965 | | | | 1,380,254 | |
Baker Hughes Co. | | | 39,064 | | | | 1,308,644 | |
Total Energy | | | | | | | 2,688,898 | |
| | | | | | | | | |
Total Common Stocks | | | | |
(Cost $381,106,082) | | | | | | | 539,669,083 | |
| | | | | | | | | |
MUTUAL FUNDS† - 0.9% |
Guggenheim Ultra Short Duration Fund — Institutional Class2 | | | 301,467 | | | | 2,987,542 | |
Guggenheim Strategy Fund II2 | | | 115,431 | | | | 2,839,614 | |
Total Mutual Funds | | | | |
(Cost $5,770,077) | | | | | | | 5,827,156 | |
| | | Face
Amount | | | | | |
U.S. TREASURY BILLS†† - 11.6% |
U.S. Treasury Bills |
5.25% due 04/23/243,4 | | $ | 35,600,000 | | | | 35,485,348 | |
5.27% due 04/02/243,4 | | | 17,000,000 | | | | 16,997,535 | |
5.17% due 04/16/244,5 | | | 16,730,000 | | | | 16,693,267 | |
5.27% due 04/23/244 | | | 5,100,000 | | | | 5,083,575 | |
5.28% due 04/23/244 | | | 300,000 | | | | 299,034 | |
Total U.S. Treasury Bills | | | | |
(Cost $74,559,194) | | | | | | | 74,558,759 | |
| | | | | | | | | |
FEDERAL AGENCY DISCOUNT NOTES†† - 4.6% |
Federal Home Loan Bank |
5.15% due 04/01/244 | | | 30,000,000 | | | | 30,000,000 | |
Total Federal Agency Discount Notes | | | | |
(Cost $30,000,000) | | | | | | | 30,000,000 | |
| | | | | | | | | |
REPURCHASE AGREEMENTS††,6 - 6.8% |
J.P. Morgan Securities LLC
issued 03/28/24 at 5.31%
due 04/01/243 | | | 25,608,041 | | | | 25,608,041 | |
BofA Securities, Inc.
issued 03/28/24 at 5.31%
due 04/01/243 | | | 9,849,246 | | | | 9,849,246 | |
Barclays Capital, Inc.
issued 03/28/24 at 5.30%
due 04/01/243 | | | 8,927,490 | | | | 8,927,490 | |
Total Repurchase Agreements | | | | |
(Cost $44,384,777) | | | | | | | 44,384,777 | |
| | | | | | | | | |
| | | Shares | | | | | |
SECURITIES LENDING COLLATERAL†,7 - 0.2% |
Money Market Fund | | | | | | | | |
First American Government Obligations Fund - Class X, 5.23%8 | | | 1,560,453 | | | | 1,560,453 | |
Total Securities Lending Collateral | | | | |
(Cost $1,560,453) | | | | | | | 1,560,453 | |
| | | | | | | | | |
Total Investments - 107.4% | | | | |
(Cost $537,380,583) | | $ | 696,000,228 | |
Other Assets & Liabilities, net - (7.4)% | | | (47,862,552 | ) |
Total Net Assets - 100.0% | | $ | 648,137,676 | |
Futures Contracts |
Description | | Number of
Contracts | | | Expiration
Date | | | Notional
Amount | | | Value and
Unrealized
Appreciation** | |
Equity Futures Contracts Purchased† |
NASDAQ-100 Index Mini Futures Contracts | | | 382 | | | | Jun 2024 | | | $ | 141,053,500 | | | $ | 1,633,863 | |
Total Return Swap Agreements |
Counterparty | Index | Type | | Financing
Rate | | Payment
Frequency | | | Maturity
Date | | | Units | | | Notional
Amount | | | Value and
Unrealized
Appreciation | |
OTC Equity Index Swap Agreements†† |
Barclays Bank plc | NASDAQ-100 Index | Pay | | 6.03% (SOFR + 0.70%) | | | At Maturity | | | | 06/25/24 | | | | 13,803 | | | $ | 251,974,214 | | | $ | 3,071,023 | |
Goldman Sachs International | NASDAQ-100 Index | Pay | | 5.83% (Federal
Funds Rate +
0.50%) | | | At Maturity | | | | 06/26/24 | | | | 18,396 | | | | 335,808,991 | | | | 345,654 | |
BNP Paribas | NASDAQ-100 Index | Pay | | 5.98% (Federal
Funds Rate +
0.65%) | | | At Maturity | | | | 06/26/24 | | | | 1,643 | | | | 29,999,776 | | | | 23,965 | |
| | | | | | | | | | | | | | | | | | | $ | 617,782,981 | | | $ | 3,440,642 | |
52 | THE RYDEX FUNDS ANNUAL REPORT | SEE NOTES TO FINANCIAL STATEMENTS. |
SCHEDULE OF INVESTMENTS (continued) | March 31, 2024 |
MONTHLY REBALANCE NASDAQ-100® 2x STRATEGY FUND | |
* | Non-income producing security. |
** | Includes cumulative appreciation (depreciation). Variation margin is reported within the Statement of Assets and Liabilities. |
† | Value determined based on Level 1 inputs — See Note 4. |
†† | Value determined based on Level 2 inputs — See Note 4. |
1 | All or a portion of this security is on loan at March 31, 2024 — See Note 7. |
2 | Affiliated issuer. |
3 | All or a portion of this security is pledged as equity index swap collateral at March 31, 2024. |
4 | Rate indicated is the effective yield at the time of purchase. |
5 | All or a portion of this security is pledged as futures collateral at March 31, 2024. |
6 | Repurchase Agreements — See Note 6. |
7 | Securities lending collateral — See Note 7. |
8 | Rate indicated is the 7-day yield as of March 31, 2024. |
| | ADR — American Depositary Receipt |
| | plc — Public Limited Company |
| | SOFR — Secured Overnight Financing Rate |
| | |
| | See Sector Classification in Other Information section. |
The following table summarizes the inputs used to value the Fund’s investments at March 31, 2024 (See Note 4 in the Notes to Financial Statements):
Investments in Securities (Assets) | | Level 1
Quoted
Prices | | | Level 2
Significant
Observable
Inputs | | | Level 3
Significant
Unobservable
Inputs | | | Total | |
Common Stocks | | $ | 539,669,083 | | | $ | — | | | $ | — | | | $ | 539,669,083 | |
Mutual Funds | | | 5,827,156 | | | | — | | | | — | | | | 5,827,156 | |
U.S. Treasury Bills | | | — | | | | 74,558,759 | | | | — | | | | 74,558,759 | |
Federal Agency Discount Notes | | | — | | | | 30,000,000 | | | | — | | | | 30,000,000 | |
Repurchase Agreements | | | — | | | | 44,384,777 | | | | — | | | | 44,384,777 | |
Securities Lending Collateral | | | 1,560,453 | | | | — | | | | — | | | | 1,560,453 | |
Equity Futures Contracts** | | | 1,633,863 | | | | — | | | | — | | | | 1,633,863 | |
Equity Index Swap Agreements** | | | — | | | | 3,440,642 | | | | — | | | | 3,440,642 | |
Total Assets | | $ | 548,690,555 | | | $ | 152,384,178 | | | $ | — | | | $ | 701,074,733 | |
** | This derivative is reported as unrealized appreciation/depreciation at period end. |
SEE NOTES TO FINANCIAL STATEMENTS. | THE RYDEX FUNDS ANNUAL REPORT | 53 |
SCHEDULE OF INVESTMENTS (concluded) | March 31, 2024 |
MONTHLY REBALANCE NASDAQ-100® 2x STRATEGY FUND | |
Affiliated Transactions
Investments representing 5% or more of the outstanding voting shares of a company, or control of or by, or common control under Guggenheim Investments (“GI”), result in that company being considered an affiliated issuer, as defined in the 1940 Act.
The Fund may invest in certain of the underlying series of Guggenheim Strategy Funds Trust, including Guggenheim Strategy Fund II and Guggenheim Strategy Fund III (collectively, the “Guggenheim Strategy Funds”), each of which are open-end management investment companies managed by GI. The Guggenheim Strategy Funds,, which launched on March 11, 2014, are offered as short term investment options only to mutual funds, trusts, and other accounts managed by GI and/or its affiliates, and are not available to the public. The Guggenheim Strategy Funds pay no investment management fees. The Guggenheim Strategy Funds’ annual report on Form N-CSR dated September 30, 2023 is available publicly or upon request. This information is available from the EDGAR database on the SEC’s website at https://www.sec.gov/Archives/edgar/data/1601445/000182126823000217/gug86449-ncsr.htm. The Fund may invest in certain of the underlying series of Guggenheim Funds Trust, which are open-end management investment companies managed by GI, are available to the public and whose most recent annual report on Form N-CSR is available publicly or upon request.
Transactions during the year ended March 31, 2024, in which the company is an affiliated issuer, were as follows:
Security Name | | Value
03/31/23 | | | Additions | | | Reductions | | | Realized
Gain (Loss) | | | Change in
Unrealized
Appreciation
(Depreciation) | | | Value
03/31/24 | | | Shares
03/31/24 | | | Investment
Income | |
Mutual Funds | | | | | | | | | | | | | | | | | | | | | | | | | | | | | | | | |
Guggenheim Strategy Fund II | | $ | 3,393,112 | | | $ | — | | | $ | (600,000 | ) | | $ | (1,978 | ) | | $ | 48,480 | | | $ | 2,839,614 | | | | 115,431 | | | $ | 166,753 | |
Guggenheim Ultra Short Duration Fund — Institutional Class | | | 3,524,787 | | | | — | | | | (600,000 | ) | | | (5,538 | ) | | | 68,293 | | | | 2,987,542 | | | | 301,467 | | | | 170,448 | |
| | | $ | 6,917,899 | | | $ | — | | | $ | (1,200,000 | ) | | $ | (7,516 | ) | | $ | 116,773 | | | $ | 5,827,156 | | | | | | | $ | 337,201 | |
54 | THE RYDEX FUNDS ANNUAL REPORT | SEE NOTES TO FINANCIAL STATEMENTS. |
MONTHLY REBALANCE NASDAQ-100® 2x STRATEGY FUND | |
STATEMENT OF ASSETS AND LIABILITIES |
March 31, 2024 |
Assets: |
Investments in unaffiliated issuers, at value - including $1,484,077 of securities loaned (cost $487,225,729) | | $ | 645,788,295 | |
Investments in affiliated issuers, at value (cost $5,770,077) | | | 5,827,156 | |
Repurchase agreements, at value (cost $44,384,777) | | | 44,384,777 | |
Cash | | | 147,162 | |
Segregated cash with broker | | | 32,880 | |
Unrealized appreciation on OTC swap agreements | | | 3,440,642 | |
Receivables: |
Securities sold | | | 90,016,048 | |
Fund shares sold | | | 643,367 | |
Investment Adviser | | | 247,136 | |
Dividends | | | 205,747 | |
Interest | | | 26,177 | |
Securities lending income | | | 10,351 | |
Total assets | | | 790,769,738 | |
| | | | | |
Liabilities: |
Segregated cash due to broker | | | 4,230,000 | |
Payable for: |
Fund shares redeemed | | | 134,165,640 | |
Return of securities lending collateral | | | 1,560,453 | |
Swap settlement | | | 629,895 | |
Management fees | | | 569,234 | |
Variation margin on futures contracts | | | 315,150 | |
Transfer agent fees | | | 275,104 | |
Distribution and service fees | | | 159,379 | |
Portfolio accounting and administration fees | | | 19,314 | |
Trustees’ fees* | | | 5,809 | |
Miscellaneous | | | 702,084 | |
Total liabilities | | | 142,632,062 | |
Net assets | | $ | 648,137,676 | |
| | | | | |
Net assets consist of: |
Paid in capital | | $ | 494,718,215 | |
Total distributable earnings (loss) | | | 153,419,461 | |
Net assets | | $ | 648,137,676 | |
Class A: |
Net assets | | $ | 7,335,009 | |
Capital shares outstanding | | | 14,437 | |
Net asset value per share | | $ | 508.07 | |
Maximum offering price per share (Net asset value divided by 95.25%) | | $ | 533.41 | |
Class C: |
Net assets | | $ | 1,744,735 | |
Capital shares outstanding | | | 3,718 | |
Net asset value per share | | $ | 469.27 | |
Class H: |
Net assets | | $ | 639,057,932 | |
Capital shares outstanding | | | 1,226,355 | |
Net asset value per share | | $ | 521.10 | |
STATEMENT OF OPERATIONS |
Year Ended March 31, 2024 |
Investment Income: |
Dividends from securities of unaffiliated issuers (net of foreign withholding tax of $5,878) | | $ | 3,847,254 | |
Dividends from securities of affiliated issuers | | | 337,201 | |
Interest | | | 4,316,482 | |
Income from securities lending, net | | | 114,783 | |
Total investment income | | | 8,615,720 | |
| | | | | |
Expenses: |
Management fees | | | 4,652,418 | |
Distribution and service fees: |
Class A | | | 14,896 | |
Class C | | | 12,539 | |
Class H | | | 1,274,285 | |
Transfer agent fees | | | 1,125,141 | |
Interest expense | | | 1,004,091 | |
Portfolio accounting and administration fees | | | 716,632 | |
Professional fees | | | 283,363 | |
Trustees’ fees* | | | 72,241 | |
Custodian fees | | | 71,035 | |
Line of credit fees | | | 896 | |
Miscellaneous | | | 883,583 | |
Total expenses | | | 10,111,120 | |
Less: |
Expenses reimbursed by Adviser | | | (440,169 | ) |
Expenses waived by Adviser | | | (2,270,395 | ) |
Total waived expenses | | | (2,710,564 | ) |
Net expenses | | | 7,400,556 | |
Net investment income | | | 1,215,164 | |
| | | | | |
Net Realized and Unrealized Gain (Loss): |
Net realized gain (loss) on: |
Investments in unaffiliated issuers | | | 27,186,778 | |
Investments in affiliated issuers | | | (7,516 | ) |
Swap agreements | | | 146,633,976 | |
Futures contracts | | | 30,842,578 | |
Net realized gain | | | 204,655,816 | |
Net change in unrealized appreciation (depreciation) on: |
Investments in unaffiliated issuers | | | 113,309,053 | |
Investments in affiliated issuers | | | 116,773 | |
Swap agreements | | | (9,722,142 | ) |
Futures contracts | | | (3,767,649 | ) |
Net change in unrealized appreciation (depreciation) | | | 99,936,035 | |
Net realized and unrealized gain | | | 304,591,851 | |
Net increase in net assets resulting from operations | | $ | 305,807,015 | |
* | Relates to Trustees not deemed “interested persons” within the meaning of Section 2(a)(19) of the 1940 Act. |
SEE NOTES TO FINANCIAL STATEMENTS. | THE RYDEX FUNDS ANNUAL REPORT | 55 |
MONTHLY REBALANCE NASDAQ-100® 2x STRATEGY FUND | |
STATEMENTS OF CHANGES IN NET ASSETS |
| | Year Ended
March 31,
2024 | | | Year Ended
March 31,
2023 | |
Increase (Decrease) in Net Assets from Operations: | | | | | | | | |
Net investment income | | $ | 1,215,164 | | | $ | 278,163 | |
Net realized gain (loss) on investments | | | 204,655,816 | | | | (78,599,679 | ) |
Net change in unrealized appreciation (depreciation) on investments | | | 99,936,035 | | | | 51,687,976 | |
Net increase (decrease) in net assets resulting from operations | | | 305,807,015 | | | | (26,633,540 | ) |
| | | | | | | | | |
Distributions to shareholders: | | | | | | | | |
Class A | | | (229,861 | ) | | | — | |
Class C | | | (52,499 | ) | | | — | |
Class H | | | (16,565,287 | ) | | | — | |
Total distributions to shareholders | | | (16,847,647 | ) | | | — | |
| | | | | | | | | |
Capital share transactions: | | | | | | | | |
Proceeds from sale of shares | | | | | | | | |
Class A | | | 5,788,991 | | | | 6,041,787 | |
Class C | | | 442,703 | | | | 275,014 | |
Class H | | | 2,095,676,099 | | | | 3,336,949,993 | |
Distributions reinvested | | | | | | | | |
Class A | | | 211,140 | | | | — | |
Class C | | | 36,396 | | | | — | |
Class H | | | 16,560,168 | | | | — | |
Cost of shares redeemed | | | | | | | | |
Class A | | | (6,391,583 | ) | | | (7,341,375 | ) |
Class C | | | (326,833 | ) | | | (299,704 | ) |
Class H | | | (2,138,872,563 | ) | | | (3,046,284,758 | ) |
Net increase (decrease) from capital share transactions | | | (26,875,482 | ) | | | 289,340,957 | |
Net increase in net assets | | | 262,083,886 | | | | 262,707,417 | |
| | | | | | | | | |
Net assets: | | | | | | | | |
Beginning of year | | | 386,053,790 | | | | 123,346,373 | |
End of year | | $ | 648,137,676 | | | $ | 386,053,790 | |
| | | | | | | | | |
Capital share activity: | | | | | | | | |
Shares sold | | | | | | | | |
Class A | | | 14,718 | | | | 21,048 | |
Class C | | | 1,149 | | | | 1,051 | |
Class H | | | 4,803,990 | | | | 11,582,345 | |
Shares issued from reinvestment of distributions | | | | | | | | |
Class A | | | 507 | | | | — | |
Class C | | | 94 | | | | — | |
Class H | | | 38,772 | | | | — | |
Shares redeemed | | | | | | | | |
Class A | | | (16,225 | ) | | | (25,121 | ) |
Class C | | | (933 | ) | | | (1,190 | ) |
Class H | | | (4,858,568 | ) | | | (10,598,076 | ) |
Net increase (decrease) in shares | | | (16,496 | ) | | | 980,057 | |
56 | THE RYDEX FUNDS ANNUAL REPORT | SEE NOTES TO FINANCIAL STATEMENTS. |
MONTHLY REBALANCE NASDAQ-100® 2x STRATEGY FUND | |
This table is presented to show selected data for a share outstanding throughout each period and to assist shareholders in evaluating a Fund’s performance for the periods presented.
Class A | | Year Ended
March 31,
2024 | | | Year Ended
March 31,
2023 | | | Year Ended
March 31,
2022 | | | Year Ended
March 31,
2021 | | | Year Ended
March 31,
2020 | |
Per Share Data |
Net asset value, beginning of period | | $ | 298.90 | | | $ | 429.31 | | | $ | 355.42 | | | $ | 141.86 | | | $ | 134.54 | |
Income (loss) from investment operations: |
Net investment income (loss)a | | | 1.04 | | | | .32 | | | | (3.11 | ) | | | (1.74 | ) | | | .23 | |
Net gain (loss) on investments (realized and unrealized) | | | 224.62 | | | | (130.73 | ) | | | 88.53 | | | | 233.57 | | | | 7.28 | |
Total from investment operations | | | 225.66 | | | | (130.41 | ) | | | 85.42 | | | | 231.83 | | | | 7.51 | |
Less distributions from: |
Net investment income | | | (.60 | ) | | | — | | | | — | | | | — | | | | (.19 | ) |
Net realized gains | | | (15.89 | ) | | | — | | | | (11.53 | ) | | | (18.27 | ) | | | — | |
Total distributions | | | (16.49 | ) | | | — | | | | (11.53 | ) | | | (18.27 | ) | | | (.19 | ) |
Net asset value, end of period | | $ | 508.07 | | | $ | 298.90 | | | $ | 429.31 | | | $ | 355.42 | | | $ | 141.86 | |
|
Total Returnb | | | 76.76 | % | | | (30.38 | %) | | | 23.48 | % | | | 164.83 | % | | | 5.56 | % |
Ratios/Supplemental Data |
Net assets, end of period (in thousands) | | $ | 7,335 | | | $ | 4,614 | | | $ | 8,376 | | | $ | 5,504 | | | $ | 2,434 | |
Ratios to average net assets: |
Net investment income (loss) | | | 0.26 | % | | | 0.12 | % | | | (0.70 | %) | | | (0.60 | %) | | | 0.15 | % |
Total expensesc | | | 1.95 | % | | | 1.77 | % | | | 1.69 | % | | | 1.77 | % | | | 1.83 | % |
Net expensesd,e | | | 1.42 | % | | | 1.31 | % | | | 1.32 | % | | | 1.33 | % | | | 1.34 | % |
Portfolio turnover rate | | | 334 | % | | | 1,054 | % | | | 922 | % | | | 509 | % | | | 990 | % |
Class C | | Year Ended
March 31,
2024 | | | Year Ended
March 31,
2023 | | | Year Ended
March 31,
2022 | | | Year Ended
March 31,
2021 | | | Year Ended
March 31,
2020 | |
Per Share Data |
Net asset value, beginning of period | | $ | 278.89 | | | $ | 403.95 | | | $ | 337.38 | | | $ | 136.06 | | | $ | 130.01 | |
Income (loss) from investment operations: |
Net investment income (loss)a | | | (1.79 | ) | | | (1.56 | ) | | | (6.08 | ) | | | (3.70 | ) | | | (.83 | ) |
Net gain (loss) on investments (realized and unrealized) | | | 208.66 | | | | (123.50 | ) | | | 84.18 | | | | 223.29 | | | | 7.07 | |
Total from investment operations | | | 206.87 | | | | (125.06 | ) | | | 78.10 | | | | 219.59 | | | | 6.24 | |
Less distributions from: |
Net investment income | | | (.60 | ) | | | — | | | | — | | | | — | | | | (.19 | ) |
Net realized gains | | | (15.89 | ) | | | — | | | | (11.53 | ) | | | (18.27 | ) | | | — | |
Total distributions | | | (16.49 | ) | | | — | | | | (11.53 | ) | | | (18.27 | ) | | | (.19 | ) |
Net asset value, end of period | | $ | 469.27 | | | $ | 278.89 | | | $ | 403.95 | | | $ | 337.38 | | | $ | 136.06 | |
|
Total Returnb | | | 75.44 | % | | | (30.96 | %) | | | 22.55 | % | | | 162.86 | % | | | 4.77 | % |
Ratios/Supplemental Data |
Net assets, end of period (in thousands) | | $ | 1,745 | | | $ | 951 | | | $ | 1,433 | | | $ | 1,751 | | | $ | 552 | |
Ratios to average net assets: |
Net investment income (loss) | | | (0.49 | %) | | | (0.61 | %) | | | (1.44 | %) | | | (1.34 | %) | | | (0.55 | %) |
Total expensesc | | | 2.71 | % | | | 2.52 | % | | | 2.44 | % | | | 2.52 | % | | | 2.58 | % |
Net expensesd,e | | | 2.17 | % | | | 2.06 | % | | | 2.07 | % | | | 2.08 | % | | | 2.09 | % |
Portfolio turnover rate | | | 334 | % | | | 1,054 | % | | | 922 | % | | | 509 | % | | | 990 | % |
SEE NOTES TO FINANCIAL STATEMENTS. | THE RYDEX FUNDS ANNUAL REPORT | 57 |
MONTHLY REBALANCE NASDAQ-100® 2x STRATEGY FUND | |
FINANCIAL HIGHLIGHTS (concluded) |
This table is presented to show selected data for a share outstanding throughout each period and to assist shareholders in evaluating a Fund’s performance for the periods presented.
Class H | | Year Ended
March 31,
2024 | | | Year Ended
March 31,
2023 | | | Year Ended
March 31,
2022 | | | Year Ended
March 31,
2021 | | | Year Ended
March 31,
2020 | |
Per Share Data |
Net asset value, beginning of period | | $ | 306.31 | | | $ | 440.25 | | | $ | 364.34 | | | $ | 145.23 | | | $ | 137.80 | |
Income (loss) from investment operations: |
Net investment income (loss)a | | | .96 | | | | .27 | | | | (3.35 | ) | | | (1.81 | ) | | | .12 | |
Net gain (loss) on investments (realized and unrealized) | | | 230.32 | | | | (134.21 | ) | | | 90.79 | | | | 239.19 | | | | 7.50 | |
Total from investment operations | | | 231.28 | | | | (133.94 | ) | | | 87.44 | | | | 237.38 | | | | 7.62 | |
Less distributions from: |
Net investment income | | | (.60 | ) | | | — | | | | — | | | | — | | | | (.19 | ) |
Net realized gains | | | (15.89 | ) | | | — | | | | (11.53 | ) | | | (18.27 | ) | | | — | |
Total distributions | | | (16.49 | ) | | | — | | | | (11.53 | ) | | | (18.27 | ) | | | (.19 | ) |
Net asset value, end of period | | $ | 521.10 | | | $ | 306.31 | | | $ | 440.25 | | | $ | 364.34 | | | $ | 145.23 | |
|
Total Return | | | 76.74 | % | | | (30.42 | %) | | | 23.46 | % | | | 164.81 | % | | | 5.51 | % |
Ratios/Supplemental Data |
Net assets, end of period (in thousands) | | $ | 639,058 | | | $ | 380,489 | | | $ | 113,538 | | | $ | 90,776 | | | $ | 22,586 | |
Ratios to average net assets: |
Net investment income (loss) | | | 0.24 | % | | | 0.10 | % | | | (0.71 | %) | | | (0.60 | %) | | | 0.08 | % |
Total expensesc | | | 1.95 | % | | | 1.77 | % | | | 1.69 | % | | | 1.77 | % | | | 1.82 | % |
Net expensesd,e | | | 1.43 | % | | | 1.32 | % | | | 1.33 | % | | | 1.33 | % | | | 1.34 | % |
Portfolio turnover rate | | | 334 | % | | | 1,054 | % | | | 922 | % | | | 509 | % | | | 990 | % |
a | Net investment income (loss) per share was computed using average shares outstanding throughout the period. |
b | Total return does not reflect the impact of any applicable sales charges. |
c | Does not include expenses of the underlying funds in which the Fund invests. |
d | Net expense information reflects the expense ratios after expense waivers and reimbursements, as applicable. |
e | Net expenses may include expenses that are excluded from the expense limitation agreement. Excluding these expenses, the net expense ratios for the years presented would be: |
| | | | 03/31/24 | | | 03/31/23 | | | 03/31/22 | | | 03/31/21 | | | 03/31/20 | |
| | Class A | | | 1.22 | % | | | 1.27 | % | | | 1.32 | % | | | 1.33 | % | | | 1.33 | % |
| | Class C | | | 1.97 | % | | | 2.02 | % | | | 2.06 | % | | | 2.08 | % | | | 2.08 | % |
| | Class H | | | 1.24 | % | | | 1.28 | % | | | 1.33 | % | | | 1.33 | % | | | 1.33 | % |
58 | THE RYDEX FUNDS ANNUAL REPORT | SEE NOTES TO FINANCIAL STATEMENTS. |
PERFORMANCE REPORT AND FUND PROFILE (Unaudited) | March 31, 2024 |
INVERSE NASDAQ-100® STRATEGY FUND
OBJECTIVE: Seeks to provide investment results that match, before fees and expenses, the performance of a specific benchmark on a daily basis. The Fund’s current benchmark is the inverse (opposite) of the performance of the NASDAQ-100® Index (the “underlying index”). The Fund does not seek to achieve its investment objective over a period of time greater than one day.
For the Reporting Period, the Inverse NASDAQ-100 Strategy Fund maintained a daily correlation of over 99% to its benchmark of -100% of the daily price movement of the NASDAQ-100 Index. The Fund Investor Class returned -23.27%, while the NASDAQ-100 Index returned 39.65% over the same time period.
The sectors that contributed the most to the return of the underlying index for the Reporting Period were Information Technology, Communication Services, and Consumer Discretionary. The only sector that detracted was Financials.
The holdings that contributed the most to the return of the underlying index were NVIDIA Corp., Microsoft Corp., and Meta Platforms, Inc. – Class A. Those that detracted the most were Tesla, Inc., Moderna, Inc., and PayPal Holdings, Inc.
Derivatives in the Fund were used to help provide exposure to the composition of the benchmark in the highest efficient manner and to provide leverage and not for hedging purposes. Derivatives performed as expected.
Due to the compounding of daily returns, the Fund’s returns over periods other than one day will likely differ in amount and possibly direction from the benchmark return for the same period. Investors should monitor their Fund holdings to ensure that they are consistent with their strategies, as frequently as daily.
The effects of compounding may cause the longer-term correlation of the Fund to its benchmark to diminish. A significant contributor to the discrepancy between the leveraged and unleveraged indices is the effect of compounding on the leveraged index, which is discussed under “A Brief Note on the Compounding of Returns” on page 6.
The Fund may invest in certain of the underlying series of Guggenheim Funds Trust and Guggenheim Strategy Funds Trust, including Guggenheim Ultra Short Duration, Guggenheim Strategy Fund II, and Guggenheim Strategy Fund III (collectively, the “Short Term Investment Vehicles”), each of which are open-end management investment companies managed by Guggenheim Investments. The Short Term Investment Vehicles, which launched on March 11, 2014, are offered as short term investment options only to mutual funds, trusts, and other accounts managed by Guggenheim Investments and/or its affiliates, and are not available to the public, with the exception of Guggenheim Ultra Short Duration Fund, which is available to the public. Guggenheim Strategy Fund II and Guggenheim Strategy Fund III do not charge an investment management fee. Guggenheim Ultra Short Duration Fund charges an investment management fee, but the Fund’s adviser has agreed to waive fees to the extent necessary to offset the proportionate share of any management fee paid by the Fund with respect to its investment in such affiliated fund. For the Reporting Period, investment in the Short Term Investment Vehicles contributed to Fund performance.
Performance displayed represents past performance, which is no guarantee of future results.
Holdings Diversification (Market Exposure as % of Net Assets)
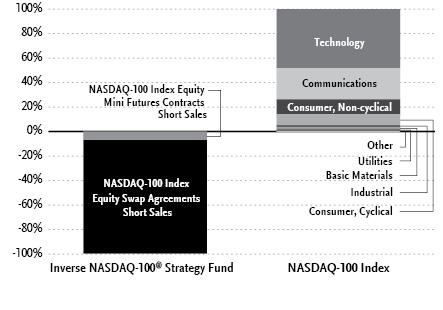
“Holdings Diversification (Market Exposure as % of Net Assets)” excludes any temporary cash investments, investments in Guggenheim Strategy Funds Trust mutual funds, or investments in Guggenheim Ultra Short Duration Fund. Investments in those Funds do not provide “market exposure” to meet the Fund’s investment objective, but will significantly increase the portfolio’s exposure to certain other asset categories (and their associated risks), which may cause the Fund to deviate from its principal investment strategy, including: (i) high yield, high risk debt securities rated below the top four long-term rating categories by a nationally recognized statistical rating organization (also known as “junk bonds”); (ii) securities issued by the U.S. government or its agencies and instrumentalities; (iii) CLOs and similar investments; and (iv) other short-term fixed income securities.
| | THE RYDEX FUNDS ANNUAL REPORT | 59 |
PERFORMANCE REPORT AND FUND PROFILE (Unaudited)(concluded) | March 31, 2024 |
Inception Dates: |
Investor Class | September 3, 1998 |
Class A | March 31, 2004 |
Class C | March 7, 2001 |
Class H | September 18, 2014 |
Cumulative Fund Performance*
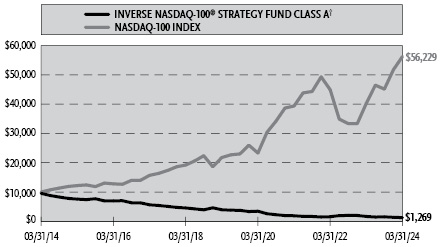

The Fund invests principally in derivative investments such as swap agreements and futures contracts.
Largest Holdings | % of Total Net Assets |
Guggenheim Strategy Fund II | 7.2% |
Guggenheim Ultra Short Duration Fund — Institutional Class | 5.1% |
Total | 12.3% |
| | |
“Largest Holdings” excludes any temporary cash or derivative investments. |
Average Annual Returns*
Periods Ended March 31, 2024
| 1 Year | 5 Year | 10 Year |
Investor Class Shares | (23.27%) | (20.09%) | (18.16%) |
Class A Shares | (23.51%) | (20.30%) | (18.26%) |
Class A Shares with sales charge† | (27.14%) | (21.07%) | (18.66%) |
Class C Shares | (24.06%) | (20.89%) | (18.98%) |
Class C Shares with CDSC‡ | (24.78%) | (20.89%) | (18.98%) |
NASDAQ-100 Index | 39.65% | 20.90% | 18.85% |
| 1 Year | 5 Year | Since
Inception
(09/18/14) |
Class H Shares | (23.41%) | (20.29%) | (17.89%) |
NASDAQ-100 Index | 39.65% | 20.90% | 18.14% |
* | The performance data above represents past performance that is not predictive of future results. The investment return and principal value of an investment in the Fund will fluctuate so that an investor’s shares, when redeemed, may be worth more or less than their original cost. Returns are historical and include changes in principal and reinvested dividends and capital gains and do not reflect the effect of taxes. The NASDAQ-100 Index is an unmanaged index and, unlike the Fund, has no management fees or operating expenses to reduce its reported return. The graphs are based on Investor Class shares and Class A shares only; performance for Class C shares and Class H shares will vary due to differences in fee structures. |
† | Fund returns are calculated using the maximum sales charge of 4.75%. |
‡ | Fund returns include a CDSC of 1% if redeemed within 12 months of purchase. |
60 | THE RYDEX FUNDS ANNUAL REPORT | |
SCHEDULE OF INVESTMENTS | March 31, 2024 |
INVERSE NASDAQ-100® STRATEGY FUND | |
| | Shares | | | Value | |
MUTUAL FUNDS† - 12.3% |
Guggenheim Strategy Fund II1 | | | 49,399 | | | $ | 1,215,224 | |
Guggenheim Ultra Short Duration Fund — Institutional Class1 | | | 87,169 | | | | 863,841 | |
Total Mutual Funds | | | | |
(Cost $2,033,556) | | | | | | | 2,079,065 | |
| | | Face
Amount | | | | | |
U.S. TREASURY BILLS†† - 24.0% |
U.S. Treasury Bills |
5.28% due 04/18/242 | | $ | 1,700,000 | | | | 1,695,774 | |
5.27% due 04/30/242 | | | 1,500,000 | | | | 1,493,646 | |
5.25% due 04/23/242,3 | | | 500,000 | | | | 498,390 | |
5.27% due 04/23/242,3 | | | 250,000 | | | | 249,195 | |
5.26% due 04/23/242,3 | | | 100,000 | | | | 99,678 | |
5.17% due 04/16/242,4 | | | 17,000 | | | | 16,963 | |
Total U.S. Treasury Bills | | | | |
(Cost $4,053,624) | | | | | | | 4,053,646 | |
| | | | | | | | | |
FEDERAL AGENCY NOTES†† - 4.7% |
Federal Home Loan Bank |
5.40% (SOFR + 0.07%, Rate Floor: 0.00%) due 06/17/24◊ | | | 800,000 | | | | 800,099 | |
Total Federal Agency Notes | | | | |
(Cost $800,000) | | | | | | | 800,099 | |
| | | | | | | | | |
REPURCHASE AGREEMENTS††,5 - 62.1% |
J.P. Morgan Securities LLC
issued 03/28/24 at 5.31%
due 04/01/243 | | | 6,051,064 | | | | 6,051,064 | |
BofA Securities, Inc.
issued 03/28/24 at 5.31%
due 04/01/243 | | | 2,327,332 | | | | 2,327,332 | |
Barclays Capital, Inc.
issued 03/28/24 at 5.30%
due 04/01/243 | | | 2,109,526 | | | | 2,109,526 | |
Total Repurchase Agreements | | | | |
(Cost $10,487,922) | | | | | | | 10,487,922 | |
| | | | | | | | | |
Total Investments - 103.1% | | | | |
(Cost $17,375,102) | | $ | 17,420,732 | |
Other Assets & Liabilities, net - (3.1)% | | | (525,322 | ) |
Total Net Assets - 100.0% | | $ | 16,895,410 | |
Futures Contracts |
Description | | Number of
Contracts | | | Expiration
Date | | | Notional
Amount | | | Value and
Unrealized
Depreciation** | |
Equity Futures Contracts Sold Short† |
NASDAQ-100 Index Mini Futures Contracts | | | 3 | | | | Jun 2024 | | | $ | 1,107,750 | | | $ | (14,747 | ) |
Total Return Swap Agreements |
Counterparty | Index | Type | | Financing
Rate | | Payment
Frequency | | | Maturity
Date | | | Units | | | Notional
Amount | | | Value and
Unrealized
Depreciation | |
OTC Equity Index Swap Agreements Sold Short†† |
Goldman Sachs International | NASDAQ-100 Index | Receive | | 5.63% (Federal
Funds Rate +
0.30%) | | | At Maturity | | | | 06/26/24 | | | | 219 | | | $ | 3,996,118 | | | $ | (3,180 | ) |
BNP Paribas | NASDAQ-100 Index | Receive | | 5.58% (Federal
Funds Rate +
0.25%) | | | At Maturity | | | | 06/26/24 | | | | 349 | | | | 6,375,056 | | | | (5,106 | ) |
Barclays Bank plc | NASDAQ-100 Index | Receive | | 5.68% (SOFR +
0.35%) | | | At Maturity | | | | 06/25/24 | | | | 293 | | | | 5,356,497 | | | | (61,983 | ) |
| | | | | | | | | | | | | | | | | | | $ | 15,727,671 | | | $ | (70,269 | ) |
SEE NOTES TO FINANCIAL STATEMENTS. | THE RYDEX FUNDS ANNUAL REPORT | 61 |
SCHEDULE OF INVESTMENTS (continued) | March 31, 2024 |
INVERSE NASDAQ-100® STRATEGY FUND | |
** | Includes cumulative appreciation (depreciation). Variation margin is reported within the Statement of Assets and Liabilities. |
† | Value determined based on Level 1 inputs — See Note 4. |
†† | Value determined based on Level 2 inputs — See Note 4. |
◊ | Variable rate security. Rate indicated is the rate effective at March 31, 2024. In some instances, the effective rate is limited by a minimum rate floor or a maximum rate cap established by the issuer. The settlement status of a position may also impact the effective rate indicated. In some cases, a position may be unsettled at period end and may not have a stated effective rate. In instances where multiple underlying reference rates and spread amounts are shown, the effective rate is based on a weighted average. |
1 | Affiliated issuer. |
2 | Rate indicated is the effective yield at the time of purchase. |
3 | All or a portion of this security is pledged as equity index swap collateral at March 31, 2024. |
4 | All or a portion of this security is pledged as futures collateral at March 31, 2024. |
5 | Repurchase Agreements — See Note 6. |
| | plc — Public Limited Company |
| | SOFR — Secured Overnight Financing Rate |
| | |
| | See Sector Classification in Other Information section. |
The following table summarizes the inputs used to value the Fund’s investments at March 31, 2024 (See Note 4 in the Notes to Financial Statements):
Investments in Securities (Assets) | | Level 1
Quoted
Prices | | | Level 2
Significant
Observable
Inputs | | | Level 3
Significant
Unobservable
Inputs | | | Total | |
Mutual Funds | | $ | 2,079,065 | | | $ | — | | | $ | — | | | $ | 2,079,065 | |
U.S. Treasury Bills | | | — | | | | 4,053,646 | | | | — | | | | 4,053,646 | |
Federal Agency Notes | | | — | | | | 800,099 | | | | — | | | | 800,099 | |
Repurchase Agreements | | | — | | | | 10,487,922 | | | | — | | | | 10,487,922 | |
Total Assets | | $ | 2,079,065 | | | $ | 15,341,667 | | | $ | — | | | $ | 17,420,732 | |
Investments in Securities (Liabilities) | | Level 1
Quoted
Prices | | | Level 2
Significant
Observable
Inputs | | | Level 3
Significant
Unobservable
Inputs | | | Total | |
Equity Futures Contracts** | | $ | 14,747 | | | $ | — | | | $ | — | | | $ | 14,747 | |
Equity Index Swap Agreements** | | | — | | | | 70,269 | | | | — | | | | 70,269 | |
Total Liabilities | | $ | 14,747 | | | $ | 70,269 | | | $ | — | | | $ | 85,016 | |
** | This derivative is reported as unrealized appreciation/depreciation at period end. |
62 | THE RYDEX FUNDS ANNUAL REPORT | SEE NOTES TO FINANCIAL STATEMENTS. |
SCHEDULE OF INVESTMENTS (concluded) | March 31, 2024 |
INVERSE NASDAQ-100® STRATEGY FUND | |
Affiliated Transactions
Investments representing 5% or more of the outstanding voting shares of a company, or control of or by, or common control under Guggenheim Investments (“GI”), result in that company being considered an affiliated issuer, as defined in the 1940 Act.
The Fund may invest in certain of the underlying series of Guggenheim Strategy Funds Trust, including Guggenheim Strategy Fund II and Guggenheim Strategy Fund III (collectively, the “Guggenheim Strategy Funds”), each of which are open-end management investment companies managed by GI. The Guggenheim Strategy Funds, which launched on March 11, 2014, are offered as short term investment options only to mutual funds, trusts, and other accounts managed by GI and/or its affiliates, and are not available to the public. The Guggenheim Strategy Funds pay no investment management fees. The Guggenheim Strategy Funds’ annual report on Form N-CSR dated September 30, 2023 is available publicly or upon request. This information is available from the EDGAR database on the SEC’s website at https://www.sec.gov/Archives/edgar/data/1601445/000182126823000217/gug86449-ncsr.htm. The Fund may invest in certain of the underlying series of Guggenheim Funds Trust, which are open-end management investment companies managed by GI, are available to the public and whose most recent annual report on Form N-CSR is available publicly or upon request.
Transactions during the year ended March 31, 2024, in which the company is an affiliated issuer, were as follows:
Security Name | | Value
03/31/23 | | | Additions | | | Reductions | | | Realized
Gain (Loss) | | | Change in
Unrealized
Appreciation
(Depreciation) | | | Value
03/31/24 | | | Shares
03/31/24 | | | Investment
Income | |
Mutual Funds | | | | | | | | | | | | | | | | | | | | | | | | | | | | | | | | |
Guggenheim Strategy Fund II | | $ | 1,195,958 | | | $ | — | | | $ | — | | | $ | — | | | $ | 19,266 | | | $ | 1,215,224 | | | | 49,399 | | | $ | 67,020 | |
Guggenheim Ultra Short Duration Fund — Institutional Class | | | 846,408 | | | | — | | | | — | | | | — | | | | 17,433 | | | | 863,841 | | | | 87,169 | | | | 46,420 | |
| | | $ | 2,042,366 | | | $ | — | | | $ | — | | | $ | — | | | $ | 36,699 | | | $ | 2,079,065 | | | | | | | $ | 113,440 | |
SEE NOTES TO FINANCIAL STATEMENTS. | THE RYDEX FUNDS ANNUAL REPORT | 63 |
INVERSE NASDAQ-100® STRATEGY FUND | |
STATEMENT OF ASSETS AND LIABILITIES |
March 31, 2024 |
Assets: |
Investments in unaffiliated issuers, at value (cost $4,853,624) | | $ | 4,853,745 | |
Investments in affiliated issuers, at value (cost $2,033,556) | | | 2,079,065 | |
Repurchase agreements, at value (cost $10,487,922) | | | 10,487,922 | |
Segregated cash with broker | | | 46,232 | |
Receivables: |
Fund shares sold | | | 109,794 | |
Swap settlement | | | 13,814 | |
Dividends | | | 9,511 | |
Interest | | | 7,981 | |
Variation margin on futures contracts | | | 2,475 | |
Total assets | | | 17,610,539 | |
| | | | | |
Liabilities: |
Unrealized depreciation on OTC swap agreements | | | 70,269 | |
Payable for: |
Fund shares redeemed | | | 606,178 | |
Management fees | | | 13,092 | |
Transfer agent fees | | | 7,165 | |
Portfolio accounting and administration fees | | | 774 | |
Distribution and service fees | | | 530 | |
Trustees’ fees* | | | 172 | |
Miscellaneous | | | 16,949 | |
Total liabilities | | | 715,129 | |
Net assets | | $ | 16,895,410 | |
| | | | | |
Net assets consist of: |
Paid in capital | | $ | 97,662,131 | |
Total distributable earnings (loss) | | | (80,766,721 | ) |
Net assets | | $ | 16,895,410 | |
| | | | | |
Investor Class : |
Net assets | | $ | 15,567,629 | |
Capital shares outstanding | | | 921,385 | |
Net asset value per share | | $ | 16.90 | |
Class A: |
Net assets | | $ | 835,675 | |
Capital shares outstanding | | | 51,833 | |
Net asset value per share | | $ | 16.12 | |
Maximum offering price per share (Net asset value divided by 95.25%) | | $ | 16.92 | |
Class C: |
Net assets | | $ | 159,912 | |
Capital shares outstanding | | | 12,272 | |
Net asset value per share | | $ | 13.03 | |
Class H: |
Net assets | | $ | 332,194 | |
Capital shares outstanding | | | 20,937 | |
Net asset value per share | | $ | 15.87 | |
STATEMENT OF OPERATIONS |
Year Ended March 31, 2024 |
Investment Income: |
Dividends from securities of affiliated issuers | | $ | 113,440 | |
Interest | | | 1,061,735 | |
Total investment income | | | 1,175,175 | |
| | | | | |
Expenses: |
Management fees | | | 192,688 | |
Distribution and service fees: |
Class A | | | 3,289 | |
Class C | | | 2,362 | |
Class H | | | 1,493 | |
Transfer agent fees | | | 46,826 | |
Portfolio accounting and administration fees | | | 32,637 | |
Registration fees | | | 24,556 | |
Professional fees | | | 9,087 | |
Interest expense | | | 4,784 | |
Trustees’ fees* | | | 4,501 | |
Custodian fees | | | 2,970 | |
Miscellaneous | | | 11,656 | |
Total expenses | | | 336,849 | |
Less: |
Expenses reimbursed by Adviser | | | (16,926 | ) |
Expenses waived by Adviser | | | (2,135 | ) |
Total waived/reimbursed expenses | | | (19,061 | ) |
Net expenses | | | 317,788 | |
Net investment income | | | 857,387 | |
| | | | | |
Net Realized and Unrealized Gain (Loss): |
Net realized gain (loss) on: |
Investments in unaffiliated issuers | | | (414 | ) |
Swap agreements | | | (7,198,979 | ) |
Futures contracts | | | (163,765 | ) |
Net realized loss | | | (7,363,158 | ) |
Net change in unrealized appreciation (depreciation) on: |
Investments in unaffiliated issuers | | | (3,986 | ) |
Investments in affiliated issuers | | | 36,699 | |
Swap agreements | | | 1,215,943 | |
Futures contracts | | | (14,747 | ) |
Net change in unrealized appreciation (depreciation) | | | 1,233,909 | |
Net realized and unrealized loss | | | (6,129,249 | ) |
Net decrease in net assets resulting from operations | | $ | (5,271,862 | ) |
* | Relates to Trustees not deemed “interested persons” within the meaning of Section 2(a)(19) of the 1940 Act. |
64 | THE RYDEX FUNDS ANNUAL REPORT | SEE NOTES TO FINANCIAL STATEMENTS. |
INVERSE NASDAQ-100® STRATEGY FUND | |
STATEMENTS OF CHANGES IN NET ASSETS |
| | Year Ended
March 31,
2024 | | | Year Ended
March 31,
2023 | |
Increase (Decrease) in Net Assets from Operations: | | | | | | | | |
Net investment income | | $ | 857,387 | | | $ | 702,459 | |
Net realized loss on investments | | | (7,363,158 | ) | | | (5,682,700 | ) |
Net change in unrealized appreciation (depreciation) on investments | | | 1,233,909 | | | | (609,495 | ) |
Net decrease in net assets resulting from operations | | | (5,271,862 | ) | | | (5,589,736 | ) |
| | | | | | | | | |
Distributions to shareholders: | | | | | | | | |
Investor Class | | | (633,663 | ) | | | — | |
Class A | | | (43,792 | ) | | | — | |
Class C | | | (10,242 | ) | | | — | |
Class H | | | (14,762 | ) | | | — | |
Total distributions to shareholders | | | (702,459 | ) | | | — | |
| | | | | | | | | |
Capital share transactions: | | | | | | | | |
Proceeds from sale of shares | | | | | | | | |
Investor Class | | | 64,417,535 | | | | 524,576,731 | |
Class A | | | 3,458,929 | | | | 6,472,154 | |
Class C | | | 737,897 | | | | 258,552 | |
Class H | | | 8,247,456 | | | | 15,316,386 | |
Distributions reinvested | | | | | | | | |
Investor Class | | | 625,369 | | | | — | |
Class A | | | 43,782 | | | | — | |
Class C | | | 10,242 | | | | — | |
Class H | | | 14,762 | | | | — | |
Cost of shares redeemed | | | | | | | | |
Investor Class | | | (73,872,760 | ) | | | (503,565,331 | ) |
Class A | | | (3,531,658 | ) | | | (7,224,219 | ) |
Class C | | | (563,509 | ) | | | (1,075,097 | ) |
Class H | | | (8,405,636 | ) | | | (17,542,627 | ) |
Net increase (decrease) from capital share transactions | | | (8,817,591 | ) | | | 17,216,549 | |
Net increase (decrease) in net assets | | | (14,791,912 | ) | | | 11,626,813 | |
| | | | | | | | | |
Net assets: | | | | | | | | |
Beginning of year | | | 31,687,322 | | | | 20,060,509 | |
End of year | | $ | 16,895,410 | | | $ | 31,687,322 | |
| | | | | | | | | |
Capital share activity: | | | | | | | | |
Shares sold | | | | | | | | |
Investor Class | | | 3,193,707 | | | | 20,063,694 | |
Class A | | | 167,977 | | | | 268,140 | |
Class C | | | 44,959 | | | | 12,742 | |
Class H | | | 427,115 | | | | 617,520 | |
Shares issued from reinvestment of distributions | | | | | | | | |
Investor Class | | | 33,822 | | | | — | |
Class A | | | 2,479 | | | | — | |
Class C | | | 716 | | | | — | |
Class H | | | 849 | | | | — | |
Shares redeemed | | | | | | | | |
Investor Class | | | (3,597,299 | ) | | | (19,458,419 | ) |
Class A | | | (177,952 | ) | | | (299,089 | ) |
Class C | | | (35,610 | ) | | | (51,367 | ) |
Class H | | | (433,402 | ) | | | (715,937 | ) |
Net increase (decrease) in shares | | | (372,639 | ) | | | 437,284 | |
SEE NOTES TO FINANCIAL STATEMENTS. | THE RYDEX FUNDS ANNUAL REPORT | 65 |
INVERSE NASDAQ-100® STRATEGY FUND | |
This table is presented to show selected data for a share outstanding throughout each period and to assist shareholders in evaluating a Fund’s performance for the periods presented.
Investor Class | | Year Ended
March 31,
2024 | | | Year Ended
March 31,
2023 | | | Year Ended
March 31,
2022 | | | Year Ended
March 31,
2021 | | | Year Ended
March 31,
2020 | |
Per Share Data |
Net asset value, beginning of period | | $ | 23.05 | | | $ | 21.73 | | | $ | 26.17 | | | $ | 47.65 | | | $ | 54.72 | |
Income (loss) from investment operations: |
Net investment income (loss)a | | | .81 | | | | .40 | | | | (.28 | ) | | | (.40 | ) | | | .09 | |
Net gain (loss) on investments (realized and unrealized) | | | (6.09 | ) | | | .92 | e | | | (4.16 | ) | | | (21.05 | ) | | | (6.83 | ) |
Total from investment operations | | | (5.28 | ) | | | 1.32 | | | | (4.44 | ) | | | (21.45 | ) | | | (6.74 | ) |
Less distributions from: |
Net investment income | | | (.87 | ) | | | — | | | | — | | | | (.03 | ) | | | (.33 | ) |
Total distributions | | | (.87 | ) | | | — | | | | — | | | | (.03 | ) | | | (.33 | ) |
Net asset value, end of period | | $ | 16.90 | | | $ | 23.05 | | | $ | 21.73 | | | $ | 26.17 | | | $ | 47.65 | |
|
Total Return | | | (23.27 | %) | | | 6.07 | % | | | (16.97 | %) | | | (45.03 | %) | | | (12.32 | %) |
Ratios/Supplemental Data |
Net assets, end of period (in thousands) | | $ | 15,568 | | | $ | 29,762 | | | $ | 14,902 | | | $ | 26,018 | | | $ | 59,321 | |
Ratios to average net assets: |
Net investment income (loss) | | | 4.04 | % | | | 1.55 | % | | | (1.22 | %) | | | (1.28 | %) | | | 0.17 | % |
Total expensesb | | | 1.54 | % | | | 1.59 | % | | | 1.46 | % | | | 1.54 | % | | | 1.57 | % |
Net expensesc | | | 1.45 | % | | | 1.55 | % | | | 1.44 | % | | | 1.52 | % | | | 1.54 | % |
Portfolio turnover rate | | | — | | | | — | | | | 23 | % | | | 37 | % | | | 37 | % |
Class A | | Year Ended
March 31,
2024 | | | Year Ended
March 31,
2023 | | | Year Ended
March 31,
2022 | | | Year Ended
March 31,
2021 | | | Year Ended
March 31,
2020 | |
Per Share Data |
Net asset value, beginning of period | | $ | 22.10 | | | $ | 20.88 | | | $ | 25.22 | | | $ | 46.04 | | | $ | 53.01 | |
Income (loss) from investment operations: |
Net investment income (loss)a | | | .74 | | | | .33 | | | | (.31 | ) | | | (.45 | ) | | | .19 | |
Net gain (loss) on investments (realized and unrealized) | | | (5.85 | ) | | | .89 | e | | | (4.03 | ) | | | (20.34 | ) | | | (6.83 | ) |
Total from investment operations | | | (5.11 | ) | | | 1.22 | | | | (4.34 | ) | | | (20.79 | ) | | | (6.64 | ) |
Less distributions from: |
Net investment income | | | (.87 | ) | | | — | | | | — | | | | (.03 | ) | | | (.33 | ) |
Total distributions | | | (.87 | ) | | | — | | | | — | | | | (.03 | ) | | | (.33 | ) |
Net asset value, end of period | | $ | 16.12 | | | $ | 22.10 | | | $ | 20.88 | | | $ | 25.22 | | | $ | 46.04 | |
|
Total Returnd | | | (23.51 | %) | | | 5.84 | % | | | (17.21 | %) | | | (45.17 | %) | | | (12.53 | %) |
Ratios/Supplemental Data |
Net assets, end of period (in thousands) | | $ | 836 | | | $ | 1,311 | | | $ | 1,885 | | | $ | 1,489 | | | $ | 523 | |
Ratios to average net assets: |
Net investment income (loss) | | | 3.80 | % | | | 1.35 | % | | | (1.41 | %) | | | (1.51 | %) | | | 0.39 | % |
Total expensesb | | | 1.78 | % | | | 1.82 | % | | | 1.70 | % | | | 1.78 | % | | | 1.81 | % |
Net expensesc | | | 1.69 | % | | | 1.78 | % | | | 1.68 | % | | | 1.76 | % | | | 1.76 | % |
Portfolio turnover rate | | | — | | | | — | | | | 23 | % | | | 37 | % | | | 37 | % |
66 | THE RYDEX FUNDS ANNUAL REPORT | SEE NOTES TO FINANCIAL STATEMENTS. |
INVERSE NASDAQ-100® STRATEGY FUND | |
FINANCIAL HIGHLIGHTS (continued) |
This table is presented to show selected data for a share outstanding throughout each period and to assist shareholders in evaluating a Fund’s performance for the periods presented.
Class C | | Year Ended
March 31,
2024 | | | Year Ended
March 31,
2023 | | | Year Ended
March 31,
2022 | | | Year Ended
March 31,
2021 | | | Year Ended
March 31,
2020 | |
Per Share Data |
Net asset value, beginning of period | | $ | 18.19 | | | $ | 17.31 | | | $ | 21.07 | | | $ | 38.76 | | | $ | 45.03 | |
Income (loss) from investment operations: |
Net investment income (loss)a | | | .48 | | | | (.24 | ) | | | (.38 | ) | | | (.60 | ) | | | (.17 | ) |
Net gain (loss) on investments (realized and unrealized) | | | (4.77 | ) | | | 1.12 | e | | | (3.38 | ) | | | (17.06 | ) | | | (5.77 | ) |
Total from investment operations | | | (4.29 | ) | | | .88 | | | | (3.76 | ) | | | (17.66 | ) | | | (5.94 | ) |
Less distributions from: |
Net investment income | | | (.87 | ) | | | — | | | | — | | | | (.03 | ) | | | (.33 | ) |
Total distributions | | | (.87 | ) | | | — | | | | — | | | | (.03 | ) | | | (.33 | ) |
Net asset value, end of period | | $ | 13.03 | | | $ | 18.19 | | | $ | 17.31 | | | $ | 21.07 | | | $ | 38.76 | |
|
Total Returnd | | | (24.06 | %) | | | 5.08 | % | | | (17.85 | %) | | | (45.58 | %) | | | (13.19 | %) |
Ratios/Supplemental Data |
Net assets, end of period (in thousands) | | $ | 160 | | | $ | 40 | | | $ | 707 | | | $ | 73 | | | $ | 234 | |
Ratios to average net assets: |
Net investment income (loss) | | | 3.10 | % | | | (1.22 | %) | | | (2.16 | %) | | | (2.26 | %) | | | (0.41 | %) |
Total expensesb | | | 2.55 | % | | | 2.56 | % | | | 2.45 | % | | | 2.55 | % | | | 2.57 | % |
Net expensesc | | | 2.46 | % | | | 2.55 | % | | | 2.43 | % | | | 2.54 | % | | | 2.53 | % |
Portfolio turnover rate | | | — | | | | — | | | | 23 | % | | | 37 | % | | | 37 | % |
SEE NOTES TO FINANCIAL STATEMENTS. | THE RYDEX FUNDS ANNUAL REPORT | 67 |
INVERSE NASDAQ-100® STRATEGY FUND | |
FINANCIAL HIGHLIGHTS (concluded) |
This table is presented to show selected data for a share outstanding throughout each period and to assist shareholders in evaluating a Fund’s performance for the periods presented.
Class H | | Year Ended
March 31,
2024 | | | Year Ended
March 31,
2023 | | | Year Ended
March 31,
2022 | | | Year Ended
March 31,
2021 | | | Year Ended
March 31,
2020 | |
Per Share Data |
Net asset value, beginning of period | | $ | 21.77 | | | $ | 20.57 | | | $ | 24.83 | | | $ | 45.36 | | | $ | 52.24 | |
Income (loss) from investment operations: |
Net investment income (loss)a | | | .71 | | | | .09 | | | | (.32 | ) | | | (.46 | ) | | | (.02 | ) |
Net gain (loss) on investments (realized and unrealized) | | | (5.74 | ) | | | 1.11 | e | | | (3.94 | ) | | | (20.04 | ) | | | (6.53 | ) |
Total from investment operations | | | (5.03 | ) | | | 1.20 | | | | (4.26 | ) | | | (20.50 | ) | | | (6.55 | ) |
Less distributions from: |
Net investment income | | | (.87 | ) | | | — | | | | — | | | | (.03 | ) | | | (.33 | ) |
Total distributions | | | (.87 | ) | | | — | | | | — | | | | (.03 | ) | | | (.33 | ) |
Net asset value, end of period | | $ | 15.87 | | | $ | 21.77 | | | $ | 20.57 | | | $ | 24.83 | | | $ | 45.36 | |
|
Total Return | | | (23.41 | %) | | | 5.83 | % | | | (17.16 | %) | | | (45.21 | %) | | | (12.54 | %) |
Ratios/Supplemental Data |
Net assets, end of period (in thousands) | | $ | 332 | | | $ | 574 | | | $ | 2,567 | | | $ | 337 | | | $ | 583 | |
Ratios to average net assets: |
Net investment income (loss) | | | 3.79 | % | | | 0.39 | % | | | (1.49 | %) | | | (1.51 | %) | | | (0.05 | %) |
Total expensesb | | | 1.80 | % | | | 1.83 | % | | | 1.72 | % | | | 1.79 | % | | | 1.82 | % |
Net expensesc | | | 1.71 | % | | | 1.80 | % | | | 1.71 | % | | | 1.78 | % | | | 1.79 | % |
Portfolio turnover rate | | | — | | | | — | | | | 23 | % | | | 37 | % | | | 37 | % |
a | Net investment income (loss) per share was computed using average shares outstanding throughout the period. |
b | Does not include expenses of the underlying funds in which the Fund invests. |
c | Net expense information reflects the expense ratios after expense waivers and reimbursements, as applicable. |
d | Total return does not reflect the impact of any applicable sales charges. |
e | The amount shown for a share outstanding throughout the period does not agree with the aggregate net loss on investments for the year because of the sales and repurchases of fund shares in relation to fluctuating market value of the investments of the Fund. |
68 | THE RYDEX FUNDS ANNUAL REPORT | SEE NOTES TO FINANCIAL STATEMENTS. |
PERFORMANCE REPORT AND FUND PROFILE (Unaudited) | March 31, 2024 |
MID-CAP 1.5x STRATEGY FUND
OBJECTIVE: Seeks to provide investment results that correlate, before fees and expenses, to the performance of a specific benchmark for mid-cap securities on a daily basis. The Fund’s current benchmark is 150% of the performance of the S&P MidCap 400® Index (the “underlying index”). The Fund does not seek to achieve its investment objective over a period of time greater than one day.
For the Reporting Period, the Mid-Cap 1.5x Strategy Fund maintained a correlation of more than 99% to its benchmark of 150% of the daily price movement of the S&P MidCap 400 Index. The Fund H Class returned 30.16%, while the S&P MidCap 400 Index returned 23.33% over the same period.
The sectors that contributed the most to the return of the underlying index for the Reporting Period were Industrials, Consumer Discretionary, and Financials. The only sectors that detracted were Communication Services and Utilities.
The holdings that contributed the most to the return of the underlying index for the Reporting Period were Super Micro Computer, Inc., Deckers Outdoor Corp., and Williams-Sonoma, Inc. Those that detracted the most were Wolfspeed, Inc., Iridium Communications, Inc., and Lattice Semiconductor Corp.
Derivatives in the Fund were used to help provide exposure to the composition of the benchmark in the highest efficient manner and to provide leverage and not for hedging purposes. Derivatives performed as expected.
Due to the compounding of daily returns, the Fund’s returns over periods other than one day will likely differ in amount and possibly direction from the benchmark return for the same period. Investors should monitor their Fund holdings to ensure that they are consistent with their strategies, as frequently as daily.
The effects of compounding may cause the longer-term correlation of the Fund to its benchmark to diminish. A significant contributor to the discrepancy between the leveraged and unleveraged indices is the effect of compounding on the leveraged index, which is discussed under “A Brief Note on the Compounding of Returns” on page 6.
The Fund may invest in certain of the underlying series of Guggenheim Funds Trust and Guggenheim Strategy Funds Trust, including Guggenheim Ultra Short Duration, Guggenheim Strategy Fund II, and Guggenheim Strategy Fund III (collectively, the “Short Term Investment Vehicles”), each of which are open-end management investment companies managed by Guggenheim Investments. The Short Term Investment Vehicles, which launched on March 11, 2014, are offered as short term investment options only to mutual funds, trusts, and other accounts managed by Guggenheim Investments and/or its affiliates, and are not available to the public, with the exception of Guggenheim Ultra Short Duration Fund, which is available to the public. Guggenheim Strategy Fund II and Guggenheim Strategy Fund III do not charge an investment management fee. Guggenheim Ultra Short Duration Fund charges an investment management fee, but the Fund’s adviser has agreed to waive fees to the extent necessary to offset the proportionate share of any management fee paid by the Fund with respect to its investment in such affiliated fund. For the Reporting Period, investment in the Short Term Investment Vehicles contributed to Fund performance.
Performance displayed represents past performance, which is no guarantee of future results.
Holdings Diversification (Market Exposure as % of Net Assets)
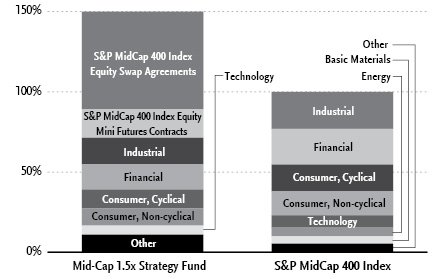
“Holdings Diversification (Market Exposure as % of Net Assets)” excludes any temporary cash investments, investments in Guggenheim Strategy Funds Trust mutual funds, or investments in Guggenheim Ultra Short Duration Fund. Investments in those Funds do not provide “market exposure” to meet the Fund’s investment objective, but will significantly increase the portfolio’s exposure to certain other asset categories (and their associated risks), which may cause the Fund to deviate from its principal investment strategy, including: (i) high yield, high risk debt securities rated below the top four long-term rating categories by a nationally recognized statistical rating organization (also known as “junk bonds”); (ii) securities issued by the U.S. government or its agencies and instrumentalities; (iii) CLOs and similar investments; and (iv) other short-term fixed income securities.
| | THE RYDEX FUNDS ANNUAL REPORT | 69 |
PERFORMANCE REPORT AND FUND PROFILE (Unaudited)(concluded) | March 31, 2024 |
Inception Dates: |
Class A | March 31, 2004 |
Class C | August 20, 2001 |
Class H | August 16, 2001 |
Cumulative Fund Performance*
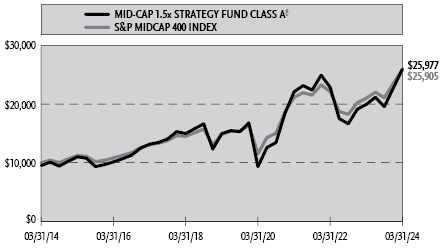
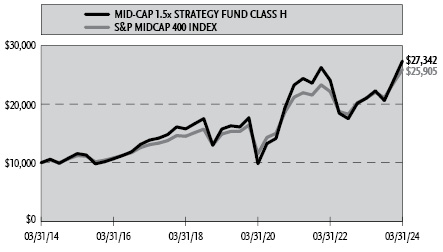
Ten Largest Holdings | % of Total Net Assets |
Guggenheim Ultra Short Duration Fund — Institutional Class | 6.4% |
Guggenheim Strategy Fund II | 1.8% |
Vistra Corp. | 0.6% |
Williams-Sonoma, Inc. | 0.5% |
Reliance, Inc. | 0.5% |
Carlisle Companies, Inc. | 0.5% |
GoDaddy, Inc. — Class A | 0.4% |
EMCOR Group, Inc. | 0.4% |
Graco, Inc. | 0.4% |
Lennox International, Inc. | 0.4% |
Top Ten Total | 11.9% |
| | |
“Ten Largest Holdings” excludes any temporary cash or derivative investments. |
Average Annual Returns*
Periods Ended March 31, 2024
| 1 Year | 5 Year | 10 Year |
Class A Shares | 30.15% | 11.67% | 10.55% |
Class A Shares with sales charge† | 23.97% | 10.59% | 10.02% |
Class C Shares | 29.20% | 10.84% | 9.73% |
Class C Shares with CDSC‡ | 28.20% | 10.84% | 9.73% |
Class H Shares | 30.16% | 11.68% | 10.58% |
S&P MidCap 400 Index | 23.33% | 11.71% | 9.99% |
* | The performance data above represents past performance that is not predictive of future results. The investment return and principal value of an investment in the Fund will fluctuate so that an investor’s shares, when redeemed, may be worth more or less than their original cost. Returns are historical and include changes in principal and reinvested dividends and capital gains and do not reflect the effect of taxes. The S&P MidCap 400 Index is an unmanaged index and, unlike the Fund, has no management fees or operating expenses to reduce its reported return. The graphs are based on Class A shares and Class H shares only; performance for Class C shares will vary due to differences in fee structures. |
† | Fund returns are calculated using the maximum sales charge of 4.75%. |
‡ | Fund returns include a CDSC of 1% if redeemed within 12 months of purchase. |
70 | THE RYDEX FUNDS ANNUAL REPORT | |
SCHEDULE OF INVESTMENTS | March 31, 2024 |
MID-CAP 1.5x STRATEGY FUND | |
| | Shares | | | Value | |
COMMON STOCKS† - 71.3% |
| | | | | | | | | |
Industrial - 16.4% |
Carlisle Companies, Inc. | | | 174 | | | $ | 68,182 | |
EMCOR Group, Inc. | | | 168 | | | | 58,834 | |
Graco, Inc. | | | 604 | | | | 56,450 | |
Lennox International, Inc. | | | 115 | | | | 56,208 | |
Saia, Inc.* | | | 95 | | | | 55,575 | |
Owens Corning | | | 318 | | | | 53,042 | |
Lincoln Electric Holdings, Inc. | | | 205 | | | | 52,365 | |
XPO, Inc.* | | | 416 | | | | 50,764 | |
TopBuild Corp.* | | | 113 | | | | 49,802 | |
AECOM | | | 487 | | | | 47,765 | |
nVent Electric plc | | | 594 | | | | 44,788 | |
Regal Rexnord Corp. | | | 237 | | | | 42,684 | |
Advanced Drainage Systems, Inc. | | | 244 | | | | 42,027 | |
Comfort Systems USA, Inc. | | | 127 | | | | 40,349 | |
ITT, Inc. | | | 294 | | | | 39,993 | |
Trex Company, Inc.* | | | 389 | | | | 38,803 | |
Fortune Brands Innovations, Inc. | | | 451 | | | | 38,186 | |
Clean Harbors, Inc.* | | | 180 | | | | 36,236 | |
Tetra Tech, Inc. | | | 191 | | | | 35,280 | |
Curtiss-Wright Corp. | | | 137 | | | | 35,064 | |
Toro Co. | | | 374 | | | | 34,269 | |
AptarGroup, Inc. | | | 236 | | | | 33,958 | |
Crown Holdings, Inc. | | | 428 | | | | 33,923 | |
BWX Technologies, Inc. | | | 328 | | | | 33,660 | |
Eagle Materials, Inc. | | | 123 | | | | 33,425 | |
Woodward, Inc. | | | 216 | | | | 33,290 | |
Donaldson Company, Inc. | | | 430 | | | | 32,112 | |
Graphic Packaging Holding Co. | | | 1,095 | | | | 31,952 | |
Knight-Swift Transportation Holdings, Inc. | | | 578 | | | | 31,802 | |
Simpson Manufacturing Company, Inc. | | | 153 | | | | 31,393 | |
Middleby Corp.* | | | 192 | | | | 30,872 | |
Acuity Brands, Inc. | | | 109 | | | | 29,292 | |
Oshkosh Corp. | | | 234 | | | | 29,182 | |
Coherent Corp.* | | | 473 | | | | 28,673 | |
RBC Bearings, Inc.* | | | 104 | | | | 28,116 | |
AGCO Corp. | | | 222 | | | | 27,310 | |
Applied Industrial Technologies, Inc. | | | 138 | | | | 27,262 | |
UFP Industries, Inc. | | | 221 | | | | 27,185 | |
Universal Display Corp. | | | 156 | | | | 26,278 | |
Cognex Corp. | | | 616 | | | | 26,131 | |
Fluor Corp.* | | | 610 | | | | 25,791 | |
MSA Safety, Inc. | | | 132 | | | | 25,554 | |
Berry Global Group, Inc. | | | 415 | | | | 25,099 | |
Vontier Corp. | | | 552 | | | | 25,039 | |
Arrow Electronics, Inc.* | | | 193 | | | | 24,986 | |
Landstar System, Inc. | | | 129 | | | | 24,866 | |
Chart Industries, Inc.* | | | 150 | | | | 24,708 | |
Crane Co. | | | 175 | | | | 23,648 | |
TD SYNNEX Corp. | | | 204 | | | | 23,072 | |
Esab Corp. | | | 203 | | | | 22,446 | |
Novanta, Inc.* | | | 128 | | | | 22,370 | |
Hexcel Corp. | | | 302 | | | | 22,000 | |
Littelfuse, Inc. | | | 89 | | | | 21,569 | |
Flowserve Corp. | | | 470 | | | | 21,469 | |
Watts Water Technologies, Inc. — Class A | | | 98 | | | | 20,830 | |
Sonoco Products Co. | | | 351 | | | | 20,302 | |
Timken Co. | | | 232 | | | | 20,284 | |
Kirby Corp.* | | | 212 | | | | 20,208 | |
MasTec, Inc.* | | | 216 | | | | 20,142 | |
Sensata Technologies Holding plc | | | 542 | | | | 19,913 | |
Louisiana-Pacific Corp. | | | 230 | | | | 19,299 | |
Ryder System, Inc. | | | 159 | | | | 19,110 | |
MDU Resources Group, Inc. | | | 729 | | | | 18,371 | |
Stericycle, Inc.* | | | 331 | | | | 17,460 | |
Valmont Industries, Inc. | | | 75 | | | | 17,121 | |
GATX Corp. | | | 127 | | | | 17,022 | |
Knife River Corp.* | | | 202 | | | | 16,378 | |
Avnet, Inc. | | | 323 | | | | 16,014 | |
Terex Corp. | | | 240 | | | | 15,456 | |
Exponent, Inc. | | | 181 | | | | 14,967 | |
Silgan Holdings, Inc. | | | 290 | | | | 14,082 | |
Belden, Inc. | | | 149 | | | | 13,799 | |
EnerSys | | | 145 | | | | 13,697 | |
Vishay Intertechnology, Inc. | | | 452 | | | | 10,251 | |
Werner Enterprises, Inc. | | | 227 | | | | 8,880 | |
Greif, Inc. — Class A | | | 91 | | | | 6,284 | |
Total Industrial | | | | | | | 2,244,969 | |
| | | | | | | | | |
Financial - 15.9% |
Fidelity National Financial, Inc. | | | 925 | | | | 49,117 | |
Reinsurance Group of America, Inc. — Class A | | | 236 | | | | 45,520 | |
RenaissanceRe Holdings Ltd. | | | 189 | | | | 44,421 | |
WP Carey, Inc. REIT | | | 783 | | | | 44,193 | |
Gaming and Leisure Properties, Inc. REIT | | | 956 | | | | 44,043 | |
Equity LifeStyle Properties, Inc. REIT | | | 667 | | | | 42,955 | |
Interactive Brokers Group, Inc. — Class A | | | 383 | | | | 42,785 | |
Equitable Holdings, Inc. | | | 1,123 | | | | 42,685 | |
American Homes 4 Rent — Class A REIT | | | 1,138 | | | | 41,856 | |
Kinsale Capital Group, Inc. | | | 79 | | | | 41,454 | |
East West Bancorp, Inc. | | | 504 | | | | 39,872 | |
Ally Financial, Inc. | | | 972 | | | | 39,453 | |
Rexford Industrial Realty, Inc. REIT | | | 754 | | | | 37,926 | |
Lamar Advertising Co. — Class A REIT | | | 313 | | | | 37,375 | |
CubeSmart REIT | | | 805 | | | | 36,402 | |
Carlyle Group, Inc. | | | 775 | | | | 36,355 | |
Erie Indemnity Co. — Class A | | | 89 | | | | 35,740 | |
Annaly Capital Management, Inc. REIT | | | 1,790 | | | | 35,245 | |
Unum Group | | | 651 | | | | 34,932 | |
Jones Lang LaSalle, Inc.* | | | 170 | | | | 33,165 | |
American Financial Group, Inc. | | | 233 | | | | 31,800 | |
Primerica, Inc. | | | 125 | | | | 31,620 | |
Webster Financial Corp. | | | 616 | | | | 31,274 | |
First Horizon Corp. | | | 2,000 | | | | 30,800 | |
EastGroup Properties, Inc. REIT | | | 171 | | | | 30,741 | |
Old Republic International Corp. | | | 933 | | | | 28,662 | |
Stifel Financial Corp. | | | 365 | | | | 28,532 | |
NNN REIT, Inc. | | | 653 | | | | 27,909 | |
Omega Healthcare Investors, Inc. REIT | | | 878 | | | | 27,806 | |
Voya Financial, Inc. | | | 369 | | | | 27,276 | |
Jefferies Financial Group, Inc. | | | 607 | | | | 26,769 | |
SEE NOTES TO FINANCIAL STATEMENTS. | THE RYDEX FUNDS ANNUAL REPORT | 71 |
SCHEDULE OF INVESTMENTS (continued) | March 31, 2024 |
MID-CAP 1.5x STRATEGY FUND | |
| | Shares | | | Value | |
Cullen/Frost Bankers, Inc. | | | 230 | | | $ | 25,891 | |
SEI Investments Co. | | | 357 | | | | 25,668 | |
Brixmor Property Group, Inc. REIT | | | 1,076 | | | | 25,232 | |
STAG Industrial, Inc. REIT | | | 650 | | | | 24,986 | |
First Industrial Realty Trust, Inc. REIT | | | 473 | | | | 24,851 | |
Houlihan Lokey, Inc. | | | 187 | | | | 23,972 | |
Evercore, Inc. — Class A | | | 124 | | | | 23,881 | |
Selective Insurance Group, Inc. | | | 217 | | | | 23,690 | |
Pinnacle Financial Partners, Inc. | | | 272 | | | | 23,359 | |
SouthState Corp. | | | 272 | | | | 23,128 | |
Zions Bancorp North America | | | 530 | | | | 23,002 | |
Wintrust Financial Corp. | | | 219 | | | | 22,861 | |
Essent Group Ltd. | | | 382 | | | | 22,733 | |
Commerce Bancshares, Inc. | | | 424 | | | | 22,557 | |
First American Financial Corp. | | | 369 | | | | 22,527 | |
Prosperity Bancshares, Inc. | | | 335 | | | | 22,036 | |
MGIC Investment Corp. | | | 975 | | | | 21,801 | |
Starwood Property Trust, Inc. REIT | | | 1,065 | | | | 21,651 | |
RLI Corp. | | | 144 | | | | 21,380 | |
Synovus Financial Corp. | | | 523 | | | | 20,951 | |
Agree Realty Corp. REIT | | | 359 | | | | 20,506 | |
Affiliated Managers Group, Inc. | | | 121 | | | | 20,264 | |
Healthcare Realty Trust, Inc. REIT | | | 1,363 | | | | 19,287 | |
Cadence Bank | | | 654 | | | | 18,966 | |
Old National Bancorp | | | 1,047 | | | | 18,228 | |
FNB Corp. | | | 1,284 | | | | 18,104 | |
Western Union Co. | | | 1,254 | | | | 17,531 | |
Hanover Insurance Group, Inc. | | | 128 | | | | 17,430 | |
United Bankshares, Inc. | | | 482 | | | | 17,251 | |
SLM Corp. | | | 788 | | | | 17,171 | |
Bank OZK | | | 377 | | | | 17,139 | |
Kite Realty Group Trust REIT | | | 785 | | | | 17,019 | |
Apartment Income REIT Corp. | | | 517 | | | | 16,787 | |
Home BancShares, Inc. | | | 671 | | | | 16,487 | |
Vornado Realty Trust REIT | | | 572 | | | | 16,456 | |
Rayonier, Inc. REIT | | | 488 | | | | 16,221 | |
Glacier Bancorp, Inc. | | | 397 | | | | 15,991 | |
Janus Henderson Group plc | | | 474 | | | | 15,590 | |
First Financial Bankshares, Inc. | | | 460 | | | | 15,093 | |
Columbia Banking System, Inc. | | | 747 | | | | 14,455 | |
Hancock Whitney Corp. | | | 308 | | | | 14,180 | |
Kilroy Realty Corp. REIT | | | 382 | | | | 13,916 | |
UMB Financial Corp. | | | 156 | | | | 13,571 | |
Kemper Corp. | | | 216 | | | | 13,375 | |
PotlatchDeltic Corp. REIT | | | 284 | | | | 13,354 | |
Park Hotels & Resorts, Inc. REIT | | | 752 | | | | 13,153 | |
Cousins Properties, Inc. REIT | | | 543 | | | | 13,054 | |
Independence Realty Trust, Inc. REIT | | | 803 | | | | 12,952 | |
Sabra Health Care REIT, Inc. | | | 828 | | | | 12,230 | |
Valley National Bancorp | | | 1,526 | | | | 12,147 | |
Brighthouse Financial, Inc.* | | | 230 | | | | 11,854 | |
EPR Properties REIT | | | 270 | | | | 11,462 | |
Associated Banc-Corp. | | | 532 | | | | 11,443 | |
National Storage Affiliates Trust REIT | | | 276 | | | | 10,808 | |
CNO Financial Group, Inc. | | | 392 | | | | 10,772 | |
International Bancshares Corp. | | | 191 | | | | 10,723 | |
Federated Hermes, Inc. — Class B | | | 292 | | | | 10,547 | |
Texas Capital Bancshares, Inc.* | | | 169 | | | | 10,402 | |
COPT Defense Properties REIT | | | 402 | | | | 9,716 | |
New York Community Bancorp, Inc.1 | | | 2,584 | | | | 8,320 | |
Total Financial | | | | | | | 2,178,795 | |
| | | | | | | | | |
Consumer, Cyclical - 11.8% |
Williams-Sonoma, Inc. | | | 230 | | | | 73,032 | |
Burlington Stores, Inc.* | | | 229 | | | | 53,172 | |
Floor & Decor Holdings, Inc. — Class A* | | | 381 | | | | 49,385 | |
Watsco, Inc. | | | 112 | | | | 48,381 | |
Toll Brothers, Inc. | | | 373 | | | | 48,255 | |
Dick’s Sporting Goods, Inc. | | | 208 | | | | 46,771 | |
Casey’s General Stores, Inc. | | | 133 | | | | 42,354 | |
Wingstop, Inc. | | | 105 | | | | 38,472 | |
Texas Roadhouse, Inc. — Class A | | | 239 | | | | 36,918 | |
BJ’s Wholesale Club Holdings, Inc.* | | | 477 | | | | 36,085 | |
Five Below, Inc.* | | | 198 | | | | 35,913 | |
Tempur Sealy International, Inc. | | | 617 | | | | 35,058 | |
Core & Main, Inc. — Class A* | | | 611 | | | | 34,980 | |
Light & Wonder, Inc. — Class A* | | | 322 | | | | 32,873 | |
Autoliv, Inc. | | | 263 | | | | 31,673 | |
Crocs, Inc.* | | | 217 | | | | 31,204 | |
Aramark | | | 939 | | | | 30,536 | |
Vail Resorts, Inc. | | | 136 | | | | 30,305 | |
Gentex Corp. | | | 835 | | | | 30,160 | |
Churchill Downs, Inc. | | | 243 | | | | 30,071 | |
PVH Corp. | | | 213 | | | | 29,950 | |
Lear Corp. | | | 204 | | | | 29,555 | |
Lithia Motors, Inc. — Class A | | | 98 | | | | 29,484 | |
Skechers USA, Inc. — Class A* | | | 478 | | | | 29,282 | |
Murphy USA, Inc. | | | 68 | | | | 28,506 | |
WESCO International, Inc. | | | 157 | | | | 26,891 | |
Hyatt Hotels Corp. — Class A | | | 158 | | | | 25,220 | |
Mattel, Inc.* | | | 1,264 | | | | 25,040 | |
Taylor Morrison Home Corp. — Class A* | | | 385 | | | | 23,936 | |
Brunswick Corp. | | | 246 | | | | 23,744 | |
Whirlpool Corp. | | | 197 | | | | 23,567 | |
Wyndham Hotels & Resorts, Inc. | | | 297 | | | | 22,795 | |
Thor Industries, Inc. | | | 191 | | | | 22,412 | |
Gap, Inc. | | | 770 | | | | 21,214 | |
Harley-Davidson, Inc. | | | 454 | | | | 19,858 | |
Macy’s, Inc. | | | 981 | | | | 19,610 | |
Planet Fitness, Inc. — Class A* | | | 306 | | | | 19,165 | |
RH* | | | 55 | | | | 19,154 | |
Polaris, Inc. | | | 190 | | | | 19,023 | |
Capri Holdings Ltd.* | | | 417 | | | | 18,890 | |
KB Home | | | 263 | | | | 18,641 | |
TKO Group Holdings, Inc. | | | 214 | | | | 18,492 | |
Dolby Laboratories, Inc. — Class A | | | 213 | | | | 17,843 | |
Ollie’s Bargain Outlet Holdings, Inc.* | | | 220 | | | | 17,506 | |
FirstCash Holdings, Inc. | | | 132 | | | | 16,835 | |
Boyd Gaming Corp. | | | 249 | | | | 16,763 | |
MSC Industrial Direct Company, Inc. — Class A | | | 164 | | | | 15,915 | |
AutoNation, Inc.* | | | 93 | | | | 15,399 | |
Goodyear Tire & Rubber Co.* | | | 1,015 | | | | 13,936 | |
72 | THE RYDEX FUNDS ANNUAL REPORT | SEE NOTES TO FINANCIAL STATEMENTS. |
SCHEDULE OF INVESTMENTS (continued) | March 31, 2024 |
MID-CAP 1.5x STRATEGY FUND | |
| | Shares | | | Value | |
Marriott Vacations Worldwide Corp. | | | 118 | | | $ | 12,712 | |
Travel + Leisure Co. | | | 259 | | | | 12,680 | |
Hilton Grand Vacations, Inc.* | | | 255 | | | | 12,038 | |
GameStop Corp. — Class A*,1 | | | 961 | | | | 12,032 | |
YETI Holdings, Inc.* | | | 311 | | | | 11,989 | |
Visteon Corp.* | | | 100 | | | | 11,761 | |
Penske Automotive Group, Inc. | | | 70 | | | | 11,339 | |
Wendy’s Co. | | | 598 | | | | 11,266 | |
Scotts Miracle-Gro Co. — Class A | | | 150 | | | | 11,188 | |
Carter’s, Inc. | | | 132 | | | | 11,178 | |
Choice Hotels International, Inc.1 | | | 88 | | | | 11,119 | |
Adient plc* | | | 327 | | | | 10,765 | |
Columbia Sportswear Co. | | | 123 | | | | 9,985 | |
Penn Entertainment, Inc.* | | | 533 | | | | 9,706 | |
Leggett & Platt, Inc. | | | 477 | | | | 9,135 | |
Fox Factory Holding Corp.* | | | 152 | | | | 7,915 | |
Nordstrom, Inc. | | | 349 | | | | 7,074 | |
Under Armour, Inc. — Class A* | | | 676 | | | | 4,989 | |
Under Armour, Inc. — Class C* | | | 683 | | | | 4,877 | |
Total Consumer, Cyclical | | | | | | | 1,617,972 | |
| | | | | | | | | |
COMMON STOCKS - 0.3% |
| | | | | | | | | |
Consumer, Non-cyclical - 10.7% |
Neurocrine Biosciences, Inc.* | | | 356 | | | | 49,100 | |
Celsius Holdings, Inc.* | | | 531 | | | | 44,031 | |
US Foods Holding Corp.* | | | 810 | | | | 43,716 | |
Shockwave Medical, Inc.* | | | 132 | | | | 42,983 | |
Performance Food Group Co.* | | | 557 | | | | 41,575 | |
Service Corporation International | | | 529 | | | | 39,257 | |
elf Beauty, Inc.* | | | 199 | | | | 39,010 | |
United Therapeutics Corp.* | | | 168 | | | | 38,593 | |
Tenet Healthcare Corp.* | | | 363 | | | | 38,155 | |
WEX, Inc.* | | | 153 | | | | 36,342 | |
Chemed Corp. | | | 54 | | | | 34,664 | |
Repligen Corp.* | | | 186 | | | | 34,209 | |
Medpace Holdings, Inc.* | | | 83 | | | | 33,545 | |
Bruker Corp. | | | 332 | | | | 31,188 | |
Penumbra, Inc.* | | | 138 | | | | 30,799 | |
Encompass Health Corp. | | | 359 | | | | 29,646 | |
Morningstar, Inc. | | | 93 | | | | 28,678 | |
BellRing Brands, Inc.* | | | 469 | | | | 27,685 | |
Ingredion, Inc. | | | 233 | | | | 27,226 | |
Jazz Pharmaceuticals plc* | | | 225 | | | | 27,095 | |
Paylocity Holding Corp.* | | | 155 | | | | 26,638 | |
Darling Ingredients, Inc.* | | | 571 | | | | 26,557 | |
FTI Consulting, Inc.* | | | 125 | | | | 26,286 | |
Acadia Healthcare Company, Inc.* | | | 330 | | | | 26,143 | |
Exelixis, Inc.* | | | 1,085 | | | | 25,747 | |
HealthEquity, Inc.* | | | 307 | | | | 25,060 | |
Cytokinetics, Inc.* | | | 351 | | | | 24,608 | |
H&R Block, Inc. | | | 499 | | | | 24,506 | |
Sprouts Farmers Market, Inc.* | | | 363 | | | | 23,406 | |
Masimo Corp.* | | | 159 | | | | 23,349 | |
GXO Logistics, Inc.* | | | 426 | | | | 22,902 | |
Globus Medical, Inc. — Class A* | | | 413 | | | | 22,153 | |
Option Care Health, Inc.* | | | 634 | | | | 21,264 | |
Valvoline, Inc.* | | | 464 | | | | 20,681 | |
Halozyme Therapeutics, Inc.* | | | 473 | | | | 19,242 | |
Post Holdings, Inc.* | | | 180 | | | | 19,130 | |
Euronet Worldwide, Inc.* | | | 157 | | | | 17,259 | |
Flowers Foods, Inc. | | | 688 | | | | 16,340 | |
Coty, Inc. — Class A* | | | 1,346 | | | | 16,098 | |
Perrigo Company plc | | | 485 | | | | 15,612 | |
Haemonetics Corp.* | | | 182 | | | | 15,534 | |
Lantheus Holdings, Inc.* | | | 245 | | | | 15,249 | |
Lancaster Colony Corp. | | | 73 | | | | 15,157 | |
Brink’s Co. | | | 161 | | | | 14,873 | |
Grand Canyon Education, Inc.* | | | 106 | | | | 14,438 | |
Coca-Cola Consolidated, Inc. | | | 17 | | | | 14,389 | |
Insperity, Inc. | | | 127 | | | | 13,921 | |
ManpowerGroup, Inc. | | | 175 | | | | 13,587 | |
Envista Holdings Corp.* | | | 614 | | | | 13,127 | |
Roivant Sciences Ltd.* | | | 1,207 | | | | 12,722 | |
Arrowhead Pharmaceuticals, Inc.* | | | 443 | | | | 12,670 | |
Azenta, Inc.* | | | 200 | | | | 12,056 | |
Progyny, Inc.* | | | 298 | | | | 11,369 | |
Neogen Corp.* | | | 705 | | | | 11,125 | |
Enovis Corp.* | | | 178 | | | | 11,116 | |
LivaNova plc* | | | 193 | | | | 10,797 | |
Amedisys, Inc.* | | | 117 | | | | 10,783 | |
Boston Beer Company, Inc. — Class A* | | | 34 | | | | 10,350 | |
Grocery Outlet Holding Corp.* | | | 355 | | | | 10,217 | |
Graham Holdings Co. — Class B | | | 13 | | | | 9,980 | |
Helen of Troy Ltd.* | | | 85 | | | | 9,795 | |
R1 RCM, Inc.* | | | 705 | | | | 9,080 | |
Integra LifeSciences Holdings Corp.* | | | 243 | | | | 8,614 | |
QuidelOrtho Corp.* | | | 177 | | | | 8,486 | |
Avis Budget Group, Inc. | | | 66 | | | | 8,082 | |
Sotera Health Co.* | | | 445 | | | | 5,344 | |
Pilgrim’s Pride Corp.* | | | 144 | | | | 4,942 | |
Hertz Global Holdings, Inc.*,1 | | | 470 | | | | 3,680 | |
Total Consumer, Non-cyclical | | | | | | | 1,471,961 | |
| | | | | | | | | |
Technology - 5.6% |
Pure Storage, Inc. — Class A* | | | 1,063 | | | | 55,265 | |
Manhattan Associates, Inc.* | | | 220 | | | | 55,051 | |
Dynatrace, Inc.* | | | 858 | | | | 39,845 | |
Lattice Semiconductor Corp.* | | | 494 | | | | 38,646 | |
Onto Innovation, Inc.* | | | 176 | | | | 31,870 | |
KBR, Inc. | | | 483 | | | | 30,748 | |
CACI International, Inc. — Class A* | | | 80 | | | | 30,306 | |
MKS Instruments, Inc. | | | 225 | | | | 29,925 | |
Science Applications International Corp. | | | 186 | | | | 24,253 | |
Rambus, Inc.* | | | 385 | | | | 23,797 | |
Dropbox, Inc. — Class A* | | | 917 | | | | 22,283 | |
Qualys, Inc.* | | | 132 | | | | 22,027 | |
Aspen Technology, Inc.* | | | 100 | | | | 21,328 | |
Genpact Ltd. | | | 591 | | | | 19,474 | |
ExlService Holdings, Inc.* | | | 590 | | | | 18,762 | |
MACOM Technology Solutions Holdings, Inc.* | | | 196 | | | | 18,745 | |
Maximus, Inc. | | | 218 | | | | 18,290 | |
Appfolio, Inc. — Class A* | | | 73 | | | | 18,012 | |
SEE NOTES TO FINANCIAL STATEMENTS. | THE RYDEX FUNDS ANNUAL REPORT | 73 |
SCHEDULE OF INVESTMENTS (continued) | March 31, 2024 |
MID-CAP 1.5x STRATEGY FUND | |
| | Shares | | | Value | |
Kyndryl Holdings, Inc.* | | | 824 | | | $ | 17,930 | |
Cirrus Logic, Inc.* | | | 193 | | | | 17,864 | |
ASGN, Inc.* | | | 169 | | | | 17,705 | |
ZoomInfo Technologies, Inc. — Class A* | | | 1,060 | | | | 16,992 | |
Silicon Laboratories, Inc.* | | | 114 | | | | 16,384 | |
CommVault Systems, Inc.* | | | 156 | | | | 15,823 | |
Power Integrations, Inc. | | | 203 | | | | 14,525 | |
Synaptics, Inc.* | | | 141 | | | | 13,756 | |
Teradata Corp.* | | | 350 | | | | 13,534 | |
Wolfspeed, Inc.* | | | 450 | | | | 13,275 | |
Amkor Technology, Inc. | | | 369 | | | | 11,896 | |
Doximity, Inc. — Class A* | | | 437 | | | | 11,760 | |
Lumentum Holdings, Inc.* | | | 241 | | | | 11,411 | |
Concentrix Corp. | | | 168 | | | | 11,125 | |
Blackbaud, Inc.* | | | 150 | | | | 11,121 | |
Crane NXT Co. | | | 173 | | | | 10,709 | |
IPG Photonics Corp.* | | | 106 | | | | 9,613 | |
Allegro MicroSystems, Inc.* | | | 256 | | | | 6,902 | |
Total Technology | | | | | | | 760,952 | |
| | | | | | | | | |
Energy - 3.8% |
Ovintiv, Inc. | | | 904 | | | | 46,918 | |
Chesapeake Energy Corp.1 | | | 398 | | | | 35,354 | |
HF Sinclair Corp. | | | 558 | | | | 33,686 | |
Weatherford International plc* | | | 259 | | | | 29,894 | |
Southwestern Energy Co.* | | | 3,942 | | | | 29,880 | |
Range Resources Corp. | | | 864 | | | | 29,748 | |
Antero Resources Corp.* | | | 1,011 | | | | 29,319 | |
Permian Resources Corp. | | | 1,647 | | | | 29,086 | |
NOV, Inc. | | | 1,410 | | | | 27,523 | |
Matador Resources Co. | | | 397 | | | | 26,508 | |
Chord Energy Corp. | | | 148 | | | | 26,380 | |
ChampionX Corp. | | | 684 | | | | 24,549 | |
Murphy Oil Corp. | | | 519 | | | | 23,718 | |
Civitas Resources, Inc. | | | 307 | | | | 23,304 | |
PBF Energy, Inc. — Class A | | | 389 | | | | 22,395 | |
DT Midstream, Inc. | | | 347 | | | | 21,202 | |
Equitrans Midstream Corp. | | | 1,551 | | | | 19,372 | |
Antero Midstream Corp. | | | 1,219 | | | | 17,139 | |
Valaris Ltd.* | | | 224 | | | | 16,858 | |
CNX Resources Corp.* | | | 543 | | | | 12,880 | |
Total Energy | | | | | | | 525,713 | |
| | | | | | | | | |
Basic Materials - 3.2% |
Reliance, Inc. | | | 206 | | | | 68,841 | |
RPM International, Inc. | | | 461 | | | | 54,836 | |
Cleveland-Cliffs, Inc.* | | | 1,783 | | | | 40,545 | |
United States Steel Corp. | | | 801 | | | | 32,665 | |
Royal Gold, Inc. | | | 235 | | | | 28,625 | |
Axalta Coating Systems Ltd.* | | | 788 | | | | 27,099 | |
Olin Corp. | | | 430 | | | | 25,284 | |
Commercial Metals Co. | | | 417 | | | | 24,507 | |
Alcoa Corp. | | | 639 | | | | 21,592 | |
Cabot Corp. | | | 198 | | | | 18,256 | |
Westlake Corp. | | | 115 | | | | 17,572 | |
Ashland, Inc. | | | 179 | | | | 17,429 | |
Arcadium Lithium plc* | | | 3,690 | | | | 15,904 | |
NewMarket Corp. | | | 25 | | | | 15,866 | |
Avient Corp. | | | 326 | | | | 14,148 | |
Chemours Co. | | | 531 | | | | 13,944 | |
MP Materials Corp.* | | | 515 | | | | 7,365 | |
Total Basic Materials | | | | | | | 444,478 | |
| | | | | | | | | |
Utilities - 2.4% |
Vistra Corp. | | | 1,203 | | | | 83,789 | |
Essential Utilities, Inc. | | | 900 | | | | 33,345 | |
OGE Energy Corp. | | | 717 | | | | 24,593 | |
UGI Corp. | | | 750 | | | | 18,405 | |
National Fuel Gas Co. | | | 330 | | | | 17,728 | |
IDACORP, Inc. | | | 181 | | | | 16,813 | |
Southwest Gas Holdings, Inc. | | | 215 | | | | 16,368 | |
Portland General Electric Co. | | | 362 | | | | 15,204 | |
New Jersey Resources Corp. | | | 352 | | | | 15,104 | |
Black Hills Corp. | | | 243 | | | | 13,268 | |
ONE Gas, Inc. | | | 198 | | | | 12,777 | |
Ormat Technologies, Inc. | | | 192 | | | | 12,708 | |
ALLETE, Inc. | | | 206 | | | | 12,286 | |
Spire, Inc. | | | 197 | | | | 12,090 | |
PNM Resources, Inc. | | | 307 | | | | 11,555 | |
Northwestern Energy Group, Inc. | | | 219 | | | | 11,154 | |
Total Utilities | | | | | | | 327,187 | |
| | | | | | | | | |
Communications - 1.4% |
GoDaddy, Inc. — Class A* | | | 504 | | | | 59,815 | |
Ciena Corp.* | | | 519 | | | | 25,665 | |
New York Times Co. — Class A | | | 586 | | | | 25,327 | |
Nexstar Media Group, Inc. — Class A | | | 115 | | | | 19,813 | |
Frontier Communications Parent, Inc.* | | | 792 | | | | 19,404 | |
Iridium Communications, Inc. | | | 443 | | | | 11,589 | |
TEGNA, Inc. | | | 705 | | | | 10,533 | |
Ziff Davis, Inc.* | | | 165 | | | | 10,401 | |
Cable One, Inc. | | | 16 | | | | 6,770 | |
Total Communications | | | | | | | 189,317 | |
Total Common Stocks | | | | |
(Cost $7,052,180) | | | | | | | 9,761,344 | |
| | | | | | | | | |
MUTUAL FUNDS† - 8.2% |
Guggenheim Ultra Short Duration Fund — Institutional Class2 | | | 88,750 | | | | 879,517 | |
Guggenheim Strategy Fund II2 | | | 9,844 | | | | 242,153 | |
Total Mutual Funds | | | | |
(Cost $1,123,599) | | | | | | | 1,121,670 | |
| | | Face
Amount | | | | | |
U.S. TREASURY BILLS†† - 2.5% |
U.S. Treasury Bills |
5.25% due 04/23/243,4 | | $ | 200,000 | | | | 199,356 | |
5.17% due 04/16/244,5 | | | 91,000 | | | | 90,800 | |
5.27% due 04/23/243,4 | | | 50,000 | | | | 49,839 | |
Total U.S. Treasury Bills | | | | |
(Cost $339,998) | | | | | | | 339,995 | |
74 | THE RYDEX FUNDS ANNUAL REPORT | SEE NOTES TO FINANCIAL STATEMENTS. |
SCHEDULE OF INVESTMENTS (continued) | March 31, 2024 |
MID-CAP 1.5x STRATEGY FUND | |
| | Face
Amount | | | Value | |
REPURCHASE AGREEMENTS††,6 - 16.8% |
J.P. Morgan Securities LLC
issued 03/28/24 at 5.31%
due 04/01/243 | | $ | 1,325,528 | | | $ | 1,325,528 | |
BofA Securities, Inc.
issued 03/28/24 at 5.31%
due 04/01/243 | | | 509,819 | | | | 509,819 | |
Barclays Capital, Inc.
issued 03/28/24 at 5.30%
due 04/01/243 | | | 462,106 | | | | 462,106 | |
Total Repurchase Agreements | | | | |
(Cost $2,297,453) | | | | | | $ | 2,297,453 | |
| | | | | | | | | |
| | Shares | | | | |
SECURITIES LENDING COLLATERAL†,7 - 0.4% |
Money Market Fund | | | | | | | | |
First American Government Obligations Fund - Class X, 5.23%8 | | | 53,198 | | | | 53,198 | |
Total Securities Lending Collateral | | | | |
(Cost $53,198) | | | | | | | 53,198 | |
| | | | | | | | | |
Total Investments - 99.2% | | | | |
(Cost $10,866,428) | | $ | 13,573,660 | |
Other Assets & Liabilities, net - 0.8% | | | 115,176 | |
Total Net Assets - 100.0% | | $ | 13,688,836 | |
Futures Contracts |
Description | | Number of
Contracts | | | Expiration
Date | | | Notional
Amount | | | Value and
Unrealized
Appreciation** | |
Equity Futures Contracts Purchased† |
S&P MidCap 400 Index Mini Futures Contracts | | | 8 | | | | Jun 2024 | | | $ | 2,460,640 | | | $ | 77,147 | |
Total Return Swap Agreements |
Counterparty | Index | Type | | Financing
Rate | | Payment
Frequency | | | Maturity
Date | | | Units | | | Notional
Amount | | | Value and
Unrealized
Appreciation | |
OTC Equity Index Swap Agreements†† |
Goldman Sachs International | S&P MidCap 400 Index | Pay | | 5.58% (Federal
Funds Rate +
0.25%) | | | At Maturity | | | | 06/26/24 | | 1,662 | | $ | 5,062,080 | | | $ | 107,439 | |
Barclays Bank plc | S&P MidCap 400 Index | Pay | | 5.88% (SOFR +
0.55%) | | | At Maturity | | | | 06/25/24 | | 822 | | | 2,503,685 | | | | 87,686 | |
BNP Paribas | S&P MidCap 400 Index | Pay | | 5.78% (Federal
Funds Rate +
0.45%) | | | At Maturity | | | | 06/26/24 | | 248 | | | 754,595 | | | | 16,538 | |
| | | | | | | | | | | | | | | | | | | $ | 8,320,360 | | | $ | 211,663 | |
* | Non-income producing security. |
** | Includes cumulative appreciation (depreciation). Variation margin is reported within the Statement of Assets and Liabilities. |
† | Value determined based on Level 1 inputs — See Note 4. |
†† | Value determined based on Level 2 inputs — See Note 4. |
1 | All or a portion of this security is on loan at March 31, 2024 — See Note 7. |
2 | Affiliated issuer. |
3 | All or a portion of this security is pledged as equity index swap collateral at March 31, 2024. |
4 | Rate indicated is the effective yield at the time of purchase. |
5 | All or a portion of this security is pledged as futures collateral at March 31, 2024. |
6 | Repurchase Agreements — See Note 6. |
7 | Securities lending collateral — See Note 7. |
8 | Rate indicated is the 7-day yield as of March 31, 2024. |
| | plc — Public Limited Company |
| | REIT — Real Estate Investment Trust |
| | SOFR — Secured Overnight Financing Rate |
| | |
| | See Sector Classification in Other Information section. |
SEE NOTES TO FINANCIAL STATEMENTS. | THE RYDEX FUNDS ANNUAL REPORT | 75 |
SCHEDULE OF INVESTMENTS (concluded) | March 31, 2024 |
MID-CAP 1.5x STRATEGY FUND | |
The following table summarizes the inputs used to value the Fund’s investments at March 31, 2024 (See Note 4 in the Notes to Financial Statements):
Investments in Securities (Assets) | | Level 1
Quoted
Prices | | | Level 2
Significant
Observable
Inputs | | | Level 3
Significant
Unobservable
Inputs | | | Total | |
Common Stocks | | $ | 9,761,344 | | | $ | — | | | $ | — | | | $ | 9,761,344 | |
Mutual Funds | | | 1,121,670 | | | | — | | | | — | | | | 1,121,670 | |
U.S. Treasury Bills | | | — | | | | 339,995 | | | | — | | | | 339,995 | |
Repurchase Agreements | | | — | | | | 2,297,453 | | | | — | | | | 2,297,453 | |
Securities Lending Collateral | | | 53,198 | | | | — | | | | — | | | | 53,198 | |
Equity Futures Contracts** | | | 77,147 | | | | — | | | | — | | | | 77,147 | |
Equity Index Swap Agreements** | | | — | | | | 211,663 | | | | — | | | | 211,663 | |
Total Assets | | $ | 11,013,359 | | | $ | 2,849,111 | | | $ | — | | | $ | 13,862,470 | |
** | This derivative is reported as unrealized appreciation/depreciation at period end. |
Affiliated Transactions
Investments representing 5% or more of the outstanding voting shares of a company, or control of or by, or common control under Guggenheim Investments (“GI”), result in that company being considered an affiliated issuer, as defined in the 1940 Act.
The Fund may invest in certain of the underlying series of Guggenheim Strategy Funds Trust, including Guggenheim Strategy Fund II and Guggenheim Strategy Fund III (collectively, the “Guggenheim Strategy Funds”), each of which are open-end management investment companies managed by GI. The Guggenheim Strategy Funds, which launched on March 11, 2014, are offered as short term investment options only to mutual funds, trusts, and other accounts managed by GI and/or its affiliates, and are not available to the public. The Guggenheim Strategy Funds pay no investment management fees. The Guggenheim Strategy Funds’ annual report on Form N-CSR dated September 30, 2023 is available publicly or upon request. This information is available from the EDGAR database on the SEC’s website at https://www.sec.gov/Archives/edgar/data/1601445/000182126823000217/gug86449-ncsr.htm. The Fund may invest in certain of the underlying series of Guggenheim Funds Trust, which are open-end management investment companies managed by GI, are available to the public and whose most recent annual report on Form N-CSR is available publicly or upon request.
Transactions during the year ended March 31, 2024, in which the company is an affiliated issuer, were as follows:
Security Name | | Value
03/31/23 | | | Additions | | | Reductions | | | Realized
Gain (Loss) | | | Change in
Unrealized
Appreciation
(Depreciation) | | | Value
03/31/24 | | | Shares
03/31/24 | | | Investment
Income | |
Mutual Funds | | | | | | | | | | | | | | | | | | | | | | | | | | | | | | | | |
Guggenheim Strategy Fund II | | $ | 238,314 | | | $ | — | | | $ | — | | | $ | — | | | $ | 3,839 | | | $ | 242,153 | | | | 9,844 | | | $ | 13,355 | |
Guggenheim Ultra Short Duration Fund — Institutional Class | | | 861,767 | | | | — | | | | — | | | | — | | | | 17,750 | | | | 879,517 | | | | 88,750 | | | | 47,262 | |
| | | $ | 1,100,081 | | | $ | — | | | $ | — | | | $ | — | | | $ | 21,589 | | | $ | 1,121,670 | | | | | | | $ | 60,617 | |
76 | THE RYDEX FUNDS ANNUAL REPORT | SEE NOTES TO FINANCIAL STATEMENTS. |
MID-CAP 1.5x STRATEGY FUND | |
STATEMENT OF ASSETS AND LIABILITIES |
March 31, 2024 |
Assets: |
Investments in unaffiliated issuers, at value - including $49,978 of securities loaned (cost $7,445,376) | | $ | 10,154,537 | |
Investments in affiliated issuers, at value (cost $1,123,599) | | | 1,121,670 | |
Repurchase agreements, at value (cost $2,297,453) | | | 2,297,453 | |
Cash | | | 3,076 | |
Segregated cash with broker | | | 33,506 | |
Unrealized appreciation on OTC swap agreements | | | 211,663 | |
Receivables: |
Securities sold | | | 19,048 | |
Dividends | | | 15,022 | |
Variation margin on futures contracts | | | 7,360 | |
Interest | | | 1,355 | |
Fund shares sold | | | 900 | |
Securities lending income | | | 15 | |
Total assets | | | 13,865,605 | |
| | | | | |
Liabilities: |
Segregated cash due to broker | | | 60,000 | |
Payable for: |
Return of securities lending collateral | | | 53,198 | |
Securities purchased | | | 30,750 | |
Management fees | | | 9,970 | |
Transfer agent fees | | | 5,239 | |
Distribution and service fees | | | 2,947 | |
Swap settlement | | | 1,624 | |
Fund shares redeemed | | | 1,403 | |
Portfolio accounting and administration fees | | | 592 | |
Trustees’ fees* | | | 119 | |
Miscellaneous | | | 10,927 | |
Total liabilities | | | 176,769 | |
Net assets | | $ | 13,688,836 | |
| | | | | |
Net assets consist of: |
Paid in capital | | $ | 11,595,049 | |
Total distributable earnings (loss) | | | 2,093,787 | |
Net assets | | $ | 13,688,836 | |
Class A: |
Net assets | | $ | 4,014,036 | |
Capital shares outstanding | | | 30,692 | |
Net asset value per share | | $ | 130.78 | |
Maximum offering price per share (Net asset value divided by 95.25%) | | $ | 137.30 | |
Class C: |
Net assets | | $ | 205,676 | |
Capital shares outstanding | | | 1,950 | |
Net asset value per share | | $ | 105.47 | |
Class H: |
Net assets | | $ | 9,469,124 | |
Capital shares outstanding | | | 72,071 | |
Net asset value per share | | $ | 131.39 | |
STATEMENT OF OPERATIONS |
Year Ended March 31, 2024 |
Investment Income: |
Dividends from securities of unaffiliated issuers | | $ | 135,789 | |
Dividends from securities of affiliated issuers | | | 60,617 | |
Interest | | | 102,621 | |
Income from securities lending, net | | | 590 | |
Total investment income | | | 299,617 | |
| | | | | |
Expenses: |
Management fees | | | 103,753 | |
Distribution and service fees: |
Class A | | | 8,371 | |
Class C | | | 1,890 | |
Class H | | | 19,976 | |
Transfer agent fees | | | 25,238 | |
Portfolio accounting and administration fees | | | 17,574 | |
Registration fees | | | 10,462 | |
Professional fees | | | 5,710 | |
Interest expense | | | 4,883 | |
Trustees’ fees* | | | 1,843 | |
Custodian fees | | | 1,754 | |
Line of credit fees | | | 43 | |
Miscellaneous | | | 5,585 | |
Total expenses | | | 207,082 | |
Less: |
Expenses reimbursed by Adviser | | | (9,766 | ) |
Expenses waived by Adviser | | | (2,173 | ) |
Total waived/reimbursed expenses | | | (11,939 | ) |
Net expenses | | | 195,143 | |
Net investment income | | | 104,474 | |
| | | | | |
Net Realized and Unrealized Gain (Loss): |
Net realized gain (loss) on: |
Investments in unaffiliated issuers | | | (49,263 | ) |
Swap agreements | | | 1,453,947 | |
Futures contracts | | | 242,294 | |
Net realized gain | | | 1,646,978 | |
Net change in unrealized appreciation (depreciation) on: |
Investments in unaffiliated issuers | | | 1,852,684 | |
Investments in affiliated issuers | | | 21,589 | |
Swap agreements | | | (16,611 | ) |
Futures contracts | | | 53,273 | |
Net change in unrealized appreciation (depreciation) | | | 1,910,935 | |
Net realized and unrealized gain | | | 3,557,913 | |
Net increase in net assets resulting from operations | | $ | 3,662,387 | |
* | Relates to Trustees not deemed “interested persons” within the meaning of Section 2(a)(19) of the 1940 Act. |
SEE NOTES TO FINANCIAL STATEMENTS. | THE RYDEX FUNDS ANNUAL REPORT | 77 |
MID-CAP 1.5x STRATEGY FUND | |
STATEMENTS OF CHANGES IN NET ASSETS |
| | Year Ended
March 31,
2024 | | | Year Ended
March 31,
2023 | |
Increase (Decrease) in Net Assets from Operations: | | | | | | | | |
Net investment income | | $ | 104,474 | | | $ | 44,699 | |
Net realized gain (loss) on investments | | | 1,646,978 | | | | (2,167,742 | ) |
Net change in unrealized appreciation (depreciation) on investments | | | 1,910,935 | | | | 71,279 | |
Net increase (decrease) in net assets resulting from operations | | | 3,662,387 | | | | (2,051,764 | ) |
| | | | | | | | | |
Distributions to shareholders: | | | | | | | | |
Class A | | | (12,601 | ) | | | — | |
Class C | | | (1,279 | ) | | | — | |
Class H | | | (30,819 | ) | | | — | |
Total distributions to shareholders | | | (44,699 | ) | | | — | |
| | | | | | | | | |
Capital share transactions: | | | | | | | | |
Proceeds from sale of shares | | | | | | | | |
Class A | | | 1,023,710 | | | | 1,273,678 | |
Class C | | | 199,913 | | | | 3,775 | |
Class H | | | 23,963,867 | | | | 30,349,399 | |
Distributions reinvested | | | | | | | | |
Class A | | | 12,590 | | | | — | |
Class C | | | 1,278 | | | | — | |
Class H | | | 30,338 | | | | — | |
Cost of shares redeemed | | | | | | | | |
Class A | | | (1,680,856 | ) | | | (1,038,553 | ) |
Class C | | | (160,513 | ) | | | (88,795 | ) |
Class H | | | (24,085,146 | ) | | | (32,255,891 | ) |
Net decrease from capital share transactions | | | (694,819 | ) | | | (1,756,387 | ) |
Net increase (decrease) in net assets | | | 2,922,869 | | | | (3,808,151 | ) |
| | | | | | | | | |
Net assets: | | | | | | | | |
Beginning of year | | | 10,765,967 | | | | 14,574,118 | |
End of year | | $ | 13,688,836 | | | $ | 10,765,967 | |
| | | | | | | | | |
Capital share activity: | | | | | | | | |
Shares sold | | | | | | | | |
Class A | | | 10,264 | | | | 13,383 | |
Class C | | | 2,417 | | | | 46 | |
Class H | | | 230,583 | | | | 301,824 | |
Shares issued from reinvestment of distributions | | | | | | | | |
Class A | | | 119 | | | | — | |
Class C | | | 15 | | | | — | |
Class H | | | 285 | | | | — | |
Shares redeemed | | | | | | | | |
Class A | | | (16,724 | ) | | | (11,115 | ) |
Class C | | | (1,864 | ) | | | (1,100 | ) |
Class H | | | (227,051 | ) | | | (322,539 | ) |
Net decrease in shares | | | (1,956 | ) | | | (19,501 | ) |
78 | THE RYDEX FUNDS ANNUAL REPORT | SEE NOTES TO FINANCIAL STATEMENTS. |
MID-CAP 1.5x STRATEGY FUND | |
This table is presented to show selected data for a share outstanding throughout each period and to assist shareholders in evaluating a Fund’s performance for the periods presented.
Class A | | Year Ended
March 31,
2024 | | | Year Ended
March 31,
2023 | | | Year Ended
March 31,
2022 | | | Year Ended
March 31,
2021 | | | Year Ended
March 31,
2020 | |
Per Share Data |
Net asset value, beginning of period | | $ | 100.88 | | | $ | 115.54 | | | $ | 131.92 | | | $ | 56.02 | | | $ | 89.82 | |
Income (loss) from investment operations: |
Net investment income (loss)a | | | 0.96 | | | | .41 | | | | (.72 | ) | | | (.68 | ) | | | .37 | |
Net gain (loss) on investments (realized and unrealized) | | | 29.35 | | | | (15.07 | ) | | | 6.46 | | | | 77.00 | | | | (33.98 | ) |
Total from investment operations | | | 30.31 | | | | (14.66 | ) | | | 5.74 | | | | 76.32 | | | | (33.61 | ) |
Less distributions from: |
Net investment income | | | (.41 | ) | | | — | | | | — | | | | (.42 | ) | | | (.19 | ) |
Net realized gains | | | — | | | | — | | | | (22.12 | ) | | | — | | | | — | |
Total distributions | | | (.41 | ) | | | — | | | | (22.12 | ) | | | (.42 | ) | | | (.19 | ) |
Net asset value, end of period | | $ | 130.78 | | | $ | 100.88 | | | $ | 115.54 | | | $ | 131.92 | | | $ | 56.02 | |
|
Total Returnb | | | 30.15 | % | | | (12.69 | %) | | | 3.49 | % | | | 136.41 | % | | | (37.52 | %) |
Ratios/Supplemental Data |
Net assets, end of period (in thousands) | | $ | 4,014 | | | $ | 3,736 | | | $ | 4,017 | | | $ | 4,337 | | | $ | 1,950 | |
Ratios to average net assets: |
Net investment income (loss) | | | 0.90 | % | | | 0.41 | % | | | (0.54 | %) | | | (0.75 | %) | | | 0.40 | % |
Total expensesc | | | 1.78 | % | | | 1.70 | % | | | 1.66 | % | | | 1.75 | % | | | 1.77 | % |
Net expensesd | | | 1.68 | % | | | 1.65 | % | | | 1.65 | % | | | 1.72 | % | | | 1.72 | % |
Portfolio turnover rate | | | 57 | % | | | 44 | % | | | 159 | % | | | 501 | % | | | 617 | % |
Class C | | Year Ended
March 31,
2024 | | | Year Ended
March 31,
2023 | | | Year Ended
March 31,
2022 | | | Year Ended
March 31,
2021 | | | Year Ended
March 31,
2020 | |
Per Share Data |
Net asset value, beginning of period | | $ | 82.02 | | | $ | 94.68 | | | $ | 112.55 | | | $ | 48.18 | | | $ | 77.86 | |
Income (loss) from investment operations: |
Net investment income (loss)a | | | .15 | | | | (.34 | ) | | | (1.48 | ) | | | (1.12 | ) | | | (.27 | ) |
Net gain (loss) on investments (realized and unrealized) | | | 23.71 | | | | (12.32 | ) | | | 5.73 | | | | 65.91 | | | | (29.22 | ) |
Total from investment operations | | | 23.86 | | | | (12.66 | ) | | | 4.25 | | | | 64.79 | | | | (29.49 | ) |
Less distributions from: |
Net investment income | | | (.41 | ) | | | — | | | | — | | | | (.42 | ) | | | (.19 | ) |
Net realized gains | | | — | | | | — | | | | (22.12 | ) | | | — | | | | — | |
Total distributions | | | (.41 | ) | | | — | | | | (22.12 | ) | | | (.42 | ) | | | (.19 | ) |
Net asset value, end of period | | $ | 105.47 | | | $ | 82.02 | | | $ | 94.68 | | | $ | 112.55 | | | $ | 48.18 | |
|
Total Returnb | | | 29.20 | % | | | (13.37 | %) | | | 2.71 | % | | | 134.67 | % | | | (37.98 | %) |
Ratios/Supplemental Data |
Net assets, end of period (in thousands) | | $ | 206 | | | $ | 113 | | | $ | 231 | | | $ | 653 | | | $ | 1,933 | |
Ratios to average net assets: |
Net investment income (loss) | | | 0.17 | % | | | (0.42 | %) | | | (1.31 | %) | | | (1.59 | %) | | | (0.34 | %) |
Total expensesc | | | 2.54 | % | | | 2.45 | % | | | 2.41 | % | | | 2.52 | % | | | 2.52 | % |
Net expensesd | | | 2.44 | % | | | 2.40 | % | | | 2.39 | % | | | 2.50 | % | | | 2.47 | % |
Portfolio turnover rate | | | 57 | % | | | 44 | % | | | 159 | % | | | 501 | % | | | 617 | % |
SEE NOTES TO FINANCIAL STATEMENTS. | THE RYDEX FUNDS ANNUAL REPORT | 79 |
MID-CAP 1.5x STRATEGY FUND | |
FINANCIAL HIGHLIGHTS (concluded) |
This table is presented to show selected data for a share outstanding throughout each period and to assist shareholders in evaluating a Fund’s performance for the periods presented.
Class H | | Year Ended
March 31,
2024 | | | Year Ended
March 31,
2023 | | | Year Ended
March 31,
2022 | | | Year Ended
March 31,
2021 | | | Year Ended
March 31,
2020 | |
Per Share Data |
Net asset value, beginning of period | | $ | 101.34 | | | $ | 116.07 | | | $ | 132.43 | | | $ | 56.24 | | | $ | 90.18 | |
Income (loss) from investment operations: |
Net investment income (loss)a | | | .98 | | | | .36 | | | | (.76 | ) | | | (.60 | ) | | | .27 | |
Net gain (loss) on investments (realized and unrealized) | | | 29.48 | | | | (15.09 | ) | | | 6.52 | | | | 77.21 | | | | (34.02 | ) |
Total from investment operations | | | 30.46 | | | | (14.73 | ) | | | 5.76 | | | | 76.61 | | | | (33.75 | ) |
Less distributions from: |
Net investment income | | | (.41 | ) | | | — | | | | — | | | | (.42 | ) | | | (.19 | ) |
Net realized gains | | | — | | | | — | | | | (22.12 | ) | | | — | | | | — | |
Total distributions | | | (.41 | ) | | | — | | | | (22.12 | ) | | | (.42 | ) | | | (.19 | ) |
Net asset value, end of period | | $ | 131.39 | | | $ | 101.34 | | | $ | 116.07 | | | $ | 132.43 | | | $ | 56.24 | |
|
Total Return | | | 30.16 | % | | | (12.69 | %) | | | 3.49 | % | | | 136.39 | % | | | (37.52 | %) |
Ratios/Supplemental Data |
Net assets, end of period (in thousands) | | $ | 9,469 | | | $ | 6,917 | | | $ | 10,327 | | | $ | 12,089 | | | $ | 4,054 | |
Ratios to average net assets: |
Net investment income (loss) | | | 0.92 | % | | | 0.36 | % | | | (0.57 | %) | | | (0.64 | %) | | | 0.28 | % |
Total expensesc | | | 1.79 | % | | | 1.70 | % | | | 1.66 | % | | | 1.74 | % | | | 1.79 | % |
Net expensesd | | | 1.68 | % | | | 1.65 | % | | | 1.65 | % | | | 1.72 | % | | | 1.77 | % |
Portfolio turnover rate | | | 57 | % | | | 44 | % | | | 159 | % | | | 501 | % | | | 617 | % |
a | Net investment income (loss) per share was computed using average shares outstanding throughout the period. |
b | Total return does not reflect the impact of any applicable sales charges. |
c | Does not include expenses of the underlying funds in which the Fund invests. |
d | Net expense information reflects the expense ratios after expense waivers and reimbursements, as applicable. |
80 | THE RYDEX FUNDS ANNUAL REPORT | SEE NOTES TO FINANCIAL STATEMENTS. |
PERFORMANCE REPORT AND FUND PROFILE (Unaudited) | March 31, 2024 |
INVERSE MID-CAP STRATEGY FUND
OBJECTIVE: Seeks to provide investment results that match, before fees and expenses, the performance of a specific benchmark on a daily basis. The Fund’s current benchmark is the inverse (opposite) of the performance of the S&P MidCap 400® Index (the “underlying index”). The Fund does not seek to achieve its investment objective over a period of time greater than one day.
For the Reporting Period, the Inverse Mid-Cap Strategy Fund maintained a daily correlation of 99% to its benchmark of -100% of the daily price movement of the S&P MidCap 400 Index. The Fund Class H returned -13.30%, while the S&P MidCap 400 Index returned 23.33% over the same period.
The sectors that contributed the most to the return of the underlying index for the Reporting Period were Industrials, Consumer Discretionary, and Financials. The only sectors that detracted were Communication Services and Utilities.
The holdings that contributed the most to the return of the underlying index for the Reporting Period were Super Micro Computer, Inc., Deckers Outdoor Corp., and Williams-Sonoma, Inc. Those that detracted the most were Wolfspeed, Inc., Iridium Communications, Inc., and Lattice Semiconductor Corp.
Derivatives in the Fund were used to help provide exposure to the composition of the benchmark in the highest efficient manner and to provide leverage and not for hedging purposes. Derivatives performed as expected.
Due to the compounding of daily returns, the Fund’s returns over periods other than one day will likely differ in amount and possibly direction from the benchmark return for the same period. Investors should monitor their Fund holdings to ensure that they are consistent with their strategies, as frequently as daily.
The effects of compounding may cause the longer-term correlation of the Fund to its benchmark to diminish. A significant contributor to the discrepancy between the leveraged and unleveraged indices is the effect of compounding on the leveraged index, which is discussed under “A Brief Note on the Compounding of Returns” on page 6.
The Fund may invest in certain of the underlying series of Guggenheim Funds Trust and Guggenheim Strategy Funds Trust, including Guggenheim Ultra Short Duration, Guggenheim Strategy Fund II, and Guggenheim Strategy Fund III (collectively, the “Short Term Investment Vehicles”), each of which are open-end management investment companies managed by Guggenheim Investments. The Short Term Investment Vehicles, which launched on March 11, 2014, are offered as short term investment options only to mutual funds, trusts, and other accounts managed by Guggenheim Investments and/or its affiliates, and are not available to the public, with the exception of Guggenheim Ultra Short Duration Fund, which is available to the public. Guggenheim Strategy Fund II and Guggenheim Strategy Fund III do not charge an investment management fee. Guggenheim Ultra Short Duration Fund charges an investment management fee, but the Fund’s adviser has agreed to waive fees to the extent necessary to offset the proportionate share of any management fee paid by the Fund with respect to its investment in such affiliated fund. For the Reporting Period, investment in the Short Term Investment Vehicles contributed to Fund performance.
Performance displayed represents past performance, which is no guarantee of future results.
Holdings Diversification (Market Exposure as % of Net Assets)
“Holdings Diversification (Market Exposure as % of Net Assets)” excludes any temporary cash investments, investments in Guggenheim Strategy Funds Trust mutual funds, or investments in Guggenheim Ultra Short Duration Fund. Investments in those Funds do not provide “market exposure” to meet the Fund’s investment objective, but will significantly increase the portfolio’s exposure to certain other asset categories (and their associated risks), which may cause the Fund to deviate from its principal investment strategy, including: (i) high yield, high risk debt securities rated below the top four long-term rating categories by a nationally recognized statistical rating organization (also known as “junk bonds”); (ii) securities issued by the U.S. government or its agencies and instrumentalities; (iii) CLOs and similar investments; and (iv) other short-term fixed income securities.
| | THE RYDEX FUNDS ANNUAL REPORT | 81 |
PERFORMANCE REPORT AND FUND PROFILE (Unaudited)(concluded) | March 31, 2024 |
Inception Dates: |
Class A | March 31, 2004 |
Class C | February 20, 2004 |
Class H | February 20, 2004 |
Cumulative Fund Performance*
The Fund invests principally in derivative investments such as swap agreements and futures contracts.
Largest Holdings | % of Total Net Assets |
Guggenheim Strategy Fund II | 8.8% |
Guggenheim Ultra Short Duration Fund — Institutional Class | 8.1% |
Total | 16.9% |
| | |
“Largest Holdings” excludes any temporary cash or derivative investments. |
Average Annual Returns*
Periods Ended March 31, 2024
| 1 Year | 5 Year | 10 Year |
Class A Shares | (13.31%) | (13.70%) | (11.53%) |
Class A Shares with sales charge† | (17.43%) | (14.54%) | (11.96%) |
Class C Shares | (12.73%)** | (13.95%) | (11.98%) |
Class C Shares with CDSC‡ | (13.53%) | (13.95%) | (11.98%) |
Class H Shares | (13.30%) | (13.70%) | (11.50%) |
S&P MidCap 400 Index | 23.33% | 11.71% | 9.99% |
* | The performance data above represents past performance that is not predictive of future results. The investment return and principal value of an investment in the Fund will fluctuate so that an investor’s shares, when redeemed, may be worth more or less than their original cost. Returns are historical and include changes in principal and reinvested dividends and capital gains and do not reflect the effect of taxes. The S&P MidCap 400 Index is an unmanaged index and, unlike the Fund, has no management fees or operating expenses to reduce its reported return. The graphs are based on Class A shares and Class H shares only; performance for Class C shares will vary due to the differences in fee structures. |
** | Certain class-specific fees were not charged to Class C shares due to low average daily net assets and shares outstanding in Class C. |
† | Fund returns are calculated using the maximum sales charge of 4.75%. |
‡ | Fund returns include a CDSC of 1% if redeemed within 12 months of purchase. |
82 | THE RYDEX FUNDS ANNUAL REPORT | |
SCHEDULE OF INVESTMENTS | March 31, 2024 |
INVERSE MID-CAP STRATEGY FUND | |
| | Shares | | | Value | |
MUTUAL FUNDS† - 16.9% |
Guggenheim Strategy Fund II1 | | | 2,020 | | | $ | 49,692 | |
Guggenheim Ultra Short Duration Fund — Institutional Class1 | | | 4,630 | | | | 45,884 | |
Total Mutual Funds | | | | |
(Cost $95,671) | | | | | | | 95,576 | |
| | | | | | | | | |
| | Face
Amount | | | | |
REPURCHASE AGREEMENTS††,2 - 81.5% |
J.P. Morgan Securities LLC
issued 03/28/24 at 5.31%
due 04/01/243 | | $ | 265,637 | | | | 265,637 | |
BofA Securities, Inc.
issued 03/28/24 at 5.31%
due 04/01/243 | | | 102,168 | | | | 102,168 | |
Barclays Capital, Inc.
issued 03/28/24 at 5.30%
due 04/01/243 | | | 92,606 | | | | 92,606 | |
Total Repurchase Agreements | | | | |
(Cost $460,411) | | | | | | | 460,411 | |
| | | | | | | | | |
Total Investments - 98.4% | | | | |
(Cost $556,082) | | $ | 555,987 | |
Other Assets & Liabilities, net - 1.6% | | | 8,784 | |
Total Net Assets - 100.0% | | $ | 564,771 | |
Total Return Swap Agreements |
Counterparty | Index | Type | | Financing
Rate | | Payment
Frequency | | | Maturity
Date | | | Units | | | Notional
Amount | | | Value and
Unrealized
Depreciation | |
OTC Equity Index Swap Agreements Sold Short†† |
BNP Paribas | S&P MidCap 400 Index | Receive | | 5.38% (Federal
Funds Rate +
0.05%) | | | At Maturity | | | | 06/26/24 | | 28 | | $ | 85,599 | | | $ | (1,875 | ) |
Goldman Sachs International | S&P MidCap 400 Index | Receive | | 5.28% (Federal
Funds Rate -
0.05%) | | | At Maturity | | | | 06/26/24 | | 40 | | | 122,341 | | | | (2,681 | ) |
Barclays Bank plc | S&P MidCap 400 Index | Receive | | 5.58% (SOFR +
0.25%) | | | At Maturity | | | | 06/25/24 | | 117 | | | 357,824 | | | | (8,674 | ) |
| | | | | | | | | | | | | | | | | | | $ | 565,764 | | | $ | (13,230 | ) |
† | Value determined based on Level 1 inputs — See Note 4. |
†† | Value determined based on Level 2 inputs — See Note 4. |
1 | Affiliated issuer. |
2 | Repurchase Agreements — See Note 6. |
3 | All or a portion of this security is pledged as equity index swap collateral at March 31, 2024. |
| | plc — Public Limited Company |
| | SOFR — Secured Overnight Financing Rate |
| | |
| | See Sector Classification in Other Information section. |
SEE NOTES TO FINANCIAL STATEMENTS. | THE RYDEX FUNDS ANNUAL REPORT | 83 |
SCHEDULE OF INVESTMENTS (concluded) | March 31, 2024 |
INVERSE MID-CAP STRATEGY FUND | |
The following table summarizes the inputs used to value the Fund’s investments at March 31, 2024 (See Note 4 in the Notes to Financial Statements):
Investments in Securities (Assets) | | Level 1
Quoted
Prices | | | Level 2
Significant
Observable
Inputs | | | Level 3
Significant
Unobservable
Inputs | | | Total | |
Mutual Funds | | $ | 95,576 | | | $ | — | | | $ | — | | | $ | 95,576 | |
Repurchase Agreements | | | — | | | | 460,411 | | | | — | | | | 460,411 | |
Total Assets | | $ | 95,576 | | | $ | 460,411 | | | $ | — | | | $ | 555,987 | |
Investments in Securities (Liabilities) | | Level 1
Quoted
Prices | | | Level 2
Significant
Observable
Inputs | | | Level 3
Significant
Unobservable
Inputs | | | Total | |
Equity Index Swap Agreements** | | $ | — | | | $ | 13,230 | | | $ | — | | | $ | 13,230 | |
** | This derivative is reported as unrealized appreciation/depreciation at period end. |
Affiliated Transactions
Investments representing 5% or more of the outstanding voting shares of a company, or control of or by, or common control under Guggenheim Investments (“GI”), result in that company being considered an affiliated issuer, as defined in the 1940 Act.
The Fund may invest in certain of the underlying series of Guggenheim Strategy Funds Trust, including Guggenheim Strategy Fund II and Guggenheim Strategy Fund III (collectively, the “Guggenheim Strategy Funds”), each of which are open-end management investment companies managed by GI. The Guggenheim Strategy Funds, which launched on March 11, 2014, are offered as short term investment options only to mutual funds, trusts, and other accounts managed by GI and/or its affiliates, and are not available to the public. The Guggenheim Strategy Funds pay no investment management fees. The Guggenheim Strategy Funds’ annual report on Form N-CSR dated September 30, 2023 is available publicly or upon request. This information is available from the EDGAR database on the SEC’s website at https://www.sec.gov/Archives/edgar/data/1601445/000182126823000217/gug86449-ncsr.htm. The Fund may invest in certain of the underlying series of Guggenheim Funds Trust, which are open-end management investment companies managed by GI, are available to the public and whose most recent annual report on Form N-CSR is available publicly or upon request.
Transactions during the year ended March 31, 2024, in which the company is an affiliated issuer, were as follows:
Security Name | | Value
03/31/23 | | | Additions | | | Reductions | | | Realized
Gain (Loss) | | | Change in
Unrealized
Appreciation
(Depreciation) | | | Value
03/31/24 | | | Shares
03/31/24 | | | Investment
Income | |
Mutual Funds | | | | | | | | | | | | | | | | | | | | | | | | | | | | | | | | |
Guggenheim Strategy Fund II | | $ | 48,904 | | | $ | — | | | $ | — | | | $ | — | | | $ | 788 | | | $ | 49,692 | | | | 2,020 | | | $ | 2,740 | |
Guggenheim Ultra Short Duration Fund — Institutional Class | | | 44,958 | | | | — | | | | — | | | | — | | | | 926 | | | | 45,884 | | | | 4,630 | | | | 2,466 | |
| | | $ | 93,862 | | | $ | — | | | $ | — | | | $ | — | | | $ | 1,714 | | | $ | 95,576 | | | | | | | $ | 5,206 | |
84 | THE RYDEX FUNDS ANNUAL REPORT | SEE NOTES TO FINANCIAL STATEMENTS. |
INVERSE MID-CAP STRATEGY FUND | |
STATEMENT OF ASSETS AND LIABILITIES |
March 31, 2024 |
Assets: |
Investments in affiliated issuers, at value (cost $95,671) | | $ | 95,576 | |
Repurchase agreements, at value (cost $460,411) | | | 460,411 | |
Segregated cash with broker | | | 28,000 | |
Receivables: |
Fund shares sold | | | 25,332 | |
Dividends | | | 434 | |
Interest | | | 272 | |
Total assets | | | 610,025 | |
| | | | | |
Liabilities: |
Unrealized depreciation on OTC swap agreements | | | 13,230 | |
Payable for: |
Fund shares redeemed | | | 30,166 | |
Swap settlement | | | 501 | |
Management fees | | | 360 | |
Transfer agent fees | | | 206 | |
Distribution and service fees | | | 103 | |
Portfolio accounting and administration fees | | | 22 | |
Trustees’ fees* | | | 8 | |
Miscellaneous | | | 658 | |
Total liabilities | | | 45,254 | |
Net assets | | $ | 564,771 | |
| | | | | |
Net assets consist of: |
Paid in capital | | $ | 6,852,314 | |
Total distributable earnings (loss) | | | (6,287,543 | ) |
Net assets | | $ | 564,771 | |
Class A: |
Net assets | | $ | 48,371 | |
Capital shares outstanding | | | 1,010 | |
Net asset value per share | | $ | 47.91 | |
Maximum offering price per share (Net asset value divided by 95.25%) | | $ | 50.30 | |
Class C: |
Net assets | | $ | 112 | |
Capital shares outstanding | | | 2 | |
Net asset value per share | | $ | 41.44 | |
Class H: |
Net assets | | $ | 516,288 | |
Capital shares outstanding | | | 10,766 | |
Net asset value per share | | $ | 47.96 | |
STATEMENT OF OPERATIONS |
Year Ended March 31, 2024 |
Investment Income: |
Dividends from securities of affiliated issuers | | $ | 5,206 | |
Interest | | | 105,387 | |
Total investment income | | | 110,593 | |
| | | | | |
Expenses: |
Management fees | | | 19,211 | |
Distribution and service fees: |
Class A | | | 140 | |
Class H | | | 5,196 | |
Transfer agent fees | | | 4,534 | |
Portfolio accounting and administration fees | | | 3,254 | |
Registration fees | | | 2,221 | |
Professional fees | | | 662 | |
Trustees’ fees* | | | 434 | |
Custodian fees | | | 297 | |
Interest expense | | | 2 | |
Miscellaneous | | | 626 | |
Total expenses | | | 36,577 | |
Less: |
Expenses reimbursed by Adviser | | | (1,489 | ) |
Expenses waived by Adviser | | | (113 | ) |
Total waived/reimbursed expenses | | | (1,602 | ) |
Net expenses | | | 34,975 | |
Net investment income | | | 75,618 | |
| | | | | |
Net Realized and Unrealized Gain (Loss): |
Net realized gain (loss) on: |
Swap agreements | | | (219,383 | ) |
Net realized loss | | | (219,383 | ) |
Net change in unrealized appreciation (depreciation) on: |
Investments in unaffiliated issuers | | | 4 | |
Investments in affiliated issuers | | | 1,714 | |
Swap agreements | | | 70,781 | |
Net change in unrealized appreciation (depreciation) | | | 72,499 | |
Net realized and unrealized loss | | | (146,884 | ) |
Net decrease in net assets resulting from operations | | $ | (71,266 | ) |
* | Relates to Trustees not deemed “interested persons” within the meaning of Section 2(a)(19) of the 1940 Act. |
SEE NOTES TO FINANCIAL STATEMENTS. | THE RYDEX FUNDS ANNUAL REPORT | 85 |
INVERSE MID-CAP STRATEGY FUND | |
STATEMENTS OF CHANGES IN NET ASSETS |
| | Year Ended
March 31,
2024 | | | Year Ended
March 31,
2023 | |
Increase (Decrease) in Net Assets from Operations: | | | | | | | | |
Net investment income | | $ | 75,618 | | | $ | 15,793 | |
Net realized loss on investments | | | (219,383 | ) | | | (262,402 | ) |
Net change in unrealized appreciation (depreciation) on investments | | | 72,499 | | | | (79,499 | ) |
Net decrease in net assets resulting from operations | | | (71,266 | ) | | | (326,108 | ) |
| | | | | | | | | |
Distributions to shareholders: | | | | | | | | |
Class A | | | (3,819 | ) | | | — | |
Class C | | | (10 | ) | | | — | |
Class H | | | (52,183 | ) | | | — | |
Total distributions to shareholders | | | (56,012 | ) | | | — | |
| | | | | | | | | |
Capital share transactions: | | | | | | | | |
Proceeds from sale of shares | | | | | | | | |
Class A | | | 87,472 | | | | 28,054 | |
Class C | | | — | | | | 34,650 | |
Class H | | | 5,523,737 | | | | 12,682,143 | |
Distributions reinvested | | | | | | | | |
Class A | | | 3,804 | | | | — | |
Class C | | | 10 | | | | — | |
Class H | | | 52,182 | | | | — | |
Cost of shares redeemed | | | | | | | | |
Class A | | | (89,458 | ) | | | (32,440 | ) |
Class C | | | — | | | | (32,762 | ) |
Class H | | | (7,533,294 | ) | | | (10,058,036 | ) |
Net increase (decrease) from capital share transactions | | | (1,955,547 | ) | | | 2,621,609 | |
Net increase (decrease) in net assets | | | (2,082,825 | ) | | | 2,295,501 | |
| | | | | | | | | |
Net assets: | | | | | | | | |
Beginning of year | | | 2,647,596 | | | | 352,095 | |
End of year | | $ | 564,771 | | | $ | 2,647,596 | |
| | | | | | | | | |
Capital share activity: | | | | | | | | |
Shares sold | | | | | | | | |
Class A | | | 1,433 | | | | 461 | |
Class C | | | — | | | | 581 | |
Class H | | | 98,363 | | | | 206,583 | |
Shares issued from reinvestment of distributions | | | | | | | | |
Class A | | | 70 | | | | — | |
Class C | | | — | | | | — | |
Class H | | | 960 | | | | — | |
Shares redeemed | | | | | | | | |
Class A | | | (1,477 | ) | | | (537 | ) |
Class C | | | — | | | | (581 | ) |
Class H | | | (132,116 | ) | | | (168,074 | ) |
Net increase (decrease) in shares | | | (32,767 | ) | | | 38,433 | |
86 | THE RYDEX FUNDS ANNUAL REPORT | SEE NOTES TO FINANCIAL STATEMENTS. |
INVERSE MID-CAP STRATEGY FUND | |
This table is presented to show selected data for a share outstanding throughout each period and to assist shareholders in evaluating a Fund’s performance for the periods presented.
Class A | | Year Ended
March 31,
2024 | | | Year Ended
March 31,
2023 | | | Year Ended
March 31,
2022 | | | Year Ended
March 31,
2021 | | | Year Ended
March 31,
2020i | |
Per Share Data |
Net asset value, beginning of period | | $ | 59.40 | | | $ | 57.57 | | | $ | 63.60 | | | $ | 127.90 | | | $ | 109.10 | |
Income (loss) from investment operations: |
Net investment income (loss)a | | | 2.02 | | | | .90 | | | | (.75 | ) | | | (.45 | ) | | | .75 | |
Net gain (loss) on investments (realized and unrealized) | | | (9.45 | ) | | | .93 | e | | | (5.28 | ) | | | (63.36 | ) | | | 18.85 | e |
Total from investment operations | | | (7.43 | ) | | | 1.83 | | | | (6.03 | ) | | | (63.81 | ) | | | 19.60 | |
Less distributions from: |
Net investment income | | | (4.06 | ) | | | — | | | | — | | | | (.49 | ) | | | (.80 | ) |
Total distributions | | | (4.06 | ) | | | — | | | | — | | | | (.49 | ) | | | (.80 | ) |
Net asset value, end of period | | $ | 47.91 | | | $ | 59.40 | | | $ | 57.57 | | | $ | 63.60 | | | $ | 127.90 | |
|
Total Returnb | | | (13.31 | %) | | | 3.18 | % | | | (9.48 | %) | | | (49.94 | %) | | | 18.13 | % |
Ratios/Supplemental Data |
Net assets, end of period (in thousands) | | $ | 48 | | | $ | 58 | | | $ | 61 | | | $ | 100 | | | $ | 60 | |
Ratios to average net assets: |
Net investment income (loss) | | | 3.52 | % | | | 1.48 | % | | | (1.25 | %) | | | (1.29 | %) | | | 0.68 | % |
Total expensesc | | | 1.73 | % | | | 1.66 | % | | | 1.66 | % | | | 1.76 | % | | | 1.77 | % |
Net expensesd | | | 1.64 | % | | | 1.61 | % | | | 1.63 | % | | | 1.73 | % | | | 1.70 | % |
Portfolio turnover rate | | | — | | | | — | | | | 24 | % | | | 42 | % | | | — | |
Class C | | Year Ended
March 31,
2024 | | | Year Ended
March 31,
2023 | | | Year Ended
March 31,
2022 | | | Year Ended
March 31,
2021 | | | Year Ended
March 31,
2020i | |
Per Share Data |
Net asset value, beginning of period | | $ | 51.61 | | | $ | 50.06 | | | $ | 55.65 | | | $ | 112.07 | | | $ | 97.04 | |
Income (loss) from investment operations: |
Net investment income (loss)a | | | 1.67 | | | | (.54 | ) | | | (1.10 | ) | | | (.83 | ) | | | — | f |
Net gain (loss) on investments (realized and unrealized) | | | (7.78 | ) | | | 2.09 | e | | | (4.49 | ) | | | (55.10 | ) | | | 15.83 | e |
Total from investment operations | | | (6.11 | ) | | | 1.55 | | | | (5.59 | ) | | | (55.93 | ) | | | 15.83 | |
Less distributions from: |
Net investment income | | | (4.06 | ) | | | — | | | | — | | | | (.49 | ) | | | (.80 | ) |
Total distributions | | | (4.06 | ) | | | — | | | | — | | | | (.49 | ) | | | (.80 | ) |
Net asset value, end of period | | $ | 41.44 | | | $ | 51.61 | | | $ | 50.06 | | | $ | 55.65 | | | $ | 112.07 | |
|
Total Returnb | | | (12.73 | %) | | | 3.10 | % | | | (10.04 | %) | | | (50.08 | %) | | | 16.78 | % |
Ratios/Supplemental Data |
Net assets, end of period (in thousands) | | $ | — | g | | $ | — | g | | $ | — | g | | $ | 3 | | | $ | — | g |
Ratios to average net assets: |
Net investment income (loss) | | | 3.97 | % | | | (0.94 | %) | | | (2.11 | %) | | | (1.95 | %) | | | 0.00 | %h |
Total expensesc | | | 1.59 | % | | | 2.39 | % | | | 2.39 | % | | | 2.49 | % | | | 2.63 | % |
Net expenses | | | 1.59 | % | | | 2.39 | % | | | 2.39 | % | | | 2.46 | % | | | 2.63 | % |
Portfolio turnover rate | | | — | | | | — | | | | 24 | % | | | 42 | % | | | — | |
SEE NOTES TO FINANCIAL STATEMENTS. | THE RYDEX FUNDS ANNUAL REPORT | 87 |
INVERSE MID-CAP STRATEGY FUND | |
FINANCIAL HIGHLIGHTS (concluded) |
This table is presented to show selected data for a share outstanding throughout each period and to assist shareholders in evaluating a Fund’s performance for the periods presented.
Class H | | Year Ended
March 31,
2024 | | | Year Ended
March 31,
2023 | | | Year Ended
March 31,
2022 | | | Year Ended
March 31,
2021 | | | Year Ended
March 31,
2020i | |
Per Share Data |
Net asset value, beginning of period | | $ | 59.44 | | | $ | 57.62 | | | $ | 63.65 | | | $ | 128.00 | | | $ | 109.20 | |
Income (loss) from investment operations: |
Net investment income (loss)a | | | 2.08 | | | | .81 | | | | (.84 | ) | | | (.42 | ) | | | .70 | |
Net gain (loss) on investments (realized and unrealized) | | | (9.50 | ) | | | 1.01 | e | | | (5.19 | ) | | | (63.44 | ) | | | 18.90 | e |
Total from investment operations | | | (7.42 | ) | | | 1.82 | | | | (6.03 | ) | | | (63.86 | ) | | | 19.60 | |
Less distributions from: |
Net investment income | | | (4.06 | ) | | | — | | | | — | | | | (.49 | ) | | | (.80 | ) |
Total distributions | | | (4.06 | ) | | | — | | | | — | | | | (.49 | ) | | | (.80 | ) |
Net asset value, end of period | | $ | 47.96 | | | $ | 59.44 | | | $ | 57.62 | | | $ | 63.65 | | | $ | 128.00 | |
|
Total Return | | | (13.30 | %) | | | 3.16 | % | | | (9.47 | %) | | | (49.94 | %) | | | 18.11 | % |
Ratios/Supplemental Data |
Net assets, end of period (in thousands) | | $ | 516 | | | $ | 2,589 | | | $ | 291 | | | $ | 779 | | | $ | 1,488 | |
Ratios to average net assets: |
Net investment income (loss) | | | 3.54 | % | | | 1.32 | % | | | (1.40 | %) | | | (1.38 | %) | | | 0.65 | % |
Total expensesc | | | 1.71 | % | | | 1.71 | % | | | 1.66 | % | | | 1.77 | % | | | 1.78 | % |
Net expensesd | | | 1.64 | % | | | 1.67 | % | | | 1.64 | % | | | 1.75 | % | | | 1.70 | % |
Portfolio turnover rate | | | — | | | | — | | | | 24 | % | | | 42 | % | | | — | |
a | Net investment income (loss) per share was computed using average shares outstanding throughout the period. |
b | Total return does not reflect the impact of any applicable sales charges. |
c | Does not include expenses of the underlying funds in which the Fund invests. |
d | Net expense information reflects the expense ratios after expense waivers and reimbursements, as applicable. |
e | The amount shown for a share outstanding throughout the period does not agree with the aggregate net loss on investments for the year because of the sales and repurchases of fund shares in relation to fluctuating market value of the investments of the Fund. |
f | Less than $0.01 per share. |
g | Less than $1,000 in Net Assets. |
h | Less than 0.01% |
i | Reverse share split — Per share amounts for the years presented through March 31, 2020 have been restated to reflect a 1:5 reverse share split effective August 17, 2020. |
88 | THE RYDEX FUNDS ANNUAL REPORT | SEE NOTES TO FINANCIAL STATEMENTS. |
PERFORMANCE REPORT AND FUND PROFILE (Unaudited) | March 31, 2024 |
RUSSELL 2000® 1.5x STRATEGY FUND
OBJECTIVE: Seeks to provide investment results that correlate, before fees and expenses, to the performance of a specific benchmark for small-cap securities on a daily basis The Fund’s current benchmark is 150% of the Russell 2000® Index (the “underlying index”). The Fund does not seek to achieve its investment objective over a period of time greater than one day.
For the Reporting Period, the Russell 2000 1.5x Strategy Fund maintained a daily correlation of over 99% to its benchmark of 150% of the daily price movement of the Russell 2000 Index. The Fund H Class returned 24.07%, while the Russell 2000 Index returned 19.71% over the same time period.
The sectors that contributed the most to the return of the underlying index were Industrials, Information Technology, and Financials. The only sectors that detracted were Utilities and Communication Services.
The holdings that contributed the most to the return of the underlying index were Super Micro Computer, Inc., MicroStrategy, Inc. – Class A, and ImmunoGen, Inc. Those that detracted the most were Fox Factory Holding Corp., Revance Therapeutics, Inc., and Arcadium Lithium Plc.
Derivatives in the Fund were used to help provide exposure to the composition of the benchmark in the highest efficient manner and to provide leverage and not for hedging purposes. Derivatives performed as expected.
Due to the compounding of daily returns, the Fund’s returns over periods other than one day will likely differ in amount and possibly direction from the benchmark return for the same period. Investors should monitor their Fund holdings to ensure that they are consistent with their strategies, as frequently as daily.
The effects of compounding may cause the longer-term correlation of the Fund to its benchmark to diminish. A significant contributor to the discrepancy between the leveraged and unleveraged indices is the effect of compounding on the leveraged index, which is discussed under “A Brief Note on the Compounding of Returns” on page 6.
The Fund may invest in certain of the underlying series of Guggenheim Funds Trust and Guggenheim Strategy Funds Trust, including Guggenheim Ultra Short Duration, Guggenheim Strategy Fund II, and Guggenheim Strategy Fund III (collectively, the “Short Term Investment Vehicles”), each of which are open-end management investment companies managed by Guggenheim Investments. The Short Term Investment Vehicles, which launched on March 11, 2014, are offered as short term investment options only to mutual funds, trusts, and other accounts managed by Guggenheim Investments and/or its affiliates, and are not available to the public, with the exception of Guggenheim Ultra Short Duration Fund, which is available to the public. Guggenheim Strategy Fund II and Guggenheim Strategy Fund III do not charge an investment management fee. Guggenheim Ultra Short Duration Fund charges an investment management fee, but the Fund’s adviser has agreed to waive fees to the extent necessary to offset the proportionate share of any management fee paid by the Fund with respect to its investment in such affiliated fund. For the Reporting Period, investment in the Short Term Investment Vehicles contributed to Fund performance.
Performance displayed represents past performance, which is no guarantee of future results.
Holdings Diversification (Market Exposure as % of Net Assets)
“Holdings Diversification (Market Exposure as % of Net Assets)” excludes any temporary cash investments, investments in Guggenheim Strategy Funds Trust mutual funds, or investments in Guggenheim Ultra Short Duration Fund. Investments in those Funds do not provide “market exposure” to meet the Fund’s investment objective, but will significantly increase the portfolio’s exposure to certain other asset categories (and their associated risks), which may cause the Fund to deviate from its principal investment strategy, including: (i) high yield, high risk debt securities rated below the top four long-term rating categories by a nationally recognized statistical rating organization (also known as “junk bonds”); (ii) securities issued by the U.S. government or its agencies and instrumentalities; (iii) CLOs and similar investments; and (iv) other short-term fixed income securities.
| | THE RYDEX FUNDS ANNUAL REPORT | 89 |
PERFORMANCE REPORT AND FUND PROFILE (Unaudited)(concluded) | March 31, 2024 |
Inception Dates: |
Class A | March 31, 2004 |
Class C | January 23, 2001 |
Class H | November 1, 2000 |
Cumulative Fund Performance*
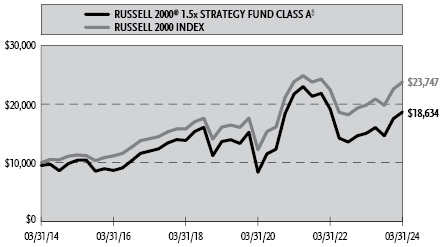
Ten Largest Holdings | % of Total Net Assets |
Guggenheim Strategy Fund II | 8.9% |
Guggenheim Ultra Short Duration Fund — Institutional Class | 7.8% |
Super Micro Computer, Inc. | 1.1% |
MicroStrategy, Inc. — Class A | 0.5% |
Comfort Systems USA, Inc. | 0.2% |
elf Beauty, Inc. | 0.2% |
Light & Wonder, Inc. — Class A | 0.2% |
Carvana Co. | 0.2% |
Onto Innovation, Inc. | 0.2% |
Simpson Manufacturing Company, Inc. | 0.2% |
Top Ten Total | 19.5% |
| | |
“Ten Largest Holdings” excludes any temporary cash or derivative investments. |
Average Annual Returns*
Periods Ended March 31, 2024
| 1 Year | 5 Year | 10 Year |
Class A Shares | 24.07% | 6.48% | 6.94% |
Class A Shares with sales charge† | 18.18% | 5.45% | 6.42% |
Class C Shares | 23.13% | 5.68% | 6.14% |
Class C Shares with CDSC‡ | 22.13% | 5.68% | 6.14% |
Class H Shares | 24.07% | 6.47% | 6.92% |
Russell 2000 Index | 19.71% | 8.10% | 9.03% |
* | The performance data above represents past performance that is not predictive of future results. The investment return and principal value of an investment in the Fund will fluctuate so that an investor’s shares, when redeemed, may be worth more or less than their original cost. Returns are historical and include changes in principal and reinvested dividends and capital gains and do not reflect the effect of taxes. The Russell 2000 Index is an unmanaged index and, unlike the Fund, has no management fees or operating expenses to reduce its reported return. The graphs are based on Class A shares and Class H shares only; performance for Class C shares will vary due to differences in fee structures. |
† | Fund returns are calculated using the maximum sales charge of 4.75%. |
‡ | Fund returns include a CDSC of 1% if redeemed within 12 months of purchase. |
90 | THE RYDEX FUNDS ANNUAL REPORT | |
SCHEDULE OF INVESTMENTS | March 31, 2024 |
RUSSELL 2000® 1.5x STRATEGY FUND | |
| | Shares | | | Value | |
COMMON STOCKS† - 56.5% |
| | | | | | | | | |
Consumer, Non-cyclical - 13.1% |
elf Beauty, Inc.* | | | 81 | | | $ | 15,878 | |
Viking Therapeutics, Inc.* | | | 154 | | | | 12,628 | |
API Group Corp.* | | | 315 | | | | 12,370 | |
BellRing Brands, Inc.* | | | 199 | | | | 11,747 | |
Vaxcyte, Inc.* | | | 159 | | | | 10,861 | |
HealthEquity, Inc.* | | | 127 | | | | 10,367 | |
Ensign Group, Inc. | | | 82 | | | | 10,202 | |
Cytokinetics, Inc.* | | | 143 | | | | 10,026 | |
Sprouts Farmers Market, Inc.* | | | 154 | | | | 9,930 | |
Intra-Cellular Therapies, Inc.* | | | 141 | | | | 9,757 | |
Blueprint Medicines Corp.* | | | 91 | | | | 8,632 | |
Option Care Health, Inc.* | | | 253 | | | | 8,486 | |
Halozyme Therapeutics, Inc.* | | | 195 | | | | 7,933 | |
Marathon Digital Holdings, Inc.* | | | 338 | | | | 7,632 | |
StoneCo Ltd. — Class A* | | | 438 | | | | 7,275 | |
Herc Holdings, Inc. | | | 43 | | | | 7,237 | |
REVOLUTION Medicines, Inc.* | | | 210 | | | | 6,768 | |
Alkermes plc* | | | 249 | | | | 6,740 | |
Glaukos Corp.* | | | 70 | | | | 6,600 | |
Merit Medical Systems, Inc.* | | | 85 | | | | 6,439 | |
Lantheus Holdings, Inc.* | | | 103 | | | | 6,411 | |
Haemonetics Corp.* | | | 75 | | | | 6,401 | |
TriNet Group, Inc. | | | 48 | | | | 6,360 | |
Alight, Inc. — Class A* | | | 629 | | | | 6,196 | |
Brink’s Co. | | | 67 | | | | 6,189 | |
Cleanspark, Inc.* | | | 291 | | | | 6,172 | |
Lancaster Colony Corp. | | | 29 | | | | 6,021 | |
Coca-Cola Consolidated, Inc. | | | 7 | | | | 5,925 | |
Insperity, Inc. | | | 54 | | | | 5,919 | |
Madrigal Pharmaceuticals, Inc.* | | | 22 | | | | 5,875 | |
Krystal Biotech, Inc.* | | | 33 | | | | 5,872 | |
Integer Holdings Corp.* | | | 50 | | | | 5,834 | |
Insmed, Inc.* | | | 210 | | | | 5,697 | |
Biohaven Ltd.* | | | 104 | | | | 5,688 | |
CBIZ, Inc.* | | | 72 | | | | 5,652 | |
Prestige Consumer Healthcare, Inc.* | | | 76 | | | | 5,515 | |
iRhythm Technologies, Inc.* | | | 47 | | | | 5,452 | |
Bridgebio Pharma, Inc.* | | | 176 | | | | 5,442 | |
Alarm.com Holdings, Inc.* | | | 73 | | | | 5,290 | |
Axonics, Inc.* | | | 76 | | | | 5,242 | |
Korn Ferry | | | 79 | | | | 5,195 | |
Neogen Corp.* | | | 328 | | | | 5,176 | |
Iovance Biotherapeutics, Inc.* | | | 345 | | | | 5,113 | |
WD-40 Co. | | | 20 | | | | 5,066 | |
Arrowhead Pharmaceuticals, Inc.* | | | 177 | | | | 5,062 | |
SpringWorks Therapeutics, Inc.* | | | 102 | | | | 5,020 | |
Amicus Therapeutics, Inc.* | | | 421 | | | | 4,959 | |
Select Medical Holdings Corp. | | | 157 | | | | 4,734 | |
Simply Good Foods Co.* | | | 137 | | | | 4,662 | |
LivaNova plc* | | | 83 | | | | 4,643 | |
Progyny, Inc.* | | | 121 | | | | 4,616 | |
Crinetics Pharmaceuticals, Inc.* | | | 97 | | | | 4,541 | |
Cerevel Therapeutics Holdings, Inc.* | | | 106 | | | | 4,481 | |
Ideaya Biosciences, Inc.* | | | 99 | | | | 4,344 | |
RadNet, Inc.* | | | 89 | | | | 4,331 | |
Primo Water Corp. | | | 236 | | | | 4,298 | |
ABM Industries, Inc. | | | 95 | | | | 4,239 | |
Marqeta, Inc. — Class A* | | | 711 | | | | 4,238 | |
Axsome Therapeutics, Inc.* | | | 53 | | | | 4,229 | |
ICF International, Inc. | | | 28 | | | | 4,218 | |
Helen of Troy Ltd.* | | | 36 | | | | 4,149 | |
Apogee Therapeutics, Inc.* | | | 62 | | | | 4,120 | |
Stride, Inc.* | | | 65 | | | | 4,098 | |
Remitly Global, Inc.* | | | 197 | | | | 4,086 | |
Arcellx, Inc.* | | | 58 | | | | 4,034 | |
Flywire Corp.* | | | 161 | | | | 3,994 | |
EVERTEC, Inc. | | | 100 | | | | 3,990 | |
Celldex Therapeutics, Inc.* | | | 94 | | | | 3,945 | |
Inter Parfums, Inc. | | | 28 | | | | 3,934 | |
Graham Holdings Co. — Class B | | | 5 | | | | 3,838 | |
Inari Medical, Inc.* | | | 80 | | | | 3,838 | |
Vericel Corp.* | | | 73 | | | | 3,797 | |
Intellia Therapeutics, Inc.* | | | 136 | | | | 3,741 | |
Beam Therapeutics, Inc.* | | | 112 | | | | 3,700 | |
Denali Therapeutics, Inc.* | | | 180 | | | | 3,694 | |
CONMED Corp. | | | 46 | | | | 3,684 | |
Cal-Maine Foods, Inc. | | | 62 | | | | 3,649 | |
AMN Healthcare Services, Inc.* | | | 58 | | | | 3,626 | |
TransMedics Group, Inc.* | | | 48 | | | | 3,549 | |
Strategic Education, Inc. | | | 34 | | | | 3,540 | |
Riot Platforms, Inc.* | | | 289 | | | | 3,537 | |
Oscar Health, Inc. — Class A* | | | 236 | | | | 3,509 | |
Guardant Health, Inc.* | | | 170 | | | | 3,507 | |
Patterson Companies, Inc. | | | 126 | | | | 3,484 | |
ACADIA Pharmaceuticals, Inc.* | | | 187 | | | | 3,458 | |
Surgery Partners, Inc.* | | | 115 | | | | 3,430 | |
Rhythm Pharmaceuticals, Inc.* | | | 79 | | | | 3,423 | |
CorVel Corp.* | | | 13 | | | | 3,419 | |
LiveRamp Holdings, Inc.* | | | 99 | | | | 3,416 | |
J & J Snack Foods Corp. | | | 23 | | | | 3,325 | |
PTC Therapeutics, Inc.* | | | 110 | | | | 3,200 | |
TG Therapeutics, Inc.* | | | 209 | | | | 3,179 | |
Owens & Minor, Inc.* | | | 114 | | | | 3,159 | |
Corcept Therapeutics, Inc.* | | | 123 | | | | 3,098 | |
Arvinas, Inc.* | | | 75 | | | | 3,096 | |
Adtalem Global Education, Inc.* | | | 60 | | | | 3,084 | |
NeoGenomics, Inc.* | | | 194 | | | | 3,050 | |
Twist Bioscience Corp.* | | | 88 | | | | 3,019 | |
PROCEPT BioRobotics Corp.* | | | 61 | | | | 3,015 | |
Nuvalent, Inc. — Class A* | | | 40 | | | | 3,004 | |
TreeHouse Foods, Inc.* | | | 77 | | | | 2,999 | |
Laureate Education, Inc. — Class A | | | 201 | | | | 2,929 | |
Edgewell Personal Care Co. | | | 75 | | | | 2,898 | |
Central Garden & Pet Co. — Class A* | | | 78 | | | | 2,880 | |
Upbound Group, Inc. | | | 81 | | | | 2,852 | |
STAAR Surgical Co.* | | | 74 | | | | 2,833 | |
Syndax Pharmaceuticals, Inc.* | | | 119 | | | | 2,832 | |
Andersons, Inc. | | | 49 | | | | 2,811 | |
Coursera, Inc.* | | | 200 | | | | 2,804 | |
Avidity Biosciences, Inc.* | | | 109 | | | | 2,782 | |
SEE NOTES TO FINANCIAL STATEMENTS. | THE RYDEX FUNDS ANNUAL REPORT | 91 |
SCHEDULE OF INVESTMENTS (continued) | March 31, 2024 |
RUSSELL 2000® 1.5x STRATEGY FUND | |
| | Shares | | | Value | |
UFP Technologies, Inc.* | | | 11 | | | $ | 2,774 | |
Astrana Health, Inc.* | | | 66 | | | | 2,771 | |
CoreCivic, Inc.* | | | 175 | | | | 2,732 | |
Huron Consulting Group, Inc.* | | | 28 | | | | 2,705 | |
Legalzoom.com, Inc.* | | | 202 | | | | 2,695 | |
Immunovant, Inc.* | | | 83 | | | | 2,682 | |
Catalyst Pharmaceuticals, Inc.* | | | 168 | | | | 2,678 | |
Myriad Genetics, Inc.* | | | 124 | | | | 2,644 | |
Vera Therapeutics, Inc.* | | | 60 | | | | 2,587 | |
Keros Therapeutics, Inc.* | | | 39 | | | | 2,582 | |
Inmode Ltd.* | | | 119 | | | | 2,572 | |
Rocket Pharmaceuticals, Inc.* | | | 95 | | | | 2,559 | |
Supernus Pharmaceuticals, Inc.* | | | 75 | | | | 2,558 | |
GEO Group, Inc.* | | | 181 | | | | 2,556 | |
Dyne Therapeutics, Inc.* | | | 89 | | | | 2,527 | |
Agios Pharmaceuticals, Inc.* | | | 86 | | | | 2,515 | |
Amphastar Pharmaceuticals, Inc.* | | | 57 | | | | 2,503 | |
Protagonist Therapeutics, Inc.* | | | 86 | | | | 2,488 | |
US Physical Therapy, Inc. | | | 22 | | | | 2,483 | |
Veracyte, Inc.* | | | 112 | | | | 2,482 | |
Addus HomeCare Corp.* | | | 24 | | | | 2,480 | |
Cimpress plc* | | | 28 | | | | 2,478 | |
Geron Corp.* | | | 749 | | | | 2,472 | |
Dynavax Technologies Corp.* | | | 199 | | | | 2,470 | |
Vector Group Ltd. | | | 221 | | | | 2,422 | |
Ardelyx, Inc.* | | | 326 | | | | 2,380 | |
Kymera Therapeutics, Inc.* | | | 59 | | | | 2,372 | |
Akero Therapeutics, Inc.* | | | 93 | | | | 2,349 | |
PROG Holdings, Inc. | | | 67 | | | | 2,307 | |
Alpine Immune Sciences, Inc.* | | | 58 | | | | 2,299 | |
Kura Oncology, Inc.* | | | 106 | | | | 2,261 | |
AtriCure, Inc.*,1 | | | 72 | | | | 2,190 | |
ADMA Biologics, Inc.* | | | 322 | | | | 2,125 | |
RxSight, Inc.* | | | 41 | | | | 2,115 | |
John Wiley & Sons, Inc. — Class A | | | 55 | | | | 2,097 | |
Recursion Pharmaceuticals, Inc. — Class A*,1 | | | 210 | | | | 2,094 | |
MGP Ingredients, Inc. | | | 24 | | | | 2,067 | |
Krispy Kreme, Inc. | | | 135 | | | | 2,057 | |
Utz Brands, Inc. | | | 111 | | | | 2,047 | |
Pacira BioSciences, Inc.* | | | 70 | | | | 2,045 | |
Chefs’ Warehouse, Inc.* | | | 54 | | | | 2,034 | |
Omnicell, Inc.* | | | 69 | | | | 2,017 | |
LeMaitre Vascular, Inc. | | | 30 | | | | 1,991 | |
Kforce, Inc. | | | 28 | | | | 1,975 | |
Xencor, Inc.* | | | 89 | | | | 1,970 | |
Payoneer Global, Inc.* | | | 405 | | | | 1,968 | |
Alphatec Holdings, Inc.* | | | 140 | | | | 1,931 | |
Quanex Building Products Corp. | | | 50 | | | | 1,922 | |
Universal Corp. | | | 37 | | | | 1,914 | |
Collegium Pharmaceutical, Inc.* | | | 49 | | | | 1,902 | |
Ligand Pharmaceuticals, Inc. — Class B* | | | 26 | | | | 1,901 | |
Ironwood Pharmaceuticals, Inc. — Class A* | | | 213 | | | | 1,855 | |
Brookdale Senior Living, Inc. — Class A* | | | 280 | | | | 1,851 | |
Morphic Holding, Inc.* | | | 52 | | | | 1,830 | |
Inhibrx, Inc.* | | | 52 | | | | 1,818 | |
National Healthcare Corp. | | | 19 | | | | 1,796 | |
MannKind Corp.* | | | 393 | | | | 1,780 | |
4D Molecular Therapeutics, Inc.* | | | 55 | | | | 1,752 | |
Perdoceo Education Corp. | | | 98 | | | | 1,721 | |
Harmony Biosciences Holdings, Inc.* | | | 51 | | | | 1,713 | |
National Beverage Corp.* | | | 36 | | | | 1,709 | |
Weis Markets, Inc. | | | 26 | | | | 1,674 | |
AdaptHealth Corp.* | | | 144 | | | | 1,657 | |
Arlo Technologies, Inc.* | | | 131 | | | | 1,657 | |
Ingles Markets, Inc. — Class A | | | 21 | | | | 1,610 | |
Tarsus Pharmaceuticals, Inc.* | | | 44 | | | | 1,599 | |
Edgewise Therapeutics, Inc.* | | | 87 | | | | 1,587 | |
Ocular Therapeutix, Inc.* | | | 174 | | | | 1,583 | |
SP Plus Corp.* | | | 30 | | | | 1,567 | |
Prothena Corporation plc* | | | 63 | | | | 1,561 | |
Day One Biopharmaceuticals, Inc.* | | | 94 | | | | 1,553 | |
Sage Therapeutics, Inc.* | | | 82 | | | | 1,537 | |
CG oncology, Inc.* | | | 35 | | | | 1,536 | |
Arcus Biosciences, Inc.* | | | 81 | | | | 1,529 | |
Herbalife Ltd.* | | | 152 | | | | 1,528 | |
ANI Pharmaceuticals, Inc.* | | | 22 | | | | 1,521 | |
CRA International, Inc. | | | 10 | | | | 1,496 | |
Scholar Rock Holding Corp.* | | | 84 | | | | 1,492 | |
John B Sanfilippo & Son, Inc. | | | 14 | | | | 1,483 | |
Monro, Inc. | | | 47 | | | | 1,482 | |
BioCryst Pharmaceuticals, Inc.* | | | 289 | | | | 1,468 | |
Udemy, Inc.* | | | 132 | | | | 1,449 | |
Pacific Biosciences of California, Inc.* | | | 386 | | | | 1,448 | |
Healthcare Services Group, Inc.* | | | 115 | | | | 1,435 | |
Sana Biotechnology, Inc.* | | | 142 | | | | 1,420 | |
Avanos Medical, Inc.* | | | 71 | | | | 1,414 | |
Matthews International Corp. — Class A | | | 45 | | | | 1,399 | |
Vita Coco Company, Inc.* | | | 57 | | | | 1,393 | |
Zentalis Pharmaceuticals, Inc.* | | | 88 | | | | 1,387 | |
89bio, Inc.* | | | 119 | | | | 1,385 | |
Deluxe Corp. | | | 67 | | | | 1,380 | |
Repay Holdings Corp.* | | | 125 | | | | 1,375 | |
Fresh Del Monte Produce, Inc. | | | 53 | | | | 1,373 | |
Innoviva, Inc.* | | | 90 | | | | 1,372 | |
MacroGenics, Inc.* | | | 93 | | | | 1,369 | |
First Advantage Corp. | | | 84 | | | | 1,362 | |
Transcat, Inc.* | | | 12 | | | | 1,337 | |
MiMedx Group, Inc.* | | | 173 | | | | 1,332 | |
Verve Therapeutics, Inc.* | | | 99 | | | | 1,315 | |
Dole plc | | | 110 | | | | 1,312 | |
Chegg, Inc.* | | | 173 | | | | 1,310 | |
Vir Biotechnology, Inc.* | | | 129 | | | | 1,307 | |
REGENXBIO, Inc.* | | | 62 | | | | 1,306 | |
Pliant Therapeutics, Inc.* | | | 87 | | | | 1,296 | |
Pediatrix Medical Group, Inc.* | | | 129 | | | | 1,294 | |
Deciphera Pharmaceuticals, Inc.* | | | 81 | | | | 1,274 | |
Quanterix Corp.* | | | 54 | | | | 1,272 | |
Artivion, Inc.* | | | 60 | | | | 1,270 | |
Barrett Business Services, Inc. | | | 10 | | | | 1,267 | |
Cytek Biosciences, Inc.* | | | 186 | | | | 1,248 | |
92 | THE RYDEX FUNDS ANNUAL REPORT | SEE NOTES TO FINANCIAL STATEMENTS. |
SCHEDULE OF INVESTMENTS (continued) | March 31, 2024 |
RUSSELL 2000® 1.5x STRATEGY FUND | |
| | Shares | | | Value | |
B&G Foods, Inc. | | | 109 | | | $ | 1,247 | |
Cassava Sciences, Inc.* | | | 61 | | | | 1,238 | |
Viad Corp.* | | | 31 | | | | 1,224 | |
Sabre Corp.* | | | 498 | | | | 1,205 | |
Kelly Services, Inc. — Class A | | | 48 | | | | 1,202 | |
ZipRecruiter, Inc. — Class A* | | | 103 | | | | 1,183 | |
Arcturus Therapeutics Holdings, Inc.* | | | 35 | | | | 1,182 | |
Embecta Corp. | | | 89 | | | | 1,181 | |
Arcutis Biotherapeutics, Inc.* | | | 119 | | | | 1,179 | |
EyePoint Pharmaceuticals, Inc.* | | | 56 | | | | 1,158 | |
Relay Therapeutics, Inc.* | | | 138 | | | | 1,145 | |
Viridian Therapeutics, Inc.* | | | 65 | | | | 1,138 | |
Amneal Pharmaceuticals, Inc.* | | | 187 | | | | 1,133 | |
Vital Farms, Inc.* | | | 47 | | | | 1,093 | |
Varex Imaging Corp.* | | | 60 | | | | 1,086 | |
Silk Road Medical, Inc.* | | | 59 | | | | 1,081 | |
Hain Celestial Group, Inc.* | | | 137 | | | | 1,077 | |
Liquidia Corp.* | | | 73 | | | | 1,077 | |
Accolade, Inc.* | | | 102 | | | | 1,069 | |
Nurix Therapeutics, Inc.* | | | 72 | | | | 1,058 | |
Astria Therapeutics, Inc.* | | | 75 | | | | 1,056 | |
SpartanNash Co. | | | 52 | | | | 1,051 | |
Heidrick & Struggles International, Inc. | | | 31 | | | | 1,043 | |
Aurinia Pharmaceuticals, Inc.* | | | 208 | | | | 1,042 | |
Janux Therapeutics, Inc.* | | | 27 | | | | 1,017 | |
LifeStance Health Group, Inc.* | | | 164 | | | | 1,012 | |
Cass Information Systems, Inc. | | | 21 | | | | 1,012 | |
United Natural Foods, Inc.* | | | 88 | | | | 1,011 | |
Cross Country Healthcare, Inc.* | | | 54 | | | | 1,011 | |
BioLife Solutions, Inc.* | | | 53 | | | | 983 | |
SunOpta, Inc.* | | | 140 | | | | 962 | |
Fate Therapeutics, Inc.* | | | 131 | | | | 962 | |
Kiniksa Pharmaceuticals Ltd. — Class A* | | | 48 | | | | 947 | |
Mirum Pharmaceuticals, Inc.* | | | 37 | | | | 929 | |
Atrion Corp. | | | 2 | | | | 927 | |
Y-mAbs Therapeutics, Inc.* | | | 57 | | | | 927 | |
Hackett Group, Inc. | | | 38 | | | | 923 | |
ImmunityBio, Inc.*,1 | | | 171 | | | | 918 | |
Treace Medical Concepts, Inc.* | | | 69 | | | | 900 | |
Editas Medicine, Inc.* | | | 121 | | | | 898 | |
Enhabit, Inc.* | | | 77 | | | | 897 | |
Evolus, Inc.* | | | 64 | | | | 896 | |
BrightSpring Health Services, Inc.* | | | 81 | | | | 880 | |
Mission Produce, Inc.* | | | 74 | | | | 878 | |
USANA Health Sciences, Inc.* | | | 18 | | | | 873 | |
National Research Corp. — Class A | | | 22 | | | | 871 | |
SI-BONE, Inc.* | | | 53 | | | | 868 | |
Castle Biosciences, Inc.* | | | 39 | | | | 864 | |
Travere Therapeutics, Inc.* | | | 112 | | | | 864 | |
Zymeworks, Inc.* | | | 82 | | | | 863 | |
CareDx, Inc.* | | | 80 | | | | 847 | |
Pennant Group, Inc.* | | | 43 | | | | 844 | |
Paragon 28, Inc.* | | | 68 | | | | 840 | |
ORIC Pharmaceuticals, Inc.* | | | 61 | | | | 839 | |
Longboard Pharmaceuticals, Inc.* | | | 38 | | | | 821 | |
Ennis, Inc. | | | 40 | | | | 820 | |
Nuvation Bio, Inc.* | | | 224 | | | | 815 | |
Disc Medicine, Inc.* | | | 13 | | | | 809 | |
I3 Verticals, Inc. — Class A* | | | 35 | | | | 801 | |
Cogent Biosciences, Inc.* | | | 119 | | | | 800 | |
Universal Technical Institute, Inc.* | | | 50 | | | | 797 | |
ACCO Brands Corp. | | | 142 | | | | 797 | |
Nevro Corp.* | | | 55 | | | | 794 | |
V2X, Inc.* | | | 17 | | | | 794 | |
Turning Point Brands, Inc. | | | 27 | | | | 791 | |
Paysafe Ltd.* | | | 50 | | | | 790 | |
Orthofix Medical, Inc.* | | | 54 | | | | 784 | |
OmniAb, Inc.* | | | 143 | | | | 775 | |
Altimmune, Inc.* | | | 76 | | | | 774 | |
PetIQ, Inc.* | | | 42 | | | | 768 | |
BrightView Holdings, Inc.* | | | 64 | | | | 762 | |
Beyond Meat, Inc.* | | | 91 | | | | 753 | |
Calavo Growers, Inc. | | | 27 | | | | 751 | |
Cabaletta Bio, Inc.* | | | 44 | | | | 751 | |
Franklin Covey Co.* | | | 19 | | | | 746 | |
Summit Therapeutics, Inc.* | | | 179 | | | | 741 | |
ACELYRIN, Inc.* | | | 109 | | | | 736 | |
Annexon, Inc.* | | | 102 | | | | 731 | |
OPKO Health, Inc.*,1 | | | 607 | | | | 728 | |
Cargo Therapeutics, Inc.* | | | 32 | | | | 714 | |
Mersana Therapeutics, Inc.* | | | 158 | | | | 708 | |
Nano-X Imaging Ltd.*,1 | | | 72 | | | | 703 | |
OrthoPediatrics Corp.* | | | 24 | | | | 700 | |
Theravance Biopharma, Inc.* | | | 78 | | | | 700 | |
Marinus Pharmaceuticals, Inc.* | | | 76 | | | | 687 | |
Community Health Systems, Inc.* | | | 194 | | | | 679 | |
European Wax Center, Inc. — Class A* | | | 52 | | | | 675 | |
Fulgent Genetics, Inc.* | | | 31 | | | | 673 | |
OraSure Technologies, Inc.* | | | 109 | | | | 670 | |
Green Dot Corp. — Class A* | | | 71 | | | | 662 | |
Zimvie, Inc.* | | | 40 | | | | 660 | |
Sterling Check Corp.* | | | 41 | | | | 659 | |
Resources Connection, Inc. | | | 50 | | | | 658 | |
Savara, Inc.* | | | 132 | | | | 657 | |
Medifast, Inc. | | | 17 | | | | 651 | |
Surmodics, Inc.* | | | 22 | | | | 646 | |
Central Garden & Pet Co.* | | | 15 | | | | 642 | |
Novavax, Inc.*,1 | | | 134 | | | | 641 | |
Avid Bioservices, Inc.* | | | 95 | | | | 636 | |
Enliven Therapeutics, Inc.* | | | 36 | | | | 633 | |
Duckhorn Portfolio, Inc.* | | | 68 | | | | 633 | |
AnaptysBio, Inc.* | | | 28 | | | | 631 | |
Revance Therapeutics, Inc.* | | | 128 | | | | 630 | |
Avita Medical, Inc.* | | | 39 | | | | 625 | |
Cullinan Oncology, Inc.* | | | 36 | | | | 613 | |
SIGA Technologies, Inc. | | | 71 | | | | 608 | |
Lyell Immunopharma, Inc.* | | | 266 | | | | 593 | |
TrueBlue, Inc.* | | | 47 | | | | 588 | |
Alector, Inc.* | | | 97 | | | | 584 | |
Harrow, Inc.*,1 | | | 44 | | | | 582 | |
Stoke Therapeutics, Inc.* | | | 43 | | | | 580 | |
Tactile Systems Technology, Inc.* | | | 35 | | | | 569 | |
SEE NOTES TO FINANCIAL STATEMENTS. | THE RYDEX FUNDS ANNUAL REPORT | 93 |
SCHEDULE OF INVESTMENTS (continued) | March 31, 2024 |
RUSSELL 2000® 1.5x STRATEGY FUND | |
| | Shares | | | Value | |
Allogene Therapeutics, Inc.* | | | 127 | | | $ | 568 | |
Adaptive Biotechnologies Corp.* | | | 175 | | | | 562 | |
Celcuity, Inc.* | | | 26 | | | | 562 | |
MaxCyte, Inc.* | | | 134 | | | | 561 | |
Beauty Health Co.* | | | 126 | | | | 560 | |
Anika Therapeutics, Inc.* | | | 22 | | | | 559 | |
WaVe Life Sciences Ltd.* | | | 90 | | | | 555 | |
Willdan Group, Inc.* | | | 19 | | | | 551 | |
HilleVax, Inc.* | | | 33 | | | | 549 | |
Anavex Life Sciences Corp.*,1 | | | 107 | | | | 545 | |
Enanta Pharmaceuticals, Inc.* | | | 31 | | | | 541 | |
Carriage Services, Inc. — Class A | | | 20 | | | | 541 | |
Tango Therapeutics, Inc.* | | | 68 | | | | 540 | |
Terawulf, Inc.* | | | 204 | | | | 537 | |
Distribution Solutions Group, Inc.* | | | 15 | | | | 532 | |
iRadimed Corp. | | | 12 | | | | 528 | |
Sutro Biopharma, Inc.* | | | 93 | | | | 525 | |
Target Hospitality Corp.* | | | 48 | | | | 522 | |
Pulmonx Corp.* | | | 56 | | | | 519 | |
iTeos Therapeutics, Inc.* | | | 38 | | | | 518 | |
Cerus Corp.* | | | 273 | | | | 516 | |
Limoneira Co. | | | 26 | | | | 509 | |
Taro Pharmaceutical Industries Ltd.* | | | 12 | | | | 508 | |
Nkarta, Inc.* | | | 47 | | | | 508 | |
Replimune Group, Inc.* | | | 62 | | | | 507 | |
Custom Truck One Source, Inc.* | | | 87 | | | | 506 | |
Caribou Biosciences, Inc.* | | | 98 | | | | 504 | |
Aerovate Therapeutics, Inc.* | | | 17 | | | | 503 | |
Axogen, Inc.* | | | 62 | | | | 500 | |
Arbutus Biopharma Corp.* | | | 192 | | | | 495 | |
Tejon Ranch Co.* | | | 32 | | | | 493 | |
Viemed Healthcare, Inc.* | | | 52 | | | | 490 | |
DocGo, Inc.* | | | 120 | | | | 485 | |
Atea Pharmaceuticals, Inc.* | | | 118 | | | | 477 | |
Entrada Therapeutics, Inc.* | | | 33 | | | | 468 | |
UroGen Pharma Ltd.* | | | 31 | | | | 465 | |
Phathom Pharmaceuticals, Inc.* | | | 43 | | | | 457 | |
Voyager Therapeutics, Inc.* | | | 49 | | | | 456 | |
Agiliti, Inc.* | | | 45 | | | | 455 | |
Seneca Foods Corp. — Class A* | | | 8 | | | | 455 | |
Olema Pharmaceuticals, Inc.* | | | 40 | | | | 453 | |
Xeris Biopharma Holdings, Inc.* | | | 204 | | | | 451 | |
KalVista Pharmaceuticals, Inc.* | | | 38 | | | | 451 | |
Biomea Fusion, Inc.*,1 | | | 30 | | | | 448 | |
ModivCare, Inc.* | | | 19 | | | | 446 | |
Westrock Coffee Co.* | | | 43 | | | | 444 | |
Heron Therapeutics, Inc.* | | | 158 | | | | 438 | |
Nature’s Sunshine Products, Inc.* | | | 21 | | | | 436 | |
Terns Pharmaceuticals, Inc.* | | | 66 | | | | 433 | |
Alta Equipment Group, Inc. | | | 33 | | | | 427 | |
Prime Medicine, Inc.*,1 | | | 60 | | | | 420 | |
2seventy bio, Inc.* | | | 77 | | | | 412 | |
RAPT Therapeutics, Inc.* | | | 45 | | | | 404 | |
Phibro Animal Health Corp. — Class A | | | 31 | | | | 401 | |
Inozyme Pharma, Inc.* | | | 52 | | | | 398 | |
Ventyx Biosciences, Inc.* | | | 72 | | | | 396 | |
Rigel Pharmaceuticals, Inc.* | | | 263 | | | | 389 | |
Forrester Research, Inc.* | | | 18 | | | | 388 | |
ARS Pharmaceuticals, Inc.* | | | 37 | | | | 378 | |
Village Super Market, Inc. — Class A | | | 13 | | | | 372 | |
Lincoln Educational Services Corp.* | | | 36 | | | | 372 | |
Zynex, Inc.* | | | 30 | | | | 371 | |
ALX Oncology Holdings, Inc.* | | | 33 | | | | 368 | |
Tenaya Therapeutics, Inc.* | | | 70 | | | | 366 | |
Vanda Pharmaceuticals, Inc.* | | | 87 | | | | 358 | |
Utah Medical Products, Inc. | | | 5 | | | | 356 | |
Nathan’s Famous, Inc. | | | 5 | | | | 354 | |
Accuray, Inc.* | | | 143 | | | | 353 | |
Gritstone bio, Inc.* | | | 135 | | | | 347 | |
Aaron’s Company, Inc. | | | 46 | | | | 345 | |
Tyra Biosciences, Inc.* | | | 21 | | | | 344 | |
Lexicon Pharmaceuticals, Inc.* | | | 142 | | | | 341 | |
AngioDynamics, Inc.* | | | 58 | | | | 340 | |
Aura Biosciences, Inc.* | | | 43 | | | | 338 | |
Zevra Therapeutics, Inc.* | | | 58 | | | | 336 | |
Poseida Therapeutics, Inc.* | | | 104 | | | | 332 | |
Monte Rosa Therapeutics, Inc.* | | | 47 | | | | 331 | |
Cipher Mining, Inc.*,1 | | | 64 | | | | 330 | |
FibroGen, Inc.* | | | 139 | | | | 327 | |
CorMedix, Inc.* | | | 77 | | | | 327 | |
Alico, Inc. | | | 11 | | | | 322 | |
Omeros Corp.*,1 | | | 93 | | | | 321 | |
Coherus Biosciences, Inc.* | | | 133 | | | | 318 | |
Neumora Therapeutics, Inc.*,1 | | | 23 | | | | 316 | |
Acacia Research Corp.* | | | 59 | | | | 314 | |
Actinium Pharmaceuticals, Inc.* | | | 40 | | | | 313 | |
CVRx, Inc.* | | | 17 | | | | 310 | |
Organogenesis Holdings, Inc.* | | | 108 | | | | 307 | |
Agenus, Inc.* | | | 526 | | | | 305 | |
MeiraGTx Holdings plc* | | | 50 | | | | 303 | |
American Well Corp. — Class A* | | | 374 | | | | 303 | |
Performant Financial Corp.* | | | 103 | | | | 303 | |
Precigen, Inc.* | | | 208 | | | | 302 | |
Quantum-Si, Inc.* | | | 153 | | | | 301 | |
Fennec Pharmaceuticals, Inc.* | | | 27 | | | | 300 | |
Larimar Therapeutics, Inc.* | | | 39 | | | | 296 | |
Lineage Cell Therapeutics, Inc.* | | | 198 | | | | 293 | |
Humacyte, Inc.* | | | 94 | | | | 292 | |
XOMA Corp.* | | | 12 | | | | 289 | |
Joint Corp.* | | | 22 | | | | 287 | |
Third Harmonic Bio, Inc.* | | | 30 | | | | 283 | |
Inogen, Inc.* | | | 35 | | | | 282 | |
Generation Bio Co.* | | | 69 | | | | 281 | |
Ovid therapeutics, Inc.* | | | 92 | | | | 281 | |
Compass Therapeutics, Inc.* | | | 141 | | | | 279 | |
Waldencast plc — Class A* | | | 42 | | | | 273 | |
Mineralys Therapeutics, Inc.* | | | 21 | | | | 271 | |
Quipt Home Medical Corp.* | | | 62 | | | | 271 | |
ArriVent Biopharma, Inc.* | | | 15 | | | | 268 | |
Kodiak Sciences, Inc.* | | | 50 | | | | 263 | |
Karyopharm Therapeutics, Inc.* | | | 174 | | | | 263 | |
X4 Pharmaceuticals, Inc.* | | | 189 | | | | 263 | |
94 | THE RYDEX FUNDS ANNUAL REPORT | SEE NOTES TO FINANCIAL STATEMENTS. |
SCHEDULE OF INVESTMENTS (continued) | March 31, 2024 |
RUSSELL 2000® 1.5x STRATEGY FUND | |
| | Shares | | | Value | |
Erasca, Inc.* | | | 125 | | | $ | 257 | |
Harvard Bioscience, Inc.* | | | 60 | | | | 254 | |
Natural Grocers by Vitamin Cottage, Inc. | | | 14 | | | | 253 | |
Quad/Graphics, Inc. | | | 47 | | | | 250 | |
BRC, Inc. — Class A* | | | 58 | | | | 248 | |
ClearPoint Neuro, Inc.* | | | 35 | | | | 238 | |
Merrimack Pharmaceuticals, Inc.* | | | 16 | | | | 236 | |
Aldeyra Therapeutics, Inc.* | | | 72 | | | | 235 | |
Lexeo Therapeutics, Inc.* | | | 15 | | | | 235 | |
BioAtla, Inc.* | | | 68 | | | | 234 | |
Semler Scientific, Inc.* | | | 8 | | | | 234 | |
InfuSystem Holdings, Inc.* | | | 27 | | | | 231 | |
Butterfly Network, Inc.* | | | 213 | | | | 230 | |
Nautilus Biotechnology, Inc.* | | | 77 | | | | 226 | |
SoundThinking, Inc.* | | | 14 | | | | 222 | |
Information Services Group, Inc. | | | 55 | | | | 222 | |
Sanara Medtech, Inc.* | | | 6 | | | | 222 | |
Amylyx Pharmaceuticals, Inc.* | | | 78 | | | | 222 | |
scPharmaceuticals, Inc.* | | | 44 | | | | 221 | |
Trevi Therapeutics, Inc.* | | | 64 | | | | 221 | |
PepGen, Inc.* | | | 15 | | | | 220 | |
HF Foods Group, Inc.* | | | 62 | | | | 217 | |
23andMe Holding Co. — Class A* | | | 396 | | | | 211 | |
Bluebird Bio, Inc.* | | | 164 | | | | 210 | |
Pulse Biosciences, Inc.* | | | 24 | | | | 209 | |
Foghorn Therapeutics, Inc.*,1 | | | 31 | | | | 208 | |
Aveanna Healthcare Holdings, Inc.* | | | 81 | | | | 202 | |
Design Therapeutics, Inc.* | | | 50 | | | | 201 | |
Emergent BioSolutions, Inc.* | | | 78 | | | | 197 | |
Verrica Pharmaceuticals, Inc.* | | | 32 | | | | 189 | |
CompoSecure, Inc. — Class A*,1 | | | 25 | | | | 181 | |
Genelux Corp.* | | | 28 | | | | 180 | |
Scilex Holding Co.* | | | 113 | | | | 180 | |
Cadiz, Inc.* | | | 62 | | | | 180 | |
IGM Biosciences, Inc.* | | | 18 | | | | 174 | |
Citius Pharmaceuticals, Inc.* | | | 190 | | | | 171 | |
PDS Biotechnology Corp.* | | | 43 | | | | 170 | |
Seer, Inc.* | | | 89 | | | | 169 | |
Ispire Technology, Inc.*,1 | | | 27 | | | | 166 | |
Optinose, Inc.* | | | 112 | | | | 164 | |
Emerald Holding, Inc.* | | | 24 | | | | 163 | |
WW International, Inc.* | | | 83 | | | | 154 | |
Century Therapeutics, Inc.* | | | 36 | | | | 150 | |
Sangamo Therapeutics, Inc.* | | | 220 | | | | 147 | |
Akoya Biosciences, Inc.* | | | 31 | | | | 145 | |
Vor BioPharma, Inc.* | | | 58 | | | | 137 | |
Tela Bio, Inc.* | | | 24 | | | | 136 | |
Omega Therapeutics, Inc.* | | | 37 | | | | 135 | |
LENZ Therapeutics, Inc. | | | 6 | | | | 134 | |
Aclaris Therapeutics, Inc.* | | | 106 | | | | 132 | |
Assertio Holdings, Inc.* | | | 137 | | | | 131 | |
Outlook Therapeutics, Inc.* | | | 11 | | | | 131 | |
Innovage Holding Corp.* | | | 29 | | | | 129 | |
Allakos, Inc.* | | | 102 | | | | 129 | |
KORU Medical Systems, Inc.* | | | 54 | | | | 127 | |
Protalix BioTherapeutics, Inc.* | | | 97 | | | | 122 | |
Biote Corp. — Class A* | | | 21 | | | | 122 | |
FiscalNote Holdings, Inc.* | | | 91 | | | | 121 | |
Mural Oncology plc* | | | 24 | | | | 117 | |
AirSculpt Technologies, Inc.* | | | 19 | | | | 117 | |
Cartesian Therapeutics, Inc.* | | | 179 | | | | 116 | |
Seres Therapeutics, Inc.* | | | 149 | | | | 115 | |
ProKidney Corp.* | | | 68 | | | | 112 | |
Adicet Bio, Inc.* | | | 47 | | | | 110 | |
CPI Card Group, Inc.* | | | 6 | | | | 107 | |
NGM Biopharmaceuticals, Inc.* | | | 66 | | | | 105 | |
HireQuest, Inc. | | | 8 | | | | 104 | |
Cue Biopharma, Inc.* | | | 54 | | | | 102 | |
Atara Biotherapeutics, Inc.* | | | 146 | | | | 101 | |
PMV Pharmaceuticals, Inc.* | | | 59 | | | | 100 | |
Kezar Life Sciences, Inc.* | | | 111 | | | | 100 | |
Immuneering Corp. — Class A* | | | 34 | | | | 98 | |
Carisma Therapeutics, Inc.*,1 | | | 41 | | | | 93 | |
Acrivon Therapeutics, Inc.* | | | 13 | | | | 93 | |
Priority Technology Holdings, Inc.* | | | 28 | | | | 92 | |
Nuvectis Pharma, Inc.* | | | 11 | | | | 90 | |
Rallybio Corp.* | | | 47 | | | | 87 | |
Vigil Neuroscience, Inc.* | | | 25 | | | | 85 | |
Bioxcel Therapeutics, Inc.* | | | 30 | | | | 85 | |
Eagle Pharmaceuticals, Inc.* | | | 16 | | | | 84 | |
MarketWise, Inc. | | | 48 | | | | 83 | |
Forafric Global plc* | | | 8 | | | | 83 | |
Prelude Therapeutics, Inc.* | | | 17 | | | | 81 | |
Beyond Air, Inc.* | | | 41 | | | | 71 | |
Cara Therapeutics, Inc.* | | | 72 | | | | 66 | |
P3 Health Partners, Inc.* | | | 61 | | | | 63 | |
Aadi Bioscience, Inc.* | | | 25 | | | | 58 | |
Allovir, Inc.* | | | 73 | | | | 55 | |
Benson Hill, Inc.* | | | 265 | | | | 53 | |
Ikena Oncology, Inc.* | | | 37 | | | | 53 | |
Ocean Biomedical, Inc.* | | | 13 | | | | 49 | |
Bakkt Holdings, Inc.*,1 | | | 107 | | | | 49 | |
2U, Inc.* | | | 122 | | | | 48 | |
Vaxxinity, Inc. — Class A* | | | 66 | | | | 47 | |
Zevia PBC — Class A* | | | 38 | | | | 44 | |
Eyenovia, Inc.* | | | 45 | | | | 44 | |
Cutera, Inc.* | | | 28 | | | | 41 | |
Orchestra BioMed Holdings, Inc.* | | | 7 | | | | 37 | |
Zura Bio Ltd.* | | | 13 | | | | 33 | |
Vicarious Surgical, Inc.* | | | 107 | | | | 32 | |
Reneo Pharmaceuticals, Inc.* | | | 17 | | | | 28 | |
Rent the Runway, Inc. — Class A* | | | 73 | | | | 25 | |
Bright Green Corp.* | | | 92 | | | | 22 | |
CareMax, Inc.* | | | 4 | | | | 19 | |
ATI Physical Therapy, Inc.* | | | 1 | | | | 6 | |
BioVie, Inc.* | | | 6 | | | | 3 | |
Ligand Pharmaceuticals, Inc.*,†† | | | 24 | | | | — | |
Total Consumer, Non-cyclical | | | | | | | 930,652 | |
| | | | | | | | | |
Financial - 11.6% |
FTAI Aviation Ltd. | | | 150 | | | | 10,095 | |
Ryman Hospitality Properties, Inc. REIT | | | 87 | | | | 10,058 | |
SEE NOTES TO FINANCIAL STATEMENTS. | THE RYDEX FUNDS ANNUAL REPORT | 95 |
SCHEDULE OF INVESTMENTS (continued) | March 31, 2024 |
RUSSELL 2000® 1.5x STRATEGY FUND | |
| | Shares | | | Value | |
Selective Insurance Group, Inc. | | | 91 | | | $ | 9,934 | |
SouthState Corp. | | | 115 | | | | 9,778 | |
Essent Group Ltd. | | | 159 | | | | 9,462 | |
Terreno Realty Corp. REIT | | | 127 | | | | 8,433 | |
Cadence Bank | | | 274 | | | | 7,946 | |
Jackson Financial, Inc. — Class A | | | 120 | | | | 7,937 | |
Radian Group, Inc. | | | 232 | | | | 7,765 | |
Old National Bancorp | | | 441 | | | | 7,678 | |
Mr Cooper Group, Inc.* | | | 98 | | | | 7,639 | |
Kite Realty Group Trust REIT | | | 327 | | | | 7,089 | |
Home BancShares, Inc. | | | 287 | | | | 7,052 | |
United Bankshares, Inc. | | | 197 | | | | 7,051 | |
Glacier Bancorp, Inc. | | | 168 | | | | 6,767 | |
American Equity Investment Life Holding Co.* | | | 117 | | | | 6,578 | |
First Financial Bankshares, Inc. | | | 197 | | | | 6,464 | |
Phillips Edison & Company, Inc. REIT | | | 177 | | | | 6,349 | |
Essential Properties Realty Trust, Inc. REIT | | | 235 | | | | 6,265 | |
Hamilton Lane, Inc. — Class A | | | 55 | | | | 6,202 | |
Hancock Whitney Corp. | | | 131 | | | | 6,031 | |
UMB Financial Corp. | | | 67 | | | | 5,828 | |
Moelis & Co. — Class A | | | 101 | | | | 5,734 | |
PotlatchDeltic Corp. REIT | | | 121 | | | | 5,689 | |
Macerich Co. REIT | | | 330 | | | | 5,686 | |
Enstar Group Ltd.* | | | 18 | | | | 5,594 | |
Independence Realty Trust, Inc. REIT | | | 345 | | | | 5,565 | |
SL Green Realty Corp. REIT | | | 97 | | | | 5,348 | |
Apple Hospitality REIT, Inc. | | | 325 | | | | 5,323 | |
Sabra Health Care REIT, Inc. | | | 354 | | | | 5,229 | |
ServisFirst Bancshares, Inc. | | | 78 | | | | 5,176 | |
Valley National Bancorp | | | 650 | | | | 5,174 | |
Piper Sandler Cos. | | | 26 | | | | 5,161 | |
Blackstone Mortgage Trust, Inc. — Class A REIT1 | | | 259 | | | | 5,157 | |
Associated Banc-Corp. | | | 228 | | | | 4,904 | |
Walker & Dunlop, Inc. | | | 48 | | | | 4,851 | |
Ameris Bancorp | | | 100 | | | | 4,838 | |
CNO Financial Group, Inc. | | | 170 | | | | 4,672 | |
United Community Banks, Inc. | | | 177 | | | | 4,659 | |
Tanger, Inc. REIT | | | 157 | | | | 4,636 | |
International Bancshares Corp. | | | 82 | | | | 4,603 | |
McGrath RentCorp | | | 37 | | | | 4,565 | |
Hannon Armstrong Sustainable Infrastructure Capital, Inc. REIT | | | 159 | | | | 4,515 | |
Broadstone Net Lease, Inc. REIT | | | 288 | | | | 4,513 | |
Axos Financial, Inc.* | | | 83 | | | | 4,485 | |
First BanCorp | | | 252 | | | | 4,420 | |
CareTrust REIT, Inc. | | | 181 | | | | 4,411 | |
Texas Capital Bancshares, Inc.* | | | 71 | | | | 4,370 | |
Genworth Financial, Inc. — Class A* | | | 679 | | | | 4,366 | |
Innovative Industrial Properties, Inc. REIT | | | 42 | | | | 4,349 | |
Pagseguro Digital Ltd. — Class A* | | | 304 | | | | 4,341 | |
SITE Centers Corp. REIT | | | 291 | | | | 4,263 | |
Artisan Partners Asset Management, Inc. — Class A | | | 93 | | | | 4,257 | |
BGC Group, Inc. — Class A | | | 543 | | | | 4,219 | |
COPT Defense Properties REIT | | | 173 | | | | 4,181 | |
WSFS Financial Corp. | | | 91 | | | | 4,108 | |
National Health Investors, Inc. REIT | | | 64 | | | | 4,021 | |
Cathay General Bancorp | | | 106 | | | | 4,010 | |
Atlantic Union Bankshares Corp. | | | 113 | | | | 3,990 | |
Community Bank System, Inc. | | | 82 | | | | 3,938 | |
LXP Industrial Trust REIT | | | 436 | | | | 3,933 | |
NMI Holdings, Inc. — Class A* | | | 120 | | | | 3,881 | |
Fulton Financial Corp. | | | 244 | | | | 3,877 | |
Outfront Media, Inc. REIT | | | 226 | | | | 3,795 | |
Bank of Hawaii Corp. | | | 60 | | | | 3,743 | |
Simmons First National Corp. — Class A | | | 188 | | | | 3,658 | |
Arbor Realty Trust, Inc. REIT1 | | | 274 | | | | 3,630 | |
CVB Financial Corp. | | | 203 | | | | 3,622 | |
PennyMac Financial Services, Inc. | | | 39 | | | | 3,552 | |
Independent Bank Corp. | | | 68 | | | | 3,537 | |
Pacific Premier Bancorp, Inc. | | | 146 | | | | 3,504 | |
First Interstate BancSystem, Inc. — Class A | | | 127 | | | | 3,456 | |
Sunstone Hotel Investors, Inc. REIT | | | 310 | | | | 3,453 | |
Douglas Emmett, Inc. REIT | | | 247 | | | | 3,426 | |
PJT Partners, Inc. — Class A | | | 36 | | | | 3,393 | |
Eastern Bankshares, Inc. | | | 238 | | | | 3,280 | |
Seacoast Banking Corporation of Florida | | | 129 | | | | 3,275 | |
Four Corners Property Trust, Inc. REIT | | | 133 | | | | 3,255 | |
First Financial Bancorp | | | 145 | | | | 3,251 | |
BankUnited, Inc. | | | 114 | | | | 3,192 | |
First Merchants Corp. | | | 90 | | | | 3,141 | |
Palomar Holdings, Inc.* | | | 37 | | | | 3,102 | |
Banc of California, Inc. | | | 203 | | | | 3,088 | |
DiamondRock Hospitality Co. REIT | | | 321 | | | | 3,085 | |
Cohen & Steers, Inc. | | | 40 | | | | 3,076 | |
Urban Edge Properties REIT | | | 177 | | | | 3,057 | |
TowneBank | | | 108 | | | | 3,030 | |
St. Joe Co. | | | 52 | | | | 3,014 | |
BancFirst Corp. | | | 34 | | | | 2,993 | |
Park National Corp. | | | 22 | | | | 2,989 | |
Upstart Holdings, Inc.*,1 | | | 111 | | | | 2,985 | |
WaFd, Inc. | | | 102 | | | | 2,961 | |
StepStone Group, Inc. — Class A | | | 82 | | | | 2,931 | |
Equity Commonwealth REIT* | | | 155 | | | | 2,926 | |
StoneX Group, Inc.* | | | 40 | | | | 2,810 | |
Bread Financial Holdings, Inc. | | | 75 | | | | 2,793 | |
RLJ Lodging Trust REIT | | | 235 | | | | 2,778 | |
Pebblebrook Hotel Trust REIT | | | 180 | | | | 2,774 | |
Farmer Mac — Class C | | | 14 | | | | 2,756 | |
Enova International, Inc.* | | | 43 | | | | 2,702 | |
InvenTrust Properties Corp. REIT | | | 105 | | | | 2,700 | |
Stewart Information Services Corp. | | | 41 | | | | 2,667 | |
Renasant Corp. | | | 85 | | | | 2,662 | |
Cushman & Wakefield plc* | | | 254 | | | | 2,657 | |
WesBanco, Inc. | | | 89 | | | | 2,653 | |
Bancorp, Inc.* | | | 79 | | | | 2,643 | |
BRP Group, Inc. — Class A* | | | 91 | | | | 2,634 | |
Triumph Financial, Inc.* | | | 33 | | | | 2,618 | |
Trustmark Corp. | | | 93 | | | | 2,614 | |
OFG Bancorp | | | 70 | | | | 2,577 | |
96 | THE RYDEX FUNDS ANNUAL REPORT | SEE NOTES TO FINANCIAL STATEMENTS. |
SCHEDULE OF INVESTMENTS (continued) | March 31, 2024 |
RUSSELL 2000® 1.5x STRATEGY FUND | |
| | Shares | | | Value | |
Independent Bank Group, Inc. | | | 56 | | | $ | 2,556 | |
NBT Bancorp, Inc. | | | 69 | | | | 2,531 | |
Lakeland Financial Corp. | | | 38 | | | | 2,520 | |
Banner Corp. | | | 52 | | | | 2,496 | |
Virtus Investment Partners, Inc. | | | 10 | | | | 2,480 | |
Acadia Realty Trust REIT | | | 143 | | | | 2,432 | |
Apollo Commercial Real Estate Finance, Inc. REIT | | | 218 | | | | 2,429 | |
Retail Opportunity Investments Corp. REIT | | | 189 | | | | 2,423 | |
Xenia Hotels & Resorts, Inc. REIT | | | 159 | | | | 2,387 | |
Bank of NT Butterfield & Son Ltd. | | | 73 | | | | 2,335 | |
Horace Mann Educators Corp. | | | 63 | | | | 2,330 | |
Compass Diversified Holdings | | | 96 | | | | 2,311 | |
Global Net Lease, Inc. REIT | | | 297 | | | | 2,308 | |
Northwest Bancshares, Inc. | | | 197 | | | | 2,295 | |
City Holding Co. | | | 22 | | | | 2,293 | |
Heartland Financial USA, Inc. | | | 65 | | | | 2,285 | |
Newmark Group, Inc. — Class A | | | 206 | | | | 2,285 | |
Customers Bancorp, Inc.* | | | 43 | | | | 2,282 | |
JBG SMITH Properties REIT | | | 142 | | | | 2,279 | |
Ready Capital Corp. REIT | | | 246 | | | | 2,246 | |
Enterprise Financial Services Corp. | | | 55 | | | | 2,231 | |
Cannae Holdings, Inc.* | | | 100 | | | | 2,224 | |
Hilltop Holdings, Inc. | | | 71 | | | | 2,224 | |
First Bancorp | | | 61 | | | | 2,203 | |
Navient Corp. | | | 126 | | | | 2,192 | |
First Commonwealth Financial Corp. | | | 157 | | | | 2,185 | |
Live Oak Bancshares, Inc. | | | 52 | | | | 2,159 | |
Uniti Group, Inc. REIT | | | 363 | | | | 2,142 | |
Goosehead Insurance, Inc. — Class A* | | | 32 | | | | 2,132 | |
Mercury General Corp. | | | 41 | | | | 2,116 | |
Empire State Realty Trust, Inc. — Class A REIT | | | 203 | | | | 2,056 | |
Stock Yards Bancorp, Inc. | | | 42 | | | | 2,054 | |
Hope Bancorp, Inc. | | | 178 | | | | 2,049 | |
LTC Properties, Inc. REIT | | | 63 | | | | 2,048 | |
FB Financial Corp. | | | 54 | | | | 2,034 | |
National Bank Holdings Corp. — Class A | | | 56 | | | | 2,020 | |
Pathward Financial, Inc. | | | 40 | | | | 2,019 | |
PennyMac Mortgage Investment Trust REIT | | | 136 | | | | 1,996 | |
Two Harbors Investment Corp. REIT | | | 149 | | | | 1,973 | |
WisdomTree, Inc. | | | 212 | | | | 1,948 | |
Ladder Capital Corp. — Class A REIT | | | 174 | | | | 1,937 | |
S&T Bancorp, Inc. | | | 60 | | | | 1,925 | |
First Busey Corp. | | | 80 | | | | 1,924 | |
Getty Realty Corp. REIT | | | 70 | | | | 1,915 | |
Westamerica BanCorp | | | 39 | | | | 1,906 | |
Nelnet, Inc. — Class A | | | 20 | | | | 1,893 | |
Elme Communities REIT | | | 135 | | | | 1,879 | |
NETSTREIT Corp. | | | 101 | | | | 1,855 | |
Alexander & Baldwin, Inc. REIT | | | 112 | | | | 1,845 | |
Veris Residential, Inc. REIT | | | 121 | | | | 1,840 | |
Apartment Investment and Management Co. — Class A REIT* | | | 222 | | | | 1,818 | |
Safety Insurance Group, Inc. | | | 22 | | | | 1,808 | |
Stellar Bancorp, Inc. | | | 74 | | | | 1,803 | |
MFA Financial, Inc. REIT | | | 157 | | | | 1,791 | |
Victory Capital Holdings, Inc. — Class A | | | 42 | | | | 1,782 | |
Fidelis Insurance Holdings Ltd.1 | | | 91 | | | | 1,773 | |
Employers Holdings, Inc. | | | 39 | | | | 1,770 | |
TriCo Bancshares | | | 48 | | | | 1,765 | |
Trupanion, Inc.*,1 | | | 62 | | | | 1,712 | |
Franklin BSP Realty Trust, Inc. REIT | | | 128 | | | | 1,710 | |
Service Properties Trust REIT | | | 252 | | | | 1,709 | |
Skyward Specialty Insurance Group, Inc.* | | | 45 | | | | 1,683 | |
Veritex Holdings, Inc. | | | 81 | | | | 1,660 | |
Provident Financial Services, Inc. | | | 113 | | | | 1,646 | |
American Assets Trust, Inc. REIT | | | 75 | | | | 1,643 | |
Encore Capital Group, Inc.* | | | 36 | | | | 1,642 | |
Nicolet Bankshares, Inc. | | | 19 | | | | 1,634 | |
Easterly Government Properties, Inc. REIT | | | 141 | | | | 1,623 | |
Chimera Investment Corp. REIT | | | 345 | | | | 1,590 | |
QCR Holdings, Inc. | | | 26 | | | | 1,579 | |
Kennedy-Wilson Holdings, Inc. | | | 183 | | | | 1,570 | |
PRA Group, Inc.* | | | 60 | | | | 1,565 | |
Compass, Inc. — Class A* | | | 433 | | | | 1,559 | |
Sandy Spring Bancorp, Inc. | | | 67 | | | | 1,553 | |
Peoples Bancorp, Inc. | | | 52 | | | | 1,540 | |
Berkshire Hills Bancorp, Inc. | | | 67 | | | | 1,536 | |
Preferred Bank/Los Angeles CA | | | 20 | | | | 1,535 | |
German American Bancorp, Inc. | | | 43 | | | | 1,490 | |
Plymouth Industrial REIT, Inc. | | | 66 | | | | 1,485 | |
OceanFirst Financial Corp. | | | 90 | | | | 1,477 | |
National Western Life Group, Inc. — Class A | | | 3 | | | | 1,476 | |
AMERISAFE, Inc. | | | 29 | | | | 1,455 | |
Enact Holdings, Inc. | | | 46 | | | | 1,434 | |
LendingClub Corp.* | | | 163 | | | | 1,433 | |
Origin Bancorp, Inc. | | | 45 | | | | 1,406 | |
Hudson Pacific Properties, Inc. REIT | | | 212 | | | | 1,367 | |
BrightSpire Capital, Inc. REIT | | | 198 | | | | 1,364 | |
UMH Properties, Inc. REIT | | | 84 | | | | 1,364 | |
ARMOUR Residential REIT, Inc.1 | | | 69 | | | | 1,364 | |
Safehold, Inc. REIT | | | 66 | | | | 1,360 | |
Ellington Financial, Inc. REIT | | | 115 | | | | 1,358 | |
Claros Mortgage Trust, Inc. | | | 139 | | | | 1,357 | |
SiriusPoint Ltd.* | | | 106 | | | | 1,347 | |
Southside Bancshares, Inc. | | | 46 | | | | 1,345 | |
Paramount Group, Inc. REIT | | | 285 | | | | 1,337 | |
Piedmont Office Realty Trust, Inc. — Class A REIT | | | 190 | | | | 1,336 | |
Brookline Bancorp, Inc. | | | 134 | | | | 1,335 | |
Centerspace REIT | | | 23 | | | | 1,314 | |
1st Source Corp. | | | 25 | | | | 1,310 | |
Lemonade, Inc.*,1 | | | 78 | | | | 1,280 | |
Marcus & Millichap, Inc. | | | 37 | | | | 1,264 | |
Brandywine Realty Trust REIT | | | 260 | | | | 1,248 | |
Patria Investments Ltd. — Class A | | | 83 | | | | 1,232 | |
Bank First Corp. | | | 14 | | | | 1,213 | |
AssetMark Financial Holdings, Inc.* | | | 34 | | | | 1,204 | |
First Bancshares, Inc. | | | 46 | | | | 1,194 | |
F&G Annuities & Life, Inc. | | | 29 | | | | 1,176 | |
SEE NOTES TO FINANCIAL STATEMENTS. | THE RYDEX FUNDS ANNUAL REPORT | 97 |
SCHEDULE OF INVESTMENTS (continued) | March 31, 2024 |
RUSSELL 2000® 1.5x STRATEGY FUND | |
| | Shares | | | Value | |
Capitol Federal Financial, Inc. | | | 196 | | | $ | 1,168 | |
Lakeland Bancorp, Inc. | | | 96 | | | | 1,162 | |
HCI Group, Inc. | | | 10 | | | | 1,161 | |
Brightsphere Investment Group, Inc. | | | 50 | | | | 1,142 | |
International Money Express, Inc.* | | | 50 | | | | 1,141 | |
NexPoint Residential Trust, Inc. REIT | | | 35 | | | | 1,127 | |
Premier Financial Corp. | | | 55 | | | | 1,117 | |
Redwood Trust, Inc. REIT | | | 175 | | | | 1,115 | |
ConnectOne Bancorp, Inc. | | | 57 | | | | 1,111 | |
Tompkins Financial Corp. | | | 22 | | | | 1,106 | |
eXp World Holdings, Inc.1 | | | 107 | | | | 1,105 | |
Redfin Corp.* | | | 163 | | | | 1,084 | |
Armada Hoffler Properties, Inc. REIT | | | 104 | | | | 1,082 | |
Ambac Financial Group, Inc.* | | | 68 | | | | 1,063 | |
Dime Community Bancshares, Inc. | | | 55 | | | | 1,059 | |
Summit Hotel Properties, Inc. REIT | | | 161 | | | | 1,048 | |
Heritage Financial Corp. | | | 54 | | | | 1,047 | |
Dynex Capital, Inc. REIT | | | 84 | | | | 1,046 | |
Merchants Bancorp | | | 24 | | | | 1,036 | |
Community Healthcare Trust, Inc. REIT | | | 39 | | | | 1,035 | |
Eagle Bancorp, Inc. | | | 44 | | | | 1,034 | |
Anywhere Real Estate, Inc.* | | | 167 | | | | 1,032 | |
Community Trust Bancorp, Inc. | | | 24 | | | | 1,024 | |
ProAssurance Corp.* | | | 79 | | | | 1,016 | |
New York Mortgage Trust, Inc. REIT | | | 140 | | | | 1,008 | |
First Mid Bancshares, Inc. | | | 30 | | | | 980 | |
Brookfield Business Corp. — Class A | | | 40 | | | | 966 | |
CBL & Associates Properties, Inc. REIT | | | 42 | | | | 962 | |
Perella Weinberg Partners | | | 68 | | | | 961 | |
CrossFirst Bankshares, Inc.* | | | 69 | | | | 955 | |
FTAI Infrastructure, Inc. | | | 152 | | | | 954 | |
Whitestone REIT — Class B | | | 75 | | | | 941 | |
Univest Financial Corp. | | | 45 | | | | 937 | |
First Community Bankshares, Inc. | | | 27 | | | | 935 | |
Amerant Bancorp, Inc. | | | 40 | | | | 932 | |
Old Second Bancorp, Inc. | | | 67 | | | | 927 | |
Mercantile Bank Corp. | | | 24 | | | | 924 | |
KKR Real Estate Finance Trust, Inc. REIT | | | 91 | | | | 915 | |
Diversified Healthcare Trust REIT | | | 365 | | | | 898 | |
Gladstone Commercial Corp. REIT | | | 63 | | | | 872 | |
Peakstone Realty Trust REIT | | | 54 | | | | 871 | |
World Acceptance Corp.* | | | 6 | | | | 870 | |
Horizon Bancorp, Inc. | | | 67 | | | | 860 | |
TPG RE Finance Trust, Inc. REIT | | | 107 | | | | 826 | |
Byline Bancorp, Inc. | | | 38 | | | | 825 | |
Business First Bancshares, Inc. | | | 37 | | | | 824 | |
Global Medical REIT, Inc. | | | 94 | | | | 823 | |
TrustCo Bank Corporation NY | | | 29 | | | | 817 | |
Midland States Bancorp, Inc. | | | 32 | | | | 804 | |
Farmland Partners, Inc. REIT | | | 72 | | | | 799 | |
Universal Insurance Holdings, Inc. | | | 39 | | | | 793 | |
Columbia Financial, Inc.* | | | 46 | | | | 792 | |
Central Pacific Financial Corp. | | | 40 | | | | 790 | |
Independent Bank Corp. | | | 31 | | | | 786 | |
Heritage Commerce Corp. | | | 91 | | | | 781 | |
Camden National Corp. | | | 23 | | | | 771 | |
Great Southern Bancorp, Inc. | | | 14 | | | | 767 | |
NerdWallet, Inc. — Class A* | | | 52 | | | | 764 | |
American National Bankshares, Inc. | | | 16 | | | | 764 | |
Equity Bancshares, Inc. — Class A | | | 22 | | | | 756 | |
Cambridge Bancorp | | | 11 | | | | 750 | |
Hanmi Financial Corp.1 | | | 47 | | | | 748 | |
Chatham Lodging Trust REIT | | | 74 | | | | 748 | |
Farmers National Banc Corp. | | | 55 | | | | 735 | |
Republic Bancorp, Inc. — Class A | | | 14 | | | | 714 | |
Washington Trust Bancorp, Inc. | | | 26 | | | | 699 | |
Metrocity Bankshares, Inc. | | | 28 | | | | 699 | |
Universal Health Realty Income Trust REIT | | | 19 | | | | 697 | |
United Fire Group, Inc. | | | 32 | | | | 697 | |
Gladstone Land Corp. REIT | | | 52 | | | | 694 | |
HarborOne Bancorp, Inc. | | | 65 | | | | 693 | |
Saul Centers, Inc. REIT | | | 18 | | | | 693 | |
First Financial Corp. | | | 18 | | | | 690 | |
LendingTree, Inc.* | | | 16 | | | | 677 | |
Amalgamated Financial Corp. | | | 28 | | | | 672 | |
Coastal Financial Corp.* | | | 17 | | | | 661 | |
Peapack-Gladstone Financial Corp. | | | 27 | | | | 657 | |
HomeTrust Bancshares, Inc. | | | 24 | | | | 656 | |
CNB Financial Corp. | | | 32 | | | | 652 | |
Alexander’s, Inc. REIT | | | 3 | | | | 651 | |
Capstar Financial Holdings, Inc. | | | 32 | | | | 643 | |
Tiptree, Inc. — Class A | | | 37 | | | | 639 | |
Alerus Financial Corp. | | | 29 | | | | 633 | |
Invesco Mortgage Capital, Inc. REIT | | | 65 | | | | 629 | |
Northfield Bancorp, Inc. | | | 64 | | | | 622 | |
GCM Grosvenor, Inc. — Class A | | | 64 | | | | 618 | |
Diamond Hill Investment Group, Inc. | | | 4 | | | | 617 | |
Metropolitan Bank Holding Corp.* | | | 16 | | | | 616 | |
FRP Holdings, Inc.* | | | 10 | | | | 614 | |
Bar Harbor Bankshares | | | 23 | | | | 609 | |
First Foundation, Inc. | | | 79 | | | | 596 | |
B Riley Financial, Inc.1 | | | 28 | | | | 593 | |
Orchid Island Capital, Inc. REIT | | | 66 | | | | 589 | |
Ares Commercial Real Estate Corp. REIT | | | 79 | | | | 589 | |
Capital City Bank Group, Inc. | | | 21 | | | | 582 | |
CTO Realty Growth, Inc. REIT | | | 34 | | | | 576 | |
RMR Group, Inc. — Class A | | | 24 | | | | 576 | |
Southern Missouri Bancorp, Inc. | | | 13 | | | | 568 | |
One Liberty Properties, Inc. REIT | | | 25 | | | | 565 | |
Burke & Herbert Financial Services Corp. | | | 10 | | | | 560 | |
P10, Inc. — Class A | | | 66 | | | | 556 | |
Flushing Financial Corp. | | | 44 | | | | 555 | |
Northeast Bank | | | 10 | | | | 553 | |
Arrow Financial Corp. | | | 22 | | | | 550 | |
Kearny Financial Corp. | | | 85 | | | | 547 | |
James River Group Holdings Ltd. | | | 57 | | | | 530 | |
Esquire Financial Holdings, Inc. | | | 11 | | | | 522 | |
Shore Bancshares, Inc. | | | 45 | | | | 518 | |
MidWestOne Financial Group, Inc. | | | 22 | | | | 516 | |
South Plains Financial, Inc. | | | 19 | | | | 508 | |
SmartFinancial, Inc. | | | 24 | | | | 506 | |
Greenlight Capital Re Ltd. — Class A* | | | 40 | | | | 499 | |
98 | THE RYDEX FUNDS ANNUAL REPORT | SEE NOTES TO FINANCIAL STATEMENTS. |
SCHEDULE OF INVESTMENTS (continued) | March 31, 2024 |
RUSSELL 2000® 1.5x STRATEGY FUND | |
| | Shares | | | Value | |
Home Bancorp, Inc. | | | 13 | | | $ | 498 | |
Farmers & Merchants Bancorp Incorporated/Archbold OH | | | 22 | | | | 490 | |
ACNB Corp. | | | 13 | | | | 489 | |
Peoples Financial Services Corp. | | | 11 | | | | 474 | |
Citizens & Northern Corp. | | | 25 | | | | 469 | |
RBB Bancorp | | | 26 | | | | 468 | |
Carter Bankshares, Inc.* | | | 37 | | | | 468 | |
MBIA, Inc.* | | | 69 | | | | 466 | |
Summit Financial Group, Inc. | | | 17 | | | | 462 | |
Northrim BanCorp, Inc. | | | 9 | | | | 455 | |
First Business Financial Services, Inc. | | | 12 | | | | 450 | |
West BanCorp, Inc. | | | 25 | | | | 446 | |
Mid Penn Bancorp, Inc. | | | 22 | | | | 440 | |
Financial Institutions, Inc. | | | 23 | | | | 433 | |
Orrstown Financial Services, Inc. | | | 16 | | | | 428 | |
Five Star Bancorp | | | 19 | | | | 428 | |
Guaranty Bancshares, Inc. | | | 14 | | | | 425 | |
Sierra Bancorp | | | 21 | | | | 424 | |
HomeStreet, Inc. | | | 28 | | | | 421 | |
Selectquote, Inc.* | | | 210 | | | | 420 | |
Postal Realty Trust, Inc. — Class A REIT | | | 29 | | | | 415 | |
Bank of Marin Bancorp | | | 24 | | | | 402 | |
MVB Financial Corp. | | | 18 | | | | 402 | |
Macatawa Bank Corp. | | | 41 | | | | 401 | |
Chicago Atlantic Real Estate Finance, Inc. REIT | | | 25 | | | | 394 | |
Enterprise Bancorp, Inc. | | | 15 | | | | 390 | |
Codorus Valley Bancorp, Inc. | | | 17 | | | | 387 | |
NewtekOne, Inc. | | | 35 | | | | 385 | |
First Bank/Hamilton NJ | | | 28 | | | | 385 | |
Southern First Bancshares, Inc.* | | | 12 | | | | 381 | |
HBT Financial, Inc. | | | 20 | | | | 381 | |
Third Coast Bancshares, Inc.* | | | 19 | | | | 380 | |
Primis Financial Corp. | | | 31 | | | | 377 | |
Granite Point Mortgage Trust, Inc. REIT | | | 78 | | | | 372 | |
BayCom Corp. | | | 18 | | | | 371 | |
First Bancorp, Inc. | | | 15 | | | | 370 | |
Civista Bancshares, Inc. | | | 24 | | | | 369 | |
Orange County Bancorp, Inc. | | | 8 | | | | 368 | |
First of Long Island Corp. | | | 33 | | | | 366 | |
Bridgewater Bancshares, Inc.* | | | 31 | | | | 361 | |
Hingham Institution For Savings | | | 2 | | | | 349 | |
Red River Bancshares, Inc. | | | 7 | | | | 349 | |
Hamilton Insurance Group Ltd. — Class B* | | | 25 | | | | 348 | |
FS Bancorp, Inc. | | | 10 | | | | 347 | |
Citizens Financial Services, Inc. | | | 7 | | | | 344 | |
Waterstone Financial, Inc. | | | 28 | | | | 341 | |
John Marshall Bancorp, Inc. | | | 19 | | | | 340 | |
Donegal Group, Inc. — Class A | | | 24 | | | | 339 | |
Fidelity D&D Bancorp, Inc. | | | 7 | | | | 339 | |
Unity Bancorp, Inc. | | | 12 | | | | 331 | |
Norwood Financial Corp. | | | 12 | | | | 327 | |
Investors Title Co. | | | 2 | | | | 326 | |
Forge Global Holdings, Inc.* | | | 168 | | | | 324 | |
Timberland Bancorp, Inc. | | | 12 | | | | 323 | |
Legacy Housing Corp.* | | | 15 | | | | 323 | |
American Coastal Insurance Corp.* | | | 30 | | | | 321 | |
Bit Digital, Inc.*,1 | | | 111 | | | | 319 | |
Blue Foundry Bancorp* | | | 34 | | | | 318 | |
Greene County Bancorp, Inc. | | | 11 | | | | 317 | |
Northeast Community Bancorp, Inc. | | | 20 | | | | 315 | |
Maiden Holdings Ltd.* | | | 139 | | | | 313 | |
City Office REIT, Inc. | | | 60 | | | | 313 | |
Capital Bancorp, Inc. | | | 15 | | | | 312 | |
NexPoint Diversified Real Estate Trust REIT1 | | | 47 | | | | 310 | |
AFC Gamma, Inc. REIT | | | 25 | | | | 309 | |
Orion Office REIT, Inc. | | | 88 | | | | 309 | |
Alpine Income Property Trust, Inc. REIT | | | 20 | | | | 306 | |
FVCBankcorp, Inc.* | | | 25 | | | | 305 | |
BRT Apartments Corp. REIT | | | 18 | | | | 302 | |
ChoiceOne Financial Services, Inc. | | | 11 | | | | 301 | |
National Bankshares, Inc. | | | 9 | | | | 301 | |
Colony Bankcorp, Inc. | | | 26 | | | | 299 | |
Community West Bancshares | | | 15 | | | | 298 | |
Plumas Bancorp | | | 8 | | | | 294 | |
Hippo Holdings, Inc.* | | | 16 | | | | 292 | |
Regional Management Corp. | | | 12 | | | | 290 | |
Middlefield Banc Corp. | | | 12 | | | | 287 | |
Southern States Bancshares, Inc. | | | 11 | | | | 285 | |
Ames National Corp. | | | 14 | | | | 283 | |
PCB Bancorp | | | 17 | | | | 278 | |
Ponce Financial Group, Inc.* | | | 31 | | | | 276 | |
Parke Bancorp, Inc. | | | 16 | | | | 276 | |
Oak Valley Bancorp | | | 11 | | | | 273 | |
Ocwen Financial Corp.* | | | 10 | | | | 270 | |
Maui Land & Pineapple Company, Inc.* | | | 12 | | | | 260 | |
Star Holdings* | | | 20 | | | | 258 | |
LCNB Corp. | | | 16 | | | | 255 | |
Silvercrest Asset Management Group, Inc. — Class A | | | 16 | | | | 253 | |
Velocity Financial, Inc.* | | | 14 | | | | 252 | |
eHealth, Inc.* | | | 41 | | | | 247 | |
Princeton Bancorp, Inc. | | | 8 | | | | 246 | |
C&F Financial Corp. | | | 5 | | | | 245 | |
BCB Bancorp, Inc. | | | 23 | | | | 240 | |
Evans Bancorp, Inc. | | | 8 | | | | 239 | |
ESSA Bancorp, Inc. | | | 13 | | | | 237 | |
Bankwell Financial Group, Inc. | | | 9 | | | | 233 | |
RE/MAX Holdings, Inc. — Class A | | | 26 | | | | 228 | |
Penns Woods Bancorp, Inc. | | | 11 | | | | 214 | |
Chemung Financial Corp. | | | 5 | | | | 212 | |
Virginia National Bankshares Corp. | | | 7 | | | | 211 | |
Crawford & Co. — Class A | | | 22 | | | | 207 | |
Atlanticus Holdings Corp.* | | | 7 | | | | 207 | |
Stratus Properties, Inc.* | | | 9 | | | | 206 | |
Braemar Hotels & Resorts, Inc. REIT | | | 101 | | | | 202 | |
Douglas Elliman, Inc.* | | | 124 | | | | 196 | |
Angel Oak Mortgage REIT, Inc. | | | 18 | | | | 193 | |
First Community Corp. | | | 11 | | | | 192 | |
SEE NOTES TO FINANCIAL STATEMENTS. | THE RYDEX FUNDS ANNUAL REPORT | 99 |
SCHEDULE OF INVESTMENTS (continued) | March 31, 2024 |
RUSSELL 2000® 1.5x STRATEGY FUND | |
| | Shares | | | Value | |
Nexpoint Real Estate Finance, Inc. REIT | | | 13 | | | $ | 187 | |
Paysign, Inc.* | | | 50 | | | | 183 | |
USCB Financial Holdings, Inc. | | | 16 | | | | 182 | |
NI Holdings, Inc.* | | | 12 | | | | 182 | |
MainStreet Bancshares, Inc. | | | 10 | | | | 182 | |
AlTi Global, Inc.* | | | 32 | | | | 181 | |
Pioneer Bancorp, Inc.* | | | 18 | | | | 177 | |
First Western Financial, Inc.* | | | 12 | | | | 175 | |
Sterling Bancorp, Inc.* | | | 33 | | | | 170 | |
Bank7 Corp. | | | 6 | | | | 169 | |
Office Properties Income Trust REIT | | | 74 | | | | 151 | |
Security National Financial Corp. — Class A* | | | 19 | | | | 151 | |
Kingsway Financial Services, Inc.* | | | 16 | | | | 133 | |
Transcontinental Realty Investors, Inc.* | | | 3 | | | | 113 | |
Consumer Portfolio Services, Inc.*,1 | | | 14 | | | | 106 | |
SWK Holdings Corp.* | | | 6 | | | | 105 | |
Clipper Realty, Inc. REIT | | | 17 | | | | 82 | |
Blue Ridge Bankshares, Inc. | | | 26 | | | | 70 | |
GoHealth, Inc. — Class A* | | | 6 | | | | 63 | |
Finance of America Companies, Inc. — Class A* | | | 82 | | | | 60 | |
American Realty Investors, Inc.* | | | 3 | | | | 54 | |
OppFi, Inc.* | | | 17 | | | | 42 | |
Total Financial | | | | | | | 825,674 | |
| | | | | | | | | |
Industrial - 8.9% |
Comfort Systems USA, Inc. | | | 53 | | | | 16,838 | |
Simpson Manufacturing Company, Inc. | | | 65 | | | | 13,337 | |
Applied Industrial Technologies, Inc. | | | 58 | | | | 11,458 | |
UFP Industries, Inc. | | | 90 | | | | 11,071 | |
NEXTracker, Inc. — Class A* | | | 191 | | | | 10,748 | |
Chart Industries, Inc.* | | | 65 | | | | 10,707 | |
Atkore, Inc. | | | 56 | | | | 10,660 | |
Fabrinet* | | | 56 | | | | 10,585 | |
Novanta, Inc.* | | | 54 | | | | 9,438 | |
Boise Cascade Co. | | | 60 | | | | 9,202 | |
Mueller Industries, Inc. | | | 169 | | | | 9,114 | |
Fluor Corp.* | | | 214 | | | | 9,048 | |
AAON, Inc. | | | 102 | | | | 8,986 | |
Watts Water Technologies, Inc. — Class A | | | 41 | | | | 8,714 | |
Casella Waste Systems, Inc. — Class A* | | | 85 | | | | 8,404 | |
SPX Technologies, Inc.* | | | 66 | | | | 8,126 | |
Summit Materials, Inc. — Class A* | | | 180 | | | | 8,022 | |
Federal Signal Corp. | | | 90 | | | | 7,639 | |
Zurn Elkay Water Solutions Corp. | | | 223 | | | | 7,464 | |
Modine Manufacturing Co.* | | | 78 | | | | 7,425 | |
Franklin Electric Company, Inc. | | | 69 | | | | 7,370 | |
Badger Meter, Inc. | | | 44 | | | | 7,120 | |
GATX Corp. | | | 53 | | | | 7,103 | |
Knife River Corp.* | | | 85 | | | | 6,892 | |
Moog, Inc. — Class A | | | 43 | | | | 6,865 | |
Terex Corp. | | | 101 | | | | 6,504 | |
Itron, Inc.* | | | 69 | | | | 6,384 | |
AeroVironment, Inc.* | | | 41 | | | | 6,285 | |
Exponent, Inc. | | | 76 | | | | 6,284 | |
Arcosa, Inc. | | | 73 | | | | 6,268 | |
Dycom Industries, Inc.* | | | 43 | | | | 6,172 | |
Encore Wire Corp. | | | 23 | | | | 6,044 | |
Kadant, Inc. | | | 18 | | | | 5,906 | |
EnerSys | | | 62 | | | | 5,857 | |
Matson, Inc. | | | 52 | | | | 5,845 | |
Belden, Inc. | | | 63 | | | | 5,834 | |
Advanced Energy Industries, Inc. | | | 57 | | | | 5,813 | |
Enpro, Inc. | | | 32 | | | | 5,401 | |
CSW Industrials, Inc. | | | 23 | | | | 5,396 | |
Hillenbrand, Inc. | | | 107 | | | | 5,381 | |
Sanmina Corp.* | | | 83 | | | | 5,161 | |
Scorpio Tankers, Inc. | | | 72 | | | | 5,152 | |
ArcBest Corp. | | | 36 | | | | 5,130 | |
John Bean Technologies Corp. | | | 48 | | | | 5,035 | |
Sterling Infrastructure, Inc.* | | | 45 | | | | 4,964 | |
Cactus, Inc. — Class A | | | 99 | | | | 4,959 | |
MYR Group, Inc.* | | | 25 | | | | 4,419 | |
Albany International Corp. — Class A | | | 47 | | | | 4,395 | |
Vishay Intertechnology, Inc. | | | 192 | | | | 4,354 | |
Masonite International Corp.* | | | 33 | | | | 4,338 | |
Griffon Corp. | | | 59 | | | | 4,327 | |
ESCO Technologies, Inc. | | | 39 | | | | 4,175 | |
Atmus Filtration Technologies, Inc.* | | | 127 | | | | 4,096 | |
Materion Corp. | | | 31 | | | | 4,084 | |
Hub Group, Inc. — Class A | | | 94 | | | | 4,063 | |
Kratos Defense & Security Solutions, Inc.* | | | 219 | | | | 4,025 | |
Frontdoor, Inc.* | | | 122 | | | | 3,975 | |
O-I Glass, Inc.* | | | 238 | | | | 3,948 | |
RXO, Inc.* | | | 179 | | | | 3,915 | |
Plexus Corp.* | | | 41 | | | | 3,888 | |
Granite Construction, Inc. | | | 67 | | | | 3,828 | |
Mueller Water Products, Inc. — Class A | | | 237 | | | | 3,813 | |
Werner Enterprises, Inc. | | | 97 | | | | 3,795 | |
Gibraltar Industries, Inc.* | | | 47 | | | | 3,785 | |
Masterbrand, Inc.* | | | 193 | | | | 3,617 | |
Golar LNG Ltd. | | | 149 | | | | 3,585 | |
Construction Partners, Inc. — Class A* | | | 62 | | | | 3,481 | |
Mirion Technologies, Inc.* | | | 306 | | | | 3,479 | |
OSI Systems, Inc.* | | | 24 | | | | 3,428 | |
Alamo Group, Inc. | | | 15 | | | | 3,425 | |
Primoris Services Corp. | | | 80 | | | | 3,405 | |
Tennant Co. | | | 28 | | | | 3,405 | |
Trinity Industries, Inc. | | | 122 | | | | 3,398 | |
Bloom Energy Corp. — Class A*,1 | | | 295 | | | | 3,316 | |
Standex International Corp. | | | 18 | | | | 3,280 | |
International Seaways, Inc. | | | 61 | | | | 3,245 | |
Energizer Holdings, Inc. | | | 110 | | | | 3,238 | |
Hillman Solutions Corp.* | | | 294 | | | | 3,128 | |
AAR Corp.* | | | 51 | | | | 3,053 | |
Kennametal, Inc. | | | 120 | | | | 2,993 | |
Worthington Enterprises, Inc. | | | 47 | | | | 2,925 | |
Enerpac Tool Group Corp. | | | 82 | | | | 2,924 | |
AZZ, Inc. | | | 37 | | | | 2,860 | |
Barnes Group, Inc. | | | 75 | | | | 2,786 | |
JELD-WEN Holding, Inc.* | | | 131 | | | | 2,781 | |
Greif, Inc. — Class A | | | 37 | | | | 2,555 | |
100 | THE RYDEX FUNDS ANNUAL REPORT | SEE NOTES TO FINANCIAL STATEMENTS. |
SCHEDULE OF INVESTMENTS (continued) | March 31, 2024 |
RUSSELL 2000® 1.5x STRATEGY FUND | |
| | Shares | | | Value | |
TTM Technologies, Inc.* | | | 157 | | | $ | 2,457 | |
Golden Ocean Group Ltd. | | | 189 | | | | 2,449 | |
American Woodmark Corp.* | | | 24 | | | | 2,440 | |
DHT Holdings, Inc. | | | 210 | | | | 2,415 | |
Greenbrier Companies, Inc. | | | 46 | | | | 2,397 | |
World Kinect Corp. | | | 90 | | | | 2,380 | |
SFL Corporation Ltd. | | | 177 | | | | 2,333 | |
Leonardo DRS, Inc.* | | | 105 | | | | 2,320 | |
CTS Corp. | | | 48 | | | | 2,246 | |
Joby Aviation, Inc.*,1 | | | 419 | | | | 2,246 | |
Helios Technologies, Inc. | | | 50 | | | | 2,234 | |
Knowles Corp.* | | | 134 | | | | 2,157 | |
Teekay Tankers Ltd. — Class A | | | 36 | | | | 2,103 | |
NV5 Global, Inc.* | | | 21 | | | | 2,058 | |
Lindsay Corp. | | | 17 | | | | 2,000 | |
Powell Industries, Inc. | | | 14 | | | | 1,992 | |
Kaman Corp. | | | 43 | | | | 1,972 | |
Janus International Group, Inc.* | | | 130 | | | | 1,967 | |
Columbus McKinnon Corp. | | | 44 | | | | 1,964 | |
Apogee Enterprises, Inc. | | | 33 | | | | 1,953 | |
Napco Security Technologies, Inc. | | | 48 | | | | 1,928 | |
Dorian LPG Ltd. | | | 49 | | | | 1,884 | |
Rocket Lab USA, Inc.* | | | 419 | | | | 1,722 | |
TriMas Corp. | | | 64 | | | | 1,711 | |
Ichor Holdings Ltd.* | | | 44 | | | | 1,699 | |
Enovix Corp.*,1 | | | 211 | | | | 1,690 | |
Thermon Group Holdings, Inc.* | | | 51 | | | | 1,669 | |
Marten Transport Ltd. | | | 90 | | | | 1,663 | |
Benchmark Electronics, Inc. | | | 55 | | | | 1,650 | |
Montrose Environmental Group, Inc.* | | | 42 | | | | 1,645 | |
IES Holdings, Inc.* | | | 13 | | | | 1,581 | |
Triumph Group, Inc.* | | | 100 | | | | 1,504 | |
Metallus, Inc.* | | | 67 | | | | 1,491 | |
Astec Industries, Inc. | | | 34 | | | | 1,486 | |
Proto Labs, Inc.* | | | 41 | | | | 1,466 | |
Ryerson Holding Corp. | | | 43 | | | | 1,441 | |
Gorman-Rupp Co. | | | 35 | | | | 1,384 | |
Aspen Aerogels, Inc.* | | | 78 | | | | 1,373 | |
Energy Recovery, Inc.* | | | 85 | | | | 1,342 | |
Genco Shipping & Trading Ltd. | | | 65 | | | | 1,321 | |
Vicor Corp.* | | | 34 | | | | 1,300 | |
Myers Industries, Inc. | | | 56 | | | | 1,298 | |
Nordic American Tankers Ltd. | | | 315 | | | | 1,235 | |
Smith & Wesson Brands, Inc. | | | 70 | | | | 1,215 | |
Forward Air Corp. | | | 39 | | | | 1,213 | |
Sturm Ruger & Company, Inc. | | | 26 | | | | 1,200 | |
FLEX LNG Ltd. | | | 46 | | | | 1,170 | |
Clearwater Paper Corp.* | | | 26 | | | | 1,137 | |
Cadre Holdings, Inc. | | | 31 | | | | 1,122 | |
Enviri Corp.* | | | 122 | | | | 1,116 | |
Insteel Industries, Inc. | | | 29 | | | | 1,108 | |
PureCycle Technologies, Inc.* | | | 178 | | | | 1,107 | |
Hyster-Yale Materials Handling, Inc. | | | 17 | | | | 1,091 | |
Archer Aviation, Inc. — Class A*,1 | | | 234 | | | | 1,081 | |
CryoPort, Inc.* | | | 61 | | | | 1,080 | |
DXP Enterprises, Inc.* | | | 20 | | | | 1,074 | |
Air Transport Services Group, Inc.* | | | 78 | | | | 1,073 | |
Olympic Steel, Inc. | | | 15 | | | | 1,063 | |
CECO Environmental Corp.* | | | 46 | | | | 1,059 | |
Ardmore Shipping Corp. | | | 63 | | | | 1,034 | |
Argan, Inc. | | | 20 | | | | 1,011 | |
Ducommun, Inc.* | | | 19 | | | | 975 | |
Bel Fuse, Inc. — Class B | | | 16 | | | | 965 | |
Tutor Perini Corp.* | | | 66 | | | | 954 | |
Great Lakes Dredge & Dock Corp.* | | | 101 | | | | 884 | |
Xometry, Inc. — Class A* | | | 52 | | | | 878 | |
Mesa Laboratories, Inc. | | | 8 | | | | 878 | |
Eagle Bulk Shipping, Inc. | | | 14 | | | | 875 | |
Pactiv Evergreen, Inc. | | | 61 | | | | 874 | |
nLight, Inc.* | | | 67 | | | | 871 | |
Heartland Express, Inc. | | | 72 | | | | 860 | |
Costamare, Inc. | | | 74 | | | | 840 | |
Kimball Electronics, Inc.* | | | 36 | | | | 779 | |
Evolv Technologies Holdings, Inc.* | | | 173 | | | | 770 | |
Astronics Corp.* | | | 40 | | | | 762 | |
Stoneridge, Inc.* | | | 41 | | | | 756 | |
SmartRent, Inc.* | | | 282 | | | | 756 | |
Manitowoc Company, Inc.* | | | 53 | | | | 750 | |
LSB Industries, Inc.* | | | 85 | | | | 746 | |
Teekay Corp.* | | | 94 | | | | 684 | |
Allient, Inc. | | | 19 | | | | 678 | |
National Presto Industries, Inc. | | | 8 | | | | 670 | |
NVE Corp. | | | 7 | | | | 631 | |
FARO Technologies, Inc.* | | | 29 | | | | 624 | |
Overseas Shipholding Group, Inc. — Class A | | | 95 | | | | 608 | |
Covenant Logistics Group, Inc. — Class A | | | 13 | | | | 603 | |
LSI Industries, Inc. | | | 39 | | | | 590 | |
Limbach Holdings, Inc.* | | | 14 | | | | 580 | |
Bowman Consulting Group Ltd.*,1 | | | 16 | | | | 557 | |
Greif, Inc. — Class B | | | 8 | | | | 556 | |
Park Aerospace Corp. | | | 32 | | | | 532 | |
Ranpak Holdings Corp.* | | | 67 | | | | 527 | |
Northwest Pipe Co.* | | | 15 | | | | 520 | |
Daseke, Inc.* | | | 62 | | | | 515 | |
Safe Bulkers, Inc.1 | | | 102 | | | | 506 | |
MicroVision, Inc.* | | | 272 | | | | 500 | |
Luxfer Holdings plc | | | 43 | | | | 446 | |
Eastman Kodak Co.* | | | 88 | | | | 436 | |
NuScale Power Corp.* | | | 82 | | | | 435 | |
GoPro, Inc. — Class A* | | | 191 | | | | 426 | |
Turtle Beach Corp.* | | | 24 | | | | 414 | |
GrafTech International Ltd. | | | 297 | | | | 410 | |
Universal Logistics Holdings, Inc. | | | 11 | | | | 405 | |
Pangaea Logistics Solutions Ltd. | | | 56 | | | | 390 | |
AMMO, Inc.* | | | 139 | | | | 382 | |
Himalaya Shipping Ltd.* | | | 46 | | | | 355 | |
Omega Flex, Inc. | | | 5 | | | | 355 | |
Park-Ohio Holdings Corp. | | | 13 | | | | 347 | |
Iteris, Inc.* | | | 66 | | | | 326 | |
Concrete Pumping Holdings, Inc.* | | | 40 | | | | 316 | |
Mistras Group, Inc.* | | | 32 | | | | 306 | |
SEE NOTES TO FINANCIAL STATEMENTS. | THE RYDEX FUNDS ANNUAL REPORT | 101 |
SCHEDULE OF INVESTMENTS (continued) | March 31, 2024 |
RUSSELL 2000® 1.5x STRATEGY FUND | |
| | Shares | | | Value | |
Radiant Logistics, Inc.* | | | 55 | | | $ | 298 | |
Pure Cycle Corp.* | | | 31 | | | | 295 | |
AerSale Corp.* | | | 39 | | | | 280 | |
Tredegar Corp. | | | 41 | | | | 267 | |
Gencor Industries, Inc.* | | | 16 | | | | 267 | |
Karat Packaging, Inc. | | | 9 | | | | 258 | |
908 Devices, Inc.* | | | 34 | | | | 257 | |
Willis Lease Finance Corp.* | | | 5 | | | | 248 | |
Mayville Engineering Company, Inc.* | | | 17 | | | | 244 | |
Blink Charging Co.*,1 | | | 80 | | | | 241 | |
Latham Group, Inc.* | | | 59 | | | | 234 | |
Core Molding Technologies, Inc.* | | | 12 | | | | 227 | |
Li-Cycle Holdings Corp.* | | | 212 | | | | 218 | |
Transphorm, Inc.* | | | 42 | | | | 206 | |
Sight Sciences, Inc.* | | | 33 | | | | 174 | |
PAM Transportation Services, Inc.* | | | 10 | | | | 162 | |
Eve Holding, Inc.* | | | 28 | | | | 151 | |
Intevac, Inc.* | | | 39 | | | | 150 | |
Comtech Telecommunications Corp.* | | | 42 | | | | 144 | |
SKYX Platforms Corp.* | | | 94 | | | | 123 | |
374Water, Inc.* | | | 90 | | | | 114 | |
Babcock & Wilcox Enterprises, Inc.* | | | 91 | | | | 103 | |
ESS Tech, Inc.* | | | 141 | | | | 102 | |
LanzaTech Global, Inc.* | | | 32 | | | | 99 | |
NL Industries, Inc. | | | 13 | | | | 95 | |
INNOVATE Corp.* | | | 106 | | | | 74 | |
Akoustis Technologies, Inc.* | | | 106 | | | | 63 | |
Redwire Corp.* | | | 12 | | | | 53 | |
Southland Holdings, Inc.* | | | 6 | | | | 31 | |
Amprius Technologies, Inc.* | | | 8 | | | | 21 | |
Total Industrial | | | | | | | 631,163 | |
| | | | | | | | | |
Technology - 7.2% |
Super Micro Computer, Inc.* | | | 78 | | | | 77,772 | |
MicroStrategy, Inc. — Class A* | | | 22 | | | | 37,500 | |
Onto Innovation, Inc.* | | | 74 | | | | 13,400 | |
SPS Commerce, Inc.* | | | 55 | | | | 10,170 | |
Rambus, Inc.* | | | 162 | | | | 10,013 | |
Duolingo, Inc.* | | | 44 | | | | 9,706 | |
Qualys, Inc.* | | | 56 | | | | 9,345 | |
Tenable Holdings, Inc.* | | | 172 | | | | 8,502 | |
MACOM Technology Solutions Holdings, Inc.* | | | 82 | | | | 7,842 | |
Insight Enterprises, Inc.* | | | 42 | | | | 7,792 | |
Varonis Systems, Inc.* | | | 164 | | | | 7,736 | |
ExlService Holdings, Inc.* | | | 243 | | | | 7,727 | |
Maximus, Inc. | | | 91 | | | | 7,635 | |
ASGN, Inc.* | | | 70 | | | | 7,333 | |
Appfolio, Inc. — Class A* | | | 29 | | | | 7,155 | |
Altair Engineering, Inc. — Class A* | | | 82 | | | | 7,064 | |
Silicon Laboratories, Inc.* | | | 48 | | | | 6,899 | |
CommVault Systems, Inc.* | | | 66 | | | | 6,694 | |
Workiva, Inc.* | | | 74 | | | | 6,275 | |
Power Integrations, Inc. | | | 85 | | | | 6,082 | |
Box, Inc. — Class A* | | | 213 | | | | 6,032 | |
Synaptics, Inc.* | | | 60 | | | | 5,854 | |
BlackLine, Inc.* | | | 87 | | | | 5,618 | |
Evolent Health, Inc. — Class A* | | | 169 | | | | 5,542 | |
Amkor Technology, Inc. | | | 171 | | | | 5,513 | |
ACI Worldwide, Inc.* | | | 166 | | | | 5,513 | |
Axcelis Technologies, Inc.* | | | 49 | | | | 5,465 | |
FormFactor, Inc.* | | | 116 | | | | 5,293 | |
Parsons Corp.* | | | 63 | | | | 5,226 | |
Verra Mobility Corp.* | | | 206 | | | | 5,144 | |
Blackbaud, Inc.* | | | 66 | | | | 4,893 | |
Diodes, Inc.* | | | 69 | | | | 4,865 | |
Freshworks, Inc. — Class A* | | | 248 | | | | 4,516 | |
Impinj, Inc.* | | | 35 | | | | 4,494 | |
Rapid7, Inc.* | | | 91 | | | | 4,463 | |
Envestnet, Inc.* | | | 76 | | | | 4,401 | |
Sprout Social, Inc. — Class A* | | | 73 | | | | 4,359 | |
Kulicke & Soffa Industries, Inc. | | | 84 | | | | 4,226 | |
ACV Auctions, Inc. — Class A* | | | 195 | | | | 3,660 | |
Progress Software Corp. | | | 67 | | | | 3,572 | |
DigitalOcean Holdings, Inc.* | | | 92 | | | | 3,513 | |
Braze, Inc. — Class A* | | | 79 | | | | 3,500 | |
C3.ai, Inc. — Class A*,1 | | | 123 | | | | 3,330 | |
Privia Health Group, Inc.* | | | 166 | | | | 3,252 | |
Xerox Holdings Corp. | | | 177 | | | | 3,168 | |
Ultra Clean Holdings, Inc.* | | | 68 | | | | 3,124 | |
Verint Systems, Inc.* | | | 94 | | | | 3,116 | |
PagerDuty, Inc.* | | | 133 | | | | 3,016 | |
AvidXchange Holdings, Inc.* | | | 228 | | | | 2,998 | |
Ambarella, Inc.* | | | 57 | | | | 2,894 | |
Veeco Instruments, Inc.* | | | 78 | | | | 2,743 | |
Clear Secure, Inc. — Class A | | | 128 | | | | 2,723 | |
Semtech Corp.* | | | 99 | | | | 2,722 | |
Agilysys, Inc.* | | | 31 | | | | 2,612 | |
Photronics, Inc.* | | | 92 | | | | 2,605 | |
SiTime Corp.* | | | 27 | | | | 2,517 | |
PROS Holdings, Inc.* | | | 69 | | | | 2,507 | |
Appian Corp. — Class A* | | | 62 | | | | 2,477 | |
IonQ, Inc.*,1 | | | 247 | | | | 2,468 | |
Cohu, Inc.* | | | 72 | | | | 2,400 | |
Fastly, Inc. — Class A* | | | 182 | | | | 2,361 | |
Donnelley Financial Solutions, Inc.* | | | 38 | | | | 2,356 | |
CSG Systems International, Inc. | | | 45 | | | | 2,319 | |
NetScout Systems, Inc.* | | | 105 | | | | 2,293 | |
Schrodinger Incorporated/United States* | | | 84 | | | | 2,268 | |
Zeta Global Holdings Corp. — Class A* | | | 207 | | | | 2,263 | |
Everbridge, Inc.* | | | 62 | | | | 2,159 | |
ACM Research, Inc. — Class A* | | | 74 | | | | 2,156 | |
MaxLinear, Inc. — Class A* | | | 115 | | | | 2,147 | |
Intapp, Inc.* | | | 60 | | | | 2,058 | |
Jamf Holding Corp.* | | | 108 | | | | 1,982 | |
SMART Global Holdings, Inc.* | | | 74 | | | | 1,948 | |
Asana, Inc. — Class A*,1 | | | 123 | | | | 1,905 | |
Phreesia, Inc.* | | | 78 | | | | 1,867 | |
PAR Technology Corp.* | | | 41 | | | | 1,860 | |
PowerSchool Holdings, Inc. — Class A* | | | 87 | | | | 1,852 | |
Adeia, Inc. | | | 164 | | | | 1,791 | |
AvePoint, Inc.* | | | 225 | | | | 1,782 | |
Zuora, Inc. — Class A* | | | 195 | | | | 1,778 | |
102 | THE RYDEX FUNDS ANNUAL REPORT | SEE NOTES TO FINANCIAL STATEMENTS. |
SCHEDULE OF INVESTMENTS (continued) | March 31, 2024 |
RUSSELL 2000® 1.5x STRATEGY FUND | |
| | Shares | | | Value | |
Digi International, Inc.* | | | 54 | | | $ | 1,724 | |
Model N, Inc.* | | | 58 | | | | 1,651 | |
PDF Solutions, Inc.* | | | 48 | | | | 1,616 | |
PubMatic, Inc. — Class A* | | | 65 | | | | 1,542 | |
Sapiens International Corporation N.V. | | | 47 | | | | 1,512 | |
Alkami Technology, Inc.* | | | 60 | | | | 1,474 | |
N-able, Inc.* | | | 107 | | | | 1,398 | |
SoundHound AI, Inc. — Class A*,1 | | | 208 | | | | 1,225 | |
Pitney Bowes, Inc. | | | 268 | | | | 1,161 | |
E2open Parent Holdings, Inc.* | | | 255 | | | | 1,132 | |
Amplitude, Inc. — Class A* | | | 104 | | | | 1,132 | |
Grid Dynamics Holdings, Inc.* | | | 85 | | | | 1,045 | |
Integral Ad Science Holding Corp.* | | | 102 | | | | 1,017 | |
Yext, Inc.* | | | 165 | | | | 995 | |
Simulations Plus, Inc. | | | 24 | | | | 988 | |
SolarWinds Corp.* | | | 78 | | | | 984 | |
Cerence, Inc.* | | | 62 | | | | 976 | |
Vimeo, Inc.* | | | 233 | | | | 953 | |
Mitek Systems, Inc.* | | | 66 | | | | 931 | |
Conduent, Inc.* | | | 263 | | | | 889 | |
Olo, Inc. — Class A* | | | 159 | | | | 873 | |
3D Systems Corp.* | | | 196 | | | | 870 | |
Matterport, Inc.* | | | 383 | | | | 866 | |
CEVA, Inc.* | | | 36 | | | | 818 | |
Navitas Semiconductor Corp.* | | | 164 | | | | 782 | |
Alpha & Omega Semiconductor Ltd.* | | | 35 | | | | 771 | |
MeridianLink, Inc.* | | | 40 | | | | 748 | |
Daily Journal Corp.* | | | 2 | | | | 723 | |
BigCommerce Holdings, Inc.* | | | 103 | | | | 710 | |
OneSpan, Inc.* | | | 61 | | | | 709 | |
Corsair Gaming, Inc.* | | | 57 | | | | 703 | |
Vishay Precision Group, Inc.* | | | 19 | | | | 671 | |
Bandwidth, Inc. — Class A* | | | 36 | | | | 657 | |
Health Catalyst, Inc.* | | | 86 | | | | 648 | |
Planet Labs PBC* | | | 253 | | | | 645 | |
Alignment Healthcare, Inc.* | | | 130 | | | | 645 | |
Instructure Holdings, Inc.* | | | 30 | | | | 641 | |
SEMrush Holdings, Inc. — Class A* | | | 48 | | | | 636 | |
Digimarc Corp.* | | | 22 | | | | 598 | |
Weave Communications, Inc.* | | | 51 | | | | 585 | |
Cantaloupe, Inc.* | | | 88 | | | | 566 | |
Definitive Healthcare Corp.* | | | 70 | | | | 565 | |
American Software, Inc. — Class A | | | 49 | | | | 561 | |
NextNav, Inc.* | | | 82 | | | | 540 | |
PlayAGS, Inc.* | | | 57 | | | | 512 | |
Consensus Cloud Solutions, Inc.* | | | 32 | | | | 508 | |
Unisys Corp.* | | | 103 | | | | 506 | |
Aehr Test Systems* | | | 40 | | | | 496 | |
Multiplan Corp.* | | | 584 | | | | 474 | |
8x8, Inc.* | | | 175 | | | | 473 | |
Climb Global Solutions, Inc. | | | 6 | | | | 425 | |
Domo, Inc. — Class B* | | | 47 | | | | 419 | |
Enfusion, Inc. — Class A* | | | 44 | | | | 407 | |
Digital Turbine, Inc.* | | | 144 | | | | 377 | |
Desktop Metal, Inc. — Class A* | | | 422 | | | | 371 | |
Playstudios, Inc.* | | | 132 | | | | 367 | |
ON24, Inc. | | | 51 | | | | 364 | |
Thoughtworks Holding, Inc.* | | | 143 | | | | 362 | |
Sharecare, Inc.* | | | 463 | | | | 355 | |
Cricut, Inc. — Class A | | | 74 | | | | 352 | |
Immersion Corp. | | | 47 | | | | 352 | |
EverCommerce, Inc.* | | | 36 | | | | 339 | |
Red Violet, Inc.* | | | 17 | | | | 332 | |
Inspired Entertainment, Inc.* | | | 33 | | | | 325 | |
TTEC Holdings, Inc. | | | 30 | | | | 311 | |
HireRight Holdings Corp.* | | | 21 | | | | 300 | |
CS Disco, Inc.* | | | 35 | | | | 285 | |
SkyWater Technology, Inc.* | | | 26 | | | | 264 | |
IBEX Holdings Ltd.* | | | 17 | | | | 262 | |
Rimini Street, Inc.* | | | 79 | | | | 258 | |
Innodata, Inc.* | | | 39 | | | | 257 | |
Outbrain, Inc.* | | | 63 | | | | 249 | |
Viant Technology, Inc. — Class A* | | | 22 | | | | 235 | |
Asure Software, Inc.* | | | 29 | | | | 226 | |
inTEST Corp.* | | | 17 | | | | 225 | |
eGain Corp.* | | | 33 | | | | 213 | |
TruBridge, Inc.* | | | 23 | | | | 212 | |
Veritone, Inc.* | | | 40 | | | | 210 | |
Atomera, Inc.* | | | 33 | | | | 203 | |
Kaltura, Inc.* | | | 128 | | | | 173 | |
Outset Medical, Inc.* | | | 76 | | | | 169 | |
Richardson Electronics Ltd. | | | 18 | | | | 166 | |
Expensify, Inc. — Class A* | | | 85 | | | | 156 | |
Rackspace Technology, Inc.* | | | 95 | | | | 150 | |
CoreCard Corp.* | | | 12 | | | | 133 | |
Brightcove, Inc.* | | | 66 | | | | 128 | |
Vuzix Corp.* | | | 90 | | | | 109 | |
LivePerson, Inc.*,1 | | | 108 | | | | 108 | |
BigBear.ai Holdings, Inc.* | | | 43 | | | | 88 | |
System1, Inc.* | | | 43 | | | | 84 | |
Velo3D, Inc.* | | | 137 | | | | 62 | |
Skillsoft Corp.* | | | 6 | | | | 54 | |
CXApp, Inc.*,1 | | | 3 | | | | 7 | |
Presto Automation, Inc.* | | | 5 | | | | 1 | |
Total Technology | | | | | | | 512,411 | |
| | | | | | | | | |
Consumer, Cyclical - 6.6% |
Light & Wonder, Inc. — Class A* | | | 137 | | | | 13,986 | |
Carvana Co.* | | | 156 | | | | 13,714 | |
Taylor Morrison Home Corp. — Class A* | | | 156 | | | | 9,699 | |
Meritage Homes Corp. | | | 55 | | | | 9,650 | |
Beacon Roofing Supply, Inc.* | | | 96 | | | | 9,410 | |
Installed Building Products, Inc. | | | 36 | | | | 9,314 | |
Abercrombie & Fitch Co. — Class A* | | | 74 | | | | 9,274 | |
Academy Sports & Outdoors, Inc. | | | 110 | | | | 7,429 | |
Asbury Automotive Group, Inc.* | | | 31 | | | | 7,309 | |
KB Home | | | 103 | | | | 7,301 | |
FirstCash Holdings, Inc. | | | 57 | | | | 7,270 | |
American Eagle Outfitters, Inc. | | | 276 | | | | 7,118 | |
Skyline Champion Corp.* | | | 82 | | | | 6,971 | |
Signet Jewelers Ltd. | | | 66 | | | | 6,605 | |
Group 1 Automotive, Inc. | | | 21 | | | | 6,137 | |
Shake Shack, Inc. — Class A* | | | 57 | | | | 5,930 | |
SEE NOTES TO FINANCIAL STATEMENTS. | THE RYDEX FUNDS ANNUAL REPORT | 103 |
SCHEDULE OF INVESTMENTS (continued) | March 31, 2024 |
RUSSELL 2000® 1.5x STRATEGY FUND | |
| | Shares | | | Value | |
GMS, Inc.* | | | 60 | | | $ | 5,840 | |
Goodyear Tire & Rubber Co.* | | | 423 | | | | 5,808 | |
MDC Holdings, Inc. | | | 90 | | | | 5,662 | |
Tri Pointe Homes, Inc.* | | | 146 | | | | 5,644 | |
Hilton Grand Vacations, Inc.* | | | 119 | | | | 5,618 | |
M/I Homes, Inc.* | | | 41 | | | | 5,588 | |
Cavco Industries, Inc.* | | | 13 | | | | 5,188 | |
Kontoor Brands, Inc. | | | 85 | | | | 5,121 | |
Resideo Technologies, Inc.* | | | 224 | | | | 5,022 | |
Visteon Corp.* | | | 42 | | | | 4,940 | |
Rush Enterprises, Inc. — Class A | | | 91 | | | | 4,870 | |
Steven Madden Ltd. | | | 111 | | | | 4,693 | |
LCI Industries | | | 37 | | | | 4,553 | |
Adient plc* | | | 138 | | | | 4,543 | |
Boot Barn Holdings, Inc.* | | | 46 | | | | 4,377 | |
Red Rock Resorts, Inc. — Class A | | | 73 | | | | 4,367 | |
Urban Outfitters, Inc.* | | | 98 | | | | 4,255 | |
SkyWest, Inc.* | | | 61 | | | | 4,214 | |
Century Communities, Inc. | | | 43 | | | | 4,149 | |
UniFirst Corp. | | | 23 | | | | 3,989 | |
Dorman Products, Inc.* | | | 40 | | | | 3,856 | |
Patrick Industries, Inc. | | | 32 | | | | 3,823 | |
Bloomin’ Brands, Inc. | | | 132 | | | | 3,786 | |
International Game Technology plc | | | 167 | | | | 3,773 | |
Sweetgreen, Inc. — Class A* | | | 149 | | | | 3,764 | |
LGI Homes, Inc.* | | | 32 | | | | 3,724 | |
JetBlue Airways Corp.* | | | 497 | | | | 3,688 | |
Foot Locker, Inc. | | | 126 | | | | 3,591 | |
Topgolf Callaway Brands Corp.* | | | 221 | | | | 3,574 | |
Sonos, Inc.* | | | 187 | | | | 3,564 | |
Fox Factory Holding Corp.* | | | 64 | | | | 3,332 | |
Brinker International, Inc.* | | | 67 | | | | 3,329 | |
Papa John’s International, Inc. | | | 49 | | | | 3,263 | |
Winnebago Industries, Inc. | | | 44 | | | | 3,256 | |
HNI Corp. | | | 71 | | | | 3,204 | |
Dave & Buster’s Entertainment, Inc.* | | | 51 | | | | 3,193 | |
PriceSmart, Inc. | | | 38 | | | | 3,192 | |
United Parks & Resorts, Inc.* | | | 55 | | | | 3,092 | |
H&E Equipment Services, Inc. | | | 48 | | | | 3,081 | |
Hanesbrands, Inc.* | | | 529 | | | | 3,068 | |
Cinemark Holdings, Inc.* | | | 169 | | | | 3,037 | |
Acushnet Holdings Corp. | | | 46 | | | | 3,034 | |
Six Flags Entertainment Corp.* | | | 111 | | | | 2,922 | |
Vista Outdoor, Inc.* | | | 87 | | | | 2,852 | |
Gentherm, Inc.* | | | 49 | | | | 2,821 | |
OPENLANE, Inc.* | | | 161 | | | | 2,785 | |
MillerKnoll, Inc. | | | 112 | | | | 2,773 | |
National Vision Holdings, Inc.* | | | 120 | | | | 2,659 | |
Atlanta Braves Holdings, Inc. — Class C* | | | 68 | | | | 2,656 | |
Cheesecake Factory, Inc. | | | 72 | | | | 2,603 | |
Oxford Industries, Inc. | | | 23 | | | | 2,585 | |
Dana, Inc. | | | 201 | | | | 2,553 | |
ODP Corp.* | | | 48 | | | | 2,546 | |
La-Z-Boy, Inc. | | | 66 | | | | 2,483 | |
Cracker Barrel Old Country Store, Inc. | | | 34 | | | | 2,473 | |
Green Brick Partners, Inc.* | | | 40 | | | | 2,409 | |
Dillard’s, Inc. — Class A | | | 5 | | | | 2,358 | |
Madison Square Garden Entertainment Corp.* | | | 60 | | | | 2,353 | |
Caleres, Inc. | | | 51 | | | | 2,093 | |
Wabash National Corp. | | | 69 | | | | 2,066 | |
Jack in the Box, Inc. | | | 30 | | | | 2,054 | |
Sally Beauty Holdings, Inc.* | | | 165 | | | | 2,049 | |
Buckle, Inc. | | | 47 | | | | 1,893 | |
XPEL, Inc.* | | | 34 | | | | 1,837 | |
Steelcase, Inc. — Class A | | | 139 | | | | 1,818 | |
Allegiant Travel Co. — Class A | | | 24 | | | | 1,805 | |
G-III Apparel Group Ltd.* | | | 62 | | | | 1,799 | |
Warby Parker, Inc. — Class A* | | | 131 | | | | 1,783 | |
Camping World Holdings, Inc. — Class A | | | 64 | | | | 1,782 | |
Leslie’s, Inc.* | | | 272 | | | | 1,768 | |
BlueLinx Holdings, Inc.* | | | 13 | | | | 1,693 | |
OneSpaWorld Holdings Ltd.* | | | 125 | | | | 1,654 | |
Lions Gate Entertainment Corp. — Class B* | | | 177 | | | | 1,648 | |
ScanSource, Inc.* | | | 37 | | | | 1,629 | |
MRC Global, Inc.* | | | 129 | | | | 1,622 | |
Dream Finders Homes, Inc. — Class A* | | | 37 | | | | 1,618 | |
Monarch Casino & Resort, Inc. | | | 21 | | | | 1,575 | |
indie Semiconductor, Inc. — Class A* | | | 210 | | | | 1,487 | |
Interface, Inc. — Class A | | | 88 | | | | 1,480 | |
Beazer Homes USA, Inc.* | | | 45 | | | | 1,476 | |
Blue Bird Corp.* | | | 38 | | | | 1,457 | |
Winmark Corp. | | | 4 | | | | 1,447 | |
VSE Corp. | | | 18 | | | | 1,440 | |
Guess?, Inc. | | | 45 | | | | 1,416 | |
Aurora Innovation, Inc.* | | | 501 | | | | 1,413 | |
Hibbett, Inc. | | | 18 | | | | 1,383 | |
Wolverine World Wide, Inc. | | | 120 | | | | 1,345 | |
Malibu Boats, Inc. — Class A* | | | 31 | | | | 1,342 | |
Everi Holdings, Inc.* | | | 129 | | | | 1,296 | |
American Axle & Manufacturing Holdings, Inc.* | | | 175 | | | | 1,288 | |
Vizio Holding Corp. — Class A* | | | 116 | | | | 1,269 | |
Sonic Automotive, Inc. — Class A | | | 22 | | | | 1,253 | |
Ethan Allen Interiors, Inc. | | | 36 | | | | 1,245 | |
BJ’s Restaurants, Inc.* | | | 34 | | | | 1,230 | |
PC Connection, Inc. | | | 18 | | | | 1,187 | |
Forestar Group, Inc.* | | | 29 | | | | 1,165 | |
Golden Entertainment, Inc. | | | 31 | | | | 1,142 | |
IMAX Corp.* | | | 69 | | | | 1,116 | |
Dine Brands Global, Inc. | | | 24 | | | | 1,116 | |
Standard Motor Products, Inc. | | | 33 | | | | 1,107 | |
Hovnanian Enterprises, Inc. — Class A* | | | 7 | | | | 1,099 | |
MarineMax, Inc.* | | | 33 | | | | 1,098 | |
REV Group, Inc. | | | 49 | | | | 1,082 | |
Nu Skin Enterprises, Inc. — Class A | | | 77 | | | | 1,065 | |
Life Time Group Holdings, Inc.* | | | 68 | | | | 1,055 | |
Hawaiian Holdings, Inc.* | | | 78 | | | | 1,040 | |
Kura Sushi USA, Inc. — Class A* | | | 9 | | | | 1,036 | |
Titan International, Inc.* | | | 81 | | | | 1,009 | |
Shoe Carnival, Inc. | | | 27 | | | | 989 | |
104 | THE RYDEX FUNDS ANNUAL REPORT | SEE NOTES TO FINANCIAL STATEMENTS. |
SCHEDULE OF INVESTMENTS (continued) | March 31, 2024 |
RUSSELL 2000® 1.5x STRATEGY FUND | |
| | Shares | | | Value | |
Accel Entertainment, Inc.* | | | 83 | | | $ | 979 | |
Nikola Corp.*,1 | | | 936 | | | | 973 | |
Portillo’s, Inc. — Class A* | | | 68 | | | | 964 | |
A-Mark Precious Metals, Inc. | | | 31 | | | | 951 | |
Chuy’s Holdings, Inc.* | | | 28 | | | | 944 | |
Global Industrial Co. | | | 20 | | | | 896 | |
Lions Gate Entertainment Corp. — Class A* | | | 90 | | | | 895 | |
Sun Country Airlines Holdings, Inc.* | | | 58 | | | | 875 | |
Miller Industries, Inc. | | | 17 | | | | 852 | |
Douglas Dynamics, Inc. | | | 35 | | | | 844 | |
Luminar Technologies, Inc.*,1 | | | 416 | | | | 819 | |
Spirit Airlines, Inc. | | | 169 | | | | 818 | |
Rush Enterprises, Inc. — Class B | | | 15 | | | | 799 | |
Titan Machinery, Inc.* | | | 32 | | | | 794 | |
Xperi, Inc.* | | | 64 | | | | 772 | |
RCI Hospitality Holdings, Inc. | | | 13 | | | | 754 | |
Savers Value Village, Inc.* | | | 39 | | | | 752 | |
Haverty Furniture Companies, Inc. | | | 22 | | | | 751 | |
Hudson Technologies, Inc.* | | | 67 | | | | 738 | |
Virgin Galactic Holdings, Inc.* | | | 498 | | | | 737 | |
Super Group SGHC Ltd.* | | | 210 | | | | 724 | |
Arko Corp. | | | 127 | | | | 724 | |
Designer Brands, Inc. — Class A | | | 66 | | | | 721 | |
Denny’s Corp.* | | | 78 | | | | 699 | |
Clean Energy Fuels Corp.* | | | 260 | | | | 697 | |
MasterCraft Boat Holdings, Inc.* | | | 29 | | | | 688 | |
Shyft Group, Inc. | | | 54 | | | | 671 | |
Movado Group, Inc. | | | 24 | | | | 670 | |
Methode Electronics, Inc. | | | 54 | | | | 658 | |
First Watch Restaurant Group, Inc.* | | | 26 | | | | 640 | |
Rush Street Interactive, Inc.* | | | 97 | | | | 631 | |
Xponential Fitness, Inc. — Class A* | | | 38 | | | | 628 | |
Atlanta Braves Holdings, Inc. — Class A* | | | 15 | | | | 628 | |
Bally’s Corp.* | | | 45 | | | | 627 | |
Build-A-Bear Workshop, Inc. — Class A | | | 21 | | | | 627 | |
America’s Car-Mart, Inc.* | | | 9 | | | | 575 | |
Daktronics, Inc.* | | | 57 | | | | 568 | |
Carrols Restaurant Group, Inc. | | | 57 | | | | 542 | |
Sleep Number Corp.* | | | 33 | | | | 529 | |
Marcus Corp. | | | 37 | | | | 527 | |
Lindblad Expeditions Holdings, Inc.* | | | 55 | | | | 513 | |
Genesco, Inc.* | | | 18 | | | | 507 | |
Lovesac Co.* | | | 22 | | | | 497 | |
Potbelly Corp.* | | | 40 | | | | 484 | |
Solid Power, Inc.* | | | 238 | | | | 483 | |
OneWater Marine, Inc. — Class A* | | | 17 | | | | 479 | |
Frontier Group Holdings, Inc.*,1 | | | 59 | | | | 478 | |
Hooker Furnishings Corp. | | | 18 | | | | 432 | |
Cooper-Standard Holdings, Inc.* | | | 26 | | | | 430 | |
El Pollo Loco Holdings, Inc.* | | | 42 | | | | 409 | |
Hyliion Holdings Corp.* | | | 225 | | | | 396 | |
Zumiez, Inc.* | | | 25 | | | | 380 | |
Johnson Outdoors, Inc. — Class A | | | 8 | | | | 369 | |
iRobot Corp.* | | | 42 | | | | 368 | |
Holley, Inc.* | | | 80 | | | | 357 | |
Bowlero Corp. — Class A1 | | | 26 | | | | 356 | |
Funko, Inc. — Class A* | | | 53 | | | | 331 | |
SES AI Corp.* | | | 192 | | | | 323 | |
Commercial Vehicle Group, Inc.* | | | 50 | | | | 321 | |
EVgo, Inc.*,1 | | | 124 | | | | 311 | |
Tile Shop Holdings, Inc.* | | | 44 | | | | 309 | |
Destination XL Group, Inc.* | | | 85 | | | | 306 | |
Clarus Corp. | | | 45 | | | | 304 | |
Global Business Travel Group I* | | | 50 | | | | 300 | |
Rocky Brands, Inc. | | | 11 | | | | 299 | |
Landsea Homes Corp.* | | | 20 | | | | 291 | |
Weyco Group, Inc. | | | 9 | | | | 287 | |
Full House Resorts, Inc.* | | | 51 | | | | 284 | |
Microvast Holdings, Inc.*,1 | | | 326 | | | | 273 | |
Vera Bradley, Inc.* | | | 40 | | | | 272 | |
JAKKS Pacific, Inc.* | | | 11 | | | | 271 | |
GrowGeneration Corp.* | | | 91 | | | | 260 | |
Snap One Holdings Corp.* | | | 28 | | | | 241 | |
Tilly’s, Inc. — Class A* | | | 35 | | | | 238 | |
Reservoir Media, Inc.* | | | 30 | | | | 238 | |
J Jill, Inc.* | | | 7 | | | | 224 | |
ThredUp, Inc. — Class A* | | | 110 | | | | 220 | |
Children’s Place, Inc.* | | | 18 | | | | 208 | |
Escalade, Inc. | | | 15 | | | | 206 | |
Biglari Holdings, Inc. — Class B* | | | 1 | | | | 190 | |
Big Lots, Inc.* | | | 43 | | | | 186 | |
Red Robin Gourmet Burgers, Inc.* | | | 24 | | | | 184 | |
ONE Group Hospitality, Inc.* | | | 33 | | | | 184 | |
Sportsman’s Warehouse Holdings, Inc.* | | | 59 | | | | 183 | |
EVI Industries, Inc. | | | 7 | | | | 174 | |
Cato Corp. — Class A | | | 27 | | | | 156 | |
PetMed Express, Inc. | | | 32 | | | | 153 | |
Marine Products Corp. | | | 13 | | | | 153 | |
VOXX International Corp. — Class A* | | | 18 | | | | 147 | |
Purple Innovation, Inc. | | | 82 | | | | 143 | |
Traeger, Inc.* | | | 53 | | | | 134 | |
Century Casinos, Inc.* | | | 42 | | | | 133 | |
Livewire Group, Inc.* | | | 17 | | | | 123 | |
Noodles & Co.* | | | 61 | | | | 116 | |
Big 5 Sporting Goods Corp. | | | 33 | | | | 116 | |
Duluth Holdings, Inc. — Class B* | | | 20 | | | | 98 | |
Aeva Technologies, Inc.* | | | 24 | | | | 94 | |
Torrid Holdings, Inc.*,1 | | | 18 | | | | 88 | |
Fossil Group, Inc.* | | | 72 | | | | 74 | |
CompX International, Inc. | | | 2 | | | | 69 | |
United Homes Group, Inc.*,1 | | | 9 | | | | 63 | |
Workhorse Group, Inc.* | | | 264 | | | | 62 | |
Envela Corp.* | | | 11 | | | | 51 | |
Lazydays Holdings, Inc.*,1 | | | 12 | | | | 48 | |
Loop Media, Inc.*,1 | | | 57 | | | | 21 | |
Dragonfly Energy Holdings Corp.* | | | 26 | | | | 14 | |
Qurate Retail, Inc. — Class B* | | | 2 | | | | 9 | |
Total Consumer, Cyclical | | | | | | | 472,474 | |
| | | | | | | | | |
Energy - 4.0% |
Weatherford International plc* | | | 107 | | | | 12,350 | |
Permian Resources Corp. | | | 688 | | | | 12,150 | |
SEE NOTES TO FINANCIAL STATEMENTS. | THE RYDEX FUNDS ANNUAL REPORT | 105 |
SCHEDULE OF INVESTMENTS (continued) | March 31, 2024 |
RUSSELL 2000® 1.5x STRATEGY FUND | |
| | Shares | | | Value | |
Matador Resources Co. | | | 170 | | | $ | 11,351 | |
Chord Energy Corp. | | | 63 | | | | 11,229 | |
ChampionX Corp. | | | 295 | | | | 10,587 | |
Murphy Oil Corp. | | | 219 | | | | 10,008 | |
PBF Energy, Inc. — Class A | | | 166 | | | | 9,557 | |
Civitas Resources, Inc. | | | 123 | | | | 9,337 | |
SM Energy Co. | | | 175 | | | | 8,724 | |
Noble Corporation plc | | | 171 | | | | 8,292 | |
Equitrans Midstream Corp. | | | 658 | | | | 8,218 | |
Magnolia Oil & Gas Corp. — Class A | | | 267 | | | | 6,929 | |
Valaris Ltd.* | | | 90 | | | | 6,773 | |
Tidewater, Inc.* | | | 70 | | | | 6,440 | |
Patterson-UTI Energy, Inc. | | | 532 | | | | 6,352 | |
Helmerich & Payne, Inc. | | | 146 | | | | 6,141 | |
California Resources Corp. | | | 106 | | | | 5,841 | |
CNX Resources Corp.* | | | 239 | | | | 5,669 | |
Alpha Metallurgical Resources, Inc. | | | 17 | | | | 5,630 | |
Northern Oil and Gas, Inc. | | | 134 | | | | 5,317 | |
Liberty Energy, Inc. — Class A | | | 250 | | | | 5,180 | |
Warrior Met Coal, Inc. | | | 78 | | | | 4,735 | |
Arch Resources, Inc. | | | 27 | | | | 4,341 | |
Archrock, Inc. | | | 210 | | | | 4,131 | |
Peabody Energy Corp. | | | 170 | | | | 4,124 | |
Kosmos Energy Ltd.* | | | 688 | | | | 4,100 | |
CONSOL Energy, Inc. | | | 46 | | | | 3,853 | |
Oceaneering International, Inc.* | | | 154 | | | | 3,603 | |
Seadrill Ltd.* | | | 71 | | | | 3,571 | |
Array Technologies, Inc.* | | | 228 | | | | 3,400 | |
Par Pacific Holdings, Inc.* | | | 85 | | | | 3,150 | |
Sitio Royalties Corp. — Class A | | | 124 | | | | 3,065 | |
Delek US Holdings, Inc. | | | 98 | | | | 3,013 | |
Shoals Technologies Group, Inc. — Class A* | | | 258 | | | | 2,885 | |
Talos Energy, Inc.* | | | 206 | | | | 2,870 | |
Expro Group Holdings N.V.* | | | 136 | | | | 2,716 | |
Gulfport Energy Corp.* | | | 16 | | | | 2,562 | |
DNOW, Inc.* | | | 160 | | | | 2,432 | |
Helix Energy Solutions Group, Inc.* | | | 221 | | | | 2,396 | |
Borr Drilling Ltd.* | | | 330 | | | | 2,260 | |
Kinetik Holdings, Inc. — Class A | | | 55 | | | | 2,193 | |
Diamond Offshore Drilling, Inc.* | | | 157 | | | | 2,141 | |
Green Plains, Inc.* | | | 90 | | | | 2,081 | |
Vital Energy, Inc.* | | | 35 | | | | 1,839 | |
CVR Energy, Inc. | | | 45 | | | | 1,605 | |
Fluence Energy, Inc.* | | | 88 | | | | 1,526 | |
SunCoke Energy, Inc. | | | 129 | | | | 1,454 | |
US Silica Holdings, Inc.* | | | 117 | | | | 1,452 | |
REX American Resources Corp.* | | | 24 | | | | 1,409 | |
Crescent Energy Co. — Class A | | | 117 | | | | 1,392 | |
Comstock Resources, Inc.1 | | | 141 | | | | 1,308 | |
Core Laboratories, Inc. | | | 72 | | | | 1,230 | |
ProPetro Holding Corp.* | | | 151 | | | | 1,220 | |
Nabors Industries Ltd.* | | | 14 | | | | 1,206 | |
SilverBow Resources, Inc.* | | | 35 | | | | 1,195 | |
Dril-Quip, Inc.* | | | 53 | | | | 1,194 | |
VAALCO Energy, Inc. | | | 166 | | | | 1,157 | |
Select Water Solutions, Inc. — Class A | | | 122 | | | | 1,126 | |
Bristow Group, Inc.* | | | 37 | | | | 1,006 | |
RPC, Inc. | | | 130 | | | | 1,006 | |
Sunnova Energy International, Inc.*,1 | | | 156 | | | | 956 | |
Berry Corp. | | | 117 | | | | 942 | |
Vitesse Energy, Inc. | | | 38 | | | | 902 | |
TETRA Technologies, Inc.* | | | 193 | | | | 855 | |
Newpark Resources, Inc.* | | | 113 | | | | 816 | |
FuelCell Energy, Inc.*,1 | | | 617 | | | | 734 | |
SandRidge Energy, Inc. | | | 49 | | | | 714 | |
NextDecade Corp.* | | | 118 | | | | 670 | |
Aris Water Solutions, Inc. — Class A | | | 46 | | | | 651 | |
Kodiak Gas Services, Inc. | | | 23 | | | | 629 | |
Oil States International, Inc.* | | | 96 | | | | 591 | |
Ramaco Resources, Inc. — Class A | | | 35 | | | | 589 | |
DMC Global, Inc.* | | | 30 | | | | 585 | |
Atlas Energy Solutions, Inc. | | | 24 | | | | 543 | |
Tellurian, Inc.* | | | 803 | | | | 531 | |
SEACOR Marine Holdings, Inc.* | | | 37 | | | | 516 | |
Stem, Inc.*,1 | | | 217 | | | | 475 | |
Excelerate Energy, Inc. — Class A | | | 28 | | | | 449 | |
Riley Exploration Permian, Inc. | | | 13 | | | | 429 | |
Montauk Renewables, Inc.* | | | 102 | | | | 424 | |
SunPower Corp. — Class A*,1 | | | 134 | | | | 402 | |
W&T Offshore, Inc. | | | 151 | | | | 400 | |
Solaris Oilfield Infrastructure, Inc. — Class A | | | 46 | | | | 399 | |
Amplify Energy Corp.* | | | 56 | | | | 370 | |
Ring Energy, Inc.* | | | 185 | | | | 363 | |
Forum Energy Technologies, Inc.* | | | 17 | | | | 340 | |
ProFrac Holding Corp. — Class A* | | | 39 | | | | 326 | |
FutureFuel Corp. | | | 40 | | | | 322 | |
Evolution Petroleum Corp. | | | 51 | | | | 313 | |
HighPeak Energy, Inc. | | | 18 | | | | 284 | |
Gevo, Inc.* | | | 358 | | | | 275 | |
Energy Vault Holdings, Inc.* | | | 151 | | | | 270 | |
Granite Ridge Resources, Inc. | | | 40 | | | | 260 | |
Ranger Energy Services, Inc. | | | 22 | | | | 248 | |
TPI Composites, Inc.*,1 | | | 67 | | | | 195 | |
Hallador Energy Co.* | | | 36 | | | | 192 | |
NACCO Industries, Inc. — Class A | | | 6 | | | | 181 | |
Eos Energy Enterprises, Inc.* | | | 165 | | | | 170 | |
KLX Energy Services Holdings, Inc.* | | | 20 | | | | 155 | |
Maxeon Solar Technologies Ltd.* | | | 44 | | | | 147 | |
Vertex Energy, Inc.* | | | 99 | | | | 139 | |
Mammoth Energy Services, Inc.* | | | 35 | | | | 127 | |
PrimeEnergy Resources Corp.* | | | 1 | | | | 100 | |
Empire Petroleum Corp.* | | | 18 | | | | 92 | |
Ramaco Resources, Inc. — Class B | | | 7 | | | | 88 | |
Verde Clean Fuels, Inc.* | | | 1 | | | | 4 | |
Total Energy | | | | | | | 283,185 | |
| | | | | | | | | |
Basic Materials - 1.9% |
Commercial Metals Co. | | | 176 | | | | 10,344 | |
ATI, Inc.* | | | 194 | | | | 9,927 | |
Cabot Corp. | | | 82 | | | | 7,560 | |
Balchem Corp. | | | 48 | | | | 7,438 | |
106 | THE RYDEX FUNDS ANNUAL REPORT | SEE NOTES TO FINANCIAL STATEMENTS. |
SCHEDULE OF INVESTMENTS (continued) | March 31, 2024 |
RUSSELL 2000® 1.5x STRATEGY FUND | |
| | Shares | | | Value | |
Arcadium Lithium plc* | | | 1,554 | | | $ | 6,698 | |
HB Fuller Co. | | | 82 | | | | 6,539 | |
Avient Corp. | | | 136 | | | | 5,902 | |
Carpenter Technology Corp. | | | 73 | | | | 5,214 | |
Innospec, Inc. | | | 38 | | | | 4,900 | |
Sensient Technologies Corp. | | | 64 | | | | 4,428 | |
Hecla Mining Co. | | | 920 | | | | 4,425 | |
Constellium SE* | | | 195 | | | | 4,311 | |
Quaker Chemical Corp. | | | 21 | | | | 4,310 | |
Minerals Technologies, Inc. | | | 50 | | | | 3,764 | |
Uranium Energy Corp.* | | | 553 | | | | 3,733 | |
Sylvamo Corp. | | | 54 | | | | 3,334 | |
Tronox Holdings plc — Class A | | | 180 | | | | 3,123 | |
Rogers Corp.* | | | 26 | | | | 3,086 | |
Stepan Co. | | | 33 | | | | 2,971 | |
Ingevity Corp.* | | | 55 | | | | 2,624 | |
Hawkins, Inc. | | | 30 | | | | 2,304 | |
Kaiser Aluminum Corp. | | | 25 | | | | 2,234 | |
Orion S.A. | | | 86 | | | | 2,023 | |
Coeur Mining, Inc.* | | | 498 | | | | 1,877 | |
Perimeter Solutions S.A.* | | | 233 | | | | 1,729 | |
Koppers Holdings, Inc. | | | 31 | | | | 1,710 | |
Worthington Steel, Inc. | | | 47 | | | | 1,685 | |
Ecovyst, Inc.* | | | 140 | | | | 1,561 | |
Mativ Holdings, Inc. | | | 83 | | | | 1,556 | |
Energy Fuels, Inc.* | | | 242 | | | | 1,522 | |
Century Aluminum Co.* | | | 81 | | | | 1,247 | |
AdvanSix, Inc. | | | 41 | | | | 1,173 | |
Haynes International, Inc. | | | 19 | | | | 1,142 | |
Novagold Resources, Inc.* | | | 371 | | | | 1,113 | |
Encore Energy Corp.* | | | 218 | | | | 955 | |
United States Lime & Minerals, Inc. | | | 3 | | | | 894 | |
Ivanhoe Electric Incorporated / US*,1 | | | 87 | | | | 853 | |
Radius Recycling, Inc. — Class A | | | 40 | | | | 845 | |
Lightwave Logic, Inc.* | | | 177 | | | | 828 | |
Compass Minerals International, Inc. | | | 52 | | | | 818 | |
Centrus Energy Corp. — Class A* | | | 19 | | | | 789 | |
American Vanguard Corp. | | | 42 | | | | 544 | |
Oil-Dri Corporation of America | | | 7 | | | | 522 | |
Rayonier Advanced Materials, Inc.* | | | 98 | | | | 468 | |
i-80 Gold Corp.*,1 | | | 296 | | | | 397 | |
Kronos Worldwide, Inc. | | | 33 | | | | 389 | |
Piedmont Lithium, Inc.* | | | 28 | | | | 373 | |
Codexis, Inc.* | | | 102 | | | | 356 | |
Intrepid Potash, Inc.* | | | 16 | | | | 334 | |
Caledonia Mining Corporation plc | | | 25 | | | | 277 | |
Perpetua Resources Corp.* | | | 57 | | | | 237 | |
Trinseo plc | | | 54 | | | | 204 | |
Dakota Gold Corp.* | | | 83 | | | | 197 | |
Danimer Scientific, Inc.* | | | 135 | | | | 147 | |
Glatfelter Corp.* | | | 68 | | | | 136 | |
Contango ORE, Inc.* | | | 6 | | | | 119 | |
Origin Materials, Inc.* | | | 176 | | | | 90 | |
5E Advanced Materials, Inc.* | | | 61 | | | | 82 | |
Valhi, Inc. | | | 4 | | | | 69 | |
NioCorp Developments Ltd.* | | | 3 | | | | 8 | |
Total Basic Materials | | | | | | | 138,438 | |
Communications - 1.8% |
DigitalBridge Group, Inc. | | | 244 | | | | 4,702 | |
Q2 Holdings, Inc.* | | | 86 | | | | 4,520 | |
TEGNA, Inc. | | | 298 | | | | 4,452 | |
Ziff Davis, Inc.* | | | 69 | | | | 4,350 | |
Cogent Communications Holdings, Inc. | | | 66 | | | | 4,312 | |
InterDigital, Inc. | | | 39 | | | | 4,152 | |
Credo Technology Group Holding Ltd.* | | | 187 | | | | 3,962 | |
Yelp, Inc. — Class A* | | | 100 | | | | 3,940 | |
Cargurus, Inc.* | | | 145 | | | | 3,347 | |
ePlus, Inc.* | | | 41 | | | | 3,220 | |
Squarespace, Inc. — Class A* | | | 86 | | | | 3,134 | |
Viavi Solutions, Inc.* | | | 333 | | | | 3,027 | |
Calix, Inc.* | | | 90 | | | | 2,984 | |
Perficient, Inc.* | | | 52 | | | | 2,927 | |
Hims & Hers Health, Inc.* | | | 189 | | | | 2,924 | |
EchoStar Corp. — Class A* | | | 185 | | | | 2,636 | |
Beyond, Inc.* | | | 70 | | | | 2,514 | |
Opendoor Technologies, Inc.* | | | 822 | | | | 2,491 | |
Telephone & Data Systems, Inc. | | | 152 | | | | 2,435 | |
Lumen Technologies, Inc.* | | | 1,517 | | | | 2,366 | |
Upwork, Inc.* | | | 190 | | | | 2,329 | |
Harmonic, Inc.* | | | 170 | | | | 2,285 | |
Extreme Networks, Inc.* | | | 192 | | | | 2,216 | |
Magnite, Inc.* | | | 206 | | | | 2,214 | |
Sphere Entertainment Co.* | | | 40 | | | | 1,963 | |
Sprinklr, Inc. — Class A* | | | 155 | | | | 1,902 | |
Infinera Corp.* | | | 306 | | | | 1,845 | |
Bumble, Inc. — Class A* | | | 156 | | | | 1,771 | |
Cars.com, Inc.* | | | 102 | | | | 1,752 | |
Shutterstock, Inc. | | | 38 | | | | 1,741 | |
Globalstar, Inc.* | | | 1,039 | | | | 1,527 | |
A10 Networks, Inc. | | | 108 | | | | 1,478 | |
Scholastic Corp. | | | 39 | | | | 1,471 | |
Liberty Latin America Ltd. — Class C* | | | 210 | | | | 1,468 | |
QuinStreet, Inc.* | | | 80 | | | | 1,413 | |
Couchbase, Inc.* | | | 52 | | | | 1,368 | |
Revolve Group, Inc.*,1 | | | 63 | | | | 1,334 | |
TechTarget, Inc.* | | | 40 | | | | 1,323 | |
Shenandoah Telecommunications Co. | | | 74 | | | | 1,285 | |
Thryv Holdings, Inc.* | | | 48 | | | | 1,067 | |
HealthStream, Inc. | | | 38 | | | | 1,013 | |
Figs, Inc. — Class A* | | | 196 | | | | 976 | |
Open Lending Corp. — Class A* | | | 153 | | | | 958 | |
Clear Channel Outdoor Holdings, Inc.* | | | 564 | | | | 931 | |
IDT Corp. — Class B | | | 24 | | | | 907 | |
Gogo, Inc.* | | | 102 | | | | 896 | |
Gray Television, Inc. | | | 127 | | | | 803 | |
Cardlytics, Inc.* | | | 52 | | | | 753 | |
Stagwell, Inc.* | | | 119 | | | | 740 | |
NETGEAR, Inc.* | | | 43 | | | | 678 | |
Vivid Seats, Inc. — Class A* | | | 113 | | | | 677 | |
Sinclair, Inc. | | | 50 | | | | 673 | |
fuboTV, Inc.* | | | 426 | | | | 673 | |
MediaAlpha, Inc. — Class A* | | | 33 | | | | 672 | |
ADTRAN Holdings, Inc. | | | 120 | | | | 653 | |
Eventbrite, Inc. — Class A* | | | 119 | | | | 652 | |
SEE NOTES TO FINANCIAL STATEMENTS. | THE RYDEX FUNDS ANNUAL REPORT | 107 |
SCHEDULE OF INVESTMENTS (continued) | March 31, 2024 |
RUSSELL 2000® 1.5x STRATEGY FUND | |
| | Shares | | | Value | |
Aviat Networks, Inc.* | | | 17 | | | $ | 652 | |
Liquidity Services, Inc.* | | | 35 | | | | 651 | |
Clearfield, Inc.* | | | 21 | | | | 648 | |
Anterix, Inc.* | | | 19 | | | | 639 | |
Grindr, Inc.* | | | 63 | | | | 638 | |
EverQuote, Inc. — Class A* | | | 33 | | | | 612 | |
AMC Networks, Inc. — Class A* | | | 49 | | | | 594 | |
Advantage Solutions, Inc.* | | | 133 | | | | 576 | |
Boston Omaha Corp. — Class A* | | | 35 | | | | 541 | |
Gannett Company, Inc.* | | | 220 | | | | 537 | |
ATN International, Inc. | | | 17 | | | | 536 | |
Preformed Line Products Co. | | | 4 | | | | 515 | |
Nextdoor Holdings, Inc.* | | | 224 | | | | 504 | |
AST SpaceMobile, Inc.* | | | 173 | | | | 502 | |
Consolidated Communications Holdings, Inc.* | | | 113 | | | | 488 | |
Applied Digital Corp.*,1 | | | 104 | | | | 445 | |
1-800-Flowers.com, Inc. — Class A* | | | 40 | | | | 433 | |
Spok Holdings, Inc. | | | 27 | | | | 431 | |
Ribbon Communications, Inc.* | | | 133 | | | | 426 | |
CommScope Holding Company, Inc.* | | | 317 | | | | 415 | |
Liberty Latin America Ltd. — Class A* | | | 53 | | | | 369 | |
EW Scripps Co. — Class A* | | | 91 | | | | 358 | |
Stitch Fix, Inc. — Class A* | | | 129 | | | | 340 | |
iHeartMedia, Inc. — Class A* | | | 158 | | | | 330 | |
OptimizeRx Corp.* | | | 26 | | | | 316 | |
Ooma, Inc.* | | | 36 | | | | 307 | |
Tucows, Inc. — Class A* | | | 15 | | | | 278 | |
WideOpenWest, Inc.* | | | 76 | | | | 275 | |
Lands’ End, Inc.* | | | 25 | | | | 272 | |
Nerdy, Inc.* | | | 91 | | | | 265 | |
Blade Air Mobility, Inc.* | | | 89 | | | | 254 | |
BlackSky Technology, Inc.* | | | 180 | | | | 245 | |
BARK, Inc.* | | | 190 | | | | 236 | |
Townsquare Media, Inc. — Class A | | | 18 | | | | 198 | |
ContextLogic, Inc. — Class A* | | | 34 | | | | 193 | |
Terran Orbital Corp.* | | | 131 | | | | 172 | |
DHI Group, Inc.* | | | 65 | | | | 166 | |
Mondee Holdings, Inc.*,1 | | | 71 | | | | 164 | |
Luna Innovations, Inc.* | | | 50 | | | | 160 | |
Entravision Communications Corp. — Class A | | | 92 | | | | 151 | |
KVH Industries, Inc.* | | | 29 | | | | 148 | |
Gambling.com Group Ltd.* | | | 16 | | | | 146 | |
CarParts.com, Inc.* | | | 82 | | | | 133 | |
Allbirds, Inc. — Class A* | | | 147 | | | | 102 | |
Cambium Networks Corp.* | | | 19 | | | | 82 | |
Solo Brands, Inc. — Class A* | | | 33 | | | | 72 | |
DZS, Inc.*,1 | | | 34 | | | | 45 | |
Urban One, Inc.* | | | 20 | | | | 41 | |
Value Line, Inc. | | | 1 | | | | 40 | |
Urban One, Inc.* | | | 14 | | | | 38 | |
Total Communications | | | | | | | 131,481 | |
| | | | | | | | | |
Utilities - 1.4% |
Southwest Gas Holdings, Inc. | | | 93 | | | | 7,080 | |
Brookfield Infrastructure Corp. — Class A | | | 181 | | | | 6,523 | |
Portland General Electric Co. | | | 154 | | | | 6,468 | |
New Jersey Resources Corp. | | | 146 | | | | 6,265 | |
Black Hills Corp. | | | 102 | | | | 5,569 | |
Ormat Technologies, Inc. | | | 81 | | | | 5,361 | |
Otter Tail Corp. | | | 62 | | | | 5,357 | |
ONE Gas, Inc. | | | 83 | | | | 5,356 | |
ALLETE, Inc. | | | 87 | | | | 5,189 | |
PNM Resources, Inc. | | | 129 | | | | 4,856 | |
Spire, Inc. | | | 79 | | | | 4,848 | |
Northwestern Energy Group, Inc. | | | 92 | | | | 4,686 | |
MGE Energy, Inc. | | | 56 | | | | 4,408 | |
Avista Corp. | | | 116 | | | | 4,062 | |
American States Water Co. | | | 56 | | | | 4,045 | |
California Water Service Group | | | 87 | | | | 4,044 | |
Chesapeake Utilities Corp. | | | 32 | | | | 3,434 | |
SJW Group | | | 48 | | | | 2,716 | |
Northwest Natural Holding Co. | | | 55 | | | | 2,047 | |
Middlesex Water Co. | | | 27 | | | | 1,418 | |
Unitil Corp. | | | 25 | | | | 1,309 | |
Ameresco, Inc. — Class A* | | | 50 | | | | 1,207 | |
York Water Co. | | | 22 | | | | 798 | |
Consolidated Water Company Ltd. | | | 23 | | | | 674 | |
Artesian Resources Corp. — Class A | | | 14 | | | | 520 | |
Altus Power, Inc.* | | | 98 | | | | 468 | |
Genie Energy Ltd. — Class B | | | 30 | | | | 452 | |
RGC Resources, Inc. | | | 12 | | | | 243 | |
Global Water Resources, Inc. | | | 18 | | | | 231 | |
FTC Solar, Inc.* | | | 97 | | | | 52 | |
Total Utilities | | | | | | | 99,686 | |
| | | | | | | | | |
Government - 0.0% |
Banco Latinoamericano de Comercio Exterior S.A. — Class E | | | 42 | | | | 1,244 | |
| | | | | | | | | |
Total Common Stocks | | | | |
(Cost $3,775,027) | | | | | | | 4,026,408 | |
| | | | | | | | | |
RIGHTS† - 0.0% |
Consumer, Non-cyclical - 0.0% |
Cartesian Therapeutics Inc.* | | | | | | | | |
Expires 09/15/24 | | | 179 | | | | — | |
Tobira Therapeutics, Inc.*,††† | | | 14 | | | | — | |
Novartis AG*,††† | | | | | | | | |
| | | | 100 | | | | — | |
Total Consumer, Non-cyclical | | | | | | | — | |
| | | | | | | | | |
Energy - 0.0% |
Empire Petroleum Corp.* | | | | | | | | |
Expires 04/03/24 | | | 18 | | | | — | |
Total Rights | | | | |
(Cost $39) | | | | | | | — | |
| | | | | | | | | |
108 | THE RYDEX FUNDS ANNUAL REPORT | SEE NOTES TO FINANCIAL STATEMENTS. |
SCHEDULE OF INVESTMENTS (continued) | March 31, 2024 |
RUSSELL 2000® 1.5x STRATEGY FUND | |
| | Shares | | | Value | |
MUTUAL FUNDS† - 16.7% |
Guggenheim Strategy Fund II2 | | | 25,618 | | | $ | 630,196 | |
Guggenheim Ultra Short Duration Fund — Institutional Class2 | | | 56,061 | | | | 555,568 | |
Total Mutual Funds | | | | |
(Cost $1,183,372) | | | | | | | 1,185,764 | |
| | | | | | | | | |
| | | Face
Amount | | | | | |
U.S. TREASURY BILLS†† - 4.6% |
U.S. Treasury Bills |
5.25% due 04/23/243,4 | | $ | 300,000 | | | | 299,034 | |
5.17% due 04/16/244,5 | | | 32,000 | | | | 31,930 | |
Total U.S. Treasury Bills | | | | |
(Cost $330,967) | | | | | | | 330,964 | |
| | | | | | | | | |
REPURCHASE AGREEMENTS††,6 - 19.0% |
J.P. Morgan Securities LLC
issued 03/28/24 at 5.31%
due 04/01/243 | | | 780,743 | | | | 780,743 | |
BofA Securities, Inc.
issued 03/28/24 at 5.31%
due 04/01/243 | | | 300,286 | | | | 300,286 | |
Barclays Capital, Inc.
issued 03/28/24 at 5.30%
due 04/01/243 | | | 272,183 | | | | 272,183 | |
Total Repurchase Agreements | | | | |
(Cost $1,353,212) | | | | | | | 1,353,212 | |
| | | | | | | | | |
SECURITIES LENDING COLLATERAL†,7 - 0.7% |
Money Market Fund | | | | | | | | |
First American Government Obligations Fund - Class X, 5.23%8 | | | 46,537 | | | $ | 46,537 | |
Total Securities Lending Collateral | | | | |
(Cost $46,537) | | | | | | | 46,537 | |
| | | | | | | | | |
Total Investments - 97.5% | | | | |
(Cost $6,689,154) | | $ | 6,942,885 | |
Other Assets & Liabilities, net - 2.5% | | | 179,082 | |
Total Net Assets - 100.0% | | $ | 7,121,967 | |
Futures Contracts |
Description | | Number of
Contracts | | | Expiration
Date | | | Notional
Amount | | | Value and
Unrealized
Appreciation** | |
Equity Futures Contracts Purchased† |
Russell 2000 Index Mini Futures Contracts | | | 5 | | | | Jun 2024 | | | $ | 536,275 | | | $ | 13,073 | |
Total Return Swap Agreements |
Counterparty | Index | Type | | Financing
Rate | | Payment
Frequency | | | Maturity
Date | | | Units | | | Notional
Amount | | | Value and
Unrealized
Appreciation | |
OTC Equity Index Swap Agreements†† |
Barclays Bank plc | Russell 2000 Index | Pay | | 5.78% (SOFR +
0.45%) | | | At Maturity | | | | 06/25/24 | | | | 1,564 | | | $ | 3,322,478 | | | $ | 137,437 | |
BNP Paribas | Russell 2000 Index | Pay | | 5.53% (Federal
Funds Rate +
0.20%) | | | At Maturity | | | | 06/26/24 | | | | 711 | | | | 1,510,561 | | | | 35,313 | |
Goldman Sachs International | Russell 2000 Index | Pay | | 5.43% (Federal
Funds Rate +
0.10%) | | | At Maturity | | | | 06/26/24 | | | | 609 | | | | 1,294,206 | | | | 27,220 | |
| | | | | | | | | | | | | | | | | | | $ | 6,127,245 | | | $ | 199,970 | |
SEE NOTES TO FINANCIAL STATEMENTS. | THE RYDEX FUNDS ANNUAL REPORT | 109 |
SCHEDULE OF INVESTMENTS (continued) | March 31, 2024 |
RUSSELL 2000® 1.5x STRATEGY FUND | |
* | Non-income producing security. |
** | Includes cumulative appreciation (depreciation). Variation margin is reported within the Statement of Assets and Liabilities. |
† | Value determined based on Level 1 inputs, unless otherwise noted — See Note 4. |
†† | Value determined based on Level 2 inputs — See Note 4. |
††† | Value determined based on Level 3 inputs — See Note 4. |
1 | All or a portion of this security is on loan at March 31, 2024 — See Note 7. |
2 | Affiliated issuer. |
3 | All or a portion of this security is pledged as equity index swap collateral at March 31, 2024. |
4 | Rate indicated is the effective yield at the time of purchase. |
5 | All or a portion of this security is pledged as futures collateral at March 31, 2024. |
6 | Repurchase Agreements — See Note 6. |
7 | Securities lending collateral — See Note 7. |
8 | Rate indicated is the 7-day yield as of March 31, 2024. |
| | plc — Public Limited Company |
| | REIT — Real Estate Investment Trust |
| | SOFR — Secured Overnight Financing Rate |
| | |
| | See Sector Classification in Other Information section. |
The following table summarizes the inputs used to value the Fund’s investments at March 31, 2024 (See Note 4 in the Notes to Financial Statements):
Investments in Securities (Assets) | | Level 1
Quoted
Prices | | | Level 2
Significant
Observable
Inputs | | | Level 3
Significant
Unobservable
Inputs | | | Total | |
Common Stocks | | $ | 4,026,408 | | | $ | — | * | | $ | — | | | $ | 4,026,408 | |
Rights | | | — | * | | | — | * | | | — | * | | | — | |
Mutual Funds | | | 1,185,764 | | | | — | | | | — | | | | 1,185,764 | |
U.S. Treasury Bills | | | — | | | | 330,964 | | | | — | | | | 330,964 | |
Repurchase Agreements | | | — | | | | 1,353,212 | | | | — | | | | 1,353,212 | |
Securities Lending Collateral | | | 46,537 | | | | — | | | | — | | | | 46,537 | |
Equity Futures Contracts** | | | 13,073 | | | | — | | | | — | | | | 13,073 | |
Equity Index Swap Agreements** | | | — | | | | 199,970 | | | | — | | | | 199,970 | |
Total Assets | | $ | 5,271,782 | | | $ | 1,884,146 | | | $ | — | | | $ | 7,155,928 | |
* | Security has a market value of $0. |
** | This derivative is reported as unrealized appreciation/depreciation at period end. |
110 | THE RYDEX FUNDS ANNUAL REPORT | SEE NOTES TO FINANCIAL STATEMENTS. |
SCHEDULE OF INVESTMENTS (concluded) | March 31, 2024 |
RUSSELL 2000® 1.5x STRATEGY FUND | |
Affiliated Transactions
Investments representing 5% or more of the outstanding voting shares of a company, or control of or by, or common control under Guggenheim Investments (“GI”), result in that company being considered an affiliated issuer, as defined in the 1940 Act.
The Fund may invest in certain of the underlying series of Guggenheim Strategy Funds Trust, including Guggenheim Strategy Fund II and Guggenheim Strategy Fund III (collectively, the “Guggenheim Strategy Funds”), each of which are open-end management investment companies managed by GI. The Guggenheim Strategy Funds, which launched on March 11, 2014, are offered as short term investment options only to mutual funds, trusts, and other accounts managed by GI and/or its affiliates, and are not available to the public. The Guggenheim Strategy Funds pay no investment management fees. The Guggenheim Strategy Funds’ annual report on Form N-CSR dated September 30, 2023 is available publicly or upon request. This information is available from the EDGAR database on the SEC’s website at https://www.sec.gov/Archives/edgar/data/1601445/000182126823000217/gug86449-ncsr.htm. The Fund may invest in certain of the underlying series of Guggenheim Funds Trust, which are open-end management investment companies managed by GI, are available to the public and whose most recent annual report on Form N-CSR is available publicly or upon request.
Transactions during the year ended March 31, 2024, in which the company is an affiliated issuer, were as follows:
Security Name | | Value
03/31/23 | | | Additions | | | Reductions | | | Realized
Gain (Loss) | | | Change in
Unrealized
Appreciation
(Depreciation) | | | Value
03/31/24 | | | Shares
03/31/24 | | | Investment
Income | |
Mutual Funds | | | | | | | | | | | | | | | | | | | | | | | | | | | | | | | | |
Guggenheim Strategy Fund II | | $ | 620,207 | | | $ | — | | | $ | — | | | $ | — | | | $ | 9,989 | | | $ | 630,196 | | | | 25,618 | | | $ | 34,755 | |
Guggenheim Ultra Short Duration Fund — Institutional Class | | | 743,330 | | | | — | | | | (200,000 | ) | | | (4,303 | ) | | | 16,541 | | | | 555,568 | | | | 56,061 | | | | 34,925 | |
| | | $ | 1,363,537 | | | $ | — | | | $ | (200,000 | ) | | $ | (4,303 | ) | | $ | 26,530 | | | $ | 1,185,764 | | | | | | | $ | 69,680 | |
SEE NOTES TO FINANCIAL STATEMENTS. | THE RYDEX FUNDS ANNUAL REPORT | 111 |
RUSSELL 2000® 1.5x STRATEGY FUND | |
STATEMENT OF ASSETS AND LIABILITIES |
March 31, 2024 |
Assets: |
Investments in unaffiliated issuers, at value - including $43,997 of securities loaned (cost $4,152,570) | | $ | 4,403,909 | |
Investments in affiliated issuers, at value (cost $1,183,372) | | | 1,185,764 | |
Repurchase agreements, at value (cost $1,353,212) | | | 1,353,212 | |
Cash | | | 4,515 | |
Segregated cash with broker | | | 23,841 | |
Unrealized appreciation on OTC swap agreements | | | 199,970 | |
Receivables: |
Dividends | | | 9,298 | |
Fund shares sold | | | 4,200 | |
Securities sold | | | 3,217 | |
Variation margin on futures contracts | | | 1,675 | |
Interest | | | 798 | |
Securities lending income | | | 161 | |
Total assets | | | 7,190,560 | |
| | | | | |
Liabilities: |
Payable for: |
Return of securities lending collateral | | | 46,537 | |
Swap settlement | | | 5,859 | |
Management fees | | | 5,117 | |
Transfer agent fees | | | 2,721 | |
Distribution and service fees | | | 1,536 | |
Portfolio accounting and administration fees | | | 305 | |
Trustees’ fees* | | | 64 | |
Fund shares redeemed | | | 8 | |
Miscellaneous | | | 6,446 | |
Total liabilities | | | 68,593 | |
Net assets | | $ | 7,121,967 | |
| | | | | |
Net assets consist of: |
Paid in capital | | $ | 9,371,248 | |
Total distributable earnings (loss) | | | (2,249,281 | ) |
Net assets | | $ | 7,121,967 | |
Class A: |
Net assets | | $ | 983,575 | |
Capital shares outstanding | | | 17,914 | |
Net asset value per share | | $ | 54.91 | |
Maximum offering price per share (Net asset value divided by 95.25%) | | $ | 57.65 | |
Class C: |
Net assets | | $ | 134,825 | |
Capital shares outstanding | | | 3,408 | |
Net asset value per share | | $ | 39.56 | |
Class H: |
Net assets | | $ | 6,003,567 | |
Capital shares outstanding | | | 110,057 | |
Net asset value per share | | $ | 54.55 | |
STATEMENT OF OPERATIONS |
Year Ended March 31, 2024 |
Investment Income: |
Dividends from securities of unaffiliated issuers (net of foreign withholding tax of $86) | | $ | 53,879 | |
Dividends from securities of affiliated issuers | | | 69,680 | |
Interest | | | 69,631 | |
Income from securities lending, net | | | 1,924 | |
Total investment income | | | 195,114 | |
| | | | | |
Expenses: |
Management fees | | | 58,510 | |
Distribution and service fees: |
Class A | | | 2,212 | |
Class C | | | 372 | |
Class H | | | 13,948 | |
Transfer agent fees | | | 14,187 | |
Portfolio accounting and administration fees | | | 9,910 | |
Registration fees | | | 6,075 | |
Professional fees | | | 3,081 | |
Interest expense | | | 1,272 | |
Trustees’ fees* | | | 1,077 | |
Custodian fees | | | 1,073 | |
Line of credit fees | | | 17 | |
Miscellaneous | | | 3,912 | |
Total expenses | | | 115,646 | |
Less: |
Expenses reimbursed by Adviser | | | (5,436 | ) |
Expenses waived by Adviser | | | (1,601 | ) |
Total waived/reimbursed expenses | | | (7,037 | ) |
Net expenses | | | 108,609 | |
Net investment income | | | 86,505 | |
| | | | | |
Net Realized and Unrealized Gain (Loss): |
Net realized gain (loss) on: |
Investments in unaffiliated issuers | | | (47,380 | ) |
Investments in affiliated issuers | | | (4,303 | ) |
Swap agreements | | | 558,084 | |
Futures contracts | | | 132,501 | |
Net realized gain | | | 638,902 | |
Net change in unrealized appreciation (depreciation) on: |
Investments in unaffiliated issuers | | | 665,527 | |
Investments in affiliated issuers | | | 26,530 | |
Swap agreements | | | 99,177 | |
Futures contracts | | | (9,766 | ) |
Net change in unrealized appreciation (depreciation) | | | 781,468 | |
Net realized and unrealized gain | | | 1,420,370 | |
Net increase in net assets resulting from operations | | $ | 1,506,875 | |
* | Relates to Trustees not deemed “interested persons” within the meaning of Section 2(a)(19) of the 1940 Act. |
112 | THE RYDEX FUNDS ANNUAL REPORT | SEE NOTES TO FINANCIAL STATEMENTS. |
RUSSELL 2000® 1.5x STRATEGY FUND | |
STATEMENTS OF CHANGES IN NET ASSETS |
| | Year Ended
March 31,
2024 | | | Year Ended
March 31,
2023 | |
Increase (Decrease) in Net Assets from Operations: | | | | | | | | |
Net investment income | | $ | 86,505 | | | $ | 35,061 | |
Net realized gain (loss) on investments | | | 638,902 | | | | (1,612,885 | ) |
Net change in unrealized appreciation (depreciation) on investments | | | 781,468 | | | | (648,288 | ) |
Net increase (decrease) in net assets resulting from operations | | | 1,506,875 | | | | (2,226,112 | ) |
| | | | | | | | | |
Distributions to shareholders: | | | | | | | | |
Class A | | | (1,949 | ) | | | — | |
Class C | | | (43 | ) | | | — | |
Class H | | | (12,432 | ) | | | — | |
Total distributions to shareholders | | | (14,424 | ) | | | — | |
| | | | | | | | | |
Capital share transactions: | | | | | | | | |
Proceeds from sale of shares | | | | | | | | |
Class A | | | 207,195 | | | | 77,416 | |
Class C | | | 524,610 | | | | 10,638 | |
Class H | | | 3,917,573 | | | | 3,226,589 | |
Distributions reinvested | | | | | | | | |
Class A | | | 1,880 | | | | — | |
Class C | | | 43 | | | | — | |
Class H | | | 12,382 | | | | — | |
Cost of shares redeemed | | | | | | | | |
Class A | | | (303,541 | ) | | | (186,855 | ) |
Class C | | | (437,323 | ) | | | (14,659 | ) |
Class H | | | (4,495,631 | ) | | | (4,670,676 | ) |
Net decrease from capital share transactions | | | (572,812 | ) | | | (1,557,547 | ) |
Net increase (decrease) in net assets | | | 919,639 | | | | (3,783,659 | ) |
| | | | | | | | | |
Net assets: | | | | | | | | |
Beginning of year | | | 6,202,328 | | | | 9,985,987 | |
End of year | | $ | 7,121,967 | | | $ | 6,202,328 | |
| | | | | | | | | |
Capital share activity: | | | | | | | | |
Shares sold | | | | | | | | |
Class A | | | 4,576 | | | | 1,603 | |
Class C | | | 14,942 | | | | 331 | |
Class H | | | 88,623 | | | | 67,658 | |
Shares issued from reinvestment of distributions | | | | | | | | |
Class A | | | 41 | | | | — | |
Class C | | | 1 | | | | — | |
Class H | | | 270 | | | | — | |
Shares redeemed | | | | | | | | |
Class A | | | (6,512 | ) | | | (4,203 | ) |
Class C | | | (12,255 | ) | | | (455 | ) |
Class H | | | (99,091 | ) | | | (101,899 | ) |
Net decrease in shares | | | (9,405 | ) | | | (36,965 | ) |
SEE NOTES TO FINANCIAL STATEMENTS. | THE RYDEX FUNDS ANNUAL REPORT | 113 |
RUSSELL 2000® 1.5x STRATEGY FUND | |
This table is presented to show selected data for a share outstanding throughout each period and to assist shareholders in evaluating a Fund’s performance for the periods presented.
Class A | | Year Ended
March 31,
2024 | | | Year Ended
March 31,
2023 | | | Year Ended
March 31,
2022 | | | Year Ended
March 31,
2021 | | | Year Ended
March 31,
2020 | |
Per Share Data |
Net asset value, beginning of period | | $ | 44.36 | | | $ | 56.57 | | | $ | 101.22 | | | $ | 39.16 | | | $ | 63.62 | |
Income (loss) from investment operations: |
Net investment income (loss)a | | | .61 | | | | .22 | | | | (1.02 | ) | | | (.94 | ) | | | .32 | |
Net gain (loss) on investments (realized and unrealized) | | | 10.05 | | | | (12.43 | ) | | | (7.02 | ) | | | 63.25 | | | | (24.78 | ) |
Total from investment operations | | | 10.66 | | | | (12.21 | ) | | | (8.04 | ) | | | 62.31 | | | | (24.46 | ) |
Less distributions from: |
Net investment income | | | (.11 | ) | | | — | | | | — | | | | (.25 | ) | | | — | |
Net realized gains | | | — | | | | — | | | | (36.61 | ) | | | — | | | | — | |
Total distributions | | | (.11 | ) | | | — | | | | (36.61 | ) | | | (.25 | ) | | | — | |
Net asset value, end of period | | $ | 54.91 | | | $ | 44.36 | | | $ | 56.57 | | | $ | 101.22 | | | $ | 39.16 | |
|
Total Returnb | | | 24.07 | % | | | (21.58 | %) | | | (11.85 | %) | | | 159.26 | % | | | (38.45 | %) |
Ratios/Supplemental Data |
Net assets, end of period (in thousands) | | $ | 984 | | | $ | 879 | | | $ | 1,268 | | | $ | 1,749 | | | $ | 948 | |
Ratios to average net assets: |
Net investment income (loss) | | | 1.32 | % | | | 0.48 | % | | | (1.18 | %) | | | (1.40 | %) | | | 0.50 | % |
Total expensesc | | | 1.77 | % | | | 1.75 | % | | | 1.71 | % | | | 1.79 | % | | | 1.82 | % |
Net expensesd | | | 1.67 | % | | | 1.69 | % | | | 1.68 | % | | | 1.77 | % | | | 1.76 | % |
Portfolio turnover rate | | | 8 | % | | | 9 | % | | | 62 | % | | | — | | | | 93 | % |
Class C | | Year Ended
March 31,
2024 | | | Year Ended
March 31,
2023 | | | Year Ended
March 31,
2022 | | | Year Ended
March 31,
2021 | | | Year Ended
March 31,
2020 | |
Per Share Data |
Net asset value, beginning of period | | $ | 32.26 | | | $ | 41.41 | | | $ | 84.58 | | | $ | 32.98 | | | $ | 54.00 | |
Income (loss) from investment operations: |
Net investment income (loss)a | | | .29 | | | | (.09 | ) | | | (1.28 | ) | | | (1.27 | ) | | | (.12 | ) |
Net gain (loss) on investments (realized and unrealized) | | | 7.12 | | | | (9.06 | ) | | | (5.28 | ) | | | 53.12 | | | | (20.90 | ) |
Total from investment operations | | | 7.41 | | | | (9.15 | ) | | | (6.56 | ) | | | 51.85 | | | | (21.02 | ) |
Less distributions from: |
Net investment income | | | (.11 | ) | | | — | | | | — | | | | (.25 | ) | | | — | |
Net realized gains | | | — | | | | — | | | | (36.61 | ) | | | — | | | | — | |
Total distributions | | | (.11 | ) | | | — | | | | (36.61 | ) | | | (.25 | ) | | | — | |
Net asset value, end of period | | $ | 39.56 | | | $ | 32.26 | | | $ | 41.41 | | | $ | 84.58 | | | $ | 32.98 | |
|
Total Returnb | | | 23.13 | % | | | (22.10 | %) | | | (12.52 | %) | | | 157.38 | % | | | (38.93 | %) |
Ratios/Supplemental Data |
Net assets, end of period (in thousands) | | $ | 135 | | | $ | 23 | | | $ | 35 | | | $ | 75 | | | $ | 22 | |
Ratios to average net assets: |
Net investment income (loss) | | | 0.82 | % | | | (0.27 | %) | | | (1.93 | %) | | | (2.16 | %) | | | (0.22 | %) |
Total expensesc | | | 2.49 | % | | | 2.50 | % | | | 2.46 | % | | | 2.52 | % | | | 2.57 | % |
Net expensesd | | | 2.38 | % | | | 2.44 | % | | | 2.43 | % | | | 2.50 | % | | | 2.51 | % |
Portfolio turnover rate | | | 8 | % | | | 9 | % | | | 62 | % | | | — | | | | 93 | % |
114 | THE RYDEX FUNDS ANNUAL REPORT | SEE NOTES TO FINANCIAL STATEMENTS. |
RUSSELL 2000® 1.5x STRATEGY FUND | |
FINANCIAL HIGHLIGHTS (concluded) |
This table is presented to show selected data for a share outstanding throughout each period and to assist shareholders in evaluating a Fund’s performance for the periods presented.
Class H | | Year Ended
March 31,
2024 | | | Year Ended
March 31,
2023 | | | Year Ended
March 31,
2022 | | | Year Ended
March 31,
2021 | | | Year Ended
March 31,
2020 | |
Per Share Data |
Net asset value, beginning of period | | $ | 44.08 | | | $ | 56.20 | | | $ | 100.81 | | | $ | 39.00 | | | $ | 63.37 | |
Income (loss) from investment operations: |
Net investment income (loss)a | | | .61 | | | | .21 | | | | (.98 | ) | | | (.98 | ) | | | .09 | |
Net gain (loss) on investments (realized and unrealized) | | | 9.97 | | | | (12.33 | ) | | | (7.02 | ) | | | 63.04 | | | | (24.46 | ) |
Total from investment operations | | | 10.58 | | | | (12.12 | ) | | | (8.00 | ) | | | 62.06 | | | | (24.37 | ) |
Less distributions from: |
Net investment income | | | (.11 | ) | | | — | | | | — | | | | (.25 | ) | | | — | |
Net realized gains | | | — | | | | — | | | | (36.61 | ) | | | — | | | | — | |
Total distributions | | | (.11 | ) | | | — | | | | (36.61 | ) | | | (.25 | ) | | | — | |
Net asset value, end of period | | $ | 54.55 | | | $ | 44.08 | | | $ | 56.20 | | | $ | 100.81 | | | $ | 39.00 | |
|
Total Return | | | 24.07 | % | | | (21.57 | %) | | | (11.86 | %) | | | 159.27 | % | | | (38.46 | %) |
Ratios/Supplemental Data |
Net assets, end of period (in thousands) | | $ | 6,004 | | | $ | 5,300 | | | $ | 8,683 | | | $ | 9,482 | | | $ | 3,347 | |
Ratios to average net assets: |
Net investment income (loss) | | | 1.34 | % | | | 0.46 | % | | | (1.17 | %) | | | (1.42 | %) | | | 0.14 | % |
Total expensesc | | | 1.77 | % | | | 1.75 | % | | | 1.71 | % | | | 1.78 | % | | | 1.84 | % |
Net expensesd | | | 1.67 | % | | | 1.69 | % | | | 1.68 | % | | | 1.76 | % | | | 1.80 | % |
Portfolio turnover rate | | | 8 | % | | | 9 | % | | | 62 | % | | | — | | | | 93 | % |
a | Net investment income (loss) per share was computed using average shares outstanding throughout the period. |
b | Total return does not reflect the impact of any applicable sales charges. |
c | Does not include expenses of the underlying funds in which the Fund invests. |
d | Net expense information reflects the expense ratios after expense waivers and reimbursements, as applicable. |
SEE NOTES TO FINANCIAL STATEMENTS. | THE RYDEX FUNDS ANNUAL REPORT | 115 |
PERFORMANCE REPORT AND FUND PROFILE (Unaudited) | March 31, 2024 |
RUSSELL 2000® FUND
OBJECTIVE: Seeks to provide investment results that match, before fees and expenses, the performance of a specific benchmark on a daily basis. The Fund’s current benchmark is the Russell 2000® Index (the “underlying index”).
For the Reporting Period, Russell 2000® Fund maintained a daily correlation of over 99% to its benchmark of the daily price movement of the Russell 2000 Index. Russell 2000® Fund Class H returned 17.77%, while the Russell 2000 Index returned 19.71% over the same time period.
The sectors that contributed the most to the return of the underlying index were Industrials, Information Technology, and Financials. The only sectors that detracted were Utilities and Communication Services.
The holdings that contributed the most to the return of the underlying index were Super Micro Computer, Inc., MicroStrategy, Inc. – Class A, and ImmunoGen, Inc. Those that detracted the most were Fox Factory Holding Corp., Revance Therapeutics, Inc., and Arcadium Lithium Plc.
Derivatives in the Fund were used to help provide exposure to the composition of the benchmark in the most efficient manner possible and not for hedging purposes. Derivatives performed as expected.
Performance displayed represents past performance, which is no guarantee of future results.
Holdings Diversification (Market Exposure as % of Net Assets)
“Holdings Diversification (Market Exposure as % of Net Assets)” excludes any temporary cash investments.
Inception Dates: |
Class A | May 31, 2006 |
Class C | May 31, 2006 |
Class H | May 31, 2006 |
Ten Largest Holdings | % of Total Net Assets |
Vanguard Russell 2000 ETF | 3.7% |
iShares Russell 2000 Index ETF | 3.7% |
Super Micro Computer, Inc. | 1.1% |
MicroStrategy, Inc. — Class A | 0.5% |
Comfort Systems USA, Inc. | 0.2% |
elf Beauty, Inc. | 0.2% |
Light & Wonder, Inc. — Class A | 0.2% |
Carvana Co. | 0.2% |
Onto Innovation, Inc. | 0.2% |
Simpson Manufacturing Company, Inc. | 0.2% |
Top Ten Total | 10.2% |
| | |
“Ten Largest Holdings” excludes any temporary cash or derivative investments. |
116 | THE RYDEX FUNDS ANNUAL REPORT | |
PERFORMANCE REPORT AND FUND PROFILE (Unaudited)(concluded) | March 31, 2024 |
Cumulative Fund Performance*
Average Annual Returns*
Periods Ended March 31, 2024
| 1 Year | 5 Year | 10 Year |
Class A Shares | 17.77% | 6.35% | 5.78% |
Class A Shares with sales charge† | 12.18% | 5.32% | 5.27% |
Class C Shares | 16.91% | 5.54% | 4.99% |
Class C Shares with CDSC‡ | 15.91% | 5.54% | 4.99% |
Class H Shares | 17.77% | 6.36% | 5.78% |
Russell 2000 Index | 19.71% | 8.10% | 9.03% |
* | The performance data above represents past performance that is not predictive of future results. The investment return and principal value of an investment in the Fund will fluctuate so that an investor’s shares, when redeemed, may be worth more or less than their original cost. Returns are historical and include changes in principal and reinvested dividends and capital gains and do not reflect the effect of taxes. The Russell 2000 Index is an unmanaged index and, unlike the Fund, has no management fees or operating expenses to reduce its reported return. The graphs are based on Class A shares and Class H shares only performance for Class C shares will vary due to differences in fee structures. |
† | Fund returns are calculated using the maximum sales charge of 4.75%. |
‡ | Fund returns include a CDSC of 1% if redeemed within 12 months of purchase. |
| | THE RYDEX FUNDS ANNUAL REPORT | 117 |
SCHEDULE OF INVESTMENTS | March 31, 2024 |
RUSSELL 2000® FUND | |
| | Shares | | | Value | |
COMMON STOCKS† - 55.2% |
| | | | | | | | | |
Consumer, Non-cyclical - 12.8% |
elf Beauty, Inc.* | | | 404 | | | $ | 79,196 | |
Viking Therapeutics, Inc.* | | | 766 | | | | 62,812 | |
API Group Corp.* | | | 1,565 | | | | 61,458 | |
BellRing Brands, Inc.* | | | 987 | | | | 58,263 | |
Vaxcyte, Inc.* | | | 790 | | | | 53,965 | |
HealthEquity, Inc.* | | | 638 | | | | 52,080 | |
Ensign Group, Inc. | | | 408 | | | | 50,763 | |
Cytokinetics, Inc.* | | | 707 | | | | 49,568 | |
Sprouts Farmers Market, Inc.* | | | 762 | | | | 49,134 | |
Intra-Cellular Therapies, Inc.* | | | 701 | | | | 48,509 | |
Blueprint Medicines Corp.* | | | 455 | | | | 43,161 | |
Option Care Health, Inc.* | | | 1,254 | | | | 42,059 | |
Halozyme Therapeutics, Inc.* | | | 971 | | | | 39,500 | |
Marathon Digital Holdings, Inc.*,1 | | | 1,676 | | | | 37,844 | |
StoneCo Ltd. — Class A* | | | 2,178 | | | | 36,177 | |
Herc Holdings, Inc. | | | 212 | | | | 35,680 | |
REVOLUTION Medicines, Inc.* | | | 1,043 | | | | 33,616 | |
Alkermes plc* | | | 1,241 | | | | 33,594 | |
Glaukos Corp.* | | | 356 | | | | 33,567 | |
Merit Medical Systems, Inc.* | | | 425 | | | | 32,194 | |
Haemonetics Corp.* | | | 375 | | | | 32,006 | |
TriNet Group, Inc. | | | 241 | | | | 31,930 | |
Lantheus Holdings, Inc.* | | | 509 | | | | 31,680 | |
Brink’s Co. | | | 334 | | | | 30,855 | |
Cleanspark, Inc.* | | | 1,442 | | | | 30,585 | |
Coca-Cola Consolidated, Inc. | | | 36 | | | | 30,471 | |
Lancaster Colony Corp. | | | 146 | | | | 30,314 | |
Alight, Inc. — Class A* | | | 3,017 | | | | 29,717 | |
Madrigal Pharmaceuticals, Inc.* | | | 111 | | | | 29,641 | |
Insperity, Inc. | | | 268 | | | | 29,376 | |
Integer Holdings Corp.* | | | 248 | | | | 28,937 | |
Krystal Biotech, Inc.* | | | 162 | | | | 28,825 | |
Insmed, Inc.* | | | 1,041 | | | | 28,242 | |
CBIZ, Inc.* | | | 359 | | | | 28,182 | |
Biohaven Ltd.* | | | 511 | | | | 27,947 | |
Prestige Consumer Healthcare, Inc.* | | | 373 | | | | 27,065 | |
Bridgebio Pharma, Inc.* | | | 869 | | | | 26,869 | |
iRhythm Technologies, Inc.* | | | 229 | | | | 26,564 | |
Alarm.com Holdings, Inc.* | | | 358 | | | | 25,944 | |
WD-40 Co. | | | 102 | | | | 25,838 | |
Neogen Corp.* | | | 1,630 | | | | 25,721 | |
Axonics, Inc.* | | | 372 | | | | 25,657 | |
Korn Ferry | | | 390 | | | | 25,646 | |
Iovance Biotherapeutics, Inc.* | | | 1,728 | | | | 25,609 | |
Amicus Therapeutics, Inc.* | | | 2,125 | | | | 25,032 | |
SpringWorks Therapeutics, Inc.* | | | 508 | | | | 25,004 | |
Arrowhead Pharmaceuticals, Inc.* | | | 868 | | | | 24,825 | |
Select Medical Holdings Corp. | | | 778 | | | | 23,457 | |
Simply Good Foods Co.* | | | 679 | | | | 23,106 | |
Crinetics Pharmaceuticals, Inc.* | | | 489 | | | | 22,890 | |
Progyny, Inc.* | | | 596 | | | | 22,737 | |
LivaNova plc* | | | 406 | | | | 22,712 | |
Cerevel Therapeutics Holdings, Inc.* | | | 527 | | | | 22,276 | |
RadNet, Inc.* | | | 452 | | | | 21,994 | |
Ideaya Biosciences, Inc.* | | | 492 | | | | 21,589 | |
Primo Water Corp. | | | 1,171 | | | | 21,324 | |
Axsome Therapeutics, Inc.* | | | 267 | | | | 21,307 | |
ICF International, Inc. | | | 140 | | | | 21,088 | |
Marqeta, Inc. — Class A* | | | 3,528 | | | | 21,027 | |
ABM Industries, Inc. | | | 471 | | | | 21,016 | |
Helen of Troy Ltd.* | | | 179 | | | | 20,628 | |
Apogee Therapeutics, Inc.* | | | 309 | | | | 20,533 | |
Remitly Global, Inc.* | | | 990 | | | | 20,533 | |
Arcellx, Inc.* | | | 288 | | | | 20,030 | |
Stride, Inc.* | | | 317 | | | | 19,987 | |
Graham Holdings Co. — Class B | | | 26 | | | | 19,960 | |
Flywire Corp.* | | | 801 | | | | 19,873 | |
Celldex Therapeutics, Inc.* | | | 465 | | | | 19,516 | |
EVERTEC, Inc. | | | 489 | | | | 19,511 | |
Inter Parfums, Inc. | | | 137 | | | | 19,250 | |
Inari Medical, Inc.* | | | 393 | | | | 18,856 | |
Vericel Corp.* | | | 356 | | | | 18,519 | |
Beam Therapeutics, Inc.* | | | 558 | | | | 18,436 | |
Intellia Therapeutics, Inc.* | | | 669 | | | | 18,404 | |
Denali Therapeutics, Inc.* | | | 896 | | | | 18,386 | |
CONMED Corp. | | | 229 | | | | 18,338 | |
Cal-Maine Foods, Inc. | | | 309 | | | | 18,185 | |
AMN Healthcare Services, Inc.* | | | 287 | | | | 17,940 | |
Strategic Education, Inc. | | | 169 | | | | 17,596 | |
Riot Platforms, Inc.* | | | 1,434 | | | | 17,552 | |
TransMedics Group, Inc.* | | | 237 | | | | 17,524 | |
Oscar Health, Inc. — Class A* | | | 1,174 | | | | 17,457 | |
Guardant Health, Inc.* | | | 845 | | | | 17,432 | |
CorVel Corp.* | | | 66 | | | | 17,355 | |
Patterson Companies, Inc. | | | 625 | | | | 17,281 | |
Surgery Partners, Inc.* | | | 570 | | | | 17,003 | |
ACADIA Pharmaceuticals, Inc.* | | | 919 | | | | 16,992 | |
Rhythm Pharmaceuticals, Inc.* | | | 390 | | | | 16,899 | |
LiveRamp Holdings, Inc.* | | | 483 | | | | 16,664 | |
J & J Snack Foods Corp. | | | 114 | | | | 16,480 | |
TG Therapeutics, Inc.* | | | 1,041 | | | | 15,834 | |
PTC Therapeutics, Inc.* | | | 537 | | | | 15,621 | |
Arvinas, Inc.* | | | 373 | | | | 15,398 | |
Owens & Minor, Inc.* | | | 555 | | | | 15,379 | |
Corcept Therapeutics, Inc.* | | | 609 | | | | 15,341 | |
Adtalem Global Education, Inc.* | | | 293 | | | | 15,060 | |
PROCEPT BioRobotics Corp.* | | | 304 | | | | 15,024 | |
Nuvalent, Inc. — Class A* | | | 200 | | | | 15,018 | |
NeoGenomics, Inc.* | | | 953 | | | | 14,981 | |
Twist Bioscience Corp.* | | | 432 | | | | 14,822 | |
TreeHouse Foods, Inc.* | | | 380 | | | | 14,801 | |
Edgewell Personal Care Co. | | | 373 | | | | 14,413 | |
Laureate Education, Inc. — Class A | | | 980 | | | | 14,279 | |
Central Garden & Pet Co. — Class A* | | | 386 | | | | 14,251 | |
STAAR Surgical Co.* | | | 369 | | | | 14,125 | |
Upbound Group, Inc. | | | 400 | | | | 14,084 | |
Syndax Pharmaceuticals, Inc.* | | | 589 | | | | 14,018 | |
Andersons, Inc. | | | 244 | | | | 13,998 | |
Coursera, Inc.* | | | 988 | | | | 13,852 | |
Avidity Biosciences, Inc.* | | | 536 | | | | 13,679 | |
118 | THE RYDEX FUNDS ANNUAL REPORT | SEE NOTES TO FINANCIAL STATEMENTS. |
SCHEDULE OF INVESTMENTS (continued) | March 31, 2024 |
RUSSELL 2000® FUND | |
| | Shares | | | Value | |
Astrana Health, Inc.* | | | 325 | | | $ | 13,647 | |
CoreCivic, Inc.* | | | 863 | | | | 13,471 | |
Huron Consulting Group, Inc.* | | | 139 | | | | 13,430 | |
UFP Technologies, Inc.* | | | 53 | | | | 13,367 | |
Legalzoom.com, Inc.* | | | 1,000 | | | | 13,340 | |
Catalyst Pharmaceuticals, Inc.* | | | 833 | | | | 13,278 | |
Immunovant, Inc.* | | | 409 | | | | 13,215 | |
Myriad Genetics, Inc.* | | | 613 | | | | 13,069 | |
Vera Therapeutics, Inc.* | | | 300 | | | | 12,936 | |
GEO Group, Inc.* | | | 906 | | | | 12,793 | |
Rocket Pharmaceuticals, Inc.* | | | 473 | | | | 12,743 | |
Supernus Pharmaceuticals, Inc.* | | | 373 | | | | 12,723 | |
Keros Therapeutics, Inc.* | | | 192 | | | | 12,710 | |
Inmode Ltd.* | | | 588 | | | | 12,707 | |
Dyne Therapeutics, Inc.* | | | 442 | | | | 12,548 | |
US Physical Therapy, Inc. | | | 111 | | | | 12,529 | |
Geron Corp.* | | | 3,774 | | | | 12,454 | |
Amphastar Pharmaceuticals, Inc.* | | | 282 | | | | 12,383 | |
Agios Pharmaceuticals, Inc.* | | | 421 | | | | 12,310 | |
Addus HomeCare Corp.* | | | 119 | | | | 12,297 | |
Veracyte, Inc.* | | | 552 | | | | 12,232 | |
Dynavax Technologies Corp.* | | | 983 | | | | 12,199 | |
Vector Group Ltd. | | | 1,104 | | | | 12,100 | |
Cimpress plc* | | | 135 | | | | 11,949 | |
Protagonist Therapeutics, Inc.* | | | 409 | | | | 11,832 | |
Ardelyx, Inc.* | | | 1,616 | | | | 11,797 | |
Akero Therapeutics, Inc.* | | | 464 | | | | 11,721 | |
Kymera Therapeutics, Inc.* | | | 288 | | | | 11,578 | |
PROG Holdings, Inc. | | | 334 | | | | 11,503 | |
Alpine Immune Sciences, Inc.* | | | 287 | | | | 11,377 | |
AtriCure, Inc.*,1 | | | 353 | | | | 10,738 | |
RxSight, Inc.* | | | 206 | | | | 10,626 | |
ADMA Biologics, Inc.* | | | 1,598 | | | | 10,547 | |
Kura Oncology, Inc.* | | | 489 | | | | 10,430 | |
MGP Ingredients, Inc. | | | 120 | | | | 10,336 | |
Recursion Pharmaceuticals, Inc. — Class A*,1 | | | 1,035 | | | | 10,319 | |
John Wiley & Sons, Inc. — Class A | | | 269 | | | | 10,257 | |
Krispy Kreme, Inc. | | | 665 | | | | 10,131 | |
Pacira BioSciences, Inc.* | | | 346 | | | | 10,110 | |
Utz Brands, Inc. | | | 547 | | | | 10,087 | |
Chefs’ Warehouse, Inc.* | | | 267 | | | | 10,055 | |
Omnicell, Inc.* | | | 341 | | | | 9,967 | |
LeMaitre Vascular, Inc. | | | 150 | | | | 9,954 | |
Kforce, Inc. | | | 141 | | | | 9,943 | |
Payoneer Global, Inc.* | | | 2,012 | | | | 9,778 | |
Xencor, Inc.* | | | 440 | | | | 9,737 | |
Quanex Building Products Corp. | | | 251 | | | | 9,646 | |
Alphatec Holdings, Inc.* | | | 695 | | | | 9,584 | |
Collegium Pharmaceutical, Inc.* | | | 244 | | | | 9,472 | |
Universal Corp. | | | 183 | | | | 9,465 | |
Ligand Pharmaceuticals, Inc. — Class B* | | | 126 | | | | 9,211 | |
Morphic Holding, Inc.* | | | 261 | | | | 9,187 | |
4D Molecular Therapeutics, Inc.* | | | 288 | | | | 9,176 | |
Ironwood Pharmaceuticals, Inc. — Class A* | | | 1,052 | | | | 9,163 | |
Inhibrx, Inc.* | | | 261 | | | | 9,125 | |
National Healthcare Corp. | | | 95 | | | | 8,978 | |
MannKind Corp.* | | | 1,948 | | | | 8,824 | |
Perdoceo Education Corp. | | | 489 | | | | 8,587 | |
National Beverage Corp.* | | | 180 | | | | 8,543 | |
Brookdale Senior Living, Inc. — Class A* | | | 1,276 | | | | 8,434 | |
AdaptHealth Corp.* | | | 725 | | | | 8,345 | |
Arlo Technologies, Inc.* | | | 658 | | | | 8,324 | |
Ingles Markets, Inc. — Class A | | | 107 | | | | 8,205 | |
Harmony Biosciences Holdings, Inc.* | | | 241 | | | | 8,093 | |
Weis Markets, Inc. | | | 125 | | | | 8,050 | |
Tarsus Pharmaceuticals, Inc.* | | | 218 | | | | 7,924 | |
Ocular Therapeutix, Inc.* | | | 864 | | | | 7,862 | |
Edgewise Therapeutics, Inc.*,1 | | | 431 | | | | 7,861 | |
Day One Biopharmaceuticals, Inc.* | | | 475 | | | | 7,847 | |
Prothena Corporation plc* | | | 315 | | | | 7,803 | |
SP Plus Corp.* | | | 149 | | | | 7,781 | |
CRA International, Inc. | | | 52 | | | | 7,778 | |
CG oncology, Inc.* | | | 174 | | | | 7,639 | |
ANI Pharmaceuticals, Inc.* | | | 110 | | | | 7,604 | |
Arcus Biosciences, Inc.* | | | 400 | | | | 7,552 | |
Herbalife Ltd.* | | | 750 | | | | 7,538 | |
Sage Therapeutics, Inc.* | | | 401 | | | | 7,515 | |
Scholar Rock Holding Corp.* | | | 418 | | | | 7,424 | |
BioCryst Pharmaceuticals, Inc.* | | | 1,438 | | | | 7,305 | |
John B Sanfilippo & Son, Inc. | | | 68 | | | | 7,202 | |
Pacific Biosciences of California, Inc.* | | | 1,912 | | | | 7,170 | |
Udemy, Inc.* | | | 651 | | | | 7,148 | |
Sana Biotechnology, Inc.* | | | 708 | | | | 7,080 | |
Healthcare Services Group, Inc.* | | | 565 | | | | 7,051 | |
Matthews International Corp. — Class A | | | 226 | | | | 7,024 | |
Monro, Inc. | | | 222 | | | | 7,002 | |
Avanos Medical, Inc.* | | | 351 | | | | 6,988 | |
Zentalis Pharmaceuticals, Inc.* | | | 440 | | | | 6,934 | |
Vita Coco Company, Inc.* | | | 282 | | | | 6,889 | |
89bio, Inc.* | | | 591 | | | | 6,879 | |
MacroGenics, Inc.* | | | 462 | | | | 6,801 | |
Deluxe Corp. | | | 330 | | | | 6,795 | |
Repay Holdings Corp.* | | | 617 | | | | 6,787 | |
First Advantage Corp. | | | 415 | | | | 6,731 | |
Fresh Del Monte Produce, Inc. | | | 258 | | | | 6,685 | |
MiMedx Group, Inc.* | | | 866 | | | | 6,668 | |
Innoviva, Inc.* | | | 436 | | | | 6,645 | |
Verve Therapeutics, Inc.* | | | 493 | | | | 6,547 | |
Chegg, Inc.* | | | 858 | | | | 6,495 | |
REGENXBIO, Inc.* | | | 308 | | | | 6,490 | |
Dole plc | | | 543 | | | | 6,478 | |
Vir Biotechnology, Inc.* | | | 635 | | | | 6,433 | |
Pediatrix Medical Group, Inc.* | | | 639 | | | | 6,409 | |
Pliant Therapeutics, Inc.* | | | 429 | | | | 6,392 | |
Artivion, Inc.* | | | 299 | | | | 6,327 | |
Quanterix Corp.* | | | 267 | | | | 6,291 | |
Deciphera Pharmaceuticals, Inc.* | | | 397 | | | | 6,245 | |
Transcat, Inc.* | | | 56 | | | | 6,240 | |
Barrett Business Services, Inc. | | | 49 | | | | 6,209 | |
B&G Foods, Inc. | | | 540 | | | | 6,178 | |
SEE NOTES TO FINANCIAL STATEMENTS. | THE RYDEX FUNDS ANNUAL REPORT | 119 |
SCHEDULE OF INVESTMENTS (continued) | March 31, 2024 |
RUSSELL 2000® FUND | |
| | Shares | | | Value | |
Cytek Biosciences, Inc.* | | | 920 | | | $ | 6,173 | |
Cassava Sciences, Inc.* | | | 302 | | | | 6,128 | |
Viad Corp.* | | | 155 | | | | 6,121 | |
Kelly Services, Inc. — Class A | | | 242 | | | | 6,060 | |
Sabre Corp.* | | | 2,494 | | | | 6,035 | |
Arcturus Therapeutics Holdings, Inc.* | | | 177 | | | | 5,977 | |
ZipRecruiter, Inc. — Class A* | | | 520 | | | | 5,975 | |
Arcutis Biotherapeutics, Inc.* | | | 591 | | | | 5,857 | |
Embecta Corp. | | | 438 | | | | 5,812 | |
EyePoint Pharmaceuticals, Inc.* | | | 279 | | | | 5,767 | |
Relay Therapeutics, Inc.* | | | 685 | | | | 5,685 | |
Amneal Pharmaceuticals, Inc.* | | | 925 | | | | 5,606 | |
Viridian Therapeutics, Inc.* | | | 320 | | | | 5,603 | |
Vital Farms, Inc.* | | | 232 | | | | 5,394 | |
Silk Road Medical, Inc.* | | | 292 | | | | 5,349 | |
Hain Celestial Group, Inc.* | | | 679 | | | | 5,337 | |
Varex Imaging Corp.* | | | 294 | | | | 5,321 | |
Liquidia Corp.* | | | 360 | | | | 5,310 | |
SpartanNash Co. | | | 262 | | | | 5,295 | |
Astria Therapeutics, Inc.* | | | 373 | | | | 5,250 | |
Accolade, Inc.* | | | 500 | | | | 5,240 | |
Nurix Therapeutics, Inc.* | | | 355 | | | | 5,218 | |
Aurinia Pharmaceuticals, Inc.* | | | 1,027 | | | | 5,145 | |
United Natural Foods, Inc.* | | | 443 | | | | 5,090 | |
Heidrick & Struggles International, Inc. | | | 150 | | | | 5,049 | |
Cass Information Systems, Inc. | | | 104 | | | | 5,010 | |
LifeStance Health Group, Inc.* | | | 805 | | | | 4,967 | |
Janux Therapeutics, Inc.* | | | 131 | | | | 4,932 | |
BioLife Solutions, Inc.* | | | 264 | | | | 4,897 | |
Cross Country Healthcare, Inc.* | | | 261 | | | | 4,886 | |
SunOpta, Inc.* | | | 689 | | | | 4,733 | |
Mirum Pharmaceuticals, Inc.* | | | 188 | | | | 4,723 | |
Fate Therapeutics, Inc.* | | | 643 | | | | 4,720 | |
Kiniksa Pharmaceuticals Ltd. — Class A* | | | 238 | | | | 4,696 | |
Atrion Corp. | | | 10 | | | | 4,636 | |
Hackett Group, Inc. | | | 190 | | | | 4,617 | |
Editas Medicine, Inc.* | | | 620 | | | | 4,600 | |
Y-mAbs Therapeutics, Inc.* | | | 279 | | | | 4,537 | |
ImmunityBio, Inc.*,1 | | | 835 | | | | 4,484 | |
Treace Medical Concepts, Inc.* | | | 343 | | | | 4,476 | |
Enhabit, Inc.* | | | 382 | | | | 4,450 | |
Evolus, Inc.* | | | 314 | | | | 4,396 | |
BrightSpring Health Services, Inc.* | | | 403 | | | | 4,381 | |
Mission Produce, Inc.* | | | 368 | | | | 4,368 | |
SI-BONE, Inc.* | | | 264 | | | | 4,322 | |
National Research Corp. — Class A | | | 109 | | | | 4,318 | |
Cabaletta Bio, Inc.* | | | 253 | | | | 4,316 | |
Travere Therapeutics, Inc.* | | | 553 | | | | 4,264 | |
Zymeworks, Inc.* | | | 405 | | | | 4,261 | |
Pennant Group, Inc.* | | | 216 | | | | 4,240 | |
CareDx, Inc.* | | | 395 | | | | 4,183 | |
USANA Health Sciences, Inc.* | | | 86 | | | | 4,171 | |
Castle Biosciences, Inc.* | | | 188 | | | | 4,164 | |
Paragon 28, Inc.* | | | 333 | | | | 4,113 | |
V2X, Inc.* | | | 88 | | | | 4,110 | |
ORIC Pharmaceuticals, Inc.* | | | 296 | | | | 4,070 | |
Nuvation Bio, Inc.* | | | 1,105 | | | | 4,022 | |
Longboard Pharmaceuticals, Inc.* | | | 186 | | | | 4,018 | |
Cogent Biosciences, Inc.* | | | 597 | | | | 4,012 | |
Universal Technical Institute, Inc.* | | | 249 | | | | 3,969 | |
Ennis, Inc. | | | 193 | | | | 3,958 | |
ACCO Brands Corp. | | | 701 | | | | 3,933 | |
I3 Verticals, Inc. — Class A* | | | 171 | | | | 3,914 | |
Nevro Corp.* | | | 269 | | | | 3,884 | |
Paysafe Ltd.* | | | 246 | | | | 3,884 | |
Orthofix Medical, Inc.* | | | 267 | | | | 3,877 | |
OmniAb, Inc.* | | | 707 | | | | 3,832 | |
Altimmune, Inc.* | | | 375 | | | | 3,817 | |
Turning Point Brands, Inc. | | | 130 | | | | 3,809 | |
PetIQ, Inc.* | | | 207 | | | | 3,784 | |
BrightView Holdings, Inc.* | | | 314 | | | | 3,737 | |
Beyond Meat, Inc.* | | | 450 | | | | 3,726 | |
OPKO Health, Inc.*,1 | | | 3,056 | | | | 3,667 | |
ACELYRIN, Inc.* | | | 543 | | | | 3,665 | |
Calavo Growers, Inc. | | | 131 | | | | 3,643 | |
Summit Therapeutics, Inc.* | | | 879 | | | | 3,639 | |
Annexon, Inc.* | | | 504 | | | | 3,614 | |
Cargo Therapeutics, Inc.* | | | 161 | | | | 3,594 | |
Disc Medicine, Inc.* | | | 57 | | | | 3,549 | |
OrthoPediatrics Corp.* | | | 120 | | | | 3,499 | |
Franklin Covey Co.* | | | 88 | | | | 3,455 | |
Marinus Pharmaceuticals, Inc.* | | | 378 | | | | 3,417 | |
Mersana Therapeutics, Inc.* | | | 758 | | | | 3,396 | |
Nano-X Imaging Ltd.*,1 | | | 346 | | | | 3,380 | |
Fulgent Genetics, Inc.* | | | 155 | | | | 3,364 | |
European Wax Center, Inc. — Class A* | | | 259 | | | | 3,362 | |
OraSure Technologies, Inc.* | | | 546 | | | | 3,358 | |
Community Health Systems, Inc.* | | | 954 | | | | 3,339 | |
Green Dot Corp. — Class A* | | | 353 | | | | 3,294 | |
Theravance Biopharma, Inc.* | | | 363 | | | | 3,256 | |
Resources Connection, Inc. | | | 246 | | | | 3,237 | |
Zimvie, Inc.* | | | 196 | | | | 3,232 | |
AnaptysBio, Inc.* | | | 142 | | | | 3,198 | |
Caribou Biosciences, Inc.* | | | 617 | | | | 3,171 | |
Central Garden & Pet Co.* | | | 74 | | | | 3,169 | |
Novavax, Inc.*,1 | | | 661 | | | | 3,160 | |
Avid Bioservices, Inc.* | | | 471 | | | | 3,156 | |
Revance Therapeutics, Inc.* | | | 633 | | | | 3,114 | |
Enliven Therapeutics, Inc.* | | | 177 | | | | 3,113 | |
Medifast, Inc. | | | 81 | | | | 3,104 | |
Duckhorn Portfolio, Inc.* | | | 333 | | | | 3,100 | |
Cullinan Oncology, Inc.* | | | 181 | | | | 3,084 | |
Avita Medical, Inc.* | | | 191 | | | | 3,062 | |
Surmodics, Inc.* | | | 104 | | | | 3,051 | |
SIGA Technologies, Inc. | | | 350 | | | | 2,996 | |
Lyell Immunopharma, Inc.* | | | 1,317 | | | | 2,937 | |
Alector, Inc.* | | | 482 | | | | 2,902 | |
TrueBlue, Inc.* | | | 231 | | | | 2,892 | |
Tactile Systems Technology, Inc.* | | | 177 | | | | 2,876 | |
Celcuity, Inc.* | | | 131 | | | | 2,830 | |
Stoke Therapeutics, Inc.* | | | 209 | | | | 2,822 | |
Anika Therapeutics, Inc.* | | | 111 | | | | 2,819 | |
120 | THE RYDEX FUNDS ANNUAL REPORT | SEE NOTES TO FINANCIAL STATEMENTS. |
SCHEDULE OF INVESTMENTS (continued) | March 31, 2024 |
RUSSELL 2000® FUND | |
| | Shares | | | Value | |
Sterling Check Corp.* | | | 175 | | | $ | 2,814 | |
Savara, Inc.* | | | 564 | | | | 2,809 | |
Allogene Therapeutics, Inc.* | | | 623 | | | | 2,785 | |
MaxCyte, Inc.* | | | 663 | | | | 2,778 | |
WaVe Life Sciences Ltd.* | | | 449 | | | | 2,770 | |
Adaptive Biotechnologies Corp.* | | | 862 | | | | 2,767 | |
Carriage Services, Inc. — Class A | | | 102 | | | | 2,758 | |
Beauty Health Co.* | | | 621 | | | | 2,757 | |
Anavex Life Sciences Corp.*,1 | | | 534 | | | | 2,718 | |
Terawulf, Inc.* | | | 1,026 | | | | 2,698 | |
Tango Therapeutics, Inc.* | | | 339 | | | | 2,692 | |
HilleVax, Inc.* | | | 161 | | | | 2,677 | |
Willdan Group, Inc.* | | | 92 | | | | 2,667 | |
Enanta Pharmaceuticals, Inc.* | | | 152 | | | | 2,654 | |
Taro Pharmaceutical Industries Ltd.* | | | 62 | | | | 2,625 | |
Limoneira Co. | | | 133 | | | | 2,602 | |
Pulmonx Corp.* | | | 278 | | | | 2,577 | |
Sutro Biopharma, Inc.* | | | 456 | | | | 2,576 | |
Target Hospitality Corp.* | | | 237 | | | | 2,576 | |
iTeos Therapeutics, Inc.* | | | 188 | | | | 2,564 | |
Harrow, Inc.*,1 | | | 193 | | | | 2,553 | |
Cerus Corp.* | | | 1,346 | | | | 2,544 | |
Replimune Group, Inc.* | | | 310 | | | | 2,533 | |
Custom Truck One Source, Inc.* | | | 430 | | | | 2,503 | |
Axogen, Inc.* | | | 309 | | | | 2,494 | |
Nkarta, Inc.* | | | 229 | | | | 2,475 | |
Tejon Ranch Co.* | | | 159 | | | | 2,450 | |
Distribution Solutions Group, Inc.* | | | 69 | | | | 2,448 | |
Arbutus Biopharma Corp.* | | | 947 | | | | 2,443 | |
Viemed Healthcare, Inc.* | | | 259 | | | | 2,442 | |
iRadimed Corp. | | | 55 | | | | 2,420 | |
DocGo, Inc.* | | | 590 | | | | 2,384 | |
Atea Pharmaceuticals, Inc.* | | | 582 | | | | 2,351 | |
Olema Pharmaceuticals, Inc.* | | | 204 | | | | 2,309 | |
Entrada Therapeutics, Inc.* | | | 162 | | | | 2,296 | |
Agiliti, Inc.* | | | 225 | | | | 2,277 | |
Seneca Foods Corp. — Class A* | | | 40 | | | | 2,276 | |
ModivCare, Inc.* | | | 97 | | | | 2,275 | |
Biomea Fusion, Inc.*,1 | | | 151 | | | | 2,257 | |
Voyager Therapeutics, Inc.* | | | 241 | | | | 2,244 | |
Xeris Biopharma Holdings, Inc.* | | | 1,010 | | | | 2,232 | |
Westrock Coffee Co.* | | | 216 | | | | 2,231 | |
UroGen Pharma Ltd.* | | | 148 | | | | 2,220 | |
KalVista Pharmaceuticals, Inc.* | | | 187 | | | | 2,218 | |
Aerovate Therapeutics, Inc.* | | | 74 | | | | 2,188 | |
Heron Therapeutics, Inc.* | | | 786 | | | | 2,177 | |
Terns Pharmaceuticals, Inc.* | | | 325 | | | | 2,132 | |
Prime Medicine, Inc.*,1 | | | 300 | | | | 2,100 | |
Nature’s Sunshine Products, Inc.* | | | 100 | | | | 2,077 | |
2seventy bio, Inc.* | | | 381 | | | | 2,038 | |
RAPT Therapeutics, Inc.* | | | 224 | | | | 2,012 | |
Phibro Animal Health Corp. — Class A | | | 155 | | | | 2,004 | |
Inozyme Pharma, Inc.* | | | 257 | | | | 1,969 | |
Ventyx Biosciences, Inc.* | | | 355 | | | | 1,953 | |
Phathom Pharmaceuticals, Inc.* | | | 182 | | | | 1,933 | |
Rigel Pharmaceuticals, Inc.* | | | 1,298 | | | | 1,921 | |
Forrester Research, Inc.* | | | 89 | | | | 1,919 | |
ARS Pharmaceuticals, Inc.* | | | 184 | | | | 1,880 | |
Village Super Market, Inc. — Class A | | | 65 | | | | 1,860 | |
Lincoln Educational Services Corp.* | | | 180 | | | | 1,859 | |
Zynex, Inc.* | | | 150 | | | | 1,856 | |
Utah Medical Products, Inc. | | | 26 | | | | 1,849 | |
ALX Oncology Holdings, Inc.* | | | 164 | | | | 1,829 | |
Alta Equipment Group, Inc. | | | 141 | | | | 1,826 | |
Tenaya Therapeutics, Inc.* | | | 347 | | | | 1,815 | |
Vanda Pharmaceuticals, Inc.* | | | 429 | | | | 1,763 | |
Aaron’s Company, Inc. | | | 234 | | | | 1,755 | |
Accuray, Inc.* | | | 708 | | | | 1,749 | |
Tyra Biosciences, Inc.* | | | 106 | | | | 1,738 | |
Gritstone bio, Inc.* | | | 666 | | | | 1,712 | |
Lexicon Pharmaceuticals, Inc.* | | | 703 | | | | 1,687 | |
AngioDynamics, Inc.* | | | 286 | | | | 1,679 | |
Poseida Therapeutics, Inc.* | | | 516 | | | | 1,646 | |
Aura Biosciences, Inc.* | | | 208 | | | | 1,633 | |
Monte Rosa Therapeutics, Inc.* | | | 231 | | | | 1,629 | |
Cipher Mining, Inc.*,1 | | | 316 | | | | 1,627 | |
FibroGen, Inc.* | | | 690 | | | | 1,621 | |
Omeros Corp.*,1 | | | 462 | | | | 1,594 | |
Alico, Inc. | | | 54 | | | | 1,581 | |
Actinium Pharmaceuticals, Inc.* | | | 197 | | | | 1,543 | |
Neumora Therapeutics, Inc.*,1 | | | 112 | | | | 1,540 | |
Acacia Research Corp.* | | | 288 | | | | 1,535 | |
Fennec Pharmaceuticals, Inc.* | | | 138 | | | | 1,535 | |
CVRx, Inc.* | | | 84 | | | | 1,530 | |
Organogenesis Holdings, Inc.* | | | 533 | | | | 1,514 | |
Agenus, Inc.* | | | 2,604 | | | | 1,510 | |
American Well Corp. — Class A* | | | 1,861 | | | | 1,509 | |
Quantum-Si, Inc.* | | | 764 | | | | 1,505 | |
Performant Financial Corp.* | | | 511 | | | | 1,502 | |
MeiraGTx Holdings plc* | | | 247 | | | | 1,499 | |
Zevra Therapeutics, Inc.* | | | 258 | | | | 1,496 | |
Nathan’s Famous, Inc. | | | 21 | | | | 1,487 | |
Precigen, Inc.* | | | 1,025 | | | | 1,486 | |
Larimar Therapeutics, Inc.* | | | 195 | | | | 1,480 | |
Lineage Cell Therapeutics, Inc.* | | | 979 | | | | 1,449 | |
Humacyte, Inc.* | | | 465 | | | | 1,446 | |
Inogen, Inc.* | | | 177 | | | | 1,428 | |
Joint Corp.* | | | 108 | | | | 1,411 | |
Generation Bio Co.* | | | 344 | | | | 1,400 | |
CorMedix, Inc.* | | | 330 | | | | 1,399 | |
Third Harmonic Bio, Inc.* | | | 148 | | | | 1,397 | |
Ovid therapeutics, Inc.* | | | 452 | | | | 1,379 | |
Compass Therapeutics, Inc.* | | | 692 | | | | 1,370 | |
Mineralys Therapeutics, Inc.* | | | 106 | | | | 1,368 | |
Coherus Biosciences, Inc.* | | | 569 | | | | 1,360 | |
Waldencast plc — Class A* | | | 208 | | | | 1,352 | |
Quipt Home Medical Corp.* | | | 306 | | | | 1,337 | |
XOMA Corp.* | | | 55 | | | | 1,323 | |
ArriVent Biopharma, Inc.* | | | 74 | | | | 1,322 | |
X4 Pharmaceuticals, Inc.* | | | 934 | | | | 1,298 | |
Karyopharm Therapeutics, Inc.* | | | 859 | | | | 1,297 | |
Kodiak Sciences, Inc.* | | | 246 | | | | 1,294 | |
SEE NOTES TO FINANCIAL STATEMENTS. | THE RYDEX FUNDS ANNUAL REPORT | 121 |
SCHEDULE OF INVESTMENTS (continued) | March 31, 2024 |
RUSSELL 2000® FUND | |
| | Shares | | | Value | |
Natural Grocers by Vitamin Cottage, Inc. | | | 71 | | | $ | 1,281 | |
Erasca, Inc.* | | | 612 | | | | 1,261 | |
Harvard Bioscience, Inc.* | | | 297 | | | | 1,259 | |
Quad/Graphics, Inc. | | | 237 | | | | 1,258 | |
BRC, Inc. — Class A* | | | 283 | | | | 1,211 | |
Lexeo Therapeutics, Inc.* | | | 77 | | | | 1,207 | |
ClearPoint Neuro, Inc.* | | | 174 | | | | 1,183 | |
InfuSystem Holdings, Inc.* | | | 138 | | | | 1,183 | |
Merrimack Pharmaceuticals, Inc.* | | | 79 | | | | 1,167 | |
BioAtla, Inc.* | | | 336 | | | | 1,156 | |
Aldeyra Therapeutics, Inc.* | | | 353 | | | | 1,154 | |
Butterfly Network, Inc.* | | | 1,059 | | | | 1,144 | |
Nautilus Biotechnology, Inc.* | | | 383 | | | | 1,126 | |
PepGen, Inc.* | | | 76 | | | | 1,117 | |
Semler Scientific, Inc.* | | | 38 | | | | 1,110 | |
scPharmaceuticals, Inc.* | | | 219 | | | | 1,099 | |
Amylyx Pharmaceuticals, Inc.* | | | 385 | | | | 1,093 | |
Trevi Therapeutics, Inc.* | | | 316 | | | | 1,090 | |
SoundThinking, Inc.* | | | 68 | | | | 1,080 | |
Information Services Group, Inc. | | | 266 | | | | 1,075 | |
Sanara Medtech, Inc.* | | | 29 | | | | 1,073 | |
Pulse Biosciences, Inc.* | | | 123 | | | | 1,071 | |
HF Foods Group, Inc.* | | | 306 | | | | 1,071 | |
23andMe Holding Co. — Class A* | | | 1,975 | | | | 1,051 | |
Bluebird Bio, Inc.* | | | 812 | | | | 1,039 | |
Foghorn Therapeutics, Inc.*,1 | | | 154 | | | | 1,033 | |
Design Therapeutics, Inc.* | | | 249 | | | | 1,003 | |
Emergent BioSolutions, Inc.* | | | 384 | | | | 972 | |
Verrica Pharmaceuticals, Inc.* | | | 158 | | | | 935 | |
Aveanna Healthcare Holdings, Inc.* | | | 375 | | | | 934 | |
Genelux Corp.* | | | 141 | | | | 907 | |
CompoSecure, Inc. — Class A*,1 | | | 125 | | | | 904 | |
Cadiz, Inc.* | | | 308 | | | | 893 | |
IGM Biosciences, Inc.* | | | 91 | | | | 878 | |
Seer, Inc.* | | | 445 | | | | 845 | |
PDS Biotechnology Corp.* | | | 212 | | | | 840 | |
Citius Pharmaceuticals, Inc.* | | | 932 | | | | 836 | |
Ispire Technology, Inc.*,1 | | | 134 | | | | 821 | |
Optinose, Inc.* | | | 553 | | | | 807 | |
Emerald Holding, Inc.* | | | 118 | | | | 804 | |
WW International, Inc.* | | | 414 | | | | 766 | |
Century Therapeutics, Inc.* | | | 178 | | | | 744 | |
Sangamo Therapeutics, Inc.* | | | 1,094 | | | | 733 | |
Outlook Therapeutics, Inc.* | | | 58 | | | | 693 | |
Tela Bio, Inc.* | | | 120 | | | | 680 | |
Vor BioPharma, Inc.* | | | 286 | | | | 678 | |
Omega Therapeutics, Inc.* | | | 185 | | | | 675 | |
LENZ Therapeutics, Inc. | | | 30 | | | | 670 | |
Aclaris Therapeutics, Inc.* | | | 527 | | | | 654 | |
Assertio Holdings, Inc.* | | | 673 | | | | 646 | |
Innovage Holding Corp.* | | | 144 | | | | 639 | |
Scilex Holding Co.* | | | 402 | | | | 639 | |
Allakos, Inc.* | | | 504 | | | | 635 | |
Akoya Biosciences, Inc.* | | | 134 | | | | 629 | |
FiscalNote Holdings, Inc.* | | | 472 | | | | 628 | |
KORU Medical Systems, Inc.* | | | 265 | | | | 625 | |
Biote Corp. — Class A*,1 | | | 106 | | | | 615 | |
Mural Oncology plc* | | | 125 | | | | 611 | |
Cartesian Therapeutics, Inc.* | | | 881 | | | | 573 | |
CPI Card Group, Inc.* | | | 32 | | | | 572 | |
Seres Therapeutics, Inc.* | | | 738 | | | | 571 | |
AirSculpt Technologies, Inc.* | | | 92 | | | | 565 | |
ProKidney Corp.* | | | 340 | | | | 558 | |
Adicet Bio, Inc.* | | | 231 | | | | 543 | |
HireQuest, Inc. | | | 41 | | | | 531 | |
NGM Biopharmaceuticals, Inc.* | | | 331 | | | | 526 | |
Protalix BioTherapeutics, Inc.* | | | 415 | | | | 523 | |
Atara Biotherapeutics, Inc.* | | | 725 | | | | 503 | |
PMV Pharmaceuticals, Inc.* | | | 293 | | | | 498 | |
Cue Biopharma, Inc.* | | | 262 | | | | 495 | |
Kezar Life Sciences, Inc.* | | | 541 | | | | 488 | |
Acrivon Therapeutics, Inc.* | | | 66 | | | | 472 | |
Carisma Therapeutics, Inc.*,1 | | | 202 | | | | 459 | |
Priority Technology Holdings, Inc.* | | | 134 | | | | 438 | |
Immuneering Corp. — Class A* | | | 151 | | | | 436 | |
Rallybio Corp.* | | | 232 | | | | 429 | |
Nuvectis Pharma, Inc.* | | | 52 | | | | 426 | |
MarketWise, Inc. | | | 241 | | | | 417 | |
Vigil Neuroscience, Inc.* | | | 122 | | | | 416 | |
Forafric Global plc* | | | 40 | | | | 414 | |
Bioxcel Therapeutics, Inc.* | | | 145 | | | | 409 | |
Eagle Pharmaceuticals, Inc.* | | | 78 | | | | 409 | |
Prelude Therapeutics, Inc.* | | | 73 | | | | 346 | |
Beyond Air, Inc.* | | | 193 | | | | 336 | |
Cara Therapeutics, Inc.* | | | 355 | | | | 323 | |
P3 Health Partners, Inc.* | | | 303 | | | | 312 | |
Aadi Bioscience, Inc.* | | | 123 | | | | 288 | |
Benson Hill, Inc.* | | | 1,314 | | | | 263 | |
Ocean Biomedical, Inc.* | | | 66 | | | | 250 | |
Bakkt Holdings, Inc.*,1 | | | 529 | | | | 243 | |
2U, Inc.* | | | 601 | | | | 234 | |
Allovir, Inc.* | | | 310 | | | | 234 | |
Vaxxinity, Inc. — Class A* | | | 323 | | | | 232 | |
Ikena Oncology, Inc.* | | | 157 | | | | 223 | |
Zevia PBC — Class A* | | | 189 | | | | 221 | |
Eyenovia, Inc.* | | | 209 | | | | 206 | |
Cutera, Inc.* | | | 124 | | | | 182 | |
Orchestra BioMed Holdings, Inc.* | | | 31 | | | | 163 | |
Vicarious Surgical, Inc.* | | | 532 | | | | 160 | |
Zura Bio Ltd.* | | | 56 | | | | 144 | |
Rent the Runway, Inc. — Class A* | | | 366 | | | | 126 | |
Reneo Pharmaceuticals, Inc.* | | | 72 | | | | 120 | |
Bright Green Corp.* | | | 458 | | | | 111 | |
CareMax, Inc. | | | 19 | | | | 92 | |
BioVie, Inc.* | | | 25 | | | | 13 | |
ATI Physical Therapy, Inc.* | | | 1 | | | | 6 | |
Ligand Pharmaceuticals, Inc.*,†† | | | 84 | | | | — | |
Total Consumer, Non-cyclical | | | | | | | 4,611,165 | |
| | | | | | | | | |
Financial - 11.3% |
Ryman Hospitality Properties, Inc. REIT | | | 438 | | | | 50,637 | |
FTAI Aviation Ltd. | | | 745 | | | | 50,139 | |
122 | THE RYDEX FUNDS ANNUAL REPORT | SEE NOTES TO FINANCIAL STATEMENTS. |
SCHEDULE OF INVESTMENTS (continued) | March 31, 2024 |
RUSSELL 2000® FUND | |
| | Shares | | | Value | |
Selective Insurance Group, Inc. | | | 451 | | | $ | 49,236 | |
SouthState Corp. | | | 570 | | | | 48,467 | |
Essent Group Ltd. | | | 784 | | | | 46,656 | |
Terreno Realty Corp. REIT | | | 621 | | | | 41,234 | |
Cadence Bank | | | 1,364 | | | | 39,556 | |
Jackson Financial, Inc. — Class A | | | 597 | | | | 39,486 | |
Radian Group, Inc. | | | 1,150 | | | | 38,491 | |
Old National Bancorp | | | 2,192 | | | | 38,163 | |
Mr Cooper Group, Inc.* | | | 483 | | | | 37,650 | |
Kite Realty Group Trust REIT | | | 1,629 | | | | 35,317 | |
United Bankshares, Inc. | | | 979 | | | | 35,038 | |
Home BancShares, Inc. | | | 1,413 | | | | 34,717 | |
Glacier Bancorp, Inc. | | | 835 | | | | 33,634 | |
American Equity Investment Life Holding Co.* | | | 590 | | | | 33,170 | |
Phillips Edison & Company, Inc. REIT | | | 896 | | | | 32,140 | |
First Financial Bankshares, Inc. | | | 975 | | | | 31,990 | |
Essential Properties Realty Trust, Inc. REIT | | | 1,167 | | | | 31,112 | |
Hamilton Lane, Inc. — Class A | | | 273 | | | | 30,783 | |
Hancock Whitney Corp. | | | 649 | | | | 29,880 | |
UMB Financial Corp. | | | 331 | | | | 28,794 | |
Moelis & Co. — Class A | | | 500 | | | | 28,385 | |
Macerich Co. REIT | | | 1,617 | | | | 27,861 | |
PotlatchDeltic Corp. REIT | | | 592 | | | | 27,836 | |
Enstar Group Ltd.* | | | 89 | | | | 27,658 | |
Independence Realty Trust, Inc. REIT | | | 1,688 | | | | 27,227 | |
SL Green Realty Corp. REIT | | | 485 | | | | 26,738 | |
Apple Hospitality REIT, Inc. | | | 1,613 | | | | 26,421 | |
Piper Sandler Cos. | | | 130 | | | | 25,804 | |
Valley National Bancorp | | | 3,230 | | | | 25,711 | |
Blackstone Mortgage Trust, Inc. — Class A REIT 1 | | | 1,289 | | | | 25,664 | |
Sabra Health Care REIT, Inc. | | | 1,732 | | | | 25,582 | |
ServisFirst Bancshares, Inc. | | | 381 | | | | 25,283 | |
Associated Banc-Corp. | | | 1,133 | | | | 24,371 | |
Walker & Dunlop, Inc. | | | 238 | | | | 24,052 | |
Ameris Bancorp | | | 495 | | | | 23,948 | |
CNO Financial Group, Inc. | | | 844 | | | | 23,193 | |
Tanger, Inc. REIT | | | 776 | | | | 22,915 | |
McGrath RentCorp | | | 185 | | | | 22,823 | |
United Community Banks, Inc. | | | 865 | | | | 22,767 | |
International Bancshares Corp. | | | 402 | | | | 22,568 | |
Hannon Armstrong Sustainable Infrastructure Capital, Inc. REIT | | | 785 | | | | 22,294 | |
Axos Financial, Inc.* | | | 409 | | | | 22,102 | |
Broadstone Net Lease, Inc. REIT | | | 1,407 | | | | 22,048 | |
First BanCorp | | | 1,249 | | | | 21,907 | |
CareTrust REIT, Inc. | | | 897 | | | | 21,860 | |
Texas Capital Bancshares, Inc.* | | | 354 | | | | 21,789 | |
Genworth Financial, Inc. — Class A* | | | 3,368 | | | | 21,656 | |
Innovative Industrial Properties, Inc. REIT | | | 209 | | | | 21,640 | |
Pagseguro Digital Ltd. — Class A* | | | 1,485 | | | | 21,206 | |
Artisan Partners Asset Management, Inc. — Class A | | | 460 | | | | 21,054 | |
BGC Group, Inc. — Class A | | | 2,699 | | | | 20,971 | |
SITE Centers Corp. REIT | | | 1,426 | | | | 20,891 | |
WSFS Financial Corp. | | | 452 | | | | 20,403 | |
COPT Defense Properties REIT | | | 844 | | | | 20,399 | |
Atlantic Union Bankshares Corp. | | | 562 | | | | 19,844 | |
Cathay General Bancorp | | | 520 | | | | 19,672 | |
National Health Investors, Inc. REIT | | | 312 | | | | 19,603 | |
LXP Industrial Trust REIT | | | 2,168 | | | | 19,555 | |
NMI Holdings, Inc. — Class A* | | | 596 | | | | 19,275 | |
Fulton Financial Corp. | | | 1,212 | | | | 19,259 | |
Community Bank System, Inc. | | | 398 | | | | 19,116 | |
Outfront Media, Inc. REIT | | | 1,104 | | | | 18,536 | |
Bank of Hawaii Corp. | | | 293 | | | | 18,280 | |
Simmons First National Corp. — Class A | | | 936 | | | | 18,215 | |
Arbor Realty Trust, Inc. REIT1 | | | 1,365 | | | | 18,086 | |
CVB Financial Corp. | | | 996 | | | | 17,769 | |
PennyMac Financial Services, Inc. | | | 191 | | | | 17,398 | |
Independent Bank Corp. | | | 331 | | | | 17,219 | |
Sunstone Hotel Investors, Inc. REIT | | | 1,538 | | | | 17,133 | |
Pacific Premier Bancorp, Inc. | | | 710 | | | | 17,040 | |
Douglas Emmett, Inc. REIT | | | 1,216 | | | | 16,866 | |
First Interstate BancSystem, Inc. — Class A | | | 618 | | | | 16,816 | |
PJT Partners, Inc. — Class A | | | 178 | | | | 16,778 | |
Four Corners Property Trust, Inc. REIT | | | 658 | | | | 16,101 | |
Seacoast Banking Corporation of Florida | | | 630 | | | | 15,996 | |
Eastern Bankshares, Inc. | | | 1,160 | | | | 15,985 | |
First Financial Bancorp | | | 705 | | | | 15,806 | |
BankUnited, Inc. | | | 557 | | | | 15,596 | |
First Merchants Corp. | | | 442 | | | | 15,426 | |
Palomar Holdings, Inc.* | | | 182 | | | | 15,257 | |
Banc of California, Inc. | | | 996 | | | | 15,149 | |
Cohen & Steers, Inc. | | | 197 | | | | 15,147 | |
St. Joe Co. | | | 261 | | | | 15,130 | |
DiamondRock Hospitality Co. REIT | | | 1,573 | | | | 15,117 | |
WaFd, Inc. | | | 512 | | | | 14,863 | |
Urban Edge Properties REIT | | | 860 | | | | 14,852 | |
TowneBank | | | 525 | | | | 14,732 | |
Upstart Holdings, Inc.*,1 | | | 547 | | | | 14,709 | |
BancFirst Corp. | | | 167 | | | | 14,701 | |
StepStone Group, Inc. — Class A | | | 410 | | | | 14,653 | |
Equity Commonwealth REIT* | | | 770 | | | | 14,538 | |
Park National Corp. | | | 107 | | | | 14,536 | |
StoneX Group, Inc.* | | | 204 | | | | 14,333 | |
Bread Financial Holdings, Inc. | | | 372 | | | | 13,853 | |
Pebblebrook Hotel Trust REIT | | | 896 | | | | 13,807 | |
Farmer Mac — Class C | | | 69 | | | | 13,585 | |
RLJ Lodging Trust REIT | | | 1,147 | | | | 13,558 | |
Enova International, Inc.* | | | 212 | | | | 13,320 | |
InvenTrust Properties Corp. REIT | | | 516 | | | | 13,266 | |
Stewart Information Services Corp. | | | 203 | | | | 13,207 | |
Cushman & Wakefield plc* | | | 1,261 | | | | 13,190 | |
Triumph Financial, Inc.* | | | 166 | | | | 13,167 | |
Renasant Corp. | | | 419 | | | | 13,123 | |
WesBanco, Inc. | | | 438 | | | | 13,057 | |
Trustmark Corp. | | | 462 | | | | 12,987 | |
BRP Group, Inc. — Class A* | | | 448 | | | | 12,965 | |
Bancorp, Inc.* | | | 385 | | | | 12,882 | |
OFG Bancorp | | | 345 | | | | 12,699 | |
SEE NOTES TO FINANCIAL STATEMENTS. | THE RYDEX FUNDS ANNUAL REPORT | 123 |
SCHEDULE OF INVESTMENTS (continued) | March 31, 2024 |
RUSSELL 2000® FUND | |
| | Shares | | | Value | |
Virtus Investment Partners, Inc. | | | 51 | | | $ | 12,647 | |
Independent Bank Group, Inc. | | | 275 | | | | 12,554 | |
Banner Corp. | | | 260 | | | | 12,480 | |
NBT Bancorp, Inc. | | | 340 | | | | 12,471 | |
Lakeland Financial Corp. | | | 186 | | | | 12,336 | |
Acadia Realty Trust REIT | | | 710 | | | | 12,077 | |
Apollo Commercial Real Estate Finance, Inc. REIT | | | 1,078 | | | | 12,009 | |
Retail Opportunity Investments Corp. REIT | | | 935 | | | | 11,987 | |
Xenia Hotels & Resorts, Inc. REIT | | | 790 | | | | 11,858 | |
Bank of NT Butterfield & Son Ltd. | | | 366 | | | | 11,708 | |
Compass Diversified Holdings | | | 480 | | | | 11,554 | |
Horace Mann Educators Corp. | | | 312 | | | | 11,541 | |
Customers Bancorp, Inc.* | | | 217 | | | | 11,514 | |
Global Net Lease, Inc. REIT | | | 1,478 | | | | 11,484 | |
City Holding Co. | | | 109 | | | | 11,360 | |
Newmark Group, Inc. — Class A | | | 1,022 | | | | 11,334 | |
Heartland Financial USA, Inc. | | | 321 | | | | 11,283 | |
JBG SMITH Properties REIT | | | 702 | | | | 11,267 | |
Northwest Bancshares, Inc. | | | 967 | | | | 11,266 | |
Enterprise Financial Services Corp. | | | 276 | | | | 11,195 | |
Hilltop Holdings, Inc. | | | 355 | | | | 11,119 | |
Ready Capital Corp. REIT | | | 1,216 | | | | 11,102 | |
Cannae Holdings, Inc.* | | | 495 | | | | 11,009 | |
First Bancorp | | | 302 | | | | 10,908 | |
Navient Corp. | | | 624 | | | | 10,858 | |
Goosehead Insurance, Inc. — Class A* | | | 161 | | | | 10,726 | |
Uniti Group, Inc. REIT | | | 1,809 | | | | 10,673 | |
Live Oak Bancshares, Inc. | | | 255 | | | | 10,585 | |
First Commonwealth Financial Corp. | | | 758 | | | | 10,551 | |
Mercury General Corp. | | | 203 | | | | 10,475 | |
Empire State Realty Trust, Inc. — Class A REIT | | | 1,003 | | | | 10,160 | |
FB Financial Corp. | | | 269 | | | | 10,131 | |
LTC Properties, Inc. REIT | | | 311 | | | | 10,111 | |
National Bank Holdings Corp. — Class A | | | 280 | | | | 10,100 | |
Hope Bancorp, Inc. | | | 876 | | | | 10,083 | |
Stock Yards Bancorp, Inc. | | | 206 | | | | 10,075 | |
Pathward Financial, Inc. | | | 195 | | | | 9,844 | |
Two Harbors Investment Corp. REIT | | | 738 | | | | 9,771 | |
WisdomTree, Inc. | | | 1,048 | | | | 9,631 | |
Westamerica BanCorp | | | 197 | | | | 9,629 | |
Ladder Capital Corp. — Class A REIT | | | 860 | | | | 9,572 | |
NETSTREIT Corp. | | | 521 | | | | 9,571 | |
PennyMac Mortgage Investment Trust REIT | | | 650 | | | | 9,542 | |
First Busey Corp. | | | 394 | | | | 9,476 | |
Getty Realty Corp. REIT | | | 340 | | | | 9,299 | |
Elme Communities REIT | | | 667 | | | | 9,285 | |
Nelnet, Inc. — Class A | | | 97 | | | | 9,181 | |
S&T Bancorp, Inc. | | | 285 | | | | 9,143 | |
Veris Residential, Inc. REIT | | | 601 | | | | 9,141 | |
Alexander & Baldwin, Inc. REIT | | | 551 | | | | 9,075 | |
Stellar Bancorp, Inc. | | | 370 | | | | 9,013 | |
Safety Insurance Group, Inc. | | | 109 | | | | 8,959 | |
MFA Financial, Inc. REIT | | | 777 | | | | 8,866 | |
Apartment Investment and Management Co. — Class A REIT* | | | 1,079 | | | | 8,837 | |
Fidelis Insurance Holdings Ltd.1 | | | 453 | | | | 8,824 | |
Employers Holdings, Inc. | | | 193 | | | | 8,760 | |
TriCo Bancshares | | | 236 | | | | 8,680 | |
Victory Capital Holdings, Inc. — Class A | | | 201 | | | | 8,528 | |
Service Properties Trust REIT | | | 1,252 | | | | 8,489 | |
Franklin BSP Realty Trust, Inc. REIT | | | 631 | | | | 8,430 | |
Nicolet Bankshares, Inc. | | | 98 | | | | 8,427 | |
National Western Life Group, Inc. — Class A | | | 17 | | | | 8,363 | |
Skyward Specialty Insurance Group, Inc.* | | | 223 | | | | 8,342 | |
Trupanion, Inc.*,1 | | | 300 | | | | 8,283 | |
Veritex Holdings, Inc. | | | 398 | | | | 8,155 | |
American Assets Trust, Inc. REIT | | | 371 | | | | 8,129 | |
Provident Financial Services, Inc. | | | 557 | | | | 8,116 | |
Easterly Government Properties, Inc. REIT | | | 704 | | | | 8,103 | |
Encore Capital Group, Inc.* | | | 176 | | | | 8,027 | |
Chimera Investment Corp. REIT | | | 1,716 | | | | 7,911 | |
Kennedy-Wilson Holdings, Inc. | | | 909 | | | | 7,799 | |
Compass, Inc. — Class A* | | | 2,147 | | | | 7,729 | |
Sandy Spring Bancorp, Inc. | | | 333 | | | | 7,719 | |
PRA Group, Inc.* | | | 293 | | | | 7,641 | |
Peoples Bancorp, Inc. | | | 257 | | | | 7,610 | |
QCR Holdings, Inc. | | | 125 | | | | 7,593 | |
Berkshire Hills Bancorp, Inc. | | | 325 | | | | 7,449 | |
German American Bancorp, Inc. | | | 213 | | | | 7,378 | |
Plymouth Industrial REIT, Inc. | | | 326 | | | | 7,335 | |
Preferred Bank/Los Angeles CA | | | 95 | | | | 7,293 | |
AMERISAFE, Inc. | | | 145 | | | | 7,275 | |
OceanFirst Financial Corp. | | | 442 | | | | 7,253 | |
Enact Holdings, Inc. | | | 228 | | | | 7,109 | |
LendingClub Corp.* | | | 808 | | | | 7,102 | |
Origin Bancorp, Inc. | | | 222 | | | | 6,935 | |
ARMOUR Residential REIT, Inc1 | | | 347 | | | | 6,860 | |
Safehold, Inc. REIT | | | 331 | | | | 6,819 | |
UMH Properties, Inc. REIT | | | 418 | | | | 6,788 | |
Hudson Pacific Properties, Inc. REIT | | | 1,049 | | | | 6,766 | |
BrightSpire Capital, Inc. REIT | | | 978 | | | | 6,738 | |
Claros Mortgage Trust, Inc. | | | 689 | | | | 6,725 | |
Ellington Financial, Inc. REIT | | | 569 | | | | 6,720 | |
SiriusPoint Ltd.* | | | 527 | | | | 6,698 | |
1st Source Corp. | | | 127 | | | | 6,657 | |
Brookline Bancorp, Inc. | | | 663 | | | | 6,604 | |
Piedmont Office Realty Trust, Inc. — Class A REIT | | | 938 | | | | 6,594 | |
Paramount Group, Inc. REIT | | | 1,404 | | | | 6,585 | |
Centerspace REIT | | | 115 | | | | 6,571 | |
Lemonade, Inc.* | | | 385 | | | | 6,318 | |
Southside Bancshares, Inc. | | | 215 | | | | 6,284 | |
Brandywine Realty Trust REIT | | | 1,292 | | | | 6,202 | |
Bank First Corp. | | | 71 | | | | 6,154 | |
Marcus & Millichap, Inc. | | | 180 | | | | 6,151 | |
Patria Investments Ltd. — Class A | | | 413 | | | | 6,129 | |
First Bancshares, Inc. | | | 231 | | | | 5,994 | |
AssetMark Financial Holdings, Inc.* | | | 167 | | | | 5,913 | |
124 | THE RYDEX FUNDS ANNUAL REPORT | SEE NOTES TO FINANCIAL STATEMENTS. |
SCHEDULE OF INVESTMENTS (continued) | March 31, 2024 |
RUSSELL 2000® FUND | |
| | Shares | | | Value | |
Capitol Federal Financial, Inc. | | | 969 | | | $ | 5,775 | |
F&G Annuities & Life, Inc. | | | 142 | | | | 5,758 | |
Lakeland Bancorp, Inc. | | | 473 | | | | 5,723 | |
HCI Group, Inc. | | | 49 | | | | 5,688 | |
Brightsphere Investment Group, Inc. | | | 247 | | | | 5,641 | |
Redwood Trust, Inc. REIT | | | 865 | | | | 5,510 | |
NexPoint Residential Trust, Inc. REIT | | | 171 | | | | 5,504 | |
ConnectOne Bancorp, Inc. | | | 281 | | | | 5,480 | |
Premier Financial Corp. | | | 268 | | | | 5,440 | |
eXp World Holdings, Inc.1 | | | 525 | | | | 5,423 | |
Redfin Corp.* | | | 807 | | | | 5,367 | |
Armada Hoffler Properties, Inc. REIT | | | 511 | | | | 5,314 | |
Tompkins Financial Corp. | | | 105 | | | | 5,280 | |
International Money Express, Inc.* | | | 231 | | | | 5,274 | |
Eagle Bancorp, Inc. | | | 224 | | | | 5,262 | |
Ambac Financial Group, Inc.* | | | 336 | | | | 5,252 | |
Summit Hotel Properties, Inc. REIT | | | 796 | | | | 5,182 | |
Merchants Bancorp | | | 120 | | | | 5,182 | |
Community Healthcare Trust, Inc. REIT | | | 194 | | | | 5,151 | |
Dynex Capital, Inc. REIT | | | 410 | | | | 5,104 | |
Dime Community Bancshares, Inc. | | | 265 | | | | 5,104 | |
Heritage Financial Corp. | | | 263 | | | | 5,100 | |
Anywhere Real Estate, Inc.* | | | 818 | | | | 5,055 | |
Community Trust Bancorp, Inc. | | | 118 | | | | 5,033 | |
New York Mortgage Trust, Inc. REIT | | | 691 | | | | 4,975 | |
ProAssurance Corp.* | | | 382 | | | | 4,913 | |
Brookfield Business Corp. — Class A | | | 197 | | | | 4,756 | |
First Mid Bancshares, Inc. | | | 145 | | | | 4,739 | |
FTAI Infrastructure, Inc. | | | 751 | | | | 4,716 | |
CrossFirst Bankshares, Inc.* | | | 338 | | | | 4,678 | |
CBL & Associates Properties, Inc. REIT | | | 204 | | | | 4,674 | |
First Community Bankshares, Inc. | | | 134 | | | | 4,640 | |
Whitestone REIT — Class B | | | 369 | | | | 4,631 | |
Univest Financial Corp. | | | 220 | | | | 4,580 | |
Mercantile Bank Corp. | | | 119 | | | | 4,580 | |
Amerant Bancorp, Inc. | | | 196 | | | | 4,565 | |
Old Second Bancorp, Inc. | | | 329 | | | | 4,553 | |
Perella Weinberg Partners | | | 319 | | | | 4,507 | |
KKR Real Estate Finance Trust, Inc. REIT | | | 447 | | | | 4,497 | |
Diversified Healthcare Trust REIT | | | 1,814 | | | | 4,462 | |
Peakstone Realty Trust REIT | | | 274 | | | | 4,420 | |
Gladstone Commercial Corp. REIT | | | 305 | | | | 4,221 | |
Horizon Bancorp, Inc. | | | 327 | | | | 4,195 | |
Byline Bancorp, Inc. | | | 188 | | | | 4,083 | |
Midland States Bancorp, Inc. | | | 162 | | | | 4,071 | |
World Acceptance Corp.* | | | 28 | | | | 4,059 | |
Business First Bancshares, Inc. | | | 182 | | | | 4,055 | |
Global Medical REIT, Inc. | | | 463 | | | | 4,051 | |
TPG RE Finance Trust, Inc. REIT | | | 524 | | | | 4,045 | |
Central Pacific Financial Corp. | | | 202 | | | | 3,990 | |
TrustCo Bank Corporation NY | | | 141 | | | | 3,971 | |
Cambridge Bancorp | | | 58 | | | | 3,953 | |
Independent Bank Corp. | | | 153 | | | | 3,879 | |
Columbia Financial, Inc.* | | | 225 | | | | 3,872 | |
Heritage Commerce Corp. | | | 450 | | | | 3,861 | |
NerdWallet, Inc. — Class A* | | | 260 | | | | 3,822 | |
Equity Bancshares, Inc. — Class A | | | 111 | | | | 3,815 | |
Great Southern Bancorp, Inc. | | | 69 | | | | 3,783 | |
Farmland Partners, Inc. REIT | | | 337 | | | | 3,741 | |
American National Bankshares, Inc. | | | 78 | | | | 3,725 | |
Chatham Lodging Trust REIT | | | 366 | | | | 3,700 | |
Universal Insurance Holdings, Inc. | | | 182 | | | | 3,698 | |
Farmers National Banc Corp. | | | 276 | | | | 3,687 | |
Hanmi Financial Corp.1 | | | 231 | | | | 3,678 | |
Camden National Corp. | | | 108 | | | | 3,620 | |
Universal Health Realty Income Trust REIT | | | 98 | | | | 3,598 | |
United Fire Group, Inc. | | | 160 | | | | 3,483 | |
Alexander’s, Inc. REIT | | | 16 | | | | 3,474 | |
Metrocity Bankshares, Inc. | | | 139 | | | | 3,469 | |
Washington Trust Bancorp, Inc. | | | 128 | | | | 3,441 | |
First Financial Corp. | | | 89 | | | | 3,411 | |
HarborOne Bancorp, Inc. | | | 318 | | | | 3,390 | |
Gladstone Land Corp. REIT | | | 254 | | | | 3,388 | |
LendingTree, Inc.* | | | 80 | | | | 3,387 | |
Saul Centers, Inc. REIT | | | 88 | | | | 3,387 | |
Republic Bancorp, Inc. — Class A | | | 65 | | | | 3,315 | |
Diamond Hill Investment Group, Inc. | | | 21 | | | | 3,238 | |
Amalgamated Financial Corp. | | | 134 | | | | 3,216 | |
CNB Financial Corp. | | | 157 | | | | 3,201 | |
Coastal Financial Corp.* | | | 82 | | | | 3,187 | |
Tiptree, Inc. — Class A | | | 182 | | | | 3,145 | |
Peapack-Gladstone Financial Corp. | | | 129 | | | | 3,139 | |
Metropolitan Bank Holding Corp.* | | | 80 | | | | 3,080 | |
Invesco Mortgage Capital, Inc. REIT | | | 318 | | | | 3,078 | |
FRP Holdings, Inc.* | | | 50 | | | | 3,070 | |
Northfield Bancorp, Inc. | | | 315 | | | | 3,062 | |
GCM Grosvenor, Inc. — Class A | | | 315 | | | | 3,043 | |
Alerus Financial Corp. | | | 138 | | | | 3,013 | |
HomeTrust Bancshares, Inc. | | | 110 | | | | 3,007 | |
B Riley Financial, Inc.1 | | | 142 | | | | 3,006 | |
Bar Harbor Bankshares | | | 113 | | | | 2,992 | |
Capstar Financial Holdings, Inc. | | | 147 | | | | 2,955 | |
Ares Commercial Real Estate Corp. REIT | | | 395 | | | | 2,943 | |
First Foundation, Inc. | | | 389 | | | | 2,937 | |
Southern Missouri Bancorp, Inc. | | | 65 | | | | 2,841 | |
CTO Realty Growth, Inc. REIT | | | 167 | | | | 2,831 | |
RMR Group, Inc. — Class A | | | 117 | | | | 2,808 | |
Arrow Financial Corp. | | | 112 | | | | 2,802 | |
One Liberty Properties, Inc. REIT | | | 123 | | | | 2,779 | |
Capital City Bank Group, Inc. | | | 100 | | | | 2,770 | |
Kearny Financial Corp. | | | 430 | | | | 2,769 | |
Northeast Bank | | | 50 | | | | 2,767 | |
Burke & Herbert Financial Services Corp. | | | 49 | | | | 2,745 | |
P10, Inc. — Class A | | | 326 | | | | 2,745 | |
Flushing Financial Corp. | | | 214 | | | | 2,699 | |
Orchid Island Capital, Inc. REIT | | | 293 | | | | 2,616 | |
James River Group Holdings Ltd. | | | 281 | | | | 2,613 | |
Shore Bancshares, Inc. | | | 226 | | | | 2,599 | |
MidWestOne Financial Group, Inc. | | | 108 | | | | 2,532 | |
SmartFinancial, Inc. | | | 120 | | | | 2,528 | |
MBIA, Inc.* | | | 367 | | | | 2,481 | |
Esquire Financial Holdings, Inc. | | | 52 | | | | 2,468 | |
SEE NOTES TO FINANCIAL STATEMENTS. | THE RYDEX FUNDS ANNUAL REPORT | 125 |
SCHEDULE OF INVESTMENTS (continued) | March 31, 2024 |
RUSSELL 2000® FUND | |
| | Shares | | | Value | |
Greenlight Capital Re Ltd. — Class A* | | | 196 | | | $ | 2,444 | |
South Plains Financial, Inc. | | | 91 | | | | 2,435 | |
ACNB Corp. | | | 63 | | | | 2,369 | |
Summit Financial Group, Inc. | | | 85 | | | | 2,309 | |
RBB Bancorp | | | 127 | | | | 2,287 | |
Peoples Financial Services Corp. | | | 53 | | | | 2,285 | |
Carter Bankshares, Inc.* | | | 179 | | | | 2,263 | |
First Business Financial Services, Inc. | | | 60 | | | | 2,250 | |
Farmers & Merchants Bancorp Incorporated/Archbold OH | | | 100 | | | | 2,229 | |
West BanCorp, Inc. | | | 123 | | | | 2,193 | |
Five Star Bancorp | | | 97 | | | | 2,183 | |
Financial Institutions, Inc. | | | 115 | | | | 2,164 | |
Mid Penn Bancorp, Inc. | | | 108 | | | | 2,161 | |
Citizens & Northern Corp. | | | 113 | | | | 2,122 | |
Northrim BanCorp, Inc. | | | 42 | | | | 2,121 | |
Sierra Bancorp | | | 105 | | | | 2,121 | |
Orrstown Financial Services, Inc. | | | 78 | | | | 2,088 | |
Selectquote, Inc.* | | | 1,035 | | | | 2,070 | |
Home Bancorp, Inc. | | | 54 | | | | 2,069 | |
HomeStreet, Inc. | | | 137 | | | | 2,062 | |
Postal Realty Trust, Inc. — Class A REIT | | | 142 | | | | 2,033 | |
Bank of Marin Bancorp | | | 119 | | | | 1,996 | |
Third Coast Bancshares, Inc.* | | | 98 | | | | 1,962 | |
Macatawa Bank Corp. | | | 200 | | | | 1,958 | |
Chicago Atlantic Real Estate Finance, Inc. REIT | | | 124 | | | | 1,955 | |
NewtekOne, Inc. | | | 177 | | | | 1,947 | |
HBT Financial, Inc. | | | 102 | | | | 1,942 | |
Hingham Institution For Savings | | | 11 | | | | 1,919 | |
MVB Financial Corp. | | | 86 | | | | 1,919 | |
Guaranty Bancshares, Inc. | | | 63 | | | | 1,913 | |
Enterprise Bancorp, Inc. | | | 73 | | | | 1,896 | |
Primis Financial Corp. | | | 154 | | | | 1,874 | |
Granite Point Mortgage Trust, Inc. REIT | | | 388 | | | | 1,851 | |
Red River Bancshares, Inc. | | | 37 | | | | 1,842 | |
Southern First Bancshares, Inc.* | | | 58 | | | | 1,842 | |
BayCom Corp. | | | 89 | | | | 1,834 | |
First Bancorp, Inc. | | | 74 | | | | 1,823 | |
Bridgewater Bancshares, Inc.* | | | 155 | | | | 1,804 | |
Civista Bancshares, Inc. | | | 117 | | | | 1,799 | |
First of Long Island Corp. | | | 162 | | | | 1,797 | |
Orange County Bancorp, Inc. | | | 39 | | | | 1,794 | |
Hamilton Insurance Group Ltd. — Class B | | | 125 | | | | 1,741 | |
FS Bancorp, Inc. | | | 50 | | | | 1,736 | |
Blue Foundry Bancorp* | | | 183 | | | | 1,713 | |
Waterstone Financial, Inc. | | | 140 | | | | 1,704 | |
John Marshall Bancorp, Inc. | | | 95 | | | | 1,702 | |
Fidelity D&D Bancorp, Inc. | | | 35 | | | | 1,695 | |
Donegal Group, Inc. — Class A | | | 117 | | | | 1,654 | |
First Bank/Hamilton NJ | | | 118 | | | | 1,621 | |
Codorus Valley Bancorp, Inc. | | | 71 | | | | 1,616 | |
Legacy Housing Corp.* | | | 75 | | | | 1,614 | |
Forge Global Holdings, Inc.* | | | 834 | | | | 1,610 | |
Northeast Community Bancorp, Inc. | | | 102 | | | | 1,604 | |
American Coastal Insurance Corp.* | | | 149 | | | | 1,593 | |
NexPoint Diversified Real Estate Trust REIT1 | | | 240 | | | | 1,584 | |
Bit Digital, Inc.*,1 | | | 549 | | | | 1,576 | |
Maiden Holdings Ltd.* | | | 689 | | | | 1,550 | |
City Office REIT, Inc. | | | 296 | | | | 1,542 | |
AFC Gamma, Inc. REIT | | | 124 | | | | 1,535 | |
Timberland Bancorp, Inc. | | | 57 | | | | 1,534 | |
BRT Apartments Corp. REIT | | | 91 | | | | 1,529 | |
Greene County Bancorp, Inc. | | | 53 | | | | 1,526 | |
Norwood Financial Corp. | | | 56 | | | | 1,524 | |
Orion Office REIT, Inc. | | | 434 | | | | 1,523 | |
Capital Bancorp, Inc. | | | 73 | | | | 1,521 | |
Unity Bancorp, Inc. | | | 55 | | | | 1,518 | |
Alpine Income Property Trust, Inc. REIT | | | 99 | | | | 1,513 | |
Community West Bancshares | | | 76 | | | | 1,512 | |
Plumas Bancorp | | | 41 | | | | 1,508 | |
FVCBankcorp, Inc.* | | | 122 | | | | 1,486 | |
Southern States Bancshares, Inc. | | | 57 | | | | 1,477 | |
National Bankshares, Inc. | | | 44 | | | | 1,470 | |
Investors Title Co. | | | 9 | | | | 1,469 | |
Hippo Holdings, Inc.* | | | 80 | | | | 1,462 | |
Regional Management Corp. | | | 60 | | | | 1,453 | |
ChoiceOne Financial Services, Inc. | | | 53 | | | | 1,450 | |
Colony Bankcorp, Inc. | | | 125 | | | | 1,438 | |
Middlefield Banc Corp. | | | 60 | | | | 1,433 | |
Citizens Financial Services, Inc. | | | 29 | | | | 1,427 | |
Ponce Financial Group, Inc.* | | | 155 | | | | 1,380 | |
Parke Bancorp, Inc. | | | 79 | | | | 1,361 | |
PCB Bancorp | | | 83 | | | | 1,355 | |
Ocwen Financial Corp.* | | | 49 | | | | 1,324 | |
Ames National Corp. | | | 65 | | | | 1,312 | |
LCNB Corp. | | | 80 | | | | 1,275 | |
Star Holdings* | | | 98 | | | | 1,266 | |
Oak Valley Bancorp | | | 51 | | | | 1,264 | |
Maui Land & Pineapple Company, Inc.* | | | 57 | | | | 1,235 | |
C&F Financial Corp. | | | 25 | | | | 1,225 | |
ESSA Bancorp, Inc. | | | 66 | | | | 1,203 | |
Princeton Bancorp, Inc. | | | 39 | | | | 1,200 | |
Evans Bancorp, Inc.1 | | | 40 | | | | 1,194 | |
BCB Bancorp, Inc. | | | 114 | | | | 1,191 | |
Velocity Financial, Inc.* | | | 66 | | | | 1,188 | |
Bankwell Financial Group, Inc. | | | 45 | | | | 1,167 | |
RE/MAX Holdings, Inc. — Class A | | | 133 | | | | 1,166 | |
Chemung Financial Corp. | | | 27 | | | | 1,147 | |
Silvercrest Asset Management Group, Inc. — Class A | | | 72 | | | | 1,138 | |
eHealth, Inc.* | | | 182 | | | | 1,097 | |
Virginia National Bankshares Corp. | | | 36 | | | | 1,084 | |
Crawford & Co. — Class A | | | 110 | | | | 1,037 | |
Atlanticus Holdings Corp.* | | | 35 | | | | 1,036 | |
Penns Woods Bancorp, Inc. | | | 52 | | | | 1,009 | |
Braemar Hotels & Resorts, Inc. REIT | | | 498 | | | | 996 | |
Stratus Properties, Inc.* | | | 43 | | | | 982 | |
First Community Corp. | | | 56 | | | | 976 | |
Douglas Elliman, Inc.* | | | 615 | | | | 972 | |
MainStreet Bancshares, Inc. | | | 53 | | | | 962 | |
126 | THE RYDEX FUNDS ANNUAL REPORT | SEE NOTES TO FINANCIAL STATEMENTS. |
SCHEDULE OF INVESTMENTS (continued) | March 31, 2024 |
RUSSELL 2000® FUND | |
| | Shares | | | Value | |
Angel Oak Mortgage REIT, Inc. | | | 89 | | | $ | 956 | |
NI Holdings, Inc.* | | | 63 | | | | 954 | |
USCB Financial Holdings, Inc. | | | 80 | | | | 912 | |
Paysign, Inc.* | | | 248 | | | | 908 | |
AlTi Global, Inc.* | | | 160 | | | | 906 | |
First Western Financial, Inc.* | | | 61 | | | | 889 | |
Nexpoint Real Estate Finance, Inc. REIT | | | 61 | | | | 876 | |
Pioneer Bancorp, Inc.* | | | 88 | | | | 863 | |
Sterling Bancorp, Inc.* | | | 159 | | | | 820 | |
Bank7 Corp. | | | 28 | | | | 790 | |
Security National Financial Corp. — Class A* | | | 95 | | | | 755 | |
Office Properties Income Trust REIT | | | 365 | | | | 745 | |
Kingsway Financial Services, Inc.* | | | 81 | | | | 676 | |
Transcontinental Realty Investors, Inc.* | | | 14 | | | | 527 | |
Consumer Portfolio Services, Inc.*,1 | | | 69 | | | | 522 | |
SWK Holdings Corp.* | | | 29 | | | | 505 | |
Clipper Realty, Inc. REIT | | | 87 | | | | 420 | |
Blue Ridge Bankshares, Inc. | | | 134 | | | | 360 | |
GoHealth, Inc. — Class A* | | | 30 | | | | 315 | |
Finance of America Companies, Inc. — Class A* | | | 405 | | | | 298 | |
OppFi, Inc.* | | | 82 | | | | 205 | |
American Realty Investors, Inc.* | | | 11 | | | | 197 | |
Total Financial | | | | | | | 4,078,293 | |
| | | | | | | | | |
Industrial - 8.6% |
Comfort Systems USA, Inc. | | | 265 | | | | 84,193 | |
Simpson Manufacturing Company, Inc. | | | 321 | | | | 65,863 | |
Applied Industrial Technologies, Inc. | | | 289 | | | | 57,092 | |
UFP Industries, Inc. | | | 449 | | | | 55,231 | |
Atkore, Inc. | | | 279 | | | | 53,111 | |
NEXTracker, Inc. — Class A* | | | 941 | | | | 52,950 | |
Chart Industries, Inc.* | | | 320 | | | | 52,710 | |
Fabrinet* | | | 275 | | | | 51,981 | |
Novanta, Inc.* | | | 268 | | | | 46,838 | |
Boise Cascade Co. | | | 297 | | | | 45,551 | |
Mueller Industries, Inc. | | | 839 | | | | 45,247 | |
Fluor Corp.* | | | 1,067 | | | | 45,113 | |
AAON, Inc. | | | 507 | | | | 44,667 | |
Watts Water Technologies, Inc. — Class A | | | 205 | | | | 43,573 | |
Casella Waste Systems, Inc. — Class A* | | | 423 | | | | 41,822 | |
SPX Technologies, Inc.* | | | 330 | | | | 40,633 | |
Summit Materials, Inc. — Class A* | | | 894 | | | | 39,845 | |
Federal Signal Corp. | | | 448 | | | | 38,022 | |
Zurn Elkay Water Solutions Corp. | | | 1,107 | | | | 37,051 | |
Franklin Electric Company, Inc. | | | 346 | | | | 36,956 | |
Modine Manufacturing Co.* | | | 385 | | | | 36,648 | |
GATX Corp. | | | 266 | | | | 35,652 | |
Badger Meter, Inc. | | | 220 | | | | 35,598 | |
Moog, Inc. — Class A | | | 215 | | | | 34,325 | |
Knife River Corp.* | | | 423 | | | | 34,297 | |
Terex Corp. | | | 498 | | | | 32,071 | |
Itron, Inc.* | | | 341 | | | | 31,549 | |
Exponent, Inc. | | | 379 | | | | 31,340 | |
Arcosa, Inc. | | | 363 | | | | 31,167 | |
AeroVironment, Inc.* | | | 202 | | | | 30,962 | |
Dycom Industries, Inc.* | | | 214 | | | | 30,715 | |
Encore Wire Corp. | | | 113 | | | | 29,694 | |
Matson, Inc. | | | 260 | | | | 29,224 | |
Belden, Inc. | | | 312 | | | | 28,894 | |
Kadant, Inc. | | | 88 | | | | 28,873 | |
EnerSys | | | 305 | | | | 28,810 | |
Advanced Energy Industries, Inc. | | | 281 | | | | 28,656 | |
CSW Industrials, Inc. | | | 115 | | | | 26,979 | |
Enpro, Inc. | | | 157 | | | | 26,497 | |
Hillenbrand, Inc. | | | 524 | | | | 26,352 | |
Scorpio Tankers, Inc. | | | 360 | | | | 25,758 | |
Sanmina Corp.* | | | 412 | | | | 25,618 | |
ArcBest Corp. | | | 179 | | | | 25,507 | |
John Bean Technologies Corp. | | | 238 | | | | 24,964 | |
Sterling Infrastructure, Inc.* | | | 224 | | | | 24,710 | |
Cactus, Inc. — Class A | | | 491 | | | | 24,594 | |
MYR Group, Inc.* | | | 124 | | | | 21,917 | |
Albany International Corp. — Class A | | | 234 | | | | 21,881 | |
Vishay Intertechnology, Inc. | | | 952 | | | | 21,591 | |
Griffon Corp. | | | 294 | | | | 21,562 | |
Masonite International Corp.* | | | 164 | | | | 21,558 | |
ESCO Technologies, Inc. | | | 192 | | | | 20,554 | |
Hub Group, Inc. — Class A | | | 470 | | | | 20,313 | |
Materion Corp. | | | 154 | | | | 20,289 | |
Atmus Filtration Technologies, Inc.* | | | 629 | | | | 20,285 | |
Kratos Defense & Security Solutions, Inc.* | | | 1,086 | | | | 19,961 | |
Frontdoor, Inc.* | | | 611 | | | | 19,906 | |
Plexus Corp.* | | | 205 | | | | 19,438 | |
O-I Glass, Inc.* | | | 1,162 | | | | 19,278 | |
RXO, Inc.* | | | 869 | | | | 19,005 | |
Granite Construction, Inc. | | | 330 | | | | 18,853 | |
Mueller Water Products, Inc. — Class A | | | 1,161 | | | | 18,681 | |
Werner Enterprises, Inc. | | | 474 | | | | 18,543 | |
Gibraltar Industries, Inc.* | | | 229 | | | | 18,441 | |
Masterbrand, Inc.* | | | 957 | | | | 17,934 | |
Golar LNG Ltd. | | | 741 | | | | 17,828 | |
Alamo Group, Inc. | | | 76 | | | | 17,353 | |
OSI Systems, Inc.* | | | 120 | | | | 17,138 | |
Construction Partners, Inc. — Class A* | | | 305 | | | | 17,126 | |
Mirion Technologies, Inc.* | | | 1,499 | | | | 17,044 | |
Trinity Industries, Inc. | | | 607 | | | | 16,905 | |
Tennant Co. | | | 139 | | | | 16,904 | |
Primoris Services Corp. | | | 397 | | | | 16,900 | |
Bloom Energy Corp. — Class A*,1 | | | 1,462 | | | | 16,433 | |
Standex International Corp. | | | 89 | | | | 16,218 | |
International Seaways, Inc. | | | 304 | | | | 16,173 | |
Energizer Holdings, Inc. | | | 536 | | | | 15,780 | |
Hillman Solutions Corp.* | | | 1,479 | | | | 15,736 | |
AAR Corp.* | | | 255 | | | | 15,267 | |
Kennametal, Inc. | | | 597 | | | | 14,889 | |
Enerpac Tool Group Corp. | | | 412 | | | | 14,692 | |
AZZ, Inc. | | | 188 | | | | 14,534 | |
Worthington Enterprises, Inc. | | | 230 | | | | 14,313 | |
JELD-WEN Holding, Inc.* | | | 646 | | | | 13,714 | |
Barnes Group, Inc. | | | 366 | | | | 13,597 | |
Greif, Inc. — Class A | | | 185 | | | | 12,774 | |
SEE NOTES TO FINANCIAL STATEMENTS. | THE RYDEX FUNDS ANNUAL REPORT | 127 |
SCHEDULE OF INVESTMENTS (continued) | March 31, 2024 |
RUSSELL 2000® FUND | |
| | Shares | | | Value | |
American Woodmark Corp.* | | | 120 | | | $ | 12,199 | |
Golden Ocean Group Ltd. | | | 934 | | | | 12,105 | |
Greenbrier Companies, Inc. | | | 232 | | | | 12,087 | |
TTM Technologies, Inc.* | | | 763 | | | | 11,941 | |
World Kinect Corp. | | | 451 | | | | 11,929 | |
DHT Holdings, Inc. | | | 1,014 | | | | 11,661 | |
SFL Corporation Ltd. | | | 874 | | | | 11,519 | |
Leonardo DRS, Inc.* | | | 520 | | | | 11,487 | |
Joby Aviation, Inc.* | | | 2,113 | | | | 11,326 | |
Helios Technologies, Inc. | | | 249 | | | | 11,128 | |
CTS Corp. | | | 232 | | | | 10,855 | |
Knowles Corp.* | | | 664 | | | | 10,690 | |
Teekay Tankers Ltd. — Class A | | | 182 | | | | 10,631 | |
NV5 Global, Inc.* | | | 104 | | | | 10,193 | |
Powell Industries, Inc. | | | 70 | | | | 9,961 | |
Apogee Enterprises, Inc. | | | 168 | | | | 9,946 | |
Lindsay Corp. | | | 84 | | | | 9,883 | |
Kaman Corp. | | | 214 | | | | 9,816 | |
Janus International Group, Inc.* | | | 645 | | | | 9,759 | |
Napco Security Technologies, Inc. | | | 240 | | | | 9,638 | |
Columbus McKinnon Corp. | | | 214 | | | | 9,551 | |
Dorian LPG Ltd. | | | 243 | | | | 9,346 | |
Rocket Lab USA, Inc.* | | | 2,113 | | | | 8,684 | |
TriMas Corp. | | | 315 | | | | 8,420 | |
Ichor Holdings Ltd.* | | | 216 | | | | 8,342 | |
Enovix Corp.*,1 | | | 1,039 | | | | 8,322 | |
Thermon Group Holdings, Inc.* | | | 254 | | | | 8,311 | |
Montrose Environmental Group, Inc.* | | | 212 | | | | 8,304 | |
Marten Transport Ltd. | | | 441 | | | | 8,150 | |
Benchmark Electronics, Inc. | | | 268 | | | | 8,043 | |
Astec Industries, Inc. | | | 173 | | | | 7,562 | |
IES Holdings, Inc.* | | | 62 | | | | 7,542 | |
Triumph Group, Inc.* | | | 489 | | | | 7,354 | |
Proto Labs, Inc.* | | | 200 | | | | 7,150 | |
Metallus, Inc.* | | | 320 | | | | 7,120 | |
Ryerson Holding Corp. | | | 212 | | | | 7,102 | |
Gorman-Rupp Co. | | | 174 | | | | 6,882 | |
Aspen Aerogels, Inc.* | | | 388 | | | | 6,829 | |
Energy Recovery, Inc.* | | | 423 | | | | 6,679 | |
Genco Shipping & Trading Ltd. | | | 319 | | | | 6,485 | |
Vicor Corp.* | | | 168 | | | | 6,424 | |
Myers Industries, Inc. | | | 277 | | | | 6,418 | |
Forward Air Corp. | | | 199 | | | | 6,191 | |
Sturm Ruger & Company, Inc. | | | 133 | | | | 6,138 | |
Nordic American Tankers Ltd. | | | 1,558 | | | | 6,107 | |
Smith & Wesson Brands, Inc. | | | 347 | | | | 6,024 | |
FLEX LNG Ltd. | | | 226 | | | | 5,747 | |
Clearwater Paper Corp.* | | | 127 | | | | 5,554 | |
PureCycle Technologies, Inc.*,1 | | | 882 | | | | 5,486 | |
Enviri Corp.* | | | 599 | | | | 5,481 | |
Insteel Industries, Inc. | | | 142 | | | | 5,427 | |
CryoPort, Inc.* | | | 305 | | | | 5,398 | |
Archer Aviation, Inc. — Class A*,1 | | | 1,158 | | | | 5,350 | |
Cadre Holdings, Inc. | | | 147 | | | | 5,322 | |
Olympic Steel, Inc. | | | 75 | | | | 5,316 | |
Air Transport Services Group, Inc.* | | | 385 | | | | 5,298 | |
DXP Enterprises, Inc.* | | | 98 | | | | 5,266 | |
Hyster-Yale Materials Handling, Inc. | | | 82 | | | | 5,262 | |
CECO Environmental Corp.* | | | 225 | | | | 5,180 | |
Ardmore Shipping Corp. | | | 312 | | | | 5,123 | |
Argan, Inc. | | | 96 | | | | 4,852 | |
Bel Fuse, Inc. — Class B | | | 79 | | | | 4,765 | |
Tutor Perini Corp.* | | | 322 | | | | 4,656 | |
Eagle Bulk Shipping, Inc. | | | 70 | | | | 4,373 | |
Xometry, Inc. — Class A* | | | 258 | | | | 4,358 | |
Great Lakes Dredge & Dock Corp.* | | | 498 | | | | 4,358 | |
nLight, Inc.* | | | 335 | | | | 4,355 | |
Pactiv Evergreen, Inc. | | | 304 | | | | 4,353 | |
Mesa Laboratories, Inc. | | | 39 | | | | 4,280 | |
Ducommun, Inc.* | | | 83 | | | | 4,258 | |
Heartland Express, Inc. | | | 356 | | | | 4,251 | |
Kimball Electronics, Inc.* | | | 182 | | | | 3,940 | |
Costamare, Inc. | | | 347 | | | | 3,938 | |
Evolv Technologies Holdings, Inc.* | | | 855 | | | | 3,805 | |
Astronics Corp.* | | | 197 | | | | 3,751 | |
Manitowoc Company, Inc.* | | | 265 | | | | 3,747 | |
SmartRent, Inc.* | | | 1,398 | | | | 3,747 | |
Stoneridge, Inc.* | | | 201 | | | | 3,706 | |
LSB Industries, Inc.* | | | 417 | | | | 3,661 | |
Allient, Inc. | | | 98 | | | | 3,497 | |
Teekay Corp.* | | | 467 | | | | 3,400 | |
National Presto Industries, Inc. | | | 39 | | | | 3,268 | |
NVE Corp. | | | 36 | | | | 3,247 | |
FARO Technologies, Inc.* | | | 144 | | | | 3,098 | |
LSI Industries, Inc. | | | 199 | | | | 3,009 | |
Covenant Logistics Group, Inc. — Class A | | | 63 | | | | 2,921 | |
Limbach Holdings, Inc.* | | | 70 | | | | 2,899 | |
Overseas Shipholding Group, Inc. — Class A | | | 432 | | | | 2,765 | |
Greif, Inc. — Class B | | | 39 | | | | 2,712 | |
Bowman Consulting Group Ltd.*,1 | | | 75 | | | | 2,609 | |
Northwest Pipe Co.* | | | 75 | | | | 2,601 | |
Ranpak Holdings Corp.* | | | 329 | | | | 2,589 | |
Daseke, Inc.* | | | 307 | | | | 2,548 | |
Safe Bulkers, Inc.1 | | | 511 | | | | 2,535 | |
MicroVision, Inc.* | | | 1,342 | | | | 2,469 | |
Park Aerospace Corp. | | | 145 | | | | 2,411 | |
NuScale Power Corp.* | | | 407 | | | | 2,161 | |
Luxfer Holdings plc | | | 208 | | | | 2,157 | |
Eastman Kodak Co.* | | | 433 | | | | 2,143 | |
GoPro, Inc. — Class A* | | | 951 | | | | 2,121 | |
Turtle Beach Corp.* | | | 119 | | | | 2,052 | |
GrafTech International Ltd. | | | 1,471 | | | | 2,030 | |
Pangaea Logistics Solutions Ltd. | | | 276 | | | | 1,924 | |
AMMO, Inc.* | | | 684 | | | | 1,881 | |
Universal Logistics Holdings, Inc. | | | 51 | | | | 1,880 | |
Omega Flex, Inc. | | | 25 | | | | 1,773 | |
Himalaya Shipping Ltd.* | | | 227 | | | | 1,750 | |
Park-Ohio Holdings Corp. | | | 64 | | | | 1,707 | |
Iteris, Inc.* | | | 324 | | | | 1,601 | |
Concrete Pumping Holdings, Inc.* | | | 197 | | | | 1,556 | |
Mistras Group, Inc.* | | | 158 | | | | 1,511 | |
128 | THE RYDEX FUNDS ANNUAL REPORT | SEE NOTES TO FINANCIAL STATEMENTS. |
SCHEDULE OF INVESTMENTS (continued) | March 31, 2024 |
RUSSELL 2000® FUND | |
| | Shares | | | Value | |
Radiant Logistics, Inc.* | | | 277 | | | $ | 1,501 | |
Pure Cycle Corp.* | | | 148 | | | | 1,406 | |
AerSale Corp.* | | | 194 | | | | 1,393 | |
Gencor Industries, Inc.* | | | 80 | | | | 1,335 | |
Tredegar Corp. | | | 200 | | | | 1,304 | |
908 Devices, Inc.* | | | 166 | | | | 1,253 | |
Karat Packaging, Inc. | | | 43 | | | | 1,230 | |
Mayville Engineering Company, Inc.* | | | 84 | | | | 1,204 | |
Latham Group, Inc.* | | | 295 | | | | 1,168 | |
Core Molding Technologies, Inc.* | | | 58 | | | | 1,098 | |
Li-Cycle Holdings Corp.* | | | 1,047 | | | | 1,078 | |
Willis Lease Finance Corp.* | | | 21 | | | | 1,042 | |
Blink Charging Co.*,1 | | | 341 | | | | 1,027 | |
Transphorm, Inc.* | | | 205 | | | | 1,006 | |
Sight Sciences, Inc.* | | | 164 | | | | 866 | |
PAM Transportation Services, Inc.* | | | 47 | | | | 762 | |
Intevac, Inc.* | | | 194 | | | | 745 | |
Eve Holding, Inc.* | | | 137 | | | | 740 | |
Comtech Telecommunications Corp.* | | | 207 | | | | 710 | |
374Water, Inc.* | | | 451 | | | | 568 | |
SKYX Platforms Corp.* | | | 424 | | | | 556 | |
Babcock & Wilcox Enterprises, Inc.* | | | 446 | | | | 504 | |
ESS Tech, Inc.* | | | 692 | | | | 501 | |
LanzaTech Global, Inc.* | | | 157 | | | | 486 | |
NL Industries, Inc. | | | 64 | | | | 469 | |
INNOVATE Corp.* | | | 526 | | | | 369 | |
Akoustis Technologies, Inc.* | | | 525 | | | | 310 | |
Redwire Corp.* | | | 60 | | | | 263 | |
Southland Holdings, Inc.* | | | 29 | | | | 149 | |
Amprius Technologies, Inc.* | | | 41 | | | | 109 | |
Total Industrial | | | | | | | 3,127,786 | |
| | | | | | | | | |
Technology - 7.0% |
Super Micro Computer, Inc.* | | | 380 | | | | 383,811 | |
MicroStrategy, Inc. — Class A*,1 | | | 111 | | | | 189,206 | |
Onto Innovation, Inc.* | | | 366 | | | | 66,275 | |
SPS Commerce, Inc.* | | | 275 | | | | 50,848 | |
Rambus, Inc.* | | | 806 | | | | 49,819 | |
Duolingo, Inc.* | | | 218 | | | | 48,086 | |
Qualys, Inc.* | | | 278 | | | | 46,390 | |
Tenable Holdings, Inc.* | | | 867 | | | | 42,856 | |
MACOM Technology Solutions Holdings, Inc.* | | | 412 | | | | 39,404 | |
Insight Enterprises, Inc.* | | | 210 | | | | 38,959 | |
ExlService Holdings, Inc.* | | | 1,210 | | | | 38,478 | |
Varonis Systems, Inc.* | | | 813 | | | | 38,349 | |
Maximus, Inc. | | | 455 | | | | 38,175 | |
ASGN, Inc.* | | | 345 | | | | 36,142 | |
Appfolio, Inc. — Class A* | | | 144 | | | | 35,531 | |
Altair Engineering, Inc. — Class A* | | | 408 | | | | 35,149 | |
Silicon Laboratories, Inc.* | | | 238 | | | | 34,205 | |
CommVault Systems, Inc.* | | | 330 | | | | 33,472 | |
Workiva, Inc.* | | | 371 | | | | 31,461 | |
Power Integrations, Inc. | | | 425 | | | | 30,409 | |
Box, Inc. — Class A* | | | 1,055 | | | | 29,878 | |
Synaptics, Inc.* | | | 295 | | | | 28,780 | |
BlackLine, Inc.* | | | 428 | | | | 27,640 | |
Evolent Health, Inc. — Class A* | | | 836 | | | | 27,412 | |
Axcelis Technologies, Inc.* | | | 244 | | | | 27,211 | |
Amkor Technology, Inc. | | | 842 | | | | 27,146 | |
ACI Worldwide, Inc.* | | | 812 | | | | 26,967 | |
FormFactor, Inc.* | | | 577 | | | | 26,328 | |
Parsons Corp.* | | | 309 | | | | 25,632 | |
Verra Mobility Corp.* | | | 1,024 | | | | 25,569 | |
Blackbaud, Inc.* | | | 326 | | | | 24,170 | |
Diodes, Inc.* | | | 338 | | | | 23,829 | |
Impinj, Inc.* | | | 175 | | | | 22,472 | |
Rapid7, Inc.* | | | 455 | | | | 22,313 | |
Freshworks, Inc. — Class A* | | | 1,212 | | | | 22,071 | |
Envestnet, Inc.* | | | 375 | | | | 21,716 | |
Sprout Social, Inc. — Class A* | | | 363 | | | | 21,675 | |
Kulicke & Soffa Industries, Inc. | | | 415 | | | | 20,879 | |
ACV Auctions, Inc. — Class A* | | | 951 | | | | 17,850 | |
Progress Software Corp. | | | 330 | | | | 17,592 | |
Braze, Inc. — Class A* | | | 397 | | | | 17,587 | |
DigitalOcean Holdings, Inc.* | | | 458 | | | | 17,486 | |
C3.ai, Inc. — Class A* | | | 613 | | | | 16,594 | |
Privia Health Group, Inc.* | | | 840 | | | | 16,456 | |
Xerox Holdings Corp. | | | 871 | | | | 15,591 | |
Ultra Clean Holdings, Inc.* | | | 333 | | | | 15,298 | |
Verint Systems, Inc.* | | | 458 | | | | 15,183 | |
AvidXchange Holdings, Inc.* | | | 1,134 | | | | 14,912 | |
PagerDuty, Inc.* | | | 646 | | | | 14,651 | |
Ambarella, Inc.* | | | 276 | | | | 14,013 | |
Veeco Instruments, Inc.* | | | 386 | | | | 13,576 | |
Semtech Corp.* | | | 485 | | | | 13,333 | |
Clear Secure, Inc. — Class A | | | 622 | | | | 13,230 | |
Photronics, Inc.* | | | 463 | | | | 13,112 | |
Agilysys, Inc.* | | | 152 | | | | 12,808 | |
Appian Corp. — Class A* | | | 311 | | | | 12,424 | |
PROS Holdings, Inc.* | | | 339 | | | | 12,316 | |
IonQ, Inc.*,1 | | | 1,220 | | | | 12,188 | |
SiTime Corp.* | | | 130 | | | | 12,120 | |
Cohu, Inc.* | | | 354 | | | | 11,799 | |
Fastly, Inc. — Class A* | | | 900 | | | | 11,673 | |
Donnelley Financial Solutions, Inc.* | | | 188 | | | | 11,658 | |
CSG Systems International, Inc. | | | 222 | | | | 11,442 | |
NetScout Systems, Inc.* | | | 518 | | | | 11,313 | |
Schrodinger Incorporated/United States* | | | 413 | | | | 11,151 | |
Zeta Global Holdings Corp. — Class A* | | | 1,018 | | | | 11,127 | |
Everbridge, Inc.* | | | 309 | | | | 10,762 | |
ACM Research, Inc. — Class A* | | | 365 | | | | 10,636 | |
MaxLinear, Inc. — Class A* | | | 566 | | | | 10,567 | |
Intapp, Inc.* | | | 298 | | | | 10,221 | |
Jamf Holding Corp.* | | | 530 | | | | 9,726 | |
SMART Global Holdings, Inc.* | | | 367 | | | | 9,659 | |
Asana, Inc. — Class A*,1 | | | 603 | | | | 9,340 | |
Phreesia, Inc.* | | | 388 | | | | 9,285 | |
PAR Technology Corp.* | | | 202 | | | | 9,163 | |
PowerSchool Holdings, Inc. — Class A* | | | 425 | | | | 9,048 | |
Adeia, Inc. | | | 812 | | | | 8,867 | |
AvePoint, Inc.* | | | 1,119 | | | | 8,863 | |
Digi International, Inc.* | | | 267 | | | | 8,525 | |
SEE NOTES TO FINANCIAL STATEMENTS. | THE RYDEX FUNDS ANNUAL REPORT | 129 |
SCHEDULE OF INVESTMENTS (continued) | March 31, 2024 |
RUSSELL 2000® FUND | |
| | Shares | | | Value | |
Zuora, Inc. — Class A* | | | 934 | | | $ | 8,518 | |
Model N, Inc.* | | | 283 | | | | 8,057 | |
PDF Solutions, Inc.* | | | 232 | | | | 7,811 | |
Sapiens International Corporation N.V. | | | 233 | | | | 7,493 | |
PubMatic, Inc. — Class A* | | | 312 | | | | 7,401 | |
Alkami Technology, Inc.* | | | 300 | | | | 7,371 | |
N-able, Inc.* | | | 531 | | | | 6,940 | |
SoundHound AI, Inc. — Class A*,1 | | | 1,047 | | | | 6,167 | |
Pitney Bowes, Inc. | | | 1,332 | | | | 5,767 | |
E2open Parent Holdings, Inc.* | | | 1,288 | | | | 5,719 | |
Amplitude, Inc. — Class A* | | | 514 | | | | 5,592 | |
Grid Dynamics Holdings, Inc.* | | | 421 | | | | 5,174 | |
Integral Ad Science Holding Corp.* | | | 504 | | | | 5,025 | |
Simulations Plus, Inc. | | | 120 | | | | 4,938 | |
Yext, Inc.* | | | 812 | | | | 4,896 | |
SolarWinds Corp.* | | | 387 | | | | 4,884 | |
Cerence, Inc.* | | | 306 | | | | 4,820 | |
Vimeo, Inc.* | | | 1,155 | | | | 4,724 | |
Mitek Systems, Inc.* | | | 324 | | | | 4,568 | |
Conduent, Inc.* | | | 1,306 | | | | 4,414 | |
Olo, Inc. — Class A* | | | 785 | | | | 4,310 | |
Matterport, Inc.* | | | 1,904 | | | | 4,303 | |
3D Systems Corp.* | | | 968 | | | | 4,298 | |
CEVA, Inc.* | | | 176 | | | | 3,997 | |
Alpha & Omega Semiconductor Ltd.* | | | 176 | | | | 3,879 | |
MeridianLink, Inc.* | | | 199 | | | | 3,721 | |
Navitas Semiconductor Corp.* | | | 768 | | | | 3,663 | |
Daily Journal Corp.* | | | 10 | | | | 3,616 | |
OneSpan, Inc.* | | | 304 | | | | 3,536 | |
BigCommerce Holdings, Inc.* | | | 510 | | | | 3,514 | |
Corsair Gaming, Inc.* | | | 280 | | | | 3,455 | |
Vishay Precision Group, Inc.* | | | 94 | | | | 3,321 | |
Planet Labs PBC* | | | 1,275 | | | | 3,251 | |
Bandwidth, Inc. — Class A* | | | 178 | | | | 3,250 | |
Alignment Healthcare, Inc.* | | | 646 | | | | 3,204 | |
Health Catalyst, Inc.* | | | 424 | | | | 3,193 | |
Instructure Holdings, Inc.* | | | 148 | | | | 3,164 | |
SEMrush Holdings, Inc. — Class A* | | | 238 | | | | 3,156 | |
Digimarc Corp.* | | | 108 | | | | 2,935 | |
Weave Communications, Inc.* | | | 249 | | | | 2,859 | |
Cantaloupe, Inc.* | | | 435 | | | | 2,797 | |
American Software, Inc. — Class A | | | 242 | | | | 2,771 | |
Definitive Healthcare Corp.* | | | 342 | | | | 2,760 | |
Enfusion, Inc. — Class A* | | | 296 | | | | 2,738 | |
NextNav, Inc.* | | | 412 | | | | 2,711 | |
PlayAGS, Inc.* | | | 280 | | | | 2,514 | |
Unisys Corp.* | | | 504 | | | | 2,475 | |
Aehr Test Systems* | | | 196 | | | | 2,430 | |
Consensus Cloud Solutions, Inc.* | | | 149 | | | | 2,363 | |
Multiplan Corp.* | | | 2,867 | | | | 2,326 | |
8x8, Inc.* | | | 858 | | | | 2,317 | |
Climb Global Solutions, Inc. | | | 32 | | | | 2,268 | |
Domo, Inc. — Class B* | | | 233 | | | | 2,078 | |
Digital Turbine, Inc.* | | | 720 | | | | 1,886 | |
Desktop Metal, Inc. — Class A* | | | 2,125 | | | | 1,870 | |
Playstudios, Inc.* | | | 649 | | | | 1,804 | |
Sharecare, Inc.* | | | 2,337 | | | | 1,794 | |
Immersion Corp. | | | 238 | | | | 1,780 | |
Thoughtworks Holding, Inc.* | | | 702 | | | | 1,776 | |
ON24, Inc. | | | 248 | | | | 1,771 | |
Cricut, Inc. — Class A | | | 363 | | | | 1,728 | |
EverCommerce, Inc.* | | | 177 | | | | 1,667 | |
Red Violet, Inc.* | | | 84 | | | | 1,642 | |
Inspired Entertainment, Inc.* | | | 165 | | | | 1,627 | |
HireRight Holdings Corp.* | | | 111 | | | | 1,584 | |
TTEC Holdings, Inc. | | | 148 | | | | 1,535 | |
CS Disco, Inc.* | | | 171 | | | | 1,390 | |
SkyWater Technology, Inc.* | | | 134 | | | | 1,363 | |
Innodata, Inc.* | | | 191 | | | | 1,261 | |
Outbrain, Inc.* | | | 311 | | | | 1,228 | |
Rimini Street, Inc.* | | | 366 | | | | 1,193 | |
Viant Technology, Inc. — Class A* | | | 109 | | | | 1,162 | |
Asure Software, Inc.* | | | 144 | | | | 1,120 | |
inTEST Corp.* | | | 81 | | | | 1,073 | |
IBEX Holdings Ltd.* | | | 69 | | | | 1,065 | |
Veritone, Inc.* | | | 199 | | | | 1,047 | |
eGain Corp.* | | | 162 | | | | 1,045 | |
TruBridge, Inc.* | | | 108 | | | | 996 | |
Atomera, Inc.* | | | 161 | | | | 992 | |
Kaltura, Inc.* | | | 630 | | | | 851 | |
Richardson Electronics Ltd. | | | 91 | | | | 838 | |
Outset Medical, Inc.* | | | 375 | | | | 833 | |
Expensify, Inc. — Class A* | | | 419 | | | | 771 | |
Rackspace Technology, Inc.* | | | 480 | | | | 758 | |
Brightcove, Inc.* | | | 328 | | | | 636 | |
CoreCard Corp.* | | | 55 | | | | 608 | |
Vuzix Corp.* | | | 448 | | | | 542 | |
LivePerson, Inc.*,1 | | | 471 | | | | 470 | |
BigBear.ai Holdings, Inc.* | | | 202 | | | | 414 | |
System1, Inc.* | | | 183 | | | | 359 | |
Velo3D, Inc.* | | | 675 | | | | 308 | |
Skillsoft Corp.* | | | 29 | | | | 261 | |
CXApp, Inc.*,1 | | | 14 | | | | 34 | |
Presto Automation, Inc.* | | | 25 | | | | 4 | |
Total Technology | | | | | | | 2,540,396 | |
| | | | | | | | | |
Consumer, Cyclical - 6.5% |
Light & Wonder, Inc. — Class A* | | | 676 | | | | 69,013 | |
Carvana Co.* | | | 772 | | | | 67,867 | |
Taylor Morrison Home Corp. — Class A* | | | 775 | | | | 48,182 | |
Meritage Homes Corp. | | | 273 | | | | 47,901 | |
Beacon Roofing Supply, Inc.* | | | 473 | | | | 46,363 | |
Installed Building Products, Inc. | | | 177 | | | | 45,795 | |
Abercrombie & Fitch Co. — Class A* | | | 365 | | | | 45,745 | |
Asbury Automotive Group, Inc.* | | | 155 | | | | 36,546 | |
Academy Sports & Outdoors, Inc. | | | 541 | | | | 36,539 | |
KB Home | | | 510 | | | | 36,149 | |
FirstCash Holdings, Inc. | | | 282 | | | | 35,966 | |
American Eagle Outfitters, Inc. | | | 1,367 | | | | 35,255 | |
Skyline Champion Corp.* | | | 407 | | | | 34,599 | |
Signet Jewelers Ltd. | | | 327 | | | | 32,723 | |
Group 1 Automotive, Inc. | | | 102 | | | | 29,807 | |
Shake Shack, Inc. — Class A* | | | 283 | | | | 29,440 | |
130 | THE RYDEX FUNDS ANNUAL REPORT | SEE NOTES TO FINANCIAL STATEMENTS. |
SCHEDULE OF INVESTMENTS (continued) | March 31, 2024 |
RUSSELL 2000® FUND | |
| | Shares | | | Value | |
GMS, Inc.* | | | 300 | | | $ | 29,202 | |
Goodyear Tire & Rubber Co.* | | | 2,107 | | | | 28,929 | |
MDC Holdings, Inc. | | | 446 | | | | 28,058 | |
Tri Pointe Homes, Inc.* | | | 725 | | | | 28,028 | |
Hilton Grand Vacations, Inc.* | | | 590 | | | | 27,854 | |
M/I Homes, Inc.* | | | 202 | | | | 27,531 | |
Kontoor Brands, Inc. | | | 423 | | | | 25,486 | |
Cavco Industries, Inc.* | | | 63 | | | | 25,141 | |
Resideo Technologies, Inc.* | | | 1,096 | | | | 24,572 | |
Visteon Corp.* | | | 208 | | | | 24,463 | |
Rush Enterprises, Inc. — Class A | | | 454 | | | | 24,298 | |
Steven Madden Ltd. | | | 553 | | | | 23,381 | |
LCI Industries | | | 185 | | | | 22,766 | |
Adient plc* | | | 684 | | | | 22,517 | |
Boot Barn Holdings, Inc.* | | | 226 | | | | 21,504 | |
Red Rock Resorts, Inc. — Class A | | | 356 | | | | 21,296 | |
SkyWest, Inc.* | | | 305 | | | | 21,069 | |
Urban Outfitters, Inc.* | | | 477 | | | | 20,711 | |
Century Communities, Inc. | | | 213 | | | | 20,554 | |
UniFirst Corp. | | | 112 | | | | 19,424 | |
Dorman Products, Inc.* | | | 197 | | | | 18,989 | |
Patrick Industries, Inc. | | | 158 | | | | 18,876 | |
Bloomin’ Brands, Inc. | | | 656 | | | | 18,814 | |
JetBlue Airways Corp.* | | | 2,508 | | | | 18,609 | |
Sweetgreen, Inc. — Class A* | | | 733 | | | | 18,516 | |
International Game Technology plc | | | 812 | | | | 18,343 | |
LGI Homes, Inc.* | | | 156 | | | | 18,154 | |
Foot Locker, Inc. | | | 623 | | | | 17,756 | |
Sonos, Inc.* | | | 926 | | | | 17,650 | |
Topgolf Callaway Brands Corp.* | | | 1,077 | | | | 17,415 | |
Fox Factory Holding Corp.* | | | 319 | | | | 16,610 | |
Papa John’s International, Inc. | | | 246 | | | | 16,384 | |
Brinker International, Inc.* | | | 328 | | | | 16,295 | |
PriceSmart, Inc. | | | 190 | | | | 15,960 | |
Dave & Buster’s Entertainment, Inc.* | | | 253 | | | | 15,838 | |
Winnebago Industries, Inc. | | | 212 | | | | 15,688 | |
H&E Equipment Services, Inc. | | | 244 | | | | 15,660 | |
HNI Corp. | | | 346 | | | | 15,615 | |
United Parks & Resorts, Inc.* | | | 276 | | | | 15,514 | |
Hanesbrands, Inc.* | | | 2,668 | | | | 15,474 | |
Acushnet Holdings Corp. | | | 227 | | | | 14,971 | |
Cinemark Holdings, Inc.* | | | 822 | | | | 14,771 | |
Six Flags Entertainment Corp.* | | | 548 | | | | 14,423 | |
Gentherm, Inc.* | | | 245 | | | | 14,107 | |
Vista Outdoor, Inc.* | | | 428 | | | | 14,030 | |
OPENLANE, Inc.* | | | 799 | | | | 13,823 | |
MillerKnoll, Inc. | | | 556 | | | | 13,766 | |
Atlanta Braves Holdings, Inc. — Class C* | | | 332 | | | | 12,968 | |
Cheesecake Factory, Inc. | | | 357 | | | | 12,906 | |
National Vision Holdings, Inc.* | | | 581 | | | | 12,875 | |
ODP Corp.* | | | 239 | | | | 12,679 | |
Oxford Industries, Inc. | | | 112 | | | | 12,589 | |
Dana, Inc. | | | 990 | | | | 12,573 | |
La-Z-Boy, Inc. | | | 330 | | | | 12,415 | |
Cracker Barrel Old Country Store, Inc. | | | 167 | | | | 12,146 | |
Green Brick Partners, Inc.* | | | 198 | | | | 11,925 | |
Dillard’s, Inc. — Class A | | | 25 | | | | 11,791 | |
Madison Square Garden Entertainment Corp.* | | | 300 | | | | 11,763 | |
Caleres, Inc. | | | 254 | | | | 10,422 | |
Wabash National Corp. | | | 347 | | | | 10,389 | |
Sally Beauty Holdings, Inc.* | | | 815 | | | | 10,122 | |
Jack in the Box, Inc. | | | 147 | | | | 10,067 | |
Buckle, Inc. | | | 232 | | | | 9,343 | |
XPEL, Inc.* | | | 172 | | | | 9,291 | |
G-III Apparel Group Ltd.* | | | 313 | | | | 9,080 | |
Allegiant Travel Co. — Class A | | | 120 | | | | 9,025 | |
Camping World Holdings, Inc. — Class A | | | 317 | | | | 8,829 | |
Leslie’s, Inc.* | | | 1,348 | | | | 8,762 | |
Warby Parker, Inc. — Class A* | | | 643 | | | | 8,751 | |
Steelcase, Inc. — Class A | | | 666 | | | | 8,711 | |
ScanSource, Inc.* | | | 188 | | | | 8,280 | |
BlueLinx Holdings, Inc.* | | | 63 | | | | 8,205 | |
Lions Gate Entertainment Corp. — Class B* | | | 879 | | | | 8,184 | |
OneSpaWorld Holdings Ltd.* | | | 615 | | | | 8,136 | |
Dream Finders Homes, Inc. — Class A* | | | 184 | | | | 8,046 | |
MRC Global, Inc.* | | | 637 | | | | 8,007 | |
Monarch Casino & Resort, Inc. | | | 102 | | | | 7,649 | |
Winmark Corp. | | | 21 | | | | 7,596 | |
VSE Corp. | | | 94 | | | | 7,520 | |
indie Semiconductor, Inc. — Class A* | | | 1,046 | | | | 7,406 | |
Beazer Homes USA, Inc.* | | | 224 | | | | 7,347 | |
Blue Bird Corp.* | | | 191 | | | | 7,323 | |
Interface, Inc. — Class A | | | 435 | | | | 7,317 | |
Aurora Innovation, Inc.* | | | 2,550 | | | | 7,191 | |
Guess?, Inc. | | | 218 | | | | 6,860 | |
Hibbett, Inc. | | | 87 | | | | 6,682 | |
Malibu Boats, Inc. — Class A* | | | 154 | | | | 6,665 | |
Wolverine World Wide, Inc. | | | 590 | | | | 6,614 | |
American Axle & Manufacturing Holdings, Inc.* | | | 867 | | | | 6,381 | |
Sonic Automotive, Inc. — Class A | | | 111 | | | | 6,320 | |
Vizio Holding Corp. — Class A* | | | 576 | | | | 6,301 | |
BJ’s Restaurants, Inc.* | | | 173 | | | | 6,259 | |
Everi Holdings, Inc.* | | | 609 | | | | 6,120 | |
Ethan Allen Interiors, Inc. | | | 173 | | | | 5,981 | |
Hovnanian Enterprises, Inc. — Class A* | | | 37 | | | | 5,807 | |
PC Connection, Inc. | | | 87 | | | | 5,736 | |
Golden Entertainment, Inc. | | | 154 | | | | 5,672 | |
Forestar Group, Inc.* | | | 139 | | | | 5,586 | |
Dine Brands Global, Inc. | | | 119 | | | | 5,531 | |
IMAX Corp.* | | | 341 | | | | 5,514 | |
MarineMax, Inc.* | | | 162 | | | | 5,388 | |
REV Group, Inc. | | | 240 | | | | 5,302 | |
Life Time Group Holdings, Inc.* | | | 339 | | | | 5,261 | |
Nu Skin Enterprises, Inc. — Class A | | | 378 | | | | 5,228 | |
Standard Motor Products, Inc. | | | 154 | | | | 5,167 | |
Hawaiian Holdings, Inc.* | | | 387 | | | | 5,159 | |
Kura Sushi USA, Inc. — Class A* | | | 44 | | | | 5,067 | |
Titan International, Inc.* | | | 398 | | | | 4,959 | |
Accel Entertainment, Inc.* | | | 409 | | | | 4,822 | |
SEE NOTES TO FINANCIAL STATEMENTS. | THE RYDEX FUNDS ANNUAL REPORT | 131 |
SCHEDULE OF INVESTMENTS (continued) | March 31, 2024 |
RUSSELL 2000® FUND | |
| | Shares | | | Value | |
Nikola Corp.*,1 | | | 4,482 | | | $ | 4,661 | |
Shoe Carnival, Inc. | | | 126 | | | | 4,617 | |
Portillo’s, Inc. — Class A* | | | 320 | | | | 4,538 | |
Global Industrial Co. | | | 100 | | | | 4,478 | |
Lions Gate Entertainment Corp. — Class A* | | | 442 | | | | 4,398 | |
A-Mark Precious Metals, Inc. | | | 143 | | | | 4,389 | |
Chuy’s Holdings, Inc.* | | | 129 | | | | 4,351 | |
Sun Country Airlines Holdings, Inc.* | | | 286 | | | | 4,316 | |
Miller Industries, Inc. | | | 84 | | | | 4,208 | |
Douglas Dynamics, Inc. | | | 171 | | | | 4,125 | |
Luminar Technologies, Inc.* | | | 2,067 | | | | 4,072 | |
First Watch Restaurant Group, Inc.* | | | 164 | | | | 4,038 | |
Spirit Airlines, Inc. | | | 833 | | | | 4,032 | |
Xperi, Inc.* | | | 321 | | | | 3,871 | |
Titan Machinery, Inc.* | | | 156 | | | | 3,870 | |
Savers Value Village, Inc.* | | | 197 | | | | 3,798 | |
Haverty Furniture Companies, Inc. | | | 111 | | | | 3,787 | |
RCI Hospitality Holdings, Inc. | | | 65 | | | | 3,770 | |
Rush Enterprises, Inc. — Class B | | | 70 | | | | 3,730 | |
Hudson Technologies, Inc.* | | | 333 | | | | 3,666 | |
Virgin Galactic Holdings, Inc.* | | | 2,474 | | | | 3,662 | |
Super Group SGHC Ltd.* | | | 1,035 | | | | 3,571 | |
Designer Brands, Inc. — Class A | | | 326 | | | | 3,563 | |
Arko Corp. | | | 625 | | | | 3,562 | |
Denny’s Corp.* | | | 387 | | | | 3,468 | |
Clean Energy Fuels Corp.* | | | 1,287 | | | | 3,449 | |
Methode Electronics, Inc. | | | 268 | | | | 3,264 | |
Shyft Group, Inc. | | | 261 | | | | 3,242 | |
Movado Group, Inc. | | | 116 | | | | 3,240 | |
Atlanta Braves Holdings, Inc. — Class A* | | | 76 | | | | 3,184 | |
Bally’s Corp.* | | | 224 | | | | 3,123 | |
Rush Street Interactive, Inc.* | | | 478 | | | | 3,112 | |
MasterCraft Boat Holdings, Inc.* | | | 131 | | | | 3,107 | |
Build-A-Bear Workshop, Inc. — Class A | | | 100 | | | | 2,987 | |
Xponential Fitness, Inc. — Class A* | | | 174 | | | | 2,878 | |
Daktronics, Inc.* | | | 285 | | | | 2,839 | |
America’s Car-Mart, Inc.* | | | 44 | | | | 2,810 | |
Carrols Restaurant Group, Inc. | | | 279 | | | | 2,653 | |
Marcus Corp. | | | 184 | | | | 2,624 | |
Sleep Number Corp.* | | | 162 | | | | 2,597 | |
OneWater Marine, Inc. — Class A* | | | 88 | | | | 2,477 | |
Lindblad Expeditions Holdings, Inc.* | | | 265 | | | | 2,472 | |
Potbelly Corp.* | | | 198 | | | | 2,398 | |
Lovesac Co.* | | | 106 | | | | 2,396 | |
Solid Power, Inc.* | | | 1,176 | | | | 2,387 | |
Frontier Group Holdings, Inc.*,1 | | | 289 | | | | 2,344 | |
Genesco, Inc.* | | | 82 | | | | 2,307 | |
Cooper-Standard Holdings, Inc.* | | | 128 | | | | 2,120 | |
El Pollo Loco Holdings, Inc.* | | | 215 | | | | 2,094 | |
Hyliion Holdings Corp.* | | | 1,120 | | | | 1,971 | |
Hooker Furnishings Corp. | | | 82 | | | | 1,969 | |
Johnson Outdoors, Inc. — Class A | | | 41 | | | | 1,891 | |
EVgo, Inc.* | | | 752 | | | | 1,888 | |
Zumiez, Inc.* | | | 121 | | | | 1,838 | |
iRobot Corp.* | | | 208 | | | | 1,822 | |
Holley, Inc.* | | | 401 | | | | 1,788 | |
Bowlero Corp. — Class A1 | | | 127 | | | | 1,740 | |
Funko, Inc. — Class A* | | | 264 | | | | 1,647 | |
Destination XL Group, Inc.* | | | 442 | | | | 1,591 | |
SES AI Corp.* | | | 947 | | | | 1,591 | |
Commercial Vehicle Group, Inc.* | | | 244 | | | | 1,569 | |
Tile Shop Holdings, Inc.* | | | 219 | | | | 1,540 | |
Clarus Corp. | | | 222 | | | | 1,499 | |
Landsea Homes Corp.* | | | 102 | | | | 1,482 | |
Global Business Travel Group I* | | | 245 | | | | 1,472 | |
Rocky Brands, Inc. | | | 53 | | | | 1,438 | |
Weyco Group, Inc. | | | 45 | | | | 1,434 | |
Full House Resorts, Inc.* | | | 249 | | | | 1,387 | |
JAKKS Pacific, Inc.* | | | 55 | | | | 1,359 | |
Microvast Holdings, Inc.*,1 | | | 1,620 | | | | 1,356 | |
Vera Bradley, Inc.* | | | 199 | | | | 1,353 | |
GrowGeneration Corp.* | | | 446 | | | | 1,276 | |
Snap One Holdings Corp.* | | | 139 | | | | 1,198 | |
Reservoir Media, Inc.* | | | 151 | | | | 1,197 | |
Tilly’s, Inc. — Class A* | | | 170 | | | | 1,156 | |
J Jill, Inc.* | | | 35 | | | | 1,119 | |
ThredUp, Inc. — Class A* | | | 545 | | | | 1,090 | |
Children’s Place, Inc.*,1 | | | 91 | | | | 1,050 | |
Escalade, Inc. | | | 76 | | | | 1,045 | |
Biglari Holdings, Inc. — Class B* | | | 5 | | | | 948 | |
Big Lots, Inc.* | | | 216 | | | | 935 | |
ONE Group Hospitality, Inc.* | | | 167 | | | | 930 | |
Red Robin Gourmet Burgers, Inc.* | | | 120 | | | | 919 | |
EVI Industries, Inc. | | | 36 | | | | 897 | |
Sportsman’s Warehouse Holdings, Inc.* | | | 287 | | | | 893 | |
Cato Corp. — Class A | | | 132 | | | | 762 | |
Marine Products Corp. | | | 64 | | | | 752 | |
PetMed Express, Inc. | | | 156 | | | | 747 | |
VOXX International Corp. — Class A* | | | 89 | | | | 726 | |
Purple Innovation, Inc. | | | 415 | | | | 722 | |
Traeger, Inc.* | | | 268 | | | | 678 | |
Century Casinos, Inc.* | | | 209 | | | | 660 | |
Livewire Group, Inc.* | | | 84 | | | | 607 | |
Noodles & Co.* | | | 305 | | | | 583 | |
Big 5 Sporting Goods Corp. | | | 163 | | | | 574 | |
Duluth Holdings, Inc. — Class B* | | | 103 | | | | 505 | |
Aeva Technologies, Inc.* | | | 120 | | | | 472 | |
Torrid Holdings, Inc.* | | | 92 | | | | 449 | |
CompX International, Inc. | | | 12 | | | | 412 | |
Fossil Group, Inc.* | | | 362 | | | | 369 | |
United Homes Group, Inc.*,1 | | | 46 | | | | 322 | |
Workhorse Group, Inc.* | | | 1,250 | | | | 293 | |
Envela Corp.* | | | 58 | | | | 268 | |
Lazydays Holdings, Inc.*,1 | | | 57 | | | | 230 | |
Loop Media, Inc.*,1 | | | 276 | | | | 101 | |
Dragonfly Energy Holdings Corp.* | | | 113 | | | | 61 | |
Qurate Retail, Inc. — Class B* | | | 10 | | | | 45 | |
Total Consumer, Cyclical | | | | | | | 2,335,997 | |
| | | | | | | | | |
Energy - 3.9% |
Weatherford International plc* | | | 533 | | | | 61,519 | |
Permian Resources Corp. | | | 3,412 | | | | 60,256 | |
132 | THE RYDEX FUNDS ANNUAL REPORT | SEE NOTES TO FINANCIAL STATEMENTS. |
SCHEDULE OF INVESTMENTS (continued) | March 31, 2024 |
RUSSELL 2000® FUND | |
| | Shares | | | Value | |
Matador Resources Co. | | | 848 | | | $ | 56,621 | |
Chord Energy Corp. | | | 313 | | | | 55,789 | |
ChampionX Corp. | | | 1,465 | | | | 52,579 | |
Murphy Oil Corp. | | | 1,088 | | | | 49,722 | |
PBF Energy, Inc. — Class A | | | 825 | | | | 47,495 | |
Civitas Resources, Inc. | | | 605 | | | | 45,926 | |
SM Energy Co. | | | 867 | | | | 43,220 | |
Equitrans Midstream Corp. | | | 3,268 | | | | 40,817 | |
Noble Corporation plc | | | 840 | | | | 40,732 | |
Magnolia Oil & Gas Corp. — Class A | | | 1,323 | | | | 34,332 | |
Valaris Ltd.* | | | 445 | | | | 33,491 | |
Tidewater, Inc.* | | | 347 | | | | 31,924 | |
Patterson-UTI Energy, Inc. | | | 2,646 | | | | 31,593 | |
Helmerich & Payne, Inc. | | | 729 | | | | 30,662 | |
Alpha Metallurgical Resources, Inc. | | | 87 | | | | 28,812 | |
California Resources Corp. | | | 521 | | | | 28,707 | |
CNX Resources Corp.* | | | 1,181 | | | | 28,013 | |
Northern Oil and Gas, Inc. | | | 659 | | | | 26,149 | |
Liberty Energy, Inc. — Class A | | | 1,229 | | | | 25,465 | |
Warrior Met Coal, Inc. | | | 387 | | | | 23,491 | |
Arch Resources, Inc. | | | 135 | | | | 21,707 | |
Peabody Energy Corp.1 | | | 845 | | | | 20,500 | |
Archrock, Inc. | | | 1,040 | | | | 20,457 | |
Kosmos Energy Ltd.* | | | 3,415 | | | | 20,353 | |
CONSOL Energy, Inc. | | | 230 | | | | 19,265 | |
Seadrill Ltd.* | | | 350 | | | | 17,605 | |
Oceaneering International, Inc.* | | | 752 | | | | 17,597 | |
Array Technologies, Inc.* | | | 1,149 | | | | 17,132 | |
Par Pacific Holdings, Inc.* | | | 413 | | | | 15,306 | |
Sitio Royalties Corp. — Class A | | | 613 | | | | 15,153 | |
Delek US Holdings, Inc. | | | 475 | | | | 14,601 | |
Shoals Technologies Group, Inc. — Class A* | | | 1,299 | | | | 14,523 | |
Talos Energy, Inc.* | | | 1,020 | | | | 14,209 | |
Expro Group Holdings N.V.* | | | 669 | | | | 13,360 | |
Gulfport Energy Corp.* | | | 82 | | | | 13,130 | |
DNOW, Inc.* | | | 807 | | | | 12,266 | |
Helix Energy Solutions Group, Inc.* | | | 1,092 | | | | 11,837 | |
Borr Drilling Ltd.* | | | 1,667 | | | | 11,419 | |
Kinetik Holdings, Inc. — Class A | | | 272 | | | | 10,845 | |
Diamond Offshore Drilling, Inc.* | | | 772 | | | | 10,530 | |
Green Plains, Inc.* | | | 441 | | | | 10,196 | |
Vital Energy, Inc.* | | | 176 | | | | 9,247 | |
CVR Energy, Inc. | | | 225 | | | | 8,023 | |
Fluence Energy, Inc.* | | | 435 | | | | 7,543 | |
SunCoke Energy, Inc. | | | 634 | | | | 7,145 | |
US Silica Holdings, Inc.* | | | 572 | | | | 7,099 | |
REX American Resources Corp.* | | | 118 | | | | 6,928 | |
Crescent Energy Co. — Class A | | | 581 | | | | 6,914 | |
Comstock Resources, Inc.1 | | | 698 | | | | 6,477 | |
Core Laboratories, Inc. | | | 356 | | | | 6,080 | |
Nabors Industries Ltd.* | | | 70 | | | | 6,029 | |
SilverBow Resources, Inc.* | | | 174 | | | | 5,940 | |
Dril-Quip, Inc.* | | | 258 | | | | 5,813 | |
ProPetro Holding Corp.* | | | 706 | | | | 5,704 | |
VAALCO Energy, Inc. | | | 818 | | | | 5,701 | |
Select Water Solutions, Inc. — Class A | | | 616 | | | | 5,686 | |
RPC, Inc. | | | 646 | | | | 5,000 | |
Bristow Group, Inc.* | | | 179 | | | | 4,869 | |
Sunnova Energy International, Inc.*,1 | | | 766 | | | | 4,695 | |
Berry Corp. | | | 579 | | | | 4,661 | |
Vitesse Energy, Inc. | | | 190 | | | | 4,509 | |
TETRA Technologies, Inc.* | | | 951 | | | | 4,213 | |
Newpark Resources, Inc.* | | | 567 | | | | 4,094 | |
FuelCell Energy, Inc.*,1 | | | 3,102 | | | | 3,691 | |
SandRidge Energy, Inc. | | | 242 | | | | 3,526 | |
NextDecade Corp.* | | | 588 | | | | 3,340 | |
Aris Water Solutions, Inc. — Class A | | | 227 | | | | 3,212 | |
Kodiak Gas Services, Inc. | | | 116 | | | | 3,171 | |
Oil States International, Inc.* | | | 479 | | | | 2,951 | |
DMC Global, Inc.* | | | 148 | | | | 2,884 | |
Ramaco Resources, Inc. — Class A | | | 171 | | | | 2,879 | |
Atlas Energy Solutions, Inc. | | | 124 | | | | 2,805 | |
Tellurian, Inc.* | | | 4,040 | | | | 2,672 | |
SEACOR Marine Holdings, Inc.* | | | 183 | | | | 2,551 | |
Stem, Inc.*,1 | | | 1,081 | | | | 2,367 | |
Riley Exploration Permian, Inc. | | | 67 | | | | 2,211 | |
Excelerate Energy, Inc. — Class A | | | 137 | | | | 2,195 | |
Montauk Renewables, Inc.* | | | 506 | | | | 2,105 | |
Solaris Oilfield Infrastructure, Inc. — Class A | | | 234 | | | | 2,029 | |
SunPower Corp. — Class A*,1 | | | 663 | | | | 1,989 | |
W&T Offshore, Inc. | | | 746 | | | | 1,977 | |
Amplify Energy Corp.* | | | 275 | | | | 1,818 | |
Ring Energy, Inc.* | | | 910 | | | | 1,784 | |
FutureFuel Corp. | | | 198 | | | | 1,594 | |
ProFrac Holding Corp. — Class A* | | | 182 | | | | 1,521 | |
Forum Energy Technologies, Inc.* | | | 73 | | | | 1,459 | |
Evolution Petroleum Corp. | | | 235 | | | | 1,443 | |
Gevo, Inc.* | | | 1,774 | | | | 1,364 | |
Energy Vault Holdings, Inc.* | | | 744 | | | | 1,332 | |
Ranger Energy Services, Inc. | | | 115 | | | | 1,298 | |
Granite Ridge Resources, Inc. | | | 197 | | | | 1,281 | |
HighPeak Energy, Inc. | | | 79 | | | | 1,246 | |
NACCO Industries, Inc. — Class A | | | 32 | | | | 966 | |
Hallador Energy Co.* | | | 173 | | | | 922 | |
TPI Composites, Inc.*,1 | | | 314 | | | | 914 | |
Eos Energy Enterprises, Inc.* | | | 817 | | | | 841 | |
KLX Energy Services Holdings, Inc.* | | | 96 | | | | 743 | |
Vertex Energy, Inc.* | | | 496 | | | | 694 | |
Mammoth Energy Services, Inc.* | | | 177 | | | | 644 | |
Maxeon Solar Technologies Ltd.* | | | 187 | | | | 623 | |
PrimeEnergy Resources Corp.* | | | 5 | | | | 501 | |
Ramaco Resources, Inc. — Class B | | | 34 | | | | 427 | |
Empire Petroleum Corp.* | | | 75 | | | | 383 | |
Verde Clean Fuels, Inc.* | | | 5 | | | | 20 | |
Total Energy | | | | | | | 1,404,049 | |
| | | | | | | | | |
Basic Materials - 1.9% |
Commercial Metals Co. | | | 877 | | | | 51,541 | |
ATI, Inc.* | | | 965 | | | | 49,379 | |
Cabot Corp. | | | 407 | | | | 37,525 | |
Balchem Corp. | | | 239 | | | | 37,033 | |
SEE NOTES TO FINANCIAL STATEMENTS. | THE RYDEX FUNDS ANNUAL REPORT | 133 |
SCHEDULE OF INVESTMENTS (continued) | March 31, 2024 |
RUSSELL 2000® FUND | |
| | Shares | | | Value | |
Arcadium Lithium plc | | | 7,655 | | | $ | 32,993 | |
HB Fuller Co. | | | 405 | | | | 32,295 | |
Avient Corp. | | | 677 | | | | 29,382 | |
Carpenter Technology Corp. | | | 366 | | | | 26,140 | |
Innospec, Inc. | | | 187 | | | | 24,112 | |
Hecla Mining Co. | | | 4,564 | | | | 21,953 | |
Sensient Technologies Corp. | | | 315 | | | | 21,795 | |
Quaker Chemical Corp. | | | 104 | | | | 21,346 | |
Constellium SE* | | | 961 | | | | 21,248 | |
Uranium Energy Corp.* | | | 2,789 | | | | 18,826 | |
Minerals Technologies, Inc. | | | 243 | | | | 18,293 | |
Sylvamo Corp. | | | 268 | | | | 16,546 | |
Rogers Corp.* | | | 131 | | | | 15,548 | |
Tronox Holdings plc — Class A | | | 876 | | | | 15,199 | |
Stepan Co. | | | 159 | | | | 14,316 | |
Ingevity Corp.* | | | 277 | | | | 13,213 | |
Hawkins, Inc. | | | 147 | | | | 11,290 | |
Kaiser Aluminum Corp. | | | 121 | | | | 10,813 | |
Orion S.A. | | | 414 | | | | 9,737 | |
Coeur Mining, Inc.* | | | 2,419 | | | | 9,120 | |
Perimeter Solutions S.A.* | | | 1,150 | | | | 8,533 | |
Koppers Holdings, Inc. | | | 153 | | | | 8,441 | |
Worthington Steel, Inc. | | | 234 | | | | 8,389 | |
Ecovyst, Inc.* | | | 692 | | | | 7,716 | |
Mativ Holdings, Inc. | | | 402 | | | | 7,537 | |
Energy Fuels, Inc.* | | | 1,192 | | | | 7,498 | |
Century Aluminum Co.* | | | 399 | | | | 6,141 | |
AdvanSix, Inc. | | | 201 | | | | 5,749 | |
Haynes International, Inc. | | | 95 | | | | 5,711 | |
Novagold Resources, Inc.* | | | 1,835 | | | | 5,505 | |
United States Lime & Minerals, Inc. | | | 16 | | | | 4,770 | |
Encore Energy Corp.* | | | 1,074 | | | | 4,704 | |
Ivanhoe Electric Incorporated / US*,1 | | | 423 | | | | 4,145 | |
Radius Recycling, Inc. — Class A | | | 196 | | | | 4,142 | |
Compass Minerals International, Inc. | | | 260 | | | | 4,092 | |
Lightwave Logic, Inc.*,1 | | | 870 | | | | 4,072 | |
Centrus Energy Corp. — Class A* | | | 93 | | | | 3,862 | |
Oil-Dri Corporation of America | | | 37 | | | | 2,759 | |
American Vanguard Corp. | | | 205 | | | | 2,655 | |
Rayonier Advanced Materials, Inc.* | | | 484 | | | | 2,313 | |
Kronos Worldwide, Inc. | | | 168 | | | | 1,982 | |
i-80 Gold Corp.*,1 | | | 1,466 | | | | 1,964 | |
Piedmont Lithium, Inc.* | | | 136 | | | | 1,811 | |
Codexis, Inc.* | | | 506 | | | | 1,766 | |
Intrepid Potash, Inc.* | | | 81 | | | | 1,690 | |
Caledonia Mining Corporation plc | | | 124 | | | | 1,373 | |
Perpetua Resources Corp.* | | | 287 | | | | 1,194 | |
Trinseo plc | | | 266 | | | | 1,005 | |
Dakota Gold Corp.* | | | 408 | | | | 967 | |
Danimer Scientific, Inc.* | | | 666 | | | | 726 | |
Glatfelter Corp.* | | | 336 | | | | 672 | |
Contango ORE, Inc.* | | | 28 | | | | 556 | |
Origin Materials, Inc.* | | | 792 | | | | 404 | |
5E Advanced Materials, Inc.* | | | 298 | | | | 399 | |
Valhi, Inc. | | | 18 | | | | 309 | |
NioCorp Developments Ltd.* | | | 14 | | | | 38 | |
Total Basic Materials | | | | | | | 685,233 | |
Communications - 1.8% |
DigitalBridge Group, Inc. | | | 1,210 | | | | 23,317 | |
Q2 Holdings, Inc.* | | | 426 | | | | 22,391 | |
TEGNA, Inc. | | | 1,477 | | | | 22,066 | |
Ziff Davis, Inc.* | | | 342 | | | | 21,560 | |
Cogent Communications Holdings, Inc. | | | 329 | | | | 21,494 | |
InterDigital, Inc. | | | 192 | | | | 20,440 | |
Yelp, Inc. — Class A* | | | 502 | | | | 19,779 | |
Credo Technology Group Holding Ltd.* | | | 930 | | | | 19,707 | |
Cargurus, Inc.* | | | 717 | | | | 16,548 | |
ePlus, Inc.* | | | 199 | | | | 15,629 | |
Squarespace, Inc. — Class A* | | | 425 | | | | 15,487 | |
Viavi Solutions, Inc.* | | | 1,655 | | | | 15,044 | |
Calix, Inc.* | | | 441 | | | | 14,624 | |
Perficient, Inc.* | | | 257 | | | | 14,467 | |
Hims & Hers Health, Inc.* | | | 927 | | | | 14,341 | |
EchoStar Corp. — Class A* | | | 918 | | | | 13,081 | |
Opendoor Technologies, Inc.* | | | 4,136 | | | | 12,532 | |
Beyond, Inc.* | | | 342 | | | | 12,281 | |
Telephone & Data Systems, Inc. | | | 751 | | | | 12,031 | |
Lumen Technologies, Inc.* | | | 7,597 | | | | 11,851 | |
Upwork, Inc.* | | | 939 | | | | 11,512 | |
Harmonic, Inc.* | | | 836 | | | | 11,236 | |
Extreme Networks, Inc.* | | | 958 | | | | 11,055 | |
Magnite, Inc.* | | | 1,016 | | | | 10,922 | |
Sphere Entertainment Co.* | | | 198 | | | | 9,718 | |
Sprinklr, Inc. — Class A* | | | 782 | | | | 9,595 | |
Infinera Corp.* | | | 1,514 | | | | 9,129 | |
Bumble, Inc. — Class A* | | | 768 | | | | 8,717 | |
Cars.com, Inc.* | | | 505 | | | | 8,676 | |
Shutterstock, Inc. | | | 187 | | | | 8,566 | |
Globalstar, Inc.* | | | 5,232 | | | | 7,691 | |
A10 Networks, Inc. | | | 536 | | | | 7,338 | |
Liberty Latin America Ltd. — Class C* | | | 1,038 | | | | 7,256 | |
Scholastic Corp. | | | 192 | | | | 7,240 | |
QuinStreet, Inc.* | | | 394 | | | | 6,958 | |
Couchbase, Inc.* | | | 258 | | | | 6,788 | |
TechTarget, Inc.* | | | 198 | | | | 6,550 | |
Shenandoah Telecommunications Co. | | | 369 | | | | 6,409 | |
Revolve Group, Inc.*,1 | | | 298 | | | | 6,309 | |
Thryv Holdings, Inc.* | | | 235 | | | | 5,224 | |
HealthStream, Inc. | | | 185 | | | | 4,932 | |
Figs, Inc. — Class A* | | | 970 | | | | 4,831 | |
Open Lending Corp. — Class A* | | | 755 | | | | 4,726 | |
Clear Channel Outdoor Holdings, Inc.* | | | 2,821 | | | | 4,655 | |
IDT Corp. — Class B | | | 118 | | | | 4,462 | |
Gogo, Inc.* | | | 503 | | | | 4,416 | |
Gray Television, Inc. | | | 628 | | | | 3,969 | |
Stagwell, Inc.* | | | 598 | | | | 3,720 | |
Cardlytics, Inc.* | | | 256 | | | | 3,709 | |
NETGEAR, Inc.* | | | 217 | | | | 3,422 | |
fuboTV, Inc.* | | | 2,147 | | | | 3,392 | |
Sinclair, Inc. | | | 249 | | | | 3,354 | |
Vivid Seats, Inc. — Class A* | | | 558 | | | | 3,342 | |
MediaAlpha, Inc. — Class A* | | | 163 | | | | 3,320 | |
Anterix, Inc.* | | | 98 | | | | 3,294 | |
Liquidity Services, Inc.* | | | 175 | | | | 3,255 | |
134 | THE RYDEX FUNDS ANNUAL REPORT | SEE NOTES TO FINANCIAL STATEMENTS. |
SCHEDULE OF INVESTMENTS (continued) | March 31, 2024 |
RUSSELL 2000® FUND | |
| | Shares | | | Value | |
Aviat Networks, Inc.* | | | 84 | | | $ | 3,221 | |
ADTRAN Holdings, Inc. | | | 592 | | | | 3,220 | |
Eventbrite, Inc. — Class A* | | | 587 | | | | 3,217 | |
Grindr, Inc.* | | | 311 | | | | 3,150 | |
Clearfield, Inc.* | | | 99 | | | | 3,053 | |
EverQuote, Inc. — Class A* | | | 161 | | | | 2,988 | |
Advantage Solutions, Inc.* | | | 659 | | | | 2,853 | |
AMC Networks, Inc. — Class A* | | | 234 | | | | 2,838 | |
Boston Omaha Corp. — Class A* | | | 176 | | | | 2,721 | |
Gannett Company, Inc.* | | | 1,095 | | | | 2,672 | |
ATN International, Inc. | | | 83 | | | | 2,615 | |
AST SpaceMobile, Inc.* | | | 858 | | | | 2,488 | |
Nextdoor Holdings, Inc.* | | | 1,104 | | | | 2,484 | |
Consolidated Communications Holdings, Inc.* | | | 565 | | | | 2,441 | |
Preformed Line Products Co. | | | 18 | | | | 2,316 | |
Applied Digital Corp.*,1 | | | 518 | | | | 2,217 | |
Spok Holdings, Inc. | | | 135 | | | | 2,153 | |
1-800-Flowers.com, Inc. — Class A* | | | 198 | | | | 2,144 | |
Ribbon Communications, Inc.* | | | 668 | | | | 2,138 | |
CommScope Holding Company, Inc.* | | | 1,573 | | | | 2,061 | |
Liberty Latin America Ltd. — Class A* | | | 272 | | | | 1,896 | |
EW Scripps Co. — Class A* | | | 452 | | | | 1,776 | |
Stitch Fix, Inc. — Class A* | | | 641 | | | | 1,692 | |
iHeartMedia, Inc. — Class A* | | | 779 | | | | 1,628 | |
Ooma, Inc.* | | | 181 | | | | 1,544 | |
OptimizeRx Corp.* | | | 126 | | | | 1,531 | |
WideOpenWest, Inc.* | | | 385 | | | | 1,394 | |
Tucows, Inc. — Class A* | | | 75 | | | | 1,392 | |
Nerdy, Inc.* | | | 450 | | | | 1,310 | |
Blade Air Mobility, Inc.* | | | 445 | | | | 1,268 | |
BlackSky Technology, Inc.* | | | 899 | | | | 1,223 | |
Lands’ End, Inc.* | | | 112 | | | | 1,220 | |
BARK, Inc.* | | | 809 | | | | 1,003 | |
Townsquare Media, Inc. — Class A | | | 88 | | | | 966 | |
ContextLogic, Inc. — Class A* | | | 167 | | | | 950 | |
Terran Orbital Corp.* | | | 647 | | | | 848 | |
DHI Group, Inc.* | | | 325 | | | | 829 | |
Mondee Holdings, Inc.*,1 | | | 344 | | | | 795 | |
Luna Innovations, Inc.* | | | 244 | | | | 782 | |
Entravision Communications Corp. — Class A | | | 457 | | | | 750 | |
Gambling.com Group Ltd.* | | | 81 | | | | 740 | |
KVH Industries, Inc.* | | | 142 | | | | 724 | |
CarParts.com, Inc.* | | | 403 | | | | 653 | |
Allbirds, Inc. — Class A* | | | 721 | | | | 500 | |
Cambium Networks Corp.* | | | 92 | | | | 396 | |
Solo Brands, Inc. — Class A* | | | 167 | | | | 362 | |
Value Line, Inc. | | | 6 | | | | 243 | |
DZS, Inc.* | | | 165 | | | | 218 | |
Urban One, Inc.* | | | 93 | | | | 190 | |
Urban One, Inc.* | | | 61 | | | | 165 | |
Focus Universal, Inc.* | | | 1 | | | | — | |
Total Communications | | | | | | | 650,336 | |
| | | | | | | | | |
Utilities - 1.4% |
Southwest Gas Holdings, Inc. | | | 469 | | | | 35,705 | |
Brookfield Infrastructure Corp. — Class A | | | 897 | | | | 32,328 | |
Portland General Electric Co. | | | 761 | | | | 31,962 | |
New Jersey Resources Corp. | | | 727 | | | | 31,195 | |
Black Hills Corp. | | | 506 | | | | 27,628 | |
Ormat Technologies, Inc. | | | 406 | | | | 26,873 | |
Otter Tail Corp. | | | 309 | | | | 26,698 | |
ONE Gas, Inc. | | | 413 | | | | 26,651 | |
ALLETE, Inc. | | | 432 | | | | 25,765 | |
PNM Resources, Inc. | | | 641 | | | | 24,127 | |
Spire, Inc. | | | 391 | | | | 23,996 | |
Northwestern Energy Group, Inc. | | | 457 | | | | 23,275 | |
MGE Energy, Inc. | | | 273 | | | | 21,491 | |
Avista Corp. | | | 573 | | | | 20,066 | |
American States Water Co. | | | 277 | | | | 20,010 | |
California Water Service Group | | | 425 | | | | 19,754 | |
Chesapeake Utilities Corp. | | | 162 | | | | 17,382 | |
SJW Group | | | 235 | | | | 13,299 | |
Northwest Natural Holding Co. | | | 273 | | | | 10,161 | |
Middlesex Water Co. | | | 133 | | | | 6,983 | |
Unitil Corp. | | | 121 | | | | 6,334 | |
Ameresco, Inc. — Class A* | | | 244 | | | | 5,888 | |
York Water Co. | | | 108 | | | | 3,917 | |
Consolidated Water Company Ltd. | | | 114 | | | | 3,341 | |
Artesian Resources Corp. — Class A | | | 63 | | | | 2,338 | |
Altus Power, Inc.* | | | 485 | | | | 2,318 | |
Genie Energy Ltd. — Class B | | | 150 | | | | 2,262 | |
RGC Resources, Inc. | | | 61 | | | | 1,235 | |
Global Water Resources, Inc. | | | 86 | | | | 1,104 | |
FTC Solar, Inc.* | | | 483 | | | | 260 | |
Total Utilities | | | | | | | 494,346 | |
| | | | | | | | | |
Government - 0.0% |
Banco Latinoamericano de Comercio Exterior S.A. — Class E | | | 209 | | | | 6,191 | |
| | | | | | | | | |
Total Common Stocks | | | | |
(Cost $19,356,193) | | | | | | | 19,933,792 | |
| | | | | | | | | |
RIGHTS† - 0.0% |
Consumer, Non-cyclical - 0.0% |
Cartesian Therapeutics Inc.* | | | 881 | | | | — | |
Oncternal Therapeutics, Inc.*, ††† | | | 7 | | | | — | |
Tobira Therapeutics, Inc.*,††† | | | 141 | | | | — | |
Novartis AG*,††† | | | 429 | | | | — | |
Total Consumer, Non-cyclical | | | | | | | — | |
| | | | | | | | | |
Energy - 0.0% |
Empire Petroleum Corp. | | | | | | | | |
Expires 04/03/24 | | | 75 | | | | — | |
| | | | | | | | | |
SEE NOTES TO FINANCIAL STATEMENTS. | THE RYDEX FUNDS ANNUAL REPORT | 135 |
SCHEDULE OF INVESTMENTS (continued) | March 31, 2024 |
RUSSELL 2000® FUND | |
| | Shares | | | Value | |
Industrial - 0.0% |
INNOVATE Corp. | | | | | | | | |
Expires 03/25/24†† | | | 339 | | | $ | — | |
Total Rights | | | | |
(Cost $271) | | | | | | | — | |
| | | | | | | | | |
EXCHANGE-TRADED FUNDS† - 7.4% |
Vanguard Russell 2000 ETF1 | | | 15,743 | | | | 1,339,099 | |
iShares Russell 2000 Index ETF | | | 6,356 | | | | 1,336,667 | |
Total Exchange-Traded Funds | | | | |
(Cost $2,799,130) | | | | | | | 2,675,766 | |
| | | | | | | | | |
| | | Face
Amount | | | | | |
U.S. TREASURY BILLS†† - 3.1% |
U.S. Treasury Bills |
5.27% due 04/23/242 | | $ | 700,000 | | | | 697,746 | |
5.25% due 04/23/242,3 | | | 300,000 | | | | 299,034 | |
5.26% due 04/23/242 | | | 100,000 | | | | 99,678 | |
5.17% due 04/16/242,4 | | | 19,000 | | | | 18,958 | |
Total U.S. Treasury Bills | | | | |
(Cost $1,115,420) | | | | | | | 1,115,416 | |
| | | | | | | | | |
REPURCHASE AGREEMENTS††,5 - 33.2% |
J.P. Morgan Securities LLC
issued 03/28/24 at 5.31%
due 04/01/243 | | | 6,933,739 | | | | 6,933,739 | |
BofA Securities, Inc.
issued 03/28/24 at 5.31%
due 04/01/243 | | | 2,666,823 | | | | 2,666,823 | |
Barclays Capital, Inc.
issued 03/28/24 at 5.30%
due 04/01/243 | | | 2,417,244 | | | | 2,417,244 | |
Total Repurchase Agreements | | | | |
(Cost $12,017,806) | | | | | | | 12,017,806 | |
| | | | | | | | | |
SECURITIES LENDING COLLATERAL†,6 - 3.5% |
Money Market Fund | | | | | | | | |
First American Government Obligations Fund - Class X, 5.23%7 | | | 1,273,415 | | | $ | 1,273,415 | |
Total Securities Lending Collateral | | | | |
(Cost $1,273,415) | | | | | | | 1,273,415 | |
| | | | | | | | | |
Total Investments - 102.4% | | | | |
(Cost $36,562,235) | | $ | 37,016,195 | |
Other Assets & Liabilities, net - (2.4)% | | | (869,255 | ) |
Total Net Assets - 100.0% | | $ | 36,146,940 | |
Futures Contracts |
Description | | Number of
Contracts | | | Expiration
Date | | | Notional
Amount | | | Value and
Unrealized
Appreciation** | |
Equity Futures Contracts Purchased† |
Russell 2000 Index Mini Futures Contracts | | | 35 | | | | Jun 2024 | | | $ | 3,753,925 | | | $ | 71,653 | |
136 | THE RYDEX FUNDS ANNUAL REPORT | SEE NOTES TO FINANCIAL STATEMENTS. |
SCHEDULE OF INVESTMENTS (continued) | March 31, 2024 |
RUSSELL 2000® FUND | |
Total Return Swap Agreements |
Counterparty | Index | Type | | Financing
Rate | | Payment
Frequency | | | Maturity
Date | | | Units | | | Notional
Amount | | | Value and
Unrealized
Appreciation | |
OTC Equity Index Swap Agreements†† |
Barclays Bank plc | Russell 2000 Index | Pay | | 5.78% (SOFR +
0.45%) | | | At Maturity | | | | 06/25/24 | | 2,006 | | $ | 4,262,699 | | | $ | 148,512 | |
Goldman Sachs International | Russell 2000 Index | Pay | | 5.43% (Federal
Funds Rate +
0.10%) | | | At Maturity | | | | 06/26/24 | | 1,807 | | | 3,839,198 | | | | 85,452 | |
BNP Paribas | Russell 2000 Index | Pay | | 5.53% (Federal
Funds Rate +
0.20%) | | | At Maturity | | | | 06/26/24 | | 811 | | | 1,723,977 | | | | 39,580 | |
| | | | | | | | | | | | | | | | | | | $ | 9,825,874 | | | $ | 273,544 | |
* | Non-income producing security. |
** | Includes cumulative appreciation (depreciation). Variation margin is reported within the Statement of Assets and Liabilities. |
† | Value determined based on Level 1 input, unless otherwise noted— See Note 4. |
†† | Value determined based on Level 2 inputs — See Note 4. |
††† | Value determined based on Level 3 inputs — See Note 4. |
1 | All or a portion of this security is on loan at March 31, 2024 — See Note 7. |
2 | Rate indicated is the effective yield at the time of purchase. |
3 | All or a portion of this security is pledged as equity index swap collateral at March 31, 2024. |
4 | All or a portion of this security is pledged as futures collateral at March 31, 2024. |
5 | Repurchase Agreements — See Note 6. |
6 | Securities lending collateral — See Note 7. |
7 | Rate indicated is the 7-day yield as of March 31, 2024. |
| | plc — Public Limited Company |
| | REIT — Real Estate Investment Trust |
| | SOFR — Secured Overnight Financing Rate |
| | |
| | See Sector Classification in Other Information section. |
SEE NOTES TO FINANCIAL STATEMENTS. | THE RYDEX FUNDS ANNUAL REPORT | 137 |
SCHEDULE OF INVESTMENTS (concluded) | March 31, 2024 |
RUSSELL 2000® FUND | |
The following table summarizes the inputs used to value the Fund’s investments at March 31, 2024 (See Note 4 in the Notes to Financial Statements):
Investments in Securities (Assets) | | Level 1
Quoted
Prices | | | Level 2
Significant
Observable
Inputs | | | Level 3
Significant
Unobservable
Inputs | | | Total | |
Common Stocks | | $ | 19,933,792 | | | $ | — | * | | $ | — | | | $ | 19,933,792 | |
Rights | | | — | | | | — | * | | | — | * | | | — | |
Exchange-Traded Funds | | | 2,675,766 | | | | — | | | | — | | | | 2,675,766 | |
U.S. Treasury Bills | | | — | | | | 1,115,416 | | | | — | | | | 1,115,416 | |
Repurchase Agreements | | | — | | | | 12,017,806 | | | | — | | | | 12,017,806 | |
Securities Lending Collateral | | | 1,273,415 | | | | — | | | | — | | | | 1,273,415 | |
Equity Futures Contracts** | | | 71,653 | | | | — | | | | — | | | | 71,653 | |
Equity Index Swap Agreements** | | | — | | | | 273,544 | | | | — | | | | 273,544 | |
Total Assets | | $ | 23,954,626 | | | $ | 13,406,766 | | | $ | — | | | $ | 37,361,392 | |
* | Security has a market value of $0. |
** | This derivative is reported as unrealized appreciation/depreciation at period end. |
138 | THE RYDEX FUNDS ANNUAL REPORT | SEE NOTES TO FINANCIAL STATEMENTS. |
STATEMENT OF ASSETS AND LIABILITIES |
March 31, 2024 |
Assets: |
Investments, at value - including $1,196,314 of securities loaned (cost $24,544,429) | | $ | 24,998,389 | |
Repurchase agreements, at value (cost $12,017,806) | | | 12,017,806 | |
Cash | | | 22,491 | |
Segregated cash with broker | | | 208,647 | |
Unrealized appreciation on OTC swap agreements | | | 273,544 | |
Receivables: |
Swap settlement | | | 145,763 | |
Fund shares sold | | | 58,980 | |
Dividends | | | 19,328 | |
Securities sold | | | 15,979 | |
Variation margin on futures contracts | | | 11,725 | |
Interest | | | 7,088 | |
Securities lending income | | | 1,462 | |
Total assets | | | 37,781,202 | |
| | | | | |
Liabilities: |
Segregated cash due to broker | | | 280,000 | |
Payable for: |
Return of securities lending collateral | | | 1,273,415 | |
Management fees | | | 20,989 | |
Transfer agent fees | | | 12,900 | |
Distribution and service fees | | | 8,400 | |
Fund shares redeemed | | | 6,718 | |
Portfolio accounting and administration fees | | | 4,338 | |
Trustees’ fees* | | | 282 | |
Miscellaneous | | | 27,220 | |
Total liabilities | | | 1,634,262 | |
Net assets | | $ | 36,146,940 | |
| | | | | |
Net assets consist of: |
Paid in capital | | $ | 38,237,568 | |
Total distributable earnings (loss) | | | (2,090,628 | ) |
Net assets | | $ | 36,146,940 | |
Class A: |
Net assets | | $ | 7,183,922 | |
Capital shares outstanding | | | 138,661 | |
Net asset value per share | | $ | 51.81 | |
Maximum offering price per share (Net asset value divided by 95.25%) | | $ | 54.39 | |
Class C: |
Net assets | | $ | 3,929,969 | |
Capital shares outstanding | | | 90,235 | |
Net asset value per share | | $ | 43.55 | |
Class H: |
Net assets | | $ | 25,033,049 | |
Capital shares outstanding | | | 484,351 | |
Net asset value per share | | $ | 51.68 | |
STATEMENT OF OPERATIONS |
Year Ended March 31, 2024 |
Investment Income: |
Dividends (net of foreign withholding tax of $397) | | $ | 279,184 | |
Interest | | | 392,104 | |
Income from securities lending, net | | | 20,869 | |
Total investment income | | | 692,157 | |
| | | | | |
Expenses: |
Management fees | | | 204,470 | |
Distribution and service fees: |
Class A | | | 12,860 | |
Class C | | | 15,067 | |
Class H | | | 51,527 | |
Transfer agent fees | | | 61,355 | |
Portfolio accounting and administration fees | | | 55,881 | |
Registration fees | | | 23,793 | |
Professional fees | | | 13,748 | |
Custodian fees | | | 4,941 | |
Trustees’ fees* | | | 4,237 | |
Interest expense | | | 1,409 | |
Miscellaneous | | | 17,119 | |
Total expenses | | | 466,407 | |
Less: |
Expenses reimbursed by Adviser | | | (9,583 | ) |
Net expenses | | | 456,824 | |
Net investment income | | | 235,333 | |
| | | | | |
Net Realized and Unrealized Gain (Loss): |
Net realized gain (loss) on: |
Investments | | | (29,436 | ) |
Swap agreements | | | 183,056 | |
Futures contracts | | | 43,852 | |
Net realized gain | | | 197,472 | |
Net change in unrealized appreciation (depreciation) on: |
Investments | | | 3,500,648 | |
Swap agreements | | | 231,902 | |
Futures contracts | | | 63,533 | |
Net change in unrealized appreciation (depreciation) | | | 3,796,083 | |
Net realized and unrealized gain | | | 3,993,555 | |
Net increase in net assets resulting from operations | | $ | 4,228,888 | |
* | Relates to Trustees not deemed “interested persons” within the meaning of Section 2(a)(19) of the 1940 Act. |
SEE NOTES TO FINANCIAL STATEMENTS. | THE RYDEX FUNDS ANNUAL REPORT | 139 |
STATEMENTS OF CHANGES IN NET ASSETS |
| | Year Ended
March 31,
2024 | | | Year Ended
March 31,
2023 | |
Increase (Decrease) in Net Assets from Operations: | | | | | | | | |
Net investment income | | $ | 235,333 | | | $ | 44,990 | |
Net realized gain (loss) on investments | | | 197,472 | | | | (2,609,582 | ) |
Net change in unrealized appreciation (depreciation) on investments | | | 3,796,083 | | | | (1,680,165 | ) |
Net increase (decrease) in net assets resulting from operations | | | 4,228,888 | | | | (4,244,757 | ) |
| | | | | | | | | |
Distributions to shareholders: | | | | | | | | |
Class A | | | (9,693 | ) | | | — | |
Class C | | | (3,174 | ) | | | — | |
Class H | | | (46,037 | ) | | | — | |
Total distributions to shareholders | | | (58,904 | ) | | | — | |
| | | | | | | | | |
Capital share transactions: | | | | | | | | |
Proceeds from sale of shares | | | | | | | | |
Class A | | | 12,021,235 | | | | 15,034,155 | |
Class C | | | 2,714,592 | | | | 287,217 | |
Class H | | | 67,073,724 | | | | 20,564,801 | |
Distributions reinvested | | | | | | | | |
Class A | | | 9,570 | | | | — | |
Class C | | | 2,469 | | | | — | |
Class H | | | 46,005 | | | | — | |
Cost of shares redeemed | | | | | | | | |
Class A | | | (9,294,688 | ) | | | (15,994,733 | ) |
Class C | | | (553,562 | ) | | | (390,831 | ) |
Class H | | | (61,143,883 | ) | | | (20,271,844 | ) |
Net increase (decrease) from capital share transactions | | | 10,875,462 | | | | (771,235 | ) |
Net increase (decrease) in net assets | | | 15,045,446 | | | | (5,015,992 | ) |
| | | | | | | | | |
Net assets: | | | | | | | | |
Beginning of year | | | 21,101,494 | | | | 26,117,486 | |
End of year | | $ | 36,146,940 | | | $ | 21,101,494 | |
| | | | | | | | | |
Capital share activity: | | | | | | | | |
Shares sold | | | | | | | | |
Class A | | | 258,409 | | | | 339,145 | |
Class C | | | 63,825 | | | | 7,559 | |
Class H | | | 1,423,771 | | | | 453,292 | |
Shares issued from reinvestment of distributions | | | | | | | | |
Class A | | | 209 | | | | — | |
Class C | | | 64 | | | | — | |
Class H | | | 1,005 | | | | — | |
Shares redeemed | | | | | | | | |
Class A | | | (206,292 | ) | | | (366,931 | ) |
Class C | | | (14,751 | ) | | | (10,500 | ) |
Class H | | | (1,298,866 | ) | | | (459,644 | ) |
Net increase (decrease) in shares | | | 227,374 | | | | (37,079 | ) |
140 | THE RYDEX FUNDS ANNUAL REPORT | SEE NOTES TO FINANCIAL STATEMENTS. |
This table is presented to show selected data for a share outstanding throughout each period and to assist shareholders in evaluating a Fund’s performance for the periods presented.
Class A | | Year Ended
March 31,
2024 | | | Year Ended
March 31,
2023 | | | Year Ended
March 31,
2022 | | | Year Ended
March 31,
2021 | | | Year Ended
March 31,
2020 | |
Per Share Data |
Net asset value, beginning of period | | $ | 44.08 | | | $ | 50.66 | | | $ | 61.82 | | | $ | 32.24 | | | $ | 43.81 | |
Income (loss) from investment operations: |
Net investment income (loss)a | | | .40 | | | | .13 | | | | (.69 | ) | | | (.77 | ) | | | — | e |
Net gain (loss) on investments (realized and unrealized) | | | 7.42 | | | | (6.71 | ) | | | (3.41 | ) | | | 30.35 | | | | (10.89 | ) |
Total from investment operations | | | 7.82 | | | | (6.58 | ) | | | (4.10 | ) | | | 29.58 | | | | (10.89 | ) |
Less distributions from: |
Net investment income | | | (.09 | ) | | | — | | | | — | | | | — | | | | (.01 | ) |
Net realized gains | | | — | | | | — | | | | (7.06 | ) | | | — | | | | (.67 | ) |
Total distributions | | | (.09 | ) | | | — | | | | (7.06 | ) | | | — | | | | (.68 | ) |
Net asset value, end of period | | $ | 51.81 | | | $ | 44.08 | | | $ | 50.66 | | | $ | 61.82 | | | $ | 32.24 | |
|
Total Returnb | | | 17.77 | % | | | (12.99 | %) | | | (7.29 | %) | | | 91.75 | % | | | (25.32 | %) |
Ratios/Supplemental Data |
Net assets, end of period (in thousands) | | $ | 7,184 | | | $ | 3,806 | | | $ | 5,781 | | | $ | 12,421 | | | $ | 10,712 | |
Ratios to average net assets: |
Net investment income (loss) | | | 0.87 | % | | | 0.28 | % | | | (1.14 | %) | | | (1.53 | %) | | | — | f |
Total expensesc | | | 1.66 | % | | | 1.65 | % | | | 1.60 | % | | | 1.67 | % | | | 1.73 | % |
Net expensesd | | | 1.63 | % | | | 1.65 | % | | | 1.60 | % | | | 1.67 | % | | | 1.73 | % |
Portfolio turnover rate | | | 12 | % | | | 25 | % | | | 76 | % | | | — | | | | 35 | % |
Class C | | Year Ended
March 31,
2024 | | | Year Ended
March 31,
2023 | | | Year Ended
March 31,
2022 | | | Year Ended
March 31,
2021 | | | Year Ended
March 31,
2020 | |
Per Share Data |
Net asset value, beginning of period | | $ | 37.35 | | | $ | 43.24 | | | $ | 54.24 | | | $ | 28.50 | | | $ | 39.09 | |
Income (loss) from investment operations: |
Net investment income (loss)a | | | .05 | | | | (.21 | ) | | | (.98 | ) | | | (.95 | ) | | | (.29 | ) |
Net gain (loss) on investments (realized and unrealized) | | | 6.24 | | | | (5.68 | ) | | | (2.96 | ) | | | 26.69 | | | | (9.62 | ) |
Total from investment operations | | | 6.29 | | | | (5.89 | ) | | | (3.94 | ) | | | 25.74 | | | | (9.91 | ) |
Less distributions from: |
Net investment income | | | (.09 | ) | | | — | | | | — | | | | — | | | | (.01 | ) |
Net realized gains | | | — | | | | — | | | | (7.06 | ) | | | — | | | | (.67 | ) |
Total distributions | | | (.09 | ) | | | — | | | | (7.06 | ) | | | — | | | | (.68 | ) |
Net asset value, end of period | | $ | 43.55 | | | $ | 37.35 | | | $ | 43.24 | | | $ | 54.24 | | | $ | 28.50 | |
|
Total Returnb | | | 16.91 | % | | | (13.62 | %) | | | (8.05 | %) | | | 90.32 | % | | | (25.88 | %) |
Ratios/Supplemental Data |
Net assets, end of period (in thousands) | | $ | 3,930 | | | $ | 1,535 | | | $ | 1,904 | | | $ | 3,717 | | | $ | 1,590 | |
Ratios to average net assets: |
Net investment income (loss) | | | 0.12 | % | | | (0.56 | %) | | | (1.89 | %) | | | (2.28 | %) | | | (0.74 | %) |
Total expensesc | | | 2.42 | % | | | 2.40 | % | | | 2.36 | % | | | 2.43 | % | | | 2.48 | % |
Net expensesd | | | 2.38 | % | | | 2.40 | % | | | 2.36 | % | | | 2.43 | % | | | 2.48 | % |
Portfolio turnover rate | | | 12 | % | | | 25 | % | | | 76 | % | | | — | | | | 35 | % |
SEE NOTES TO FINANCIAL STATEMENTS. | THE RYDEX FUNDS ANNUAL REPORT | 141 |
FINANCIAL HIGHLIGHTS (concluded) |
This table is presented to show selected data for a share outstanding throughout each period and to assist shareholders in evaluating a Fund’s performance for the periods presented.
Class H | | Year Ended
March 31,
2024 | | | Year Ended
March 31,
2023 | | | Year Ended
March 31,
2022 | | | Year Ended
March 31,
2021 | | | Year Ended
March 31,
2020 | |
Per Share Data |
Net asset value, beginning of period | | $ | 43.97 | | | $ | 50.53 | | | $ | 61.68 | | | $ | 32.17 | | | $ | 43.70 | |
Income (loss) from investment operations: |
Net investment income (loss)a | | | .42 | | | | .09 | | | | (.66 | ) | | | (.75 | ) | | | .01 | |
Net gain (loss) on investments (realized and unrealized) | | | 7.38 | | | | (6.65 | ) | | | (3.43 | ) | | | 30.26 | | | | (10.86 | ) |
Total from investment operations | | | 7.80 | | | | (6.56 | ) | | | (4.09 | ) | | | 29.51 | | | | (10.85 | ) |
Less distributions from: |
Net investment income | | | (.09 | ) | | | — | | | | — | | | | — | | | | (.01 | ) |
Net realized gains | | | — | | | | — | | | | (7.06 | ) | | | — | | | | (.67 | ) |
Total distributions | | | (.09 | ) | | | — | | | | (7.06 | ) | | | — | | | | (.68 | ) |
Net asset value, end of period | | $ | 51.68 | | | $ | 43.97 | | | $ | 50.53 | | | $ | 61.68 | | | $ | 32.17 | |
|
Total Return | | | 17.77 | % | | | (12.98 | %) | | | (7.29 | %) | | | 91.73 | % | | | (25.30 | %) |
Ratios/Supplemental Data |
Net assets, end of period (in thousands) | | $ | 25,033 | | | $ | 15,761 | | | $ | 18,432 | | | $ | 29,743 | | | $ | 6,731 | |
Ratios to average net assets: |
Net investment income (loss) | | | 0.92 | % | | | 0.21 | % | | | (1.12 | %) | | | (1.52 | %) | | | 0.01 | % |
Total expensesc | | | 1.67 | % | | | 1.65 | % | | | 1.61 | % | | | 1.67 | % | | | 1.73 | % |
Net expensesd | | | 1.63 | % | | | 1.65 | % | | | 1.61 | % | | | 1.67 | % | | | 1.73 | % |
Portfolio turnover rate | | | 12 | % | | | 25 | % | | | 76 | % | | | — | | | | 35 | % |
a | Net investment income (loss) per share was computed using average shares outstanding throughout the period. |
b | Total return does not reflect the impact of any applicable sales charges. |
c | Does not include expenses of the underlying funds in which the Fund invests. |
d | Net expense information reflects the expense ratios after expense waivers and reimbursements, as applicable. |
e | Less than $0.01 per share. |
f | Less than 0.01% |
142 | THE RYDEX FUNDS ANNUAL REPORT | SEE NOTES TO FINANCIAL STATEMENTS. |
PERFORMANCE REPORT AND FUND PROFILE (Unaudited) | March 31, 2024 |
INVERSE RUSSELL 2000® STRATEGY FUND
OBJECTIVE: Seeks to provide investment results that match, before fees and expenses, the performance of a specific benchmark on a daily basis. The Fund’s current benchmark is the inverse (opposite) of the performance of the Russell 2000® Index (the “underlying index”). The Fund does not seek to achieve its investment objective over a period of time greater than one day.
For the Reporting Period, the Inverse Russell 2000® Strategy Fund maintained a daily correlation of over 99% to its benchmark of -100% of the daily price movement of the Russell 2000 Index. The Fund Class H returned -11.70%, while the Russell 2000 Index returned 19.71% over the same time period.
The sectors that contributed the most to the return of the underlying index were Industrials, Information Technology, and Financials. The only sectors that detracted were Utilities and Communication Services.
The holdings that contributed the most to the return of the underlying index were Super Micro Computer, Inc., MicroStrategy, Inc. – Class A, and ImmunoGen, Inc. Those that detracted the most were Fox Factory Holding Corp., Revance Therapeutics, Inc., and Arcadium Lithium Plc.
Derivatives in the Fund were used to help provide exposure to the composition of the benchmark in the highest efficient manner and to provide leverage and not for hedging purposes. Derivatives performed as expected.
Due to the compounding of daily returns, the Fund’s returns over periods other than one day will likely differ in amount and possibly direction from the benchmark return for the same period. Investors should monitor their Fund holdings to ensure that they are consistent with their strategies, as frequently as daily.
The effects of compounding may cause the longer-term correlation of the Fund to its benchmark to diminish. A significant contributor to the discrepancy between the leveraged and unleveraged indices is the effect of compounding on the leveraged index, which is discussed under “A Brief Note on the Compounding of Returns” on page 6.
The Fund may invest in certain of the underlying series of Guggenheim Funds Trust and Guggenheim Strategy Funds Trust, including Guggenheim Ultra Short Duration, Guggenheim Strategy Fund II, and Guggenheim Strategy Fund III (collectively, the “Short Term Investment Vehicles”), each of which are open-end management investment companies managed by Guggenheim Investments. The Short Term Investment Vehicles, which launched on March 11, 2014, are offered as short term investment options only to mutual funds, trusts, and other accounts managed by Guggenheim Investments and/or its affiliates, and are not available to the public, with the exception of Guggenheim Ultra Short Duration Fund, which is available to the public. Guggenheim Strategy Fund II and Guggenheim Strategy Fund III do not charge an investment management fee. Guggenheim Ultra Short Duration Fund charges an investment management fee, but the Fund’s adviser has agreed to waive fees to the extent necessary to offset the proportionate share of any management fee paid by the Fund with respect to its investment in such affiliated fund. For the Reporting Period, investment in the Short Term Investment Vehicles contributed to Fund performance.
Performance displayed represents past performance, which is no guarantee of future results.
Holdings Diversification (Market Exposure as % of Net Assets)
“Holdings Diversification (Market Exposure as % of Net Assets)” excludes any temporary cash investments, investments in Guggenheim Strategy Funds Trust mutual funds, or investments in Guggenheim Ultra Short Duration Fund. Investments in those Funds do not provide “market exposure” to meet the Fund’s investment objective, but will significantly increase the portfolio’s exposure to certain other asset categories (and their associated risks), which may cause the Fund to deviate from its principal investment strategy, including: (i) high yield, high risk debt securities rated below the top four long-term rating categories by a nationally recognized statistical rating organization (also known as “junk bonds”); (ii) securities issued by the U.S. government or its agencies and instrumentalities; (iii) CLOs and similar investments; and (iv) other short-term fixed income securities.
| | THE RYDEX FUNDS ANNUAL REPORT | 143 |
PERFORMANCE REPORT AND FUND PROFILE (Unaudited)(concluded) | March 31, 2024 |
Inception Dates: |
Class A | March 31, 2004 |
Class C | February 20, 2004 |
Class H | February 20, 2004 |
Cumulative Fund Performance*
The Fund invests principally in derivative investments such as swap agreements and futures contracts.
Largest Holdings | % of Total Net Assets |
Guggenheim Ultra Short Duration Fund — Institutional Class | 19.9% |
Guggenheim Strategy Fund II | 19.9% |
Total | 39.8% |
| | |
“Largest Holdings” excludes any temporary cash or derivative investments. |
Average Annual Returns*
Periods Ended March 31, 2024
| 1 Year | 5 Year | 10 Year |
Class A Shares | (11.70%) | (12.11%) | (10.65%) |
Class A Shares with sales charge† | (15.89%) | (12.96%) | (11.08%) |
Class C Shares | (12.35%) | (12.76%) | (11.32%) |
Class C Shares with CDSC‡ | (13.15%) | (12.76%) | (11.32%) |
Class H Shares | (11.70%) | (12.10%) | (10.64%) |
Russell 2000 Index | 19.71% | 8.10% | 9.03% |
* | The performance data above represents past performance that is not predictive of future results. The investment return and principal value of an investment in the Fund will fluctuate so that an investor’s shares, when redeemed, may be worth more or less than their original cost. Returns are historical and include changes in principal and reinvested dividends and capital gains and do not reflect the effect of taxes. The Russell 2000 Index is an unmanaged index and, unlike the Fund, has no management fees or operating expenses to reduce its reported return. The graphs are based on Class A shares and Class H shares only; performance for Class C shares will vary due to differences in fee structures. |
† | Fund returns are calculated using the maximum sales charge of 4.75%. |
‡ | Fund returns include a CDSC of 1% if redeemed within 12 months of purchase. |
144 | THE RYDEX FUNDS ANNUAL REPORT | |
SCHEDULE OF INVESTMENTS | March 31, 2024 |
INVERSE RUSSELL 2000® STRATEGY FUND | |
| | Shares | | | Value | |
MUTUAL FUNDS† - 39.8% |
Guggenheim Ultra Short Duration Fund — Institutional Class1 | | | 44,544 | | | $ | 441,426 | |
Guggenheim Strategy Fund II1 | | | 17,889 | | | | 440,079 | |
Total Mutual Funds | | | | |
(Cost $868,958) | | | | | | | 881,505 | |
| | | Face
Amount | | | | | |
U.S. TREASURY BILLS†† - 0.6% |
U.S. Treasury Bills |
5.17% due 04/16/242 | | $ | 13,000 | | | | 12,972 | |
Total U.S. Treasury Bills | | | | |
(Cost $12,972) | | | | | | | 12,972 | |
| | | | | | | | | |
REPURCHASE AGREEMENTS††,3 - 75.1% |
J.P. Morgan Securities LLC
issued 03/28/24 at 5.31%
due 04/01/244 | | | 959,793 | | | | 959,793 | |
BofA Securities, Inc.
issued 03/28/24 at 5.31%
due 04/01/244 | | | 369,151 | | | | 369,151 | |
Barclays Capital, Inc.
issued 03/28/24 at 5.30%
due 04/01/244 | | | 334,603 | | | | 334,603 | |
Total Repurchase Agreements | | | | |
(Cost $1,663,547) | | | | | | | 1,663,547 | |
| | | | | | | | | |
Total Investments - 115.5% | | | | |
(Cost $2,545,477) | | $ | 2,558,024 | |
Other Assets & Liabilities, net - (15.5)% | | | (343,054 | ) |
Total Net Assets - 100.0% | | $ | 2,214,970 | |
Total Return Swap Agreements |
Counterparty | Index | Type | | Financing
Rate | | Payment
Frequency | | | Maturity
Date | | | Units | | | Notional
Amount | | | Value and
Unrealized
Depreciation | |
OTC Equity Index Swap Agreements Sold Short†† |
Barclays Bank plc | Russell 2000 Index | Receive | | 5.38% (SOFR +
0.05%) | | | At Maturity | | | | 06/25/24 | | 168 | | $ | 356,662 | | | $ | (14,914 | ) |
BNP Paribas | Russell 2000 Index | Receive | | 5.13% (Federal
Funds Rate -
0.20%) | | | At Maturity | | | | 06/26/24 | | 320 | | | 679,792 | | | | (15,893 | ) |
Goldman Sachs International | Russell 2000 Index | Receive | | 5.18% (Federal
Funds Rate -
0.15%) | | | At Maturity | | | | 06/26/24 | | 546 | | | 1,159,644 | | | | (27,110 | ) |
| | | | | | | | | | | | | | | | | | | $ | 2,196,098 | | | $ | (57,917 | ) |
† | Value determined based on Level 1 inputs — See Note 4. |
†† | Value determined based on Level 2 inputs — See Note 4. |
1 | Affiliated issuer. |
2 | Rate indicated is the effective yield at the time of purchase. |
3 | Repurchase Agreements — See Note 6. |
4 | All or a portion of this security is pledged as equity index swap collateral at March 31, 2024. |
| | plc — Public Limited Company |
| | SOFR — Secured Overnight Financing Rate |
| | |
| | See Sector Classification in Other Information section. |
SEE NOTES TO FINANCIAL STATEMENTS. | THE RYDEX FUNDS ANNUAL REPORT | 145 |
SCHEDULE OF INVESTMENTS (concluded) | March 31, 2024 |
INVERSE RUSSELL 2000® STRATEGY FUND | |
The following table summarizes the inputs used to value the Fund’s investments at March 31, 2024 (See Note 4 in the Notes to Financial Statements):
Investments in Securities (Assets) | | Level 1
Quoted
Prices | | | Level 2
Significant
Observable
Inputs | | | Level 3
Significant
Unobservable
Inputs | | | Total | |
Mutual Funds | | $ | 881,505 | | | $ | — | | | $ | — | | | $ | 881,505 | |
U.S. Treasury Bills | | | — | | | | 12,972 | | | | — | | | | 12,972 | |
Repurchase Agreements | | | — | | | | 1,663,547 | | | | — | | | | 1,663,547 | |
Total Assets | | $ | 881,505 | | | $ | 1,676,519 | | | $ | — | | | $ | 2,558,024 | |
Investments in Securities (Liabilities) | | Level 1
Quoted
Prices | | | Level 2
Significant
Observable
Inputs | | | Level 3
Significant
Unobservable
Inputs | | | Total | |
Equity Index Swap Agreements** | | $ | — | | | $ | 57,917 | | | $ | — | | | $ | 57,917 | |
** | This derivative is reported as unrealized appreciation/depreciation at period end. |
Affiliated Transactions
Investments representing 5% or more of the outstanding voting shares of a company, or control of or by, or common control under Guggenheim Investments (“GI”), result in that company being considered an affiliated issuer, as defined in the 1940 Act.
The Fund may invest in certain of the underlying series of Guggenheim Strategy Funds Trust, including Guggenheim Strategy Fund II and Guggenheim Strategy Fund III (collectively, the “Guggenheim Strategy Funds”), each of which are open-end management investment companies managed by GI. The Guggenheim Strategy Funds, which launched on March 11, 2014, are offered as short term investment options only to mutual funds, trusts, and other accounts managed by GI and/or its affiliates, and are not available to the public. The Guggenheim Strategy Funds pay no investment management fees. The Guggenheim Strategy Funds’ annual report on Form N-CSR dated September 30, 2023 is available publicly or upon request. This information is available from the EDGAR database on the SEC’s website at https://www.sec.gov/Archives/edgar/data/1601445/000182126823000217/gug86449-ncsr.htm. The Fund may invest in certain of the underlying series of Guggenheim Funds Trust, which are open-end management investment companies managed by GI, are available to the public and whose most recent annual report on Form N-CSR is available publicly or upon request.
Transactions during the year ended March 31, 2024, in which the company is an affiliated issuer, were as follows:
Security Name | | Value
03/31/23 | | | Additions | | | Reductions | | | Realized
Gain (Loss) | | | Change in
Unrealized
Appreciation
(Depreciation) | | | Value
03/31/24 | | | Shares
03/31/24 | | | Investment
Income | |
Mutual Funds | | | | | | | | | | | | | | | | | | | | | | | | | | | | | | | | |
Guggenheim Strategy Fund II | | $ | 946,618 | | | $ | — | | | $ | (515,000 | ) | | $ | (7,780 | ) | | $ | 16,241 | | | $ | 440,079 | | | | 17,889 | | | $ | 38,028 | |
Guggenheim Ultra Short Duration Fund — Institutional Class | | | 944,879 | | | | — | | | | (515,000 | ) | | | (7,484 | ) | | | 19,031 | | | | 441,426 | | | | 44,544 | | | | 36,849 | |
| | | $ | 1,891,497 | | | $ | — | | | $ | (1,030,000 | ) | | $ | (15,264 | ) | | $ | 35,272 | | | $ | 881,505 | | | | | | | $ | 74,877 | |
146 | THE RYDEX FUNDS ANNUAL REPORT | SEE NOTES TO FINANCIAL STATEMENTS. |
INVERSE RUSSELL 2000® STRATEGY FUND | |
STATEMENT OF ASSETS AND LIABILITIES |
March 31, 2024 |
Assets: |
Investments in unaffiliated issuers, at value (cost $12,972) | | $ | 12,972 | |
Investments in affiliated issuers, at value (cost $868,958) | | | 881,505 | |
Repurchase agreements, at value (cost $1,663,547) | | | 1,663,547 | |
Segregated cash with broker | | | 28,000 | |
Receivables: |
Dividends | | | 3,993 | |
Interest | | | 981 | |
Fund shares sold | | | 75 | |
Total assets | | | 2,591,073 | |
| | | | | |
Liabilities: |
Unrealized depreciation on OTC swap agreements | | | 57,917 | |
Payable for: |
Fund shares redeemed | | | 299,835 | |
Swap settlement | | | 12,274 | |
Management fees | | | 1,987 | |
Transfer agent fees | | | 1,020 | |
Distribution and service fees | | | 578 | |
Portfolio accounting and administration fees | | | 121 | |
Trustees’ fees* | | | 25 | |
Miscellaneous | | | 2,346 | |
Total liabilities | | | 376,103 | |
Net assets | | $ | 2,214,970 | |
| | | | | |
Net assets consist of: |
Paid in capital | | $ | 44,835,744 | |
Total distributable earnings (loss) | | | (42,620,774 | ) |
Net assets | | $ | 2,214,970 | |
Class A: |
Net assets | | $ | 366,065 | |
Capital shares outstanding | | | 7,429 | |
Net asset value per share | | $ | 49.28 | |
Maximum offering price per share (Net asset value divided by 95.25%) | | $ | 51.74 | |
Class C: |
Net assets | | $ | 138 | |
Capital shares outstanding | | | 3 | |
Net asset value per share | | $ | 41.76 | |
Class H: |
Net assets | | $ | 1,848,767 | |
Capital shares outstanding | | | 37,360 | |
Net asset value per share | | $ | 49.49 | |
STATEMENT OF OPERATIONS |
Year Ended March 31, 2024 |
Investment Income: |
Dividends from securities of affiliated issuers | | $ | 74,877 | |
Interest | | | 135,532 | |
Total investment income | | | 210,409 | |
| | | | | |
Expenses: |
Management fees | | | 35,621 | |
Distribution and service fees: |
Class A | | | 965 | |
Class C | | | 255 | |
Class H | | | 8,866 | |
Transfer agent fees | | | 8,612 | |
Portfolio accounting and administration fees | | | 6,033 | |
Registration fees | | | 4,882 | |
Professional fees | | | 1,684 | |
Trustees’ fees* | | | 907 | |
Custodian fees | | | 554 | |
Interest expense | | | 59 | |
Miscellaneous | | | 693 | |
Total expenses | | | 69,131 | |
Less: |
Expenses reimbursed by Adviser | | | (2,906 | ) |
Expenses waived by Adviser | | | (1,720 | ) |
Total waived/reimbursed expenses | | | (4,626 | ) |
Net expenses | | | 64,505 | |
Net investment income | | | 145,904 | |
| | | | | |
Net Realized and Unrealized Gain (Loss): |
Net realized gain (loss) on: |
Investments in affiliated issuers | | | (15,264 | ) |
Swap agreements | | | (613,528 | ) |
Futures contracts | | | 43,868 | |
Net realized loss | | | (584,924 | ) |
Net change in unrealized appreciation (depreciation) on: |
Investments in unaffiliated issuers | | | 4 | |
Investments in affiliated issuers | | | 35,272 | |
Swap agreements | | | 107,698 | |
Net change in unrealized appreciation (depreciation) | | | 142,974 | |
Net realized and unrealized loss | | | (441,950 | ) |
Net decrease in net assets resulting from operations | | $ | (296,046 | ) |
* | Relates to Trustees not deemed “interested persons” within the meaning of Section 2(a)(19) of the 1940 Act. |
SEE NOTES TO FINANCIAL STATEMENTS. | THE RYDEX FUNDS ANNUAL REPORT | 147 |
INVERSE RUSSELL 2000® STRATEGY FUND | |
STATEMENTS OF CHANGES IN NET ASSETS |
| | Year Ended
March 31,
2024 | | | Year Ended
March 31,
2023 | |
Increase (Decrease) in Net Assets from Operations: | | | | | | | | |
Net investment income | | $ | 145,904 | | | $ | 126,926 | |
Net realized loss on investments | | | (584,924 | ) | | | (909,496 | ) |
Net change in unrealized appreciation (depreciation) on investments | | | 142,974 | | | | (164,866 | ) |
Net decrease in net assets resulting from operations | | | (296,046 | ) | | | (947,436 | ) |
| | | | | | | | | |
Distributions to shareholders: | | | | | | | | |
Class A | | | (22,717 | ) | | | — | |
Class C | | | (871 | ) | | | — | |
Class H | | | (106,847 | ) | | | — | |
Total distributions to shareholders | | | (130,435 | ) | | | — | |
| | | | | | | | | |
Capital share transactions: | | | | | | | | |
Proceeds from sale of shares | | | | | | | | |
Class A | | | 611,136 | | | | 403,082 | |
Class C | | | 3,800 | | | | 117,157 | |
Class H | | | 18,993,823 | | | | 101,535,042 | |
Distributions reinvested | | | | | | | | |
Class A | | | 22,700 | | | | — | |
Class C | | | 871 | | | | — | |
Class H | | | 106,719 | | | | — | |
Cost of shares redeemed | | | | | | | | |
Class A | | | (707,833 | ) | | | (372,766 | ) |
Class C | | | (56,811 | ) | | | (85,772 | ) |
Class H | | | (22,343,474 | ) | | | (100,505,459 | ) |
Net increase (decrease) from capital share transactions | | | (3,369,069 | ) | | | 1,091,284 | |
Net increase (decrease) in net assets | | | (3,795,550 | ) | | | 143,848 | |
| | | | | | | | | |
Net assets: | | | | | | | | |
Beginning of year | | | 6,010,520 | | | | 5,866,672 | |
End of year | | $ | 2,214,970 | | | $ | 6,010,520 | |
| | | | | | | | | |
Capital share activity: | | | | | | | | |
Shares sold | | | | | | | | |
Class A | | | 11,015 | | | | 6,565 | |
Class C | | | 78 | | | | 2,169 | |
Class H | | | 318,605 | | | | 1,660,486 | |
Shares issued from reinvestment of distributions | | | | | | | | |
Class A | | | 413 | | | | — | |
Class C | | | 19 | | | | — | |
Class H | | | 1,933 | | | | — | |
Shares redeemed | | | | | | | | |
Class A | | | (12,333 | ) | | | (6,263 | ) |
Class C | | | (1,155 | ) | | | (1,696 | ) |
Class H | | | (373,513 | ) | | | (1,667,628 | ) |
Net decrease in shares | | | (54,938 | ) | | | (6,367 | ) |
148 | THE RYDEX FUNDS ANNUAL REPORT | SEE NOTES TO FINANCIAL STATEMENTS. |
INVERSE RUSSELL 2000® STRATEGY FUND | |
This table is presented to show selected data for a share outstanding throughout each period and to assist shareholders in evaluating a Fund’s performance for the periods presented.
Class A | | Year Ended
March 31,
2024 | | | Year Ended
March 31,
2023 | | | Year Ended
March 31,
2022 | | | Year Ended
March 31,
2021 | | | Year Ended
March 31,
2020e | |
Per Share Data |
Net asset value, beginning of period | | $ | 60.13 | | | $ | 55.13 | | | $ | 55.28 | | | $ | 120.61 | | | $ | 102.08 | |
Income (loss) from investment operations: |
Net investment income (loss)a | | | 2.16 | | | | .67 | | | | (.64 | ) | | | (.45 | ) | | | .50 | |
Net gain (loss) on investments (realized and unrealized) | | | (8.72 | ) | | | 4.33 | f | | | .49 | | | | (64.83 | ) | | | 18.73 | f |
Total from investment operations | | | (6.56 | ) | | | 5.00 | | | | (.15 | ) | | | (65.28 | ) | | | 19.23 | |
Less distributions from: |
Net investment income | | | (4.29 | ) | | | — | | | | — | | | | (.05 | ) | | | (.70 | ) |
Total distributions | | | (4.29 | ) | | | — | | | | — | | | | (.05 | ) | | | (.70 | ) |
Net asset value, end of period | | $ | 49.28 | | | $ | 60.13 | | | $ | 55.13 | | | $ | 55.28 | | | $ | 120.61 | |
|
Total Returnb | | | (11.70 | %) | | | 9.07 | % | | | (0.27 | %) | | | (54.13 | %) | | | 19.00 | % |
Ratios/Supplemental Data |
Net assets, end of period (in thousands) | | $ | 366 | | | $ | 501 | | | $ | 443 | | | $ | 320 | | | $ | 207 | |
Ratios to average net assets: |
Net investment income (loss) | | | 3.73 | % | | | 1.13 | % | | | (1.17 | %) | | | (1.38 | %) | | | 0.51 | % |
Total expensesc | | | 1.75 | % | | | 1.80 | % | | | 1.71 | % | | | 1.80 | % | | | 1.82 | % |
Net expensesd | | | 1.62 | % | | | 1.75 | % | | | 1.66 | % | | | 1.78 | % | | | 1.78 | % |
Portfolio turnover rate | | | — | | | | — | | | | — | | | | 14 | % | | | 7 | % |
Class C | | Year Ended
March 31,
2024 | | | Year Ended
March 31,
2023 | | | Year Ended
March 31,
2022 | | | Year Ended
March 31,
2021 | | | Year Ended
March 31,
2020e | |
Per Share Data |
Net asset value, beginning of period | | $ | 52.00 | | | $ | 48.07 | | | $ | 48.51 | | | $ | 106.73 | | | $ | 91.07 | |
Income (loss) from investment operations: |
Net investment income (loss)a | | | 1.50 | | | | .30 | | | | (.89 | ) | | | (.61 | ) | | | (.30 | ) |
Net gain (loss) on investments (realized and unrealized) | | | (7.45 | ) | | | 3.63 | f | | | .45 | | | | (57.56 | ) | | | 16.66 | f |
Total from investment operations | | | (5.95 | ) | | | 3.93 | | | | (.44 | ) | | | (58.17 | ) | | | 16.36 | |
Less distributions from: |
Net investment income | | | (4.29 | ) | | | — | | | | — | | | | (.05 | ) | | | (.70 | ) |
Total distributions | | | (4.29 | ) | | | — | | | | — | | | | (.05 | ) | | | (.70 | ) |
Net asset value, end of period | | $ | 41.76 | | | $ | 52.00 | | | $ | 48.07 | | | $ | 48.51 | | | $ | 106.73 | |
|
Total Returnb | | | (12.35 | %) | | | 8.18 | % | | | (0.91 | %) | | | (54.49 | %) | | | 18.22 | % |
Ratios/Supplemental Data |
Net assets, end of period (in thousands) | | $ | 0 | | | $ | 55 | | | $ | 28 | | | $ | 26 | | | $ | 94 | |
Ratios to average net assets: |
Net investment income (loss) | | | 2.92 | % | | | 0.58 | % | | | (1.88 | %) | | | (2.15 | %) | | | (0.34 | %) |
Total expensesc | | | 2.49 | % | | | 2.55 | % | | | 2.46 | % | | | 2.57 | % | | | 2.57 | % |
Net expensesd | | | 2.38 | % | | | 2.49 | % | | | 2.40 | % | | | 2.54 | % | | | 2.53 | % |
Portfolio turnover rate | | | — | | | | — | | | | — | | | | 14 | % | | | 7 | % |
SEE NOTES TO FINANCIAL STATEMENTS. | THE RYDEX FUNDS ANNUAL REPORT | 149 |
INVERSE RUSSELL 2000® STRATEGY FUND | |
FINANCIAL HIGHLIGHTS (concluded) |
This table is presented to show selected data for a share outstanding throughout each period and to assist shareholders in evaluating a Fund’s performance for the periods presented.
Class H | | Year Ended
March 31,
2024 | | | Year Ended
March 31,
2023 | | | Year Ended
March 31,
2022 | | | Year Ended
March 31,
2021 | | | Year Ended
March 31,
2020e | |
Per Share Data |
Net asset value, beginning of period | | $ | 60.38 | | | $ | 55.35 | | | $ | 55.51 | | | $ | 121.09 | | | $ | 102.43 | |
Income (loss) from investment operations: |
Net investment income (loss)a | | | 2.16 | | | | .64 | | | | (.64 | ) | | | (.44 | ) | | | .10 | |
Net gain (loss) on investments (realized and unrealized) | | | (8.76 | ) | | | 4.39 | f | | | .48 | | | | (65.09 | ) | | | 19.26 | f |
Total from investment operations | | | (6.60 | ) | | | 5.03 | | | | (.16 | ) | | | (65.53 | ) | | | 19.36 | |
Less distributions from: |
Net investment income | | | (4.29 | ) | | | — | | | | — | | | | (.05 | ) | | | (.70 | ) |
Total distributions | | | (4.29 | ) | | | — | | | | — | | | | (.05 | ) | | | (.70 | ) |
Net asset value, end of period | | $ | 49.49 | | | $ | 60.38 | | | $ | 55.35 | | | $ | 55.51 | | | $ | 121.09 | |
|
Total Return | | | (11.70 | %) | | | 9.09 | % | | | (0.29 | %) | | | (54.13 | %) | | | 19.08 | % |
Ratios/Supplemental Data |
Net assets, end of period (in thousands) | | $ | 1,849 | | | $ | 5,454 | | | $ | 5,396 | | | $ | 5,087 | | | $ | 22,414 | |
Ratios to average net assets: |
Net investment income (loss) | | | 3.69 | % | | | 1.06 | % | | | (1.17 | %) | | | (1.42 | %) | | | 0.07 | % |
Total expensesc | | | 1.74 | % | | | 1.78 | % | | | 1.71 | % | | | 1.81 | % | | | 1.82 | % |
Net expensesd | | | 1.62 | % | | | 1.72 | % | | | 1.66 | % | | | 1.79 | % | | | 1.79 | % |
Portfolio turnover rate | | | — | | | | — | | | | — | | | | 14 | % | | | 7 | % |
a | Net investment income (loss) per share was computed using average shares outstanding throughout the period. |
b | Total return does not reflect the impact of any applicable sales charges. |
c | Does not include expenses of the underlying funds in which the Fund invests. |
d | Net expense information reflects the expense ratios after expense waivers and reimbursements, as applicable. |
e | Reverse share split — Per share amounts for the periods presented through March 31, 2020 have been restated to reflect a 1:5 reverse share split effective August 17, 2020. |
f | The amount shown for a share outstanding throughout the period does not agree with the aggregate net loss on investments for the year because of the sales and repurchases of fund shares in relation to fluctuating market value of the investments of the Fund. |
150 | THE RYDEX FUNDS ANNUAL REPORT | SEE NOTES TO FINANCIAL STATEMENTS. |
PERFORMANCE REPORT AND FUND PROFILE (Unaudited) | March 31, 2024 |
DOW JONES INDUSTRIAL AVERAGE® FUND
OBJECTIVE: Seeks to provide investment results that match, before fees and expenses, the performance of a specific benchmark on a daily basis. The Fund’s current benchmark is the Dow Jones Industrial Average® (the “underlying index”).
For the Reporting Period, Dow Jones Industrial Average® Fund maintained a daily correlation of over 99% to its benchmark of 100% of the daily price movement of the Dow Jones Industrial Average. Dow Jones Industrial Average® Fund Class H returned 20.21%, while the Dow Jones Industrial Average returned 22.18% over the same time period.
The sectors that contributed the most to the return of the underlying index were Information Technology, Financials, and Industrials. The only sector that detracted was Energy.
The holdings that contributed the most to the return of the underlying index were Microsoft Corp., Caterpillar, Inc., and Salesforce, Inc. Those that detracted the most were Nike, Inc. – Class B, Boeing Co., and Walgreens Boot Alliance, Inc.
Derivatives in the Fund were used to help provide exposure to the composition of the benchmark in the most efficient manner possible and not for hedging purposes. Derivatives performed as expected.
The Fund may invest in certain of the underlying series of Guggenheim Funds Trust and Guggenheim Strategy Funds Trust, including Guggenheim Ultra Short Duration, Guggenheim Strategy Fund II, and Guggenheim Strategy Fund III (collectively, the “Short Term Investment Vehicles”), each of which are open-end management investment companies managed by Guggenheim Investments. The Short Term Investment Vehicles, which launched on March 11, 2014, are offered as short term investment options only to mutual funds, trusts, and other accounts managed by Guggenheim Investments and/or its affiliates, and are not available to the public, with the exception of Guggenheim Ultra Short Duration Fund, which is available to the public. Guggenheim Strategy Fund II and Guggenheim Strategy Fund III do not charge an investment management fee. Guggenheim Ultra Short Duration Fund charges an investment management fee, but the Fund’s adviser has agreed to waive fees to the extent necessary to offset the proportionate share of any management fee paid by the Fund with respect to its investment in such affiliated fund. For the Reporting Period, investment in the Short Term Investment Vehicles contributed to Fund performance.
Performance displayed represents past performance, which is no guarantee of future results.
Holdings Diversification (Market Exposure as % of Net Assets)
“Holdings Diversification (Market Exposure as % of Net Assets)” excludes any temporary cash investments, investments in Guggenheim Strategy Funds Trust mutual funds, or investments in Guggenheim Ultra Short Duration Fund. Investments in those Funds do not provide “market exposure” to meet the Fund’s investment objective, but will significantly increase the portfolio’s exposure to certain other asset categories (and their associated risks), which may cause the Fund to deviate from its principal investment strategy, including: (i) high yield, high risk debt securities rated below the top four long-term rating categories by a nationally recognized statistical rating organization (also known as “junk bonds”); (ii) securities issued by the U.S. government or its agencies and instrumentalities; (iii) CLOs and similar investments; and (iv) other short-term fixed income securities.
| | THE RYDEX FUNDS ANNUAL REPORT | 151 |
PERFORMANCE REPORT AND FUND PROFILE (Unaudited)(concluded) | March 31, 2024 |
Inception Dates: |
Class A | December 1, 2015 |
Class C | December 1, 2015 |
Class H | December 1, 2015 |
Cumulative Fund Performance*
Ten Largest Holdings | % of Total Net Assets |
UnitedHealth Group, Inc. | 6.3% |
Microsoft Corp. | 5.3% |
Goldman Sachs Group, Inc. | 5.3% |
Home Depot, Inc. | 4.9% |
Caterpillar, Inc. | 4.6% |
Salesforce, Inc. | 3.8% |
Amgen, Inc. | 3.6% |
McDonald’s Corp. | 3.6% |
Visa, Inc. — Class A | 3.5% |
Travelers Companies, Inc. | 2.9% |
Top Ten Total | 43.8% |
| | |
“Ten Largest Holdings” excludes any temporary cash or derivative investments. |
Average Annual Returns*
Periods Ended March 31, 2024
| 1 Year | 5 Year | Since
Inception
(12/01/15) |
Class A Shares | 20.22% | 9.30% | 10.65% |
Class A Shares with sales charge† | 14.50% | 8.24% | 10.00% |
Class C Shares | 19.32% | 8.48% | 9.82% |
Class C Shares with CDSC‡ | 18.32% | 8.48% | 9.82% |
Class H Shares | 20.21% | 9.30% | 10.66% |
Dow Jones Industrial Average® | 22.18% | 11.31% | 12.58% |
* | The performance data above represents past performance that is not predictive of future results. The investment return and principal value of an investment in the Fund will fluctuate so that an investor’s shares, when redeemed, may be worth more or less than their original cost. Returns are historical and include changes in principal and reinvested dividends and capital gains and do not reflect the effect of taxes. The Dow Jones Industrial Average® is an unmanaged index and, unlike the Fund, has no management fees or operating expenses to reduce its reported return. The graphs are based on Class A shares and Class H shares only; performance for Class C shares will vary due to differences in fee structures. |
† | Fund returns are calculated using the maximum sales charge of 4.75%. |
‡ | Fund returns include a CDSC of 1% if redeemed within 12 months of purchase. |
152 | THE RYDEX FUNDS ANNUAL REPORT | |
SCHEDULE OF INVESTMENTS | March 31, 2024 |
DOW JONES INDUSTRIAL AVERAGE® FUND | |
| | Shares | | | Value | |
COMMON STOCKS† - 76.9% |
| | | | | | | | | |
Financial - 17.1% |
Goldman Sachs Group, Inc. | | | 3,376 | | | $ | 1,410,121 | |
Visa, Inc. — Class A | | | 3,376 | | | | 942,174 | |
Travelers Companies, Inc. | | | 3,376 | | | | 776,953 | |
American Express Co. | | | 3,376 | | | | 768,681 | |
JPMorgan Chase & Co. | | | 3,376 | | | | 676,213 | |
Total Financial | | | | | | | 4,574,142 | |
| | | | | | | | | |
Consumer, Non-cyclical - 16.4% |
UnitedHealth Group, Inc. | | | 3,376 | | | | 1,670,107 | |
Amgen, Inc. | | | 3,376 | | | | 959,864 | |
Procter & Gamble Co. | | | 3,376 | | | | 547,756 | |
Johnson & Johnson | | | 3,376 | | | | 534,050 | |
Merck & Company, Inc. | | | 3,376 | | | | 445,463 | |
Coca-Cola Co. | | | 3,376 | | | | 206,544 | |
Total Consumer, Non-cyclical | | | | | | | 4,363,784 | |
| | | | | | | | | |
Technology - 14.3% |
Microsoft Corp. | | | 3,376 | | | | 1,420,351 | |
Salesforce, Inc. | | | 3,376 | | | | 1,016,783 | |
International Business Machines Corp. | | | 3,376 | | | | 644,681 | |
Apple, Inc. | | | 3,376 | | | | 578,917 | |
Intel Corp. | | | 3,376 | | | | 149,118 | |
Total Technology | | | | | | | 3,809,850 | |
| | | | | | | | | |
Industrial - 11.0% |
Caterpillar, Inc. | | | 3,376 | | | | 1,237,068 | |
Honeywell International, Inc. | | | 3,376 | | | | 692,924 | |
Boeing Co.* | | | 3,376 | | | | 651,534 | |
3M Co. | | | 3,376 | | | | 358,092 | |
Total Industrial | | | | | | | 2,939,618 | |
| | | | | | | | | |
Consumer, Cyclical - 10.4% |
Home Depot, Inc. | | | 3,376 | | | | 1,295,034 | |
McDonald’s Corp. | | | 3,376 | | | | 951,863 | |
NIKE, Inc. — Class B | | | 3,376 | | | | 317,276 | |
Walmart, Inc. | | | 3,375 | | | | 203,074 | |
Total Consumer, Cyclical | | | | | | | 2,767,247 | |
| | | | | | | | | |
Communications - 5.0% |
Amazon.com, Inc.* | | | 3,376 | | | | 608,963 | |
Walt Disney Co. | | | 3,376 | | | | 413,087 | |
Cisco Systems, Inc. | | | 3,376 | | | | 168,496 | |
Verizon Communications, Inc. | | | 3,376 | | | | 141,657 | |
Total Communications | | | | | | | 1,332,203 | |
| | | | | | | | | |
Energy - 2.0% |
Chevron Corp. | | | 3,376 | | | | 532,530 | |
| | | | | | | | | |
Basic Materials - 0.7% |
Dow, Inc. | | | 3,376 | | | | 195,572 | |
| | | | | | | | | |
Total Common Stocks | | | | |
(Cost $15,056,234) | | | | | | | 20,514,946 | |
| | | | | | | | | |
MUTUAL FUNDS† - 4.8% |
Guggenheim Ultra Short Duration Fund — Institutional Class1 | | | 67,906 | | | | 672,952 | |
Guggenheim Strategy Fund II1 | | | 24,698 | | | | 607,579 | |
Total Mutual Funds | | | | |
(Cost $1,285,414) | | | | | | | 1,280,531 | |
| | | | | | | | | |
| | | Face
Amount | | | | | |
U.S. TREASURY BILLS†† - 1.4% |
U.S. Treasury Bills |
5.25% due 04/23/242,3 | | $ | 200,000 | | | | 199,356 | |
5.26% due 04/23/243 | | | 100,000 | | | | 99,678 | |
5.17% due 04/16/243,4 | | | 92,000 | | | | 91,798 | |
Total U.S. Treasury Bills | | | | |
(Cost $390,835) | | | | | | | 390,832 | |
| | | | | | | | | |
REPURCHASE AGREEMENTS††,5 - 16.9% |
J.P. Morgan Securities LLC
issued 03/28/24 at 5.31%
due 04/01/242 | | | 2,593,950 | | | | 2,593,950 | |
BofA Securities, Inc.
issued 03/28/24 at 5.31%
due 04/01/242 | | | 997,673 | | | | 997,673 | |
Barclays Capital, Inc.
issued 03/28/24 at 5.30%
due 04/01/242 | | | 904,304 | | | | 904,304 | |
Total Repurchase Agreements | | | | |
(Cost $4,495,927) | | | | | | | 4,495,927 | |
| | | | | | | | | |
Total Investments - 100.0% | | | | |
(Cost $21,228,410) | | $ | 26,682,236 | |
Other Assets & Liabilities, net - 0.0% | | | (9,728 | ) |
Total Net Assets - 100.0% | | $ | 26,672,508 | |
SEE NOTES TO FINANCIAL STATEMENTS. | THE RYDEX FUNDS ANNUAL REPORT | 153 |
SCHEDULE OF INVESTMENTS (continued) | March 31, 2024 |
DOW JONES INDUSTRIAL AVERAGE® FUND | |
Futures Contracts |
Description | | Number of
Contracts | | | Expiration
Date | | | Notional
Amount | | | Value and
Unrealized
Appreciation** | |
Equity Futures Contracts Purchased† |
Dow Jones Industrial Average Mini Futures Contracts | | | 13 | | | | Jun 2024 | | | $ | 2,610,140 | | | $ | 46,220 | |
Total Return Swap Agreements |
Counterparty | Index | Type | | Financing
Rate | | Payment
Frequency | | | Maturity
Date | | | Units | | | Notional
Amount | | | Value and
Unrealized
Appreciation | |
OTC Equity Index Swap Agreements†† |
Barclays Bank plc | Dow Jones Industrial Average | Pay | | 5.93% (SOFR +
0.60%) | | | At Maturity | | | | 06/25/24 | | 66 | | $ | 2,618,043 | | | $ | 42,613 | |
BNP Paribas | Dow Jones Industrial Average | Pay | | 5.88% (Federal
Funds Rate +
0.55%) | | | At Maturity | | | | 06/26/24 | | 24 | | | 940,043 | | | | 6,966 | |
| | | | | | | | | | | | | | | | | | | $ | 3,558,086 | | | $ | 49,579 | |
* | Non-income producing security. |
** | Includes cumulative appreciation (depreciation). Variation margin is reported within the Statement of Assets and Liabilities. |
† | Value determined based on Level 1 inputs — See Note 4. |
†† | Value determined based on Level 2 inputs — See Note 4. |
1 | Affiliated issuer. |
2 | All or a portion of this security is pledged as equity index swap collateral at March 31, 2024. |
3 | Rate indicated is the effective yield at the time of purchase. |
4 | All or a portion of this security is pledged as futures collateral at March 31, 2024. |
5 | Repurchase Agreements — See Note 6. |
| | plc — Public Limited Company |
| | SOFR — Secured Overnight Financing Rate |
| | |
| | See Sector Classification in Other Information section. |
The following table summarizes the inputs used to value the Fund’s investments at March 31, 2024 (See Note 4 in the Notes to Financial Statements):
Investments in Securities (Assets) | | Level 1
Quoted
Prices | | | Level 2
Significant
Observable
Inputs | | | Level 3
Significant
Unobservable
Inputs | | | Total | |
Common Stocks | | $ | 20,514,946 | | | $ | — | | | $ | — | | | $ | 20,514,946 | |
Mutual Funds | | | 1,280,531 | | | | — | | | | — | | | | 1,280,531 | |
U.S. Treasury Bills | | | — | | | | 390,832 | | | | — | | | | 390,832 | |
Repurchase Agreements | | | — | | | | 4,495,927 | | | | — | | | | 4,495,927 | |
Equity Futures Contracts** | | | 46,220 | | | | — | | | | — | | | | 46,220 | |
Equity Index Swap Agreements** | | | — | | | | 49,579 | | | | — | | | | 49,579 | |
Total Assets | | $ | 21,841,697 | | | $ | 4,936,338 | | | $ | — | | | $ | 26,778,035 | |
** | This derivative is reported as unrealized appreciation/depreciation at period end. |
154 | THE RYDEX FUNDS ANNUAL REPORT | SEE NOTES TO FINANCIAL STATEMENTS. |
SCHEDULE OF INVESTMENTS (concluded) | March 31, 2024 |
DOW JONES INDUSTRIAL AVERAGE® FUND | |
Affiliated Transactions
Investments representing 5% or more of the outstanding voting shares of a company, or control of or by, or common control under Guggenheim Investments (“GI”), result in that company being considered an affiliated issuer, as defined in the 1940 Act.
The Fund may invest in certain of the underlying series of Guggenheim Strategy Funds Trust, including Guggenheim Strategy Fund II and Guggenheim Strategy Fund III (collectively, the “Guggenheim Strategy Funds”), each of which are open-end management investment companies managed by GI. The Guggenheim Strategy Funds, which launched on March 11, 2014, are offered as short term investment options only to mutual funds, trusts, and other accounts managed by GI and/or its affiliates, and are not available to the public. The Guggenheim Strategy Funds pay no investment management fees. The Guggenheim Strategy Funds’ annual report on Form N-CSR dated September 30, 2023 is available publicly or upon request. This information is available from the EDGAR database on the SEC’s website at https://www.sec.gov/Archives/edgar/data/1601445/000182126823000217/gug86449-ncsr.htm. The Fund may invest in certain of the underlying series of Guggenheim Funds Trust, which are open-end management investment companies managed by GI, are available to the public and whose most recent annual report on Form N-CSR is available publicly or upon request.
Transactions during the year ended March 31, 2024, in which the company is an affiliated issuer, were as follows:
Security Name | | Value
03/31/23 | | | Additions | | | Reductions | | | Realized
Gain (Loss) | | | Change in
Unrealized
Appreciation
(Depreciation) | | | Value
03/31/24 | | | Shares
03/31/24 | | | Investment
Income | |
Mutual Funds | | | | | | | | | | | | | | | | | | | | | | | | | | | | | | | | |
Guggenheim Strategy Fund II | | $ | 897,823 | | | $ | — | | | $ | (300,000 | ) | | $ | (7,060 | ) | | $ | 16,816 | | | $ | 607,579 | | | | 24,698 | | | $ | 37,690 | |
Guggenheim Ultra Short Duration Fund — Institutional Class | | | 958,754 | | | | — | | | | (300,000 | ) | | | (5,796 | ) | | | 19,994 | | | | 672,952 | | | | 67,906 | | | | 40,257 | |
| | | $ | 1,856,577 | | | $ | — | | | $ | (600,000 | ) | | $ | (12,856 | ) | | $ | 36,810 | | | $ | 1,280,531 | | | | | | | $ | 77,947 | |
SEE NOTES TO FINANCIAL STATEMENTS. | THE RYDEX FUNDS ANNUAL REPORT | 155 |
DOW JONES INDUSTRIAL AVERAGE® FUND | |
STATEMENT OF ASSETS AND LIABILITIES |
March 31, 2024 |
Assets: |
Investments in unaffiliated issuers, at value (cost $15,447,069) | | $ | 20,905,778 | |
Investments in affiliated issuers, at value (cost $1,285,414) | | | 1,280,531 | |
Repurchase agreements, at value (cost $4,495,927) | | | 4,495,927 | |
Cash | | | 3,376 | |
Segregated cash with broker | | | 18,300 | |
Unrealized appreciation on OTC swap agreements | | | 49,579 | |
Receivables: |
Dividends | | | 13,320 | |
Fund shares sold | | | 5,451 | |
Interest | | | 2,652 | |
Variation margin on futures contracts | | | 780 | |
Total assets | | | 26,775,694 | |
| | | | | |
Liabilities: |
Payable for: |
Fund shares redeemed | | | 41,086 | |
Management fees | | | 16,016 | |
Transfer agent fees | | | 10,059 | |
Distribution and service fees | | | 7,168 | |
Licensing fees | | | 5,936 | |
Swap settlement | | | 2,965 | |
Portfolio accounting and administration fees | | | 2,208 | |
Trustees’ fees* | | | 225 | |
Miscellaneous | | | 17,523 | |
Total liabilities | | | 103,186 | |
Net assets | | $ | 26,672,508 | |
| | | | | |
Net assets consist of: |
Paid in capital | | $ | 22,197,520 | |
Total distributable earnings (loss) | | | 4,474,988 | |
Net assets | | $ | 26,672,508 | |
Class A: |
Net assets | | $ | 4,110,994 | |
Capital shares outstanding | | | 42,984 | |
Net asset value per share | | $ | 95.64 | |
Maximum offering price per share (Net asset value divided by 95.25%) | | $ | 100.41 | |
Class C: |
Net assets | | $ | 2,775,093 | |
Capital shares outstanding | | | 31,108 | |
Net asset value per share | | $ | 89.21 | |
Class H: |
Net assets | | $ | 19,786,421 | |
Capital shares outstanding | | | 206,682 | |
Net asset value per share | | $ | 95.73 | |
STATEMENT OF OPERATIONS |
Year Ended March 31, 2024 |
Investment Income: |
Dividends from securities of unaffiliated issuers | | $ | 425,395 | |
Dividends from securities of affiliated issuers | | | 77,947 | |
Interest | | | 107,837 | |
Income from securities lending, net | | | 339 | |
Total investment income | | | 611,518 | |
| | | | | |
Expenses: |
Management fees | | | 179,644 | |
Distribution and service fees: |
Class A | | | 8,404 | |
Class C | | | 28,043 | |
Class H | | | 44,460 | |
Transfer agent fees | | | 52,143 | |
Portfolio accounting and administration fees | | | 36,511 | |
Registration fees | | | 22,468 | |
Professional fees | | | 11,382 | |
Trustees’ fees* | | | 4,092 | |
Custodian fees | | | 3,456 | |
Interest expense | | | 308 | |
Line of credit fees | | | 39 | |
Miscellaneous | | | 29,247 | |
Total expenses | | | 420,197 | |
Less: |
Expenses reimbursed by Adviser | | | (7,557 | ) |
Expenses waived by Adviser | | | (1,856 | ) |
Total waived/reimbursed expenses | | | (9,413 | ) |
Net expenses | | | 410,784 | |
Net investment income | | | 200,734 | |
| | | | | |
Net Realized and Unrealized Gain (Loss): |
Net realized gain (loss) on: |
Investments in unaffiliated issuers | | | 878,103 | |
Investments in affiliated issuers | | | (12,856 | ) |
Swap agreements | | | 359,463 | |
Futures contracts | | | 32,873 | |
Net realized gain | | | 1,257,583 | |
Net change in unrealized appreciation (depreciation) on: |
Investments in unaffiliated issuers | | | 2,346,691 | |
Investments in affiliated issuers | | | 36,810 | |
Swap agreements | | | 12,722 | |
Futures contracts | | | 26,195 | |
Net change in unrealized appreciation (depreciation) | | | 2,422,418 | |
Net realized and unrealized gain | | | 3,680,001 | |
Net increase in net assets resulting from operations | | $ | 3,880,735 | |
* | Relates to Trustees not deemed “interested persons” within the meaning of Section 2(a)(19) of the 1940 Act. |
156 | THE RYDEX FUNDS ANNUAL REPORT | SEE NOTES TO FINANCIAL STATEMENTS. |
DOW JONES INDUSTRIAL AVERAGE® FUND | |
STATEMENTS OF CHANGES IN NET ASSETS |
| | Year Ended
March 31,
2024 | | | Year Ended
March 31,
2023 | |
Increase (Decrease) in Net Assets from Operations: | | | | | | | | |
Net investment income | | $ | 200,734 | | | $ | 184,869 | |
Net realized gain on investments | | | 1,257,583 | | | | 3,787,609 | |
Net change in unrealized appreciation (depreciation) on investments | | | 2,422,418 | | | | (3,212,347 | ) |
Net increase in net assets resulting from operations | | | 3,880,735 | | | | 760,131 | |
| | | | | | | | | |
Distributions to shareholders: | | | | | | | | |
Class A | | | (21,691 | ) | | | (125,880 | ) |
Class C | | | (22,672 | ) | | | (88,282 | ) |
Class H | | | (125,457 | ) | | | (617,177 | ) |
Total distributions to shareholders | | | (169,820 | ) | | | (831,339 | ) |
| | | | | | | | | |
Capital share transactions: | | | | | | | | |
Proceeds from sale of shares | | | | | | | | |
Class A | | | 3,228,603 | | | | 16,530,435 | |
Class C | | | 1,275,512 | | | | 719,834 | |
Class H | | | 60,224,253 | | | | 136,595,167 | |
Distributions reinvested | | | | | | | | |
Class A | | | 21,667 | | | | 122,857 | |
Class C | | | 21,421 | | | | 85,555 | |
Class H | | | 125,178 | | | | 614,515 | |
Cost of shares redeemed | | | | | | | | |
Class A | | | (3,459,658 | ) | | | (17,340,135 | ) |
Class C | | | (1,846,636 | ) | | | (719,478 | ) |
Class H | | | (61,937,128 | ) | | | (141,871,511 | ) |
Net decrease from capital share transactions | | | (2,346,788 | ) | | | (5,262,761 | ) |
Net increase (decrease) in net assets | | | 1,364,127 | | | | (5,333,969 | ) |
| | | | | | | | | |
Net assets: | | | | | | | | |
Beginning of year | | | 25,308,381 | | | | 30,642,350 | |
End of year | | $ | 26,672,508 | | | $ | 25,308,381 | |
| | | | | | | | | |
Capital share activity: | | | | | | | | |
Shares sold | | | | | | | | |
Class A | | | 37,560 | | | | 205,921 | |
Class C | | | 16,180 | | | | 9,409 | |
Class H | | | 695,077 | | | | 1,714,832 | |
Shares issued from reinvestment of distributions | | | | | | | | |
Class A | | | 247 | | | | 1,554 | |
Class C | | | 261 | | | | 1,149 | |
Class H | | | 1,423 | | | | 7,766 | |
Shares redeemed | | | | | | | | |
Class A | | | (41,584 | ) | | | (214,524 | ) |
Class C | | | (23,085 | ) | | | (9,543 | ) |
Class H | | | (722,979 | ) | | | (1,756,498 | ) |
Net decrease in shares | | | (36,900 | ) | | | (39,934 | ) |
SEE NOTES TO FINANCIAL STATEMENTS. | THE RYDEX FUNDS ANNUAL REPORT | 157 |
DOW JONES INDUSTRIAL AVERAGE® FUND | |
This table is presented to show selected data for a share outstanding throughout each period and to assist shareholders in evaluating a Fund’s performance for the periods presented.
Class A | | Year Ended
March 31,
2024 | | | Year Ended
March 31,
2023 | | | Year Ended
March 31,
2022 | | | Year Ended
March 31,
2021 | | | Year Ended
March 31,
2020 | |
Per Share Data |
Net asset value, beginning of period | | $ | 80.18 | | | $ | 86.09 | | | $ | 82.82 | | | $ | 57.33 | | | $ | 70.54 | |
Income (loss) from investment operations: |
Net investment income (loss)a | | | .79 | | | | .52 | | | | .05 | | | | .02 | | | | .47 | |
Net gain (loss) on investments (realized and unrealized) | | | 15.35 | | | | (3.90 | )e | | | 4.32 | f | | | 29.21 | | | | (10.67 | ) |
Total from investment operations | | | 16.14 | | | | (3.38 | ) | | | 4.37 | | | | 29.23 | | | | (10.20 | ) |
Less distributions from: |
Net investment income | | | (.59 | ) | | | (.47 | ) | | | — | | | | (.06 | ) | | | (.31 | ) |
Net realized gains | | | (.09 | ) | | | (2.06 | ) | | | (1.10 | ) | | | (3.68 | ) | | | (2.70 | ) |
Total distributions | | | (.68 | ) | | | (2.53 | ) | | | (1.10 | ) | | | (3.74 | ) | | | (3.01 | ) |
Net asset value, end of period | | $ | 95.64 | | | $ | 80.18 | | | $ | 86.09 | | | $ | 82.82 | | | $ | 57.33 | |
|
Total Returnb | | | 20.22 | % | | | (3.90 | %) | | | 5.23 | % | | | 51.61 | % | | | (15.38 | %) |
Ratios/Supplemental Data |
Net assets, end of period (in thousands) | | $ | 4,111 | | | $ | 3,749 | | | $ | 4,632 | | | $ | 2,952 | | | $ | 2,652 | |
Ratios to average net assets: |
Net investment income (loss) | | | 0.93 | % | | | 0.65 | % | | | 0.05 | % | | | 0.02 | % | | | 0.65 | % |
Total expensesc | | | 1.67 | % | | | 1.57 | % | | | 1.56 | % | | | 1.69 | % | | | 1.66 | % |
Net expensesd | | | 1.63 | % | | | 1.55 | % | | | 1.55 | % | | | 1.68 | % | | | 1.64 | % |
Portfolio turnover rate | | | 140 | % | | | 414 | % | | | 240 | % | | | 110 | % | | | 186 | % |
Class C | | Year Ended
March 31,
2024 | | | Year Ended
March 31,
2023 | | | Year Ended
March 31,
2022 | | | Year Ended
March 31,
2021 | | | Year Ended
March 31,
2020 | |
Per Share Data |
Net asset value, beginning of period | | $ | 75.39 | | | $ | 81.70 | | | $ | 79.25 | | | $ | 55.37 | | | $ | 68.74 | |
Income (loss) from investment operations: |
Net investment income (loss)a | | | .14 | | | | (.03 | ) | | | (.56 | ) | | | (.49 | ) | | | (.02 | ) |
Net gain (loss) on investments (realized and unrealized) | | | 14.36 | | | | (3.75 | )e | | | 4.11 | f | | | 28.11 | | | | (10.34 | ) |
Total from investment operations | | | 14.50 | | | | (3.78 | ) | | | 3.55 | | | | 27.62 | | | | (10.36 | ) |
Less distributions from: |
Net investment income | | | (.59 | ) | | | (.47 | ) | | | — | | | | (.06 | ) | | | (.31 | ) |
Net realized gains | | | (.09 | ) | | | (2.06 | ) | | | (1.10 | ) | | | (3.68 | ) | | | (2.70 | ) |
Total distributions | | | (.68 | ) | | | (2.53 | ) | | | (1.10 | ) | | | (3.74 | ) | | | (3.01 | ) |
Net asset value, end of period | | $ | 89.21 | | | $ | 75.39 | | | $ | 81.70 | | | $ | 79.25 | | | $ | 55.37 | |
|
Total Returnb | | | 19.32 | % | | | (4.61 | %) | | | 4.43 | % | | | 50.52 | % | | | (16.03 | %) |
Ratios/Supplemental Data |
Net assets, end of period (in thousands) | | $ | 2,775 | | | $ | 2,846 | | | $ | 3,001 | | | $ | 2,842 | | | $ | 1,637 | |
Ratios to average net assets: |
Net investment income (loss) | | | 0.17 | % | | | (0.04 | %) | | | (0.68 | %) | | | (0.70 | %) | | | (0.03 | %) |
Total expensesc | | | 2.42 | % | | | 2.32 | % | | | 2.32 | % | | | 2.44 | % | | | 2.42 | % |
Net expensesd | | | 2.38 | % | | | 2.30 | % | | | 2.31 | % | | | 2.43 | % | | | 2.40 | % |
Portfolio turnover rate | | | 140 | % | | | 414 | % | | | 240 | % | | | 110 | % | | | 186 | % |
158 | THE RYDEX FUNDS ANNUAL REPORT | SEE NOTES TO FINANCIAL STATEMENTS. |
DOW JONES INDUSTRIAL AVERAGE® FUND | |
FINANCIAL HIGHLIGHTS (concluded) |
This table is presented to show selected data for a share outstanding throughout each period and to assist shareholders in evaluating a Fund’s performance for the periods presented.
Class H | | Year Ended
March 31,
2024 | | | Year Ended
March 31,
2023 | | | Year Ended
March 31,
2022 | | | Year Ended
March 31,
2021 | | | Year Ended
March 31,
2020 | |
Per Share Data |
Net asset value, beginning of period | | $ | 80.26 | | | $ | 86.15 | | | $ | 82.88 | | | $ | 57.36 | | | $ | 70.59 | |
Income (loss) from investment operations: |
Net investment income (loss)a | | | .79 | | | | .60 | | | | .17 | | | | .03 | | | | .51 | |
Net gain (loss) on investments (realized and unrealized) | | | 15.36 | | | | (3.96 | )e | | | 4.20 | f | | | 29.23 | | | | (10.73 | ) |
Total from investment operations | | | 16.15 | | | | (3.36 | ) | | | 4.37 | | | | 29.26 | | | | (10.22 | ) |
Less distributions from: |
Net investment income | | | (.59 | ) | | | (.47 | ) | | | — | | | | (.06 | ) | | | (.31 | ) |
Net realized gains | | | (.09 | ) | | | (2.06 | ) | | | (1.10 | ) | | | (3.68 | ) | | | (2.70 | ) |
Total distributions | | | (.68 | ) | | | (2.53 | ) | | | (1.10 | ) | | | (3.74 | ) | | | (3.01 | ) |
Net asset value, end of period | | $ | 95.73 | | | $ | 80.26 | | | $ | 86.15 | | | $ | 82.88 | | | $ | 57.36 | |
|
Total Return | | | 20.21 | % | | | (3.87 | %) | | | 5.23 | % | | | 51.64 | % | | | (15.40 | %) |
Ratios/Supplemental Data |
Net assets, end of period (in thousands) | | $ | 19,786 | | | $ | 18,713 | | | $ | 23,009 | | | $ | 17,500 | | | $ | 24,331 | |
Ratios to average net assets: |
Net investment income (loss) | | | 0.93 | % | | | 0.74 | % | | | 0.19 | % | | | 0.05 | % | | | 0.70 | % |
Total expensesc | | | 1.67 | % | | | 1.57 | % | | | 1.57 | % | | | 1.70 | % | | | 1.66 | % |
Net expensesd | | | 1.63 | % | | | 1.56 | % | | | 1.55 | % | | | 1.69 | % | | | 1.64 | % |
Portfolio turnover rate | | | 140 | % | | | 414 | % | | | 240 | % | | | 110 | % | | | 186 | % |
a | Net investment income (loss) per share was computed using average shares outstanding throughout the period. |
b | Total return does not reflect the impact of any applicable sales charges. |
c | Does not include expenses of the underlying funds in which the Fund invests. |
d | Net expense information reflects the expense ratios after expense waivers and reimbursements, as applicable. |
e | The amount shown for a share outstanding throughout the period does not agree with the aggregate net gain on investments for the year because of the sales and repurchases of fund shares in relation to fluctuating market value of the investments of the Fund. |
f | The amount shown for a share outstanding throughout the period does not agree with the aggregate net loss on investments for the year because of the sales and repurchases of fund shares in relation to fluctuating market value of the investments of the Fund. |
SEE NOTES TO FINANCIAL STATEMENTS. | THE RYDEX FUNDS ANNUAL REPORT | 159 |
PERFORMANCE REPORT AND FUND PROFILE (Unaudited) | March 31, 2024 |
GOVERNMENT LONG BOND 1.2x STRATEGY FUND
OBJECTIVE: Seeks to provide investment results that correspond, before fees and expenses, to a benchmark for U.S. Government securities on a daily basis. The Fund’s current benchmark is 120% of the daily price movement of the Long Treasury Bond. The Long Treasury Bond is the most recently issued 30 Year U.S. Treasury Bond. The price movement of the Long Treasury Bond is based on the daily price change of the most recently issued 30 Year U.S. Treasury Bond. The Fund does not seek to achieve its investment objective over a period of time greater than one day.
For the Reporting Period, the Government Long Bond 1.2x Strategy Fund Investor Class returned -11.71%. The Price Movement of the Long Treasury Bond was -2.62% for the period. The return of the Bloomberg U.S. Treasury Bellwethers 30 Yr. Index was -7.73%.
Prices of long-term Treasury bonds fell over the Reporting Period. Yields, which move opposite from prices, rose from 3.67% to 4.34%. Yields of on-the-run U.S. Treasury 30 year bonds reached their low for the Reporting Period in April 2023 at 3.54% and their peak in October at 5.11%. This performance was partly due to the U.S. Federal Reserve’s (the “Fed”) aggressive pace of interest rate hikes to fight inflation—11 times since March 2022; its last rate hike was 25 basis points in July 2023, keeping the Fed funds rate at 5.25-5.50% through the rest of the Reporting Period.
The hikes kept investors watchful for signs of economic weakness or even recession for much of the Reporting Period, but few materialized as the Fed was resolute in its campaign to keep inflation near its target of 2%. By November 2023, investors seemed certain that the Fed was done hiking for this cycle, and would soon begin cutting rates, which led to a drop in yields across the curve. Long-term Treasury yields fell from the October high to 4.01% by the end of 2023.
However, a string of higher-than-expected inflation reports and a stronger-than-expected economy boosted yields higher through the first quarter of 2024, fueling concern that any rate cuts would be further out on the horizon. Market expectations for rate cuts in 2024 adjusted significantly from six at the beginning of 2024 to only three as of the end of the Reporting Period.
Derivatives in the Fund are used to provide additional exposure to composition of the benchmark in the most efficient manner possible and to provide leverage and not for hedging purposes. Derivatives performed as expected.
Due to the compounding of daily returns, the Fund’s returns over periods other than one day will likely differ in amounts and possibly direction from the benchmark return for the same period. Investors should monitor their Fund holdings to ensure that they are consistent with their strategies, as frequently as daily.
The effects of compounding may cause the longer-term correlation of the Fund to its benchmark to diminish. A significant contributor to the discrepancy between the leveraged and unleveraged indices is the effect of compounding on the leveraged index, which is discussed under “A Brief Note on the Compounding of Returns” on page 6.
The Fund may invest in certain of the underlying series of Guggenheim Funds Trust and Guggenheim Strategy Funds Trust, including Guggenheim Ultra Short Duration, Guggenheim Strategy Fund II, and Guggenheim Strategy Fund III (collectively, the “Short Term Investment Vehicles”), each of which are open-end management investment companies managed by Guggenheim Investments. The Short Term Investment Vehicles, which launched on March 11, 2014, are offered as short term investment options only to mutual funds, trusts, and other accounts managed by Guggenheim Investments and/or its affiliates, and are not available to the public, with the exception of Guggenheim Ultra Short Duration Fund, which is available to the public. Guggenheim Strategy Fund II and Guggenheim Strategy Fund III do not charge an investment management fee. Guggenheim Ultra Short Duration Fund charges an investment management fee, but the Fund’s adviser has agreed to waive fees to the extent necessary to offset the proportionate share of any management fee paid by the Fund with respect to its investment in such affiliated fund. For the Reporting Period, investment in the Short Term Investment Vehicles contributed to Fund performance.
Performance displayed represents past performance, which is no guarantee of future results.
160 | THE RYDEX FUNDS ANNUAL REPORT | |
PERFORMANCE REPORT AND FUND PROFILE (Unaudited)(continued) | March 31, 2024 |
Holdings Diversification (Market Exposure as % of Net Assets)
“Holdings Diversification (Market Exposure as % of Net Assets)” excludes any temporary cash investments, investments in Guggenheim Strategy Funds Trust mutual funds, or investments in Guggenheim Ultra Short Duration Fund. Investments in those Funds do not provide “market exposure” to meet the Fund’s investment objective, but will significantly increase the portfolio’s exposure to certain other asset categories (and their associated risks), which may cause the Fund to deviate from its principal investment strategy, including: (i) high yield, high risk debt securities rated below the top four long-term rating categories by a nationally recognized statistical rating organization (also known as “junk bonds”); (ii) securities issued by the U.S. government or its agencies and instrumentalities; (iii) CLOs and similar investments; and (iv) other short-term fixed income securities.
Inception Dates: |
Investor Class | January 3, 1994 |
Class A | March 31, 2004 |
Class C | May 2, 2001 |
Class H | September 18, 2014 |
Largest Holdings | % of Total Net Assets |
U.S. Treasury Bond | 81.6% |
Guggenheim Ultra Short Duration Fund — Institutional Class | 11.4% |
Guggenheim Strategy Fund II | 10.1% |
Total | 103.1% |
| | |
“Largest Holdings” excludes any temporary cash or derivative investments. |
| | THE RYDEX FUNDS ANNUAL REPORT | 161 |
PERFORMANCE REPORT AND FUND PROFILE (Unaudited)(concluded) | March 31, 2024 |
Cumulative Fund Performance*
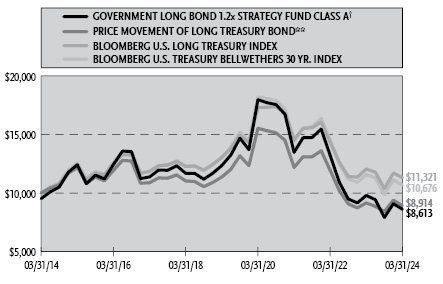
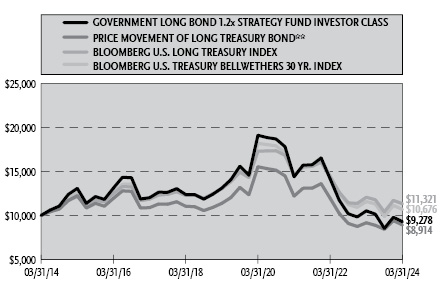
Average Annual Returns*
Periods Ended March 31, 2024
| 1 Year | 5 Year | 10 Year |
Investor Class Class Shares | (11.71%) | (6.67%) | (0.75%) |
Class A Shares | (12.04%) | (6.95%) | (1.00%) |
Class A Shares with sales charge† | (16.22%) | (7.85%) | (1.48%) |
Class C Shares | (12.67%) | (7.64%) | (1.74%) |
Class C Shares with CDSC‡ | (13.53%) | (7.64%) | (1.74%) |
Bloomberg U.S. Long Treasury Index | (6.08%) | (2.78%) | 1.25% |
Bloomberg U.S. Treasury Bellwethers 30 Yr. Index*** | (7.73%) | (3.91%) | 0.66% |
Price Movement of Long Treasury Bond** | (2.62%) | (4.74%) | (1.14%) |
| 1 Year | 5 Year | Since
Inception
(09/18/14) |
Class H Shares | (11.87%) | (6.90%) | (1.68%) |
Bloomberg U.S. Long Treasury Index | (6.08%) | (2.78%) | 0.81% |
Bloomberg U.S. Treasury Bellwethers 30 Yr. Index*** | (7.73%) | (3.91%) | 0.12% |
Price Movement of Long Treasury Bond** | (2.62%) | (4.74%) | (1.61%) |
* | The performance data above represents past performance that is not predictive of future results. The investment return and principal value of an investment in the Fund will fluctuate so that an investor’s shares, when redeemed, may be worth more or less than their original cost. Returns are historical and include changes in principal and reinvested dividends and capital gains and do not reflect the effect of taxes. The Bloomberg U.S. Long Treasury Index, Bloomberg U.S. Treasury Bellwethers 30 Yr. Index and the Price Movement of Long Treasury Bond are unmanaged indices and, unlike the Fund, have no management fees or operating expenses to reduce their reported returns. The graphs are based on Investor Class shares and Class A shares only; performance for Class C shares and Class H shares will vary due to differences in fee structures. |
** | Does not reflect any interest. |
*** | Effective August 1, 2022, the Fund changed its comparative benchmark to the Bloomberg U.S. Treasury Bellwethers 30 Yr. Index. |
† | Fund returns are calculated using the maximum sales charge of 4.75%. |
‡ | Fund returns include a CDSC of 1% if redeemed within 12 months of purchase. |
162 | THE RYDEX FUNDS ANNUAL REPORT | |
SCHEDULE OF INVESTMENTS | March 31, 2024 |
GOVERNMENT LONG BOND 1.2x STRATEGY FUND | |
| | Shares | | | Value | |
MUTUAL FUNDS† - 21.5% |
Guggenheim Ultra Short Duration Fund — Institutional Class1 | | | 182,265 | | | $ | 1,806,249 | |
Guggenheim Strategy Fund II1 | | | 64,935 | | | | 1,597,404 | |
Total Mutual Funds | | | | |
(Cost $3,420,585) | | | | | | | 3,403,653 | |
| | | Face
Amount | | | | | |
U.S. GOVERNMENT SECURITIES†† - 81.6% |
U.S. Treasury Bond |
4.25% due 02/15/54 | | $ | 13,100,000 | | | | 12,909,641 | |
Total U.S. Government Securities | | | | |
(Cost $12,702,508) | | | | | | | 12,909,641 | |
| | | | | | | | | |
U.S. TREASURY BILLS†† - 3.6% |
U.S. Treasury Bills |
5.17% due 04/16/242,3 | | | 572,000 | | | | 570,743 | |
Total U.S. Treasury Bills | | | | |
(Cost $570,745) | | | | | | | 570,743 | |
| | | | | | | | | |
REPURCHASE AGREEMENTS††,4 - 1.0% |
J.P. Morgan Securities LLC
issued 03/28/24 at 5.31%
due 04/01/24 | | | 90,267 | | | | 90,267 | |
BofA Securities, Inc.
issued 03/28/24 at 5.31%
due 04/01/24 | | | 34,718 | | | | 34,718 | |
Barclays Capital, Inc.
issued 03/28/24 at 5.30%
due 04/01/24 | | | 31,469 | | | | 31,469 | |
Total Repurchase Agreements | | | | |
(Cost $156,454) | | | | | | | 156,454 | |
| | | | | | | | | |
Total Investments - 107.7% | | | | |
(Cost $16,850,292) | | $ | 17,040,491 | |
Other Assets & Liabilities, net - (7.7)% | | | (1,217,027 | ) |
Total Net Assets - 100.0% | | $ | 15,823,464 | |
Futures Contracts |
Description | | Number of
Contracts | | | Expiration
Date | | | Notional
Amount | | | Value and
Unrealized
Appreciation** | |
Interest Rate Futures Contracts Purchased† |
U.S. Treasury Ultra Long Bond Futures Contracts | | | 48 | | | | Jun 2024 | | | $ | 6,192,000 | | | $ | 108,896 | |
** | Includes cumulative appreciation (depreciation). Variation margin is reported within the Statement of Assets and Liabilities. |
† | Value determined based on Level 1 inputs — See Note 4. |
†† | Value determined based on Level 2 inputs — See Note 4. |
1 | Affiliated issuer. |
2 | All or a portion of this security is pledged as futures collateral at March 31, 2024. |
3 | Rate indicated is the effective yield at the time of purchase. |
4 | Repurchase Agreements — See Note 6. |
| | |
| | See Sector Classification in Other Information section. |
SEE NOTES TO FINANCIAL STATEMENTS. | THE RYDEX FUNDS ANNUAL REPORT | 163 |
SCHEDULE OF INVESTMENTS (concluded) | March 31, 2024 |
GOVERNMENT LONG BOND 1.2x STRATEGY FUND | |
The following table summarizes the inputs used to value the Fund’s investments at March 31, 2024 (See Note 4 in the Notes to Financial Statements):
Investments in Securities (Assets) | | Level 1
Quoted
Prices | | | Level 2
Significant
Observable
Inputs | | | Level 3
Significant
Unobservable
Inputs | | | Total | |
Mutual Funds | | $ | 3,403,653 | | | $ | — | | | $ | — | | | $ | 3,403,653 | |
U.S. Government Securities | | | — | | | | 12,909,641 | | | | — | | | | 12,909,641 | |
U.S. Treasury Bills | | | — | | | | 570,743 | | | | — | | | | 570,743 | |
Repurchase Agreements | | | — | | | | 156,454 | | | | — | | | | 156,454 | |
Interest Rate Futures Contracts** | | | 108,896 | | | | — | | | | — | | | | 108,896 | |
Total Assets | | $ | 3,512,549 | | | $ | 13,636,838 | | | $ | — | | | $ | 17,149,387 | |
** | This derivative is reported as unrealized appreciation/depreciation at period end. |
Affiliated Transactions
Investments representing 5% or more of the outstanding voting shares of a company, or control of or by, or common control under Guggenheim Investments (“GI”), result in that company being considered an affiliated issuer, as defined in the 1940 Act.
The Fund may invest in certain of the underlying series of Guggenheim Strategy Funds Trust, including Guggenheim Strategy Fund II and Guggenheim Strategy Fund III (collectively, the “Guggenheim Strategy Funds”), each of which are open-end management investment companies managed by GI. The Guggenheim Strategy Funds, which launched on March 11, 2014, are offered as short term investment options only to mutual funds, trusts, and other accounts managed by GI and/or its affiliates, and are not available to the public. The Guggenheim Strategy Funds pay no investment management fees. The Guggenheim Strategy Funds’ annual report on Form N-CSR dated September 30, 2023 is available publicly or upon request. This information is available from the EDGAR database on the SEC’s website at https://www.sec.gov/Archives/edgar/data/1601445/000182126823000217/gug86449-ncsr.htm. The Fund may invest in certain of the underlying series of Guggenheim Funds Trust, which are open-end management investment companies managed by GI, are available to the public and whose most recent annual report on Form N-CSR is available publicly or upon request.
Transactions during the year ended March 31, 2024, in which the company is an affiliated issuer, were as follows:
Security Name | | Value
03/31/23 | | | Additions | | | Reductions | | | Realized
Gain (Loss) | | | Change in
Unrealized
Appreciation
(Depreciation) | | | Value
03/31/24 | | | Shares
03/31/24 | | | Investment
Income | |
Mutual Funds | | | | | | | | | | | | | | | | | | | | | | | | | | | | | | | | |
Guggenheim Strategy Fund II | | $ | 1,966,699 | | | $ | — | | | $ | (400,000 | ) | | $ | (4,238 | ) | | $ | 34,943 | | | $ | 1,597,404 | | | | 64,935 | | | $ | 106,946 | |
Guggenheim Ultra Short Duration Fund — Institutional Class | | | 2,462,516 | | | | — | | | | (700,000 | ) | | | (10,555 | ) | | | 54,288 | | | | 1,806,249 | | | | 182,265 | | | | 117,911 | |
| | | $ | 4,429,215 | | | $ | — | | | $ | (1,100,000 | ) | | $ | (14,793 | ) | | $ | 89,231 | | | $ | 3,403,653 | | | | | | | $ | 224,857 | |
164 | THE RYDEX FUNDS ANNUAL REPORT | SEE NOTES TO FINANCIAL STATEMENTS. |
GOVERNMENT LONG BOND 1.2x STRATEGY FUND | |
STATEMENT OF ASSETS AND LIABILITIES |
March 31, 2024 |
Assets: |
Investments in unaffiliated issuers, at value (cost $13,273,253) | | $ | 13,480,384 | |
Investments in affiliated issuers, at value (cost $3,420,585) | | | 3,403,653 | |
Repurchase agreements, at value (cost $156,454) | | | 156,454 | |
Receivables: |
Securities sold | | | 4,336,062 | |
Interest | | | 94,083 | |
Variation margin on futures contracts | | | 31,689 | |
Dividends | | | 15,295 | |
Fund shares sold | | | 7,184 | |
Total assets | | | 21,524,804 | |
| | | | | |
Liabilities: |
Payable for: |
Fund shares redeemed | | | 5,648,547 | |
Management fees | | | 12,050 | |
Transfer agent fees | | | 11,893 | |
Portfolio accounting and administration fees | | | 2,548 | |
Distribution and service fees | | | 423 | |
Trustees’ fees* | | | 323 | |
Distributions to shareholders | | | 301 | |
Miscellaneous | | | 25,255 | |
Total liabilities | | | 5,701,340 | |
Net assets | | $ | 15,823,464 | |
| | | | | |
Net assets consist of: |
Paid in capital | | $ | 83,574,271 | |
Total distributable earnings (loss) | | | (67,750,807 | ) |
Net assets | | $ | 15,823,464 | |
| | | | | |
Investor Class : |
Net assets | | $ | 14,402,549 | |
Capital shares outstanding | | | 630,040 | |
Net asset value per share | | $ | 22.86 | |
Class A: |
Net assets | | $ | 323,932 | |
Capital shares outstanding | | | 14,038 | |
Net asset value per share | | $ | 23.08 | |
Maximum offering price per share (Net asset value divided by 95.25%) | | $ | 24.23 | |
Class C: |
Net assets | | $ | 120,248 | |
Capital shares outstanding | | | 5,154 | |
Net asset value per share | | $ | 23.33 | |
Class H: |
Net assets | | $ | 976,735 | |
Capital shares outstanding | | | 42,213 | |
Net asset value per share | | $ | 23.14 | |
STATEMENT OF OPERATIONS |
Year Ended March 31, 2024 |
Investment Income: |
Dividends from securities of affiliated issuers | | $ | 224,857 | |
Interest | | | 1,506,196 | |
Total investment income | | | 1,731,053 | |
| | | | | |
Expenses: |
Management fees | | | 198,105 | |
Distribution and service fees: |
Class A | | | 1,952 | |
Class C | | | 1,566 | |
Class H | | | 16,158 | |
Transfer agent fees | | | 73,205 | |
Portfolio accounting and administration fees | | | 60,399 | |
Registration fees | | | 43,120 | |
Professional fees | | | 16,327 | |
Trustees’ fees* | | | 7,650 | |
Custodian fees | | | 5,469 | |
Line of credit fees | | | 383 | |
Miscellaneous | | | 11,003 | |
Total expenses | | | 435,337 | |
Less: |
Expenses reimbursed by Adviser | | | (11,364 | ) |
Expenses waived by Adviser | | | (5,427 | ) |
Total waived/reimbursed expenses | | | (16,791 | ) |
Net expenses | | | 418,546 | |
Net investment income | | | 1,312,507 | |
| | | | | |
Net Realized and Unrealized Gain (Loss): |
Net realized gain (loss) on: |
Investments in unaffiliated issuers | | | (3,083,914 | ) |
Investments in affiliated issuers | | | (14,793 | ) |
Futures contracts | | | (1,588,334 | ) |
Net realized loss | | | (4,687,041 | ) |
Net change in unrealized appreciation (depreciation) on: |
Investments in unaffiliated issuers | | | (1,242,400 | ) |
Investments in affiliated issuers | | | 89,231 | |
Futures contracts | | | (611,574 | ) |
Net change in unrealized appreciation (depreciation) | | | (1,764,743 | ) |
Net realized and unrealized loss | | | (6,451,784 | ) |
Net decrease in net assets resulting from operations | | $ | (5,139,277 | ) |
* | Relates to Trustees not deemed “interested persons” within the meaning of Section 2(a)(19) of the 1940 Act. |
SEE NOTES TO FINANCIAL STATEMENTS. | THE RYDEX FUNDS ANNUAL REPORT | 165 |
GOVERNMENT LONG BOND 1.2x STRATEGY FUND | |
STATEMENTS OF CHANGES IN NET ASSETS |
| | Year Ended
March 31,
2024 | | | Year Ended
March 31,
2023 | |
Increase (Decrease) in Net Assets from Operations: | | | | | | | | |
Net investment income | | $ | 1,312,507 | | | $ | 1,298,594 | |
Net realized loss on investments | | | (4,687,041 | ) | | | (37,235,351 | ) |
Net change in unrealized appreciation (depreciation) on investments | | | (1,764,743 | ) | | | 1,314,424 | |
Net decrease in net assets resulting from operations | | | (5,139,277 | ) | | | (34,622,333 | ) |
| | | | | | | | | |
Distributions to shareholders: | | | | | | | | |
Investor Class | | | (1,100,587 | ) | | | (482,297 | ) |
Class A | | | (22,850 | ) | | | (45,813 | ) |
Class C | | | (1,389 | ) | | | — | |
Class H | | | (185,370 | ) | | | (765,619 | ) |
Total distributions to shareholders | | | (1,310,196 | ) | | | (1,293,729 | ) |
| | | | | | | | | |
Capital share transactions: | | | | | | | | |
Proceeds from sale of shares | | | | | | | | |
Investor Class | | | 572,977,937 | | | | 1,129,806,243 | |
Class A | | | 464,696 | | | | 3,185,992 | |
Class C | | | 256,440 | | | | 844,347 | |
Class H | | | 93,228,054 | | | | 749,356,668 | |
Distributions reinvested | | | | | | | | |
Investor Class | | | 1,095,330 | | | | 407,526 | |
Class A | | | 21,720 | | | | 44,878 | |
Class C | | | 1,265 | | | | — | |
Class H | | | 179,852 | | | | 765,619 | |
Cost of shares redeemed | | | | | | | | |
Investor Class | | | (572,664,631 | ) | | | (1,104,284,363 | ) |
Class A | | | (2,656,842 | ) | | | (2,176,557 | ) |
Class C | | | (494,082 | ) | | | (573,858 | ) |
Class H | | | (114,651,594 | ) | | | (760,516,645 | ) |
Net increase (decrease) from capital share transactions | | | (22,241,855 | ) | | | 16,859,850 | |
Net decrease in net assets | | | (28,691,328 | ) | | | (19,056,212 | ) |
| | | | | | | | | |
Net assets: | | | | | | | | |
Beginning of year | | | 44,514,792 | | | | 63,571,004 | |
End of year | | $ | 15,823,464 | | | $ | 44,514,792 | |
| | | | | | | | | |
Capital share activity: | | | | | | | | |
Shares sold | | | | | | | | |
Investor Class | | | 24,603,342 | | | | 37,816,102 | |
Class A | | | 19,515 | | | | 112,769 | |
Class C | | | 10,565 | | | | 29,443 | |
Class H | | | 3,777,836 | | | | 26,450,947 | |
Shares issued from reinvestment of distributions | | | | | | | | |
Investor Class | | | 47,018 | | | | 14,010 | |
Class A | | | 873 | | | | 1,631 | |
Class C | | | 53 | | | | — | |
Class H | | | 7,194 | | | | 27,540 | |
Shares redeemed | | | | | | | | |
Investor Class | | | (24,664,484 | ) | | | (37,508,178 | ) |
Class A | | | (104,176 | ) | | | (76,327 | ) |
Class C | | | (19,733 | ) | | | (19,239 | ) |
Class H | | | (4,636,683 | ) | | | (26,903,414 | ) |
Net decrease in shares | | | (958,680 | ) | | | (54,716 | ) |
166 | THE RYDEX FUNDS ANNUAL REPORT | SEE NOTES TO FINANCIAL STATEMENTS. |
GOVERNMENT LONG BOND 1.2x STRATEGY FUND | |
This table is presented to show selected data for a share outstanding throughout each period and to assist shareholders in evaluating a Fund’s performance for the periods presented.
Investor Class | | Year Ended
March 31,
2024 | | | Year Ended
March 31,
2023 | | | Year Ended
March 31,
2022 | | | Year Ended
March 31,
2021 | | | Year Ended
March 31,
2020 | |
Per Share Data |
Net asset value, beginning of period | | $ | 26.79 | | | $ | 36.94 | | | $ | 37.93 | | | $ | 74.11 | | | $ | 53.22 | |
Income (loss) from investment operations: |
Net investment income (loss)a | | | .80 | | | | .64 | | | | .39 | | | | .25 | | | | .77 | |
Net gain (loss) on investments (realized and unrealized) | | | (3.93 | ) | | | (10.11 | ) | | | (1.00 | ) | | | (14.59 | ) | | | 22.86 | |
Total from investment operations | | | (3.13 | ) | | | (9.47 | ) | | | (.61 | ) | | | (14.34 | ) | | | 23.63 | |
Less distributions from: |
Net investment income | | | (.80 | ) | | | (.68 | ) | | | (.38 | ) | | | (.25 | ) | | | (.77 | ) |
Net realized gains | | | — | | | | — | | | | — | | | | (21.59 | ) | | | (1.97 | ) |
Total distributions | | | (.80 | ) | | | (.68 | ) | | | (.38 | ) | | | (21.84 | ) | | | (2.74 | ) |
Net asset value, end of period | | $ | 22.86 | | | $ | 26.79 | | | $ | 36.94 | | | $ | 37.93 | | | $ | 74.11 | |
|
Total Return | | | (11.71 | %) | | | (25.66 | %) | | | (1.71 | %) | | | (24.72 | %) | | | 45.84 | % |
Ratios/Supplemental Data |
Net assets, end of period (in thousands) | | $ | 14,403 | | | $ | 17,260 | | | $ | 11,904 | | | $ | 69,360 | | | $ | 37,919 | |
Ratios to average net assets: |
Net investment income (loss) | | | 3.42 | % | | | 2.15 | % | | | 0.95 | % | | | 0.40 | % | | | 1.28 | % |
Total expensesb | | | 1.05 | % | | | 1.01 | % | | | 0.96 | % | | | 1.07 | % | | | 1.07 | % |
Net expensesd | | | 1.00 | % | | | 0.99 | % | | | 0.95 | % | | | 1.05 | % | | | 1.05 | % |
Portfolio turnover rate | | | 1,573 | % | | | 2,562 | % | | | 2,153 | % | | | 1,938 | % | | | 1,130 | % |
Class A | | Year Ended
March 31,
2024 | | | Year Ended
March 31,
2023 | | | Year Ended
March 31,
2022 | | | Year Ended
March 31,
2021 | | | Year Ended
March 31,
2020 | |
Per Share Data |
Net asset value, beginning of period | | $ | 27.07 | | | $ | 37.34 | | | $ | 38.34 | | | $ | 74.70 | | | $ | 53.63 | |
Income (loss) from investment operations: |
Net investment income (loss)a | | | .73 | | | | .62 | | | | .28 | | | | .11 | | | | .72 | |
Net gain (loss) on investments (realized and unrealized) | | | (3.97 | ) | | | (10.28 | ) | | | (1.00 | ) | | | (14.78 | ) | | | 22.95 | |
Total from investment operations | | | (3.24 | ) | | | (9.66 | ) | | | (.72 | ) | | | (14.67 | ) | | | 23.67 | |
Less distributions from: |
Net investment income | | | (.75 | ) | | | (.61 | ) | | | (.28 | ) | | | (.10 | ) | | | (.63 | ) |
Net realized gains | | | — | | | | — | | | | — | | | | (21.59 | ) | | | (1.97 | ) |
Total distributions | | | (.75 | ) | | | (.61 | ) | | | (.28 | ) | | | (21.69 | ) | | | (2.60 | ) |
Net asset value, end of period | | $ | 23.08 | | | $ | 27.07 | | | $ | 37.34 | | | $ | 38.34 | | | $ | 74.70 | |
|
Total Returnc | | | (12.04 | %) | | | (25.88 | %) | | | (1.96 | %) | | | (24.98 | %) | | | 45.48 | % |
Ratios/Supplemental Data |
Net assets, end of period (in thousands) | | $ | 324 | | | $ | 2,648 | | | $ | 2,231 | | | $ | 1,610 | | | $ | 2,775 | |
Ratios to average net assets: |
Net investment income (loss) | | | 2.93 | % | | | 2.18 | % | | | 0.66 | % | | | 0.18 | % | | | 1.24 | % |
Total expensesb | | | 1.29 | % | | | 1.25 | % | | | 1.21 | % | | | 1.30 | % | | | 1.32 | % |
Net expensesd | | | 1.26 | % | | | 1.24 | % | | | 1.19 | % | | | 1.29 | % | | | 1.30 | % |
Portfolio turnover rate | | | 1,573 | % | | | 2,562 | % | | | 2,153 | % | | | 1,938 | % | | | 1,130 | % |
SEE NOTES TO FINANCIAL STATEMENTS. | THE RYDEX FUNDS ANNUAL REPORT | 167 |
GOVERNMENT LONG BOND 1.2x STRATEGY FUND | |
FINANCIAL HIGHLIGHTS (continued) |
This table is presented to show selected data for a share outstanding throughout each period and to assist shareholders in evaluating a Fund’s performance for the periods presented.
Class C | | Year Ended
March 31,
2024 | | | Year Ended
March 31,
2023 | | | Year Ended
March 31,
2022 | | | Year Ended
March 31,
2021 | | | Year Ended
March 31,
2020 | |
Per Share Data |
Net asset value, beginning of period | | $ | 26.92 | | | $ | 36.61 | | | $ | 37.63 | | | $ | 74.15 | | | $ | 53.27 | |
Income (loss) from investment operations: |
Net investment income (loss)a | | | .57 | | | | .40 | | | | (.05 | ) | | | (.33 | ) | | | .13 | |
Net gain (loss) on investments (realized and unrealized) | | | (3.97 | ) | | | (10.09 | ) | | | (.97 | ) | | | (14.60 | ) | | | 22.92 | |
Total from investment operations | | | (3.40 | ) | | | (9.69 | ) | | | (1.02 | ) | | | (14.93 | ) | | | 23.05 | |
Less distributions from: |
Net investment income | | | (.19 | ) | | | — | | | | — | | | | — | | | | (.20 | ) |
Net realized gains | | | — | | | | — | | | | — | | | | (21.59 | ) | | | (1.97 | ) |
Total distributions | | | (.19 | ) | | | — | | | | — | | | | (21.59 | ) | | | (2.17 | ) |
Net asset value, end of period | | $ | 23.33 | | | $ | 26.92 | | | $ | 36.61 | | | $ | 37.63 | | | $ | 74.15 | |
|
Total Returnc | | | (12.67 | %) | | | (26.47 | %) | | | (2.71 | %) | | | (25.55 | %) | | | 44.41 | % |
Ratios/Supplemental Data |
Net assets, end of period (in thousands) | | $ | 120 | | | $ | 384 | | | $ | 149 | | | $ | 169 | | | $ | 1,249 | |
Ratios to average net assets: |
Net investment income (loss) | | | 2.36 | % | | | 1.41 | % | | | (0.12 | %) | | | (0.55 | %) | | | 0.21 | % |
Total expensesb | | | 2.05 | % | | | 2.01 | % | | | 1.96 | % | | | 2.05 | % | | | 2.08 | % |
Net expensesd | | | 2.00 | % | | | 1.99 | % | | | 1.94 | % | | | 2.03 | % | | | 2.06 | % |
Portfolio turnover rate | | | 1,573 | % | | | 2,562 | % | | | 2,153 | % | | | 1,938 | % | | | 1,130 | % |
168 | THE RYDEX FUNDS ANNUAL REPORT | SEE NOTES TO FINANCIAL STATEMENTS. |
GOVERNMENT LONG BOND 1.2x STRATEGY FUND | |
FINANCIAL HIGHLIGHTS (concluded) |
This table is presented to show selected data for a share outstanding throughout each period and to assist shareholders in evaluating a Fund’s performance for the periods presented.
Class H | | Year Ended
March 31,
2024 | | | Year Ended
March 31,
2023 | | | Year Ended
March 31,
2022 | | | Year Ended
March 31,
2021 | | | Year Ended
March 31,
2020 | |
Per Share Data |
Net asset value, beginning of period | | $ | 27.10 | | | $ | 37.37 | | | $ | 38.38 | | | $ | 74.75 | | | $ | 53.65 | |
Income (loss) from investment operations: |
Net investment income (loss)a | | | .73 | | | | .60 | | | | .28 | | | | .13 | | | | .61 | |
Net gain (loss) on investments (realized and unrealized) | | | (3.94 | ) | | | (10.26 | ) | | | (1.01 | ) | | | (14.82 | ) | | | 23.09 | |
Total from investment operations | | | (3.21 | ) | | | (9.66 | ) | | | (.73 | ) | | | (14.69 | ) | | | 23.70 | |
Less distributions from: |
Net investment income | | | (.75 | ) | | | (.61 | ) | | | (.28 | ) | | | (.09 | ) | | | (.63 | ) |
Net realized gains | | | — | | | | — | | | | — | | | | (21.59 | ) | | | (1.97 | ) |
Total distributions | | | (.75 | ) | | | (.61 | ) | | | (.28 | ) | | | (21.68 | ) | | | (2.60 | ) |
Net asset value, end of period | | $ | 23.14 | | | $ | 27.10 | | | $ | 37.37 | | | $ | 38.38 | | | $ | 74.75 | |
|
Total Return | | | (11.87 | %) | | | (25.87 | %) | | | (1.95 | %) | | | (24.98 | %) | | | 45.55 | % |
Ratios/Supplemental Data |
Net assets, end of period (in thousands) | | $ | 977 | | | $ | 24,223 | | | $ | 49,287 | | | $ | 85,087 | | | $ | 78,070 | |
Ratios to average net assets: |
Net investment income (loss) | | | 2.87 | % | | | 2.05 | % | | | 0.69 | % | | | 0.23 | % | | | 1.02 | % |
Total expensesb | | | 1.28 | % | | | 1.25 | % | | | 1.21 | % | | | 1.29 | % | | | 1.32 | % |
Net expensesd | | | 1.26 | % | | | 1.24 | % | | | 1.19 | % | | | 1.28 | % | | | 1.30 | % |
Portfolio turnover rate | | | 1,573 | % | | | 2,562 | % | | | 2,153 | % | | | 1,938 | % | | | 1,130 | % |
a | Net investment income (loss) per share was computed using average shares outstanding throughout the period. |
b | Does not include expenses of the underlying funds in which the Fund invests. |
c | Total return does not reflect the impact of any applicable sales charges. |
d | Net expense information reflects the expense ratios after expense waivers and reimbursements, as applicable. |
SEE NOTES TO FINANCIAL STATEMENTS. | THE RYDEX FUNDS ANNUAL REPORT | 169 |
PERFORMANCE REPORT AND FUND PROFILE (Unaudited) | March 31, 2024 |
INVERSE GOVERNMENT LONG BOND STRATEGY FUND
OBJECTIVE: Seeks to provide total returns that inversely correlate, before fees and expenses, to the price movement of a benchmark for U.S. Treasury debt instruments or futures contract on a specified debt instrument on a daily basis. The Fund’s current benchmark is the daily price movement of the Long Treasury Bond. The Long Treasury Bond is the most recently issued 30 Year U.S. Treasury Bond. The price movement of the Long Treasury Bond is based on the daily price change of the most recently issued 30 Year U.S. Treasury Bond. The Fund does not seek to achieve its investment objective over a period of time greater than one day.
For the Reporting Period, the Inverse Government Long Bond Strategy Fund Investor Class returned 16.72%. The Price Movement of the Long Treasury Bond was -2.62% for the period. The return of the Bloomberg U.S. Treasury Bellwethers 30 Yr. Index was -7.73%.
Prices of long-term Treasury bonds fell over the Reporting Period. Yields, which move opposite from prices, rose from 3.67% to 4.34%. Yields of on-the-run U.S. Treasury 30 year bonds reached their low for the Reporting Period in April 2023 at 3.54% and their peak in October at 5.11%. This performance was partly due to the U.S. Federal Reserve’s (the “Fed”) aggressive pace of interest rate hikes to fight inflation—11 times since March 2022; its last rate hike was 25 basis points in July 2023, keeping the Fed funds rate at 5.25-5.50% through the rest of the Reporting Period.
The hikes kept investors watchful for signs of economic weakness or even recession for much of the Reporting Period, but few materialized as the Fed was resolute in its campaign to keep inflation near its target of 2%. By November 2023, investors seemed certain that the Fed was done hiking for this cycle, and would soon begin cutting rates, which led to a drop in yields across the curve. Long-term Treasury yields fell from the October high to 4.01% by the end of 2023.
However, a string of higher-than-expected inflation reports and a stronger-than-expected economy boosted yields higher through the first quarter of 2024, fueling concern that any rate cuts would be further out on the horizon. Market expectations for rate cuts in 2024 adjusted significantly from six at the beginning of 2024 to only three as of the end of the Reporting Period.
Derivatives in the Fund are used to provide additional exposure to composition of the benchmark in the most efficient manner possible and to provide leverage and not for hedging purposes. Derivatives performed as expected.
Due to the compounding of daily returns, the Fund’s returns over periods other than one day will likely differ in amounts and possibly direction from the benchmark return for the same period. Investors should monitor their Fund holdings to ensure that they are consistent with their strategies, as frequently as daily.
The effects of compounding may cause the longer-term correlation of the Fund to its benchmark to diminish. A significant contributor to the discrepancy between the leveraged and unleveraged indices is the effect of compounding on the leveraged index, which is discussed under “A Brief Note on the Compounding of Returns” on page 6.
The Fund may invest in certain of the underlying series of Guggenheim Funds Trust and Guggenheim Strategy Funds Trust, including Guggenheim Ultra Short Duration, Guggenheim Strategy Fund II, and Guggenheim Strategy Fund III (collectively, the “Short Term Investment Vehicles”), each of which are open-end management investment companies managed by Guggenheim Investments. The Short Term Investment Vehicles, which launched on March 11, 2014, are offered as short term investment options only to mutual funds, trusts, and other accounts managed by Guggenheim Investments and/or its affiliates, and are not available to the public, with the exception of Guggenheim Ultra Short Duration Fund, which is available to the public. Guggenheim Strategy Fund II and Guggenheim Strategy Fund III do not charge an investment management fee. Guggenheim Ultra Short Duration Fund charges an investment management fee, but the Fund’s adviser has agreed to waive fees to the extent necessary to offset the proportionate share of any management fee paid by the Fund with respect to its investment in such affiliated fund. For the Reporting Period, investment in the Short Term Investment Vehicles contributed to Fund performance.
Performance displayed represents past performance, which is no guarantee of future results.
170 | THE RYDEX FUNDS ANNUAL REPORT | |
PERFORMANCE REPORT AND FUND PROFILE (Unaudited)(continued) | March 31, 2024 |
Holdings Diversification (Market Exposure as % of Net Assets)

“Holdings Diversification (Market Exposure as % of Net Assets)” excludes any temporary cash investments, investments in Guggenheim Strategy Funds Trust mutual funds, or investments in Guggenheim Ultra Short Duration Fund. Investments in those Funds do not provide “market exposure” to meet the Fund’s investment objective, but will significantly increase the portfolio’s exposure to certain other asset categories (and their associated risks), which may cause the Fund to deviate from its principal investment strategy, including: (i) high yield, high risk debt securities rated below the top four long-term rating categories by a nationally recognized statistical rating organization (also known as “junk bonds”); (ii) securities issued by the U.S. government or its agencies and instrumentalities; (iii) CLOs and similar investments; and (iv) other short-term fixed income securities.
Inception Dates: |
Investor Class | March 3, 1995 |
Class A | March 31, 2004 |
Class C | March 28, 2001 |
Class H | September 18, 2014 |
The Fund invests principally in short sales and derivative investments such as futures contracts.
Largest Holdings | % of Total Net Assets |
Guggenheim Strategy Fund II | 26.8% |
Guggenheim Ultra Short Duration Fund — Institutional Class | 24.5% |
Total | 51.3% |
| | |
“Largest Holdings” excludes any temporary cash or derivative investments. |
| | THE RYDEX FUNDS ANNUAL REPORT | 171 |
PERFORMANCE REPORT AND FUND PROFILE (Unaudited)(concluded) | March 31, 2024 |
Cumulative Fund Performance*
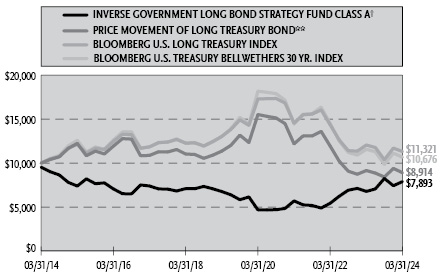

Average Annual Returns*
Periods Ended March 31, 2024
| 1 Year | 5 Year | 10 Year |
Investor Class Shares | 16.72% | 3.39% | (1.62%) |
Class A Shares | 16.42% | 3.14% | (1.86%) |
Class A Shares with sales charge† | 10.89% | 2.14% | (2.34%) |
Class C Shares | 15.56% | 2.37% | (2.59%) |
Class C Shares with CDSC§ | 14.56% | 2.37% | (2.59%) |
Bloomberg U.S. Long Treasury Index | (6.08%) | (2.78%) | 1.25% |
Bloomberg U.S. Treasury Bellwethers 30 Yr. Index*** | (7.73%) | (3.91%) | 0.66% |
Price Movement of Long Treasury Bond** | (2.62%) | (4.74%) | (1.14%) |
| 1 Year | 5 Year | Since
Inception
(09/18/14) |
Class H Shares | 16.43% | 3.17% | (1.23%) |
Bloomberg U.S. Long Treasury Index | (6.08%) | (2.78%) | 0.81% |
Bloomberg U.S. Treasury Bellwethers 30 Yr. Index*** | (7.73%) | (3.91%) | 0.12% |
Price Movement of Long Treasury Bond** | (2.62%) | (4.74%) | (1.61%) |
* | The performance data above represents past performance that is not predictive of future results. The investment return and principal value of an investment in the Fund will fluctuate so that an investor’s shares, when redeemed, may be worth more or less than their original cost. Returns are historical and include changes in principal and reinvested dividends and capital gains and do not reflect the effect of taxes. The Bloomberg U.S. Long Treasury Index, Bloomberg U.S. Treasury Bellwethers 30 Yr. Index, and the Price Movement of Long Treasury Bond are unmanaged indices and, unlike the Fund, have no management fees or operating expenses to reduce their reported returns. The graphs are based on Investor Class shares and Class A shares only; performance for Class C shares and Class H shares will vary due to differences in fee structures. |
** | Does not reflect any interest. |
*** | Effective August 1, 2022, the Fund changed its comparative benchmark to the Bloomberg U.S. Treasury Bellwethers 30 Yr. Index. |
† | Fund returns are calculated using the maximum sales charge of 4.75%. |
§ | Fund returns include a CDSC of 1% if redeemed within 12 months of purchase. |
172 | THE RYDEX FUNDS ANNUAL REPORT | |
SCHEDULE OF INVESTMENTS | March 31, 2024 |
INVERSE GOVERNMENT LONG BOND STRATEGY FUND | |
| | Shares | | | Value | |
MUTUAL FUNDS† - 51.3% |
Guggenheim Strategy Fund II1 | | | 210,588 | | | $ | 5,180,462 | |
Guggenheim Ultra Short Duration Fund — Institutional Class1 | | | 477,750 | | | | 4,734,506 | |
Total Mutual Funds | | | | |
(Cost $9,964,837) | | | | | | | 9,914,968 | |
| | | | | | | | | |
| | | Face
Amount | | | | | |
FEDERAL AGENCY NOTES†† - 9.8% |
Federal Home Loan Bank |
5.40% (SOFR + 0.07%, Rate Floor: 0.00%) due 06/17/24◊ | | $ | 1,900,000 | | | | 1,900,235 | |
Total Federal Agency Notes | | | | |
(Cost $1,900,000) | | | | | | | 1,900,235 | |
| | | | | | | | | |
U.S. TREASURY BILLS†† - 1.3% |
U.S. Treasury Bills |
5.17% due 04/16/242,3 | | | 244,000 | | | | 243,464 | |
Total U.S. Treasury Bills | | | | |
(Cost $243,465) | | | | | | | 243,464 | |
| | | | | | | | | |
REPURCHASE AGREEMENTS††,4 - 100.7% |
Individual Repurchase Agreements5 |
Mizuho Securities USA LLC issued 03/28/24 at 5.05% due 04/01/24 (secured by a U.S. Treasury Bond, at a rate of 4.25% and maturing 02/15/54 as collateral, with a value of $7,216,308) to be repurchased at $7,073,297 | | | 7,072,305 | | | | 7,072,305 | |
Barclays Capital, Inc.
issued 03/28/24 at 5.00%
due 04/01/24 (secured by a U.S. Treasury Bond, at a rate of 4.25% and maturing 02/15/54 as collateral, with a value of $6,910,402) to be repurchased at $6,773,441 | | | 6,772,500 | | | | 6,772,500 | |
Joint Repurchase Agreements5 | | | | | | | | |
J.P. Morgan Securities LLC issued 03/28/24 at 5.31% due 04/01/24 | | | 3,232,005 | | | | 3,232,005 | |
BofA Securities, Inc.
issued 03/28/24 at 5.31%
due 04/01/24 | | | 1,243,079 | | | | 1,243,079 | |
Barclays Capital, Inc.
issued 03/28/24 at 5.30%
due 04/01/24 | | | 1,126,743 | | | | 1,126,743 | |
Total Repurchase Agreements | | | | |
(Cost $19,446,632) | | | | | | | 19,446,632 | |
| | | | | | | | | |
Total Investments - 163.1% | | | | |
(Cost $31,554,934) | | $ | 31,505,299 | |
| | | | | | | | | |
U.S. Government Securities Sold Short† - (80.6)% |
U.S. Treasury Bond |
4.25% due 02/15/54†† | | | 15,800,000 | | | | (15,570,406 | ) |
Total U.S. Government Securities Sold Short - (80.6)% | | | | |
(Proceeds $15,363,619) | | $ | (15,570,406 | ) |
Other Assets & Liabilities, net - 17.5% | | | 3,383,291 | |
Total Net Assets - 100.0% | | $ | 19,318,184 | |
Futures Contracts |
Description | | Number of
Contracts | | | Expiration
Date | | | Notional
Amount | | | Value and
Unrealized
Depreciation** | |
Interest Rate Futures Contracts Sold Short† |
U.S. Treasury Ultra Long Bond Futures Contracts | | | 30 | | | | Jun 2024 | | | $ | 3,870,000 | | | $ | (50,255 | ) |
SEE NOTES TO FINANCIAL STATEMENTS. | THE RYDEX FUNDS ANNUAL REPORT | 173 |
SCHEDULE OF INVESTMENTS (continued) | March 31, 2024 |
INVERSE GOVERNMENT LONG BOND STRATEGY FUND | |
** | Includes cumulative appreciation (depreciation). Variation margin is reported within the Statement of Assets and Liabilities. |
† | Value determined based on Level 1 inputs — See Note 4. |
†† | Value determined based on Level 2 inputs — See Note 4. |
◊ | Variable rate security. Rate indicated is the rate effective at March 31, 2024. In some instances, the effective rate is limited by a minimum rate floor or a maximum rate cap established by the issuer. The settlement status of a position may also impact the effective rate indicated. In some cases, a position may be unsettled at period end and may not have a stated effective rate. In instances where multiple underlying reference rates and spread amounts are shown, the effective rate is based on a weighted average. |
1 | Affiliated issuer. |
2 | All or a portion of this security is pledged as futures collateral at March 31, 2024. |
3 | Rate indicated is the effective yield at the time of purchase. |
4 | Repurchase Agreements — See Note 6. |
5 | All or a portion of this security is pledged as short security collateral at March 31, 2024. |
| | SOFR — Secured Overnight Financing Rate |
| | |
| | See Sector Classification in Other Information section. |
The following table summarizes the inputs used to value the Fund’s investments at March 31, 2024 (See Note 4 in the Notes to Financial Statements):
Investments in Securities (Assets) | | Level 1
Quoted
Prices | | | Level 2
Significant
Observable
Inputs | | | Level 3
Significant
Unobservable
Inputs | | | Total | |
Mutual Funds | | $ | 9,914,968 | | | $ | — | | | $ | — | | | $ | 9,914,968 | |
Federal Agency Notes | | | — | | | | 1,900,235 | | | | — | | | | 1,900,235 | |
U.S. Treasury Bills | | | — | | | | 243,464 | | | | — | | | | 243,464 | |
Repurchase Agreements | | | — | | | | 19,446,632 | | | | — | | | | 19,446,632 | |
Total Assets | | $ | 9,914,968 | | | $ | 21,590,331 | | | $ | — | | | $ | 31,505,299 | |
Investments in Securities (Liabilities) | | Level 1
Quoted
Prices | | | Level 2
Significant
Observable
Inputs | | | Level 3
Significant
Unobservable
Inputs | | | Total | |
U.S. Government Securities Sold Short | | $ | — | | | $ | 15,570,406 | | | $ | — | | | $ | 15,570,406 | |
Interest Rate Futures Contracts** | | | 50,255 | | | | — | | | | — | | | | 50,255 | |
Total Liabilities | | $ | 50,255 | | | $ | 15,570,406 | | | $ | — | | | $ | 15,620,661 | |
** | This derivative is reported as unrealized appreciation/depreciation at period end. |
174 | THE RYDEX FUNDS ANNUAL REPORT | SEE NOTES TO FINANCIAL STATEMENTS. |
SCHEDULE OF INVESTMENTS (concluded) | March 31, 2024 |
INVERSE GOVERNMENT LONG BOND STRATEGY FUND | |
Affiliated Transactions
Investments representing 5% or more of the outstanding voting shares of a company, or control of or by, or common control under Guggenheim Investments (“GI”), result in that company being considered an affiliated issuer, as defined in the 1940 Act.
The Fund may invest in certain of the underlying series of Guggenheim Strategy Funds Trust, including Guggenheim Strategy Fund II and Guggenheim Strategy Fund III (collectively, the “Guggenheim Strategy Funds”), each of which are open-end management investment companies managed by GI. The Guggenheim Strategy Funds, which launched on March 11, 2014, are offered as short term investment options only to mutual funds, trusts, and other accounts managed by GI and/or its affiliates, and are not available to the public. The Guggenheim Strategy Funds pay no investment management fees. The Guggenheim Strategy Funds’ annual report on Form N-CSR dated September 30, 2023 is available publicly or upon request. This information is available from the EDGAR database on the SEC’s website at https://www.sec.gov/Archives/edgar/data/1601445/000182126823000217/gug86449-ncsr.htm. The Fund may invest in certain of the underlying series of Guggenheim Funds Trust, which are open-end management investment companies managed by GI, are available to the public and whose most recent annual report on Form N-CSR is available publicly or upon request.
Transactions during the year ended March 31, 2024, in which the company is an affiliated issuer, were as follows:
Security Name | | Value
03/31/23 | | | Additions | | | Reductions | | | Realized
Gain (Loss) | | | Change in
Unrealized
Appreciation
(Depreciation) | | | Value
03/31/24 | | | Shares
03/31/24 | | | Investment
Income | |
Mutual Funds | | | | | | | | | | | | | | | | | | | | | | | | | | | | | | | | |
Guggenheim Strategy Fund II | | $ | 5,098,333 | | | $ | — | | | $ | — | | | $ | — | | | $ | 82,129 | | | $ | 5,180,462 | | | | 210,588 | | | $ | 285,689 | |
Guggenheim Ultra Short Duration Fund — Institutional Class | | | 5,131,850 | | | | — | | | | (500,001 | ) | | | (6,091 | ) | | | 108,748 | | | | 4,734,506 | | | | 477,750 | | | | 274,392 | |
| | | $ | 10,230,183 | | | $ | — | | | $ | (500,001 | ) | | $ | (6,091 | ) | | $ | 190,877 | | | $ | 9,914,968 | | | | | | | $ | 560,081 | |
SEE NOTES TO FINANCIAL STATEMENTS. | THE RYDEX FUNDS ANNUAL REPORT | 175 |
INVERSE GOVERNMENT LONG BOND STRATEGY FUND | |
STATEMENT OF ASSETS AND LIABILITIES |
March 31, 2024 |
Assets: |
Investments in unaffiliated issuers, at value (cost $2,143,465) | | $ | 2,143,699 | |
Investments in affiliated issuers, at value (cost $9,964,837) | | | 9,914,968 | |
Repurchase agreements, at value (cost $19,446,632) | | | 19,446,632 | |
Receivables: |
Fund shares sold | | | 1,978,232 | |
Securities sold | | | 1,478,203 | |
Dividends | | | 44,849 | |
Interest | | | 15,299 | |
Total assets | | | 35,021,882 | |
| | | | | |
Liabilities: |
Securities sold short, at value (proceeds $15,363,619) | | | 15,570,406 | |
Payable for: |
Management fees | | | 12,844 | |
Variation margin on futures contracts | | | 12,225 | |
Transfer agent fees | | | 8,443 | |
Distribution and service fees | | | 1,707 | |
Portfolio accounting and administration fees | | | 807 | |
Trustees’ fees* | | | 258 | |
Fund shares redeemed | | | 3 | |
Miscellaneous | | | 97,005 | |
Total liabilities | | | 15,703,698 | |
Net assets | | $ | 19,318,184 | |
| | | | | |
Net assets consist of: |
Paid in capital | | $ | 254,925,082 | |
Total distributable earnings (loss) | | | (235,606,898 | ) |
Net assets | | $ | 19,318,184 | |
| | | | | |
Investor Class : |
Net assets | | $ | 13,105,067 | |
Capital shares outstanding | | | 68,111 | |
Net asset value per share | | $ | 192.41 | |
Class A: |
Net assets | | $ | 2,861,653 | |
Capital shares outstanding | | | 15,714 | |
Net asset value per share | | $ | 182.11 | |
Maximum offering price per share (Net asset value divided by 95.25%) | | $ | 191.19 | |
Class C: |
Net assets | | $ | 582,389 | |
Capital shares outstanding | | | 3,828 | |
Net asset value per share | | $ | 152.14 | |
Class H: |
Net assets | | $ | 2,769,075 | |
Capital shares outstanding | | | 15,138 | |
Net asset value per share | | $ | 182.92 | |
STATEMENT OF OPERATIONS |
Year Ended March 31, 2024 |
Investment Income: |
Dividends from securities of affiliated issuers | | $ | 560,081 | |
Interest | | | 2,621,965 | |
Total investment income | | | 3,182,046 | |
| | | | | |
Expenses: |
Management fees | | | 309,328 | |
Distribution and service fees: |
Class A | | | 8,807 | |
Class C | | | 7,920 | |
Class H | | | 9,522 | |
Transfer agent fees | | | 74,909 | |
Interest expense | | | 1,123,549 | |
Portfolio accounting and administration fees | | | 52,391 | |
Professional fees | | | 13,160 | |
Trustees’ fees* | | | 7,160 | |
Custodian fees | | | 4,787 | |
Line of credit fees | | | 98 | |
Miscellaneous | | | 47,877 | |
Total expenses | | | 1,659,508 | |
Less: |
Expenses reimbursed by Adviser | | | (27,997 | ) |
Expenses waived by Adviser | | | (12,516 | ) |
Total waived/reimbursed expenses | | | (40,513 | ) |
Net expenses | | | 1,618,995 | |
Net investment income | | | 1,563,051 | |
| | | | | |
Net Realized and Unrealized Gain (Loss): |
Net realized gain (loss) on: |
Investments in unaffiliated issuers | | | 150 | |
Investments in affiliated issuers | | | (6,091 | ) |
Investments sold short | | | 2,340,162 | |
Futures contracts | | | 702,820 | |
Net realized gain | | | 3,037,041 | |
Net change in unrealized appreciation (depreciation) on: |
Investments in unaffiliated issuers | | | (2,705 | ) |
Investments in affiliated issuers | | | 190,877 | |
Investments sold short | | | 700,129 | |
Futures contracts | | | 270,129 | |
Net change in unrealized appreciation (depreciation) | | | 1,158,430 | |
Net realized and unrealized gain | | | 4,195,471 | |
Net increase in net assets resulting from operations | | $ | 5,758,522 | |
* | Relates to Trustees not deemed “interested persons” within the meaning of Section 2(a)(19) of the 1940 Act. |
176 | THE RYDEX FUNDS ANNUAL REPORT | SEE NOTES TO FINANCIAL STATEMENTS. |
INVERSE GOVERNMENT LONG BOND STRATEGY FUND | |
STATEMENTS OF CHANGES IN NET ASSETS |
| | Year Ended
March 31,
2024 | | | Year Ended
March 31,
2023 | |
Increase (Decrease) in Net Assets from Operations: | | | | | | | | |
Net investment income (loss) | | $ | 1,563,051 | | | $ | (136,714 | ) |
Net realized gain on investments | | | 3,037,041 | | | | 27,500,883 | |
Net change in unrealized appreciation (depreciation) on investments | | | 1,158,430 | | | | (5,573,390 | ) |
Net increase in net assets resulting from operations | | | 5,758,522 | | | | 21,790,779 | |
| | | | | | | | | |
Distributions to shareholders: | | | | | | | | |
Investor Class | | | (201,149 | ) | | | — | |
Class A | | | (41,496 | ) | | | — | |
Class C | | | (11,320 | ) | | | — | |
Class H | | | (41,518 | ) | | | — | |
Total distributions to shareholders | | | (295,483 | ) | | | — | |
| | | | | | | | | |
Capital share transactions: | | | | | | | | |
Proceeds from sale of shares | | | | | | | | |
Investor Class | | | 146,365,405 | | | | 463,344,342 | |
Class A | | | 873,386 | | | | 6,466,235 | |
Class C | | | 219,029 | | | | 1,595,615 | |
Class H | | | 12,820,341 | | | | 264,686,394 | |
Distributions reinvested | | | | | | | | |
Investor Class | | | 195,362 | | | | — | |
Class A | | | 38,381 | | | | — | |
Class C | | | 10,648 | | | | — | |
Class H | | | 41,355 | | | | — | |
Cost of shares redeemed | | | | | | | | |
Investor Class | | | (167,273,388 | ) | | | (528,744,464 | ) |
Class A | | | (2,276,323 | ) | | | (8,316,812 | ) |
Class C | | | (642,663 | ) | | | (2,143,895 | ) |
Class H | | | (24,814,951 | ) | | | (266,169,839 | ) |
Net decrease from capital share transactions | | | (34,443,418 | ) | | | (69,282,424 | ) |
Net decrease in net assets | | | (28,980,379 | ) | | | (47,491,645 | ) |
| | | | | | | | | |
Net assets: | | | | | | | | |
Beginning of year | | | 48,298,563 | | | | 95,790,208 | |
End of year | | $ | 19,318,184 | | | $ | 48,298,563 | |
| | | | | | | | | |
Capital share activity: | | | | | | | | |
Shares sold | | | | | | | | |
Investor Class | | | 793,646 | | | | 2,832,017 | |
Class A | | | 4,973 | | | | 45,564 | |
Class C | | | 1,456 | | | | 12,795 | |
Class H | | | 75,821 | | | | 1,740,575 | |
Shares issued from reinvestment of distributions | | | | | | | | |
Investor Class | | | 1,032 | | | | — | |
Class A | | | 214 | | | | — | |
Class C | | | 71 | | | | — | |
Class H | | | 230 | | | | — | |
Shares redeemed | | | | | | | | |
Investor Class | | | (904,401 | ) | | | (3,242,605 | ) |
Class A | | | (12,690 | ) | | | (56,908 | ) |
Class C | | | (4,333 | ) | | | (15,875 | ) |
Class H | | | (149,365 | ) | | | (1,745,689 | ) |
Net decrease in shares | | | (193,346 | ) | | | (430,126 | ) |
SEE NOTES TO FINANCIAL STATEMENTS. | THE RYDEX FUNDS ANNUAL REPORT | 177 |
INVERSE GOVERNMENT LONG BOND STRATEGY FUND | |
This table is presented to show selected data for a share outstanding throughout each period and to assist shareholders in evaluating a Fund’s performance for the periods presented.
Investor Class | | Year Ended
March 31,
2024 | | | Year Ended
March 31,
2023 | | | Year Ended
March 31,
2022 | | | Year Ended
March 31,
2021 | | | Year Ended
March 31,
2020f | |
Per Share Data |
Net asset value, beginning of period | | $ | 166.83 | | | $ | 133.30 | | | $ | 139.52 | | | $ | 114.58 | | | $ | 165.45 | |
Income (loss) from investment operations: |
Net investment income (loss)a | | | 8.64 | | | | (.15 | ) | | | (3.89 | ) | | | (1.30 | ) | | | .60 | |
Net gain (loss) on investments (realized and unrealized) | | | 19.22 | | | | 33.68 | | | | (2.33 | ) | | | 26.68 | | | | (51.47 | ) |
Total from investment operations | | | 27.86 | | | | 33.53 | | | | (6.22 | ) | | | 25.38 | | | | (50.87 | ) |
Less distributions from: |
Net investment income | | | (2.28 | ) | | | — | | | | — | | | | (.44 | ) | | | — | |
Total distributions | | | (2.28 | ) | | | — | | | | — | | | | (.44 | ) | | | — | |
Net asset value, end of period | | $ | 192.41 | | | $ | 166.83 | | | $ | 133.30 | | | $ | 139.52 | | | $ | 114.58 | |
|
Total Return | | | 16.72 | % | | | 25.15 | % | | | (4.46 | %) | | | 22.19 | % | | | (30.73 | %) |
Ratios/Supplemental Data |
Net assets, end of period (in thousands) | | $ | 13,105 | | | $ | 29,663 | | | $ | 78,436 | | | $ | 36,863 | | | $ | 20,983 | |
Ratios to average net assets: |
Net investment income (loss) | | | 4.62 | % | | | (0.09 | %) | | | (3.02 | %) | | | (2.46 | %) | | | 0.40 | % |
Total expensesb | | | 4.75 | % | | | 4.32 | % | | | 3.31 | % | | | 2.75 | % | | | 2.91 | % |
Net expensesc,d | | | 4.63 | % | | | 4.28 | % | | | 3.29 | % | | | 2.73 | % | | | 2.89 | % |
Portfolio turnover rate | | | 662 | % | | | 1,076 | % | | | 2,058 | % | | | 2,159 | % | | | 864 | % |
Class A | | Year Ended
March 31,
2024 | | | Year Ended
March 31,
2023 | | | Year Ended
March 31,
2022 | | | Year Ended
March 31,
2021 | | | Year Ended
March 31,
2020f | |
Per Share Data |
Net asset value, beginning of period | | $ | 158.40 | | | $ | 126.88 | | | $ | 133.13 | | | $ | 109.61 | | | $ | 158.62 | |
Income (loss) from investment operations: |
Net investment income (loss)a | | | 7.77 | | | | .56 | | | | (3.77 | ) | | | (1.09 | ) | | | .20 | |
Net gain (loss) on investments (realized and unrealized) | | | 18.22 | | | | 30.96 | | | | (2.48 | ) | | | 25.05 | | | | (49.21 | ) |
Total from investment operations | | | 25.99 | | | | 31.52 | | | | (6.25 | ) | | | 23.96 | | | | (49.01 | ) |
Less distributions from: |
Net investment income | | | (2.28 | ) | | | — | | | | — | | | | (.44 | ) | | | — | |
Total distributions | | | (2.28 | ) | | | — | | | | — | | | | (.44 | ) | | | — | |
Net asset value, end of period | | $ | 182.11 | | | $ | 158.40 | | | $ | 126.88 | | | $ | 133.13 | | | $ | 109.61 | |
|
Total Returne | | | 16.42 | % | | | 24.84 | % | | | (4.69 | %) | | | 21.95 | % | | | (30.90 | %) |
Ratios/Supplemental Data |
Net assets, end of period (in thousands) | | $ | 2,862 | | | $ | 3,677 | | | $ | 4,385 | | | $ | 4,798 | | | $ | 4,832 | |
Ratios to average net assets: |
Net investment income (loss) | | | 4.40 | % | | | 0.37 | % | | | (3.11 | %) | | | (2.59 | %) | | | 0.15 | % |
Total expensesb | | | 5.01 | % | | | 4.61 | % | | | 3.47 | % | | | 2.97 | % | | | 3.17 | % |
Net expensesc,d | | | 4.88 | % | | | 4.56 | % | | | 3.45 | % | | | 2.94 | % | | | 3.15 | % |
Portfolio turnover rate | | | 662 | % | | | 1,076 | % | | | 2,058 | % | | | 2,159 | % | | | 864 | % |
178 | THE RYDEX FUNDS ANNUAL REPORT | SEE NOTES TO FINANCIAL STATEMENTS. |
INVERSE GOVERNMENT LONG BOND STRATEGY FUND | |
FINANCIAL HIGHLIGHTS (continued) |
This table is presented to show selected data for a share outstanding throughout each period and to assist shareholders in evaluating a Fund’s performance for the periods presented.
Class C | | Year Ended
March 31,
2024 | | | Year Ended
March 31,
2023 | | | Year Ended
March 31,
2022 | | | Year Ended
March 31,
2021 | | | Year Ended
March 31,
2020f | |
Per Share Data |
Net asset value, beginning of period | | $ | 133.62 | | | $ | 107.86 | | | $ | 114.03 | | | $ | 94.64 | | | $ | 138.00 | |
Income (loss) from investment operations: |
Net investment income (loss)a | | | 5.42 | | | | (1.03 | ) | | | (4.01 | ) | | | (1.11 | ) | | | (.75 | ) |
Net gain (loss) on investments (realized and unrealized) | | | 15.38 | | | | 26.79 | | | | (2.16 | ) | | | 20.94 | | | | (42.61 | ) |
Total from investment operations | | | 20.80 | | | | 25.76 | | | | (6.17 | ) | | | 19.83 | | | | (43.36 | ) |
Less distributions from: |
Net investment income | | | (2.28 | ) | | | — | | | | — | | | | (.44 | ) | | | — | |
Total distributions | | | (2.28 | ) | | | — | | | | — | | | | (.44 | ) | | | — | |
Net asset value, end of period | | $ | 152.14 | | | $ | 133.62 | | | $ | 107.86 | | | $ | 114.03 | | | $ | 94.64 | |
|
Total Returne | | | 15.56 | % | | | 23.88 | % | | | (5.41 | %) | | | 21.00 | % | | | (31.41 | %) |
Ratios/Supplemental Data |
Net assets, end of period (in thousands) | | $ | 582 | | | $ | 886 | | | $ | 1,048 | | | $ | 1,500 | | | $ | 2,472 | |
Ratios to average net assets: |
Net investment income (loss) | | | 3.64 | % | | | (0.79 | %) | | | (3.85 | %) | | | (3.32 | %) | | | (0.59 | %) |
Total expensesb | | | 5.76 | % | | | 5.35 | % | | | 4.22 | % | | | 3.70 | % | | | 3.93 | % |
Net expensesc,d | | | 5.64 | % | | | 5.31 | % | | | 4.19 | % | | | 3.68 | % | | | 3.91 | % |
Portfolio turnover rate | | | 662 | % | | | 1,076 | % | | | 2,058 | % | | | 2,159 | % | | | 864 | % |
SEE NOTES TO FINANCIAL STATEMENTS. | THE RYDEX FUNDS ANNUAL REPORT | 179 |
INVERSE GOVERNMENT LONG BOND STRATEGY FUND | |
FINANCIAL HIGHLIGHTS (concluded) |
This table is presented to show selected data for a share outstanding throughout each period and to assist shareholders in evaluating a Fund’s performance for the periods presented.
Class H | | Year Ended
March 31,
2024 | | | Year Ended
March 31,
2023 | | | Year Ended
March 31,
2022 | | | Year Ended
March 31,
2021 | | | Year Ended
March 31,
2020f | |
Per Share Data |
Net asset value, beginning of period | | $ | 159.09 | | | $ | 127.42 | | | $ | 133.70 | | | $ | 109.85 | | | $ | 159.05 | |
Income (loss) from investment operations: |
Net investment income (loss)a | | | 7.67 | | | | (.55 | ) | | | (3.95 | ) | | | (.98 | ) | | | .25 | |
Net gain (loss) on investments (realized and unrealized) | | | 18.44 | | | | 32.22 | | | | (2.33 | ) | | | 25.27 | | | | (49.45 | ) |
Total from investment operations | | | 26.11 | | | | 31.67 | | | | (6.28 | ) | | | 24.29 | | | | (49.20 | ) |
Less distributions from: |
Net investment income | | | (2.28 | ) | | | — | | | | — | | | | (.44 | ) | | | — | |
Total distributions | | | (2.28 | ) | | | — | | | | — | | | | (.44 | ) | | | — | |
Net asset value, end of period | | $ | 182.92 | | | $ | 159.09 | | | $ | 127.42 | | | $ | 133.70 | | | $ | 109.85 | |
|
Total Return | | | 16.43 | % | | | 24.85 | % | | | (4.70 | %) | | | 22.18 | % | | | (30.93 | %) |
Ratios/Supplemental Data |
Net assets, end of period (in thousands) | | $ | 2,769 | | | $ | 14,072 | | | $ | 11,922 | | | $ | 7,472 | | | $ | 5,881 | |
Ratios to average net assets: |
Net investment income (loss) | | | 4.37 | % | | | (0.36 | %) | | | (3.20 | %) | | | (2.62 | %) | | | 0.16 | % |
Total expensesb | | | 4.99 | % | | | 4.55 | % | | | 3.49 | % | | | 2.94 | % | | | 3.30 | % |
Net expensesc,d | | | 4.88 | % | | | 4.51 | % | | | 3.47 | % | | | 2.92 | % | | | 3.28 | % |
Portfolio turnover rate | | | 662 | % | | | 1,076 | % | | | 2,058 | % | | | 2,159 | % | | | 872 | % |
a | Net investment income (loss) per share was computed using average shares outstanding throughout the period. |
b | Does not include expenses of the underlying funds in which the Fund invests. |
c | Net expense information reflects the expense ratios after expense waivers and reimbursements, as applicable. |
d | Total expenses may include interest expense related to short sales. Excluding interest expense, the operating expense ratios for the years presented were as follows: |
| | | 03/31/24 | 03/31/23 | 03/31/22 | 03/31/21 | 03/31/20 |
| | Investor Class | 1.37% | 1.40% | 1.39% | 1.47% | 1.50% |
| | Class A | 1.61% | 1.64% | 1.63% | 1.73% | 1.75% |
| | Class C | 2.36% | 2.40% | 2.38% | 2.48% | 2.50% |
| | Class H | 1.62% | 1.65% | 1.64% | 1.73% | 1.75% |
e | Total return does not reflect the impact of any applicable sales charges. |
f | Reverse share split — Per share amounts for the periods presented through March 31, 2020 have been restated to reflect a 1:5 reverse share split effective August 17, 2020. |
180 | THE RYDEX FUNDS ANNUAL REPORT | SEE NOTES TO FINANCIAL STATEMENTS. |
PERFORMANCE REPORT AND FUND PROFILE (Unaudited) | March 31, 2024 |
HIGH YIELD STRATEGY FUND
OBJECTIVE: Seeks to provide investment results that correlate, before fees and expenses, to the performance of the high yield bond market.
For the Reporting Period, the High Yield Strategy Fund Class H returned 10.32%. For comparison, the Bloomberg U.S. Corporate High Yield Index (the “Index”) returned 11.15% for the same period.
The Fund primarily invests in credit default swaps, swaps on ETFs, and bond futures to gain exposure similar to the high yield bond market. Credit default swaps are instruments which allow for the full or partial transfer of third party credit risk, with respect to a particular entity or entities, from one counterparty to the other. The Fund will normally be a seller of credit protection (assuming credit risk) as it seeks to gain exposure to the high yield bond market, but also may buy credit protection from time to time in order to maintain the appropriate level of exposure to the high yield bond market, such as during times of heavy redemption activity. The Fund’s investments in bond futures are expected to provide exposure to interest rate risk comparable to that experienced in the high yield bond market, and will complement the Fund’s swaps investments exposure to produce investment exposure that in the aggregate is similar to that of the high yield bond market.
The high yield sector rallied over the Reporting Period, as the Fed seemed ready to start cutting rates amid market optimism that an economic soft-landing might be possible. Spreads generally tightened over the Reporting Period, and remain quite tight compared with history. Issuance was approximately $220 billion during the Reporting Period, better than the $176 billion in 2023 as a whole. After about $8 billion in outflows from mutual funds and ETFs in 2023, the first quarter of 2024 saw inflows of more than $2 billion.
For the Reporting Period, lower-rated credit outperformed, with CCC rated issues in the index returning almost 16%, compared with 12% for B rated issues and 9% for BB rated issues. Issues in the consumer cyclical and energy sectors were the leading contributors to the return of the index, while those in the transportation and electric utilities sectors provided lower contributions; all sectors had positive returns for the Reporting Period. On a fundamental basis, average leverage and coverage levels remain ahead of historical averages. Defaults are expected to remain subdued as borrowers have solid balance sheets and a manageable maturity wall.
Derivatives in the Fund are used to help provide exposure to the composition of the benchmark in the most efficient manner possible and not for hedging purposes. Derivatives performed as expected.
The Fund may invest in certain of the underlying series of Guggenheim Funds Trust and Guggenheim Strategy Funds Trust, including Guggenheim Ultra Short Duration, Guggenheim Strategy Fund II, and Guggenheim Strategy Fund III (collectively, the “Short Term Investment Vehicles”), each of which are open-end management investment companies managed by Guggenheim Investments. The Short Term Investment Vehicles, which launched on March 11, 2014, are offered as short term investment options only to mutual funds, trusts, and other accounts managed by Guggenheim Investments and/or its affiliates, and are not available to the public, with the exception of Guggenheim Ultra Short Duration Fund, which is available to the public. Guggenheim Strategy Fund II and Guggenheim Strategy Fund III do not charge an investment management fee. Guggenheim Ultra Short Duration Fund charges an investment management fee, but the Fund’s adviser has agreed to waive fees to the extent necessary to offset the proportionate share of any management fee paid by the Fund with respect to its investment in such affiliated fund. For the Reporting Period, investment in the Short Term Investment Vehicles contributed to Fund performance.
Performance displayed represents past performance, which is no guarantee of future results.
| | THE RYDEX FUNDS ANNUAL REPORT | 181 |
PERFORMANCE REPORT AND FUND PROFILE (Unaudited)(continued) | March 31, 2024 |
Holdings Diversification (Market Exposure as % of Net Assets)
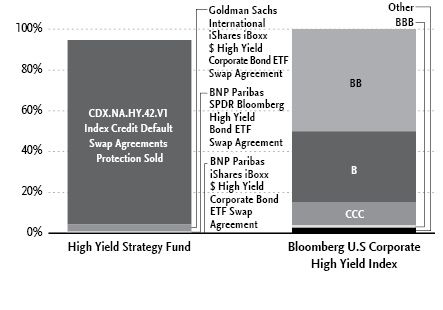
“Holdings Diversification (Market Exposure as % of Net Assets)” excludes any temporary cash investments, investments in Guggenheim Strategy Funds Trust mutual funds, or investments in Guggenheim Ultra Short Duration Fund. Investments in those Funds do not provide “market exposure” to meet the Fund’s investment objective, but will significantly increase the portfolio’s exposure to certain other asset categories (and their associated risks), which may cause the Fund to deviate from its principal investment strategy, including: (i) high yield, high risk debt securities rated below the top four long-term rating categories by a nationally recognized statistical rating organization (also known as “junk bonds”); (ii) securities issued by the U.S. government or its agencies and instrumentalities; (iii) CLOs and similar investments; and (iv) other short-term fixed income securities.
Inception Dates: |
Class A | April 16, 2007 |
Class C | April 16, 2007 |
Class H | April 16, 2007 |
The Fund invests principally in derivative investments such as high yield credit default swap agreements and futures contracts.
Largest Holdings | % of Total Net Assets |
Guggenheim Strategy Fund III | 5.4% |
Guggenheim Ultra Short Duration Fund — Institutional Class | 3.7% |
Guggenheim Strategy Fund II | 3.6% |
Total | 12.7% |
| | |
“Largest Holdings” excludes any temporary cash or derivative investments. |
182 | THE RYDEX FUNDS ANNUAL REPORT | |
PERFORMANCE REPORT AND FUND PROFILE (Unaudited)(concluded) | March 31, 2024 |
Cumulative Fund Performance*
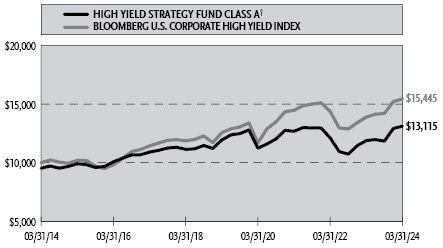
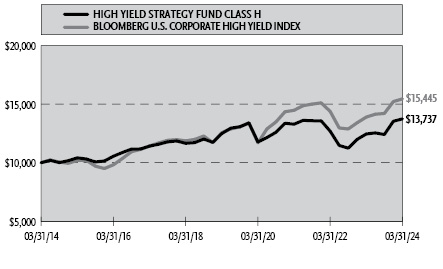
Average Annual Returns*
Periods Ended March 31, 2024
| 1 Year | 5 Year | 10 Year |
Class A Shares | 10.33% | 1.91% | 3.25% |
Class A Shares with sales charge† | 5.09% | 0.92% | 2.75% |
Class C Shares | 9.51% | 1.16% | 2.47% |
Class C Shares with CDSC‡ | 8.51% | 1.16% | 2.47% |
Class H Shares | 10.32% | 1.93% | 3.23% |
Bloomberg U.S. Corporate High Yield Index | 11.15% | 4.21% | 4.44% |
* | The performance data above represents past performance that is not predictive of future results. The investment return and principal value of an investment in the Fund will fluctuate so that an investor’s shares, when redeemed, may be worth more or less than their original cost. Returns are historical and include changes in principal and reinvested dividends and capital gains and do not reflect the effect of taxes. The Bloomberg U.S. Corporate High Yield Index is an unmanaged index and, unlike the Fund, has no management fees or operating expenses to reduce its reported return. The graphs are based on Class A shares and Class H shares only; performance for Class C shares will vary due to differences in fee structures. |
† | Fund returns are calculated using the maximum sales charge of 4.75%. |
‡ | Fund returns include a CDSC of 1% if redeemed within 12 months of purchase. |
| | THE RYDEX FUNDS ANNUAL REPORT | 183 |
SCHEDULE OF INVESTMENTS | March 31, 2024 |
HIGH YIELD STRATEGY FUND | |
| | Shares | | | Value | |
MUTUAL FUNDS† - 12.7% |
Guggenheim Strategy Fund III1 | | | 79,841 | | | $ | 1,969,680 | |
Guggenheim Ultra Short Duration Fund — Institutional Class1 | | | 133,249 | | | | 1,320,497 | |
Guggenheim Strategy Fund II1 | | | 53,173 | | | | 1,308,049 | |
Total Mutual Funds | | | | |
(Cost $4,578,426) | | | | | | | 4,598,226 | |
| | | Face
Amount | | | | | |
FEDERAL AGENCY DISCOUNT NOTES†† - 27.6% |
Federal Home Loan Bank |
5.15% due 04/01/242 | | $ | 10,000,000 | | | | 10,000,000 | |
Total Federal Agency Discount Notes | | | | |
(Cost $10,000,000) | | | | | | | 10,000,000 | |
| | | | | | | | | |
U.S. GOVERNMENT SECURITIES†† - 17.9% |
United States Treasury Floating Rate Note |
5.44% (3 Month U.S. Treasury Bill Rate + 0.14%, Rate Floor: 0.00%) due 10/31/24◊ | | | 4,000,000 | | | | 4,001,603 | |
5.23% (3 Month U.S. Treasury Bill Rate - 0.08%, Rate Floor: 0.00%) due 04/30/24◊ | | | 2,500,000 | | | | 2,499,388 | |
Total U.S. Government Securities | | | | |
(Cost $6,498,912) | | | | | | | 6,500,991 | |
| | | | | | | | | |
U.S. TREASURY BILLS†† - 12.8% |
U.S. Treasury Bills |
5.28% due 04/18/242 | | | 3,700,000 | | | | 3,690,803 | |
5.17% due 04/16/242,3 | | | 945,000 | | | | 942,924 | |
Total U.S. Treasury Bills | | | | |
(Cost $4,633,709) | | | | | | | 4,633,727 | |
| | | | | | | | | |
FEDERAL AGENCY NOTES†† - 6.9% |
Federal Home Loan Bank |
5.59% due 09/27/24 | | | 2,500,000 | | | | 2,500,440 | |
Total Federal Agency Notes | | | | |
(Cost $2,499,976) | | | | | | | 2,500,440 | |
| | | | | | | | | |
REPURCHASE AGREEMENTS††,4 - 16.1% |
J.P. Morgan Securities LLC
issued 03/28/24 at 5.31%
due 04/01/245 | | | 3,359,828 | | | | 3,359,828 | |
BofA Securities, Inc.
issued 03/28/24 at 5.31%
due 04/01/245 | | | 1,292,241 | | | | 1,292,241 | |
Barclays Capital, Inc.
issued 03/28/24 at 5.30%
due 04/01/245 | | | 1,171,305 | | | | 1,171,305 | |
Total Repurchase Agreements | | | | |
(Cost $5,823,374) | | | | | | | 5,823,374 | |
| | | | | | | | | |
Total Investments - 94.0% | | | | |
(Cost $34,034,397) | | $ | 34,056,758 | |
Other Assets & Liabilities, net - 6.0% | | | 2,186,980 | |
Total Net Assets - 100.0% | | $ | 36,243,738 | |
184 | THE RYDEX FUNDS ANNUAL REPORT | SEE NOTES TO FINANCIAL STATEMENTS. |
SCHEDULE OF INVESTMENTS (continued) | March 31, 2024 |
HIGH YIELD STRATEGY FUND | |
Futures Contracts |
Description | | Number of
Contracts | | | Expiration
Date | | | Notional
Amount | | | Value and
Unrealized
Appreciation** | |
Interest Rate Futures Contracts Purchased† |
U.S. Treasury 5 Year Note Futures Contracts | | | 342 | | | | Jun 2024 | | | $ | 36,602,016 | | | $ | 93,728 | |
Centrally Cleared Credit Default Swap Agreements Protection Sold†† |
Counterparty | | Exchange | | Index | Protection
Premium
Rate | | Payment
Frequency | | | Maturity
Date | | | Notional
Amount | | Value | | | Upfront
Premiums
Paid | | | Unrealized
Appreciation** | |
Barclays Bank plc | | ICE | | CDX.NA.HY.42.V1 | 5.00% | | | Quarterly | | | | 06/20/29 | | | $ | 26,050,000 | | $ | 1,861,429 | | | $ | 1,815,028 | | | $ | 46,401 | |
Goldman Sachs International | | ICE | | CDX.NA.HY.42.V1 | 5.00% | | | Quarterly | | | | 06/20/29 | | | | 6,700,000 | | | 478,755 | | | | 468,827 | | | | 9,928 | |
| | | | | | | | | | | | | | | | | | | $ | 2,340,184 | | | $ | 2,283,855 | | | $ | 56,329 | |
Total Return Swap Agreements |
Counterparty | Reference Obligation | Type | | Financing
Rate | | Payment
Frequency | | | Maturity
Date | | | Units | | | Notional
Amount | | | Value and
Unrealized
Appreciation
(Depreciation) | |
OTC Credit Index Swap Agreements†† |
Goldman Sachs International | iShares iBoxx $ High Yield Corporate Bond ETF | Pay | | 5.58% (Federal
Funds Rate +
0.25%) | At Maturity | 04/25/24 | 16,337 | | $ | 1,271,345 | | | $ | 5,391 | |
BNP Paribas | iShares iBoxx $ High Yield Corporate Bond ETF | Pay | | 5.73% (Federal
Funds Rate +
0.40%) | At Maturity | 06/26/24 | 1,222 | | | 95,112 | | | | — | |
BNP Paribas | SPDR Bloomberg High Yield Bond ETF | Pay | | 5.78% (Federal
Funds Rate +
0.45%) | At Maturity | 06/26/24 | 1,788 | | | 170,262 | | | | (53 | ) |
| | | | | | | | | | | | | | | | | | | $ | 1,536,719 | | | $ | 5,338 | |
** | Includes cumulative appreciation (depreciation). Variation margin is reported within the Statement of Assets and Liabilities. |
† | Value determined based on Level 1 inputs — See Note 4. |
†† | Value determined based on Level 2 inputs — See Note 4. |
◊ | Variable rate security. Rate indicated is the rate effective at March 31, 2024. In some instances, the effective rate is limited by a minimum rate floor or a maximum rate cap established by the issuer. The settlement status of a position may also impact the effective rate indicated. In some cases, a position may be unsettled at period end and may not have a stated effective rate. In instances where multiple underlying reference rates and spread amounts are shown, the effective rate is based on a weighted average. |
1 | Affiliated issuer. |
2 | Rate indicated is the effective yield at the time of purchase. |
3 | All or a portion of this security is pledged as futures and credit default swap collateral at March 31, 2024. |
4 | Repurchase Agreements — See Note 6. |
5 | All or a portion of this security is pledged as equity index swap collateral at March 31, 2024. |
| | CDX.NA.HY.42.V1 — Credit Default Swap North American High Yield Series 42 Index Version 1 |
| | ICE — Intercontinental Exchange |
| | plc — Public Limited Company |
| | |
| | See Sector Classification in Other Information section. |
SEE NOTES TO FINANCIAL STATEMENTS. | THE RYDEX FUNDS ANNUAL REPORT | 185 |
SCHEDULE OF INVESTMENTS (concluded) | March 31, 2024 |
HIGH YIELD STRATEGY FUND | |
The following table summarizes the inputs used to value the Fund’s investments at March 31, 2024 (See Note 4 in the Notes to Financial Statements):
Investments in Securities (Assets) | | Level 1
Quoted
Prices | | | Level 2
Significant
Observable
Inputs | | | Level 3
Significant
Unobservable
Inputs | | | Total | |
Mutual Funds | | $ | 4,598,226 | | | $ | — | | | $ | — | | | $ | 4,598,226 | |
Federal Agency Discount Notes | | | — | | | | 10,000,000 | | | | — | | | | 10,000,000 | |
U.S. Government Securities | | | — | | | | 6,500,991 | | | | — | | | | 6,500,991 | |
U.S. Treasury Bills | | | — | | | | 4,633,727 | | | | — | | | | 4,633,727 | |
Federal Agency Notes | | | — | | | | 2,500,440 | | | | — | | | | 2,500,440 | |
Repurchase Agreements | | | — | | | | 5,823,374 | | | | — | | | | 5,823,374 | |
Interest Rate Futures Contracts** | | | 93,728 | | | | — | | | | — | | | | 93,728 | |
Credit Default Swap Agreements** | | | — | | | | 56,329 | | | | — | | | | 56,329 | |
Credit Index Swap Agreements** | | | — | | | | 5,391 | | | | — | | | | 5,391 | |
Total Assets | | $ | 4,691,954 | | | $ | 29,520,252 | | | $ | — | | | $ | 34,212,206 | |
Investments in Securities (Liabilities) | | Level 1
Quoted
Prices | | | Level 2
Significant
Observable
Inputs | | | Level 3
Significant
Unobservable
Inputs | | | Total | |
Credit Index Swap Agreements** | | $ | — | | | $ | 53 | | | $ | — | | | $ | 53 | |
** | This derivative is reported as unrealized appreciation/depreciation at period end. |
Affiliated Transactions
Investments representing 5% or more of the outstanding voting shares of a company, or control of or by, or common control under Guggenheim Investments (“GI”), result in that company being considered an affiliated issuer, as defined in the 1940 Act.
The Fund may invest in certain of the underlying series of Guggenheim Strategy Funds Trust, including Guggenheim Strategy Fund II and Guggenheim Strategy Fund III (collectively, the “Guggenheim Strategy Funds”), each of which are open-end management investment companies managed by GI. The Guggenheim Strategy Funds, which launched on March 11, 2014, are offered as short term investment options only to mutual funds, trusts, and other accounts managed by GI and/or its affiliates, and are not available to the public. The Guggenheim Strategy Funds pay no investment management fees. The Guggenheim Strategy Funds’ annual report on Form N-CSR dated September 30, 2023 is available publicly or upon request. This information is available from the EDGAR database on the SEC’s website at https://www.sec.gov/Archives/edgar/data/1601445/000182126823000217/gug86449-ncsr.htm. The Fund may invest in certain of the underlying series of Guggenheim Funds Trust, which are open-end management investment companies managed by GI, are available to the public and whose most recent annual report on Form N-CSR is available publicly or upon request.
Transactions during the year ended March 31, 2024, in which the company is an affiliated issuer, were as follows:
Security Name | | Value
03/31/23 | | | Additions | | | Reductions | | | Realized
Gain (Loss) | | | Change in
Unrealized
Appreciation
(Depreciation) | | | Value
03/31/24 | | | Shares
03/31/24 | | | Investment
Income | |
Mutual Funds | | | | | | | | | | | | | | | | | | | | | | | | | | | | | | | | |
Guggenheim Strategy Fund II | | $ | 1,287,312 | | | $ | — | | | $ | — | | | $ | — | | | $ | 20,737 | | | $ | 1,308,049 | | | | 53,173 | | | $ | 72,135 | |
Guggenheim Strategy Fund III | | | 1,936,146 | | | | — | | | | — | | | | — | | | | 33,534 | | | | 1,969,680 | | | | 79,841 | | | | 106,112 | |
Guggenheim Ultra Short Duration Fund — Institutional Class | | | 1,293,848 | | | | — | | | | — | | | | — | | | | 26,649 | | | | 1,320,497 | | | | 133,249 | | | | 70,912 | |
| | | $ | 4,517,306 | | | $ | — | | | $ | — | | | $ | — | | | $ | 80,920 | | | $ | 4,598,226 | | | | | | | $ | 249,159 | |
186 | THE RYDEX FUNDS ANNUAL REPORT | SEE NOTES TO FINANCIAL STATEMENTS. |
STATEMENT OF ASSETS AND LIABILITIES |
March 31, 2024 |
Assets: |
Investments in unaffiliated issuers, at value (cost $23,632,597) | | $ | 23,635,158 | |
Investments in affiliated issuers, at value (cost $4,578,426) | | | 4,598,226 | |
Repurchase agreements, at value (cost $5,823,374) | | | 5,823,374 | |
Segregated cash with broker | | | 1,817,574 | |
Unamortized upfront premiums paid on credit default swap agreements | | | 2,283,855 | |
Unrealized appreciation on OTC swap agreements | | | 5,391 | |
Receivables: |
Interest | | | 64,069 | |
Protection fees on credit default swap agreements | | | 54,583 | |
Dividends | | | 20,910 | |
Fund shares sold | | | 918 | |
Total assets | | | 38,304,058 | |
| | | | | |
Liabilities: |
Segregated cash due to broker | | | 10,035 | |
Unrealized depreciation on OTC swap agreements | | | 53 | |
Payable for: |
Variation margin on credit default swap agreements | | | 1,930,206 | |
Variation margin on futures contracts | | | 37,402 | |
Management fees | | | 22,806 | |
Transfer agent fees | | | 16,396 | |
Distribution and service fees | | | 7,963 | |
Portfolio accounting and administration fees | | | 3,155 | |
Fund shares redeemed | | | 785 | |
Swap settlement | | | 664 | |
Trustees’ fees* | | | 392 | |
Miscellaneous | | | 30,463 | |
Total liabilities | | | 2,060,320 | |
Net assets | | $ | 36,243,738 | |
| | | | | |
Net assets consist of: |
Paid in capital | | $ | 47,866,524 | |
Total distributable earnings (loss) | | | (11,622,786 | ) |
Net assets | | $ | 36,243,738 | |
Class A: |
Net assets | | $ | 2,989,674 | |
Capital shares outstanding | | | 24,648 | |
Net asset value per share | | $ | 121.29 | |
Maximum offering price per share (Net asset value divided by 95.25%) | | $ | 127.34 | |
Class C: |
Net assets | | $ | 417,340 | |
Capital shares outstanding | | | 4,135 | |
Net asset value per share | | $ | 100.93 | |
Class H: |
Net assets | | $ | 32,836,724 | |
Capital shares outstanding | | | 270,881 | |
Net asset value per share | | $ | 121.22 | |
STATEMENT OF OPERATIONS |
Year Ended March 31, 2024 |
Investment Income: |
Dividends from securities of affiliated issuers | | $ | 249,159 | |
Interest | | | 1,699,680 | |
Total investment income | | | 1,948,839 | |
| | | | | |
Expenses: |
Management fees | | | 295,252 | |
Distribution and service fees: |
Class A | | | 7,371 | |
Class C | | | 7,089 | |
Class H | | | 89,263 | |
Transfer agent fees | | | 85,325 | |
Portfolio accounting and administration fees | | | 60,007 | |
Professional fees | | | 17,862 | |
Trustees’ fees* | | | 5,319 | |
Custodian fees | | | 5,311 | |
Miscellaneous | | | 55,726 | |
Total expenses | | | 628,525 | |
Less: |
Expenses reimbursed by Adviser | | | (13,805 | ) |
Expenses waived by Adviser | | | (3,263 | ) |
Total waived/reimbursed expenses | | | (17,068 | ) |
Net expenses | | | 611,457 | |
Net investment income | | | 1,337,382 | |
| | | | | |
Net Realized and Unrealized Gain (Loss): |
Net realized gain (loss) on: |
Investments in unaffiliated issuers | | | (101 | ) |
Swap agreements | | | 4,044,285 | |
Futures contracts | | | (1,546,589 | ) |
Net realized gain | | | 2,497,595 | |
Net change in unrealized appreciation (depreciation) on: |
Investments in unaffiliated issuers | | | 2,006 | |
Investments in affiliated issuers | | | 80,920 | |
Swap agreements | | | (256,414 | ) |
Futures contracts | | | (63,728 | ) |
Net change in unrealized appreciation (depreciation) | | | (237,216 | ) |
Net realized and unrealized gain | | | 2,260,379 | |
Net increase in net assets resulting from operations | | $ | 3,597,761 | |
* | Relates to Trustees not deemed “interested persons” within the meaning of Section 2(a)(19) of the 1940 Act. |
SEE NOTES TO FINANCIAL STATEMENTS. | THE RYDEX FUNDS ANNUAL REPORT | 187 |
STATEMENTS OF CHANGES IN NET ASSETS |
| | Year Ended
March 31,
2024 | | | Year Ended
March 31,
2023 | |
Increase (Decrease) in Net Assets from Operations: | | | | | | | | |
Net investment income | | $ | 1,337,382 | | | $ | 268,301 | |
Net realized gain (loss) on investments | | | 2,497,595 | | | | (2,621,292 | ) |
Net change in unrealized appreciation (depreciation) on investments | | | (237,216 | ) | | | 671,805 | |
Net increase (decrease) in net assets resulting from operations | | | 3,597,761 | | | | (1,681,186 | ) |
| | | | | | | | | |
Distributions to shareholders: | | | | | | | | |
Class A | | | (137,018 | ) | | | (8,535 | ) |
Class C | | | (33,052 | ) | | | (4,445 | ) |
Class H | | | (1,598,601 | ) | | | (37,467 | ) |
Total distributions to shareholders | | | (1,768,671 | ) | | | (50,447 | ) |
| | | | | | | | | |
Capital share transactions: | | | | | | | | |
Proceeds from sale of shares | | | | | | | | |
Class A | | | 1,827,822 | | | | 499,340 | |
Class C | | | 785,584 | | | | 450,915 | |
Class H | | | 136,262,338 | | | | 192,130,601 | |
Distributions reinvested | | | | | | | | |
Class A | | | 136,021 | | | | 8,316 | |
Class C | | | 27,809 | | | | 4,332 | |
Class H | | | 1,594,479 | | | | 36,864 | |
Cost of shares redeemed | | | | | | | | |
Class A | | | (1,695,572 | ) | | | (866,875 | ) |
Class C | | | (1,677,806 | ) | | | (472,670 | ) |
Class H | | | (121,545,224 | ) | | | (192,581,810 | ) |
Net increase (decrease) from capital share transactions | | | 15,715,451 | | | | (790,987 | ) |
Net increase (decrease) in net assets | | | 17,544,541 | | | | (2,522,620 | ) |
| | | | | | | | | |
Net assets: | | | | | | | | |
Beginning of year | | | 18,699,197 | | | | 21,221,817 | |
End of year | | $ | 36,243,738 | | | $ | 18,699,197 | |
| | | | | | | | | |
Capital share activity: | | | | | | | | |
Shares sold | | | | | | | | |
Class A | | | 15,897 | | | | 4,376 | |
Class C | | | 8,108 | | | | 4,689 | |
Class H | | | 1,177,645 | | | | 1,733,394 | |
Shares issued from reinvestment of distributions | | | | | | | | |
Class A | | | 1,178 | | | | 76 | |
Class C | | | 289 | | | | 46 | |
Class H | | | 13,812 | | | | 335 | |
Shares redeemed | | | | | | | | |
Class A | | | (14,472 | ) | | | (7,702 | ) |
Class C | | | (17,200 | ) | | | (4,955 | ) |
Class H | | | (1,051,014 | ) | | | (1,748,098 | ) |
Net increase (decrease) in shares | | | 134,243 | | | | (17,839 | ) |
188 | THE RYDEX FUNDS ANNUAL REPORT | SEE NOTES TO FINANCIAL STATEMENTS. |
This table is presented to show selected data for a share outstanding throughout each period and to assist shareholders in evaluating a Fund’s performance for the periods presented.
Class A | | Year Ended
March 31,
2024 | | | Year Ended
March 31,
2023 | | | Year Ended
March 31,
2022 | | | Year Ended
March 31,
2021 | | | Year Ended
March 31,
2020f | |
Per Share Data |
Net asset value, beginning of period | | $ | 114.48 | | | $ | 117.11 | | | $ | 122.60 | | | $ | 108.68 | | | $ | 120.48 | |
Income (loss) from investment operations: |
Net investment income (loss)a | | | 3.96 | | | | 1.41 | | | | (1.36 | ) | | | (.55 | ) | | | .70 | |
Net gain (loss) on investments (realized and unrealized) | | | 7.66 | | | | (3.68 | ) | | | (4.13 | ) | | | 14.47 | e | | | (7.05 | ) |
Total from investment operations | | | 11.62 | | | | (2.27 | ) | | | (5.49 | ) | | | 13.92 | | | | (6.35 | ) |
Less distributions from: |
Net investment income | | | (4.81 | ) | | | (.36 | ) | | | — | | | | — | | | | (5.45 | ) |
Total distributions | | | (4.81 | ) | | | (.36 | ) | | | — | | | | — | | | | (5.45 | ) |
Net asset value, end of period | | $ | 121.29 | | | $ | 114.48 | | | $ | 117.11 | | | $ | 122.60 | | | $ | 108.68 | |
|
Total Returnb | | | 10.33 | % | | | (1.89 | %) | | | (4.48 | %) | | | 12.81 | % | | | (5.76 | %) |
Ratios/Supplemental Data |
Net assets, end of period (in thousands) | | $ | 2,990 | | | $ | 2,524 | | | $ | 2,962 | | | $ | 4,021 | | | $ | 3,933 | |
Ratios to average net assets: |
Net investment income (loss) | | | 3.40 | % | | | 1.28 | % | | | (1.10 | %) | | | (1.21 | %) | | | 0.58 | % |
Total expensesc | | | 1.59 | % | | | 1.54 | % | | | 1.51 | % | | | 1.60 | % | | | 1.63 | % |
Net expensesd | | | 1.54 | % | | | 1.52 | % | | | 1.49 | % | | | 1.57 | % | | | 1.61 | % |
Portfolio turnover rate | | | — | | | | — | | | | 40 | % | | | 134 | % | | | — | |
Class C | | Year Ended
March 31,
2024 | | | Year Ended
March 31,
2023 | | | Year Ended
March 31,
2022 | | | Year Ended
March 31,
2021 | | | Year Ended
March 31,
2020f | |
Per Share Data |
Net asset value, beginning of period | | $ | 96.73 | | | $ | 99.75 | | | $ | 105.21 | | | $ | 93.96 | | | $ | 105.62 | |
Income (loss) from investment operations: |
Net investment income (loss)a | | | 2.49 | | | | .50 | | | | (1.97 | ) | | | (.81 | ) | | | (.20 | ) |
Net gain (loss) on investments (realized and unrealized) | | | 6.52 | | | | (3.16 | ) | | | (3.49 | ) | | | 12.06 | e | | | (6.01 | ) |
Total from investment operations | | | 9.01 | | | | (2.66 | ) | | | (5.46 | ) | | | 11.25 | | | | (6.21 | ) |
Less distributions from: |
Net investment income | | | (4.81 | ) | | | (.36 | ) | | | — | | | | — | | | | (5.45 | ) |
Total distributions | | | (4.81 | ) | | | (.36 | ) | | | — | | | | — | | | | (5.45 | ) |
Net asset value, end of period | | $ | 100.93 | | | $ | 96.73 | | | $ | 99.75 | | | $ | 105.21 | | | $ | 93.96 | |
|
Total Returnb | | | 9.51 | % | | | (2.62 | %) | | | (5.19 | %) | | | 11.97 | % | | | (6.45 | %) |
Ratios/Supplemental Data |
Net assets, end of period (in thousands) | | $ | 417 | | | $ | 1,251 | | | $ | 1,313 | | | $ | 2,136 | | | $ | 866 | |
Ratios to average net assets: |
Net investment income (loss) | | | 2.55 | % | | | 0.53 | % | | | (1.86 | %) | | | (1.96 | %) | | | (0.20 | %) |
Total expensesc | | | 2.33 | % | | | 2.29 | % | | | 2.26 | % | | | 2.34 | % | | | 2.38 | % |
Net expensesd | | | 2.30 | % | | | 2.27 | % | | | 2.24 | % | | | 2.32 | % | | | 2.36 | % |
Portfolio turnover rate | | | — | | | | — | | | | 40 | % | | | 134 | % | | | — | |
SEE NOTES TO FINANCIAL STATEMENTS. | THE RYDEX FUNDS ANNUAL REPORT | 189 |
FINANCIAL HIGHLIGHTS (concluded) |
This table is presented to show selected data for a share outstanding throughout each period and to assist shareholders in evaluating a Fund’s performance for the periods presented.
Class H | | Year Ended
March 31,
2024 | | | Year Ended
March 31,
2023 | | | Year Ended
March 31,
2022 | | | Year Ended
March 31,
2021 | | | Year Ended
March 31,
2020f | |
Per Share Data |
Net asset value, beginning of period | | $ | 114.41 | | | $ | 117.03 | | | $ | 122.51 | | | $ | 108.54 | | | $ | 120.32 | |
Income (loss) from investment operations: |
Net investment income (loss)a | | | 3.98 | | | | 1.61 | | | | (1.41 | ) | | | (.47 | ) | | | .75 | |
Net gain (loss) on investments (realized and unrealized) | | | 7.64 | | | | (3.87 | ) | | | (4.07 | ) | | | 14.44 | e | | | (7.08 | ) |
Total from investment operations | | | 11.62 | | | | (2.26 | ) | | | (5.48 | ) | | | 13.97 | | | | (6.33 | ) |
Less distributions from: |
Net investment income | | | (4.81 | ) | | | (.36 | ) | | | — | | | | — | | | | (5.45 | ) |
Total distributions | | | (4.81 | ) | | | (.36 | ) | | | — | | | | — | | | | (5.45 | ) |
Net asset value, end of period | | $ | 121.22 | | | $ | 114.41 | | | $ | 117.03 | | | $ | 122.51 | | | $ | 108.54 | |
|
Total Return | | | 10.32 | % | | | (1.88 | %) | | | (4.47 | %) | | | 12.87 | % | | | (5.73 | %) |
Ratios/Supplemental Data |
Net assets, end of period (in thousands) | | $ | 32,837 | | | $ | 14,924 | | | $ | 16,947 | | | $ | 19,835 | | | $ | 23,125 | |
Ratios to average net assets: |
Net investment income (loss) | | | 3.41 | % | | | 1.45 | % | | | (1.14 | %) | | | (1.23 | %) | | | 0.59 | % |
Total expensesc | | | 1.58 | % | | | 1.55 | % | | | 1.51 | % | | | 1.61 | % | | | 1.63 | % |
Net expensesd | | | 1.54 | % | | | 1.53 | % | | | 1.49 | % | | | 1.59 | % | | | 1.61 | % |
Portfolio turnover rate | | | — | | | | — | | | | 40 | % | | | 134 | % | | | — | |
a | Net investment income (loss) per share was computed using average shares outstanding throughout the period. |
b | Total return does not reflect the impact of any applicable sales charges. |
c | Does not include expenses of the underlying funds in which the Fund invests. |
d | Net expense information reflects the expense ratios after expense waivers and reimbursements, as applicable. |
e | The amount shown for a share outstanding throughout the period does not agree with the aggregate net loss on investments for the year because of sales and repurchases of fund shares in relation to fluctuating market value of the investments of the Fund. |
f | Reverse share split — Per share amounts for the periods presented through March 31, 2020 have been restated to reflect a 1:5 reverse share split effective August 17, 2020. |
190 | THE RYDEX FUNDS ANNUAL REPORT | SEE NOTES TO FINANCIAL STATEMENTS. |
PERFORMANCE REPORT AND FUND PROFILE (Unaudited) | March 31, 2024 |
INVERSE HIGH YIELD STRATEGY FUND
OBJECTIVE: Seeks to provide investment results that inversely correlate, before fees and expenses, to the performance of the high yield bond market.
For the Reporting Period, Inverse High Yield Strategy Fund Class H returned -2.68%. For comparison, the Bloomberg U.S. Corporate High Yield Index (the “Index”) returned 11.15% for the same period.
The Fund primarily invests in credit default swaps, swaps on ETFs, and bond futures to gain exposure similar to the high yield bond market. Credit default swaps are instruments which allow for the full or partial transfer of third party credit risk, with respect to a particular entity or entities, from one counterparty to the other. The Fund will normally be a buyer of credit protection (mitigating credit risk) as it seeks to gain exposure to the high yield bond market, but also may sell credit protection from time to time in order to maintain the appropriate level of exposure to the high yield bond market, such as during times of heavy redemption activity. The Fund’s investments in bond futures are expected to provide exposure to interest rate risk comparable to that experienced in the high yield bond market, and will complement the Fund’s swaps investments exposure to produce investment exposure that in the aggregate is similar to that of the high yield bond market.
The high yield sector rallied over the Reporting Period, as the Fed seemed ready to start cutting rates amid market optimism that an economic soft-landing might be possible. Spreads generally tightened over the Reporting Period, and remain quite tight compared with history. Issuance was approximately $220 billion during the Reporting Period, better than the $176 billion in 2023 as a whole. After about $8 billion in outflows from mutual funds and ETFs in 2023, the first quarter of 2024 saw inflows of more than $2 billion.
For the Reporting Period, lower-rated credit outperformed, with CCC rated issues in the index returning almost 16%, compared with 12% for B rated issues and 9% for BB rated issues. Issues in the consumer cyclical and energy sectors were the leading contributors to the return of the index, while those in the transportation and electric utilities sectors provided lower contributions; all sectors had positive returns for the Reporting Period. On a fundamental basis, average leverage and coverage levels remain ahead of historical averages. Defaults are expected to remain subdued as borrowers have solid balance sheets and a manageable maturity wall.
Derivatives in the Fund are used to help provide exposure to the composition of the benchmark in the most efficient manner possible and to provide leverage and not for hedging purposes. Derivatives performed as expected.
The effects of compounding may cause the longer-term correlation of the Fund to its benchmark to diminish. A significant contributor to the discrepancy between the leveraged and unleveraged indices is the effect of compounding on the leveraged index, which is discussed under “A Brief Note on the Compounding of Returns” on page 6.
The Fund may invest in certain of the underlying series of Guggenheim Funds Trust and Guggenheim Strategy Funds Trust, including Guggenheim Ultra Short Duration, Guggenheim Strategy Fund II, and Guggenheim Strategy Fund III (collectively, the “Short Term Investment Vehicles”), each of which are open-end management investment companies managed by Guggenheim Investments. The Short Term Investment Vehicles, which launched on March 11, 2014, are offered as short term investment options only to mutual funds, trusts, and other accounts managed by Guggenheim Investments and/or its affiliates, and are not available to the public, with the exception of Guggenheim Ultra Short Duration Fund, which is available to the public. Guggenheim Strategy Fund II and Guggenheim Strategy Fund III do not charge an investment management fee. Guggenheim Ultra Short Duration Fund charges an investment management fee, but the Fund’s adviser has agreed to waive fees to the extent necessary to offset the proportionate share of any management fee paid by the Fund with respect to its investment in such affiliated fund. For the Reporting Period, investment in the Short Term Investment Vehicles contributed to Fund performance.
Performance displayed represents past performance, which is no guarantee of future results.
| | THE RYDEX FUNDS ANNUAL REPORT | 191 |
PERFORMANCE REPORT AND FUND PROFILE (Unaudited) | March 31, 2024 |
Holdings Diversification (Market Exposure as % of Net Assets)
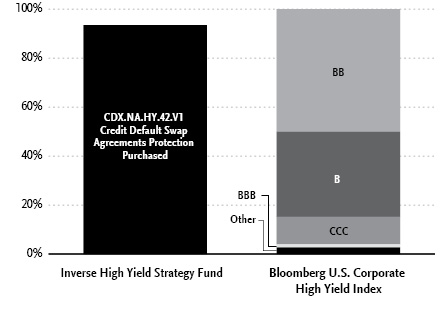
“Holdings Diversification (Market Exposure as % of Net Assets)” excludes any temporary cash investments, investments in Guggenheim Strategy Funds Trust mutual funds, or investments in Guggenheim Ultra Short Duration Fund. Investments in those Funds do not provide “market exposure” to meet the Fund’s investment objective, but will significantly increase the portfolio’s exposure to certain other asset categories (and their associated risks), which may cause the Fund to deviate from its principal investment strategy, including: (i) high yield, high risk debt securities rated below the top four long-term rating categories by a nationally recognized statistical rating organization (also known as “junk bonds”); (ii) securities issued by the U.S. government or its agencies and instrumentalities; (iii) CLOs and similar investments; and (iv) other short-term fixed income securities.
Inception Dates: |
Class A | April 16, 2007 |
Class C | April 16, 2007 |
Class H | April 16, 2007 |
The Fund invests principally in derivative investments such as high yield credit default swap agreements and futures contracts.
Largest Holdings | % of Total Net Assets |
Guggenheim Strategy Fund II | 11.3% |
Guggenheim Ultra Short Duration Fund — Institutional Class | 5.9% |
Total | 17.2% |
| | |
“Largest Holdings” excludes any temporary cash or derivative investments. |
192 | THE RYDEX FUNDS ANNUAL REPORT | |
PERFORMANCE REPORT AND FUND PROFILE (Unaudited)(concluded) | March 31, 2024 |
Cumulative Fund Performance*
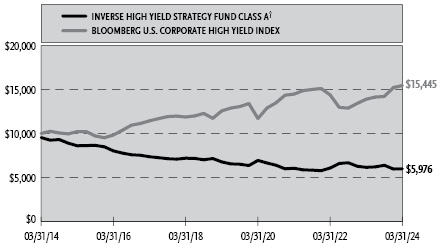
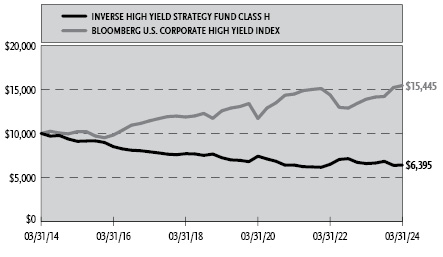
Average Annual Returns*
Periods Ended March 31, 2024
| 1 Year | 5 Year | 10 Year |
Class A Shares | (2.65%) | (2.42%) | (4.56%) |
Class A Shares with sales charge† | (7.27%) | (3.37%) | (5.02%) |
Class C Shares | (3.41%) | (3.20%) | (5.23%) |
Class C Shares with CDSC‡ | (4.40%) | (3.20%) | (5.23%) |
Class H Shares | (2.68%) | (2.44%) | (4.37%) |
Bloomberg U.S. Corporate High Yield Index | 11.15% | 4.21% | 4.44% |
* | The performance data above represents past performance that is not predictive of future results. The investment return and principal value of an investment in the Fund will fluctuate so that an investor’s shares, when redeemed, may be worth more or less than their original cost. Returns are historical and include changes in principal and reinvested dividends and capital gains and do not reflect the effect of taxes. The Bloomberg U.S. Corporate High Yield Index is an unmanaged index and, unlike the Fund, has no management fees or operating expenses to reduce its reported return. The graphs are based Class A shares and Class H shares only; performance for Class C shares will vary due to differences in fee structures. |
† | Fund returns are calculated using the maximum sales charge of 4.75%. |
‡ | Fund returns include a CDSC of 1% if redeemed within 12 months of purchase. |
| | THE RYDEX FUNDS ANNUAL REPORT | 193 |
SCHEDULE OF INVESTMENTS | March 31, 2024 |
INVERSE HIGH YIELD STRATEGY FUND | |
| | Shares | | | Value | |
MUTUAL FUNDS† - 17.2% |
Guggenheim Strategy Fund II1 | | | 29,310 | | | $ | 721,015 | |
Guggenheim Ultra Short Duration Fund — Institutional Class1 | | | 37,683 | | | | 373,439 | |
Total Mutual Funds | | | | |
(Cost $1,096,686) | | | | | | | 1,094,454 | |
| | | Face
Amount | | | | |
U.S. TREASURY BILLS†† - 1.6% |
U.S. Treasury Bills |
5.17% due 04/16/242,3 | | $ | 102,000 | | | | 101,775 | |
Total U.S. Treasury Bills | | | | |
(Cost $101,776) | | | | | | | 101,775 | |
| | | | | | | | | |
REPURCHASE AGREEMENTS††,4 - 76.1% |
J.P. Morgan Securities LLC
issued 03/28/24 at 5.31%
due 04/01/24 | | | 2,794,190 | | | | 2,794,190 | |
BofA Securities, Inc.
issued 03/28/24 at 5.31%
due 04/01/24 | | | 1,074,688 | | | | 1,074,688 | |
Barclays Capital, Inc.
issued 03/28/24 at 5.30%
due 04/01/24 | | | 974,112 | | | | 974,112 | |
Total Repurchase Agreements | | | | |
(Cost $4,842,990) | | | | | | | 4,842,990 | |
| | | | | | | | | |
Total Investments - 94.9% | | | | |
(Cost $6,041,452) | | $ | 6,039,219 | |
Other Assets & Liabilities, net - 5.1% | | | 326,067 | |
Total Net Assets - 100.0% | | $ | 6,365,286 | |
Futures Contracts |
Description | | Number of
Contracts | | | Expiration
Date | | | Notional
Amount | | | Value and
Unrealized
Depreciation** | |
Interest Rate Futures Contracts Sold Short† |
U.S. Treasury 5 Year Note Futures Contracts | | | 62 | | | | Jun 2024 | | | $ | 6,635,453 | | | $ | (18,176 | ) |
Centrally Cleared Credit Default Swap Agreements Protection Purchased†† |
Counterparty | | Exchange | Index | | Protection
Premium
Rate | | | Payment
Frequency | | | Maturity
Date | | | Notional
Amount | | | Value | | | Upfront
Premiums
Received | | | Unrealized
Depreciation** | |
Barclays Bank plc | | ICE | CDX.NA.HY.42.V1 | | | 5.00 | % | | | Quarterly | | | | 06/20/29 | | | $ | 5,950,000 | | | $ | (425,163 | ) | | $ | (411,941 | ) | | $ | (13,222 | ) |
** | Includes cumulative appreciation (depreciation). Variation margin is reported within the Statement of Assets and Liabilities. |
† | Value determined based on Level 1 inputs — See Note 4. |
†† | Value determined based on Level 2 inputs — See Note 4. |
1 | Affiliated issuer. |
2 | All or a portion of this security is pledged as futures and credit default swap collateral at March 31, 2024. |
3 | Rate indicated is the effective yield at the time of purchase. |
4 | Repurchase Agreements — See Note 6. |
| | CDX.NA.HY.42.V1 — Credit Default Swap North American High Yield Series 42 Index Version 1 |
| | ICE — Intercontinental Exchange |
| | plc — Public Limited Company |
| | |
| | See Sector Classification in Other Information section. |
194 | THE RYDEX FUNDS ANNUAL REPORT | SEE NOTES TO FINANCIAL STATEMENTS. |
SCHEDULE OF INVESTMENTS (concluded) | March 31, 2024 |
INVERSE HIGH YIELD STRATEGY FUND | |
The following table summarizes the inputs used to value the Fund’s investments at March 31, 2024 (See Note 4 in the Notes to Financial Statements):
Investments in Securities (Assets) | | Level 1
Quoted
Prices | | | Level 2
Significant
Observable
Inputs | | | Level 3
Significant
Unobservable
Inputs | | | Total | |
Mutual Funds | | $ | 1,094,454 | | | $ | — | | | $ | — | | | $ | 1,094,454 | |
U.S. Treasury Bills | | | — | | | | 101,775 | | | | — | | | | 101,775 | |
Repurchase Agreements | | | — | | | | 4,842,990 | | | | — | | | | 4,842,990 | |
Total Assets | | $ | 1,094,454 | | | $ | 4,944,765 | | | $ | — | | | $ | 6,039,219 | |
Investments in Securities (Liabilities) | | Level 1
Quoted
Prices | | | Level 2
Significant
Observable
Inputs | | | Level 3
Significant
Unobservable
Inputs | | | Total | |
Interest Rate Futures Contracts** | | $ | 18,176 | | | $ | — | | | $ | — | | | $ | 18,176 | |
Credit Default Swap Agreements** | | | — | | | | 13,222 | | | | — | | | | 13,222 | |
Total Liabilities | | $ | 18,176 | | | $ | 13,222 | | | $ | — | | | $ | 31,398 | |
** | This derivative is reported as unrealized appreciation/depreciation at period end. |
Affiliated Transactions
Investments representing 5% or more of the outstanding voting shares of a company, or control of or by, or common control under Guggenheim Investments (“GI”), result in that company being considered an affiliated issuer, as defined in the 1940 Act.
The Fund may invest in certain of the underlying series of Guggenheim Strategy Funds Trust, including Guggenheim Strategy Fund II and Guggenheim Strategy Fund III (collectively, the “Guggenheim Strategy Funds”), each of which are open-end management investment companies managed by GI. The Guggenheim Strategy Funds, which launched on March 11, 2014, are offered as short term investment options only to mutual funds, trusts, and other accounts managed by GI and/or its affiliates, and are not available to the public. The Guggenheim Strategy Funds pay no investment management fees. The Guggenheim Strategy Funds’ annual report on Form N-CSR dated September 30, 2023 is available publicly or upon request. This information is available from the EDGAR database on the SEC’s website at https://www.sec.gov/Archives/edgar/data/1601445/000182126823000217/gug86449-ncsr.htm. The Fund may invest in certain of the underlying series of Guggenheim Funds Trust, which are open-end management investment companies managed by GI, are available to the public and whose most recent annual report on Form N-CSR is available publicly or upon request.
Transactions during the year ended March 31, 2024, in which the company is an affiliated issuer, were as follows:
Security Name | | Value
03/31/23 | | | Additions | | | Reductions | | | Realized
Gain (Loss) | | | Change in
Unrealized
Appreciation
(Depreciation) | | | Value
03/31/24 | | | Shares
03/31/24 | | | Investment
Income | |
Mutual Funds | | | | | | | | | | | | | | | | | | | | | | | | | | | | | | | | |
Guggenheim Strategy Fund II | | $ | 709,584 | | | $ | — | | | $ | — | | | $ | — | | | $ | 11,431 | | | $ | 721,015 | | | | 29,310 | | | $ | 39,762 | |
Guggenheim Ultra Short Duration Fund — Institutional Class | | | 365,903 | | | | — | | | | — | | | | — | | | | 7,536 | | | | 373,439 | | | | 37,683 | | | | 20,054 | |
| | | $ | 1,075,487 | | | $ | — | | | $ | — | | | $ | — | | | $ | 18,967 | | | $ | 1,094,454 | | | | | | | $ | 59,816 | |
SEE NOTES TO FINANCIAL STATEMENTS. | THE RYDEX FUNDS ANNUAL REPORT | 195 |
INVERSE HIGH YIELD STRATEGY FUND | |
STATEMENT OF ASSETS AND LIABILITIES |
March 31, 2024 |
Assets: |
Investments in unaffiliated issuers, at value (cost $101,776) | | $ | 101,775 | |
Investments in affiliated issuers, at value (cost $1,096,686) | | | 1,094,454 | |
Repurchase agreements, at value (cost $4,842,990) | | | 4,842,990 | |
Cash | | | 2 | |
Segregated cash with broker | | | 691,816 | |
Receivables: |
Variation margin on credit default swap agreements | | | 58,126 | |
Variation margin on futures contracts | | | 6,781 | |
Dividends | | | 5,034 | |
Interest | | | 2,856 | |
Fund shares sold | | | 126 | |
Total assets | | | 6,803,960 | |
| | | | | |
Liabilities: |
Unamortized upfront premiums received on credit default swap agreements | | | 411,941 | |
Payable for: |
Protection fees on credit default swap agreements | | | 9,917 | |
Management fees | | | 4,287 | |
Transfer agent fees | | | 3,336 | |
Distribution and service fees | | | 1,473 | |
Portfolio accounting and administration fees | | | 597 | |
Fund shares redeemed | | | 129 | |
Trustees’ fees* | | | 89 | |
Miscellaneous | | | 6,905 | |
Total liabilities | | | 438,674 | |
Net assets | | $ | 6,365,286 | |
| | | | | |
Net assets consist of: |
Paid in capital | | $ | 17,500,421 | |
Total distributable earnings (loss) | | | (11,135,135 | ) |
Net assets | | $ | 6,365,286 | |
Class A: |
Net assets | | $ | 232,446 | |
Capital shares outstanding | | | 4,794 | |
Net asset value per share | | $ | 48.49 | |
Maximum offering price per share (Net asset value divided by 95.25%) | | $ | 50.91 | |
Class C: |
Net assets | | $ | 24,259 | |
Capital shares outstanding | | | 571 | |
Net asset value per share | | $ | 42.50 | |
Class H: |
Net assets | | $ | 6,108,581 | |
Capital shares outstanding | | | 122,776 | |
Net asset value per share | | $ | 49.75 | |
STATEMENT OF OPERATIONS |
Year Ended March 31, 2024 |
Investment Income: |
Dividends from securities of affiliated issuers | | $ | 59,816 | |
Interest | | | 519,453 | |
Total investment income | | | 579,269 | |
| | | | | |
Expenses: |
Management fees | | | 87,973 | |
Distribution and service fees: |
Class A | | | 808 | |
Class C | | | 581 | |
Class H | | | 28,368 | |
Transfer agent and administrative fees | | | 25,882 | |
Portfolio accounting and administration fees | | | 17,879 | |
Registration fees | | | 8,856 | |
Professional fees | | | 8,945 | |
Trustees’ fees* | | | 2,677 | |
Custodian fees | | | 1,640 | |
Miscellaneous | | | 2,333 | |
Total expenses | | | 185,942 | |
Less: |
Expenses reimbursed by Adviser | | | (3,259 | ) |
Expenses waived by Adviser | | | (923 | ) |
Total waived expenses | | | (4,182 | ) |
Net expenses | | | 181,760 | |
Net investment income | | | 397,509 | |
| | | | | |
Net Realized and Unrealized Gain (Loss): |
Net realized gain (loss) on: |
Investments in affiliated issuers | | | 58 | |
Swap agreements | | | (1,322,669 | ) |
Futures contracts | | | 282,179 | |
Net realized loss | | | (1,040,432 | ) |
Net change in unrealized appreciation (depreciation) on: |
Investments in unaffiliated issuers | | | (353 | ) |
Investments in affiliated issuers | | | 18,967 | |
Swap agreements | | | 242,946 | |
Futures contracts | | | 228,962 | |
Net change in unrealized appreciation (depreciation) | | | 490,522 | |
Net realized and unrealized loss | | | (549,910 | ) |
Net decrease in net assets resulting from operations | | $ | (152,401 | ) |
* | Relates to Trustees not deemed “interested persons” within the meaning of Section 2(a)(19) of the 1940 Act. |
196 | THE RYDEX FUNDS ANNUAL REPORT | SEE NOTES TO FINANCIAL STATEMENTS. |
INVERSE HIGH YIELD STRATEGY FUND | |
STATEMENTS OF CHANGES IN NET ASSETS |
| | Year Ended
March 31,
2024 | | | Year Ended
March 31,
2023 | |
Increase (Decrease) in Net Assets from Operations: | | | | | | | | |
Net investment income | | $ | 397,509 | | | $ | 174,868 | |
Net realized loss on investments | | | (1,040,432 | ) | | | (1,076,306 | ) |
Net change in unrealized appreciation (depreciation) on investments | | | 490,522 | | | | (687,523 | ) |
Net decrease in net assets resulting from operations | | | (152,401 | ) | | | (1,588,961 | ) |
| | | | | | | | | |
Capital share transactions: | | | | | | | | |
Proceeds from sale of shares | | | | | | | | |
Class A | | | 149,996 | | | | 12,971,586 | |
Class C | | | 14,129 | | | | 198,714 | |
Class H | | | 37,702,557 | | | | 376,217,137 | |
Cost of shares redeemed | | | | | | | | |
Class A | | | (259,305 | ) | | | (12,561,305 | ) |
Class C | | | (73,793 | ) | | | (234,107 | ) |
Class H | | | (49,378,394 | ) | | | (363,702,708 | ) |
Net increase (decrease) from capital share transactions | | | (11,844,810 | ) | | | 12,889,317 | |
Net increase (decrease) in net assets | | | (11,997,211 | ) | | | 11,300,356 | |
| | | | | | | | | |
Net assets: | | | | | | | | |
Beginning of year | | | 18,362,497 | | | | 7,062,141 | |
End of year | | $ | 6,365,286 | | | $ | 18,362,497 | |
| | | | | | | | | |
Capital share activity: | | | | | | | | |
Shares sold | | | | | | | | |
Class A | | | 2,986 | | | | 245,159 | |
Class C | | | 320 | | | | 4,376 | |
Class H | | | 732,244 | | | | 7,080,789 | |
Shares redeemed | | | | | | | | |
Class A | | | (5,233 | ) | | | (242,948 | ) |
Class C | | | (1,679 | ) | | | (5,160 | ) |
Class H | | | (960,166 | ) | | | (6,863,025 | ) |
Net increase (decrease) in shares | | | (231,528 | ) | | | 219,191 | |
SEE NOTES TO FINANCIAL STATEMENTS. | THE RYDEX FUNDS ANNUAL REPORT | 197 |
INVERSE HIGH YIELD STRATEGY FUND | |
This table is presented to show selected data for a share outstanding throughout each period and to assist shareholders in evaluating a Fund’s performance for the periods presented.
Class A | | Year Ended
March 31,
2024 | | | Year Ended
March 31,
2023 | | | Year Ended
March 31,
2022 | | | Year Ended
March 31,
2021 | | | Year Ended
March 31,
2020 | |
Per Share Data |
Net asset value, beginning of period | | $ | 49.81 | | | $ | 49.19 | | | $ | 50.15 | | | $ | 62.01 | | | $ | 60.47 | |
Income (loss) from investment operations: |
Net investment income (loss)a | | | 1.72 | | | | (.01 | ) | | | (.64 | ) | | | (.68 | ) | | | .24 | |
Net gain (loss) on investments (realized and unrealized)e | | | (3.04 | ) | | | .63 | e | | | .82 | | | | (7.31 | ) | | | 1.30 | |
Total from investment operations | | | (1.32 | ) | | | .62 | | | | .18 | | | | (7.99 | ) | | | 1.54 | |
Less distributions from: |
Net investment income | | | — | | | | — | | | | (1.14 | ) | | | (3.87 | ) | | | — | |
Total distributions | | | — | | | | — | | | | (1.14 | ) | | | (3.87 | ) | | | — | |
Net asset value, end of period | | $ | 48.49 | | | $ | 49.81 | | | $ | 49.19 | | | $ | 50.15 | | | $ | 62.01 | |
|
Total Returnb | | | (2.65 | %) | | | 1.26 | % | | | 0.47 | % | | | (12.88 | %) | | | 2.56 | % |
Ratios/Supplemental Data |
Net assets, end of period (in thousands) | | $ | 232 | | | $ | 351 | | | $ | 238 | | | $ | 5,612 | | | $ | 256 | |
Ratios to average net assets: |
Net investment income (loss) | | | 3.43 | % | | | (0.02 | %) | | | (1.31 | %) | | | (1.28 | %) | | | 0.40 | % |
Total expensesc | | | 1.58 | % | | | 1.55 | % | | | 1.50 | % | | | 1.56 | % | | | 1.62 | % |
Net expensesd | | | 1.54 | % | | | 1.55 | % | | | 1.49 | % | | | 1.54 | % | | | 1.61 | % |
Portfolio turnover rate | | | — | | | | — | | | | 344 | % | | | 438 | % | | | 254 | % |
Class C | | Year Ended
March 31,
2024 | | | Year Ended
March 31,
2023 | | | Year Ended
March 31,
2022 | | | Year Ended
March 31,
2021 | | | Year Ended
March 31,
2020 | |
Per Share Data |
Net asset value, beginning of period | | $ | 44.00 | | | $ | 43.75 | | | $ | 44.74 | | | $ | 56.62 | | | $ | 55.76 | |
Income (loss) from investment operations: |
Net investment income (loss)a | | | 1.17 | | | | .01 | | | | (.81 | ) | | | (.90 | ) | | | (.05 | ) |
Net gain (loss) on investments (realized and unrealized)e | | | (2.67 | ) | | | .24 | e | | | .96 | | | | (7.11 | ) | | | .91 | |
Total from investment operations | | | (1.50 | ) | | | .25 | | | | .15 | | | | (8.01 | ) | | | .86 | |
Less distributions from: |
Net investment income | | | — | | | | — | | | | (1.14 | ) | | | (3.87 | ) | | | — | |
Total distributions | | | — | | | | — | | | | (1.14 | ) | | | (3.87 | ) | | | — | |
Net asset value, end of period | | $ | 42.50 | | | $ | 44.00 | | | $ | 43.75 | | | $ | 44.74 | | | $ | 56.62 | |
|
Total Returnb | | | (3.41 | %) | | | 0.57 | % | | | 0.45 | % | | | (14.23 | %) | | | 1.54 | % |
Ratios/Supplemental Data |
Net assets, end of period (in thousands) | | $ | 24 | | | $ | 85 | | | $ | 119 | | | $ | 162 | | | $ | 362 | |
Ratios to average net assets: |
Net investment income (loss) | | | 2.64 | % | | | 0.01 | % | | | (1.88 | %) | | | (1.78 | %) | | | (0.09 | %) |
Total expensesc | | | 2.33 | % | | | 2.29 | % | | | 2.26 | % | | | 2.36 | % | | | 2.37 | % |
Net expensesd | | | 2.29 | % | | | 2.29 | % | | | 2.22 | % | | | 2.31 | % | | | 2.34 | % |
Portfolio turnover rate | | | — | | | | — | | | | 344 | % | | | 438 | % | | | 254 | % |
198 | THE RYDEX FUNDS ANNUAL REPORT | SEE NOTES TO FINANCIAL STATEMENTS. |
INVERSE HIGH YIELD STRATEGY FUND | |
FINANCIAL HIGHLIGHTS (concluded) |
This table is presented to show selected data for a share outstanding throughout each period and to assist shareholders in evaluating a Fund’s performance for the periods presented.
Class H | | Year Ended
March 31,
2024 | | | Year Ended
March 31,
2023 | | | Year Ended
March 31,
2022 | | | Year Ended
March 31,
2021 | | | Year Ended
March 31,
2020 | |
Per Share Data |
Net asset value, beginning of period | | $ | 51.12 | | | $ | 50.44 | | | $ | 50.99 | | | $ | 63.45 | | | $ | 61.97 | |
Income (loss) from investment operations: |
Net investment income (loss)a | | | 1.75 | | | | .47 | | | | (.68 | ) | | | (.74 | ) | | | .06 | |
Net gain (loss) on investments (realized and unrealized)e | | | (3.12 | ) | | | .21 | e | | | 1.27 | | | | (7.85 | ) | | | 1.42 | |
Total from investment operations | | | (1.37 | ) | | | .68 | | | | .59 | | | | (8.59 | ) | | | 1.48 | |
Less distributions from: |
Net investment income | | | — | | | | — | | | | (1.14 | ) | | | (3.87 | ) | | | — | |
Total distributions | | | — | | | | — | | | | (1.14 | ) | | | (3.87 | ) | | | — | |
Net asset value, end of period | | $ | 49.75 | | | $ | 51.12 | | | $ | 50.44 | | | $ | 50.99 | | | $ | 63.45 | |
|
Total Return | | | (2.68 | %) | | | 1.35 | % | | | 1.27 | % | | | (13.58 | %) | | | 2.39 | % |
Ratios/Supplemental Data |
Net assets, end of period (in thousands) | | $ | 6,109 | | | $ | 17,927 | | | $ | 6,706 | | | $ | 3,719 | | | $ | 13,479 | |
Ratios to average net assets: |
Net investment income (loss) | | | 3.39 | % | | | 0.88 | % | | | (1.35 | %) | | | (1.26 | %) | | | 0.09 | % |
Total expensesc | | | 1.58 | % | | | 1.54 | % | | | 1.52 | % | | | 1.62 | % | | | 1.64 | % |
Net expensesd | | | 1.55 | % | | | 1.53 | % | | | 1.51 | % | | | 1.60 | % | | | 1.62 | % |
Portfolio turnover rate | | | — | | | | — | | | | 344 | % | | | 438 | % | | | 254 | % |
a | Net investment income (loss) per share was computed using average shares outstanding throughout the period. |
b | Total return does not reflect the impact of any applicable sales charges. |
c | Does not include expenses of the underlying funds in which the Fund invests. |
d | Net expense information reflects the expense ratios after expense waivers and reimbursements, as applicable. |
e | The amount shown for a share outstanding throughout the period does not agree with the aggregate net loss on investments for the year because of the sales and repurchases of fund shares in relation to fluctuating market value of the investments of the Fund. |
SEE NOTES TO FINANCIAL STATEMENTS. | THE RYDEX FUNDS ANNUAL REPORT | 199 |
PERFORMANCE REPORT AND FUND PROFILE (Unaudited) | March 31, 2024 |
U.S. GOVERNMENT MONEY MARKET FUND
OBJECTIVE: Seeks to provide security of principal, high current income, and liquidity.
For the Reporting Period, the U.S. Government Money Market Fund returned 4.33%
The U.S. Federal Reserve’s (the “Fed”) aggressive pace of interest rate hikes—11 times since March 2022—has pushed short-term rates up in an effort to contain inflation. The last rate hike was 25 basis points in July 2023, keeping the Fed funds rate at 5.25%-5.50% through the rest of the Reporting Period.
The hikes kept investors watchful for signs of economic weakness or even recession for much of the Reporting Period, but few materialized as the Fed was resolute in its campaign to keep inflation near its target of 2%. By November 2023, investors seemed certain that the Fed was done hiking for this cycle, and would soon begin cutting rates, which led to a drop in yields across the curve.
However, a string of higher-than-expected inflation reports and a stronger-than-expected economy boosted yields higher through the first quarter of 2024, fueling concern that any rate cuts would be further out on the horizon. Market expectations for rate cuts in 2024 adjusted significantly from six at the beginning of 2024 to only three as of the end of the Reporting Period.
Performance displayed represents past performance, which is no guarantee of future results.
Holdings Diversification (Market Exposure as % of Net Assets)
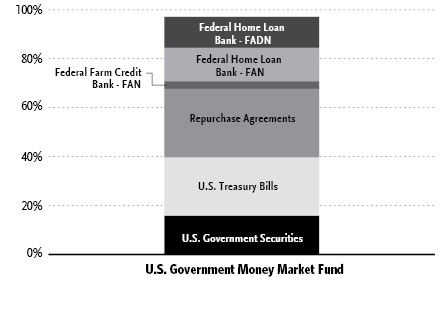
“Holdings Diversification (Market Exposure as % of Net Assets)” excludes any temporary cash investments.
FADN – Federal Agency Discount Note
FAN – Federal Agency Note
Inception Date: June 18, 2012 |
The Fund invests principally in money market instruments issued or guaranteed as to principal and interest by the U.S. Government, its agencies or instrumentalities and enters into repurchase agreements fully collateralized by U.S. government securities.
Average Annual Returns*
Periods Ended March 31, 2024
| 1 Year | 5 Year | 10 Year |
U.S. Government Money Market Fund | 4.33% | 1.43% | 0.85% |
* | The performance data above represents past performance that is not predictive of future results. The investment return and principal value of an investment in the Fund will fluctuate so that an investor’s shares, when redeemed, may be worth more or less than their original cost. Returns are historical and include changes in principal and reinvested dividends and capital gains and do not reflect the effect of taxes. |
200 | THE RYDEX FUNDS ANNUAL REPORT | |
SCHEDULE OF INVESTMENTS | March 31, 2024 |
U.S. GOVERNMENT MONEY MARKET FUND | |
| | Face
Amount | | | Value | |
U.S. TREASURY BILLS†† - 23.8% |
U.S. Treasury Bills |
5.29% due 04/16/241 | | $ | 15,000,000 | | | $ | 14,966,969 | |
5.27% due 05/02/241 | | | 15,000,000 | | | | 14,931,911 | |
4.84% due 05/21/241 | | | 15,000,000 | | | | 14,890,234 | |
5.28% due 04/30/241 | | | 11,000,000 | | | | 10,953,260 | |
5.26% due 04/09/241 | | | 10,000,000 | | | | 9,988,305 | |
Total U.S. Treasury Bills | | | | |
(Cost $65,730,679) | | | | | | | 65,730,679 | |
| | | | | | | | | |
FEDERAL AGENCY NOTES†† - 16.7% |
Federal Home Loan Bank |
5.59% due 09/27/24 | | | 15,000,000 | | | | 14,999,855 | |
5.40% (SOFR + 0.07%, Rate Floor: 0.00%) due 06/17/24◊ | | | 12,600,000 | | | | 12,600,000 | |
0.88% due 05/28/24 | | | 10,000,000 | | | | 9,930,275 | |
Federal Farm Credit Bank |
5.21% (3 Month U.S. Treasury Bill Rate - 0.09%, Rate Floor: 0.00%) due 04/30/24◊ | | | 8,500,000 | | | | 8,499,177 | |
Total Federal Agency Notes | | | | |
(Cost $46,029,307) | | | | | | | 46,029,307 | |
| | | | | | | | | |
U.S. GOVERNMENT SECURITIES†† - 15.8% |
United States Treasury Floating Rate Note |
5.23% (3 Month U.S. Treasury Bill Rate - 0.08%, Rate Floor: 0.00%) due 04/30/24◊ | | | 18,000,000 | | | | 17,997,956 | |
5.44% (3 Month U.S. Treasury Bill Rate + 0.14%, Rate Floor: 0.00%) due 10/31/24◊ | | | 15,000,000 | | | | 14,996,948 | |
5.34% (3 Month U.S. Treasury Bill Rate + 0.04%, Rate Floor: 0.00%) due 07/31/24◊ | | | 10,500,000 | | | | 10,496,639 | |
Total U.S. Government Securities | | | | |
(Cost $43,491,543) | | | | | | | 43,491,543 | |
| | | | | | | | | |
FEDERAL AGENCY DISCOUNT NOTES†† - 12.7% |
Federal Home Loan Bank |
5.15% due 04/01/241 | | | 20,000,000 | | | | 20,000,000 | |
5.26% due 04/01/241 | | | 10,000,000 | | | | 10,000,000 | |
5.19% due 05/31/241 | | | 5,000,000 | | | | 4,956,733 | |
Total Federal Agency Discount Notes | | | | |
(Cost $34,956,733) | | | | | | | 34,956,733 | |
| | | | | | | | | |
REPURCHASE AGREEMENTS††,2 - 28.1% |
J.P. Morgan Securities LLC
issued 03/28/24 at 5.31%
due 04/01/24 | | | 44,613,234 | | | | 44,613,234 | |
BofA Securities, Inc.
issued 03/28/24 at 5.31%
due 04/01/24 | | | 17,158,936 | | | | 17,158,936 | |
Barclays Capital, Inc.
issued 03/28/24 at 5.30%
due 04/01/24 | | | 15,553,092 | | | | 15,553,092 | |
Total Repurchase Agreements | | | | |
(Cost $77,325,262) | | | | | | | 77,325,262 | |
| | | | | | | | | |
Total Investments - 97.1% | | | | |
(Cost $267,533,524) | | $ | 267,533,524 | |
Other Assets & Liabilities, net - 2.9% | | | 8,116,233 | |
Total Net Assets - 100.0% | | $ | 275,649,757 | |
†† | Value determined based on Level 2 inputs — See Note 4. |
◊ | Variable rate security. Rate indicated is the rate effective at March 31, 2024. In some instances, the effective rate is limited by a minimum rate floor or a maximum rate cap established by the issuer. The settlement status of a position may also impact the effective rate indicated. In some cases, a position may be unsettled at period end and may not have a stated effective rate. In instances where multiple underlying reference rates and spread amounts are shown, the effective rate is based on a weighted average. |
1 | Rate indicated is the effective yield at the time of purchase. |
2 | Repurchase Agreements — See Note 6. |
| | SOFR — Secured Overnight Financing Rate |
| | |
| | See Sector Classification in Other Information section. |
SEE NOTES TO FINANCIAL STATEMENTS. | THE RYDEX FUNDS ANNUAL REPORT | 201 |
SCHEDULE OF INVESTMENTS (concluded) | March 31, 2024 |
U.S. GOVERNMENT MONEY MARKET FUND | |
The following table summarizes the inputs used to value the Fund’s investments at March 31, 2024 (See Note 4 in the Notes to Financial Statements):
Investments in Securities (Assets) | | Level 1
Quoted
Prices | | | Level 2
Significant
Observable
Inputs | | | Level 3
Significant
Unobservable
Inputs | | | Total | |
U.S. Treasury Bills | | $ | — | | | $ | 65,730,679 | | | $ | — | | | $ | 65,730,679 | |
Federal Agency Notes | | | — | | | | 46,029,307 | | | | — | | | | 46,029,307 | |
U.S. Government Securities | | | — | | | | 43,491,543 | | | | — | | | | 43,491,543 | |
Federal Agency Discount Notes | | | — | | | | 34,956,733 | | | | — | | | | 34,956,733 | |
Repurchase Agreements | | | — | | | | 77,325,262 | | | | — | | | | 77,325,262 | |
Total Assets | | $ | — | | | $ | 267,533,524 | | | $ | — | | | $ | 267,533,524 | |
202 | THE RYDEX FUNDS ANNUAL REPORT | SEE NOTES TO FINANCIAL STATEMENTS. |
U.S. GOVERNMENT MONEY MARKET FUND | |
STATEMENT OF ASSETS AND LIABILITIES |
March 31, 2024 |
Assets: |
Investments, at value (cost $190,208,262) | | $ | 190,208,262 | |
Repurchase agreements, at value (cost $77,325,262) | | | 77,325,262 | |
Cash | | | 4,269 | |
Receivables: |
Fund shares sold | | | 16,429,058 | |
Interest | | | 584,749 | |
Total assets | | | 284,551,600 | |
| | | | | |
Liabilities: |
Payable for: |
Fund shares redeemed | | | 8,448,623 | |
Management fees | | | 113,699 | |
Transfer agent fees | | | 100,574 | |
Portfolio accounting and administration fees | | | 34,248 | |
Distributions to shareholders | | | 6,183 | |
Trustees’ fees* | | | 2,514 | |
Miscellaneous | | | 196,002 | |
Total liabilities | | | 8,901,843 | |
Net assets | | $ | 275,649,757 | |
| | | | | |
Net assets consist of: |
Paid in capital | | $ | 275,514,534 | |
Total distributable earnings (loss) | | | 135,223 | |
Net assets | | $ | 275,649,757 | |
Capital shares outstanding | | | 275,492,325 | |
Net asset value per share | | $ | 1.00 | |
STATEMENT OF OPERATIONS |
Year Ended March 31, 2024 |
Investment Income: |
Interest | | $ | 13,939,083 | |
Total investment income | | | 13,939,083 | |
| | | | | |
Expenses: |
Management fees | | | 1,312,941 | |
Transfer agent fees | | | 482,383 | |
Portfolio accounting and administration fees | | | 396,462 | |
Registration fees | | | 260,475 | |
Professional fees | | | 121,439 | |
Trustees’ fees* | | | 46,667 | |
Custodian fees | | | 35,979 | |
Miscellaneous | | | 89,723 | |
Total expenses | | | 2,746,069 | |
Net investment income | | | 11,193,014 | |
| | | | | |
Net Realized and Unrealized Gain (Loss): |
Net realized gain (loss) on: |
Investments | | | 996 | |
Net realized gain | | | 996 | |
Net increase in net assets resulting from operations | | $ | 11,194,010 | |
* | Relates to Trustees not deemed “interested persons” within the meaning of Section 2(a)(19) of the 1940 Act. |
SEE NOTES TO FINANCIAL STATEMENTS. | THE RYDEX FUNDS ANNUAL REPORT | 203 |
U.S. GOVERNMENT MONEY MARKET FUND | |
STATEMENTS OF CHANGES IN NET ASSETS |
| | Year Ended
March 31,
2024 | | | Year Ended
March 31,
2023 | |
Increase (Decrease) in Net Assets from Operations: | | | | | | | | |
Net investment income | | $ | 11,193,014 | | | $ | 6,954,262 | |
Net realized gain on investments | | | 996 | | | | 126,680 | |
Net change in unrealized appreciation (depreciation) on investments | | | — | | | | — | |
Net increase in net assets resulting from operations | | | 11,194,010 | | | | 7,080,942 | |
| | | | | | | | | |
Distributions to shareholders | | | (11,193,012 | ) | | | (6,835,558 | ) |
| | | | | | | | | |
Capital share transactions: | | | | | | | | |
Proceeds from sale of shares | | | 4,820,555,785 | | | | 5,208,833,348 | |
Distributions reinvested | | | 11,032,690 | | | | 6,220,015 | |
Cost of shares redeemed | | | (4,867,638,651 | ) | | | (5,259,800,910 | ) |
Net decrease from capital share transactions | | | (36,050,176 | ) | | | (44,747,547 | ) |
Net decrease in net assets | | | (36,049,178 | ) | | | (44,502,163 | ) |
| | | | | | | | | |
Net assets: | | | | | | | | |
Beginning of year | | | 311,698,935 | | | | 356,201,098 | |
End of year | | $ | 275,649,757 | | | $ | 311,698,935 | |
| | | | | | | | | |
Capital share activity: | | | | | | | | |
Shares sold | | | 4,820,555,785 | | | | 5,208,833,322 | |
Shares issued from reinvestment of distributions | | | 11,032,702 | | | | 6,218,785 | |
Shares redeemed | | | (4,867,638,651 | ) | | | (5,259,800,910 | ) |
Net decrease in shares | | | (36,050,164 | ) | | | (44,748,803 | ) |
204 | THE RYDEX FUNDS ANNUAL REPORT | SEE NOTES TO FINANCIAL STATEMENTS. |
U.S. GOVERNMENT MONEY MARKET FUND | |
This table is presented to show selected data for a share outstanding throughout each period and to assist shareholders in evaluating a Fund’s performance for the periods presented.
| | Year Ended
March 31,
2024 | | | Year Ended
March 31,
2023 | | | Year Ended
March 31,
2022 | | | Year Ended
March 31,
2021 | | | Year Ended
March 31,
2020 | |
Per Share Data |
Net asset value, beginning of period | | $ | 1.00 | | | $ | 1.00 | | | $ | 1.00 | | | $ | 1.00 | | | $ | 1.00 | |
Income (loss) from investment operations: |
Net investment income (loss)a | | | .04 | | | | .02 | | | | — | c | | | — | c | | | .01 | |
Net gain (loss) on investments (realized and unrealized) | | | — | c | | | — | c | | | — | c | | | — | c | | | — | c |
Total from investment operations | | | .04 | | | | .02 | | | | — | c | | | — | c | | | .01 | |
Less distributions from: |
Net investment income | | | (.04 | ) | | | (.02 | ) | | | — | | | | — | | | | (.01 | ) |
Net realized gains | | | — | c | | | — | | | | — | | | | — | | | | — | |
Total distributions | | | (.04 | ) | | | (.02 | ) | | | — | | | | — | | | | (.01 | ) |
Net asset value, end of period | | $ | 1.00 | | | $ | 1.00 | | | $ | 1.00 | | | $ | 1.00 | | | $ | 1.00 | |
|
Total Return | | | 4.33 | % | | | 1.86 | % | | | 0.00 | %b | | | 0.05 | % | | | 0.99 | % |
Ratios/Supplemental Data |
Net assets, end of period (in thousands) | | $ | 275,650 | | | $ | 311,699 | | | $ | 356,201 | | | $ | 348,971 | | | $ | 390,791 | |
Ratios to average net assets: |
Net investment income (loss) | | | 4.26 | % | | | 1.81 | % | | | (0.04 | %) | | | 0.00 | %d | | | 1.01 | % |
Total expenses | | | 1.05 | % | | | 0.99 | % | | | 0.95 | % | | | 1.04 | % | | | 1.06 | % |
Net expensesb | | | 1.05 | % | | | 0.86 | % | | | 0.12 | % | | | 0.16 | % | | | 1.03 | % |
a | Net investment income (loss) per share was computed using average shares outstanding throughout the period. |
b | Net expense information reflects the expense ratios after expense waivers and reimbursements, as applicable. |
c | Less than $0.01 per share. |
d | Less than 0.01%. |
SEE NOTES TO FINANCIAL STATEMENTS. | THE RYDEX FUNDS ANNUAL REPORT | 205 |
NOTES TO FINANCIAL STATEMENTS |
Note 1 – Organization and Significant Accounting Policies
Organization
The Rydex Series Funds (the “Trust”), a Delaware statutory trust, is registered with the U.S. Securities and Exchange Commission (the “SEC”) under the Investment Company Act of 1940 (the ”1940 Act”), as an open-ended investment company of the series type. Each series, in effect, is representing a separate fund (each, a “Fund”). The Trust may issue an unlimited number of authorized shares. The Trust accounts for the assets of each Fund separately.
The Trust offers a combination of seven separate classes of shares: Investor Class shares, Class A shares, Class C shares, Class H shares, Class P shares, Institutional Class shares and Money Market Class shares. Sales of shares of each Class are made without a front-end sales charge at the net asset value per share (“NAV”), with the exception of Class A shares.Class A shares are sold at the NAV, plus the applicable front-end sales charge. The sales charge varies depending on the amount purchased, but will not exceed 4.75%. Class A share purchases of $1 million or more are exempt from the front-end sales charge but have a 1% contingent deferred sales charge (“CDSC”) if shares are redeemed within 12 months of purchase. Class C shares have a 1% CDSC if shares are redeemed within 12 months of purchase. Class C shares of each Fund automatically convert to Class A shares of the same Fund on or about the 10th day of the month following the 8-year anniversary of the purchase of the Class C shares. This conversion will be executed without any sales charge, fee or other charge. After the conversion is completed, the shares will be subject to all features and expenses of Class A shares. Institutional Class shares are offered primarily for direct investment by institutions such as pension and profit sharing plans, endowments, foundations and corporations. Institutional Class shares require a minimum initial investment of $2 million and a minimum account balance of $1 million. At March 31, 2024, the Trust consisted of fifty-two funds.
This report covers the following funds (collectively, the “Funds”):
Fund Name | | Investment
Company Type | |
Nova Fund | | | Non-diversified | |
S&P 500® Fund | | | Non-diversified | |
Inverse S&P 500® Strategy Fund | | | Non-diversified | |
Monthly Rebalance NASDAQ-100® 2x Strategy Fund | | | Non-diversified | |
Inverse NASDAQ-100® Strategy Fund | | | Non-diversified | |
Mid-Cap 1.5x Strategy Fund | | | Non-diversified | |
Inverse Mid-Cap Strategy Fund | | | Non-diversified | |
Russell 2000® 1.5x Strategy Fund | | | Non-diversified | |
Russell 2000® Fund | | | Non-diversified | |
Inverse Russell 2000® Strategy Fund | | | Non-diversified | |
Dow Jones Industrial Average® Fund | | | Non-diversified | |
Government Long Bond 1.2x Strategy Fund | | | Diversified | |
Inverse Government Long Bond Strategy Fund | | | Diversified | |
High Yield Strategy Fund | | | Non-diversified | |
Inverse High Yield Strategy Fund | | | Non-diversified | |
U.S. Government Money Market Fund | | | Diversified | |
At March 31, 2024, Investor Class, Class A, Class C, Class H, and Money Market Class shares have been issued by the Funds.
The Funds are designed and operated to accommodate frequent trading by shareholders and, unlike most mutual funds, offer unlimited exchange privileges with no minimum holding periods or transactions fees, which may cause the Funds to experience high portfolio turnover.
Security Investors, LLC (the “Adviser”), which operates under the name Guggenheim Investments (“GI”), provides advisory services. Guggenheim Funds Distributors, LLC (“GFD”) serves as distributor of the Funds’ shares. GI and GFD are affiliated entities.
Significant Accounting Policies
The Funds operate as investment companies and, accordingly, follow the investment company accounting and reporting guidance of the Financial Accounting Standards Board (“FASB”) Accounting Standards Codification Topic 946 Financial Services – Investment Companies.
The following significant accounting policies are in conformity with U.S. generally accepted accounting principles (“U.S. GAAP”) and are consistently followed by the Trust. This requires management to make estimates and assumptions that affect the reported amount of assets and liabilities, contingent assets and liabilities at the date of the financial statements, and the reported amounts of revenues and expenses during the reporting period. Actual results could differ from these estimates. All time references are based on Eastern Time.
The NAV of each share class of a fund is calculated by dividing the market value of a fund’s securities and other assets, less all liabilities attributable to the share class by the number of outstanding shares of the share class on the specified date.
The Trust calculates a NAV twice each business day; at 10:45 a.m. and at the close of the New York Stock Exchange (“NYSE”), usually 4:00 p.m. for the Russell 2000® Fund and the S&P 500® Fund. All other Funds in this report will price at the afternoon NAV. The NAV is calculated using the current market value of each Fund’s total assets as of the respective time of calculation. These financial statements are based on the afternoon NAV.
(a) Valuation of Investments
The Board of Trustees of the Funds (the “Board”) adopted policies and procedures for the valuation of the Funds’ investments (the “Fund Valuation Procedures”). The SEC adopted Rule 2a-5 under the 1940 Act (“Rule 2a-5”) which establishes requirements for determining fair value in good faith. Rule 2a-5 also defines “readily
206 | THE RYDEX FUNDS ANNUAL REPORT | |
NOTES TO FINANCIAL STATEMENTS (continued) |
available market quotations” for purposes of the 1940 Act and establishes requirements for determining whether a fund must fair value a security in good faith.
Pursuant to Rule 2a-5, the Board has designated the Adviser as the valuation designee to perform fair valuation determinations for the Funds with respect to all Fund investments and other assets. As the Funds’ valuation designee pursuant to Rule 2a-5, the Adviser has adopted separate procedures (the “Valuation Designee Procedures” and collectively with the Fund Valuation Procedures, the “Valuation Procedures”) reasonably designed to prevent violations of the requirements of Rule 2a-5 and Rule 31a-4. The Adviser, in its role as valuation designee, utilizes the assistance of a valuation committee, consisting of representatives from Guggenheim’s investment management, fund administration, legal and compliance departments (the “Valuation Committee”), in determining the fair value of the Funds’ securities and other assets.
Valuations of the Funds’ securities and other assets are supplied primarily by pricing service providers appointed pursuant to the processes set forth in the Valuation Procedures. The Adviser, with the assistance of the Valuation Committee, convenes monthly, or more frequently as needed, to review the valuation of all assets which have been fair valued. The Adviser, consistent with the monitoring and review responsibilities set forth in the Valuation Procedures, regularly reviews the appropriateness of the inputs, methods, models and assumptions employed by the pricing service providers.
If the pricing service provider cannot or does not provide a valuation for a particular investment or such valuation is deemed unreliable, such investment is fair valued by the Adviser.
Equity securities listed or traded on a recognized U.S. securities exchange or the Nasdaq Stock Market (“NASDAQ”) will generally be valued on the basis of the last sale price on the primary U.S. exchange or market on which the security is listed or traded; provided, however, that securities listed on NASDAQ will be valued at the NASDAQ official closing price, which may not necessarily represent the last sale price.
Open-end investment companies are valued at their NAV as of the close of business, on the valuation date. Exchange-traded funds and closed-end investment companies are generally valued at the last quoted sale price.
The U.S. Government Money Market Fund values debt securities at amortized cost pursuant to Rule 2a-7 of the 1940 Act, which approximates market value.
With the exception of the U.S. Government Money Market Fund, U.S. government securities are valued by either independent pricing services, the last traded fill price, or at the reported bid price at the close of business.
U.S. Government securities are valued by pricing service providers, using the last traded fill price, or at the reported bid price at the close of business on the valuation date.
Repurchase agreements are generally valued at amortized cost, provided such amounts approximate market value.
Commercial paper and discount notes with a maturity of greater than 60 days at acquisition are valued at prices that reflect broker-dealer supplied valuations or are obtained from pricing service providers, which may consider the trade activity, treasury spreads, yields or price of bonds of comparable quality, coupon, maturity, and type, as well as prices quoted by dealers who make markets in such securities. Commercial paper and discount notes with a maturity of 60 days or less at acquisition are valued at amortized cost, unless the Adviser concludes that amortized cost does not represent the fair value of the applicable asset in which case it will be valued using a pricing service provider.
Futures contracts are valued on the basis of the last sale price as of 4:00 p.m. on the valuation date. In the event that the exchange for a specific futures contract closes earlier than 4:00 p.m., the futures contract is valued at the official settlement price of the exchange. However, the underlying securities from which the futures contract value is derived are monitored until 4:00 p.m. to determine if fair valuation of the underlying securities would provide a more accurate valuation of the futures contract.
Swap agreements entered into by a Fund are generally valued using an evaluated price provided by a pricing service provider.
Investments for which market quotations are not readily available are fair valued as determined in good faith by the Adviser. Valuations in accordance with these methods are intended to reflect each security’s (or asset’s or liability’s) “fair value”. Each such determination is based on a consideration of all relevant factors, which are likely to vary from one pricing context to another. Examples of such factors may include, but are not limited to market prices; sale prices; broker quotes; and models which derive prices based on inputs such as prices of securities with comparable maturities and characteristics, or on inputs such anticipated cash flows or collateral, spread over U.S. Treasury securities, and other information analysis. In connection with futures contracts and other derivative investments, such factors may include obtaining information as to how (a) these contracts and other derivative investments trade in the futures or other derivative markets, respectively, and (b) the securities underlying these contracts and other derivative investments trade in the cash market.
| | THE RYDEX FUNDS ANNUAL REPORT | 207 |
NOTES TO FINANCIAL STATEMENTS (continued) |
(b) U.S. Government and Agency Obligations
Certain U.S. Government and Agency Obligations are traded on a discount basis; the interest rates shown on the Schedules of Investments reflect the effective rates paid at the time of purchase by the Funds. Other securities bear interest at the rates shown, payable at fixed dates through maturity.
(c) Short Sales
When a Fund engages in a short sale of a security, an amount equal to the proceeds is reflected as an asset and an equivalent liability. The amount of the liability is subsequently marked-to-market to reflect the market value of the short sale. The Fund maintains a segregated account of cash and/or securities as collateral for short sales.
Fees, if any, paid to brokers to borrow securities in connection with short sales are recorded as interest expense. In addition, the Fund must pay out the dividend rate of the equity or coupon rate of the obligation to the lender and record this as an expense. Short dividend or interest expense is a cost associated with the investment objective of short sales transactions, rather than an operational cost associated with the day-to-day management of any mutual fund. The Fund may also receive rebate income from the broker resulting from the investment of the proceeds from securities sold short.
(d) Futures Contracts
Upon entering into a futures contract, a Fund deposits and maintains as collateral such initial margin as required by the exchange on which the transaction is affected. Pursuant to the contract, the Fund agrees to receive from or pay to the broker an amount of cash equal to the daily fluctuation in value of the contract. Such receipts or payments are known as variation margin and are recorded by the Fund as unrealized appreciation or depreciation. When the contract is closed, the Fund records a realized gain or loss equal to the difference between the value of the contract at the time it was opened and the value at the time it was closed.
(e) Swap Agreements
Swap agreements are marked-to-market daily and the change, if any, is recorded as unrealized appreciation or depreciation. Payments received or made as a result of an agreement or termination of an agreement are recognized as realized gains or losses.
Upon entering into certain centrally-cleared swap transactions, a Fund is required to deposit with its clearing broker an amount of cash or securities as an initial margin. Subsequent variation margin receipts or payments are received or made by the Fund depending on fluctuations in the fair value of the reference entity and are recorded by the Fund as unrealized appreciation or depreciation. When the contract is closed, the Fund records a realized gain or loss equal to the difference between the value of the contract at the time it was opened and the value at the time it was closed.
Upfront payments received or made by a Fund on credit default swap agreements and interest rate swap agreements are amortized over the expected life of the agreement. Periodic payments received or paid by a Fund are recorded as realized gains or losses. Payments received or made as a result of a credit event or termination of the contract are recognized, net of a proportional amount of the upfront payment, as realized gains or losses.
(f) Foreign Taxes
The Funds may be subject to foreign taxes (a portion of which may be reclaimable) on income, stock dividends, capital gains on investments or certain foreign currency transactions. All foreign taxes are recorded in accordance with the applicable foreign tax regulations and rates that exist in the foreign jurisdictions in which the Funds invest. These foreign taxes, if any, are paid by the Funds and reflected in their Statements of Operations as follows: foreign taxes withheld at source are presented as a reduction of income and foreign taxes on capital gains from sales of investments are included with the net realized gain (loss) on investments. Foreign taxes payable or deferred as of March 31, 2024, if any, are disclosed in the Funds’ Statements of Assets and Liabilities.
(g) Security Transactions
Security transactions are recorded on the trade date for financial reporting purposes. Realized gains and losses from securities transactions are recorded using the identified cost basis. Proceeds from lawsuits related to investment holdings are recorded as a reduction to cost if the securities are still held and as realized gains if no longer held in the respective Fund. Dividend income is recorded on the ex-dividend date, net of applicable taxes withheld by foreign countries, if any. Taxable non-cash dividends are recorded as dividend income. Interest income, including amortization of premiums and accretion of discounts, is accrued on a daily basis. Dividend income from Real Estate Investment Trusts (“REITs”) is recorded based on the income included in the distributions received from the REIT investments using published REIT classifications, including some management estimates when actual amounts are not available. Distributions received in excess of this estimated amount are recorded as a reduction of the cost of investments or reclassified to realized gains. The actual amounts of income, return of capital, and realized gains are only determined by each REIT after its fiscal year-end, and may differ from the estimated amounts.
208 | THE RYDEX FUNDS ANNUAL REPORT | |
NOTES TO FINANCIAL STATEMENTS (continued) |
(h) Distributions
Dividends from net investment income are declared daily in the Government Long Bond 1.2x Strategy Fund and the U.S. Government Money Market Fund. Distributions of net investment income in the remaining Funds and distributions of net realized gains, if any, in all Funds are declared at least annually. Dividends are reinvested in additional shares unless shareholders request payment in cash. Distributions are recorded on the ex-dividend date and are determined in accordance with U.S. federal income tax regulations which may differ from U.S. GAAP.
(i) Class Allocations
Interest and dividend income, most expenses, all realized gains and losses, and all unrealized appreciation and depreciation are allocated to the share classes based upon the value of the outstanding shares in each share class. Certain costs, such as distribution and service fees are charged directly to specific share classes. In addition, certain expenses have been allocated to the individual Funds in the Trust based on the respective net assets of each Fund included in the Trust.
(j) Cash
The Funds may leave cash overnight in their cash account with the custodian. Periodically, a Fund may have cash due to the custodian bank as an overdraft balance. A fee is incurred on this overdraft, calculated by multiplying the overdraft by a rate based on the federal funds rate, which was 5.33% at March 31, 2024.
(k) Indemnifications
Under the Funds’ organizational documents, the Trustees and Officers are indemnified against certain liabilities arising out of the performance of their duties to the Trust. In addition, throughout the normal course of business, the Funds enter into contracts that contain a variety of representations and warranties which provide general indemnifications. The Funds’ maximum exposure under these arrangements is unknown, as this would involve future claims that may be made against the Funds and/or their affiliates that have not yet occurred. However, based on experience, the Funds expect the risk of loss to be remote.
Note 2 – Financial Instruments and Derivatives
As part of their investment strategies, the Funds may utilize short sales and a variety of derivative instruments. These investments involve, to varying degrees, elements of market risk and risks in excess of amounts recognized on the Funds’ Statements of Assets and Liabilities. Valuation and accounting treatment of these instruments can be found under Significant Accounting Policies in Note 1 of these Notes to Financial Statements.
Short Sales
A short sale is a transaction in which a Fund sells a security it does not own. If the security sold short decreases in price between the time the Fund sells the security and closes its short position, the Fund will realize a gain on the transaction. Conversely, if the security increases in price during the period, the Fund will realize a loss on the transaction. The risk of such price increases is the principal risk of engaging in short sales.
Derivatives
Derivatives are instruments whose values depend on, or are derived from, in whole or in part, the value of one or more other assets, such as securities, currencies, commodities or indices. Derivative instruments may be used for investment purposes (including to maintain cash reserves while maintaining exposure to certain other assets), for risk management (hedging) purposes, to facilitate trading, to reduce transaction costs and to pursue higher investment returns. Derivative instruments may also be used to seek to mitigate certain investment risks, such as foreign currency exchange rate risk, interest rate risk and credit risk. U.S. GAAP requires disclosures to enable investors to better understand how and why a Fund uses derivative instruments, how these derivative instruments are accounted for and their effects on the Fund’s financial position and results of operations.
The Funds may utilize derivatives for the following purposes:
Duration: the use of an instrument to manage the interest rate risk of a portfolio.
Index Exposure: the use of an instrument to obtain exposure to a listed or other type of index.
Leverage: gaining total exposure to equities or other assets on the long and short sides at greater than 100% of invested capital.
Liquidity: the ability to buy or sell exposure with little price/market impact.
If a Fund’s whose investment strategy consistently involves applying leverage, the value of the Fund’s shares will tend to increase or decrease more than the value of any increase or decrease in the underlying index or other asset. In addition, because an investment in derivative instruments generally requires a small investment relative to the amount of investment exposure assumed, an opportunity for increased net income is created; but, at the same time, leverage risk will increase. The Fund’s use of leverage, through borrowings or instruments such as derivatives, may cause the Fund to be more volatile and riskier than if Fund had not been leveraged.
| | THE RYDEX FUNDS ANNUAL REPORT | 209 |
NOTES TO FINANCIAL STATEMENTS (continued) |
Futures Contracts
A futures contract is an agreement to purchase (long) or sell (short) an agreed amount of securities or other instruments at a set price for delivery at a future date. There are significant risks associated with a Fund’s use of futures contracts, including (i) there may be an imperfect or no correlation between the changes in market value of the underlying asset and the prices of futures contracts; (ii) there may not be a liquid secondary market for a futures contract; (iii) trading restrictions or limitations may be imposed by an exchange; and (iv) government regulations may restrict trading in futures contracts. When investing in futures, there is minimal counterparty credit risk to a Fund because futures are exchange-traded and the exchange’s clearinghouse, as counterparty to all exchange-traded futures, guarantees against default. Cash deposits are shown as segregated cash with broker on the Funds’ Statements of Assets and Liabilities; securities held as collateral are noted on the Funds’ Schedules of Investments.
The following table represents the Funds’ use and volume of futures on a monthly basis:
| | | | Average Notional Amount | |
Fund | Use | | Long | | | Short | |
Nova Fund | Index exposure, Leverage, Liquidity | | $ | 41,408,107 | | | $ | — | |
S&P 500® Fund | Index exposure, Liquidity | | | 2,165,444 | | | | 421,225 | |
Inverse S&P 500® Strategy Fund | Index exposure, Liquidity | | | — | | | | 11,896,279 | |
Monthly Rebalance NASDAQ-100® 2x Strategy Fund | Index exposure, Leverage, Liquidity | | | 85,176,164 | | | | — | |
Inverse NASDAQ-100® Strategy Fund | Index exposure, Liquidity | | | — | | | | 581,273 | |
Mid-Cap 1.5x Strategy Fund | Index exposure, Leverage, Liquidity | | | 1,470,516 | | | | — | |
Russell 2000® 1.5x Strategy Fund | Index exposure, Leverage, Liquidity | | | 511,768 | | | | — | |
Russell 2000® Fund | Index exposure, Liquidity | | | 616,280 | | | | — | |
Inverse Russell 2000® Strategy Fund | Index exposure, Liquidity | | | — | | | | 379,543 | |
Dow Jones Industrial Average® Fund | Index exposure, Leverage, Liquidity | | | 1,036,539 | | | | — | |
Government Long Bond 1.2x Strategy Fund | Duration, Index exposure, Leverage, Liquidity | | | 13,463,326 | | | | — | |
Inverse Government Long Bond Strategy Fund | Duration, Index exposure, Liquidity | | | — | | | | 7,598,005 | |
High Yield Strategy Fund | Duration, Index exposure, Liquidity | | | 35,788,947 | | | | — | |
Inverse High Yield Strategy Fund | Duration, Index exposure, Liquidity | | | — | | | | 10,399,172 | |
Swap Agreements
A swap is an agreement that obligates two parties to exchange a series of cash flows at specified intervals based upon or calculated by reference to changes in specified prices or rates for a specified amount of an underlying asset. When utilizing over-the-counter (“OTC”) swaps, a Fund bears the risk of loss of the amount expected to be received under a swap agreement in the event of the default or bankruptcy of a swap agreement counterparty or if the underlying asset declines in value. Certain standardized swaps are subject to mandatory central clearing and are executed on a multi-lateral or other trade facility platform, such as a registered exchange. There is limited counterparty credit risk with respect to centrally-cleared swaps as the transaction is facilitated through a central clearinghouse, much like exchange-traded futures contracts. For a Fund utilizing centrally-cleared swaps, the exchange bears the risk of loss resulting from a counterparty not being able to pay. There is no guarantee that a Fund or an underlying fund could eliminate its exposure under an outstanding swap agreement by entering into an offsetting swap agreement with the same or another party.
Total return swaps involve commitments where single or multiple cash flows are exchanged based on the price of an underlying reference asset (such as an index) for a fixed or variable interest rate. Total return swaps will usually be computed based on the current value of the reference asset as of the close of regular trading on the NYSE or other exchange, with the swap value being adjusted to include dividends accrued, financing charges and/or interest associated with the swap agreement. When utilizing total return swaps, a Fund bears the risk of loss of the amount expected to be received under a swap agreement in the event of the default or bankruptcy of a swap agreement counterparty or if the underlying reference asset declines in value.
210 | THE RYDEX FUNDS ANNUAL REPORT | |
NOTES TO FINANCIAL STATEMENTS (continued) |
The following table represents the Funds’ use and volume of total return swaps on a monthly basis:
| | | | Average Notional Amount | |
Fund | Use | | Long | | | Short | |
Nova Fund | Index exposure, Leverage, Liquidity | | $ | 94,919,342 | | | $ | — | |
S&P 500® Fund | Index exposure, Liquidity | | | 8,641,727 | | | | — | |
Inverse S&P 500® Strategy Fund | Index exposure, Liquidity | | | — | | | | 36,154,831 | |
Monthly Rebalance NASDAQ-100® 2x Strategy Fund | Index exposure, Leverage, Liquidity | | | 497,037,032 | | | | — | |
Inverse NASDAQ-100® Strategy Fund | Index exposure, Liquidity | | | — | | | | 19,410,244 | |
Mid-Cap 1.5x Strategy Fund | Index exposure, Liquidity | | | 8,050,081 | | | | — | |
Inverse Mid-Cap Strategy Fund | Index exposure, Liquidity | | | — | | | | 1,956,364 | |
Russell 2000® 1.5x Strategy Fund | Index exposure, Liquidity | | | 5,279,439 | | | | — | |
Russell 2000® Fund | Index exposure, Liquidity | | | 7,165,654 | | | | — | |
Inverse Russell 2000® Strategy Fund | Index exposure, Liquidity | | | — | | | | 3,330,280 | |
Dow Jones Industrial Average® Fund | Index exposure, Liquidity | | | 2,575,010 | | | | — | |
High Yield Strategy Fund | Duration, Index exposure, Liquidity | | | 1,493,724 | | | | — | |
Credit default swaps are instruments which allow for the full or partial transfer of third party credit risk, with respect to a particular entity or entities, from one counterparty to the other. A fund enters into credit default swaps as a “seller” or “buyer” of protection primarily to gain or reduce exposure to the investment grade and/or high yield bond market. A seller of credit default swaps is selling credit protection or assuming credit risk with respect to the underlying entity or entities. The buyer in a credit default swap is obligated to pay the seller a periodic stream of payments over the term of the contract provided that no event of default on an underlying reference obligation has occurred. If a credit event occurs, as defined under the terms of the swap agreement, the seller will either (i) pay to the buyer of protection an amount equal to the notional amount of the swap and take delivery of the referenced obligation or underlying securities comprising the referenced index or (ii) pay a net settlement amount in the form of cash or securities equal to the notional amount of the swap less the recovery value of the referenced obligation or underlying securities comprising the referenced index. The notional amount reflects the maximum potential amount the seller of credit protection could be required to pay to the buyer if a credit event occurs. The seller of protection receives periodic premium payments from the buyer and may also receive or pay an upfront premium adjustment to the stated periodic payments. In the event a credit default occurs on a credit default swap referencing an index, a factor adjustment will take place and the buyer of protection will receive a payment reflecting the par less the default recovery rate of the defaulted index component based on its weighting in the index. If no default occurs, the counterparty will pay the stream of payments and have no further obligations to the fund selling the credit protection. For a fund utilizing centrally cleared credit default swaps, the exchange bears the risk of loss resulting from a counterparty not being able to pay. For OTC credit default swaps, a fund bears the risk of loss of the amount expected to be received under a swap agreement in the event of the default or bankruptcy of a swap agreement counterparty, or in the case of a credit default swap in which a fund is selling credit protection, the default of a third party issuer.
The quoted market prices and resulting market values for credit default swap agreements on securities and credit indices serve as an indicator of the current status of the payment/performance risk and represent the likelihood of an expected liability (or profit) for the credit derivative had the notional amount of the swap agreement been closed/sold as of the period end. Increasing market values, in absolute terms when compared to the notional amount of the swap, represent a deterioration of the referenced entity’s credit soundness and a greater likelihood or risk of default or other credit event occurring as defined under the terms of the agreement.
The following table represents the Funds’ use and volume of credit default swaps on a monthly basis:
| | | | Average Notional Amount | |
Fund | Use | | Protection Sold | | | Protection Purchased | |
High Yield Strategy Fund | Duration, Index exposure, Liquidity | | $ | 36,364,833 | | | $ | — | |
Inverse High Yield Strategy Fund | Duration, Index exposure, Liquidity | | | — | | | | 10,814,833 | |
| | THE RYDEX FUNDS ANNUAL REPORT | 211 |
NOTES TO FINANCIAL STATEMENTS (continued) |
Derivative Investment Holdings Categorized by Risk Exposure
The following is a summary of the location of derivative investments on the Funds’ Statements of Assets and Liabilities as of March 31, 2024:
Derivative Investment Type | Asset Derivatives | Liability Derivatives |
Equity/Interest rate futures contracts | Variation margin on futures contracts | Variation margin on futures contracts |
Credit default swap agreements | Unamortized upfront premiums paid on credit default swap agreements Unrealized appreciation on OTC swap agreements Variation margin on credit default swap agreements | Unamortized upfront premiums received on credit default swap agreements Unrealized depreciation on OTC swap agreements Unamortized upfront premiums Variation margin on credit default swap agreements |
The following tables set forth the fair value of the Funds’ derivative investments categorized by primary risk exposure at March 31, 2024:
Asset Derivative Investments Value |
Fund | | Futures
Equity Risk* | | | Swaps
Equity Risk | | | Futures
Interest
Rate Risk* | | | Swaps
Credit
Risk* | | | Total Value at
March 31,
2024 | |
Nova Fund | | $ | 1,386,317 | | | $ | 977,771 | | | $ | — | | | $ | — | | | $ | 2,364,088 | |
S&P 500® Fund | | | 34,026 | | | | 55,218 | | | | — | | | | — | | | | 89,244 | |
Monthly Rebalance NASDAQ-100® 2x Strategy Fund | | | 1,633,863 | | | | 3,440,642 | | | | — | | | | — | | | | 5,074,505 | |
Mid-Cap 1.5x Strategy Fund | | | 77,147 | | | | 211,663 | | | | — | | | | — | | | | 288,810 | |
Russell 2000® 1.5x Strategy Fund | | | 13,073 | | | | 199,970 | | | | — | | | | — | | | | 213,043 | |
Russell 2000® Fund | | | 71,653 | | | | 273,544 | | | | — | | | | — | | | | 345,197 | |
Dow Jones Industrial Average® Fund | | | 46,220 | | | | 49,579 | | | | — | | | | — | | | | 95,799 | |
Government Long Bond 1.2x Strategy Fund | | | — | | | | — | | | | 108,896 | | | | — | | | | 108,896 | |
High Yield Strategy Fund | | | — | | | | — | | | | 93,728 | | | | 61,720 | | | | 155,448 | |
Liability Derivative Investments Value |
Fund | | Futures
Equity Risk* | | | Swaps
Equity Risk | | | Futures
Interest
Rate Risk* | | | Swaps
Credit
Risk* | | | Total Value at
March 31,
2024 | |
Inverse S&P 500® Strategy Fund | | $ | 53,946 | | | $ | 305,561 | | | $ | — | | | $ | — | | | $ | 359,507 | |
Inverse NASDAQ-100® Strategy Fund | | | 14,747 | | | | 70,269 | | | | — | | | | — | | | | 85,016 | |
Inverse Mid-Cap Strategy Fund | | | — | | | | 13,230 | | | | — | | | | — | | | | 13,230 | |
Inverse Russell 2000® Strategy Fund | | | — | | | | 57,917 | | | | — | | | | — | | | | 57,917 | |
Inverse Government Long Bond Strategy Fund | | | — | | | | — | | | | 50,255 | | | | — | | | | 50,255 | |
High Yield Strategy Fund | | | — | | | | — | | | | — | | | | 53 | | | | 53 | |
Inverse High Yield Strategy Fund | | | — | | | | — | | | | 18,176 | | | | 13,222 | | | | 31,398 | |
* | Includes cumulative appreciation (depreciation) of exchange-traded, OTC and centrally-cleared derivatives contracts as reported on the Schedules of Investments. For exchange-traded and centrally-cleared derivatives, variation margin is reported within the Funds’ Statements of Assets and Liabilities. |
The following is a summary of the location of derivative investments on the Funds’ Statements of Operations for the year ended March 31, 2024:
Derivative Investment Type | Location of Gain (Loss) on Derivatives |
Equity/Interest rate futures contracts | Net realized gain (loss) on futures contracts Net change in unrealized appreciation (depreciation) on futures contracts |
Credit/Equity rate swap agreements | Net realized gain (loss) on swap agreements Net change in unrealized appreciation (depreciation) on swap agreements |
212 | THE RYDEX FUNDS ANNUAL REPORT | |
NOTES TO FINANCIAL STATEMENTS (continued) |
The following is a summary of the Funds’ realized gain (loss) and change in unrealized appreciation (depreciation) on derivative investments recognized on the Funds’ Statements of Operations categorized by primary risk exposure for the year ended March 31, 2024:
Realized Gain (Loss) on Derivative Investments Recognized on the Statements of Operations |
Fund | | Futures
Equity
Risk | | | Swaps
Equity
Risk | | | Futures
Interest Rate
Risk | | | Swaps
Credit
Risk | | | Total | |
Nova Fund | | $ | 3,236,362 | | | $ | 24,650,008 | | | $ | — | | | $ | — | | | $ | 27,886,370 | |
S&P 500® Fund | | | 380,459 | | | | 1,971,729 | | | | — | | | | — | | | | 2,352,188 | |
Inverse S&P 500® Strategy Fund | | | (1,952,244 | ) | | | (10,617,835 | ) | | | — | | | | — | | | | (12,570,079 | ) |
Monthly Rebalance NASDAQ-100® 2x Strategy Fund | | | 30,842,578 | | | | 146,633,976 | | | | — | | | | — | | | | 177,476,554 | |
Inverse NASDAQ-100® Strategy Fund | | | (163,765 | ) | | | (7,198,979 | ) | | | — | | | | — | | | | (7,362,744 | ) |
Mid-Cap 1.5x Strategy Fund | | | 242,294 | | | | 1,453,947 | | | | — | | | | — | | | | 1,696,241 | |
Inverse Mid-Cap Strategy Fund | | | — | | | | (219,383 | ) | | | — | | | | — | | | | (219,383 | ) |
Russell 2000® 1.5x Strategy Fund | | | 132,501 | | | | 558,084 | | | | — | | | | — | | | | 690,585 | |
Russell 2000® Fund | | | 43,852 | | | | 183,056 | | | | — | | | | — | | | | 226,908 | |
Inverse Russell 2000® Strategy Fund | | | 43,868 | | | | (613,528 | ) | | | — | | | | — | | | | (569,660 | ) |
Dow Jones Industrial Average® Fund | | | 32,873 | | | | 359,463 | | | | — | | | | — | | | | 392,336 | |
Government Long Bond 1.2x Strategy Fund | | | — | | | | — | | | | (1,588,334 | ) | | | — | | | | (1,588,334 | ) |
Inverse Government Long Bond Strategy Fund | | | — | | | | — | | | | 702,820 | | | | — | | | | 702,820 | |
High Yield Strategy Fund | | | — | | | | — | | | | (1,546,589 | ) | | | 4,044,285 | | | | 2,497,696 | |
Inverse High Yield Strategy Fund | | | — | | | | — | | | | 282,179 | | | | (1,322,669 | ) | | | (1,040,490 | ) |
Change in Unrealized Appreciation (Depreciation) on Derivative Investments Recognized on the Statements of Operations |
Fund | | Futures
Equity
Risk | | | Swaps
Equity
Risk | | | Futures
Interest Rate
Risk | | | Swaps
Credit
Risk | | | Total | |
Nova Fund | | $ | 215,903 | | | $ | (3,144,951 | ) | | $ | — | | | $ | — | | | $ | (2,929,048 | ) |
S&P 500® Fund | | | (194,629 | ) | | | (219,027 | ) | | | — | | | | — | | | | (413,656 | ) |
Inverse S&P 500® Strategy Fund | | | 508,966 | | | | 1,426,258 | | | | — | | | | — | | | | 1,935,224 | |
Monthly Rebalance NASDAQ-100® 2x Strategy Fund | | | (3,767,649 | ) | | | (9,722,142 | ) | | | — | | | | — | | | | (13,489,791 | ) |
Inverse NASDAQ-100® Strategy Fund | | | (14,747 | ) | | | 1,215,943 | | | | — | | | | — | | | | 1,201,196 | |
Mid-Cap 1.5x Strategy Fund | | | 53,273 | | | | (16,611 | ) | | | — | | | | — | | | | 36,662 | |
Inverse Mid-Cap Strategy Fund | | | — | | | | 70,781 | | | | — | | | | — | | | | 70,781 | |
Russell 2000® 1.5x Strategy Fund | | | (9,766 | ) | | | 99,177 | | | | — | | | | — | | | | 89,411 | |
Russell 2000® Fund | | | 63,533 | | | | 231,902 | | | | — | | | | — | | | | 295,435 | |
Inverse Russell 2000® Strategy Fund | | | — | | | | 107,698 | | | | — | | | | — | | | | 107,698 | |
Dow Jones Industrial Average® Fund | | | 26,195 | | | | 12,722 | | | | — | | | | — | | | | 38,917 | |
Government Long Bond 1.2x Strategy Fund | | | — | | | | — | | | | (611,574 | ) | | | — | | | | (611,574 | ) |
Inverse Government Long Bond Strategy Fund | | | — | | | | — | | | | 270,129 | | | | — | | | | 270,129 | |
High Yield Strategy Fund | | | — | | | | — | | | | (63,728 | ) | | | (256,414 | ) | | | (320,142 | ) |
Inverse High Yield Strategy Fund | | | — | | | | — | | | | 228,962 | | | | 242,946 | | | | 471,908 | |
In conjunction with short sales and the use of derivative instruments, the Funds are required to maintain collateral in various forms. Depending on the financial instrument utilized and the broker involved, the Funds use margin deposits at the broker, cash and/or securities segregated at the custodian bank, discount notes or repurchase agreements allocated to the Funds as collateral.
The Trust has established counterparty credit guidelines and enters into transactions only with financial institutions rated/identified as investment grade or better. The Trust monitors the counterparty credit risk.
Note 3 – Offsetting
In the normal course of business, the Funds enter into transactions subject to enforceable master netting arrangements or other similar arrangements. Generally, the right to offset in those agreements allows the Funds to counteract the exposure to a specific counterparty with collateral received from or delivered to that counterparty based on the terms of the arrangements. These arrangements provide for the right to liquidate upon the occurrence of an event of default, credit event upon merger or additional termination event.
| | THE RYDEX FUNDS ANNUAL REPORT | 213 |
NOTES TO FINANCIAL STATEMENTS (continued) |
In order to better define their contractual rights and to secure rights that will help the Funds mitigate their counterparty risk, the Funds may enter into an International Swaps and Derivatives Association, Inc. Master Agreement (“ISDA Master Agreement”) or similar agreement with their derivative contract counterparties. An ISDA Master Agreement is a bilateral agreement between a fund and a counterparty that governs OTC derivatives, including foreign exchange contracts, and typically contains, among other things, collateral posting terms and netting provisions in the event of a default and/or termination event. The provisions of the ISDA Master Agreement typically permit a single net payment in the event of a default (close-out netting) or similar event, including the bankruptcy or insolvency of the counterparty.
For derivatives traded under an ISDA Master Agreement, the collateral requirements are typically calculated by netting the mark-to-market amount for each transaction under such agreement and comparing that amount to the value of any collateral currently pledged by the Funds and the counterparty. For financial reporting purposes, cash collateral that has been pledged to cover obligations of the Funds and cash collateral received from the counterparty, if any, are reported separately on the Funds’ Statements of Assets and Liabilities as segregated cash with broker/receivable for variation margin, or payable for swap settlement/variation margin. Cash and/or securities pledged or received as collateral by the Funds in connection with an OTC derivative subject to an ISDA Master Agreement generally may not be invested, sold or rehypothecated by the counterparty or the Funds, as applicable, absent an event of default under such agreement, in which case such collateral generally may be applied towards obligations due to and payable by such counterparty or the Funds, as applicable. Generally, the amount of collateral due from or to a counterparty must exceed a minimum transfer amount threshold (e.g., $300,000) before a transfer is required to be made. To the extent amounts due to the Funds from their counterparties are not fully collateralized, contractually or otherwise, the Funds bear the risk of loss from counterparty nonperformance. The Funds attempt to mitigate counterparty risk by only entering into agreements with counterparties that they believe to be of good standing and by monitoring the financial stability of those counterparties.
For financial reporting purposes, the Funds do not offset derivative assets and derivative liabilities that are subject to netting arrangements in the Funds’ Statements of Assets and Liabilities.
The following tables present derivative financial instruments and secured financing transactions that are subject to enforceable netting arrangements:
| | | | | | | | | | | | | | | | Gross Amounts Not Offset
in the Statements of
Assets and Liabilities | | | | | |
Fund | Instrument | | Gross
Amounts of
Recognized
Assets1 | | | Gross
Amounts
Offset in the
Statements
of Assets and
Liabilities | | | Net Amount
of Assets
Presented on
the Statements
of Assets and
Liabilities | | | Financial
Instruments | | | Cash
Collateral
Received | | | Net
Amount | |
Nova Fund | Swap equity agreements | | $ | 977,771 | | | $ | — | | | $ | 977,771 | | | $ | — | | | $ | (810,000 | ) | | $ | 167,771 | |
S&P 500® Fund | Swap equity agreements | | | 55,218 | | | | — | | | | 55,218 | | | | — | | | | — | | | | 55,218 | |
Monthly Rebalance NASDAQ-100® 2x Strategy Fund | Swap equity agreements | | | 3,440,642 | | | | — | | | | 3,440,642 | | | | — | | | | (3,416,677 | ) | | | 23,965 | |
Mid-Cap 1.5x Strategy Fund | Swap equity agreements | | | 211,663 | | | | — | | | | 211,663 | | | | — | | | | (60,000 | ) | | | 151,663 | |
Russell 2000® 1.5x Strategy Fund | Swap equity agreements | | | 199,970 | | | | — | | | | 199,970 | | | | — | | | | — | | | | 199,970 | |
Russell 2000® Fund | Swap equity agreements | | | 273,544 | | | | — | | | | 273,544 | | | | — | | | | (148,512 | ) | | | 125,032 | |
Dow Jones Industrial Average® Fund | Swap equity agreements | | | 49,579 | | | | — | | | | 49,579 | | | | — | | | | — | | | | 49,579 | |
High Yield Strategy Fund | Credit index swap agreements | | | 5,391 | | | | — | | | | 5,391 | | | | — | | | | — | | | $ | 5,391 | |
214 | THE RYDEX FUNDS ANNUAL REPORT | |
NOTES TO FINANCIAL STATEMENTS (continued) |
| | | | | | | | | | | | | | | | Gross Amounts Not Offset
in the Statements of
Assets and Liabilities | | | | | |
Fund | Instrument | | Gross
Amounts of
Recognized
Liabilities1 | | | Gross
Amounts
Offset in the
Statements
of Assets and
Liabilities | | | Net Amounts of
Liabilities
Presented on
the Statements
of Assets and
Liabilities | | | Financial
Instruments | | | Cash
Collateral
Pledged | | | Net
Amount | |
Inverse S&P 500® Strategy Fund | Swap equity agreements | | $ | 305,561 | | | $ | — | | | $ | 305,561 | | | $ | (305,561 | ) | | $ | — | | | $ | — | |
Inverse NASDAQ-100® Strategy Fund | Swap equity agreements | | | 70,269 | | | | — | | | | 70,269 | | | | (60,269 | ) | | | (10,000 | ) | | | — | |
Inverse Mid-Cap Strategy Fund | Swap equity agreements | | | 13,230 | | | | — | | | | 13,230 | | | | (4,556 | ) | | | (8,674 | ) | | | — | |
Inverse Russell 2000® Strategy Fund | Swap equity agreements | | | 57,917 | | | | — | | | | 57,917 | | | | (43,003 | ) | | | (14,914 | ) | | | — | |
High Yield Strategy Fund | Credit index swap agreements | | | 53 | | | | — | | | | 53 | | | | (53 | ) | | | — | | | | — | |
1 | Exchange-traded or centrally-cleared derivatives are excluded from these reported amounts. |
The Funds have the right to offset deposits against any related derivative liabilities outstanding with each counterparty with the exception of exchange-traded or centrally-cleared derivatives. The following table presents deposits held by others in connection with derivative investments as of March 31, 2024.
Fund | Counterparty | Asset Type | | Cash Pledged | | | Cash Received | |
Nova Fund | Barclays Bank plc | Total return swap agreements | | $ | — | | | $ | 660,000 | |
| | Goldman Sachs International | Futures contracts | | | 1,715,952 | | | | — | |
| Goldman Sachs International | Total return swap agreements | | | — | | | | 150,000 | |
Nova Fund Total | | | | | 1,715,952 | | | | 810,000 | |
S&P 500® Fund | Goldman Sachs International | Futures contracts | | | 271,400 | | | | — | |
Monthly Rebalance NASDAQ-100® 2x Strategy Fund | Barclays Bank plc | Total return swap agreements | | | 32,880 | | | | 3,500,000 | |
| Goldman Sachs International | Total return swap agreements | | | — | | | | 730,000 | |
Monthly Rebalance NASDAQ-100® 2x Strategy Fund Total | | | | | 32,880 | | | | 4,230,000 | |
Inverse NASDAQ-100® Strategy Fund | Barclays Bank plc | Total return swap agreements | | | 10,000 | | | | — | |
| Goldman Sachs International | Futures contracts | | | 36,232 | | | | — | |
Inverse NASDAQ-100® Strategy Fund Total | | | | | 46,232 | | | | — | |
Mid-Cap 1.5x Strategy Fund | Barclays Bank plc | Total return swap agreements | | | 3,000 | | | | — | |
| Goldman Sachs International | Futures contracts | | | 30,506 | | | | — | |
| Goldman Sachs International | Total return swap agreements | | | — | | | | 60,000 | |
Mid-Cap 1.5x Strategy Fund Total | | | | | 33,506 | | | | 60,000 | |
Inverse Mid-Cap Strategy Fund | Barclays Bank plc | Total return swap agreements | | | 28,000 | | | | — | |
Russell 2000® 1.5x Strategy Fund | Barclays Bank plc | Total return swap agreements | | | 23,093 | | | | — | |
| Goldman Sachs International | Futures contracts | | | 748 | | | | — | |
Russell 2000® 1.5x Strategy Fund Total | | | | | 23,841 | | | | — | |
Russell 2000® Fund | Barclays Bank plc | Total return swap agreements | | | — | | | | 280,000 | |
| Goldman Sachs International | Futures contracts | | | 208,647 | | | | — | |
Russell 2000® Fund Total | | | | | 208,647 | | | | 280,000 | |
Inverse Russell 2000® Strategy Fund | Barclays Bank plc | Total return swap agreements | | | 28,000 | | | | — | |
Dow Jones Industrial Average® Fund | Goldman Sachs International | Futures contracts | | | 18,300 | | | | — | |
| | THE RYDEX FUNDS ANNUAL REPORT | 215 |
NOTES TO FINANCIAL STATEMENTS (continued) |
Fund | Counterparty | Asset Type | | Cash Pledged | | | Cash Received | |
High Yield Strategy Fund | Barclays Bank plc | Credit default swap agreements | | $ | 1,784,474 | | | $ | — | |
| Goldman Sachs International | Futures contracts | | | 33,100 | | | | — | |
| Goldman Sachs International | Credit default swap agreements | | | — | | | | 10,035 | |
High Yield Strategy Fund Total | | | | | 1,817,574 | | | | 10,035 | |
Inverse High Yield Strategy Fund | Barclays Bank plc | Credit default swap agreements | | | 691,816 | | | | — | |
Note 4 – Fair Value Measurement
In accordance with U.S. GAAP, fair value is defined as the price that the Funds would receive to sell an investment or pay to transfer a liability in an orderly transaction between market participants at the measurement date. U.S. GAAP establishes a three-tier fair value hierarchy based on the types of inputs used to value assets and liabilities and requires corresponding disclosure. The hierarchy and the corresponding inputs are summarized below:
Level 1 — | unadjusted quoted prices in active markets for identical assets or liabilities. |
Level 2 — | significant other observable inputs (for example quoted prices for securities that are similar based on characteristics such as interest rates, prepayment speeds, credit risk, etc.). |
Level 3 — | significant unobservable inputs based on the best information available under the circumstances, to the extent observable inputs are not available, which may include assumptions. |
Rule 2a-5 sets forth a definition of “readily available market quotations,” which is consistent with the definition of a Level 1 input under U.S. GAAP. Rule 2a-5 provides that “a market quotation is readily available only when that quotation is a quoted price (unadjusted) in active markets for identical investments that the fund can access at the measurement date, provided that a quotation will not be readily available if it is not reliable.”
Securities for which market quotations are not readily available must be valued at fair value as determined in good faith. Accordingly, any security priced using inputs other than Level 1 inputs will be subject to fair value requirements. The types of inputs available depend on a variety of factors, such as the type of security and the characteristics of the markets in which it trades, if any. Fair valuation determinations that rely on fewer or no observable inputs require greater judgment. Accordingly, fair value determinations for Level 3 securities require the greatest amount of judgment.
The inputs or methodologies selected and applied for valuing securities or other assets are not necessarily an indication of the risk associated with investing in those securities. The suitability, appropriateness and accuracy of the techniques, methodologies and sources employed to determine fair valuation are periodically reviewed and subject to change.
216 | THE RYDEX FUNDS ANNUAL REPORT | |
NOTES TO FINANCIAL STATEMENTS (continued) |
Note 5 – Investment Advisory Agreement and Other Agreements
Under the terms of an investment advisory contract, the Funds pay GI investment advisory fees on a monthly basis calculated daily at the annualized rates below, based on the average daily net assets of the Funds:
Fund | | Management Fees
(as a % of Net Assets) | |
Nova Fund | | | 0.75 | % |
S&P 500® Fund | | | 0.75 | % |
Inverse S&P 500® Strategy Fund | | | 0.90 | % |
Monthly Rebalance NASDAQ-100® 2x Strategy Fund | | | 0.90 | % |
Inverse NASDAQ-100® Strategy Fund | | | 0.90 | % |
Mid-Cap 1.5x Strategy Fund | | | 0.90 | % |
Inverse Mid-Cap Strategy Fund | | | 0.90 | % |
Russell 2000® 1.5x Strategy Fund | | | 0.90 | % |
Russell 2000® Fund | | | 0.75 | % |
Inverse Russell 2000® Strategy Fund | | | 0.90 | % |
Dow Jones Industrial Average® Fund | | | 0.75 | % |
Government Long Bond 1.2x Strategy Fund | | | 0.50 | % |
Inverse Government Long Bond Strategy Fund | | | 0.90 | % |
High Yield Strategy Fund | | | 0.75 | % |
Inverse High Yield Strategy Fund | | | 0.75 | % |
U.S. Government Money Market Fund | | | 0.50 | % |
When the aggregate assets of each series of the Trust (excluding the Long Short Equity Fund, Managed Futures Strategy Fund and Multi-Hedge Strategies Fund) and each series of Rydex Dynamic Funds equal or exceed $10 billion, the advisory fee rate paid by each individual Fund (excluding the Long Short Equity Fund, Managed Futures Strategy Fund and Multi-Hedge Strategies Fund) will be reduced in accordance with the asset level and breakpoint schedule set forth below.
Fund Assets Under Management | | Fund Asset-Based
Breakpoint Reductions | |
$500 million - $1 billion | | | 0.025 | % |
>$1 billion - $2 billion | | | 0.050 | % |
>$2 billion | | | 0.075 | % |
GI pays operating expenses on behalf of the Trust, such as audit and accounting related services, legal services, custody, printing and mailing, among others, on a pass-through basis. Such expenses are allocated to various Funds within the complex based on relative net assets.
The Board has adopted separate Distribution Plans applicable to Class A shares and Class H shares for which GFD and other firms that provide distribution and/or shareholder services (“Service Providers”) may receive compensation. If a Service Provider provides distribution services, the Funds will pay distribution fees to GFD at an annual rate not to exceed 0.25% of average daily net assets, pursuant to Rule 12b-1 of the 1940 Act. GFD, in turn, will pay the Service Provider out of its fees. GFD may, at its discretion, retain a portion of such payments to compensate itself for distribution services it performs.
The Board has adopted a separate Distribution and Shareholder Services Plan applicable to Class C shares that allows the Funds to pay annual distribution and service fees of 1.00% of the Funds’ Class C shares average daily net assets. The annual 0.25% service fee compensates a shareholder’s financial adviser for providing ongoing services to the shareholder. The annual distribution fee of 0.75% reimburses GFD for paying the shareholder’s financial adviser an ongoing sales commission. GFD advances the first year’s service and distribution fees to the financial adviser. GFD retains the service and distribution fees on accounts with no authorized dealer of record.
For the year ended March 31, 2024, GFD retained sales charges of $75,543 relating to sales of Class A shares of the Trust.
| | THE RYDEX FUNDS ANNUAL REPORT | 217 |
NOTES TO FINANCIAL STATEMENTS (continued) |
If a Fund invests in a fund that is advised by the same adviser or an affiliated adviser, the investing Fund’s adviser has agreed to waive fees at the investing fund level to the extent necessary to offset the proportionate share of any management fee paid by each Fund with respect to its investment in such affiliated fund. Fee waivers will be calculated at the investing fund level without regard to any expense cap in effect for the investing fund. Fees waived under this arrangement are not subject to reimbursement to GI. For the year ended March 31, 2024, the following Funds waived fees related to investments in affiliated funds:
Fund | | Amount Waived | |
Nova Fund | | $ | 18,557 | |
Inverse S&P 500® Strategy Fund | | | 10,457 | |
Monthly Rebalance NASDAQ-100® 2x Strategy Fund | | | 7,854 | |
Inverse NASDAQ-100® Strategy Fund | | | 2,135 | |
Mid-Cap 1.5x Strategy Fund | | | 2,173 | |
Inverse Mid-Cap Strategy Fund | | | 113 | |
Russell 2000® 1.5x Strategy Fund | | | 1,601 | |
Inverse Russell 2000® Strategy Fund | | | 1,720 | |
Dow Jones Industrial Average® Fund | | | 1,856 | |
Government Long Bond 1.2x Strategy Fund | | | 5,427 | |
Inverse Government Long Bond Strategy Fund | | | 12,516 | |
High Yield Strategy Fund | | | 3,263 | |
Inverse High Yield Strategy Fund | | | 923 | |
GI and its affiliates have voluntarily agreed to waive their fees, including but not limited to accounting, shareholder investor services and investment advisory fees, in an attempt to maintain a positive net yield for the U.S. Government Money Market Fund. GI or its affiliates may terminate this voluntary waiver at any time upon notice to the Fund. When shareholder investor services fees are waived, dealer compensation will be reduced to the extent of such waiver.
GI has contractually agreed to reduce fees and/or reimburse expenses for the Monthly Rebalance NASDAQ-100 2x Strategy Fund to the extent necessary to keep net operating expenses for Class A, Class C and Class H shares (including Rule 12b-1 fees if any) (excluding brokerage, dividends on securities sold short, acquired fund fees and expenses, interest, taxes, litigation, indemnifi cation, and extraordinary expenses) from exceeding 1.35%, 2.10% and 1.35% of the Fund’s Class A, Class C and Class H shares average daily net assets, respectively. The Total Annual Fund Operating Expenses After Fee Waiver and /or Expense Reimbursement includes Excluded Expenses and, thus, from time to time may be higher than 1.35%, 2.10% and 1.35%, respectively. The current term of this agreement expires on August 1, 2025.This agreement may be terminated by GI by written notice to the Fund at least ninety days prior to the end of the then-current term. This agreement may be terminated at any time by the Fund’s Board.
Effective August 1, 2022, GI has contractually agreed to waive and/or reimburse expenses for Inverse S&P 500® Strategy Fund, Monthly Rebalance NASDAQ-100® 2x Strategy Fund, Inverse NASDAQ-100® Strategy Fund, Mid-Cap 1.5x Strategy Fund, Inverse Mid-Cap Strategy Fund, Russell 2000® 1.5x Strategy Fund, Inverse Russell 2000® Strategy Fund and Inverse Government Long Bond Strategy Fund and U.S. Government Money Market Fund in an amount equal to an annual percentage rate of 0.05% of each Fund’s average daily net assets. This agreement shall automatically renew for one-year terms, unless GI provides written notice to the Fund of the termination at least thirty days prior to the end of the then-current term. This agreement may be terminated at any time by the Fund’s Board upon sixty days’ written notice to the Adviser. In addition, the agreement will terminate automatically if the Advisory Agreement, with respect to a Fund, is terminated, with such termination effective upon the effective date of the termination of the Advisory Agreement.
On May 24, 2023 the Board approved a waiver and/or expense reimbursement arrangement whereby GI has agreed to waive and/or reimburse expenses for Nova Fund, S&P 500 Fund, Inverse S&P 500 Strategy Fund, Monthly Rebalance NASDAQ-100 2x Strategy Fund, Inverse NASDAQ-100 Strategy Fund, Mid-Cap 1.5x Strategy Fund, Inverse Mid-Cap Strategy Fund, Russell 2000 1.5x Strategy Fund, Russell 2000 Fund, Inverse Russell 2000 Strategy Fund, Dow Jones Industrial Average Fund, Government Long Bond 1.2x Strategy Fund, Inverse Government Long Bond Strategy Fund, High Yield Strategy Fund and Inverse High Yield Strategy Fund in an amount equal to an annual percentage rate of 0.05% of each Fund’s average daily net assets. This arrangement went into effect on August 1, 2023 and the end of the initial term is August 1, 2024. This agreement shall automatically renew for one-year terms, unless GI provides written notice to the Fund of the termination at least thirty days prior to the end of the then-current term. This agreement may be terminated at any time by the Fund’s Board upon sixty days’ written notice to
218 | THE RYDEX FUNDS ANNUAL REPORT | |
NOTES TO FINANCIAL STATEMENTS (continued) |
the Adviser. In addition, the agreement will terminate automatically if the Advisory Agreement, with respect to a Fund, is terminated, with such termination effective upon the effective date of the termination of the Advisory Agreement.
Certain trustees and officers of the Trust are also officers of GI and/or GFD. The Trust does not compensate its officers or trustees who are officers, directors and/or employees of GI or GFD.
MUFG Investor Services (US), LLC (“MUIS”) acts as the Funds’ administrator, transfer agent and accounting agent. As administrator, transfer agent and accounting agent, MUIS maintains the books and records of the Funds’ securities and cash. U.S. Bank, N.A. (“U.S. Bank”) acts as the Funds’ custodian. As custodian, U.S. Bank is responsible for the custody of the Funds’ assets. For providing the aforementioned services, MUIS and U.S. Bank are entitled to receive a monthly fee equal to an annual percentage of each Fund’s average daily net assets and out of pocket expenses.
Note 6 – Repurchase Agreements
The Funds transfer uninvested cash balances into a single joint account, the daily aggregate balance of which is invested in one or more repurchase agreements collateralized by obligations of the U.S. Treasury and U.S. government agencies. The joint account includes other Funds in the Guggenheim complex not covered in this report. The collateral is in the possession of the Funds’ custodian and is evaluated to ensure that its market value exceeds, at a minimum, 102% of the original face amount of the repurchase agreements. Each Fund holds a pro rata share of the collateral based on the dollar amount of the repurchase agreement entered into by each Fund.
At March 31, 2024, the repurchase agreements in the joint account were as follows:
Counterparty and
Terms of Agreement | | Face Value | | | Repurchase Price | | | Collateral | | Par Value | | | Fair Value | |
J.P. Morgan Securities LLC | | | | | | | | | | U.S. Treasury Notes | | | | | | | | |
5.31% | | | | | | | | | | 0.25% - 5.00% | | | | | | | | |
Due 04/01/24 | | $ | 166,514,975 | | | $ | 166,588,658 | | | Due 03/31/24 - 02/15/33 | | $ | 172,847,100 | | | $ | 169,834,991 | |
| | | | | | | | | | | | | | | | | | | |
| | | | | | | | | | | U.S. Treasury Strips | | | | | | | | |
| | | | | | | | | | | 0.00% | | | | | | | | |
| | | | | | | | | | | Due 11/15/27 - 05/15/48 | | | 4,894 | | | | 4,141 | |
| | | | | | | | | | | | | | | | | | | |
| | | | | | | | | | | U.S. Treasury Bills | | | | | | | | |
| | | | | | | | | | | 0.00% | | | | | | | | |
| | | | | | | | | | | Due 04/11/24 - 05/02/24 | | | 4,500 | | | | 4,480 | |
| | | | | | | | | | | | | | | | | | | |
| | | | | | | | | | | U.S. Treasury Bond | | | | | | | | |
| | | | | | | | | | | 4.50% | | | | | | | | |
| | | | | | | | | | | Due 05/15/38 | | | 800 | | | | 840 | |
| | | | | | | | | | | | | | | | | | | |
| | | | | | | | | | | U.S. Treasury Inflation Indexed Bond | | | | | | | | |
| | | | | | | | | | | 0.13% | | | | | | | | |
| | | | | | | | | | | Due 04/15/27 | | | 874 | | | | 823 | |
| | | | | | | | | | | | | | 172,858,168 | | | | 169,845,275 | |
| | | | | | | | | | | | | | | | | | | |
BofA Securities, Inc. | | | | | | | | | | U.S. Treasury Note | | | | | | | | |
5.31% | | | | | | | | | | 0.75% | | | | | | | | |
Due 04/01/24 | | | 64,044,221 | | | | 64,072,561 | | | Due 03/31/26 | | | 70,171,700 | | | | 65,325,118 | |
| | | | | | | | | | | | | | | | | | | |
Barclays Capital, Inc. | | | | | | | | | | U.S. Treasury Notes | | | | | | | | |
5.30% | | | | | | | | | | 0.63% - 3.50% | | | | | | | | |
Due 04/01/24 | | | 58,050,546 | | | | 58,076,185 | | | Due 11/30/27 - 02/15/33 | | | 64,598,100 | | | | 59,211,567 | |
| | THE RYDEX FUNDS ANNUAL REPORT | 219 |
NOTES TO FINANCIAL STATEMENTS (continued) |
In the event of counterparty default, the Funds have the right to collect the collateral to offset losses incurred. There is potential loss to the Funds in the event the Funds are delayed or prevented from exercising their rights to dispose of the collateral securities, including the risk of a possible decline in the value of the underlying securities during the period while the Funds seek to assert their rights. GI, acting under the supervision of the Board, reviews the value of the collateral and the creditworthiness of those banks and dealers with which the Funds enter into repurchase agreements to evaluate potential risks.
Note 7 – Portfolio Securities Loaned
The Funds may lend their securities to approved brokers to earn additional income. Securities lending income shown on the Funds’ Statements of Operations is shown net of rebates paid to the borrowers and earnings on cash collateral investments shared with the lending agent. Within this arrangement, the Funds act as the lender, U.S. Bank acts as the lending agent, and other approved registered broker dealers act as the borrowers. The Funds receive cash collateral, valued at 102% of the value of the securities on loan. Under the terms of the Funds’ securities lending agreement with U.S. Bank, cash collateral and proceeds are invested in the First American Government Obligations Fund — Class X. The Funds bear the risk of loss on cash collateral investments. Collateral is maintained over the life of the loan in an amount not less than the value of loaned securities, as determined at the close of fund business each day; any additional collateral required due to changes in security values is delivered to the Funds the next business day. Although the collateral mitigates the risk, the Funds could experience a delay in recovering their securities and a possible loss of income or value if the borrower fails to return the securities. The Funds have the right under the securities lending agreement to recover the securities from the borrower on demand. Securities lending transactions are accounted for as secured borrowings. The remaining contractual maturity of the securities lending agreement is overnight and continuous.
At March 31, 2024, the following Funds participated in securities lending transactions, which are subject to enforceable netting arrangements, as follows:
| | | Gross Amounts Not Offset in the
Statements of Assets and Liabilities | | | | Securities Lending Collateral | |
Fund | | Value of
Securities
Loaned | | | Collateral
Received(a) | | | Net
Amount | | | | Cash
Collateral
Invested | | | Cash
Collateral
Uninvested | | | Total
Collateral | |
Monthly Rebalance NASDAQ-100® 2x Strategy Fund | | $ | 1,484,077 | | | $ | (1,484,077 | ) | | $ | — | | | | $ | 1,560,453 | | | $ | — | | | $ | 1,560,453 | |
Mid-Cap 1.5x Strategy Fund | | | 49,978 | | | | (49,978 | ) | | | — | | | | | 53,198 | | | | — | | | | 53,198 | |
Russell 2000® 1.5x Strategy Fund | | | 43,997 | | | | (43,997 | ) | | | — | | | | | 46,537 | | | | — | | | | 46,537 | |
Russell 2000® Fund | | | 1,196,314 | | | | (1,196,314 | ) | | | — | | | | | 1,273,415 | | | | — | | | | 1,273,415 | |
(a) | Actual collateral received by the Fund is generally greater than the amount shown due to overcollateralization. |
In the event of counterparty default, the Funds have the right to collect the collateral to offset losses incurred. There is potential loss to the Funds in the event the Funds are delayed or prevented from exercising their rights to dispose of the collateral securities, including the risk of a possible decline in the value of the underlying securities during the period while the Funds seek to assert their rights. GI, acting under the supervision of the Board, reviews the value of the collateral and the creditworthiness of those banks and dealers to evaluate potential risks.
Note 8 – Federal Income Tax Information
The Funds intend to comply with the provisions of Subchapter M of the Internal Revenue Code of 1986, as amended (the “Internal Revenue Code”), applicable to regulated investment companies and will distribute substantially all taxable net investment income and capital gains sufficient to relieve the Funds from all, or substantially all, federal income, excise and state income taxes. Therefore, no provision for federal or state income tax or federal excise tax is required.
Tax positions taken or expected to be taken in the course of preparing the Funds’ tax returns are evaluated to determine whether the tax positions are “more-likely-than-not” of being sustained by the applicable tax authority. Tax positions not deemed to meet the “more-likely-than-not” threshold would be recorded as a tax benefit or expense in the current year. Management has analyzed the Funds’ tax positions taken, or to be taken, on U.S. federal income tax returns for all open tax years, and has concluded that no provision for income tax is required in the Funds’ financial statements. The Funds’ U.S. federal income tax returns are subject to examination by the Internal Revenue Service (“IRS”) for a period of three years after they are filed.
220 | THE RYDEX FUNDS ANNUAL REPORT | |
NOTES TO FINANCIAL STATEMENTS (continued) |
The tax character of distributions paid during the year ended March 31, 2024 was as follows:
Fund | | Ordinary
Income | | | Long-Term
Capital Gain | | | Total
Distributions | |
Nova Fund | | $ | 1,311,978 | | | $ | — | | | $ | 1,311,978 | |
S&P 500® Fund | | | 411,430 | | | | 608,279 | | | | 1,019,709 | |
Inverse S&P 500® Strategy Fund | | | 1,093,992 | | | | — | | | | 1,093,992 | |
Monthly Rebalance NASDAQ-100® 2x Strategy Fund | | | 16,847,647 | | | | — | | | | 16,847,647 | |
Inverse NASDAQ-100® Strategy Fund | | | 702,459 | | | | — | | | | 702,459 | |
Mid-Cap 1.5x Strategy Fund | | | 44,699 | | | | — | | | | 44,699 | |
Inverse Mid-Cap Strategy Fund | | | 56,012 | | | | — | | | | 56,012 | |
Russell 2000® 1.5x Strategy Fund | | | 14,424 | | | | — | | | | 14,424 | |
Russell 2000® Fund | | | 58,904 | | | | — | | | | 58,904 | |
Inverse Russell 2000® Strategy Fund | | | 130,435 | | | | — | | | | 130,435 | |
Dow Jones Industrial Average® Fund | | | 169,820 | | | | — | | | | 169,820 | |
Government Long Bond 1.2x Strategy Fund | | | 1,310,196 | | | | — | | | | 1,310,196 | |
Inverse Government Long Bond Strategy Fund | | | 295,483 | | | | — | | | | 295,483 | |
High Yield Strategy Fund | | | 1,768,671 | | | | — | | | | 1,768,671 | |
U.S. Government Money Market Fund | | | 11,072,089 | | | | 120,923 | | | | 11,193,012 | |
The tax character of distributions paid during the year ended March 31, 2023 was as follows:
Fund | | Ordinary
Income | | | Long-Term
Capital Gain | | | Total
Distributions | |
Nova Fund | | $ | 14,448,535 | | | $ | — | | | $ | 14,448,535 | |
S&P 500® Fund | | | 1,381,295 | | | | — | | | | 1,381,295 | |
Dow Jones Industrial Average® Fund | | | 210,716 | | | | 620,623 | | | | 831,339 | |
Government Long Bond 1.2x Strategy Fund | | | 1,293,729 | | | | — | | | | 1,293,729 | |
High Yield Strategy Fund | | | 50,447 | | | | — | | | | 50,447 | |
U.S. Government Money Market Fund | | | 6,835,528 | | | | 30 | | | | 6,835,558 | |
Note: For U.S. federal income tax purposes, short-term capital gain distributions are treated as ordinary income distributions.
The tax components of distributable earnings/(loss) as of March 31, 2024 were as follows:
Fund | | Undistributed
Ordinary
Income | | | Undistributed
Long-Term
Capital Gain | | | Net Unrealized
Appreciation
(Depreciation) | | | Accumulated
Capital and
Other Losses | | | Total | |
Nova Fund | | $ | 1,654,145 | | | $ | — | | | $ | 10,248,884 | | | $ | (95,401,523 | ) | | $ | (83,498,494 | ) |
S&P 500® Fund | | | 1,999,873 | | | | — | | | | 40,631,178 | | | | — | | | | 42,631,051 | |
Inverse S&P 500® Strategy Fund | | | 1,976,484 | | | | — | | | | (351,217 | ) | | | (278,374,767 | ) | | | (276,749,500 | ) |
Monthly Rebalance NASDAQ-100® 2x Strategy Fund | | | 73,613,459 | | | | — | | | | 79,806,002 | | | | — | | | | 153,419,461 | |
Inverse NASDAQ-100® Strategy Fund | | | 857,387 | | | | — | | | | (46,497 | ) | | | (81,577,611 | ) | | | (80,766,721 | ) |
Mid-Cap 1.5x Strategy Fund | | | 104,474 | | | | — | | | | 2,128,709 | | | | (139,396 | ) | | | 2,093,787 | |
Inverse Mid-Cap Strategy Fund | | | 35,399 | | | | — | | | | (13,325 | ) | | | (6,309,617 | ) | | | (6,287,543 | ) |
Russell 2000® 1.5x Strategy Fund | | | 97,317 | | | | — | | | | 275,093 | | | | (2,621,691 | ) | | | (2,249,281 | ) |
Russell 2000® Fund | | | 252,224 | | | | — | | | | 199,489 | | | | (2,542,341 | ) | | | (2,090,628 | ) |
Inverse Russell 2000® Strategy Fund | | | 24,355 | | | | — | | | | (45,370 | ) | | | (42,599,759 | ) | | | (42,620,774 | ) |
Dow Jones Industrial Average® Fund | | | 390,850 | | | | — | | | | 4,084,138 | | | | — | | | | 4,474,988 | |
Government Long Bond 1.2x Strategy Fund | | | 7,228 | | | | — | | | | 28,585 | | | | (67,786,620 | ) | | | (67,750,807 | ) |
Inverse Government Long Bond Strategy Fund | | | 1,042,391 | | | | — | | | | (335,632 | ) | | | (236,313,657 | ) | | | (235,606,898 | ) |
High Yield Strategy Fund | | | 732,884 | | | | — | | | | 62,146 | | | | (12,417,816 | ) | | | (11,622,786 | ) |
Inverse High Yield Strategy Fund | | | — | | | | — | | | | (16,728 | ) | | | (11,118,407 | ) | | | (11,135,135 | ) |
U.S. Government Money Market Fund | | | 135,207 | | | | 16 | | | | — | | | | — | | | | 135,223 | |
| | THE RYDEX FUNDS ANNUAL REPORT | 221 |
NOTES TO FINANCIAL STATEMENTS (continued) |
For U.S. federal income tax purposes, capital loss carryforwards represent realized losses of the Funds that may be carried forward and applied against future capital gains. The Funds are permitted to carry forward capital losses for an unlimited period and such capital loss carryforwards retain their character as either short-term or long-term capital losses. As of March 31, 2024, capital loss carryforwards for the Funds were as follows:
| | | Unlimited | | | | | |
Fund | | Short-Term | | | Long-Term | | | Total
Capital Loss
Carryforward | |
Nova Fund | | $ | (80,962,450 | ) | | $ | (14,439,073 | ) | | $ | (95,401,523 | ) |
Inverse S&P 500® Strategy Fund | | | (250,270,189 | ) | | | (28,104,578 | ) | | | (278,374,767 | ) |
Inverse NASDAQ-100® Strategy Fund | | | (77,591,974 | ) | | | (3,985,637 | ) | | | (81,577,611 | ) |
Mid-Cap 1.5x Strategy Fund | | | (139,396 | ) | | | — | | | | (139,396 | ) |
Inverse Mid-Cap Strategy Fund | | | (5,563,302 | ) | | | (746,315 | ) | | | (6,309,617 | ) |
Russell 2000® 1.5x Strategy Fund | | | (2,331,065 | ) | | | (290,626 | ) | | | (2,621,691 | ) |
Russell 2000® Fund | | | (1,898,107 | ) | | | (644,234 | ) | | | (2,542,341 | ) |
Inverse Russell 2000® Strategy Fund | | | (35,787,369 | ) | | | (6,812,390 | ) | | | (42,599,759 | ) |
Government Long Bond 1.2x Strategy Fund | | | (55,586,677 | ) | | | (12,199,943 | ) | | | (67,786,620 | ) |
Inverse Government Long Bond Strategy Fund | | | (189,449,930 | ) | | | (46,863,727 | ) | | | (236,313,657 | ) |
High Yield Strategy Fund | | | (9,977,722 | ) | | | (2,440,094 | ) | | | (12,417,816 | ) |
Inverse High Yield Strategy Fund | | | (9,788,416 | ) | | | (1,328,257 | ) | | | (11,116,673 | ) |
For the year ended March 31, 2024, the following capital loss carryforward amounts were utilized:
Fund | | Utilized | |
Nova Fund | | $ | 39,148,764 | |
Monthly Rebalance NASDAQ-100® 2x Strategy Fund | | | 39,188,008 | |
Mid-Cap 1.5x Strategy Fund | | | 1,831,326 | |
Russell 2000® 1.5x Strategy Fund | | | 576,059 | |
Russell 2000® Fund | | | 197,667 | |
Inverse Government Long Bond Strategy Fund | | | 2,652,968 | |
High Yield Strategy Fund | | | 1,033,153 | |
Net investment income and net realized gains (losses) may differ for financial statement and tax purposes because of temporary or permanent book/tax differences. These differences are primarily due to investments in swap agreements, losses deferred due to wash sales, distributions in connection with redemption of fund shares, the deferral of qualified late-year losses, non-deductible excise tax paid, reclassification of distributions, and the “mark-to-market,” recharacterization, or disposition of certain Passive Foreign Investment Companies (PFICs). Additional differences may result from the tax treatment of net operating losses and the “mark-to-market” of certain derivatives. To the extent these differences are permanent and would require a reclassification between Paid in Capital and Total Distributable Earnings (Loss), such reclassifications are made in the period that the differences arise. These reclassifications have no effect on net assets or NAV per share.
The following adjustments were made on the Statements of Assets and Liabilities as of March 31, 2024 for permanent book/tax differences:
Fund | | Paid In
Capital | | | Total
Distributable
Earnings/(Loss) | |
S&P 500® Fund | | $ | 1,661,218 | | | $ | (1,661,218 | ) |
Monthly Rebalance NASDAQ-100® 2x Strategy Fund | | | 78,829,303 | | | | (78,829,303 | ) |
Russell 2000® Fund | | | (1,061 | ) | | | 1,061 | |
Inverse Russell 2000® Strategy Fund | | | 93,571 | | | | (93,571 | ) |
Dow Jones Industrial Average® Fund | | | 309,490 | | | | (309,490 | ) |
Inverse Government Long Bond Strategy Fund | | | 225,177 | | | | (225,177 | ) |
High Yield Strategy Fund | | | 340,397 | | | | (340,397 | ) |
Inverse High Yield Strategy Fund | | | (933,147 | ) | | | 933,147 | |
222 | THE RYDEX FUNDS ANNUAL REPORT | |
NOTES TO FINANCIAL STATEMENTS (continued) |
At March 31, 2024, the cost of investments for U.S. federal income tax purposes, the aggregate gross unrealized appreciation for all investments for which there was an excess of value over tax cost and the aggregate gross unrealized depreciation for all investments for which there was an excess of tax cost over value, were as follows:
Fund | | Tax
Cost | | | Tax
Unrealized
Appreciation | | | Tax
Unrealized
Depreciation | | | Net Tax Unrealized
Appreciation/
(Depreciation) | |
Nova Fund | | $ | 262,867,873 | | | $ | 10,583,625 | | | $ | (334,741 | ) | | $ | 10,248,884 | |
S&P 500® Fund | | | 173,639,841 | | | | 40,767,672 | | | | (136,494 | ) | | | 40,631,178 | |
Inverse S&P 500® Strategy Fund | | | 38,648,622 | | | | 6,684 | | | | (357,901 | ) | | | (351,217 | ) |
Monthly Rebalance NASDAQ-100® 2x Strategy Fund | | | 619,634,868 | | | | 80,362,785 | | | | (556,783 | ) | | | 79,806,002 | |
Inverse NASDAQ-100® Strategy Fund | | | 17,396,960 | | | | 23,782 | | | | (70,279 | ) | | | (46,497 | ) |
Mid-Cap 1.5x Strategy Fund | | | 11,656,614 | | | | 2,319,016 | | | | (190,307 | ) | | | 2,128,709 | |
Inverse Mid-Cap Strategy Fund | | | 556,082 | | | | 46 | | | | (13,371 | ) | | | (13,325 | ) |
Russell 2000® 1.5x Strategy Fund | | | 6,867,762 | | | | 1,090,713 | | | | (815,620 | ) | | | 275,093 | |
Russell 2000® Fund | | | 37,090,250 | | | | 4,538,199 | | | | (4,338,710 | ) | | | 199,489 | |
Inverse Russell 2000® Strategy Fund | | | 2,545,477 | | | | 12,547 | | | | (57,917 | ) | | | (45,370 | ) |
Dow Jones Industrial Average® Fund | | | 22,647,677 | | | | 4,090,293 | | | | (6,155 | ) | | | 4,084,138 | |
Government Long Bond 1.2x Strategy Fund | | | 17,011,906 | | | | 57,733 | | | | (29,148 | ) | | | 28,585 | |
Inverse Government Long Bond Strategy Fund | | | 16,270,525 | | | | 163 | | | | (335,795 | ) | | | (335,632 | ) |
High Yield Strategy Fund | | | 34,056,279 | | | | 79,302 | | | | (17,156 | ) | | | 62,146 | |
Inverse High Yield Strategy Fund | | | 6,042,725 | | | | 2 | | | | (16,730 | ) | | | (16,728 | ) |
U.S. Government Money Market Fund | | | 267,533,524 | | | | — | | | | — | | | | — | |
Pursuant to U.S. federal income tax regulations applicable to regulated investment companies, the Funds have elected to treat net capital losses and certain ordinary losses realized between November 1 and March 31 of each year as occurring on the first day of the following tax year. The Funds have also elected to treat certain ordinary losses realized between January 1 and March 31 of each year as occurring on the first day of the following tax year. For the year ended March 31, 2024, the following losses reflected in the accompanying financial statements were deferred for U.S. federal income tax purposes until April 1, 2024:
Fund | | Ordinary | | | Capital | |
Inverse High Yield Strategy Fund | | $ | (1,734 | ) | | $ | — | |
Note 9 – Securities Transactions
For the year ended March 31, 2024, the cost of purchases and proceeds from sales of investment securities, excluding government securities, short-term investments and derivatives, were as follows:
Fund | | Purchases | | | Sales | |
Nova Fund | | $ | 1,900,447,353 | | | $ | 1,877,455,393 | |
S&P 500® Fund | | | 436,727,518 | | | | 365,137,541 | |
Inverse S&P 500® Strategy Fund | | | — | | | | — | |
Monthly Rebalance NASDAQ-100® 2x Strategy Fund | | | 1,498,394,739 | | | | 1,428,803,383 | |
Inverse NASDAQ-100® Strategy Fund | | | — | | | | — | |
Mid-Cap 1.5x Strategy Fund | | | 5,723,776 | | | | 5,473,014 | |
Inverse Mid-Cap Strategy Fund | | | — | | | | — | |
Russell 2000® 1.5x Strategy Fund | | | 431,488 | | | | 1,218,966 | |
Russell 2000® Fund | | | 2,361,616 | | | | 2,554,575 | |
Inverse Russell 2000® Strategy Fund | | | — | | | | 1,030,000 | |
Dow Jones Industrial Average® Fund | | | 31,134,309 | | | | 37,066,950 | |
Government Long Bond 1.2x Strategy Fund | | | — | | | | 1,100,000 | |
Inverse Government Long Bond Strategy Fund | | | — | | | | 500,001 | |
High Yield Strategy Fund | | | — | | | | — | |
Inverse High Yield Strategy Fund | | | — | | | | — | |
U.S. Government Money Market Fund | | | — | | | | — | |
| | THE RYDEX FUNDS ANNUAL REPORT | 223 |
NOTES TO FINANCIAL STATEMENTS (continued) |
For the year ended March 31, 2024, the cost of purchases and proceeds from sales of government securities were as follows:
Fund | | Purchases | | | Sales | |
Government Long Bond 1.2x Strategy Fund | | $ | 619,029,172 | | | $ | 639,640,000 | |
Inverse Government Long Bond Strategy Fund | | | 270,477,188 | | | | 248,073,047 | |
The Funds are permitted to purchase or sell securities from or to certain affiliated funds under specified conditions outlined in procedures adopted by the Board. The procedures have been designed to ensure that any purchase or sale of securities by a Fund from or to another fund or portfolio that is or could be considered an affiliate by virtue of having a common investment adviser (or affiliated investment advisers), common trustees and/or common officers complies with Rule 17a-7 of the 1940 Act. Further, as defined under these procedures, each transaction is effected at the current market price. For the year ended March 31, 2024, the Funds engaged in purchases and sales of securities pursuant to Rule 17a-7 of the 1940 Act, as follows:
Fund | | Purchases | | | Sales | | | Realized
Gain (Loss) | |
Nova Fund | | $ | 407,411,599 | | | $ | 259,302,790 | | | $ | 3,136,912 | |
S&P 500® Fund | | | 161,852,061 | | | | 208,770,588 | | | | 155,754 | |
Monthly Rebalance Nasdaq-100® 2x Strategy Fund | | | 740,160,850 | | | | 577,126,028 | | | | 28,597,020 | |
Mid-Cap 1.5x Strategy Fund | | | 856,315 | | | | 390,410 | | | | 306,262 | |
Russell 2000® 1.5x Strategy Fund | | | — | | | | 453,004 | | | | (80,201 | ) |
Russell 2000® Fund | | | 453,004 | | | | — | | | | — | |
Dow Jones Industrial Average® Fund | | | 18,930,413 | | | | 14,685,321 | | | | 588,986 | |
Note 10 – Line of Credit
The Trust, along with other affiliated trusts, secured an uncommitted $200,000,000 line of credit from U.S. Bank, N.A. On June 5, 2023, the line of credit agreement was renewed and expires on June 3, 2024. This line of credit is reserved for emergency or temporary purposes. Borrowings, if any, under this arrangement bear interest equal to the Prime Rate, minus 2%, which shall be paid monthly, averaging 6.39% for the year ended March 31, 2024. The Funds did not have any borrowings outstanding under this agreement at March 31, 2024.
The average daily balances borrowed for the year ended March 31, 2024, were as follows:
Fund | | Average Daily Balance | |
Nova Fund | | $ | 30,079 | |
Monthly Rebalance Nasdaq-100® 2x Strategy Fund | | | 13,661 | |
Mid-Cap 1.5x Strategy Fund | | | 653 | |
Russell 2000® 1.5x Strategy Fund | | | 251 | |
Dow Jones Industrial Average® Fund | | | 617 | |
Government Long Bond 1.2x Strategy Fund | | | 5,978 | |
Inverse Government Long Bond Strategy Fund | | | 1,486 | |
Note 11– Market Risks
The value of, or income generated by, the investments held by the Funds are subject to the possibility of rapid and unpredictable fluctuation, and loss that may result from various factors. These factors include, among others, developments affecting individual companies, or from broader influences, including real or perceived changes in prevailing interest rates (which may change at any time based on changes in monetary policies and various market and other economic condition), changes in inflation rates or expectations about inflation rates, adverse investor confidence or sentiment, changing economic, political (including geopolitical), social or financial market conditions, increased instability or general uncertainty, environmental disasters, governmental actions, public health emergencies (such as the spread of infectious diseases, pandemics and epidemics), debt crises, actual or threatened wars or other armed conflicts (such as the ongoing Russia-Ukraine conflict and its collateral economic and other effects, including, but not limited to, sanctions and other international trade barriers) or ratings downgrades, and other similar events, each of which may be temporary or last for extended periods. Moreover, changing economic, political, geopolitical, social, financial market or other conditions in one country, geographic region or industry could adversely affect the value, yield and return of the investments held by the Funds in a different country, geographic region, economy, industry or market because of the increasingly interconnected
224 | THE RYDEX FUNDS ANNUAL REPORT | |
NOTES TO FINANCIAL STATEMENTS (concluded) |
global economies and financial markets. The duration and extent of the foregoing types of factors or conditions are highly uncertain and difficult to predict and have in the past, and may in the future, cause volatility and distress in economies and financial markets or other adverse circumstances, which may negatively affect the value of the Funds’ investments and performance of the Funds.
Note 12 – Subsequent Events
The Funds evaluated subsequent events through the date the financial statements are issued and determined there were no material events that would require adjustment to or disclosure in the Funds’ financial statements.
| | THE RYDEX FUNDS ANNUAL REPORT | 225 |
REPORT OF INDEPENDENT REGISTERED PUBLIC ACCOUNTING FIRM |
To the Shareholders of Nova Fund, S&P 500® Fund, Inverse S&P 500® Strategy Fund, Monthly Rebalance NASDAQ-100® 2x Strategy Fund, Inverse NASDAQ-100® Strategy Fund, Mid-Cap 1.5x Strategy Fund, Inverse Mid-Cap Strategy Fund, Russell 2000® 1.5x Strategy Fund, Russell 2000® Fund, Inverse Russell 2000® Strategy Fund, Dow Jones Industrial Average® Fund, Government Long Bond 1.2x Strategy Fund, Inverse Government Long Bond Strategy Fund, High Yield Strategy Fund, Inverse High Yield Strategy Fund and U.S. Government Money Market Fund and the Board of Trustees of Rydex Series Funds
Opinion on the Financial Statements
We have audited the accompanying statements of assets and liabilities of Nova Fund, S&P 500® Fund, Inverse S&P 500® Strategy Fund, Monthly Rebalance NASDAQ-100® 2x Strategy Fund, Inverse NASDAQ-100® Strategy Fund, Mid-Cap 1.5x Strategy Fund, Inverse Mid-Cap Strategy Fund, Russell 2000® 1.5x Strategy Fund, Russell 2000® Fund, Inverse Russell 2000® Strategy Fund, Dow Jones Industrial Average® Fund, Government Long Bond 1.2x Strategy Fund, Inverse Government Long Bond Strategy Fund, High Yield Strategy Fund, Inverse High Yield Strategy Fund and U.S. Government Money Market Fund (collectively referred to as the “Funds”), (sixteen of the funds constituting Rydex Series Funds (the “Trust”)), including the schedules of investments, as of March 31, 2024, and the related statements of operations for the year then ended, the statements of changes in net assets for each of the two years in the period then ended, the financial highlights for each of the five years in the period then ended and the related notes (collectively referred to as the “financial statements”). In our opinion, the financial statements present fairly, in all material respects, the financial position of each of the Funds (sixteen of the funds constituting Rydex Series Funds) at March 31, 2024, the results of their operations for the year then ended, the changes in their net assets for each of the two years in the period then ended and their financial highlights for each of the five years in the period then ended, in conformity with U.S. generally accepted accounting principles.
Basis for Opinion
These financial statements are the responsibility of the Trust’s management. Our responsibility is to express an opinion on each of the Funds’ financial statements based on our audits. We are a public accounting firm registered with the Public Company Accounting Oversight Board (United States) (“PCAOB”) and are required to be independent with respect to the Trust in accordance with the U.S. federal securities laws and the applicable rules and regulations of the Securities and Exchange Commission and the PCAOB.
We conducted our audits in accordance with the standards of the PCAOB. Those standards require that we plan and perform the audit to obtain reasonable assurance about whether the financial statements are free of material misstatement, whether due to error or fraud. The Trust is not required to have, nor were we engaged to perform, an audit of the Trust’s internal control over financial reporting. As part of our audits, we are required to obtain an understanding of internal control over financial reporting but not for the purpose of expressing an opinion on the effectiveness of the Trust’s internal control over financial reporting. Accordingly, we express no such opinion.
Our audits included performing procedures to assess the risks of material misstatement of the financial statements, whether due to error or fraud, and performing procedures that respond to those risks. Such procedures included examining, on a test basis, evidence regarding the amounts and disclosures in the financial statements. Our procedures included confirmation of securities owned as of March 31, 2024, by correspondence with the custodian, transfer agent, and brokers; when replies were not received from brokers, we performed other auditing procedures. Our audits also included evaluating the accounting principles used and significant estimates made by management, as well as evaluating the overall presentation of the financial statements. We believe that our audits provide a reasonable basis for our opinion.

We have served as the auditor of one or more Guggenheim investment companies since 1979.
Tysons, Virginia
May 22, 2024
226 | THE RYDEX FUNDS ANNUAL REPORT | |
OTHER INFORMATION (Unaudited) |
Federal Income Tax Information
This information is being provided as required by the Internal Revenue Code. Amounts shown may differ from those elsewhere in the report because of differences in tax and financial reporting practice.
In January 2025, shareholders will be advised on IRS Form 1099 DIV or substitute 1099 DIV as to the federal tax status of the distributions received by shareholders in the calendar year 2024.
The Funds’ investment income (dividend income plus short-term capital gains, if any) qualifies as follows:
Of the taxable ordinary income distributions paid during the fiscal year ended March 31, 2024, the following funds had the corresponding percentages qualify for the reduced tax rate pursuant to the Jobs and Growth Tax Relief and Reconciliation Act of 2003 or for the dividends received deduction for corporations. See the qualified dividend income and dividend received deduction columns, respectively, in the table below.
Additionally, of the taxable ordinary income distributions paid during the fiscal year ended March 31, 2024, the following funds had the corresponding percentages qualify as interest related dividends and qualified short-term capital gains as permitted by IRC Section 871(k)(1) and IRC Section 871(k)(2), respectively. See the qualified interest income and qualified short-term capital gain columns, respectively, in the table below.
Fund | | Qualified
Dividend
Income | | | Dividend
Received
Deduction | | | Qualified
Interest
Income | | | Qualified
Short-Term
Capital Gain | |
Nova Fund | | | 74.49 | % | | | 84.93 | % | | | 26.68 | % | | | 0.00 | % |
S&P 500® Fund | | | 100.00 | % | | | 100.00 | % | | | 8.66 | % | | | 100.00 | % |
Inverse S&P 500® Strategy Fund | | | 0.00 | % | | | 0.00 | % | | | 45.25 | % | | | 0.00 | % |
Monthly Rebalance NASDAQ-100® 2x Strategy Fund | | | 3.77 | % | | | 3.76 | % | | | 2.63 | % | | | 100.00 | % |
Inverse NASDAQ-100® Strategy Fund | | | 0.00 | % | | | 0.00 | % | | | 47.88 | % | | | 0.00 | % |
Mid-Cap 1.5x Strategy Fund | | | 100.00 | % | | | 100.00 | % | | | 22.44 | % | | | 0.00 | % |
Inverse Mid-Cap Strategy Fund | | | 0.00 | % | | | 0.00 | % | | | 76.38 | % | | | 0.00 | % |
Russell 2000® 1.5x Strategy Fund | | | 100.00 | % | | | 100.00 | % | | | 26.26 | % | | | 0.00 | % |
Russell 2000® Fund | | | 98.23 | % | | | 94.40 | % | | | 30.96 | % | | | 0.00 | % |
Inverse Russell 2000® Strategy Fund | | | 0.00 | % | | | 0.00 | % | | | 47.15 | % | | | 0.00 | % |
Dow Jones Industrial Average® Fund | | | 51.72 | % | | | 51.72 | % | | | 12.52 | % | | | 100.00 | % |
Government Long Bond 1.2x Strategy Fund | | | 0.00 | % | | | 0.00 | % | | | 94.18 | % | | | 0.00 | % |
Inverse Government Long Bond Strategy Fund | | | 0.00 | % | | | 0.00 | % | | | 92.16 | % | | | 0.00 | % |
High Yield Strategy Fund | | | 0.00 | % | | | 0.00 | % | | | 54.77 | % | | | 0.00 | % |
U.S. Government Money Market Fund | | | 0.00 | % | | | 0.00 | % | | | 99.99 | % | | | 100.00 | % |
With respect to the taxable year ended March 31, 2024, the Funds hereby designate as capital gain dividends the amounts listed below, or, if subsequently determined to be different, the net capital gain of such year:
Fund | | From long-term
capital gain: | | | From long-term capital
gain, using proceeds
from shareholder
redemptions: | |
S&P 500® Fund | | $ | 608,279 | | | $ | — | |
Monthly Rebalance NASDAQ-100® 2x Strategy Fund | | | — | | | | 9,816,538 | |
Dow Jones Industrial Average® Fund | | | — | | | | 74,988 | |
U.S. Government Money Market Fund | | | 120,923 | | | | — | |
Delivery of Shareholder Reports
Paper copies of the Funds’ annual and semi-annual shareholder reports are not sent by mail, unless you specifically request paper copies of the reports from a Fund or from your financial intermediary. Instead, the reports are made available on a website, and you are notified by mail each time a report is posted and provided with a website link to access the report.
| | THE RYDEX FUNDS ANNUAL REPORT | 227 |
OTHER INFORMATION (Unaudited)(continued) |
You may elect to receive all future shareholder reports in paper free of charge. If you hold shares of a Fund directly, you can inform the Fund that you wish to receive paper copies of reports by calling 800.820.0888. If you hold shares of a Fund through a financial intermediary, please contact the financial intermediary to make this election. Your election to receive reports in paper may apply to all Guggenheim funds in which you are invested and may apply to all Guggenheim funds held with your financial intermediary.
Tailored Shareholder Reports for Open-End Mutual Funds and Exchange-Traded Funds
Effective January 24, 2023, the SEC adopted rule and form amendments to require open-end mutual funds and exchange-traded funds registered on Form N-1A to transmit concise and visually engaging streamlined annual and semi-annual reports to shareholders that highlight key information. Other information, including financial statements, will no longer appear in a streamlined shareholder report but must be available online, delivered free of charge upon request, and filed on a semi-annual basis on Form N-CSR. The rule and form amendments have a compliance date of July 24, 2024. At this time, management is evaluating the impact of these amendments on the shareholder reports for the Funds.
Proxy Voting Information
A description of the policies and procedures that the Trust uses to determine how to vote proxies relating to securities held in the Funds’ portfolios is available, without charge and upon request, by calling 800.820.0888. This information is also available from the EDGAR database on the SEC’s website at https://www.sec.gov.
Information regarding how the Funds’ voted proxies relating to portfolio securities during the most recent 12-month period ended June 30 is available without charge, upon request, by calling 800.820.0888. This information is also available from the EDGAR database on the SEC’s website at https://www.sec.gov.
Sector Classification
Information in the Schedule of Investments is categorized by sectors using sector-level Classifications defined by the Bloomberg Industry Classification System, a widely recognized industry classification system provider. Each Fund’s registration statement has investment policies relating to concentration in specific sectors/industries. For purposes of these investment policies, the Funds usually classify sectors/industries based on industry-level Classifications used by widely recognized industry classification system providers such as Bloomberg Industry Classification System, Global Industry Classification Standards and Barclays Global Classification Scheme.
Quarterly Portfolio Schedules Information
The Trust files its complete schedule of portfolio holdings with the SEC for the first and third quarters of each fiscal year as an exhibit to its reports on Form N-PORT. The Funds’ Forms N-PORT are available on the SEC’s website at https://www.sec.gov. The Funds’ complete schedule of securities holdings as of the end of each fiscal quarter will be made available to the public on the SEC’s website at www.sec.gov and on our website at www.guggenheiminvestments.com, and will be made available, upon request and without charge, by calling 800.820.0888.
228 | THE RYDEX FUNDS ANNUAL REPORT | |
INFORMATION ON BOARD OF TRUSTEES AND OFFICERS (Unaudited) |
A Board of Trustees oversees the Trust, as well as other trusts of GI, in which its members have no stated term of service, and continue to serve after election until resignation. The Funds’ Statement of Additional Information includes further information about Fund Trustees and Officers, and can be obtained without charge by visiting guggenheiminvestments.com or by calling 800.820.0888.
Name, Address*
and Year of Birth | Position(s)
Held with
Trust | Term of Office
and Length of
Time Served** | Principal Occupation(s)
During Past Five Years | Number of
Portfolios
in Fund
Complex
Overseen | Other
Directorships Held
by Trustees*** |
INDEPENDENT TRUSTEES | | | |
Randall C. Barnes (1951) | Trustee and Chair of the Valuation Oversight Committee | Since 2019 (Trustee) Since 2020 (Chair of the Valuation Oversight Committee) | Current: Private Investor (2001-present). Former: Senior Vice President and Treasurer, PepsiCo, Inc. (1993-1997); President, Pizza Hut International (1991-1993); Senior Vice President, Strategic Planning and New Business Development, PepsiCo, Inc. (1987-1990). | 153 | Current: Advent Convertible and Income Fund (2005-present); Purpose Investments Funds (2013-present). Former: Guggenheim Energy & Income Fund (2015-2023); Fiduciary/Claymore Energy Infrastructure Fund (2004-2022); Guggenheim Enhanced Equity Income Fund (2005-2021); Guggenheim Credit Allocation Fund (2013-2021). |
Angela Brock-Kyle (1959) | Trustee | Since 2016 | Current: Founder and Chief Executive Officer, B.O.A.R.D.S. (consulting firm) (2013-present); Director, Mutual Fund Directors Forum (2022-present). Former: Senior Leader, TIAA (financial services firm) (1987-2012). | 152 | Current: Bowhead Insurance GP, LLC (2020-present); Hunt Companies, Inc. (2019-present). Former: Guggenheim Energy & Income Fund (2019-2023); Fiduciary/Claymore Energy Infrastructure Fund (2019-2022); Guggenheim Enhanced Equity Income Fund (2019-2021); Guggenheim Credit Allocation Fund (2019-2021); Infinity Property & Casualty Corp. (2014-2018). |
| | THE RYDEX FUNDS ANNUAL REPORT | 229 |
INFORMATION ON BOARD OF TRUSTEES AND OFFICERS (Unaudited)(continued) |
Name, Address*
and Year of Birth | Position(s)
Held with
Trust | Term of Office
and Length of
Time Served** | Principal Occupation(s)
During Past Five Years | Number of
Portfolios
in Fund
Complex
Overseen | Other
Directorships Held
by Trustees*** |
INDEPENDENT TRUSTEES - continued | | | | |
Thomas F. Lydon, Jr. (1960) | Trustee and Chair of the Contracts Review Committee | Since 2005 (Trustee) Since 2020 (Chair of the Contracts Review Committee) | Current: President, Global Trends Investments (registered investment adviser) (1996-present); Chief Executive Officer, Lydon Media (2016-present); Vice Chairman, VettaFi, a wholly owned subsidiary of The TMX Group (financial advisor content, research and digital distribution provider) (2022-present). Former: Chief Executive Officer, ETF Flows, LLC (financial advisor education and research provider) (2019-2023); Director, GDX Index Partners, LLC (index provider) (2021-2023). | 152 | Current: US Global Investors, Inc. (GROW) (1995-present); The 2023 ETF Series Trust (4) (2023-present); The 2023 ETF Series II (1) (2023-present). Former: Guggenheim Energy & Income Fund (2019-2023); Fiduciary/Claymore Energy Infrastructure Fund (2019-2022); Guggenheim Enhanced Equity Income Fund (2019-2021); Guggenheim Credit Allocation Fund (2019-2021); Harvest Volatility Edge Trust (3) (2017-2019). |
Ronald A. Nyberg (1953) | Trustee and Chair of the Nominating and Governance Committee | Since 2019 | Current: Of Counsel (formerly Partner), Momkus LLP (law firm) (2016-present). Former: Partner, Nyberg & Cassioppi, LLC (law firm) (2000-2016); Executive Vice President, General Counsel, and Corporate Secretary, Van Kampen Investments (1982-1999). | 153 | Current: Advent Convertible and Income Fund (2003-present); PPM Funds (2) (2018-present); Endeavor Health (2012-present). Former: Guggenheim Energy & Income Fund (2015-2023); Fiduciary/Claymore Energy Infrastructure Fund (2004-2022); Guggenheim Enhanced Equity Income Fund (2005-2021); Guggenheim Credit Allocation Fund (2013-2021); Western Asset Inflation-Linked Opportunities & Income Fund (2004-2020); Western Asset Inflation-Linked Income Fund (2003-2020). |
230 | THE RYDEX FUNDS ANNUAL REPORT | |
INFORMATION ON BOARD OF TRUSTEES AND OFFICERS (Unaudited)(continued) |
Name, Address*
and Year of Birth | Position(s)
Held with
Trust | Term of Office
and Length of
Time Served** | Principal Occupation(s)
During Past Five Years | Number of
Portfolios
in Fund
Complex
Overseen | Other
Directorships Held
by Trustees*** |
INDEPENDENT TRUSTEES - concluded | | | | |
Sandra G. Sponem (1958) | Trustee and Chair of the Audit Committee | Since 2016 (Trustee) Since 2019 (Chair of the Audit Committee) | Current: Retired. Former: Senior Vice President and Chief Financial Officer, M.A. Mortenson-Companies, Inc. (construction and real estate development company) (2007-2017). | 152 | Current: SPDR Series Trust (81) (2018-present); SPDR Index Shares Funds (30) (2018-present); SSGA Active Trust (14) (2018-present). Former: Guggenheim Energy & Income Fund (2019-2023); Fiduciary/Claymore Energy Infrastructure Fund (2019-2022); Guggenheim Enhanced Equity Income Fund (2019-2021); Guggenheim Credit Allocation Fund (2019-2021); SSGA Master Trust (1) (2018-2020). |
Ronald E. Toupin, Jr. (1958) | Trustee, Chair of the Board and Chair of the Executive Committee | Since 2019 | Current: Portfolio Consultant (2010-present); Member, Governing Council, Independent Directors Council (2013-present); Governor, Board of Governors, Investment Company Institute (2018-present). Former: Member, Executive Committee, Independent Directors Council (2016-2018); Vice President, Manager and Portfolio Manager, Nuveen Asset Management (1998-1999); Vice President, Nuveen Investment Advisory Corp. (1992-1999); Vice President and Manager, Nuveen Unit Investment Trusts (1991-1999); and Assistant Vice President and Portfolio Manager, Nuveen Unit Investment Trusts (1988-1999), each of John Nuveen & Co., Inc. (registered broker dealer) (1982-1999). | 152 | Former: Guggenheim Energy & Income Fund (2015-2023); Fiduciary/Claymore Energy Infrastructure Fund (2004-2022); Guggenheim Enhanced Equity Income Fund (2005-2021); Guggenheim Credit Allocation Fund (2013-2021); Western Asset Inflation-Linked Opportunities & Income Fund (2004-2020); Western Asset Inflation-Linked Income Fund (2003-2020). |
| | THE RYDEX FUNDS ANNUAL REPORT | 231 |
INFORMATION ON BOARD OF TRUSTEES AND OFFICERS (Unaudited)(continued) |
Name, Address*
and Year of Birth | Position(s)
Held with
Trust | Term of Office
and Length of
Time Served** | Principal Occupation(s)
During Past Five Years | Number of
Portfolios
in Fund
Complex
Overseen | Other
Directorships Held
by Trustees*** |
INTERESTED TRUSTEE | | | | |
Amy J. Lee**** (1961) | Trustee, Vice President and Chief Legal Officer | Since 2019 | Current: Interested Trustee, certain other funds in the Fund Complex (2018-present); Chief Legal Officer, certain other funds in the Fund Complex (2014-present); Vice President, certain other funds in the Fund Complex (2007-present); Senior Managing Director, Guggenheim Investments (2012-present). Former: President and/or Chief Executive Officer, certain other funds in the Fund Complex (2017-2019); Vice President, Associate General Counsel and Assistant Secretary, Security Benefit Life Insurance Company and Security Benefit Corporation (2004-2012). | 152 | Former: Guggenheim Energy & Income Fund (2018-2023); Fiduciary/Claymore Energy Infrastructure Fund (2018-2022); Guggenheim Enhanced Equity Income Fund (2018-2021); Guggenheim Credit Allocation Fund (2018-2021). |
* | The business address of each Trustee is c/o Guggenheim Investments, 227 West Monroe Street, Chicago, Illinois 60606. |
** | Each Trustee serves an indefinite term, until his or her successor is elected and qualified. |
*** | Each Trustee also serves on the Boards of Trustees of Guggenheim Funds Trust, Guggenheim Variable Funds Trust, Guggenheim Strategy Funds Trust, Guggenheim Taxable Municipal Bond & Investment Grade Debt Trust, Guggenheim Strategic Opportunities Fund, Guggenheim Active Allocation Fund, Rydex Series Funds, Rydex Dynamic Funds, Rydex Variable Trust and Transparent Value Trust. Messrs. Barnes and Nyberg also serve on the Board of Trustees of Advent Convertible & Income Fund. |
**** | This Trustee is deemed to be an “interested person” of the Funds under the 1940 Act by reason of her position with the Funds’ Adviser and/or the parent of the Adviser. |
232 | THE RYDEX FUNDS ANNUAL REPORT | |
INFORMATION ON BOARD OF TRUSTEES AND OFFICERS (Unaudited)(continued) |
Name, Address*
and Year of Birth | Position(s)
Held with
Trust | Term of Office
and Length of
Time Served** | Principal Occupation(s)
During Past Five Years |
OFFICERS | | | |
Brian E. Binder (1972) | President and Chief Executive Officer | Since 2019 | Current: President, Mutual Fund Boards, Guggenheim Investments (2022-present); President and Chief Executive Officer, certain other funds in the Fund Complex (2018-present); President, Mutual Funds Boards and Senior Managing Director, Guggenheim Funds Investment Advisors, LLC and Security Investors, LLC (2018-present); Board Member, Guggenheim Partners Investment Funds plc (2022-present); Board Member, Guggenheim Global Investments plc (2022-present); Board Member, Guggenheim Partners Fund Management (Europe) Limited (2018-present). Former: Senior Managing Director and Chief Administrative Officer, Guggenheim Investments (2018-2022); Managing Director and President, Deutsche Funds, and Head of US Product, Trading and Fund Administration, Deutsche Asset Management (2013-2018); Managing Director, Chairman of North American Executive Committee and Head of Business Management and Consulting, Invesco Ltd. (2010-2012). |
James Howley (1972) | Chief Financial Officer, Chief Accounting Officer and Treasurer | Since 2022 | Current: Managing Director, Guggenheim Investments (2004-present); Chief Financial Officer, Chief Accounting Officer, and Treasurer, certain other funds in the Fund Complex (2022-present). Former: Assistant Treasurer, certain other funds in the Fund Complex (2006-2022); Manager, Mutual Fund Administration of Van Kampen Investments, Inc. (1996-2004). |
Mark E. Mathiasen (1978) | Secretary | Since 2017 | Current: Secretary, certain other funds in the Fund Complex (2007-present); Managing Director, Guggenheim Investments (2007-present). |
Glenn McWhinnie (1969) | Assistant Treasurer | Since 2016 | Current: Vice President, Guggenheim Investments (2009-present); Assistant Treasurer, certain other funds in the Fund Complex (2016-present). |
Michael P. Megaris (1984) | Assistant Secretary | Since 2018 | Current: Assistant Secretary, certain other funds in the Fund Complex (2014-present); Managing Director, Guggenheim Investments (2012-present). |
Elisabeth Miller (1968) | Chief Compliance Officer | Since 2012 | Current: Chief Compliance Officer, certain other funds in the Fund Complex (2012-present); Senior Managing Director, Guggenheim Investments (2012-present); Senior Managing Director, Guggenheim Funds Distributors, LLC (2014-present). Former: Chief Compliance Officer, Security Investors, LLC and Guggenheim Funds Investment Advisors, LLC (2012-2018); Chief Compliance Officer, Guggenheim Distributors, LLC (2009-2014); Senior Manager, Security Investors, LLC (2004-2014); Senior Manager, Guggenheim Distributors, LLC (2004-2014). |
Margaux Misantone (1978) | AML Officer | Since 2017 | Current: Chief Compliance Officer, Security Investors, LLC and Guggenheim Funds Investment Advisors, LLC (2018-present); AML Officer, Security Investors, LLC and certain other funds in the Fund Complex (2017-present); Managing Director, Guggenheim Investments (2015-present). Former: Assistant Chief Compliance Officer, Security Investors, LLC and Guggenheim Funds Investments Advisors, LLC (2015-2018). |
| | THE RYDEX FUNDS ANNUAL REPORT | 233 |
INFORMATION ON BOARD OF TRUSTEES AND OFFICERS (Unaudited)(concluded) |
Name, Address*
and Year of Birth | Position(s)
Held with
Trust | Term of Office
and Length of
Time Served** | Principal Occupation(s)
During Past Five Years |
OFFICERS - concluded | |
Kimberly J. Scott (1974) | Assistant Treasurer | Since 2016 | Current: Director, Guggenheim Investments (2012-present); Assistant Treasurer, certain other funds in the Fund Complex (2012-present). Former: Financial Reporting Manager, Invesco, Ltd. (2010-2011); Vice President/Assistant Treasurer, Mutual Fund Administration for Van Kampen Investments, Inc./Morgan Stanley Investment Management (2009-2010); Manager of Mutual Fund Administration, Van Kampen Investments, Inc./Morgan Stanley Investment Management (2005-2009). |
Jon Szafran (1989) | Assistant Treasurer | Since 2017 | Current: Director, Guggenheim Investments (2017-present); Assistant Treasurer, certain other funds in the Fund Complex (2017-present). Former: Assistant Treasurer of Henderson Global Funds and Manager of US Fund Administration, Henderson Global Investors (North America) Inc. (“HGINA”), (2017); Senior Analyst of US Fund Administration, HGINA (2014–2017); Senior Associate of Fund Administration, Cortland Capital Market Services, LLC (2013-2014); Experienced Associate, PricewaterhouseCoopers LLP (2012-2013). |
* | The business address of each officer is c/o Guggenheim Investments, 227 West Monroe Street, Chicago, Illinois 60606. |
** | Each officer serves an indefinite term, until his or her successor is duly elected and qualified. |
234 | THE RYDEX FUNDS ANNUAL REPORT | |
GUGGENHEIM INVESTMENTS PRIVACY NOTICE (Unaudited) |
Who We Are
This Privacy Notice describes the data protection practices of Guggenheim Investments. Guggenheim Investments as used herein refers to the affiliated investment management businesses of Guggenheim Partners, LLC: Guggenheim Funds Investment Advisors, LLC, Guggenheim Partners Investment Management, LLC, Guggenheim Funds Distributors, LLC, Security Investors, LLC, Guggenheim Investment Advisors (Europe) Limited, Guggenheim Real Estate, LLC, GS Gamma Advisors, LLC, Guggenheim Partners India Management, LLC, Guggenheim Partners Europe Limited, as well as the funds in the Guggenheim Funds complex (the “Funds”) (“Guggenheim Investments,” “we,” “us,” or “our”).
Guggenheim Partners Investment Management Holdings, LLC, located at 330 Madison Avenue, New York, New York, 10017 is the data controller for your information. The affiliates who are also controllers of certain of your information are: Guggenheim Investment Advisors (Europe) Limited, Guggenheim Partners Europe Limited, Guggenheim Partners, LLC, Guggenheim Funds Investment Advisors, LLC, Guggenheim Partners Investment Management, LLC, Guggenheim Funds Distributors, LLC and Security Investors, LLC, as well as the Funds.
Our Commitment to You
Guggenheim Investments considers your privacy our utmost concern. When you become our client or investor, you entrust us with not only your hard-earned money but also with your personal and financial information. Because we have access to your private information, we hold ourselves to the highest standards in its safekeeping and use. We strictly limit how we share your information with others, whether you are a current or former Guggenheim Investments client or investor.
The Information We Collect About You
We collect certain nonpublic personal information about you from information you provide on applications, other forms, our website, and/or from third parties including investment advisors. This information includes Social Security or other tax identification number, assets, income, tax information, retirement and estate plan information, transaction history, account balance, payment history, bank account information, marital status, family relationships, information that we collect on our website through the use of “cookies,” and other personal information that you or others provide to us. We may also collect such information through your inquiries by mail, e-mail or telephone. We may also collect customer due diligence information, as required by applicable law and regulation, through third party service providers.
How We Handle Your Personal Information
The legal basis for using your information as set out in this Privacy Notice is as follows: (a) use of your personal data is necessary to perform our obligations under any contract with you (such as a contract for us to provide financial services to you); or (b) where use of your personal data is not necessary for performance of a contract, use of your personal data is necessary for our legitimate interests or the legitimate interests of others (for example, to enforce the legal terms governing our services, operate and market our website and other services we offer, ensure safe environments for our personnel and others, make and receive payments, prevent fraud and to know the customer to whom we are providing the services). Some processing is done to comply with applicable law.
In addition to the specific uses described above, we also use your information in the following manner:
| | ● | We use your information in connection with servicing your accounts. |
| | ● | We use information to respond to your requests or questions. For example, we might use your information to respond to your customer feedback. |
| | ● | We use information to improve our products and services. We may use your information to make our website and products better. We may use your information to customize your experience with us. |
| | ● | We use information for security purposes. We may use your information to protect our company and our customers. |
| | ● | We use information to communicate with you. For example, we will communicate with you about your account or our relationship. We may contact you about your feedback. We might also contact you about this Privacy Notice. We may also enroll you in our email newsletter. |
| | THE RYDEX FUNDS ANNUAL REPORT | 235 |
GUGGENHEIM INVESTMENTS PRIVACY NOTICE (Unaudited)(continued) |
| | ● | We use information as otherwise permitted by law, as we may notify you. |
| | ● | Aggregate/Anonymous Data. We may aggregate and/or anonymize any information collected through the website so that such information can no longer be linked to you or your device (“Aggregate/Anonymous Information”). We may use Aggregate/Anonymous Information for any purpose, including without limitation for research and marketing purposes, and may also share such data with any third parties, including advertisers, promotional partners, and sponsors. |
We do not sell information about current or former clients or their accounts to third parties. Nor do we share this information, except when necessary to complete transactions at your request, to make you aware of investment products and services that we or our affiliates offer, or as permitted or required by law.
We provide information about you to companies and individuals not affiliated with Guggenheim Investments to complete certain transactions or account changes, or to perform services for us related to your account. For example, if you ask to transfer assets from another financial institution to Guggenheim Investments, we must provide certain information about you to that company to complete the transaction. We provide the third party with only the information necessary to carry out its responsibilities and only for that purpose. And we require these third parties to treat your private information with the same high degree of confidentiality that we do. To alert you to other Guggenheim Investments products and services, we share your information within our family of affiliated companies. You may limit our sharing with affiliated companies as set out below. We may also share information with any successor to all or part of our business, or in connection with steps leading up to a merger or acquisition. For example, if part of our business was sold we may give customer information as part of that transaction. We may also share information about you with your consent.
We will release information about you if you direct us to do so, if we are compelled by law to do so, or in other circumstances as permitted by law (for example, to protect your account from fraud).
If you close your account(s) or become an inactive client or investor, we will continue to adhere to the privacy policies and practices described in this notice.
Opt-Out Provisions and Your Data Choices
The law allows you to “opt out” of certain kinds of information sharing with third parties. We do not share personal information about you with any third parties that triggers this opt-out right. This means YOU ARE ALREADY OPTED OUT.
When you are no longer our client or investor, we continue to share your information as described in this notice, and you may contact us at any time to limit our sharing by sending an email to CorporateDataPrivacy@GuggenheimPartners.com.
European Union Data Subjects and certain others: In addition to the choices set forth above, residents of the European Union and certain other jurisdictions have certain rights to (1) request access to or rectification or deletion of information we collect about them, (2) request a restriction on the processing of their information, (3) object to the processing of their information, or (4) request the portability of certain information. To exercise these or other rights, please contact us using the contact information below. We will consider all requests and provide our response within the time period stated by applicable law. Please note, however, that certain information may be exempt from such requests in some circumstances, which may include if we need to keep processing your information for our legitimate interests or to comply with a legal obligation. We may request you provide us with information necessary to confirm your identity before responding to your request.
Residents of France and certain other jurisdictions may also provide us with instructions regarding the manner in which we may continue to store, erase and share your information after your death, and where applicable, the person you have designated to exercise these rights after your death.
How We Protect Privacy Online
We take steps to protect your privacy when you use our web site – www.guggenheiminvestments.com – by using secure forms of online communication, including encryption technology, Secure Socket Layer (SSL) protocol, firewalls and user names and passwords. These safeguards vary based on the sensitivity of the information that we collect and store. However, we cannot and do not guarantee that these measures will prevent every unauthorized attempt to access, use, or disclose your information since despite our efforts, no Internet and/or other
236 | THE RYDEX FUNDS ANNUAL REPORT | |
GUGGENHEIM INVESTMENTS PRIVACY NOTICE (Unaudited)(concluded) |
electronic transmissions can be completely secure. Our web site uses “http cookies”—tiny pieces of information that we ask your browser to store. We use cookies for session management and security features on the Guggenheim Investments web site. We do not use them to pull data from your hard drive, to learn your e-mail address, or to view data in cookies created by other web sites. We will not share the information in our cookies or give others access to it. See the legal information area on our web site for more details about web site security and privacy features.
How We Safeguard Your Personal Information and Data Retention
We restrict access to nonpublic personal information about you to our employees and in some cases to third parties (for example, the service providers described above) as permitted by law. We maintain strict physical, electronic and procedural safeguards that comply with federal standards to guard your nonpublic personal information.
We keep your information for no longer than necessary for the purposes for which it is processed. The length of time for which we retain information depends on the purposes for which we collected and use it and/or as required to comply with applicable laws. Information may persist in copies made for backup and business continuity purposes for additional time.
International Visitors
If you are not a resident of the United States, please be aware that your information may be transferred to, stored and processed in the United States where our servers are located and our databases are operated. The data protection and other laws of the United States and other countries might not be as comprehensive as those in your country.
In such cases, we ensure that a legal basis for such a transfer exists and that adequate protection is provided as required by applicable law, for example, by using standard contractual clauses or by transferring your data to a jurisdiction that has obtained an adequacy finding. Individuals whose data may be transferred on the basis of standard contractual clauses may contact us as described below.
We’ll Keep You Informed
If you have any questions or concerns about how we treat your personal data, we encourage you to consult with us first. You may also contact the relevant supervisory authority.
We reserve the right to modify this policy at any time and will inform you promptly of material changes. You may access our privacy policy from our web site at www.guggenheiminvestments.com. Should you have any questions regarding our privacy policy, contact us by email at CorporateDataPrivacy@GuggenheimPartners.com.
| | THE RYDEX FUNDS ANNUAL REPORT | 237 |
3.31.2024
Rydex Funds Annual Report
Sector Funds |
Banking Fund | | |
Basic Materials Fund | | |
Biotechnology Fund | | |
Consumer Products Fund | | |
Electronics Fund | | |
Energy Fund | | |
Energy Services Fund | | |
Financial Services Fund | | |
Health Care Fund | | |
Internet Fund | | |
Leisure Fund | | |
Precious Metals Fund | | |
Real Estate Fund | | |
Retailing Fund | | |
Technology Fund | | |
Telecommunications Fund | | |
Transportation Fund | | |
Utilities Fund | | |
GuggenheimInvestments.com | RSECF-ANN-0324x0325 |

| | |
DEAR SHAREHOLDER | 2 |
ECONOMIC AND MARKET OVERVIEW | 3 |
ABOUT SHAREHOLDERS’ FUND EXPENSES | 5 |
BANKING FUND | 10 |
BASIC MATERIALS FUND | 18 |
BIOTECHNOLOGY FUND | 26 |
CONSUMER PRODUCTS FUND | 34 |
ELECTRONICS FUND | 42 |
ENERGY FUND | 50 |
ENERGY SERVICES FUND | 58 |
FINANCIAL SERVICES FUND | 66 |
HEALTH CARE FUND | 75 |
INTERNET FUND | 83 |
LEISURE FUND | 91 |
PRECIOUS METALS FUND | 99 |
REAL ESTATE FUND | 107 |
RETAILING FUND | 116 |
TECHNOLOGY FUND | 124 |
TELECOMMUNICATIONS FUND | 133 |
TRANSPORTATION FUND | 141 |
UTILITIES FUND | 149 |
NOTES TO FINANCIAL STATEMENTS | 157 |
REPORT OF INDEPENDENT REGISTERED PUBLIC ACCOUNTING FIRM | 169 |
OTHER INFORMATION | 170 |
INFORMATION ON BOARD OF TRUSTEES AND OFFICERS | 172 |
GUGGENHEIM INVESTMENTS PRIVACY NOTICE | 178 |
| | THE RYDEX FUNDS ANNUAL REPORT | 1 |
Dear Shareholder:
Security Investors, LLC (the “Investment Adviser”) is pleased to present the annual shareholder report for Rydex Sector Funds (the “Fund” or “Funds”). This report covers the performance for the annual period ended March 31, 2024 (the “Reporting Period”).
The Investment Adviser is part of Guggenheim Investments, which represents the investment management businesses of Guggenheim Partners, LLC (“Guggenheim”), a global, diversified financial services firm.
Guggenheim Funds Distributors, LLC is the distributor of the Funds. Guggenheim Funds Distributors, LLC is affiliated with Guggenheim and the Investment Adviser.
We encourage you to read the Economic and Market Overview section of the report, which follows this letter, and then the Performance Report and Fund Profile for each Fund.
We are committed to providing innovative investment solutions and appreciate the trust you place in us.
Sincerely,
Security Investors, LLC
April 30, 2024
Read a prospectus and summary prospectus (if available) carefully before investing. It contains the investment objectives, risks, charges, expenses and other information, which should be considered carefully before investing. Obtain a prospectus and summary prospectus (if available) at guggenheiminvestments.com or call 800.820.0888.
This material is not intended as a recommendation or as investment advice of any kind, including in connection with rollovers, transfers, and distributions. Such material is not provided in a fiduciary capacity, may not be relied upon for or in connection with the making of investment decisions, and does not constitute a solicitation of an offer to buy or sell securities. All content has been provided for informational or educational purposes only and is not intended to be and should not be construed as legal or tax advice and/or a legal opinion. Always consult a financial, tax and/or legal professional regarding your specific situation.
Sector funds may not be suitable for all investors. Investing in sector funds is more volatile than investing in broadly diversified funds, as there is a greater risk due to the concentration of the Funds’ holdings in issuers of the same or similar offerings. Certain of the Funds are considered non-diversified and can invest a greater portion of their assets in securities of individual issuers than a diversified fund. As a result, changes in the market value of a single security could cause greater fluctuations in the value of fund shares than would occur in a more diversified fund.
2 | THE RYDEX FUNDS ANNUAL REPORT | |
ECONOMIC AND MARKET OVERVIEW (Unaudited) | March 31, 2024 |
While job growth remains robust, recent labor data brought increased confidence in a labor market in better balance, allowing for inflation to soften further. Labor force growth remains strong, aided by high immigration flows, helping bring labor supply in line with gradually cooling demand. The Small Business Survey indicates that plans to increase compensation have returned to pre-COVID levels. Additionally, Bureau of Labor Statistics data reveal a continued decline in the “quits rate,” reducing the pressure on businesses to raise wages to attract or retain employees. These developments suggest wage pressures may ease further by year end. And despite some speculation against any Federal Reserve (“Fed”) rate cuts materializing in 2024, we continue to anticipate cuts later this year.
Following the stronger-than-expected March Consumer Price Index, we believe that there is a high probability that the easing cycle will start in the second half of the year, since the Fed will likely need more time to gather confirming data. In the latest Summary of Economic Projections, the Federal Open Market Committee (“FOMC”) significantly increased the median forecast for 2024 U.S. gross domestic product, slightly increased it for core personal consumption expenditures year over year, and continues to expect no material increase in the unemployment rate. These adjustments left the median view for three rate cuts for 2024, which suggests the bar is very high for the Fed to keep rates where they are all year, and even higher for more rate hikes to materialize.
Amid this macroeconomic backdrop, in the first quarter of 2024 the two-year Treasury yield increased to 4.59% from 4.23%, and the 10-year Treasury yield increased to 4.20% from 3.88%, keeping the inverted 2s/10s yield curve consistent at 39 basis points as of the end of the Reporting Period, up four basis points since the start of the year. One basis point equals 0.01%. In general, spreads to Treasurys have remained tight across sectors. In investment-grade corporate bonds, BBB-rated bonds continued to remain attractive relative to A and BB-rated bonds, and supply slowed toward the end of the first quarter of 2024, which we believe should support spreads in the near term. High yield bond spreads tightened during the first quarter of 2024 to 301 basis points from 323 basis points at the start of the year, while leveraged loans’ discount margins to maturity tightened to 509 basis points from 528 basis points. Structured credit spreads tightened marginally amid strong demand. Investor demand and an improved arbitrage led to robust new collateralized loan obligation issuance, and tightening liabilities led to an increase in refinances/resets.
Looking forward, Fed officials continue to advocate for a patient approach. A conventional easing cycle is therefore far from guaranteed. Market expectations have already adjusted significantly from market-implied expectations of six rate cuts in 2024 just two months ago to only three as of the end of the Reporting Period, aligning more closely with the FOMC’s views. So far, the market has taken this delay in stride, but its patience and assessment of credit risk could be tested.
For the Reporting Period, the S&P 500® Index* returned 29.88%. The MSCI Europe-Australasia-Far East (“EAFE”) Index* returned 15.32%. The return of the MSCI Emerging Markets Index* was 8.15%.
In the bond market, the Bloomberg U.S. Aggregate Bond Index* posted a 1.70% return for the Reporting Period, while the Bloomberg U.S. Corporate High Yield Index* returned 11.15%. The return of the ICE Bank of America (“BofA”) 3-Month U.S. Treasury Bill Index* was 5.27% for the Reporting Period.
The opinions and forecasts expressed may not actually come to pass. This information is subject to change at any time, based on market and other conditions, and should not be construed as a recommendation of any specific security or strategy.
*Index Definitions:
The following indices are referenced throughout this report. Indices are unmanaged and not available for direct investment. Index performance does not reflect transaction costs, fees, or expenses.
Bloomberg U.S. Aggregate Bond Index is a broad-based flagship benchmark that measures the investment grade, U.S. dollar-denominated, fixed-rate taxable bond market, including U.S. Treasuries, government-related and corporate securities, mortgage-backed securities or “MBS”(agency fixed-rate and hybrid adjustable-rate mortgage, or “ARM”, pass-throughs), asset-backed securities (“ABS”), and commercial mortgage-backed securities (“CMBS”) (agency and non-agency).
Bloomberg U.S. Corporate High Yield Index measures the U.S. dollar-denominated, high yield, fixed-rate corporate bond market. Securities are classified as high yield if the middle rating of Moody’s, Fitch, and S&P is Ba1/BB +/BB + or below.
ICE BofA 3-Month U.S. Treasury Bill Index is an unmanaged market index of U.S. Treasury securities maturing in 90 days that assumes reinvestment of all income.
MSCI EAFE Index is a free float-adjusted market capitalization index that is designed to measure the equity market performance of developed markets, excluding the U.S. & Canada.
MSCI Emerging Markets Index is a free float-adjusted market capitalization weighted index that is designed to measure equity market performance in the global emerging markets.
| | THE RYDEX FUNDS ANNUAL REPORT | 3 |
ECONOMIC AND MARKET OVERVIEW (Unaudited)(concluded) | March 31, 2024 |
MSCI U.S. REIT Index is a free float market capitalization weighted index that is comprised of equity real estate investment trust (“REIT”) securities that belong to the MSCI U.S. Investable Market 2500 Index. The MSCI U.S. REIT Index includes only REIT securities that are of reasonable size in terms of full and free float-adjusted market capitalization to ensure that the performance of the equity REIT universe can be captured and replicated in actual institutional and retail portfolios of different sizes.
S&P 500® Index is a broad-based index, the performance of which is based on the performance of 500 widely held common stocks chosen for market size, liquidity, and industry group representation.
S&P 500® Communication Services Index is a sub-index of the S&P 500®. The Communication Services index contains companies that provide communications services primarily through a fixed-line, cellular, wireless, high bandwidth and/or fiber optic cable network.
S&P 500® Consumer Discretionary Index is a sub-index of the S&P 500®. The Consumer Discretionary index includes companies in the following industries: automobiles and components, consumer durables, apparel, hotels, restaurants, leisure, media and retailing.
S&P 500® Consumer Staples Index is a sub-index of the S&P 500®. The Consumer Staples index comprises companies whose businesses are less sensitive to economic cycles. It includes manufacturers and distributors of food, beverages and tobacco and producers of non-durable household goods and personal products. It also includes food & drug retailing companies as well as hypermarkets and consumer super centers.
S&P 500® Energy Index is a sub-index of the S&P 500®. The Energy index comprises companies whose businesses are dominated by either of the following activities: The construction or provision of oil rigs, drilling equipment and other energy-related equipment and services, including seismic data collection; companies engaged in the exploration, production, marketing, refining and/or transportation of oil and gas products, coal and other consumable fuels.
S&P 500® Financials Index is a sub-index of the S&P 500®. The Financials index contains companies involved in activities such as banking, mortgage finance, consumer finance, specialized finance, investment banking and brokerage, asset management and custody, corporate lending, insurance, and financial investment, and real estate, including REITs.
S&P 500® Health Care Index is a sub-index of the S&P 500®. The Health Care index encompasses two main industry groups. The first includes companies who manufacture health care equipment and supplies or provide health care related services, including distributors of health care products, providers of basic health-care services, and owners and operators of health care facilities and organizations. The first group also includes companies operating in the health care technology industry. The second group includes companies primarily involved in the research, development, production and marketing of pharmaceuticals, biotechnology and life sciences products.
S&P 500® Industrials Index is a sub-index of the S&P 500®. The Industrials index includes companies whose businesses are dominated by one of the following activities: the manufacture and distribution of capital goods, including aerospace & defense, construction, engineering & building products, electrical equipment and industrial machinery; the provision of commercial services and supplies, including printing, environmental, office and security services; the provision of professional services, including employment and research & consulting services; or the provision of transportation services, including airlines, couriers, marine, road & rail and transportation infrastructure.
S&P 500® Information Technology Index is a sub-index of the S&P 500®. The Information Technology index covers the following general areas: technology software & services, including companies that primarily develop software in various fields such as the Internet, applications, systems, databases management and/or home entertainment, and companies that provide information technology consulting and services, as well as data processing and outsourced services; secondly, technology hardware & equipment, including manufacturers and distributors of communications equipment, computers & peripherals, electronic equipment and related instruments; and thirdly, semiconductors & semiconductor equipment manufacturers.
S&P 500® Materials Index is a sub-index of the S&P 500®. The Materials index encompasses a wide range of commodity-related manufacturing industries. Included in this sector are companies that manufacture chemicals, construction materials, glass, paper, forest products and related packaging products, and metals, minerals and mining companies, including producers of steel.
S&P 500® Utilities Index is a sub-index of the S&P 500®. The Utilities index encompasses those companies considered electric, gas or water utilities, or companies that operate as independent producers and/or distributors of power.
4 | THE RYDEX FUNDS ANNUAL REPORT | |
ABOUT SHAREHOLDERS’ FUND EXPENSES (Unaudited) | |
All mutual funds have operating expenses, and it is important for our shareholders to understand the impact of costs on their investments. Shareholders of a fund incur two types of costs: (i) transaction costs, including sales charges (loads) on purchase payments, reinvested dividends, other distributions, and exchange fees, and (ii) ongoing costs, including management fees, administrative services, and shareholder reports, among others. These ongoing costs, or operating expenses, are deducted from a fund’s gross income and reduce the investment return of the fund.
A fund’s expenses are expressed as a percentage of its average net assets, which is known as the expense ratio. The following examples are intended to help investors understand the ongoing costs (in dollars) of investing in a fund and to compare these costs with the ongoing costs of investing in other mutual funds.
The examples are based on an investment of $1,000 made at the beginning of the period and held for the entire six-month period beginning September 30, 2023 and ending March 31, 2024.
The following tables illustrate the Funds’ costs in two ways:
Table 1. Based on actual Fund return: This section helps investors estimate the actual expenses paid over the period. The “Ending Account Value” shown is derived from the Fund’s actual return, and the fifth column shows the dollar amount that would have been paid by an investor who started with $1,000 in the Fund. Investors may use the information here, together with the amount invested, to estimate the expenses paid over the period. Simply divide the Fund’s account value by $1,000 (for example, an $8,600 account value divided by $1,000 = 8.6), then multiply the result by the number provided under the heading “Expenses Paid During Period.”
Table 2. Based on hypothetical 5% return: This section is intended to help investors compare a fund’s cost with those of other mutual funds. The table provides information about hypothetical account values and hypothetical expenses based on the Fund’s actual expense ratio and an assumed rate of return of 5% per year before expenses, which is not the Fund’s actual return. The hypothetical account values and expenses may not be used to estimate the actual ending account balance or expenses paid during the period. The example is useful in making comparisons because the U.S. Securities and Exchange Commission (the “SEC”) requires all mutual funds to calculate expenses based on the 5% return. Investors can assess a fund’s costs by comparing this hypothetical example with the hypothetical examples that appear in shareholder reports of other funds.
The calculations illustrated above assume no shares were bought or sold during the period. Actual costs may have been higher or lower, depending on the amount of investment and the timing of any purchases or redemptions.
Please note that the expenses shown in the table are meant to highlight your ongoing costs only and do not reflect any transactional costs, such as sales charges (loads) on purchase payments, and contingent deferred sales charges (“CDSC”) on redemptions, if any. Therefore, the second table is useful in comparing ongoing costs only, and will not help you determine the relative total costs of owning different funds. In addition, if these transactional costs were included, your costs would have been higher.
More information about the Funds’ expenses, including annual expense ratios for periods up to five years (subject to the Fund’s inception date), can be found in the Financial Highlights section of this report. For additional information on operating expenses and other shareholder costs, please refer to the appropriate Fund prospectus.
| | THE RYDEX FUNDS ANNUAL REPORT | 5 |
ABOUT SHAREHOLDERS’ FUND EXPENSES (Unaudited)(continued) | |
| | Expense
Ratio1 | | | Fund
Return | | | Beginning
Account Value
September 30, 2023 | | | Ending
Account Value
March 31, 2024 | | | Expenses
Paid During
Period2 | |
Table 1. Based on actual Fund return3 | | | | | | | | | | | | | | | | | | | | |
Banking Fund | | | | | | | | | | | | | | | | | | | | |
Investor Class | | | 1.39 | % | | | 28.93 | % | | $ | 1,000.00 | | | $ | 1,289.30 | | | $ | 7.96 | |
Class A | | | 1.67 | % | | | 28.78 | % | | | 1,000.00 | | | | 1,287.80 | | | | 9.55 | |
Class C | | | 2.43 | % | | | 28.28 | % | | | 1,000.00 | | | | 1,282.80 | | | | 13.87 | |
Class H | | | 1.66 | % | | | 28.77 | % | | | 1,000.00 | | | | 1,287.70 | | | | 9.49 | |
Basic Materials Fund | | | | | | | | | | | | | | | | | | | | |
Investor Class | | | 1.42 | % | | | 16.16 | % | | | 1,000.00 | | | | 1,161.60 | | | | 7.67 | |
Class A | | | 1.67 | % | | | 16.01 | % | | | 1,000.00 | | | | 1,160.10 | | | | 9.02 | |
Class C | | | 2.42 | % | | | 15.60 | % | | | 1,000.00 | | | | 1,156.00 | | | | 13.04 | |
Class H | | | 1.67 | % | | | 16.02 | % | | | 1,000.00 | | | | 1,160.20 | | | | 9.02 | |
Biotechnology Fund | | | | | | | | | | | | | | | | | | | | |
Investor Class | | | 1.41 | % | | | 13.56 | % | | | 1,000.00 | | | | 1,135.60 | | | | 7.53 | |
Class A | | | 1.66 | % | | | 13.41 | % | | | 1,000.00 | | | | 1,134.10 | | | | 8.86 | |
Class C | | | 2.42 | % | | | 13.00 | % | | | 1,000.00 | | | | 1,130.00 | | | | 12.89 | |
Class H | | | 1.66 | % | | | 13.41 | % | | | 1,000.00 | | | | 1,134.10 | | | | 8.86 | |
Consumer Products Fund | | | | | | | | | | | | | | | | | | | | |
Investor Class | | | 1.42 | % | | | 10.18 | % | | | 1,000.00 | | | | 1,101.80 | | | | 7.46 | |
Class A | | | 1.67 | % | | | 10.03 | % | | | 1,000.00 | | | | 1,100.30 | | | | 8.77 | |
Class C | | | 2.42 | % | | | 9.64 | % | | | 1,000.00 | | | | 1,096.40 | | | | 12.68 | |
Class H | | | 1.67 | % | | | 10.04 | % | | | 1,000.00 | | | | 1,100.40 | | | | 8.77 | |
Electronics Fund | | | | | | | | | | | | | | | | | | | | |
Investor Class | | | 1.41 | % | | | 38.85 | % | | | 1,000.00 | | | | 1,388.50 | | | | 8.42 | |
Class A | | | 1.66 | % | | | 38.67 | % | | | 1,000.00 | | | | 1,386.70 | | | | 9.90 | |
Class C | | | 2.41 | % | | | 38.16 | % | | | 1,000.00 | | | | 1,381.60 | | | | 14.35 | |
Class H | | | 1.66 | % | | | 38.68 | % | | | 1,000.00 | | | | 1,386.80 | | | | 9.91 | |
Energy Fund | | | | | | | | | | | | | | | | | | | | |
Investor Class | | | 1.43 | % | | | 5.58 | % | | | 1,000.00 | | | | 1,055.80 | | | | 7.35 | |
Class A | | | 1.67 | % | | | 5.45 | % | | | 1,000.00 | | | | 1,054.50 | | | | 8.58 | |
Class C | | | 2.42 | % | | | 5.05 | % | | | 1,000.00 | | | | 1,050.50 | | | | 12.41 | |
Class H | | | 1.67 | % | | | 5.45 | % | | | 1,000.00 | | | | 1,054.50 | | | | 8.58 | |
Energy Services Fund | | | | | | | | | | | | | | | | | | | | |
Investor Class | | | 1.44 | % | | | (0.42 | %) | | | 1,000.00 | | | | 995.80 | | | | 7.18 | |
Class A | | | 1.67 | % | | | (0.54 | %) | | | 1,000.00 | | | | 994.60 | | | | 8.33 | |
Class C | | | 2.42 | % | | | (0.91 | %) | | | 1,000.00 | | | | 990.90 | | | | 12.04 | |
Class H | | | 1.67 | % | | | (0.53 | %) | | | 1,000.00 | | | | 994.70 | | | | 8.33 | |
Financial Services Fund | | | | | | | | | | | | | | | | | | | | |
Investor Class | | | 1.39 | % | | | 26.19 | % | | | 1,000.00 | | | | 1,261.90 | | | | 7.86 | |
Class A | | | 1.66 | % | | | 26.04 | % | | | 1,000.00 | | | | 1,260.40 | | | | 9.38 | |
Class C | | | 2.42 | % | | | 25.56 | % | | | 1,000.00 | | | | 1,255.60 | | | | 13.65 | |
Class H | | | 1.67 | % | | | 26.04 | % | | | 1,000.00 | | | | 1,260.40 | | | | 9.44 | |
Health Care Fund | | | | | | | | | | | | | | | | | | | | |
Investor Class | | | 1.41 | % | | | 16.23 | % | | | 1,000.00 | | | | 1,162.30 | | | | 7.62 | |
Class A | | | 1.67 | % | | | 16.07 | % | | | 1,000.00 | | | | 1,160.70 | | | | 9.02 | |
Class C | | | 2.42 | % | | | 15.66 | % | | | 1,000.00 | | | | 1,156.60 | | | | 13.05 | |
Class H | | | 1.66 | % | | | 16.09 | % | | | 1,000.00 | | | | 1,160.90 | | | | 8.97 | |
6 | THE RYDEX FUNDS ANNUAL REPORT | |
ABOUT SHAREHOLDERS’ FUND EXPENSES (Unaudited)(continued) | |
| | Expense
Ratio1 | | | Fund
Return | | | Beginning
Account Value
September 30, 2023 | | | Ending
Account Value
March 31, 2024 | | | Expenses
Paid During
Period2 | |
Internet Fund | | | | | | | | | | | | | | | | | | | | |
Investor Class | | | 1.39 | % | | | 23.25 | % | | $ | 1,000.00 | | | $ | 1,232.50 | | | $ | 7.76 | |
Class A | | | 1.67 | % | | | 23.09 | % | | | 1,000.00 | | | | 1,230.90 | | | | 9.31 | |
Class C | | | 2.41 | % | | | 22.63 | % | | | 1,000.00 | | | | 1,226.30 | | | | 13.41 | |
Class H | | | 1.67 | % | | | 23.10 | % | | | 1,000.00 | | | | 1,231.00 | | | | 9.31 | |
Leisure Fund | | | | | | | | | | | | | | | | | | | | |
Investor Class | | | 1.42 | % | | | 15.80 | % | | | 1,000.00 | | | | 1,158.00 | | | | 7.66 | |
Class A | | | 1.67 | % | | | 15.65 | % | | | 1,000.00 | | | | 1,156.50 | | | | 9.00 | |
Class C | | | 2.42 | % | | | 15.21 | % | | | 1,000.00 | | | | 1,152.10 | | | | 13.02 | |
Class H | | | 1.67 | % | | | 15.64 | % | | | 1,000.00 | | | | 1,156.40 | | | | 9.00 | |
Precious Metals Fund | | | | | | | | | | | | | | | | | | | | |
Investor Class | | | 1.32 | % | | | 19.08 | % | | | 1,000.00 | | | | 1,190.80 | | | | 7.23 | |
Class A | | | 1.57 | % | | | 18.95 | % | | | 1,000.00 | | | | 1,189.50 | | | | 8.59 | |
Class C | | | 2.32 | % | | | 18.48 | % | | | 1,000.00 | | | | 1,184.80 | | | | 12.67 | |
Class H | | | 1.57 | % | | | 18.91 | % | | | 1,000.00 | | | | 1,189.10 | | | | 8.59 | |
Real Estate Fund | | | | | | | | | | | | | | | | | | | | |
Class A | | | 1.68 | % | | | 16.19 | % | | | 1,000.00 | | | | 1,161.90 | | | | 9.08 | |
Class C | | | 2.43 | % | | | 15.74 | % | | | 1,000.00 | | | | 1,157.40 | | | | 13.11 | |
Class H | | | 1.68 | % | | | 16.20 | % | | | 1,000.00 | | | | 1,162.00 | | | | 9.08 | |
Retailing Fund | | | | | | | | | | | | | | | | | | | | |
Investor Class | | | 1.42 | % | | | 27.87 | % | | | 1,000.00 | | | | 1,278.70 | | | | 8.09 | |
Class A | | | 1.67 | % | | | 27.70 | % | | | 1,000.00 | | | | 1,277.00 | | | | 9.51 | |
Class C | | | 2.43 | % | | | 27.22 | % | | | 1,000.00 | | | | 1,272.20 | | | | 13.80 | |
Class H | | | 1.67 | % | | | 27.70 | % | | | 1,000.00 | | | | 1,277.00 | | | | 9.51 | |
Technology Fund | | | | | | | | | | | | | | | | | | | | |
Investor Class | | | 1.43 | % | | | 29.42 | % | | | 1,000.00 | | | | 1,294.20 | | | | 8.20 | |
Class A | | | 1.66 | % | | | 29.26 | % | | | 1,000.00 | | | | 1,292.60 | | | | 9.51 | |
Class C | | | 2.41 | % | | | 28.79 | % | | | 1,000.00 | | | | 1,287.90 | | | | 13.78 | |
Class H | | | 1.67 | % | | | 29.26 | % | | | 1,000.00 | | | | 1,292.60 | | | | 9.57 | |
Telecommunications Fund | | | | | | | | | | | | | | | | | | | | |
Investor Class | | | 1.42 | % | | | 5.65 | % | | | 1,000.00 | | | | 1,056.50 | | | | 7.30 | |
Class A | | | 1.70 | % | | | 5.53 | % | | | 1,000.00 | | | | 1,055.30 | | | | 8.74 | |
Class C | | | 2.44 | % | | | 5.13 | % | | | 1,000.00 | | | | 1,051.30 | | | | 12.51 | |
Class H | | | 1.70 | % | | | 5.50 | % | | | 1,000.00 | | | | 1,055.00 | | | | 8.73 | |
Transportation Fund | | | | | | | | | | | | | | | | | | | | |
Investor Class | | | 1.43 | % | | | 5.72 | % | | | 1,000.00 | | | | 1,057.20 | | | | 7.35 | |
Class A | | | 1.67 | % | | | 5.59 | % | | | 1,000.00 | | | | 1,055.90 | | | | 8.58 | |
Class C | | | 2.42 | % | | | 5.18 | % | | | 1,000.00 | | | | 1,051.80 | | | | 12.41 | |
Class H | | | 1.67 | % | | | 5.60 | % | | | 1,000.00 | | | | 1,056.00 | | | | 8.58 | |
Utilities Fund | | | | | | | | | | | | | | | | | | | | |
Investor Class | | | 1.41 | % | | | 13.27 | % | | | 1,000.00 | | | | 1,132.70 | | | | 7.52 | |
Class A | | | 1.67 | % | | | 13.10 | % | | | 1,000.00 | | | | 1,131.00 | | | | 8.90 | |
Class C | | | 2.43 | % | | | 12.70 | % | | | 1,000.00 | | | | 1,127.00 | | | | 12.92 | |
Class H | | | 1.67 | % | | | 13.14 | % | | | 1,000.00 | | | | 1,131.40 | | | | 8.90 | |
| | THE RYDEX FUNDS ANNUAL REPORT | 7 |
ABOUT SHAREHOLDERS’ FUND EXPENSES (Unaudited)(continued) | |
| | Expense
Ratio1 | | | Fund
Return | | | Beginning
Account Value
September 30, 2023 | | | Ending
Account Value
March 31, 2024 | | | Expenses
Paid During
Period2 | |
Table 2. Based on hypothetical 5% return (before expenses) | | | | | | | | | | | | | | | | |
Banking Fund | | | | | | | | | | | | | | | | | | | | |
Investor Class | | | 1.39 | % | | | 5.00 | % | | $ | 1,000.00 | | | $ | 1,018.05 | | | $ | 7.01 | |
Class A | | | 1.67 | % | | | 5.00 | % | | | 1,000.00 | | | | 1,016.65 | | | | 8.42 | |
Class C | | | 2.43 | % | | | 5.00 | % | | | 1,000.00 | | | | 1,012.85 | | | | 12.23 | |
Class H | | | 1.66 | % | | | 5.00 | % | | | 1,000.00 | | | | 1,016.70 | | | | 8.37 | |
Basic Materials Fund | | | | | | | | | | | | | | | | | | | | |
Investor Class | | | 1.42 | % | | | 5.00 | % | | | 1,000.00 | | | | 1,017.90 | | | | 7.16 | |
Class A | | | 1.67 | % | | | 5.00 | % | | | 1,000.00 | | | | 1,016.65 | | | | 8.42 | |
Class C | | | 2.42 | % | | | 5.00 | % | | | 1,000.00 | | | | 1,012.90 | | | | 12.18 | |
Class H | | | 1.67 | % | | | 5.00 | % | | | 1,000.00 | | | | 1,016.65 | | | | 8.42 | |
Biotechnology Fund | | | | | | | | | | | | | | | | | | | | |
Investor Class | | | 1.41 | % | | | 5.00 | % | | | 1,000.00 | | | | 1,017.95 | | | | 7.11 | |
Class A | | | 1.66 | % | | | 5.00 | % | | | 1,000.00 | | | | 1,016.70 | | | | 8.37 | |
Class C | | | 2.42 | % | | | 5.00 | % | | | 1,000.00 | | | | 1,012.90 | | | | 12.18 | |
Class H | | | 1.66 | % | | | 5.00 | % | | | 1,000.00 | | | | 1,016.70 | | | | 8.37 | |
Consumer Products Fund | | | | | | | | | | | | | | | | | | | | |
Investor Class | | | 1.42 | % | | | 5.00 | % | | | 1,000.00 | | | | 1,017.90 | | | | 7.16 | |
Class A | | | 1.67 | % | | | 5.00 | % | | | 1,000.00 | | | | 1,016.65 | | | | 8.42 | |
Class C | | | 2.42 | % | | | 5.00 | % | | | 1,000.00 | | | | 1,012.90 | | | | 12.18 | |
Class H | | | 1.67 | % | | | 5.00 | % | | | 1,000.00 | | | | 1,016.65 | | | | 8.42 | |
Electronics Fund | | | | | | | | | | | | | | | | | | | | |
Investor Class | | | 1.41 | % | | | 5.00 | % | | | 1,000.00 | | | | 1,017.95 | | | | 7.11 | |
Class A | | | 1.66 | % | | | 5.00 | % | | | 1,000.00 | | | | 1,016.70 | | | | 8.37 | |
Class C | | | 2.41 | % | | | 5.00 | % | | | 1,000.00 | | | | 1,012.95 | | | | 12.13 | |
Class H | | | 1.66 | % | | | 5.00 | % | | | 1,000.00 | | | | 1,016.70 | | | | 8.37 | |
Energy Fund | | | | | | | | | | | | | | | | | | | | |
Investor Class | | | 1.43 | % | | | 5.00 | % | | | 1,000.00 | | | | 1,017.85 | | | | 7.21 | |
Class A | | | 1.67 | % | | | 5.00 | % | | | 1,000.00 | | | | 1,016.65 | | | | 8.42 | |
Class C | | | 2.42 | % | | | 5.00 | % | | | 1,000.00 | | | | 1,012.90 | | | | 12.18 | |
Class H | | | 1.67 | % | | | 5.00 | % | | | 1,000.00 | | | | 1,016.65 | | | | 8.42 | |
Energy Services Fund | | | | | | | | | | | | | | | | | | | | |
Investor Class | | | 1.44 | % | | | 5.00 | % | | | 1,000.00 | | | | 1,017.80 | | | | 7.26 | |
Class A | | | 1.67 | % | | | 5.00 | % | | | 1,000.00 | | | | 1,016.65 | | | | 8.42 | |
Class C | | | 2.42 | % | | | 5.00 | % | | | 1,000.00 | | | | 1,012.90 | | | | 12.18 | |
Class H | | | 1.67 | % | | | 5.00 | % | | | 1,000.00 | | | | 1,016.65 | | | | 8.42 | |
Financial Services Fund | | | | | | | | | | | | | | | | | | | | |
Investor Class | | | 1.39 | % | | | 5.00 | % | | | 1,000.00 | | | | 1,018.05 | | | | 7.01 | |
Class A | | | 1.66 | % | | | 5.00 | % | | | 1,000.00 | | | | 1,016.70 | | | | 8.37 | |
Class C | | | 2.42 | % | | | 5.00 | % | | | 1,000.00 | | | | 1,012.90 | | | | 12.18 | |
Class H | | | 1.67 | % | | | 5.00 | % | | | 1,000.00 | | | | 1,016.65 | | | | 8.42 | |
Health Care Fund | | | | | | | | | | | | | | | | | | | | |
Investor Class | | | 1.41 | % | | | 5.00 | % | | | 1,000.00 | | | | 1,017.95 | | | | 7.11 | |
Class A | | | 1.67 | % | | | 5.00 | % | | | 1,000.00 | | | | 1,016.65 | | | | 8.42 | |
Class C | | | 2.42 | % | | | 5.00 | % | | | 1,000.00 | | | | 1,012.90 | | | | 12.18 | |
Class H | | | 1.66 | % | | | 5.00 | % | | | 1,000.00 | | | | 1,016.70 | | | | 8.37 | |
8 | THE RYDEX FUNDS ANNUAL REPORT | |
ABOUT SHAREHOLDERS’ FUND EXPENSES (Unaudited)(concluded) | |
| | Expense
Ratio1 | | | Fund
Return | | | Beginning
Account Value
September 30, 2023 | | | Ending
Account Value
March 31, 2024 | | | Expenses
Paid During
Period2 | |
Internet Fund | | | | | | | | | | | | | | | | | | | | |
Investor Class | | | 1.39 | % | | | 5.00 | % | | $ | 1,000.00 | | | $ | 1,018.05 | | | $ | 7.01 | |
Class A | | | 1.67 | % | | | 5.00 | % | | | 1,000.00 | | | | 1,016.65 | | | | 8.42 | |
Class C | | | 2.41 | % | | | 5.00 | % | | | 1,000.00 | | | | 1,012.95 | | | | 12.13 | |
Class H | | | 1.67 | % | | | 5.00 | % | | | 1,000.00 | | | | 1,016.65 | | | | 8.42 | |
Leisure Fund | | | | | | | | | | | | | | | | | | | | |
Investor Class | | | 1.42 | % | | | 5.00 | % | | | 1,000.00 | | | | 1,017.90 | | | | 7.16 | |
Class A | | | 1.67 | % | | | 5.00 | % | | | 1,000.00 | | | | 1,016.65 | | | | 8.42 | |
Class C | | | 2.42 | % | | | 5.00 | % | | | 1,000.00 | | | | 1,012.90 | | | | 12.18 | |
Class H | | | 1.67 | % | | | 5.00 | % | | | 1,000.00 | | | | 1,016.65 | | | | 8.42 | |
Precious Metals Fund | | | | | | | | | | | | | | | | | | | | |
Investor Class | | | 1.32 | % | | | 5.00 | % | | | 1,000.00 | | | | 1,018.40 | | | | 6.66 | |
Class A | | | 1.57 | % | | | 5.00 | % | | | 1,000.00 | | | | 1,017.15 | | | | 7.92 | |
Class C | | | 2.32 | % | | | 5.00 | % | | | 1,000.00 | | | | 1,013.40 | | | | 11.68 | |
Class H | | | 1.57 | % | | | 5.00 | % | | | 1,000.00 | | | | 1,017.15 | | | | 7.92 | |
Real Estate Fund | | | | | | | | | | | | | | | | | | | | |
Class A | | | 1.68 | % | | | 5.00 | % | | | 1,000.00 | | | | 1,016.60 | | | | 8.47 | |
Class C | | | 2.43 | % | | | 5.00 | % | | | 1,000.00 | | | | 1,012.85 | | | | 12.23 | |
Class H | | | 1.68 | % | | | 5.00 | % | | | 1,000.00 | | | | 1,016.60 | | | | 8.47 | |
Retailing Fund | | | | | | | | | | | | | | | | | | | | |
Investor Class | | | 1.42 | % | | | 5.00 | % | | | 1,000.00 | | | | 1,017.90 | | | | 7.16 | |
Class A | | | 1.67 | % | | | 5.00 | % | | | 1,000.00 | | | | 1,016.65 | | | | 8.42 | |
Class C | | | 2.43 | % | | | 5.00 | % | | | 1,000.00 | | | | 1,012.85 | | | | 12.23 | |
Class H | | | 1.67 | % | | | 5.00 | % | | | 1,000.00 | | | | 1,016.65 | | | | 8.42 | |
Technology Fund | | | | | | | | | | | | | | | | | | | | |
Investor Class | | | 1.43 | % | | | 5.00 | % | | | 1,000.00 | | | | 1,017.85 | | | | 7.21 | |
Class A | | | 1.66 | % | | | 5.00 | % | | | 1,000.00 | | | | 1,016.70 | | | | 8.37 | |
Class C | | | 2.41 | % | | | 5.00 | % | | | 1,000.00 | | | | 1,012.95 | | | | 12.13 | |
Class H | | | 1.67 | % | | | 5.00 | % | | | 1,000.00 | | | | 1,016.65 | | | | 8.42 | |
Telecommunications Fund | | | | | | | | | | | | | | | | | | | | |
Investor Class | | | 1.42 | % | | | 5.00 | % | | | 1,000.00 | | | | 1,017.90 | | | | 7.16 | |
Class A | | | 1.70 | % | | | 5.00 | % | | | 1,000.00 | | | | 1,016.50 | | | | 8.57 | |
Class C | | | 2.44 | % | | | 5.00 | % | | | 1,000.00 | | | | 1,012.80 | | | | 12.28 | |
Class H | | | 1.70 | % | | | 5.00 | % | | | 1,000.00 | | | | 1,016.50 | | | | 8.57 | |
Transportation Fund | | | | | | | | | | | | | | | | | | | | |
Investor Class | | | 1.43 | % | | | 5.00 | % | | | 1,000.00 | | | | 1,017.85 | | | | 7.21 | |
Class A | | | 1.67 | % | | | 5.00 | % | | | 1,000.00 | | | | 1,016.65 | | | | 8.42 | |
Class C | | | 2.42 | % | | | 5.00 | % | | | 1,000.00 | | | | 1,012.90 | | | | 12.18 | |
Class H | | | 1.67 | % | | | 5.00 | % | | | 1,000.00 | | | | 1,016.65 | | | | 8.42 | |
Utilities Fund | | | | | | | | | | | | | | | | | | | | |
Investor Class | | | 1.41 | % | | | 5.00 | % | | | 1,000.00 | | | | 1,017.95 | | | | 7.11 | |
Class A | | | 1.67 | % | | | 5.00 | % | | | 1,000.00 | | | | 1,016.65 | | | | 8.42 | |
Class C | | | 2.43 | % | | | 5.00 | % | | | 1,000.00 | | | | 1,012.85 | | | | 12.23 | |
Class H | | | 1.67 | % | | | 5.00 | % | | | 1,000.00 | | | | 1,016.65 | | | | 8.42 | |
1 | Annualized and excludes expense of the underlying funds in which the Funds invest, if any. |
2 | Expenses are equal to the Fund’s annualized expense ratio, net of any applicable fee waivers, multiplied by the average account value over the period, multiplied by 183/366 (to reflect the one-half year period). |
3 | Actual cumulative return at net asset value for the period September 30, 2023 to March 31, 2024. |
| | THE RYDEX FUNDS ANNUAL REPORT | 9 |
PERFORMANCE REPORT AND FUND PROFILE (Unaudited) | March 31, 2024 |
BANKING FUND
OBJECTIVE: Seeks to provide capital appreciation by investing in companies that are involved in the banking sector, including commercial banks (and their holding companies) and savings and loan institutions (“Banking Companies”).
For the Reporting Period, Banking Fund Investor Class returned 26.99%, compared with the S&P 500 Index, which returned 29.88%. The S&P 500 Financials Index returned 33.55%.
The industries that contributed the most to performance were regional banks, diversified banks, and consumer finance. No industry detracted from performance.
The holdings that contributed the most to performance were Wells Fargo & Co., JPMorgan Chase & Co., and Nu Holdings, Limited/Cayman Islands – Class A. Those that detracted the most were First Republic Bank, New York Community Bancorp, Inc., and First Horizon Corp.
Performance displayed represents past performance, which is no guarantee of future results.
Holdings Diversification (Market Exposure as % of Net Assets)
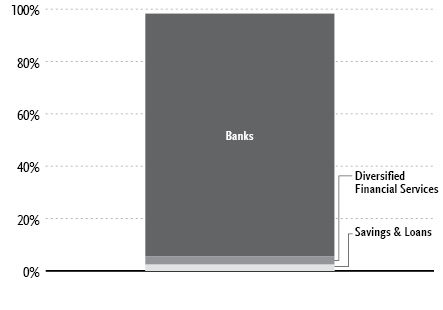
“Holdings Diversification (Market Exposure as % of Net Assets)” excludes any temporary cash investments.
Inception Dates: |
Investor Class | April 1, 1998 |
Class A | September 1, 2004 |
Class C | March 30, 2001 |
Class H | April 1, 1998 |
Ten Largest Holdings | % of Total Net Assets |
Citigroup, Inc. | 4.2% |
Bank of America Corp. | 4.1% |
JPMorgan Chase & Co. | 4.1% |
Wells Fargo & Co. | 3.9% |
U.S. Bancorp | 3.3% |
PNC Financial Services Group, Inc. | 3.3% |
Capital One Financial Corp. | 3.0% |
Truist Financial Corp. | 3.0% |
Bank of New York Mellon Corp. | 2.7% |
NU Holdings Limited/Cayman Islands — Class A | 2.1% |
Top Ten Total | 33.7% |
| | |
“Ten Largest Holdings” excludes any temporary cash investments. |
10 | THE RYDEX FUNDS ANNUAL REPORT | |
PERFORMANCE REPORT AND FUND PROFILE (Unaudited)(concluded) | March 31, 2024 |
Cumulative Fund Performance*
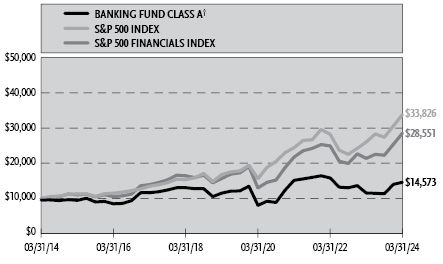
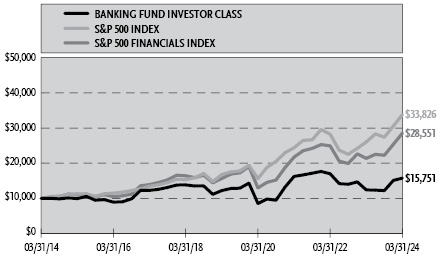
Average Annual Returns*
Periods Ended March 31, 2024
| 1 Year | 5 Year | 10 Year |
Investor Class Shares | 26.99% | 5.21% | 4.65% |
Class A Shares | 26.66% | 4.86% | 4.34% |
Class A Shares with sales charge† | 20.65% | 3.84% | 3.84% |
Class C Shares | 25.72% | 4.07% | 3.56% |
Class C Shares with CDSC‡ | 24.72% | 4.07% | 3.56% |
Class H Shares** | 26.66% | 4.86% | 4.32% |
S&P 500 Financials Index | 33.55% | 12.76% | 11.06% |
S&P 500 Index | 29.88% | 15.05% | 12.96% |
* | The performance data above represents past performance that is not predictive of future results. The investment return and principal value of an investment in the Fund will fluctuate so that an investor’s shares, when redeemed, may be worth more or less than their original cost. Returns are historical and include changes in principal and reinvested dividends and capital gains and do not reflect the effect of taxes. The S&P 500 Index and S&P 500 Financials Index are unmanaged indices and, unlike the Fund, have no management fees or operating expenses to reduce their reported returns. The graphs are based on Investor Class shares and Class A shares only; performance for Class C and Class H shares will vary due to differences in fee structures. |
** | Effective September 30, 2015, the Fund’s Advisor Class shares were converted into Class H shares |
† | Fund returns are calculated using the maximum sales charge of 4.75%. |
‡ | Fund returns include a CDSC of 1% if redeemed within 12 months of purchase. |
| | THE RYDEX FUNDS ANNUAL REPORT | 11 |
SCHEDULE OF INVESTMENTS | March 31, 2024 |
BANKING FUND | |
| | Shares | | | Value | |
COMMON STOCKS† - 98.3% |
| | | | | | | | | |
Banks - 92.8% |
Citigroup, Inc. | | | 17,631 | | | $ | 1,114,984 | |
Bank of America Corp. | | | 28,522 | | | | 1,081,554 | |
JPMorgan Chase & Co. | | | 5,399 | | | | 1,081,420 | |
Wells Fargo & Co. | | | 17,791 | | | | 1,031,166 | |
U.S. Bancorp | | | 19,794 | | | | 884,792 | |
PNC Financial Services Group, Inc. | | | 5,425 | | | | 876,680 | |
Truist Financial Corp. | | | 20,137 | | | | 784,940 | |
Bank of New York Mellon Corp. | | | 12,301 | | | | 708,784 | |
NU Holdings Limited/Cayman Islands — Class A* | | | 45,579 | | | | 543,757 | |
Fifth Third Bancorp | | | 14,349 | | | | 533,926 | |
M&T Bank Corp. | | | 3,573 | | | | 519,657 | |
State Street Corp. | | | 6,622 | | | | 512,013 | |
Huntington Bancshares, Inc. | | | 34,412 | | | | 480,047 | |
Regions Financial Corp. | | | 22,716 | | | | 477,945 | |
Northern Trust Corp. | | | 5,186 | | | | 461,139 | |
Citizens Financial Group, Inc. | | | 11,935 | | | | 433,121 | |
KeyCorp | | | 26,390 | | | | 417,226 | |
ICICI Bank Ltd. ADR | | | 15,195 | | | | 401,300 | |
Toronto-Dominion Bank | | | 6,540 | | | | 394,885 | |
HDFC Bank Ltd. ADR | | | 6,843 | | | | 383,003 | |
East West Bancorp, Inc. | | | 4,485 | | | | 354,808 | |
Webster Financial Corp. | | | 6,235 | | | | 316,551 | |
Bank of Nova Scotia | | | 6,111 | | | | 316,428 | |
Royal Bank of Canada | | | 3,123 | | | | 315,048 | |
First Horizon Corp. | | | 20,320 | | | | 312,928 | |
Comerica, Inc. | | | 5,300 | | | | 291,447 | |
Western Alliance Bancorporation | | | 4,421 | | | | 283,784 | |
Cullen/Frost Bankers, Inc. | | | 2,467 | | | | 277,710 | |
Wintrust Financial Corp. | | | 2,632 | | | | 274,754 | |
Zions Bancorp North America | | | 6,276 | | | | 272,378 | |
HSBC Holdings plc ADR1 | | | 6,845 | | | | 269,419 | |
Canadian Imperial Bank of Commerce | | | 5,295 | | | | 268,562 | |
Pinnacle Financial Partners, Inc. | | | 3,125 | | | | 268,375 | |
SouthState Corp. | | | 3,153 | | | | 268,100 | |
Popular, Inc. | | | 3,039 | | | | 267,706 | |
Commerce Bancshares, Inc. | | | 5,021 | | | | 267,117 | |
Prosperity Bancshares, Inc. | | | 3,964 | | | | 260,752 | |
Synovus Financial Corp. | | | 6,243 | | | | 250,095 | |
Bank of Montreal | | | 2,538 | | | | 247,912 | |
Cadence Bank | | | 8,476 | | | | 245,804 | |
UBS Group AG* | | | 7,951 | | | | 244,255 | |
Bank OZK | | | 5,323 | | | | 241,984 | |
Old National Bancorp | | | 13,891 | | | | 241,842 | |
FNB Corp. | | | 17,037 | | | | 240,222 | |
United Bankshares, Inc. | | | 6,502 | | | | 232,707 | |
Home BancShares, Inc. | | | 9,323 | | | | 229,066 | |
Hancock Whitney Corp. | | | 4,591 | | | | 211,370 | |
Columbia Banking System, Inc. | | | 10,865 | | | | 210,238 | |
First Financial Bankshares, Inc. | | | 6,383 | | | | 209,426 | |
Barclays plc ADR1 | | | 21,532 | | | | 203,477 | |
UMB Financial Corp. | | | 2,312 | | | | 201,121 | |
First Citizens BancShares, Inc. — Class A | | | 122 | | | | 199,470 | |
Associated Banc-Corp. | | | 8,908 | | | | 191,611 | |
Valley National Bancorp | | | 24,004 | | | | 191,072 | |
International Bancshares Corp. | | | 3,402 | | | | 190,988 | |
Ameris Bancorp | | | 3,913 | | | | 189,311 | |
United Community Banks, Inc. | | | 7,046 | | | | 185,451 | |
Texas Capital Bancshares, Inc.* | | | 2,925 | | | | 180,034 | |
First Hawaiian, Inc. | | | 8,159 | | | | 179,172 | |
Fulton Financial Corp. | | | 10,662 | | | | 169,419 | |
Cathay General Bancorp | | | 4,365 | | | | 165,128 | |
First Interstate BancSystem, Inc. — Class A | | | 6,065 | | | | 165,029 | |
Bank of Hawaii Corp. | | | 2,617 | | | | 163,275 | |
Simmons First National Corp. — Class A | | | 8,316 | | | | 161,829 | |
CVB Financial Corp. | | | 8,947 | | | | 159,615 | |
Eastern Bankshares, Inc. | | | 11,581 | | | | 159,586 | |
Banco Bradesco S.A. ADR | | | 54,454 | | | | 155,738 | |
BOK Financial Corp. | | | 1,687 | | | | 155,204 | |
Independent Bank Corp. | | | 2,978 | | | | 154,916 | |
Seacoast Banking Corporation of Florida | | | 6,042 | | | | 153,406 | |
Bancorp, Inc.* | | | 3,684 | | | | 123,267 | |
Total Banks | | | | | | | 24,611,246 | |
| | | | | | | | | |
Diversified Financial Services - 3.1% |
Capital One Financial Corp. | | | 5,415 | | | | 806,239 | |
| | | | | | | | | |
Savings & Loans - 2.4% |
WSFS Financial Corp. | | | 3,888 | | | | 175,504 | |
WaFd, Inc. | | | 5,641 | | | | 163,758 | |
Pacific Premier Bancorp, Inc. | | | 6,629 | | | | 159,096 | |
New York Community Bancorp, Inc.1 | | | 43,602 | | | | 140,399 | |
Total Savings & Loans | | | | | | | 638,757 | |
| | | | | | | | | |
Total Common Stocks | | | | |
(Cost $22,953,310) | | | | | | | 26,056,242 | |
| | | | | | | | | |
PREFERRED STOCKS† - 0.9% |
Financial - 0.9% |
Itau Unibanco Holding S.A. |
ADR | | | 37,412 | | | | 259,265 | |
| | | | | | | | | |
Total Preferred Stocks | | | | |
(Cost $231,059) | | | | | | | 259,265 | |
12 | THE RYDEX FUNDS ANNUAL REPORT | SEE NOTES TO FINANCIAL STATEMENTS. |
SCHEDULE OF INVESTMENTS (concluded) | March 31, 2024 |
BANKING FUND | |
| | Face
Amount | | | Value | |
REPURCHASE AGREEMENTS††,2 - 0.4% |
J.P. Morgan Securities LLC
issued 03/28/24 at 5.31%
due 04/01/24 | | $ | 55,472 | | | $ | 55,472 | |
BofA Securities, Inc.
issued 03/28/24 at 5.31%
due 04/01/24 | | | 21,335 | | | | 21,335 | |
Barclays Capital, Inc.
issued 03/28/24 at 5.30%
due 04/01/24 | | | 19,339 | | | | 19,339 | |
Total Repurchase Agreements | | | | |
(Cost $96,146) | | | | | | | 96,146 | |
| | Shares | | | | |
SECURITIES LENDING COLLATERAL†,3 - 1.8% |
Money Market Fund | | | | | | | | |
First American Government Obligations Fund - Class X, 5.23%4 | | | 473,691 | | | | 473,691 | |
Total Securities Lending Collateral | | | | |
(Cost $473,691) | | | | | | | 473,691 | |
| | | | | | | | | |
Total Investments - 101.4% | | | | |
(Cost $23,754,206) | | $ | 26,885,344 | |
Other Assets & Liabilities, net - (1.4)% | | | (375,494 | ) |
Total Net Assets - 100.0% | | $ | 26,509,850 | |
* | Non-income producing security. |
† | Value determined based on Level 1 inputs — See Note 4. |
†† | Value determined based on Level 2 inputs — See Note 4. |
1 | All or a portion of this security is on loan at March 31, 2024 — See Note 7. |
2 | Repurchase Agreements — See Note 6. |
3 | Securities lending collateral — See Note 7. |
4 | Rate indicated is the 7-day yield as of March 31, 2024. |
| | ADR — American Depositary Receipt |
| | plc — Public Limited Company |
| | |
| | See Sector Classification in Other Information section. |
The following table summarizes the inputs used to value the Fund’s investments at March 31, 2024 (See Note 4 in the Notes to Financial Statements):
Investments in Securities (Assets) | | Level 1
Quoted
Prices | | | Level 2
Significant
Observable
Inputs | | | Level 3
Significant
Unobservable
Inputs | | | Total | |
Common Stocks | | $ | 26,056,242 | | | $ | — | | | $ | — | | | $ | 26,056,242 | |
Preferred Stocks | | | 259,265 | | | | — | | | | — | | | | 259,265 | |
Repurchase Agreements | | | — | | | | 96,146 | | | | — | | | | 96,146 | |
Securities Lending Collateral | | | 473,691 | | | | — | | | | — | | | | 473,691 | |
Total Assets | | $ | 26,789,198 | | | $ | 96,146 | | | $ | — | | | $ | 26,885,344 | |
SEE NOTES TO FINANCIAL STATEMENTS. | THE RYDEX FUNDS ANNUAL REPORT | 13 |
STATEMENT OF ASSETS AND LIABILITIES |
March 31, 2024 |
Assets: |
Investments, at value - including $443,592 of securities loaned (cost $23,658,060) | | $ | 26,789,198 | |
Repurchase agreements, at value (cost $96,146) | | | 96,146 | |
Cash | | | 14,504 | |
Receivables: |
Dividends | | | 92,050 | |
Fund shares sold | | | 40,728 | |
Foreign tax reclaims | | | 1,060 | |
Securities lending income | | | 118 | |
Interest | | | 57 | |
Total assets | | | 27,033,861 | |
| | | | | |
Liabilities: |
Payable for: |
Return of securities lending collateral | | | 473,691 | |
Management fees | | | 19,611 | |
Transfer agent fees | | | 9,964 | |
Fund shares redeemed | | | 3,151 | |
Portfolio accounting and administration fees | | | 2,365 | |
Distribution and service fees | | | 869 | |
Trustees’ fees* | | | 182 | |
Miscellaneous | | | 14,178 | |
Total liabilities | | | 524,011 | |
Net assets | | $ | 26,509,850 | |
| | | | | |
Net assets consist of: |
Paid in capital | | $ | 34,679,808 | |
Total distributable earnings (loss) | | | (8,169,958 | ) |
Net assets | | $ | 26,509,850 | |
| | | | | |
Investor Class: |
Net assets | | $ | 23,499,447 | |
Capital shares outstanding | | | 266,631 | |
Net asset value per share | | $ | 88.13 | |
| | | | | |
Class A: |
Net assets | | $ | 2,465,068 | |
Capital shares outstanding | | | 31,615 | |
Net asset value per share | | $ | 77.97 | |
Maximum offering price per share (Net asset value divided by 95.25%) | | $ | 81.86 | |
| | | | | |
Class C: |
Net assets | | $ | 308,213 | |
Capital shares outstanding | | | 4,668 | |
Net asset value per share | | $ | 66.03 | |
| | | | | |
Class H: |
Net assets | | $ | 237,122 | |
Capital shares outstanding | | | 3,132 | |
Net asset value per share | | $ | 75.71 | |
STATEMENT OF OPERATIONS |
Year Ended March 31, 2024 |
Investment Income: |
Dividends (net of foreign withholding tax of $5,872) | | $ | 466,816 | |
Interest | | | 2,733 | |
Income from securities lending, net | | | 4,262 | |
Total investment income | | | 473,811 | |
| | | | | |
Expenses: |
Management fees | | | 104,166 | |
Distribution and service fees: |
Class A | | | 6,817 | |
Class C | | | 4,386 | |
Class H | | | 423 | |
Transfer agent fees | | | 26,685 | |
Portfolio accounting and administration fees | | | 18,684 | |
Professional fees | | | 8,318 | |
Custodian fees | | | 1,805 | |
Trustees’ fees* | | | 1,170 | |
Line of credit fees | | | 189 | |
Miscellaneous | | | 14,325 | |
Total expenses | | | 186,968 | |
Less: |
Expenses reimbursed by Adviser | | | (4,772 | ) |
Net expenses | | | 182,196 | |
Net investment income | | | 291,615 | |
| | | | | |
Net Realized and Unrealized Gain (Loss): |
Net realized gain (loss) on: |
Investments | | | 271,737 | |
Net realized gain | | | 271,737 | |
Net change in unrealized appreciation (depreciation) on: |
Investments | | | 2,440,315 | |
Net change in unrealized appreciation (depreciation) | | | 2,440,315 | |
Net realized and unrealized gain | | | 2,712,052 | |
Net increase in net assets resulting from operations | | $ | 3,003,667 | |
* | Relates to Trustees not deemed “interested persons” within the meaning of Section 2(a)(19) of the 1940 Act. |
14 | THE RYDEX FUNDS ANNUAL REPORT | SEE NOTES TO FINANCIAL STATEMENTS. |
STATEMENTS OF CHANGES IN NET ASSETS |
| | Year Ended
March 31,
2024 | | | Year Ended
March 31,
2023 | |
Increase (Decrease) in Net Assets from Operations: | | | | | | | | |
Net investment income | | $ | 291,615 | | | $ | 124,157 | |
Net realized gain on investments | | | 271,737 | | | | 1,142,823 | |
Net change in unrealized appreciation (depreciation) on investments | | | 2,440,315 | | | | (4,044,030 | ) |
Net increase (decrease) in net assets resulting from operations | | | 3,003,667 | | | | (2,777,050 | ) |
| | | | | | | | | |
Distributions to shareholders: | | | | | | | | |
Investor Class | | | (68,740 | ) | | | (141,982 | ) |
Class A | | | (46,546 | ) | | | (115,109 | ) |
Class C | | | (5,758 | ) | | | (38,799 | ) |
Class H | | | (3,113 | ) | | | (4,792 | ) |
Total distributions to shareholders | | | (124,157 | ) | | | (300,682 | ) |
| | | | | | | | | |
Capital share transactions: | | | | | | | | |
Proceeds from sale of shares | | | | | | | | |
Investor Class | | | 49,655,248 | | | | 37,557,660 | |
Class A | | | 3,251,051 | | | | 1,993,053 | |
Class C | | | 77,970 | | | | 389,919 | |
Class H | | | 417,622 | | | | 540,677 | |
Distributions reinvested | | | | | | | | |
Investor Class | | | 67,792 | | | | 140,351 | |
Class A | | | 46,127 | | | | 113,828 | |
Class C | | | 5,758 | | | | 38,698 | |
Class H | | | 3,067 | | | | 4,695 | |
Cost of shares redeemed | | | | | | | | |
Investor Class | | | (29,991,468 | ) | | | (39,145,083 | ) |
Class A | | | (4,243,656 | ) | | | (2,695,148 | ) |
Class C | | | (653,022 | ) | | | (1,161,889 | ) |
Class H | | | (324,799 | ) | | | (2,535,748 | ) |
Net increase (decrease) from capital share transactions | | | 18,311,690 | | | | (4,758,987 | ) |
Net increase (decrease) in net assets | | | 21,191,200 | | | | (7,836,719 | ) |
| | | | | | | | | |
Net assets: | | | | | | | | |
Beginning of year | | | 5,318,650 | | | | 13,155,369 | |
End of year | | $ | 26,509,850 | | | $ | 5,318,650 | |
| | | | | | | | | |
Capital share activity: | | | | | | | | |
Shares sold | | | | | | | | |
Investor Class | | | 632,229 | | | | 422,891 | |
Class A | | | 50,010 | | | | 26,938 | |
Class C | | | 1,375 | | | | 5,630 | |
Class H | | | 6,000 | | | | 7,214 | |
Shares issued from reinvestment of distributions | | | | | | | | |
Investor Class | | | 864 | | | | 1,726 | |
Class A | | | 664 | | | | 1,574 | |
Class C | | | 98 | | | | 624 | |
Class H | | | 45 | | | | 67 | |
Shares redeemed | | | | | | | | |
Investor Class | | | (388,185 | ) | | | (445,428 | ) |
Class A | | | (64,468 | ) | | | (34,617 | ) |
Class C | | | (12,251 | ) | | | (16,813 | ) |
Class H | | | (4,785 | ) | | | (32,132 | ) |
Net increase (decrease) in shares | | | 221,596 | | | | (62,326 | ) |
SEE NOTES TO FINANCIAL STATEMENTS. | THE RYDEX FUNDS ANNUAL REPORT | 15 |
This table is presented to show selected data for a share outstanding throughout each period and to assist shareholders in evaluating a Fund’s performance for the periods presented.
Investor Class | | Year Ended
March 31,
2024 | | | Year Ended
March 31,
2023 | | | Year Ended
March 31,
2022 | | | Year Ended
March 31,
2021 | | | Year Ended
March 31,
2020 | |
Per Share Data |
Net asset value, beginning of period | | $ | 70.50 | | | $ | 99.66 | | | $ | 95.71 | | | $ | 51.83 | | | $ | 74.58 | |
Income (loss) from investment operations: |
Net investment income (loss)a | | | 1.96 | | | | 1.43 | | | | 1.03 | | | | 1.25 | | | | 1.14 | |
Net gain (loss) on investments (realized and unrealized) | | | 16.90 | | | | (28.00 | ) | | | 3.42 | | | | 44.89 | | | | (23.38 | ) |
Total from investment operations | | | 18.86 | | | | (26.57 | ) | | | 4.45 | | | | 46.14 | | | | (22.24 | ) |
Less distributions from: |
Net investment income | | | (1.23 | ) | | | (2.59 | ) | | | (.50 | ) | | | (2.26 | ) | | | (.51 | ) |
Total distributions | | | (1.23 | ) | | | (2.59 | ) | | | (.50 | ) | | | (2.26 | ) | | | (.51 | ) |
Net asset value, end of period | | $ | 88.13 | | | $ | 70.50 | | | $ | 99.66 | | | $ | 95.71 | | | $ | 51.83 | |
|
Total Return | | | 26.99 | % | | | (27.01 | %) | | | 4.62 | % | | | 90.06 | % | | | (30.08 | %) |
Ratios/Supplemental Data |
Net assets, end of period (in thousands) | | $ | 23,499 | | | $ | 1,531 | | | $ | 4,239 | | | $ | 9,027 | | | $ | 17,507 | |
Ratios to average net assets: |
Net investment income (loss) | | | 2.46 | % | | | 1.62 | % | | | 1.02 | % | | | 1.79 | % | | | 1.47 | % |
Total expenses | | | 1.43 | % | | | 1.40 | % | | | 1.36 | % | | | 1.43 | % | | | 1.48 | % |
Net expensesb | | | 1.39 | % | | | 1.40 | % | | | 1.36 | % | | | 1.43 | % | | | 1.48 | % |
Portfolio turnover rate | | | 233 | % | | | 384 | % | | | 501 | % | | | 799 | % | | | 360 | % |
Class A | | Year Ended
March 31,
2024 | | | Year Ended
March 31,
2023 | | | Year Ended
March 31,
2022 | | | Year Ended
March 31,
2021 | | | Year Ended
March 31,
2020 | |
Per Share Data |
Net asset value, beginning of period | | $ | 62.66 | | | $ | 89.12 | | | $ | 85.85 | | | $ | 46.98 | | | $ | 67.81 | |
Income (loss) from investment operations: |
Net investment income (loss)a | | | 1.49 | | | | 1.08 | | | | .71 | | | | 1.02 | | | | .87 | |
Net gain (loss) on investments (realized and unrealized) | | | 15.05 | | | | (24.95 | ) | | | 3.06 | | | | 40.11 | | | | (21.19 | ) |
Total from investment operations | | | 16.54 | | | | (23.87 | ) | | | 3.77 | | | | 41.13 | | | | (20.32 | ) |
Less distributions from: |
Net investment income | | | (1.23 | ) | | | (2.59 | ) | | | (.50 | ) | | | (2.26 | ) | | | (.51 | ) |
Total distributions | | | (1.23 | ) | | | (2.59 | ) | | | (.50 | ) | | | (2.26 | ) | | | (.51 | ) |
Net asset value, end of period | | $ | 77.97 | | | $ | 62.66 | | | $ | 89.12 | | | $ | 85.85 | | | $ | 46.98 | |
|
Total Returnc | | | 26.66 | % | | | (27.18 | %) | | | 4.36 | % | | | 88.72 | % | | | (30.25 | %) |
Ratios/Supplemental Data |
Net assets, end of period (in thousands) | | $ | 2,465 | | | $ | 2,845 | | | $ | 4,591 | | | $ | 4,050 | | | $ | 2,789 | |
Ratios to average net assets: |
Net investment income (loss) | | | 2.25 | % | | | 1.38 | % | | | 0.77 | % | | | 1.67 | % | | | 1.23 | % |
Total expenses | | | 1.69 | % | | | 1.65 | % | | | 1.61 | % | | | 1.69 | % | | | 1.73 | % |
Net expensesb | | | 1.65 | % | | | 1.65 | % | | | 1.61 | % | | | 1.69 | % | | | 1.73 | % |
Portfolio turnover rate | | | 233 | % | | | 384 | % | | | 501 | % | | | 799 | % | | | 360 | % |
16 | THE RYDEX FUNDS ANNUAL REPORT | SEE NOTES TO FINANCIAL STATEMENTS. |
FINANCIAL HIGHLIGHTS (concluded) |
This table is presented to show selected data for a share outstanding throughout each period and to assist shareholders in evaluating a Fund’s performance for the periods presented.
Class C | | Year Ended
March 31,
2024 | | | Year Ended
March 31,
2023 | | | Year Ended
March 31,
2022 | | | Year Ended
March 31,
2021 | | | Year Ended
March 31,
2020 | |
Per Share Data |
Net asset value, beginning of period | | $ | 53.62 | | | $ | 77.28 | | | $ | 75.07 | | | $ | 41.57 | | | $ | 60.51 | |
Income (loss) from investment operations: |
Net investment income (loss)a | | | .85 | | | | .41 | | | | .03 | | | | .49 | | | | .31 | |
Net gain (loss) on investments (realized and unrealized) | | | 12.79 | | | | (21.48 | ) | | | 2.68 | | | | 35.27 | | | | (18.74 | ) |
Total from investment operations | | | 13.64 | | | | (21.07 | ) | | | 2.71 | | | | 35.76 | | | | (18.43 | ) |
Less distributions from: |
Net investment income | | | (1.23 | ) | | | (2.59 | ) | | | (.50 | ) | | | (2.26 | ) | | | (.51 | ) |
Total distributions | | | (1.23 | ) | | | (2.59 | ) | | | (.50 | ) | | | (2.26 | ) | | | (.51 | ) |
Net asset value, end of period | | $ | 66.03 | | | $ | 53.62 | | | $ | 77.28 | | | $ | 75.07 | | | $ | 41.57 | |
|
Total Returnc | | | 25.72 | % | | | (27.73 | %) | | | 3.58 | % | | | 87.34 | % | | | (30.78 | %) |
Ratios/Supplemental Data |
Net assets, end of period (in thousands) | | $ | 308 | | | $ | 828 | | | $ | 2,010 | | | $ | 892 | | | $ | 764 | |
Ratios to average net assets: |
Net investment income (loss) | | | 1.54 | % | | | 0.61 | % | | | 0.03 | % | | | 0.93 | % | | | 0.49 | % |
Total expenses | | | 2.43 | % | | | 2.40 | % | | | 2.36 | % | | | 2.45 | % | | | 2.48 | % |
Net expensesb | | | 2.41 | % | | | 2.40 | % | | | 2.36 | % | | | 2.45 | % | | | 2.48 | % |
Portfolio turnover rate | | | 233 | % | | | 384 | % | | | 501 | % | | | 799 | % | | | 360 | % |
Class H | | Year Ended
March 31,
2024 | | | Year Ended
March 31,
2023 | | | Year Ended
March 31,
2022 | | | Year Ended
March 31,
2021 | | | Year Ended
March 31,
2020 | |
Per Share Data |
Net asset value, beginning of period | | $ | 60.85 | | | $ | 86.66 | | | $ | 83.48 | | | $ | 45.73 | | | $ | 66.00 | |
Income (loss) from investment operations: |
Net investment income (loss)a | | | 1.47 | | | | .91 | | | | .63 | | | | .85 | | | | .74 | |
Net gain (loss) on investments (realized and unrealized) | | | 14.62 | | | | (24.13 | ) | | | 3.05 | | | | 39.16 | | | | (20.50 | ) |
Total from investment operations | | | 16.09 | | | | (23.22 | ) | | | 3.68 | | | | 40.01 | | | | (19.76 | ) |
Less distributions from: |
Net investment income | | | (1.23 | ) | | | (2.59 | ) | | | (.50 | ) | | | (2.26 | ) | | | (.51 | ) |
Total distributions | | | (1.23 | ) | | | (2.59 | ) | | | (.50 | ) | | | (2.26 | ) | | | (.51 | ) |
Net asset value, end of period | | $ | 75.71 | | | $ | 60.85 | | | $ | 86.66 | | | $ | 83.48 | | | $ | 45.73 | |
|
Total Return | | | 26.66 | % | | | (27.18 | %) | | | 4.38 | % | | | 88.66 | % | | | (30.24 | %) |
Ratios/Supplemental Data |
Net assets, end of period (in thousands) | | $ | 237 | | | $ | 114 | | | $ | 2,316 | | | $ | 4,601 | | | $ | 162 | |
Ratios to average net assets: |
Net investment income (loss) | | | 2.23 | % | | | 1.16 | % | | | 0.71 | % | | | 1.15 | % | | | 1.02 | % |
Total expenses | | | 1.69 | % | | | 1.65 | % | | | 1.60 | % | | | 1.63 | % | | | 1.74 | % |
Net expensesb | | | 1.65 | % | | | 1.65 | % | | | 1.60 | % | | | 1.63 | % | | | 1.74 | % |
Portfolio turnover rate | | | 233 | % | | | 384 | % | | | 501 | % | | | 799 | % | | | 360 | % |
a | Net investment income (loss) per share was computed using average shares outstanding throughout the period. |
b | Net expense information reflects the expense ratios after expense waivers and reimbursements, as applicable. |
c | Total return does not reflect the impact of any applicable sales charges. |
SEE NOTES TO FINANCIAL STATEMENTS. | THE RYDEX FUNDS ANNUAL REPORT | 17 |
PERFORMANCE REPORT AND FUND PROFILE (Unaudited) | March 31, 2024 |
BASIC MATERIALS FUND
OBJECTIVE: Seeks to provide capital appreciation by investing in companies engaged in the mining, manufacture, or sale of basic materials, such as lumber, steel, iron, aluminum, concrete, chemicals, and other basic building and manufacturing materials (“Basic Materials Companies”).
For the Reporting Period, Basic Materials Fund Investor Class returned 9.55%, compared with the S&P 500 Index, which returned 29.88%. The S&P 500 Materials Index returned 17.57%.
The industries that contributed the most to performance were construction materials, specialty chemicals, and steel. Those that detracted the most were fertilizers & agricultural chemicals, diversified metals & mining, and gold.
The holdings that contributed the most to performance were Linde Plc, Sherwin-Williams Co., and Martin Marietta Materials, Inc. Those that detracted the most were Albemarle Corp., FMC Corp., and Newmont Corp.
Performance displayed represents past performance, which is no guarantee of future results.
Holdings Diversification (Market Exposure as % of Net Assets)
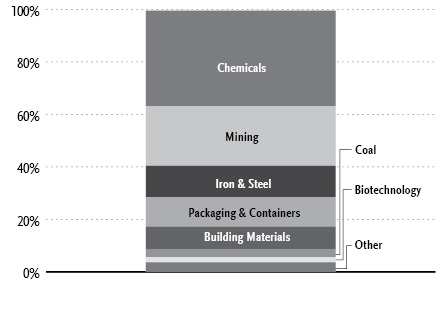
“Holdings Diversification (Market Exposure as % of Net Assets)” excludes any temporary cash investments.
Inception Dates: |
Investor Class | April 1, 1998 |
Class A | September 1, 2004 |
Class C | May 3, 2001 |
Class H | April 14, 1998 |
Ten Largest Holdings | % of Total Net Assets |
Linde plc | 4.6% |
Sherwin-Williams Co. | 2.8% |
Freeport-McMoRan, Inc. | 2.7% |
Ecolab, Inc. | 2.4% |
Air Products and Chemicals, Inc. | 2.3% |
Nucor Corp. | 2.2% |
Newmont Corp. | 2.1% |
Dow, Inc. | 2.0% |
Corteva, Inc. | 2.0% |
Martin Marietta Materials, Inc. | 1.9% |
Top Ten Total | 25.0% |
| | |
“Ten Largest Holdings” excludes any temporary cash investments. |
18 | THE RYDEX FUNDS ANNUAL REPORT | |
PERFORMANCE REPORT AND FUND PROFILE (Unaudited)(concluded) | March 31, 2024 |
Cumulative Fund Performance*
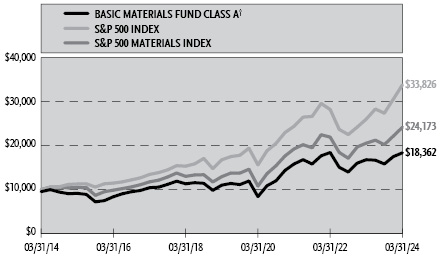
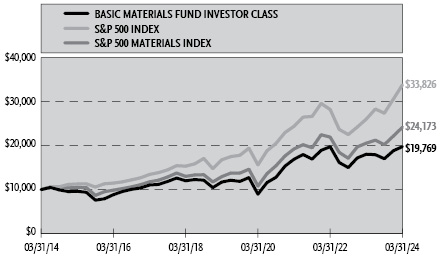
Average Annual Returns*
Periods Ended March 31, 2024
| 1 Year | 5 Year | 10 Year |
Investor Class Class Shares | 9.55% | 11.03% | 7.05% |
Class A Shares | 9.29% | 10.76% | 6.78% |
Class A Shares with sales charge† | 4.11% | 9.68% | 6.27% |
Class C Shares | 8.47% | 9.93% | 5.99% |
Class C Shares with CDSC‡ | 7.47% | 9.93% | 5.99% |
Class H Shares** | 9.29% | 10.75% | 6.75% |
S&P 500 Materials Index | 17.57% | 13.30% | 9.23% |
S&P 500 Index | 29.88% | 15.05% | 12.96% |
* | The performance data above represents past performance that is not predictive of future results. The investment return and principal value of an investment in the Fund will fluctuate so that an investor’s shares, when redeemed, may be worth more or less than their original cost. Returns are historical and include changes in principal and reinvested dividends and capital gains and do not reflect the effect of taxes. The S&P 500 Index and the S&P 500 Materials Index are unmanaged indices and, unlike the Fund, have no management fees or operating expenses to reduce their reported returns. The graphs are based on Investor Class share and Class A shares only; performance for Class C shares and Class H shares will vary due to differences in fee structures. |
** | Effective September 30, 2015, the Fund’s Advisor Class shares were converted into Class H shares. |
† | Fund returns are calculated using the maximum sales charge of 4.75%. |
‡ | Fund returns include a CDSC of 1% if redeemed within 12 months of purchase. |
| | THE RYDEX FUNDS ANNUAL REPORT | 19 |
SCHEDULE OF INVESTMENTS | March 31, 2024 |
BASIC MATERIALS FUND | |
| | Shares | | | Value | |
COMMON STOCKS† - 99.4% |
| | | | | | | | | |
Chemicals - 36.4% |
Linde plc | | | 2,929 | | | $ | 1,359,993 | |
Sherwin-Williams Co. | | | 2,348 | | | | 815,531 | |
Ecolab, Inc. | | | 3,057 | | | | 705,861 | |
Air Products and Chemicals, Inc. | | | 2,724 | | | | 659,943 | |
Dow, Inc. | | | 10,142 | | | | 587,526 | |
PPG Industries, Inc. | | | 3,722 | | | | 539,318 | |
DuPont de Nemours, Inc. | | | 6,496 | | | | 498,048 | |
LyondellBasell Industries N.V. — Class A | | | 4,663 | | | | 476,932 | |
International Flavors & Fragrances, Inc. | | | 5,098 | | | | 438,377 | |
Celanese Corp. — Class A | | | 2,365 | | | | 406,449 | |
Albemarle Corp. | | | 2,772 | | | | 365,183 | |
CF Industries Holdings, Inc. | | | 4,260 | | | | 354,475 | |
RPM International, Inc. | | | 2,971 | | | | 353,400 | |
Nutrien Ltd. | | | 6,205 | | | | 336,994 | |
Eastman Chemical Co. | | | 3,273 | | | | 328,020 | |
Mosaic Co. | | | 9,010 | | | | 292,465 | |
Axalta Coating Systems Ltd.* | | | 7,382 | | | | 253,867 | |
FMC Corp. | | | 3,985 | | | | 253,845 | |
Olin Corp. | | | 4,150 | | | | 244,020 | |
Arcadium Lithium plc* | | | 53,114 | | | | 228,921 | |
Westlake Corp. | | | 1,435 | | | | 219,268 | |
Element Solutions, Inc. | | | 8,707 | | | | 217,501 | |
Ashland, Inc. | | | 1,981 | | | | 192,890 | |
Huntsman Corp. | | | 7,211 | | | | 187,702 | |
Balchem Corp. | | | 1,138 | | | | 176,333 | |
Chemours Co. | | | 6,454 | | | | 169,482 | |
Total Chemicals | | | | | | | 10,662,344 | |
| | | | | | | | | |
Mining - 22.7% |
Freeport-McMoRan, Inc. | | | 16,890 | | | | 794,168 | |
Newmont Corp. | | | 16,885 | | | | 605,158 | |
Barrick Gold Corp. | | | 28,545 | | | | 474,989 | |
Agnico Eagle Mines Ltd. | | | 6,614 | | | | 394,525 | |
Rio Tinto plc ADR | | | 5,756 | | | | 366,887 | |
BHP Group Ltd. ADR1 | | | 6,205 | | | | 357,966 | |
Wheaton Precious Metals Corp. | | | 7,197 | | | | 339,195 | |
Kinross Gold Corp. | | | 51,312 | | | | 314,543 | |
Franco-Nevada Corp. | | | 2,601 | | | | 309,935 | |
Southern Copper Corp. | | | 2,842 | | | | 302,730 | |
Pan American Silver Corp. | | | 19,760 | | | | 297,981 | |
Gold Fields Ltd. ADR | | | 18,378 | | | | 292,026 | |
Alamos Gold, Inc. — Class A | | | 19,379 | | | | 285,840 | |
Anglogold Ashanti plc1 | | | 12,387 | | | | 274,991 | |
Royal Gold, Inc. | | | 2,200 | | | | 267,982 | |
Alcoa Corp. | | | 6,886 | | | | 232,678 | |
Sigma Lithium Corp.*,1 | | | 15,422 | | | | 199,869 | |
B2Gold Corp. | | | 72,167 | | | | 188,356 | |
Hecla Mining Co. | | | 33,797 | | | | 162,564 | |
MP Materials Corp.* | | | 8,615 | | | | 123,195 | |
SSR Mining, Inc. | | | 19,000 | | | | 84,740 | |
Total Mining | | | | | | | 6,670,318 | |
| | | | | | | | | |
Iron & Steel - 11.9% |
Nucor Corp. | | | 3,254 | | | | 643,967 | |
Steel Dynamics, Inc. | | | 3,035 | | | | 449,878 | |
Vale S.A. ADR | | | 34,408 | | | | 419,434 | |
Reliance, Inc. | | | 1,222 | | | | 408,368 | |
Cleveland-Cliffs, Inc.* | | | 13,634 | | | | 310,037 | |
ArcelorMittal S.A.1 | | | 10,492 | | | | 289,369 | |
Gerdau S.A. ADR | | | 58,044 | | | | 256,555 | |
Commercial Metals Co. | | | 4,184 | | | | 245,894 | |
United States Steel Corp. | | | 5,922 | | | | 241,499 | |
ATI, Inc.* | | | 4,520 | | | | 231,288 | |
Total Iron & Steel | | | | | | | 3,496,289 | |
| | | | | | | | | |
Packaging & Containers - 11.3% |
Ball Corp. | | | 6,322 | | | | 425,850 | |
Packaging Corporation of America | | | 1,987 | | | | 377,093 | |
Westrock Co. | | | 6,793 | | | | 335,914 | |
Amcor plc | | | 33,607 | | | | 319,602 | |
Crown Holdings, Inc. | | | 3,565 | | | | 282,562 | |
Graphic Packaging Holding Co. | | | 9,632 | | | | 281,062 | |
AptarGroup, Inc. | | | 1,931 | | | | 277,852 | |
Berry Global Group, Inc. | | | 3,971 | | | | 240,166 | |
Sonoco Products Co. | | | 3,738 | | | | 216,206 | |
Sealed Air Corp. | | | 5,767 | | | | 214,532 | |
Silgan Holdings, Inc. | | | 3,935 | | | | 191,084 | |
O-I Glass, Inc.* | | | 8,500 | | | | 141,015 | |
Total Packaging & Containers | | | | | | | 3,302,938 | |
| | | | | | | | | |
Building Materials - 8.7% |
Martin Marietta Materials, Inc. | | | 911 | | | | 559,299 | |
Vulcan Materials Co. | | | 1,981 | | | | 540,654 | |
CRH plc* | | | 5,058 | | | | 436,303 | |
Cemex SAB de CV ADR* | | | 34,405 | | | | 309,989 | |
Eagle Materials, Inc. | | | 1,028 | | | | 279,359 | |
Louisiana-Pacific Corp. | | | 2,626 | | | | 220,348 | |
Summit Materials, Inc. — Class A* | | | 4,784 | | | | 213,223 | |
Total Building Materials | | | | | | | 2,559,175 | |
| | | | | | | | | |
Coal - 2.8% |
Teck Resources Ltd. — Class B | | | 8,833 | | | | 404,375 | |
Warrior Met Coal, Inc. | | | 2,606 | | | | 158,184 | |
Arch Resources, Inc. | | | 888 | | | | 142,782 | |
Alpha Metallurgical Resources, Inc. | | | 305 | | | | 101,007 | |
Total Coal | | | | | | | 806,348 | |
| | | | | | | | | |
Biotechnology - 2.0% |
Corteva, Inc. | | | 10,159 | | | | 585,870 | |
| | | | | | | | | |
Household Products & Housewares - 1.3% |
Avery Dennison Corp. | | | 1,749 | | | | 390,464 | |
| | | | | | | | | |
Forest Products & Paper - 1.2% |
International Paper Co. | | | 8,917 | | | | 347,941 | |
| | | | | | | | | |
Housewares - 0.6% |
Scotts Miracle-Gro Co. — Class A | | | 2,332 | | | | 173,944 | |
| | | | | | | | | |
20 | THE RYDEX FUNDS ANNUAL REPORT | SEE NOTES TO FINANCIAL STATEMENTS. |
SCHEDULE OF INVESTMENTS (concluded) | March 31, 2024 |
BASIC MATERIALS FUND | |
| | Shares | | | Value | |
Environmental Control - 0.3% |
PureCycle Technologies, Inc.*,1 | | | 15,083 | | | $ | 93,816 | |
| | | | | | | | | |
Healthcare-Services - 0.2% |
Ginkgo Bioworks Holdings, Inc.*,1 | | | 44,640 | | | | 51,782 | |
| | | | | | | | | |
Total Common Stocks | | | | |
(Cost $17,066,472) | | | | | | | 29,141,229 | |
| | | | | | | | | |
| | | Face
Amount | | | | | |
REPURCHASE AGREEMENTS††,2 - 0.6% |
J.P. Morgan Securities LLC
issued 03/28/24 at 5.31%
due 04/01/24 | | $ | 100,148 | | | | 100,148 | |
BofA Securities, Inc.
issued 03/28/24 at 5.31%
due 04/01/24 | | | 38,518 | | | | 38,518 | |
Barclays Capital, Inc.
issued 03/28/24 at 5.30%
due 04/01/24 | | | 34,914 | | | | 34,914 | |
Total Repurchase Agreements | | | | |
(Cost $173,580) | | | | | | | 173,580 | |
SECURITIES LENDING COLLATERAL†,3 - 2.9% |
Money Market Fund | | | | | | | | |
First American Government Obligations Fund - Class X, 5.23%4 | | | 862,835 | | | | 862,835 | |
Total Securities Lending Collateral | | | | |
(Cost $862,835) | | | | | | | 862,835 | |
| | | | | | | | | |
Total Investments - 102.9% | | | | |
(Cost $18,102,887) | | $ | 30,177,644 | |
Other Assets & Liabilities, net - (2.9)% | | | (856,664 | ) |
Total Net Assets - 100.0% | | $ | 29,320,980 | |
* | Non-income producing security. |
† | Value determined based on Level 1 inputs — See Note 4. |
†† | Value determined based on Level 2 inputs — See Note 4. |
1 | All or a portion of this security is on loan at March 31, 2024 — See Note 7. |
2 | Repurchase Agreements — See Note 6. |
3 | Securities lending collateral — See Note 7. |
4 | Rate indicated is the 7-day yield as of March 31, 2024. |
| | ADR — American Depositary Receipt |
| | plc — Public Limited Company |
| | |
| | See Sector Classification in Other Information section. |
The following table summarizes the inputs used to value the Fund’s investments at March 31, 2024 (See Note 4 in the Notes to Financial Statements):
Investments in Securities (Assets) | | Level 1
Quoted
Prices | | | Level 2
Significant
Observable
Inputs | | | Level 3
Significant
Unobservable
Inputs | | | Total | |
Common Stocks | | $ | 29,141,229 | | | $ | — | | | $ | — | | | $ | 29,141,229 | |
Repurchase Agreements | | | — | | | | 173,580 | | | | — | | | | 173,580 | |
Securities Lending Collateral | | | 862,835 | | | | — | | | | — | | | | 862,835 | |
Total Assets | | $ | 30,004,064 | | | $ | 173,580 | | | $ | — | | | $ | 30,177,644 | |
SEE NOTES TO FINANCIAL STATEMENTS. | THE RYDEX FUNDS ANNUAL REPORT | 21 |
STATEMENT OF ASSETS AND LIABILITIES |
March 31, 2024 |
Assets: |
Investments, at value - including $821,007 of securities loaned (cost $17,929,307) | | $ | 30,004,064 | |
Repurchase agreements, at value (cost $173,580) | | | 173,580 | |
Cash | | | 18,625 | |
Receivables: |
Dividends | | | 41,364 | |
Fund shares sold | | | 14,727 | |
Securities lending income | | | 1,279 | |
Foreign tax reclaims | | | 439 | |
Interest | | | 103 | |
Total assets | | | 30,254,181 | |
| | | | | |
Liabilities: |
Payable for: |
Return of securities lending collateral | | | 862,835 | |
Management fees | | | 20,735 | |
Transfer agent fees | | | 11,775 | |
Fund shares redeemed | | | 10,056 | |
Distribution and service fees | | | 3,097 | |
Portfolio accounting and administration fees | | | 2,500 | |
Trustees’ fees* | | | 281 | |
Miscellaneous | | | 21,922 | |
Total liabilities | | | 933,201 | |
Net assets | | $ | 29,320,980 | |
| | | | | |
Net assets consist of: |
Paid in capital | | $ | 19,721,716 | |
Total distributable earnings (loss) | | | 9,599,264 | |
Net assets | | $ | 29,320,980 | |
| | | | | |
Investor Class: |
Net assets | | $ | 19,369,029 | |
Capital shares outstanding | | | 224,176 | |
Net asset value per share | | $ | 86.40 | |
| | | | | |
Class A: |
Net assets | | $ | 7,227,573 | |
Capital shares outstanding | | | 91,504 | |
Net asset value per share | | $ | 78.99 | |
Maximum offering price per share (Net asset value divided by 95.25%) | | $ | 82.93 | |
| | | | | |
Class C: |
Net assets | | $ | 1,694,836 | |
Capital shares outstanding | | | 25,916 | |
Net asset value per share | | $ | 65.40 | |
| | | | | |
Class H: |
Net assets | | $ | 1,029,542 | |
Capital shares outstanding | | | 13,511 | |
Net asset value per share | | $ | 76.20 | |
STATEMENT OF OPERATIONS |
Year Ended March 31, 2024 |
Investment Income: |
Dividends (net of foreign withholding tax of $13,790) | | $ | 673,739 | |
Interest | | | 12,187 | |
Income from securities lending, net | | | 10,137 | |
Total investment income | | | 696,063 | |
| | | | | |
Expenses: |
Management fees | | | 262,786 | |
Distribution and service fees: |
Class A | | | 17,413 | |
Class C | | | 21,805 | |
Class H | | | 2,992 | |
Transfer agent fees | | | 67,590 | |
Portfolio accounting and administration fees | | | 47,126 | |
Registration fees | | | 32,613 | |
Professional fees | | | 13,598 | |
Trustees’ fees* | | | 5,794 | |
Custodian fees | | | 4,435 | |
Line of credit fees | | | 35 | |
Miscellaneous | | | 8,830 | |
Total expenses | | | 485,017 | |
Less: |
Expenses reimbursed by Adviser | | | (9,931 | ) |
Net expenses | | | 475,086 | |
Net investment income | | | 220,977 | |
| | | | | |
Net Realized and Unrealized Gain (Loss): |
Net realized gain (loss) on: |
Investments** | | | 3,098,421 | |
Net realized gain | | | 3,098,421 | |
Net change in unrealized appreciation (depreciation) on: |
Investments | | | (1,001,241 | ) |
Net change in unrealized appreciation (depreciation) | | | (1,001,241 | ) |
Net realized and unrealized gain | | | 2,097,180 | |
Net increase in net assets resulting from operations | | $ | 2,318,157 | |
* | Relates to Trustees not deemed “interested persons” within the meaning of Section 2(a)(19) of the 1940 Act. |
** | Includes $130,382 of realized gains from the expiration of deferred foreign tax liabilities on capital gains from sales of Peruvian securities prior to 2018. See Note 1(c) in the Notes to Financial Statements. |
22 | THE RYDEX FUNDS ANNUAL REPORT | SEE NOTES TO FINANCIAL STATEMENTS. |
STATEMENTS OF CHANGES IN NET ASSETS |
| | Year Ended
March 31,
2024 | | | Year Ended
March 31,
2023 | |
Increase (Decrease) in Net Assets from Operations: | | | | | | | | |
Net investment income | | $ | 220,977 | | | $ | 394,270 | |
Net realized gain on investments | | | 3,098,421 | | | | 999,821 | |
Net change in unrealized appreciation (depreciation) on investments | | | (1,001,241 | ) | | | (10,382,838 | ) |
Net increase (decrease) in net assets resulting from operations | | | 2,318,157 | | | | (8,988,747 | ) |
| | | | | | | | | |
Distributions to shareholders: | | | | | | | | |
Investor Class | | | (430,177 | ) | | | (383,064 | ) |
Class A | | | (163,593 | ) | | | (129,402 | ) |
Class C | | | (58,233 | ) | | | (58,507 | ) |
Class H | | | (29,080 | ) | | | (72,279 | ) |
Total distributions to shareholders | | | (681,083 | ) | | | (643,252 | ) |
| | | | | | | | | |
Capital share transactions: | | | | | | | | |
Proceeds from sale of shares | | | | | | | | |
Investor Class | | | 15,390,212 | | | | 49,912,072 | |
Class A | | | 1,725,949 | | | | 2,856,561 | |
Class C | | | 348,442 | | | | 1,128,838 | |
Class H | | | 68,201 | | | | 5,008,351 | |
Distributions reinvested | | | | | | | | |
Investor Class | | | 417,109 | | | | 372,564 | |
Class A | | | 159,729 | | | | 123,203 | |
Class C | | | 57,991 | | | | 58,257 | |
Class H | | | 28,998 | | | | 72,218 | |
Cost of shares redeemed | | | | | | | | |
Investor Class | | | (20,690,843 | ) | | | (70,700,665 | ) |
Class A | | | (2,660,085 | ) | | | (2,088,268 | ) |
Class C | | | (1,389,009 | ) | | | (1,903,212 | ) |
Class H | | | (690,092 | ) | | | (13,113,466 | ) |
Net decrease from capital share transactions | | | (7,233,398 | ) | | | (28,273,547 | ) |
Net decrease in net assets | | | (5,596,324 | ) | | | (37,905,546 | ) |
| | | | | | | | | |
Net assets: | | | | | | | | |
Beginning of year | | | 34,917,304 | | | | 72,822,850 | |
End of year | | $ | 29,320,980 | | | $ | 34,917,304 | |
| | | | | | | | | |
Capital share activity: | | | | | | | | |
Shares sold | | | | | | | | |
Investor Class | | | 192,395 | | | | 592,203 | |
Class A | | | 23,750 | | | | 38,096 | |
Class C | | | 5,700 | | | | 17,926 | |
Class H | | | 972 | | | | 68,572 | |
Shares issued from reinvestment of distributions | | | | | | | | |
Investor Class | | | 5,424 | | | | 4,847 | |
Class A | | | 2,270 | | | | 1,744 | |
Class C | | | 993 | | | | 982 | |
Class H | | | 427 | | | | 1,059 | |
Shares redeemed | | | | | | | | |
Investor Class | | | (260,804 | ) | | | (878,910 | ) |
Class A | | | (36,612 | ) | | | (28,466 | ) |
Class C | | | (23,075 | ) | | | (31,357 | ) |
Class H | | | (9,742 | ) | | | (178,116 | ) |
Net decrease in shares | | | (98,302 | ) | | | (391,420 | ) |
SEE NOTES TO FINANCIAL STATEMENTS. | THE RYDEX FUNDS ANNUAL REPORT | 23 |
This table is presented to show selected data for a share outstanding throughout each period and to assist shareholders in evaluating a Fund’s performance for the periods presented.
Investor Class | | Year Ended
March 31,
2024 | | | Year Ended
March 31,
2023 | | | Year Ended
March 31,
2022 | | | Year Ended
March 31,
2021 | | | Year Ended
March 31,
2020 | |
Per Share Data |
Net asset value, beginning of period | | $ | 80.67 | | | $ | 89.73 | | | $ | 78.37 | | | $ | 42.39 | | | $ | 58.04 | |
Income (loss) from investment operations: |
Net investment income (loss)a | | | 0.67 | | | | .89 | | | | .60 | | | | .43 | | | | .43 | |
Net gain (loss) on investments (realized and unrealized) | | | 6.81 | | | | (8.66 | ) | | | 12.39 | | | | 37.12 | | | | (13.42 | ) |
Total from investment operations | | | 7.48 | | | | (7.77 | ) | | | 12.99 | | | | 37.55 | | | | (12.99 | ) |
Less distributions from: |
Net investment income | | | (1.75 | ) | | | (1.29 | ) | | | — | | | | (.54 | ) | | | (.90 | ) |
Net realized gains | | | — | | | | — | | | | (1.63 | ) | | | (1.03 | ) | | | (1.76 | ) |
Total distributions | | | (1.75 | ) | | | (1.29 | ) | | | (1.63 | ) | | | (1.57 | ) | | | (2.66 | ) |
Net asset value, end of period | | $ | 86.40 | | | $ | 80.67 | | | $ | 89.73 | | | $ | 78.37 | | | $ | 42.39 | |
|
Total Return | | | 9.55 | % | | | (8.59 | %) | | | 16.72 | % | | | 89.00 | % | | | (23.61 | %) |
Ratios/Supplemental Data |
Net assets, end of period (in thousands) | | $ | 19,369 | | | $ | 23,164 | | | $ | 51,058 | | | $ | 38,112 | | | $ | 13,313 | |
Ratios to average net assets: |
Net investment income (loss) | | | 0.85 | % | | | 1.11 | % | | | 0.71 | % | | | 0.67 | % | | | 0.74 | % |
Total expenses | | | 1.43 | % | | | 1.39 | % | | | 1.36 | % | | | 1.43 | % | | | 1.48 | % |
Net expensesb | | | 1.40 | % | | | 1.39 | % | | | 1.36 | % | | | 1.43 | % | | | 1.48 | % |
Portfolio turnover rate | | | 49 | % | | | 126 | % | | | 169 | % | | | 162 | % | | | 67 | % |
Class A | | Year Ended
March 31,
2024 | | | Year Ended
March 31,
2023 | | | Year Ended
March 31,
2022 | | | Year Ended
March 31,
2021 | | | Year Ended
March 31,
2020 | |
Per Share Data |
Net asset value, beginning of period | | $ | 74.08 | | | $ | 82.73 | | | $ | 72.55 | | | $ | 39.41 | | | $ | 54.27 | |
Income (loss) from investment operations: |
Net investment income (loss)a | | | .46 | | | | .56 | | | | .35 | | | | .25 | | | | .26 | |
Net gain (loss) on investments (realized and unrealized) | | | 6.20 | | | | (7.92 | ) | | | 11.46 | | | | 34.46 | | | | (12.46 | ) |
Total from investment operations | | | 6.66 | | | | (7.36 | ) | | | 11.81 | | | | 34.71 | | | | (12.20 | ) |
Less distributions from: |
Net investment income | | | (1.75 | ) | | | (1.29 | ) | | | — | | | | (.54 | ) | | | (.90 | ) |
Net realized gains | | | — | | | | — | | | | (1.63 | ) | | | (1.03 | ) | | | (1.76 | ) |
Total distributions | | | (1.75 | ) | | | (1.29 | ) | | | (1.63 | ) | | | (1.57 | ) | | | (2.66 | ) |
Net asset value, end of period | | $ | 78.99 | | | $ | 74.08 | | | $ | 82.73 | | | $ | 72.55 | | | $ | 39.41 | |
|
Total Returnc | | | 9.29 | % | | | (8.83 | %) | | | 16.43 | % | | | 88.52 | % | | | (23.80 | %) |
Ratios/Supplemental Data |
Net assets, end of period (in thousands) | | $ | 7,228 | | | $ | 7,563 | | | $ | 7,506 | | | $ | 5,599 | | | $ | 2,966 | |
Ratios to average net assets: |
Net investment income (loss) | | | 0.63 | % | | | 0.77 | % | | | 0.45 | % | | | 0.44 | % | | | 0.48 | % |
Total expenses | | | 1.68 | % | | | 1.64 | % | | | 1.61 | % | | | 1.69 | % | | | 1.73 | % |
Net expensesb | | | 1.65 | % | | | 1.64 | % | | | 1.61 | % | | | 1.69 | % | | | 1.73 | % |
Portfolio turnover rate | | | 49 | % | | | 126 | % | | | 169 | % | | | 162 | % | | | 67 | % |
24 | THE RYDEX FUNDS ANNUAL REPORT | SEE NOTES TO FINANCIAL STATEMENTS. |
FINANCIAL HIGHLIGHTS (concluded) |
This table is presented to show selected data for a share outstanding throughout each period and to assist shareholders in evaluating a Fund’s performance for the periods presented.
Class C | | Year Ended
March 31,
2024 | | | Year Ended
March 31,
2023 | | | Year Ended
March 31,
2022 | | | Year Ended
March 31,
2021 | | | Year Ended
March 31,
2020 | |
Per Share Data |
Net asset value, beginning of period | | $ | 62.10 | | | $ | 70.12 | | | $ | 62.18 | | | $ | 34.17 | | | $ | 47.73 | |
Income (loss) from investment operations: |
Net investment income (loss)a | | | (.11 | ) | | | — | d | | | (.18 | ) | | | (.17 | ) | | | (.11 | ) |
Net gain (loss) on investments (realized and unrealized) | | | 5.16 | | | | (6.73 | ) | | | 9.75 | | | | 29.75 | | | | (10.79 | ) |
Total from investment operations | | | 5.05 | | | | (6.73 | ) | | | 9.57 | | | | 29.58 | | | | (10.90 | ) |
Less distributions from: |
Net investment income | | | (1.75 | ) | | | (1.29 | ) | | | — | | | | (.54 | ) | | | (.90 | ) |
Net realized gains | | | — | | | | — | | | | (1.63 | ) | | | (1.03 | ) | | | (1.76 | ) |
Total distributions | | | (1.75 | ) | | | (1.29 | ) | | | (1.63 | ) | | | (1.57 | ) | | | (2.66 | ) |
Net asset value, end of period | | $ | 65.40 | | | $ | 62.10 | | | $ | 70.12 | | | $ | 62.18 | | | $ | 34.17 | |
|
Total Returnc | | | 8.47 | % | | | (9.51 | %) | | | 15.57 | % | | | 87.07 | % | | | (24.35 | %) |
Ratios/Supplemental Data |
Net assets, end of period (in thousands) | | $ | 1,695 | | | $ | 2,627 | | | $ | 3,839 | | | $ | 2,534 | | | $ | 1,526 | |
Ratios to average net assets: |
Net investment income (loss) | | | (0.18 | %) | | | — | e | | | (0.27 | %) | | | (0.34 | %) | | | (0.23 | %) |
Total expenses | | | 2.43 | % | | | 2.39 | % | | | 2.36 | % | | | 2.44 | % | | | 2.47 | % |
Net expensesb | | | 2.40 | % | | | 2.39 | % | | | 2.36 | % | | | 2.44 | % | | | 2.47 | % |
Portfolio turnover rate | | | 49 | % | | | 126 | % | | | 169 | % | | | 162 | % | | | 67 | % |
Class H | | Year Ended
March 31,
2024 | | | Year Ended
March 31,
2023 | | | Year Ended
March 31,
2022 | | | Year Ended
March 31,
2021 | | | Year Ended
March 31,
2020 | |
Per Share Data |
Net asset value, beginning of period | | $ | 71.53 | | | $ | 79.95 | | | $ | 70.17 | | | $ | 38.15 | | | $ | 52.62 | |
Income (loss) from investment operations: |
Net investment income (loss)a | | | .41 | | | | .28 | | | | .56 | | | | .19 | | | | .27 | |
Net gain (loss) on investments (realized and unrealized) | | | 6.01 | | | | (7.41 | ) | | | 10.85 | | | | 33.40 | | | | (12.08 | ) |
Total from investment operations | | | 6.42 | | | | (7.13 | ) | | | 11.41 | | | | 33.59 | | | | (11.81 | ) |
Less distributions from: |
Net investment income | | | (1.75 | ) | | | (1.29 | ) | | | — | | | | (.54 | ) | | | (.90 | ) |
Net realized gains | | | — | | | | — | | | | (1.63 | ) | | | (1.03 | ) | | | (1.76 | ) |
Total distributions | | | (1.75 | ) | | | (1.29 | ) | | | (1.63 | ) | | | (1.57 | ) | | | (2.66 | ) |
Net asset value, end of period | | $ | 76.20 | | | $ | 71.53 | | | $ | 79.95 | | | $ | 70.17 | | | $ | 38.15 | |
|
Total Return | | | 9.29 | % | | | (8.85 | %) | | | 16.42 | % | | | 88.51 | % | | | (23.81 | %) |
Ratios/Supplemental Data |
Net assets, end of period (in thousands) | | $ | 1,030 | | | $ | 1,563 | | | $ | 10,420 | | | $ | 2,108 | | | $ | 825 | |
Ratios to average net assets: |
Net investment income (loss) | | | 0.59 | % | | | 0.38 | % | | | 0.73 | % | | | 0.33 | % | | | 0.51 | % |
Total expenses | | | 1.68 | % | | | 1.65 | % | | | 1.60 | % | | | 1.68 | % | | | 1.72 | % |
Net expensesb | | | 1.65 | % | | | 1.65 | % | | | 1.60 | % | | | 1.68 | % | | | 1.72 | % |
Portfolio turnover rate | | | 49 | % | | | 126 | % | | | 169 | % | | | 162 | % | | | 67 | % |
a | Net investment income (loss) per share was computed using average shares outstanding throughout the period. |
b | Net expense information reflects the expense ratios after expense waivers and reimbursements, as applicable. |
c | Total return does not reflect the impact of any applicable sales charges. |
d | Less than $0.01 per share. |
e | Less than 0.01% or (0.01%). |
SEE NOTES TO FINANCIAL STATEMENTS. | THE RYDEX FUNDS ANNUAL REPORT | 25 |
PERFORMANCE REPORT AND FUND PROFILE (Unaudited) | March 31, 2024 |
BIOTECHNOLOGY FUND
OBJECTIVE: Seeks to provide capital appreciation by investing in companies that are involved in the biotechnology industry, including companies involved in research and development, genetic, or other biological engineering, and in the design, manufacture, or sale of related biotechnology products or services (“Biotechnology Companies”).
For the Reporting Period, Biotechnology Fund Investor Class returned 9.30%, compared with the S&P 500 Index, which returned 29.88%. The S&P 500 Health Care Index returned 16.09%.
The industries that contributed the most to performance were biotechnology, health care equipment, and pharmaceuticals. Those that detracted the most were life sciences tools & services, fertilizers & agricultural chemicals, and health care services.
The holdings that contributed the most to performance were AbbVie, Inc., Amgen, Inc., and Vertex Pharmaceuticals, Inc. Those that detracted the most were Illumina, Inc., Moderna, Inc., and Biogen, Inc.
Performance displayed represents past performance, which is no guarantee of future results.
Holdings Diversification (Market Exposure as % of Net Assets)
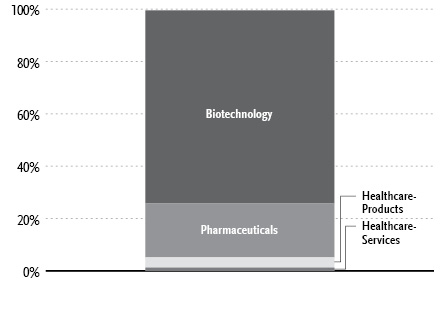
“Holdings Diversification (Market Exposure as % of Net Assets)” excludes any temporary cash investments.
Inception Dates: |
Investor Class | April 1, 1998 |
Class A | September 1, 2004 |
Class C | March 30, 2001 |
Class H | April 1, 1998 |
Ten Largest Holdings | % of Total Net Assets |
AbbVie, Inc. | 9.1% |
Amgen, Inc. | 6.4% |
Regeneron Pharmaceuticals, Inc. | 5.1% |
Vertex Pharmaceuticals, Inc. | 4.2% |
Gilead Sciences, Inc. | 3.8% |
Corteva, Inc. | 3.2% |
Moderna, Inc. | 3.1% |
Biogen, Inc. | 2.8% |
AstraZeneca plc ADR | 2.7% |
Illumina, Inc. | 2.4% |
Top Ten Total | 42.8% |
| | |
“Ten Largest Holdings” excludes any temporary cash investments. |
26 | THE RYDEX FUNDS ANNUAL REPORT | |
PERFORMANCE REPORT AND FUND PROFILE (Unaudited)(concluded) | March 31, 2024 |
Cumulative Fund Performance*
Average Annual Returns*
Periods Ended March 31, 2024
| 1 Year | 5 Year | 10 Year |
Investor Class Shares | 9.30% | 4.04% | 6.43% |
Class A Shares | 9.03% | 3.78% | 6.16% |
Class A Shares with sales charge† | 3.85% | 2.78% | 5.64% |
Class C Shares | 8.21% | 3.01% | 5.37% |
Class C Shares with CDSC‡ | 7.21% | 3.01% | 5.37% |
Class H Shares** | 9.02% | 3.79% | 6.12% |
S&P 500 Health Care Index | 16.09% | 12.05% | 11.67% |
S&P 500 Index | 29.88% | 15.05% | 12.96% |
* | The performance data above represents past performance that is not predictive of future results. The investment return and principal value of an investment in the Fund will fluctuate so that an investor’s shares, when redeemed, may be worth more or less than their original cost. Returns are historical and include changes in principal and reinvested dividends and capital gains and do not reflect the effect of taxes. The S&P 500 Index and the S&P 500 Health Care Index are unmanaged indices and, unlike the Fund, have no management fees or operating expenses to reduce their reported returns. The graphs are based on Investor Class shares and Class A shares only; performance for Class C shares and Class H shares will vary due to differences in fee structures. |
** | Effective September 30, 2015, the Fund’s Advisor Class shares were converted into Class H shares. |
† | Fund returns are calculated using the maximum sales charge of 4.75%. |
‡ | Fund returns include a CDSC of 1% if redeemed within 12 months of purchase. |
| | THE RYDEX FUNDS ANNUAL REPORT | 27 |
SCHEDULE OF INVESTMENTS | March 31, 2024 |
BIOTECHNOLOGY FUND | |
| | Shares | | | Value | |
COMMON STOCKS† - 99.6% |
| | | | | | | | | |
Biotechnology - 73.8% |
Amgen, Inc. | | | 24,732 | | | $ | 7,031,802 | |
Regeneron Pharmaceuticals, Inc.* | | | 5,792 | | | | 5,574,742 | |
Vertex Pharmaceuticals, Inc.* | | | 11,049 | | | | 4,618,592 | |
Gilead Sciences, Inc. | | | 57,387 | | | | 4,203,598 | |
Corteva, Inc. | | | 61,639 | | | | 3,554,721 | |
Moderna, Inc.* | | | 31,852 | | | | 3,394,149 | |
Biogen, Inc.* | | | 14,196 | | | | 3,061,083 | |
Illumina, Inc.* | | | 18,761 | | | | 2,576,260 | |
Alnylam Pharmaceuticals, Inc.* | | | 15,959 | | | | 2,385,073 | |
BioMarin Pharmaceutical, Inc.* | | | 25,837 | | | | 2,256,604 | |
Royalty Pharma plc — Class A | | | 71,829 | | | | 2,181,447 | |
Sarepta Therapeutics, Inc.* | | | 15,022 | | | | 1,944,748 | |
Incyte Corp.* | | | 31,182 | | | | 1,776,439 | |
United Therapeutics Corp.* | | | 7,578 | | | | 1,740,818 | |
Legend Biotech Corp. ADR* | | | 30,111 | | | | 1,688,926 | |
Argenx SE ADR* | | | 4,196 | | | | 1,652,049 | |
Cytokinetics, Inc.* | | | 21,997 | | | | 1,542,210 | |
Exelixis, Inc.* | | | 63,269 | | | | 1,501,373 | |
BioNTech SE ADR* | | | 15,100 | | | | 1,392,975 | |
CRISPR Therapeutics AG*,1 | | | 20,413 | | | | 1,391,350 | |
Intra-Cellular Therapies, Inc.* | | | 20,089 | | | | 1,390,159 | |
Apellis Pharmaceuticals, Inc.* | | | 22,299 | | | | 1,310,735 | |
Ionis Pharmaceuticals, Inc.* | | | 29,419 | | | | 1,275,314 | |
Halozyme Therapeutics, Inc.* | | | 30,345 | | | | 1,234,435 | |
REVOLUTION Medicines, Inc.* | | | 38,269 | | | | 1,233,410 | |
Blueprint Medicines Corp.* | | | 12,634 | | | | 1,198,461 | |
Roivant Sciences Ltd.*,1 | | | 112,163 | | | | 1,182,198 | |
Bridgebio Pharma, Inc.* | | | 37,164 | | | | 1,149,111 | |
Insmed, Inc.* | | | 40,289 | | | | 1,093,041 | |
Ultragenyx Pharmaceutical, Inc.* | | | 21,540 | | | | 1,005,703 | |
Amicus Therapeutics, Inc.* | | | 85,233 | | | | 1,004,045 | |
Axsome Therapeutics, Inc.* | | | 12,544 | | | | 1,001,011 | |
Iovance Biotherapeutics, Inc.* | | | 66,996 | | | | 992,881 | |
Prothena Corporation plc* | | | 39,542 | | | | 979,455 | |
Arrowhead Pharmaceuticals, Inc.* | | | 33,426 | | | | 955,984 | |
Guardant Health, Inc.* | | | 41,004 | | | | 845,912 | |
Intellia Therapeutics, Inc.* | | | 30,368 | | | | 835,424 | |
Beam Therapeutics, Inc.* | | | 23,627 | | | | 780,636 | |
Immunovant, Inc.* | | | 24,151 | | | | 780,319 | |
PTC Therapeutics, Inc.* | | | 26,205 | | | | 762,303 | |
TG Therapeutics, Inc.* | | | 48,615 | | | | 739,434 | |
ACADIA Pharmaceuticals, Inc.* | | | 39,352 | | | | 727,618 | |
Dynavax Technologies Corp.* | | | 55,099 | | | | 683,779 | |
Krystal Biotech, Inc.* | | | 3,638 | | | | 647,309 | |
Akero Therapeutics, Inc.* | | | 20,468 | | | | 517,022 | |
Sage Therapeutics, Inc.* | | | 26,796 | | | | 502,157 | |
Novavax, Inc.*,1 | | | 83,168 | | | | 397,543 | |
Total Biotechnology | | | | | | | 80,694,358 | |
| | | | | | | | | |
Pharmaceuticals - 20.7% |
AbbVie, Inc. | | | 54,865 | | | | 9,990,916 | |
AstraZeneca plc ADR | | | 43,805 | | | | 2,967,789 | |
Neurocrine Biosciences, Inc.* | | | 14,843 | | | | 2,047,147 | |
Viatris, Inc. | | | 170,310 | | | | 2,033,501 | |
Jazz Pharmaceuticals plc* | | | 12,556 | | | | 1,511,993 | |
Alkermes plc* | | | 55,814 | | | | 1,510,885 | |
Vaxcyte, Inc.* | | | 20,625 | | | | 1,408,894 | |
Ironwood Pharmaceuticals, Inc. — Class A* | | | 67,889 | | | | 591,313 | |
Madrigal Pharmaceuticals, Inc.* | | | 2,065 | | | | 551,438 | |
Total Pharmaceuticals | | | | | | | 22,613,876 | |
| | | | | | | | | |
Healthcare-Products - 3.9% |
Exact Sciences Corp.* | | | 29,095 | | | | 2,009,301 | |
Natera, Inc.* | | | 19,319 | | | | 1,766,916 | |
Pacific Biosciences of California, Inc.* | | | 125,198 | | | | 469,492 | |
Total Healthcare-Products | | | | | | | 4,245,709 | |
| | | | | | | | | |
Healthcare-Services - 1.2% |
Medpace Holdings, Inc.* | | | 3,359 | | | | 1,357,540 | |
| | | | | | | | | |
Total Common Stocks | | | | |
(Cost $56,457,113) | | | | | | | 108,911,483 | |
| | | | | | | | | |
| | | Face
Amount | | | | | |
REPURCHASE AGREEMENTS††,2 - 0.2% |
J.P. Morgan Securities LLC
issued 03/28/24 at 5.31%
due 04/01/24 | | $ | 138,611 | | | | 138,611 | |
BofA Securities, Inc.
issued 03/28/24 at 5.31%
due 04/01/24 | | | 53,312 | | | | 53,312 | |
Barclays Capital, Inc.
issued 03/28/24 at 5.30%
due 04/01/24 | | | 48,322 | | | | 48,322 | |
Total Repurchase Agreements | | | | |
(Cost $240,245) | | | | | | | 240,245 | |
| | | | | | | | | |
| | | Shares | | | | | |
SECURITIES LENDING COLLATERAL†,3 - 1.6% |
Money Market Fund | | | | | | | | |
First American Government Obligations Fund - Class X, 5.23%4 | | | 1,757,813 | | | | 1,757,813 | |
Total Securities Lending Collateral | | | | |
(Cost $1,757,813) | | | | | | | 1,757,813 | |
| | | | | | | | | |
Total Investments - 101.4% | | | | |
(Cost $58,455,171) | | $ | 110,909,541 | |
Other Assets & Liabilities, net - (1.4)% | | | (1,533,451 | ) |
Total Net Assets - 100.0% | | $ | 109,376,090 | |
28 | THE RYDEX FUNDS ANNUAL REPORT | SEE NOTES TO FINANCIAL STATEMENTS. |
SCHEDULE OF INVESTMENTS (concluded) | March 31, 2024 |
BIOTECHNOLOGY FUND | |
* | Non-income producing security. |
† | Value determined based on Level 1 inputs — See Note 4. |
†† | Value determined based on Level 2 inputs — See Note 4. |
1 | All or a portion of this security is on loan at March 31, 2024 — See Note 7. |
2 | Repurchase Agreements — See Note 6. |
3 | Securities lending collateral — See Note 7. |
4 | Rate indicated is the 7-day yield as of March 31, 2024. |
| | ADR — American Depositary Receipt |
| | plc — Public Limited Company |
| | |
| | See Sector Classification in Other Information section. |
The following table summarizes the inputs used to value the Fund’s investments at March 31, 2024 (See Note 4 in the Notes to Financial Statements):
Investments in Securities (Assets) | | Level 1
Quoted
Prices | | | Level 2
Significant
Observable
Inputs | | | Level 3
Significant
Unobservable
Inputs | | | Total | |
Common Stocks | | $ | 108,911,483 | | | $ | — | | | $ | — | | | $ | 108,911,483 | |
Repurchase Agreements | | | — | | | | 240,245 | | | | — | | | | 240,245 | |
Securities Lending Collateral | | | 1,757,813 | | | | — | | | | — | | | | 1,757,813 | |
Total Assets | | $ | 110,669,296 | | | $ | 240,245 | | | $ | — | | | $ | 110,909,541 | |
SEE NOTES TO FINANCIAL STATEMENTS. | THE RYDEX FUNDS ANNUAL REPORT | 29 |
STATEMENT OF ASSETS AND LIABILITIES |
March 31, 2024 |
Assets: |
Investments, at value - including $1,620,914 of securities loaned (cost $58,214,926) | | $ | 110,669,296 | |
Repurchase agreements, at value (cost $240,245) | | | 240,245 | |
Receivables: |
Securities sold | | | 685,284 | |
Fund shares sold | | | 11,574 | |
Foreign tax reclaims | | | 4,335 | |
Securities lending income | | | 1,765 | |
Interest | | | 141 | |
Total assets | | | 111,612,640 | |
| | | | | |
Liabilities: |
Payable for: |
Return of securities lending collateral | | | 1,757,813 | |
Fund shares redeemed | | | 254,996 | |
Management fees | | | 79,910 | |
Transfer agent fees | | | 45,501 | |
Portfolio accounting and administration fees | | | 9,636 | |
Distribution and service fees | | | 5,099 | |
Trustees’ fees* | | | 1,056 | |
Miscellaneous | | | 82,539 | |
Total liabilities | | | 2,236,550 | |
Net assets | | $ | 109,376,090 | |
| | | | | |
Net assets consist of: |
Paid in capital | | $ | 51,713,450 | |
Total distributable earnings (loss) | | | 57,662,640 | |
Net assets | | $ | 109,376,090 | |
| | | | | |
Investor Class: |
Net assets | | $ | 88,327,800 | |
Capital shares outstanding | | | 1,183,397 | |
Net asset value per share | | $ | 74.64 | |
| | | | | |
Class A: |
Net assets | | $ | 14,769,635 | |
Capital shares outstanding | | | 228,247 | |
Net asset value per share | | $ | 64.71 | |
Maximum offering price per share (Net asset value divided by 95.25%) | | $ | 67.94 | |
| | | | | |
Class C: |
Net assets | | $ | 979,639 | |
Capital shares outstanding | | | 19,296 | |
Net asset value per share | | $ | 50.77 | |
| | | | | |
Class H: |
Net assets | | $ | 5,299,016 | |
Capital shares outstanding | | | 85,826 | |
Net asset value per share | | $ | 61.74 | |
STATEMENT OF OPERATIONS |
Year Ended March 31, 2024 |
Investment Income: |
Dividends (net of foreign withholding tax of $312) | | $ | 1,076,131 | |
Interest | | | 28,262 | |
Income from securities lending, net | | | 49,012 | |
Total investment income | | | 1,153,405 | |
| | | | | |
Expenses: |
Management fees | | | 953,505 | |
Distribution and service fees: |
Class A | | | 37,892 | |
Class C | | | 12,173 | |
Class H | | | 13,817 | |
Transfer agent fees | | | 244,861 | |
Portfolio accounting and administration fees | | | 170,996 | |
Registration fees | | | 106,929 | |
Professional fees | | | 51,475 | |
Trustees’ fees* | | | 19,268 | |
Custodian fees | | | 15,523 | |
Line of credit fees | | | 393 | |
Miscellaneous | | | 43,575 | |
Total expenses | | | 1,670,407 | |
Less: |
Expenses reimbursed by Adviser | | | (36,299 | ) |
Net expenses | | | 1,634,108 | |
Net investment loss | | | (480,703 | ) |
| | | | | |
Net Realized and Unrealized Gain (Loss): |
Net realized gain (loss) on: |
Investments | | | 14,859,997 | |
Net realized gain | | | 14,859,997 | |
Net change in unrealized appreciation (depreciation) on: |
Investments | | | (5,138,730 | ) |
Net change in unrealized appreciation (depreciation) | | | (5,138,730 | ) |
Net realized and unrealized gain | | | 9,721,267 | |
Net increase in net assets resulting from operations | | $ | 9,240,564 | |
* | Relates to Trustees not deemed “interested persons” within the meaning of Section 2(a)(19) of the 1940 Act. |
30 | THE RYDEX FUNDS ANNUAL REPORT | SEE NOTES TO FINANCIAL STATEMENTS. |
STATEMENTS OF CHANGES IN NET ASSETS |
| | Year Ended
March 31,
2024 | | | Year Ended
March 31,
2023 | |
Increase (Decrease) in Net Assets from Operations: | | | | | | | | |
Net investment loss | | $ | (480,703 | ) | | $ | (546,385 | ) |
Net realized gain (loss) on investments | | | 14,859,997 | | | | (1,868,860 | ) |
Net change in unrealized appreciation (depreciation) on investments | | | (5,138,730 | ) | | | (6,943,222 | ) |
Net increase (decrease) in net assets resulting from operations | | | 9,240,564 | | | | (9,358,467 | ) |
| | | | | | | | | |
Distributions to shareholders: | | | | | | | | |
Investor Class | | | — | | | | (1,400,398 | ) |
Class A | | | — | | | | (261,302 | ) |
Class C | | | — | | | | (40,352 | ) |
Class H | | | — | | | | (98,449 | ) |
Total distributions to shareholders | | | — | | | | (1,800,501 | ) |
| | | | | | | | | |
Capital share transactions: | | | | | | | | |
Proceeds from sale of shares | | | | | | | | |
Investor Class | | | 27,388,563 | | | | 59,349,087 | |
Class A | | | 1,750,509 | | | | 4,270,307 | |
Class C | | | 185,861 | | | | 288,533 | |
Class H | | | 438,546 | | | | 1,146,596 | |
Distributions reinvested | | | | | | | | |
Investor Class | | | — | | | | 1,340,834 | |
Class A | | | — | | | | 256,294 | |
Class C | | | — | | | | 39,028 | |
Class H | | | — | | | | 98,371 | |
Cost of shares redeemed | | | | | | | | |
Investor Class | | | (40,330,995 | ) | | | (80,587,920 | ) |
Class A | | | (4,351,712 | ) | | | (6,316,518 | ) |
Class C | | | (1,010,807 | ) | | | (1,527,907 | ) |
Class H | | | (1,653,324 | ) | | | (4,045,536 | ) |
Net decrease from capital share transactions | | | (17,583,359 | ) | | | (25,688,831 | ) |
Net decrease in net assets | | | (8,342,795 | ) | | | (36,847,799 | ) |
| | | | | | | | | |
Net assets: | | | | | | | | |
Beginning of year | | | 117,718,885 | | | | 154,566,684 | |
End of year | | $ | 109,376,090 | | | $ | 117,718,885 | |
| | | | | | | | | |
Capital share activity: | | | | | | | | |
Shares sold | | | | | | | | |
Investor Class | | | 389,294 | | | | 854,810 | |
Class A | | | 29,027 | | | | 71,911 | |
Class C | | | 3,821 | | | | 5,958 | |
Class H | | | 7,277 | | | | 20,151 | |
Shares issued from reinvestment of distributions | | | | | | | | |
Investor Class | | | — | | | | 19,100 | |
Class A | | | — | | | | 4,197 | |
Class C | | | — | | | | 807 | |
Class H | | | — | | | | 1,688 | |
Shares redeemed | | | | | | | | |
Investor Class | | | (579,083 | ) | | | (1,175,811 | ) |
Class A | | | (72,392 | ) | | | (105,566 | ) |
Class C | | | (21,302 | ) | | | (32,044 | ) |
Class H | | | (29,105 | ) | | | (67,269 | ) |
Net decrease in shares | | | (272,463 | ) | | | (402,068 | ) |
SEE NOTES TO FINANCIAL STATEMENTS. | THE RYDEX FUNDS ANNUAL REPORT | 31 |
This table is presented to show selected data for a share outstanding throughout each period and to assist shareholders in evaluating a Fund’s performance for the periods presented.
Investor Class | | Year Ended
March 31,
2024 | | | Year Ended
March 31,
2023 | | | Year Ended
March 31,
2022 | | | Year Ended
March 31,
2021 | | | Year Ended
March 31,
2020 | |
Per Share Data |
Net asset value, beginning of period | | $ | 68.29 | | | $ | 73.30 | | | $ | 94.01 | | | $ | 71.72 | | | $ | 83.02 | |
Income (loss) from investment operations: |
Net investment income (loss)a | | | (.26 | ) | | | (.24 | ) | | | (.52 | ) | | | (.58 | ) | | | (.44 | ) |
Net gain (loss) on investments (realized and unrealized) | | | 6.61 | | | | (3.87 | ) | | | (4.42 | ) | | | 29.82 | | | | (7.26 | ) |
Total from investment operations | | | 6.35 | | | | (4.11 | ) | | | (4.94 | ) | | | 29.24 | | | | (7.70 | ) |
Less distributions from: |
Net realized gains | | | — | | | | (.90 | ) | | | (15.77 | ) | | | (6.95 | ) | | | (3.60 | ) |
Total distributions | | | — | | | | (.90 | ) | | | (15.77 | ) | | | (6.95 | ) | | | (3.60 | ) |
Net asset value, end of period | | $ | 74.64 | | | $ | 68.29 | | | $ | 73.30 | | | $ | 94.01 | | | $ | 71.72 | |
|
Total Return | | | 9.30 | % | | | (5.64 | %) | | | (6.81 | %) | | | 40.80 | % | | | (9.91 | %) |
Ratios/Supplemental Data |
Net assets, end of period (in thousands) | | $ | 88,328 | | | $ | 93,776 | | | $ | 122,777 | | | $ | 151,506 | | | $ | 122,194 | |
Ratios to average net assets: |
Net investment income (loss) | | | (0.37 | %) | | | (0.34 | %) | | | (0.56 | %) | | | (0.62 | %) | | | (0.56 | %) |
Total expenses | | | 1.43 | % | | | 1.39 | % | | | 1.36 | % | | | 1.45 | % | | | 1.48 | % |
Net expensesb | | | 1.40 | % | | | 1.39 | % | | | 1.36 | % | | | 1.45 | % | | | 1.48 | % |
Portfolio turnover rate | | | 51 | % | | | 61 | % | | | 65 | % | | | 115 | % | | | 64 | % |
Class A | | Year Ended
March 31,
2024 | | | Year Ended
March 31,
2023 | | | Year Ended
March 31,
2022 | | | Year Ended
March 31,
2021 | | | Year Ended
March 31,
2020 | |
Per Share Data |
Net asset value, beginning of period | | $ | 59.35 | | | $ | 63.98 | | | $ | 84.21 | | | $ | 64.92 | | | $ | 75.66 | |
Income (loss) from investment operations: |
Net investment income (loss)a | | | (.38 | ) | | | (.35 | ) | | | (.65 | ) | | | (.73 | ) | | | (.57 | ) |
Net gain (loss) on investments (realized and unrealized) | | | 5.74 | | | | (3.38 | ) | | | (3.81 | ) | | | 26.97 | | | | (6.57 | ) |
Total from investment operations | | | 5.36 | | | | (3.73 | ) | | | (4.46 | ) | | | 26.24 | | | | (7.14 | ) |
Less distributions from: |
Net realized gains | | | — | | | | (.90 | ) | | | (15.77 | ) | | | (6.95 | ) | | | (3.60 | ) |
Total distributions | | | — | | | | (.90 | ) | | | (15.77 | ) | | | (6.95 | ) | | | (3.60 | ) |
Net asset value, end of period | | $ | 64.71 | | | $ | 59.35 | | | $ | 63.98 | | | $ | 84.21 | | | $ | 64.92 | |
|
Total Returnc | | | 9.03 | % | | | (5.87 | %) | | | (7.04 | %) | | | 40.44 | % | | | (10.14 | %) |
Ratios/Supplemental Data |
Net assets, end of period (in thousands) | | $ | 14,770 | | | $ | 16,121 | | | $ | 19,263 | | | $ | 22,317 | | | $ | 14,565 | |
Ratios to average net assets: |
Net investment income (loss) | | | (0.62 | %) | | | (0.59 | %) | | | (0.80 | %) | | | (0.87 | %) | | | (0.80 | %) |
Total expenses | | | 1.68 | % | | | 1.64 | % | | | 1.61 | % | | | 1.69 | % | | | 1.73 | % |
Net expensesb | | | 1.65 | % | | | 1.64 | % | | | 1.61 | % | | | 1.69 | % | | | 1.73 | % |
Portfolio turnover rate | | | 51 | % | | | 61 | % | | | 65 | % | | | 115 | % | | | 64 | % |
32 | THE RYDEX FUNDS ANNUAL REPORT | SEE NOTES TO FINANCIAL STATEMENTS. |
FINANCIAL HIGHLIGHTS (concluded) |
This table is presented to show selected data for a share outstanding throughout each period and to assist shareholders in evaluating a Fund’s performance for the periods presented.
Class C | | Year Ended
March 31,
2024 | | | Year Ended
March 31,
2023 | | | Year Ended
March 31,
2022 | | | Year Ended
March 31,
2021 | | | Year Ended
March 31,
2020 | |
Per Share Data |
Net asset value, beginning of period | | $ | 46.92 | | | $ | 51.15 | | | $ | 70.90 | | | $ | 55.85 | | | $ | 66.05 | |
Income (loss) from investment operations: |
Net investment income (loss)a | | | (.66 | ) | | | (.64 | ) | | | (1.09 | ) | | | (1.15 | ) | | | (.97 | ) |
Net gain (loss) on investments (realized and unrealized) | | | 4.51 | | | | (2.69 | ) | | | (2.89 | ) | | | 23.15 | | | | (5.63 | ) |
Total from investment operations | | | 3.85 | | | | (3.33 | ) | | | (3.98 | ) | | | 22.00 | | | | (6.60 | ) |
Less distributions from: |
Net realized gains | | | — | | | | (.90 | ) | | | (15.77 | ) | | | (6.95 | ) | | | (3.60 | ) |
Total distributions | | | — | | | | (.90 | ) | | | (15.77 | ) | | | (6.95 | ) | | | (3.60 | ) |
Net asset value, end of period | | $ | 50.77 | | | $ | 46.92 | | | $ | 51.15 | | | $ | 70.90 | | | $ | 55.85 | |
|
Total Returnc | | | 8.21 | % | | | (6.58 | %) | | | (7.74 | %) | | | 39.39 | % | | | (10.80 | %) |
Ratios/Supplemental Data |
Net assets, end of period (in thousands) | | $ | 980 | | | $ | 1,725 | | | $ | 3,174 | | | $ | 8,221 | | | $ | 8,692 | |
Ratios to average net assets: |
Net investment income (loss) | | | (1.38 | %) | | | (1.34 | %) | | | (1.58 | %) | | | (1.61 | %) | | | (1.56 | %) |
Total expenses | | | 2.43 | % | | | 2.39 | % | | | 2.36 | % | | | 2.45 | % | | | 2.48 | % |
Net expensesb | | | 2.40 | % | | | 2.39 | % | | | 2.36 | % | | | 2.45 | % | | | 2.48 | % |
Portfolio turnover rate | | | 51 | % | | | 61 | % | | | 65 | % | | | 115 | % | | | 64 | % |
Class H | | Year Ended
March 31,
2024 | | | Year Ended
March 31,
2023 | | | Year Ended
March 31,
2022 | | | Year Ended
March 31,
2021 | | | Year Ended
March 31,
2020 | |
Per Share Data |
Net asset value, beginning of period | | $ | 56.63 | | | $ | 61.09 | | | $ | 81.10 | | | $ | 62.70 | | | $ | 73.18 | |
Income (loss) from investment operations: |
Net investment income (loss)a | | | (.36 | ) | | | (.34 | ) | | | (.64 | ) | | | (.66 | ) | | | (.59 | ) |
Net gain (loss) on investments (realized and unrealized) | | | 5.47 | | | | (3.22 | ) | | | (3.60 | ) | | | 26.01 | | | | (6.29 | ) |
Total from investment operations | | | 5.11 | | | | (3.56 | ) | | | (4.24 | ) | | | 25.35 | | | | (6.88 | ) |
Less distributions from: |
Net realized gains | | | — | | | | (.90 | ) | | | (15.77 | ) | | | (6.95 | ) | | | (3.60 | ) |
Total distributions | | | — | | | | (.90 | ) | | | (15.77 | ) | | | (6.95 | ) | | | (3.60 | ) |
Net asset value, end of period | | $ | 61.74 | | | $ | 56.63 | | | $ | 61.09 | | | $ | 81.10 | | | $ | 62.70 | |
|
Total Return | | | 9.02 | % | | | (5.87 | %) | | | (7.04 | %) | | | 40.45 | % | | | (10.12 | %) |
Ratios/Supplemental Data |
Net assets, end of period (in thousands) | | $ | 5,299 | | | $ | 6,096 | | | $ | 9,352 | | | $ | 9,565 | | | $ | 8,365 | |
Ratios to average net assets: |
Net investment income (loss) | | | (0.62 | %) | | | (0.59 | %) | | | (0.82 | %) | | | (0.83 | %) | | | (0.85 | %) |
Total expenses | | | 1.68 | % | | | 1.64 | % | | | 1.61 | % | | | 1.72 | % | | | 1.73 | % |
Net expensesb | | | 1.65 | % | | | 1.64 | % | | | 1.61 | % | | | 1.72 | % | | | 1.73 | % |
Portfolio turnover rate | | | 51 | % | | | 61 | % | | | 65 | % | | | 115 | % | | | 64 | % |
a | Net investment income (loss) per share was computed using average shares outstanding throughout the period. |
b | Net expense information reflects the expense ratios after expense waivers and reimbursements, as applicable. |
c | Total return does not reflect the impact of any applicable sales charges. |
SEE NOTES TO FINANCIAL STATEMENTS. | THE RYDEX FUNDS ANNUAL REPORT | 33 |
PERFORMANCE REPORT AND FUND PROFILE (Unaudited) | March 31, 2024 |
CONSUMER PRODUCTS FUND
OBJECTIVE: Seeks to provide capital appreciation by investing in companies engaged in manufacturing finished goods and services both domestically and internationally (“Consumer Products Companies”).
For the Reporting Period, Consumer Products Fund Investor Class returned 2.71%, compared with the S&P 500 Index, which returned 29.88%. The S&P 500 Consumer Staples Index returned 7.19%.
The industries that contributed the most to performance were soft drinks, household products, and food retail. Those that detracted the most were packaged foods & meats, personal care products, and agricultural products & services.
The holdings that contributed the most to performance were Celsius Holdings, Inc., Procter & Gamble Co., and Colgate-Palmolive Co. Those that detracted the most were Estee Lauder Companies, Inc. – Class A, Hershey Co., and Archer-Daniels-Midland Co.
Performance displayed represents past performance, which is no guarantee of future results.
Holdings Diversification (Market Exposure as % of Net Assets)
“Holdings Diversification (Market Exposure as % of Net Assets)” excludes any temporary cash investments.
Inception Dates: |
Investor Class | July 6, 1998 |
Class A | September 1, 2004 |
Class C | July 24, 2001 |
Class H | August 17, 1998 |
Ten Largest Holdings | % of Total Net Assets |
Procter & Gamble Co. | 6.8% |
PepsiCo, Inc. | 5.6% |
Coca-Cola Co. | 5.4% |
Philip Morris International, Inc. | 4.1% |
Mondelez International, Inc. — Class A | 3.3% |
Altria Group, Inc. | 3.1% |
Colgate-Palmolive Co. | 3.0% |
Estee Lauder Companies, Inc. — Class A | 2.5% |
Constellation Brands, Inc. — Class A | 2.4% |
Kimberly-Clark Corp. | 2.3% |
Top Ten Total | 38.5% |
| | |
“Ten Largest Holdings” excludes any temporary cash investments. |
34 | THE RYDEX FUNDS ANNUAL REPORT | |
PERFORMANCE REPORT AND FUND PROFILE (Unaudited)(concluded) | March 31, 2024 |
Average Annual Returns*
Periods Ended March 31, 2024
| 1 Year | 5 Year | 10 Year |
Investor Class Shares | 2.71% | 6.38% | 6.55% |
Class A Shares | 2.46% | 6.12% | 6.28% |
Class A Shares with sales charge† | (2.41%) | 5.09% | 5.77% |
Class C Shares | 1.70% | 5.32% | 5.49% |
Class C Shares with CDSC‡ | 0.85% | 5.32% | 5.49% |
Class H Shares** | 2.45% | 6.12% | 6.24% |
S&P 500 Consumer Staples Index | 7.19% | 9.96% | 9.27% |
S&P 500 Index | 29.88% | 15.05% | 12.96% |
Cumulative Fund Performance*
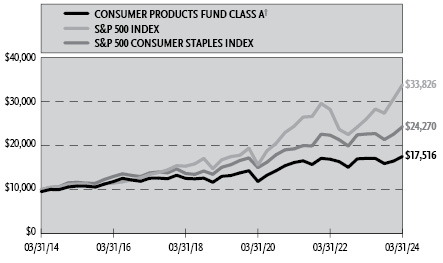
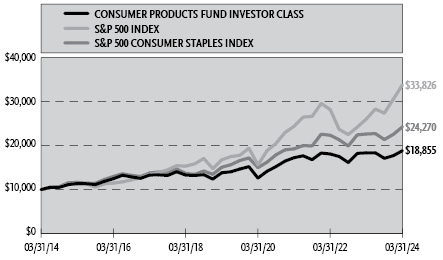
* | The performance data above represents past performance that is not predictive of future results. The investment return and principal value of an investment in the Fund will fluctuate so that an investor’s shares, when redeemed, may be worth more or less than their original cost. Returns are historical and include changes in principal and reinvested dividends and capital gains and do not reflect the effect of taxes. The S&P 500 Index and the S&P 500 Consumer Staples Index are unmanaged indices and, unlike the Fund, have no management fees or operating expenses to reduce their reported returns. The graphs are based on Investor Class shares and Class A shares only; performance for Class C and Class H shares will vary due to differences in fee structures. |
** | Effective September 30, 2015, the Fund’s Advisor Class shares were converted into Class H shares. |
† | Fund returns are calculated using the maximum sales charge of 4.75%. |
‡ | Fund returns include a CDSC of 1% if redeemed within 12 months of purchase. |
| | THE RYDEX FUNDS ANNUAL REPORT | 35 |
SCHEDULE OF INVESTMENTS | March 31, 2024 |
CONSUMER PRODUCTS FUND | |
| | Shares | | | Value | |
COMMON STOCKS† - 100.9% |
| | | | | | | | | |
Food - 34.4% |
Mondelez International, Inc. — Class A | | | 28,954 | | | $ | 2,026,780 | |
General Mills, Inc. | | | 20,160 | | | | 1,410,595 | |
Sysco Corp. | | | 16,673 | | | | 1,353,514 | |
Hershey Co. | | | 6,867 | | | | 1,335,632 | |
Kroger Co. | | | 22,341 | | | | 1,276,341 | |
Kraft Heinz Co. | | | 32,014 | | | | 1,181,317 | |
McCormick & Company, Inc. | | | 13,324 | | | | 1,023,416 | |
Tyson Foods, Inc. — Class A | | | 17,221 | | | | 1,011,389 | |
Kellanova | | | 14,986 | | | | 858,548 | |
Lamb Weston Holdings, Inc. | | | 8,029 | | | | 855,329 | |
Conagra Brands, Inc. | | | 28,009 | | | | 830,187 | |
J M Smucker Co. | | | 6,258 | | | | 787,695 | |
US Foods Holding Corp.* | | | 13,631 | | | | 735,665 | |
Performance Food Group Co.* | | | 9,318 | | | | 695,496 | |
Hormel Foods Corp. | | | 19,636 | | | | 685,100 | |
Campbell Soup Co. | | | 14,709 | | | | 653,815 | |
Ingredion, Inc. | | | 5,005 | | | | 584,834 | |
Albertsons Companies, Inc. — Class A | | | 26,418 | | | | 566,402 | |
Sprouts Farmers Market, Inc.* | | | 8,481 | | | | 546,855 | |
Post Holdings, Inc.* | | | 4,638 | | | | 492,927 | |
Flowers Foods, Inc. | | | 18,751 | | | | 445,336 | |
Simply Good Foods Co.* | | | 11,011 | | | | 374,704 | |
Grocery Outlet Holding Corp.* | | | 12,432 | | | | 357,793 | |
Cal-Maine Foods, Inc. | | | 5,831 | | | | 343,154 | |
Lancaster Colony Corp. | | | 1,536 | | | | 318,920 | |
Pilgrim’s Pride Corp.* | | | 7,583 | | | | 260,249 | |
Total Food | | | | | | | 21,011,993 | |
| | | | | | | | | |
Beverages - 26.7% |
PepsiCo, Inc. | | | 19,480 | | | | 3,409,195 | |
Coca-Cola Co. | | | 54,186 | | | | 3,315,099 | |
Constellation Brands, Inc. — Class A | | | 5,331 | | | | 1,448,753 | |
Monster Beverage Corp.* | | | 23,702 | | | | 1,405,055 | |
Keurig Dr Pepper, Inc. | | | 41,013 | | | | 1,257,869 | |
Brown-Forman Corp. — Class B | | | 19,865 | | | | 1,025,431 | |
Coca-Cola Europacific Partners plc | | | 14,287 | | | | 999,376 | |
Fomento Economico Mexicano SAB de CV ADR | | | 6,553 | | | | 853,659 | |
Anheuser-Busch InBev S.A. ADR1 | | | 13,571 | | | | 824,845 | |
Celsius Holdings, Inc.* | | | 9,571 | | | | 793,627 | |
Molson Coors Beverage Co. — Class B | | | 11,571 | | | | 778,150 | |
Coca-Cola Consolidated, Inc. | | | 223 | | | | 188,749 | |
Total Beverages | | | | | | | 16,299,808 | |
| | | | | | | | | |
Cosmetics & Personal Care - 17.0% |
Procter & Gamble Co. | | | 25,587 | | | | 4,151,491 | |
Colgate-Palmolive Co. | | | 20,431 | | | | 1,839,811 | |
Estee Lauder Companies, Inc. — Class A | | | 9,993 | | | | 1,540,421 | |
Kenvue, Inc. | | | 62,161 | | | | 1,333,975 | |
Unilever plc ADR | | | 17,173 | | | | 861,913 | |
elf Beauty, Inc.* | | | 3,385 | | | | 663,562 | |
Total Cosmetics & Personal Care | | | | | | | 10,391,173 | |
| | | | | | | | | |
Agriculture - 13.2% |
Philip Morris International, Inc. | | | 27,563 | | | | 2,525,322 | |
Altria Group, Inc. | | | 43,681 | | | | 1,905,365 | |
Archer-Daniels-Midland Co. | | | 20,684 | | | | 1,299,162 | |
British American Tobacco plc ADR | | | 28,593 | | | | 872,087 | |
Bunge Global S.A. | | | 8,300 | | | | 850,916 | |
Darling Ingredients, Inc.* | | | 12,661 | | | | 588,863 | |
Total Agriculture | | | | | | | 8,041,715 | |
| | | | | | | | | |
Household Products & Housewares - 6.6% |
Kimberly-Clark Corp. | | | 11,023 | | | | 1,425,825 | |
Church & Dwight Company, Inc. | | | 10,234 | | | | 1,067,508 | |
Clorox Co. | | | 5,987 | | | | 916,670 | |
Spectrum Brands Holdings, Inc. | | | 3,981 | | | | 354,349 | |
WD-40 Co. | | | 1,072 | | | | 271,548 | |
Total Household Products & Housewares | | | | | | | 4,035,900 | |
| | | | | | | | | |
Retail - 2.1% |
Casey’s General Stores, Inc. | | | 2,313 | | | | 736,574 | |
Freshpet, Inc.* | | | 4,451 | | | | 515,693 | |
Total Retail | | | | | | | 1,252,267 | |
| | | | | | | | | |
Pharmaceuticals - 0.9% |
BellRing Brands, Inc.* | | | 9,535 | | | | 562,851 | |
| | | | | | | | | |
Total Common Stocks | | | | |
(Cost $32,833,485) | | | | | | | 61,595,707 | |
| | | | | | | | | |
| | | Face
Amount | | | | | |
REPURCHASE AGREEMENTS††,2 - 0.1% |
J.P. Morgan Securities LLC
issued 03/28/24 at 5.31%
due 04/01/24 | | $ | 43,009 | | | | 43,009 | |
BofA Securities, Inc.
issued 03/28/24 at 5.31%
due 04/01/24 | | | 16,542 | | | | 16,542 | |
Barclays Capital, Inc.
issued 03/28/24 at 5.30%
due 04/01/24 | | | 14,994 | | | | 14,994 | |
Total Repurchase Agreements | | | | |
(Cost $74,545) | | | | | | | 74,545 | |
| | | | | | | | | |
| | | Shares | | | | | |
SECURITIES LENDING COLLATERAL†,3 - 1.0% |
Money Market Fund | | | | | | | | |
First American Government Obligations Fund - Class X, 5.23%4 | | | 630,624 | | | | 630,624 | |
Total Securities Lending Collateral | | | | |
(Cost $630,624) | | | | | | | 630,624 | |
| | | | | | | | | |
Total Investments - 102.0% | | | | |
(Cost $33,538,654) | | $ | 62,300,876 | |
Other Assets & Liabilities, net - (2.0)% | | | (1,207,584 | ) |
Total Net Assets - 100.0% | | $ | 61,093,292 | |
36 | THE RYDEX FUNDS ANNUAL REPORT | SEE NOTES TO FINANCIAL STATEMENTS. |
SCHEDULE OF INVESTMENTS (concluded) | March 31, 2024 |
CONSUMER PRODUCTS FUND | |
* | Non-income producing security. |
† | Value determined based on Level 1 inputs — See Note 4. |
†† | Value determined based on Level 2 inputs — See Note 4. |
1 | All or a portion of this security is on loan at March 31, 2024 — See Note 7. |
2 | Repurchase Agreements — See Note 6. |
3 | Securities lending collateral — See Note 7. |
4 | Rate indicated is the 7-day yield as of March 31, 2024. |
| | ADR — American Depositary Receipt |
| | plc — Public Limited Company |
| | |
| | See Sector Classification in Other Information section. |
The following table summarizes the inputs used to value the Fund’s investments at March 31, 2024 (See Note 4 in the Notes to Financial Statements):
Investments in Securities (Assets) | | Level 1
Quoted
Prices | | | Level 2
Significant
Observable
Inputs | | | Level 3
Significant
Unobservable
Inputs | | | Total | |
Common Stocks | | $ | 61,595,707 | | | $ | — | | | $ | — | | | $ | 61,595,707 | |
Repurchase Agreements | | | — | | | | 74,545 | | | | — | | | | 74,545 | |
Securities Lending Collateral | | | 630,624 | | | | — | | | | — | | | | 630,624 | |
Total Assets | | $ | 62,226,331 | | | $ | 74,545 | | | $ | — | | | $ | 62,300,876 | |
SEE NOTES TO FINANCIAL STATEMENTS. | THE RYDEX FUNDS ANNUAL REPORT | 37 |
STATEMENT OF ASSETS AND LIABILITIES |
March 31, 2024 |
Assets: |
Investments, at value - including $598,379 of securities loaned (cost $33,464,109) | | $ | 62,226,331 | |
Repurchase agreements, at value (cost $74,545) | | | 74,545 | |
Cash | | | 12,980 | |
Receivables: |
Dividends | | | 185,357 | |
Fund shares sold | | | 70,023 | |
Foreign tax reclaims | | | 1,389 | |
Securities lending income | | | 99 | |
Interest | | | 44 | |
Total assets | | | 62,570,768 | |
| | | | | |
Liabilities: |
Payable for: |
Fund shares redeemed | | | 728,248 | |
Return of securities lending collateral | | | 630,624 | |
Management fees | | | 42,089 | |
Transfer agent fees | | | 23,139 | |
Portfolio accounting and administration fees | | | 5,075 | |
Distribution and service fees | | | 4,655 | |
Trustees’ fees* | | | 552 | |
Miscellaneous | | | 43,094 | |
Total liabilities | | | 1,477,476 | |
Net assets | | $ | 61,093,292 | |
| | | | | |
Net assets consist of: |
Paid in capital | | $ | 33,929,040 | |
Total distributable earnings (loss) | | | 27,164,252 | |
Net assets | | $ | 61,093,292 | |
| | | | | |
Investor Class: |
Net assets | | $ | 48,221,412 | |
Capital shares outstanding | | | 914,918 | |
Net asset value per share | | $ | 52.71 | |
| | | | | |
Class A: |
Net assets | | $ | 8,392,689 | |
Capital shares outstanding | | | 187,925 | |
Net asset value per share | | $ | 44.66 | |
Maximum offering price per share (Net asset value divided by 95.25%) | | $ | 46.89 | |
| | | | | |
Class C: |
Net assets | | $ | 3,103,370 | |
Capital shares outstanding | | | 97,786 | |
Net asset value per share | | $ | 31.74 | |
| | | | | |
Class H: |
Net assets | | $ | 1,375,821 | |
Capital shares outstanding | | | 32,932 | |
Net asset value per share | | $ | 41.78 | |
STATEMENT OF OPERATIONS |
Year Ended March 31, 2024 |
Investment Income: |
Dividends | | $ | 1,770,388 | |
Interest | | | 12,297 | |
Income from securities lending, net | | | 45,470 | |
Total investment income | | | 1,828,155 | |
| | | | | |
Expenses: |
Management fees | | | 557,421 | |
Distribution and service fees: |
Class A | | | 21,828 | |
Class C | | | 39,077 | |
Class H | | | 3,767 | |
Transfer agent fees | | | 142,708 | |
Portfolio accounting and administration fees | | | 99,963 | |
Registration fees | | | 66,487 | |
Professional fees | | | 29,051 | |
Trustees’ fees* | | | 12,092 | |
Custodian fees | | | 9,204 | |
Line of credit fees | | | 520 | |
Miscellaneous | | | 20,304 | |
Total expenses | | | 1,002,422 | |
Less: |
Expenses reimbursed by Adviser | | | (19,739 | ) |
Net expenses | | | 982,683 | |
Net investment income | | | 845,472 | |
| | | | | |
Net Realized and Unrealized Gain (Loss): |
Net realized gain (loss) on: |
Investments | | | 9,038,604 | |
Net realized gain | | | 9,038,604 | |
Net change in unrealized appreciation (depreciation) on: |
Investments | | | (9,386,084 | ) |
Net change in unrealized appreciation (depreciation) | | | (9,386,084 | ) |
Net realized and unrealized loss | | | (347,480 | ) |
Net increase in net assets resulting from operations | | $ | 497,992 | |
* | Relates to Trustees not deemed “interested persons” within the meaning of Section 2(a)(19) of the 1940 Act. |
38 | THE RYDEX FUNDS ANNUAL REPORT | SEE NOTES TO FINANCIAL STATEMENTS. |
STATEMENTS OF CHANGES IN NET ASSETS |
| | Year Ended
March 31,
2024 | | | Year Ended
March 31,
2023 | |
Increase (Decrease) in Net Assets from Operations: | | | | | | | | |
Net investment income | | $ | 845,472 | | | $ | 1,380,538 | |
Net realized gain on investments | | | 9,038,604 | | | | 7,319,617 | |
Net change in unrealized appreciation (depreciation) on investments | | | (9,386,084 | ) | | | (6,377,523 | ) |
Net increase in net assets resulting from operations | | | 497,992 | | | | 2,322,632 | |
| | | | | | | | | |
Distributions to shareholders: | | | | | | | | |
Investor Class | | | (4,528,074 | ) | | | (6,119,772 | ) |
Class A | | | (1,009,716 | ) | | | (795,613 | ) |
Class C | | | (579,599 | ) | | | (516,440 | ) |
Class H | | | (180,801 | ) | | | (157,306 | ) |
Total distributions to shareholders | | | (6,298,190 | ) | | | (7,589,131 | ) |
| | | | | | | | | |
Capital share transactions: | | | | | | | | |
Proceeds from sale of shares | | | | | | | | |
Investor Class | | | 30,668,858 | | | | 79,518,264 | |
Class A | | | 1,318,675 | | | | 2,870,632 | |
Class C | | | 190,577 | | | | 258,817 | |
Class H | | | 507,400 | | | | 506,704 | |
Distributions reinvested | | | | | | | | |
Investor Class | | | 4,402,722 | | | | 6,019,493 | |
Class A | | | 991,237 | | | | 773,384 | |
Class C | | | 568,974 | | | | 506,935 | |
Class H | | | 180,564 | | | | 154,590 | |
Cost of shares redeemed | | | | | | | | |
Investor Class | | | (45,479,254 | ) | | | (86,456,869 | ) |
Class A | | | (2,493,154 | ) | | | (3,292,719 | ) |
Class C | | | (1,917,191 | ) | | | (1,983,481 | ) |
Class H | | | (896,056 | ) | | | (1,211,992 | ) |
Net decrease from capital share transactions | | | (11,956,648 | ) | | | (2,336,242 | ) |
Net decrease in net assets | | | (17,756,846 | ) | | | (7,602,741 | ) |
| | | | | | | | | |
Net assets: | | | | | | | | |
Beginning of year | | | 78,850,138 | | | | 86,452,879 | |
End of year | | $ | 61,093,292 | | | $ | 78,850,138 | |
| | | | | | | | | |
Capital share activity: | | | | | | | | |
Shares sold | | | | | | | | |
Investor Class | | | 565,331 | | | | 1,362,299 | |
Class A | | | 28,215 | | | | 54,959 | |
Class C | | | 5,111 | | | | 6,490 | |
Class H | | | 11,051 | | | | 10,521 | |
Shares issued from reinvestment of distributions | | | | | | | | |
Investor Class | | | 90,183 | | | | 106,502 | |
Class A | | | 23,943 | | | | 15,803 | |
Class C | | | 19,294 | | | | 13,772 | |
Class H | | | 4,662 | | | | 3,349 | |
Shares redeemed | | | | | | | | |
Investor Class | | | (838,002 | ) | | | (1,488,436 | ) |
Class A | | | (55,030 | ) | | | (65,081 | ) |
Class C | | | (56,953 | ) | | | (49,841 | ) |
Class H | | | (20,051 | ) | | | (25,191 | ) |
Net decrease in shares | | | (222,246 | ) | | | (54,854 | ) |
SEE NOTES TO FINANCIAL STATEMENTS. | THE RYDEX FUNDS ANNUAL REPORT | 39 |
This table is presented to show selected data for a share outstanding throughout each period and to assist shareholders in evaluating a Fund’s performance for the periods presented.
Investor Class | | Year Ended
March 31,
2024 | | | Year Ended
March 31,
2023 | | | Year Ended
March 31,
2022 | | | Year Ended
March 31,
2021 | | | Year Ended
March 31,
2020 | |
Per Share Data |
Net asset value, beginning of period | | $ | 57.24 | | | $ | 60.53 | | | $ | 66.72 | | | $ | 52.88 | | | $ | 59.56 | |
Income (loss) from investment operations: |
Net investment income (loss)a | | | .75 | | | | .97 | | | | .66 | | | | .70 | | | | .72 | |
Net gain (loss) on investments (realized and unrealized) | | | .35 | d | | | (.17 | )e | | | 2.18 | | | | 18.44 | | | | (5.71 | ) |
Total from investment operations | | | 1.10 | | | | .80 | | | | 2.84 | | | | 19.14 | | | | (4.99 | ) |
Less distributions from: |
Net investment income | | | (.88 | ) | | | (.62 | ) | | | (.62 | ) | | | (.73 | ) | | | (.77 | ) |
Net realized gains | | | (4.75 | ) | | | (3.47 | ) | | | (8.41 | ) | | | (4.57 | ) | | | (.92 | ) |
Total distributions | | | (5.63 | ) | | | (4.09 | ) | | | (9.03 | ) | | | (5.30 | ) | | | (1.69 | ) |
Net asset value, end of period | | $ | 52.71 | | | $ | 57.24 | | | $ | 60.53 | | | $ | 66.72 | | | $ | 52.88 | |
|
Total Return | | | 2.71 | % | | | 1.40 | % | | | 4.89 | % | | | 36.78 | % | | | (8.81 | %) |
Ratios/Supplemental Data |
Net assets, end of period (in thousands) | | $ | 48,221 | | | $ | 62,816 | | | $ | 67,612 | | | $ | 83,023 | | | $ | 79,890 | |
Ratios to average net assets: |
Net investment income (loss) | | | 1.39 | % | | | 1.65 | % | | | 1.01 | % | | | 1.12 | % | | | 1.17 | % |
Total expenses | | | 1.43 | % | | | 1.39 | % | | | 1.36 | % | | | 1.45 | % | | | 1.47 | % |
Net expensesb | | | 1.40 | % | | | 1.39 | % | | | 1.36 | % | | | 1.45 | % | | | 1.47 | % |
Portfolio turnover rate | | | 43 | % | | | 79 | % | | | 60 | % | | | 38 | % | | | 59 | % |
Class A | | Year Ended
March 31,
2024 | | | Year Ended
March 31,
2023 | | | Year Ended
March 31,
2022 | | | Year Ended
March 31,
2021 | | | Year Ended
March 31,
2020 | |
Per Share Data |
Net asset value, beginning of period | | $ | 49.52 | | | $ | 53.05 | | | $ | 59.72 | | | $ | 47.88 | | | $ | 54.21 | |
Income (loss) from investment operations: |
Net investment income (loss)a | | | .54 | | | | .68 | | | | .44 | | | | .50 | | | | .51 | |
Net gain (loss) on investments (realized and unrealized) | | | .23 | d | | | (.12 | )e | | | 1.92 | | | | 16.64 | | | | (5.15 | ) |
Total from investment operations | | | .77 | | | | .56 | | | | 2.36 | | | | 17.14 | | | | (4.64 | ) |
Less distributions from: |
Net investment income | | | (.88 | ) | | | (.62 | ) | | | (.62 | ) | | | (.73 | ) | | | (.77 | ) |
Net realized gains | | | (4.75 | ) | | | (3.47 | ) | | | (8.41 | ) | | | (4.57 | ) | | | (.92 | ) |
Total distributions | | | (5.63 | ) | | | (4.09 | ) | | | (9.03 | ) | | | (5.30 | ) | | | (1.69 | ) |
Net asset value, end of period | | $ | 44.66 | | | $ | 49.52 | | | $ | 53.05 | | | $ | 59.72 | | | $ | 47.88 | |
|
Total Returnc | | | 2.46 | % | | | 1.13 | % | | | 4.65 | % | | | 36.43 | % | | | (9.04 | %) |
Ratios/Supplemental Data |
Net assets, end of period (in thousands) | | $ | 8,393 | | | $ | 9,449 | | | $ | 9,820 | | | $ | 10,751 | | | $ | 8,561 | |
Ratios to average net assets: |
Net investment income (loss) | | | 1.15 | % | | | 1.34 | % | | | 0.76 | % | | | 0.89 | % | | | 0.92 | % |
Total expenses | | | 1.68 | % | | | 1.64 | % | | | 1.61 | % | | | 1.69 | % | | | 1.72 | % |
Net expensesb | | | 1.65 | % | | | 1.64 | % | | | 1.61 | % | | | 1.69 | % | | | 1.72 | % |
Portfolio turnover rate | | | 43 | % | | | 79 | % | | | 60 | % | | | 38 | % | | | 59 | % |
40 | THE RYDEX FUNDS ANNUAL REPORT | SEE NOTES TO FINANCIAL STATEMENTS. |
FINANCIAL HIGHLIGHTS (concluded) |
This table is presented to show selected data for a share outstanding throughout each period and to assist shareholders in evaluating a Fund’s performance for the periods presented.
Class C | | Year Ended
March 31,
2024 | | | Year Ended
March 31,
2023 | | | Year Ended
March 31,
2022 | | | Year Ended
March 31,
2021 | | | Year Ended
March 31,
2020 | |
Per Share Data |
Net asset value, beginning of period | | $ | 37.17 | | | $ | 41.14 | | | $ | 48.68 | | | $ | 40.08 | | | $ | 45.98 | |
Income (loss) from investment operations: |
Net investment income (loss)a | | | .13 | | | | .22 | | | | — | | | | .06 | | | | .08 | |
Net gain (loss) on investments (realized and unrealized) | | | .07 | d | | | (.10 | )e | | | 1.49 | | | | 13.84 | | | | (4.29 | ) |
Total from investment operations | | | .20 | | | | .12 | | | | 1.49 | | | | 13.90 | | | | (4.21 | ) |
Less distributions from: |
Net investment income | | | (.88 | ) | | | (.62 | ) | | | (.62 | ) | | | (.73 | ) | | | (.77 | ) |
Net realized gains | | | (4.75 | ) | | | (3.47 | ) | | | (8.41 | ) | | | (4.57 | ) | | | (.92 | ) |
Total distributions | | | (5.63 | ) | | | (4.09 | ) | | | (9.03 | ) | | | (5.30 | ) | | | (1.69 | ) |
Net asset value, end of period | | $ | 31.74 | | | $ | 37.17 | | | $ | 41.14 | | | $ | 48.68 | | | $ | 40.08 | |
|
Total Returnc | | | 1.70 | % | | | 0.37 | % | | | 3.87 | % | | | 35.40 | % | | | (9.73 | %) |
Ratios/Supplemental Data |
Net assets, end of period (in thousands) | | $ | 3,103 | | | $ | 4,845 | | | $ | 6,578 | | | $ | 9,035 | | | $ | 9,816 | |
Ratios to average net assets: |
Net investment income (loss) | | | 0.38 | % | | | 0.56 | % | | | — | | | | 0.12 | % | | | 0.16 | % |
Total expenses | | | 2.43 | % | | | 2.39 | % | | | 2.36 | % | | | 2.45 | % | | | 2.47 | % |
Net expensesb | | | 2.40 | % | | | 2.39 | % | | | 2.36 | % | | | 2.45 | % | | | 2.47 | % |
Portfolio turnover rate | | | 43 | % | | | 79 | % | | | 60 | % | | | 38 | % | | | 59 | % |
Class H | | Year Ended
March 31,
2024 | | | Year Ended
March 31,
2023 | | | Year Ended
March 31,
2022 | | | Year Ended
March 31,
2021 | | | Year Ended
March 31,
2020 | |
Per Share Data |
Net asset value, beginning of period | | $ | 46.71 | | | $ | 50.27 | | | $ | 57.06 | | | $ | 45.93 | | | $ | 52.07 | |
Income (loss) from investment operations: |
Net investment income (loss)a | | | .50 | | | | .62 | | | | .38 | | | | .49 | | | | .46 | |
Net gain (loss) on investments (realized and unrealized) | | | .20 | d | | | (.09 | )e | | | 1.86 | | | | 15.94 | | | | (4.91 | ) |
Total from investment operations | | | .70 | | | | .53 | | | | 2.24 | | | | 16.43 | | | | (4.45 | ) |
Less distributions from: |
Net investment income | | | (.88 | ) | | | (.62 | ) | | | (.62 | ) | | | (.73 | ) | | | (.77 | ) |
Net realized gains | | | (4.75 | ) | | | (3.47 | ) | | | (8.41 | ) | | | (4.57 | ) | | | (.92 | ) |
Total distributions | | | (5.63 | ) | | | (4.09 | ) | | | (9.03 | ) | | | (5.30 | ) | | | (1.69 | ) |
Net asset value, end of period | | $ | 41.78 | | | $ | 46.71 | | | $ | 50.27 | | | $ | 57.06 | | | $ | 45.93 | |
|
Total Return | | | 2.45 | % | | | 1.14 | % | | | 4.65 | % | | | 36.43 | % | | | (9.05 | %) |
Ratios/Supplemental Data |
Net assets, end of period (in thousands) | | $ | 1,376 | | | $ | 1,741 | | | $ | 2,443 | | | $ | 5,601 | | | $ | 4,284 | |
Ratios to average net assets: |
Net investment income (loss) | | | 1.15 | % | | | 1.28 | % | | | 0.68 | % | | | 0.90 | % | | | 0.86 | % |
Total expenses | | | 1.68 | % | | | 1.64 | % | | | 1.61 | % | | | 1.69 | % | | | 1.72 | % |
Net expensesb | | | 1.65 | % | | | 1.64 | % | | | 1.61 | % | | | 1.69 | % | | | 1.72 | % |
Portfolio turnover rate | | | 43 | % | | | 79 | % | | | 60 | % | | | 38 | % | | | 59 | % |
a | Net investment income (loss) per share was computed using average shares outstanding throughout the period. |
b | Net expense information reflects the expense ratios after expense waivers and reimbursements, as applicable. |
c | Total return does not reflect the impact of any applicable sales charges. |
d | The amount shown for a share outstanding throughout the period does not agree with the aggregate net loss on investments for the year because of the sales and repurchases of fund shares in relation to fluctuating market value of the investments of the Fund. |
e | The amount shown for a share outstanding throughout the period does not agree with the aggregate net gain on investments for the year because of the sales and repurchases of fund shares in relation to fluctuating market value of the investments of the Fund. |
SEE NOTES TO FINANCIAL STATEMENTS. | THE RYDEX FUNDS ANNUAL REPORT | 41 |
PERFORMANCE REPORT AND FUND PROFILE (Unaudited) | March 31, 2024 |
ELECTRONICS FUND
OBJECTIVE: Seeks to provide capital appreciation by investing in companies that are involved in the electronics sector, including semiconductor manufacturers and distributors, and makers and vendors of other electronic components and devices (“Electronics Companies”).
For the Reporting Period, Electronics Fund Investor Class returned 43.79%, compared with the S&P 500 Index, which returned 29.88%. The S&P 500 Information Technology Index returned 46.01%.
The industries that contributed the most to performance were semiconductors and semiconductor materials & equipment. No industry detracted from performance.
The holdings that contributed the most to performance were NVIDIA Corp., Broadcom, Inc., and Advanced Micro Devices, Inc. Those that detracted the most were SolarEdge Technologies, Inc., Enphase Energy, Inc., and Wolfspeed, Inc.
Performance displayed represents past performance, which is no guarantee of future results.
Holdings Diversification (Market Exposure as % of Net Assets)
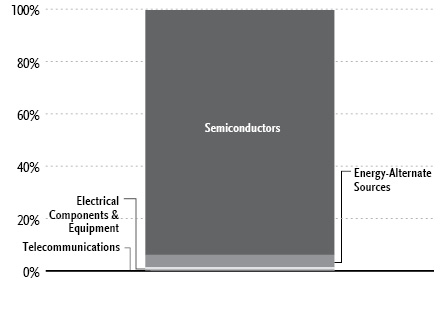
“Holdings Diversification (Market Exposure as % of Net Assets)” excludes any temporary cash investments.
Inception Dates: |
Investor Class | April 1, 1998 |
Class A | September 1, 2004 |
Class C | March 26, 2001 |
Class H | April 2, 1998 |
Ten Largest Holdings | % of Total Net Assets |
NVIDIA Corp. | 15.2% |
Broadcom, Inc. | 7.9% |
Advanced Micro Devices, Inc. | 5.3% |
Intel Corp. | 4.4% |
QUALCOMM, Inc. | 4.4% |
Applied Materials, Inc. | 4.3% |
Texas Instruments, Inc. | 4.1% |
Micron Technology, Inc. | 4.1% |
Lam Research Corp. | 3.7% |
Analog Devices, Inc. | 3.2% |
Top Ten Total | 56.6% |
| | |
“Ten Largest Holdings” excludes any temporary cash investments. |
42 | THE RYDEX FUNDS ANNUAL REPORT | |
PERFORMANCE REPORT AND FUND PROFILE (Unaudited)(concluded) | March 31, 2024 |
Cumulative Fund Performance*
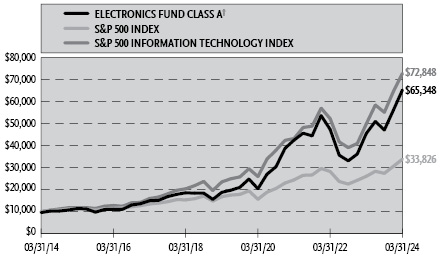
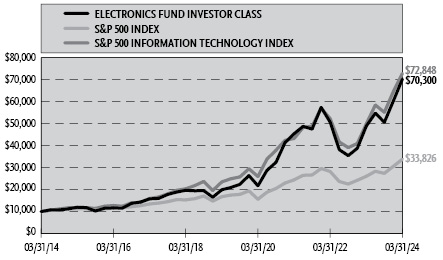
Average Annual Returns*
Periods Ended March 31, 2024
| 1 Year | 5 Year | 10 Year |
Investor Class Shares | 43.79% | 28.68% | 21.53% |
Class A Shares | 43.45% | 28.36% | 21.24% |
Class A Shares with sales charge† | 36.63% | 27.12% | 20.65% |
Class C Shares | 42.38% | 27.40% | 20.33% |
Class C Shares with CDSC‡ | 41.38% | 27.40% | 20.33% |
Class H Shares** | 43.44% | 28.36% | 21.19% |
S&P 500 Information Technology Index | 46.01% | 25.39% | 21.97% |
S&P 500 Index | 29.88% | 15.05% | 12.96% |
* | The performance data above represents past performance that is not predictive of future results. The investment return and principal value of an investment in the Fund will fluctuate so that an investor’s shares, when redeemed, may be worth more or less than their original cost. Returns are historical and include changes in principal and reinvested dividends and capital gains and do not reflect the effect of taxes. The S&P 500 Index and the S&P 500 Information Technology Index are unmanaged indices and, unlike the Fund, have no management fees or operating expenses to reduce their reported returns. The graphs are based on Investor Class shares and Class A shares only; performance for Class C and Class H shares will vary due to differences in fee structures. |
** | Effective September 30, 2015, the Fund’s Advisor Class shares were converted into Class H shares. |
† | Fund returns are calculated using the maximum sales charge of 4.75%. |
‡ | Fund returns include a CDSC of 1% if redeemed within 12 months of purchase. |
| | THE RYDEX FUNDS ANNUAL REPORT | 43 |
SCHEDULE OF INVESTMENTS | March 31, 2024 |
ELECTRONICS FUND | |
| | Shares | | | Value | |
COMMON STOCKS† - 99.7% |
| | | | | | | | | |
Semiconductors - 93.6% |
NVIDIA Corp. | | | 15,850 | | | $ | 14,321,426 | |
Broadcom, Inc. | | | 5,601 | | | | 7,423,621 | |
Advanced Micro Devices, Inc.* | | | 27,454 | | | | 4,955,172 | |
Intel Corp. | | | 93,983 | | | | 4,151,229 | |
QUALCOMM, Inc. | | | 24,501 | | | | 4,148,019 | |
Applied Materials, Inc. | | | 19,626 | | | | 4,047,470 | |
Texas Instruments, Inc. | | | 22,235 | | | | 3,873,559 | |
Micron Technology, Inc. | | | 32,672 | | | | 3,851,702 | |
Lam Research Corp. | | | 3,590 | | | | 3,487,936 | |
Analog Devices, Inc. | | | 15,468 | | | | 3,059,416 | |
KLA Corp. | | | 4,276 | | | | 2,987,085 | |
Marvell Technology, Inc. | | | 31,396 | | | | 2,225,348 | |
NXP Semiconductor N.V. | | | 8,445 | | | | 2,092,418 | |
Microchip Technology, Inc. | | | 22,922 | | | | 2,056,333 | |
ASML Holding N.V. — Class G | | | 1,785 | | | | 1,732,289 | |
Monolithic Power Systems, Inc. | | | 2,334 | | | | 1,581,098 | |
ON Semiconductor Corp.* | | | 21,353 | | | | 1,570,513 | |
Taiwan Semiconductor Manufacturing Company Ltd. ADR | | | 10,632 | | | | 1,446,484 | |
Entegris, Inc. | | | 9,916 | | | | 1,393,595 | |
Teradyne, Inc. | | | 11,584 | | | | 1,307,023 | |
Skyworks Solutions, Inc. | | | 11,956 | | | | 1,295,074 | |
Qorvo, Inc.* | | | 8,828 | | | | 1,013,719 | |
Lattice Semiconductor Corp.* | | | 12,349 | | | | 966,062 | |
MKS Instruments, Inc. | | | 6,925 | | | | 921,025 | |
STMicroelectronics N.V. — Class Y1 | | | 21,147 | | | | 914,396 | |
United Microelectronics Corp. ADR1 | | | 111,835 | | | | 904,745 | |
Kulicke & Soffa Industries, Inc. | | | 17,900 | | | | 900,549 | |
ASE Technology Holding Company Ltd. ADR | | | 78,800 | | | | 866,012 | |
Rambus, Inc.* | | | 12,476 | | | | 771,142 | |
MACOM Technology Solutions Holdings, Inc.* | | | 7,435 | | | | 711,083 | |
Cirrus Logic, Inc.* | | | 7,366 | | | | 681,797 | |
GLOBALFOUNDRIES, Inc.*,1 | | | 12,123 | | | | 631,730 | |
Silicon Laboratories, Inc.* | | | 4,276 | | | | 614,547 | |
Amkor Technology, Inc. | | | 18,391 | | | | 592,926 | |
Wolfspeed, Inc.* | | | 20,058 | | | | 591,711 | |
Power Integrations, Inc. | | | 8,200 | | | | 586,710 | |
Axcelis Technologies, Inc.* | | | 5,061 | | | | 564,403 | |
Synaptics, Inc.* | | | 5,728 | | | | 558,824 | |
Diodes, Inc.* | | | 7,601 | | | | 535,871 | |
Impinj, Inc.* | | | 3,570 | | | | 458,424 | |
Semtech Corp.* | | | 16,419 | | | | 451,358 | |
Allegro MicroSystems, Inc.* | | | 15,497 | | | | 417,799 | |
Ambarella, Inc.* | | | 7,837 | | | | 397,885 | |
Aehr Test Systems* | | | 12,300 | | | | 152,520 | |
Total Semiconductors | | | | | | | 88,212,048 | |
| | | | | | | | | |
Energy-Alternate Sources - 4.7% |
First Solar, Inc.* | | | 7,807 | | | | 1,317,822 | |
Enphase Energy, Inc.* | | | 9,808 | | | | 1,186,572 | |
SolarEdge Technologies, Inc.* | | | 15,399 | | | | 1,093,021 | |
Canadian Solar, Inc.*,1 | | | 43,490 | | | | 859,362 | |
Total Energy-Alternate Sources | | | | | | | 4,456,777 | |
| | | | | | | | | |
Electrical Components & Equipment - 0.9% |
Universal Display Corp. | | | 4,934 | | | | 831,132 | |
| | | | | | | | | |
Telecommunications - 0.5% |
Credo Technology Group Holding Ltd.* | | | 23,609 | | | | 500,275 | |
| | | | | | | | | |
Total Common Stocks | | | | |
(Cost $45,702,032) | | | | | | | 94,000,232 | |
| | | | | | | | | |
| | | Face
Amount | | | | | |
REPURCHASE AGREEMENTS††,2 - 0.5% |
J.P. Morgan Securities LLC
issued 03/28/24 at 5.31%
due 04/01/24 | | $ | 248,367 | | | | 248,367 | |
BofA Securities, Inc.
issued 03/28/24 at 5.31%
due 04/01/24 | | | 95,525 | | | | 95,525 | |
Barclays Capital, Inc.
issued 03/28/24 at 5.30%
due 04/01/24 | | | 86,586 | | | | 86,586 | |
Total Repurchase Agreements | | | | |
(Cost $430,478) | | | | | | | 430,478 | |
| | | | | | | | | |
| | | Shares | | | | | |
SECURITIES LENDING COLLATERAL†,3 - 2.6% |
Money Market Fund | | | | | | | | |
First American Government Obligations Fund - Class X, 5.23%4 | | | 2,421,986 | | | | 2,421,986 | |
Total Securities Lending Collateral | | | | |
(Cost $2,421,986) | | | | | | | 2,421,986 | |
| | | | | | | | | |
Total Investments - 102.8% | | | | |
(Cost $48,554,496) | | $ | 96,852,696 | |
Other Assets & Liabilities, net - (2.8)% | | | (2,617,594 | ) |
Total Net Assets - 100.0% | | $ | 94,235,102 | |
44 | THE RYDEX FUNDS ANNUAL REPORT | SEE NOTES TO FINANCIAL STATEMENTS. |
SCHEDULE OF INVESTMENTS (concluded) | March 31, 2024 |
ELECTRONICS FUND | |
* | Non-income producing security. |
† | Value determined based on Level 1 inputs — See Note 4. |
†† | Value determined based on Level 2 inputs — See Note 4. |
1 | All or a portion of this security is on loan at March 31, 2024 — See Note 7. |
2 | Repurchase Agreements — See Note 6. |
3 | Securities lending collateral — See Note 7. |
4 | Rate indicated is the 7-day yield as of March 31, 2024. |
| | ADR — American Depositary Receipt |
| | |
| | See Sector Classification in Other Information section. |
The following table summarizes the inputs used to value the Fund’s investments at March 31, 2024 (See Note 4 in the Notes to Financial Statements):
Investments in Securities (Assets) | | Level 1
Quoted
Prices | | | Level 2
Significant
Observable
Inputs | | | Level 3
Significant
Unobservable
Inputs | | | Total | |
Common Stocks | | $ | 94,000,232 | | | $ | — | | | $ | — | | | $ | 94,000,232 | |
Repurchase Agreements | | | — | | | | 430,478 | | | | — | | | | 430,478 | |
Securities Lending Collateral | | | 2,421,986 | | | | — | | | | — | | | | 2,421,986 | |
Total Assets | | $ | 96,422,218 | | | $ | 430,478 | | | $ | — | | | $ | 96,852,696 | |
SEE NOTES TO FINANCIAL STATEMENTS. | THE RYDEX FUNDS ANNUAL REPORT | 45 |
STATEMENT OF ASSETS AND LIABILITIES |
March 31, 2024 |
Assets: |
Investments, at value - including $2,299,497 of securities loaned (cost $48,124,018) | | $ | 96,422,218 | |
Repurchase agreements, at value (cost $430,478) | | | 430,478 | |
Cash | | | 31,035 | |
Receivables: |
Fund shares sold | | | 108,434 | |
Dividends | | | 30,536 | |
Securities lending income | | | 2,440 | |
Interest | | | 254 | |
Total assets | | | 97,025,395 | |
| | | | | |
Liabilities: |
Payable for: |
Return of securities lending collateral | | | 2,421,986 | |
Fund shares redeemed | | | 198,813 | |
Management fees | | | 66,215 | |
Transfer agent fees | | | 33,388 | |
Portfolio accounting and administration fees | | | 7,985 | |
Distribution and service fees | | | 3,636 | |
Trustees’ fees* | | | 738 | |
Miscellaneous | | | 57,532 | |
Total liabilities | | | 2,790,293 | |
Net assets | | $ | 94,235,102 | |
| | | | | |
Net assets consist of: |
Paid in capital | | $ | 51,522,545 | |
Total distributable earnings (loss) | | | 42,712,557 | |
Net assets | | $ | 94,235,102 | |
| | | | | |
Investor Class: |
Net assets | | $ | 82,054,635 | |
Capital shares outstanding | | | 194,210 | |
Net asset value per share | | $ | 422.50 | |
| | | | | |
Class A: |
Net assets | | $ | 7,634,681 | |
Capital shares outstanding | | | 19,866 | |
Net asset value per share | | $ | 384.31 | |
Maximum offering price per share (Net asset value divided by 95.25%) | | $ | 403.48 | |
| | | | | |
Class C: |
Net assets | | $ | 1,747,872 | |
Capital shares outstanding | | | 5,370 | |
Net asset value per share | | $ | 325.49 | |
| | | | | |
Class H: |
Net assets | | $ | 2,797,914 | |
Capital shares outstanding | | | 7,514 | |
Net asset value per share | | $ | 372.36 | |
STATEMENT OF OPERATIONS |
Year Ended March 31, 2024 |
Investment Income: |
Dividends (net of foreign withholding tax of $7,565) | | $ | 836,059 | |
Interest | | | 27,753 | |
Income from securities lending, net | | | 22,359 | |
Total investment income | | | 886,171 | |
| | | | | |
Expenses: |
Management fees | | | 674,669 | |
Distribution and service fees: |
Class A | | | 15,271 | |
Class C | | | 13,847 | |
Class H | | | 8,603 | |
Transfer agent fees | | | 170,877 | |
Portfolio accounting and administration fees | | | 120,992 | |
Registration fees | | | 63,227 | |
Professional fees | | | 39,734 | |
Trustees’ fees* | | | 11,768 | |
Custodian fees | | | 10,929 | |
Miscellaneous | | | 40,405 | |
Total expenses | | | 1,170,322 | |
Less: |
Expenses reimbursed by Adviser | | | (25,795 | ) |
Net expenses | | | 1,144,527 | |
Net investment loss | | | (258,356 | ) |
| | | | | |
Net Realized and Unrealized Gain (Loss): |
Net realized gain (loss) on: |
Investments | | | 2,298,068 | |
Net realized gain | | | 2,298,068 | |
Net change in unrealized appreciation (depreciation) on: |
Investments | | | 25,104,892 | |
Net change in unrealized appreciation (depreciation) | | | 25,104,892 | |
Net realized and unrealized gain | | | 27,402,960 | |
Net increase in net assets resulting from operations | | $ | 27,144,604 | |
* | Relates to Trustees not deemed “interested persons” within the meaning of Section 2(a)(19) of the 1940 Act. |
46 | THE RYDEX FUNDS ANNUAL REPORT | SEE NOTES TO FINANCIAL STATEMENTS. |
STATEMENTS OF CHANGES IN NET ASSETS |
| | Year Ended
March 31,
2024 | | | Year Ended
March 31,
2023 | |
Increase (Decrease) in Net Assets from Operations: | | | | | | | | |
Net investment loss | | $ | (258,356 | ) | | $ | (82,834 | ) |
Net realized gain (loss) on investments | | | 2,298,068 | | | | (400,879 | ) |
Net change in unrealized appreciation (depreciation) on investments | | | 25,104,892 | | | | (329,138 | ) |
Net increase (decrease) in net assets resulting from operations | | | 27,144,604 | | | | (812,851 | ) |
| | | | | | | | | |
Capital share transactions: | | | | | | | | |
Proceeds from sale of shares | | | | | | | | |
Investor Class | | | 117,824,436 | | | | 64,807,683 | |
Class A | | | 3,569,727 | | | | 2,458,522 | |
Class C | | | 870,356 | | | | 644,277 | |
Class H | | | 1,607,175 | | | | 4,876,943 | |
Cost of shares redeemed | | | | | | | | |
Investor Class | | | (101,602,963 | ) | | | (83,230,672 | ) |
Class A | | | (4,009,456 | ) | | | (5,039,489 | ) |
Class C | | | (848,357 | ) | | | (1,075,489 | ) |
Class H | | | (5,124,430 | ) | | | (1,279,413 | ) |
Net increase (decrease) from capital share transactions | | | 12,286,488 | | | | (17,837,638 | ) |
Net increase (decrease) in net assets | | | 39,431,092 | | | | (18,650,489 | ) |
| | | | | | | | | |
Net assets: | | | | | | | | |
Beginning of year | | | 54,804,010 | | | | 73,454,499 | |
End of year | | $ | 94,235,102 | | | $ | 54,804,010 | |
| | | | | | | | | |
Capital share activity: | | | | | | | | |
Shares sold | | | | | | | | |
Investor Class | | | 369,137 | | | | 248,810 | |
Class A | | | 12,025 | | | | 10,279 | |
Class C | | | 3,332 | | | | 3,082 | |
Class H | | | 5,523 | | | | 19,796 | |
Shares redeemed | | | | | | | | |
Investor Class | | | (318,257 | ) | | | (304,912 | ) |
Class A | | | (13,692 | ) | | | (20,454 | ) |
Class C | | | (3,413 | ) | | | (5,309 | ) |
Class H | | | (19,867 | ) | | | (5,543 | ) |
Net increase (decrease) in shares | | | 34,788 | | | | (54,251 | ) |
SEE NOTES TO FINANCIAL STATEMENTS. | THE RYDEX FUNDS ANNUAL REPORT | 47 |
This table is presented to show selected data for a share outstanding throughout each period and to assist shareholders in evaluating a Fund’s performance for the periods presented.
Investor Class | | Year Ended
March 31,
2024 | | | Year Ended
March 31,
2023 | | | Year Ended
March 31,
2022 | | | Year Ended
March 31,
2021 | | | Year Ended
March 31,
2020 | |
Per Share Data |
Net asset value, beginning of period | | $ | 293.83 | | | $ | 304.55 | | | $ | 281.78 | | | $ | 137.65 | | | $ | 126.31 | |
Income (loss) from investment operations: |
Net investment income (loss)a | | | (.90 | ) | | | (.35 | ) | | | (1.59 | ) | | | (.71 | ) | | | — | d |
Net gain (loss) on investments (realized and unrealized) | | | 129.57 | | | | (10.37 | ) | | | 35.88 | | | | 150.08 | | | | 11.35 | |
Total from investment operations | | | 128.67 | | | | (10.72 | ) | | | 34.29 | | | | 149.37 | | | | 11.35 | |
Less distributions from: |
Net investment income | | | — | | | | — | | | | — | | | | — | | | | (.01 | ) |
Net realized gains | | | — | | | | — | | | | (11.52 | ) | | | (5.24 | ) | | | — | |
Total distributions | | | — | | | | — | | | | (11.52 | ) | | | (5.24 | ) | | | (.01 | ) |
Net asset value, end of period | | $ | 422.50 | | | $ | 293.83 | | | $ | 304.55 | | | $ | 281.78 | | | $ | 137.65 | |
|
Total Return | | | 43.79 | % | | | (3.52 | %) | | | 11.63 | % | | | 109.05 | % | | | 8.99 | % |
Ratios/Supplemental Data |
Net assets, end of period (in thousands) | | $ | 82,055 | | | $ | 42,114 | | | $ | 60,738 | | | $ | 55,324 | | | $ | 38,634 | |
Ratios to average net assets: |
Net investment income (loss) | | | (0.27 | %) | | | (0.14 | %) | | | (0.51 | %) | | | (0.33 | %) | | | — | e |
Total expenses | | | 1.43 | % | | | 1.39 | % | | | 1.36 | % | | | 1.44 | % | | | 1.48 | % |
Net expensesb | | | 1.39 | % | | | 1.39 | % | | | 1.36 | % | | | 1.44 | % | | | 1.48 | % |
Portfolio turnover rate | | | 96 | % | | | 147 | % | | | 281 | % | | | 163 | % | | | 265 | % |
Class A | | Year Ended
March 31,
2024 | | | Year Ended
March 31,
2023 | | | Year Ended
March 31,
2022 | | | Year Ended
March 31,
2021 | | | Year Ended
March 31,
2020 | |
Per Share Data |
Net asset value, beginning of period | | $ | 267.90 | | | $ | 278.40 | | | $ | 259.00 | | | $ | 127.06 | | | $ | 116.88 | |
Income (loss) from investment operations: |
Net investment income (loss)a | | | (1.69 | ) | | | (.95 | ) | | | (2.15 | ) | | | (1.15 | ) | | | (.31 | ) |
Net gain (loss) on investments (realized and unrealized) | | | 118.10 | | | | (9.55 | ) | | | 33.07 | | | | 138.33 | | | | 10.50 | |
Total from investment operations | | | 116.41 | | | | (10.50 | ) | | | 30.92 | | | | 137.18 | | | | 10.19 | |
Less distributions from: |
Net investment income | | | — | | | | — | | | | — | | | | — | | | | (.01 | ) |
Net realized gains | | | — | | | | — | | | | (11.52 | ) | | | (5.24 | ) | | | — | |
Total distributions | | | — | | | | — | | | | (11.52 | ) | | | (5.24 | ) | | | (.01 | ) |
Net asset value, end of period | | $ | 384.31 | | | $ | 267.90 | | | $ | 278.40 | | | $ | 259.00 | | | $ | 127.06 | |
|
Total Returnc | | | 43.45 | % | | | (3.77 | %) | | | 11.35 | % | | | 108.53 | % | | | 8.72 | % |
Ratios/Supplemental Data |
Net assets, end of period (in thousands) | | $ | 7,635 | | | $ | 5,769 | | | $ | 8,827 | | | $ | 5,156 | | | $ | 2,120 | |
Ratios to average net assets: |
Net investment income (loss) | | | (0.56 | %) | | | (0.41 | %) | | | (0.76 | %) | | | (0.58 | %) | | | (0.23 | %) |
Total expenses | | | 1.68 | % | | | 1.64 | % | | | 1.61 | % | | | 1.69 | % | | | 1.73 | % |
Net expensesb | | | 1.65 | % | | | 1.64 | % | | | 1.61 | % | | | 1.69 | % | | | 1.73 | % |
Portfolio turnover rate | | | 96 | % | | | 147 | % | | | 281 | % | | | 163 | % | | | 265 | % |
48 | THE RYDEX FUNDS ANNUAL REPORT | SEE NOTES TO FINANCIAL STATEMENTS. |
FINANCIAL HIGHLIGHTS (concluded) |
This table is presented to show selected data for a share outstanding throughout each period and to assist shareholders in evaluating a Fund’s performance for the periods presented.
Class C | | Year Ended
March 31,
2024 | | | Year Ended
March 31,
2023 | | | Year Ended
March 31,
2022 | | | Year Ended
March 31,
2021 | | | Year Ended
March 31,
2020 | |
Per Share Data |
Net asset value, beginning of period | | $ | 228.60 | | | $ | 239.35 | | | $ | 225.59 | | | $ | 111.87 | | | $ | 103.69 | |
Income (loss) from investment operations: |
Net investment income (loss)a | | | (3.35 | ) | | | (2.30 | ) | | | (3.58 | ) | | | (2.32 | ) | | | (1.14 | ) |
Net gain (loss) on investments (realized and unrealized) | | | 100.24 | | | | (8.45 | ) | | | 28.86 | | | | 121.28 | | | | 9.33 | |
Total from investment operations | | | 96.89 | | | | (10.75 | ) | | | 25.28 | | | | 118.96 | | | | 8.19 | |
Less distributions from: |
Net investment income | | | — | | | | — | | | | — | | | | — | | | | (.01 | ) |
Net realized gains | | | — | | | | — | | | | (11.52 | ) | | | (5.24 | ) | | | — | |
Total distributions | | | — | | | | — | | | | (11.52 | ) | | | (5.24 | ) | | | (.01 | ) |
Net asset value, end of period | | $ | 325.49 | | | $ | 228.60 | | | $ | 239.35 | | | $ | 225.59 | | | $ | 111.87 | |
|
Total Returnc | | | 42.38 | % | | | (4.49 | %) | | | 10.51 | % | | | 106.98 | % | | | 7.91 | % |
Ratios/Supplemental Data |
Net assets, end of period (in thousands) | | $ | 1,748 | | | $ | 1,246 | | | $ | 1,838 | | | $ | 2,987 | | | $ | 1,701 | |
Ratios to average net assets: |
Net investment income (loss) | | | (1.31 | %) | | | (1.16 | %) | | | (1.48 | %) | | | (1.34 | %) | | | (0.96 | %) |
Total expenses | | | 2.43 | % | | | 2.39 | % | | | 2.36 | % | | | 2.44 | % | | | 2.48 | % |
Net expensesb | | | 2.40 | % | | | 2.39 | % | | | 2.36 | % | | | 2.44 | % | | | 2.48 | % |
Portfolio turnover rate | | | 96 | % | | | 147 | % | | | 281 | % | | | 163 | % | | | 265 | % |
Class H | | Year Ended
March 31,
2024 | | | Year Ended
March 31,
2023 | | | Year Ended
March 31,
2022 | | | Year Ended
March 31,
2021 | | | Year Ended
March 31,
2020 | |
Per Share Data |
Net asset value, beginning of period | | $ | 259.59 | | | $ | 269.75 | | | $ | 251.22 | | | $ | 123.34 | | | $ | 113.47 | |
Income (loss) from investment operations: |
Net investment income (loss)a | | | (1.56 | ) | | | (.97 | ) | | | (2.32 | ) | | | (1.23 | ) | | | (.30 | ) |
Net gain (loss) on investments (realized and unrealized) | | | 114.33 | | | | (9.19 | ) | | | 32.37 | | | | 134.35 | | | | 10.18 | |
Total from investment operations | | | 112.77 | | | | (10.16 | ) | | | 30.05 | | | | 133.12 | | | | 9.88 | |
Less distributions from: |
Net investment income | | | — | | | | — | | | | — | | | | — | | | | (.01 | ) |
Net realized gains | | | — | | | | — | | | | (11.52 | ) | | | (5.24 | ) | | | — | |
Total distributions | | | — | | | | — | | | | (11.52 | ) | | | (5.24 | ) | | | (.01 | ) |
Net asset value, end of period | | $ | 372.36 | | | $ | 259.59 | | | $ | 269.75 | | | $ | 251.22 | | | $ | 123.34 | |
|
Total Return | | | 43.44 | % | | | (3.77 | %) | | | 11.35 | % | | | 108.53 | % | | | 8.72 | % |
Ratios/Supplemental Data |
Net assets, end of period (in thousands) | | $ | 2,798 | | | $ | 5,674 | | | $ | 2,051 | | | $ | 8,383 | | | $ | 2,142 | |
Ratios to average net assets: |
Net investment income (loss) | | | (0.56 | %) | | | (0.43 | %) | | | (0.85 | %) | | | (0.60 | %) | | | (0.22 | %) |
Total expenses | | | 1.68 | % | | | 1.64 | % | | | 1.60 | % | | | 1.67 | % | | | 1.73 | % |
Net expensesb | | | 1.65 | % | | | 1.64 | % | | | 1.60 | % | | | 1.67 | % | | | 1.73 | % |
Portfolio turnover rate | | | 96 | % | | | 147 | % | | | 281 | % | | | 163 | % | | | 265 | % |
a | Net investment income (loss) per share was computed using average shares outstanding throughout the period. |
b | Net expense information reflects the expense ratios after expense waivers and reimbursements, as applicable. |
c | Total return does not reflect the impact of any applicable sales charges. |
d | Less than $0.01 per share. |
e | Less than 0.01% or (0.01%) |
SEE NOTES TO FINANCIAL STATEMENTS. | THE RYDEX FUNDS ANNUAL REPORT | 49 |
PERFORMANCE REPORT AND FUND PROFILE (Unaudited) | March 31, 2024 |
ENERGY FUND
OBJECTIVE: Seeks to provide capital appreciation by investing in companies involved in the energy field, including the exploration, production, and development of oil, gas, coal, and alternative sources of energy (“Energy Companies”).
For the Reporting Period, Energy Fund Investor Class returned 18.30%, compared with the S&P 500 Index, which returned 29.88%. The S&P 500 Energy Index returned 17.67%.
The industries that contributed the most to performance were oil & gas exploration & production, oil & gas storage & transportation, and oil & gas equipment & services. Those that detracted the most were semiconductor materials & equipment, electrical components & equipment, and semiconductors.
The holdings that contributed the most to performance were Phillips 66, Petroleo Brasileiro S.A. ADR, and Marathon Petroleum Corp. Those that detracted the most were SolarEdge Technologies, Inc., Enphase Energy, Inc., and Plug Power, Inc.
Performance displayed represents past performance, which is no guarantee of future results.
Holdings Diversification (Market Exposure as % of Net Assets)
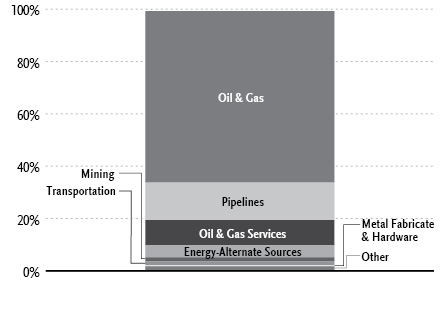
“Holdings Diversification (Market Exposure as % of Net Assets)” excludes any temporary cash investments.
Inception Dates: |
Investor Class | April 21, 1998 |
Class A | September 1, 2004 |
Class C | April 19, 2001 |
Class H | May 5, 1998 |
Ten Largest Holdings | % of Total Net Assets |
Exxon Mobil Corp. | 6.3% |
Chevron Corp. | 4.8% |
ConocoPhillips | 3.7% |
Schlumberger N.V. | 2.6% |
Marathon Petroleum Corp. | 2.5% |
EOG Resources, Inc. | 2.5% |
Phillips 66 | 2.4% |
Pioneer Natural Resources Co. | 2.3% |
Valero Energy Corp. | 2.2% |
Williams Companies, Inc. | 2.0% |
Top Ten Total | 31.3% |
| | |
“Ten Largest Holdings” excludes any temporary cash investments. |
50 | THE RYDEX FUNDS ANNUAL REPORT | |
PERFORMANCE REPORT AND FUND PROFILE (Unaudited)(concluded) | March 31, 2024 |
Cumulative Fund Performance*
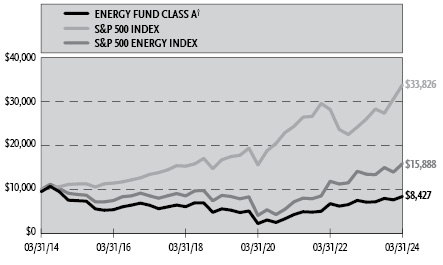

Average Annual Returns*
Periods Ended March 31, 2024
| 1 Year | 5 Year | 10 Year |
Investor Class Class Shares | 18.30% | 8.72% | (0.99%) |
Class A Shares | 18.02% | 8.45% | (1.22%) |
Class A Shares with sales charge† | 12.41% | 7.40% | (1.70%) |
Class C Shares | 17.14% | 7.64% | (1.97%) |
Class C Shares with CDSC‡ | 16.14% | 7.64% | (1.97%) |
Class H Shares** | 18.02% | 8.43% | (1.28%) |
S&P 500 Energy Index | 17.67% | 12.86% | 4.74% |
S&P 500 Index | 29.88% | 15.05% | 12.96% |
* | The performance data above represents past performance that is not predictive of future results. The investment return and principal value of an investment in the Fund will fluctuate so that an investor’s shares, when redeemed, may be worth more or less than their original cost. Returns are historical and include changes in principal and reinvested dividends and capital gains and do not reflect the effect of taxes. The S&P 500 Index and the S&P 500 Energy Index are unmanaged indices and, unlike the Fund, have no management fees or operating expenses to reduce their reported returns. The graphs are based on Investor Class shares and Class A shares only; performance for Class C and Class H shares will vary due to differences in fee structures. |
** | Effective September 30, 2015, the Fund’s Advisor Class shares were converted into Class H shares. |
† | Fund returns are calculated using the maximum sales charge of 4.75%. |
‡ | Fund returns include a CDSC of 1% if redeemed within 12 months of purchase. |
| | THE RYDEX FUNDS ANNUAL REPORT | 51 |
SCHEDULE OF INVESTMENTS | March 31, 2024 |
ENERGY FUND | |
| | Shares | | | Value | |
COMMON STOCKS† - 99.2% |
| | | | | | | | | |
Oil & Gas - 65.7% |
Exxon Mobil Corp. | | | 18,193 | | | $ | 2,114,754 | |
Chevron Corp. | | | 10,155 | | | | 1,601,850 | |
ConocoPhillips | | | 9,674 | | | | 1,231,307 | |
Marathon Petroleum Corp. | | | 4,182 | | | | 842,673 | |
EOG Resources, Inc. | | | 6,584 | | | | 841,699 | |
Phillips 66 | | | 5,023 | | | | 820,457 | |
Pioneer Natural Resources Co. | | | 2,915 | | | | 765,187 | |
Valero Energy Corp. | | | 4,376 | | | | 746,939 | |
Hess Corp. | | | 4,238 | | | | 646,888 | |
Occidental Petroleum Corp. | | | 9,671 | | | | 628,518 | |
Diamondback Energy, Inc. | | | 2,946 | | | | 583,809 | |
Devon Energy Corp. | | | 11,037 | | | | 553,837 | |
Shell plc ADR | | | 7,575 | | | | 507,828 | |
BP plc ADR | | | 12,833 | | | | 483,547 | |
Coterra Energy, Inc. — Class A | | | 15,738 | | | | 438,775 | |
Canadian Natural Resources Ltd. | | | 5,608 | | | | 428,003 | |
Marathon Oil Corp. | | | 14,393 | | | | 407,898 | |
Cenovus Energy, Inc. | | | 19,282 | | | | 385,447 | |
Petroleo Brasileiro S.A. ADR | | | 25,324 | | | | 385,178 | |
Equities Corp. | | | 10,265 | | | | 380,524 | |
Suncor Energy, Inc. | | | 10,259 | | | | 378,660 | |
Ovintiv, Inc. | | | 6,968 | | | | 361,639 | |
Permian Resources Corp. | | | 18,928 | | | | 334,268 | |
Chesapeake Energy Corp.1 | | | 3,706 | | | | 329,204 | |
APA Corp. | | | 9,373 | | | | 322,244 | |
HF Sinclair Corp. | | | 4,929 | | | | 297,564 | |
Southwestern Energy Co.* | | | 37,563 | | | | 284,728 | |
Antero Resources Corp.* | | | 9,733 | | | | 282,257 | |
Range Resources Corp. | | | 8,007 | | | | 275,681 | |
Equinor ASA ADR1 | | | 10,118 | | | | 273,490 | |
Civitas Resources, Inc. | | | 3,569 | | | | 270,923 | |
Chord Energy Corp. | | | 1,486 | | | | 264,865 | |
Matador Resources Co. | | | 3,847 | | | | 256,864 | |
Murphy Oil Corp. | | | 5,536 | | | | 252,995 | |
SM Energy Co. | | | 4,760 | | | | 237,286 | |
PBF Energy, Inc. — Class A | | | 4,110 | | | | 236,613 | |
Noble Corporation plc | | | 4,766 | | | | 231,103 | |
Weatherford International plc* | | | 1,923 | | | | 221,953 | |
Magnolia Oil & Gas Corp. — Class A | | | 8,416 | | | | 218,395 | |
Valaris Ltd.* | | | 2,846 | | | | 214,190 | |
Patterson-UTI Energy, Inc. | | | 16,858 | | | | 201,284 | |
Northern Oil and Gas, Inc. | | | 4,685 | | | | 185,901 | |
Transocean Ltd.* | | | 29,534 | | | | 185,473 | |
California Resources Corp. | | | 3,356 | | | | 184,916 | |
Helmerich & Payne, Inc. | | | 4,394 | | | | 184,812 | |
CNX Resources Corp.* | | | 7,785 | | | | 184,660 | |
Kosmos Energy Ltd.* | | | 26,675 | | | | 158,983 | |
Callon Petroleum Co.* | | | 4,075 | | | | 145,722 | |
Delek US Holdings, Inc. | | | 4,591 | | | | 141,127 | |
Comstock Resources, Inc.1 | | | 9,830 | | | | 91,222 | |
Total Oil & Gas | | | | | | | 22,004,140 | |
| | | | | | | | | |
Pipelines - 14.3% |
Williams Companies, Inc. | | | 17,568 | | | | 684,625 | |
ONEOK, Inc. | | | 8,219 | | | | 658,917 | |
Cheniere Energy, Inc. | | | 3,631 | | | | 585,608 | |
Kinder Morgan, Inc. | | | 31,195 | | | | 572,116 | |
Targa Resources Corp. | | | 4,344 | | | | 486,484 | |
Enbridge, Inc. | | | 11,641 | | | | 421,171 | |
TC Energy Corp. | | | 7,278 | | | | 292,576 | |
Golar LNG Ltd. | | | 10,506 | | | | 252,774 | |
DT Midstream, Inc. | | | 3,856 | | | | 235,602 | |
Equitrans Midstream Corp. | | | 18,281 | | | | 228,330 | |
Pembina Pipeline Corp. | | | 6,337 | | | | 223,950 | |
New Fortress Energy, Inc. | | | 4,851 | | | | 148,392 | |
Total Pipelines | | | | | | | 4,790,545 | |
| | | | | | | | | |
Oil & Gas Services - 9.7% |
Schlumberger N.V. | | | 15,879 | | | | 870,328 | |
Baker Hughes Co. | | | 16,995 | | | | 569,332 | |
Halliburton Co. | | | 14,055 | | | | 554,048 | |
TechnipFMC plc | | | 13,890 | | | | 348,778 | |
NOV, Inc. | | | 13,930 | | | | 271,914 | |
ChampionX Corp. | | | 7,265 | | | | 260,741 | |
Tidewater, Inc.* | | | 2,233 | | | | 205,436 | |
Liberty Energy, Inc. — Class A | | | 7,760 | | | | 160,787 | |
Total Oil & Gas Services | | | | | | | 3,241,364 | |
| | | | | | | | | |
Energy-Alternate Sources - 4.6% |
SolarEdge Technologies, Inc.* | | | 5,867 | | | | 416,440 | |
First Solar, Inc.* | | | 2,352 | | | | 397,017 | |
Enphase Energy, Inc.* | | | 2,952 | | | | 357,133 | |
Sunrun, Inc.* | | | 12,485 | | | | 164,552 | |
Green Plains, Inc.* | | | 5,101 | | | | 117,935 | |
Plug Power, Inc.*,1 | | | 24,411 | | | | 83,974 | |
Total Energy-Alternate Sources | | | | | | | 1,537,051 | |
| | | | | | | | | |
Mining - 1.5% |
Cameco Corp. | | | 8,485 | | | | 367,570 | |
Uranium Energy Corp.* | | | 22,212 | | | | 149,931 | |
Total Mining | | | | | | | 517,501 | |
| | | | | | | | | |
Transportation - 1.4% |
Scorpio Tankers, Inc. | | | 3,472 | | | | 248,422 | |
Frontline plc | | | 9,724 | | | | 227,347 | |
Total Transportation | | | | | | | 475,769 | |
| | | | | | | | | |
Metal Fabricate & Hardware - 0.7% |
Tenaris S.A. ADR | | | 6,365 | | | | 249,954 | |
| | | | | | | | | |
Coal - 0.7% |
Peabody Energy Corp.1 | | | 6,277 | | | | 152,280 | |
CONSOL Energy, Inc. | | | 1,095 | | | | 91,717 | |
Total Coal | | | | | | | 243,997 | |
| | | | | | | | | |
Retail - 0.6% |
Murphy USA, Inc. | | | 491 | | | | 205,827 | |
| | | | | | | | | |
Total Common Stocks | | | | |
(Cost $16,694,732) | | | | | | | 33,266,148 | |
52 | THE RYDEX FUNDS ANNUAL REPORT | SEE NOTES TO FINANCIAL STATEMENTS. |
SCHEDULE OF INVESTMENTS (concluded) | March 31, 2024 |
ENERGY FUND | |
| | Face
Amount | | | Value | |
REPURCHASE AGREEMENTS††,2 - 0.6% |
J.P. Morgan Securities LLC
issued 03/28/24 at 5.31%
due 04/01/24 | | $ | 110,982 | | | $ | 110,982 | |
BofA Securities, Inc.
issued 03/28/24 at 5.31%
due 04/01/24 | | | 42,686 | | | | 42,686 | |
Barclays Capital, Inc.
issued 03/28/24 at 5.30%
due 04/01/24 | | | 38,691 | | | | 38,691 | |
Total Repurchase Agreements | | | | |
(Cost $192,359) | | | | | | | 192,359 | |
| | | | | | | | | |
| | Shares | | | | |
SECURITIES LENDING COLLATERAL†,3 - 1.5% |
Money Market Fund | | | | | | | | |
First American Government Obligations Fund - Class X, 5.23%4 | | | 506,774 | | | | 506,774 | |
Total Securities Lending Collateral | | | | |
(Cost $506,774) | | | | | | $ | 506,774 | |
| | | | | | | | | |
Total Investments - 101.3% | | | | |
(Cost $17,393,865) | | $ | 33,965,281 | |
Other Assets & Liabilities, net - (1.3)% | | | (443,127 | ) |
Total Net Assets - 100.0% | | $ | 33,522,154 | |
* | Non-income producing security. |
† | Value determined based on Level 1 inputs — See Note 4. |
†† | Value determined based on Level 2 inputs — See Note 4. |
1 | All or a portion of this security is on loan at March 31, 2024 — See Note 7. |
2 | Repurchase Agreements — See Note 6. |
3 | Securities lending collateral — See Note 7. |
4 | Rate indicated is the 7-day yield as of March 31, 2024. |
| | ADR — American Depositary Receipt |
| | plc — Public Limited Company |
| | |
| | See Sector Classification in Other Information section. |
The following table summarizes the inputs used to value the Fund’s investments at March 31, 2024 (See Note 4 in the Notes to Financial Statements):
Investments in Securities (Assets) | | Level 1
Quoted
Prices | | | Level 2
Significant
Observable
Inputs | | | Level 3
Significant
Unobservable
Inputs | | | Total | |
Common Stocks | | $ | 33,266,148 | | | $ | — | | | $ | — | | | $ | 33,266,148 | |
Repurchase Agreements | | | — | | | | 192,359 | | | | — | | | | 192,359 | |
Securities Lending Collateral | | | 506,774 | | | | — | | | | — | | | | 506,774 | |
Total Assets | | $ | 33,772,922 | | | $ | 192,359 | | | $ | — | | | $ | 33,965,281 | |
SEE NOTES TO FINANCIAL STATEMENTS. | THE RYDEX FUNDS ANNUAL REPORT | 53 |
STATEMENT OF ASSETS AND LIABILITIES |
March 31, 2024 |
Assets: |
Investments, at value - including $485,516 of securities loaned (cost $17,201,506) | | $ | 33,772,922 | |
Repurchase agreements, at value (cost $192,359) | | | 192,359 | |
Cash | | | 9,196 | |
Receivables: |
Fund shares sold | | | 113,640 | |
Dividends | | | 18,808 | |
Securities lending income | | | 395 | |
Interest | | | 113 | |
Total assets | | | 34,107,433 | |
| | | | | |
Liabilities: |
Payable for: |
Return of securities lending collateral | | | 506,774 | |
Management fees | | | 21,114 | |
Transfer agent fees | | | 13,328 | |
Fund shares redeemed | | | 8,535 | |
Distribution and service fees | | | 2,741 | |
Portfolio accounting and administration fees | | | 2,546 | |
Trustees’ fees* | | | 383 | |
Miscellaneous | | | 29,858 | |
Total liabilities | | | 585,279 | |
Net assets | | $ | 33,522,154 | |
| | | | | |
Net assets consist of: |
Paid in capital | | $ | 34,292,440 | |
Total distributable earnings (loss) | | | (770,286 | ) |
Net assets | | $ | 33,522,154 | |
| | | | | |
Investor Class: |
Net assets | | $ | 24,579,467 | |
Capital shares outstanding | | | 86,728 | |
Net asset value per share | | $ | 283.41 | |
| | | | | |
Class A: |
Net assets | | $ | 4,413,808 | |
Capital shares outstanding | | | 17,032 | |
Net asset value per share | | $ | 259.15 | |
Maximum offering price per share (Net asset value divided by 95.25%) | | $ | 272.07 | |
| | | | | |
Class C: |
Net assets | | $ | 1,885,406 | |
Capital shares outstanding | | | 8,735 | |
Net asset value per share | | $ | 215.84 | |
| | | | | |
Class H: |
Net assets | | $ | 2,643,473 | |
Capital shares outstanding | | | 10,566 | |
Net asset value per share | | $ | 250.19 | |
STATEMENT OF OPERATIONS |
Year Ended March 31, 2024 |
Investment Income: |
Dividends (net of foreign withholding tax of $18,039) | | $ | 1,379,932 | |
Interest | | | 9,539 | |
Income from securities lending, net | | | 5,948 | |
Total investment income | | | 1,395,419 | |
| | | | | |
Expenses: |
Management fees | | | 360,371 | |
Distribution and service fees: |
Class A | | | 10,808 | |
Class C | | | 21,496 | |
Class H | | | 4,339 | |
Transfer agent fees | | | 94,390 | |
Portfolio accounting and administration fees | | | 64,624 | |
Registration fees | | | 53,484 | |
Professional fees | | | 16,884 | |
Trustees’ fees* | | | 9,204 | |
Custodian fees | | | 6,089 | |
Line of credit fees | | | 259 | |
Miscellaneous | | | 7,045 | |
Total expenses | | | 648,993 | |
Less: |
Expenses reimbursed by Adviser | | | (14,678 | ) |
Net expenses | | | 634,315 | |
Net investment income | | | 761,104 | |
| | | | | |
Net Realized and Unrealized Gain (Loss): |
Net realized gain (loss) on: |
Investments | | | 10,149,054 | |
Net realized gain | | | 10,149,054 | |
Net change in unrealized appreciation (depreciation) on: |
Investments | | | (8,687,737 | ) |
Net change in unrealized appreciation (depreciation) | | | (8,687,737 | ) |
Net realized and unrealized gain | | | 1,461,317 | |
Net increase in net assets resulting from operations | | $ | 2,222,421 | |
* | Relates to Trustees not deemed “interested persons” within the meaning of Section 2(a)(19) of the 1940 Act. |
54 | THE RYDEX FUNDS ANNUAL REPORT | SEE NOTES TO FINANCIAL STATEMENTS. |
STATEMENTS OF CHANGES IN NET ASSETS |
| | Year Ended
March 31,
2024 | | | Year Ended
March 31,
2023 | |
Increase (Decrease) in Net Assets from Operations: | | | | | | | | |
Net investment income | | $ | 761,104 | | | $ | 2,624,759 | |
Net realized gain on investments | | | 10,149,054 | | | | 1,513,188 | |
Net change in unrealized appreciation (depreciation) on investments | | | (8,687,737 | ) | | | (3,129,366 | ) |
Net increase in net assets resulting from operations | | | 2,222,421 | | | | 1,008,581 | |
| | | | | | | | | |
Distributions to shareholders: | | | | | | | | |
Investor Class | | | (1,379,867 | ) | | | (1,959,102 | ) |
Class A | | | (122,041 | ) | | | (135,857 | ) |
Class C | | | (71,490 | ) | | | (93,199 | ) |
Class H | | | (36,889 | ) | | | (44,531 | ) |
Total distributions to shareholders | | | (1,610,287 | ) | | | (2,232,689 | ) |
| | | | | | | | | |
Capital share transactions: | | | | | | | | |
Proceeds from sale of shares | | | | | | | | |
Investor Class | | | 231,819,975 | | | | 407,488,224 | |
Class A | | | 2,695,528 | | | | 3,874,977 | |
Class C | | | 752,936 | | | | 2,397,625 | |
Class H | | | 5,454,292 | | | | 6,210,390 | |
Distributions reinvested | | | | | | | | |
Investor Class | | | 1,308,347 | | | | 1,886,962 | |
Class A | | | 117,682 | | | | 123,065 | |
Class C | | | 69,867 | | | | 90,710 | |
Class H | | | 36,342 | | | | 44,038 | |
Cost of shares redeemed | | | | | | | | |
Investor Class | | | (272,676,183 | ) | | | (401,744,251 | ) |
Class A | | | (3,672,418 | ) | | | (3,229,120 | ) |
Class C | | | (1,516,746 | ) | | | (1,613,288 | ) |
Class H | | | (4,148,511 | ) | | | (6,982,117 | ) |
Net increase (decrease) from capital share transactions | | | (39,758,889 | ) | | | 8,547,215 | |
Net increase (decrease) in net assets | | | (39,146,755 | ) | | | 7,323,107 | |
| | | | | | | | | |
Net assets: | | | | | | | | |
Beginning of year | | | 72,668,909 | | | | 65,345,802 | |
End of year | | $ | 33,522,154 | | | $ | 72,668,909 | |
| | | | | | | | | |
Capital share activity: | | | | | | | | |
Shares sold | | | | | | | | |
Investor Class | | | 869,045 | | | | 1,598,042 | |
Class A | | | 11,283 | | | | 16,517 | |
Class C | | | 3,642 | | | | 11,680 | |
Class H | | | 22,654 | | | | 27,295 | |
Shares issued from reinvestment of distributions | | | | | | | | |
Investor Class | | | 5,398 | | | | 7,383 | |
Class A | | | 531 | | | | 524 | |
Class C | | | 377 | | | | 456 | |
Class H | | | 170 | | | | 194 | |
Shares redeemed | | | | | | | | |
Investor Class | | | (1,048,889 | ) | | | (1,584,347 | ) |
Class A | | | (15,653 | ) | | | (14,291 | ) |
Class C | | | (7,663 | ) | | | (8,415 | ) |
Class H | | | (17,865 | ) | | | (31,583 | ) |
Net increase (decrease) in shares | | | (176,970 | ) | | | 23,455 | |
SEE NOTES TO FINANCIAL STATEMENTS. | THE RYDEX FUNDS ANNUAL REPORT | 55 |
This table is presented to show selected data for a share outstanding throughout each period and to assist shareholders in evaluating a Fund’s performance for the periods presented.
Investor Class | | Year Ended
March 31,
2024 | | | Year Ended
March 31,
2023 | | | Year Ended
March 31,
2022 | | | Year Ended
March 31,
2021 | | | Year Ended
March 31,
2020d | |
Per Share Data |
Net asset value, beginning of period | | $ | 246.39 | | | $ | 239.96 | | | $ | 152.94 | | | $ | 81.74 | | | $ | 204.01 | |
Income (loss) from investment operations: |
Net investment income (loss)a | | | 4.93 | | | | 7.06 | | | | 3.62 | | | | 1.44 | | | | 2.91 | |
Net gain (loss) on investments (realized and unrealized) | | | 38.98 | | | | 6.01 | e | | | 84.29 | | | | 72.59 | | | | (123.74 | ) |
Total from investment operations | | | 43.91 | | | | 13.07 | | | | 87.91 | | | | 74.03 | | | | (120.83 | ) |
Less distributions from: |
Net investment income | | | (6.89 | ) | | | (6.64 | ) | | | (.89 | ) | | | (2.83 | ) | | | (1.44 | ) |
Total distributions | | | (6.89 | ) | | | (6.64 | ) | | | (.89 | ) | | | (2.83 | ) | | | (1.44 | ) |
Net asset value, end of period | | $ | 283.41 | | | $ | 246.39 | | | $ | 239.96 | | | $ | 152.94 | | | $ | 81.74 | |
|
Total Return | | | 18.30 | % | | | 5.34 | % | | | 57.65 | % | | | 91.43 | % | | | (59.61 | %) |
Ratios/Supplemental Data |
Net assets, end of period (in thousands) | | $ | 24,579 | | | $ | 64,350 | | | $ | 57,612 | | | $ | 18,220 | | | $ | 4,216 | |
Ratios to average net assets: |
Net investment income (loss) | | | 1.91 | % | | | 2.79 | % | | | 1.99 | % | | | 2.02 | % | | | 1.65 | % |
Total expenses | | | 1.45 | % | | | 1.39 | % | | | 1.36 | % | | | 1.42 | % | | | 1.48 | % |
Net expensesb | | | 1.41 | % | | | 1.39 | % | | | 1.36 | % | | | 1.42 | % | | | 1.48 | % |
Portfolio turnover rate | | | 500 | % | | | 363 | % | | | 382 | % | | | 939 | % | | | 428 | % |
Class A | | Year Ended
March 31,
2024 | | | Year Ended
March 31,
2023 | | | Year Ended
March 31,
2022 | | | Year Ended
March 31,
2021 | | | Year Ended
March 31,
2020d | |
Per Share Data |
Net asset value, beginning of period | | $ | 226.42 | | | $ | 221.55 | | | $ | 141.62 | | | $ | 76.01 | | | $ | 190.30 | |
Income (loss) from investment operations: |
Net investment income (loss)a | | | 3.80 | | | | 5.79 | | | | 2.67 | | | | 1.00 | | | | 2.46 | |
Net gain (loss) on investments (realized and unrealized) | | | 35.82 | | | | 5.72 | e | | | 78.15 | | | | 67.44 | | | | (115.31 | ) |
Total from investment operations | | | 39.62 | | | | 11.51 | | | | 80.82 | | | | 68.44 | | | | (112.85 | ) |
Less distributions from: |
Net investment income | | | (6.89 | ) | | | (6.64 | ) | | | (.89 | ) | | | (2.83 | ) | | | (1.44 | ) |
Total distributions | | | (6.89 | ) | | | (6.64 | ) | | | (.89 | ) | | | (2.83 | ) | | | (1.44 | ) |
Net asset value, end of period | | $ | 259.15 | | | $ | 226.42 | | | $ | 221.55 | | | $ | 141.62 | | | $ | 76.01 | |
|
Total Returnc | | | 18.02 | % | | | 5.08 | % | | | 57.25 | % | | | 90.89 | % | | | (59.69 | %) |
Ratios/Supplemental Data |
Net assets, end of period (in thousands) | | $ | 4,414 | | | $ | 4,726 | | | $ | 4,015 | | | $ | 2,214 | | | $ | 985 | |
Ratios to average net assets: |
Net investment income (loss) | | | 1.61 | % | | | 2.48 | % | | | 1.60 | % | | | 1.60 | % | | | 1.50 | % |
Total expenses | | | 1.68 | % | | | 1.64 | % | | | 1.61 | % | | | 1.68 | % | | | 1.73 | % |
Net expensesb | | | 1.65 | % | | | 1.64 | % | | | 1.61 | % | | | 1.68 | % | | | 1.73 | % |
Portfolio turnover rate | | | 500 | % | | | 363 | % | | | 382 | % | | | 939 | % | | | 428 | % |
56 | THE RYDEX FUNDS ANNUAL REPORT | SEE NOTES TO FINANCIAL STATEMENTS. |
FINANCIAL HIGHLIGHTS (concluded) |
This table is presented to show selected data for a share outstanding throughout each period and to assist shareholders in evaluating a Fund’s performance for the periods presented.
Class C | | Year Ended
March 31,
2024 | | | Year Ended
March 31,
2023 | | | Year Ended
March 31,
2022 | | | Year Ended
March 31,
2021 | | | Year Ended
March 31,
2020d | |
Per Share Data |
Net asset value, beginning of period | | $ | 191.16 | | | $ | 189.40 | | | $ | 122.07 | | | $ | 66.27 | | | $ | 167.39 | |
Income (loss) from investment operations: |
Net investment income (loss)a | | | 1.68 | | | | 3.61 | | | | 1.32 | | | | .56 | | | | 1.08 | |
Net gain (loss) on investments (realized and unrealized) | | | 29.89 | | | | 4.79 | e | | | 66.90 | | | | 58.07 | | | | (100.76 | ) |
Total from investment operations | | | 31.57 | | | | 8.40 | | | | 68.22 | | | | 58.63 | | | | (99.68 | ) |
Less distributions from: |
Net investment income | | | (6.89 | ) | | | (6.64 | ) | | | (.89 | ) | | | (2.83 | ) | | | (1.44 | ) |
Total distributions | | | (6.89 | ) | | | (6.64 | ) | | | (.89 | ) | | | (2.83 | ) | | | (1.44 | ) |
Net asset value, end of period | | $ | 215.84 | | | $ | 191.16 | | | $ | 189.40 | | | $ | 122.07 | | | $ | 66.27 | |
|
Total Returnc | | | 17.14 | % | | | 4.29 | % | | | 56.07 | % | | | 89.48 | % | | | (60.01 | %) |
Ratios/Supplemental Data |
Net assets, end of period (in thousands) | | $ | 1,885 | | | $ | 2,366 | | | $ | 1,640 | | | $ | 746 | | | $ | 432 | |
Ratios to average net assets: |
Net investment income (loss) | | | 0.84 | % | | | 1.82 | % | | | 0.91 | % | | | 1.05 | % | | | 0.76 | % |
Total expenses | | | 2.43 | % | | | 2.39 | % | | | 2.36 | % | | | 2.44 | % | | | 2.48 | % |
Net expensesb | | | 2.40 | % | | | 2.39 | % | | | 2.36 | % | | | 2.44 | % | | | 2.48 | % |
Portfolio turnover rate | | | 500 | % | | | 363 | % | | | 382 | % | | | 939 | % | | | 428 | % |
Class H | | Year Ended
March 31,
2024 | | | Year Ended
March 31,
2023 | | | Year Ended
March 31,
2022 | | | Year Ended
March 31,
2021 | | | Year Ended
March 31,
2020d | |
Per Share Data |
Net asset value, beginning of period | | $ | 218.83 | | | $ | 214.30 | | | $ | 137.02 | | | $ | 73.61 | | | $ | 184.50 | |
Income (loss) from investment operations: |
Net investment income (loss)a | | | 2.97 | | | | 5.41 | | | | 2.80 | | | | 1.06 | | | | 1.92 | |
Net gain (loss) on investments (realized and unrealized) | | | 35.28 | | | | 5.76 | e | | | 75.37 | | | | 65.18 | | | | (111.37 | ) |
Total from investment operations | | | 38.25 | | | | 11.17 | | | | 78.17 | | | | 66.24 | | | | (109.45 | ) |
Less distributions from: |
Net investment income | | | (6.89 | ) | | | (6.64 | ) | | | (.89 | ) | | | (2.83 | ) | | | (1.44 | ) |
Total distributions | | | (6.89 | ) | | | (6.64 | ) | | | (.89 | ) | | | (2.83 | ) | | | (1.44 | ) |
Net asset value, end of period | | $ | 250.19 | | | $ | 218.83 | | | $ | 214.30 | | | $ | 137.02 | | | $ | 73.61 | |
|
Total Return | | | 18.02 | % | | | 5.08 | % | | | 57.25 | % | | | 90.87 | % | | | (59.73 | %) |
Ratios/Supplemental Data |
Net assets, end of period (in thousands) | | $ | 2,643 | | | $ | 1,227 | | | $ | 2,079 | | | $ | 1,578 | | | $ | 646 | |
Ratios to average net assets: |
Net investment income (loss) | | | 1.28 | % | | | 2.40 | % | | | 1.73 | % | | | 1.60 | % | | | 1.25 | % |
Total expenses | | | 1.68 | % | | | 1.65 | % | | | 1.61 | % | | | 1.68 | % | | | 1.72 | % |
Net expensesb | | | 1.65 | % | | | 1.65 | % | | | 1.61 | % | | | 1.68 | % | | | 1.72 | % |
Portfolio turnover rate | | | 500 | % | | | 363 | % | | | 382 | % | | | 939 | % | | | 428 | % |
a | Net investment income (loss) per share was computed using average shares outstanding throughout the period. |
b | Net expense information reflects the expense ratios after expense waivers and reimbursements, as applicable. |
c | Total return does not reflect the impact of any applicable sales charges. |
d | Reverse share split — Per share amounts for the years presented through March 31, 2020 have been restated to reflect a 1:3 reverse share split effective August 10, 2020. |
e | The amount shown for a share outstanding throughout the period does not agree with the aggregate net loss on investments for the year because of the sales and repurchases of fund shares in relation to fluctuating market value of the investments of the Fund. |
SEE NOTES TO FINANCIAL STATEMENTS. | THE RYDEX FUNDS ANNUAL REPORT | 57 |
PERFORMANCE REPORT AND FUND PROFILE (Unaudited) | March 31, 2024 |
ENERGY SERVICES FUND
OBJECTIVE: Seeks to provide capital appreciation by investing in companies that are involved in the energy services field, including those that provide services and equipment in the areas of oil, coal, and gas exploration and production (“Energy Services Companies”).
For the Reporting Period, Energy Services Fund Investor Class returned 25.37%, compared with the S&P 500 Index, which returned 29.88%. The S&P 500 Energy Index returned 17.67%.
The industries that contributed the most to performance were oil & gas equipment & services and oil & gas drilling. No industry detracted from performance.
The holdings that contributed the most to performance were Weatherford International Plc, TechnipFMC Plc, and Tidewater, Inc. Those that detracted the most were ProFac Holding Corp. – Class A, Nabors Industries Ltd., and Nine Energy Services, Inc.
Performance displayed represents past performance, which is no guarantee of future results.
Holdings Diversification (Market Exposure as % of Net Assets)
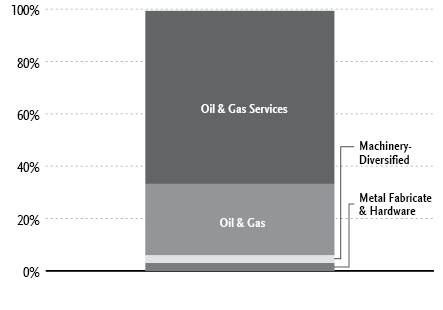
“Holdings Diversification (Market Exposure as % of Net Assets)” excludes any temporary cash investments.
Inception Dates: |
Investor Class | April 1, 1998 |
Class A | September 1, 2004 |
Class C | March 30, 2001 |
Class H | April 2, 1998 |
Ten Largest Holdings | % of Total Net Assets |
Schlumberger N.V. | 13.6% |
Baker Hughes Co. | 8.9% |
Halliburton Co. | 8.6% |
NOV, Inc. | 4.2% |
TechnipFMC plc | 4.1% |
ChampionX Corp. | 4.1% |
Weatherford International plc | 4.0% |
Noble Corporation plc | 3.6% |
Transocean Ltd. | 3.4% |
Tidewater, Inc. | 3.4% |
Top Ten Total | 57.9% |
| | |
“Ten Largest Holdings” excludes any temporary cash investments. |
58 | THE RYDEX FUNDS ANNUAL REPORT | |
PERFORMANCE REPORT AND FUND PROFILE (Unaudited)(concluded) | March 31, 2024 |
Cumulative Fund Performance*
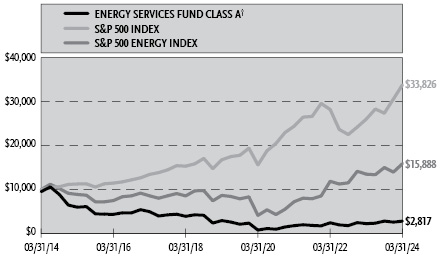
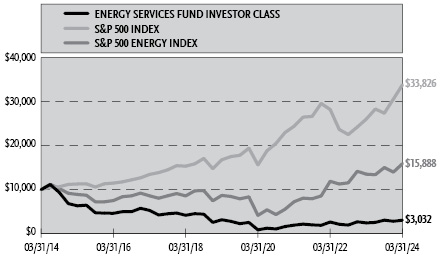
Average Annual Returns*
Periods Ended March 31, 2024
| 1 Year | 5 Year | 10 Year |
Investor Class Shares | 25.37% | (0.67%) | (11.25%) |
Class A Shares | 25.07% | (0.92%) | (11.47%) |
Class A Shares with sales charge† | 19.13% | (1.88%) | (11.90%) |
Class C Shares | 24.12% | (1.66%) | (12.13%) |
Class C Shares with CDSC‡ | 23.12% | (1.66%) | (12.13%) |
Class H Shares ** | 25.07% | (0.88%) | (11.51%) |
S&P 500 Energy Index | 17.67% | 12.86% | 4.74% |
S&P 500 Index | 29.88% | 15.05% | 12.96% |
* | The performance data above represents past performance that is not predictive of future results. The investment return and principal value of an investment in the Fund will fluctuate so that an investor’s shares, when redeemed, may be worth more or less than their original cost. Returns are historical and include changes in principal and reinvested dividends and capital gains and do not reflect the effect of taxes. The S&P 500 Index and S&P 500 Energy Index are unmanaged indices and, unlike the Fund, have no management fees or operating expenses to reduce their reported returns. The graphs are based on Investor Class shares and Class A shares only; performance for Class C and Class H shares will vary due to differences in fee structures |
** | Effective September 30, 2015, the Fund’s Advisor Class shares were converted into Class H shares. |
† | Fund returns are calculated using the maximum sales charge of 4.75%. |
‡ | Fund returns include a CDSC of 1% if redeemed within 12 months of purchase. |
| | THE RYDEX FUNDS ANNUAL REPORT | 59 |
SCHEDULE OF INVESTMENTS | March 31, 2024 |
ENERGY SERVICES FUND | |
| | Shares | | | Value | |
COMMON STOCKS† - 99.4% |
| | | | | | | | | |
Oil & Gas Services - 66.2% |
Schlumberger N.V. | | | 36,699 | | | $ | 2,011,472 | |
Baker Hughes Co. | | | 39,276 | | | | 1,315,746 | |
Halliburton Co. | | | 32,481 | | | | 1,280,401 | |
NOV, Inc. | | | 32,195 | | | | 628,446 | |
TechnipFMC plc | | | 24,527 | | | | 615,873 | |
ChampionX Corp. | | | 16,793 | | | | 602,701 | |
Tidewater, Inc.* | | | 5,419 | | | | 498,548 | |
Archrock, Inc. | | | 20,823 | | | | 409,589 | |
Liberty Energy, Inc. — Class A | | | 17,931 | | | | 371,530 | |
Oceaneering International, Inc.* | | | 15,048 | | | | 352,123 | |
Expro Group Holdings N.V.* | | | 15,288 | | | | 305,301 | |
Helix Energy Solutions Group, Inc.* | | | 26,538 | | | | 287,672 | |
Atlas Energy Solutions, Inc. | | | 12,068 | | | | 272,978 | |
US Silica Holdings, Inc.* | | | 17,315 | | | | 214,879 | |
ProPetro Holding Corp.* | | | 24,087 | | | | 194,623 | |
RPC, Inc. | | | 24,451 | | | | 189,251 | |
Core Laboratories, Inc. | | | 10,245 | | | | 174,985 | |
ProFrac Holding Corp. - Class A* | | | 11,670 | | | | 97,561 | |
Total Oil & Gas Services | | | | | | | 9,823,679 | |
| | | | | | | | | |
Oil & Gas - 27.3% |
Weatherford International plc* | | | 5,173 | | | | 597,068 | |
Noble Corporation plc | | | 11,017 | | | | 534,214 | |
Transocean Ltd.* | | | 79,421 | | | | 498,764 | |
Valaris Ltd.* | | | 6,574 | | | | 494,759 | |
Patterson-UTI Energy, Inc. | | | 38,962 | | | | 465,206 | |
Helmerich & Payne, Inc. | | | 10,158 | | | | 427,245 | |
Seadrill Ltd.* | | | 7,347 | | | | 369,554 | |
Borr Drilling Ltd.* | | | 45,915 | | | | 314,518 | |
Diamond Offshore Drilling, Inc.* | | | 19,673 | | | | 268,340 | |
Nabors Industries Ltd.* | | | 982 | | | | 84,580 | |
Total Oil & Gas | | | | | | | 4,054,248 | |
| | | | | | | | | |
Machinery-Diversified - 3.0% |
Cactus, Inc. — Class A | | | 8,886 | | | | 445,100 | |
| | | | | | | | | |
Metal Fabricate & Hardware - 2.9% |
Tenaris S.A. ADR | | | 10,882 | | | | 427,336 | |
| | | | | | | | | |
Total Common Stocks | | | | |
(Cost $8,193,588) | | | | | | | 14,750,363 | |
| | | | | | | | | |
| | Face
Amount | | | Value | |
REPURCHASE AGREEMENTS††,1 - 0.6% |
J.P. Morgan Securities LLC
issued 03/28/24 at 5.31%
due 04/01/24 | | $ | 50,565 | | | | 50,565 | |
BofA Securities, Inc.
issued 03/28/24 at 5.31%
due 04/01/24 | | | 19,448 | | | | 19,448 | |
Barclays Capital, Inc.
issued 03/28/24 at 5.30%
due 04/01/24 | | | 17,628 | | | | 17,628 | |
Total Repurchase Agreements | | | | |
(Cost $87,641) | | | | | | | 87,641 | |
| | | | | | | | | |
Total Investments - 100.0% | | | | |
(Cost $8,281,229) | | $ | 14,838,004 | |
Other Assets & Liabilities, net - 0.0% | | | (4,558 | ) |
Total Net Assets - 100.0% | | $ | 14,833,446 | |
* | Non-income producing security. |
† | Value determined based on Level 1 inputs — See Note 4. |
†† | Value determined based on Level 2 inputs — See Note 4. |
1 | Repurchase Agreements — See Note 6. |
| | ADR — American Depositary Receipt |
| | plc — Public Limited Company |
| | |
| | See Sector Classification in Other Information section. |
60 | THE RYDEX FUNDS ANNUAL REPORT | SEE NOTES TO FINANCIAL STATEMENTS. |
SCHEDULE OF INVESTMENTS (concluded) | March 31, 2024 |
ENERGY SERVICES FUND | |
The following table summarizes the inputs used to value the Fund’s investments at March 31, 2024 (See Note 4 in the Notes to Financial Statements):
Investments in Securities (Assets) | | Level 1
Quoted
Prices | | | Level 2
Significant
Observable
Inputs | | | Level 3
Significant
Unobservable
Inputs | | | Total | |
Common Stocks | | $ | 14,750,363 | | | $ | — | | | $ | — | | | $ | 14,750,363 | |
Repurchase Agreements | | | — | | | | 87,641 | | | | — | | | | 87,641 | |
Total Assets | | $ | 14,750,363 | | | $ | 87,641 | | | $ | — | | | $ | 14,838,004 | |
SEE NOTES TO FINANCIAL STATEMENTS. | THE RYDEX FUNDS ANNUAL REPORT | 61 |
STATEMENT OF ASSETS AND LIABILITIES |
March 31, 2024 |
Assets: |
Investments, at value (cost $8,193,588) | | $ | 14,750,363 | |
Repurchase agreements, at value (cost $87,641) | | | 87,641 | |
Receivables: |
Fund shares sold | | | 42,349 | |
Dividends | | | 10,551 | |
Interest | | | 52 | |
Securities lending income | | | 3 | |
Total assets | | | 14,890,959 | |
| | | | | |
Liabilities: |
Overdraft due to custodian bank | | | 393 | |
Payable for: |
Fund shares redeemed | | | 24,690 | |
Management fees | | | 9,030 | |
Transfer agent fees | | | 6,216 | |
Professional fees | | | 3,542 | |
Portfolio accounting and administration fees | | | 1,089 | |
Distribution and service fees | | | 916 | |
Trustees’ fees* | | | 192 | |
Miscellaneous | | | 11,445 | |
Total liabilities | | | 57,513 | |
Net assets | | $ | 14,833,446 | |
| | | | | |
Net assets consist of: |
Paid in capital | | $ | 50,019,761 | |
Total distributable earnings (loss) | | | (35,186,315 | ) |
Net assets | | $ | 14,833,446 | |
| | | | | |
Investor Class: |
Net assets | | $ | 12,099,645 | |
Capital shares outstanding | | | 45,119 | |
Net asset value per share | | $ | 268.17 | |
| | | | | |
Class A: |
Net assets | | $ | 1,299,892 | |
Capital shares outstanding | | | 5,248 | |
Net asset value per share | | $ | 247.69 | |
Maximum offering price per share (Net asset value divided by 95.25%) | | $ | 260.04 | |
| | | | | |
Class C: |
Net assets | | $ | 571,403 | |
Capital shares outstanding | | | 2,706 | |
Net asset value per share | | $ | 211.16 | |
| | | | | |
Class H: |
Net assets | | $ | 862,506 | |
Capital shares outstanding | | | 3,593 | |
Net asset value per share | | $ | 240.05 | |
STATEMENT OF OPERATIONS |
Year Ended March 31, 2024 |
Investment Income: |
Dividends | | $ | 359,248 | |
Interest | | | 7,933 | |
Income from securities lending, net | | | 86 | |
Total investment income | | | 367,267 | |
| | | | | |
Expenses: |
Management fees | | | 211,774 | |
Distribution and service fees: |
Class A | | | 3,415 | |
Class C | | | 6,708 | |
Class H | | | 3,422 | |
Transfer agent fees | | | 55,285 | |
Portfolio accounting and administration fees | | | 37,975 | |
Registration fees | | | 29,769 | |
Professional fees | | | 9,278 | |
Trustees’ fees* | | | 5,351 | |
Custodian fees | | | 3,659 | |
Line of credit fees | | | 92 | |
Miscellaneous | | | 6,420 | |
Total expenses | | | 373,148 | |
Less: |
Expenses reimbursed by Adviser | | | (7,370 | ) |
Net expenses | | | 365,778 | |
Net investment income | | | 1,489 | |
| | | | | |
Net Realized and Unrealized Gain (Loss): |
Net realized gain (loss) on: |
Investments | | | (1,622,348 | ) |
Net realized loss | | | (1,622,348 | ) |
Net change in unrealized appreciation (depreciation) on: |
Investments | | | 2,917,554 | |
Net change in unrealized appreciation (depreciation) | | | 2,917,554 | |
Net realized and unrealized gain | | | 1,295,206 | |
Net increase in net assets resulting from operations | | $ | 1,296,695 | |
* | Relates to Trustees not deemed “interested persons” within the meaning of Section 2(a)(19) of the 1940 Act. |
62 | THE RYDEX FUNDS ANNUAL REPORT | SEE NOTES TO FINANCIAL STATEMENTS. |
STATEMENTS OF CHANGES IN NET ASSETS |
| | Year Ended
March 31,
2024 | | | Year Ended
March 31,
2023 | |
Increase (Decrease) in Net Assets from Operations: | | | | | | | | |
Net investment income (loss) | | $ | 1,489 | | | $ | (115,350 | ) |
Net realized loss on investments | | | (1,622,348 | ) | | | (3,763,523 | ) |
Net change in unrealized appreciation (depreciation) on investments | | | 2,917,554 | | | | (4,501,202 | ) |
Net increase (decrease) in net assets resulting from operations | | | 1,296,695 | | | | (8,380,075 | ) |
| | | | | | | | | |
Capital share transactions: | | | | | | | | |
Proceeds from sale of shares | | | | | | | | |
Investor Class | | | 80,881,054 | | | | 101,215,610 | |
Class A | | | 2,254,084 | | | | 3,290,830 | |
Class C | | | 121,373 | | | | 1,085,028 | |
Class H | | | 3,381,767 | | | | 5,884,787 | |
Cost of shares redeemed | | | | | | | | |
Investor Class | | | (102,094,522 | ) | | | (71,089,547 | ) |
Class A | | | (2,540,156 | ) | | | (2,884,947 | ) |
Class C | | | (662,919 | ) | | | (791,941 | ) |
Class H | | | (3,827,092 | ) | | | (14,588,982 | ) |
Net increase (decrease) from capital share transactions | | | (22,486,411 | ) | | | 22,120,838 | |
Net increase (decrease) in net assets | | | (21,189,716 | ) | | | 13,740,763 | |
| | | | | | | | | |
Net assets: | | | | | | | | |
Beginning of year | | | 36,023,162 | | | | 22,282,399 | |
End of year | | $ | 14,833,446 | | | $ | 36,023,162 | |
| | | | | | | | | |
Capital share activity: | | | | | | | | |
Shares sold | | | | | | | | |
Investor Class | | | 317,141 | | | | 457,345 | |
Class A | | | 10,056 | | | | 16,020 | |
Class C | | | 645 | | | | 6,039 | |
Class H | | | 14,895 | | | | 28,497 | |
Shares redeemed | | | | | | | | |
Investor Class | | | (424,550 | ) | | | (345,252 | ) |
Class A | | | (11,542 | ) | | | (14,097 | ) |
Class C | | | (3,706 | ) | | | (4,641 | ) |
Class H | | | (16,942 | ) | | | (75,866 | ) |
Net increase (decrease) in shares | | | (114,003 | ) | | | 68,045 | |
SEE NOTES TO FINANCIAL STATEMENTS. | THE RYDEX FUNDS ANNUAL REPORT | 63 |
This table is presented to show selected data for a share outstanding throughout each period and to assist shareholders in evaluating a Fund’s performance for the periods presented.
Investor Class | | Year Ended
March 31,
2024 | | | Year Ended
March 31,
2023 | | | Year Ended
March 31,
2022 | | | Year Ended
March 31,
2021 | | | Year Ended
March 31,
2020d | |
Per Share Data |
Net asset value, beginning of period | | $ | 213.90 | | | $ | 231.88 | | | $ | 169.20 | | | $ | 75.50 | | | $ | 281.99 | |
Income (loss) from investment operations: |
Net investment income (loss)a | | | .15 | | | | (.56 | ) | | | (.63 | ) | | | .20 | | | | 2.40 | |
Net gain (loss) on investments (realized and unrealized) | | | 54.12 | | | | (17.42 | ) | | | 63.81 | | | | 95.34 | | | | (208.59 | ) |
Total from investment operations | | | 54.27 | | | | (17.98 | ) | | | 63.18 | | | | 95.54 | | | | (206.19 | ) |
Less distributions from: |
Net investment income | | | — | | | | — | | | | (.50 | ) | | | (1.84 | ) | | | (.30 | ) |
Total distributions | | | — | | | | — | | | | (.50 | ) | | | (1.84 | ) | | | (.30 | ) |
Net asset value, end of period | | $ | 268.17 | | | $ | 213.90 | | | $ | 231.88 | | | $ | 169.20 | | | $ | 75.50 | |
|
Total Return | | | 25.37 | % | | | (7.75 | %) | | | 37.44 | % | | | 127.06 | % | | | (73.21 | %) |
Ratios/Supplemental Data |
Net assets, end of period (in thousands) | | $ | 12,100 | | | $ | 32,626 | | | $ | 9,376 | | | $ | 4,703 | | | $ | 1,502 | |
Ratios to average net assets: |
Net investment income (loss) | | | 0.06 | % | | | (0.26 | %) | | | (0.35 | %) | | | 0.82 | % | | | 1.11 | % |
Total expenses | | | 1.45 | % | | | 1.39 | % | | | 1.36 | % | | | 1.42 | % | | | 1.48 | % |
Net expensesb | | | 1.42 | % | | | 1.39 | % | | | 1.36 | % | | | 1.42 | % | | | 1.48 | % |
Portfolio turnover rate | | | 296 | % | | | 242 | % | | | 290 | % | | | 770 | % | | | 810 | % |
Class A | | Year Ended
March 31,
2024 | | | Year Ended
March 31,
2023 | | | Year Ended
March 31,
2022 | | | Year Ended
March 31,
2021 | | | Year Ended
March 31,
2020d | |
Per Share Data |
Net asset value, beginning of period | | $ | 198.04 | | | $ | 215.25 | | | $ | 157.49 | | | $ | 70.51 | | | $ | 264.03 | |
Income (loss) from investment operations: |
Net investment income (loss)a | | | (.38 | ) | | | (1.16 | ) | | | (1.04 | ) | | | .19 | | | | 1.95 | |
Net gain (loss) on investments (realized and unrealized) | | | 50.03 | | | | (16.05 | ) | | | 59.30 | | | | 88.63 | | | | (195.17 | ) |
Total from investment operations | | | 49.65 | | | | (17.21 | ) | | | 58.26 | | | | 88.82 | | | | (193.22 | ) |
Less distributions from: |
Net investment income | | | — | | | | — | | | | (.50 | ) | | | (1.84 | ) | | | (.30 | ) |
Total distributions | | | — | | | | — | | | | (.50 | ) | | | (1.84 | ) | | | (.30 | ) |
Net asset value, end of period | | $ | 247.69 | | | $ | 198.04 | | | $ | 215.25 | | | $ | 157.49 | | | $ | 70.51 | |
|
Total Returnc | | | 25.07 | % | | | (8.00 | %) | | | 37.09 | % | | | 126.39 | % | | | (73.26 | %) |
Ratios/Supplemental Data |
Net assets, end of period (in thousands) | | $ | 1,300 | | | $ | 1,334 | | | $ | 1,036 | | | $ | 676 | | | $ | 191 | |
Ratios to average net assets: |
Net investment income (loss) | | | (0.17 | %) | | | (0.58 | %) | | | (0.61 | %) | | | 0.87 | % | | | 0.94 | % |
Total expenses | | | 1.68 | % | | | 1.64 | % | | | 1.61 | % | | | 1.68 | % | | | 1.73 | % |
Net expensesb | | | 1.65 | % | | | 1.64 | % | | | 1.61 | % | | | 1.68 | % | | | 1.73 | % |
Portfolio turnover rate | | | 296 | % | | | 242 | % | | | 290 | % | | | 770 | % | | | 810 | % |
64 | THE RYDEX FUNDS ANNUAL REPORT | SEE NOTES TO FINANCIAL STATEMENTS. |
FINANCIAL HIGHLIGHTS (concluded) |
This table is presented to show selected data for a share outstanding throughout each period and to assist shareholders in evaluating a Fund’s performance for the periods presented.
Class C | | Year Ended
March 31,
2024 | | | Year Ended
March 31,
2023 | | | Year Ended
March 31,
2022 | | | Year Ended
March 31,
2021 | | | Year Ended
March 31,
2020d | |
Per Share Data |
Net asset value, beginning of period | | $ | 170.13 | | | $ | 186.29 | | | $ | 137.36 | | | $ | 62.08 | | | $ | 234.26 | |
Income (loss) from investment operations: |
Net investment income (loss)a | | | (1.79 | ) | | | (2.20 | ) | | | (2.02 | ) | | | (.01 | ) | | | .30 | |
Net gain (loss) on investments (realized and unrealized) | | | 42.82 | | | | (13.96 | ) | | | 51.45 | | | | 77.13 | | | | (172.18 | ) |
Total from investment operations | | | 41.03 | | | | (16.16 | ) | | | 49.43 | | | | 77.12 | | | | (171.88 | ) |
Less distributions from: |
Net investment income | | | — | | | | — | | | | (.50 | ) | | | (1.84 | ) | | | (.30 | ) |
Total distributions | | | — | | | | — | | | | (.50 | ) | | | (1.84 | ) | | | (.30 | ) |
Net asset value, end of period | | $ | 211.16 | | | $ | 170.13 | | | $ | 186.29 | | | $ | 137.36 | | | $ | 62.08 | |
|
Total Returnc | | | 24.12 | % | | | (8.67 | %) | | | 36.07 | % | | | 124.62 | % | | | (73.46 | %) |
Ratios/Supplemental Data |
Net assets, end of period (in thousands) | | $ | 571 | | | $ | 981 | | | $ | 814 | | | $ | 479 | | | $ | 192 | |
Ratios to average net assets: |
Net investment income (loss) | | | (0.95 | %) | | | (1.27 | %) | | | (1.37 | %) | | | (0.03 | %) | | | 0.20 | % |
Total expenses | | | 2.43 | % | | | 2.40 | % | | | 2.36 | % | | | 2.43 | % | | | 2.48 | % |
Net expensesb | | | 2.40 | % | | | 2.40 | % | | | 2.36 | % | | | 2.43 | % | | | 2.48 | % |
Portfolio turnover rate | | | 296 | % | | | 242 | % | | | 290 | % | | | 770 | % | | | 810 | % |
Class H | | Year Ended
March 31,
2024 | | | Year Ended
March 31,
2023 | | | Year Ended
March 31,
2022 | | | Year Ended
March 31,
2021 | | | Year Ended
March 31,
2020d | |
Per Share Data |
Net asset value, beginning of period | | $ | 191.93 | | | $ | 208.59 | | | $ | 152.63 | | | $ | 68.37 | | | $ | 255.45 | |
Income (loss) from investment operations: |
Net investment income (loss)a | | | (.49 | ) | | | (1.52 | ) | | | (.75 | ) | | | .02 | | | | 1.65 | |
Net gain (loss) on investments (realized and unrealized) | | | 48.61 | | | | (15.14 | ) | | | 57.21 | | | | 86.08 | | | | (188.43 | ) |
Total from investment operations | | | 48.12 | | | | (16.66 | ) | | | 56.46 | | | | 86.10 | | | | (186.78 | ) |
Less distributions from: |
Net investment income | | | — | | | | — | | | | (.50 | ) | | | (1.84 | ) | | | (.30 | ) |
Total distributions | | | — | | | | — | | | | (.50 | ) | | | (1.84 | ) | | | (.30 | ) |
Net asset value, end of period | | $ | 240.05 | | | $ | 191.93 | | | $ | 208.59 | | | $ | 152.63 | | | $ | 68.37 | |
|
Total Return | | | 25.07 | % | | | (7.99 | %) | | | 37.09 | % | | | 126.23 | % | | | (73.19 | %) |
Ratios/Supplemental Data |
Net assets, end of period (in thousands) | | $ | 863 | | | $ | 1,082 | | | $ | 11,057 | | | $ | 689 | | | $ | 528 | |
Ratios to average net assets: |
Net investment income (loss) | | | (0.23 | %) | | | (0.76 | %) | | | (0.43 | %) | | | 0.11 | % | | | 0.77 | % |
Total expenses | | | 1.68 | % | | | 1.65 | % | | | 1.62 | % | | | 1.68 | % | | | 1.72 | % |
Net expensesb | | | 1.65 | % | | | 1.65 | % | | | 1.62 | % | | | 1.68 | % | | | 1.72 | % |
Portfolio turnover rate | | | 296 | % | | | 242 | % | | | 290 | % | | | 770 | % | | | 810 | % |
a | Net investment income (loss) per share was computed using average shares outstanding throughout the period. |
b | Net expense information reflects the expense ratios after expense waivers and reimbursements, as applicable. |
c | Total return does not reflect the impact of any applicable sales charges. |
d | Reverse share split — Per share amounts for years presented through March 31, 2020 have been restated to reflect a 1:15 reverse share split effective August 10, 2020. |
SEE NOTES TO FINANCIAL STATEMENTS. | THE RYDEX FUNDS ANNUAL REPORT | 65 |
PERFORMANCE REPORT AND FUND PROFILE (Unaudited) | March 31, 2024 |
FINANCIAL SERVICES FUND
OBJECTIVE: Seeks to provide capital appreciation by investing in companies that are involved in the financial services sector (“Financial Services Companies”).
For the Reporting Period, Financial Services Fund Investor Class returned 28.77%, compared with the S&P 500 Index, which returned 29.88%. The S&P 500 Financials Index returned 33.55%.
The industries that contributed the most to performance were diversified banks, transaction & payment processing services, and asset management & custody banks. Those that detracted the most were telecom tower REITs, self-storage REITs, and industrial REITs.
The holdings that contributed the most to performance were JPMorgan Chase & Co., Berkshire Hathaway, Inc. – Class B, and Coinbase Global, Inc. – Class A. Those that detracted the most were MarketAxess Holdings, Inc., PayPal Holdings, Inc., and Crown Castle, Inc.
Performance displayed represents past performance, which is no guarantee of future results.
Holdings Diversification (Market Exposure as % of Net Assets)
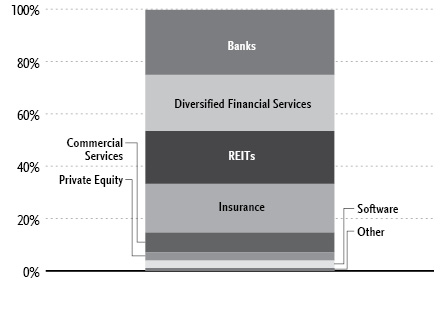
“Holdings Diversification (Market Exposure as % of Net Assets)” excludes any temporary cash investments.
Inception Dates: |
Investor Class | April 2, 1998 |
Class A | September 1, 2004 |
Class C | April 19, 2001 |
Class H | April 6, 1998 |
Ten Largest Holdings | % of Total Net Assets |
Berkshire Hathaway, Inc. — Class B | 3.3% |
JPMorgan Chase & Co. | 2.7% |
Visa, Inc. — Class A | 2.6% |
Mastercard, Inc. — Class A | 2.2% |
Bank of America Corp. | 1.8% |
Wells Fargo & Co. | 1.6% |
Blackstone, Inc. — Class A | 1.4% |
Goldman Sachs Group, Inc. | 1.3% |
S&P Global, Inc. | 1.2% |
Progressive Corp. | 1.2% |
Top Ten Total | 19.3% |
| | |
“Ten Largest Holdings” excludes any temporary cash investments. |
66 | THE RYDEX FUNDS ANNUAL REPORT | |
PERFORMANCE REPORT AND FUND PROFILE (Unaudited)(concluded) | March 31, 2024 |
Cumulative Fund Performance*
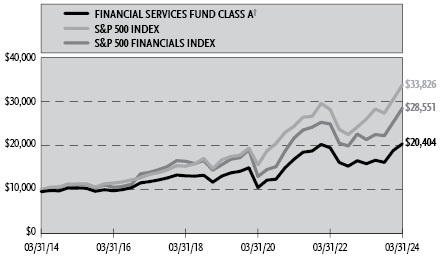
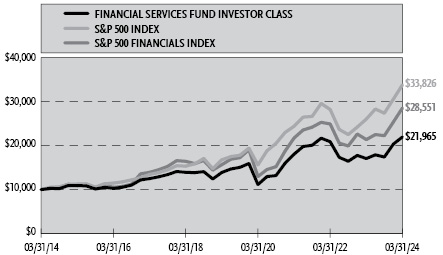
Average Annual Returns*
Periods Ended March 31, 2024
| 1 Year | 5 Year | 10 Year |
Investor Class Shares | 28.77% | 9.59% | 8.19% |
Class A Shares | 28.44% | 9.32% | 7.92% |
Class A Shares with sales charge† | 22.34% | 8.26% | 7.39% |
Class C Shares | 27.48% | 8.50% | 7.11% |
Class C Shares with CDSC‡ | 26.48% | 8.50% | 7.11% |
Class H Shares** | 28.45% | 9.32% | 7.89% |
S&P 500 Financials Index | 33.55% | 12.76% | 11.06% |
S&P 500 Index | 29.88% | 15.05% | 12.96% |
* | The performance data above represents past performance that is not predictive of future results. The investment return and principal value of an investment in the Fund will fluctuate so that an investor’s shares, when redeemed, may be worth more or less than their original cost. Returns are historical and include changes in principal and reinvested dividends and capital gains and do not reflect the effect of taxes. The S&P 500 Index and the S&P 500 Financials Index are unmanaged indices and, unlike the Fund, have no management fees or operating expenses to reduce their reported returns. The graphs are based on Investor Class shares and Class A shares only; performance for Class C and Class H shares will vary due to differences in fee structures. |
** | Effective September 30, 2015, the Fund’s Advisor Class shares were converted into Class H shares. |
† | Fund returns are calculated using the maximum sales charge of 4.75%. |
‡ | Fund returns include a CDSC of 1% if redeemed within 12 months of purchase. |
| | THE RYDEX FUNDS ANNUAL REPORT | 67 |
SCHEDULE OF INVESTMENTS | March 31, 2024 |
FINANCIAL SERVICES FUND | |
| | Shares | | | Value | |
COMMON STOCKS† - 99.2% |
| | | | | | | | | |
Banks - 24.3% |
JPMorgan Chase & Co. | | | 4,849 | | | $ | 971,255 | |
Bank of America Corp. | | | 17,133 | | | | 649,683 | |
Wells Fargo & Co. | | | 9,823 | | | | 569,341 | |
Goldman Sachs Group, Inc. | | | 1,155 | | | | 482,432 | |
Citigroup, Inc. | | | 7,002 | | | | 442,807 | |
Morgan Stanley | | | 4,695 | | | | 442,081 | |
U.S. Bancorp | | | 7,334 | | | | 327,830 | |
PNC Financial Services Group, Inc. | | | 2,009 | | | | 324,654 | |
Truist Financial Corp. | | | 7,461 | | | | 290,830 | |
NU Holdings Limited/Cayman Islands — Class A* | | | 22,599 | | | | 269,606 | |
Bank of New York Mellon Corp. | | | 4,559 | | | | 262,690 | |
ICICI Bank Ltd. ADR | | | 8,682 | | | | 229,292 | |
Toronto-Dominion Bank | | | 3,750 | | | | 226,425 | |
HDFC Bank Ltd. ADR | | | 4,006 | | | | 224,216 | |
Bank of Nova Scotia | | | 4,086 | | | | 211,573 | |
Royal Bank of Canada | | | 2,076 | | | | 209,427 | |
Fifth Third Bancorp | | | 5,315 | | | | 197,771 | |
M&T Bank Corp. | | | 1,323 | | | | 192,417 | |
State Street Corp. | | | 2,454 | | | | 189,743 | |
Huntington Bancshares, Inc. | | | 12,747 | | | | 177,821 | |
Regions Financial Corp. | | | 8,416 | | | | 177,073 | |
Northern Trust Corp. | | | 1,922 | | | | 170,904 | |
Citizens Financial Group, Inc. | | | 4,422 | | | | 160,474 | |
KeyCorp | | | 9,774 | | | | 154,527 | |
East West Bancorp, Inc. | | | 1,663 | | | | 131,560 | |
First Horizon Corp. | | | 7,527 | | | | 115,916 | |
Comerica, Inc. | | | 1,964 | | | | 108,000 | |
Western Alliance Bancorporation | | | 1,638 | | | | 105,143 | |
Wintrust Financial Corp. | | | 973 | | | | 101,571 | |
Zions Bancorp North America | | | 2,324 | | | | 100,862 | |
Pinnacle Financial Partners, Inc. | | | 1,159 | | | | 99,535 | |
SouthState Corp. | | | 1,169 | | | | 99,400 | |
Old National Bancorp | | | 5,147 | | | | 89,609 | |
Bank OZK | | | 1,971 | | | | 89,602 | |
Columbia Banking System, Inc. | | | 4,027 | | | | 77,922 | |
Valley National Bancorp | | | 8,892 | | | | 70,780 | |
First Citizens BancShares, Inc. — Class A | | | 32 | | | | 52,320 | |
Total Banks | | | | | | | 8,797,092 | |
| | | | | | | | | |
Diversified Financial Services - 21.5% |
Visa, Inc. — Class A | | | 3,399 | | | | 948,593 | |
Mastercard, Inc. — Class A | | | 1,666 | | | | 802,296 | |
American Express Co. | | | 1,883 | | | | 428,740 | |
BlackRock, Inc. — Class A | | | 508 | | | | 423,520 | |
Charles Schwab Corp. | | | 5,742 | | | | 415,376 | |
CME Group, Inc. — Class A | | | 1,621 | | | | 348,985 | |
Intercontinental Exchange, Inc. | | | 2,513 | | | | 345,362 | |
Coinbase Global, Inc. — Class A* | | | 1,208 | | | | 320,265 | |
Capital One Financial Corp. | | | 2,006 | | | | 298,673 | |
Interactive Brokers Group, Inc. — Class A | | | 2,391 | | | | 267,099 | |
Ameriprise Financial, Inc. | | | 609 | | | | 267,010 | |
Apollo Global Management, Inc. | | | 2,314 | | | | 260,209 | |
XP, Inc. — Class A | | | 9,540 | | | | 244,796 | |
Ares Management Corp. — Class A | | | 1,792 | | | | 238,300 | |
Discover Financial Services | | | 1,761 | | | | 230,849 | |
T. Rowe Price Group, Inc. | | | 1,694 | | | | 206,532 | |
Nasdaq, Inc. | | | 3,217 | | | | 202,993 | |
Raymond James Financial, Inc. | | | 1,540 | | | | 197,767 | |
Tradeweb Markets, Inc. — Class A | | | 1,862 | | | | 193,964 | |
Cboe Global Markets, Inc. | | | 942 | | | | 173,074 | |
LPL Financial Holdings, Inc. | | | 648 | | | | 171,202 | |
Synchrony Financial | | | 3,841 | | | | 165,624 | |
Ally Financial, Inc. | | | 3,364 | | | | 136,545 | |
SEI Investments Co. | | | 1,631 | | | | 117,269 | |
Franklin Resources, Inc. | | | 4,167 | | | | 117,134 | |
Invesco Ltd. | | | 6,557 | | | | 108,781 | |
SoFi Technologies, Inc.* | | | 13,636 | | | | 99,543 | |
Upstart Holdings, Inc.*,1 | | | 1,786 | | | | 48,025 | |
Total Diversified Financial Services | | | | | | | 7,778,526 | |
| | | | | | | | | |
REITs - 20.2% |
Prologis, Inc. | | | 3,273 | | | | 426,210 | |
American Tower Corp. — Class A | | | 1,880 | | | | 371,469 | |
Equinix, Inc. | | | 403 | | | | 332,608 | |
Welltower, Inc. | | | 3,084 | | | | 288,169 | |
Simon Property Group, Inc. | | | 1,796 | | | | 281,056 | |
Realty Income Corp. | | | 5,021 | | | | 271,636 | |
Public Storage | | | 924 | | | | 268,015 | |
Crown Castle, Inc. | | | 2,461 | | | | 260,448 | |
Digital Realty Trust, Inc. | | | 1,792 | | | | 258,120 | |
VICI Properties, Inc. | | | 7,433 | | | | 221,429 | |
Extra Space Storage, Inc. | | | 1,498 | | | | 220,206 | |
Weyerhaeuser Co. | | | 5,721 | | | | 205,441 | |
AvalonBay Communities, Inc. | | | 1,078 | | | | 200,034 | |
Equity Residential | | | 3,007 | | | | 189,772 | |
SBA Communications Corp. | | | 872 | | | | 188,962 | |
Iron Mountain, Inc. | | | 2,352 | | | | 188,654 | |
Alexandria Real Estate Equities, Inc. | | | 1,453 | | | | 187,306 | |
Invitation Homes, Inc. | | | 5,070 | | | | 180,543 | |
Ventas, Inc. | | | 3,757 | | | | 163,580 | |
Essex Property Trust, Inc. | | | 634 | | | | 155,210 | |
Sun Communities, Inc. | | | 1,190 | | | | 153,010 | |
Mid-America Apartment Communities, Inc. | | | 1,155 | | | | 151,975 | |
Host Hotels & Resorts, Inc. | | | 7,156 | | | | 147,986 | |
Kimco Realty Corp. | | | 7,250 | | | | 142,173 | |
Gaming and Leisure Properties, Inc. | | | 2,968 | | | | 136,736 | |
UDR, Inc. | | | 3,655 | | | | 136,734 | |
Lamar Advertising Co. — Class A | | | 1,127 | | | | 134,575 | |
American Homes 4 Rent — Class A | | | 3,638 | | | | 133,806 | |
Regency Centers Corp. | | | 2,181 | | | | 132,081 | |
Healthpeak Properties, Inc. | | | 6,872 | | | | 128,850 | |
Equity LifeStyle Properties, Inc. | | | 1,960 | | | | 126,224 | |
Rexford Industrial Realty, Inc. | | | 2,506 | | | | 126,052 | |
Camden Property Trust | | | 1,281 | | | | 126,050 | |
CubeSmart | | | 2,783 | | | | 125,847 | |
Annaly Capital Management, Inc. | | | 6,246 | | | | 122,984 | |
Boston Properties, Inc. | | | 1,869 | | | | 122,064 | |
Omega Healthcare Investors, Inc. | | | 3,515 | | | | 111,320 | |
68 | THE RYDEX FUNDS ANNUAL REPORT | SEE NOTES TO FINANCIAL STATEMENTS. |
SCHEDULE OF INVESTMENTS (continued) | March 31, 2024 |
FINANCIAL SERVICES FUND | |
| | Shares | | | Value | |
AGNC Investment Corp. | | | 10,467 | | | $ | 103,623 | |
Sabra Health Care REIT, Inc. | | | 5,098 | | | | 75,297 | |
Total REITs | | | | | | | 7,296,255 | |
| | | | | | | | | |
Insurance - 18.6% |
Berkshire Hathaway, Inc. — Class B* | | | 2,856 | | | | 1,201,005 | |
Progressive Corp. | | | 2,160 | | | | 446,731 | |
Marsh & McLennan Companies, Inc. | | | 1,918 | | | | 395,070 | |
Arch Capital Group Ltd.* | | | 3,764 | | | | 347,944 | |
Aon plc — Class A | | | 963 | | | | 321,372 | |
Chubb Ltd. | | | 1,218 | | | | 315,620 | |
Willis Towers Watson plc | | | 1,120 | | | | 308,000 | |
American International Group, Inc. | | | 3,743 | | | | 292,590 | |
Travelers Companies, Inc. | | | 1,271 | | | | 292,508 | |
Arthur J Gallagher & Co. | | | 1,148 | | | | 287,046 | |
Aflac, Inc. | | | 3,273 | | | | 281,020 | |
Allstate Corp. | | | 1,603 | | | | 277,335 | |
MetLife, Inc. | | | 3,596 | | | | 266,500 | |
Prudential Financial, Inc. | | | 2,223 | | | | 260,980 | |
Hartford Financial Services Group, Inc. | | | 2,174 | | | | 224,031 | |
Everest Group Ltd. | | | 560 | | | | 222,600 | |
RenaissanceRe Holdings Ltd. | | | 854 | | | | 200,716 | |
Principal Financial Group, Inc. | | | 2,135 | | | | 184,272 | |
Brown & Brown, Inc. | | | 2,034 | | | | 178,056 | |
Cincinnati Financial Corp. | | | 1,421 | | | | 176,446 | |
W R Berkley Corp. | | | 1,869 | | | | 165,294 | |
Erie Indemnity Co. — Class A | | | 172 | | | | 69,070 | |
Total Insurance | | | | | | | 6,714,206 | |
| | | | | | | | | |
Commercial Services - 7.5% |
S&P Global, Inc. | | | 1,061 | | | | 451,402 | |
PayPal Holdings, Inc.* | | | 5,259 | | | | 352,300 | |
Moody’s Corp. | | | 788 | | | | 309,708 | |
Block, Inc. — Class A* | | | 3,451 | | | | 291,886 | |
Global Payments, Inc. | | | 1,740 | | | | 232,568 | |
StoneCo Ltd. — Class A* | | | 12,635 | | | | 209,867 | |
Corpay, Inc.* | | | 595 | | | | 183,581 | |
Toast, Inc. — Class A* | | | 5,612 | | | | 139,851 | |
Affirm Holdings, Inc.* | | | 3,287 | | | | 122,474 | |
MarketAxess Holdings, Inc. | | | 438 | | | | 96,032 | |
Euronet Worldwide, Inc.* | | | 770 | | | | 84,646 | |
Morningstar, Inc. | | | 270 | | | | 83,260 | |
Shift4 Payments, Inc. — Class A* | | | 1,225 | | | | 80,936 | |
Flywire Corp.* | | | 2,601 | | | | 64,531 | |
Total Commercial Services | | | | | | | 2,703,042 | |
| | | | | | | | | |
Private Equity - 3.2% |
Blackstone, Inc. — Class A | | | 3,838 | | | | 504,198 | |
KKR & Company, Inc. — Class A | | | 3,224 | | | | 324,270 | |
Brookfield Corp. | | | 4,968 | | | | 208,011 | |
Carlyle Group, Inc. | | | 2,776 | | | | 130,222 | |
Total Private Equity | | | | | | | 1,166,701 | |
| | | | | | | | | |
Software - 2.9% |
Fiserv, Inc.* | | | 2,457 | | | | 392,678 | |
Fidelity National Information Services, Inc. | | | 3,575 | | | | 265,193 | |
MSCI, Inc. — Class A | | | 462 | | | | 258,928 | |
Jack Henry & Associates, Inc. | | | 802 | | | | 139,331 | |
Total Software | | | | | | | 1,056,130 | |
| | | | | | | | | |
Internet - 0.5% |
Robinhood Markets, Inc. — Class A* | | | 8,136 | | | | 163,778 | |
| | | | | | | | | |
Media - 0.4% |
FactSet Research Systems, Inc. | | | 354 | | | | 160,854 | |
| | | | | | | | | |
Savings & Loans - 0.1% |
New York Community Bancorp, Inc.1 | | | 11,778 | | | | 37,925 | |
| | | | | | | | | |
Total Common Stocks | | | | |
(Cost $31,079,167) | | | | | | | 35,874,509 | |
| | | | | | | | | |
PREFERRED STOCKS† - 0.5% |
Financial - 0.5% |
Itau Unibanco Holding S.A. |
ADR | | | 28,095 | | | | 194,698 | |
Total Preferred Stocks | | | | |
(Cost $172,075) | | | | | | | 194,698 | |
| | | | | | | | | |
| | | Face
Amount | | | | | |
REPURCHASE AGREEMENTS††,2 - 0.2% |
J.P. Morgan Securities LLC
issued 03/28/24 at 5.31%
due 04/01/24 | | $ | 46,890 | | | | 46,890 | |
BofA Securities, Inc.
issued 03/28/24 at 5.31%
due 04/01/24 | | | 18,034 | | | | 18,034 | |
Barclays Capital, Inc.
issued 03/28/24 at 5.30%
due 04/01/24 | | | 16,347 | | | | 16,347 | |
Total Repurchase Agreements | | | | |
(Cost $81,271) | | | | | | | 81,271 | |
| | | | | | | | | |
| | | Shares | | | | | |
SECURITIES LENDING COLLATERAL†,3 - 0.1% |
Money Market Fund | | | | | | | | |
First American Government Obligations Fund — Class X, 5.23%4 | | | 45,776 | | | | 45,776 | |
Total Securities Lending Collateral | | | | |
(Cost $45,776) | | | | | | | 45,776 | |
| | | | | | | | | |
Total Investments - 100.0% | | | | |
(Cost $31,378,289) | | $ | 36,196,254 | |
Other Assets & Liabilities, net - 0.0% | | | (15,409 | ) |
Total Net Assets - 100.0% | | $ | 36,180,845 | |
SEE NOTES TO FINANCIAL STATEMENTS. | THE RYDEX FUNDS ANNUAL REPORT | 69 |
SCHEDULE OF INVESTMENTS (concluded) | March 31, 2024 |
FINANCIAL SERVICES FUND | |
* | Non-income producing security. |
† | Value determined based on Level 1 inputs — See Note 4. |
†† | Value determined based on Level 2 inputs — See Note 4. |
1 | All or a portion of this security is on loan at March 31, 2024 — See Note 7. |
2 | Repurchase Agreements — See Note 6. |
3 | Securities lending collateral — See Note 7. |
4 | Rate indicated is the 7-day yield as of March 31, 2024. |
| | ADR — American Depositary Receipt |
| | plc — Public Limited Company |
| | REIT — Real Estate Investment Trust |
| | |
| | See Sector Classification in Other Information section. |
The following table summarizes the inputs used to value the Fund’s investments at March 31, 2024 (See Note 4 in the Notes to Financial Statements):
Investments in Securities (Assets) | | Level 1
Quoted
Prices | | | Level 2
Significant
Observable
Inputs | | | Level 3
Significant
Unobservable
Inputs | | | Total | |
Common Stocks | | $ | 35,874,509 | | | $ | — | | | $ | — | | | $ | 35,874,509 | |
Preferred Stocks | | | 194,698 | | | | — | | | | — | | | | 194,698 | |
Repurchase Agreements | | | — | | | | 81,271 | | | | — | | | | 81,271 | |
Securities Lending Collateral | | | 45,776 | | | | — | | | | — | | | | 45,776 | |
Total Assets | | $ | 36,114,983 | | | $ | 81,271 | | | $ | — | | | $ | 36,196,254 | |
70 | THE RYDEX FUNDS ANNUAL REPORT | SEE NOTES TO FINANCIAL STATEMENTS. |
STATEMENT OF ASSETS AND LIABILITIES |
March 31, 2024 |
Assets: |
Investments, at value - including $41,134 of securities loaned (cost $31,297,018) | | $ | 36,114,983 | |
Repurchase agreements, at value (cost $81,271) | | | 81,271 | |
Cash | | | 23,004 | |
Receivables: |
Dividends | | | 57,577 | |
Fund shares sold | | | 23,293 | |
Foreign tax reclaims | | | 299 | |
Interest | | | 48 | |
Securities lending income | | | 23 | |
Total assets | | | 36,300,498 | |
| | | | | |
Liabilities: |
Payable for: |
Return of securities lending collateral | | | 45,776 | |
Management fees | | | 25,670 | |
Transfer agent fees | | | 12,830 | |
Fund shares redeemed | | | 12,753 | |
Professional fees | | | 10,070 | |
Portfolio accounting and administration fees | | | 3,096 | |
Distribution and service fees | | | 1,155 | |
Trustees’ fees* | | | 233 | |
Miscellaneous | | | 8,070 | |
Total liabilities | | | 119,653 | |
Net assets | | $ | 36,180,845 | |
| | | | | |
Net assets consist of: |
Paid in capital | | $ | 34,812,866 | |
Total distributable earnings (loss) | | | 1,367,979 | |
Net assets | | $ | 36,180,845 | |
| | | | | |
Investor Class: |
Net assets | | $ | 33,024,409 | |
Capital shares outstanding | | | 387,925 | |
Net asset value per share | | $ | 85.13 | |
| | | | | |
Class A: |
Net assets | | $ | 1,984,406 | |
Capital shares outstanding | | | 25,797 | |
Net asset value per share | | $ | 76.92 | |
Maximum offering price per share (Net asset value divided by 95.25%) | | $ | 80.76 | |
| | | | | |
Class C: |
Net assets | | $ | 814,267 | |
Capital shares outstanding | | | 13,167 | |
Net asset value per share | | $ | 61.84 | |
| | | | | |
Class H: |
Net assets | | $ | 357,763 | |
Capital shares outstanding | | | 4,843 | |
Net asset value per share | | $ | 73.87 | |
STATEMENT OF OPERATIONS |
Year Ended March 31, 2024 |
Investment Income: |
Dividends (net of foreign withholding tax of $1,885) | | $ | 361,458 | |
Interest | | | 4,014 | |
Income from securities lending, net | | | 1,246 | |
Total investment income | | | 366,718 | |
| | | | | |
Expenses: |
Management fees | | | 123,172 | |
Distribution and service fees: |
Class A | | | 3,944 | |
Class C | | | 7,280 | |
Class H | | | 858 | |
Transfer agent fees | | | 31,823 | |
Portfolio accounting and administration fees | | | 22,093 | |
Professional fees | | | 10,655 | |
Registration Fees | | | 7,820 | |
Custodian fees | | | 2,089 | |
Trustees’ fees* | | | 1,275 | |
Line of credit fees | | | 70 | |
Miscellaneous | | | 8,797 | |
Total expenses | | | 219,876 | |
Less: |
Expenses reimbursed by Adviser | | | (6,083 | ) |
Net expenses | | | 213,793 | |
Net investment income | | | 152,925 | |
| | | | | |
Net Realized and Unrealized Gain (Loss): |
Net realized gain (loss) on: |
Investments | | | (195,131 | ) |
Net realized loss | | | (195,131 | ) |
Net change in unrealized appreciation (depreciation) on: |
Investments | | | 4,604,554 | |
Net change in unrealized appreciation (depreciation) | | | 4,604,554 | |
Net realized and unrealized gain | | | 4,409,423 | |
Net increase in net assets resulting from operations | | $ | 4,562,348 | |
* | Relates to Trustees not deemed “interested persons” within the meaning of Section 2(a)(19) of the 1940 Act. |
SEE NOTES TO FINANCIAL STATEMENTS. | THE RYDEX FUNDS ANNUAL REPORT | 71 |
STATEMENTS OF CHANGES IN NET ASSETS |
| | Year Ended
March 31,
2024 | | | Year Ended
March 31,
2023 | |
Increase (Decrease) in Net Assets from Operations: | | | | | | | | |
Net investment income | | $ | 152,925 | | | $ | 99,687 | |
Net realized gain (loss) on investments | | | (195,131 | ) | | | 4,933,068 | |
Net change in unrealized appreciation (depreciation) on investments | | | 4,604,554 | | | | (8,604,998 | ) |
Net increase (decrease) in net assets resulting from operations | | | 4,562,348 | | | | (3,572,243 | ) |
| | | | | | | | | |
Distributions to shareholders: | | | | | | | | |
Investor Class | | | — | | | | (1,002,375 | ) |
Class A | | | — | | | | (472,199 | ) |
Class C | | | — | | | | (229,698 | ) |
Class H | | | — | | | | (110,821 | ) |
Total distributions to shareholders | | | — | | | | (1,815,093 | ) |
| | | | | | | | | |
Capital share transactions: | | | | | | | | |
Proceeds from sale of shares | | | | | | | | |
Investor Class | | | 44,844,326 | | | | 25,704,725 | |
Class A | | | 1,349,282 | | | | 1,026,489 | |
Class C | | | 87,965 | | | | 204,435 | |
Class H | | | 95,281 | | | | 753,776 | |
Distributions reinvested | | | | | | | | |
Investor Class | | | — | | | | 933,611 | |
Class A | | | — | | | | 466,298 | |
Class C | | | — | | | | 227,947 | |
Class H | | | — | | | | 109,475 | |
Cost of shares redeemed | | | | | | | | |
Investor Class | | | (19,986,831 | ) | | | (51,332,334 | ) |
Class A | | | (1,342,196 | ) | | | (2,206,918 | ) |
Class C | | | (280,194 | ) | | | (361,088 | ) |
Class H | | | (197,524 | ) | | | (12,509,239 | ) |
Net increase (decrease) from capital share transactions | | | 24,570,109 | | | | (36,982,823 | ) |
Net increase (decrease) in net assets | | | 29,132,457 | | | | (42,370,159 | ) |
| | | | | | | | | |
Net assets: | | | | | | | | |
Beginning of year | | | 7,048,388 | | | | 49,418,547 | |
End of year | | $ | 36,180,845 | | | $ | 7,048,388 | |
| | | | | | | | | |
Capital share activity: | | | | | | | | |
Shares sold | | | | | | | | |
Investor Class | | | 597,215 | | | | 299,625 | |
Class A | | | 20,506 | | | | 13,965 | |
Class C | | | 1,688 | | | | 3,210 | |
Class H | | | 1,600 | | | | 9,815 | |
Shares issued from reinvestment of distributions | | | | | | | | |
Investor Class | | | — | | | | 13,794 | |
Class A | | | — | | | | 7,601 | |
Class C | | | — | | | | 4,577 | |
Class H | | | — | | | | 1,858 | |
Shares redeemed | | | | | | | | |
Investor Class | | | (273,868 | ) | | | (562,772 | ) |
Class A | | | (21,022 | ) | | | (29,906 | ) |
Class C | | | (5,621 | ) | | | (5,673 | ) |
Class H | | | (3,256 | ) | | | (146,214 | ) |
Net increase (decrease) in shares | | | 317,242 | | | | (390,120 | ) |
72 | THE RYDEX FUNDS ANNUAL REPORT | SEE NOTES TO FINANCIAL STATEMENTS. |
This table is presented to show selected data for a share outstanding throughout each period and to assist shareholders in evaluating a Fund’s performance for the periods presented.
Investor Class | | Year Ended
March 31,
2024 | | | Year Ended
March 31,
2023 | | | Year Ended
March 31,
2022 | | | Year Ended
March 31,
2021 | | | Year Ended
March 31,
2020 | |
Per Share Data |
Net asset value, beginning of period | | $ | 66.11 | | | $ | 101.95 | | | $ | 88.84 | | | $ | 54.80 | | | $ | 68.68 | |
Income (loss) from investment operations: |
Net investment income (loss)a | | | .86 | | | | .87 | | | | .64 | | | | .88 | | | | .83 | |
Net gain (loss) on investments (realized and unrealized) | | | 18.16 | | | | (19.17 | ) | | | 13.35 | | | | 33.16 | | | | (14.39 | ) |
Total from investment operations | | | 19.02 | | | | (18.30 | ) | | | 13.99 | | | | 34.04 | | | | (13.56 | ) |
Less distributions from: |
Net investment income | | | — | | | | (2.30 | ) | | | (.34 | ) | | | — | | | | (.32 | ) |
Net realized gains | | | — | | | | (15.24 | ) | | | (.54 | ) | | | — | | | | — | |
Total distributions | | | — | | | | (17.54 | ) | | | (.88 | ) | | | — | | | | (.32 | ) |
Net asset value, end of period | | $ | 85.13 | | | $ | 66.11 | | | $ | 101.95 | | | $ | 88.84 | | | $ | 54.80 | |
|
Total Return | | | 28.77 | % | | | (18.35 | %) | | | 15.72 | % | | | 62.12 | % | | | (19.88 | %) |
Ratios/Supplemental Data |
Net assets, end of period (in thousands) | | $ | 33,024 | | | $ | 4,269 | | | $ | 32,004 | | | $ | 32,328 | | | $ | 2,968 | |
Ratios to average net assets: |
Net investment income (loss) | | | 1.12 | % | | | 1.00 | % | | | 0.63 | % | | | 1.19 | % | | | 1.12 | % |
Total expenses | | | 1.43 | % | | | 1.40 | % | | | 1.36 | % | | | 1.41 | % | | | 1.48 | % |
Net expensesb | | | 1.39 | % | | | 1.40 | % | | | 1.36 | % | | | 1.41 | % | | | 1.48 | % |
Portfolio turnover rate | | | 119 | % | | | 177 | % | | | 406 | % | | | 246 | % | | | 249 | % |
Class A | | Year Ended
March 31,
2024 | | | Year Ended
March 31,
2023 | | | Year Ended
March 31,
2022 | | | Year Ended
March 31,
2021 | | | Year Ended
March 31,
2020 | |
Per Share Data |
Net asset value, beginning of period | | $ | 59.89 | | | $ | 94.54 | | | $ | 82.65 | | | $ | 51.10 | | | $ | 64.22 | |
Income (loss) from investment operations: |
Net investment income (loss)a | | | .63 | | | | .76 | | | | .36 | | | | .55 | | | | .54 | |
Net gain (loss) on investments (realized and unrealized) | | | 16.40 | | | | (17.87 | ) | | | 12.41 | | | | 31.00 | | | | (13.34 | ) |
Total from investment operations | | | 17.03 | | | | (17.11 | ) | | | 12.77 | | | | 31.55 | | | | (12.80 | ) |
Less distributions from: |
Net investment income | | | — | | | | (2.30 | ) | | | (.34 | ) | | | — | | | | (.32 | ) |
Net realized gains | | | — | | | | (15.24 | ) | | | (.54 | ) | | | — | | | | — | |
Total distributions | | | — | | | | (17.54 | ) | | | (.88 | ) | | | — | | | | (.32 | ) |
Net asset value, end of period | | $ | 76.92 | | | $ | 59.89 | | | $ | 94.54 | | | $ | 82.65 | | | $ | 51.10 | |
|
Total Returnc | | | 28.44 | % | | | (18.56 | %) | | | 15.42 | % | | | 61.74 | % | | | (20.07 | %) |
Ratios/Supplemental Data |
Net assets, end of period (in thousands) | | $ | 1,984 | | | $ | 1,576 | | | $ | 3,276 | | | $ | 2,780 | | | $ | 5,745 | |
Ratios to average net assets: |
Net investment income (loss) | | | 0.96 | % | | | 0.97 | % | | | 0.39 | % | | | 0.86 | % | | | 0.78 | % |
Total expenses | | | 1.69 | % | | | 1.64 | % | | | 1.61 | % | | | 1.70 | % | | | 1.72 | % |
Net expensesb | | | 1.65 | % | | | 1.64 | % | | | 1.61 | % | | | 1.70 | % | | | 1.72 | % |
Portfolio turnover rate | | | 119 | % | | | 177 | % | | | 406 | % | | | 246 | % | | | 249 | % |
SEE NOTES TO FINANCIAL STATEMENTS. | THE RYDEX FUNDS ANNUAL REPORT | 73 |
FINANCIAL HIGHLIGHTS (concluded) |
This table is presented to show selected data for a share outstanding throughout each period and to assist shareholders in evaluating a Fund’s performance for the periods presented.
Class C | | Year Ended
March 31,
2024 | | | Year Ended
March 31,
2023 | | | Year Ended
March 31,
2022 | | | Year Ended
March 31,
2021 | | | Year Ended
March 31,
2020 | |
Per Share Data |
Net asset value, beginning of period | | $ | 48.51 | | | $ | 81.13 | | | $ | 71.57 | | | $ | 44.59 | | | $ | 56.49 | |
Income (loss) from investment operations: |
Net investment income (loss)a | | | .11 | | | | .15 | | | | (.28 | ) | | | (.03 | ) | | | .01 | |
Net gain (loss) on investments (realized and unrealized) | | | 13.22 | | | | (15.23 | ) | | | 10.72 | | | | 27.01 | | | | (11.59 | ) |
Total from investment operations | | | 13.33 | | | | (15.08 | ) | | | 10.44 | | | | 26.98 | | | | (11.58 | ) |
Less distributions from: |
Net investment income | | | — | | | | (2.30 | ) | | | (.34 | ) | | | — | | | | (.32 | ) |
Net realized gains | | | — | | | | (15.24 | ) | | | (.54 | ) | | | — | | | | — | |
Total distributions | | | — | | | | (17.54 | ) | | | (.88 | ) | | | — | | | | (.32 | ) |
Net asset value, end of period | | $ | 61.84 | | | $ | 48.51 | | | $ | 81.13 | | | $ | 71.57 | | | $ | 44.59 | |
|
Total Returnc | | | 27.48 | % | | | (19.17 | %) | | | 14.55 | % | | | 60.51 | % | | | (20.66 | %) |
Ratios/Supplemental Data |
Net assets, end of period (in thousands) | | $ | 814 | | | $ | 829 | | | $ | 1,216 | | | $ | 1,036 | | | $ | 638 | |
Ratios to average net assets: |
Net investment income (loss) | | | 0.20 | % | | | 0.24 | % | | | (0.35 | %) | | | (0.06 | %) | | | 0.02 | % |
Total expenses | | | 2.44 | % | | | 2.40 | % | | | 2.36 | % | | | 2.43 | % | | | 2.47 | % |
Net expensesb | | | 2.40 | % | | | 2.40 | % | | | 2.36 | % | | | 2.43 | % | | | 2.47 | % |
Portfolio turnover rate | | | 119 | % | | | 177 | % | | | 406 | % | | | 246 | % | | | 249 | % |
Class H | | Year Ended
March 31,
2024 | | | Year Ended
March 31,
2023 | | | Year Ended
March 31,
2022 | | | Year Ended
March 31,
2021 | | | Year Ended
March 31,
2020 | |
Per Share Data |
Net asset value, beginning of period | | $ | 57.51 | | | $ | 91.63 | | | $ | 80.10 | | | $ | 49.53 | | | $ | 62.26 | |
Income (loss) from investment operations: |
Net investment income (loss)a | | | .59 | | | | (.06 | ) | | | .41 | | | | .68 | | | | .54 | |
Net gain (loss) on investments (realized and unrealized) | | | 15.77 | | | | (16.52 | ) | | | 12.00 | | | | 29.89 | | | | (12.95 | ) |
Total from investment operations | | | 16.36 | | | | (16.58 | ) | | | 12.41 | | | | 30.57 | | | | (12.41 | ) |
Less distributions from: |
Net investment income | | | — | | | | (2.30 | ) | | | (.34 | ) | | | — | | | | (.32 | ) |
Net realized gains | | | — | | | | (15.24 | ) | | | (.54 | ) | | | — | | | | — | |
Total distributions | | | — | | | | (17.54 | ) | | | (.88 | ) | | | — | | | | (.32 | ) |
Net asset value, end of period | | $ | 73.87 | | | $ | 57.51 | | | $ | 91.63 | | | $ | 80.10 | | | $ | 49.53 | |
|
Total Return | | | 28.45 | % | | | (18.56 | %) | | | 15.47 | % | | | 61.72 | % | | | (20.08 | %) |
Ratios/Supplemental Data |
Net assets, end of period (in thousands) | | $ | 358 | | | $ | 374 | | | $ | 12,923 | | | $ | 3,250 | | | $ | 611 | |
Ratios to average net assets: |
Net investment income (loss) | | | 0.95 | % | | | (0.08 | %) | | | 0.45 | % | | | 1.07 | % | | | 0.81 | % |
Total expenses | | | 1.68 | % | | | 1.66 | % | | | 1.61 | % | | | 1.69 | % | | | 1.72 | % |
Net expensesb | | | 1.65 | % | | | 1.66 | % | | | 1.61 | % | | | 1.69 | % | | | 1.72 | % |
Portfolio turnover rate | | | 119 | % | | | 177 | % | | | 406 | % | | | 246 | % | | | 249 | % |
a | Net investment income (loss) per share was computed using average shares outstanding throughout the period. |
b | Net expense information reflects the expense ratios after expense waivers and reimbursements, as applicable. |
c | Total return does not reflect the impact of any applicable sales charges. |
74 | THE RYDEX FUNDS ANNUAL REPORT | SEE NOTES TO FINANCIAL STATEMENTS. |
PERFORMANCE REPORT AND FUND PROFILE (Unaudited) | March 31, 2024 |
HEALTH CARE FUND
OBJECTIVE: Seeks to provide capital appreciation by investing in companies that are involved in the health care industry (“Health Care Companies”).
For the Reporting Period, Health Care Fund Investor Class returned 13.86%, compared with the S&P 500 Index, which returned 29.88%. The S&P 500 Health Care Index returned 16.09%.
The industries that contributed the most to performance were pharmaceuticals, biotechnology and health care equipment. Those that detracted the most were health care supplies and environmental & facilities services.
The holdings that contributed the most to performance were Eli Lilly and Co., Intuitive Surgical, Inc., and Merck & Company, Inc. Those that detracted the most were Pfizer, Inc., Illumina, Inc., and Bristol-Myers Squibb Co.
Performance displayed represents past performance, which is no guarantee of future results.
Holdings Diversification (Market Exposure as % of Net Assets)
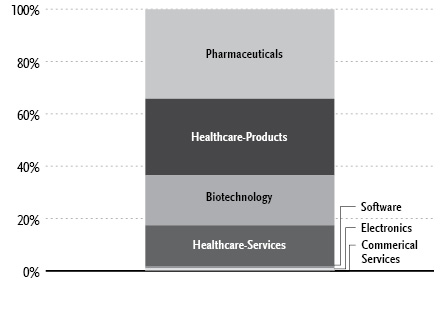
“Holdings Diversification (Market Exposure as % of Net Assets)” excludes any temporary cash investments.
Inception Dates: |
Investor Class | April 17, 1998 |
Class A | September 1, 2004 |
Class C | March 30, 2001 |
Class H | May 11, 1998 |
Ten Largest Holdings | % of Total Net Assets |
Eli Lilly & Co. | 3.9% |
UnitedHealth Group, Inc. | 3.3% |
Johnson & Johnson | 3.0% |
Merck & Company, Inc. | 2.9% |
AbbVie, Inc. | 2.8% |
Thermo Fisher Scientific, Inc. | 2.2% |
Abbott Laboratories | 2.1% |
Danaher Corp. | 2.0% |
Pfizer, Inc. | 2.0% |
Amgen, Inc. | 2.0% |
Top Ten Total | 26.2% |
| | |
“Ten Largest Holdings” excludes any temporary cash investments. |
| | THE RYDEX FUNDS ANNUAL REPORT | 75 |
PERFORMANCE REPORT AND FUND PROFILE (Unaudited)(concluded) | March 31, 2024 |
Cumulative Fund Performance*
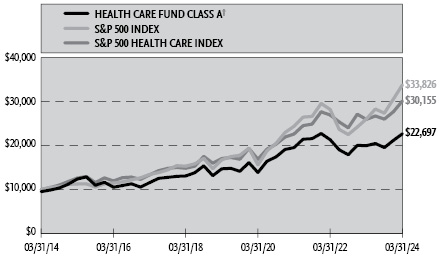
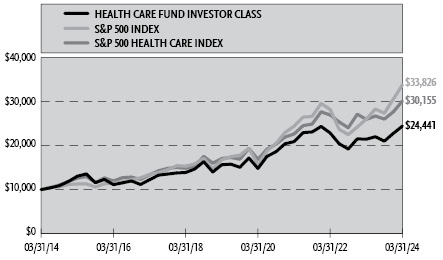
Average Annual Returns*
Periods Ended March 31, 2024
| 1 Year | 5 Year | 10 Year |
Investor Class Shares | 13.86% | 9.31% | 9.35% |
Class A Shares | 13.60% | 9.03% | 9.07% |
Class A Shares with sales charge† | 8.19% | 7.97% | 8.54% |
Class C Shares | 12.78% | 8.23% | 8.27% |
Class C Shares with CDSC‡ | 11.78% | 8.23% | 8.27% |
Class H Shares** | 13.58% | 9.05% | 9.04% |
S&P 500 Health Care Index | 16.09% | 12.05% | 11.67% |
S&P 500 Index | 29.88% | 15.05% | 12.96% |
* | The performance data above represents past performance that is not predictive of future results. The investment return and principal value of an investment in the Fund will fluctuate so that an investor’s shares, when redeemed, may be worth more or less than their original cost. Returns are historical and include changes in principal and reinvested dividends and capital gains and do not reflect the effect of taxes. The S&P 500 Index and the S&P 500 Health Care Index are unmanaged Indices and, unlike the Fund, have no management fees or operating expenses to reduce their reported returns. The graphs are based on Investor Class shares and Class A shares only; performance for Class C and Class H shares will vary due to differences in fee structures. |
** | Effective September 20, 2015, the Fund’s Advisor Class shares were converted into Class H shares. |
† | Fund returns are calculated using the maximum sales charge of 4.75%. |
‡ | Fund returns include a CDSC of 1% if redeemed within 12 months of purchase. |
76 | THE RYDEX FUNDS ANNUAL REPORT | |
SCHEDULE OF INVESTMENTS | March 31, 2024 |
HEALTH CARE FUND | |
| | Shares | | | Value | |
COMMON STOCKS† - 99.9% |
| | | | | | | | | |
Pharmaceuticals - 34.2% |
Eli Lilly & Co. | | | 1,241 | | | $ | 965,448 | |
Johnson & Johnson | | | 4,690 | | | | 741,911 | |
Merck & Company, Inc. | | | 5,401 | | | | 712,662 | |
AbbVie, Inc. | | | 3,767 | | | | 685,971 | |
Pfizer, Inc. | | | 17,459 | | | | 484,487 | |
Cigna Group | | | 1,108 | | | | 402,415 | |
Bristol-Myers Squibb Co. | | | 7,405 | | | | 401,573 | |
CVS Health Corp. | | | 4,947 | | | | 394,573 | |
Becton Dickinson & Co. | | | 1,320 | | | | 326,634 | |
AstraZeneca plc ADR | | | 4,759 | | | | 322,422 | |
McKesson Corp. | | | 597 | | | | 320,499 | |
Zoetis, Inc. | | | 1,819 | | | | 307,793 | |
Dexcom, Inc.* | | | 2,031 | | | | 281,700 | |
Cencora, Inc. — Class A | | | 1,022 | | | | 248,336 | |
Novo Nordisk A/S ADR | | | 1,821 | | | | 233,816 | |
GSK plc ADR | | | 4,722 | | | | 202,432 | |
Teva Pharmaceutical Industries Ltd. ADR* | | | 14,294 | | | | 201,688 | |
Cardinal Health, Inc. | | | 1,747 | | | | 195,489 | |
Alkermes plc* | | | 7,193 | | | | 194,715 | |
Novartis AG ADR | | | 2,006 | | | | 194,040 | |
Neurocrine Biosciences, Inc.* | | | 1,019 | | | | 140,541 | |
Viatris, Inc. | | | 11,693 | | | | 139,614 | |
Henry Schein, Inc.* | | | 1,555 | | | | 117,434 | |
Jazz Pharmaceuticals plc* | | | 861 | | | | 103,682 | |
Option Care Health, Inc.* | | | 2,729 | | | | 91,531 | |
Madrigal Pharmaceuticals, Inc.* | | | 148 | | | | 39,522 | |
Total Pharmaceuticals | | | | | | | 8,450,928 | |
| | | | | | | | | |
Healthcare-Products - 29.2% |
Thermo Fisher Scientific, Inc. | | | 955 | | | | 555,055 | |
Abbott Laboratories | | | 4,508 | | | | 512,379 | |
Danaher Corp. | | | 1,957 | | | | 488,702 | |
Intuitive Surgical, Inc.* | | | 1,120 | | | | 446,981 | |
Stryker Corp. | | | 1,170 | | | | 418,708 | |
Boston Scientific Corp.* | | | 5,571 | | | | 381,558 | |
Medtronic plc | | | 3,595 | | | | 313,304 | |
Edwards Lifesciences Corp.* | | | 2,981 | | | | 284,864 | |
IDEXX Laboratories, Inc.* | | | 454 | | | | 245,128 | |
Agilent Technologies, Inc. | | | 1,668 | | | | 242,711 | |
GE HealthCare Technologies, Inc. | | | 2,527 | | | | 229,730 | |
West Pharmaceutical Services, Inc. | | | 538 | | | | 212,892 | |
ResMed, Inc. | | | 1,022 | | | | 202,387 | |
Zimmer Biomet Holdings, Inc. | | | 1,515 | | | | 199,950 | |
Align Technology, Inc.* | | | 563 | | | | 184,619 | |
Baxter International, Inc. | | | 4,081 | | | | 174,422 | |
Cooper Companies, Inc.* | | | 1,661 | | | | 168,525 | |
Waters Corp.* | | | 481 | | | | 165,575 | |
Hologic, Inc.* | | | 2,078 | | | | 162,001 | |
Avantor, Inc.* | | | 6,146 | | | | 157,153 | |
Exact Sciences Corp.* | | | 1,999 | | | | 138,051 | |
Shockwave Medical, Inc.* | | | 422 | | | | 137,416 | |
Insulet Corp.* | | | 723 | | | | 123,922 | |
Natera, Inc.* | | | 1,328 | | | | 121,459 | |
Bio-Techne Corp. | | | 1,690 | | | | 118,959 | |
Repligen Corp.* | | | 614 | | | | 112,927 | |
Bruker Corp. | | | 1,172 | | | | 110,098 | |
Masimo Corp.* | | | 726 | | | | 106,613 | |
Dentsply Sirona, Inc. | | | 3,116 | | | | 103,420 | |
Penumbra, Inc.* | | | 452 | | | | 100,877 | |
Inspire Medical Systems, Inc.* | | | 410 | | | | 88,064 | |
Lantheus Holdings, Inc.* | | | 1,251 | | | | 77,862 | |
Azenta, Inc.* | | | 1,069 | | | | 64,439 | |
Inari Medical, Inc.* | | | 1,281 | | | | 61,462 | |
Total Healthcare-Products | | | | | | | 7,212,213 | |
| | | | | | | | | |
Biotechnology - 19.1% |
Amgen, Inc. | | | 1,698 | | | | 482,775 | |
Vertex Pharmaceuticals, Inc.* | | | 950 | | | | 397,110 | |
Regeneron Pharmaceuticals, Inc.* | | | 397 | | | | 382,109 | |
Gilead Sciences, Inc. | | | 4,937 | | | | 361,635 | |
Moderna, Inc.* | | | 2,187 | | | | 233,047 | |
Argenx SE ADR* | | | 540 | | | | 212,609 | |
Biogen, Inc.* | | | 975 | | | | 210,239 | |
CRISPR Therapeutics AG*,1 | | | 2,623 | | | | 178,784 | |
Illumina, Inc.* | | | 1,288 | | | | 176,868 | |
Alnylam Pharmaceuticals, Inc.* | | | 1,096 | | | | 163,797 | |
BioMarin Pharmaceutical, Inc.* | | | 1,774 | | | | 154,941 | |
Royalty Pharma plc — Class A | | | 4,932 | | | | 149,785 | |
Sarepta Therapeutics, Inc.* | | | 1,032 | | | | 133,603 | |
Incyte Corp.* | | | 2,142 | | | | 122,030 | |
United Therapeutics Corp.* | | | 521 | | | | 119,684 | |
Cytokinetics, Inc.* | | | 1,510 | | | | 105,866 | |
Exelixis, Inc.* | | | 4,345 | | | | 103,107 | |
Intra-Cellular Therapies, Inc.* | | | 1,380 | | | | 95,496 | |
Apellis Pharmaceuticals, Inc.* | | | 1,530 | | | | 89,933 | |
Ionis Pharmaceuticals, Inc.* | | | 2,021 | | | | 87,610 | |
Blueprint Medicines Corp.* | | | 906 | | | | 85,943 | |
Halozyme Therapeutics, Inc.* | | | 2,083 | | | | 84,736 | |
Revolution Medicines, Inc.* | | | 2,628 | | | | 84,700 | |
Roivant Sciences Ltd.* | | | 7,701 | | | | 81,169 | |
Bridgebio Pharma, Inc.* | | | 2,552 | | | | 78,908 | |
Ultragenyx Pharmaceutical, Inc.* | | | 1,481 | | | | 69,148 | |
Axsome Therapeutics, Inc.* | | | 861 | | | | 68,708 | |
Arrowhead Pharmaceuticals, Inc.* | | | 2,295 | | | | 65,637 | |
Guardant Health, Inc.* | | | 2,816 | | | | 58,094 | |
TG Therapeutics, Inc.* | | | 3,339 | | | | 50,786 | |
ACADIA Pharmaceuticals, Inc.* | | | 2,702 | | | | 49,960 | |
Total Biotechnology | | | | | | | 4,738,817 | |
| | | | | | | | | |
Healthcare-Services - 15.6% |
UnitedHealth Group, Inc. | | | 1,653 | | | | 817,739 | |
Elevance Health, Inc. | | | 817 | | | | 423,647 | |
HCA Healthcare, Inc. | | | 923 | | | | 307,848 | |
IQVIA Holdings, Inc.* | | | 985 | | | | 249,097 | |
Humana, Inc. | | | 711 | | | | 246,518 | |
Centene Corp.* | | | 3,082 | | | | 241,875 | |
ICON plc* | | | 708 | | | | 237,853 | |
Molina Healthcare, Inc.* | | | 461 | | | | 189,393 | |
Laboratory Corporation of America Holdings | | | 740 | | | | 161,660 | |
Quest Diagnostics, Inc. | | | 1,118 | | | | 148,817 | |
SEE NOTES TO FINANCIAL STATEMENTS. | THE RYDEX FUNDS ANNUAL REPORT | 77 |
SCHEDULE OF INVESTMENTS (concluded) | March 31, 2024 |
HEALTH CARE FUND | |
| | Shares | | | Value | |
Universal Health Services, Inc. — Class B | | | 718 | | | $ | 131,006 | |
Tenet Healthcare Corp.* | | | 1,177 | | | | 123,714 | |
Catalent, Inc.* | | | 2,108 | | | | 118,997 | |
HealthEquity, Inc.* | | | 1,222 | | | | 99,752 | |
Acadia Healthcare Company, Inc.* | | | 1,249 | | | | 98,946 | |
DaVita, Inc.* | | | 711 | | | | 98,154 | |
Medpace Holdings, Inc.* | | | 242 | | | | 97,804 | |
Teladoc Health, Inc.* | | | 3,851 | | | | 58,150 | |
Total Healthcare-Services | | | | | | | 3,850,970 | |
| | | | | | | | | |
Software - 0.9% |
Veeva Systems, Inc. — Class A* | | | 950 | | | | 220,106 | |
| | | | | | | | | |
Electronics - 0.7% |
Mettler-Toledo International, Inc.* | | | 121 | | | | 161,086 | |
| | | | | | | | | |
Commercial Services - 0.2% |
R1 RCM, Inc.* | | | 3,935 | | | | 50,683 | |
| | | | | | | | | |
Total Common Stocks | | | | |
(Cost $15,366,362) | | | | | | | 24,684,803 | |
| | | | | | | | | |
RIGHTS††† - 0.0% |
Pharmaceuticals — 0.0% |
Johnson & Johnson | | | | | | | | |
Expires 12/31/29 | | | 752 | | | | — | |
Total Rights | | | | |
(Cost $—) | | | | | | | — | |
| | | | | | | | | |
| | Face
Amount | | | Value | |
REPURCHASE AGREEMENTS††,2 - 0.3% |
J.P. Morgan Securities LLC
issued 03/28/24 at 5.31%
due 04/01/24 | | $ | 42,684 | | | | 42,684 | |
BofA Securities, Inc.
issued 03/28/24 at 5.31%
due 04/01/24 | | | 16,417 | | | | 16,417 | |
Barclays Capital, Inc.
issued 03/28/24 at 5.30%
due 04/01/24 | | | 14,880 | | | | 14,880 | |
Total Repurchase Agreements | | | | |
(Cost $73,981) | | | | | | | 73,981 | |
| | | | | | | | | |
| | | Shares | | | | | |
SECURITIES LENDING COLLATERAL†,3 - 0.6% |
Money Market Fund | | | | | | | | |
First American Government Obligations Fund - Class X, 5.23%4 | | | 144,339 | | | | 144,339 | |
Total Securities Lending Collateral | | | | |
(Cost $144,339) | | | | | | | 144,339 | |
| | | | | | | | | |
Total Investments - 100.8% | | | | |
(Cost $15,584,682) | | $ | 24,903,123 | |
Other Assets & Liabilities, net - (0.8)% | | | (190,205 | ) |
Total Net Assets - 100.0% | | $ | 24,712,918 | |
* | Non-income producing security. |
† | Value determined based on Level 1 inputs — See Note 4. |
†† | Value determined based on Level 2 inputs — See Note 4. |
††† | Value determined based on Level 3 inputs — See Note 4. |
1 | All or a portion of this security is on loan at March 31, 2024 — See Note 7. |
2 | Repurchase Agreements — See Note 6. |
3 | Securities lending collateral — See Note 7. |
4 | Rate indicated is the 7-day yield as of March 31, 2024. |
| | ADR — American Depositary Receipt |
| | plc — Public Limited Company |
| | |
| | See Sector Classification in Other Information section. |
The following table summarizes the inputs used to value the Fund’s investments at March 31, 2024 (See Note 4 in the Notes to Financial Statements):
Investments in Securities (Assets) | | Level 1
Quoted
Prices | | | Level 2
Significant
Observable
Inputs | | | Level 3
Significant
Unobservable
Inputs | | | Total | |
Common Stocks | | $ | 24,684,803 | | | $ | — | | | $ | — | | | $ | 24,684,803 | |
Rights | | | — | | | | — | | | | — | * | | | — | |
Repurchase Agreements | | | — | | | | 73,981 | | | | — | | | | 73,981 | |
Securities Lending Collateral | | | 144,339 | | | | — | | | | — | | | | 144,339 | |
Total Assets | | $ | 24,829,142 | | | $ | 73,981 | | | $ | — | | | $ | 24,903,123 | |
* | Security has a market value of $0. |
78 | THE RYDEX FUNDS ANNUAL REPORT | SEE NOTES TO FINANCIAL STATEMENTS. |
STATEMENT OF ASSETS AND LIABILITIES |
March 31, 2024 |
Assets: |
Investments, at value - including $133,253 of securities loaned (cost $15,510,701) | | $ | 24,829,142 | |
Repurchase agreements, at value (cost $73,981) | | | 73,981 | |
Cash | | | 1,898 | |
Receivables: |
Fund shares sold | | | 22,643 | |
Dividends | | | 20,802 | |
Foreign tax reclaims | | | 2,571 | |
Interest | | | 43 | |
Securities lending income | | | 15 | |
Total assets | | | 24,951,095 | |
| | | | | |
Liabilities: |
Payable for: |
Return of securities lending collateral | | | 144,339 | |
Fund shares redeemed | | | 43,154 | |
Management fees | | | 18,353 | |
Transfer agent fees | | | 9,996 | |
Portfolio accounting and administration fees | | | 2,213 | |
Distribution and service fees | | | 2,162 | |
Trustees’ fees* | | | 227 | |
Miscellaneous | | | 17,733 | |
Total liabilities | | | 238,177 | |
Net assets | | $ | 24,712,918 | |
| | | | | |
Net assets consist of: |
Paid in capital | | $ | 18,262,502 | |
Total distributable earnings (loss) | | | 6,450,416 | |
Net assets | | $ | 24,712,918 | |
| | | | | |
Investor Class: |
Net assets | | $ | 16,928,879 | |
Capital shares outstanding | | | 387,464 | |
Net asset value per share | | $ | 43.69 | |
| | | | | |
Class A: |
Net assets | | $ | 5,543,801 | |
Capital shares outstanding | | | 144,255 | |
Net asset value per share | | $ | 38.43 | |
Maximum offering price per share (Net asset value divided by 95.25%) | | $ | 40.35 | |
| | | | | |
Class C: |
Net assets | | $ | 995,731 | |
Capital shares outstanding | | | 32,417 | |
Net asset value per share | | $ | 30.72 | |
| | | | | |
Class H: |
Net assets | | $ | 1,244,507 | |
Capital shares outstanding | | | 33,830 | |
Net asset value per share | | $ | 36.79 | |
STATEMENT OF OPERATIONS |
Year Ended March 31, 2024 |
Investment Income: |
Dividends (net of foreign withholding tax of $1,643) | | $ | 282,724 | |
Interest | | | 6,897 | |
Income from securities lending, net | | | 3,308 | |
Total investment income | | | 292,929 | |
| | | | | |
Expenses: |
Management fees | | | 205,305 | |
Distribution and service fees: |
Class A | | | 12,674 | |
Class C | | | 10,882 | |
Class H | | | 2,942 | |
Transfer agent fees | | | 52,696 | |
Portfolio accounting and administration fees | | | 36,818 | |
Registration fees | | | 23,003 | |
Professional fees | | | 11,654 | |
Trustees’ fees* | | | 4,153 | |
Custodian fees | | | 3,489 | |
Line of credit fees | | | 39 | |
Miscellaneous | | | 8,657 | |
Total expenses | | | 372,312 | |
Less: |
Expenses reimbursed by Adviser | | | (7,713 | ) |
Net expenses | | | 364,599 | |
Net investment loss | | | (71,670 | ) |
| | | | | |
Net Realized and Unrealized Gain (Loss): |
Net realized gain (loss) on: |
Investments | | | 1,685,621 | |
Net realized gain | | | 1,685,621 | |
Net change in unrealized appreciation (depreciation) on: |
Investments | | | 1,402,616 | |
Net change in unrealized appreciation (depreciation) | | | 1,402,616 | |
Net realized and unrealized gain | | | 3,088,237 | |
Net increase in net assets resulting from operations | | $ | 3,016,567 | |
* | Relates to Trustees not deemed “interested persons” within the meaning of Section 2(a)(19) of the 1940 Act. |
SEE NOTES TO FINANCIAL STATEMENTS. | THE RYDEX FUNDS ANNUAL REPORT | 79 |
STATEMENTS OF CHANGES IN NET ASSETS |
| | Year Ended
March 31,
2024 | | | Year Ended
March 31,
2023 | |
Increase (Decrease) in Net Assets from Operations: | | | | | | | | |
Net investment loss | | $ | (71,670 | ) | | $ | (132,483 | ) |
Net realized gain on investments | | | 1,685,621 | | | | 1,740,666 | |
Net change in unrealized appreciation (depreciation) on investments | | | 1,402,616 | | | | (4,500,536 | ) |
Net increase (decrease) in net assets resulting from operations | | | 3,016,567 | | | | (2,892,353 | ) |
| | | | | | | | | |
Distributions to shareholders: | | | | | | | | |
Investor Class | | | — | | | | (558,000 | ) |
Class A | | | — | | | | (94,447 | ) |
Class C | | | — | | | | (39,724 | ) |
Class H | | | — | | | | (27,218 | ) |
Total distributions to shareholders | | | — | | | | (719,389 | ) |
| | | | | | | | | |
Capital share transactions: | | | | | | | | |
Proceeds from sale of shares | | | | | | | | |
Investor Class | | | 29,374,905 | | | | 102,301,697 | |
Class A | | | 2,065,989 | | | | 1,972,855 | |
Class C | | | 425,218 | | | | 372,082 | |
Class H | | | 732,223 | | | | 3,780,739 | |
Distributions reinvested | | | | | | | | |
Investor Class | | | — | | | | 549,584 | |
Class A | | | — | | | | 93,606 | |
Class C | | | — | | | | 38,384 | |
Class H | | | — | | | | 26,585 | |
Cost of shares redeemed | | | | | | | | |
Investor Class | | | (32,465,824 | ) | | | (108,242,862 | ) |
Class A | | | (2,082,409 | ) | | | (2,315,534 | ) |
Class C | | | (1,051,086 | ) | | | (1,340,731 | ) |
Class H | | | (945,315 | ) | | | (12,105,427 | ) |
Net decrease from capital share transactions | | | (3,946,299 | ) | | | (14,869,022 | ) |
Net decrease in net assets | | | (929,732 | ) | | | (18,480,764 | ) |
| | | | | | | | | |
Net assets: | | | | | | | | |
Beginning of year | | | 25,642,650 | | | | 44,123,414 | |
End of year | | $ | 24,712,918 | | | $ | 25,642,650 | |
| | | | | | | | | |
Capital share activity: | | | | | | | | |
Shares sold | | | | | | | | |
Investor Class | | | 734,248 | | | | 2,667,799 | |
Class A | | | 58,855 | | | | 58,331 | |
Class C | | | 14,625 | | | | 13,452 | |
Class H | | | 21,681 | | | | 117,002 | |
Shares issued from reinvestment of distributions | | | | | | | | |
Investor Class | | | — | | | | 14,383 | |
Class A | | | — | | | | 2,777 | |
Class C | | | — | | | | 1,411 | |
Class H | | | — | | | | 824 | |
Shares redeemed | | | | | | | | |
Investor Class | | | (812,620 | ) | | | (2,829,507 | ) |
Class A | | | (60,114 | ) | | | (69,097 | ) |
Class C | | | (38,320 | ) | | | (48,731 | ) |
Class H | | | (28,553 | ) | | | (369,188 | ) |
Net decrease in shares | | | (110,198 | ) | | | (440,544 | ) |
80 | THE RYDEX FUNDS ANNUAL REPORT | SEE NOTES TO FINANCIAL STATEMENTS. |
This table is presented to show selected data for a share outstanding throughout each period and to assist shareholders in evaluating a Fund’s performance for the periods presented.
Investor Class | | Year Ended
March 31,
2024 | | | Year Ended
March 31,
2023 | | | Year Ended
March 31,
2022 | | | Year Ended
March 31,
2021 | | | Year Ended
March 31,
2020 | |
Per Share Data |
Net asset value, beginning of period | | $ | 38.37 | | | $ | 41.55 | | | $ | 39.24 | | | $ | 30.27 | | | $ | 32.03 | |
Income (loss) from investment operations: |
Net investment income (loss)a | | | (.07 | ) | | | (.10 | ) | | | (.12 | ) | | | (.15 | ) | | | (.06 | ) |
Net gain (loss) on investments (realized and unrealized) | | | 5.39 | | | | (2.45 | ) | | | 3.84 | | | | 12.50 | | | | (1.70 | ) |
Total from investment operations | | | 5.32 | | | | (2.55 | ) | | | 3.72 | | | | 12.35 | | | | (1.76 | ) |
Less distributions from: |
Net realized gains | | | — | | | | (.63 | ) | | | (1.41 | ) | | | (3.38 | ) | | | — | |
Total distributions | | | — | | | | (.63 | ) | | | (1.41 | ) | | | (3.38 | ) | | | — | |
Net asset value, end of period | | $ | 43.69 | | | $ | 38.37 | | | $ | 41.55 | | | $ | 39.24 | | | $ | 30.27 | |
|
Total Return | | | 13.86 | % | | | (6.16 | %) | | | 9.40 | % | | | 41.24 | % | | | (5.49 | %) |
Ratios/Supplemental Data |
Net assets, end of period (in thousands) | | $ | 16,929 | | | $ | 17,873 | | | $ | 25,478 | | | $ | 20,831 | | | $ | 12,408 | |
Ratios to average net assets: |
Net investment income (loss) | | | (0.19 | %) | | | (0.26 | %) | | | (0.29 | %) | | | (0.41 | %) | | | (0.19 | %) |
Total expenses | | | 1.43 | % | | | 1.39 | % | | | 1.35 | % | | | 1.46 | % | | | 1.47 | % |
Net expensesb | | | 1.40 | % | | | 1.39 | % | | | 1.35 | % | | | 1.46 | % | | | 1.47 | % |
Portfolio turnover rate | | | 116 | % | | | 268 | % | | | 238 | % | | | 256 | % | | | 248 | % |
Class A | | Year Ended
March 31,
2024 | | | Year Ended
March 31,
2023 | | | Year Ended
March 31,
2022 | | | Year Ended
March 31,
2021 | | | Year Ended
March 31,
2020 | |
Per Share Data |
Net asset value, beginning of period | | $ | 33.83 | | | $ | 36.81 | | | $ | 34.99 | | | $ | 27.33 | | | $ | 29.00 | |
Income (loss) from investment operations: |
Net investment income (loss)a | | | (.15 | ) | | | (.16 | ) | | | (.19 | ) | | | (.21 | ) | | | (.12 | ) |
Net gain (loss) on investments (realized and unrealized) | | | 4.75 | | | | (2.19 | ) | | | 3.42 | | | | 11.25 | | | | (1.55 | ) |
Total from investment operations | | | 4.60 | | | | (2.35 | ) | | | 3.23 | | | | 11.04 | | | | (1.67 | ) |
Less distributions from: |
Net realized gains | | | — | | | | (.63 | ) | | | (1.41 | ) | | | (3.38 | ) | | | — | |
Total distributions | | | — | | | | (.63 | ) | | | (1.41 | ) | | | (3.38 | ) | | | — | |
Net asset value, end of period | | $ | 38.43 | | | $ | 33.83 | | | $ | 36.81 | | | $ | 34.99 | | | $ | 27.33 | |
|
Total Returnc | | | 13.60 | % | | | (6.38 | %) | | | 9.14 | % | | | 40.87 | % | | | (5.76 | %) |
Ratios/Supplemental Data |
Net assets, end of period (in thousands) | | $ | 5,544 | | | $ | 4,923 | | | $ | 5,650 | | | $ | 5,575 | | | $ | 3,606 | |
Ratios to average net assets: |
Net investment income (loss) | | | (0.43 | %) | | | (0.49 | %) | | | (0.50 | %) | | | (0.63 | %) | | | (0.43 | %) |
Total expenses | | | 1.68 | % | | | 1.64 | % | | | 1.61 | % | | | 1.69 | % | | | 1.73 | % |
Net expensesb | | | 1.65 | % | | | 1.64 | % | | | 1.61 | % | | | 1.69 | % | | | 1.73 | % |
Portfolio turnover rate | | | 116 | % | | | 268 | % | | | 238 | % | | | 256 | % | | | 248 | % |
SEE NOTES TO FINANCIAL STATEMENTS. | THE RYDEX FUNDS ANNUAL REPORT | 81 |
FINANCIAL HIGHLIGHTS (concluded) |
This table is presented to show selected data for a share outstanding throughout each period and to assist shareholders in evaluating a Fund’s performance for the periods presented.
Class C | | Year Ended
March 31,
2024 | | | Year Ended
March 31,
2023 | | | Year Ended
March 31,
2022 | | | Year Ended
March 31,
2021 | | | Year Ended
March 31,
2020 | |
Per Share Data |
Net asset value, beginning of period | | $ | 27.24 | | | $ | 29.99 | | | $ | 28.95 | | | $ | 23.21 | | | $ | 24.81 | |
Income (loss) from investment operations: |
Net investment income (loss)a | | | (.33 | ) | | | (.34 | ) | | | (.39 | ) | | | (.40 | ) | | | (.30 | ) |
Net gain (loss) on investments (realized and unrealized) | | | 3.81 | | | | (1.78 | ) | | | 2.84 | | | | 9.52 | | | | (1.30 | ) |
Total from investment operations | | | 3.48 | | | | (2.12 | ) | | | 2.45 | | | | 9.12 | | | | (1.60 | ) |
Less distributions from: |
Net realized gains | | | — | | | | (.63 | ) | | | (1.41 | ) | | | (3.38 | ) | | | — | |
Total distributions | | | — | | | | (.63 | ) | | | (1.41 | ) | | | (3.38 | ) | | | — | |
Net asset value, end of period | | $ | 30.72 | | | $ | 27.24 | | | $ | 29.99 | | | $ | 28.95 | | | $ | 23.21 | |
|
Total Returnc | | | 12.78 | % | | | (7.07 | %) | | | 8.34 | % | | | 39.82 | % | | | (6.45 | %) |
Ratios/Supplemental Data |
Net assets, end of period (in thousands) | | $ | 996 | | | $ | 1,529 | | | $ | 2,699 | | | $ | 3,147 | | | $ | 2,826 | |
Ratios to average net assets: |
Net investment income (loss) | | | (1.20 | %) | | | (1.25 | %) | | | (1.26 | %) | | | (1.39 | %) | | | (1.20 | %) |
Total expenses | | | 2.43 | % | | | 2.39 | % | | | 2.36 | % | | | 2.45 | % | | | 2.48 | % |
Net expensesb | | | 2.40 | % | | | 2.39 | % | | | 2.36 | % | | | 2.45 | % | | | 2.48 | % |
Portfolio turnover rate | | | 116 | % | | | 268 | % | | | 238 | % | | | 256 | % | | | 248 | % |
Class H | | Year Ended
March 31,
2024 | | | Year Ended
March 31,
2023 | | | Year Ended
March 31,
2022 | | | Year Ended
March 31,
2021 | | | Year Ended
March 31,
2020 | |
Per Share Data |
Net asset value, beginning of period | | $ | 32.39 | | | $ | 35.26 | | | $ | 33.57 | | | $ | 26.31 | | | $ | 27.91 | |
Income (loss) from investment operations: |
Net investment income (loss)a | | | (.14 | ) | | | (.21 | ) | | | (.17 | ) | | | (.21 | ) | | | (.13 | ) |
Net gain (loss) on investments (realized and unrealized) | | | 4.54 | | | | (2.03 | ) | | | 3.27 | | | | 10.85 | | | | (1.47 | ) |
Total from investment operations | | | 4.40 | | | | (2.24 | ) | | | 3.10 | | | | 10.64 | | | | (1.60 | ) |
Less distributions from: |
Net realized gains | | | — | | | | (.63 | ) | | | (1.41 | ) | | | (3.38 | ) | | | — | |
Total distributions | | | — | | | | (.63 | ) | | | (1.41 | ) | | | (3.38 | ) | | | — | |
Net asset value, end of period | | $ | 36.79 | | | $ | 32.39 | | | $ | 35.26 | | | $ | 33.57 | | | $ | 26.31 | |
|
Total Return | | | 13.58 | % | | | (6.38 | %) | | | 9.14 | % | | | 40.93 | % | | | (5.73 | %) |
Ratios/Supplemental Data |
Net assets, end of period (in thousands) | | $ | 1,245 | | | $ | 1,318 | | | $ | 10,297 | | | $ | 1,760 | | | $ | 1,021 | |
Ratios to average net assets: |
Net investment income (loss) | | | (0.43 | %) | | | (0.64 | %) | | | (0.46 | %) | | | (0.68 | %) | | | (0.45 | %) |
Total expenses | | | 1.68 | % | | | 1.65 | % | | | 1.61 | % | | | 1.76 | % | | | 1.72 | % |
Net expensesb | | | 1.65 | % | | | 1.65 | % | | | 1.61 | % | | | 1.76 | % | | | 1.72 | % |
Portfolio turnover rate | | | 116 | % | | | 268 | % | | | 238 | % | | | 256 | % | | | 248 | % |
a | Net investment income (loss) per share was computed using average shares outstanding throughout the period. |
b | Net expense information reflects the expense ratios after expense waivers and reimbursements, as applicable. |
c | Total return does not reflect the impact of any applicable sales charges. |
82 | THE RYDEX FUNDS ANNUAL REPORT | SEE NOTES TO FINANCIAL STATEMENTS. |
PERFORMANCE REPORT AND FUND PROFILE (Unaudited) | March 31, 2024 |
INTERNET FUND
OBJECTIVE: Seeks to provide capital appreciation by investing in companies that provide products or services designed for or related to the internet (“internet Companies”).
For the Reporting Period, Internet Fund Investor Class returned 30.42%, compared with the S&P 500 Index, which returned 29.88%. The S&P 500 Information Technology Index returned 46.01%.
The industries that contributed the most to performance were interactive media & services, application software, and internet services & infrastructure. Those that detracted the most were other specialty retail, transaction & payment processing services, and interactive home entertainment.
The holdings that contributed the most to performance were Meta Platforms, Inc. – Class A, Amazon.com, Inc., and Alphabet, Inc. – Class A. Those that detracted the most were Alibaba Group Holding Ltd. ADR, Bilibili, Inc. ADR, and JD.com, Inc. ADR.
Performance displayed represents past performance, which is no guarantee of future results.
Holdings Diversification (Market Exposure as % of Net Assets)
“Holdings Diversification (Market Exposure as % of Net Assets)” excludes any temporary cash investments.
Inception Dates: |
Investor Class | April 6, 2000 |
Class A | September 1, 2004 |
Class C | April 19, 2001 |
Class H | April 6, 2000 |
Ten Largest Holdings | % of Total Net Assets |
Alphabet, Inc. — Class A | 8.3% |
Amazon.com, Inc. | 7.5% |
Meta Platforms, Inc. — Class A | 6.3% |
Salesforce, Inc. | 3.7% |
Netflix, Inc. | 3.5% |
Adobe, Inc. | 3.1% |
Cisco Systems, Inc. | 3.0% |
Uber Technologies, Inc. | 2.7% |
Airbnb, Inc. — Class A | 2.2% |
PayPal Holdings, Inc. | 2.0% |
Top Ten Total | 42.3% |
| | |
“Ten Largest Holdings” excludes any temporary cash investments. |
| | THE RYDEX FUNDS ANNUAL REPORT | 83 |
PERFORMANCE REPORT AND FUND PROFILE (Unaudited)(concluded) | March 31, 2024 |
Cumulative Fund Performance*
Average Annual Returns*
Periods Ended March 31, 2024
| 1 Year | 5 Year | 10 Year |
Investor Class Shares | 30.42% | 6.90% | 10.09% |
Class A Shares | 30.10% | 6.63% | 9.81% |
Class A Shares with sales charge† | 23.91% | 5.60% | 9.28% |
Class C Shares | 29.13% | 5.83% | 8.99% |
Class C Shares with CDSC‡ | 28.13% | 5.83% | 8.99% |
Class H Shares** | 30.09% | 6.63% | 9.77% |
S&P 500 Information Technology Index | 46.01% | 25.39% | 21.97% |
S&P 500 Index | 29.88% | 15.05% | 12.96% |
* | The performance data above represents past performance that is not predictive of future results. The investment return and principal value of an investment in the Fund will fluctuate so that an investor’s shares, when redeemed, may be worth more or less than their original cost. Returns are historical and include changes in principal and reinvested dividends and capital gains and do not reflect the effect of taxes. The S&P 500 Index and the S&P 500 Information Technology Index are unmanaged indices, unlike the Fund, have no management fees or operating expenses to reduce their reported returns. The graphs are based on Investor Class shares and Class A shares only; performance for Class C and Class H shares will vary due to differences in fee structures. |
** | Effective September 30, 2015, the Fund’s Advisor Class shares were converted into Class H shares. |
† | Fund returns are calculated using the maximum sales charge of 4.75%. |
‡ | Fund returns include a CDSC of 1% if redeemed within 12 months of purchase. |
84 | THE RYDEX FUNDS ANNUAL REPORT | |
SCHEDULE OF INVESTMENTS | March 31, 2024 |
INTERNET FUND | |
| | Shares | | | Value | |
COMMON STOCKS† - 99.9% |
| | | | | | | | | |
Internet - 58.0% |
Alphabet, Inc. — Class A* | | | 21,096 | | | $ | 3,184,019 | |
Amazon.com, Inc.* | | | 16,089 | | | | 2,902,134 | |
Meta Platforms, Inc. — Class A | | | 4,999 | | | | 2,427,414 | |
Netflix, Inc.* | | | 2,244 | | | | 1,362,849 | |
Uber Technologies, Inc.* | | | 13,387 | | | | 1,030,665 | |
Airbnb, Inc. — Class A* | | | 5,030 | | | | 829,749 | |
Booking Holdings, Inc. | | | 206 | | | | 747,343 | |
DoorDash, Inc. — Class A* | | | 4,133 | | | | 569,197 | |
Alibaba Group Holding Ltd. ADR | | | 7,228 | | | | 523,018 | |
Shopify, Inc. — Class A* | | | 6,423 | | | | 495,663 | |
JD.com, Inc. ADR | | | 17,585 | | | | 481,653 | |
eBay, Inc. | | | 8,590 | | | | 453,380 | |
Baidu, Inc. ADR* | | | 4,026 | | | | 423,857 | |
Pinterest, Inc. — Class A* | | | 11,693 | | | | 405,396 | |
Spotify Technology S.A.* | | | 1,435 | | | | 378,697 | |
Expedia Group, Inc.* | | | 2,721 | | | | 374,818 | |
Trip.com Group Ltd. ADR* | | | 8,315 | | | | 364,945 | |
GoDaddy, Inc. — Class A* | | | 2,950 | | | | 350,106 | |
VeriSign, Inc.* | | | 1,805 | | | | 342,066 | |
Okta, Inc.* | | | 3,248 | | | | 339,806 | |
Bilibili, Inc. ADR*,1 | | | 30,132 | | | | 337,478 | |
Sea Ltd. ADR* | | | 6,239 | | | | 335,097 | |
MercadoLibre, Inc.* | | | 221 | | | | 334,143 | |
Wix.com Ltd.* | | | 2,305 | | | | 316,891 | |
Snap, Inc. — Class A* | | | 26,816 | | | | 307,848 | |
F5, Inc.* | | | 1,484 | | | | 281,352 | |
Match Group, Inc.* | | | 7,480 | | | | 271,374 | |
Roku, Inc.* | | | 4,083 | | | | 266,089 | |
Zillow Group, Inc. — Class C* | | | 5,282 | | | | 257,656 | |
Wayfair, Inc. — Class A* | | | 3,725 | | | | 252,853 | |
Etsy, Inc.* | | | 3,518 | | | | 241,757 | |
Lyft, Inc. — Class A* | | | 11,658 | | | | 225,582 | |
Chewy, Inc. — Class A* | | | 12,280 | | | | 195,375 | |
IAC, Inc.* | | | 3,232 | | | | 172,395 | |
TripAdvisor, Inc.* | | | 5,545 | | | | 154,096 | |
Cargurus, Inc.* | | | 5,602 | | | | 129,294 | |
Ziff Davis, Inc.* | | | 2,030 | | | | 127,971 | |
Bumble, Inc. — Class A* | | | 9,724 | | | | 110,367 | |
Total Internet | | | | | | | 22,304,393 | |
| | | | | | | | | |
Software - 26.0% |
Salesforce, Inc. | | | 4,763 | | | | 1,434,520 | |
Adobe, Inc.* | | | 2,397 | | | | 1,209,526 | |
Workday, Inc. — Class A* | | | 2,656 | | | | 724,424 | |
Snowflake, Inc. — Class A* | | | 3,530 | | | | 570,448 | |
Datadog, Inc. — Class A* | | | 4,244 | | | | 524,558 | |
Electronic Arts, Inc. | | | 3,797 | | | | 503,748 | |
Veeva Systems, Inc. — Class A* | | | 2,137 | | | | 495,122 | |
Cloudflare, Inc. — Class A* | | | 4,671 | | | | 452,293 | |
Take-Two Interactive Software, Inc.* | | | 2,900 | | | | 430,621 | |
ROBLOX Corp. — Class A* | | | 9,895 | | | | 377,791 | |
Zoom Video Communications, Inc. — Class A* | | | 5,476 | | | | 357,966 | |
NetEase, Inc. ADR | | | 3,290 | | | | 340,416 | |
Akamai Technologies, Inc.* | | | 3,068 | | | | 333,676 | |
MongoDB, Inc.* | | | 927 | | | | 332,459 | |
Nutanix, Inc. — Class A* | | | 5,255 | | | | 324,339 | |
DocuSign, Inc.* | | | 5,140 | | | | 306,087 | |
Twilio, Inc. — Class A* | | | 4,469 | | | | 273,279 | |
Dropbox, Inc. — Class A* | | | 9,945 | | | | 241,664 | |
ZoomInfo Technologies, Inc. — Class A* | | | 12,208 | | | | 195,694 | |
Smartsheet, Inc. — Class A* | | | 4,766 | | | | 183,491 | |
Box, Inc. — Class A* | | | 5,850 | | | | 165,672 | |
DigitalOcean Holdings, Inc.* | | | 3,209 | | | | 122,520 | |
Fastly, Inc. — Class A* | | | 8,029 | | | | 104,136 | |
Total Software | | | | | | | 10,004,450 | |
| | | | | | | | | |
Telecommunications - 10.2% |
Cisco Systems, Inc. | | | 23,496 | | | | 1,172,685 | |
Arista Networks, Inc.* | | | 2,484 | | | | 720,310 | |
Motorola Solutions, Inc. | | | 1,897 | | | | 673,397 | |
Telefonaktiebolaget LM Ericsson ADR1 | | | 55,498 | | | | 305,794 | |
Juniper Networks, Inc. | | | 7,926 | | | | 293,738 | |
Ciena Corp.* | | | 4,690 | | | | 231,921 | |
Nokia Oyj ADR | | | 55,525 | | | | 196,559 | |
Viasat, Inc.* | | | 6,312 | | | | 114,184 | |
Viavi Solutions, Inc.* | | | 12,315 | | | | 111,943 | |
Extreme Networks, Inc.* | | | 8,720 | | | | 100,629 | |
Total Telecommunications | | | | | | | 3,921,160 | |
| | | | | | | | | |
Commercial Services - 3.9% |
PayPal Holdings, Inc.* | | | 11,445 | | | | 766,701 | |
CoStar Group, Inc.* | | | 5,900 | | | | 569,940 | |
Paylocity Holding Corp.* | | | 1,034 | | | | 177,703 | |
Total Commercial Services | | | | | | | 1,514,344 | |
| | | | | | | | | |
Entertainment - 1.0% |
DraftKings, Inc. — Class A* | | | 8,510 | | | | 386,439 | |
| | | | | | | | | |
Computers - 0.4% |
Lumentum Holdings, Inc.* | | | 3,202 | | | | 151,615 | |
| | | | | | | | | |
Healthcare-Services - 0.4% |
Teladoc Health, Inc.* | | | 8,659 | | | | 130,751 | |
| | | | | | | | | |
Total Common Stocks | | | | |
(Cost $29,357,537) | | | | | | | 38,413,152 | |
| | | | | | | | | |
SEE NOTES TO FINANCIAL STATEMENTS. | THE RYDEX FUNDS ANNUAL REPORT | 85 |
SCHEDULE OF INVESTMENTS (concluded) | March 31, 2024 |
INTERNET FUND | |
| | Face
Amount | | | Value | |
REPURCHASE AGREEMENTS††,2 - 0.3% |
J.P. Morgan Securities LLC
issued 03/28/24 at 5.31%
due 04/01/24 | | $ | 55,891 | | | $ | 55,891 | |
BofA Securities, Inc.
issued 03/28/24 at 5.31%
due 04/01/24 | | | 21,497 | | | | 21,497 | |
Barclays Capital, Inc.
issued 03/28/24 at 5.30%
due 04/01/24 | | | 19,485 | | | | 19,485 | |
Total Repurchase Agreements | | | | |
(Cost $96,873) | | | | | | | 96,873 | |
| | | | | | | | | |
| | Shares | | | | |
SECURITIES LENDING COLLATERAL†,3 - 0.7% |
Money Market Fund | | | | | | | | |
First American Government Obligations Fund - Class X, 5.23%4 | | | 254,249 | | | | 254,249 | |
Total Securities Lending Collateral | | | | |
(Cost $254,249) | | | | | | | 254,249 | |
| | | | | | | | | |
Total Investments - 100.9% | | | | |
(Cost $29,708,659) | | $ | 38,764,274 | |
Other Assets & Liabilities, net - (0.9)% | | | (330,226 | ) |
Total Net Assets - 100.0% | | $ | 38,434,048 | |
* | Non-income producing security. |
† | Value determined based on Level 1 inputs — See Note 4. |
†† | Value determined based on Level 2 inputs — See Note 4. |
1 | All or a portion of this security is on loan at March 31, 2024 — See Note 7. |
2 | Repurchase Agreements — See Note 6. |
3 | Securities lending collateral — See Note 7. |
4 | Rate indicated is the 7-day yield as of March 31, 2024. |
| | ADR — American Depositary Receipt |
| | |
| | See Sector Classification in Other Information section. |
The following table summarizes the inputs used to value the Fund’s investments at March 31, 2024 (See Note 4 in the Notes to Financial Statements):
Investments in Securities (Assets) | | Level 1
Quoted
Prices | | | Level 2
Significant
Observable
Inputs | | | Level 3
Significant
Unobservable
Inputs | | | Total | |
Common Stocks | | $ | 38,413,152 | | | $ | — | | | $ | — | | | $ | 38,413,152 | |
Repurchase Agreements | | | — | | | | 96,873 | | | | — | | | | 96,873 | |
Securities Lending Collateral | | | 254,249 | | | | — | | | | — | | | | 254,249 | |
Total Assets | | $ | 38,667,401 | | | $ | 96,873 | | | $ | — | | | $ | 38,764,274 | |
86 | THE RYDEX FUNDS ANNUAL REPORT | SEE NOTES TO FINANCIAL STATEMENTS. |
STATEMENT OF ASSETS AND LIABILITIES |
March 31, 2024 |
Assets: |
Investments, at value - including $236,892 of securities loaned (cost $29,611,786) | | $ | 38,667,401 | |
Repurchase agreements, at value (cost $96,873) | | | 96,873 | |
Receivables: |
Fund shares sold | | | 19,973 | |
Dividends | | | 3,820 | |
Interest | | | 57 | |
Securities lending income | | | 56 | |
Total assets | | | 38,788,180 | |
| | | | | |
Liabilities: |
Payable for: |
Return of securities lending collateral | | | 254,249 | |
Fund shares redeemed | | | 28,358 | |
Management fees | | | 27,809 | |
Transfer agent fees | | | 14,234 | |
Distribution and service fees | | | 3,405 | |
Portfolio accounting and administration fees | | | 3,353 | |
Trustees’ fees* | | | 288 | |
Miscellaneous | | | 22,436 | |
Total liabilities | | | 354,132 | |
Net assets | | $ | 38,434,048 | |
| | | | | |
Net assets consist of: |
Paid in capital | | $ | 34,441,479 | |
Total distributable earnings (loss) | | | 3,992,569 | |
Net assets | | $ | 38,434,048 | |
| | | | | |
Investor Class: |
Net assets | | $ | 32,558,067 | |
Capital shares outstanding | | | 263,329 | |
Net asset value per share | | $ | 123.64 | |
| | | | | |
Class A: |
Net assets | | $ | 1,878,355 | |
Capital shares outstanding | | | 17,080 | |
Net asset value per share | | $ | 109.97 | |
Maximum offering price per share (Net asset value divided by 95.25%) | | $ | 115.45 | |
| | | | | |
Class C: |
Net assets | | $ | 3,341,398 | |
Capital shares outstanding | | | 39,053 | |
Net asset value per share | | $ | 85.56 | |
| | | | | |
Class H: |
Net assets | | $ | 656,228 | |
Capital shares outstanding | | | 6,257 | |
Net asset value per share | | $ | 104.88 | |
STATEMENT OF OPERATIONS |
Year Ended March 31, 2024 |
Investment Income: |
Dividends (net of foreign withholding tax of $3,477) | | $ | 70,417 | |
Interest | | | 7,888 | |
Income from securities lending, net | | | 1,126 | |
Total investment income | | | 79,431 | |
| | | | | |
Expenses: |
Management fees | | | 224,448 | |
Distribution and service fees: |
Class A | | | 4,008 | |
Class C | | | 29,138 | |
Class H | | | 1,595 | |
Transfer agent fees | | | 56,614 | |
Portfolio accounting and administration fees | | | 40,254 | |
Registration fees | | | 19,562 | |
Professional fees | | | 13,957 | |
Custodian fees | | | 3,723 | |
Trustees’ fees* | | | 3,499 | |
Miscellaneous | | | 13,493 | |
Total expenses | | | 410,291 | |
Less: |
Expenses reimbursed by Adviser | | | (9,630 | ) |
Net expenses | | | 400,661 | |
Net investment loss | | | (321,230 | ) |
| | | | | |
Net Realized and Unrealized Gain (Loss): |
Net realized gain (loss) on: |
Investments | | | 230,876 | |
Net realized gain | | | 230,876 | |
Net change in unrealized appreciation (depreciation) on: |
Investments | | | 5,041,324 | |
Net change in unrealized appreciation (depreciation) | | | 5,041,324 | |
Net realized and unrealized gain | | | 5,272,200 | |
Net increase in net assets resulting from operations | | $ | 4,950,970 | |
* | Relates to Trustees not deemed “interested persons” within the meaning of Section 2(a)(19) of the 1940 Act. |
SEE NOTES TO FINANCIAL STATEMENTS. | THE RYDEX FUNDS ANNUAL REPORT | 87 |
STATEMENTS OF CHANGES IN NET ASSETS |
| | Year Ended
March 31,
2024 | | | Year Ended
March 31,
2023 | |
Increase (Decrease) in Net Assets from Operations: | | | | | | | | |
Net investment loss | | $ | (321,230 | ) | | $ | (163,483 | ) |
Net realized gain (loss) on investments | | | 230,876 | | | | (3,082,146 | ) |
Net change in unrealized appreciation (depreciation) on investments | | | 5,041,324 | | | | (666,835 | ) |
Net increase (decrease) in net assets resulting from operations | | | 4,950,970 | | | | (3,912,464 | ) |
| | | | | | | | | |
Capital share transactions: | | | | | | | | |
Proceeds from sale of shares | | | | | | | | |
Investor Class | | | 67,759,919 | | | | 21,020,911 | |
Class A | | | 2,033,502 | | | | 1,013,188 | |
Class C | | | 382,516 | | | | 935,936 | |
Class H | | | 141,027 | | | | 3,169,571 | |
Cost of shares redeemed | | | | | | | | |
Investor Class | | | (54,950,256 | ) | | | (11,401,168 | ) |
Class A | | | (1,922,686 | ) | | | (1,449,349 | ) |
Class C | | | (325,691 | ) | | | (736,844 | ) |
Class H | | | (226,709 | ) | | | (2,834,259 | ) |
Net increase from capital share transactions | | | 12,891,622 | | | | 9,717,986 | |
Net increase in net assets | | | 17,842,592 | | | | 5,805,522 | |
| | | | | | | | | |
Net assets: | | | | | | | | |
Beginning of year | | | 20,591,456 | | | | 14,785,934 | |
End of year | | $ | 38,434,048 | | | $ | 20,591,456 | |
| | | | | | | | | |
Capital share activity: | | | | | | | | |
Shares sold | | | | | | | | |
Investor Class | | | 632,253 | | | | 228,196 | |
Class A | | | 21,711 | | | | 12,712 | |
Class C | | | 5,346 | | | | 14,997 | |
Class H | | | 1,586 | | | | 34,804 | |
Shares redeemed | | | | | | | | |
Investor Class | | | (539,260 | ) | | | (133,794 | ) |
Class A | | | (20,504 | ) | | | (18,515 | ) |
Class C | | | (4,358 | ) | | | (11,503 | ) |
Class H | | | (2,516 | ) | | | (37,230 | ) |
Net increase in shares | | | 94,258 | | | | 89,667 | |
88 | THE RYDEX FUNDS ANNUAL REPORT | SEE NOTES TO FINANCIAL STATEMENTS. |
This table is presented to show selected data for a share outstanding throughout each period and to assist shareholders in evaluating a Fund’s performance for the periods presented.
Investor Class | | Year Ended
March 31,
2024 | | | Year Ended
March 31,
2023 | | | Year Ended
March 31,
2022 | | | Year Ended
March 31,
2021 | | | Year Ended
March 31,
2020 | |
Per Share Data |
Net asset value, beginning of period | | $ | 94.80 | | | $ | 115.59 | | | $ | 195.59 | | | $ | 105.23 | | | $ | 118.80 | |
Income (loss) from investment operations: |
Net investment income (loss)a | | | (1.18 | ) | | | (.99 | ) | | | (2.11 | ) | | | (2.03 | ) | | | (1.30 | ) |
Net gain (loss) on investments (realized and unrealized) | | | 30.02 | | | | (19.80 | ) | | | (34.69 | ) | | | 92.39 | | | | (8.17 | ) |
Total from investment operations | | | 28.84 | | | | (20.79 | ) | | | (36.80 | ) | | | 90.36 | | | | (9.47 | ) |
Less distributions from: |
Net realized gains | | | — | | | | — | | | | (43.20 | ) | | | — | | | | (4.10 | ) |
Total distributions | | | — | | | | — | | | | (43.20 | ) | | | — | | | | (4.10 | ) |
Net asset value, end of period | | $ | 123.64 | | | $ | 94.80 | | | $ | 115.59 | | | $ | 195.59 | | | $ | 105.23 | |
|
Total Return | | | 30.42 | % | | | (17.99 | %) | | | (23.48 | %) | | | 85.87 | % | | | (8.25 | %) |
Ratios/Supplemental Data |
Net assets, end of period (in thousands) | | $ | 32,558 | | | $ | 16,148 | | | $ | 8,777 | | | $ | 25,113 | | | $ | 10,741 | |
Ratios to average net assets: |
Net investment income (loss) | | | (1.09 | %) | | | (1.13 | %) | | | (1.18 | %) | | | (1.21 | %) | | | (1.08 | %) |
Total expenses | | | 1.42 | % | | | 1.39 | % | | | 1.36 | % | | | 1.44 | % | | | 1.47 | % |
Net expensesb | | | 1.38 | % | | | 1.39 | % | | | 1.36 | % | | | 1.44 | % | | | 1.47 | % |
Portfolio turnover rate | | | 205 | % | | | 133 | % | | | 150 | % | | | 284 | % | | | 359 | % |
Class A | | Year Ended
March 31,
2024 | | | Year Ended
March 31,
2023 | | | Year Ended
March 31,
2022 | | | Year Ended
March 31,
2021 | | | Year Ended
March 31,
2020 | |
Per Share Data |
Net asset value, beginning of period | | $ | 84.53 | | | $ | 103.33 | | | $ | 179.98 | | | $ | 97.07 | | | $ | 110.18 | |
Income (loss) from investment operations: |
Net investment income (loss)a | | | (1.26 | ) | | | (1.10 | ) | | | (2.28 | ) | | | (2.22 | ) | | | (1.32 | ) |
Net gain (loss) on investments (realized and unrealized) | | | 26.70 | | | | (17.70 | ) | | | (31.17 | ) | | | 85.13 | | | | (7.69 | ) |
Total from investment operations | | | 25.44 | | | | (18.80 | ) | | | (33.45 | ) | | | 82.91 | | | | (9.01 | ) |
Less distributions from: |
Net realized gains | | | — | | | | — | | | | (43.20 | ) | | | — | | | | (4.10 | ) |
Total distributions | | | — | | | | — | | | | (43.20 | ) | | | — | | | | (4.10 | ) |
Net asset value, end of period | | $ | 109.97 | | | $ | 84.53 | | | $ | 103.33 | | | $ | 179.98 | | | $ | 97.07 | |
|
Total Returnc | | | 30.10 | % | | | (18.19 | %) | | | (23.67 | %) | | | 85.41 | % | | | (8.48 | %) |
Ratios/Supplemental Data |
Net assets, end of period (in thousands) | | $ | 1,878 | | | $ | 1,342 | | | $ | 2,240 | | | $ | 2,952 | | | $ | 2,060 | |
Ratios to average net assets: |
Net investment income (loss) | | | (1.33 | %) | | | (1.39 | %) | | | (1.44 | %) | | | (1.45 | %) | | | (1.20 | %) |
Total expenses | | | 1.69 | % | | | 1.65 | % | | | 1.61 | % | | | 1.69 | % | | | 1.73 | % |
Net expensesb | | | 1.65 | % | | | 1.65 | % | | | 1.61 | % | | | 1.69 | % | | | 1.73 | % |
Portfolio turnover rate | | | 205 | % | | | 133 | % | | | 150 | % | | | 284 | % | | | 359 | % |
SEE NOTES TO FINANCIAL STATEMENTS. | THE RYDEX FUNDS ANNUAL REPORT | 89 |
FINANCIAL HIGHLIGHTS (concluded) |
This table is presented to show selected data for a share outstanding throughout each period and to assist shareholders in evaluating a Fund’s performance for the periods presented.
Class C | | Year Ended
March 31,
2024 | | | Year Ended
March 31,
2023 | | | Year Ended
March 31,
2022 | | | Year Ended
March 31,
2021 | | | Year Ended
March 31,
2020 | |
Per Share Data |
Net asset value, beginning of period | | $ | 66.26 | | | $ | 81.61 | | | $ | 152.56 | | | $ | 82.90 | | | $ | 95.40 | |
Income (loss) from investment operations: |
Net investment income (loss)a | | | (1.54 | ) | | | (1.32 | ) | | | (2.89 | ) | | | (2.91 | ) | | | (1.96 | ) |
Net gain (loss) on investments (realized and unrealized) | | | 20.84 | | | | (14.03 | ) | | | (24.86 | ) | | | 72.57 | | | | (6.44 | ) |
Total from investment operations | | | 19.30 | | | | (15.35 | ) | | | (27.75 | ) | | | 69.66 | | | | (8.40 | ) |
Less distributions from: |
Net realized gains | | | — | | | | — | | | | (43.20 | ) | | | — | | | | (4.10 | ) |
Total distributions | | | — | | | | — | | | | (43.20 | ) | | | — | | | | (4.10 | ) |
Net asset value, end of period | | $ | 85.56 | | | $ | 66.26 | | | $ | 81.61 | | | $ | 152.56 | | | $ | 82.90 | |
|
Total Returnc | | | 29.13 | % | | | (18.81 | %) | | | (24.24 | %) | | | 84.03 | % | | | (9.16 | %) |
Ratios/Supplemental Data |
Net assets, end of period (in thousands) | | $ | 3,341 | | | $ | 2,522 | | | $ | 2,821 | | | $ | 4,124 | | | $ | 1,931 | |
Ratios to average net assets: |
Net investment income (loss) | | | (2.08 | %) | | | (2.14 | %) | | | (2.19 | %) | | | (2.21 | %) | | | (2.06 | %) |
Total expenses | | | 2.44 | % | | | 2.40 | % | | | 2.36 | % | | | 2.43 | % | | | 2.47 | % |
Net expensesb | | | 2.40 | % | | | 2.40 | % | | | 2.36 | % | | | 2.43 | % | | | 2.47 | % |
Portfolio turnover rate | | | 205 | % | | | 133 | % | | | 150 | % | | | 284 | % | | | 359 | % |
Class H | | Year Ended
March 31,
2024 | | | Year Ended
March 31,
2023 | | | Year Ended
March 31,
2022 | | | Year Ended
March 31,
2021 | | | Year Ended
March 31,
2020 | |
Per Share Data |
Net asset value, beginning of period | | $ | 80.62 | | | $ | 98.55 | | | $ | 173.71 | | | $ | 93.70 | | | $ | 106.51 | |
Income (loss) from investment operations: |
Net investment income (loss)a | | | (1.19 | ) | | | (1.09 | ) | | | (2.23 | ) | | | (1.75 | ) | | | (1.41 | ) |
Net gain (loss) on investments (realized and unrealized) | | | 25.45 | | | | (16.84 | ) | | | (29.73 | ) | | | 81.76 | | | | (7.30 | ) |
Total from investment operations | | | 24.26 | | | | (17.93 | ) | | | (31.96 | ) | | | 80.01 | | | | (8.71 | ) |
Less distributions from: |
Net realized gains | | | — | | | | — | | | | (43.20 | ) | | | — | | | | (4.10 | ) |
Total distributions | | | — | | | | — | | | | (43.20 | ) | | | — | | | | (4.10 | ) |
Net asset value, end of period | | $ | 104.88 | | | $ | 80.62 | | | $ | 98.55 | | | $ | 173.71 | | | $ | 93.70 | |
|
Total Return | | | 30.09 | % | | | (18.19 | %) | | | (23.67 | %) | | | 85.39 | % | | | (8.49 | %) |
Ratios/Supplemental Data |
Net assets, end of period (in thousands) | | $ | 656 | | | $ | 579 | | | $ | 947 | | | $ | 1,067 | | | $ | 825 | |
Ratios to average net assets: |
Net investment income (loss) | | | (1.33 | %) | | | (1.39 | %) | | | (1.45 | %) | | | (1.42 | %) | | | (1.30 | %) |
Total expenses | | | 1.68 | % | | | 1.65 | % | | | 1.61 | % | | | 1.76 | % | | | 1.71 | % |
Net expensesb | | | 1.65 | % | | | 1.65 | % | | | 1.61 | % | | | 1.76 | % | | | 1.71 | % |
Portfolio turnover rate | | | 205 | % | | | 133 | % | | | 150 | % | | | 284 | % | | | 359 | % |
a | Net investment income (loss) per share was computed using average shares outstanding throughout the period. |
b | Net expense information reflects the expense ratios after expense waivers and reimbursements, as applicable. |
c | Total return does not reflect the impact of any applicable sales charges. |
90 | THE RYDEX FUNDS ANNUAL REPORT | SEE NOTES TO FINANCIAL STATEMENTS. |
PERFORMANCE REPORT AND FUND PROFILE (Unaudited) | March 31, 2024 |
LEISURE FUND
OBJECTIVE: Seeks to provide capital appreciation by investing in companies engaged in leisure and entertainment businesses (“Leisure Companies”).
For the Reporting Period, Leisure Fund Investor Class returned 14.58%, compared with the S&P 500 Index, which returned 29.88%. The S&P 500 Consumer Discretionary Index returned 28.73%.
The industries that contributed the most to performance were hotels/resorts & cruise lines, restaurants, and movies & entertainment. Those that detracted the most were broadcasting, cable & satellite, and leisure products.
The holdings that contributed the most to performance were Netflix, Inc., DoorDash, Inc. – Class A, and Chipotle Mexican Grill, Inc. The holdings that detracted the most were Warner Bros. Discovery, Inc. – Series A, Bilibili, Inc. ADR, and AMC Entertainment Holdings, Inc. – Class A.
Performance displayed represents past performance, which is no guarantee of future results.
Holdings Diversification (Market Exposure as % of Net Assets)
“Holdings Diversification (Market Exposure as % of Net Assets)” excludes any temporary cash investments.
Inception Dates: |
Investor Class | April 1, 1998 |
Class A | September 1, 2004 |
Class C | May 3, 2001 |
Class H | June 3, 1998 |
Ten Largest Holdings | % of Total Net Assets |
Netflix, Inc. | 4.2% |
Walt Disney Co. | 4.2% |
McDonald’s Corp. | 3.7% |
Comcast Corp. — Class A | 3.6% |
Philip Morris International, Inc. | 3.2% |
Starbucks Corp. | 2.7% |
Booking Holdings, Inc. | 2.6% |
Airbnb, Inc. — Class A | 2.6% |
Altria Group, Inc. | 2.4% |
Marriott International, Inc. — Class A | 2.0% |
Top Ten Total | 31.2% |
| | |
“Ten Largest Holdings” excludes any temporary cash investments. |
| | THE RYDEX FUNDS ANNUAL REPORT | 91 |
PERFORMANCE REPORT AND FUND PROFILE (Unaudited)(concluded) | March 31, 2024 |
Cumulative Fund Performance*
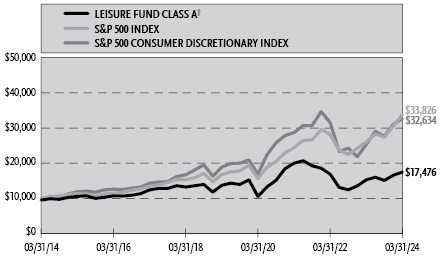
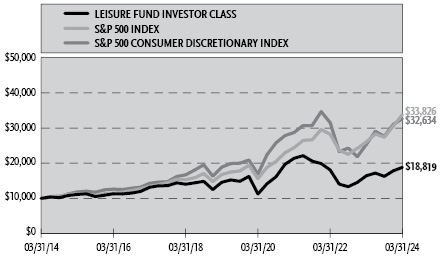
Average Annual Returns*
Periods Ended March 31, 2024
| 1 Year | 5 Year | 10 Year |
Investor Class Shares | 14.58% | 5.22% | 6.53% |
Class A Shares | 14.28% | 4.96% | 6.26% |
Class A Shares with sales charge† | 8.84% | 3.94% | 5.74% |
Class C Shares | 13.43% | 4.17% | 5.46% |
Class C Shares with CDSC‡ | 12.43% | 4.17% | 5.46% |
Class H Shares** | 14.26% | 4.96% | 6.23% |
S&P 500 Consumer Discretionary Index | 28.73% | 11.54% | 12.56% |
S&P 500 Index | 29.88% | 15.05% | 12.96% |
* | The performance data above represents past performance that is not predictive of future results. The investment return and principal value of an investment in the Fund will fluctuate so that an investor’s shares, when redeemed, may be worth more or less than their original cost. Returns are historical and include changes in principal and reinvested dividends and capital gains and do not reflect the effect of taxes. The S&P 500 Index and the S&P 500 Consumer Discretionary Index are unmanaged indices and, unlike the Fund, have no management fees or operating expenses to reduce their reported returns. The graphs are based on Investor Class shares and Class A shares only; performance for Class C and Class H shares will vary due to differences in fee structures. |
** | Effective September 30, 2015, the Fund’s Advisor Class shares were converted into Class H shares. |
† | Fund returns are calculated using the maximum sales charge of 4.75%. |
‡ | Fund returns include a CDSC of 1% if redeemed within 12 months of purchase. |
92 | THE RYDEX FUNDS ANNUAL REPORT | |
SCHEDULE OF INVESTMENTS | March 31, 2024 |
LEISURE FUND | |
| | Shares | | | Value | |
COMMON STOCKS† - 99.8% |
| | | | | | | | | |
Retail - 19.5% |
McDonald’s Corp. | | | 1,102 | | | $ | 310,709 | |
Starbucks Corp. | | | 2,459 | | | | 224,728 | |
Chipotle Mexican Grill, Inc. — Class A* | | | 55 | | | | 159,872 | |
Yum! Brands, Inc. | | | 986 | | | | 136,709 | |
Darden Restaurants, Inc. | | | 587 | | | | 98,117 | |
Domino’s Pizza, Inc. | | | 195 | | | | 96,892 | |
Restaurant Brands International, Inc. | | | 999 | | | | 79,371 | |
Yum China Holdings, Inc. | | | 1,960 | | | | 77,988 | |
Wingstop, Inc. | | | 199 | | | | 72,914 | |
Texas Roadhouse, Inc. — Class A | | | 470 | | | | 72,601 | |
Shake Shack, Inc. — Class A* | | | 423 | | | | 44,005 | |
Wendy’s Co. | | | 2,147 | | | | 40,449 | |
Bloomin’ Brands, Inc. | | | 1,184 | | | | 33,957 | |
Brinker International, Inc.* | | | 659 | | | | 32,739 | |
Papa John’s International, Inc. | | | 479 | | | | 31,901 | |
Dave & Buster’s Entertainment, Inc.* | | | 496 | | | | 31,050 | |
Cheesecake Factory, Inc. | | | 798 | | | | 28,848 | |
Cracker Barrel Old Country Store, Inc. | | | 396 | | | | 28,801 | |
Jack in the Box, Inc. | | | 349 | | | | 23,899 | |
Total Retail | | | | | | | 1,625,550 | |
| | | | | | | | | |
Internet - 17.4% |
Netflix, Inc.* | | | 584 | | | | 354,681 | |
Booking Holdings, Inc. | | | 61 | | | | 221,301 | |
Airbnb, Inc. — Class A* | | | 1,308 | | | | 215,768 | |
DoorDash, Inc. — Class A* | | | 1,074 | | | | 147,911 | |
Expedia Group, Inc.* | | | 707 | | | | 97,389 | |
Spotify Technology S.A.* | | | 360 | | | | 95,004 | |
Trip.com Group Ltd. ADR* | | | 2,039 | | | | 89,492 | |
Sea Ltd. ADR* | | | 1,537 | | | | 82,552 | |
Bilibili, Inc. ADR*,1 | | | 7,084 | | | | 79,341 | |
Roku, Inc.* | | | 1,061 | | | | 69,145 | |
Total Internet | | | | | | | 1,452,584 | |
| | | | | | | | | |
Media - 16.1% |
Walt Disney Co. | | | 2,864 | | | | 350,439 | |
Comcast Corp. — Class A | | | 6,854 | | | | 297,121 | |
Charter Communications, Inc. — Class A* | | | 433 | | | | 125,843 | |
Warner Bros Discovery, Inc.* | | | 11,033 | | | | 96,318 | |
Fox Corp. — Class A | | | 2,795 | | | | 87,399 | |
News Corp. — Class A | | | 3,301 | | | | 86,420 | |
Liberty Broadband Corp. — Class C* | | | 1,073 | | | | 61,408 | |
Paramount Global — Class B | | | 5,010 | | | | 58,968 | |
New York Times Co. — Class A | | | 1,325 | | | | 57,266 | |
Endeavor Group Holdings, Inc. — Class A | | | 2,053 | | | | 52,824 | |
Nexstar Media Group, Inc. — Class A | | | 234 | | | | 40,316 | |
Sirius XM Holdings, Inc.1 | | | 7,399 | | | | 28,708 | |
Total Media | | | | | | | 1,343,030 | |
| | | | | | | | | |
Entertainment - 10.8% |
DraftKings, Inc. — Class A* | | | 2,212 | | | | 100,447 | |
Live Nation Entertainment, Inc.* | | | 869 | | | | 91,914 | |
Warner Music Group Corp. — Class A | | | 2,681 | | | | 88,527 | |
TKO Group Holdings, Inc. | | | 872 | | | | 75,350 | |
Caesars Entertainment, Inc.* | | | 1,552 | | | | 67,884 | |
Light & Wonder, Inc. — Class A* | | | 654 | | | | 66,767 | |
Churchill Downs, Inc. | | | 538 | | | | 66,577 | |
Vail Resorts, Inc. | | | 285 | | | | 63,507 | |
Red Rock Resorts, Inc. — Class A | | | 863 | | | | 51,625 | |
Marriott Vacations Worldwide Corp. | | | 409 | | | | 44,062 | |
Penn Entertainment, Inc.* | | | 1,983 | | | | 36,110 | |
International Game Technology plc | | | 1,461 | | | | 33,004 | |
United Parks & Resorts, Inc.* | | | 581 | | | | 32,658 | |
Cinemark Holdings, Inc.* | | | 1,718 | | | | 30,872 | |
Six Flags Entertainment Corp.* | | | 1,149 | | | | 30,242 | |
AMC Entertainment Holdings, Inc. — Class A*,1 | | | 4,772 | | | | 17,751 | |
Total Entertainment | | | | | | | 897,297 | |
| | | | | | | | | |
Lodging - 9.8% |
Marriott International, Inc. — Class A | | | 677 | | | | 170,814 | |
Hilton Worldwide Holdings, Inc. | | | 775 | | | | 165,315 | |
Las Vegas Sands Corp. | | | 1,861 | | | | 96,214 | |
Hyatt Hotels Corp. — Class A | | | 561 | | | | 89,547 | |
MGM Resorts International* | | | 1,635 | | | | 77,188 | |
Wynn Resorts Ltd. | | | 670 | | | | 68,494 | |
Wyndham Hotels & Resorts, Inc. | | | 717 | | | | 55,030 | |
Boyd Gaming Corp. | | | 721 | | | | 48,538 | |
Choice Hotels International, Inc.1 | | | 342 | | | | 43,211 | |
Total Lodging | | | | | | | 814,351 | |
| | | | | | | | | |
Leisure Time - 7.3% |
Royal Caribbean Cruises Ltd.* | | | 942 | | | | 130,947 | |
Carnival Corp.* | | | 5,927 | | | | 96,847 | |
Norwegian Cruise Line Holdings Ltd.* | | | 3,208 | | | | 67,143 | |
Brunswick Corp. | | | 605 | | | | 58,395 | |
Harley-Davidson, Inc. | | | 1,248 | | | | 54,588 | |
Polaris, Inc. | | | 522 | | | | 52,263 | |
Planet Fitness, Inc. — Class A* | | | 804 | | | | 50,355 | |
YETI Holdings, Inc.* | | | 1,043 | | | | 40,208 | |
Topgolf Callaway Brands Corp.* | | | 2,225 | | | | 35,978 | |
Peloton Interactive, Inc. — Class A* | | | 5,647 | | | | 24,197 | |
Total Leisure Time | | | | | | | 610,921 | |
| | | | | | | | | |
Agriculture - 6.5% |
Philip Morris International, Inc. | | | 2,887 | | | | 264,507 | |
Altria Group, Inc. | | | 4,575 | | | | 199,561 | |
British American Tobacco plc ADR | | | 2,627 | | | | 80,124 | |
Total Agriculture | | | | | | | 544,192 | |
| | | | | | | | | |
Software - 5.1% |
Electronic Arts, Inc. | | | 987 | | | | 130,945 | |
Take-Two Interactive Software, Inc.* | | | 754 | | | | 111,962 | |
ROBLOX Corp. — Class A* | | | 2,573 | | | | 98,237 | |
NetEase, Inc. ADR | | | 798 | | | | 82,569 | |
Total Software | | | | | | | 423,713 | |
| | | | | | | | | |
Beverages - 5.0% |
Constellation Brands, Inc. — Class A | | | 558 | | | | 151,642 | |
Brown-Forman Corp. — Class B | | | 2,081 | | | | 107,421 | |
Molson Coors Beverage Co. — Class B | | | 1,212 | | | | 81,507 | |
SEE NOTES TO FINANCIAL STATEMENTS. | THE RYDEX FUNDS ANNUAL REPORT | 93 |
SCHEDULE OF INVESTMENTS (concluded) | March 31, 2024 |
LEISURE FUND | |
| | Shares | | | Value | |
Anheuser-Busch InBev S.A. ADR1 | | | 1,248 | | | $ | 75,854 | |
Total Beverages | | | | | | | 416,424 | |
| | | | | | | | | |
Toys, Games & Hobbies - 1.4% |
Hasbro, Inc. | | | 1,117 | | | | 63,133 | |
Mattel, Inc.* | | | 2,936 | | | | 58,162 | |
Total Toys, Games & Hobbies | | | | | | | 121,295 | |
| | | | | | | | | |
Food Service - 0.8% |
Aramark | | | 2,006 | | | | 65,235 | |
| | | | | | | | | |
Commercial Services - 0.1% |
Sabre Corp.* | | | 4,558 | | | | 11,030 | |
| | | | | | | | | |
Total Common Stocks | | | | |
(Cost $4,790,137) | | | | | | | 8,325,622 | |
| | | | | | | | | |
| | | Face
Amount | | | | | |
REPURCHASE AGREEMENTS††,2 - 0.5% |
J.P. Morgan Securities LLC
issued 03/28/24 at 5.31%
due 04/01/24 | | $ | 22,284 | | | | 22,284 | |
BofA Securities, Inc.
issued 03/28/24 at 5.31%
due 04/01/24 | | | 8,571 | | | | 8,571 | |
Barclays Capital, Inc.
issued 03/28/24 at 5.30%
due 04/01/24 | | | 7,769 | | | | 7,769 | |
Total Repurchase Agreements | | | | |
(Cost $38,624) | | | | | | | 38,624 | |
SECURITIES LENDING COLLATERAL†,3 - 1.3% |
Money Market Fund | | | | | | | | |
First American Government Obligations Fund - Class X, 5.23%4 | | | 105,185 | | | | 105,185 | |
Total Securities Lending Collateral | | | | |
(Cost $105,185) | | | | | | | 105,185 | |
| | | | | | | | | |
Total Investments - 101.6% | | | | |
(Cost $4,933,946) | | $ | 8,469,431 | |
Other Assets & Liabilities, net - (1.6)% | | | (130,104 | ) |
Total Net Assets - 100.0% | | $ | 8,339,327 | |
* | Non-income producing security. |
† | Value determined based on Level 1 inputs — See Note 4. |
†† | Value determined based on Level 2 inputs — See Note 4. |
1 | All or a portion of this security is on loan at March 31, 2024 — See Note 7. |
2 | Repurchase Agreements — See Note 6. |
3 | Securities lending collateral — See Note 7. |
4 | Rate indicated is the 7-day yield as of March 31, 2024. |
| | ADR — American Depositary Receipt |
| | plc — Public Limited Company |
| | |
| | See Sector Classification in Other Information section. |
The following table summarizes the inputs used to value the Fund’s investments at March 31, 2024 (See Note 4 in the Notes to Financial Statements):
Investments in Securities (Assets) | | Level 1
Quoted
Prices | | | Level 2
Significant
Observable
Inputs | | | Level 3
Significant
Unobservable
Inputs | | | Total | |
Common Stocks | | $ | 8,325,622 | | | $ | — | | | $ | — | | | $ | 8,325,622 | |
Repurchase Agreements | | | — | | | | 38,624 | | | | — | | | | 38,624 | |
Securities Lending Collateral | | | 105,185 | | | | — | | | | — | | | | 105,185 | |
Total Assets | | $ | 8,430,807 | | | $ | 38,624 | | | $ | — | | | $ | 8,469,431 | |
94 | THE RYDEX FUNDS ANNUAL REPORT | SEE NOTES TO FINANCIAL STATEMENTS. |
STATEMENT OF ASSETS AND LIABILITIES |
March 31, 2024 |
Assets: |
Investments, at value - including $97,241 of securities loaned (cost $4,895,322) | | $ | 8,430,807 | |
Repurchase agreements, at value (cost $38,624) | | | 38,624 | |
Cash | | | 1,401 | |
Receivables: |
Dividends | | | 12,977 | |
Fund shares sold | | | 1,176 | |
Securities lending income | | | 519 | |
Interest | | | 23 | |
Total assets | | | 8,485,527 | |
| | | | | |
Liabilities: |
Payable for: |
Return of securities lending collateral | | | 105,185 | |
Fund shares redeemed | | | 21,893 | |
Management fees | | | 6,114 | |
Transfer agent fees | | | 3,778 | |
Distribution and service fees | | | 968 | |
Portfolio accounting and administration fees | | | 737 | |
Trustees’ fees* | | | 95 | |
Miscellaneous | | | 7,430 | |
Total liabilities | | | 146,200 | |
Net assets | | $ | 8,339,327 | |
| | | | | |
Net assets consist of: |
Paid in capital | | $ | 7,008,078 | |
Total distributable earnings (loss) | | | 1,331,249 | |
Net assets | | $ | 8,339,327 | |
| | | | | |
Investor Class: |
Net assets | | $ | 4,785,549 | |
Capital shares outstanding | | | 57,311 | |
Net asset value per share | | $ | 83.50 | |
| | | | | |
Class A: |
Net assets | | $ | 1,894,354 | |
Capital shares outstanding | | | 25,251 | |
Net asset value per share | | $ | 75.02 | |
Maximum offering price per share (Net asset value divided by 95.25%) | | $ | 78.76 | |
| | | | | |
Class C: |
Net assets | | $ | 277,426 | |
Capital shares outstanding | | | 4,394 | |
Net asset value per share | | $ | 63.14 | |
| | | | | |
Class H: |
Net assets | | $ | 1,381,998 | |
Capital shares outstanding | | | 19,009 | |
Net asset value per share | | $ | 72.70 | |
STATEMENT OF OPERATIONS |
Year Ended March 31, 2024 |
Investment Income: |
Dividends (net of foreign withholding tax of $861) | | $ | 181,540 | |
Interest | | | 3,372 | |
Income from securities lending, net | | | 46,096 | |
Total investment income | | | 231,008 | |
| | | | | |
Expenses: |
Management fees | | | 110,626 | |
Distribution and service fees: |
Class A | | | 5,990 | |
Class C | | | 3,020 | |
Class H | | | 4,212 | |
Transfer agent fees | | | 28,528 | |
Portfolio accounting and administration fees | | | 19,838 | |
Registration fees | | | 15,911 | |
Professional fees | | | 4,836 | |
Trustees’ fees* | | | 2,797 | |
Custodian fees | | | 1,993 | |
Miscellaneous | | | 1,402 | |
Total expenses | | | 199,153 | |
Less: |
Expenses reimbursed by Adviser | | | (3,557 | ) |
Net expenses | | | 195,596 | |
Net investment income | | | 35,412 | |
| | | | | |
Net Realized and Unrealized Gain (Loss): |
Net realized gain (loss) on: |
Investments | | | 445,439 | |
Net realized gain | | | 445,439 | |
Net change in unrealized appreciation (depreciation) on: |
Investments | | | (86,095 | ) |
Net change in unrealized appreciation (depreciation) | | | (86,095 | ) |
Net realized and unrealized gain | | | 359,344 | |
Net increase in net assets resulting from operations | | $ | 394,756 | |
* | Relates to Trustees not deemed “interested persons” within the meaning of Section 2(a)(19) of the 1940 Act. |
SEE NOTES TO FINANCIAL STATEMENTS. | THE RYDEX FUNDS ANNUAL REPORT | 95 |
STATEMENTS OF CHANGES IN NET ASSETS |
| | Year Ended
March 31,
2024 | | | Year Ended
March 31,
2023 | |
Increase (Decrease) in Net Assets from Operations: | | | | | | | | |
Net investment income | | $ | 35,412 | | | $ | 7,181 | |
Net realized gain (loss) on investments | | | 445,439 | | | | (1,130,794 | ) |
Net change in unrealized appreciation (depreciation) on investments | | | (86,095 | ) | | | (460,307 | ) |
Net increase (decrease) in net assets resulting from operations | | | 394,756 | | | | (1,583,920 | ) |
| | | | | | | | | |
Distributions to shareholders: | | | | | | | | |
Investor Class | | | (4,283 | ) | | | — | |
Class A | | | (1,567 | ) | | | — | |
Class C | | | (220 | ) | | | — | |
Class H | | | (1,111 | ) | | | — | |
Total distributions to shareholders | | | (7,181 | ) | | | — | |
| | | | | | | | | |
Capital share transactions: | | | | | | | | |
Proceeds from sale of shares | | | | | | | | |
Investor Class | | | 28,182,518 | | | | 32,776,086 | |
Class A | | | 320,756 | | | | 119,240 | |
Class C | | | 19,815 | | | | 30,193 | |
Class H | | | 1,246,731 | | | | 348,684 | |
Distributions reinvested | | | | | | | | |
Investor Class | | | 4,166 | | | | — | |
Class A | | | 1,122 | | | | — | |
Class C | | | 220 | | | | — | |
Class H | | | 1,103 | | | | — | |
Cost of shares redeemed | | | | | | | | |
Investor Class | | | (43,870,062 | ) | | | (16,932,942 | ) |
Class A | | | (1,314,667 | ) | | | (1,360,710 | ) |
Class C | | | (96,413 | ) | | | (226,825 | ) |
Class H | | | (1,868,660 | ) | | | (383,917 | ) |
Net increase (decrease) from capital share transactions | | | (17,373,371 | ) | | | 14,369,809 | |
Net increase (decrease) in net assets | | | (16,985,796 | ) | | | 12,785,889 | |
| | | | | | | | | |
Net assets: | | | | | | | | |
Beginning of year | | | 25,325,123 | | | | 12,539,234 | |
End of year | | $ | 8,339,327 | | | $ | 25,325,123 | |
| | | | | | | | | |
Capital share activity: | | | | | | | | |
Shares sold | | | | | | | | |
Investor Class | | | 368,511 | | | | 454,555 | |
Class A | | | 4,855 | | | | 1,902 | |
Class C | | | 347 | | | | 575 | |
Class H | | | 19,672 | | | | 5,556 | |
Shares issued from reinvestment of distributions | | | | | | | | |
Investor Class | | | 54 | | | | — | |
Class A | | | 16 | | | | — | |
Class C | | | 4 | | | | — | |
Class H | | | 16 | | | | — | |
Shares redeemed | | | | | | | | |
Investor Class | | | (594,121 | ) | | | (241,133 | ) |
Class A | | | (19,188 | ) | | | (22,358 | ) |
Class C | | | (1,664 | ) | | | (4,407 | ) |
Class H | | | (28,613 | ) | | | (6,410 | ) |
Net increase (decrease) in shares | | | (250,111 | ) | | | 188,280 | |
96 | THE RYDEX FUNDS ANNUAL REPORT | SEE NOTES TO FINANCIAL STATEMENTS. |
This table is presented to show selected data for a share outstanding throughout each period and to assist shareholders in evaluating a Fund’s performance for the periods presented.
Investor Class | | Year Ended
March 31,
2024 | | | Year Ended
March 31,
2023 | | | Year Ended
March 31,
2022 | | | Year Ended
March 31,
2021 | | | Year Ended
March 31,
2020 | |
Per Share Data |
Net asset value, beginning of period | | $ | 72.93 | | | $ | 80.27 | | | $ | 100.94 | | | $ | 53.01 | | | $ | 68.98 | |
Income (loss) from investment operations: |
Net investment income (loss)a | | | .27 | | | | .21 | | | | (.44 | ) | | | (.34 | ) | | | .08 | |
Net gain (loss) on investments (realized and unrealized) | | | 10.35 | | | | (7.55 | ) | | | (14.80 | ) | | | 48.27 | | | | (15.86 | ) |
Total from investment operations | | | 10.62 | | | | (7.34 | ) | | | (15.24 | ) | | | 47.93 | | | | (15.78 | ) |
Less distributions from: |
Net investment income | | | (.05 | ) | | | — | | | | — | | | | — | | | | (.19 | ) |
Net realized gains | | | — | | | | — | | | | (5.43 | ) | | | — | | | | — | |
Total distributions | | | (.05 | ) | | | — | | | | (5.43 | ) | | | — | | | | (.19 | ) |
Net asset value, end of period | | $ | 83.50 | | | $ | 72.93 | | | $ | 80.27 | | | $ | 100.94 | | | $ | 53.01 | |
|
Total Return | | | 14.58 | % | | | (9.14 | %) | | | (15.52 | %) | | | 90.42 | % | | | (22.96 | %) |
Ratios/Supplemental Data |
Net assets, end of period (in thousands) | | $ | 4,786 | | | $ | 20,629 | | | $ | 5,574 | | | $ | 40,995 | | | $ | 2,839 | |
Ratios to average net assets: |
Net investment income (loss) | | | 0.36 | % | | | 0.30 | % | | | (0.45 | %) | | | (0.39 | %) | | | 0.11 | % |
Total expenses | | | 1.43 | % | | | 1.39 | % | | | 1.36 | % | | | 1.41 | % | | | 1.48 | % |
Net expensesb | | | 1.40 | % | | | 1.39 | % | | | 1.36 | % | | | 1.41 | % | | | 1.48 | % |
Portfolio turnover rate | | | 214 | % | | | 145 | % | | | 168 | % | | | 144 | % | | | 369 | % |
Class A | | Year Ended
March 31,
2024 | | | Year Ended
March 31,
2023 | | | Year Ended
March 31,
2022 | | | Year Ended
March 31,
2021 | | | Year Ended
March 31,
2020 | |
Per Share Data |
Net asset value, beginning of period | | $ | 65.70 | | | $ | 72.50 | | | $ | 91.96 | | | $ | 48.41 | | | $ | 63.17 | |
Income (loss) from investment operations: |
Net investment income (loss)a | | | .10 | | | | (.12 | ) | | | (.51 | ) | | | (.41 | ) | | | .01 | |
Net gain (loss) on investments (realized and unrealized) | | | 9.27 | | | | (6.68 | ) | | | (13.52 | ) | | | 43.96 | | | | (14.58 | ) |
Total from investment operations | | | 9.37 | | | | (6.80 | ) | | | (14.03 | ) | | | 43.55 | | | | (14.57 | ) |
Less distributions from: |
Net investment income | | | (.05 | ) | | | — | | | | — | | | | — | | | | (.19 | ) |
Net realized gains | | | — | | | | — | | | | (5.43 | ) | | | — | | | | — | |
Total distributions | | | (.05 | ) | | | — | | | | (5.43 | ) | | | — | | | | (.19 | ) |
Net asset value, end of period | | $ | 75.02 | | | $ | 65.70 | | | $ | 72.50 | | | $ | 91.96 | | | $ | 48.41 | |
|
Total Returnc | | | 14.28 | % | | | (9.38 | %) | | | (15.72 | %) | | | 89.96 | % | | | (23.15 | %) |
Ratios/Supplemental Data |
Net assets, end of period (in thousands) | | $ | 1,894 | | | $ | 2,600 | | | $ | 4,351 | | | $ | 4,291 | | | $ | 816 | |
Ratios to average net assets: |
Net investment income (loss) | | | 0.15 | % | | | (0.20 | %) | | | (0.59 | %) | | | (0.56 | %) | | | 0.02 | % |
Total expenses | | | 1.68 | % | | | 1.64 | % | | | 1.61 | % | | | 1.68 | % | | | 1.73 | % |
Net expensesb | | | 1.65 | % | | | 1.64 | % | | | 1.61 | % | | | 1.68 | % | | | 1.73 | % |
Portfolio turnover rate | | | 214 | % | | | 145 | % | | | 168 | % | | | 144 | % | | | 369 | % |
SEE NOTES TO FINANCIAL STATEMENTS. | THE RYDEX FUNDS ANNUAL REPORT | 97 |
FINANCIAL HIGHLIGHTS (concluded) |
This table is presented to show selected data for a share outstanding throughout each period and to assist shareholders in evaluating a Fund’s performance for the periods presented.
Class C | | Year Ended
March 31,
2024 | | | Year Ended
March 31,
2023 | | | Year Ended
March 31,
2022 | | | Year Ended
March 31,
2021 | | | Year Ended
March 31,
2020 | |
Per Share Data |
Net asset value, beginning of period | | $ | 55.72 | | | $ | 61.94 | | | $ | 80.01 | | | $ | 42.44 | | | $ | 55.82 | |
Income (loss) from investment operations: |
Net investment income (loss)a | | | (.35 | ) | | | (.50 | ) | | | (1.04 | ) | | | (.87 | ) | | | (.42 | ) |
Net gain (loss) on investments (realized and unrealized) | | | 7.82 | | | | (5.72 | ) | | | (11.60 | ) | | | 38.44 | | | | (12.77 | ) |
Total from investment operations | | | 7.47 | | | | (6.22 | ) | | | (12.64 | ) | | | 37.57 | | | | (13.19 | ) |
Less distributions from: |
Net investment income | | | (.05 | ) | | | — | | | | — | | | | — | | | | (.19 | ) |
Net realized gains | | | — | | | | — | | | | (5.43 | ) | | | — | | | | — | |
Total distributions | | | (.05 | ) | | | — | | | | (5.43 | ) | | | — | | | | (.19 | ) |
Net asset value, end of period | | $ | 63.14 | | | $ | 55.72 | | | $ | 61.94 | | | $ | 80.01 | | | $ | 42.44 | |
|
Total Returnc | | | 13.43 | % | | | (10.04 | %) | | | (16.35 | %) | | | 88.52 | % | | | (23.73 | %) |
Ratios/Supplemental Data |
Net assets, end of period (in thousands) | | $ | 277 | | | $ | 318 | | | $ | 591 | | | $ | 942 | | | $ | 398 | |
Ratios to average net assets: |
Net investment income (loss) | | | (0.60 | %) | | | (0.96 | %) | | | (1.38 | %) | | | (1.36 | %) | | | (0.74 | %) |
Total expenses | | | 2.43 | % | | | 2.39 | % | | | 2.36 | % | | | 2.44 | % | | | 2.48 | % |
Net expensesb | | | 2.40 | % | | | 2.39 | % | | | 2.36 | % | | | 2.44 | % | | | 2.48 | % |
Portfolio turnover rate | | | 214 | % | | | 145 | % | | | 168 | % | | | 144 | % | | | 369 | % |
Class H | | Year Ended
March 31,
2024 | | | Year Ended
March 31,
2023 | | | Year Ended
March 31,
2022 | | | Year Ended
March 31,
2021 | | | Year Ended
March 31,
2020 | |
Per Share Data |
Net asset value, beginning of period | | $ | 63.67 | | | $ | 70.26 | | | $ | 89.30 | | | $ | 47.01 | | | $ | 61.36 | |
Income (loss) from investment operations: |
Net investment income (loss)a | | | .10 | | | | (.10 | ) | | | (.59 | ) | | | (.40 | ) | | | (.01 | ) |
Net gain (loss) on investments (realized and unrealized) | | | 8.98 | | | | (6.49 | ) | | | (13.02 | ) | | | 42.69 | | | | (14.15 | ) |
Total from investment operations | | | 9.08 | | | | (6.59 | ) | | | (13.61 | ) | | | 42.29 | | | | (14.16 | ) |
Less distributions from: |
Net investment income | | | (.05 | ) | | | — | | | | — | | | | — | | | | (.19 | ) |
Net realized gains | | | — | | | | — | | | | (5.43 | ) | | | — | | | | — | |
Total distributions | | | (.05 | ) | | | — | | | | (5.43 | ) | | | — | | | | (.19 | ) |
Net asset value, end of period | | $ | 72.70 | | | $ | 63.67 | | | $ | 70.26 | | | $ | 89.30 | | | $ | 47.01 | |
|
Total Return | | | 14.26 | % | | | (9.38 | %) | | | (15.72 | %) | | | 89.96 | % | | | (23.17 | %) |
Ratios/Supplemental Data |
Net assets, end of period (in thousands) | | $ | 1,382 | | | $ | 1,779 | | | $ | 2,023 | | | $ | 6,594 | | | $ | 976 | |
Ratios to average net assets: |
Net investment income (loss) | | | 0.15 | % | | | (0.16 | %) | | | (0.69 | %) | | | (0.55 | %) | | | (0.01 | %) |
Total expenses | | | 1.68 | % | | | 1.64 | % | | | 1.61 | % | | | 1.68 | % | | | 1.72 | % |
Net expensesb | | | 1.65 | % | | | 1.64 | % | | | 1.61 | % | | | 1.68 | % | | | 1.72 | % |
Portfolio turnover rate | | | 214 | % | | | 145 | % | | | 168 | % | | | 144 | % | | | 369 | % |
a | Net investment income (loss) per share was computed using average shares outstanding throughout the period. |
b | Net expense information reflects the expense ratios after expense waivers and reimbursements, as applicable. |
c | Total return does not reflect the impact of any applicable sales charges. |
98 | THE RYDEX FUNDS ANNUAL REPORT | SEE NOTES TO FINANCIAL STATEMENTS. |
PERFORMANCE REPORT AND FUND PROFILE (Unaudited) | March 31, 2024 |
PRECIOUS METALS FUND
OBJECTIVE: Seeks to provide capital appreciation by investing in U.S. and foreign companies that are involved in the precious metals sector, including exploration, mining, production and development, and other precious metals-related services (“Precious Metals Companies”).
For the Reporting Period, Precious Metals Fund Investor Class returned -3.46%, compared with the S&P 500 Index, which returned 29.88%. The S&P 500 Materials Index returned 17.57%.
The only industry that contributed was copper. Those that detracted the most were silver, precious metals & minerals, and gold.
The holdings that contributed the most to performance were Harmony Gold Mining Co Ltd. ADR, Freeport-McMoRan, Inc., and Agnico Eagle Mines Ltd. The holdings that detracted the most were SSR Mining, Inc., Newmont Corp., and Sibanye Stillwater Ltd. ADR.
Performance displayed represents past performance, which is no guarantee of future results.
Holdings Diversification (Market Exposure as % of Net Assets)
“Holdings Diversification (Market Exposure as % of Net Assets)” excludes any temporary cash investments.
Inception Dates: |
Investor Class | December 1, 1993 |
Class A | September 1, 2004 |
Class C | April 27, 2001 |
Class H | August 1, 2003 |
Ten Largest Holdings | % of Total Net Assets |
Freeport-McMoRan, Inc. | 11.6% |
Newmont Corp. | 8.8% |
Agnico Eagle Mines Ltd. | 7.4% |
Barrick Gold Corp. | 7.3% |
Wheaton Precious Metals Corp. | 6.3% |
Royal Gold, Inc. | 3.9% |
Franco-Nevada Corp. | 3.9% |
Kinross Gold Corp. | 3.9% |
Gold Fields Ltd. ADR | 3.8% |
Anglogold Ashanti plc | 3.8% |
Top Ten Total | 60.7% |
| | |
“Ten Largest Holdings” excludes any temporary cash investments. |
| | THE RYDEX FUNDS ANNUAL REPORT | 99 |
PERFORMANCE REPORT AND FUND PROFILE (Unaudited)(concluded) | March 31, 2024 |
Cumulative Fund Performance*
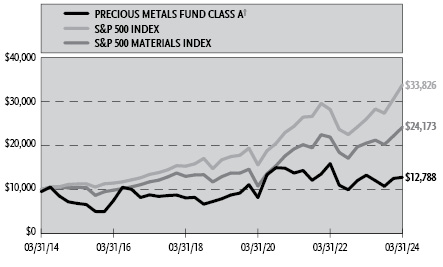
Average Annual Returns*
Periods Ended March 31, 2024
| 1 Year | 5 Year | 10 Year |
Investor Class Shares | (3.46%) | 10.35% | 3.26% |
Class A Shares | (3.68%) | 10.08% | 2.99% |
Class A Shares with sales charge† | (8.25%) | 9.01% | 2.49% |
Class C Shares | (4.43%) | 9.26% | 2.23% |
Class C Shares with CDSC‡ | (5.34%) | 9.26% | 2.23% |
Class H Shares** | (3.71%) | 10.09% | 2.94% |
S&P 500 Materials Index | 17.57% | 13.30% | 9.23% |
S&P 500 Index | 29.88% | 15.05% | 12.96% |
* | The performance data above represents past performance that is not predictive of future results. The investment return and principal value of an investment in the Fund will fluctuate so that an investor’s shares, when redeemed, may be worth more or less than their original cost. Returns are historical and include changes in principal and reinvested dividends and capital gains and do not reflect the effect of taxes. The S&P 500 Index and the S&P 500 Materials Index are unmanaged indices and, unlike the Fund, have no management fees or operating expenses to reduce their reported returns. The graphs are based on Investor Class shares and Class A shares only; performance for Class C and Class H shares will vary due to differences in fee structures. |
** | Effective September 30, 2015, the Fund’s Advisor Class shares were converted into Class H shares. |
† | Fund returns are calculated using the maximum sales charge of 4.75%. |
‡ | Fund returns include a CDSC of 1% if redeemed within 12 months of purchase. |
100 | THE RYDEX FUNDS ANNUAL REPORT | |
SCHEDULE OF INVESTMENTS | March 31, 2024 |
PRECIOUS METALS FUND | |
| | Shares | | | Value | |
COMMON STOCKS† - 99.5% |
| | | | | | | | | |
Mining - 99.5% |
Freeport-McMoRan, Inc. | | | 151,195 | | | $ | 7,109,189 | |
Newmont Corp. | | | 151,162 | | | | 5,417,646 | |
Agnico Eagle Mines Ltd. | | | 76,317 | | | | 4,552,309 | |
Barrick Gold Corp. | | | 268,998 | | | | 4,476,127 | |
Wheaton Precious Metals Corp. | | | 82,292 | | | | 3,878,422 | |
Royal Gold, Inc. | | | 19,698 | | | | 2,399,413 | |
Franco-Nevada Corp. | | | 19,982 | | | | 2,381,055 | |
Kinross Gold Corp. | | | 386,667 | | | | 2,370,269 | |
Gold Fields Ltd. ADR | | | 148,018 | | | | 2,352,006 | |
Anglogold Ashanti plc1 | | | 105,033 | | | | 2,331,733 | |
Alamos Gold, Inc. — Class A | | | 139,713 | | | | 2,060,767 | |
Pan American Silver Corp. | | | 130,260 | | | | 1,964,321 | |
Eldorado Gold Corp.* | | | 105,261 | | | | 1,481,022 | |
Hecla Mining Co. | | | 302,569 | | | | 1,455,357 | |
Osisko Gold Royalties Ltd. | | | 87,754 | | | | 1,440,921 | |
Sibanye Stillwater Ltd. ADR1 | | | 296,421 | | | | 1,396,143 | |
Harmony Gold Mining Company Ltd. ADR | | | 160,821 | | | | 1,313,908 | |
B2Gold Corp. | | | 480,909 | | | | 1,255,172 | |
Equinox Gold Corp.* | | | 204,146 | | | | 1,228,959 | |
First Majestic Silver Corp. | | | 183,284 | | | | 1,077,710 | |
Sandstorm Gold Ltd. | | | 204,252 | | | | 1,072,323 | |
IAMGOLD Corp.* | | | 290,334 | | | | 966,812 | |
Coeur Mining, Inc.* | | | 251,725 | | | | 949,003 | |
Fortuna Silver Mines, Inc.* | | | 240,153 | | | | 895,771 | |
Seabridge Gold, Inc.* | | | 58,620 | | | | 886,334 | |
MAG Silver Corp.* | | | 83,039 | | | | 878,553 | |
SilverCrest Metals, Inc.* | | | 130,522 | | | | 869,276 | |
SSR Mining, Inc. | | | 170,107 | | | | 758,677 | |
Novagold Resources, Inc.* | | | 197,625 | | | | 592,875 | |
Silvercorp Metals, Inc. | | | 169,399 | | | | 552,241 | |
Gatos Silver, Inc.* | | | 62,460 | | | | 524,039 | |
Endeavour Silver Corp.*,1 | | | 156,189 | | | | 376,415 | |
Total Mining | | | | | | | 61,264,768 | |
| | | | | | | | | |
Total Common Stocks | | | | |
(Cost $44,487,215) | | | | | | | 61,264,768 | |
| | | | | | | | | |
| | Face
Amount | | | | |
REPURCHASE AGREEMENTS††,2 - 0.5% |
J.P. Morgan Securities LLC
issued 03/28/24 at 5.31%
due 04/01/24 | | $ | 168,613 | | | | 168,613 | |
BofA Securities, Inc.
issued 03/28/24 at 5.31%
due 04/01/24 | | | 64,851 | | | | 64,851 | |
Barclays Capital, Inc.
issued 03/28/24 at 5.30%
due 04/01/24 | | | 58,782 | | | | 58,782 | |
Total Repurchase Agreements | | | | |
(Cost $292,246) | | | | | | | 292,246 | |
| | | | | | | | | |
| | | Shares | | | | | |
SECURITIES LENDING COLLATERAL†,3 - 3.8% |
Money Market Fund | | | | | | | | |
First American Government Obligations Fund - Class X, 5.23%4 | | | 2,309,160 | | | | 2,309,160 | |
Total Securities Lending Collateral | | | | |
(Cost $2,309,160) | | | | | | | 2,309,160 | |
| | | | | | | | | |
Total Investments - 103.8% | | | | |
(Cost $47,088,621) | | $ | 63,866,174 | |
Other Assets & Liabilities, net - (3.8)% | | | (2,316,705 | ) |
Total Net Assets - 100.0% | | $ | 61,549,469 | |
* | Non-income producing security. |
† | Value determined based on Level 1 inputs — See Note 4. |
†† | Value determined based on Level 2 inputs — See Note 4. |
1 | All or a portion of this security is on loan at March 31, 2024 — See Note 7. |
2 | Repurchase Agreements — See Note 6. |
3 | Securities lending collateral — See Note 7. |
4 | Rate indicated is the 7-day yield as of March 31, 2024. |
| | ADR — American Depositary Receipt |
| | plc — Public Limited Company |
| | |
| | See Sector Classification in Other Information section. |
SEE NOTES TO FINANCIAL STATEMENTS. | THE RYDEX FUNDS ANNUAL REPORT | 101 |
SCHEDULE OF INVESTMENTS (concluded) | March 31, 2024 |
PRECIOUS METALS FUND | |
The following table summarizes the inputs used to value the Fund’s investments at March 31, 2024 (See Note 4 in the Notes to Financial Statements):
Investments in Securities (Assets) | | Level 1
Quoted
Prices | | | Level 2
Significant
Observable
Inputs | | | Level 3
Significant
Unobservable
Inputs | | | Total | |
Common Stocks | | $ | 61,264,768 | | | $ | — | | | $ | — | | | $ | 61,264,768 | |
Repurchase Agreements | | | — | | | | 292,246 | | | | — | | | | 292,246 | |
Securities Lending Collateral | | | 2,309,160 | | | | — | | | | — | | | | 2,309,160 | |
Total Assets | | $ | 63,573,928 | | | $ | 292,246 | | | $ | — | | | $ | 63,866,174 | |
102 | THE RYDEX FUNDS ANNUAL REPORT | SEE NOTES TO FINANCIAL STATEMENTS. |
STATEMENT OF ASSETS AND LIABILITIES |
March 31, 2024 |
Assets: |
Investments, at value - including $2,218,140 of securities loaned (cost $46,796,375) | | $ | 63,573,928 | |
Repurchase agreements, at value (cost $292,246) | | | 292,246 | |
Cash | | | 25,596 | |
Receivables: |
Fund shares sold | | | 9,100,854 | |
Dividends | | | 3,024 | |
Foreign tax reclaims | | | 1,430 | |
Interest | | | 172 | |
Securities lending income | | | 136 | |
Total assets | | | 72,997,386 | |
| | | | | |
Liabilities: |
Payable for: |
Securities purchased | | | 8,865,949 | |
Return of securities lending collateral | | | 2,309,160 | |
Fund shares redeemed | | | 176,293 | |
Management fees | | | 31,825 | |
Transfer agent fees | | | 19,925 | |
Portfolio accounting and administration fees | | | 4,349 | |
Distribution and service fees | | | 2,633 | |
Trustees’ fees* | | | 477 | |
Miscellaneous | | | 37,306 | |
Total liabilities | | | 11,447,917 | |
Net assets | | $ | 61,549,469 | |
| | | | | |
Net assets consist of: |
Paid in capital | | $ | 115,272,789 | |
Total distributable earnings (loss) | | | (53,723,320 | ) |
Net assets | | $ | 61,549,469 | |
| | | | | |
Investor Class: |
Net assets | | $ | 51,211,159 | |
Capital shares outstanding | | | 1,470,431 | |
Net asset value per share | | $ | 34.83 | |
| | | | | |
Class A: |
Net assets | | $ | 7,146,098 | |
Capital shares outstanding | | | 221,068 | |
Net asset value per share | | $ | 32.33 | |
Maximum offering price per share (Net asset value divided by 95.25%) | | $ | 33.94 | |
| | | | | |
Class C: |
Net assets | | $ | 1,025,602 | |
Capital shares outstanding | | | 40,679 | |
Net asset value per share | | $ | 25.21 | |
| | | | | |
Class H: |
Net assets | | $ | 2,166,610 | |
Capital shares outstanding | | | 69,867 | |
Net asset value per share | | $ | 31.01 | |
STATEMENT OF OPERATIONS |
Year Ended March 31, 2024 |
Investment Income: |
Dividends (net of foreign withholding tax of $115,239) | | $ | 857,664 | |
Interest | | | 28,246 | |
Income from securities lending, net | | | 8,213 | |
Total investment income | | | 894,123 | |
| | | | | |
Expenses: |
Management fees | | | 447,856 | |
Distribution and service fees: |
Class A | | | 18,928 | |
Class C | | | 13,327 | |
Class H | | | 5,889 | |
Transfer agent fees | | | 130,778 | |
Portfolio accounting and administration fees | | | 91,019 | |
Registration fees | | | 64,184 | |
Professional fees | | | 25,516 | |
Trustees’ fees* | | | 11,651 | |
Custodian fees | | | 8,440 | |
Line of credit fees | | | 410 | |
Miscellaneous | | | 15,152 | |
Total expenses | | | 833,150 | |
Less: |
Expenses reimbursed by Adviser | | | (16,416 | ) |
Net expenses | | | 816,734 | |
Net investment income | | | 77,389 | |
| | | | | |
Net Realized and Unrealized Gain (Loss): |
Net realized gain (loss) on: |
Investments** | | | (3,579,215 | ) |
Foreign currency transactions | | | (2 | ) |
Net realized loss | | | (3,579,217 | ) |
Net change in unrealized appreciation (depreciation) on: |
Investments | | | (2,840,129 | ) |
Net change in unrealized appreciation (depreciation) | | | (2,840,129 | ) |
Net realized and unrealized loss | | | (6,419,346 | ) |
Net decrease in net assets resulting from operations | | $ | (6,341,957 | ) |
* | Relates to Trustees not deemed “interested persons” within the meaning of Section 2(a)(19) of the 1940 Act. |
** | Includes $276,532 of realized gains from the expiration of deferred foreign tax liabilities on capital gains from sales of Peruvian securities prior to 2018. See Note 1(c) in the Notes to Financial Statements. |
SEE NOTES TO FINANCIAL STATEMENTS. | THE RYDEX FUNDS ANNUAL REPORT | 103 |
STATEMENTS OF CHANGES IN NET ASSETS |
| | Year Ended
March 31,
2024 | | | Year Ended
March 31,
2023 | |
Increase (Decrease) in Net Assets from Operations: | | | | | | | | |
Net investment income | | $ | 77,389 | | | $ | 296,552 | |
Net realized loss on investments | | | (3,579,217 | ) | | | (3,305,647 | ) |
Net change in unrealized appreciation (depreciation) on investments | | | (2,840,129 | ) | | | (21,862,013 | ) |
Net decrease in net assets resulting from operations | | | (6,341,957 | ) | | | (24,871,108 | ) |
| | | | | | | | | |
Distributions to shareholders: | | | | | | | | |
Investor Class | | | (1,400,288 | ) | | | (2,803,065 | ) |
Class A | | | (280,268 | ) | | | (569,109 | ) |
Class C | | | (63,185 | ) | | | (131,374 | ) |
Class H | | | (78,773 | ) | | | (232,336 | ) |
Total distributions to shareholders | | | (1,822,514 | ) | | | (3,735,884 | ) |
| | | | | | | | | |
Capital share transactions: | | | | | | | | |
Proceeds from sale of shares | | | | | | | | |
Investor Class | | | 313,283,695 | | | | 424,056,776 | |
Class A | | | 2,870,709 | | | | 8,446,979 | |
Class C | | | 691,727 | | | | 1,037,950 | |
Class H | | | 2,898,452 | | | | 5,325,957 | |
Distributions reinvested | | | | | | | | |
Investor Class | | | 1,350,549 | | | | 2,726,426 | |
Class A | | | 272,009 | | | | 551,816 | |
Class C | | | 63,121 | | | | 129,839 | |
Class H | | | 78,773 | | | | 229,110 | |
Cost of shares redeemed | | | | | | | | |
Investor Class | | | (330,913,484 | ) | | | (391,469,073 | ) |
Class A | | | (3,922,482 | ) | | | (9,098,155 | ) |
Class C | | | (1,371,976 | ) | | | (993,146 | ) |
Class H | | | (3,056,070 | ) | | | (5,860,563 | ) |
Net increase (decrease) from capital share transactions | | | (17,754,977 | ) | | | 35,083,916 | |
Net increase (decrease) in net assets | | | (25,919,448 | ) | | | 6,476,924 | |
| | | | | | | | | |
Net assets: | | | | | | | | |
Beginning of year | | | 87,468,917 | | | | 80,991,993 | |
End of year | | $ | 61,549,469 | | | $ | 87,468,917 | |
| | | | | | | | | |
Capital share activity: | | | | | | | | |
Shares sold | | | | | | | | |
Investor Class | | | 9,492,990 | | | | 11,588,025 | |
Class A | | | 90,664 | | | | 245,322 | |
Class C | | | 26,656 | | | | 37,585 | |
Class H | | | 92,253 | | | | 168,402 | |
Shares issued from reinvestment of distributions | | | | | | | | |
Investor Class | | | 43,176 | | | | 80,378 | |
Class A | | | 9,363 | | | | 17,424 | |
Class C | | | 2,779 | | | | 5,150 | |
Class H | | | 2,826 | | | | 7,529 | |
Shares redeemed | | | | | | | | |
Investor Class | | | (10,049,980 | ) | | | (10,998,582 | ) |
Class A | | | (127,787 | ) | | | (272,588 | ) |
Class C | | | (54,849 | ) | | | (37,351 | ) |
Class H | | | (102,337 | ) | | | (191,476 | ) |
Net increase (decrease) in shares | | | (574,246 | ) | | | 649,818 | |
104 | THE RYDEX FUNDS ANNUAL REPORT | SEE NOTES TO FINANCIAL STATEMENTS. |
This table is presented to show selected data for a share outstanding throughout each period and to assist shareholders in evaluating a Fund’s performance for the periods presented.
Investor Class | | Year Ended
March 31,
2024 | | | Year Ended
March 31,
2023 | | | Year Ended
March 31,
2022 | | | Year Ended
March 31,
2021 | | | Year Ended
March 31,
2020 | |
Per Share Data |
Net asset value, beginning of period | | $ | 37.47 | | | $ | 47.98 | | | $ | 44.22 | | | $ | 26.50 | | | $ | 26.14 | |
Income (loss) from investment operations: |
Net investment income (loss)a | | | .06 | | | | .18 | | | | .16 | | | | (.06 | ) | | | (.12 | ) |
Net gain (loss) on investments (realized and unrealized) | | | (1.50 | ) | | | (8.26 | ) | | | 6.21 | | | | 18.28 | | | | 1.23 | d |
Total from investment operations | | | (1.44 | ) | | | (8.08 | ) | | | 6.37 | | | | 18.22 | | | | 1.11 | |
Less distributions from: |
Net investment income | | | (1.20 | ) | | | (2.43 | ) | | | (2.61 | ) | | | (.50 | ) | | | (.75 | ) |
Total distributions | | | (1.20 | ) | | | (2.43 | ) | | | (2.61 | ) | | | (.50 | ) | | | (.75 | ) |
Net asset value, end of period | | $ | 34.83 | | | $ | 37.47 | | | $ | 47.98 | | | $ | 44.22 | | | $ | 26.50 | |
|
Total Return | | | (3.46 | %) | | | (16.34 | %) | | | 15.84 | % | | | 68.71 | % | | | 3.65 | % |
Ratios/Supplemental Data |
Net assets, end of period (in thousands) | | $ | 51,211 | | | $ | 74,345 | | | $ | 63,069 | | | $ | 87,174 | | | $ | 46,153 | |
Ratios to average net assets: |
Net investment income (loss) | | | 0.19 | % | | | 0.48 | % | | | 0.35 | % | | | (0.13 | %) | | | (0.40 | %) |
Total expenses | | | 1.33 | % | | | 1.30 | % | | | 1.26 | % | | | 1.34 | % | | | 1.38 | % |
Net expensesb | | | 1.30 | % | | | 1.30 | % | | | 1.26 | % | | | 1.34 | % | | | 1.38 | % |
Portfolio turnover rate | | | 387 | % | | | 424 | % | | | 114 | % | | | 281 | % | | | 277 | % |
Class A | | Year Ended
March 31,
2024 | | | Year Ended
March 31,
2023 | | | Year Ended
March 31,
2022 | | | Year Ended
March 31,
2021 | | | Year Ended
March 31,
2020 | |
Per Share Data |
Net asset value, beginning of period | | $ | 34.96 | | | $ | 45.09 | | | $ | 41.82 | | | $ | 25.14 | | | $ | 24.89 | |
Income (loss) from investment operations: |
Net investment income (loss)a | | | (.01 | ) | | | .08 | | | | .04 | | | | (.17 | ) | | | (.19 | ) |
Net gain (loss) on investments (realized and unrealized) | | | (1.42 | ) | | | (7.78 | ) | | | 5.84 | | | | 17.35 | | | | 1.19 | d |
Total from investment operations | | | (1.43 | ) | | | (7.70 | ) | | | 5.88 | | | | 17.18 | | | | 1.00 | |
Less distributions from: |
Net investment income | | | (1.20 | ) | | | (2.43 | ) | | | (2.61 | ) | | | (.50 | ) | | | (.75 | ) |
Total distributions | | | (1.20 | ) | | | (2.43 | ) | | | (2.61 | ) | | | (.50 | ) | | | (.75 | ) |
Net asset value, end of period | | $ | 32.33 | | | $ | 34.96 | | | $ | 45.09 | | | $ | 41.82 | | | $ | 25.14 | |
|
Total Returnc | | | (3.68 | %) | | | (16.54 | %) | | | 15.57 | % | | | 68.28 | % | | | 3.39 | % |
Ratios/Supplemental Data |
Net assets, end of period (in thousands) | | $ | 7,146 | | | $ | 8,698 | | | $ | 11,664 | | | $ | 18,801 | | | $ | 12,803 | |
Ratios to average net assets: |
Net investment income (loss) | | | (0.02 | %) | | | 0.23 | % | | | 0.08 | % | | | (0.41 | %) | | | (0.67 | %) |
Total expenses | | | 1.58 | % | | | 1.54 | % | | | 1.51 | % | | | 1.59 | % | | | 1.63 | % |
Net expensesb | | | 1.55 | % | | | 1.54 | % | | | 1.51 | % | | | 1.59 | % | | | 1.63 | % |
Portfolio turnover rate | | | 387 | % | | | 424 | % | | | 114 | % | | | 281 | % | | | 277 | % |
SEE NOTES TO FINANCIAL STATEMENTS. | THE RYDEX FUNDS ANNUAL REPORT | 105 |
FINANCIAL HIGHLIGHTS (concluded) |
This table is presented to show selected data for a share outstanding throughout each period and to assist shareholders in evaluating a Fund’s performance for the periods presented.
Class C | | Year Ended
March 31,
2024 | | | Year Ended
March 31,
2023 | | | Year Ended
March 31,
2022 | | | Year Ended
March 31,
2021 | | | Year Ended
March 31,
2020 | |
Per Share Data |
Net asset value, beginning of period | | $ | 27.77 | | | $ | 36.75 | | | $ | 34.86 | | | $ | 21.16 | | | $ | 21.19 | |
Income (loss) from investment operations: |
Net investment income (loss)a | | | (.19 | ) | | | (.13 | ) | | | (.21 | ) | | | (.43 | ) | | | (.35 | ) |
Net gain (loss) on investments (realized and unrealized) | | | (1.17 | ) | | | (6.42 | ) | | | 4.71 | | | | 14.63 | | | | 1.07 | d |
Total from investment operations | | | (1.36 | ) | | | (6.55 | ) | | | 4.50 | | | | 14.20 | | | | .72 | |
Less distributions from: |
Net investment income | | | (1.20 | ) | | | (2.43 | ) | | | (2.61 | ) | | | (.50 | ) | | | (.75 | ) |
Total distributions | | | (1.20 | ) | | | (2.43 | ) | | | (2.61 | ) | | | (.50 | ) | | | (.75 | ) |
Net asset value, end of period | | $ | 25.21 | | | $ | 27.77 | | | $ | 36.75 | | | $ | 34.86 | | | $ | 21.16 | |
|
Total Returnc | | | (4.43 | %) | | | (17.16 | %) | | | 14.70 | % | | | 67.04 | % | | | 2.65 | % |
Ratios/Supplemental Data |
Net assets, end of period (in thousands) | | $ | 1,026 | | | $ | 1,836 | | | $ | 2,231 | | | $ | 2,086 | | | $ | 1,686 | |
Ratios to average net assets: |
Net investment income (loss) | | | (0.76 | %) | | | (0.48 | %) | | | (0.59 | %) | | | (1.20 | %) | | | (1.41 | %) |
Total expenses | | | 2.33 | % | | | 2.29 | % | | | 2.26 | % | | | 2.35 | % | | | 2.38 | % |
Net expensesb | | | 2.30 | % | | | 2.29 | % | | | 2.26 | % | | | 2.35 | % | | | 2.38 | % |
Portfolio turnover rate | | | 387 | % | | | 424 | % | | | 114 | % | | | 281 | % | | | 277 | % |
Class H | | Year Ended
March 31,
2024 | | | Year Ended
March 31,
2023 | | | Year Ended
March 31,
2022 | | | Year Ended
March 31,
2021 | | | Year Ended
March 31,
2020 | |
Per Share Data |
Net asset value, beginning of period | | $ | 33.59 | | | $ | 43.46 | | | $ | 40.41 | | | $ | 24.30 | | | $ | 24.06 | |
Income (loss) from investment operations: |
Net investment income (loss)a | | | (.02 | ) | | | .06 | | | | .08 | | | | (.25 | ) | | | (.22 | ) |
Net gain (loss) on investments (realized and unrealized) | | | (1.36 | ) | | | (7.50 | ) | | | 5.58 | | | | 16.86 | | | | 1.21 | d |
Total from investment operations | | | (1.38 | ) | | | (7.44 | ) | | | 5.66 | | | | 16.61 | | | | .99 | |
Less distributions from: |
Net investment income | | | (1.20 | ) | | | (2.43 | ) | | | (2.61 | ) | | | (.50 | ) | | | (.75 | ) |
Total distributions | | | (1.20 | ) | | | (2.43 | ) | | | (2.61 | ) | | | (.50 | ) | | | (.75 | ) |
Net asset value, end of period | | $ | 31.01 | | | $ | 33.59 | | | $ | 43.46 | | | $ | 40.41 | | | $ | 24.30 | |
|
Total Return | | | (3.71 | %) | | | (16.54 | %) | | | 15.57 | % | | | 68.30 | % | | | 3.46 | % |
Ratios/Supplemental Data |
Net assets, end of period (in thousands) | | $ | 2,167 | | | $ | 2,591 | | | $ | 4,028 | | | $ | 2,628 | | | $ | 1,830 | |
Ratios to average net assets: |
Net investment income (loss) | | | (0.05 | %) | | | 0.18 | % | | | 0.20 | % | | | (0.59 | %) | | | (0.78 | %) |
Total expenses | | | 1.58 | % | | | 1.54 | % | | | 1.51 | % | | | 1.60 | % | | | 1.63 | % |
Net expensesb | | | 1.55 | % | | | 1.54 | % | | | 1.51 | % | | | 1.60 | % | | | 1.63 | % |
Portfolio turnover rate | | | 387 | % | | | 424 | % | | | 114 | % | | | 281 | % | | | 277 | % |
a | Net investment income (loss) per share was computed using average shares outstanding throughout the period. |
b | Net expense information reflects the expense ratios after expense waivers and reimbursements, as applicable. |
c | Total return does not reflect the impact of any applicable sales charges. |
d | The amount shown for a share outstanding throughout the period does not agree with the aggregate net loss on investments for the year because of the sales and repurchases of fund shares in relation to fluctuating market value of investments of the Fund. |
106 | THE RYDEX FUNDS ANNUAL REPORT | SEE NOTES TO FINANCIAL STATEMENTS. |
PERFORMANCE REPORT AND FUND PROFILE (Unaudited) | March 31, 2024 |
REAL ESTATE FUND
OBJECTIVE: Seeks to provide capital appreciation by investing in companies that are involved in the real estate industry, including real estate investment trusts (“REITs”) (collectively, “Real Estate Companies”).
For the Reporting Period, Real Estate Fund Class H returned 9.33%, compared with the S&P 500 Index, which returned 29.88%. The MSCI U.S. REIT Index returned 10.37%.
The industries that contributed the most to performance were office REITs, data center REITs, and retail REITs. Those that detracted the most were telecom tower REITs, self-storage REITs, and diversified REITs.
The holdings that contributed the most to performance were Digital Realty Trust, Inc., Simon Property Group, Inc., and Welltower, Inc. Those that detracted the most were Crown Castle, Inc., WP Carey, Inc., and Medical Properties Trust, Inc.
Performance displayed represents past performance, which is no guarantee of future results.
Holdings Diversification (Market Exposure as % of Net Assets)
“Holdings Diversification (Market Exposure as % of Net Assets)” excludes any temporary cash investments.
Inception Dates: |
Class A | September 1, 2004 |
Class C | February 20, 2004 |
Class H | February 20, 2004 |
Ten Largest Holdings | % of Total Net Assets |
Prologis, Inc. | 3.8% |
American Tower Corp. — Class A | 3.3% |
Equinix, Inc. | 2.8% |
Welltower, Inc. | 2.6% |
Simon Property Group, Inc. | 2.5% |
Realty Income Corp. | 2.4% |
Public Storage | 2.4% |
CoStar Group, Inc. | 2.3% |
Crown Castle, Inc. | 2.3% |
Digital Realty Trust, Inc. | 2.3% |
Top Ten Total | 26.7% |
| | |
“Ten Largest Holdings” excludes any temporary cash investments. |
| | THE RYDEX FUNDS ANNUAL REPORT | 107 |
PERFORMANCE REPORT AND FUND PROFILE (Unaudited)(concluded) | March 31, 2024 |
Cumulative Fund Performance*
Average Annual Returns*
Periods Ended March 31, 2024
| 1 Year | 5 Year | 10 Year |
Class A Shares | 9.34% | 1.57% | 3.90% |
Class A Shares with sales charge† | 4.15% | 0.58% | 3.39% |
Class C Shares | 8.55% | 0.96% | 3.20% |
Class C Shares with CDSC‡ | 7.55% | 0.96% | 3.20% |
Class H Shares | 9.33% | 1.58% | 3.90% |
MSCI U.S. REIT Index | 10.37% | 4.14% | 6.54% |
S&P 500 Index | 29.88% | 15.05% | 12.96% |
* | The performance data above represents past performance that is not predictive of future results. The investment return and principal value of an investment in the Fund will fluctuate so that an investor’s shares, when redeemed, may be worth more or less than their original cost. Returns are historical and include changes in principal and reinvested dividends and capital gains and do not reflect the effect of taxes. The S&P 500 Index and MSCI U.S. REIT Index are unmanaged indices and, unlike the Fund, have no management fees or operating expenses to reduce their reported returns. The graphs are based on Class H shares and Class A shares only; performance for Class C shares will vary due to differences in fee structure. |
† | Fund returns are calculated using the maximum sales charge of 4.75%. |
‡ | Fund returns include a CDSC of 1% if redeemed within 12 months of purchase. |
108 | THE RYDEX FUNDS ANNUAL REPORT | |
SCHEDULE OF INVESTMENTS | March 31, 2024 |
REAL ESTATE FUND | |
| | Shares | | | Value | |
COMMON STOCKS† - 99.5% |
| | | | | | | | | |
REITs - 91.4% |
| | | | | | | | | |
REITs-Diversified - 23.5% |
American Tower Corp. — Class A | | | 411 | | | $ | 81,210 | |
Equinix, Inc. | | | 83 | | | | 68,502 | |
Crown Castle, Inc. | | | 537 | | | | 56,831 | |
Digital Realty Trust, Inc. | | | 391 | | | | 56,320 | |
VICI Properties, Inc. | | | 1,624 | | | | 48,379 | |
Weyerhaeuser Co. | | | 1,250 | | | | 44,888 | |
SBA Communications Corp. | | | 191 | | | | 41,390 | |
Gaming and Leisure Properties, Inc. | | | 648 | | | | 29,853 | |
WP Carey, Inc. | | | 522 | | | | 29,462 | |
Lamar Advertising Co. — Class A | | | 240 | | | | 28,658 | |
Vornado Realty Trust | | | 703 | | | | 20,225 | |
National Storage Affiliates Trust | | | 467 | | | | 18,288 | |
PotlatchDeltic Corp. | | | 351 | | | | 16,504 | |
EPR Properties | | | 356 | | | | 15,112 | |
Outfront Media, Inc. | | | 800 | | | | 13,432 | |
Uniti Group, Inc. | | | 1,608 | | | | 9,487 | |
Total REITs-Diversified | | | | | | | 578,541 | |
| | | | | | | | | |
REITs-Apartments - 12.7% |
AvalonBay Communities, Inc. | | | 236 | | | | 43,792 | |
Equity Residential | | | 657 | | | | 41,463 | |
Invitation Homes, Inc. | | | 1,107 | | | | 39,420 | |
Essex Property Trust, Inc. | | | 138 | | | | 33,784 | |
Mid-America Apartment Communities, Inc. | | | 253 | | | | 33,290 | |
UDR, Inc. | | | 798 | | | | 29,853 | |
American Homes 4 Rent — Class A | | | 795 | | | | 29,240 | |
Camden Property Trust | | | 280 | | | | 27,552 | |
Apartment Income REIT Corp. | | | 557 | | | | 18,086 | |
Independence Realty Trust, Inc. | | | 1,003 | | | | 16,178 | |
Total REITs-Apartments | | | | | | | 312,658 | |
| | | | | | | | | |
REITs-Warehouse/Industries - 9.5% |
Prologis, Inc. | | | 715 | | | | 93,107 | |
Rexford Industrial Realty, Inc. | | | 548 | | | | 27,564 | |
EastGroup Properties, Inc. | | | 139 | | | | 24,988 | |
STAG Industrial, Inc. | | | 606 | | | | 23,295 | |
First Industrial Realty Trust, Inc. | | | 427 | | | | 22,435 | |
Americold Realty Trust, Inc. | | | 893 | | | | 22,254 | |
Terreno Realty Corp. | | | 317 | | | | 21,049 | |
Total REITs-Warehouse/Industries | | | | | | | 234,692 | |
| | | | | | | | | |
REITs-Health Care - 8.7% |
Welltower, Inc. | | | 674 | | | | 62,979 | |
Ventas, Inc. | | | 821 | | | | 35,746 | |
Healthpeak Properties, Inc. | | | 1,501 | | | | 28,144 | |
Omega Healthcare Investors, Inc. | | | 768 | | | | 24,323 | |
Healthcare Realty Trust, Inc. | | | 1,446 | | | | 20,461 | |
Sabra Health Care REIT, Inc. | | | 1,113 | | | | 16,439 | |
CareTrust REIT, Inc. | | | 637 | | | | 15,524 | |
Medical Properties Trust, Inc.1 | | | 2,313 | | | | 10,871 | |
Total REITs-Health Care | | | | | | | 214,487 | |
| | | | | | | | | |
REITs-Office Property - 7.2% |
Alexandria Real Estate Equities, Inc. | | | 317 | | | | 40,864 | |
Boston Properties, Inc. | | | 408 | | | | 26,647 | |
Kilroy Realty Corp. | | | 480 | | | | 17,486 | |
SL Green Realty Corp. | | | 307 | | | | 16,925 | |
Cousins Properties, Inc. | | | 685 | | | | 16,467 | |
Highwoods Properties, Inc. | | | 558 | | | | 14,608 | |
LXP Industrial Trust | | | 1,538 | | | | 13,873 | |
Douglas Emmett, Inc. | | | 937 | | | | 12,996 | |
JBG SMITH Properties | | | 628 | | | | 10,079 | |
Hudson Pacific Properties, Inc. | | | 1,252 | | | | 8,075 | |
Total REITs-Office Property | | | | | | | 178,020 | |
| | | | | | | | | |
REITs-Storage - 7.2% |
Public Storage | | | 202 | | | | 58,592 | |
Extra Space Storage, Inc. | | | 327 | | | | 48,069 | |
Iron Mountain, Inc. | | | 514 | | | | 41,228 | |
CubeSmart | | | 608 | | | | 27,494 | |
Total REITs-Storage | | | | | | | 175,383 | |
| | | | | | | | | |
REITs-Shopping Centers - 7.0% |
Kimco Realty Corp. | | | 1,584 | | | | 31,062 | |
Regency Centers Corp. | | | 476 | | | | 28,827 | |
Federal Realty Investment Trust | | | 243 | | | | 24,815 | |
Brixmor Property Group, Inc. | | | 985 | | | | 23,098 | |
Phillips Edison & Company, Inc. | | | 531 | | | | 19,047 | |
Kite Realty Group Trust | | | 868 | | | | 18,818 | |
SITE Centers Corp. | | | 982 | | | | 14,386 | |
Retail Opportunity Investments Corp. | | | 828 | | | | 10,615 | |
Total REITs-Shopping Centers | | | | | | | 170,668 | |
| | | | | | | | | |
REITs-Single Tenant - 5.0% |
Realty Income Corp. | | | 1,097 | | | | 59,348 | |
NNN REIT, Inc. | | | 559 | | | | 23,892 | |
Agree Realty Corp. | | | 358 | | | | 20,449 | |
Essential Properties Realty Trust, Inc. | | | 704 | | | | 18,769 | |
Total REITs-Single Tenant | | | | | | | 122,458 | |
| | | | | | | | | |
REITs-Hotels - 4.5% |
Host Hotels & Resorts, Inc. | | | 1,564 | | | | 32,344 | |
Ryman Hospitality Properties, Inc. | | | 189 | | | | 21,850 | |
Park Hotels & Resorts, Inc. | | | 919 | | | | 16,073 | |
Apple Hospitality REIT, Inc. | | | 980 | | | | 16,052 | |
Sunstone Hotel Investors, Inc. | | | 1,151 | | | | 12,822 | |
Pebblebrook Hotel Trust | | | 732 | | | | 11,280 | |
Total REITs-Hotels | | | | | | | 110,421 | |
| | | | | | | | | |
REITs-Regional Malls - 3.1% |
Simon Property Group, Inc. | | | 392 | | | | 61,344 | |
Tanger, Inc. | | | 516 | | | | 15,238 | |
Total REITs-Regional Malls | | | | | | | 76,582 | |
| | | | | | | | | |
REITs-Manufactured Homes - 2.5% |
Sun Communities, Inc. | | | 260 | | | | 33,431 | |
Equity LifeStyle Properties, Inc. | | | 428 | | | | 27,563 | |
Total REITs-Manufactured Homes | | | | | | | 60,994 | |
| | | | | | | | | |
SEE NOTES TO FINANCIAL STATEMENTS. | THE RYDEX FUNDS ANNUAL REPORT | 109 |
SCHEDULE OF INVESTMENTS (continued) | March 31, 2024 |
REAL ESTATE FUND | |
| | Shares | | | Value | |
Specialized REITs - 0.5% |
DiamondRock Hospitality Co. | | | 1,262 | | | $ | 12,128 | |
Total REITs | | | | | | | 2,247,032 | |
| | | | | | | | | |
Real Estate - 3.8% |
Real Estate Management/Services - 3.8% |
CBRE Group, Inc. — Class A* | | | 485 | | | | 47,161 | |
Jones Lang LaSalle, Inc.* | | | 98 | | | | 19,119 | |
Cushman & Wakefield plc* | | | 1,206 | | | | 12,615 | |
Redfin Corp.* | | | 1,123 | | | | 7,468 | |
eXp World Holdings, Inc.1 | | | 656 | | | | 6,776 | |
Total Real Estate Management/Services | | | | | | | 93,139 | |
| | | | | | | | | |
Total Real Estate | | | | | | | 93,139 | |
| | | | | | | | | |
Commercial Services - 2.3% |
Research & Consulting Services - 2.3% |
CoStar Group, Inc.* | | | 592 | | | | 57,187 | |
| | | | | | | | | |
Internet - 1.3% |
E-Commerce/Services - 1.3% |
Zillow Group, Inc. — Class C* | | | 530 | | | | 25,853 | |
Opendoor Technologies, Inc.* | | | 2,024 | | | | 6,133 | |
Total E-Commerce/Services | | | | | | | 31,986 | |
| | | | | | | | | |
Total Internet | | | | | | | 31,986 | |
| | | | | | | | | |
Telecommunications - 0.7% |
Telecom Services - 0.7% |
DigitalBridge Group, Inc. | | | 810 | | | | 15,609 | |
| | | | | | | | | |
Total Common Stocks | | | | |
(Cost $1,815,113) | | | | | | | 2,444,953 | |
| | Face
Amount | | | | |
REPURCHASE AGREEMENTS††,2 - 0.5% |
J.P. Morgan Securities LLC
issued 03/28/24 at 5.31%
due 04/01/24 | | $ | 6,920 | | | | 6,920 | |
BofA Securities, Inc.
issued 03/28/24 at 5.31%
due 04/01/24 | | | 2,662 | | | | 2,662 | |
Barclays Capital, Inc.
issued 03/28/24 at 5.30%
due 04/01/24 | | | 2,413 | | | | 2,413 | |
Total Repurchase Agreements | | | | |
(Cost $11,995) | | | | | | | 11,995 | |
| | | | | | | | | |
| | | Shares | | | | | |
SECURITIES LENDING COLLATERAL†,3 - 0.5% |
Money Market Fund | | | | | | | | |
First American Government Obligations Fund - Class X, 5.23%4 | | | 13,316 | | | | 13,316 | |
Total Securities Lending Collateral | | | | |
(Cost $13,316) | | | | | | | 13,316 | |
| | | | | | | | | |
Total Investments - 100.5% | | | | |
(Cost $1,840,424) | | $ | 2,470,264 | |
Other Assets & Liabilities, net - (0.5)% | | | (12,204 | ) |
Total Net Assets - 100.0% | | $ | 2,458,060 | |
* | Non-income producing security. |
† | Value determined based on Level 1 inputs — See Note 4. |
†† | Value determined based on Level 2 inputs — See Note 4. |
1 | All or a portion of this security is on loan at March 31, 2024 — See Note 7. |
2 | Repurchase Agreements — See Note 6. |
3 | Securities lending collateral — See Note 7. |
4 | Rate indicated is the 7-day yield as of March 31, 2024. |
| | plc — Public Limited Company |
| | REIT — Real Estate Investment Trust |
| | |
| | See Sector Classification in Other Information section. |
110 | THE RYDEX FUNDS ANNUAL REPORT | SEE NOTES TO FINANCIAL STATEMENTS. |
SCHEDULE OF INVESTMENTS (concluded) | March 31, 2024 |
REAL ESTATE FUND | |
The following table summarizes the inputs used to value the Fund’s investments at March 31, 2024 (See Note 4 in the Notes to Financial Statements):
Investments in Securities (Assets) | | Level 1
Quoted
Prices | | | Level 2
Significant
Observable
Inputs | | | Level 3
Significant
Unobservable
Inputs | | | Total | |
Common Stocks | | $ | 2,444,953 | | | $ | — | | | $ | — | | | $ | 2,444,953 | |
Repurchase Agreements | | | — | | | | 11,995 | | | | — | | | | 11,995 | |
Securities Lending Collateral | | | 13,316 | | | | — | | | | — | | | | 13,316 | |
Total Assets | | $ | 2,458,269 | | | $ | 11,995 | | | $ | — | | | $ | 2,470,264 | |
SEE NOTES TO FINANCIAL STATEMENTS. | THE RYDEX FUNDS ANNUAL REPORT | 111 |
STATEMENT OF ASSETS AND LIABILITIES |
March 31, 2024 |
Assets: |
Investments, at value - including $12,485 of securities loaned (cost $1,828,429) | | $ | 2,458,269 | |
Repurchase agreements, at value (cost $11,995) | | | 11,995 | |
Cash | | | 2,795 | |
Receivables: |
Securities sold | | | 23,725 | |
Fund shares sold | | | 13,059 | |
Dividends | | | 9,508 | |
Securities lending income | | | 14 | |
Interest | | | 7 | |
Total assets | | | 2,519,372 | |
| | | | | |
Liabilities: |
Payable for: |
Fund shares redeemed | | | 42,826 | |
Return of securities lending collateral | | | 13,316 | |
Management fees | | | 1,670 | |
Transfer agent fees | | | 978 | |
Distribution and service fees | | | 560 | |
Portfolio accounting and administration fees | | | 201 | |
Trustees’ fees* | | | 22 | |
Miscellaneous | | | 1,739 | |
Total liabilities | | | 61,312 | |
Net assets | | $ | 2,458,060 | |
| | | | | |
Net assets consist of: |
Paid in capital | | $ | 9,281,426 | |
Total distributable earnings (loss) | | | (6,823,366 | ) |
Net assets | | $ | 2,458,060 | |
| | | | | |
Class A: |
Net assets | | $ | 340,227 | |
Capital shares outstanding | | | 9,041 | |
Net asset value per share | | $ | 37.63 | |
Maximum offering price per share (Net asset value divided by 95.25%) | | $ | 39.51 | |
| | | | | |
Class C: |
Net assets | | $ | 108,770 | |
Capital shares outstanding | | | 3,526 | |
Net asset value per share | | $ | 30.85 | |
| | | | | |
Class H: |
Net assets | | $ | 2,009,063 | |
Capital shares outstanding | | | 53,501 | |
Net asset value per share | | $ | 37.55 | |
STATEMENT OF OPERATIONS |
Year Ended March 31, 2024 |
Investment Income: |
Dividends | | $ | 70,277 | |
Interest | | | 596 | |
Income from securities lending, net | | | 94 | |
Total investment income | | | 70,967 | |
| | | | | |
Expenses: |
Management fees | | | 19,189 | |
Distribution and service fees: |
Class A | | | 876 | |
Class C | | | 1,123 | |
Class H | | | 4,486 | |
Transfer agent fees | | | 4,954 | |
Portfolio accounting and administration fees | | | 3,441 | |
Registration fees | | | 2,285 | |
Professional fees | | | 1,084 | |
Custodian fees | | | 495 | |
Trustees’ fees* | | | 411 | |
Line of credit fees | | | 97 | |
Miscellaneous | | | 678 | |
Total expenses | | | 39,119 | |
Less: |
Expenses reimbursed by Adviser | | | (733 | ) |
Net expenses | | | 38,386 | |
Net investment income | | | 32,581 | |
| | | | | |
Net Realized and Unrealized Gain (Loss): |
Net realized gain (loss) on: |
Investments | | | (36,172 | ) |
Net realized loss | | | (36,172 | ) |
Net change in unrealized appreciation (depreciation) on: |
Investments | | | 194,275 | |
Net change in unrealized appreciation (depreciation) | | | 194,275 | |
Net realized and unrealized gain | | | 158,103 | |
Net increase in net assets resulting from operations | | $ | 190,684 | |
* | Relates to Trustees not deemed “interested persons” within the meaning of Section 2(a)(19) of the 1940 Act. |
112 | THE RYDEX FUNDS ANNUAL REPORT | SEE NOTES TO FINANCIAL STATEMENTS. |
STATEMENTS OF CHANGES IN NET ASSETS |
| | Year Ended
March 31,
2024 | | | Year Ended
March 31,
2023 | |
Increase (Decrease) in Net Assets from Operations: | | | | | | | | |
Net investment income | | $ | 32,581 | | | $ | 54,116 | |
Net realized loss on investments | | | (36,172 | ) | | | (809,345 | ) |
Net change in unrealized appreciation (depreciation) on investments | | | 194,275 | | | | (606,010 | ) |
Net increase (decrease) in net assets resulting from operations | | | 190,684 | | | | (1,361,239 | ) |
| | | | | | | | | |
Distributions to shareholders: | | | | | | | | |
Class A | | | (6,465 | ) | | | (16,248 | ) |
Class C | | | (2,581 | ) | | | (5,699 | ) |
Class H | | | (45,070 | ) | | | (69,671 | ) |
Total distributions to shareholders | | | (54,116 | ) | | | (91,618 | ) |
| | | | | | | | | |
Capital share transactions: | | | | | | | | |
Proceeds from sale of shares | | | | | | | | |
Class A | | | 591,538 | | | | 727,350 | |
Class C | | | 50,541 | | | | 116,553 | |
Class H | | | 5,981,741 | | | | 21,964,959 | |
Distributions reinvested | | | | | | | | |
Class A | | | 6,454 | | | | 16,248 | |
Class C | | | 2,581 | | | | 5,586 | |
Class H | | | 43,900 | | | | 69,314 | |
Cost of shares redeemed | | | | | | | | |
Class A | | | (774,547 | ) | | | (1,065,206 | ) |
Class C | | | (69,641 | ) | | | (269,249 | ) |
Class H | | | (6,169,856 | ) | | | (55,408,046 | ) |
Net decrease from capital share transactions | | | (337,289 | ) | | | (33,842,491 | ) |
Net decrease in net assets | | | (200,721 | ) | | | (35,295,348 | ) |
| | | | | | | | | |
Net assets: | | | | | | | | |
Beginning of year | | | 2,658,781 | | | | 37,954,129 | |
End of year | | $ | 2,458,060 | | | $ | 2,658,781 | |
| | | | | | | | | |
Capital share activity: | | | | | | | | |
Shares sold | | | | | | | | |
Class A | | | 16,705 | | | | 18,498 | |
Class C | | | 1,715 | | | | 3,396 | |
Class H | | | 169,328 | | | | 523,937 | |
Shares issued from reinvestment of distributions | | | | | | | | |
Class A | | | 182 | | | | 468 | |
Class C | | | 88 | | | | 193 | |
Class H | | | 1,238 | | | | 1,999 | |
Shares redeemed | | | | | | | | |
Class A | | | (21,815 | ) | | | (25,859 | ) |
Class C | | | (2,401 | ) | | | (7,546 | ) |
Class H | | | (175,501 | ) | | | (1,242,549 | ) |
Net decrease in shares | | | (10,461 | ) | | | (727,463 | ) |
SEE NOTES TO FINANCIAL STATEMENTS. | THE RYDEX FUNDS ANNUAL REPORT | 113 |
This table is presented to show selected data for a share outstanding throughout each period and to assist shareholders in evaluating a Fund’s performance for the periods presented.
Class A | | Year Ended
March 31,
2024 | | | Year Ended
March 31,
2023 | | | Year Ended
March 31,
2022 | | | Year Ended
March 31,
2021 | | | Year Ended
March 31,
2020 | |
Per Share Data |
Net asset value, beginning of period | | $ | 35.12 | | | $ | 47.38 | | | $ | 40.87 | | | $ | 30.70 | | | $ | 41.24 | |
Income (loss) from investment operations: |
Net investment income (loss)a | | | .50 | | | | .65 | | | | .21 | | | | .32 | | | | .56 | |
Net gain (loss) on investments (realized and unrealized) | | | 2.74 | | | | (11.59 | ) | | | 6.48 | | | | 13.33 | | | | (10.37 | ) |
Total from investment operations | | | 3.24 | | | | (10.94 | ) | | | 6.69 | | | | 13.65 | | | | (9.81 | ) |
Less distributions from: |
Net investment income | | | (.73 | ) | | | (1.32 | ) | | | (.18 | ) | | | (3.48 | ) | | | (.73 | ) |
Total distributions | | | (.73 | ) | | | (1.32 | ) | | | (.18 | ) | | | (3.48 | ) | | | (.73 | ) |
Net asset value, end of period | | $ | 37.63 | | | $ | 35.12 | | | $ | 47.38 | | | $ | 40.87 | | | $ | 30.70 | |
|
Total Returnb | | | 9.34 | % | | | (23.05 | %) | | | 16.36 | % | | | 45.79 | % | | | (24.28 | %) |
Ratios/Supplemental Data |
Net assets, end of period (in thousands) | | $ | 340 | | | $ | 491 | | | $ | 988 | | | $ | 1,049 | | | $ | 781 | |
Ratios to average net assets: |
Net investment income (loss) | | | 1.42 | % | | | 1.65 | % | | | 0.46 | % | | | 0.87 | % | | | 1.33 | % |
Total expenses | | | 1.69 | % | | | 1.65 | % | | | 1.61 | % | | | 1.70 | % | | | 1.72 | % |
Net expensesc | | | 1.66 | % | | | 1.65 | % | | | 1.61 | % | | | 1.70 | % | | | 1.72 | % |
Portfolio turnover rate | | | 249 | % | | | 308 | % | | | 380 | % | | | 499 | % | | | 539 | % |
Class C | | Year Ended
March 31,
2024 | | | Year Ended
March 31,
2023 | | | Year Ended
March 31,
2022 | | | Year Ended
March 31,
2021 | | | Year Ended
March 31,
2020 | |
Per Share Data |
Net asset value, beginning of period | | $ | 29.13 | | | $ | 39.90 | | | $ | 34.44 | | | $ | 26.48 | | | $ | 35.94 | |
Income (loss) from investment operations: |
Net investment income (loss)a | | | .20 | | | | .31 | | | | (.09 | ) | | | (.03 | ) | | | .26 | |
Net gain (loss) on investments (realized and unrealized) | | | 2.25 | | | | (9.76 | ) | | | 5.73 | | | | 11.47 | | | | (8.99 | ) |
Total from investment operations | | | 2.45 | | | | (9.45 | ) | | | 5.64 | | | | 11.44 | | | | (8.73 | ) |
Less distributions from: |
Net investment income | | | (.73 | ) | | | (1.32 | ) | | | (.18 | ) | | | (3.48 | ) | | | (.73 | ) |
Total distributions | | | (.73 | ) | | | (1.32 | ) | | | (.18 | ) | | | (3.48 | ) | | | (.73 | ) |
Net asset value, end of period | | $ | 30.85 | | | $ | 29.13 | | | $ | 39.90 | | | $ | 34.44 | | | $ | 26.48 | |
|
Total Returnb | | | 8.55 | % | | | (23.65 | %) | | | 16.37 | % | | | 44.71 | % | | | (24.86 | %) |
Ratios/Supplemental Data |
Net assets, end of period (in thousands) | | $ | 109 | | | $ | 120 | | | $ | 322 | | | $ | 194 | | | $ | 430 | |
Ratios to average net assets: |
Net investment income (loss) | | | 0.68 | % | | | 0.94 | % | | | (0.22 | %) | | | (0.09 | %) | | | 0.71 | % |
Total expenses | | | 2.44 | % | | | 2.40 | % | | | 2.36 | % | | | 2.45 | % | | | 2.47 | % |
Net expensesc | | | 2.41 | % | | | 2.40 | % | | | 2.36 | % | | | 2.45 | % | | | 2.47 | % |
Portfolio turnover rate | | | 249 | % | | | 308 | % | | | 380 | % | | | 499 | % | | | 539 | % |
114 | THE RYDEX FUNDS ANNUAL REPORT | SEE NOTES TO FINANCIAL STATEMENTS. |
FINANCIAL HIGHLIGHTS (concluded) |
This table is presented to show selected data for a share outstanding throughout each period and to assist shareholders in evaluating a Fund’s performance for the periods presented.
Class H | | Year Ended
March 31,
2024 | | | Year Ended
March 31,
2023 | | | Year Ended
March 31,
2022 | | | Year Ended
March 31,
2021 | | | Year Ended
March 31,
2020 | |
Per Share Data |
Net asset value, beginning of period | | $ | 35.05 | | | $ | 47.28 | | | $ | 40.78 | | | $ | 30.63 | | | $ | 41.14 | |
Income (loss) from investment operations: |
Net investment income (loss)a | | | .53 | | | | .54 | | | | .22 | | | | .23 | | | | .55 | |
Net gain (loss) on investments (realized and unrealized) | | | 2.70 | | | | (11.45 | ) | | | 6.46 | | | | 13.40 | | | | (10.33 | ) |
Total from investment operations | | | 3.23 | | | | (10.91 | ) | | | 6.68 | | | | 13.63 | | | | (9.78 | ) |
Less distributions from: |
Net investment income | | | (.73 | ) | | | (1.32 | ) | | | (.18 | ) | | | (3.48 | ) | | | (.73 | ) |
Total distributions | | | (.73 | ) | | | (1.32 | ) | | | (.18 | ) | | | (3.48 | ) | | | (.73 | ) |
Net asset value, end of period | | $ | 37.55 | | | $ | 35.05 | | | $ | 47.28 | | | $ | 40.78 | | | $ | 30.63 | |
|
Total Return | | | 9.33 | % | | | (23.04 | %) | | | 16.37 | % | | | 45.83 | % | | | (24.27 | %) |
Ratios/Supplemental Data |
Net assets, end of period (in thousands) | | $ | 2,009 | | | $ | 2,048 | | | $ | 36,643 | | | $ | 10,907 | | | $ | 2,284 | |
Ratios to average net assets: |
Net investment income (loss) | | | 1.50 | % | | | 1.33 | % | | | 0.49 | % | | | 0.60 | % | | | 1.30 | % |
Total expenses | | | 1.70 | % | | | 1.65 | % | | | 1.62 | % | | | 1.66 | % | | | 1.72 | % |
Net expensesc | | | 1.66 | % | | | 1.65 | % | | | 1.62 | % | | | 1.66 | % | | | 1.72 | % |
Portfolio turnover rate | | | 249 | % | | | 308 | % | | | 380 | % | | | 499 | % | | | 539 | % |
a | Net investment income (loss) per share was computed using average shares outstanding throughout the period. |
b | Total return does not reflect the impact of any applicable sales charges. |
c | Net expense information reflects the expense ratios after expense waivers and reimbursements, as applicable. |
SEE NOTES TO FINANCIAL STATEMENTS. | THE RYDEX FUNDS ANNUAL REPORT | 115 |
PERFORMANCE REPORT AND FUND PROFILE (Unaudited) | March 31, 2024 |
RETAILING FUND
OBJECTIVE: Seeks to provide capital appreciation by investing in companies engaged in merchandising finished goods and services, including department stores, mail order operations, and other companies involved in selling products to consumers (“Retailing Companies”).
For the Reporting Period, Retailing Fund Investor Class returned 21.33%, compared with the S&P 500 Index, which returned 29.88%. The S&P 500 Consumer Discretionary Index returned 28.73%.
The industries that contributed the most to performance were broadline retail, automotive retail, and apparel retail. Those that detracted the most were drug retail, computer & electronics retail, and distributors.
The holdings that contributed the most to performance were Amazon.com, Inc., Costco Wholesale Corp., and PDD Holdings, Inc. ADR. Those that detracted the most were Farfetch Ltd. – Class A, Alibaba Group Holding Ltd. ADR, and JD.com, Inc. ADR.
Performance displayed represents past performance, which is no guarantee of future results.
Holdings Diversification (Market Exposure as % of Net Assets)
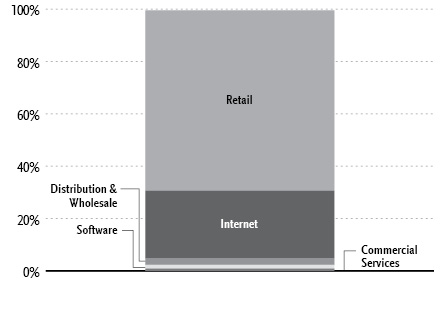
“Holdings Diversification (Market Exposure as % of Net Assets)” excludes any temporary cash investments.
Inception Dates: |
Investor Class | April 1, 1998 |
Class A | September 1, 2004 |
Class C | May 9, 2001 |
Class H | April 21, 1998 |
Ten Largest Holdings | % of Total Net Assets |
Amazon.com, Inc. | 11.1% |
Home Depot, Inc. | 5.2% |
Walmart, Inc. | 4.3% |
Lowe’s Companies, Inc. | 4.2% |
Costco Wholesale Corp. | 4.1% |
TJX Companies, Inc. | 3.8% |
Target Corp. | 3.1% |
O’Reilly Automotive, Inc. | 2.8% |
PDD Holdings, Inc. ADR | 2.4% |
Ross Stores, Inc. | 2.4% |
Top Ten Total | 43.4% |
| | |
“Ten Largest Holdings” excludes any temporary cash investments. |
116 | THE RYDEX FUNDS ANNUAL REPORT | |
PERFORMANCE REPORT AND FUND PROFILE (Unaudited)(concluded) | March 31, 2024 |
Cumulative Fund Performance*

Average Annual Returns*
Periods Ended March 31, 2024
| 1 Year | 5 Year | 10 Year |
Investor Class Shares | 21.33% | 10.83% | 9.07% |
Class A Shares | 21.03% | 10.55% | 8.83% |
Class A Shares with sales charge† | 15.28% | 9.48% | 8.30% |
Class C Shares | 20.11% | 9.71% | 8.00% |
Class C Shares with CDSC‡ | 19.11% | 9.71% | 8.00% |
Class H Shares** | 21.02% | 10.54% | 8.79% |
S&P 500 Consumer Discretionary Index | 28.73% | 11.54% | 12.56% |
S&P 500 Index | 29.88% | 15.05% | 12.96% |
* | The performance data above represents past performance that is not predictive of future results. The investment return and principal value of an investment in the Fund will fluctuate so that an investor’s shares, when redeemed, may be worth more or less than their original cost. Returns are historical and include changes in principal and reinvested dividends and capital gains and do not reflect the effect of taxes. The S&P 500 Index and the S&P 500 Consumer Discretionary Index are unmanaged indices and, unlike the Fund, have no management fees or operating expenses to reduce their reported returns. The graphs are based on Investor Class shares and Class A shares only; performance for Class C and Class H shares will vary due to differences in fee structures. |
** | Effective September 30, 2015, the Fund’s Advisor Class shares were converted into Class H shares. |
† | Fund returns are calculated using the maximum sales charge of 4.75%. |
‡ | Fund returns include a CDSC of 1% if redeemed within 12 months of purchase. |
| | THE RYDEX FUNDS ANNUAL REPORT | 117 |
SCHEDULE OF INVESTMENTS | March 31, 2024 |
RETAILING FUND | |
| | Shares | | | Value | |
COMMON STOCKS† - 99.6% |
| | | | | | | | | |
Retail - 69.0% |
Home Depot, Inc. | | | 1,309 | | | $ | 502,132 | |
Walmart, Inc. | | | 6,961 | | | | 418,843 | |
Lowe’s Companies, Inc. | | | 1,612 | | | | 410,625 | |
Costco Wholesale Corp. | | | 541 | | | | 396,353 | |
TJX Companies, Inc. | | | 3,648 | | | | 369,980 | |
Target Corp. | | | 1,731 | | | | 306,750 | |
O’Reilly Automotive, Inc.* | | | 244 | | | | 275,447 | |
Ross Stores, Inc. | | | 1,588 | | | | 233,055 | |
Dollar General Corp. | | | 1,239 | | | | 193,358 | |
Tractor Supply Co. | | | 699 | | | | 182,942 | |
Williams-Sonoma, Inc. | | | 524 | | | | 166,386 | |
Dollar Tree, Inc.* | | | 1,239 | | | | 164,973 | |
AutoZone, Inc.* | | | 52 | | | | 163,886 | |
Ulta Beauty, Inc.* | | | 312 | | | | 163,138 | |
Genuine Parts Co. | | | 1,005 | | | | 155,705 | |
Dick’s Sporting Goods, Inc. | | | 685 | | | | 154,029 | |
Best Buy Company, Inc. | | | 1,632 | | | | 133,873 | |
Walgreens Boots Alliance, Inc. | | | 6,126 | | | | 132,873 | |
CarMax, Inc.* | | | 1,478 | | | | 128,748 | |
Burlington Stores, Inc.* | | | 552 | | | | 128,169 | |
Bath & Body Works, Inc. | | | 2,401 | | | | 120,098 | |
Floor & Decor Holdings, Inc. — Class A* | | | 924 | | | | 119,769 | |
Gap, Inc. | | | 3,728 | | | | 102,706 | |
BJ’s Wholesale Club Holdings, Inc.* | | | 1,335 | | | | 100,993 | |
Five Below, Inc.* | | | 541 | | | | 98,127 | |
Murphy USA, Inc. | | | 224 | | | | 93,901 | |
Abercrombie & Fitch Co. — Class A* | | | 672 | | | | 84,222 | |
AutoNation, Inc.* | | | 505 | | | | 83,618 | |
Advance Auto Parts, Inc. | | | 942 | | | | 80,155 | |
RH* | | | 225 | | | | 78,358 | |
Macy’s, Inc. | | | 3,814 | | | | 76,242 | |
Ollie’s Bargain Outlet Holdings, Inc.* | | | 955 | | | | 75,989 | |
American Eagle Outfitters, Inc. | | | 2,862 | | | | 73,811 | |
Lithia Motors, Inc. — Class A | | | 241 | | | | 72,507 | |
Academy Sports & Outdoors, Inc. | | | 1,071 | | | | 72,335 | |
Signet Jewelers Ltd. | | | 696 | | | | 69,649 | |
Carvana Co.* | | | 770 | | | | 67,691 | |
Kohl’s Corp. | | | 2,127 | | | | 62,002 | |
Urban Outfitters, Inc.* | | | 1,339 | | | | 58,139 | |
Foot Locker, Inc. | | | 2,023 | | | | 57,655 | |
Boot Barn Holdings, Inc.* | | | 598 | | | | 56,900 | |
GameStop Corp. — Class A*,1 | | | 4,381 | | | | 54,850 | |
Nordstrom, Inc. | | | 2,558 | | | | 51,851 | |
Victoria’s Secret & Co.* | | | 2,620 | | | | 50,776 | |
National Vision Holdings, Inc.* | | | 1,892 | | | | 41,927 | |
Leslie’s, Inc.* | | | 4,874 | | | | 31,681 | |
Petco Health & Wellness Company, Inc.* | | | 3,914 | | | | 8,924 | |
Total Retail | | | | | | | 6,726,141 | |
| | | | | | | | | |
Internet - 25.7% |
Amazon.com, Inc.* | | | 5,980 | | | | 1,078,672 | |
PDD Holdings, Inc. ADR* | | | 2,033 | | | | 236,336 | |
Alibaba Group Holding Ltd. ADR | | | 2,787 | | | | 201,667 | |
JD.com, Inc. ADR | | | 6,965 | | | | 190,771 | |
eBay, Inc. | | | 3,353 | | | | 176,971 | |
MercadoLibre, Inc.* | | | 112 | | | | 169,340 | |
Coupang, Inc.* | | | 8,269 | | | | 147,106 | |
Wayfair, Inc. — Class A* | | | 1,453 | | | | 98,630 | |
Etsy, Inc.* | | | 1,374 | | | | 94,421 | |
Chewy, Inc. — Class A* | | | 4,793 | | | | 76,257 | |
Beyond, Inc.* | | | 1,192 | | | | 42,805 | |
Total Internet | | | | | | | 2,512,976 | |
| | | | | | | | | |
Distribution & Wholesale - 2.6% |
LKQ Corp. | | | 2,398 | | | | 128,077 | |
Pool Corp. | | | 311 | | | | 125,489 | |
Total Distribution & Wholesale | | | | | | | 253,566 | |
| | | | | | | | | |
Software - 1.5% |
Global-e Online Ltd* | | | 3,967 | | | | 144,201 | |
| | | | | | | | | |
Commercial Services - 0.8% |
Valvoline, Inc.* | | | 1,798 | | | | 80,137 | |
| | | | | | | | | |
Total Common Stocks | | | | |
(Cost $6,531,089) | | | | | | | 9,717,021 | |
| | | | | | | | | |
| | | Face
Amount | | | | | |
REPURCHASE AGREEMENTS††,2 - 0.5% |
J.P. Morgan Securities LLC
issued 03/28/24 at 5.31%
due 04/01/24 | | $ | 26,101 | | | | 26,101 | |
BofA Securities, Inc.
issued 03/28/24 at 5.31%
due 04/01/24 | | | 10,039 | | | | 10,039 | |
Barclays Capital, Inc.
issued 03/28/24 at 5.30%
due 04/01/24 | | | 9,099 | | | | 9,099 | |
Total Repurchase Agreements | | | | |
(Cost $45,239) | | | | | | | 45,239 | |
| | | | | | | | | |
| | | Shares | | | | | |
SECURITIES LENDING COLLATERAL†,3 - 0.4% |
Money Market Fund | | | | | | | | |
First American Government Obligations Fund - Class X, 5.23%4 | | | 34,798 | | | | 34,798 | |
Total Securities Lending Collateral | | | | |
(Cost $34,798) | | | | | | | 34,798 | |
| | | | | | | | | |
Total Investments - 100.5% | | | | |
(Cost $6,611,126) | | $ | 9,797,058 | |
Other Assets & Liabilities, net - (0.5)% | | | (48,975 | ) |
Total Net Assets - 100.0% | | $ | 9,748,083 | |
118 | THE RYDEX FUNDS ANNUAL REPORT | SEE NOTES TO FINANCIAL STATEMENTS. |
SCHEDULE OF INVESTMENTS (concluded) | March 31, 2024 |
RETAILING FUND | |
* | Non-income producing security. |
† | Value determined based on Level 1 inputs — See Note 4. |
†† | Value determined based on Level 2 inputs — See Note 4. |
1 | All or a portion of this security is on loan at March 31, 2024 — See Note 7. |
2 | Repurchase Agreements — See Note 6. |
3 | Securities lending collateral — See Note 7. |
4 | Rate indicated is the 7-day yield as of March 31, 2024. |
| | ADR — American Depositary Receipt |
| | |
| | See Sector Classification in Other Information section. |
The following table summarizes the inputs used to value the Fund’s investments at March 31, 2024 (See Note 4 in the Notes to Financial Statements):
Investments in Securities (Assets) | | Level 1
Quoted
Prices | | | Level 2
Significant
Observable
Inputs | | | Level 3
Significant
Unobservable
Inputs | | | Total | |
Common Stocks | | $ | 9,717,021 | | | $ | — | | | $ | — | | | $ | 9,717,021 | |
Repurchase Agreements | | | — | | | | 45,239 | | | | — | | | | 45,239 | |
Securities Lending Collateral | | | 34,798 | | | | — | | | | — | | | | 34,798 | |
Total Assets | | $ | 9,751,819 | | | $ | 45,239 | | | $ | — | | | $ | 9,797,058 | |
SEE NOTES TO FINANCIAL STATEMENTS. | THE RYDEX FUNDS ANNUAL REPORT | 119 |
STATEMENT OF ASSETS AND LIABILITIES |
March 31, 2024 |
Assets: |
Investments, at value - including $31,363 of securities loaned (cost $6,565,887) | | $ | 9,751,819 | |
Repurchase agreements, at value (cost $45,239) | | | 45,239 | |
Cash | | | 446 | |
Receivables: |
Fund shares sold | | | 2,308,884 | |
Dividends | | | 5,252 | |
Securities lending income | | | 33 | |
Interest | | | 27 | |
Total assets | | | 12,111,700 | |
| | | | | |
Liabilities: |
Payable for: |
Securities purchased | | | 2,290,584 | |
Return of securities lending collateral | | | 34,798 | |
Fund shares redeemed | | | 23,348 | |
Management fees | | | 5,352 | |
Transfer agent fees | | | 2,928 | |
Portfolio accounting and administration fees | | | 645 | |
Distribution and service fees | | | 305 | |
Trustees’ fees* | | | 72 | |
Miscellaneous | | | 5,585 | |
Total liabilities | | | 2,363,617 | |
Net assets | | $ | 9,748,083 | |
| | | | | |
Net assets consist of: |
Paid in capital | | $ | 8,656,493 | |
Total distributable earnings (loss) | | | 1,091,590 | |
Net assets | | $ | 9,748,083 | |
| | | | | |
Investor Class: |
Net assets | | $ | 8,533,485 | |
Capital shares outstanding | | | 165,931 | |
Net asset value per share | | $ | 51.43 | |
| | | | | |
Class A: |
Net assets | | $ | 750,183 | |
Capital shares outstanding | | | 15,708 | |
Net asset value per share | | $ | 47.76 | |
Maximum offering price per share (Net asset value divided by 95.25%) | | $ | 50.14 | |
| | | | | |
Class C: |
Net assets | | $ | 70,809 | |
Capital shares outstanding | | | 1,770 | |
Net asset value per share | | $ | 40.01 | |
| | | | | |
Class H: |
Net assets | | $ | 393,606 | |
Capital shares outstanding | | | 8,470 | |
Net asset value per share | | $ | 46.47 | |
STATEMENT OF OPERATIONS |
Year Ended March 31, 2024 |
Investment Income: |
Dividends (net of foreign withholding tax of $153) | | $ | 113,450 | |
Interest | | | 2,489 | |
Income from securities lending, net | | | 2,413 | |
Total investment income | | | 118,352 | |
| | | | | |
Expenses: |
Management fees | | | 75,419 | |
Distribution and service fees: |
Class A | | | 1,936 | |
Class C | | | 1,127 | |
Class H | | | 1,014 | |
Transfer agent fees | | | 19,199 | |
Portfolio accounting and administration fees | | | 13,525 | |
Registration fees | | | 8,982 | |
Professional fees | | | 3,805 | |
Trustees’ fees* | | | 1,612 | |
Custodian fees | | | 1,404 | |
Line of credit fees | | | 136 | |
Miscellaneous | | | 2,819 | |
Total expenses | | | 130,978 | |
Less: |
Expenses reimbursed by Adviser | | | (2,650 | ) |
Net expenses | | | 128,328 | |
Net investment loss | | | (9,976 | ) |
| | | | | |
Net Realized and Unrealized Gain (Loss): |
Net realized gain (loss) on: |
Investments | | | 690,181 | |
Net realized gain | | | 690,181 | |
Net change in unrealized appreciation (depreciation) on: |
Investments | | | 648,186 | |
Net change in unrealized appreciation (depreciation) | | | 648,186 | |
Net realized and unrealized gain | | | 1,338,367 | |
Net increase in net assets resulting from operations | | $ | 1,328,391 | |
* | Relates to Trustees not deemed “interested persons” within the meaning of Section 2(a)(19) of the 1940 Act. |
120 | THE RYDEX FUNDS ANNUAL REPORT | SEE NOTES TO FINANCIAL STATEMENTS. |
STATEMENTS OF CHANGES IN NET ASSETS |
| | Year Ended
March 31,
2024 | | | Year Ended
March 31,
2023 | |
Increase (Decrease) in Net Assets from Operations: | | | | | | | | |
Net investment loss | | $ | (9,976 | ) | | $ | (26,073 | ) |
Net realized gain (loss) on investments | | | 690,181 | | | | (803,782 | ) |
Net change in unrealized appreciation (depreciation) on investments | | | 648,186 | | | | (960,613 | ) |
Net increase (decrease) in net assets resulting from operations | | | 1,328,391 | | | | (1,790,468 | ) |
| | | | | | | | | |
Capital share transactions: | | | | | | | | |
Proceeds from sale of shares | | | | | | | | |
Investor Class | | | 27,699,473 | | | | 35,012,254 | |
Class A | | | 244,458 | | | | 491,568 | |
Class C | | | 108,390 | | | | 43,721 | |
Class H | | | 16,566 | | | | 905,776 | |
Cost of shares redeemed | | | | | | | | |
Investor Class | | | (27,611,388 | ) | | | (34,168,872 | ) |
Class A | | | (620,195 | ) | | | (1,197,684 | ) |
Class C | | | (194,132 | ) | | | (73,673 | ) |
Class H | | | (292,400 | ) | | | (938,009 | ) |
Net increase (decrease) from capital share transactions | | | (649,228 | ) | | | 75,081 | |
Net increase (decrease) in net assets | | | 679,163 | | | | (1,715,387 | ) |
| | | | | | | | | |
Net assets: | | | | | | | | |
Beginning of year | | | 9,068,920 | | | | 10,784,307 | |
End of year | | $ | 9,748,083 | | | $ | 9,068,920 | |
| | | | | | | | | |
Capital share activity: | | | | | | | | |
Shares sold | | | | | | | | |
Investor Class | | | 622,418 | | | | 829,827 | |
Class A | | | 6,259 | | | | 12,925 | |
Class C | | | 3,140 | | | | 1,362 | |
Class H | | | 425 | | | | 24,999 | |
Shares redeemed | | | | | | | | |
Investor Class | | | (629,522 | ) | | | (827,870 | ) |
Class A | | | (15,500 | ) | | | (31,900 | ) |
Class C | | | (5,786 | ) | | | (2,232 | ) |
Class H | | | (7,656 | ) | | | (25,143 | ) |
Net decrease in shares | | | (26,222 | ) | | | (18,032 | ) |
SEE NOTES TO FINANCIAL STATEMENTS. | THE RYDEX FUNDS ANNUAL REPORT | 121 |
This table is presented to show selected data for a share outstanding throughout each period and to assist shareholders in evaluating a Fund’s performance for the periods presented.
Investor Class | | Year Ended
March 31,
2024 | | | Year Ended
March 31,
2023 | | | Year Ended
March 31,
2022 | | | Year Ended
March 31,
2021 | | | Year Ended
March 31,
2020 | |
Per Share Data |
Net asset value, beginning of period | | $ | 42.39 | | | $ | 46.75 | | | $ | 57.11 | | | $ | 28.62 | | | $ | 33.46 | |
Income (loss) from investment operations: |
Net investment income (loss)a | | | (.03 | ) | | | (.08 | ) | | | (.30 | ) | | | (.25 | ) | | | (.06 | ) |
Net gain (loss) on investments (realized and unrealized) | | | 9.07 | | | | (4.28 | ) | | | (5.31 | ) | | | 28.74 | | | | (4.78 | ) |
Total from investment operations | | | 9.04 | | | | (4.36 | ) | | | (5.61 | ) | | | 28.49 | | | | (4.84 | ) |
Less distributions from: |
Net realized gains | | | — | | | | — | | | | (4.75 | ) | | | — | | | | — | |
Total distributions | | | — | | | | — | | | | (4.75 | ) | | | — | | | | — | |
Net asset value, end of period | | $ | 51.43 | | | $ | 42.39 | | | $ | 46.75 | | | $ | 57.11 | | | $ | 28.62 | |
|
Total Return | | | 21.33 | % | | | (9.33 | %) | | | (10.94 | %) | | | 99.55 | % | | | (14.47 | %) |
Ratios/Supplemental Data |
Net assets, end of period (in thousands) | | $ | 8,533 | | | $ | 7,334 | | | $ | 7,998 | | | $ | 24,987 | | | $ | 3,316 | |
Ratios to average net assets: |
Net investment income (loss) | | | (0.08 | %) | | | (0.19 | %) | | | (0.53 | %) | | | (0.52 | %) | | | (0.17 | %) |
Total expenses | | | 1.43 | % | | | 1.40 | % | | | 1.36 | % | | | 1.43 | % | | | 1.47 | % |
Net expensesb | | | 1.40 | % | | | 1.40 | % | | | 1.36 | % | | | 1.43 | % | | | 1.47 | % |
Portfolio turnover rate | | | 299 | % | | | 371 | % | | | 214 | % | | | 270 | % | | | 228 | % |
Class A | | Year Ended
March 31,
2024 | | | Year Ended
March 31,
2023 | | | Year Ended
March 31,
2022 | | | Year Ended
March 31,
2021 | | | Year Ended
March 31,
2020 | |
Per Share Data |
Net asset value, beginning of period | | $ | 39.46 | | | $ | 43.64 | | | $ | 53.75 | | | $ | 27.00 | | | $ | 31.64 | |
Income (loss) from investment operations: |
Net investment income (loss)a | | | (.11 | ) | | | (.17 | ) | | | (.42 | ) | | | (.38 | ) | | | (.13 | ) |
Net gain (loss) on investments (realized and unrealized) | | | 8.41 | | | | (4.01 | ) | | | (4.94 | ) | | | 27.13 | | | | (4.51 | ) |
Total from investment operations | | | 8.30 | | | | (4.18 | ) | | | (5.36 | ) | | | 26.75 | | | | (4.64 | ) |
Less distributions from: |
Net realized gains | | | — | | | | — | | | | (4.75 | ) | | | — | | | | — | |
Total distributions | | | — | | | | — | | | | (4.75 | ) | | | — | | | | — | |
Net asset value, end of period | | $ | 47.76 | | | $ | 39.46 | | | $ | 43.64 | | | $ | 53.75 | | | $ | 27.00 | |
|
Total Returnc | | | 21.03 | % | | | (9.58 | %) | | | (11.17 | %) | | | 99.07 | % | | | (14.66 | %) |
Ratios/Supplemental Data |
Net assets, end of period (in thousands) | | $ | 750 | | | $ | 985 | | | $ | 1,917 | | | $ | 2,133 | | | $ | 456 | |
Ratios to average net assets: |
Net investment income (loss) | | | (0.27 | %) | | | (0.45 | %) | | | (0.79 | %) | | | (0.83 | %) | | | (0.42 | %) |
Total expenses | | | 1.69 | % | | | 1.65 | % | | | 1.61 | % | | | 1.67 | % | | | 1.72 | % |
Net expensesb | | | 1.65 | % | | | 1.65 | % | | | 1.61 | % | | | 1.67 | % | | | 1.72 | % |
Portfolio turnover rate | | | 299 | % | | | 371 | % | | | 214 | % | | | 270 | % | | | 228 | % |
122 | THE RYDEX FUNDS ANNUAL REPORT | SEE NOTES TO FINANCIAL STATEMENTS. |
FINANCIAL HIGHLIGHTS (concluded) |
This table is presented to show selected data for a share outstanding throughout each period and to assist shareholders in evaluating a Fund’s performance for the periods presented.
Class C | | Year Ended
March 31,
2024 | | | Year Ended
March 31,
2023 | | | Year Ended
March 31,
2022 | | | Year Ended
March 31,
2021 | | | Year Ended
March 31,
2020 | |
Per Share Data |
Net asset value, beginning of period | | $ | 33.31 | | | $ | 37.12 | | | $ | 46.74 | | | $ | 23.67 | | | $ | 27.95 | |
Income (loss) from investment operations: |
Net investment income (loss)a | | | (.34 | ) | | | (.39 | ) | | | (.70 | ) | | | (.62 | ) | | | (.33 | ) |
Net gain (loss) on investments (realized and unrealized) | | | 7.04 | | | | (3.42 | ) | | | (4.17 | ) | | | 23.69 | | | | (3.95 | ) |
Total from investment operations | | | 6.70 | | | | (3.81 | ) | | | (4.87 | ) | | | 23.07 | | | | (4.28 | ) |
Less distributions from: |
Net realized gains | | | — | | | | — | | | | (4.75 | ) | | | — | | | | — | |
Total distributions | | | — | | | | — | | | | (4.75 | ) | | | — | | | | — | |
Net asset value, end of period | | $ | 40.01 | | | $ | 33.31 | | | $ | 37.12 | | | $ | 46.74 | | | $ | 23.67 | |
|
Total Returnc | | | 20.11 | % | | | (10.26 | %) | | | (11.84 | %) | | | 97.47 | % | | | (15.31 | %) |
Ratios/Supplemental Data |
Net assets, end of period (in thousands) | | $ | 71 | | | $ | 147 | | | $ | 196 | | | $ | 294 | | | $ | 230 | |
Ratios to average net assets: |
Net investment income (loss) | | | (1.01 | %) | | | (1.18 | %) | | | (1.54 | %) | | | (1.65 | %) | | | (1.16 | %) |
Total expenses | | | 2.43 | % | | | 2.40 | % | | | 2.36 | % | | | 2.44 | % | | | 2.48 | % |
Net expensesb | | | 2.40 | % | | | 2.40 | % | | | 2.36 | % | | | 2.44 | % | | | 2.48 | % |
Portfolio turnover rate | | | 299 | % | | | 371 | % | | | 214 | % | | | 270 | % | | | 228 | % |
Class H | | Year Ended
March 31,
2024 | | | Year Ended
March 31,
2023 | | | Year Ended
March 31,
2022 | | | Year Ended
March 31,
2021 | | | Year Ended
March 31,
2020 | |
Per Share Data |
Net asset value, beginning of period | | $ | 38.40 | | | $ | 42.47 | | | $ | 52.44 | | | $ | 26.35 | | | $ | 30.87 | |
Income (loss) from investment operations: |
Net investment income (loss)a | | | (.10 | ) | | | (.18 | ) | | | (.38 | ) | | | (.39 | ) | | | (.20 | ) |
Net gain (loss) on investments (realized and unrealized) | | | 8.17 | | | | (3.89 | ) | | | (4.84 | ) | | | 26.48 | | | | (4.32 | ) |
Total from investment operations | | | 8.07 | | | | (4.07 | ) | | | (5.22 | ) | | | 26.09 | | | | (4.52 | ) |
Less distributions from: |
Net realized gains | | | — | | | | — | | | | (4.75 | ) | | | — | | | | — | |
Total distributions | | | — | | | | — | | | | (4.75 | ) | | | — | | | | — | |
Net asset value, end of period | | $ | 46.47 | | | $ | 38.40 | | | $ | 42.47 | | | $ | 52.44 | | | $ | 26.35 | |
|
Total Return | | | 21.02 | % | | | (9.58 | %) | | | (11.18 | %) | | | 99.01 | % | | | (14.64 | %) |
Ratios/Supplemental Data |
Net assets, end of period (in thousands) | | $ | 394 | | | $ | 603 | | | $ | 673 | | | $ | 661 | | | $ | 345 | |
Ratios to average net assets: |
Net investment income (loss) | | | (0.26 | %) | | | (0.47 | %) | | | (0.73 | %) | | | (0.91 | %) | | | (0.64 | %) |
Total expenses | | | 1.68 | % | | | 1.65 | % | | | 1.60 | % | | | 1.69 | % | | | 1.72 | % |
Net expensesb | | | 1.65 | % | | | 1.65 | % | | | 1.60 | % | | | 1.69 | % | | | 1.72 | % |
Portfolio turnover rate | | | 299 | % | | | 371 | % | | | 214 | % | | | 270 | % | | | 228 | % |
a | Net investment income (loss) per share was computed using average shares outstanding throughout the period. |
b | Net expense information reflects the expense ratios after expense waivers and reimbursements, as applicable. |
c | Total return does not reflect the impact of any applicable sales charges. |
SEE NOTES TO FINANCIAL STATEMENTS. | THE RYDEX FUNDS ANNUAL REPORT | 123 |
PERFORMANCE REPORT AND FUND PROFILE (Unaudited) | March 31, 2024 |
TECHNOLOGY FUND
OBJECTIVE: Seeks to provide capital appreciation by investing in companies that are involved in the technology sector, including computer software and service companies, semiconductor manufacturers, networking and telecommunications equipment manufacturers, PC hardware, and peripherals companies (“Technology Companies”).
For the Reporting Period, Technology Fund Investor Class returned 39.06%, compared with the S&P 500 Index, which returned 29.88%. The S&P 500 Information Technology Index returned 46.01%.
The industries that contributed the most to performance were semiconductors, systems software, and application software. Those that detracted the most were electronic equipment & instruments and electrical components & equipment.
The holdings that contributed the most to performance were NVIDIA Corp., Meta Platforms, Inc. – Class A, and Microsoft Corp. Those that detracted the most were SolarEdge Technologies, Inc., Sea Ltd. ADR, and Enphase Energy, Inc.
Performance displayed represents past performance, which is no guarantee of future results.
Holdings Diversification (Market Exposure as % of Net Assets)
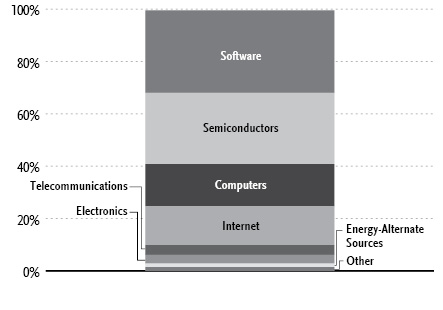
“Holdings Diversification (Market Exposure as % of Net Assets)” excludes any temporary cash investments.
Inception Dates: |
Investor Class | April 14, 1998 |
Class A | September 1, 2004 |
Class C | April 18, 2001 |
Class H | April 29, 1998 |
Ten Largest Holdings | % of Total Net Assets |
Microsoft Corp. | 6.0% |
Apple, Inc. | 5.3% |
Alphabet, Inc. — Class A | 4.8% |
NVIDIA Corp. | 4.8% |
Meta Platforms, Inc. — Class A | 3.6% |
Broadcom, Inc. | 2.5% |
Salesforce, Inc. | 1.8% |
Advanced Micro Devices, Inc. | 1.7% |
Oracle Corp. | 1.6% |
Adobe, Inc. | 1.5% |
Top Ten Total | 33.6% |
| | |
“Ten Largest Holdings” excludes any temporary cash investments. |
124 | THE RYDEX FUNDS ANNUAL REPORT | |
PERFORMANCE REPORT AND FUND PROFILE (Unaudited)(concluded) | March 31, 2024 |
Cumulative Fund Performance*
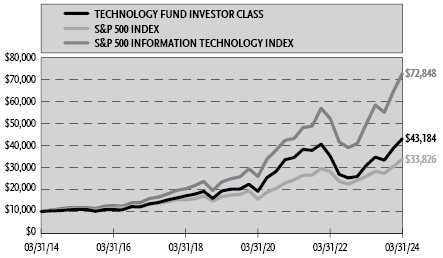
Average Annual Returns*
Periods Ended March 31, 2024
| 1 Year | 5 Year | 10 Year |
Investor Class Shares | 39.06% | 17.37% | 15.75% |
Class A Shares | 38.72% | 17.07% | 15.47% |
Class A Shares with sales charge† | 32.13% | 15.94% | 14.91% |
Class C Shares | 37.69% | 16.20% | 14.61% |
Class C Shares with CDSC‡ | 36.69% | 16.20% | 14.61% |
Class H Shares** | 38.72% | 17.07% | 15.43% |
S&P 500 Information Technology Index | 46.01% | 25.39% | 21.97% |
S&P 500 Index | 29.88% | 15.05% | 12.96% |
* | The performance data above represents past performance that is not predictive of future results. The investment return and principal value of an investment in the Fund will fluctuate so that an investor’s shares, when redeemed, may be worth more or less than their original cost. Returns are historical and include changes in principal and reinvested dividends and capital gains and do not reflect the effect of taxes. The S&P 500 Index and the S&P 500 Information Technology Index are unmanaged indices and, unlike the Fund, have no management fees or operating expenses to reduce their reported returns. The graphs are based on Investor Class shares and Class A shares only; performance for Class C and Class H shares will vary due to differences in fee structures. |
** | Effective September 30, 2015, the Fund’s Advisor Class shares were converted into Class H shares. |
† | Fund returns are calculated using the maximum sales charge of 4.75%. |
‡ | Fund returns include a CDSC of 1% if redeemed within 12 months of purchase. |
| | THE RYDEX FUNDS ANNUAL REPORT | 125 |
SCHEDULE OF INVESTMENTS | March 31, 2024 |
TECHNOLOGY FUND | |
| | Shares | | | Value | |
COMMON STOCKS† - 99.6% |
| | | | | | | | | |
Software - 31.6% |
Microsoft Corp. | | | 7,030 | | | $ | 2,957,671 | |
Salesforce, Inc. | | | 2,924 | | | | 880,650 | |
Oracle Corp. | | | 6,174 | | | | 775,516 | |
Adobe, Inc.* | | | 1,472 | | | | 742,771 | |
Intuit, Inc. | | | 1,067 | | | | 693,550 | |
ServiceNow, Inc.* | | | 846 | | | | 644,990 | |
Synopsys, Inc.* | | | 836 | | | | 477,774 | |
Cadence Design Systems, Inc.* | | | 1,512 | | | | 470,655 | |
Workday, Inc. — Class A* | | | 1,632 | | | | 445,128 | |
Roper Technologies, Inc. | | | 726 | | | | 407,170 | |
Autodesk, Inc.* | | | 1,512 | | | | 393,755 | |
Snowflake, Inc. — Class A* | | | 2,168 | | | | 350,349 | |
Atlassian Corp. — Class A* | | | 1,753 | | | | 342,028 | |
Palantir Technologies, Inc. — Class A* | | | 14,271 | | | | 328,376 | |
Datadog, Inc. — Class A* | | | 2,609 | | | | 322,472 | |
Electronic Arts, Inc. | | | 2,328 | | | | 308,856 | |
NetEase, Inc. ADR | | | 2,734 | | | | 282,887 | |
Cloudflare, Inc. — Class A* | | | 2,869 | | | | 277,805 | |
Monday.com Ltd.* | | | 1,177 | | | | 265,849 | |
Take-Two Interactive Software, Inc.* | | | 1,783 | | | | 264,758 | |
HubSpot, Inc.* | | | 406 | | | | 254,383 | |
PTC, Inc.* | | | 1,272 | | | | 240,332 | |
ANSYS, Inc.* | | | 691 | | | | 239,888 | |
ROBLOX Corp. — Class A* | | | 6,079 | | | | 232,096 | |
Zoom Video Communications, Inc. — Class A* | | | 3,360 | | | | 219,643 | |
MongoDB, Inc.* | | | 606 | | | | 217,336 | |
AppLovin Corp. — Class A* | | | 3,109 | | | | 215,205 | |
Akamai Technologies, Inc.* | | | 1,883 | | | | 204,795 | |
Nutanix, Inc. — Class A* | | | 3,225 | | | | 199,047 | |
DocuSign, Inc.* | | | 3,155 | | | | 187,880 | |
Dynatrace, Inc.* | | | 3,996 | | | | 185,574 | |
Manhattan Associates, Inc.* | | | 741 | | | | 185,420 | |
Twilio, Inc. — Class A* | | | 2,744 | | | | 167,796 | |
MicroStrategy, Inc. — Class A* | | | 95 | | | | 161,933 | |
Gitlab, Inc. — Class A* | | | 2,559 | | | | 149,241 | |
Dropbox, Inc. — Class A* | | | 6,109 | | | | 148,449 | |
Confluent, Inc. — Class A* | | | 4,767 | | | | 145,489 | |
BILL Holdings, Inc.* | | | 2,018 | | | | 138,677 | |
Unity Software, Inc.* | | | 5,132 | | | | 137,024 | |
ZoomInfo Technologies, Inc. — Class A* | | | 7,496 | | | | 120,161 | |
Five9, Inc.* | | | 1,783 | | | | 110,742 | |
C3.ai, Inc. — Class A*,1 | | | 3,099 | | | | 83,890 | |
Total Software | | | | | | | 15,578,011 | |
| | | | | | | | | |
Semiconductors - 27.2% |
NVIDIA Corp. | | | 2,634 | | | | 2,379,977 | |
Broadcom, Inc. | | | 931 | | | | 1,233,957 | |
Advanced Micro Devices, Inc.* | | | 4,562 | | | | 823,395 | |
Intel Corp. | | | 15,613 | | | | 689,626 | |
QUALCOMM, Inc. | | | 4,071 | | | | 689,220 | |
Applied Materials, Inc. | | | 3,260 | | | | 672,310 | |
Texas Instruments, Inc. | | | 3,695 | | | | 643,706 | |
Micron Technology, Inc. | | | 5,428 | | | | 639,907 | |
Lam Research Corp. | | | 596 | | | | 579,056 | |
Analog Devices, Inc. | | | 2,569 | | | | 508,123 | |
KLA Corp. | | | 711 | | | | 496,683 | |
NXP Semiconductor N.V. | | | 1,808 | | | | 447,968 | |
ASML Holding N.V. — Class G | | | 401 | | | | 389,159 | |
Marvell Technology, Inc. | | | 5,218 | | | | 369,852 | |
Taiwan Semiconductor Manufacturing Company Ltd. ADR | | | 2,524 | | | | 343,390 | |
Microchip Technology, Inc. | | | 3,811 | | | | 341,885 | |
ON Semiconductor Corp.* | | | 3,550 | | | | 261,103 | |
STMicroelectronics N.V. — Class Y | | | 5,949 | | | | 257,235 | |
Entegris, Inc. | | | 1,647 | | | | 231,469 | |
Teradyne, Inc. | | | 1,923 | | | | 216,972 | |
Skyworks Solutions, Inc. | | | 1,988 | | | | 215,340 | |
Monolithic Power Systems, Inc. | | | 270 | | | | 182,903 | |
Qorvo, Inc.* | | | 1,467 | | | | 168,456 | |
Lattice Semiconductor Corp.* | | | 2,053 | | | | 160,606 | |
MKS Instruments, Inc. | | | 1,152 | | | | 153,216 | |
Rambus, Inc.* | | | 2,073 | | | | 128,132 | |
GLOBALFOUNDRIES, Inc.*,1 | | | 2,013 | | | | 104,897 | |
Axcelis Technologies, Inc.* | | | 661 | | | | 73,715 | |
Total Semiconductors | | | | | | | 13,402,258 | |
| | | | | | | | | |
Computers - 16.2% |
Apple, Inc. | | | 15,332 | | | | 2,629,131 | |
International Business Machines Corp. | | | 3,560 | | | | 679,818 | |
Crowdstrike Holdings, Inc. — Class A* | | | 1,432 | | | | 459,085 | |
Dell Technologies, Inc. — Class C | | | 3,730 | | | | 425,630 | |
Super Micro Computer, Inc.* | | | 335 | | | | 338,360 | |
Fortinet, Inc.* | | | 4,822 | | | | 329,391 | |
Check Point Software Technologies Ltd.* | | | 1,883 | | | | 308,831 | |
Cognizant Technology Solutions Corp. — Class A | | | 4,176 | | | | 306,059 | |
Accenture plc — Class A | | | 876 | | | | 303,630 | |
HP, Inc. | | | 9,248 | | | | 279,474 | |
Infosys Ltd. ADR | | | 14,786 | | | | 265,113 | |
Western Digital Corp.* | | | 3,735 | | | | 254,876 | |
Hewlett Packard Enterprise Co. | | | 14,271 | | | | 253,025 | |
NetApp, Inc. | | | 2,338 | | | | 245,420 | |
Seagate Technology Holdings plc | | | 2,494 | | | | 232,067 | |
Zscaler, Inc.* | | | 1,117 | | | | 215,168 | |
Pure Storage, Inc. — Class A* | | | 3,836 | | | | 199,434 | |
Amdocs Ltd. | | | 1,833 | | | | 165,648 | |
Lumentum Holdings, Inc.* | | | 1,968 | | | | 93,185 | |
Total Computers | | | | | | | 7,983,345 | |
| | | | | | | | | |
Internet - 14.8% |
Alphabet, Inc. — Class A* | | | 15,773 | | | | 2,380,619 | |
Meta Platforms, Inc. — Class A | | | 3,630 | | | | 1,762,655 | |
Palo Alto Networks, Inc.* | | | 1,733 | | | | 492,397 | |
Shopify, Inc. — Class A* | | | 4,692 | | | | 362,082 | |
Baidu, Inc. ADR* | | | 3,180 | | | | 334,790 | |
CDW Corp. | | | 1,212 | | | | 310,005 | |
Sea Ltd. ADR* | | | 5,072 | | | | 272,417 | |
Pinterest, Inc. — Class A* | | | 7,180 | | | | 248,931 | |
VeriSign, Inc.* | | | 1,112 | | | | 210,735 | |
Okta, Inc.* | | | 1,993 | | | | 208,508 | |
126 | THE RYDEX FUNDS ANNUAL REPORT | SEE NOTES TO FINANCIAL STATEMENTS. |
SCHEDULE OF INVESTMENTS (continued) | March 31, 2024 |
TECHNOLOGY FUND | |
| | Shares | | | Value | |
Snap, Inc. — Class A* | | | 16,469 | | | $ | 189,064 | |
Gen Digital, Inc. | | | 8,312 | | | | 186,189 | |
F5, Inc.* | | | 911 | | | | 172,717 | |
Match Group, Inc.* | | | 4,592 | | | | 166,598 | |
Total Internet | | | | | | | 7,297,707 | |
| | | | | | | | | |
Telecommunications - 3.7% |
Cisco Systems, Inc. | | | 14,431 | | | | 720,251 | |
Arista Networks, Inc.* | | | 1,522 | | | | 441,349 | |
Motorola Solutions, Inc. | | | 1,167 | | | | 414,262 | |
Corning, Inc. | | | 8,132 | | | | 268,031 | |
Total Telecommunications | | | | | | | 1,843,893 | |
| | | | | | | | | |
Electronics - 3.3% |
Amphenol Corp. — Class A | | | 3,826 | | | | 441,329 | |
TE Connectivity Ltd. | | | 2,429 | | | | 352,788 | |
Keysight Technologies, Inc.* | | | 1,738 | | | | 271,789 | |
Trimble, Inc.* | | | 3,265 | | | | 210,135 | |
Jabil, Inc. | | | 1,472 | | | | 197,174 | |
Flex Ltd.* | | | 6,124 | | | | 175,208 | |
Total Electronics | | | | | | | 1,648,423 | |
| | | | | | | | | |
Energy-Alternate Sources - 1.4% |
SolarEdge Technologies, Inc.* | | | 4,156 | | | | 294,993 | |
First Solar, Inc.* | | | 1,297 | | | | 218,934 | |
Enphase Energy, Inc.* | | | 1,627 | | | | 196,834 | |
Total Energy-Alternate Sources | | | | | | | 710,761 | |
| | | | | | | | | |
Commercial Services - 1.1% |
Gartner, Inc.* | | | 666 | | | | 317,462 | |
Marathon Digital Holdings, Inc.*,1 | | | 5,723 | | | | 129,225 | |
Riot Platforms, Inc.* | | | 7,240 | | | | 88,618 | |
Total Commercial Services | | | | | | | 535,305 | |
| | | | | | | | | |
Office & Business Equipment - 0.3% |
Zebra Technologies Corp. — Class A* | | | 541 | | | | 163,079 | |
| | | | | | | | | |
Total Common Stocks | | | | |
(Cost $21,883,614) | | | | | | | 49,162,782 | |
| | Face
Amount | | | | |
REPURCHASE AGREEMENTS††,2 - 0.6% |
J.P. Morgan Securities LLC
issued 03/28/24 at 5.31%
due 04/01/24 | | $ | 165,598 | | | | 165,598 | |
BofA Securities, Inc.
issued 03/28/24 at 5.31%
due 04/01/24 | | | 63,691 | | | | 63,691 | |
Barclays Capital, Inc.
issued 03/28/24 at 5.30%
due 04/01/24 | | | 57,731 | | | | 57,731 | |
Total Repurchase Agreements | | | | |
(Cost $287,020) | | | | | | | 287,020 | |
| | | | | | | | | |
| | | Shares | | | | | |
SECURITIES LENDING COLLATERAL†,3 - 0.3% |
Money Market Fund | | | | | | | | |
First American Government Obligations Fund - Class X, 5.23%4 | | | 141,163 | | | | 141,163 | |
Total Securities Lending Collateral | | | | |
(Cost $141,163) | | | | | | | 141,163 | |
| | | | | | | | | |
Total Investments - 100.5% | | | | |
(Cost $22,311,797) | | $ | 49,590,965 | |
Other Assets & Liabilities, net - (0.5)% | | | (236,192 | ) |
Total Net Assets - 100.0% | | $ | 49,354,773 | |
* | Non-income producing security. |
† | Value determined based on Level 1 inputs — See Note 4. |
†† | Value determined based on Level 2 inputs — See Note 4. |
1 | All or a portion of this security is on loan at March 31, 2024 — See Note 7. |
2 | Repurchase Agreements — See Note 6. |
3 | Securities lending collateral — See Note 7. |
4 | Rate indicated is the 7-day yield as of March 31, 2024. |
| | ADR — American Depositary Receipt |
| | plc — Public Limited Company |
| | |
| | See Sector Classification in Other Information section. |
SEE NOTES TO FINANCIAL STATEMENTS. | THE RYDEX FUNDS ANNUAL REPORT | 127 |
SCHEDULE OF INVESTMENTS (concluded) | March 31, 2024 |
TECHNOLOGY FUND | |
The following table summarizes the inputs used to value the Fund’s investments at March 31, 2024 (See Note 4 in the Notes to Financial Statements):
Investments in Securities (Assets) | | Level 1
Quoted
Prices | | | Level 2
Significant
Observable
Inputs | | | Level 3
Significant
Unobservable
Inputs | | | Total | |
Common Stocks | | $ | 49,162,782 | | | $ | — | | | $ | — | | | $ | 49,162,782 | |
Repurchase Agreements | | | — | | | | 287,020 | | | | — | | | | 287,020 | |
Securities Lending Collateral | | | 141,163 | | | | — | | | | — | | | | 141,163 | |
Total Assets | | $ | 49,303,945 | | | $ | 287,020 | | | $ | — | | | $ | 49,590,965 | |
128 | THE RYDEX FUNDS ANNUAL REPORT | SEE NOTES TO FINANCIAL STATEMENTS. |
STATEMENT OF ASSETS AND LIABILITIES |
March 31, 2024 |
Assets: |
Investments, at value - including $133,825 of securities loaned (cost $22,024,777) | | $ | 49,303,945 | |
Repurchase agreements, at value (cost $287,020) | | | 287,020 | |
Cash | | | 4,888 | |
Receivables: |
Fund shares sold | | | 15,584 | |
Dividends | | | 15,202 | |
Foreign tax reclaims | | | 1,108 | |
Securities lending income | | | 254 | |
Interest | | | 169 | |
Total assets | | | 49,628,170 | |
| | | | | |
Liabilities: |
Payable for: |
Return of securities lending collateral | | | 141,163 | |
Management fees | | | 36,192 | |
Fund shares redeemed | | | 22,048 | |
Transfer agent fees | | | 21,351 | |
Distribution and service fees | | | 4,843 | |
Portfolio accounting and administration fees | | | 4,364 | |
Trustees’ fees* | | | 552 | |
Miscellaneous | | | 42,884 | |
Total liabilities | | | 273,397 | |
Net assets | | $ | 49,354,773 | |
| | | | | |
Net assets consist of: |
Paid in capital | | $ | 23,545,007 | |
Total distributable earnings (loss) | | | 25,809,766 | |
Net assets | | $ | 49,354,773 | |
| | | | | |
Investor Class: |
Net assets | | $ | 36,091,993 | |
Capital shares outstanding | | | 188,276 | |
Net asset value per share | | $ | 191.70 | |
| | | | | |
Class A: |
Net assets | | $ | 8,986,756 | |
Capital shares outstanding | | | 51,921 | |
Net asset value per share | | $ | 173.09 | |
Maximum offering price per share (Net asset value divided by 95.25%) | | $ | 181.72 | |
| | | | | |
Class C: |
Net assets | | $ | 3,023,324 | |
Capital shares outstanding | | | 20,910 | |
Net asset value per share | | $ | 144.59 | |
| | | | | |
Class H: |
Net assets | | $ | 1,252,700 | |
Capital shares outstanding | | | 7,437 | |
Net asset value per share | | $ | 168.44 | |
STATEMENT OF OPERATIONS |
Year Ended March 31, 2024 |
Investment Income: |
Dividends (net of foreign withholding tax of $2,078) | | $ | 430,901 | |
Interest | | | 18,550 | |
Income from securities lending, net | | | 4,050 | |
Total investment income | | | 453,501 | |
| | | | | |
Expenses: |
Management fees | | | 487,287 | |
Distribution and service fees: |
Class A | | | 19,552 | |
Class C | | | 27,602 | |
Class H | | | 3,910 | |
Transfer agent fees | | | 124,404 | |
Portfolio accounting and administration fees | | | 87,385 | |
Registration fees | | | 47,956 | |
Professional fees | | | 25,527 | |
Trustees’ fees* | | | 8,637 | |
Custodian fees | | | 7,958 | |
Line of credit fees | | | 198 | |
Miscellaneous | | | 34,874 | |
Total expenses | | | 875,290 | |
Less: |
Expenses reimbursed by Adviser | | | (20,798 | ) |
Net expenses | | | 854,492 | |
Net investment loss | | | (400,991 | ) |
| | | | | |
Net Realized and Unrealized Gain (Loss): |
Net realized gain (loss) on: |
Investments | | | 4,495,145 | |
Net realized gain | | | 4,495,145 | |
Net change in unrealized appreciation (depreciation) on: |
Investments | | | 11,784,979 | |
Net change in unrealized appreciation (depreciation) | | | 11,784,979 | |
Net realized and unrealized gain | | | 16,280,124 | |
Net increase in net assets resulting from operations | | $ | 15,879,133 | |
* | Relates to Trustees not deemed “interested persons” within the meaning of Section 2(a)(19) of the 1940 Act. |
SEE NOTES TO FINANCIAL STATEMENTS. | THE RYDEX FUNDS ANNUAL REPORT | 129 |
STATEMENTS OF CHANGES IN NET ASSETS |
| | Year Ended
March 31,
2024 | | | Year Ended
March 31,
2023 | |
Increase (Decrease) in Net Assets from Operations: | | | | | | | | |
Net investment loss | | $ | (400,991 | ) | | $ | (224,306 | ) |
Net realized gain on investments | | | 4,495,145 | | | | 2,648,828 | |
Net change in unrealized appreciation (depreciation) on investments | | | 11,784,979 | | | | (9,724,943 | ) |
Net increase (decrease) in net assets resulting from operations | | | 15,879,133 | | | | (7,300,421 | ) |
| | | | | | | | | |
Distributions to shareholders: | | | | | | | | |
Investor Class | | | (1,548,617 | ) | | | (915,758 | ) |
Class A | | | (227,970 | ) | | | (308,843 | ) |
Class C | | | (91,187 | ) | | | (159,211 | ) |
Class H | | | (87,573 | ) | | | (51,262 | ) |
Total distributions to shareholders | | | (1,955,347 | ) | | | (1,435,074 | ) |
| | | | | | | | | |
Capital share transactions: | | | | | | | | |
Proceeds from sale of shares | | | | | | | | |
Investor Class | | | 120,416,346 | | | | 37,968,887 | |
Class A | | | 2,572,213 | | | | 1,537,399 | |
Class C | | | 747,840 | | | | 415,397 | |
Class H | | | 4,472,665 | | | | 1,388,075 | |
Distributions reinvested | | | | | | | | |
Investor Class | | | 1,514,370 | | | | 873,134 | |
Class A | | | 226,883 | | | | 307,295 | |
Class C | | | 90,293 | | | | 158,242 | |
Class H | | | 87,101 | | | | 50,898 | |
Cost of shares redeemed | | | | | | | | |
Investor Class | | | (119,846,391 | ) | | | (41,421,053 | ) |
Class A | | | (2,736,773 | ) | | | (2,195,787 | ) |
Class C | | | (1,447,009 | ) | | | (1,143,360 | ) |
Class H | | | (4,714,179 | ) | | | (1,407,924 | ) |
Net increase (decrease) from capital share transactions | | | 1,383,359 | | | | (3,468,797 | ) |
Net increase (decrease) in net assets | | | 15,307,145 | | | | (12,204,292 | ) |
| | | | | | | | | |
Net assets: | | | | | | | | |
Beginning of year | | | 34,047,628 | | | | 46,251,920 | |
End of year | | $ | 49,354,773 | | | $ | 34,047,628 | |
| | | | | | | | | |
Capital share activity: | | | | | | | | |
Shares sold | | | | | | | | |
Investor Class | | | 767,301 | | | | 274,043 | |
Class A | | | 18,121 | | | | 12,444 | |
Class C | | | 6,073 | | | | 3,929 | |
Class H | | | 31,365 | | | | 10,716 | |
Shares issued from reinvestment of distributions | | | | | | | | |
Investor Class | | | 9,148 | | | | 7,358 | |
Class A | | | 1,517 | | | | 2,851 | |
Class C | | | 721 | | | | 1,731 | |
Class H | | | 598 | | | | 485 | |
Shares redeemed | | | | | | | | |
Investor Class | | | (755,479 | ) | | | (305,989 | ) |
Class A | | | (18,662 | ) | | | (18,151 | ) |
Class C | | | (12,187 | ) | | | (10,922 | ) |
Class H | | | (32,507 | ) | | | (12,220 | ) |
Net increase (decrease) in shares | | | 16,009 | | | | (33,725 | ) |
130 | THE RYDEX FUNDS ANNUAL REPORT | SEE NOTES TO FINANCIAL STATEMENTS. |
This table is presented to show selected data for a share outstanding throughout each period and to assist shareholders in evaluating a Fund’s performance for the periods presented.
Investor Class | | Year Ended
March 31,
2024 | | | Year Ended
March 31,
2023 | | | Year Ended
March 31,
2022 | | | Year Ended
March 31,
2021 | | | Year Ended
March 31,
2020 | |
Per Share Data |
Net asset value, beginning of period | | $ | 141.40 | | | $ | 168.83 | | | $ | 177.69 | | | $ | 100.21 | | | $ | 101.77 | |
Income (loss) from investment operations: |
Net investment income (loss)a | | | (.97 | ) | | | (.68 | ) | | | (1.32 | ) | | | (.96 | ) | | | (.22 | ) |
Net gain (loss) on investments (realized and unrealized) | | | 55.52 | | | | (20.64 | ) | | | 6.56 | | | | 81.24 | | | | (.80 | ) |
Total from investment operations | | | 54.55 | | | | (21.32 | ) | | | 5.24 | | | | 80.28 | | | | (1.02 | ) |
Less distributions from: |
Net realized gains | | | (4.25 | ) | | | (6.11 | ) | | | (14.10 | ) | | | (2.80 | ) | | | (.54 | ) |
Total distributions | | | (4.25 | ) | | | (6.11 | ) | | | (14.10 | ) | | | (2.80 | ) | | | (.54 | ) |
Net asset value, end of period | | $ | 191.70 | | | $ | 141.40 | | | $ | 168.83 | | | $ | 177.69 | | | $ | 100.21 | |
|
Total Return | | | 39.06 | % | | | (11.94 | %) | | | 1.94 | % | | | 80.31 | % | | | (1.06 | %) |
Ratios/Supplemental Data |
Net assets, end of period (in thousands) | | $ | 36,092 | | | $ | 23,656 | | | $ | 32,397 | | | $ | 35,562 | | | $ | 23,190 | |
Ratios to average net assets: |
Net investment income (loss) | | | (0.61 | %) | | | (0.50 | %) | | | (0.68 | %) | | | (0.65 | %) | | | (0.20 | %) |
Total expenses | | | 1.44 | % | | | 1.39 | % | | | 1.36 | % | | | 1.44 | % | | | 1.47 | % |
Net expensesb | | | 1.40 | % | | | 1.39 | % | | | 1.36 | % | | | 1.44 | % | | | 1.47 | % |
Portfolio turnover rate | | | 211 | % | | | 121 | % | | | 175 | % | | | 195 | % | | | 165 | % |
Class A | | Year Ended
March 31,
2024 | | | Year Ended
March 31,
2023 | | | Year Ended
March 31,
2022 | | | Year Ended
March 31,
2021 | | | Year Ended
March 31,
2020 | |
Per Share Data |
Net asset value, beginning of period | | $ | 128.33 | | | $ | 154.37 | | | $ | 163.90 | | | $ | 92.79 | | | $ | 94.51 | |
Income (loss) from investment operations: |
Net investment income (loss)a | | | (1.27 | ) | | | (.93 | ) | | | (1.68 | ) | | | (1.24 | ) | | | (.41 | ) |
Net gain (loss) on investments (realized and unrealized) | | | 50.28 | | | | (19.00 | ) | | | 6.25 | | | | 75.15 | | | | (.77 | ) |
Total from investment operations | | | 49.01 | | | | (19.93 | ) | | | 4.57 | | | | 73.91 | | | | (1.18 | ) |
Less distributions from: |
Net realized gains | | | (4.25 | ) | | | (6.11 | ) | | | (14.10 | ) | | | (2.80 | ) | | | (.54 | ) |
Total distributions | | | (4.25 | ) | | | (6.11 | ) | | | (14.10 | ) | | | (2.80 | ) | | | (.54 | ) |
Net asset value, end of period | | $ | 173.09 | | | $ | 128.33 | | | $ | 154.37 | | | $ | 163.90 | | | $ | 92.79 | |
|
Total Returnc | | | 38.72 | % | | | (12.16 | %) | | | 1.69 | % | | | 79.86 | % | | | (1.31 | %) |
Ratios/Supplemental Data |
Net assets, end of period (in thousands) | | $ | 8,987 | | | $ | 6,538 | | | $ | 8,305 | | | $ | 9,190 | | | $ | 5,321 | |
Ratios to average net assets: |
Net investment income (loss) | | | (0.87 | %) | | | (0.75 | %) | | | (0.96 | %) | | | (0.90 | %) | | | (0.40 | %) |
Total expenses | | | 1.68 | % | | | 1.64 | % | | | 1.61 | % | | | 1.69 | % | | | 1.73 | % |
Net expensesb | | | 1.65 | % | | | 1.64 | % | | | 1.61 | % | | | 1.69 | % | | | 1.73 | % |
Portfolio turnover rate | | | 211 | % | | | 121 | % | | | 175 | % | | | 195 | % | | | 165 | % |
SEE NOTES TO FINANCIAL STATEMENTS. | THE RYDEX FUNDS ANNUAL REPORT | 131 |
FINANCIAL HIGHLIGHTS (concluded) |
This table is presented to show selected data for a share outstanding throughout each period and to assist shareholders in evaluating a Fund’s performance for the periods presented.
Class C | | Year Ended
March 31,
2024 | | | Year Ended
March 31,
2023 | | | Year Ended
March 31,
2022 | | | Year Ended
March 31,
2021 | | | Year Ended
March 31,
2020 | |
Per Share Data |
Net asset value, beginning of period | | $ | 108.59 | | | $ | 132.87 | | | $ | 143.81 | | | $ | 82.23 | | | $ | 84.44 | |
Income (loss) from investment operations: |
Net investment income (loss)a | | | (1.97 | ) | | | (1.59 | ) | | | (2.60 | ) | | | (2.01 | ) | | | (1.06 | ) |
Net gain (loss) on investments (realized and unrealized) | | | 42.22 | | | | (16.58 | ) | | | 5.76 | | | | 66.39 | | | | (.61 | ) |
Total from investment operations | | | 40.25 | | | | (18.17 | ) | | | 3.16 | | | | 64.38 | | | | (1.67 | ) |
Less distributions from: |
Net realized gains | | | (4.25 | ) | | | (6.11 | ) | | | (14.10 | ) | | | (2.80 | ) | | | (.54 | ) |
Total distributions | | | (4.25 | ) | | | (6.11 | ) | | | (14.10 | ) | | | (2.80 | ) | | | (.54 | ) |
Net asset value, end of period | | $ | 144.59 | | | $ | 108.59 | | | $ | 132.87 | | | $ | 143.81 | | | $ | 82.23 | |
|
Total Returnc | | | 37.69 | % | | | (12.82 | %) | | | 0.92 | % | | | 78.52 | % | | | (2.05 | %) |
Ratios/Supplemental Data |
Net assets, end of period (in thousands) | | $ | 3,023 | | | $ | 2,856 | | | $ | 4,194 | | | $ | 6,214 | | | $ | 3,796 | |
Ratios to average net assets: |
Net investment income (loss) | | | (1.62 | %) | | | (1.51 | %) | | | (1.70 | %) | | | (1.65 | %) | | | (1.17 | %) |
Total expenses | | | 2.43 | % | | | 2.39 | % | | | 2.36 | % | | | 2.44 | % | | | 2.48 | % |
Net expensesb | | | 2.40 | % | | | 2.39 | % | | | 2.36 | % | | | 2.44 | % | | | 2.48 | % |
Portfolio turnover rate | | | 211 | % | | | 121 | % | | | 175 | % | | | 195 | % | | | 165 | % |
Class H | | Year Ended
March 31,
2024 | | | Year Ended
March 31,
2023 | | | Year Ended
March 31,
2022 | | | Year Ended
March 31,
2021 | | | Year Ended
March 31,
2020 | |
Per Share Data |
Net asset value, beginning of period | | $ | 124.98 | | | $ | 150.57 | | | $ | 160.17 | | | $ | 90.72 | | | $ | 92.40 | |
Income (loss) from investment operations: |
Net investment income (loss)a | | | (1.26 | ) | | | (.92 | ) | | | (1.62 | ) | | | (1.01 | ) | | | (.47 | ) |
Net gain (loss) on investments (realized and unrealized) | | | 48.97 | | | | (18.56 | ) | | | 6.12 | | | | 73.26 | | | | (.67 | ) |
Total from investment operations | | | 47.71 | | | | (19.48 | ) | | | 4.50 | | | | 72.25 | | | | (1.14 | ) |
Less distributions from: |
Net realized gains | | | (4.25 | ) | | | (6.11 | ) | | | (14.10 | ) | | | (2.80 | ) | | | (.54 | ) |
Total distributions | | | (4.25 | ) | | | (6.11 | ) | | | (14.10 | ) | | | (2.80 | ) | | | (.54 | ) |
Net asset value, end of period | | $ | 168.44 | | | $ | 124.98 | | | $ | 150.57 | | | $ | 160.17 | | | $ | 90.72 | |
|
Total Return | | | 38.72 | % | | | (12.17 | %) | | | 1.68 | % | | | 79.85 | % | | | (1.30 | %) |
Ratios/Supplemental Data |
Net assets, end of period (in thousands) | | $ | 1,253 | | | $ | 997 | | | $ | 1,355 | | | $ | 1,734 | | | $ | 3,435 | |
Ratios to average net assets: |
Net investment income (loss) | | | (0.88 | %) | | | (0.76 | %) | | | (0.93 | %) | | | (0.83 | %) | | | (0.47 | %) |
Total expenses | | | 1.69 | % | | | 1.64 | % | | | 1.60 | % | | | 1.74 | % | | | 1.72 | % |
Net expensesb | | | 1.65 | % | | | 1.64 | % | | | 1.60 | % | | | 1.74 | % | | | 1.72 | % |
Portfolio turnover rate | | | 211 | % | | | 121 | % | | | 175 | % | | | 195 | % | | | 165 | % |
a | Net investment income (loss) per share was computed using average shares outstanding throughout the period. |
b | Net expense information reflects the expense ratios after expense waivers and reimbursements, as applicable. |
c | Total return does not reflect the impact of any applicable sales charges. |
132 | THE RYDEX FUNDS ANNUAL REPORT | SEE NOTES TO FINANCIAL STATEMENTS. |
PERFORMANCE REPORT AND FUND PROFILE (Unaudited) | March 31, 2024 |
TELECOMMUNICATIONS FUND
OBJECTIVE: Seeks to provide capital appreciation by investing in companies engaged in the development, manufacture, or sale of communications services or communications equipment (“Telecommunications Companies”).
For the Reporting Period, Telecommunications Fund Investor Class returned -0.91%, compared with the S&P 500 Index, which returned 29.88%. The S&P 500 Communication Services Index returned 49.76%.
The industries that contributed the most to performance were application software, integrated telecommunication services, and wireless telecommunication services. Those that detracted the most were alternative carriers and cable & satellite.
The holdings that contributed the most to performance were Arista Networks, Inc., Comcast Corp. – Class A, and Verizon Communications, Inc. Those that detracted the most were Iridium Communications, Inc., Liberty Broadband Corp. – Class C, and Viasat, Inc.
Performance displayed represents past performance, which is no guarantee of future results.
Holdings Diversification (Market Exposure as % of Net Assets)
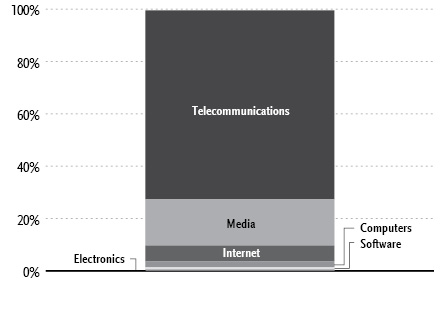
“Holdings Diversification (Market Exposure as % of Net Assets)” excludes any temporary cash investments.
Inception Dates: |
Investor Class | April 1, 1998 |
Class A | September 1, 2004 |
Class C | April 18, 2001 |
Class H | April 1, 1998 |
Ten Largest Holdings | % of Total Net Assets |
Cisco Systems, Inc. | 9.3% |
Comcast Corp. — Class A | 9.1% |
Verizon Communications, Inc. | 9.0% |
AT&T, Inc. | 7.8% |
T-Mobile US, Inc. | 6.9% |
Motorola Solutions, Inc. | 4.3% |
Arista Networks, Inc. | 4.2% |
Charter Communications, Inc. — Class A | 3.9% |
Juniper Networks, Inc. | 2.6% |
F5, Inc. | 2.5% |
Top Ten Total | 59.6% |
| | |
“Ten Largest Holdings” excludes any temporary cash investments. |
| | THE RYDEX FUNDS ANNUAL REPORT | 133 |
PERFORMANCE REPORT AND FUND PROFILE (Unaudited)(concluded) | March 31, 2024 |
Cumulative Fund Performance*
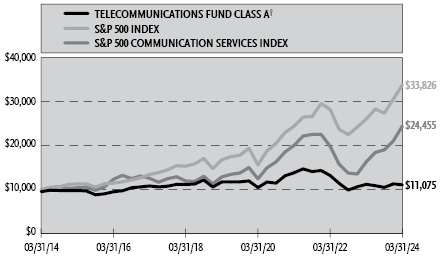
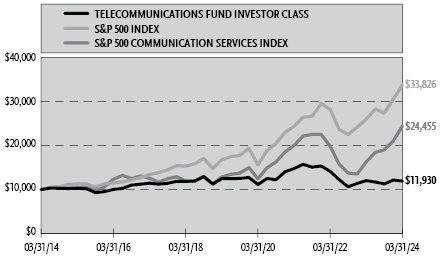
Average Annual Returns*
Periods Ended March 31, 2024
| 1 Year | 5 Year | 10 Year |
Investor Class Shares | (0.91%) | (0.93%) | 1.78% |
Class A Shares | (1.08%) | (1.17%) | 1.52% |
Class A Shares with sales charge† | (5.78%) | (2.13%) | 1.03% |
Class C Shares | (1.84%) | (1.91%) | 0.75% |
Class C Shares with CDSC‡ | (2.80%) | (1.91%) | 0.75% |
Class H Shares** | (1.12%) | (1.18%) | 1.50% |
S&P 500 Communication Services Index | 49.76% | 13.67% | 9.35% |
S&P 500 Index | 29.88% | 15.05% | 12.96% |
* | The performance data above represents past performance that is not predictive of future results. The investment return and principal value of an investment in the Fund will fluctuate so that an investor’s shares, when redeemed, may be worth more or less than their original cost. Returns are historical and include changes in principal and reinvested dividends and capital gains and do not reflect the effect of taxes. The S&P 500 Index and the S&P 500 Communication Services Index are unmanaged indices and, unlike the Fund, have no management fees or operating expenses to reduce their reported returns. The graphs are based on Investor Class shares and Class A shares only; performance for Class C and Class H shares will vary due to differences in fee structures. |
** | Effective September 30, 2015, the Fund’s Advisor Class shares were converted into Class H shares. |
† | Fund returns are calculated using the maximum sales charge of 4.75%. |
‡ | Fund returns include a CDSC of 1% if redeemed within 12 months of purchase. |
134 | THE RYDEX FUNDS ANNUAL REPORT | |
SCHEDULE OF INVESTMENTS | March 31, 2024 |
TELECOMMUNICATIONS FUND | |
| | Shares | | | Value | |
COMMON STOCKS† - 99.6% |
| | | | | | | | | |
Telecommunications - 72.3% |
Cisco Systems, Inc. | | | 7,527 | | | $ | 375,673 | |
Verizon Communications, Inc. | | | 8,595 | | | | 360,646 | |
AT&T, Inc. | | | 17,764 | | | | 312,646 | |
T-Mobile US, Inc. | | | 1,696 | | | | 276,821 | |
Motorola Solutions, Inc. | | | 483 | | | | 171,455 | |
Arista Networks, Inc.* | | | 585 | | | | 169,638 | |
Juniper Networks, Inc. | | | 2,821 | | | | 104,546 | |
Ciena Corp.* | | | 1,670 | | | | 82,582 | |
Nice Ltd. ADR*,1 | | | 305 | | | | 79,489 | |
Frontier Communications Parent, Inc.* | | | 3,014 | | | | 73,843 | |
Vodafone Group plc ADR | | | 7,316 | | | | 65,112 | |
BCE, Inc. | | | 1,909 | | | | 64,868 | |
Telefonaktiebolaget LM Ericsson ADR1 | | | 11,640 | | | | 64,136 | |
America Movil SAB de CV ADR | | | 3,337 | | | | 62,268 | |
TELUS Corp. | | | 3,669 | | | | 58,741 | |
Nokia Oyj ADR | | | 16,128 | | | | 57,093 | |
Rogers Communications, Inc. — Class B | | | 1,382 | | | | 56,662 | |
EchoStar Corp. — Class A* | | | 3,952 | | | | 56,318 | |
InterDigital, Inc. | | | 472 | | | | 50,249 | |
Iridium Communications, Inc. | | | 1,863 | | | | 48,736 | |
Viasat, Inc.* | | | 2,247 | | | | 40,648 | |
Telephone & Data Systems, Inc. | | | 2,497 | | | | 40,002 | |
Calix, Inc.* | | | 1,205 | | | | 39,958 | |
Viavi Solutions, Inc.* | | | 4,383 | | | | 39,842 | |
Infinera Corp.* | | | 6,475 | | | | 39,044 | |
Harmonic, Inc.* | | | 2,765 | | | | 37,162 | |
Extreme Networks, Inc.* | | | 3,104 | | | | 35,820 | |
Gogo, Inc.* | | | 2,473 | | | | 21,713 | |
ADTRAN Holdings, Inc. | | | 3,126 | | | | 17,006 | |
CommScope Holding Company, Inc.* | | | 3,473 | | | | 4,550 | |
Lumen Technologies, Inc.* | | | 2,195 | | | | 3,424 | |
Total Telecommunications | | | | | | | 2,910,691 | |
| | | | | | | | | |
Media - 17.7% |
Comcast Corp. — Class A | | | 8,448 | | | | 366,221 | |
Charter Communications, Inc. — Class A* | | | 545 | | | | 158,393 | |
Liberty Broadband Corp. — Class C* | | | 1,470 | | | | 84,128 | |
Liberty Global Ltd. — Class C* | | | 3,892 | | | | 68,655 | |
Liberty Latin America Ltd. — Class C* | | | 4,966 | | | | 34,712 | |
Total Media | | | | | | | 712,109 | |
| | | | | | | | | |
Internet - 6.0% |
F5, Inc.* | | | 529 | | | | 100,293 | |
Roku, Inc.* | | | 1,453 | | | | 94,692 | |
Cogent Communications Holdings, Inc. | | | 681 | | | | 44,490 | |
Total Internet | | | | | | | 239,475 | |
| | | | | | | | | |
Computers - 2.3% |
Lumentum Holdings, Inc.* | | | 1,139 | | | | 53,932 | |
NetScout Systems, Inc.* | | | 1,706 | | | | 37,259 | |
Total Computers | | | | | | | 91,191 | |
| | | | | | | | | |
Software - 0.8% |
Digi International, Inc.* | | | 970 | | | | 30,972 | |
| | | | | | | | | |
Electronics - 0.5% |
Applied Optoelectronics, Inc.* | | | 1,504 | | | | 20,845 | |
| | | | | | | | | |
Total Common Stocks | | | | |
(Cost $3,758,695) | | | | | | | 4,005,283 | |
| | | | | | | | | |
| | | Face
Amount | | | | | |
REPURCHASE AGREEMENTS††,2 - 0.5% |
J.P. Morgan Securities LLC
issued 03/28/24 at 5.31%
due 04/01/24 | | $ | 11,808 | | | | 11,808 | |
BofA Securities, Inc.
issued 03/28/24 at 5.31%
due 04/01/24 | | | 4,542 | | | | 4,542 | |
Barclays Capital, Inc.
issued 03/28/24 at 5.30%
due 04/01/24 | | | 4,116 | | | | 4,116 | |
Total Repurchase Agreements | | | | |
(Cost $20,466) | | | | | | | 20,466 | |
| | | | | | | | | |
| | | Shares | | | | | |
SECURITIES LENDING COLLATERAL†,3 - 2.7% |
Money Market Fund | | | | | | | | |
First American Government Obligations Fund - Class X, 5.23%4 | | | 109,698 | | | | 109,698 | |
Total Securities Lending Collateral | | | | |
(Cost $109,698) | | | | | | | 109,698 | |
| | | | | | | | | |
Total Investments - 102.8% | | | | |
(Cost $3,888,859) | | $ | 4,135,447 | |
Other Assets & Liabilities, net - (2.8)% | | | (110,748 | ) |
Total Net Assets - 100.0% | | $ | 4,024,699 | |
SEE NOTES TO FINANCIAL STATEMENTS. | THE RYDEX FUNDS ANNUAL REPORT | 135 |
SCHEDULE OF INVESTMENTS (concluded) | March 31, 2024 |
TELECOMMUNICATIONS FUND | |
* | Non-income producing security. |
† | Value determined based on Level 1 inputs — See Note 4. |
†† | Value determined based on Level 2 inputs — See Note 4. |
1 | All or a portion of this security is on loan at March 31, 2024 — See Note 7. |
2 | Repurchase Agreements — See Note 6. |
3 | Securities lending collateral — See Note 7. |
4 | Rate indicated is the 7-day yield as of March 31, 2024. |
| | ADR — American Depositary Receipt |
| | plc — Public Limited Company |
| | |
| | See Sector Classification in Other Information section. |
The following table summarizes the inputs used to value the Fund’s investments at March 31, 2024 (See Note 4 in the Notes to Financial Statements):
Investments in Securities (Assets) | | Level 1
Quoted
Prices | | | Level 2
Significant
Observable
Inputs | | | Level 3
Significant
Unobservable
Inputs | | | Total | |
Common Stocks | | $ | 4,005,283 | | | $ | — | | | $ | — | | | $ | 4,005,283 | |
Repurchase Agreements | | | — | | | | 20,466 | | | | — | | | | 20,466 | |
Securities Lending Collateral | | | 109,698 | | | | — | | | | — | | | | 109,698 | |
Total Assets | | $ | 4,114,981 | | | $ | 20,466 | | | $ | — | | | $ | 4,135,447 | |
136 | THE RYDEX FUNDS ANNUAL REPORT | SEE NOTES TO FINANCIAL STATEMENTS. |
STATEMENT OF ASSETS AND LIABILITIES |
March 31, 2024 |
Assets: |
Investments, at value - including $104,544 of securities loaned (cost $3,868,393) | | $ | 4,114,981 | |
Repurchase agreements, at value (cost $20,466) | | | 20,466 | |
Cash | | | 236 | |
Receivables: |
Fund shares sold | | | 81,632 | |
Dividends | | | 3,560 | |
Securities lending income | | | 76 | |
Interest | | | 12 | |
Total assets | | | 4,220,963 | |
| | | | | |
Liabilities: |
Payable for: |
Return of securities lending collateral | | | 109,698 | |
Securities purchased | | | 80,437 | |
Management fees | | | 2,703 | |
Transfer agent fees | | | 1,110 | |
Portfolio accounting and administration fees | | | 326 | |
Distribution and service fees | | | 64 | |
Fund shares redeemed | | | 56 | |
Trustees’ fees* | | | 23 | |
Miscellaneous | | | 1,847 | |
Total liabilities | | | 196,264 | |
Net assets | | $ | 4,024,699 | |
| | | | | |
Net assets consist of: |
Paid in capital | | $ | 6,796,390 | |
Total distributable earnings (loss) | | | (2,771,691 | ) |
Net assets | | $ | 4,024,699 | |
| | | | | |
Investor Class: |
Net assets | | $ | 3,799,302 | |
Capital shares outstanding | | | 87,017 | |
Net asset value per share | | $ | 43.66 | |
| | | | | |
Class A: |
Net assets | | $ | 105,416 | |
Capital shares outstanding | | | 2,689 | |
Net asset value per share | | $ | 39.20 | |
Maximum offering price per share (Net asset value divided by 95.25%) | | $ | 41.15 | |
| | | | | |
Class C: |
Net assets | | $ | 25,205 | |
Capital shares outstanding | | | 765 | |
Net asset value per share | | $ | 32.95 | |
| | | | | |
Class H: |
Net assets | | $ | 94,776 | |
Capital shares outstanding | | | 2,487 | |
Net asset value per share | | $ | 38.11 | |
STATEMENT OF OPERATIONS |
Year Ended March 31, 2024 |
Investment Income: |
Dividends (net of foreign withholding tax of $1,542) | | $ | 76,721 | |
Interest | | | 955 | |
Income from securities lending, net | | | 760 | |
Total investment income | | | 78,436 | |
| | | | | |
Expenses: |
Management fees | | | 26,523 | |
Distribution and service fees: |
Class A | | | 395 | |
Class C | | | 274 | |
Class H | | | 237 | |
Transfer agent fees | | | 6,852 | |
Portfolio accounting and administration fees | | | 4,756 | |
Professional fees | | | 3,400 | |
Trustees’ fees* | | | 922 | |
Custodian fees | | | 626 | |
Line of credit fees | | | 58 | |
Miscellaneous | | | 1,174 | |
Total expenses | | | 45,217 | |
Less: |
Expenses reimbursed by Adviser | | | (972 | ) |
Net expenses | | | 44,245 | |
Net investment income | | | 34,191 | |
| | | | | |
Net Realized and Unrealized Gain (Loss): |
Net realized gain (loss) on: |
Investments | | | (342,667 | ) |
Net realized loss | | | (342,667 | ) |
Net change in unrealized appreciation (depreciation) on: |
Investments | | | (142,776 | ) |
Net change in unrealized appreciation (depreciation) | | | (142,776 | ) |
Net realized and unrealized loss | | | (485,443 | ) |
Net decrease in net assets resulting from operations | | $ | (451,252 | ) |
* | Relates to Trustees not deemed “interested persons” within the meaning of Section 2(a)(19) of the 1940 Act. |
SEE NOTES TO FINANCIAL STATEMENTS. | THE RYDEX FUNDS ANNUAL REPORT | 137 |
STATEMENTS OF CHANGES IN NET ASSETS |
| | Year Ended
March 31,
2024 | | | Year Ended
March 31,
2023 | |
Increase (Decrease) in Net Assets from Operations: | | | | | | | | |
Net investment income | | $ | 34,191 | | | $ | 10,153 | |
Net realized loss on investments | | | (342,667 | ) | | | (199,183 | ) |
Net change in unrealized appreciation (depreciation) on investments | | | (142,776 | ) | | | 27,014 | |
Net decrease in net assets resulting from operations | | | (451,252 | ) | | | (162,016 | ) |
| | | | | | | | | |
Distributions to shareholders: | | | | | | | | |
Investor Class | | | (26,701 | ) | | | (24,300 | ) |
Class A | | | (2,067 | ) | | | (3,183 | ) |
Class C | | | (525 | ) | | | (507 | ) |
Class H | | | (1,690 | ) | | | (1,266 | ) |
Total distributions to shareholders | | | (30,983 | ) | | | (29,256 | ) |
| | | | | | | | | |
Capital share transactions: | | | | | | | | |
Proceeds from sale of shares | | | | | | | | |
Investor Class | | | 16,845,642 | | | | 21,655,460 | |
Class A | | | 356,728 | | | | 873,075 | |
Class C | | | 30,651 | | | | 148,695 | |
Class H | | | 2,683 | | | | 83,296 | |
Distributions reinvested | | | | | | | | |
Investor Class | | | 26,583 | | | | 24,198 | |
Class A | | | 2,067 | | | | 3,171 | |
Class C | | | 525 | | | | 507 | |
Class H | | | 1,690 | | | | 1,266 | |
Cost of shares redeemed | | | | | | | | |
Investor Class | | | (20,759,144 | ) | | | (14,437,253 | ) |
Class A | | | (501,197 | ) | | | (928,506 | ) |
Class C | | | (37,327 | ) | | | (213,612 | ) |
Class H | | | (17,010 | ) | | | (73,875 | ) |
Net increase (decrease) from capital share transactions | | | (4,048,109 | ) | | | 7,136,422 | |
Net increase (decrease) in net assets | | | (4,530,344 | ) | | | 6,945,150 | |
| | | | | | | | | |
Net assets: | | | | | | | | |
Beginning of year | | | 8,555,043 | | | | 1,609,893 | |
End of year | | $ | 4,024,699 | | | $ | 8,555,043 | |
| | | | | | | | | |
Capital share activity: | | | | | | | | |
Shares sold | | | | | | | | |
Investor Class | | | 384,658 | | | | 476,797 | |
Class A | | | 9,249 | | | | 21,062 | |
Class C | | | 936 | | | | 4,085 | |
Class H | | | 71 | | | | 2,034 | |
Shares issued from reinvestment of distributions | | | | | | | | |
Investor Class | | | 619 | | | | 579 | |
Class A | | | 54 | | | | 84 | |
Class C | | | 16 | | | | 16 | |
Class H | | | 45 | | | | 35 | |
Shares redeemed | | | | | | | | |
Investor Class | | | (480,325 | ) | | | (313,995 | ) |
Class A | | | (13,018 | ) | | | (22,353 | ) |
Class C | | | (1,155 | ) | | | (6,066 | ) |
Class H | | | (460 | ) | | | (1,868 | ) |
Net increase (decrease) in shares | | | (99,310 | ) | | | 160,410 | |
138 | THE RYDEX FUNDS ANNUAL REPORT | SEE NOTES TO FINANCIAL STATEMENTS. |
This table is presented to show selected data for a share outstanding throughout each period and to assist shareholders in evaluating a Fund’s performance for the periods presented.
Investor Class | | Year Ended
March 31,
2024 | | | Year Ended
March 31,
2023 | | | Year Ended
March 31,
2022 | | | Year Ended
March 31,
2021 | | | Year Ended
March 31,
2020 | |
Per Share Data |
Net asset value, beginning of period | | $ | 44.78 | | | $ | 53.37 | | | $ | 56.03 | | | $ | 43.19 | | | $ | 50.17 | |
Income (loss) from investment operations: |
Net investment income (loss)a | | | .49 | | | | .11 | | | | .58 | | | | .66 | | | | .69 | |
Net gain (loss) on investments (realized and unrealized) | | | (.92 | ) | | | (8.10 | ) | | | (3.00 | ) | | | 13.33 | | | | (5.91 | ) |
Total from investment operations | | | (.43 | ) | | | (7.99 | ) | | | (2.42 | ) | | | 13.99 | | | | (5.22 | ) |
Less distributions from: |
Net investment income | | | (.69 | ) | | | (.60 | ) | | | (.24 | ) | | | (1.15 | ) | | | (1.76 | ) |
Total distributions | | | (.69 | ) | | | (.60 | ) | | | (.24 | ) | | | (1.15 | ) | | | (1.76 | ) |
Net asset value, end of period | | $ | 43.66 | | | $ | 44.78 | | | $ | 53.37 | | | $ | 56.03 | | | $ | 43.19 | |
|
Total Return | | | (0.91 | %) | | | (14.87 | %) | | | (4.36 | %) | | | 32.55 | % | | | (10.74 | %) |
Ratios/Supplemental Data |
Net assets, end of period (in thousands) | | $ | 3,799 | | | $ | 8,152 | | | $ | 997 | | | $ | 1,773 | | | $ | 2,984 | |
Ratios to average net assets: |
Net investment income (loss) | | | 1.13 | % | | | 0.26 | % | | | 1.02 | % | | | 1.33 | % | | | 1.38 | % |
Total expenses | | | 1.42 | % | | | 1.40 | % | | | 1.36 | % | | | 1.46 | % | | | 1.48 | % |
Net expensesb | | | 1.39 | % | | | 1.40 | % | | | 1.36 | % | | | 1.46 | % | | | 1.48 | % |
Portfolio turnover rate | | | 466 | % | | | 471 | % | | | 551 | % | | | 344 | % | | | 561 | % |
Class A | | Year Ended
March 31,
2024 | | | Year Ended
March 31,
2023 | | | Year Ended
March 31,
2022 | | | Year Ended
March 31,
2021 | | | Year Ended
March 31,
2020 | |
Per Share Data |
Net asset value, beginning of period | | $ | 40.35 | | | $ | 48.30 | | | $ | 50.87 | | | $ | 39.40 | | | $ | 46.03 | |
Income (loss) from investment operations: |
Net investment income (loss)a | | | .32 | | | | .22 | | | | .37 | | | | .41 | | | | .31 | |
Net gain (loss) on investments (realized and unrealized) | | | (.78 | ) | | | (7.57 | ) | | | (2.70 | ) | | | 12.21 | | | | (5.18 | ) |
Total from investment operations | | | (.46 | ) | | | (7.35 | ) | | | (2.33 | ) | | | 12.62 | | | | (4.87 | ) |
Less distributions from: |
Net investment income | | | (.69 | ) | | | (.60 | ) | | | (.24 | ) | | | (1.15 | ) | | | (1.76 | ) |
Total distributions | | | (.69 | ) | | | (.60 | ) | | | (.24 | ) | | | (1.15 | ) | | | (1.76 | ) |
Net asset value, end of period | | $ | 39.20 | | | $ | 40.35 | | | $ | 48.30 | | | $ | 50.87 | | | $ | 39.40 | |
|
Total Returnc | | | (1.08 | %) | | | (15.12 | %) | | | (4.59 | %) | | | 32.20 | % | | | (10.95 | %) |
Ratios/Supplemental Data |
Net assets, end of period (in thousands) | | $ | 105 | | | $ | 258 | | | $ | 368 | | | $ | 467 | | | $ | 446 | |
Ratios to average net assets: |
Net investment income (loss) | | | 0.82 | % | | | 0.54 | % | | | 0.71 | % | | | 0.90 | % | | | 0.69 | % |
Total expenses | | | 1.69 | % | | | 1.65 | % | | | 1.61 | % | | | 1.70 | % | | | 1.73 | % |
Net expensesb | | | 1.66 | % | | | 1.65 | % | | | 1.61 | % | | | 1.70 | % | | | 1.73 | % |
Portfolio turnover rate | | | 466 | % | | | 471 | % | | | 551 | % | | | 344 | % | | | 561 | % |
SEE NOTES TO FINANCIAL STATEMENTS. | THE RYDEX FUNDS ANNUAL REPORT | 139 |
FINANCIAL HIGHLIGHTS (concluded) |
This table is presented to show selected data for a share outstanding throughout each period and to assist shareholders in evaluating a Fund’s performance for the periods presented.
Class C | | Year Ended
March 31,
2024 | | | Year Ended
March 31,
2023 | | | Year Ended
March 31,
2022 | | | Year Ended
March 31,
2021 | | | Year Ended
March 31,
2020 | |
Per Share Data |
Net asset value, beginning of period | | $ | 34.29 | | | $ | 41.46 | | | $ | 44.03 | | | $ | 34.47 | | | $ | 40.81 | |
Income (loss) from investment operations: |
Net investment income (loss)a | | | — | d | | | (.08 | ) | | | (.01 | ) | | | .01 | | | | .04 | |
Net gain (loss) on investments (realized and unrealized) | | | (.65 | ) | | | (6.49 | ) | | | (2.32 | ) | | | 10.70 | | | | (4.62 | ) |
Total from investment operations | | | (.65 | ) | | | (6.57 | ) | | | (2.33 | ) | | | 10.71 | | | | (4.58 | ) |
Less distributions from: |
Net investment income | | | (.69 | ) | | | (.60 | ) | | | (.24 | ) | | | (1.15 | ) | | | (1.76 | ) |
Total distributions | | | (.69 | ) | | | (.60 | ) | | | (.24 | ) | | | (1.15 | ) | | | (1.76 | ) |
Net asset value, end of period | | $ | 32.95 | | | $ | 34.29 | | | $ | 41.46 | | | $ | 44.03 | | | $ | 34.47 | |
|
Total Returnc | | | (1.84 | %) | | | (15.76 | %) | | | (5.30 | %) | | | 31.22 | % | | | (11.62 | %) |
Ratios/Supplemental Data |
Net assets, end of period (in thousands) | | $ | 25 | | | $ | 33 | | | $ | 122 | | | $ | 188 | | | $ | 116 | |
Ratios to average net assets: |
Net investment income (loss) | | | — | e | | | (0.22 | %) | | | (0.02 | %) | | | 0.03 | % | | | 0.10 | % |
Total expenses | | | 2.45 | % | | | 2.39 | % | | | 2.36 | % | | | 2.43 | % | | | 2.48 | % |
Net expensesb | | | 2.42 | % | | | 2.39 | % | | | 2.36 | % | | | 2.43 | % | | | 2.48 | % |
Portfolio turnover rate | | | 466 | % | | | 471 | % | | | 551 | % | | | 344 | % | | | 561 | % |
Class H | | Year Ended
March 31,
2024 | | | Year Ended
March 31,
2023 | | | Year Ended
March 31,
2022 | | | Year Ended
March 31,
2021 | | | Year Ended
March 31,
2020 | |
Per Share Data |
Net asset value, beginning of period | | $ | 39.24 | | | $ | 47.00 | | | $ | 49.50 | | | $ | 38.36 | | | $ | 44.88 | |
Income (loss) from investment operations: |
Net investment income (loss)a | | | .28 | | | | .22 | | | | .44 | | | | .28 | | | | .44 | |
Net gain (loss) on investments (realized and unrealized) | | | (.72 | ) | | | (7.38 | ) | | | (2.70 | ) | | | 12.01 | | | | (5.20 | ) |
Total from investment operations | | | (.44 | ) | | | (7.16 | ) | | | (2.26 | ) | | | 12.29 | | | | (4.76 | ) |
Less distributions from: |
Net investment income | | | (.69 | ) | | | (.60 | ) | | | (.24 | ) | | | (1.15 | ) | | | (1.76 | ) |
Total distributions | | | (.69 | ) | | | (.60 | ) | | | (.24 | ) | | | (1.15 | ) | | | (1.76 | ) |
Net asset value, end of period | | $ | 38.11 | | | $ | 39.24 | | | $ | 47.00 | | | $ | 49.50 | | | $ | 38.36 | |
|
Total Return | | | (1.12 | %) | | | (15.14 | %) | | | (4.60 | %) | | | 32.24 | % | | | (10.98 | %) |
Ratios/Supplemental Data |
Net assets, end of period (in thousands) | | $ | 95 | | | $ | 111 | | | $ | 124 | | | $ | 245 | | | $ | 104 | |
Ratios to average net assets: |
Net investment income (loss) | | | 0.73 | % | | | 0.55 | % | | | 0.86 | % | | | 0.61 | % | | | 0.99 | % |
Total expenses | | | 1.70 | % | | | 1.65 | % | | | 1.61 | % | | | 1.68 | % | | | 1.73 | % |
Net expensesb | | | 1.67 | % | | | 1.65 | % | | | 1.61 | % | | | 1.68 | % | | | 1.73 | % |
Portfolio turnover rate | | | 466 | % | | | 471 | % | | | 551 | % | | | 344 | % | | | 561 | % |
a | Net investment income (loss) per share was computed using average shares outstanding throughout the period. |
b | Net expense information reflects the expense ratios after expense waivers and reimbursements, as applicable. |
c | Total return does not reflect the impact of any applicable sales charges. |
d | Less than $0.01 per share. |
e | Less than 0.01% or (0.01%). |
140 | THE RYDEX FUNDS ANNUAL REPORT | SEE NOTES TO FINANCIAL STATEMENTS. |
PERFORMANCE REPORT AND FUND PROFILE (Unaudited) | March 31, 2024 |
TRANSPORTATION FUND
OBJECTIVE: Seeks to provide capital appreciation by investing in companies engaged in providing transportation services or companies engaged in the design, manufacture, distribution, or sale of transportation equipment (“Transportation Companies”).
For the Reporting Period, Transportation Fund Investor Class returned 9.49%, compared with the S&P 500 Index, which returned 29.88%. The S&P 500 Industrials Index returned 26.70%.
The industries that contributed the most to performance were passenger ground transportation, cargo ground transportation, and rail transportation. Those that detracted the most were automotive parts & equipment, air freight & logistics, and marine transportation.
The holdings that contributed the most to performance were Uber Technologies, Inc., XPO, Inc., and Union Pacific Corp. Those that detracted the most were NIO, Inc. ADR, United Parcel Service, Inc. – Class B, and ZIM Integrated Shipping Services Ltd.
Performance displayed represents past performance, which is no guarantee of future results.
Holdings Diversification (Market Exposure as % of Net Assets)
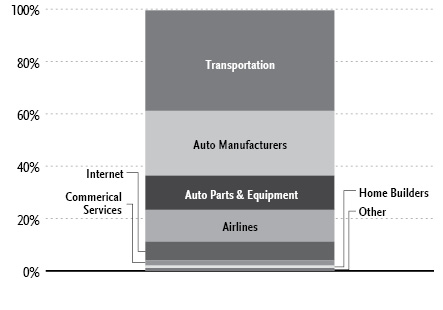
“Holdings Diversification (Market Exposure as % of Net Assets)” excludes any temporary cash investments.
Inception Dates: |
Investor Class | April 2, 1998 |
Class A | September 1, 2004 |
Class C | May 14, 2001 |
Class H | June 9, 1998 |
Ten Largest Holdings | % of Total Net Assets |
Tesla, Inc. | 8.5% |
Union Pacific Corp. | 4.7% |
Uber Technologies, Inc. | 4.7% |
United Parcel Service, Inc. — Class B | 4.0% |
FedEx Corp. | 3.5% |
CSX Corp. | 3.3% |
General Motors Co. | 3.1% |
Norfolk Southern Corp. | 3.0% |
Ford Motor Co. | 3.0% |
Old Dominion Freight Line, Inc. | 2.5% |
Top Ten Total | 40.3% |
| | |
“Ten Largest Holdings” excludes any temporary cash investments. |
| | THE RYDEX FUNDS ANNUAL REPORT | 141 |
PERFORMANCE REPORT AND FUND PROFILE (Unaudited)(concluded) | March 31, 2024 |
Cumulative Fund Performance*
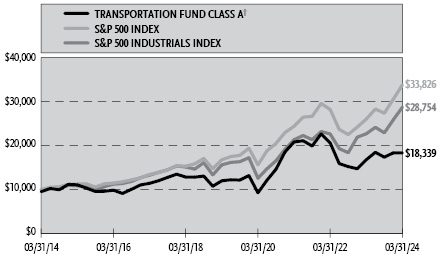
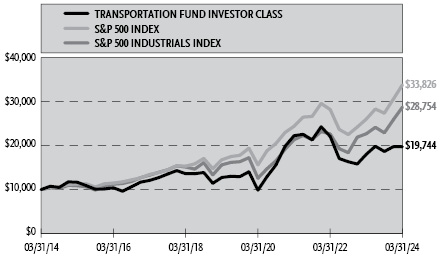
Average Annual Returns*
Periods Ended March 31, 2024
| 1 Year | 5 Year | 10 Year |
Investor Class Shares | 9.49% | 9.13% | 7.04% |
Class A Shares | 9.23% | 8.86% | 6.77% |
Class A Shares with sales charge† | 4.04% | 7.81% | 6.25% |
Class C Shares | 8.39% | 8.04% | 5.97% |
Class C Shares with CDSC‡ | 7.39% | 8.04% | 5.97% |
Class H Shares** | 9.24% | 8.87% | 6.74% |
S&P 500 Industrials Index | 26.70% | 12.97% | 11.14% |
S&P 500 Index | 29.88% | 15.05% | 12.96% |
* | The performance data above represents past performance that is not predictive of future results. The investment return and principal value of an investment in the Fund will fluctuate so that an investor’s shares, when redeemed, may be worth more or less than their original cost. Returns are historical and include changes in principal and reinvested dividends and capital gains and do not reflect the effect of taxes. The S&P 500 Index and the S&P 500 Industrials Index are unmanaged indices and, unlike the Fund, have no management fees or operating expenses to reduce their reported returns. The graphs are based on Investor Class shares and Class A shares only; performance for Class C and Class H shares will vary due to differences in fee structures. |
** | Effective September 30, 2015, the Fund’s Advisor Class shares were converted into Class H shares. |
† | Fund returns are calculated using the maximum sales charge of 4.75%. |
‡ | Fund returns include a CDSC of 1% if redeemed within 12 months of purchase. |
142 | THE RYDEX FUNDS ANNUAL REPORT | |
SCHEDULE OF INVESTMENTS | March 31, 2024 |
TRANSPORTATION FUND | |
| | Shares | | | Value | |
COMMON STOCKS† - 99.6% |
| | | | | | | | | |
Transportation - 38.5% |
Union Pacific Corp. | | | 2,269 | | | $ | 558,015 | |
United Parcel Service, Inc. — Class B | | | 3,197 | | | | 475,170 | |
FedEx Corp. | | | 1,413 | | | | 409,403 | |
CSX Corp. | | | 10,412 | | | | 385,973 | |
Norfolk Southern Corp. | | | 1,366 | | | | 348,152 | |
Old Dominion Freight Line, Inc. | | | 1,358 | | | | 297,823 | |
Expeditors International of Washington, Inc. | | | 1,574 | | | | 191,351 | |
J.B. Hunt Transport Services, Inc. | | | 925 | | | | 184,306 | |
Canadian National Railway Co. | | | 1,389 | | | | 182,945 | |
ZTO Express Cayman, Inc. ADR | | | 8,547 | | | | 178,974 | |
Canadian Pacific Kansas City Ltd. | | | 2,029 | | | | 178,897 | |
TFI International, Inc. | | | 1,117 | | | | 178,117 | |
XPO, Inc.* | | | 1,363 | | | | 166,327 | |
CH Robinson Worldwide, Inc. | | | 1,837 | | | | 139,869 | |
Saia, Inc.* | | | 233 | | | | 136,305 | |
Knight-Swift Transportation Holdings, Inc. | | | 2,411 | | | | 132,653 | |
Landstar System, Inc. | | | 631 | | | | 121,632 | |
Hub Group, Inc. — Class A | | | 1,745 | | | | 75,419 | |
ArcBest Corp. | | | 505 | | | | 71,963 | |
Werner Enterprises, Inc. | | | 1,803 | | | | 70,533 | |
Forward Air Corp. | | | 1,288 | | | | 40,070 | |
Total Transportation | | | | | | | 4,523,897 | |
| | | | | | | | | |
Auto Manufacturers - 24.7% |
Tesla, Inc.* | | | 5,705 | | | | 1,002,882 | |
General Motors Co. | | | 7,931 | | | | 359,671 | |
Ford Motor Co. | | | 26,192 | | | | 347,830 | |
Stellantis N.V. | | | 6,393 | | | | 180,922 | |
Ferrari N.V. | | | 408 | | | | 177,864 | |
Honda Motor Company Ltd. ADR | | | 4,754 | | | | 176,991 | |
Toyota Motor Corp. ADR1 | | | 682 | | | | 171,646 | |
Li Auto, Inc. ADR* | | | 5,082 | | | | 153,883 | |
NIO, Inc. ADR*,1 | | | 32,363 | | | | 145,633 | |
Rivian Automotive, Inc. — Class A* | | | 11,475 | | | | 125,651 | |
Lucid Group, Inc.*,1 | | | 22,840 | | | | 65,094 | |
Total Auto Manufacturers | | | | | | | 2,908,067 | |
| | | | | | | | | |
Auto Parts & Equipment - 13.1% |
Mobileye Global, Inc. — Class A*,1 | | | 6,280 | | | | 201,902 | |
Aptiv plc* | | | 2,291 | | | | 182,478 | |
Autoliv, Inc. | | | 1,435 | | | | 172,817 | |
Magna International, Inc. | | | 3,125 | | | | 170,250 | |
BorgWarner, Inc. | | | 3,835 | | | | 133,228 | |
Lear Corp. | | | 916 | | | | 132,710 | |
Gentex Corp. | | | 3,619 | | | | 130,718 | |
Goodyear Tire & Rubber Co.* | | | 6,895 | | | | 94,668 | |
Visteon Corp.* | | | 696 | | | | 81,857 | |
Adient plc* | | | 2,290 | | | | 75,387 | |
QuantumScape Corp.*,1 | | | 11,327 | | | | 71,247 | |
Fox Factory Holding Corp.* | | | 1,310 | | | | 68,212 | |
Luminar Technologies, Inc.*,1 | | | 13,225 | | | | 26,053 | |
Total Auto Parts & Equipment | | | | | | | 1,541,527 | |
| | | | | | | | | |
Airlines - 12.2% |
Delta Air Lines, Inc. | | | 5,583 | | | | 267,258 | |
United Airlines Holdings, Inc.* | | | 3,948 | | | | 189,030 | |
Ryanair Holdings plc ADR | | | 1,223 | | | | 178,057 | |
Southwest Airlines Co. | | | 6,016 | | | | 175,607 | |
Copa Holdings S.A. — Class A | | | 1,667 | | | | 173,635 | |
American Airlines Group, Inc.* | | | 9,556 | | | | 146,685 | |
Alaska Air Group, Inc.* | | | 2,677 | | | | 115,084 | |
SkyWest, Inc.* | | | 1,104 | | | | 76,264 | |
JetBlue Airways Corp.* | | | 9,733 | | | | 72,219 | |
Allegiant Travel Co. — Class A | | | 524 | | | | 39,410 | |
Total Airlines | | | | | | | 1,433,249 | |
| | | | | | | | | |
Internet - 7.1% |
Uber Technologies, Inc.* | | | 7,238 | | | | 557,254 | |
Grab Holdings Ltd. — Class A* | | | 49,636 | | | | 155,857 | |
Lyft, Inc. — Class A* | | | 6,302 | | | | 121,944 | |
Total Internet | | | | | | | 835,055 | |
| | | | | | | | | |
Commercial Services - 2.0% |
GXO Logistics, Inc.* | | | 2,233 | | | | 120,046 | |
Avis Budget Group, Inc. | | | 550 | | | | 67,353 | |
Hertz Global Holdings, Inc.*,1 | | | 5,788 | | | | 45,320 | |
Total Commercial Services | | | | | | | 232,719 | |
| | | | | | | | | |
Home Builders - 1.0% |
Thor Industries, Inc. | | | 1,001 | | | | 117,457 | |
| | | | | | | | | |
Leisure Time - 1.0% |
Harley-Davidson, Inc. | | | 2,596 | | | | 113,549 | |
| | | | | | | | | |
Total Common Stocks | | | | |
(Cost $6,653,175) | | | | | | | 11,705,520 | |
| | | | | | | | | |
| | | Face
Amount | | | | | |
REPURCHASE AGREEMENTS††,2 - 0.6% |
J.P. Morgan Securities LLC
issued 03/28/24 at 5.31%
due 04/01/24 | | $ | 42,423 | | | | 42,423 | |
BofA Securities, Inc.
issued 03/28/24 at 5.31%
due 04/01/24 | | | 16,317 | | | | 16,317 | |
Barclays Capital, Inc.
issued 03/28/24 at 5.30%
due 04/01/24 | | | 14,790 | | | | 14,790 | |
Total Repurchase Agreements | | | | |
(Cost $73,530) | | | | | | | 73,530 | |
SEE NOTES TO FINANCIAL STATEMENTS. | THE RYDEX FUNDS ANNUAL REPORT | 143 |
SCHEDULE OF INVESTMENTS (concluded) | March 31, 2024 |
TRANSPORTATION FUND | |
| | Shares | | | Value | |
SECURITIES LENDING COLLATERAL†,3 - 4.8% |
Money Market Fund | | | | | | | | |
First American Government Obligations Fund - Class X, 5.23%4 | | | 569,470 | | | $ | 569,470 | |
Total Securities Lending Collateral | | | | |
(Cost $569,470) | | | | | | | 569,470 | |
| | | | | | | | | |
Total Investments - 105.0% | | | | |
(Cost $7,296,175) | | $ | 12,348,520 | |
Other Assets & Liabilities, net - (5.0)% | | | (586,039 | ) |
Total Net Assets - 100.0% | | $ | 11,762,481 | |
* | Non-income producing security. |
† | Value determined based on Level 1 inputs — See Note 4. |
†† | Value determined based on Level 2 inputs — See Note 4. |
1 | All or a portion of this security is on loan at March 31, 2024 — See Note 7. |
2 | Repurchase Agreements — See Note 6. |
3 | Securities lending collateral — See Note 7. |
4 | Rate indicated is the 7-day yield as of March 31, 2024. |
| | ADR — American Depositary Receipt |
| | plc — Public Limited Company |
| | |
| | See Sector Classification in Other Information section. |
The following table summarizes the inputs used to value the Fund’s investments at March 31, 2024 (See Note 4 in the Notes to Financial Statements):
Investments in Securities (Assets) | | Level 1
Quoted
Prices | | | Level 2
Significant
Observable
Inputs | | | Level 3
Significant
Unobservable
Inputs | | | Total | |
Common Stocks | | $ | 11,705,520 | | | $ | — | | | $ | — | | | $ | 11,705,520 | |
Repurchase Agreements | | | — | | | | 73,530 | | | | — | | | | 73,530 | |
Securities Lending Collateral | | | 569,470 | | | | — | | | | — | | | | 569,470 | |
Total Assets | | $ | 12,274,990 | | | $ | 73,530 | | | $ | — | | | $ | 12,348,520 | |
144 | THE RYDEX FUNDS ANNUAL REPORT | SEE NOTES TO FINANCIAL STATEMENTS. |
STATEMENT OF ASSETS AND LIABILITIES |
March 31, 2024 |
Assets: |
Investments, at value - including $521,321 of securities loaned (cost $7,222,645) | | $ | 12,274,990 | |
Repurchase agreements, at value (cost $73,530) | | | 73,530 | |
Cash | | | 3,800 | |
Receivables: |
Fund shares sold | | | 98,590 | |
Dividends | | | 3,320 | |
Securities lending income | | | 772 | |
Foreign tax reclaims | | | 117 | |
Interest | | | 44 | |
Total assets | | | 12,455,163 | |
| | | | | |
Liabilities: |
Payable for: |
Return of securities lending collateral | | | 569,470 | |
Securities purchased | | | 88,020 | |
Management fees | | | 8,431 | |
Fund shares redeemed | | | 8,279 | |
Transfer agent fees | | | 5,391 | |
Distribution and service fees | | | 1,444 | |
Portfolio accounting and administration fees | | | 1,017 | |
Trustees’ fees* | | | 135 | |
Miscellaneous | | | 10,495 | |
Total liabilities | | | 692,682 | |
Net assets | | $ | 11,762,481 | |
| | | | | |
Net assets consist of: |
Paid in capital | | $ | 9,075,135 | |
Total distributable earnings (loss) | | | 2,687,346 | |
Net assets | | $ | 11,762,481 | |
| | | | | |
Investor Class: |
Net assets | | $ | 6,399,816 | |
Capital shares outstanding | | | 105,163 | |
Net asset value per share | | $ | 60.86 | |
| | | | | |
Class A: |
Net assets | | $ | 4,506,445 | |
Capital shares outstanding | | | 84,857 | |
Net asset value per share | | $ | 53.11 | |
Maximum offering price per share (Net asset value divided by 95.25%) | | $ | 55.76 | |
| | | | | |
Class C: |
Net assets | | $ | 481,362 | |
Capital shares outstanding | | | 10,870 | |
Net asset value per share | | $ | 44.28 | |
| | | | | |
Class H: |
Net assets | | $ | 374,858 | |
Capital shares outstanding | | | 7,362 | |
Net asset value per share | | $ | 50.92 | |
STATEMENT OF OPERATIONS |
Year Ended March 31, 2024 |
Investment Income: |
Dividends (net of foreign withholding tax of $19,243) | | $ | 239,876 | |
Interest | | | 4,330 | |
Income from securities lending, net | | | 28,657 | |
Total investment income | | | 272,863 | |
| | | | | |
Expenses: |
Management fees | | | 128,758 | |
Distribution and service fees: |
Class A | | | 11,587 | |
Class C | | | 6,432 | |
Class H | | | 1,246 | |
Transfer agent fees | | | 32,893 | |
Portfolio accounting and administration fees | | | 23,090 | |
Registration fees | | | 14,169 | |
Professional fees | | | 6,159 | |
Trustees’ fees* | | | 2,508 | |
Custodian fees | | | 2,254 | |
Line of credit fees | | | 178 | |
Miscellaneous | | | 7,084 | |
Total expenses | | | 236,358 | |
Less: |
Expenses reimbursed by Adviser | | | (4,913 | ) |
Net expenses | | | 231,445 | |
Net investment income | | | 41,418 | |
| | | | | |
Net Realized and Unrealized Gain (Loss): |
Net realized gain (loss) on: |
Investments | | | (287,164 | ) |
Net realized loss | | | (287,164 | ) |
Net change in unrealized appreciation (depreciation) on: |
Investments | | | 586,127 | |
Net change in unrealized appreciation (depreciation) | | | 586,127 | |
Net realized and unrealized gain | | | 298,963 | |
Net increase in net assets resulting from operations | | $ | 340,381 | |
* | Relates to Trustees not deemed “interested persons” within the meaning of Section 2(a)(19) of the 1940 Act. |
SEE NOTES TO FINANCIAL STATEMENTS. | THE RYDEX FUNDS ANNUAL REPORT | 145 |
STATEMENTS OF CHANGES IN NET ASSETS |
| | Year Ended
March 31,
2024 | | | Year Ended
March 31,
2023 | |
Increase (Decrease) in Net Assets from Operations: | | | | | | | | |
Net investment income | | $ | 41,418 | | | $ | 22,238 | |
Net realized loss on investments | | | (287,164 | ) | | | (300,533 | ) |
Net change in unrealized appreciation (depreciation) on investments | | | 586,127 | | | | (4,527,618 | ) |
Net increase (decrease) in net assets resulting from operations | | | 340,381 | | | | (4,805,913 | ) |
| | | | | | | | | |
Distributions to shareholders: | | | | | | | | |
Investor Class | | | (12,384 | ) | | | (517,452 | ) |
Class A | | | (8,129 | ) | | | (443,398 | ) |
Class C | | | (1,000 | ) | | | (112,729 | ) |
Class H | | | (725 | ) | | | (39,319 | ) |
Total distributions to shareholders | | | (22,238 | ) | | | (1,112,898 | ) |
| | | | | | | | | |
Capital share transactions: | | | | | | | | |
Proceeds from sale of shares | | | | | | | | |
Investor Class | | | 31,587,618 | | | | 28,038,241 | |
Class A | | | 1,457,449 | | | | 1,227,683 | |
Class C | | | 194,980 | | | | 247,689 | |
Class H | | | 1,200,445 | | | | 405,790 | |
Distributions reinvested | | | | | | | | |
Investor Class | | | 12,097 | | | | 502,738 | |
Class A | | | 8,065 | | | | 436,099 | |
Class C | | | 930 | | | | 108,412 | |
Class H | | | 703 | | | | 38,188 | |
Cost of shares redeemed | | | | | | | | |
Investor Class | | | (32,364,144 | ) | | | (28,399,593 | ) |
Class A | | | (2,285,805 | ) | | | (2,118,995 | ) |
Class C | | | (748,914 | ) | | | (727,210 | ) |
Class H | | | (1,373,938 | ) | | | (394,815 | ) |
Net decrease from capital share transactions | | | (2,310,514 | ) | | | (635,773 | ) |
Net decrease in net assets | | | (1,992,371 | ) | | | (6,554,584 | ) |
| | | | | | | | | |
Net assets: | | | | | | | | |
Beginning of year | | | 13,754,852 | | | | 20,309,436 | |
End of year | | $ | 11,762,481 | | | $ | 13,754,852 | |
| | | | | | | | | |
Capital share activity: | | | | | | | | |
Shares sold | | | | | | | | |
Investor Class | | | 547,710 | | | | 424,628 | |
Class A | | | 28,562 | | | | 23,206 | |
Class C | | | 4,639 | | | | 5,048 | |
Class H | | | 27,017 | | | | 8,916 | |
Shares issued from reinvestment of distributions | | | | | | | | |
Investor Class | | | 208 | | | | 10,136 | |
Class A | | | 159 | | | | 10,041 | |
Class C | | | 22 | | | | 2,964 | |
Class H | | | 14 | | | | 917 | |
Shares redeemed | | | | | | | | |
Investor Class | | | (575,081 | ) | | | (447,193 | ) |
Class A | | | (45,165 | ) | | | (39,330 | ) |
Class C | | | (16,906 | ) | | | (15,882 | ) |
Class H | | | (30,498 | ) | | | (8,403 | ) |
Net decrease in shares | | | (59,319 | ) | | | (24,952 | ) |
146 | THE RYDEX FUNDS ANNUAL REPORT | SEE NOTES TO FINANCIAL STATEMENTS. |
This table is presented to show selected data for a share outstanding throughout each period and to assist shareholders in evaluating a Fund’s performance for the periods presented.
Investor Class | | Year Ended
March 31,
2024 | | | Year Ended
March 31,
2023 | | | Year Ended
March 31,
2022 | | | Year Ended
March 31,
2021 | | | Year Ended
March 31,
2020 | |
Per Share Data |
Net asset value, beginning of period | | $ | 55.68 | | | $ | 74.70 | | | $ | 84.28 | | | $ | 37.39 | | | $ | 50.08 | |
Income (loss) from investment operations: |
Net investment income (loss)a | | | .21 | | | | .19 | | | | .04 | | | | (.20 | ) | | | .30 | |
Net gain (loss) on investments (realized and unrealized) | | | 5.06 | | | | (14.50 | ) | | | .07 | | | | 47.09 | | | | (11.07 | ) |
Total from investment operations | | | 5.27 | | | | (14.31 | ) | | | .11 | | | | 46.89 | | | | (10.77 | ) |
Less distributions from: |
Net investment income | | | (.09 | ) | | | — | | | | — | | | | — | | | | (.15 | ) |
Net realized gains | | | — | | | | (4.71 | ) | | | (9.69 | ) | | | — | | | | (1.77 | ) |
Total distributions | | | (.09 | ) | | | (4.71 | ) | | | (9.69 | ) | | | — | | | | (1.92 | ) |
Net asset value, end of period | | $ | 60.86 | | | $ | 55.68 | | | $ | 74.70 | | | $ | 84.28 | | | $ | 37.39 | |
|
Total Return | | | 9.49 | % | | | (18.40 | %) | | | (0.71 | %) | | | 125.41 | % | | | (22.59 | %) |
Ratios/Supplemental Data |
Net assets, end of period (in thousands) | | $ | 6,400 | | | $ | 7,367 | | | $ | 10,814 | | | $ | 65,281 | | | $ | 3,283 | |
Ratios to average net assets: |
Net investment income (loss) | | | 0.36 | % | | | 0.32 | % | | | 0.05 | % | | | (0.29 | %) | | | 0.58 | % |
Total expenses | | | 1.43 | % | | | 1.39 | % | | | 1.35 | % | | | 1.41 | % | | | 1.48 | % |
Net expensesb | | | 1.40 | % | | | 1.39 | % | | | 1.35 | % | | | 1.41 | % | | | 1.48 | % |
Portfolio turnover rate | | | 207 | % | | | 185 | % | | | 162 | % | | | 205 | % | | | 483 | % |
Class A | | Year Ended
March 31,
2024 | | | Year Ended
March 31,
2023 | | | Year Ended
March 31,
2022 | | | Year Ended
March 31,
2021 | | | Year Ended
March 31,
2020 | |
Per Share Data |
Net asset value, beginning of period | | $ | 48.72 | | | $ | 66.33 | | | $ | 76.03 | | | $ | 33.82 | | | $ | 45.58 | |
Income (loss) from investment operations: |
Net investment income (loss)a | | | .10 | | | | .03 | | | | (.04 | ) | | | (.34 | ) | | | .17 | |
Net gain (loss) on investments (realized and unrealized) | | | 4.38 | | | | (12.93 | ) | | | .03 | | | | 42.55 | | | | (10.01 | ) |
Total from investment operations | | | 4.48 | | | | (12.90 | ) | | | (.01 | ) | | | 42.21 | | | | (9.84 | ) |
Less distributions from: |
Net investment income | | | (.09 | ) | | | — | | | | — | | | | — | | | | (.15 | ) |
Net realized gains | | | — | | | | (4.71 | ) | | | (9.69 | ) | | | — | | | | (1.77 | ) |
Total distributions | | | (.09 | ) | | | (4.71 | ) | | | (9.69 | ) | | | — | | | | (1.92 | ) |
Net asset value, end of period | | $ | 53.11 | | | $ | 48.72 | | | $ | 66.33 | | | $ | 76.03 | | | $ | 33.82 | |
|
Total Returnc | | | 9.23 | % | | | (18.60 | %) | | | (0.95 | %) | | | 124.81 | % | | | (22.78 | %) |
Ratios/Supplemental Data |
Net assets, end of period (in thousands) | | $ | 4,506 | | | $ | 4,935 | | | $ | 7,123 | | | $ | 7,785 | | | $ | 1,757 | |
Ratios to average net assets: |
Net investment income (loss) | | | 0.20 | % | | | 0.07 | % | | | (0.05 | %) | | | (0.59 | %) | | | 0.37 | % |
Total expenses | | | 1.68 | % | | | 1.64 | % | | | 1.61 | % | | | 1.68 | % | | | 1.73 | % |
Net expensesb | | | 1.65 | % | | | 1.64 | % | | | 1.61 | % | | | 1.68 | % | | | 1.73 | % |
Portfolio turnover rate | | | 207 | % | | | 185 | % | | | 162 | % | | | 205 | % | | | 483 | % |
SEE NOTES TO FINANCIAL STATEMENTS. | THE RYDEX FUNDS ANNUAL REPORT | 147 |
FINANCIAL HIGHLIGHTS (concluded) |
This table is presented to show selected data for a share outstanding throughout each period and to assist shareholders in evaluating a Fund’s performance for the periods presented.
Class C | | Year Ended
March 31,
2024 | | | Year Ended
March 31,
2023 | | | Year Ended
March 31,
2022 | | | Year Ended
March 31,
2021 | | | Year Ended
March 31,
2020 | |
Per Share Data |
Net asset value, beginning of period | | $ | 40.94 | | | $ | 57.20 | | | $ | 67.28 | | | $ | 30.15 | | | $ | 41.14 | |
Income (loss) from investment operations: |
Net investment income (loss)a | | | (.17 | ) | | | (.32 | ) | | | (.52 | ) | | | (.67 | ) | | | (.18 | ) |
Net gain (loss) on investments (realized and unrealized) | | | 3.60 | | | | (11.23 | ) | | | .13 | | | | 37.80 | | | | (8.89 | ) |
Total from investment operations | | | 3.43 | | | | (11.55 | ) | | | (.39 | ) | | | 37.13 | | | | (9.07 | ) |
Less distributions from: |
Net investment income | | | (.09 | ) | | | — | | | | — | | | | — | | | | (.15 | ) |
Net realized gains | | | — | | | | (4.71 | ) | | | (9.69 | ) | | | — | | | | (1.77 | ) |
Total distributions | | | (.09 | ) | | | (4.71 | ) | | | (9.69 | ) | | | — | | | | (1.92 | ) |
Net asset value, end of period | | $ | 44.28 | | | $ | 40.94 | | | $ | 57.20 | | | $ | 67.28 | | | $ | 30.15 | |
|
Total Returnc | | | 8.39 | % | | | (19.21 | %) | | | (1.68 | %) | | | 123.15 | % | | | (23.37 | %) |
Ratios/Supplemental Data |
Net assets, end of period (in thousands) | | $ | 481 | | | $ | 946 | | | $ | 1,772 | | | $ | 1,954 | | | $ | 632 | |
Ratios to average net assets: |
Net investment income (loss) | | | (0.40 | %) | | | (0.70 | %) | | | (0.80 | %) | | | (1.33 | %) | | | (0.43 | %) |
Total expenses | | | 2.43 | % | | | 2.39 | % | | | 2.36 | % | | | 2.43 | % | | | 2.48 | % |
Net expensesb | | | 2.40 | % | | | 2.39 | % | | | 2.36 | % | | | 2.43 | % | | | 2.48 | % |
Portfolio turnover rate | | | 207 | % | | | 185 | % | | | 162 | % | | | 205 | % | | | 483 | % |
Class H | | Year Ended
March 31,
2024 | | | Year Ended
March 31,
2023 | | | Year Ended
March 31,
2022 | | | Year Ended
March 31,
2021 | | | Year Ended
March 31,
2020 | |
Per Share Data |
Net asset value, beginning of period | | $ | 46.71 | | | $ | 63.86 | | | $ | 73.53 | | | $ | 32.70 | | | $ | 44.14 | |
Income (loss) from investment operations: |
Net investment income (loss)a | | | .08 | | | | .03 | | | | (.25 | ) | | | (.32 | ) | | | (.02 | ) |
Net gain (loss) on investments (realized and unrealized) | | | 4.22 | | | | (12.47 | ) | | | .27 | | | | 41.15 | | | | (9.50 | ) |
Total from investment operations | | | 4.30 | | | | (12.44 | ) | | | .02 | | | | 40.83 | | | | (9.52 | ) |
Less distributions from: |
Net investment income | | | (.09 | ) | | | — | | | | — | | | | — | | | | (.15 | ) |
Net realized gains | | | — | | | | (4.71 | ) | | | (9.69 | ) | | | — | | | | (1.77 | ) |
Total distributions | | | (.09 | ) | | | (4.71 | ) | | | (9.69 | ) | | | — | | | | (1.92 | ) |
Net asset value, end of period | | $ | 50.92 | | | $ | 46.71 | | | $ | 63.86 | | | $ | 73.53 | | | $ | 32.70 | |
|
Total Return | | | 9.24 | % | | | (18.60 | %) | | | (0.94 | %) | | | 124.86 | % | | | (22.78 | %) |
Ratios/Supplemental Data |
Net assets, end of period (in thousands) | | $ | 375 | | | $ | 506 | | | $ | 600 | | | $ | 1,169 | | | $ | 325 | |
Ratios to average net assets: |
Net investment income (loss) | | | 0.17 | % | | | 0.07 | % | | | (0.35 | %) | | | (0.56 | %) | | | (0.03 | %) |
Total expenses | | | 1.68 | % | | | 1.64 | % | | | 1.61 | % | | | 1.68 | % | | | 1.72 | % |
Net expensesb | | | 1.65 | % | | | 1.64 | % | | | 1.61 | % | | | 1.68 | % | | | 1.72 | % |
Portfolio turnover rate | | | 207 | % | | | 185 | % | | | 162 | % | | | 205 | % | | | 483 | % |
a | Net investment income (loss) per share was computed using average shares outstanding throughout the period. |
b | Net expense information reflects the expense ratios after expense waivers and reimbursements, as applicable. |
c | Total return does not reflect the impact of any applicable sales charges. |
148 | THE RYDEX FUNDS ANNUAL REPORT | SEE NOTES TO FINANCIAL STATEMENTS. |
PERFORMANCE REPORT AND FUND PROFILE (Unaudited) | March 31, 2024 |
UTILITIES FUND
OBJECTIVE: Seeks to provide capital appreciation by investing in companies that operate public utilities (“Utilities Companies”).
For the Reporting Period, Utilities Fund Investor Class returned -0.14%, compared with the S&P 500 Index, which returned 29.88%. The S&P 500 Utilities Index returned 0.42%.
The industries that contributed the most to performance were electric utilities and independent power producers. Those that detracted the most were renewable electricity, multi-utilities, and water utilities.
The holdings that contributed the most to performance were Constellation Energy Corp., Vistra Corp., and NRG Energy, Inc. Those that detracted the most were NextEra Energy, Inc., NextEra Energy Partners LP, and Eversource Energy.
Performance displayed represents past performance, which is no guarantee of future results.
Holdings Diversification (Market Exposure as % of Net Assets)
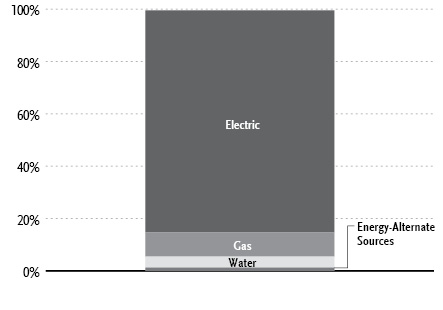
“Holdings Diversification (Market Exposure as % of Net Assets)” excludes any temporary cash investments.
Inception Dates: |
Investor Class | April 3, 2000 |
Class A | September 1, 2004 |
Class C | April 27, 2001 |
Class H | April 3, 2000 |
Ten Largest Holdings | % of Total Net Assets |
NextEra Energy, Inc. | 5.8% |
Southern Co. | 4.3% |
Duke Energy Corp. | 4.2% |
Constellation Energy Corp. | 3.8% |
Sempra | 3.3% |
American Electric Power Company, Inc. | 3.2% |
Dominion Energy, Inc. | 3.0% |
Exelon Corp. | 3.0% |
PG&E Corp. | 2.9% |
Public Service Enterprise Group, Inc. | 2.8% |
Top Ten Total | 36.3% |
| | |
“Ten Largest Holdings” excludes any temporary cash investments. |
| | THE RYDEX FUNDS ANNUAL REPORT | 149 |
PERFORMANCE REPORT AND FUND PROFILE (Unaudited)(concluded) | March 31, 2024 |
Cumulative Fund Performance*
Average Annual Returns*
Periods Ended March 31, 2024
| 1 Year | 5 Year | 10 Year |
Investor Class Shares | (0.14%) | 3.22% | 6.29% |
Class A Shares | (0.40%) | 2.96% | 6.02% |
Class A Shares with sales charge† | (5.13%) | 1.97% | 5.51% |
Class C Shares | (1.13%) | 2.19% | 5.23% |
Class C Shares with CDSC‡ | (2.07%) | 2.19% | 5.23% |
Class H Shares** | (0.39%) | 2.96% | 5.99% |
S&P 500 Utilities Index | 0.42% | 5.87% | 8.35% |
S&P 500 Index | 29.88% | 15.05% | 12.96% |
* | The performance data above represents past performance that is not predictive of future results. The investment return and principal value of an investment in the Fund will fluctuate so that an investor’s shares, when redeemed, may be worth more or less than their original cost. Returns are historical and include changes in principal and reinvested dividends and capital gains and do not reflect the effect of taxes. The S&P 500 Index and S&P 500 Utilities Index are unmanaged indices and, unlike the Fund, have no management fees or operating expenses to reduce their reported returns. The graphs are based on Investor Class shares and Class A shares only; performance for Class C and Class H shares will vary due to differences in fee structures. |
** | Effective September 30, 2015, the Fund’s Advisor Class shares were converted into Class H shares |
† | Fund returns are calculated using the maximum sales charge of 4.75%. |
‡ | Fund returns include a CDSC of 1% if redeemed within 12 months of purchase. |
150 | THE RYDEX FUNDS ANNUAL REPORT | |
SCHEDULE OF INVESTMENTS | March 31, 2024 |
UTILITIES FUND | |
| | Shares | | | Value | |
COMMON STOCKS† - 99.6% |
| | | | | | | | | |
ELECTRIC- 84.9% |
NextEra Energy, Inc. | | | 13,170 | | | $ | 841,695 | |
Southern Co. | | | 8,716 | | | | 625,286 | |
Duke Energy Corp. | | | 6,294 | | | | 608,693 | |
Constellation Energy Corp. | | | 2,955 | | | | 546,232 | |
Sempra | | | 6,627 | | | | 476,017 | |
American Electric Power Company, Inc. | | | 5,444 | | | | 468,728 | |
Dominion Energy, Inc. | | | 9,005 | | | | 442,956 | |
Exelon Corp. | | | 11,460 | | | | 430,552 | |
PG&E Corp. | | | 24,782 | | | | 415,346 | |
Public Service Enterprise Group, Inc. | | | 6,124 | | | | 408,961 | |
Xcel Energy, Inc. | | | 7,373 | | | | 396,299 | |
Consolidated Edison, Inc. | | | 4,323 | | | | 392,572 | |
Edison International | | | 5,198 | | | | 367,654 | |
Vistra Corp. | | | 5,232 | | | | 364,409 | |
WEC Energy Group, Inc. | | | 4,338 | | | | 356,237 | |
Entergy Corp. | | | 3,172 | | | | 335,217 | |
FirstEnergy Corp. | | | 8,371 | | | | 323,288 | |
PPL Corp. | | | 11,551 | | | | 317,999 | |
Eversource Energy | | | 5,294 | | | | 316,422 | |
DTE Energy Co. | | | 2,804 | | | | 314,440 | |
Ameren Corp. | | | 4,192 | | | | 310,040 | |
CenterPoint Energy, Inc. | | | 10,408 | | | | 296,524 | |
CMS Energy Corp. | | | 4,871 | | | | 293,916 | |
NRG Energy, Inc. | | | 4,085 | | | | 276,514 | |
AES Corp. | | | 14,361 | | | | 257,493 | |
Alliant Energy Corp. | | | 4,994 | | | | 251,698 | |
Evergy, Inc. | | | 4,626 | | | | 246,936 | |
Pinnacle West Capital Corp. | | | 2,881 | | | | 215,297 | |
Fortis, Inc. | | | 5,377 | | | | 212,445 | |
OGE Energy Corp. | | | 5,342 | | | | 183,231 | |
Clearway Energy, Inc. — Class C | | | 6,522 | | | | 150,332 | |
Portland General Electric Co. | | | 3,409 | | | | 143,178 | |
Black Hills Corp. | | | 2,360 | | | | 128,856 | |
Northwestern Energy Group, Inc. | | | 2,426 | | | | 123,556 | |
Avista Corp. | | | 3,317 | | | | 116,161 | |
Avangrid, Inc. | | | 2,930 | | | | 106,769 | |
Ormat Technologies, Inc. | | | 1,540 | | | | 101,933 | |
Otter Tail Corp. | | | 947 | | | | 81,821 | |
Hawaiian Electric Industries, Inc. | | | 6,733 | | | | 75,881 | |
Total Electric | | | | | | | 12,321,584 | |
| | | | | | | | | |
Gas - 9.3% |
Atmos Energy Corp. | | | 2,514 | | | | 298,839 | |
NiSource, Inc. | | | 8,983 | | | | 248,470 | |
Brookfield Infrastructure Corp. — Class A | | | 5,948 | | | | 214,366 | |
UGI Corp. | | | 6,346 | | | | 155,731 | |
Southwest Gas Holdings, Inc. | | | 1,964 | | | | 149,519 | |
New Jersey Resources Corp. | | | 3,316 | | | | 142,290 | |
ONE Gas, Inc. | | | 2,074 | | | | 133,835 | |
Total Gas | | | | | | | 1,343,050 | |
| | | | | | | | | |
WATER- 4.2% |
American Water Works Company, Inc. | | | 2,841 | | | | 347,199 | |
Essential Utilities, Inc. | | | 6,992 | | | | 259,053 | |
Total Water | | | | | | | 606,252 | |
| | | | | | | | | |
ENERGY-ALTERNATE SOURCES - 1.2% |
NextEra Energy Partners, LP | | | 4,010 | | | | 120,621 | |
Sunnova Energy International, Inc.*,1 | | | 8,502 | | | | 52,117 | |
Total Energy-Alternate Sources | | | | | | | 172,738 | |
| | | | | | | | | |
Total Common Stocks | | | | |
(Cost $10,945,427) | | | | | | | 14,443,624 | |
| | | | | | | | | |
| | | Face
Amount | | | | | |
REPURCHASE AGREEMENTS††,2 - 0.4% |
J.P. Morgan Securities LLC
issued 03/28/24 at 5.31%
due 04/01/24 | | $ | 35,384 | | | | 35,384 | |
BofA Securities, Inc.
issued 03/28/24 at 5.31%
due 04/01/24 | | | 13,609 | | | | 13,609 | |
Barclays Capital, Inc.
issued 03/28/24 at 5.30%
due 04/01/24 | | | 12,335 | | | | 12,335 | |
Total Repurchase Agreements | | | | |
(Cost $61,328) | | | | | | | 61,328 | |
| | | | | | | | | |
| | | Shares | | | | | |
SECURITIES LENDING COLLATERAL†,3 - 0.3% |
Money Market Fund | | | | | | | | |
First American Government Obligations Fund - Class X, 5.23%4 | | | 49,270 | | | | 49,270 | |
Total Securities Lending Collateral | | | | |
(Cost $49,270) | | | | | | | 49,270 | |
| | | | | | | | | |
Total Investments - 100.3% | | | | |
(Cost $11,056,025) | | $ | 14,554,222 | |
Other Assets & Liabilities, net - (0.3)% | | | (40,123 | ) |
Total Net Assets - 100.0% | | $ | 14,514,099 | |
SEE NOTES TO FINANCIAL STATEMENTS. | THE RYDEX FUNDS ANNUAL REPORT | 151 |
SCHEDULE OF INVESTMENTS (concluded) | March 31, 2024 |
UTILITIES FUND | |
* | Non-income producing security. |
† | Value determined based on Level 1 inputs — See Note 4. |
†† | Value determined based on Level 2 inputs — See Note 4. |
1 | All or a portion of this security is on loan at March 31, 2024 — See Note 7. |
2 | Repurchase Agreements — See Note 6. |
3 | Securities lending collateral — See Note 7. |
4 | Rate indicated is the 7-day yield as of March 31, 2024. |
| | |
| | See Sector Classification in Other Information section. |
The following table summarizes the inputs used to value the Fund’s investments at March 31, 2024 (See Note 4 in the Notes to Financial Statements):
Investments in Securities (Assets) | | Level 1
Quoted
Prices | | | Level 2
Significant
Observable
Inputs | | | Level 3
Significant
Unobservable
Inputs | | | Total | |
Common Stocks | | $ | 14,443,624 | | | $ | — | | | $ | — | | | $ | 14,443,624 | |
Repurchase Agreements | | | — | | | | 61,328 | | | | — | | | | 61,328 | |
Securities Lending Collateral | | | 49,270 | | | | — | | | | — | | | | 49,270 | |
Total Assets | | $ | 14,492,894 | | | $ | 61,328 | | | $ | — | | | $ | 14,554,222 | |
152 | THE RYDEX FUNDS ANNUAL REPORT | SEE NOTES TO FINANCIAL STATEMENTS. |
STATEMENT OF ASSETS AND LIABILITIES |
March 31, 2024 |
Assets: |
Investments, at value - including $46,962 of securities loaned (cost $10,994,697) | | $ | 14,492,894 | |
Repurchase agreements, at value (cost $61,328) | | | 61,328 | |
Cash | | | 18,825 | |
Receivables: |
Securities sold | | | 3,117,641 | |
Fund shares sold | | | 136,036 | |
Dividends | | | 30,347 | |
Interest | | | 36 | |
Securities lending income | | | 6 | |
Total assets | | | 17,857,113 | |
| | | | | |
Liabilities: |
Payable for: |
Fund shares redeemed | | | 3,259,006 | |
Return of securities lending collateral | | | 49,270 | |
Management fees | | | 12,276 | |
Transfer agent fees | | | 6,861 | |
Distribution and service fees | | | 1,728 | |
Portfolio accounting and administration fees | | | 1,480 | |
Trustees’ fees* | | | 156 | |
Miscellaneous | | | 12,237 | |
Total liabilities | | | 3,343,014 | |
Net assets | | $ | 14,514,099 | |
| | | | | |
Net assets consist of: |
Paid in capital | | $ | 14,975,714 | |
Total distributable earnings (loss) | | | (461,615 | ) |
Net assets | | $ | 14,514,099 | |
| | | | | |
Investor Class: |
Net assets | | $ | 8,148,468 | |
Capital shares outstanding | | | 165,899 | |
Net asset value per share | | $ | 49.12 | |
| | | | | |
Class A: |
Net assets | | $ | 5,037,281 | |
Capital shares outstanding | | | 114,062 | |
Net asset value per share | | $ | 44.16 | |
Maximum offering price per share (Net asset value divided by 95.25%) | | $ | 46.36 | |
| | | | | |
Class C: |
Net assets | | $ | 670,450 | |
Capital shares outstanding | | | 19,288 | |
Net asset value per share | | $ | 34.76 | |
| | | | | |
Class H: |
Net assets | | $ | 657,900 | |
Capital shares outstanding | | | 15,542 | |
Net asset value per share | | $ | 42.33 | |
STATEMENT OF OPERATIONS |
Year Ended March 31, 2024 |
Investment Income: |
Dividends (net of foreign withholding tax of $3,932) | | $ | 562,782 | |
Interest | | | 3,928 | |
Income from securities lending, net | | | 1,358 | |
Total investment income | | | 568,068 | |
| | | | | |
Expenses: |
Management fees | | | 144,975 | |
Distribution and service fees: |
Class A | | | 13,010 | |
Class C | | | 10,140 | |
Class H | | | 2,255 | |
Transfer agent fees | | | 37,247 | |
Portfolio accounting and administration fees | | | 25,999 | |
Registration fees | | | 17,534 | |
Professional fees | | | 8,102 | |
Trustees’ fees* | | | 3,173 | |
Custodian fees | | | 2,531 | |
Line of credit fees | | | 98 | |
Miscellaneous | | | 4,469 | |
Total expenses | | | 269,533 | |
Less: |
Expenses reimbursed by Adviser | | | (5,316 | ) |
Net expenses | | | 264,217 | |
Net investment income | | | 303,851 | |
| | | | | |
Net Realized and Unrealized Gain (Loss): |
Net realized gain (loss) on: |
Investments | | | 602,047 | |
Net realized gain | | | 602,047 | |
Net change in unrealized appreciation (depreciation) on: |
Investments | | | (1,034,402 | ) |
Net change in unrealized appreciation (depreciation) | | | (1,034,402 | ) |
Net realized and unrealized loss | | | (432,355 | ) |
Net decrease in net assets resulting from operations | | $ | (128,504 | ) |
* | Relates to Trustees not deemed “interested persons” within the meaning of Section 2(a)(19) of the 1940 Act. |
SEE NOTES TO FINANCIAL STATEMENTS. | THE RYDEX FUNDS ANNUAL REPORT | 153 |
STATEMENTS OF CHANGES IN NET ASSETS |
| | Year Ended
March 31,
2024 | | | Year Ended
March 31,
2023 | |
Increase (Decrease) in Net Assets from Operations: | | | | | | | | |
Net investment income | | $ | 303,851 | | | $ | 571,486 | |
Net realized gain (loss) on investments | | | 602,047 | | | | (1,121,273 | ) |
Net change in unrealized appreciation (depreciation) on investments | | | (1,034,402 | ) | | | (4,260,659 | ) |
Net decrease in net assets resulting from operations | | | (128,504 | ) | | | (4,810,446 | ) |
| | | | | | | | | |
Distributions to shareholders: | | | | | | | | |
Investor Class | | | (335,092 | ) | | | (413,416 | ) |
Class A | | | (172,630 | ) | | | (56,697 | ) |
Class C | | | (34,955 | ) | | | (13,938 | ) |
Class H | | | (28,809 | ) | | | (22,762 | ) |
Total distributions to shareholders | | | (571,486 | ) | | | (506,813 | ) |
| | | | | | | | | |
Capital share transactions: | | | | | | | | |
Proceeds from sale of shares | | | | | | | | |
Investor Class | | | 33,347,601 | | | | 146,439,669 | |
Class A | | | 993,331 | | | | 1,572,530 | |
Class C | | | 628,816 | | | | 783,087 | |
Class H | | | 1,058,498 | | | | 2,811,465 | |
Distributions reinvested | | | | | | | | |
Investor Class | | | 331,250 | | | | 412,288 | |
Class A | | | 171,729 | | | | 55,468 | |
Class C | | | 33,611 | | | | 13,638 | |
Class H | | | 27,589 | | | | 22,354 | |
Cost of shares redeemed | | | | | | | | |
Investor Class | | | (36,872,854 | ) | | | (182,903,217 | ) |
Class A | | | (1,754,754 | ) | | | (1,847,934 | ) |
Class C | | | (1,138,951 | ) | | | (989,467 | ) |
Class H | | | (2,083,156 | ) | | | (3,009,354 | ) |
Net decrease from capital share transactions | | | (5,257,290 | ) | | | (36,639,473 | ) |
Net decrease in net assets | | | (5,957,280 | ) | | | (41,956,732 | ) |
| | | | | | | | | |
Net assets: | | | | | | | | |
Beginning of year | | | 20,471,379 | | | | 62,428,111 | |
End of year | | $ | 14,514,099 | | | $ | 20,471,379 | |
| | | | | | | | | |
Capital share activity: | | | | | | | | |
Shares sold | | | | | | | | |
Investor Class | | | 703,176 | | | | 2,758,080 | |
Class A | | | 23,160 | | | | 33,209 | |
Class C | | | 18,640 | | | | 20,211 | |
Class H | | | 24,643 | | | | 60,430 | |
Shares issued from reinvestment of distributions | | | | | | | | |
Investor Class | | | 7,145 | | | | 7,985 | |
Class A | | | 4,116 | | | | 1,187 | |
Class C | | | 1,021 | | | | 364 | |
Class H | | | 690 | | | | 498 | |
Shares redeemed | | | | | | | | |
Investor Class | | | (774,299 | ) | | | (3,496,421 | ) |
Class A | | | (40,855 | ) | | | (38,937 | ) |
Class C | | | (33,733 | ) | | | (26,242 | ) |
Class H | | | (48,639 | ) | | | (67,419 | ) |
Net decrease in shares | | | (114,935 | ) | | | (747,055 | ) |
154 | THE RYDEX FUNDS ANNUAL REPORT | SEE NOTES TO FINANCIAL STATEMENTS. |
This table is presented to show selected data for a share outstanding throughout each period and to assist shareholders in evaluating a Fund’s performance for the periods presented.
Investor Class | | Year Ended
March 31,
2024 | | | Year Ended
March 31,
2023 | | | Year Ended
March 31,
2022 | | | Year Ended
March 31,
2021 | | | Year Ended
March 31,
2020 | |
Per Share Data |
Net asset value, beginning of period | | $ | 50.77 | | | $ | 54.36 | | | $ | 47.92 | | | $ | 41.80 | | | $ | 46.23 | |
Income (loss) from investment operations: |
Net investment income (loss)a | | | .91 | | | | .69 | | | | .77 | | | | .76 | | | | .74 | |
Net gain (loss) on investments (realized and unrealized) | | | (1.07 | ) | | | (3.86 | ) | | | 7.02 | | | | 6.37 | | | | (4.72 | ) |
Total from investment operations | | | (.16 | ) | | | (3.17 | ) | | | 7.79 | | | | 7.13 | | | | (3.98 | ) |
Less distributions from: |
Net investment income | | | (1.49 | ) | | | (.42 | ) | | | (1.35 | ) | | | (1.01 | ) | | | (.45 | ) |
Total distributions | | | (1.49 | ) | | | (.42 | ) | | | (1.35 | ) | | | (1.01 | ) | | | (.45 | ) |
Net asset value, end of period | | $ | 49.12 | | | $ | 50.77 | | | $ | 54.36 | | | $ | 47.92 | | | $ | 41.80 | |
|
Total Return | | | (0.14 | %) | | | (5.84 | %) | | | 16.53 | % | | | 17.17 | % | | | (8.74 | %) |
Ratios/Supplemental Data |
Net assets, end of period (in thousands) | | $ | 8,148 | | | $ | 11,671 | | | $ | 52,202 | | | $ | 21,099 | | | $ | 34,073 | |
Ratios to average net assets: |
Net investment income (loss) | | | 1.90 | % | | | 1.30 | % | | | 1.55 | % | | | 1.68 | % | | | 1.53 | % |
Total expenses | | | 1.43 | % | | | 1.39 | % | | | 1.36 | % | | | 1.45 | % | | | 1.48 | % |
Net expensesb | | | 1.40 | % | | | 1.39 | % | | | 1.36 | % | | | 1.45 | % | | | 1.48 | % |
Portfolio turnover rate | | | 163 | % | | | 293 | % | | | 175 | % | | | 156 | % | | | 169 | % |
Class A | | Year Ended
March 31,
2024 | | | Year Ended
March 31,
2023 | | | Year Ended
March 31,
2022 | | | Year Ended
March 31,
2021 | | | Year Ended
March 31,
2020 | |
Per Share Data |
Net asset value, beginning of period | | $ | 45.92 | | | $ | 49.34 | | | $ | 43.72 | | | $ | 38.30 | | | $ | 42.50 | |
Income (loss) from investment operations: |
Net investment income (loss)a | | | .76 | | | | .56 | | | | .57 | | | | .57 | | | | .57 | |
Net gain (loss) on investments (realized and unrealized) | | | (1.03 | ) | | | (3.56 | ) | | | 6.40 | | | | 5.86 | | | | (4.32 | ) |
Total from investment operations | | | (.27 | ) | | | (3.00 | ) | | | 6.97 | | | | 6.43 | | | | (3.75 | ) |
Less distributions from: |
Net investment income | | | (1.49 | ) | | | (.42 | ) | | | (1.35 | ) | | | (1.01 | ) | | | (.45 | ) |
Total distributions | | | (1.49 | ) | | | (.42 | ) | | | (1.35 | ) | | | (1.01 | ) | | | (.45 | ) |
Net asset value, end of period | | $ | 44.16 | | | $ | 45.92 | | | $ | 49.34 | | | $ | 43.72 | | | $ | 38.30 | |
|
Total Returnc | | | (0.40 | %) | | | (6.09 | %) | | | 16.24 | % | | | 16.91 | % | | | (8.96 | %) |
Ratios/Supplemental Data |
Net assets, end of period (in thousands) | | $ | 5,037 | | | $ | 5,862 | | | $ | 6,522 | | | $ | 5,399 | | | $ | 4,225 | |
Ratios to average net assets: |
Net investment income (loss) | | | 1.76 | % | | | 1.18 | % | | | 1.26 | % | | | 1.39 | % | | | 1.29 | % |
Total expenses | | | 1.68 | % | | | 1.64 | % | | | 1.61 | % | | | 1.70 | % | | | 1.73 | % |
Net expensesb | | | 1.65 | % | | | 1.64 | % | | | 1.61 | % | | | 1.70 | % | | | 1.73 | % |
Portfolio turnover rate | | | 163 | % | | | 293 | % | | | 175 | % | | | 156 | % | | | 169 | % |
SEE NOTES TO FINANCIAL STATEMENTS. | THE RYDEX FUNDS ANNUAL REPORT | 155 |
FINANCIAL HIGHLIGHTS (concluded) |
This table is presented to show selected data for a share outstanding throughout each period and to assist shareholders in evaluating a Fund’s performance for the periods presented.
Class C | | Year Ended
March 31,
2024 | | | Year Ended
March 31,
2023 | | | Year Ended
March 31,
2022 | | | Year Ended
March 31,
2021 | | | Year Ended
March 31,
2020 | |
Per Share Data |
Net asset value, beginning of period | | $ | 36.75 | | | $ | 39.87 | | | $ | 35.84 | | | $ | 31.80 | | | $ | 35.63 | |
Income (loss) from investment operations: |
Net investment income (loss)a | | | .33 | | | | .16 | | | | .18 | | | | .21 | | | | .21 | |
Net gain (loss) on investments (realized and unrealized) | | | (.83 | ) | | | (2.86 | ) | | | 5.20 | | | | 4.84 | | | | (3.59 | ) |
Total from investment operations | | | (.50 | ) | | | (2.70 | ) | | | 5.38 | | | | 5.05 | | | | (3.38 | ) |
Less distributions from: |
Net investment income | | | (1.49 | ) | | | (.42 | ) | | | (1.35 | ) | | | (1.01 | ) | | | (.45 | ) |
Total distributions | | | (1.49 | ) | | | (.42 | ) | | | (1.35 | ) | | | (1.01 | ) | | | (.45 | ) |
Net asset value, end of period | | $ | 34.76 | | | $ | 36.75 | | | $ | 39.87 | | | $ | 35.84 | | | $ | 31.80 | |
|
Total Returnc | | | (1.13 | %) | | | (6.79 | %) | | | 15.37 | % | | | 16.02 | % | | | (9.65 | %) |
Ratios/Supplemental Data |
Net assets, end of period (in thousands) | | $ | 670 | | | $ | 1,226 | | | $ | 1,556 | | | $ | 2,646 | | | $ | 5,093 | |
Ratios to average net assets: |
Net investment income (loss) | | | 0.95 | % | | | 0.43 | % | | | 0.48 | % | | | 0.61 | % | | | 0.57 | % |
Total expenses | | | 2.43 | % | | | 2.39 | % | | | 2.36 | % | | | 2.45 | % | | | 2.47 | % |
Net expensesb | | | 2.40 | % | | | 2.39 | % | | | 2.36 | % | | | 2.45 | % | | | 2.47 | % |
Portfolio turnover rate | | | 163 | % | | | 293 | % | | | 175 | % | | | 156 | % | | | 169 | % |
Class H | | Year Ended
March 31,
2024 | | | Year Ended
March 31,
2023 | | | Year Ended
March 31,
2022 | | | Year Ended
March 31,
2021 | | | Year Ended
March 31,
2020 | |
Per Share Data |
Net asset value, beginning of period | | $ | 44.08 | | | $ | 47.38 | | | $ | 42.04 | | | $ | 36.86 | | | $ | 40.92 | |
Income (loss) from investment operations: |
Net investment income (loss)a | | | .67 | | | | .52 | | | | .63 | | | | .42 | | | | .50 | |
Net gain (loss) on investments (realized and unrealized) | | | (.93 | ) | | | (3.40 | ) | | | 6.06 | | | | 5.77 | | | | (4.11 | ) |
Total from investment operations | | | (.26 | ) | | | (2.88 | ) | | | 6.69 | | | | 6.19 | | | | (3.61 | ) |
Less distributions from: |
Net investment income | | | (1.49 | ) | | | (.42 | ) | | | (1.35 | ) | | | (1.01 | ) | | | (.45 | ) |
Total distributions | | | (1.49 | ) | | | (.42 | ) | | | (1.35 | ) | | | (1.01 | ) | | | (.45 | ) |
Net asset value, end of period | | $ | 42.33 | | | $ | 44.08 | | | $ | 47.38 | | | $ | 42.04 | | | $ | 36.86 | |
|
Total Return | | | (0.39 | %) | | | (6.09 | %) | | | 16.23 | % | | | 16.92 | % | | | (8.97 | %) |
Ratios/Supplemental Data |
Net assets, end of period (in thousands) | | $ | 658 | | | $ | 1,713 | | | $ | 2,148 | | | $ | 719 | | | $ | 2,427 | |
Ratios to average net assets: |
Net investment income (loss) | | | 1.61 | % | | | 1.14 | % | | | 1.45 | % | | | 1.08 | % | | | 1.18 | % |
Total expenses | | | 1.68 | % | | | 1.64 | % | | | 1.61 | % | | | 1.72 | % | | | 1.73 | % |
Net expensesb | | | 1.65 | % | | | 1.64 | % | | | 1.61 | % | | | 1.72 | % | | | 1.73 | % |
Portfolio turnover rate | | | 163 | % | | | 293 | % | | | 175 | % | | | 156 | % | | | 169 | % |
a | Net investment income (loss) per share was computed using average shares outstanding throughout the period. |
b | Net expense information reflects the expense ratios after expense waivers and reimbursements, as applicable. |
c | Total return does not reflect the impact of any applicable sales charges. |
156 | THE RYDEX FUNDS ANNUAL REPORT | SEE NOTES TO FINANCIAL STATEMENTS. |
NOTES TO FINANCIAL STATEMENTS |
Note 1 – Organization and Significant Accounting Policies
Organization
The Rydex Series Funds (the “Trust”), a Delaware statutory trust, is registered with the U.S. Securities and Exchange Commission (the “SEC”) under the Investment Company Act of 1940 (the ”1940 Act”), as an open-ended investment company of the series type. Each series, in effect, is representing a separate fund (each, a “Fund”). The Trust may issue an unlimited number of authorized shares. The Trust accounts for the assets of each Fund separately.
The Trust offers a combination of seven separate classes of shares: Investor Class shares, Class A shares, Class C shares, Class H shares, Class P shares, Institutional Class shares and Money Market Class shares. Sales of shares of each Class are made without a front-end sales charge at the net asset value per share (“NAV”), with the exception of Class A shares.Class A shares are sold at the NAV, plus the applicable front-end sales charge. The sales charge varies depending on the amount purchased, but will not exceed 4.75%. Class A share purchases of $1 million or more are exempt from the front-end sales charge but have a 1% contingent deferred sales charge (“CDSC”) if shares are redeemed within 12 months of purchase. Class C shares have a 1% CDSC if shares are redeemed within 12 months of purchase. Class C shares of each Fund automatically convert to Class A shares of the same Fund on or about the 10th day of the month following the 8-year anniversary of the purchase of the Class C shares. This conversion will be executed without any sales charge, fee or other charge. After the conversion is completed, the shares will be subject to all features and expenses of Class A shares. Institutional Class shares are offered primarily for direct investment by institutions such as pension and profit sharing plans, endowments, foundations and corporations. Institutional Class shares require a minimum initial investment of $2 million and a minimum account balance of $1 million. At March 31, 2024, the Trust consisted of fifty-two funds.
This report covers the following funds (collectively, the “Funds”):
Fund Name | Investment
Company Type |
Banking Fund | Diversified |
Basic Materials Fund | Diversified |
Biotechnology Fund | Diversified |
Consumer Products Fund | Diversified |
Electronics Fund | Non-diversified |
Energy Fund | Diversified |
Energy Services Fund | Non-diversified |
Financial Services Fund | Diversified |
Health Care Fund | Diversified |
Internet Fund | Diversified |
Leisure Fund | Diversified |
Precious Metals Fund | Non-diversified |
Real Estate Fund | Diversified |
Retailing Fund | Diversified |
Technology Fund | Diversified |
Telecommunications Fund | Non-diversified |
Transportation Fund | Diversified |
Utilities Fund | Diversified |
At March 31, 2024, Investor Class, Class A, Class C, and Class H shares have been issued by the Funds.
The Funds invest in a specific industry sector. To the extent that investments are concentrated in a single sector, the Funds are subject to legislative or regulatory changes, adverse market conditions and/or increased competition affecting such sector.
The Funds seek capital appreciation and invest substantially all of their assets in equity securities of companies involved in their sector.
The Funds are designed and operated to accommodate frequent trading by shareholders and, unlike most mutual funds, offer unlimited exchange privileges with no minimum holding periods or transactions fees, which may cause the Funds to experience high portfolio turnover.
Security Investors, LLC (the “Adviser”), which operates under the name Guggenheim Investments (“GI”), provides advisory services. Guggenheim Funds Distributors, LLC (“GFD”) serves as distributor of the Funds’ shares. GI and GFD are affiliated entities.
Significant Accounting Policies
The Funds operate as investment companies and, accordingly, follow the investment company accounting and reporting guidance of the Financial Accounting Standards Board (“FASB”) Accounting Standards Codification Topic 946 Financial Services – Investment Companies.
The following significant accounting policies are in conformity with U.S. generally accepted accounting principles (“U.S. GAAP”) and are consistently followed by the Trust. This requires management to make estimates and assumptions that affect the reported amount of assets and liabilities, contingent assets and liabilities at the date of the financial statements, and the reported amounts of revenues and expenses during the reporting period. Actual results could differ from these estimates. All time references are based on Eastern Time.
The NAV of each share class of a fund is calculated by dividing the market value of a fund’s securities and other assets, less all liabilities attributable to the share class by the number of outstanding shares of the share class on the specified date.
(a) Valuation of Investments
The Board of Trustees of the Funds (the “Board”) adopted policies and procedures for the valuation of the Funds’ investments (the “Fund Valuation Procedures”). The SEC adopted Rule 2a-5 under the 1940 Act (“Rule 2a-5”) which establishes requirements for determining fair value in good faith. Rule 2a-5 also defines “readily
| | THE RYDEX FUNDS ANNUAL REPORT | 157 |
NOTES TO FINANCIAL STATEMENTS (continued) |
available market quotations” for purposes of the 1940 Act and establishes requirements for determining whether a fund must fair value a security in good faith.
Pursuant to Rule 2a-5, the Board has designated the Adviser as the valuation designee to perform fair valuation determinations for the Funds with respect to all Fund investments and other assets. As the Funds’ valuation designee pursuant to Rule 2a-5, the Adviser has adopted separate procedures (the “Valuation Designee Procedures” and collectively with the Fund Valuation Procedures, the “Valuation Procedures”) reasonably designed to prevent violations of the requirements of Rule 2a-5 and Rule 31a-4. The Adviser, in its role as valuation designee, utilizes the assistance of a valuation committee, consisting of representatives from Guggenheim’s investment management, fund administration, legal and compliance departments (the “Valuation Committee”), in determining the fair value of the Funds’ securities and other assets.
Valuations of the Funds’ securities and other assets are supplied primarily by pricing service providers appointed pursuant to the processes set forth in the Valuation Procedures. The Adviser, with the assistance of the Valuation Committee, convenes monthly, or more frequently as needed, to review the valuation of all assets which have been fair valued. The Adviser, consistent with the monitoring and review responsibilities set forth in the Valuation Procedures, regularly reviews the appropriateness of the inputs, methods, models and assumptions employed by the pricing service provider.
If the pricing service provider cannot or does not provide a valuation for a particular investment or such valuation is deemed unreliable, such investment is fair valued by the Adviser.
Equity securities listed or traded on a recognized U.S. securities exchange or the Nasdaq Stock Market (“NASDAQ”) will generally be valued on the basis of the last sale price on the primary U.S. exchange or market on which the security is listed or traded; provided, however, that securities listed on NASDAQ will be valued at the NASDAQ official closing price, which may not necessarily represent the last sale price.
Open-end investment companies are valued at their NAV as of the close of business, on the valuation date. Exchange-traded funds and closed-end investment companies are generally valued at the last quoted sale price.
Repurchase agreements are generally valued at amortized cost, provided such amounts approximate market value.
Investments for which market quotations are not readily available are fair valued as determined in good faith by the Adviser. Valuations in accordance with these methods are intended to reflect each security’s (or asset’s or liability’s) “fair value”. Each such determination is based on a consideration of all relevant factors, which are likely to vary from one pricing context to another. Examples of such factors may include, but are not limited to market prices; sale prices; broker quotes; and models which derive prices based on inputs such as anticipated cash flows or collateral, spread over U.S. Treasury securities, and other information analysis.
(b) Currency Translations
The accounting records of the Funds are maintained in U.S. dollars. All assets and liabilities initially expressed in foreign currencies are converted into U.S. dollars at prevailing exchange rates. Purchases and sales of investment securities, dividend and interest income, and certain expenses are translated at the rates of exchange prevailing on the respective dates of such transactions. Changes in the relationship of these foreign currencies to the U.S. dollar can significantly affect the value of the investments and earnings of the Funds. Foreign investments may also subject the Funds to foreign government exchange restrictions, expropriation, taxation, or other political, social, geopolitical or economic developments, all of which could affect the market and/or credit risk of the investments.
The Funds do not isolate that portion of the results of operations resulting from changes in the foreign exchange rates on investments from the fluctuations arising from changes in the market prices of securities held. Such fluctuations are included with the net realized gain or loss and unrealized appreciation or depreciation on investments.
Reported net realized foreign exchange gains and losses arise from sales of foreign currencies and currency gains or losses realized between the trade and settlement dates on investment transactions. Net unrealized appreciation and depreciation arise from changes in the fair values of assets and liabilities other than investments in securities at the fiscal period end, resulting from changes in exchange rates.
(c) Foreign Taxes
The Funds may be subject to foreign taxes (a portion of which may be reclaimable) on income, stock dividends, capital gains on investments or certain foreign currency transactions. All foreign taxes are recorded in accordance with the applicable foreign tax regulations and rates that exist in the foreign jurisdictions in which the Funds invest. These foreign taxes, if any, are paid by the Funds and reflected in the Funds’ Statements of Operations as follows: foreign taxes withheld at source are presented as a reduction of income and foreign taxes on capital gains from sales of investments are included with the net realized gain (loss) on
158 | THE RYDEX FUNDS ANNUAL REPORT | |
NOTES TO FINANCIAL STATEMENTS (continued) |
investments. Foreign taxes payable or deferred as of March 31, 2024, if any, are disclosed in the Funds’ Statements of Assets and Liabilities.
On January 1, 2024, the statute of limitations for deferred foreign taxes on capital gains from sales of Peruvian securities prior to 2018 in the Basic Materials Fund and Precious Metals Fund expired. On January 2, 2024, the deferred foreign capital gains tax liabilities were relieved, and realized gains on investments were recognized, in the amounts of $130,382 and $276,532 for the Basic Materials Fund and Precious Metals Fund, respectively.
(d) Security Transactions
Security transactions are recorded on the trade date for financial reporting purposes. Realized gains and losses from securities transactions are recorded using the identified cost basis. Proceeds from lawsuits related to investment holdings are recorded as a reduction to cost if the securities are still held and as realized gains if no longer held in the respective Fund. Dividend income is recorded on the ex-dividend date, net of applicable taxes withheld by foreign countries, if any. Taxable non-cash dividends are recorded as dividend income. Interest income, including amortization of premiums and accretion of discounts, is accrued on a daily basis. Dividend income from Real Estate Investment Trusts (“REITs”) is recorded based on the income included in the distributions received from the REIT investments using published REIT classifications, including some management estimates when actual amounts are not available. Distributions received in excess of this estimated amount are recorded as a reduction of the cost of investments or reclassified to realized gains. The actual amounts of income, return of capital, and realized gains are only determined by each REIT after its fiscal year-end, and may differ from the estimated amounts.
(e) Distributions
Distributions of net investment income and net realized gains, if any, are declared and paid at least annually. Dividends are reinvested in additional shares, unless shareholders request payment in cash. Distributions are recorded on the ex-dividend date and are determined in accordance with U.S. federal income tax regulations which may differ from U.S. GAAP.
(f) Class Allocations
Interest and dividend income, most expenses, all realized gains and losses, and all unrealized appreciation and depreciation are allocated to the share classes based upon the value of the outstanding shares in each share class. Certain costs, such as distribution and service fees are charged directly to specific share classes. In addition, certain expenses have been allocated to the individual Funds in the Trust based on the respective net assets of each Fund included in the Trust.
(g) Cash
The Funds may leave cash overnight in their cash account with the custodian. Periodically, a Fund may have cash due to the custodian bank as an overdraft balance. A fee is incurred on this overdraft, calculated by multiplying the overdraft by a rate based on the federal funds rate, which was 5.33% at March 31, 2024.
(h) Indemnifications
Under the Funds’ organizational documents, the Trustees and Officers are indemnified against certain liabilities arising out of the performance of their duties to the Trust. In addition, throughout the normal course of business, the Funds enter into contracts that contain a variety of representations and warranties which provide general indemnifications. The Funds’ maximum exposure under these arrangements is unknown, as this would involve future claims that may be made against the Funds and/or their affiliates that have not yet occurred. However, based on experience, the Funds expect the risk of loss to be remote.
Note 2 – Investment Advisory Agreement and Other Agreements
Under the terms of an investment advisory contract, the Funds pay GI investment advisory fees on a monthly basis calculated daily at the annualized rates below, based on the average daily net assets of the Funds:
Fund | | Management Fees
(as a % of Net Assets) | |
Banking Fund | | | 0.85 | % |
Basic Materials Fund | | | 0.85 | % |
Biotechnology Fund | | | 0.85 | % |
Consumer Products Fund | | | 0.85 | % |
Electronics Fund | | | 0.85 | % |
Energy Fund | | | 0.85 | % |
Energy Services Fund | | | 0.85 | % |
Financial Services Fund | | | 0.85 | % |
Health Care Fund | | | 0.85 | % |
Internet Fund | | | 0.85 | % |
Leisure Fund | | | 0.85 | % |
Precious Metals Fund | | | 0.75 | % |
Real Estate Fund | | | 0.85 | % |
Retailing Fund | | | 0.85 | % |
Technology Fund | | | 0.85 | % |
Telecommunications Fund | | | 0.85 | % |
Transportation Fund | | | 0.85 | % |
Utilities Fund | | | 0.85 | % |
| | THE RYDEX FUNDS ANNUAL REPORT | 159 |
NOTES TO FINANCIAL STATEMENTS (continued) |
When the aggregate assets of each series of the Trust (excluding the Long Short Equity Fund, Managed Futures Strategy Fund and Multi-Hedge Strategies Fund) and each series of Rydex Dynamic Funds equal or exceed $10 billion, the advisory fee rate paid by each individual Fund (excluding the Long Short Equity Fund, Managed Futures Strategy Fund and Multi-Hedge Strategies Fund) will be reduced in accordance with the asset level and breakpoint schedule set forth below.
Fund Assets Under Management | | Fund Asset-Based
Breakpoint Reductions | |
$500 million - $1 billion | | | 0.025 | % |
$1 billion - $2 billion | | | 0.050 | % |
>$2 billion | | | 0.075 | % |
GI pays operating expenses on behalf of the Trust, such as audit and accounting related services, legal services, custody, printing and mailing, among others, on a pass-through basis. Such expenses are allocated to various Funds within the complex based on relative net assets.
The Board has adopted a separate Distribution Plan applicable to Class A shares and Class H shares for which GFD and other firms that provide distribution and/or shareholder services (“Service Providers”) may receive compensation. If a Service Provider provides distribution services, the Funds will pay distribution fees to GFD at an annual rate not to exceed 0.25% of average daily net assets, pursuant to Rule 12b-1 of the 1940 Act. GFD, in turn, will pay the Service Provider out of its fees. GFD may, at its discretion, retain a portion of such payments to compensate itself for distribution services it performs.
The Board has adopted a separate Distribution and Shareholder Services Plan applicable to Class C shares that allows the Funds to pay annual distribution and service fees of 1.00% of the Funds’ Class C shares average daily net assets. The annual 0.25% service fee compensates a shareholder’s financial adviser for providing ongoing services to the shareholder. The annual distribution fee of 0.75% reimburses GFD for paying the shareholder’s financial adviser an ongoing sales commission. GFD advances the first year’s service and distribution fees to the financial adviser. GFD retains the service and distribution fees on accounts with no authorized dealer of record.
For the year ended March 31, 2024, GFD retained sales charges of $75,543 relating to sales of Class A shares of the Trust.
On May 24, 2023, the Board approved a waiver and/or expense reimbursement arrangement whereby GI has agreed to waive and/or reimburse expenses for the Funds in an amount equal to an annual percentage rate of 0.05% of each Fund’s average daily net assets. This arrangement went into effect on August 1, 2023 and the end of the initial term is August 1, 2024. This agreement shall automatically renew for one-year terms, unless GI provides written notice to the Fund of the termination at least thirty days prior to the end of the then-current term. This agreement may be terminated at any time by the Fund’s Board upon sixty days’ written notice to the Adviser. In addition, the agreement will terminate automatically if the Advisory Agreement, with respect to a Fund, is terminated, with such termination effective upon the effective date of the termination of the Advisory Agreement.
Certain trustees and officers of the Trust are also officers of GI and/or GFD. The Trust does not compensate its officers or trustees who are officers, directors and/or employees of GI or GFD.
MUFG Investor Services (US), LLC (“MUIS”) acts as the Funds’ administrator, transfer agent and accounting agent. As administrator, transfer agent and accounting agent, MUIS maintains the books and records of the Funds’ securities and cash. U.S. Bank, N.A. (“U.S. Bank”) acts as the Funds’ custodian. As custodian, U.S. Bank is responsible for the custody of the Funds’ assets. For providing the aforementioned services, MUIS and U.S. Bank are entitled to receive a monthly fee equal to an annual percentage of each Fund’s average daily net assets and out of pocket expenses.
Note 3 – Federal Income Tax Information
The Funds intend to comply with the provisions of Subchapter M of the Internal Revenue Code of 1986, as amended (the “Internal Revenue Code”), applicable to regulated investment companies and will distribute substantially all taxable net investment income and capital gains sufficient to relieve the Funds from all, or substantially all, federal income, excise and state income taxes. Therefore, no provision for federal or state income tax or federal excise tax is required.
160 | THE RYDEX FUNDS ANNUAL REPORT | |
NOTES TO FINANCIAL STATEMENTS (continued) |
Tax positions taken or expected to be taken in the course of preparing the Funds’ tax returns are evaluated to determine whether the tax positions are “more-likely-than-not” of being sustained by the applicable tax authority. Tax positions not deemed to meet the “more-likely-than-not” threshold would be recorded as a tax benefit or expense in the current year. Management has analyzed the Funds’ tax positions taken, or to be taken, on U.S. federal income tax returns for all open tax years, and has concluded that no provision for income tax is required in the Funds’ financial statements. The Funds’ U.S. federal income tax returns are subject to examination by the Internal Revenue Service (“IRS”) for a period of three years after they are filed.
The tax character of distributions paid during the year ended March 31, 2024 was as follows:
Fund | | Ordinary
Income | | | Long-Term
Capital Gain | | | Return of
Capital | | | Total
Distributions | |
Banking Fund | | $ | 124,157 | | | $ | — | | | $ | — | | | $ | 124,157 | |
Basic Materials Fund | | | 558,233 | | | | 122,850 | | | | — | | | | 681,083 | |
Consumer Products Fund | | | 988,858 | | | | 5,309,332 | | | | — | | | | 6,298,190 | |
Energy Fund | | | 1,610,287 | | | | — | | | | — | | | | 1,610,287 | |
Leisure Fund | | | 7,181 | | | | — | | | | — | | | | 7,181 | |
Precious Metals Fund | | | 1,822,514 | | | | — | | | | — | | | | 1,822,514 | |
Real Estate Fund | | | 54,116 | | | | — | | | | — | | | | 54,116 | |
Technology Fund | | | — | | | | 1,955,347 | | | | — | | | | 1,955,347 | |
Telecommunications Fund | | | 30,983 | | | | — | | | | — | | | | 30,983 | |
Transportation Fund | | | 22,238 | | | | — | | | | — | | | | 22,238 | |
Utilities Fund | | | 571,486 | | | | — | | | | — | | | | 571,486 | |
The tax character of distributions paid during the year ended March 31, 2023 was as follows:
Fund | | Ordinary
Income | | | Long-Term
Capital Gain | | | Return of
Capital | | | Total
Distributions | |
Banking Fund | | $ | 300,682 | | | $ | — | | | $ | — | | | $ | 300,682 | |
Basic Materials Fund | | | 643,252 | | | | — | | | | — | | | | 643,252 | |
Biotechnology Fund | | | — | | | | 1,800,501 | | | | — | | | | 1,800,501 | |
Consumer Products Fund | | | 1,347,460 | | | | 6,241,671 | | | | — | | | | 7,589,131 | |
Energy Fund | | | 2,232,689 | | | | — | | | | — | | | | 2,232,689 | |
Financial Services Fund | | | 1,815,093 | | | | — | | | | — | | | | 1,815,093 | |
Health Care Fund | | | — | | | | 719,389 | | | | — | | | | 719,389 | |
Precious Metals Fund | | | 3,735,884 | | | | — | | | | — | | | | 3,735,884 | |
Real Estate Fund | | | 91,618 | | | | — | | | | — | | | | 91,618 | |
Technology Fund | | | — | | | | 1,435,074 | | | | — | | | | 1,435,074 | |
Telecommunications Fund | | | 29,256 | | | | — | | | | — | | | | 29,256 | |
Transportation Fund | | | 1,112,898 | | | | — | | | | — | | | | 1,112,898 | |
Utilities Fund | | | 506,813 | | | | — | | | | — | | | | 506,813 | |
Note: For U.S. federal income tax purposes, short-term capital gain distributions are treated as ordinary income distributions.
| | THE RYDEX FUNDS ANNUAL REPORT | 161 |
NOTES TO FINANCIAL STATEMENTS (continued) |
The tax components of distributable earnings/(loss) as of March 31, 2024 were as follows:
Fund | | Undistributed
Ordinary
Income | | | Undistributed
Long-Term
Capital Gain | | | Net
Unrealized
Appreciation
(Depreciation) | | | Accumulated
Capital and
Other Losses | | | Other
Temporary
Differences | | | Total | |
Banking Fund | | $ | 291,615 | | | $ | — | | | $ | 1,386,637 | | | $ | (9,848,210 | ) | | $ | — | | | $ | (8,169,958 | ) |
Basic Materials Fund | | | — | | | | 48,047 | | | | 9,551,217 | | | | — | | | | — | | | | 9,599,264 | |
Biotechnology Fund | | | 2,249,904 | | | | 10,208,020 | | | | 45,204,716 | | | | — | | | | — | | | | 57,662,640 | |
Consumer Products Fund | | | 982,105 | | | | 336,363 | | | | 25,845,784 | | | | — | | | | — | | | | 27,164,252 | |
Electronics Fund | | | 1,648,848 | | | | — | | | | 41,063,709 | | | | — | | | | — | | | | 42,712,557 | |
Energy Fund | | | 761,104 | | | | — | | | | 8,710,660 | | | | (10,242,050 | ) | | | — | | | | (770,286 | ) |
Energy Services Fund | | | — | | | | — | | | | 2,170,066 | | | | (37,356,381 | ) | | | — | | | | (35,186,315 | ) |
Financial Services Fund | | | 152,924 | | | | — | | | | 2,399,610 | | | | (1,184,555 | ) | | | — | | | | 1,367,979 | |
Health Care Fund | | | — | | | | — | | | | 6,582,799 | | | | (132,383 | ) | | | — | | | | 6,450,416 | |
Internet Fund | | | — | | | | — | | | | 6,736,666 | | | | (2,744,097 | ) | | | — | | | | 3,992,569 | |
Leisure Fund | | | 35,412 | | | | — | | | | 2,423,689 | | | | (1,127,852 | ) | | | — | | | | 1,331,249 | |
Precious Metals Fund | | | — | | | | — | | | | (12,472,890 | ) | | | (41,250,430 | ) | | | — | | | | (53,723,320 | ) |
Real Estate Fund | | | 32,581 | | | | — | | | | 100,479 | | | | (6,956,426 | ) | | | — | | | | (6,823,366 | ) |
Retailing Fund | | | — | | | | — | | | | 1,952,892 | | | | (861,302 | ) | | | — | | | | 1,091,590 | |
Technology Fund | | | 2,232,562 | | | | — | | | | 23,577,204 | | | | — | | | | — | | | | 25,809,766 | |
Telecommunications Fund | | | 1,548 | | | | — | | | | (1,879 | ) | | | (2,771,360 | ) | | | — | | | | (2,771,691 | ) |
Transportation Fund | | | 41,418 | | | | — | | | | 3,252,374 | | | | (606,446 | ) | | | — | | | | 2,687,346 | |
Utilities Fund | | | 303,851 | | | | — | | | | 643,603 | | | | (1,409,069 | ) | | | — | | | | (461,615 | ) |
For U.S. federal income tax purposes, capital loss carryforwards represent realized losses of the Funds that may be carried forward and applied against future capital gains. The Funds are permitted to carry forward capital losses for an unlimited period and such capital loss carryforwards retain their character as either short-term or long-term capital losses. As of March 31, 2024, capital loss carryforwards for the Funds were as follows:
Fund | | Unlimited | | | Total
Capital Loss
Carryforward | |
Short-Term | | Long-Term | |
Banking Fund | | $ | (8,766,669 | ) | | $ | (1,081,541 | ) | | $ | (9,848,210 | ) |
Energy Fund | | | (3,490,233 | ) | | | (6,751,817 | ) | | | (10,242,050 | ) |
Energy Services Fund | | | (22,289,844 | ) | | | (15,066,537 | ) | | | (37,356,381 | ) |
Financial Services Fund | | | (8,922 | ) | | | (1,175,633 | ) | | | (1,184,555 | ) |
Health Care Fund | | | — | | | | (132,383 | ) | | | (132,383 | ) |
Internet Fund | | | (1,055,658 | ) | | | (1,688,439 | ) | | | (2,744,097 | ) |
Leisure Fund | | | (845,464 | ) | | | (282,388 | ) | | | (1,127,852 | ) |
Precious Metals Fund | | | (11,042,416 | ) | | | (30,208,014 | ) | | | (41,250,430 | ) |
Real Estate Fund | | | (4,650,187 | ) | | | (2,306,239 | ) | | | (6,956,426 | ) |
Retailing Fund | | | (608,735 | ) | | | (252,567 | ) | | | (861,302 | ) |
Telecommunications Fund | | | (2,019,348 | ) | | | (752,012 | ) | | | (2,771,360 | ) |
Transportation Fund | | | (569,329 | ) | | | (37,117 | ) | | | (606,446 | ) |
Utilities Fund | | | (1,058,810 | ) | | | (350,259 | ) | | | (1,409,069 | ) |
For the year ended March 31, 2024, the following capital loss carryforward amounts were utilized:
Fund | | Utilized | |
Banking Fund | | $ | 207,803 | |
Basic Materials Fund | | | 2,095,620 | |
Biotechnology Fund | | | 1,397,404 | |
Electronics Fund | | | 2,394,338 | |
Energy Fund | | | 5,411,416 | |
Retailing Fund | | | 238,495 | |
Utilities Fund | | | 521,005 | |
162 | THE RYDEX FUNDS ANNUAL REPORT | |
NOTES TO FINANCIAL STATEMENTS (continued) |
Net investment income and net realized gains (losses) may differ for financial statement and tax purposes because of temporary or permanent book/tax differences. These differences are primarily due to investments in real estate investment trusts, foreign currency gains and losses, losses deferred due to wash sales, distributions in connection with redemption of fund shares, and the “mark-to-market,” recharacterization, or disposition of certain Passive Foreign Investment Companies (PFICs). Additional differences may result from the tax treatment of net operating losses, certain corporate actions, return of capital distributions, and foreign capital gains taxes. To the extent these differences are permanent and would require a reclassification between Paid in Capital and Total Distributable Earnings (Loss), such reclassifications are made in the period that the differences arise. These reclassifications have no effect on net assets or NAV per share.
The following adjustments were made on the Statements of Assets and Liabilities as of March 31, 2024 for permanent book/tax differences:
Fund | | Paid In
Capital | | | Total
Distributable
Earnings/(Loss) | |
Basic Materials Fund | | $ | 36,444 | | | $ | (36,444 | ) |
Biotechnology Fund | | | 1,771,729 | | | | (1,771,729 | ) |
Consumer Products Fund | | | 1,764,537 | | | | (1,764,537 | ) |
Electronics Fund | | | 395,037 | | | | (395,037 | ) |
Energy Services Fund | | | (45,780 | ) | | | 45,780 | |
Financial Services Fund | | | (126 | ) | | | 126 | |
Health Care Fund | | | (89,688 | ) | | | 89,688 | |
Internet Fund | | | (362,556 | ) | | | 362,556 | |
Precious Metals Fund | | | (713,786 | ) | | | 713,786 | |
Retailing Fund | | | (16,350 | ) | | | 16,350 | |
Technology Fund | | | 2,622,352 | | | | (2,622,352 | ) |
At March 31, 2024, the cost of investments for U.S. federal income tax purposes, the aggregate gross unrealized appreciation for all investments for which there was an excess of value over tax cost and the aggregate gross unrealized depreciation for all investments for which there was an excess of tax cost over value, were as follows:
Fund | | Tax
Cost | | | Tax
Unrealized
Appreciation | | | Tax
Unrealized
Depreciation | | | Net Tax
Unrealized
Appreciation/
(Depreciation) | |
Banking Fund | | $ | 25,498,707 | | | $ | 1,930,259 | | | $ | (543,622 | ) | | $ | 1,386,637 | |
Basic Materials Fund | | | 20,626,427 | | | | 10,204,650 | | | | (653,433 | ) | | | 9,551,217 | |
Biotechnology Fund | | | 65,704,825 | | | | 48,982,667 | | | | (3,777,951 | ) | | | 45,204,716 | |
Consumer Products Fund | | | 36,455,092 | | | | 25,982,160 | | | | (136,376 | ) | | | 25,845,784 | |
Electronics Fund | | | 55,788,987 | | | | 41,969,259 | | | | (905,550 | ) | | | 41,063,709 | |
Energy Fund | | | 25,254,621 | | | | 8,780,885 | | | | (70,225 | ) | | | 8,710,660 | |
Energy Services Fund | | | 12,667,938 | | | | 2,170,066 | | | | — | | | | 2,170,066 | |
Financial Services Fund | | | 33,796,644 | | | | 2,739,405 | | | | (339,795 | ) | | | 2,399,610 | |
Health Care Fund | | | 18,320,324 | | | | 6,716,349 | | | | (133,550 | ) | | | 6,582,799 | |
Internet Fund | | | 32,027,608 | | | | 7,258,602 | | | | (521,936 | ) | | | 6,736,666 | |
Leisure Fund | | | 6,045,742 | | | | 2,527,021 | | | | (103,332 | ) | | | 2,423,689 | |
Precious Metals Fund | | | 76,339,064 | | | | — | | | | (12,472,890 | ) | | | (12,472,890 | ) |
Real Estate Fund | | | 2,369,785 | | | | 105,905 | | | | (5,426 | ) | | | 100,479 | |
Retailing Fund | | | 7,844,166 | | | | 1,974,678 | | | | (21,786 | ) | | | 1,952,892 | |
Technology Fund | | | 26,013,761 | | | | 23,687,018 | | | | (109,814 | ) | | | 23,577,204 | |
Telecommunications Fund | | | 4,137,326 | | | | 111,343 | | | | (113,222 | ) | | | (1,879 | ) |
Transportation Fund | | | 9,096,146 | | | | 3,469,205 | | | | (216,831 | ) | | | 3,252,374 | |
Utilities Fund | | | 13,910,619 | | | | 697,075 | | | | (53,472 | ) | | | 643,603 | |
| | THE RYDEX FUNDS ANNUAL REPORT | 163 |
NOTES TO FINANCIAL STATEMENTS (continued) |
Note 4 – Fair Value Measurement
In accordance with U.S. GAAP, fair value is defined as the price that the Funds would receive to sell an investment or pay to transfer a liability in an orderly transaction between market participants at the measurement date. U.S. GAAP establishes a three-tier fair value hierarchy based on the types of inputs used to value assets and liabilities and requires corresponding disclosure. The hierarchy and the corresponding inputs are summarized below:
Level 1 — | unadjusted quoted prices in active markets for identical assets or liabilities. |
Level 2 — | significant other observable inputs (for example quoted prices for securities that are similar based on characteristics such as interest rates, prepayment speeds, credit risk, etc.). |
Level 3 — | significant unobservable inputs based on the best information available under the circumstances, to the extent observable inputs are not available, which may include assumptions. |
Rule 2a-5 sets forth a definition of “readily available market quotations,” which is consistent with the definition of a Level 1 input under U.S. GAAP. Rule 2a-5 provides that “a market quotation is readily available only when that quotation is a quoted price (unadjusted) in active markets for identical investments that the fund can access at the measurement date, provided that a quotation will not be readily available if it is not reliable.”
Securities for which market quotations are not readily available must be valued at fair value as determined in good faith. Accordingly, any security priced using inputs other than Level 1 inputs will be subject to fair value requirements. The types of inputs available depend on a variety of factors, such as the type of security and the characteristics of the markets in which it trades, if any. Fair valuation determinations that rely on fewer or no observable inputs require greater judgment. Accordingly, fair value determinations for Level 3 securities require the greatest amount of judgment.
The inputs or methodologies selected and applied for valuing securities or other assets are not necessarily an indication of the risk associated with investing in those securities. The suitability, appropriateness and accuracy of the techniques, methodologies and sources employed to determine fair valuation are periodically reviewed and subject to change.
Note 5 – Securities Transactions
For the year ended March 31, 2024, the cost of purchases and proceeds from sales of investment securities, excluding short-term investments, were as follows:
Fund | | Purchases | | | Sales | |
Banking Fund | | $ | 45,599,475 | | | $ | 27,284,290 | |
Basic Materials Fund | | | 15,040,663 | | | | 22,629,961 | |
Biotechnology Fund | | | 56,777,970 | | | | 74,744,682 | |
Consumer Products Fund | | | 28,203,851 | | | | 44,510,685 | |
Electronics Fund | | | 87,702,787 | | | | 75,582,640 | |
Energy Fund | | | 216,757,976 | | | | 257,041,515 | |
Energy Services Fund | | | 72,670,602 | | | | 95,125,156 | |
Financial Services Fund | | | 41,630,956 | | | | 16,918,518 | |
Health Care Fund | | | 27,416,350 | | | | 31,214,688 | |
Internet Fund | | | 65,713,686 | | | | 52,966,554 | |
Leisure Fund | | | 27,562,929 | | | | 44,775,128 | |
Precious Metals Fund | | | 235,090,882 | | | | 254,247,812 | |
Real Estate Fund | | | 5,610,350 | | | | 5,912,266 | |
Retailing Fund | | | 25,394,632 | | | | 26,041,164 | |
Technology Fund | | | 119,027,295 | | | | 120,009,439 | |
Telecommunications Fund | | | 15,817,406 | | | | 19,791,118 | |
Transportation Fund | | | 30,848,454 | | | | 33,121,138 | |
Utilities Fund | | | 27,555,689 | | | | 33,024,124 | |
164 | THE RYDEX FUNDS ANNUAL REPORT | |
NOTES TO FINANCIAL STATEMENTS (continued) |
The Funds are permitted to purchase or sell securities from or to certain affiliated funds under specified conditions outlined in procedures adopted by the Board. The procedures have been designed to ensure that any purchase or sale of securities by a Fund from or to another fund or portfolio that is or could be considered an affiliate by virtue of having a common investment adviser (or affiliated investment advisers), common trustees and/or common officers complies with Rule 17a-7 of the 1940 Act. Further, as defined under these procedures, each transaction is effected at the current market price. For the year ended March 31, 2024, the Funds engaged in purchases and sales of securities pursuant to Rule 17a-7 of the 1940 Act, as follows:
Fund | | Purchases | | | Sales | | | Realized
Gain (Loss) | |
Banking Fund | | $ | 3,741,273 | | | $ | 2,739,244 | | | $ | 7,041 | |
Basic Materials Fund | | | 1,953,452 | | | | 2,881,494 | | | | 347,972 | |
Biotechnology Fund | | | 1,207,189 | | | | 2,696,017 | | | | 231,966 | |
Consumer Products Fund | | | 2,110,385 | | | | 6,434,364 | | | | 1,613,676 | |
Electronics Fund | | | 10,780,449 | | | | 11,337,151 | | | | (800,704 | ) |
Energy Fund | | | 12,135,881 | | | | 17,122,127 | | | | 658,255 | |
Energy Services Fund | | | 4,765,090 | | | | 5,947,452 | | | | (250,690 | ) |
Financial Services Fund | | | 2,849,368 | | | | 4,114,645 | | | | (178,203 | ) |
Health Care Fund | | | 3,004,732 | | | | 3,351,386 | | | | 7,482 | |
Internet Fund | | | 11,433,599 | | | | 5,605,482 | | | | 127,448 | |
Leisure Fund | | | 3,275,569 | | | | 6,102,743 | | | | 6,109 | |
Precious Metals Fund | | | 8,301,760 | | | | 4,229,290 | | | | (95,355 | ) |
Real Estate Fund | | | 886,868 | | | | 1,288,707 | | | | (9,223 | ) |
Retailing Fund | | | 3,021,338 | | | | 3,490,354 | | | | 83,482 | |
Technology Fund | | | 16,121,868 | | | | 20,880,505 | | | | 1,026,357 | |
Telecommunications Fund | | | 893,770 | | | | 1,093,939 | | | | (1,572 | ) |
Transportation Fund | | | 2,769,942 | | | | 2,912,536 | | | | (71,127 | ) |
Utilities Fund | | | 3,725,301 | | | | 3,957,449 | | | | 40,699 | |
Note 6– Repurchase Agreements
The Funds transfer uninvested cash balances into a single joint account, the daily aggregate balance of which is invested in one or more repurchase agreements collateralized by obligations of the U.S. Treasury and U.S. government agencies. The joint account includes other Funds in the Guggenheim complex not covered in this report. The collateral is in the possession of the Funds’ custodian and is evaluated to ensure that its market value exceeds, at a minimum, 102% of the original face amount of the repurchase agreements. Each Fund holds a pro rata share of the collateral based on the dollar amount of the repurchase agreement entered into by each Fund.
| | THE RYDEX FUNDS ANNUAL REPORT | 165 |
NOTES TO FINANCIAL STATEMENTS (continued) |
At March 31, 2024, the repurchase agreements in the joint account were as follows:
Counterparty and
Terms of Agreement | | Face Value | | | Repurchase Price | | | Collateral | | Par Value | | | Fair Value | |
J.P. Morgan Securities LLC | | | | | | | | | | U.S. Treasury Notes | | | | | | | | |
5.31% | | | | | | | | | | 0.25% - 5.00% | | | | | | | | |
Due 04/01/24 | | $ | 166,514,975 | | | $ | 166,588,658 | | | Due 03/31/24 - 02/15/33 | | $ | 172,847,100 | | | $ | 169,834,991 | |
| | | | | | | | | | | | | | | | | | | |
| | | | | | | | | | | U.S. Treasury Strips | | | | | | | | |
| | | | | | | | | | | 0.00% | | | | | | | | |
| | | | | | | | | | | Due 11/15/27 - 05/15/48 | | | 4,894 | | | | 4,141 | |
| | | | | | | | | | | | | | | | | | | |
| | | | | | | | | | | U.S. Treasury Bills | | | | | | | | |
| | | | | | | | | | | 0.00% | | | | | | | | |
| | | | | | | | | | | Due 04/11/24 - 05/02/24 | | | 4,500 | | | | 4,480 | |
| | | | | | | | | | | | | | | | | | | |
| | | | | | | | | | | U.S. Treasury Bond | | | | | | | | |
| | | | | | | | | | | 4.50% | | | | | | | | |
| | | | | | | | | | | Due 05/15/38 | | | 800 | | | | 840 | |
| | | | | | | | | | | | | | | | | | | |
| | | | | | | | | | | U.S. Treasury Inflation Indexed Bond | | | | | | | | |
| | | | | | | | | | | 0.13% | | | | | | | | |
| | | | | | | | | | | Due 04/15/27 | | | 874 | | | | 823 | |
| | | | | | | | | | | | | | 172,858,168 | | | | 169,845,275 | |
BofA Securities, Inc. | | | | | | | | | | U.S. Treasury Note | | | | | | | | |
5.31% | | | | | | | | | | 0.75% | | | | | | | | |
Due 04/01/24 | | | 64,044,221 | | | | 64,072,561 | | | Due 03/31/26 | | | 70,171,700 | | | | 65,325,118 | |
| | | | | | | | | | | | | | | | | | | |
Barclays Capital, Inc. | | | | | | | | | | U.S. Treasury Notes | | | | | | | | |
5.30% | | | | | | | | | | 0.63% - 3.50% | | | | | | | | |
Due 04/01/24 | | | 58,050,546 | | | | 58,076,185 | | | Due 11/30/27 - 02/15/33 | | | 64,598,100 | | | | 59,211,567 | |
In the event of counterparty default, the Funds have the right to collect the collateral to offset losses incurred. There is potential loss to the Funds in the event the Funds are delayed or prevented from exercising their rights to dispose of the collateral securities, including the risk of a possible decline in the value of the underlying securities during the period while the Funds seek to assert their rights. GI, acting under the supervision of the Board, reviews the value of the collateral and the creditworthiness of those banks and dealers with which the Funds enter into repurchase agreements to evaluate potential risks.
Note 7 – Portfolio Securities Loaned
The Funds may lend their securities to approved brokers to earn additional income. Securities lending income shown on the Funds’ Statements of Operations is shown net of rebates paid to the borrowers and earnings on cash collateral investments shared with the lending agent. Within this arrangement, the Funds act as the lender, U.S. Bank acts as the lending agent, and other approved registered broker dealers act as the borrowers. The Funds receive cash collateral, valued at 102% of the value of the securities on loan. Under the terms of the Funds’ securities lending agreement with U.S. Bank, cash collateral and proceeds are invested in the First American Government Obligations Fund — Class X. The Funds bear the risk of loss on cash collateral investments. Collateral is maintained over the life of the loan in an amount not less than the value of loaned securities, as determined at the close of fund business each day; any additional collateral required due to changes in security values is delivered to the Funds the next business day. Although the collateral mitigates the risk, the Funds could experience a delay in recovering their securities and a possible loss of income or value if the borrower fails to return the securities. The Funds have the right under the securities lending agreement to recover the securities from the borrower on demand. Securities lending transactions are accounted for as secured borrowings. The remaining contractual maturity of the securities lending agreement is overnight and continuous.
166 | THE RYDEX FUNDS ANNUAL REPORT | |
NOTES TO FINANCIAL STATEMENTS (continued) |
At March 31, 2024, the following Funds participated in securities lending transactions, which are subject to enforceable netting arrangements, as follows:
| | | Gross Amounts Not Offset in the
Statements of Assets and Liabilities | | | | Securities Lending Collateral | |
Fund | | Value of
Securities
Loaned | | | Collateral
Received(a) | | | Net
Amount | | | | Cash
Collateral
Invested | | | Cash
Collateral
Uninvested | | | Total
Collateral | |
Banking Fund | | $ | 443,592 | | | $ | (443,592 | ) | | $ | — | | | | $ | 473,691 | | | $ | — | | | $ | 473,691 | |
Basic Materials Fund | | | 821,007 | | | | (821,007 | ) | | | — | | | | | 862,835 | | | | — | | | | 862,835 | |
Biotechnology Fund | | | 1,620,914 | | | | (1,620,914 | ) | | | — | | | | | 1,757,813 | | | | — | | | | 1,757,813 | |
Consumer Products Fund | | | 598,379 | | | | (598,379 | ) | | | — | | | | | 630,624 | | | | — | | | | 630,624 | |
Electronics Fund | | | 2,299,497 | | | | (2,299,497 | ) | | | — | | | | | 2,421,986 | | | | — | | | | 2,421,986 | |
Energy Fund | | | 485,516 | | | | (485,516 | ) | | | — | | | | | 506,774 | | | | — | | | | 506,774 | |
Financial Services Fund | | | 41,134 | | | | (41,134 | ) | | | — | | | | | 45,776 | | | | — | | | | 45,776 | |
Health Care Fund | | | 133,253 | | | | (133,253 | ) | | | — | | | | | 144,339 | | | | — | | | | 144,339 | |
Internet Fund | | | 236,892 | | | | (236,892 | ) | | | — | | | | | 254,249 | | | | — | | | | 254,249 | |
Leisure Fund | | | 97,241 | | | | (97,241 | ) | | | — | | | | | 105,185 | | | | — | | | | 105,185 | |
Precious Metals Fund | | | 2,218,140 | | | | (2,218,140 | ) | | | — | | | | | 2,309,160 | | | | — | | | | 2,309,160 | |
Real Estate Fund | | | 12,485 | | | | (12,485 | ) | | | — | | | | | 13,316 | | | | — | | | | 13,316 | |
Retailing Fund | | | 31,363 | | | | (31,363 | ) | | | — | | | | | 34,798 | | | | — | | | | 34,798 | |
Technology Fund | | | 133,825 | | | | (133,825 | ) | | | — | | | | | 141,163 | | | | — | | | | 141,163 | |
Telecommunications Fund | | | 104,544 | | | | (104,544 | ) | | | — | | | | | 109,698 | | | | — | | | | 109,698 | |
Transportation Fund | | | 521,321 | | | | (521,321 | ) | | | — | | | | | 569,470 | | | | — | | | | 569,470 | |
Utilities Fund | | | 46,962 | | | | (46,962 | ) | | | — | | | | | 49,270 | | | | — | | | | 49,270 | |
(a) | Actual collateral received by the Fund is generally greater than the amount shown due to overcollateralization. |
In the event of counterparty default, the Funds have the right to collect the collateral to offset losses incurred. There is potential loss to the Funds in the event the Funds are delayed or prevented from exercising their rights to dispose of the collateral securities, including the risk of a possible decline in the value of the underlying securities during the period while the Funds seek to assert their rights. GI, acting under the supervision of the Board, reviews the value of the collateral and the creditworthiness of those banks and dealers to evaluate potential risks.
Note 8 – Line of Credit
The Trust, along with other affiliated trusts, secured an uncommitted $200,000,000 line of credit from U.S. Bank, N.A. On June 5, 2023, the line of credit agreement was renewed and expires on June 3, 2024. This line of credit is reserved for emergency or temporary purposes. Borrowings, if any, under this arrangement bear interest equal to the Prime Rate, minus 2%, which shall be paid monthly, averaging 6.39% for the year ended March 31, 2024. The Funds did not have any borrowings outstanding under this agreement at March 31, 2024.
| | THE RYDEX FUNDS ANNUAL REPORT | 167 |
NOTES TO FINANCIAL STATEMENTS (concluded) |
The average daily balances borrowed for the year ended March 31, 2024, were as follows:
Fund | | Average Daily Balance | |
Banking Fund | | $ | 2,874 | |
Basic Materials Fund | | | 525 | |
Biotechnology Fund | | | 6,041 | |
Consumer Products Fund | | | 8,060 | |
Electronics Fund | | | — | |
Energy Fund | | | 3,967 | |
Energy Services Fund | | | 1,396 | |
Financial Services Fund | | | 1,082 | |
Health Care Fund | | | 596 | |
Internet Fund | | | 68 | |
Leisure Fund | | | 63 | |
Precious Metals Fund | | | 6,205 | |
Real Estate Fund | | | 1,505 | |
Retailing Fund | | | 2,068 | |
Technology Fund | | | 3,107 | |
Telecommunications Fund | | | 885 | |
Transportation Fund | | | 2,740 | |
Utilities Fund | | | 1,503 | |
Note 9 – Market Risks
The value of, or income generated by, the investments held by the Funds are subject to the possibility of rapid and unpredictable fluctuation, and loss that may result from various factors. These factors include, among others, developments affecting individual companies, or from broader influences, including real or perceived changes in prevailing interest rates (which may change at any time based on changes in monetary policies and various market and other economic condition), changes in inflation rates or expectations about inflation rates, adverse investor confidence or sentiment, changing economic, political (including geopolitical), social or financial market conditions, increased instability or general uncertainty, environmental disasters, governmental actions, public health emergencies (such as the spread of infectious diseases, pandemics and epidemics), debt crises, actual or threatened wars or other armed conflicts (such as the ongoing Russia-Ukraine conflict and its collateral economic and other effects, including, but not limited to, sanctions and other international trade barriers) or ratings downgrades, and other similar events, each of which may be temporary or last for extended periods. Moreover, changing economic, political, geopolitical, social, financial market or other conditions in one country, geographic region or industry could adversely affect the value, yield and return of the investments held by the Funds in a different country, geographic region, economy, industry or market because of the increasingly interconnected global economies and financial markets. The duration and extent of the foregoing types of factors or conditions are highly uncertain and difficult to predict and have in the past, and may in the future, cause volatility and distress in economies and financial markets or other adverse circumstances, which may negatively affect the value of the Funds’ investments and performance of the Funds.
Note 10 – Subsequent Events
The Funds evaluated subsequent events through the date the financial statements are issued and determined there were no material events that would require adjustment to or disclosure in the Funds’ financial statements.
168 | THE RYDEX FUNDS ANNUAL REPORT | |
REPORT OF INDEPENDENT REGISTERED PUBLIC ACCOUNTING FIRM |
To the Shareholders of Banking Fund, Basic Materials Fund, Biotechnology Fund, Consumer Products Fund, Electronics Fund, Energy Fund, Energy Services Fund, Financial Services Fund, Health Care Fund, Internet Fund, Leisure Fund, Precious Metals Fund, Real Estate Fund, Retailing Fund, Technology Fund, Telecommunications Fund, Transportation Fund and Utilities Fund and the Board of Trustees of Rydex Series Funds
Opinion on the Financial Statements
We have audited the accompanying statements of assets and liabilities of Banking Fund, Basic Materials Fund, Biotechnology Fund, Consumer Products Fund, Electronics Fund, Energy Fund, Energy Services Fund, Financial Services Fund, Health Care Fund, Internet Fund, Leisure Fund, Precious Metals Fund, Real Estate Fund, Retailing Fund, Technology Fund, Telecommunications Fund, Transportation Fund and Utilities Fund (collectively referred to as the “Funds”), (eighteen of the funds constituting Rydex Series Funds (the “Trust”)), including the schedules of investments, as of March 31, 2024, and the related statements of operations for the year then ended, the statements of changes in net assets for each of the two years in the period then ended, the financial highlights for each of the five years in the period then ended and the related notes (collectively referred to as the “financial statements”). In our opinion, the financial statements present fairly, in all material respects, the financial position of each of the Funds (eighteen of the funds constituting Rydex Series Funds) at March 31, 2024, the results of their operations for the year then ended, the changes in their net assets for each of the two years in the period then ended and their financial highlights for each of the five years in the period then ended, in conformity with U.S. generally accepted accounting principles.
Basis for Opinion
These financial statements are the responsibility of the Trust’s management. Our responsibility is to express an opinion on each of the Funds’ financial statements based on our audits. We are a public accounting firm registered with the Public Company Accounting Oversight Board (United States) (“PCAOB”) and are required to be independent with respect to the Trust in accordance with the U.S. federal securities laws and the applicable rules and regulations of the Securities and Exchange Commission and the PCAOB.
We conducted our audits in accordance with the standards of the PCAOB. Those standards require that we plan and perform the audit to obtain reasonable assurance about whether the financial statements are free of material misstatement, whether due to error or fraud. The Trust is not required to have, nor were we engaged to perform, an audit of the Trust’s internal control over financial reporting. As part of our audits, we are required to obtain an understanding of internal control over financial reporting but not for the purpose of expressing an opinion on the effectiveness of the Trust’s internal control over financial reporting. Accordingly, we express no such opinion.
Our audits included performing procedures to assess the risks of material misstatement of the financial statements, whether due to error or fraud, and performing procedures that respond to those risks. Such procedures included examining, on a test basis, evidence regarding the amounts and disclosures in the financial statements. Our procedures included confirmation of securities owned as of March 31, 2024, by correspondence with the custodian and brokers; when replies were not received from brokers, we performed other auditing procedures. Our audits also included evaluating the accounting principles used and significant estimates made by management, as well as evaluating the overall presentation of the financial statements. We believe that our audits provide a reasonable basis for our opinion.

We have served as the auditor of one or more Guggenheim investment companies since 1979.
Tysons, Virginia
May 22, 2024
| | THE RYDEX FUNDS ANNUAL REPORT | 169 |
OTHER INFORMATION (Unaudited) |
Federal Income Tax Information
This information is being provided as required by the Internal Revenue Code. Amounts shown may differ from those elsewhere in the report because of differences in tax and financial reporting practice.
In January 2025, shareholders will be advised on IRS Form 1099 DIV or substitute 1099 DIV as to the federal tax status of the distributions received by shareholders in the calendar year 2024.
Precious Metals Fund intends to designate $101,535 of foreign tax withholding on foreign source income of $1,037,713.
The Funds’ investment income (dividend income plus short-term capital gains, if any) qualifies as follows:
Of the taxable ordinary income distributions paid during the fiscal year ended March 31, 2024, the following funds had the corresponding percentages qualify for the reduced tax rate pursuant to the Jobs and Growth Tax Relief and Reconciliation Act of 2003 or for the dividends received deduction for corporations. See the qualified dividend income and dividend received deduction columns, respectively, in the table below.
Additionally, of the taxable ordinary income distributions paid during the fiscal year ended March 31, 2024, the following funds had the corresponding percentages qualify as interest related dividends and qualified short-term capital gains as permitted by IRC Section 871(k)(1) and IRC Section 871(k)(2), respectively. See the qualified interest income and qualified short-term capital gain columns, respectively, in the table below.
Fund | | Qualified
Dividend
Income | | | Dividend
Received
Deduction | | | Qualified
Interest
Income | | | Qualified
Short-Term
Capital Gain | |
Banking Fund | | | 100.00 | % | | | 100.00 | % | | | 0.40 | % | | | 0.00 | % |
Basic Materials Fund | | | 100.00 | % | | | 100.00 | % | | | 1.36 | % | | | 0.00 | % |
Consumer Products Fund | | | 90.06 | % | | | 84.33 | % | | | 0.38 | % | | | 100.00 | % |
Energy Fund | | | 100.00 | % | | | 100.00 | % | | | 0.43 | % | | | 0.00 | % |
Leisure Fund | | | 100.00 | % | | | 100.00 | % | | | 0.73 | % | | | 0.00 | % |
Precious Metals Fund | | | 60.55 | % | | | 17.63 | % | | | 1.69 | % | | | 0.00 | % |
Real Estate Fund | | | 5.89 | % | | | 2.77 | % | | | 0.53 | % | | | 0.00 | % |
Telecommunications Fund | | | 100.00 | % | | | 100.00 | % | | | 1.24 | % | | | 0.00 | % |
Transportation Fund | | | 100.00 | % | | | 100.00 | % | | | 1.01 | % | | | 0.00 | % |
Utilities Fund | | | 100.00 | % | | | 100.00 | % | | | 0.46 | % | | | 0.00 | % |
With respect to the taxable year ended March 31, 2024, the Funds hereby designate as capital gain dividends the amounts listed below, or, if subsequently determined to be different, the net capital gain of such year:
Fund | | From long-term
capital gain: | | | From long-term capital
gain, using proceeds
from shareholder
redemptions: | |
Basic Materials Fund | | $ | 122,850 | | | $ | 36,444 | |
Biotechnology Fund | | | — | | | | 1,771,729 | |
Consumer Products Fund | | | 5,309,332 | | | | 1,764,537 | |
Electronics Fund | | | — | | | | 319,997 | |
Technology Fund | | | 1,955,347 | | | | 908,727 | |
Final regulations dated June 24, 2020 enable a regulated investment company to pay Section 199A dividends to its shareholders. Section 199A, enacted as part of the Tax Cuts and Jobs Act of 2017, may allow non-corporate tax payers a deduction of up to 20% of qualified business income from flow-through entities, including dividends from real estate investment trusts. The qualifying percentage of the Real Estate Fund’s ordinary income and short-term capital gain distributions, if any, for the purpose of the Section 199A deduction was 74.25%.
170 | THE RYDEX FUNDS ANNUAL REPORT | |
OTHER INFORMATION (Unaudited)(concluded) |
Delivery of Shareholder Reports
Paper copies of the Fund’s annual and semi-annual shareholder reports are not sent by mail, unless you specifically request paper copies of the reports from the Fund or from your financial intermediary. Instead, the reports are made available on a website, and you are notified by mail each time a report is posted and provided with a website link to access the report.
You may elect to receive all future shareholder reports in paper free of charge. If you hold shares of the Fund directly, you can inform the Fund that you wish to receive paper copies of reports by calling 800.820.0888. If you hold shares of the Fund through a financial intermediary, please contact the financial intermediary to make this election. Your election to receive reports in paper may apply to all Guggenheim funds in which you are invested and may apply to all Guggenheim funds held with your financial intermediary.
Tailored Shareholder Reports for Open-End Mutual Funds and Exchange-Traded Funds
Effective January 24, 2023, the SEC adopted rule and form amendments to require open-end mutual funds and exchange-traded funds registered on Form N-1A to transmit concise and visually engaging streamlined annual and semi-annual reports to shareholders that highlight key information. Other information, including financial statements, will no longer appear in a streamlined shareholder report but must be available online, delivered free of charge upon request, and filed on a semi-annual basis on Form N-CSR. The rule and form amendments have a compliance date of July 24, 2024. At this time, management is evaluating the impact of these amendments on the shareholder reports for the Funds.
Proxy Voting Information
A description of the policies and procedures that the Trust uses to determine how to vote proxies relating to securities held in the Fund’s portfolio is available, without charge and upon request, by calling 800.820.0888. This information is also available from the EDGAR database on the SEC’s website at https://www.sec.gov.
Information regarding how the Fund voted proxies relating to portfolio securities during the most recent 12-month period ended June 30 is available without charge, upon request, by calling 800.820.0888. This information is also available from the EDGAR database on the SEC’s website at https://www.sec.gov.
Sector Classification
Information in the Schedule of Investments is categorized by sectors using sector-level Classifications defined by the Bloomberg Industry Classification System, a widely recognized industry classification system provider. The Fund’s registration statement has investment policies relating to concentration in specific sectors/industries. For purposes of these investment policies, the Fund usually classifies sectors/industries based on industry-level Classifications used by widely recognized industry classification system providers such as Bloomberg Industry Classification System, Global Industry Classification Standards and Barclays Global Classification Scheme.
Quarterly Portfolio Schedules Information
The Trust files its complete schedule of portfolio holdings with the SEC for the first and third quarters of each fiscal year as an exhibit to its reports on Form N-PORT. The Funds’ Forms N-PORT are available on the SEC’s website at https://www.sec.gov. The Funds’ complete schedule of securities holdings as of the end of each fiscal quarter will be made available to the public on the SEC’s website at www.sec.gov and on our website at www.guggenheiminvestments.com, and will be made available, upon request and without charge, by calling 800.820.0888.
| | THE RYDEX FUNDS ANNUAL REPORT | 171 |
INFORMATION ON BOARD OF TRUSTEES AND OFFICERS (Unaudited) |
A Board of Trustees oversees the Trust, as well as other trusts of GI, in which its members have no stated term of service, and continue to serve after election until resignation. The Statement of Additional Information includes further information about Fund Trustees and Officers, and can be obtained without charge by visiting guggenheiminvestments.com or by calling 800.820.0888.
Name, Address*
and Year of Birth | Position(s)
Held with
Trust | Term of Office
and Length of
Time Served** | Principal Occupation(s)
During Past Five Years | Number of
Portfolios
in Fund
Complex
Overseen | Other
Directorships Held
by Trustees*** |
INDEPENDENT TRUSTEES | | | |
Randall C. Barnes (1951) | Trustee and Chair of the Valuation Oversight Committee | Since 2019 (Trustee)
Since 2020 (Chair of the Valuation Oversight Committee) | Current: Private Investor (2001-present).
Former: Senior Vice President and Treasurer, PepsiCo, Inc. (1993-1997); President, Pizza Hut International (1991-1993); Senior Vice President, Strategic Planning and New Business Development, PepsiCo, Inc. (1987-1990). | 153 | Current: Advent Convertible and Income Fund (2005-present); Purpose Investments Funds (2013-present).
Former: Guggenheim Energy & Income Fund (2015-2023); Fiduciary/Claymore Energy Infrastructure Fund (2004-2022); Guggenheim Enhanced Equity Income Fund (2005-2021); Guggenheim Credit Allocation Fund (2013-2021). |
Angela Brock-Kyle (1959) | Trustee | Since 2016 | Current: Founder and Chief Executive Officer, B.O.A.R.D.S. (consulting firm) (2013-present); Director, Mutual Fund Directors Forum (2022-present).
Former: Senior Leader, TIAA (financial services firm) (1987-2012). | 152 | Current: Bowhead Insurance GP, LLC (2020-present); Hunt Companies, Inc. (2019-present).
Former: Guggenheim Energy & Income Fund (2019-2023); Fiduciary/Claymore Energy Infrastructure Fund (2019-2022); Guggenheim Enhanced Equity Income Fund (2019-2021); Guggenheim Credit Allocation Fund (2019-2021); Infinity Property & Casualty Corp. (2014-2018). |
172 | THE RYDEX FUNDS ANNUAL REPORT | |
INFORMATION ON BOARD OF TRUSTEES AND OFFICERS (Unaudited)(continued) |
Name, Address*
and Year of Birth | Position(s)
Held with
Trust | Term of Office
and Length of
Time Served** | Principal Occupation(s)
During Past Five Years | Number of
Portfolios
in Fund
Complex
Overseen | Other
Directorships Held
by Trustees*** |
INDEPENDENT TRUSTEES - continued | | | |
Thomas F. Lydon, Jr. (1960) | Trustee and Chair of the Contracts Review Committee | Since 2005 (Trustee)
Since 2020 (Chair of the Contracts Review Committee) | Current: President, Global Trends Investments (registered investment adviser) (1996-present); Chief Executive Officer, Lydon Media (2016-present); Vice Chairman, VettaFi, a wholly owned subsidiary of The TMX Group (financial advisor content, research and digital distribution provider) (2022-present).
Former: Chief Executive Officer, ETF Flows, LLC (financial advisor education and research provider) (2019-2023); Director, GDX Index Partners, LLC (index provider) (2021-2023). | 152 | Current: US Global Investors, Inc. (GROW) (1995-present); The 2023 ETF Series Trust (4) (2023-present); The 2023 ETF Series II (1) (2023-present).
Former: Guggenheim Energy & Income Fund (2019-2023); Fiduciary/Claymore Energy Infrastructure Fund (2019-2022); Guggenheim Enhanced Equity Income Fund (2019-2021); Guggenheim Credit Allocation Fund (2019-2021); Harvest Volatility Edge Trust (3) (2017-2019). |
Ronald A. Nyberg (1953) | Trustee and Chair of the Nominating and Governance Committee | Since 2019 | Current: Of Counsel (formerly Partner), Momkus LLP (law firm) (2016-present).
Former: Partner, Nyberg & Cassioppi, LLC (law firm) (2000-2016); Executive Vice President, General Counsel, and Corporate Secretary, Van Kampen Investments (1982-1999). | 153 | Current: Advent Convertible and Income Fund (2003-present); PPM Funds (2) (2018-present); Endeavor Health (2012-present). Former: Guggenheim Energy & Income Fund (2015-2023); Fiduciary/Claymore Energy Infrastructure Fund (2004-2022); Guggenheim Enhanced Equity Income Fund (2005-2021); Guggenheim Credit Allocation Fund (2013-2021); Western Asset Inflation-Linked Opportunities & Income Fund (2004-2020); Western Asset Inflation-Linked Income Fund (2003-2020). |
| | THE RYDEX FUNDS ANNUAL REPORT | 173 |
INFORMATION ON BOARD OF TRUSTEES AND OFFICERS (Unaudited)(continued) |
Name, Address*
and Year of Birth | Position(s)
Held with
Trust | Term of Office
and Length of
Time Served** | Principal Occupation(s)
During Past Five Years | Number of
Portfolios
in Fund
Complex
Overseen | Other
Directorships Held
by Trustees*** |
INDEPENDENT TRUSTEES - concluded | | |
Sandra G. Sponem (1958) | Trustee and Chair of the Audit Committee | Since 2016 (Trustee)
Since 2019 (Chair of the Audit Committee) | Current: Retired.
Former: Senior Vice President and Chief Financial Officer, M.A. Mortenson-Companies, Inc. (construction and real estate development company) (2007-2017). | 152 | Current: SPDR Series Trust (81) (2018-present); SPDR Index Shares Funds (30) (2018-present); SSGA Active Trust (14) (2018-present).
Former: Guggenheim Energy & Income Fund (2019-2023); Fiduciary/Claymore Energy Infrastructure Fund (2019-2022); Guggenheim Enhanced Equity Income Fund (2019-2021); Guggenheim Credit Allocation Fund (2019-2021); SSGA Master Trust (1) (2018-2020). |
Ronald E. Toupin, Jr. (1958) | Trustee, Chair of the Board and Chair of the Executive Committee | Since 2019 | Current: Portfolio Consultant (2010-present); Member, Governing Council, Independent Directors Council (2013-present); Governor, Board of Governors, Investment Company Institute (2018-present).
Former: Member, Executive Committee, Independent Directors Council (2016-2018); Vice President, Manager and Portfolio Manager, Nuveen Asset Management (1998-1999); Vice President, Nuveen Investment Advisory Corp. (1992-1999); Vice President and Manager, Nuveen Unit Investment Trusts (1991-1999); and Assistant Vice President and Portfolio Manager, Nuveen Unit Investment Trusts (1988-1999), each of John Nuveen & Co., Inc. (registered broker dealer) (1982-1999). | 152 | Former: Guggenheim Energy & Income Fund (2015-2023); Fiduciary/Claymore Energy Infrastructure Fund (2004-2022); Guggenheim Enhanced Equity Income Fund (2005-2021); Guggenheim Credit Allocation Fund (2013-2021); Western Asset Inflation-Linked Opportunities & Income Fund (2004-2020); Western Asset Inflation-Linked Income Fund (2003-2020). |
174 | THE RYDEX FUNDS ANNUAL REPORT | |
INFORMATION ON BOARD OF TRUSTEES AND OFFICERS (Unaudited)(continued) |
Name, Address*
and Year of Birth | Position(s)
Held with
Trust | Term of Office
and Length of
Time Served** | Principal Occupation(s)
During Past Five Years | Number of
Portfolios
in Fund
Complex
Overseen | Other
Directorships Held
by Trustees*** |
INTERESTED TRUSTEE | | | | |
Amy J. Lee**** (1961) | Trustee, Vice President and Chief Legal Officer | Since 2019 | Current: Interested Trustee, certain other funds in the Fund Complex (2018-present); Chief Legal Officer, certain other funds in the Fund Complex (2014-present); Vice President, certain other funds in the Fund Complex (2007-present); Senior Managing Director, Guggenheim Investments (2012-present).
Former: President and/or Chief Executive Officer, certain other funds in the Fund Complex (2017-2019); Vice President, Associate General Counsel and Assistant Secretary, Security Benefit Life Insurance Company and Security Benefit Corporation (2004-2012). | 152 | Former: Guggenheim Energy & Income Fund (2018-2023); Fiduciary/Claymore Energy Infrastructure Fund (2018-2022); Guggenheim Enhanced Equity Income Fund (2018-2021); Guggenheim Credit Allocation Fund (2018-2021). |
* | The business address of each Trustee is c/o Guggenheim Investments, 227 West Monroe Street, Chicago, Illinois 60606. |
** | Each Trustee serves an indefinite term, until his or her successor is elected and qualified. |
*** | Each Trustee also serves on the Boards of Trustees of Guggenheim Funds Trust, Guggenheim Variable Funds Trust, Guggenheim Strategy Funds Trust, Guggenheim Taxable Municipal Bond & Investment Grade Debt Trust, Guggenheim Strategic Opportunities Fund, Guggenheim Active Allocation Fund, Rydex Series Funds, Rydex Dynamic Funds, Rydex Variable Trust and Transparent Value Trust. Messrs. Barnes and Nyberg also serve on the Board of Trustees of Advent Convertible & Income Fund. |
**** | This Trustee is deemed to be an “interested person” of the Funds under the 1940 Act by reason of her position with the Funds’ Adviser and/or the parent of the Adviser. |
| | THE RYDEX FUNDS ANNUAL REPORT | 175 |
INFORMATION ON BOARD OF TRUSTEES AND OFFICERS (Unaudited)(continued) |
Name, Address*
and Year of Birth | Position(s)
Held with
Trust | Term of Office
and Length of
Time Served** | Principal Occupation(s)
During Past Five Years |
OFFICERS | | | |
Brian E. Binder (1972) | President and Chief Executive Officer | Since 2019 | Current: President, Mutual Fund Boards, Guggenheim Investments (2022-present); President and Chief Executive Officer, certain other funds in the Fund Complex (2018-present); President, Mutual Funds Boards and Senior Managing Director, Guggenheim Funds Investment Advisors, LLC and Security Investors, LLC (2018-present); Board Member, Guggenheim Partners Investment Funds plc (2022-present); Board Member, Guggenheim Global Investments plc (2022-present); Board Member, Guggenheim Partners Fund Management (Europe) Limited (2018-present).
Former: Senior Managing Director and Chief Administrative Officer, Guggenheim Investments (2018-2022); Managing Director and President, Deutsche Funds, and Head of US Product, Trading and Fund Administration, Deutsche Asset Management (2013-2018); Managing Director, Chairman of North American Executive Committee and Head of Business Management and Consulting, Invesco Ltd. (2010-2012). |
James Howley (1972) | Chief Financial Officer, Chief Accounting Officer and Treasurer | Since 2022 | Current: Managing Director, Guggenheim Investments (2004-present); Chief Financial Officer, Chief Accounting Officer, and Treasurer, certain other funds in the Fund Complex (2022-present).
Former: Assistant Treasurer, certain other funds in the Fund Complex (2006-2022); Manager, Mutual Fund Administration of Van Kampen Investments, Inc. (1996-2004). |
Mark E. Mathiasen (1978) | Secretary | Since 2017 | Current: Secretary, certain other funds in the Fund Complex (2007-present); Managing Director, Guggenheim Investments (2007-present). |
Glenn McWhinnie (1969) | Assistant Treasurer | Since 2016 | Current: Vice President, Guggenheim Investments (2009-present); Assistant Treasurer, certain other funds in the Fund Complex (2016-present). |
Michael P. Megaris (1984) | Assistant Secretary | Since 2018 | Current: Assistant Secretary, certain other funds in the Fund Complex (2014-present); Managing Director, Guggenheim Investments (2012-present). |
Elisabeth Miller (1968) | Chief Compliance Officer | Since 2012 | Current: Chief Compliance Officer, certain other funds in the Fund Complex (2012-present); Senior Managing Director, Guggenheim Investments (2012-present); Senior Managing Director, Guggenheim Funds Distributors, LLC (2014-present).
Former: Chief Compliance Officer, Security Investors, LLC and Guggenheim Funds Investment Advisors, LLC (2012-2018); Chief Compliance Officer, Guggenheim Distributors, LLC (2009-2014); Senior Manager, Security Investors, LLC (2004-2014); Senior Manager, Guggenheim Distributors, LLC (2004-2014). |
Margaux Misantone (1978) | AML Officer | Since 2017 | Current: Chief Compliance Officer, Security Investors, LLC and Guggenheim Funds Investment Advisors, LLC (2018-present); AML Officer, Security Investors, LLC and certain other funds in the Fund Complex (2017-present); Managing Director, Guggenheim Investments (2015-present).
Former: Assistant Chief Compliance Officer, Security Investors, LLC and Guggenheim Funds Investments Advisors, LLC (2015-2018). |
176 | THE RYDEX FUNDS ANNUAL REPORT | |
INFORMATION ON BOARD OF TRUSTEES AND OFFICERS (Unaudited)(concluded) |
Name, Address*
and Year of Birth | Position(s)
Held with
Trust | Term of Office
and Length of
Time Served** | Principal Occupation(s)
During Past Five Years |
OFFICERS - concluded | |
Kimberly J. Scott (1974) | Assistant Treasurer | Since 2016 | Current: Director, Guggenheim Investments (2012-present); Assistant Treasurer, certain other funds in the Fund Complex (2012-present).
Former: Financial Reporting Manager, Invesco, Ltd. (2010-2011); Vice President/Assistant Treasurer, Mutual Fund Administration for Van Kampen Investments, Inc./Morgan Stanley Investment Management (2009-2010); Manager of Mutual Fund Administration, Van Kampen Investments, Inc./Morgan Stanley Investment Management (2005-2009). |
Jon Szafran (1989) | Assistant Treasurer | Since 2017 | Current: Director, Guggenheim Investments (2017-present); Assistant Treasurer, certain other funds in the Fund Complex (2017-present).
Former: Assistant Treasurer of Henderson Global Funds and Manager of US Fund Administration, Henderson Global Investors (North America) Inc. (“HGINA”), (2017); Senior Analyst of US Fund Administration, HGINA (2014–2017); Senior Associate of Fund Administration, Cortland Capital Market Services, LLC (2013-2014); Experienced Associate, PricewaterhouseCoopers LLP (2012-2013). |
* | The business address of each officer is c/o Guggenheim Investments, 227 West Monroe Street, Chicago, Illinois 60606. |
** | Each officer serves an indefinite term, until his or her successor is duly elected and qualified. |
| | THE RYDEX FUNDS ANNUAL REPORT | 177 |
GUGGENHEIM INVESTMENTS PRIVACY NOTICE (Unaudited) |
Who We Are
This Privacy Notice describes the data protection practices of Guggenheim Investments. Guggenheim Investments as used herein refers to the affiliated investment management businesses of Guggenheim Partners, LLC: Guggenheim Funds Investment Advisors, LLC, Guggenheim Partners Investment Management, LLC, Guggenheim Funds Distributors, LLC, Security Investors, LLC, Guggenheim Investment Advisors (Europe) Limited, Guggenheim Real Estate, LLC, GS Gamma Advisors, LLC, Guggenheim Partners India Management, LLC, Guggenheim Partners Europe Limited, as well as the funds in the Guggenheim Funds complex (the “Funds”) (“Guggenheim Investments,” “we,” “us,” or “our”).
Guggenheim Partners Investment Management Holdings, LLC, located at 330 Madison Avenue, New York, New York, 10017 is the data controller for your information. The affiliates who are also controllers of certain of your information are: Guggenheim Investment Advisors (Europe) Limited, Guggenheim Partners Europe Limited, Guggenheim Partners, LLC, Guggenheim Funds Investment Advisors, LLC, Guggenheim Partners Investment Management, LLC, Guggenheim Funds Distributors, LLC and Security Investors, LLC, as well as the Funds.
Our Commitment to You
Guggenheim Investments considers your privacy our utmost concern. When you become our client or investor, you entrust us with not only your hard-earned money but also with your personal and financial information. Because we have access to your private information, we hold ourselves to the highest standards in its safekeeping and use. We strictly limit how we share your information with others, whether you are a current or former Guggenheim Investments client or investor.
The Information We Collect About You
We collect certain nonpublic personal information about you from information you provide on applications, other forms, our website, and/or from third parties including investment advisors. This information includes Social Security or other tax identification number, assets, income, tax information, retirement and estate plan information, transaction history, account balance, payment history, bank account information, marital status, family relationships, information that we collect on our website through the use of “cookies,” and other personal information that you or others provide to us. We may also collect such information through your inquiries by mail, e-mail or telephone. We may also collect customer due diligence information, as required by applicable law and regulation, through third party service providers.
How We Handle Your Personal Information
The legal basis for using your information as set out in this Privacy Notice is as follows: (a) use of your personal data is necessary to perform our obligations under any contract with you (such as a contract for us to provide financial services to you); or (b) where use of your personal data is not necessary for performance of a contract, use of your personal data is necessary for our legitimate interests or the legitimate interests of others (for example, to enforce the legal terms governing our services, operate and market our website and other services we offer, ensure safe environments for our personnel and others, make and receive payments, prevent fraud and to know the customer to whom we are providing the services). Some processing is done to comply with applicable law.
In addition to the specific uses described above, we also use your information in the following manner:
| | ● | We use your information in connection with servicing your accounts. ● We use information to respond to your requests or questions. For example, we might use your information to respond to your customer feedback. ● We use information to improve our products and services. We may use your information to make our website and products better. We may use your information to customize your experience with us. |
| | ● | We use information for security purposes. We may use your information to protect our company and our customers. |
| | ● | We use information to communicate with you. For example, we will communicate with you about your account or our relationship. We may contact you about your feedback. We might also contact you about this Privacy Notice. We may also enroll you in our email newsletter. |
| | ● | We use information as otherwise permitted by law, as we may notify you. |
178 | THE RYDEX FUNDS ANNUAL REPORT | |
GUGGENHEIM INVESTMENTS PRIVACY NOTICE (Unaudited)(continued) |
| | ● | Aggregate/Anonymous Data. We may aggregate and/or anonymize any information collected through the website so that such information can no longer be linked to you or your device (“Aggregate/Anonymous Information”). We may use Aggregate/Anonymous Information for any purpose, including without limitation for research and marketing purposes, and may also share such data with any third parties, including advertisers, promotional partners, and sponsors. |
We do not sell information about current or former clients or their accounts to third parties. Nor do we share this information, except when necessary to complete transactions at your request, to make you aware of investment products and services that we or our affiliates offer, or as permitted or required by law.
We provide information about you to companies and individuals not affiliated with Guggenheim Investments to complete certain transactions or account changes, or to perform services for us related to your account. For example, if you ask to transfer assets from another financial institution to Guggenheim Investments, we must provide certain information about you to that company to complete the transaction. We provide the third party with only the information necessary to carry out its responsibilities and only for that purpose. And we require these third parties to treat your private information with the same high degree of confidentiality that we do. To alert you to other Guggenheim Investments products and services, we share your information within our family of affiliated companies. You may limit our sharing with affiliated companies as set out below. We may also share information with any successor to all or part of our business, or in connection with steps leading up to a merger or acquisition. For example, if part of our business was sold we may give customer information as part of that transaction. We may also share information about you with your consent.
We will release information about you if you direct us to do so, if we are compelled by law to do so, or in other circumstances as permitted by law (for example, to protect your account from fraud).
If you close your account(s) or become an inactive client or investor, we will continue to adhere to the privacy policies and practices described in this notice.
Opt-Out Provisions and Your Data Choices
The law allows you to “opt out” of certain kinds of information sharing with third parties. We do not share personal information about you with any third parties that triggers this opt-out right. This means YOU ARE ALREADY OPTED OUT.
When you are no longer our client or investor, we continue to share your information as described in this notice, and you may contact us at any time to limit our sharing by sending an email to CorporateDataPrivacy@GuggenheimPartners.com.
European Union Data Subjects and certain others: In addition to the choices set forth above, residents of the European Union and certain other jurisdictions have certain rights to (1) request access to or rectification or deletion of information we collect about them, (2) request a restriction on the processing of their information, (3) object to the processing of their information, or (4) request the portability of certain information. To exercise these or other rights, please contact us using the contact information below. We will consider all requests and provide our response within the time period stated by applicable law. Please note, however, that certain information may be exempt from such requests in some circumstances, which may include if we need to keep processing your information for our legitimate interests or to comply with a legal obligation. We may request you provide us with information necessary to confirm your identity before responding to your request.
Residents of France and certain other jurisdictions may also provide us with instructions regarding the manner in which we may continue to store, erase and share your information after your death, and where applicable, the person you have designated to exercise these rights after your death.
How We Protect Privacy Online
We take steps to protect your privacy when you use our web site – www.guggenheiminvestments.com – by using secure forms of online communication, including encryption technology, Secure Socket Layer (SSL) protocol, firewalls and user names and passwords. These safeguards vary based on the sensitivity of the information that we collect and store. However, we cannot and do not guarantee that these measures will prevent every unauthorized attempt to access, use, or disclose your information since despite our efforts, no Internet and/or other electronic transmissions can be completely secure. Our web site uses “http cookies”—tiny pieces of information that we ask your browser to
| | THE RYDEX FUNDS ANNUAL REPORT | 179 |
GUGGENHEIM INVESTMENTS PRIVACY NOTICE (Unaudited)(concluded) |
store. We use cookies for session management and security features on the Guggenheim Investments web site. We do not use them to pull data from your hard drive, to learn your e-mail address, or to view data in cookies created by other web sites. We will not share the information in our cookies or give others access to it. See the legal information area on our web site for more details about web site security and privacy features.
How We Safeguard Your Personal Information and Data Retention
We restrict access to nonpublic personal information about you to our employees and in some cases to third parties (for example, the service providers described above) as permitted by law. We maintain strict physical, electronic and procedural safeguards that comply with federal standards to guard your nonpublic personal information.
We keep your information for no longer than necessary for the purposes for which it is processed. The length of time for which we retain information depends on the purposes for which we collected and use it and/or as required to comply with applicable laws. Information may persist in copies made for backup and business continuity purposes for additional time.
International Visitors
If you are not a resident of the United States, please be aware that your information may be transferred to, stored and processed in the United States where our servers are located and our databases are operated. The data protection and other laws of the United States and other countries might not be as comprehensive as those in your country.
In such cases, we ensure that a legal basis for such a transfer exists and that adequate protection is provided as required by applicable law, for example, by using standard contractual clauses or by transferring your data to a jurisdiction that has obtained an adequacy finding. Individuals whose data may be transferred on the basis of standard contractual clauses may contact us as described below.
We’ll Keep You Informed
If you have any questions or concerns about how we treat your personal data, we encourage you to consult with us first. You may also contact the relevant supervisory authority. We reserve the right to modify this policy at any time and will inform you promptly of material changes. You may access our privacy policy from our web site at www.guggenheiminvestments.com. Should you have any questions regarding our privacy policy, contact us by email at CorporateDataPrivacy@GuggenheimPartners.com.
180 | THE RYDEX FUNDS ANNUAL REPORT | |
This page intentionally left blank.
Item 2. Code of Ethics.
The registrant’s Board of Trustees has adopted a code of ethics that applies to the registrant’s principal executive officer and principal financial officer. No substantive amendments were approved or waivers were granted to the code of ethics during the period covered by this report. The code of ethics is filed as an exhibit to this Form N-CSR.
Item 3. Audit Committee Financial Expert.
The registrant's Board of Trustees has determined that it has at least one audit committee financial expert serving on its audit committee (the “Audit Committee”), Sandra G. Sponem. Ms. Sponem is “independent,” meaning that she is not an “interested person” of the registrant (as that term is defined in Section 2(a)(19) of the Investment Company Act) and she does not accept any consulting, advisory, or other compensatory fee from the registrant (except in her capacity as a Board or committee member).
(Under applicable securities laws, a person who is determined to be an audit committee financial expert will not be deemed an "expert" for any purpose, including without limitation for the purposes of Section 11 of the Securities Act of 1933, as a result of being designated or identified as an audit committee financial expert. The designation or identification of a person as an audit committee financial expert does not impose on such person any duties, obligations, or liabilities that are greater than the duties, obligations, and liabilities imposed on such person as a member of the Audit Committee and Board of Trustees in the absence of such designation or identification The designation or identification of a person as an audit committee financial expert does not affect the duties, obligations or liability of any other member of the audit committee or Board of Trustees.).
Item 4. Principal Accountant Fees and Services.
(a) Audit Fees. The aggregate Audit Fees billed by the registrant’s principal accountant for professional services rendered for the audit of the annual financial statements or services that are normally provided by the accountant in connection with statutory and regulatory filings or engagements for the fiscal years ended March 31, 2024 and March 31, 2023 were $919,853 and $919,853, respectively.
(b) Audit Related Fees. The aggregate Audit-Related Fees billed by the registrant’s principal accountant for assurance and related services that are reasonably related to the performance of the audit of the registrant’s financial statements and are not reported under paragraph (a) of this Item for the fiscal years ended March 31, 2024 and March 31, 2023 were $0 and $0, respectively.
The aggregate fees billed in the Reporting Periods for assurance and related services by the Auditor to the registrant’s investment adviser (not including any sub-investment adviser whose role is primarily portfolio management and is subcontracted with or overseen by another investment adviser), and any entity controlling, controlled by or under common control with the investment adviser that provides ongoing services to the registrant (“Service Affiliates”) which required pre-approval by the Audit Committee which related to the review of the transfer agent function for the fiscal years ended March 31, 2024 and March 31, 2023 were $0 and $0, respectively.
(c) Tax Fees: The aggregate Tax Fees billed by the registrant’s principal accountant for professional services rendered for tax compliance, tax advice, and tax planning, including preparation of tax returns and distribution assistance, for the fiscal years ended March 31, 2024 and March 31, 2023 were $439,140 and $447,790, respectively. These services consisted of (i) preparation of U.S. federal, state and excise tax returns; (ii) U.S. federal and state tax planning, advice and assistance regarding statutory, regulatory or administrative developments, (iii) tax advice regarding tax qualification matters and/or treatment of various financial instruments held or proposed to be acquired and (iv) review of U.S. federal excise distribution calculations.
(d) All Other Fees. The aggregate All Other Fees billed by the registrant’s principal accountant for products and services provided by the principal accountant, other than the services reported in paragraphs (a) through (c) of this Item, for the fiscal years ended March 31, 2024 and March 31, 2023 were $0 and $0, respectively.
(e) Audit Committee Pre-Approval Policies and Procedures.
(1) Audit Committee pre-approval policies and procedures:
To fulfill its responsibilities and duties the Audit Committee (the “Committee”) shall:
1. Pre-Approval Policy (Trusts). Pre-approve any engagement of the independent auditors to provide any services, other than “prohibited non-audit services,” to the Trust, including the fees and other compensation to be paid to the independent auditors (unless an exception is available under Rule 2-01 of Regulation S-X).
(a) The categories of services to be reviewed and considered for pre-approval include those services set forth under Section II.A.1. of the Background and Definitions for Audit Committee Charter (collectively, “Identified Services”).
(b) The Committee has pre-approved Identified Services for which the estimated fees are less than $25,000.
(c) For Identified Services with estimated fees of $25,000 or more, but less than $50,000, the Chair or any member of the Committee designated by the Chair is hereby authorized to pre-approve such Identified Services on behalf of the Committee.
(d) For Identified Services with estimated fees of $50,000 or more, such Identified Services require pre-approval by the Committee.
(e) All requests for Identified Services to be provided by the independent auditor that were pre-approved by the Committee shall be submitted to the Chief Accounting Officer (“CAO”) of the Trust by the independent auditor using the pre-approval request form. The Trust’s CAO will determine whether such services are included within the list of services that have received the general pre-approval of the Committee.
(f) The independent auditors or the CAO of the Trust (or an officer of the Trust who reports to the CAO) shall report to the Committee at each of its regular scheduled meetings all audit, audit-related and permissible non-audit services initiated since the last such report (unless the services were contained in the initial audit plan, as previously presented to, and approved by, the Committee). The report shall include a general description of the services and projected fees, and the means by which such services were approved by the Committee (including the particular category of Identified Services under which pre-approval was obtained).
2. Pre-Approval Policy (Adviser or Any Control Affiliate). Pre-approve any engagement of the independent auditors, including the fees and other compensation to be paid to the independent auditors, to provide any non-audit services to the Adviser (or any “control affiliate” of the Adviser providing ongoing services to the Trust), if the engagement relates directly to the operations or financial reporting of the Trust (unless an exception is available under Rule 2-01 of Regulation S-X).
(a) The Chair or any member of the Committee designated by the Chair may grant the pre-approval for non-audit services to the Adviser (or any “control affiliate” of the Adviser providing ongoing services to the Trust) relating directly to the operations or financial reporting of the Trust for which the estimated fees are less than $25,000. All such delegated pre-approvals shall be presented to the Committee no later than the next regularly scheduled Committee meeting.
(b) For non-audit services to the Adviser (or any “control affiliate” of the Adviser providing ongoing services to the Trust) relating directly to the operations or financial reporting of the Trust for which the estimated fees are $25,000 or more, such services require pre-approval by the Committee.
| A. | Pre-Approval Requirements |
| 1. | Categories of Services to be Reviewed and Considered for Pre-Approval |
| (i) | Annual financial statement audits |
| (ii) | Seed audits (related to new product filings, as required) |
| (iii) | SEC and regulatory filings and consents |
| (b) | Audit-Related Services |
| (i) | Accounting consultations |
| (ii) | Fund merger/reorganization support services |
| (iii) | Other accounting related matters |
| (iv) | Agreed upon procedures reports |
| (vi) | Other internal control reports |
| (i) | Recurring tax services: |
| (a) | Preparation of Federal and state income tax returns, including extensions |
| (b) | Preparation of calculations of taxable income, including fiscal year tax designations |
| (c) | Preparation of annual Federal excise tax returns (if applicable) |
| (d) | Preparation of calendar year excise distribution calculations |
| (e) | Calculation of tax equalization on an as-needed basis |
| (f) | Preparation of monthly/quarterly estimates of tax undistributed position for closed-end funds |
| (g) | Preparation of the estimated excise distribution calculations on an as-needed basis |
| (h) | Preparation of calendar year shareholder reporting designations on Form 1099 |
| (i) | Preparation of quarterly Federal, state and local and franchise tax estimated tax payments on an as-needed basis |
| (j) | Preparation of state apportionment calculations to properly allocate Fund taxable income among the states for state tax filing purposes |
| (k) | Assistance with management’s identification of passive foreign investment companies (PFICs) for tax purposes |
| (ii) | Permissible non-recurring tax services upon request: |
| (a) | Assistance with determining ownership changes which impact a Fund’s utilization of loss carryforwards |
| (b) | Assistance with corporate actions and tax treatment of complex securities and structured products |
| (c) | Assistance with IRS ruling requests and calculation of deficiency dividends |
| (d) | Conduct training sessions for the Adviser’s internal tax resources |
| (e) | Assistance with Federal, state, local and international tax planning and advice regarding the tax consequences of proposed or actual transactions |
| (f) | Tax services related to amendments to Federal, state and local returns and sales and use tax compliance |
| (g) | RIC qualification reviews |
| (h) | Tax distribution analysis and planning |
| (i) | Tax authority examination services |
| (j) | Tax appeals support services |
| (k) | Tax accounting methods studies |
| (l) | Fund merger, reorganization and liquidation support services |
| (m) | Tax compliance, planning and advice services and related projects |
| (n) | Assistance with out of state residency status |
| (o) | Provision of tax compliance services in India for Funds with direct investments in India |
| B. | Pre-Approval Not Required |
Under Section 10A(h)(i)(1)(B) of the Exchange Act and Rule 2-01 under Regulation S-X (Section (c)(7)), pre-approval of non-audit services for the Trust pursuant to Section V.B.2 is not required, if:
| 1. | the aggregate amount of all non-audit services provided to the Trust is no more than 5% of the total fees paid by the Trust to the independent auditors during the fiscal year in which the non-audit services are provided; |
| 2. | the services were not recognized by Trust management at the time of the engagement as non-audit services; and |
| 3. | such services are promptly brought to the attention of the Audit Committee by Trust management and the Committee approves them (which may be by delegation) prior to the completion of the audit. |
Under Section 10A(h)(i)(1)(B) of the Exchange Act and Rule 2-01 under Regulation S-X (Section (c)(7)), pre-approval of non-audit services for the Adviser (or any affiliate of the Adviser providing ongoing services to the Trust) pursuant to Section V.B.3 is not required, if:
| 1. | the aggregate amount of all non-audit services provided is no more than 5% of the total fees paid to the Trust’s independent auditors by the Trust, the Adviser and any “control affiliate” of the Adviser providing ongoing services to the Trust during the fiscal year in which the non-audit services are provided; |
| 2. | the services were not recognized by Trust management at the time of the engagement as non-audit services; and |
| 3. | such services are promptly brought to the attention of the Audit Committee by Trust management and the Committee approves them (which may be by delegation) prior to the completion of the audit. |
(2) None of the services described in each of Items 4(b) through (d) were approved by the Audit Committee pursuant to paragraph (c)(7)(i)(C) of Rule 2-01 of Regulation S-X
(f) Not applicable.
(g) Non-Audit Fees. The aggregate non-audit fees billed by the registrant’s accountant for the most recent fiscal year and the preceding fiscal year for services rendered to the registrant, the investment adviser, and any entity controlling, controlled by, or under common control with the adviser that provides ongoing services to the registrant were $439,140 and $447,790, respectively. These aggregate fees were less than the aggregate fees billed for the same periods by the registrant’s principal accountant for audit services rendered to the registrant, the investment adviser, and any entity controlling, controlled by, or under common control with the adviser that provides ongoing services to the registrant.
(h) Auditor Independence. The registrant’s Audit Committee was provided with information relating to the provision of non-audit services by Ernst & Young, LLP to the registrant’s investment adviser (not including any sub adviser whose role is primarily portfolio management and is subcontracted with or overseen by another investment adviser), and any entity controlling, controlled by, or under common control with the investment adviser that provides ongoing services to the registrant that were not pre-approved by the Audit Committee so that a determination could be made whether the provision of such services is compatible with maintaining Ernst & Young, LLP’s independence.
(i) Not applicable.
(j) Not applicable.
Item 5. Audit Committee of Listed Registrants.
Not applicable.
Item 6. Investments.
(a) The Schedule of Investments is included under Item 1 of this Form.
(b) Not applicable.
Item 7. Disclosure of Proxy Voting Policies and Procedures for Closed-End Management Investment Companies.
Not applicable.
Item 8. Portfolio Managers of Closed-End Management Investment Companies.
Not applicable.
Item 9. Purchases of Equity Securities by Closed-End Management Investment Company and Affiliated Purchasers.
Not applicable.
Item 10. Submission of Matters to a Vote of Security Holders.
The registrant does not currently have in place procedures by which shareholders may recommend nominees to the registrant’s board.
There have been no changes to the procedures by which shareholders may recommend nominees to the registrant’s board.
Item 11. Controls and Procedures.
(a) The registrant’s President (principal executive officer) and Treasurer (principal financial officer) have evaluated the registrant’s disclosure controls and procedures within 90 days of this filing and have concluded that based on such evaluation as required by Rule 30a-3(b) under the Investment Company Act, that the registrant’s disclosure controls and procedures were effective as of that date in ensuring that information required to be disclosed by the registrant in this Form N-CSR was recorded, processed, summarized, and reported within the time periods specified in the Securities and Exchange Commission’s rules and forms.
(b) There were no changes in the registrant’s internal control over financial reporting (as defined in Rule 30a-3(d) under the Investment Company Act) that occurred during the period covered by this report that have materially affected, or are reasonably likely to materially affect, the registrant’s internal control over financial reporting.
Item 12. Disclosure of Securities Lending Activities for Closed-End Management Investment Companies.
Not applicable.
Item 13. Recovery of Erroneously Awarded Compensation.
(a) Not applicable.
(b) Not applicable.
Item 14. Exhibits.
(a)(1) The registrant’s code of ethics pursuant to Item 2 of Form N-CSR is attached.
(a)(2) Separate certifications by the President (principal executive officer) and Treasurer (principal financial officer) of the registrant as required by Rule 30a-2(a) under the Investment Company Act (17 CFR 270.30a-2(a)) are attached.
(a)(3) Not applicable.
(a)(4) Not applicable.
(b) A certification by the registrant’s President (principal executive officer) and Treasurer (principal financial officer) as required by Rule 30a-2(b) under the Investment Company Act (17 CFR 270.30a-2(b)) is attached.
SIGNATURES
Pursuant to the requirements of the Securities Exchange Act of 1934 and the Investment Company Act of 1940, the registrant has duly caused this report to be signed on its behalf by the undersigned, thereunto duly authorized.
| (Registrant) | Rydex Series Funds | |
| | | |
| By (Signature and Title)* | /s/ Brian E. Binder | |
| | Brian E. Binder, President and Chief Executive Officer | |
| | | |
| Date | May 31, 2024 | |
Pursuant to the requirements of the Securities Exchange Act of 1934 and the Investment Company Act of 1940, this report has been signed below by the following persons on behalf of the registrant and in the capacities and on the dates indicated.
| By (Signature and Title)* | /s/ Brian E. Binder | |
| | Brian E. Binder, President and Chief Executive Officer | |
| | | |
| Date | May 31, 2024 | |
| | | |
| By (Signature and Title)* | /s/ James Howley | |
| | James Howley, Chief Financial Officer, Chief Accounting Officer and Treasurer | |
| | | |
| Date | May 31, 2024 | |
* Print the name and title of each signing officer under his or her signature.


