UNITED STATES
SECURITIES AND EXCHANGE COMMISSION
Washington, D.C. 20549
FORM N-CSR
CERTIFIED SHAREHOLDER REPORT OF REGISTERED MANAGEMENT
INVESTMENT COMPANIES
Investment Company Act file number 811- 07584
Rydex Series Funds
(Exact name of registrant as specified in charter)
702 King Farm Boulevard, Suite 200
Rockville, Maryland 20850
(Address of principal executive offices) (Zip code)
Amy J. Lee
Rydex Series Funds
702 King Farm Boulevard, Suite 200
Rockville, Maryland 20850
(Name and address of agent for service)
Registrant's telephone number, including area code: 1-301-296-5100
Date of fiscal year end: December 31
Date of reporting period: January 1, 2022 - December 31, 2022
Form N-CSR is to be used by management investment companies to file reports with the Commission not later than 10 days after the transmission to stockholders of any report that is required to be transmitted to stockholders under Rule 30e-1 under the Investment Company Act of 1940 (17 CFR 270.30e-1). The Commission may use the information provided on Form N-CSR in its regulatory, disclosure review, inspection, and policymaking roles.
A registrant is required to disclose the information specified by Form N-CSR, and the Commission will make this information public. A registrant is not required to respond to the collection of information contained in Form N-CSR unless the Form displays a currently valid Office of Management and Budget ("OMB") control number. Please direct comments concerning the accuracy of the information collection burden estimate and any suggestions for reducing the burden to Secretary, Securities and Exchange Commission, 450 Fifth Street, NW, Washington, DC 20549-0609. The OMB has reviewed this collection of information under the clearance requirements of 44 U.S.C. § 3507.
Item 1. Reports to Stockholders.
The registrant’s annual report transmitted to shareholders pursuant to Rule 30e-1 under the Investment Company Act of 1940, as amended (the “Investment Company Act”), is as follows:
12.31.2022
Guggenheim Funds Annual Report
Guggenheim Alternative Fund |
Guggenheim Multi-Hedge Strategies Fund | | |
Rydex Commodities Fund |
Rydex Commodities Strategy Fund | | |
GuggenheimInvestments.com | RDXSGIALT-ANN-1222x1223 |

| | |
DEAR SHAREHOLDER | 2 |
ECONOMIC AND MARKET OVERVIEW | 4 |
ABOUT SHAREHOLDERS’ FUND EXPENSES | 6 |
ALTERNATIVE FUND | |
MULTI-HEDGE STRATEGIES FUND | 9 |
COMMODITIES FUND | |
COMMODITIES STRATEGY FUND | 56 |
NOTES TO CONSOLIDATED FINANCIAL STATEMENTS | 71 |
REPORT OF INDEPENDENT REGISTERED PUBLIC ACCOUNTING FIRM | 93 |
OTHER INFORMATION | 95 |
INFORMATION ON BOARD OF TRUSTEES AND OFFICERS | 97 |
GUGGENHEIM INVESTMENTS PRIVACY NOTICE | 105 |
| | THE GUGGENHEIM FUNDS ANNUAL REPORT | 1 |
Dear Shareholder:
Security Investors, LLC (the “Investment Adviser”) is pleased to present the annual shareholder report for two alternative strategy funds that are part of the Rydex Series Funds (each a “Fund”). This report covers performance of the Funds for the annual period ended December 31, 2022 (the “Reporting Period”).
In December 2022, Guggenheim Partners announced the untimely and unexpected death of Scott Minerd, one of Guggenheim’s Managing Partners and its Global Chief Investment Officer. He joined Guggenheim as a Managing Partner shortly after the firm was formed. He was a frequent commentator on markets and investments, both on television and via social media. He also was one of the designers of the organization, systems and processes that make Guggenheim Investments a strong, robust and scalable leader in the asset management business.
Guggenheim has implemented its succession plan, which is designed to deal with unexpected events. There has been and will continue to be no disruption of service to our clients, no change in the daily management of client portfolios and no change in the process of selecting investment assets, all of which continue to be handled by the longstanding committees and long-tenured investment professionals who, every day, implement our investment processes.
Guggenheim Investments continues to be led by its Co-Presidents, Dina DiLorenzo and David Rone, and by Anne B. Walsh, a Managing Partner and Chief Investment Officer of Guggenheim Partners Investment Management.
The Investment Adviser is a part of Guggenheim Investments, which represents the investment management businesses of Guggenheim Partners, LLC (“Guggenheim”), a global, diversified financial services firm.
Guggenheim Funds Distributors, LLC is the distributor of the Funds. Guggenheim Funds Distributors, LLC is affiliated with Guggenheim and the Investment Adviser.
We encourage you to read the Economic and Market Overview section of the report, which follows this letter, and then the Performance Report and Fund Profile for each Fund.
We are committed to providing innovative investment solutions and appreciate the trust you place in us.
Sincerely,
Security Investors, LLC
January 31, 2023
2 | THE GUGGENHEIM FUNDS ANNUAL REPORT | |
Read a prospectus and summary prospectus (if available) carefully before investing. It contains the investment objectives, risks, charges, expenses and other information, which should be considered carefully before investing. Obtain a prospectus and summary prospectus (if available) at guggenheiminvestments.com or call 800.820.0888.
This material is not intended as a recommendation or as investment advice of any kind, including in connection with rollovers, transfers, and distributions. Such material is not provided in a fiduciary capacity, may not be relied upon for or in connection with the making of investment decisions, and does not constitute a solicitation of an offer to buy or sell securities. All content has been provided for informational or educational purposes only and is not intended to be and should not be construed as legal or tax advice and/or a legal opinion. Always consult a financial, tax and/or legal professional regarding your specific situation.
The Multi-Hedge Strategies Fund is subject to a number of risks and may not be suitable for all investors. ● The Fund’s use of derivatives such as futures, options and swap agreements may expose the Fund to additional risks that it would not be subject to if it invested directly in the securities underlying those derivatives. ● The more the Fund invests in leveraged instruments, the more the leverage will magnify any gains or losses on those investments. ● The Fund’s use of short selling involves increased risks and costs. The Fund risks paying more for a security than it received from its sale. ● The Fund’s investments in high yield securities and unrated securities of similar credit quality (“junk bonds”) may be subject to greater levels of interest rate, credit and liquidity risk than funds that do not invest in such securities. ● The Fund’s fixed income investments will change in value in response to interest rate changes and other factors. ● The Fund’s exposure to the commodity and currency markets may subject the Fund to greater volatility as commodity- and currency-linked derivative investments may be affected by changes in overall market movements, commodity index volatility, changes in interest rates or factors affecting a particular industry, commodity or currency—such as droughts, floods, weather, livestock disease, embargoes, tariffs and international economic, political and regulatory developments. The Fund may also incur transaction costs with the conversion between various currencies. ● The Fund’s exposure to foreign currencies subjects the Fund to the risk that those currencies will decline in value relative to the U.S. dollar, or, in the case of short positions, that the U.S. dollar will decline in value relative to the currency being hedged. ● These risks may cause the Fund to experience higher losses and/or volatility than a fund that does not invest in derivatives, use leverage or short sales or have exposure to high yield/fixed income securities, foreign currencies and/or securities. ● See the prospectus for more information on these and additional risks.
The Commodities Strategy Fund is subject to a number of risks and may not be suitable for all investors. ● The Fund’s exposure to the commodity markets may subject the Fund to greater volatility as commodity-linked investments may be affected by changes in overall market movements, commodity index volatility, changes in interest rates or factors affecting a particular industry or commodity—such as droughts, floods, weather, embargos, tariffs and international economic, political and regulatory developments. ● To the extent that the Fund’s investments are concentrated in energy-related commodities, the Fund is subject to the risk that this sector will underperform the market as a whole. ● The Fund’s use of derivatives, such as futures, options, structured notes and swap agreements, may expose the Fund to additional risks that it would not be subject to if it invested directly in the securities or investments underlying those derivatives. ● The more the Fund invests in leveraged instruments, the more the leverage will magnify any gains or losses on those investments. ● The Fund is subject to tracking error risks, which may cause the Fund’s performance not to match that of or be lower than the Fund’s underlying benchmark. ● The Fund’s investments in other investment companies subjects the Fund to those risks affecting the investment company, including the possibility that the value of the underlying securities held by the investment company could decrease. Moreover, the Fund will incur its pro rata share of the expenses of the underlying investment companies’ expenses. ●This Fund is considered non-diversified and can invest a greater portion of its assets in securities of individual issuers than a diversified fund. As a result, changes in the market value of a single security could cause greater fluctuations in the value of Fund shares than would occur in a more diversified fund. ● See the prospectus for more information on these and additional risks.
| | THE GUGGENHEIM FUNDS ANNUAL REPORT | 3 |
ECONOMIC AND MARKET OVERVIEW (Unaudited) | December 31, 2022 |
Helped by lower energy prices, real economic growth reaccelerated in the fourth quarter of 2022. Amid this continued strong growth, the Federal Reserve (the “Fed”) is explicitly targeting a weaker labor market, and several leading indicators point to rising unemployment by the middle of the year. Consumption also faces headwinds from dwindling excess savings buffers and a sharply negative wealth shock as financial asset and home prices fall. Business investment also appears to be weakening due to the sharp tightening in financial conditions and more challenging outlook for economic growth. The housing sector could subtract further from gross domestic product (“GDP”) as the spike in mortgage rates has adversely impacted demand.
Because private sector balance sheets are generally healthy in the aggregate and the economy lacks major imbalances, we do not expect a particularly deep recession. But the likelihood of a limited monetary and fiscal policy response means the economic recovery could be weak, and certain highly levered companies may suffer.
Moderation in goods prices as supply chains normalize should bring inflation lower over the next several months, and shelter inflation should roll over by mid-2023. Services inflation outside of shelter is the main concern for the Fed, but a softening labor market and cooling wage growth may keep this category contained. As a result, core inflation could fall below 3 percent by the end of the year.
The Fed’s continued rate hike campaign may cause the front end of the yield curve to remain elevated in the near term. But should the economic cycle roll over later this year, Treasury yields may see a significant decline. Weakening corporate earnings growth and an emerging recession would present downside risk to equity returns later in 2023 but, given corporate fundamentals remain solid, high quality fixed income and carefully selected high yield issuers should provide attractive returns.
For the Reporting Period, the S&P 500® Index* returned -18.11%. The MSCI Europe-Australasia-Far East (“EAFE”) Index* returned -14.45%. The return of the MSCI Emerging Markets Index* was -20.09%.
In the bond market, the Bloomberg U.S. Aggregate Bond Index* posted a -13.01% return for the Reporting Period, while the Bloomberg U.S. Corporate High Yield Index* returned -11.19%. The return of the ICE Bank of America (“BofA”) 3-Month U.S. Treasury Bill Index* was 1.47% for the Reporting Period.
4 | THE GUGGENHEIM FUNDS ANNUAL REPORT | |
ECONOMIC AND MARKET OVERVIEW (Unaudited)(concluded) | December 31, 2022 |
The opinions and forecasts expressed may not actually come to pass. This information is subject to change at any time, based on market and other conditions, and should not be construed as a recommendation of any specific security or strategy.
*Index Definitions:
The following indices are referenced throughout this report. Indices are unmanaged and not available for direct investment. Index performance does not reflect transaction costs, fees, or expenses.
Bloomberg U.S. Aggregate Bond Index is a broad-based flagship benchmark that measures the investment grade, U.S. dollar-denominated, fixed-rate taxable bond market, including U.S. Treasuries, government-related and corporate securities, mortgage-backed securities or “MBS” (agency fixed-rate and hybrid adjustable-rate mortgage, or “ARM”, pass-throughs), asset-backed securities (“ABS”), and commercial mortgage-backed securities (“CMBS”) (agency and non-agency).
Bloomberg U.S. Corporate High Yield Index measures the U.S. dollar-denominated, high yield, fixed-rate corporate bond market. Securities are classified as high yield if the middle rating of Moody’s, Fitch, and S&P is Ba1/BB +/BB + or below.
HFRX Global Hedge Fund Index is designed to be representative of the overall composition of the hedge fund universe. It is comprised of all eligible hedge fund strategies, including, but not limited to, convertible arbitrage, distressed securities, equity hedge, equity market neutral, event driven, macro, merger arbitrage and relative-value arbitrage. The strategies are asset weighted based on the distribution of assets in the hedge fund industry.
ICE BofA 3-Month U.S. Treasury Bill Index is an unmanaged market index of U.S. Treasury securities maturing in 90 days that assumes reinvestment of all income.
MSCI EAFE Index is a free float-adjusted market capitalization index that is designed to measure the equity market performance of developed markets, excluding the U.S. & Canada.
MSCI Emerging Markets Index is a free float-adjusted market capitalization weighted index that is designed to measure equity market performance in the global emerging markets.
S&P 500® Index is a broad-based index, the performance of which is based on the performance of 500 widely held common stocks chosen for market size, liquidity, and industry group representation.
S&P Goldman Sachs Commodity Index (S&P GSCI®), a benchmark for investment performance in the commodity markets, measures investable commodity price movements and inflation in the world economy. The index is calculated primarily on a world production weighted basis and is comprised of the principal physical commodities that are the subject of active, liquid futures markets.
Wilshire Focused Liquid Alternative Index measures the performance of a focused basket of mutual funds that provides risk adjusted exposure to equity hedge, global macro, relative value, and event driven alternative investment strategies.
| | THE GUGGENHEIM FUNDS ANNUAL REPORT | 5 |
ABOUT SHAREHOLDERS’ FUND EXPENSES (Unaudited) |
All mutual funds have operating expenses, and it is important for our shareholders to understand the impact of costs on their investments. Shareholders of a fund incur two types of costs: (i) transaction costs, including sales charges (loads) on purchase payments, reinvested dividends, other distributions, and exchange fees, and (ii) ongoing costs, including management fees, administrative services, and shareholder reports, among others. These ongoing costs, or operating expenses, are deducted from a fund’s gross income and reduce the investment return of the fund.
A fund’s expenses are expressed as a percentage of its average net assets, which is known as the expense ratio. The following examples are intended to help investors understand the ongoing costs (in dollars) of investing in a fund and to compare these costs with the ongoing costs of investing in other mutual funds.
The examples are based on an investment of $1,000 made at the beginning of the period and held for the entire six-month period beginning June 30, 2022 and ending December 31, 2022.
The following tables illustrate the Funds’ costs in two ways:
Table 1. Based on actual Fund return: This section helps investors estimate the actual expenses paid over the period. The “Ending Account Value” shown is derived from the Fund’s actual return, and the fifth column shows the dollar amount that would have been paid by an investor who started with $1,000 in the Fund. Investors may use the information here, together with the amount invested, to estimate the expenses paid over the period. Simply divide the Fund’s account value by $1,000 (for example, an $8,600 account value divided by $1,000 = 8.6), then multiply the result by the number provided under the heading “Expenses Paid During Period.”
Table 2. Based on hypothetical 5% return: This section is intended to help investors compare a fund’s cost with those of other mutual funds. The table provides information about hypothetical account values and hypothetical expenses based on the Fund’s actual expense ratio and an assumed rate of return of 5% per year before expenses, which is not the Fund’s actual return. The hypothetical account values and expenses may not be used to estimate the actual ending account balance or expenses paid during the period. The example is useful in making comparisons because the U.S. Securities and Exchange Commission (the “SEC”) requires all mutual funds to calculate expenses based on the 5% return. Investors can assess a fund’s costs by comparing this hypothetical example with the hypothetical examples that appear in shareholder reports of other funds.
The calculations illustrated above assume no shares were bought or sold during the period. Actual costs may have been higher or lower, depending on the amount of investment and the timing of any purchases or redemptions.
6 | THE GUGGENHEIM FUNDS ANNUAL REPORT | |
ABOUT SHAREHOLDERS’ FUND EXPENSES (Unaudited)(continued) |
Please note that the expenses shown in the table are meant to highlight your ongoing costs only and do not reflect any transactional costs, such as sales charges (loads) on purchase payments, and contingent deferred sales charges (“CDSC”) on redemptions, if any. Therefore, the second table is useful in comparing ongoing costs only, and will not help you determine the relative total costs of owning different funds. In addition, if these transactional costs were included, your costs would have been higher.
More information about the Funds’ expenses, including annual expense ratios for periods up to five years (subject to the Fund’s inception date), can be found in the Financial Highlights section of this report. For additional information on operating expenses and other shareholder costs, please refer to the appropriate Fund prospectus.
| | THE GUGGENHEIM FUNDS ANNUAL REPORT | 7 |
ABOUT SHAREHOLDERS’ FUND EXPENSES (Unaudited)(concluded) |
| Expense
Ratio1 | Fund
Return | Beginning
Account Value
June 30,
2022 | Ending
Account Value
December 31,
2022 | Expenses
Paid During
Period2 |
Table 1. Based on actual Fund return3 |
Multi-Hedge Strategies Fund |
A-Class | 1.67% | (1.76%) | $ 1,000.00 | $ 982.40 | $ 8.34 |
C-Class | 2.44% | (2.11%) | 1,000.00 | 978.90 | 12.17 |
P-Class | 1.70% | (1.73%) | 1,000.00 | 982.70 | 8.50 |
Institutional Class | 1.45% | (1.61%) | 1,000.00 | 983.90 | 7.25 |
Commodities Strategy Fund |
A-Class | 1.57% | (8.06%) | 1,000.00 | 919.40 | 7.60 |
C-Class | 2.32% | (8.37%) | 1,000.00 | 916.30 | 11.21 |
H-Class | 1.57% | (8.04%) | 1,000.00 | 919.60 | 7.60 |
|
Table 2. Based on hypothetical 5% return (before expenses) |
Multi-Hedge Strategies Fund |
A-Class | 1.67% | 5.00% | $ 1,000.00 | $ 1,016.79 | $ 8.49 |
C-Class | 2.44% | 5.00% | 1,000.00 | 1,012.91 | 12.38 |
P-Class | 1.70% | 5.00% | 1,000.00 | 1,016.64 | 8.64 |
Institutional Class | 1.45% | 5.00% | 1,000.00 | 1,017.90 | 7.38 |
Commodities Strategy Fund |
A-Class | 1.57% | 5.00% | 1,000.00 | 1,017.29 | 7.98 |
C-Class | 2.32% | 5.00% | 1,000.00 | 1,013.51 | 11.77 |
H-Class | 1.57% | 5.00% | 1,000.00 | 1,017.29 | 7.98 |
1 | Annualized and excludes expenses of the underlying funds in which the Funds invest. This ratio represents net expenses which includes dividends on short sales and interest expenses. Excluding these expenses, the net expense ratio of the Multi-Hedge Strategies Fund would be 1.40%, 2.15%, 1.40% and 1.15% for the A-Class, C-Class, P-Class and Institutional Class, respectively. |
2 | Expenses are equal to the Fund’s annualized expense ratio, net of any applicable fee waivers, multiplied by the average account value over the period, multiplied by 184/365 (to reflect the one-half year period). |
3 | Actual cumulative return at net asset value for the period June 30, 2022 to December 31, 2022. |
8 | THE GUGGENHEIM FUNDS ANNUAL REPORT | |
PERFORMANCE REPORT AND FUND PROFILE (Unaudited) | December 31, 2022 |
MULTI-HEDGE STRATEGIES FUND
OBJECTIVE: Seeks to provide long-term capital appreciation with less risk than traditional equity funds.
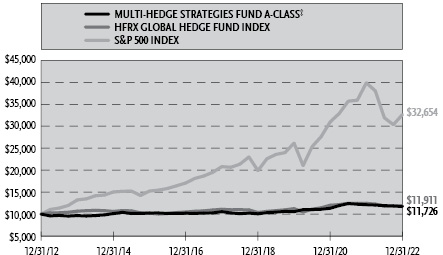
For the Reporting Period, Guggenheim Multi-Hedge Strategies Fund Institutional shares returned -3.22%, outperforming the HFRX Global Hedge Fund Index, the Fund’s benchmark, which returned -4.41%.
What factors contributed or detracted from the Fund’s performance during the Reporting Period?
In 2022, continued supply constraints and worker shortages drove inflation steadily higher. Inflation was also intensified by Russia’s war with Ukraine and China Covid-related shutdowns, which threw supply chains into more chaos. To drive inflation downward closer to its 2% target, the Federal Reserve (the “Fed”) announced seven rate increases during the year by raising the target upper bound lending rate, from 0.25% to 4.50% by year end. This significant increase in lending rates did begin to dampen inflation, but also led to corresponding drops in both stocks and bonds.
The S&P 500 Index ended the year down 18.11% and, with the Bloomberg U.S. Aggregate Bond Index also down 13.01%, investors looking for diversification benefits from these typically uncorrelated asset classes were left highly disappointed. Whether looking at a universe of hedge funds (HFRX Global Hedge Fund Index, down 4.4%) or mutual funds (Wilshire Focused Liquid Alternative Index, down 5.6%) it was also a difficult year for alternative investments in general. Given this challenging market environment, the Fund’s return of -3.22% for the Reporting Period should be seen in a positive light in that it not only outperformed the majority of its peers, but also both equities and bonds.
By providing exposure to a collection of uncorrelated alternative strategies, the Fund generally mitigates the impact of macroeconomic and market fluctuations. Even in such a volatile year as 2022, the Fund had just a 35% correlation to equities, -18% correlation to bonds, and an annualized standard deviation of only 4.6% in 2022.
Standard deviation is a measure of risk, a statistic of the historical volatility of an investment, usually computed using the most recent 36-monthly returns and then annualized. More generally, it is a measure of the extent to which numbers are spread around their average. The higher the number, the more volatility is to be expected.
Positive contributors to the Fund included the Merger Arbitrage (+0.8%) and Global Macro (+0.6%) strategies, but the Market Neutral (-2.5%) and Long/Short Equity (-1.3%) strategies both had challenging years. Within Global Macro, the Momentum (+1.0%) strategies were by far the strongest drivers of returns while the Flow (-0.5%) strategies had a down year. The Carry and Value
| | THE GUGGENHEIM FUNDS ANNUAL REPORT | 9 |
PERFORMANCE REPORT AND FUND PROFILE (Unaudited)(continued) | December 31, 2022 |
strategies were essentially flat for the year. Within Market Neutral, both the Closed-End Fund Arbitrage (-0.4%) and Market Neutral Real Estate (-2.1%) strategies were down similar amounts, but Market Neutral Real Estate was a much larger allocation to the Fund.
How did the Fund use derivatives during the Reporting Period?
Our equity-based strategies, primarily Long/Short Equity and Market Neutral, use total return swaps to gain exposure to both long and short positions. Our Global Macro strategies use exchange traded futures contracts covering a wide variety of equity indexes, fixed income, commodities, and currencies. In aggregate, while largely hedged, the derivatives had a net long exposure. The net performance impact of these derivatives was negative this fiscal year as the overall market had a large negative return.
Guggenheim Ultra Short Duration Fund and Guggenheim Strategy Funds were utilized within the Fund to achieve higher yields than what would otherwise be achieved through overnight repurchase agreements or short-term investments.
How was the Fund positioned at the end of the Reporting Period?
As of the end of the Reporting Period, the Fund was long 163% and short 122%. This provides the Fund with a net exposure of 41% and a gross exposure of 285%. By providing exposure to a wide variety of uncorrelated alternative strategies, we expect the Fund will generally mitigate the impact of macroeconomic and market fluctuations while seeking capital appreciation with low correlations to both equity and bond markets.
Performance displayed represents past performance which is no guarantee of future results.
10 | THE GUGGENHEIM FUNDS ANNUAL REPORT | |
PERFORMANCE REPORT AND FUND PROFILE (Unaudited)(continued) | December 31, 2022 |
Consolidated Holdings Diversification (Market Exposure as % of Net Assets)

“Consolidated Holdings Diversification (Market Exposure as % of Net Assets)” excludes any temporary cash investments, investments in Guggenheim Strategy Funds Trust mutual funds, or investments in Guggenheim Ultra Short Duration Fund. Investments in those Funds do not provide “market exposure” to meet the Fund’s investment objective, but will significantly increase the portfolio’s exposure to certain other asset categories (and their associated risks), which may cause the Fund to deviate from its principal investment strategy, including: (i) high yield, high risk debt securities rated below the top four long-term rating categories by a nationally recognized statistical rating organization (also known as “junk bonds”); (ii) securities issued by the U.S. government or its agencies and instrumentalities; (iii) CLOs and similar investments; and (iv) other short-term fixed income securities.
| | THE GUGGENHEIM FUNDS ANNUAL REPORT | 11 |
PERFORMANCE REPORT AND FUND PROFILE (Unaudited)(continued) | December 31, 2022 |
Inception Dates: |
Institutional Class | May 3, 2010 |
A-Class | September 19, 2005 |
C-Class | September 19, 2005 |
P-Class | September 19, 2005 |
Ten Largest Holdings | (% of Total Net Assets) |
Guggenheim Ultra Short Duration Fund — Institutional Class | 5.3% |
Guggenheim Strategy Fund II | 5.3% |
Guggenheim Strategy Fund III | 1.5% |
First Horizon Corp. | 1.4% |
Atlas Air Worldwide Holdings, Inc. | 1.4% |
VMware, Inc. — Class A | 1.4% |
Activision Blizzard, Inc. | 1.4% |
South Jersey Industries, Inc. | 1.3% |
TEGNA, Inc. | 1.3% |
STORE Capital Corp. REIT | 1.3% |
Top Ten Total | 21.6% |
| | |
“Ten Largest Holdings” excludes any temporary cash or derivative investments. |
Cumulative Fund Performance*
12 | THE GUGGENHEIM FUNDS ANNUAL REPORT | |
PERFORMANCE REPORT AND FUND PROFILE (Unaudited)(concluded) | December 31, 2022 |
Average Annual Returns*
Periods Ended December 31, 2022
| 1 Year | 5 Year | 10 Year |
A-Class Shares | (3.47%) | 2.11% | 2.10% |
A-Class Shares with sales charge‡ | (8.05%) | 1.12% | 1.60% |
C-Class Shares | (4.16%) | 1.38% | 1.36% |
C-Class Shares with CDSC§ | (5.11%) | 1.38% | 1.36% |
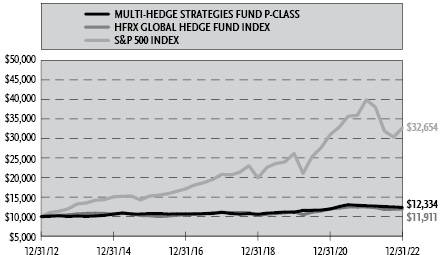
P-Class Shares | (3.44%) | 2.15% | 2.12% |
Institutional Class Shares | (3.22%) | 2.37% | 2.36% |
S&P 500 Index | (18.11%) | 9.42% | 12.56% |
HFRX Global Hedge Fund Index | (4.41%) | 1.41% | 1.76% |
* | The performance data above represents past performance that is not predictive of future results. The investment return and principal value of an investment in the Fund will fluctuate so that an investor’s shares, when redeemed, may be worth more or less than their original cost. Returns are historical and include changes in principal and reinvested dividends and capital gains and do not reflect the effect of taxes. The S&P 500 Index and HFRX Global Hedge Fund Index are unmanaged indices and, unlike the Fund, have no management fees or operating expenses to reduce their reported returns. The graphs are based on A-Class share and P-Class shares only; performance for C-Class and Institutional Class shares will vary due to differences in fee structures. |
‡ | Fund returns are calculated using the maximum sales charge of 4.75%. |
§ | Fund returns include a CDSC of 1% if redeemed within 12 months of purchase. |
| | THE GUGGENHEIM FUNDS ANNUAL REPORT | 13 |
CONSOLIDATED SCHEDULE OF INVESTMENTS | December 31, 2022 |
MULTI-HEDGE STRATEGIES FUND | |
| | Shares | | | Value | |
COMMON STOCKS† - 28.4% |
| | | �� | | | | | | |
Consumer, Non-cyclical - 7.8% |
MoneyGram International, Inc.*,4 | | | 144,299 | | | $ | 1,571,422 | |
LHC Group, Inc.*,4 | | | 9,265 | | | | 1,498,058 | |
Meridian Bioscience, Inc.* | | | 43,177 | | | | 1,433,908 | |
Signify Health, Inc. — Class A*,4 | | | 42,716 | | | | 1,224,240 | |
Vivint Smart Home, Inc.* | | | 57,576 | | | | 685,154 | |
Horizon Therapeutics plc* | | | 5,990 | | | | 681,662 | |
Evo Payments, Inc. — Class A* | | | 19,215 | | | | 650,236 | |
Myovant Sciences Ltd.* | | | 22,007 | | | | 593,309 | |
AVEO Pharmaceuticals, Inc.* | | | 33,807 | | | | 505,415 | |
Oyster Point Pharma, Inc.* | | | 31,686 | | | | 353,933 | |
Imago Biosciences, Inc.* | | | 9,635 | | | | 346,378 | |
Total Consumer, Non-cyclical | | | 9,543,715 | |
| | | | | | | | | |
Technology - 6.6% |
VMware, Inc. — Class A*,4 | | | 14,269 | | | | 1,751,666 | |
Activision Blizzard, Inc.4 | | | 22,496 | | | | 1,722,069 | |
1Life Healthcare, Inc.* | | | 85,190 | | | | 1,423,525 | |
ForgeRock, Inc. — Class A* | | | 56,557 | | | | 1,287,803 | |
KnowBe4, Inc. — Class A* | | | 42,352 | | | | 1,049,483 | |
Tower Semiconductor Ltd.*,4 | | | 22,123 | | | | 955,714 | |
Total Technology | | | | | | | 8,190,260 | |
| | | | | | | | | |
Financial - 4.1% |
First Horizon Corp.4 | | | 72,786 | | | | 1,783,257 | |
STORE Capital Corp. REIT | | | 49,255 | | | | 1,579,115 | |
Cowen, Inc. — Class A4 | | | 36,423 | | | | 1,406,656 | |
Umpqua Holdings Corp. | | | 14,485 | | | | 258,557 | |
Total Financial | | | | | | | 5,027,585 | |
| | | | | | | | | |
Industrial - 3.0% |
Atlas Air Worldwide Holdings, Inc.* | | | 17,470 | | | | 1,760,976 | |
Atlas Corp.4 | | | 68,634 | | | | 1,052,846 | |
Altra Industrial Motion Corp.4 | | | 15,492 | | | | 925,647 | |
MasTec, Inc.* | | | 1 | | | | 85 | |
Total Industrial | | | | | | | 3,739,554 | |
| | | | | | | | | |
Communications - 2.8% |
TEGNA, Inc. | | | 75,374 | | | | 1,597,175 | |
Sierra Wireless, Inc.* | | | 34,898 | | | | 1,011,693 | |
Poshmark, Inc. — Class A* | | | 35,978 | | | | 643,287 | |
Maxar Technologies, Inc. | | | 4,608 | | | | 238,418 | |
Total Communications | | | | | | | 3,490,573 | |
| | | | | | | | | |
Consumer, Cyclical - 2.3% |
Spirit Airlines, Inc.*,4 | | | 59,579 | | | | 1,160,599 | |
IAA, Inc.* | | | 25,847 | | | | 1,033,880 | |
iRobot Corp.*,4 | | | 12,316 | | | | 592,769 | |
Total Consumer, Cyclical | | | 2,787,248 | |
| | | | | | | | | |
Utilities - 1.3% |
South Jersey Industries, Inc.4 | | | 45,446 | | | | 1,614,696 | |
| | | | | | | | | |
Diversified - 0.5% |
Professional Holding Corp. — Class A* | | | 21,815 | | | | 605,148 | |
| | | | | | | | | |
Total Common Stocks | | | | |
(Cost $34,874,325) | | | | | | | 34,998,779 | |
| | | | | | | | | |
14 | THE GUGGENHEIM FUNDS ANNUAL REPORT | SEE NOTES TO CONSOLIDATED FINANCIAL STATEMENTS. |
CONSOLIDATED SCHEDULE OF INVESTMENTS (continued) | December 31, 2022 |
MULTI-HEDGE STRATEGIES FUND | |
| | Shares | | | Value | |
RIGHTS††† - 0.0% |
Consumer, Non-cyclical - 0.0% |
Lantheus Holdings, Inc.* | | | 42,000 | | | $ | — | |
Alexion Pharmaceuticals, Inc.* | | | 34,843 | | | | — | |
Johnson & Johnson* | | | 3,841 | | | | — | |
Total Consumer, Non-cyclical | | | — | |
| | | | | | | | | |
Total Rights | | | | |
(Cost $—) | | | | | | | — | |
| | | | | | | | | |
MUTUAL FUNDS† - 12.1% |
Guggenheim Ultra Short Duration Fund — Institutional Class1 | | | 674,462 | | | | 6,501,817 | |
Guggenheim Strategy Fund II1 | | | 269,618 | | | | 6,481,618 | |
Guggenheim Strategy Fund III1 | | | 79,031 | | | | 1,901,492 | |
Total Mutual Funds | | | | |
(Cost $15,386,814) | | | | | | | 14,884,927 | |
| | | | | | | | | |
CLOSED-END FUNDS† - 6.6% |
BlackRock Resources & Commodities Strategy Trust | | | 22,276 | | | | 222,092 | |
Western Asset Inflation-Linked Opportunities & Income Fund | | | 23,546 | | | | 214,975 | |
Nuveen New Jersey Quality Municipal Income Fund | | | 18,604 | | | | 210,225 | |
Virtus Convertible & Income Fund II | | | 72,607 | | | | 209,108 | |
General American Investors Company, Inc. | | | 5,559 | | | | 200,958 | |
Gabelli Dividend & Income Trust | | | 9,728 | | | | 200,494 | |
Aberdeen Total Dynamic Dividend Fund | | | 25,611 | | | | 199,766 | |
Adams Diversified Equity Fund, Inc. | | | 13,729 | | | | 199,620 | |
BlackRock California Municipal Income Trust | | | 17,560 | | | | 190,175 | |
SRH Total Return Fund, Inc. | | | 14,426 | | | | 183,210 | |
Western Asset Emerging Markets Debt Fund, Inc. | | | 19,323 | | | | 176,033 | |
Eaton Vance California Municipal Bond Fund | | | 19,501 | | | | 168,489 | |
Nuveen Real Asset Income and Growth Fund | | | 14,256 | | | | 166,795 | |
Nuveen Credit Strategies Income Fund | | | 31,008 | | | | 157,831 | |
Morgan Stanley Emerging Markets Domestic Debt Fund, Inc. | | | 34,929 | | | | 153,688 | |
Nuveen Pennsylvania Quality Municipal Income Fund | | | 13,601 | | | | 151,379 | |
Tekla Life Sciences Investors | | | 9,173 | | | | 130,348 | |
Eaton Vance New York Municipal Bond Fund | | | 13,027 | | | | 117,373 | |
Invesco Pennsylvania Value Municipal Income Trust | | | 10,755 | | | | 105,399 | |
Voya Infrastructure Industrials and Materials Fund | | | 10,190 | | | | 93,442 | |
MFS Municipal Income Trust | | | 17,431 | | | | 90,293 | |
SEE NOTES TO CONSOLIDATED FINANCIAL STATEMENTS. | THE GUGGENHEIM FUNDS ANNUAL REPORT | 15 |
CONSOLIDATED SCHEDULE OF INVESTMENTS (continued) | December 31, 2022 |
MULTI-HEDGE STRATEGIES FUND | |
| | Shares | | | Value | |
BlackRock MuniHoldings New York Quality Fund, Inc. | | | 8,614 | | | $ | 88,466 | |
First Trust Dynamic Europe Equity Income Fund | | | 7,773 | | | | 87,679 | |
BlackRock MuniYield New York Quality Fund, Inc. | | | 8,395 | | | | 82,271 | |
Western Asset Inflation - Linked Securities & Income Fund | | | 9,460 | | | | 81,451 | |
Virtus Convertible & Income Fund | | | 23,867 | | | | 81,148 | |
MFS High Yield Municipal Trust | | | 24,751 | | | | 77,471 | |
Gabelli Healthcare & WellnessRx Trust | | | 7,070 | | | | 72,680 | |
Ellsworth Growth and Income Fund Ltd. | | | 8,244 | | | | 65,787 | |
abrdn Emerging Markets Equity | | | 12,674 | | | | 65,271 | |
Invesco Senior Income Trust | | | 16,932 | | | | 64,850 | |
Nuveen New York Quality Municipal Income Fund | | | 5,886 | | | | 62,980 | |
DWS Strategic Municipal Income Trust | | | 7,413 | | | | 60,564 | |
Nuveen New York AMT-Free Quality Municipal Income Fund | | | 5,803 | | | | 59,539 | |
Mexico Fund, Inc. | | | 3,985 | | | | 58,739 | |
Templeton Emerging Markets Fund/United States | | | 4,826 | | | | 55,113 | |
Royce Micro-Capital Trust, Inc. | | | 5,939 | | | | 51,547 | |
Tri-Continental Corp. | | | 1,926 | | | | 49,375 | |
Voya Asia Pacific High Dividend Equity Income Fund | | | 8,037 | | | | 49,267 | |
Franklin Limited Duration Income Trust | | | 7,795 | | | | 48,407 | |
BlackRock New York Municipal Income Trust | | | 4,698 | | | | 47,309 | |
Voya Emerging Markets High Dividend Equity Fund | | | 9,117 | | | | 47,044 | |
Western Asset Intermediate Muni Fund, Inc. | | | 6,028 | | | | 45,753 | |
Eaton Vance California Municipal Income Trust | | | 4,544 | | | | 45,349 | |
Tortoise Power and Energy Infrastructure Fund, Inc. | | | 3,298 | | | | 42,082 | |
Neuberger Berman California Municipal Fund, Inc. | | | 3,684 | | | | 41,627 | |
Morgan Stanley Emerging Markets Debt Fund, Inc. | | | 6,273 | | | | 41,025 | |
Bancroft Fund Ltd. | | | 2,399 | | | | 39,296 | |
Western Asset Municipal Partners Fund, Inc. | | | 3,243 | | | | 37,749 | |
Korea Fund, Inc. | | | 1,748 | | | | 36,411 | |
Invesco Trust for Investment Grade New York Municipals | | | 3,495 | | | | 35,299 | |
Nuveen Floating Rate Income Opportunity Fund | | | 4,509 | | | | 35,215 | |
16 | THE GUGGENHEIM FUNDS ANNUAL REPORT | SEE NOTES TO CONSOLIDATED FINANCIAL STATEMENTS. |
CONSOLIDATED SCHEDULE OF INVESTMENTS (continued) | December 31, 2022 |
MULTI-HEDGE STRATEGIES FUND | |
| | Shares | | | Value | |
BlackRock MuniYield Fund, Inc. | | | 3,341 | | | $ | 34,780 | |
MFS Investment Grade Municipal Trust | | | 4,271 | | | | 30,410 | |
PGIM High Yield Bond Fund, Inc. | | | 2,336 | | | | 27,728 | |
BlackRock MuniAssets Fund, Inc. | | | 2,540 | | | | 27,483 | |
Eaton Vance Municipal Bond Fund | | | 2,605 | | | | 27,066 | |
BlackRock MuniYield Quality Fund III, Inc. | | | 2,413 | | | | 27,050 | |
Nuveen Quality Municipal Income Fund | | | 2,279 | | | | 26,892 | |
Nuveen California AMT-Free Quality Municipal Income Fund | | | 2,185 | | | | 26,876 | |
Apollo Senior Floating Rate Fund, Inc. | | | 2,169 | | | | 26,765 | |
Nuveen AMT-Free Quality Municipal Income Fund | | | 2,336 | | | | 26,560 | |
Invesco Value Municipal Income Trust | | | 2,199 | | | | 26,498 | |
Swiss Helvetia Fund, Inc. | | | 3,504 | | | | 26,490 | |
Nuveen California Quality Municipal Income Fund | | | 2,389 | | | | 26,446 | |
Cohen & Steers Limited Duration Preferred and Income Fund, Inc. | | | 1,387 | | | | 26,381 | |
DWS Municipal Income Trust | | | 3,062 | | | | 26,364 | |
BlackRock MuniYield Quality Fund, Inc. | | | 2,268 | | | | 26,309 | |
Nuveen Municipal Credit Income Fund | | | 2,177 | | | | 26,298 | |
BlackRock Municipal 2030 Target Term Trust | | | 1,234 | | | | 26,272 | |
BlackRock Municipal Income Fund, Inc. | | | 2,312 | | | | 26,195 | |
BlackRock Municipal Income Trust | | | 2,599 | | | | 26,146 | |
BlackRock MuniHoldings California Quality Fund, Inc. | | | 2,431 | | | | 26,109 | |
Nuveen AMT-Free Municipal Credit Income Fund | | | 2,150 | | | | 26,101 | |
BlackRock Municipal Income Trust II | | | 2,512 | | | | 25,949 | |
BlackRock Enhanced Global Dividend Trust | | | 2,713 | | | | 25,936 | |
Invesco California Value Municipal Income Trust | | | 2,733 | | | | 25,909 | |
BlackRock Enhanced International Dividend Trust | | | 5,145 | | | | 25,828 | |
PGIM Global High Yield Fund, Inc. | | | 2,381 | | | | 25,810 | |
Tekla Healthcare Opportunities Fund | | | 1,299 | | | | 25,733 | |
Nuveen Preferred & Income Securities Fund | | | 3,784 | | | | 25,731 | |
Invesco Quality Municipal Income Trust | | | 2,728 | | | | 25,698 | |
Flaherty & Crumrine Dynamic Preferred and Income Fund, Inc. | | | 1,369 | | | | 25,614 | |
SEE NOTES TO CONSOLIDATED FINANCIAL STATEMENTS. | THE GUGGENHEIM FUNDS ANNUAL REPORT | 17 |
CONSOLIDATED SCHEDULE OF INVESTMENTS (continued) | December 31, 2022 |
MULTI-HEDGE STRATEGIES FUND | |
| | Shares | | | Value | |
BlackRock MuniHoldings Fund, Inc. | | | 2,108 | | | $ | 25,591 | |
Eaton Vance Tax-Advantaged Global Dividend Income Fund | | | 1,693 | | | | 25,564 | |
BlackRock MuniHoldings New Jersey Quality Fund, Inc. | | | 2,307 | | | | 25,538 | |
Tekla Healthcare Investors | | | 1,408 | | | | 25,344 | |
Principal Real Estate Income Fund | | | 2,444 | | | | 25,295 | |
Nuveen Ohio Quality Municipal Income Fund | | | 1,987 | | | | 25,215 | |
Nuveen Floating Rate Income Fund/Closed-end Fund | | | 3,176 | | | | 25,154 | |
Eaton Vance Floating-Rate Income Trust | | | 2,190 | | | | 24,287 | |
Western Asset Managed Municipals Fund, Inc. | | | 2,402 | | | | 24,188 | |
abrdn Japan Equity Fund, Inc. | | | 4,570 | | | | 24,130 | |
Saba Capital Income & Opportunities Fund | | | 3,144 | | | | 23,926 | |
First Trust Aberdeen Global Opportunity Income Fund | | | 3,974 | | | | 23,844 | |
Eaton Vance Senior Floating-Rate Trust | | | 2,161 | | | | 23,641 | |
BNY Mellon Strategic Municipal Bond Fund, Inc. | | | 4,040 | | | | 23,351 | |
Eaton Vance National Municipal Opportunities Trust | | | 1,403 | | | | 23,051 | |
Barings Global Short Duration High Yield Fund | | | 1,779 | | | | 22,558 | |
BNY Mellon High Yield Strategies Fund | | | 10,331 | | | | 22,315 | |
Western Asset High Income Opportunity Fund, Inc. | | | 5,627 | | | | 22,227 | |
BlackRock MuniHoldings Quality Fund II, Inc. | | | 2,175 | | | | 21,641 | |
Putnam Premier Income Trust | | | 5,844 | | | | 21,214 | |
Apollo Tactical Income Fund, Inc. | | | 1,726 | | | | 20,919 | |
KKR Income Opportunities Fund | | | 1,893 | | | | 20,842 | |
MFS High Income Municipal Trust | | | 5,954 | | | | 20,779 | |
BlackRock MuniVest Fund II, Inc. | | | 1,980 | | | | 20,691 | |
Eaton Vance Tax-Advantaged Global Dividend Opportunities Fund | | | 985 | | | | 20,626 | |
BNY Mellon Strategic Municipals, Inc. | | | 3,277 | | | | 20,022 | |
BlackRock MuniYield Quality Fund II, Inc. | | | 1,952 | | | | 19,949 | |
BlackRock MuniYield Michigan Quality Fund, Inc. | | | 1,795 | | | | 19,907 | |
18 | THE GUGGENHEIM FUNDS ANNUAL REPORT | SEE NOTES TO CONSOLIDATED FINANCIAL STATEMENTS. |
CONSOLIDATED SCHEDULE OF INVESTMENTS (continued) | December 31, 2022 |
MULTI-HEDGE STRATEGIES FUND | |
| | Shares | | | Value | |
Nuveen California Municipal Value Fund, Inc. | | | 2,355 | | | $ | 19,900 | |
Nuveen AMT-Free Municipal Value Fund | | | 1,456 | | | | 19,816 | |
Nuveen Global High Income Fund | | | 1,737 | | | | 19,541 | |
Herzfeld Caribbean Basin Fund, Inc. | | | 5,192 | | | | 19,210 | |
First Trust Enhanced Equity Income Fund | | | 1,214 | | | | 19,133 | |
MFS Multimarket Income Trust | | | 4,158 | | | | 18,753 | |
BlackRock MuniYield Pennsylvania Quality Fund | | | 1,676 | | | | 18,453 | |
LMP Capital and Income Fund, Inc. | | | 1,532 | | | | 18,445 | |
Federated Hermes Premier Municipal Income Fund2 | | | 1,732 | | | | 18,186 | |
Nuveen New York Municipal Value Fund | | | 2,177 | | | | 17,982 | |
BNY Mellon Municipal Income, Inc. | | | 2,800 | | | | 17,528 | |
Nuveen Short Duration Credit Opportunities Fund | | | 1,471 | | | | 17,446 | |
Flaherty & Crumrine Total Return Fund, Inc. | | | 1,102 | | | | 17,401 | |
BrandywineGLOBAL Global Income Opportunities Fund, Inc. | | | 2,134 | | | | 17,392 | |
Pioneer Municipal High Income Fund Trust | | | 2,025 | | | | 17,375 | |
Franklin Universal Trust | | | 2,519 | | | | 16,953 | |
Pioneer Municipal High Income Advantage Fund, Inc. | | | 2,081 | | | | 16,856 | |
Gabelli Global Small and Mid Capital Value Trust | | | 1,453 | | | | 16,303 | |
Miller/Howard High Dividend Fund | | | 1,554 | | | | 16,239 | |
Nuveen Massachusetts Quality Municipal Income Fund | | | 1,536 | | | | 16,236 | |
Nuveen Select Maturities Municipal Fund | | | 1,778 | | | | 16,109 | |
New America High Income Fund, Inc. | | | 2,413 | | | | 15,926 | |
Putnam Master Intermediate Income Trust | | | 4,916 | | | | 15,731 | |
European Equity Fund, Inc. | | | 2,079 | | | | 15,592 | |
Nuveen Georgia Quality Municipal Income Fund | | | 1,532 | | | | 15,517 | |
Nuveen Minnesota Quality Municipal Income Fund | | | 1,365 | | | | 15,356 | |
John Hancock Income Securities Trust | | | 1,437 | | | | 15,304 | |
Allspring Utilities and High I | | | 1,344 | | | | 15,053 | |
John Hancock Tax-Advantaged Global Shareholder Yield Fund2 | | | 3,023 | | | | 14,994 | |
Invesco High Income Trust II | | | 1,436 | | | | 14,733 | |
Nuveen Municipal Income Fund, Inc.2 | | | 1,566 | | | | 14,720 | |
Source Capital, Inc. | | | 380 | | | | 14,691 | |
SEE NOTES TO CONSOLIDATED FINANCIAL STATEMENTS. | THE GUGGENHEIM FUNDS ANNUAL REPORT | 19 |
CONSOLIDATED SCHEDULE OF INVESTMENTS (continued) | December 31, 2022 |
MULTI-HEDGE STRATEGIES FUND | |
| | Shares | | | Value | |
DTF Tax-Free Income 2028 Term Fund, Inc. | | | 1,339 | | | $ | 14,608 | |
Invesco Bond Fund | | | 931 | | | | 14,598 | |
Delaware Investments Dividend and Income Fund, Inc. | | | 1,772 | | | | 14,406 | |
Western Asset Premier Bond Fund2 | | | 1,352 | | | | 14,385 | |
Invesco Municipal Trust | | | 1,435 | | | | 14,207 | |
BlackRock MuniVest Fund, Inc. | | | 2,026 | | | | 14,202 | |
BlackRock Income Trust, Inc. | | | 1,142 | | | | 14,092 | |
Royce Global Value Trust, Inc. | | | 1,623 | | | | 14,040 | |
Insight Select Income Fund | | | 921 | | | | 13,916 | |
First Trust High Income Long/Short Fund | | | 1,215 | | | | 13,912 | |
Pioneer Floating Rate Fund, Inc. | | | 1,582 | | | | 13,874 | |
abrdn Global Dynamic Dividend | | | 1,453 | | | | 13,745 | |
Sprott Focus Trust, Inc. | | | 1,722 | | | | 13,725 | |
Eaton Vance Municipal Income Trust | | | 1,388 | | | | 13,700 | |
AllianceBernstein National Municipal Income Fund, Inc. | | | 1,306 | | | | 13,687 | |
Pioneer Diversified High Income Fund, Inc. | | | 1,357 | | | | 13,679 | |
New Germany Fund, Inc. | | | 1,732 | | | | 13,665 | |
Eaton Vance Senior Income Trust | | | 2,591 | | | | 13,655 | |
First Trust Intermediate Duration Preferred & Income Fund | | | 808 | | | | 13,631 | |
Neuberger Berman New York Municipal Fund, Inc. | | | 1,434 | | | | 13,523 | |
Lazard Global Total Return and Income Fund, Inc. | | | 919 | | | | 13,454 | |
BlackRock Floating Rate Income Strategies Fund, Inc. | | | 1,193 | | | | 13,433 | |
Virtus Total Return Fund, Inc. | | | 2,046 | | | | 13,401 | |
abrdn Australia Equity Fund In | | | 3,046 | | | | 13,372 | |
Neuberger Berman Municipal Fund, Inc. | | | 1,276 | | | | 13,296 | |
Pioneer High Income Fund, Inc. | | | 2,038 | | | | 13,247 | |
Gabelli Global Utility & Income Trust | | | 939 | | | | 13,221 | |
Macquarie/First Trust Global Infrastructure/Utilities Dividend & Income Fund | | | 1,627 | | | | 13,162 | |
Virtus Diversified Income & Co. | | | 702 | | | | 13,029 | |
Eaton Vance Tax-Managed Global Diversified Equity Income Fund | | | 1,653 | | | | 12,480 | |
Nuveen Preferred and Income Fund | | | 705 | | | | 12,471 | |
Nuveen Municipal Value Fund, Inc. | | | 1,447 | | | | 12,444 | |
20 | THE GUGGENHEIM FUNDS ANNUAL REPORT | SEE NOTES TO CONSOLIDATED FINANCIAL STATEMENTS. |
CONSOLIDATED SCHEDULE OF INVESTMENTS (continued) | December 31, 2022 |
MULTI-HEDGE STRATEGIES FUND | |
| | Shares | | | Value | |
Nuveen Preferred & Income Opportunities Fund | | | 1,693 | | | $ | 12,325 | |
Eaton Vance Tax Managed Global Buy Write Opportunities Fund | | | 1,588 | | | | 12,323 | |
Nuveen Multi-Asset Income Fund | | | 1,072 | | | | 12,317 | |
CBRE Global Real Estate Income Fund | | | 2,143 | | | | 12,279 | |
Highland Income Fund | | | 1,191 | | | | 12,267 | |
BlackRock Energy and Resources Trust | | | 969 | | | | 12,142 | |
Eaton Vance Risk-Managed Diversified Equity Income Fund | | | 1,617 | | | | 12,127 | |
Cohen & Steers Quality Income Realty Fund, Inc. | | | 1,050 | | | | 12,075 | |
Clough Global Opportunities Fund | | | 2,377 | | | | 12,051 | |
Templeton Global Income Fund | | | 2,344 | | | | 10,149 | |
Nuveen Dow 30sm Dynamic Overwrite Fund | | | 652 | | | | 10,113 | |
Blackrock Investment Quality Municipal Trust, Inc. | | | 816 | | | | 9,515 | |
Nuveen New York Select Tax-Free Income Portfolio | | | 796 | | | | 9,226 | |
BlackRock Utilities Infrastructure & Power Opportunities Trust | | | 426 | | | | 8,848 | |
Templeton Emerging Markets Income Fund | | | 1,571 | | | | 8,625 | |
BlackRock Municipal Income Quality Trust | | | 707 | | | | 8,024 | |
Allspring Income Opportunities | | | 1,219 | | | | 7,789 | |
BlackRock Long-Term Municipal Advantage Trust | | | 824 | | | | 7,746 | |
BNY Mellon Municipal Bond Infrastructure Fund, Inc. | | | 733 | | | | 7,704 | |
Cohen & Steers Select Preferred and Income Fund, Inc. | | | 394 | | | | 7,376 | |
Clough Global Equity Fund | | | 1,129 | | | | 7,350 | |
Western Asset High Yield Defined Opportunity Fund, Inc. | | | 531 | | | | 6,627 | |
Macquarie Global Infrastructure Total Return Fund, Inc. | | | 291 | | | | 6,612 | |
MFS Intermediate Income Trust | | | 2,256 | | | | 6,227 | |
Eaton Vance Municipal Income 2028 Term Trust | | | 343 | | | | 6,116 | |
Western Asset Mortgage Opportunity Fund, Inc. | | | 524 | | | | 5,643 | |
Nuveen Real Estate Income Fund | | | 723 | | | | 5,466 | |
SEE NOTES TO CONSOLIDATED FINANCIAL STATEMENTS. | THE GUGGENHEIM FUNDS ANNUAL REPORT | 21 |
CONSOLIDATED SCHEDULE OF INVESTMENTS (continued) | December 31, 2022 |
MULTI-HEDGE STRATEGIES FUND | |
| | Shares | | | Value | |
MFS Charter Income Trust | | | 822 | | | $ | 5,055 | |
Western Asset Investment Grade Defined Opportunity Trust, Inc. | | | 297 | | | | 4,835 | |
Neuberger Berman MLP & Energy Income Fund, Inc. | | | 685 | | | | 4,562 | |
Delaware Ivy High Income Opportunities Fund | | | 411 | | | | 4,505 | |
Nuveen Missouri Quality Municipal Income Fund | | | 431 | | | | 4,504 | |
Western Asset Global Corporate Defined Opportunity Fund, Inc. | | | 346 | | | | 4,418 | |
Western Asset Municipal High Income Fund, Inc. | | | 691 | | | | 4,409 | |
High Income Securities Fund | | | 655 | | | | 4,257 | |
Highland Global Allocation Fund | | | 442 | | | | 4,164 | |
Delaware Investments National Municipal Income Fund | | | 356 | | | | 3,692 | |
Nuveen Virginia Quality Municipal Income Fund | | | 291 | | | | 3,248 | |
PIMCO New York Municipal Income Fund II | | | 399 | | | | 3,172 | |
BlackRock Enhanced Government Fund, Inc. | | | 311 | | | | 3,010 | |
Neuberger Berman Real Estate Securities Income Fund, Inc. | | | 893 | | | | 2,795 | |
Western Asset Global High Income Fund, Inc. | | | 384 | | | | 2,611 | |
Clough Global Dividend and Income Fund | | | 406 | | | | 2,598 | |
Special Opportunities Fund, Inc. | | | 214 | | | | 2,440 | |
Nuveen Arizona Quality Municipal Income Fund | | | 218 | | | | 2,433 | |
Western Asset Investment Grade Income Fund, Inc. | | | 176 | | | | 2,038 | |
Nuveen Multi-Market Income Fund | | | 343 | | | | 2,013 | |
Nuveen Mortgage and Income Fund | | | 115 | | | | 1,861 | |
John Hancock Investors Trust | | | 148 | | | | 1,856 | |
MFS Government Markets Income Trust | | | 532 | | | | 1,761 | |
Delaware Enhanced Global Dividend & Income Fund | | | 201 | | | | 1,568 | |
Vertical Capital Income Fund | | | 118 | | | | 1,028 | |
Central Securities Corp. | | | 26 | | | | 865 | |
BlackRock Virginia Municipal Bond Trust | | | 60 | | | | 680 | |
MFS Special Value Trust | | | 79 | | | | 330 | |
Total Closed-End Funds | | | | |
(Cost $8,207,497) | | | | | | | 8,078,597 | |
| | | | | | | | | |
22 | THE GUGGENHEIM FUNDS ANNUAL REPORT | SEE NOTES TO CONSOLIDATED FINANCIAL STATEMENTS. |
CONSOLIDATED SCHEDULE OF INVESTMENTS (continued) | December 31, 2022 |
MULTI-HEDGE STRATEGIES FUND | |
| | | Face
Amount | | | Value | |
U.S. TREASURY BILLS†† - 15.1% |
| U.S. Treasury Bills |
4.00% due 01/24/233,4 | | $ | 11,700,000 | | | $ | 11,673,787 | |
3.79% due 01/17/233,5 | | | 6,894,000 | | | | 6,884,137 | |
| Total U.S. Treasury Bills | | | | | | | | |
| (Cost $18,551,666) | | | | | | | 18,557,924 | |
| | | | | | | | | |
| REPURCHASE AGREEMENTS††,6 - 31.5% |
J.P. Morgan Securities LLC
issued 12/30/22 at 4.26%
due 01/03/234 | | | 21,924,288 | | | | 21,924,288 | |
BofA Securities, Inc.
issued 12/30/22 at 4.25%
due 01/03/234 | | | 8,432,419 | | | | 8,432,419 | |
Barclays Capital, Inc.
issued 12/30/22 at 4.21%
due 01/03/234 | | | 8,406,303 | | | | 8,406,303 | |
| Total Repurchase Agreements | | | | | | | | |
| (Cost $38,763,010) | | | | | | | 38,763,010 | |
| | | | | | | | | |
| SECURITIES LENDING COLLATERAL†,7 - 0.0% |
| Money Market Fund | | | | | | | | |
First American Government Obligations Fund - Class X, 4.10%8 | | | 25,951 | | | | 25,951 | |
| Total Securities Lending Collateral | | | | | | | | |
| (Cost $25,951) | | | | | | | 25,951 | |
| | | | | | | | | |
| Total Investments - 93.7% | | | | | | | | |
| (Cost $115,809,263) | | | | | | $ | 115,309,188 | |
| | | | | | | | | |
| COMMON STOCKS SOLD SHORT† - (2.2)% |
| Consumer, Non-cyclical - (0.7)% |
| Ritchie Bros Auctioneers, Inc. | | | 15,002 | | | | (867,566 | ) |
| | | | | | | | | |
| Financial - (0.7)% |
| Columbia Banking System, Inc. | | | 8,710 | | | | (262,432 | ) |
| | | Shares | | | | |
| Seacoast Banking Corporation of Florida | | | 19,435 | | | | (606,177 | ) |
| Total Financial | | | | | | | (868,609 | ) |
| | | | | | | | | |
| Technology - (0.8)% |
| Broadcom, Inc. | | | 1,798 | | | | (1,005,316 | ) |
| | | | | | | | | |
| Total Common Stocks Sold Short | | | | | | | | |
| (Proceeds $2,566,663) | | | | | | | (2,741,491 | ) |
| | | | | | | | | |
| EXCHANGE-TRADED FUNDS SOLD SHORT† - (6.7)% |
| iShares 7-10 Year Treasury Bond ETF | | | 52 | | | | (4,981 | ) |
| iShares Mortgage Real Estate ETF | | | 239 | | | | (5,423 | ) |
| VanEck Gold Miners ETF | | | 210 | | | | (6,018 | ) |
| iShares U.S. Real Estate ETF | | | 103 | | | | (8,671 | ) |
| iShares MBS ETF | | | 119 | | | | (11,037 | ) |
| iShares Agency Bond ETF | | | 104 | | | | (11,069 | ) |
| Energy Select Sector SPDR Fund | | | 223 | | | | (19,506 | ) |
| Utilities Select Sector SPDR Fund | | | 356 | | | | (25,098 | ) |
| iShares MSCI All Country Asia ex Japan ETF | | | 396 | | | | (25,657 | ) |
| iShares Latin America 40 ETF | | | 1,476 | | | | (33,786 | ) |
| iShares Russell 1000 Growth ETF | | | 162 | | | | (34,707 | ) |
| VanEck High Yield Muni ETF | | | 824 | | | | (41,653 | ) |
| SPDR S&P Biotech ETF* | | | 778 | | | | (64,574 | ) |
| iShares Preferred & Income Securities ETF | | | 2,137 | | | | (65,242 | ) |
| iShares Core High Dividend ETF | | | 1,108 | | | | (115,498 | ) |
| Health Care Select Sector SPDR Fund | | | 884 | | | | (120,091 | ) |
SEE NOTES TO CONSOLIDATED FINANCIAL STATEMENTS. | THE GUGGENHEIM FUNDS ANNUAL REPORT | 23 |
CONSOLIDATED SCHEDULE OF INVESTMENTS (continued) | December 31, 2022 |
MULTI-HEDGE STRATEGIES FUND | |
| | | Shares | | | Value | |
| iShares MSCI Emerging Markets ETF | | | 3,213 | | | $ | (121,773 | ) |
| iShares Russell 2000 Index ETF | | | 1,106 | | | | (192,842 | ) |
| iShares JP Morgan USD Emerging Markets Bond ETF | | | 2,715 | | | | (229,662 | ) |
| iShares TIPS Bond ETF | | | 2,532 | | | | (269,506 | ) |
| SPDR Nuveen Bloomberg High Yield Municipal Bond ETF | | | 6,205 | | | | (303,859 | ) |
| SPDR Bloomberg Convertible Securities ETF | | | 5,473 | | | | (352,133 | ) |
| Schwab U.S. Aggregate Bond ETF | | | 8,039 | | | | (366,980 | ) |
| iShares National Muni Bond ETF | | | 3,663 | | | | (386,520 | ) |
| iShares iBoxx $ Investment Grade Corporate Bond ETF | | | 3,724 | | | | (392,621 | ) |
| iShares Floating Rate Bond ETF | | | 9,631 | | | | (484,728 | ) |
| SPDR S&P 500 ETF Trust | | | 1,480 | | | | (565,997 | ) |
| iShares Russell 1000 Value ETF | | | 3,738 | | | | (566,868 | ) |
| SPDR Nuveen Bloomberg Municipal Bond ETF | | | 14,769 | | | | (673,762 | ) |
| Invesco Senior Loan ETF | | | 33,083 | | | | (679,194 | ) |
| iShares MSCI EAFE ETF | | | 10,625 | | | | (697,425 | ) |
| iShares iBoxx High Yield Corporate Bond ETF | | | 17,563 | | | | (1,293,164 | ) |
| Total Exchange-Traded Funds Sold Short | | | | | | | | |
| (Proceeds $8,930,653) | | | | | | | (8,170,045 | ) |
| Total Securities Sold Short - (8.9)% | | | | | | | | |
| (Proceeds $11,497,316) | | | | | | $ | (10,911,536 | ) |
| Other Assets & Liabilities, net - 15.2% | | | | | | | 18,649,236 | |
| Total Net Assets - 100.0% | | | | | | $ | 123,046,888 | |
Futures Contracts | | | | | | | | | | | | | | | | |
Description | | Number of
Contracts | | | Expiration
Date | | | Notional
Amount | | | Value and
Unrealized
Appreciation
(Depreciation)** | |
Commodity Futures Contracts Purchased† |
Gasoline RBOB Futures Contracts | | | 31 | | | | Jan 2023 | | | $ | 3,236,251 | | | $ | 287,533 | |
Sugar #11 Futures Contracts | | | 207 | | | | Jun 2023 | | | | 4,173,120 | | | | 268,705 | |
Live Cattle Futures Contracts | | | 151 | | | | Jun 2023 | | | | 9,532,630 | | | | 134,640 | |
Soybean Meal Futures Contracts | | | 44 | | | | Mar 2023 | | | | 2,074,160 | | | | 82,638 | |
Live Cattle Futures Contracts | | | 66 | | | | Feb 2023 | | | | 4,169,220 | | | | 51,693 | |
Soybean Futures Contracts | | | 27 | | | | Mar 2023 | | | | 2,057,738 | | | | 38,964 | |
Corn Futures Contracts | | | 42 | | | | Mar 2023 | | | | 1,424,850 | | | | 32,488 | |
Soybean Oil Futures Contracts | | | 21 | | | | Mar 2023 | | | | 807,912 | | | | 16,065 | |
NY Harbor ULSD Futures Contracts | | | 24 | | | | Mar 2023 | | | | 3,085,286 | | | | 13,709 | |
LME Lead Futures Contracts | | | 6 | | | | Feb 2023 | | | | 347,063 | | | | 11,894 | |
Silver Futures Contracts | | | 1 | | | | Mar 2023 | | | | 120,700 | | | | 3,189 | |
24 | THE GUGGENHEIM FUNDS ANNUAL REPORT | SEE NOTES TO CONSOLIDATED FINANCIAL STATEMENTS. |
CONSOLIDATED SCHEDULE OF INVESTMENTS (continued) | December 31, 2022 |
MULTI-HEDGE STRATEGIES FUND | |
Futures Contracts (continued)
| Description | | Number of
Contracts | | Expiration
Date | | Notional
Amount | | | Value and
Unrealized
Appreciation
(Depreciation)** | |
| Commodity Futures Contracts Purchased† (continued) |
| Low Sulphur Gas Oil Futures Contracts | | 1 | | Feb 2023 | | $ | 92,650 | | | $ | 1,798 | |
| Hard Red Winter Wheat Futures Contracts | | 11 | | Mar 2023 | | | 487,988 | | | | (591 | ) |
| Lean Hogs Futures Contracts | | 25 | | Feb 2023 | | | 879,750 | | | | (3,740 | ) |
| Cocoa Futures Contracts | | 15 | | Mar 2023 | | | 388,800 | | | | (6,564 | ) |
| LME Nickel Futures Contracts | | 4 | | Feb 2023 | | | 719,160 | | | | (15,485 | ) |
| Natural Gas Futures Contracts | | 7 | | Mar 2023 | | | 273,350 | | | | (53,638 | ) |
| Natural Gas Futures Contracts | | 24 | | Feb 2023 | | | 974,880 | | | | (88,265 | ) |
| | | | | | | $ | 34,845,508 | | | $ | 775,033 | |
| Currency Futures Contracts Purchased† |
| Japanese Yen Futures Contracts | | 42 | | Mar 2023 | | $ | 4,036,725 | | | $ | 158,650 | |
| Canadian Dollar Futures Contracts | | 20 | | Mar 2023 | | | 1,478,200 | | | | (728 | ) |
| New Zealand Dollar Futures Contracts | | 81 | | Mar 2023 | | | 5,145,930 | | | | (20,330 | ) |
| British Pound Futures Contracts | | 76 | | Mar 2023 | | | 5,752,250 | | | | (77,147 | ) |
| | | | | | | $ | 16,413,105 | | | $ | 60,445 | |
| Interest Rate Futures Contracts Purchased† |
Long Gilt Futures Contracts†† | | 5 | | Mar 2023 | | $ | 602,394 | | | $ | (761 | ) |
| Euro - Bund Futures Contracts | | 4 | | Mar 2023 | | | 568,919 | | | | (2,798 | ) |
Australian Government 10 Year Bond Futures Contracts†† | | 46 | | Mar 2023 | | | 3,617,485 | | | | (4,912 | ) |
Euro - BTP Italian Government Bond Futures Contracts†† | | 20 | | Mar 2023 | | | 2,323,230 | | | | (20,465 | ) |
| | | | | | | $ | 7,112,028 | | | $ | (28,936 | ) |
| Equity Futures Contracts Purchased† |
FTSE 100 Index Futures Contracts†† | | 87 | | Mar 2023 | | $ | 7,865,738 | | | $ | 60,879 | |
SPI 200 Index Futures Contracts†† | | 4 | | Mar 2023 | | | 476,445 | | | | (8,495 | ) |
| Euro STOXX 50 Index Futures Contracts | | 40 | | Mar 2023 | | | 1,622,791 | | | | (12,462 | ) |
| FTSE MIB Index Futures Contracts | | 9 | | Mar 2023 | | | 1,141,266 | | | | (17,564 | ) |
| CBOE Volatility Index Futures Contracts | | 102 | | Mar 2023 | | | 2,585,700 | | | | (18,588 | ) |
OMX Stockholm 30 Index Futures Contracts†† | | 65 | | Jan 2023 | | | 1,278,043 | | | | (31,566 | ) |
| CAC 40 10 Euro Index Futures Contracts | | 20 | | Jan 2023 | | | 1,383,742 | | | | (32,800 | ) |
| Amsterdam Index Futures Contracts | | 10 | | Jan 2023 | | | 1,477,562 | | | | (60,979 | ) |
| CBOE Volatility Index Futures Contracts | | 279 | | Jun 2023 | | | 7,351,650 | | | | (101,024 | ) |
| Tokyo Stock Price Index Futures Contracts | | 31 | | Mar 2023 | | | 4,415,278 | | | | (207,469 | ) |
| | | | | | | $ | 29,598,215 | | | $ | (430,068 | ) |
| Interest Rate Futures Contracts Sold Short† |
Canadian Government 10 Year Bond Futures Contracts†† | | 109 | | Mar 2023 | | $ | 9,848,694 | | | $ | 190,358 | |
| U.S. Treasury 10 Year Note Futures Contracts | | 61 | | Mar 2023 | | | 6,839,625 | | | | 41,198 | |
| U.S. Treasury Long Bond Futures Contracts | | 7 | | Mar 2023 | | | 872,812 | | | | 5,310 | |
| U.S. Treasury Ultra Long Bond Futures Contracts | | 5 | | Mar 2023 | | | 667,813 | | | | 4,459 | |
| Euro - 30 year Bond Futures Contracts | | 4 | | Mar 2023 | | | 577,744 | | | | 1,480 | |
SEE NOTES TO CONSOLIDATED FINANCIAL STATEMENTS. | THE GUGGENHEIM FUNDS ANNUAL REPORT | 25 |
CONSOLIDATED SCHEDULE OF INVESTMENTS (continued) | December 31, 2022 |
MULTI-HEDGE STRATEGIES FUND | |
Futures Contracts (continued)
| Description | | Number of
Contracts | | Expiration
Date | | Notional
Amount | | | Value and
Unrealized
Appreciation
(Depreciation)** | |
Interest Rate Futures Contracts Sold Short† (continued) | | | | | | | | | | | | |
| Euro - OATS Futures Contracts | | 5 | | Mar 2023 | | $ | 681,429 | | | $ | 226 | |
| | | | | | | $ | 19,488,117 | | | $ | 243,031 | |
| Equity Futures Contracts Sold Short† |
| CBOE Volatility Index Futures Contracts | | 149 | | Feb 2023 | | $ | 3,650,500 | | | $ | 31,446 | |
| S&P/TSX 60 IX Index Futures Contracts | | 6 | | Mar 2023 | | | 1,036,031 | | | | 15,220 | |
| CBOE Volatility Index Futures Contracts | | 55 | | Jan 2023 | | | 1,267,750 | | | | 5,640 | |
IBEX 35 Index Futures Contracts†† | | 24 | | Jan 2023 | | | 2,104,823 | | | | 3,473 | |
| Nikkei 225 Index Futures Contracts | | 1 | | Mar 2023 | | | 196,405 | | | | 1,045 | |
| DAX Index Futures Contracts | | 2 | | Mar 2023 | | | 744,404 | | | | 1,010 | |
| Russell 2000 Index Mini Futures Contracts | | 21 | | Mar 2023 | | | 1,859,865 | | | | 462 | |
| CBOE Volatility Index Futures Contracts | | 8 | | Apr 2023 | | | 206,800 | | | | (588 | ) |
| NASDAQ-100 Index Mini Futures Contracts | | 9 | | Mar 2023 | | | 1,984,140 | | | | (769 | ) |
| S&P 500 Index Mini Futures Contracts | | 10 | | Mar 2023 | | | 1,930,750 | | | | (1,220 | ) |
| | | | | | | $ | 14,981,468 | | | $ | 55,719 | |
| Commodity Futures Contracts Sold Short† |
| Natural Gas Futures Contracts | | 27 | | Jan 2023 | | $ | 1,196,910 | | | $ | 340,861 | |
| LME Zinc Futures Contracts | | 6 | | Feb 2023 | | | 447,488 | | | | 30,657 | |
| LME Primary Aluminum Futures Contracts | | 8 | | Feb 2023 | | | 471,932 | | | | 20,531 | |
| Wheat Futures Contracts | | 36 | | Mar 2023 | | | 1,423,800 | | | | 11,450 | |
| Cotton #2 Futures Contracts | | 13 | | Mar 2023 | | | 542,100 | | | | 9,461 | |
| Sugar #11 Futures Contracts | | 31 | | Feb 2023 | | | 696,136 | | | | 355 | |
| Brent Crude Futures Contracts | | 1 | | Jan 2023 | | | 85,990 | | | | (3,242 | ) |
| Coffee ‘C’ Futures Contracts | | 7 | | Mar 2023 | | | 438,638 | | | | (6,406 | ) |
| NY Harbor ULSD Futures Contracts | | 14 | | Jan 2023 | | | 1,935,226 | | | | (6,909 | ) |
| WTI Crude Futures Contracts | | 1 | | Jan 2023 | | | 80,380 | | | | (7,093 | ) |
| Copper Futures Contracts | | 3 | | Mar 2023 | | | 286,500 | | | | (11,602 | ) |
| Gold 100 oz. Futures Contracts | | 3 | | Feb 2023 | | | 548,970 | | | | (27,564 | ) |
| Cattle Feeder Futures Contracts | | 33 | | Mar 2023 | | | 3,069,412 | | | | (41,689 | ) |
| Live Cattle Futures Contracts | | 125 | | Apr 2023 | | | 8,088,750 | | | | (117,023 | ) |
| Gasoline RBOB Futures Contracts | | 31 | | Mar 2023 | | | 3,432,072 | | | | (236,636 | ) |
| | | | | | | $ | 22,744,304 | | | $ | (44,849 | ) |
| Currency Futures Contracts Sold Short† |
| Euro FX Futures Contracts | | 2 | | Mar 2023 | | $ | 268,988 | | | $ | (2,025 | ) |
| Australian Dollar Futures Contracts | | 64 | | Mar 2023 | | | 4,369,280 | | | | (26,100 | ) |
| Swiss Franc Futures Contracts | | 153 | | Mar 2023 | | | 20,843,381 | | | | (133,961 | ) |
| | | | | | | $ | 25,481,649 | | | $ | (162,086 | ) |
26 | THE GUGGENHEIM FUNDS ANNUAL REPORT | SEE NOTES TO CONSOLIDATED FINANCIAL STATEMENTS. |
CONSOLIDATED SCHEDULE OF INVESTMENTS (continued) | December 31, 2022 |
MULTI-HEDGE STRATEGIES FUND | |
Custom Basket Swap Agreements |
Counterparty | Reference
Obligation | Type | Financing
Rate | | Payment
Frequency | | | Maturity
Date | | | Notional
Amount | | | Value and
Unrealized
Appreciation
(Depreciation) | |
OTC Custom Basket Swap Agreements†† |
Goldman Sachs International | GS Long/Short Equity Custom Basket | Pay | 4.78% (Federal Funds Rate + 0.45%) | | | At Maturity | | | | 05/06/24 | | | $ | 17,253,266 | | | $ | 121,541 | |
Morgan Stanley Capital Services LLC | MS Long/Short Equity Custom Basket | Pay | 4.73% (Federal Funds Rate + 0.40%) | | | At Maturity | | | | 08/31/23 | | | | 17,211,244 | | | | 99,765 | |
Morgan Stanley Capital Services LLC | MS Equity Market Neutral Custom Basket | Pay | 4.73% (Federal Funds Rate + 0.40%) | | | At Maturity | | | | 08/31/23 | | | | 17,639,508 | | | | (308,621 | ) |
Goldman Sachs International | GS Equity Market Neutral Custom Basket | Pay | 4.78% (Federal Funds Rate + 0.45%) | | | At Maturity | | | | 05/06/24 | | | | 17,639,517 | | | | (328,800 | ) |
| | | | | | | | | | | | | | $ | 69,743,535 | | | $ | (416,115 | ) |
OTC Custom Basket Swap Agreements Sold Short†† |
Morgan Stanley Capital Services LLC | MS Equity Market Neutral Custom Basket | Receive | 4.03% (Federal Funds Rate - 0.30%) | | | At Maturity | | | | 08/31/23 | | | $ | 16,842,761 | | | $ | 2,513,675 | |
Goldman Sachs International | GS Equity Market Neutral Custom Basket | Receive | 4.11% (Federal Funds Rate - 0.22%) | | | At Maturity | | | | 05/06/24 | | | | 16,842,771 | | | | 2,492,617 | |
Goldman Sachs International | GS Long/Short Equity Custom Basket | Receive | 4.13% (Federal Funds Rate - 0.20%) | | | At Maturity | | | | 05/06/24 | | | | 11,372,788 | | | | 468,620 | |
Morgan Stanley Capital Services LLC | MS Long/Short Equity Custom Basket | Receive | 4.03% (Federal Funds Rate - 0.30%) | | | At Maturity | | | | 08/31/23 | | | | 11,463,137 | | | | 460,889 | |
| | | | | | | | | | | | | | $ | 56,521,457 | | | $ | 5,935,801 | |
SEE NOTES TO CONSOLIDATED FINANCIAL STATEMENTS. | THE GUGGENHEIM FUNDS ANNUAL REPORT | 27 |
CONSOLIDATED SCHEDULE OF INVESTMENTS (continued) | December 31, 2022 |
MULTI-HEDGE STRATEGIES FUND | |
| | Shares | | | Percentage
Notional
Amount | | | Value and
Unrealized
Appreciation
(Depreciation) | |
MS LONG/SHORT EQUITY LONG CUSTOM BASKET |
Consumer, Cyclical | | | | | | | | | | | | |
Home Depot, Inc. | | | 449 | | | | 0.86 | % | | $ | 16,487 | |
GMS, Inc. | | | 2,952 | | | | 0.88 | % | | | 14,750 | |
Academy Sports & Outdoors, Inc. | | | 1,341 | | | | 0.41 | % | | | 13,430 | |
Buckle, Inc. | | | 2,230 | | | | 0.59 | % | | | 11,690 | |
Allison Transmission Holdings, Inc. | | | 3,231 | | | | 0.78 | % | | | 9,637 | |
Patrick Industries, Inc. | | | 607 | | | | 0.21 | % | | | 9,001 | |
Methode Electronics, Inc. | | | 2,304 | | | | 0.59 | % | | | 7,251 | |
Haverty Furniture Companies, Inc. | | | 2,236 | | | | 0.39 | % | | | 3,294 | |
Group 1 Automotive, Inc. | | | 291 | | | | 0.30 | % | | | 3,234 | |
Starbucks Corp. | | | 805 | | | | 0.46 | % | | | 2,940 | |
Ethan Allen Interiors, Inc. | | | 1,513 | | | | 0.23 | % | | | (799 | ) |
Wyndham Hotels & Resorts, Inc. | | | 2,482 | | | | 1.03 | % | | | (1,579 | ) |
Watsco, Inc. | | | 208 | | | | 0.30 | % | | | (2,200 | ) |
Boyd Gaming Corp. | | | 1,395 | | | | 0.44 | % | | | (2,383 | ) |
Lowe’s Companies, Inc. | | | 312 | | | | 0.36 | % | | | (2,515 | ) |
Columbia Sportswear Co. | | | 2,014 | | | | 1.02 | % | | | (3,344 | ) |
Yum! Brands, Inc. | | | 1,374 | | | | 1.02 | % | | | (3,444 | ) |
Winnebago Industries, Inc. | | | 808 | | | | 0.25 | % | | | (3,596 | ) |
MSC Industrial Direct Company, Inc. — Class A | | | 1,368 | | | | 0.65 | % | | | (3,817 | ) |
Oxford Industries, Inc. | | | 687 | | | | 0.37 | % | | | (4,242 | ) |
Steven Madden Ltd. | | | 2,223 | | | | 0.41 | % | | | (5,420 | ) |
Williams-Sonoma, Inc. | | | 488 | | | | 0.33 | % | | | (6,531 | ) |
Brunswick Corp. | | | 1,937 | | | | 0.81 | % | | | (7,184 | ) |
Total Consumer, Cyclical | | | 44,660 | |
| | | | | | | | | | | | | |
Technology | | | | | | | | | | | | |
Rambus, Inc. | | | 1,311 | | | | 0.27 | % | | | 20,096 | |
Axcelis Technologies, Inc. | | | 559 | | | | 0.26 | % | | | 8,574 | |
CSG Systems International, Inc. | | | 737 | | | | 0.24 | % | | | 7,049 | |
Diodes, Inc. | | | 832 | | | | 0.37 | % | | | 6,724 | |
QUALCOMM, Inc. | | | 451 | | | | 0.29 | % | | | 2,276 | |
NetApp, Inc. | | | 776 | | | | 0.27 | % | | | 1,880 | |
Maximus, Inc. | | | 1,094 | | | | 0.47 | % | | | 873 | |
Adobe, Inc. | | | 154 | | | | 0.30 | % | | | 470 | |
Dropbox, Inc. — Class A | | | 4,454 | | | | 0.58 | % | | | (707 | ) |
Teradata Corp. | | | 1,810 | | | | 0.35 | % | | | (780 | ) |
Veeco Instruments, Inc. | | | 2,216 | | | | 0.24 | % | | | (1,778 | ) |
Apple, Inc. | | | 406 | | | | 0.31 | % | | | (2,041 | ) |
Synaptics, Inc. | | | 585 | | | | 0.32 | % | | | (2,161 | ) |
Cirrus Logic, Inc. | | | 2,341 | | | | 1.01 | % | | | (3,438 | ) |
Kulicke & Soffa Industries, Inc. | | | 1,001 | | | | 0.26 | % | | | (3,506 | ) |
Avid Technology, Inc. | | | 2,039 | | | | 0.32 | % | | | (3,751 | ) |
NetScout Systems, Inc. | | | 1,730 | | | | 0.33 | % | | | (3,916 | ) |
Microsoft Corp. | | | 475 | | | | 0.66 | % | | | (4,609 | ) |
ACI Worldwide, Inc. | | | 1,729 | | | | 0.23 | % | | | (5,232 | ) |
Synopsys, Inc. | | | 428 | | | | 0.79 | % | | | (5,722 | ) |
28 | THE GUGGENHEIM FUNDS ANNUAL REPORT | SEE NOTES TO CONSOLIDATED FINANCIAL STATEMENTS. |
CONSOLIDATED SCHEDULE OF INVESTMENTS (continued) | December 31, 2022 |
MULTI-HEDGE STRATEGIES FUND | |
| | Shares | | | Percentage
Notional
Amount | | | Value and
Unrealized
Appreciation
(Depreciation) | |
Applied Materials, Inc. | | | 1,434 | | | | 0.81 | % | | $ | (12,698 | ) |
Total Technology | | | | | | | | | | | (2,397 | ) |
| | | | | | | | | | | | | |
Industrial | | | | | | | | | | | | |
Vishay Intertechnology, Inc. | | | 6,257 | | | | 0.78 | % | | | 24,454 | |
Standex International Corp. | | | 1,676 | | | | 1.00 | % | | | 17,098 | |
Dorian LPG Ltd. | | | 4,632 | | | | 0.51 | % | | | 15,700 | |
Louisiana-Pacific Corp. | | | 2,462 | | | | 0.85 | % | | | 12,086 | |
Snap-on, Inc. | | | 744 | | | | 0.99 | % | | | 10,635 | |
Albany International Corp. — Class A | | | 1,591 | | | | 0.91 | % | | | 10,593 | |
Eagle Materials, Inc. | | | 1,191 | | | | 0.92 | % | | | 10,379 | |
Emerson Electric Co. | | | 1,734 | | | | 0.97 | % | | | 9,360 | |
Textron, Inc. | | | 2,497 | | | | 1.03 | % | | | 6,416 | |
Lockheed Martin Corp. | | | 273 | | | | 0.77 | % | | | 2,579 | |
Advanced Energy Industries, Inc. | | | 1,275 | | | | 0.64 | % | | | 2,163 | |
Donaldson Company, Inc. | | | 3,000 | | | | 1.03 | % | | | 1,743 | |
OSI Systems, Inc. | | | 658 | | | | 0.30 | % | | | 681 | |
Otis Worldwide Corp. | | | 699 | | | | 0.32 | % | | | (68 | ) |
General Dynamics Corp. | | | 545 | | | | 0.79 | % | | | (253 | ) |
AMETEK, Inc. | | | 558 | | | | 0.45 | % | | | (1,757 | ) |
3M Co. | | | 547 | | | | 0.38 | % | | | (2,662 | ) |
Graco, Inc. | | | 2,612 | | | | 1.02 | % | | | (4,552 | ) |
Mueller Industries, Inc. | | | 1,550 | | | | 0.53 | % | | | (5,112 | ) |
Sealed Air Corp. | | | 1,770 | | | | 0.51 | % | | | (5,678 | ) |
Acuity Brands, Inc. | | | 656 | | | | 0.63 | % | | | (10,082 | ) |
PGT Innovations, Inc. | | | 2,835 | | | | 0.30 | % | | | (12,579 | ) |
Sturm Ruger & Company, Inc. | | | 2,280 | | | | 0.67 | % | | | (33,227 | ) |
Total Industrial | | | | | | | | | | | 47,917 | |
| | | | | | | | | | | | | |
Basic Materials | | | | | | | | | | | | |
FMC Corp. | | | 461 | | | | 0.33 | % | | | 5,406 | |
Westlake Corp. | | | 440 | | | | 0.26 | % | | | 5,363 | |
NewMarket Corp. | | | 280 | | | | 0.51 | % | | | 1,065 | |
American Vanguard Corp. | | | 2,167 | | | | 0.27 | % | | | 1,056 | |
Olin Corp. | | | 1,441 | | | | 0.44 | % | | | (3,176 | ) |
Ingevity Corp. | | | 715 | | | | 0.29 | % | | | (3,834 | ) |
AdvanSix, Inc. | | | 1,322 | | | | 0.29 | % | | | (5,094 | ) |
Minerals Technologies, Inc. | | | 2,014 | | | | 0.71 | % | | | (7,697 | ) |
Huntsman Corp. | | | 3,591 | | | | 0.57 | % | | | (9,284 | ) |
Balchem Corp. | | | 919 | | | | 0.65 | % | | | (9,707 | ) |
LyondellBasell Industries N.V. — Class A | | | 894 | | | | 0.43 | % | | | (9,809 | ) |
Total Basic Materials | | | (35,711 | ) |
| | | | | | | | | | | | | |
Financial | | | | | | | | | | | | |
S&T Bancorp, Inc. | | | 5,032 | | | | 1.00 | % | | | 28,705 | |
Renasant Corp. | | | 4,569 | | | | 1.00 | % | | | 18,926 | |
TowneBank | | | 5,439 | | | | 0.97 | % | | | 14,204 | |
Preferred Bank/Los Angeles CA | | | 2,443 | | | | 1.06 | % | | | 13,696 | |
PennyMac Financial Services, Inc. | | | 808 | | | | 0.27 | % | | | 7,384 | |
Virtus Investment Partners, Inc. | | | 306 | | | | 0.34 | % | | | 7,334 | |
Associated Banc-Corp. | | | 1,727 | | | | 0.23 | % | | | 5,294 | |
NMI Holdings, Inc. — Class A | | | 1,841 | | | | 0.22 | % | | | 4,028 | |
SEE NOTES TO CONSOLIDATED FINANCIAL STATEMENTS. | THE GUGGENHEIM FUNDS ANNUAL REPORT | 29 |
CONSOLIDATED SCHEDULE OF INVESTMENTS (continued) | December 31, 2022 |
MULTI-HEDGE STRATEGIES FUND | |
| | Shares | | | Percentage
Notional
Amount | | | Value and
Unrealized
Appreciation
(Depreciation) | |
Evercore, Inc. — Class A | | | 992 | | | | 0.63 | % | | $ | 3,900 | |
Bread Financial Holdings, Inc. | | | 1,347 | | | | 0.29 | % | | | 3,500 | |
International Bancshares Corp. | | | 1,972 | | | | 0.52 | % | | | 3,456 | |
Hilltop Holdings, Inc. | | | 1,851 | | | | 0.32 | % | | | 2,948 | |
National Bank Holdings Corp. — Class A | | | 4,131 | | | | 1.01 | % | | | 2,011 | |
Visa, Inc. — Class A | | | 237 | | | | 0.29 | % | | | (1,612 | ) |
Marcus & Millichap, Inc. | | | 1,593 | | | | 0.32 | % | | | (4,115 | ) |
Hope Bancorp, Inc. | | | 13,565 | | | | 1.01 | % | | | (7,253 | ) |
BankUnited, Inc. | | | 2,134 | | | | 0.42 | % | | | (7,856 | ) |
Stewart Information Services Corp. | | | 1,618 | | | | 0.40 | % | | | (16,148 | ) |
Central Pacific Financial Corp. | | | 3,613 | | | | 0.43 | % | | | (16,247 | ) |
Heritage Financial Corp. | | | 5,748 | | | | 1.02 | % | | | (18,137 | ) |
Office Properties Income Trust | | | 5,934 | | | | 0.46 | % | | | (38,506 | ) |
Total Financial | | | | | | | | | | | 5,512 | |
| | | | | | | | | | | | | |
Communications | | | | | | | | | | | | |
Cisco Systems, Inc. | | | 1,984 | | | | 0.55 | % | | | 10,246 | |
T-Mobile US, Inc. | | | 1,025 | | | | 0.83 | % | | | 3,134 | |
VeriSign, Inc. | | | 364 | | | | 0.43 | % | | | 2,971 | |
Alphabet, Inc. — Class C | | | 592 | | | | 0.31 | % | | | (5,489 | ) |
Gogo, Inc. | | | 8,671 | | | | 0.74 | % | | | (15,941 | ) |
Meta Platforms, Inc. — Class A | | | 973 | | | | 0.68 | % | | | (16,028 | ) |
Verizon Communications, Inc. | | | 4,168 | | | | 0.95 | % | | | (18,591 | ) |
InterDigital, Inc. | | | 1,394 | | | | 0.40 | % | | | (18,710 | ) |
Total Communications | | | | | | | (58,408 | ) |
| | | | | | | | | | | | | |
Consumer, Non-cyclical | | | | | | | | |
Perdoceo Education Corp. | | | 11,714 | | | | 0.95 | % | | | 34,775 | |
Ironwood Pharmaceuticals, Inc. — Class A | | | 14,890 | | | | 1.07 | % | | | 22,146 | |
United Therapeutics Corp. | | | 337 | | | | 0.54 | % | | | 19,326 | |
Coca-Cola Co. | | | 2,818 | | | | 1.04 | % | | | 13,570 | |
Regeneron Pharmaceuticals, Inc. | | | 72 | | | | 0.30 | % | | | 13,423 | |
Hologic, Inc. | | | 2,383 | | | | 1.04 | % | | | 12,166 | |
Bristol-Myers Squibb Co. | | | 2,212 | | | | 0.92 | % | | | 11,540 | |
Jazz Pharmaceuticals plc | | | 596 | | | | 0.55 | % | | | 11,446 | |
Vertex Pharmaceuticals, Inc. | | | 297 | | | | 0.50 | % | | | 10,797 | |
Incyte Corp. | | | 892 | | | | 0.42 | % | | | 9,577 | |
Quest Diagnostics, Inc. | | | 1,200 | | | | 1.09 | % | | | 8,886 | |
Triton International Ltd. | | | 1,610 | | | | 0.64 | % | | | 8,557 | |
Amphastar Pharmaceuticals, Inc. | | | 1,686 | | | | 0.27 | % | | | 8,105 | |
Supernus Pharmaceuticals, Inc. | | | 2,492 | | | | 0.52 | % | | | 6,933 | |
Eli Lilly & Co. | | | 100 | | | | 0.21 | % | | | 5,383 | |
Post Holdings, Inc. | | | 1,360 | | | | 0.71 | % | | | 4,507 | |
Altria Group, Inc. | | | 2,903 | | | | 0.77 | % | | | 4,177 | |
Lamb Weston Holdings, Inc. | | | 765 | | | | 0.40 | % | | | 2,952 | |
30 | THE GUGGENHEIM FUNDS ANNUAL REPORT | SEE NOTES TO CONSOLIDATED FINANCIAL STATEMENTS. |
CONSOLIDATED SCHEDULE OF INVESTMENTS (continued) | December 31, 2022 |
MULTI-HEDGE STRATEGIES FUND | |
| | Shares | | | Percentage
Notional
Amount | | | Value and
Unrealized
Appreciation
(Depreciation) | |
Quanex Building Products Corp. | | | 2,025 | | | | 0.28 | % | | $ | 2,585 | |
Prestige Consumer Healthcare, Inc. | | | 2,348 | | | | 0.85 | % | | | 2,307 | |
Globus Medical, Inc. — Class A | | | 1,249 | | | | 0.54 | % | | | 2,099 | |
Innoviva, Inc. | | | 5,117 | | | | 0.39 | % | | | 2,092 | |
John B Sanfilippo & Son, Inc. | | | 2,188 | | | | 1.03 | % | | | 1,058 | |
Monster Beverage Corp. | | | 1,032 | | | | 0.61 | % | | | (590 | ) |
Hershey Co. | | | 768 | | | | 1.03 | % | | | (1,175 | ) |
Inter Parfums, Inc. | | | 529 | | | | 0.30 | % | | | (1,269 | ) |
Danaher Corp. | | | 529 | | | | 0.82 | % | | | (1,485 | ) |
Gilead Sciences, Inc. | | | 1,066 | | | | 0.53 | % | | | (2,333 | ) |
Exelixis, Inc. | | | 2,940 | | | | 0.27 | % | | | (3,048 | ) |
IDEXX Laboratories, Inc. | | | 399 | | | | 0.95 | % | | | (5,091 | ) |
Varex Imaging Corp. | | | 6,458 | | | | 0.76 | % | | | (7,826 | ) |
EVERTEC, Inc. | | | 3,302 | | | | 0.62 | % | | | (9,096 | ) |
Royalty Pharma plc — Class A | | | 3,335 | | | | 0.77 | % | | | (11,248 | ) |
Eagle Pharmaceuticals, Inc. | | | 2,703 | | | | 0.46 | % | | | (25,343 | ) |
Vanda Pharmaceuticals, Inc. | | | 6,607 | | | | 0.28 | % | | | (35,721 | ) |
Tyson Foods, Inc. — Class A | | | 2,090 | | | | 0.76 | % | | | (41,502 | ) |
USANA Health Sciences, Inc. | | | 2,482 | | | | 0.77 | % | | | (44,974 | ) |
Total Consumer, Non-cyclical | | | 27,706 | |
| | | | | | | | | | | | | |
Energy | | | | | | | | | | | | |
Marathon Petroleum Corp. | | | 1,567 | | | | 1.06 | % | | | 22,504 | |
Phillips 66 | | | 894 | | | | 0.54 | % | | | 16,241 | |
Exxon Mobil Corp. | | | 1,655 | | | | 1.06 | % | | | 15,926 | |
Valero Energy Corp. | | | 906 | | | | 0.67 | % | | | 12,542 | |
Par Pacific Holdings, Inc. | | | 1,944 | | | | 0.26 | % | | | 6,922 | |
Antero Midstream Corp. | | | 15,965 | | | | 1.00 | % | | | 6,893 | |
REX American Resources Corp. | | | 1,838 | | | | 0.34 | % | | | 4,746 | |
ONEOK, Inc. | | | 633 | | | | 0.24 | % | | | 3,602 | |
SunCoke Energy, Inc. | | | 6,583 | | | | 0.33 | % | | | 2,764 | |
Kinder Morgan, Inc. | | | 9,147 | | | | 0.96 | % | | | 1,526 | |
Williams Companies, Inc. | | | 3,029 | | | | 0.58 | % | | | (1,058 | ) |
Equitrans Midstream Corp. | | | 6,334 | | | | 0.25 | % | | | (4,482 | ) |
DT Midstream, Inc. | | | 3,010 | | | | 0.97 | % | | | (5,338 | ) |
Occidental Petroleum Corp. | | | 1,092 | | | | 0.40 | % | | | (8,964 | ) |
CVR Energy, Inc. | | | 2,778 | | | | 0.51 | % | | | (9,037 | ) |
Total Energy | | | | | | | | | | | 64,787 | |
| | | | | | | | | | | | | |
Utilities | | | | | | | | | | | | |
FirstEnergy Corp. | | | 4,337 | | | | 1.06 | % | | | 18,262 | |
ONE Gas, Inc. | | | 1,315 | | | | 0.58 | % | | | 3,449 | |
UGI Corp. | | | 4,416 | | | | 0.95 | % | | | 1,888 | |
Black Hills Corp. | | | 2,542 | | | | 1.04 | % | | | 534 | |
National Fuel Gas Co. | | | 761 | | | | 0.28 | % | | | 230 | |
OGE Energy Corp. | | | 4,539 | | | | 1.04 | % | | | 35 | |
Chesapeake Utilities Corp. | | | 932 | | | | 0.64 | % | | | (551 | ) |
Otter Tail Corp. | | | 1,290 | | | | 0.44 | % | | | (4,069 | ) |
SEE NOTES TO CONSOLIDATED FINANCIAL STATEMENTS. | THE GUGGENHEIM FUNDS ANNUAL REPORT | 31 |
CONSOLIDATED SCHEDULE OF INVESTMENTS (continued) | December 31, 2022 |
MULTI-HEDGE STRATEGIES FUND | |
| | Shares | | | Percentage
Notional
Amount | | | Value and
Unrealized
Appreciation
(Depreciation) | |
Clearway Energy, Inc. — Class C | | | 3,120 | | | | 0.58 | % | | $ | (6,791 | ) |
MGE Energy, Inc. | | | 1,819 | | | | 0.74 | % | | | (7,288 | ) |
Total Utilities | | | | | | | | | | | 5,699 | |
Total MS Long/Short Equity Long Custom Basket | | | | | | | 99,765 | |
| | | | | | | | | |
MS LONG/SHORT EQUITY SHORT CUSTOM BASKET |
Consumer, Non-cyclical | | | | |
ASGN, Inc. | | | 830 | | | | (0.58 | )% | | $ | 30,277 | |
Viad Corp. | | | 1,771 | | | | (0.38 | )% | | | 29,348 | |
Healthcare Services Group, Inc. | | | 5,398 | | | | (0.57 | )% | | | 21,353 | |
FTI Consulting, Inc. | | | 712 | | | | (0.99 | )% | | | 11,691 | |
Equifax, Inc. | | | 883 | | | | (1.50 | )% | | | 11,088 | |
TransUnion | | | 2,669 | | | | (1.32 | )% | | | 9,813 | |
CoStar Group, Inc. | | | 1,536 | | | | (1.04 | )% | | | 8,970 | |
Driven Brands Holdings, Inc. | | | 4,383 | | | | (1.04 | )% | | | 8,168 | |
Rollins, Inc. | | | 1,406 | | | | (0.45 | )% | | | 4,993 | |
Patterson Companies, Inc. | | | 1,749 | | | | (0.43 | )% | | | 4,646 | |
GXO Logistics, Inc. | | | 1,123 | | | | (0.42 | )% | | | 2,520 | |
ABM Industries, Inc. | | | 3,572 | | | | (1.38 | )% | | | (1,974 | ) |
Quanta Services, Inc. | | | 433 | | | | (0.54 | )% | | | (3,821 | ) |
Cintas Corp. | | | 391 | | | | (1.54 | )% | | | (11,148 | ) |
ICU Medical, Inc. | | | 970 | | | | (1.33 | )% | | | (20,889 | ) |
Total Consumer, Non-cyclical | | | 105,035 | |
| | | | | | | | | | | | | |
Utilities | | | | | | | | | | | | |
AES Corp. | | | 2,152 | | | | (0.54 | )% | | | (766 | ) |
Vistra Corp. | | | 3,372 | | | | (0.68 | )% | | | (1,338 | ) |
Public Service Enterprise Group, Inc. | | | 2,945 | | | | (1.57 | )% | | | (6,084 | ) |
Exelon Corp. | | | 4,012 | | | | (1.51 | )% | | | (6,708 | ) |
Edison International | | | 2,742 | | | | (1.52 | )% | | | (13,407 | ) |
Total Utilities | | | | | | | | | | | (28,303 | ) |
| | | | | | | | | | | | | |
Basic Materials | | | | | | | | | | | | |
Alcoa Corp. | | | 1,295 | | | | (0.51 | )% | | | 2,387 | |
Freeport-McMoRan, Inc. | | | 1,731 | | | | (0.57 | )% | | | 1,648 | |
ATI, Inc. | | | 1,808 | | | | (0.47 | )% | | | 1,261 | |
Total Basic Materials | | | 5,296 | |
| | | | | | | | | | | | | |
Financial | | | | | | | | | | | | |
Signature Bank | | | 495 | | | | (0.50 | )% | | | 58,709 | |
Invitation Homes, Inc. | | | 3,107 | | | | (0.80 | )% | | | 35,284 | |
Welltower, Inc. | | | 1,224 | | | | (0.70 | )% | | | 31,474 | |
Crown Castle, Inc. | | | 569 | | | | (0.67 | )% | | | 26,625 | |
Sun Communities, Inc. | | | 1,255 | | | | (1.57 | )% | | | 18,491 | |
Bank of America Corp. | | | 5,118 | | | | (1.48 | )% | | | 16,917 | |
Equinix, Inc. | | | 206 | | | | (1.18 | )% | | | 16,839 | |
KKR & Company, Inc. — Class A | | | 2,323 | | | | (0.94 | )% | | | 16,773 | |
Ares Management Corp. — Class A | | | 1,892 | | | | (1.13 | )% | | | 15,082 | |
Americold Realty Trust, Inc. | | | 3,196 | | | | (0.79 | )% | | | 13,893 | |
Equitable Holdings, Inc. | | | 5,733 | | | | (1.44 | )% | | | 13,217 | |
Kennedy-Wilson Holdings, Inc. | | | 7,598 | | | | (1.04 | )% | | | 13,180 | |
Raymond James Financial, Inc. | | | 1,540 | | | | (1.44 | )% | | | 13,152 | |
Digital Realty Trust, Inc. | | | 773 | | | | (0.68 | )% | | | 11,393 | |
American Tower Corp. — Class A | | | 816 | | | | (1.51 | )% | | | 10,960 | |
Assurant, Inc. | | | 553 | | | | (0.60 | )% | | | 9,598 | |
32 | THE GUGGENHEIM FUNDS ANNUAL REPORT | SEE NOTES TO CONSOLIDATED FINANCIAL STATEMENTS. |
CONSOLIDATED SCHEDULE OF INVESTMENTS (continued) | December 31, 2022 |
MULTI-HEDGE STRATEGIES FUND | |
| | Shares | | | Percentage
Notional
Amount | | | Value and
Unrealized
Appreciation
(Depreciation) | |
Independence Realty Trust, Inc. | | | 4,185 | | | | (0.62 | )% | | $ | 8,929 | |
Ryman Hospitality Properties, Inc. | | | 1,480 | | | | (1.06 | )% | | | 7,666 | |
Host Hotels & Resorts, Inc. | | | 4,190 | | | | (0.59 | )% | | | 6,942 | |
Pebblebrook Hotel Trust | | | 2,806 | | | | (0.33 | )% | | | 6,105 | |
KeyCorp | | | 7,597 | | | | (1.15 | )% | | | 5,298 | |
Alexandria Real Estate Equities, Inc. | | | 1,179 | | | | (1.50 | )% | | | 4,803 | |
Wells Fargo & Co. | | | 1,548 | | | | (0.56 | )% | | | 4,688 | |
Kite Realty Group Trust | | | 6,664 | | | | (1.22 | )% | | | 4,681 | |
Principal Financial Group, Inc. | | | 613 | | | | (0.45 | )% | | | 3,158 | |
UDR, Inc. | | | 4,410 | | | | (1.49 | )% | | | 2,915 | |
Kimco Realty Corp. | | | 5,899 | | | | (1.09 | )% | | | 2,835 | |
Northern Trust Corp. | | | 1,995 | | | | (1.54 | )% | | | 2,728 | |
Ventas, Inc. | | | 1,597 | | | | (0.63 | )% | | | 2,596 | |
Iron Mountain, Inc. | | | 2,819 | | | | (1.23 | )% | | | 2,005 | |
Citigroup, Inc. | | | 2,710 | | | | (1.07 | )% | | | 930 | |
Cboe Global Markets, Inc. | | | 536 | | | | (0.59 | )% | | | 921 | |
Willis Towers Watson plc | | | 358 | | | | (0.76 | )% | | | 797 | |
Cullen/Frost Bankers, Inc. | | | 419 | | | | (0.49 | )% | | | 382 | |
Progressive Corp. | | | 1,364 | | | | (1.54 | )% | | | (1,578 | ) |
Cincinnati Financial Corp. | | | 510 | | | | (0.46 | )% | | | (1,692 | ) |
American International Group, Inc. | | | 1,266 | | | | (0.70 | )% | | | (2,452 | ) |
TFS Financial Corp. | | | 4,821 | | | | (0.61 | )% | | | (3,344 | ) |
Intercontinental Exchange, Inc. | | | 1,060 | | | | (0.95 | )% | | | (4,631 | ) |
BlackRock, Inc. — Class A | | | 140 | | | | (0.87 | )% | | | (5,058 | ) |
Arthur J Gallagher & Co. | | | 336 | | | | (0.55 | )% | | | (5,484 | ) |
Howard Hughes Corp. | | | 2,765 | | | | (1.84 | )% | | | (5,912 | ) |
CBRE Group, Inc. — Class A | | | 1,179 | | | | (0.79 | )% | | | (7,774 | ) |
First Republic Bank | | | 1,060 | | | | (1.13 | )% | | | (8,819 | ) |
Allstate Corp. | | | 1,121 | | | | (1.33 | )% | | | (9,902 | ) |
Invesco Ltd. | | | 6,340 | | | | (0.99 | )% | | | (10,041 | ) |
Apollo Global Management, Inc. | | | 2,750 | | | | (1.53 | )% | | | (13,653 | ) |
Total Financial | | | | | | | | | | | 309,626 | |
| | | | | | | | | | | | | |
Consumer, Cyclical | | | | | | | | | | | | |
MillerKnoll, Inc. | | | 3,063 | | | | (0.56 | )% | | | 45,862 | |
CarMax, Inc. | | | 1,076 | | | | (0.57 | )% | | | 20,450 | |
American Airlines Group, Inc. | | | 4,513 | | | | (0.50 | )% | | | 18,630 | |
Hawaiian Holdings, Inc. | | | 4,020 | | | | (0.36 | )% | | | 13,765 | |
Floor & Decor Holdings, Inc. — Class A | | | 604 | | | | (0.37 | )% | | | 3,872 | |
Live Nation Entertainment, Inc. | | | 959 | | | | (0.58 | )% | | | 3,682 | |
Walgreens Boots Alliance, Inc. | | | 2,825 | | | | (0.92 | )% | | | (1,319 | ) |
Delta Air Lines, Inc. | | | 4,481 | | | | (1.28 | )% | | | (1,644 | ) |
Copart, Inc. | | | 2,708 | | | | (1.44 | )% | | | (4,871 | ) |
Madison Square Garden Sports Corp. — Class A | | | 396 | | | | (0.63 | )% | | | (15,205 | ) |
Total Consumer, Cyclical | | | | | | | 83,222 | |
| | | | | | | | | | | | | |
SEE NOTES TO CONSOLIDATED FINANCIAL STATEMENTS. | THE GUGGENHEIM FUNDS ANNUAL REPORT | 33 |
CONSOLIDATED SCHEDULE OF INVESTMENTS (continued) | December 31, 2022 |
MULTI-HEDGE STRATEGIES FUND | |
| | Shares | | | Percentage
Notional
Amount | | | Value and
Unrealized
Appreciation
(Depreciation) | |
Industrial | | | | | | | | | | | | |
Stanley Black & Decker, Inc. | | | 811 | | | | (0.53 | )% | | $ | 28,622 | |
Stericycle, Inc. | | | 841 | | | | (0.37 | )% | | | 17,126 | |
Waste Management, Inc. | | | 1,067 | | | | (1.46 | )% | | | 14,186 | |
TD SYNNEX Corp. | | | 1,813 | | | | (1.50 | )% | | | 6,461 | |
Kirby Corp. | | | 919 | | | | (0.52 | )% | | | 3,741 | |
Jacobs Solutions, Inc. | | | 1,473 | | | | (1.54 | )% | | | 2,286 | |
J.B. Hunt Transport Services, Inc. | | | 278 | | | | (0.42 | )% | | | (991 | ) |
Casella Waste Systems, Inc. — Class A | | | 1,391 | | | | (0.96 | )% | | | (1,627 | ) |
Norfolk Southern Corp. | | | 252 | | | | (0.54 | )% | | | (3,597 | ) |
TransDigm Group, Inc. | | | 58 | | | | (0.32 | )% | | | (4,868 | ) |
FedEx Corp. | | | 340 | | | | (0.51 | )% | | | (6,110 | ) |
Boeing Co. | | | 315 | | | | (0.52 | )% | | | (8,619 | ) |
MSA Safety, Inc. | | | 1,021 | | | | (1.28 | )% | | | (24,167 | ) |
Total Industrial | | | | | | | | | | | 22,443 | |
| | | | | | | | | | | | | |
Energy | | | | | | | | | | | | |
NOV, Inc. | | | 3,276 | | | | (0.60 | )% | | | 7,459 | |
Helmerich & Payne, Inc. | | | 1,156 | | | | (0.50 | )% | | | (550 | ) |
Patterson-UTI Energy, Inc. | | | 5,161 | | | | (0.76 | )% | | | (794 | ) |
Halliburton Co. | | | 4,768 | | | | (1.64 | )% | | | (5,066 | ) |
Liberty Energy, Inc. — Class A | | | 3,946 | | | | (0.55 | )% | | | (6,344 | ) |
ChampionX Corp. | | | 1,209 | | | | (0.31 | )% | | | (8,566 | ) |
Hess Corp. | | | 781 | | | | (0.97 | )% | | | (10,671 | ) |
Valaris Ltd. | | | 1,291 | | | | (0.76 | )% | | | (19,565 | ) |
EOG Resources, Inc. | | | 1,264 | | | | (1.43 | )% | | | (21,409 | ) |
Schlumberger Ltd. | | | 1,618 | | | | (0.75 | )% | | | (23,344 | ) |
Total Energy | | | | | | | | | | | (88,850 | ) |
| | | | | | | | | | | | | |
Communications | | | | | | | | | | | | |
IAC, Inc. | | | 1,883 | | | | (0.73 | )% | | | 20,933 | |
Walt Disney Co. | | | 1,468 | | | | (1.11 | )% | | | 17,114 | |
Warner Bros Discovery, Inc. | | | 6,066 | | | | (0.50 | )% | | | 13,542 | |
Paramount Global — Class B | | | 3,765 | | | | (0.55 | )% | | | 10,011 | |
Uber Technologies, Inc. | | | 3,635 | | | | (0.78 | )% | | | 4,422 | |
Interpublic Group of Companies, Inc. | | | 3,668 | | | | (1.07 | )% | | | (14,565 | ) |
Total Communications | | | | | | | 51,457 | |
| | | | | | | | | | | | | |
Technology | | | | | | | | | | | | |
Take-Two Interactive Software, Inc. | | | 1,105 | | | | (1.00 | )% | | $ | 3,010 | |
Science Applications International Corp. | | | 1,343 | | | | (1.30 | )% | | | (2,047 | ) |
Total Technology | | | | | | | | | | | 963 | |
Total MS Long/Short Equity Short Custom Basket | | | | | | $ | 460,889 | |
34 | THE GUGGENHEIM FUNDS ANNUAL REPORT | SEE NOTES TO CONSOLIDATED FINANCIAL STATEMENTS. |
CONSOLIDATED SCHEDULE OF INVESTMENTS (continued) | December 31, 2022 |
MULTI-HEDGE STRATEGIES FUND | |
| | Shares | | | Percentage
Notional
Amount | | | Value and
Unrealized
Appreciation
(Depreciation) | |
GS LONG/SHORT EQUITY LONG CUSTOM BASKET |
Consumer, Cyclical | | | | | | | | | | | | |
Patrick Industries, Inc. | | | 1,301 | | | | 0.48 | % | | $ | 19,142 | |
Home Depot, Inc. | | | 449 | | | | 0.82 | % | | | 16,624 | |
GMS, Inc. | | | 2,952 | | | | 0.85 | % | | | 14,472 | |
Academy Sports & Outdoors, Inc. | | | 1,341 | | | | 0.41 | % | | | 13,569 | |
Buckle, Inc. | | | 2,230 | | | | 0.59 | % | | | 11,772 | |
Allison Transmission Holdings, Inc. | | | 3,231 | | | | 0.78 | % | | | 9,656 | |
Methode Electronics, Inc. | | | 2,304 | | | | 0.59 | % | | | 7,311 | |
Group 1 Automotive, Inc. | | | 291 | | | | 0.30 | % | | | 3,549 | |
Haverty Furniture Companies, Inc. | | | 2,236 | | | | 0.39 | % | | | 3,254 | |
Starbucks Corp. | | | 805 | | | | 0.46 | % | | | 2,951 | |
Ethan Allen Interiors, Inc. | | | 1,513 | | | | 0.23 | % | | | (707 | ) |
Watsco, Inc. | | | 208 | | | | 0.30 | % | | | (1,800 | ) |
Wyndham Hotels & Resorts, Inc. | | | 2,482 | | | | 1.03 | % | | | (1,862 | ) |
Boyd Gaming Corp. | | | 1,395 | | | | 0.44 | % | | | (2,245 | ) |
Lowe’s Companies, Inc. | | | 312 | | | | 0.36 | % | | | (2,583 | ) |
Winnebago Industries, Inc. | | | 808 | | | | 0.25 | % | | | (3,232 | ) |
Yum! Brands, Inc. | | | 1,374 | | | | 1.02 | % | | | (3,418 | ) |
Columbia Sportswear Co. | | | 2,014 | | | | 1.02 | % | | | (3,529 | ) |
MSC Industrial Direct Company, Inc. — Class A | | | 1,368 | | | | 0.65 | % | | | (3,831 | ) |
Oxford Industries, Inc. | | | 687 | | | | 0.37 | % | | | (4,778 | ) |
Steven Madden Ltd. | | | 2,222 | | | | 0.41 | % | | | (5,589 | ) |
Williams-Sonoma, Inc. | | | 488 | | | | 0.33 | % | | | (6,136 | ) |
Brunswick Corp. | | | 1,937 | | | | 0.81 | % | | | (6,765 | ) |
Total Consumer, Cyclical | | | | | | | 55,825 | |
| | | | | | | | | | | | | |
Technology | | | | | | | | | | | | |
Rambus, Inc. | | | 1,311 | | | | 0.27 | % | | | 20,081 | |
Axcelis Technologies, Inc. | | | 559 | | | | 0.26 | % | | | 8,756 | |
CSG Systems International, Inc. | | | 737 | | | | 0.24 | % | | | 6,973 | |
Diodes, Inc. | | | 832 | | | | 0.37 | % | | | 6,710 | |
QUALCOMM, Inc. | | | 451 | | | | 0.29 | % | | | 2,336 | |
NetApp, Inc. | | | 776 | | | | 0.27 | % | | | 1,847 | |
Maximus, Inc. | | | 1,094 | | | | 0.46 | % | | | 1,061 | |
Adobe, Inc. | | | 154 | | | | 0.30 | % | | | 391 | |
Teradata Corp. | | | 1,810 | | | | 0.35 | % | | | (805 | ) |
Dropbox, Inc. — Class A | | | 4,454 | | | | 0.58 | % | | | (1,010 | ) |
Veeco Instruments, Inc. | | | 2,216 | | | | 0.24 | % | | | (1,735 | ) |
Apple, Inc. | | | 406 | | | | 0.31 | % | | | (2,003 | ) |
Synaptics, Inc. | | | 585 | | | | 0.32 | % | | | (2,031 | ) |
Kulicke & Soffa Industries, Inc. | | | 1,001 | | | | 0.26 | % | | | (3,501 | ) |
NetScout Systems, Inc. | | | 1,730 | | | | 0.33 | % | | | (3,507 | ) |
Cirrus Logic, Inc. | | | 2,341 | | | | 1.01 | % | | | (3,600 | ) |
Avid Technology, Inc. | | | 2,039 | | | | 0.31 | % | | | (4,136 | ) |
Microsoft Corp. | | | 475 | | | | 0.66 | % | | | (4,697 | ) |
ACI Worldwide, Inc. | | | 1,729 | | | | 0.23 | % | | | (5,165 | ) |
Synopsys, Inc. | | | 428 | | | | 0.79 | % | | | (5,815 | ) |
SEE NOTES TO CONSOLIDATED FINANCIAL STATEMENTS. | THE GUGGENHEIM FUNDS ANNUAL REPORT | 35 |
CONSOLIDATED SCHEDULE OF INVESTMENTS (continued) | December 31, 2022 |
MULTI-HEDGE STRATEGIES FUND | |
| | Shares | | | Percentage
Notional
Amount | | | Value and
Unrealized
Appreciation
(Depreciation) | |
Applied Materials, Inc. | | | 1,434 | | | | 0.81 | % | | $ | (13,023 | ) |
Total Technology | | | | | | | | | | | (2,873 | ) |
| | | | | | | | | | | | | |
Industrial | | | | | | | | | | | | |
Vishay Intertechnology, Inc. | | | 6,257 | | | | 0.78 | % | | | 24,388 | |
Standex International Corp. | | | 1,676 | | | | 0.99 | % | | | 16,742 | |
Dorian LPG Ltd. | | | 4,632 | | | | 0.51 | % | | | 15,994 | |
Louisiana-Pacific Corp. | | | 2,462 | | | | 0.84 | % | | | 12,941 | |
Albany International Corp. — Class A | | | 1,591 | | | | 0.91 | % | | | 10,567 | |
Snap-on, Inc. | | | 744 | | | | 0.99 | % | | | 10,561 | |
Eagle Materials, Inc. | | | 1,191 | | | | 0.92 | % | | | 10,509 | |
Emerson Electric Co. | | | 1,734 | | | | 0.97 | % | | | 9,454 | |
Textron, Inc. | | | 2,497 | | | | 1.02 | % | | | 7,831 | |
Lockheed Martin Corp. | | | 273 | | | | 0.77 | % | | | 2,786 | |
Advanced Energy Industries, Inc. | | | 1,275 | | | | 0.63 | % | | | 2,444 | |
Donaldson Company, Inc. | | | 3,000 | | | | 1.02 | % | | | 1,944 | |
OSI Systems, Inc. | | | 658 | | | | 0.30 | % | | | 647 | |
General Dynamics Corp. | | | 545 | | | | 0.78 | % | | | 41 | |
Otis Worldwide Corp. | | | 699 | | | | 0.32 | % | | | (91 | ) |
AMETEK, Inc. | | | 558 | | | | 0.45 | % | | | (1,789 | ) |
3M Co. | | | 547 | | | | 0.38 | % | | | (2,718 | ) |
Graco, Inc. | | | 2,612 | | | | 1.02 | % | | | (4,645 | ) |
Mueller Industries, Inc. | | | 1,550 | | | | 0.53 | % | | | (5,117 | ) |
Sealed Air Corp. | | | 1,770 | | | | 0.51 | % | | | (5,715 | ) |
Acuity Brands, Inc. | | | 656 | | | | 0.63 | % | | | (9,850 | ) |
PGT Innovations, Inc. | | | 2,835 | | | | 0.30 | % | | | (12,483 | ) |
Sturm Ruger & Company, Inc. | | | 2,280 | | | | 0.67 | % | | | (33,671 | ) |
Total Industrial | | | | | | | | | | | 50,770 | |
| | | | | | | | | | | | | |
Basic Materials | | | | | | | | | | | | |
FMC Corp. | | | 461 | | | | 0.33 | % | | | 5,589 | |
Westlake Corp. | | | 440 | | | | 0.26 | % | | | 5,222 | |
NewMarket Corp. | | | 280 | | | | 0.50 | % | | | 1,333 | |
American Vanguard Corp. | | | 2,167 | | | | 0.27 | % | | | 1,026 | |
Olin Corp. | | | 1,441 | | | | 0.44 | % | | | (3,213 | ) |
Ingevity Corp. | | | 715 | | | | 0.29 | % | | | (3,873 | ) |
AdvanSix, Inc. | | | 1,322 | | | | 0.29 | % | | | (5,107 | ) |
Minerals Technologies, Inc. | | | 2,014 | | | | 0.71 | % | | | (7,584 | ) |
Huntsman Corp. | | | 3,591 | | | | 0.57 | % | | | (9,514 | ) |
Balchem Corp. | | | 919 | | | | 0.65 | % | | | (9,671 | ) |
LyondellBasell Industries N.V. — Class A | | | 894 | | | | 0.43 | % | | | (9,807 | ) |
Total Basic Materials | | | | | | | (35,599 | ) |
| | | | | | | | | | | | | |
Financial | | | | | | | | | | | | |
S&T Bancorp, Inc. | | | 5,032 | | | | 1.00 | % | | | 28,590 | |
Renasant Corp. | | | 4,569 | | | | 1.00 | % | | | 18,899 | |
TowneBank | | | 5,439 | | | | 0.97 | % | | | 14,870 | |
Preferred Bank/Los Angeles CA | | | 2,443 | | | | 1.06 | % | | | 13,510 | |
PennyMac Financial Services, Inc. | | | 808 | | | | 0.27 | % | | | 7,493 | |
Virtus Investment Partners, Inc. | | | 306 | | | | 0.34 | % | | | 7,207 | |
Associated Banc-Corp. | | | 1,727 | | | | 0.23 | % | | | 5,389 | |
Evercore, Inc. — Class A | | | 992 | | | | 0.63 | % | | | 4,850 | |
36 | THE GUGGENHEIM FUNDS ANNUAL REPORT | SEE NOTES TO CONSOLIDATED FINANCIAL STATEMENTS. |
CONSOLIDATED SCHEDULE OF INVESTMENTS (continued) | December 31, 2022 |
MULTI-HEDGE STRATEGIES FUND | |
| | Shares | | | Percentage
Notional
Amount | | | Value and
Unrealized
Appreciation
(Depreciation) | |
NMI Holdings, Inc. — Class A | | | 1,841 | | | | 0.22 | % | | $ | 4,107 | |
Bread Financial Holdings, Inc. | | | 1,347 | | | | 0.29 | % | | | 3,696 | |
International Bancshares Corp. | | | 1,972 | | | | 0.52 | % | | | 3,432 | |
Hilltop Holdings, Inc. | | | 1,851 | | | | 0.32 | % | | | 2,946 | |
National Bank Holdings Corp. — Class A | | | 4,131 | | | | 1.01 | % | | | 2,175 | |
Visa, Inc. — Class A | | | 237 | | | | 0.29 | % | | | (1,690 | ) |
Marcus & Millichap, Inc. | | | 1,593 | | | | 0.32 | % | | | (4,187 | ) |
Hope Bancorp, Inc. | | | 13,565 | | | | 1.01 | % | | | (7,198 | ) |
BankUnited, Inc. | | | 2,134 | | | | 0.42 | % | | | (7,716 | ) |
Stewart Information Services Corp. | | | 1,618 | | | | 0.40 | % | | | (16,241 | ) |
Central Pacific Financial Corp. | | | 3,613 | | | | 0.42 | % | | | (16,297 | ) |
Heritage Financial Corp. | | | 5,748 | | | | 1.02 | % | | | (18,362 | ) |
Office Properties Income Trust | | | 5,934 | | | | 0.46 | % | | | (38,390 | ) |
Total Financial | | | | | | | | | | | 7,083 | |
| | | | | | | | | | | | | |
Communications | | | | | | | | | | | | |
Cisco Systems, Inc. | | | 1,984 | | | | 0.55 | % | | | 10,409 | |
T-Mobile US, Inc. | | | 1,025 | | | | 0.83 | % | | | 3,112 | |
VeriSign, Inc. | | | 364 | | | | 0.43 | % | | | 3,016 | |
Alphabet, Inc. — Class C | | | 592 | | | | 0.30 | % | | | (5,476 | ) |
Gogo, Inc. | | | 8,671 | | | | 0.74 | % | | | (14,185 | ) |
Meta Platforms, Inc. — Class A | | | 973 | | | | 0.68 | % | | | (16,030 | ) |
Verizon Communications, Inc. | | | 4,168 | | | | 0.95 | % | | | (18,662 | ) |
InterDigital, Inc. | | | 1,394 | | | | 0.40 | % | | | (18,727 | ) |
Total Communications | | | (56,543 | ) |
| | | | | | | | | | | | | |
Consumer, Non-cyclical | | | | |
Perdoceo Education Corp. | | | 11,714 | | | | 0.94 | % | | | 34,791 | |
Ironwood Pharmaceuticals, Inc. — Class A | | | 14,890 | | | | 1.07 | % | | | 21,943 | |
United Therapeutics Corp. | | | 337 | | | | 0.54 | % | | | 19,362 | |
Coca-Cola Co. | | | 2,818 | | | | 1.04 | % | | | 13,850 | |
Regeneron Pharmaceuticals, Inc. | | | 72 | | | | 0.30 | % | | | 13,426 | |
Hologic, Inc. | | | 2,383 | | | | 1.03 | % | | | 12,141 | |
Jazz Pharmaceuticals plc | | | 596 | | | | 0.55 | % | | | 11,733 | |
Bristol-Myers Squibb Co. | | | 2,212 | | | | 0.92 | % | | | 11,581 | |
Vertex Pharmaceuticals, Inc. | | | 297 | | | | 0.50 | % | | | 10,744 | |
Incyte Corp. | | | 892 | | | | 0.42 | % | | | 9,885 | |
Quest Diagnostics, Inc. | | | 1,200 | | | | 1.09 | % | | | 8,766 | |
Triton International Ltd. | | | 1,610 | | | | 0.64 | % | | | 8,574 | |
Amphastar Pharmaceuticals, Inc. | | | 1,686 | | | | 0.27 | % | | | 8,119 | |
Supernus Pharmaceuticals, Inc. | | | 2,492 | | | | 0.52 | % | | | 5,984 | |
Eli Lilly & Co. | | | 100 | | | | 0.21 | % | | | 5,392 | |
Post Holdings, Inc. | | | 1,360 | | | | 0.71 | % | | | 4,797 | |
Altria Group, Inc. | | | 2,903 | | | | 0.77 | % | | | 4,149 | |
SEE NOTES TO CONSOLIDATED FINANCIAL STATEMENTS. | THE GUGGENHEIM FUNDS ANNUAL REPORT | 37 |
CONSOLIDATED SCHEDULE OF INVESTMENTS (continued) | December 31, 2022 |
MULTI-HEDGE STRATEGIES FUND | |
| | Shares | | | Percentage
Notional
Amount | | | Value and
Unrealized
Appreciation
(Depreciation) | |
Lamb Weston Holdings, Inc. | | | 765 | | | | 0.40 | % | | $ | 2,994 | |
Quanex Building Products Corp. | | | 2,025 | | | | 0.28 | % | | | 2,554 | |
Prestige Consumer Healthcare, Inc. | | | 2,348 | | | | 0.85 | % | | | 2,299 | |
Innoviva, Inc. | | | 5,117 | | | | 0.39 | % | | | 2,075 | |
Globus Medical, Inc. — Class A | | | 1,249 | | | | 0.54 | % | | | 1,721 | |
John B Sanfilippo & Son, Inc. | | | 2,188 | | | | 1.03 | % | | | 1,150 | |
Monster Beverage Corp. | | | 1,032 | | | | 0.61 | % | | | (734 | ) |
Hershey Co. | | | 768 | | | | 1.03 | % | | | (1,011 | ) |
Inter Parfums, Inc. | | | 529 | | | | 0.30 | % | | | (1,164 | ) |
Danaher Corp. | | | 529 | | | | 0.81 | % | | | (1,761 | ) |
Gilead Sciences, Inc. | | | 1,066 | | | | 0.53 | % | | | (2,491 | ) |
Exelixis, Inc. | | | 2,940 | | | | 0.27 | % | | | (2,872 | ) |
IDEXX Laboratories, Inc. | | | 399 | | | | 0.94 | % | | | (5,244 | ) |
Varex Imaging Corp. | | | 6,458 | | | | 0.76 | % | | | (7,378 | ) |
EVERTEC, Inc. | | | 3,302 | | | | 0.62 | % | | | (8,898 | ) |
Royalty Pharma plc — Class A | | | 3,335 | | | | 0.76 | % | | | (10,774 | ) |
Eagle Pharmaceuticals, Inc. | | | 2,703 | | | | 0.46 | % | | | (25,780 | ) |
Vanda Pharmaceuticals, Inc. | | | 6,607 | | | | 0.28 | % | | | (35,708 | ) |
Tyson Foods, Inc. — Class A | | | 2,090 | | | | 0.75 | % | | | (41,359 | ) |
USANA Health Sciences, Inc. | | | 2,482 | | | | 0.77 | % | | | (45,028 | ) |
Total Consumer, Non-cyclical | | | 27,828 | |
| | | | | | | | | | | | | |
Energy | | | | | | | | | | | | |
Marathon Petroleum Corp. | | | 1,567 | | | | 1.06 | % | | | 22,833 | |
Phillips 66 | | | 894 | | | | 0.54 | % | | | 16,352 | |
Exxon Mobil Corp. | | | 1,655 | | | | 1.06 | % | | | 16,254 | |
Valero Energy Corp. | | | 906 | | | | 0.67 | % | | | 12,812 | |
Antero Midstream Corp. | | | 15,965 | | | | 1.00 | % | | | 7,202 | |
Par Pacific Holdings, Inc. | | | 1,944 | | | | 0.26 | % | | | 7,030 | |
REX American Resources Corp. | | | 1,838 | | | | 0.34 | % | | | 5,031 | |
ONEOK, Inc. | | | 633 | | | | 0.24 | % | | | 3,626 | |
SunCoke Energy, Inc. | | | 6,583 | | | | 0.33 | % | | | 2,755 | |
Kinder Morgan, Inc. | | | 9,147 | | | | 0.96 | % | | | 1,768 | |
Williams Companies, Inc. | | | 3,029 | | | | 0.58 | % | | | (925 | ) |
Equitrans Midstream Corp. | | | 6,334 | | | | 0.25 | % | | | (4,766 | ) |
DT Midstream, Inc. | | | 3,010 | | | | 0.96 | % | | | (5,148 | ) |
Occidental Petroleum Corp. | | | 1,092 | | | | 0.40 | % | | | (8,359 | ) |
CVR Energy, Inc. | | | 2,778 | | | | 0.50 | % | | | (8,638 | ) |
Total Energy | | | | | | | | | | | 67,827 | |
| | | | | | | | | | | | | |
Utilities | | | | | | | | | | | | |
FirstEnergy Corp. | | | 4,337 | | | | 1.05 | % | | | 19,309 | |
ONE Gas, Inc. | | | 1,315 | | | | 0.58 | % | | | 3,599 | |
UGI Corp. | | | 4,416 | | | | 0.95 | % | | | 2,386 | |
OGE Energy Corp. | | | 4,539 | | | | 1.04 | % | | | 409 | |
38 | THE GUGGENHEIM FUNDS ANNUAL REPORT | SEE NOTES TO CONSOLIDATED FINANCIAL STATEMENTS. |
CONSOLIDATED SCHEDULE OF INVESTMENTS (continued) | December 31, 2022 |
MULTI-HEDGE STRATEGIES FUND | |
| | Shares | | | Percentage
Notional
Amount | | | Value and
Unrealized
Appreciation
(Depreciation) | |
National Fuel Gas Co. | | | 761 | | | | 0.28 | % | | $ | 340 | |
Black Hills Corp. | | | 2,542 | | | | 1.04 | % | | | 211 | |
Chesapeake Utilities Corp. | | | 932 | | | | 0.64 | % | | | (684 | ) |
Otter Tail Corp. | | | 1,290 | | | | 0.44 | % | | | (4,157 | ) |
Clearway Energy, Inc. — Class C | | | 3,120 | | | | 0.58 | % | | | (6,802 | ) |
MGE Energy, Inc. | | | 1,819 | | | | 0.74 | % | | | (7,388 | ) |
Total Utilities | | | | | | | | | | | 7,223 | |
Total GS Long/Short Equity Long Custom Basket | | | | | | | 121,541 | |
| | | | | | | | | |
GS LONG/SHORT EQUITY SHORT CUSTOM BASKET |
Consumer, Non-cyclical | | | | | | | | |
ASGN, Inc. | | | 830 | | | | (0.59 | )% | | | 30,455 | |
Viad Corp. | | | 1,771 | | | | (0.38 | )% | | | 29,429 | |
Healthcare Services Group, Inc. | | | 5,398 | | | | (0.57 | )% | | | 21,535 | |
FTI Consulting, Inc. | | | 712 | | | | (0.99 | )% | | | 12,562 | |
Equifax, Inc. | | | 883 | | | | (1.51 | )% | | | 11,212 | |
TransUnion | | | 2,669 | | | | (1.33 | )% | | | 9,366 | |
CoStar Group, Inc. | | | 1,536 | | | | (1.04 | )% | | | 8,529 | |
Driven Brands Holdings, Inc. | | | 4,383 | | | | (1.05 | )% | | | 8,330 | |
Rollins, Inc. | | | 1,405 | | | | (0.45 | )% | | | 4,926 | |
Patterson Companies, Inc. | | | 1,749 | | | | (0.43 | )% | | | 4,491 | |
GXO Logistics, Inc. | | | 1,123 | | | | (0.42 | )% | | | 2,505 | |
ABM Industries, Inc. | | | 3,572 | | | | (1.40 | )% | | | (1,989 | ) |
Quanta Services, Inc. | | | 433 | | | | (0.54 | )% | | | (3,742 | ) |
Cintas Corp. | | | 391 | | | | (1.55 | )% | | | (11,639 | ) |
ICU Medical, Inc. | | | 970 | | | | (1.34 | )% | | | (21,033 | ) |
Total Consumer, Non-cyclical | | | 104,937 | |
| | | | | | | | | | | | | |
Utilities |
AES Corp. | | | 2,152 | | | | (0.54 | )% | | | (654 | ) |
Vistra Corp. | | | 3,372 | | | | (0.69 | )% | | | (1,627 | ) |
Public Service Enterprise Group, Inc. | | | 2,945 | | | | (1.59 | )% | | | (5,442 | ) |
Exelon Corp. | | | 4,012 | | | | (1.53 | )% | | | (6,831 | ) |
Edison International | | | 2,742 | | | | (1.53 | )% | | | (14,377 | ) |
Total Utilities | | | | | | | | | | | (28,931 | ) |
| | | | | | | | | | | | | |
Basic Materials | | | | | | | | | | | | |
Alcoa Corp. | | | 1,295 | | | | (0.52 | )% | | | 2,622 | |
Freeport-McMoRan, Inc. | | | 1,731 | | | | (0.58 | )% | | | 1,681 | |
ATI, Inc. | | | 1,808 | | | | (0.47 | )% | | | 1,453 | |
Total Basic Materials | | | | | | | 5,756 | |
| | | | | | | | | | | | | |
Financial | | | | | | | | | | | | |
Signature Bank | | | 495 | | | | (0.50 | )% | | | 58,586 | |
Invitation Homes, Inc. | | | 3,107 | | | | (0.81 | )% | | | 35,311 | |
Welltower, Inc. | | | 1,224 | | | | (0.71 | )% | | | 31,499 | |
Crown Castle, Inc. | | | 569 | | | | (0.68 | )% | | | 26,638 | |
Sun Communities, Inc. | | | 1,255 | | | | (1.58 | )% | | | 18,420 | |
Bank of America Corp. | | | 5,118 | | | | (1.49 | )% | | | 16,866 | |
KKR & Company, Inc. — Class A | | | 2,323 | | | | (0.95 | )% | | | 16,781 | |
Equinix, Inc. | | | 206 | | | | (1.19 | )% | | | 16,633 | |
Howard Hughes Corp. | �� | | 1,584 | | | | (1.06 | )% | | | 15,701 | |
Ares Management Corp. — Class A | | | 1,892 | | | | (1.14 | )% | | | 15,052 | |
Americold Realty Trust, Inc. | | | 3,196 | | | | (0.80 | )% | | | 13,835 | |
Kennedy-Wilson Holdings, Inc. | | | 7,598 | | | | (1.05 | )% | | | 13,162 | |
SEE NOTES TO CONSOLIDATED FINANCIAL STATEMENTS. | THE GUGGENHEIM FUNDS ANNUAL REPORT | 39 |
CONSOLIDATED SCHEDULE OF INVESTMENTS (continued) | December 31, 2022 |
MULTI-HEDGE STRATEGIES FUND | |
| | | Shares | | | Percentage
Notional
Amount | | | Value and
Unrealized
Appreciation | |
| Equitable Holdings, Inc. | | | 5,733 | | | | (1.45 | )% | | $ | 12,932 | |
| Raymond James Financial, Inc. | | | 1,540 | | | | (1.45 | )% | | | 12,892 | |
| American Tower Corp. — Class A | | | 816 | | | | (1.52 | )% | | | 11,335 | |
| Digital Realty Trust, Inc. | | | 773 | | | | (0.68 | )% | | | 11,286 | |
| Assurant, Inc. | | | 553 | | | | (0.61 | )% | | | 9,599 | |
| Independence Realty Trust, Inc. | | | 4,185 | | | | (0.62 | )% | | | 8,855 | |
| Ryman Hospitality Properties, Inc. | | | 1,480 | | | | (1.06 | )% | | | 7,610 | |
| Host Hotels & Resorts, Inc. | | | 4,190 | | | | (0.59 | )% | | | 7,091 | |
| Pebblebrook Hotel Trust | | | 2,806 | | | | (0.33 | )% | | | 6,164 | |
| Kite Realty Group Trust | | | 6,664 | | | | (1.23 | )% | | | 4,741 | |
| Wells Fargo & Co. | | | 1,548 | | | | (0.56 | )% | | | 4,667 | |
| KeyCorp | | | 7,597 | | | | (1.16 | )% | | | 4,582 | |
| Alexandria Real Estate Equities, Inc. | | | 1,179 | | | | (1.51 | )% | | | 3,832 | |
| Principal Financial Group, Inc. | | | 613 | | | | (0.45 | )% | | | 3,181 | |
| UDR, Inc. | | | 4,410 | | | | (1.50 | )% | | | 2,833 | |
| Kimco Realty Corp. | | | 5,899 | | | | (1.10 | )% | | | 2,437 | |
| Ventas, Inc. | | | 1,597 | | | | (0.63 | )% | | | 2,276 | |
| Iron Mountain, Inc. | | | 2,819 | | | | (1.24 | )% | | | 1,967 | |
| Northern Trust Corp. | | | 1,995 | | | | (1.55 | )% | | | 1,892 | |
| Citigroup, Inc. | | | 2,710 | | | | (1.08 | )% | | | 1,137 | |
| Cboe Global Markets, Inc. | | | 536 | | | | (0.59 | )% | | | 993 | |
| Willis Towers Watson plc | | | 358 | | | | (0.77 | )% | | | 964 | |
| | | Shares | | | Percentage
Notional
Amount | | | Value and
Unrealized
Appreciation
(Depreciation) | |
| Cullen/Frost Bankers, Inc. | | | 419 | | | | (0.49 | )% | | | 324 | |
| Progressive Corp. | | | 1,364 | | | | (1.56 | )% | | | (1,697 | ) |
| Cincinnati Financial Corp. | | | 510 | | | | (0.46 | )% | | | (2,114 | ) |
| American International Group, Inc. | | | 1,266 | | | | (0.70 | )% | | | (2,320 | ) |
| TFS Financial Corp. | | | 4,821 | | | | (0.61 | )% | | | (3,329 | ) |
| Intercontinental Exchange, Inc. | | | 1,060 | | | | (0.96 | )% | | | (4,861 | ) |
| BlackRock, Inc. — Class A | | | 140 | | | | (0.87 | )% | | | (5,082 | ) |
| Arthur J Gallagher & Co. | | | 336 | | | | (0.56 | )% | | | (5,430 | ) |
| CBRE Group, Inc. — Class A | | | 1,179 | | | | (0.80 | )% | | | (8,499 | ) |
| First Republic Bank | | | 1,060 | | | | (1.14 | )% | | | (9,189 | ) |
| Allstate Corp. | | | 1,121 | | | | (1.34 | )% | | | (9,887 | ) |
| Invesco Ltd. | | | 6,340 | | | | (1.00 | )% | | | (10,260 | ) |
| Apollo Global Management, Inc. | | | 2,750 | | | | (1.54 | )% | | | (13,844 | ) |
| Total Financial | | | | | | | | | | | 325,562 | |
| | | | | | | | | | | | | |
| Consumer, Cyclical | | | | | | | | | | | | |
| MillerKnoll, Inc. | | | 3,063 | | | | (0.57 | )% | | | 45,930 | |
| CarMax, Inc. | | | 1,076 | | | | (0.58 | )% | | | 20,345 | |
| American Airlines Group, Inc. | | | 4,513 | | | | (0.50 | )% | | | 18,711 | |
| Hawaiian Holdings, Inc. | | | 4,020 | | | | (0.36 | )% | | | 13,662 | |
| Live Nation Entertainment, Inc. | | | 959 | | | | (0.59 | )% | | | 3,830 | |
| Floor & Decor Holdings, Inc. — Class A | | | 604 | | | | (0.37 | )% | | | 3,772 | |
| Delta Air Lines, Inc. | | | 4,481 | | | | (1.29 | )% | | | (1,808 | ) |
40 | THE GUGGENHEIM FUNDS ANNUAL REPORT | SEE NOTES TO CONSOLIDATED FINANCIAL STATEMENTS. |
CONSOLIDATED SCHEDULE OF INVESTMENTS (continued) | December 31, 2022 |
MULTI-HEDGE STRATEGIES FUND | |
| | | Shares | | | Percentage
Notional
Amount | | | Value and
Unrealized
Appreciation
(Depreciation) | |
| Walgreens Boots Alliance, Inc. | | | 2,825 | | | | (0.93 | )% | | $ | (2,018 | ) |
| Copart, Inc. | | | 2,708 | | | | (1.45 | )% | | | (5,755 | ) |
| Madison Square Garden Sports Corp. — Class A | | | 396 | | | | (0.64 | )% | | | (16,887 | ) |
| Total Consumer, Cyclical | | | | | | | | | | | 79,782 | |
| | | | | | | | | | | | | |
| Industrial | | | | | | | | | | | | |
| Stanley Black & Decker, Inc. | | | 811 | | | | (0.54 | )% | | | 28,507 | |
| Stericycle, Inc. | | | 841 | | | | (0.37 | )% | | | 17,091 | |
| Waste Management, Inc. | | | 1,067 | | | | (1.47 | )% | | | 14,110 | |
| TD SYNNEX Corp. | | | 1,813 | | | | (1.51 | )% | | | 6,292 | |
| Kirby Corp. | | | 919 | | | | (0.52 | )% | | | 3,999 | |
| Jacobs Solutions, Inc. | | | 1,473 | | | | (1.56 | )% | | | 1,801 | |
| J.B. Hunt Transport Services, Inc. | | | 278 | | | | (0.43 | )% | | | (1,198 | ) |
| Casella Waste Systems, Inc. — Class A | | | 1,391 | | | | (0.97 | )% | | | (1,600 | ) |
| Norfolk Southern Corp. | | | 252 | | | | (0.55 | )% | | | (3,634 | ) |
| TransDigm Group, Inc. | | | 58 | | | | (0.32 | )% | | | (4,761 | ) |
| FedEx Corp. | | | 340 | | | | (0.52 | )% | | | (6,198 | ) |
| Boeing Co. | | | 315 | | | | (0.53 | )% | | | (8,731 | ) |
| MSA Safety, Inc. | | | 1,021 | | | | (1.29 | )% | | | (23,556 | ) |
| Total Industrial | | | | | | | | | | | 22,122 | |
| | | | | | | | | | | | | |
| Energy | | | | | | | | | | | | |
| NOV, Inc. | | | 3,276 | | | | (0.60 | )% | | | 7,514 | |
| Helmerich & Payne, Inc. | | | 1,156 | | | | (0.50 | )% | | | (531 | ) |
| Patterson-UTI Energy, Inc. | | | 5,161 | | | | (0.76 | )% | | | (596 | ) |
| Halliburton Co. | | | 4,768 | | | | (1.65 | )% | | | (5,690 | ) |
| Liberty Energy, Inc. — Class A | | | 3,946 | | | | (0.56 | )% | | | (6,663 | ) |
| ChampionX Corp. | | | 1,209 | | | | (0.31 | )% | | | (8,474 | ) |
| Hess Corp. | | | 781 | | | | (0.97 | )% | | | (10,691 | ) |
| Valaris Ltd. | | | 1,291 | | | | (0.77 | )% | | | (19,685 | ) |
| EOG Resources, Inc. | | | 1,264 | | | | (1.44 | )% | | | (21,901 | ) |
| Schlumberger Ltd. | | | 1,618 | | | | (0.76 | )% | | | (23,489 | ) |
| Total Energy | | | | | | | | | | | (90,206 | ) |
| | | | | | | | | | | | | |
| Communications | | | | | | | | | | | | |
| IAC, Inc. | | | 1,883 | | | | (0.74 | )% | | | 19,985 | |
| Walt Disney Co. | | | 1,468 | | | | (1.12 | )% | | | 16,814 | |
| Warner Bros Discovery, Inc. | | | 6,066 | | | | (0.51 | )% | | | 12,920 | |
| Paramount Global — Class B | | | 3,765 | | | | (0.56 | )% | | | 10,180 | |
| Uber Technologies, Inc. | | | 3,635 | | | | (0.79 | )% | | | 4,537 | |
| Interpublic Group of Companies, Inc. | | | 3,668 | | | | (1.07 | )% | | | (15,775 | ) |
| Total Communications | | | | | | | | | | | 48,661 | |
| | | | | | | | | | | | | |
| Technology | | | | | | | | | | | | |
| Take-Two Interactive Software, Inc. | | | 1,105 | | | | (1.01 | )% | | | 3,277 | |
| Science Applications International Corp. | | | 1,343 | | | | (1.31 | )% | | | (2,340 | ) |
| Total Technology | | | | | | | | | | | 937 | |
| Total GS Long/Short Equity Short Custom Basket | | | | | | | | | | $ | 468,620 | |
SEE NOTES TO CONSOLIDATED FINANCIAL STATEMENTS. | THE GUGGENHEIM FUNDS ANNUAL REPORT | 41 |
CONSOLIDATED SCHEDULE OF INVESTMENTS (continued) | December 31, 2022 |
MULTI-HEDGE STRATEGIES FUND | |
| | Shares | | | Percentage
Notional
Amount | | | Value and
Unrealized
Appreciation
(Depreciation) | |
MS EQUITY MARKET NEUTRAL LONG CUSTOM BASKET |
Financial | | | | | | | | | | | | |
Gaming and Leisure Properties, Inc. | | | 24,371 | | | | 7.20 | % | | $ | 182,755 | |
Sun Communities, Inc. | | | 6,469 | | | | 5.24 | % | | | 69,855 | |
Brixmor Property Group, Inc. | | | 29,594 | | | | 3.80 | % | | | 60,153 | |
SITE Centers Corp. | | | 57,019 | | | | 4.42 | % | | | 52,569 | |
Ryman Hospitality Properties, Inc. | | | 16,845 | | | | 7.81 | % | | | 48,335 | |
Agree Realty Corp. | | | 16,195 | | | | 6.51 | % | | | 42,416 | |
Ventas, Inc. | | | 19,421 | | | | 4.96 | % | | | 31,701 | |
CareTrust REIT, Inc. | | | 53,864 | | | | 5.67 | % | | | 24,160 | |
InvenTrust Properties Corp. | | | 30,957 | | | | 4.15 | % | | | 4,121 | |
Four Corners Property Trust, Inc. | | | 38,152 | | | | 5.61 | % | | | 1,026 | |
Cousins Properties, Inc. | | | 10,812 | | | | 1.55 | % | | | (3,744 | ) |
Alexandria Real Estate Equities, Inc. | | | 7,123 | | | | 5.88 | % | | | (10,733 | ) |
SBA Communications Corp. | | | 1,427 | | | | 2.27 | % | | | (30,026 | ) |
American Tower Corp. — Class A | | | 1,803 | | | | 2.17 | % | | | (39,876 | ) |
Boston Properties, Inc. | | | 3,838 | | | | 1.47 | % | | | (50,795 | ) |
Piedmont Office Realty Trust, Inc. — Class A | | | 30,026 | | | | 1.56 | % | | | (71,517 | ) |
NETSTREIT Corp. | | | 60,346 | | | | 6.27 | % | | | (84,635 | ) |
Rexford Industrial Realty, Inc. | | | 27,914 | | | | 8.65 | % | | | (102,829 | ) |
AvalonBay Communities, Inc. | | | 5,819 | | | | 5.33 | % | | | (121,868 | ) |
Equity Residential | | | 15,391 | | | | 5.15 | % | | | (127,646 | ) |
Xenia Hotels & Resorts, Inc. | | | 57,970 | | | | 4.33 | % | | | (182,043 | ) |
Total Financial | | | | | | | | | | | (308,621 | ) |
Total MS Equity Market Neutral Long Custom Basket | | $ | (308,621 | ) |
| | | | | | | | | |
MS EQUITY MARKET NEUTRAL SHORT CUSTOM BASKET |
Financial | | | | | | | | | | | | |
Douglas Emmett, Inc. | | | 71,528 | | | | (6.65 | )% | | $ | 483,848 | |
Office Properties Income Trust | | | 58,173 | | | | (4.61 | )% | | | 402,834 | |
Broadstone Net Lease, Inc. | | | 62,099 | | | | (5.98 | )% | | | 297,120 | |
Essex Property Trust, Inc. | | | 5,132 | | | | (6.46 | )% | | | 239,173 | |
Necessity Retail REIT, Inc. | | | 98,087 | | | | (3.45 | )% | | | 156,491 | |
Apartment Income REIT Corp. | | | 14,877 | | | | (3.03 | )% | | | 144,824 | |
Mid-America Apartment Communities, Inc. | | | 6,082 | | | | (5.67 | )% | | | 137,956 | |
Camden Property Trust | | | 4,723 | | | | (3.14 | )% | | | 135,269 | |
Host Hotels & Resorts, Inc. | | | 33,126 | | | | (3.16 | )% | | | 92,063 | |
Realty Income Corp. | | | 28,128 | | | | (10.59 | )% | | | 55,247 | |
Apple Hospitality REIT, Inc. | | | 60,170 | | | | (5.64 | )% | | | 43,972 | |
STAG Industrial, Inc. | | | 47,113 | | | | (9.04 | )% | | | 22,585 | |
42 | THE GUGGENHEIM FUNDS ANNUAL REPORT | SEE NOTES TO CONSOLIDATED FINANCIAL STATEMENTS. |
CONSOLIDATED SCHEDULE OF INVESTMENTS (continued) | December 31, 2022 |
MULTI-HEDGE STRATEGIES FUND | |
| | Shares | | | Percentage
Notional
Amount | | | Value and
Unrealized
Appreciation
(Depreciation) | |
Federal Realty Investment Trust | | | 9,132 | | | | (5.48 | )% | | $ | 1,858 | |
Phillips Edison & Company, Inc. | | | 60,318 | | | | (11.40 | )% | | | (4,902 | ) |
Welltower, Inc. | | | 12,447 | | | | (4.84 | )% | | | (55,047 | ) |
Total Financial | | | | | | | | | | | 2,153,291 | |
| | | | | | | | | | | | | |
Exchange Traded Funds | | | | |
Vanguard Real Estate ETF | | | 22,168 | | | | (10.86 | )% | | | 360,384 | |
Total MS Equity Market Neutral Short Custom Basket | | $ | 2,513,675 | |
| | | | | |
GS EQUITY MARKET NEUTRAL LONG CUSTOM BASKET |
Financial | | | | | | | | | | | | |
Gaming and Leisure Properties, Inc. | | | 24,371 | | | | 7.20 | % | | $ | 182,598 | |
Brixmor Property Group, Inc. | | | 29,594 | | | | 3.80 | % | | | 60,427 | |
SITE Centers Corp. | | | 57,019 | | | | 4.42 | % | | | 54,428 | |
Ryman Hospitality Properties, Inc. | | | 16,845 | | | | 7.81 | % | | | 49,372 | |
Sun Communities, Inc. | | | 6,469 | | | | 5.24 | % | | | 43,372 | |
Agree Realty Corp. | | | 16,195 | | | | 6.51 | % | | | 40,904 | |
Ventas, Inc. | | | 19,421 | | | | 4.96 | % | | | 32,043 | |
CareTrust REIT, Inc. | | | 53,864 | | | | 5.67 | % | | | 23,849 | |
InvenTrust Properties Corp. | | | 30,957 | | | | 4.15 | % | | | 6,424 | |
Four Corners Property Trust, Inc. | | | 38,152 | | | | 5.61 | % | | | 1,070 | |
Cousins Properties, Inc. | | | 10,812 | | | | 1.55 | % | | | (3,924 | ) |
Alexandria Real Estate Equities, Inc. | | | 7,123 | | | | 5.88 | % | | | (10,644 | ) |
SBA Communications Corp. | | | 1,427 | | | | 2.27 | % | | | (29,794 | ) |
American Tower Corp. — Class A | | | 1,803 | | | | 2.17 | % | | | (39,929 | ) |
Boston Properties, Inc. | | | 3,838 | | | | 1.47 | % | | | (51,236 | ) |
Piedmont Office Realty Trust, Inc. — Class A | | | 30,026 | | | | 1.56 | % | | | (72,015 | ) |
NETSTREIT Corp. | | | 60,346 | | | | 6.27 | % | | | (83,965 | ) |
Rexford Industrial Realty, Inc. | | | 27,914 | | | | 8.65 | % | | | (100,864 | ) |
AvalonBay Communities, Inc. | | | 5,819 | | | | 5.33 | % | | | (122,322 | ) |
Equity Residential | | | 15,391 | | | | 5.15 | % | | | (128,227 | ) |
Xenia Hotels & Resorts, Inc. | | | 57,970 | | | | 4.33 | % | | | (180,367 | ) |
Total Financial | | | | | | | | | | | (328,800 | ) |
Total GS Equity Market Neutral Long Custom Basket | | $ | (328,800 | ) |
| | | | | | | | | |
GS EQUITY MARKET NEUTRAL SHORT CUSTOM BASKET |
Financial | | | | | | | | | | | | |
Douglas Emmett, Inc. | | | 71,528 | | �� | | (6.65 | )% | | | 485,657 | |
Office Properties Income Trust | | | 58,173 | | | | (4.61 | )% | | | 404,887 | |
Broadstone Net Lease, Inc. | | | 62,099 | | | | (5.98 | )% | | | 291,251 | |
Essex Property Trust, Inc. | | | 5,132 | | | | (6.46 | )% | | | 235,743 | |
Necessity Retail REIT, Inc. | | | 98,087 | | | | (3.45 | )% | | | 156,038 | |
Apartment Income REIT Corp. | | | 14,877 | | | | (3.03 | )% | | | 145,460 | |
SEE NOTES TO CONSOLIDATED FINANCIAL STATEMENTS. | THE GUGGENHEIM FUNDS ANNUAL REPORT | 43 |
CONSOLIDATED SCHEDULE OF INVESTMENTS (continued) | December 31, 2022 |
MULTI-HEDGE STRATEGIES FUND | |
| | Shares | | | Percentage
Notional
Amount | | | Value and
Unrealized
Appreciation
(Depreciation) | |
Mid-America Apartment Communities, Inc. | | | 6,082 | | | | (5.67 | )% | | $ | 137,867 | |
Camden Property Trust | | | 4,723 | | | | (3.14 | )% | | | 135,235 | |
Host Hotels & Resorts, Inc. | | | 33,126 | | | | (3.16 | )% | | | 92,487 | |
Realty Income Corp. | | | 28,128 | | | | (10.59 | )% | | | 54,859 | |
Apple Hospitality REIT, Inc. | | | 60,170 | | | | (5.64 | )% | | | 33,037 | |
STAG Industrial, Inc. | | | 47,113 | | | | (9.04 | )% | | | 20,208 | |
Federal Realty Investment Trust | | | 9,132 | | | | (5.48 | )% | | | 1,129 | |
Phillips Edison & Company, Inc. | | | 60,318 | | | | (11.40 | )% | | | (8,203 | ) |
Welltower, Inc. | | | 12,447 | | | | (4.84 | )% | | | (56,391 | ) |
Total Financial | | | | | | | | | | | 2,129,264 | |
| | | | | | | | | | | | | |
Exchange Traded Funds | | | | | | | | | | | | |
Vanguard Real Estate ETF | | | 22,168 | | | | (10.86 | )% | | | 363,353 | |
Total GS Equity Market Neutral Short Custom Basket | | $ | 2,492,617 | |
44 | THE GUGGENHEIM FUNDS ANNUAL REPORT | SEE NOTES TO CONSOLIDATED FINANCIAL STATEMENTS. |
CONSOLIDATED SCHEDULE OF INVESTMENTS (continued) | December 31, 2022 |
MULTI-HEDGE STRATEGIES FUND | |
* | Non-income producing security. |
** | Includes cumulative appreciation (depreciation). Variation margin is reported within the Consolidated Statement of Assets and Liabilities. |
† | Value determined based on Level 1 inputs, unless otherwise noted — See Note 4. |
†† | Value determined based on Level 2 inputs — See Note 4. |
††† | Value determined based on Level 3 inputs — See Note 4. |
1 | Affiliated issuer. |
2 | All or a portion of this security is on loan at December 31, 2022 — See Note 7. |
3 | Rate indicated is the effective yield at the time of purchase. |
4 | All or a portion of this security is pledged as short security and equity custom basket swap collateral at December 31, 2022. |
5 | All or a portion of this security is pledged as futures collateral at December 31, 2022. |
6 | Repurchase Agreements — See Note 6. |
7 | Securities lending collateral — See Note 7. |
8 | Rate indicated is the 7-day yield as of December 31, 2022. |
| | GS — Goldman Sachs International |
| | MS — Morgan Stanley Capital Services LLC |
| | plc — Public Limited Company |
| | REIT — Real Estate Investment Trust |
| | |
| | See Sector Classification in Other Information section. |
The following table summarizes the inputs used to value the Fund’s investments at December 31, 2022 (See Note 4 in the Notes to Consolidated Financial Statements):
Investments in Securities (Assets) | | Level 1
Quoted
Prices | | | Level 2
Significant
Observable
Inputs | | | Level 3
Significant
Unobservable
Inputs | | | Total | |
Common Stocks | | $ | 34,998,779 | | | $ | — | | | $ | — | | | $ | 34,998,779 | |
Rights | | | — | | | | — | | | | — | * | | | — | |
Mutual Funds | | | 14,884,927 | | | | — | | | | — | | | | 14,884,927 | |
Closed-End Funds | | | 8,078,597 | | | | — | | | | — | | | | 8,078,597 | |
U.S. Treasury Bills | | | — | | | | 18,557,924 | | | | — | | | | 18,557,924 | |
Repurchase Agreements | | | — | | | | 38,763,010 | | | | — | | | | 38,763,010 | |
Securities Lending Collateral | | | 25,951 | | | | — | | | | — | | | | 25,951 | |
Commodity Futures Contracts** | | | 1,356,631 | | | | — | | | | — | | | | 1,356,631 | |
Interest Rate Futures Contracts** | | | 52,673 | | | | 190,358 | | | | — | | | | 243,031 | |
Currency Futures Contracts** | | | 158,650 | | | | — | | | | — | | | | 158,650 | |
Equity Futures Contracts** | | | 54,823 | | | | 64,352 | | | | — | | | | 119,175 | |
Equity Custom Basket Swap Agreements** | | | — | | | | 6,157,107 | | | | — | | | | 6,157,107 | |
Total Assets | | $ | 59,611,031 | | | $ | 63,732,751 | | | $ | — | | | $ | 123,343,782 | |
SEE NOTES TO CONSOLIDATED FINANCIAL STATEMENTS. | THE GUGGENHEIM FUNDS ANNUAL REPORT | 45 |
CONSOLIDATED SCHEDULE OF INVESTMENTS (continued) | December 31, 2022 |
MULTI-HEDGE STRATEGIES FUND | |
Investments in Securities (Liabilities) | | Level 1
Quoted
Prices | | | Level 2
Significant
Observable
Inputs | | | Level 3
Significant
Unobservable
Inputs | | | Total | |
Common Stocks Sold Short | | $ | 2,741,491 | | | $ | — | | | $ | — | | | $ | 2,741,491 | |
Exchange-Traded Funds Sold Short | | | 8,170,045 | | | | — | | | | — | | | | 8,170,045 | |
Commodity Futures Contracts** | | | 626,447 | | | | — | | | | — | | | | 626,447 | |
Equity Futures Contracts** | | | 453,463 | | | | 40,061 | | | | — | | | | 493,524 | |
Currency Futures Contracts** | | | 260,291 | | | | — | | | | — | | | | 260,291 | |
Interest Rate Futures Contracts** | | | 2,798 | | | | 26,138 | | | | — | | | | 28,936 | |
Equity Custom Basket Swap Agreements** | | | — | | | | 637,421 | | | | — | | | | 637,421 | |
Total Liabilities | | $ | 12,254,535 | | | $ | 703,620 | | | $ | — | | | $ | 12,958,155 | |
* | Includes securities with a market value of $0. |
** | This derivative is reported as unrealized appreciation/depreciation at period end. |
Affiliated Transactions
Investments representing 5% or more of the outstanding voting shares of a company, or control of or by, or common control under Guggenheim Investments (“GI”), result in that company being considered an affiliated issuer, as defined in the 1940 Act.
The Fund may invest in certain of the underlying series of Guggenheim Strategy Funds Trust, including Guggenheim Strategy Fund II and Guggenheim Strategy Fund III, (collectively, the “Short Term Investment Vehicles”), each of which are open-end management investment companies managed by GI. The Short Term Investment Vehicles, which launched on March 11, 2014, are offered as short term investment options only to mutual funds, trusts, and other accounts managed by GI and/or its affiliates, and are not available to the public. The Short Term Investment Vehicles pay no investment management fees. The Short Term Investment Vehicles’ annual report on Form N-CSR dated September 30, 2022, is available publicly or upon request. This information is available from the EDGAR database on the SEC’s website at https://www.sec.gov/Archives/edgar/data/1601445/000182126822000340/gug84768.htm. The Fund may invest in certain of the underlying series of Guggenheim Funds Trust, which are open-end management investment companies managed by GI, are available to the public and whose most recent annual report on Form N-CSR is available publicly or upon request.
46 | THE GUGGENHEIM FUNDS ANNUAL REPORT | SEE NOTES TO CONSOLIDATED FINANCIAL STATEMENTS. |
CONSOLIDATED SCHEDULE OF INVESTMENTS (concluded) | December 31, 2022 |
MULTI-HEDGE STRATEGIES FUND | |
Transactions during the year ended December 31, 2022, in which the company is an affiliated issuer, were as follows:
Security Name | | Value
12/31/21 | | | Additions | | | Reductions | | | Realized
Gain (Loss) | | | Change in
Unrealized
Appreciation
(Depreciation) | | | Value
12/31/22 | | | Shares
12/31/22 | | | Investment
Income | |
Mutual Funds | | | | | | | | | | | | | | | | | | | | | | | | | | | | | | | | |
Guggenheim Strategy Fund II | | $ | 5,207,495 | | | $ | 1,500,000 | | | $ | — | | | $ | — | | | $ | (225,877 | ) | | $ | 6,481,618 | | | | 269,618 | | | $ | 183,840 | |
Guggenheim Strategy Fund III | | | 977,752 | | | | 1,000,000 | | | | — | | | | — | | | | (76,260 | ) | | | 1,901,492 | | | | 79,031 | | | | 56,160 | |
Guggenheim Ultra Short Duration Fund — Institutional Class | | | 3,690,666 | | | | 3,000,000 | | | | — | | | | — | | | | (188,849 | ) | | | 6,501,817 | | | | 674,462 | | | | 146,926 | |
| | | $ | 9,875,913 | | | $ | 5,500,000 | | | $ | — | | | $ | — | | | $ | (490,986 | ) | | $ | 14,884,927 | | | | | | | $ | 386,926 | |
SEE NOTES TO CONSOLIDATED FINANCIAL STATEMENTS. | THE GUGGENHEIM FUNDS ANNUAL REPORT | 47 |
CONSOLIDATED STATEMENT OF ASSETS AND LIABILITIES |
MULTI-HEDGE STRATEGIES FUND |
December 31, 2022
Assets: |
Investments in unaffiliated issuers, at value - including $24,587 of securities loaned (cost $61,659,439) | | $ | 61,661,251 | |
Investments in affiliated issuers, at value (cost $15,386,814) | | | 14,884,927 | |
Repurchase agreements, at value (cost $38,763,010) | | | 38,763,010 | |
Cash | | | 11,300,666 | |
Segregated cash with broker | | | 1,611,618 | |
Unrealized appreciation on OTC swap agreements | | | 6,157,107 | |
Receivables: |
Securities sold | | | 1,074,495 | |
Dividends | | | 104,093 | |
Fund shares sold | | | 44,326 | |
Short sale rebate income | | | 27,204 | |
Interest | | | 9,146 | |
Securities lending income | | | 2,946 | |
Other assets | | | 4,215 | |
Total assets | | | 135,645,004 | |
| | | | | |
Liabilities: |
Securities sold short, at value (proceeds $11,497,316) | | | 10,911,536 | |
Unrealized depreciation on OTC swap agreements | | | 637,421 | |
Payable for: |
Swap settlement | | | 393,073 | |
Fund shares redeemed | | | 320,323 | |
Variation margin on futures contracts | | | 205,596 | |
Management fees | | | 93,359 | |
Return of securities lending collateral | | | 25,951 | |
Distribution and service fees | | | 3,534 | |
Trustees’ fees* | | | 1,639 | |
Miscellaneous | | | 5,684 | |
Total liabilities | | | 12,598,116 | |
Net assets | | $ | 123,046,888 | |
| | | | | |
Net assets consist of: |
Paid in capital | | $ | 131,239,434 | |
Total distributable earnings (loss) | | | (8,192,546 | ) |
Net assets | | $ | 123,046,888 | |
| | | | | |
A-Class: |
Net assets | | $ | 3,915,105 | |
Capital shares outstanding | | | 149,675 | |
Net asset value per share | | $ | 26.16 | |
Maximum offering price per share (Net asset value divided by 95.25%) | | $ | 27.46 | |
| | | | | |
C-Class: |
Net assets | | $ | 621,371 | |
Capital shares outstanding | | | 25,999 | |
Net asset value per share | | $ | 23.90 | |
| | | | | |
P-Class: |
Net assets | | $ | 9,105,276 | |
Capital shares outstanding | | | 346,816 | |
Net asset value per share | | $ | 26.25 | |
| | | | | |
Institutional Class: |
Net assets | | $ | 109,405,136 | |
Capital shares outstanding | | | 4,095,804 | |
Net asset value per share | | $ | 26.71 | |
* | Relates to Trustees not deemed “interested persons” within the meaning of Section 2(a)(19) of the 1940 Act. |
48 | THE GUGGENHEIM FUNDS ANNUAL REPORT | SEE NOTES TO CONSOLIDATED FINANCIAL STATEMENTS. |
CONSOLIDATED STATEMENT OF OPERATIONS |
MULTI-HEDGE STRATEGIES FUND |
Year Ended December 31, 2022
Investment Income: |
Dividends from securities of unaffiliated issuers (net of foreign withholding tax of $1,215) | | $ | 1,066,171 | |
Dividends from securities of affiliated issuers | | | 386,926 | |
Interest | | | 955,106 | |
Income from securities lending, net | | | 17,797 | |
Total investment income | | | 2,426,000 | |
| | | | | |
Expenses: |
Management fees | | | 1,323,915 | |
Distribution and service fees: |
A-Class | | | 10,673 | |
C-Class | | | 5,945 | |
P-Class | | | 31,370 | |
Short sales dividend expense | | | 360,861 | |
Interest expense | | | 45,023 | |
Trustees’ fees* | | | 12,834 | |
Miscellaneous | | | 1,832 | |
Total expenses | | | 1,792,453 | |
Less: |
Expenses waived by Adviser | | | (48,332 | ) |
Net expenses | | | 1,744,121 | |
Net investment income | | | 681,879 | |
| | | | | |
Net Realized and Unrealized Gain (Loss): |
Net realized gain (loss) on: |
Investments in unaffiliated issuers | | $ | (656,969 | ) |
Investments in unaffiliated issuers sold short | | | (380,717 | ) |
Swap agreements | | | (4,815,089 | ) |
Futures contracts | | | (1,299,595 | ) |
Foreign currency transactions | | | (8,098 | ) |
Net realized loss | | | (7,160,468 | ) |
Net change in unrealized appreciation (depreciation) on: |
Investments in unaffiliated issuers | | | (1,938,918 | ) |
Investments in affiliated issuers | | | (490,986 | ) |
Investments in unaffiliated issuers sold short | | | 2,430,887 | |
Swap agreements | | | 1,540,584 | |
Futures contracts | | | 706,267 | |
Foreign currency translations | | | (1,957 | ) |
Net change in unrealized appreciation (depreciation) | | | 2,245,877 | |
Net realized and unrealized loss | | | (4,914,591 | ) |
Net decrease in net assets resulting from operations | | $ | (4,232,712 | ) |
* | Relates to Trustees not deemed “interested persons” within the meaning of Section 2(a)(19) of the 1940 Act. |
SEE NOTES TO CONSOLIDATED FINANCIAL STATEMENTS. | THE GUGGENHEIM FUNDS ANNUAL REPORT | 49 |
CONSOLIDATED STATEMENTS OF CHANGES IN NET ASSETS |
MULTI-HEDGE STRATEGIES FUND | |
| | Year Ended
December 31,
2022 | | | Year Ended
December 31,
2021 | |
Increase (Decrease) in Net Assets from Operations: | | | | | | | | |
Net investment income (loss) | | $ | 681,879 | | | $ | (226,650 | ) |
Net realized gain (loss) on investments | | | (7,160,468 | ) | | | 1,909,180 | |
Net change in unrealized appreciation (depreciation) on investments | | | 2,245,877 | | | | 2,292,870 | |
Net increase (decrease) in net assets resulting from operations | | | (4,232,712 | ) | | | 3,975,400 | |
| | | | | | | | | |
Distributions to shareholders: | | | | | | | | |
A-Class | | | (64,618 | ) | | | (35,537 | ) |
C-Class | | | (8,214 | ) | | | — | |
P-Class | | | (146,350 | ) | | | (75,821 | ) |
Institutional Class | | | (2,026,121 | ) | | | (522,203 | ) |
Total distributions to shareholders | | | (2,245,303 | ) | | | (633,561 | ) |
| | | | | | | | | |
Capital share transactions: | | | | | | | | |
Proceeds from sale of shares | | | | | | | | |
A-Class | | | 542,921 | | | | 1,180,993 | |
C-Class | | | 626,154 | | | | 170,987 | |
P-Class | | | 9,484,918 | | | | 8,838,032 | |
Institutional Class | | | 100,372,725 | | | | 36,579,357 | |
Distributions reinvested | | | | | | | | |
A-Class | | | 56,992 | | | | 31,190 | |
C-Class | | | 7,668 | | | | — | |
P-Class | | | 144,149 | | | | 74,817 | |
Institutional Class | | | 2,026,121 | | | | 522,203 | |
Cost of shares redeemed | | | | | | | | |
A-Class | | | (1,065,975 | ) | | | (899,012 | ) |
C-Class | | | (463,253 | ) | | | (961,782 | ) |
P-Class | | | (10,011,852 | ) | | | (6,963,597 | ) |
Institutional Class | | | (42,837,229 | ) | | | (21,644,416 | ) |
Net increase from capital share transactions | | | 58,883,339 | | | | 16,928,772 | |
Net increase in net assets | | | 52,405,324 | | | | 20,270,611 | |
| | | | | | | | | |
Net assets: | | | | | | | | |
Beginning of year | | | 70,641,564 | | | | 50,370,953 | |
End of year | | $ | 123,046,888 | | | $ | 70,641,564 | |
50 | THE GUGGENHEIM FUNDS ANNUAL REPORT | SEE NOTES TO CONSOLIDATED FINANCIAL STATEMENTS. |
CONSOLIDATED STATEMENTS OF CHANGES IN NET ASSETS (concluded) |
MULTI-HEDGE STRATEGIES FUND | |
| | Year Ended
December 31,
2022 | | | Year Ended
December 31,
2021 | |
| | | | | | | | | |
Capital share activity: | | | | | | | | |
Shares sold | | | | | | | | |
A-Class | | | 19,818 | | | | 43,014 | |
C-Class | | | 25,338 | | | | 6,768 | |
P-Class | | | 347,219 | | | | 316,524 | |
Institutional Class | | | 3,596,742 | | | | 1,302,242 | |
Shares issued from reinvestment of distributions | | | | | | | | |
A-Class | | | 2,178 | | | | 1,139 | |
C-Class | | | 321 | | | | — | |
P-Class | | | 5,487 | | | | 2,722 | |
Institutional Class | | | 75,828 | | | | 18,677 | |
Shares redeemed | | | | | | | | |
A-Class | | | (39,184 | ) | | | (32,507 | ) |
C-Class | | | (18,974 | ) | | | (38,215 | ) |
P-Class | | | (371,723 | ) | | | (249,021 | ) |
Institutional Class | | | (1,551,157 | ) | | | (765,263 | ) |
Net increase in shares | | | 2,091,893 | | | | 606,080 | |
SEE NOTES TO CONSOLIDATED FINANCIAL STATEMENTS. | THE GUGGENHEIM FUNDS ANNUAL REPORT | 51 |
CONSOLIDATED FINANCIAL HIGHLIGHTS |
MULTI-HEDGE STRATEGIES FUND | |
This table is presented to show selected data for a share outstanding throughout each period and to assist shareholders in evaluating a Fund’s performance for the periods presented.
A-Class | | Year
Ended
Dec. 31,
2022 | | | Year
Ended
Dec. 31,
2021 | | | Year
Ended
Dec. 31,
2020 | | | Year
Ended
Dec. 31,
2019 | | | Year
Ended
Dec. 31,
2018 | |
Per Share Data |
Net asset value, beginning of period | | $ | 27.52 | | | $ | 25.89 | | | $ | 24.36 | | | $ | 23.69 | | | $ | 24.91 | |
Income (loss) from investment operations: |
Net investment income (loss)a | | | .09 | | | | (.14 | ) | | | (.10 | ) | | | .16 | | | | .08 | |
Net gain (loss) on investments (realized and unrealized) | | | (1.01 | ) | | | 1.98 | | | | 1.90 | | | | 1.02 | | | | (1.26 | ) |
Total from investment operations | | | (.92 | ) | | | 1.84 | | | | 1.80 | | | | 1.18 | | | | (1.18 | ) |
Less distributions from: |
Net investment income | | | (.44 | ) | | | (.21 | ) | | | (.27 | ) | | | (.51 | ) | | | (.04 | ) |
Total distributions | | | (.44 | ) | | | (.21 | ) | | | (.27 | ) | | | (.51 | ) | | | (.04 | ) |
Net asset value, end of period | | $ | 26.16 | | | $ | 27.52 | | | $ | 25.89 | | | $ | 24.36 | | | $ | 23.69 | |
|
Total Returnb | | | (3.47 | %) | | | 7.17 | % | | | 7.39 | % | | | 4.97 | % | | | (4.78 | %) |
Ratios/Supplemental Data |
Net assets, end of period (in thousands) | | $ | 3,915 | | | $ | 4,593 | | | $ | 4,019 | | | $ | 3,570 | | | $ | 3,622 | |
Ratios to average net assets: |
Net investment income (loss) | | | 0.32 | % | | | (0.52 | %) | | | (0.40 | %) | | | 0.64 | % | | | 0.32 | % |
Total expensesc | | | 1.80 | % | | | 2.18 | % | | | 1.93 | % | | | 1.96 | % | | | 1.75 | % |
Net expensesd,e | | | 1.76 | % | | | 2.11 | % | | | 1.87 | % | | | 1.93 | % | | | 1.73 | % |
Portfolio turnover rate | | | 203 | % | | | 205 | % | | | 248 | % | | | 156 | % | | | 212 | % |
52 | THE GUGGENHEIM FUNDS ANNUAL REPORT | SEE NOTES TO CONSOLIDATED FINANCIAL STATEMENTS. |
CONSOLIDATED FINANCIAL HIGHLIGHTS (continued) |
MULTI-HEDGE STRATEGIES FUND | |
This table is presented to show selected data for a share outstanding throughout each period and to assist shareholders in evaluating a Fund’s performance for the periods presented.
C-Class | | Year
Ended
Dec. 31,
2022 | | | Year
Ended
Dec. 31,
2021 | | | Year
Ended
Dec. 31,
2020 | | | Year
Ended
Dec. 31,
2019 | | | Year
Ended
Dec. 31,
2018 | |
Per Share Data |
Net asset value, beginning of period | | $ | 25.25 | | | $ | 23.75 | | | $ | 22.36 | | | $ | 21.46 | | | $ | 22.68 | |
Income (loss) from investment operations: |
Net investment income (loss)a | | | (.09 | ) | | | (.32 | ) | | | (.27 | ) | | | (.02 | ) | | | (.09 | ) |
Net gain (loss) on investments (realized and unrealized) | | | (.94 | ) | | | 1.82 | | | | 1.75 | | | | .92 | | | | (1.13 | ) |
Total from investment operations | | | (1.03 | ) | | | 1.50 | | | | 1.48 | | | | .90 | | | | (1.22 | ) |
Less distributions from: |
Net investment income | | | (.32 | ) | | | — | | | | (.09 | ) | | | — | | | | — | |
Total distributions | | | (.32 | ) | | | — | | | | (.09 | ) | | | — | | | | — | |
Net asset value, end of period | | $ | 23.90 | | | $ | 25.25 | | | $ | 23.75 | | | $ | 22.36 | | | $ | 21.46 | |
|
Total Returnb | | | (4.16 | %) | | | 6.32 | % | | | 6.57 | % | | | 4.19 | % | | | (5.38 | %) |
Ratios/Supplemental Data |
Net assets, end of period (in thousands) | | $ | 621 | | | $ | 488 | | | $ | 1,206 | | | $ | 1,435 | | | $ | 2,657 | |
Ratios to average net assets: |
Net investment income (loss) | | | (0.35 | %) | | | (1.26 | %) | | | (1.18 | %) | | | (0.08 | %) | | | (0.42 | %) |
Total expensesc | | | 2.56 | % | | | 2.93 | % | | | 2.68 | % | | | 2.70 | % | | | 2.53 | % |
Net expensesd,e | | | 2.51 | % | | | 2.86 | % | | | 2.62 | % | | | 2.67 | % | | | 2.51 | % |
Portfolio turnover rate | | | 203 | % | | | 205 | % | | | 248 | % | | | 156 | % | | | 212 | % |
SEE NOTES TO CONSOLIDATED FINANCIAL STATEMENTS. | THE GUGGENHEIM FUNDS ANNUAL REPORT | 53 |
CONSOLIDATED FINANCIAL HIGHLIGHTS (continued) |
MULTI-HEDGE STRATEGIES FUND |
This table is presented to show selected data for a share outstanding throughout each period and to assist shareholders in evaluating a Fund’s performance for the periods presented.
P-Class | | Year
Ended
Dec. 31,
2022 | | | Year
Ended
Dec. 31,
2021 | | | Year
Ended
Dec. 31,
2020 | | | Year
Ended
Dec. 31,
2019 | | | Year
Ended
Dec. 31,
2018 | |
Per Share Data |
Net asset value, beginning of period | | $ | 27.61 | | | $ | 25.97 | | | $ | 24.42 | | | $ | 23.74 | | | $ | 24.93 | |
Income (loss) from investment operations: |
Net investment income (loss)a | | | .10 | | | | (.15 | ) | | | (.10 | ) | | | .16 | | | | .08 | |
Net gain (loss) on investments (realized and unrealized) | | | (1.04 | ) | | | 2.00 | | | | 1.90 | | | | 1.03 | | | | (1.23 | ) |
Total from investment operations | | | (.94 | ) | | | 1.85 | | | | 1.80 | | | | 1.19 | | | | (1.15 | ) |
Less distributions from: |
Net investment income | | | (.42 | ) | | | (.21 | ) | | | (.25 | ) | | | (.51 | ) | | | (.04 | ) |
Total distributions | | | (.42 | ) | | | (.21 | ) | | | (.25 | ) | | | (.51 | ) | | | (.04 | ) |
Net asset value, end of period | | $ | 26.25 | | | $ | 27.61 | | | $ | 25.97 | | | $ | 24.42 | | | $ | 23.74 | |
|
Total Return | | | (3.44 | %) | | | 7.16 | % | | | 7.40 | % | | | 5.00 | % | | | (4.61 | %) |
Ratios/Supplemental Data |
Net assets, end of period (in thousands) | | $ | 9,105 | | | $ | 10,100 | | | $ | 7,676 | | | $ | 7,442 | | | $ | 7,892 | |
Ratios to average net assets: |
Net investment income (loss) | | | 0.38 | % | | | (0.53 | %) | | | (0.39 | %) | | | 0.65 | % | | | 0.34 | % |
Total expensesc | | | 1.80 | % | | | 2.18 | % | | | 1.93 | % | | | 1.96 | % | | | 1.77 | % |
Net expensesd,e | | | 1.76 | % | | | 2.12 | % | | | 1.87 | % | | | 1.93 | % | | | 1.75 | % |
Portfolio turnover rate | | | 203 | % | | | 205 | % | | | 248 | % | | | 156 | % | | | 212 | % |
54 | THE GUGGENHEIM FUNDS ANNUAL REPORT | SEE NOTES TO CONSOLIDATED FINANCIAL STATEMENTS. |
CONSOLIDATED FINANCIAL HIGHLIGHTS (concluded) |
MULTI-HEDGE STRATEGIES FUND |
This table is presented to show selected data for a share outstanding throughout each period and to assist shareholders in evaluating a Fund’s performance for the periods presented.
Institutional Class | | Year
Ended
Dec. 31,
2022 | | | Year
Ended
Dec. 31,
2021 | | | Year
Ended
Dec. 31,
2020 | | | Year
Ended
Dec. 31,
2019 | | | Year
Ended
Dec. 31,
2018 | |
Per Share Data |
Net asset value, beginning of period | | $ | 28.09 | | | $ | 26.41 | | | $ | 24.83 | | | $ | 24.12 | | | $ | 25.42 | |
Income (loss) from investment operations: |
Net investment income (loss)a | | | .18 | | | | (.08 | ) | | | (.04 | ) | | | .22 | | | | .17 | |
Net gain (loss) on investments (realized and unrealized) | | | (1.06 | ) | | | 2.03 | | | | 1.94 | | | | 1.05 | | | | (1.33 | ) |
Total from investment operations | | | (.88 | ) | | | 1.95 | | | | 1.90 | | | | 1.27 | | | | (1.16 | ) |
Less distributions from: |
Net investment income | | | (.50 | ) | | | (.27 | ) | | | (.32 | ) | | | (.56 | ) | | | (.14 | ) |
Total distributions | | | (.50 | ) | | | (.27 | ) | | | (.32 | ) | | | (.56 | ) | | | (.14 | ) |
Net asset value, end of period | | $ | 26.71 | | | $ | 28.09 | | | $ | 26.41 | | | $ | 24.83 | | | $ | 24.12 | |
|
Total Return | | | (3.22 | %) | | | 7.43 | % | | | 7.70 | % | | | 5.26 | % | | | (4.56 | %) |
Ratios/Supplemental Data |
Net assets, end of period (in thousands) | | $ | 109,405 | | | $ | 55,461 | | | $ | 37,470 | | | $ | 24,854 | | | $ | 23,539 | |
Ratios to average net assets: |
Net investment income (loss) | | | 0.66 | % | | | (0.27 | %) | | | (0.15 | %) | | | 0.90 | % | | | 0.68 | % |
Total expensesc | | | 1.55 | % | | | 1.92 | % | | | 1.68 | % | | | 1.72 | % | | | 1.58 | % |
Net expensesd,e | | | 1.51 | % | | | 1.87 | % | | | 1.62 | % | | | 1.69 | % | | | 1.56 | % |
Portfolio turnover rate | | | 203 | % | | | 205 | % | | | 248 | % | | | 156 | % | | | 212 | % |
a | Net investment income (loss) per share was computed using average shares outstanding throughout the period. |
b | Total return does not reflect the impact of any applicable sales charges. |
c | Does not include expenses of the underlying funds in which the Fund invests. |
d | Net expense information reflects the expense ratios after expense waivers and reimbursements, as applicable. |
e | Excluding interest and dividend expense related to short sales, the net expense ratios for the years presented would be: |
| | | 12/31/22 | 12/31/21 | 12/31/20 | 12/31/19 | 12/31/18 |
| | A-Class | 1.40% | 1.41% | 1.37% | 1.41% | 1.41% |
| | C-Class | 2.15% | 2.16% | 2.12% | 2.16% | 2.16% |
| | P-Class | 1.40% | 1.41% | 1.37% | 1.41% | 1.41% |
| | Institutional Class | 1.15% | 1.16% | 1.12% | 1.16% | 1.16% |
SEE NOTES TO CONSOLIDATED FINANCIAL STATEMENTS. | THE GUGGENHEIM FUNDS ANNUAL REPORT | 55 |
PERFORMANCE REPORT AND FUND PROFILE (Unaudited) | December 31, 2022 |
COMMODITIES STRATEGY FUND
OBJECTIVE: Seeks to provide investment results that correlate, before fees and expenses, to the performance of a benchmark for commodities. The Fund’s current benchmark is the S&P Goldman Sachs Commodity Index (“GSCI” or “Index”).
For the Reporting Period, Rydex Commodities Strategy Fund H-Class shares returned 23.53%, compared with the 25.99% return of the Index, the Fund’s benchmark.
What factors contributed or detracted from the Fund’s performance during the Reporting Period?
Commodity prices saw an increase in volatility during 2022 due to unforeseen geopolitical events. In response to the Russian invasion of Ukraine in the first quarter of 2022, there was a strong rally in the agriculture, energy, and industrial metals sectors. After the immediate shock due to supply and demand concerns, commodity prices stabilized, and the Index realized a positive return for the year. The energy sector continued to stay elevated throughout the year due to international sanctions on Russian oil and gas exports along with fears of a cold European winter.
Fifteen of the twenty-four components of the Index had positive returns during the period. The best performing component was Heating Oil, with a return above 110%. Gas Oil, Unleaded Gas, and Nickel also saw strong performance for the year, returning above 90%, 45% and 45%, respectively. Coffee, Aluminum, and Zinc saw the strongest declines for the year, being down more than 20%, 15% and 10%, respectively.
Three of the five Index sectors experienced positive performance during the period. Energy, agriculture, and livestock were the Index sectors with positive performance. Industrial Metals and Precious Metals were the Index sectors with negative performance.
How did the Fund use derivatives during the Reporting Period?
The Fund used futures contracts to help provide exposure to the composition of the benchmark in the most efficient manner, as well as to provide liquidity. Futures contracts are the primary way in which the Fund gains exposure to the S&P GSCI Index, and therefore most of the Fund’s performance is due to these derivatives.
The Fund may invest in certain of the underlying series of Guggenheim Funds Trust and Guggenheim Strategy Funds Trust, including Guggenheim Ultra Short Duration, Guggenheim Strategy Fund II, Guggenheim Strategy Fund III, and Guggenheim Variable Insurance Strategy Fund III, (collectively, the “Short Term Investment Vehicles”), each of which are open-end management investment companies managed by Guggenheim Investments. The Short Term Investment Vehicles, which launched on March 11, 2014, are offered as short term investment options only to mutual funds, trusts, and other accounts managed by Guggenheim Investments and/or its affiliates, and are not available to the public, with the exception of Guggenheim Ultra Short Duration Fund, which is available to the public. Guggenheim Strategy Fund II, Guggenheim
56 | THE GUGGENHEIM FUNDS ANNUAL REPORT | |
PERFORMANCE REPORT AND FUND PROFILE (Unaudited)(continued) | December 31, 2022 |
Strategy Fund III, and Guggenheim Variable Insurance Strategy Fund III do not charge an investment management fee. Guggenheim Ultra Short Duration Fund charges an investment management fee, but the Fund’s adviser has agreed to waive fees to the extent necessary to offset the proportionate share of any management fee paid by the Fund with respect to its investment in such affiliated fund. For the Reporting Period, investment in the Short Term Investment Vehicles detracted from Fund performance.
Performance displayed represents past performance which is no guarantee of future results.
| | THE GUGGENHEIM FUNDS ANNUAL REPORT | 57 |
PERFORMANCE REPORT AND FUND PROFILE (Unaudited)(continued) | December 31, 2022 |
Consolidated Holdings Diversification (Market Exposure as % of Net Assets)

“Consolidated Holdings Diversification (Market Exposure as % of Net Assets)” excludes any temporary cash investments, investments in Guggenheim Strategy Funds Trust mutual funds, or investments in Guggenheim Ultra Short Duration Fund. Investments in those Funds do not provide “market exposure” to meet the Fund’s investment objective, but will significantly increase the portfolio’s exposure to certain other asset categories (and their associated risks), which may cause the Fund to deviate from its principal investment strategy, including: (i) high yield, high risk debt securities rated below the top four long-term rating categories by a nationally recognized statistical rating organization (also known as “junk bonds”); (ii) securities issued by the U.S. government or its agencies and instrumentalities; (iii) CLOs and similar investments; and (iv) other short-term fixed income securities.
58 | THE GUGGENHEIM FUNDS ANNUAL REPORT | |
PERFORMANCE REPORT AND FUND PROFILE (Unaudited)(continued) | December 31, 2022 |
Inception Dates: |
A-Class | May 25, 2005 |
C-Class | May 25, 2005 |
H-Class | May 25, 2005 |
Largest Holdings | (% of Total Net Assets) |
Guggenheim Ultra Short Duration Fund — Institutional Class | 14.3% |
Guggenheim Strategy Fund II | 14.3% |
Total | 28.6% |
| | |
The Fund invests principally in derivative investments such as futures contracts. “Largest Holdings” excludes any temporary cash or derivative investments. |
Cumulative Fund Performance*
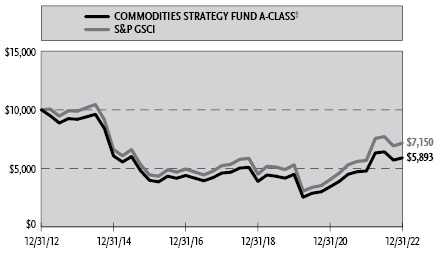

| | THE GUGGENHEIM FUNDS ANNUAL REPORT | 59 |
PERFORMANCE REPORT AND FUND PROFILE (Unaudited)(concluded) | December 31, 2022 |
Average Annual Returns*
Periods Ended December 31, 2022
| 1 Year | 5 Year | 10 Year |
A-Class Shares | 23.52% | 5.08% | (4.69%) |
A-Class Shares with sales charge‡ | 17.64% | 4.06% | (5.15%) |
C-Class Shares | 22.60% | 4.31% | (5.39%) |
C-Class Shares with CDSC§ | 21.66% | 4.31% | (5.39%) |
H-Class Shares | 23.53% | 5.08% | (4.69%) |
S&P Goldman Sachs Commodity Index | 25.99% | 6.46% | (3.30%) |
* | The performance data above represents past performance that is not predictive of future results. The investment return and principal value of an investment in the Fund will fluctuate so that an investor’s shares, when redeemed, may be worth more or less than their original cost. Returns are historical and include changes in principal and reinvested dividends and capital gains and do not reflect the effect of taxes. The S&P Goldman Sachs Commodity Index is an unmanaged index and, unlike the Fund, has no management fees or operating expenses to reduce its reported return. The graphs are based on A-Class shares and H-Class shares only; performance for C-Class shares will vary due to differences in fee structures. |
‡ | Fund returns are calculated using the maximum sales charge of 4.75%. |
§ | Fund returns include a CDSC of 1% if redeemed within 12 months of purchase. |
60 | THE GUGGENHEIM FUNDS ANNUAL REPORT | |
CONSOLIDATED SCHEDULE OF INVESTMENTS | December 31, 2022 |
COMMODITIES STRATEGY FUND | |
| | Shares | | | Value | |
MUTUAL FUNDS† - 28.6% |
Guggenheim Ultra Short Duration Fund — Institutional Class1 | | | 141,704 | | | $ | 1,366,026 | |
Guggenheim Strategy Fund II1 | | | 56,518 | | | | 1,358,701 | |
Total Mutual Funds | | | | |
(Cost $2,822,291) | | | | | | | 2,724,727 | |
| | | | | | | | | |
| | | Face
Amount | | | | | |
FEDERAL AGENCY DISCOUNT NOTES†† - 31.5% |
Federal Home Loan Bank |
4.00% due 01/11/232 | | $ | 1,000,000 | | | | 999,129 | |
3.84% due 01/13/232 | | | 1,000,000 | | | | 998,906 | |
4.05% due 01/27/232 | | | 1,000,000 | | | | 997,252 | |
Total Federal Agency Discount Notes | | | | |
(Cost $2,994,634) | | | | | | | 2,995,287 | |
| | | | | | | | | |
FEDERAL AGENCY NOTES†† - 10.5% |
Federal Home Loan Bank |
4.36% (SOFR + 0.06%, Rate Floor: 0.00%) due 03/14/23◊ | | | 1,000,000 | | | | 1,000,077 | |
Total Federal Agency Notes | | | | |
(Cost $1,000,000) | | | | | | | 1,000,077 | |
| | | | | | | | | |
U.S. TREASURY BILLS†† - 3.1% |
U.S. Treasury Bills |
3.80% due 01/17/232,3 | | | 300,000 | | | | 299,571 | |
Total U.S. Treasury Bills | | | | |
(Cost $299,482) | | | | | | | 299,571 | |
| | | | | | | | | |
REPURCHASE AGREEMENTS††,4 - 16.0% |
J.P. Morgan Securities LLC
issued 12/30/22 at 4.26%
due 01/03/23 | | | 862,950 | | | | 862,950 | |
BofA Securities, Inc.
issued 12/30/22 at 4.25%
due 01/03/23 | | | 331,904 | | | | 331,904 | |
Barclays Capital, Inc.
issued 12/30/22 at 4.21%
due 01/03/23 | | | 330,876 | | | | 330,876 | |
Total Repurchase Agreements | | | | |
(Cost $1,525,730) | | | | | | | 1,525,730 | |
| | | | | | | | | |
Total Investments - 89.7% | | | | |
(Cost $8,642,137) | | $ | 8,545,392 | |
Other Assets & Liabilities, net - 10.3% | | | 978,612 | |
Total Net Assets - 100.0% | | $ | 9,524,004 | |
Futures Contracts |
Description | | Number of
Contracts | | | Expiration
Date | | | Notional
Amount | | | Value and
Unrealized
Appreciation** | |
Commodity Futures Contracts Purchased† |
Goldman Sachs Commodity Index Futures Contracts | | | 63 | | | | Jan 2023 | | | $ | 9,641,363 | | | $ | 566,100 | |
| | THE GUGGENHEIM FUNDS ANNUAL REPORT | 61 |
CONSOLIDATED SCHEDULE OF INVESTMENTS (continued) | December 31, 2022 |
COMMODITIES STRATEGY FUND | |
** | Includes cumulative appreciation (depreciation). Variation margin is reported within the Consolidated Statement of Assets and Liabilities. |
† | Value determined based on Level 1 inputs — See Note 4. |
†† | Value determined based on Level 2 inputs — See Note 4. |
◊ | Variable rate security. Rate indicated is the rate effective at December 31, 2022. In some instances, the effective rate is limited by a minimum rate floor or a maximum rate cap established by the issuer. The settlement status of a position may also impact the effective rate indicated. In some cases, a position may be unsettled at period end and may not have a stated effective rate. In instances where multiple underlying reference rates and spread amounts are shown, the effective rate is based on a weighted average. |
1 | Affiliated issuer. |
2 | Rate indicated is the effective yield at the time of purchase. |
3 | All or a portion of this security is pledged as futures collateral at December 31, 2022. |
4 | Repurchase Agreements — See Note 6. |
| | SOFR — Secured Overnight Financing Rate |
| | |
| | See Sector Classification in Other Information section. |
The following table summarizes the inputs used to value the Fund’s investments at December 31, 2022 (See Note 4 in the Notes to Consolidated Financial Statements):
Investments in Securities (Assets) | | Level 1
Quoted
Prices | | | Level 2
Significant
Observable
Inputs | | | Level 3
Significant
Unobservable
Inputs | | | Total | |
Mutual Funds | | $ | 2,724,727 | | | $ | — | | | $ | — | | | $ | 2,724,727 | |
Federal Agency Discount Notes | | | — | | | | 2,995,287 | | | | — | | | | 2,995,287 | |
Federal Agency Notes | | | — | | | | 1,000,077 | | | | — | | | | 1,000,077 | |
U.S. Treasury Bills | | | — | | | | 299,571 | | | | — | | | | 299,571 | |
Repurchase Agreements | | | — | | | | 1,525,730 | | | | — | | | | 1,525,730 | |
Commodity Futures Contracts** | | | 566,100 | | | | — | | | | — | | | | 566,100 | |
Total Assets | | $ | 3,290,827 | | | $ | 5,820,665 | | | $ | — | | | $ | 9,111,492 | |
** | This derivative is reported as unrealized appreciation/depreciation at period end. |
62 | THE GUGGENHEIM FUNDS ANNUAL REPORT | SEE NOTES TO CONSOLIDATED FINANCIAL STATEMENTS. |
CONSOLIDATED SCHEDULE OF INVESTMENTS (concluded) | December 31, 2022 |
COMMODITIES STRATEGY FUND | |
Affiliated Transactions
Investments representing 5% or more of the outstanding voting shares of a company, or control of or by, or common control under Guggenheim Investments (“GI”), result in that company being considered an affiliated issuer, as defined in the 1940 Act.
The Fund may invest in certain of the underlying series of Guggenheim Strategy Funds Trust, including Guggenheim Strategy Fund II and Guggenheim Strategy Fund III, (collectively, the “Short Term Investment Vehicles”), each of which are open-end management investment companies managed by GI. The Short Term Investment Vehicles, which launched on March 11, 2014, are offered as short term investment options only to mutual funds, trusts, and other accounts managed by GI and/or its affiliates, and are not available to the public. The Short Term Investment Vehicles pay no investment management fees. The Short Term Investment Vehicles’ annual report on Form N-CSR dated September 30, 2022, is available publicly or upon request. This information is available from the EDGAR database on the SEC’s website at
https://www.sec.gov/Archives/edgar/data/1601445/000182126821000490/gugg84768-ncsr.htm. The Fund may invest in certain of the underlying series of Guggenheim Funds Trust, which are open-end management investment companies managed by GI, are available to the public and whose most recent annual report on Form N-CSR is available publicly or upon request.
Transactions during the year ended December 31, 2022, in which the company is an affiliated issuer, were as follows:
Security Name | | Value
12/31/21 | | | Additions | | | Reductions | | | Realized
Gain (Loss) | | | Change in
Unrealized
Appreciation
(Depreciation) | | | Value
12/31/22 | | | Shares
12/31/22 | | | Investment
Income | |
Mutual Funds | | | | | | | | | | | | | | | | | | | | | | | | | | | | | | | | |
Guggenheim Strategy Fund II | | $ | 1,406,176 | | | $ | — | | | $ | — | | | $ | — | | | $ | (47,475 | ) | | $ | 1,358,701 | | | | 56,518 | | | $ | 38,636 | |
Guggenheim Ultra Short Duration Fund — Institutional Class | | | 1,405,703 | | | | — | | | | — | | | | — | | | | (39,677 | ) | | | 1,366,026 | | | | 141,704 | | | | 31,019 | |
| | | $ | 2,811,879 | | | $ | — | | | $ | — | | | $ | — | | | $ | (87,152 | ) | | $ | 2,724,727 | | | | | | | $ | 69,655 | |
SEE NOTES TO CONSOLIDATED FINANCIAL STATEMENTS. | THE GUGGENHEIM FUNDS ANNUAL REPORT | 63 |
CONSOLIDATED STATEMENT OF ASSETS AND LIABILITIES |
COMMODITIES STRATEGY FUND |
December 31, 2022
Assets: |
Investments in unaffiliated issuers, at value (cost $4,294,116) | | $ | 4,294,935 | |
Investments in affiliated issuers, at value (cost $2,822,291) | | | 2,724,727 | |
Repurchase agreements, at value (cost $1,525,730) | | | 1,525,730 | |
Cash | | | 571 | |
Segregated cash with broker | | | 836,004 | |
Receivables: |
Variation margin on futures contracts | | | 133,088 | |
Fund shares sold | | | 52,978 | |
Dividends | | | 10,530 | |
Interest | | | 2,512 | |
Other assets | | | 1,585 | |
Total assets | | | 9,582,660 | |
| | | | | |
Liabilities: |
Payable for: |
Fund shares redeemed | | | 18,359 | |
Professional fees | | | 10,554 | |
Management fees | | | 6,008 | |
Registration fees | | | 4,586 | |
Printing fees | | | 5,414 | |
Distribution and service fees | | | 2,494 | |
Transfer agent fees | | | 2,065 | |
Portfolio accounting and administration fees | | | 1,240 | |
Trustees’ fees* | | | 288 | |
Miscellaneous | | | 7,648 | |
Total liabilities | | | 58,656 | |
Net assets | | $ | 9,524,004 | |
| | | | | |
Net assets consist of: |
Paid in capital | | $ | 20,621,427 | |
Total distributable earnings (loss) | | | (11,097,423 | ) |
Net assets | | $ | 9,524,004 | |
| | | | | |
A-Class: |
Net assets | | $ | 1,463,301 | |
Capital shares outstanding | | | 47,021 | |
Net asset value per share | | $ | 31.12 | |
Maximum offering price per share (Net asset value divided by 95.25%) | | $ | 32.67 | |
| | | | | |
C-Class: |
Net assets | | $ | 727,607 | |
Capital shares outstanding | | | 40,074 | |
Net asset value per share | | $ | 18.16 | |
| | | | | |
H-Class: |
Net assets | | $ | 7,333,096 | |
Capital shares outstanding | | | 235,301 | |
Net asset value per share | | $ | 31.16 | |
* | Relates to Trustees not deemed “interested persons” within the meaning of Section 2(a)(19) of the 1940 Act. |
64 | THE GUGGENHEIM FUNDS ANNUAL REPORT | SEE NOTES TO CONSOLIDATED FINANCIAL STATEMENTS. |
CONSOLIDATED STATEMENT OF OPERATIONS |
COMMODITIES STRATEGY FUND |
Year Ended December 31, 2022
Investment Income: |
Dividends from securities of affiliated issuers | | $ | 69,655 | |
Interest | | | 265,671 | |
Total investment income | | | 335,326 | |
| | | | | |
Expenses: |
Management fees | | | 274,058 | |
Distribution and service fees: |
A-Class | | | 4,311 | |
C-Class | | | 6,823 | |
H-Class | | | 72,159 | |
Transfer agent fees | | | 80,587 | |
Professional fees | | | 38,564 | |
Portfolio accounting and administration fees | | | 35,763 | |
Custodian fees | | | 5,026 | |
Trustees’ fees* | | | 4,427 | |
Line of credit fees | | | 196 | |
Miscellaneous | | | 29,779 | |
Total expenses | | | 551,693 | |
Less: |
Expenses waived by Adviser | | | (42,772 | ) |
Net expenses | | | 508,921 | |
Net investment loss | | | (173,595 | ) |
| | | | | |
Net Realized and Unrealized Gain (Loss): |
Net realized gain (loss) on: |
Investments in unaffiliated issuers | | $ | (5,345 | ) |
Futures contracts | | | 5,405,009 | |
Net realized gain | | | 5,399,664 | |
Net change in unrealized appreciation (depreciation) on: |
Investments in unaffiliated issuers | | | 1,260 | |
Investments in affiliated issuers | | | (87,152 | ) |
Futures contracts | | | (270,919 | ) |
Net change in unrealized appreciation (depreciation) | | | (356,811 | ) |
Net realized and unrealized gain | | | 5,042,853 | |
Net increase in net assets resulting from operations | | $ | 4,869,258 | |
* | Relates to Trustees not deemed “interested persons” within the meaning of Section 2(a)(19) of the 1940 Act. |
SEE NOTES TO CONSOLIDATED FINANCIAL STATEMENTS. | THE GUGGENHEIM FUNDS ANNUAL REPORT | 65 |
CONSOLIDATED STATEMENTS OF CHANGES IN NET ASSETS |
COMMODITIES STRATEGY FUND | |
| | Year Ended
December 31,
2022 | | | Year Ended
December 31,
2021 | |
Increase (Decrease) in Net Assets from Operations: | | | | | | | | |
Net investment loss | | $ | (173,595 | ) | | $ | (232,914 | ) |
Net realized gain on investments | | | 5,399,664 | | | | 2,360,816 | |
Net change in unrealized appreciation (depreciation) on investments | | | (356,811 | ) | | | 761,861 | |
Net increase in net assets resulting from operations | | | 4,869,258 | | | | 2,889,763 | |
| | | | | | | | | |
Distributions to shareholders: | | | | | | | | |
A-Class | | | (219,005 | ) | | | (20,464 | ) |
C-Class | | | (172,741 | ) | | | (8,077 | ) |
H-Class | | | (1,133,847 | ) | | | (603,257 | ) |
Total distributions to shareholders | | | (1,525,593 | ) | | | (631,798 | ) |
| | | | | | | | | |
Capital share transactions: | | | | | | | | |
Proceeds from sale of shares | | | | | | | | |
A-Class | | | 3,237,040 | | | | 919,688 | |
C-Class | | | 954,727 | | | | 142,753 | |
H-Class | | | 195,107,548 | | | | 87,058,046 | |
Distributions reinvested | | | | | | | | |
A-Class | | | 214,121 | | | | 19,901 | |
C-Class | | | 151,621 | | | | 7,304 | |
H-Class | | | 1,092,822 | | | | 596,439 | |
Cost of shares redeemed | | | | | | | | |
A-Class | | | (2,584,515 | ) | | | (521,253 | ) |
C-Class | | | (423,915 | ) | | | (49,482 | ) |
H-Class | | | (213,373,909 | ) | | | (69,747,995 | ) |
Net increase (decrease) from capital share transactions | | | (15,624,460 | ) | | | 18,425,401 | |
Net increase (decrease) in net assets | | | (12,280,795 | ) | | | 20,683,366 | |
| | | | | | | | | |
Net assets: | | | | | | | | |
Beginning of year | | | 21,804,799 | | | | 1,121,433 | |
End of year | | $ | 9,524,004 | | | $ | 21,804,799 | |
| | | | | | | | | |
66 | THE GUGGENHEIM FUNDS ANNUAL REPORT | SEE NOTES TO CONSOLIDATED FINANCIAL STATEMENTS. |
CONSOLIDATED STATEMENTS OF CHANGES IN NET ASSETS (concluded) |
COMMODITIES STRATEGY FUND | |
| | Year Ended
December 31,
2022 | | | Year Ended
December 31,
2021 | |
Capital share activity: | | | | | | | | |
Shares sold | | | | | | | | |
A-Class | | | 81,976 | | | | 32,719 | |
C-Class | | | 38,976 | | | | 8,052 | |
H-Class | | | 5,022,099 | | | | 3,084,506 | |
Shares issued from reinvestment of distributions | | | | | | | | |
A-Class | | | 6,986 | | | | 702 | |
C-Class | | | 8,475 | | | | 396 | |
H-Class | | | 35,608 | | | | 21,016 | |
Shares redeemed | | | | | | | | |
A-Class | | | (66,418 | ) | | | (18,569 | ) |
C-Class | | | (16,898 | ) | | | (2,702 | ) |
H-Class | | | (5,527,844 | ) | | | (2,439,032 | ) |
Net increase (decrease) in shares | | | (417,040 | ) | | | 687,088 | |
SEE NOTES TO CONSOLIDATED FINANCIAL STATEMENTS. | THE GUGGENHEIM FUNDS ANNUAL REPORT | 67 |
CONSOLIDATED FINANCIAL HIGHLIGHTS |
COMMODITIES STRATEGY FUND |
This table is presented to show selected data for a share outstanding throughout each period and to assist shareholders in evaluating a Fund’s performance for the periods presented.
A-Class | | Year
Ended
Dec. 31,
2022 | | | Year
Ended
Dec. 31,
2021 | | | Year
Ended
Dec. 31,
2020 | | | Year
Ended
Dec. 31,
2019 | | | Year
Ended
Dec. 31,
2018 | |
Per Share Data |
Net asset value, beginning of period | | $ | 29.59 | | | $ | 21.93 | | | $ | 61.06 | | | $ | 53.27 | | | $ | 88.34 | |
Income (loss) from investment operations: |
Net investment income (loss)a | | | (.02 | ) | | | (.40 | ) | | | (.28 | ) | | | .36 | | | | .39 | |
Net gain (loss) on investments (realized and unrealized) | | | 6.89 | | | | 8.94 | | | | (14.84 | ) | | | 7.88 | | | | (11.90 | ) |
Total from investment operations | | | 6.87 | | | | 8.54 | | | | (15.12 | ) | | | 8.24 | | | | (11.51 | ) |
Less distributions from: |
Net investment income | | | (5.34 | ) | | | (.88 | ) | | | (24.01 | ) | | | (.45 | ) | | | (23.56 | ) |
Total distributions | | | (5.34 | ) | | | (.88 | ) | | | (24.01 | ) | | | (.45 | ) | | | (23.56 | ) |
Net asset value, end of period | | $ | 31.12 | | | $ | 29.59 | | | $ | 21.93 | | | $ | 61.06 | | | $ | 53.27 | |
|
Total Returnb | | | 23.52 | % | | | 39.06 | % | | | (23.58 | %) | | | 15.47 | % | | | (15.47 | %) |
Ratios/Supplemental Data |
Net assets, end of period (in thousands) | | $ | 1,463 | | | $ | 724 | | | $ | 211 | | | $ | 592 | | | $ | 830 | |
Ratios to average net assets: |
Net investment income (loss) | | | (0.05 | %) | | | (1.43 | %) | | | (0.65 | %) | | | 0.60 | % | | | 0.44 | % |
Total expensesc | | | 1.74 | % | | | 1.78 | % | | | 1.79 | % | | | 1.88 | % | | | 1.81 | % |
Net expensesd | | | 1.60 | % | | | 1.63 | % | | | 1.61 | % | | | 1.73 | % | | | 1.68 | % |
Portfolio turnover rate | | | — | | | | — | | | | 5 | % | | | — | | | | 65 | % |
68 | THE GUGGENHEIM FUNDS ANNUAL REPORT | SEE NOTES TO CONSOLIDATED FINANCIAL STATEMENTS. |
CONSOLIDATED FINANCIAL HIGHLIGHTS (continued) |
COMMODITIES STRATEGY FUND |
This table is presented to show selected data for a share outstanding throughout each period and to assist shareholders in evaluating a Fund’s performance for the periods presented.
C-Class | | Year
Ended
Dec. 31,
2022 | | | Year
Ended
Dec. 31,
2021 | | | Year
Ended
Dec. 31,
2020 | | | Year
Ended
Dec. 31,
2019 | | | Year
Ended
Dec. 31,
2018 | |
Per Share Data |
Net asset value, beginning of period | | $ | 19.23 | | | $ | 14.59 | | | $ | 51.84 | | | $ | 45.63 | | | $ | 79.89 | |
Income (loss) from investment operations: |
Net investment income (loss)a | | | (.17 | ) | | | (.41 | ) | | | (.50 | ) | | | (.07 | ) | | | (.41 | ) |
Net gain (loss) on investments (realized and unrealized) | | | 4.44 | | | | 5.93 | | | | (12.74 | ) | | | 6.73 | | | | (10.29 | ) |
Total from investment operations | | | 4.27 | | | | 5.52 | | | | (13.24 | ) | | | 6.66 | | | | (10.70 | ) |
Less distributions from: |
Net investment income | | | (5.34 | ) | | | (.88 | ) | | | (24.01 | ) | | | (.45 | ) | | | (23.56 | ) |
Total distributions | | | (5.34 | ) | | | (.88 | ) | | | (24.01 | ) | | | (.45 | ) | | | (23.56 | ) |
Net asset value, end of period | | $ | 18.16 | | | $ | 19.23 | | | $ | 14.59 | | | $ | 51.84 | | | $ | 45.63 | |
|
Total Returnb | | | 22.60 | % | | | 38.08 | % | | | (24.15 | %) | | | 14.61 | % | | | (16.11 | %) |
Ratios/Supplemental Data |
Net assets, end of period (in thousands) | | $ | 728 | | | $ | 183 | | | $ | 55 | | | $ | 111 | | | $ | 110 | |
Ratios to average net assets: |
Net investment income (loss) | | | (0.68 | %) | | | (2.18 | %) | | | (1.44 | %) | | | (0.13 | %) | | | (0.49 | %) |
Total expensesc | | | 2.49 | % | | | 2.53 | % | | | 2.54 | % | | | 2.63 | % | | | 2.55 | % |
Net expensesd | | | 2.35 | % | | | 2.38 | % | | | 2.36 | % | | | 2.48 | % | | | 2.42 | % |
Portfolio turnover rate | | | — | | | | — | | | | 5 | % | | | — | | | | 65 | % |
SEE NOTES TO CONSOLIDATED FINANCIAL STATEMENTS. | THE GUGGENHEIM FUNDS ANNUAL REPORT | 69 |
CONSOLIDATED FINANCIAL HIGHLIGHTS (concluded) |
COMMODITIES STRATEGY FUND |
This table is presented to show selected data for a share outstanding throughout each period and to assist shareholders in evaluating a Fund’s performance for the periods presented.
H-Class | | Year
Ended
Dec. 31,
2022 | | | Year
Ended
Dec. 31,
2021 | | | Year
Ended
Dec. 31,
2020 | | | Year
Ended
Dec. 31,
2019 | | | Year
Ended
Dec. 31,
2018 | |
Per Share Data |
Net asset value, beginning of period | | $ | 29.62 | | | $ | 21.96 | | | $ | 61.10 | | | $ | 53.31 | | | $ | 88.39 | |
Income (loss) from investment operations: |
Net investment income (loss)a | | | (.23 | ) | | | (.41 | ) | | | (.34 | ) | | | .35 | | | | .25 | |
Net gain (loss) on investments (realized and unrealized) | | | 7.11 | | | | 8.95 | | | | (14.79 | ) | | | 7.89 | | | | (11.77 | ) |
Total from investment operations | | | 6.88 | | | | 8.54 | | | | (15.13 | ) | | | 8.24 | | | | (11.52 | ) |
Less distributions from: |
Net investment income | | | (5.34 | ) | | | (.88 | ) | | | (24.01 | ) | | | (.45 | ) | | | (23.56 | ) |
Total distributions | | | (5.34 | ) | | | (.88 | ) | | | (24.01 | ) | | | (.45 | ) | | | (23.56 | ) |
Net asset value, end of period | | $ | 31.16 | | | $ | 29.62 | | | $ | 21.96 | | | $ | 61.10 | | | $ | 53.31 | |
|
Total Return | | | 23.53 | % | | | 39.06 | % | | | (23.58 | %) | | | 15.48 | % | | | (15.50 | %) |
Ratios/Supplemental Data |
Net assets, end of period (in thousands) | | $ | 7,333 | | | $ | 20,898 | | | $ | 855 | | | $ | 4,911 | | | $ | 8,744 | |
Ratios to average net assets: |
Net investment income (loss) | | | (0.58 | %) | | | (1.44 | %) | | | (0.77 | %) | | | 0.59 | % | | | 0.27 | % |
Total expensesc | | | 1.75 | % | | | 1.77 | % | | | 1.78 | % | | | 1.89 | % | | | 1.81 | % |
Net expensesd | | | 1.61 | % | | | 1.63 | % | | | 1.61 | % | | | 1.74 | % | | | 1.68 | % |
Portfolio turnover rate | | | — | | | | — | | | | 5 | % | | | — | | | | 65 | % |
a | Net investment income (loss) per share was computed using average shares outstanding throughout the period. |
b | Total return does not reflect the impact of any applicable sales charges. |
c | Does not include expenses of the underlying funds in which the Fund invests. |
d | Net expense information reflects the expense ratios after expense waivers and reimbursements, as applicable. |
70 | THE GUGGENHEIM FUNDS ANNUAL REPORT | SEE NOTES TO CONSOLIDATED FINANCIAL STATEMENTS. |
NOTES TO CONSOLIDATED FINANCIAL STATEMENTS |
Note 1 – Organization, Consolidation of Subsidiary and Significant Accounting Policies
Organization
The Rydex Series Funds (the “Trust”), a Delaware statutory trust, is registered with the U.S. Securities and Exchange Commission (the “SEC”) under the Investment Company Act of 1940 (”1940 Act”), as an open-ended investment company of the series type. Each series, in effect, is representing a separate fund. The Trust may issue an unlimited number of authorized shares. The Trust accounts for the assets of each fund separately.
The Trust offers a combination of seven separate classes of shares: Investor Class shares, A-Class shares, C-Class shares, H-Class shares, P-Class shares, Institutional Class shares and Money Market Class shares. Sales of shares of each Class are made without a front-end sales charge at the net asset value per share (“NAV”), with the exception of A-Class shares. A-Class shares are sold at the NAV, plus the applicable front-end sales charge. The sales charge varies depending on the amount purchased, but will not exceed 4.75%. A-Class share purchases of $1 million or more are exempt from the front-end sales charge but have a 1% contingent deferred sales charge (“CDSC”) if shares are redeemed within 12 months of purchase. C-Class shares have a 1% CDSC if shares are redeemed within 12 months of purchase. C-Class shares of each Fund automatically convert to A-Class shares of the same Fund on or about the 10th day of the month following the 10-year anniversary of the purchase of the C-Class shares. This conversion will be executed without any sales charge, fee or other charge. After the conversion is completed, the shares will be subject to all features and expenses of A-Class shares. Institutional Class shares are offered primarily for direct investment by institutions such as pension and profit sharing plans, endowments, foundations and corporations. Institutional Class shares require a minimum initial investment of $2 million and a minimum account balance of $1 million. At December 31, 2022, the Trust consisted of fifty-two funds.
This report covers the following funds (each, a “Fund” and together, the “Funds”):
Fund Name | | Investment
Company Type | |
Multi-Hedge Strategies Fund | | | Diversified | |
Commodities Strategy Fund | | | Non-diversified | |
At December 31, 2022, A-Class, C-Class, H-Class, P-Class and Institutional Class shares have been issued by the Funds.
The Commodities Strategy Fund is designed and operated to accommodate frequent trading by shareholders and, unlike most mutual funds, offers unlimited exchange priviledges with no minimum holding periods or transactions fees, which may cause the Fund to experience high portfolio turnover.
| | THE GUGGENHEIM FUNDS ANNUAL REPORT | 71 |
NOTES TO CONSOLIDATED FINANCIAL STATEMENTS (continued) |
Security Investors, LLC (the “Adviser”), which operates under the name Guggenheim Investments (“GI”), provides advisory services. Guggenheim Funds Distributors, LLC (“GFD”) acts as principal underwriter for the Trust. GI and GFD are affiliated entities.
Consolidation of Subsidiaries
The consolidated financial statements of each of the Multi-Hedge Strategies Fund and Commodities Strategy Fund include the accounts of a wholly-owned and controlled Cayman Islands subsidiary (each, a “Subsidiary”). Significant inter-company accounts and transactions have been eliminated in consolidation for the Funds.
Each Fund may invest up to 25% of its total assets in its Subsidiary which acts as an investment vehicle in order to effect certain investments consistent with the Fund’s investment objective and policies.
A summary of each Fund’s investment in its respective Subsidiary is as follows:
Fund | | Inception
Date of
Subsidiary | | | Subsidiary
Net Assets at
December 31, 2022 | | | % of Net Assets
of the Fund at
December 31, 2022 | |
Multi-Hedge Strategies Fund | | | 09/18/09 | | | $ | 3,077,882 | | | | 2.5 | % |
Commodities Strategy Fund | | | 09/08/09 | | | | 2,001,625 | | | | 21.0 | % |
Significant Accounting Policies
The Funds operate as investment companies and, accordingly, follow the investment company accounting and reporting guidance of the Financial Accounting Standards Board (“FASB”) Accounting Standards Codification Topic 946 Financial Services – Investment Companies.
The following significant accounting policies are in conformity with U.S. generally accepted accounting principles (“U.S. GAAP”) and are consistently followed by the Trust. This requires management to make estimates and assumptions that affect the reported amount of assets and liabilities, contingent assets and liabilities at the date of the consolidated financial statements, and the reported amounts of revenues and expenses during the reporting period. Actual results could differ from these estimates. All time references are based on Eastern Time.
The NAV of each Class of a Fund is calculated by dividing the market value of the Fund’s securities and other assets, less all liabilities, attributable to the Class by the number of outstanding shares of the Class.
(a) Valuation of Investments
The Board of Trustees of the Funds (the “Board”) has adopted policies and procedures for the valuation of the Funds’ investments (the “Valuation Procedures”). The SEC adopted Rule 2a-5 under the 1940 Act (“Rule 2a-5”) which establishes requirements for determining fair value in
72 | THE GUGGENHEIM FUNDS ANNUAL REPORT | |
NOTES TO CONSOLIDATED FINANCIAL STATEMENTS (continued) |
good faith and became effective September 8, 2022. Rule 2a-5 also defines “readily available market quotations” for purposes of the 1940 Act and establishes requirements for determining whether a fund must fair value a security in good faith.
Pursuant to Rule 2a-5, the Board has designated the Adviser as the valuation designee to perform fair valuation determinations for the Funds with respect to all Fund investments and other assets. As the Funds’ valuation designee pursuant to Rule 2a-5, the Adviser has adopted separate procedures (the “Valuation Designee Procedures”) reasonably designed to prevent violations of the requirements of Rule 2a-5 and Rule 31a-4. The Adviser, in its role as valuation designee, utilizes the assistance of a valuation committee consisting of representatives from Guggenheim’s investment management, fund administration, legal and compliance departments (the “Valuation Committee”), in determining the fair value of the Funds’ securities and other assets.
Valuations of the Funds’ securities and other assets are supplied primarily by pricing services appointed pursuant to the processes set forth in the Valuation Procedures. The Adviser, with the assistance of the Valuation Committee, convenes monthly, or more frequently as needed, to review the valuation of all assets which have been fair valued for reasonableness. The Adviser, consistent with the monitoring and review responsibilities set forth in the Valuation Designee Procedures, regularly reviews the appropriateness of the inputs, methods, models and assumptions employed by the pricing services. If the pricing service cannot or does not provide a valuation for a particular investment or such valuation is deemed unreliable, the investment is fair valued by the Adviser.
Equity securities listed or traded on a recognized U.S. securities exchange or the National Association of Securities Dealers Automated Quotations (“NASDAQ”) National Market System shall generally be valued on the basis of the last sale price on the primary U.S. exchange or market on which the security is listed or traded; provided, however, that securities listed on NASDAQ will be valued at the NASDAQ official closing price, which may not necessarily represent the last sale price.
Open-end investment companies are valued at their NAV as of the close of business, on the valuation date. Exchange-traded funds and closed-end investment companies are generally valued at the last quoted sale price.
U.S. Government securities are valued by independent pricing services, the last traded fill price, or at the reported bid price at the close of business.
Repurchase agreements are generally valued at amortized cost, provided such amounts approximate market value.
Commercial paper and discount notes with a maturity of greater than 60 days at acquisition are valued at prices that reflect broker-dealer supplied valuations or are obtained from independent pricing services, which may consider the trade activity, treasury spreads, yields or price of bonds of comparable quality, coupon, maturity, and type, as well as prices quoted by dealers who make markets in such securities. Commercial paper and discount notes with a maturity of 60 days or
| | THE GUGGENHEIM FUNDS ANNUAL REPORT | 73 |
NOTES TO CONSOLIDATED FINANCIAL STATEMENTS (continued) |
less at acquisition are valued at amortized cost, unless the Adviser concludes that amortized cost does not represent the fair value of the applicable asset in which case it will be valued using an independent pricing service.
The value of futures contracts are valued on the basis of the last sale price at the 4:00 p.m. price on the valuation date. In the event that the exchange for a specific futures contract closes earlier than 4:00 p.m., the futures contract is valued at the official settlement price of the exchange. However, the underlying securities from which the futures contract value is derived are monitored until 4:00 p.m. to determine if fair valuation would provide a more accurate valuation.
The value of swap agreements entered into by a fund will generally be valued using an evaluated price provided by a third-party pricing vendor.
Investments for which market quotations are not readily available are fair valued as determined in good faith by the Adviser. Valuations in accordance with these methods are intended to reflect each security’s (or asset’s or liability’s) “fair value”. Each such determination is based on a consideration of all relevant factors, which are likely to vary from one pricing context to another. Examples of such factors may include, but are not limited to market prices; sale prices; broker quotes; and models which derive prices based on inputs such as prices of securities with comparable maturities and characteristics, or based on inputs such as anticipated cash flows or collateral, spread over U.S. Treasury securities, and other information analysis. In connection with futures contracts and other derivative investments, such factors may include obtaining information as to how (a) these contracts and other derivative investments trade in the futures or other derivative markets, respectively, and (b) the securities underlying these contracts and other derivative investments trade in the cash market.
(b) U.S. Government and Agency Obligations
Certain U.S. Government and Agency Obligations are traded on a discount basis; the interest rates shown on the Schedules of Investments reflect the effective rates paid at the time of purchase by the Funds. Other securities bear interest at the rates shown, payable at fixed dates through maturity.
(c) Short Sales
When a Fund engages in a short sale of a security, an amount equal to the proceeds is reflected as an asset and an equivalent liability. The amount of the liability is subsequently marked-to-market to reflect the market value of the short sale.
Fees, if any, paid to brokers to borrow securities in connection with short sales are recorded as interest expense. In addition, the Fund must pay out the dividend rate of the equity or coupon rate of the obligation to the lender and record this as an expense. Short dividend or interest expense is a cost associated with the investment objective of short sales transactions, rather than an
74 | THE GUGGENHEIM FUNDS ANNUAL REPORT | |
NOTES TO CONSOLIDATED FINANCIAL STATEMENTS (continued) |
operational cost associated with the day-to-day management of any mutual fund. The Fund may also receive rebate income from the broker resulting from the investment of the proceeds from securities sold short.
(d) Futures Contracts
Upon entering into a futures contract, a Fund deposits and maintains as collateral such initial margin as required by the exchange on which the transaction is affected. Pursuant to the contract, the Fund agrees to receive from or pay to the broker an amount of cash equal to the daily fluctuation in value of the contract. Such receipts or payments are known as variation margin and are recorded by the Fund as unrealized appreciation or depreciation. When the contract is closed, the Fund records a realized gain or loss equal to the difference between the value of the contract at the time it was opened and the value at the time it was closed.
(e) Swap Agreements
Swap agreements are marked-to-market daily and the change, if any, is recorded as unrealized appreciation or depreciation. Payments received or made as a result of an agreement or termination of an agreement are recognized as realized gains or losses.
Upon entering into certain centrally-cleared swap transactions, a Fund is required to deposit with its clearing broker an amount of cash or securities as an initial margin. Subsequent variation margin receipts or payments are received or made by the Fund depending on fluctuations in the fair value of the reference entity and are recorded by the Fund as unrealized appreciation or depreciation. When the contract is closed, the Fund records a realized gain or loss equal to the difference between the value of the contract at the time it was opened and the value at the time it was closed.
(f) Currency Translations
The accounting records of the Funds are maintained in U.S. dollars. All assets and liabilities initially expressed in foreign currencies are converted into U.S. dollars at prevailing exchange rates. Purchases and sales of investment securities, dividend and interest income, and certain expenses are translated at the rates of exchange prevailing on the respective dates of such transactions. Changes in the relationship of these foreign currencies to the U.S. dollar can significantly affect the value of the investments and earnings of the Funds. Foreign investments may also subject the Funds to foreign government exchange restrictions, expropriation, taxation, or other political, social or economic developments, all of which could affect the market and/or credit risk of the investments.
The Funds do not isolate that portion of the results of operations resulting from changes in the foreign exchange rates on investments from the fluctuations arising from changes in the market prices of securities held. Such fluctuations are included with the net realized gain or loss and unrealized appreciation or depreciation on investments.
| | THE GUGGENHEIM FUNDS ANNUAL REPORT | 75 |
NOTES TO CONSOLIDATED FINANCIAL STATEMENTS (continued) |
Reported net realized foreign exchange gains and losses arise from sales of foreign currencies and currency gains or losses realized between the trade and settlement dates on investment transactions. Net unrealized appreciation and depreciation arise from changes in the fair values of assets and liabilities other than investments in securities at the fiscal period end, resulting from changes in exchange rates.
(g) Foreign Taxes
The Funds may be subject to foreign taxes (a portion of which may be reclaimable) on income, stock dividends, capital gains on investments or certain foreign currency transactions. All foreign taxes are recorded in accordance with the applicable foreign tax regulations and rates that exist in the foreign jurisdictions in which the Funds invest. These foreign taxes, if any, are paid by the Funds and reflected in the Funds’ Consolidated Statements of Operations as follows: foreign taxes withheld at source are presented as a reduction of income and foreign taxes on capital gains from sales of investments are included with the net realized gain (loss) on investments. Foreign taxes payable or deferred as of December 31, 2022, if any, are disclosed in the Funds’ Consolidated Statements of Assets and Liabilities.
(h) Security Transactions
Security transactions are recorded on the trade date for financial reporting purposes. Realized gains and losses from securities transactions are recorded using the identified cost basis. Proceeds from lawsuits related to investment holdings are recorded as a reduction to cost if the securities are still held and as realized gains if no longer held in the respective Fund. Dividend income is recorded on the ex-dividend date, net of applicable taxes withheld by foreign countries, if any. Taxable non-cash dividends are recorded as dividend income. Interest income, including amortization of premiums and accretion of discounts, is accrued on a daily basis. Dividend income from Real Estate Investment Trusts (“REITs”) is recorded based on the income included in the distributions received from the REIT investments using published REIT classifications, including some management estimates when actual amounts are not available. Distributions received in excess of this estimated amount are recorded as a reduction of the cost of investments or reclassified to realized gains. The actual amounts of income, return of capital, and realized gains are only determined by each REIT after its fiscal year-end, and may differ from the estimated amounts.
(i) Distributions
Distributions of net investment income and net realized gains, if any, are declared and paid at least annually. Dividends are reinvested in additional shares, unless shareholders request payment in cash. Distributions are recorded on the ex-dividend date and are determined in accordance with U.S. federal income tax regulations which may differ from U.S. GAAP.
76 | THE GUGGENHEIM FUNDS ANNUAL REPORT | |
NOTES TO CONSOLIDATED FINANCIAL STATEMENTS (continued) |
(j) Class Allocations
Interest and dividend income, most expenses, all realized gains and losses, and all unrealized appreciation and depreciation are allocated to the classes based upon the value of the outstanding shares in each Class. Certain costs, such as distribution and service fees are charged directly to specific classes. In addition, certain expenses have been allocated to the individual Funds in the Trust based on the respective net assets of each Fund included in the Trust.
(k) Cash
The Funds may leave cash overnight in their cash account with the custodian. Periodically, a Fund may have cash due to the custodian bank as an overdraft balance. A fee is incurred on this overdraft, calculated by multiplying the overdraft by a rate based on the federal funds rate, which was 4.33% at December 31, 2022.
(l) Indemnifications
Under the Funds’ organizational documents, the Trustees and Officers are indemnified against certain liabilities arising out of the performance of their duties to the Trust. In addition, throughout the normal course of business, the Funds enter into contracts that contain a variety of representations and warranties which provide general indemnifications. The Funds’ maximum exposure under these arrangements is unknown, as this would involve future claims that may be made against the Funds and/or their affiliates that have not yet occurred. However, based on experience, the Funds expect the risk of loss to be remote.
Note 2 – Financial Instruments and Derivatives
As part of their investment strategy, the Funds may utilize short sales and a variety of derivative instruments. These investments involve, to varying degrees, elements of market risk and risks in excess of amounts recognized on the Funds’ Consolidated Statements of Assets and Liabilities. Valuation and accounting treatment of these instruments can be found under Significant Accounting Policies in Note 1 of these Notes to Consolidated Financial Statements.
Short Sales
A short sale is a transaction in which a Fund sells a security it does not own. If the security sold short decreases in price between the time the Fund sells the security and closes its short position, the Fund will realize a gain on the transaction. Conversely, if the security increases in price during the period, the Fund will realize a loss on the transaction. The risk of such price increases is the principal risk of engaging in short sales.
Derivatives
Derivatives are instruments whose values depend on, or are derived from, in whole or in part, the value of one or more other assets, such as securities, currencies, commodities or indices. Derivative instruments may be used to increase investment flexibility (including to maintain cash reserves while maintaining exposure to certain other assets), for risk management (hedging)
| | THE GUGGENHEIM FUNDS ANNUAL REPORT | 77 |
NOTES TO CONSOLIDATED FINANCIAL STATEMENTS (continued) |
purposes, to facilitate trading, to reduce transaction costs and to pursue higher investment returns. Derivative instruments may also be used to mitigate certain investment risks, such as foreign currency exchange rate risk, interest rate risk and credit risk. U.S. GAAP requires disclosures to enable investors to better understand how and why a fund uses derivative instruments, how these derivative instruments are accounted for and their effects on a fund’s financial position and results of operations.
The Funds may utilize derivatives for the following purposes:
Duration: the use of an instrument to manage the interest rate risk of a portfolio.
Hedge: an investment made in order to reduce the risk of adverse price movements in a security, by taking an offsetting position to protect against broad market moves.
Index Exposure: the use of an instrument to obtain exposure to a listed or other type of index.
Leverage: gaining total exposure to equities or other assets on the long and short sides at greater than 100% of invested capital.
Liquidity: the ability to buy or sell exposure with little price/market impact.
Speculation: the use of an instrument to express macro-economic and other investment views.
To the extent a Fund’s investment strategy consistently involves applying leverage, the value of the Fund’s shares will tend to increase or decrease more than the value of any increase or decrease in the underlying index or other asset. In addition, because an investment in derivative instruments generally requires a small investment relative to the amount of investment exposure assumed, an opportunity for increased net income is created; but, at the same time, leverage risk will increase. The Fund’s use of leverage, through borrowings or instruments such as derivatives, may cause the Fund’s investments to be more volatile and riskier than if they had not been leveraged.
Futures Contracts
A futures contract is an agreement to purchase (long) or sell (short) an agreed amount of securities or other instruments at a set price for delivery at a future date. There are significant risks associated with a Fund’s use of futures contracts, including (i) there may be an imperfect or no correlation between the changes in market value of the underlying asset and the prices of futures contracts; (ii) there may not be a liquid secondary market for a futures contract; (iii) trading restrictions or limitations may be imposed by an exchange; and (iv) government regulations may restrict trading in futures contracts. When investing in futures, there is minimal counterparty credit risk to a Fund because futures are exchange-traded and the exchange’s clearinghouse, as counterparty to all exchange-traded futures, guarantees against default. Cash deposits are shown as segregated cash with broker on the Funds’ Consolidated Statements of Assets and Liabilities; securities held as collateral are noted on the Consolidated Schedules of Investments.
78 | THE GUGGENHEIM FUNDS ANNUAL REPORT | |
NOTES TO CONSOLIDATED FINANCIAL STATEMENTS (continued) |
The following table represents the Funds’ use and volume of futures on a monthly basis:
| | | | Average Notional Amount | |
Fund | Use | | Long | | | Short | |
Multi-Hedge Strategies Fund | Duration, Hedge, Index exposure, Leverage, Liquidity, Speculation | | $ | 78,474,987 | | | $ | 78,309,381 | |
Commodities Strategy Fund | Index exposure, Liquidity | | | 28,730,662 | | | | — | |
Swap Agreements
A swap is an agreement that obligates two parties to exchange a series of cash flows at specified intervals based upon or calculated by reference to changes in specified prices or rates for a specified amount of an underlying asset. When utilizing over-the-counter (“OTC”) swaps, a fund bears the risk of loss of the amount expected to be received under a swap agreement in the event of the default or bankruptcy of a swap agreement counterparty or if the underlying asset declines in value. Certain standardized swaps are subject to mandatory central clearing and are executed on a multi-lateral or other trade facility platform, such as a registered exchange. There is limited counterparty credit risk with respect to centrally-cleared swaps as the transaction is facilitated through a central clearinghouse, much like exchange-traded futures contracts. For a fund utilizing centrally-cleared swaps, the exchange bears the risk of loss resulting from a counterparty not being able to pay. There is no guarantee that a fund or an underlying fund could eliminate its exposure under an outstanding swap agreement by entering into an offsetting swap agreement with the same or another party.
Custom basket swaps involve commitments where single or multiple cash flows are exchanged based on the price of an underlying reference asset (such as a custom basket of securities) for a fixed or variable interest rate. Custom basket swaps will usually be computed based on the current value of the reference asset as of the close of regular trading on the NYSE or other exchange, with the swap value being adjusted to include dividends accrued, financing charges and/or interest associated with the swap agreement. When utilizing custom basket swaps, a fund bears the risk of loss of the amount expected to be received under a swap agreement in the event of the default or bankruptcy of a swap agreement counterparty or if the underlying reference asset declines in value.
The following table represents the Funds’ use and volume of custom basket swaps on a monthly basis:
| | | | Average Notional Amount | |
Fund | Use | | Long | | | Short | |
Multi-Hedge Strategies Fund | Hedge, Index exposure, Leverage, Liquidity, Speculation | | $ | 55,827,188 | | | $ | 46,683,194 | |
| | THE GUGGENHEIM FUNDS ANNUAL REPORT | 79 |
NOTES TO CONSOLIDATED FINANCIAL STATEMENTS (continued) |
Derivative Investment Holdings Categorized by Risk Exposure
The following is a summary of the location of derivative investments on the Funds’ Consolidated Statements of Assets and Liabilities as of December 31, 2022:
Derivative Investment Type | Asset Derivatives | Liability Derivatives |
Commodity/currency/equity/interest rate futures contracts | Variation margin on futures contracts | Variation margin on futures contracts |
Equity swap contracts | Unrealized appreciation on OTC swap agreements | Unrealized depreciation on OTC swap agreements |
The following tables set forth the fair value of the Funds’ derivative investments categorized by primary risk exposure at December 31, 2022:
Asset Derivative Investments Value |
Fund | | Futures
Equity
Risk* | | | Swaps
Equity
Risk | | | Futures
Foreign
Currency
Exchange
Risk* | | | Futures
Interest Rate
Risk* | | | Futures
Commodity
Risk* | | | Total
Value at
December 31,
2022 | |
Multi-Hedge Strategies Fund | | $ | 119,175 | | | $ | 6,157,107 | | | $ | 158,650 | | | $ | 243,031 | | | $ | 1,356,631 | | | $ | 8,034,594 | |
Commodities Strategy Fund | | | — | | | | — | | | | — | | | | — | | | | 566,100 | | | | 566,100 | |
Liability Derivative Investments Value |
Fund | | Futures
Equity Risk* | | | Swaps
Equity Risk | | | Futures
Foreign
Currency
Exchange
Risk* | | | Futures
Interest
Rate Risk* | | | Futures
Commodity
Risk* | | | Total
Value at
December 31,
2022 | |
Multi-Hedge Strategies Fund | | $ | 493,524 | | | $ | 637,421 | | | $ | 260,291 | | | $ | 28,936 | | | $ | 626,447 | | | $ | 2,046,619 | |
* | Includes cumulative appreciation (depreciation) of exchange-traded, OTC and centrally-cleared derivatives contracts as reported on the Consolidated Schedules of Investments. For exchange-traded and centrally-cleared derivatives, variation margin is reported within the Funds’ Consolidated Statements of Assets and Liabilities. |
80 | THE GUGGENHEIM FUNDS ANNUAL REPORT | |
NOTES TO CONSOLIDATED FINANCIAL STATEMENTS (continued) |
The following is a summary of the location of derivative investments on the Funds’ Consolidated Statements of Operations for the year ended December 31, 2022:
Derivative Investment Type | Location of Gain (Loss) on Derivatives |
Commodity/currency/equity/interest rate futures contracts | Net realized gain (loss) on futures contracts |
| | Net change in unrealized appreciation (depreciation) on futures contracts |
Equity swap contracts | Net realized gain (loss) on swap agreements |
| | Net change in unrealized appreciation (depreciation) on swap agreements |
The following is a summary of the Funds’ realized gain (loss) and change in unrealized appreciation (depreciation) on derivative investments recognized on the Funds’ Consolidated Statements of Operations categorized by primary risk exposure for the year ended December 31, 2022:
Realized Gain (Loss) on Derivative Investments Recognized on the Consolidated Statements of Operations |
Fund | | Futures
Equity
Risk | | | Swaps
Equity
Risk | | | Futures
Foreign
Currency
Exchange
Risk | | | Futures
Interest Rate
Risk | | | Futures
Commodity
Risk | | | Total | |
Multi-Hedge Strategies Fund | | $ | (839,931 | ) | | $ | (4,815,089 | ) | | $ | (332,920 | ) | | $ | 706,162 | | | $ | (832,906 | ) | | $ | (6,114,684 | ) |
Commodities Strategy Fund | | | — | | | | — | | | | — | | | | — | | | | 5,405,009 | | | | 5,405,009 | |
Change in Unrealized Appreciation (Depreciation) on Derivative Investments
Recognized on the Consolidated Statements of Operations |
Fund | | Futures
Equity
Risk | | | Swaps
Equity
Risk | | | Futures
Foreign
Currency
Exchange
Risk | | | Futures
Interest Rate
Risk | | | Futures
Commodity
Risk | | | Total | |
Multi-Hedge Strategies Fund | | $ | (469,026 | ) | | $ | 1,540,584 | | | $ | 78,698 | | | $ | 388,121 | | | $ | 708,474 | | | $ | 2,246,851 | |
Commodities Strategy Fund | | | — | | | | — | | | | — | | | | — | | | | (270,919 | ) | | | (270,919 | ) |
In conjunction with short sales and the use of derivative instruments, the Funds are required to maintain collateral in various forms. Depending on the financial instrument utilized and the broker involved, the Funds use margin deposits at the broker, cash and/or securities segregated at the custodian bank, discount notes or repurchase agreements allocated to the Funds as collateral.
| | THE GUGGENHEIM FUNDS ANNUAL REPORT | 81 |
NOTES TO CONSOLIDATED FINANCIAL STATEMENTS (continued) |
The Trust has established counterparty credit guidelines and enters into transactions only with financial institutions of investment grade or better. The Trust monitors the counterparty credit risk.
Note 3 – Offsetting
In the normal course of business, the Funds enter into transactions subject to enforceable master netting arrangements or other similar arrangements. Generally, the right to offset in those agreements allows the Funds to counteract the exposure to a specific counterparty with collateral received from or delivered to that counterparty based on the terms of the arrangements. These arrangements provide for the right to liquidate upon the occurrence of an event of default, credit event upon merger or additional termination event.
In order to better define their contractual rights and to secure rights that will help the Funds mitigate their counterparty risk, the Funds may enter into an International Swaps and Derivatives Association, Inc. Master Agreement (“ISDA Master Agreement”) or similar agreement with their derivative contract counterparties. An ISDA Master Agreement is a bilateral agreement between a fund and a counterparty that governs OTC derivatives, including foreign exchange contracts, and typically contains, among other things, collateral posting terms and netting provisions in the event of a default and/or termination event. The provisions of the ISDA Master Agreement typically permit a single net payment in the event of a default (close-out netting) or similar event, including the bankruptcy or insolvency of the counterparty.
For derivatives traded under an ISDA Master Agreement, the collateral requirements are typically calculated by netting the mark-to-market amount for each transaction under such agreement and comparing that amount to the value of any collateral currently pledged by the Funds and the counterparty. For financial reporting purposes, cash collateral that has been pledged to cover obligations of the Funds and cash collateral received from the counterparty, if any, are reported separately on the Funds’ Consolidated Statements of Assets and Liabilities as segregated cash with broker/receivable for variation margin, or payable for swap settlement/variation margin. Cash and/or securities pledged or received as collateral by the Funds in connection with an OTC derivative subject to an ISDA Master Agreement generally may not be invested, sold or rehypothecated by the counterparty or the Funds, as applicable, absent an event of default under such agreement, in which case such collateral generally may be applied towards obligations due to and payable by such counterparty or the Funds, as applicable. Generally, the amount of collateral due from or to a counterparty must exceed a minimum transfer amount threshold (e.g., $300,000) before a transfer is required to be made. To the extent amounts due to the Funds from their counterparties are not fully collateralized, contractually or otherwise, the Funds bear the risk of loss from counterparty nonperformance. The Funds attempt to mitigate counterparty risk by only entering into agreements with counterparties that they believe to be of good standing and by monitoring the financial stability of those counterparties.
82 | THE GUGGENHEIM FUNDS ANNUAL REPORT | |
NOTES TO CONSOLIDATED FINANCIAL STATEMENTS (continued) |
For financial reporting purposes, the Funds do not offset derivative assets and derivative liabilities that are subject to netting arrangements in the Funds’ Consolidated Statements of Assets and Liabilities.
The following tables present derivative financial instruments and secured financing transactions that are subject to enforceable netting arrangements:
| | | | | | | | | | | | | | | | Gross Amounts Not
Offset in the Consolidated
Statements of Assets
and Liabilities | | | | | |
Fund | Instrument | | Gross
Amounts of
Recognized
Assets1 | | | Gross
Amounts
Offset in the
Consolidated
Statements
of Assets and
Liabilities | | | Net Amount
of Assets
Presented
on the
Consolidated
Statements
of Assets and
Liabilities | | | Financial
Instruments | | | Cash
Collateral
Received | | | Net
Amount | |
Multi-Hedge Strategies Fund | Custom basket swap agreements | | $ | 6,157,107 | | | $ | — | | | $ | 6,157,107 | | | $ | (637,421 | ) | | $ | — | | | $ | 5,519,686 | |
| | | | | | | | | | | | | | | | Gross Amounts Not
Offset in the Consolidated
Statements of Assets
and Liabilities | | | | | |
Fund | Instrument | | Gross
Amounts of
Recognized
Liabilities1 | | | Gross
Amounts
Offset in the
Consolidated
Statements
of Assets and
Liabilities | | | Net Amount
of Liabilities
Presented
on the
Consolidated
Statements
of Assets and
Liabilities | | | Financial
Instruments | | | Cash
Collateral
Pledged | | | Net
Amount | |
Multi-Hedge Strategies Fund | Custom basket swap agreements | | $ | 637,421 | | | $ | — | | | $ | 637,421 | | | $ | (637,421 | ) | | $ | — | | | $ | — | |
1 | Exchange-traded or centrally-cleared derivatives are excluded from these reported amounts. |
| | THE GUGGENHEIM FUNDS ANNUAL REPORT | 83 |
NOTES TO CONSOLIDATED FINANCIAL STATEMENTS (continued) |
The Funds have the right to offset deposits against any related derivative liabilities outstanding with each counterparty with the exception of exchange-traded or centrally-cleared derivatives. The following table presents deposits held by others in connection with derivative investments as of December 31, 2022.
Fund | Counterparty | Asset Type | | Cash Pledged | | | Cash Received | |
Multi-Hedge Strategies Fund | Goldman Sachs International | Futures contracts | | $ | 1,611,618 | | | $ | — | |
Commodities Strategy Fund | Goldman Sachs International | Futures contracts | | | 836,004 | | | | — | |
Note 4 – Fair Value Measurement
In accordance with U.S. GAAP, fair value is defined as the price that the Funds would receive to sell an investment or pay to transfer a liability in an orderly transaction between market participants at the measurement date. U.S. GAAP establishes a three-tier fair value hierarchy based on the types of inputs used to value assets and liabilities and requires corresponding disclosure. The hierarchy and the corresponding inputs are summarized below:
Level 1 | — unadjusted quoted prices in active markets for identical assets or liabilities. |
Level 2 — | significant other observable inputs (for example quoted prices for securities that are similar based on characteristics such as interest rates, prepayment speeds, credit risk, etc.). |
Level 3 — | significant unobservable inputs based on the best information available under the circumstances, to the extent observable inputs are not available, which may include assumptions. |
Rule 2a-5 sets forth a definition of “readily available market quotations,” which is consistent with the definition of a Level 1 input under U.S. GAAP. Rule 2a-5 provides that “a market quotation is readily available only when that quotation is a quoted price (unadjusted) in active markets for identical investments that the fund can access at the measurement date, provided that a quotation will not be readily available if it is not reliable.”
Securities for which market quotations are not readily available must be valued at fair value as determined in good faith. Accordingly, any security priced using inputs other than Level 1 inputs will be subject to fair value requirements. The types of inputs available depend on a variety of factors, such as the type of security and the characteristics of the markets in which it trades, if any. Fair valuation determinations that rely on fewer or no observable inputs require greater judgment. Accordingly, fair value determinations for Level 3 securities require the greatest amount of judgment.
84 | THE GUGGENHEIM FUNDS ANNUAL REPORT | |
NOTES TO CONSOLIDATED FINANCIAL STATEMENTS (continued) |
The inputs or methodologies selected and applied for valuing securities are not necessarily an indication of the risk associated with investing in those securities. The suitability, appropriateness and accuracy of the techniques, methodologies and sources employed to determine fair valuation are periodically reviewed and subject to change.
Note 5 – Investment Advisory Agreement and Other Agreements
Under the terms of an investment advisory contract, the Funds pay GI investment advisory fees calculated at the annualized rates below, based on the average daily net assets of the Funds:
Fund | | Management Fees
(as a % of Net Assets) | |
Multi-Hedge Strategies Fund | | | 1.15 | % |
Commodities Strategy Fund | | | 0.75 | % |
When the aggregate assets of each series of the Trust (excluding the Long Short Equity Fund, Managed Futures Strategy Fund and Multi-Hedge Strategies Fund) and each series of Rydex Dynamic Funds equal or exceed $10 billion, the advisory fee rate paid by each individual Fund (excluding the Long Short Equity Fund, Managed Futures Strategy Fund and Multi-Hedge Strategies Fund) will be reduced in accordance with the asset level and breakpoint schedule set forth below.
Fund Assets Under Management | | Fund Asset-Based
Breakpoint Reductions | |
$500 million - $1 billion | | | 0.025 | % |
>$1 billion - $2 billion | | | 0.050 | % |
>$2 billion | | | 0.075 | % |
GI has contractually agreed to waive the management fee it receives from each Subsidiary in an amount equal to the management fee paid to GI by the Subsidiary. This undertaking will continue in effect for so long as the Funds invest in the Subsidiaries, and may not be terminated by GI unless GI obtains the prior approval of the Funds’ Board for such termination. Fees waived under this arrangement are not subject to reimbursement by GI. For the year ended December 31, 2022, the Multi-Hedge Strategies Fund and Commodities Strategy Fund waived $32,217 and $39,330, respectively, related to advisory fees in each Fund’s respective Subsidiary.
As part of its agreement with the Trust, GI will pay all expenses of the Multi-Hedge Strategies Fund, including the cost of transfer agency, custody, fund administration, legal, audit and other services, except interest expense, taxes (expected to be de minimis), brokerage commissions and other expenses connected with execution of portfolio transactions, short dividend expenses, subsidiary expenses and extraordinary expenses.
| | THE GUGGENHEIM FUNDS ANNUAL REPORT | 85 |
NOTES TO CONSOLIDATED FINANCIAL STATEMENTS (continued) |
GI pays operating expenses on behalf of the Trust, such as audit and accounting related services, legal services, custody, printing and mailing, among others, on a pass-through basis. Such expenses are allocated to various Funds within the complex based on relative net assets.
The Board has adopted a Distribution Plan applicable to A-Class shares, P-Class shares and H-Class shares for which GFD and other firms that provide distribution and/or shareholder services (“Service Providers”) may receive compensation. If a Service Provider provides distribution services, the Funds will pay distribution fees to GFD at an annual rate not to exceed 0.25% of average daily net assets, pursuant to Rule 12b-1 of the 1940 Act. GFD, in turn, will pay the Service Provider out of its fees. GFD may, at its discretion, retain a portion of such payments to compensate itself for distribution services.
The Board has adopted a separate Distribution and Shareholder Services Plan applicable to C-Class shares that allows the Funds to pay annual distribution and service fees of 1.00% of the Funds’ C-Class shares average daily net assets. The annual 0.25% service fee compensates a shareholder’s financial adviser for providing ongoing services to the shareholder. The annual distribution fee of 0.75% reimburses GFD for paying the shareholder’s financial adviser an ongoing sales commission. GFD advances the first year’s service and distribution fees to the financial adviser. GFD retains the service and distribution fees on accounts with no authorized dealer of record.
For the year ended December 31, 2022, GFD retained sales charges of $102,568 relating to sales of A-Class shares of the Trust.
If a Fund invests in a fund that is advised by the same adviser or an affiliated adviser, the investing Fund’s adviser has agreed to waive fees at the investing fund level to the extent necessary to offset the proportionate share of any management fee paid by each Fund with respect to its investment in such affiliated fund. Fee waivers will be calculated at the investing Fund level without regard to any expense cap in effect for the investing Fund. Fees waived under this arrangement are not subject to reimbursement to GI. For the year ended December 31, 2022, the Multi-Hedge Strategies Fund and Commodities Strategy Fund waived $16,115 and $3,442, respectively, related to investments in affiliated funds.
Certain trustees and officers of the Trust are also officers of GI and/or GFD. The Trust does not compensate its officers or trustees who are officers, directors and/or employees of GI or GFD.
MUFG Investor Services (US), LLC (“MUIS”) acts as the Funds’ administrator, transfer agent and accounting agent. As administrator, transfer agent and accounting agent, MUIS maintains the books and records of the Funds’ securities and cash. U.S. Bank, N.A. (“U.S. Bank”) acts as the Funds’ custodian. As custodian, U.S. Bank is responsible for the custody of the Funds’ assets. For providing the aforementioned services, MUIS and U.S. Bank are entitled to receive a monthly fee equal to an annual percentage of each Fund’s average daily net assets and out of pocket expenses.
86 | THE GUGGENHEIM FUNDS ANNUAL REPORT | |
NOTES TO CONSOLIDATED FINANCIAL STATEMENTS (continued) |
Note 6 – Repurchase Agreements
The Funds transfer uninvested cash balances into a single joint account, the daily aggregate balance of which is invested in one or more repurchase agreements collateralized by obligations of the U.S. Treasury and U.S. government agencies. The joint account includes other Funds in the Guggenheim complex not covered in this report. The collateral is in the possession of the Funds’ custodian and is evaluated to ensure that its market value exceeds, at a minimum, 102% of the original face amount of the repurchase agreements. Each Fund holds a pro rata share of the collateral based on the dollar amount of the repurchase agreement entered into by each Fund.
At December 31, 2022, the repurchase agreements in the joint account were as follows:
Counterparty and
Terms of Agreement | | Face
Value | | | Repurchase
Price | | | Collateral | | Par
Value | | | Fair
Value | |
J.P. Morgan Securities LLC | | | | | | | | | | U.S. Treasury Notes | | | | | | | | |
4.26% | | | | | | | | | | 0.38% - 2.13% | | | | | | | | |
Due 01/03/23 | | $ | 152,635,704 | | | $ | 152,689,890 | | | Due 10/31/23 - 05/31/26 | | $ | 171,586,500 | | | $ | 155,688,423 | |
| | | | | | | | | | | | | | | | | | | |
BofA Securities, Inc. | | | | | | | | | | U.S. Treasury Notes | | | | | | | | |
4.25% | | | | | | | | | | 0.88% - 1.38% | | | | | | | | |
Due 01/03/23 | | | 58,706,040 | | | | 58,726,832 | | | Due 09/30/26 - 12/31/28 | | | 67,728,600 | | | | 59,880,171 | |
| | | | | | | | | | | | | | | | | | | |
Barclays Capital, Inc. | | | | | | | | | | U.S. Treasury Inflation Indexed Bond | | | | | | | | |
4.21% | | | | | | | | | | 0.13% | | | | | | | | |
Due 01/03/23 | | | 58,524,226 | | | | 58,544,758 | | | Due 01/15/31 | | | 67,503,920 | | | | 59,694,784 | |
In the event of counterparty default, the Funds have the right to collect the collateral to offset losses incurred. There is potential loss to the Funds in the event the Funds are delayed or prevented from exercising their rights to dispose of the collateral securities, including the risk of a possible decline in the value of the underlying securities during the period while the Funds seek to assert their rights. GI, acting under the supervision of the Board, reviews the value of the collateral and the creditworthiness of those banks and dealers with which the Funds enter into repurchase agreements to evaluate potential risks.
Note 7 – Portfolio Securities Loaned
The Funds may lend their securities to approved brokers to earn additional income. Securities lending income shown on the Funds’ Consolidated Statements of Operations is shown net of rebates paid to the borrowers and earnings on cash collateral investments shared with the lending agent. Within this arrangement, the Funds act as the lender, U.S. Bank acts as the lending agent, and other approved registered broker dealers act as the borrowers. The Funds receive cash collateral, valued at 102% of the value of the securities on loan. Under the terms of the Funds’ securities lending agreement with U.S. Bank, cash collateral and proceeds are invested in the First American Government Obligations Fund — Class X. The Funds bear the risk of loss on cash collateral investments. Collateral is maintained over the life of the loan in an amount not less
| | THE GUGGENHEIM FUNDS ANNUAL REPORT | 87 |
NOTES TO CONSOLIDATED FINANCIAL STATEMENTS (continued) |
than the value of loaned securities, as determined at the close of fund business each day; any additional collateral required due to changes in security values is delivered to the Funds the next business day. Although the collateral mitigates the risk, the Funds could experience a delay in recovering their securities and a possible loss of income or value if the borrower fails to return the securities. The Funds have the right under the securities lending agreement to recover the securities from the borrower on demand. Securities lending transactions are accounted for as secured borrowings. The remaining contractual maturity of the securities lending agreement is overnight and continuous.
At December 31, 2022, the Funds participated in securities lending transactions, which are subject to enforceable netting arrangements, as follows:
| | | Gross Amounts Not Offset in the Consolidated
Statements of Assets and Liabilities | | | | Securities Lending Collateral | |
Fund | | Value of
Securities
Loaned | | | Collateral
Received(a) | | | Net Amount | | | | Cash
Collateral
Invested | | | Cash
Collateral
Uninvested | | | Total
Collateral | |
Multi-Hedge Strategies Fund | | $ | 24,587 | | | $ | (24,587 | ) | | $ | — | | | | $ | 25,951 | | | $ | — | | | $ | 25,951 | |
(a) | Actual collateral received by the Fund is generally greater than the amount shown due to overcollateralization. |
In the event of counterparty default, the Funds have the right to collect the collateral to offset losses incurred. There is potential loss to the Funds in the event the Funds are delayed or prevented from exercising their rights to dispose of the collateral securities, including the risk of a possible decline in the value of the underlying securities during the period while the Funds seek to assert their rights. GI, acting under the supervision of the Board, reviews the value of the collateral and the creditworthiness of those banks and dealers to evaluate potential risks.
Note 8 – Federal Income Tax Information
The Funds intend to comply with the provisions of Subchapter M of the Internal Revenue Code of 1986, as amended (the “Internal Revenue Code”), applicable to regulated investment companies and will distribute substantially all taxable net investment income and capital gains sufficient to relieve the Funds from all, or substantially all, federal income, excise and state income taxes. Therefore, no provision for federal or state income tax or federal excise tax is required.
Tax positions taken or expected to be taken in the course of preparing the Funds’ tax returns are evaluated to determine whether the tax positions are “more-likely-than-not” of being sustained by the applicable tax authority. Tax positions not deemed to meet the more-likely-than-not threshold would be recorded as a tax benefit or expense in the current year. Management has analyzed the Funds’ tax positions taken, or to be taken, on U.S. federal income tax returns for all open tax
88 | THE GUGGENHEIM FUNDS ANNUAL REPORT | |
NOTES TO CONSOLIDATED FINANCIAL STATEMENTS (continued) |
years, and has concluded that no provision for income tax is required in the Funds’ consolidated financial statements. The Funds’ U.S. federal income tax returns are subject to examination by the Internal Revenue Service (“IRS”) for a period of three years after they are filed.
The Funds intend to invest up to 25% of their assets in the respective Subsidiary, which is expected to provide the Funds with exposure to the commodities markets within the limitations of the U.S. federal income tax requirements under Subchapter M of the Internal Revenue Code. The Funds have received a private letter ruling from the IRS that concludes that the income the Funds receive from the Subsidiary will constitute qualifying income for purposes of Subchapter M of the Internal Revenue Code. The Subsidiary will be classified as a corporation for U.S. federal income tax purposes. A foreign corporation, such as the Subsidiary, will generally not be subject to U.S. federal income taxation unless it is deemed to be engaged in a U.S. trade or business. If, during a taxable year, the Subsidiary’s taxable losses (and other deductible items) exceed its income and gains, the net loss will not pass through to the Fund as a deductible amount for U.S. federal income tax purposes and cannot be carried forward to reduce future income from the Subsidiary in subsequent years.
The tax character of distributions paid during the year ended December 31, 2022 was as follows:
Fund | | Ordinary
Income | | | Long-Term
Capital Gain | | | Total
Distributions | |
Multi-Hedge Strategies Fund | | $ | 2,245,303 | | | $ | — | | | $ | 2,245,303 | |
Commodities Strategy Fund | | | 1,525,593 | | | | — | | | | 1,525,593 | |
The tax character of distributions paid during the year ended December 31, 2021 was as follows:
Fund | | Ordinary
Income | | | Long-Term
Capital Gain | | | Total
Distributions | |
Multi-Hedge Strategies Fund | | $ | 633,561 | | | $ | — | | | $ | 633,561 | |
Commodities Strategy Fund | | | 631,798 | | | | — | | | | 631,798 | |
Note: For U.S. federal income tax purposes, short-term capital gain distributions are treated as ordinary income distributions.
| | THE GUGGENHEIM FUNDS ANNUAL REPORT | 89 |
NOTES TO CONSOLIDATED FINANCIAL STATEMENTS (continued) |
The tax components of distributable earnings/(loss) as of December 31, 2022 were as follows:
Fund | | Undistributed
Ordinary
Income | | | Undistributed
Long-Term
Capital Gain | | | Net Unrealized
Appreciation
(Depreciation) | | | Accumulated
Capital and
Other Losses | | | Other
Temporary
Differences | | | Total | |
Multi-Hedge Strategies Fund | | $ | 181,650 | | | $ | — | | | $ | (474,872 | ) | | $ | (7,809,925 | ) | | $ | — | | | $ | (8,103,147 | ) |
Commodities Strategy Fund | | | 352,828 | | | | — | | | | (11,008,321 | ) | | | (62,359 | ) | | | — | | | | (10,717,852 | ) |
| | | | | | | | | | | | | | | | | | | | | | | | | |
For U.S. federal income tax purposes, capital loss carryforwards represent realized losses of the Funds that may be carried forward and applied against future capital gains. The Funds are permitted to carry forward capital losses for an unlimited period and such capital loss carryforwards retain their character as either short-term or long-term capital losses. As of December 31, 2022, capital loss carryforwards for the Funds were as follows:
| | | Unlimited | | | | | |
Fund | | Short-Term | | | Long-Term | | | Total
Capital Loss
Carryforward | |
Multi-Hedge Strategies Fund | | $ | (7,570,568 | ) | | $ | — | | | $ | (7,570,568 | ) |
Commodities Strategy Fund | | | (46,153 | ) | | | (16,206 | ) | | | (62,359 | ) |
| | | | | | | | | | | | | |
Net investment income and net realized gains (losses) may differ for financial statement and tax purposes because of temporary or permanent book/tax differences. These differences are primarily due to investments in subsidiaries, the “mark-to-market” of certain derivatives, investments in securities sold short, straddle loss deferrals, foreign currency gains and losses, losses deferred due to wash sales, and distributions in connection with redemption of fund shares. To the extent these differences are permanent and would require a reclassification between Paid in Capital and Total Distributable Earnings (Loss), such reclassifications are made in the period that the differences arise. These reclassifications have no effect on net assets or NAV per share.
90 | THE GUGGENHEIM FUNDS ANNUAL REPORT | |
NOTES TO CONSOLIDATED FINANCIAL STATEMENTS (continued) |
The following adjustments were made on the Funds’ Consolidated Statements of Assets and Liabilities as of December 31, 2022 for permanent book/tax differences:
Fund | | Paid In
Capital | | | Total
Distributable
Earnings/(Loss) | |
Multi-Hedge Strategies Fund | | $ | (1,609,882 | ) | | $ | 1,609,882 | |
Commodities Strategy Fund | | | 10,998,004 | | | | (10,998,004 | ) |
At December 31, 2022, the cost of investments for U.S. federal income tax purposes, the aggregate gross unrealized appreciation for all investments for which there was an excess of value over tax cost and the aggregate gross unrealized depreciation for all investments for which there was an excess of tax cost over value, were as follows:
Fund | | Tax
Cost | | | Tax
Unrealized
Appreciation | | | Tax
Unrealized
Depreciation | | | Net Tax
Unrealized
Appreciation/
(Depreciation) | |
Multi-Hedge Strategies Fund | | $ | 111,088,865 | | | $ | 6,407,659 | | | $ | (6,879,757 | ) | | $ | (472,098 | ) |
Commodities Strategy Fund | | | 20,151,037 | | | | 502,336 | | | | (11,510,657 | ) | | | (11,008,321 | ) |
Note 9 – Securities Transactions
For the year ended December 31, 2022, the cost of purchases and proceeds from sales of investment securities, excluding government securities, short-term investments and derivatives, were as follows:
Fund | | Purchases | | | Sales | |
Multi-Hedge Strategies Fund | | $ | 164,962,660 | | | $ | 143,852,415 | |
Commodities Strategy Fund | | | — | | | | — | |
The Funds are permitted to purchase or sell securities from or to certain affiliated funds under specified conditions outlined in procedures adopted by the Board. The procedures have been designed to ensure that any purchase or sale of securities by a Fund from or to another fund or portfolio that is or could be considered an affiliate by virtue of having a common investment adviser (or affiliated investment advisers), common trustees and/or common officers complies with Rule 17a-7 of the 1940 Act. Further, as defined under these procedures, each transaction is effected at the current market price to save costs, where permissible. For the year ended December 31, 2022, the Funds did not engage in purchases and sales of securities, pursuant to Rule 17a-7 of the 1940 Act.
| | THE GUGGENHEIM FUNDS ANNUAL REPORT | 91 |
NOTES TO CONSOLIDATED FINANCIAL STATEMENTS (concluded) |
Note 10 – Line of Credit
The Trust, along with other affiliated trusts, secured an uncommitted $150,000,000 line of credit from U.S. Bank, N.A., which was increased to $200,000,000 on February 10, 2021. On June 6, 2022, the line of credit agreement was renewed and expires on June 5, 2023. This line of credit is reserved for emergency or temporary purposes. Borrowings, if any, under this arrangement bear interest equal to the Prime Rate, minus 2%, which shall be paid monthly, averaging 2.82% for the year ended December 31, 2022. The Funds did not have any borrowings outstanding under this agreement at December 31, 2022.
The average daily balances borrowed for the year ended December 31, 2022, were as follows:
Fund | | Average Daily Balance | |
Commodities Strategy Fund | | $ | 5,532 | |
Note 11 – Market Risks
The value of, or income generated by, the investments held by the Funds are subject to the possibility of rapid and unpredictable fluctuation, and loss that may result from various factors. These factors include, among others, developments affecting individual companies, or from broader influences, including real or perceived changes in prevailing interest rates (which have since risen and may continue to rise), changes in inflation rates or expectations about inflation rates (which are currently elevated relative to normal conditions), adverse investor confidence or sentiment, changing economic, political (including geopolitical), social or financial market conditions, increased instability or general uncertainty, environmental disasters, governmental actions, public health emergencies (such as the spread of infectious diseases, pandemics and epidemics), debt crises, actual or threatened wars or other armed conflicts (such as the current Russia-Ukraine conflict and its risk of expansion or collateral economic and other effects) or ratings downgrades, and other similar events, each of which may be temporary or last for extended periods. Moreover, changing economic, political, geopolitical, social, financial market or other conditions in one country or geographic region could adversely affect the value, yield and return of the investments held by the Funds in a different country or geographic region, economy, and market because of the increasingly interconnected global economies and financial markets. The duration and extent of the foregoing types of factors or conditions are highly uncertain and difficult to predict and have in the past, and may in the future, cause volatility and distress in economies and financial markets or other adverse circumstances, which may negatively affect the value of the Funds’ investments and performance of the Funds.
Note 12 – Subsequent Events
The Funds evaluated subsequent events through the date the consolidated financial statements were available for issue and determined there were no material events that would require adjustment to or disclosure in the Funds’ consolidated financial statements.
92 | THE GUGGENHEIM FUNDS ANNUAL REPORT | |
REPORT OF INDEPENDENT REGISTERED PUBLIC ACCOUNTING FIRM |
To the Shareholders of Guggenheim Multi-Hedge Strategies Fund and Rydex Commodities Strategy Fund and the Board of Trustees of Rydex Series Funds
Opinion on the Financial Statements
We have audited the accompanying consolidated statements of assets and liabilities of Guggenheim Multi-Hedge Strategies Fund and Rydex Commodities Strategy Fund (collectively referred to as the “Funds”), (two of the funds constituting Rydex Series Funds (the “Trust”)), including the consolidated schedules of investments, as of December 31, 2022, and the related consolidated statements of operations for the year then ended, the consolidated statements of changes in net assets for each of the two years in the period then ended, the consolidated financial highlights for each of the five years in the period then ended and the related notes (collectively referred to as the “financial statements”). In our opinion, the financial statements present fairly, in all material respects, the consolidated financial position of each of the Funds (two of the funds constituting Rydex Series Funds) at December 31, 2022, the consolidated results of their operations for the year then ended, the consolidated changes in their net assets for each of the two years in the period then ended and their consolidated financial highlights for each of the five years in the period then ended, in conformity with U.S. generally accepted accounting principles.
Basis for Opinion
These financial statements are the responsibility of the Trust’s management. Our responsibility is to express an opinion on each of the Funds’ financial statements based on our audits. We are a public accounting firm registered with the Public Company Accounting Oversight Board (United States) (“PCAOB”) and are required to be independent with respect to the Trust in accordance with the U.S. federal securities laws and the applicable rules and regulations of the Securities and Exchange Commission and the PCAOB.
We conducted our audits in accordance with the standards of the PCAOB. Those standards require that we plan and perform the audit to obtain reasonable assurance about whether the financial statements are free of material misstatement, whether due to error or fraud. The Trust is not required to have, nor were we engaged to perform, an audit of the Trust’s internal control over financial reporting. As part of our audits, we are required to obtain an understanding of internal control over financial reporting but not for the purpose of expressing an opinion on the effectiveness of the Trust’s internal control over financial reporting. Accordingly, we express no such opinion.
Our audits included performing procedures to assess the risks of material misstatement of the financial statements, whether due to error or fraud, and performing procedures that respond to those risks. Such procedures included examining, on a test basis, evidence regarding the amounts and disclosures in the financial statements. Our procedures included confirmation of securities owned as of December 31, 2022, by correspondence with the custodian, transfer agent, and brokers; when replies were not received from brokers, we performed other auditing procedures.
| | THE GUGGENHEIM FUNDS ANNUAL REPORT | 93 |
REPORT OF INDEPENDENT REGISTERED PUBLIC ACCOUNTING FIRM (concluded) |
Our audits also included evaluating the accounting principles used and significant estimates made by management, as well as evaluating the overall presentation of the financial statements. We believe that our audits provide a reasonable basis for our opinion.

We have served as the auditor of one or more Guggenheim investment companies since 1979.
Tysons, Virginia
February 24, 2023
94 | THE GUGGENHEIM FUNDS ANNUAL REPORT | |
Federal Income Tax Information
This information is being provided as required by the Internal Revenue Code. Amounts shown may differ from those elsewhere in the report because of differences in tax and financial reporting practice.
In January 2023, shareholders will be advised on IRS Form 1099 DIV or substitute 1099 DIV as to the federal tax status of the distributions received by shareholders in the calendar year 2022.
The Funds’ investment income (dividend income plus short-term capital gains, if any) qualifies as follows:
Of the taxable ordinary income distributions paid during the fiscal year ended December 31, 2022, the following funds had the corresponding percentages qualify for the reduced tax rate pursuant to the Jobs and Growth Tax Relief and Reconciliation Act of 2003 or for the dividends received deduction for corporations. See the qualified dividend income and dividend received deduction columns, respectively, in the table below.
Fund | | Qualified
Dividend
Income | | | Dividend
Received
Deduction | |
Multi-Hedge Strategies Fund | | | 0.00 | % | | | 0.00 | % |
Commodities Strategy Fund | | | 0.00 | % | | | 0.00 | % |
Delivery of Shareholder Reports
Paper copies of the Funds’ annual and semi-annual shareholder reports are not sent by mail, unless you specifically request paper copies of the reports from a Fund or from your financial intermediary. Instead, the reports are made available on a website, and you are notified by mail each time a report is posted and provided with a website link to access the report.
You may elect to receive all future shareholder reports in paper free of charge. If you hold shares of a Fund directly, you can inform the Fund that you wish to receive paper copies of reports by calling 800.820.0888. If you hold shares of a Fund through a financial intermediary, please contact the financial intermediary to make this election. Your election to receive reports in paper may apply to all Guggenheim Funds in which you are invested and may apply to all Guggenheim funds held with your financial intermediary.
Proxy Voting Information
A description of the policies and procedures that the Trust uses to determine how to vote proxies relating to securities held in the Funds’ portfolio is available, without charge and upon request, by calling 800.820.0888. This information is also available from the EDGAR database on the SEC’s website at https://www.sec.gov.
| | THE GUGGENHEIM FUNDS ANNUAL REPORT | 95 |
OTHER INFORMATION (Unaudited) (concluded) |
Information regarding how the Funds voted proxies relating to portfolio securities during the most recent 12-month period ended June 30 is available without charge, upon request, by calling 800.820.0888. This information is also available from the EDGAR database on the SEC’s website at https://www.sec.gov.
Sector Classification
Information in the Schedule of Investments is categorized by sectors using sector-level Classifications defined by the Bloomberg Industry Classification System, a widely recognized industry classification system provider. Each Fund’s registration statement has investment policies relating to concentration in specific sectors/industries. For purposes of these investment policies, the Funds usually classify sectors/industries based on industry-level Classifications used by widely recognized industry classification system providers such as Bloomberg Industry Classification System, Global Industry Classification Standards and Barclays Global Classification Scheme.
Quarterly Portfolio Schedules Information
The Trust files its complete schedule of portfolio holdings with the SEC for the first and third quarters of each fiscal year as an exhibit to its reports on Form N-PORT, and for reporting periods ended prior to March 31, 2019, filed such information on Form N-Q. The Funds’ Forms N-PORT and N-Q are available on the SEC’s website at https://www.sec.gov. Copies of the portfolio holdings are also available to shareholders, without charge and upon request, by calling 800.820.0888.
96 | THE GUGGENHEIM FUNDS ANNUAL REPORT | |
INFORMATION ON BOARD OF TRUSTEES AND OFFICERS (Unaudited) |
A Board of Trustees oversees the Trust, as well as other trusts of GI, in which its members have no stated term of service, and continue to serve after election until resignation. The Funds’ Statement of Additional Information includes further information about Fund Trustees and Officers, and can be obtained without charge by visiting guggenheiminvestments.com or by calling 800.820.0888.
Name, Address*
and Year of Birth | Position(s)
Held with
Trust | Term of Office
and Length of
Time Served** | Principal Occupation(s)
During Past Five Years | Number of
Portfolios
in Fund
Complex
Overseen | Other
Directorships Held
by Trustees*** |
INDEPENDENT TRUSTEES | | | |
Randall C. Barnes (1951) | Trustee and Chair of the Valuation Oversight Committee | Since 2019 (Trustee) Since 2020 (Chair of the Valuation Oversight Committee) | Current: Private Investor (2001-present).
Former: Senior Vice President and Treasurer, PepsiCo, Inc. (1993-1997); President, Pizza Hut International (1991-1993); Senior Vice President, Strategic Planning and New Business Development, PepsiCo, Inc. (1987-1990). | 155 | Current: Advent Convertible and Income Fund (2005-present); Purpose Investments Funds (2013-present).
Former: Fiduciary/Claymore Energy Infrastructure Fund (2004-2022); Guggenheim Enhanced Equity Income Fund (2005-2021); Guggenheim Credit Allocation Fund (2013-2021). |
Angela Brock-Kyle (1959) | Trustee | Since 2016 | Current: Founder and Chief Executive Officer, B.O.A.R.D.S. (2013-present); Director, Mutual Fund Directors Forum (2022-present).
Former: Senior Leader, TIAA (1987-2012). | 154 | Current: Bowhead Insurance GP, LLC (2020-present); Hunt Companies, Inc. (2019-present).
Former: Fiduciary/Claymore Energy Infrastructure Fund (2019-2022); Guggenheim Enhanced Equity Income Fund (2019-2021); Guggenheim Credit Allocation Fund (2019-2021); Infinity Property & Casualty Corp. (2014-2018). |
| | THE GUGGENHEIM FUNDS ANNUAL REPORT | 97 |
INFORMATION ON BOARD OF TRUSTEES AND OFFICERS (Unaudited)(continued) |
Name, Address*
and Year of Birth | Position(s)
Held with
Trust | Term of Office
and Length of
Time Served** | Principal Occupation(s)
During Past Five Years | Number of
Portfolios
in Fund
Complex
Overseen | Other
Directorships Held
by Trustees*** |
INDEPENDENT TRUSTEES - continued | | |
Thomas F. Lydon, Jr. (1960) | Trustee and Chair of the Contracts Review Committee | Since 2005 (Trustee) Since 2020 (Chair of the Contracts Review Committee) | Current: President, Global Trends Investments (1996-present); Chief Executive Officer, ETF Flows, LLC (2019-present); Chief Executive Officer, Lydon Media (2016-present); Director, GDX Index Partners, LLC (2021-present); Vice Chairman, VettaFi (2022-present). | 154 | Current: US Global Investors, Inc. (GROW) (1995-present).
Former: Fiduciary/Claymore Energy Infrastructure Fund (2019-2022); Guggenheim Enhanced Equity Income Fund (2019-2021); Guggenheim Credit Allocation Fund (2019-2021); Harvest Volatility Edge Trust (3) (2017-2019). |
Ronald A. Nyberg (1953) | Trustee and Chair of the Nominating and Governance Committee | Since 2019 | Current: Of Counsel, Momkus LLP (2016-present).
Former: Partner, Nyberg & Cassioppi, LLC (2000-2016); Executive Vice President, General Counsel, and Corporate Secretary, Van Kampen Investments (1982-1999). | 155 | Current: Advent Convertible and Income Fund (2003-present); PPM Funds (2) (2018-present); NorthShore-Edward-Elmhurst Health (2012-present).
Former: Fiduciary/Claymore Energy Infrastructure Fund (2004-2022); Guggenheim Enhanced Equity Income Fund (2005-2021); Guggenheim Credit Allocation Fund (2013-2021); Western Asset Inflation-Linked Opportunities & Income Fund (2004-2020); Western Asset Inflation-Linked Income Fund (2003-2020). |
98 | THE GUGGENHEIM FUNDS ANNUAL REPORT | |
INFORMATION ON BOARD OF TRUSTEES AND OFFICERS (Unaudited)(continued) |
Name, Address*
and Year of Birth | Position(s)
Held with
Trust | Term of Office
and Length of
Time Served** | Principal Occupation(s)
During Past Five Years | Number of
Portfolios
in Fund
Complex
Overseen | Other
Directorships Held
by Trustees*** |
INDEPENDENT TRUSTEES - continued | | |
Sandra G. Sponem (1958) | Trustee and Chair of the Audit Committee | Since 2016 (Trustee) Since 2019 (Chair of the Audit Committee) | Current: Retired.
Former: Senior Vice President and Chief Financial Officer, M.A. Mortenson-Companies, Inc. (2007-2017). | 154 | Current: SPDR Series Trust (81) (2018-present); SPDR Index Shares Funds (30) (2018-present); SSGA Active Trust (14) (2018-present). Former: Fiduciary/Claymore Energy Infrastructure Fund (2019-2022); Guggenheim Enhanced Equity Income Fund (2019-2021); Guggenheim Credit Allocation Fund (2019-2021); SSGA Master Trust (1) (2018-2020). |
| | THE GUGGENHEIM FUNDS ANNUAL REPORT | 99 |
INFORMATION ON BOARD OF TRUSTEES AND OFFICERS (Unaudited)(continued) |
Name, Address*
and Year of Birth | Position(s)
Held with
Trust | Term of Office
and Length of
Time Served** | Principal Occupation(s)
During Past Five Years | Number of
Portfolios
in Fund
Complex
Overseen | Other
Directorships Held
by Trustees*** |
INDEPENDENT TRUSTEES - concluded | | |
Ronald E. Toupin, Jr. (1958) | Trustee, Chair of the Board and Chair of the Executive Committee | Since 2019 | Current: Portfolio Consultant (2010-present); Member, Governing Council, Independent Directors Council (2013-present); Governor, Board of Governors, Investment Company Institute (2018-present).
Former: Member, Executive Committee, Independent Directors Council (2016-2018); Vice President, Manager and Portfolio Manager, Nuveen Asset Management (1998-1999); Vice President, Nuveen Investment Advisory Corp. (1992-1999); Vice President and Manager, Nuveen Unit Investment Trusts (1991-1999); and Assistant Vice President and Portfolio Manager, Nuveen Unit Investment Trusts (1988-1999), each of John Nuveen & Co., Inc. (1982-1999). | 154 | Former: Fiduciary/Claymore Energy Infrastructure Fund (2004-2022); Guggenheim Enhanced Equity Income Fund (2005-2021); Guggenheim Credit Allocation Fund (2013-2021); Western Asset Inflation-Linked Opportunities & Income Fund (2004-2020); Western Asset Inflation-Linked Income Fund (2003-2020). |
100 | THE GUGGENHEIM FUNDS ANNUAL REPORT | |
INFORMATION ON BOARD OF TRUSTEES AND OFFICERS (Unaudited)(continued) |
Name, Address*
and Year of Birth | Position(s)
Held with
Trust | Term of Office
and Length of
Time Served** | Principal Occupation(s)
During Past Five Years | Number of
Portfolios
in Fund
Complex
Overseen | Other
Directorships Held
by Trustees*** |
INTERESTED TRUSTEE | |
Amy J. Lee**** (1961) | Trustee, Vice President and Chief Legal Officer | Since 2019 | Current: Interested Trustee, certain other funds in the Fund Complex (2018-present); Chief Legal Officer, certain other funds in the Fund Complex (2014-present); Vice President, certain other funds in the Fund Complex (2007-present); Senior Managing Director, Guggenheim Investments (2012-present).
Former: President and Chief Executive Officer, certain other funds in the Fund Complex (2017-2019); Vice President, Associate General Counsel and Assistant Secretary, Security Benefit Life Insurance Company and Security Benefit Corporation (2004-2012). | 154 | Former: Fiduciary/Claymore Energy Infrastructure Fund (2018-2022); Guggenheim Enhanced Equity Income Fund (2018-2021); Guggenheim Credit Allocation Fund (2018-2021). |
* | The business address of each Trustee is c/o Guggenheim Investments, 227 West Monroe Street, Chicago, Illinois 60606. |
** | Each Trustee serves an indefinite term, until his or her successor is elected and qualified. |
*** | Each Trustee also serves on the Boards of Trustees of Guggenheim Funds Trust, Guggenheim Variable Funds Trust, Guggenheim Strategy Funds Trust, Guggenheim Taxable Municipal Bond & Investment Grade Debt Trust, Guggenheim Strategic Opportunities Fund, Guggenheim Energy & Income Fund, Guggenheim Active Allocation Fund, Rydex Series Funds, Rydex Dynamic Funds, Rydex Variable Trust and Transparent Value Trust. Messrs. Barnes and Nyberg also serve on the Board of Trustees of Advent Convertible & Income Fund. |
**** | This Trustee is deemed to be an “interested person” of the Funds under the 1940 Act by reason of her position with the Adviser and/or the parent of the Adviser. |
| | THE GUGGENHEIM FUNDS ANNUAL REPORT | 101 |
INFORMATION ON BOARD OF TRUSTEES AND OFFICERS (Unaudited)(continued) |
Name, Address*
and Year of Birth | Position(s)
Held with
Trust | Term of Office
and Length of
Time Served** | Principal Occupation(s)
During Past Five Years |
OFFICERS | | | |
Brian E. Binder (1972) | President and Chief Executive Officer | Since 2019 | Current: President, Mutual Fund Boards, Guggenheim Investments (2022-present);President and Chief Executive Officer, certain other funds in the Fund Complex (2018-present); President, Chief Executive Officer and Chairman of the Board of Managers, Guggenheim Funds Investment Advisors, LLC (2018-present); President and Chief Executive Officer, Security Investors, LLC (2018-present); Board Member, Guggenheim Partners Investment Funds plc (2022-present); Board Member, Guggenheim Global Investments plc (2022-present); Board Member, Guggenheim Partners Fund Management (Europe) Limited (2018-present).
Former: Senior Managing Director and Chief Administrative Officer, Guggenheim Investments (2018-2022); Managing Director and President, Deutsche Funds, and Head of US Product, Trading and Fund Administration, Deutsche Asset Management (2013-2018); Managing Director, Chairman of North American Executive Committee and Head of Business Management and Consulting, Invesco Ltd. (2010-2012). |
James M. Howley (1972) | Chief Financial Officer, Chief Accounting Officer and Treasurer | Since 2022 | Current: Managing Director, Guggenheim Investments (2004-present); Chief Financial Officer, Chief Accounting Officer, and Treasurer, certain other funds in the Fund Complex (2022-present).
Former: Assistant Treasurer, certain other funds in the Fund Complex (2006-2022); Manager, Mutual Fund Administration of Van Kampen Investments, Inc. (1996-2004). |
Mark E. Mathiasen (1978) | Secretary | Since 2017 | Current: Secretary, certain other funds in the Fund Complex (2007-present); Managing Director, Guggenheim Investments (2007-present). |
Glenn McWhinnie (1969) | Assistant Treasurer | Since 2016 | Current: Vice President, Guggenheim Investments (2009-present); Assistant Treasurer, certain other funds in the Fund Complex (2016-present). |
Michael P. Megaris (1984) | Assistant
Secretary | Since 2018 | Current: Assistant Secretary, certain other funds in the Fund Complex (2014-present); Managing Director, Guggenheim Investments (2012-present). |
102 | THE GUGGENHEIM FUNDS ANNUAL REPORT | |
INFORMATION ON BOARD OF TRUSTEES AND OFFICERS (Unaudited)(continued) |
Name, Address*
and Year of Birth | Position(s)
Held with
Trust | Term of Office
and Length of
Time Served** | Principal Occupation(s)
During Past Five Years |
OFFICERS - continued | |
Elisabeth Miller (1968) | Chief Compliance Officer | Since 2012 | Current: Chief Compliance Officer, certain other funds in the Fund Complex (2012-present); Senior Managing Director, Guggenheim Investments (2012-present); Vice President, Guggenheim Funds Distributors, LLC (2014-present).
Former: Chief Compliance Officer, Security Investors, LLC and Guggenheim Funds Investment Advisors, LLC (2012-2018); Chief Compliance Officer, Guggenheim Distributors, LLC (2009-2014); Senior Manager, Security Investors, LLC (2004-2014); Senior Manager, Guggenheim Distributors, LLC (2004-2014). |
Margaux Misantone (1978) | AML Officer | Since 2017 | Current: Chief Compliance Officer, Security Investors, LLC and Guggenheim Funds Investment Advisors, LLC (2018-present); AML Officer, Security Investors, LLC and certain other funds in the Fund Complex (2017-present); Managing Director, Guggenheim Investments (2015-present).
Former: Assistant Chief Compliance Officer, Security Investors, LLC and Guggenheim Funds Investments Advisors, LLC (2015-2018). |
Kimberly J. Scott (1974) | Assistant Treasurer | Since 2016 | Current: Director, Guggenheim Investments (2012-present); Assistant Treasurer, certain other funds in the Fund Complex (2012-present).
Former: Financial Reporting Manager, Invesco, Ltd. (2010-2011); Vice President/Assistant Treasurer, Mutual Fund Administration for Van Kampen Investments, Inc./Morgan Stanley Investment Management (2009-2010); Manager of Mutual Fund Administration, Van Kampen Investments, Inc./Morgan Stanley Investment Management (2005-2009).
|
Bryan Stone (1979) | Vice President | Since 2019 | Current: Vice President, certain other funds in the Fund Complex (2014-present); Managing Director, Guggenheim Investments (2013-present).
Former: Senior Vice President, Neuberger Berman Group LLC (2009-2013); Vice President, Morgan Stanley (2002-2009).
|
| | THE GUGGENHEIM FUNDS ANNUAL REPORT | 103 |
INFORMATION ON BOARD OF TRUSTEES AND OFFICERS (Unaudited)(concluded) |
Name, Address*
and Year of Birth | Position(s)
Held with
Trust | Term of Office
and Length of
Time Served** | Principal Occupation(s)
During Past Five Years |
OFFICERS - concluded | |
Jon Szafran (1989) | Assistant Treasurer | Since 2017 | Current: Director, Guggenheim Investments (2017-present); Assistant Treasurer, certain other funds in the Fund Complex (2017-present).
Former: Assistant Treasurer of Henderson Global Funds and Manager of US Fund Administration, Henderson Global Investors (North America) Inc. (“HGINA”), (2017); Senior Analyst of US Fund Administration, HGINA (2014–2017); Senior Associate of Fund Administration, Cortland Capital Market Services, LLC (2013-2014); Experienced Associate, PricewaterhouseCoopers LLP (2012-2013). |
* | The business address of each officer is c/o Guggenheim Investments, 227 West Monroe Street, Chicago, Illinois 60606. |
** | Each officer serves an indefinite term, until his or her successor is duly elected and qualified. |
104 | THE GUGGENHEIM FUNDS ANNUAL REPORT | |
GUGGENHEIM INVESTMENTS PRIVACY NOTICE (Unaudited) |
Who We Are
This Privacy Notice describes the data protection practices of Guggenheim Investments. Guggenheim Investments as used herein refers to the affiliated investment management businesses of Guggenheim Partners, LLC: Guggenheim Funds Investment Advisors, LLC, Guggenheim Partners Investment Management, LLC, Guggenheim Funds Distributors, LLC, Security Investors, LLC, Guggenheim Investment Advisors (Europe) Limited, Guggenheim Real Estate, LLC, GS Gamma Advisors, LLC, Guggenheim Partners India Management, LLC, Guggenheim Partners Europe Limited, as well as the funds in the Guggenheim Funds complex (the “Funds”) (“Guggenheim Investments,” “we,” “us,” or “our”).
Guggenheim Partners Investment Management Holdings, LLC, located at 330 Madison Avenue, New York, New York 10017, is the data controller for your information. The affiliates who are also controllers of certain of your information are: Guggenheim Investment Advisors (Europe) Limited, Guggenheim Partners Europe Limited, Guggenheim Partners, LLC, Guggenheim Funds Investment Advisors, LLC, Guggenheim Partners Investment Management, LLC, Guggenheim Funds Distributors, LLC and Security Investors, LLC, as well as the Funds.
Our Commitment to You
Guggenheim Investments considers your privacy our utmost concern. When you become our client or investor, you entrust us with not only your hard-earned money but also with your personal and financial information. Because we have access to your private information, we hold ourselves to the highest standards in its safekeeping and use. We strictly limit how we share your information with others, whether you are a current or former Guggenheim Investments client or investor.
The Information We Collect About You
We collect certain nonpublic personal information about you from information you provide on applications, other forms, our website, and/or from third parties including investment advisors. This information includes Social Security or other tax identification number, assets, income, tax information, retirement and estate plan information, transaction history, account balance, payment history, bank account information, marital status, family relationships, information that we collect on our website through the use of “cookies,” and other personal information that you or others provide to us. We may also collect such information through your inquiries by mail, e-mail or telephone. We may also collect customer due diligence information, as required by applicable law and regulation, through third party service providers.
How We Handle Your Personal Information
The legal basis for using your information as set out in this Privacy Notice is as follows: (a) use of your personal data is necessary to perform our obligations under any contract with you (such as a contract for us to provide financial services to you); or (b) where use of your personal data is not necessary for performance of a contract, use of your personal data is necessary for our legitimate interests or the legitimate interests of others (for example, to enforce the legal terms
| | THE GUGGENHEIM FUNDS ANNUAL REPORT | 105 |
GUGGENHEIM INVESTMENTS PRIVACY NOTICE (Unaudited)(continued) |
governing our services, operate and market our website and other services we offer, ensure safe environments for our personnel and others, make and receive payments, prevent fraud and to know the customer to whom we are providing the services). Some processing is done to comply with applicable law.
In addition to the specific uses described above, we also use your information in the following manner:
| | ● | We use your information in connection with servicing your accounts. |
| | ● | We use information to respond to your requests or questions. For example, we might use your information to respond to your customer feedback. |
| | ● | We use information to improve our products and services. We may use your information to make our website and products better. We may use your information to customize your experience with us. |
| | ● | We use information for security purposes. We may use your information to protect our company and our customers. |
| | ● | We use information to communicate with you. For example, we will communicate with you about your account or our relationship. We may contact you about your feedback. We might also contact you about this Privacy Notice. We may also enroll you in our email newsletter. |
| | ● | We use information as otherwise permitted by law, as we may notify you. |
| | ● | Aggregate/Anonymous Data. We may aggregate and/or anonymize any information collected through the website so that such information can no longer be linked to you or your device (“Aggregate/Anonymous Information”). We may use Aggregate/Anonymous Information for any purpose, including without limitation for research and marketing purposes, and may also share such data with any third parties, including advertisers, promotional partners, and sponsors. |
We do not sell information about current or former clients or their accounts to third parties. Nor do we share this information, except when necessary to complete transactions at your request, to make you aware of investment products and services that we or our affiliates offer, or as permitted or required by law.
We provide information about you to companies and individuals not affiliated with Guggenheim Investments to complete certain transactions or account changes, or to perform services for us related to your account. For example, if you ask to transfer assets from another financial institution to Guggenheim Investments, we must provide certain information about you to that company to complete the transaction. We provide the third party with only the information necessary to carry out its responsibilities and only for that purpose. And we require these third parties to treat your private information with the same high degree of confidentiality that we do.
106 | THE GUGGENHEIM FUNDS ANNUAL REPORT | |
GUGGENHEIM INVESTMENTS PRIVACY NOTICE (Unaudited)(continued) |
To alert you to other Guggenheim Investments products and services, we share your information within our family of affiliated companies. You may limit our sharing with affiliated companies as set out below. We may also share information with any successor to all or part of our business, or in connection with steps leading up to a merger or acquisition. For example, if part of our business was sold we may give customer information as part of that transaction. We may also share information about you with your consent.
We will release information about you if you direct us to do so, if we are compelled by law to do so, or in other circumstances as permitted by law (for example, to protect your account from fraud).
If you close your account(s) or become an inactive client or investor, we will continue to adhere to the privacy policies and practices described in this notice.
Opt-Out Provisions and Your Data Choices
The law allows you to “opt out” of certain kinds of information sharing with third parties. We do not share personal information about you with any third parties that triggers this opt-out right. This means YOU ARE ALREADY OPTED OUT.
When you are no longer our client or investor, we continue to share your information as described in this notice, and you may contact us at any time to limit our sharing by sending an email to CorporateDataPrivacy@GuggenheimPartners.com.
European Union Data Subjects and certain others: In addition to the choices set forth above, residents of the European Union and certain other jurisdictions have certain rights to (1) request access to or rectification or deletion of information we collect about them, (2) request a restriction on the processing of their information, (3) object to the processing of their information, or (4) request the portability of certain information. To exercise these or other rights, please contact us using the contact information below. We will consider all requests and provide our response within the time period stated by applicable law. Please note, however, that certain information may be exempt from such requests in some circumstances, which may include if we need to keep processing your information for our legitimate interests or to comply with a legal obligation. We may request you provide us with information necessary to confirm your identity before responding to your request.
Residents of France and certain other jurisdictions may also provide us with instructions regarding the manner in which we may continue to store, erase and share your information after your death, and where applicable, the person you have designated to exercise these rights after your death.
How We Protect Privacy Online
We take steps to protect your privacy when you use our web site – www.guggenheiminvestments.com – by using secure forms of online communication, including encryption technology, Secure Socket Layer (SSL) protocol, firewalls and user names and
| | THE GUGGENHEIM FUNDS ANNUAL REPORT | 107 |
GUGGENHEIM INVESTMENTS PRIVACY NOTICE (Unaudited)(concluded) |
passwords. These safeguards vary based on the sensitivity of the information that we collect and store. However, we cannot and do not guarantee that these measures will prevent every unauthorized attempt to access, use, or disclose your information since despite our efforts, no Internet and/or other electronic transmissions can be completely secure. Our web site uses “http cookies”—tiny pieces of information that we ask your browser to store. We use cookies for session management and security features on the Guggenheim Investments web site. We do not use them to pull data from your hard drive, to learn your e-mail address, or to view data in cookies created by other web sites. We will not share the information in our cookies or give others access to it. See the legal information area on our web site for more details about web site security and privacy features.
How We Safeguard Your Personal Information and Data Retention
We restrict access to nonpublic personal information about you to our employees and in some cases to third parties (for example, the service providers described above) as permitted by law. We maintain strict physical, electronic and procedural safeguards that comply with federal standards to guard your nonpublic personal information.
We keep your information for no longer than necessary for the purposes for which it is processed. The length of time for which we retain information depends on the purposes for which we collected and use it and/or as required to comply with applicable laws. Information may persist in copies made for backup and business continuity purposes for additional time.
International Visitors
If you are not a resident of the United States, please be aware that your information may be transferred to, stored and processed in the United States where our servers are located and our databases are operated. The data protection and other laws of the United States and other countries might not be as comprehensive as those in your country.
In such cases, we ensure that a legal basis for such a transfer exists and that adequate protection is provided as required by applicable law, for example, by using standard contractual clauses or by transferring your data to a jurisdiction that has obtained an adequacy finding. Individuals whose data may be transferred on the basis of standard contractual clauses may contact us as described below.
We’ll Keep You Informed
If you have any questions or concerns about how we treat your personal data, we encourage you to consult with us first. You may also contact the relevant supervisory authority.
We reserve the right to modify this policy at any time and will inform you promptly of material changes. You may access our privacy policy from our web site at www.guggenheiminvestments.com. Should you have any questions regarding our privacy policy, contact us by email at CorporateDataPrivacy@GuggenheimPartners.com.
108 | THE GUGGENHEIM FUNDS ANNUAL REPORT | |
This page intentionally left blank.
This page intentionally left blank.
This page intentionally left blank.
This page intentionally left blank.
This page intentionally left blank.
12.31.2022
Guggenheim Funds Annual Report
Guggenheim Alternative Fund |
Guggenheim Managed Futures Strategy Fund | | |
GuggenheimInvestments.com | RMFSF-ANN-1222x1223 |

| | |
DEAR SHAREHOLDER | 2 |
ECONOMIC AND MARKET OVERVIEW | 4 |
ABOUT SHAREHOLDERS’ FUND EXPENSES | 6 |
MANAGED FUTURES STRATEGY FUND | 9 |
NOTES TO CONSOLIDATED FINANCIAL STATEMENTS | 28 |
REPORT OF INDEPENDENT REGISTERED PUBLIC ACCOUNTING FIRM | 44 |
OTHER INFORMATION | 46 |
INFORMATION ON BOARD OF TRUSTEES AND OFFICERS | 48 |
GUGGENHEIM INVESTMENTS PRIVACY NOTICE | 57 |
| | THE GUGGENHEIM FUNDS ANNUAL REPORT | 1 |
Dear Shareholder:
Security Investors, LLC (the “Investment Adviser”), is pleased to present the annual shareholder report for the Managed Futures Strategy Fund (the “Fund”) that is part of the Rydex Series Funds. This report covers performance of the Fund for the annual period ended December 31, 2022 (the “Reporting Period”).
In December 2022, Guggenheim Partners announced the untimely and unexpected death of Scott Minerd, one of Guggenheim’s Managing Partners and its Global Chief Investment Officer. He joined Guggenheim as a Managing Partner shortly after the firm was formed. He was a frequent commentator on markets and investments, both on television and via social media. He also was one of the designers of the organization, systems and processes that make Guggenheim Investments a strong, robust and scalable leader in the asset management business.
Guggenheim has implemented its succession plan, which is designed to deal with unexpected events. There has been and will continue to be no disruption of service to our clients, no change in the daily management of client portfolios and no change in the process of selecting investment assets, all of which continue to be handled by the longstanding committees and long-tenured investment professionals who, every day, implement our investment processes.
Guggenheim Investments continues to be led by its Co-Presidents, Dina DiLorenzo and David Rone, and by Anne B. Walsh, a Managing Partner and Chief Investment Officer of Guggenheim Partners Investment Management.
The Investment Adviser is a part of Guggenheim Investments, which represents the investment management businesses of Guggenheim Partners, LLC (“Guggenheim”), a global, diversified financial services firm.
Guggenheim Funds Distributors, LLC is the distributor of the Funds. Guggenheim Funds Distributors, LLC is affiliated with Guggenheim and the Investment Adviser.
We encourage you to read the Economic and Market Overview section of the report, which follows this letter, and then the Performance Report and Fund Profile for the Fund.
We are committed to providing innovative investment solutions and appreciate the trust you place in us.
Sincerely,
Security Investors, LLC
January 31, 2023
Read a prospectus and summary prospectus (if available) carefully before investing. It contains the investment objectives, risks, charges, expenses and other information, which should be considered carefully before investing. Obtain a prospectus and summary prospectus (if available) at guggenheiminvestments.com or call 800.820.0888.
2 | THE GUGGENHEIM FUNDS ANNUAL REPORT | |
This material is not intended as a recommendation or as investment advice of any kind, including in connection with rollovers, transfers, and distributions. Such material is not provided in a fiduciary capacity, may not be relied upon for or in connection with the making of investment decisions, and does not constitute a solicitation of an offer to buy or sell securities. All content has been provided for informational or educational purposes only and is not intended to be and should not be construed as legal or tax advice and/or a legal opinion. Always consult a financial, tax and/or legal professional regarding your specific situation.
The Managed Futures Strategy Fund may not be suitable for all investors. ● The Fund’s investments in securities and derivatives, in general, are subject to market risks that may cause their prices, and therefore the Fund’s value, to fluctuate over time. An investment in the Fund may lose money. ● The Fund’s investments in derivatives may pose risks in addition to those associated with investing directly in securities or other investments, including illiquidity of the derivatives, imperfect correlations with underlying investments or the Fund’s other portfolio holdings, lack of availability and counterparty risk. To the extent the Fund invests in derivatives to seek to hedge risk or limit leveraged exposure created by other investments, there is no guarantee that such hedging strategies will be effective at managing risk or limiting exposure to leveraged investments. ● The Fund’s use of leverage will exaggerate the effect on net asset value of any increase or decrease in the market value of the Fund’s portfolio. ●The Fund’s use of short selling involves increased risk and costs. The Fund risks paying more for a security than it received from its sale. Theoretically, securities sold short have the risk of unlimited losses. ● The Fund’s investments in fixed income securities will change in value in response to interest rate changes and other factors. In general, bond prices rise when interest rates fall and vice versa. ● The Fund‘s exposure to high yield, asset backed and mortgaged backed securities may subject the Fund to greater volatility. ● The Fund’s indirect and direct exposure to foreign currencies subjects the Fund to the risk that those currencies will decline in value relative to the U.S. dollar, or, in the case of short positions, that the U.S. dollar will decline in value relative to the currency being hedged. ● The Fund’s exposure to the commodity markets may subject the fund to greater volatility as commodity-linked investments may be affected by changes in overall market movements, commodity index volatility, changes in interest rates or factors affecting a particular industry or commodity such as droughts, floods, weather, embargos, tariffs and international economic, political and regulatory developments. ● The Fund may invest in securities of foreign companies directly, or indirectly through the use of other investment companies and financial instruments that are linked to the performance of foreign issuers. Foreign securities markets generally have less trading volume and less liquidity than U.S. markets, and prices in some foreign markets may fluctuate more than those of securities traded on U.S. markets. ● This Fund is considered nondiversified and can invest a greater portion of its assets in securities of individual issuers than a diversified fund. As a result, changes in the market value of a single security could cause greater fluctuations in the value of fund shares than would occur in a more diversified fund. ●See the prospectus for more information on these and other risks.
| | THE GUGGENHEIM FUNDS ANNUAL REPORT | 3 |
ECONOMIC AND MARKET OVERVIEW (Unaudited) | December 31, 2022 |
Helped by lower energy prices, real economic growth reaccelerated in the fourth quarter of 2022. Amid this continued strong growth, the Federal Reserve (the “Fed”) is explicitly targeting a weaker labor market, and several leading indicators point to rising unemployment by the middle of the year. Consumption also faces headwinds from dwindling excess savings buffers and a sharply negative wealth shock as financial asset and home prices fall. Business investment also appears to be weakening due to the sharp tightening in financial conditions and more challenging outlook for economic growth. The housing sector could subtract further from gross domestic product (“GDP”) as the spike in mortgage rates has adversely impacted demand.
Because private sector balance sheets are generally healthy in the aggregate and the economy lacks major imbalances, we do not expect a particularly deep recession. But the likelihood of a limited monetary and fiscal policy response means the economic recovery could be weak, and certain highly levered companies may suffer.
Moderation in goods prices as supply chains normalize should bring inflation lower over the next several months, and shelter inflation should roll over by mid-2023. Services inflation outside of shelter is the main concern for the Fed, but a softening labor market and cooling wage growth may keep this category contained. As a result, core inflation could fall below 3 percent by the end of the year.
The Fed’s continued rate hike campaign may cause the front end of the yield curve to remain elevated in the near term. But should the economic cycle roll over later this year, Treasury yields may see a significant decline. Weakening corporate earnings growth and an emerging recession would present downside risk to equity returns later in 2023 but, given corporate fundamentals remain solid, high quality fixed income and carefully selected high yield issuers should provide attractive returns.
For the Reporting Period, the S&P 500® Index* returned -18.11%. The MSCI Europe-Australasia-Far East (“EAFE”) Index* returned -14.45%. The return of the MSCI Emerging Markets Index* was -20.09%.
In the bond market, the Bloomberg U.S. Aggregate Bond Index* posted a -13.01% return for the Reporting Period, while the Bloomberg U.S. Corporate High Yield Index* returned -11.19%. The return of the ICE Bank of America (“BofA”) 3-Month U.S. Treasury Bill Index* was 1.47% for the Reporting Period.
The opinions and forecasts expressed may not actually come to pass. This information is subject to change at any time, based on market and other conditions, and should not be construed as a recommendation of any specific security or strategy.
4 | THE GUGGENHEIM FUNDS ANNUAL REPORT | |
ECONOMIC AND MARKET OVERVIEW (Unaudited)(concluded) | December 31, 2022 |
*Index Definitions:
The following indices are referenced throughout this report. Indices are unmanaged and not available for direct investment. Index performance does not reflect transaction costs, fees, or expenses.
Bloomberg U.S. Aggregate Bond Index is a broad-based flagship benchmark that measures the investment grade, U.S. dollar-denominated, fixed-rate taxable bond market, including U.S. Treasuries, government-related and corporate securities, mortgage-backed securities or “MBS” (agency fixed-rate and hybrid adjustable-rate mortgage, or “ARM”, pass-throughs), asset-backed securities (“ABS”), and commercial mortgage-backed securities (“CMBS”) (agency and non-agency).
Bloomberg U.S. Corporate High Yield Index measures the U.S. dollar-denominated, high yield, fixed-rate corporate bond market. Securities are classified as high yield if the middle rating of Moody’s, Fitch, and S&P is Ba1/BB +/BB + or below.
ICE BofA 3-Month U.S. Treasury Bill Index is an unmanaged market Index of U.S. Treasury securities maturing in 90 days that assumes reinvestment of all income.
MSCI EAFE Index is a free float-adjusted market capitalization index that is designed to measure the equity market performance of developed markets, excluding the U.S. & Canada.
MSCI Emerging Markets Index is a free float-adjusted market capitalization weighted index that is designed to measure equity market performance in the global emerging markets.
S&P 500® is a broad-based index, the performance of which is based on the performance of 500 widely held common stocks chosen for market size, liquidity, and industry group representation.
SG (Societe Generale) CTA Index is designed to track the largest 20 (by AUM) Commodity Trading Advisors, or CTAs, and be representative of the managed futures space. The CTA Index is equally weighted, and reblanced and reconstituted annually.
| | THE GUGGENHEIM FUNDS ANNUAL REPORT | 5 |
ABOUT SHAREHOLDERS’ FUND EXPENSES (Unaudited) |
All mutual funds have operating expenses, and it is important for our shareholders to understand the impact of costs on their investments. Shareholders of a fund incur two types of costs: (i) transaction costs, including sales charges (loads) on purchase payments, reinvested dividends, other distributions, and exchange fees, and (ii) ongoing costs, including management fees, administrative services, and shareholder reports, among others. These ongoing costs, or operating expenses, are deducted from a fund’s gross income and reduce the investment return of the fund.
A fund’s expenses are expressed as a percentage of its average net assets, which is known as the expense ratio. The following examples are intended to help investors understand the ongoing costs (in dollars) of investing in a fund and to compare these costs with the ongoing costs of investing in other mutual funds.
The examples are based on an investment of $1,000 made at the beginning of the period and held for the entire six-month period beginning June 30, 2022 and ending December 31, 2022.
The following tables illustrate the Fund’s costs in two ways:
Table 1. Based on actual Fund return: This section helps investors estimate the actual expenses paid over the period. The “Ending Account Value” shown is derived from the Fund’s actual return, and the fifth column shows the dollar amount that would have been paid by an investor who started with $1,000 in the Fund. Investors may use the information here, together with the amount invested, to estimate the expenses paid over the period. Simply divide the Fund’s account value by $1,000 (for example, an $8,600 account value divided by $1,000 = 8.6), then multiply the result by the number provided under the heading “Expenses Paid During Period.”
Table 2. Based on hypothetical 5% return: This section is intended to help investors compare a fund’s cost with those of other mutual funds. The table provides information about hypothetical account values and hypothetical expenses based on the Fund’s actual expense ratio and an assumed rate of return of 5% per year before expenses, which is not the Fund’s actual return. The hypothetical account values and expenses may not be used to estimate the actual ending account balance or expenses paid during the period. The example is useful in making comparisons because the U.S. Securities and Exchange Commission (the “SEC”) requires all mutual funds to calculate expenses based on the 5% return. Investors can assess a Fund’s costs by comparing this hypothetical example with the hypothetical examples that appear in shareholder reports of other funds.
The calculations illustrated above assume no shares were bought or sold during the period. Actual costs may have been higher or lower, depending on the amount of investment and the timing of any purchases or redemptions.
6 | THE GUGGENHEIM FUNDS ANNUAL REPORT | |
ABOUT SHAREHOLDERS’ FUND EXPENSES (Unaudited)(continued) |
Please note that the expenses shown in the table are meant to highlight your ongoing costs only and do not reflect any transactional costs, such as sales charges (loads) on purchase payments, and contingent deferred sales charges (“CDSC”) on redemptions, if any. Therefore, the second table is useful in comparing ongoing costs only, and will not help you determine the relative total costs of owning different funds. In addition, if these transactional costs were included, your costs would have been higher.
More information about the Fund’s expenses, including annual expense ratios for periods up to five years (subject to the Fund’s inception date), can be found in the Financial Highlights section of this report. For additional information on operating expenses and other shareholder costs, please refer to the Fund’s prospectus.
| | THE GUGGENHEIM FUNDS ANNUAL REPORT | 7 |
ABOUT SHAREHOLDERS’ FUND EXPENSES (Unaudited)(concluded) |
| Expense
Ratio1 | Fund
Return | Beginning
Account Value
June 30,
2022 | Ending
Account Value
December 31,
2022 | Expenses
Paid During
Period2 |
Table 1. Based on actual Fund return3 |
A-Class | 1.73% | (0.10%) | $ 1,000.00 | $ 999.00 | $ 8.72 |
C-Class | 2.48% | (0.46%) | 1,000.00 | 995.40 | 12.47 |
P-Class | 1.69% | (0.16%) | 1,000.00 | 998.40 | 8.51 |
Institutional Class | 1.45% | 0.04% | 1,000.00 | 1,000.40 | 7.31 |
|
Table 2. Based on hypothetical 5% return (before expenses) |
A-Class | 1.73% | 5.00% | $ 1,000.00 | $ 1,016.48 | $ 8.79 |
C-Class | 2.48% | 5.00% | 1,000.00 | 1,012.70 | 12.58 |
P-Class | 1.69% | 5.00% | 1,000.00 | 1,016.69 | 8.59 |
Institutional Class | 1.45% | 5.00% | 1,000.00 | 1,017.90 | 7.38 |
1 | Annualized and excludes expenses of the underlying funds in which the Fund invests, if any. |
2 | Expenses are equal to the Fund’s annualized expense ratio, net of any applicable fee waivers, multiplied by the average account value over the period, multiplied by 184/365 (to reflect the one-half year period). |
3 | Actual cumulative return at net asset value for the period June 30, 2022 to December 31, 2022. |
8 | THE GUGGENHEIM FUNDS ANNUAL REPORT | |
PERFORMANCE REPORT AND FUND PROFILE (Unaudited) | December 31, 2022 |
MANAGED FUTURES STRATEGY FUND
OBJECTIVE: Seeks to achieve absolute returns.
For the Reporting Period, Guggenheim Managed Futures Strategy Fund Institutional shares returned 15.03%, outperforming the ICE BofA 3-Month U.S. Treasury Bill Index, the Fund’s benchmark, which returned 1.47%. The Fund underperformed the SG (Societe Generale) CTA Index for the year, which returned 20.15%.
What factors contributed or detracted from the Fund’s performance during the Reporting Period?
For the Reporting Period, markets continued to be influenced by fallout from the Covid pandemic as well as the war in Ukraine. Worker shortages and supply chain disruptions due to Covid combined with reduced oil and grain production out of Ukraine and Russia to create inflationary pressures around the world. In turn, central banks responded by increasing interest rates, causing in a drop in both stock and bond prices. These events helped produce strong trends in all sectors which were profitably captured by the Fund’s various trend-following strategies.
With price momentum being the main story for 2022, commodities delivered strong returns in the first quarter and then detracted for the next three, with a net positive contribution on the year. Currencies delivered positive returns in the first three quarters, were negative in the fourth, and were also net positive on the year. Fixed income delivered steady positive returns in all four quarters and was the best-performing sector in the Fund for 2022. Although equity indexes generally trended downward in 2022, there were enough reversals throughout the year to confuse trend-following systems, resulting in equities being a net detractor overall.
The non-trend-following alpha strategies (which include a range of sector-specific carry, flow, value, and calendar effects models, among others) contributed positive returns in the first half of the year and detracted in the second half. For the year, they provided a net positive contribution.
How did the Fund use derivatives during the Reporting Period?
The Fund’s performance is primarily derived from the trading of liquid futures. Futures are used to express investment views and hedge exposures across a wide range of global markets, including commodities, currencies, fixed income, and stock indexes. Positions held may be long or short depending on the investment view and/or nature of the hedge. The use of futures also enables the ready use of leverage, which actively facilitates portfolio diversification and risk management.
Additionally, the Guggenheim Ultra Short Duration Fund and Guggenheim Strategy Funds were utilized within the Fund to obtain higher cash yields than what would otherwise be achieved through overnight repurchase agreements or short-term investments.
| | THE GUGGENHEIM FUNDS ANNUAL REPORT | 9 |
PERFORMANCE REPORT AND FUND PROFILE (Unaudited)(continued) | December 31, 2022 |
How was the Fund positioned at the end of the Reporting Period?
At the end of 2022, the Fund was net long equities, commodities, the U.S. dollar, and bond yields (short bond futures). The Fund’s gross leverage was approximately 380%, with 67% of its expected risk in fixed income, 25% of expected risk in commodities, 5% in foreign exchange, and 3% in equities. The Fund’s net leverage was approximately -180%.
Performance displayed represents past performance which is no guarantee of future results.
10 | THE GUGGENHEIM FUNDS ANNUAL REPORT | |
PERFORMANCE REPORT AND FUND PROFILE (Unaudited)(continued) | December 31, 2022 |
Consolidated Holdings Diversification (Market Exposure as % of Net Assets)
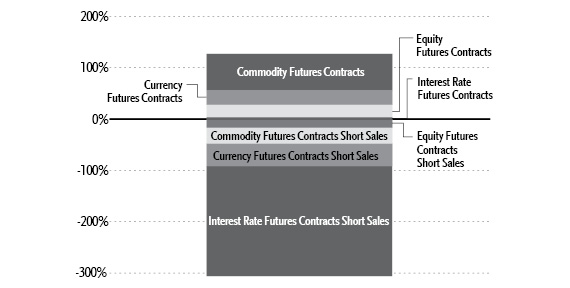
“Consolidated Holdings Diversification (Market Exposure as % of Net Assets)” excludes any temporary cash investments, investments in Guggenheim Strategy Funds Trust mutual funds, or investments in Guggenheim Ultra Short Duration Fund. Investments in those Funds do not provide “market exposure” to meet the Fund’s investment objective, but will significantly increase the portfolio’s exposure to certain other asset categories (and their associated risks), which may cause the Fund to deviate from its principal investment strategy, including: (i) high yield, high risk debt securities rated below the top four long-term rating categories by a nationally recognized statistical rating organization (also known as “junk bonds”); (ii) securities issued by the U.S. government or its agencies and instrumentalities; (iii) CLOs and similar investments; and (iv) other short-term fixed income securities.
Inception Dates: |
A-Class | March 2, 2007 |
C-Class | March 2, 2007 |
P-Class | March 2, 2007 |
Institutional Class | May 3, 2010 |
The Fund invests principally in derivative investments such as futures contracts.
Largest Holdings | (% of Total Net Assets) |
Guggenheim Strategy Fund III | 14.8% |
Guggenheim Strategy Fund II | 10.4% |
Guggenheim Ultra Short Duration Fund — Institutional Class | 6.5% |
Total | 31.7% |
| | |
“Largest Holdings” excludes any temporary cash or derivative investments. |
| | THE GUGGENHEIM FUNDS ANNUAL REPORT | 11 |
PERFORMANCE REPORT AND FUND PROFILE (Unaudited)(continued) | December 31, 2022 |
Cumulative Fund Performance*


12 | THE GUGGENHEIM FUNDS ANNUAL REPORT | |
PERFORMANCE REPORT AND FUND PROFILE (Unaudited)(concluded) | December 31, 2022 |
Average Annual Returns*
Periods Ended December 31, 2022
| 1 Year | 5 Year | 10 Year |
A-Class Shares | 14.76% | 3.48% | 2.08% |
A-Class Shares with sales charge‡ | 9.30% | 2.47% | 1.58% |
C-Class Shares | 13.96% | 2.71% | 1.32% |
C-Class Shares with CDSC§ | 12.96% | 2.71% | 1.32% |
P-Class Shares | 14.75% | 3.47% | 2.10% |
Institutional Class Shares | 15.03% | 3.74% | 2.33% |
ICE BofA 3-Month U.S. Treasury Bill Index | 1.47% | 1.27% | 0.77% |
* | The performance data above represents past performance that is not predictive of future results. The investment return and principal value of an investment in the Fund will fluctuate so that an investor’s shares, when redeemed, may be worth more or less than their original cost. Returns are historical and include changes in principal and reinvested dividends and capital gains and do not reflect the effect of taxes. The ICE BofA 3-Month U.S. Treasury Bill Index is an unmanaged index and, unlike the Fund, has no management fees or operating expenses to reduce its reported return. The graphs are based on A-Class shares and P-Class shares only; performance for C-Class shares and Institutional Class shares will vary due to differences in fee structure. |
‡ | Fund returns are calculated using the maximum sales charge of 4.75%. |
§ | Fund returns include a CDSC of 1% if redeemed within 12 months of purchase. |
| | THE GUGGENHEIM FUNDS ANNUAL REPORT | 13 |
CONSOLIDATED SCHEDULE OF INVESTMENTS | December 31, 2022 |
MANAGED FUTURES STRATEGY FUND | |
| | Shares | | | Value | |
MUTUAL FUNDS† - 31.7% |
Guggenheim Strategy Fund III1 | | | 235,195 | | | $ | 5,658,797 | |
Guggenheim Strategy Fund II1 | | | 166,856 | | | | 4,011,215 | |
Guggenheim Ultra Short Duration Fund — Institutional Class1 | | | 257,497 | | | | 2,482,268 | |
Total Mutual Funds | | | | |
(Cost $12,548,781) | | | | | | | 12,152,280 | |
| | | | | | | | | |
| | | Face
Amount | | | | | |
U.S. TREASURY BILLS†† - 13.7% |
U.S. Treasury Bills |
3.80% due 01/17/232,3 | | $ | 5,041,000 | | | | 5,033,789 | |
3.79% due 01/17/232,3 | | | 210,000 | | | | 209,699 | |
Total U.S. Treasury Bills | | | | |
(Cost $5,241,933) | | | | | | | 5,243,488 | |
| | | | | | | | | |
REPURCHASE AGREEMENTS††,4 - 50.8% |
J.P. Morgan Securities LLC
issued 12/30/22 at 4.26%
due 01/03/23 | | | 10,999,677 | | | | 10,999,677 | |
BofA Securities, Inc.
issued 12/30/22 at 4.25%
due 01/03/23 | | | 4,230,645 | | | | 4,230,645 | |
Barclays Capital, Inc.
issued 12/30/22 at 4.21%
due 01/03/23 | | | 4,217,542 | | | | 4,217,542 | |
Total Repurchase Agreements | | | | |
(Cost $19,447,864) | | | | | | | 19,447,864 | |
| | | | | | | | | |
Total Investments - 96.2% | | | | |
(Cost $37,238,578) | | $ | 36,843,632 | |
Other Assets & Liabilities, net - 3.8% | | | 1,450,664 | |
Total Net Assets - 100.0% | | $ | 38,294,296 | |
Futures Contracts |
Description | | Number of
Contracts | | | Expiration
Date | | | Notional
Amount | | | Value and
Unrealized
Appreciation
(Depreciation)** | |
Commodity Futures Contracts Purchased† |
Corn Futures Contracts | | | 87 | | | | Mar 2023 | | | $ | 2,951,475 | | | $ | 96,568 | |
Gasoline RBOB Futures Contracts | | | 10 | | | | Jan 2023 | | | | 1,043,952 | | | | 88,011 | |
Sugar #11 Futures Contracts | | | 49 | | | | Jun 2023 | | | | 987,840 | | | | 61,880 | |
Soybean Futures Contracts | | | 26 | | | | Mar 2023 | | | | 1,981,525 | | | | 40,978 | |
Soybean Meal Futures Contracts | | | 20 | | | | Mar 2023 | | | | 942,800 | | | | 37,870 | |
Live Cattle Futures Contracts | | | 36 | | | | Jun 2023 | | | | 2,272,680 | | | | 37,641 | |
NY Harbor ULSD Futures Contracts | | | 5 | | | | Jan 2023 | | | | 691,152 | | | | 32,539 | |
Coffee ‘C’ Futures Contracts | | | 15 | | | | Mar 2023 | | | | 939,938 | | | | 25,456 | |
Gold 100 oz. Futures Contracts | | | 10 | | | | Feb 2023 | | | | 1,829,900 | | | | 24,683 | |
Live Cattle Futures Contracts | | | 45 | | | | Feb 2023 | | | | 2,842,650 | | | | 23,188 | |
Silver Futures Contracts | | | 6 | | | | Mar 2023 | | | | 724,200 | | | | 21,065 | |
Soybean Oil Futures Contracts | | | 27 | | | | Mar 2023 | | | | 1,038,744 | | | | 20,655 | |
14 | THE GUGGENHEIM FUNDS ANNUAL REPORT | SEE NOTES TO CONSOLIDATED FINANCIAL STATEMENTS. |
CONSOLIDATED SCHEDULE OF INVESTMENTS (continued) | December 31, 2022 |
MANAGED FUTURES STRATEGY FUND | |
Futures Contracts (continued) | | | | | | | | | | | | | | | | |
Description | | Number of
Contracts | | | Expiration
Date | | | Notional
Amount | | | Value and
Unrealized
Appreciation
(Depreciation)** | |
Low Sulphur Gas Oil Futures Contracts | | | 6 | | | | Feb 2023 | | | $ | 555,900 | | | $ | 15,190 | |
Sugar #11 Futures Contracts | | | 13 | | | | Feb 2023 | | | | 291,928 | | | | 15,139 | |
Platinum Futures Contracts | | | 8 | | | | Apr 2023 | | | | 433,680 | | | | 14,869 | |
SGX Iron Ore 62% Futures Contracts | | | 33 | | | | Feb 2023 | | | | 383,460 | | | | 12,114 | |
Red Spring Wheat Futures Contracts | | | 14 | | | | Mar 2023 | | | | 658,000 | | | | 5,797 | |
NY Harbor ULSD Futures Contracts | | | 6 | | | | Mar 2023 | | | | 771,322 | | | | 3,427 | |
LME Tin Futures Contracts | | | 1 | | | | Feb 2023 | | | | 124,141 | | | | 2,309 | |
Canadian Canola (WCE) Futures Contracts | | | 18 | | | | Mar 2023 | | | | 230,274 | | | | 2,191 | |
WTI Crude Futures Contracts | | | 2 | | | | Jan 2023 | | | | 160,760 | | | | 2,155 | |
Lean Hogs Futures Contracts | | | 2 | | | | Feb 2023 | | | | 70,380 | | | | 641 | |
Cattle Feeder Futures Contracts | | | 1 | | | | Mar 2023 | | | | 93,013 | | | | 439 | |
Cotton #2 Futures Contracts | | | 10 | | | | Mar 2023 | | | | 417,000 | | | | (536 | ) |
Palladium Futures Contracts | | | 2 | | | | Mar 2023 | | | | 357,700 | | | | (1,868 | ) |
Hard Red Winter Wheat Futures Contracts | | | 1 | | | | Mar 2023 | | | | 44,363 | | | | (1,953 | ) |
LME Nickel Futures Contracts | | | 4 | | | | Feb 2023 | | | | 719,160 | | | | (4,859 | ) |
Natural Gas Futures Contracts | | | 2 | | | | Mar 2023 | | | | 78,100 | | | | (15,325 | ) |
LME Primary Aluminum Futures Contracts | | | 10 | | | | Feb 2023 | | | | 589,915 | | | | (18,907 | ) |
Cocoa Futures Contracts | | | 87 | | | | Mar 2023 | | | | 2,255,040 | | | | (23,781 | ) |
Natural Gas Futures Contracts | | | 6 | | | | Feb 2023 | | | | 243,720 | | | | (26,339 | ) |
ECX Emission Futures Contracts | | | 5 | | | | Dec 2023 | | | | 449,663 | | | | (35,473 | ) |
| | | | | | | | | | | $ | 27,174,375 | | | $ | 455,764 | |
Currency Futures Contracts Purchased† |
Mexican Peso Futures Contracts | | | 195 | | | | Mar 2023 | | | $ | 4,940,325 | | | $ | 91,799 | |
Japanese Yen Futures Contracts | | | 12 | | | | Mar 2023 | | | | 1,153,350 | | | | 46,638 | |
Euro FX Futures Contracts | | | 2 | | | | Mar 2023 | | | | 268,988 | | | | 2,767 | |
Canadian Dollar Futures Contracts | | | 19 | | | | Mar 2023 | | | | 1,404,290 | | | | 2,382 | |
Australian Dollar Futures Contracts | | | 6 | | | | Mar 2023 | | | | 409,620 | | | | 339 | |
Swiss Franc Futures Contracts | | | 9 | | | | Mar 2023 | | | | 1,226,081 | | | | (428 | ) |
New Zealand Dollar Futures Contracts | | | 10 | | | | Mar 2023 | | | | 635,300 | | | | (2,982 | ) |
British Pound Futures Contracts | | | 13 | | | | Mar 2023 | | | | 983,938 | | | | (14,700 | ) |
| | | | | | | | | | | $ | 11,021,892 | | | $ | 125,815 | |
Interest Rate Futures Contracts Purchased† |
Euro - Bund Futures Contracts | | | 1 | | | | Mar 2023 | | | $ | 142,230 | | | $ | (699 | ) |
Long Gilt Futures Contracts†† | | | 3 | | | | Mar 2023 | | | | 361,436 | | | | (1,259 | ) |
Australian Government 10 Year Bond Futures Contracts†† | | | 9 | | | | Mar 2023 | | | | 707,769 | | | | (1,872 | ) |
Euro - BTP Italian Government Bond Futures Contracts†† | | | 3 | | | | Mar 2023 | | | | 348,485 | | | | (2,768 | ) |
| | | | | | | | | | | $ | 1,559,920 | | | $ | (6,598 | ) |
SEE NOTES TO CONSOLIDATED FINANCIAL STATEMENTS. | THE GUGGENHEIM FUNDS ANNUAL REPORT | 15 |
CONSOLIDATED SCHEDULE OF INVESTMENTS (continued) | December 31, 2022 |
MANAGED FUTURES STRATEGY FUND | |
Futures Contracts (continued) | | | | | | | | | | | | | | | | |
Description | | Number of
Contracts | | | Expiration
Date | | | Notional
Amount | | | Value and
Unrealized
Appreciation
(Depreciation)** | |
Equity Futures Contracts Purchased† |
FTSE 100 Index Futures Contracts†† | | | 21 | | | | Mar 2023 | | | $ | 1,898,627 | | | $ | 5,420 | |
CBOE Volatility Index Futures Contracts | | | 10 | | | | Mar 2023 | | | | 253,500 | | | | (1,887 | ) |
FTSE MIB Index Futures Contracts | | | 1 | | | | Mar 2023 | | | | 126,807 | | | | (2,580 | ) |
Euro STOXX 50 Index Futures Contracts | | | 8 | | | | Mar 2023 | | | | 324,558 | | | | (2,959 | ) |
IBEX 35 Index Futures Contracts†† | | | 13 | | | | Jan 2023 | | | | 1,140,113 | | | | (3,448 | ) |
OMX Stockholm 30 Index Futures Contracts†† | | | 7 | | | | Jan 2023 | | | | 137,635 | | | | (4,012 | ) |
CAC 40 10 Euro Index Futures Contracts | | | 10 | | | | Jan 2023 | | | | 691,871 | | | | (9,435 | ) |
CBOE Volatility Index Futures Contracts | | | 27 | | | | Jun 2023 | | | | 711,450 | | | | (10,096 | ) |
FTSE/JSE TOP 40 Index Futures Contracts†† | | | 30 | | | | Mar 2023 | | | | 1,197,826 | | | | (23,380 | ) |
Amsterdam Index Futures Contracts | | | 5 | | | | Jan 2023 | | | | 738,781 | | | | (35,807 | ) |
Tokyo Stock Price Index Futures Contracts | | | 14 | | | | Mar 2023 | | | | 1,993,997 | | | | (80,324 | ) |
| | | | | | | | | | | $ | 9,215,165 | | | $ | (168,508 | ) |
Interest Rate Futures Contracts Sold Short† |
Euro - Bund Futures Contracts | | | 59 | | | | Mar 2023 | | | $ | 8,391,560 | | | $ | 334,538 | |
Euro - Bobl Futures Contracts | | | 40 | | | | Mar 2023 | | | | 4,955,339 | | | | 120,626 | |
Australian Government 3 Year Bond Futures Contracts†† | | | 109 | | | | Mar 2023 | | | | 7,912,835 | | | | 118,347 | |
U.S. Treasury 5 Year Note Futures Contracts | | | 87 | | | | Mar 2023 | | | | 9,381,047 | | | | 62,955 | |
U.S. Treasury Long Bond Futures Contracts | | | 27 | | | | Mar 2023 | | | | 3,366,563 | | | | 55,878 | |
Euro - Schatz Futures Contracts | | | 117 | | | | Mar 2023 | | | | 13,203,068 | | | | 54,633 | |
U.S. Treasury 10 Year Note Futures Contracts | | | 49 | | | | Mar 2023 | | | | 5,494,125 | | | | 54,204 | |
U.S. Treasury 2 Year Note Futures Contracts | | | 117 | | | | Mar 2023 | | | | 23,985,000 | | | | 53,331 | |
U.S. Treasury Ultra Long Bond Futures Contracts | | | 18 | | | | Mar 2023 | | | | 2,404,125 | | | | 49,571 | |
Canadian Government 10 Year Bond Futures Contracts†† | | | 27 | | | | Mar 2023 | | | | 2,439,585 | | | | 45,299 | |
Australian Government 10 Year Bond Futures Contracts†† | | | 5 | | | | Mar 2023 | | | | 393,205 | | | | 8,566 | |
Euro - OATS Futures Contracts | | | 1 | | | | Mar 2023 | | | | 136,286 | | | | 45 | |
| | | | | | | | | | | $ | 82,062,738 | | | $ | 957,993 | |
Commodity Futures Contracts Sold Short† |
Natural Gas Futures Contracts | | | 14 | | | | Jan 2023 | | | $ | 620,620 | | | $ | 122,331 | |
ICE Endex Dutch TTF Natural Gas Futures Contracts | | | 10 | | | | Jan 2023 | | | | 523,594 | | | | 79,871 | |
LME Zinc Futures Contracts | | | 5 | | | | Feb 2023 | | | | 372,906 | | | | 15,797 | |
Hard Red Winter Wheat Futures Contracts | | | 21 | | | | Mar 2023 | | | | 931,613 | | | | 15,455 | |
Euro - Rapeseed Futures Contracts | | | 8 | | | | Jan 2023 | | | | 250,295 | | | | 12,794 | |
CME Random Length Lumber Futures Contracts | | | 6 | | | | Mar 2023 | | | | 250,602 | | | | 12,033 | |
Oat Futures Contracts | | | 8 | | | | Mar 2023 | | | | 146,100 | | | | 6,842 | |
Palladium Futures Contracts | | | 1 | | | | Mar 2023 | | | | 178,850 | | | | 6,197 | |
Wheat Futures Contracts | | | 19 | | | | Mar 2023 | | | | 751,450 | | | | 5,431 | |
Euro - Mill Wheat Futures Contracts | | | 16 | | | | Mar 2023 | | | | 264,967 | | | | 4,704 | |
Sugar #11 Futures Contracts | | | 47 | | | | Feb 2023 | | | | 1,055,432 | | | | 2,304 | |
Cotton #2 Futures Contracts | | | 1 | | | | Mar 2023 | | | | 41,700 | | | | 1,017 | |
NY Harbor ULSD Futures Contracts | | | 2 | | | | Jan 2023 | | | | 276,461 | | | | (987 | ) |
16 | THE GUGGENHEIM FUNDS ANNUAL REPORT | SEE NOTES TO CONSOLIDATED FINANCIAL STATEMENTS. |
CONSOLIDATED SCHEDULE OF INVESTMENTS (continued) | December 31, 2022 |
MANAGED FUTURES STRATEGY FUND | |
Futures Contracts (continued) | | | | | | | | | | | | | | | | |
Description | | Number of
Contracts | | | Expiration
Date | | | Notional
Amount | | | Value and
Unrealized
Appreciation
(Depreciation)** | |
Lean Hogs Futures Contracts | | | 13 | | | | Feb 2023 | | | $ | 457,470 | | | $ | (1,922 | ) |
Coffee ‘C’ Futures Contracts | | | 1 | | | | Mar 2023 | | | | 62,663 | | | | (2,403 | ) |
Brent Crude Futures Contracts | | | 1 | | | | Jan 2023 | | | | 85,990 | | | | (3,242 | ) |
WTI Crude Futures Contracts | | | 1 | | | | Jan 2023 | | | | 80,380 | | | | (5,423 | ) |
Cattle Feeder Futures Contracts | | | 12 | | | | Mar 2023 | | | | 1,116,150 | | | | (6,793 | ) |
LME Lead Futures Contracts | | | 5 | | | | Feb 2023 | | | | 289,219 | | | | (13,340 | ) |
Copper Futures Contracts | | | 12 | | | | Mar 2023 | | | | 1,146,000 | | | | (16,452 | ) |
Live Cattle Futures Contracts | | | 30 | | | | Apr 2023 | | | | 1,941,300 | | | | (19,790 | ) |
Gasoline RBOB Futures Contracts | | | 8 | | | | Mar 2023 | | | | 885,696 | | | | (62,012 | ) |
| | | | | | | | | | | $ | 11,729,458 | | | $ | 152,412 | |
Equity Futures Contracts Sold Short† |
MSCI EAFE Index Futures Contracts | | | 10 | | | | Mar 2023 | | | $ | 974,550 | | | $ | 18,195 | |
NASDAQ-100 Index Mini Futures Contracts | | | 4 | | | | Mar 2023 | | | | 881,840 | | | | 14,453 | |
FTSE Taiwan Index Futures Contracts | | | 25 | | | | Jan 2023 | | | | 1,235,750 | | | | 9,852 | |
DAX Index Futures Contracts | | | 1 | | | | Mar 2023 | | | | 372,202 | | | | 6,866 | |
S&P 500 Index Mini Futures Contracts | | | 3 | | | | Mar 2023 | | | | 579,225 | | | | 6,550 | |
Nikkei 225 (OSE) Index Futures Contracts | | | 1 | | | | Mar 2023 | | | | 196,406 | | | | 3,371 | |
CBOE Volatility Index Futures Contracts | | | 15 | | | | Feb 2023 | | | | 367,500 | | | | 3,026 | |
SPI 200 Index Futures Contracts†† | | | 4 | | | | Mar 2023 | | | | 476,445 | | | | 2,720 | |
IBEX 35 Index Futures Contracts†† | | | 2 | | | | Jan 2023 | | | | 175,402 | | | | 674 | |
CBOE Volatility Index Futures Contracts | | | 5 | | | | Jan 2023 | | | | 115,250 | | | | 513 | |
Russell 2000 Index Mini Futures Contracts | | | 4 | | | | Mar 2023 | | | | 354,260 | | | | 123 | |
CBOE Volatility Index Futures Contracts | | | 1 | | | | Apr 2023 | | | | 25,850 | | | | (73 | ) |
S&P MidCap 400 Index Mini Futures Contracts | | | 1 | | | | Mar 2023 | | | | 244,330 | | | | (3,892 | ) |
| | | | | | | | | | | $ | 5,999,010 | | | $ | 62,378 | |
Currency Futures Contracts Sold Short† |
British Pound Futures Contracts | | | 37 | | | | Mar 2023 | | | $ | 2,800,437 | | | $ | 18,277 | |
New Zealand Dollar Futures Contracts | | | 5 | | | | Mar 2023 | | | | 317,650 | | | | 27 | |
Canadian Dollar Futures Contracts | | | 4 | | | | Mar 2023 | | | | 295,640 | | | | (192 | ) |
Australian Dollar Futures Contracts | | | 13 | | | | Mar 2023 | | | | 887,510 | | | | (5,269 | ) |
Swiss Franc Futures Contracts | | | 28 | | | | Mar 2023 | | | | 3,814,475 | | | | (25,637 | ) |
Euro FX Futures Contracts | | | 46 | | | | Mar 2023 | | | | 6,186,713 | | | | (60,836 | ) |
Japanese Yen Futures Contracts | | | 29 | | | | Mar 2023 | | | | 2,787,263 | | | | (82,244 | ) |
| | | | | | | | | | | $ | 17,089,688 | | | $ | (155,874 | ) |
SEE NOTES TO CONSOLIDATED FINANCIAL STATEMENTS. | THE GUGGENHEIM FUNDS ANNUAL REPORT | 17 |
CONSOLIDATED SCHEDULE OF INVESTMENTS (continued) | December 31, 2022 |
MANAGED FUTURES STRATEGY FUND | |
** | Includes cumulative appreciation (depreciation). Variation margin is reported within the Consolidated Statement of Assets and Liabilities. |
† | Value determined based on Level 1 inputs, unless otherwise noted — See Note 4. |
†† | Value determined based on Level 2 inputs — See Note 4. |
1 | Affiliated issuer. |
2 | All or a portion of this security is pledged as futures collateral at December 31, 2022. |
3 | Rate indicated is the effective yield at the time of purchase. |
4 | Repurchase Agreements — See Note 6. |
| | CME — Chicago Mercantile Exchange |
| | ICE — Intercontinental Exchange |
| | |
| | See Sector Classification in Other Information section. |
The following table summarizes the inputs used to value the Fund’s investments at December 31, 2022 (See Note 4 in the Notes to Consolidated Financial Statements):
Investments in Securities (Assets) | | Level 1
Quoted
Prices | | | Level 2
Significant
Observable
Inputs | | | Level 3
Significant
Unobservable
Inputs | | | Total | |
Mutual Funds | | $ | 12,152,280 | | | $ | — | | | $ | — | | | $ | 12,152,280 | |
U.S. Treasury Bills | | | — | | | | 5,243,488 | | | | — | | | | 5,243,488 | |
Repurchase Agreements | | | — | | | | 19,447,864 | | | | — | | | | 19,447,864 | |
Interest Rate Futures Contracts** | | | 785,781 | | | | 172,212 | | | | — | | | | 957,993 | |
Commodity Futures Contracts** | | | 869,581 | | | | — | | | | — | | | | 869,581 | |
Currency Futures Contracts** | | | 162,229 | | | | — | | | | — | | | | 162,229 | |
Equity Futures Contracts** | | | 62,949 | | | | 8,814 | | | | — | | | | 71,763 | |
Total Assets | | $ | 14,032,820 | | | $ | 24,872,378 | | | $ | — | | | $ | 38,905,198 | |
Investments in Securities (Liabilities) | | Level 1
Quoted
Prices | | | Level 2
Significant
Observable
Inputs | | | Level 3
Significant
Unobservable
Inputs | | | Total | |
Commodity Futures Contracts** | | $ | 261,405 | | | $ | — | | | $ | — | | | $ | 261,405 | |
Currency Futures Contracts** | | | 192,288 | | | | — | | | | — | | | | 192,288 | |
Equity Futures Contracts** | | | 147,053 | | | | 30,840 | | | | — | | | | 177,893 | |
Interest Rate Futures Contracts** | | | 699 | | | | 5,899 | | | | — | | | | 6,598 | |
Total Liabilities | | $ | 601,445 | | | $ | 36,739 | | | $ | — | | | $ | 638,184 | |
** | This derivative is reported as unrealized appreciation/depreciation at period end. |
18 | THE GUGGENHEIM FUNDS ANNUAL REPORT | SEE NOTES TO CONSOLIDATED FINANCIAL STATEMENTS. |
CONSOLIDATED SCHEDULE OF INVESTMENTS (concluded) | December 31, 2022 |
MANAGED FUTURES STRATEGY FUND | |
Affiliated Transactions
Investments representing 5% or more of the outstanding voting shares of a company, or control of or by, or common control under Guggenheim Investments (“GI”), result in that company being considered an affiliated issuer, as defined in the 1940 Act.
The Fund may invest in certain of the underlying series of Guggenheim Strategy Funds Trust, including Guggenheim Strategy Fund II and Guggenheim Strategy Fund III, (collectively, the “Short Term Investment Vehicles”), each of which are open-end management investment companies managed by GI. The Short Term Investment Vehicles, which launched on March 11, 2014, are offered as short term investment options only to mutual funds, trusts, and other accounts managed by GI and/or its affiliates, and are not available to the public. The Short Term Investment Vehicles pay no investment management fees. The Short Term Investment Vehicles’ annual report on Form N-CSR dated September 30, 2022, is available publicly or upon request. This information is available from the EDGAR database on the SEC’s website at https://www.sec.gov/Archives/edgar/data/1601445/000182126822000340/gug84768.htm. The Fund may invest in certain of the underlying series of Guggenheim Funds Trust, which are open-end management investment companies managed by GI, are available to the public and whose most recent annual report on Form N-CSR is available publicly or upon request.
Transactions during the year ended December 31, 2022, in which the company is an affiliated issuer, were as follows:
Security Name | | Value
12/31/21 | | | Additions | | | Reductions | | | Realized
Gain (Loss) | | | Change in
Unrealized
Appreciation
(Depreciation) | | | Value
12/31/22 | | | Shares
12/31/22 | | | Investment
Income | |
Mutual Funds | | | | | | | | | | | | | | | | | | | | | | | | | | | | | | | | |
Guggenheim Strategy Fund II | | $ | 4,951,696 | | | $ | — | | | $ | (800,000 | ) | | $ | (3,539 | ) | | $ | (136,942 | ) | | $ | 4,011,215 | | | | 166,856 | | | $ | 114,490 | |
Guggenheim Strategy Fund III | | | 5,886,936 | | | | — | | | | — | | | | — | | | | (228,139 | ) | | | 5,658,797 | | | | 235,195 | | | | 168,137 | |
Guggenheim Ultra Short Duration Fund — Institutional Class | | | 1,753,560 | | | | 800,000 | | | | — | | | | — | | | | (71,292 | ) | | | 2,482,268 | | | | 257,497 | | | | 56,021 | |
| | | $ | 12,592,192 | | | $ | 800,000 | | | $ | (800,000 | ) | | $ | (3,539 | ) | | $ | (436,373 | ) | | $ | 12,152,280 | | | | | | | $ | 338,648 | |
SEE NOTES TO CONSOLIDATED FINANCIAL STATEMENTS. | THE GUGGENHEIM FUNDS ANNUAL REPORT | 19 |
CONSOLIDATED STATEMENT OF ASSETS AND LIABILITIES |
MANAGED FUTURES STRATEGY FUND |
December 31, 2022
Assets: |
Investments in unaffiliated issuers, at value (cost $5,241,933) | | $ | 5,243,488 | |
Investments in affiliated issuers, at value (cost $12,548,781) | | | 12,152,280 | |
Repurchase agreements, at value (cost $19,447,864) | | | 19,447,864 | |
Cash | | | 3,027 | |
Segregated cash with broker | | | 1,475,457 | |
Receivables: |
Dividends | | | 48,050 | |
Variation margin on futures contracts | | | 25,255 | |
Fund shares sold | | | 11,668 | |
Interest | | | 4,589 | |
Other assets | | | 1,010 | |
Total assets | | | 38,412,688 | |
| | | | | |
Liabilities: |
Payable for: |
Management fees | | | 29,218 | |
Fund shares redeemed | | | 18,911 | |
Professional fees | | | 12,115 | |
Transfer agent fees | | | 10,832 | |
Printing fees | | | 7,095 | |
Registration fees | | | 6,011 | |
Portfolio accounting and administration fees | | | 4,977 | |
Distribution and service fees | | | 4,904 | |
Trustees’ fees* | | | 546 | |
Miscellaneous | | | 23,783 | |
Total liabilities | | | 118,392 | |
Net assets | | $ | 38,294,296 | |
| | | | | |
Net assets consist of: |
Paid in capital | | $ | 80,382,355 | |
Total distributable earnings (loss) | | | (42,088,059 | ) |
Net assets | | $ | 38,294,296 | |
| | | | | |
A-Class: |
Net assets | | $ | 6,477,679 | |
Capital shares outstanding | | | 321,250 | |
Net asset value per share | | $ | 20.16 | |
Maximum offering price per share (Net asset value divided by 95.25%) | | $ | 21.17 | |
| | | | | |
C-Class: |
Net assets | | $ | 2,121,303 | |
Capital shares outstanding | | | 120,326 | |
Net asset value per share | | $ | 17.63 | |
| | | | | |
P-Class: |
Net assets | | $ | 8,423,335 | |
Capital shares outstanding | | | 414,986 | |
Net asset value per share | | $ | 20.30 | |
| | | | | |
Institutional Class: |
Net assets | | $ | 21,271,979 | |
Capital shares outstanding | | | 1,019,906 | |
Net asset value per share | | $ | 20.86 | |
* | Relates to Trustees not deemed “interested persons” within the meaning of Section 2(a)(19) of the 1940 Act. |
20 | THE GUGGENHEIM FUNDS ANNUAL REPORT | SEE NOTES TO CONSOLIDATED FINANCIAL STATEMENTS. |
CONSOLIDATED STATEMENT OF OPERATIONS |
MANAGED FUTURES STRATEGY FUND |
Year Ended December 31, 2022
Investment Income: |
Dividends from securities of affiliated issuers | | $ | 338,648 | |
Interest | | | 464,280 | |
Total investment income | | | 802,928 | |
| | | | | |
Expenses: |
Management fees | | | 429,752 | |
Distribution and service fees: |
A-Class | | | 16,413 | |
C-Class | | | 13,929 | |
P-Class | | | 44,167 | |
Transfer agent fees | | | 92,883 | |
Portfolio accounting and administration fees | | | 51,463 | |
Professional fees | | | 41,196 | |
Custodian fees | | | 6,079 | |
Trustees’ fees* | | | 4,857 | |
Miscellaneous | | | 50,716 | |
Total expenses | | | 751,455 | |
Less: |
Expenses waived by Adviser | | | (66,706 | ) |
Net expenses | | | 684,749 | |
Net investment income | | | 118,179 | |
| | | | | |
Net Realized and Unrealized Gain (Loss): |
Net realized gain (loss) on: |
Investments in unaffiliated issuers | | $ | (4 | ) |
Investments in affiliated issuers | | | (3,539 | ) |
Futures contracts | | | 2,038,393 | |
Foreign currency transactions | | | (482 | ) |
Net realized gain | | | 2,034,368 | |
Net change in unrealized appreciation (depreciation) on: |
Investments in unaffiliated issuers | | | 1,540 | |
Investments in affiliated issuers | | | (436,373 | ) |
Futures contracts | | | 1,520,762 | |
Foreign currency translations | | | 1,121 | |
Net change in unrealized appreciation (depreciation) | | | 1,087,050 | |
Net realized and unrealized gain | | | 3,121,418 | |
Net increase in net assets resulting from operations | | $ | 3,239,597 | |
* | Relates to Trustees not deemed “interested persons” within the meaning of Section 2(a)(19) of the 1940 Act. |
SEE NOTES TO CONSOLIDATED FINANCIAL STATEMENTS. | THE GUGGENHEIM FUNDS ANNUAL REPORT | 21 |
CONSOLIDATED STATEMENTS OF CHANGES IN NET ASSETS |
MANAGED FUTURES STRATEGY FUND | |
| | Year Ended
December 31,
2022 | | | Year Ended
December 31,
2021 | |
Increase (Decrease) in Net Assets from Operations: | | | | | | | | |
Net investment income (loss) | | $ | 118,179 | | | $ | (212,848 | ) |
Net realized gain on investments | | | 2,034,368 | | | | 1,612,221 | |
Net change in unrealized appreciation (depreciation) on investments | | | 1,087,050 | | | | (768,377 | ) |
Net increase in net assets resulting from operations | | | 3,239,597 | | | | 630,996 | |
| | | | | | | | | |
Distributions to shareholders: | | | | | | | | |
A-Class | | | (290,823 | ) | | | — | |
C-Class | | | (105,236 | ) | | | — | |
P-Class | | | (376,691 | ) | | | — | |
Institutional Class | | | (1,029,250 | ) | | | — | |
Total distributions to shareholders | | | (1,802,000 | ) | | | — | |
| | | | | | | | | |
Capital share transactions: | | | | | | | | |
Proceeds from sale of shares | | | | | | | | |
A-Class | | | 1,054,342 | | | | 537,216 | |
C-Class | | | 2,333,140 | | | | 19,947 | |
P-Class | | | 38,401,599 | | | | 7,859,685 | |
Institutional Class | | | 27,909,131 | | | | 2,520,243 | |
Distributions reinvested | | | | | | | | |
A-Class | | | 282,405 | | | | — | |
C-Class | | | 103,217 | | | | — | |
P-Class | | | 369,009 | | | | — | |
Institutional Class | | | 1,026,092 | | | | — | |
Cost of shares redeemed | | | | | | | | |
A-Class | | | (1,183,747 | ) | | | (1,245,643 | ) |
C-Class | | | (778,290 | ) | | | (594,228 | ) |
P-Class | | | (38,944,183 | ) | | | (9,126,556 | ) |
Institutional Class | | | (14,913,234 | ) | | | (2,375,208 | ) |
Net increase (decrease) from capital share transactions | | | 15,659,481 | | | | (2,404,544 | ) |
Net increase (decrease) in net assets | | | 17,097,078 | | | | (1,773,548 | ) |
| | | | | | | | | |
Net assets: | | | | | | | | |
Beginning of year | | | 21,197,218 | | | | 22,970,766 | |
End of year | | $ | 38,294,296 | | | $ | 21,197,218 | |
| | | | | | | | | |
22 | THE GUGGENHEIM FUNDS ANNUAL REPORT | SEE NOTES TO CONSOLIDATED FINANCIAL STATEMENTS. |
CONSOLIDATED STATEMENTS OF CHANGES IN NET ASSETS (concluded) |
MANAGED FUTURES STRATEGY FUND | |
| | Year Ended
December 31,
2022 | | | Year Ended
December 31,
2021 | |
Capital share activity: | | | | | | | | |
Shares sold | | | | | | | | |
A-Class | | | 50,726 | | | | 29,197 | |
C-Class | | | 121,236 | | | | 1,220 | |
P-Class | | | 1,893,070 | | | | 415,340 | |
Institutional Class | | | 1,237,422 | | | | 132,079 | |
Shares issued from reinvestment of distributions | | | | | | | | |
A-Class | | | 14,328 | | | | — | |
C-Class | | | 5,987 | | | | — | |
P-Class | | | 18,599 | | | | — | |
Institutional Class | | | 50,348 | | | | — | |
Shares redeemed | | | | | | | | |
A-Class | | | (56,772 | ) | | | (67,428 | ) |
C-Class | | | (41,924 | ) | | | (36,270 | ) |
P-Class | | | (1,859,103 | ) | | | (482,276 | ) |
Institutional Class | | | (697,841 | ) | | | (124,121 | ) |
Net increase (decrease) in shares | | | 736,076 | | | | (132,259 | ) |
SEE NOTES TO CONSOLIDATED FINANCIAL STATEMENTS. | THE GUGGENHEIM FUNDS ANNUAL REPORT | 23 |
CONSOLIDATED FINANCIAL HIGHLIGHTS |
MANAGED FUTURES STRATEGY FUND | |
This table is presented to show selected data for a share outstanding throughout each period and to assist shareholders in evaluating a Fund’s performance for the periods presented.
A-Class | | Year
Ended
Dec. 31,
2022 | | | Year
Ended
Dec. 31,
2021 | | | Year
Ended
Dec. 31,
2020 | | | Year
Ended
Dec. 31,
2019 | | | Year
Ended
Dec. 31,
2018 | |
Per Share Data |
Net asset value, beginning of period | | $ | 18.41 | | | $ | 17.96 | | | $ | 18.96 | | | $ | 17.65 | | | $ | 19.19 | |
Income (loss) from investment operations: |
Net investment income (loss)a | | | .05 | | | | (.18 | ) | | | (.12 | ) | | | .15 | | | | .15 | |
Net gain (loss) on investments (realized and unrealized) | | | 2.67 | | | | .63 | | | | .48 | | | | 1.16 | | | | (1.69 | ) |
Total from investment operations | | | 2.72 | | | | .45 | | | | .36 | | | | 1.31 | | | | (1.54 | ) |
Less distributions from: |
Net investment income | | | (.97 | ) | | | — | | | | (1.36 | ) | | | — | | | | — | |
Total distributions | | | (.97 | ) | | | — | | | | (1.36 | ) | | | — | | | | — | |
Net asset value, end of period | | $ | 20.16 | | | $ | 18.41 | | | $ | 17.96 | | | $ | 18.96 | | | $ | 17.65 | |
|
Total Returnb | | | 14.76 | % | | | 2.51 | % | | | 2.01 | % | | | 7.42 | % | | | (8.03 | %) |
Ratios/Supplemental Data |
Net assets, end of period (in thousands) | | $ | 6,478 | | | $ | 5,760 | | | $ | 6,306 | | | $ | 7,033 | | | $ | 6,793 | |
Ratios to average net assets: |
Net investment income (loss) | | | 0.22 | % | | | (0.99 | %) | | | (0.62 | %) | | | 0.82 | % | | | 0.80 | % |
Total expensesc | | | 1.91 | % | | | 1.88 | % | | | 1.87 | % | | | 1.90 | % | | | 1.84 | % |
Net expensesd | | | 1.75 | % | | | 1.73 | % | | | 1.75 | % | | | 1.80 | % | | | 1.79 | % |
Portfolio turnover rate | | | 7 | % | | | 27 | % | | | 111 | % | | | 26 | % | | | 21 | % |
24 | THE GUGGENHEIM FUNDS ANNUAL REPORT | SEE NOTES TO CONSOLIDATED FINANCIAL STATEMENTS. |
CONSOLIDATED FINANCIAL HIGHLIGHTS (continued) |
MANAGED FUTURES STRATEGY FUND | |
This table is presented to show selected data for a share outstanding throughout each period and to assist shareholders in evaluating a Fund’s performance for the periods presented.
C-Class | | Year
Ended
Dec. 31,
2022 | | | Year
Ended
Dec. 31,
2021 | | | Year
Ended
Dec. 31,
2020 | | | Year
Ended
Dec. 31,
2019 | | | Year
Ended
Dec. 31,
2018 | |
Per Share Data |
Net asset value, beginning of period | | $ | 16.28 | | | $ | 16.00 | | | $ | 17.03 | | | $ | 15.97 | | | $ | 17.49 | |
Income (loss) from investment operations: |
Net investment income (loss)a | | | (.06 | ) | | | (.29 | ) | | | (.23 | ) | | | .01 | | | | .01 | |
Net gain (loss) on investments (realized and unrealized) | | | 2.33 | | | | .57 | | | | .41 | | | | 1.05 | | | | (1.53 | ) |
Total from investment operations | | | 2.27 | | | | .28 | | | | .18 | | | | 1.06 | | | | (1.52 | ) |
Less distributions from: |
Net investment income | | | (.92 | ) | | | — | | | | (1.21 | ) | | | — | | | | — | |
Total distributions | | | (.92 | ) | | | — | | | | (1.21 | ) | | | — | | | | — | |
Net asset value, end of period | | $ | 17.63 | | | $ | 16.28 | | | $ | 16.00 | | | $ | 17.03 | | | $ | 15.97 | |
|
Total Returnb | | | 13.96 | % | | | 1.75 | % | | | 1.25 | % | | | 6.64 | % | | | (8.69 | %) |
Ratios/Supplemental Data |
Net assets, end of period (in thousands) | | $ | 2,121 | | | $ | 570 | | | $ | 1,121 | | | $ | 1,815 | | | $ | 4,485 | |
Ratios to average net assets: |
Net investment income (loss) | | | (0.31 | %) | | | (1.74 | %) | | | (1.37 | %) | | | 0.06 | % | | | 0.04 | % |
Total expensesc | | | 2.65 | % | | | 2.63 | % | | | 2.62 | % | | | 2.65 | % | | | 2.59 | % |
Net expensesd | | | 2.49 | % | | | 2.49 | % | | | 2.50 | % | | | 2.57 | % | | | 2.53 | % |
Portfolio turnover rate | | | 7 | % | | | 27 | % | | | 111 | % | | | 26 | % | | | 21 | % |
SEE NOTES TO CONSOLIDATED FINANCIAL STATEMENTS. | THE GUGGENHEIM FUNDS ANNUAL REPORT | 25 |
CONSOLIDATED FINANCIAL HIGHLIGHTS (continued) |
MANAGED FUTURES STRATEGY FUND |
This table is presented to show selected data for a share outstanding throughout each period and to assist shareholders in evaluating a Fund’s performance for the periods presented.
P-Class | | Year
Ended
Dec. 31,
2022 | | | Year
Ended
Dec. 31,
2021 | | | Year
Ended
Dec. 31,
2020 | | | Year
Ended
Dec. 31,
2019 | | | Year
Ended
Dec. 31,
2018 | |
Per Share Data |
Net asset value, beginning of period | | $ | 18.48 | | | $ | 18.03 | | | $ | 19.00 | | | $ | 17.70 | | | $ | 19.23 | |
Income (loss) from investment operations: |
Net investment income (loss)a | | | .01 | | | | (.18 | ) | | | (.12 | ) | | | .15 | | | | .15 | |
Net gain (loss) on investments (realized and unrealized) | | | 2.73 | | | | .63 | | | | .49 | | | | 1.15 | | | | (1.68 | ) |
Total from investment operations | | | 2.74 | | | | .45 | | | | .37 | | | | 1.30 | | | | (1.53 | ) |
Less distributions from: |
Net investment income | | | (.92 | ) | | | — | | | | (1.34 | ) | | | — | | | | — | |
Total distributions | | | (.92 | ) | | | — | | | | (1.34 | ) | | | — | | | | — | |
Net asset value, end of period | | $ | 20.30 | | | $ | 18.48 | | | $ | 18.03 | | | $ | 19.00 | | | $ | 17.70 | |
|
Total Return | | | 14.75 | % | | | 2.50 | % | | | 2.05 | % | | | 7.34 | % | | | (7.96 | %) |
Ratios/Supplemental Data |
Net assets, end of period (in thousands) | | $ | 8,423 | | | $ | 6,697 | | | $ | 7,741 | | | $ | 10,946 | | | $ | 13,669 | |
Ratios to average net assets: |
Net investment income (loss) | | | 0.07 | % | | | (0.99 | %) | | | (0.63 | %) | | | 0.82 | % | | | 0.80 | % |
Total expensesc | | | 1.91 | % | | | 1.88 | % | | | 1.88 | % | | | 1.90 | % | | | 1.84 | % |
Net expensesd | | | 1.74 | % | | | 1.73 | % | | | 1.77 | % | | | 1.81 | % | | | 1.78 | % |
Portfolio turnover rate | | | 7 | % | | | 27 | % | | | 111 | % | | | 26 | % | | | 21 | % |
26 | THE GUGGENHEIM FUNDS ANNUAL REPORT | SEE NOTES TO CONSOLIDATED FINANCIAL STATEMENTS. |
CONSOLIDATED FINANCIAL HIGHLIGHTS (concluded) |
MANAGED FUTURES STRATEGY FUND |
This table is presented to show selected data for a share outstanding throughout each period and to assist shareholders in evaluating a Fund’s performance for the periods presented.
Institutional Class | | Year
Ended
Dec. 31,
2022 | | | Year
Ended
Dec. 31,
2021 | | | Year
Ended
Dec. 31,
2020 | | | Year
Ended
Dec. 31,
2019 | | | Year
Ended
Dec. 31,
2018 | |
Per Share Data |
Net asset value, beginning of period | | $ | 19.00 | | | $ | 18.49 | | | $ | 19.48 | | | $ | 18.09 | | | $ | 19.61 | |
Income (loss) from investment operations: |
Net investment income (loss)a | | | .14 | | | | (.14 | ) | | | (.08 | ) | | | .21 | | | | .20 | |
Net gain (loss) on investments (realized and unrealized) | | | 2.74 | | | | .65 | | | | .49 | | | | 1.18 | | | | (1.72 | ) |
Total from investment operations | | | 2.88 | | | | .51 | | | | .41 | | | | 1.39 | | | | (1.52 | ) |
Less distributions from: |
Net investment income | | | (1.02 | ) | | | — | | | | (1.40 | ) | | | — | | | | — | |
Total distributions | | | (1.02 | ) | | | — | | | | (1.40 | ) | | | — | | | | — | |
Net asset value, end of period | | $ | 20.86 | | | $ | 19.00 | | | $ | 18.49 | | | $ | 19.48 | | | $ | 18.09 | |
|
Total Return | | | 15.03 | % | | | 2.76 | % | | | 2.29 | % | | | 7.68 | % | | | (7.75 | %) |
Ratios/Supplemental Data |
Net assets, end of period (in thousands) | | $ | 21,272 | | | $ | 8,169 | | | $ | 7,802 | | | $ | 7,195 | | | $ | 7,711 | |
Ratios to average net assets: |
Net investment income (loss) | | | 0.63 | % | | | (0.73 | %) | | | (0.38 | %) | | | 1.07 | % | | | 1.05 | % |
Total expensesc | | | 1.64 | % | | | 1.63 | % | | | 1.61 | % | | | 1.65 | % | | | 1.59 | % |
Net expensesd | | | 1.48 | % | | | 1.48 | % | | | 1.49 | % | | | 1.55 | % | | | 1.54 | % |
Portfolio turnover rate | | | 7 | % | | | 27 | % | | | 111 | % | | | 26 | % | | | 21 | % |
a | Net investment income (loss) per share was computed using average shares outstanding throughout the period. |
b | Total return does not reflect the impact of any applicable sales charges. |
c | Does not include expenses of the underlying funds in which the Fund invests. |
d | Net expense information reflects the expense ratios after expense waivers and reimbursements, as applicable. |
SEE NOTES TO CONSOLIDATED FINANCIAL STATEMENTS. | THE GUGGENHEIM FUNDS ANNUAL REPORT | 27 |
NOTES TO CONSOLIDATED FINANCIAL STATEMENTS |
Note 1 – Organization, Consolidation of Subsidiary and Significant Accounting Policies
Organization
The Rydex Series Funds (the “Trust”), a Delaware statutory trust, is registered with the U.S. Securities and Exchange Commission (the “SEC”) under the Investment Company Act of 1940 (”1940 Act”), as an open-ended investment company of the series type. Each series, in effect, is representing a separate fund. The Trust may issue an unlimited number of authorized shares. The Trust accounts for the assets of each fund separately.
The Trust offers a combination of seven separate classes of shares: Investor Class shares, A-Class shares, C-Class shares, H-Class shares, P-Class shares, Institutional Class shares and Money Market Class shares. Sales of shares of each Class are made without a front-end sales charge at the net asset value per share (“NAV”), with the exception of A-Class shares. A-Class shares are sold at the NAV, plus the applicable front-end sales charge. The sales charge varies depending on the amount purchased, but will not exceed 4.75%. A-Class share purchases of $1 million or more are exempt from the front-end sales charge but have a 1% contingent deferred sales charge (“CDSC”) if shares are redeemed within 12 months of purchase. C-Class shares have a 1% CDSC if shares are redeemed within 12 months of purchase. C-Class shares automatically convert to A-Class shares on or about the 10th day of the month following the 8-year anniversary of the purchase of the C-Class shares. This conversion will be executed without any sales charge, fee or other charge. After the conversion is completed, the shares will be subject to all features and expenses of A-Class shares. Institutional Class shares are offered primarily for direct investment by institutions such as pension and profit sharing plans, endowments, foundations and corporations. Institutional Class shares require a minimum initial investment of $2 million and a minimum account balance of $1 million. At December 31, 2022, the Trust consisted of fifty-two funds (each, a “Fund” and collectively, the “Funds”).
This report covers the Managed Futures Strategy Fund, a diversified investment company. At December 31, 2022, only A-Class, C-Class, P-Class, and Institutional Class shares have been issued by the Fund.
Security Investors, LLC (the “Adviser”), which operates under the name Guggenheim Investments (“GI”), provides advisory services. Guggenheim Funds Distributors, LLC (“GFD”) acts as principal underwriter for the Trust. GI and GFD are affiliated entities.
Consolidation of Subsidiary
The consolidated financial statements of the Fund include the accounts of a wholly-owned and controlled Cayman Islands subsidiary (the “Subsidiary”). Significant inter-company accounts and transactions have been eliminated in consolidation for the Fund.
The Fund may invest up to 25% of its total assets in its Subsidiary which acts as an investment vehicle in order to effect certain investments consistent with the Fund’s investment objective and policies.
28 | THE GUGGENHEIM FUNDS ANNUAL REPORT | |
NOTES TO CONSOLIDATED FINANCIAL STATEMENTS (continued) |
A summary of the Fund’s investment in its Subsidiary is as follows:
| | Inception
Date of
Subsidiary | | | Subsidiary
Net Assets at
December 31,
2022 | | | % of Net Assets
of the Fund at
December 31,
2022 | |
| | | | 05/01/08 | | | $ | 5,038,766 | | | | 13.2 | % |
Significant Accounting Policies
The Fund operates as an investment company and, accordingly, follows the investment company accounting and reporting guidance of the Financial Accounting Standards Board (“FASB”) Accounting Standards Codification Topic 946 Financial Services – Investment Companies.
The following significant accounting policies are in conformity with U.S. generally accepted accounting principles (“U.S. GAAP”) and are consistently followed by the Trust. This requires management to make estimates and assumptions that affect the reported amount of assets and liabilities, contingent assets and liabilities at the date of the consolidated financial statements, and the reported amounts of revenues and expenses during the reporting period. Actual results could differ from these estimates. All time references are based on Eastern Time.
The NAV of each Class of the Fund is calculated by dividing the market value of the Fund’s securities and other assets, less all liabilities, attributable to the Class by the number of outstanding shares of the Class.
(a) Valuation of Investments
The Board of Trustees of the Fund (the “Board”) has adopted policies and procedures for the valuation of the Fund’s investments (the “Valuation Procedures”). The SEC adopted Rule 2a-5 under the 1940 Act (“Rule 2a-5”) which establishes requirements for determining fair value in good faith and became effective September 8, 2022. Rule 2a-5 also defines “readily available market quotations” for purposes of the 1940 Act and establishes requirements for determining whether a fund must fair value a security in good faith.
Pursuant to Rule 2a-5, the Board has designated the Adviser as the valuation designee to perform fair valuation determinations for the Fund with respect to all Fund investments and other assets. As the Fund’s valuation designee pursuant to Rule 2a-5, the Adviser has adopted separate procedures (the “Valuation Designee Procedures”) reasonably designed to prevent violations of the requirements of Rule 2a-5 and Rule 31a-4. The Adviser, in its role as valuation designee, utilizes the assistance of a valuation committee consisting of representatives from Guggenheim’s investment management, fund administration, legal and compliance departments (the “Valuation Committee”), in determining the fair value of the Fund’s securities and other assets.
| | THE GUGGENHEIM FUNDS ANNUAL REPORT | 29 |
NOTES TO CONSOLIDATED FINANCIAL STATEMENTS (continued) |
Valuations of the Fund’s securities and other assets are supplied primarily by pricing services appointed pursuant to the processes set forth in the Valuation Procedures. The Adviser, with the assistance of the Valuation Committee, convenes monthly, or more frequently as needed, to review the valuation of all assets which have been fair valued for reasonableness. The Adviser, consistent with the monitoring and review responsibilities set forth in the Valuation Designee Procedures, regularly reviews the appropriateness of the inputs, methods, models and assumptions employed by the pricing services.
If the pricing service cannot or does not provide a valuation for a particular investment or such valuation is deemed unreliable, the investment is fair valued by the Adviser.
Open-end investment companies are valued at their NAV as of the close of business, on the valuation date. Exchange-traded funds and closed-end investment companies are generally valued at the last quoted sale price.
U.S. Government securities are valued by independent pricing services, the last traded fill price, or at the reported bid price at the close of business.
Commercial paper and discount notes with a maturity of greater than 60 days at acquisition are valued at prices that reflect broker-dealer supplied valuations or are obtained from independent pricing services, which may consider the trade activity, treasury spreads, yields or price of bonds of comparable quality, coupon, maturity, and type, as well as prices quoted by dealers who make markets in such securities. Commercial paper and discount notes with a maturity of 60 days or less at acquisition are valued at amortized cost, unless the Adviser concludes that amortized cost does not represent the fair value of the applicable asset in which case it will be valued using an independent pricing service.
Repurchase agreements are generally valued at amortized cost, provided such amounts approximate market value.
The value of futures contracts are valued on the basis of the last sale price at the 4:00 p.m. price on the valuation date. In the event that the exchange for a specific futures contract closes earlier than 4:00 p.m., the futures contract is valued at the official settlement price of the exchange. However, the underlying securities from which the futures contract value is derived are monitored until 4:00 p.m. to determine if fair valuation would provide a more accurate valuation.
Investments for which market quotations are not readily available are fair valued as determined in good faith by the Adviser. Valuations in accordance with these methods are intended to reflect each security’s (or asset’s or liability’s) “fair value”. Each such determination is based on a consideration of all relevant factors, which are likely to vary from one pricing context to another. Examples of such factors may include, but are not limited to market prices; sale prices; broker quotes; and models which derive prices based on inputs such as prices of securities with comparable maturities and characteristics, or based on inputs such as anticipated cash flows or collateral, spread over U.S. Treasury securities, and other information analysis. In connection
30 | THE GUGGENHEIM FUNDS ANNUAL REPORT | |
NOTES TO CONSOLIDATED FINANCIAL STATEMENTS (continued) |
with futures contracts and other derivative investments, such factors may include obtaining information as to how (a) these contracts and other derivative investments trade in the futures or other derivative markets, respectively, and (b) the securities underlying these contracts and other derivative investments trade in the cash market.
(b) U.S. Government and Agency Obligations
Certain U.S. Government and Agency Obligations are traded on a discount basis; the interest rates shown on the Consolidated Schedule of Investments reflect the effective rates paid at the time of purchase by the Fund. Other securities bear interest at the rates shown, payable at fixed dates through maturity.
(c) Futures Contracts
Upon entering into a futures contract, the Fund deposits and maintains as collateral such initial margin as required by the exchange on which the transaction is affected. Pursuant to the contract, the Fund agrees to receive from or pay to the broker an amount of cash equal to the daily fluctuation in value of the contract. Such receipts or payments are known as variation margin and are recorded by the Fund as unrealized appreciation or depreciation. When the contract is closed, the Fund records a realized gain or loss equal to the difference between the value of the contract at the time it was opened and the value at the time it was closed.
(d) Currency Translations
The accounting records of the Fund are maintained in U.S. dollars. All assets and liabilities initially expressed in foreign currencies are converted into U.S. dollars at prevailing exchange rates. Purchases and sales of investment securities, dividend and interest income, and certain expenses are translated at the rates of exchange prevailing on the respective dates of such transactions. Changes in the relationship of these foreign currencies to the U.S. dollar can significantly affect the value of the investments and earnings of the Fund. Foreign investments may also subject the Fund to foreign government exchange restrictions, expropriation, taxation, or other political, social or economic developments, all of which could affect the market and/or credit risk of the investments.
The Fund does not isolate that portion of the results of operations resulting from changes in the foreign exchange rates on investments from the fluctuations arising from changes in the market prices of securities held. Such fluctuations are included with the net realized gain or loss and unrealized appreciation or depreciation on investments.
Reported net realized foreign exchange gains and losses arise from sales of foreign currencies and currency gains or losses realized between the trade and settlement dates on investment transactions. Net unrealized appreciation and depreciation arise from changes in the fair values of assets and liabilities other than investments in securities at the fiscal period end, resulting from changes in exchange rates.
| | THE GUGGENHEIM FUNDS ANNUAL REPORT | 31 |
NOTES TO CONSOLIDATED FINANCIAL STATEMENTS (continued) |
(e) Security Transactions
Security transactions are recorded on the trade date for financial reporting purposes. Realized gains and losses from securities transactions are recorded using the identified cost basis. Proceeds from lawsuits related to investment holdings are recorded as a reduction to cost if the securities are still held and as realized gains if no longer held in the Fund. Dividend income is recorded on the ex-dividend date, net of applicable taxes withheld by foreign countries, if any. Taxable non-cash dividends are recorded as dividend income. Interest income, including amortization of premiums and accretion of discounts, is accrued on a daily basis.
(f) Distributions
Distributions of net investment income and net realized gains, if any, are declared and paid at least annually. Dividends are reinvested in additional shares, unless shareholders request payment in cash. Distributions are recorded on the ex-dividend date and are determined in accordance with U.S. federal income tax regulations which may differ from U.S. GAAP.
(g) Class Allocations
Interest and dividend income, most expenses, all realized gains and losses, and all unrealized appreciation and depreciation are allocated to the classes based upon the value of the outstanding shares in each Class. Certain costs, such as distribution and service fees are charged directly to specific classes. In addition, certain expenses have been allocated to the individual Funds in the Trust based on the respective net assets of each Fund included in the Trust.
(h) Cash
The Fund may leave cash overnight in its cash account with the custodian. Periodically, the Fund may have cash due to the custodian bank as an overdraft balance. A fee is incurred on this overdraft, calculated by multiplying the overdraft by a rate based on the federal funds rate, which was 4.33% at December 31, 2022.
(i) Indemnifications
Under the Fund’s organizational documents, its Trustees and Officers are indemnified against certain liabilities arising out of the performance of their duties to the Trust. In addition, throughout the normal course of business, the Fund enters into contracts that contain a variety of representations and warranties which provide general indemnifications. The Fund’s maximum exposure under these arrangements is unknown, as this would involve future claims that may be made against the Fund and/or its affiliates that have not yet occurred. However, based on experience, the Fund expects the risk of loss to be remote.
32 | THE GUGGENHEIM FUNDS ANNUAL REPORT | |
NOTES TO CONSOLIDATED FINANCIAL STATEMENTS (continued) |
Note 2 – Derivatives
As part of its investment strategy, the Fund utilizes a variety of derivative instruments. These investments involve, to varying degrees, elements of market risk and risks in excess of amounts recognized on the Fund’s Consolidated Statement of Assets and Liabilities. Valuation and accounting treatment of these instruments can be found under Significant Accounting Policies in Note 1 of these Notes to Consolidated Financial Statements.
Derivatives are instruments whose values depend on, or are derived from, in whole or in part, the value of one or more other assets, such as securities, currencies, commodities or indices. Derivative instruments may be used to increase investment flexibility (including to maintain cash reserves while maintaining exposure to certain other assets), for risk management (hedging) purposes, to facilitate trading, to reduce transaction costs and to pursue higher investment returns. Derivative instruments may also be used to mitigate certain investment risks, such as foreign currency exchange rate risk, interest rate risk and credit risk. U.S. GAAP requires disclosures to enable investors to better understand how and why a fund uses derivative instruments, how these derivative instruments are accounted for and their effects on a fund’s financial position and results of operations.
The Fund may utilize derivatives for the following purposes:
Hedge: an investment made in order to reduce the risk of adverse price movements in a security, by taking an offsetting position to protect against broad market moves.
Leverage: gaining total exposure to equities or other assets on the long and short sides at greater than 100% of invested capital.
Liquidity: the ability to buy or sell exposure with little price/market impact.
Speculation: the use of an instrument to express macro-economic and other investment views.
To the extent the Fund’s investment strategy consistently involves applying leverage, the value of the Fund’s shares will tend to increase or decrease more than the value of any increase or decrease in the underlying index or other asset. In addition, because an investment in derivative instruments generally requires a small investment relative to the amount of investment exposure assumed, an opportunity for increased net income is created; but, at the same time, leverage risk will increase. The Fund’s use of leverage, through borrowings or instruments such as derivatives, may cause the Fund’s investments to be more volatile and riskier than if they had not been leveraged.
Futures Contracts
A futures contract is an agreement to purchase (long) or sell (short) an agreed amount of securities or other instruments at a set price for delivery at a future date. There are significant risks associated with the Fund’s use of futures contracts, including (i) there may be an imperfect or no correlation between the changes in market value of the underlying asset and the prices of futures contracts; (ii) there may not be a liquid secondary market for a futures contract; (iii) trading restrictions or
| | THE GUGGENHEIM FUNDS ANNUAL REPORT | 33 |
NOTES TO CONSOLIDATED FINANCIAL STATEMENTS (continued) |
limitations may be imposed by an exchange; and (iv) government regulations may restrict trading in futures contracts. When investing in futures, there is minimal counterparty credit risk to the Fund because futures are exchange-traded and the exchange’s clearinghouse, as counterparty to all exchange-traded futures, guarantees against default. Cash deposits are shown as segregated cash with broker on the Fund’s Consolidated Statement of Assets and Liabilities; securities held as collateral are noted on the Fund’s Consolidated Schedule of Investments.
The following table represents the Fund’s use and volume of futures on a monthly basis:
| | | Average Notional Amount | |
Use | | Long | | | Short | |
Hedge, Leverage, Liquidity, Speculation | | $ | 58,565,676 | | | $ | 98,626,733 | |
Derivative Investment Holdings Categorized by Risk Exposure
The following is a summary of the location of derivative investments on the Fund’s Consolidated Statement of Assets and Liabilities as of December 31, 2022:
Derivative Investment Type | Asset Derivatives | Liability Derivatives |
Equity/interest rate/currency/commodity futures contracts | Variation margin on futures contracts | — |
The following tables set forth the fair value of the Fund’s derivative investments categorized by primary risk exposure at December 31, 2022:
Asset Derivative Investments Value |
| | Futures
Equity
Risk* | | | Futures
Foreign
Currency
Exchange
Risk* | | | Futures
Interest
Rate
Risk* | | | Futures
Commodity
Risk* | | | Total Value at
December 31,
2022 | |
| | | $ | 71,763 | | | $ | 162,229 | | | $ | 957,993 | | | $ | 869,581 | | | $ | 2,061,566 | |
Liability Derivative Investments Value |
| | Futures
Equity
Risk* | | | Futures
Foreign
Currency
Exchange
Risk* | | | Futures
Interest
Rate
Risk* | | | Futures
Commodity
Risk* | | | Total Value at
December 31,
2022 | |
| | | $ | 177,893 | | | $ | 192,288 | | | $ | 6,598 | | | $ | 261,405 | | | $ | 638,184 | |
* | Includes cumulative appreciation (depreciation) of futures contracts as reported on the Consolidated Schedule of Investments. For exchange-traded and centrally-cleared derivatives, variation margin is reported within the Fund’s Consolidated Statement of Assets and Liabilities. |
34 | THE GUGGENHEIM FUNDS ANNUAL REPORT | |
NOTES TO CONSOLIDATED FINANCIAL STATEMENTS (continued) |
The following is a summary of the location of derivative investments on the Fund’s Consolidated Statement of Operations for the year ended December 31, 2022:
Derivative Investment Type | Location of Gain (Loss) on Derivatives |
Equity/interest rate/currency/commodity futures contracts | Net realized gain (loss) on futures contracts |
| Net change in unrealized appreciation (depreciation) on futures contracts |
The following is a summary of the Fund’s realized gain (loss) and change in unrealized appreciation (depreciation) on derivative investments recognized on the Fund’s Consolidated Statement of Operations categorized by primary risk exposure for the year ended December 31, 2022:
Realized Gain (Loss) on Derivative Investments Recognized on the Consolidated Statement of Operations |
| | Futures
Equity
Risk | | | Futures
Foreign
Currency
Exchange
Risk | | | Futures
Interest
Rate
Risk | | | Futures
Commodity
Risk | | | Total | |
| | | $ | (1,573,500 | ) | | $ | 1,292,641 | | | $ | 2,686,171 | | | $ | (366,919 | ) | | $ | 2,038,393 | |
Change in Unrealized Appreciation (Depreciation) on Derivative Investments
Recognized on the Consolidated Statement of Operations |
| | Futures
Equity
Risk | | | Futures
Foreign
Currency
Exchange
Risk | | | Futures
Interest
Rate
Risk | | | Futures
Commodity
Risk | | | Total | |
| | | $ | (150,474 | ) | | $ | 128,807 | | | $ | 983,426 | | | $ | 559,003 | | | $ | 1,520,762 | |
In conjunction with the use of derivative instruments, the Fund is required to maintain collateral in various forms. Depending on the financial instrument utilized and the broker involved, the Fund uses margin deposits at the broker, cash and/or securities segregated at the custodian bank, discount notes or repurchase agreements allocated to the Fund as collateral.
The Trust has established counterparty credit guidelines and enters into transactions only with financial institutions of investment grade or better. The Trust monitors the counterparty credit risk.
Note 3 – Offsetting
In the normal course of business, the Fund enters into transactions subject to enforceable master netting arrangements or other similar arrangements. Generally, the right to offset in those agreements allows the Fund to counteract the exposure to a specific counterparty with collateral
| | THE GUGGENHEIM FUNDS ANNUAL REPORT | 35 |
NOTES TO CONSOLIDATED FINANCIAL STATEMENTS (continued) |
received from or delivered to that counterparty based on the terms of the arrangements. These arrangements provide for the right to liquidate upon the occurrence of an event of default, credit event upon merger or additional termination event.
In order to better define its contractual rights and to secure rights that will help the Fund mitigate its counterparty risk, the Fund may enter into an International Swaps and Derivatives Association, Inc. Master Agreement (“ISDA Master Agreement”) or similar agreement with its derivative contract counterparties. An ISDA Master Agreement is a bilateral agreement between a fund and a counterparty that governs over-the-counter (“OTC”) derivatives, including foreign exchange contracts, and typically contains, among other things, collateral posting terms and netting provisions in the event of a default and/or termination event. The provisions of the ISDA Master Agreement typically permit a single net payment in the event of a default (close-out netting) or similar event, including the bankruptcy or insolvency of the counterparty.
For derivatives traded under an ISDA Master Agreement, the collateral requirements are typically calculated by netting the mark-to-market amount for each transaction under such agreement and comparing that amount to the value of any collateral currently pledged by the Fund and the counterparty. For financial reporting purposes, cash collateral that has been pledged to cover obligations of the Fund and cash collateral received from the counterparty, if any, are reported separately on the Fund’s Consolidated Statement of Assets and Liabilities as segregated cash with broker/ receivable for variation margin, or payable for swap settlement/variation margin. Cash and/ or securities pledged or received as collateral by the Fund in connection with an OTC derivative subject to an ISDA Master Agreement generally may not be invested, sold or rehypothecated by the counterparty or the Fund, as applicable, absent an event of default under such agreement, in which case such collateral generally may be applied towards obligations due to and payable by such counterparty or the Fund, as applicable. Generally, the amount of collateral due from or to a counterparty must exceed a minimum transfer amount threshold (e.g., $300,000) before a transfer is required to be made. To the extent amounts due to the Fund from its counterparties are not fully collateralized, contractually or otherwise, the Fund bears the risk of loss from counterparty nonperformance. The Fund attempts to mitigate counterparty risk by only entering into agreements with counterparties that they believe to be of good standing and by monitoring the financial stability of those counterparties.
For financial reporting purposes, the Fund does not offset derivative assets and derivative liabilities that are subject to netting arrangements in the Fund’s Consolidated Statement of Assets and Liabilities. The Fund does not have any derivative financial instruments that are subject to enforceable master netting arrangements as of December 31, 2022.
36 | THE GUGGENHEIM FUNDS ANNUAL REPORT | |
NOTES TO CONSOLIDATED FINANCIAL STATEMENTS (continued) |
The Fund has the right to offset deposits against any related derivative liabilities outstanding with each counterparty with the exception of exchange-traded or centrally-cleared derivatives. The following table presents deposits held by others in connection with derivative investments as of December 31, 2022.
Counterparty | Asset Type | | Cash
Pledged | | | Cash
Received | |
Goldman Sachs International | Futures Contracts | | $ | 1,475,457 | | | $ | — | |
Note 4 – Fair Value Measurement
In accordance with U.S. GAAP, fair value is defined as the price that the Fund would receive to sell an investment or pay to transfer a liability in an orderly transaction between market participants at the measurement date. U.S. GAAP establishes a three-tier fair value hierarchy based on the types of inputs used to value assets and liabilities and requires corresponding disclosure. The hierarchy and the corresponding inputs are summarized below:
Level 1 — | unadjusted quoted prices in active markets for identical assets or liabilities. |
Level 2 — | significant other observable inputs (for example quoted prices for securities that are similar based on characteristics such as interest rates, prepayment speeds, credit risk, etc.). |
Level 3 — | significant unobservable inputs based on the best information available under the circumstances, to the extent observable inputs are not available, which may include assumptions. |
Rule 2a-5 sets forth a definition of “readily available market quotations,” which is consistent with the definition of a Level 1 input under U.S. GAAP. Rule 2a-5 provides that “a market quotation is readily available only when that quotation is a quoted price (unadjusted) in active markets for identical investments that the fund can access at the measurement date, provided that a quotation will not be readily available if it is not reliable.”
Securities for which market quotations are not readily available must be valued at fair value as determined in good faith. Accordingly, any security priced using inputs other than Level 1 inputs will be subject to fair value requirements. The types of inputs available depend on a variety of factors, such as the type of security and the characteristics of the markets in which it trades, if any. Fair valuation determinations that rely on fewer or no observable inputs require greater judgment. Accordingly, fair value determinations for Level 3 securities require the greatest amount of judgment.
The inputs or methodologies selected and applied for valuing securities are not necessarily an indication of the risk associated with investing in those securities. The suitability, appropriateness and accuracy of the techniques, methodologies and sources employed to determine fair valuation are periodically reviewed and subject to change.
| | THE GUGGENHEIM FUNDS ANNUAL REPORT | 37 |
NOTES TO CONSOLIDATED FINANCIAL STATEMENTS (continued) |
Note 5 – Investment Advisory Agreement and Other Agreements
Under the terms of an investment advisory contract, the Fund pays GI investment advisory fees calculated at an annualized rate of 0.90% of the average daily net assets of the Fund.
GI has contractually agreed to waive the management fee it receives from the Subsidiary in an amount equal to the management fee paid to GI by the Subsidiary. This undertaking will continue in effect for so long as the Fund invests in the Subsidiary, and may not be terminated by GI unless GI obtains the prior approval of the Fund’s Board for such termination. Fees waived under this arrangement are not subject to reimbursement to GI. For the year ended December 31, 2022, the Fund waived $60,549 related to advisory fees in the Subsidiary.
GI pays operating expenses on behalf of the Trust, such as audit and accounting related services, legal services, custody, printing and mailing, among others, on a pass-through basis. Such expenses are allocated to various Funds within the complex based on relative net assets.
The Board has adopted a Distribution Plan applicable to A-Class and P-Class shares for which GFD and other firms that provide distribution and/or shareholder services (“Service Providers”) may receive compensation. If a Service Provider provides distribution services, the Fund will pay distribution fees to GFD at an annual rate not to exceed 0.25% of average daily net assets, pursuant to Rule 12b-1 of the 1940 Act. GFD, in turn, will pay the Service Provider out of its fees. GFD may, at its discretion, retain a portion of such payments to compensate itself for distribution services.
The Board has adopted a separate Distribution and Shareholder Services Plan applicable to C-Class shares that allows the Fund to pay annual distribution and service fees of 1.00% of the Fund’s C-Class shares average daily net assets. The annual 0.25% service fee compensates a shareholder’s financial adviser for providing ongoing services to the shareholder. The annual distribution fee of 0.75% reimburses GFD for paying the shareholder’s financial adviser an ongoing sales commission. GFD advances the first year’s service and distribution fees to the financial adviser. GFD retains the service and distribution fees on accounts with no authorized dealer of record.
For the year ended December 31, 2022, GFD retained sales charges of $102,568 relating to sales of A-Class shares of the Trust.
If the Fund invests in a fund that is advised by the same adviser or an affiliated adviser, the investing Fund’s adviser has agreed to waive fees at the investing Fund level to the extent necessary to offset the proportionate share of any management fee paid by the Fund with respect to its investment in such affiliated fund. Fee waivers will be calculated at the investing Fund level without regard to any expense cap, if any, in effect for the investing Fund. Fees waived under this arrangement are not subject to reimbursement to GI. For the year ended December 31, 2022, the Fund waived $6,157 related to investments in affiliated funds.
38 | THE GUGGENHEIM FUNDS ANNUAL REPORT | |
NOTES TO CONSOLIDATED FINANCIAL STATEMENTS (continued) |
Certain trustees and officers of the Trust are also officers of GI and/or GFD. The Trust does not compensate its officers or trustees who are officers, directors and/or employees of GI or GFD.
MUFG Investor Services (US), LLC (“MUIS”) acts as the Fund’s administrator, transfer agent and accounting agent. As administrator, transfer agent and accounting agent, MUIS maintains the books and records of the Fund’s securities and cash. U.S. Bank, N.A. (“U.S. Bank”) acts as the Fund’s custodian. As custodian, U.S. Bank is responsible for the custody of the Fund’s assets. For providing the aforementioned services, MUIS and U.S. Bank are entitled to receive a monthly fee equal to an annual percentage of the Fund’s average daily net assets and out of pocket expenses.
Note 6 – Repurchase Agreements
The Fund transfers uninvested cash balances into a single joint account, the daily aggregate balance of which is invested in one or more repurchase agreements collateralized by obligations of the U.S. Treasury and U.S. government agencies. The joint account includes other Funds in the Guggenheim complex not covered in this report. The collateral is in the possession of the Funds’ custodian and is evaluated to ensure that its market value exceeds, at a minimum, 102% of the original face amount of the repurchase agreements. Each Fund holds a pro rata share of the collateral based on the dollar amount of the repurchase agreement entered into by each Fund.
At December 31, 2022, the repurchase agreements in the joint account were as follows:
Counterparty and
Terms of Agreement | | Face
Value | | | Repurchase
Price | | | Collateral | | Par
Value | | | Fair
Value | |
J.P. Morgan Securities LLC | | | | | | | | | | U.S. Treasury Notes | | | | | | | | |
4.26% | | | | | | | | | | 0.38% - 2.13% | | | | | | | | |
Due 01/03/23 | | $ | 152,635,704 | | | $ | 152,689,890 | | | Due 10/31/23 - 05/31/26 | | $ | 171,586,500 | | | $ | 155,688,423 | |
| | | | | | | | | | | | | | | | | | | |
BofA Securities, Inc. | | | | | | | | | | U.S. Treasury Notes | | | | | | | | |
4.25% | | | | | | | | | | 0.88% - 1.38% | | | | | | | | |
Due 01/03/23 | | | 58,706,040 | | | | 58,726,832 | | | Due 09/30/26 - 12/31/28 | | | 67,728,600 | | | | 59,880,171 | |
| | | | | | | | | | | | | | | | | | | |
Barclays Capital, Inc. | | | | | | | | | | U.S. Treasury Inflation Indexed Bond | | | | | | | | |
4.21% | | | | | | | | | | 0.13% | | | | | | | | |
Due 01/03/23 | | | 58,524,226 | | | | 58,544,758 | | | Due 01/15/31 | | | 67,503,920 | | | | 59,694,784 | |
In the event of counterparty default, the Funds have the right to collect the collateral to offset losses incurred. There is potential loss to the Funds in the event the Funds are delayed or prevented from exercising their rights to dispose of the collateral securities, including the risk of a possible decline in the value of the underlying securities during the period while the Funds seek to assert their rights. GI, acting under the supervision of the Board, reviews the value of the collateral and the creditworthiness of those banks and dealers with which the Funds enter into repurchase agreements to evaluate potential risks.
| | THE GUGGENHEIM FUNDS ANNUAL REPORT | 39 |
NOTES TO CONSOLIDATED FINANCIAL STATEMENTS (continued) |
Note 7 – Federal Income Tax Information
The Fund intends to comply with the provisions of Subchapter M of the Internal Revenue Code of 1986, as amended (the “Internal Revenue Code”), applicable to regulated investment companies and will distribute substantially all taxable net investment income and capital gains sufficient to relieve the Fund from all, or substantially all, federal income, excise and state income taxes. Therefore, no provision for federal or state income tax or federal excise tax is required.
Tax positions taken or expected to be taken in the course of preparing the Fund’s tax returns are evaluated to determine whether the tax positions are “more-likely-than-not” of being sustained by the applicable tax authority. Tax positions not deemed to meet the more-likely-than-not threshold would be recorded as a tax benefit or expense in the current year. Management has analyzed the Fund’s tax positions taken, or to be taken, on U.S. federal income tax returns for all open tax years, and has concluded that no provision for income tax is required in the Fund’s consolidatead financial statements. The Fund’s U.S. federal income tax returns are subject to examination by the Internal Revenue Service (“IRS”) for a period of three years after they are filed.
The Fund intends to invest up to 25% of its assets in the Subsidiary which is expected to provide the Fund with exposure to the commodities markets within the limitations of the U.S. federal income tax requirements under Subchapter M of the Internal Revenue Code. The Fund has received a private letter ruling from the IRS that concludes that the income the Fund receives from the Subsidiary will constitute qualifying income for purposes of Subchapter M of the Internal Revenue Code. The Subsidiary will be classified as a corporation for U.S. federal income tax purposes. A foreign corporation, such as the Subsidiary, will generally not be subject to U.S. federal income taxation unless it is deemed to be engaged in a U.S. trade or business. If, during a taxable year, the Subsidiary’s taxable losses (and other deductible items) exceed its income and gains, the net loss will not pass through to the Fund as a deductible amount for U.S. federal income tax purposes and cannot be carried forward to reduce future income from the Subsidiary in subsequent years.
The tax character of distributions paid during the year ended December 31, 2022 was as follows:
| | Ordinary
Income | | | Long-Term
Capital Gain | | | Total
Distributions | |
| | | $ | 1,802,000 | | | $ | — | | | $ | 1,802,000 | |
Note: For U.S. federal income tax purposes, short-term capital gain distributions are treated as ordinary income distributions.
40 | THE GUGGENHEIM FUNDS ANNUAL REPORT | |
NOTES TO CONSOLIDATED FINANCIAL STATEMENTS (continued) |
The tax components of distributable earnings/(loss) as of December 31, 2022 were as follows:
| | Undistributed
Ordinary
Income | | | Undistributed
Long-Term
Capital Gain | | | Net Unrealized
Appreciation
(Depreciation) | | | Accumulated
Capital and
Other Losses | | | Total | |
| | | $ | 824,064 | | | $ | - | | | $ | (17,555,904 | ) | | $ | (25,646,874 | ) | | $ | (42,378,714 | ) |
For U.S. federal income tax purposes, capital loss carryforwards represent realized losses of the Fund that may be carried forward and applied against future capital gains. The Fund is permitted to carry forward capital losses for an unlimited period and such capital loss carryforwards retain their character as either short-term or long-term capital losses. As of December 31, 2022, capital loss carryforwards for the Fund were as follows:
| | | Unlimited | | | | | |
| | Short-Term | | | Long-Term | | | Total
Capital Loss
Carryforward | |
| | | $ | (4,053,990 | ) | | $ | (21,592,884 | ) | | $ | (25,646,874 | ) |
For the year ended December 31, 2022, the capital loss carryforward amount utilized was $2,446,995.
Net investment income and net realized gains (losses) may differ for financial statement and tax purposes because of temporary or permanent book/tax differences. These differences are primarily due to investments in subsidiaries, foreign currency gains and losses, losses deferred due to wash sales, and the “mark-to-market” of certain derivatives. To the extent these differences are permanent and would require a reclassification between Paid in Capital and Total Distributable Earnings (Loss), such reclassifications are made in the period that the differences arise. These reclassifications have no effect on net assets or NAV per share.
The following adjustments were made on the Consolidated Statement of Assets and Liabilities as of December 31, 2022 for permanent book/tax differences:
| | Paid In
Capital | | | Total
Distributable
Earnings/(Loss) | |
| | | $ | (382,788 | ) | | $ | 382,788 | |
| | THE GUGGENHEIM FUNDS ANNUAL REPORT | 41 |
NOTES TO CONSOLIDATED FINANCIAL STATEMENTS (continued) |
At December 31, 2022, the cost of investments for U.S. federal income tax purposes, the aggregate gross unrealized appreciation for all investments for which there was an excess of value over tax cost and the aggregate gross unrealized depreciation for all investments for which there was an excess of tax cost over value, were as follows:
| | Tax
Cost | | | Tax
Unrealized
Appreciation | | | Tax
Unrealized
Depreciation | | | Net Tax
Unrealized
Appreciation/
(Depreciation) | |
| | | $ | 57,003,767 | | | $ | 2,886,790 | | | $ | (20,443,784 | ) | | $ | (17,556,994 | ) |
Note 8 – Securities Transactions
For the year ended December 31, 2022, the cost of purchases and proceeds from sales of investment securities, excluding government securities, short-term investments and derivatives, were as follows:
| | Purchases | | | Sales | |
| | | $ | 800,000 | | | $ | 800,000 | |
The Fund is permitted to purchase or sell securities from or to certain affiliated funds under specified conditions outlined in procedures adopted by the Board. The procedures have been designed to ensure that any purchase or sale of securities by the Fund from or to another fund or portfolio that is or could be considered an affiliate by virtue of having a common investment adviser (or affiliated investment advisers), common trustees and/or common officers complies with Rule 17a-7 of the 1940 Act. Further, as defined under these procedures, each transaction is effected at the current market price to save costs, where permissible. For the year ended December 31, 2022, the Fund did not engage in purchases and sales of securities, pursuant to Rule 17a-7 of the 1940 Act.
Note 9 – Line of Credit
The Trust, along with other affiliated trusts, secured an uncommitted $150,000,000 line of credit from U.S. Bank, N.A., which was increased to $200,000,000 on February 10, 2021. On June 6, 2022, the line of credit agreement was renewed and expires on June 5, 2023. This line of credit is reserved for emergency or temporary purposes. Borrowings, if any, under this arrangement bear interest equal to the Prime Rate, minus 2%, which shall be paid monthly, averaging 2.82% for the year ended December 31, 2022. The Fund did not have any borrowings outstanding under this agreement at December 31, 2022.
Note 10 – Market Risks
The value of, or income generated by, the investments held by the Fund are subject to the possibility of rapid and unpredictable fluctuation, and loss that may result from various factors. These factors include, among others, developments affecting individual companies, or from
42 | THE GUGGENHEIM FUNDS ANNUAL REPORT | |
NOTES TO CONSOLIDATED FINANCIAL STATEMENTS (concluded) |
broader influences, including real or perceived changes in prevailing interest rates (which have since risen and may continue to rise), changes in inflation rates or expectations about inflation rates (which are currently elevated relative to normal conditions), adverse investor confidence or sentiment, changing economic, political (including geopolitical), social or financial market conditions, increased instability or general uncertainty, environmental disasters, governmental actions, public health emergencies (such as the spread of infectious diseases, pandemics and epidemics), debt crises, actual or threatened wars or other armed conflicts (such as the current Russia-Ukraine conflict and its risk of expansion or collateral economic and other effects) or ratings downgrades, and other similar events, each of which may be temporary or last for extended periods. Moreover, changing economic, political, geopolitical, social, financial market or other conditions in one country or geographic region could adversely affect the value, yield and return of the investments held by the Fund in a different country or geographic region, economy, and market because of the increasingly interconnected global economies and financial markets. The duration and extent of the foregoing types of factors or conditions are highly uncertain and difficult to predict and have in the past, and may in the future, cause volatility and distress in economies and financial markets or other adverse circumstances, which may negatively affect the value of the Fund’s investments and performance of the Fund.
Note 11 – Subsequent Events
The Fund evaluated subsequent events through the date the consolidated financial statements were available for issue and determined there were no material events that would require adjustment to or disclosure in the Fund’s consolidated financial statements.
| | THE GUGGENHEIM FUNDS ANNUAL REPORT | 43 |
REPORT OF INDEPENDENT REGISTERED PUBLIC ACCOUNTING FIRM |
To the Shareholders of Guggenheim Managed Futures Strategy Fund and the Board of Trustees of Rydex Series Funds
Opinion on the Financial Statements
We have audited the accompanying consolidated statement of assets and liabilities of Guggenheim Managed Futures Strategy Fund (the “Fund”) (one of the funds constituting Rydex Series Funds (the “Trust”)), including the consolidated schedule of investments, as of December 31, 2022, and the related consolidated statement of operations for the year then ended, the consolidated statements of changes in net assets for each of the two years in the period then ended, the consolidated financial highlights for each of the five years in the period then ended and the related notes (collectively referred to as the “financial statements”). In our opinion, the financial statements present fairly, in all material respects, the consolidated financial position of the Fund (one of the funds constituting Rydex Series Funds) at December 31, 2022, the consolidated results of its operations for the year then ended, the consolidated changes in its net assets for each of the two years in the period then ended and its consolidated financial highlights for each of the five years in the period then ended, in conformity with U.S. generally accepted accounting principles.
Basis for Opinion
These financial statements are the responsibility of the Trust’s management. Our responsibility is to express an opinion on the Fund’s financial statements based on our audits. We are a public accounting firm registered with the Public Company Accounting Oversight Board (United States) (“PCAOB”) and are required to be independent with respect to the Trust in accordance with the U.S. federal securities laws and the applicable rules and regulations of the Securities and Exchange Commission and the PCAOB.
We conducted our audits in accordance with the standards of the PCAOB. Those standards require that we plan and perform the audit to obtain reasonable assurance about whether the financial statements are free of material misstatement, whether due to error or fraud. The Trust is not required to have, nor were we engaged to perform, an audit of the Trust’s internal control over financial reporting. As part of our audits, we are required to obtain an understanding of internal control over financial reporting, but not for the purpose of expressing an opinion on the effectiveness of the Trust’s internal control over financial reporting. Accordingly, we express no such opinion.
Our audits included performing procedures to assess the risks of material misstatement of the financial statements, whether due to error or fraud, and performing procedures that respond to those risks. Such procedures included examining, on a test basis, evidence regarding the amounts and disclosures in the financial statements. Our procedures included confirmation of securities owned as of December 31, 2022, by correspondence with the custodian, transfer agent,
44 | THE GUGGENHEIM FUNDS ANNUAL REPORT | |
REPORT OF INDEPENDENT REGISTERED PUBLIC ACCOUNTING FIRM (concluded) |
and brokers. Our audits also included evaluating the accounting principles used and significant estimates made by management, as well as evaluating the overall presentation of the financial statements. We believe that our audits provide a reasonable basis for our opinion.
We have served as the auditor of one or more Guggenheim investment companies since 1979.
Tysons, Virginia
February 24, 2023
| | THE GUGGENHEIM FUNDS ANNUAL REPORT | 45 |
OTHER INFORMATION (Unaudited) |
Federal Income Tax Information
This information is being provided as required by the Internal Revenue Code. Amounts shown may differ from those elsewhere in the report because of differences in tax and financial reporting practice.
In January 2023, shareholders will be advised on IRS Form 1099 DIV or substitute 1099 DIV as to the federal tax status of the distributions received by shareholders in the calendar year 2022.
The Fund’s investment income (dividend income plus short-term capital gains, if any) qualifies as follows:
Of the taxable ordinary income distributions paid during the fiscal year ended December 31, 2022, the Fund had the corresponding percentages qualify for the reduced tax rate pursuant to the Jobs and Growth Tax Relief and Reconciliation Act of 2003 or for the dividends received deduction for corporations. See the qualified dividend income and dividend received deduction columns, respectively, in the table below.
| | Qualified
Dividend
Income | | | Dividend
Received
Deduction | |
| | | | 0.00 | % | | | 0.00 | % |
Delivery of Shareholder Reports
Paper copies of the Fund’s annual and semi-annual shareholder reports are not sent by mail, unless you specifically request paper copies of the reports from the Fund or from your financial intermediary. Instead, the reports are made available on a website, and you are notified by mail each time a report is posted and provided with a website link to access the report.
You may elect to receive all future shareholder reports in paper free of charge. If you hold shares of the Fund directly, you can inform the Fund that you wish to receive paper copies of reports by calling 800.820.0888. If you hold shares of the Fund through a financial intermediary, please contact the financial intermediary to make this election. Your election to receive reports in paper may apply to all Guggenheim Funds in which you are invested and may apply to all Guggenheim Funds held with your financial intermediary.
Proxy Voting Information
A description of the policies and procedures that the Trust uses to determine how to vote proxies relating to securities held in the Fund’s portfolio is available, without charge and upon request, by calling 800.820.0888. This information is also available from the EDGAR database on the SEC’s website at https://www.sec.gov.
46 | THE GUGGENHEIM FUNDS ANNUAL REPORT | |
OTHER INFORMATION (Unaudited)(concluded) |
Information regarding how the Fund voted proxies relating to portfolio securities during the most recent 12-month period ended June 30 is available without charge, upon request, by calling 800.820.0888. This information is also available from the EDGAR database on the SEC’s website at https://www.sec.gov.
Sector Classification
Information in the Consolidated Schedule of Investments is categorized by sectors using sector-level Classifications defined by the Bloomberg Industry Classification System, a widely recognized industry classification system provider. The Fund’s registration statement has investment policies relating to concentration in specific sectors/industries. For purposes of these investment policies, the Fund usually classifies sectors/industries based on industry-level Classifications used by widely recognized industry classification system providers such as Bloomberg Industry Classification System, Global Industry Classification Standards and Barclays Global Classification Scheme.
Quarterly Portfolio Schedules Information
The Trust files its complete schedule of portfolio holdings with the SEC for the first and third quarters of each fiscal year as an exhibit to its reports on Form N-PORT, and for reporting periods ended prior to March 31, 2019, filed such information on Form N-Q. The Fund’s Forms N-PORT and N-Q are available on the SEC’s website at https://www.sec.gov. Copies of the portfolio holdings are also available to shareholders, without charge and upon request, by calling 800.820.0888.
| | THE GUGGENHEIM FUNDS ANNUAL REPORT | 47 |
INFORMATION ON BOARD OF TRUSTEES AND OFFICERS (Unaudited) |
A Board of Trustees oversees the Trust, as well as other trusts of GI, in which its members have no stated term of service, and continue to serve after election until resignation. The Fund’s Statement of Additional Information includes further information about Fund Trustees and Officers, and can be obtained without charge by visiting guggenheiminvestments.com or by calling 800.820.0888.
Name, Address*
and Year of Birth | Position(s)
Held with
Trust | Term of Office
and Length of
Time Served** | Principal Occupation(s)
During Past Five Years | Number of
Portfolios
in Fund
Complex
Overseen | Other
Directorships Held
by Trustees*** |
INDEPENDENT TRUSTEES | | |
Randall C. Barnes (1951) | Trustee and Chair of the Valuation Oversight Committee | Since 2019 (Trustee)
Since 2020 (Chair of the Valuation Oversight Committee) | Current: Private Investor (2001-present).
Former: Senior Vice President and Treasurer, PepsiCo, Inc. (1993-1997); President, Pizza Hut International (1991-1993); Senior Vice President, Strategic Planning and New Business Development, PepsiCo, Inc. (1987-1990). | 155 | Current: Advent Convertible and Income Fund (2005-present); Purpose Investments Funds (2013-present).
Former: Fiduciary/Claymore Energy Infrastructure Fund (2004-2022); Guggenheim Enhanced Equity Income Fund (2005-2021); Guggenheim Credit Allocation Fund (2013-2021). |
Angela Brock-Kyle (1959) | Trustee | Since 2016 | Current: Founder and Chief Executive Officer, B.O.A.R.D.S. (2013-present); Director, Mutual Fund Directors Forum (2022-present).
Former: Senior Leader, TIAA (1987-2012). | 154 | Current: Bowhead Insurance GP, LLC (2020-present); Hunt Companies, Inc. (2019-present).
Former: Fiduciary/Claymore Energy Infrastructure Fund (2019-2022); Guggenheim Enhanced Equity Income Fund (2019-2021); Guggenheim Credit Allocation Fund (2019-2021); Infinity Property & Casualty Corp. (2014-2018). |
48 | THE GUGGENHEIM FUNDS ANNUAL REPORT | |
INFORMATION ON BOARD OF TRUSTEES AND OFFICERS (Unaudited)(continued) |
Name, Address*
and Year of Birth | Position(s)
Held with
Trust | Term of Office
and Length of
Time Served** | Principal Occupation(s)
During Past Five Years | Number of
Portfolios
in Fund
Complex
Overseen | Other
Directorships Held
by Trustees*** |
INDEPENDENT TRUSTEES - continued | | |
Thomas F. Lydon, Jr. (1960) | Trustee and Chair of the Contracts Review Committee | Since 2005 (Trustee)
Since 2020 (Chair of the Contracts Review Committee) | Current: President, Global Trends Investments (1996-present); Chief Executive Officer, ETF Flows, LLC (2019-present); Chief Executive Officer, Lydon Media (2016-present); Director, GDX Index Partners, LLC (2021-present); Vice Chairman, VettaFi (2022-present). | 154 | Current: US Global Investors, Inc. (GROW) (1995-present).
Former: Fiduciary/Claymore Energy Infrastructure Fund (2019-2022); Guggenheim Enhanced Equity Income Fund (2019-2021); Guggenheim Credit Allocation Fund (2019-2021); Harvest Volatility Edge Trust (3) (2017-2019). |
| | THE GUGGENHEIM FUNDS ANNUAL REPORT | 49 |
INFORMATION ON BOARD OF TRUSTEES AND OFFICERS (Unaudited)(continued) |
Name, Address*
and Year of Birth | Position(s)
Held with
Trust | Term of Office
and Length of
Time Served** | Principal Occupation(s)
During Past Five Years | Number of
Portfolios
in Fund
Complex
Overseen | Other
Directorships Held
by Trustees*** |
INDEPENDENT TRUSTEES - continued | | |
Ronald A. Nyberg (1953) | Trustee and Chair of the Nominating and Governance Committee | Since 2019 | Current: Of Counsel, Momkus LLP (2016-present).
Former: Partner, Nyberg & Cassioppi, LLC (2000-2016); Executive Vice President, General Counsel, and Corporate Secretary, Van Kampen Investments (1982-1999). | 155 | Current: Advent Convertible and Income Fund (2003-present); PPM Funds (2) (2018-present); NorthShore-Edward-Elmhurst Health (2012-present).
Former: Fiduciary/Claymore Energy Infrastructure Fund (2004-2022); Guggenheim Enhanced Equity Income Fund (2005-2021); Guggenheim Credit Allocation Fund (2013-2021); Western Asset Inflation-Linked Opportunities & Income Fund (2004-2020); Western Asset Inflation-Linked Income Fund (2003-2020). |
50 | THE GUGGENHEIM FUNDS ANNUAL REPORT | |
INFORMATION ON BOARD OF TRUSTEES AND OFFICERS (Unaudited)(continued) |
Name, Address*
and Year of Birth | Position(s)
Held with
Trust | Term of Office
and Length of
Time Served** | Principal Occupation(s)
During Past Five Years | Number of
Portfolios
in Fund
Complex
Overseen | Other
Directorships Held
by Trustees*** |
INDEPENDENT TRUSTEES - continued | | |
Sandra G. Sponem (1958) | Trustee and Chair of the Audit Committee | Since 2016 (Trustee)
Since 2019 (Chair of the Audit Committee) | Current: Retired.
Former: Senior Vice President and Chief Financial Officer, M.A. Mortenson-Companies, Inc. (2007-2017). | 154 | Current: SPDR Series Trust (81) (2018-present); SPDR Index Shares Funds (30) (2018-present); SSGA Active Trust (14) (2018-present).
Former: Fiduciary/Claymore Energy Infrastructure Fund (2019-2022); Guggenheim Enhanced Equity Income Fund (2019-2021); Guggenheim Credit Allocation Fund (2019-2021); SSGA Master Trust (1) (2018-2020). |
| | THE GUGGENHEIM FUNDS ANNUAL REPORT | 51 |
INFORMATION ON BOARD OF TRUSTEES AND OFFICERS (Unaudited)(continued) |
Name, Address*
and Year of Birth | Position(s)
Held with
Trust | Term of Office
and Length of
Time Served** | Principal Occupation(s)
During Past Five Years | Number of
Portfolios
in Fund
Complex
Overseen | Other
Directorships Held
by Trustees*** |
INDEPENDENT TRUSTEES - concluded | | |
Ronald E. Toupin, Jr. (1958) | Trustee, Chair of the Board and Chair of the Executive Committee | Since 2019 | Current: Portfolio Consultant (2010-present); Member, Governing Council, Independent Directors Council (2013-present); Governor, Board of Governors, Investment Company Institute (2018-present).
Former: Member, Executive Committee, Independent Directors Council (2016-2018); Vice President, Manager and Portfolio Manager, Nuveen Asset Management (1998-1999); Vice President, Nuveen Investment Advisory Corp. (1992-1999); Vice President and Manager, Nuveen Unit Investment Trusts (1991-1999); and Assistant Vice President and Portfolio Manager, Nuveen Unit Investment Trusts (1988-1999), each of John Nuveen & Co., Inc. (1982-1999). | 154 | Former: Fiduciary/Claymore Energy Infrastructure Fund (2004-2022); Guggenheim Enhanced Equity Income Fund (2005-2021); Guggenheim Credit Allocation Fund (2013-2021); Western Asset Inflation-Linked Opportunities & Income Fund (2004-2020); Western Asset Inflation-Linked Income Fund (2003-2020). |
52 | THE GUGGENHEIM FUNDS ANNUAL REPORT | |
INFORMATION ON BOARD OF TRUSTEES AND OFFICERS (Unaudited)(continued) |
Name, Address*
and Year of Birth | Position(s)
Held with
Trust | Term of Office
and Length of
Time Served** | Principal Occupation(s)
During Past Five Years | Number of
Portfolios
in Fund
Complex
Overseen | Other
Directorships Held
by Trustees*** |
INTERESTED TRUSTEE | | |
Amy J. Lee**** (1961) | Trustee, Vice President and Chief Legal Officer | Since 2019 | Current: Interested Trustee, certain other funds in the Fund Complex (2018-present); Chief Legal Officer, certain other funds in the Fund Complex (2014-present); Vice President, certain other funds in the Fund Complex (2007-present); Senior Managing Director, Guggenheim Investments (2012-present).
Former: President and Chief Executive Officer, certain other funds in the Fund Complex (2017-2019); Vice President, Associate General Counsel and Assistant Secretary, Security Benefit Life Insurance Company and Security Benefit Corporation (2004-2012). | 154 | Former: Fiduciary/Claymore Energy Infrastructure Fund (2018-2022); Guggenheim Enhanced Equity Income Fund (2018-2021); Guggenheim Credit Allocation Fund (2018-2021). |
* | The business address of each Trustee is c/o Guggenheim Investments, 227 West Monroe Street, Chicago, Illinois 60606. |
** | Each Trustee serves an indefinite term, until his or her successor is elected and qualified. |
*** | Each Trustee also serves on the Boards of Trustees of Guggenheim Funds Trust, Guggenheim Variable Funds Trust, Guggenheim Strategy Funds Trust, Guggenheim Taxable Municipal Bond & Investment Grade Debt Trust, Guggenheim Strategic Opportunities Fund, Guggenheim Energy & Income Fund, Guggenheim Active Allocation Fund, Rydex Series Funds, Rydex Dynamic Funds, Rydex Variable Trust and Transparent Value Trust. Messrs. Barnes and Nyberg also serve on the Board of Trustees of Advent Convertible & Income Fund. |
**** | This Trustee is deemed to be an “interested person” of the Funds under the 1940 Act by reason of her position with the Adviser and/or the parent of the Adviser. |
| | THE GUGGENHEIM FUNDS ANNUAL REPORT | 53 |
INFORMATION ON BOARD OF TRUSTEES AND OFFICERS (Unaudited)(continued) |
Name, Address*
and Year of Birth | Position(s)
Held with
Trust | Term of Office
and Length of
Time Served** | Principal Occupation(s) During Past Five Years |
OFFICERS | | | |
Brian E. Binder (1972) | President and Chief Executive Officer | Since 2019 | Current: President, Mutual Fund Boards, Guggenheim Investments (2022-present); President and Chief Executive Officer, certain other funds in the Fund Complex (2018-present); President, Chief Executive Officer and Chairman of the Board of Managers, Guggenheim Funds Investment Advisors, LLC (2018-present); President and Chief Executive Officer, Security Investors, LLC (2018-present); Board Member, Guggenheim Partners Investment Funds plc (2022-present); Board Member, Guggenheim Global Investments plc (2022-present); Board Member, Guggenheim Partners Fund Management (Europe) Limited (2018-present).
Former: Senior Managing Director and Chief Administrative Officer, Guggenheim Investments (2018-2022); Managing Director and President, Deutsche Funds, and Head of US Product, Trading and Fund Administration, Deutsche Asset Management (2013-2018); Managing Director, Chairman of North American Executive Committee and Head of Business Management and Consulting, Invesco Ltd. (2010-2012). |
James M. Howley (1972) | Chief Financial Officer, Chief Accounting Officer and Treasurer | Since 2022 | Current: Managing Director, Guggenheim Investments (2004-present); Chief Financial Officer, Chief Accounting Officer, and Treasurer, certain other funds in the Fund Complex (2022-present).
Former: Assistant Treasurer, certain other funds in the Fund Complex (2006-2022); Manager, Mutual Fund Administration of Van Kampen Investments, Inc. (1996-2004). |
Mark E. Mathiasen (1978) | Secretary | Since 2017 | Current: Secretary, certain other funds in the Fund Complex (2007-present); Managing Director, Guggenheim Investments (2007-present). |
Glenn McWhinnie (1969) | Assistant Treasurer | Since 2016 | Current: Vice President, Guggenheim Investments (2009-present); Assistant Treasurer, certain other funds in the Fund Complex (2016-present). |
Michael P. Megaris (1984) | Assistant Secretary | Since 2018 | Current: Assistant Secretary, certain other funds in the Fund Complex (2014-present); Managing Director, Guggenheim Investments (2012-present). |
54 | THE GUGGENHEIM FUNDS ANNUAL REPORT | |
INFORMATION ON BOARD OF TRUSTEES AND OFFICERS (Unaudited)(continued) |
Name, Address*
and Year of Birth | Position(s)
Held with
Trust | Term of Office
and Length of
Time Served** | Principal Occupation(s) During Past Five Years |
OFFICERS - continued | | |
Elisabeth Miller (1968) | Chief Compliance Officer | Since 2012 | Current: Chief Compliance Officer, certain other funds in the Fund Complex (2012-present); Senior Managing Director, Guggenheim Investments (2012-present); Vice President, Guggenheim Funds Distributors, LLC (2014-present).
Former: Chief Compliance Officer, Security Investors, LLC and Guggenheim Funds Investment Advisors, LLC (2012-2018); Chief Compliance Officer, Guggenheim
Distributors, LLC (2009-2014); Senior Manager, Security Investors, LLC (2004-2014); Senior Manager, Guggenheim Distributors, LLC (2004-2014). |
Margaux Misantone (1978) | AML Officer | Since 2017 | Current: Chief Compliance Officer, Security Investors, LLC and Guggenheim Funds Investment Advisors, LLC (2018-present); AML Officer, Security Investors, LLC and certain other funds in the Fund Complex (2017-present); Managing Director, Guggenheim Investments (2015-present).
Former: Assistant Chief Compliance Officer, Security Investors, LLC and Guggenheim Funds Investments Advisors, LLC (2015-2018). |
Kimberly J. Scott (1974) | Assistant Treasurer | Since 2016 | Current: Director, Guggenheim Investments (2012-present); Assistant Treasurer, certain other funds in the Fund Complex (2012-present).
Former: Financial Reporting Manager, Invesco, Ltd. (2010-2011); Vice President/Assistant Treasurer, Mutual Fund Administration for Van Kampen Investments, Inc./Morgan Stanley Investment Management (2009-2010); Manager of Mutual Fund Administration, Van Kampen Investments, Inc./Morgan Stanley Investment Management (2005-2009). |
Bryan Stone (1979) | Vice President | Since 2019 | Current: Vice President, certain other funds in the Fund Complex (2014-present); Managing Director, Guggenheim Investments (2013-present).
Former: Senior Vice President, Neuberger Berman Group LLC (2009-2013); Vice President, Morgan Stanley (2002-2009). |
| | THE GUGGENHEIM FUNDS ANNUAL REPORT | 55 |
INFORMATION ON BOARD OF TRUSTEES AND OFFICERS (Unaudited)(concluded) |
Name, Address*
and Year of Birth | Position(s)
Held with
Trust | Term of Office
and Length of
Time Served** | Principal Occupation(s) During Past Five Years |
OFFICERS - concluded | | |
Jon Szafran (1989) | Assistant Treasurer | Since 2017 | Current: Director, Guggenheim Investments (2017-present); Assistant Treasurer, certain other funds in the Fund Complex (2017-present).
Former: Assistant Treasurer of Henderson Global Funds and Manager of US Fund Administration, Henderson Global Investors (North America) Inc. (“HGINA”), (2017); Senior Analyst of US Fund Administration, HGINA (2014–2017); Senior Associate of Fund Administration, Cortland Capital Market Services, LLC (2013-2014); Experienced Associate, PricewaterhouseCoopers LLP (2012-2013). |
* | The business address of each officer is c/o Guggenheim Investments, 227 West Monroe Street, Chicago, Illinois 60606. |
** | Each officer serves an indefinite term, until his or her successor is duly elected and qualified. |
56 | THE GUGGENHEIM FUNDS ANNUAL REPORT | |
GUGGENHEIM INVESTMENTS PRIVACY NOTICE (Unaudited) |
Who We Are
This Privacy Notice describes the data protection practices of Guggenheim Investments. Guggenheim Investments as used herein refers to the affiliated investment management businesses of Guggenheim Partners, LLC: Guggenheim Funds Investment Advisors, LLC, Guggenheim Partners Investment Management, LLC, Guggenheim Funds Distributors, LLC, Security Investors, LLC, Guggenheim Investment Advisors (Europe) Limited, Guggenheim Real Estate, LLC, GS Gamma Advisors, LLC, Guggenheim Partners India Management, LLC, Guggenheim Partners Europe Limited, as well as the funds in the Guggenheim Funds complex (the “Funds”) (“Guggenheim Investments,” “we,” “us,” or “our”).
Guggenheim Partners Investment Management Holdings, LLC, located at 330 Madison Avenue, New York, New York 10017, is the data controller for your information. The affiliates who are also controllers of certain of your information are: Guggenheim Investment Advisors (Europe) Limited, Guggenheim Partners Europe Limited, Guggenheim Partners, LLC, Guggenheim Funds Investment Advisors, LLC, Guggenheim Partners Investment Management, LLC, Guggenheim Funds Distributors, LLC and Security Investors, LLC, as well as the Funds.
Our Commitment to You
Guggenheim Investments considers your privacy our utmost concern. When you become our client or investor, you entrust us with not only your hard-earned money but also with your personal and financial information. Because we have access to your private information, we hold ourselves to the highest standards in its safekeeping and use. We strictly limit how we share your information with others, whether you are a current or former Guggenheim Investments client or investor.
The Information We Collect About You
We collect certain nonpublic personal information about you from information you provide on applications, other forms, our website, and/or from third parties including investment advisors. This information includes Social Security or other tax identification number, assets, income, tax information, retirement and estate plan information, transaction history, account balance, payment history, bank account information, marital status, family relationships, information that we collect on our website through the use of “cookies,” and other personal information that you or others provide to us. We may also collect such information through your inquiries by mail, e-mail or telephone. We may also collect customer due diligence information, as required by applicable law and regulation, through third party service providers.
How We Handle Your Personal Information
The legal basis for using your information as set out in this Privacy Notice is as follows: (a) use of your personal data is necessary to perform our obligations under any contract with you (such as a contract for us to provide financial services to you); or (b) where use of your personal data is not necessary for performance of a contract, use of your personal data is necessary for our
| | THE GUGGENHEIM FUNDS ANNUAL REPORT | 57 |
GUGGENHEIM INVESTMENTS PRIVACY NOTICE (Unaudited)(continued) |
legitimate interests or the legitimate interests of others (for example, to enforce the legal terms governing our services, operate and market our website and other services we offer, ensure safe environments for our personnel and others, make and receive payments, prevent fraud and to know the customer to whom we are providing the services). Some processing is done to comply with applicable law.
In addition to the specific uses described above, we also use your information in the following manner:
| | ● | We use your information in connection with servicing your accounts. |
| | ● | We use information to respond to your requests or questions. For example, we might use your information to respond to your customer feedback. |
| | ● | We use information to improve our products and services. We may use your information to make our website and products better. We may use your information to customize your experience with us. |
| | ● | We use information for security purposes. We may use your information to protect our company and our customers. |
| | ● | We use information to communicate with you. For example, we will communicate with you about your account or our relationship. We may contact you about your feedback. We might also contact you about this Privacy Notice. We may also enroll you in our email newsletter. |
| | ● | We use information as otherwise permitted by law, as we may notify you. |
| | ● | Aggregate/Anonymous Data. We may aggregate and/or anonymize any information collected through the website so that such information can no longer be linked to you or your device (“Aggregate/Anonymous Information”). We may use Aggregate/Anonymous Information for any purpose, including without limitation for research and marketing purposes, and may also share such data with any third parties, including advertisers, promotional partners, and sponsors. |
We do not sell information about current or former clients or their accounts to third parties. Nor do we share this information, except when necessary to complete transactions at your request, to make you aware of investment products and services that we or our affiliates offer, or as permitted or required by law.
We provide information about you to companies and individuals not affiliated with Guggenheim Investments to complete certain transactions or account changes, or to perform services for us related to your account. For example, if you ask to transfer assets from another financial institution to Guggenheim Investments, we must provide certain information about you to that company to complete the transaction. We provide the third party with only the information necessary to carry out its responsibilities and only for that purpose. And we require these third
58 | THE GUGGENHEIM FUNDS ANNUAL REPORT | |
GUGGENHEIM INVESTMENTS PRIVACY NOTICE (Unaudited)(continued) |
parties to treat your private information with the same high degree of confidentiality that we do. To alert you to other Guggenheim Investments products and services, we share your information within our family of affiliated companies. You may limit our sharing with affiliated companies as set out below. We may also share information with any successor to all or part of our business, or in connection with steps leading up to a merger or acquisition. For example, if part of our business was sold we may give customer information as part of that transaction. We may also share information about you with your consent.
We will release information about you if you direct us to do so, if we are compelled by law to do so, or in other circumstances as permitted by law (for example, to protect your account from fraud).
If you close your account(s) or become an inactive client or investor, we will continue to adhere to the privacy policies and practices described in this notice.
Opt-Out Provisions and Your Data Choices
The law allows you to “opt out” of certain kinds of information sharing with third parties. We do not share personal information about you with any third parties that triggers this opt-out right. This means YOU ARE ALREADY OPTED OUT.
When you are no longer our client or investor, we continue to share your information as described in this notice, and you may contact us at any time to limit our sharing by sending an email to CorporateDataPrivacy@GuggenheimPartners.com.
European Union Data Subjects and certain others: In addition to the choices set forth above, residents of the European Union and certain other jurisdictions have certain rights to (1) request access to or rectification or deletion of information we collect about them, (2) request a restriction on the processing of their information, (3) object to the processing of their information, or (4) request the portability of certain information. To exercise these or other rights, please contact us using the contact information below. We will consider all requests and provide our response within the time period stated by applicable law. Please note, however, that certain information may be exempt from such requests in some circumstances, which may include if we need to keep processing your information for our legitimate interests or to comply with a legal obligation. We may request you provide us with information necessary to confirm your identity before responding to your request.
Residents of France and certain other jurisdictions may also provide us with instructions regarding the manner in which we may continue to store, erase and share your information after your death, and where applicable, the person you have designated to exercise these rights after your death.
How We Protect Privacy Online
We take steps to protect your privacy when you use our web site – www.guggenheiminvestments.com – by using secure forms of online communication, including encryption technology, Secure Socket Layer (SSL) protocol, firewalls and user names and passwords. These safeguards vary based on the
| | THE GUGGENHEIM FUNDS ANNUAL REPORT | 59 |
GUGGENHEIM INVESTMENTS PRIVACY NOTICE (Unaudited)(concluded) |
sensitivity of the information that we collect and store. However, we cannot and do not guarantee that these measures will prevent every unauthorized attempt to access, use, or disclose your information since despite our efforts, no Internet and/or other electronic transmissions can be completely secure. Our web site uses “http cookies”—tiny pieces of information that we ask your browser to store. We use cookies for session management and security features on the Guggenheim Investments web site. We do not use them to pull data from your hard drive, to learn your e-mail address, or to view data in cookies created by other web sites. We will not share the information in our cookies or give others access to it. See the legal information area on our web site for more details about web site security and privacy features.
How We Safeguard Your Personal Information and Data Retention
We restrict access to nonpublic personal information about you to our employees and in some cases to third parties (for example, the service providers described above) as permitted by law. We maintain strict physical, electronic and procedural safeguards that comply with federal standards to guard your nonpublic personal information.
We keep your information for no longer than necessary for the purposes for which it is processed. The length of time for which we retain information depends on the purposes for which we collected and use it and/or as required to comply with applicable laws. Information may persist in copies made for backup and business continuity purposes for additional time.
International Visitors
If you are not a resident of the United States, please be aware that your information may be transferred to, stored and processed in the United States where our servers are located and our databases are operated. The data protection and other laws of the United States and other countries might not be as comprehensive as those in your country.
In such cases, we ensure that a legal basis for such a transfer exists and that adequate protection is provided as required by applicable law, for example, by using standard contractual clauses or by transferring your data to a jurisdiction that has obtained an adequacy finding. Individuals whose data may be transferred on the basis of standard contractual clauses may contact us as described below.
We’ll Keep You Informed
If you have any questions or concerns about how we treat your personal data, we encourage you to consult with us first. You may also contact the relevant supervisory authority.
We reserve the right to modify this policy at any time and will inform you promptly of material changes. You may access our privacy policy from our web site at www.guggenheiminvestments.com. Should you have any questions regarding our privacy policy, contact us by email at CorporateDataPrivacy@GuggenheimPartners.com.
60 | THE GUGGENHEIM FUNDS ANNUAL REPORT | |
This page intentionally left blank.
Item 2. Code of Ethics.
The registrant’s Board of Trustees has adopted a code of ethics that applies to the registrant’s principal executive officer and principal financial officer. No substantive amendments were approved or waivers were granted to the Code during the period covered by this report. The Code is filed as an exhibit to this Form N-CSR.
Item 3. Audit Committee Financial Expert.
The registrant's Board of Trustees has determined that it has at least one audit committee financial expert serving on its audit committee (the “Audit Committee”), Sandra G. Sponem. Ms. Sponem is “independent,” meaning that she is not an “interested person” of the Registrant (as that term is defined in Section 2(a)(19) of the Investment Company Act of 1940, as amended) and she does not accept any consulting, advisory, or other compensatory fee from the Registrant (except in her capacity as a Board or committee member).
(Under applicable securities laws, a person who is determined to be an audit committee financial expert will not be deemed an "expert" for any purpose, including without limitation for the purposes of Section 11 of the Securities Act of 1933, as amended, as a result of being designated or identified as an audit committee financial expert. The designation or identification of a person as an audit committee financial expert does not impose on such person any duties, obligations, or liabilities that are greater than the duties, obligations, and liabilities imposed on such person as a member of the Audit Committee and Board of Trustees in the absence of such designation or identification. The designation or identification of a person as an audit committee financial expert does not affect the duties, obligations or liability of any other member of the Audit Committee or Board of Trustees.)
Item 4. Principal Accountant Fees and Services.
(a) Audit Fees. The aggregate Audit Fees billed by the registrant’s principal accountant for professional services rendered for the audit of the annual financial statements or services that are normally provided by the accountant in connection with statutory and regulatory filings or engagements for the fiscal years ended December 31, 2022 and December 31, 2021 were $99,823 and $96,915, respectively.
(b) Audit Related Fees. The aggregate Audit-Related Fees billed by the registrant’s principal accountant for assurance and related services that are reasonably related to the performance of the audit of the registrant’s financial statements and are not reported under paragraph (a) of this Item for the fiscal years ended December 31, 2022 and December 31, 2021 were $0 and $0, respectively.
The aggregate fees billed in the Reporting Periods for assurance and related services by the Auditor to the registrant’s investment adviser (not including any sub-investment adviser whose role is primarily portfolio management and is subcontracted with or overseen by another investment adviser), and any entity controlling, controlled by or under common control with the investment adviser that provides ongoing services to the registrant (“Service Affiliates”) which required pre-approval by the Audit Committee which related to the review of the transfer agent function for the fiscal years ended December 31, 2022 and December 31, 2021 were $0 and $0, respectively.
(c) Tax Fees: The aggregate Tax Fees billed by the registrant’s principal accountant for professional services rendered for tax compliance, tax advice, and tax planning, including preparation of tax returns and distribution assistance, for the fiscal years ended December 31, 2022 and December 31, 2021 were $38,433 and $40,229, respectively. These services consisted of [(i) preparation of U.S. federal, state and excise tax returns; (ii) U.S. federal and state tax planning, advice and assistance regarding statutory, regulatory or administrative developments, (iii) tax advice regarding tax qualification matters and/or treatment of various financial instruments held or proposed to be acquired and (iv) review of U.S. federal excise distribution calculations].
(d) All Other Fees. The aggregate All Other Fees billed by the registrant’s principal accountant for products and services provided by the principal accountant, other than the services reported in paragraphs (a) through (c) of this Item, for the fiscal years ended December 31, 2022 and December 31, 2021 were $0 and $0, respectively.
(e) Audit Committee Pre-Approval Policies and Procedures.
(1) Audit Committee pre-approval policies and procedures:
To fulfill its responsibilities and duties the Audit Committee (the “Committee”) shall:
| 1. | Pre-Approval Policy (Trusts). Pre-approve any engagement of the independent auditors to provide any services, other than “prohibited non-audit services,” to the Trust, including the fees and other compensation to be paid to the independent auditors (unless an exception is available under Rule 2-01 of Regulation S-X). |
| (a) | The categories of services to be reviewed and considered for pre-approval include those services set forth under Section II.A.1. of the Background and Definitions for Audit Committee Charter, attached hereto as Appendix B (collectively, “Identified Services”). |
| (b) | The Committee has pre-approved Identified Services for which the estimated fees are less than $25,000. |
| (c) | For Identified Services with estimated fees of $25,000 or more, but less than $50,000, the Chair or any member of the Committee designated by the Chair is hereby authorized to pre-approve such Identified Services on behalf of the Committee. |
| (d) | For Identified Services with estimated fees of $50,000 or more, such Identified Services require pre-approval by the Committee. |
| (e) | All requests for Identified Services to be provided by the independent auditor that were pre-approved by the Committee shall be submitted to the Chief Accounting Officer (“CAO”) of the Trust by the independent auditor using the pre-approval request form attached as Appendix C hereto. The Trust’s CAO will determine whether such services are included within the list of services that have received the general pre-approval of the Committee. |
| (f) | The independent auditors or the CAO of the Trust (or an officer of the Trust who reports to the CAO) shall report to the Committee at each of its regular scheduled meetings all audit, audit-related and permissible non-audit services initiated since the last such report (unless the services were contained in the initial audit plan, as previously presented to, and approved by, the Committee). The report shall include a general description of the services and projected fees, and the means by which such services were approved by the Committee (including the particular category of Identified Services as set forth in Appendix B under which pre-approval was obtained). |
| 2. | Pre-Approval Policy (Adviser or Any Control Affiliate). Pre-approve any engagement of the independent auditors, including the fees and other compensation to be paid to the independent auditors, to provide any non-audit services to the Adviser (or any “control affiliate” of the Adviser providing ongoing services to the Trust), if the engagement relates directly to the operations or financial reporting of the Trust (unless an exception is available under Rule 2-01 of Regulation S-X). |
| (a) | The Chair or any member of the Committee designated by the Chair may grant the pre-approval for non-audit services to the Adviser (or any “control affiliate” of the Adviser providing ongoing services to the Trust) relating directly to the operations or financial reporting of the Trust for which the estimated fees are less than $25,000. All such delegated pre-approvals shall be presented to the Committee no later than the next regularly scheduled Committee meeting. |
| (b) | For non-audit services to the Adviser (or any “control affiliate” of the Adviser providing ongoing services to the Trust) relating directly to the operations or financial reporting of the Trust for which the estimated fees are $25,000 or more, such services require pre-approval by the Committee. |
| a. | Pre-Approval Requirements |
| i. | Categories of Services to be Reviewed and Considered for Pre-Approval |
| a. | Annual financial statement audits |
| b. | Seed audits (related to new product filings, as required) |
| c. | SEC and regulatory filings and consents |
| a. | Accounting consultations |
| b. | Fund merger/reorganization support services |
| c. | Other accounting related matters |
| d. | Agreed upon procedures reports |
| f. | Other internal control reports |
| a. | Recurring tax services: |
| i. | Preparation of Federal and state income tax returns, including extensions |
| ii. | Preparation of calculations of taxable income, including fiscal year tax designations |
| iii. | Preparation of annual Federal excise tax returns (if applicable) |
| iv. | Preparation of calendar year excise distribution calculations |
| v. | Calculation of tax equalization on an as-needed basis |
| vi. | Preparation of monthly/quarterly estimates of tax undistributed position for closed-end funds |
| vii. | Preparation of the estimated excise distribution calculations on an as-needed basis |
| viii. | Preparation of calendar year shareholder reporting designations on Form 1099 |
| ix. | Preparation of quarterly Federal, state and local and franchise tax estimated tax payments on an as-needed basis |
| x. | Preparation of state apportionment calculations to properly allocate Fund taxable income among the states for state tax filing purposes |
| xi. | Assistance with management’s identification of passive foreign investment companies (PFICs) for tax purposes |
| b. | Permissible non-recurring tax services upon request: |
| i. | Assistance with determining ownership changes which impact a Fund’s utilization of loss carryforwards |
| ii. | Assistance with corporate actions and tax treatment of complex securities and structured products |
| iii. | Assistance with IRS ruling requests and calculation of deficiency dividends |
| iv. | Conduct training sessions for the Adviser’s internal tax resources |
| v. | Assistance with Federal, state, local and international tax planning and advice regarding the tax consequences of proposed or actual transactions |
| vi. | Tax services related to amendments to Federal, state and local returns and sales and use tax compliance |
| vii. | RIC qualification reviews |
| viii. | Tax distribution analysis and planning |
| ix. | Tax authority examination services |
| x. | Tax appeals support services |
| xi. | Tax accounting methods studies |
| xii. | Fund merger, reorganization and liquidation support services |
| xiii. | Tax compliance, planning and advice services and related projects |
| xiv. | Assistance with out of state residency status |
| xv. | Provision of tax compliance services in India for Funds with direct investments in India |
| B. | Pre-Approval Not Required |
Under Section 10A(h)(i)(1)(B) of the Exchange Act and Rule 2-01 under Regulation S-X (Section (c)(7)), pre-approval of non-audit services for the Trust pursuant to Section V.B.2 is not required, if:
1. the aggregate amount of all non-audit services provided to the Trust is no more than 5% of the total fees paid by the Trust to the independent auditors during the fiscal year in which the non-audit services are provided;
2. the services were not recognized by Trust management at the time of the engagement as non-audit services; and
3. such services are promptly brought to the attention of the Audit Committee by Trust management and the Committee approves them (which may be by delegation) prior to the completion of the audit.
Under Section 10A(h)(i)(1)(B) of the Exchange Act and Rule 2-01 under Regulation S-X (Section (c)(7)), pre-approval of non-audit services for the Adviser (or any affiliate of the Adviser providing ongoing services to the Trust) pursuant to Section V.B.3 is not required, if:
1. the aggregate amount of all non-audit services provided is no more than 5% of the total fees paid to the Trust’s independent auditors by the Trust, the Adviser and any “control affiliate” of the Adviser providing ongoing services to the Trust during the fiscal year in which the non-audit services are provided;
2. the services were not recognized by Trust management at the time of the engagement as non-audit services; and
3. such services are promptly brought to the attention of the Audit Committee by Trust management and the Committee approves them (which may be by delegation) prior to the completion of the audit.
(2) None of the services described in each of Items 4(b) through (d) were approved by the Audit Committee pursuant to paragraph (c)(7)(i)(C) of Rule 2-01 of Regulation S-X
(f) Not applicable.
(g) Non-Audit Fees. The aggregate non-audit fees billed by the registrant’s accountant for the most recent fiscal year and the preceding fiscal year for services rendered to the registrant, the investment advisor, and any entity controlling, controlled by, or under common control with the advisor that provides ongoing services to the registrant were $38,433 and $40,229, respectively. These aggregate fees were less than the aggregate fees billed for the same periods by the registrant’s principal accountant for audit services rendered to the registrant, the investment advisor, and any entity controlling, controlled by, or under common control with the advisor that provides ongoing services to the registrant.
(h) Auditor Independence. The registrant’s Audit Committee was provided with information relating to the provision of non-audit services by Ernst & Young, LLP to the registrant’s investment adviser (not including any sub adviser whose role is primarily portfolio management and is subcontracted with or overseen by another investment adviser), and any entity controlling, controlled by, or under common control with the investment adviser that provides ongoing services to the registrant that were not pre-approved by the Audit Committee so that a determination could be made whether the provision of such services is compatible with maintaining Ernst & Young, LLP’s independence
Item 5. Audit Committee of Listed Registrants.
Not applicable.
Item 6. Investments.
Schedule of Investments is included as part of the report to shareholders filed under Item 1 of this form.
Item 7. Disclosure of Proxy Voting Policies and Procedures for Closed-End Management Investment Companies.
Not applicable.
Item 8. Portfolio Managers of Closed-End Management Investment Companies.
Not applicable.
Item 9. Purchases of Equity Securities by Closed-End Management Investment Company and Affiliated Purchasers.
Not applicable.
Item 10. Submission of Matters to a Vote of Security Holders.
The registrant does not currently have in place procedures by which shareholders may recommend nominees to the registrant’s board.
There have been no changes to the procedures by which shareholders may recommend nominees to the registrant’s board.
Item 11. Controls and Procedures.
(a) The registrant’s President (principal executive officer) and Treasurer (principal financial officer) have evaluated the registrant’s disclosure controls and procedures (as defined in Rule 30a-3(c) under the Investment Company Act) as of a date within 90 days of this filing and have concluded that based on such evaluation as required by Rule 30a-3(b) under the Investment Company Act, that the registrant’s disclosure controls and procedures were effective as of that date in ensuring that information required to be disclosed by the registrant in this Form N-CSR was recorded, processed, summarized, and reported within the time periods specified in the Securities and Exchange Commission’s rules and forms.
(b) The registrant’s principal executive officer and principal financial officer are aware of no change in the registrant’s internal control over financial reporting that occurred during the period covered by this report that has materially affected, or is reasonably likely to materially affect, the registrant’s internal control over financial reporting.
Item 12. Disclosure of Securities Lending Activities for Closed-End Management Investment Companies.
Not Applicable.
Item 13. Exhibits.
(a)(1) The registrant’s code of ethics pursuant to Item 2 of Form N-CSR is attached.
(a)(2) Separate certifications by the President (principal executive officer) and Treasurer (principal financial officer) of the registrant as required by Rule 30a-2(a) under the Act (17 CFR 270.30a-2(a)) are attached.
(b) A certification by the registrant’s President (principal executive officer) and Treasurer (principal financial officer) as required by Rule 30a-2(b) under the Act (17 CFR 270.30a-2(b)) is attached.
SIGNATURES
Pursuant to the requirements of the Securities Exchange Act of 1934 and the Investment Company Act of 1940, the registrant has duly caused this report to be signed on its behalf by the undersigned, thereunto duly authorized.
| (Registrant) | Rydex Series Funds | |
| | | |
| By (Signature and Title)* | /s/ Brian E. Binder | |
| | Brian E. Binder, President and Chief Executive Officer | |
| | | |
| Date | March 6, 2023 | |
Pursuant to the requirements of the Securities Exchange Act of 1934 and the Investment Company Act of 1940, this report has been signed below by the following persons on behalf of the registrant and in the capacities and on the dates indicated.
| By (Signature and Title)* | /s/ Brian E. Binder | |
| | Brian E. Binder, President and Chief Executive Officer | |
| | | |
| Date | March 6, 2023 | |
| | | |
| By (Signature and Title)* | /s/ James M. Howley | |
| | James M. Howley, Chief Financial Officer, Chief Accounting Officer, and Treasurer | |
| | | |
| Date | March 6, 2023 | |
| * | Print the name and title of each signing officer under his or her signature. |


