UNITED STATES
SECURITIES AND EXCHANGE COMMISSION
Washington, D.C. 20549
FORM N-CSR
CERTIFIED SHAREHOLDER REPORT OF REGISTERED MANAGEMENT
INVESTMENT COMPANIES
Investment Company Act file number 811- 07584
Rydex Series Funds
(Exact name of registrant as specified in charter)
702 King Farm Boulevard, Suite 200
Rockville, Maryland 20850
(Address of principal executive offices) (Zip code)
Amy J. Lee
Rydex Series Funds
702 King Farm Boulevard, Suite 200
Rockville, Maryland 20850
(Name and address of agent for service)
Registrant's telephone number, including area code: 1-301-296-5100
Date of fiscal year end: December 31
Date of reporting period: January 1, 2021 - December 31, 2021
Form N-CSR is to be used by management investment companies to file reports with the Commission not later than 10 days after the transmission to stockholders of any report that is required to be transmitted to stockholders under Rule 30e-1 under the Investment Company Act of 1940 (17 CFR 270.30e-1). The Commission may use the information provided on Form N-CSR in its regulatory, disclosure review, inspection, and policymaking roles.
A registrant is required to disclose the information specified by Form N-CSR, and the Commission will make this information public. A registrant is not required to respond to the collection of information contained in Form N-CSR unless the Form displays a currently valid Office of Management and Budget ("OMB") control number. Please direct comments concerning the accuracy of the information collection burden estimate and any suggestions for reducing the burden to Secretary, Securities and Exchange Commission, 450 Fifth Street, NW, Washington, DC 20549-0609. The OMB has reviewed this collection of information under the clearance requirements of 44 U.S.C. § 3507.
Item 1. Reports to Stockholders.
The registrant’s annual report transmitted to shareholders pursuant to Rule 30e-1 under the Investment Company Act of 1940, as amended (the “Investment Company Act”), is as follows:
12.31.2021
Guggenheim Funds Annual Report
Guggenheim Alternative Fund |
Guggenheim Multi-Hedge Strategies Fund | | |
Rydex Commodities Fund |
Rydex Commodities Strategy Fund | | |
GuggenheimInvestments.com | RDXSGIALT-ANN-1221x1222 |

| | |
DEAR SHAREHOLDER | 2 |
ECONOMIC AND MARKET OVERVIEW | 4 |
ABOUT SHAREHOLDERS’ FUND EXPENSES | 6 |
ALTERNATIVE FUND | |
MULTI-HEDGE STRATEGIES FUND | 9 |
COMMODITIES FUND | |
COMMODITIES STRATEGY FUND | 49 |
NOTES TO CONSOLIDATED FINANCIAL STATEMENTS | 63 |
REPORT OF INDEPENDENT REGISTERED PUBLIC ACCOUNTING FIRM | 89 |
OTHER INFORMATION | 91 |
INFORMATION ON BOARD OF TRUSTEES AND OFFICERS | 93 |
GUGGENHEIM INVESTMENTS PRIVACY NOTICE | 101 |
| | THE GUGGENHEIM FUNDS ANNUAL REPORT | 1 |
Dear Shareholder:
Security Investors, LLC (the “Investment Adviser”) is pleased to present the annual shareholder report for two alternative strategy funds that are part of the Rydex Series Funds (each a “Fund”). This report covers performance of the Funds for the annual period ended December 31, 2021.
The Investment Adviser is a part of Guggenheim Investments, which represents the investment management businesses of Guggenheim Partners, LLC (“Guggenheim”), a global, diversified financial services firm.
Guggenheim Funds Distributors, LLC is the distributor of the Funds. Guggenheim Funds Distributors, LLC is affiliated with Guggenheim and the Investment Adviser.
We encourage you to read the Economic and Market Overview section of the report, which follows this letter, and then the Performance Report and Fund Profile for each Fund.
We are committed to providing innovative investment solutions and appreciate the trust you place in us.
Sincerely,
Security Investors, LLC
January 31, 2022
Read a prospectus and summary prospectus (if available) carefully before investing. It contains the investment objectives, risks, charges, expenses and other information, which should be considered carefully before investing. Obtain a prospectus and summary prospectus (if available) at guggenheiminvestments.com or call 800.820.0888.
This material is not intended as a recommendation or as investment advice of any kind, including in connection with rollovers, transfers, and distributions. Such material is not provided in a fiduciary capacity, may not be relied upon for or in connection with the making of investment decisions, and does not constitute a solicitation of an offer to buy or sell securities. All content has been provided for informational or educational purposes only and is not intended to be and should not be construed as legal or tax advice and/or a legal opinion. Always consult a financial, tax and/or legal professional regarding your specific situation.
COVID-19 The outbreak of COVID-19 and the recovery response causes at times disruption to consumer demand, economic output, and supply chains. There are still travel restrictions, quarantines, and disparate global vaccine distributions. As with other serious economic disruptions, governmental authorities and regulators have responded to this situation with significant fiscal and monetary policy changes. These include providing direct capital infusions into companies, introducing new monetary programs, and considerably lowering interest rates. In some cases, these responses resulted in negative interest rates and higher inflation. Recently, the U.S. and other governments have also made investments and engaged in infrastructure modernization projects that have also increased public debt and spending. These actions, including their possible unexpected or sudden reversal or potential ineffectiveness, could further increase volatility in securities and other financial markets, reduce market liquidity, continue to cause higher inflation, heighten investor uncertainty, and adversely affect the value of the Funds’ investments and the performance of the Funds. These actions also contribute to a risk that asset prices have a higher degree of correlation than historically seen across markets and asset classes. The duration and extent of COVID-19 over the long term cannot be reasonably estimated at
2 | THE GUGGENHEIM FUNDS ANNUAL REPORT | |
this time. The ultimate impact of COVID-19 and the extent to which COVID-19 impacts the Funds will depend on future developments, which are highly uncertain and difficult to predict. Management continues to monitor and evaluate this situation.
The Multi-Hedge Strategies Fund is subject to a number of risks and may not be suitable for all investors. ● The Fund’s use of derivatives such as futures, options and swap agreements may expose the Fund to additional risks that it would not be subject to if it invested directly in the securities underlying those derivatives. ● The more the Fund invests in leveraged instruments, the more the leverage will magnify any gains or losses on those investments. ● The Fund’s use of short selling involves increased risks and costs. The Fund risks paying more for a security than it received from its sale. ● The Fund’s investments in high yield securities and unrated securities of similar credit quality (“junk bonds”) may be subject to greater levels of interest rate, credit and liquidity risk than funds that do not invest in such securities. ● The Fund’s fixed income investments will change in value in response to interest rate changes and other factors. ● The Fund’s exposure to the commodity and currency markets may subject the Fund to greater volatility as commodity- and currency-linked derivative investments may be affected by changes in overall market movements, commodity index volatility, changes in interest rates or factors affecting a particular industry, commodity or currency—such as droughts, floods, weather, livestock disease, embargoes, tariffs and international economic, political and regulatory developments. The Fund may also incur transaction costs with the conversion between various currencies. ● The Fund’s exposure to foreign currencies subjects the Fund to the risk that those currencies will decline in value relative to the U.S. dollar, or, in the case of short positions, that the U.S. dollar will decline in value relative to the currency being hedged. ● These risks may cause the Fund to experience higher losses and/or volatility than a fund that does not invest in derivatives, use leverage or short sales or have exposure to high yield/fixed income securities, foreign currencies and/or securities. ● Please read the prospectus for more detailed information regarding these and other risks.
The Commodities Strategy Fund is subject to a number of risks and may not be suitable for all investors. ● The Fund’s exposure to the commodity markets may subject the Fund to greater volatility as commodity-linked investments may be affected by changes in overall market movements, commodity index volatility, changes in interest rates or factors affecting a particular industry or commodity—such as droughts, floods, weather, embargos, tariffs and international economic, political and regulatory developments. ● To the extent that the Fund’s investments are concentrated in energy-related commodities, the Fund is subject to the risk that this sector will underperform the market as a whole. ● The Fund’s use of derivatives, such as futures, options, structured notes and swap agreements, may expose the Fund to additional risks that it would not be subject to if it invested directly in the securities or investments underlying those derivatives. ● The more the Fund invests in leveraged instruments, the more the leverage will magnify any gains or losses on those investments. ● The Fund is subject to tracking error risks, which may cause the Fund’s performance not to match that of or be lower than the Fund’s underlying benchmark. ● The Fund’s investments in other investment companies subjects the Fund to those risks affecting the investment company, including the possibility that the value of the underlying securities held by the investment company could decrease. Moreover, the Fund will incur its pro rata share of the expenses of the underlying investment companies’ expenses. ●This Fund is considered non-diversified and can invest a greater portion of its assets in securities of individual issuers than a diversified fund. As a result, changes in the market value of a single security could cause greater fluctuations in the value of Fund shares than would occur in a more diversified fund. ● Please read the prospectus for more detailed information regarding these and other risks.
| | THE GUGGENHEIM FUNDS ANNUAL REPORT | 3 |
ECONOMIC AND MARKET OVERVIEW (Unaudited) | December 31, 2021 |
During the 12-month period ended December 31, 2021, the S&P 500 Index reached all-time highs as investors largely brushed off concerns about new COVID-19 variants, global supply chain disruptions, inflationary fears, and other worrying factors that resulted in little more than brief selloffs before the index resumed its upward march.
The economic recovery made considerable progress in 2021 with the help of COVID-19 vaccines and enormous policy stimulus. We expect policymakers, led by the Federal Reserve (the “Fed”), will begin to scale back their support in 2022. However, because of their dovish policy framework, the Fed is deliberately “behind the curve.” As such, we expect real interest rates could remain negative in the near term, supporting above-potential economic growth and risk asset returns. Eventually an overheated economy will require that the Fed apply the brakes more firmly, but we believe that will be a greater concern in 2023.
U.S. real gross domestic product (“GDP”) slowed to 2.3% in the third quarter of 2021, but output has now fully recovered and now exceeds its supply side potential. We believe growth could bounce back to a robust 6–7% in the fourth quarter and remain well above potential in 2022, which would ensure a continued rapid decline in the unemployment rate.
A rapidly tightening labor market will put further pressure on wages, which are already surging. The Employment Cost Index, which is a measure of wage growth given that it controls for compositional changes (e.g. low paid industries losing jobs disproportionately), saw the largest quarterly gain in over 30 years in the third quarter reading. The share of businesses reporting plans to raise wages is also spiking, which suggests that further wage gains are in the pipeline.
As a result, the inflation narrative is evolving from a focus on the series of “transitory” shocks of 2021 to a focus on accelerating wage growth and housing inflation. While we believe that overall inflation will slow in 2022 as durable goods prices recede, core inflation should remain meaningfully above the Fed’s 2.0% target. We therefore expect that the Fed will deliver four rate increases in 2022, starting in March, and begin the process of quantitative tightening.
A key risk to our positive outlook is China, where massive property and credit imbalances threaten to unravel. Real GDP growth in 2021 slowed to a pace of just 4.0%, the weakest in the modern era excluding the first half of 2020. However, Chinese policymakers appear ready to step in to support faster growth. Separately, while the Omicron variant of COVID-19 has produced record cases, reduced severity and vaccines/treatments may portend only a modest drag on growth.
For the 12-month period ended December 31, 2021, the S&P 500® Index* returned 28.71%. The MSCI Europe-Australasia-Far East (“EAFE”) Index* returned 11.26%. The return of the MSCI Emerging Markets Index* was -2.54%.
In the bond market, the Bloomberg U.S. Aggregate Bond Index* posted a -1.54% return for the 12-month period, while the Bloomberg U.S. Corporate High Yield Index* returned 5.28%. The return of the ICE Bank of America (“BofA”) 3-Month U.S. Treasury Bill Index* was 0.05% for the 12-month period.
4 | THE GUGGENHEIM FUNDS ANNUAL REPORT | |
ECONOMIC AND MARKET OVERVIEW (Unaudited)(concluded) | December 31, 2021 |
The opinions and forecasts expressed may not actually come to pass. This information is subject to change at any time, based on market and other conditions, and should not be construed as a recommendation of any specific security or strategy.
*Index Definitions:
The following indices are referenced throughout this report. Indices are unmanaged and not available for direct investment. Index performance does not reflect transaction costs, fees, or expenses.
Bloomberg U.S. Aggregate Bond Index is a broad-based flagship benchmark that measures the investment grade, U.S. dollar-denominated, fixed-rate taxable bond market, including U.S. Treasuries, government-related and corporate securities, mortgage-backed securities or “MBS” (agency fixed-rate and hybrid adjustable-rate mortgage, or “ARM”, pass-throughs), asset-backed securities (“ABS”), and commercial mortgage-backed securities (“CMBS”) (agency and non-agency).
Bloomberg U.S. Corporate High Yield Index measures the U.S. dollar-denominated, high yield, fixed-rate corporate bond market. Securities are classified as high yield if the middle rating of Moody’s, Fitch, and S&P is Ba1/BB +/BB + or below.
HFRX Global Hedge Fund Index is designed to be representative of the overall composition of the hedge fund universe. It is comprised of all eligible hedge fund strategies, including, but not limited to, convertible arbitrage, distressed securities, equity hedge, equity market neutral, event driven, macro, merger arbitrage and relative-value arbitrage. The strategies are asset weighted based on the distribution of assets in the hedge fund industry.
ICE BofA 3-Month U.S. Treasury Bill Index is an unmanaged market Index of U.S. Treasury securities maturing in 90 days that assumes reinvestment of all income.
MSCI EAFE Index is a free float-adjusted market capitalization index that is designed to measure the equity market performance of developed markets, excluding the U.S. & Canada.
MSCI Emerging Markets Index is a free float-adjusted market capitalization weighted index that is designed to measure equity market performance in the global emerging markets.
S&P 500® Index is a broad-based index, the performance of which is based on the performance of 500 widely held common stocks chosen for market size, liquidity, and industry group representation.
S&P Goldman Sachs Commodity Index (S&P GSCI®), a benchmark for investment performance in the commodity markets, measures investable commodity price movements and inflation in the world economy. The index is calculated primarily on a world production weighted basis and is comprised of the principal physical commodities that are the subject of active, liquid futures markets.
| | THE GUGGENHEIM FUNDS ANNUAL REPORT | 5 |
ABOUT SHAREHOLDERS’ FUND EXPENSES (Unaudited) |
All mutual funds have operating expenses, and it is important for our shareholders to understand the impact of costs on their investments. Shareholders of a fund incur two types of costs: (i) transaction costs, including sales charges (loads) on purchase payments, reinvested dividends, other distributions, and exchange fees, and (ii) ongoing costs, including management fees, administrative services, and shareholder reports, among others. These ongoing costs, or operating expenses, are deducted from a fund’s gross income and reduce the investment return of the fund.
A fund’s expenses are expressed as a percentage of its average net assets, which is known as the expense ratio. The following examples are intended to help investors understand the ongoing costs (in dollars) of investing in a fund and to compare these costs with the ongoing costs of investing in other mutual funds.
The examples are based on an investment of $1,000 made at the beginning of the period and held for the entire six-month period beginning June 30, 2021 and ending December 31, 2021.
The following tables illustrate the Funds’ costs in two ways:
Table 1. Based on actual Fund return: This section helps investors estimate the actual expenses paid over the period. The “Ending Account Value” shown is derived from the Fund’s actual return, and the fifth column shows the dollar amount that would have been paid by an investor who started with $1,000 in the Fund. Investors may use the information here, together with the amount invested, to estimate the expenses paid over the period. Simply divide the Fund’s account value by $1,000 (for example, an $8,600 account value divided by $1,000 = 8.6), then multiply the result by the number provided under the heading “Expenses Paid During Period.”
Table 2. Based on hypothetical 5% return: This section is intended to help investors compare a fund’s cost with those of other mutual funds. The table provides information about hypothetical account values and hypothetical expenses based on the Fund’s actual expense ratio and an assumed rate of return of 5% per year before expenses, which is not the Fund’s actual return. The hypothetical account values and expenses may not be used to estimate the actual ending account balance or expenses paid during the period. The example is useful in making comparisons because the U.S. Securities and Exchange Commission (the “SEC”) requires all mutual funds to calculate expenses based on the 5% return. Investors can assess a fund’s costs by comparing this hypothetical example with the hypothetical examples that appear in shareholder reports of other funds.
The calculations illustrated above assume no shares were bought or sold during the period. Actual costs may have been higher or lower, depending on the amount of investment and the timing of any purchases or redemptions.
6 | THE GUGGENHEIM FUNDS ANNUAL REPORT | |
ABOUT SHAREHOLDERS’ FUND EXPENSES (Unaudited)(continued) |
Please note that the expenses shown in the table are meant to highlight your ongoing costs only and do not reflect any transactional costs, such as sales charges (loads) on purchase payments, and contingent deferred sales charges (“CDSC”) on redemptions, if any. Therefore, the second table is useful in comparing ongoing costs only, and will not help you determine the relative total costs of owning different funds. In addition, if these transactional costs were included, your costs would have been higher.
More information about the Funds’ expenses, including annual expense ratios for periods up to five years (subject to the Fund’s inception date), can be found in the Financial Highlights section of this report. For additional information on operating expenses and other shareholder costs, please refer to the appropriate Fund prospectus.
| | THE GUGGENHEIM FUNDS ANNUAL REPORT | 7 |
ABOUT SHAREHOLDERS’ FUND EXPENSES (Unaudited)(concluded) |
| Expense
Ratio1 | Fund
Return | Beginning
Account Value
June 30,
2021 | Ending
Account Value
December 31,
2021 | Expenses
Paid During
Period2 |
Table 1. Based on actual Fund return3 |
Multi-Hedge Strategies Fund |
A-Class | 2.17% | (2.10%) | $ 1,000.00 | $ 979.00 | $ 10.82 |
C-Class | 2.97% | (2.43%) | 1,000.00 | 975.70 | 14.79 |
P-Class | 2.16% | (2.08%) | 1,000.00 | 979.20 | 10.78 |
Institutional Class | 1.91% | (1.93%) | 1,000.00 | 980.70 | 9.54 |
Commodities Strategy Fund |
A-Class | 1.67% | 5.96% | 1,000.00 | 1,059.60 | 8.67 |
C-Class | 2.41% | 5.59% | 1,000.00 | 1,055.90 | 12.49 |
H-Class | 1.65% | 5.99% | 1,000.00 | 1,059.90 | 8.57 |
|
Table 2. Based on hypothetical 5% return (before expenses) |
Multi-Hedge Strategies Fund |
A-Class | 2.17% | 5.00% | $ 1,000.00 | $ 1,014.27 | $ 11.02 |
C-Class | 2.97% | 5.00% | 1,000.00 | 1,010.23 | 15.05 |
P-Class | 2.16% | 5.00% | 1,000.00 | 1,014.32 | 10.97 |
Institutional Class | 1.91% | 5.00% | 1,000.00 | 1,015.58 | 9.70 |
Commodities Strategy Fund |
A-Class | 1.67% | 5.00% | 1,000.00 | 1,016.79 | 8.49 |
C-Class | 2.41% | 5.00% | 1,000.00 | 1,013.06 | 12.23 |
H-Class | 1.65% | 5.00% | 1,000.00 | 1,016.89 | 8.39 |
1 | Annualized and excludes expenses of the underlying funds in which the Funds invest. This ratio represents net expenses which includes dividends on short sales and prime broker interest expenses. Excluding these expenses, the net expense ratio of the Multi-Hedge Strategies Fund would be 1.42%, 2.19%, 1.42% and 1.17% for the A-Class, C-Class, P-Class and Institutional Class, respectively. |
2 | Expenses are equal to the Fund’s annualized expense ratio, net of any applicable fee waivers, multiplied by the average account value over the period, multiplied by 184/365 (to reflect the one-half year period). |
3 | Actual cumulative return at net asset value for the period June 30, 2021 to December 31, 2021. |
8 | THE GUGGENHEIM FUNDS ANNUAL REPORT | |
PERFORMANCE REPORT AND FUND PROFILE (Unaudited) | December 31, 2021 |
MULTI-HEDGE STRATEGIES FUND
OBJECTIVE: Seeks to provide long-term capital appreciation with less risk than traditional equity funds.
The Fund seeks capital appreciation with low correlation to equity and fixed income markets, while doing so with low risk*–typically in the 5% to 8% range.
For the one-year period ended December 31, 2021, the Institutional Class shares of the Fund produced a return of 7.43%.
The Fund succeeded in maintaining low correlation with stock and bond indices, as its correlation with the S&P 500 Index and the Bloomberg U.S. Aggregate Bond Index came in at 49% and -16%, respectively. During the period the Fund experienced 6.5% risk, as measured by annualized daily return standard deviation.
The Fund outperformed the HFRX Global Hedge Fund Index, which returned 3.65% for the year. The HFRX Global Hedge Fund Index had a correlation of 71% with the S&P 500 Index and a -18% correlation to the Bloomberg U.S. Aggregate Bond Index in 2021.
Three hedge fund strategies used within the Fund contributed positively to Fund returns in 2021. Specifically, Equity Market Neutral, Merger Arbitrage, and Long/Short Equity strategies were positive contributors for the year. Global Macro was the only strategy to detract from performance this year.
The Fund held derivatives for a number of reasons, including liquidity, leverage, speculation, duration management, index exposure, and hedging. Derivatives were liquid and allowed the Fund to gain leveraged access to markets in order to express investment views and to hedge exposures. During the year, derivatives were used within the Global Macro, Long/Short Equity, and Equity Market Neutral strategies and to a limited extent in the Merger Arbitrage strategy. Overall, the use of derivatives had a positive contribution to Fund performance for the year.
Guggenheim Ultra Short Duration Fund and Guggenheim Strategy Funds were utilized within the Fund to achieve higher yields than what would otherwise be achieved through overnight repurchase agreements or short-term investments.
Performance displayed represents past performance which is no guarantee of future results.
* | Risk is measured by standard deviation, a statistic of the historical volatility of an investment, usually computed using the most recent 36-monthly returns and then annualized. More generally, it is a measure of the extent to which numbers are spread around their average. The higher the number, the more volatility is to be expected. |
| | THE GUGGENHEIM FUNDS ANNUAL REPORT | 9 |
PERFORMANCE REPORT AND FUND PROFILE (Unaudited)(continued) | December 31, 2021 |
Consolidated Holdings Diversification (Market Exposure as % of Net Assets)
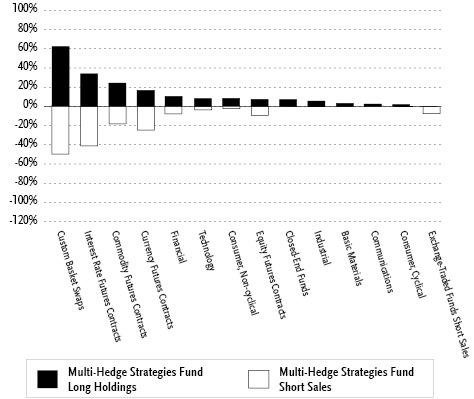
“Consolidated Holdings Diversification (Market Exposure as % of Net Assets)” excludes any temporary cash investments, investments in Guggenheim Strategy Funds Trust mutual funds, or investments in Guggenheim Ultra Short Duration Fund. Investments in those Funds do not provide “market exposure” to meet the Fund’s investment objective, but will significantly increase the portfolio’s exposure to certain other asset categories (and their associated risks), which may cause the Fund to deviate from its principal investment strategy, including: (i) high yield, high risk debt securities rated below the top four long-term rating categories by a nationally recognized statistical rating organization (also known as “junk bonds”); (ii) securities issued by the U.S. government or its agencies and instrumentalities; (iii) CLOs and similar investments; and (iv) other short-term fixed income securities.
10 | THE GUGGENHEIM FUNDS ANNUAL REPORT | |
PERFORMANCE REPORT AND FUND PROFILE (Unaudited)(continued) | December 31, 2021 |
Inception Dates: |
Institutional Class | May 3, 2010 |
A-Class | September 19, 2005 |
C-Class | September 19, 2005 |
P-Class | September 19, 2005 |
Ten Largest Holdings (% of Total Net Assets) |
Guggenheim Strategy Fund II | 7.4% |
Guggenheim Ultra Short Duration Fund — Institutional Class | 5.2% |
Xilinx, Inc. | 2.8% |
IHS Markit Ltd. | 2.5% |
Nuance Communications, Inc. | 2.4% |
Magellan Health, Inc. | 1.5% |
Guggenheim Strategy Fund III | 1.4% |
Athene Holding Ltd. — Class A | 1.3% |
Coherent, Inc. | 1.3% |
Ferro Corp. | 1.2% |
Top Ten Total | 27.0% |
| | |
“Ten Largest Holdings” excludes any temporary cash or derivative investments. |
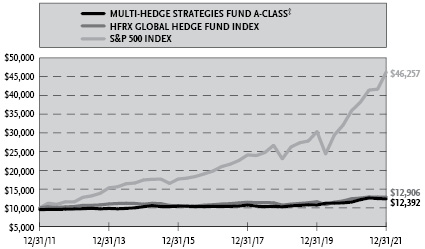
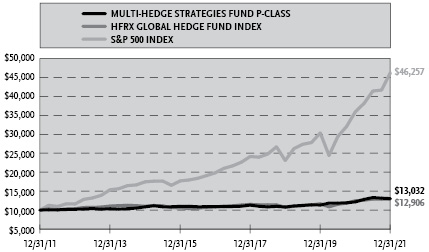
Cumulative Fund Performance*
| | THE GUGGENHEIM FUNDS ANNUAL REPORT | 11 |
PERFORMANCE REPORT AND FUND PROFILE (Unaudited)(concluded) | December 31, 2021 |
Average Annual Returns*
Periods Ended December 31, 2021
| 1 Year | 5 Year | 10 Year |
A-Class Shares | 7.17% | 3.54% | 2.67% |
A-Class Shares with sales charge‡ | 2.08% | 2.54% | 2.17% |
C-Class Shares | 6.32% | 2.80% | 1.91% |
C-Class Shares with CDSC§ | 5.32% | 2.80% | 1.91% |
P-Class Shares | 7.16% | 3.58% | 2.68% |
Institutional Class Shares | 7.43% | 3.80% | 2.93% |
S&P 500 Index | 28.71% | 18.47% | 16.55% |
HFRX Global Hedge Fund Index | 3.65% | 3.52% | 2.58% |
* | The performance data above represents past performance that is not predictive of future results. The investment return and principal value of an investment in the Fund will fluctuate so that an investor’s shares, when redeemed, may be worth more or less than their original cost. Returns are historical and include changes in principal and reinvested dividends and capital gains and do not reflect the effect of taxes. The S&P 500 Index and HFRX Global Hedge Fund Index are unmanaged indices and, unlike the Fund, have no management fees or operating expenses to reduce their reported returns. The graphs are based on A-Class share and P-Class shares only; performance for C-Class and Institutional Class shares will vary due to differences in fee structures. |
‡ | Fund returns are calculated using the maximum sales charge of 4.75%. |
§ | Fund returns include a CDSC of 1% if redeemed within 12 months of purchase. |
12 | THE GUGGENHEIM FUNDS ANNUAL REPORT | |
CONSOLIDATED SCHEDULE OF INVESTMENTS | December 31, 2021 |
MULTI-HEDGE STRATEGIES FUND | |
| | Shares | | | Value | |
COMMON STOCKS† - 39.4% |
| | | | | | | | | |
Financial - 10.6% |
Athene Holding Ltd. — Class A* | | | 11,013 | | | $ | 917,713 | |
People’s United Financial, Inc. | | | 48,387 | | | | 862,256 | |
Monmouth Real Estate Investment Corp. REIT | | | 40,114 | | | | 842,795 | |
CyrusOne, Inc. REIT | | | 9,392 | | | | 842,650 | |
MGM Growth Properties LLC — Class A REIT | | | 16,551 | | | | 676,108 | |
CIT Group, Inc. | | | 10,573 | | | | 542,818 | |
Investors Bancorp, Inc. | | | 31,211 | | | | 472,847 | |
Flagstar Bancorp, Inc. | | | 9,355 | | | | 448,479 | |
TriState Capital Holdings, Inc.* | | | 13,971 | | | | 422,762 | |
CorePoint Lodging, Inc. REIT* | | | 26,565 | | | | 417,071 | |
Great Western Bancorp, Inc. | | | 10,324 | | | | 350,603 | |
Sterling Bancorp | | | 13,158 | | | | 339,345 | |
State Auto Financial Corp. | | | 6,307 | | | | 326,009 | |
Total Financial | | | 7,461,456 | |
| | | | | | | | | |
Technology - 8.1% |
Xilinx, Inc. | | | 9,242 | | | | 1,959,581 | |
Nuance Communications, Inc.* | | | 30,874 | | | | 1,707,950 | |
PAE, Inc.* | | | 85,495 | | | | 848,965 | |
Change Healthcare, Inc.* | | | 36,682 | | | | 784,261 | |
Cerner Corp. | | | 4,553 | | | | 422,837 | |
Total Technology | | | 5,723,594 | |
| | | | | | | | | |
Consumer, Non-cyclical - 8.0% |
IHS Markit Ltd. | | | 13,091 | | | | 1,740,056 | |
Magellan Health, Inc.* | | | 11,030 | | | | 1,047,740 | |
Sanderson Farms, Inc. | | | 3,900 | | | | 745,212 | |
GreenSky, Inc. — Class A* | | | 65,037 | | | | 738,820 | |
Intersect ENT, Inc.* | | | 23,678 | | | | 646,646 | |
Arena Pharmaceuticals, Inc.* | | | 4,606 | | | | 428,082 | |
RR Donnelley & Sons Co.* | | | 29,423 | | | | 331,303 | |
Total Consumer, Non-cyclical | | | 5,677,859 | |
| | | | | | | | | |
Industrial - 5.4% |
Coherent, Inc.* | | | 3,364 | | | | 896,664 | |
Forterra, Inc.* | | | 31,588 | | | | 751,162 | |
Welbilt, Inc.* | | | 28,767 | | | | 683,792 | |
Teekay LNG Partners, LP | | | 37,040 | | | | 627,087 | |
Aerojet Rocketdyne Holdings, Inc. | | | 13,359 | | | | 624,667 | |
SPX FLOW, Inc. | | | 2,340 | | | | 202,363 | |
Total Industrial | | | 3,785,735 | |
| | | | | | | | | |
Basic Materials - 3.1% |
Ferro Corp.* | | | 40,498 | | | | 884,071 | |
Kraton Corp.* | | | 9,514 | | | | 440,689 | |
Atotech Ltd.* | | | 17,259 | | | | 440,450 | |
Rogers Corp.* | | | 1,562 | | | | 426,426 | |
Total Basic Materials | | | 2,191,636 | |
| | | | | | | | | |
Communications - 2.4% |
Mimecast Ltd.* | | | 8,007 | | | | 637,117 | |
Vonage Holdings Corp.* | | | 30,603 | | | | 636,236 | |
NeoPhotonics Corp.* | | | 26,811 | | | | 412,085 | |
Total Communications | | | 1,685,438 | |
| | | | | | | | | |
SEE NOTES TO CONSOLIDATED FINANCIAL STATEMENTS. | THE GUGGENHEIM FUNDS ANNUAL REPORT | 13 |
CONSOLIDATED SCHEDULE OF INVESTMENTS (continued) | December 31, 2021 |
MULTI-HEDGE STRATEGIES FUND | |
| | Shares | | | Value | |
Consumer, Cyclical - 1.8% |
Veoneer, Inc.* | | | 18,045 | | | $ | 640,241 | |
Casper Sleep, Inc.* | | | 61,814 | | | | 412,917 | |
Golden Nugget Online Gaming, Inc.* | | | 23,257 | | | | 231,407 | |
Total Consumer, Cyclical | | | 1,284,565 | |
| | | | | | | | | |
Total Common Stocks |
(Cost $26,062,455) | | | | | | | 27,810,283 | |
| | | | | | | | | |
RIGHTS††† - 0.0% |
Consumer, Non-cyclical - 0.0% |
Lantheus Holdings, Inc.* | | | 42,000 | | | | — | |
Alexion Pharmaceuticals, Inc.* | | | 34,843 | | | | — | |
Total Consumer, Non-cyclical | | | — | |
| | | | | | | | | |
Total Rights |
(Cost $—) | | | | | | | — | |
| | | | | | | | | |
MUTUAL FUNDS† - 14.0% |
Guggenheim Strategy Fund II1 | | | 209,304 | | | | 5,207,495 | |
Guggenheim Ultra Short Duration Fund — Institutional Class1 | | | 372,043 | | | | 3,690,666 | |
Guggenheim Strategy Fund III1 | | | 39,063 | | | | 977,752 | |
Total Mutual Funds |
(Cost $9,886,814) | | | | | | | 9,875,913 | |
| | | | | | | | | |
CLOSED-END FUNDS† - 7.0% |
Aberdeen Global Premier Properties Fund | | | 29,937 | | | | 204,769 | |
Nuveen Real Estate Income Fund | | | 15,935 | | | | 204,287 | |
CBRE Global Real Estate Income Fund | | | 20,822 | | | | 203,847 | |
Royce Value Trust, Inc.2 | | | 10,123 | | | | 198,309 | |
Aberdeen Total Dynamic Dividend Fund | | | 19,359 | | | | 197,849 | |
General American Investors Company, Inc. | | | 4,423 | | | | 195,497 | |
Gabelli Dividend & Income Trust | | | 7,204 | | | | 194,508 | |
LMP Capital and Income Fund, Inc. | | | 12,687 | | | | 192,842 | |
Adams Diversified Equity Fund, Inc. | | | 9,906 | | | | 192,276 | |
Royce Micro-Capital Trust, Inc. | | | 16,531 | | | | 190,933 | |
Virtus AllianzGI Convertible & Income Fund | | | 32,720 | | | | 190,758 | |
BlackRock California Municipal Income Trust | | | 13,066 | | | | 190,110 | |
PGIM Global High Yield Fund, Inc. | | | 12,573 | | | | 189,727 | |
Nuveen New York AMT-Free Quality Municipal Income Fund | | | 13,746 | | | | 189,557 | |
Saba Capital Income & Opportunities Fund | | | 41,689 | | | | 188,434 | |
Virtus AllianzGI Convertible & Income Fund II | | | 36,770 | | | | 187,527 | |
Tri-Continental Corp.2 | | | 5,399 | | | | 179,193 | |
Miller/Howard High Dividend Fund | | | 15,368 | | | | 158,598 | |
Nuveen New York Quality Municipal Income Fund | | | 9,472 | | | | 140,091 | |
Gabelli Healthcare & WellnessRx Trust | | | 8,447 | | | | 114,626 | |
14 | THE GUGGENHEIM FUNDS ANNUAL REPORT | SEE NOTES TO CONSOLIDATED FINANCIAL STATEMENTS. |
CONSOLIDATED SCHEDULE OF INVESTMENTS (continued) | December 31, 2021 |
MULTI-HEDGE STRATEGIES FUND | |
| | Shares | | | Value | |
Invesco Trust for Investment Grade New York Municipals | | | 8,536 | | | $ | 114,553 | |
Western Asset Managed Municipals Fund, Inc. | | | 8,660 | | | | 113,273 | |
Invesco Dynamic Credit Opportunities Fund* | | | 9,072 | | | | 112,765 | |
Invesco Pennsylvania Value Municipal Income Trust | | | 7,747 | | | | 108,226 | |
Nuveen New Jersey Quality Municipal Income Fund | | | 6,826 | | | | 104,984 | |
Delaware Ivy High Income Opportunities Fund | | | 6,594 | | | | 91,854 | |
Sprott Focus Trust, Inc. | | | 10,508 | | | | 90,365 | |
Aberdeen Japan Equity Fund, Inc. | | | 8,046 | | | | 65,414 | |
Morgan Stanley Emerging Markets Debt Fund, Inc. | | | 7,039 | | | | 63,421 | |
Swiss Helvetia Fund, Inc. | | | 5,667 | | | | 56,330 | |
Nuveen Ohio Quality Municipal Income Fund | | | 3,413 | | | | 54,506 | |
Source Capital, Inc. | | | 986 | | | | 42,605 | |
Tortoise Power and Energy Infrastructure Fund, Inc. | | | 2,552 | | | | 34,758 | |
Neuberger Berman New York Municipal Fund, Inc. | | | 2,630 | | | | 34,190 | |
Gabelli Global Small and Mid Capital Value Trust | | | 2,095 | | | | 33,310 | |
Delaware Investments Minnesota Municipal Income Fund II, Inc. | | | 2,289 | | | | 32,298 | |
Western Asset Municipal Partners Fund, Inc. | | | 1,937 | | | | 30,140 | |
MFS Investment Grade Municipal Trust | | | 2,215 | | | | 22,836 | |
Western Asset Intermediate Muni Fund, Inc. | | | 1,928 | | | | 18,586 | |
Herzfeld Caribbean Basin Fund, Inc. | | | 3,326 | | | | 18,562 | |
Royce Global Value Trust, Inc. | | | 1,032 | | | | 13,540 | |
Delaware Investments National Municipal Income Fund | | | 937 | | | | 13,230 | |
New Ireland Fund, Inc. | | | 905 | | | | 10,100 | |
Total Closed-End Funds |
(Cost $4,790,725) | | | | | | | 4,983,584 | |
| | | | | | | | | |
| | | Face
Amount | | | | | |
U.S. TREASURY BILLS†† - 12.8% |
U.S. Treasury Bills |
0.02% due 01/18/223,4 | | $ | 5,800,000 | | | | 5,799,964 | |
0.04% due 01/06/224,5 | | | 3,286,000 | | | | 3,285,999 | |
Total U.S. Treasury Bills |
(Cost $9,085,920) | | | | | | | 9,085,963 | |
SEE NOTES TO CONSOLIDATED FINANCIAL STATEMENTS. | THE GUGGENHEIM FUNDS ANNUAL REPORT | 15 |
CONSOLIDATED SCHEDULE OF INVESTMENTS (continued) | December 31, 2021 |
MULTI-HEDGE STRATEGIES FUND | |
| | Face
Amount | | | Value | |
REPURCHASE AGREEMENTS††,6 - 22.5% |
J.P. Morgan Securities LLC
issued 12/31/21 at 0.05%
due 01/03/22 | | $ | 8,866,539 | | | $ | 8,866,539 | |
Barclays Capital, Inc.
issued 12/31/21 at 0.01%
due 01/03/22 | | | 3,666,936 | | | | 3,666,936 | |
BofA Securities, Inc.
issued 12/31/21 at 0.02%
due 01/03/22 | | | 3,333,578 | | | | 3,333,578 | |
Total Repurchase Agreements |
(Cost $15,867,053) | | | | | | | 15,867,053 | |
| | | | | | | | | |
| | | Shares | | | | | |
SECURITIES LENDING COLLATERAL†,7 - 0.4% |
Money Market Fund |
First American Government Obligations Fund — Class Z, 0.02%8 | | | 281,926 | | | | 281,926 | |
Total Securities Lending Collateral |
(Cost $281,926) | | | | | | | 281,926 | |
| | | | | | | | | |
Total Investments - 96.1% |
(Cost $65,974,893) | | $ | 67,904,722 | |
| | | | | | | | | |
COMMON STOCKS SOLD SHORT† - (14.7)% |
Industrial - (0.3)% |
II-VI, Inc.* | | | 3,061 | | | | (209,158 | ) |
| | | | | | | | | |
Consumer, Cyclical - (0.3)% |
DraftKings, Inc. — Class A* | | | 8,489 | | | | (233,193 | ) |
| | | | | | | | | |
Consumer, Non-cyclical - (2.5)% |
S&P Global, Inc. | | | 3,715 | | | | (1,753,220 | ) |
Technology - (3.5)% |
MKS Instruments, Inc. | | | 953 | | | | (165,984 | ) |
Advanced Micro Devices, Inc.* | | | 15,928 | | | | (2,292,039 | ) |
Total Technology | | | (2,458,023 | ) |
| | | | | | | | | |
Financial - (8.1)% |
Webster Financial Corp. | | | 6,104 | | | | (340,847 | ) |
Raymond James Financial, Inc. | | | 3,493 | | | | (350,697 | ) |
First Interstate BancSystem, Inc. — Class A | | | 8,698 | | | | (353,748 | ) |
Citizens Financial Group, Inc. | | | 9,270 | | | | (438,007 | ) |
New York Community Bancorp, Inc. | | | 37,561 | | | | (458,620 | ) |
First Citizens BancShares, Inc. — Class A | | | 656 | | | | (544,375 | ) |
VICI Properties, Inc. | | | 22,609 | | | | (680,757 | ) |
Goldman Sachs Group, Inc. | | | 1,951 | | | | (746,355 | ) |
M&T Bank Corp. | | | 5,710 | | | | (876,942 | ) |
Apollo Asset Management, Inc. | | | 12,654 | | | | (916,529 | ) |
Total Financial | | | (5,706,877 | ) |
| | | | | | | | | |
Total Common Stocks Sold Short |
(Proceeds $8,650,335) | | | (10,360,471 | ) |
| | | | | | | | | |
16 | THE GUGGENHEIM FUNDS ANNUAL REPORT | SEE NOTES TO CONSOLIDATED FINANCIAL STATEMENTS. |
CONSOLIDATED SCHEDULE OF INVESTMENTS (continued) | December 31, 2021 |
MULTI-HEDGE STRATEGIES FUND | |
| | Shares | | | Value | |
EXCHANGE-TRADED FUNDS SOLD SHORT† - (7.5)% |
iShares Preferred & Income Securities ETF | | | 65 | | | $ | (2,563 | ) |
SPDR Gold Shares — Class D* | | | 41 | | | | (7,009 | ) |
iShares Mortgage Real Estate ETF | | | 259 | | | | (8,938 | ) |
iShares 7-10 Year Treasury Bond ETF | | | 92 | | | | (10,580 | ) |
VanEck Gold Miners ETF | | | 350 | | | | (11,210 | ) |
Energy Select Sector SPDR Fund | | | 313 | | | | (17,372 | ) |
iShares Core High Dividend ETF | | | 193 | | | | (19,491 | ) |
iShares iBoxx $ Investment Grade Corporate Bond ETF | | | 240 | | | | (31,805 | ) |
iShares Floating Rate Bond ETF | | | 1,541 | | | | (78,175 | ) |
Health Care Select Sector SPDR Fund | | | 614 | | | | (86,506 | ) |
iShares Russell 1000 Growth ETF | | | 296 | | | | (90,455 | ) |
VanEck High Yield Muni ETF | | | 2,545 | | | | (158,884 | ) |
Invesco Senior Loan ETF | | | 11,557 | | | | (255,410 | ) |
SPDR Bloomberg Convertible Securities ETF | | | 3,293 | | | | (273,187 | ) |
iShares National Muni Bond ETF | | | 2,800 | | | | (325,584 | ) |
iShares U.S. Real Estate ETF | | | 4,950 | | | | (574,893 | ) |
iShares iBoxx High Yield Corporate Bond ETF | | | 6,661 | | | | (579,574 | ) |
iShares Russell 2000 Index ETF | | | 2,637 | | | | (586,600 | ) |
iShares Russell 1000 Value ETF | | | 3,712 | | | | (623,356 | ) |
SPDR Nuveen Bloomberg Municipal Bond ETF | | | 14,980 | | | | (774,916 | ) |
SPDR S&P 500 ETF Trust | | | 1,682 | | | | (798,883 | ) |
Total Exchange-Traded Funds Sold Short |
(Proceeds $5,180,420) | | | (5,315,391 | ) |
| | | | | | | | | |
Total Securities Sold Short - (22.2)% |
(Proceeds $13,830,755) | | $ | (15,675,862 | ) |
Other Assets & Liabilities, net - 26.1% | | | 18,412,704 | |
Total Net Assets - 100.0% | | $ | 70,641,564 | |
Futures Contracts |
Description | | Number of
Contracts | | | Expiration
Date | | | Notional
Amount | | | Value and
Unrealized
Appreciation
(Depreciation)** | |
Commodity Futures Contracts Purchased† |
Gasoline RBOB Futures Contracts | | | 32 | | | | Jan 2022 | | | $ | 2,986,234 | | | $ | 83,032 | |
Cotton #2 Futures Contracts | | | 38 | | | | Jul 2022 | | | | 2,046,870 | | | | 82,602 | |
Live Cattle Futures Contracts | | | 105 | | | | Jun 2022 | | | | 5,842,200 | | | | 18,727 | |
Live Cattle Futures Contracts | | | 15 | | | | Feb 2022 | | | | 837,900 | | | | 15,754 | |
NY Harbor ULSD Futures Contracts | | | 3 | | | | Jan 2022 | | | | 293,366 | | | | 14,029 | |
Soybean Oil Futures Contracts | | | 7 | | | | Mar 2022 | | | | 237,594 | | | | 12,831 | |
SEE NOTES TO CONSOLIDATED FINANCIAL STATEMENTS. | THE GUGGENHEIM FUNDS ANNUAL REPORT | 17 |
CONSOLIDATED SCHEDULE OF INVESTMENTS (continued) | December 31, 2021 |
MULTI-HEDGE STRATEGIES FUND | |
Futures Contracts (continued) |
Description | | Number of
Contracts | | | Expiration
Date | | | Notional
Amount | | | Value and
Unrealized
Appreciation
(Depreciation)** | |
Commodity Futures Contracts Purchased† (continued) | | | | | | | | | | | | | | | | |
Brent Crude Futures Contracts | | | 3 | | | | Jan 2022 | | | $ | 233,820 | | | $ | 12,475 | |
LME Zinc Futures Contracts | | | 2 | | | | Feb 2022 | | | | 178,132 | | | | 12,239 | |
Soybean Futures Contracts | | | 5 | | | | Mar 2022 | | | | 334,937 | | | | 11,572 | |
WTI Crude Futures Contracts | | | 3 | | | | Jan 2022 | | | | 226,350 | | | | 11,186 | |
LME Primary Aluminum Futures Contracts | | | 2 | | | | Feb 2022 | | | | 140,250 | | | | 8,994 | |
Low Sulphur Gas Oil Futures Contracts | | | 4 | | | | Feb 2022 | | | | 266,400 | | | | 8,079 | |
Corn Futures Contracts | | | 19 | | | | Mar 2022 | | | | 562,875 | | | | 6,768 | |
LME Nickel Futures Contracts | | | 1 | | | | Feb 2022 | | | | 125,001 | | | | 3,383 | |
Copper Futures Contracts | | | 1 | | | | Mar 2022 | | | | 111,413 | | | | 2,659 | |
LME Lead Futures Contracts | | | 3 | | | | Feb 2022 | | | | 173,963 | | | | 385 | |
Soybean Meal Futures Contracts | | | 7 | | | | Mar 2022 | | | | 279,930 | | | | (31 | ) |
Sugar #11 Futures Contracts | | | 16 | | | | Feb 2022 | | | | 337,075 | | | | (8,114 | ) |
Coffee ‘C’ Futures Contracts | | | 3 | | | | Mar 2022 | | | | 253,969 | | | | (21,216 | ) |
Natural Gas Futures Contracts | | | 45 | | | | Feb 2022 | | | | 1,616,400 | | | | (54,565 | ) |
| | | | | | | | | | | $ | 17,084,679 | | | $ | 220,789 | |
Currency Futures Contracts Purchased† |
British Pound Futures Contracts | | | 33 | | | | Mar 2022 | | | $ | 2,788,500 | | | $ | 57,538 | |
New Zealand Dollar Futures Contracts | | | 59 | | | | Mar 2022 | | | | 4,032,650 | | | | 51,978 | |
Canadian Dollar Futures Contracts | | | 18 | | | | Mar 2022 | | | | 1,423,170 | | | | 10,951 | |
Euro FX Futures Contracts | | | 1 | | | | Mar 2022 | | | | 142,400 | | | | 1,171 | |
Japanese Yen Futures Contracts | | | 32 | | | | Mar 2022 | | | | 3,477,200 | | | | (38,090 | ) |
| | | | | | | | | | | $ | 11,863,920 | | | $ | 83,548 | |
Equity Futures Contracts Purchased† |
NASDAQ-100 Index Mini Futures Contracts | | | 1 | | | | Mar 2022 | | | $ | 326,505 | | | $ | 14,094 | |
Nikkei 225 (OSE) Index Futures Contracts†† | | | 1 | | | | Mar 2022 | | | | 250,677 | | | | 11,593 | |
Tokyo Stock Price Index Futures Contracts†† | | | 1 | | | | Mar 2022 | | | | 173,291 | | | | 7,014 | |
Russell 2000 Index Mini Futures Contracts | | | 1 | | | | Mar 2022 | | | | 112,125 | | | | 5,346 | |
OMX Stockholm 30 Index Futures Contracts†† | | | 8 | | | | Jan 2022 | | | | 212,929 | | | | 4,974 | |
SPI 200 Index Futures Contracts†† | | | 3 | | | | Mar 2022 | | | | 403,819 | | | | 4,295 | |
CAC 40 10 Euro Index Futures Contracts†† | | | 2 | | | | Jan 2022 | | | | 162,318 | | | | 3,024 | |
FTSE MIB Index Futures Contracts†† | | | 1 | | | | Mar 2022 | | | | 154,266 | | | | 2,183 | |
S&P/TSX 60 IX Index Futures Contracts | | | 1 | | | | Mar 2022 | | | | 202,606 | | | | 1,932 | |
Amsterdam Index Futures Contracts†† | | | 1 | | | | Jan 2022 | | | | 181,418 | | | | 1,805 | |
Euro STOXX 50 Index Futures Contracts†† | | | 3 | | | | Mar 2022 | | | | 145,772 | | | | (668 | ) |
S&P 500 Index Mini Futures Contracts | | | 1 | | | | Mar 2022 | | | | 237,975 | | | | (814 | ) |
FTSE 100 Index Futures Contracts†† | | | 3 | | | | Mar 2022 | | | | 296,654 | | | | (1,520 | ) |
CBOE Volatility Index Futures Contracts | | | 60 | | | | Feb 2022 | | | | 1,317,000 | | | | (10,195 | ) |
CBOE Volatility Index Futures Contracts | | | 49 | | | | Jan 2022 | | | | 966,280 | | | | (100,778 | ) |
| | | | | | | | | | | $ | 5,143,635 | | | $ | (57,715 | ) |
18 | THE GUGGENHEIM FUNDS ANNUAL REPORT | SEE NOTES TO CONSOLIDATED FINANCIAL STATEMENTS. |
CONSOLIDATED SCHEDULE OF INVESTMENTS (continued) | December 31, 2021 |
MULTI-HEDGE STRATEGIES FUND | |
Futures Contracts (continued) |
Description | | Number of
Contracts | | | Expiration
Date | | | Notional
Amount | | | Value and
Unrealized
Appreciation
(Depreciation)** | |
Interest Rate Futures Contracts Purchased† |
U.S. Treasury 10 Year Note Futures Contracts | | | 28 | | | | Mar 2022 | | | $ | 3,649,187 | | | $ | 27,450 | |
U.S. Treasury Ultra Long Bond Futures Contracts | | | 3 | | | | Mar 2022 | | | | 588,281 | | | | 5,091 | |
U.S. Treasury Long Bond Futures Contracts | | | 5 | | | | Mar 2022 | | | | 799,687 | | | | 2,341 | |
Euro - 30 year Bond Futures Contracts†† | | | 3 | | | | Mar 2022 | | | | 705,772 | | | | (1,492 | ) |
Euro - OATS Futures Contracts†† | | | 47 | | | | Mar 2022 | | | | 8,725,285 | | | | (76,508 | ) |
Euro - BTP Italian Government Bond Futures Contracts†† | | | 57 | | | | Mar 2022 | | | | 9,533,743 | | | | (95,924 | ) |
| | | | | | | | | | | $ | 24,001,955 | | | $ | (139,042 | ) |
Equity Futures Contracts Sold Short† |
CBOE Volatility Index Futures Contracts | | | 145 | | | | May 2022 | | | $ | 3,658,350 | | | $ | 130,099 | |
CBOE Volatility Index Futures Contracts | | | 119 | | | | Jun 2022 | | | | 3,042,830 | | | | 22,294 | |
| | | | | | | | | | | $ | 6,701,180 | | | $ | 152,393 | |
Interest Rate Futures Contracts Sold Short†† |
Long Gilt Futures Contracts | | | 48 | | | | Mar 2022 | | | $ | 8,101,805 | | | $ | 54,916 | |
Euro - Bund Futures Contracts | | | 21 | | | | Mar 2022 | | | | 4,095,765 | | | | 15,149 | |
Australian Government 10 Year Bond Futures Contracts | | | 51 | | | | Mar 2022 | | | | 5,178,940 | | | | (19,178 | ) |
Canadian Government 10 Year Bond Futures Contracts | | | 105 | | | | Mar 2022 | | | | 11,830,389 | | | | (85,870 | ) |
| | | | | | | | | | | $ | 29,206,899 | | | $ | (34,983 | ) |
Commodity Futures Contracts Sold Short† |
Natural Gas Futures Contracts | | | 48 | | | | Mar 2022 | | | $ | 1,697,280 | | | $ | 47,398 | |
Wheat Futures Contracts | | | 4 | | | | Mar 2022 | | | | 154,050 | | | | 6,188 | |
Silver Futures Contracts | | | 1 | | | | Mar 2022 | | | | 116,600 | | | | 4,977 | |
Hard Red Winter Wheat Futures Contracts | | | 3 | | | | Mar 2022 | | | | 120,075 | | | | 3,589 | |
Natural Gas Futures Contracts | | | 2 | | | | Jan 2022 | | | | 75,300 | | | | (344 | ) |
Lean Hogs Futures Contracts | | | 1 | | | | Feb 2022 | | | | 32,520 | | | | (1,103 | ) |
Cocoa Futures Contracts | | | 4 | | | | Mar 2022 | | | | 101,560 | | | | (2,008 | ) |
Cattle Feeder Futures Contracts | | | 2 | | | | Mar 2022 | | | | 170,000 | | | | (5,119 | ) |
Live Cattle Futures Contracts | | | 105 | | | | Apr 2022 | | | | 6,080,550 | | | | (48,943 | ) |
Cotton #2 Futures Contracts | | | 30 | | | | Mar 2022 | | | | 1,689,750 | | | | (64,912 | ) |
Gasoline RBOB Futures Contracts | | | 29 | | | | Mar 2022 | | | | 2,839,402 | | | | (138,804 | ) |
| | | | | | | | | | | $ | 13,077,087 | | | $ | (199,081 | ) |
Currency Futures Contracts Sold Short† |
Australian Dollar Futures Contracts | | | 33 | | | | Mar 2022 | | | $ | 2,398,275 | | | $ | (47,282 | ) |
Swiss Franc Futures Contracts | | | 110 | | | | Mar 2022 | | | | 15,098,875 | | | | (216,605 | ) |
| | | | | | | | | | | $ | 17,497,150 | | | $ | (263,887 | ) |
SEE NOTES TO CONSOLIDATED FINANCIAL STATEMENTS. | THE GUGGENHEIM FUNDS ANNUAL REPORT | 19 |
CONSOLIDATED SCHEDULE OF INVESTMENTS (continued) | December 31, 2021 |
MULTI-HEDGE STRATEGIES FUND | |
Custom Basket Swap Agreements |
Counterparty | Reference
Obligation | Type | Financing
Rate | | Payment
Frequency | | | Maturity
Date | | | Notional
Amount | | | Value and
Unrealized
Appreciation
(Depreciation) | |
OTC Custom Basket Swap Agreements†† |
Morgan Stanley Capital Services LLC | MS Equity Market Neutral Custom Basket | Pay | 0.48% (Federal Funds Rate + 0.40%) | | | At Maturity | | | | 08/31/23 | | | $ | 13,017,639 | | | $ | 2,087,083 | |
Goldman Sachs International | GS Equity Market Neutral Custom Basket | Pay | 0.53% (Federal Funds Rate + 0.45%) | | | At Maturity | | | | 05/06/24 | | | | 13,017,650 | | | | 2,044,462 | |
Goldman Sachs International | GS Long/Short Equity Custom Basket | Pay | 0.53% (Federal Funds Rate + 0.45%) | | | At Maturity | | | | 05/06/24 | | | | 9,009,748 | | | | 902,053 | |
Morgan Stanley Capital Services LLC | MS Long/Short Equity Custom Basket | Pay | 0.48% (Federal Funds Rate + 0.40%) | | | At Maturity | | | | 08/31/23 | | | | 9,009,793 | | | | 900,851 | |
| | | | | | | | | | | | | | $ | 44,054,830 | | | $ | 5,934,449 | |
OTC Custom Basket Swap Agreements Sold Short†† |
Morgan Stanley Capital Services LLC | MS Long/Short Equity Custom Basket | Pay | (0.22)% (Federal Funds Rate - 0.30%) | | | At Maturity | | | | 08/31/23 | | | $ | 4,919,821 | | | $ | (24,704 | ) |
Goldman Sachs International | GS Long/Short Equity Custom Basket | Pay | (0.12)% (Federal Funds Rate - 0.20%) | | | At Maturity | | | | 05/06/24 | | | | 4,919,750 | | | | (26,733 | ) |
Morgan Stanley Capital Services LLC | MS Equity Market Neutral Custom Basket | Pay | (0.23)% (Federal Funds Rate - 0.31%) | | | At Maturity | | | | 08/31/23 | | | | 12,984,844 | | | | (948,917 | ) |
Goldman Sachs International | GS Equity Market Neutral Custom Basket | Pay | (0.15)% (Federal Funds Rate - 0.23%) | | | At Maturity | | | | 05/06/24 | | | | 12,997,199 | | | | (954,993 | ) |
| | | | | | | | | | | | | | $ | 35,821,614 | | | $ | (1,955,347 | ) |
20 | THE GUGGENHEIM FUNDS ANNUAL REPORT | SEE NOTES TO CONSOLIDATED FINANCIAL STATEMENTS. |
CONSOLIDATED SCHEDULE OF INVESTMENTS (continued) | December 31, 2021 |
MULTI-HEDGE STRATEGIES FUND | |
| | Shares | | | Percentage
Notional
Amount | | |
Value and
Unrealized
Appreciation
| |
MS LONG/SHORT EQUITY LONG CUSTOM BASKET |
Utilities |
UGI Corp. | | | 2,046 | | | | 1.03 | % | | $ | 22,713 | |
IDACORP, Inc. | | | 825 | | | | 1.04 | % | | | 18,084 | |
National Fuel Gas Co. | | | 1,476 | | | | 1.05 | % | | | 16,965 | |
Chesapeake Utilities Corp. | | | 654 | | | | 1.06 | % | | | 16,763 | |
American States Water Co. | | | 610 | | | | 0.70 | % | | | 13,077 | |
Southern Co. | | | 1,115 | | | | 0.85 | % | | | 12,884 | |
MGE Energy, Inc. | | | 1,095 | | | | 1.00 | % | | | 6,672 | |
Portland General Electric Co. | | | 1,750 | | | | 1.03 | % | | | 5,211 | |
WEC Energy Group, Inc. | | | 935 | | | | 1.01 | % | | | 2,953 | |
PPL Corp. | | | 3,119 | | | | 1.04 | % | | | 1,212 | |
CMS Energy Corp. | | | 281 | | | | 0.20 | % | | | 1 | |
Total Utilities | | | 116,535 | |
| | | | | | | | | | | | | |
Consumer, Non-cyclical |
United Therapeutics Corp. | | | 181 | | | | 0.43 | % | | | 22,413 | |
Prestige Consumer Healthcare, Inc. | | | 770 | | | | 0.52 | % | | | 18,673 | |
Innoviva, Inc. | | | 4,224 | | | | 0.81 | % | | | 17,734 | |
Quest Diagnostics, Inc. | | | 449 | | | | 0.86 | % | | | 16,389 | |
Gilead Sciences, Inc. | | | 1,271 | | | | 1.02 | % | | | 12,931 | |
Eagle Pharmaceuticals, Inc. | | | 970 | | | | 0.55 | % | | | 10,161 | |
AbbVie, Inc. | | | 467 | | | | 0.70 | % | | | 9,065 | |
Molson Coors Beverage Co. — Class B | | | 681 | | | | 0.35 | % | | | 8,748 | |
| | | | | | | | | | | | | |
| | Shares | | | Percentage
Notional
Amount | | | Value and
Unrealized
Appreciation
(Depreciation) | |
John B Sanfilippo & Son, Inc. | | | 992 | | | | 0.99 | % | | $ | 8,074 | |
Regeneron Pharmaceuticals, Inc. | | | 96 | | | | 0.67 | % | | | 7,735 | |
Hologic, Inc. | | | 847 | | | | 0.72 | % | | | 6,827 | |
Amgen, Inc. | | | 413 | | | | 1.03 | % | | | 6,695 | |
Amphastar Pharmaceuticals, Inc. | | | 1,785 | | | | 0.46 | % | | | 5,965 | |
PerkinElmer, Inc. | | | 107 | | | | 0.24 | % | | | 5,851 | |
Johnson & Johnson | | | 531 | | | | 1.01 | % | | | 5,710 | |
Vertex Pharmaceuticals, Inc. | | | 161 | | | | 0.39 | % | | | 4,721 | |
Perdoceo Education Corp. | | | 4,774 | | | | 0.62 | % | | | 4,489 | |
Vector Group Ltd. | | | 1,570 | | | | 0.20 | % | | | 4,211 | |
EVERTEC, Inc. | | | 939 | | | | 0.52 | % | | | 3,438 | |
Waters Corp. | | | 95 | | | | 0.39 | % | | | 2,079 | |
Coherus Biosciences, Inc. | | | 1,170 | | | | 0.21 | % | | | 1,910 | |
Laboratory Corporation of America Holdings | | | 102 | | | | 0.36 | % | | | 1,765 | |
USANA Health Sciences, Inc. | | | 567 | | | | 0.64 | % | | | 1,504 | |
Bio-Rad Laboratories, Inc. — Class A | | | 65 | | | | 0.55 | % | | | 1,221 | |
Halozyme Therapeutics, Inc. | | | 516 | | | | 0.23 | % | | | 1,155 | |
Royalty Pharma plc — Class A | | | 784 | | | | 0.35 | % | | | 919 | |
Merck & Company, Inc. | | | 471 | | | | 0.40 | % | | | 830 | |
Pfizer, Inc. | | | 503 | | | | 0.33 | % | | | (425 | ) |
SEE NOTES TO CONSOLIDATED FINANCIAL STATEMENTS. | THE GUGGENHEIM FUNDS ANNUAL REPORT | 21 |
CONSOLIDATED SCHEDULE OF INVESTMENTS (continued) | December 31, 2021 |
MULTI-HEDGE STRATEGIES FUND | |
| | Shares | | | Percentage
Notional
Amount | | | Value and
Unrealized
Appreciation
(Depreciation) | |
Bristol-Myers Squibb Co. | | | 1,479 | | | | 1.02 | % | | $ | (1,161 | ) |
Incyte Corp. | | | 588 | | | | 0.48 | % | | | (2,137 | ) |
Vanda Pharmaceuticals, Inc. | | | 2,556 | | | | 0.45 | % | | | (2,507 | ) |
Exelixis, Inc. | | | 1,043 | | | | 0.21 | % | | | (3,223 | ) |
Total Consumer, Non-cyclical | | | 181,760 | |
| | | | | | | | | | | | | |
Technology |
NetApp, Inc. | | | 537 | | | | 0.55 | % | | | 24,600 | |
CSG Systems International, Inc. | | | 1,630 | | | | 1.04 | % | | | 20,440 | |
Rambus, Inc. | | | 2,056 | | | | 0.67 | % | | | 19,573 | |
HP, Inc. | | | 690 | | | | 0.29 | % | | | 15,318 | |
Cirrus Logic, Inc. | | | 362 | | | | 0.37 | % | | | 10,070 | |
ExlService Holdings, Inc. | | | 182 | | | | 0.29 | % | | | 7,243 | |
Lumentum Holdings, Inc. | | | 212 | | | | 0.25 | % | | | 5,309 | |
International Business Machines Corp. | | | 428 | | | | 0.63 | % | | | 2,344 | |
Progress Software Corp. | | | 684 | | | | 0.37 | % | | | 1,055 | |
Intel Corp. | | | 608 | | | | 0.35 | % | | | 459 | |
Microsoft Corp. | | | 91 | | | | 0.34 | % | | | 369 | |
Texas Instruments, Inc. | | | 141 | | | | 0.29 | % | | | 149 | |
Xperi Holding Corp. | | | 1,750 | | | | 0.37 | % | | | (3,411 | ) |
CommVault Systems, Inc. | | | 281 | | | | 0.21 | % | | | (3,512 | ) |
Total Technology | | | 100,006 | |
| | | | | | | | | | | | | |
Consumer, Cyclical |
AutoZone, Inc. | | | 45 | | | | 1.05 | % | | | 39,390 | |
Gentex Corp. | | | 2,700 | | | | 1.04 | % | | | 23,030 | |
Gentherm, Inc. | | | 347 | | | | 0.33 | % | | | 18,007 | |
Brunswick Corp. | | | 485 | | | | 0.54 | % | | | 16,640 | |
AutoNation, Inc. | | | 311 | | | | 0.40 | % | | | 16,135 | |
| | | | | | | | | | | | | |
| | Shares | | | Percentage
Notional
Amount | | | Value and
Unrealized
Appreciation
(Depreciation) | |
NVR, Inc. | | | 12 | | | | 0.79 | % | | $ | 12,459 | |
Cummins, Inc. | | | 360 | | | | 0.87 | % | | | 8,527 | |
O’Reilly Automotive, Inc. | | | 132 | | | | 1.03 | % | | | 7,857 | |
Dolby Laboratories, Inc. — Class A | | | 476 | | | | 0.50 | % | | | 7,362 | |
Tri Pointe Homes, Inc. | | | 1,096 | | | | 0.34 | % | | | 6,365 | |
LKQ Corp. | | | 1,622 | | | | 1.08 | % | | | 6,307 | |
Zumiez, Inc. | | | 791 | | | | 0.42 | % | | | 5,865 | |
Autoliv, Inc. | | | 302 | | | | 0.35 | % | | | 4,516 | |
Dick’s Sporting Goods, Inc. | | | 301 | | | | 0.38 | % | | | 4,463 | |
Methode Electronics, Inc. | | | 637 | | | | 0.35 | % | | | 4,317 | |
MarineMax, Inc. | | | 396 | | | | 0.26 | % | | | 4,028 | |
Ethan Allen Interiors, Inc. | | | 1,690 | | | | 0.49 | % | | | 3,866 | |
Lennar Corp. — Class A | | | 312 | | | | 0.40 | % | | | 3,108 | |
Acushnet Holdings Corp. | | | 966 | | | | 0.57 | % | | | 2,825 | |
Buckle, Inc. | | | 1,058 | | | | 0.50 | % | | | 2,627 | |
Whirlpool Corp. | | | 262 | | | | 0.68 | % | | | 2,309 | |
PulteGroup, Inc. | | | 485 | | | | 0.31 | % | | | 1,917 | |
Kontoor Brands, Inc. | | | 390 | | | | 0.22 | % | | | 1,403 | |
Oxford Industries, Inc. | | | 228 | | | | 0.26 | % | | | 1,100 | |
Shoe Carnival, Inc. | | | 489 | | | | 0.21 | % | | | 753 | |
Tapestry, Inc. | | | 730 | | | | 0.33 | % | | | (615 | ) |
Allison Transmission Holdings, Inc. | | | 1,573 | | | | 0.63 | % | | | (878 | ) |
Haverty Furniture Companies, Inc. | | | 573 | | | | 0.19 | % | | | (2,000 | ) |
Polaris, Inc. | | | 285 | | | | 0.35 | % | | | (2,805 | ) |
Foot Locker, Inc. | | | 570 | | | | 0.28 | % | | | (5,328 | ) |
22 | THE GUGGENHEIM FUNDS ANNUAL REPORT | SEE NOTES TO CONSOLIDATED FINANCIAL STATEMENTS. |
CONSOLIDATED SCHEDULE OF INVESTMENTS (continued) | December 31, 2021 |
MULTI-HEDGE STRATEGIES FUND | |
| | Shares | | | Percentage
Notional
Amount | | | Value and
Unrealized
Appreciation
(Depreciation) | |
Jack in the Box, Inc. | | | 315 | | | | 0.31 | % | | $ | (6,856 | ) |
Hibbett, Inc. | | | 305 | | | | 0.24 | % | | | (7,948 | ) |
Total Consumer, Cyclical | | | 178,746 | |
| | | | | | | | | | | | | |
Industrial |
Mueller Industries, Inc. | | | 1,480 | | | | 0.98 | % | | | 24,942 | |
Encore Wire Corp. | | | 489 | | | | 0.78 | % | | | 21,170 | |
Snap-on, Inc. | | | 374 | | | | 0.89 | % | | | 20,181 | |
Knowles Corp. | | | 4,172 | | | | 1.08 | % | | | 18,957 | |
Vishay Intertechnology, Inc. | | | 2,902 | | | | 0.70 | % | | | 17,304 | |
Owens Corning | | | 446 | | | | 0.45 | % | | | 17,146 | |
Keysight Technologies, Inc. | | | 349 | | | | 0.80 | % | | | 16,923 | |
Louisiana-Pacific Corp. | | | 459 | | | | 0.40 | % | | | 7,726 | |
Hillenbrand, Inc. | | | 1,115 | | | | 0.64 | % | | | 7,124 | |
Boise Cascade Co. | | | 577 | | | | 0.46 | % | | | 6,229 | |
Atkore, Inc. | | | 193 | | | | 0.24 | % | | | 4,831 | |
Eagle Materials, Inc. | | | 231 | | | | 0.43 | % | | | 3,638 | |
Sanmina Corp. | | | 1,741 | | | | 0.80 | % | | | 3,608 | |
Albany International Corp. — Class A | | | 302 | | | | 0.30 | % | | | 3,344 | |
Crane Co. | | | 436 | | | | 0.49 | % | | | 3,060 | |
TTM Technologies, Inc. | | | 3,700 | | | | 0.61 | % | | | 2,670 | |
Simpson Manufacturing Company, Inc. | | | 139 | | | | 0.21 | % | | | 2,595 | |
Oshkosh Corp. | | | 440 | | | | 0.55 | % | | | 1,503 | |
Packaging Corporation of America | | | 433 | | | | 0.65 | % | | | 1,444 | |
Textron, Inc. | | | 405 | | | | 0.35 | % | | | 1,177 | |
| | | | | | | | | | | | | |
| | Shares | | | Percentage
Notional
Amount | | | Value and
Unrealized
Appreciation
(Depreciation) | |
3M Co. | | | 446 | | | | 0.88 | % | | $ | 879 | |
Insteel Industries, Inc. | | | 542 | | | | 0.24 | % | | | 404 | |
Dorian LPG Ltd. | | | 1,887 | | | | 0.27 | % | | | (22 | ) |
Worthington Industries, Inc. | | | 626 | | | | 0.38 | % | | | (320 | ) |
Garmin Ltd. | | | 684 | | | | 1.03 | % | | | (1,205 | ) |
Donaldson Company, Inc. | | | 863 | | | | 0.57 | % | | | (1,761 | ) |
OSI Systems, Inc. | | | 513 | | | | 0.53 | % | | | (2,474 | ) |
MDU Resources Group, Inc. | | | 1,631 | | | | 0.56 | % | | | (3,921 | ) |
Toro Co. | | | 866 | | | | 0.96 | % | | | (4,752 | ) |
Vontier Corp. | | | 1,839 | | | | 0.63 | % | | | (5,225 | ) |
Huntington Ingalls Industries, Inc. | | | 309 | | | | 0.64 | % | | | (5,295 | ) |
Sturm Ruger & Company, Inc. | | | 862 | | | | 0.65 | % | | | (6,720 | ) |
Total Industrial | | | 155,160 | |
| | | | | | | | | | | | | |
Financial |
Stewart Information Services Corp. | | | 1,132 | | | | 1.00 | % | | | 21,439 | |
Raymond James Financial, Inc. | | | 930 | | | | 1.04 | % | | | 12,236 | |
Piper Sandler Cos. | | | 353 | | | | 0.70 | % | | | 12,217 | |
Synchrony Financial | | | 545 | | | | 0.28 | % | | | 12,094 | |
Interactive Brokers Group, Inc. — Class A | | | 643 | | | | 0.57 | % | | | 9,291 | |
Arch Capital Group Ltd. | | | 1,931 | | | | 0.95 | % | | | 8,335 | |
First American Financial Corp. | | | 623 | | | | 0.54 | % | | | 6,441 | |
Enstar Group Ltd. | | | 361 | | | | 0.99 | % | | | 6,402 | |
Safety Insurance Group, Inc. | | | 1,064 | | | | 1.00 | % | | | 5,544 | |
Preferred Bank/Los Angeles CA | | | 1,330 | | | | 1.06 | % | | | 5,129 | |
SEE NOTES TO CONSOLIDATED FINANCIAL STATEMENTS. | THE GUGGENHEIM FUNDS ANNUAL REPORT | 23 |
CONSOLIDATED SCHEDULE OF INVESTMENTS (continued) | December 31, 2021 |
MULTI-HEDGE STRATEGIES FUND | |
| | Shares | | | Percentage
Notional
Amount | | | Value and
Unrealized
Appreciation
(Depreciation) | |
Douglas Elliman, Inc. | | | 785 | | | | 0.10 | % | | $ | 4,452 | |
HomeStreet, Inc. | | | 1,042 | | | | 0.60 | % | | | 2,754 | |
United Bankshares, Inc. | | | 1,702 | | | | 0.69 | % | | | 2,568 | |
Janus Henderson Group plc | | | 756 | | | | 0.35 | % | | | 2,210 | |
Citigroup, Inc. | | | 1,505 | | | | 1.01 | % | | | 1,578 | |
National Bank Holdings Corp. — Class A | | | 1,685 | | | | 0.82 | % | | | 1,308 | |
Fulton Financial Corp. | | | 1,568 | | | | 0.30 | % | | | 1,085 | |
Everest Re Group Ltd. | | | 180 | | | | 0.55 | % | | | 863 | |
Markel Corp. | | | 23 | | | | 0.32 | % | | | 674 | |
Affiliated Managers Group, Inc. | | | 133 | | | | 0.24 | % | | | 465 | |
Western Union Co. | | | 1,816 | | | | 0.36 | % | | | (80 | ) |
Ameris Bancorp | | | 376 | | | | 0.21 | % | | | (832 | ) |
BankUnited, Inc. | | | 1,212 | | | | 0.57 | % | | | (1,447 | ) |
Essent Group Ltd. | | | 892 | | | | 0.45 | % | | | (1,487 | ) |
MGIC Investment Corp. | | | 4,128 | | | | 0.66 | % | | | (1,739 | ) |
Evercore, Inc. — Class A | | | 520 | | | | 0.78 | % | | | (1,840 | ) |
Meta Financial Group, Inc. | | | 701 | | | | 0.46 | % | | | (3,597 | ) |
Hilltop Holdings, Inc. | | | 1,198 | | | | 0.47 | % | | | (3,669 | ) |
Old Republic International Corp. | | | 3,423 | | | | 0.93 | % | | | (4,456 | ) |
Radian Group, Inc. | | | 2,751 | | | | 0.65 | % | | | (4,591 | ) |
OneMain Holdings, Inc. | | | 677 | | | | 0.38 | % | | | (4,617 | ) |
AMERISAFE, Inc. | | | 1,252 | | | | 0.75 | % | | | (4,953 | ) |
| | | | | | | | | | | | | |
| | Shares | | | Percentage
Notional
Amount | | | Value and
Unrealized
Appreciation
(Depreciation) | |
Mercury General Corp. | | | 1,593 | | | | 0.94 | % | | $ | (10,178 | ) |
Total Financial | | | 73,599 | |
| | | | | | | | | | | | | |
Communications |
Viavi Solutions, Inc. | | | 5,550 | | | | 1.09 | % | | | 32,719 | |
Cisco Systems, Inc. | | | 1,524 | | | | 1.07 | % | | | 27,102 | |
Juniper Networks, Inc. | | | 1,101 | | | | 0.44 | % | | | 14,974 | |
Omnicom Group, Inc. | | | 1,119 | | | | 0.91 | % | | | 11,430 | |
F5, Inc. | | | 78 | | | | 0.21 | % | | | 4,134 | |
InterDigital, Inc. | | | 527 | | | | 0.42 | % | | | 3,758 | |
Shenandoah Telecommunications | | | | | | | | |
Co. | | | 1,151 | | | | 0.33 | % | | | (751 | ) |
Yelp, Inc. — Class A | | | 535 | | | | 0.22 | % | | | (786 | ) |
T-Mobile US, Inc. | | | 160 | | | | 0.21 | % | | | (1,248 | ) |
Cogent Communications Holdings, Inc. | | | 425 | | | | 0.35 | % | | | (1,451 | ) |
Verizon Communications, Inc. | | | 1,394 | | | | 0.80 | % | | | (2,985 | ) |
Telephone & Data Systems, Inc. | | | 1,513 | | | | 0.34 | % | | | (3,658 | ) |
Total Communications | | | 83,238 | |
| | | | | | | | | | | | | |
Basic Materials |
Westlake Chemical Corp. | | | 696 | | | | 0.75 | % | | | 3,259 | |
Celanese Corp. — Class A | | | 351 | | | | 0.65 | % | | | 2,625 | |
LyondellBasell Industries N.V. — Class A | | | 572 | | | | 0.59 | % | | | 1,959 | |
AdvanSix, Inc. | | | 479 | | | | 0.25 | % | | | 1,786 | |
Dow, Inc. | | | 660 | | | | 0.42 | % | | | 1,424 | |
Newmont Corp. | | | 380 | | | | 0.26 | % | | | 791 | |
Nucor Corp. | | | 315 | | | | 0.40 | % | | | (222 | ) |
24 | THE GUGGENHEIM FUNDS ANNUAL REPORT | SEE NOTES TO CONSOLIDATED FINANCIAL STATEMENTS. |
CONSOLIDATED SCHEDULE OF INVESTMENTS (continued) | December 31, 2021 |
MULTI-HEDGE STRATEGIES FUND | |
| | Shares | | | Percentage
Notional
Amount | | | Value and
Unrealized
Appreciation
(Depreciation) | |
Steel Dynamics, Inc. | | | 523 | | | | 0.36 | % | | $ | (222 | ) |
Total Basic Materials | | | 11,400 | |
| | | | | | | | | | | | | |
Energy |
Equitrans Midstream Corp. | | | 1,850 | | | | 0.21 | % | | | 1,967 | |
Kinder Morgan, Inc. | | | 1,159 | | | | 0.20 | % | | | 176 | |
Antero Midstream Corp. | | | 1,944 | | | | 0.21 | % | | | (1,736 | ) |
Total Energy | | | 407 | |
Total MS Long/Short Equity Long Custom Basket | | $ | 900,851 | |
| | | | | | | | | |
MS LONG/SHORT EQUITY SHORT CUSTOM BASKET |
Consumer, Non-cyclical |
Teladoc Health, Inc. | | | 397 | | | | (0.77 | )% | | $ | 12,558 | |
Guardant Health, Inc. | | | 375 | | | | (0.76 | )% | | | 11,707 | |
CoStar Group, Inc. | | | 791 | | | | (1.27 | )% | | | 7,286 | |
Viad Corp. | | | 848 | | | | (0.74 | )% | | | 3,589 | |
US Foods Holding Corp. | | | 772 | | | | (0.55 | )% | | | 827 | |
ASGN, Inc. | | | 330 | | | | (0.83 | )% | | | 686 | |
Brink’s Co. | | | 289 | | | | (0.39 | )% | | | 41 | |
Verisk Analytics, Inc. — Class A | | | 196 | | | | (0.91 | )% | | | (669 | ) |
Equifax, Inc. | | | 134 | | | | (0.80 | )% | | | (1,523 | ) |
TransUnion | | | 296 | | | | (0.71 | )% | | | (1,579 | ) |
Rollins, Inc. | | | 1,330 | | | | (0.92 | )% | | | (1,584 | ) |
Sysco Corp. | | | 627 | | | | (1.00 | )% | | | (3,253 | ) |
Dun & Bradstreet Holdings, Inc. | | | 2,301 | | | | (0.96 | )% | | | (3,440 | ) |
Cintas Corp. | | | 176 | | | | (1.59 | )% | | | (4,094 | ) |
Driven Brands Holdings, Inc. | | | 2,217 | | | | (1.52 | )% | | | (11,832 | ) |
Total Consumer, Non-cyclical | | | 8,720 | |
| | | | | | | | | | | | | |
| | Shares | | | Percentage
Notional
Amount | | | Value and
Unrealized
Appreciation
(Depreciation) | |
Technology |
Coupa Software, Inc. | | | 152 | | | | (0.49 | )% | | $ | 16,483 | |
Twilio, Inc. — Class A | | | 93 | | | | (0.50 | )% | | | 9,230 | |
Clarivate plc | | | 962 | | | | (0.46 | )% | | | 5,102 | |
Avalara, Inc. | | | 93 | | | | (0.24 | )% | | | 3,369 | |
Zscaler, Inc. | | | 42 | | | | (0.27 | )% | | | 1,018 | |
Smartsheet, Inc. — Class A | | | 173 | | | | (0.27 | )% | | | 882 | |
Allscripts Healthcare Solutions, Inc. | | | 1,444 | | | | (0.54 | )% | | | 286 | |
Leidos Holdings, Inc. | | | 284 | | | | (0.51 | )% | | | (352 | ) |
Snowflake, Inc. — Class A | | | 82 | | | | (0.56 | )% | | | (2,655 | ) |
Ceridian HCM Holding, Inc. | | | 303 | | | | (0.64 | )% | | | (4,359 | ) |
KBR, Inc. | | | 1,756 | | | | (1.70 | )% | | | (11,985 | ) |
Total Technology | | | 17,019 | |
| | | | | | | | | | | | | |
Industrial |
Stericycle, Inc. | | | 1,067 | | | | (1.29 | )% | | | 15,523 | |
Boeing Co. | | | 380 | | | | (1.55 | )% | | | 9,286 | |
US Ecology, Inc. | | | 1,401 | | | | (0.91 | )% | | | 7,562 | |
TransDigm Group, Inc. | | | 43 | | | | (0.56 | )% | | | 532 | |
Jacobs Engineering Group, Inc. | | | 666 | | | | (1.88 | )% | | | 509 | |
Howmet Aerospace, Inc. | | | 1,449 | | | | (0.94 | )% | | | (2,781 | ) |
Waste Management, Inc. | | | 355 | | | | (1.20 | )% | | | (9,983 | ) |
Tetra Tech, Inc. | | | 312 | | | | (1.08 | )% | | | (10,256 | ) |
Republic Services, Inc. — Class A | | | 490 | | | | (1.39 | )% | | | (14,755 | ) |
SEE NOTES TO CONSOLIDATED FINANCIAL STATEMENTS. | THE GUGGENHEIM FUNDS ANNUAL REPORT | 25 |
CONSOLIDATED SCHEDULE OF INVESTMENTS (continued) | December 31, 2021 |
MULTI-HEDGE STRATEGIES FUND | |
| | Shares | | | Percentage
Notional
Amount | | | Value and
Unrealized
Appreciation
(Depreciation) | |
Casella Waste Systems, Inc. — Class A | | | 843 | | | | (1.46 | )% | | $ | (17,856 | ) |
Total Industrial | | | (22,219 | ) |
| | | | | | | | | | | | | |
Consumer, Cyclical |
United Airlines Holdings, Inc. | | | 1,991 | | | | (1.77 | )% | | | 20,500 | |
Freshpet, Inc. | | | 250 | | | | (0.48 | )% | | | 18,002 | |
Delta Air Lines, Inc. | | | 2,227 | | | | (1.77 | )% | | | 13,047 | |
Spirit Airlines, Inc. | | | 1,580 | | | | (0.70 | )% | | | 6,208 | |
Frontier Group Holdings, Inc. | | | 1,785 | | | | (0.49 | )% | | | 5,685 | |
Tesla, Inc. | | | 24 | | | | (0.52 | )% | | | 2,907 | |
American Airlines Group, Inc. | | | 4,556 | | | | (1.66 | )% | | | 748 | |
Royal Caribbean Cruises Ltd. | | | 508 | | | | (0.79 | )% | | | (402 | ) |
Wynn Resorts Ltd. | | | 226 | | | | (0.39 | )% | | | (769 | ) |
Las Vegas Sands Corp. | | | 533 | | | | (0.41 | )% | | | (1,303 | ) |
IAA, Inc. | | | 914 | | | | (0.94 | )% | | | (1,797 | ) |
Carnival Corp. | | | 2,022 | | | | (0.83 | )% | | | (3,682 | ) |
Madison Square Garden Sports Corp. — Class A | | | 446 | | | | (1.57 | )% | | | (4,491 | ) |
Copart, Inc. | | | 310 | | | | (0.96 | )% | | | (4,969 | ) |
Total Consumer, Cyclical | | | 49,684 | |
| | | | | | | | | | | | | |
Financial |
Americold Realty Trust | | | 1,356 | | | | (0.90 | )% | | | 8,402 | |
Park Hotels & Resorts, Inc. | | | 4,179 | | | | (1.60 | )% | | | 1,466 | |
RLJ Lodging Trust | | | 5,158 | | | | (1.46 | )% | | | 1,136 | |
Welltower, Inc. | | | 805 | | | | (1.40 | )% | | | 635 | |
DiamondRock Hospitality Co. | | | 4,576 | | | | (0.89 | )% | | | 546 | |
Safehold, Inc. | | | 941 | | | | (1.53 | )% | | | 544 | |
| | | | | | | | | | | | | |
| | Shares | | | Percentage
Notional
Amount | | | Value and
Unrealized
Appreciation
(Depreciation) | |
Lincoln National Corp. | | | 720 | | | | (1.00 | )% | | $ | (85 | ) |
Sunstone Hotel Investors, Inc. | | | 5,316 | | | | (1.27 | )% | | | (264 | ) |
Sun Communities, Inc. | | | 176 | | | | (0.75 | )% | | | (1,425 | ) |
Wells Fargo & Co. | | | 1,308 | | | | (1.28 | )% | | | (1,766 | ) |
Xenia Hotels & Resorts, Inc. | | | 2,410 | | | | (0.89 | )% | | | (2,137 | ) |
Pebblebrook Hotel Trust | | | 2,934 | | | | (1.33 | )% | | | (2,810 | ) |
Northern Trust Corp. | | | 329 | | | | (0.80 | )% | | | (2,962 | ) |
Equitable Holdings, Inc. | | | 2,036 | | | | (1.36 | )% | | | (3,357 | ) |
Equinix, Inc. | | | 83 | | | | (1.43 | )% | | | (3,445 | ) |
Host Hotels & Resorts, Inc. | | | 4,756 | | | | (1.68 | )% | | | (3,468 | ) |
Signature Bank | | | 147 | | | | (0.97 | )% | | | (3,702 | ) |
Bank of New York Mellon Corp. | | | 986 | | | | (1.16 | )% | | | (3,778 | ) |
Ryman Hospitality Properties, Inc. | | | 780 | | | | (1.46 | )% | | | (3,932 | ) |
Kennedy-Wilson Holdings, Inc. | | | 3,733 | | | | (1.81 | )% | | | (4,775 | ) |
Outfront Media, Inc. | | | 2,208 | | | | (1.20 | )% | | | (5,434 | ) |
State Street Corp. | | | 912 | | | | (1.72 | )% | | | (5,859 | ) |
Apartment Income REIT Corp. | | | 1,621 | | | | (1.80 | )% | | | (5,998 | ) |
Western Alliance Bancorporation | | | 685 | | | | (1.50 | )% | | | (6,395 | ) |
Comerica, Inc. | | | 1,056 | | | | (1.87 | )% | | | (7,999 | ) |
Howard Hughes Corp. | | | 679 | | | | (1.40 | )% | | | (8,046 | ) |
Total Financial | | | (64,908 | ) |
| | | | | | | | | | | | | |
26 | THE GUGGENHEIM FUNDS ANNUAL REPORT | SEE NOTES TO CONSOLIDATED FINANCIAL STATEMENTS. |
CONSOLIDATED SCHEDULE OF INVESTMENTS (continued) | December 31, 2021 |
MULTI-HEDGE STRATEGIES FUND | |
| | Shares | | | Percentage
Notional
Amount | | | Value and
Unrealized
Appreciation
(Depreciation) | |
Communications |
Uber Technologies, Inc. | | | 1,426 | | | | (1.22 | )% | | $ | 8,007 | |
Okta, Inc. | | | 159 | | | | (0.72 | )% | | | 7,932 | |
Airbnb, Inc. — Class A | | | 148 | | | | (0.50 | )% | | | 3,871 | |
Zillow Group, Inc. — Class C | | | 373 | | | | (0.48 | )% | | | (719 | ) |
Opendoor Technologies, Inc. | | | 1,589 | | | | (0.47 | )% | | | (1,051 | ) |
Lyft, Inc. — Class A | | | 1,383 | | | | (1.20 | )% | | | (1,664 | ) |
Total Communications | | | 16,376 | |
| | | | | | | | | | | | | |
Energy |
Plug Power, Inc. | | | 414 | | | | (0.24 | )% | | | 4,443 | |
NOV, Inc. | | | 2,222 | | | | (0.61 | )% | | | 808 | |
Denbury, Inc. | | | 346 | | | | (0.54 | )% | | | (593 | ) |
Range Resources Corp. | | | 1,182 | | | | (0.43 | )% | | | (673 | ) |
Marathon Petroleum Corp. | | | 567 | | | | (0.74 | )% | | | (702 | ) |
| | | | | | | | | | | | | |
| | Shares | | | Percentage
Notional
Amount | | |
Value and
Unrealized
Depreciation
| |
Hess Corp. | | | 525 | | | | (0.79 | )% | | $ | (1,468 | ) |
Schlumberger N.V. | | | 2,180 | | | | (1.33 | )% | | | (1,531 | ) |
Halliburton Co. | | | 3,347 | | | | (1.56 | )% | | | (2,001 | ) |
Pioneer Natural Resources Co. | | | 315 | | | | (1.16 | )% | | | (2,670 | ) |
Patterson-UTI Energy, Inc. | | | 4,062 | | | | (0.70 | )% | | | (2,799 | ) |
Total Energy | | | (7,186 | ) |
| | | | | | | | | | | | | |
Utilities |
ONE Gas, Inc. | | | 1,223 | | | | (1.93 | )% | | | (253 | ) |
Atmos Energy Corp. | | | 916 | | | | (1.95 | )% | | | (3,063 | ) |
CenterPoint Energy, Inc. | | | 2,903 | | | | (1.65 | )% | | | (5,044 | ) |
Edison International | | | 1,354 | | | | (1.88 | )% | | | (13,830 | ) |
Total Utilities | | | (22,190 | ) |
Total MS Long/Short Equity Short Custom Basket | | $ | (24,704 | ) |
SEE NOTES TO CONSOLIDATED FINANCIAL STATEMENTS. | THE GUGGENHEIM FUNDS ANNUAL REPORT | 27 |
CONSOLIDATED SCHEDULE OF INVESTMENTS (continued) | December 31, 2021 |
MULTI-HEDGE STRATEGIES FUND | |
| | Shares | | | Percentage
Notional
Amount | | |
Value and
Unrealized
Appreciation
| |
GS LONG/SHORT EQUITY LONG CUSTOM BASKET |
Utilities |
UGI Corp. | | | 2,046 | | | | 1.03 | % | | $ | 22,657 | |
IDACORP, Inc. | | | 825 | | | | 1.04 | % | | | 18,123 | |
National Fuel Gas Co. | | | 1,476 | | | | 1.05 | % | | | 16,887 | |
Chesapeake Utilities Corp. | | | 654 | | | | 1.06 | % | | | 16,633 | |
American States Water Co. | | | 610 | | | | 0.70 | % | | | 13,018 | |
Southern Co. | | | 1,115 | | | | 0.85 | % | | | 12,714 | |
MGE Energy, Inc. | | | 1,095 | | | | 1.00 | % | | | 6,697 | |
Portland General Electric Co. | | | 1,750 | | | | 1.03 | % | | | 5,271 | |
WEC Energy Group, Inc. | | | 935 | | | | 1.01 | % | | | 3,105 | |
PPL Corp. | | | 3,119 | | | | 1.04 | % | | | 1,341 | |
CMS Energy Corp. | | | 281 | | | | 0.20 | % | | | (38 | ) |
Total Utilities | | | 116,408 | |
| | | | | | | | | | | | | |
Consumer, Non-cyclical |
United Therapeutics Corp. | | | 181 | | | | 0.43 | % | | | 22,395 | |
Prestige Consumer Healthcare, Inc. | | | 770 | | | | 0.52 | % | | | 18,652 | |
Innoviva, Inc. | | | 4,224 | | | | 0.81 | % | | | 17,726 | |
Quest Diagnostics, Inc. | | | 449 | | | | 0.86 | % | | | 16,417 | |
Gilead Sciences, Inc. | | | 1,271 | | | | 1.02 | % | | | 12,743 | |
Eagle Pharmaceuticals, Inc. | | | 970 | | | | 0.55 | % | | | 9,644 | |
AbbVie, Inc. | | | 467 | | | | 0.70 | % | | | 9,065 | |
Molson Coors Beverage Co. — Class B | | | 681 | | | | 0.35 | % | | | 8,725 | |
| | | | | | | | | | | | | |
| | Shares | | | Percentage
Notional
Amount | | | Value and
Unrealized
Appreciation
(Depreciation) | |
John B Sanfilippo & Son, Inc. | | | 992 | | | | 0.99 | % | | $ | 8,121 | |
Amgen, Inc. | | | 413 | | | | 1.03 | % | | | 7,856 | |
Regeneron Pharmaceuticals, Inc. | | | 96 | | | | 0.67 | % | | | 7,708 | |
Hologic, Inc. | | | 847 | | | | 0.72 | % | | | 6,857 | |
Johnson & Johnson | | | 531 | | | | 1.01 | % | | | 5,973 | |
Amphastar Pharmaceuticals, Inc. | | | 1,785 | | | | 0.46 | % | | | 5,920 | |
PerkinElmer, Inc. | | | 107 | | | | 0.24 | % | | | 5,856 | |
Vertex Pharmaceuticals, Inc. | | | 161 | | | | 0.39 | % | | | 4,649 | |
Perdoceo Education Corp. | | | 4,774 | | | | 0.62 | % | | | 4,505 | |
Vector Group Ltd. | | | 1,570 | | | | 0.20 | % | | | 4,206 | |
EVERTEC, Inc. | | | 939 | | | | 0.52 | % | | | 3,369 | |
Waters Corp. | | | 95 | | | | 0.39 | % | | | 2,115 | |
Coherus Biosciences, Inc. | | | 1,170 | | | | 0.21 | % | | | 1,939 | |
Laboratory Corporation of America Holdings | | | 102 | | | | 0.36 | % | | | 1,898 | |
USANA Health Sciences, Inc. | | | 567 | | | | 0.64 | % | | | 1,515 | |
Halozyme Therapeutics, Inc. | | | 516 | | | | 0.23 | % | | | 1,168 | |
Bio-Rad Laboratories, Inc. — Class A | | | 65 | | | | 0.55 | % | | | 1,067 | |
Royalty Pharma plc — Class A | | | 784 | | | | 0.35 | % | | | 954 | |
Merck & Company, Inc. | | | 471 | | | | 0.40 | % | | | 859 | |
Pfizer, Inc. | | | 503 | | | | 0.33 | % | | | (400 | ) |
28 | THE GUGGENHEIM FUNDS ANNUAL REPORT | SEE NOTES TO CONSOLIDATED FINANCIAL STATEMENTS. |
CONSOLIDATED SCHEDULE OF INVESTMENTS (continued) | December 31, 2021 |
MULTI-HEDGE STRATEGIES FUND | |
| | Shares | | | Percentage
Notional
Amount | | | Value and
Unrealized
Appreciation
(Depreciation) | |
Bristol-Myers Squibb Co. | | | 1,479 | | | | 1.02 | % | | $ | (1,120 | ) |
Incyte Corp. | | | 588 | | | | 0.48 | % | | | (2,266 | ) |
Vanda Pharmaceuticals, Inc. | | | 2,556 | | | | 0.45 | % | | | (2,508 | ) |
Exelixis, Inc. | | | 1,043 | | | | 0.21 | % | | | (3,214 | ) |
Total Consumer, Non-cyclical | | | 182,394 | |
| | | | | | | | | | | | | |
Technology |
NetApp, Inc. | | | 537 | | | | 0.55 | % | | | 24,617 | |
CSG Systems International, Inc. | | | 1,630 | | | | 1.04 | % | | | 20,278 | |
Rambus, Inc. | | | 2,056 | | | | 0.67 | % | | | 19,563 | |
HP, Inc. | | | 690 | | | | 0.29 | % | | | 15,346 | |
Cirrus Logic, Inc. | | | 362 | | | | 0.37 | % | | | 10,148 | |
ExlService Holdings, Inc. | | | 182 | | | | 0.29 | % | | | 7,214 | |
Lumentum Holdings, Inc. | | | 212 | | | | 0.25 | % | | | 5,292 | |
International Business Machines Corp. | | | 428 | | | | 0.63 | % | | | 2,362 | |
Progress Software Corp. | | | 684 | | | | 0.37 | % | | | 1,044 | |
Intel Corp. | | | 608 | | | | 0.35 | % | | | 495 | |
Microsoft Corp. | | | 91 | | | | 0.34 | % | | | 351 | |
Texas Instruments, Inc. | | | 141 | | | | 0.29 | % | | | 126 | |
CommVault Systems, Inc. | | | 281 | | | | 0.21 | % | | | (3,562 | ) |
Xperi Holding Corp. | | | 1,750 | | | | 0.37 | % | | | (3,608 | ) |
Total Technology | | | 99,666 | |
| | | | | | | | | | | | | |
Financial |
Stewart Information Services Corp. | | | 1,132 | | | | 1.00 | % | | | 21,435 | |
Piper Sandler Cos. | | | 353 | | | | 0.70 | % | | | 12,241 | |
| | | | | | | | | �� | | | | |
| | Shares | | | Percentage
Notional
Amount | | | Value and
Unrealized
Appreciation
(Depreciation) | |
Raymond James Financial, Inc. | | | 930 | | | | 1.04 | % | | $ | 12,151 | |
Synchrony Financial | | | 545 | | | | 0.28 | % | | | 12,080 | |
Interactive Brokers Group, Inc. — Class A | | | 643 | | | | 0.57 | % | | | 9,246 | |
Arch Capital Group Ltd. | | | 1,931 | | | | 0.95 | % | | | 8,275 | |
Enstar Group Ltd. | | | 361 | | | | 0.99 | % | | | 8,118 | |
First American Financial Corp. | | | 623 | | | | 0.54 | % | | | 6,428 | |
Safety Insurance Group, Inc. | | | 1,064 | | | | 1.00 | % | | | 5,553 | |
Preferred Bank/Los Angeles CA | | | 1,330 | | | | 1.06 | % | | | 5,209 | |
Douglas Elliman, Inc. | | | 785 | | | | 0.10 | % | | | 4,450 | |
HomeStreet, Inc. | | | 1,042 | | | | 0.60 | % | | | 2,808 | |
United Bankshares, Inc. | | | 1,702 | | | | 0.69 | % | | | 2,481 | |
Janus Henderson Group plc | | | 756 | | | | 0.35 | % | | | 2,219 | |
Citigroup, Inc. | | | 1,505 | | | | 1.01 | % | | | 1,657 | |
National Bank Holdings Corp. — Class A | | | 1,685 | | | | 0.82 | % | | | 1,492 | |
Fulton Financial Corp. | | | 1,568 | | | | 0.30 | % | | | 982 | |
Everest Re Group Ltd. | | | 180 | | | | 0.55 | % | | | 836 | |
Markel Corp. | | | 23 | | | | 0.32 | % | | | 644 | |
Affiliated Managers Group, Inc. | | | 133 | | | | 0.24 | % | | | 451 | |
Western Union Co. | | | 1,816 | | | | 0.36 | % | | | (62 | ) |
Ameris Bancorp | | | 376 | | | | 0.21 | % | | | (732 | ) |
BankUnited, Inc. | | | 1,212 | | | | 0.57 | % | | | (1,555 | ) |
Essent Group Ltd. | | | 892 | | | | 0.45 | % | | | (1,595 | ) |
MGIC Investment Corp. | | | 4,128 | | | | 0.66 | % | | | (1,892 | ) |
SEE NOTES TO CONSOLIDATED FINANCIAL STATEMENTS. | THE GUGGENHEIM FUNDS ANNUAL REPORT | 29 |
CONSOLIDATED SCHEDULE OF INVESTMENTS (continued) | December 31, 2021 |
MULTI-HEDGE STRATEGIES FUND | |
| | Shares | | | Percentage
Notional
Amount | | | Value and
Unrealized
Appreciation
(Depreciation) | |
Evercore, Inc. — Class A | | | 520 | | | | 0.78 | % | | $ | (1,946 | ) |
Meta Financial Group, Inc. | | | 701 | | | | 0.46 | % | | | (3,639 | ) |
Hilltop Holdings, Inc. | | | 1,198 | | | | 0.47 | % | | | (3,691 | ) |
Old Republic International Corp. | | | 3,423 | | | | 0.93 | % | | | (4,464 | ) |
OneMain Holdings, Inc. | | | 677 | | | | 0.38 | % | | | (4,583 | ) |
Radian Group, Inc. | | | 2,751 | | | | 0.65 | % | | | (4,714 | ) |
AMERISAFE, Inc. | | | 1,252 | | | | 0.75 | % | | | (4,960 | ) |
Mercury General Corp. | | | 1,593 | | | | 0.94 | % | | | (10,385 | ) |
Total Financial | | | 74,538 | |
| | | | | | | | | | | | | |
Consumer, Cyclical |
AutoZone, Inc. | | | 45 | | | | 1.05 | % | | | 39,440 | |
Gentex Corp. | | | 2,700 | | | | 1.04 | % | | | 23,053 | |
Gentherm, Inc. | | | 347 | | | | 0.33 | % | | | 18,021 | |
Brunswick Corp. | | | 485 | | | | 0.54 | % | | | 16,665 | |
AutoNation, Inc. | | | 311 | | | | 0.40 | % | | | 16,099 | |
NVR, Inc. | | | 12 | | | | 0.79 | % | | | 12,173 | |
Cummins, Inc. | | | 360 | | | | 0.87 | % | | | 8,549 | |
O’Reilly Automotive, Inc. | | | 132 | | | | 1.03 | % | | | 7,881 | |
Dolby Laboratories, Inc. — Class A | | | 476 | | | | 0.50 | % | | | 7,343 | |
Tri Pointe Homes, Inc. | | | 1,096 | | | | 0.34 | % | | | 6,344 | |
LKQ Corp. | | | 1,622 | | | | 1.08 | % | | | 5,980 | |
Zumiez, Inc. | | | 791 | | | | 0.42 | % | | | 5,466 | |
Autoliv, Inc. | | | 302 | | | | 0.35 | % | | | 4,497 | |
Dick’s Sporting Goods, Inc. | | | 301 | | | | 0.38 | % | | | 4,429 | |
Methode Electronics, Inc. | | | 637 | | | | 0.35 | % | | | 4,319 | |
MarineMax, Inc. | | | 396 | | | | 0.26 | % | | | 4,011 | |
| | | | | | | | | | | | | |
| | Shares | | | Percentage
Notional
Amount | | | Value and
Unrealized
Appreciation
(Depreciation) | |
Ethan Allen Interiors, Inc. | | | 1,690 | | | | 0.49 | % | | $ | 3,810 | |
Lennar Corp. — Class A | | | 312 | | | | 0.40 | % | | | 3,031 | |
Acushnet Holdings Corp. | | | 966 | | | | 0.57 | % | | | 2,846 | |
Buckle, Inc. | | | 1,058 | | | | 0.50 | % | | | 2,551 | |
Whirlpool Corp. | | | 262 | | | | 0.68 | % | | | 2,328 | |
PulteGroup, Inc. | | | 485 | | | | 0.31 | % | | | 1,883 | |
Kontoor Brands, Inc. | | | 390 | | | | 0.22 | % | | | 1,386 | |
Oxford Industries, Inc. | | | 228 | | | | 0.26 | % | | | 1,146 | |
Shoe Carnival, Inc. | | | 489 | | | | 0.21 | % | | | 808 | |
Tapestry, Inc. | | | 730 | | | | 0.33 | % | | | (574 | ) |
Allison Transmission Holdings, Inc. | | | 1,573 | | | | 0.63 | % | | | (1,004 | ) |
Haverty Furniture Companies, Inc. | | | 573 | | | | 0.19 | % | | | (2,054 | ) |
Polaris, Inc. | | | 285 | | | | 0.35 | % | | | (2,792 | ) |
Foot Locker, Inc. | | | 570 | | | | 0.28 | % | | | (5,295 | ) |
Jack in the Box, Inc. | | | 315 | | | | 0.31 | % | | | (6,667 | ) |
Hibbett, Inc. | | | 305 | | | | 0.24 | % | | | (7,982 | ) |
Total Consumer, Cyclical | | | 177,691 | |
| | | | | | | | | | | | | |
Industrial |
Mueller Industries, Inc. | | | 1,480 | | | | 0.98 | % | | | 25,136 | |
Encore Wire Corp. | | | 489 | | | | 0.78 | % | | | 22,323 | |
Snap-on, Inc. | | | 374 | | | | 0.89 | % | | | 19,977 | |
Knowles Corp. | | | 4,172 | | | | 1.08 | % | | | 19,240 | |
Vishay Intertechnology, Inc. | | | 2,902 | | | | 0.70 | % | | | 17,222 | |
Owens Corning | | | 446 | | | | 0.45 | % | | | 17,153 | |
Keysight Technologies, Inc. | | | 349 | | | | 0.80 | % | | | 16,925 | |
30 | THE GUGGENHEIM FUNDS ANNUAL REPORT | SEE NOTES TO CONSOLIDATED FINANCIAL STATEMENTS. |
CONSOLIDATED SCHEDULE OF INVESTMENTS (continued) | December 31, 2021 |
MULTI-HEDGE STRATEGIES FUND | |
| | Shares | | | Percentage
Notional
Amount | | | Value and
Unrealized
Appreciation
(Depreciation) | |
Louisiana-Pacific Corp. | | | 459 | | | | 0.40 | % | | $ | 7,716 | |
Hillenbrand, Inc. | | | 1,115 | | | | 0.64 | % | | | 7,218 | |
Boise Cascade Co. | | | 577 | | | | 0.46 | % | | | 6,163 | |
Atkore, Inc. | | | 193 | | | | 0.24 | % | | | 4,866 | |
Sanmina Corp. | | | 1,741 | | | | 0.80 | % | | | 3,762 | |
Eagle Materials, Inc. | | | 231 | | | | 0.43 | % | | | 3,581 | |
Albany International Corp. — Class A | | | 302 | | | | 0.30 | % | | | 3,338 | |
Crane Co. | | | 436 | | | | 0.49 | % | | | 3,097 | |
Simpson Manufacturing Company, Inc. | | | 139 | | | | 0.21 | % | | | 2,566 | |
TTM Technologies, Inc. | | | 3,700 | | | | 0.61 | % | | | 2,559 | |
Oshkosh Corp. | | | 440 | | | | 0.55 | % | | | 1,527 | |
Packaging Corporation of America | | | 433 | | | | 0.65 | % | | | 1,380 | |
Textron, Inc. | | | 405 | | | | 0.35 | % | | | 1,165 | |
Insteel Industries, Inc. | | | 542 | | | | 0.24 | % | | | 940 | |
3M Co. | | | 446 | | | | 0.88 | % | | | 927 | |
Dorian LPG Ltd. | | | 1,887 | | | | 0.27 | % | | | (34 | ) |
Worthington Industries, Inc. | | | 626 | | | | 0.38 | % | | | (491 | ) |
Garmin Ltd. | | | 684 | | | | 1.03 | % | | | (1,230 | ) |
Donaldson Company, Inc. | | | 863 | | | | 0.57 | % | | | (1,615 | ) |
OSI Systems, Inc. | | | 513 | | | | 0.53 | % | | | (2,491 | ) |
MDU Resources Group, Inc. | | | 1,631 | | | | 0.56 | % | | | (3,928 | ) |
Toro Co. | | | 866 | | | | 0.96 | % | | | (4,873 | ) |
Vontier Corp. | | | 1,839 | | | | 0.63 | % | | | (5,139 | ) |
Huntington Ingalls Industries, Inc. | | | 309 | | | | 0.64 | % | | | (5,329 | ) |
| | | | | | | | | | | | | |
| | Shares | | | Percentage
Notional
Amount | | | Value and
Unrealized
Appreciation
(Depreciation) | |
Sturm Ruger & Company, Inc. | | | 862 | | | | 0.65 | % | | $ | (6,748 | ) |
Total Industrial | | | 156,903 | |
| | | | | | | | | | | | | |
Basic Materials |
Westlake Chemical Corp. | | | 696 | | | | 0.75 | % | | | 2,993 | |
Celanese Corp. — Class A | | | 351 | | | | 0.65 | % | | | 2,619 | |
LyondellBasell Industries N.V. — Class A | | | 572 | | | | 0.59 | % | | | 1,957 | |
AdvanSix, Inc. | | | 479 | | | | 0.25 | % | | | 1,776 | |
Dow, Inc. | | | 660 | | | | 0.42 | % | | | 1,447 | |
Newmont Corp. | | | 380 | | | | 0.26 | % | | | 801 | |
Steel Dynamics, Inc. | | | 523 | | | | 0.36 | % | | | (147 | ) |
Nucor Corp. | | | 315 | | | | 0.40 | % | | | (247 | ) |
Total Basic Materials | | | 11,199 | |
| | | | | | | | | | | | | |
Communications |
Viavi Solutions, Inc. | | | 5,550 | | | | 1.09 | % | | | 32,258 | |
Cisco Systems, Inc. | | | 1,524 | | | | 1.07 | % | | | 27,101 | |
Juniper Networks, Inc. | | | 1,101 | | | | 0.44 | % | | | 15,055 | |
Omnicom Group, Inc. | | | 1,119 | | | | 0.91 | % | | | 11,441 | |
F5, Inc. | | | 78 | | | | 0.21 | % | | | 4,119 | |
InterDigital, Inc. | | | 527 | | | | 0.42 | % | | | 3,725 | |
Yelp, Inc. — Class A | | | 535 | | | | 0.22 | % | | | (783 | ) |
Shenandoah Telecommunications | | | | | | | | |
Co. | | | 1,151 | | | | 0.33 | % | | | (851 | ) |
T-Mobile US, Inc. | | | 160 | | | | 0.21 | % | | | (1,224 | ) |
Cogent Communications Holdings, Inc. | | | 425 | | | | 0.35 | % | | | (1,436 | ) |
Verizon Communications, Inc. | | | 1,394 | | | | 0.80 | % | | | (2,840 | ) |
SEE NOTES TO CONSOLIDATED FINANCIAL STATEMENTS. | THE GUGGENHEIM FUNDS ANNUAL REPORT | 31 |
CONSOLIDATED SCHEDULE OF INVESTMENTS (continued) | December 31, 2021 |
MULTI-HEDGE STRATEGIES FUND | |
| | Shares | | | Percentage
Notional
Amount | | | Value and
Unrealized
Appreciation
(Depreciation) | |
Telephone & Data Systems, Inc. | | | 1,513 | | | | 0.34 | % | | $ | (3,687 | ) |
Total Communications | | | 82,878 | |
| | | | | | | | | | | | | |
Energy |
Equitrans Midstream Corp. | | | 1,850 | | | | 0.21 | % | | | 1,947 | |
Kinder Morgan, Inc. | | | 1,159 | | | | 0.20 | % | | | 138 | |
Antero Midstream Corp. | | | 1,944 | | | | 0.21 | % | | | (1,709 | ) |
Total Energy | | | 376 | |
Total GS Long/Short Equity Long Custom Basket | | $ | 902,053 | |
| | | | | | | | | |
GS LONG/SHORT EQUITY SHORT CUSTOM BASKET |
Consumer, Non-cyclical |
Teladoc Health, Inc. | | | 397 | | | | (0.77 | )% | | $ | 12,578 | |
Guardant Health, Inc. | | | 375 | | | | (0.76 | )% | | | 11,720 | |
CoStar Group, Inc. | | | 791 | | | | (1.27 | )% | | | 7,203 | |
Viad Corp. | | | 848 | | | | (0.74 | )% | | | 3,498 | |
US Foods Holding Corp. | | | 772 | | | | (0.55 | )% | | | 921 | |
ASGN, Inc. | | | 330 | | | | (0.83 | )% | | | 654 | |
Brink’s Co. | | | 289 | | | | (0.39 | )% | | | 111 | |
Verisk Analytics, Inc. — Class A | | | 196 | | | | (0.91 | )% | | | (662 | ) |
Equifax, Inc. | | | 134 | | | | (0.80 | )% | | | (1,571 | ) |
Rollins, Inc. | | | 1,329 | | | | (0.92 | )% | | | (1,618 | ) |
TransUnion | | | 296 | | | | (0.71 | )% | | | (1,618 | ) |
Sysco Corp. | | | 627 | | | | (1.00 | )% | | | (3,096 | ) |
Dun & Bradstreet Holdings, Inc. | | | 2,301 | | | | (0.96 | )% | | | (3,695 | ) |
Cintas Corp. | | | 176 | | | | (1.59 | )% | | | (4,220 | ) |
Driven Brands Holdings, Inc. | | | 2,217 | | | | (1.52 | )% | | | (11,849 | ) |
Total Consumer, Non-cyclical | | | 8,356 | |
| | | | | | | | | | | | | |
| | Shares | | | Percentage
Notional
Amount | | | Value and
Unrealized
Appreciation
(Depreciation) | |
Technology |
Coupa Software, Inc. | | | 152 | | | | (0.49 | )% | | $ | 16,442 | |
Twilio, Inc. — Class A | | | 93 | | | | (0.50 | )% | | | 9,196 | |
Clarivate plc | | | 962 | | | | (0.46 | )% | | | 5,124 | |
Avalara, Inc. | | | 93 | | | | (0.24 | )% | | | 3,402 | |
Zscaler, Inc. | | | 42 | | | | (0.27 | )% | | | 984 | |
Smartsheet, Inc. — Class A | | | 173 | | | | (0.27 | )% | | | 858 | |
Allscripts Healthcare Solutions, Inc. | | | 1,444 | | | | (0.54 | )% | | | 420 | |
Leidos Holdings, Inc. | | | 284 | | | | (0.51 | )% | | | (377 | ) |
Snowflake, Inc. — Class A | | | 82 | | | | (0.56 | )% | | | (2,649 | ) |
Ceridian HCM Holding, Inc. | | | 303 | | | | (0.64 | )% | | | (4,393 | ) |
KBR, Inc. | | | 1,756 | | | | (1.70 | )% | | | (12,029 | ) |
Total Technology | | | 16,978 | |
| | | | | | | | | | | | | |
Consumer, Cyclical |
United Airlines Holdings, Inc. | | | 1,991 | | | | (1.77 | )% | | | 20,535 | |
Freshpet, Inc. | | | 250 | | | | (0.48 | )% | | | 18,009 | |
Delta Air Lines, Inc. | | | 2,227 | | | | (1.77 | )% | | | 13,068 | |
Spirit Airlines, Inc. | | | 1,580 | | | | (0.70 | )% | | | 6,151 | |
Frontier Group Holdings, Inc. | | | 1,785 | | | | (0.49 | )% | | | 5,689 | |
Tesla, Inc. | | | 24 | | | | (0.52 | )% | | | 2,888 | |
American Airlines Group, Inc. | | | 4,556 | | | | (1.66 | )% | | | 686 | |
Royal Caribbean Cruises Ltd. | | | 508 | | | | (0.79 | )% | | | (421 | ) |
Wynn Resorts Ltd. | | | 226 | | | | (0.39 | )% | | | (781 | ) |
Las Vegas Sands Corp. | | | 533 | | | | (0.41 | )% | | | (1,342 | ) |
IAA, Inc. | | | 914 | | | | (0.94 | )% | | | (1,873 | ) |
Carnival Corp. | | | 2,022 | | | | (0.83 | )% | | | (3,714 | ) |
32 | THE GUGGENHEIM FUNDS ANNUAL REPORT | SEE NOTES TO CONSOLIDATED FINANCIAL STATEMENTS. |
CONSOLIDATED SCHEDULE OF INVESTMENTS (continued) | December 31, 2021 |
MULTI-HEDGE STRATEGIES FUND | |
| | Shares | | | Percentage
Notional
Amount | | | Value and
Unrealized
Appreciation
(Depreciation) | |
Madison Square Garden Sports Corp. — Class A | | | 446 | | | | (1.57 | )% | | $ | (4,612 | ) |
Copart, Inc. | | | 310 | | | | (0.96 | )% | | | (5,104 | ) |
Total Consumer, Cyclical | | | 49,179 | |
| | | | | | | | | | | | | |
Industrial |
Stericycle, Inc. | | | 1,067 | | | | (1.29 | )% | | | 15,505 | |
Boeing Co. | | | 380 | | | | (1.55 | )% | | | 9,255 | |
US Ecology, Inc. | | | 1,401 | | | | (0.91 | )% | | | 7,536 | |
TransDigm Group, Inc. | | | 43 | | | | (0.56 | )% | | | 525 | |
Jacobs Engineering Group, Inc. | | | 666 | | | | (1.88 | )% | | | 515 | |
Howmet Aerospace, Inc. | | | 1,449 | | | | (0.94 | )% | | | (2,824 | ) |
Waste Management, Inc. | | | 355 | | | | (1.20 | )% | | | (9,978 | ) |
Tetra Tech, Inc. | | | 312 | | | | (1.08 | )% | | | (10,213 | ) |
Republic Services, Inc. — Class A | | | 490 | | | | (1.39 | )% | | | (14,859 | ) |
Casella Waste Systems, Inc. — Class A | | | 843 | | | | (1.46 | )% | | | (17,871 | ) |
Total Industrial | | | (22,409 | ) |
| | | | | | | | | | | | | |
Energy |
Plug Power, Inc. | | | 414 | | | | (0.24 | )% | | | 4,461 | |
NOV, Inc. | | | 2,222 | | | | (0.61 | )% | | | 763 | |
Range Resources Corp. | | | 1,182 | | | | (0.43 | )% | | | (568 | ) |
Denbury, Inc. | | | 346 | | | | (0.54 | )% | | | (568 | ) |
Marathon Petroleum Corp. | | | 567 | | | | (0.74 | )% | | | (711 | ) |
Schlumberger N.V. | | | 2,180 | | | | (1.33 | )% | | | (1,382 | ) |
Hess Corp. | | | 525 | | | | (0.79 | )% | | | (1,505 | ) |
Halliburton Co. | | | 3,347 | | | | (1.56 | )% | | | (1,855 | ) |
| | | | | | | | | | | | | |
| | Shares | | | Percentage
Notional
Amount | | | Value and
Unrealized
Appreciation
(Depreciation) | |
Pioneer Natural Resources Co. | | | 315 | | | | (1.16 | )% | | $ | (2,625 | ) |
Patterson-UTI Energy, Inc. | | | 4,062 | | | | (0.70 | )% | | | (2,782 | ) |
Total Energy | | | (6,772 | ) |
| | | | | | | | | | | | | |
Financial |
Americold Realty Trust | | | 1,356 | | | | (0.90 | )% | | | 8,320 | |
Park Hotels & Resorts, Inc. | | | 4,179 | | | | (1.60 | )% | | | 1,579 | |
RLJ Lodging Trust | | | 5,158 | | | | (1.46 | )% | | | 792 | |
Welltower, Inc. | | | 805 | | | | (1.40 | )% | | | 614 | |
DiamondRock Hospitality Co. | | | 4,576 | | | | (0.89 | )% | | | 538 | |
Safehold, Inc. | | | 941 | | | | (1.53 | )% | | | 380 | |
Lincoln National Corp. | | | 720 | | | | (1.00 | )% | | | 50 | |
Sunstone Hotel Investors, Inc. | | | 5,316 | | | | (1.27 | )% | | | (442 | ) |
Sun Communities, Inc. | | | 176 | | | | (0.75 | )% | | | (1,403 | ) |
Xenia Hotels & Resorts, Inc. | | | 2,410 | | | | (0.89 | )% | | | (1,628 | ) |
Wells Fargo & Co. | | | 1,308 | | | | (1.28 | )% | | | (1,778 | ) |
Pebblebrook Hotel Trust | | | 2,934 | | | | (1.33 | )% | | | (2,888 | ) |
Northern Trust Corp. | | | 329 | | | | (0.80 | )% | | | (3,307 | ) |
Equitable Holdings, Inc. | | | 2,036 | | | | (1.36 | )% | | | (3,395 | ) |
Equinix, Inc. | | | 83 | | | | (1.43 | )% | | | (3,489 | ) |
Host Hotels & Resorts, Inc. | | | 4,756 | | | | (1.68 | )% | | | (3,497 | ) |
Signature Bank | | | 147 | | | | (0.97 | )% | | | (3,717 | ) |
Ryman Hospitality Properties, Inc. | | | 780 | | | | (1.46 | )% | | | (3,964 | ) |
Bank of New York Mellon Corp. | | | 986 | | | | (1.16 | )% | | | (3,993 | ) |
Kennedy-Wilson Holdings, Inc. | | | 3,733 | | | | (1.81 | )% | | | (4,817 | ) |
SEE NOTES TO CONSOLIDATED FINANCIAL STATEMENTS. | THE GUGGENHEIM FUNDS ANNUAL REPORT | 33 |
CONSOLIDATED SCHEDULE OF INVESTMENTS (continued) | December 31, 2021 |
MULTI-HEDGE STRATEGIES FUND | |
| | Shares | | | Percentage
Notional
Amount | | | Value and
Unrealized
Appreciation
(Depreciation) | |
Outfront Media, Inc. | | | 2,208 | | | | (1.20 | )% | | $ | (5,427 | ) |
State Street Corp. | | | 912 | | | | (1.72 | )% | | | (5,822 | ) |
Apartment Income REIT Corp. | | | 1,621 | | | | (1.80 | )% | | | (6,280 | ) |
Western Alliance Bancorporation | | | 685 | | | | (1.50 | )% | | | (6,401 | ) |
Comerica, Inc. | | | 1,056 | | | | (1.87 | )% | | | (7,793 | ) |
Howard Hughes Corp. | | | 679 | | | | (1.40 | )% | | | (7,953 | ) |
Total Financial | | | (65,721 | ) |
| | | | | | | | | | | | | |
Communications |
Uber Technologies, Inc. | | | 1,426 | | | | (1.22 | )% | | | 8,017 | |
Okta, Inc. | | | 159 | | | | (0.72 | )% | | | 7,887 | |
Airbnb, Inc. — Class A | | | 148 | | | | (0.50 | )% | | | 3,968 | |
Zillow Group, Inc. — Class C | | | 373 | | | | (0.48 | )% | | | (751 | ) |
Opendoor Technologies, Inc. | | | 1,589 | | | | (0.47 | )% | | | (1,121 | ) |
Lyft, Inc. — Class A | | | 1,383 | | | | (1.20 | )% | | | (1,848 | ) |
Total Communications | | | 16,152 | |
| | | | | | | | | | �� | | | |
Utilities |
ONE Gas, Inc. | | | 1,223 | | | | (1.93 | )% | | | (282 | ) |
Atmos Energy Corp. | | | 916 | | | | (1.95 | )% | | | (3,129 | ) |
CenterPoint Energy, Inc. | | | 2,903 | | | | (1.65 | )% | | | (5,112 | ) |
Edison International | | | 1,354 | | | | (1.88 | )% | | | (13,973 | ) |
Total Utilities | | | (22,496 | ) |
Total GS Long/Short Equity Short Custom Basket | | $ | (26,733 | ) |
| | Shares | | | Percentage
Notional
Amount | | |
Value and
Unrealized
Appreciation
| |
MS EQUITY MARKET NEUTRAL LONG CUSTOM BASKET |
Financial |
Sun Communities, Inc. | | | 3,020 | | | | 4.85 | % | | $ | 221,107 | |
National Storage Affiliates Trust | | | 9,736 | | | | 5.18 | % | | | 165,838 | |
AvalonBay Communities, Inc. | | | 2,047 | | | | 3.97 | % | | | 159,345 | |
Equity Residential | | | 5,724 | | | | 3.98 | % | | | 133,486 | |
CyrusOne, Inc. | | | 6,367 | | | | 4.39 | % | | | 124,115 | |
Rexford Industrial Realty, Inc. | | | 5,539 | | | | 3.45 | % | | | 120,089 | |
Alexandria Real Estate Equities, Inc. | | | 2,041 | | | | 3.50 | % | | | 117,407 | |
Prologis, Inc. | | | 1,701 | | | | 2.20 | % | | | 105,668 | |
Jones Lang LaSalle, Inc. | | | 1,226 | | | | 2.54 | % | | | 102,894 | |
Ryman Hospitality Properties, Inc. | | | 4,924 | | | | 3.48 | % | | | 101,460 | |
Invitation Homes, Inc. | | | 8,838 | | | | 3.08 | % | | | 95,571 | |
Innovative Industrial Properties, Inc. | | | 405 | | | | 0.82 | % | | | 74,325 | |
Gaming and Leisure Properties, Inc. | | | 9,594 | | | | 3.59 | % | | | 70,972 | |
Healthpeak Properties, Inc. | | | 8,813 | | | | 2.44 | % | | | 60,324 | |
American Campus Communities, Inc. | | | 4,470 | | | | 1.97 | % | | | 51,847 | |
American Assets Trust, Inc. | | | 8,517 | | | | 2.46 | % | | | 49,336 | |
Brixmor Property Group, Inc. | | | 10,377 | | | | 2.03 | % | | | 48,157 | |
DiamondRock Hospitality Co. | | | 46,997 | | | | 3.47 | % | | | 48,113 | |
34 | THE GUGGENHEIM FUNDS ANNUAL REPORT | SEE NOTES TO CONSOLIDATED FINANCIAL STATEMENTS. |
CONSOLIDATED SCHEDULE OF INVESTMENTS (continued) | December 31, 2021 |
MULTI-HEDGE STRATEGIES FUND | |
| | Shares | | | Percentage
Notional
Amount | | | Value and
Unrealized
Appreciation
(Depreciation) | |
MGM Growth Properties LLC — Class A | | | 5,874 | | | | 1.84 | % | | $ | 47,016 | |
VICI Properties, Inc. | | | 11,229 | | | | 2.60 | % | | | 36,248 | |
Medical Properties Trust, Inc. | | | 11,421 | | | | 2.07 | % | | | 30,411 | |
Agree Realty Corp. | | | 7,268 | | | | 3.98 | % | | | 30,309 | |
Ventas, Inc. | | | 4,451 | | | | 1.75 | % | | | 29,452 | |
Four Corners Property Trust, Inc. | | | 14,975 | | | | 3.38 | % | | | 24,580 | |
Acadia Realty Trust | | | 23,561 | | | | 3.95 | % | | | 17,162 | |
Kite Realty Group Trust | | | 16,000 | | | | 2.68 | % | | | 11,611 | |
CareTrust REIT, Inc. | | | 17,644 | | | | 3.09 | % | | | (3,390 | ) |
Hudson Pacific Properties, Inc. | | | 12,119 | | | | 2.30 | % | | | (15,648 | ) |
Xenia Hotels & Resorts, Inc. | | | 32,624 | | | | 4.54 | % | | | (16,498 | ) |
Empire State Realty Trust, Inc. — Class A | | | 34,982 | | | | 2.39 | % | | | (84,562 | ) |
Total Financial | | | 1,956,745 | |
| | | | | | | | | | | | | |
Consumer, Cyclical |
Hilton Grand Vacations, Inc. | | | 5,137 | | | | 2.06 | % | | | 62,920 | |
DR Horton, Inc. | | | 1,379 | | | | 1.15 | % | | | 29,276 | |
Lennar Corp. — Class A | | | 1,280 | | | | 1.14 | % | | | 23,949 | |
PulteGroup, Inc. | | | 3,571 | | | | 1.57 | % | | | 12,747 | |
Marriott Vacations Worldwide Corp. | | | 1,626 | | | | 2.11 | % | | | 1,446 | |
Total Consumer, Cyclical | | | 130,338 | |
Total MS Equity Market Neutral Long Custom Basket | | $ | 2,087,083 | |
| | | | | | | | | |
| | Shares | | | Percentage
Notional
Amount | | | Value and
Unrealized
Appreciation
(Depreciation) | |
MS EQUITY MARKET NEUTRAL SHORT CUSTOM BASKET |
Financial |
Omega Healthcare Investors, Inc. | | | 17,506 | | | | (4.00 | )% | | $ | 120,864 | |
LTC Properties, Inc. | | | 7,064 | | | | (1.86 | )% | | | 56,011 | |
Broadstone Net Lease, Inc. | | | 19,331 | | | | (3.70 | )% | | | 47,762 | |
National Health Investors, Inc. | | | 2,861 | | | | (1.27 | )% | | | 38,657 | |
Office Properties Income Trust | | | 13,427 | | | | (2.57 | )% | | | 37,965 | |
RLJ Lodging Trust | | | 34,309 | | | | (3.68 | )% | | | 33,665 | |
Equity Commonwealth | | | 7,657 | | | | (1.53 | )% | | | 19,591 | |
American Finance Trust, Inc. | | | 27,375 | | | | (1.92 | )% | | | (979 | ) |
CorePoint Lodging, Inc. | | | 8,537 | | | | (1.03 | )% | | | (1,376 | ) |
Industrial Logistics Properties Trust | | | 6,273 | | | | (1.21 | )% | | | (1,720 | ) |
Healthcare Realty Trust, Inc. | | | 5,341 | | | | (1.30 | )% | | | (2,559 | ) |
Phillips Edison & Company, Inc. | | | 15,143 | | | | (3.85 | )% | | | (7,576 | ) |
Easterly Government Properties, Inc. | | | 7,561 | | | | (1.33 | )% | | | (9,572 | ) |
Welltower, Inc. | | | 2,605 | | | | (1.72 | )% | | | (9,991 | ) |
Corporate Office Properties Trust | | | 11,582 | | | | (2.49 | )% | | | (10,801 | ) |
STORE Capital Corp. | | | 19,272 | | | | (5.11 | )% | | | (11,470 | ) |
Douglas Emmett, Inc. | | | 12,203 | | | | (3.15 | )% | | | (12,566 | ) |
Host Hotels & Resorts, Inc. | | | 28,335 | | | | (3.79 | )% | | | (21,382 | ) |
CubeSmart | | | 3,062 | | | | (1.34 | )% | | | (40,341 | ) |
SEE NOTES TO CONSOLIDATED FINANCIAL STATEMENTS. | THE GUGGENHEIM FUNDS ANNUAL REPORT | 35 |
CONSOLIDATED SCHEDULE OF INVESTMENTS (continued) | December 31, 2021 |
MULTI-HEDGE STRATEGIES FUND | |
| | Shares | | | Percentage
Notional
Amount | | |
Value and
Unrealized
Depreciation
| |
Washington Real Estate Investment Trust | | | 15,225 | | | | (3.03 | )% | | $ | (46,183 | ) |
Realty Income Corp. | | | 12,227 | | | | (6.74 | )% | | | (47,336 | ) |
Apple Hospitality REIT, Inc. | | | 41,724 | | | | (5.19 | )% | | | (49,862 | ) |
Digital Realty Trust, Inc. | | | 2,208 | | | | (3.01 | )% | | | (66,536 | ) |
Apartment Income REIT Corp. | | | 7,753 | | | | (3.26 | )% | | | (69,369 | ) |
Essential Properties Realty Trust, Inc. | | | 18,729 | | | | (4.16 | )% | | | (82,283 | ) |
Camden Property Trust | | | 2,506 | | | | (3.45 | )% | | | (87,597 | ) |
STAG Industrial, Inc. | | | 9,273 | | | | (3.43 | )% | | | (119,428 | ) |
Independence Realty Trust, Inc. | | | 17,613 | | | | (3.50 | )% | | | (164,500 | ) |
Mid-America Apartment Communities, Inc. | | | 4,060 | | | | (7.17 | )% | | | (306,354 | ) |
Total Financial | | | (815,266 | ) |
| | | | | | | | | | | | | |
Exchange Traded Funds |
Vanguard Real Estate ETF | | | 11,428 | | | | (10.21 | )% | | | (133,651 | ) |
Total MS Equity Market Neutral Short Custom Basket | | $ | (948,917 | ) |
| | Shares | | | Percentage
Notional
Amount | | |
Value and
Unrealized
Appreciation
| |
GS EQUITY MARKET NEUTRAL LONG CUSTOM BASKET |
Financial |
Sun Communities, Inc. | | | 3,020 | | | | 4.85 | % | | $ | 192,591 | |
National Storage Affiliates Trust | | | 9,736 | | | | 5.18 | % | | | 165,603 | |
AvalonBay Communities, Inc. | | | 2,047 | | | | 3.97 | % | | | 159,001 | |
Equity Residential | | | 5,724 | | | | 3.98 | % | | | 133,041 | |
CyrusOne, Inc. | | | 6,367 | | | | 4.39 | % | | | 124,569 | |
Rexford Industrial Realty, Inc. | | | 5,539 | | | | 3.45 | % | | | 119,781 | |
Alexandria Real Estate Equities, Inc. | | | 2,041 | | | | 3.50 | % | | | 117,492 | |
Prologis, Inc. | | | 1,701 | | | | 2.20 | % | | | 105,583 | |
Jones Lang LaSalle, Inc. | | | 1,226 | | | | 2.54 | % | | | 103,275 | |
Ryman Hospitality Properties, Inc. | | | 4,924 | | | | 3.48 | % | | | 102,974 | |
Invitation Homes, Inc. | | | 8,838 | | | | 3.08 | % | | | 95,534 | |
Innovative Industrial Properties, Inc. | | | 405 | | | | 0.82 | % | | | 74,813 | |
Gaming and Leisure Properties, Inc. | | | 9,594 | | | | 3.59 | % | | | 70,888 | |
American Campus Communities, Inc. | | | 4,470 | | | | 1.97 | % | | | 50,972 | |
American Assets Trust, Inc. | | | 8,517 | | | | 2.46 | % | | | 49,787 | |
Brixmor Property Group, Inc. | | | 10,377 | | | | 2.03 | % | | | 48,219 | |
Healthpeak Properties, Inc. | | | 8,813 | | | | 2.44 | % | | | 47,173 | |
36 | THE GUGGENHEIM FUNDS ANNUAL REPORT | SEE NOTES TO CONSOLIDATED FINANCIAL STATEMENTS. |
CONSOLIDATED SCHEDULE OF INVESTMENTS (continued) | December 31, 2021 |
MULTI-HEDGE STRATEGIES FUND | |
| | Shares | | | Percentage
Notional
Amount | | | Value and
Unrealized
Appreciation
(Depreciation) | |
MGM Growth Properties LLC — Class A | | | 5,874 | | | | 1.84 | % | | $ | 47,020 | |
DiamondRock Hospitality Co. | | | 46,997 | | | | 3.47 | % | | | 46,658 | |
VICI Properties, Inc. | | | 11,229 | | | | 2.60 | % | | | 36,068 | |
Medical Properties Trust, Inc. | | | 11,421 | | | | 2.07 | % | | | 30,324 | |
Ventas, Inc. | | | 4,451 | | | | 1.75 | % | | | 29,533 | |
Agree Realty Corp. | | | 7,268 | | | | 3.98 | % | | | 29,299 | |
Four Corners Property Trust, Inc. | | | 14,975 | | | | 3.38 | % | | | 25,184 | |
Acadia Realty Trust | | | 23,561 | | | | 3.95 | % | | | 17,676 | |
Kite Realty Group Trust | | | 16,000 | | | | 2.68 | % | | | 12,166 | |
CareTrust REIT, Inc. | | | 17,644 | | | | 3.09 | % | | | (1,086 | ) |
Hudson Pacific Properties, Inc. | | | 12,119 | | | | 2.30 | % | | | (15,545 | ) |
Xenia Hotels & Resorts, Inc. | | | 32,624 | | | | 4.54 | % | | | (17,915 | ) |
Empire State Realty Trust, Inc. — Class A | | | 34,982 | | | | 2.39 | % | | | (87,540 | ) |
Total Financial | | | 1,913,138 | |
| | | | | | | | | | | | | |
Consumer, Cyclical |
Hilton Grand Vacations, Inc. | | | 5,137 | | | | 2.06 | % | | | 62,949 | |
DR Horton, Inc. | | | 1,379 | | | | 1.15 | % | | | 29,059 | |
Lennar Corp. — Class A | | | 1,280 | | | | 1.14 | % | | | 24,069 | |
PulteGroup, Inc. | | | 3,571 | | | | 1.57 | % | | | 12,831 | |
| | | | | | | | | | | | | |
| | Shares | | | Percentage
Notional
Amount | | | Value and
Unrealized
Appreciation
(Depreciation) | |
Marriott Vacations Worldwide Corp. | | | 1,626 | | | | 2.11 | % | | $ | 2,416 | |
Total Consumer, Cyclical | | | 131,324 | |
Total GS Equity Market Neutral Long Custom Basket | | $ | 2,044,462 | |
| | | | | | | | | |
GS EQUITY MARKET NEUTRAL SHORT CUSTOM BASKET |
Financial |
Omega Healthcare Investors, Inc. | | | 17,506 | | | | (3.99 | )% | | $ | 123,231 | |
LTC Properties, Inc. | | | 7,183 | | | | (1.89 | )% | | | 56,867 | |
Broadstone Net Lease, Inc. | | | 19,331 | | | | (3.69 | )% | | | 42,259 | |
National Health Investors, Inc. | | | 3,050 | | | | (1.35 | )% | | | 40,441 | |
Office Properties Income Trust | | | 13,427 | | | | (2.57 | )% | | | 39,858 | |
RLJ Lodging Trust | | | 34,309 | | | | (3.68 | )% | | | 36,900 | |
Equity Commonwealth | | | 7,657 | | | | (1.53 | )% | | | 19,637 | |
American Finance Trust, Inc. | | | 27,375 | | | | (1.92 | )% | | | (685 | ) |
CorePoint Lodging, Inc. | | | 8,537 | | | | (1.03 | )% | | | (1,299 | ) |
Industrial Logistics Properties Trust | | | 6,170 | | | | (1.19 | )% | | | (1,845 | ) |
Healthcare Realty Trust, Inc. | | | 5,341 | | | | (1.30 | )% | | | (2,630 | ) |
Easterly Government Properties, Inc. | | | 7,561 | | | | (1.33 | )% | | | (9,601 | ) |
Welltower, Inc. | | | 2,605 | | | | (1.72 | )% | | | (10,464 | ) |
Phillips Edison & Company, Inc. | | | 15,143 | | | | (3.85 | )% | | | (11,327 | ) |
Douglas Emmett, Inc. | | | 12,203 | | | | (3.15 | )% | | | (11,686 | ) |
SEE NOTES TO CONSOLIDATED FINANCIAL STATEMENTS. | THE GUGGENHEIM FUNDS ANNUAL REPORT | 37 |
CONSOLIDATED SCHEDULE OF INVESTMENTS (continued) | December 31, 2021 |
MULTI-HEDGE STRATEGIES FUND | |
| | Shares | | | Percentage
Notional
Amount | | |
Value and
Unrealized
Depreciation
| |
Corporate Office Properties Trust | | | 11,582 | | | | (2.49 | )% | | $ | (11,796 | ) |
STORE Capital Corp. | | | 19,272 | | | | (5.10 | )% | | | (11,969 | ) |
Host Hotels & Resorts, Inc. | | | 28,335 | | | | (3.79 | )% | | | (21,360 | ) |
CubeSmart | | | 3,062 | | | | (1.34 | )% | | | (40,780 | ) |
Washington Real Estate Investment Trust | | | 15,225 | | | | (3.03 | )% | | | (47,627 | ) |
Apple Hospitality REIT, Inc. | | | 41,724 | | | | (5.18 | )% | | | (48,254 | ) |
Realty Income Corp. | | | 12,227 | | | | (6.73 | )% | | | (49,612 | ) |
Digital Realty Trust, Inc. | | | 2,208 | | | | (3.00 | )% | | | (67,049 | ) |
Apartment Income REIT Corp. | | | 7,753 | | | | (3.26 | )% | | | (69,823 | ) |
| | | | | | | | | | | | | |
| | Shares | | | Percentage
Notional
Amount | | |
Value and
Unrealized
Depreciation
| |
Essential Properties Realty Trust, Inc. | | | 18,729 | | | | (4.15 | )% | | $ | (84,472 | ) |
Camden Property Trust | | | 2,506 | | | | (3.45 | )% | | | (87,684 | ) |
STAG Industrial, Inc. | | | 9,273 | | | | (3.42 | )% | | | (120,290 | ) |
Independence Realty Trust, Inc. | | | 17,613 | | | | (3.50 | )% | | | (162,315 | ) |
Mid-America Apartment Communities, Inc. | | | 4,060 | | | | (7.17 | )% | | | (307,498 | ) |
Total Financial | | | (820,873 | ) |
| | | | | | | | | | | | | |
Exchange Traded Funds |
Vanguard Real Estate ETF | | | 11,428 | | | | (10.20 | )% | | | (134,120 | ) |
Total GS Equity Market Neutral Short Custom Basket | | $ | (954,993 | ) |
* | Non-income producing security. |
** | Includes cumulative appreciation (depreciation). Variation margin is reported within the Consolidated Statement of Assets and Liabilities. |
† | Value determined based on Level 1 inputs, unless otherwise noted — See Note 4. |
†† | Value determined based on Level 2 inputs — See Note 4. |
††† | Value determined based on Level 3 inputs — See Note 4. |
1 | Affiliated issuer. |
2 | All or a portion of this security is on loan at December 31, 2021 — See Note 8. |
3 | All or a portion of this security is pledged as short security and equity custom basket swap collateral at December 31, 2021. |
4 | Rate indicated is the effective yield at the time of purchase. |
5 | All or a portion of this security is pledged as futures collateral at December 31, 2021. |
6 | Repurchase Agreements — See Note 6. |
7 | Securities lending collateral — See Note 8. |
8 | Rate indicated is the 7-day yield as of December 31, 2021. |
| | GS — Goldman Sachs International |
| | MS — Morgan Stanley Capital Services LLC |
| | plc — Public Limited Company |
| | REIT — Real Estate Investment Trust |
| | |
| | See Sector Classification in Other Information section. |
38 | THE GUGGENHEIM FUNDS ANNUAL REPORT | SEE NOTES TO CONSOLIDATED FINANCIAL STATEMENTS. |
CONSOLIDATED SCHEDULE OF INVESTMENTS (continued) | December 31, 2021 |
MULTI-HEDGE STRATEGIES FUND | |
The following table summarizes the inputs used to value the Fund’s investments at December 31, 2021 (See Note 4 in the Notes to Consolidated Financial Statements):
Investments in Securities (Assets) | | Level 1
Quoted
Prices | | | Level 2
Significant
Observable
Inputs | | | Level 3
Significant
Unobservable
Inputs | | | Total | |
Common Stocks | | $ | 27,810,283 | | | $ | — | | | $ | — | | | $ | 27,810,283 | |
Rights | | | — | | | | — | | | | — | * | | | — | |
Mutual Funds | | | 9,875,913 | | | | — | | | | — | | | | 9,875,913 | |
Closed-End Funds | | | 4,983,584 | | | | — | | | | — | | | | 4,983,584 | |
U.S. Treasury Bills | | | — | | | | 9,085,963 | | | | — | | | | 9,085,963 | |
Repurchase Agreements | | | — | | | | 15,867,053 | | | | — | | | | 15,867,053 | |
Securities Lending Collateral | | | 281,926 | | | | — | | | | — | | | | 281,926 | |
Commodity Futures Contracts** | | | 366,867 | | | | — | | | | — | | | | 366,867 | |
Equity Futures Contracts** | | | 173,765 | | | | 34,888 | | | | — | | | | 208,653 | |
Currency Futures Contracts** | | | 121,638 | | | | — | | | | — | | | | 121,638 | |
Interest Rate Futures Contracts** | | | 34,882 | | | | 70,065 | | | | — | | | | 104,947 | |
Equity Custom Basket Swap Agreements** | | | — | | | | 5,934,449 | | | | — | | | | 5,934,449 | |
Total Assets | | $ | 43,648,858 | | | $ | 30,992,418 | | | $ | — | | | $ | 74,641,276 | |
Investments in Securities (Liabilities) | | Level 1
Quoted
Prices | | | Level 2
Significant
Observable
Inputs | | | Level 3
Significant
Unobservable
Inputs | | | Total | |
Common Stocks Sold Short | | $ | 10,360,471 | | | $ | — | | | $ | — | | | $ | 10,360,471 | |
Exchange-Traded Funds Sold Short | | | 5,315,391 | | | | — | | | | — | | | | 5,315,391 | |
Commodity Futures Contracts** | | | 345,159 | | | | — | | | | — | | | | 345,159 | |
Currency Futures Contracts** | | | 301,977 | | | | — | | | | — | | | | 301,977 | |
Interest Rate Futures Contracts** | | | — | | | | 278,972 | | | | — | | | | 278,972 | |
Equity Futures Contracts** | | | 111,787 | | | | 2,188 | | | | — | | | | 113,975 | |
Equity Custom Basket Swap Agreements** | | | — | | | | 1,955,347 | | | | — | | | | 1,955,347 | |
Total Liabilities | | $ | 16,434,785 | | | $ | 2,236,507 | | | $ | — | | | $ | 18,671,292 | |
* | Includes securities with a market value of $0. |
** | This derivative is reported as unrealized appreciation/depreciation at period end. |
SEE NOTES TO CONSOLIDATED FINANCIAL STATEMENTS. | THE GUGGENHEIM FUNDS ANNUAL REPORT | 39 |
CONSOLIDATED SCHEDULE OF INVESTMENTS (concluded) | December 31, 2021 |
MULTI-HEDGE STRATEGIES FUND | |
Affiliated Transactions
Investments representing 5% or more of the outstanding voting shares of a company, or control of or by, or common control under Guggenheim Investments (“GI”), result in that company being considered an affiliated issuer, as defined in the 1940 Act.
The Fund may invest in certain of the underlying series of Guggenheim Strategy Funds Trust, including Guggenheim Strategy Fund II and Guggenheim Strategy Fund III, (collectively, the “Short Term Investment Vehicles”), each of which are open-end management investment companies managed by GI. The Short Term Investment Vehicles, which launched on March 11, 2014, are offered as short term investment options only to mutual funds, trusts, and other accounts managed by GI and/or its affiliates, and are not available to the public. The Short Term Investment Vehicles pay no investment management fees. The Short Term Investment Vehicles’ annual report on Form N-CSR dated September 30, 2021, is available publicly or upon request. This information is available from the EDGAR database on the SEC’s website at https://www.sec.gov/Archives/edgar/data/1601445/000182126821000490/gugg83048-ncsr.htm. The Fund may invest in certain of the underlying series of Guggenheim Fund Trust, which are open-end management investment companies managed by GI, are available to the public and whose most recent annual report on Form N-CSR is available publicly or upon request.
Transactions during the year ended December 31, 2021, in which the company is an affiliated issuer, were as follows:
Security Name | | Value
12/31/20 | | | Additions | | | Reductions | | | Realized
Gain (Loss) | | | Change in
Unrealized
Appreciation
(Depreciation) | | | Value
12/31/21 | | | Shares
12/31/21 | | | Investment
Income | |
Mutual Funds | | | | | | | | | | | | | | | | | | | | | | | | | | | | | | | | |
Guggenheim Strategy Fund II | | $ | 4,605,176 | | | $ | 6,020,279 | | | $ | (5,400,000 | ) | | $ | 18,330 | | | $ | (36,290 | ) | | $ | 5,207,495 | | | | 209,304 | | | $ | 61,876 | |
Guggenheim Strategy Fund III | | | 718,511 | | | | 262,584 | | | | — | | | | — | | | | (3,343 | ) | | | 977,752 | | | | 39,063 | | | | 14,098 | |
Guggenheim Ultra Short Duration Fund — Institutional Class | | | 7,021,947 | | | | 5,687,299 | | | | (9,000,000 | ) | | | 10,985 | | | | (29,565 | ) | | | 3,690,666 | | | | 372,043 | | | | 38,988 | |
| | | $ | 12,345,634 | | | $ | 11,970,162 | | | $ | (14,400,000 | ) | | $ | 29,315 | | | $ | (69,198 | ) | | $ | 9,875,913 | | | | | | | $ | 114,962 | |
40 | THE GUGGENHEIM FUNDS ANNUAL REPORT | SEE NOTES TO CONSOLIDATED FINANCIAL STATEMENTS. |
CONSOLIDATED STATEMENT OF ASSETS AND LIABILITIES |
MULTI-HEDGE STRATEGIES FUND |
December 31, 2021
Assets: |
Investments in unaffiliated issuers, at value - including $276,598 of securities loaned (cost $40,221,026) | | $ | 42,161,756 | |
Investments in affiliated issuers, at value (cost $9,886,814) | | | 9,875,913 | |
Repurchase agreements, at value (cost $15,867,053) | | | 15,867,053 | |
Cash | | | 15,095,525 | |
Unrealized appreciation on OTC swap agreements | | | 5,934,449 | |
Receivables: |
Securities sold | | | 487,332 | |
Swap settlement | | | 160,392 | |
Variation margin on futures contracts | | | 133,445 | |
Fund shares sold | | | 78,423 | |
Dividends | | | 47,590 | |
Securities lending income | | | 1,026 | |
Interest | | | 15 | |
Total assets | | | 89,842,919 | |
| | | | | |
Liabilities: |
Securities sold short, at value (proceeds $13,830,755) | | | 15,675,862 | |
Unrealized depreciation on OTC swap agreements | | | 1,955,347 | |
Payable for: |
Securities purchased | | | 1,211,671 | |
Return of securities lending collateral | | | 281,926 | |
Management fees | | | 49,969 | |
Distribution and service fees | | | 3,543 | |
Trustees’ fees* | | | 666 | |
Miscellaneous | | | 22,371 | |
Total liabilities | | | 19,201,355 | |
Commitments and contingent liabilities (Note 11) | | | — | |
Net assets | | $ | 70,641,564 | |
| | | | | |
Net assets consist of: |
Paid in capital | | $ | 73,965,977 | |
Total distributable earnings (loss) | | | (3,324,413 | ) |
Net assets | | $ | 70,641,564 | |
| | | | | |
A-Class: |
Net assets | | $ | 4,592,687 | |
Capital shares outstanding | | | 166,863 | |
Net asset value per share | | $ | 27.52 | |
Maximum offering price per share (Net asset value divided by 95.25%) | | $ | 28.89 | |
| | | | | |
C-Class: |
Net assets | | $ | 487,775 | |
Capital shares outstanding | | | 19,314 | |
Net asset value per share | | $ | 25.25 | |
| | | | | |
P-Class: |
Net assets | | $ | 10,099,607 | |
Capital shares outstanding | | | 365,833 | |
Net asset value per share | | $ | 27.61 | |
| | | | | |
Institutional Class: |
Net assets | | $ | 55,461,495 | |
Capital shares outstanding | | | 1,974,391 | |
Net asset value per share | | $ | 28.09 | |
* | Relates to Trustees not deemed “interested persons” within the meaning of Section 2(a)(19) of the 1940 Act. |
SEE NOTES TO CONSOLIDATED FINANCIAL STATEMENTS. | THE GUGGENHEIM FUNDS ANNUAL REPORT | 41 |
CONSOLIDATED STATEMENT OF OPERATIONS |
MULTI-HEDGE STRATEGIES FUND |
Year Ended December 31, 2021
Investment Income: |
Dividends from securities of unaffiliated issuers | | $ | 919,765 | |
Dividends from securities of affiliated issuers | | | 114,962 | |
Interest | | | 5,740 | |
Income from securities lending, net | | | 15,526 | |
Total investment income | | | 1,055,993 | |
| | | | | |
Expenses: |
Management fees | | | 792,099 | |
Distribution and service fees: |
A-Class | | | 11,131 | |
C-Class | | | 6,895 | |
P-Class | | | 27,071 | |
Short sales dividend expense | | | 301,914 | |
Prime broker interest expense | | | 164,277 | |
Miscellaneous | | | 18,930 | |
Total expenses | | | 1,322,317 | |
Less: |
Expenses waived by Adviser | | | (39,674 | ) |
Net expenses | | | 1,282,643 | |
Net investment loss | | | (226,650 | ) |
| | | | | |
Net Realized and Unrealized Gain (Loss): |
Net realized gain (loss) on: |
Investments in unaffiliated issuers | | $ | 2,468,022 | |
Investments in affiliated issuers | | | 29,315 | |
Investments sold short | | | (1,730,315 | ) |
Swap agreements | | | 87,120 | |
Futures contracts | | | 1,047,299 | |
Foreign currency transactions | | | 7,739 | |
Net realized gain | | | 1,909,180 | |
Net change in unrealized appreciation (depreciation) on: |
Investments in unaffiliated issuers | | | 652,706 | |
Investments in affiliated issuers | | | (69,198 | ) |
Investments sold short | | | (869,158 | ) |
Swap agreements | | | 3,305,633 | |
Futures contracts | | | (727,234 | ) |
Foreign currency translations | | | 121 | |
Net change in unrealized appreciation (depreciation) | | | 2,292,870 | |
Net realized and unrealized gain | | | 4,202,050 | |
Net increase in net assets resulting from operations | | $ | 3,975,400 | |
42 | THE GUGGENHEIM FUNDS ANNUAL REPORT | SEE NOTES TO CONSOLIDATED FINANCIAL STATEMENTS. |
CONSOLIDATED STATEMENTS OF CHANGES IN NET ASSETS |
MULTI-HEDGE STRATEGIES FUND | |
| | Year Ended
December 31,
2021 | | | Year Ended
December 31,
2020 | |
Increase (Decrease) in Net Assets from Operations: | | | | | | | | |
Net investment loss | | $ | (226,650 | ) | | $ | (110,501 | ) |
Net realized gain on investments | | | 1,909,180 | | | | 2,588,403 | |
Net change in unrealized appreciation (depreciation) on investments | | | 2,292,870 | | | | 158,601 | |
Net increase in net assets resulting from operations | | | 3,975,400 | | | | 2,636,503 | |
| | | | | | | | | |
Distributions to shareholders: | | | | | | | | |
A-Class | | | (35,537 | ) | | | (41,281 | ) |
C-Class | | | — | | | | (4,460 | ) |
P-Class | | | (75,821 | ) | | | (75,583 | ) |
Institutional Class | | | (522,203 | ) | | | (442,898 | ) |
Total distributions to shareholders | | | (633,561 | ) | | | (564,222 | ) |
| | | | | | | | | |
Capital share transactions: | | | | | | | | |
Proceeds from sale of shares | | | | | | | | |
A-Class | | | 1,180,993 | | | | 1,306,835 | |
C-Class | | | 170,987 | | | | 211,800 | |
P-Class | | | 8,838,032 | | | | 11,055,670 | |
Institutional Class | | | 36,579,357 | | | | 27,020,776 | |
Distributions reinvested | | | | | | | | |
A-Class | | | 31,190 | | | | 34,896 | |
C-Class | | | — | | | | 3,943 | |
P-Class | | | 74,817 | | | | 74,354 | |
Institutional Class | | | 522,203 | | | | 442,728 | |
Cost of shares redeemed | | | | | | | | |
A-Class | | | (899,012 | ) | | | (1,102,066 | ) |
C-Class | | | (961,782 | ) | | | (521,624 | ) |
P-Class | | | (6,963,597 | ) | | | (11,250,761 | ) |
Institutional Class | | | (21,644,416 | ) | | | (16,278,135 | ) |
Net increase from capital share transactions | | | 16,928,772 | | | | 10,998,416 | |
Net increase in net assets | | | 20,270,611 | | | | 13,070,697 | |
| | | | | | | | | |
Net assets: | | | | | | | | |
Beginning of year | | | 50,370,953 | | | | 37,300,256 | |
End of year | | $ | 70,641,564 | | | $ | 50,370,953 | |
| | | | | | | | | |
SEE NOTES TO CONSOLIDATED FINANCIAL STATEMENTS. | THE GUGGENHEIM FUNDS ANNUAL REPORT | 43 |
CONSOLIDATED STATEMENTS OF CHANGES IN NET ASSETS (concluded) |
MULTI-HEDGE STRATEGIES FUND | |
| | Year Ended
December 31,
2021 | | | Year Ended
December 31,
2020 | |
Capital share activity: | | | | | | | | |
Shares sold | | | | | | | | |
A-Class | | | 43,014 | | | | 50,836 | |
C-Class | | | 6,768 | | | | 8,911 | |
P-Class | | | 316,524 | | | | 428,583 | |
Institutional Class | | | 1,302,242 | | | | 1,029,374 | |
Shares issued from reinvestment of distributions | | | | | | | | |
A-Class | | | 1,139 | | | | 1,357 | |
C-Class | | | — | | | | 167 | |
P-Class | | | 2,722 | | | | 2,884 | |
Institutional Class | | | 18,677 | | | | 16,885 | |
Shares redeemed | | | | | | | | |
A-Class | | | (32,507 | ) | | | (43,501 | ) |
C-Class | | | (38,215 | ) | | | (22,471 | ) |
P-Class | | | (249,021 | ) | | | (440,618 | ) |
Institutional Class | | | (765,263 | ) | | | (628,619 | ) |
Net increase in shares | | | 606,080 | | | | 403,788 | |
44 | THE GUGGENHEIM FUNDS ANNUAL REPORT | SEE NOTES TO CONSOLIDATED FINANCIAL STATEMENTS. |
CONSOLIDATED FINANCIAL HIGHLIGHTS |
MULTI-HEDGE STRATEGIES FUND | |
This table is presented to show selected data for a share outstanding throughout each period and to assist shareholders in evaluating a Fund’s performance for the periods presented.
A-Class | | Year
Ended
Dec. 31,
2021 | | | Year
Ended
Dec. 31,
2020 | | | Year
Ended
Dec. 31,
2019 | | | Year
Ended
Dec. 31,
2018 | | | Year
Ended
Dec. 31,
2017 | |
Per Share Data |
Net asset value, beginning of period | | $ | 25.89 | | | $ | 24.36 | | | $ | 23.69 | | | $ | 24.91 | | | $ | 24.08 | |
Income (loss) from investment operations: |
Net investment income (loss)a | | | (.14 | ) | | | (.10 | ) | | | .16 | | | | .08 | | | | (.13 | ) |
Net gain (loss) on investments (realized and unrealized) | | | 1.98 | | | | 1.90 | | | | 1.02 | | | | (1.26 | ) | | | .96 | |
Total from investment operations | | | 1.84 | | | | 1.80 | | | | 1.18 | | | | (1.18 | ) | | | .83 | |
Less distributions from: |
Net investment income | | | (.21 | ) | | | (.27 | ) | | | (.51 | ) | | | (.04 | ) | | | — | |
Total distributions | | | (.21 | ) | | | (.27 | ) | | | (.51 | ) | | | (.04 | ) | | | — | |
Net asset value, end of period | | $ | 27.52 | | | $ | 25.89 | | | $ | 24.36 | | | $ | 23.69 | | | $ | 24.91 | |
|
Total Returnb | | | 7.17 | % | | | 7.39 | % | | | 4.97 | % | | | (4.78 | %) | | | 3.49 | % |
Ratios/Supplemental Data |
Net assets, end of period (in thousands) | | $ | 4,593 | | | $ | 4,019 | | | $ | 3,570 | | | $ | 3,622 | | | $ | 12,154 | |
Ratios to average net assets: |
Net investment income (loss) | | | (0.52 | %) | | | (0.40 | %) | | | 0.64 | % | | | 0.32 | % | | | (0.53 | %) |
Total expensesc | | | 2.18 | % | | | 1.93 | % | | | 1.96 | % | | | 1.75 | % | | | 2.18 | % |
Net expensesd,e | | | 2.11 | % | | | 1.87 | % | | | 1.93 | % | | | 1.73 | % | | | 2.14 | % |
Portfolio turnover rate | | | 205 | % | | | 248 | % | | | 156 | % | | | 212 | % | | | 172 | % |
SEE NOTES TO CONSOLIDATED FINANCIAL STATEMENTS. | THE GUGGENHEIM FUNDS ANNUAL REPORT | 45 |
CONSOLIDATED FINANCIAL HIGHLIGHTS (continued) |
MULTI-HEDGE STRATEGIES FUND | |
This table is presented to show selected data for a share outstanding throughout each period and to assist shareholders in evaluating a Fund’s performance for the periods presented.
C-Class | | Year
Ended
Dec. 31,
2021 | | | Year
Ended
Dec. 31,
2020 | | | Year
Ended
Dec. 31,
2019 | | | Year
Ended
Dec. 31,
2018 | | | Year
Ended
Dec. 31,
2017 | |
Per Share Data |
Net asset value, beginning of period | | $ | 23.75 | | | $ | 22.36 | | | $ | 21.46 | | | $ | 22.68 | | | $ | 22.08 | |
Income (loss) from investment operations: |
Net investment income (loss)a | | | (.32 | ) | | | (.27 | ) | | | (.02 | ) | | | (.09 | ) | | | (.29 | ) |
Net gain (loss) on investments (realized and unrealized) | | | 1.82 | | | | 1.75 | | | | .92 | | | | (1.13 | ) | | | .89 | |
Total from investment operations | | | 1.50 | | | | 1.48 | | | | .90 | | | | (1.22 | ) | | | .60 | |
Less distributions from: |
Net investment income | | | — | | | | (.09 | ) | | | — | | | | — | | | | — | |
Total distributions | | | — | | | | (.09 | ) | | | — | | | | — | | | | — | |
Net asset value, end of period | | $ | 25.25 | | | $ | 23.75 | | | $ | 22.36 | | | $ | 21.46 | | | $ | 22.68 | |
|
Total Returnb | | | 6.32 | % | | | 6.57 | % | | | 4.19 | % | | | (5.38 | %) | | | 2.72 | % |
Ratios/Supplemental Data |
Net assets, end of period (in thousands) | | $ | 488 | | | $ | 1,206 | | | $ | 1,435 | | | $ | 2,657 | | | $ | 7,586 | |
Ratios to average net assets: |
Net investment income (loss) | | | (1.26 | %) | | | (1.18 | %) | | | (0.08 | %) | | | (0.42 | %) | | | (1.30 | %) |
Total expensesc | | | 2.93 | % | | | 2.68 | % | | | 2.70 | % | | | 2.53 | % | | | 2.94 | % |
Net expensesd,e | | | 2.86 | % | | | 2.62 | % | | | 2.67 | % | | | 2.51 | % | | | 2.90 | % |
Portfolio turnover rate | | | 205 | % | | | 248 | % | | | 156 | % | | | 212 | % | | | 172 | % |
46 | THE GUGGENHEIM FUNDS ANNUAL REPORT | SEE NOTES TO CONSOLIDATED FINANCIAL STATEMENTS. |
CONSOLIDATED FINANCIAL HIGHLIGHTS (continued) |
MULTI-HEDGE STRATEGIES FUND |
This table is presented to show selected data for a share outstanding throughout each period and to assist shareholders in evaluating a Fund’s performance for the periods presented.
P-Class | | Year
Ended
Dec. 31,
2021 | | | Year
Ended
Dec. 31,
2020 | | | Year
Ended
Dec. 31,
2019 | | | Year
Ended
Dec. 31,
2018 | | | Year
Ended
Dec. 31,
2017 | |
Per Share Data |
Net asset value, beginning of period | | $ | 25.97 | | | $ | 24.42 | | | $ | 23.74 | | | $ | 24.93 | | | $ | 24.10 | |
Income (loss) from investment operations: |
Net investment income (loss)a | | | (.15 | ) | | | (.10 | ) | | | .16 | | | | .08 | | | | (.14 | ) |
Net gain (loss) on investments (realized and unrealized) | | | 2.00 | | | | 1.90 | | | | 1.03 | | | | (1.23 | ) | | | .97 | |
Total from investment operations | | | 1.85 | | | | 1.80 | | | | 1.19 | | | | (1.15 | ) | | | .83 | |
Less distributions from: |
Net investment income | | | (.21 | ) | | | (.25 | ) | | | (.51 | ) | | | (.04 | ) | | | — | |
Total distributions | | | (.21 | ) | | | (.25 | ) | | | (.51 | ) | | | (.04 | ) | | | — | |
Net asset value, end of period | | $ | 27.61 | | | $ | 25.97 | | | $ | 24.42 | | | $ | 23.74 | | | $ | 24.93 | |
|
Total Return | | | 7.16 | % | | | 7.40 | % | | | 5.00 | % | | | (4.61 | %) | | | 3.49 | % |
Ratios/Supplemental Data |
Net assets, end of period (in thousands) | | $ | 10,100 | | | $ | 7,676 | | | $ | 7,442 | | | $ | 7,892 | | | $ | 14,066 | |
Ratios to average net assets: |
Net investment income (loss) | | | (0.53 | %) | | | (0.39 | %) | | | 0.65 | % | | | 0.34 | % | | | (0.56 | %) |
Total expensesc | | | 2.18 | % | | | 1.93 | % | | | 1.96 | % | | | 1.77 | % | | | 2.20 | % |
Net expensesd,e | | | 2.12 | % | | | 1.87 | % | | | 1.93 | % | | | 1.75 | % | | | 2.16 | % |
Portfolio turnover rate | | | 205 | % | | | 248 | % | | | 156 | % | | | 212 | % | | | 172 | % |
SEE NOTES TO CONSOLIDATED FINANCIAL STATEMENTS. | THE GUGGENHEIM FUNDS ANNUAL REPORT | 47 |
CONSOLIDATED FINANCIAL HIGHLIGHTS (concluded) |
MULTI-HEDGE STRATEGIES FUND | |
This table is presented to show selected data for a share outstanding throughout each period and to assist shareholders in evaluating a Fund’s performance for the periods presented.
Institutional Class | | Year
Ended
Dec. 31,
2021 | | | Year
Ended
Dec. 31,
2020 | | | Year
Ended
Dec. 31,
2019 | | | Year
Ended
Dec. 31,
2018 | | | Year
Ended
Dec. 31,
2017 | |
Per Share Data |
Net asset value, beginning of period | | $ | 26.41 | | | $ | 24.83 | | | $ | 24.12 | | | $ | 25.42 | | | $ | 24.50 | |
Income (loss) from investment operations: |
Net investment income (loss)a | | | (.08 | ) | | | (.04 | ) | | | .22 | | | | .17 | | | | (.07 | ) |
Net gain (loss) on investments (realized and unrealized) | | | 2.03 | | | | 1.94 | | | | 1.05 | | | | (1.33 | ) | | | .99 | |
Total from investment operations | | | 1.95 | | | | 1.90 | | | | 1.27 | | | | (1.16 | ) | | | .92 | |
Less distributions from: |
Net investment income | | | (.27 | ) | | | (.32 | ) | | | (.56 | ) | | | (.14 | ) | | | — | |
Total distributions | | | (.27 | ) | | | (.32 | ) | | | (.56 | ) | | | (.14 | ) | | | — | |
Net asset value, end of period | | $ | 28.09 | | | $ | 26.41 | | | $ | 24.83 | | | $ | 24.12 | | | $ | 25.42 | |
|
Total Return | | | 7.43 | % | | | 7.70 | % | | | 5.26 | % | | | (4.56 | %) | | | 3.76 | % |
Ratios/Supplemental Data |
Net assets, end of period (in thousands) | | $ | 55,461 | | | $ | 37,470 | | | $ | 24,854 | | | $ | 23,539 | | | $ | 25,376 | |
Ratios to average net assets: |
Net investment income (loss) | | | (0.27 | %) | | | (0.15 | %) | | | 0.90 | % | | | 0.68 | % | | | (0.30 | %) |
Total expensesc | | | 1.92 | % | | | 1.68 | % | | | 1.72 | % | | | 1.58 | % | | | 1.92 | % |
Net expensesd,e | | | 1.87 | % | | | 1.62 | % | | | 1.69 | % | | | 1.56 | % | | | 1.88 | % |
Portfolio turnover rate | | | 205 | % | | | 248 | % | | | 156 | % | | | 212 | % | | | 172 | % |
a | Net investment income (loss) per share was computed using average shares outstanding throughout the period. |
b | Total return does not reflect the impact of any applicable sales charges. |
c | Does not include expenses of the underlying funds in which the Fund invests. |
d | Net expense information reflects the expense ratios after expense waivers and reimbursements, as applicable. |
e | Excluding interest and dividend expense related to short sales, the net expense ratios for the years presented would be: |
| | | 12/31/21 | 12/31/20 | 12/31/19 | 12/31/18 | 12/31/17 |
| | A-Class | 1.41% | 1.37% | 1.41% | 1.41% | 1.42% |
| | C-Class | 2.16% | 2.12% | 2.16% | 2.16% | 2.17% |
| | P-Class | 1.41% | 1.37% | 1.41% | 1.41% | 1.42% |
| | Institutional Class | 1.16% | 1.12% | 1.16% | 1.16% | 1.17% |
48 | THE GUGGENHEIM FUNDS ANNUAL REPORT | SEE NOTES TO CONSOLIDATED FINANCIAL STATEMENTS. |
PERFORMANCE REPORT AND FUND PROFILE (Unaudited) | December 31, 2021 |
COMMODITIES STRATEGY FUND
OBJECTIVE: Seeks to provide investment results that correlate, before fees and expenses, to the performance of a benchmark for commodities. The Fund’s current benchmark is the S&P Goldman Sachs Commodity Index (“GSCI” or “Index”).
For the one-year period ended December 31, 2021, the Fund’s H-Class returned 39.06%, compared with a return of 40.35% for the Index.
Commodities prices continued to rebound throughout 2021 with a strengthening U.S. and global economy. The rally was led by strong increases in petroleum along with industrial metals and grain prices. Broad central bank and government support throughout the world helped maintain consumer demand which helped lead a broad increase in commodities prices.
Twenty of the twenty-four components in the Index had positive returns during the period. The best-performing component was Unleaded Gasoline with a return above 70%. Coffee, Brent Crude, and Crude Oil all had returns above 60% for the year. Silver was down more than 10% after being the strongest commodity a year earlier.
Four of the five S&P GSCI sectors experienced positive performance during the period. Energy (+61%), Industrial Metals (+30%), Agriculture (+25%), and Livestock (+8%) were the S&P GSCI sectors with positive performance. Precious Metals (-5%) was the only sector with negative performance.
Derivatives in the Fund are used to help provide exposure to the composition of the benchmark in the most efficient manner, as well as to provide liquidity. Derivatives are the primary way in which the Fund gains exposure to commodities, and therefore most of the Fund’s performance is due to derivatives.
Guggenheim Ultra Short Duration Fund and Guggenheim Strategy Funds were utilized within the Fund to achieve higher yields than what would otherwise be achieved through overnight repurchase agreements or short-term investments.
Performance displayed represents past performance which is no guarantee of future results.
| | THE GUGGENHEIM FUNDS ANNUAL REPORT | 49 |
PERFORMANCE REPORT AND FUND PROFILE (Unaudited)(continued) | December 31, 2021 |
Consolidated Holdings Diversification (Market Exposure as % of Net Assets)
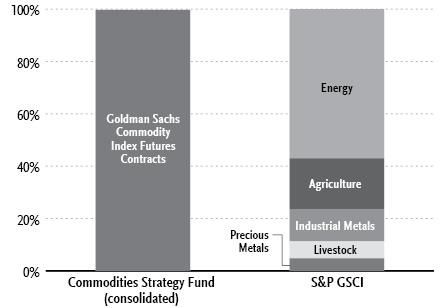
“Consolidated Holdings Diversification (Market Exposure as % of Net Assets)” excludes any temporary cash investments, investments in Guggenheim Strategy Funds Trust mutual funds, or investments in Guggenheim Ultra Short Duration Fund. Investments in those Funds do not provide “market exposure” to meet the Fund’s investment objective, but will significantly increase the portfolio’s exposure to certain other asset categories (and their associated risks), which may cause the Fund to deviate from its principal investment strategy, including: (i) high yield, high risk debt securities rated below the top four long-term rating categories by a nationally recognized statistical rating organization (also known as “junk bonds”); (ii) securities issued by the U.S. government or its agencies and instrumentalities; (iii) CLOs and similar investments; and (iv) other short-term fixed income securities.
50 | THE GUGGENHEIM FUNDS ANNUAL REPORT | |
PERFORMANCE REPORT AND FUND PROFILE (Unaudited)(continued) | December 31, 2021 |
Inception Dates: |
A-Class | May 25, 2005 |
C-Class | May 25, 2005 |
H-Class | May 25, 2005 |
The Fund invests principally in derivative investments such as swap agreements and futures contracts.
Largest Holdings (% of Total Net Assets) |
Guggenheim Strategy Fund II | 6.5% |
Guggenheim Ultra Short Duration Fund — Institutional Class | 6.4% |
Total | 12.9% |
| | |
“Largest Holdings” excludes any temporary cash or derivative investments. |
Cumulative Fund Performance*
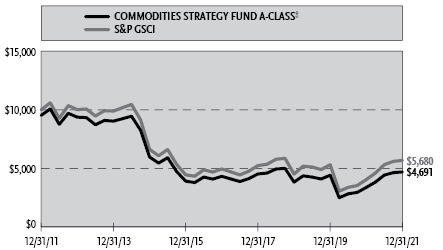
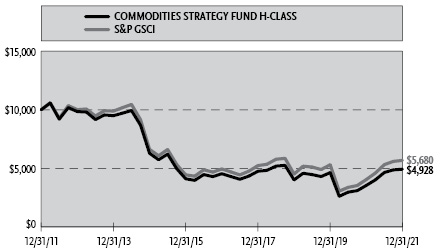
| | THE GUGGENHEIM FUNDS ANNUAL REPORT | 51 |
PERFORMANCE REPORT AND FUND PROFILE (Unaudited)(concluded) | December 31, 2021 |
Average Annual Returns*
Periods Ended December 31, 2021
| 1 Year | 5 Year | 10 Year |
A-Class Shares | 39.06% | 1.66% | (6.84%) |
A-Class Shares with sales charge‡ | 32.45% | 0.68% | (7.29%) |
C-Class Shares | 38.08% | 0.89% | (7.52%) |
C-Class Shares with CDSC§ | 37.08% | 0.89% | (7.52%) |
H-Class Shares | 39.06% | 1.65% | (6.83%) |
S&P Goldman Sachs Commodity Index | 40.35% | 2.80% | (5.50%) |
* | The performance data above represents past performance that is not predictive of future results. The investment return and principal value of an investment in the Fund will fluctuate so that an investor’s shares, when redeemed, may be worth more or less than their original cost. Returns are historical and include changes in principal and reinvested dividends and capital gains and do not reflect the effect of taxes. The S&P Goldman Sachs Commodity Index is an unmanaged index and, unlike the Fund, has no management fees or operating expenses to reduce its reported return. The graphs are based on A-Class shares and H-Class shares only; performance for C-Class shares will vary due to differences in fee structures. |
‡ | Fund returns are calculated using the maximum sales charge of 4.75%. |
§ | Fund returns include a CDSC of 1% if redeemed within 12 months of purchase. |
52 | THE GUGGENHEIM FUNDS ANNUAL REPORT | |
CONSOLIDATED SCHEDULE OF INVESTMENTS | December 31, 2021 |
COMMODITIES STRATEGY FUND | |
| | Shares | | | Value | |
MUTUAL FUNDS† - 12.9% |
Guggenheim Strategy Fund II1 | | | 56,518 | | | $ | 1,406,176 | |
Guggenheim Ultra Short Duration Fund — Institutional Class1 | | | 141,704 | | | | 1,405,703 | |
Total Mutual Funds | | | | |
(Cost $2,822,291) | | | | | | | 2,811,879 | |
| | | | | | | | | |
| | | Face
Amount | | | | | |
FEDERAL AGENCY NOTES†† - 16.1% |
Freddie Mac |
2.38% due 01/13/22 | | | 2,498,000 | | | | 2,499,625 | |
Federal Farm Credit Bank |
0.07% (U.S. Prime Rate - 3.18%, Rate Floor: 0.00%) due 10/25/222 | | | 1,000,000 | | | | 999,763 | |
Total Federal Agency Notes | | | | |
(Cost $3,499,836) | | | | | | | 3,499,388 | |
U.S. TREASURY BILLS†† - 5.6% |
U.S. Treasury Bills |
0.04% due 01/06/223,4 | | | 1,227,000 | | | | 1,227,000 | |
Total U.S. Treasury Bills | | | | |
(Cost $1,226,993) | | | | | | | 1,227,000 | |
| | | | | | | | | |
REPURCHASE AGREEMENTS††,5 - 65.3% |
J.P. Morgan Securities LLC
issued 12/31/21 at 0.05%
due 01/03/22 | | | 7,959,739 | | | | 7,959,739 | |
Barclays Capital, Inc.
issued 12/31/21 at 0.01%
due 01/03/22 | | | 3,291,911 | | | | 3,291,911 | |
BofA Securities, Inc.
issued 12/31/21 at 0.02%
due 01/03/22 | | | 2,992,647 | | | | 2,992,647 | |
Total Repurchase Agreements | | | | |
(Cost $14,244,297) | | | | | | | 14,244,297 | |
| | | | | | | | | |
Total Investments - 99.9% | | | | |
(Cost $21,793,417) | | $ | 21,782,564 | |
Other Assets & Liabilities, net - 0.1% | | | 22,235 | |
Total Net Assets - 100.0% | | $ | 21,804,799 | |
Futures Contracts |
Description | | Number of
Contracts | | | Expiration
Date | | | Notional
Amount | | | Value and
Unrealized
Appreciation** | |
Commodity Futures Contracts Purchased† |
Goldman Sachs Commodity Index Futures Contracts | | | 155 | | | | Jan 2022 | | | $ | 21,752,313 | | | $ | 837,019 | |
SEE NOTES TO CONSOLIDATED FINANCIAL STATEMENTS. | THE GUGGENHEIM FUNDS ANNUAL REPORT | 53 |
CONSOLIDATED SCHEDULE OF INVESTMENTS (continued) | December 31, 2021 |
COMMODITIES STRATEGY FUND | |
** | Includes cumulative appreciation (depreciation). Variation margin is reported within the Consolidated Statement of Assets and Liabilities. |
† | Value determined based on Level 1 inputs — See Note 4. |
†† | Value determined based on Level 2 inputs — See Note 4. |
1 | Affiliated issuer. |
2 | Variable rate security. Rate indicated is the rate effective at December 31, 2021. In some instances, the effective rate is limited by a minimum rate floor or a maximum rate cap established by the issuer. The settlement status of a position may also impact the effective rate indicated. In some cases, a position may be unsettled at period end and may not have a stated effective rate. In instances where multiple underlying reference rates and spread amounts are shown, the effective rate is based on a weighted average. |
3 | All or a portion of this security is pledged as futures collateral at December 31, 2021. |
4 | Rate indicated is the effective yield at the time of purchase. |
5 | Repurchase Agreements — See Note 6. |
| | |
| | See Sector Classification in Other Information section. |
The following table summarizes the inputs used to value the Fund’s investments at December 31, 2021 (See Note 4 in the Notes to Consolidated Financial Statements):
Investments in Securities (Assets) | | Level 1
Quoted
Prices | | | Level 2
Significant
Observable
Inputs | | | Level 3
Significant
Unobservable
Inputs | | | Total | |
Mutual Funds | | $ | 2,811,879 | | | $ | — | | | $ | — | | | $ | 2,811,879 | |
Federal Agency Notes | | | — | | | | 3,499,388 | | | | — | | | | 3,499,388 | |
U.S. Treasury Bills | | | — | | | | 1,227,000 | | | | — | | | | 1,227,000 | |
Repurchase Agreements | | | — | | | | 14,244,297 | | | | — | | | | 14,244,297 | |
Commodity Futures Contracts** | | | 837,019 | | | | — | | | | — | | | | 837,019 | |
Total Assets | | $ | 3,648,898 | | | $ | 18,970,685 | | | $ | — | | | $ | 22,619,583 | |
** | This derivative is reported as unrealized appreciation/depreciation at period end. |
54 | THE GUGGENHEIM FUNDS ANNUAL REPORT | SEE NOTES TO CONSOLIDATED FINANCIAL STATEMENTS. |
CONSOLIDATED SCHEDULE OF INVESTMENTS (concluded) | December 31, 2021 |
COMMODITIES STRATEGY FUND | |
Affiliated Transactions
Investments representing 5% or more of the outstanding voting shares of a company, or control of or by, or common control under Guggenheim Investments (“GI”), result in that company being considered an affiliated issuer, as defined in the 1940 Act.
The Fund may invest in certain of the underlying series of Guggenheim Strategy Funds Trust, including Guggenheim Strategy Fund II and Guggenheim Strategy Fund III, (collectively, the “Short Term Investment Vehicles”), each of which are open-end management investment companies managed by GI. The Short Term Investment Vehicles, which launched on March 11, 2014, are offered as short term investment options only to mutual funds, trusts, and other accounts managed by GI and/or its affiliates, and are not available to the public. The Short Term Investment Vehicles pay no investment management fees. The Short Term Investment Vehicles’ annual report on Form N-CSR dated September 30, 2021, is available publicly or upon request. This information is available from the EDGAR database on the SEC’s website at https://www.sec.gov/Archives/edgar/data/1601445/000182126821000490/gugg83048-ncsr.htm. The Fund may invest in certain of the underlying series of Guggenheim Fund Trust, which are open-end management investment companies managed by GI, are available to the public and whose most recent annual report on Form N-CSR is available publicly or upon request.
Transactions during the year ended December 31, 2021, in which the company is an affiliated issuer, were as follows:
Security Name | | Value
12/31/20 | | | Additions | | | Reductions | | | Realized
Gain (Loss) | | | Change in
Unrealized
Appreciation
(Depreciation) | | | Value
12/31/21 | | | Shares
12/31/21 | | | Investment
Income | |
Mutual Funds | | | | | | | | | | | | | | | | | | | | | | | | | | | | | | | | |
Guggenheim Strategy Fund II | | $ | 202,174 | | | $ | 1,210,000 | | | $ | — | | | $ | — | | | $ | (5,998 | ) | | $ | 1,406,176 | | | | 56,518 | | | $ | 12,508 | |
Guggenheim Ultra Short Duration Fund — Institutional Class | | | 208,126 | | | | 1,205,000 | | | | — | | | | — | | | | (7,423 | ) | | | 1,405,703 | | | | 141,704 | | | | 8,353 | |
| | | $ | 410,300 | | | $ | 2,415,000 | | | $ | — | | | $ | — | | | $ | (13,421 | ) | | $ | 2,811,879 | | | | | | | $ | 20,861 | |
SEE NOTES TO CONSOLIDATED FINANCIAL STATEMENTS. | THE GUGGENHEIM FUNDS ANNUAL REPORT | 55 |
CONSOLIDATED STATEMENT OF ASSETS AND LIABILITIES |
COMMODITIES STRATEGY FUND |
December 31, 2021
Assets: |
Investments in unaffiliated issuers, at value (cost $4,726,829) | | $ | 4,726,388 | |
Investments in affiliated issuers, at value (cost $2,822,291) | | | 2,811,879 | |
Repurchase agreements, at value (cost $14,244,297) | | | 14,244,297 | |
Cash | | | 20 | |
Segregated cash with broker | | | 722,910 | |
Receivables: |
Interest | | | 27,832 | |
Fund shares sold | | | 11,808 | |
Dividends | | | 2,894 | |
Total assets | | | 22,548,028 | |
| | | | | |
Liabilities: |
Payable for: |
Fund shares redeemed | | | 441,798 | |
Variation margin on futures contracts | | | 254,494 | |
Management fees | | | 13,351 | |
Transfer agent and administrative fees | | | 4,915 | |
Distribution and service fees | | | 4,682 | |
Portfolio accounting fees | | | 1,827 | |
Trustees’ fees* | | | 175 | |
Miscellaneous | | | 21,987 | |
Total liabilities | | | 743,229 | |
Commitments and contingent liabilities (Note 11) | | | — | |
Net assets | | $ | 21,804,799 | |
| | | | | |
Net assets consist of: |
Paid in capital | | $ | 25,247,883 | |
Total distributable earnings (loss) | | | (3,443,084 | ) |
Net assets | | $ | 21,804,799 | |
| | | | | |
A-Class: |
Net assets | | $ | 724,159 | |
Capital shares outstanding | | | 24,477 | |
Net asset value per share | | $ | 29.59 | |
Maximum offering price per share (Net asset value divided by 95.25%) | | $ | 31.07 | |
| | | | | |
C-Class: |
Net assets | | $ | 183,063 | |
Capital shares outstanding | | | 9,521 | |
Net asset value per share | | $ | 19.23 | |
| | | | | |
H-Class: |
Net assets | | $ | 20,897,577 | |
Capital shares outstanding | | | 705,438 | |
Net asset value per share | | $ | 29.62 | |
* | Relates to Trustees not deemed “interested persons” within the meaning of Section 2(a)(19) of the 1940 Act. |
56 | THE GUGGENHEIM FUNDS ANNUAL REPORT | SEE NOTES TO CONSOLIDATED FINANCIAL STATEMENTS. |
CONSOLIDATED STATEMENT OF OPERATIONS |
COMMODITIES STRATEGY FUND |
Year Ended December 31, 2021
Investment Income: |
Dividends from securities of affiliated issuers | | $ | 20,861 | |
Interest | | | 9,555 | |
Total investment income | | | 30,416 | |
| | | | | |
Expenses: |
Management fees | | | 141,784 | |
Distribution and service fees: |
A-Class | | | 1,137 | |
C-Class | | | 1,439 | |
H-Class | | | 38,782 | |
Transfer agent and administrative fees | | | 44,305 | |
Professional fees | | | 20,063 | |
Portfolio accounting fees | | | 16,111 | |
Custodian fees | | | 2,182 | |
Trustees’ fees* | | | 1,244 | |
Miscellaneous | | | 19,570 | |
Total expenses | | | 286,617 | |
Less: |
Expenses waived by Adviser | | | (23,287 | ) |
Net expenses | | | 263,330 | |
Net investment loss | | | (232,914 | ) |
| | | | | |
Net Realized and Unrealized Gain (Loss): |
Net realized gain (loss) on: |
Investments in unaffiliated issuers | | $ | (5,047 | ) |
Futures contracts | | | 2,365,863 | |
Net realized gain | | | 2,360,816 | |
Net change in unrealized appreciation (depreciation) on: |
Investments in unaffiliated issuers | | | (443 | ) |
Investments in affiliated issuers | | | (13,421 | ) |
Futures contracts | | | 775,725 | |
Net change in unrealized appreciation (depreciation) | | | 761,861 | |
Net realized and unrealized gain | | | 3,122,677 | |
Net increase in net assets resulting from operations | | $ | 2,889,763 | |
* | Relates to Trustees not deemed “interested persons” within the meaning of Section 2(a)(19) of the 1940 Act. |
SEE NOTES TO CONSOLIDATED FINANCIAL STATEMENTS. | THE GUGGENHEIM FUNDS ANNUAL REPORT | 57 |
CONSOLIDATED STATEMENTS OF CHANGES IN NET ASSETS |
COMMODITIES STRATEGY FUND | |
| | Year Ended
December 31,
2021 | | | Year Ended
December 31,
2020 | |
Increase (Decrease) in Net Assets from Operations: | | | | | | | | |
Net investment loss | | $ | (232,914 | ) | | $ | (18,325 | ) |
Net realized gain (loss) on investments | | | 2,360,816 | | | | (438,192 | ) |
Net change in unrealized appreciation (depreciation) on investments | | | 761,861 | | | | (125,419 | ) |
Net increase (decrease) in net assets resulting from operations | | | 2,889,763 | | | | (581,936 | ) |
| | | | | | | | | |
Distributions to shareholders: | | | | | | | | |
A-Class | | | (20,464 | ) | | | (134,155 | ) |
C-Class | | | (8,077 | ) | | | (37,215 | ) |
H-Class | | | (603,257 | ) | | | (569,791 | ) |
Total distributions to shareholders | | | (631,798 | ) | | | (741,161 | ) |
| | | | | | | | | |
Capital share transactions: | | | | | | | | |
Proceeds from sale of shares | | | | | | | | |
A-Class | | | 919,688 | | | | 108,251 | |
C-Class | | | 142,753 | | | | 394 | |
H-Class | | | 87,058,046 | | | | 7,866,887 | |
Distributions reinvested | | | | | | | | |
A-Class | | | 19,901 | | | | 116,280 | |
C-Class | | | 7,304 | | | | 37,106 | |
H-Class | | | 596,439 | | | | 535,101 | |
Cost of shares redeemed | | | | | | | | |
A-Class | | | (521,253 | ) | | | (311,469 | ) |
C-Class | | | (49,482 | ) | | | (29,316 | ) |
H-Class | | | (69,747,995 | ) | | | (11,492,371 | ) |
Net increase (decrease) from capital share transactions | | | 18,425,401 | | | | (3,169,137 | ) |
Net increase (decrease) in net assets | | | 20,683,366 | | | | (4,492,234 | ) |
| | | | | | | | | |
Net assets: | | | | | | | | |
Beginning of year | | | 1,121,433 | | | | 5,613,667 | |
End of year | | $ | 21,804,799 | | | $ | 1,121,433 | |
| | | | | | | | | |
58 | THE GUGGENHEIM FUNDS ANNUAL REPORT | SEE NOTES TO CONSOLIDATED FINANCIAL STATEMENTS. |
CONSOLIDATED STATEMENTS OF CHANGES IN NET ASSETS (concluded) |
COMMODITIES STRATEGY FUND | |
| | Year Ended
December 31,
2021 | | | Year Ended
December 31,
2020 | |
Capital share activity: | | | | | | | | |
Shares sold | | | | | | | | |
A-Class | | | 32,719 | | | | 3,057 | |
C-Class | | | 8,052 | | | | 13 | |
H-Class | | | 3,084,506 | | | | 201,034 | |
Shares issued from reinvestment of distributions | | | | | | | | |
A-Class | | | 702 | | | | 5,462 | |
C-Class | | | 396 | | | | 2,619 | |
H-Class | | | 21,016 | | | | 25,099 | |
Shares redeemed | | | | | | | | |
A-Class | | | (18,569 | ) | | | (8,589 | ) |
C-Class | | | (2,702 | ) | | | (999 | ) |
H-Class | | | (2,439,032 | ) | | | (267,560 | ) |
Net increase (decrease) in shares | | | 687,088 | | | | (39,864 | ) |
SEE NOTES TO CONSOLIDATED FINANCIAL STATEMENTS. | THE GUGGENHEIM FUNDS ANNUAL REPORT | 59 |
CONSOLIDATED FINANCIAL HIGHLIGHTS |
COMMODITIES STRATEGY FUND | |
This table is presented to show selected data for a share outstanding throughout each period and to assist shareholders in evaluating a Fund’s performance for the periods presented.
A-Class | | Year
Ended
Dec. 31,
2021 | | | Year
Ended
Dec. 31,
2020 | | | Year
Ended
Dec. 31,
2019 | | | Year
Ended
Dec. 31,
2018 | | | Year
Ended
Dec. 31,
2017 | |
Per Share Data |
Net asset value, beginning of period | | $ | 21.93 | | | $ | 61.06 | | | $ | 53.27 | | | $ | 88.34 | | | $ | 85.75 | |
Income (loss) from investment operations: |
Net investment income (loss)a | | | (.40 | ) | | | (.28 | ) | | | .36 | | | | .39 | | | | (.22 | ) |
Net gain (loss) on investments (realized and unrealized) | | | 8.94 | | | | (14.84 | ) | | | 7.88 | | | | (11.90 | ) | | | 4.13 | |
Total from investment operations | | | 8.54 | | | | (15.12 | ) | | | 8.24 | | | | (11.51 | ) | | | 3.91 | |
Less distributions from: |
Net investment income | | | (.88 | ) | | | (24.01 | ) | | | (.45 | ) | | | (23.56 | ) | | | (1.32 | ) |
Total distributions | | | (.88 | ) | | | (24.01 | ) | | | (.45 | ) | | | (23.56 | ) | | | (1.32 | ) |
Net asset value, end of period | | $ | 29.59 | | | $ | 21.93 | | | $ | 61.06 | | | $ | 53.27 | | | $ | 88.34 | |
|
Total Returnb | | | 39.06 | % | | | (23.58 | %) | | | 15.47 | % | | | (15.47 | %) | | | 4.68 | % |
Ratios/Supplemental Data |
Net assets, end of period (in thousands) | | $ | 724 | | | $ | 211 | | | $ | 592 | | | $ | 830 | | | $ | 819 | |
Ratios to average net assets: |
Net investment income (loss) | | | (1.43 | %) | | | (0.65 | %) | | | 0.60 | % | | | 0.44 | % | | | (0.28 | %) |
Total expensesc | | | 1.78 | % | | | 1.79 | % | | | 1.88 | % | | | 1.81 | % | | | 1.73 | % |
Net expensesd | | | 1.63 | % | | | 1.61 | % | | | 1.73 | % | | | 1.68 | % | | | 1.63 | % |
Portfolio turnover rate | | | — | | | | 5 | % | | | — | | | | 65 | % | | | 25 | % |
60 | THE GUGGENHEIM FUNDS ANNUAL REPORT | SEE NOTES TO CONSOLIDATED FINANCIAL STATEMENTS. |
CONSOLIDATED FINANCIAL HIGHLIGHTS (continued) |
COMMODITIES STRATEGY FUND | |
This table is presented to show selected data for a share outstanding throughout each period and to assist shareholders in evaluating a Fund’s performance for the periods presented.
C-Class | | Year
Ended
Dec. 31,
2021 | | | Year
Ended
Dec. 31,
2020 | | | Year
Ended
Dec. 31,
2019 | | | Year
Ended
Dec. 31,
2018 | | | Year
Ended
Dec. 31,
2017 | |
Per Share Data |
Net asset value, beginning of period | | $ | 14.59 | | | $ | 51.84 | | | $ | 45.63 | | | $ | 79.89 | | | $ | 78.32 | |
Income (loss) from investment operations: |
Net investment income (loss)a | | | (.41 | ) | | | (.50 | ) | | | (.07 | ) | | | (.41 | ) | | | (.70 | ) |
Net gain (loss) on investments (realized and unrealized) | | | 5.93 | | | | (12.74 | ) | | | 6.73 | | | | (10.29 | ) | | | 3.59 | |
Total from investment operations | | | 5.52 | | | | (13.24 | ) | | | 6.66 | | | | (10.70 | ) | | | 2.89 | |
Less distributions from: |
Net investment income | | | (.88 | ) | | | (24.01 | ) | | | (.45 | ) | | | (23.56 | ) | | | (1.32 | ) |
Total distributions | | | (.88 | ) | | | (24.01 | ) | | | (.45 | ) | | | (23.56 | ) | | | (1.32 | ) |
Net asset value, end of period | | $ | 19.23 | | | $ | 14.59 | | | $ | 51.84 | | | $ | 45.63 | | | $ | 79.89 | |
|
Total Returnb | | | 38.08 | % | | | (24.15 | %) | | | 14.61 | % | | | (16.11 | %) | | | 3.80 | % |
Ratios/Supplemental Data |
Net assets, end of period (in thousands) | | $ | 183 | | | $ | 55 | | | $ | 111 | | | $ | 110 | | | $ | 332 | |
Ratios to average net assets: |
Net investment income (loss) | | | (2.18 | %) | | | (1.44 | %) | | | (0.13 | %) | | | (0.49 | %) | | | (0.94 | %) |
Total expensesc | | | 2.53 | % | | | 2.54 | % | | | 2.63 | % | | | 2.55 | % | | | 2.48 | % |
Net expensesd | | | 2.38 | % | | | 2.36 | % | | | 2.48 | % | | | 2.42 | % | | | 2.36 | % |
Portfolio turnover rate | | | — | | | | 5 | % | | | — | | | | 65 | % | | | 25 | % |
SEE NOTES TO CONSOLIDATED FINANCIAL STATEMENTS. | THE GUGGENHEIM FUNDS ANNUAL REPORT | 61 |
CONSOLIDATED FINANCIAL HIGHLIGHTS (concluded) |
COMMODITIES STRATEGY FUND | |
This table is presented to show selected data for a share outstanding throughout each period and to assist shareholders in evaluating a Fund’s performance for the periods presented.
H-Class | | Year
Ended
Dec. 31,
2021 | | | Year
Ended
Dec. 31,
2020 | | | Year
Ended
Dec. 31,
2019 | | | Year
Ended
Dec. 31,
2018 | | | Year
Ended
Dec. 31,
2017 | |
Per Share Data |
Net asset value, beginning of period | | $ | 21.96 | | | $ | 61.10 | | | $ | 53.31 | | | $ | 88.39 | | | $ | 85.82 | |
Income (loss) from investment operations: |
Net investment income (loss)a | | | (.41 | ) | | | (.34 | ) | | | .35 | | | | .25 | | | | (.25 | ) |
Net gain (loss) on investments (realized and unrealized) | | | 8.95 | | | | (14.79 | ) | | | 7.89 | | | | (11.77 | ) | | | 4.14 | |
Total from investment operations | | | 8.54 | | | | (15.13 | ) | | | 8.24 | | | | (11.52 | ) | | | 3.89 | |
Less distributions from: |
Net investment income | | | (.88 | ) | | | (24.01 | ) | | | (.45 | ) | | | (23.56 | ) | | | (1.32 | ) |
Total distributions | | | (.88 | ) | | | (24.01 | ) | | | (.45 | ) | | | (23.56 | ) | | | (1.32 | ) |
Net asset value, end of period | | $ | 29.62 | | | $ | 21.96 | | | $ | 61.10 | | | $ | 53.31 | | | $ | 88.39 | |
|
Total Return | | | 39.06 | % | | | (23.58 | %) | | | 15.48 | % | | | (15.50 | %) | | | 4.65 | % |
Ratios/Supplemental Data |
Net assets, end of period (in thousands) | | $ | 20,898 | | | $ | 855 | | | $ | 4,911 | | | $ | 8,744 | | | $ | 6,002 | |
Ratios to average net assets: |
Net investment income (loss) | | | (1.44 | %) | | | (0.77 | %) | | | 0.59 | % | | | 0.27 | % | | | (0.31 | %) |
Total expensesc | | | 1.77 | % | | | 1.78 | % | | | 1.89 | % | | | 1.81 | % | | | 1.74 | % |
Net expensesd | | | 1.63 | % | | | 1.61 | % | | | 1.74 | % | | | 1.68 | % | | | 1.65 | % |
Portfolio turnover rate | | | — | | | | 5 | % | | | — | | | | 65 | % | | | 25 | % |
a | Net investment income (loss) per share was computed using average shares outstanding throughout the period. |
b | Total return does not reflect the impact of any applicable sales charges. |
c | Does not include expenses of the underlying funds in which the Fund invests. |
d | Net expense information reflects the expense ratios after expense waivers and reimbursements, as applicable. |
62 | THE GUGGENHEIM FUNDS ANNUAL REPORT | SEE NOTES TO CONSOLIDATED FINANCIAL STATEMENTS. |
NOTES TO CONSOLIDATED FINANCIAL STATEMENTS |
Note 1 – Organization, Consolidation of Subsidiary and and Significant Accounting Policies
Organization
The Rydex Series Funds (the “Trust”), a Delaware statutory trust, is registered with the SEC under the Investment Company Act of 1940 (”1940 Act”), as an open-ended investment company of the series type. Each series, in effect, is representing a separate fund (each, a “Fund”). The Trust may issue an unlimited number of authorized shares. The Trust accounts for the assets of each Fund separately.
The Trust offers a combination of seven separate classes of shares: Investor Class shares, A-Class shares, C-Class shares, H-Class shares, P-Class shares, Institutional Class shares and Money Market Class shares. Sales of shares of each Class are made without a front-end sales charge at the net asset value per share (“NAV”), with the exception of A-Class shares. A-Class shares are sold at the NAV, plus the applicable front-end sales charge. The sales charge varies depending on the amount purchased, but will not exceed 4.75%. A-Class share purchases of $1 million or more are exempt from the front-end sales charge but have a 1% contingent deferred sales charge (“CDSC”) if shares are redeemed within 12 months of purchase. C-Class shares have a 1% CDSC if shares are redeemed within 12 months of purchase. C-Class shares of each Fund automatically convert to A-Class shares of the same Fund on or about the 10th day of the month following the 10-year anniversary of the purchase of the C-Class shares. This conversion will be executed without any sales charge, fee or other charge. After the conversion is completed, the shares will be subject to all features and expenses of A-Class shares. Institutional Class shares are offered primarily for direct investment by institutions such as pension and profit sharing plans, endowments, foundations and corporations. Institutional Class shares require a minimum initial investment of $2 million and a minimum account balance of $1 million. At December 31, 2021, the Trust consisted of fifty-two funds.
This report covers the following funds (collectively, the “Funds”):
Fund Name | | Investment
Company Type | |
Multi-Hedge Strategies Fund | | | Diversified | |
Commodities Strategy Fund | | | Non-diversified | |
At December 31, 2021, A-Class, C-Class, H-Class, P-Class and Institutional Class shares have been issued by the Funds.
The Commodities Strategy Fund is designed and operated to accommodate frequent trading by shareholders and, unlike most mutual funds, offers unlimited exchange priviledges with no minimum holding periods or transactions fees, which may cause the Fund to experience high portfolio turnover.
| | THE GUGGENHEIM FUNDS ANNUAL REPORT | 63 |
NOTES TO CONSOLIDATED FINANCIAL STATEMENTS (continued) |
Security Investors, LLC, which operates under the name Guggenheim Investments (“GI”), provides advisory services. Guggenheim Funds Distributors, LLC (“GFD”) acts as principal underwriter for the Trust. GI and GFD are affiliated entities.
Consolidation of Subsidiary
The consolidated financial statements of the Multi-Hedge Strategies Fund and Commodities Strategy Fund include the accounts of a wholly-owned and controlled Cayman Islands subsidiary (the “Subsidiary”). Significant inter-company accounts and transactions have eliminated in consolidation for the Funds.
Each Fund may invest up to 25% of its total assets in its Subsidiary which acts as an investment vehicle in order to effect certain investments consistent with the Fund’s investment objectives and policies.
A summary of each Fund’s investment in its respective Subsidiary is as follows:
Fund | | Inception
Date of
Subsidiary | | | Subsidiary
Net Assets at
December 31,
2021 | | | % of Net Assets
of the Fund at
December 31,
2021 | |
Multi-Hedge Strategies Fund | | | 09/18/09 | | | $ | 1,709,069 | | | | 2.4 | % |
Commodities Strategy Fund | | | 09/08/09 | | | | 3,937,548 | | | | 18.1 | % |
Significant Accounting Policies
The Funds operate as investment companies and, accordingly, follow the investment company accounting and reporting guidance of the Financial Accounting Standards Board (“FASB”) Accounting Standards Codification Topic 946 Financial Services – Investment Companies.
The following significant accounting policies are in conformity with U.S. generally accepted accounting principles (“U.S. GAAP”) and are consistently followed by the Trust. This requires management to make estimates and assumptions that affect the reported amount of assets and liabilities, contingent assets and liabilities at the date of the consolidated financial statements, and the reported amounts of revenues and expenses during the reporting period. Actual results could differ from these estimates. All time references are based on Eastern Time.
The NAV of each Class of a fund is calculated by dividing the market value of a fund’s securities and other assets, less all liabilities, attributable to the Class by the number of outstanding shares of the Class.
(a) Valuation of Investments
The Board of Trustees of the Funds (the “Board”) has adopted policies and procedures for the valuation of the Funds’ investments (the “Valuation Procedures”). Pursuant to the Valuation Procedures, the Board has delegated to a valuation committee, consisting of representatives from
64 | THE GUGGENHEIM FUNDS ANNUAL REPORT | |
NOTES TO CONSOLIDATED FINANCIAL STATEMENTS (continued) |
Guggenheim’s investment management, fund administration, legal and compliance departments (the “Valuation Committee”), the day-to-day responsibility for implementing the Valuation Procedures, including, under most circumstances, the responsibility for determining the fair value of the Funds’ securities and/or other assets.
Valuations of the Funds’ securities and other assets are supplied primarily by pricing services appointed pursuant to the processes set forth in the Valuation Procedures. The Valuation Committee convenes monthly, or more frequently as needed, to review the valuation of all assets which have been fair valued for reasonableness. The Funds’ officers, through the Valuation Committee and consistent with the monitoring and review responsibilities set forth in the Valuation Procedures, regularly review procedures used and valuations provided by the pricing services.
If the pricing service cannot or does not provide a valuation for a particular investment or such valuation is deemed unreliable, such investment is fair valued by the Valuation Committee.
Equity securities listed or traded on a recognized U.S. securities exchange or the National Association of Securities Dealers Automated Quotations (“NASDAQ”) National Market System shall generally be valued on the basis of the last sale price on the primary U.S. exchange or market on which the security is listed or traded; provided, however, that securities listed on NASDAQ will be valued at the NASDAQ Official Closing Price, which may not necessarily represent the last sale price. If there is no sale on the valuation date, exchange-traded U.S. equity securities will be valued on the basis of the last bid price.
Generally, trading in foreign securities markets is substantially completed each day at various times prior to the close of the New York Stock Exchange (“NYSE”). The values of foreign securities are determined as of the close of such foreign markets or the close of the NYSE, if earlier. All investments quoted in foreign currencies are valued in U.S. dollars on the basis of the foreign currency exchange rates prevailing at the close of business at 4:00 p.m. Investments in foreign securities may involve risks not present in domestic investments. The Valuation Committee will determine the current value of such foreign securities by taking into consideration certain factors which may include those discussed above, as well as the following factors, among others: the value of the securities traded on other foreign markets, ADR trading, closed-end fund trading, foreign currency exchange activity, and the trading prices of financial products that are tied to foreign securities. In addition, the Board has authorized the Valuation Committee and GI to use prices and other information supplied by a third party pricing vendor in valuing foreign securities.
Open-end investment companies are valued at their NAV as of the close of business, on the valuation date. Exchange-traded funds and closed-end investment companies are valued at the last quoted sale price.
U.S. Government securities are valued by independent pricing services, the last traded fill price, or at the reported bid price at the close of business.
| | THE GUGGENHEIM FUNDS ANNUAL REPORT | 65 |
NOTES TO CONSOLIDATED FINANCIAL STATEMENTS (continued) |
Repurchase agreements are generally valued at amortized cost, provided such amounts approximate market value.
The value of futures contracts is accounted for using the unrealized appreciation or depreciation on the contracts that is determined by marking the contracts to their current realized settlement prices. Financial futures contracts are valued at the 4:00 p.m. price on the valuation date. In the event that the exchange for a specific futures contract closes earlier than 4:00 p.m., the futures contract is valued at the official settlement price of the exchange. However, the underlying securities from which the futures contract value is derived are monitored until 4:00 p.m. to determine if fair valuation would provide a more accurate valuation.
The values of swap agreements entered into by a fund are accounted for using the unrealized appreciation or depreciation on the agreements that are determined by marking the agreements to the last quoted value of the index or other underlying position that the swaps pertain to at the close of the NYSE.
Investments for which market quotations are not readily available are fair-valued as determined in good faith by GI, subject to review and approval by the Valuation Committee, pursuant to methods established or ratified by the Board. Valuations in accordance with these methods are intended to reflect each security’s (or asset’s or liability’s) “fair value”. Each such determination is based on a consideration of all relevant factors, which are likely to vary from one pricing context to another. Examples of such factors may include, but are not limited to market prices; sale prices; broker quotes; and models which derive prices based on inputs such as prices of securities with comparable maturities and characteristics, or based on inputs such as anticipated cash flows or collateral, spread over U.S. Treasury securities, and other information analysis.
In connection with futures contracts and other derivative investments, such factors may include obtaining information as to how (a) these contracts and other derivative investments trade in the futures or other derivative markets, respectively, and (b) the securities underlying these contracts and other derivative investments trade in the cash market.
(b) U.S. Government and Agency Obligations
Certain U.S. Government and Agency Obligations are traded on a discount basis; the interest rates shown on the Schedules of Investments reflect the effective rates paid at the time of purchase by the Funds. Other securities bear interest at the rates shown, payable at fixed dates through maturity.
(c) Short Sales
When a Fund engages in a short sale of a security, an amount equal to the proceeds is reflected as an asset and an equivalent liability. The amount of the liability is subsequently marked-to-market to reflect the market value of the short sale.
66 | THE GUGGENHEIM FUNDS ANNUAL REPORT | |
NOTES TO CONSOLIDATED FINANCIAL STATEMENTS (continued) |
Fees, if any, paid to brokers to borrow securities in connection with short sales are recorded as interest expense. In addition, the Fund must pay out the dividend rate of the equity or coupon rate of the obligation to the lender and record this as an expense. Short dividend or interest expense is a cost associated with the investment objective of short sales transactions, rather than an operational cost associated with the day-to-day management of any mutual fund. The Fund may also receive rebate income from the broker resulting from the investment of the proceeds from securities sold short.
(d) Options
Upon the purchase of an option, the premium paid is recorded as an investment, the value of which is marked-to-market daily. If a purchased option expires, the Fund realizes a loss in the amount of the cost of the option. When the Fund enters into a closing sale transaction, it realizes a gain or loss depending on whether the proceeds from the closing sale transaction are greater or less than the cost of the option. If the Fund exercises a put option, it realizes a gain or loss from the sale of the underlying security and the proceeds from such sale will be decreased by the premium originally paid. When the Fund exercises a call option, the cost of the security purchased by the Fund upon exercise increases by the premium originally paid.
When the Fund writes (sells) an option, an amount equal to the premium received is entered in that Fund’s accounting records as an asset and equivalent liability. The amount of the liability is subsequently marked-to-market to reflect the current value of the option written. When a written option expires, or if the Fund enters into a closing purchase transaction, it realizes a gain (or loss if the cost of a closing purchase transaction exceeds the premium received when the option was sold).
(e) Futures Contracts
Upon entering into a futures contract, a Fund deposits and maintains as collateral such initial margin as required by the exchange on which the transaction is affected. Pursuant to the contract, the Fund agrees to receive from or pay to the broker an amount of cash equal to the daily fluctuation in value of the contract. Such receipts or payments are known as variation margin and are recorded by the Fund as unrealized appreciation or depreciation. When the contract is closed, the Fund records a realized gain or loss equal to the difference between the value of the contract at the time it was opened and the value at the time it was closed.
(f) Swap Agreements
Swap agreements are marked-to-market daily and the change, if any, is recorded as unrealized appreciation or depreciation. Payments received or made as a result of an agreement or termination of an agreement are recognized as realized gains or losses.
Upon entering into certain centrally-cleared swap transactions, a Fund is required to deposit with its clearing broker an amount of cash or securities as an initial margin. Subsequent variation margin receipts or payments are received or made by the Fund depending on fluctuations in
| | THE GUGGENHEIM FUNDS ANNUAL REPORT | 67 |
NOTES TO CONSOLIDATED FINANCIAL STATEMENTS (continued) |
the fair value of the reference entity and are recorded by the Fund as unrealized appreciation or depreciation. When the contract is closed, the Fund records a realized gain or loss equal to the difference between the value of the contract at the time it was opened and the value at the time it was closed.
(g) Currency Translations
The accounting records of the Funds are maintained in U.S. dollars. All assets and liabilities initially expressed in foreign currencies are converted into U.S. dollars at prevailing exchange rates. Purchases and sales of investment securities, dividend and interest income, and certain expenses are translated at the rates of exchange prevailing on the respective dates of such transactions. Changes in the relationship of these foreign currencies to the U.S. dollar can significantly affect the value of the investments and earnings of the Funds. Foreign investments may also subject the Funds to foreign government exchange restrictions, expropriation, taxation, or other political, social or economic developments, all of which could affect the market and/or credit risk of the investments.
The Funds do not isolate that portion of the results of operations resulting from changes in the foreign exchange rates on investments from the fluctuations arising from changes in the market prices of securities held. Such fluctuations are included with the net realized gain or loss and unrealized appreciation or depreciation on investments.
Reported net realized foreign exchange gains and losses arise from sales of foreign currencies and currency gains or losses realized between the trade and settlement dates on investment transactions. Net unrealized appreciation and depreciation arise from changes in the fair values of assets and liabilities other than investments in securities at the fiscal period end, resulting from changes in exchange rates.
(h) Foreign Taxes
The Funds may be subject to foreign taxes (a portion of which may be reclaimable) on income, stock dividends, capital gains on investments or certain foreign currency transactions. All foreign taxes are recorded in accordance with the applicable foreign tax regulations and rates that exist in the foreign jurisdictions in which the Funds invest. These foreign taxes, if any, are paid by the Funds and reflected in their Consolidated Statements of Operations as follows: foreign taxes withheld at source are presented as a reduction of income and foreign taxes on capital gains from sales of investments are included with the net realized gain (loss) on investments. Foreign taxes payable or deferred as of December 31, 2021, if any, are disclosed in the Funds’ Consolidated Statements of Assets and Liabilities.
(i) Security Transactions
Security transactions are recorded on the trade date for financial reporting purposes. Realized gains and losses from securities transactions are recorded using the identified cost basis. Proceeds from lawsuits related to investment holdings are recorded as a reduction to cost if the
68 | THE GUGGENHEIM FUNDS ANNUAL REPORT | |
NOTES TO CONSOLIDATED FINANCIAL STATEMENTS (continued) |
securities are still held and as realized gains if no longer held in the respective Fund. Dividend income is recorded on the ex-dividend date, net of applicable taxes withheld by foreign countries, if any. Taxable non-cash dividends are recorded as dividend income. Interest income, including amortization of premiums and accretion of discounts, is accrued on a daily basis. Dividend income from Real Estate Investment Trusts (“REITs”) is recorded based on the income included in the distributions received from the REIT investments using published REIT classifications, including some management estimates when actual amounts are not available. Distributions received in excess of this estimated amount are recorded as a reduction of the cost of investments or reclassified to realized gains. The actual amounts of income, return of capital, and realized gains are only determined by each REIT after its fiscal year-end, and may differ from the estimated amounts.
(j) Distributions
Distributions of net investment income and net realized gains, if any, are declared and paid at least annually. Dividends are reinvested in additional shares, unless shareholders request payment in cash. Distributions are recorded on the ex-dividend date and are determined in accordance with U.S. federal income tax regulations which may differ from U.S. GAAP.
(k) Class Allocations
Interest and dividend income, most expenses, all realized gains and losses, and all unrealized appreciation and depreciation are allocated to the classes based upon the value of the outstanding shares in each Class. Certain costs, such as distribution and service fees are charged directly to specific classes. In addition, certain expenses have been allocated to the individual Funds in the Trust based on the respective net assets of each Fund included in the Trust.
(l) Cash
The Funds may leave cash overnight in their cash account with the custodian. Periodically, a Fund may have cash due to the custodian bank as an overdraft balance. A fee is incurred on this overdraft, calculated by multiplying the overdraft by a rate based on the federal funds rate, which was 0.07% at December 31, 2021.
(m) Indemnifications
Under the Funds’ organizational documents, the Trustees and Officers are indemnified against certain liabilities arising out of the performance of their duties to the Trust. In addition, throughout the normal course of business, the Funds enter into contracts that contain a variety of representations and warranties which provide general indemnifications. The Funds’ maximum exposure under these arrangements is unknown, as this would involve future claims that may be made against the Funds and/or their affiliates that have not yet occurred. However, based on experience, the Funds expect the risk of loss to be remote.
| | THE GUGGENHEIM FUNDS ANNUAL REPORT | 69 |
NOTES TO CONSOLIDATED FINANCIAL STATEMENTS (continued) |
Note 2 – Financial Instruments and Derivatives
As part of their investment strategy, the Funds may utilize short sales and a variety of derivative instruments. These investments involve, to varying degrees, elements of market risk and risks in excess of amounts recognized on the Consolidated Statements of Assets and Liabilities. Valuation and accounting treatment of these instruments can be found under Significant Accounting Policies in Note 1 of these Notes to Consolidated Financial Statements.
Short Sales
A short sale is a transaction in which a Fund sells a security it does not own. If the security sold short decreases in price between the time the Fund sells the security and closes its short position, the Fund will realize a gain on the transaction. Conversely, if the security increases in price during the period, the Fund will realize a loss on the transaction. The risk of such price increases is the principal risk of engaging in short sales.
Derivatives
Derivatives are instruments whose values depend on, or are derived from, in whole or in part, the value of one or more other assets, such as securities, currencies, commodities or indices. Derivative instruments may be used to increase investment flexibility (including to maintain cash reserves while maintaining exposure to certain other assets), for risk management (hedging) purposes, to facilitate trading, to reduce transaction costs and to pursue higher investment returns. Derivative instruments may also be used to mitigate certain investment risks, such as foreign currency exchange rate risk, interest rate risk and credit risk. U.S. GAAP requires disclosures to enable investors to better understand how and why a Fund uses derivative instruments, how these derivative instruments are accounted for and their effects on the Fund’s financial position and results of operations.
The Funds may utilize derivatives for the following purposes:
Duration: the use of an instrument to manage the interest rate risk of a portfolio.
Hedge: an investment made in order to reduce the risk of adverse price movements in a security, by taking an offsetting position to protect against broad market moves.
Index Exposure: the use of an instrument to obtain exposure to a listed or other type of index.
Leverage: gaining total exposure to equities or other assets on the long and short sides at greater than 100% of invested capital.
Liquidity: the ability to buy or sell exposure with little price/market impact.
Speculation: the use of an instrument to express macro-economic and other investment views.
70 | THE GUGGENHEIM FUNDS ANNUAL REPORT | |
NOTES TO CONSOLIDATED FINANCIAL STATEMENTS (continued) |
For any Fund whose investment strategy consistently involves applying leverage, the value of the Fund’s shares will tend to increase or decrease more than the value of any increase or decrease in the underlying index or other asset. In addition, because an investment in derivative instruments generally requires a small investment relative to the amount of investment exposure assumed, an opportunity for increased net income is created; but, at the same time, leverage risk will increase. The Fund’s use of leverage, through borrowings or instruments such as derivatives, may cause the Fund to be more volatile and riskier than if they had not been leveraged.
Futures Contracts
A futures contract is an agreement to purchase (long) or sell (short) an agreed amount of securities or other instruments at a set price for delivery at a future date. There are significant risks associated with a Fund’s use of futures contracts, including (i) there may be an imperfect or no correlation between the changes in market value of the underlying asset and the prices of futures contracts; (ii) there may not be a liquid secondary market for a futures contract; (iii) trading restrictions or limitations may be imposed by an exchange; and (iv) government regulations may restrict trading in futures contracts. When investing in futures, there is minimal counterparty credit risk to a Fund because futures are exchange-traded and the exchange’s clearinghouse, as counterparty to all exchange-traded futures, guarantees against default. Cash deposits are shown as segregated cash with broker on the Consolidated Statements of Assets and Liabilities; securities held as collateral are noted on the Consolidated Schedules of Investments.
The following table represents the Funds’ use and volume of futures on a monthly basis:
| | | | Average Notional Amount | |
Fund | Use | | Long | | | Short | |
Multi-Hedge Strategies Fund | Duration, Hedge, Index exposure, Leverage, Liquidity, Speculation | | $ | 144,992,554 | | | $ | 87,331,383 | |
Commodities Strategy Fund | Index exposure, Liquidity | | | 15,670,339 | | | | — | |
Swap Agreements
A swap is an agreement that obligates two parties to exchange a series of cash flows at specified intervals based upon or calculated by reference to changes in specified prices or rates for a specified amount of an underlying asset. When utilizing over-the-counter (“OTC”) swaps, a fund bears the risk of loss of the amount expected to be received under a swap agreement in the event of the default or bankruptcy of a swap agreement counterparty or if the underlying asset declines in value. Certain standardized swaps are subject to mandatory central clearing and are executed on a multi-lateral or other trade facility platform, such as a registered exchange. There is limited counterparty credit risk with respect to centrally-cleared swaps as the transaction is facilitated through a central clearinghouse, much like exchange-traded futures contracts. For a fund utilizing centrally-cleared swaps, the exchange bears the risk of loss resulting from a counterparty not
| | THE GUGGENHEIM FUNDS ANNUAL REPORT | 71 |
NOTES TO CONSOLIDATED FINANCIAL STATEMENTS (continued) |
being able to pay. There is no guarantee that a fund or an underlying fund could eliminate its exposure under an outstanding swap agreement by entering into an offsetting swap agreement with the same or another party.
Custom basket swaps involve commitments where single or multiple cash flows are exchanged based on the price of an underlying reference asset (such as custom basket of securities) for a fixed or variable interest rate. Custom basket swaps will usually be computed based on the current value of the reference asset as of the close of regular trading on the NYSE or other exchange, with the swap value being adjusted to include dividends accrued, financing charges and/or interest associated with the swap agreement. When utilizing custom basket swaps, a fund bears the risk of loss of the amount expected to be received under a swap agreement in the event of the default or bankruptcy of a swap agreement counterparty or if the underlying reference asset declines in value.
The following table represents the Funds’ use and volume of custom basket swaps on a monthly basis:
| | | | Average Notional Amount | |
Fund | Use | | Long | | | Short | |
Multi-Hedge Strategies Fund | Hedge, Index exposure, Leverage, Liquidity, Speculation | | $ | 51,889,057 | | | $ | 42,684,531 | |
Derivative Investment Holdings Categorized by Risk Exposure
The following is a summary of the location of derivative investments on the Funds’ Consolidated Statements of Assets and Liabilities as of December 31, 2021:
Derivative Investment Type | Asset Derivatives | Liability Derivatives |
Commodity/currency/equity/ interest rate futures contracts | Variation margin on futures contracts | Variation margin on futures contracts |
Equity swap contracts | Unrealized appreciation on OTC swap agreements | Unrealized depreciation on OTC swap agreements |
72 | THE GUGGENHEIM FUNDS ANNUAL REPORT | |
NOTES TO CONSOLIDATED FINANCIAL STATEMENTS (continued) |
The following tables set forth the fair value of the Funds’ derivative investments categorized by primary risk exposure at December 31, 2021:
Asset Derivative Investments Value |
Fund | | Futures
Equity
Risk* | | | Swaps
Equity
Risk | | | Futures
Foreign
Currency
Exchange
Risk* | | | Futures
Interest Rate
Risk* | | | Futures
Commodity
Risk* | | | Total Value at
December 31,
2021 | |
Multi-Hedge Strategies Fund | | $ | 208,653 | | | $ | 5,934,449 | | | $ | 121,638 | | | $ | 104,947 | | | $ | 366,867 | | | $ | 6,736,554 | |
Commodities Strategy Fund | | | — | | | | — | | | | — | | | | — | | | | 837,019 | | | | 837,019 | |
Liability Derivative Investments Value |
Fund | | Futures
Equity
Risk* | | | Swaps
Equity
Risk | | | Futures
Foreign
Currency
Exchange
Risk* | | | Futures
Interest Rate
Risk* | | | Futures
Commodity
Risk* | | | Total Value at
December 31,
2021 | |
Multi-Hedge Strategies Fund | | $ | 113,975 | | | $ | 1,955,347 | | | $ | 301,977 | | | $ | 278,972 | | | $ | 345,159 | | | $ | 2,995,430 | |
* | Includes cumulative appreciation (depreciation) of exchange-traded, OTC and centrally-cleared derivatives contracts as reported on the Consolidated Schedules of Investments. For exchange-traded and centrally-cleared derivatives, variation margin is reported within the Consolidated Statements of Assets and Liabilities. |
The following is a summary of the location of derivative investments on the Funds’ Consolidated Statements of Operations for the year ended December 31, 2021:
Derivative Investment Type | Location of Gain (Loss) on Derivatives |
Commodity/currency/equity/interest rate futures contracts | Net realized gain (loss) on futures contracts |
| | Net change in unrealized appreciation (depreciation) on futures contracts |
Equity swap contracts | Net realized gain (loss) on swap agreements |
| | Net change in unrealized appreciation (depreciation) on swap agreements |
| | THE GUGGENHEIM FUNDS ANNUAL REPORT | 73 |
NOTES TO CONSOLIDATED FINANCIAL STATEMENTS (continued) |
The following is a summary of the Funds’ realized gain (loss) and change in unrealized appreciation (depreciation) on derivative investments recognized on the Consolidated Statements of Operations categorized by primary risk exposure for the year ended December 31, 2021:
Realized Gain (Loss) on Derivative Investments Recognized on the Consolidated Statements of Operations |
Fund | | Futures
Equity
Risk | | | Swaps
Equity
Risk | | | Futures
Foreign
Currency
Exchange
Risk | | | Futures
Interest Rate
Risk | | | Futures
Commodity
Risk | | | Total | |
Multi-Hedge Strategies Fund | | $ | (286,849 | ) | | $ | 87,120 | | | $ | 276,859 | | | $ | (1,391,499 | ) | | $ | 2,448,788 | | | $ | 1,134,419 | |
Commodities Strategy Fund | | | — | | | | — | | | | — | | | | — | | | | 2,365,863 | | | | 2,365,863 | |
Change in Unrealized Appreciation (Depreciation) on Derivative Investments
Recognized on the Consolidated Statements of Operations |
Fund | | Futures
Equity
Risk | | | Swaps
Equity
Risk | | | Futures
Foreign
Currency
Exchange
Risk | | | Futures
Interest Rate
Risk | | | Futures
Commodity
Risk | | | Total | |
Multi-Hedge Strategies Fund | | $ | 137,524 | | | $ | 3,305,633 | | | $ | (397,398 | ) | | $ | (265,540 | ) | | $ | (201,820 | ) | | $ | 2,578,399 | |
Commodities Strategy Fund | | | — | | | | — | | | | — | | | | — | | | | 775,725 | | | | 775,725 | |
In conjunction with short sales and the use of derivative instruments, the Funds are required to maintain collateral in various forms. Depending on the financial instrument utilized and the broker involved, the Funds use margin deposits at the broker, cash and/or securities segregated at the custodian bank, discount notes or repurchase agreements allocated to the Funds as collateral.
The Trust has established counterparty credit guidelines and enters into transactions only with financial institutions of investment grade or better. The Trust monitors the counterparty credit risk.
Note 3 – Offsetting
In the normal course of business, the Funds enter into transactions subject to enforceable master netting arrangements or other similar arrangements. Generally, the right to offset in those agreements allows the Funds to counteract the exposure to a specific counterparty with collateral received from or delivered to that counterparty based on the terms of the arrangements. These arrangements provide for the right to liquidate upon the occurrence of an event of default, credit event upon merger or additional termination event.
74 | THE GUGGENHEIM FUNDS ANNUAL REPORT | |
NOTES TO CONSOLIDATED FINANCIAL STATEMENTS (continued) |
In order to better define their contractual rights and to secure rights that will help the Funds mitigate their counterparty risk, the Funds may enter into an International Swaps and Derivatives Association, Inc. Master Agreement (“ISDA Master Agreement”) or similar agreement with their derivative contract counterparties. An ISDA Master Agreement is a bilateral agreement between a fund and a counterparty that governs OTC derivatives, including foreign exchange contracts, and typically contains, among other things, collateral posting terms and netting provisions in the event of a default and/or termination event. The provisions of the ISDA Master Agreement typically permit a single net payment in the event of a default (close-out netting) or similar event, including the bankruptcy or insolvency of the counterparty.
For derivatives traded under an ISDA Master Agreement, the collateral requirements are typically calculated by netting the mark-to-market amount for each transaction under such agreement and comparing that amount to the value of any collateral currently pledged by the Funds and the counterparty. For financial reporting purposes, cash collateral that has been pledged to cover obligations of the Funds and cash collateral received from the counterparty, if any, are reported separately on the Consolidated Statements of Assets and Liabilities as segregated cash with broker/receivable for variation margin, or payable for swap settlement/variation margin. Cash and/or securities pledged or received as collateral by the Funds in connection with an OTC derivative subject to an ISDA Master Agreement generally may not be invested, sold or rehypothecated by the counterparty or the Funds, as applicable, absent an event of default under such agreement, in which case such collateral generally may be applied towards obligations due to and payable by such counterparty or the Funds, as applicable. Generally, the amount of collateral due from or to a counterparty must exceed a minimum transfer amount threshold (e.g., $300,000) before a transfer is required to be made. To the extent amounts due to the Funds from their counterparties are not fully collateralized, contractually or otherwise, the Funds bear the risk of loss from counterparty nonperformance. The Funds attempt to mitigate counterparty risk by only entering into agreements with counterparties that they believe to be of good standing and by monitoring the financial stability of those counterparties.
For financial reporting purposes, the Funds do not offset derivative assets and derivative liabilities that are subject to netting arrangements in the Consolidated Statements of Assets and Liabilities.
| | THE GUGGENHEIM FUNDS ANNUAL REPORT | 75 |
NOTES TO CONSOLIDATED FINANCIAL STATEMENTS (continued) |
The following tables present derivative financial instruments and secured financing transactions that are subject to enforceable netting arrangements:
| | | | | | | | | | | | | | | | Gross Amounts Not
Offset in the Consolidated
Statements of Assets
and Liabilities | | | | | |
Fund | Instrument | | Gross
Amounts of
Recognized
Assets1 | | | Gross
Amounts
Offset in the
Consolidated
Statements
of Assets and
Liabilities | | | Net Amount
of Assets
Presented
on the
Consolidated
Statements
of Assets and
Liabilities | | | Financial
Instruments | | | Cash
Collateral
Received | | | Net
Amount | |
Multi-Hedge Strategies Fund | Custom basket swap agreements | | $ | 5,934,449 | | | $ | — | | | $ | 5,934,449 | | | $ | (1,955,347 | ) | | $ | — | | | $ | 3,979,102 | |
| | | | | | | | | | | | | | | | Gross Amounts Not
Offset in the Consolidated
Statements of Assets
and Liabilities | | | | | |
Fund | Instrument | | Gross
Amounts of
Recognized
Liabilities1 | | | Gross
Amounts
Offset in the
Consolidated
Statements
of Assets and
Liabilities | | | Net Amount
of Liabilities
Presented
on the
Consolidated
Statements
of Assets and
Liabilities | | | Financial
Instruments | | | Cash
Collateral
Pledged | | | Net
Amount | |
Multi-Hedge Strategies Fund | Custom basket swap agreements | | $ | 1,955,347 | | | $ | — | | | $ | 1,955,347 | | | $ | (1,955,347 | ) | | $ | — | | | $ | — | |
1 | Exchange-traded or centrally-cleared derivatives are excluded from these reported amounts. |
The Funds have the right to offset deposits against any related derivative liabilities outstanding with each counterparty with the exception of exchange-traded or centrally-cleared derivatives. The following table presents deposits held by others in connection with derivative investments as of December 31, 2021.
Fund | Counterparty | Asset Type | | Cash Pledged | | | Cash Received | |
Commodities Strategy Fund | Goldman Sachs International | Futures contracts | | $ | 722,910 | | | $ | — | |
76 | THE GUGGENHEIM FUNDS ANNUAL REPORT | |
NOTES TO CONSOLIDATED FINANCIAL STATEMENTS (continued) |
Note 4 – Fair Value Measurement
In accordance with U.S. GAAP, fair value is defined as the price that the Funds would receive to sell an investment or pay to transfer a liability in an orderly transaction with an independent buyer in the principal market, or in the absence of a principal market, the most advantageous market for the investment or liability. U.S. GAAP establishes a three-tier fair value hierarchy based on the types of inputs used to value assets and liabilities and requires corresponding disclosure. The hierarchy and the corresponding inputs are summarized below:
Level 1 — | quoted prices in active markets for identical assets or liabilities. |
Level 2 — | significant other observable inputs (for example quoted prices for securities that are similar based on characteristics such as interest rates, prepayment speeds, credit risk, etc.). |
Level 3 — | significant unobservable inputs based on the best information available under the circumstances, to the extent observable inputs are not available, which may include assumptions. |
The types of inputs available depend on a variety of factors, such as the type of security and the characteristics of the markets in which it trades, if any. Fair valuation determinations that rely on fewer or no observable inputs require greater judgment. Accordingly, fair value determinations for Level 3 securities require the greatest amount of judgment.
The inputs or methodologies used for valuing securities are not necessarily an indication of the risk associated with investing in those securities. The suitability of the techniques and sources employed to determine fair valuation are regularly monitored and subject to change.
Note 5 – Investment Advisory Agreement and Other Agreements
Under the terms of an investment advisory contract, the Funds pay GI investment advisory fees calculated at the annualized rates below, based on the average daily net assets of the Funds:
Fund | | Management Fees
(as a % of Net Assets) | |
Multi-Hedge Strategies Fund | | | 1.15 | % |
Commodities Strategy Fund | | | 0.75 | % |
When the aggregate assets of each series of the Trust (excluding the Long Short Equity Fund, Managed Futures Strategy Fund and Multi-Hedge Strategies Fund) and each series of Rydex Dynamic Funds equal or exceed $10 billion, the advisory fee rate paid by each individual Fund
| | THE GUGGENHEIM FUNDS ANNUAL REPORT | 77 |
NOTES TO CONSOLIDATED FINANCIAL STATEMENTS (continued) |
(excluding the Long Short Equity Fund, Managed Futures Strategy Fund and Multi-Hedge Strategies Fund) will be reduced in accordance with the asset level and breakpoint schedule set forth below.
Fund Assets Under Management | | Fund Asset-Based
Breakpoint Reductions | |
$500 million - $1 billion | | | 0.025 | % |
$1 billion - $2 billion | | | 0.050 | % |
> $2 billion | | | 0.075 | % |
GI has contractually agreed to waive the management fee it receives from each Subsidiary in an amount equal to the management fee paid to GI by the Subsidiary. This undertaking will continue in effect for so long as the Funds invest in the Subsidiaries, and may not be terminated by GI unless GI obtains the prior approval of the Funds’ Board for such termination. Fees waived under this arrangement are not subject to reimbursement to GI. For the year ended December 31, 2021, Multi-Hedge Strategies Fund and Commodities Strategy Fund waived $29,112 and $20,950, respectively, related to advisory fees in the Subsidiary.
As part of its agreement with the Trust, GI will pay all expenses of the Multi-Hedge Strategies Fund, including the cost of transfer agency, custody, fund administration, legal, audit and other services, except interest expense, taxes (expected to be de minimis), brokerage commissions and other expenses connected with execution of portfolio transactions, short dividend expenses, subsidiary expenses and extraordinary expenses.
GI pays operating expenses on behalf of the Trust, such as audit and accounting related services, legal services, custody, printing and mailing, among others, on a pass-through basis. Such expenses are allocated to various Funds within the complex based on relative net assets.
The Board has adopted a Distribution Plan applicable to A-Class shares, P-Class shares and H-Class shares for which GFD and other firms that provide distribution and/or shareholder services (“Service Providers”) may receive compensation. If a Service Provider provides distribution services, the Funds will pay distribution fees to GFD at an annual rate not to exceed 0.25% of average daily net assets, pursuant to Rule 12b-1 of the 1940 Act. GFD, in turn, will pay the Service Provider out of its fees. GFD may, at its discretion, retain a portion of such payments to compensate itself for distribution services.
The Board has adopted a separate Distribution and Shareholder Services Plan applicable to C-Class shares that allows the Funds to pay annual distribution and service fees of 1.00% of the Funds’ C-Class shares average daily net assets. The annual 0.25% service fee compensates a shareholder’s financial adviser for providing ongoing services to the shareholder. The annual distribution fee of 0.75% reimburses GFD for paying the shareholder’s financial adviser an ongoing sales commission. GFD advances the first year’s service and distribution fees to the financial adviser. GFD retains the service and distribution fees on accounts with no authorized dealer of record.
78 | THE GUGGENHEIM FUNDS ANNUAL REPORT | |
NOTES TO CONSOLIDATED FINANCIAL STATEMENTS (continued) |
For the year ended December 31, 2021, GFD retained sales charges of $128,027 relating to sales of A-Class shares of the Trust.
If a Fund invests in a fund that is advised by the same adviser or an affiliated adviser, the investing Fund’s adviser has agreed to waive fees at the investing fund level to the extent necessary to offset the proportionate share of any management fee paid by each Fund with respect to its investment in such affiliated fund. Fee waivers will be calculated at the investing Fund level without regard to any expense cap in effect for the investing Fund. Fees waived under this arrangement are not subject to reimbursement to GI. For the year ended December 31, 2021, the Multi-Hedge Strategies Fund and Commodities Strategy Fund waived $10,562 and $2,337, respectively, related to investments in affiliated funds.
Certain trustees and officers of the Trust are also officers of GI and/or GFD. The Trust does not compensate its officers or trustees who are officers, directors and/or employees of GI or GFD.
MUFG Investor Services (US), LLC (“MUIS”) acts as the Funds’ administrator, transfer agent and accounting agent. As administrator, transfer agent and accounting agent, MUIS maintains the books and records of the Funds’ securities and cash. U.S. Bank, N.A. (“U.S. Bank”) acts as the Funds’ custodian. As custodian, U.S. Bank is responsible for the custody of the Funds’ assets. For providing the aforementioned services, MUIS and U.S. Bank are entitled to receive a monthly fee equal to an annual percentage of each Fund’s average daily net assets and out of pocket expenses.
Note 6 – Repurchase Agreements
The Funds transfer uninvested cash balances into a single joint account, the daily aggregate balance of which is invested in one or more repurchase agreements collateralized by obligations of the U.S. Treasury and U.S. government agencies. The joint account includes other Funds in the Guggenheim complex not covered in this report. The collateral is in the possession of the Funds’ custodian and is evaluated to ensure that its market value exceeds, at a minimum, 102% of the original face amount of the repurchase agreements. Each Fund holds a pro rata share of the collateral based on the dollar amount of the repurchase agreement entered into by each Fund.
| | THE GUGGENHEIM FUNDS ANNUAL REPORT | 79 |
NOTES TO CONSOLIDATED FINANCIAL STATEMENTS (continued) |
At December 31, 2021, the repurchase agreements in the joint account were as follows:
Counterparty and
Terms of Agreement | | Face
Value | | | Repurchase
Price | | | Collateral | | Par
Value | | | Fair
Value | |
J.P. Morgan Securities LLC | | | | | | | | | | U.S. Treasury Note | | | | | | | | |
0.05% | | | | | | | | | | 1.25% | | | | | | | | |
Due 01/03/22 | | $ | 132,534,999 | | | $ | 132,535,551 | | | Due 11/30/26 | | $ | 135,013,600 | | | $ | 135,185,818 | |
| | | | | | | | | | | | | | | | | | | |
Barclays Capital, Inc. | | | | | | | | | | U.S. Treasury Inflation Indexed Bond | | | | | | | | |
0.01% | | | | | | | | | | 0.13% | | | | | | | | |
Due 01/03/22 | | | 54,812,529 | | | | 54,812,575 | | | Due 07/15/30 | | | 49,979,168 | | | | 55,908,855 | |
| | | | | | | | | | | | | | | | | | | |
BofA Securities, Inc. | | | | | | | | | | U.S. Treasury Note | | | | | | | | |
0.02% | | | | | | | | | | 2.88% | | | | | | | | |
Due 01/03/22 | | | 49,829,572 | | | | 49,829,655 | | | Due 11/30/25 | | | 47,581,300 | | | | 50,826,225 | |
In the event of counterparty default, the Funds have the right to collect the collateral to offset losses incurred. There is potential loss to the Funds in the event the Funds are delayed or prevented from exercising their rights to dispose of the collateral securities, including the risk of a possible decline in the value of the underlying securities during the period while the Funds seek to assert their rights. GI, acting under the supervision of the Board, reviews the value of the collateral and the creditworthiness of those banks and dealers with which the Funds enter into repurchase agreements to evaluate potential risks.
Note 7 – Federal Income Tax Information
The Funds intend to comply with the provisions of Subchapter M of the Internal Revenue Code applicable to regulated investment companies and will distribute substantially all taxable net investment income and capital gains sufficient to relieve the Funds from all, or substantially all, federal income, excise and state income taxes. Therefore, no provision for federal or state income tax or federal excise tax is required.
Tax positions taken or expected to be taken in the course of preparing the Funds’ tax returns are evaluated to determine whether the tax positions are “more-likely-than-not” of being sustained by the applicable tax authority. Tax positions not deemed to meet the more-likely-than-not threshold would be recorded as a tax benefit or expense in the current year. Management has analyzed the Funds’ tax positions taken, or to be taken, on U.S. federal income tax returns for all open tax years, and has concluded that no provision for income tax is required in the Funds’ consolidated financial statements. The Funds’ U.S. federal income tax returns are subject to examination by the Internal Revenue Service (“IRS”) for a period of three years after they are filed.
The Funds intend to invest up to 25% of their assets in the respective Subsidiary, which is expected to provide the Funds with exposure to the commodities markets within the limitations of the U.S. federal income tax requirements under Subchapter M of the Internal Revenue Code. The Funds have received a private letter ruling from the IRS that concludes that the income the Funds
80 | THE GUGGENHEIM FUNDS ANNUAL REPORT | |
NOTES TO CONSOLIDATED FINANCIAL STATEMENTS (continued) |
receive from the Subsidiary will constitute qualifying income for purposes of Subchapter M of the Internal Revenue Code. The Subsidiary will be classified as a corporation for U.S. federal income tax purposes. A foreign corporation, such as the Subsidiary, will generally not be subject to U.S. federal income taxation unless it is deemed to be engaged in a U.S. trade or business. If, during a taxable year, the Subsidiary’s taxable losses (and other deductible items) exceed its income and gains, the net loss will not pass through to the Fund as a deductible amount for U.S. federal income tax purposes and cannot be carried forward to reduce future income from the Subsidiary in subsequent years.
The tax character of distributions paid during the year ended December 31, 2021 was as follows:
Fund | | Ordinary
Income | | | Long-Term
Capital Gain | | | Total
Distributions | |
Multi-Hedge Strategies Fund | | $ | 633,561 | | | $ | — | | | $ | 633,561 | |
Commodities Strategy Fund | | | 631,798 | | | | — | | | | 631,798 | |
The tax character of distributions paid during the year ended December 31, 2020 was as follows:
Fund | | Ordinary
Income | | | Long-Term
Capital Gain | | | Total
Distributions | |
Multi-Hedge Strategies Fund | | $ | 564,222 | | | $ | — | | | $ | 564,222 | |
Commodities Strategy Fund | | | 741,161 | | | | — | | | | 741,161 | |
Note: For U.S. federal income tax purposes, short-term capital gain distributions are treated as ordinary income distributions.
The tax components of distributable earnings/(loss) as of December 31, 2021 were as follows:
Fund | | Undistributed
Ordinary
Income | | | Undistributed
Long-Term
Capital Gain | | | Net Unrealized
Appreciation
(Depreciation) | | | Accumulated
Capital and
Other Losses | | | Total | |
Multi-Hedge Strategies Fund | | $ | 1,370,577 | | | $ | — | | | $ | (1,755,029 | ) | | $ | (2,030,247 | ) | | $ | (2,414,699 | ) |
Commodities Strategy Fund | | | 810,092 | | | | — | | | | (2,843,730 | ) | | | (56,874 | ) | | | (2,090,512 | ) |
| | THE GUGGENHEIM FUNDS ANNUAL REPORT | 81 |
NOTES TO CONSOLIDATED FINANCIAL STATEMENTS (continued) |
For U.S. federal income tax purposes, capital loss carryforwards represent realized losses of the Funds that may be carried forward and applied against future capital gains. The Funds are permitted to carry forward capital losses for an unlimited period and such capital loss carryforwards retain their character as either short-term or long-term capital losses. As of December 31, 2021, capital loss carryforwards for the Funds were as follows:
| | | Unlimited | | | | | |
Fund | | Short-Term | | | Long-Term | | | Total
Capital Loss
Carryforward | |
Multi-Hedge Strategies Fund | | $ | (1,667,979 | ) | | $ | — | | | $ | (1,667,979 | ) |
Commodities Strategy Fund | | | (40,762 | ) | | | (16,112 | ) | | | (56,874 | ) |
Net investment income and net realized gains (losses) may differ for financial statement and tax purposes because of temporary or permanent book/tax differences. These differences are primarily due to investments in subsidiaries, the “mark-to-market” of certain derivatives, investments in securities sold short, straddle loss deferrals, foreign currency gains and losses, losses deferred due to wash sales, and distributions in connection with redemption of fund shares. To the extent these differences are permanent and would require a reclassification between Paid in Capital and Total Distributable Earnings (Loss), such reclassifications are made in the period that the differences arise. These reclassifications have no effect on net assets or NAV per share.
The following adjustments were made on the Consolidated Statements of Assets and Liabilities as of December 31, 2021 for permanent book/tax differences:
Fund | | Paid In
Capital | | | Total
Distributable
Earnings/(Loss) | |
Multi-Hedge Strategies Fund | | $ | 3,423,133 | | | $ | (3,423,133 | ) |
Commodities Strategy Fund | | | 2,322,865 | | | | (2,322,865 | ) |
At December 31, 2021, the cost of investments for U.S. federal income tax purposes, the aggregate gross unrealized appreciation for all investments for which there was an excess of value over tax cost and the aggregate gross unrealized depreciation for all investments for which there was an excess of tax cost over value, were as follows:
Fund | | Tax
Cost | | | Tax
Unrealized
Appreciation | | | Tax
Unrealized
Depreciation | | | Net Tax
Unrealized
Appreciation/
(Depreciation) | |
Multi-Hedge Strategies Fund | | $ | 58,529,410 | | | $ | 6,601,411 | | | $ | (8,355,719 | ) | | $ | (1,754,308 | ) |
Commodities Strategy Fund | | | 27,336,856 | | | | 2,707,493 | | | | (5,551,237 | ) | | | (2,843,744 | ) |
82 | THE GUGGENHEIM FUNDS ANNUAL REPORT | |
NOTES TO CONSOLIDATED FINANCIAL STATEMENTS (continued) |
Note 8 – Portfolio Securities Loaned
The Funds may lend their securities to approved brokers to earn additional income. Security lending income shown on the Consolidated Statements of Operations is shown net of rebates paid to the borrowers and earnings on cash collateral investments shared with the lending agent. Within this arrangement, the Funds act as the lender, U.S. Bank acts as the lending agent, and other approved registered broker dealers act as the borrowers. The Funds receive cash collateral, valued at 102% of the value of the securities on loan. Under the terms of the Funds’ securities lending agreement with U.S. Bank, cash collateral and proceeds are invested in the First American Government Obligations Fund — Class Z. The Funds bear the risk of loss on cash collateral investments. Collateral is maintained over the life of the loan in an amount not less than the value of loaned securities, as determined at the close of fund business each day; any additional collateral required due to changes in security values is delivered to the Funds the next business day. Although the collateral mitigates the risk, the Funds could experience a delay in recovering their securities and a possible loss of income or value if the borrower fails to return the securities. The Funds have the right under the securities lending agreement to recover the securities from the borrower on demand. Securities lending transactions are accounted for as secured borrowings. The remaining contractual maturity of the securities lending agreement is overnight and continuous.
At December 31, 2021, the Funds participated in securities lending transactions, which are subject to enforceable netting arrangements, as follows:
| | | Gross Amounts Not Offset in the Consolidated
Statements of Assets and Liabilities | | | | Securities Lending Collateral | |
Fund | | Value of
Securities
Loaned | | | Collateral
Received(a) | | | Net
Amount | | | | Cash
Collateral
Invested | | | Cash
Collateral
Uninvested | | | Total
Collateral | |
Multi-Hedge Strategies Fund | | $ | 276,598 | | | $ | (276,598 | ) | | $ | — | | | | $ | 281,926 | | | $ | — | | | $ | 281,926 | |
(a) | Actual collateral received by the Fund is generally greater than the amount shown due to overcollateralization. |
In the event of counterparty default, the Funds have the right to collect the collateral to offset losses incurred. There is potential loss to the Funds in the event the Funds are delayed or prevented from exercising their rights to dispose of the collateral securities, including the risk of a possible decline in the value of the underlying securities during the period while the Funds seek to assert their rights. GI, acting under the supervision of the Board, reviews the value of the collateral and the creditworthiness of those banks and dealers to evaluate potential risks.
| | THE GUGGENHEIM FUNDS ANNUAL REPORT | 83 |
NOTES TO CONSOLIDATED FINANCIAL STATEMENTS (continued) |
Note 9 – Securities Transactions
For the year ended December 31, 2021, the cost of purchases and proceeds from sales of investment securities, excluding government securities, short-term investments and derivatives, were as follows:
Fund | | Purchases | | | Sales | |
Multi-Hedge Strategies Fund | | $ | 123,146,056 | | | $ | 120,315,245 | |
Commodities Strategy Fund | | | 2,415,000 | | | | — | |
The Funds are permitted to purchase or sell securities from or to certain affiliated funds under specified conditions outlined in procedures adopted by the Board. The procedures have been designed to ensure that any purchase or sale of securities by a Fund from or to another fund or portfolio that is or could be considered an affiliate by virtue of having a common investment adviser (or affiliated investment advisers), common trustees and/or common officers complies with Rule 17a-7 of the 1940 Act. Further, as defined under these procedures, each transaction is effected at the current market price to save costs, where permissible. For the year ended December 31, 2021, the Funds did not engage in purchases and sales of securities, pursuant to Rule 17a-7 of the 1940 Act.
Note 10 – Line of Credit
The Trust, along with other affiliated trusts, secured an uncommitted $150,000,000 line of credit from U.S. Bank, N.A., which was increased to $200,000,000 on February 10, 2021. On June 7, 2021, the line of credit agreement was renewed and expires on June 6, 2022. This line of credit is reserved for emergency or temporary purposes. Borrowings, if any, under this arrangement bear interest equal to the Prime Rate, minus 2%, which shall be paid monthly, averaging 1.25% for the year ended December 31, 2021. The Funds did not have any borrowings outstanding under this agreement at December 31, 2021.
The average daily balances borrowed for the year ended December 31, 2021, were as follows:
Fund | | Average Daily Balance | |
Multi-Hedge Strategies Fund | | $ | 1,562 | |
Note 11 – Legal Proceedings
Tribune Company
Rydex Series Funds has been named as a defendant and a putative member of the proposed defendant class of shareholders in the case entitled Kirschner v. FitzSimons, No. 12-2652 (S.D.N.Y.) (formerly Official Committee of Unsecured Creditors of Tribune Co. v. FitzSimons, Adv. Pro. No. 10-54010 (Bankr. D. Del.)) (the “FitzSimons action”), as a result of ownership by certain series of the Rydex Series Funds of shares in the Tribune Company (“Tribune”) in 2007, when Tribune effected a leveraged buyout transaction (“LBO”) by which
84 | THE GUGGENHEIM FUNDS ANNUAL REPORT | |
NOTES TO CONSOLIDATED FINANCIAL STATEMENTS (continued) |
Tribune converted to a privately-held company. In his complaint, the plaintiff has alleged that, in connection with the LBO, Tribune insiders and shareholders were overpaid for their Tribune stock using financing that the insiders knew would, and ultimately did, leave Tribune insolvent. The plaintiff has asserted claims against certain insiders, major shareholders, professional advisers, and others involved in the LBO. The plaintiff is also attempting to obtain from former Tribune shareholders, including the Rydex Series Funds, the proceeds they received in connection with the LBO.
In June 2011, a group of Tribune creditors filed multiple actions against former Tribune shareholders involving state law constructive fraudulent conveyance claims arising out of the 2007 LBO (the “SLCFC actions”). Rydex Series Funds has been named as a defendant in one or more of these suits. In those actions, the creditors seek to recover from Tribune’s former shareholders the proceeds received in connection with the 2007 LBO.
The FitzSimons action and the SLCFC actions have been consolidated with the majority of the other Tribune LBO-related lawsuits in a multidistrict litigation proceeding captioned In re Tribune Company Fraudulent Conveyance Litig., No. 11-md-2296 (S.D.N.Y.) (the “MDL Proceeding”).
On September 23, 2013, the District Court granted the defendants’ omnibus motion to dismiss the SLCFC actions, on the basis that the creditors lacked standing. On September 30, 2013, the creditors filed a notice of appeal of the September 23 order. On October 28, 2013, the defendants filed a joint notice of cross-appeal of that same order.
On March 29, 2016, the U.S. Court of Appeals for the Second Circuit issued its opinion on the appeal of the SLCFC actions. The appeals court affirmed the district court’s dismissal of those lawsuits, but on different grounds than the district court. The appeals court held that while the plaintiffs have standing under the U.S. Bankruptcy Code, their claims were preempted by Section 546(e) of the Bankruptcy Code—the statutory safe harbor for settlement payments.
On April 12, 2016, the Plaintiffs in the SLCFC actions filed a petition seeking rehearing en banc before the appeals court. On July 22, 2016, the appeals court denied the petition. On September 9, 2016, the plaintiffs filed a petition for writ of certiorari in the U.S. Supreme Court challenging the Second Circuit’s decision that the safe harbor of Section 546(e) applied to their claims. The shareholder defendants, including the Funds, filed a joint brief in opposition to the petition for certiorari on October 24, 2016. On April 3, 2018, Justice Kennedy and Justice Thomas issued a “Statement” related to the petition for certiorari suggesting that the Second Circuit and/or District Court may want to take steps to reexamine the application of the Section 546(e) safe harbor to the previously dismissed state law constructive fraudulent transfer claims based on the Supreme Court’s decision in Merit Management Group LP v. FTI Consulting, Inc. On April 10, 2018, Plaintiffs filed in the Second Circuit a motion for that court to recall its mandate, vacate its prior decision, and remand to the district court for further proceedings consistent with Merit Management. On April 20, 2018, the shareholder defendants filed an opposition to Plaintiffs’ motion to recall the mandate. On May 15, 2018, the Second Circuit issued an order
| | THE GUGGENHEIM FUNDS ANNUAL REPORT | 85 |
NOTES TO CONSOLIDATED FINANCIAL STATEMENTS (continued) |
recalling the mandate “in anticipation of further panel review.” On December 19, 2019, the Second Circuit issued an amended opinion that again affirmed the district court’s ruling on the basis that plaintiffs’ claims were preempted by Section 546(e) of the Bankruptcy Code. Plaintiffs filed a motion for rehearing and rehearing en banc on January 2, 2020. The Second Circuit denied the petition on February 6, 2020. On July 6, 2020, plaintiffs filed a new petition for a writ of certiorari in the U.S. Supreme Court. In that petition, plaintiffs stated that “[t]o make it more likely that there will be a quorum for this petition,” they have “abandon[ed] the case and let the judgment below stand” with respect to certain defendants. That list did not include the Rydex Series Funds. Defendants filed an opposition to the certiorari petition on August 26, 2020, and plaintiffs filed a reply in support of the petition for certiorari on September 8, 2020. On March 12, 2021, the Solicitor General filed an amicus brief recommending that certiorari be denied. Plaintiffs filed a supplemental brief in response to the Solicitor General’s amicus brief on March 31, 2021, and Defendants filed a supplemental brief on April 1, 2021. The Court denied the petition for certiorari on April 19, 2021.
On May 23, 2014, the defendants filed motions to dismiss the FitzSimons action, including a global motion to dismiss Count I, which is the claim brought against former Tribune shareholders for intentional fraudulent conveyance under U.S. federal law. On January 6, 2017, the United States District Court for the Southern District of New York granted the shareholder defendants’ motion to dismiss the intentional fraudulent conveyance claim in the FitzSimons action. In dismissing the intentional fraudulent conveyance claim, the Court denied the plaintiff’s request to amend the complaint. The plaintiff requested that the Court direct entry of a final judgment in order to make the order immediately appealable. On February 23, 2017, the Court issued an order stating that it intended to permit an interlocutory appeal of the dismissal order, but would wait to do so until it has resolved outstanding motions to dismiss filed by other defendants.
On July 18, 2017, the plaintiff submitted a letter to the District Court seeking leave to amend its complaint to add a constructive fraudulent transfer claim. The shareholder defendants opposed that request. On August 24, 2017, the Court denied the plaintiff’s request without prejudice to renewal of the request in the event of an intervening change in the law. On March 8, 2018, the plaintiff renewed his request for leave to file a motion to amend the complaint to assert a constructive fraudulent transfer claim based on the Supreme Court’s ruling in Merit Management Group LP v. FTI Consulting, Inc. The shareholder defendants opposed that request. On June 18, 2018 the District Court ordered that the request would be stayed pending further action by the Second Circuit in the SLCFC actions.
On December 18, 2018, plaintiff filed a letter with the District Court requesting that the stay be dissolved in order to permit briefing on the motion to amend the complaint and indicating plaintiff’s intention to file another motion to amend the complaint to reinstate claims for intentional fraudulent transfer. The shareholder defendants opposed that request. On January 14, 2019, the court held a case management conference, during which the court stated that it would not lift the stay prior to further action from the Second Circuit in the SLCFC actions. The court further stated that it would allow the plaintiff to file a motion to amend to try to reinstate its
86 | THE GUGGENHEIM FUNDS ANNUAL REPORT | |
NOTES TO CONSOLIDATED FINANCIAL STATEMENTS (continued) |
intentional fraudulent transfer claim. On January 23, 2019, the court ordered the parties still facing pending claims to participate in a mediation, to commence on January 28, 2019. The mediation did not result in a settlement of the claims against the shareholder defendants.
On April 4, 2019, plaintiff filed a motion to amend the Fifth Amended Complaint to assert a federal constructive fraudulent transfer claim against certain shareholder defendants. On April 10, 2019, the shareholder defendants filed a brief in opposition to plaintiff’s motion to amend. On April 12, 2019, the plaintiff filed a reply brief. On April 23, 2019, the court denied the plaintiff’s motion to amend. On June 13, 2019, the court entered judgment pursuant to Rule 54(b). On July 12, 2019, the Plaintiff filed a notice of appeal with respect to the dismissal of his claims and the District Court’s denial of his motion for leave to amend. Plaintiff filed an appellate brief on January 7, 2020. The shareholder defendants’ brief was filed on April 27, 2020. Plaintiff filed a reply brief on May 18, 2020. The Court held oral argument on August 24, 2020. On August 20, 2021, the Second Circuit affirmed the District Court’s orders: (1) dismissing the intentional fraudulent conveyance claims against the shareholder-defendants; and (2) denying the plaintiff leave to amend the complaint to add a constructive fraudulent conveyance claim against the shareholder-defendants. Plaintiff filed a petition for rehearing en banc on September 3, 2021. On October 7, 2021, the Second Circuit denied the petition. On January 5, 2022, Plaintiff filed a petition for certiorari in the U.S. Supreme Court. That petition was denied on February 22, 2022.
None of these lawsuits alleges any wrongdoing on the part of Rydex Series Funds. The following series of Rydex Series Funds held shares of Tribune and tendered these shares as part of Tribune’s LBO: Nova Fund, S&P 500® Pure Value Fund, Multi-Cap Core Equity Fund, S&P 500® Fund, Multi-Hedge Strategies Fund and Hedged Equity Fund (the “Funds”). The value of the proceeds received by the foregoing Funds was $28,220, $109,242, $9,860, $3,400, $1,181,160, and $10,880, respectively. At this stage of the proceedings, Rydex Series Funds is not able to make a reliable predication as to the outcome of these lawsuits or the effect, if any, on a Fund’s net asset value.
Note 12 – COVID-19
The outbreak of COVID-19 and the recovery response causes at times disruption to consumer demand, economic output, and supply chains. There are still travel restrictions, quarantines, and disparate global vaccine distributions. As with other serious economic disruptions, governmental authorities and regulators have responded to this situation with significant fiscal and monetary policy changes. These include providing direct capital infusions into companies, introducing new monetary programs, and considerably lowering interest rates. In some cases, these responses resulted in negative interest rates and higher inflation. Recently, the U.S. and other governments have also made investments and engaged in infrastructure modernization projects that have also increased public debt and spending. These actions, including their possible unexpected or sudden reversal or potential ineffectiveness, could further increase volatility in securities and other financial markets, reduce market liquidity, continue to cause higher inflation, heighten investor uncertainty, and adversely affect the value of the Funds’ investments and the performance of the Funds. These actions also contribute to a risk that asset prices have a higher degree of correlation
| | THE GUGGENHEIM FUNDS ANNUAL REPORT | 87 |
NOTES TO CONSOLIDATED FINANCIAL STATEMENTS (concluded) |
than historically seen across markets and asset classes. The duration and extent of COVID-19 over the long term cannot be reasonably estimated at this time. The ultimate impact of COVID-19 and the extent to which COVID-19 impacts the Funds will depend on future developments, which are highly uncertain and difficult to predict. Management continues to monitor and evaluate this situation.
Note 13 – Subsequent Events
The Funds evaluated subsequent events through the date the consolidated financial statements were available for issue and determined there were no material events that would require adjustment to or disclosure in the Funds’ consolidated financial statements.
88 | THE GUGGENHEIM FUNDS ANNUAL REPORT | |
REPORT OF INDEPENDENT REGISTERED PUBLIC ACCOUNTING FIRM |
To the Shareholders of Guggenheim Multi-Hedge Strategies Fund and Rydex Commodities Strategy Fund and the Board of Trustees of Rydex Series Funds
Opinion on the Financial Statements
We have audited the accompanying consolidated statements of assets and liabilities of Guggenheim Multi-Hedge Strategies Fund and Rydex Commodities Strategy Fund (collectively referred to as the “Funds”), (two of the funds constituting Rydex Series Funds (the “Trust”)), including the consolidated schedules of investments, as of December 31, 2021, and the related consolidated statements of operations for the year then ended, the consolidated statements of changes in net assets for each of the two years in the period then ended, the consolidated financial highlights for each of the five years in the period then ended and the related notes (collectively referred to as the “financial statements”). In our opinion, the financial statements present fairly, in all material respects, the consolidated financial position of each of the Funds (two of the funds constituting Rydex Series Funds) at December 31, 2021, the consolidated results of their operations for the year then ended, the consolidated changes in their net assets for each of the two years in the period then ended and their consolidated financial highlights for each of the five years in the period then ended, in conformity with U.S. generally accepted accounting principles.
Basis for Opinion
These financial statements are the responsibility of the Trust’s management. Our responsibility is to express an opinion on each of the Funds’ financial statements based on our audits. We are a public accounting firm registered with the Public Company Accounting Oversight Board (United States) (“PCAOB”) and are required to be independent with respect to the Trust in accordance with the U.S. federal securities laws and the applicable rules and regulations of the Securities and Exchange Commission and the PCAOB.
We conducted our audits in accordance with the standards of the PCAOB. Those standards require that we plan and perform the audit to obtain reasonable assurance about whether the financial statements are free of material misstatement, whether due to error or fraud. The Trust is not required to have, nor were we engaged to perform, an audit of the Trust’s internal control over financial reporting. As part of our audits, we are required to obtain an understanding of internal control over financial reporting but not for the purpose of expressing an opinion on the effectiveness of the Trust’s internal control over financial reporting. Accordingly, we express no such opinion.
Our audits included performing procedures to assess the risks of material misstatement of the financial statements, whether due to error or fraud, and performing procedures that respond to those risks. Such procedures included examining, on a test basis, evidence regarding the amounts and disclosures in the financial statements. Our procedures included confirmation of securities owned as of December 31, 2021, by correspondence with the custodian, transfer agent, and brokers or by other appropriate auditing procedures where replies from brokers were not received.
| | THE GUGGENHEIM FUNDS ANNUAL REPORT | 89 |
REPORT OF INDEPENDENT REGISTERED PUBLIC ACCOUNTING FIRM (concluded) |
Our audits also included evaluating the accounting principles used and significant estimates made by management, as well as evaluating the overall presentation of the financial statements. We believe that our audits provide a reasonable basis for our opinion.

We have served as the auditor of one or more Guggenheim investment companies since 1979.
Tysons, Virginia
February 28, 2022
90 | THE GUGGENHEIM FUNDS ANNUAL REPORT | |
OTHER INFORMATION (Unaudited) |
Federal Income Tax Information
This information is being provided as required by the Internal Revenue Code. Amounts shown may differ from those elsewhere in the report because of differences in tax and financial reporting practice.
In January 2022, shareholders will be advised on IRS Form 1099 DIV or substitute 1099 DIV as to the federal tax status of the distributions received by shareholders in the calendar year 2021.
The Funds’ investment income (dividend income plus short-term capital gains, if any) qualifies as follows:
Of the taxable ordinary income distributions paid during the fiscal year ending December 31, 2021, the following funds had the corresponding percentages qualify for the reduced tax rate pursuant to the Jobs and Growth Tax Relief and Reconciliation Act of 2003 or for the dividends received deduction for corporations. See the qualified dividend income and dividend received deduction columns, respectively, in the table below.
Additionally, of the taxable ordinary income distributions paid during the fiscal year ended December 31, 2021, the following funds had the corresponding percentages qualify as interest related dividends permitted by IRC Section 871(k)(1). See qualified interest income in the table below.
Fund | | Qualified
Dividend
Income | | | Dividend
Received
Deduction | |
Multi-Hedge Strategies Fund | | | 0.00 | % | | | 0.04 | % |
Commodities Strategy Fund | | | 0.00 | % | | | 0.06 | % |
Delivery of Shareholder Reports
Paper copies of the Funds’ annual and semi-annual shareholder reports are not sent by mail, unless you specifically request paper copies of the reports from a fund or from your financial intermediary. Instead, the reports are made available on a website, and you are notified by mail each time a report is posted and provided with a website link to access the report.
You may elect to receive all future shareholder reports in paper free of charge. If you hold shares of a fund directly, you can inform the Fund that you wish to receive paper copies of reports by calling 800.820.0888. If you hold shares of a fund through a financial intermediary, please contact the financial intermediary to make this election. Your election to receive reports in paper may apply to all Guggenheim Funds in which you are invested and may apply to all Guggenheim funds held with your financial intermediary.
| | THE GUGGENHEIM FUNDS ANNUAL REPORT | 91 |
OTHER INFORMATION (Unaudited) (concluded) |
Proxy Voting Information
A description of the policies and procedures that the Trust uses to determine how to vote proxies relating to securities held in the Funds’ portfolios is available, without charge and upon request, by calling 800.820.0888. This information is also available from the EDGAR database on the SEC’s website at https://www.sec.gov.
Information regarding how the Funds’ voted proxies relating to portfolio securities during the most recent 12-month period ended June 30 is available without charge, upon request, by calling 800.820.0888. This information is also available from the EDGAR database on the SEC’s website at https://www.sec.gov.
Sector Classification
Information in the Schedule of Investments is categorized by sectors using sector-level Classifications defined by the Bloomberg Industry Classification System, a widely recognized industry classification system provider. Each Fund’s registration statement has investment policies relating to concentration in specific sectors/industries. For purposes of these investment policies, the Funds usually classify sectors/industries based on industry-level Classifications used by widely recognized industry classification system providers such as Bloomberg Industry Classification System, Global Industry Classification Standards and Barclays Global Classification Scheme.
Quarterly Portfolio Schedules Information
The Trust files its complete schedule of portfolio holdings with the SEC for the first and third quarters of each fiscal year as an exhibit to its reports on Form N-PORT, and for reporting periods ended prior to March 31, 2019, filed such information on Form N-Q. The Funds’ Forms N-PORT and N-Q are available on the SEC’s website at https://www.sec.gov. Copies of the portfolio holdings are also available to shareholders, without charge and upon request, by calling 800.820.0888.
92 | THE GUGGENHEIM FUNDS ANNUAL REPORT | |
INFORMATION ON BOARD OF TRUSTEES AND OFFICERS (Unaudited) |
A Board of Trustees oversees the Trust, as well as other trusts of GI, in which its members have no stated term of service, and continue to serve after election until resignation. The Statement of Additional Information includes further information about Fund Trustees and Officers, and can be obtained without charge, upon request, by visiting guggenheiminvestments.com or by calling 800.820.0888.
Name, Address*
and Year of Birth | Position(s)
Held with
Trust | Term of Office
and Length of
Time Served** | Principal Occupation(s)
During Past Five Years | Number of
Portfolios
in Fund
Complex
Overseen | Other
Directorships Held
by Trustees*** |
INDEPENDENT TRUSTEES | | | |
Randall C. Barnes (1951) | Trustee and Chair of the Valuation Oversight Committee | Since 2019 (Trustee) Since 2020 (Chair of the Valuation Oversight Committee) | Current: Private Investor (2001-present).
Former: Senior Vice President and Treasurer, PepsiCo, Inc. (1993-1997); President, Pizza Hut International (1991-1993); Senior Vice President, Strategic Planning and New Business Development, PepsiCo, Inc. (1987-1990). | 156 | Current: Advent Convertible and Income Fund (2005-present); Purpose Investments Funds (2013-present).
Former: Guggenheim Enhanced Equity Income Fund (2005-2021); Guggenheim Credit Allocation Fund (2013-2021). |
Angela Brock-Kyle (1959) | Trustee | Since 2016 | Current: Founder and Chief Executive Officer, B.O.A.R.D.S. (2013-present).
Former: Senior Leader, TIAA (1987-2012). | 155 | Current: Bowhead Insurance GP, LLC (2020-present); Hunt Companies, Inc. (2019-present).
Former: Guggenheim Enhanced Equity Income Fund (2019-2021); Guggenheim Credit Allocation Fund (2019-2021); Infinity Property & Casualty Corp. (2014-2018). |
| | THE GUGGENHEIM FUNDS ANNUAL REPORT | 93 |
INFORMATION ON BOARD OF TRUSTEES AND OFFICERS (Unaudited)(continued) |
Name, Address*
and Year of Birth | Position(s)
Held with
Trust | Term of Office
and Length of
Time Served** | Principal Occupation(s)
During Past Five Years | Number of
Portfolios
in Fund
Complex
Overseen | Other
Directorships Held
by Trustees*** |
INDEPENDENT TRUSTEES - continued | | |
Thomas F. Lydon, Jr. (1960) | Trustee and Chair of the Contracts Review Committee | Since 2005 (Trustee) Since 2020 (Chair of the Contracts Review Committee) | Current: President, Global Trends Investments (1996-present); Chief Executive Officer, ETF Flows, LLC (2019-present); Chief Executive Officer, Lydon Media (2016-present); Director, GDX Index Partners, LLC (2021-present). | 155 | Current: US Global Investors, Inc. (GROW) (1995-present).
Former: Guggenheim Enhanced Equity Income Fund (2019-2021); Guggenheim Credit Allocation Fund (2019-2021); Harvest Volatility Edge Trust (3) (2017-2019). |
Ronald A. Nyberg (1953) | Trustee and Chair of the Nominating and Governance Committee | Since 2019 | Current: Of Counsel, Momkus LLP (2016-present).
Former: Partner, Nyberg & Cassioppi, LLC (2000-2016); Executive Vice President, General Counsel, and Corporate Secretary, Van Kampen Investments (1982-1999). | 156 | Current: Advent Convertible and Income Fund (2005-present); PPM Funds (2) (2018-present); NorthShore-Edward-Elmhurst Health (2012-present).
Former: Guggenheim Enhanced Equity Income Fund (2005-2021); Guggenheim Credit Allocation Fund (2013-2021); Western Asset Inflation-Linked Opportunities & Income Fund (2004-2020); Western Asset Inflation-Linked Income Fund (2003-2020). |
94 | THE GUGGENHEIM FUNDS ANNUAL REPORT | |
INFORMATION ON BOARD OF TRUSTEES AND OFFICERS (Unaudited)(continued) |
Name, Address*
and Year of Birth | Position(s)
Held with
Trust | Term of Office
and Length of
Time Served** | Principal Occupation(s)
During Past Five Years | Number of
Portfolios
in Fund
Complex
Overseen | Other
Directorships Held
by Trustees*** |
INDEPENDENT TRUSTEES - continued | | |
Sandra G. Sponem (1958) | Trustee and Chair of the Audit Committee | Since 2016 (Trustee) Since 2020 (Chair of the Audit Committee) | Current: Retired.
Former: Senior Vice President and Chief Financial Officer, M.A. Mortenson-Companies, Inc. (2007-2017). | 155 | Current: SPDR Series Trust (81) (2018-present); SPDR Index Shares Funds (30) (2018-present); SSGA Active Trust (14) (2018-present). Former: Guggenheim Enhanced Equity Income Fund (2019-2021); Guggenheim Credit Allocation Fund (2019-2021); SSGA Master Trust (1) (2018-2020). |
| | THE GUGGENHEIM FUNDS ANNUAL REPORT | 95 |
INFORMATION ON BOARD OF TRUSTEES AND OFFICERS (Unaudited)(continued) |
Name, Address*
and Year of Birth | Position(s)
Held with
Trust | Term of Office
and Length of
Time Served** | Principal Occupation(s)
During Past Five Years | Number of
Portfolios
in Fund
Complex
Overseen | Other
Directorships Held
by Trustees*** |
INDEPENDENT TRUSTEES - concluded | | |
Ronald E. Toupin, Jr. (1958) | Trustee, Chair of the Board and Chair of the Executive Committee | Since 2019 | Current: Portfolio Consultant (2010-present); Member, Governing Council, Independent Directors Council (2013-present); Governor, Board of Governors, Investment Company Institute (2018-present).
Former: Member, Executive Committee, Independent Directors Council (2016-2018); Vice President, Manager and Portfolio Manager, Nuveen Asset Management (1998-1999); Vice President, Nuveen Investment Advisory Corp. (1992-1999); Vice President and Manager, Nuveen Unit Investment Trusts (1991-1999); and Assistant Vice President and Portfolio Manager, Nuveen Unit Investment Trusts (1988-1999), each of John Nuveen & Co., Inc. (1982-1999). | 155 | Former: Guggenheim Enhanced Equity Income Fund (2005-2021); Guggenheim Credit Allocation Fund (2013-2021); Western Asset Inflation-Linked Opportunities & Income Fund (2004-2020); Western Asset Inflation-Linked Income Fund (2003-2020). |
96 | THE GUGGENHEIM FUNDS ANNUAL REPORT | |
INFORMATION ON BOARD OF TRUSTEES AND OFFICERS (Unaudited)(continued) |
Name, Address*
and Year of Birth | Position(s)
Held with
Trust | Term of Office
and Length of
Time Served** | Principal Occupation(s)
During Past Five Years | Number of
Portfolios
in Fund
Complex
Overseen | Other
Directorships Held
by Trustees*** |
INTERESTED TRUSTEE | |
Amy J. Lee**** (1961) | Trustee, Vice President and Chief Legal Officer | Since 2019 | Current: Interested Trustee, certain other funds in the Fund Complex (2018-present); Chief Legal Officer, certain other funds in the Fund Complex (2014-present); Vice President, certain other funds in the Fund Complex (2007-present); Senior Managing Director, Guggenheim Investments (2012-present).
Former: President and Chief Executive Officer, certain other funds in the Fund Complex (2017-2019); Vice President, Associate General Counsel and Assistant Secretary, Security Benefit Life Insurance Company and Security Benefit Corporation (2004-2012). | 155 | Former: Guggenheim Enhanced Equity Income Fund (2018-2021); Guggenheim Credit Allocation Fund (2018-2021). |
* | The business address of each Trustee is c/o Guggenheim Investments, 227 West Monroe Street, Chicago, Illinois 60606. |
** | Each Trustee serves an indefinite term, until his or her successor is elected and qualified. |
*** | Each Trustee also serves on the Boards of Trustees of Guggenheim Funds Trust, Guggenheim Variable Funds Trust, Guggenheim Strategy Funds Trust, Fiduciary/Claymore Energy Infrastructure Fund, Guggenheim Taxable Municipal Bond & Investment Grade Debt Trust, Guggenheim Strategic Opportunities Fund, Guggenheim Energy & Income Fund, Guggenheim Active Allocation Fund, Rydex Series Funds, Rydex Dynamic Funds, Rydex Variable Trust and Transparent Value Trust. Messrs. Barnes and Nyberg also serve on the Board of Trustees of Advent Convertible & Income Fund. |
**** | This Trustee is deemed to be an “interested person” of the Fund under the 1940 Act by reason of her position with the Fund’s Investment Manager and/or the parent of the Investment Manager. |
| | THE GUGGENHEIM FUNDS ANNUAL REPORT | 97 |
INFORMATION ON BOARD OF TRUSTEES AND OFFICERS (Unaudited)(continued) |
Name, Address*
and Year of Birth | Position(s)
Held with
Trust | Term of Office
and Length of
Time Served** | Principal Occupation(s)
During Past Five Years |
OFFICERS | | | |
Brian E. Binder (1972) | President and Chief Executive Officer | Since 2019 | Current: President and Chief Executive Officer, certain other funds in the Fund Complex (2018-present); President, Chief Executive Officer and Chairman of the Board of Managers, Guggenheim Funds Investment Advisors, LLC (2018-present); President and Chief Executive Officer, Security Investors, LLC (2018-present); Board Member of Guggenheim Partners Fund Management (Europe) Limited (2018-present); Senior Managing Director and Chief Administrative Officer, Guggenheim Investments (2018-present).
Former: Managing Director and President, Deutsche Funds, and Head of US Product, Trading and Fund Administration, Deutsche Asset Management (2013-2018); Managing Director, Head of Business Management and Consulting, Invesco Ltd. (2010-2012). |
James M. Howley (1972) | Assistant Treasurer | Since 2016 | Current: Managing Director, Guggenheim Investments (2004-present); Assistant Treasurer, certain other funds in the Fund Complex (2006-present).
Former: Manager, Mutual Fund Administration of Van Kampen Investments, Inc. (1996-2004). |
Mark E. Mathiasen (1978) | Secretary | Since 2017 | Current: Secretary, certain other funds in the Fund Complex (2007-present); Managing Director, Guggenheim Investments (2007-present). |
Glenn McWhinnie (1969) | Assistant Treasurer | Since 2016 | Current: Vice President, Guggenheim Investments (2009-present); Assistant Treasurer, certain other funds in the Fund Complex (2016-present). |
Michael P. Megaris (1984) | Assistant Secretary | Since 2018 | Current: Assistant Secretary, certain other funds in the Fund Complex (2014-present); Managing Director, Guggenheim Investments (2012-present). |
98 | THE GUGGENHEIM FUNDS ANNUAL REPORT | |
INFORMATION ON BOARD OF TRUSTEES AND OFFICERS (Unaudited)(continued) |
Name, Address*
and Year of Birth | Position(s)
Held with
Trust | Term of Office
and Length of
Time Served** | Principal Occupation(s)
During Past Five Years |
OFFICERS - continued | |
Elisabeth Miller (1968) | Chief Compliance Officer | Since 2012 | Current: Chief Compliance Officer, certain other funds in the Fund Complex (2012-present); Senior Managing Director, Guggenheim Investments (Vice President, Guggenheim Funds Distributors, LLC (2014-present). Former: Chief Compliance Officer, Security Investors, LLC and Guggenheim Funds Investment Advisors, LLC (2012-2018); Chief Compliance Officer, Guggenheim Distributors, LLC (2009-2014); Senior Manager, Security Investors, LLC (2004-2014); Senior Manager, Guggenheim Distributors, LLC (2004-2014). |
Margaux Misantone (1978) | AML Officer | Since 2017 | Current: Chief Compliance Officer, Security Investors, LLC and Guggenheim Funds Investment Advisors, LLC (2018-present); AML Officer, Security Investors, LLC and certain other funds in the Fund Complex (2017-present); Managing Director, Guggenheim Investments (2015-present). Former: Assistant Chief Compliance Officer, Security Investors, LLC and Guggenheim Funds Investments Advisors, LLC (2015-2018) |
Kimberly J. Scott (1974) | Assistant Treasurer | Since 2016 | Current: Director, Guggenheim Investments (2012-present); Assistant Treasurer, certain other funds in the Fund Complex (2012-present).
Former: Financial Reporting Manager, Invesco, Ltd. (2010-2011); Vice President/Assistant Treasurer, Mutual Fund Administration for Van Kampen Investments, Inc./Morgan Stanley Investment Management (2009-2010); Manager of Mutual Fund Administration, Van Kampen Investments, Inc./Morgan Stanley Investment Management (2005-2009). |
Bryan Stone (1979) | Vice President | Since 2019 | Current: Vice President, certain other funds in the Fund Complex (2014-present); Managing Director, Guggenheim Investments (2013-present).
Former: Senior Vice President, Neuberger Berman Group LLC (2009-2013); Vice President, Morgan Stanley (2002-2009). |
| | THE GUGGENHEIM FUNDS ANNUAL REPORT | 99 |
INFORMATION ON BOARD OF TRUSTEES AND OFFICERS (Unaudited)(concluded) |
Name, Address*
and Year of Birth | Position(s)
Held with
Trust | Term of Office
and Length of
Time Served** | Principal Occupation(s)
During Past Five Years |
OFFICERS - concluded | |
John L. Sullivan (1955) | Chief Financial Officer, Chief Accounting Officer and Treasurer | Since 2016 | Current: Chief Financial Officer, Chief Accounting Officer and Treasurer, certain other funds in the Fund Complex (2010-present); Senior Managing Director, Guggenheim Investments (2010-present).
Former: Managing Director and Chief Compliance Officer, each of the funds in the Van Kampen Investments fund complex (2004-2010); Managing Director and Head of Fund Accounting and Administration, Morgan Stanley Investment Management (2002-2004); Chief Financial Officer and Treasurer, Van Kampen Funds (1996-2004). |
Jon Szafran (1989) | Assistant Treasurer | Since 2017 | Current: Director, Guggenheim Investments (2017-present); Assistant Treasurer, certain other funds in the Fund Complex (2017-present).
Former: Assistant Treasurer of Henderson Global Funds and Manager of US Fund Administration, Henderson Global Investors (North America) Inc. (“HGINA”), (2017); Senior Analyst of US Fund Administration, HGINA (2014–2017); Senior Associate of Fund Administration, Cortland Capital Market Services, LLC (2013-2014); Experienced Associate, PricewaterhouseCoopers LLP (2012-2013). |
* | The business address of each officer is c/o Guggenheim Investments, 227 West Monroe Street, Chicago, Illinois 60606. |
** | Each officer serves an indefinite term, until his or her successor is duly elected and qualified. |
100 | THE GUGGENHEIM FUNDS ANNUAL REPORT | |
GUGGENHEIM INVESTMENTS PRIVACY NOTICE (Unaudited) |
Who We Are
This Privacy Notice describes the data protection practices of Guggenheim Investments. Guggenheim Investments as used herein refers to the affiliated investment management businesses of Guggenheim Partners, LLC: Guggenheim Funds Investment Advisors, LLC, Guggenheim Partners Investment Management, LLC, Guggenheim Funds Distributors, LLC, Security Investors, LLC, Guggenheim Investment Advisors (Europe) Limited, Guggenheim Real Estate, LLC, GS Gamma Advisors, LLC, Guggenheim Partners India Management, LLC, Guggenheim Partners Europe Limited, as well as the funds in the Guggenheim Funds complex (the “Funds”) (“Guggenheim Investments,” “we,” “us,” or “our”).
Guggenheim Partners Investment Management Holdings, LLC, located at 330 Madison Avenue, New York, New York 10017 is the data controller for your information. The affiliates who are also controllers of certain of your information are: Guggenheim Investment Advisors (Europe) Limited, Guggenheim Partners Europe Limited, Guggenheim Partners, LLC, Guggenheim Funds Investment Advisors, LLC, Guggenheim Partners Investment Management, LLC, Guggenheim Funds Distributors, LLC and Security Investors, LLC, as well as the Funds.
Our Commitment to You
Guggenheim Investments considers your privacy our utmost concern. When you become our client or investor, you entrust us with not only your hard-earned money but also with your personal and financial information. Because we have access to your private information, we hold ourselves to the highest standards in its safekeeping and use. We strictly limit how we share your information with others, whether you are a current or former Guggenheim Investments client or investor.
The Information We Collect About You
We collect certain nonpublic personal information about you from information you provide on applications, other forms, our website, and/or from third parties including investment advisors. This information includes Social Security or other tax identification number, assets, income, tax information, retirement and estate plan information, transaction history, account balance, payment history, bank account information, marital status, family relationships, information that we collect on our website through the use of “cookies,” and other personal information that you or others provide to us. We may also collect such information through your inquiries by mail, e-mail or telephone. We may also collect customer due diligence information, as required by applicable law and regulation, through third party service providers.
How We Handle Your Personal Information
The legal basis for using your information as set out in this Privacy Notice is as follows: (a) use of your personal data is necessary to perform our obligations under any contract with you (such as a contract for us to provide financial services to you); or (b) where use of your personal data is not necessary for performance of a contract, use of your personal data is necessary for our
| | THE GUGGENHEIM FUNDS ANNUAL REPORT | 101 |
GUGGENHEIM INVESTMENTS PRIVACY NOTICE (Unaudited)(continued) |
legitimate interests or the legitimate interests of others (for example, to enforce the legal terms governing our services, operate and market our website and other services we offer, ensure safe environments for our personnel and others, make and receive payments, prevent fraud and to know the customer to whom we are providing the services). Some processing is done to comply with applicable law.
In addition to the specific uses described above, we also use your information in the following manner:
| | ● | We use your information in connection with servicing your accounts. |
| | ● | We use information to respond to your requests or questions. For example, we might use your information to respond to your customer feedback. |
| | ● | We use information to improve our products and services. We may use your information to make our website and products better. We may use your information to customize your experience with us. |
| | ● | We use information for security purposes. We may use your information to protect our company and our customers. |
| | ● | We use information to communicate with you. For example, we will communicate with you about your account or our relationship. We may contact you about your feedback. We might also contact you about this Privacy Notice. We may also enroll you in our email newsletter. |
| | ● | We use information as otherwise permitted by law, as we may notify you. |
| | ● | Aggregate/Anonymous Data. We may aggregate and/or anonymize any information collected through the website so that such information can no longer be linked to you or your device (“Aggregate/Anonymous Information”). We may use Aggregate/Anonymous Information for any purpose, including without limitation for research and marketing purposes, and may also share such data with any third parties, including advertisers, promotional partners, and sponsors. |
We do not sell information about current or former clients or their accounts to third parties. Nor do we share this information, except when necessary to complete transactions at your request, to make you aware of investment products and services that we or our affiliates offer, or as permitted or required by law.
We provide information about you to companies and individuals not affiliated with Guggenheim Investments to complete certain transactions or account changes, or to perform services for us related to your account. For example, if you ask to transfer assets from another financial institution to Guggenheim Investments, we must provide certain information about you to that company to complete the transaction. We provide the third party with only the information necessary to carry out its responsibilities and only for that purpose. And we require these third
102 | THE GUGGENHEIM FUNDS ANNUAL REPORT | |
GUGGENHEIM INVESTMENTS PRIVACY NOTICE (Unaudited)(continued) |
parties to treat your private information with the same high degree of confidentiality that we do. To alert you to other Guggenheim Investments products and services, we share your information within our family of affiliated companies. You may limit our sharing with affiliated companies as set out below. We may also share information with any successor to all or part of our business, or in connection with steps leading up to a merger or acquisition. For example, if part of our business was sold we may give customer information as part of that transaction. We may also share information about you with your consent.
We will release information about you if you direct us to do so, if we are compelled by law to do so, or in other circumstances as permitted by law (for example, to protect your account from fraud).
If you close your account(s) or become an inactive client or investor, we will continue to adhere to the privacy policies and practices described in this notice.
Opt-Out Provisions and Your Data Choices
The law allows you to “opt out” of certain kinds of information sharing with third parties. We do not share personal information about you with any third parties that triggers this opt-out right. This means YOU ARE ALREADY OPTED OUT.
When you are no longer our client or investor, we continue to share your information as described in this notice, and you may contact us at any time to limit our sharing by sending an email to CorporateDataPrivacy@GuggenheimPartners.com.
European Union Data Subjects and certain others: In addition to the choices set forth above, residents of the European Union and certain other jurisdictions have certain rights to (1) request access to or rectification or deletion of information we collect about them, (2) request a restriction on the processing of their information, (3) object to the processing of their information, or (4) request the portability of certain information. To exercise these or other rights, please contact us using the contact information below. We will consider all requests and provide our response within the time period stated by applicable law. Please note, however, that certain information may be exempt from such requests in some circumstances, which may include if we need to keep processing your information for our legitimate interests or to comply with a legal obligation. We may request you provide us with information necessary to confirm your identity before responding to your request.
Residents of France and certain other jurisdictions may also provide us with instructions regarding the manner in which we may continue to store, erase and share your information after your death, and where applicable, the person you have designated to exercise these rights after your death.
How We Protect Privacy Online
We take steps to protect your privacy when you use our web site – www.guggenheiminvestments.com – by using secure forms of online communication, including encryption technology, Secure Socket Layer (SSL) protocol, firewalls and user names and passwords. These safeguards vary based
| | THE GUGGENHEIM FUNDS ANNUAL REPORT | 103 |
GUGGENHEIM INVESTMENTS PRIVACY NOTICE (Unaudited)(concluded) |
on the sensitivity of the information that we collect and store. However, we cannot and do not guarantee that these measures will prevent every unauthorized attempt to access, use, or disclose your information since despite our efforts, no Internet and/or other electronic transmissions can be completely secure. Our web site uses “http cookies”—tiny pieces of information that we ask your browser to store. We use cookies for session management and security features on the Guggenheim Investments web site. We do not use them to pull data from your hard drive, to learn your e-mail address, or to view data in cookies created by other web sites. We will not share the information in our cookies or give others access to it. See the legal information area on our web site for more details about web site security and privacy features.
How We Safeguard Your Personal Information and Data Retention
We restrict access to nonpublic personal information about you to our employees and in some cases to third parties (for example, the service providers described above) as permitted by law. We maintain strict physical, electronic and procedural safeguards that comply with federal standards to guard your nonpublic personal information.
We keep your information for no longer than necessary for the purposes for which it is processed. The length of time for which we retain information depends on the purposes for which we collected and use it and/or as required to comply with applicable laws. Information may persist in copies made for backup and business continuity purposes for additional time.
International Visitors
If you are not a resident of the United States, please be aware that your information may be transferred to, stored and processed in the United States where our servers are located and our databases are operated. The data protection and other laws of the United States and other countries might not be as comprehensive as those in your country.
In such cases, we ensure that a legal basis for such a transfer exists and that adequate protection is provided as required by applicable law, for example, by using standard contractual clauses or by transferring your data to a jurisdiction that has obtained an adequacy finding. Individuals whose data may be transferred on the basis of standard contractual clauses may contact us as described below.
We’ll Keep You Informed
If you have any questions or concerns about how we treat your personal data, we encourage you to consult with us first. You may also contact the relevant supervisory authority.
We reserve the right to modify this policy at any time and will inform you promptly of material changes. You may access our privacy policy from our web site at www.guggenheiminvestments.com. Should you have any questions regarding our privacy policy, contact us by email at CorporateDataPrivacy@GuggenheimPartners.com.
104 | THE GUGGENHEIM FUNDS ANNUAL REPORT | |
This page intentionally left blank.
12.31.2021
Guggenheim Funds Annual Report
Guggenheim Alternative Fund |
Guggenheim Managed Futures Strategy Fund | | |
GuggenheimInvestments.com | RMFSF-ANN-1221x1222 |

| | |
DEAR SHAREHOLDER | 2 |
ECONOMIC AND MARKET OVERVIEW | 4 |
ABOUT SHAREHOLDERS’ FUND EXPENSES | 6 |
MANAGED FUTURES STRATEGY FUND | 9 |
NOTES TO CONSOLIDATED FINANCIAL STATEMENTS | 27 |
REPORT OF INDEPENDENT REGISTERED PUBLIC ACCOUNTING FIRM | 45 |
OTHER INFORMATION | 47 |
INFORMATION ON BOARD OF TRUSTEES AND OFFICERS | 48 |
GUGGENHEIM INVESTMENTS PRIVACY NOTICE | 56 |
| | THE GUGGENHEIM FUNDS ANNUAL REPORT | 1 |
Dear Shareholder:
Security Investors, LLC (the “Investment Adviser”), is pleased to present the annual shareholder report for the Managed Futures Strategy Fund (the “Fund”) that is part of the Rydex Series Funds. This report covers performance of the Fund for the annual period ended December 31, 2021.
The Investment Adviser is a part of Guggenheim Investments, which represents the investment management businesses of Guggenheim Partners, LLC (“Guggenheim”), a global, diversified financial services firm.
Guggenheim Funds Distributors, LLC is the distributor of the Fund. Guggenheim Funds Distributors, LLC is affiliated with Guggenheim and the Investment Adviser.
We encourage you to read the Economic and Market Overview section of the report, which follows this letter, and then the Performance Report and Fund Profile for the Fund.
We are committed to providing innovative investment solutions and appreciate the trust you place in us.
Sincerely,
Security Investors, LLC
January 31, 2022
Read a prospectus and summary prospectus (if available) carefully before investing. It contains the investment objectives, risks, charges, expenses and other information, which should be considered carefully before investing. Obtain a prospectus and summary prospectus (if available) at guggenheiminvestments.com or call 800.820.0888.
This material is not intended as a recommendation or as investment advice of any kind, including in connection with rollovers, transfers, and distributions. Such material is not provided in a fiduciary capacity, may not be relied upon for or in connection with the making of investment decisions, and does not constitute a solicitation of an offer to buy or sell securities. All content has been provided for informational or educational purposes only and is not intended to be and should not be construed as legal or tax advice and/or a legal opinion. Always consult a financial, tax and/or legal professional regarding your specific situation.
COVID-19. The outbreak of COVID-19 and the recovery response causes at times disruption to consumer demand, economic output, and supply chains. There are still travel restrictions, quarantines, and disparate global vaccine distributions. As with other serious economic disruptions, governmental authorities and regulators have responded to this situation with significant fiscal and monetary policy changes. These include providing direct capital infusions into companies, introducing new monetary programs, and considerably lowering interest rates. In some cases, these responses resulted in negative interest rates and higher inflation. Recently, the U.S. and other governments have also made investments and engaged in infrastructure modernization projects that have also increased public debt and spending. These actions, including their possible unexpected or sudden reversal or potential ineffectiveness, could further increase volatility in securities and other financial markets, reduce market liquidity, continue to cause higher inflation, heighten investor uncertainty, and adversely affect the value of the Fund’s investments and the performance of the Fund. These actions also contribute to a risk that asset prices have a higher degree of correlation than historically seen across markets and asset classes. The duration and extent of COVID-19 over the long term cannot be reasonably estimated at
2 | THE GUGGENHEIM FUNDS ANNUAL REPORT | |
this time. The ultimate impact of COVID-19 and the extent to which COVID-19 impacts the Fund will depend on future developments, which are highly uncertain and difficult to predict. Management continues to monitor and evaluate this situation.
The Managed Futures Strategy Fund may not be suitable for all investors. ●The Fund’s investments in securities and derivatives, in general, are subject to market risks that may cause their prices, and therefore the Fund’s value, to fluctuate over time. An investment in the Fund may lose money. ● The Fund’s investments in derivatives may pose risks in addition to those associated with investing directly in securities or other investments, including illiquidity of the derivatives, imperfect correlations with underlying investments or the Fund’s other portfolio holdings, lack of availability and counterparty risk. To the extent the Fund invests in derivatives to seek to hedge risk or limit leveraged exposure created by other investments, there is no guarantee that such hedging strategies will be effective at managing risk or limiting exposure to leveraged investments. ● The Fund’s use of leverage will exaggerate the effect on net asset value of any increase or decrease in the market value of the Fund’s portfolio. ●The Fund’s use of short selling involves increased risk and costs. The Fund risks paying more for a security than it received from its sale. Theoretically, securities sold short have the risk of unlimited losses. ●The Fund’s investments in fixed income securities will change in value in response to interest rate changes and other factors. In general, bond prices rise when interest rates fall and vice versa. ● The Fund‘s exposure to high yield, asset backed and mortgaged backed securities may subject the Fund to greater volatility. ●The Fund’s indirect and direct exposure to foreign currencies subjects the Fund to the risk that those currencies will decline in value relative to the U.S. dollar, or, in the case of short positions, that the U.S. dollar will decline in value relative to the currency being hedged. ●The Fund’s exposure to the commodity markets may subject the Fund to greater volatility as commodity-linked investments may be affected by changes in overall market movements, commodity index volatility, changes in interest rates or factors affecting a particular industry or commodity such as droughts, floods, weather, embargos, tariffs and international economic, political and regulatory developments. ●The Fund may invest in securities of foreign companies directly, or indirectly through the use of other investment companies and financial instruments that are linked to the performance of foreign issuers. Foreign securities markets generally have less trading volume and less liquidity than U.S. markets, and prices in some foreign markets may fluctuate more than those of securities traded on U.S. markets. ●This Fund is considered nondiversified and can invest a greater portion of its assets in securities of individual issuers than a diversified fund. As a result, changes in the market value of a single security could cause greater fluctuations in the value of fund shares than would occur in a more diversified fund. ●See the prospectus for more information on these and additional risks.
| | THE GUGGENHEIM FUNDS ANNUAL REPORT | 3 |
ECONOMIC AND MARKET OVERVIEW (Unaudited) | December 31, 2021 |
During the 12-month period ended December 31, 2021, the S&P 500 Index reached all-time highs as investors largely brushed off concerns about new COVID-19 variants, global supply chain disruptions, inflationary fears, and other worrying factors that resulted in little more than brief selloffs before the index resumed its upward march.
The economic recovery made considerable progress in 2021 with the help of COVID-19 vaccines and enormous policy stimulus. We expect policymakers, led by the Federal Reserve (the “Fed”), will begin to scale back their support in 2022. However, because of their dovish policy framework, the Fed is deliberately “behind the curve.” As such, we expect real interest rates could remain negative in the near term, supporting above-potential economic growth and risk asset returns. Eventually an overheated economy will require that the Fed apply the brakes more firmly, but we believe that will be a greater concern in 2023.
U.S. real gross domestic product (“GDP”) slowed to 2.3% in the third quarter of 2021, but output has now fully recovered and now exceeds its supply side potential. We believe growth could bounce back to a robust 6–7% in the fourth quarter and remain well above potential in 2022, which would ensure a continued rapid decline in the unemployment rate.
A rapidly tightening labor market will put further pressure on wages, which are already surging. The Employment Cost Index, which is a measure of wage growth given that it controls for compositional changes (e.g. low paid industries losing jobs disproportionately), saw the largest quarterly gain in over 30 years in the third quarter reading. The share of businesses reporting plans to raise wages is also spiking, which suggests that further wage gains are in the pipeline.
As a result, the inflation narrative is evolving from a focus on the series of “transitory” shocks of 2021 to a focus on accelerating wage growth and housing inflation. While we believe that overall inflation will slow in 2022 as durable goods prices recede, core inflation should remain meaningfully above the Fed’s 2.0% target. We therefore expect that the Fed will deliver four rate increases in 2022, starting in March, and begin the process of quantitative tightening.
A key risk to our positive outlook is China, where massive property and credit imbalances threaten to unravel. Real GDP growth in 2021 slowed to a pace of just 4.0%, the weakest in the modern era excluding the first half of 2020. However, Chinese policymakers appear ready to step in to support faster growth. Separately, while the Omicron variant of COVID-19 has produced record cases, reduced severity and vaccines/treatments may portend only a modest drag on growth.
For the 12-month period ended December 31, 2021, the S&P 500® Index* returned 28.71%. The MSCI Europe-Australasia-Far East (“EAFE”) Index* returned 11.26%. The return of the MSCI Emerging Markets Index* was -2.54%.
In the bond market, the Bloomberg U.S. Aggregate Bond Index* posted a -1.54% return for the 12-month period, while the Bloomberg U.S. Corporate High Yield Index* returned 5.28%. The return of the ICE Bank of America (“BofA”) 3-Month U.S. Treasury Bill Index* was 0.05% for the 12-month period.
4 | THE GUGGENHEIM FUNDS ANNUAL REPORT | |
ECONOMIC AND MARKET OVERVIEW (Unaudited)(concluded) | December 31, 2021 |
The opinions and forecasts expressed may not actually come to pass. This information is subject to change at any time, based on market and other conditions, and should not be construed as a recommendation of any specific security or strategy.
*Index Definitions:
The following indices are referenced throughout this report. Indices are unmanaged and not available for direct investment. Index performance does not reflect transaction costs, fees, or expenses.
Bloomberg U.S. Aggregate Bond Index is a broad-based flagship benchmark that measures the investment grade, U.S. dollar-denominated, fixed-rate taxable bond market, including U.S. Treasuries, government-related and corporate securities, mortgage-backed securities or “MBS” (agency fixed-rate and hybrid adjustable-rate mortgage, or “ARM”, pass-throughs), asset-backed securities (“ABS”), and commercial mortgage-backed securities (“CMBS”) (agency and non-agency).
Bloomberg U.S. Corporate High Yield Index measures the U.S. dollar-denominated, high yield, fixed-rate corporate bond market. Securities are classified as high yield if the middle rating of Moody’s, Fitch, and S&P is Ba1/BB +/BB + or below.
ICE BofA 3-Month U.S. Treasury Bill Index is an unmanaged market Index of U.S. Treasury securities maturing in 90 days that assumes reinvestment of all income.
MSCI EAFE Index is a free float-adjusted market capitalization index that is designed to measure the equity market performance of developed markets, excluding the U.S. & Canada.
MSCI Emerging Markets Index is a free float-adjusted market capitalization weighted index that is designed to measure equity market performance in the global emerging markets.
S&P 500® is a broad-based index, the performance of which is based on the performance of 500 widely held common stocks chosen for market size, liquidity, and industry group representation.
SG (Societe Generale) CTA Index is designed to track the largest 20 (by AUM) Commodity Trading Advisors, or CTAs, and be representative of the managed futures space. The CTA Index is equally weighted, and reblanced and reconstituted annually.
| | THE GUGGENHEIM FUNDS ANNUAL REPORT | 5 |
ABOUT SHAREHOLDERS’ FUND EXPENSES (Unaudited) |
All mutual funds have operating expenses, and it is important for our shareholders to understand the impact of costs on their investments. Shareholders of a fund incur two types of costs: (i) transaction costs, including sales charges (loads) on purchase payments, reinvested dividends, other distributions, and exchange fees, and (ii) ongoing costs, including management fees, administrative services, and shareholder reports, among others. These ongoing costs, or operating expenses, are deducted from a fund’s gross income and reduce the investment return of the fund.
A fund’s expenses are expressed as a percentage of its average net assets, which is known as the expense ratio. The following examples are intended to help investors understand the ongoing costs (in dollars) of investing in a fund and to compare these costs with the ongoing costs of investing in other mutual funds.
The examples are based on an investment of $1,000 made at the beginning of the period and held for the entire six-month period beginning June 30, 2021 and ending December 31, 2021.
The following tables illustrate the Fund’s costs in two ways:
Table 1. Based on actual Fund return: This section helps investors estimate the actual expenses paid over the period. The “Ending Account Value” shown is derived from the Fund’s actual return, and the fifth column shows the dollar amount that would have been paid by an investor who started with $1,000 in the Fund. Investors may use the information here, together with the amount invested, to estimate the expenses paid over the period. Simply divide the Fund’s account value by $1,000 (for example, an $8,600 account value divided by $1,000 = 8.6), then multiply the result by the number provided under the heading “Expenses Paid During Period.”
Table 2. Based on hypothetical 5% return: This section is intended to help investors compare a fund’s cost with those of other mutual funds. The table provides information about hypothetical account values and hypothetical expenses based on the Fund’s actual expense ratio and an assumed rate of return of 5% per year before expenses, which is not the Fund’s actual return. The hypothetical account values and expenses may not be used to estimate the actual ending account balance or expenses paid during the period. The example is useful in making comparisons because the U.S. Securities and Exchange Commission (the “SEC”) requires all mutual funds to calculate expenses based on the 5% return. Investors can assess a Fund’s costs by comparing this hypothetical example with the hypothetical examples that appear in shareholder reports of other funds.
The calculations illustrated above assume no shares were bought or sold during the period. Actual costs may have been higher or lower, depending on the amount of investment and the timing of any purchases or redemptions.
6 | THE GUGGENHEIM FUNDS ANNUAL REPORT | |
ABOUT SHAREHOLDERS’ FUND EXPENSES (Unaudited)(continued) |
Please note that the expenses shown in the table are meant to highlight your ongoing costs only and do not reflect any transactional costs, such as sales charges (loads) on purchase payments, and contingent deferred sales charges (“CDSC”) on redemptions, if any. Therefore, the second table is useful in comparing ongoing costs only, and will not help you determine the relative total costs of owning different funds. In addition, if these transactional costs were included, your costs would have been higher.
More information about the Fund’s expenses, including annual expense ratios for periods up to five years (subject to the Fund’s inception date), can be found in the Financial Highlights section of this report. For additional information on operating expenses and other shareholder costs, please refer to the Fund’s prospectus.
| | THE GUGGENHEIM FUNDS ANNUAL REPORT | 7 |
ABOUT SHAREHOLDERS’ FUND EXPENSES (Unaudited)(concluded) |
| Expense
Ratio1 | Fund
Return | Beginning
Account Value
June 30,
2021 | Ending
Account Value
December 31,
2021 | Expenses
Paid During
Period2 |
Table 1. Based on actual Fund return3 |
A-Class | 1.76% | (1.86%) | $ 1,000.00 | $ 981.40 | $ 8.79 |
C-Class | 2.53% | (2.28%) | 1,000.00 | 977.20 | 12.61 |
P-Class | 1.76% | (1.91%) | 1,000.00 | 980.90 | 8.79 |
Institutional Class | 1.50% | (1.71%) | 1,000.00 | 982.90 | 7.50 |
|
Table 2. Based on hypothetical 5% return (before expenses) |
A-Class | 1.76% | 5.00% | $ 1,000.00 | $ 1,016.33 | $ 8.94 |
C-Class | 2.53% | 5.00% | 1,000.00 | 1,012.45 | 12.83 |
P-Class | 1.76% | 5.00% | 1,000.00 | 1,016.33 | 8.94 |
Institutional Class | 1.50% | 5.00% | 1,000.00 | 1,017.64 | 7.63 |
1 | Annualized and excludes expenses of the underlying funds in which the Fund invests, if any. |
2 | Expenses are equal to the Fund’s annualized expense ratio, net of any applicable fee waivers, multiplied by the average account value over the period, multiplied by 184/365 (to reflect the one-half year period). |
3 | Actual cumulative return at net asset value for the period June 30, 2021 to December 31, 2021. |
8 | THE GUGGENHEIM FUNDS ANNUAL REPORT | |
PERFORMANCE REPORT AND FUND PROFILE (Unaudited) | December 31, 2021 |
MANAGED FUTURES STRATEGY FUND
OBJECTIVE: Seeks to achieve absolute returns.
For the one-year period ended December 31, 2021, the Managed Futures Strategy Fund Institutional shares returned 2.76%. The ICE BofA 3-Month U.S. Treasury Bill Index, the Fund’s benchmark, returned 0.05%. The Fund underperformed the SG CTA Index for the year, which returned 6.17%, but within expected performance dispersion.
The Fund is comprised of multiple proprietary strategies designed to systematically profit from market inefficiencies in futures markets around the world.
For the one-year period ending December 31, 2021, positions in Equity Indexes and Commodities contributed positively to the fund. Positions in Fixed Income detracted from fund returns.
The Fund held derivatives for a number of reasons, including liquidity, leverage, speculation, and hedging. Derivatives were liquid and allowed the Fund to gain leveraged access to markets in order to express investment views and to hedge exposures. Futures are an integral part of a managed futures strategy, and therefore derivatives performance was the primary driver of the Fund’s performance for the period.
Guggenheim Ultra Short Duration Fund and Guggenheim Strategy Funds were utilized within the Fund to achieve higher yields than what would otherwise be achieved through overnight repurchase agreements or short-term investments.
Performance displayed represents past performance which is no guarantee of future results.
| | THE GUGGENHEIM FUNDS ANNUAL REPORT | 9 |
PERFORMANCE REPORT AND FUND PROFILE (Unaudited)(continued) | December 31, 2021 |
Consolidated Holdings Diversification (Market Exposure as % of Net Assets)
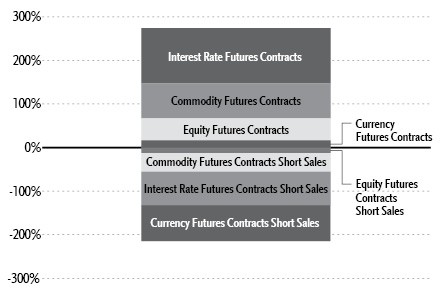
“Consolidated Holdings Diversification (Market Exposure as % of Net Assets)” excludes any temporary cash investments, investments in Guggenheim Strategy Funds Trust mutual funds, or investments in Guggenheim Ultra Short Duration Fund. Investments in those Funds do not provide “market exposure” to meet the Fund’s investment objective, but will significantly increase the portfolio’s exposure to certain other asset categories (and their associated risks), which may cause the Fund to deviate from its principal investment strategy, including: (i) high yield, high risk debt securities rated below the top four long-term rating categories by a nationally recognized statistical rating organization (also known as “junk bonds”); (ii) securities issued by the U.S. government or its agencies and instrumentalities; (iii) CLOs and similar investments; and (iv) other short-term fixed income securities.
Inception Dates: |
A-Class | March 2, 2007 |
C-Class | March 2, 2007 |
P-Class | March 2, 2007 |
Institutional Class | May 3, 2010 |
The Fund invests principally in derivative investments such as futures contracts.
Largest Holdings (% of Total Net Assets) |
Guggenheim Strategy Fund III | 27.8% |
Guggenheim Strategy Fund II | 23.3% |
Guggenheim Ultra Short Duration Fund — Institutional Class | 8.3% |
Total | 59.4% |
| | |
“Largest Holdings” excludes any temporary cash or derivative investments. |
10 | THE GUGGENHEIM FUNDS ANNUAL REPORT | |
PERFORMANCE REPORT AND FUND PROFILE (Unaudited)(continued) | December 31, 2021 |
Cumulative Fund Performance*

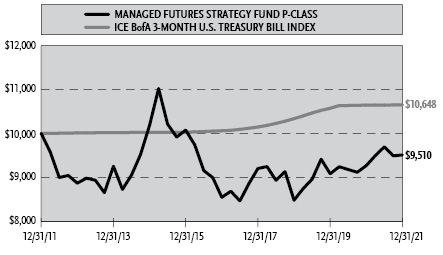
| | THE GUGGENHEIM FUNDS ANNUAL REPORT | 11 |
PERFORMANCE REPORT AND FUND PROFILE (Unaudited)(concluded) | December 31, 2021 |
Average Annual Returns*
Periods Ended December 31, 2021
| 1 Year | 5 Year | 10 Year |
A-Class Shares | 2.51% | 2.12% | (0.52%) |
A-Class Shares with sales charge‡ | (2.36%) | 1.13% | (1.00%) |
C-Class Shares | 1.75% | 1.36% | (1.27%) |
C-Class Shares with CDSC§ | 0.75% | 1.36% | (1.27%) |
P-Class Shares | 2.50% | 2.16% | (0.50%) |
Institutional Class Shares | 2.76% | 2.38% | (0.28%) |
ICE BofA 3-Month U.S. Treasury Bill Index | 0.05% | 1.14% | 0.63% |
* | The performance data above represents past performance that is not predictive of future results. The investment return and principal value of an investment in the Fund will fluctuate so that an investor’s shares, when redeemed, may be worth more or less than their original cost. Returns are historical and include changes in principal and reinvested dividends and capital gains and do not reflect the effect of taxes. The ICE BofA 3-Month U.S. Treasury Bill Index is an unmanaged index and, unlike the Fund, has no management fees or operating expenses to reduce its reported return. The graphs are based on A-Class shares and P-Class shares only; performance for C-Class shares and Institutional Class shares will vary due to differences in fee structure. |
‡ | Fund returns are calculated using the maximum sales charge of 4.75%. |
§ | Fund returns include a CDSC of 1% if redeemed within 12 months of purchase. |
12 | THE GUGGENHEIM FUNDS ANNUAL REPORT | |
CONSOLIDATED SCHEDULE OF INVESTMENTS | December 31, 2021 |
MANAGED FUTURES STRATEGY FUND | |
| | Shares | | | Value | |
MUTUAL FUNDS† - 59.4% |
Guggenheim Strategy Fund III1 | | | 235,195 | | | $ | 5,886,936 | |
Guggenheim Strategy Fund II1 | | | 199,023 | | | | 4,951,696 | |
Guggenheim Ultra Short Duration Fund — Institutional Class1 | | | 176,770 | | | | 1,753,560 | |
Total Mutual Funds | | | | |
(Cost $12,552,320) | | | | | | | 12,592,192 | |
| | | | | | | | | |
| | | Face
Amount | | | | | |
U.S. TREASURY BILLS†† - 14.1% |
U.S. Treasury Bills |
0.04% due 01/06/222,3 | | $ | 2,980,000 | | | | 2,979,999 | |
Total U.S. Treasury Bills | | | | |
(Cost $2,979,984) | | | | | | | 2,979,999 | |
| | | | | | | | | |
| REPURCHASE AGREEMENTS††,4 - 25.0% |
J.P. Morgan Securities LLC
issued 12/31/21 at 0.05%
due 01/03/22 | | | 2,962,991 | | | | 2,962,991 | |
Barclays Capital, Inc.
issued 12/31/21 at 0.01%
due 01/03/22 | | | 1,225,405 | | | | 1,225,405 | |
BofA Securities, Inc.
issued 12/31/21 at 0.02%
due 01/03/22 | | | 1,114,005 | | | | 1,114,005 | |
| Total Repurchase Agreements | | | | | | | | |
| (Cost $5,302,401) | | | | | | | 5,302,401 | |
| | | | | | | | | |
| Total Investments - 98.5% | | | | | | | | |
| (Cost $20,834,705) | | | | | | $ | 20,874,592 | |
| Other Assets & Liabilities, net - 1.5% | | | | | | | 322,626 | |
| Total Net Assets - 100.0% | | | | | | $ | 21,197,218 | |
Futures Contracts |
Description | | Number of
Contracts | | | Expiration
Date | | | Notional
Amount | | | Value and
Unrealized
Appreciation
(Depreciation)** | |
Commodity Futures Contracts Purchased† |
Cotton #2 Futures Contracts | | | 25 | | | | Jul 2022 | | | $ | 1,346,625 | | | $ | 55,021 | |
Gasoline RBOB Futures Contracts | | | 20 | | | | Jan 2022 | | | | 1,866,396 | | | | 49,958 | |
FCOJ-A Futures Contracts | | | 12 | | | | Mar 2022 | | | | 251,910 | | | | 17,875 | |
Live Cattle Futures Contracts | | | 18 | | | | Feb 2022 | | | | 1,005,480 | | | | 15,830 | |
Palladium Futures Contracts | | | 1 | | | | Mar 2022 | | | | 189,400 | | | | 15,497 | |
CME Cash-Settled Butter Futures Contracts | | | 3 | | | | Feb 2022 | | | | 139,500 | | | | 11,052 | |
WTI Crude Futures Contracts | | | 3 | | | | Jan 2022 | | | | 226,350 | | | | 10,086 | |
Cattle Feeder Futures Contracts | | | 4 | | | | Mar 2022 | | | | 340,000 | | | | 10,029 | |
Live Cattle Futures Contracts | | | 69 | | | | Jun 2022 | | | | 3,839,160 | | | | 8,658 | |
CME Class III Milk Futures Contracts | | | 4 | | | | Mar 2022 | | | | 166,000 | | | | 7,136 | |
Soybean Futures Contracts | | | 6 | | | | Mar 2022 | | | | 401,925 | | | | 6,346 | |
Canadian Canola (WCE) Futures Contracts | | | 16 | | | | Mar 2022 | | | | 256,328 | | | | 5,847 | |
Cotton #2 Futures Contracts | | | 4 | | | | Mar 2022 | | | | 225,300 | | | | 4,659 | |
CME Nonfat Dry Milk Futures Contracts | | | 3 | | | | Feb 2022 | | | | 210,969 | | | | 4,381 | |
NYMEX Chicago Ethanol Platts Swap Futures Contracts | | | 1 | | | | Jan 2022 | | | | 96,600 | | | | 4,200 | |
SEE NOTES TO CONSOLIDATED FINANCIAL STATEMENTS. | THE GUGGENHEIM FUNDS ANNUAL REPORT | 13 |
CONSOLIDATED SCHEDULE OF INVESTMENTS (continued) | December 31, 2021 |
MANAGED FUTURES STRATEGY FUND | |
Futures Contracts (continued) |
Description | | Number of
Contracts | | | Expiration
Date | | | Notional
Amount | | | Value and
Unrealized
Appreciation
(Depreciation)** | |
Soybean Oil Futures Contracts | | | 4 | | | | Mar 2022 | | | $ | 135,768 | | | $ | 3,538 | |
CBOT Rough Rice Futures Contracts | | | 12 | | | | Mar 2022 | | | | 356,880 | | | | 3,503 | |
NY Harbor ULSD Futures Contracts | | | 2 | | | | Jan 2022 | | | | 195,577 | | | | 2,381 | |
Corn Futures Contracts | | | 10 | | | | Mar 2022 | | | | 296,250 | | | | 2,035 | |
Low Sulphur Gas Oil Futures Contracts | | | 2 | | | | Feb 2022 | | | | 133,200 | | | | 1,397 | |
Brent Crude Futures Contracts | | | 3 | | | | Jan 2022 | | | | 233,820 | | | | 1,235 | |
LME Primary Aluminum Futures Contracts | | | 9 | | | | Feb 2022 | | | | 631,125 | | | | 904 | |
Natural Gas Futures Contracts | | | 3 | | | | Jan 2022 | | | | 112,950 | | | | 772 | |
LME Zinc Futures Contracts | | | 2 | | | | Feb 2022 | | | | 178,133 | | | | 739 | |
Copper Futures Contracts | | | 1 | | | | Mar 2022 | | | | 111,413 | | | | 572 | |
CME Cheese Futures Contracts | | | 3 | | | | Feb 2022 | | | | 113,760 | | | | 319 | |
SGX Iron Ore 62% Futures Contracts | | | 2 | | | | Feb 2022 | | | | 24,190 | | | | 286 | |
Soybean Meal Futures Contracts | | | 3 | | | | Mar 2022 | | | | 119,970 | | | | 151 | |
LME Lead Futures Contracts | | | 1 | | | | Feb 2022 | | | | 57,988 | | | | 128 | |
Dry Whey Futures Contracts | | | 1 | | | | Feb 2022 | | | | 29,876 | | | | (135 | ) |
Euro - Mill Wheat Futures Contracts | | | 2 | | | | Mar 2022 | | | | 31,705 | | | | (496 | ) |
CME Random Length Lumber Futures Contracts | | | 1 | | | | Mar 2022 | | | | 125,411 | | | | (762 | ) |
LME Tin Futures Contracts | | | 1 | | | | Feb 2022 | | | | 196,025 | | | | (1,217 | ) |
Platinum Futures Contracts | | | 3 | | | | Apr 2022 | | | | 144,690 | | | | (1,381 | ) |
Sugar #11 Futures Contracts | | | 32 | | | | Feb 2022 | | | | 674,150 | | | | (3,248 | ) |
Coffee ‘C’ Futures Contracts | | | 6 | | | | Mar 2022 | | | | 507,938 | | | | (6,053 | ) |
Oat Futures Contracts | | | 6 | | | | Mar 2022 | | | | 205,350 | | | | (8,540 | ) |
ECX Emission Futures Contracts | | | 1 | | | | Dec 2022 | | | | 91,815 | | | | (10,859 | ) |
Red Spring Wheat Futures Contracts | | | 14 | | | | Mar 2022 | | | | 685,300 | | | | (13,096 | ) |
Natural Gas Futures Contracts | | | 30 | | | | Feb 2022 | | | | 1,077,600 | | | | (36,376 | ) |
| | | | | | | | | | | $ | 17,032,827 | | | $ | 162,372 | |
Equity Futures Contracts Purchased† |
NASDAQ-100 Index Mini Futures Contracts | | | 1 | | | | Mar 2022 | | | $ | 326,505 | | | $ | 14,094 | |
SPI 200 Index Futures Contracts†† | | | 19 | | | | Mar 2022 | | | | 2,557,523 | | | | 9,293 | |
S&P/TSX 60 IX Index Futures Contracts | | | 5 | | | | Mar 2022 | | | | 1,013,029 | | | | 6,235 | |
FTSE Taiwan Index Futures Contracts | | | 13 | | | | Jan 2022 | | | | 833,170 | | | | 4,415 | |
Dow Jones Industrial Average Index Mini Futures Contracts | | | 6 | | | | Mar 2022 | | | | 1,086,900 | | | | 3,682 | |
S&P 500 Index Mini Futures Contracts | | | 4 | | | | Mar 2022 | | | | 951,900 | | | | 2,557 | |
OMX Stockholm 30 Index Futures Contracts†† | | | 2 | | | | Jan 2022 | | | | 53,232 | | | | 1,887 | |
Amsterdam Index Futures Contracts†† | | | 4 | | | | Jan 2022 | | | | 725,674 | | | | 1,717 | |
Tokyo Stock Price Index Futures Contracts†† | | | 2 | | | | Mar 2022 | | | | 346,582 | | | | 535 | |
CAC 40 10 Euro Index Futures Contracts†† | | | 13 | | | | Jan 2022 | | | | 1,055,065 | | | | 371 | |
Nikkei 225 (OSE) Index Futures Contracts†† | | | 2 | | | | Mar 2022 | | | | 501,353 | | | | (855 | ) |
FTSE 100 Index Futures Contracts†† | | | 2 | | | | Mar 2022 | | | | 197,769 | | | | (1,013 | ) |
Euro STOXX 50 Index Futures Contracts†† | | | 12 | | | | Mar 2022 | | | | 583,090 | | | | (1,552 | ) |
CBOE Volatility Index Futures Contracts | | | 11 | | | | Feb 2022 | | | | 241,450 | | | | (1,869 | ) |
14 | THE GUGGENHEIM FUNDS ANNUAL REPORT | SEE NOTES TO CONSOLIDATED FINANCIAL STATEMENTS. |
CONSOLIDATED SCHEDULE OF INVESTMENTS (continued) | December 31, 2021 |
MANAGED FUTURES STRATEGY FUND | |
Futures Contracts (continued) |
Description | | Number of
Contracts | | | Expiration
Date | | | Notional
Amount | | | Value and
Unrealized
Appreciation
(Depreciation)** | |
CBOE Volatility Index Futures Contracts | | | 10 | | | | Jan 2022 | | | $ | 197,200 | | | $ | (20,741 | ) |
| | | | | | | | | | | $ | 10,670,442 | | | $ | 18,756 | |
Currency Futures Contracts Purchased† |
British Pound Futures Contracts | | | 8 | | | | Mar 2022 | | | $ | 676,000 | | | $ | 11,695 | |
Canadian Dollar Futures Contracts | | | 3 | | | | Mar 2022 | | | | 237,195 | | | | 2,733 | |
New Zealand Dollar Futures Contracts | | | 3 | | | | Mar 2022 | | | | 205,050 | | | | 2,014 | |
Euro FX Futures Contracts | | | 3 | | | | Mar 2022 | | | | 427,200 | | | | 1,161 | |
Japanese Yen Futures Contracts | | | 20 | | | | Mar 2022 | | | | 2,173,250 | | | | (13,486 | ) |
| | | | | | | | | | | $ | 3,718,695 | | | $ | 4,117 | |
Interest Rate Futures Contracts Purchased† |
U.S. Treasury 10 Year Note Futures Contracts | | | 14 | | | | Mar 2022 | | | $ | 1,824,594 | | | $ | 13,256 | |
U.S. Treasury Ultra Long Bond Futures Contracts | | | 2 | | | | Mar 2022 | | | | 392,188 | | | | 2,019 | |
U.S. Treasury 2 Year Note Futures Contracts | | | 19 | | | | Mar 2022 | | | | 4,144,523 | | | | 447 | |
U.S. Treasury Long Bond Futures Contracts | | | 3 | | | | Mar 2022 | | | | 479,813 | | | | (370 | ) |
Euro - Bobl Futures Contracts†† | | | 2 | | | | Mar 2022 | | | | 303,188 | | | | (912 | ) |
Euro - Schatz Futures Contracts†† | | | 100 | | | | Mar 2022 | | | | 12,753,871 | | | | (2,276 | ) |
Euro - 30 year Bond Futures Contracts†† | | | 1 | | | | Mar 2022 | | | | 235,257 | | | | (3,702 | ) |
Euro - Bund Futures Contracts†† | | | 5 | | | | Mar 2022 | | | | 975,182 | | | | (6,307 | ) |
Euro - OATS Futures Contracts†† | | | 14 | | | | Mar 2022 | | | | 2,599,021 | | | | (24,520 | ) |
Euro - BTP Italian Government Bond Futures Contracts†† | | | 19 | | | | Mar 2022 | | | | 3,177,914 | | | | (33,051 | ) |
| | | | | | | | | | | $ | 26,885,551 | | | $ | (55,416 | ) |
Equity Futures Contracts Sold Short† |
CBOE Volatility Index Futures Contracts | | | 27 | | | | May 2022 | | | $ | 681,210 | | | $ | 27,131 | |
CBOE Volatility Index Futures Contracts | | | 22 | | | | Jun 2022 | | | | 562,540 | | | | 4,226 | |
Russell 2000 Index Mini Futures Contracts | | | 1 | | | | Mar 2022 | | | | 112,125 | | | | 212 | |
MSCI EAFE Index Futures Contracts | | | 3 | | | | Mar 2022 | | | | 348,105 | | | | (125 | ) |
IBEX 35 Index Futures Contracts†† | | | 2 | | | | Jan 2022 | | | | 197,073 | | | | (1,091 | ) |
DAX Index Futures Contracts†† | | | 1 | | | | Mar 2022 | | | | 449,542 | | | | (4,764 | ) |
| | | | | | | | | | | $ | 2,350,595 | | | $ | 25,589 | |
Interest Rate Futures Contracts Sold Short† |
Long Gilt Futures Contracts†† | | | 28 | | | | Mar 2022 | | | $ | 4,726,053 | | | $ | 26,994 | |
Euro - Bund Futures Contracts | | | 7 | | | | Mar 2022 | | | | 1,365,255 | | | | 13,165 | |
U.S. Treasury 10 Year Note Futures Contracts | | | 4 | | | | Mar 2022 | | | | 521,313 | | | | 536 | |
Australian Government 3 Year Bond Futures Contracts†† | | | 57 | | | | Mar 2022 | | | | 4,730,739 | | | | (1,076 | ) |
Australian Government 10 Year Bond Futures Contracts†† | | | 17 | | | | Mar 2022 | | | | 1,726,314 | | | | (5,489 | ) |
Canadian Government 10 Year Bond Futures Contracts†† | | | 30 | | | | Mar 2022 | | | | 3,380,111 | | | | (10,745 | ) |
| | | | | | | | | | | $ | 16,449,785 | | | $ | 23,385 | |
Commodity Futures Contracts Sold Short† |
Natural Gas Futures Contracts | | | 32 | | | | Mar 2022 | | | $ | 1,131,520 | | | $ | 31,598 | |
Lean Hogs Futures Contracts | | | 5 | | | | Feb 2022 | | | | 162,600 | | | | 2,638 | |
SEE NOTES TO CONSOLIDATED FINANCIAL STATEMENTS. | THE GUGGENHEIM FUNDS ANNUAL REPORT | 15 |
CONSOLIDATED SCHEDULE OF INVESTMENTS (continued) | December 31, 2021 |
MANAGED FUTURES STRATEGY FUND | |
Futures Contracts (continued) |
Description | | Number of
Contracts | | | Expiration
Date | | | Notional
Amount | | | Value and
Unrealized
Appreciation
(Depreciation)** | |
Corn Futures Contracts | | | 1 | | | | Mar 2022 | | | $ | 29,625 | | | $ | 1,110 | |
Black Sea Wheat Financially Settled (Platts) Futures Contracts | | | 3 | | | | Mar 2022 | | | | 50,100 | | | | (8 | ) |
Soybean Oil Futures Contracts | | | 1 | | | | Mar 2022 | | | | 33,942 | | | | (219 | ) |
Soybean Meal Futures Contracts | | | 4 | | | | Mar 2022 | | | | 159,960 | | | | (492 | ) |
LME Lead Futures Contracts | | | 3 | | | | Feb 2022 | | | | 173,963 | | | | (665 | ) |
Copper Futures Contracts | | | 1 | | | | Mar 2022 | | | | 111,413 | | | | (1,570 | ) |
Cocoa Futures Contracts | | | 6 | | | | Mar 2022 | | | | 152,340 | | | | (2,870 | ) |
Gold 100 oz. Futures Contracts | | | 2 | | | | Feb 2022 | | | | 366,040 | | | | (3,626 | ) |
Cotton #2 Futures Contracts | | | 14 | | | | Mar 2022 | | | | 788,550 | | | | (21,573 | ) |
Live Cattle Futures Contracts | | | 69 | | | | Apr 2022 | | | | 3,995,790 | | | | (26,582 | ) |
Gasoline RBOB Futures Contracts | | | 19 | | | | Mar 2022 | | | | 1,860,298 | | | | (90,941 | ) |
| | | | | | | | | | | $ | 9,016,141 | | | $ | (113,200 | ) |
Currency Futures Contracts Sold Short† |
Japanese Yen Futures Contracts | | | 13 | | | | Mar 2022 | | | $ | 1,412,613 | | | $ | 6,506 | |
Mexican Peso Futures Contracts | | | 14 | | | | Mar 2022 | | | | 337,050 | | | | 546 | |
British Pound Futures Contracts | | | 6 | | | | Mar 2022 | | | | 507,000 | | | | (583 | ) |
Canadian Dollar Futures Contracts | | | 9 | | | | Mar 2022 | | | | 711,585 | | | | (4,503 | ) |
New Zealand Dollar Futures Contracts | | | 9 | | | | Mar 2022 | | | | 615,150 | | | | (5,947 | ) |
Euro FX Futures Contracts | | | 15 | | | | Mar 2022 | | | | 2,136,000 | | | | (8,238 | ) |
Australian Dollar Futures Contracts | | | 28 | | | | Mar 2022 | | | | 2,034,900 | | | | (21,416 | ) |
Swiss Franc Futures Contracts | | | 71 | | | | Mar 2022 | | | | 9,745,637 | | | | (129,348 | ) |
| | | | | | | | | | | $ | 17,499,935 | | | $ | (162,983 | ) |
** | Includes cumulative appreciation (depreciation). Variation margin is reported within the Consolidated Statement of Assets and Liabilities. |
† | Value determined based on Level 1 inputs, unless otherwise noted — See Note 4. |
†† | Value determined based on Level 2 inputs — See Note 4. |
1 | Affiliated issuer. |
2 | All or a portion of this security is pledged as futures collateral at December 31, 2021. |
3 | Rate indicated is the effective yield at the time of purchase. |
4 | Repurchase Agreements — See Note 6. |
| | |
| | See Sector Classification in Other Information section. |
16 | THE GUGGENHEIM FUNDS ANNUAL REPORT | SEE NOTES TO CONSOLIDATED FINANCIAL STATEMENTS. |
CONSOLIDATED SCHEDULE OF INVESTMENTS (continued) | December 31, 2021 |
MANAGED FUTURES STRATEGY FUND | |
The following table summarizes the inputs used to value the Fund’s investments at December 31, 2021 (See Note 4 in the Notes to Consolidated Financial Statements):
Investments in Securities (Assets) | | Level 1
Quoted
Prices | | | Level 2
Significant
Observable
Inputs | | | Level 3
Significant
Unobservable
Inputs | | | Total | |
Mutual Funds | | $ | 12,592,192 | | | $ | — | | | $ | — | | | $ | 12,592,192 | |
U.S. Treasury Bills | | | — | | | | 2,979,999 | | | | — | | | | 2,979,999 | |
Repurchase Agreements | | | — | | | | 5,302,401 | | | | — | | | | 5,302,401 | |
Commodity Futures Contracts** | | | 279,881 | | | | — | | | | — | | | | 279,881 | |
Equity Futures Contracts** | | | 62,552 | | | | 13,803 | | | | — | | | | 76,355 | |
Interest Rate Futures Contracts** | | | 29,423 | | | | 26,994 | | | | — | | | | 56,417 | |
Currency Futures Contracts** | | | 24,655 | | | | — | | | | — | | | | 24,655 | |
Total Assets | | $ | 12,988,703 | | | $ | 8,323,197 | | | $ | — | | | $ | 21,311,900 | |
Investments in Securities (Liabilities) | | Level 1
Quoted
Prices | | | Level 2
Significant
Observable
Inputs | | | Level 3
Significant
Unobservable
Inputs | | | Total | |
Commodity Futures Contracts** | | $ | 230,709 | | | $ | — | | | $ | — | | | $ | 230,709 | |
Currency Futures Contracts** | | | 183,521 | | | | — | | | | — | | | | 183,521 | |
Interest Rate Futures Contracts** | | | 370 | | | | 88,078 | | | | — | | | | 88,448 | |
Equity Futures Contracts** | | | 22,735 | | | | 9,275 | | | | — | | | | 32,010 | |
Total Liabilities | | $ | 437,335 | | | $ | 97,353 | | | $ | — | | | $ | 534,688 | |
** | This derivative is reported as unrealized appreciation/depreciation at period end. |
SEE NOTES TO CONSOLIDATED FINANCIAL STATEMENTS. | THE GUGGENHEIM FUNDS ANNUAL REPORT | 17 |
CONSOLIDATED SCHEDULE OF INVESTMENTS (concluded) | December 31, 2021 |
MANAGED FUTURES STRATEGY FUND | |
Affiliated Transactions
Investments representing 5% or more of the outstanding voting shares of a company, or control of or by, or common control under Guggenheim Investments (“GI”), result in that company being considered an affiliated issuer, as defined in the 1940 Act.
The Fund may invest in certain of the underlying series of Guggenheim Strategy Funds Trust, including Guggenheim Strategy Fund II and Guggenheim Strategy Fund III, (collectively, the “Short Term Investment Vehicles”), each of which are open-end management investment companies managed by GI. The Short Term Investment Vehicles, which launched on March 11, 2014, are offered as short term investment options only to mutual funds, trusts, and other accounts managed by GI and/or its affiliates, and are not available to the public. The Short Term Investment Vehicles pay no investment management fees. The Short Term Investment Vehicles’ annual report on Form N-CSR dated September 30, 2021, is available publicly or upon request. This information is available from the EDGAR database on the SEC’s website at https://www.sec.gov/Archives/edgar/data/1601445/000182126821000490/gugg83048-ncsr.htm. The Fund may invest in certain of the underlying series of Guggenheim Fund Trust, which are open-end management investment companies managed by GI, are available to the public and whose most recent annual report on Form N-CSR is available publicly or upon request.
Transactions during the year ended December 31, 2021, in which the company is an affiliated issuer, were as follows:
Security Name | | Value
12/31/20 | | | Additions | | | Reductions | | | Realized
Gain (Loss) | | | Change in
Unrealized
Appreciation
(Depreciation) | | | Value
12/31/21 | | | Shares
12/31/21 | | | Investment
Income | |
Mutual Funds | | | | | | | | | | | | | | | | | | | | | | | | | | | | | | | | |
Guggenheim Strategy Fund II | | $ | 3,510,413 | | | $ | 2,658,326 | | | $ | (1,200,000 | ) | | $ | 19,979 | | | $ | (37,022 | ) | | $ | 4,951,696 | | | | 199,023 | | | $ | 58,334 | |
Guggenheim Strategy Fund III | | | 5,614,498 | | | | 789,403 | | | | (500,000 | ) | | | 3,281 | | | | (20,246 | ) | | | 5,886,936 | | | | 235,195 | | | | 89,635 | |
Guggenheim Ultra Short Duration Fund — Institutional Class | | | 2,594,622 | | | | 770,615 | | | | (1,600,000 | ) | | | 4,745 | | | | (16,422 | ) | | | 1,753,560 | | | | 176,770 | | | | 20,666 | |
| | | $ | 11,719,533 | | | $ | 4,218,344 | | | $ | (3,300,000 | ) | | $ | 28,005 | | | $ | (73,690 | ) | | $ | 12,592,192 | | | | | | | $ | 168,635 | |
18 | THE GUGGENHEIM FUNDS ANNUAL REPORT | SEE NOTES TO CONSOLIDATED FINANCIAL STATEMENTS. |
CONSOLIDATED STATEMENT OF ASSETS AND LIABILITIES |
MANAGED FUTURES STRATEGY FUND |
December 31, 2021
Assets: |
Investments in unaffiliated issuers, at value (cost $2,979,984) | | $ | 2,979,999 | |
Investments in affiliated issuers, at value (cost $12,552,320) | | | 12,592,192 | |
Repurchase agreements, at value (cost $5,302,401) | | | 5,302,401 | |
Cash | | | 2,034 | |
Segregated cash with broker | | | 191,318 | |
Receivables: |
Variation margin on futures contracts | | | 126,648 | |
Fund shares sold | | | 58,955 | |
Dividends | | | 16,842 | |
Interest | | | 5 | |
Total assets | | | 21,270,394 | |
| | | | | |
Liabilities: |
Payable for: |
Securities purchased | | | 17,671 | |
Management fees | | | 16,018 | |
Registration fees | | | 7,926 | |
Professional fees | | | 5,193 | |
Transfer agent and administrative fees | | | 4,883 | |
Fund shares redeemed | | | 3,780 | |
Distribution and service fees | | | 3,250 | |
Portfolio accounting fees | | | 1,815 | |
Trustees’ fees* | | | 231 | |
Miscellaneous | | | 12,409 | |
Total liabilities | | | 73,176 | |
Commitments and contingent liabilities (Note 10) | | | — | |
Net assets | | $ | 21,197,218 | |
| | | | | |
Net assets consist of: |
Paid in capital | | $ | 65,105,662 | |
Total distributable earnings (loss) | | | (43,908,444 | ) |
Net assets | | $ | 21,197,218 | |
| | | | | |
A-Class: |
Net assets | | $ | 5,760,498 | |
Capital shares outstanding | | | 312,968 | |
Net asset value per share | | $ | 18.41 | |
Maximum offering price per share (Net asset value divided by 95.25%) | | $ | 19.33 | |
| | | | | |
C-Class: |
Net assets | | $ | 570,305 | |
Capital shares outstanding | | | 35,027 | |
Net asset value per share | | $ | 16.28 | |
| | | | | |
P-Class: |
Net assets | | $ | 6,697,115 | |
Capital shares outstanding | | | 362,420 | |
Net asset value per share | | $ | 18.48 | |
| | | | | |
Institutional Class: |
Net assets | | $ | 8,169,300 | |
Capital shares outstanding | | | 429,977 | |
Net asset value per share | | $ | 19.00 | |
* | Relates to Trustees not deemed “interested persons” within the meaning of Section 2(a)(19) of the 1940 Act. |
SEE NOTES TO CONSOLIDATED FINANCIAL STATEMENTS. | THE GUGGENHEIM FUNDS ANNUAL REPORT | 19 |
CONSOLIDATED STATEMENT OF OPERATIONS |
MANAGED FUTURES STRATEGY FUND |
Year Ended December 31, 2021
Investment Income: |
Dividends from securities of affiliated issuers | | $ | 168,635 | |
Interest | | | 3,260 | |
Total investment income | | | 171,895 | |
| | | | | |
Expenses: |
Management fees | | | 235,507 | |
Distribution and service fees: |
A-Class | | | 15,791 | |
C-Class | | | 8,387 | |
P-Class | | | 18,892 | |
Transfer agent and administrative fees | | | 64,584 | |
Portfolio accounting fees | | | 23,062 | |
Professional fees | | | 22,734 | |
Registration fees | | | 21,194 | |
Trustees’ fees* | | | 4,214 | |
Custodian fees | | | 3,354 | |
Miscellaneous | | | 646 | |
Total expenses | | | 418,365 | |
Less: |
Expenses waived by Adviser | | | (33,622 | ) |
Net expenses | | | 384,743 | |
Net investment loss | | | (212,848 | ) |
| | | | | |
Net Realized and Unrealized Gain (Loss): |
Net realized gain (loss) on: |
Investments in unaffiliated issuers | | $ | (6 | ) |
Investments in affiliated issuers | | | 28,005 | |
Futures contracts | | | 1,578,525 | |
Foreign currency transactions | | | 5,697 | |
Net realized gain | | | 1,612,221 | |
Net change in unrealized appreciation (depreciation) on: |
Investments in unaffiliated issuers | | | (34 | ) |
Investments in affiliated issuers | | | (73,690 | ) |
Futures contracts | | | (694,940 | ) |
Foreign currency translations | | | 287 | |
Net change in unrealized appreciation (depreciation) | | | (768,377 | ) |
Net realized and unrealized gain | | | 843,844 | |
Net increase in net assets resulting from operations | | $ | 630,996 | |
* | Relates to Trustees not deemed “interested persons” within the meaning of Section 2(a)(19) of the 1940 Act. |
20 | THE GUGGENHEIM FUNDS ANNUAL REPORT | SEE NOTES TO CONSOLIDATED FINANCIAL STATEMENTS. |
CONSOLIDATED STATEMENTS OF CHANGES IN NET ASSETS |
MANAGED FUTURES STRATEGY FUND | |
| | Year Ended
December 31,
2021 | | | Year Ended
December 31,
2020 | |
Increase (Decrease) in Net Assets from Operations: | | | | | | | | |
Net investment loss | | $ | (212,848 | ) | | $ | (172,698 | ) |
Net realized gain (loss) on investments | | | 1,612,221 | | | | (133,795 | ) |
Net change in unrealized appreciation (depreciation) on investments | | | (768,377 | ) | | | 980,520 | |
Net increase in net assets resulting from operations | | | 630,996 | | | | 674,027 | |
| | | | | | | | | |
Distributions to shareholders: | | | | | | | | |
A-Class | | | — | | | | (451,080 | ) |
C-Class | | | — | | | | (80,374 | ) |
P-Class | | | — | | | | (543,862 | ) |
Institutional Class | | | — | | | | (548,863 | ) |
Total distributions to shareholders | | | — | | | | (1,624,179 | ) |
| | | | | | | | | |
Capital share transactions: | | | | | | | | |
Proceeds from sale of shares | | | | | | | | |
A-Class | | | 537,216 | | | | 2,075,146 | |
C-Class | | | 19,947 | | | | 121,954 | |
P-Class | | | 7,859,685 | | | | 51,171,335 | |
Institutional Class | | | 2,520,243 | | | | 7,313,155 | |
Distributions reinvested | | | | | | | | |
A-Class | | | — | | | | 436,975 | |
C-Class | | | — | | | | 80,300 | |
P-Class | | | — | | | | 532,574 | |
Institutional Class | | | — | | | | 546,866 | |
Cost of shares redeemed | | | | | | | | |
A-Class | | | (1,245,643 | ) | | | (2,942,119 | ) |
C-Class | | | (594,228 | ) | | | (835,458 | ) |
P-Class | | | (9,126,556 | ) | | | (54,761,136 | ) |
Institutional Class | | | (2,375,208 | ) | | | (6,807,075 | ) |
Net decrease from capital share transactions | | | (2,404,544 | ) | | | (3,067,483 | ) |
Net decrease in net assets | | | (1,773,548 | ) | | | (4,017,635 | ) |
| | | | | | | | | |
Net assets: | | | | | | | | |
Beginning of year | | | 22,970,766 | | | | 26,988,401 | |
End of year | | $ | 21,197,218 | | | $ | 22,970,766 | |
| | | | | | | | | |
SEE NOTES TO CONSOLIDATED FINANCIAL STATEMENTS. | THE GUGGENHEIM FUNDS ANNUAL REPORT | 21 |
CONSOLIDATED STATEMENTS OF CHANGES IN NET ASSETS (concluded) |
MANAGED FUTURES STRATEGY FUND | |
| | Year Ended
December 31,
2021 | | | Year Ended
December 31,
2020 | |
Capital share activity: | | | | | | | | |
Shares sold | | | | | | | | |
A-Class | | | 29,197 | | | | 108,202 | |
C-Class | | | 1,220 | | | | 7,056 | |
P-Class | | | 415,340 | | | | 2,659,332 | |
Institutional Class | | | 132,079 | | | | 372,363 | |
Shares issued from reinvestment of distributions | | | | | | | | |
A-Class | | | — | | | | 24,786 | |
C-Class | | | — | | | | 5,108 | |
P-Class | | | — | | | | 30,072 | |
Institutional Class | | | — | | | | 30,130 | |
Shares redeemed | | | | | | | | |
A-Class | | | (67,428 | ) | | | (152,744 | ) |
C-Class | | | (36,270 | ) | | | (48,680 | ) |
P-Class | | | (482,276 | ) | | | (2,836,006 | ) |
Institutional Class | | | (124,121 | ) | | | (349,861 | ) |
Net decrease in shares | | | (132,259 | ) | | | (150,242 | ) |
22 | THE GUGGENHEIM FUNDS ANNUAL REPORT | SEE NOTES TO CONSOLIDATED FINANCIAL STATEMENTS. |
CONSOLIDATED FINANCIAL HIGHLIGHTS |
MANAGED FUTURES STRATEGY FUND | |
This table is presented to show selected data for a share outstanding throughout each period and to assist shareholders in evaluating a Fund’s performance for the periods presented.
A-Class | | Year
Ended
Dec. 31,
2021 | | | Year
Ended
Dec. 31,
2020 | | | Year
Ended
Dec. 31,
2019 | | | Year
Ended
Dec. 31,
2018 | | | Year
Ended
Dec. 31,
2017 | |
Per Share Data |
Net asset value, beginning of period | | $ | 17.96 | | | $ | 18.96 | | | $ | 17.65 | | | $ | 19.19 | | | $ | 18.71 | |
Income (loss) from investment operations: |
Net investment income (loss)a | | | (.18 | ) | | | (.12 | ) | | | .15 | | | | .15 | | | | .04 | |
Net gain (loss) on investments (realized and unrealized) | | | .63 | | | | .48 | | | | 1.16 | | | | (1.69 | ) | | | 1.34 | |
Total from investment operations | | | .45 | | | | .36 | | | | 1.31 | | | | (1.54 | ) | | | 1.38 | |
Less distributions from: |
Net investment income | | | — | | | | (1.36 | ) | | | — | | | | — | | | | (.90 | ) |
Total distributions | | | — | | | | (1.36 | ) | | | — | | | | — | | | | (.90 | ) |
Net asset value, end of period | | $ | 18.41 | | | $ | 17.96 | | | $ | 18.96 | | | $ | 17.65 | | | $ | 19.19 | |
|
Total Returnb | | | 2.51 | % | | | 2.01 | % | | | 7.42 | % | | | (8.03 | %) | | | 7.41 | % |
Ratios/Supplemental Data |
Net assets, end of period (in thousands) | | $ | 5,760 | | | $ | 6,306 | | | $ | 7,033 | | | $ | 6,793 | | | $ | 10,621 | |
Ratios to average net assets: |
Net investment income (loss) | | | (0.99 | %) | | | (0.62 | %) | | | 0.82 | % | | | 0.80 | % | | | 0.21 | % |
Total expensesc | | | 1.88 | % | | | 1.87 | % | | | 1.90 | % | | | 1.84 | % | | | 1.78 | % |
Net expensesd | | | 1.73 | % | | | 1.75 | % | | | 1.80 | % | | | 1.79 | % | | | 1.72 | % |
Portfolio turnover rate | | | 27 | % | | | 111 | % | | | 26 | % | | | 21 | % | | | 68 | % |
SEE NOTES TO CONSOLIDATED FINANCIAL STATEMENTS. | THE GUGGENHEIM FUNDS ANNUAL REPORT | 23 |
CONSOLIDATED FINANCIAL HIGHLIGHTS (continued) |
MANAGED FUTURES STRATEGY FUND | |
This table is presented to show selected data for a share outstanding throughout each period and to assist shareholders in evaluating a Fund’s performance for the periods presented.
C-Class | | Year
Ended
Dec. 31,
2021 | | | Year
Ended
Dec. 31,
2020 | | | Year
Ended
Dec. 31,
2019 | | | Year
Ended
Dec. 31,
2018 | | | Year
Ended
Dec. 31,
2017 | |
Per Share Data |
Net asset value, beginning of period | | $ | 16.00 | | | $ | 17.03 | | | $ | 15.97 | | | $ | 17.49 | | | $ | 17.26 | |
Income (loss) from investment operations: |
Net investment income (loss)a | | | (.29 | ) | | | (.23 | ) | | | .01 | | | | .01 | | | | (.10 | ) |
Net gain (loss) on investments (realized and unrealized) | | | .57 | | | | .41 | | | | 1.05 | | | | (1.53 | ) | | | 1.23 | |
Total from investment operations | | | .28 | | | | .18 | | | | 1.06 | | | | (1.52 | ) | | | 1.13 | |
Less distributions from: |
Net investment income | | | — | | | | (1.21 | ) | | | — | | | | — | | | | (.90 | ) |
Total distributions | | | — | | | | (1.21 | ) | | | — | | | | — | | | | (.90 | ) |
Net asset value, end of period | | $ | 16.28 | | | $ | 16.00 | | | $ | 17.03 | | | $ | 15.97 | | | $ | 17.49 | |
|
Total Returnb | | | 1.75 | % | | | 1.25 | % | | | 6.64 | % | | | (8.69 | %) | | | 6.64 | % |
Ratios/Supplemental Data |
Net assets, end of period (in thousands) | | $ | 570 | | | $ | 1,121 | | | $ | 1,815 | | | $ | 4,485 | | | $ | 8,234 | |
Ratios to average net assets: |
Net investment income (loss) | | | (1.74 | %) | | | (1.37 | %) | | | 0.06 | % | | | 0.04 | % | | | (0.56 | %) |
Total expensesc | | | 2.63 | % | | | 2.62 | % | | | 2.65 | % | | | 2.59 | % | | | 2.53 | % |
Net expensesd | | | 2.49 | % | | | 2.50 | % | | | 2.57 | % | | | 2.53 | % | | | 2.47 | % |
Portfolio turnover rate | | | 27 | % | | | 111 | % | | | 26 | % | | | 21 | % | | | 68 | % |
24 | THE GUGGENHEIM FUNDS ANNUAL REPORT | SEE NOTES TO CONSOLIDATED FINANCIAL STATEMENTS. |
CONSOLIDATED FINANCIAL HIGHLIGHTS (continued) |
MANAGED FUTURES STRATEGY FUND |
This table is presented to show selected data for a share outstanding throughout each period and to assist shareholders in evaluating a Fund’s performance for the periods presented.
P-Class | | Year
Ended
Dec. 31,
2021 | | | Year
Ended
Dec. 31,
2020 | | | Year
Ended
Dec. 31,
2019 | | | Year
Ended
Dec. 31,
2018 | | | Year
Ended
Dec. 31,
2017 | |
Per Share Data |
Net asset value, beginning of period | | $ | 18.03 | | | $ | 19.00 | | | $ | 17.70 | | | $ | 19.23 | | | $ | 18.71 | |
Income (loss) from investment operations: |
Net investment income (loss)a | | | (.18 | ) | | | (.12 | ) | | | .15 | | | | .15 | | | | .06 | |
Net gain (loss) on investments (realized and unrealized) | | | .63 | | | | .49 | | | | 1.15 | | | | (1.68 | ) | | | 1.36 | |
Total from investment operations | | | .45 | | | | .37 | | | | 1.30 | | | | (1.53 | ) | | | 1.42 | |
Less distributions from: |
Net investment income | | | — | | | | (1.34 | ) | | | — | | | | — | | | | (.90 | ) |
Total distributions | | | — | | | | (1.34 | ) | | | — | | | | — | | | | (.90 | ) |
Net asset value, end of period | | $ | 18.48 | | | $ | 18.03 | | | $ | 19.00 | | | $ | 17.70 | | | $ | 19.23 | |
|
Total Return | | | 2.50 | % | | | 2.05 | % | | | 7.34 | % | | | (7.96 | %) | | | 7.68 | % |
Ratios/Supplemental Data |
Net assets, end of period (in thousands) | | $ | 6,697 | | | $ | 7,741 | | | $ | 10,946 | | | $ | 13,669 | | | $ | 21,426 | |
Ratios to average net assets: |
Net investment income (loss) | | | (0.99 | %) | | | (0.63 | %) | | | 0.82 | % | | | 0.80 | % | | | 0.29 | % |
Total expensesc | | | 1.88 | % | | | 1.88 | % | | | 1.90 | % | | | 1.84 | % | | | 1.78 | % |
Net expensesd | | | 1.73 | % | | | 1.77 | % | | | 1.81 | % | | | 1.78 | % | | | 1.72 | % |
Portfolio turnover rate | | | 27 | % | | | 111 | % | | | 26 | % | | | 21 | % | | | 68 | % |
SEE NOTES TO CONSOLIDATED FINANCIAL STATEMENTS. | THE GUGGENHEIM FUNDS ANNUAL REPORT | 25 |
CONSOLIDATED FINANCIAL HIGHLIGHTS (concluded) |
MANAGED FUTURES STRATEGY FUND |
This table is presented to show selected data for a share outstanding throughout each period and to assist shareholders in evaluating a Fund’s performance for the periods presented.
Institutional Class | | Year
Ended
Dec. 31,
2021 | | | Year
Ended
Dec. 31,
2020 | | | Year
Ended
Dec. 31,
2019 | | | Year
Ended
Dec. 31,
2018 | | | Year
Ended
Dec. 31,
2017 | |
Per Share Data |
Net asset value, beginning of period | | $ | 18.49 | | | $ | 19.48 | | | $ | 18.09 | | | $ | 19.61 | | | $ | 19.07 | |
Income (loss) from investment operations: |
Net investment income (loss)a | | | (.14 | ) | | | (.08 | ) | | | .21 | | | | .20 | | | | .08 | |
Net gain (loss) on investments (realized and unrealized) | | | .65 | | | | .49 | | | | 1.18 | | | | (1.72 | ) | | | 1.36 | |
Total from investment operations | | | .51 | | | | .41 | | | | 1.39 | | | | (1.52 | ) | | | 1.44 | |
Less distributions from: |
Net investment income | | | — | | | | (1.40 | ) | | | — | | | | — | | | | (.90 | ) |
Total distributions | | | — | | | | (1.40 | ) | | | — | | | | — | | | | (.90 | ) |
Net asset value, end of period | | $ | 19.00 | | | $ | 18.49 | | | $ | 19.48 | | | $ | 18.09 | | | $ | 19.61 | |
|
Total Return | | | 2.76 | % | | | 2.29 | % | | | 7.68 | % | | | (7.75 | %) | | | 7.69 | % |
Ratios/Supplemental Data |
Net assets, end of period (in thousands) | | $ | 8,169 | | | $ | 7,802 | | | $ | 7,195 | | | $ | 7,711 | | | $ | 10,339 | |
Ratios to average net assets: |
Net investment income (loss) | | | (0.73 | %) | | | (0.38 | %) | | | 1.07 | % | | | 1.05 | % | | | 0.41 | % |
Total expensesc | | | 1.63 | % | | | 1.61 | % | | | 1.65 | % | | | 1.59 | % | | | 1.53 | % |
Net expensesd | | | 1.48 | % | | | 1.49 | % | | | 1.55 | % | | | 1.54 | % | | | 1.46 | % |
Portfolio turnover rate | | | 27 | % | | | 111 | % | | | 26 | % | | | 21 | % | | | 68 | % |
a | Net investment income (loss) per share was computed using average shares outstanding throughout the period. |
b | Total return does not reflect the impact of any applicable sales charges. |
c | Does not include expenses of the underlying funds in which the Fund invests. |
d | Net expense information reflects the expense ratios after expense waivers and reimbursements, as applicable. |
26 | THE GUGGENHEIM FUNDS ANNUAL REPORT | SEE NOTES TO CONSOLIDATED FINANCIAL STATEMENTS. |
NOTES TO CONSOLIDATED FINANCIAL STATEMENTS |
Note 1 – Organization, Consolidation of Subsidiary and Significant Accounting Policies
Organization
The Rydex Series Funds (the “Trust”), a Delaware statutory trust, is registered with the SEC under the Investment Company Act of 1940 (”1940 Act”), as an open-ended investment company of the series type. Each series, in effect, is representing a separate fund. The Trust may issue an unlimited number of authorized shares. The Trust accounts for the assets of each fund separately.
The Trust offers a combination of seven separate classes of shares: Investor Class shares, A-Class shares, C-Class shares, H-Class shares, P-Class shares, Institutional Class shares and Money Market Class shares. Sales of shares of each Class are made without a front-end sales charge at the net asset value per share (“NAV”), with the exception of A-Class shares. A-Class shares are sold at the NAV, plus the applicable front-end sales charge. The sales charge varies depending on the amount purchased, but will not exceed 4.75%. A-Class share purchases of $1 million or more are exempt from the front-end sales charge but have a 1% contingent deferred sales charge (“CDSC”) if shares are redeemed within 12 months of purchase. C-Class shares have a 1% CDSC if shares are redeemed within 12 months of purchase. C-Class shares automatically convert to A-Class shares on or about the 10th day of the month following the 10-year anniversary of the purchase of the C-Class shares. This conversion will be executed without any sales charge, fee or other charge. After the conversion is completed, the shares will be subject to all features and expenses of A-Class shares. Institutional Class shares are offered primarily for direct investment by institutions such as pension and profit sharing plans, endowments, foundations and corporations. Institutional Class shares require a minimum initial investment of $2 million and a minimum account balance of $1 million. At December 31, 2021, the Trust consisted of fifty-two funds (the “Funds”).
This report covers the Managed Futures Strategy Fund (the “Fund”), a diversified investment company. At December 31, 2021, only A-Class, C-Class, P-Class, and Institutional Class shares have been issued by the Fund.
Security Investors, LLC, which operates under the name Guggenheim Investments (“GI”), provides advisory services. Guggenheim Funds Distributors, LLC (“GFD”) acts as principal underwriter for the Trust. GI and GFD are affiliated entities.
Consolidation of Subsidiary
The consolidated financial statements of the Fund include the accounts of a wholly-owned and controlled Cayman Islands subsidiary (the “Subsidiary”). Significant inter-company accounts and transactions have been eliminated in consolidation for the Fund.
The Fund may invest up to 25% of its total assets in its Subsidiary which acts as an investment vehicle in order to effect certain investments consistent with the Fund’s investment objectives and policies.
| | THE GUGGENHEIM FUNDS ANNUAL REPORT | 27 |
NOTES TO CONSOLIDATED FINANCIAL STATEMENTS (continued) |
A summary of the Fund’s investment in its Subsidiary is as follows:
| | Inception
Date of
Subsidiary | | | Subsidiary
Net Assets at
December 31,
2021 | | | % of Net Assets
of the Fund at
December 31,
2021 | |
| | | | 05/01/08 | | | $ | 3,312,108 | | | | 15.6 | % |
Significant Accounting Policies
The Fund operates as an investment company and, accordingly, follows the investment company accounting and reporting guidance of the Financial Accounting Standards Board (“FASB”) Accounting Standards Codification Topic 946 Financial Services – Investment Companies.
The following significant accounting policies are in conformity with U.S. generally accepted accounting principles (“U.S. GAAP”) and are consistently followed by the Trust. This requires management to make estimates and assumptions that affect the reported amount of assets and liabilities, contingent assets and liabilities at the date of the consolidated financial statements, and the reported amounts of revenues and expenses during the reporting period. Actual results could differ from these estimates. All time references are based on Eastern Time.
The NAV of each Class of the Fund is calculated by dividing the market value of the Fund’s securities and other assets, less all liabilities, attributable to the Class by the number of outstanding shares of the Class.
(a) Valuation of Investments
The Board of Trustees of the Fund (the “Board”) has adopted policies and procedures for the valuation of the Fund’s investments (the “Valuation Procedures”). Pursuant to the Valuation Procedures, the Board has delegated to a valuation committee, consisting of representatives from Guggenheim’s investment management, fund administration, legal and compliance departments (the “Valuation Committee”), the day-to-day responsibility for implementing the Valuation Procedures, including, under most circumstances, the responsibility for determining the fair value of the Fund’s securities and/or other assets.
Valuations of the Fund’s securities and other assets are supplied primarily by pricing services appointed pursuant to the processes set forth in the Valuation Procedures. The Valuation Committee convenes monthly, or more frequently as needed, to review the valuation of all assets which have been fair valued for reasonableness. The Fund’s officers, through the Valuation Committee and consistent with the monitoring and review responsibilities set forth in the Valuation Procedures, regularly review procedures used and valuations provided by the pricing services.
If the pricing service cannot or does not provide a valuation for a particular investment or such valuation is deemed unreliable, such investment is fair valued by the Valuation Committee.
28 | THE GUGGENHEIM FUNDS ANNUAL REPORT | |
NOTES TO CONSOLIDATED FINANCIAL STATEMENTS (continued) |
Open-end investment companies are valued at their NAV as of the close of business, on the valuation date.
U.S. Government securities are valued by independent pricing services, the last traded fill price, or at the reported bid price at the close of business.
Debt securities with a maturity of greater than 60 days at acquisition are valued at prices that reflect broker-dealer supplied valuations or are obtained from independent pricing services, which may consider the trade activity, treasury spreads, yields or price of bonds of comparable quality, coupon, maturity, and type, as well as prices quoted by dealers who make markets in such securities. Short-term debt securities with a maturity of 60 days or less at acquisition are valued at amortized cost, provided such amount approximates market value.
Repurchase agreements are generally valued at amortized cost, provided such amounts approximate market value.
The value of futures contracts is accounted for using the unrealized appreciation or depreciation on the contracts that is determined by marking the contracts to their current realized settlement prices. Financial futures contracts are valued at the 4:00 p.m. price on the valuation date. In the event that the exchange for a specific futures contract closes earlier than 4:00 p.m., the futures contract is valued at the official settlement price of the exchange. However, the underlying securities from which the futures contract value is derived are monitored until 4:00 p.m. to determine if fair valuation would provide a more accurate valuation.
Investments for which market quotations are not readily available are fair-valued as determined in good faith by GI, subject to review and approval by the Valuation Committee, pursuant to methods established or ratified by the Board. Valuations in accordance with these methods are intended to reflect each security’s (or asset’s or liability’s) “fair value”. Each such determination is based on a consideration of all relevant factors, which are likely to vary from one pricing context to another. Examples of such factors may include, but are not limited to market prices; sale prices; broker quotes; and models which derive prices based on inputs such as prices of securities with comparable maturities and characteristics, or based on inputs such as anticipated cash flows or collateral, spread over U.S. Treasury securities, and other information analysis. In connection with futures contracts and other derivative investments, such factors may include obtaining information as to how (a) these contracts and other derivative investments trade in the futures or other derivative markets, respectively, and (b) the securities underlying these contracts and other derivative investments trade in the cash market.
(b) U.S. Government and Agency Obligations
Certain U.S. Government and Agency Obligations are traded on a discount basis; the interest rates shown on the Consolidated Schedule of Investments reflect the effective rates paid at the time of purchase by the Fund. Other securities bear interest at the rates shown, payable at fixed dates through maturity.
| | THE GUGGENHEIM FUNDS ANNUAL REPORT | 29 |
NOTES TO CONSOLIDATED FINANCIAL STATEMENTS (continued) |
(c) Futures Contracts
Upon entering into a futures contract, the Fund deposits and maintains as collateral such initial margin as required by the exchange on which the transaction is affected. Pursuant to the contract, the Fund agrees to receive from or pay to the broker an amount of cash equal to the daily fluctuation in value of the contract. Such receipts or payments are known as variation margin and are recorded by the Fund as unrealized appreciation or depreciation. When the contract is closed, the Fund records a realized gain or loss equal to the difference between the value of the contract at the time it was opened and the value at the time it was closed.
(d) Currency Translations
The accounting records of the Fund are maintained in U.S. dollars. All assets and liabilities initially expressed in foreign currencies are converted into U.S. dollars at prevailing exchange rates. Purchases and sales of investment securities, dividend and interest income, and certain expenses are translated at the rates of exchange prevailing on the respective dates of such transactions. Changes in the relationship of these foreign currencies to the U.S. dollar can significantly affect the value of the investments and earnings of the Fund. Foreign investments may also subject the Fund to foreign government exchange restrictions, expropriation, taxation, or other political, social or economic developments, all of which could affect the market and/or credit risk of the investments.
The Fund does not isolate that portion of the results of operations resulting from changes in the foreign exchange rates on investments from the fluctuations arising from changes in the market prices of securities held. Such fluctuations are included with the net realized gain or loss and unrealized appreciation or depreciation on investments.
Reported net realized foreign exchange gains and losses arise from sales of foreign currencies and currency gains or losses realized between the trade and settlement dates on investment transactions. Net unrealized appreciation and depreciation arise from changes in the fair values of assets and liabilities other than investments in securities at the fiscal period end, resulting from changes in exchange rates.
(e) Security Transactions
Security transactions are recorded on the trade date for financial reporting purposes. Realized gains and losses from securities transactions are recorded using the identified cost basis. Proceeds from lawsuits related to investment holdings are recorded as a reduction to cost if the securities are still held and as realized gains if no longer held in the Fund. Dividend income is recorded on the ex-dividend date, net of applicable taxes withheld by foreign countries, if any. Taxable non-cash dividends are recorded as dividend income. Interest income, including amortization of premiums and accretion of discounts, is accrued on a daily basis.
30 | THE GUGGENHEIM FUNDS ANNUAL REPORT | |
NOTES TO CONSOLIDATED FINANCIAL STATEMENTS (continued) |
(f) Distributions
Distributions of net investment income and net realized gains, if any, are declared and paid at least annually. Dividends are reinvested in additional shares, unless shareholders request payment in cash. Distributions are recorded on the ex-dividend date and are determined in accordance with U.S. federal income tax regulations which may differ from U.S. GAAP.
(g) Class Allocations
Interest and dividend income, most expenses, all realized gains and losses, and all unrealized appreciation and depreciation are allocated to the classes based upon the value of the outstanding shares in each Class. Certain costs, such as distribution and service fees are charged directly to specific classes. In addition, certain expenses have been allocated to the individual Funds in the Trust based on the respective net assets of each Fund included in the Trust.
(h) Cash
The Fund may leave cash overnight in its cash account with the custodian. Periodically, the Fund may have cash due to the custodian bank as an overdraft balance. A fee is incurred on this overdraft, calculated by multiplying the overdraft by a rate based on the federal funds rate, which was 0.07% at December 31, 2021.
(i) Indemnifications
Under the Fund’s organizational documents, its Trustees and Officers are indemnified against certain liabilities arising out of the performance of their duties to the Trust. In addition, throughout the normal course of business, the Fund enters into contracts that contain a variety of representations and warranties which provide general indemnifications. The Fund’s maximum exposure under these arrangements is unknown, as this would involve future claims that may be made against the Fund and/or its affiliates that have not yet occurred. However, based on experience, the Fund expects the risk of loss to be remote.
Note 2 – Derivatives
As part of its investment strategy, the Fund may utilize a variety of derivative instruments. These investments involve, to varying degrees, elements of market risk and risks in excess of amounts recognized on the Consolidated Statement of Assets and Liabilities. Valuation and accounting treatment of these instruments can be found under Significant Accounting Policies in Note 1 of these Consolidated Notes to Financial Statements.
Derivatives are instruments whose values depend on, or are derived from, in whole or in part, the value of one or more other assets, such as securities, currencies, commodities or indices. Derivative instruments may be used to increase investment flexibility (including to maintain cash reserves while maintaining exposure to certain other assets), for risk management (hedging) purposes, to facilitate trading, to reduce transaction costs and to pursue higher investment returns. Derivative instruments may also be used to mitigate certain investment risks, such
| | THE GUGGENHEIM FUNDS ANNUAL REPORT | 31 |
NOTES TO CONSOLIDATED FINANCIAL STATEMENTS (continued) |
as foreign currency exchange rate risk, interest rate risk and credit risk. U.S. GAAP requires disclosures to enable investors to better understand how and why a Fund uses derivative instruments, how these derivative instruments are accounted for and their effects on the Fund’s financial position and results of operations.
The Fund utilized derivatives for the following purposes:
Hedge: an investment made in order to reduce the risk of adverse price movements in a security, by taking an offsetting position to protect against broad market moves.
Leverage: gaining total exposure to equities or other assets on the long and short sides at greater than 100% of invested capital.
Liquidity: the ability to buy or sell exposure with little price/market impact.
Speculation: the use of an instrument to express macro-economic and other investment views.
For any Fund whose investment strategy consistently involves applying leverage, the value of the Fund’s shares will tend to increase or decrease more than the value of any increase or decrease in the underlying index or other asset. In addition, because an investment in derivative instruments generally requires a small investment relative to the amount of investment exposure assumed, an opportunity for increased net income is created; but, at the same time, leverage risk will increase. The Fund’s use of leverage, through borrowings or instruments such as derivatives, may cause the Fund to be more volatile and riskier than if they had not been leveraged.
Futures Contracts
A futures contract is an agreement to purchase (long) or sell (short) an agreed amount of securities or other instruments at a set price for delivery at a future date. There are significant risks associated with a Fund’s use of futures contracts, including (i) there may be an imperfect or no correlation between the changes in market value of the underlying asset and the prices of futures contracts; (ii) there may not be a liquid secondary market for a futures contract; (iii) trading restrictions or limitations may be imposed by an exchange; and (iv) government regulations may restrict trading in futures contracts. When investing in futures, there is minimal counterparty credit risk to a Fund because futures are exchange-traded and the exchange’s clearinghouse, as counterparty to all exchange-traded futures, guarantees against default. Cash deposits are shown as segregated cash with broker on the Consolidated Statement of Assets and Liabilities; securities held as collateral are noted on the Consolidated Schedule of Investments.
The following table represents the Fund’s use and volume of futures on a monthly basis:
| | | Average Notional Amount | |
Use | �� | Long | | | Short | |
Hedge, Leverage, Liquidity, Speculation | | $ | 81,712,785 | | | $ | 58,360,001 | |
32 | THE GUGGENHEIM FUNDS ANNUAL REPORT | |
NOTES TO CONSOLIDATED FINANCIAL STATEMENTS (continued) |
Derivative Investment Holdings Categorized by Risk Exposure
The following is a summary of the location of derivative investments on the Fund’s Consolidated Statement of Assets and Liabilities as of December 31, 2021:
Derivative Investment Type | Asset Derivatives | Liability Derivatives |
Equity/interest rate/currency/ commodity future contracts | Variation margin on futures contracts | — |
The following tables set forth the fair value of the Fund’s derivative investments categorized by primary risk exposure at December 31, 2021:
Asset Derivative Investments Value |
| | Futures
Equity
Risk* | | | Futures
Foreign
Currency
Exchange
Risk* | | | Futures
Interest
Rate
Risk* | | | Futures
Commodity
Risk* | | | Total Value at
December 31,
2021 | |
| | | $ | 76,355 | | | $ | 24,655 | | | $ | 56,417 | | | $ | 279,881 | | | $ | 437,308 | |
Liability Derivative Investments Value |
| | Futures
Equity
Risk* | | | Futures
Foreign
Currency
Exchange
Risk* | | | Futures
Interest
Rate
Risk* | | | Futures
Commodity
Risk* | | | Total Value at
December 31,
2021 | |
| | | $ | 32,010 | | | $ | 183,521 | | | $ | 88,448 | | | $ | 230,709 | | | $ | 534,688 | |
* | Includes cumulative appreciation (depreciation) of futures contracts as reported on the Consolidated Schedule of Investments. For exchange-traded and centrally-cleared derivatives, variation margin is reported within the Consolidated Statement of Assets and Liabilities. |
The following is a summary of the location of derivative investments on the Fund’s Consolidated Statement of Operations for the year ended December 31, 2021:
Derivative Investment Type | Location of Gain (Loss) on Derivatives |
Equity/interest rate/currency/commodity future contracts | Net realized gain (loss) on futures contracts |
| Net change in unrealized appreciation (depreciation) on futures contracts |
| | THE GUGGENHEIM FUNDS ANNUAL REPORT | 33 |
NOTES TO CONSOLIDATED FINANCIAL STATEMENTS (continued) |
The following is a summary of the Fund’s realized gain (loss) and change in unrealized appreciation (depreciation) on derivative investments recognized on the Consolidated Statement of Operations categorized by primary risk exposure for the year ended December 31, 2021:
Realized Gain (Loss) on Derivative Investments Recognized on the Consolidated Statement of Operations |
| | Futures
Equity
Risk | | | Futures
Foreign
Currency
Exchange
Risk | | | Futures
Interest
Rate
Risk | | | Futures
Commodity
Risk | | | Total | |
| | | $ | 1,186,723 | | | $ | 424,917 | | | $ | (1,721,715 | ) | | $ | 1,688,600 | | | $ | 1,578,525 | |
Change in Unrealized Appreciation (Depreciation) on Derivative Investments
Recognized on the Consolidated Statement of Operations |
| | Futures
Equity
Risk | | | Futures
Foreign
Currency
Exchange
Risk | | | Futures
Interest
Rate
Risk | | | Futures
Commodity
Risk | | | Total | |
| | | $ | (97,194 | ) | | $ | (354,384 | ) | | $ | (101,345 | ) | | $ | (142,017 | ) | | $ | (694,940 | ) |
In conjunction with the use of derivative instruments, the Fund is required to maintain collateral in various forms. Depending on the financial instrument utilized and the broker involved, the Fund uses margin deposits at the broker, cash and/or securities segregated at the custodian bank, discount notes or repurchase agreements allocated to the Fund as collateral.
The Trust has established counterparty credit guidelines and enters into transactions only with financial institutions of investment grade or better. The Trust monitors the counterparty credit risk.
Note 3 – Offsetting
In the normal course of business, the Fund enters into transactions subject to enforceable master netting arrangements or other similar arrangements. Generally, the right to offset in those agreements allows the Fund to counteract the exposure to a specific counterparty with collateral received from or delivered to that counterparty based on the terms of the arrangements. These arrangements provide for the right to liquidate upon the occurrence of an event of default, credit event upon merger or additional termination event.
In order to better define its contractual rights and to secure rights that will help the Fund mitigate its counterparty risk, the Fund may enter into an International Swaps and Derivatives Association, Inc. Master Agreement (“ISDA Master Agreement”) or similar agreement with its derivative contract counterparties. An ISDA Master Agreement is a bilateral agreement between a fund and a counterparty that governs over-the-counter (“OTC”) derivatives, including foreign exchange
34 | THE GUGGENHEIM FUNDS ANNUAL REPORT | |
NOTES TO CONSOLIDATED FINANCIAL STATEMENTS (continued) |
contracts, and typically contains, among other things, collateral posting terms and netting provisions in the event of a default and/or termination event. The provisions of the ISDA Master Agreement typically permit a single net payment in the event of a default (close-out netting) or similar event, including the bankruptcy or insolvency of the counterparty.
For derivatives traded under an ISDA Master Agreement, the collateral requirements are typically calculated by netting the mark-to-market amount for each transaction under such agreement and comparing that amount to the value of any collateral currently pledged by the Fund and the counterparty. For financial reporting purposes, cash collateral that has been pledged to cover obligations of the Fund and cash collateral received from the counterparty, if any, are reported separately on the Consolidated Statement of Assets and Liabilities as segregated cash with broker/receivable for variation margin, or payable for swap settlement/variation margin. Cash and/or securities pledged or received as collateral by the Fund in connection with an OTC derivative subject to an ISDA Master Agreement generally may not be invested, sold or rehypothecated by the counterparty or the Fund, as applicable, absent an event of default under such agreement, in which case such collateral generally may be applied towards obligations due to and payable by such counterparty or the Fund, as applicable. Generally, the amount of collateral due from or to a counterparty must exceed a minimum transfer amount threshold (e.g., $300,000) before a transfer is required to be made. To the extent amounts due to the Fund from its counterparties are not fully collateralized, contractually or otherwise, the Fund bears the risk of loss from counterparty nonperformance. The Fund attempts to mitigate counterparty risk by only entering into agreements with counterparties that they believe to be of good standing and by monitoring the financial stability of those counterparties.
For financial reporting purposes, the Fund does not offset derivative assets and derivative liabilities that are subject to netting arrangements in the Consolidated Statement of Assets and Liabilities. The Fund does not have any derivative financial instruments that are subject to enforceable master netting arrangements as of December 31, 2021.
The Fund has the right to offset deposits against any related derivative liabilities outstanding with each counterparty with the exception of exchange-traded or centrally-cleared derivatives. The following table presents deposits held by others in connection with derivative investments as of December 31, 2021.
Counterparty | Asset Type | | Cash
Pledged | | | Cash
Received | |
Goldman Sachs International | Futures Contracts | | $ | 191,318 | | | $ | — | |
Note 4 – Fair Value Measurement
In accordance with U.S. GAAP, fair value is defined as the price that the Fund would receive to sell an investment or pay to transfer a liability in an orderly transaction with an independent buyer in the principal market, or in the absence of a principal market, the most advantageous market for
| | THE GUGGENHEIM FUNDS ANNUAL REPORT | 35 |
NOTES TO CONSOLIDATED FINANCIAL STATEMENTS (continued) |
the investment or liability. U.S. GAAP establishes a three-tier fair value hierarchy based on the types of inputs used to value assets and liabilities and requires corresponding disclosure. The hierarchy and the corresponding inputs are summarized below:
Level 1 — | quoted prices in active markets for identical assets or liabilities. |
Level 2 — | significant other observable inputs (for example quoted prices for securities that are similar based on characteristics such as interest rates, prepayment speeds, credit risk, etc.). |
Level 3 — | significant unobservable inputs based on the best information available under the circumstances, to the extent observable inputs are not available, which may include assumptions. |
The types of inputs available depend on a variety of factors, such as the type of security and the characteristics of the markets in which it trades, if any. Fair valuation determinations that rely on fewer or no observable inputs require greater judgment. Accordingly, fair value determinations for Level 3 securities require the greatest amount of judgment.
The inputs or methodologies used for valuing securities are not necessarily an indication of the risk associated with investing in those securities. The suitability of the techniques and sources employed to determine fair valuation are regularly monitored and subject to change.
Note 5 – Investment Advisory Agreement and Other Agreements
Under the terms of an investment advisory contract, the Fund pays GI investment advisory fees calculated at an annualized rate of 0.90% of the average daily net assets of the Fund.
GI has contractually agreed to waive the management fee it receives from the Subsidiary in an amount equal to the management fee paid to GI by the Subsidiary. This undertaking will continue in effect for so long as the Fund invests in the Subsidiary, and may not be terminated by GI unless GI obtains the prior approval of the Fund’s Board for such termination. Fees waived under this arrangement are not subject to reimbursement to GI. For the year ended December 31, 2021, the Fund waived $27,946 related to advisory fees in the Subsidiary.
GI pays operating expenses on behalf of the Trust, such as audit and accounting related services, legal services, custody, printing and mailing, among others, on a pass-through basis. Such expenses are allocated to various Funds within the complex based on relative net assets.
The Board has adopted a Distribution Plan applicable to A-Class and P-Class shares for which GFD and other firms that provide distribution and/or shareholder services (“Service Providers”) may receive compensation. If a Service Provider provides distribution services, the Fund will pay distribution fees to GFD at an annual rate not to exceed 0.25% of average daily net assets, pursuant to Rule 12b-1 of the 1940 Act. GFD, in turn, will pay the Service Provider out of its fees. GFD may, at its discretion, retain a portion of such payments to compensate itself for distribution services.
36 | THE GUGGENHEIM FUNDS ANNUAL REPORT | |
NOTES TO CONSOLIDATED FINANCIAL STATEMENTS (continued) |
The Board has adopted a separate Distribution and Shareholder Services Plan applicable to C-Class shares that allows the Fund to pay annual distribution and service fees of 1.00% of the Fund’s C-Class shares average daily net assets. The annual 0.25% service fee compensates a shareholder’s financial adviser for providing ongoing services to the shareholder. The annual distribution fee of 0.75% reimburses GFD for paying the shareholder’s financial adviser an ongoing sales commission. GFD advances the first year’s service and distribution fees to the financial adviser. GFD retains the service and distribution fees on accounts with no authorized dealer of record.
For the year ended December 31, 2021, GFD retained sales charges of $128,027 relating to sales of A-Class shares of the Trust.
If the Fund invests in a fund that is advised by the same adviser or an affiliated adviser, the investing Fund’s adviser has agreed to waive fees at the investing fund level to the extent necessary to offset the proportionate share of any management fee paid by the Fund with respect to its investment in such affiliated fund. Fee waivers will be calculated at the investing Fund level without regard to any expense cap, if any, in effect for the investing Fund. Fees waived under this arrangement are not subject to reimbursement to GI. For the year ended December 31, 2021, the Fund waived $5,675 related to investments in affiliated funds.
Certain trustees and officers of the Trust are also officers of GI and/or GFD. The Trust does not compensate its officers or trustees who are officers, directors and/or employees of GI or GFD.
MUFG Investor Services (US), LLC (“MUIS”) acts as the Fund’s administrator, transfer agent and accounting agent. As administrator, transfer agent and accounting agent, MUIS maintains the books and records of the Fund’s securities and cash. U.S. Bank, N.A. (“U.S. Bank”) acts as the Fund’s custodian. As custodian, U.S. Bank is responsible for the custody of the Fund’s assets. For providing the aforementioned services, MUIS and U.S. Bank are entitled to receive a monthly fee equal to an annual percentage of the Fund’s average daily net assets and out of pocket expenses.
Note 6 – Repurchase Agreements
The Fund transfers uninvested cash balances into a single joint account, the daily aggregate balance of which is invested in one or more repurchase agreements collateralized by obligations of the U.S. Treasury and U.S. government agencies. The joint account includes other Funds in the Guggenheim complex not covered in this report. The collateral is in the possession of the Funds’ custodian and is evaluated to ensure that its market value exceeds, at a minimum, 102% of the original face amount of the repurchase agreements. Each Fund holds a pro rata share of the collateral based on the dollar amount of the repurchase agreement entered into by each Fund.
| | THE GUGGENHEIM FUNDS ANNUAL REPORT | 37 |
NOTES TO CONSOLIDATED FINANCIAL STATEMENTS (continued) |
At December 31, 2021, the repurchase agreements in the joint account were as follows:
Counterparty and
Terms of Agreement | | Face
Value | | | Repurchase
Price | | | Collateral | | Par
Value | | | Fair
Value | |
J.P. Morgan Securities LLC | | | | | | | | | | U.S. Treasury Note | | | | | | | | |
0.05% | | | | | | | | | | 1.25% | | | | | | | | |
Due 01/03/22 | | $ | 132,534,999 | | | $ | 132,535,551 | | | Due 11/30/26 | | $ | 135,013,600 | | | $ | 135,185,818 | |
| | | | | | | | | | | | | | | | | | | |
Barclays Capital, Inc. | | | | | | | | | | U.S. Treasury Inflation Indexed Bond | | | | | | | | |
0.01% | | | | | | | | | | 0.13% | | | | | | | | |
Due 01/03/22 | | | 54,812,529 | | | | 54,812,575 | | | Due 07/15/30 | | | 49,979,168 | | | | 55,908,855 | |
| | | | | | | | | | | | | | | | | | | |
BofA Securities, Inc. | | | | | | | | | | U.S. Treasury Note | | | | | | | | |
0.02% | | | | | | | | | | 2.88% | | | | | | | | |
Due 01/03/22 | | | 49,829,572 | | | | 49,829,655 | | | Due 11/30/25 | | | 47,581,300 | | | | 50,826,225 | |
In the event of counterparty default, the Funds have the right to collect the collateral to offset losses incurred. There is potential loss to the Funds in the event the Funds are delayed or prevented from exercising their rights to dispose of the collateral securities, including the risk of a possible decline in the value of the underlying securities during the period while the Funds seek to assert their rights. GI, acting under the supervision of the Board, reviews the value of the collateral and the creditworthiness of those banks and dealers with which the Funds enter into repurchase agreements to evaluate potential risks.
Note 7 – Federal Income Tax Information
The Fund intends to comply with the provisions of Subchapter M of the Internal Revenue Code applicable to regulated investment companies and will distribute substantially all taxable net investment income and capital gains sufficient to relieve the Fund from all, or substantially all, federal income, excise and state income taxes. Therefore, no provision for federal or state income tax or federal excise tax is required.
Tax positions taken or expected to be taken in the course of preparing the Fund’s tax returns are evaluated to determine whether the tax positions are “more-likely-than-not” of being sustained by the applicable tax authority. Tax positions not deemed to meet the more-likely-than-not threshold would be recorded as a tax benefit or expense in the current year. Management has analyzed the Fund’s tax positions taken, or to be taken, on U.S. federal income tax returns for all open tax years, and has concluded that no provision for income tax is required in the Fund’s consolidated financial statements. The Fund’s U.S. federal income tax returns are subject to examination by the Internal Revenue Service (“IRS”) for a period of three years after they are filed.
The Fund intends to invest up to 25% of its assets in the Subsidiary which is expected to provide the Fund with exposure to the commodities markets within the limitations of the U.S. federal income tax requirements under Subchapter M of the Internal Revenue Code. The Fund has received a private letter ruling from the IRS that concludes that the income the Fund receives
38 | THE GUGGENHEIM FUNDS ANNUAL REPORT | |
NOTES TO CONSOLIDATED FINANCIAL STATEMENTS (continued) |
from the Subsidiary will constitute qualifying income for purposes of Subchapter M of the Internal Revenue Code. The Subsidiary will be classified as a corporation for U.S. federal income tax purposes. A foreign corporation, such as the Subsidiary, will generally not be subject to U.S. federal income taxation unless it is deemed to be engaged in a U.S. trade or business. If, during a taxable year, the Subsidiary’s taxable losses (and other deductible items) exceed its income and gains, the net loss will not pass through to the Fund as a deductible amount for U.S. federal income tax purposes and cannot be carried forward to reduce future income from the Subsidiary in subsequent years.
The tax character of distributions paid during the year ended December 31, 2020 was as follows:
| | Ordinary
Income | | | Long-Term
Capital Gain | | | Return
of Capital | | | Total
Distributions | |
| | | $ | 1,624,179 | | | $ | — | | | $ | — | | | $ | 1,624,179 | |
Note: For U.S. federal income tax purposes, short-term capital gain distributions are treated as ordinary income distributions.
The tax components of distributable earnings/(loss) as of December 31, 2021 were as follows:
| | Undistributed
Ordinary
Income | | | Undistributed
Long-Term
Capital Gain | | | Net Unrealized
Appreciation
(Depreciation) | | | Accumulated
Capital and
Other Losses | | | Total | |
| | | $ | 1,802,000 | | | $ | — | | | $ | (16,896,675 | ) | | $ | (28,093,768 | ) | | $ | (43,188,443 | ) |
For U.S. federal income tax purposes, capital loss carryforwards represent realized losses of the Fund that may be carried forward and applied against future capital gains. The Fund is permitted to carry forward capital losses for an unlimited period and such capital loss carryforwards retain their character as either short-term or long-term capital losses. As of December 31, 2021, capital loss carryforwards for the Fund were as follows:
| | | Unlimited | | | | | |
| | Short-Term | | | Long-Term | | | Total
Capital Loss
Carryforward | |
| | | $ | (5,135,816 | ) | | $ | (22,957,952 | ) | | $ | (28,093,768 | ) |
Net investment income and net realized gains (losses) may differ for financial statement and tax purposes because of temporary or permanent book/tax differences. These differences are primarily due to investments in subsidiaries, foreign currency gains and losses, losses deferred due to wash sales, and the “mark-to-market” of certain derivatives. To the extent these differences
| | THE GUGGENHEIM FUNDS ANNUAL REPORT | 39 |
NOTES TO CONSOLIDATED FINANCIAL STATEMENTS (continued) |
are permanent and would require a reclassification between Paid in Capital and Total Distributable Earnings (Loss), such reclassifications are made in the period that the differences arise. These reclassifications have no effect on net assets or NAV per share.
The following adjustments were made on the Consolidated Statement of Assets and Liabilities as of December 31, 2021 for permanent book/tax differences:
| | Paid In
Capital | | | Total
Distributable
Earnings/(Loss) | |
| | | $ | 1,815,135 | | | $ | (1,815,135 | ) |
At December 31, 2021, the cost of investments for U.S. federal income tax purposes, the aggregate gross unrealized appreciation for all investments for which there was an excess of value over tax cost and the aggregate gross unrealized depreciation for all investments for which there was an excess of tax cost over value, were as follows:
| | Tax
Cost | | | Tax
Unrealized
Appreciation | | | Tax
Unrealized
Depreciation | | | Net Tax
Unrealized
Appreciation/
(Depreciation) | |
| | | $ | 50,372,061 | | | $ | — | | | $ | (16,896,644 | ) | | $ | (16,896,644 | ) |
Note 8 – Securities Transactions
For the year ended December 31, 2021, the cost of purchases and proceeds from sales of investment securities, excluding government securities, short-term investments and derivatives, were as follows:
| | Purchases | | | Sales | |
| | | $ | 4,218,344 | | | $ | 3,300,000 | |
The Fund is permitted to purchase or sell securities from or to certain affiliated funds under specified conditions outlined in procedures adopted by the Board. The procedures have been designed to ensure that any purchase or sale of securities by the Fund from or to another fund or portfolio that is or could be considered an affiliate by virtue of having a common investment adviser (or affiliated investment advisers), common trustees and/or common officers complies with Rule 17a-7 of the 1940 Act. Further, as defined under these procedures, each transaction is effected at the current market price to save costs, where permissible. For the year ended December 31, 2021, the Fund did not engage in purchases and sales of securities, pursuant to Rule 17a-7 of the 1940 Act.
40 | THE GUGGENHEIM FUNDS ANNUAL REPORT | |
NOTES TO CONSOLIDATED FINANCIAL STATEMENTS (continued) |
Note 9 – Line of Credit
The Trust, along with other affiliated trusts, secured an uncommitted $150,000,000 line of credit from U.S. Bank, N.A., which was increased to $200,000,000 on February 10, 2021. On June 7, 2021, the line of credit agreement was renewed and expires on June 6, 2022. This line of credit is reserved for emergency or temporary purposes. Borrowings, if any, under this arrangement bear interest equal to the Prime Rate, minus 2%, which shall be paid monthly, averaging 1.25% for the year ended December 31, 2021. The Fund did not have any borrowings outstanding under this agreement at December 31, 2021.
The average daily balance borrowed for the year ended December 31,2021 was $134.
Note 10 – Legal Proceedings
Tribune Company
Rydex Series Funds has been named as a defendant and a putative member of the proposed defendant class of shareholders in the case entitled Kirschner v. FitzSimons, No. 12-2652 (S.D.N.Y.) (formerly Official Committee of Unsecured Creditors of Tribune Co. v. FitzSimons, Adv. Pro. No. 10-54010 (Bankr. D. Del.)) (the “FitzSimons action”), as a result of ownership by certain series of the Rydex Series Funds of shares in the Tribune Company (“Tribune”) in 2007, when Tribune effected a leveraged buyout transaction (“LBO”) by which Tribune converted to a privately-held company. In his complaint, the plaintiff has alleged that, in connection with the LBO, Tribune insiders and shareholders were overpaid for their Tribune stock using financing that the insiders knew would, and ultimately did, leave Tribune insolvent. The plaintiff has asserted claims against certain insiders, major shareholders, professional advisers, and others involved in the LBO. The plaintiff is also attempting to obtain from former Tribune shareholders, including the Rydex Series Funds, the proceeds they received in connection with the LBO.
In June 2011, a group of Tribune creditors filed multiple actions against former Tribune shareholders involving state law constructive fraudulent conveyance claims arising out of the 2007 LBO (the “SLCFC actions”). Rydex Series Funds has been named as a defendant in one or more of these suits. In those actions, the creditors seek to recover from Tribune’s former shareholders the proceeds received in connection with the 2007 LBO.
The FitzSimons action and the SLCFC actions have been consolidated with the majority of the other Tribune LBO-related lawsuits in a multidistrict litigation proceeding captioned In re Tribune Company Fraudulent Conveyance Litig., No. 11-md-2296 (S.D.N.Y.) (the “MDL Proceeding”).
On September 23, 2013, the District Court granted the defendants’ omnibus motion to dismiss the SLCFC actions, on the basis that the creditors lacked standing. On September 30, 2013, the creditors filed a notice of appeal of the September 23 order. On October 28, 2013, the defendants filed a joint notice of cross-appeal of that same order.
| | THE GUGGENHEIM FUNDS ANNUAL REPORT | 41 |
NOTES TO CONSOLIDATED FINANCIAL STATEMENTS (continued) |
On March 29, 2016, the U.S. Court of Appeals for the Second Circuit issued its opinion on the appeal of the SLCFC actions. The appeals court affirmed the district court’s dismissal of those lawsuits, but on different grounds than the district court. The appeals court held that while the plaintiffs have standing under the U.S. Bankruptcy Code, their claims were preempted by Section 546(e) of the Bankruptcy Code—the statutory safe harbor for settlement payments.
On April 12, 2016, the Plaintiffs in the SLCFC actions filed a petition seeking rehearing en banc before the appeals court. On July 22, 2016, the appeals court denied the petition. On September 9, 2016, the plaintiffs filed a petition for writ of certiorari in the U.S. Supreme Court challenging the Second Circuit’s decision that the safe harbor of Section 546(e) applied to their claims. The shareholder defendants, including the Funds, filed a joint brief in opposition to the petition for certiorari on October 24, 2016. On April 3, 2018, Justice Kennedy and Justice Thomas issued a “Statement” related to the petition for certiorari suggesting that the Second Circuit and/or District Court may want to take steps to reexamine the application of the Section 546(e) safe harbor to the previously dismissed state law constructive fraudulent transfer claims based on the Supreme Court’s decision in Merit Management Group LP v. FTI Consulting, Inc. On April 10, 2018, Plaintiffs filed in the Second Circuit a motion for that court to recall its mandate, vacate its prior decision, and remand to the district court for further proceedings consistent with Merit Management. On April 20, 2018, the shareholder defendants filed an opposition to Plaintiffs’ motion to recall the mandate. On May 15, 2018, the Second Circuit issued an order recalling the mandate “in anticipation of further panel review.” On December 19, 2019, the Second Circuit issued an amended opinion that again affirmed the district court’s ruling on the basis that plaintiffs’ claims were preempted by Section 546(e) of the Bankruptcy Code. Plaintiffs filed a motion for rehearing and rehearing en banc on January 2, 2020. The Second Circuit denied the petition on February 6, 2020. On July 6, 2020, plaintiffs filed a new petition for a writ of certiorari in the U.S. Supreme Court. In that petition, plaintiffs stated that “[t]o make it more likely that there will be a quorum for this petition,” they have “abandon[ed] the case and let the judgment below stand” with respect to certain defendants. That list did not include the Rydex Series Funds. Defendants filed an opposition to the certiorari petition on August 26, 2020, and plaintiffs filed a reply in support of the petition for certiorari on September 8, 2020. On March 12, 2021, the Solicitor General filed an amicus brief recommending that certiorari be denied. Plaintiffs filed a supplemental brief in response to the Solicitor General’s amicus brief on March 31, 2021, and Defendants filed a supplemental brief on April 1, 2021. The Court denied the petition for certiorari on April 19, 2021.
On May 23, 2014, the defendants filed motions to dismiss the FitzSimons action, including a global motion to dismiss Count I, which is the claim brought against former Tribune shareholders for intentional fraudulent conveyance under U.S. federal law. On January 6, 2017, the United States District Court for the Southern District of New York granted the shareholder defendants’ motion to dismiss the intentional fraudulent conveyance claim in the FitzSimons action. In dismissing the intentional fraudulent conveyance claim, the Court denied the plaintiff’s request to amend the complaint. The plaintiff requested that the Court direct entry of a final judgment in order to make
42 | THE GUGGENHEIM FUNDS ANNUAL REPORT | |
NOTES TO CONSOLIDATED FINANCIAL STATEMENTS (continued) |
the order immediately appealable. On February 23, 2017, the Court issued an order stating that it intended to permit an interlocutory appeal of the dismissal order, but would wait to do so until it has resolved outstanding motions to dismiss filed by other defendants.
On July 18, 2017, the plaintiff submitted a letter to the District Court seeking leave to amend its complaint to add a constructive fraudulent transfer claim. The shareholder defendants opposed that request. On August 24, 2017, the Court denied the plaintiff’s request without prejudice to renewal of the request in the event of an intervening change in the law. On March 8, 2018, the plaintiff renewed his request for leave to file a motion to amend the complaint to assert a constructive fraudulent transfer claim based on the Supreme Court’s ruling in Merit Management Group LP v. FTI Consulting, Inc. The shareholder defendants opposed that request. On June 18, 2018 the District Court ordered that the request would be stayed pending further action by the Second Circuit in the SLCFC actions.
On December 18, 2018, plaintiff filed a letter with the District Court requesting that the stay be dissolved in order to permit briefing on the motion to amend the complaint and indicating plaintiff’s intention to file another motion to amend the complaint to reinstate claims for intentional fraudulent transfer. The shareholder defendants opposed that request. On January 14, 2019, the court held a case management conference, during which the court stated that it would not lift the stay prior to further action from the Second Circuit in the SLCFC actions. The court further stated that it would allow the plaintiff to file a motion to amend to try to reinstate its intentional fraudulent transfer claim. On January 23, 2019, the court ordered the parties still facing pending claims to participate in a mediation, to commence on January 28, 2019. The mediation did not result in a settlement of the claims against the shareholder defendants.
On April 4, 2019, plaintiff filed a motion to amend the Fifth Amended Complaint to assert a federal constructive fraudulent transfer claim against certain shareholder defendants. On April 10, 2019, the shareholder defendants filed a brief in opposition to plaintiff’s motion to amend. On April 12, 2019, the plaintiff filed a reply brief. On April 23, 2019, the court denied the plaintiff’s motion to amend. On June 13, 2019, the court entered judgment pursuant to Rule 54(b). On July 12, 2019, the Plaintiff filed a notice of appeal with respect to the dismissal of his claims and the District Court’s denial of his motion for leave to amend. Plaintiff filed an appellate brief on January 7, 2020. The shareholder defendants’ brief was filed on April 27, 2020. Plaintiff filed a reply brief on May 18, 2020. The Court held oral argument on August 24, 2020. On August 20, 2021, the Second Circuit affirmed the District Court’s orders: (1) dismissing the intentional fraudulent conveyance claims against the shareholder-defendants; and (2) denying the plaintiff leave to amend the complaint to add a constructive fraudulent conveyance claim against the shareholder-defendants. Plaintiff filed a petition for rehearing en banc on September 3, 2021. On October 7, 2021, the Second Circuit denied the petition. On January 5, 2022, Plaintiff filed a petition for certiorari in the U.S. Supreme Court. That petition was denied on February 22, 2022.
| | THE GUGGENHEIM FUNDS ANNUAL REPORT | 43 |
NOTES TO CONSOLIDATED FINANCIAL STATEMENTS (concluded) |
None of these lawsuits alleges any wrongdoing on the part of Rydex Series Funds. The following series of Rydex Series Funds held shares of Tribune and tendered these shares as part of Tribune’s LBO: Nova Fund, S&P 500® Pure Value Fund, Multi-Cap Core Equity Fund, S&P 500® Fund, Multi-Hedge Strategies Fund and Hedged Equity Fund (the “Funds”). The value of the proceeds received by the foregoing Funds was $28,220, $109,242, $9,860, $3,400, $1,181,160, and $10,880, respectively. At this stage of the proceedings, Rydex Series Funds is not able to make a reliable predication as to the outcome of these lawsuits or the effect, if any, on a Fund’s net asset value.
Note 11 – COVID-19
The outbreak of COVID-19 and the recovery response causes at times disruption to consumer demand, economic output, and supply chains. There are still travel restrictions, quarantines, and disparate global vaccine distributions. As with other serious economic disruptions, governmental authorities and regulators have responded to this situation with significant fiscal and monetary policy changes. These include providing direct capital infusions into companies, introducing new monetary programs, and considerably lowering interest rates. In some cases, these responses resulted in negative interest rates and higher inflation. Recently, the U.S. and other governments have also made investments and engaged in infrastructure modernization projects that have also increased public debt and spending. These actions, including their possible unexpected or sudden reversal or potential ineffectiveness, could further increase volatility in securities and other financial markets, reduce market liquidity, continue to cause higher inflation, heighten investor uncertainty, and adversely affect the value of the Fund’s investments and the performance of the Fund. These actions also contribute to a risk that asset prices have a higher degree of correlation than historically seen across markets and asset classes. The duration and extent of COVID-19 over the long term cannot be reasonably estimated at this time. The ultimate impact of COVID-19 and the extent to which COVID-19 impacts the Fund will depend on future developments, which are highly uncertain and difficult to predict. Management continues to monitor and evaluate this situation.
Note 12 – Subsequent Events
The Fund evaluated subsequent events through the date the consolidated financial statements were available for issue and determined there were no material events that would require adjustment to or disclosure in the Fund’s consolidated financial statements.
44 | THE GUGGENHEIM FUNDS ANNUAL REPORT | |
REPORT OF INDEPENDENT REGISTERED PUBLIC ACCOUNTING FIRM |
To the Shareholders of Guggenheim Managed Futures Strategy Fund and the Board of Trustees of Rydex Series Funds
Opinion on the Financial Statements
We have audited the accompanying consolidated statement of assets and liabilities of Guggenheim Managed Futures Strategy Fund (the “Fund”) (one of the funds constituting Rydex Series Funds (the “Trust”)), including the consolidated schedule of investments, as of December 31, 2021, and the related consolidated statement of operations for the year then ended, the consolidated statements of changes in net assets for each of the two years in the period then ended, the consolidated financial highlights for each of the five years in the period then ended and the related notes (collectively referred to as the “financial statements”). In our opinion, the financial statements present fairly, in all material respects, the consolidated financial position of the Fund (one of the funds constituting Rydex Series Funds) at December 31, 2021, the consolidated results of its operations for the year then ended, the consolidated changes in its net assets for each of the two years in the period then ended and its consolidated financial highlights for each of the five years in the period then ended, in conformity with U.S. generally accepted accounting principles.
Basis for Opinion
These financial statements are the responsibility of the Trust’s management. Our responsibility is to express an opinion on the Fund’s financial statements based on our audits. We are a public accounting firm registered with the Public Company Accounting Oversight Board (United States) (“PCAOB”) and are required to be independent with respect to the Trust in accordance with the U.S. federal securities laws and the applicable rules and regulations of the Securities and Exchange Commission and the PCAOB.
We conducted our audits in accordance with the standards of the PCAOB. Those standards require that we plan and perform the audit to obtain reasonable assurance about whether the financial statements are free of material misstatement, whether due to error or fraud. The Trust is not required to have, nor were we engaged to perform, an audit of the Trust’s internal control over financial reporting. As part of our audits, we are required to obtain an understanding of internal control over financial reporting, but not for the purpose of expressing an opinion on the effectiveness of the Trust’s internal control over financial reporting. Accordingly, we express no such opinion.
Our audits included performing procedures to assess the risks of material misstatement of the financial statements, whether due to error or fraud, and performing procedures that respond to those risks. Such procedures included examining, on a test basis, evidence regarding the amounts and disclosures in the financial statements. Our procedures included confirmation of securities owned as of December 31, 2021, by correspondence with the custodian, transfer agent, and brokers or by other appropriate auditing procedures where replies from brokers were not received.
| | THE GUGGENHEIM FUNDS ANNUAL REPORT | 45 |
REPORT OF INDEPENDENT REGISTERED PUBLIC ACCOUNTING FIRM (concluded) |
Our audits also included evaluating the accounting principles used and significant estimates made by management, as well as evaluating the overall presentation of the financial statements. We believe that our audits provide a reasonable basis for our opinion.

We have served as the auditor of one or more Guggenheim investment companies since 1979.
Tysons, Virginia
February 28, 2022
46 | THE GUGGENHEIM FUNDS ANNUAL REPORT | |
OTHER INFORMATION (Unaudited) |
Federal Income Tax Information
This information is being provided as required by the Internal Revenue Code. Amounts shown may differ from those elsewhere in the report because of differences in tax and financial reporting practice.
In January 2022, shareholders will be advised on IRS Form 1099 DIV or substitute 1099 DIV as to the federal tax status of the distributions received by shareholders in the calendar year 2021.
Delivery of Shareholder Reports
Paper copies of the Fund’s annual and semi-annual shareholder reports are not sent by mail, unless you specifically request paper copies of the reports from a fund or from your financial intermediary. Instead, the reports are made available on a website, and you are notified by mail each time a report is posted and provided with a website link to access the report.
You may elect to receive all future shareholder reports in paper free of charge. If you hold shares of a fund directly, you can inform the Fund that you wish to receive paper copies of reports by calling 800.820.0888. If you hold shares of a fund through a financial intermediary, please contact the financial intermediary to make this election. Your election to receive reports in paper may apply to all Guggenheim Funds in which you are invested and may apply to all Guggenheim funds held with your financial intermediary.
Proxy Voting Information
A description of the policies and procedures that the Trust uses to determine how to vote proxies relating to securities held in the Fund’s portfolio is available, without charge and upon request, by calling 800.820.0888. This information is also available from the EDGAR database on the SEC’s website at https://www.sec.gov.
Information regarding how the Fund voted proxies relating to portfolio securities during the most recent 12-month period ended June 30 is available without charge, upon request, by calling 800.820.0888. This information is also available from the EDGAR database on the SEC’s website at https://www.sec.gov.
Sector Classification
Information in the Schedule of Investments is categorized by sectors using sector-level Classifications defined by the Bloomberg Industry Classification System, a widely recognized industry classification system provider. The Fund’s registration statement has investment policies relating to concentration in specific sectors/industries. For purposes of these investment policies, the Fund usually classifies sectors/industries based on industry-level Classifications used by widely recognized industry classification system providers such as Bloomberg Industry Classification System, Global Industry Classification Standards and Barclays Global Classification Scheme.
Quarterly Portfolio Schedules Information
The Trust files its complete schedule of portfolio holdings with the SEC for the first and third quarters of each fiscal year as an exhibit to its reports on Form N-PORT, and for reporting periods ended prior to March 31, 2019, filed such information on Form N-Q. The Fund’s Forms N-PORT and N-Q are available on the SEC’s website at https://www.sec.gov. Copies of the portfolio holdings are also available to shareholders, without charge and upon request, by calling 800.820.0888.
| | THE GUGGENHEIM FUNDS ANNUAL REPORT | 47 |
INFORMATION ON BOARD OF TRUSTEES AND OFFICERS (Unaudited) |
A Board of Trustees oversees the Trust, as well as other trusts of GI, in which its members have no stated term of service, and continue to serve after election until resignation. The Statement of Additional Information includes further information about Fund Trustees and Officers, and can be obtained without charge, upon request, by visiting guggenheiminvestments.com or by calling 800.820.0888.
Name, Address*
and Year of Birth | Position(s)
Held with
Trust | Term of Office
and Length of
Time Served** | Principal Occupation(s)
During Past Five Years | Number of
Portfolios
in Fund
Complex
Overseen | Other
Directorships Held
by Trustees*** |
INDEPENDENT TRUSTEES | | |
Randall C. Barnes (1951) | Trustee and Chair of the Valuation Oversight Committee | Since 2019 (Trustee)
Since 2020 (Chair of the Valuation Oversight Committee) | Current: Private Investor (2001-present).
Former: Senior Vice President and Treasurer, PepsiCo, Inc. (1993-1997); President, Pizza Hut International (1991-1993); Senior Vice President, Strategic Planning and New Business Development, PepsiCo, Inc. (1987-1990). | 156 | Current: Advent Convertible and Income Fund (2005-present); Purpose Investments Funds (2013-present).
Former: Guggenheim Enhanced Equity Income Fund (2005-2021); Guggenheim Credit Allocation Fund (2013-2021). |
Angela Brock-Kyle (1959) | Trustee | Since 2016 | Current: Founder and Chief Executive Officer, B.O.A.R.D.S. (2013-present).
Former: Senior Leader, TIAA (1987-2012). | 155 | Current: Bowhead Insurance GP, LLC (2020-present); Hunt Companies, Inc. (2019-present).
Former: Guggenheim Enhanced Equity Income Fund (2019-2021); Guggenheim Credit Allocation Fund (2019-2021); Infinity Property & Casualty Corp. (2014-2018). |
48 | THE GUGGENHEIM FUNDS ANNUAL REPORT | |
INFORMATION ON BOARD OF TRUSTEES AND OFFICERS (Unaudited)(continued) |
Name, Address*
and Year of Birth | Position(s)
Held with
Trust | Term of Office
and Length of
Time Served** | Principal Occupation(s)
During Past Five Years | Number of
Portfolios
in Fund
Complex
Overseen | Other
Directorships Held
by Trustees*** |
INDEPENDENT TRUSTEES - continued | | |
Thomas F. Lydon, Jr. (1960) | Trustee and Chair of the Contracts Review Committee | Since 2005 (Trustee)
Since 2020 (Chair of the Contracts Review Committee) | Current: President, Global Trends Investments (1996-present); Chief Executive Officer, ETF Flows, LLC (2019-present); Chief Executive Officer, Lydon Media (2016-present); Director, GDX Index Partners, LLC (2021-present). | 155 | Current: US Global Investors, Inc. (GROW) (1995-present).
Former: Guggenheim Enhanced Equity Income Fund (2019-2021); Guggenheim Credit Allocation Fund (2019-2021); Harvest Volatility Edge Trust (3) (2017-2019). |
Ronald A. Nyberg (1953) | Trustee and Chair of the Nominating and Governance Committee | Since 2019 | Current: Of Counsel, Momkus LLP (2016-present).
Former: Partner, Nyberg & Cassioppi, LLC (2000-2016); Executive Vice President, General Counsel, and Corporate Secretary, Van Kampen Investments (1982-1999). | 156 | Current: Advent Convertible and Income Fund (2005-present); PPM Funds (2) (2018-present); NorthShore-Edward-Elmhurst Health (2012-present).
Former: Guggenheim Enhanced Equity Income Fund (2005-2021); Guggenheim Credit Allocation Fund (2013-2021); Western Asset Inflation-Linked Opportunities & Income Fund (2004-2020); Western Asset Inflation-Linked Income Fund (2003-2020). |
| | THE GUGGENHEIM FUNDS ANNUAL REPORT | 49 |
INFORMATION ON BOARD OF TRUSTEES AND OFFICERS (Unaudited)(continued) |
Name, Address*
and Year of Birth | Position(s)
Held with
Trust | Term of Office
and Length of
Time Served** | Principal Occupation(s)
During Past Five Years | Number of
Portfolios
in Fund
Complex
Overseen | Other
Directorships Held
by Trustees*** |
INDEPENDENT TRUSTEES - continued | | |
Sandra G. Sponem (1958) | Trustee and Chair of the Audit Committee | Since 2016 (Trustee)
Since 2020 (Chair of the Audit Committee) | Current: Retired.
Former: Senior Vice President and Chief Financial Officer, M.A. Mortenson-Companies, Inc. (2007-2017). | 155 | Current: SPDR Series Trust (81) (2018-present); SPDR Index Shares Funds (30) (2018-present); SSGA Active Trust (14) (2018-present).
Former: Guggenheim Enhanced Equity Income Fund (2019-2021); Guggenheim Credit Allocation Fund (2019-2021); SSGA Master Trust (1) (2018-2020). |
50 | THE GUGGENHEIM FUNDS ANNUAL REPORT | |
INFORMATION ON BOARD OF TRUSTEES AND OFFICERS (Unaudited)(continued) |
Name, Address*
and Year of Birth | Position(s)
Held with
Trust | Term of Office
and Length of
Time Served** | Principal Occupation(s)
During Past Five Years | Number of
Portfolios
in Fund
Complex
Overseen | Other
Directorships Held
by Trustees*** |
INDEPENDENT TRUSTEES - concluded | | |
Ronald E. Toupin, Jr. (1958) | Trustee, Chair of the Board and Chair of the Executive Committee | Since 2019 | Current: Portfolio Consultant (2010-present); Member, Governing Council, Independent Directors Council (2013-present); Governor, Board of Governors, Investment Company Institute (2018-present).
Former: Member, Executive Committee, Independent Directors Council (2016-2018); Vice President, Manager and Portfolio Manager, Nuveen Asset Management (1998-1999); Vice President, Nuveen Investment Advisory Corp. (1992-1999); Vice President and Manager, Nuveen Unit Investment Trusts (1991-1999); and Assistant Vice President and Portfolio Manager, Nuveen Unit Investment Trusts (1988-1999), each of John Nuveen & Co., Inc. (1982-1999). | 155 | Former: Guggenheim Enhanced Equity Income Fund (2005-2021); Guggenheim Credit Allocation Fund (2013-2021); Western Asset Inflation-Linked Opportunities & Income Fund (2004-2020); Western Asset Inflation-Linked Income Fund (2003-2020). |
| | THE GUGGENHEIM FUNDS ANNUAL REPORT | 51 |
INFORMATION ON BOARD OF TRUSTEES AND OFFICERS (Unaudited)(continued) |
Name, Address*
and Year of Birth | Position(s)
Held with
Trust | Term of Office
and Length of
Time Served** | Principal Occupation(s)
During Past Five Years | Number of
Portfolios
in Fund
Complex
Overseen | Other
Directorships Held
by Trustees*** |
Interested Trustee | | |
Amy J. Lee**** (1961) | Trustee, Vice President and Chief Legal Officer | Since 2019 | Current: Interested Trustee, certain other funds in the Fund Complex (2018-present); Chief Legal Officer, certain other funds in the Fund Complex (2014-present); Vice President, certain other funds in the Fund Complex (2007-present); Senior Managing Director, Guggenheim Investments (2012-present).
Former: President and Chief Executive Officer, certain other funds in the Fund Complex (2017-2019); Vice President, Associate General Counsel and Assistant Secretary, Security Benefit Life Insurance Company and Security Benefit Corporation (2004-2012). | 155 | Former: Guggenheim Enhanced Equity Income Fund (2018-2021); Guggenheim Credit Allocation Fund (2018-2021). |
* | The business address of each Trustee is c/o Guggenheim Investments, 227 West Monroe Street, Chicago, Illinois 60606. |
** | Each Trustee serves an indefinite term, until his or her successor is elected and qualified. |
*** | Each Trustee also serves on the Boards of Trustees of Guggenheim Funds Trust, Guggenheim Variable Funds Trust, Guggenheim Strategy Funds Trust, Fiduciary/Claymore Energy Infrastructure Fund, Guggenheim Taxable Municipal Bond & Investment Grade Debt Trust, Guggenheim Strategic Opportunities Fund, Guggenheim Energy & Income Fund, Guggenheim Active Allocation Fund, Rydex Series Funds, Rydex Dynamic Funds, Rydex Variable Trust and Transparent Value Trust. Messrs. Barnes and Nyberg also serve on the Board of Trustees of Advent Convertible & Income Fund. |
**** | This Trustee is deemed to be an “interested person” of the Fund under the 1940 Act by reason of her position with the Fund’s Investment Manager and/or the parent of the Investment Manager. |
52 | THE GUGGENHEIM FUNDS ANNUAL REPORT | |
INFORMATION ON BOARD OF TRUSTEES AND OFFICERS (Unaudited)(continued) |
Name, Address*
and Year of Birth | Position(s)
Held with
Trust | Term of Office
and Length of
Time Served** | Principal Occupation(s) During Past Five Years |
OFFICERS | | | |
Brian E. Binder (1972) | President and Chief Executive Officer | Since 2019 | Current: President and Chief Executive Officer, certain other funds in the Fund Complex (2018-present); President, Chief Executive Officer and Chairman of the Board of Managers, Guggenheim Funds Investment Advisors, LLC (2018-present); President and Chief Executive Officer, Security Investors, LLC (2018-present); Board Member of Guggenheim Partners Fund Management (Europe) Limited (2018-present); Senior Managing Director and Chief Administrative Officer, Guggenheim Investments (2018-present).
Former: Managing Director and President, Deutsche Funds, and Head of US Product, Trading and Fund Administration, Deutsche Asset Management (2013-2018); Managing Director, Head of Business Management and Consulting, Invesco Ltd. (2010-2012). |
James M. Howley (1972) | Assistant Treasurer | Since 2016 | Current: Managing Director, Guggenheim Investments (2004-present); Assistant Treasurer, certain other funds in the Fund Complex (2006-present).
Former: Manager, Mutual Fund Administration of Van Kampen Investments, Inc. (1996-2004). |
Mark E. Mathiasen (1978) | Secretary | Since 2017 | Current: Secretary, certain other funds in the Fund Complex (2007-present); Managing Director, Guggenheim Investments (2007-present). |
Glenn McWhinnie (1969) | Assistant Treasurer | Since 2016 | Current: Vice President, Guggenheim Investments (2009-present); Assistant Treasurer, certain other funds in the Fund Complex (2016-present). |
Michael P. Megaris (1984) | Assistant Secretary | Since 2018 | Current: Assistant Secretary, certain other funds in the Fund Complex (2014-present); Managing Director, Guggenheim Investments (2012-present). |
Elisabeth Miller (1968) | Chief Compliance Officer | Since 2012 | Current: Chief Compliance Officer, certain other funds in the Fund Complex (2012-present); Senior Managing Director, Guggenheim Investments (Vice President, Guggenheim Funds Distributors, LLC (2014-present).
Former: Chief Compliance Officer, Security Investors, LLC and Guggenheim Funds Investment Advisors, LLC (2012-2018); Chief Compliance Officer, Guggenheim Distributors, LLC (2009-2014); Senior Manager, Security Investors, LLC (2004-2014); Senior Manager, Guggenheim Distributors, LLC (2004-2014). |
| | THE GUGGENHEIM FUNDS ANNUAL REPORT | 53 |
INFORMATION ON BOARD OF TRUSTEES AND OFFICERS (Unaudited)(continued) |
Name, Address*
and Year of Birth | Position(s)
Held with
Trust | Term of Office
and Length of
Time Served** | Principal Occupation(s) During Past Five Years |
OFFICERS - continued | | |
Margaux Misantone (1978) | AML Officer | Since 2017 | Current: Chief Compliance Officer, Security Investors, LLC and Guggenheim Funds Investment Advisors, LLC (2018-present); AML Officer, Security Investors, LLC and certain other funds in the Fund Complex (2017-present); Managing Director, Guggenheim Investments (2015-present).
Former: Assistant Chief Compliance Officer, Security Investors, LLC and Guggenheim Funds Investments Advisors, LLC (2015-2018) |
Kimberly J. Scott (1974) | Assistant Treasurer | Since 2016 | Current: Director, Guggenheim Investments (2012-present); Assistant Treasurer, certain other funds in the Fund Complex (2012-present).
Former: Financial Reporting Manager, Invesco, Ltd. (2010-2011); Vice President/Assistant Treasurer, Mutual Fund Administration for Van Kampen Investments, Inc./Morgan Stanley Investment Management (2009-2010); Manager of Mutual Fund Administration, Van Kampen Investments, Inc./Morgan Stanley Investment Management (2005-2009). |
Bryan Stone (1979) | Vice President | Since 2019 | Current: Vice President, certain other funds in the Fund Complex (2014-present); Managing Director, Guggenheim Investments (2013-present).
Former: Senior Vice President, Neuberger Berman Group LLC (2009-2013); Vice President, Morgan Stanley (2002-2009). |
John L. Sullivan (1955) | Chief Financial Officer, Chief Accounting Officer and Treasurer | Since 2016 | Current: Chief Financial Officer, Chief Accounting Officer and Treasurer, certain other funds in the Fund Complex (2010-present); Senior Managing Director, Guggenheim Investments (2010-present).
Former: Managing Director and Chief Compliance Officer, each of the funds in the Van Kampen Investments fund complex (2004-2010); Managing Director and Head of Fund Accounting and Administration, Morgan Stanley Investment Management (2002-2004); Chief Financial Officer and Treasurer, Van Kampen Funds (1996-2004). |
54 | THE GUGGENHEIM FUNDS ANNUAL REPORT | |
INFORMATION ON BOARD OF TRUSTEES AND OFFICERS (Unaudited)(concluded) |
Name, Address*
and Year of Birth | Position(s)
Held with
Trust | Term of Office
and Length of
Time Served** | Principal Occupation(s) During Past Five Years |
OFFICERS - concluded | | |
Jon Szafran (1989) | Assistant Treasurer | Since 2017 | Current: Director, Guggenheim Investments (2017-present); Assistant Treasurer, certain other funds in the Fund Complex (2017-present).
Former: Assistant Treasurer of Henderson Global Funds and Manager of US Fund Administration, Henderson Global Investors (North America) Inc. (“HGINA”), (2017); Senior Analyst of US Fund Administration, HGINA (2014–2017); Senior Associate of Fund Administration, Cortland Capital Market Services, LLC (2013-2014); Experienced Associate, PricewaterhouseCoopers LLP (2012-2013). |
* | The business address of each officer is c/o Guggenheim Investments, 227 West Monroe Street, Chicago, Illinois 60606. |
** | Each officer serves an indefinite term, until his or her successor is duly elected and qualified. |
| | THE GUGGENHEIM FUNDS ANNUAL REPORT | 55 |
GUGGENHEIM INVESTMENTS PRIVACY NOTICE (Unaudited) |
Who We Are
This Privacy Notice describes the data protection practices of Guggenheim Investments. Guggenheim Investments as used herein refers to the affiliated investment management businesses of Guggenheim Partners, LLC: Guggenheim Funds Investment Advisors, LLC, Guggenheim Partners Investment Management, LLC, Guggenheim Funds Distributors, LLC, Security Investors, LLC, Guggenheim Investment Advisors (Europe) Limited, Guggenheim Real Estate, LLC, GS Gamma Advisors, LLC, Guggenheim Partners India Management, LLC, Guggenheim Partners Europe Limited, as well as the funds in the Guggenheim Funds complex (the “Funds”) (“Guggenheim Investments,” “we,” “us,” or “our”).
Guggenheim Partners Investment Management Holdings, LLC, located at 330 Madison Avenue, New York, New York 10017 is the data controller for your information. The affiliates who are also controllers of certain of your information are: Guggenheim Investment Advisors (Europe) Limited, Guggenheim Partners Europe Limited, Guggenheim Partners, LLC, Guggenheim Funds Investment Advisors, LLC, Guggenheim Partners Investment Management, LLC, Guggenheim Funds Distributors, LLC and Security Investors, LLC, as well as the Funds.
Our Commitment to You
Guggenheim Investments considers your privacy our utmost concern. When you become our client or investor, you entrust us with not only your hard-earned money but also with your personal and financial information. Because we have access to your private information, we hold ourselves to the highest standards in its safekeeping and use. We strictly limit how we share your information with others, whether you are a current or former Guggenheim Investments client or investor.
The Information We Collect About You
We collect certain nonpublic personal information about you from information you provide on applications, other forms, our website, and/or from third parties including investment advisors. This information includes Social Security or other tax identification number, assets, income, tax information, retirement and estate plan information, transaction history, account balance, payment history, bank account information, marital status, family relationships, information that we collect on our website through the use of “cookies,” and other personal information that you or others provide to us. We may also collect such information through your inquiries by mail, e-mail or telephone. We may also collect customer due diligence information, as required by applicable law and regulation, through third party service providers.
How We Handle Your Personal Information
The legal basis for using your information as set out in this Privacy Notice is as follows: (a) use of your personal data is necessary to perform our obligations under any contract with you (such as a contract for us to provide financial services to you); or (b) where use of your personal data is not necessary for performance of a contract, use of your personal data is necessary for our
56 | THE GUGGENHEIM FUNDS ANNUAL REPORT | |
GUGGENHEIM INVESTMENTS PRIVACY NOTICE (Unaudited)(continued) |
legitimate interests or the legitimate interests of others (for example, to enforce the legal terms governing our services, operate and market our website and other services we offer, ensure safe environments for our personnel and others, make and receive payments, prevent fraud and to know the customer to whom we are providing the services). Some processing is done to comply with applicable law.
In addition to the specific uses described above, we also use your information in the following manner:
| | ● | We use your information in connection with servicing your accounts. |
| | ● | We use information to respond to your requests or questions. For example, we might use your information to respond to your customer feedback. |
| | ● | We use information to improve our products and services. We may use your information to make our website and products better. We may use your information to customize your experience with us. |
| | ● | We use information for security purposes. We may use your information to protect our company and our customers. |
| | ● | We use information to communicate with you. For example, we will communicate with you about your account or our relationship. We may contact you about your feedback. We might also contact you about this Privacy Notice. We may also enroll you in our email newsletter. |
| | ● | We use information as otherwise permitted by law, as we may notify you. |
| | ● | Aggregate/Anonymous Data. We may aggregate and/or anonymize any information collected through the website so that such information can no longer be linked to you or your device (“Aggregate/Anonymous Information”). We may use Aggregate/Anonymous Information for any purpose, including without limitation for research and marketing purposes, and may also share such data with any third parties, including advertisers, promotional partners, and sponsors. |
We do not sell information about current or former clients or their accounts to third parties. Nor do we share this information, except when necessary to complete transactions at your request, to make you aware of investment products and services that we or our affiliates offer, or as permitted or required by law.
We provide information about you to companies and individuals not affiliated with Guggenheim Investments to complete certain transactions or account changes, or to perform services for us related to your account. For example, if you ask to transfer assets from another financial institution to Guggenheim Investments, we must provide certain information about you to that company to complete the transaction. We provide the third party with only the information necessary to carry out its responsibilities and only for that purpose. And we require these third
| | THE GUGGENHEIM FUNDS ANNUAL REPORT | 57 |
GUGGENHEIM INVESTMENTS PRIVACY NOTICE (Unaudited)(continued) |
parties to treat your private information with the same high degree of confidentiality that we do. To alert you to other Guggenheim Investments products and services, we share your information within our family of affiliated companies. You may limit our sharing with affiliated companies as set out below. We may also share information with any successor to all or part of our business, or in connection with steps leading up to a merger or acquisition. For example, if part of our business was sold we may give customer information as part of that transaction. We may also share information about you with your consent.
We will release information about you if you direct us to do so, if we are compelled by law to do so, or in other circumstances as permitted by law (for example, to protect your account from fraud).
If you close your account(s) or become an inactive client or investor, we will continue to adhere to the privacy policies and practices described in this notice.
Opt-Out Provisions and Your Data Choices
The law allows you to “opt out” of certain kinds of information sharing with third parties. We do not share personal information about you with any third parties that triggers this opt-out right. This means YOU ARE ALREADY OPTED OUT.
When you are no longer our client or investor, we continue to share your information as described in this notice, and you may contact us at any time to limit our sharing by sending an email to CorporateDataPrivacy@GuggenheimPartners.com.
European Union Data Subjects and certain others: In addition to the choices set forth above, residents of the European Union and certain other jurisdictions have certain rights to (1) request access to or rectification or deletion of information we collect about them, (2) request a restriction on the processing of their information, (3) object to the processing of their information, or (4) request the portability of certain information. To exercise these or other rights, please contact us using the contact information below. We will consider all requests and provide our response within the time period stated by applicable law. Please note, however, that certain information may be exempt from such requests in some circumstances, which may include if we need to keep processing your information for our legitimate interests or to comply with a legal obligation. We may request you provide us with information necessary to confirm your identity before responding to your request.
Residents of France and certain other jurisdictions may also provide us with instructions regarding the manner in which we may continue to store, erase and share your information after your death, and where applicable, the person you have designated to exercise these rights after your death.
58 | THE GUGGENHEIM FUNDS ANNUAL REPORT | |
GUGGENHEIM INVESTMENTS PRIVACY NOTICE (Unaudited)(continued) |
How We Protect Privacy Online
We take steps to protect your privacy when you use our web site – www.guggenheiminvestments.com – by using secure forms of online communication, including encryption technology, Secure Socket Layer (SSL) protocol, firewalls and user names and passwords. These safeguards vary based on the sensitivity of the information that we collect and store. However, we cannot and do not guarantee that these measures will prevent every unauthorized attempt to access, use, or disclose your information since despite our efforts, no Internet and/or other electronic transmissions can be completely secure. Our web site uses “http cookies”—tiny pieces of information that we ask your browser to store. We use cookies for session management and security features on the Guggenheim Investments web site. We do not use them to pull data from your hard drive, to learn your e-mail address, or to view data in cookies created by other web sites. We will not share the information in our cookies or give others access to it. See the legal information area on our web site for more details about web site security and privacy features.
How We Safeguard Your Personal Information and Data Retention
We restrict access to nonpublic personal information about you to our employees and in some cases to third parties (for example, the service providers described above) as permitted by law. We maintain strict physical, electronic and procedural safeguards that comply with federal standards to guard your nonpublic personal information.
We keep your information for no longer than necessary for the purposes for which it is processed. The length of time for which we retain information depends on the purposes for which we collected and use it and/or as required to comply with applicable laws. Information may persist in copies made for backup and business continuity purposes for additional time.
International Visitors
If you are not a resident of the United States, please be aware that your information may be transferred to, stored and processed in the United States where our servers are located and our databases are operated. The data protection and other laws of the United States and other countries might not be as comprehensive as those in your country.
In such cases, we ensure that a legal basis for such a transfer exists and that adequate protection is provided as required by applicable law, for example, by using standard contractual clauses or by transferring your data to a jurisdiction that has obtained an adequacy finding. Individuals whose data may be transferred on the basis of standard contractual clauses may contact us as described below.
We’ll Keep You Informed
If you have any questions or concerns about how we treat your personal data, we encourage you to consult with us first. You may also contact the relevant supervisory authority.
| | THE GUGGENHEIM FUNDS ANNUAL REPORT | 59 |
GUGGENHEIM INVESTMENTS PRIVACY NOTICE (Unaudited)(concluded) |
We reserve the right to modify this policy at any time and will inform you promptly of material changes. You may access our privacy policy from our web site at www.guggenheiminvestments.com. Should you have any questions regarding our privacy policy, contact us by email at CorporateDataPrivacy@GuggenheimPartners.com.
60 | THE GUGGENHEIM FUNDS ANNUAL REPORT | |
This page intentionally left blank.
This page intentionally left blank.
This page intentionally left blank.
This page intentionally left blank.
This page intentionally left blank.
Item 2. Code of Ethics.
The registrant’s Board of Trustees has adopted a code of ethics that applies to the registrant’s principal executive officer and principal financial officer. No substantive amendments were approved or waivers were granted to the Code during the period covered by this report. The Code is filed as an exhibit to this Form N-CSR.
Item 3. Audit Committee Financial Expert.
The registrant's Board of Trustees has determined that it has at least one audit committee financial expert serving on its audit committee (the “Audit Committee”), Sandra G. Sponem. Ms. Sponem is “independent,” meaning that she is not an “interested person” of the Registrant (as that term is defined in Section 2(a)(19) of the Investment Company Act of 1940, as amended) and she does not accept any consulting, advisory, or other compensatory fee from the Registrant (except in her capacity as a Board or committee member).
(Under applicable securities laws, a person who is determined to be an audit committee financial expert will not be deemed an "expert" for any purpose, including without limitation for the purposes of Section 11 of the Securities Act of 1933, as amended, as a result of being designated or identified as an audit committee financial expert. The designation or identification of a person as an audit committee financial expert does not impose on such person any duties, obligations, or liabilities that are greater than the duties, obligations, and liabilities imposed on such person as a member of the Audit Committee and Board of Trustees in the absence of such designation or identification. The designation or identification of a person as an audit committee financial expert does not affect the duties, obligations or liability of any other member of the Audit Committee or Board of Trustees.)
Item 4. Principal Accountant Fees and Services.
(a) Audit Fees. The aggregate Audit Fees billed by the registrant’s principal accountant for professional services rendered for the audit of the annual financial statements or services that are normally provided by the accountant in connection with statutory and regulatory filings or engagements for the fiscal years ended December 31, 2021 and December 31, 2020 were $96,915 and $96,915, respectively.
(b) Audit Related Fees. The aggregate Audit-Related Fees billed by the registrant’s principal accountant for assurance and related services that are reasonably related to the performance of the audit of the registrant’s financial statements and are not reported under paragraph (a) of this Item for the fiscal years ended December 31, 2021 and December 31, 2020 were $0 and $0, respectively.
The aggregate fees billed in the Reporting Periods for assurance and related services by the Auditor to the registrant’s investment adviser (not including any sub-investment adviser whose role is primarily portfolio management and is subcontracted with or overseen by another investment adviser), and any entity controlling, controlled by or under common control with the investment adviser that provides ongoing services to the registrant (“Service Affiliates”) which required pre-approval by the Audit Committee which related to the review of the transfer agent function for the fiscal years ended December 31, 2021 and December 31, 2020 were $0 and $0, respectively.
(c) Tax Fees: The aggregate Tax Fees billed by the registrant’s principal accountant for professional services rendered for tax compliance, tax advice, and tax planning, including preparation of tax returns and distribution assistance, for the fiscal years ended December 31, 2021 and December 31, 2020 were $40,229, and $36,979, respectively. These services consisted of [(i) preparation of U.S. federal, state and excise tax returns; (ii) U.S. federal and state tax planning, advice and assistance regarding statutory, regulatory or administrative developments, (iii) tax advice regarding tax qualification matters and/or treatment of various financial instruments held or proposed to be acquired and (iv) review of U.S. federal excise distribution calculations].
(d) All Other Fees. The aggregate All Other Fees billed by the registrant’s principal accountant for products and services provided by the principal accountant, other than the services reported in paragraphs (a) through (c) of this Item, for the fiscal years ended December 31, 2021 and December 31, 2020 were $0 and $0, respectively.
(e) Audit Committee Pre-Approval Policies and Procedures.
(1) Audit Committee pre-approval policies and procedures:
To fulfill its responsibilities and duties the Audit Committee (the “Committee”) shall:
| 1. | Pre-Approval Policy (Trusts). Pre-approve any engagement of the independent auditors to provide any services, other than “prohibited non-audit services,” to the Trust, including the fees and other compensation to be paid to the independent auditors (unless an exception is available under Rule 2-01 of Regulation S-X). |
| (a) | The categories of services to be reviewed and considered for pre-approval include those services set forth under Section II.A.1. of the Background and Definitions for Audit Committee Charter (collectively, “Identified Services”). |
| (b) | The Committee has pre-approved Identified Services for which the estimated fees are less than $25,000. |
| (c) | For Identified Services with estimated fees of $25,000 or more, but less than $50,000, the Chair or any member of the Committee designated by the Chair is hereby authorized to pre-approve such Identified Services on behalf of the Committee. |
| (d) | For Identified Services with estimated fees of $50,000 or more, such Identified Services require pre-approval by the Committee. |
| (e) | All requests for Identified Services to be provided by the independent auditor that were pre-approved by the Committee shall be submitted to the Principal/Chief Accounting Officer (“CAO”) of the Trust by the independent auditor using the pre-approval request form. The Trust’s CAO will determine whether such services are included within the list of services that have received the general pre-approval of the Committee. |
| (f) | The independent auditors or the CAO of the Trust (or an officer of the Trust who reports to the CAO) shall report to the Committee at each of its regular scheduled meetings all audit, audit-related and permissible non-audit services initiated since the last such report (unless the services were contained in the initial audit plan, as previously presented to, and approved by, the Committee). The report shall include a general description of the services and projected fees, and the means by which such services were approved by the Committee (including the particular category of Identified Services under which pre-approval was obtained). |
| 2. | Pre-Approval Policy (Adviser or Any Control Affiliate). Pre-approve any engagement of the independent auditors, including the fees and other compensation to be paid to the independent auditors, to provide any non-audit services to the Adviser (or any “control affiliate” of the Adviser providing ongoing services to the Trust), if the engagement relates directly to the operations or financial reporting of the Trust (unless an exception is available under Rule 2-01 of Regulation S-X). |
| (a) | The Chair or any member of the Committee designated by the Chair may grant the pre-approval for non-audit services to the Adviser (or any “control affiliate” of the Adviser providing ongoing services to the Trust) relating directly to the operations or financial reporting of the Trust for which the estimated fees are less than $25,000. All such delegated pre-approvals shall be presented to the Committee no later than the next Committee meeting. |
| (b) | For non-audit services to the Adviser (or any “control affiliate” of the Adviser providing ongoing services to the Trust) relating directly to the operations or financial reporting of the Trust for which the estimated fees are $25,000 or more, such services require pre-approval by the Committee. |
| a. | Pre-Approval Requirements |
| i. | Categories of Services to be Reviewed and Considered for Pre-Approval |
| a. | Annual financial statement audits |
| b. | Seed audits (related to new product filings, as required) |
| c. | SEC and regulatory filings and consents |
| a. | Accounting consultations |
| b. | Fund merger/reorganization support services |
| c. | Other accounting related matters |
| d. | Agreed upon procedures reports |
| f. | Other internal control reports |
| a. | Recurring tax services: |
| i. | Preparation of Federal and state income tax returns, including extensions |
| ii. | Preparation of calculations of taxable income, including fiscal year tax designations |
| iii. | Preparation of annual Federal excise tax returns (if applicable) |
| iv. | Preparation of calendar year excise distribution calculations |
| v. | Calculation of tax equalization on an as-needed basis |
| vi. | Preparation of monthly/quarterly estimates of tax undistributed position for closed-end funds |
| vii. | Preparation of the estimated excise distribution calculations on an as-needed basis |
| viii. | Preparation of calendar year shareholder reporting designations on Form 1099 |
| ix. | Preparation of quarterly Federal, state and local and franchise tax estimated tax payments on an as-needed basis |
| x. | Preparation of state apportionment calculations to properly allocate Fund taxable income among the states for state tax filing purposes |
| xi. | Assistance with management’s identification of passive foreign investment companies (PFICs) for tax purposes |
| b. | Permissible non-recurring tax services upon request: |
| i. | Assistance with determining ownership changes which impact a Fund’s utilization of loss carryforwards |
| ii. | Assistance with corporate actions and tax treatment of complex securities and structured products |
| iii. | Assistance with IRS ruling requests and calculation of deficiency dividends |
| iv. | Conduct training sessions for the Adviser’s internal tax resources |
| v. | Assistance with Federal, state, local and international tax planning and advice regarding the tax consequences of proposed or actual transactions |
| vi. | Tax services related to amendments to Federal, state and local returns and sales and use tax compliance |
| vii. | RIC qualification reviews |
| viii. | Tax distribution analysis and planning |
| ix. | Tax authority examination services |
| x. | Tax appeals support services |
| xi. | Tax accounting methods studies |
| xii. | Fund merger, reorganization and liquidation support services |
| xiii. | Tax compliance, planning and advice services and related projects |
| xiv. | Assistance with out of state residency status |
| xv. | Provision of tax compliance services in India for Funds with direct investments in India |
(2) None of the services described in each of Items 4(b) through (d) were approved by the Audit Committee pursuant to paragraph (c)(7)(i)(C) of Rule 2-01 of Regulation S-X
(f) Not applicable.
(g) Non-Audit Fees. The aggregate non-audit fees billed by the registrant’s accountant for the most recent fiscal year and the preceding fiscal year for services rendered to the registrant, the investment advisor, and any entity controlling, controlled by, or under common control with the advisor that provides ongoing services to the registrant were $40,229, and $36,979, respectively. These aggregate fees were less than the aggregate fees billed for the same periods by the registrant’s principal accountant for audit services rendered to the registrant, the investment advisor, and any entity controlling, controlled by, or under common control with the advisor that provides ongoing services to the registrant.
(h) Auditor Independence. The registrant’s Audit Committee was provided with information relating to the provision of non-audit services by Ernst & Young, LLP to the registrant’s investment adviser (not including any sub adviser whose role is primarily portfolio management and is subcontracted with or overseen by another investment adviser), and any entity controlling, controlled by, or under common control with the investment adviser that provides ongoing services to the registrant that were not pre-approved by the Audit Committee so that a determination could be made whether the provision of such services is compatible with maintaining Ernst & Young, LLP’s independence
Item 5. Audit Committee of Listed Registrants.
Not applicable.
Item 6. Investments.
Schedule of Investments is included as part of the report to shareholders filed under Item 1 of this form.
Item 7. Disclosure of Proxy Voting Policies and Procedures for Closed-End Management Investment Companies.
Not applicable.
Item 8. Portfolio Managers of Closed-End Management Investment Companies.
Not applicable.
Item 9. Purchases of Equity Securities by Closed-End Management Investment Company and Affiliated Purchasers.
Not applicable.
Item 10. Submission of Matters to a Vote of Security Holders.
The registrant does not currently have in place procedures by which shareholders may recommend nominees to the registrant’s board.
There have been no changes to the procedures by which shareholders may recommend nominees to the registrant’s board.
Item 11. Controls and Procedures.
(a) The registrant’s President (principal executive officer) and Treasurer (principal financial officer) have evaluated the registrant’s disclosure controls and procedures (as defined in Rule 30a-3(c) under the Investment Company Act) as of a date within 90 days of this filing and have concluded that based on such evaluation as required by Rule 30a-3(b) under the Investment Company Act, that the registrant’s disclosure controls and procedures were effective as of that date in ensuring that information required to be disclosed by the registrant in this Form N-CSR was recorded, processed, summarized, and reported within the time periods specified in the Securities and Exchange Commission’s rules and forms.
(b) The registrant’s principal executive officer and principal financial officer are aware of no change in the registrant’s internal control over financial reporting that occurred during the period covered by this report that has materially affected, or is reasonably likely to materially affect, the registrant’s internal control over financial reporting.
Item 12. Disclosure of Securities Lending Activities for Closed-End Management Investment Companies.
Not Applicable.
Item 13. Exhibits.
(a)(1) The registrant’s code of ethics pursuant to Item 2 of Form N-CSR is attached.
(a)(2) Separate certifications by the President (principal executive officer) and Treasurer (principal financial officer) of the registrant as required by Rule 30a-2(a) under the Act (17 CFR 270.30a-2(a)) are attached.
(b) A certification by the registrant’s President (principal executive officer) and Treasurer (principal financial officer) as required by Rule 30a-2(b) under the Act (17 CFR 270.30a-2(b)) is attached.
SIGNATURES
Pursuant to the requirements of the Securities Exchange Act of 1934 and the Investment Company Act of 1940, the registrant has duly caused this report to be signed on its behalf by the undersigned, thereunto duly authorized.
| (Registrant) | Rydex Series Funds | |
| | | |
| By (Signature and Title)* | /s/ Brian E. Binder | |
| | Brian E. Binder, President and Chief Executive Officer | |
| | | |
| Date | March 10, 2022 | |
Pursuant to the requirements of the Securities Exchange Act of 1934 and the Investment Company Act of 1940, this report has been signed below by the following persons on behalf of the registrant and in the capacities and on the dates indicated.
| By (Signature and Title)* | /s/ Brian E. Binder | |
| Brian E. Binder, President and Chief Executive Officer | |
| | | |
| Date | March 10, 2022 | |
| | | |
| By (Signature and Title)* | /s/ John L. Sullivan | |
| | John L. Sullivan, Chief Financial Officer, Chief Accounting Officer, and Treasurer | |
| | | |
| Date | March 10, 2022 | |
| * | Print the name and title of each signing officer under his or her signature. |

